UNITED STATES
SECURITIES AND EXCHANGE COMMISSION
Washington, D.C. 20549
FORM 10-K
x | ANNUAL REPORT PURSUANT TO SECTION 13 OR 15(d) OF THE SECURITIES EXCHANGE ACT OF 1934 |
For the fiscal year ended December 31, 2015
OR
¨ | TRANSITION REPORT PURSUANT TO SECTION 13 OR 15(d) OF THE SECURITIES EXCHANGE ACT OF 1934 |
For the transition period from to
Commission File Number: 0-024399
UNITED COMMUNITY FINANCIAL CORP.
(Exact name of registrant as specified in its charter)
Ohio | | 34-1856319 |
(State or other jurisdiction of incorporation or organization) | | (I.R.S. Employer Identification Number) |
275 West Federal Street, Youngstown, Ohio | | 44503 |
(Address of principal executive offices) | | (Zip Code) |
Registrant’s telephone number: (330) 742-0500
Securities registered pursuant to Section 12(b) of the Act:
Common shares, no par value per share | | Nasdaq Global Market |
(Title of Class) | | (Name of each exchange on which registered) |
Securities registered pursuant to Section 12(g) of the Act:
None
(Title of Class)
Indicate by checkmark if the registrant is a well-known seasoned issuer, as defined in Rule 405 of the Securities Act. Yes ¨ No x
Indicate by checkmark if the registrant is not required to file reports pursuant to Section 13 or 15(d) of the Act. Yes ¨ No x
Indicate by check mark whether the registrant (1) has filed all reports required to be filed by Section 13 or 15(d) of the Securities Exchange Act of 1934 during the preceding 12 months (or for such shorter period that the registrant was required to file such reports), and (2) has been subject to such filing requirements for the past 90 days. Yes x No ¨
Indicate by checkmark whether the registrant has submitted electronically and posted on its corporate website, if any, every Interactive Data File required to be submitted and posted pursuant to Rule 405 of Regulation S-T (§232.405 of this chapter) during the preceding 12 months or for such shorter period that the registrant was required to submit and post such files). Yes x No ¨
Indicate by checkmark if disclosure of delinquent filers pursuant to Item 405 of Regulation S-K (§229.405 of this chapter) is not contained herein, and will not be contained, to the best of the registrant’s knowledge, in definitive proxy or information statements incorporated by reference in Part III of this Form 10-K or any amendment to this 10-K. ¨
Indicate by check mark whether the registrant is a large accelerated filer, an accelerated filer, or a non-accelerated filer or a smaller reporting company. See definitions of “large accelerated filer”, “accelerated filer”, and “smaller reporting company” in Rule 12b-2 of the Exchange Act (Check one):
Large accelerated filer ¨ | Accelerated filer x | Non-accelerated filer ¨ | Small reporting company ¨ |
Indicate by checkmark whether the registrant is a shell company (as defined in Rule 12b-2 of the Act.). Yes ¨ No x
The aggregate market value of the voting and non-voting common equity held by non-affiliates computed by reference to the last reported sale on June 30, 2015 was approximately $248.0 million. (The exclusion from such amount of the market value of the shares owned by any person shall not be deemed an admission by the registrant that such person is an affiliate of the registrant.)
As of March 4, 2016, there were 47,634,899 of the Registrant’s Common Shares outstanding.
DOCUMENTS INCORPORATED BY REFERENCE
Part III of Form 10-K - Portions of the Proxy Statement for the 2016 Annual Meeting of Shareholders
TABLE OF CONTENTS
PART I
DISCUSSION OF FORWARD-LOOKING STATEMENTS
When used in this Form 10-K, the words or phrases “will likely result,” “are expected to,” “will continue,” “is anticipated,” “estimate,” “project” or similar expressions are intended to identify “forward-looking statements” within the meaning of the Private Securities Litigation Reform Act of 1995. Such statements are subject to certain risks and uncertainties, including government intervention in the U.S. financial markets, changes in economic conditions in the Company’s market area, changes in policies by regulatory agencies, fluctuations in interest rates, demand for loans in the Company’s market area and competition, that could cause actual results to differ materially from results presently anticipated or projected. United Community cautions readers not to place undue reliance on any such forward-looking statements, which speak only as of the date made. The Company advises readers that the factors listed above could affect United Community’s financial performance and could cause the Company’s actual results for future periods to differ materially from any opinions or statements expressed with respect to future periods in any current statements.
United Community does not undertake, and specifically disclaims any obligation, to release publicly the result of any revisions that may be made to any forward-looking statements to reflect events or circumstances after the date of such statements or to reflect the occurrence of anticipated or unanticipated events.
GENERAL
United Community Financial Corp. (United Community) was incorporated in the State of Ohio in February 1998 for the purpose of owning all of the outstanding capital stock of The Home Savings and Loan Company of Youngstown, Ohio (Home Savings or the Bank) issued upon the conversion of Home Savings from a mutual savings association to a permanent capital stock savings association (Conversion). The Conversion was completed on July 8, 1998. The term Company is used in this Form 10-K to refer to United Community and Home Savings, collectively.
The contents of our website are not incorporated into, or otherwise made a part of, this Annual Report on Form 10-K. Our filings with the SEC may be read and copied at the SEC’s Public Reference Room at 100 F Street, NE, Washington, DC 20549. Information on the operation of the Public Reference Room may be obtained by calling 1-800-SEC-0330. These filings are also available on the SEC’s web-site at http://www.sec.gov free of charge as soon as reasonably practicable after we have filed the above referenced reports.
United Community’s Internet site, http://www.ucfconline.com, contains a hyperlink to the Securities and Exchange Commission (SEC) where United Community’s annual report on Form 10-K, quarterly reports on Form 10-Q, current reports on Form 8-K, Section 16 Insider Reports and amendments to those reports filed or furnished pursuant to Section 13(a) or 15(d) of the Securities Exchange Act of 1934 are available free of charge as soon as reasonably practicable after United Community has filed the report with the SEC.
As a unitary thrift holding company, United Community is subject to regulation, supervision and examination by the Board of Governors of the Federal Reserve System (FRB) and the SEC. United Community’s primary activity is holding the common shares of Home Savings. Consequently, the following discussion focuses primarily on the business of Home Savings.
Home Savings was organized as a mutual savings association under Ohio law in 1889. Currently, Home Savings is an Ohio state-chartered savings bank, subject to supervision and regulation by the Federal Deposit Insurance Corporation (FDIC) and the Division of Financial Institutions of the Ohio Department of Commerce (Ohio Division). Home Savings is a member of the Federal Home Loan Bank of Cincinnati (FHLB) and the deposits of Home Savings are insured up to applicable limits by the FDIC.
Home Savings conducts business from its main office located in Youngstown, Ohio, and through 31 retail banking offices and loan production centers located throughout Ohio and western Pennsylvania. The principal business of Home Savings is the origination of mortgage loans, including construction loans, on residential and nonresidential real estate located in Home Savings’ primary market area, which consists of Ashland, Columbiana, Cuyahoga, Erie, Franklin, Geauga, Huron, Lake, Mahoning, Portage, Richland, Stark, Summit and Trumbull Counties in Ohio and Allegheny and Beaver Counties in Pennsylvania. In addition to real estate lending, Home Savings originates commercial loans and various types of consumer loans. For liquidity and interest rate risk management purposes, Home Savings invests in various financial instruments as discussed below under the heading Investment Activities. Funds for lending
1
and other investment activities are obtained primarily from retail deposits, which are insured up to applicable limits by the FDIC, principal repayments of loans, borrowings from the FHLB, repurchase agreements and maturities of securities.
Interest on loans and other investments is Home Savings’ primary source of income. Home Savings’ principal expenses are interest paid on deposit accounts and other borrowings, as well as salaries and benefits paid to employees. Operating results are dependent to a significant degree on the net interest income of Home Savings, which is the difference between interest earned on loans and other investments and interest paid on deposits and borrowed funds. Like most financial institutions, Home Savings’ interest income and interest expense can be affected significantly by general economic conditions and by the policies of various regulatory authorities.
From August 8, 2008 until July 2, 2013, United Community was subject to an Order to Cease and Desist, as amended, and from July 9, 2013 to January 8, 2014 a Memorandum of Understanding. The Order and Memorandum of Understanding generally restricted United Community’s ability to pay dividends, repurchase shares or issue debt without the FRB’s (as successor to the Office of Thrift Supervision) prior approval.
As of December 31, 2015, the FDIC categorized Home Savings as well capitalized.
On January 29, 2016, United Community acquired James & Sons Insurance. James & Sons Insurance is an insurance agency that offers a wide variety of insurance products for business and residential customers, which include, auto, homeowners, life-health, commercial, surety bonds, and aviation. This transaction marks the initial step in the formation of The Home Savings Insurance Group. Home Savings intends to expand the insurance business via organic growth coupled with a selective acquisition strategy.
LENDING ACTIVITIES
General. Home Savings’ principal lending activity is the origination of conventional residential real estate loans secured by real estate located in Home Savings’ primary market area. In addition to residential real estate lending, Home Savings originates commercial real estate, commercial and industrial loans, and various types of consumer loans, including home equity loans, loans secured by savings accounts, motor vehicles, boats and recreational vehicles and unsecured loans.
2
Loan Portfolio Composition. The following table presents certain information regarding the composition of Home Savings’ loan portfolio at the dates indicated:
| | At December 31, | |
| | 2015 | | | 2014 | | | 2013 | | | 2012 | | | 2011 | |
| | Amount | | | Percent of total loans | | | Amount | | | Percent of total loans | | | Amount | | | Percent of total loans | | | Amount | | | Percent of total loans | | | Amount | | | Percent of total loans | |
| | (Dollars in thousands) | |
Commercial Loans | | | | | | | | | | | | | | | | | | | | | | | | | | | | | | | | | | | | | | | | |
Multifamily | | $ | 80,170 | | | | 6.02 | % | | $ | 60,546 | | | | 5.20 | % | | $ | 54,485 | | | | 5.19 | % | | $ | 80,923 | | | | 7.45 | % | | $ | 120,991 | | | | 8.52 | % |
Nonresidential | | | 175,456 | | | | 13.17 | % | | | 121,595 | | | | 10.44 | % | | | 131,251 | | | | 12.52 | % | | | 138,188 | | | | 12.72 | % | | | 276,198 | | | | 19.44 | % |
Land | | | 9,301 | | | | 0.70 | % | | | 9,484 | | | | 0.81 | % | | | 9,683 | | | | 0.92 | % | | | 15,808 | | | | 1.46 | % | | | 23,222 | | | | 1.64 | % |
Construction | | | 38,812 | | | | 2.91 | % | | | 16,064 | | | | 1.38 | % | | | 4,452 | | | | 0.42 | % | | | 14,421 | | | | 1.33 | % | | | 41,262 | | | | 2.91 | % |
Secured | | | 63,182 | | | | 4.74 | % | | | 45,088 | | | | 3.87 | % | | | 25,714 | | | | 2.45 | % | | | 24,243 | | | | 2.23 | % | | | 25,120 | | | | 1.77 | % |
Unsecured | | | 2,831 | | | | 0.21 | % | | | 134 | | | | 0.01 | % | | | 427 | | | | 0.04 | % | | | 2,300 | | | | 0.21 | % | | | 5,026 | | | | 0.35 | % |
Total commercial loans | | | 369,752 | | | | 27.75 | % | | | 252,911 | | | | 21.71 | % | | | 226,012 | | | | 21.54 | % | | | 275,883 | | | | 25.40 | % | | | 491,819 | | | | 34.63 | % |
Residential Mortgage Loans | | | | | | | | | | | | | | | | | | | | | | | | | | | | | | | | | | | | | | | | |
One-to four-family | | | 733,685 | | | | 55.06 | % | | | 694,105 | | | | 59.58 | % | | | 585,025 | | | | 55.76 | % | | | 577,249 | | | | 53.14 | % | | | 667,375 | | | | 46.99 | % |
Construction | | | 40,898 | | | | 3.07 | % | | | 37,113 | | | | 3.19 | % | | | 48,897 | | | | 4.66 | % | | | 18,431 | | | | 1.70 | % | | | 22,605 | | | | 1.59 | % |
Total residential mortgage loans | | | 774,583 | | | | 58.13 | % | | | 731,218 | | | | 62.77 | % | | | 633,922 | | | | 60.42 | % | | | 595,680 | | | | 54.84 | % | | | 689,980 | | | | 48.58 | % |
Consumer Loans | | | | | | | | | | | | | | | | | | | | | | | | | | | | | | | | | | | | | | | | |
Home Equity | | | 161,338 | | | | 12.11 | % | | | 154,776 | | | | 13.28 | % | | | 159,795 | | | | 15.22 | % | | | 177,230 | | | | 16.33 | % | | | 191,827 | | | | 13.50 | % |
Auto | | | 11,348 | | | | 0.85 | % | | | 5,902 | | | | 0.51 | % | | | 5,669 | | | | 0.54 | % | | | 7,648 | | | | 0.70 | % | | | 8,933 | | | | 0.63 | % |
Marine | | | 2,699 | | | | 0.20 | % | | | 3,917 | | | | 0.34 | % | | | 4,308 | | | | 0.42 | % | | | 4,942 | | | | 0.45 | % | | | 5,900 | | | | 0.42 | % |
Recreational Vehicle | | | 10,656 | | | | 0.80 | % | | | 14,054 | | | | 1.21 | % | | | 17,347 | | | | 1.66 | % | | | 22,250 | | | | 2.05 | % | | | 28,530 | | | | 2.01 | % |
Other (1) | | | 2,217 | | | | 0.17 | % | | | 2,105 | | | | 0.18 | % | | | 2,112 | | | | 0.20 | % | | | 2,523 | | | | 0.23 | % | | | 3,207 | | | | 0.23 | % |
Total consumer loans | | | 188,258 | | | | 14.13 | % | | | 180,754 | | | | 15.52 | % | | | 189,231 | | | | 18.04 | % | | | 214,593 | | | | 19.76 | % | | | 238,397 | | | | 16.79 | % |
Total Loans | | | 1,332,593 | | | | 100.00 | % | | | 1,164,883 | | | | 100.00 | % | | | 1,049,165 | | | | 100.00 | % | | | 1,086,156 | | | | 100.00 | % | | | 1,420,196 | | | | 100.00 | % |
Less net items | | | 16,401 | | | | | | | | 16,790 | | | | | | | | 19,973 | | | | | | | | 19,916 | | | | | | | | 40,920 | | | | | |
Total Loans, net | | $ | 1,316,192 | | | | | | | $ | 1,148,093 | | | | | | | $ | 1,029,192 | | | | | | | $ | 1,066,240 | | | | | | | $ | 1,379,276 | | | | | |
(1) | Consists primarily of overdraft protection loans and loans to individuals secured by demand accounts, deposits and other consumer assets. |
3
Loan Maturity. The following table sets forth certain information as of December 31, 2015, regarding the dollar amount of construction and commercial loans maturing in Home Savings’ portfolio based on their contractual terms to maturity. Demand and other loans having no stated schedule of repayments or no stated maturity are reported as due in one year or less. Mortgage loans originated by Home Savings always include due-on-sale clauses that provide Home Savings with the contractual right to deem the loan immediately due and payable in the event the borrower transfers the ownership of the property without Home Savings’ consent. The table does not include the effects of possible prepayments.
| | Principal payments contractually due in the years ended December 31, | |
| | 2016 | | | 2017-2020 | | | 2021 and thereafter | | | Total | |
| | (Dollars in thousands) | |
Construction loans: | | | | | | | | | | | | | | | | |
Residential mortgage construction | | $ | — | | | $ | — | | | $ | 40,898 | | | $ | 40,898 | |
Commercial construction | | | 4,518 | | | | 25,710 | | | | 8,585 | | | | 38,813 | |
Commercial loans | | | 8,848 | | | | 34,763 | | | | 22,402 | | | | 66,013 | |
Total | | $ | 13,366 | | | $ | 60,473 | | | $ | 71,885 | | | $ | 145,724 | |
The table below sets forth the dollar amount of all loans reported above becoming due after December 31, 2015, which have fixed or adjustable interest rates:
| | Due after December 31, 2016 | |
| | (Dollars in thousands) | |
Fixed rate | | $ | 43,138 | |
Adjustable rate | | | 89,220 | |
| | $ | 132,358 | |
Commercial Loans:
Multifamily. Home Savings originates loans secured by multifamily properties that contain more than four units. Multifamily loans are offered with adjustable and fixed rates of interest, which adjust according to a specified index, and typically have terms ranging from five to ten years and of the value of the real estate and improvements (LTV) of up to 80%.
Multifamily lending generally is considered to involve a higher degree of risk than one-to-four family residential lending because the borrower typically depends upon income generated by the subject property to cover operating expenses and debt service. The profitability of a subject property can be affected by economic conditions, government policies and other factors beyond the control of the borrower. Home Savings attempts to mitigate the risk associated with multifamily lending by evaluating the creditworthiness of the borrower and the projected income from the subject property and by obtaining personal guarantees on loans made to corporations, limited liability companies and partnerships. Home Savings requires borrowers to submit financial statements annually to enable management to monitor the loan and requires an assignment of rents from borrowers.
At December 31, 2015, loans secured by multifamily properties totaled approximately $80.2 million, or 6.0% of total loans. There were no multifamily loans that were considered nonperforming at December 31, 2015. New originations in this loan category totaled $30.0 million in 2015.
Nonresidential. Home Savings originates loans secured by nonresidential real estate, such as shopping centers, office buildings, and industrial buildings. Home Savings’ nonresidential real estate loans typically have both fixed and adjustable rates, amortization of up to 25 years and LTVs of up to 80%. The majority of such properties are located within Home Savings’ primary lending area.
Nonresidential real estate lending generally is considered to involve a higher degree of risk than residential lending due to the relatively larger loan amounts and the effects of general economic conditions on the successful operation of income-producing properties. Home Savings has endeavored to reduce such risk by evaluating the credit history of the borrower and their affiliates, the location of the real estate, analyzing the financial condition of the borrower, obtaining personal guarantees from the borrower or the borrowers affiliates, and considering the quality and characteristics of the income stream generated by the property and the appraisal supporting the property’s valuation.
4
At December 31, 2015, approximately $175.5 million, or 13.2% of Home Savings’ total loans, were secured by mortgages on nonresidential real estate, of which $3.6 million, or 2.1% of Home Savings’ total nonresidential real estate loans, were considered nonperforming. New originations in this loan category totaled $75.8 million in 2015.
Land. Home Savings also originates a limited number of loans secured by vacant land. Home Savings’ land loans generally are fixed-rate loans for terms of up to five years and require a LTV of 65% or less. At December 31, 2015, approximately $9.3 million, or 0.7%, of Home Savings’ total loans were land loans. Nonperforming land loans totaled $384,000, or 4.1% of such loans, at December 31, 2015. New originations in this loan category totaled $3.1 million in 2015.
Construction. Home Savings originates loans for the construction of multifamily properties, nonresidential real estate projects and to builders on a presold or speculative (unsold) basis. Home Savings limits the number of outstanding loans to each residential builder on unsold homes under construction, both by dollar amount and number. Construction loans for multifamily and nonresidential properties, as well as loans to builders, typically have LTV at origination of up to 75% based on estimated value at completion, with the value of the land included as part of the owner’s equity.
Construction loans involve greater underwriting and default risks than loans secured by mortgages on existing properties because construction loans are more difficult to appraise and to monitor. Loan funds are advanced upon the security of the project under construction. In the event a default on a construction loan occurs and foreclosure follows, Home Savings may take control of the project and attempt either to arrange for completion of construction or dispose of the unfinished project.
At December 31, 2015, Home Savings had approximately $38.8 million, or 2.9% of its total loans, invested in commercial construction loans. None of these loans were nonperforming at December 31, 2015. New originations for commercial construction loans totaled $75.1 million in 2015.
Secured and Unsecured. Home Savings makes commercial loans to businesses in its primary market area, including traditional lines of credit, revolving lines of credit and term loans. The collateral coverage ratios for commercial loans depend upon the nature of the underlying collateral. Lines of credit and revolving credits generally are priced on a floating rate basis, which is tied to the prime interest rate or LIBOR. Term loans usually have adjustable rates, but can have fixed rates of interest, and typically have terms of one to five years.
The repayment of commercial loans typically is dependent on the cash flow stream and successful operation of a business, which can be affected by economic conditions. The collateral for commercial loans often consists of depreciating assets, which are generally matched to the amortization of the underlying loan.
At December 31, 2015, Home Savings had approximately $66.2 million invested in secured commercial loans and $2.8 million in unsecured commercial loans. The majority of these loans are secured by inventory, accounts receivable, equipment, investment property, vehicles or other assets of the borrower. These loans are underwritten based on the creditworthiness of the borrower and the guarantors, where applicable.
Nonperforming secured and unsecured commercial loans at December 31, 2015, amounted to $4.0 million, or 6.1% of total commercial loans. New originations of commercial loans totaled $45.7 million in 2015, of which $39.7 million were secured.
Residential Mortgage Loans:
One-to Four-Family. Home Savings mainly originates conventional loans secured by first mortgages on one-to four-family residences primarily located within Home Savings’ market area.
Home Savings currently offers fixed-rate mortgage loans and adjustable-rate mortgage loans (ARMs). Although Home Savings’ loan portfolio includes a significant amount of 30-year fixed-rate loans, a considerable portion of fixed rate loans are originated for sale. The interest rate adjustment periods on ARMs are typically one, three, five, seven or ten years. The maximum interest rate adjustment on most of the ARMs is 2.0% on any adjustment date and a total of 6.0% over the life of the loan. The interest rate adjustments on three-year, five-year and seven-year ARMs presently offered by Home Savings are indexed to the weekly average rate on the one-year U.S. Treasury securities. Rate adjustments are computed by adding a stated margin to the index.
5
FDIC regulations and Ohio law limit the amount that Home Savings may lend in relationship to the appraised value of the real estate and improvements that secure the loan at the time of loan origination. In accordance with such regulations, Home Savings is permitted to make loans up to 100% of the LTV. Home Savings typically requires private mortgage insurance on the portion of the principal amount of the loan that exceeds 80% of the appraised value or sales price of the property (whichever is less) securing the loan.
Under certain circumstances, Home Savings will offer loans with LTV’s exceeding 80% without private mortgage insurance. Customers may borrow up to 80% of the home’s appraised value and obtain a second loan or line of credit from Home Savings for up to 9% of the appraised value without having to purchase mortgage insurance. Home Savings also offers a first-time homebuyers product that permits an LTV of 97% without private mortgage insurance. Such loans involve a higher degree of risk because, in the event of a borrower default, the value of the underlying collateral may not satisfy the principal and interest outstanding on the loan. To reduce this risk, Home Savings underwrites all portfolio loans to Freddie Mac and Fannie Mae underwriting guidelines.
Currently, no interest-only, one-to four-family loans are contained in the Home Savings’ mortgage loan portfolio.
Home Savings issues loan origination commitments to qualified borrowers primarily for the purchase of single-family residential real estate. Such commitments have specified terms and conditions and are made for periods of up to 60 days, during which time the interest rate is locked in. Home Savings utilizes various hedge strategies to mitigate its interest rate risk during this time period.
At December 31, 2015, Home Savings’ one-to four-family residential real estate loans held for investment totaled approximately $733.7 million, or 55.1% of total loans. At December 31, 2015, $6.2 million, or 0.8%, of Home Savings’ one-to four-family loans were nonperforming. New originations in this loan category totaled $226.3 million in 2015.
Construction. Home Savings originates loans for the construction of one-to four-family residences. These construction loans to owner-occupants are structured as permanent loans with fixed or adjustable rates of interest and terms of up to 30 years. During the construction phase, the borrower is required to pay interest only. These loans have LTVs at origination of up to 95% with appropriate mortgage insurance.
At December 31, 2015, Home Savings had approximately $40.9 million, or 3.1% of its total loans, invested in one-to four-family residential construction loans. All of these loans were performing according to the terms of their agreement as of December 31, 2015.
New originations for residential mortgage construction loans to owner-occupants totaled $162.5 million in 2015. The level of new originations exceeded the outstanding balance of these loans as not all funds have been drawn on such loans as of December 31, 2015.
Consumer Loans:
Home Savings originates various types of consumer loans, including home equity loans, home equity lines of credit, vehicle loans, unsecured loans, and cash-secured loans. Home Savings generally does not originate recreational vehicle loans or marine loans. Consumer loans are made at fixed and variable rates of interest for different terms based on the type of loan.
Home Savings generally makes closed-end home equity loans and lines of credit in an amount that, when added to the prior indebtedness secured by the real estate, does not exceed 90% of the estimated value of the real estate. Home equity loans typically are secured by a second mortgage on the real estate. Home Savings frequently holds the first mortgage, although Home Savings will make home equity loans in cases where it sells the first mortgage or another lender holds the first mortgage. Home Savings also offers home equity lines of credit. Fixed-rate home equity loans typically have terms of ten years. Rate adjustments on adjustable home equity loans change based on the prime interest rate for loans on residences of up to 90% LTV regardless of lien position. At December 31, 2015, approximately $161.3 million, or 12.1%, of Home Savings’ consumer loan portfolio consisted of home equity loans. Home Savings also makes cash-secured consumer loans for up to 100% of the principal balance of the account. These loans generally have fixed rates tied to market conditions.
For new automobiles, loans are originated for up to 110% of the MSRP value of the car with terms of up to 72 months. For used automobiles, loans are made for up to the National Automobile Dealers Association (N.A.D.A.) retail value of the car model and a term of up to 72 months. Most automobile loans are originated indirectly through approved auto dealerships. At December 31, 2015, automobile loans totaled $11.3 million, or 0.9% of Home Savings’ consumer loan portfolio.
6
At December 31, 2015, Home Savings had approximately $188.3 million, or 14.1% of its total loans, invested in consumer loans. Nonperforming consumer loans at December 31, 2015, amounted to $2.6 million, or 1.4% of such loans. New originations of consumer loans totaled $76.8 million in 2015.
Lending Process:
Loan Solicitation and Processing. The lending activities of Home Savings are subject to the written, non-discriminatory underwriting standards and loan origination procedures approved by Home Savings’ Board of Directors (Board). Loan originations generally are obtained from existing customers and members of the local community and from referrals by real estate brokers, lawyers, accountants, builders and current and former customers. Home Savings also advertises in the local print media, radio television, billboards and online.
Each of Home Savings’ retail banking offices and loan production centers have loan personnel who can accept loan applications, which are then forwarded to Home Savings’ Credit Department for processing and approval. In underwriting real estate loans, Home Savings typically obtains a credit report and verification of employment and analyzes the cash flows of the borrower and other documentation concerning the creditworthiness of the borrower. Typically, an appraisal of the fair market value of the real estate that will be given as security for the loan is prepared by an approved independent fee appraiser. For all nonresidential real estate loans, the appraisal is conducted by an outside fee appraiser whose report is reviewed by a third party appraisal review firm engaged by Home Savings. Upon the completion of the appraisal and the receipt of information on the credit history of the borrower, the loan application is submitted for review to the appropriate persons. Generally, all commercial requests and consumer loan requests of $500,000 or more and residential mortgage loan requests over $800,000 up to and including $5.0 million require the approval of the Officers’ Loan Committee or the appropriate Officer’s Loan Committee member. All loans that would cause the aggregate lending relationship to be greater than $5.0 million require approval from both the Officers’ Loan Committee and the Executive Officers’ Loan Committee. Lending relationships greater than $10.0 million must be approved by the Board Loan Committee.
Borrowers are required to carry satisfactory fire and casualty insurance and flood insurance, if applicable, and to name Home Savings as an insured mortgagee. Home Savings generally obtains a title guarantee or title insurance on real estate loans.
The procedure for approval of construction loans is the same as for permanent real estate loans, except that an appraiser evaluates the building plans, construction specifications and estimates of construction costs. Home Savings also evaluates the feasibility of the proposed construction project and the experience and record of the builder. Once approved, the construction loan is disbursed in installments based upon periodic inspections of the construction progress and lien releases.
Consumer loans are underwritten on the basis of the borrower’s credit history and an analysis of the borrower’s income and expenses, ability to repay the loan and the value of the collateral, if any.
Loan Originations, Purchases and Sales. Home Savings’ residential loans generally are made on terms and conditions and documented to conform to the secondary market guidelines for sale to Freddie Mac, Fannie Mae and other institutional and private investors in the secondary market. Home Savings originates first mortgage loans insured by the Federal Housing Authority and the Veteran’s Administration with the intention to sell in the secondary market.
Home Savings generally retains the servicing rights on the sale of loans originated in the geographic area surrounding its full service branches. Home Savings anticipates continued participation in the secondary mortgage loan market to maintain its desired risk profile.
At December 31, 2015, Home Savings had $75.3 million of outstanding commitments to make mortgage loans with the intention to sell in the secondary market, as well as $126.0 million available to borrowers under consumer and commercial lines of credit and $46.1 million available in the OverdraftPrivilege™ program. At December 31, 2015, Home Savings had $73.9 million in funds related to commercial loans in process and $38.5 million related to construction loans in process under existing contractual obligations.
Loans to One Borrower Limits. Regulations generally limit the aggregate amount that Home Savings may lend to any one borrower to an amount equal to 15.0% of Home Savings’ unimpaired capital and unimpaired surplus (Lending Limit Capital). A savings association may lend to one borrower an additional amount not to exceed 10.0% of Lending Limit Capital if the additional amount is fully secured by certain forms of readily marketable collateral. Real estate is not considered readily marketable collateral. In applying this limit, regulations require that loans to certain related or affiliated borrowers be aggregated.
7
Based on such limits, Home Savings could lend approximately $36.1million to one borrower at December 31, 2015. The largest amount Home Savings had committed to one borrower at December 31, 2015, was $15.8 million spread across 4 loans, $12.1 million of which was outstanding at December 31, 2015. At December 31, 2015, these commercial real estate loans were performing in accordance with their terms.
Delinquent Loans, Nonperforming Assets and Classified Assets. The following table reflects the amount of all loans in a delinquent status as of the dates indicated:
| | At December 31, | |
| | 2015 | | | 2014 | |
| | | | | | | | | | Percent of net | | | | | | | | | | | Percent of net | |
| | Number | | | Amount | | | loans | | | Number | | | Amount | | | loans | |
| | (Dollars in thousands) | |
Loans delinquent for: | | | | | | | | | | | | | | | | | | | | | | | | |
30-59 days | | | 103 | | | $ | 5,383 | | | | 0.41 | % | | | 69 | | | $ | 3,343 | | | | 0.29 | % |
60-89 days | | | 30 | | | | 955 | | | | 0.07 | % | | | 23 | | | | 1,587 | | | | 0.14 | % |
90 days or over | | | 204 | | | | 16,279 | | | | 1.24 | % | | | 179 | | | | 16,017 | | | | 1.40 | % |
Total delinquent loans | | | 337 | | | $ | 22,617 | | | | 1.72 | % | | | 271 | | | $ | 20,947 | | | | 1.82 | % |
Home Savings determines the past due status of loans based on the number of calendar months the loan is past due.
Nonperforming assets include loans past due 90 days and on a nonaccrual status, loans past due 90 days and still accruing, loans less than 90 days past due and on a nonaccrual status, real estate acquired by foreclosure or by deed-in-lieu of foreclosure and repossessed assets. Once a loan becomes 90 days delinquent, it generally is placed on nonaccrual status.
Loans are placed on nonaccrual status when collection in full is considered by management to be in doubt. Interest accrued and unpaid at the time a loan is placed on nonaccrual status is charged against interest income. Subsequent cash payments received, if any, generally are applied to principal unless the remaining recorded investment in the asset (i.e., after charge-off of identified losses, if any) is deemed to be fully collectable. In those cases, subsequent cash payments are applied to principal and interest income in accordance with the original terms of the note.
Home Savings does not extend additional credit to borrowers whose loans are classified — i.e., loans that exhibit a well-defined weakness such that management determines that the loan should be classified as substandard, doubtful or loss — without approval by the applicable loan committee.
8
The following table sets forth information with respect to Home Savings’ nonperforming loans and other assets by year at the dates indicated:
| | At December 31, | |
| | 2015 | | | 2014 | | | 2013 | | | 2012 | | | 2011 | |
| | (Dollars in thousands) | |
Nonperforming loans: | | | | | | | | | | | | | | | | | | | | |
Nonaccrual loans | | | | | | | | | | | | | | | | | | | | |
Commercial Loans: | | | | | | | | | | | | | | | | | | | | |
Multifamily and nonresidential | | $ | 3,599 | | | $ | 5,874 | | | $ | 6,201 | | | $ | 19,092 | | | $ | 48,762 | |
Construction and land | | | 384 | | | | 1,582 | | | | 3,580 | | | | 13,513 | | | | 38,246 | |
Commercial and industrial | | | 4,016 | | | | 4,016 | | | | 4,158 | | | | 1,225 | | | | 2,830 | |
Total commercial loans | | | 7,999 | | | | 11,472 | | | | 13,939 | | | | 33,830 | | | | 89,838 | |
Residential mortgage loans: | | | 6,181 | | | | 6,816 | | | | 6,356 | | | | 5,437 | | | | 26,637 | |
Consumer Loans: | | | 2,567 | | | | 2,163 | | | | 3,248 | | | | 4,842 | | | | 6,581 | |
Total nonaccrual loans | | | 16,747 | | | | 20,451 | | | | 23,543 | | | | 44,109 | | | | 123,056 | |
Past due 90 days and still accruing | | | — | | | | — | | | | 45 | | | | 3,678 | | | | 39 | |
Total nonperforming loans | | | 16,747 | | | | 20,451 | | | | 23,588 | | | | 47,787 | | | | 123,095 | |
Real estate acquired through foreclosure and other repossessed assets | | | 2,727 | | | | 3,467 | | | | 6,341 | | | | 18,440 | | | | 33,486 | |
Total nonperforming assets | | $ | 19,474 | | | $ | 23,918 | | | $ | 29,929 | | | $ | 66,227 | | | $ | 156,581 | |
Total impaired loans | | $ | 39,659 | | | $ | 45,897 | | | $ | 48,181 | | | $ | 61,017 | | | $ | 153,567 | |
Nonperforming loans as a percent of loans, net | | | 1.27 | % | | | 1.78 | % | | | 2.29 | % | | | 4.48 | % | | | 8.92 | % |
Nonperforming assets as a percent of total assets | | | 0.98 | % | | | 1.31 | % | | | 1.72 | % | | | 3.66 | % | | | 7.71 | % |
Allowance for loan losses as a percent of nonperforming loans | | | 105.76 | % | | | 86.48 | % | | | 89.52 | % | | | 44.22 | % | | | 34.34 | % |
Allowance for loan losses as a percent of loans, net | | | 1.33 | % | | | 1.52 | % | | | 2.01 | % | | | 1.94 | % | | | 2.97 | % |
In 2015, net income did not include uncollected interest on nonperforming loans. During 2015, approximately $1.5 million in additional interest income would have been recorded had nonaccrual loans been accruing pursuant to contractual terms.
A loan is considered impaired when, based on current information and events, it is probable that Home Savings will be unable to collect the scheduled payments of principal or interest when due according to the contractual terms of the loan agreement. Factors considered by management in determining impairment include payment status, collateral value and the strength of guarantors (if any). Loans that experience insignificant payment delays and payment shortfalls generally are not classified as impaired. Management determines the significance of payment delays and payment shortfalls on a case-by-case basis, taking into consideration all of the facts and circumstances surrounding the loans and the borrower, including the length of the delay, the reasons for the delay, the borrower’s prior payment record and the amount of shortfall in relation to the principal and interest owed. Impairment is measured on a loan-by-loan basis by the fair value of the collateral if the loan is collateral dependent, the present value of expected future cash flows discounted at the loan’s effective interest rate, or the market value of the loan. Home Savings considers all troubled debt restructured loans as impaired.
During 2015, Home Savings experienced a decline in impaired loans of $6.2 million. Home Savings recognized a decrease in nonperforming nonresidential loans of approximately $3.9 million. Nonperforming construction and land loans decreased $1.2 million.
Real estate acquired in settlement of loans is classified separately on the balance sheet at estimated fair value less costs to sell as of the date of acquisition. At foreclosure, the loan is written down to the value of the underlying collateral by a charge to the allowance for loan losses, if necessary. Any subsequent write-downs are charged against operating expenses. Operating expenses of such properties, net of related income or loss on disposition, are included in real estate owned and other repossessed asset expenses. At December 31, 2015, the carrying value of real estate and other repossessed assets acquired in settlement of loans was $2.7 million and consisted primarily of $1.7 million in one-to four-family residential properties, $785,000 secured by land and one-to four-family residential construction properties and $76,000 in recreational vehicles.
9
In addition to the classified loans identified above, other loans may be identified as having potential credit problems as a result of those loans being identified by our internal loan review function. These special mention loans, which have not exhibited the more severe weaknesses generally present in classified loans, amounted to $11.0 million, as of December 31, 2015, compared to $18.3 million at December 31, 2014.
Allowance for Loan Losses. Management has established a methodology to calculate the allowance for loan losses at a level it believes adequate to absorb probable incurred losses in the loan portfolio. The methodology is reviewed regularly by the Board and is revised as conditions and circumstances within the Bank’s loan portfolio dictate. Management bases its determination of the adequacy of the allowance upon estimates derived from an analysis of individual credits, prior and current loss experience, loan portfolio delinquency levels, overall growth in the loan portfolio, current economic conditions and results of regulatory examinations. Furthermore, in determining the level of the allowance for loan losses, management reviews and evaluates on a monthly basis the necessity of a reserve for individual impaired loans classified by management. The specifically allocated reserve for a classified loan is determined based on management’s estimate of the borrower’s ability to repay the loan given the availability of collateral, market value of collateral, other sources of cash flow and legal options available to Home Savings. Once a review is completed, a specific reserve is determined and allocated to the loan.
Other loans not reviewed specifically by management are evaluated as a homogenous group of loans (generally single-family residential mortgage loans and all consumer credits except marine loans) using a loss factor applied to the outstanding loan balance to determine the level of reserve required. This loss factor consists of two components, a quantitative and a qualitative component. The quantitative component is based on a historical analysis of all charged-off loans, net of recovery. In determining the qualitative factors, consideration is given to such attributes as lending policies, economic conditions, nature and volume of the portfolio, management, loan quality trend, loan review, collateral value, concentrations, economic cycles and other external factors. At December 31, 2014, the Company evaluated two years of net charge-off history and applied the information to the current period. This component was combined with the qualitative component to arrive at the loss factor, which is applied to the outstanding principal balance by type of credit and internal risk grade applied to specific risk pools, plus specific loss allocations and adjustments for current events and conditions. As of December 31, 2015, the Company evaluated 12 quarters of net charge-off history and applied this information to the current period. This component is combined with the qualitative component to arrive at the loss factor, which is applied to the average outstanding balance of homogenous loans and is no longer being applied by internal risk grade. This change in methodology, which was made in the first quarter of 2015, did not have a material effect on the calculation of the allowance for loan losses. The change in methodology was made in order to facilitate technological improvements in the calculation of the allowance for loan loss.
In determining the qualitative factors, consideration is given to such factors as economic conditions, changes in the nature and volume of the portfolio, lending personnel, lending policies, past-due loan trends, and trends in collateral values. Specific reserves on individual loans and historical ratios are reviewed periodically and adjusted as necessary based on subsequent collections, loan upgrades or downgrades, nonperforming trends or actual principal charge-offs. When evaluating the adequacy of the allowance for loan losses, consideration is given to geographic concentrations and the effect that changing economic conditions have on Home Savings. These estimates are particularly susceptible to changes that could result in a material adjustment to results of operations. The provision for loan losses represents a charge against current earnings in order to maintain the allowance for loan losses at an appropriate level.
10
The following table sets forth an analysis of Home Savings’ allowance for loan losses for the periods indicated:
| | Year ended December 31, | |
| | 2015 | | | 2014 | | | 2013 | | | 2012 | | | 2011 | |
| | (Dollars in thousands) | |
Balance at beginning of period | | $ | 17,687 | | | $ | 21,116 | | | $ | 21,130 | | | $ | 42,271 | | | $ | 50,883 | |
(Recovery) provision for loan losses | | | 2,135 | | | | (1,271 | ) | | | 4,116 | | | | 39,325 | | | | 24,658 | |
Charge-offs: | | | | | | | | | | | | | | | | | | | | |
Commercial loans | | | (1,268 | ) | | | (1,656 | ) | | | (5,208 | ) | | | (19,049 | ) | | | (28,648 | ) |
Residential mortgage loans | | | (1,301 | ) | | | (1,005 | ) | | | (1,536 | ) | | | (2,479 | ) | | | (3,645 | ) |
Consumer loans | | | (1,257 | ) | | | (1,578 | ) | | | (1,883 | ) | | | (2,740 | ) | | | (3,446 | ) |
Total charge-offs | | | (3,826 | ) | | | (4,239 | ) | | | (8,627 | ) | | | (24,268 | ) | | | (35,739 | ) |
Recoveries: | | | | | | | | | | | | | | | | | | | | |
Commercial loans | | | 733 | | | | 1,011 | | | | 3,527 | | | | 1,056 | | | | 1,404 | |
Residential mortgage loans | | | 388 | | | | 242 | | | | 253 | | | | 180 | | | | 474 | |
Consumer loans | | | 595 | | | | 828 | | | | 717 | | | | 724 | | | | 591 | |
Total recoveries | | | 1,716 | | | | 2,081 | | | | 4,497 | | | | 1,960 | | | | 2,469 | |
Net charge-offs from asset sale | | | — | | | | — | | | | — | | | | (38,158 | ) | | | — | |
Net charge-offs | | | (2,110 | ) | | | (2,158 | ) | | | (4,130 | ) | | | (60,466 | ) | | | (33,270 | ) |
Balance at end of year | | $ | 17,712 | | | $ | 17,687 | | | $ | 21,116 | | | $ | 21,130 | | | $ | 42,271 | |
Ratio of net charge-offs to average net loans | | | (0.17 | )% | | | (0.20 | )% | | | (0.40 | )% | | | (4.88 | )% | | | (2.17 | )% |
At December 31, 2015, the allowance for loan losses was 1.33% of total loans, net and 105.76% of total nonperforming loans.
The following table sets forth the allocation of the allowance for loan losses by category. The allocations are based on management’s assessment of the risk characteristics of each of the components of the total loan portfolio and are subject to change when the risk factors of each component change. The allocation is not indicative of either the specific amounts or the loan categories in which future charge-offs may be taken, nor should it be taken as an indicator of future loss trends. The allocation of the allowance to each category is not necessarily indicative of future loss in any particular category and does not restrict the use of the allowance to absorb losses in any category.
| | At December 31, | |
| | 2015 | | | 2014 | | | 2013 | | | 2012 | | | 2011 | |
| | | | | | Percent | | | | | | | Percent | | | | | | | Percent | | | | | | | Percent | | | | | | | Percent | |
| | | | | | of loans | | | | | | | of loans | | | | | | | of loans | | | | | | | of loans | | | | | | | of loans | |
| | | | | | in each | | | | | | | in each | | | | | | | in each | | | | | | | in each | | | | | | | in each | |
| | | | | | category to | | | | | | | category to | | | | | | | category to | | | | | | | category to | | | | | | | category to | |
| | Amount | | | total loans | | | Amount | | | total loans | | | Amount | | | total loans | | | Amount | | | total loans | | | Amount | | | total loans | |
| | (Dollars in thousands) | |
Commercial loans | | $ | 8,077 | | | | 45.60 | % | | $ | 5,690 | | | | 21.71 | % | | $ | 6,984 | | | | 21.54 | % | | $ | 9,156 | | | | 25.40 | % | | $ | 29,427 | | | | 34.63 | % |
Residential mortgage loans | | | 6,630 | | | | 37.43 | % | | | 8,517 | | | | 62.77 | % | | | 9,830 | | | | 60.42 | % | | | 7,515 | | | | 54.84 | % | | | 8,268 | | | | 48.58 | % |
Consumer loans | | | 3,005 | | | | 16.97 | % | | | 3,480 | | | | 15.52 | % | | | 4,302 | | | | 18.04 | % | | | 4,459 | | | | 19.76 | % | | | 4,576 | | | | 16.79 | % |
Total | | $ | 17,712 | | | | 100.00 | % | | $ | 17,687 | | | | 100.00 | % | | $ | 21,116 | | | | 100.00 | % | | $ | 21,130 | | | | 100.00 | % | | $ | 42,271 | | | | 100.00 | % |
INVESTMENT ACTIVITIES
General. Investment securities are classified upon acquisition as available for sale, held to maturity or trading. Securities classified as available for sale are carried at estimated fair value with the unrealized holding gain or loss, net of taxes, reflected in other comprehensive income and as a component of shareholders’ equity. Securities classified as held to maturity are carried at amortized cost. Securities classified as trading are carried at estimated fair value with the unrealized holding gain or loss reflected as a component of income. United Community and Home Savings recognize premiums and discounts in interest on the level yield method without anticipating prepayments and realized gains or losses on the sale of debt securities based on the amortized cost of the specific securities sold.
Home Savings Investment Activities. Federal laws and regulations as well as Ohio law permit Home Savings to invest in various types of marketable securities, including interest-bearing deposits in other financial institutions, federal funds, U.S. Treasury
11
and agency obligations, mortgage-related securities and certain other specified investments. The Board has adopted an investment policy that authorizes management to make investments in U.S. Treasury obligations, U.S. Federal agency and federally-sponsored corporation obligations, mortgage-related securities issued or sponsored by Fannie Mae, Freddie Mac and Government National Mortgage Association (GNMA), investment-grade municipal obligations and creditworthy, unrated securities issued by municipalities in which Home Savings is located. Such securities comprised 100% of Home Savings’ investment securities portfolio at December 31, 2015. The investment policy also authorizes management to make investments in securities issued by private issuers, investment-grade corporate debt securities, investment-grade asset-backed securities, certificates of deposit that are fully-insured by the FDIC, bankers’ acceptances, federal funds and money market funds. Home Savings’ investment policy is designed primarily to provide and maintain liquidity within regulatory guidelines, to maintain a balance of high quality investments to minimize risk and to maximize return without sacrificing liquidity.
Home Savings maintains a significant portfolio of mortgage-backed securities that are issued by Fannie Mae, GNMA and Freddie Mac. Mortgage-backed securities generally entitle Home Savings to receive a portion of the cash flows from an identified pool of mortgages. Home Savings is exposed to prepayment risk and reinvestment risk to the extent that actual prepayments will differ from those estimated in pricing the security, which may result in adjustments to the net yield on such securities. Mortgage-related securities enable Home Savings to generate positive interest rate spreads with minimal administrative expense and reduce credit risk due to either guarantees provided by the issuer or the high credit rating of the issuer. Mortgage-related securities classified as available for sale also provide Home Savings with an additional source of liquid funds.
United Community Investment Activities. Funds maintained by United Community for general corporate purposes primarily are invested in an account with Home Savings.
The following table presents the amortized cost, fair value and weighted average yield of securities available for sale at December 31, 2015 by maturity:
| | At December 31, 2015 | |
| | No stated | | | | | | After one year through | |
| | maturity | | | One year or less | | | five years | |
| | Amortized cost | | | Average yield | | | Amortized cost | | | Average yield | | | Amortized cost | | | Average yield | |
| | (Dollars in thousands) | |
Securities: | | | | | | | | | | | | | | | | | | | | | | | | |
U.S Government agencies and corporations | | $ | — | | | | 0.00 | % | | $ | — | | | | 0.00 | % | | $ | — | | | | 0.00 | % |
Mortgage-related securities-residential | | | — | | | | 0.00 | % | | | 2 | | | | 1.76 | % | | | — | | | | 0.00 | % |
States of the U.S. and political subdivisions | | | — | | | | 0.00 | % | | | — | | | | 0.00 | % | | | — | | | | 0.00 | % |
Total securities available for sale | | $ | — | | | | 0.00 | % | | $ | 2 | | | | 1.76 | % | | $ | — | | | | 0.00 | % |
| | | | | | | | | | | | | | | | | | | | | | | | |
| | At December 31, 2015 | |
| | Five years through | | | After | | | | |
| | ten years | | | ten years | | | Total | |
| | Amortized cost | | | Average yield | | | Amortized cost | | | Average yield | | | Amortized cost | | | Average yield | |
| | (Dollars in thousands) | |
Securities: | | | | | | | | | | | | | | | | | | | | | | | | |
U.S Government agencies and corporations | | $ | 199,242 | | | | 2.18 | % | | $ | 22,258 | | | | 2.56 | % | | $ | 221,500 | | | | 2.22 | % |
Mortgage-related securities-residential | | | 33,462 | | | | 2.09 | % | | | 95,691 | | | | 2.38 | % | | | 129,155 | | | | 2.30 | % |
States of the U.S. and political subdivisions | | | 198 | | | | 3.56 | % | | | 10,650 | | | | 4.11 | % | | | 10,848 | | | | 4.10 | % |
Total securities available for sale | | $ | 232,902 | | | | 2.17 | % | | $ | 128,599 | | | | 2.55 | % | | $ | 361,503 | | | | 2.31 | % |
12
The following table presents the amortized cost, fair value and weighted average yield of securities held to maturity at December 31, 2015 by maturity:
| | At December 31, 2015 | |
| | No stated | | | | | | After one year through | |
| | maturity | | | One year or less | | | five years | |
| | Amortized cost | | | Average yield | | | Amortized cost | | | Average yield | | | Amortized cost | | | Average yield | |
| | (Dollars in thousands) | |
Securities: | | | | | | | | | | | | | | | | | | | | | | | | |
U.S Government agencies and corporations | | $ | — | | | | 0.00 | % | | $ | — | | | | 0.00 | % | | $ | — | | | | 0.00 | % |
Mortgage-related securities-residential | | | — | | | | 0.00 | % | | | — | | | | 0.00 | % | | | — | | | | 0.00 | % |
States of the U.S. and political subdivisions | | | — | | | | 0.00 | % | | | 1,100 | | | | 2.15 | % | | | — | | | | 0.00 | % |
Total securities held to maturity | | $ | — | | | | 0.00 | % | | $ | 1,100 | | | | 2.15 | % | | $ | — | | | | 0.00 | % |
| | | | | | | | | | | | | | | | | | | | | | | | |
| | At December 31, 2015 | |
| | Five years through | | | After | | | | |
| | ten years | | | ten years | | | Total | |
| | Amortized cost | | | Average yield | | | Amortized cost | | | Average yield | | | Amortized cost | | | Average yield | |
| | (Dollars in thousands) | |
Securities: | | | | | | | | | | | | | | | | | | | | | | | | |
U.S Government agencies and corporations | | $ | — | | | | 0.00 | % | | $ | — | | | | 0.00 | % | | $ | — | | | | 0.00 | % |
Mortgage-related securities-residential | | | — | | | | 0.00 | % | | | 100,322 | | | | 2.28 | % | | | 100,322 | | | | 2.28 | % |
States of the U.S. and political subdivisions | | | 2,249 | | | | 3.13 | % | | | 7,028 | | | | 3.40 | % | | | 10,377 | | | | 3.21 | % |
Total securities held to maturity | | $ | 2,249 | | | | 3.13 | % | | $ | 107,350 | | | | 2.35 | % | | $ | 110,699 | | | | 2.37 | % |
SOURCES OF FUNDS
General. Deposits traditionally have been the primary source of Home Savings’ funds for use in lending and other investment activities. In addition to deposits, Home Savings derives funds from interest payments and principal repayments on loans and income on other earning assets. Loan payments are a relatively stable source of funds, while deposit inflows and outflows fluctuate in response to general interest rates and money market conditions. Home Savings also may borrow from the FHLB and other suitable lenders as well as use repurchase agreements as sources of funds.
Deposits. Deposits are attracted principally from within Home Savings’ primary market area through the offering of a selection of deposit instruments, including regular savings accounts, demand deposits, individual retirement accounts (IRAs), checking accounts, money market accounts and certificates of deposit. Interest rates paid, maturity terms, service fees and withdrawal penalties for the various types of accounts are monitored periodically by management. The amount of deposits from outside Home Savings’ primary market area is not significant.
Brokered deposits represent funds, which Home Savings obtained, directly or indirectly, through a deposit broker. A deposit broker places deposits from third parties with insured depository institutions or places deposits with an institution for the purpose of selling interest in those deposits to third parties. Home Savings had no brokered deposits at December 31, 2015 or 2014.
13
The following table sets forth the dollar amount of deposits in the various types of accounts offered by Home Savings at the dates indicated:
| | At December 31, 2015 | | | For the Year Ended December 31, 2015 | |
| | | | | | Percent | | | Weighted | | | | | | | Percent | | | Weighted | |
| | | | | | of total | | | average | | | Average | | | of average | | | average | |
| | Amount | | | deposits | | | rate | | | balance | | | deposits | | | rate | |
| | (Dollars in thousands) | |
Noninterest bearing demand | | $ | 227,505 | | | | 15.85 | % | | | 0.00 | % | | $ | 209,165 | | | | 14.78 | % | | | 0.00 | % |
Checking and money market accounts | | | 472,389 | | | | 32.90 | % | | | 0.22 | % | | | 480,520 | | | | 33.94 | % | | | 0.19 | % |
Savings accounts | | | 280,889 | | | | 19.56 | % | | | 0.06 | % | | | 279,964 | | | | 19.77 | % | | | 0.05 | % |
Certificates of deposit | | | 454,960 | | | | 31.69 | % | | | 1.19 | % | | | 446,148 | | | | 31.51 | % | | | 1.22 | % |
Total deposits | | $ | 1,435,743 | | | | 100.00 | % | | | 0.46 | % | | $ | 1,415,797 | | | | 100.00 | % | | | 0.46 | % |
| | | | | | | | | | | | | | | | | | | | | | | | |
| | For the Year Ended December 31, 2014 | | | For the Year Ended December 31, 2013 | |
| | | | | | Percent | | | Weighted | | | | | | | Percent | | | Weighted | |
| | Average | | | of total | | | average | | | Average | | | of average | | | average | |
| | balance | | | deposits | | | rate | | | balance | | | deposits | | | rate | |
| | (Dollars in thousands) | |
Noninterest bearing demand | | $ | 186,006 | | | | 13.54 | % | | | 0.00 | % | | $ | 167,505 | | | | 11.70 | % | | | 0.00 | % |
Checking and money market accounts | | | 457,183 | | | | 33.26 | % | | | 0.18 | % | | | 470,266 | | | | 32.84 | % | | | 0.22 | % |
Savings accounts | | | 275,027 | | | | 20.01 | % | | | 0.06 | % | | | 270,136 | | | | 18.86 | % | | | 0.09 | % |
Certificates of deposit | | | 456,170 | | | | 33.19 | % | | | 1.19 | % | | | 524,177 | | | | 36.60 | % | | | 1.21 | % |
Total deposits | | $ | 1,374,386 | | | | 100.00 | % | | | 0.47 | % | | $ | 1,432,084 | | | | 100.00 | % | | | 0.53 | % |
The following table shows rate and maturity information for Home Savings’ certificates of deposit at December 31, 2015:
| | | | | | Over | | | Over | | | | | | | | | |
| | Up to | | | 1 year to | | | 2 years to | | | | | | | | | |
Rate | | one year | | | 2 years | | | 3 years | | | Thereafter | | | Total | |
| | (Dollars in thousands) | |
2.00% or less | | $ | 146,375 | | | $ | 83,652 | | | $ | 57,201 | | | $ | 57,774 | | | $ | 345,002 | |
2.01% to 4.00% | | | 61,440 | | | | 38,693 | | | | 9,777 | | | | 48 | | | | 109,958 | |
Total certificates of deposit | | $ | 207,815 | | | $ | 122,345 | | | $ | 66,978 | | | $ | 57,822 | | | $ | 454,960 | |
At December 31, 2015, approximately $207.8 million of Home Savings’ certificates of deposit will mature within one year. Based on past experience and Home Savings’ prevailing pricing strategies, management believes that a substantial percentage of such certificates will be renewed with Home Savings at maturity. If, however, Home Savings is unable to renew the maturing certificates for any reason, borrowings of up to $206.3 million, as of December 31, 2015, were available from the FHLB.
The following table presents the amount of Home Savings’ certificates of deposit of $100,000 or more by the time remaining until maturity at December 31, 2015:
Maturity | | Amount | |
| | (Dollars in thousands) | |
Three months or less | | $ | 11,368 | |
Over 3 months to 6 months | | | 8,186 | |
Over 6 months to 12 months | | | 42,694 | |
Over 12 months | | | 98,265 | |
Total | | $ | 160,513 | |
14
The following table presents the amount of Home Savings’ certificates of deposit of $250,000 or more by the time remaining until maturity at December 31, 2015:
Maturity | | Amount | |
| | (Dollars in thousands) | |
Three months or less | | $ | 751 | |
Over 3 months to 6 months | | | 2,067 | |
Over 6 months to 12 months | | | 25,668 | |
Over 12 months | | | 46,779 | |
Total | | $ | 75,265 | |
The following table sets forth Home Savings’ deposit account balance activity for the periods indicated:
| | Year ended December 31, | |
| | 2015 | | | 2014 | |
| | (Dollars in thousands) | |
Beginning balance | | $ | 1,347,836 | | | $ | 1,391,752 | |
Net increase (decrease) in other deposits | | | 81,555 | | | | (50,290 | ) |
Net deposits before interest credited | | | 1,429,391 | | | | 1,341,462 | |
Interest credited | | | 6,352 | | | | 6,374 | |
Ending balance | | | 1,435,743 | | | | 1,347,836 | |
Net increase (decrease) | | $ | 87,907 | | | $ | (43,916 | ) |
Percent increase (decrease) | | | 6.52 | % | | | (3.16 | )% |
Borrowings. The FHLB system functions as a central reserve bank providing credit for its member institutions and certain other financial institutions. As a member in good standing of the FHLB, Home Savings is authorized to apply for advances, provided certain standards of creditworthiness have been met. Under current regulations, an association must meet certain qualifications to be eligible for FHLB advances. The extent to which an association is eligible for such advances will depend upon whether it meets the Qualified Thrift Lender (QTL) test. If an association meets the QTL test, it will be eligible for 100% of the advances available. If an association does not meet the QTL test, the association will be eligible for such advances only to the extent it holds specified QTL test assets. At December 31, 2015, Home Savings was in compliance with the QTL test. Home Savings may borrow up to an additional $206.3 million from the FHLB, and had $279.0 million in outstanding advances at December 31, 2015. None of the advances outstanding are callable.
COMPETITION
Home Savings faces competition for deposits and loans from other financial institutions, credit unions and mortgage originators in Home Savings’ primary market area. The primary factors in competition for deposits are customer service, convenience of office location and interest rates. Home Savings competes for loan originations primarily through the interest rates and loan fees it charges and through the efficiency and quality of service it provides to borrowers. Competition is affected by, among other things, the general availability of lendable funds, general and local economic conditions, current interest rate levels and other factors, which are not readily predictable.
EMPLOYEES
At December 31, 2015, Home Savings had 428 full-time equivalent employees. Home Savings believes that relations with its employees are good. Home Savings makes available health, life and disability benefits, access to variable compensation and a 401(k) plan for its employees.
15
REGULATION
United Community is a unitary thrift holding company, and subject to regulation, examination and oversight by the FRB. There generally are no restrictions on the activities of United Community, unless the FRB determines that there is reasonable cause to believe that an activity constitutes a serious risk to the financial safety, soundness, or stability of Home Savings. Home Savings is subject to regulation, examination and oversight by the Ohio Division and the FDIC, and it also is subject to certain provisions of the Federal Reserve Act. United Community and Home Savings also are subject to the provisions of the Ohio Revised Code applicable to corporations generally, including laws that restrict takeover bids, tender offers and control-share acquisitions involving public companies that have significant ties to Ohio.
The FRB, the FDIC, the Ohio Division and the SEC each have various powers to initiate supervisory measures or formal enforcement actions if United Community or Home Savings do not comply with applicable regulations. If the grounds provided by law exist, the FDIC or the Ohio Division may place an institution such as Home Savings in conservatorship or receivership. Home Savings also is subject to regulatory oversight under various consumer protection and fair lending laws that govern, among other things, truth-in-lending disclosures, equal credit opportunity, fair credit reporting and community reinvestment. Failure to abide by federal laws and regulations governing community reinvestment could limit the ability of Home Savings to open a new branch or engage in a merger.
Federal law prohibits Home Savings from making a capital distribution to anyone or paying management fees to any person having control of Home Savings if, after such distribution or payment, Home Savings would be undercapitalized.
FRB regulations currently require savings associations to maintain certain reserves of net transaction accounts (primarily checking accounts). At December 31, 2015, Home Savings was in compliance with its reserve requirements.
Loans by Home Savings to executive officers, directors and principal shareholders and their related interests must conform to the lending limit on loans to one borrower, and the total of such loans to executive officers, directors, principal shareholders and their related interests cannot exceed specified limits. Most loans to directors, executive officers and principal shareholders must be approved in advance by a majority of the disinterested members of the Board with any interested director abstaining. All loans to directors, executive officers, and principal shareholders must be made on terms substantially the same as offered in comparable transactions with the general public or as offered to all employees in a company-wide benefit program, and loans to executive officers are subject to additional limitations. All other transactions between Home Savings and its affiliates must comply with Sections 23A and 23B of the Federal Reserve Act. United Community is an affiliate of Home Savings for this purpose.
Under federal law and regulations, no person, directly or indirectly, or acting in concert with others, may acquire control of Home Savings or United Community without 60 days prior notice to the FRB. Control is generally defined as having more than 25% ownership or voting power; however, ownership or voting power of more than 10% may be deemed control if certain factors are in place. If the acquisition of control is by a company, the acquirer must obtain approval, rather than give notice, of the acquisition as a savings and loan holding company.
In addition, a statutory limitation on the acquisition of control of an Ohio savings bank requires the written approval of the Ohio Division prior to the acquisition by any person or entity of a controlling interest in an Ohio association. Control exists, for purposes of Ohio law, when any person or entity which, either directly or indirectly, or acting in concert with one or more other persons or entities, owns, controls, holds with power to vote, or holds proxies representing, 15% or more of the voting shares or rights of an association, or controls in any manner the election or appointment of a majority of the directors. Ohio law also requires that certain acquisitions of voting securities that would result in the acquiring shareholder owning 20%, 33 1/3% or 50% of the outstanding voting securities of United Community must be approved in advance by the holders of at least a majority of the outstanding voting shares represented at a meeting at which a quorum is present and a majority of the portion of the outstanding voting shares represented at such a meeting, excluding the voting shares by the acquiring shareholder.
Federal law generally prohibits a unitary thrift holding company, such as United Community, from controlling any other savings association or savings and loan holding company without prior approval of the FRB, or from acquiring or retaining more than 5% of the voting shares of a savings association or holding company thereof, which is not a subsidiary. Except with the prior approval of the FRB, no director or officer of a savings and loan holding company or person owning or controlling by proxy or otherwise more than 25% of such holding company’s stock also may acquire control of any savings institution, other than a subsidiary institution, or any other savings and loan holding company.
The FRB has adopted risk-based capital guidelines for bank holding companies and the FDIC has adopted risk-based capital guidelines for state non-member banks. Prior to January 1, 2015, the guidelines included a minimum for the ratio of total capital to
16
risk-weighted assets of 8%, with at least half of the ratio composed of common shareholders’ equity, minority interests in certain equity accounts of consolidated subsidiaries and a limited amount of qualifying preferred stock and qualified trust preferred securities, less goodwill and certain other intangible assets (known as “Tier 1” risk-based capital). The guidelines also provided for a minimum ratio of Tier 1 capital to average assets, or “leverage ratio,” of 3% for bank holding companies that meet certain criteria, including having the highest regulatory rating, and 4% for all other bank holding companies.
The risk-based capital guidelines adopted by the federal banking agencies are based on the “International Convergence of Capital Measurement and Capital Standard” (Basel I), published by the Basel Committee on Banking Supervision (the “Basel Committee”) in 1988. In 2004, the Basel Committee published a new capital adequacy framework (Basel II) for large, internationally active banking organizations, and in December 2010 and January 2011, the Basel Committee issued an update to Basel II (“Basel III”). The Basel Committee frameworks did not become applicable to banks supervised in the United States until adopted into United States law or regulations. Although the United States banking regulators imposed some of the Basel II and Basel III rules on banks with $250 billion or more in assets or $10 billion of on-balance sheet foreign exposure, it was not until July 2013 that the United States banking regulators issued final (or, in the case of the FDIC, interim final) new capital rules applicable to smaller banking organizations which also implement certain of the provisions of the Dodd-Frank Act (the “Basel III Capital Rules”). Community banking organizations, including United Community and Home Savings, began transitioning to the new rules on January 1, 2015. The new minimum capital requirements became effective on January 1, 2015, whereas a new capital conservation buffer and deductions from common equity capital phase in from January 1, 2016, through January 1, 2019, and most deductions from common equity tier 1 capital will phase in from January 1, 2015, through January 1, 2019.
The new rules include (a) a new common equity tier 1 capital ratio of at least 4.5%, (b) a Tier 1 capital ratio of at least 6.0%, rather than the former 4.0%, (c) a minimum total capital ratio that remains at 8.0 percent, and (d) a minimum leverage ratio of 4.0%.
Common equity for the common equity tier 1 capital ratio includes common stock (plus related surplus) and retained earnings, plus limited amounts of minority interests in the form of common stock, less the majority of certain regulatory deductions.
Tier 1 capital includes common equity as defined for the common equity tier 1 capital ratio, plus certain non-cumulative preferred stock and related surplus, cumulative preferred stock and related surplus and trust preferred securities that have been grandfathered (but which are not permitted going forward), and limited amounts of minority interests in the form of additional Tier 1 capital instruments, less certain deductions.
Tier 2 capital, which can be included in the total capital ratio, includes certain capital instruments (such as subordinated debt) and limited amounts of the allowance for loan and lease losses, subject to new eligibility criteria, less applicable deductions.
The deductions from common equity tier 1 capital include goodwill and other intangibles, certain deferred tax assets, mortgage-servicing assets above certain levels, gains on sale in connection with a securitization, investments in a banking organization’s own capital instruments and investments in the capital of unconsolidated financial institutions (above certain levels). The deductions phase in from 2015 through 2019.
Under the guidelines, capital is compared to the relative risk related to the balance sheet. To derive the risk included in the balance sheet, one of several risk weights is applied to different balance sheet and off-balance sheet assets, primarily based on the relative credit risk of the counterparty. The capital amounts and classification are also subject to qualitative judgments by the regulators about components, risk weightings and other factors. Some of the risk weightings have been changed effective January 1, 2015.
The new rules also place restrictions on the payment of capital distributions, including dividends, and certain discretionary bonus payments to executive officers if the company does not hold a capital conservation buffer of greater than 2.5% composed of common equity tier 1 capital above its minimum risk-based capital requirements, or if its eligible retained income is negative in that quarter and its capital conservation buffer ratio was less than 2.5% at the beginning of the quarter. The capital conservation buffer phases in starting on January 1, 2016, at .625%.
In addition to the capital adequacy requirements set forth above, every financial institution is classified into one of five categories based upon the institution’s capital ratios, the results of regulatory examinations of the institution and whether the institution is subject to enforcement agreements with its regulatory authorities. The categories are “well capitalized,” “adequately capitalized,” “undercapitalized,” “significantly undercapitalized” and “critically undercapitalized.” A bank with a capital level that might qualify for well-capitalized or adequately-capitalized status may nevertheless be treated as though the bank is in the next lower capital category if the bank’s primary federal banking supervisory authority determines that an unsafe or unsound condition or practice warrants that treatment. A bank’s operations can be significantly affected by its capital classification under the prompt corrective
17
action rules. For example, a bank that is not well capitalized generally is prohibited from accepting brokered deposits and offering interest rates on deposits higher than the prevailing rate in its market without advance regulatory approval. At each successively lower capital category, an insured depository institution is subject to additional restrictions. Undercapitalized banks are required to take specified actions to increase their capital or otherwise decrease the risk to the federal deposit insurance fund. Bank regulatory agencies generally are required to appoint a receiver or conservator within 90 days after a bank becomes critically undercapitalized.
Effective January 1, 2015, in order to be “well-capitalized,” a bank must have a common equity tier 1 capital ratio of at least 6.5%, a total risk-based capital ratio of at least 10%, a Tier 1 risk-based capital ratio of at least 8% and a leverage ratio of at least 5%, and the bank must not be subject to any written agreement, order, capital directive or prompt corrective action directive to meet and maintain a specific capital level or any capital measure.
Like all financial companies, United Community’s business and results of operations are subject to a number of risks, many of which are outside of our control. In addition to the other information in this report, readers should carefully consider that the following important factors, among others, could materially impact our business and future results of operations.
United Community and the Bank have an enterprise risk management program. The Board Risk Management Committee provides oversight of the program. The Board also adopted the Corporate Risk Management and Control Policy. The policy provides a framework for risk identification, monitoring and mitigation through a risk assessment process, including reviewing of policies and procedures to enhance the controls and risk management practices at United Community and the Bank. The Officers Risk Management Committee leads this process as part of an ongoing program.
Economic conditions may adversely affect our results of operations and financial condition.
A reduction in the availability of credit, the lack of confidence in the financial sector, a decrease in consumer confidence, an increase in volatility in the financial markets and reduced business activity could materially and adversely affect our business, financial condition and results of operations. Economic turmoil in Europe and Asia and changes in oil production in the Middle East affect the economy and stock prices in the United States, which can affect United Community’s earnings and capital and the ability of its customers to repay loans. As a result of the challenges presented by economic conditions, the Company may face the following risks in connection with these events:
| ● | Inability of borrowers to make timely repayments of their loans, or decreases in value of real estate collateral securing the payment of such loans resulting in significant credit losses, which could result in increased delinquencies, foreclosures and customer bankruptcies, any of which could have a material adverse effect on our operating results. |
| ● | Increased regulation of the financial services industry, including heightened legal standards and regulatory requirements or expectations. Compliance with such regulation will likely increase costs and may limit the Company’s ability to pursue business opportunities. |
| ● | Disruptions in the capital markets or other events, including actions by rating agencies and deteriorating investor expectations, may result in an inability to borrow on favorable terms or at all from other financial institutions. |
| ● | Increased competition among financial services companies due to the recent consolidation of certain competing financial institutions, which may adversely affect the Company’s ability to market competitive products and services. |
Changes in interest rates could adversely affect our financial condition and results of operations.
Our results of operations depend substantially on our net interest income, which is the difference between the interest earned on loans, securities and other interest-earning assets and the interest paid on deposits and other borrowings. These rates are highly sensitive to many factors beyond our control, including general economic conditions, inflation, recession, unemployment, the money supply and the policies of various governmental and regulatory authorities. While we have taken measures intended to manage the risks of operating in a changing interest rate environment, there can be no assurance that these measures will be effective in avoiding undue interest rate risk.
Increases in interest rates can affect the value of available for sale securities, loans and other assets, including our ability to realize gains on the sale of these assets. We originate loans for sale and for our portfolio. Increasing interest rates may reduce the origination of loans for sale and consequently the fee income we earn on such sales. Further, increasing interest rates may adversely affect the ability of borrowers to pay the principal or interest on loans and leases, resulting in an increase in nonperforming assets and a reduction of income recognized.
18
In contrast, decreasing interest rates have the effect of causing clients to refinance mortgage loans faster than anticipated. This causes the value of assets related to the servicing rights on loans sold to be lower than originally anticipated. If this happens, we may need to write down our servicing assets faster, which would accelerate our expense and lower our earnings.
Increasing credit risks could adversely affect our results of operations.
There are inherent risks associated with our lending activities, including credit risk, which is the risk that borrowers may not repay outstanding loans or the value of the collateral securing loans will decrease. We attempt to manage credit risk through a program of underwriting standards, the review of certain credit decisions and an on-going assessment of the quality of the credit already extended. However, conditions such as inflation, recession, unemployment, changes in interest rates, money supply, declines in real estate value and other factors beyond our control may increase our credit risk. Such changes in the economy may have a negative impact on the ability of borrowers to repay their loans. Because we have a significant amount of real estate loans, decreases in real estate values could adversely affect the value of our collateral. In addition, substantial portions of our loans are to individuals and businesses in Ohio. Consequently, any decline in the state’s economy could have a materially adverse effect on our financial condition and results of operations.
A loan is impaired when, based on current information and events, it is probable that Home Savings will be unable to collect both the contractual interest payments and the contractual principal payments, as scheduled in the loan agreement. Construction loans generally involve greater underwriting and default risks than loans secured by mortgages on existing properties because construction loans are more difficult to appraise and to monitor. In the event a default on a construction loan occurs and foreclosure follows, we may need to take control of the project and attempt either to arrange for completion of construction or dispose of the unfinished project.
We operate in an extremely competitive market, and our business will suffer if we are unable to compete effectively.
In our market area, we encounter significant competition from savings and loan associations, banks, credit unions, mortgage-banking firms, securities brokerage firms, asset management firms and insurance companies. Many of our competitors have substantially greater resources and lending limits than we do and may offer services that we do not or cannot provide. In order to compete, Home Savings may need to lower interest rates on its products to match interest rates offered by its competition, which could have a negative impact on net interest margin and earnings.
The Dodd-Frank Act and other legislative or regulatory changes or actions could adversely impact the financial services industry or our business, financial condition or results of operations.
The financial services industry is extensively regulated. Federal and state banking laws and regulations are primarily intended for the protection of consumers, depositors and the deposit insurance funds, and are not necessarily intended to benefit our shareholders. Changes to laws and regulations or other actions by regulatory agencies may negatively impact us. Regulatory authorities have extensive discretion in connection with their supervisory and enforcement activities, including the imposition of restrictions on the operation of an institution, the classification of assets by the institution and the adequacy of an institution’s allowance for loan losses. The significant federal and state banking regulations that affect us are described in this 10-K under the heading Regulation.
On July 21, 2010, President Obama signed the Dodd-Frank Act into law. The Dodd-Frank Act has significantly changed the regulation of financial institutions and the financial services industry. The Dodd-Frank Act requires various federal agencies to adopt a broad range of regulations with significant discretion. Among the provisions already implemented that have an effect on United Community are the following:
| ● | the Consumer Financial Protection Bureau (CFPB) was formed, which has broad powers to adopt and enforce consumer protection regulations; |
| ● | the federal law prohibiting the payment of interest on commercial demand deposit accounts was eliminated; |
| ● | the standard maximum amount of deposit insurance per customer was permanently increased to $250,000; |
| ● | the assessment base for determining deposit insurance premiums was expanded from domestic deposits to average assets minus average tangible equity; and |
| ● | new capital regulations were adopted. |
19
Additional provisions that may have an effect on United Community include that new corporate governance requirements that will require other new compensation practices and disclosure requirements, including requiring companies to “claw back” incentive compensation under certain circumstances.
Implementation of Dodd-Frank Act’s provisions have already increased compliance costs and the implementation of future provisions will likely increase both compliance costs and fees paid to regulators, along with possibly restricting the operations of United Community. Future legislation or regulatory changes would likely have a similar effect.
The preparation of financial statements requires management to make estimates about matters that are inherently uncertain.
Management’s accounting policies and methods are fundamental to how we record and report our financial condition and results of operations. Our management must exercise judgment in selecting and applying many of these accounting policies and methods in order to ensure that they comply with generally accepted accounting principles and reflect management’s judgment as to the most appropriate manner in which to record and report our financial condition and results of operations. Three of the most critical estimates are the level of the allowance for loan losses, the fair value of real estate owned and the valuation of mortgage servicing rights. Due to the inherent nature of these estimates, we cannot provide absolute assurance that we will not significantly increase the allowance for loan losses, sustain loan losses that are significantly higher than the provided allowance or recognize a significant provision for the impairment of mortgage servicing rights. Material additions to the allowance for loan losses and any loan losses that exceed our reserves would materially adversely affect our results of operations and financial condition.
Material breaches in security of our vendors and our systems may have a significant effect on our business.
Financial institutions are under continuous threat of loss due to cyber-attacks especially as we continue to expand customer capabilities to utilize internet and other remote channels to transact business. The most significant cyber–attack risks that we face are e-fraud, denial of service, and loss of sensitive customer data. Loss from e-fraud occurs when cybercriminals breach and extract funds directly from customer or our accounts. Loss can occur as a result of negative customer experience in the event of a successful denial of service attack that disrupts availability of our on-line banking services. The attempts to breach sensitive customer data, such as account numbers and social security numbers, could present significant operational, reputational, legal and/or regulatory costs to us if successful. The Company has security, backup and recovery systems in place and a comprehensive business continuity plan to ensure the systems will not be inoperable. The Company also has security in place to prevent unauthorized access to the systems. In addition, the Company has a cyber-liability insurance policy to protect against breaches of the Company and Vendor systems. Third party service providers also are required to maintain similar controls. However, the Company cannot be certain the measures will be successful to prevent a security breach. Our risk and exposure to these matters remains heightened because of the evolving nature and complexity of these threats from cybercriminals and hackers, our plans to continue to provide internet banking and mobile banking channels, and our plans to develop additional remote connectivity solutions to serve our customers. Security breaches also may increase reputational and legal risks, and the Company could experience an increase in expenses or losses resulting from such breaches.
Potential misuse of funds or information by the Bank’s employees or by third parties could result in damage to our customers for which we could be held liable, subject the Company to regulatory sanctions and otherwise adversely affect our financial condition and results of operations.
Our employees handle a significant amount of funds, as well as financial and personal information. Although the Company has implemented systems to minimize the risk of fraudulent taking or misuse of funds or information, there can be no assurance that such systems will be adequate or that a taking or misuse of funds or information by employees, by third parties who have authorized access to funds or information, or by third parties who are able to access funds or information without authorization will never occur. We could be held liable for such an event and could also be subject to regulatory sanctions. We could also incur the expense of developing additional controls to prevent future such occurrences. Although the Company has insurance to cover such potential losses, we cannot provide assurance that such insurance will be adequate to meet any liability. In addition, any loss of trust or confidence placed in the Company by our clients could result in a loss of business, which could adversely affect our financial condition and results of operations.
Our allowance for loan losses may prove to be insufficient to absorb probable incurred losses in our loan portfolio.
Lending money is a substantial part of our business. However, every loan we make carries a risk of non-payment. This risk is affected by, among other things: cash flow of the borrower and/or the project being financed; in the case of a collateralized loan, the changes and uncertainties as to the future value of the collateral; the credit history of a particular borrower; changes in economic and industry conditions; and the duration of the loan.
20
The preparation of consolidated financial statements in conformity with accounting principles generally accepted in the United States (GAAP) requires management to make significant estimates that affect the financial statements. One of our most critical estimates is the adequacy of the allowance for loan losses. Due to the inherent nature of these estimates, we cannot provide absolute assurance that we will not be required to charge earnings for significant unexpected loan losses.
We maintain an allowance for loan losses that we believe is a reasonable estimate of known and probable incurred losses within the loan portfolio. We make various assumptions and judgments about the collectability of our loan portfolio, including the creditworthiness of our borrowers and the value of the real estate and other assets serving as collateral for the repayment of loans. Through a periodic review and consideration of the loan portfolio, management determines the amount of the allowance for loan losses by considering general market conditions, credit quality of the loan portfolio, the collateral supporting the loans and performance of customers relative to their financial obligations with us. The amount of future losses is susceptible to changes in economic, operating and other conditions, including changes in interest rates and real estate values, which may be beyond our control, and these losses may exceed current estimates. We cannot fully predict the amount or timing of losses or whether the loan loss allowance will be adequate in the future.
In addition, bank regulators periodically review our allowance for loan losses and may require us to increase our provision for loan losses or recognize further loan charge-offs. Any increase in our allowance for loan losses or loan charge-offs as required by these regulatory authorities might have a material adverse effect on our financial condition and results of operations.
The Company’s results of operations, financial condition or liquidity may be adversely impacted by potential losses in connection with actual or projected repurchases and indemnification payments related to mortgages sold into the secondary market.
In connection with the origination and sale of residential mortgages into the secondary market, the Company makes certain representations and warranties, which, if breached, may require it to repurchase such loans, substitute other loans or indemnify the purchasers of such loans for actual losses incurred in respect of such loans. Although the Company believes that its mortgage documentation and procedures have been appropriate, it is possible that the Company will receive repurchase requests in the future and the Company may not be able to reach favorable settlements with respect to such requests. It is therefore possible that the Company may increase its reserves or may sustain losses associated with such loan repurchases and indemnification payments.
We may not be able to attract and retain skilled people.
Our success depends in large part on our ability to attract and retain key people. There are a limited number of qualified persons in our market area with the knowledge and experience required to successfully manage our business. The unexpected loss of services of other key personnel could have a material adverse impact on our business because of a loss of their skills, knowledge of our market and years of industry experience. If the Company is not able to promptly recruit qualified personnel, which the Company requires to conduct our operations, our business and our ability to successfully implement our strategic plan could be affected.
Volatility in the economy may negatively impact the fair value of our common shares.
The market price for our common shares has been volatile in the past, and several factors could cause the price to fluctuate substantially in the future, including:
| ● | Announcements of developments related to our business; |
| ● | Fluctuations in our results of operations; |
| ● | Sales of substantial amounts of our securities into the marketplace; |
| ● | General conditions in our markets or the worldwide economy; |
| ● | A default by another large financial institution; |
| ● | A shortfall in revenues or earnings compared to market expectations; |
| ● | Our inability to pay dividends; and |
| ● | Our announcement of other projects. |
21
We rely, in part, on external financing to fund our operations and the availability of such funds in the future could adversely impact our growth strategy and prospects.
Home Savings relies on deposits, advances from the FHLB and other borrowings to fund its banking operations. United Community has no debt outstanding. Although the Company considers its sources of funds to be adequate for its current funding needs, the Company may seek additional debt or equity capital in the future to achieve its long-term business objectives. The sale of equity or convertible debt securities in the future may be dilutive to the Company’s shareholders, and debt refinancing arrangements may require the Company to pledge some of its assets and enter into covenants that would restrict its ability to incur further indebtedness. Additional financing sources, if sought, might be unavailable to the Company or, if available, could be on terms unfavorable to it. If additional financing sources are unavailable, not available on reasonable terms or the Company is unable to obtain any required regulatory approval for additional debt, the Company’s growth strategy and future prospects could be adversely impacted.
Our ability to pay cash dividends is subject to certain regulatory requirements.
United Community is generally dependent upon the earnings of Home Savings for funds to pay dividends on our common shares. The payment of dividends by Home Savings is subject to certain regulatory restrictions. Federal law generally prohibits a depository institution from making any capital distributions (including payment of a dividend) to its parent holding company if the depository institution would thereafter and or continue to be undercapitalized.
U.S. tax laws applicable to Home Savings would cause a taxable recapture of accumulated bad debt reserves of up to $21.1 million to the extent that Home Savings makes a distribution to United Community while Home Savings does not have sufficient tax earnings and profits at the time of such distribution. The income tax liability resulting from such a distribution could be as great as $7.3 million. No deferred tax liability has been recorded for this potential recapture liability. For a further description, refer to Note 14 to our financial statements contained in our Form 10-K for the year ended December 31, 2015. Accordingly, until Home Savings restores its tax earnings and profits to an amount sufficient to avoid taxable bad debt reserve recapture upon distributions to United Community, we may be unwilling to approve a dividend from Home Savings to United Community even if Home Savings was otherwise permitted or able to make a dividend to United Community. As of December 31, 2015, the deficit in tax earnings and profits was approximately $21.7 million. Tax earnings and profits is generally increased by taxable income and tax-exempt income and decreased by income taxes payable and non-deductible expenses.
As a result, any payment of dividends in the future by United Community will be generally dependent on Home Savings’ earnings, capital requirements, financial condition and other factors.
Changes in the fair value of our investment securities may reduce stockholders’ equity and net income.
As of December 31, 2015, securities available for sale were $357.7 million and the net unrealized losses on those securities were $3.8 million. Stockholders’ equity is increased or decreased by the change in unrealized gain or loss on these securities, through accumulated other comprehensive income (loss) (AOCI). The unrealized gain or loss represents the difference between the estimated fair value and the amortized cost of the securities. A decline in the estimated fair value of the portfolio results in, but is not limited to, a decline in stockholders’ equity, book value per common share, and tangible book value per common share. Potential recovery of a debt security is dependent upon a number of factors as it approaches maturity, including, but not limited to, credit quality and market interest rates. Increases in market interest rates commonly result in declines in the fair value of debt securities. Equity securities have no stated maturity; therefore, declines in fair value may or may not be recovered over time and are subject to market and issuer fundamentals.
We conduct quarterly reviews of our securities portfolio to determine if the declines are other-than-temporary. If we determine that fair value decreases are other-than-temporary, the security is written down to a new cost basis and the resulting loss is charged to earnings as a component of noninterest income.
We continue to monitor the fair value of our securities portfolio as part of our ongoing other-than-temporary-impairment (OTTI) evaluation process. No assurance can be given that we will not need to recognize OTTI charges in the future. Additional OTTI charges may materially affect our financial condition and earnings. See Note 1 to our consolidated financial statements for a further discussion on OTTI.
22
We are dependent on our information technology and telecommunications systems and third-party servicers, and systems failures, interruptions could have an adverse effect on our financial condition and results of operations.
Our business is highly dependent on the successful and uninterrupted functioning of our information technology and telecommunications systems and third-party servicers. We outsource many of our major systems, such as data processing, loan servicing and deposit processing systems. The failure of these systems, or the termination of a third-party software license or service agreement on which any of these systems is based, could interrupt our operations. Because our information technology and telecommunications systems interface with and depend on third-party systems, we could experience service denials if demand for such services exceeds capacity or such third-party systems fail or experience interruptions. If sustained or repeated, a system failure or service denial could result in a deterioration of our ability to process new and renewal loans, gather deposits and provide customer service, compromise our ability to operate effectively, damage our reputation, result in a loss of customer business and/or subject us to additional regulatory scrutiny and possible financial liability, any of which could have a material adverse effect on our financial condition and results of operations.
Item 1B. | Unresolved Staff Comments |
None.
Home Savings owns its corporate headquarters building located in Youngstown, Ohio. Of Home Savings’ 31 retail banking offices, 27 are owned and the remaining offices are leased. Loan origination offices are leased under long-term lease agreements. The information contained in Note 8 to the consolidated financial statements: Premises and Equipment is incorporated herein by reference.
United Community and Home Savings are parties to litigation arising in the normal course of business. While it is impossible to determine the ultimate resolution of these contingent matters, management believes any resulting liability would not have a material effect upon United Community’s financial statements.
Item 4. | Mine Safety Disclosures |
Not applicable.
23
PART II
Item 5. | Market for Registrant’s Common Equity, Related Shareholder Matters and Issuer Purchases of Equity Securities |
There were 54,138,910 United Community common shares issued and 47,634,899 shares outstanding and held by approximately 9,500 record holders as of March 4, 2016. United Community’s common shares are traded on The Nasdaq Stock Market® under the symbol UCFC. Quarterly stock prices and dividends declared are shown in the following table.
| | First Quarter | | | Second Quarter | | | Third Quarter | | | Fourth Quarter | |
2015 | | | | | | | | | | | | | | | | |
High | | $ | 5.61 | | | $ | 5.68 | | | $ | 5.44 | | | $ | 6.33 | |
Low | | | 4.95 | | | | 5.27 | | | | 3.58 | | | | 4.84 | |
Dividends declared and paid | | | 0.01 | | | | 0.01 | | | | 0.03 | | | | 0.03 | |
| | | | | | | | | | | | | | | | |
| | First Quarter | | | Second Quarter | | | Third Quarter | | | Fourth Quarter | |
2014 | | | | | | | | | | | | | | | | |
High | | $ | 4.11 | | | $ | 4.14 | | | $ | 4.87 | | | $ | 5.49 | |
Low | | | 3.35 | | | | 3.19 | | | | 3.85 | | | | 4.57 | |
Dividends declared and paid | | — | | | — | | | | 0.01 | | | | 0.01 | |
The following table provides information concerning purchases of United Community’s common shares made by United Community during the three months ended December 31, 2015:
Period | | Total number of common shares purchased | | | Average price paid per common share | | | Total number of common shares purchased as part of publicly announced plans | | | Maximum number of shares that may yet be purchased under the plan | |
October 1 through October 31, 2015 | | | — | | | $ | — | | | | — | | | | 862,789 | |
November 1 through November 30, 2015 | | | — | | | | — | | | | — | | | | 862,789 | |
December 1 through December 31, 2015 (1) | | | 119,683 | | | | 6.04 | | | | 116,000 | | | | 746,789 | |
Total | | | 119,683 | | | $ | 6.04 | | | | 116,000 | | | | 746,789 | |
(1) | United Community purchased 3,683 shares at an average price of $5.83 per share from employees that used shares to pay employment taxes during the period. The purchase of these shares was not part of United Community's share repurchase program. |
24
Performance Graph
The following graph compares the cumulative total return on United Community’s common shares since December 31, 2010, with the total return of an index of companies whose shares are traded on The Nasdaq Stock Market and an index of publicly traded thrift institutions and thrift holding companies. The graph assumes that $100 was invested in United Community shares on December 31, 2010.
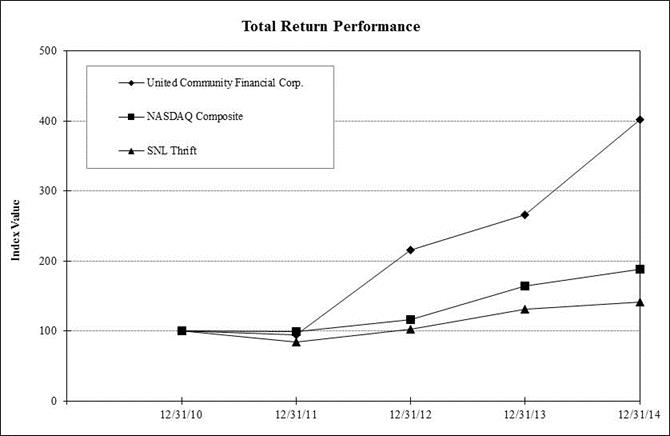
| | Period Ending | |
Index | | 12/31/10 | | 12/31/11 | | 12/31/12 | | 12/31/13 | | 12/31/14 | | 12/31/15 | |
United Community Financial Corp. | | | 100.00 | | | 94.78 | | | 215.67 | | | 266.42 | | | 402.47 | | | 447.97 | |
NASDAQ Composite | | | 100.00 | | | 99.21 | | | 116.82 | | | 163.75 | | | 188.03 | | | 201.40 | |
SNL Thrift | | | 100.00 | | | 84.12 | | | 102.32 | | | 131.30 | | | 141.22 | | | 158.80 | |
Equity Compensation Plan Information
Information regarding United Community’s common shares that have been authorized for issuance under the United Community equity compensation plan, as of December 31, 2015, appears under Item 12 of this Form 10-K and is incorporated herein by reference.
25
Item 6. | Selected Financial Data |
Selected financial condition data:
| | At December 31, | |
| | 2015 | | | 2014 | | | 2013 | | | 2012 | | | 2011 | |
| | (Dollars in thousands) | |
Total assets | | $ | 1,987,989 | | | $ | 1,833,550 | | | $ | 1,737,850 | | | $ | 1,808,365 | | | $ | 2,030,687 | |
Cash and cash equivalents | | | 35,910 | | | | 32,980 | | | | 77,331 | | | | 42,613 | | | | 54,136 | |
Securities: | | | | | | | | | | | | | | | | | | | | |
Available for sale, at fair value | | | 357,670 | | | | 499,790 | | | | 511,006 | | | | 574,562 | | | | 459,598 | |
Held to maturity, at amortized cost | | | 110,699 | | | | — | | | | — | | | | — | | | | — | |
Loans held for sale | | | 35,801 | | | | 20,730 | | | | 4,838 | | | | 13,031 | | | | 12,727 | |
Loans, net | | | 1,316,192 | | | | 1,148,093 | | | | 1,029,192 | | | | 1,066,240 | | | | 1,379,276 | |
Federal Home Loan Bank stock, at cost | | | 18,068 | | | | 18,068 | | | | 26,464 | | | | 26,464 | | | | 26,464 | |
Cash surrender value of life insurance | | | 54,366 | | | | 46,401 | | | | 44,972 | | | | 28,881 | | | | 28,354 | |
Deposits | | | 1,435,743 | | | | 1,347,836 | | | | 1,391,752 | | | | 1,462,074 | | | | 1,588,497 | |
Borrowed funds | | | 279,510 | | | | 216,752 | | | | 140,578 | | | | 140,598 | | | | 218,773 | |
Total shareholders’ equity | | | 244,245 | | | | 240,135 | | | | 175,074 | | | | 170,760 | | | | 188,745 | |
Summary of earnings:
| | Year ended December 31, | |
| | 2015 | | | 2014 | | | 2013 | | | 2012 | | | 2011 | |
| | (Dollars in thousands) | |
Interest income | | $ | 65,635 | | | $ | 63,244 | | | $ | 64,744 | | | $ | 78,444 | | | $ | 96,387 | |
Interest expense | | | 9,113 | | | | 11,825 | | | | 13,413 | | | | 18,006 | | | | 31,212 | |
Net interest income | | | 56,522 | | | | 51,419 | | | | 51,331 | | | | 60,438 | | | | 65,175 | |
Provision for loan losses | | | 2,135 | | | | (1,271 | ) | | | 4,116 | | | | 39,325 | | | | 24,658 | |
Net interest income after provision for loan losses | | | 54,387 | | | | 52,690 | | | | 47,215 | | | | 21,113 | | | | 40,517 | |
Non-interest income | | | 19,717 | | | | 13,741 | | | | 19,749 | | | | 22,731 | | | | 23,225 | |
Non-interest expenses | | | 49,929 | | | | 55,960 | | | | 56,737 | | | | 65,169 | | | | 63,512 | |
Income (loss) before taxes | | | 24,175 | | | | 10,471 | | | | 10,227 | | | | (21,325 | ) | | | 230 | |
Income tax expense (benefit) | | | 7,893 | | | | (39,735 | ) | | | 200 | | | | (888 | ) | | | — | |
Net income (loss) | | | 16,282 | | | | 50,206 | | | | 10,027 | | | | (20,437 | ) | | | 230 | |
Amortization of discount on preferred stock | | | — | | | | — | | | | (6,751 | ) | | | — | | | | — | |
Earnings (loss) available to common shareholders | | $ | 16,282 | | | $ | 50,206 | | | $ | 3,276 | | | $ | (20,437 | ) | | $ | 230 | |
26
Selected financial ratios and other data:
| | At or for the year ended December 31, | |
| | 2015 | | | 2014 | | | 2013 | | | 2012 | | | 2011 | |
Performance ratios: | | | | | | | | | | | | | | | | | | | | |
Return on average assets (1) | | | 0.85 | % | | | 2.82 | % | | | 0.56 | % | | | (1.06 | )% | | | 0.01 | % |
Return on average equity (2) | | | 6.65 | % | | | 23.30 | % | | | 5.32 | % | | | (10.71 | )% | | | 0.13 | % |
Interest rate spread (3) | | | 3.06 | % | | | 2.93 | % | | | 2.88 | % | | | 3.14 | % | | | 3.07 | % |
Net interest margin (4) | | | 3.18 | % | | | 3.10 | % | | | 3.04 | % | | | 3.31 | % | | | 3.28 | % |
Noninterest expense to average assets | | | 2.61 | % | | | 3.14 | % | | | 3.16 | % | | | 3.33 | % | | | 3.00 | % |
Efficiency ratio (5) | | | 65.10 | % | | | 80.11 | % | | | 80.15 | % | | | 79.28 | % | | | 77.41 | % |
Average interest-earning assets to average interest-bearing liabilities | | | 124.39 | % | | | 122.83 | % | | | 119.98 | % | | | 117.18 | % | | | 113.20 | % |
Capital ratios: | | | | | | | | | | | | | | | | | | | | |
Average equity to average assets | | | 12.81 | % | | | 12.10 | % | | | 10.51 | % | | | 9.89 | % | | | 8.69 | % |
Equity to assets, end of period | | | 12.29 | % | | | 13.10 | % | | | 10.07 | % | | | 9.44 | % | | | 9.29 | % |
Tier 1 leverage ratio | | | 11.46 | % | | | 12.11 | % | | | 10.50 | % | | | 8.70 | % | | | 8.61 | % |
Common equity Tier 1 ratio | | | 17.46 | % | | n/a | | | n/a | | | n/a | | | n/a | |
Tier 1 risk-based capital ratio | | | 17.46 | % | | | 19.87 | % | | | 18.50 | % | | | 14.95 | % | | | 13.30 | % |
Total risk-based capital ratio | | | 18.72 | % | | | 21.13 | % | | | 19.76 | % | | | 16.21 | % | | | 14.57 | % |
Asset quality ratios: | | | | | | | | | | | | | | | | | | | | |
Nonperforming loans to net loans at end of period (6) | | | 1.27 | % | | | 1.78 | % | | | 2.29 | % | | | 4.48 | % | | | 8.92 | % |
Nonperforming assets to average assets (7) | | | 1.02 | % | | | 1.34 | % | | | 1.67 | % | | | 3.42 | % | | | 7.40 | % |
Nonperforming assets to total assets at end of period | | | 0.98 | % | | | 1.30 | % | | | 1.72 | % | | | 3.66 | % | | | 7.71 | % |
Allowance for loan losses as a percent of loans | | | 1.33 | % | | | 1.52 | % | | | 2.01 | % | | | 1.94 | % | | | 2.97 | % |
Allowance for loan losses as a percent of nonperforming loans (6) | | | 105.76 | % | | | 86.48 | % | | | 89.52 | % | | | 44.22 | % | | | 34.34 | % |
Texas ratio (8) | | | 7.43 | % | | | 9.28 | % | | | 15.27 | % | | | 34.56 | % | | | 67.88 | % |
Total classified assets as a percent of Tier 1 Capital | | | 17.74 | % | | | 18.64 | % | | | 31.83 | % | | | 48.76 | % | | | 123.99 | % |
Total classified loans as a percent of Tier 1 Capital and ALLL | | | 15.32 | % | | | 15.79 | % | | | 25.58 | % | | | 32.95 | % | | | 99.39 | % |
Total classified assets as a percent of Tier 1 Capital and ALLL | | | 16.44 | % | | | 17.25 | % | | | 28.62 | % | | | 43.09 | % | | | 114.48 | % |
Net chargeoffs as a percent of average loans | | | 0.17 | % | | | 0.20 | % | | | 0.40 | % | | | 4.88 | % | | | 2.17 | % |
Total 90+ days past due as a percent of net loans | | | 1.24 | % | | | 1.40 | % | | | 1.97 | % | | | 3.94 | % | | | 7.60 | % |
Per share data: | | | | | | | | | | | | | | | | | | | | |
Basic earnings (loss) per common share (9) | | $ | 0.34 | | | $ | 1.00 | | | $ | 0.07 | | | $ | (0.62 | ) | | $ | 0.01 | |
Diluted earnings (loss) per common share (9) | | | 0.34 | | | | 1.00 | | | | 0.07 | | | | 0.62 | | | | 0.01 | |
Book value per common share (10) | | | 5.14 | | | | 4.88 | | | | 3.48 | | | | 5.17 | | | | 5.79 | |
Tangible book value per common share (11) | | | 5.14 | | | | 4.88 | | | | 3.47 | | | | 5.16 | | | | 5.78 | |
Cash dividend per common share | | | 0.07 | | | | 0.02 | | | | — | | | | — | | | | — | |
Dividend payout ratio (12) | | | 20.59 | % | | | 2.00 | % | | n/a | | | n/a | | | n/a | |
Notes:
1. | Net income divided by average total assets |
2. | Net income divided by average total equity |
3. | Difference between weighted average yield on interest-earning assets and weighted average cost of interest-bearing liabilities |
4. | Net interest income as a percent of average interest-earning assets |
5. | Noninterest expense, excluding the amortization of the core deposit intangible and prepayment penalty, divided by the sum of net interest income and noninterest income, excluding gains and losses on securities and gains and losses on foreclosed assets |
6. | Nonperforming loans consist of nonaccrual loans and loans past due ninety days and still accruing |
7. | Nonperforming assets consist of nonperforming loans, real estate owned and other repossessed assets |
8. | Nonperforming assets divided by the sum of tangible common equity and the allowance for loan losses |
9. | Net income divided by the number of basic or diluted shares outstanding |
10. | Shareholders’ equity divided by number of shares outstanding |
11. | Shareholders’ equity minus core deposit intangible divided by number of shares outstanding |
12. | Historical per share dividends declared and paid for the year divided by the diluted earnings per share for that year |
27
Item 7. | Management’s Discussion and Analysis of Financial Condition and Results of Operations |
General
United Community was incorporated in the State of Ohio in February 1998 for the purpose of owning all of the outstanding capital stock of Home Savings issued upon the Conversion of Home Savings from a mutual savings association to a permanent capital stock savings association. The Conversion was completed on July 8, 1998.
From August 8, 2008 until July 2, 2013, United Community was subject to an Order to Cease and Desist, as amended, and from July 9, 2013 to January 8, 2014 a Memorandum of Understanding. The Order and Memorandum of Understanding generally restricted United Community’s ability to pay dividends, repurchase shares or issue debt without the FRB’s (as successor to the Office of Thrift Supervision) prior approval.
The following discussion and analysis of the financial condition and results of operations of United Community and its subsidiary, Home Savings, should be read in conjunction with the consolidated financial statements, and the notes thereto, included in this Annual Report.
Overview
Total assets increased 8.4% to $2.0 billion at December 31, 2015. Contributing to the change were increases in net loans, loans held for sale and cash surrender value of life insurance. These changes were offset by decreases in securities, real estate owned and other repossessed assets and other assets. Total liabilities increased 9.4% to $1.7 billion at December 31, 2015. This change was primarily the result of increased deposits, both interest bearing and non-interest bearing, as well as overnight advances from the Federal Home Loan Bank (FHLB), which were used to fund balance sheet growth and to prepay repurchase agreements.
The Company recognized net income of $16.3 million for the year ended December 31, 2015, compared to net income of $50.2 million in 2014. Materially impacting 2014 net income was the reversal of the valuation allowance on net deferred tax assets, which provided an income tax benefit of $39.7 million.
Changes in Financial Condition
Total assets increased $154.4 million, or 8.4%, from $1.8 billion at December 31, 2014 to $2.0 billion at December 31, 2015. The net change in assets consisted primarily of increases in cash and cash equivalents of $2.9 million, net loans of $168.1 million, loans held for sale of $15.1 million and cash surrender value of life insurance of $8.0 million offset by decreases in securities of $31.4 million, real estate owned and other repossessed assets of $740,000 and other assets of $7.3 million. Total liabilities increased $150.3 million, or 9.4%, as a result of increases of $48.4 million in interest bearing deposits, $39.5 million in non-interest bearing deposits, and $92.8 million in FHLB advances, which were offset by a $30.0 million decrease in repurchase agreements.
Funds not currently utilized for general corporate purposes are invested in overnight funds and securities. Cash and cash equivalents increased $2.9 million, or 8.9%, to $35.9 million at December 31, 2015, compared to $33.0 million at December 31, 2014. Cash and cash equivalents increased in 2015 as a result of increased balances on hand with correspondent banks.
During the third quarter of 2015, Home Savings transferred securities with a total amortized cost of $105.3 million with a corresponding fair value of $103.8 million from available for sale to held to maturity. These securities were moved to held to maturity in part to reduce volatility in tangible book value. The net unrealized loss, net of taxes, on these securities at the date of transfer was $999,000. The fair value at the date of transfer became the securities’ new cost basis. The unrealized holding loss at the time of transfer continues to be reported in accumulated other comprehensive income, net of tax and is amortized over the remaining lives of the securities as an adjustment of the yield. The amortization of the unamortized holding loss reported in accumulated other comprehensive income will directly offset the effect on interest income from the accretion of the reduced amortized cost for the transferred securities. In addition to the securities transferred to held to maturity in 2015, Home Savings purchased $10.4 million in municipal securities and classified them as held to maturity.
Also affecting available for sale securities, were maturities, paydowns and amortization totaling $31.1 million and sales of $16.6 million, along with a positive market value adjustment of $1.3 million during 2015. The balance of the unrealized loss position at December 31, 2015 was $4.0 million, pretax, compared to $6.6 million, pretax at December 31, 2014. The unrealized loss position recognized in available for sale securities is primarily driven by market conditions. To that end, the Company expects to receive all principal and interest payments contractually due and has no intent to sell and more than likely will not be required to sell these securities until maturity. The majority of the securities are Government Sponsored Entities (GSE) issued debt or mortgage-backed securities and carry the same rating as the U.S. Government.
28
The duration of the available for sale securities portfolio was approximately 6.1 years at December 31, 2015. There is risk that longer-term rates could rise, resulting in greater unrealized losses. It is also possible, however, that longer term rates could fall, resulting in the recovery of all of the unrealized losses. Management continues to allow the portfolio to decline in the normal course. In addition, the Company may look for opportunities to sell securities to continue to reduce the portfolio, change the duration characteristics of the portfolio, and/or change the mix of the portfolio.
Loans held for sale, carried at lower of cost or market, were $9.1 million and loans held for sale, carried at fair value were $26.7 million at December 31, 2015. The Company elected the fair value option for all permanent construction loans held for sale originated on or after January 1, 2015. The increase in loans held for sale during 2015 was the result of loan originations exceeding sales during the period.
Net loans increased 14.6% to $1.3 billion at December 31, 2015, compared to $1.1 billion at December 31, 2014. Commercial loans increased $116.8 million, residential mortgage loans increased $43.4 million and consumer loans increased $7.5 million. The primary reason for the increase is the continued focus on growing the commercial loan portfolio. See Note 4 to the consolidated financial statements for additional information regarding the composition of net loans.
Allowance for Loan Losses. The allowance for loan losses is a valuation allowance for probable incurred credit losses established through a provision for probable loan losses charged to expense. The allowance for loan losses was $17.7 million at December 31, 2015, and 2014. The allowance for loan losses as a percentage of loans was 1.33% at December 31, 2015, compared to 1.52% at December 31, 2014. The allowance for loan losses as a percentage of nonperforming loans was 105.76% at December 31, 2015, compared to 86.48% at December 31, 2014. Loan losses are charged against the allowance when the uncollectability of a loan balance is confirmed. Subsequent recoveries, if any, are added back to the allowance. Home Savings’ allowance for loan loss methodology includes allowance allocations calculated in accordance with ASC Topic 310, “Receivables,” and allowance allocations calculated in accordance with ASC Topic 450, “Contingencies”. Accordingly, the methodology is based on historical loss experience by type of credit and internal risk grade applied to specific risk pools, plus specific loss allocations and adjustments for current events and conditions. Home Savings’ process for determining the appropriate level of the allowance for probable loan losses is designed to account for credit deterioration as it occurs. The provision for probable loan losses reflects loan quality trends, including the levels of and trends related to nonaccrual loans, past due loans, classified loans and net charge-offs or recoveries, among other factors.
During 2015, the Company recorded a loan loss provision of $2.1 million. This provision expense was the result of overall growth in the loan portfolio offset by the level of net charge-offs and disposition of nonperforming loans.
Impaired Loans. A loan is considered impaired when there is a deterioration of the credit worthiness of the borrower to the extent that there is no longer reasonable assurance of the timely collection of the full amount of principal and interest. The total outstanding balance of all impaired loans was $39.7 million at December 31, 2015 as compared to $45.9 million at December 31, 2014. The decrease in impaired loans can be largely attributed to the resolution of loans through principal payments, charge-offs, sale of the loan or collateral or by Home Savings taking possession of the collateral.
Included in impaired loans are certain loans Home Savings considers to be troubled debt restructurings (TDR). A loan is considered a TDR if Home Savings grants a concession to the debtor that it would otherwise not consider. The concession either stems from an agreement between the creditor and the debtor or is imposed by law or a court. Total TDR loans aggregated $26.3 million at December 31, 2015, compared to $31.2 million in the prior year.
A restructured loan that has fallen into nonaccrual status will return to accruing status if either of the following criteria are met: (i) none of the principal and interest is due or unpaid and Home Savings expects repayment of the remaining contractual principal and interest, or (ii) the borrower has resumed paying the full amount of the scheduled contractual interest and principal payments on a loan that is between 30 and 89 days past due and there is reasonable assurance of prepayment established through payment performance over a period of six months. TDR loans that were on nonaccrual status aggregated $2.8 million and $3.5 million at December 31, 2015 and December 31, 2014, respectively. Such loans are considered nonperforming loans. TDR loans that were accruing according to their terms aggregated $23.4 million and $24.7 million at December 31, 2015 and December 31, 2014, respectively.
Nonperforming Loans. Nonperforming loans consist of nonaccrual loans and loans past due 90 days and still accruing. Nonperforming loans were $16.7 million, or 1.27% of net loans, at December 31, 2015, compared to $20.5 million, or 1.78% of net loans, at December 31, 2014.
Generally, loans are placed on nonaccrual status if principal or interest payments become 90 days past due and/or management deems the collectability of the principal and/or interest to be in question, as well as when required by regulatory guidance. Loans to a customer whose financial condition has deteriorated are considered for nonaccrual status whether or not the loan is 90 or more days
29
past due. Once interest accruals are discontinued, accrued but uncollected interest is charged to current year operations. Subsequent cash receipts on nonaccrual loans are recorded as a reduction of principal. Interest income is recorded only after principal recovery is reasonably assured. Classification of a loan as nonaccrual does not preclude the ultimate collection of loan principal or interest.
Federal Home Loan Bank Stock. FHLB stock was $18.1 million at December 31, 2015 and 2014. During 2015, the FHLB paid a cash dividend of $723,000 in lieu of stock dividends to its member banks.
Real Estate Owned and Other Repossessed Assets. Real estate owned and other repossessed assets decreased $740,000 or 21.3% during the year ended December 31, 2015, as compared to the year ended December 31, 2014. Property acquired in the settlement of loans is recorded at the lower of the loan’s acquisition balance less cost to sell or the fair market value of the property secured less costs to sell. Appraisals are obtained at least annually on properties that exceed $1.0 million in value. Based on current appraisals, a valuation allowance may be established to reflect properly the asset at fair value.
Bank Owned Life Insurance. Bank Owned Life Insurance (BOLI) is maintained on select officers and employees of Home Savings whereby Home Savings is the beneficiary. BOLI is recorded at its cash surrender value, or the amount currently realizable. Increases in the Home Savings’ policy cash surrender value are tax exempt and death benefit proceeds received by Home Savings are tax-free. Income from these policies and changes in the cash surrender value are recorded in other income. There is no post-termination coverage, split dollar or other benefits provided to participants covered by the BOLI. During 2015, Home Savings purchased an additional $7.0 million in BOLI. Home Savings recognized $1.7 million (including a death benefit of $248,000) and $1.4 million, as other non-interest income based on the change in cash value of the policies in the twelve months ended December 31, 2015 and 2014, respectively.
Other Assets. Other assets decreased $7.3 million, largely due to change in net deferred tax assets (DTA) during 2015. As of December 31, 2015, the net DTA was $20.4 million, and as of December 31, 2014, the net DTA was $28.1 million.
As of December 31, 2014, the Company had reversed $42.8 million of the valuation allowance on its net DTA. Included in the reversal was $4.1 million due to current year-to-date operating income; the remaining $38.7 million is due to management’s reassessment and judgment regarding the ability to realize deferred tax assets in future years. The realization of a DTA is assessed and a valuation allowance is recorded if it is “more likely than not” that all or a portion of the DTA will not be realized. “More likely than not” is defined as the DTA being more than 50% likely of being realized. All available evidence, both positive and negative, is considered to determine whether, based on the weight of that evidence, a valuation allowance against the net DTA is required. In assessing the need for a valuation allowance, the Company considered all available evidence about the realization of the DTA, both positive and negative, that could be objectively verified.
After weighing both the positive and negative evidence, management determined that a full valuation allowance on the net DTA was no longer warranted as of June 30, 2014. For a more detailed discussion of the Company’s tax calculation, see Note 14 to the consolidated financial statements.
The Company’s ultimate realization of the DTA is dependent upon the generation of future taxable income during the periods in which temporary differences become deductible. Management considers the nature and amount of historical and projected future taxable income, the scheduled reversal of deferred tax assets and liabilities, and available tax planning strategies in making this assessment. The amount of deferred taxes recognized could be impacted by changes to any of these variables.
Total Deposits. Total deposits increased $87.9 million to $1.4 billion at December 31, 2015, compared to $1.3 billion at December 31, 2014. Non-interest bearing accounts increased $39.5 million, or 21.0%, since year-end. During the same time period, interest bearing deposits increased 4.2%, or $48.4 million, which can be attributed to Home Savings’ planned expansion efforts in attracting public funds. As of December 31, 2015, Home Savings had $91.3 million in public funds. As of December 31, 2015 and 2014, Home Savings had no brokered deposits.
Funds needed in excess of deposit growth are borrowed in the normal course of business, if necessary. Home Savings has an established credit relationship with the FHLB of Cincinnati under which Home Savings could borrow up to an additional $206.3 million as of December 31, 2015. These borrowings are collateralized by residential mortgage loans. Of the total borrowing capacity at the FHLB, Home Savings had outstanding term advances of $47.0 million with an effective rate of 2.19% and overnight advances of $232.0 million with a rate of 0.35 % at December 31, 2015.
30
On November 18, 2014, Home Savings modified the $50.0 million fixed-rate term advance with the FHLB. The modification was completed in order to reduce the Company’s funding cost. A $3.9 million prepayment penalty was paid by Home Savings as part of the modification, which was deferred and will be amortized on a level yield method over the five-year remaining term of the modified borrowing. The effective rate on the modified borrowing is currently 2.19%, including the impact of the prepayment penalty amortization.
Repurchase Agreements and Other Borrowings. Repurchase agreements and other borrowings decreased from $30.6 million at December 31, 2014 to $535,000 at December 31, 2015. At the end of December 2015, Home Savings prepaid a $30.0 million tranche of the Company’s repurchase agreements and, as a result, incurred a $1.3 million prepayment charge. Similar to the FHLB term advance modification discussed above, these debt prepayment actions were completed in order to reduce the Company’s funding costs.
Securities sold under agreements to repurchase are secured primarily by mortgage-backed securities with a fair value of $0 at December 31, 2015 and approximately $54.7 million at December 31, 2014. Securities sold under agreements to repurchase are held by a brokerage firm in a wholesale transaction and by an independent third party when they are for retail customers. At maturity, the securities underlying the agreements were returned to United Community.
Other Liabilities. Home Savings receives requests for reimbursements from both Freddie Mac and Fannie Mae to make them whole on loans sold to them in the secondary market. These loans were originated by Home Savings in the normal course, but such loans have certain defined weaknesses such that a settlement to the investor is required. For the twelve months ended December 31, 2015, Home Savings recognized a recovery on such expenses of $554,000 associated with these repurchases as a reduction to the reserve. Home Savings has no reserve for future make-whole settlements aggregating at December 31, 2015. Management believes this is adequate given the historical losses incurred to date and the probability that future losses may occur.
Shareholders’ Equity. Shareholders’ equity increased $4.1 million to $244.2 million at December 31, 2015, from $240.1 million at December 31, 2014. The change occurred as a result of net income for the period, along with positive adjustments to other comprehensive income for the recovery of value of available for sale securities during the period, offset by the payment of a quarterly dividend as well as the purchase of treasury stock.
Accumulated other comprehensive income improved $778,000 from December 31, 2015 to December 31, 2014. Unrealized losses on U.S. Treasury and government sponsored entities and mortgage-backed securities included in other comprehensive income have not been recognized in income at December 31, 2015 and December 31, 2014 because the issuer’s securities are of high credit quality (rated AA or higher), management does not intend to sell (and it is likely that management will not be required to sell) the securities prior to their anticipated recovery, and the decline in fair value is largely due to the rise in longer-term interest rates in 2014 and 2015. The fair value is expected to recover as the investments approach maturity.
Events beyond management’s control, such as fluctuations in interest rates or a downturn in the economy in areas in which Home Savings’ loans and securities are concentrated, could adversely affect future earnings and consequently Home Savings’ ability to meet its future capital requirements.
Book value per common share as of December 31, 2015 was $5.14 as compared to $4.88 per common share as of December 31, 2014. Book value per share is calculated as total common equity divided by the number of common shares outstanding. Book value was impacted by the overall change in equity as mentioned above.
Comparison of Operating Results for the Years Ended December 31, 2015 and December 31, 2014
Net Income. United Community recognized net income for the twelve months ended December 31, 2015, of $16.3 million, or $0.34 per diluted common share, compared to net income of $50.2 million, or $1.00 per diluted common share.
The significant change in earnings for 2015 was primarily a result of the reversal of the valuation allowance on net deferred tax assets, which provided an income tax benefit of $39.7 million in 2014. Pretax income was significantly higher in 2015. Net interest income for 2015 increased $5.2 million. The provision for loan losses increased $3.4 million during the same period. Additionally, non-interest income increased $6.0 million and noninterest expense decreased $6.0 million. United Community’s annualized return on average assets and return on average equity were 0.85 and 6.65%, respectively for the twelve months ended December 31, 2015 and 2.82% and 23.30%, respectively, for the twelve months ended December 31, 2014.
Net Interest Income. Net interest income for the twelve months ended December 31, 2015 and December 31, 2014 was $56.6 million and $51.4 million, respectively.
31
Total interest income increased $2.5 million in 2015 compared to 2014, primarily as a result of an increase of $133.1 million in the average balance of net loans, despite a decrease in yield on net loans of 25 basis points.
Total interest expense decreased $2.7 million for the twelve months ended December 31, 2015, as compared to the same period last year. The change was due primarily to reductions of $2.1 million in interest paid on repurchase agreements and $688,000 on FHLB advances. These decreases were caused by a reduction of 180 basis points in the cost of FHLB advances due to the 2014 modification discussed above. Additionally the impact of the prepayment of repurchase agreements in 2014 caused that expense to decline, year over year. The prepayment of a repurchase agreement in late 2015 did not have a material impact on 2015 results, but is expected to improve margin beginning with the first quarter of 2016.
Provision for Loan Losses. A provision for loan losses is charged to income to bring the total allowance for loan losses to a level considered by management to be adequate, based on management’s evaluation of such factors as the delinquency status of loans, current economic conditions, the net realizable value of the underlying collateral, changes in the composition of the loan portfolio and prior loan loss experience. The Company recognized a loan loss provision of $2.1 million in 2015, compared to a negative provision of $1.3 million in 2014. The increase in provision for loan losses was caused by an overall increase in outstanding loans during 2015. Also affecting the comparison, during this time period, a large commercial real estate loan paid off in the second quarter of 2014, releasing approximately $748,000 in reserves at that time. For the twelve months ended December 31, 2015, net chargeoffs to average outstanding loans was 17 basis points. This compares to 20 basis points for the same period last year.
Noninterest Income. Noninterest income increased in 2015 to $19.7 million, as compared to $13.7 million in 2014. The increase in noninterest income was driven by increased mortgage banking income, which was due to an increase in the volume of loans sold in the secondary market in the current year, as compared to the prior year. Additionally, Home Savings was able to benefit from the increased pricing from loans originated in the previous year. Home Savings adopted fair-value accounting for newly originated construction perm loans in 2015 and has elected the fair value option for newly originated permanent construction loans held for sale. Fair value accounting more appropriately aligns the recognition of gains with hedging costs incurred during the construction period. See Note 18 discussing fair value.
Noninterest Expense. Noninterest expense was $49.9 million in 2015, compared to $56.0 million in 2014, a difference of $6.0 million. During 2015, salaries and employee benefits declined, primarily due to organizational restructuring and modification of certain employee benefit plans. The Home Savings postretirement medical plan was curtailed in 2015, and medical benefits will no longer be provided to plan participants as of December 31, 2016. This resulted in the reduction of the postretirement liability and the acceleration of the net periodic benefit credit aggregating $1.3 million. Also affecting the comparison was the recognition of a $923,000 charge related to cost reduction initiatives incurred during the second quarter of 2014, which did not recur in 2015. Equipment and data processing expense declined as a result of lower core-processing system costs. A prepayment penalty was recognized in 2015 as a result of the early payoff of one $30.0 million repurchase agreement. During the previous year, Home Savings paid in full two repurchase agreements aggregating $60.0 million. Other expenses declined $586,000 to $4.8 million for the twelve months ended December 31, 2015, compared to last year. Other expenses decreased primarily because of lower expenses incurred associated with a repurchase reserve associated with loans that have been sold in the secondary market. In 2015, Home Savings recognized a recovery of $554,000, based on historical losses and the quantity of loans with potential weakness that would require repurchase. In 2014, Home Savings recognized a recovery of $374,000 for repurchased loans.
Federal Income Taxes. During the twelve months ended December 31, 2015, the Company recognized a tax expense of $7.9 million on pre-tax income of $24.2 million, compared to a tax benefit of $39.7 million on pre-tax income of $10.5 million for the twelve months ended December 31, 2014. The primary reason for the variance was the reversal of substantially all of the Company’s deferred tax asset valuation allowance during the quarter ended June 30, 2014.
As of December 31, 2014, the Company had reversed $42.8 million of the valuation allowance on its net DTA. $4.1 million of the reversal is due to current year-to-date operating income; the remaining $38.7 million is due to management’s reassessment and judgment regarding the ability to realize deferred tax assets in future years. The realization of a DTA is assessed and a valuation allowance is recorded if it is “more likely than not” that all or a portion of the DTA will not be realized. “More likely than not” is defined as the DTA being more than 50% likely of being realized. All available evidence, both positive and negative is considered to determine whether, based on the weight of that evidence, a valuation allowance against the net DTA is required. In assessing the need for a valuation allowance, the Company considered all available evidence about the realization of the DTA both positive and negative that could be objectively verified.
The Company’s ultimate realization of the DTA is dependent upon the generation of future taxable income during the periods in which temporary differences become deductible. Management considers the nature and amount of historical and projected future
32
taxable income, the scheduled reversal of deferred tax assets and liabilities, and available tax planning strategies in making this assessment. The amount of deferred taxes recognized could be impacted by changes to any of these variables.
The effective tax rate for 2015 was 32.6%. The reversal of the valuation allowance resulted in an effective tax rate of zero, excluding the discrete benefit recorded in the second quarter of 2014.
Comparison of Operating Results for the Years Ended December 31, 2014 and December 31, 2013
Net Income. United Community recognized net income for the twelve months ended December 31, 2014, of $50.2 million, or $1.00 per diluted common share, compared to net income of $10.0 million, before amortization of the discount on preferred stock for the twelve months ended December 31, 2013. As part of the capital raise in 2013, United Community issued preferred stock that was later converted to common stock. No dividend was declared or paid on the preferred stock. However, because the preferred stock was issued at a price below the then market price of our common stock, the difference is deemed a non-cash dividend under U.S. Generally Accepted Accounting Principles and is deducted in the calculation of net income available to common shareholders. Therefore, net income available to common shareholders as of December 31, 2013 was $3.3 million, or $0.07 per diluted share.
The significant increase in earnings for 2014 was primarily a result of the reversal of the valuation allowance on net deferred tax assets, which provided an income tax benefit of $39.7 million. In addition, the Company recorded a negative loan loss provision of $1.3 million, compared to provision for loan losses of $4.1 million for 2013.
Net interest income for 2014 increased $88,000. The provision for loan losses decreased $5.4 million during the same period. Additionally, non-interest income decreased $6.0 million and noninterest expense decreased $777,000. United Community’s annualized return on average assets and return on average equity were 2.82% and 23.30%, respectively, for the twelve months ended December 31, 2014. The annualized return on average assets and return on average equity for the comparable period in 2013 were 0.56% and 5.32%, respectively.
Net Interest Income. Net interest income for the twelve months ended December 31, 2014 and December 31, 2013 was $51.4 million and $51.3 million, respectively.
Total interest income decreased $1.5 million in 2014 compared to 2013, primarily as a result of a decrease of $52.6 million in the average balance of available for sale securities. United Community also experienced a decrease in the yield on net loans of 31 basis points.
Total interest expense decreased $1.6 million for the twelve months ended December 31, 2014, as compared to the same period last year. The change was due primarily to reductions of $1.2 million in interest paid on deposits. The overall decrease in deposit interest expense was attributable to a shift in deposit balances from certificates of deposit to relatively less expensive non-time deposits. Between December 31, 2013, and December 31, 2014, the average outstanding balance of certificates of deposit declined by $68.0 million, while savings deposits increased by $4.9 million. Also contributing to the decrease in interest expense was a reduction of 142 basis points in the cost of Federal Home Loan Bank advances due to the modification discussed above. Additionally the impact of the prepayment of repurchase agreements caused that expense to decline $316,000, year over year.
Provision for Loan Losses. A provision for loan losses is charged to income to bring the total allowance for loan losses to a level considered by management to be adequate, based on management’s evaluation of such factors as the delinquency status of loans, current economic conditions, the net realizable value of the underlying collateral, changes in the composition of the loan portfolio and prior loan loss experience. The Company recognized negative loan loss provision of $1.3 million in 2014, compared to a $4.1 million expense in 2013. During the second quarter of 2014, a nonresidential commercial real estate loan aggregating $7.7 million paid off, causing a reduction in the loan loss provision of $748,000. Furthermore, the provision was reduced by $968,000 due to the realignment of loan loss factors assigned to residential mortgage construction loans to parallel the factors of residential mortgage loans. In addition, a $382,000 specific reserve was established in 2013 on another commercial relationship to adjust the net book value to the anticipated resolution balance. This was not a recurring expense in 2014.
During 2014, chargeoffs exceeded provision expense primarily as a result of reserves for loans charged off being established in a prior period. Home Savings also made a change in loan loss factors associated with residential mortgage construction loans. When construction is complete, the loan will convert to a residential mortgage loan. Accordingly, the loan loss factors applied to these construction loans are being aligned with residential mortgage loans. As the level of problem assets has decreased over time, the level of reserves required has declined as well. The historical loss rates have improved and the Company has experienced a lower rate of charge-offs in all loan categories.
33
Noninterest Income. Noninterest income decreased in 2014 to $13.7 million, as compared to $19.7 million in 2013. Lower gains on the sale of securities accounted for some of the change. During 2014, $444,000 in gains on the sale of available for sale securities were recognized as compared to $2.6 million during 2013. Additionally, Home Savings recognized lower mortgage banking income due to a $68.1 million reduction in mortgage originations sold, which resulted in a $3.2 million decline in mortgage banking income. Also affecting the comparison, other income declined and was the result of lower net rental income received on real estate owned and lower debit card fees earned in the current period, compared to the same period last year. In addition, Home Savings recognized a recovery of $628,000 on interest rate caps in 2013. A similar recovery did not reoccur in 2014. The reduction in noninterest income was partially offset by Home Savings incurring fewer losses on the valuation and disposition of real estate owned and other repossessed assets in 2014 as compared to 2013.
Noninterest Expense. Noninterest expense was $56.0 million in 2014, compared to $56.7 million in 2013, a difference of $777,000. In 2014, noninterest expenses decreased primarily because of lower other expenses incurred of $1.7 million, reduced FDIC premiums of $1.1 million and lowered franchise/financial institutions tax expenses of $772,000. Also contributing to the decline were fewer costs associated with real estate owned and other repossessed assets of $819,000.
Other non-interest expenses decreased because of lower expenses associated with Home Savings’ repurchases of loans sold to investors in the secondary market. For the twelve months ended December 31, 2014, Home Savings recognized a recovery on such expenses of $374,000 associated with these repurchases. For the twelve months ended December 31, 2013, Home Savings recognized expenses of $2.0 million.
Reduced FDIC premiums are the result of the termination of all regulatory orders under which the Bank had been operating. The lower franchise/financial institutions tax is the result of a change in Ohio tax law.
After Home Savings takes possession of property in satisfaction of nonperforming loans, all of the repairs, routine maintenance, utilities and real estate taxes associated with such loans are expensed as incurred in order to maintain the properties in saleable condition. Expenses to maintain other real estate owned have continued to decline through 2014 because of the decrease in the number of properties owned by Home Savings. These expenses totaled $631,000 in 2014, as compared to $1.5 million in 2013.
The decline in noninterest expense was offset partially by a $3.4 million prepayment charge incurred on the early termination of repurchase agreements mentioned above.
Federal Income Taxes. During the twelve months ended December 31, 2014, the Company recognized a tax benefit of $39.7 million on pre-tax income of $10.5 million, compared to tax expense of $200,000 on pre-tax income of $10.2 million for the twelve months ended December 31, 2013. The primary reason for the variance was the reversal of substantially all of the Company’s deferred tax asset valuation allowance in the quarter ended June 30, 2014. As of December 31, 2014, the net DTA was $28.1 million, and as of December 31, 2013, the net DTA (prior to any valuation allowance) was $42.8 million. Management maintained a valuation allowance against the net deferred tax assets at December 31, 2013 based on consideration of, but not limited to, its cumulative pre-tax losses during the past three years, the composition of recurring and non-recurring income from operations over the past several years and the magnitude of recent taxable income as compared to net operating loss carryforwards.
As of December 31, 2014, the Company had reversed $42.8 million of the valuation allowance on its net DTA. $4.1 million of the reversal is due to current year-to-date operating income; the remaining $38.7 million is due to management’s reassessment and judgment regarding the ability to realize deferred tax assets in future years. The realization of a DTA is assessed and a valuation allowance is recorded if it is “more likely than not” that all or a portion of the DTA will not be realized. “More likely than not” is defined as the DTA being more than 50% likely of being realized. All available evidence, both positive and negative is considered to determine whether, based on the weight of that evidence, a valuation allowance against the net DTA is required. In assessing the need for a valuation allowance, the Company considered all available evidence about the realization of the DTA both positive and negative that could be objectively verified.
Positive evidence considered included (1) the Company’s recent history of quarterly pre-tax earnings (ten out of the last eleven quarters with the most recent quarterly loss being recorded for the quarter ended September 30, 2012 due to a bulk sale of troubled assets), (2) expectations for sustained and continued profitability with sufficient taxable income to fully utilize the remaining net deferred tax benefits, (3) significant reductions in the level of non-performing assets since their peak, which was the primary source of the losses generated in prior periods, (4) resolution of an executive search focused on a key management position, (5) evaluation of core earnings, (6) adequacy of capital to fund balance sheet and future growth, and (7) successful cost-saving initiatives realized during the period.
34
Negative evidence considered was (1) the uncertainty about the potential impact on future earnings from nonperforming assets along with (2) a pre-tax loss reported by the Company during one quarterly period over the previous eleven quarters. As the number of consecutive periods of profitability increased and the level of profits are indicative of on-going results, the weight of cumulative losses as negative evidence decreased. A reduction in the weight given to such losses is further validated given that the source of the losses was due to an elevated level of problem assets and related credit costs, which have since been significantly reduced due to the bulk asset sale in 2012 and as evidenced by the improvements in the Company’s asset quality metrics.
After weighing both the positive and negative evidence, management determined that a valuation allowance on the net DTA was no longer warranted as of June 30, 2014. For a more detailed discussion of the Company’s tax calculation, see Note 14 to the consolidated financial statements.
The Company’s ultimate realization of the DTA is dependent upon the generation of future taxable income during the periods in which temporary differences become deductible. Management considers the nature and amount of historical and projected future taxable income, the scheduled reversal of deferred tax assets and liabilities, and available tax planning strategies in making this assessment. The amount of deferred taxes recognized could be impacted by changes to any of these variables.
The reversal of the valuation allowance results in an effective tax rate of zero, excluding the discrete benefit recorded in the second quarter of 2014. The effective tax rate for 2015 more closely reflects marginal tax rates.
Critical Accounting Policies and Estimates
The accounting and reporting policies of United Community comply with accounting principles generally accepted within the United States of America and conform to general practices within the financial services industry. Application of these principles requires management to make estimates, assumptions and judgments that affect the amounts reported in the financial statements and accompanying notes. These estimates, assumptions and judgments are based on information available as of the date of the financial statements. Accordingly, as this information changes, the financial statements could reflect different estimates, assumptions and judgments.
The most significant accounting policies followed by United Community are presented in Note 1 to the consolidated financial statements. Accounting and reporting policies for the allowance for loan losses, income taxes, mortgage servicing rights and other-than-temporary impairment are deemed critical since they involve the use of estimates and require significant management judgments. Application of assumptions different from those used by management could result in material changes in United Community’s financial position or results of operations.
Allowance for Loan Losses. The allowance for loan losses is an amount that management believes will be adequate to absorb probable incurred losses in existing loans taking into consideration such factors as past loss experience, changes in the nature and volume of the portfolio, overall portfolio quality, loan concentrations, specific problem loans, collateral values securing loans and current economic conditions that affect the borrower’s ability to pay. Determination of the allowance inherently is subjective due to the aforementioned reasons. Loan losses are charged-off against the allowance when management believes that the full collectability of the loan is unlikely. Recoveries of amounts previously charged-off are credited to the allowance.
Home Savings maintains a well-documented methodology for maintaining an allowance for loan losses that management believes is compliant with all applicable regulatory guidance and GAAP. The documentation of the adequacy of the allowance for loan losses is reviewed by the board of directors on a quarterly basis.
The allowance is based on management’s evaluation of homogeneous groups of loans (single-family residential mortgage loans and all consumer credit except marine loans) to which loss factors have been applied, as well as an evaluation of individual credits (multi-family, nonresidential mortgage loans, marine loans and commercial loans) based on internal risk ratings, collateral and other unique characteristics of each loan.
Management believes that it uses the best information available to determine the adequacy of the allowance for loan losses. However, future adjustments to the allowance may be necessary and the results of operations could be significantly and adversely affected if circumstances differ substantially from the assumptions used in making the determinations.
35
Mortgage Servicing Rights. The cost of mortgage loans sold or securitized is allocated between the mortgage servicing rights and the mortgage loans based on the relative fair values of each. The fair value of the mortgage servicing rights is determined by using a discounted cash flow model, which estimates the present value of the future net cash flows of the servicing portfolio, about which management must make assumptions considering future expectations based on various factors, such as servicing costs, expected prepayment speeds and discount rates.
Mortgage servicing rights are amortized in proportion to, and over the period of, estimated net servicing income. Management evaluates mortgage servicing rights for impairment on a quarterly basis by stratifying the loans by original maturity, interest rate and loan type. Impairment is measured by estimating the fair value of each pool, taking into consideration the estimated level of prepayments based upon current industry expectations. An impairment allowance is recorded for a pool when, and in an amount which, its fair value is less than its carrying value.
The value of mortgage servicing rights is subject to prepayment risk. Future expected net cash flows from servicing a loan will not be realized if the loan pays off earlier than anticipated. Since most of these loans do not contain prepayment penalties, the Company receives no economic benefit if the loan pays off earlier than anticipated.
Income Taxes. We are subject to the income tax laws of the United States, its states and the municipalities in which we operate. These tax laws are complex and subject to different interpretations by the taxpayer and the relevant government taxing authorities. We review income tax expense and the carrying value of deferred tax assets quarterly, and as new information becomes available, the balances are adjusted as appropriate. We assess any uncertain tax positions using a recognition threshold of more-likely-than-not, and a measurement attribute for all tax positions taken or expected to be taken on a tax return, in order for those tax positions to be recognized in the financial statements.
Valuation of Investment Securities. Management evaluates securities for other-than-temporary impairment on at least a quarterly basis, and more frequently when economic or market concerns warrant such evaluation. When an other-than-temporary impairment has occurred, the amount of the other-than-temporary impairment recognized in earnings depends on whether we intend to sell the security or more likely than not will be required to sell the security before recovery of its amortized cost basis less any current-period credit loss. To determine whether impairment is other-than-temporary, we consider all available information relevant to the collectability of the security, including past events, current conditions, and reasonable and supportable forecasts when developing estimates of cash flows expected to be collected. Factors considered in this assessment include the reasons for the impairment, the severity and duration of the impairment, changes in value subsequent to year-end, forecasted performance of the obligor, and the general market conditions in the geographic area or industry the in vestee operates in.
If we intend to sell the security or it is more likely than not that we will be required to sell the security before recovery of its amortized cost basis less any current-period credit loss, the impairment is recognized in earnings equal to the entire difference between the investment’s amortized cost basis and its fair value at the balance sheet date. If we do not intend to sell the security and it is not more likely than not that we will be required to sell the security before recovery of its amortized cost basis less any current-period credit loss, the other-than-temporary impairment is separated, into the amount representing the credit loss and the amount related to all other factors. The amount of the total other-than-temporary impairment related to the credit loss is recognized in earnings. The amount of the total impairment related to other factors is recognized in other comprehensive income.
Obligation for Loans Sold. Management evaluates certain loans sold to Freddie Mac and Fannie Mae, both of whom in the normal course purchase loans originated by Home Savings, for the purpose of making them whole on those loans sold in the secondary market. Historically, some loans sold had certain identified weaknesses such that, in the opinion of management, a settlement to the investor is required. In performing its evaluation, management considers all available evidence relevant to the collectability of the loan as well as the value of any underlying collateral. In determining a reserve for future make-whole reserves, management develops a factor based on historical loss experience and a probability that sold loans will require make-whole settlements and applies that against its total servicing portfolio to determine a reserve to absorb future settlements. Management believes that it uses the best information available to determine the adequacy of the reserve. However, future adjustments to the reserve may be necessary and the results of operations could be significantly and adversely affected if circumstances differ substantially from the assumptions used in making the determinations.
36
Yields Earned and Rates Paid
The following table sets forth certain information relating to United Community’s average balance sheet and reflects the average yield on interest earning assets and the average cost of interest bearing liabilities for the periods indicated. Such yields and costs are derived by dividing income or expense by the average balances of interest earning assets or interest bearing liabilities, respectively, for the periods presented. Average balances are derived from daily balances. Nonaccruing loans have been included in the table as loans carrying a zero yield. Loan fees are included in interest income. The average balance for securities available for sale is computed using the carrying value, and the average yield on securities available for sale has been computed using the historical amortized cost average balance.
| | Year ended December 31, | |
| | 2015 | | | 2014 | | | 2013 | |
| | Average | | | Interest | | | | | | | Average | | | Interest | | | | | | | Average | | | Interest | | | | | |
| | outstanding | | | earned/ | | | Yield/ | | | outstanding | | | earned/ | | | Yield/ | | | outstanding | | | earned/ | | | Yield/ | |
| | balance | | | paid | | | rate | | | balance | | | paid | | | rate | | | balance | | | paid | | | rate | |
| | (Dollars in thousands) | |
Interest earning assets: | | | | | | | | | | | | | | | | | | | | | | | | | | | | | | | | | | | | |
Net loans (1) | | $ | 1,220,698 | | | $ | 52,620 | | | | 4.31 | % | | $ | 1,087,628 | | | $ | 49,559 | | | | 4.56 | % | | $ | 1,021,832 | | | $ | 49,724 | | | | 4.87 | % |
Loans held for sale | | | 34,665 | | | | 1,396 | | | | 4.03 | % | | | 9,160 | | | | 454 | | | | 4.96 | % | | | 8,004 | | | | 310 | | | | 3.87 | % |
Securities: | | | | | | | | | | | | | | | | | | | | | | | | | | | | | | | | | | | | |
Available for sale | | | 453,312 | | | | 10,194 | | | | 2.25 | % | | | 512,157 | | | | 12,314 | | | | 2.40 | % | | | 564,768 | | | | 13,454 | | | | 2.38 | % |
Held to maturity | | | 30,717 | | | | 737 | | | | 2.40 | % | | | — | | | | — | | | | 0.00 | % | | | — | | | | — | | | | 0.00 | % |
Federal Home Loan Bank stock | | | 18,068 | | | | 723 | | | | 4.00 | % | | | 19,333 | | | | 859 | | | | 4.44 | % | | | 26,464 | | | | 1,107 | | | | 4.18 | % |
Other interest earning assets | | | 19,806 | | | | 35 | | | | 0.18 | % | | | 31,986 | | | | 58 | | | | 0.18 | % | | | 69,399 | | | | 149 | | | | 0.21 | % |
Total interest earning assets | | | 1,777,266 | | | | 65,705 | | | | 3.70 | % | | | 1,660,264 | | | | 63,244 | | | | 3.81 | % | | | 1,690,467 | | | | 64,744 | | | | 3.83 | % |
Non-interest earning assets | | | 133,489 | | | | | | | | | | | | 119,831 | | | | | | | | | | | | 102,547 | | | | | | | | | |
Total assets | | $ | 1,910,755 | | | | | | | | | | | $ | 1,780,095 | | | | | | | | | | | $ | 1,793,014 | | | | | | | | | |
Interest bearing liabilities: | | | | | | | | | | | | | | | | | | | | | | | | | | | | | | | | | | | | |
Deposits: | | | | | | | | | | | | | | | | | | | | | | | | | | | | | | | | | | | | |
Checking accounts | | $ | 480,520 | | | | 919 | | | | 0.19 | % | | $ | 457,183 | | | | 838 | | | | 0.18 | % | | $ | 470,266 | | | | 1,016 | | | | 0.22 | % |
Savings accounts | | | 279,964 | | | | 148 | | | | 0.05 | % | | | 275,027 | | | | 169 | | | | 0.06 | % | | | 270,136 | | | | 242 | | | | 0.09 | % |
Certificates of deposit | | | 446,148 | | | | 5,459 | | | | 1.22 | % | | | 456,170 | | | | 5,428 | | | | 1.19 | % | | | 524,177 | | | | 6,365 | | | | 1.21 | % |
Federal Home Loan Bank advances | | | 192,295 | | | | 1,334 | | | | 0.69 | % | | | 81,207 | | | | 2,022 | | | | 2.49 | % | | | 53,838 | | | | 2,106 | | | | 3.91 | % |
Repurchase agreements and other | | | 29,891 | | | | 1,253 | | | | 4.19 | % | | | 82,102 | | | | 3,368 | | | | 4.10 | % | | | 90,588 | | | | 3,684 | | | | 4.07 | % |
Total interest bearing liabilities | | | 1,428,818 | | | | 9,113 | | | | 0.64 | % | | | 1,351,689 | | | | 11,825 | | | | 0.87 | % | | | 1,409,005 | | | | 13,413 | | | | 0.95 | % |
Non-interest bearing deposits | | | 209,165 | | | | | | | | | | | | 186,006 | | | | | | | | | | | | 167,505 | | | | | | | | | |
Other non-interest bearing liabilities | | | 27,977 | | | | | | | | | | | | 26,932 | | | | | | | | | | | | 28,089 | | | | | | | | | |
Total liabilities | | | 1,665,960 | | | | | | | | | | | | 1,564,627 | | | | | | | | | | | | 1,604,599 | | | | | | | | | |
Shareholders’ equity | | | 244,795 | | | | | | | | | | | | 215,468 | | | | | | | | | | | | 188,415 | | | | | | | | | |
Total liabilities and equity | | $ | 1,910,755 | | | | | | | | | | | $ | 1,780,095 | | | | | | | | | | | $ | 1,793,014 | | | | | | | | | |
Net interest income and interest rate spread | | | | | | $ | 56,592 | | | | 3.06 | % | | | | | | $ | 51,419 | | | | 2.94 | % | | | | | | $ | 51,331 | | | | 2.88 | % |
Net interest margin | | | | | | | | | | | 3.18 | % | | | | | | | | | | | 3.10 | % | | | | | | | | | | | 3.04 | % |
Average interest earning assets to average interest bearing liabilities | | | | | | | | | | | 124.39 | % | | | | | | | | | | | 122.83 | % | | | | | | | | | | | 119.98 | % |
(1) | Nonaccrual loans are included in the average balance. |
37
The table below describes the extent to which changes in interest rates and changes in volume of interest earning assets and interest bearing liabilities have affected United Community’s interest income and interest expense during the periods indicated. For each category of interest earning assets and interest bearing liabilities, information is provided on changes attributable to (i) changes in volume (change in volume multiplied by prior period rate), (ii) changes in rate (change in rate multiplied by prior period volume) and (iii) total changes in rate and volume. The combined effects of changes in both volume and rate, which cannot be separately identified, have been allocated in proportion to the changes due to volume and rate:
| | Year ended December 31, | |
| | 2015 vs. 2014 | | | 2014 vs. 2013 | |
| | Increase | | | Total | | | Increase | | | Total | |
| | (decrease) due to | | | increase | | | (decrease) due to | | | increase | |
| | Rate | | | Volume | | | (decrease) | | | Rate | | | Volume | | | (decrease) | |
| | (Dollars in thousands) | |
Interest earning assets: | | | | | | | | | | | | | | | | | | | | | | | | |
Loans | | $ | (2,417 | ) | | $ | 5,478 | | | $ | 3,061 | | | $ | 13,496 | | | $ | (13,661 | ) | | $ | (165 | ) |
Loans held for sale | | | (68 | ) | | | 1,010 | | | | 942 | | | | 95 | | | | 49 | | | | 144 | |
Securities: | | | | | | | | | | | | | | | | | | | | | | | | |
Available for sale | | | (764 | ) | | | (1,356 | ) | | | (2,120 | ) | | | 126 | | | | (1,266 | ) | | | (1,140 | ) |
Held to maturity | | | 368 | | | | 369 | | | | 737 | | | | — | | | | — | | | | — | |
Federal Home Loan Bank stock | | | (82 | ) | | | (54 | ) | | | (136 | ) | | | 74 | | | | (322 | ) | | | (248 | ) |
Other interest earning assets | | | (1 | ) | | | (22 | ) | | | (23 | ) | | | (20 | ) | | | (71 | ) | | | (91 | ) |
Total interest earning assets | | $ | (2,964 | ) | | $ | 5,425 | | | $ | 2,461 | | | $ | 13,771 | | | $ | (15,271 | ) | | $ | (1,500 | ) |
Interest bearing liabilities: | | | | | | | | | | | | | | | | | | | | | | | | |
Checking accounts | | $ | 37 | | | $ | 44 | | | $ | 81 | | | $ | (77 | ) | | $ | 4 | | | $ | (73 | ) |
Savings accounts | | | (24 | ) | | | 3 | | | | (21 | ) | | | (150 | ) | | | (28 | ) | | | (178 | ) |
Certificates of deposit | | | 139 | | | | (108 | ) | | | 31 | | | | (126 | ) | | | (811 | ) | | | (937 | ) |
Federal Home Loan Bank advances | | | 768 | | | | (1,456 | ) | | | (688 | ) | | | 211 | | | | (295 | ) | | | (84 | ) |
Repurchase agreements and other | | | 75 | | | | (2,190 | ) | | | (2,115 | ) | | | 32 | | | | (348 | ) | | | (316 | ) |
Total interest bearing liabilities | | | 995 | | | | (3,707 | ) | | | (2,712 | ) | | | (110 | ) | | | (1,478 | ) | | | (1,588 | ) |
Change in net interest income | | | | | | | | | | $ | 5,173 | | | | | | | | | | | $ | 88 | |
Contractual Obligations, Commitments, Contingent Liabilities and Off-balance Sheet Arrangements
The following table presents, as of December 31, 2015, United Community’s significant fixed and determinable contractual obligations by payment date. The payment amounts represent those amounts contractually due to the recipient and do not include any unamortized premiums, discounts, or other similar carrying value adjustments. Further detail of the nature of each obligation is included in the referenced note to the consolidated financial statements.
| | Payment Due In | |
| | Note Reference | | One Year or Less | | | One to Three Years | | | Three to Five Years | | | Over Five Years | | | Total | |
| | (Dollars in thousands) | |
Operating leases | | 8 | | $ | 559 | | | $ | 1,169 | | | $ | 1,189 | | | $ | 595 | | | $ | 3,512 | |
Deposits without a stated maturity | | 10 | | | 980,783 | | | | — | | | | — | | | | — | | | | 980,783 | |
Certificates of deposit | | 10 | | | 207,814 | | | | 189,323 | | | | 42,153 | | | | 15,670 | | | | 454,960 | |
Federal Home Loan Bank advances | | 11 | | | 232,000 | | | | — | | | | 46,975 | | | | — | | | | 278,975 | |
Repurchase agreements and other borrowings | | 12 | | | 535 | | | | — | | | | — | | | | — | | | | 535 | |
Discussion of loan commitments is included in Note 5 to the consolidated financial statements. In addition, United Community has commitments under benefit plans as described in Note 17 to the consolidated financial statements.
38
Potential Impact of Changes in Interest Rates
Home Savings’ profitability depends to a large extent on its net interest income, which is the difference between interest income from loans and securities and interest expense on deposits and borrowings. Like most financial institutions, Home Savings’ short-term interest income and interest expense are significantly affected by changes in market interest rates and other economic factors beyond its control. Accordingly, Home Savings’ earnings could be adversely affected during a continued period of low interest rates or a continued period of rising interest rates.
The impact of changes in interest rates is further described in Item 7A.
Liquidity and Capital
United Community’s liquidity, primarily represented by cash and cash equivalents, is a result of its operating, investing and financing activities. These activities are summarized below for the years indicated.
| | Years ended December 31, | |
| | 2015 | | | 2014 | | | 2013 | |
| | (Dollars in thousands) | |
Net income (loss) | | $ | 16,282 | | | $ | 50,206 | | | $ | 10,027 | |
Adjustments to reconcile net income to net cash from operating activities | | | (3,360 | ) | | | (52,968 | ) | | | 16,009 | |
Net cash from operating activities | | | 12,922 | | | | (2,762 | ) | | | 26,036 | |
Net cash from investing activities | | | (147,472 | ) | | | (66,376 | ) | | | 40,052 | |
Net cash from financing activities | | | 137,480 | | | | 24,787 | | | | (31,370 | ) |
Net change in cash and cash equivalents | | | 2,930 | | | | (44,351 | ) | | | 34,718 | |
Cash and cash equivalents at beginning of year | | | 32,980 | | | | 77,331 | | | | 42,613 | |
Cash and cash equivalents at end of year | | $ | 35,910 | | | $ | 32,980 | | | $ | 77,331 | |
The principal sources of funds for United Community are deposits, loan repayments, maturities of securities, borrowings from financial institutions, repurchase agreements and other funds provided by operations. Home Savings also has the ability to borrow from the FHLB. While scheduled loan repayments and maturing investments are relatively predictable, deposit flows and early loan prepayments are more influenced by interest rates, general economic conditions and competition. Investments in liquid assets maintained by United Community and Home Savings are based upon management’s assessment of (1) the need for funds, (2) expected deposit flows, (3) yields available on short-term liquid assets, and (4) objectives of the asset and liability management program. At December 31, 2015, approximately $207.8 million of Home Savings’ certificates of deposit were expected to mature within one year. Based on past experience and Home Savings’ prevailing pricing strategies, management believes that a substantial percentage of such certificates will be renewed with Home Savings at maturity, although there can be no assurance that this will occur.
Home Savings’ Asset/Liability Committee (ALCO) is responsible for establishing and monitoring liquidity guidelines, policies and procedures. ALCO uses a variety of methods to monitor the liquidity position of Home Savings including a liquidity analysis that measures potential sources and uses of funds over future time periods out to one year. ALCO also performs contingency funding analyses to determine Home Savings’ ability to meet potential liquidity needs under stress scenarios that cover varying time horizons ranging from immediate to long-term.
At December 31, 2015, United Community had total on-hand liquidity, defined as cash and cash equivalents, unencumbered securities and additional FHLB borrowing capacity, of $206.3 million.
Home Savings and United Community are subject to various regulatory capital requirements administered by the federal banking agencies. On January 1, 2015, Home Savings and United Community adopted the new Basel III regulatory capital framework as approved by the federal banking agencies. The adoption of this new framework modified the calculation of the various capital ratios, added a new ratio, common equity Tier 1, and revised the adequately and well-capitalized thresholds. Failure to meet minimum capital requirements can initiate certain mandatory and possible additional discretionary actions by regulators that, if undertaken, could have a direct material effect on Home Savings and United Community. The regulations require Home Savings to meet specific capital adequacy guidelines in keeping with the regulatory framework for prompt corrective action that involve quantitative measures of Home Savings’ assets, liabilities, and certain off balance sheet items as calculated under regulatory accounting practices. Home Savings’ capital classification is also subject to qualitative judgments by the regulators about components of capital, risk weightings, and other factors.
39
The Basel III Capital Rules establish a new common equity Tier 1 minimum capital requirement (4.5% of risk-weighted assets), increases the minimum Tier 1 capital to risk-based assets requirement (from 4% to 6% of risk-weighted assets) and assigns a higher risk weight (150%) to exposures that are more than 90 days past due or are on nonaccrual status and to certain commercial real estate facilities that finance the acquisition, development or construction of real property. The final rules also requires unrealized gains and losses on certain available-for-sale securities holdings to be included for purposes of calculating regulatory capital requirements unless a one-time opt-in or opt-out is exercised. In connection with the adoption of the Basel III Capital Rules, United Community and Home Savings elected to opt-out of the requirement to include most components of accumulated other comprehensive income in Common Equity Tier 1. The rule limits a banking organization’s capital distributions and certain discretionary bonus payments if the banking organization does not hold a “capital conservation buffer” consisting of 2.5% of common equity Tier 1 capital risk-based weighted assets in addition to the amount necessary to meeting its minimum risk-based capital requirements.
The capital conservation buffer requirement will be phased in beginning January 1, 2016 and ending January 1, 2019, when the full capital conservation buffer requirement will be effective. The final rule also implemented consolidated capital requirements, which became effective January 1, 2015.
Quantitative measures established by regulation for capital adequacy require Home Savings to maintain minimum ratios of Tier 1 (or Core) capital (as defined in the regulations) to average total assets (as defined) and of total risk-based capital (as defined) to risk-weighted assets (as defined). United Community and Home Savings’ Common Equity Tier 1 capital consists of common stock and related paid-in capital, net of treasury stock, and retained earnings. Common Equity Tier 1 for both United Community and Home Savings is reduced by intangible assets, net of associated deferred tax liabilities and subject to transition provisions. Actual and regulatory required capital ratios for Home Savings, along with the dollar amount of capital implied by such ratios, are presented below.
Refer to Note 16 to the consolidated financial statements for details on current capital levels of United Community and Home Savings.
The following table summarizes Home Savings’ regulatory capital requirements and actual capital at December 31, 2015.
| | Actual capital | | | Minimum requirement per regulation | | | Excess of actual capital over minimum requirement | | | Applicable asset base | | |
| | Amount | | | Percent | | | Amount | | | Percent | | | Amount | | | Percent | | | Total | | |
| | (Dollars in thousands) | | |
Total capital (to risk-weighted assets) | | $ | 240,692 | | | | 18.72 | % | | $ | 102,879 | | | | 8.00 | % | | $ | 137,813 | | | | 10.72 | % | | $ | 1,286,081 | | (1) |
Tier 1 capital (to risk-weighted assets) | | | 224,481 | | | | 17.46 | % | | | 77,159 | | | | 6.00 | % | | | 147,322 | | | | 11.46 | % | | | 1,286,081 | | (1) |
Common equity Tier 1 capital (to risk-weighted assets) | | | 224,481 | | | | 17.46 | % | | | 57,869 | | | | 4.50 | % | | | 166,612 | | | | 12.96 | % | | | 1,286,081 | | (1) |
Tier 1 capital (to average assets) | | | 224,481 | | | | 11.46 | % | | | 78,347 | | | | 4.00 | % | | | 146,134 | | | | 7.46 | % | | | 1,958,689 | | (2) |
(1) | Total risk-weighted assets as of December 31, 2015 |
(2) | Average total assets for leverage capital purposes for the quarter ended December 31, 2015 |
The following table summarizes Home Savings’ regulatory capital requirements and actual capital at December 31, 2014.
| | Actual capital | | | Minimum requirement per regulation | | | Excess of actual capital over minimum requirement | | | Applicable asset base | | |
| | Amount | | | Percent | | | Amount | | | Percent | | | Amount | | | Percent | | | Total | | |
| | (Dollars in thousands) | | |
Tangible capital | | $ | 220,080 | | | | 12.11 | % | | $ | 27,253 | | | | 1.50 | % | | $ | 192,827 | | | | 10.61 | % | | $ | 1,816,853 | | (1) |
Tier 1 capital (leverage) | | | 220,080 | | | | 12.11 | % | | | 72,674 | | | | 4.00 | % | | | 147,406 | | | | 8.11 | % | | | 1,816,853 | | (2) |
Risk-based capital | | | 233,974 | | | | 21.13 | % | | | 88,602 | | | | 8.00 | % | | | 145,372 | | | | 13.13 | % | | | 1,107,520 | | (3) |
(1) | Average tangible assets for the quarter ended December 31, 2014 |
(2) | Average total assets for leverage capital purposes for the quarter ended December 31, 2014 |
(3) | Total risk-weighted assets as of December 31, 2014 |
40
The following table summarizes United Community’s regulatory capital requirements and actual capital at December 31, 2015.
| | Actual capital | | | Minimum requirement per regulation | | | Excess of actual capital over minimum requirement | | | Applicable asset base | | |
| | Amount | | | Percent | | | Amount | | | Percent | | | Amount | | | Percent | | | Total | | |
| | (Dollars in thousands) | | |
Total capital (to risk-weighted assets) | | $ | 261,732 | | | | 20.35 | % | | $ | 102,886 | | | | 8.00 | % | | $ | 158,846 | | | | 12.35 | % | | $ | 1,286,081 | | (1) |
Tier 1 capital (to risk-weighted assets) | | | 245,503 | | | | 19.09 | % | | | 77,165 | | | | 6.00 | % | | | 168,338 | | | | 13.09 | % | | | 1,286,081 | | (1) |
Common equity Tier 1 capital (to risk-weighted assets) | | | 245,503 | | | | 19.09 | % | | | 57,874 | | | | 4.50 | % | | | 187,629 | | | | 14.59 | % | | | 1,286,081 | | (1) |
Tier 1 capital (to average assets) | | | 245,503 | | | | 12.53 | % | | | 78,348 | | | | 4.00 | % | | | 167,155 | | | | 8.53 | % | | | 1,958,689 | | (2) |
(1) | Total risk-weighted assets as of December 31, 2015 |
(2) | Average total assets for leverage capital purposes for the quarter ended December 31, 2015 |
United Community was not subject to regulatory capital requirements prior to January 1, 2015.
Item 7A. | Quantitative and Qualitative Disclosures About Market Risk |
Qualitative Aspects of Market Risk. The principal market risk affecting United Community is interest rate risk. United Community is subject to interest rate risk to the extent that its interest earning assets reprice differently than its interest bearing liabilities. Interest rate risk is defined as the sensitivity of United Community’s earnings and net asset values to changes in interest rates. As part of its efforts to monitor and manage the interest rate risk, the Board of Directors of Home Savings has adopted an interest rate risk policy that requires the Home Savings Board to review quarterly reports related to interest rate risk and to annually set exposure limits for Home Savings as a guide to management in setting and implementing day to day operating strategies.
Quantitative Aspects of Market Risk. As part of its interest rate risk analysis, Home Savings uses the net portfolio value (NPV) and net interest income methodology. Generally, NPV is the discounted present value of the difference between incoming cash flows on interest earning and other assets and outgoing cash flows on interest bearing and other liabilities. The application of the methodology attempts to quantify interest rate risk as the change in the NPV and net interest income that would result from various levels of theoretical basis point changes in market interest rates.
Home Savings uses an NPV and earnings simulation model prepared internally as its primary method to identify and manage its interest rate risk profile. The model is based on actual cash flows and repricing characteristics for all financial instruments and incorporates market-based assumptions regarding the impact of changing interest rates on future volumes and the prepayment rate of applicable financial instruments. Assumptions based on the historical behavior of deposit rates and balances in relation to changes in interest rates also are incorporated into the model. These assumptions inherently are uncertain and, as a result, the model cannot measure precisely NPV or net interest income or precisely predict the impact of fluctuations in interest rates on net interest rate changes as well as changes in market conditions and management strategies.
41
Presented below are analyses of Home Savings’ interest rate risk as measured by changes in NPV and net interest income for instantaneous and sustained parallel shifts of 100 basis point increments in market interest rates. As noted, for the year ended December 31, 2015, the percentage changes fall within the policy limits set by the Board of Directors of Home Savings as the minimum NPV ratio and the maximum change in interest income the Home Savings Board deems advisable in the event of various changes in interest rates. See the table below for Board adopted policy limits.
Year Ended December 31, 2015 | |
NPV as % of portfolio value of assets | | | Next 12 months net interest income | |
| | | | | | | (Dollars in thousands) | |
Change in rates (Basis points) | | NPV Ratio | | | Internal policy limitations | | | Change in % | | | Internal policy limitations on NPV Change | | | $ Change | | | Internal policy limitations | | | % Change | |
400 | | | 11.91 | % | | | 6.00 | % | | | (1.71 | )% | | | 30.00 | % | | $ | (4,740 | ) | | | (20.00 | )% | | | (7.95 | )% |
300 | | | 12.59 | % | | | 6.00 | % | | | (1.03 | )% | | | 25.00 | % | | | (3,585 | ) | | | (15.00 | )% | | | (6.01 | )% |
200 | | | 13.19 | % | | | 7.00 | % | | | (0.43 | )% | | | 20.00 | % | | | (2,484 | ) | | | (10.00 | )% | | | (4.16 | )% |
100 | | | 13.65 | % | | | 7.00 | % | | | 0.03 | % | | | 15.00 | % | | | (1,365 | ) | | | (5.00 | )% | | | (2.29 | )% |
Static | | | 13.62 | % | | | 9.00 | % | | | 0.00 | % | | | 0.00 | % | | | — | | | | — | % | | | — | % |
| | | | | | | | | | | | | | | | | | | | | | | | | | | | |
Year Ended December 31, 2014 | |
NPV as % of portfolio value of assets | | | Next 12 months net interest income | |
| | | | | | | (Dollars in thousands) | |
Change in rates (Basis points) | | NPV Ratio | | | Internal policy limitations | | | Change in % | | | Internal policy limitations on NPV Change | | | $ Change | | | Internal policy limitations | | | % Change | |
400 | | | 11.71 | % | | | 6.00 | % | | | (2.77 | )% | | | 30.00 | % | | $ | (4,650 | ) | | | (20.00 | )% | | | (8.31 | )% |
300 | | | 12.63 | % | | | 6.00 | % | | | (1.85 | )% | | | 25.00 | % | | | (3,647 | ) | | | (15.00 | )% | | | (6.52 | )% |
200 | | | 13.50 | % | | | 7.00 | % | | | (0.98 | )% | | | 20.00 | % | | | (2,655 | ) | | | (10.00 | )% | | | (4.75 | )% |
100 | | | 14.22 | % | | | 7.00 | % | | | (0.26 | )% | | | 15.00 | % | | | (1,556 | ) | | | (5.00 | )% | | | (2.78 | )% |
Static | | | 14.48 | % | | | 9.00 | % | | | 0.00 | % | | | 0.00 | % | | | — | | | | — | % | | | — | % |
Due to a low interest rate environment, it was not meaningful to calculate results for a drop in interest rates.
As with any method of measuring interest rate risk, certain shortcomings are inherent in the above approach. For example, although certain assets and liabilities may have similar maturities or periods of repricing, they may react in different degrees to changes in market interest rates. Also, the interest rates on certain types of assets and liabilities may fluctuate in advance of changes in market interest rates, while interest rates on other types may lag behind changes in market rates. Further, in the event of a change in interest rates, expected rates of prepayment on loans and early withdrawal levels from certificates of deposit may deviate significantly from those assumed in making risk calculations.
42
Item 8. | Financial Statements and Supplementary Data |
CONSOLIDATED STATEMENTS OF FINANCIAL CONDITION
| | December 31, | | | December 31, | |
| | 2015 | | | 2014 | |
| | (Dollars in thousands) | |
Assets: | | | | | | | | |
Cash and deposits with banks | | $ | 20,528 | | | $ | 21,152 | |
Federal funds sold | | | 15,382 | | | | 11,828 | |
Total cash and cash equivalents | | | 35,910 | | | | 32,980 | |
Securities: | | | | | | | | |
Available for sale, at fair value | | | 357,670 | | | | 499,790 | |
Held to maturity (fair value of $109,644 and $0, respectively) | | | 110,699 | | | | — | |
Loans held for sale, at lower of cost or market | | | 9,085 | | | | 20,730 | |
Loans held for sale, at fair value | | | 26,716 | | | | — | |
Loans, net of allowance for loan losses of $17,712 and $17,687 | | | 1,316,192 | | | | 1,148,093 | |
Federal Home Loan Bank stock, at cost | | | 18,068 | | | | 18,068 | |
Premises and equipment, net | | | 20,678 | | | | 21,002 | |
Accrued interest receivable | | | 5,978 | | | | 5,763 | |
Real estate owned and other repossessed assets, net | | | 2,727 | | | | 3,467 | |
Core deposit intangible | | | 30 | | | | 84 | |
Cash surrender value of life insurance | | | 54,366 | | | | 46,401 | |
Other assets | | | 29,870 | | | | 37,172 | |
Total assets | | $ | 1,987,989 | | | $ | 1,833,550 | |
Liabilities and Shareholders' Equity | | | | | | | | |
Liabilities: | | | | | | | | |
Deposits: | | | | | | | | |
Interest bearing | | $ | 1,208,238 | | | $ | 1,159,871 | |
Non-interest bearing | | | 227,505 | | | | 187,965 | |
Total deposits | | | 1,435,743 | | | | 1,347,836 | |
Borrowed funds: | | | | | | | | |
Federal Home Loan Bank advances | | | | | | | | |
Long-term Federal Home Loan Bank advances | | | 46,975 | | | | 46,194 | |
Short-term Federal Home Loan Bank advances | | | 232,000 | | | | 140,000 | |
Total Federal Home Loan Bank advances | | | 278,975 | | | | 186,194 | |
Repurchase agreements | | | — | | | | 30,000 | |
Other borrowed funds | | | 535 | | | | 558 | |
Total borrowed funds | | | 279,510 | | | | 216,752 | |
Advance payments by borrowers for taxes and insurance | | | 21,174 | | | | 19,904 | |
Accrued interest payable | | | 53 | | | | 185 | |
Accrued expenses and other liabilities | | | 7,264 | | | | 8,738 | |
Total liabilities | | | 1,743,744 | | | | 1,593,415 | |
Commitments and contingent liabilities (Note 5 and Note 13) | | | — | | | | — | |
Shareholders' Equity: | | | | | | | | |
Preferred stock-no par value; 1,000,000 shares authorized and no shares issued and outstanding | | | — | | | | — | |
Common stock-no par value; 499,000,000 shares authorized; 54,138,910 shares issued and 47,517,644 and 49,239,004 shares, respectively, outstanding | | | 174,304 | | | | 174,385 | |
Retained earnings | | | 140,819 | | | | 128,512 | |
Accumulated other comprehensive loss | | | (19,220 | ) | | | (19,998 | ) |
Treasury stock, at cost, 6,621,266 and 4,899,906 shares, respectively | | | (51,658 | ) | | | (42,764 | ) |
Total shareholders’ equity | | | 244,245 | | | | 240,135 | |
Total liabilities and shareholders’ equity | | $ | 1,987,989 | | | $ | 1,833,550 | |
See Notes to Consolidated Financial Statements.
43
CONSOLIDATED STATEMENTS OF OPERATIONS AND COMPREHENSIVE INCOME (LOSS)
| | For the Twelve Months Ended | |
| | December 31, | |
| | 2015 | | | 2014 | | | 2013 | |
| | (Dollars in thousands, except per share data) | |
Interest income | | | | | | | | | | | | |
Loans | | $ | 52,619 | | | $ | 49,559 | | | $ | 49,724 | |
Loans held for sale | | | 1,396 | | | | 454 | | | | 310 | |
Securities available for sale, nontaxable | | | 35 | | | | — | | | | — | |
Securities available for sale, taxable | | | 10,141 | | | | 12,314 | | | | 13,454 | |
Securities held to maturity, nontaxable | | | 96 | | | | — | | | | — | |
Securities held to maturity, taxable | | | 590 | | | | — | | | | — | |
Federal Home Loan Bank stock dividends | | | 723 | | | | 859 | | | | 1,107 | |
Other interest earning assets | | | 35 | | | | 58 | | | | 149 | |
Total interest income | | | 65,635 | | | | 63,244 | | | | 64,744 | |
Interest expense | | | | | | | | | | | | |
Deposits | | | 6,526 | | | | 6,435 | | | | 7,623 | |
Federal Home Loan Bank advances | | | 1,334 | | | | 2,022 | | | | 2,106 | |
Repurchase agreements and other | | | 1,253 | | | | 3,368 | | | | 3,684 | |
Total interest expense | | | 9,113 | | | | 11,825 | | | | 13,413 | |
Net interest income | | | 56,522 | | | | 51,419 | | | | 51,331 | |
Provision (recovery) for loan losses | | | 2,135 | | | | (1,271 | ) | | | 4,116 | |
Net interest income after provision for loan losses | | | 54,387 | | | | 52,690 | | | | 47,215 | |
Non-interest income | | | | | | | | | | | | |
Non-deposit investment income | | | 1,115 | | | | 1,415 | | | | 1,562 | |
Mortgage servicing fees | | | 2,730 | | | | 2,737 | | | | 2,808 | |
Deposit related fees | | | 5,384 | | | | 4,901 | | | | 5,564 | |
Mortgage servicing rights valuation | | | 19 | | | | (58 | ) | | | 680 | |
Mortgage servicing rights amortization | | | (1,800 | ) | | | (1,687 | ) | | | (2,143 | ) |
Other service fees | | | 75 | | | | 20 | | | | 74 | |
Net gains (losses): | | | | | | | | | | | | |
Securities available for sale (includes $142, $444 and $2,577, respectively, accumulated other comprehensive income reclassifications for unrealized net gains on available for sale securities) | | | 142 | | | | 444 | | | | 2,577 | |
Mortgage banking income | | | 6,841 | | | | 1,570 | | | | 4,777 | |
Real estate owned and other repossessed assets, net | | | (445 | ) | | | (800 | ) | | | (2,181 | ) |
Card fees | | | 3,684 | | | | 3,354 | | | | 3,584 | |
Other income | | | 1,972 | | | | 1,845 | | | | 2,447 | |
Total non-interest income | | | 19,717 | | | | 13,741 | | | | 19,749 | |
Non-interest expense | | | | | | | | | | | | |
Salaries and employee benefits (includes $315, $220 and $189, respectively accumulated other comprehensive income reclassifications for prior service credit on the postretirement plan). | | | 26,724 | | | | 29,546 | | | | 27,675 | |
Occupancy | | | 3,249 | | | | 3,469 | | | | 3,390 | |
Equipment and data processing | | | 6,865 | | | | 7,470 | | | | 7,103 | |
Financial institutions tax | | | 1,241 | | | | 795 | | | | 1,567 | |
Advertising | | | 737 | | | | 838 | | | | 893 | |
Amortization of core deposit intangible | | | 54 | | | | 68 | | | | 86 | |
FDIC insurance premiums | | | 1,241 | | | | 1,216 | | | | 2,347 | |
Other insurance premiums | | | 355 | | | | 495 | | | | 662 | |
Legal and consulting fees | | | 1,227 | | | | 607 | | | | 688 | |
Other professional fees | | | 1,733 | | | | 1,945 | | | | 2,228 | |
Prepayment penalty | | | 1,280 | | | | 3,409 | | | | — | |
Real estate owned and other repossessed asset expenses | | | 338 | | | | 631 | | | | 1,450 | |
Other expenses | | | 4,885 | | | | 5,471 | | | | 8,648 | |
Total non-interest expenses | | | 49,929 | | | | 55,960 | | | | 56,737 | |
Income before income taxes | | | 24,175 | | | | 10,471 | | | | 10,227 | |
Income tax (benefit) expense (includes $160, $232 and $11 income tax expense from reclassification items) | | | 7,893 | | | | (39,735 | ) | | | 200 | |
Net income | | | 16,282 | | | | 50,206 | | | | 10,027 | |
Amortization of discount on preferred stock | | | — | | | | — | | | | (6,751 | ) |
Earnings available to common shareholders | | $ | 16,282 | | | $ | 50,206 | | | $ | 3,276 | |
(Continued)
44
CONSOLIDATED STATEMENTS OF OPERATIONS AND COMPREHENSIVE INCOME (LOSS)
| | For the Twelve Months Ended December 31, | |
| | | 2015 | | | | 2014 | | | | 2013 | |
| | (Dollars in thousands, except per share data) | |
Net income | | $ | 16,282 | | | $ | 50,206 | | | $ | 10,027 | |
Other comprehensive income (loss) | | | | | | | | | | | | |
Unrealized gains (losses) on securities available for sale, net of reclassifications and tax of $444, $11,814 and $0, respectively | | | 824 | | | | 21,940 | | | | (48,446 | ) |
Accretion of unrealized losses on securities transferred from available for sale to held to maturity, net of tax of $21, $0, and $0, respectively | | | 39 | | | | — | | | | — | |
Unrealized gains (losses) and amortization of prior service credit on postretirement plan, net of tax of $46, $147 and $0, respectively | | | (85 | ) | | | (273 | ) | | | 99 | |
Total other comprehensive income (loss) | | $ | 778 | | | $ | 21,667 | | | $ | (48,347 | ) |
Comprehensive income (loss) | | $ | 17,060 | | | $ | 71,873 | | | $ | (38,320 | ) |
Earnings per share | | | | | | | | | | | | |
Basic | | $ | 0.34 | | | $ | 1.00 | | | $ | 0.07 | |
Diluted | | | 0.34 | | | | 1.00 | | | | 0.07 | |
See Notes to Consolidated Financial Statements.
45
CONSOLIDATED STATEMENTS OF SHAREHOLDERS’ EQUITY
| | Preferred Shares Outstanding | | | Common Shares Outstanding | | | Preferred Stock | | | Common Stock | | | Retained Earnings | | | Accumulated Other Comprehensive Income (Loss) | | | Treasury Stock | | | Total | |
| | (Dollars in thousands, except per share data) | |
Balance January 1, 2013 | | | — | | | | 33,027,886 | | | $ | — | | | $ | 128,026 | | | $ | 86,345 | | | $ | 6,682 | | | $ | (50,293 | ) | | $ | 170,760 | |
Net income | | | | | | | | | | | | | | | | | | | 10,027 | | | | | | | | | | | | 10,027 | |
Other comprehensive loss | | | | | | | | | | | | | | | | | | | | | | | (48,347 | ) | | | | | | | (48,347 | ) |
Stock option exercises | | | | | | | 104,142 | | | | | | | | | | | | (1,051 | ) | | | | | | | 1,206 | | | | 155 | |
Stock option expense | | | | | | | | | | | | | | | 24 | | | | | | | | | | | | | | | | 24 | |
Restricted stock grants | | | | | | | 116,788 | | | | | | | | (346 | ) | | | (1,175 | ) | | | | | | | 1,634 | | | | 113 | |
Issuance of common stock, net of issuance costs of $4,655 | | | | | | | 9,148,273 | | | | | | | | 18,423 | | | | (5,880 | ) | | | | | | | 7,958 | | | | 20,501 | |
Issuance of preferred stock | | | 7,942 | | | | | | | | 15,090 | | | | 6,751 | | | | | | | | | | | | | | | | 21,841 | |
Amortization of preferred stock discount | | | | | | | | | | | 6,751 | | | | | | | | (6,751 | ) | | | | | | | | | | | — | |
Conversion of preferred stock to common stock | | | (7,942 | ) | | | 7,942,000 | | | | (21,841 | ) | | | 21,841 | | | | | | | | | | | | | | | | — | |
Balance December 31, 2013 | | | — | | | | 50,339,089 | | | | — | | | | 174,719 | | | | 81,515 | | | | (41,665 | ) | | | (39,495 | ) | | | 175,074 | |
Net income | | | | | | | | | | | | | | | | | | | 50,206 | | | | | | | | | | | | 50,206 | |
Other comprehensive income | | | | | | | | | | | | | | | | | | | | | | | 21,667 | | | | | | | | 21,667 | |
Stock option exercises | | | | | | | 85,000 | | | | | | | | | | | | (701 | ) | | | | | | | 873 | | | | 172 | |
Stock option expense | | | | | | | | | | | | | | | 25 | | | | | | | | | | | | | | | | 25 | |
Restricted stock grants | | | | | | | 254,541 | | | | | | | | (988 | ) | | | (1,640 | ) | | | | | | | 2,628 | | | | — | |
Restricted stock forfeitures | | | | | | | (76,126 | ) | | | | | | | 147 | | | | 133 | | | | | | | | (381 | ) | | | (101 | ) |
Restricted stock expense | | | | | | | | | | | | | | | 482 | | | | | | | | | | | | | | | | 482 | |
Cash dividend payments ($0.02 per share) | | | | | | | | | | | | | | | | | | | (1,001 | ) | | | | | | | | | | | (1,001 | ) |
Treasury stock purchases | | | | | | | (1,363,500 | ) | | | | | | | | | | | | | | | | | | | (6,389 | ) | | | (6,389 | ) |
Balance December 31, 2014 | | | — | | | | 49,239,004 | | | | — | | | | 174,385 | | | | 128,512 | | | | (19,998 | ) | | | (42,764 | ) | | | 240,135 | |
Net income | | | | | | | | | | | | | | | | | | | 16,282 | | | | | | | | | | | | 16,282 | |
Other comprehensive income | | | | | | | | | | | | | | | | | | | | | | | 778 | | | | | | | | 778 | |
Stock option exercises | | | | | | | 14,200 | | | | | | | | | | | | (95 | ) | | | | | | | 123 | | | | 28 | |
Stock option expense | | | | | | | | | | | | | | | 24 | | | | | | | | | | | | | | | | 24 | |
Restricted stock grants | | | | | | | 162,711 | | | | | | | | (867 | ) | | | (524 | ) | | | | | | | 1,391 | | | | — | |
Restricted stock forfeitures | | | | | | | (11,954 | ) | | | | | | | 6 | | | | 13 | | | | | | | | (75 | ) | | | (56 | ) |
Restricted stock expense | | | | | | | | | | | | | | | 756 | | | | | | | | | | | | | | | | 756 | |
Cash dividend payments ($0.07 per share) | | | | | | | | | | | | | | | | | | | (3,369 | ) | | | | | | | | | | | (3,369 | ) |
Treasury stock purchases | | | | | | | (1,886,317 | ) | | | | | | | | | | | | | | | | | | | (10,333 | ) | | | (10,333 | ) |
Balance December 31, 2015 | | | — | | | | 47,517,644 | | | $ | — | | | $ | 174,304 | | | $ | 140,819 | | | $ | (19,220 | ) | | $ | (51,658 | ) | | $ | 244,245 | |
See Notes to Consolidated Financial Statements.
46
CONSOLIDATED STATEMENTS OF CASH FLOWS
| | Twelve Months Ended December 31, | |
| | 2015 | | | 2014 | | | 2013 | |
| | (Dollars in thousands) | |
Cash Flows from Operating Activities | | | | | | | |
Net income | | $ | 16,282 | | | $ | 50,206 | | | $ | 10,027 | |
Adjustments to reconcile net income to net cash provided by operating activities | | | | | | | | | | | | |
Provision (recovery) for loan losses | | | 2,135 | | | | (1,271 | ) | | | 4,116 | |
Mortgage banking income | | | (5,322 | ) | | | (1,570 | ) | | | (4,777 | ) |
Changes in fair value on loans held for sale | | | (1,519 | ) | | | — | | | | — | |
Net losses on real estate owned and other repossessed assets sold | | | 445 | | | | 800 | | | | 2,181 | |
Net gain on available for sale securities sold | | | (142 | ) | | | (444 | ) | | | (2,577 | ) |
Net loss (gain) on other assets sold | | | (21 | ) | | | 18 | | | | (10 | ) |
Amortization of premiums and accretion of discounts | | | 5,849 | | | | 822 | | | | 2,694 | |
Depreciation and amortization | | | 2,119 | | | | 1,997 | | | | 1,871 | |
Net change in interest receivable | | | (215 | ) | | | (69 | ) | | | 544 | |
Net change in interest payable | | | (132 | ) | | | (365 | ) | | | (13 | ) |
Net change in prepaid and other assets | | | (572 | ) | | | 3,015 | | | | 919 | |
Net change in other liabilities | | | (1,529 | ) | | | (1,098 | ) | | | (1,060 | ) |
Stock based compensation | | | 780 | | | | 406 | | | | 352 | |
Net principal disbursed on loans originated for sale | | | (215,026 | ) | | | (155,577 | ) | | | (226,921 | ) |
Proceeds from sale of loans held for sale | | | 204,845 | | | | 141,255 | | | | 239,891 | |
Net change in deferred tax assets | | | 7,316 | | | | (39,824 | ) | | | — | |
Cash surrender value increase of life insurance and death proceeds in excess of cash surrender value | | | (1,720 | ) | | | (1,429 | ) | | | (1,091 | ) |
Net change in interest rate caps | | | 177 | | | | 366 | | | | (110 | ) |
Net cash from operating activities | | | 13,750 | | | | (2,762 | ) | | | 26,036 | |
Cash Flows from Investing Activities | | | | | | | | | | | | |
Proceeds from the principal repayments and maturities of securities available for sale | | | 31,066 | | | | 27,878 | | | | 47,262 | |
Proceeds from the principal repayments and maturities of securities held to maturity | | | 3,311 | | | | — | | | | — | |
Proceeds from the sale of securities available for sale | | | 16,627 | | | | 14,595 | | | | 137,467 | |
Proceeds from the sale of real estate owned and other repossessed assets | | | 2,559 | | | | 4,056 | | | | 11,778 | |
Proceeds from the sale of loans held for investment | | | 514 | | | | 1,081 | | | | 13,709 | |
Proceeds from the sale of premises and equipment | | | 154 | | | | 30 | | | | 20 | |
Purchases of securities available for sale | | | (10,865 | ) | | | — | | | | (170,876 | ) |
Purchases of securities held to maturity | | | (10,390 | ) | | | — | | | | — | |
Purchase of bank-owned life insurance | | | (7,000 | ) | | | — | | | | (15,000 | ) |
Purchases of premises and equipment | | | (1,895 | ) | | | (2,091 | ) | | | (1,223 | ) |
Principal disbursed on loans, net of repayments | | | (157,982 | ) | | | (120,175 | ) | | | 16,965 | |
Loans purchased | | | (15,154 | ) | | | (146 | ) | | | (50 | ) |
Redemption of FHLB stock | | | — | | | | 8,396 | | | | — | |
Death benefit proceeds from bank owned life insurance | | | 755 | | | | — | | | | — | |
Net cash from investing activities | | | (148,300 | ) | | | (66,376 | ) | | | 40,052 | |
Cash Flows from Financing Activities | | | | | | | | | | | | |
Net increase (decrease) in checking, savings and money market accounts | | | 68,247 | | | | 13,055 | | | | (3,295 | ) |
Net increase (decrease) in certificates of deposit | | | 19,660 | | | | (56,971 | ) | | | (67,022 | ) |
Net increase (decrease) in advance payments by borrowers for taxes and insurance | | | 1,270 | | | | (156 | ) | | | (3,530 | ) |
Net change in Federal Home Loan Bank overnight advances | | | 92,000 | | | | 140,000 | | | | — | |
Net change in repurchase agreements and other borrowed funds | | | (30,023 | ) | | | (60,020 | ) | | | (20 | ) |
Prepayment penalty on Federal Home Loan Bank advances | | | — | | | | (3,903 | ) | | | — | |
Proceeds from the exercise of stock options | | | 28 | | | | 172 | | | | 155 | |
Dividends paid | | | (3,369 | ) | | | (1,001 | ) | | | — | |
Purchase of treasury stock | | | (10,333 | ) | | | (6,389 | ) | | | — | |
Issuance of preferred stock, net of issuance costs | | | — | | | | — | | | | 21,841 | |
Issuance of common stock, net of issuance costs | | | — | | | | — | | | | 20,501 | |
Net cash from financing activities | | | 137,480 | | | | 24,787 | | | | (31,370 | ) |
Change in cash and cash equivalents | | | 2,930 | | | | (44,351 | ) | | | 34,718 | |
Cash and cash equivalents, beginning of period | | | 32,980 | | | | 77,331 | | | | 42,613 | |
Cash and cash equivalents, end of period | | $ | 35,910 | | | $ | 32,980 | | | $ | 77,331 | |
See Notes to Consolidated Financial Statements
47
NOTES TO CONSOLIDATED FINANCIAL STATEMENTS
1. | Summary of Significant Accounting Policies |
The accounting policies of United Community Financial Corp. (United Community or the Company) and its subsidiary, The Home Savings and Loan Company of Youngstown, Ohio (Home Savings or the Bank) conform to U.S. Generally Accepted Accounting Principles (GAAP) and prevailing practices within the banking and thrift industries. A summary of the more significant accounting policies follows.
Nature of Operations
The business of Home Savings is providing consumer and business banking service to its market area in Ohio and western Pennsylvania. At the end of 2015, Home Savings was doing business through 31 retail banking offices and full-service banking branches and loan production centers. Loans and deposits are primarily generated from the areas where banking branches are located. Substantially all loans are secured by specific items of collateral including business assets, consumer assets, and commercial and residential real estate. Commercial loans are expected to be repaid from cash flow from operations of businesses. There are no significant concentrations of loans to any one industry or customer. However, the customers’ ability to repay their loans is dependent on the real estate and general economic conditions in the market area. Home Savings derives its income predominantly from interest on loans, securities, and to a lesser extent, non-interest income. Home Savings’ principal expenses are interest paid on deposits and Federal Home Loan Bank advances, loan loss provisions and normal operating costs.
Basis of Presentation
The consolidated financial statements include the accounts of United Community and its subsidiary. On January 29, 2016, United Community acquired James & Sons Insurance. James & Sons Insurance is not included in the financial statements as it was acquired after December 31, 2015. All material inter-company transactions have been eliminated. Certain prior period data has been reclassified to conform to current period presentation.
Use of Estimates in the Preparation of Financial Statements
The preparation of financial statements in conformity with GAAP requires management to make estimates and assumptions based on available information. These estimates and assumptions affect the amounts reported in the financial statements and the disclosures provided, and future results could differ.
Cash Flows
For purposes of the statement of cash flows, United Community considers all highly liquid investments with a term of three months or less to be cash equivalents. Net cash flows are reported for loan and deposit transactions, short-term borrowings and advance payments by borrowers for taxes and insurance.
Securities
Securities are classified as available for sale, held to maturity or trading upon their acquisition. Securities are classified as available for sale when they might be sold before maturity. Securities classified as available for sale are carried at estimated fair value with the unrealized holding gain or loss reported in other comprehensive income, net of tax. Securities classified as held to maturity are carried at amortized cost when management has the positive intent and ability to old them to maturity. Equity securities with readily determinable fair values are classified as available for sale. Restricted securities such as FHLB stock are carried at cost. Interest income includes amortization of purchase premium or discount on debt securities. Premiums or discounts are amortized on the level-yield method without anticipating prepayments. Gains and losses on sales are recorded on the trade date and are determined using the specific identification method.
Management evaluates securities for other-than-temporary impairment (OTTI) at least quarterly, and more frequently when economic or market conditions warrant such an evaluation. For securities in an unrealized loss position, management considers the extent and duration of the unrealized loss and the financial condition and near-term prospects of the issuer. Management also assesses whether it intends to sell, or it is more likely than not that it will be required to sell, a security in an unrealized loss position before recovery of its amortized cost basis. If either of the criteria regarding intent or requirement to sell is met, the entire difference between amortized cost and fair value is recognized as impairment through earnings. For debt securities that do not meet the aforementioned criteria, the amount of impairment is split into two components as follows: 1) OTTI related to credit loss, which must be recognized in the income statement and 2) OTTI related to other factors, which is recognized in other comprehensive income. The credit loss is
48
defined as the difference between the present value of the cash flows expected to be collected and the amortized cost basis. For equity securities, the entire amount of OTTI is recognized through earnings.
Loans Held for Sale
Loans held for sale primarily consist of residential mortgage loans originated for sale and other loans that have been identified for sale. These loans are carried at the lower of cost or fair value, determined in the aggregate. Net unrealized losses, if any, are recorded as a valuation allowance and charged to earnings.
Mortgage loans held for sale are sold with either servicing rights retained or servicing released. The carrying value of mortgage loans sold is reduced by the amount allocated to the servicing right. Gains and losses on sales of mortgage loans are based on the difference between the selling price and the carrying value of the related loan sold.
Loans held for sale, for which the fair value option has been elected, are recorded at fair value as of each balance sheet date. The fair value of the Company’s construction perm loans held for sale is determined based on quoted prices for similar loans in active markets. The fair value of permanent construction loans held for sale is determined, based on the committed loan amount, using quoted prices for similar assets, adjusted for specific attributes of that loan and other unobservable market data, such as time it takes to complete the project.
Loans
Loans that management has the intent and ability to hold for the foreseeable future or until maturity or payoff are reported at the outstanding principal balance, net of purchase premiums or discounts, deferred loan fees and costs and an allowance for loan losses. Interest income is accrued on the unpaid principal balance. Loan origination fees, net of certain direct origination costs, are deferred and recognized in interest income using the level-yield method without anticipating prepayments.
Interest income includes amortization of net deferred loan fees and costs. Deferred loan fees and costs received for loans are deferred and amortized to interest income over the contractual lives of the loans using the level yield method. Fees received for loan commitments that are expected to be drawn, based on Home Savings’ experience with similar commitments, are deferred and amortized over the lives of the loans using the level-yield method. Fees for other loan commitments are deferred and amortized over the loan commitment period on a straight-line basis. Unamortized deferred loan fees or costs related to loans paid off are included in income. Unamortized net fees or costs on loans sold are included in the basis of the loans in calculating gains and losses. The accrual of interest income and amortization of net deferred fees on mortgage and commercial loans is discontinued at the time the loan is 90 days delinquent unless the loan is both well secured and in the process of collection. Consumer loans are typically charged-off no later than 180 days past due. Past due status is based on the contractual terms of the loan. In all cases, loans are placed on nonaccrual or charged-off at an earlier date if collection of principal or interest is considered doubtful. Nonaccrual loans and loans past due 90 days still on accrual include both smaller balance homogeneous loans that are collectively evaluated for impairment and individually classified impaired loans.
All interest accrued but not received for a loan placed on nonaccrual is reversed against interest income. Nonaccrual loans are comprised principally of loans 90 days past due as well as certain loans which are less than 90 days past due, but where serious doubt exists as to the ability of the borrowers to comply with the repayment terms. Once a loan is on nonaccrual, it will remain on nonaccrual until the loan becomes current and the borrower demonstrates the ability to pay the loan per the contractual terms for a minimum of six months. Interest received on such loans is accounted for on the cash-basis or cost-recovery method, until qualifying for return to accrual. Under the cost-recovery method, interest income is not recognized until the loan balance is reduced to zero. Under the cash-basis method, interest income is recorded when the payment is received in cash. Loans are returned to accrual status when future payments are reasonably assured.
Home Savings determines the past due status of loans based on the number of calendar months the loan is past due. Impaired loans consist of loans that are non-homogenous and in a nonaccrual status; loans considered troubled debt restructurings and loans that have been individually analyzed for impairment.
Residential mortgage loans. Residential mortgage loans are revalued at the time they reach 180 days past due and any portion of the principal that exceeds the fair value is charged-off. Mortgage loans are considered to be homogenous until the loan is individually evaluated at 180 days past due and charged-down to the fair value of the underlying collateral, at which time the loan becomes non-homogenous and is considered impaired. Residential mortgage loans that have been modified and determined to be TDR are revalued based upon the present value of the modified cash flows of the loan to establish a specific reserve on that loan.
49
Consumer loans. Consumer loans that are secured by residential real estate are revalued once they reach 180 days past due and charged-down to the fair value if necessary. Consumer loans that are not secured by residential real estate are revalued once they reach 120 days past due and are charged-down to the fair value if necessary. Consumer loans are considered to be homogenous until the loan is individually evaluated and charged-down to the fair value of the underlying collateral, at which time the loan becomes non-homogenous and is considered impaired. Consumer loans that have been modified and determined to be TDR are revalued based upon the present value of the modified cash flows of the loan to establish a specific reserve on that loan.
Commercial loans. A commercial real estate loan is impaired when, based on current information and events, it is probable that the Company will be unable to collect all amounts due according to the contractual terms of the loan agreement. At this time the loan is charged-down to the fair value. Commercial and industrial loans are impaired when, based on current information and events, it is probable that the Company will be unable to collect all amounts due according to the contractual terms of the loan agreement. The repayment of commercial loans typically is dependent on the income stream and successful operation of a business. If there is no underlying collateral to value, the company will calculate the present value of expected future cash flows to determine the amount of impairment, if any.
Concentration of Credit Risk
Most of the Company’s business activity is with customers located within Home Savings’ market area. Therefore, the Company’s exposure to credit risk is significantly affected by changes in the economy in Ohio, Western Pennsylvania and Northern West Virginia.
Allowance for Loan Losses
The allowance for loan losses is a valuation allowance for probable incurred credit losses. Loan losses are charged against the allowance when management believes the uncollectibility of a loan balance is confirmed. Subsequent recoveries, if any, are credited to the allowance. Management estimates the allowance balance required based on an analysis using past loan loss experience, the nature and volume of the portfolio, information about specific borrower situations, estimated collateral values, general economic conditions in the market area and other factors. Allocations of the allowance may be made for specific loans, but the entire allowance is available for any loan that, in management’s judgment, should be charged-off.
The allowance consists of specific and general components. The specific component relates to loans that are individually classified as impaired or loans otherwise classified as substandard or doubtful. The general component covers non-classified loans and is based on historical loss experience adjusted for current factors.
Other loans not reviewed specifically by management are evaluated as a homogenous group of loans (generally single-family residential mortgage loans and all consumer credits except marine loans) using a loss factor applied to the outstanding loan balance to determine the level of reserve required. This loss factor consists of two components, a quantitative and a qualitative component. The quantitative component is based on a historical analysis of all charged-off loans, net of recoveries. In determining the qualitative factors, consideration is given to such attributes as lending policies, economic conditions, nature and volume of the portfolio, management, loan quality trend, loan review, collateral value, concentrations, economic cycles and other external factors. At December 31, 2014, the Company evaluated two years of net charge-off history and applied the information to the current period. This component was combined with the qualitative component to arrive at the loss factor, which is applied to the outstanding principal balance by type of credit and internal risk grade applied to specific risk pools, plus specific loss allocations and adjustments for current events and conditions. As of December 31, 2015, the Company evaluated 12 quarters of net charge-off history and applied this information to the current period. This component is combined with the qualitative component to arrive at the loss factor, which is applied to the average outstanding balance of homogenous loans and is no longer being applied by internal risk grade. This change in methodology, which was made in the first quarter of 2015, did not have a material effect on the calculation of the allowance for loan losses. The change in methodology was made in order to facilitate technological improvements in the calculation of the allowance for loan loss.
A loan is impaired when, based on current information and events, it is probable that the Company will be unable to collect all amounts due according to the contractual terms of the loan agreement. Impaired loans are individually evaluated based on the borrower’s ability to repay the loan given the availability of collateral, other sources of cash flow and legal options available to Home Savings. Once a review is completed, a specific reserve is determined and allocated to the loan. These specific reserves on individual loans are reviewed periodically and adjusted as necessary based on subsequent collection, loan upgrades or downgrades, nonperforming trends or actual principal charge-offs. Loans for which the terms have been modified, and for which the borrower is experiencing financial difficulties, are considered troubled debt restructurings and classified as impaired. Factors considered by management in determining impairment include payment status, collateral value and the probability of collecting scheduled principal
50
and interest payments when due. Loans that experience insignificant payment delays and payment shortfalls generally are not classified as impaired. Management determines the significance of payment delays and payment shortfalls on a case-by-case basis, taking into consideration all of the facts and circumstances surrounding the loan and the borrower, including the length of the delay, the reasons for the delay, the borrower’s prior payment record and the amount of shortfall in relation to the principal and interest owed. Impairment is measured on a loan-by-loan basis for commercial and construction loans by either the present value of expected future cash flows discounted at the loan’s effective interest rate or the fair value of the collateral if the loan is collateral dependent. Troubled debt restructurings (TDRs) are separately identified for impairment disclosures and are measured at the present value of estimated future cash flows using the loan’s effective rate at inception. If a TDR is considered to be a collateral dependent loan, the loan is reported, net, at the fair value of the collateral. For TDRs that subsequently default, the Company determines the amount of reserve in accordance with the accounting policy for the allowance for loan losses.
The Bank’s portfolio has the following segments: commercial and commercial real estate loans, residential mortgage loans and consumer loans. Residential mortgage loans are made to customers in Home Savings’ market area. These loans are secured by the underlying real estate as collateral. Repayment of these loans is dependent on general economic conditions and unemployment levels in Home Savings’ market area. To reduce any risk on loans secured by one-to four-family residences, Home Savings underwrites all portfolio loans to Freddie Mac underwriting guidelines.
Consumer loans primarily consist of home equity loans. Similar to residential mortgage loans, repayment of consumer loans depends on the general economic conditions and unemployment levels in Home Savings’ market area. The majority of Home Savings’ consumer loans consist of closed-end home equity loans in an amount that, when added to the prior indebtedness secured by the real estate, does not exceed 90% of the estimated value of the real estate. Other consumer loans, such as automobiles and recreational vehicles, have a higher degree of risk than home equity loans as the collateral depreciates at a faster rate.
Multifamily and nonresidential real estate loans generally have a higher degree of risk than loans secured by one-to four-family residences. These riskier loans can be affected by economic conditions, operating expenses, debt service and successful operation of income-producing properties. Home Savings tries to reduce this risk by evaluating the credit history of the borrower, location of the real estate, the financial condition of the borrower, obtaining personal guarantees of the principals, the characteristics of the income stream generated by the property and the appraisal supporting the property.
Commercial loans generally entail greater risk than real estate lending. The repayment of commercial loans typically is dependent on the income stream and successful operation of a business, which can be affected by economic conditions. The collateral for commercial loans, if any, often consists of rapidly depreciating assets.
Construction loans involve a higher degree of underwriting and default risk than loans secured by mortgages on existing properties because construction loans are more difficult to appraise and to monitor. Loan funds are advanced based upon the status of the project under construction.
Home Savings has established a methodology to calculate the allowance for loan losses at a level it believes adequate to absorb probable incurred losses in the loan portfolio. An analysis of individual credits, prior and current loss experience, loan portfolio delinquency levels, changes in the loan portfolio, current economic conditions and results of regulatory examinations is completed on a regular basis to determine the adequacy of the allowance.
Servicing Assets
Servicing assets are recognized as separate assets when rights are acquired through the purchase or sale of financial assets. Servicing rights are initially recorded at fair value with the income statement effect recorded in gains on sales of loans. Fair value is based on market prices for comparable mortgage servicing contracts, when available, or alternatively, is based on a valuation model that calculates the present value of estimated future net servicing income. The valuation model incorporates assumptions that market participants would use in estimating future net servicing income, such as the cost to service, discount rate, the custodial earnings rate, an inflation rate, ancillary income, prepayment speeds and default rates and losses. Capitalized servicing rights are reported in other assets and are amortized into non-interest income in proportion to, and over the period of, the estimated future net servicing income of the underlying assets.
Servicing assets are evaluated for impairment based upon the fair value of the rights as compared to carrying amount. Impairment is determined by stratifying rights into tranches based on predominant risk characteristics, such as original maturity, interest rate and loan type. Impairment is recognized through a valuation allowance for an individual tranche. If Home Savings later determines that all or a portion of the impairment no longer exists for a particular tranche, a reduction of the allowance may be recorded as an increase to income.
51
Servicing fee income is recorded for fees earned for servicing loans. The fees are based on a contractual percentage of the outstanding principal, or a fixed amount per loan, and are recorded as income when earned. The amortization of mortgage servicing rights is netted against loan servicing fee income.
Transfers of Financial Assets
Transfers of financial assets are accounted for as sales when control over the assets has been relinquished. Control over transferred assets is deemed to be surrendered when the assets have been isolated from the Company, the transferee obtains the right (free of conditions that constrain it from taking advantage of that right) to pledge or exchange the transferred assets, and the Company does not maintain effective control over the transferred assets through an agreement to repurchase them before their maturity.
Real Estate Owned and Other Repossessed Assets
Real estate owned, including property acquired in settlement of foreclosed loans, is initially transferred at fair value less estimated cost to sell after foreclosure, establishing a new cost basis. Physical possession of residential real estate property collateralizing a residential mortgage loan occurs when legal title is obtained upon completion of foreclosure or when the borrower conveys all interest in the property to satisfy the loan through completion of a deed in lieu of foreclosure or through a similar legal agreement. These assets are subsequently accounted for at lower of cost or fair value less estimated costs to sell. If fair value declines after acquisition, a valuation allowance is recorded through expense. Costs relating to the development and improvement of real estate owned are capitalized, whereas costs relating to holding and maintaining the properties are charged to expense. Other repossessed assets are carried at estimated fair value less estimated cost to sell after acquisition.
Premises and Equipment
Land is carried at cost. Premises and equipment are stated at cost less accumulated depreciation and amortization. Buildings and related components are depreciated and amortized using the straight-line method over the useful lives, generally ranging from 20 years to 40 years (or term of the lease, if shorter) of the related assets. Furniture and fixtures are depreciated using the straight-line method with useful lives ranging from three to five years.
Federal Home Loan Bank (FHLB) stock
The Bank is a member of the FHLB system. Members are required to own a certain amount of stock based on the level of borrowings and other factors, and may invest in additional amounts. FHLB stock is carried at cost, classified as a restricted security, and periodically evaluated for impairment based on ultimate recovery of par value. Both cash and stock dividends are reported as income.
Cash Surrender Value of Life Insurance
Life insurance is carried on the lives of certain employees where Home Savings is the beneficiary. Life insurance is recorded at its cash surrender value, or the amount currently realizable. Increases in the Home Savings’ policy cash surrender value are tax exempt and death benefit proceeds received by Home Savings are tax-free. Income from these policies and changes in the cash surrender value are recorded in other income. The policies contain no split dollar or postretirement benefits for covered employees.
Core Deposit Intangible
Intangible assets with definite useful lives are amortized over their estimated useful lives to their estimated residual values. Home Savings has no goodwill recorded as of December 31, 2015 or December 31, 2014.
Core deposit intangible assets arose from whole bank acquisitions. They were initially measured at fair value and are being amortized on an accelerated method over their estimated useful lives.
Derivatives
At the inception of a derivative contract, the Company designates the derivative as one of three types based on the Company’s intentions and belief as to likely effectiveness as a hedge. These three types are (1) a hedge of the fair value of a recognized asset or liability or of an unrecognized firm commitment (“fair value hedge”), (2) a hedge of a forecasted transaction or the variability of cash flows to be received or paid related to a recognized asset or liability (“cash flow hedge”), or (3) an instrument with no hedging designation (“stand-alone derivative”). For a fair value hedge, the gain or loss on the derivative, as well as the offsetting loss or gain
52
on the hedged item, are recognized in current earnings as fair values change. For a cash flow hedge, the gain or loss on the derivative is reported in other comprehensive income and is reclassified into earnings in the same periods during which the hedged transaction affects earnings. For both types of hedges, changes in the fair value of derivatives that are not highly effective in hedging the changes in fair value or expected cash flows of the hedged item are recognized immediately in current earnings. Changes in the fair value of derivatives that do not qualify for hedge accounting are reported currently in earnings, as noninterest income.
Net cash settlements on derivatives that qualify for hedge accounting are recorded in interest income or interest expense, based on the item being hedged. Net cash settlements on derivatives that do not qualify for hedge accounting are reported in noninterest income. Cash flows on hedges are classified in the cash flow statement the same as the cash flows of the items being hedged.
The Company formally documents the relationship between derivatives and hedged items, as well as the risk-management objective and the strategy for undertaking hedge transactions at the inception of the hedging relationship. This documentation includes linking fair value or cash flow hedges to specific assets and liabilities on the balance sheet or to specific firm commitments or forecasted transactions. The Company also formally assesses, both at the hedge’s inception and on an ongoing basis, whether the derivative instruments that are used are highly effective in offsetting changes in fair values or cash flows of the hedged items. The Company discontinues hedge accounting when it determines that the derivative is no longer effective in offsetting changes in the fair value or cash flows of the hedged item, the derivative is settled or terminates, a hedged forecasted transaction is no longer probable, a hedged firm commitment is no longer firm, or treatment of the derivative as a hedge is no longer appropriate or intended.
When hedge accounting is discontinued, subsequent changes in fair value of the derivative are recorded as noninterest income. When a fair value hedge is discontinued, the hedged asset or liability is no longer adjusted for changes in fair value and the existing basis adjustment is amortized or accreted over the remaining life of the asset or liability. When a cash flow hedge is discontinued but the hedged cash flows or forecasted transactions are still expected to occur, gains or losses that were accumulated in other comprehensive income are amortized into earnings over the same periods which the hedged transactions will affect earnings.
Mortgage Banking Derivatives
Commitments to fund mortgage loans (interest rate locks) to be sold into the secondary market and forward commitments for the future delivery of these mortgage loans are accounted for as free standing derivatives. Fair values of these mortgage derivatives are estimated based on changes in mortgage interest rates from the date the interest rate on the loan is locked. The Company enters into forward commitments for the future delivery of mortgage loans when interest rate locks are entered into in order to hedge the change in interest rates resulting from its commitments to fund the loans. Changes in the fair values of these derivatives are included in mortgage banking income on the consolidated statements of income and comprehensive income.
Long-term Assets
Premises and equipment and other long–term assets are reviewed for impairment when events indicate their carrying amounts may not be recoverable from future undiscounted cash flows. If impaired, the assets are recorded at fair value.
Stock Compensation
Compensation cost is recognized for stock options and restricted stock awards issued to employees and nonemployee directors, based on the fair value of these awards at the date of grant. A Black-Scholes model is utilized to estimate the fair value of stock options, while the market price of the Corporation’s common shares at the date of grant is used for restricted stock awards. Compensation cost is recognized over the required service period, generally defined as the vesting period. For awards with graded vesting, compensation cost is recognized on a straight-line basis over the requisite service period for the entire award.
Income Taxes
Income tax expense is the total of the current year income tax due or refundable and the change in deferred tax assets and liabilities. Deferred tax assets and liabilities are the expected future tax amounts for the temporary differences between carrying amounts and tax basis of assets and liabilities, computed using enacted tax rates. A valuation allowance, if needed, reduces deferred tax assets to the amount expected to be realized.
A tax position is recognized as a benefit only if it is “more likely than not” that the tax position would be sustained in a tax examination, with a tax examination being presumed to occur. The amount recognized is the largest amount of tax benefit that is greater than 50% likely of being realized on examination. For tax positions not meeting the “more likely than not” test, no tax benefit is recorded.
53
The Company recognizes interest and/or penalties related to income tax matters in income tax expense.
401(k) Savings Plan
Employee 401(k) and profit sharing plan expense is the amount of matching contributions and administrative costs to administer the plan.
Postretirement Benefit Plans
In addition to Home Savings’ retirement plans, Home Savings sponsors a defined benefit health care plan that was curtailed in 2000 to provide postretirement medical benefits for employees who worked 20 years and attained a minimum age of 60 by September 1, 2000, while in service with Home Savings. That modified plan was further curtailed in 2015, and medical benefits will no longer be provided to plan particpants as of December 31, 2016. The plan is unfunded and, as such, has no assets. Furthermore, the plan is contributory and contains minor cost-sharing features such as deductibles and coinsurance. In addition, postretirement life insurance coverage is provided for employees who were participants prior to December 10, 1976. The life insurance plan is non-contributory. Home Savings’ policy is to pay premiums monthly, with no pre-funding. The benefit obligation is measured annually by a third-party actuary.
Dividend Restriction
Banking regulations require maintaining certain capital levels and may limit the dividends paid by the bank to the holding company or by the holding company to shareholders.
Earnings Per Share
Basic earnings per common share is net income available to common shareholders divided by the weighted average number of common shares outstanding during the period. All outstanding unvested share-based payment awards that contain rights to nonforfeitable dividends are considered participating securities for this calculation. Diluted earnings per common share includes the dilutive effect of additional potential common shares issuable under stock options.
Loss Contingencies
Loss contingencies, including claims and legal actions arising in the ordinary course of business, are recorded as liabilities when the likelihood of loss is probable and an amount or range of loss can be reasonably estimated. See further discussion at Note 13.
Fair Value of Financial Instruments
Fair values of financial instruments are estimated using relevant market information and other assumptions, as more fully disclosed in Note 18. Fair value estimates involve uncertainties and matters of significant judgment regarding interest rates, credit risk, prepayments, and other factors, especially in the absence of broad markets for particular items. Changes in assumptions or in market conditions could significantly affect the estimates.
Comprehensive Income (Loss)
Comprehensive income (loss) consists of net income and unrealized gains and losses on securities available for sale and changes in unrealized gains and losses on postretirement liabilities, which are also recognized as separate components of equity, net of tax.
Off Balance Sheet Financial Instruments
Financial instruments include off-balance sheet credit instruments, such as commitments to make loans and commercial letters of credit, issued to meet customer financing needs. The face amount for these items represents the exposure to loss, before considering customer collateral or ability to repay. Such financial instruments are recorded when they are funded.
New Accounting Standards
In January 2014, FASB issued Accounting Standards Update (ASU) 2014-04, Receivables—Troubled Debt Restructurings by Creditors (Subtopic 310-40): Reclassification of Residential Real Estate Collateralized Consumer Mortgage Loans upon Foreclosure
54
(a consensus of the FASB Emerging Issues Task Force). The ASU clarifies when an in-substance repossession or foreclosure occurs and a creditor is considered to have received physical possession of real estate property collateralizing a consumer mortgage loan.
Specifically, the new ASU requires a creditor to reclassify a collateralized consumer mortgage loan to real estate property upon obtaining legal title to the real estate collateral, or the borrower voluntarily conveying all interest in the real estate property to the lender to satisfy the loan through a deed in lieu of foreclosure or similar legal agreement. Additional disclosures are required detailing the amount of foreclosed residential real estate property held by the creditor and the recorded investment in consumer mortgages collateralized by real estate property that are in the process of foreclosure. The new guidance is effective for annual periods, and interim reporting periods within those annual periods, beginning after December 15, 2014. The adoption of this guidance did not have a material impact on the Company’s consolidated financial statements, but did result in additional disclosures.
In May 2014, FASB issued ASU 2014-09, Revenue from Contracts with Customers (Topic 606). The ASU creates a new topic, Topic 606, to provide guidance on revenue recognition for entities that enter into contracts with customers to transfer goods or services or enter into contracts for the transfer of nonfinancial assets. The core principle of the guidance is that an entity should recognize revenue to depict the transfer of promised goods or services to customers in an amount that reflects the consideration to which the entity expects to be entitled in exchange for those goods or services. Additional disclosures are required to provide quantitative and qualitative information regarding the nature, amount, timing, and uncertainty of revenue and cash flows arising from contracts with customers. The new guidance is effective for annual reporting periods, and interim reporting periods within those annual periods, beginning after December 15, 2017. Early adoption is not permitted. Management is currently evaluating the impact of the adoption of this guidance on the Company’s consolidated financial statements.
In June 2014, the FASB issued Accounting Standards Update 2014-11, Transfers and Servicing (Topic 860): Repurchase-to-Maturity Transactions, Repurchase Financings, and Disclosures. The amendments in this ASU change the accounting for repurchase-to-maturity transactions and linked repurchase financings to secured borrowing accounting, which is consistent with the accounting for other repurchase agreements. The amendments also require two new disclosures. The first disclosure requires an entity to disclose information on transfers accounted for as sales in transactions that are economically similar to repurchase agreements. The second disclosure provides increased transparency about the types of collateral pledged in repurchase agreements and similar transactions accounted for as secured borrowings. The accounting changes are effective for annual periods, and interim reporting periods within those annual periods, beginning after December 15, 2014. The disclosure for certain transactions accounted for as a sale is required to be presented for interim and annual periods beginning after December 15, 2014, with all other disclosure requirements required to be presented for annual periods beginning after December 15, 2014, and for interim periods beginning after March 15, 2015. The adoption of this guidance as of January 1, 2015 did not have an impact on the Company’s consolidated financial statements, but did result in additional disclosures.
In February 2015, the FASB issued ASU 2015-02, Consolidation (Topic 810): Amendments to the Consolidation Analysis. The ASU amends the current consolidation guidance and affects both the variable interest entity and voting interest entity consolidation models. The new guidance is effective for annual reporting periods and interim reporting periods within those annual periods, beginning after December 15, 2015. Early adoption is permitted. Management is currently evaluating the impact of the adoption of this guidance on the Company’s consolidated financial statements.
In January 2016, the FASB issued ASU 2016-1, Financial Instruments – Overall (Subtopic 825-10): Recognition and Measurement of Financial Assets and Financial Liabilities. ASU 2016-1, among other things, (i) requires equity investments, with certain exceptions, to be measured at fair value with changes in fair value recognized in net income, (ii) simplifies the impairment assessment of equity investments without readily determinable fair values by requiring a qualitative assessment to identify impairment, (iii) eliminates the requirement for public business entities to disclose the methods and significant assumptions used to estimate the fair value that is required to be disclosed for financial instruments measured at amortized cost on the balance sheet, (iv) requires public business entities to use the exit price notion when measuring the fair value of financial instruments for disclosure purposes, (v) requires an entity to present separately in other comprehensive income the portion of the total change in the fair value of a liability resulting from a change in the instrument-specific credit risk when the entity has elected to measure the liability at fair value in accordance with the fair value option for financial instruments, (vi) requires separate presentation of financial assets and financial liabilities by measurement category and form of financial asset on the balance sheet or the accompanying notes to the financial statements and (viii) clarifies that an entity should evaluate the need for a valuation allowance on a deferred tax asset related to available-for-sale. The new guidance is effective for annual reporting periods and interim reporting periods within those annual periods, beginning after December 15, 2017. Management is currently evaluating the impact of the adoption of this guidance on the Company’s consolidated financial statements.
55
Operating Segments
Internal financial information is primarily reported and aggregated in one line of business, which is banking services.
Reclassifications
Some items in the prior year financial statements were reclassified to conform to the current presentation. Reclassifications had no effect on prior year consolidated statements of operations or shareholders’ equity.
2. | SUBSEQUENT EVENTS (UNAUDITED) |
On January 29, 2016, the Company completed the purchase of James & Sons Insurance Company of Youngstown, Ohio. James & Sons Insurance is engaged in the business of selling insurance including auto, commercial, homeowners and life-health insurance. Under the purchase agreement, the Company paid $1.5 million in stock and $360,000 in cash in connection with this acquisition. Total assets purchased was $2.3 million, including $1.6 million in goodwill.
3. | CASH AND CASH EQUIVALENTS |
Federal Reserve Board (FRB) regulations require depository institutions to maintain certain non-interest bearing reserve balances. These reserves, which consisted of vault cash at Home Savings, totaled approximately $10.9 million and $12.3 million at December 31, 2015 and 2014, respectively.
The components of securities available for sale are as follows:
| | December 31, 2015 | |
| | | | | | Gross | | | Gross | | | | | |
| | Amortized | | | unrealized | | | unrealized | | | Fair | |
| | cost | | | gains | | | losses | | | value | |
| | (Dollars in thousands) | |
Available for Sale | | | | | | | | | | | | | | | | |
U.S. Treasury and government sponsored entities' securities | | $ | 221,500 | | | $ | 159 | | | $ | (3,009 | ) | | $ | 218,650 | |
States of the U.S. and political subdivisions | | | 10,848 | | | | 192 | | | | — | | | | 11,040 | |
Mortgage-backed GSE securities: residential | | | 129,155 | | | | 55 | | | | (1,230 | ) | | | 127,980 | |
Total | | $ | 361,503 | | | $ | 406 | | | $ | (4,239 | ) | | $ | 357,670 | |
| | December 31, 2014 | |
| | | | | | Gross | | | Gross | | | | | |
| | Amortized | | | unrealized | | | unrealized | | | Fair | |
| | cost | | | gains | | | losses | | | value | |
| | (Dollars in thousands) | |
Available for Sale | | | | | | | | | | | | | | | | |
U.S. Treasury and government sponsored entities' securities | | $ | 232,225 | | | $ | 184 | | | $ | (4,452 | ) | | $ | 227,957 | |
Mortgage-backed GSE securities: residential | | | 274,204 | | | | 331 | | | | (2,702 | ) | | | 271,833 | |
Total | | $ | 506,429 | | | $ | 515 | | | $ | (7,154 | ) | | $ | 499,790 | |
The components of securities held to maturity are as follows:
| | December 31, 2015 | |
| | | | | | Gross | | | Gross | | | | | |
| | Amortized | | | unrecognized | | | unrecognized | | | Fair | |
| | cost | | | gains | | | losses | | | value | |
| | (Dollars in thousands) | |
Held to maturity | | | | | | | | | | | | | | | | |
Mortgage-backed GSE securities: residential | | $ | 100,322 | | | $ | — | | | $ | (1,203 | ) | | $ | 99,119 | |
States of the U.S. and political subdivisions | | | 10,377 | | | | 148 | | | | — | | | | 10,525 | |
Total | | $ | 110,699 | | | $ | 148 | | | $ | (1,203 | ) | | $ | 109,644 | |
56
The Company had no held to maturity securities at December 31, 2014.
Debt securities available for sale by contractual maturity, repricing or expected call date are shown below:
| | December 31, 2015 | |
| | Amortized cost | | | Fair value | |
| | (Dollars in thousands) | |
Due in one year or less | | $ | — | | | $ | — | |
Due after one year through five years | | | — | | | | — | |
Due after five years through ten years | | | 199,440 | | | | 197,097 | |
Due after ten years | | | 32,908 | | | | 32,593 | |
Mortgage-backed GSE securities: residential | | | 129,155 | | | | 127,980 | |
Total | | $ | 361,503 | | | $ | 357,670 | |
Debt securities held to maturity by contractual maturity, repricing or expected call date are shown below:
| | December 31, 2015 | |
| | Amortized cost | | | Fair value | |
| | (Dollars in thousands) | |
Due in one year or less | | $ | 1,100 | | | $ | 1,108 | |
Due after one year through five years | | | — | | | | — | |
Due after five years through ten years | | | 2,249 | | | | 2,289 | |
Due after ten years | | | 7,028 | | | | 7,128 | |
Mortgage-backed GSE securities: residential | | $ | 100,322 | | | $ | 99,119 | |
Total | | $ | 110,699 | | | $ | 109,644 | |
Proceeds, gross realized gains, losses and impairment charges of available for sale securities were as follows:
| | 2015 | | | 2014 | | | 2013 | |
| | (Dollars in thousands) | |
Proceeds | | $ | 16,627 | | | $ | 14,595 | | | $ | 137,467 | |
Gross gains | | | 142 | | | | 444 | | | | 2,712 | |
Gross losses | | | — | | | | — | | | | (135 | ) |
Income tax expense related to net realized gains and losses was $50,000 for 2015 and $155,000 for 2014 and $0 for 2013 due to the full valuation allowance recorded on the net deferred tax asset of the Company.
Securities pledged for participation in the Ohio Linked Deposit Program were $0 and approximately $501,000 at December 31, 2015 and 2014, respectively. See further discussion regarding pledged securities in Note 12.
Securities available for sale that have been in an unrealized loss position for less than twelve months or twelve months or more are as follows at December 31, 2015:
| | Less than 12 months | | | 12 months or more | | | Total | |
| | Fair | | | Unrealized loss | | | Fair | | | Unrealized loss | | | Fair | | | Unrealized loss | |
| | value | | | Loss | | | value | | | Loss | | | value | | | Loss | |
| | (Dollars in thousands) | |
Description of securities: | | | | | | | | | | | | | | | | | | | | | | | | |
U.S. Treasury and government sponsored entities | | $ | 139,876 | | | $ | (1,654 | ) | | $ | 55,055 | | | $ | (1,355 | ) | | $ | 194,931 | | | $ | (3,009 | ) |
Mortgage-backed GSE securities: residential | | | 100,585 | | | | (842 | ) | | | 14,278 | | | | (388 | ) | | | 114,863 | | | | (1,230 | ) |
Total temporarily impaired securities | | $ | 240,461 | | | $ | (2,496 | ) | | $ | 69,333 | | | $ | (1,743 | ) | | $ | 309,794 | | | $ | (4,239 | ) |
All of the U.S. Treasury and government sponsored entities and mortgage-backed securities that were temporarily impaired at December 31, 2015, were impaired due to the level of interest rates at that time. Unrealized losses on these securities have not been recognized into income as of December 31, 2015 because the issuer’s securities are of high credit quality (rated AA or higher),
57
management does not intend to sell, and it is likely that management will not be required to sell, the securities prior to their anticipated recovery, and the decline in fair value is largely due to changes in interest rates and other market conditions.
Securities available for sale that have been in an unrealized loss position for less than twelve months or twelve months or more are as follows at December 31, 2014:
| | Less than 12 months | | | 12 months or more | | | Total | |
| | Fair | | | Unrealized loss | | | Fair | | | Unrealized loss | | | Fair | | | Unrealized loss | |
| | value | | | Loss | | | value | | | Loss | | | value | | | Loss | |
| | (Dollars in thousands) | |
Description of securities: | | | | | | | | | | | | | | | | | | | | | | | | |
U.S. Treasury and government sponsored entities | | $ | — | | | $ | — | | | $ | 214,495 | | | $ | (4,452 | ) | | $ | 214,495 | | | $ | (4,452 | ) |
Mortgage-backed GSE securities: residential | | | 4,625 | | | | (40 | ) | | | 193,434 | | | | (2,662 | ) | | | 198,059 | | | | (2,702 | ) |
Total temporarily impaired securities | | $ | 4,625 | | | $ | (40 | ) | | $ | 407,929 | | | $ | (7,114 | ) | | $ | 412,554 | | | $ | (7,154 | ) |
All of the U.S. Treasury and government sponsored entities and mortgage-backed securities that were temporarily impaired at December 31, 2014, were impaired due to the level of interest rates at that time. Unrealized losses on these securities have not been recognized into income as of December 31, 2014 because the issuer’s securities are of high credit quality (rated AA or higher), management does not intend to sell, and it is likely that management will not be required to sell, the securities prior to their anticipated recovery, and the decline in fair value is largely due to changes in interest rates and other market conditions.
Securities held to maturity that have been in an unrealized loss position for less than twelve months or twelve months or more are as follows at December 31, 2015:
| | December 31, 2015 | |
| | Less than 12 months | | | 12 months or more | | | Total | |
| | Fair | | | Unrealized loss | | | Fair | | | Unrealized | | | Fair | | | Unrealized | |
| | value | | | Loss | | | value | | | Loss | | | value | | | Loss | |
| | (Dollars in thousands) | |
Description of securities: | | | | | | | | | | | | | | | | | | | | | | | | |
Mortgage-backed GSE securities: residential | | $ | 22,723 | | | $ | (289 | ) | | $ | 76,396 | | | $ | (2,390 | ) | | $ | 99,119 | | | $ | (2,679 | ) |
Total temporarily impaired securities | | $ | 22,723 | | | $ | (289 | ) | | $ | 76,396 | | | $ | (2,390 | ) | | $ | 99,119 | | | $ | (2,679 | ) |
During the third quarter of 2015, Home Savings transferred securities with a total amortized cost of $105.3 million with a corresponding fair value of $103.8 million from available for sale to held to maturity. The net unrealized loss, net of taxes, on these securities at the date of transfer was $999,000. The fair value at the date of transfer becomes the securities’ new cost basis. The unrealized holding loss at the time of transfer continues to be reported in accumulated other comprehensive income, net of tax and is amortized over the remaining lives of the securities as an adjustment of the yield. The amortization of the unamortized holding loss reported in accumulated other comprehensive income will directly offset the effect on interest income from the accretion of the reduced amortized cost for the transferred securities. Because of this transfer, the total losses less than 12 months and greater than 12 months reported in the table above will not agree to the unrealized losses reported in the inventory of held to maturity securities. The inventory table reports unrealized gains and losses based upon the transferred securities adjusted cost basis and current fair value. The reporting of losses less than 12 months and greater than 12 months represents that actual period of time that these securities have been in an unrealized loss position and the securities amortized cost basis as if the transfer did not occur.
All of the mortgage-backed securities that were temporarily impaired at December 31, 2015, were impaired due to the level of interest rates at that time. Unrealized losses on these securities have not been recognized into income as of December 31, 2015 because the issuer’s securities are of high credit quality (rated AA or higher), management does not intend to sell, and it is likely that management will not be required to sell, the securities prior to their anticipated recovery, and the decline in fair value is largely due to changes in interest rates and other market conditions.
The Company recognized no OTTI charges in 2015, 2014 and 2013.
58
Portfolio loans consist of the following:
| | December 31, | | | December 31, | |
| | 2015 | | | 2014 | |
| | (Dollars in thousands) | |
Commercial loans | | | | | | | | |
Multifamily | | $ | 80,170 | | | $ | 60,546 | |
Nonresidential | | | 175,456 | | | | 121,595 | |
Land | | | 9,301 | | | | 9,484 | |
Construction | | | 38,812 | | | | 16,064 | |
Secured | | | 63,182 | | | | 45,088 | |
Unsecured | | | 2,831 | | | | 134 | |
Total commercial loans | | | 369,752 | | | | 252,911 | |
Residential mortgage loans | | | | | | | | |
One-to four-family | | | 733,685 | | | | 694,105 | |
Construction | | | 40,898 | | | | 37,113 | |
Total residential mortgage loans | | | 774,583 | | | | 731,218 | |
Consumer loans | | | | | | | | |
Home equity | | | 161,338 | | | | 154,776 | |
Auto | | | 11,348 | | | | 5,902 | |
Marine | | | 2,699 | | | | 3,917 | |
Recreational vehicle | | | 10,656 | | | | 14,054 | |
Other | | | 2,217 | | | | 2,105 | |
Total consumer loans | | | 188,258 | | | | 180,754 | |
Total loans | | | 1,332,593 | | | | 1,164,883 | |
Less: | | | | | | | | |
Allowance for loan losses | | | 17,712 | | | | 17,687 | |
Deferred loan fees, net | | | (1,311 | ) | | | (897 | ) |
Total | | | 16,401 | | | | 16,790 | |
Loans, net | | $ | 1,316,192 | | | $ | 1,148,093 | |
Loan commitments are agreements to lend to a customer as long as there is no violation of any condition established in the contract. Commitments generally have fixed expiration dates or other termination clauses, may require payment of a fee and may expire unused. Commitments to extend credit at fixed rates expose Home Savings to some degree of interest rate risk. Home Savings evaluates each customer’s creditworthiness on a case-by-case basis. The type or amount of collateral obtained varies and is based on management’s credit evaluation of the potential borrower. Home Savings normally has a number of outstanding commitments to extend credit.
| | December 31, | |
| | 2015 | | | 2014 | |
| | Fixed Rate | | | Variable Rate | | | Fixed Rate | | | Variable Rate | |
| | (Dollars in thousands) | |
Commitments to make loans | | $ | 44,957 | | | $ | 33,384 | | | $ | 44,192 | | | $ | 17,539 | |
Undisbursed loans in process | | | 674 | | | | 111,738 | | | | 480 | | | | 86,736 | |
Unused lines of credit | | | 10,162 | | | | 115,812 | | | | 13,995 | | | | 93,802 | |
Terms of the commitments in both years extend up to six months, but are generally less than two months. The fixed rate loan commitments have interest rates ranging from 2.75% to 18.00%; and maturities ranging from three months to thirty years. Commitments to fund certain mortgage loans (interest rate locks) to be sold into the secondary market and forward commitments for the future delivery of mortgage loans to third party investors are considered derivatives. It is the Company’s practice to enter into forward commitments for the future delivery of residential mortgage loans when interest rate lock commitments are entered into in order to economically hedge the effect of changes in interest rates resulting from its commitments to fund the loans. These mortgage banking derivatives are not designated as hedge relationships.
59
At December 31, 2015 and 2014, there were $474,000 and $465,000 of outstanding standby letters of credit, respectively. These are issued to guarantee the performance of a customer to a third party. Standby letters of credit are generally contingent upon the failure of the customer to perform according to the terms of an underlying contract with the third party.
At December 31, 2015 and 2014, there were $46.1 million and $41.7 million in outstanding commitments to fund the OverdraftPrivilege™ Program at Home Savings. With OverdraftPrivilege™, Home Savings pays non-sufficient funds checks and fees on checking accounts up to a preapproved limit.
60
The following tables present the balance in the allowance for loan losses and the recorded investment in loans by portfolio segment and based on impairment method as of December 31, 2015 and December 31, 2014 and activity for the years ended December 31, 2015, 2014 and 2013.
| | Commercial Loans | | | Residential Loans | | | Consumer Loans | | | Total | |
| | (Dollars in thousands) | |
2015 | | | | | | | | | | | | | | | |
Beginning balance | | $ | 5,690 | | | $ | 8,517 | | | $ | 3,480 | | | $ | 17,687 | |
Provision | | | 2,922 | | | | (974 | ) | | | 187 | | | | 2,135 | |
Charge-offs | | | (1,268 | ) | | | (1,301 | ) | | | (1,257 | ) | | | (3,826 | ) |
Recoveries | | | 733 | | | | 388 | | | | 595 | | | | 1,716 | |
Ending balance | | $ | 8,077 | | | $ | 6,630 | | | $ | 3,005 | | | $ | 17,712 | |
Period-end amount allocated to: | | | | | | | | | | | | | | | | |
Loans individually evaluated for impairment | | $ | 568 | | | $ | 1,541 | | | $ | 707 | | | $ | 2,816 | |
Loans collectively evaluated for impairment | | | 7,509 | | | | 5,089 | | | | 2,298 | | | | 14,896 | |
Ending balance | | $ | 8,077 | | | $ | 6,630 | | | $ | 3,005 | | | $ | 17,712 | |
Period-end balances: | | | | | | | | | | | | | | | | |
Loans individually evaluated for impairment | | $ | 9,698 | | | $ | 19,348 | | | $ | 10,613 | | | $ | 39,659 | |
Loans collectively evaluated for impairment | | | 360,054 | | | | 755,235 | | | | 177,645 | | | | 1,292,934 | |
Ending balance | | $ | 369,752 | | | $ | 774,583 | | | $ | 188,258 | | | $ | 1,332,593 | |
| | | | | | | | | | | | | | | | |
| | Commercial Loans | | | Residential Loans | | | Consumer Loans | | | Total | |
| | (Dollars in thousands) | |
2014 | | | | | | | | | | | | | | | |
Beginning balance | | $ | 6,984 | | | $ | 9,830 | | | $ | 4,302 | | | $ | 21,116 | |
Provision | | | (649 | ) | | | (550 | ) | | | (72 | ) | | | (1,271 | ) |
Charge-offs | | | (1,656 | ) | | | (1,005 | ) | | | (1,578 | ) | | | (4,239 | ) |
Recoveries | | | 1,011 | | | | 242 | | | | 828 | | | | 2,081 | |
Ending balance | | $ | 5,690 | | | $ | 8,517 | | | $ | 3,480 | | | $ | 17,687 | |
Period-end amount allocated to: | | | | | | | | | | | | | | | | |
Loans individually evaluated for impairment | | $ | 717 | | | $ | 1,751 | | | $ | 842 | | | $ | 3,310 | |
Loans collectively evaluated for impairment | | | 4,973 | | | | 6,766 | | | | 2,638 | | | | 14,377 | |
Ending balance | | $ | 5,690 | | | $ | 8,517 | | | $ | 3,480 | | | $ | 17,687 | |
Period-end balances: | | | | | | | | | | | | | | | | |
Loans individually evaluated for impairment | | $ | 14,845 | | | $ | 19,209 | | | $ | 11,843 | | | $ | 45,897 | |
Loans collectively evaluated for impairment | | | 238,066 | | | | 712,009 | | | | 168,911 | | | | 1,118,986 | |
Ending balance | | $ | 252,911 | | | $ | 731,218 | | | $ | 180,754 | | | $ | 1,164,883 | |
| | | | | | | | | | | | | | | | |
| | Commercial Loans | | | Residential Loans | | | Consumer Loans | | | Total | |
| | (Dollars in thousands) | |
2013 | | | | | | | | | | | | | | | |
Beginning balance | | $ | 9,156 | | | $ | 7,515 | | | $ | 4,459 | | | $ | 21,130 | |
Provision | | | (491 | ) | | | 3,598 | | | | 1,009 | | | | 4,116 | |
Charge-offs | | | (5,208 | ) | | | (1,536 | ) | | | (1,883 | ) | | | (8,627 | ) |
Recoveries | | | 3,527 | | | | 253 | | | | 717 | | | | 4,497 | |
Ending balance | | $ | 6,984 | | | $ | 9,830 | | | $ | 4,302 | | | $ | 21,116 | |
The unpaid principal balance is the total amount of the loan that is due to Home Savings. The recorded investment includes the unpaid principal balance less any chargeoffs or partial chargeoffs applied to specific loans. The unpaid principal balance and the recorded investment both exclude accrued interest receivable and deferred loan costs, both of which are immaterial.
The allowance for loan losses is a valuation allowance for probable incurred credit losses. Loan losses are charged against the allowance when management believes the uncollectibility of a loan balance is confirmed. Subsequent recoveries, if any, are credited to
61
the allowance. Management estimates the allowance balance required based on an analysis using past loan loss experience, the nature and volume of the portfolio, information about specific borrower situations, estimated collateral values, general economic conditions in the market area and other factors. Allocations of the allowance may be made for specific loans, but the entire allowance is available for any loan that, in management’s judgment, should be charged-off.
Other loans not reviewed specifically by management are evaluated as a homogenous group of loans (generally single-family residential mortgage loans and all consumer credits except marine loans) using a loss factor applied to the outstanding loan balance to determine the level of reserve required. This loss factor consists of two components, a quantitative and a qualitative component. The quantitative component is based on a historical analysis of all charged-off loans, net of recoveries. In determining the qualitative factors, consideration is given to such attributes as lending policies, economic conditions, nature and volume of the portfolio, management, loan quality trend, loan review, collateral value, concentrations, economic cycles and other external factors. At December 31, 2014, the Company evaluated two years of net charge-off history and applied the information to the current period. This component was combined with the qualitative component to arrive at the loss factor, which is applied to the outstanding principal balance by type of credit and internal risk grade applied to specific risk pools, plus specific loss allocations and adjustments for current events and conditions. As of December 31, 2015, the Company evaluated 12 quarters of net charge-off history and applied this information to the current period. This component is combined with the qualitative component to arrive at the loss factor, which is applied to the average outstanding balance of homogenous loans and is no longer being applied by internal risk grade. This change in methodology, which was made in the first quarter of 2015, did not have a material effect on the calculation of the allowance for loan losses. The change in methodology was made in order to facilitate technological improvements in the calculation of the allowance for loan loss.
62
The following table presents loans individually evaluated for impairment by class of loans as of and for the year ended December 31, 2015:
Impaired Loans
(Dollars in thousands)
| | Unpaid Principal Balance | | | Recorded Investment | | | Allowance for Loan Losses Allocated | | | Average Recorded Investment | | | Interest Income Recognized | | | Cash Basis Income Recognized | |
With no specific allowance recorded | | | | | | | | | | | | | | | | | | | | | | | | |
Commercial loans | | | | | | | | | | | | | | | | | | | | | | | | |
Multifamily | | $ | 165 | | | $ | — | | | $ | — | | | $ | 21 | | | $ | 4 | | | $ | 4 | |
Nonresidential | | | 1,215 | | | | 306 | | | | — | | | | 1,389 | | | | 6 | | | | 6 | |
Land | | | 3,922 | | | | 384 | | | | — | | | | 474 | | | | — | | | | — | |
Construction | | | 3,593 | | | | — | | | | — | | | | 69 | | | | — | | | | — | |
Secured | | | 3,884 | | | | 3,700 | | | | — | | | | 3,700 | | | | — | | | | — | |
Unsecured | | | 1,132 | | | | — | | | | — | | | | — | | | | — | | | | — | |
Total commercial loans | | | 13,911 | | | | 4,390 | | | | — | | | | 5,653 | | | | 10 | | | | 10 | |
Residential mortgage loans | | | | | | | | | | | | | | | | | | | | | | | | |
One-to four-family | | | 7,607 | | | | 5,866 | | | | — | | | | 4,710 | | | | 156 | | | | 149 | |
Construction | | | — | | | | — | | | | — | | | | — | | | | — | | | | — | |
Total residential mortgage loans | | | 7,607 | | | | 5,866 | | | | — | | | | 4,710 | | | | 156 | | | | 149 | |
Consumer loans | | | | | | | | | | | | | | | | | | | | | | | | |
Home equity | | | 2,245 | | | | 1,718 | | | | — | | | | 1,491 | | | | 31 | | | | 29 | |
Auto | | | 20 | | | | 14 | | | | — | | | | 22 | | | | — | | | | — | |
Marine | | | 496 | | | | 271 | | | | — | | | | 280 | | | | 2 | | | | 2 | |
Recreational vehicle | | | 121 | | | | 78 | | | | — | | | | 70 | | | | 4 | | | | 4 | |
Other | | | 3 | | | | 3 | | | | — | | | | 1 | | | | — | | | | — | |
Total consumer loans | | | 2,885 | | | | 2,084 | | | | — | | | | 1,864 | | | | 37 | | | | 35 | |
Total | | $ | 24,403 | | | $ | 12,340 | | | $ | — | | | $ | 12,227 | | | $ | 203 | | | $ | 194 | |
With a specific allowance recorded | | | | | | | | | | | | | | | | | | | | | | | | |
Commercial loans | | | | | | | | | | | | | | | | | | | | | | | | |
Multifamily | | $ | — | | | $ | — | | | $ | — | | | $ | 21 | | | $ | — | | | $ | — | |
Nonresidential | | | 5,164 | | | | 4,984 | | | | 565 | | | | 5,659 | | | | 119 | | | | 117 | |
Land | | | — | | | | — | | | | — | | | | — | | | | — | | | | — | |
Construction | | | — | | | | — | | | | — | | | | 379 | | | | — | | | | — | |
Secured | | | 324 | | | | 324 | | | | 3 | | | | 324 | | | | — | | | | — | |
Unsecured | | | — | | | | — | | | | — | | | | — | | | | — | | | | — | |
Total commercial loans | | | 5,488 | | | | 5,308 | | | | 568 | | | | 6,383 | | | | 119 | | | | 117 | |
Residential mortgage loans | | | | | | | | | | | | | | | | | | | | | | | | |
One-to four-family | | | 13,482 | | | | 13,482 | | | | 1,541 | | | | 14,324 | | | | 592 | | | | 539 | |
Construction | | | — | | | | — | | | | — | | | | — | | | | — | | | | — | |
Total residential mortgage loans | | | 13,482 | | | | 13,482 | | | | 1,541 | | | | 14,324 | | | | 592 | | | | 539 | |
Consumer loans | | | | | | | | | | | | | | | | | | | | | | | | |
Home equity | | | 7,236 | | | | 7,236 | | | | 522 | | | | 8,346 | | | | 402 | | | | 381 | |
Auto | | | — | | | | — | | | | — | | | | 2 | | | | — | | | | — | |
Marine | | | 163 | | | | 163 | | | | 3 | | | | 41 | | | | 7 | | | | 7 | |
Recreational vehicle | | | 1,122 | | | | 1,122 | | | | 181 | | | | 783 | | | | 33 | | | | 33 | |
Other | | | 8 | | | | 8 | | | | 1 | | | | 2 | | | | 1 | | | | 1 | |
Total consumer loans | | | 8,529 | | | | 8,529 | | | | 707 | | | | 9,174 | | | | 443 | | | | 422 | |
Total | | | 27,499 | | | | 27,319 | | | | 2,816 | | | | 29,881 | | | | 1,154 | | | | 1,078 | |
Total impaired loans | | $ | 51,902 | | | $ | 39,659 | | | $ | 2,816 | | | $ | 42,108 | | | $ | 1,357 | | | $ | 1,272 | |
63
The following table presents loans individually evaluated for impairment by class of loans as of and for the year ended December 31, 2014:
Impaired Loans
(Dollars in thousands)
| | Unpaid Principal Balance | | | Recorded Investment | | | Allowance for Loan Losses Allocated | | | Average Recorded Investment | | | Interest Income Recognized | | | Cash Basis Income Recognized | |
With no specific allowance recorded | | | | | | | | | | | | | | | | | | | | | | | | |
Commercial loans | | | | | | | | | | | | | | | | | | | | | | | | |
Multifamily | | $ | 185 | | | $ | 85 | | | $ | — | | | $ | 87 | | | $ | — | | | $ | — | |
Nonresidential | | | 7,201 | | | | 5,582 | | | | — | | | | 4,248 | | | | 260 | | | | 256 | |
Land | | | 3,958 | | | | 532 | | | | — | | | | 521 | | | | — | | | | — | |
Construction | | | 1,126 | | | | 188 | | | | — | | | | 552 | | | | — | | | | — | |
Secured | | | 3,903 | | | | 3,702 | | | | — | | | | 3,706 | | | | — | | | | — | |
Unsecured | | | 3,258 | | | | — | | | | — | | | | — | | | | — | | | | — | |
Total commercial loans | | | 19,631 | | | | 10,089 | | | | — | | | | 9,114 | | | | 260 | | | | 256 | |
Residential mortgage loans | | | | | | | | | | | | | | | | | | | | | | | | |
One-to four-family | | | 6,015 | | | | 4,518 | | | | — | | | | 5,287 | | | | 83 | | | | 77 | |
Construction | | | — | | | | — | | | | — | | | | — | | | | — | | | | — | |
Total residential mortgage loans | | | 6,015 | | | | 4,518 | | | | — | | | | 5,287 | | | | 83 | | | | 77 | |
Consumer loans | | | | | | | | | | | | | | | | | | | | | | | | |
Home equity | | | 1,901 | | | | 1,262 | | | | — | | | | 1,757 | | | | 29 | | | | 29 | |
Auto | | | 47 | | | | 37 | | | | — | | | | 66 | | | | 1 | | | | 1 | |
Marine | | | 151 | | | | 151 | | | | | | | | 155 | | | | — | | | | — | |
Recreational vehicle | | | 124 | | | | 81 | | | | — | | | | 181 | | | | 4 | | | | 3 | |
Other | | | — | | | | — | | | | — | | | | 3 | | | | — | | | | — | |
Total consumer loans | | | 2,223 | | | | 1,531 | | | | — | | | | 2,162 | | | | 34 | | | | 33 | |
Total | | $ | 27,869 | | | $ | 16,138 | | | $ | — | | | $ | 16,563 | | | $ | 377 | | | $ | 366 | |
With a specific allowance recorded | | | | | | | | | | | | | | | | | | | | | | | | |
Commercial loans | | | | | | | | | | | | | | | | | | | | | | | | |
Multifamily | | $ | 33 | | | $ | 8 | | | $ | 6 | | | $ | 293 | | | $ | — | | | $ | — | |
Nonresidential | | | 3,944 | | | | 3,561 | | | | 615 | | | | 2,408 | | | | — | | | | — | |
Land | | | — | | | | — | | | | — | | | | — | | | | — | | | | — | |
Construction | | | 2,815 | | | | 863 | | | | 93 | | | | 1,682 | | | | — | | | | — | |
Secured | | | 324 | | | | 324 | | | | 3 | | | | 324 | | | | — | | | | — | |
Unsecured | | | — | | | | — | | | | — | | | | — | | | | — | | | | — | |
Total commercial loans | | | 7,116 | | | | 4,756 | | | | 717 | | | | 4,707 | | | | — | | | | — | |
Residential mortgage loans | | | | | | | | | | | | | | | | | | | | | | | | |
One-to four-family | | | 14,691 | | | | 14,691 | | | | 1,751 | | | | 15,039 | | | | 607 | | | | 561 | |
Construction | | | — | | | | — | | | | — | | | | — | | | | — | | | | — | |
Total residential mortgage loans | | | 14,691 | | | | 14,691 | | | | 1,751 | | | | 15,039 | | | | 607 | | | | 561 | |
Consumer loans | | | | | | | | | | | | | | | | | | | | | | | | |
Home equity | | | 9,577 | | | | 9,577 | | | | 722 | | | | 10,007 | | | | 494 | | | | 470 | |
Auto | | | 7 | | | | 6 | | | | 1 | | | | 8 | | | | — | | | | — | |
Marine | | | — | | | | — | | | | — | | | | — | | | | — | | | | — | |
Recreational vehicle | | | 729 | | | | 729 | | | | 119 | | | | 765 | | | | 24 | | | | 23 | |
Other | | | — | | | | — | | | | — | | | | — | | | | — | | | | — | |
Total consumer loans | | | 10,313 | | | | 10,312 | | | | 842 | | | | 10,780 | | | | 518 | | | | 493 | |
Total | | | 32,120 | | | | 29,759 | | | | 3,310 | | | | 30,526 | | | | 1,125 | | | | 1,054 | |
Total impaired loans | | $ | 59,989 | | | $ | 45,897 | | | $ | 3,310 | | | $ | 47,089 | | | $ | 1,502 | | | $ | 1,420 | |
64
The following table presents loans individually evaluated for impairment by class of loans as of and for the year ended December 31, 2013:
Impaired Loans
(Dollars in thousands)
| | Average Recorded Investment | | | Interest Income Recognized | | | Cash Basis Income Recognized | |
With no specific allowance recorded | | | | | | | | | | | | |
Commercial loans | | | | | | | | | | | | |
Multifamily | | $ | 638 | | | $ | 2 | | | $ | 2 | |
Nonresidential | | | 5,377 | | | | 19 | | | | 19 | |
Land | | | 1,290 | | | | — | | | | — | |
Construction | | | 1,381 | | | | — | | | | — | |
Secured | | | 3,506 | | | | — | | | | — | |
Unsecured | | | 179 | | | | 1 | | | | 1 | |
Total commercial loans | | | 12,371 | | | | 22 | | | | 22 | |
Residential mortgage loans | | | | | | | | | | | | |
One-to four-family | | | 14,679 | | | | 393 | | | | 361 | |
Construction | | | — | | | | — | | | | — | |
Total residential mortgage loans | | | 14,679 | | | | 393 | | | | 361 | |
Consumer loans | | | | | | | | | | | | |
Home equity | | | 8,404 | | | | 245 | | | | 234 | |
Auto | | | 45 | | | | 1 | | | | 1 | |
Marine | | | 174 | | | | — | | | | — | |
Recreational vehicle | | | 685 | | | | 23 | | | | 22 | |
Other | | | 2 | | | | — | | | | — | |
Total consumer loans | | | 9,310 | | | | 269 | | | | 257 | |
Total | | $ | 36,360 | | | $ | 684 | | | $ | 640 | |
With a specific allowance recorded | | | | | | | | | | | | |
Commercial loans | | | | | | | | | | | | |
Multifamily | | $ | 330 | | | $ | — | | | $ | — | |
Nonresidential | | | 3,835 | | | | — | | | | — | |
Land | | | 532 | | | | — | | | | — | |
Construction | | | 2,559 | | | | — | | | | — | |
Secured | | | 102 | | | | — | | | | — | |
Unsecured | | | — | | | | — | | | | — | |
Total commercial loans | | | 7,358 | | | | — | | | | — | |
Residential mortgage loans | | | | | | | | | | | | |
One-to four-family | | | 4,077 | | | | 369 | | | | 342 | |
Construction | | | — | | | | — | | | | — | |
Total residential mortgage loans | | | 4,077 | | | | 369 | | | | 342 | |
Consumer loans | | | | | | | | | | | | |
Home equity | | | 2,369 | | | | 320 | | | | 303 | |
Auto | | | — | | | | — | | | | — | |
Marine | | | — | | | | — | | | | — | |
Recreational vehicle | | | 346 | | | | 16 | | | | 16 | |
Other | | | — | | | | — | | | | — | |
Total consumer loans | | | 2,715 | | | | 336 | | | | 319 | |
Total | | | 14,150 | | | | 705 | | | | 661 | |
Total impaired loans | | $ | 50,510 | | | $ | 1,389 | | | $ | 1,301 | |
65
Within secured and nonresidential impaired loans, there are two related credits with a total principal balance outstanding of $7.0 million. The source of repayment for the loan resides in funds held in escrow by a court that has administered foreclosure and receivership proceedings surrounding the loan. The loan has been subject to protracted litigation and a reserve of $546,000 was placed on one of the loans in 2015.
Home Savings reclassifies a collateralized mortgage loan and consumer loans secured by real estate to real estate owned and other repossessed assets once it has either obtained legal title to the real estate collateral or the borrower voluntarily conveys all interest in the real property to the Bank to satisfy the loan through a deed in lieu of foreclosure or similar legal agreement. The table below presents loans that are in the process of foreclosure at December 31, 2015 and December 31, 2014, but legal title, deed in lieu of foreclosure or similar legal agreement to the property has not yet been obtained:
| | December 31, 2015 | | | December 31, 2014 | |
| | Unpaid Principal Balance | | | Recorded Investment | | | Unpaid Principal Balance | | | Recorded Investment | |
Mortgage loans in the process of foreclosure | | $ | 1,294 | | | $ | 1,162 | | | $ | 1,714 | | | $ | 1,661 | |
Consumer loans in the process of foreclosure | | | 845 | | | | 643 | | | | 707 | | | | 489 | |
The following tables present the recorded investment in nonaccrual and loans past due over 90 days and still on accrual by class of loans as of December 31, 2015:
Nonaccrual Loans and Loans Past Due Over 90 Days and Still Accruing
As of December 31, 2015
| | Nonaccrual | | | Loans past due over 90 days and still accruing | |
| | (Dollars in thousands) | |
Commercial loans | | | | | | | | |
Multifamily | | $ | — | | | $ | — | |
Nonresidential | | | 3,599 | | | | — | |
Land | | | 384 | | | | — | |
Construction | | | — | | | | — | |
Secured | | | 4,016 | | | | — | |
Unsecured | | | — | | | | — | |
Total commercial loans | | | 7,999 | | | | — | |
Residential mortgage loans | | | | | | | | |
One-to four-family | | | 6,181 | | | | — | |
Construction | | | — | | | | — | |
Total residential mortgage loans | | | 6,181 | | | | — | |
Consumer Loans | | | | | | | | |
Home equity | | | 1,804 | | | | — | |
Auto | | | 23 | | | | — | |
Marine | | | 218 | | | | — | |
Recreational vehicle | | | 511 | | | | — | |
Other | | | 11 | | | | — | |
Total consumer loans | | | 2,567 | | | | — | |
Total nonaccrual loans and loans past due over 90 days and still accruing | | $ | 16,747 | | | $ | — | |
66
The following tables present the recorded investment in nonaccrual and loans past due over 90 days and still on accrual by class of loans as of December 31, 2014:
Nonaccrual Loans and Loans Past Due Over 90 Days and Still Accruing
As of December 31, 2014
| | Nonaccrual | | | Loans past due over 90 days and still accruing | |
| | (Dollars in thousands) | |
Commercial loans | | | | | | | | |
Multifamily | | $ | 93 | | | $ | — | |
Nonresidential | | | 5,781 | | | | — | |
Land | | | 531 | | | | — | |
Construction | | | 1,051 | | | | — | |
Secured | | | 4,016 | | | | — | |
Unsecured | | | — | | | | — | |
Total commercial loans | | | 11,472 | | | | — | |
Residential mortgage loans | | | | | | | | |
One-to four-family | | | 6,816 | | | | — | |
Construction | | | — | | | | — | |
Total residential mortgage loans | | | 6,816 | | | | — | |
Consumer Loans | | | | | | | | |
Home equity | | | 1,792 | | | | — | |
Auto | | | 66 | | | | — | |
Marine | | | 119 | | | | — | |
Recreational vehicle | | | 184 | | | | — | |
Other | | | 2 | | | | — | |
Total consumer loans | | | 2,163 | | | | — | |
Total nonaccrual loans and loans past due over 90 days and still accruing | | $ | 20,451 | | | $ | — | |
67
The following tables present an age analysis of past-due loans, segregated by class of loans as of December 31, 2015:
Past Due Loans
(Dollars in thousands)
| | 30-59 Days Past Due | | | 60-89 Days Past Due | | | Greater than 90 Days Past Due | | | Total Past Due | | | Current Loans | | | Total Loans | |
Commercial loans | | | | | | | | | | | | | | | | | | | | | | | | |
Multifamily | | $ | — | | | $ | — | | | $ | — | | | $ | — | | | $ | 80,170 | | | $ | 80,170 | |
Nonresidential | | | — | | | | — | | | | 3,558 | | | | 3,558 | | | | 171,898 | | | | 175,456 | |
Land | | | — | | | | — | | | | 384 | | | | 384 | | | | 8,917 | | | | 9,301 | |
Construction | | | — | | | | — | | | | — | | | | — | | | | 38,812 | | | | 38,812 | |
Secured | | | 488 | | | | — | | | | 4,016 | | | | 4,504 | | | | 58,678 | | | | 63,182 | |
Unsecured | | | | | | | — | | | | — | | | | — | | | | 2,831 | | | | 2,831 | |
Total commercial loans | | | 488 | | | | — | | | | 7,958 | | | | 8,446 | | | | 361,306 | | | | 369,752 | |
Residential mortgage loans | | | | | | | | | | | | | | | | | | | | | | | | |
One-to four-family | | | 3,843 | | | | 635 | | | | 5,901 | | | | 10,379 | | | | 723,306 | | | | 733,685 | |
Construction | | | — | | | | — | | | | — | | | | — | | | | 40,898 | | | | 40,898 | |
Total residential mortgage loans | | | 3,843 | | | | 635 | | | | 5,901 | | | | 10,379 | | | | 764,204 | | | | 774,583 | |
Consumer Loans: | | | | | | | | | | | | | | | | | | | | | | | | |
Home equity | | | 961 | | | | 268 | | | | 1,788 | | | | 3,017 | | | | 158,321 | | | | 161,338 | |
Automobile | | | 5 | | | | — | | | | 10 | | | | 15 | | | | 11,333 | | | | 11,348 | |
Marine | | | — | | | | 51 | | | | 117 | | | | 168 | | | | 2,531 | | | | 2,699 | |
Recreational vehicle | | | 71 | | | | — | | | | 494 | | | | 565 | | | | 10,091 | | | | 10,656 | |
Other | | | 15 | | | | 1 | | | | 11 | | | | 27 | | | | 2,190 | | | | 2,217 | |
Total consumer loans | | | 1,052 | | | | 320 | | | | 2,420 | | | | 3,792 | | | | 184,466 | | | | 188,258 | |
Total loans | | $ | 5,383 | | | $ | 955 | | | $ | 16,279 | | | $ | 22,617 | | | $ | 1,309,976 | | | $ | 1,332,593 | |
68
The following tables present an age analysis of past-due loans, segregated by class of loans as of December 31, 2014:
Past Due Loans
(Dollars in thousands)
| | 30-59 Days Past Due | | | 60-89 Days Past Due | | | Greater than 90 Days Past Due | | | Total Past Due | | | Current Loans | | | Total Loans | |
Commercial loans | | | | | | | | | | | | | | | | | | | | | | | | |
Multifamily | | $ | — | | | $ | — | | | $ | 93 | | | $ | 93 | | | $ | 60,453 | | | $ | 60,546 | |
Nonresidential | | | — | | | | — | | | | 3,891 | | | | 3,891 | | | | 117,704 | | | | 121,595 | |
Land | | | — | | | | — | | | | 531 | | | | 531 | | | | 8,953 | | | | 9,484 | |
Construction | | | — | | | | — | | | | 1,051 | | | | 1,051 | | | | 15,013 | | | | 16,064 | |
Secured | | | — | | | | — | | | | 4,016 | | | | 4,016 | | | | 41,072 | | | | 45,088 | |
Unsecured | | | — | | | | — | | | | — | | | | — | | | | 134 | | | | 134 | |
Total commercial loans | | | — | | | | — | | | | 9,582 | | | | 9,582 | | | | 243,329 | | | | 252,911 | |
Residential mortgage loans | | | | | | | | | | | | | | | | | | | | | | | | |
One-to four-family | | | 2,279 | | | | 605 | | | | 4,856 | | | | 7,740 | | | | 686,365 | | | | 694,105 | |
Construction | | | — | | | | — | | | | — | | | | — | | | | 37,113 | | | | 37,113 | |
Total residential mortgage loans | | | 2,279 | | | | 605 | | | | 4,856 | | | | 7,740 | | | | 723,478 | | | | 731,218 | |
Consumer Loans: | | | | | | | | | | | | | | | | | | | | | | | | |
Home equity | | | 588 | | | | 183 | | | | 1,531 | | | | 2,302 | | | | 152,474 | | | | 154,776 | |
Automobile | | | 21 | | | | — | | | | 30 | | | | 51 | | | | 5,851 | | | | 5,902 | |
Marine | | | — | | | | 686 | | | | — | | | | 686 | | | | 3,231 | | | | 3,917 | |
Recreational vehicle | | | 452 | | | | 109 | | | | 18 | | | | 579 | | | | 13,475 | | | | 14,054 | |
Other | | | 3 | | | | 4 | | | | 1 | | | | 8 | | | | 2,097 | | | | 2,105 | |
Total consumer loans | | | 1,064 | | | | 982 | | | | 1,580 | | | | 3,626 | | | | 177,128 | | | | 180,754 | |
Total loans | | $ | 3,343 | | | $ | 1,587 | | | $ | 16,018 | | | $ | 20,948 | | | $ | 1,143,935 | | | $ | 1,164,883 | |
69
The following table presents loans by class modified as TDRs that occurred during the year ended December 31, 2015:
| | Number of Loans | | | Pre-Modification Outstanding Recorded Investment | | | Post-Modification Recorded Investment | |
| | | | | | (In thousands) | |
Commercial loans | | | | | | | | | | | | |
Multifamily | | | — | | | $ | — | | | $ | — | |
Nonresidential | | | — | | | | — | | | | — | |
Land | | | — | | | | — | | | | — | |
Construction | | | — | | | | — | | | | — | |
Secured | | | — | | | | — | | | | — | |
Unsecured | | | — | | | | — | | | | — | |
Total commercial loans | | | — | | | | — | | | | — | |
Residential mortgage loans | | | | | | | | | | | | |
One-to four-family | | | 14 | | | | 1,283 | | | | 1,337 | |
Construction | | | — | | | | — | | | | — | |
Total residential mortgage loans | | | 14 | | | | 1,283 | | | | 1,337 | |
Consumer loans | | | | | | | | | | | | |
Home equity | | | 14 | | | | 844 | | | | 845 | |
Auto | | | — | | | | — | | | | — | |
Marine | | | — | | | | — | | | | — | |
Recreational vehicle | | | — | | | | — | | | | — | |
Other | | | 1 | | | | 28 | | | | 8 | |
Total consumer loans | | | 15 | | | | 872 | | | | 853 | |
Total restructured loans | | | 29 | | | $ | 2,155 | | | $ | 2,190 | |
The TDRs described above increased the allowance for loan losses by $135,000, and resulted in no charge-offs during the twelve months ended December 31, 2015.
70
The following table presents loans by class modified as TDRs that occurred during the year ended December 31, 2014:
| | Number of Loans | | | Pre-Modification Outstanding Recorded Investment | | | Post-Modification Recorded Investment | |
| | | | | | (Dollars in thousands) | |
Commercial loans | | | | | | | | | | | | |
Multifamily | | | — | | | $ | — | | | $ | — | |
Nonresidential | | | 1 | | | | 120 | | | | 120 | |
Land | | | — | | | | — | | | | — | |
Construction | | | — | | | | — | | | | — | |
Secured | | | — | | | | — | | | | — | |
Unsecured | | | — | | | | — | | | | — | |
Total commercial loans | | | 1 | | | | 120 | | | | 120 | |
Residential mortgage loans | | | | | | | | | | | | |
One-to four-family | | | 29 | | | | 2,385 | | | | 2,447 | |
Construction | | | — | | | | — | | | | — | |
Total residential mortgage loans | | | 29 | | | | 2,385 | | | | 2,447 | |
Consumer loans | | | | | | | | | | | | |
Home equity | | | 27 | | | | 1,449 | | | | 1,452 | |
Auto | | | — | | | | — | | | | — | |
Marine | | | — | | | | — | | | | — | |
Recreational vehicle | | | — | | | | — | | | | — | |
Other | | | — | | | | — | | | | — | |
Total consumer loans | | | 27 | | | | 1,449 | | | | 1,452 | |
Total restructured loans | | | 57 | | | $ | 3,954 | | | $ | 4,019 | |
The TDRs described above increased the allowance for loan losses by $193,000, and resulted in $73,000 of charge-offs during the twelve months ended December 31, 2014.
71
The following table presents loans by class modified as TDRs that occurred during the year ended December 31, 2013:
| | Number of Loans | | | Pre-Modification Outstanding Recorded Investment | | | Post-Modification Recorded Investment | |
| | | | | | (Dollars in thousands) | |
Commercial loans | | | | | | | | | | | | |
Multifamily | | | 1 | | | $ | 469 | | | $ | 469 | |
Nonresidential | | | 1 | | | | 41 | | | | 41 | |
Land | | | 2 | | | | 2,127 | | | | 487 | |
Construction | | | 1 | | | | 942 | | | | 823 | |
Secured | | | — | | | | — | | | | — | |
Unsecured | | | — | | | | — | | | | — | |
Total commercial loans | | | 5 | | | | 3,579 | | | | 1,820 | |
Residential mortgage loans | | | | | | | | | | | | |
One-to four-family | | | 42 | | | | 3,568 | | | | 3,381 | |
Construction | | | — | | | | — | | | | — | |
Total residential mortgage loans | | | 42 | | | | 3,568 | | | | 3,381 | |
Consumer loans | | | | | | | | | | | | |
Home equity | | | 110 | | | | 4,556 | | | | 4,487 | |
Auto | | | — | | | | — | | | | — | |
Marine | | | — | | | | — | | | | — | |
Recreational vehicle | | | 4 | | | | 791 | | | | 804 | |
Other | | | — | | | | — | | | | — | |
Total consumer loans | | | 114 | | | | 5,347 | | | | 5,291 | |
Total restructured loans | | | 161 | | | $ | 12,494 | | | $ | 10,492 | |
The TDRs described above increased the allowance for loan losses by $951,000, and resulted in $1.8 million charge-offs during the twelve months ended December 31, 2013.
During the period ended December 31, 2015, the terms of certain loans were modified as TDRs. The modification of the terms of such loans included one or a combination of the following: a reduction of the stated interest rate of the loan; an extension of the maturity date at a stated rate of interest lower than the current market rate for new debt with similar risk; or a permanent reduction of the recorded investment in the loan. Modifications involving a reduction of the stated interest rate of a loan were for periods ranging from six months to 2 years. Modifications involving an extension of the maturity date were for periods ranging from six months to ten years.
As of December 31, 2015 and December 31, 2014, the Company has a recorded investment in troubled debt restructurings of $26.3 million and $31.2 million, respectively. The Company has allocated $2.3 million of specific reserves to customers whose loan terms were modified in TDRs as of December 31, 2015. The Company had allocated $2.6 million of specific reserves to customers whose loan terms were modified in troubled debt restructurings as of December 31, 2014. The Company committed to lend additional amounts totaling up to $42,000 and $50,000 at December 31 2015 and December 31, 2014, respectively.
TDR loans that were on nonaccrual status aggregated $2.9 million and $3.5 million at December 31, 2015 and December 31, 2014, respectively. Such loans are considered nonperforming loans. TDR loans that were accruing according to their terms aggregated $23.4 million and $27.7 million at December 31, 2015 and December 31, 2014, respectively.
72
The following table presents loans by class modified as TDRs for which there was a payment default within twelve months following the modification during the period ended December 31, 2015:
| | Number of loans | | | Recorded Investment | |
| | | | | | (Dollars in thousands) | |
Commercial loans | | | | | | | | |
Multifamily | | | — | | | $ | — | |
Nonresidential | | | — | | | | — | |
Land | | | — | | | | — | |
Construction | | | — | | | | — | |
Secured | | | — | | | | — | |
Unsecured | | | — | | | | — | |
Total commercial loans | | | — | | | | — | |
Residential mortgage loans | | | | | | | | |
One-to four-family | | | 2 | | | | 29 | |
Construction | | | — | | | | — | |
Total residential mortgage loans | | | 2 | | | | 29 | |
Consumer loans | | | | | | | | |
Home equity | | | 1 | | | | 40 | |
Auto | | | — | | | | — | |
Marine | | | — | | | | — | |
Recreational vehicle | | | — | | | | — | |
Other | | | 1 | | | | 8 | |
Total consumer loans | | | 2 | | | | 48 | |
Total restructured loans | | | 4 | | | $ | 77 | |
A TDR is considered to be in payment default once it is 30 days contractually past due under the modified terms.
The TDRs that subsequently defaulted described above resulted in no charge-offs during the twelve months ended December 31, 2015, and had no effect on the provision for loan losses.
The terms of certain other loans were modified during the period ended December 31, 2015, but they did not meet the definition of a TDR. The modification of these loans involved either a modification of the terms of a loan to borrowers who were not experiencing financial difficulties or a delay in a payment that was considered to be insignificant.
73
The following table presents loans by class modified as TDRs for which there was a payment default within twelve months following the modification during the period ended December 31, 2014:
| | Number of loans | | | Recorded Investment | |
| | | | | | (Dollars in thousands) | |
Commercial loans | | | | | | | | |
Multifamily | | | — | | | $ | — | |
Nonresidential | | | — | | | | — | |
Land | | | — | | | | — | |
Construction | | | — | | | | — | |
Secured | | | — | | | | — | |
Unsecured | | | — | | | | — | |
Total commercial loans | | | — | | | | — | |
Residential mortgage loans | | | | | | | | |
One-to four-family | | | 3 | | | | 440 | |
Construction | | | — | | | | — | |
Total residential mortgage loans | | | 3 | | | | 440 | |
Consumer loans | | | | | | | | |
Home equity | | | 2 | | | | 90 | |
Auto | | | — | | | | — | |
Marine | | | — | | | | — | |
Recreational vehicle | | | — | | | | — | |
Other | | | — | | | | — | |
Total consumer loans | | | 2 | | | | 90 | |
Total restructured loans | | | 5 | | | $ | 530 | |
The TDRs that subsequently defaulted described above resulted in no charge-offs during the twelve months ended December 31, 2014, and had no effect on the provision for loan losses
The terms of certain other loans were modified during the period ended December 31, 2014, but they did not meet the definition of a TDR. The modification of these loans involved either a modification of the terms of a loan to borrowers who were not experiencing financial difficulties or a delay in a payment that was considered to be insignificant.
74
The following table presents loans by class modified as TDRs for which there was a payment default within twelve months following the modification during the period ended December 31, 2013:
| | Number of loans | | | Recorded Investment | |
| | | | | | (Dollars in thousands) | |
Commercial loans | | | | | | | | |
Multifamily | | | 1 | | | $ | 463 | |
Nonresidential | | | — | | | | — | |
Land | | | 2 | | | | 487 | |
Construction | | | 1 | | | | 623 | |
Secured | | | — | | | | — | |
Unsecured | | | — | | | | — | |
Total commercial loans | | | 4 | | | | 1,573 | |
Residential mortgage loans | | | | | | | | |
One-to four-family | | | 4 | | | | 576 | |
Construction | | | — | | | | — | |
Total residential mortgage loans | | | 4 | | | | 576 | |
Consumer loans | | | | | | | | |
Home equity | | | 6 | | | | 207 | |
Auto | | | — | | | | — | |
Marine | | | — | | | | — | |
Recreational vehicle | | | 2 | | | | 184 | |
Other | | | — | | | | — | |
Total consumer loans | | | 8 | | | | 391 | |
Total restructured loans | | | 16 | | | $ | 2,540 | |
The TDRs that subsequently defaulted described above resulted in no charge-offs during the twelve months ended December 31, 2013, and had no effect on the provision for loan losses.
The terms of certain other loans were modified during the period ended December 31, 2013, but they did not meet the definition of a TDR. The modification of these loans involved either a modification of the terms of a loan to borrowers who were not experiencing financial difficulties or a delay in a payment that was considered to be insignificant.
In order to determine whether a borrower is experiencing financial difficulty an evaluation is performed of the probability that the borrower will be in payment default on any of its debt in the foreseeable future without the modification. This evaluation is performed in accordance with the Company’s internal underwriting policy.
Credit Quality Indicators:
The Company categorizes loans into risk categories based on relevant information about the ability of borrowers to service their debt such as current financial information, historical payment experience, credit documentation, public information and current economic trends among other factors. The Company analyzes loans individually by classifying the loans as to credit risk. This analysis includes homogeneous loans past due 90 cumulative days, and all non-homogeneous loans including commercial loans and commercial real estate loans. Smaller balance homogeneous loans are primarily monitored by payment status.
Asset quality ratings are divided into two groups: Pass (unclassified) and Classified. Within the unclassified group, loans that display potential weakness are risk rated as special mention. In addition, there are three classified risk ratings: substandard, doubtful and loss. These specific credit risk categories are defined as follows:
Special Mention. Loans classified as special mention have potential weakness that deserves management’s close attention. If left uncorrected, these potential weaknesses may result in deterioration of the repayment prospects for the loan or of the institution’s credit position at some future date. Loans may be housed in this category for no longer than 12 months during which time information is obtained to determine if the credit should be downgraded to the substandard category.
75
Substandard. Loans classified as substandard are inadequately protected by the current net worth and paying capacity of the obligor or of the collateral pledged, if any. Loans so classified have a well-defined weakness or weaknesses that jeopardize the liquidation of the debt. They are characterized by the distinct possibility that the institution will sustain some loss if the deficiencies are not corrected.
Doubtful. Loans classified as doubtful have all the weaknesses inherent in those classified as substandard, with the added characteristic that the weaknesses make collection or liquidation in full, on the basis of currently existing facts, conditions and values, highly questionable and improbable.
Loss. Loans classified as loss are considered uncollectible and of such little value, that continuance as assets is not warranted. Although there may be a chance of recovery on these assets, it is not practical or desirable to defer writing off the asset.
The Company monitors loans on a monthly basis to determine if they should be included in one of the categories listed above. All impaired non-homogeneous credits classified as Substandard, Doubtful or Loss are analyzed on an individual basis for a specific reserve requirement. This analysis is performed on each individual credit at least annually or more frequently if warranted.
76
As of December 31, 2015 and December 31, 2014, and based on the most recent analysis performed, the risk category of loans by class of loans is as follows:
December 31, 2015
(Dollars in thousands)
| | Unclassified | | | Classified | |
| | Unclassified | | | Special Mention | | | Substandard | | | Doubtful | | | Loss | | | Total Classified | | | Total Loans | |
Commercial Loans | | | | | | | | | | | | | | | | | | | | | | | | | | | | |
Multifamily | | $ | 75,535 | | | $ | 3,727 | | | $ | 908 | | | $ | — | | | $ | — | | | $ | 908 | | | $ | 80,170 | |
Nonresidential | | | 151,415 | | | | 4,121 | | | | 19,920 | | | | — | | | | — | | | | 19,920 | | | | 175,456 | �� |
Land | | | 8,917 | | | | — | | | | 384 | | | | — | | | | — | | | | 384 | | | | 9,301 | |
Construction | | | 38,812 | | | | — | | | | — | | | | — | | | | — | | | | — | | | | 38,812 | |
Secured | | | 53,801 | | | | 3,037 | | | | 6,344 | | | | — | | | | — | | | | 6,344 | | | | 63,182 | |
Unsecured | | | 2,728 | | | | — | | | | 103 | | | | — | | | | — | | | | 103 | | | | 2,831 | |
Total commercial loans | | | 331,208 | | | | 10,885 | | | | 27,659 | | | | — | | | | — | | | | 27,659 | | | | 369,752 | |
Residential mortgage loans | | | | | | | | | | | | | | | | | | | | | | | | | | | | |
One-to four-family | | | 726,922 | | | | 111 | | | | 6,652 | | | | — | | | | — | | | | 6,652 | | | | 733,685 | |
Construction | | | 40,898 | | | | — | | | | — | | | | — | | | | — | | | | — | | | | 40,898 | |
Total residential mortgage loans | | | 767,820 | | | | 111 | | | | 6,652 | | | | — | | | | — | | | | 6,652 | | | | 774,583 | |
Consumer Loans | | | | | | | | | | | | | | | | | | | | | | | | | | | | |
Home equity | | | 159,371 | | | | — | | | | 1,967 | | | | — | | | | — | | | | 1,967 | | | | 161,338 | |
Auto | | | 11,304 | | | | 2 | | | | 42 | | | | — | | | | — | | | | 42 | | | | 11,348 | |
Marine | | | 2,428 | | | | — | | | | 271 | | | | — | | | | — | | | | 271 | | | | 2,699 | |
Recreational vehicle | | | 10,157 | | | | — | | | | 499 | | | | — | | | | — | | | | 499 | | | | 10,656 | |
Other | | | 2,206 | | | | — | | | | 11 | | | | — | | | | — | | | | 11 | | | | 2,217 | |
Total consumer loans | | | 185,466 | | | | 2 | | | | 2,790 | | | | — | | | | — | | | | 2,790 | | | | 188,258 | |
Total loans | | $ | 1,284,494 | | | $ | 10,998 | | | $ | 37,101 | | | $ | — | | | $ | — | | | $ | 37,101 | | | $ | 1,332,593 | |
77
December 31, 2014
(Dollars in thousands)
| | Unclassified | | | Classified | |
| | Unclassified | | | Special Mention | | | Substandard | | | Doubtful | | | Loss | | | Total Classified | | | Total Loans | |
Commercial Loans | | | | | | | | | | | | | | | | | | | | | | | | | | | | |
Multifamily | | $ | 53,485 | | | $ | 4,134 | | | $ | 2,927 | | | $ | — | | | $ | — | | | $ | 2,927 | | | $ | 60,546 | |
Nonresidential | | | 92,074 | | | | 12,290 | | | | 17,231 | | | | — | | | | — | | | | 17,231 | | | | 121,595 | |
Land | | | 8,952 | | | | — | | | | 532 | | | | — | | | | — | | | | 532 | | | | 9,484 | |
Construction | | | 15,013 | | | | — | | | | 1,051 | | | | — | | | | — | | | | 1,051 | | | | 16,064 | |
Secured | | | 39,480 | | | | 900 | | | | 4,708 | | | | — | | | | — | | | | 4,708 | | | | 45,088 | |
Unsecured | | | 22 | | | | — | | | | 112 | | | | — | | | | — | | | | 112 | | | | 134 | |
Total commercial loans | | | 209,026 | | | | 17,324 | | | | 26,561 | | | | — | | | | — | | | | 26,561 | | | | 252,911 | |
Residential mortgage loans | | | | | | | | | | | | | | | | | | | | | | | | | | | | |
One-to four-family | | | 684,779 | | | | 939 | | | | 8,387 | | | | — | | | | — | | | | 8,387 | | | | 694,105 | |
Construction | | | 37,113 | | | | — | | | | — | | | | — | | | | — | | | | — | | | | 37,113 | |
Total residential mortgage loans | | | 721,892 | | | | 939 | | | | 8,387 | | | | — | | | | — | | | | 8,387 | | | | 731,218 | |
Consumer Loans | | | | | | | | | | | | | | | | | | | | | | | | | | | | |
Home equity | | | 152,599 | | | | — | | | | 2,177 | | | | — | | | | — | | | | 2,177 | | | | 154,776 | |
Auto | | | 5,829 | | | | 10 | | | | 63 | | | | — | | | | — | | | | 63 | | | | 5,902 | |
Marine | | | 3,766 | | | | — | | | | 151 | | | | — | | | | — | | | | 151 | | | | 3,917 | |
Recreational vehicle | | | 13,846 | | | | — | | | | 208 | | | | — | | | | — | | | | 208 | | | | 14,054 | |
Other | | | 2,099 | | | | — | | | | 6 | | | | — | | | | — | | | | 6 | | | | 2,105 | |
Total consumer loans | | | 178,139 | | | | 10 | | | | 2,605 | | | | — | | | | — | | | | 2,605 | | | | 180,754 | |
Total loans | | $ | 1,109,057 | | | $ | 18,273 | | | $ | 37,553 | | | $ | — | | | $ | — | | | $ | 37,553 | | | $ | 1,164,883 | |
Directors and officers of United Community and Home Savings are customers of Home Savings in the ordinary course of business. The following describes loans to officers and/or directors of United Community and Home Savings:
| | (Dollars in thousands) | |
Balance as of December 31, 2014 | | $ | 527 | |
New loans to officers and/or directors | | | — | |
Loan payments during 2015 | | | (8 | ) |
Reductions due to changes in officers and/or directors | | | — | |
Balance as of December 31, 2015 | | $ | 519 | |
6. | MORTGAGE BANKING ACTIVITIES |
Mortgage loans serviced for others, which are not reported in United Community’s assets, totaled $1.1 billion at December 31, 2015 and 2014. Mortgage banking income is comprised of gains recognized on the sale of loans and changes in fair value of mortgage banking derivatives.
Mortgage loans serviced for others are not reported as assets. The principal balance of these loans at year-end are as follows:
| | 2015 | | | 2014 | |
| | (Dollars in thousands) | |
Mortgage loan portfolios serviced for: | | | | | | | | |
FHLMC | | $ | 878,300 | | | $ | 821,609 | |
FNMA | | | 233,026 | | | | 259,463 | |
Customer escrow balances in connection with loans serviced for FHLMC and FNMA totaled $13.2 million and $12.5 million at year-end 2015 and 2014.
78
Activity for capitalized mortgage servicing rights, included in other assets, was as follows:
| | For the Year Ended December 31, | |
| | 2015 | | | 2014 | | | 2013 | |
| | (Dollars in thousands) | |
Balance, beginning of period | | $ | 5,535 | | | $ | 5,941 | | | $ | 6,186 | |
Originations | | | 1,951 | | | | 1,281 | | | | 1,898 | |
Amortized to expense | | | (1,800 | ) | | | (1,687 | ) | | | (2,143 | ) |
Balance, end of period | | | 5,686 | | | | 5,535 | | | | 5,941 | |
Less valuation allowance | | | (39 | ) | | | (58 | ) | | | — | |
Net balance | | $ | 5,647 | | | $ | 5,477 | | | $ | 5,941 | |
Fair value of mortgage servicing rights was $9.1 million, $9.0 million and $10.2 million at December 31, 2015, 2014, and 2013, respectively.
Activity in the valuation allowance for mortgage servicing rights was as follows:
| | For the Year Ended December 31, | |
| | 2015 | | | 2014 | | | 2013 | |
| | (Dollars in thousands) | |
Balance, beginning of period | | $ | (58 | ) | | $ | — | | | $ | (680 | ) |
Impairment charges | | | (299 | ) | | | (60 | ) | | | — | |
Recoveries | | | 318 | | | | 2 | | | | 680 | |
Balance, end of period | | $ | (39 | ) | | $ | (58 | ) | | $ | — | |
Key economic assumptions used in measuring the value of mortgage servicing rights at December 31, 2015 and 2014 were as follows:
| | 2015 | | | 2014 | |
Weighted average prepayment rate | | 192 PSA | | | 219 PSA | |
Weighted average life (in years) | | 3.47 | | | 3.61 | |
Weighted average discount rate | | | 9 | % | | | 8 | % |
At year-end 2015, the Company had approximately $28.5 million of interest rate lock commitments and $75.0 million of forward commitments for the future delivery of residential mortgage loans, including construction perm loans that are held in available for sale. At year-end 2014, the Company had approximately $22.7 million of interest rate lock commitments and $51.5 million of forward commitments for the future delivery of residential mortgage loans, including construction perm loans that are held in available for sale. The fair value of these mortgage banking derivatives was not material at year-end 2015 or 2014.
Home Savings may receive requests for reimbursements from Freddie Mac and Fannie Mae, both of whom in the normal course purchase loans originated by Home Savings, for the purpose of making them whole on certain loans sold in the secondary market. These sold loans may have certain identified weaknesses such that, in the opinion of management, a settlement to the investor might be required. For the twelve months ended December 31, 2015, Home Savings recognized a recovery of expenses of $554,000 associated with such repurchases. Home Savings had no liability reserve for future make-whole settlements at December 31, 2015 because management believed no reserve was necessary given the recent historical losses incurred to date, there were no loans in the pipeline to be repurchased and the probability that future losses will not occur. For the twelve months ended December 31, 2014, Home Savings recognized a recovery of expenses of $374,000 associated with such repurchases. Home Savings has included in other liabilities a reserve for future make-whole settlements aggregating $554,000 at December 31, 2014. For the twelve months ended December 31, 2013, Home Savings incurred expenses of $2.0 million associated with such repurchases as a reduction in reserves.
79
7. | OTHER REAL ESTATE OWNED AND OTHER REPOSSESSED ASSETS |
Real estate owned and other repossessed assets at December 31, 2015 and 2014 was as follows:
| | December 31, | | | December 31, | |
| | 2015 | | | 2014 | |
| | (Dollars in thousands) | |
Real estate owned and other repossessed assets | | $ | 3,956 | | | $ | 4,890 | |
Valuation allowance | | | (1,229 | ) | | | (1,423 | ) |
End of period | | $ | 2,727 | | | $ | 3,467 | |
Activity in the valuation allowance was as follows:
| | 2015 | | | 2014 | | | 2013 | |
| | (Dollars in thousands) | |
Beginning of year | | $ | 1,423 | | | $ | 4,059 | | | $ | 6,796 | |
Additions charged to expense | | | 287 | | | | 580 | | | | 2,014 | |
Direct write-downs | | | (481 | ) | | | (3,216 | ) | | | (4,751 | ) |
End of year | | $ | 1,229 | | | $ | 1,423 | | | $ | 4,059 | |
Expenses related to foreclosed and repossessed assets include:
| | 2015 | | | 2014 | | | 2013 | |
| | (Dollars in thousands) | |
Net loss on sales | | $ | 158 | | | $ | 220 | | | $ | 167 | |
Provision for unrealized losses | | | 287 | | | | 580 | | | | 2,014 | |
Operating expenses, net of rental income | | | 338 | | | | 631 | | | | 1,450 | |
Total Expenses | | $ | 783 | | | $ | 1,431 | | | $ | 3,631 | |
Premises and equipment consist of the following:
| | December 31, | |
| | 2015 | | | 2014 | |
| | (Dollars in thousands) | |
Land | | $ | 6,993 | | | $ | 7,054 | |
Buildings | | | 23,841 | | | | 23,487 | |
Leasehold improvements | | | 1,179 | | | | 1,126 | |
Furniture and equipment | | | 23,861 | | | | 22,931 | |
| | | 55,874 | | | | 54,598 | |
Less: Accumulated depreciation and amortization | | | 35,196 | | | | 33,596 | |
Total | | $ | 20,678 | | | $ | 21,002 | |
Depreciation expense was $2.1 million for 2015, $1.9 million for 2014 and $1.8 million for 2013.
Rent expense was $338,000 for 2015, $588,000 for 2014 and $672,000 for 2013. Rent commitments under noncancelable operating leases for offices were as follows, before considering renewal options that generally are present:
| | (Dollars in thousands) | |
2016 | | $ | 559 | |
2017 | | | 579 | |
2018 | | | 590 | |
2019 | | | 594 | |
2020 | | | 595 | |
Thereafter | | | 595 | |
Total | | $ | 3,512 | |
80
Acquired Intangible Assets
| | As of December 31, | |
| | 2015 | | | 2014 | |
| | Gross | | | | | | | Gross | | | | | |
| | Carrying | | | Accumulated | | | Carrying | | | Accumulated | |
| | Amount | | | Amortization | | | Amount | | | Amortization | |
Amortized intangible assets: | | | | | | | | | | | | | | | | |
Core deposit intangibles | | $ | 8,952 | | | $ | 8,922 | | | $ | 8,952 | | | $ | 8,868 | |
Total | | $ | 8,952 | | | $ | 8,922 | | | $ | 8,952 | | | $ | 8,868 | |
Estimated amortization expense for 2016 is $25,000, for 2017 is $3,000 and for 2018 is $2,000. Aggregate amortization expense for the years ended December 31, 2015, 2014 and 2013, was $54,000, $68,000, and $86,000, respectively.
Deposits consist of the following:
| | December 31, | |
| | 2015 | | | 2014 | |
| | (Dollars in thousands) | |
Checking accounts: | | | | | | | | |
Interest bearing | | $ | 160,264 | | | $ | 137,511 | |
Non-interest bearing | | | 227,505 | | | | 187,965 | |
Savings accounts | | | 280,889 | | | | 274,149 | |
Money market accounts | | | 312,125 | | | | 312,911 | |
Certificates of deposit | | | 454,960 | | | | 435,300 | |
Total deposits | | $ | 1,435,743 | | | $ | 1,347,836 | |
Included in total deposits above are related-party deposits of $2.8 million at December 31, 2015 and 2014.
Interest expense on deposits is summarized as follows:
| | December 31, | |
| | 2015 | | | 2014 | | | 2013 | |
| | (Dollars in thousands) | |
Interest bearing demand deposits and money market accounts | | $ | 1,006 | | | $ | 838 | | | $ | 1,016 | |
Savings accounts | | | 161 | | | | 169 | | | | 242 | |
Certificates of deposit | | | 5,359 | | | | 5,428 | | | | 6,365 | |
Total | | $ | 6,526 | | | $ | 6,435 | | | $ | 7,623 | |
A summary of certificates of deposit by maturity follows:
| | December 31, | |
| | 2015 | |
| | (Dollars in thousands) | |
2016 | | $ | 207,814 | |
2017 | | | 122,345 | |
2018 | | | 66,978 | |
2019 | | | 22,288 | |
2020 and thereafter | | | 35,535 | |
Total | | $ | 454,960 | |
81
A summary of certificates of deposit with balances greater than $250,000 by maturity is as follows:
| | December 31, | |
| | 2015 | | | 2014 | |
| | (Dollars in thousands) | |
Three months or less | | $ | 751 | | | $ | 558 | |
Over three months to six months | | | 2,067 | | | | 2,761 | |
Over six months to twelve months | | | 25,668 | | | | 1,691 | |
Over twelve months | | | 46,779 | | | | 11,716 | |
Total | | $ | 75,265 | | | $ | 16,726 | |
Home Savings had no brokered deposits at December 31, 2015 and 2014.
Home Savings offers an equity-linked time deposit product (the Power CD). The Power CD is a time deposit that provides the purchaser a guaranteed return of principal at maturity plus a potential equity return. Home Savings had $12.3 million in Power CDs that were included in certificates of deposit at December 31, 2015. Home Savings had $8.3 million in Power CDs that were included in certificates of deposit at December 31, 2014.
11. | FEDERAL HOME LOAN BANK ADVANCES |
The following is a summary of FHLB advances:
| | December 31, | |
| | 2015 | | | 2014 | |
| | (Dollars in thousands) | |
| | | | | | Weighted | | | | | | | Weighted | |
Year of maturity | | Amount | | | average rate | | | Amount | | | average rate | |
2015 | | $ | — | | | | 0.00 | % | | $ | 140,000 | | | | 0.14 | % |
2016 | | | 232,000 | | | | 0.35 | % | | | — | | | | 0.00 | % |
2019 | | | 46,975 | | | | 2.19 | % | | | 46,194 | | | | 2.05 | % |
| | $ | 278,975 | | | | 0.66 | % | | $ | 186,194 | | | | 0.51 | % |
At December 31, 2015, Home Savings has remaining available credit, subject to collateral requirements, with the FHLB of approximately $206.3 million. At December 31, 2014, Home Savings had remaining available credit, subject to collateral requirements, with the FHLB of approximately $257.2 million. All advances must be secured by eligible collateral as specified by the FHLB. Accordingly, Home Savings had a blanket pledge of its one-to four-family mortgages as collateral for the advances outstanding at December 31, 2015 and 2014. The required minimum ratio of collateral to advances is 122% for one-to four-family loans. Additional changes in value can be applied to one-to four-family mortgage collateral based upon characteristics such as loan-to-value ratios and FICO scores.
On November 18, 2014, Home Savings modified a $50.0 million fixed-rate term advance with the FHLB. The modification reduced the weighted average interest rate paid on the debt from 4.20% fixed-rate to a floating rate, and extended the weighted average maturity from 2.0 years to 5.0 years. A $3.9 million prepayment penalty was incurred by Home Savings as part of the modification which will be amortized using a level yield method over the five-year remaining term of the modified borrowing as a yield adjustment. The floating rate was 0.62% at December 31, 2015 and 0.49% at December 31, 2014. The effective rate on the modified borrowing was 2.19% at December 31, 2015 and 2.05% at December 31, 2014, including the impact of the prepayment penalty amortization. FHLB term advances are subject to prepayment penalties.
82
12. | SECURITIES SOLD UNDER AGREEMENT TO REPURCHASE AND OTHER BORROWINGS |
The following is a summary of securities sold under an agreement to repurchase and other borrowings:
| | December 31, | |
| | 2015 | | | 2014 | |
| | (Dollars in thousands) | |
| | Amount | | | Weighted average rate | | | Amount | | | Weighted average rate | |
Securities sold under agreement to repurchase-term | | $ | — | | | | — | % | | $ | 30,000 | | | | 4.14 | % |
Other borrowings | | | 535 | | | | 4.00 | % | | | 558 | | | | 4.00 | % |
Total repurchase agreements and other | | $ | 535 | | | | 4.00 | % | | $ | 30,558 | | | | 4.14 | % |
| | December 31, | |
| | 2015 | | | 2014 | | | 2013 | |
| | (Dollars in thousands) | |
Average daily balance during the year | | $ | 29,891 | | | $ | 82,102 | | | $ | 90,588 | |
Average interest rate during the year | | | 4.19 | % | | | 4.10 | % | | | 4.01 | % |
Maximum month end balance during the year | | $ | 30,556 | | | $ | 90,577 | | | $ | 90,597 | |
Weighted average interest rate at year end | | | 4.00 | % | | | 4.14 | % | | | 4.01 | % |
At the end of fourth quarter of 2015, Home Savings prepaid the remaining $30.0 million tranche of repurchase agreements and incurred a prepayment penalty of $1.3 million. During the third and fourth quarters of 2014, Home Savings prepaid $60.0 million in repurchase agreements and incurred penalties of $3.4 million.
Securities sold under agreements to repurchase are secured primarily by mortgage-backed securities with a fair value of $0 at December 31, 2015 and $54.7 million at December 31, 2014. Securities sold under agreements to repurchase are typically held by a brokerage firm in a wholesale transaction and by an independent third party when they are for retail customers. At maturity, the securities underlying the agreements are returned to Home Savings. Other borrowings consist of a match-funding advance related to a commercial participation loan aggregating $535,000 at December 31, 2015 and $558,000 at December 31, 2014.
United Community and Home Savings are parties to litigation arising in the normal course of business. While it is difficult to determine the ultimate resolution of these matters, management believes any resulting liability would not have a material effect upon United Community’s financial statements.
The income tax expense (benefit) consists of the following components:
| | For the Year Ended December 31, | |
| | 2015 | | | 2014 | | | 2013 | |
| | (Dollars in thousands) | |
Current | | $ | 577 | | | $ | 89 | | | $ | 200 | |
Deferred | | | 7,316 | | | | 2,978 | | | | 2,958 | |
Change in valuation allowance | | | — | | | | (42,802 | ) | | | (2,958 | ) |
Total | | $ | 7,893 | | | $ | (39,735 | ) | | $ | 200 | |
83
Effective tax rates differ from the statutory federal income tax rate of 35% due to the following:
| | For the Year Ended December 31, | |
| | 2015 | | | 2014 | | | 2013 | |
| | Dollars | | | Rate | | | Dollars | | | Rate | | | Dollars | | | Rate | |
| | (Dollars in thousands) | |
Tax (benefit) at statutory rate | | $ | 8,461 | | | | 35.0 | % | | $ | 3,665 | | | | 35.0 | % | | $ | 3,580 | | | | 35.0 | % |
Increase (decrease) due to: | | | | | | | | | | | | | | | | | | | | | | | | |
Tax exempt income | | | (45 | ) | | | (0.2 | )% | | | — | | | | — | % | | | — | | | | — | % |
Life insurance | | | (602 | ) | | | (2.5 | )% | | | (500 | ) | | | (4.8 | )% | | | (382 | ) | | | (3.7 | )% |
Other | | | 79 | | | | 0.3 | % | | | (98 | ) | | | (0.9 | )% | | | (40 | ) | | | (0.4 | )% |
Valuation allowance | | | — | | | | — | % | | | (42,802 | ) | | | (408.8 | )% | | | (2,958 | ) | | | (28.9 | )% |
Income tax provision (benefit) | | $ | 7,893 | | | | 32.6 | % | | $ | (39,735 | ) | | | (379.5 | )% | | $ | 200 | | | | 2.0 | % |
Significant components of the deferred tax assets and liabilities are as follows:
| | December 31, | |
| | 2015 | | | 2014 | |
| | (Dollars in thousands) | |
Deferred tax assets: | | | | | | | | |
Loan loss reserves | | $ | 6,199 | | | $ | 6,190 | |
Postretirement benefits | | | 564 | | | | 1,066 | |
Depreciation | | | 611 | | | | 625 | |
Other real estate owned valuation | | | 430 | | | | 498 | |
Tax credits carryforward | | | 951 | | | | 513 | |
Unrealized loss on securities available for sale | | | 1,341 | | | | 2,324 | |
Unrealized loss on securities held to maturity | | | 517 | | | | — | |
Interest on nonaccrual loans | | | 834 | | | | 943 | |
Net operating loss carryforward | | | 16,903 | | | | 24,027 | |
Purchase accounting adjustment | | | 90 | | | | 82 | |
Accrued bonuses | | | 723 | | | | 459 | |
Other | | | 50 | | | | 279 | |
Deferred tax assets | | | 29,213 | | | | 37,006 | |
Deferred tax liabilities: | | | | | | | | |
Deferred loan fees | | | 510 | | | | 321 | |
Federal Home Loan Bank stock dividends | | | 4,585 | | | | 4,585 | |
Mortgage servicing rights | | | 1,976 | | | | 1,917 | |
FHLB prepayment penalty | | | 1,059 | | | | 1,332 | |
Postretirement benefits accrual | | | 447 | | | | 493 | |
Prepaid expenses | | | 215 | | | | 201 | |
Deferred tax liabilities | | | 8,792 | | | | 8,849 | |
Net deferred tax asset | | $ | 20,421 | | | $ | 28,157 | |
Management had recorded a valuation allowance against the net deferred tax assets as of December 31, 2013 based on consideration of, but not limited to, its cumulative pre-tax losses from 2010 through 2012, the composition of recurring and non-recurring income from operations over the past several years and the magnitude of recent taxable income as compared to net operating loss carryforwards. At June 30, 2014, the Company had fully reversed $42.8 million of the valuation allowance on its net DTA. The realization of a DTA is assessed and a valuation allowance is recorded if it is “more likely than not” that all or a portion of the DTA will not be realized. “More likely than not” is defined as the DTA being more than 50% likely of being realized. All available evidence, both positive and negative is considered to determine whether, based on the weight of that evidence, a valuation allowance against the net DTA is required. In assessing the need for a valuation allowance, the Company considered all available evidence about the realization of the DTA both positive and negative, that could be objectively verified.
The Company’s ultimate realization of the DTA is dependent upon the generation of future taxable income during the periods in which temporary differences become deductible. Management considers the nature and amount of historical and projected future taxable income, the scheduled reversal of deferred tax assets and liabilities, and available tax planning strategies in making this assessment. The amount of deferred taxes recognized could be impacted by changes to any of these variables.
84
United Community’s net operating loss of $48.3 million will be carried forward to use against future taxable income. The net operating loss carryforwards begin to expire in the year ending December 31, 2030. In addition, United Community is carrying forward $951,000 of alternative minimum tax credits. The alternative minimum tax credits are carried forward indefinitely.
Retained earnings at December 31, 2015 included approximately $21.1 million for which no provision for federal income taxes has been made. This amount represents the tax bad debt reserve at December 31, 1987, which is the end of United Community’s base year for purposes of calculating the bad debt deduction for tax purposes. If this portion of retained earnings is used in the future for any purpose other than to absorb bad debts, the amount used will be added to future taxable income. The unrecorded deferred tax liability on the above amount at December 31, 2015 was approximately $7.3 million. At December 31, 2015, Home Savings had approximately $21.2 million deficit in tax earnings and profits. Any distribution from Home Savings to United Community, other than current period earnings, in excess of tax earnings and profits, including any distributions made by Home Savings in direct redemption of stock from United Community, could result in recapture of proportionate amounts of these bad debt reserves and, as a result, recording of the related tax liability.
As of December 31, 2015 and December 31, 2014, United Community had no unrecognized tax benefits or accrued interest and penalties recorded. United Community does not expect the total amount of unrecognized tax benefits to significantly increase within the next twelve months. United Community will record interest and penalties as a component of income tax expense.
United Community and Home Savings are subject to U.S. federal income tax. Home Savings is subject to tax in Ohio based upon its net worth. United Community and Home Savings also file state income tax returns in Pennsylvania, Indiana and Florida. United Community is no longer subject to examination by taxing authorities for years prior to 2012.
Dividends
United Community’s source of funds for dividends to its shareholders is earnings on its investments and dividends from Home Savings. During the year ended December 31, 2015, United Community paid total cash dividends of $0.07 per common share. While Home Savings’ primary regulator is the FDIC, the FRB has regulations that impose certain restrictions on payments of dividends to United Community as of December 31, 2015.
Home Savings must file an application with, and obtain approval from, the FRB if (i) the proposed distribution would cause total distributions for the calendar year to exceed net income for that year-to-date plus retained net income (as defined) for the preceding two years; (ii) Home Savings would not be at least adequately capitalized following the capital distribution; or (iii) the proposed distribution would violate a prohibition contained in any applicable statute, regulation or agreement between Home Savings and the FRB or the FDIC, or any condition imposed on Home Savings in an FRB-approved application or notice. If Home Savings is not required to file an application, it must file a notice of the proposed capital distribution with the FRB. As of December 31, 2015, Home Savings had no retained earnings that could be distributed based on cumulative dividends and net income over the aforementioned period. Home Savings paid a $15.0 million dividend to United Community during 2015.
Accumulated Other Comprehensive Income (Loss)
Accumulated other comprehensive income (loss) included in the consolidated statements of shareholders’ equity consists of unrealized gains and losses on available for sale securities, unrealized losses on securities transferred from available for sale to held to maturity, accretion of unrealized losses on securities transferred from available for sale to held to maturity, disproportional tax effects and changes in unrealized gains and losses on the postretirement plan. The change includes reclassification of net gains or (losses) on sales of securities of $142,000, $444,000 and $2.6 million for the years ended December 31, 2015, 2014 and 2013.
85
The following is a summary of accumulated other comprehensive income (loss) to net income balances:
| | Unrealized Gains (Losses) on Securities Available for Sale | | | Disproportionate Tax Effect from Securities Available for Sale | | | Unrealized Gains (Losses) on Held to Maturity | | | Unrealized Gains (Losses) from Postretirement Plan | | | Disproportionate Tax Effect from Postretirement Plan | | | Total | |
2015 | | (Dollars in thousands) | |
Balances at beginning of period, net of tax | | $ | (4,315 | ) | | $ | (17,110 | ) | | $ | — | | | $ | 916 | | | $ | 511 | | | $ | (19,998 | ) |
Transfer of losses from available for sale to held to maturity | | | 999 | | | | — | | | | (999 | ) | | | — | | | | — | | | | — | |
Other comprehensive income before reclassifications | | | 916 | | | | — | | | | — | | | | 120 | | | | — | | | | 1,036 | |
Accretion of unrealized losses transferred from available for sale to held to maturity recognized in other comprehensive income | | | — | | | | — | | | | 39 | | | | — | | | | — | | | | 39 | |
Reclassification adjustment for (gains) losses realized in income | | | (92 | ) | | | — | | | | — | | | | (205 | ) | | | — | | | | (297 | ) |
Net current period other comprehensive income | | | 1,823 | | | | — | | | | (960 | ) | | | (85 | ) | | | — | | | | 778 | |
Balances at end of period, net of tax | | $ | (2,492 | ) | | $ | (17,110 | ) | | $ | (960 | ) | | $ | 831 | | | $ | 511 | | | $ | (19,220 | ) |
| | Unrealized Gains (Losses) on Securities Available for Sale | | | Disproportionate Tax Effect from Securities Available for Sale | | | Unrealized Gains (Losses) from Postretirement Plan | | | Disproportionate Tax Effect from Postretirement Plan | | | Total | |
2014 | | (Dollars in thousands) | |
Balances at beginning of period | | $ | (40,393 | ) | | $ | (2,972 | ) | | $ | 1,829 | | | $ | (129 | ) | | $ | (41,665 | ) |
Income tax | | | 14,138 | | | | (14,138 | ) | | | (640 | ) | | | 640 | | | | — | |
Balances at beginning of period, net of tax | | | (26,255 | ) | | | (17,110 | ) | | | 1,189 | | | | 511 | | | | (41,665 | ) |
Other comprehensive income (loss) before reclassifications | | | 22,229 | | | | — | | | | (130 | ) | | | — | | | | 22,099 | |
Reclassification adjustment for (gains) losses realized in income | | | (289 | ) | | | — | | | | (143 | ) | | | — | | | | (432 | ) |
Net current period other comprehensive income | | | 21,940 | | | | — | | | | (273 | ) | | | — | | | | 21,667 | |
Balances at end of period, net of tax | | $ | (4,315 | ) | | $ | (17,110 | ) | | $ | 916 | | | $ | 511 | | | $ | (19,998 | ) |
| | | | | | | | | | | | | | | | | | | | |
| | Unrealized Gains (Losses) on Securities Available for Sale | | | Disproportionate Tax Effect from Securities Available for Sale | | | Unrealized Gains (Losses) from Postretirement Plan | | | Disproportionate Tax Effect from Postretirement Plan | | | Total | |
2013 | | (Dollars in thousands) | |
Balances at beginning of period | | $ | 8,053 | | | $ | (2,972 | ) | | $ | 1,730 | | | $ | (129 | ) | | $ | 6,682 | |
Other comprehensive income (loss) before reclassifications | | | (45,869 | ) | | | — | | | | 288 | | | | — | | | | (45,581 | ) |
Reclassification adjustment for (gains) losses realized in income | | | (2,577 | ) | | | — | | | | (189 | ) | | | — | | | | (2,766 | ) |
Net current period other comprehensive income | | | (48,446 | ) | | | — | | | | 99 | | | | — | | | | (48,347 | ) |
Balances at end of period | | $ | (40,393 | ) | | $ | (2,972 | ) | | $ | 1,829 | | | $ | (129 | ) | | $ | (41,665 | ) |
As of June 30, 2014, management concluded it was more likely than not that the Company’s net deferred tax asset (DTA) would be realized and accordingly determined a full deferred tax valuation allowance was no longer required. Upon reversal of the former full deferred tax valuation allowance as of June 30, 2014, certain disproportionate tax effects are retained in accumulated other comprehensive income (loss) totaling approximately a ($16.6) million loss. Almost the entire disproportionate tax effect is attributable
86
to valuation allowance expense recorded through other comprehensive income (loss) on the tax benefit of losses sustained on the available for sale securities portfolio while the Company was in a full deferred tax valuation allowance. This valuation allowance was appropriately reversed through continuing operations at June 30, 2014, leaving the original expense in accumulated other comprehensive income (loss), where it will remain in accordance with the Company’s election of the “portfolio approach”, until such time as the Company would cease to have an available for sale security portfolio.
The following is significant amounts reclassified out of each component of accumulated comprehensive income (loss) to net income for the year ended December 31, 2015:
| | Amount Reclassified | | | |
| | From Accumulated | | | |
Details About Accumulated Other | | Other Comprehensive | | | Affected Line Item on the Statement Where |
Comprehensive Income Components | | Income to Net Income | | | Net Income is Presented |
| (Dollars in thousands) | |
Realized net gains on the sale of available for sale securities | | $ | (142 | ) | | Net gains on securities available for sale |
| | | 50 | | | Tax expense (benefit) |
| | | (92 | ) | | Net of tax |
Amortization of postretirement benefits prior service costs | | | (315 | ) | | Reduction of salaries & employee benefits expense |
| | | 110 | | | Tax expense (benefit) |
| | | (205 | ) | | Net of tax |
Total reclassification during the period | | $ | (297 | ) | | Increase to net income |
The following is significant amounts reclassified out of each component of accumulated comprehensive income (loss) to net income for the year ended December 31, 2014:
| | Amount Reclassified | | | |
| | From Accumulated | | | |
Details About Accumulated Other | | Other Comprehensive | | | Affected Line Item on the Statement Where |
Comprehensive Income Components | | Income to Net Income | | | Net Income is Presented |
| (Dollars in thousands) | |
Realized net gains on the sale of available for sale securities | | $ | (444 | ) | | Net gains on securities available for sale |
| | | 155 | | | Tax expense (benefit) |
| | | (289 | ) | | Net of tax |
Amortization of postretirement benefits prior service costs | | | (220 | ) | | Reduction of salaries & employee benefits expense |
| | | 77 | | | Tax expense (benefit) |
| | | (143 | ) | | Net of tax |
Total reclassification during the period | | $ | (432 | ) | | Increase to net income |
87
The following is significant amounts reclassified out of each component of accumulated comprehensive income (loss) for the year ended December 31, 2013:
| | Amount Reclassified | | | |
| | From Accumulated | | | |
Details About Accumulated Other | | Other Comprehensive | | | Affected Line Item on the Statement Where |
Comprehensive Income Components | | Income to Net Income | | | Net Income is Presented |
| (Dollars in thousands) | |
Realized net gains on the sale of available for sale securities | | $ | (2,577 | ) | | Net gains on securities available for sale |
| | | — | | | Tax expense (benefit) |
| | | (2,577 | ) | | Net of tax |
Amortization of postretirement benefits prior service costs | | | (189 | ) | | Reduction of salaries & employee benefits expense |
| | | — | | | Tax expense (benefit) |
| | | (189 | ) | | Net of tax |
Total reclassification during the period | | $ | (2,766 | ) | | Increase to net income |
Liquidation Account
At the time of the Conversion, Home Savings established a liquidation account, totaling $141.4 million, which was equal to its regulatory capital as of the latest practicable date prior to the Conversion. In the event of a complete liquidation, each eligible depositor will be entitled to receive a distribution from the liquidation account in an amount proportionate to the current adjusted qualifying balances for the accounts then held.
16. | REGULATORY CAPITAL MATTERS |
Home Savings and United Community are subject to various regulatory capital requirements administered by the federal banking agencies. During the first quarter of 2015, Home Savings and United Community adopted the new Basel III regulatory capital framework as approved by the federal banking agencies. Failure to meet minimum capital requirements can initiate certain mandatory and possible additional discretionary actions by regulators that, if undertaken, could have a direct material effect on Home Savings and United Community. The regulations require Home Savings to meet specific capital adequacy guidelines in keeping with the regulatory framework for prompt corrective action that involve quantitative measures of Home Savings’ assets, liabilities, and certain off balance sheet items as calculated under regulatory accounting practices. Home Savings’ capital classification is also subject to qualitative judgments by the regulators about components of capital, risk weightings, and other factors.
The Basel III Capital Rules establish a new common equity Tier 1 minimum capital requirement (4.5% of risk-weighted assets), increases the minimum Tier 1 capital to risk-based assets requirement (from 4% to 6% of risk-weighted assets) and assigns a higher risk weight (150%) to exposures that are more than 90 days past due or are on nonaccrual status and to certain commercial real estate facilities that finance the acquisition, development or construction of real property. The final rules also required unrealized gains and losses on certain available-for-sale securities holdings to be included for purposes of calculating regulatory capital requirements unless a one-time opt-out is exercised. In connection with the adoption of the Basel III Capital Rules, United Community and Home Savings elected to opt-out of the requirement to include most components of accumulated other comprehensive income in Common Equity Tier 1. The rule limits a banking organization’s capital distributions and certain discretionary bonus payments if the banking organization does not hold a “capital conservation buffer” consisting of 2.5% of common equity Tier 1 capital risk-based weighted assets in addition to the amount necessary to meeting its minimum risk-based capital requirements.
The capital conservation buffer requirement will be phased in beginning January 1, 2016 and ending January 1, 2019, when the full capital conservation buffer requirement will be effective. The final rule also implemented consolidated capital requirements, which became effective January 1, 2015.
88
Quantitative measures established by regulation for capital adequacy require Home Savings to maintain minimum ratios of Tier 1 (or Core) capital (as defined in the regulations) to average total assets (as defined) and of total risk-based capital (as defined) to risk-weighted assets (as defined). United Community and Home Savings’ Common Equity Tier 1 capital consists of common stock and related paid-in capital, net of treasury stock, and retained earnings. Common Equity Tier 1 for both United Community and Home Savings is reduced by intangible assets, net of associated deferred tax liabilities and subject to transition provisions. Actual and regulatory required capital ratios for Home Savings, along with the dollar amount of capital implied by such ratios, are presented below.
| | December 31, 2015 | |
| | | | | | | | | | | | | | | | | | To Be Well Capitalized | |
| | | | | | | | | | Minimum Capital | | | Under Prompt | |
| | | | | | | | | | Requirements For Capital | | | Corrective Action | |
| | Actual | | | Adequacy Purposes | | | Provisions | |
| | Amount | | | Ratio | | | Amount | | | Ratio | | | Amount | | | Ratio | |
| | (Dollars in thousands) | |
Total capital (to risk-weighted assets) | | $ | 240,697 | | | | 18.72 | % | | $ | 102,879 | | | | 8.00 | % | | $ | 128,599 | | | | 10.00 | % |
Tier 1 capital (to risk-weighted assets) | | | 224,486 | | | | 17.46 | % | | | 77,159 | | | | 6.00 | % | | | 102,879 | | | | 8.00 | % |
Common equity Tier 1 capital (to risk-weighted assets) | | | 224,486 | | | | 17.46 | % | | | 57,869 | | | | 4.50 | % | | | 83,589 | | | | 6.50 | % |
Tier 1 capital (to average assets)** | | | 224,486 | | | | 11.46 | % | | | 78,347 | | | | 4.00 | % | | | 97,934 | | | | 5.00 | % |
**Tier 1 Leverage Capital Ratio
| | December 31, 2014 | |
| | | | | | | | | | | | | | | | | | To Be Well Capitalized | |
| | | | | | | | | | Minimum Capital | | | Under Prompt | |
| | | | | | | | | | Requirements For Capital | | | Corrective Action | |
| | Actual | | | Adequacy Purposes | | | Provisions | |
| | Amount | | | Ratio | | | Amount | | | Ratio | | | Amount | | | Ratio | |
| | (Dollars in thousands) | |
Total risk-based capital to risk-weighted assets | | $ | 233,974 | | | | 21.13 | % | | $ | 88,602 | | | | 8.00 | % | | $ | 110,752 | | | | 10.00 | % |
Tier 1 capital to risk-weighted assets | | | 220,080 | | | | 19.87 | % | | * | | | * | | | | 66,451 | | | | 6.00 | % |
Tier 1 capital to average total assets** | | | 220,080 | | | | 12.11 | % | | | 72,674 | | | | 4.00 | % | | | 90,843 | | | | 5.00 | % |
* Ratio was not required under regulations existing at that time
**Tier 1 Leverage Capital Ratio
The components of Home Savings’ regulatory capital are as follows:
| | December 31, 2015 | | | December 31, 2014 | |
| | (Dollars in thousands) | |
Total shareholders' equity | | $ | 220,872 | | | $ | 217,372 | |
Add (deduct) | | | | | | | | |
Accumulated other comprehensive income | | | 19,236 | | | | 20,015 | |
Intangible assets | | | (12 | ) | | | (84 | ) |
Disallowed deferred tax assets | | | (15,610 | ) | | | (17,223 | ) |
Disallowed capitalized mortgage loan servicing rights | | — | | | — | |
Tier 1 Capital | | | 224,486 | | | | 220,080 | |
Allowance for loan losses and allowance for unfunded lending commitments limited to 1.25% of total risk-weighted assets | | | 16,211 | | | | 13,894 | |
Total risk-based capital | | $ | 240,697 | | | $ | 233,974 | |
89
Actual and regulatory required consolidated capital ratios for United Community, along with the dollar amount of capital implied by such ratios, are presented below.
| | December 31, 2015 | |
| | | | | | | | | | | | | | | | | | To Be Well Capitalized | |
| | | | | | | | | | Minimum Capital | | | Under Prompt | |
| | | | | | | | | | Requirements For Capital | | | Corrective Action | |
| | Actual | | | Adequacy Purposes | | | Provisions | |
| | Amount | | | Ratio | | | Amount | | | Ratio | | | Amount | | | Ratio | |
| | (Dollars in thousands) | |
Total capital (to risk-weighted assets) | | $ | 261,732 | | | | 20.35 | % | | $ | 102,886 | | | | 8.00 | % | | $ | 128,608 | | | | 10.00 | % |
Tier 1 capital (to risk-weighted assets) | | | 245,503 | | | | 19.09 | % | | | 77,165 | | | | 6.00 | % | | | 102,886 | | | | 8.00 | % |
Common equity Tier 1 capital (to risk-weighted assets) | | | 245,503 | | | | 19.09 | % | | | 57,874 | | | | 4.50 | % | | | 83,595 | | | | 6.50 | % |
Tier 1 capital (to average assets)** | | | 245,503 | | | | 12.53 | % | | | 78,348 | | | | 4.00 | % | | | 97,934 | | | | 5.00 | % |
The components of United Community’s consolidated regulatory capital are as follows:
| | December 31, 2015 | |
| | (Dollars in thousands) | |
Total shareholders' equity | | $ | 244,245 | |
Add (deduct) | | | | |
Accumulated other comprehensive income | | | 19,220 | |
Intangible assets | | | (12 | ) |
Disallowed deferred tax assets | | | (17,950 | ) |
Disallowed capitalized mortgage loan servicing rights | | | — | |
Tier 1 Capital | | | 245,503 | |
Allowance for loan losses and allowance for unfunded lending commitments limited to 1.25% of total risk-weighted assets | | | 16,229 | |
Total risk-based capital | | $ | 261,732 | |
United Community was not subject required regulatory capital ratios prior to January 1, 2015.
Management believes that as of December 31, 2015 and 2014, Home Savings meets all capital adequacy requirements to which they were subject. As of December 31, 2015 and 2014, Home Savings was considered well capitalized.
90
Postretirement Benefit Plans
In addition to Home Savings’ retirement plans, Home Savings sponsors a defined benefit health care plan that was curtailed in 2000 to provide postretirement medical benefits only for these employees who worked 20 years and attained a minimum age of 60 by September 1, 2000, while in service with Home Savings. That plan was curtailed again in 2015, and medical benefits will no longer be provided to plan participants as of December 31, 2016. The curtailment resulted in a gain of $1.1 million to be recognized in salaries and employee benefits. The plan is unfunded and, as such, has no assets. Furthermore, the plan is contributory and contains minor cost-sharing features such as deductibles and coinsurance. In addition, postretirement life insurance coverage is provided for employees who were participants prior to December 10, 1976. The life insurance plan is non-contributory. Home Savings’ policy is to pay premiums monthly, with no pre-funding. The life insurance portion of the plan will continue. The benefit obligation measurement date is December 31. Information about changes in obligations of the benefit plan follows:
| | For the Year Ended December 31, | |
| | 2015 | | | 2014 | |
| | (Dollars in thousands) | |
Change in Benefit Obligation: | | | | | | | | |
Benefit obligation at beginning of year | | $ | 1,636 | | | $ | 1,490 | |
Service cost | | | — | | | | — | |
Net periodic benefit cost (benefit) | | | (261 | ) | | | (163 | ) |
Actuarial gain | | | 131 | | | | 420 | |
Benefits paid | | | (101 | ) | | | (111 | ) |
Curtailment gain | | | (1,072 | ) | | | — | |
Benefit obligation at end of the year | | | 333 | | | | 1,636 | |
Funded status of the plan | | $ | (333 | ) | | $ | (1,636 | ) |
Amounts recognized in accumulated other comprehensive income, at December 31, 2015 and 2014 consists of the following:
| | For the Year Ended December 31, | |
| | 2015 | | | 2014 | |
| | (Dollars in thousands) | |
Prior service credit | | $ | 228 | | | $ | 456 | |
Net actuarial gains | | | 1,050 | | | | 952 | |
| | $ | 1,278 | | | $ | 1,408 | |
The accumulated benefit obligation was $333,000 and $1.6 million at year-end 2015 and 2014, respectively.
Components of net periodic benefit cost/(benefit) are as follows:
| | For the Year Ended December 31, | |
| | 2015 | | | 2014 | | | 2013 | |
| | (Dollars in thousands) | |
Service cost | | $ | — | | | $ | — | | | $ | — | |
Interest cost | | | 53 | | | | 56 | | | | 53 | |
Expected return on plan assets | | | — | | | | — | | | | — | |
Net amortization of prior service cost (benefit) | | | (228 | ) | | | (77 | ) | | | (77 | ) |
Amortization of net actuarial gain | | | (86 | ) | | | (142 | ) | | | (112 | ) |
Curtailment gain | | | (1,072 | ) | | | — | | | | — | |
Net periodic benefit cost | | | (1,333 | ) | | | (163 | ) | | | (136 | ) |
Net (gain) loss | | | (184 | ) | | | 200 | | | | (288 | ) |
Prior service credit | | | — | | | | — | | | | — | |
Amortization of prior service cost and net actuarial gain | | | 315 | | | | 220 | | | | 189 | |
Total recognized in other comprehensive income | | | 131 | | | | 420 | | | | (99 | ) |
Total recognized in net periodic benefit cost and other comprehensive income | | $ | (1,202 | ) | | $ | 257 | | | $ | (235 | ) |
Assumptions used in the valuations were as follows: | | | | | | | | | | | | |
Weighted average discount rate | | | 3.90 | % | | | 3.40 | % | | | 3.95 | % |
91
The estimated net gain and prior service costs for the postretirement plan that will be amortized from accumulated other comprehensive income into net periodic benefit cost over the next fiscal year are $895,000 and $228,000, respectively.
No weighted-average annual assumed rate of increase in the per capita cost of coverage benefits (i.e., health care cost trend rate) was included in the projected benefit obligation because retiree medical benefits are only going to be provided through 2016.
United Community anticipates benefits payable over the next ten years as follows:
| | (Dollars in thousands) | |
2016 | | $ | 119 | |
2017 | | | 18 | |
2018 | | | 18 | |
2019 | | | 17 | |
2020 | | | 17 | |
2021-2025 | | | 77 | |
Total | | $ | 266 | |
401(k) Savings Plan
Home Savings sponsors a defined contribution 401(k) savings plan, which covers substantially all employees. Under the provisions of the plan, Home Savings’ matching contribution is discretionary and may be changed from year to year. For 2015, Home Savings’ match was 50% of pretax contributions up to a maximum of 6%. For 2014 and 2013, Home Savings’ match was 25% of pre-tax contributions, up to a maximum of 6% of the employees’ base pay. Participants become 100% vested in Home Savings contributions upon completion of three years of service. For the years ended 2015, 2014 and 2013, the expense related to this plan was approximately $465,000, $224,000 and $204,000, respectively.
Stock-based Compensation: Stock Options
On April 30, 2015, shareholders approved the United Community Financial Corp. 2015 Long Term Incentive Compensation Plan (the 2015 Plan). The purpose of the 2015 Plan is to provide a means through which United Community may attract and retain employees and non-employee directors, to provide incentives that align their interest with those of United Community’s shareholders and promote the success of United Community’s business. All employees and non-employee directors are eligible to participate in the 2015 Plan. The 2015 Plan provides for the issuance of up to 1,200,000 shares that are to be used for awards of stock options, stock awards, stock units, stock appreciation rights, annual bonus awards and long-term incentive awards.
On April 26, 2007, shareholders approved the United Community Financial Corp. 2007 Long-Term Incentive Plan (as amended, the 2007 Plan). The purpose of the 2007 Plan was to promote and advance the interests of United Community and its shareholders by enabling United Community to attract, retain and reward directors, directors emeritus, managerial and other key employees of United Community, including Home Savings, by facilitating their purchase of an ownership interest in United Community. The 2007 Plan was terminated on April 30, 2015 upon the adoption of the 2015 Plan, although the 2007 Plan survives so long as awards issued under the 2007 Plan remain outstanding and exercisable. The 2007 Plan provided for the issuance of up to 2,000,000 shares that were to be used for awards of restricted stock, stock options, performance awards, stock appreciation rights (SARs), or other forms of stock-based incentive awards.
On July 12, 1999, shareholders approved the United Community Financial Corp. 1999 Long-Term Incentive Plan (as amended, the 1999 Plan). The purpose of the 1999 Plan was the same as the 2007 Plan. The 1999 Plan terminated on May 20, 2009, although the 1999 Plan survives so long as options issued under the 1999 Plan remain outstanding and exercisable.
The 1999 Plan provided for the grant of either incentive or nonqualified stock options. Options were awarded at exercise prices that were not less than the fair market value of the share at the grant date. The maximum number of common shares that could be issued under the 1999 Plan was 3,569,766. Because the 1999 Plan terminated, no additional options may be issued under it. All of the options awarded became exercisable on the date of grant except that options granted in 2009 became exercisable over three years beginning on December 31, 2009. All options expire 10 years from the date of grant.
There were 6,618 stock options granted in 2015 and there were 7,124 stock options granted in 2014. The options must be exercised within 10 years from the date of grant. Expenses related to stock option grants are included with salaries and employee
92
benefits. The Company recognized $24,000, $25,000 and $24,000, in stock option expenses for the twelve months ended December 31, 2015, 2014 and 2013, respectively. The Company expects to recognize additional expense of $8,000 in 2016 and $1,000 in 2017.
A summary of activity in the plans is as follows:
| | For the Year Ended December 31, | |
| | 2015 | |
| | Shares | | | Weighted average exercise price | | | Aggregate intrinsic value (Dollars in thousands) | |
Outstanding at beginning of year | | | 579,905 | | | $ | 2.52 | | | | | |
Granted | | | 6,618 | | | | 5.42 | | | | | |
Exercised | | | (14,200 | ) | | | 1.99 | | | | | |
Forfeited | | | — | | | | — | | | | | |
Outstanding at end of period | | | 572,323 | | | | 2.56 | | | $ | 1,907 | |
Options exercisable at end of period | | | 558,581 | | | | 2.51 | | | | 1,893 | |
Information related to the stock options granted and exercised during each year follows:
| | 2015 | | | 2014 | | | 2013 | |
Intrinsic value of options exercised | | $ | 48,000 | | | $ | 147,000 | | | $ | 305,000 | |
Cash received from option exercises | | | 28,000 | | | | 172,000 | | | | 155,000 | |
Tax benefit realized from option exercises | | | — | | | | — | | | | — | |
Weighted average fair value of options granted | | | 1.70 | | | | 1.73 | | | | 2.44 | |
As of December 31, 2015, there was approximately $9,000 of total unrecognized compensation cost related to nonvested stock options granted under the 2007 Plan. The cost is expected to be recognized over a weighted-average period of 1.5 years.
The fair value of options granted in 2015, 2014 and 2013 were determined using the following weighted-average assumptions as of the grant date:
| | 2015 | | | 2014 | | | 2013 | |
Risk-free interest rate | | | 1.49 | % | | | 1.74 | % | | | 0.99 | % |
Expected term (years) | | | 5 | | | | 5 | | | | 5 | |
Expected stock volatility | | | 35.95 | % | | | 85.75 | % | | | 85.75 | % |
Dividend yield | | | 0.74 | % | | | 0.80 | % | | | — | % |
Outstanding stock options have a weighted average remaining life of 4.05 years and may be exercised in the range of $1.20 to $5.89.
Stock-based Compensation: Restricted Stock Awards
The 2015 and 2007 Plans permit the issuance of restricted stock awards to employees and nonemployee directors. Nonvested shares at December 31, 2015 aggregated 260,490, of which, 114,708 will vest in 2016, 84,359 will vest in 2017 and 61,423 will vest in 2018. Expenses related to restricted stock awards are charged to salaries and employee benefits and are recognized over the vesting period of the awards based on the market value of the shares at the grant date. The Company recognized approximately $756,000, $482,000 and $328,000 in restricted stock award expenses for the twelve months ended December 31, 2015, 2014 and 2013, respectively. The Company expects to recognize additional expenses of approximately $601,000 in 2016, $288,000 in 2017, and $122,000 in 2018.
93
A summary of changes in the Company’s nonvested restricted shares for the year is as follows:
| | Shares | | | Weighted average exercise price | |
Nonvested shares at January 1, 2015 | | | 223,624 | | | $ | 3.88 | |
Granted | | | 162,711 | | | | 5.33 | |
Vested | | | (117,754 | ) | | | 4.03 | |
Forfeited | | | (8,091 | ) | | | 4.87 | |
Nonvested shares at December 31, 2015 | | | 260,490 | | | | 4.68 | |
Executive Incentive Plan
The Executive Incentive Plan (“EIP”) provides incentive compensation awards to certain officers of the Company. Executive incentive awards are generally based upon the actual performance of the Company for the twelve months ending December 31, compared to the actual performance of a peer group during the same twelve month period. The target incentive awards for each year are measured as a percentage of the base salary of participating officers. Once the awards under the EIP are calculated, they are paid 80% in cash and 20% in restricted stock. The restricted stock will be granted and vest equally over three years, beginning on the first anniversary of the date the restricted stock is issued. The Company incurred $269,000, $286,000 and $98,000 in expense for the restricted stock portion of the EIP and $804,000, 640,000 and $350,000 for the cash portion of the EIP for the twelve months ended December 31, 2015, 2014 and 2013, respectively. Restricted stock expenses for the EIP are included in the total restricted stock expenses discussed above. The total average per share fair value of shares vested during the years ended December 31, 2015, 2014 and 2013 was $5.48, $4.73 and $3.74, respectively.
Long-term Incentive Plan
The Long-term Incentive Plan (“LTIP”) provides a long-term incentive compensation opportunity to certain executive officers, whose participation and target award opportunities will be approved by the Compensation Committee of the Board of Directors. Each participant in the LTIP will be granted a target number of Performance Share Units (“PSUs”). Target PSUs will be determined as a percentage of base salary and translated into share units based on the Company’s average stock price at the appropriate measurement date. The performance period for the annual grant for a given year will be from January 1, year 1 through December 31, year 3. The Company incurred $199,000 and $179,000 in expense for the LTIP for the twelve months ended December 31, 2015 and 2014, respectively. The Company incurred no expense for the LTIP in 2013 because it was not adopted until 2014.
Fair value is the exchange price that would be received for an asset if paid to transfer a liability (exit price) in the principal or most advantageous market for the asset or liability in an orderly transaction between market participants on the measurement date. There are three levels of inputs that may be used to measure fair value:
Level 1: Quoted prices (unadjusted) for identical assets or liabilities in active markets that the entity has the ability to access as of the measurement date.
Level 2: Significant other observable inputs other than Level 1 prices, such as quoted prices for similar assets or liabilities; quoted prices in markets that are not active; or other inputs that are observable or can be corroborated by observable market data.
Level 3: Significant unobservable inputs that reflect a reporting entity’s own beliefs about the assumptions that market participants would use in pricing an asset or liability.
United Community uses the following methods and significant assumptions to estimate the fair value of each type of financial instrument:
Available for sale securities: The fair values of securities available for sale are determined by obtaining quoted prices on nationally recognized securities exchanges (Level 1 inputs). For securities where quoted prices are not available, fair values are calculated based on market prices of similar securities (Level 2), using matrix pricing. Matrix pricing is a mathematical technique commonly used to price debt securities that are not actively traded, values debt securities without relying on the securities’ relationship to other benchmark quoted securities (Level 2 inputs).
94
Impaired loans: At the time a loan is considered impaired, it is valued at the lower of cost or fair value. Impaired loans carried at fair value generally receive specific allocations of the allowance for loan losses. For collateral dependent loans, fair value is commonly based on recent real estate appraisals. These appraisals may utilize a single valuation approach or a combination of approaches including comparable sales and the income approach. Adjustments are routinely made in the appraisal process by the independent appraisers to adjust for differences between the comparable sales and income data available. Such adjustments are usually significant and typically result in a Level 3 classification of the inputs for determining fair value. Non-real estate collateral may be valued using an appraisal, net book value per the borrower’s financial statements, or aging reports, adjusted or discounted based on management’s historical knowledge, changes in market conditions from the time of the valuation, and management’s expertise and knowledge of the client and client’s business, resulting in a Level 3 fair value classification. Impaired loans are evaluated on a quarterly basis for additional impairment and adjusted accordingly.
Other real estate owned: Assets acquired through or instead of loan foreclosure are initially recorded at fair value less costs to sell when acquired, establishing a new cost basis. These assets are subsequently accounted for at lower of cost or fair value less estimated costs to sell. Fair value is commonly based on recent real estate appraisals. These appraisals may utilize a single valuation approach or a combination of approaches including comparable sales and the income approach. Adjustments are routinely made in the appraisal process by the independent appraisers to adjust for differences between the comparable sales and income data available. Such adjustments are usually significant and typically result in a Level 3 classification of the inputs for determining fair value. Real estate owned properties are individually evaluated at least annually for additional impairment and adjusted accordingly.
Appraisals for both collateral-dependent impaired loans and other real estate owned are performed by certified general appraisers (for commercial properties) or certified residential appraisers (for residential properties) whose qualifications and licenses have been reviewed and verified by Home Savings. Once received, a member of the Special Assets Department reviews the assumptions and approaches utilized in the appraisal as well as the overall resulting fair value in comparison with the independent data sources such as recent market data or industry-wide statistics. On an annual basis, Home Savings compares the actual selling price of collateral that has been sold to the most recent appraised value to determine what additional adjustment should be made to the appraisal value to arrive at fair value. At the time a property is acquired and classified as real estate owned, the fair value is determined utilizing the most appropriate method. A fair value in excess of $250,000 will be supported by an appraisal. After determination of fair value, each property will be recorded at the lower of cost (i.e., recorded investment in the loan) or the estimated net realizable value on the date of transfer to real estate owned. In determining net realizable value, reductions to fair market value may be taken for estimated costs of sale, conditions that must be remedied immediately upon acquisition, and other factors that negatively impact the marketability and prompt sale of the property.
Mortgage servicing rights: On a quarterly basis, loan servicing rights are evaluated for impairment based upon the fair value of the rights as compared to carrying amount. If the carrying amount of an individual tranche exceeds fair value, impairment is recorded on that tranche so that the servicing asset is carried at fair value. Fair value is determined at a tranche level, based on market prices for comparable mortgage servicing contracts (Level 1), when available, or alternatively based on a valuation model that calculates the present value of estimated future net servicing income. The valuation model utilizes assumptions that market participants would use in estimating future net servicing income and that can be validated against available market data (Level 2).
Loans held for sale: Loans held for sale are carried at the lower of cost or fair value, which is evaluated on a pool-level basis. The fair value of loans held for sale is determined using quoted prices for similar assets, adjusted for specific attributes of that loan or other observable market data, such as outstanding commitments from third party investors (Level 2).
Loans held for sale, at fair value: The Company elected the fair value option for all permanent construction loans held for sale originated after January 1, 2015. The fair value of permanent construction loans held for sale is determined using the current 60 day forward contract price for 30 year conventional mortgages which is then adjusted by extrapolating this rate to the estimated time period remaining until construction is complete. The fair value is also adjusted for unobservable market data such as estimated fall out rates and the estimated time from origination to completion of construction (level 3).
Interest rate caps: Home Savings uses an independent third party that performs a market valuation analysis for interest rate caps. The methodology used consists of a discounted cash flow model, all future floating cash flows are projected and both floating and fixed cash flows are discounted to the valuation date. The yield curve utilized for discounting and projecting is built by obtaining publicly available third party market quotes from Reuters, which handle up to 30-year swap maturities (Level 3) Assumptions used in the valuation of interest rate caps are back-tested for reasonableness on a quarterly basis using an independent source along with a third party service.
95
Purchased and written certificate of deposit option: Home Savings periodically enters into written and purchased option derivative instruments to facilitate the Power CD. The written and purchased options are mirror derivative instruments which are carried at fair value on the consolidated balance sheets. Home Savings uses an independent third party that performs a market valuation analysis for purchased and written certificate of deposit options. (Level 2)
Assets and Liabilities Measured on a Recurring Basis: Assets and liabilities measured at fair value on a recurring basis are summarized below:
| | | | | | Fair Value Measurements at December 31, 2015 Using: | |
| | | | | | Quoted | | | | | | | Significant | |
| | | | | | Prices in | | | | | | | Unobservable | |
| | | | | | Active | | | Significant | | | Inputs | |
| | | | | | Markets for | | | Other | | | Significant | |
| | | | | | Identical | | | Observable | | | Unobservable | |
| | December 31, | | | Assets | | | Inputs | | | Inputs | |
| | 2015 | | | (Level 1) | | | (Level 2) | | | (Level 3) | |
| | (Dollars in thousands) | |
Assets: | | | | | | | | | | | | | | | | |
Available for sale securities | | | | | | | | | | | | | | | | |
US Treasury and government sponsored entities’ securities | | $ | 218,650 | | | $ | — | | | $ | 218,650 | | | $ | — | |
States of the U.S. and policical subdivisions | | | 11,040 | | | | — | | | | 11,040 | | | | — | |
Mortgage-backed GSE securities: residential | | | 127,980 | | | | — | | | | 127,980 | | | | — | |
Loans held for sale, at fair value | | | 26,716 | | | | — | | | | — | | | | 26,716 | |
Interest rate caps | | | 3 | | | | — | | | | — | | | | 3 | |
Purchased certificate of deposit option | | | 805 | | | | — | | | | 805 | | | | — | |
Liabilities | | | | | | | | | | | | | | | | |
Written certificate of deposit option | | | 805 | | | | — | | | | 805 | | | | — | |
| | | | | | | | | | | | | | | | |
| | | | | | Fair Value Measurements at December 31, 2014 Using: | |
| | | | | | Quoted | | | | | | | Significant | |
| | | | | | Prices in | | | | | | | Unobservable | |
| | | | | | Active | | | Significant | | | Inputs | |
| | | | | | Markets for | | | Other | | | Significant | |
| | | | | | Identical | | | Observable | | | Unobservable | |
| | December 31, | | | Assets | | | Inputs | | | Inputs | |
| | 2014 | | | (Level 1) | | | (Level 2) | | | (Level 3) | |
| | (Dollars in thousands) | |
Assets: | | | | | | | | | | | | | | | | |
Available for sale securities | | | | | | | | | | | | | | | | |
US Treasury and government sponsored entities’ securities | | $ | 227,957 | | | $ | — | | | $ | 227,957 | | | $ | — | |
Mortgage-backed GSE securities: residential | | | 271,833 | | | | — | | | | 271,833 | | | | — | |
Interest rate caps | | 180 | | | | — | | | | — | | | 180 | |
Purchased certificate of deposit option | | 930 | | | | — | | | 930 | | | | — | |
Liabilities | | | | | | | | | | | | | | | | |
Written certificate of deposit option | | 930 | | | | — | | | 930 | | | | — | |
There were no transfers between level 1 and level 2 during 2015 and 2014.
96
The table below presents a reconciliation of all assets measured at fair value on a recurring basis using significant unobservable inputs (Level 3) for the years ended December 31, 2015 and 2014, in thousands:
| | Loans held for sale | |
| | Twelve Months Ended December 31, | |
| | 2015 | |
| | (Dollars in thousands) | |
Balance of recurring Level 3 assets at beginning of period | | $ | — | |
Total gains (losses) for the period | | | | |
Included in change in fair value of loans held for sale | | | 1,519 | |
Included in other comprehensive income | | | — | |
Originations | | | 41,026 | |
Amortizations | | | — | |
Sales | | | (15,829 | ) |
Balance of recurring Level 3 assets at end of period | | $ | 26,716 | |
| | Interest Rate Caps | |
| | Twelve Months Ended December 31, | |
| | 2015 | | | 2014 | |
| | (Dollars in thousands) | |
Balance of recurring Level 3 assets at beginning of period | | $ | 180 | | | $ | 546 | |
Total gains (losses) for the period | | | | | | | | |
Included in other income | | | 341 | | | | 152 | |
Included in other comprehensive income | | | — | | | | — | |
Purchases | | | — | | | | — | |
Amortization | | | (518 | ) | | | (518 | ) |
Sales | | | — | | | | — | |
Balance of recurring Level 3 assets at end of period | | $ | 3 | | | $ | 180 | |
There were no transfers between Level 2 and Level 3 during 2015 or 2014.
The following table presents quantitative information about recurring Level 3 fair value measurements at December 31, 2015:
| | Fair Value | | | Valuation Technique | | Unobservable Inputs | | Range |
| | (Dollars in thousands) |
Loans held for sale | | $ | 26,716 | | | Comparable sales | | Time Discount | | 0.00%-1.80% |
Interest rate caps | | | 3 | | | Discounted cash flow | | Discount Rate | | 0.49%-1.18% |
The following table presents quantitative information about recurring Level 3 fair value measurements at December 31, 2014:
| | Fair Value | | | Valuation Technique | | Unobservable Inputs | | Range |
| | (Dollars in thousands) |
Interest rate caps | | $ | 180 | | | Discounted cash flow | | Discount Rate | | 0.49%-1.18% |
The significant unobservable inputs used in the fair value measurement of interest rate caps was determined using proprietary models from third-party sources taking into account such factors as size of the transaction, the lack of a quoted market and the custom-tailored nature of the transaction. The fair value is inclusive of interest accruals, as applicable. Significant increases/(decreases) in any of those inputs in isolation would result in a significantly lower/(higher) fair value measurement.
97
Assets Measured on a Non-Recurring Basis
Assets measured at fair value on a non-recurring basis are summarized below:
| | | | | | Fair Value Measurements at December 31, 2015 Using: | |
| | | | | | Quoted | | | | | | | Significant | |
| | | | | | Prices in | | | | | | | Unobservable | |
| | | | | | Active | | | Significant | | | Inputs | |
| | | | | | Markets for | | | Other | | | Significant | |
| | | | | | Identical | | | Observable | | | Unobservable | |
| | December 31, | | | Assets | | | Inputs | | | Inputs | |
| | 2015 | | | (Level 1) | | | (Level 2) | | | (Level 3) | |
| | (Dollars in thousands) | |
Assets: | | | | | | | | | | | | | | | | |
Impaired loans | | | | | | | | | | | | | | | | |
Commercial loans | | | | | | | | | | | | | | | | |
Nonresidential | | $ | 2,857 | | | $ | — | | | $ | — | | | $ | 2,857 | |
Land | | | 175 | | | | — | | | | — | | | | 175 | |
Residential loans | | | | | | | | | | | | | | | | |
One-to four-family residential | | | 1,493 | | | | — | | | | — | | | | 1,493 | |
Consumer loans | | | | | | | | | | | | | | | | |
Home Equity | | | 392 | | | | — | | | | — | | | | 392 | |
Auto | | | 1 | | | | — | | | | — | | | | 1 | |
Mortgage servicing rights | | | 604 | | | | — | | | | 604 | | | | — | |
Other real estate owned, net | | | | | | | | | | | | | | | | |
Commercial loans | | | | | | | | | | | | | | | | |
Construction loans | | | 785 | | | | — | | | | — | | | | 785 | |
Nonresidential loans | | | 175 | | | | — | | | | — | | | | 175 | |
Residential loans | | | | | | | | | | | | | | | | |
One-to four-family residential | | | 1,088 | | | | — | | | | — | | | | 1,088 | |
| | | | | | | | | | | | | | | | |
| | | | | | Fair Value Measurements at December 31, 2014 Using: | |
| | | | | | Quoted | | | | | | | Significant | |
| | | | | | Prices in | | | | | | | Unobservable | |
| | | | | | Active | | | Significant | | | Inputs | |
| | | | | | Markets for | | | Other | | | Significant | |
| | | | | | Identical | | | Observable | | | Unobservable | |
| | December 31, | | | Assets | | | Inputs | | | Inputs | |
| | 2014 | | | (Level 1) | | | (Level 2) | | | (Level 3) | |
| | (Dollars in thousands) | |
Assets: | | | | | | | | | | | | | | | | |
Impaired loans | | | | | | | | | | | | | | | | |
Commercial loans | | | | | | | | | | | | | | | | |
Multifamily | | $ | 2 | | | $ | — | | | $ | — | | | $ | 2 | |
Nonresidential | | | 2,843 | | | | — | | | | — | | | | 2,843 | |
Construction | | | 958 | | | | — | | | | — | | | | 958 | |
Residential loans | | | | | | | | | | | | | | | | |
One-to four-family residential | | | 765 | | | | — | | | | — | | | | 765 | |
Consumer loans | | | | | | | | | | | | | | | | |
Home Equity | | | 236 | | | | — | | | | — | | | | 236 | |
Auto | | | 24 | | | | — | | | | — | | | | 24 | |
Mortgage servicing rights | | | 1,138 | | | | — | | | | 1,138 | | | | — | |
Other real estate owned, net | | | | | | | | | | | | | | | | |
Commercial loans | | | | | | | | | | | | | | | | |
Construction loans | | | 1,286 | | | | — | | | | — | | | | 1,286 | |
Residential loans | | | | | | | | | | | | | | | | |
One-to four-family residential | | | 640 | | | | — | | | | — | | | | 640 | |
Impaired loans with specific allocations of the allowance for loan losses, carried at fair value, which are measured for impairment using the fair value of the collateral for collateral dependent loans, had a net carrying amount of $4.9 million at December 31, 2015, that includes a specific valuation allowance of $548,000. This resulted in an increase of the provision for loan losses of $29,000 during the twelve months ended December 31, 2015. Impaired loans with specific allocations of the allowance for loan losses, carried at fair value, which are measured for impairment using the fair value of the collateral for collateral dependent
98
loans, had a net carrying amount of $4.8 million at December 31, 2014, that includes a specific valuation allowance of $713,000. This resulted in an increase of the provision for loan losses of $79,000 during the twelve months ended December 31, 2014.
The significant unobservable (Level 3) inputs used in the fair value measurement of collateral for collateral dependent impaired loans included in the above table primarily relate to the adjustment between carrying value versus appraised value. During the reported periods, discounts applied to appraisals for estimated selling costs were 10%.
At December 31, 2015, mortgage servicing rights carried at fair value was $604,000, resulting in a net recoveries of $19,000 for the year ended December 31, 2015. At December 31, 2014, mortgage servicing rights carried at fair value was $1.1 million, resulting in a net loss of $58,000 for the year ended December 31, 2014. Mortgage servicing rights are valued by an independent third party that is active in purchasing and selling these instruments. The value reflects the characteristics of the underlying loans discounted at a market multiple.
At December 31, 2015, other real estate owned, carried at fair value, which is measured for impairment using the fair value of the property less estimated selling costs and had a net carrying amount of $2.0 million, that includes a valuation allowance of $1.2 million. This resulted in additional expenses of $287,000 during the twelve months ended December 31, 2015. At December 31, 2014, other real estate owned, carried at fair value, which is measured for impairment using the fair value of the property less estimated selling costs and had a net carrying amount of $1.9 million, with a valuation allowance of $1.4 million. This resulted in additional expenses of $580,000 million during the twelve months ended December 31, 2014.
The following table presents quantitative information about Level 3 fair value measurements for financial instruments measured at fair value on a nonrecurring basis at December 31, 2015:
| | Fair Value | | | Valuation Technique(s) | | Unobservable Input(s) | | Range (Average) |
| | (Dollars in thousands) |
Impaired loans | | | | | | | | | | |
Commercial loans | | | | | | | | | | |
Nonresidential | | $ | 2,857 | | | Sales comparison approach | | Adjustment for differences between comparable sales | | 9.19%-12.380% (10.79%) |
Land | | | 175 | | | Sales comparison approach | | Adjustment for differences between comparable sales | | 0.00%-27.47% (13.74%) |
Residential loans | | | | | | | | | | |
One-to four-family residential | | | 1,493 | | | Sales comparison approach | | Adjustment for differences between comparable sales | | 0.00%-10.77% (4.27%) |
Consumer loans | | | | | | | | | | |
Home Equity | | | 392 | | | Sales comparison approach | | Adjustment for differences between comparable sales | | 0.00%-17.85% (8.93%) |
Other real estate owned, net | | | | | | | | | | |
Commercial loans | | | | | | | | | | |
Construction loans | | | 785 | | | Sales comparison approach | | Adjustment for differences between comparable sales | | 0.00-50.00% (21.71%) |
Nonresidential loans | | | 175 | | | Sales comparison approach | | Adjustment for differences between comparable sales | | 40.00-60.00% (50.00%) |
Residential loans | | | | | | | | | | |
One-to four-family residential | | | 1,088 | | | Sales comparison approach | | Adjustment for differences between comparable sales | | 0.00-40.50% (15.51%) |
Auto loans were excluded from the table above as their value is considered immaterial.
99
The following table presents quantitative information about Level 3 fair value measurements for financial instruments measured at fair value on a nonrecurring basis at December 31, 2014:
| | Fair Value | | | Valuation Technique(s) | | Unobservable Input(s) | | Range (Average) |
| | (Dollars in thousands) |
Impaired loans | | | | | | | | | | |
Commercial loans | | | | | | | | | | |
Nonresidential | | $ | 2,843 | | | Sales comparison approach | | Adjustment for differences between comparable sales | | 0.00%-20.00% (10.00%) |
Multifamily | | | 2 | | | Sales comparison approach | | Adjustment for differences between comparable sales | | 0.00%-20.00% (10.00%) |
Construction loans | | | 958 | | | Sales comparison approach | | Adjustment for differences between comparable sales | | 0.00%-11.80% (3.70%) |
Residential loans | | | | | | | | | | |
One-to four-family residential | | | 765 | | | Sales comparison approach | | Adjustment for differences between comparable sales | | 0.00%-20.00% (10.00%) |
Consumer loans | | | | | | | | | | |
Home Equity | | | 236 | | | Sales comparison approach | | Adjustment for differences between comparable sales | | 0.00%-10.00% (5.00%) |
Auto | | | 24 | | | Sales comparison approach | | Adjustment for differences between comparable sales | | 0.00%-10.00% (5.00%) |
Other real estate owned, net | | | | | | | | | | |
Commercial loans | | | | | | | | | | |
Construction loans | | | 1,286 | | | Sales comparison approach | | Adjustment for differences between comparable sales | | 0.00-51.10% (26.83%) |
Residential loans | | | | | | | | | | |
One-to four-family residential | | | 640 | | | Sales comparison approach | | Adjustment for differences between comparable sales | | 0.00-58.10% (22.20%) |
The Company has elected the fair value option for loans held for sale as of January 1, 2015. The Company had no loans held for sale using the fair value option as of December 31, 2014 or 2013. These loans are intended for sale and the Company believes that the fair value is the best indicator of the resolution of these loans. Interest income is recorded based on the contractual terms of the loan and in accordance with the Company’s policy on loans held for investment. None of these loans are 90 days or more past due nor on nonaccrual as of December 31, 2015.
As of December 31, 2015, the aggregate fair value, contractual balance and gain or loss was as follows:
| | December 31, 2015 | |
| | (Dollars in thousands) | |
Aggregate fair value | | $ | 26,716 | |
Contractual balance | | | 25,197 | |
Gain | | | 1,519 | |
The total amount of gains from changes in fair value including in earnings for the year ended December 31, 2015 was $1.5 million.
100
The carrying value and estimated fair values of financial instruments at December 31, 2015 and December 31, 2014, were as follows:
| | | | | | Fair Value Measurements at December 31, 2015 Using: | |
| | December 31, | | | | | | | | | | | | | |
| | 2015 | | | | | | | | | | | | | |
| | Carrying | | | | | | | | | | | | | |
| | Value | | | (Level 1) | | | (Level 2) | | | (Level 3) | |
| | (Dollars in thousands) | |
Assets: | | | | | | | | | | | | | | | | |
Cash and cash equivalents | | $ | 35,910 | | | $ | 35,910 | | | $ | — | | | $ | — | |
Available for sale securities | | | 357,670 | | | | — | | | | 357,670 | | | | — | |
Held to maturity securities | | | 110,699 | | | | �� | | | | 108,536 | | | | 1,108 | |
Loans held for sale at lower of cost or market | | | 9,085 | | | | — | | | | 9,207 | | | | — | |
Loans held for sale at fair value | | | 26,716 | | | | — | | | | — | | | | 26,716 | |
Loans, net | | | 1,316,192 | | | | — | | | | — | | | | 1,322,338 | |
FHLB stock | | | 18,068 | | | n/a | | | n/a | | | n/a | |
Accrued interest receivable | | | 5,978 | | | | — | | | | 2,276 | | | | 3,702 | |
Interest rate caps | | | 3 | | | | — | | | | — | | | | 3 | |
Purchased certificate of deposit option | | | 805 | | | | — | | | | 805 | | | | — | |
Liabilities: | | | | | | | | | | | | | | | | |
Deposits: | | | | | | | | | | | | | | | | |
Checking, savings and money market accounts | | | (980,783 | ) | | | (980,783 | ) | | | — | | | | — | |
Certificates of deposit | | | (454,960 | ) | | | — | | | | (459,433 | ) | | | — | |
FHLB advances | | | (278,975 | ) | | | — | | | | (279,053 | ) | | | — | |
Repurchase agreements and other | | | (535 | ) | | | — | | | | (548 | ) | | | — | |
Advance payments by borrowers for taxes and insurance | | | (21,174 | ) | | | (21,174 | ) | | | — | | | | — | |
Accrued interest payable | | | (53 | ) | | | — | | | | (53 | ) | | | — | |
Written certificate of deposit option | | | (805 | ) | | | — | | | | (805 | ) | | | — | |
| | | | | | Fair Value Measurements at December 31, 2014 Using: | |
| | December 31, | | | | | | | | | | | | | |
| | 2014 | | | | | | | | | | | | | |
| | Carrying | | | | | | | | | | | | | |
| | Value | | | (Level 1) | | | (Level 2) | | | (Level 3) | |
| | (Dollars in thousands) | |
Assets: | | | | | | | | | | | | | | | | |
Cash and cash equivalents | | $ | 32,980 | | | $ | 32,980 | | | $ | — | | | $ | — | |
Available for sale securities | | | 499,790 | | | | — | | | | 499,790 | | | | — | |
Loans held for sale | | | 20,730 | | | | — | | | | 21,528 | | | | — | |
Loans, net | | | 1,148,093 | | | | — | | | | — | | | | 1,167,372 | |
FHLB stock | | | 18,068 | | | n/a | | | n/a | | | n/a | |
Accrued interest receivable | | | 5,763 | | | | — | | | | 2,374 | | | | 3,389 | |
Interest rate caps | | | 180 | | | | — | | | | — | | | | 180 | |
Purchased certificate of deposit option | | | 930 | | | | — | | | | 930 | | | | — | |
Liabilities: | | | | | | | | | | | | | | | | |
Deposits: | | | | | | | | | | | | | | | | |
Checking, savings and money market accounts | | | (912,536 | ) | | | (912,536 | ) | | | — | | | | — | |
Certificates of deposit | | | (435,300 | ) | | | — | | | | (442,268 | ) | | | — | |
FHLB advances | | | (186,194 | ) | | | — | | | | (186,290 | ) | | | — | |
Repurchase agreements and other | | | (30,558 | ) | | | — | | | | (32,817 | ) | | | — | |
Advance payments by borrowers for taxes and insurance | | | (19,904 | ) | | | (19,904 | ) | | | — | | | | — | |
Accrued interest payable | | | (185 | ) | | | — | | | | (185 | ) | | | — | |
Written certificate of deposit option | | | (930 | ) | | | — | | | | (930 | ) | | | — | |
The methods and assumptions, not previously presented, used to estimate fair values are described as follows:
(a) Cash and Cash Equivalents
The carrying amounts of cash and short-term instruments approximate fair values and are classified as Level 1.
101
(b) FHLB Stock
It is not practical to determine the fair value of FHLB stock due to restrictions placed on its transferability.
(c) Held to maturity securities
Fair values for held to maturity securities are based on quoted market prices, where available. If quoted market prices are not available, fair values are based on quoted market prices of comparable instruments. For securities where quoted prices or market prices of similar securities are not available, fair values are calculated using discounted cash flows.
(d) Loans
Fair values of loans, excluding loans held for sale, are estimated as follows: For variable rate loans that reprice frequently and with no significant change in credit risk, fair values are based on carrying values resulting in a Level 3 classification. Fair values for other loans are estimated using discounted cash flow analyses, using interest rates currently being offered for loans with similar terms to borrowers of similar credit quality resulting in a Level 3 classification. Impaired loans are valued at the lower of cost or fair value as described previously. The methods utilized to estimate the fair value of loans do not necessarily represent an exit price.
The fair value of loans held for sale is estimated based upon binding contracts and quotes from third-party investors resulting in a Level 2 classification.
(e) Deposits
The fair values disclosed for demand deposits (e.g., interest and non-interest checking, savings, and certain types of money market accounts) are, by definition, equal to the amount payable on demand at the reporting date (i.e., their carrying amount) resulting in a Level 1 classification. The carrying amounts of variable rate, fixed-term money market accounts approximate their fair values at the reporting date resulting in a Level 1 classification. Fair values for fixed and variable rate certificates of deposit are estimated using a discounted cash flow calculation that applies interest rates currently being offered on certificates of deposit to a schedule of aggregated expected monthly maturities on time deposits resulting in a Level 2 classification.
(f) Short-term Borrowings
The carrying amounts of federal funds purchased, borrowings under repurchase agreements, and other short-term borrowings, generally maturing within 90 days, approximate their fair values resulting in a Level 2 classification.
(g) Other Borrowings
The fair values of Home Savings long-term borrowings are estimated using discounted cash flow analyses based on the current borrowing rates for similar types of borrowing arrangements resulting in a Level 2 classification.
(h) Accrued Interest Receivable/Payable
The carrying amounts of accrued interest approximate fair value resulting in a Level 2 or Level 3 classification, depending on the classification of the underlying asset or liability.
(i) Off-balance Sheet Instruments
Fair values for off-balance sheet, credit-related financial instruments are based on fees currently charged to enter into similar agreements, taking into account the remaining terms of the agreements and the counterparties’ credit standing. The fair value of commitments is not material.
102
19. | STATEMENT OF CASH FLOWS SUPPLEMENTAL DISCLOSURE |
Supplemental disclosures of cash flow information are summarized below:
| | For the Year Ended December 31, | |
| | 2015 | | | 2014 | | | 2013 | |
| | (Dollars in thousands) | |
Supplemental disclosures of cash flow information: | | | | | | | | | | | | |
Cash paid during the year for: | | | | | | | | | | | | |
Interest on deposits and borrowings | | $ | 9,245 | | | $ | 12,190 | | | $ | 13,426 | |
Income taxes | | | 375 | | | | 130 | | | | 1,300 | |
Supplemental schedule of noncash activities: | | | | | | | | | | | | |
Securities transferred from available for sale to held to maturity, at fair value | | | 103,768 | | | | — | | | | — | |
Transfers from loans to real estate owned | | | 2,264 | | | | 1,982 | | | | 1,860 | |
Amortization of preferred stock discount | | | — | | | | — | | | | 6,751 | |
Conversion of preferred stock to common stock | | | — | | | | — | | | | 21,841 | |
Home Savings utilizes interest rate cap agreements as part of its asset/liability management strategy to help manage its interest rate risk position. Home Savings entered into an interest rate cap agreement in October 2011 with an outside counterparty. Home Savings receives proceeds from the counterparty if interest rates exceed the cap rate computed based on the underlying notional amounts. The notional amount of the interest rate caps does not represent amounts exchanged by the parties. The amount exchanged is determined by reference to the notional amount and the other terms of the individual interest rate cap agreements. The interest rate caps are carried as freestanding derivatives, considered an economic hedge and classified as an other asset with a carrying value of $3,000 at December 31, 2015 and $180,000 at December 31, 2014 with changes in fair value of approximately $(177,000), $(366,000) and $110,000 during 2015, 2014 and 2013 reported in current earnings through other noninterest income.
Summary information about the interest rate caps not designated hedges as of December 31, 2015 and 2014 is as follows:
| | December 31, 2015 | | | December 31, 2014 | |
| | (Dollars in thousands) | |
Notional amounts | | $ | 100,000 | | | $ | 100,000 | |
Weighted average strike rate, based on three-month LIBOR | | | 1.50 | % | | | 1.50 | % |
Weighted average maturity remaining | | 0.75 years | | | 1.75 years | |
Fair value of combined interest rate caps | | $ | 3 | | | $ | 180 | |
The following table presents net gains/(losses) recorded in noninterest income relating to instruments not designated as hedges:
| | December 31, 2015 | | | December 31, 2014 | | | December 31, 2013 | |
| | (Dollars in thousands) | |
Interest rate caps | | $ | (177 | ) | | $ | (366 | ) | | $ | 110 | |
Home Savings periodically enters into written and purchased option derivative instruments to facilitate an equity linked time deposit product (the Power CD). The Power CD is a time deposit that provides the purchaser a guaranteed return of principal at maturity plus a potential equity return (a written option), while Home Savings receives a known stream of funds based on the equity return (a purchased option). The written and purchased options are mirror derivative instruments which are carried at fair value on the consolidated statements of financial condition.
Summary information about purchased and written options is as follows:
| | December 31, 2015 | | | December 31, 2014 | |
| | (Dollars in thousands) | |
Notion amount of purchased/written option | | $ | 13,468 | | | $ | 8,264 | |
Weighted average maturity | | 4.8 years | | | 5.4 years | |
Fair value of purchased/written option | | $ | 805 | | | $ | 930 | |
103
Purchased and written options are mirror derivative instruments and as such the changes in fair value are recorded through noninterest income, and offset each other. These options decreased in value $125,000 in 2015.
The following table reflects the fair value and location in the consolidated statement of financial condition of interest rate caps, along with purchased and written certificates of deposit options:
Included in other assets:
| | December 31, 2015 | | | December 31, 2014 | |
| | (Dollars in thousands) | |
Freestanding derivative assets not designated as hedges: | | | | | | | | |
Interest rate caps | | $ | 3 | | | $ | 180 | |
Purchased certificate of deposit option | | | 805 | | | | 930 | |
Included in other liabilities:
| | December 31, 2015 | | | December 31, 2014 | |
| | (Dollars in thousands) | |
Freestanding derivative assets not designated as hedges: | | | | | | | | |
Written certificate of deposit option | | $ | 805 | | | $ | 930 | |
Home Savings is subject to counterparty risk. Counterparty risk is the risk to Home Savings that the counterparty will not live up to its contractual obligations. The ability of Home Savings to realize the benefit of the derivative contracts is dependent on the creditworthiness of the counterparty, which Home Savings expects will perform in accordance with the terms of the contracts.
21. | PARENT COMPANY FINANCIAL STATEMENTS |
Condensed Statements of Financial Condition
| | December 31, | |
| | 2015 | | | 2014 | |
| | (Dollars in thousands) | |
Assets | | | | | | | | |
Cash and deposits with banks | | $ | 21,163 | | | $ | 20,764 | |
Federal funds sold and other | | | — | | | | — | |
Total cash and cash equivalents | | | 21,163 | | | | 20,764 | |
Securities: | | | | | | | | |
Available for sale | | | — | | | | — | |
Investment in subsidiary-Home Savings | | | 220,873 | | | | 217,372 | |
Other assets | | | 2,395 | | | | 2,043 | |
Total assets | | $ | 244,431 | | | $ | 240,179 | |
Liabilities and Shareholders’ Equity | | | | | | | | |
Accrued expenses and other liabilities | | $ | 186 | | | $ | 44 | |
Total liabilities | | | 186 | | | | 44 | |
Total shareholders’ equity | | | 244,245 | | | | 240,135 | |
Total liabilities and shareholders’ equity | | $ | 244,431 | | | $ | 240,179 | |
104
Condensed Statements of Income and Comprehensive Income
| | Year ended December 31, | |
| | 2015 | | | 2014 | | | 2013 | |
| | (Dollars in thousands) | |
Income | | | | | | | | | | | | |
Interest income | | $ | — | | | $ | 8 | | | $ | 5 | |
Non-interest income | | | — | | | | 331 | | | | — | |
Total income | | | — | | | | 339 | | | | 5 | |
Expenses | | | | | | | | | | | | |
Non-interest expenses | | | 1,017 | | | | 867 | | | | 957 | |
Total expenses | | | 1,017 | | | | 867 | | | | 957 | |
Loss before income taxes | | | (1,017 | ) | | | (528 | ) | | | (952 | ) |
Income tax benefit | | | (356 | ) | | | (2,035 | ) | | | — | |
Income (loss) before equity in undistributed net earnings of subsidiaries | | | (661 | ) | | | 1,507 | | | | (952 | ) |
Earnings distributed by subsidiaries | | | 15,000 | | | | — | | | | — | |
Increase in undistributed earnings of subsidiaries | | | 1,943 | | | | 48,699 | | | | 10,979 | |
Net income | | $ | 16,282 | | | $ | 50,206 | | | $ | 10,027 | |
Comprehensive income (loss) | | $ | 17,060 | | | $ | 71,873 | | | $ | (38,320 | ) |
Condensed Statements of Cash Flows
| | Year ended December 31, | |
| | 2015 | | | 2014 | | | 2013 | |
| | (Dollars in thousands) | |
Cash Flows from Operating Activities | | | | | | | | | | | | |
Net income (loss) | | $ | 16,282 | | | $ | 50,206 | | | $ | 10,027 | |
Adjustments to reconcile net income to net cash provided by operating activities: | | | | | | | | | | | | |
Increase in undistributed earnings of the subsidiaries | | | (1,943 | ) | | | (48,699 | ) | | | (10,979 | ) |
Increase in deferred tax assets | | | (356 | ) | | | (1,996 | ) | | | — | |
Decrease in other assets | | | 4 | | | | — | | | | 2,058 | |
Net gains on securities sales | | | — | | | | (331 | ) | | | — | |
Increase (decrease) in other liabilities | | | 86 | | | | (535 | ) | | | 45 | |
Net cash from operating activities | | | 14,073 | | | | (1,355 | ) | | | 1,151 | |
Cash Flows from Investing Activities | | | | | | | | | | | | |
Sales of: | | | | | | | | | | | | |
Securities available for sale | | | — | | | | 431 | | | | — | |
Equity investment in Home Savings | | | — | | | | — | | | | (16,000 | ) |
Net cash from investing activities | | | — | | | | 431 | | | | (16,000 | ) |
Cash Flows from Financing Activities | | | | | | | | | | | | |
Issuance of preferred stock | | | — | | | | — | | | | 21,841 | |
Issuance of common stock, net of issuance costs | | | — | | | | — | | | | 20,501 | |
Purchase of treasury stock | | | (10,333 | ) | | | (6,389 | ) | | | — | |
Dividends paid | | | (3,369 | ) | | | (1,001 | ) | | | — | |
Proceeds from the exercise of stock options | | | 28 | | | | 172 | | | | 155 | |
Net cash from financing activities | | | (13,674 | ) | | | (7,218 | ) | | | 42,497 | |
Change in cash and cash equivalents | | | 399 | | | | (8,142 | ) | | | 27,648 | |
Cash and cash equivalents, beginning of year | | | 20,764 | | | | 28,906 | | | | 1,258 | |
Cash and cash equivalents, end of year | | $ | 21,163 | | | $ | 20,764 | | | $ | 28,906 | |
105
The Company’s management monitors the revenue streams of the various Company products and services. The identifiable segments are not material, operations are managed, and financial performance is evaluated on a Company-wide basis. All of Home Savings’ financial service operations are considered by management to be aggregated in one reportable operating segment, which is banking services.
Earnings per share are computed by dividing net income by the weighted average number of shares outstanding during the period. Diluted earnings per share is computed using the weighted average number of common shares determined for the basic computation plus the dilutive effect of potential common shares that could be issued under outstanding stock options. Stock options for 76,317, 74,869 and 364,880 shares were anti-dilutive for the year ended December 31, 2015, 2014 and 2013, respectively.
| | Twelve months ended | |
| | December 31, | |
| | 2015 | | | 2014 | | | 2013 | |
| | (In thousands, except per share data) | |
Net income (loss) per consolidated statements of income | | $ | 16,282 | | | $ | 50,206 | | | $ | 10,027 | |
Net (income) loss allocated to participating securities | | | (81 | ) | | | (209 | ) | | | (36 | ) |
Amortization of discount on preferred stock | | | — | | | | — | | | | (6,751 | ) |
Net income (loss) allocated to common stock | | $ | 16,201 | | | $ | 49,997 | | | $ | 3,240 | |
Basic earnings (loss) per common share computation: | | | | | | | | | | | | |
Distributed earnings allocated to common stock | | $ | 3,350 | | | $ | 1,001 | | | $ | — | |
Undistributed earnings (loss) allocated to common stock | | | 12,851 | | | | 48,996 | | | | 3,240 | |
Net earnings (loss) allocated to common stock | | $ | 16,201 | | | $ | 49,997 | | | $ | 3,240 | |
Weighted average common shares outstanding, including shares considered participating securities | | | 48,320 | | | | 50,125 | | | | 44,423 | |
Less: Average participating securities | | | (242 | ) | | | (208 | ) | | | (161 | ) |
Weighted average shares | | | 48,078 | | | | 49,917 | | | | 44,262 | |
Basic earnings (loss) per common share | | $ | 0.34 | | | $ | 1.00 | | | $ | 0.07 | |
Diluted earnings (loss) per common share computation: | | | | | | | | | | | | |
Net earnings (loss) allocated to common stock | | $ | 16,201 | | | $ | 49,997 | | | $ | 3,240 | |
Weighted average common shares outstanding for basic earnings per common share | | | 48,078 | | | | 49,917 | | | | 44,262 | |
Add: Dilutive effects of assumed exercises of stock options | | | 272 | | | | 251 | | | | 271 | |
Weighted average shares and dilutive potential common shares | | | 48,350 | | | | 50,168 | | | | 44,533 | |
Diluted earnings (loss) per common share | | $ | 0.34 | | | $ | 1.00 | | | $ | 0.07 | |
As previously announced and described under Note 25 following, on March 22, 2013, United Community sold 7,942 preferred shares to various investors. In accordance with U.S. GAAP, United Community recorded a beneficial conversion feature (“BCF”) related to the issuance of these preferred shares because they contain a conversion feature at a fixed rate that was in-the-money when issued. A BCF is “in-the-money” when the investor is deemed to be able to obtain the underlying common shares at a below-market price upon conversion of the preferred shares. The BCF was recognized in United Community’s Shareholders’ Equity and measured by allocating a portion of the proceeds equal to the intrinsic value of that feature to additional paid-in capital. The effective purchase price of the common shares into which the preferred shares were convertible was deemed to be $2.75, which was used to compute the intrinsic value. The intrinsic value was calculated as the difference between the deemed purchase price of the common shares ($2.75 per share) and the market value ($3.60 per share) on the date the preferred shares were issued (March 22, 2013), multiplied by the number of shares into which the preferred shares were convertible. The BCF resulting from the issuance of the preferred shares of United Community is calculated as follows:
| | (In thousands) | |
Total common shares that may be issued upon conversion of preferred shares | | | 7,942 | |
Intrinsic value (difference between consideration allocated to preferred stock upon conversion at $2.75 per
share and market price of $3.60 per share on March 22, 2013) | | $ | 0.85 | |
Beneficial conversion feature | | $ | 6,751 | |
106
The BCF has no effect on net income. The BCF calculated above is deemed to be an implied dividend for purposes of determining earnings per common share in accordance with U.S. GAAP, and is amortized over the period the preferred shares were outstanding. The preferred shares converted to common shares upon shareholder approval which was obtained in the second quarter 2013. This amortization resulted in a reduction to retained earnings and thus net income available to common shareholders for earnings per common share purposes. Therefore, United Community took into account the BCF discount when computing earnings per common share in 2013.
24. | QUARTERLY FINANCIAL INFORMATION (UNAUDITED) |
The following table presents summarized quarterly data for each of the years indicated.
| | Unaudited | |
| | First | | | Second | | | Third | | | Fourth | | | | | |
2015: | | Quarter | | | Quarter | | | Quarter | | | Quarter | | | Total | |
| | (Dollars in thousands, except per share data) | |
Interest income | | $ | 16,034 | | | $ | 16,111 | | | $ | 16,654 | | | $ | 16,836 | | | $ | 65,635 | |
Interest expense | | | 2,154 | | | | 2,260 | | | | 2,353 | | | | 2,346 | | | | 9,113 | |
Net interest income | | | 13,880 | | | | 13,851 | | | | 14,301 | | | | 14,490 | | | | 56,522 | |
Provision for loan losses | | | (184 | ) | | | 753 | | | | 673 | | | | 893 | | | | 2,135 | |
Net interest income after provision for loan losses | | | 14,064 | | | | 13,098 | | | | 13,628 | | | | 13,597 | | | | 54,387 | |
Non-interest income | | | 4,118 | | | | 5,275 | | | | 4,873 | | | | 5,451 | | | | 19,717 | |
Non-interest expenses | | | 12,681 | | | | 12,208 | | | | 12,285 | | | | 12,755 | | (1) | | 49,929 | |
Income before taxes | | | 5,501 | | | | 6,165 | | | | 6,216 | | | | 6,293 | | | | 24,175 | |
Income tax expense | | | 1,815 | | | | 2,040 | | | | 2,073 | | | | 1,965 | | | | 7,893 | |
Net income | | $ | 3,686 | | | $ | 4,125 | | | $ | 4,143 | | | $ | 4,328 | | | $ | 16,282 | |
Earnings per share: | | | | | | | | | | | | | | | | | | | | |
Basic earnings | | $ | 0.07 | | | $ | 0.08 | | | $ | 0.09 | | | $ | 0.09 | | | $ | 0.34 | |
Diluted earnings | | | 0.07 | | | | 0.08 | | | | 0.09 | | | | 0.09 | | | | 0.34 | |
1. | Non-interest expense was higher for the fourth quarter of 2015 as a result of the Company incurring a $1.3 million prepayment penalty for the repayment of a high-cost repurchase agreement. Partially offsetting this expense was a decrease in salaries and employee benefits, which was due to organizational restructuring and modification of certain employee benefit plans. |
107
| | Unaudited | |
| | First | | | Second | | | Third | | | Fourth | | | | | |
2014: | | Quarter | | | Quarter | | | Quarter | | | Quarter | | | Total | |
| | (Dollars in thousands, except per share data) | |
Interest income | | $ | 15,705 | | | $ | 15,811 | | | $ | 15,736 | | | $ | 15,992 | | | $ | 63,244 | |
Interest expense | | | 3,103 | | | | 3,070 | | | | 3,011 | | | | 2,641 | | | | 11,825 | |
Net interest income | | | 12,602 | | | | 12,741 | | | | 12,725 | | | | 13,351 | | | | 51,419 | |
Provision for loan losses | | | 33 | | | | (1,614 | ) | (1) | | 116 | | | | 194 | | | | (1,271 | ) |
Net interest income after provision for loan losses | | | 12,569 | | | | 14,355 | | | | 12,609 | | | | 13,157 | | | | 52,690 | |
Non-interest income | | | 3,224 | | | | 3,438 | | | | 4,174 | | | | 2,905 | | | | 13,741 | |
Non-interest expenses | | | 13,543 | | | | 14,226 | | | | 14,252 | | | | 13,939 | | | | 55,960 | |
Income before taxes | | | 2,250 | | | | 3,567 | | | | 2,531 | | | | 2,123 | | | | 10,471 | |
Income tax expense (benefit) | | | 156 | | | | (38,837 | ) | (2) | | (369 | ) | | | (685 | ) | | | (39,735 | ) |
Net income | | $ | 2,094 | | | $ | 42,404 | | | $ | 2,900 | | | $ | 2,808 | | | $ | 50,206 | |
Earnings per share: | | | | | | | | | | | | | | | | | | | | |
Basic earnings | | $ | 0.04 | | | $ | 0.84 | | | $ | 0.06 | | | $ | 0.06 | | | $ | 1.00 | |
Diluted earnings | | | 0.04 | | | | 0.84 | | | | 0.06 | | | | 0.06 | | | | 1.00 | |
1. | The decrease in provision for loan losses in the second quarter, which was due primarily to a recovery of $1.0 million associated with a commercial loan customer, resulted in a release of approximately $748,000 in reserves. In addition to a change in loan loss factors associated with residential mortgage construction loans resulted in the release of approximately $794,000 in reserves. |
2. | As of June 30, 2014, the Company had reversed $38.8 million of the valuation allowance on its net deferred tax asset (DTA). The Company has evaluated its future taxable earnings projections and as a result, the entire amount of the DTA allowance reversal was determined to be a discrete item. The realization of a DTA is assessed and a valuation allowance is recorded if it is “more likely than not” that all or a portion of the DTA will not be realized. “More likely than not” is defined as the DTA being more than 50% likely of being realized. All available evidence, both positive and negative is considered to determine whether, based on the weight of that evidence, a valuation allowance against the net DTA is required. In assessing the need for a valuation allowance, the Company considered all available evidence about the realization of the DTA both positive and negative, that could be objectively verified. |
On January 11, 2013, United Community entered into securities purchase agreements with 28 accredited investors, pursuant to which the investors agreed to invest an aggregate of approximately $39.9 million in United Community for 6,574,272 newly issued common shares of United Community at a purchase price of $2.75 per share, and 7,942 newly created and issued perpetual mandatorily convertible non-cumulative preferred shares of United Community at a purchase price of $2,750 per share. On March 22, 2013, United Community received $39.9 million from the completion of this portion of the private placement of the capital raise. Upon receipt of United Community shareholder approval, each of the preferred shares automatically converted into 1,000 United Community common shares. Shareholder approval was obtained at a special meeting of shareholders held on May 28, 2013. The preferred shares did not pay any preferred dividends.
Also on January 11, 2013, United Community entered into subscription agreements with certain of United Community’s directors, officers and their affiliates pursuant to which these insider investors agreed to invest an aggregate of approximately $2.1 million in United Community for 755,820 newly issued common shares, at the same purchase price of $2.75 per share. The issuance and sale of common shares to the insider investors, pursuant to the subscription agreements, was subject to United Community shareholder approval, which was obtained on May 28, 2013.
On April 26, 2013, United Community issued a prospectus for the purpose of offering existing shareholders the right to purchase up to $5.0 million of United Community common shares at $2.75 per share. The rights offering closed on May 28, 2013 and United Community issued 1,818,181 shares to existing shareholders that elected to participate.
Legal, investment banking and other consulting expenses incurred by United Community to complete the capital raise were approximately $4.6 million in the aggregate. The increase in equity from the capital raise was reduced by these expenses.
108
REPORT OF INDEPENDENT REGISTERED PUBLIC ACCOUNTING FIRM
Board of Directors and Shareholders
United Community Financial Corp.
Youngstown, Ohio
We have audited the accompanying consolidated statements of financial condition of United Community Financial Corp. (Company) as of December 31, 2015 and 2014 and the related consolidated statements of operations and comprehensive income (loss), shareholders’ equity and cash flows for each of the years in the three-year period ended December 31, 2015. We also have audited the Company’s internal control over financial reporting as of December 31, 2015, based on criteria established in the 2013 Internal Control – Integrated Framework issued by the Committee of Sponsoring Organizations of the Treadway Commission (COSO). The Company’s management is responsible for these consolidated financial statements, for maintaining effective internal control over financial reporting, and for its assessment of the effectiveness of internal control over financial reporting, included in the accompanying Management’s Report on Internal Controls over Financial Reporting. Our responsibility is to express an opinion on these consolidated financial statements and an opinion on the Company’s internal control over financial reporting based on our audits.
We conducted our audits in accordance with the standards of the Public Company Accounting Oversight Board (United States). Those standards require that we plan and perform the audits to obtain reasonable assurance about whether the consolidated financial statements are free of material misstatement and whether effective internal control over financial reporting was maintained in all material respects. Our audits of the consolidated financial statements included examining, on a test basis, evidence supporting the amounts and disclosures in the consolidated financial statements, assessing the accounting principles used and significant estimates made by management, and evaluating the overall financial statement presentation. Our audit of internal control over financial reporting included obtaining an understanding of internal control over financial reporting, assessing the risk that a material weakness exists, and testing and evaluating the design and operating effectiveness of internal control based on the assessed risk. Our audits also included performing such other procedures as we considered necessary in the circumstances. We believe that our audits provide a reasonable basis for our opinions.
A company’s internal control over financial reporting is a process designed to provide reasonable assurance regarding the reliability of financial reporting and the preparation of financial statements for external purposes in accordance with generally accepted accounting principles. A company’s internal control over financial reporting includes those policies and procedures that (1) pertain to the maintenance of records that, in reasonable detail, accurately and fairly reflect the transactions and dispositions of the assets of the company; (2) provide reasonable assurance that transactions are recorded as necessary to permit preparation of financial statements in accordance with generally accepted accounting principles, and that receipts and expenditures of the company are being made only in accordance with authorizations of management and directors of the company; and (3) provide reasonable assurance regarding prevention or timely detection of unauthorized acquisition, use, or disposition of the company’s assets that could have a material effect on the financial statements.
Because of its inherent limitations, internal control over financial reporting may not prevent or detect misstatements. Also, projections of any evaluation of effectiveness to future periods are subject to the risk that controls may become inadequate because of changes in conditions, or that the degree of compliance with the policies or procedures may deteriorate.
In our opinion, the consolidated financial statements referred to above present fairly, in all material respects, the financial position of the Company as of December 31, 2015 and 2014, and the results of its operations and its cash flows for each of the years in the three-year period ended December 31, 2015, in conformity with accounting principles generally accepted in the United States of America. Also in our opinion, the Company maintained, in all material respects, effective internal control over financial reporting as of December 31, 2015, based on criteria established in the 2013 Internal Control – Integrated Framework issued by the Committee of Sponsoring Organizations of the Treadway Commission.
|
/s/ Crowe Horwath LLP |
Crowe Horwath LLP |
Cleveland, Ohio |
March 11, 2016 |
109
MANAGEMENT’S REPORT ON INTERNAL CONTROL OVER FINANCIAL REPORTING
The management of United Community Financial Corp. (United Community) is responsible for establishing and maintaining adequate internal control over financial reporting (as defined in Rules 13a-15(f) or 15d-15(f) under the Securities Exchange Act of 1934). United Community’s internal control over financial reporting is designed to provide reasonable assurance regarding the reliability of financial reporting and the preparation of financial statements for external purposes in accordance with generally accepted accounting principles. United Community’s internal control over financial reporting includes those policies and procedures that: (i) pertain to the maintenance of records that, in reasonable detail, accurately and fairly reflect the transactions and dispositions of the assets of United Community; (ii) provide reasonable assurance that transactions are recorded as necessary to permit preparation of financial statements in accordance with generally accepted accounting principles, and that receipts and expenditures of United Community are being made only in accordance with authorizations of management and directors of United Community; and (iii) provide reasonable assurance regarding prevention or timely detection of unauthorized acquisition, use or disposition of United Community’s assets that could have a material effect on the financial statements.
Because of its inherent limitations, internal control over financial reporting may not prevent or detect misstatements. Also, projections of any evaluation of effectiveness to future periods are subject to the risk that controls may become inadequate because of changes in conditions, or that the degree of compliance with the policies or procedures may deteriorate. Management assessed the effectiveness of United Community’s internal control over financial reporting as of December 31, 2015. In making this assessment, management used the criteria set forth by the Committee of Sponsoring Organizations of the Treadway Commission (COSO) in the 2013 Internal Control-Integrated Framework. Based on our assessment and those criteria, management concluded that United Community maintained effective internal control over financial reporting as of December 31, 2015.
United Community’s independent registered public accounting firm has issued its report on the effectiveness of United Community’s internal control over financial reporting as of December 31, 2015, as stated in their report dated March 11, 2016.
/s/ Gary M. Small | | /s/ Timothy W. Esson |
Gary M. Small, Chief Executive Officer | | Timothy W. Esson, Chief Financial Officer |
March 11, 2016 | | March 11, 2016 |
110
Item 9. | Changes in and Disagreements with Accountants on Accounting and Financial Disclosure |
None.
Item 9A. | Controls and Procedures |
United Community’s management is responsible for establishing and maintaining effective disclosure controls and procedures, as defined under Rules 13a-15(e) or 15d-15(e) of the Securities Exchange Act of 1934. As of December 31, 2015, an evaluation was performed under the supervision and with the participation of management, including the Chief Executive Officer and Chief Financial Officer, of the effectiveness of the design and operation of United Community’s disclosure controls and procedures. Based on that evaluation, management concluded that disclosure controls and procedures as of December 31, 2015 were effective in ensuring material information required to be disclosed in this Annual Report on Form 10-K was recorded, processed, summarized and reported on a timely basis. Management concluded that disclosure controls and procedures as of December 31, 2015, are effective to ensure that information required to be disclosed in the reports that United Community files or submits under the Exchange Act is accumulated and communicated to management, including United Community’s Chief Executive Officer and Chief Financial Officer, to allow timely decisions regarding required disclosure. Additionally, there were no changes in United Community’s internal control over financial reporting that occurred during the quarter ended December 31, 2015, that have materially affected, or are reasonably likely to materially affect, United Community’s internal control over financial reporting. See Management’s Report on Internal Control Over Financial Reporting and the Report of Independent Registered Public Accounting Firm on Internal Control Over Financial Reporting, both of which are contained in Item 8 of this Form 10-K and incorporated herein by reference.
Item 9B. | Other Information |
None.
PART III
Item 10. | Directors, Executive Officers and Corporate Governance |
Information relating to United Community’s directors, nominees for directorship, executive officers, and board committees is provided in, and incorporated by reference from, the proxy statement for the 2016 Annual Meeting of Shareholders of United Community (Proxy Statement) to be filed with the SEC on or about March 18, 2016, under the heading EXECUTIVE OFFICERS and under the captions Nominees for Director, Continuing Directors, and Board Committees following the heading PROPOSAL 1—ELECTION OF DIRECTORS. Information regarding compliance with Section 16(a) of the Securities Act of 1943 is provided in the Proxy Statement under the heading SECTION 16(a) BENEFICIAL OWNERSHIP REPORTING COMPLIANCE and is incorporated herein by reference. There have been no material changes to the procedures by which shareholders may recommend nominees to the board of directors.
Item 11. | Executive Compensation |
Information relating to director compensation is set forth in the Proxy Statement under the caption Compensation of Non-Employee Directors, following the heading PROPOSAL 1—ELECTION OF DIRECTORS, and information relating to executive compensation is set forth in the Proxy Statement under the headings COMPENSATION DISCUSSION AND ANALYSIS and COMPENSATION OF EXECUTIVE OFFICERS. Such information from the Proxy Statement is incorporated herein by reference.
The sections of the Proxy Statement under the heading COMPENSATION COMMITTEE REPORT and within the Compensation Committee subsection under the caption Board Committees following the heading PROPOSAL 1 – ELECTION OF DIRECTORS is incorporated herein by reference.
Item 12. | Security Ownership of Certain Beneficial Owners and Management and Related Shareholder Matters |
The information contained in the Proxy Statement under the caption Security Ownership of Certain Beneficial Owners and Management is incorporated herein by reference.
United Community maintains the United Community Financial Corp. 1999 Long-Term Incentive Plan (1999 Plan) under which it issued equity securities to its directors, officers and employees in exchange for goods or services. The 1999 Plan was approved by United Community’s shareholders at the 1999 Special Meeting of Shareholders.
111
On April 26, 2007, shareholders approved the United Community Financial Corp. 2007 Long-Term Incentive Plan (2007 Plan). The purpose of the 2007 Plan is the same as that of the 1999 Plan. The 2007 Plan provided for the issuance of up to 2,000,000 shares and is to be used for awards of restricted stock shares, stock options, performance awards, stock appreciation rights (SARs), or other forms of stock-based incentive awards.
On April 30, 2015, shareholders approved the United Community Financial Corp. 2015 Long Term Incentive Compensation Plan (the 2015 Plan). The purpose of the 2015 Plan is to provide a means through which United Community may attract and retain employees and non-employee directors, to provide incentives that align their interest with those of United Community’s shareholders and promote the success of United Community’s business. The 2015 Plan provides for the issuance of up to 1,200,000 shares that are to be used for awards of stock options, stock awards, stock units, stock appreciation rights, annual bonus awards and long-term incentive awards.
Further description of the 1999 Plan, 2007 Plan and 2015 Plan is included in Note 17 to the consolidated financial statements and incorporated herein by reference.
The following table shows, as of December 31, 2015, the number of common shares issuable upon the exercise of outstanding stock options, the weighted average exercise price of those stock options, the number of common shares issued under restricted stock grants, the weighted average share price of those grants, and the number of common shares remaining for future issuance under the 2007 Plan, excluding shares issuable upon exercise of outstanding stock options.
Equity Compensation Plan Information
| | (a) | | | (b) | | | (a) | | | (b) | | | (c) | |
Plan Category | | Number of
securities to be issued upon
exercise of
outstanding
options | | | Weighted-
average exercise
price of
outstanding
options | | | Number of
securities to be
issued upon
vesting of
restricted stock
awards | | | Weighted-
average grant
price of
restricted stock
awards | | | Number of
securities
remaining
available for
future issuance
under equity
compensation
plans (excluding
securities
reflected in
column (a)) | |
Equity
compensation
plans approved by
security holders | | | 558,581 | | | $ | 2.51 | | | | 260,490 | | | $ | 4.68 | | | | 1,165,488 | |
Item 13. | Certain Relationships and Related Transactions and Director Independence |
The information contained in the Proxy Statement under the captions Board Meetings and Committees, and Compensation of Executive Officers –Related Person Transactions is incorporated herein by reference.
Item 14. | Principal Accounting Fees and Services |
The information relating to audit fees and pre-approval of services provided by United Community’s principal accountant is contained in the Proxy Statement under the captions Audit Fees and Audit and Non-Audit Pre-Approval Policy following the heading Proposal 3 – Ratification of the Selection of Our Independent Registered Public Accounting Firm is incorporated herein by reference.
112
PART IV
Item 15. | Exhibits and Financial Statement Schedules |
(1) | The financial statements filed as part of this Annual Report on Form 10-K are listed below: |
| 1. | Consolidated Statements of Financial Condition as of December 31, 2014 and 2015. |
| 2. | Consolidated Statements of Operations and Comprehensive Income (Loss) for 2013, 2014, and 2015. |
| 3. | Consolidated Statements of Shareholders’ Equity as of December 31, 2012, 2013, 2014, and 2015. |
| 4. | Consolidated Statements of Cash Flows for 2013, 2014, and 2015. |
| 5. | Notes to Consolidated Financial Statements. |
| 6. | Report of Independent Registered Public Accounting Firm, dated March 11, 2016. |
| 7. | Management’s Report on Internal Control over Financial Reporting. |
(2) | Financial Statement Schedules. All schedules are omitted because they are not applicable or the required information is shown in the financial statements or notes thereto. |
| 3.1 | Articles of Incorporation |
| 3.2 | Amendment to Articles of Incorporation |
| 3.3 | Amended Code of Regulations |
| 11 | Statement Regarding Computation of Per Share Earnings |
| 21 | Subsidiaries of Registrant |
| 23 | Crowe Horwath LLP Consent |
| 31.1 | Section 302 Certification by Chief Executive Officer |
| 31.2 | Section 302 Certification by Chief Financial Officer |
| 32 | Certification of Financial Statements by Chief Executive Officer and Chief Financial Officer |
113
SIGNATURES
Pursuant to the requirements of Section 13 or 15(d) of the Securities Exchange Act of 1934, the Registrant has duly caused this report to be signed on its behalf by the undersigned, thereunto duly authorized.
|
UNITED COMMUNITY FINANCIAL CORP. |
/s/ Gary M. Small |
Gary M. Small Chief Executive Officer, Principal Executive Officer and Director |
(Duly Authorized Representative) |
Date: March 11, 2016 |
Pursuant to the requirements of the Securities Exchange Act of 1934, this report has been signed below by the following persons on behalf of the registrant and in the capacities and on the dates indicated.
/s/ Richard J. Schiraldi | | /s/ Gary M. Small |
Richard J. Schiraldi | | Gary M. Small |
Chairman of the Board and Director | | Chief Executive Officer, Principal Executive Officer and Director |
Date: March 11, 2016 | | Date: March 11, 2016 |
| | |
/s/ Timothy W. Esson | | /s/ Marty E. Adams |
Timothy W. Esson | | Marty E. Adams |
Chief Financial Officer and Principal Financial Officer | | Director |
Date: March 11, 2016 | | Date: March 11, 2016 |
| | |
/s/ Zahid Afzal | | /s/ Patrick W. Bevack |
Zahid Afzal | | Patrick W. Bevack |
Director | | Director |
Date: March 11, 2016 | | Date: March 11, 2016 |
| | |
/s/ Lee Burdman | | /s/ Scott N. Crewson |
Lee Burdman | | Scott N. Crewson |
Director | | Director |
Date: March 11, 2016 | | Date: March 11, 2016 |
| | |
/s/ Scott D. Hunter | | /s/ Ellen Tressel |
Scott D. Hunter | | Ellen Tressel |
Director | | Director |
Date: March 11, 2016 | | Date: March 11, 2016 |
114
INDEX TO EXHIBITS
Exhibit Number | | | | |
| | | | |
3.1 | | Articles of Incorporation | | Incorporated by reference to the Registration Statement on Form S-1 filed by United Community on March 13, 1998 (S-1) (Film No. 98565717) with the Securities and Exchange Commission (SEC), Exhibit 3.1 |
| | | | |
3.2 | | Amendment to Articles of Incorporation | | Incorporated by reference to the Form 8-A filed by United Community on June 5, 1998 (Film No. 98642962) with the SEC, Exhibit 2(b) |
| | | | |
3.3 | | Amended Code of Regulations | | Incorporated by reference to the 1998 Form 10-K filed by United Community on March 31, 1999 via Edgar, film number 99582343, Exhibit 3.2 |
| | | | |
10.1 | | The Home Savings and Loan Company of Youngstown, Ohio Employee Stock Ownership Plan | | Incorporated by reference to the 2001 Form 10-K filed by United Community on March 29, 2002 via Edgar, film number 02593161, Exhibit 10.1 |
| | | | |
10.2 | | Consulting Agreement between The Home Savings and Loan Company of Youngstown, Ohio and Patrick W. Bevack dated March 17, 2014 | | Incorporated by reference to the Form 8-K filed by United Community on March 21, 2014 via Edgar, film number 14709682, Exhibit 10.1 |
| | | | |
10.3 | | Employment Agreement between The Home Savings and Loan Company of Youngstown, Ohio and Gary M. Small dated March 17, 2014 | | Incorporated by reference to the Form 8-K filed by United Community on March 21, 2014 via Edgar, film number 14709682, Exhibit 10.2 |
| | | | |
10.4 | | Employment Agreement between The Home Savings and Loan Company of Youngstown, Ohio and Jude J. Nohra dated April 30, 2010 | | Incorporated by reference to the Second Quarter Form 10-Q filed by United Community on August 16, 2010 via Edgar, film number 101021114, Exhibit 10.4 |
| | | | |
10.5 | | Employment Agreement between The Home Savings and Loan Company of Youngstown, Ohio and Matthew T. Garrity dated April 30, 2010 | | Incorporated by reference to the 2014 Form 10-K filed by United Community on March 13, 2015 via Edgar, film number 15697203, Exhibit 10.5 |
| | | | |
10.6 | | Employment Agreement between The Home Savings and Loan Company of Youngstown, Ohio and Timothy W. Esson dated September 29, 2011 | | Incorporated by reference to the 2014 Form 10-K filed by United Community on March 13, 2015 via Edgar, film number 15697203, Exhibit 10.6 |
| | | | |
10.7 | | 2013 Executive Incentive Plan | | Incorporated by reference to the Form 8-K filed by United Community on March 28, 2013 via Edgar, film number 13724891, Exhibit 10.1 |
| | | | |
10.8 | | Amended and Restated 2014 Executive Incentive Plan | | Incorporated by reference to the Form 8-K filed by United Community on September 29, 2014 via Edgar, film number 141127272, Exhibit 10.1 |
| | | | |
10.9 | | 2014 Long Term Incentive Plan | | Incorporated by reference to the Form 8-K filed by United Community on January 27, 2014 via Edgar, film number 14549383, Exhibit 10.2 |
| | | | |
10.10 | | United Community 2015 Long Term Incentive Plan | | Incorporated by reference to the Form 8-K filed by United Community on May 5, 2015 via Edgar, film number 15833578, Exhibit 10.1 |
| | | | |
10.11 | | United Community 2015 Performance Share Units Grant Agreement to the 2015 Long Term Incentive Plan | | Incorporated by reference to the Form 8-K filed by United Community on June 2, 2015 via Edgar, film number 15904676, Exhibit 10.1 |
115
Exhibit Number | | | | |
| | | | |
10.12 | | United Community 2015 Annual Incentive Award Grant Agreement to the 2015 Long Term Incentive Plan | | Incorporated by reference to the Form 8-K filed by United Community on June 2, 2015 via Edgar, film number 15904676, Exhibit 10.2 |
| | | | |
10.13 | | United Community 2014 Performance Share Units Grant Agreement to the 2007 Long Term Incentive Plan | | Incorporated by reference to the Form 8-K filed by United Community on June 2, 2015 via Edgar, film number 15904676, Exhibit 10.3 |
| | | | |
10.14 | | United Community 2014 Annual Incentive Award Grant Agreement to the 2007 Long Term Incentive Plan | | Incorporated by reference to the Form 8-K filed by United Community on June 2, 2015 via Edgar, film number 15904676, Exhibit 10.4 |
| | | | |
11 | | Statement Regarding Computation of Per Share Earnings | | Incorporated by reference to Note 23 to the Consolidated Financial Statements under Item 8 herein |
| | | | |
21 | | Subsidiaries of Registrant | | * |
| | | | |
23 | | Crowe Horwath LLP Consent | | * |
| | | | |
31.1 | | Section 302 Certification by Chief Executive Officer | | * |
| | | | |
31.2 | | Section 302 Certification by Chief Financial Officer | | * |
| | | | |
32 | | Certification of Financial Statements by Chief Executive Officer and Chief Financial Officer | | * |
| | | | |
101 | | Interactive Data File | | * |
116