UNITED STATES
SECURITIES AND EXCHANGE COMMISSION
Washington, D.C. 20549
FORM N-CSR
CERTIFIED SHAREHOLDER REPORT OF REGISTERED
MANAGEMENT INVESTMENT COMPANIES
Investment Company Act file number 811-3587
Fidelity Financial Trust
(Exact name of registrant as specified in charter)
245 Summer St., Boston, Massachusetts 02210
(Address of principal executive offices) (Zip code)
William C. Coffey, Secretary
245 Summer St.
Boston, Massachusetts 02210
(Name and address of agent for service)
Registrant's telephone number, including area code:
617-563-7000
| |
Date of fiscal year end: | November 30 |
| |
Date of reporting period: | November 30, 2018 |
Item 1.
Reports to Stockholders
Fidelity® Independence Fund
Annual Report November 30, 2018 |
 |
Beginning on January 1, 2021, as permitted by regulations adopted by the Securities and Exchange Commission, paper copies of a fund’s shareholder reports will no longer be sent by mail, unless you specifically request paper copies of the reports from the fund or from your financial intermediary, such as a financial advisor, broker-dealer or bank. Instead, the reports will be made available on a website, and you will be notified by mail each time a report is posted and provided with a website link to access the report.
If you already elected to receive shareholder reports electronically, you will not be affected by this change and you need not take any action. You may elect to receive shareholder reports and other communications from a fund electronically, by contacting your financial intermediary. For Fidelity customers, visit Fidelity's web site or call Fidelity using the contact information listed below.
You may elect to receive all future reports in paper free of charge. If you wish to continue receiving paper copies of your shareholder reports, you may contact your financial intermediary or, if you are a Fidelity customer, visit Fidelity’s website, or call Fidelity at the applicable toll-free number listed below. Your election to receive reports in paper will apply to all funds held with the fund complex/your financial intermediary.
| Account Type | Website | Phone Number |
| Brokerage, Mutual Fund, or Annuity Contracts: | fidelity.com/mailpreferences | 1-800-343-3548 |
| Employer Provided Retirement Accounts: | netbenefits.fidelity.com/preferences (choose 'no' under Required Disclosures to continue to print) | 1-800-343-0860 |
| Advisor Sold Accounts Serviced Through Your Financial Intermediary: | Contact Your Financial Intermediary | Your Financial Intermediary's phone number |
| Advisor Sold Accounts Serviced by Fidelity: | institutional.fidelity.com | 1-877-208-0098 |
Contents
To view a fund's proxy voting guidelines and proxy voting record for the 12-month period ended June 30, visit http://www.fidelity.com/proxyvotingresults or visit the Securities and Exchange Commission's (SEC) web site at http://www.sec.gov.
You may also call 1-800-544-8544 to request a free copy of the proxy voting guidelines.
Standard & Poor's, S&P and S&P 500 are registered service marks of The McGraw-Hill Companies, Inc. and have been licensed for use by Fidelity Distributors Corporation.
Other third-party marks appearing herein are the property of their respective owners.
All other marks appearing herein are registered or unregistered trademarks or service marks of FMR LLC or an affiliated company. © 2019 FMR LLC. All rights reserved.
This report and the financial statements contained herein are submitted for the general information of the shareholders of the Fund. This report is not authorized for distribution to prospective investors in the Fund unless preceded or accompanied by an effective prospectus.
A fund files its complete schedule of portfolio holdings with the SEC for the first and third quarters of each fiscal year on Form N-Q. Forms N-Q are available on the SEC’s web site at http://www.sec.gov. A fund's Forms N-Q may be reviewed and copied at the SEC’s Public Reference Room in Washington, DC. Information regarding the operation of the SEC's Public Reference Room may be obtained by calling 1-800-SEC-0330.
For a complete list of a fund's portfolio holdings, view the most recent holdings listing, semiannual report, or annual report on Fidelity's web site at http://www.fidelity.com, http://www.institutional.fidelity.com, or http://www.401k.com, as applicable.
NOT FDIC INSURED •MAY LOSE VALUE •NO BANK GUARANTEE
Neither the Fund nor Fidelity Distributors Corporation is a bank.
Performance: The Bottom Line
Average annual total return reflects the change in the value of an investment, assuming reinvestment of distributions from dividend income and capital gains (the profits earned upon the sale of securities that have grown in value, if any) and assuming a constant rate of performance each year. The hypothetical investment and the average annual total returns do not reflect the deduction of taxes that a shareholder would pay on fund distributions or the redemption of fund shares. During periods of reimbursement by Fidelity, a fund’s total return will be greater than it would be had the reimbursement not occurred. How a fund did yesterday is no guarantee of how it will do tomorrow.
Average Annual Total Returns
| For the periods ended November 30, 2018 | Past 1 year | Past 5 years | Past 10 years |
| Fidelity® Independence Fund | 3.99% | 8.29% | 14.09% |
$10,000 Over 10 Years
Let's say hypothetically that $10,000 was invested in Fidelity® Independence Fund, a class of the fund, on November 30, 2008.
The chart shows how the value of your investment would have changed, and also shows how the S&P 500® Index performed over the same period.

| Period Ending Values |
| $37,354 | Fidelity® Independence Fund |
| $38,109 | S&P 500® Index |
Management's Discussion of Fund Performance
Market Recap: The S&P 500
® index gained 6.27% for the 12 months ending November 30, 2018, as the U.S. equity bellwether declined sharply in October after climbing steadily beginning in May and achieving a record close in late September. Rising U.S. Treasury yields and concern about peaking corporate earnings growth sent many investors fleeing from risk assets at a time when they were still dealing with lingering uncertainty related to global trade and the U.S. Federal Reserve picking up the pace of interest rate hikes. The index returned -6.84% in October alone, its largest monthly drop in roughly seven years, and then endured a highly volatile November in which it gained 2.04%. For the full year, growth stocks within the index maintained a sizable advantage over their value counterparts, extending a trend that began in early 2017. A number of economically sensitive sectors dropped to the bottom of the 12-month performance scale, with materials (-7%) and energy (-2%) faring worst, followed by industrials (-1%) and financials (0%). In contrast, the defensive-oriented health care sector gained about 16% to lead the way. Consumer discretionary and information technology were rattled in October but earlier strength resulted in each advancing roughly 13% for the full 12 months. The newly reconstituted communication services sector, which includes dividend-rich telecom stocks, rose about 4%. Real estate (+5%), consumer staples (+3%) and utilities (+2%) also advanced but lagged the broader market.
Comments from Portfolio Manager Jeffrey Feingold: For the fiscal year, the fund’s share classes gained about 4%, trailing the benchmark S&P 500
® index. The fund's underperformance relative to the benchmark was primarily a function of security selection within the industrials, consumer discretionary and consumer staples sectors. Among industrials stocks, my decision to overweight a number of higher-quality defense companies hampered our relative result. In fact, the largest individual detractor was aerospace and defense technology company Northrop Grumman. Looking at the consumer sectors, untimely positioning in global retailer Walmart, which was sold prior to the end of the period, and an overweighted stake in apparel company PVH, hampered our relative result. On the plus side, the fund’s relative performance benefitted from overall exposure to growth stocks, as well as strong security selection within the technology sector this period. An out-of-benchmark stake in enterprise resource-planning software provider Workday was the top relative contributor, as the company continued to gain market share among cloud-based financial management firms. Lastly, within the newly reconstituted communications services sector, Netflix was the fund’s second-best contributor. This period, key metrics, including U.S. and international subscribers, remained extremely strong and above expectations.
The views expressed above reflect those of the portfolio manager(s) only through the end of the period as stated on the cover of this report and do not necessarily represent the views of Fidelity or any other person in the Fidelity organization. Any such views are subject to change at any time based upon market or other conditions and Fidelity disclaims any responsibility to update such views. These views may not be relied on as investment advice and, because investment decisions for a Fidelity fund are based on numerous factors, may not be relied on as an indication of trading intent on behalf of any Fidelity fund.
Investment Summary (Unaudited)
Top Ten Stocks as of November 30, 2018
| | % of fund's net assets |
| Microsoft Corp. | 6.7 |
| Alphabet, Inc. Class A | 4.9 |
| Amazon.com, Inc. | 4.1 |
| Apple, Inc. | 2.8 |
| UnitedHealth Group, Inc. | 2.7 |
| JPMorgan Chase & Co. | 2.2 |
| Home Depot, Inc. | 1.9 |
| American Tower Corp. | 1.9 |
| Northrop Grumman Corp. | 1.7 |
| Facebook, Inc. Class A | 1.7 |
| | 30.6 |
Top Five Market Sectors as of November 30, 2018
| | % of fund's net assets |
| Information Technology | 25.5 |
| Health Care | 16.1 |
| Financials | 11.9 |
| Industrials | 11.4 |
| Consumer Discretionary | 11.2 |
Asset Allocation (% of fund's net assets)
| As of November 30, 2018 * |
| | Stocks | 98.5% |
| | Convertible Securities | 0.4% |
| | Short-Term Investments and Net Other Assets (Liabilities) | 1.1% |

* Foreign investments - 6.7%
Schedule of Investments November 30, 2018
Showing Percentage of Net Assets
| Common Stocks - 98.5% | | | |
| | | Shares | Value (000s) |
| COMMUNICATION SERVICES - 8.4% | | | |
| Entertainment - 1.8% | | | |
| Activision Blizzard, Inc. | | 319,900 | $15,957 |
| Electronic Arts, Inc. (a) | | 165,800 | 13,939 |
| Netflix, Inc. (a) | | 125,100 | 35,795 |
| | | | 65,691 |
| Interactive Media & Services - 6.6% | | | |
| Alphabet, Inc.: | | | |
| Class A (a) | | 161,500 | 179,208 |
| Class C (a) | | 400 | 438 |
| Facebook, Inc. Class A (a) | | 436,440 | 61,368 |
| | | | 241,014 |
|
| TOTAL COMMUNICATION SERVICES | | | 306,705 |
|
| CONSUMER DISCRETIONARY - 11.2% | | | |
| Diversified Consumer Services - 0.4% | | | |
| Service Corp. International | | 349,300 | 16,138 |
| Hotels, Restaurants & Leisure - 2.0% | | | |
| Domino's Pizza, Inc. | | 36,000 | 9,984 |
| McDonald's Corp. | | 324,300 | 61,134 |
| | | | 71,118 |
| Household Durables - 0.3% | | | |
| D.R. Horton, Inc. | | 324,500 | 12,078 |
| Internet & Direct Marketing Retail - 4.1% | | | |
| Amazon.com, Inc. (a) | | 87,500 | 147,890 |
| Multiline Retail - 0.6% | | | |
| Dollar Tree, Inc. (a) | | 246,000 | 21,345 |
| Specialty Retail - 3.0% | | | |
| Best Buy Co., Inc. | | 294,900 | 19,048 |
| Home Depot, Inc. | | 386,700 | 69,730 |
| TJX Companies, Inc. | | 389,000 | 19,003 |
| | | | 107,781 |
| Textiles, Apparel & Luxury Goods - 0.8% | | | |
| PVH Corp. | | 279,300 | 30,865 |
|
| TOTAL CONSUMER DISCRETIONARY | | | 407,215 |
|
| CONSUMER STAPLES - 4.0% | | | |
| Beverages - 1.6% | | | |
| Constellation Brands, Inc. Class A (sub. vtg.) | | 110,600 | 21,651 |
| Fever-Tree Drinks PLC | | 127,939 | 3,900 |
| Monster Beverage Corp. (a) | | 535,200 | 31,941 |
| | | | 57,492 |
| Food & Staples Retailing - 0.9% | | | |
| Costco Wholesale Corp. | | 137,900 | 31,894 |
| Food Products - 0.7% | | | |
| Post Holdings, Inc. (a) | | 196,400 | 19,002 |
| The J.M. Smucker Co. | | 82,400 | 8,612 |
| | | | 27,614 |
| Personal Products - 0.8% | | | |
| elf Beauty, Inc. (a)(b) | | 865,100 | 11,039 |
| Unilever NV (Certificaten Van Aandelen) (Bearer) | | 336,100 | 18,652 |
| | | | 29,691 |
|
| TOTAL CONSUMER STAPLES | | | 146,691 |
|
| ENERGY - 5.3% | | | |
| Energy Equipment & Services - 0.2% | | | |
| Baker Hughes, a GE Co. Class A | | 415,800 | 9,489 |
| Oil, Gas & Consumable Fuels - 5.1% | | | |
| Anadarko Petroleum Corp. | | 758,200 | 40,109 |
| ConocoPhillips Co. | | 382,700 | 25,327 |
| Continental Resources, Inc. (a) | | 265,600 | 12,143 |
| Devon Energy Corp. | | 652,700 | 17,642 |
| Enterprise Products Partners LP | | 379,800 | 9,970 |
| EOG Resources, Inc. | | 463,100 | 47,843 |
| Pioneer Natural Resources Co. | | 94,900 | 14,021 |
| Suncor Energy, Inc. | | 537,900 | 17,344 |
| | | | 184,399 |
|
| TOTAL ENERGY | | | 193,888 |
|
| FINANCIALS - 11.9% | | | |
| Banks - 6.5% | | | |
| Bank of America Corp. | | 1,852,200 | 52,602 |
| Citigroup, Inc. | | 550,800 | 35,686 |
| JPMorgan Chase & Co. | | 727,000 | 80,835 |
| SunTrust Banks, Inc. | | 227,300 | 14,249 |
| Wells Fargo & Co. | | 1,009,100 | 54,774 |
| | | | 238,146 |
| Capital Markets - 3.5% | | | |
| BlackRock, Inc. Class A | | 63,800 | 27,307 |
| Charles Schwab Corp. | | 599,300 | 26,849 |
| MSCI, Inc. | | 132,300 | 20,783 |
| Northern Trust Corp. | | 135,300 | 13,426 |
| PJT Partners, Inc. | | 235,900 | 11,142 |
| S&P Global, Inc. | | 93,900 | 17,171 |
| The Blackstone Group LP | | 279,200 | 9,417 |
| | | | 126,095 |
| Insurance - 1.9% | | | |
| Chubb Ltd. | | 312,900 | 41,847 |
| The Travelers Companies, Inc. | | 220,400 | 28,734 |
| | | | 70,581 |
|
| TOTAL FINANCIALS | | | 434,822 |
|
| HEALTH CARE - 16.1% | | | |
| Biotechnology - 4.3% | | | |
| Acorda Therapeutics, Inc. (a) | | 345,700 | 7,063 |
| Alexion Pharmaceuticals, Inc. (a) | | 334,200 | 41,157 |
| Alnylam Pharmaceuticals, Inc. (a) | | 76,261 | 6,189 |
| Amgen, Inc. | | 215,900 | 44,961 |
| Amicus Therapeutics, Inc. (a)(b) | | 1,298,135 | 14,331 |
| Intercept Pharmaceuticals, Inc. (a) | | 149,900 | 16,625 |
| Regeneron Pharmaceuticals, Inc. (a) | | 39,000 | 14,260 |
| Vertex Pharmaceuticals, Inc. (a) | | 66,500 | 12,023 |
| | | | 156,609 |
| Health Care Equipment & Supplies - 3.1% | | | |
| Becton, Dickinson & Co. | | 149,800 | 37,862 |
| Boston Scientific Corp. (a) | | 1,449,300 | 54,595 |
| Danaher Corp. | | 184,100 | 20,166 |
| | | | 112,623 |
| Health Care Providers & Services - 5.8% | | | |
| CVS Health Corp. | | 462,500 | 37,093 |
| HCA Holdings, Inc. | | 171,900 | 24,752 |
| Humana, Inc. | | 136,900 | 45,104 |
| Ryman Healthcare Group Ltd. | | 628,252 | 5,005 |
| UnitedHealth Group, Inc. | | 348,100 | 97,941 |
| Wellcare Health Plans, Inc. (a) | | 7,300 | 1,861 |
| | | | 211,756 |
| Life Sciences Tools & Services - 1.5% | | | |
| Agilent Technologies, Inc. | | 200,200 | 14,484 |
| Thermo Fisher Scientific, Inc. | | 165,100 | 41,201 |
| | | | 55,685 |
| Pharmaceuticals - 1.4% | | | |
| AstraZeneca PLC sponsored ADR | | 565,700 | 22,526 |
| Jazz Pharmaceuticals PLC (a) | | 121,000 | 18,295 |
| Nektar Therapeutics (a) | | 211,816 | 8,555 |
| | | | 49,376 |
|
| TOTAL HEALTH CARE | | | 586,049 |
|
| INDUSTRIALS - 11.4% | | | |
| Aerospace & Defense - 7.5% | | | |
| General Dynamics Corp. | | 243,400 | 45,002 |
| Huntington Ingalls Industries, Inc. | | 160,700 | 34,631 |
| Lockheed Martin Corp. | | 103,100 | 30,974 |
| Northrop Grumman Corp. | | 241,500 | 62,761 |
| Raytheon Co. | | 248,200 | 43,519 |
| United Technologies Corp. | | 461,100 | 56,180 |
| | | | 273,067 |
| Air Freight & Logistics - 0.2% | | | |
| C.H. Robinson Worldwide, Inc. | | 69,000 | 6,371 |
| Airlines - 0.3% | | | |
| American Airlines Group, Inc. | | 290,300 | 11,658 |
| Commercial Services & Supplies - 0.3% | | | |
| Copart, Inc. (a) | | 206,600 | 10,574 |
| Construction & Engineering - 0.3% | | | |
| Fluor Corp. | | 318,800 | 13,048 |
| Machinery - 0.6% | | | |
| Xylem, Inc. | | 283,900 | 20,719 |
| Professional Services - 1.4% | | | |
| IHS Markit Ltd. (a) | | 956,575 | 51,052 |
| Road & Rail - 0.8% | | | |
| Norfolk Southern Corp. | | 164,800 | 28,138 |
|
| TOTAL INDUSTRIALS | | | 414,627 |
|
| INFORMATION TECHNOLOGY - 25.1% | | | |
| IT Services - 5.2% | | | |
| Accenture PLC Class A | | 178,000 | 29,285 |
| Adyen BV | | 2,100 | 1,087 |
| FleetCor Technologies, Inc. (a) | | 65,400 | 12,648 |
| GoDaddy, Inc. (a) | | 10,800 | 705 |
| MasterCard, Inc. Class A | | 223,200 | 44,879 |
| PayPal Holdings, Inc. (a) | | 298,300 | 25,597 |
| Shopify, Inc. Class A (a) | | 104,200 | 15,861 |
| Visa, Inc. Class A | | 404,600 | 57,336 |
| | | | 187,398 |
| Semiconductors & Semiconductor Equipment - 2.9% | | | |
| Broadcom, Inc. | | 116,400 | 27,635 |
| Lam Research Corp. | | 69,600 | 10,924 |
| NVIDIA Corp. | | 222,900 | 36,429 |
| Qualcomm, Inc. | | 513,300 | 29,905 |
| | | | 104,893 |
| Software - 14.2% | | | |
| 2U, Inc. (a) | | 234,100 | 13,669 |
| Adobe, Inc. (a) | | 175,100 | 43,931 |
| Autodesk, Inc. (a) | | 173,600 | 25,085 |
| Citrix Systems, Inc. | | 340,600 | 37,115 |
| DocuSign, Inc. | | 93,800 | 3,917 |
| HubSpot, Inc. (a) | | 22,169 | 3,082 |
| Intuit, Inc. | | 230,300 | 49,406 |
| Microsoft Corp. | | 2,189,100 | 242,747 |
| Nuance Communications, Inc. (a) | | 549,300 | 8,783 |
| Nutanix, Inc. Class A (a) | | 244,400 | 10,927 |
| Salesforce.com, Inc. (a) | | 261,100 | 37,275 |
| Tableau Software, Inc. (a) | | 152,700 | 19,033 |
| Tanium, Inc. Class B (a)(c)(d) | | 98,100 | 853 |
| Workday, Inc. Class A (a) | | 128,500 | 21,074 |
| | | | 516,897 |
| Technology Hardware, Storage & Peripherals - 2.8% | | | |
| Apple, Inc. | | 575,800 | 102,826 |
|
| TOTAL INFORMATION TECHNOLOGY | | | 912,014 |
|
| MATERIALS - 2.4% | | | |
| Chemicals - 1.8% | | | |
| CF Industries Holdings, Inc. | | 250,800 | 10,581 |
| DowDuPont, Inc. | | 593,200 | 34,317 |
| LyondellBasell Industries NV Class A | | 233,700 | 21,807 |
| | | | 66,705 |
| Metals & Mining - 0.6% | | | |
| Newmont Mining Corp. | | 627,600 | 20,297 |
|
| TOTAL MATERIALS | | | 87,002 |
|
| REAL ESTATE - 2.4% | | | |
| Equity Real Estate Investment Trusts (REITs) - 2.4% | | | |
| American Tower Corp. | | 414,300 | 68,148 |
| Crown Castle International Corp. | | 160,200 | 18,407 |
| | | | 86,555 |
| UTILITIES - 0.3% | | | |
| Electric Utilities - 0.3% | | | |
| Vistra Energy Corp. (a) | | 430,877 | 10,117 |
| TOTAL COMMON STOCKS | | | |
| (Cost $2,700,789) | | | 3,585,685 |
|
| Convertible Preferred Stocks - 0.4% | | | |
| CONSUMER DISCRETIONARY - 0.0% | | | |
| Hotels, Restaurants & Leisure - 0.0% | | | |
| Neutron Holdings, Inc. Series C (c)(d) | | 7,644,500 | 1,398 |
| INFORMATION TECHNOLOGY - 0.4% | | | |
| Internet Software & Services - 0.4% | | | |
| Lyft, Inc.: | | | |
| Series H (c)(d) | | 236,501 | 11,199 |
| Series I (c)(d) | | 42,235 | 2,000 |
| | | | 13,199 |
| TOTAL CONVERTIBLE PREFERRED STOCKS | | | |
| (Cost $12,798) | | | 14,597 |
|
| Money Market Funds - 1.2% | | | |
| Fidelity Cash Central Fund, 2.27% (e) | | 34,169,615 | 34,176 |
| Fidelity Securities Lending Cash Central Fund 2.27% (e)(f) | | 10,039,936 | 10,041 |
| TOTAL MONEY MARKET FUNDS | | | |
| (Cost $44,217) | | | 44,217 |
| TOTAL INVESTMENT IN SECURITIES - 100.1% | | | |
| (Cost $2,757,804) | | | 3,644,499 |
| NET OTHER ASSETS (LIABILITIES) - (0.1)% | | | (3,005) |
| NET ASSETS - 100% | | | $3,641,494 |
Legend
(a) Non-income producing
(b) Security or a portion of the security is on loan at period end.
(c) Restricted securities - Investment in securities not registered under the Securities Act of 1933 (excluding 144A issues). At the end of the period, the value of restricted securities (excluding 144A issues) amounted to $15,450,000 or 0.4% of net assets.
(d) Level 3 security
(e) Affiliated fund that is generally available only to investment companies and other accounts managed by Fidelity Investments. The rate quoted is the annualized seven-day yield of the fund at period end. A complete unaudited listing of the fund's holdings as of its most recent quarter end is available upon request. In addition, each Fidelity Central Fund's financial statements, which are not covered by the Fund's Report of Independent Registered Public Accounting Firm, are available on the SEC's website or upon request.
(f) Investment made with cash collateral received from securities on loan.
Additional information on each restricted holding is as follows:
| Security | Acquisition Date | Acquisition Cost (000s) |
| Lyft, Inc. Series H | 11/22/17 | $9,400 |
| Lyft, Inc. Series I | 6/27/18 | $2,000 |
| Neutron Holdings, Inc. Series C | 7/3/18 | $1,398 |
| Tanium, Inc. Class B | 4/21/17 | $487 |
Affiliated Central Funds
Information regarding fiscal year to date income earned by the Fund from investments in Fidelity Central Funds is as follows:
| Fund | Income earned |
| | (Amounts in thousands) |
| Fidelity Cash Central Fund | $503 |
| Fidelity Securities Lending Cash Central Fund | 994 |
| Total | $1,497 |
Amounts in the income column in the above table include any capital gain distributions from underlying funds, which are presented in the corresponding line-item in the Statement of Operations if applicable.
Investment Valuation
The following is a summary of the inputs used, as of November 30, 2018, involving the Fund's assets and liabilities carried at fair value. The inputs or methodology used for valuing securities may not be an indication of the risk associated with investing in those securities. For more information on valuation inputs, and their aggregation into the levels used below, please refer to the Investment Valuation section in the accompanying Notes to Financial Statements.
| | Valuation Inputs at Reporting Date: |
| Description | Total | Level 1 | Level 2 | Level 3 |
| (Amounts in thousands) | | | | |
| Investments in Securities: | | | | |
| Equities: | | | | |
| Communication Services | $306,705 | $306,705 | $-- | $-- |
| Consumer Discretionary | 408,613 | 407,215 | -- | 1,398 |
| Consumer Staples | 146,691 | 128,039 | 18,652 | -- |
| Energy | 193,888 | 193,888 | -- | -- |
| Financials | 434,822 | 434,822 | -- | -- |
| Health Care | 586,049 | 586,049 | -- | -- |
| Industrials | 414,627 | 414,627 | -- | -- |
| Information Technology | 925,213 | 911,161 | -- | 14,052 |
| Materials | 87,002 | 87,002 | -- | -- |
| Real Estate | 86,555 | 86,555 | -- | -- |
| Utilities | 10,117 | 10,117 | -- | -- |
| Money Market Funds | 44,217 | 44,217 | -- | -- |
| Total Investments in Securities: | $3,644,499 | $3,610,397 | $18,652 | $15,450 |
See accompanying notes which are an integral part of the financial statements.
Financial Statements
Statement of Assets and Liabilities
| Amounts in thousands (except per-share amounts) | | November 30, 2018 |
| Assets | | |
Investment in securities, at value (including securities loaned of $10,043) — See accompanying schedule:
Unaffiliated issuers (cost $2,713,587) | $3,600,282 | |
| Fidelity Central Funds (cost $44,217) | 44,217 | |
| Total Investment in Securities (cost $2,757,804) | | $3,644,499 |
| Receivable for investments sold | | 36,969 |
| Receivable for fund shares sold | | 270 |
| Dividends receivable | | 5,351 |
| Distributions receivable from Fidelity Central Funds | | 78 |
| Prepaid expenses | | 7 |
| Other receivables | | 154 |
| Total assets | | 3,687,328 |
| Liabilities | | |
| Payable for investments purchased | $29,287 | |
| Payable for fund shares redeemed | 4,895 | |
| Accrued management fee | 988 | |
| Other affiliated payables | 458 | |
| Other payables and accrued expenses | 171 | |
| Collateral on securities loaned | 10,035 | |
| Total liabilities | | 45,834 |
| Net Assets | | $3,641,494 |
| Net Assets consist of: | | |
| Paid in capital | | $2,394,036 |
| Total distributable earnings (loss) | | 1,247,458 |
| Net Assets | | $3,641,494 |
| Net Asset Value and Maximum Offering Price | | |
| Independence: | | |
| Net Asset Value, offering price and redemption price per share ($3,342,196 ÷ 87,079 shares) | | $38.38 |
| Class K: | | |
| Net Asset Value, offering price and redemption price per share ($299,298 ÷ 7,790 shares) | | $38.42 |
See accompanying notes which are an integral part of the financial statements.
Statement of Operations
| Amounts in thousands | | Year ended November 30, 2018 |
| Investment Income | | |
| Dividends | | $46,618 |
| Interest | | 1 |
| Income from Fidelity Central Funds | | 1,497 |
| Total income | | 48,116 |
| Expenses | | |
| Management fee | | |
| Basic fee | $21,281 | |
| Performance adjustment | (7,855) | |
| Transfer agent fees | 4,623 | |
| Accounting and security lending fees | 1,045 | |
| Custodian fees and expenses | 77 | |
| Independent trustees' fees and expenses | 20 | |
| Registration fees | 49 | |
| Audit | 72 | |
| Legal | 11 | |
| Miscellaneous | 26 | |
| Total expenses before reductions | 19,349 | |
| Expense reductions | (233) | |
| Total expenses after reductions | | 19,116 |
| Net investment income (loss) | | 29,000 |
| Realized and Unrealized Gain (Loss) | | |
| Net realized gain (loss) on: | | |
| Investment securities: | | |
| Unaffiliated issuers | 370,518 | |
| Fidelity Central Funds | 4 | |
| Foreign currency transactions | (23) | |
| Futures contracts | 3,190 | |
| Total net realized gain (loss) | | 373,689 |
| Change in net unrealized appreciation (depreciation) on: | | |
| Investment securities: | | |
| Unaffiliated issuers | (234,366) | |
| Fidelity Central Funds | (1) | |
| Assets and liabilities in foreign currencies | (12) | |
| Futures contracts | (2,863) | |
| Total change in net unrealized appreciation (depreciation) | | (237,242) |
| Net gain (loss) | | 136,447 |
| Net increase (decrease) in net assets resulting from operations | | $165,447 |
See accompanying notes which are an integral part of the financial statements.
Statement of Changes in Net Assets
| Amounts in thousands | Year ended November 30, 2018 | Year ended November 30, 2017 |
| Increase (Decrease) in Net Assets | | |
| Operations | | |
| Net investment income (loss) | $29,000 | $39,704 |
| Net realized gain (loss) | 373,689 | 459,249 |
| Change in net unrealized appreciation (depreciation) | (237,242) | 350,897 |
| Net increase (decrease) in net assets resulting from operations | 165,447 | 849,850 |
| Distributions to shareholders | (469,108) | – |
| Distributions to shareholders from net investment income | – | (18,779) |
| Distributions to shareholders from net realized gain | – | (191,464) |
| Total distributions | (469,108) | (210,243) |
| Share transactions - net increase (decrease) | 27,406 | (331,634) |
| Total increase (decrease) in net assets | (276,255) | 307,973 |
| Net Assets | | |
| Beginning of period | 3,917,749 | 3,609,776 |
| End of period | $3,641,494 | $3,917,749 |
| Other Information | | |
| Undistributed net investment income end of period | | $27,967 |
See accompanying notes which are an integral part of the financial statements.
Financial Highlights
Fidelity Independence Fund
| Years ended November 30, | 2018 | 2017 | 2016 | 2015 | 2014 |
| Selected Per–Share Data | | | | | |
| Net asset value, beginning of period | $41.90 | $35.38 | $39.08 | $40.89 | $35.10 |
| Income from Investment Operations | | | | | |
| Net investment income (loss)A | .29 | .40B | .20 | .05 | .10 |
| Net realized and unrealized gain (loss) | 1.25 | 8.21 | (1.44) | .13 | 5.80 |
| Total from investment operations | 1.54 | 8.61 | (1.24) | .18 | 5.90 |
| Distributions from net investment income | (.41) | (.18) | (.03) | (.04) | (.11) |
| Distributions from net realized gain | (4.65) | (1.91) | (2.43) | (1.95) | – |
| Total distributions | (5.06) | (2.09) | (2.46) | (1.99) | (.11) |
| Net asset value, end of period | $38.38 | $41.90 | $35.38 | $39.08 | $40.89 |
| Total ReturnC | 3.99% | 25.72% | (3.15)% | .63% | 16.87% |
| Ratios to Average Net AssetsD,E | | | | | |
| Expenses before reductions | .50% | .48% | .54% | .86% | .73% |
| Expenses net of fee waivers, if any | .50% | .48% | .54% | .86% | .73% |
| Expenses net of all reductions | .49% | .48% | .54% | .86% | .73% |
| Net investment income (loss) | .73% | 1.06%B | .59% | .12% | .27% |
| Supplemental Data | | | | | |
| Net assets, end of period (in millions) | $3,342 | $3,564 | $3,262 | $3,910 | $4,251 |
| Portfolio turnover rateF | 46% | 62% | 76% | 48% | 53% |
A Calculated based on average shares outstanding during the period.
B Net investment income per share reflects a large, non-recurring dividend which amounted to $.07 per share. Excluding this non-recurring dividend, the ratio of net investment income (loss) to average net assets would have been .89%.
C Total returns would have been lower if certain expenses had not been reduced during the applicable periods shown.
D Fees and expenses of any underlying Fidelity Central Funds are not included in the Fund's expense ratio. The Fund indirectly bears its proportionate share of the expenses of any underlying Fidelity Central Funds.
E Expense ratios reflect operating expenses of the class. Expenses before reductions do not reflect amounts reimbursed by the investment adviser or reductions from brokerage service arrangements or reductions from other expense offset arrangements and do not represent the amount paid by the class during periods when reimbursements or reductions occur. Expenses net of fee waivers reflect expenses after reimbursement by the investment adviser but prior to reductions from brokerage service arrangements or other expense offset arrangements. Expenses net of all reductions represent the net expenses paid by the class.
F Amount does not include the portfolio activity of any underlying Fidelity Central Funds.
See accompanying notes which are an integral part of the financial statements.
Fidelity Independence Fund Class K
| Years ended November 30, | 2018 | 2017 | 2016 | 2015 | 2014 |
| Selected Per–Share Data | | | | | |
| Net asset value, beginning of period | $41.94 | $35.41 | $39.12 | $40.93 | $35.14 |
| Income from Investment Operations | | | | | |
| Net investment income (loss)A | .32 | .43B | .23 | .08 | .14 |
| Net realized and unrealized gain (loss) | 1.25 | 8.22 | (1.45) | .14 | 5.79 |
| Total from investment operations | 1.57 | 8.65 | (1.22) | .22 | 5.93 |
| Distributions from net investment income | (.44) | (.22) | (.06) | (.08) | (.14) |
| Distributions from net realized gain | (4.65) | (1.91) | (2.43) | (1.95) | – |
| Total distributions | (5.09) | (2.12)C | (2.49) | (2.03) | (.14) |
| Net asset value, end of period | $38.42 | $41.94 | $35.41 | $39.12 | $40.93 |
| Total ReturnD | 4.08% | 25.84% | (3.08)% | .73% | 16.95% |
| Ratios to Average Net AssetsE,F | | | | | |
| Expenses before reductions | .42% | .40% | .45% | .78% | .64% |
| Expenses net of fee waivers, if any | .42% | .40% | .45% | .78% | .64% |
| Expenses net of all reductions | .41% | .39% | .45% | .77% | .64% |
| Net investment income (loss) | .81% | 1.15%B | .68% | .20% | .36% |
| Supplemental Data | | | | | |
| Net assets, end of period (in millions) | $299 | $354 | $348 | $493 | $668 |
| Portfolio turnover rateG | 46% | 62% | 76% | 48% | 53% |
A Calculated based on average shares outstanding during the period.
B Net investment income per share reflects a large, non-recurring dividend which amounted to $.07 per share. Excluding this non-recurring dividend, the ratio of net investment income (loss) to average net assets would have been .97%.
C Total distributions of $2.12 per share is comprised of distributions from net investment income of $.216 and distributions from net realized gain of $1.907 per share.
D Total returns would have been lower if certain expenses had not been reduced during the applicable periods shown.
E Fees and expenses of any underlying Fidelity Central Funds are not included in the Fund's expense ratio. The Fund indirectly bears its proportionate share of the expenses of any underlying Fidelity Central Funds.
F Expense ratios reflect operating expenses of the class. Expenses before reductions do not reflect amounts reimbursed by the investment adviser or reductions from brokerage service arrangements or reductions from other expense offset arrangements and do not represent the amount paid by the class during periods when reimbursements or reductions occur. Expenses net of fee waivers reflect expenses after reimbursement by the investment adviser but prior to reductions from brokerage service arrangements or other expense offset arrangements. Expenses net of all reductions represent the net expenses paid by the class.
G Amount does not include the portfolio activity of any underlying Fidelity Central Funds.
See accompanying notes which are an integral part of the financial statements.
Notes to Financial Statements
For the period ended November 30, 2018
(Amounts in thousands except percentages)
1. Organization.
Fidelity Independence Fund (the Fund) is a fund of Fidelity Financial Trust (the Trust) and is authorized to issue an unlimited number of shares. The Trust is registered under the Investment Company Act of 1940, as amended (the 1940 Act), as an open-end management investment company organized as a Massachusetts business trust. The Fund offers Independence and Class K shares, each of which has equal rights as to assets and voting privileges. Each class has exclusive voting rights with respect to matters that affect that class.
2. Investments in Fidelity Central Funds.
The Fund invests in Fidelity Central Funds, which are open-end investment companies generally available only to other investment companies and accounts managed by the investment adviser and its affiliates. The Fund's Schedule of Investments lists each of the Fidelity Central Funds held as of period end, if any, as an investment of the Fund, but does not include the underlying holdings of each Fidelity Central Fund. As an Investing Fund, the Fund indirectly bears its proportionate share of the expenses of the underlying Fidelity Central Funds.
The Money Market Central Funds seek preservation of capital and current income and are managed by Fidelity Investments Money Management, Inc. (FIMM), an affiliate of the investment adviser. Annualized expenses of the Money Market Central Funds as of their most recent shareholder report date are less than .005%.
A complete unaudited list of holdings for each Fidelity Central Fund is available upon request or at the Securities and Exchange Commission (the SEC) website at www.sec.gov. In addition, the financial statements of the Fidelity Central Funds, which are not covered by the Fund's Report of Independent Registered Public Accounting Firm, are available on the SEC website or upon request.
3. Significant Accounting Policies.
The Fund is an investment company and applies the accounting and reporting guidance of the Financial Accounting Standards Board (FASB) Accounting Standards Codification Topic 946 Financial Services – Investments Companies. The financial statements have been prepared in conformity with accounting principles generally accepted in the United States of America (GAAP), which require management to make certain estimates and assumptions at the date of the financial statements. Actual results could differ from those estimates. Subsequent events, if any, through the date that the financial statements were issued have been evaluated in the preparation of the financial statements. The following summarizes the significant accounting policies of the Fund:
Investment Valuation. Investments are valued as of 4:00 p.m. Eastern time on the last calendar day of the period. The Board of Trustees (the Board) has delegated the day to day responsibility for the valuation of the Fund's investments to the Fair Value Committee (the Committee) established by the Fund's investment adviser. In accordance with valuation policies and procedures approved by the Board, the Fund attempts to obtain prices from one or more third party pricing vendors or brokers to value its investments. When current market prices, quotations or currency exchange rates are not readily available or reliable, investments will be fair valued in good faith by the Committee, in accordance with procedures adopted by the Board. Factors used in determining fair value vary by investment type and may include market or investment specific events. The frequency with which these procedures are used cannot be predicted and they may be utilized to a significant extent. The Committee oversees the Fund's valuation policies and procedures and reports to the Board on the Committee's activities and fair value determinations. The Board monitors the appropriateness of the procedures used in valuing the Fund's investments and ratifies the fair value determinations of the Committee.
The Fund categorizes the inputs to valuation techniques used to value its investments into a disclosure hierarchy consisting of three levels as shown below:
- Level 1 – quoted prices in active markets for identical investments
- Level 2 – other significant observable inputs (including quoted prices for similar investments, interest rates, prepayment speeds, etc.)
- Level 3 – unobservable inputs (including the Fund's own assumptions based on the best information available)
Valuation techniques used to value the Fund's investments by major category are as follows:
Equity securities, including restricted securities, for which market quotations are readily available, are valued at the last reported sale price or official closing price as reported by a third party pricing vendor on the primary market or exchange on which they are traded and are categorized as Level 1 in the hierarchy. In the event there were no sales during the day or closing prices are not available, securities are valued at the last quoted bid price or may be valued using the last available price and are generally categorized as Level 2 in the hierarchy. For foreign equity securities, when market or security specific events arise, comparisons to the valuation of American Depositary Receipts (ADRs), futures contracts, Exchange-Traded Funds (ETFs) and certain indexes as well as quoted prices for similar securities may be used and would be categorized as Level 2 in the hierarchy. Utilizing these techniques may result in transfers between Level 1 and Level 2. For equity securities, including restricted securities, where observable inputs are limited, assumptions about market activity and risk are used and these securities may be categorized as Level 3 in the hierarchy.
Investments in open-end mutual funds, including the Fidelity Central Funds, are valued at their closing net asset value (NAV) each business day and are categorized as Level 1 in the hierarchy.
Changes in valuation techniques may result in transfers in or out of an assigned level within the disclosure hierarchy. The aggregate value of investments by input level as of November 30, 2018 is included at the end of the Fund's Schedule of Investments.
Foreign Currency. The Fund may use foreign currency contracts to facilitate transactions in foreign-denominated securities. Gains and losses from these transactions may arise from changes in the value of the foreign currency or if the counterparties do not perform under the contracts' terms.
Foreign-denominated assets, including investment securities, and liabilities are translated into U.S. dollars at the exchange rates at period end. Purchases and sales of investment securities, income and dividends received and expenses denominated in foreign currencies are translated into U.S. dollars at the exchange rate in effect on the transaction date.
The effects of exchange rate fluctuations on investments are included with the net realized and unrealized gain (loss) on investment securities. Other foreign currency transactions resulting in realized and unrealized gain (loss) are disclosed separately.
Investment Transactions and Income. For financial reporting purposes, the Fund's investment holdings and NAV include trades executed through the end of the last business day of the period. The NAV per share for processing shareholder transactions is calculated as of the close of business of the New York Stock Exchange (NYSE), normally 4:00 p.m. Eastern time and includes trades executed through the end of the prior business day. Gains and losses on securities sold are determined on the basis of identified cost and include proceeds received from litigation. Dividend income is recorded on the ex-dividend date, except for certain dividends from foreign securities where the ex-dividend date may have passed, which are recorded as soon as the Fund is informed of the ex-dividend date. Non-cash dividends included in dividend income, if any, are recorded at the fair market value of the securities received. Income and capital gain distributions from Fidelity Central Funds, if any, are recorded on the ex-dividend date. Certain distributions received by the Fund represent a return of capital or capital gain. The Fund determines the components of these distributions subsequent to the ex-dividend date, based upon receipt of tax filings or other correspondence relating to the underlying investment. These distributions are recorded as a reduction of cost of investments and/or as a realized gain. Interest income is accrued as earned and includes coupon interest and amortization of premium and accretion of discount on debt securities as applicable. Investment income is recorded net of foreign taxes withheld where recovery of such taxes is uncertain.
Class Allocations and Expenses. Investment income, realized and unrealized capital gains and losses, common expenses of the Fund, and certain fund-level expense reductions, if any, are allocated daily on a pro-rata basis to each class based on the relative net assets of each class to the total net assets of the Fund. Each class differs with respect to transfer agent fees incurred. Certain expense reductions may also differ by class. For the reporting period, the allocated portion of income and expenses to each class as a percent of its average net assets may vary due to the timing of recording these transactions in relation to fluctuating net assets of the classes. Expenses directly attributable to a fund are charged to that fund. Expenses attributable to more than one fund are allocated among the respective funds on the basis of relative net assets or other appropriate methods. Expense estimates are accrued in the period to which they relate and adjustments are made when actual amounts are known.
Deferred Trustee Compensation. Under a Deferred Compensation Plan (the Plan) for the Fund, certain independent Trustees have elected to defer receipt of a portion of their annual compensation. Deferred amounts are invested in a cross-section of Fidelity funds, are marked-to-market and remain in the Fund until distributed in accordance with the Plan. The investment of deferred amounts and the offsetting payable to the Trustees of $83 are included in the accompanying Statement of Assets and Liabilities in other receivables and other payables and accrued expenses, respectively.
Income Tax Information and Distributions to Shareholders. Each year, the Fund intends to qualify as a regulated investment company under Subchapter M of the Internal Revenue Code, including distributing substantially all of its taxable income and realized gains. As a result, no provision for U.S. Federal income taxes is required. As of November 30, 2018, the Fund did not have any unrecognized tax benefits in the financial statements; nor is the Fund aware of any tax positions for which it is reasonably possible that the total amounts of unrecognized tax benefits will significantly change in the next twelve months. The Fund files a U.S. federal tax return, in addition to state and local tax returns as required. The Fund's federal income tax returns are subject to examination by the Internal Revenue Service (IRS) for a period of three fiscal years after they are filed. State and local tax returns may be subject to examination for an additional fiscal year depending on the jurisdiction. Foreign taxes are provided for based on the Fund's understanding of the tax rules and rates that exist in the foreign markets in which it invests.
Distributions are declared and recorded on the ex-dividend date. Income and capital gain distributions are declared separately for each class. Income and capital gain distributions are determined in accordance with income tax regulations, which may differ from GAAP. In addition, the Fund claimed a portion of the payment made to redeeming shareholders as a distribution for income tax purposes.
Capital accounts within the financial statements are adjusted for permanent book-tax differences. These adjustments have no impact on net assets or the results of operations. Capital accounts are not adjusted for temporary book-tax differences which will reverse in a subsequent period.
Book-tax differences are primarily due to futures contracts, foreign currency transactions, market discount, partnerships, deferred trustees compensation and losses deferred due to wash sales.
As of period end, the cost and unrealized appreciation (depreciation) in securities, and derivatives if applicable, for federal income tax purposes were as follows:
| Gross unrealized appreciation | $989,067 |
| Gross unrealized depreciation | (102,742) |
| Net unrealized appreciation (depreciation) | $886,325 |
| Tax Cost | $2,758,174 |
The tax-based components of distributable earnings as of period end were as follows:
| Undistributed ordinary income | $18,643 |
| Undistributed long-term capital gain | $345,052 |
| Net unrealized appreciation (depreciation) on securities and other investments | $883,846 |
The tax character of distributions paid was as follows:
| | November 30, 2018 | November 30, 2017 |
| Ordinary Income | $45,415 | $ 19,783 |
| Long-term Capital Gains | 423,693 | 190,460 |
| Total | $469,108 | $ 210,243 |
Restricted Securities. The Fund may invest in securities that are subject to legal or contractual restrictions on resale. These securities generally may be resold in transactions exempt from registration or to the public if the securities are registered. Disposal of these securities may involve time-consuming negotiations and expense, and prompt sale at an acceptable price may be difficult. Information regarding restricted securities is included at the end of the Fund's Schedule of Investments.
New Rule Issuance. During August 2018, the U.S. Securities and Exchange Commission issued Final Rule Release No. 33-10532, Disclosure Update and Simplification. This Final Rule includes amendments specific to registered investment companies that are intended to eliminate overlap in disclosure requirements between Regulation S-X and GAAP. In accordance with these amendments, certain line-items in the Fund's financial statements have been combined or removed for the current period as outlined in the table below.
| Financial Statement | Current Line-Item Presentation | Prior Line-Item Presentation |
| Statement of Assets and Liabilities | Total distributable earnings (loss) | Undistributed/Distributions in excess of/Accumulated net investment income (loss)
Accumulated/Undistributed net realized gain (loss)
Net unrealized appreciation (depreciation) |
| Statement of Changes in Net Assets | N/A - removed | Undistributed/Distributions in excess of/Accumulated net investment income (loss) end of period |
| Statement of Changes in Net Assets | Distributions to shareholders | Distributions to shareholders from net investment income
Distributions to shareholders from net realized gain |
| Distributions to Shareholders Note to Financial Statements | Distributions to shareholders | Distributions to shareholders from net investment income
Distributions to shareholders from net realized gain |
4. Derivative Instruments.
Risk Exposures and the Use of Derivative Instruments. The Fund's investment objective allows the Fund to enter into various types of derivative contracts, including futures contracts. Derivatives are investments whose value is primarily derived from underlying assets, indices or reference rates and may be transacted on an exchange or over-the-counter (OTC). Derivatives may involve a future commitment to buy or sell a specified asset based on specified terms, to exchange future cash flows at periodic intervals based on a notional principal amount, or for one party to make one or more payments upon the occurrence of specified events in exchange for periodic payments from the other party.
The Fund used derivatives to increase returns and to manage exposure to certain risks as defined below. The success of any strategy involving derivatives depends on analysis of numerous economic factors, and if the strategies for investment do not work as intended, the Fund may not achieve its objectives.
The Fund's use of derivatives increased or decreased its exposure to the following risks:
| Equity Risk | Equity risk relates to the fluctuations in the value of financial instruments as a result of changes in market prices (other than those arising from interest rate risk or foreign exchange risk), whether caused by factors specific to an individual investment, its issuer, or all factors affecting all instruments traded in a market or market segment.
|
The Fund is also exposed to additional risks from investing in derivatives, such as liquidity risk and counterparty credit risk. Liquidity risk is the risk that the Fund will be unable to close out the derivative in the open market in a timely manner. Counterparty credit risk is the risk that the counterparty will not be able to fulfill its obligation to the Fund. Counterparty credit risk related to exchange-traded futures contracts may be mitigated by the protection provided by the exchange on which they trade.
Investing in derivatives may involve greater risks than investing in the underlying assets directly and, to varying degrees, may involve risk of loss in excess of any initial investment and collateral received and amounts recognized in the Statement of Assets and Liabilities. In addition, there may be the risk that the change in value of the derivative contract does not correspond to the change in value of the underlying instrument.
Futures Contracts. A futures contract is an agreement between two parties to buy or sell a specified underlying instrument for a fixed price at a specified future date. The Fund used futures contracts to manage its exposure to the stock market.
Upon entering into a futures contract, a fund is required to deposit either cash or securities (initial margin) with a clearing broker in an amount equal to a certain percentage of the face value of the contract. Futures contracts are marked-to-market daily and subsequent daily payments (variation margin) are made or received by a fund depending on the daily fluctuations in the value of the futures contracts and are recorded as unrealized appreciation or (depreciation). This receivable and/or payable, if any, is included in daily variation margin on futures contracts in the Statement of Assets and Liabilities. Realized gain or (loss) is recorded upon the expiration or closing of a futures contract. The net realized gain (loss) and change in net unrealized appreciation (depreciation) on futures contracts during the period is presented in the Statement of Operations.
Any open futures contracts at period end are presented in the Schedule of Investments under the caption "Futures Contracts". The notional amount at value reflects each contract's exposure to the underlying instrument or index at period end.
5. Purchases and Sales of Investments.
Purchases and sales of securities, other than short-term securities, aggregated $1,793,355 and $2,200,355, respectively.
6. Fees and Other Transactions with Affiliates.
Management Fee. Fidelity Management & Research Company (the investment adviser) and its affiliates provide the Fund with investment management related services for which the Fund pays a monthly management fee. The management fee is the sum of an individual fund fee rate that is based on an annual rate of .30% of the Fund's average net assets and an annualized group fee rate that averaged .24% during the period. The group fee rate is based upon the average net assets of all the mutual funds advised by the investment adviser, including any mutual funds previously advised by the investment adviser that are currently advised by Fidelity SelectCo, LLC, an affiliate of the investment adviser. The group fee rate decreases as assets under management increase and increases as assets under management decrease. In addition, the management fee is subject to a performance adjustment (up to a maximum of +/- .20% of the Fund's average net assets over a 36 month performance period). The upward or downward adjustment to the management fee is based on the relative investment performance of Independence as compared to its benchmark index, the S&P 500 Index, over the same 36 month performance period. For the reporting period, the total annual management fee rate, including the performance adjustment, was .34% of the Fund's average net assets. The performance adjustment included in the management fee rate may be higher or lower than the maximum performance adjustment rate due to the difference between the average net assets for the reporting and performance periods.
Transfer Agent Fees. Fidelity Investments Institutional Operations Company, Inc., (FIIOC), an affiliate of the investment adviser, is the transfer, dividend disbursing and shareholder servicing agent for each class of the Fund. FIIOC receives account fees and asset-based fees that vary according to the account size and type of account of the shareholders of Independence, except for Class K. FIIOC receives an asset based fee of Class K's average net assets. FIIOC pays for typesetting, printing and mailing of shareholder reports, except proxy statements.
For the period, transfer agent fees for each class were as follows:
| | Amount | % of Class-Level Average Net Assets |
| Independence | $4,466 | .12 |
| Class K | 157 | .05 |
| | $4,623 | |
Accounting and Security Lending Fees. Fidelity Service Company, Inc. (FSC), an affiliate of the investment adviser, maintains the Fund's accounting records. The accounting fee is based on the level of average net assets for each month. Under a separate contract, FSC administers the security lending program. The security lending fee is based on the number and duration of lending transactions. For the period, the fees were equivalent to an annual rate of .03%.
Brokerage Commissions. The Fund placed a portion of its portfolio transactions with brokerage firms which are affiliates of the investment adviser. Brokerage commissions are included in net realized gain (loss) and change in net unrealized appreciation (depreciation) in the Statement of Operations. The commissions paid to these affiliated firms were $43 for the period.
Interfund Trades. The Fund may purchase from or sell securities to other Fidelity Funds under procedures adopted by the Board. The procedures have been designed to ensure these interfund trades are executed in accordance with Rule 17a-7 of the 1940 Act. Interfund trades are included within the respective purchases and sales amounts shown in the Purchases and Sales of Investments note.
Other. During the period, the investment adviser reimbursed the Fund for certain losses in the amount of $4.
7. Committed Line of Credit.
The Fund participates with other funds managed by the investment adviser or an affiliate in a $4.25 billion credit facility (the "line of credit") to be utilized for temporary or emergency purposes to fund shareholder redemptions or for other short-term liquidity purposes. The Fund has agreed to pay commitment fees on its pro-rata portion of the line of credit, which amounted to $11 and is reflected in Miscellaneous expenses on the Statement of Operations. During the period, the Fund did not borrow on this line of credit.
8. Security Lending.
The Fund lends portfolio securities through a lending agent from time to time in order to earn additional income. For equity securities, a lending agent is used and may loan securities to certain qualified borrowers, including Fidelity Capital Markets (FCM), a broker-dealer affiliated with the Fund. On the settlement date of the loan, the Fund receives collateral (in the form of U.S. Treasury obligations, letters of credit and/or cash) against the loaned securities and maintains collateral in an amount not less than 100% of the market value of the loaned securities during the period of the loan. The market value of the loaned securities is determined at the close of business of the Fund and any additional required collateral is delivered to the Fund on the next business day. The Fund or borrower may terminate the loan at any time, and if the borrower defaults on its obligation to return the securities loaned because of insolvency or other reasons, the Fund may apply collateral received from the borrower against the obligation. The Fund may experience delays and costs in recovering the securities loaned. Any cash collateral received is invested in the Fidelity Securities Lending Cash Central Fund. The value of loaned securities and cash collateral at period end are disclosed on the Fund's Statement of Assets and Liabilities. At period end, there were no security loans outstanding with FCM. Security lending income represents the income earned on investing cash collateral, less rebates paid to borrowers and any lending agent fees associated with the loan, plus any premium payments received for lending certain types of securities. Security lending income is presented in the Statement of Operations as a component of income from Fidelity Central Funds. Total security lending income during the period amounted to $994, including $115 from securities loaned to FCM.
9. Expense Reductions.
Commissions paid to certain brokers with whom the investment adviser, or its affiliates, places trades on behalf of the Fund include an amount in addition to trade execution, which may be rebated back to the Fund to offset certain expenses. This amount totaled $185 for the period. In addition, through arrangements with the Fund's custodian, credits realized as a result of certain uninvested cash balances were used to reduce the Fund's expenses. During the period, these credits reduced the Fund's custody expenses by $1.
During the period, these credits reduced each class' transfer agent expense as noted in the table below.
| | Transfer Agent expense reduction |
| Independence | $8 |
In addition, during the period the investment adviser reimbursed and/or waived a portion of fund-level operating expenses in the amount of $39.
10. Distributions to Shareholders.
Distributions to shareholders of each class were as follows:
| | Year ended
November 30, 2018 | Year ended
November 30, 2017 |
| Distributions to shareholders | | |
| Independence | $426,623 | $– |
| Class K | 42,485 | – |
| Total | $469,108 | $– |
| From net investment income | | |
| Independence | $– | $16,716 |
| Class K | – | 2,063 |
| Total | $– | $18,779 |
| From net realized gain | | |
| Independence | $– | $173,251 |
| Class K | – | 18,213 |
| Total | $– | $191,464 |
11. Share Transactions.
Share transactions for each class were as follows and may contain automatic conversions between classes or exchanges between affiliated funds:
| | Shares | Shares | Dollars | Dollars |
| | Year ended November 30, 2018 | Year ended November 30, 2017 | Year ended November 30, 2018 | Year ended November 30, 2017 |
| Independence | | | | |
| Shares sold | 1,442 | 1,414 | $57,236 | $52,592 |
| Reinvestment of distributions | 11,131 | 5,465 | 416,289 | 185,699 |
| Shares redeemed | (10,563) | (14,014) | (418,873) | (518,484) |
| Net increase (decrease) | 2,010 | (7,135) | $54,652 | $(280,193) |
| Class K | | | | |
| Shares sold | 760 | 1,192 | $30,044 | $44,637 |
| Reinvestment of distributions | 1,136 | 597 | 42,485 | 20,276 |
| Shares redeemed | (2,539) | (3,178) | (99,775) | (116,354) |
| Net increase (decrease) | (643) | (1,389) | $(27,246) | $(51,441) |
12. Other.
The Fund's organizational documents provide former and current trustees and officers with a limited indemnification against liabilities arising in connection with the performance of their duties to the Fund. In the normal course of business, the Fund may also enter into contracts that provide general indemnifications. The Fund's maximum exposure under these arrangements is unknown as this would be dependent on future claims that may be made against the Fund. The risk of material loss from such claims is considered remote.
Report of Independent Registered Public Accounting Firm
To the Board of Trustees of Fidelity Financial Trust and Shareholders of Fidelity Independence Fund:
Opinion on the Financial Statements
We have audited the accompanying statement of assets and liabilities, including the schedule of investments, of Fidelity Independence Fund (one of the funds constituting Fidelity Financial Trust, referred to hereafter as the "Fund") as of November 30, 2018, the related statement of operations for the year ended November 30, 2018, the statement of changes in net assets for each of the two years in the period ended November 30, 2018, including the related notes, and the financial highlights for each of the five years in the period ended November 30, 2018 (collectively referred to as the “financial statements”). In our opinion, the financial statements present fairly, in all material respects, the financial position of the Fund as of November 30, 2018, the results of its operations for the year then ended, the changes in its net assets for each of the two years in the period ended November 30, 2018 and the financial highlights for each of the five years in the period ended November 30, 2018 in conformity with accounting principles generally accepted in the United States of America.
Basis for Opinion
These financial statements are the responsibility of the Fund’s management. Our responsibility is to express an opinion on the Fund’s financial statements based on our audits. We are a public accounting firm registered with the Public Company Accounting Oversight Board (United States) (“PCAOB”) and are required to be independent with respect to the Fund in accordance with the U.S. federal securities laws and the applicable rules and regulations of the Securities and Exchange Commission and the PCAOB.
We conducted our audits of these financial statements in accordance with the standards of the PCAOB. Those standards require that we plan and perform the audit to obtain reasonable assurance about whether the financial statements are free of material misstatement, whether due to error or fraud.
Our audits included performing procedures to assess the risks of material misstatement of the financial statements, whether due to error or fraud, and performing procedures that respond to those risks. Such procedures included examining, on a test basis, evidence regarding the amounts and disclosures in the financial statements. Our audits also included evaluating the accounting principles used and significant estimates made by management, as well as evaluating the overall presentation of the financial statements. Our procedures included confirmation of securities owned as of November 30, 2018 by correspondence with the custodian and brokers; when replies were not received from brokers, we performed other auditing procedures. We believe that our audits provide a reasonable basis for our opinion.
PricewaterhouseCoopers LLP
Boston, Massachusetts
January 14, 2019
We have served as the auditor of one or more investment companies in the Fidelity group of funds since 1932.
Trustees and Officers
The Trustees, Members of the Advisory Board (if any), and officers of the trust and fund, as applicable, are listed below. The Board of Trustees governs the fund and is responsible for protecting the interests of shareholders. The Trustees are experienced executives who meet periodically throughout the year to oversee the fund's activities, review contractual arrangements with companies that provide services to the fund, oversee management of the risks associated with such activities and contractual arrangements, and review the fund's performance. Except for Michael E. Wiley, each of the Trustees oversees 281 funds. Mr. Wiley oversees 192 funds.
The Trustees hold office without limit in time except that (a) any Trustee may resign; (b) any Trustee may be removed by written instrument, signed by at least two-thirds of the number of Trustees prior to such removal; (c) any Trustee who requests to be retired or who has become incapacitated by illness or injury may be retired by written instrument signed by a majority of the other Trustees; and (d) any Trustee may be removed at any special meeting of shareholders by a two-thirds vote of the outstanding voting securities of the trust. Each Trustee who is not an interested person (as defined in the 1940 Act) of the trust and the fund is referred to herein as an Independent Trustee. Each Independent Trustee shall retire not later than the last day of the calendar year in which his or her 75th birthday occurs. The Independent Trustees may waive this mandatory retirement age policy with respect to individual Trustees. Officers and Advisory Board Members hold office without limit in time, except that any officer or Advisory Board Member may resign or may be removed by a vote of a majority of the Trustees at any regular meeting or any special meeting of the Trustees. Except as indicated, each individual has held the office shown or other offices in the same company for the past five years.
The fund’s Statement of Additional Information (SAI) includes more information about the Trustees. To request a free copy, call Fidelity at 1-800-544-8544.
Experience, Skills, Attributes, and Qualifications of the Trustees. The Governance and Nominating Committee has adopted a statement of policy that describes the experience, qualifications, attributes, and skills that are necessary and desirable for potential Independent Trustee candidates (Statement of Policy). The Board believes that each Trustee satisfied at the time he or she was initially elected or appointed a Trustee, and continues to satisfy, the standards contemplated by the Statement of Policy. The Governance and Nominating Committee also engages professional search firms to help identify potential Independent Trustee candidates who have the experience, qualifications, attributes, and skills consistent with the Statement of Policy. From time to time, additional criteria based on the composition and skills of the current Independent Trustees, as well as experience or skills that may be appropriate in light of future changes to board composition, business conditions, and regulatory or other developments, have also been considered by the professional search firms and the Governance and Nominating Committee. In addition, the Board takes into account the Trustees' commitment and participation in Board and committee meetings, as well as their leadership of standing and ad hoc committees throughout their tenure.
In determining that a particular Trustee was and continues to be qualified to serve as a Trustee, the Board has considered a variety of criteria, none of which, in isolation, was controlling. The Board believes that, collectively, the Trustees have balanced and diverse experience, qualifications, attributes, and skills, which allow the Board to operate effectively in governing the fund and protecting the interests of shareholders. Information about the specific experience, skills, attributes, and qualifications of each Trustee, which in each case led to the Board's conclusion that the Trustee should serve (or continue to serve) as a trustee of the fund, is provided below.
Board Structure and Oversight Function. James C. Curvey is an interested person and currently serves as Chairman. The Trustees have determined that an interested Chairman is appropriate and benefits shareholders because an interested Chairman has a personal and professional stake in the quality and continuity of services provided to the fund. Independent Trustees exercise their informed business judgment to appoint an individual of their choosing to serve as Chairman, regardless of whether the Trustee happens to be independent or a member of management. The Independent Trustees have determined that they can act independently and effectively without having an Independent Trustee serve as Chairman and that a key structural component for assuring that they are in a position to do so is for the Independent Trustees to constitute a substantial majority for the Board. The Independent Trustees also regularly meet in executive session. Ned C. Lautenbach serves as Chairman of the Independent Trustees and as such (i) acts as a liaison between the Independent Trustees and management with respect to matters important to the Independent Trustees and (ii) with management prepares agendas for Board meetings.
Fidelity® funds are overseen by different Boards of Trustees. The fund's Board oversees Fidelity's high income and certain equity funds, and other Boards oversee Fidelity's investment-grade bond, money market, asset allocation, and other equity funds. The asset allocation funds may invest in Fidelity® funds overseen by the fund's Board. The use of separate Boards, each with its own committee structure, allows the Trustees of each group of Fidelity® funds to focus on the unique issues of the funds they oversee, including common research, investment, and operational issues. On occasion, the separate Boards establish joint committees to address issues of overlapping consequences for the Fidelity® funds overseen by each Board.
The Trustees operate using a system of committees to facilitate the timely and efficient consideration of all matters of importance to the Trustees, the fund, and fund shareholders and to facilitate compliance with legal and regulatory requirements and oversight of the fund's activities and associated risks. The Board, acting through its committees, has charged FMR and its affiliates with (i) identifying events or circumstances the occurrence of which could have demonstrably adverse effects on the fund's business and/or reputation; (ii) implementing processes and controls to lessen the possibility that such events or circumstances occur or to mitigate the effects of such events or circumstances if they do occur; and (iii) creating and maintaining a system designed to evaluate continuously business and market conditions in order to facilitate the identification and implementation processes described in (i) and (ii) above. Because the day-to-day operations and activities of the fund are carried out by or through FMR, its affiliates, and other service providers, the fund's exposure to risks is mitigated but not eliminated by the processes overseen by the Trustees. While each of the Board's committees has responsibility for overseeing different aspects of the fund's activities, oversight is exercised primarily through the Operations, Audit, and Compliance Committees. In addition, the Independent Trustees have worked with Fidelity to enhance the Board's oversight of investment and financial risks, legal and regulatory risks, technology risks, and operational risks, including the development of additional risk reporting to the Board. Appropriate personnel, including but not limited to the fund's Chief Compliance Officer (CCO), FMR's internal auditor, the independent accountants, the fund's Treasurer and portfolio management personnel, make periodic reports to the Board's committees, as appropriate, including an annual review of Fidelity's risk management program for the Fidelity® funds. The responsibilities of each standing committee, including their oversight responsibilities, are described further under "Standing Committees of the Trustees."
Interested Trustees*:
Correspondence intended for a Trustee who is an interested person may be sent to Fidelity Investments, 245 Summer Street, Boston, Massachusetts 02210.
Name, Year of Birth; Principal Occupations and Other Relevant Experience+
James C. Curvey (1935)
Year of Election or Appointment: 2007
Trustee
Chairman of the Board of Trustees
Mr. Curvey also serves as Trustee of other Fidelity® funds. Mr. Curvey is Vice Chairman (2007-present) and Director of FMR LLC (diversified financial services company). In addition, Mr. Curvey is an Overseer Emeritus for the Boston Symphony Orchestra, a Director of Artis-Naples, and a Trustee of Brewster Academy in Wolfeboro, New Hampshire. Previously, Mr. Curvey served as a Director of Fidelity Research & Analysis Co. (investment adviser firm, 2009-2018), Director of Fidelity Investments Money Management, Inc. (investment adviser firm, 2009-2014) and a Director of FMR and FMR Co., Inc. (investment adviser firms, 2007-2014).
* Determined to be an “Interested Trustee” by virtue of, among other things, his or her affiliation with the trust or various entities under common control with FMR.
+ The information includes the Trustee's principal occupation during the last five years and other information relating to the experience, attributes, and skills relevant to the Trustee's qualifications to serve as a Trustee, which led to the conclusion that the Trustee should serve as a Trustee for the fund.
Independent Trustees:
Correspondence intended for an Independent Trustee may be sent to Fidelity Investments, P.O. Box 55235, Boston, Massachusetts 02205-5235.
Name, Year of Birth; Principal Occupations and Other Relevant Experience+
Dennis J. Dirks (1948)
Year of Election or Appointment: 2005
Trustee
Mr. Dirks also serves as Trustee of other Fidelity® funds. Prior to his retirement in May 2003, Mr. Dirks was Chief Operating Officer and a member of the Board of The Depository Trust & Clearing Corporation (DTCC). He also served as President, Chief Operating Officer, and Board member of The Depository Trust Company (DTC) and President and Board member of the National Securities Clearing Corporation (NSCC). In addition, Mr. Dirks served as Chief Executive Officer and Board member of the Government Securities Clearing Corporation, Chief Executive Officer and Board member of the Mortgage-Backed Securities Clearing Corporation, as a Trustee and a member of the Finance Committee of Manhattan College (2005-2008), as a Trustee and a member of the Finance Committee of AHRC of Nassau County (2006-2008), as a member of the Independent Directors Council (IDC) Governing Council (2010-2015), and as a member of the Board of Directors for The Brookville Center for Children’s Services, Inc. (2009-2017). Mr. Dirks is a member of the Finance Committee (2016-present) and Board of Directors (2017-present) and is Treasurer (2018-present) of the Asolo Repertory Theatre.
Donald F. Donahue (1950)
Year of Election or Appointment: 2018
Trustee
Mr. Donahue also serves as a Trustee of other Fidelity® funds. Mr. Donahue is President and Chief Executive Officer of Miranda Partners, LLC (risk consulting for the financial services industry, 2012-present). Previously, Mr. Donahue served as a Member of the Advisory Board of certain Fidelity® funds (2015-2018) and Chief Executive Officer (2006-2012), Chief Operating Officer (2003-2006), and Managing Director, Customer Marketing and Development (1999-2003) of The Depository Trust & Clearing Corporation (financial markets infrastructure). Mr. Donahue serves as a Member (2007-present) and Co-Chairman (2016-present) of the Board of Directors of United Way of New York, Member of the Board of Directors of NYC Leadership Academy (2012-present) and Member of the Board of Advisors of Ripple Labs, Inc. (financial services, 2015-present). He also served as Chairman (2010-2012) and Member of the Board of Directors (2012-2013) of Omgeo, LLC (financial services), Treasurer of United Way of New York (2012-2016), and Member of the Board of Directors of XBRL US (financial services non-profit, 2009-2012) and the International Securities Services Association (2009-2012).
Alan J. Lacy (1953)
Year of Election or Appointment: 2008
Trustee
Mr. Lacy also serves as Trustee of other Fidelity® funds. Mr. Lacy serves as a Director of Bristol-Myers Squibb Company (global pharmaceuticals, 2008-present). He is a Trustee of the California Chapter of The Nature Conservancy (2015-present) and a Director of the Center for Advanced Study in the Behavioral Sciences at Stanford University (2015-present). In addition, Mr. Lacy served as Senior Adviser (2007-2014) of Oak Hill Capital Partners, L.P. (private equity) and also served as Chief Executive Officer (2005) and Vice Chairman (2005-2006) of Sears Holdings Corporation (retail) and Chief Executive Officer and Chairman of the Board of Sears, Roebuck and Co. (retail, 2000-2005). Previously, Mr. Lacy served as Chairman (2014-2017) and a member (2010-2017) of the Board of Directors of Dave & Buster’s Entertainment, Inc. (restaurant and entertainment complexes), as Chairman (2008-2011) and a member (2006-2015) of the Board of Trustees of the National Parks Conservation Association, and as a member of the Board of Directors for The Hillman Companies, Inc. (hardware wholesalers, 2010-2014), Earth Fare, Inc. (retail grocery, 2010-2014), and The Western Union Company (global money transfer, 2006-2011).
Ned C. Lautenbach (1944)
Year of Election or Appointment: 2000
Trustee
Chairman of the Independent Trustees
Mr. Lautenbach also serves as Trustee of other Fidelity® funds. Mr. Lautenbach currently serves as Chair (2018-present) and Member (2013-present) of the Board of Governors, State University System of Florida and is a member of the Council on Foreign Relations (1994-present). He is also a member and has most recently served as Chairman of the Board of Directors of Artis-Naples (2012-present). Previously, Mr. Lautenbach served as a member and then Lead Director of the Board of Directors of Eaton Corporation (diversified industrial, 1997-2016). He was also a Partner and Advisory Partner at Clayton, Dubilier & Rice, LLC (private equity investment, 1998-2010), as well as a Director of Sony Corporation (2006-2007). In addition, Mr. Lautenbach also had a 30-year career with IBM (technology company) during which time he served as Senior Vice President and a member of the Corporate Executive Committee (1968-1998).
Joseph Mauriello (1944)
Year of Election or Appointment: 2008
Trustee
Mr. Mauriello also serves as Trustee of other Fidelity® funds. Prior to his retirement in January 2006, Mr. Mauriello served in numerous senior management positions including Deputy Chairman and Chief Operating Officer (2004-2005), and Vice Chairman of Financial Services (2002-2004) of KPMG LLP US (professional services, 1965-2005). Mr. Mauriello currently serves as a member of the Independent Directors Council (IDC) Governing Council (2015-present). Previously, Mr. Mauriello served as a member of the Board of Directors of XL Group plc. (global insurance and re-insurance, 2006-2018).
Cornelia M. Small (1944)
Year of Election or Appointment: 2005
Trustee
Ms. Small also serves as Trustee of other Fidelity® funds. Ms. Small is a member of the Board of Directors (2009-present) and Chair of the Investment Committee (2010-present) of the Teagle Foundation. Ms. Small also serves on the Investment Committee of the Berkshire Taconic Community Foundation (2008-present). Previously, Ms. Small served as Chairperson (2002-2008) and a member of the Investment Committee and Chairperson (2008-2012) and a member of the Board of Trustees of Smith College. In addition, Ms. Small served as Chief Investment Officer, Director of Global Equity Investments, and a member of the Board of Directors of Scudder, Stevens & Clark and Scudder Kemper Investments.
Garnett A. Smith (1947)
Year of Election or Appointment: 2018
Trustee
Mr. Smith also serves as Trustee of other Fidelity® funds. Prior to Mr. Smith's retirement, he served as Chairman and Chief Executive Officer of Inbrand Corp. (manufacturer of personal absorbent products, 1990-1997). He also served as President (1986-1990) of Inbrand Corp. Prior to his employment with Inbrand Corp., he was employed by a retail fabric chain and North Carolina National Bank. In addition, Mr. Smith served as a Member of the Advisory Board of certain Fidelity® funds (2012-2013) and as a board member of the Jackson Hole Land Trust (2009-2012).
David M. Thomas (1949)
Year of Election or Appointment: 2008
Trustee
Mr. Thomas also serves as Trustee of other Fidelity® funds. Mr. Thomas serves as Non-Executive Chairman of the Board of Directors of Fortune Brands Home and Security (home and security products, 2011-present) and as a member of the Board of Directors (2004-present) and Presiding Director (2013-present) of Interpublic Group of Companies, Inc. (marketing communication). Previously, Mr. Thomas served as Executive Chairman (2005-2006) and Chairman and Chief Executive Officer (2000-2005) of IMS Health, Inc. (pharmaceutical and healthcare information solutions), a Director of Fortune Brands, Inc. (consumer products, 2000-2011), and a member of the Board of Trustees of the University of Florida (2013-2018).
Michael E. Wiley (1950)
Year of Election or Appointment: 2018
Trustee
Mr. Wiley also serves as Trustee or Member of the Advisory Board of other Fidelity® funds. Mr. Wiley serves as a Director of High Point Resources (exploration and production, 2005-present). Previously, Mr. Wiley served as a Director of Andeavor Corporation (independent oil refiner and marketer, 2005-2018), a Director of Andeavor Logistics LP (natural resources logistics, 2015-2018), a Director of Post Oak Bank (privately-held bank, 2004-2018), a Director of Asia Pacific Exploration Consolidated (international oil and gas exploration and production, 2008-2013), a member of the Board of Trustees of the University of Tulsa (2000-2006; 2007-2010), a Senior Energy Advisor of Katzenbach Partners, LLC (consulting, 2006-2007), an Advisory Director of Riverstone Holdings (private investment), a Director of Spinnaker Exploration Company (exploration and production, 2001-2005) and Chairman, President, and CEO of Baker Hughes, Inc. (oilfield services, 2000-2004).
+ The information includes the Trustee's principal occupation during the last five years and other information relating to the experience, attributes, and skills relevant to the Trustee's qualifications to serve as a Trustee, which led to the conclusion that the Trustee should serve as a Trustee for the fund.
Advisory Board Members and Officers:
Correspondence intended for a Member of the Advisory Board (if any) may be sent to Fidelity Investments, P.O. Box 55235, Boston, Massachusetts 02205-5235. Correspondence intended for an officer or Peter S. Lynch may be sent to Fidelity Investments, 245 Summer Street, Boston, Massachusetts 02210. Officers appear below in alphabetical order.
Name, Year of Birth; Principal Occupation
Vicki L. Fuller (1957)
Year of Election or Appointment: 2018
Member of the Advisory Board
Ms. Fuller also serves as Member of the Advisory Board of other Fidelity® funds. Ms. Fuller serves as a member of the Board of Directors, Audit Committee, and Nominating and Governance Committee of The Williams Companies, Inc. (natural gas infrastructure, 2018-present). Previously, Ms. Fuller served as the Chief Investment Officer of the New York State Common Retirement Fund (2012-2018) and held a variety of positions at AllianceBernstein L.P. (global asset management, 1985-2012), including Managing Director (2006-2012) and Senior Vice President and Senior Portfolio Manager (2001-2006).
Peter S. Lynch (1944)
Year of Election or Appointment: 2003
Member of the Advisory Board
Mr. Lynch also serves as Member of the Advisory Board of other Fidelity® funds. Mr. Lynch is Vice Chairman and a Director of FMR (investment adviser firm) and FMR Co., Inc. (investment adviser firm). In addition, Mr. Lynch serves as a Trustee of Boston College and as the Chairman of the Inner-City Scholarship Fund. Previously, Mr. Lynch served on the Special Olympics International Board of Directors (1997-2006).
Carol B. Tomé (1957)
Year of Election or Appointment: 2018
Member of the Advisory Board
Ms. Tomé also serves as Member of the Advisory Board of other Fidelity® funds. Ms. Tomé is Chief Financial Officer (2001-present) and Executive Vice President of Corporate Services (2007-present) of The Home Depot, Inc. (home improvement retailer) and a Director (2003-present) and Chair of the Audit Committee (2004-present) of United Parcel Service, Inc. (package delivery and supply chain management). Previously, Ms. Tomé served as Trustee of certain Fidelity® funds (2017), Senior Vice President of Finance and Accounting/Treasurer (2000-2007) and Vice President and Treasurer (1995-2000) of The Home Depot, Inc. and Chair of the Board (2010-2012), Vice Chair of the Board (2009 and 2013), and a Director (2008-2013) of the Federal Reserve Bank of Atlanta. Ms. Tomé is also a director or trustee of many community and professional organizations.
Elizabeth Paige Baumann (1968)
Year of Election or Appointment: 2017
Anti-Money Laundering (AML) Officer
Ms. Baumann also serves as AML Officer of other funds. She is Chief AML Officer (2012-present) and Senior Vice President (2014-present) of FMR LLC (diversified financial services company) and is an employee of Fidelity Investments. Previously, Ms. Baumann served as AML Officer of the funds (2012-2016), and Vice President (2007-2014) and Deputy Anti-Money Laundering Officer (2007-2012) of FMR LLC.
John J. Burke III (1964)
Year of Election or Appointment: 2018
Chief Financial Officer
Mr. Burke also serves as Chief Financial Officer of other funds. Mr. Burke serves as Head of Investment Operations for Fidelity Fund and Investment Operations (2018-present) and is an employee of Fidelity Investments (1998-present). Previously Mr. Burke served as head of Asset Management Investment Operations (2012-2018).
William C. Coffey (1969)
Year of Election or Appointment: 2018
Secretary and Chief Legal Officer (CLO)
Mr. Coffey also serves as Secretary and CLO of other funds. Mr. Coffey serves as CLO, Secretary, and Senior Vice President of Fidelity Management & Research Company and FMR Co., Inc. (investment adviser firms, 2018-present); Secretary of Fidelity SelectCo, LLC and Fidelity Investments Money Management, Inc. (investment adviser firms, 2018-present); and CLO of Fidelity Management & Research (Hong Kong) Limited, FMR Investment Management (UK) Limited, and Fidelity Management & Research (Japan) Limited (investment adviser firms, 2018-present). He is Senior Vice President and Deputy General Counsel of FMR LLC (diversified financial services company, 2010-present), and is an employee of Fidelity Investments. Previously, Mr. Coffey served as Assistant Secretary of certain funds (2009-2018) and as Vice President and Associate General Counsel of FMR LLC (2005-2009).
Timothy M. Cohen (1969)
Year of Election or Appointment: 2018
Vice President
Mr. Cohen also serves as Vice President of other funds. Mr. Cohen serves as Co-Head of Global Equity Research (2016-present), a Director of Fidelity Management & Research (Japan) Limited (investment adviser firm, 2016-present), and is an employee of Fidelity Investments. Previously, Mr. Cohen served as Chief Investment Officer - Equity and a Director of Fidelity Management & Research (U.K.) Inc. (investment adviser firm, 2013-2015) and as a Director of Fidelity Management & Research (Hong Kong) Limited (investment adviser firm, 2017).
Jonathan Davis (1968)
Year of Election or Appointment: 2010
Assistant Treasurer
Mr. Davis also serves as Assistant Treasurer of other funds. Mr. Davis serves as Assistant Treasurer of FMR Capital, Inc. (2017-present) and is an employee of Fidelity Investments. Previously, Mr. Davis served as Vice President and Associate General Counsel of FMR LLC (diversified financial services company, 2003-2010).
Adrien E. Deberghes (1967)
Year of Election or Appointment: 2016
Assistant Treasurer
Mr. Deberghes also serves as an officer of other funds. He serves as Assistant Treasurer of FMR Capital, Inc. (2017-present), Executive Vice President of Fidelity Investments Money Management, Inc. (FIMM) (investment adviser firm, 2016-present), and is an employee of Fidelity Investments (2008-present). Previously, Mr. Deberghes served as President and Treasurer of certain Fidelity® funds (2013-2018). Prior to joining Fidelity Investments, Mr. Deberghes was Senior Vice President of Mutual Fund Administration at State Street Corporation (2007-2008), Senior Director of Mutual Fund Administration at Investors Bank & Trust (2005-2007), and Director of Finance for Dunkin' Brands (2000-2005). Previously, Mr. Deberghes served in other fund officer roles.
Laura M. Del Prato (1964)
Year of Election or Appointment: 2018
Assistant Treasurer
Ms. Del Prato also serves as an officer of other funds. Ms. Del Prato is an employee of Fidelity Investments (2017-present). Prior to joining Fidelity Investments, Ms. Del Prato served as a Managing Director and Treasurer of the JPMorgan Mutual Funds (2014-2017). Prior to JPMorgan, Ms. Del Prato served as a partner at Cohen Fund Audit Services (accounting firm, 2012-2013) and KPMG LLP (accounting firm, 2004-2012).
Colm A. Hogan (1973)
Year of Election or Appointment: 2016
Deputy Treasurer
Mr. Hogan also serves as an officer of other funds. Mr. Hogan serves as Assistant Treasurer of FMR Capital, Inc. (2017-present) and is an employee of Fidelity Investments (2005-present). Previously, Mr. Hogan served as Assistant Treasurer of certain Fidelity® funds (2016-2018).
Pamela R. Holding (1964)
Year of Election or Appointment: 2018
Vice President
Ms. Holding also serves as Vice President of other funds. Ms. Holding serves as Co-Head of Global Equity Research (2018-present) and is an employee of Fidelity Investments (2013-present).
Chris Maher (1972)
Year of Election or Appointment: 2013
Assistant Treasurer
Mr. Maher serves as Assistant Treasurer of other funds. Mr. Maher is Vice President of Valuation Oversight, serves as Assistant Treasurer of FMR Capital, Inc. (2017-present), and is an employee of Fidelity Investments. Previously, Mr. Maher served as Vice President of Asset Management Compliance (2013), Vice President of the Program Management Group of FMR (investment adviser firm, 2010-2013), and Vice President of Valuation Oversight (2008-2010).
Rieco E. Mello (1969)
Year of Election or Appointment: 2017
Assistant Treasurer
Mr. Mello also serves as Assistant Treasurer of other funds. Mr. Mello serves as Assistant Treasurer of FMR Capital, Inc. (2017-present) and is an employee of Fidelity Investments (1995-present).
Kenneth B. Robins (1969)
Year of Election or Appointment: 2016
Chief Compliance Officer
Mr. Robins also serves as an officer of other funds. Mr. Robins serves as Compliance Officer of Fidelity Management & Research Company and FMR Co., Inc. (investment adviser firms, 2016-present) and is an employee of Fidelity Investments (2004-present). Previously, Mr. Robins served as Executive Vice President of Fidelity Investments Money Management, Inc. (investment adviser firm, 2013-2016) and served in other fund officer roles.
Stacie M. Smith (1974)
Year of Election or Appointment: 2016
President and Treasurer
Ms. Smith also serves as an officer of other funds. Ms. Smith serves as Assistant Treasurer of FMR Capital, Inc. (2017-present), is an employee of Fidelity Investments (2009-present), and has served in other fund officer roles. Prior to joining Fidelity Investments, Ms. Smith served as Senior Audit Manager of Ernst & Young LLP (accounting firm, 1996-2009). Previously, Ms. Smith served as Assistant Treasurer (2013-2018) and Deputy Treasurer (2013-2016) of certain Fidelity® funds.
Marc L. Spector (1972)
Year of Election or Appointment: 2016
Assistant Treasurer
Mr. Spector also serves as an officer of other funds. Mr. Spector serves as Assistant Treasurer of FMR Capital, Inc. (2017-present) and is an employee of Fidelity Investments (2016-present). Prior to joining Fidelity Investments, Mr. Spector served as Director at the Siegfried Group (accounting firm, 2013-2016), and prior to Siegfried Group as audit senior manager at Deloitte & Touche (accounting firm, 2005-2013).
Shareholder Expense Example
As a shareholder of the Fund, you incur two types of costs: (1) transaction costs, and (2) ongoing costs, including management fees and other Fund expenses. This Example is intended to help you understand your ongoing costs (in dollars) of investing in the Fund and to compare these costs with the ongoing costs of investing in other mutual funds.
The Example is based on an investment of $1,000 invested at the beginning of the period and held for the entire period (June 1, 2018 to November 30, 2018).
Actual Expenses
The first line of the accompanying table for each class of the Fund provides information about actual account values and actual expenses. You may use the information in this line, together with the amount you invested, to estimate the expenses that you paid over the period. Simply divide your account value by $1,000.00 (for example, an $8,600 account value divided by $1,000.00 = 8.6), then multiply the result by the number in the first line for a class of the Fund under the heading entitled "Expenses Paid During Period" to estimate the expenses you paid on your account during this period. A small balance maintenance fee of $12.00 that is charged once a year may apply for certain accounts with a value of less than $2,000. This fee, which was eliminated effective August 1, 2018, is not included in the table below. If it was, the estimate of expenses you paid during the period would be higher, and your ending account value lower, by this amount. In addition, the Fund, as a shareholder in the underlying Fidelity Central Funds, will indirectly bear its pro-rata share of the fees and expenses incurred by the underlying Fidelity Central Funds. These fees and expenses are not included in the Fund's annualized expense ratio used to calculate the expense estimate in the table below.
Hypothetical Example for Comparison Purposes
The second line of the accompanying table for each class of the Fund provides information about hypothetical account values and hypothetical expenses based on a Class' actual expense ratio and an assumed rate of return of 5% per year before expenses, which is not the Class' actual return. The hypothetical account values and expenses may not be used to estimate the actual ending account balance or expenses you paid for the period. You may use this information to compare the ongoing costs of investing in the Fund and other funds. To do so, compare this 5% hypothetical example with the 5% hypothetical examples that appear in the shareholder reports of the other funds. A small balance maintenance fee of $12.00 that is charged once a year may apply for certain accounts with a value of less than $2,000. This fee, which was eliminated effective August 1, 2018, is not included in the table below. If it was, the estimate of expenses you paid during the period would be higher, and your ending account value lower, by this amount. In addition, the Fund, as a shareholder in the underlying Fidelity Central Funds, will indirectly bear its pro-rata share of the fees and expenses incurred by the underlying Fidelity Central Funds. These fees and expenses are not included in the Fund's annualized expense ratio used to calculate the expense estimate in the table below.
Please note that the expenses shown in the table are meant to highlight your ongoing costs only and do not reflect any transaction costs. Therefore, the second line of the table is useful in comparing ongoing costs only, and will not help you determine the relative total costs of owning different funds.
| | Annualized Expense Ratio-A | Beginning
Account Value
June 1, 2018 | Ending
Account Value
November 30, 2018 | Expenses Paid
During Period-B
June 1, 2018
to November 30, 2018 |
| Independence | .50% | | | |
| Actual | | $1,000.00 | $976.30 | $2.48 |
| Hypothetical-C | | $1,000.00 | $1,022.56 | $2.54 |
| Class K | .42% | | | |
| Actual | | $1,000.00 | $976.90 | $2.08 |
| Hypothetical-C | | $1,000.00 | $1,022.96 | $2.13 |
A Annualized expense ratio reflects expenses net of applicable fee waivers.
B Expenses are equal to each Class' annualized expense ratio, multiplied by the average account value over the period, multiplied by 183/365 (to reflect the one-half year period).
C 5% return per year before expenses
Distributions (Unaudited)
The Board of Trustees of Fidelity Independence Fund voted to pay to shareholders of record at the opening of business on record date, the following distributions per share derived from capital gains realized from sales of portfolio securities, and dividends derived from net investment income:
| | Pay Date | Record Date | Dividends | Capital Gains |
| Fidelity Independence Fund | | | | |
| Fidelity Independence Fund | 12/27/2018 | 12/26/2018 | $0.221 | $3.682 |
| Class K | 12/27/2018 | 12/26/2018 | $0.253 | $3.682 |
|
The fund hereby designates as a capital gain dividend with respect to the taxable year ended November 30, 2018, $369,600,574, or, if subsequently determined to be different, the net capital gain of such year.
Fidelity Independence Fund designates 100% and Class K designates 93% of the dividends distributed during the fiscal year as qualifying for the dividends–received deduction for corporate shareholders.
Fidelity Independence Fund and Class K designate 100% of the dividends distributed during the fiscal year as amounts which may be taken into account as a dividend for purposes of the maximum rate under section 1(h)(11) of the Internal Revenue Code.
The fund will notify shareholders in January 2019 of amounts for use in preparing 2018 income tax returns.
Board Approval of Investment Advisory Contracts
Fidelity Independence Fund
At its July 2018 meeting, the Board of Trustees, including the Independent Trustees (together, the Board), voted to continue the management contract with Fidelity Management & Research Company (FMR) and the sub-advisory agreements (together, the Advisory Contracts) for the fund for six months through January 31, 2019, in connection with the reunification of the Fidelity Equity High Income Funds Board, which oversees the fund, and the Sector Portfolios Board.
The Board considered that the approval of the fund's Advisory Contracts will not result in any changes in (i) the investment process or strategies employed in the management of the fund's assets; (ii) the fees and expenses paid by shareholders; (iii) the nature, extent or quality of services provided under the fund's Advisory Contracts; or (iv) the day-to-day management of the fund or the persons primarily responsible for such management. The Board concluded that the fund's Advisory Contracts are fair and reasonable, and that the fund's Advisory Contracts should be renewed, without modification, through January 31, 2019, with the understanding that the Board will consider the annual renewal for a full one year period in January 2019.
In connection with its consideration of future renewals of the fund's Advisory Contracts, the Board will consider: (i) the nature, extent and quality of services provided to the fund, including shareholder and administrative services and investment performance; (ii) the competitiveness of the management fee and total expenses for the fund; (iii) the costs of the services and profitability, including the revenues earned and the expenses incurred in conducting the business of developing, marketing, distributing, managing, administering, and servicing the fund and its shareholders, to the extent applicable, as well as potential fall-out benefits from Fidelity's non-fund businesses; and (iv) whether there have been economies of scale in respect of the Fidelity funds, whether the Fidelity funds (including the fund) have appropriately benefited from any such economies of scale, and whether there is the potential for realization of any further economies.
Based on its evaluation of all of the conclusions noted above, and after considering all factors it believed relevant, the Board ultimately concluded that the fund's management fee structure is fair and reasonable, and that the continuation of the fund's Advisory Contracts should be approved.

Corporate Headquarters
245 Summer St.
Boston, MA 02210
www.fidelity.com
FRE-ANN-0119
1.539094.121
Fidelity® Independence Fund Class K
Annual Report November 30, 2018 |
|
Beginning on January 1, 2021, as permitted by regulations adopted by the Securities and Exchange Commission, paper copies of a fund’s shareholder reports will no longer be sent by mail, unless you specifically request paper copies of the reports from the fund or from your financial intermediary, such as a financial advisor, broker-dealer or bank. Instead, the reports will be made available on a website, and you will be notified by mail each time a report is posted and provided with a website link to access the report.
If you already elected to receive shareholder reports electronically, you will not be affected by this change and you need not take any action. You may elect to receive shareholder reports and other communications from a fund electronically, by contacting your financial intermediary. For Fidelity customers, visit Fidelity's web site or call Fidelity using the contact information listed below.
You may elect to receive all future reports in paper free of charge. If you wish to continue receiving paper copies of your shareholder reports, you may contact your financial intermediary or, if you are a Fidelity customer, visit Fidelity’s website, or call Fidelity at the applicable toll-free number listed below. Your election to receive reports in paper will apply to all funds held with the fund complex/your financial intermediary.
| Account Type | Website | Phone Number |
| Brokerage, Mutual Fund, or Annuity Contracts: | fidelity.com/mailpreferences | 1-800-343-3548 |
| Employer Provided Retirement Accounts: | netbenefits.fidelity.com/preferences (choose 'no' under Required Disclosures to continue to print) | 1-800-343-0860 |
| Advisor Sold Accounts Serviced Through Your Financial Intermediary: | Contact Your Financial Intermediary | Your Financial Intermediary's phone number |
| Advisor Sold Accounts Serviced by Fidelity: | institutional.fidelity.com | 1-877-208-0098 |
Contents
To view a fund's proxy voting guidelines and proxy voting record for the 12-month period ended June 30, visit http://www.fidelity.com/proxyvotingresults or visit the Securities and Exchange Commission's (SEC) web site at http://www.sec.gov.
You may also call 1-800-835-5092 to request a free copy of the proxy voting guidelines.
Standard & Poor's, S&P and S&P 500 are registered service marks of The McGraw-Hill Companies, Inc. and have been licensed for use by Fidelity Distributors Corporation.
Other third-party marks appearing herein are the property of their respective owners.
All other marks appearing herein are registered or unregistered trademarks or service marks of FMR LLC or an affiliated company. © 2019 FMR LLC. All rights reserved.
This report and the financial statements contained herein are submitted for the general information of the shareholders of the Fund. This report is not authorized for distribution to prospective investors in the Fund unless preceded or accompanied by an effective prospectus.
A fund files its complete schedule of portfolio holdings with the SEC for the first and third quarters of each fiscal year on Form N-Q. Forms N-Q are available on the SEC’s web site at http://www.sec.gov. A fund's Forms N-Q may be reviewed and copied at the SEC’s Public Reference Room in Washington, DC. Information regarding the operation of the SEC's Public Reference Room may be obtained by calling 1-800-SEC-0330.
For a complete list of a fund's portfolio holdings, view the most recent holdings listing, semiannual report, or annual report on Fidelity's web site at http://www.fidelity.com, http://www.institutional.fidelity.com, or http://www.401k.com, as applicable.
NOT FDIC INSURED •MAY LOSE VALUE •NO BANK GUARANTEE
Neither the Fund nor Fidelity Distributors Corporation is a bank.
Performance: The Bottom Line
Average annual total return reflects the change in the value of an investment, assuming reinvestment of distributions from dividend income and capital gains (the profits earned upon the sale of securities that have grown in value, if any) and assuming a constant rate of performance each year. The hypothetical investment and the average annual total returns do not reflect the deduction of taxes that a shareholder would pay on fund distributions or the redemption of fund shares. During periods of reimbursement by Fidelity, a fund’s total return will be greater than it would be had the reimbursement not occurred. How a fund did yesterday is no guarantee of how it will do tomorrow.
Average Annual Total Returns
| For the periods ended November 30, 2018 | Past 1 year | Past 5 years | Past 10 years |
| Class K | 4.08% | 8.38% | 14.22% |
$10,000 Over 10 Years
Let's say hypothetically that $10,000 was invested in Fidelity® Independence Fund - Class K on November 30, 2008.
The chart shows how the value of your investment would have changed, and also shows how the S&P 500® Index performed over the same period.
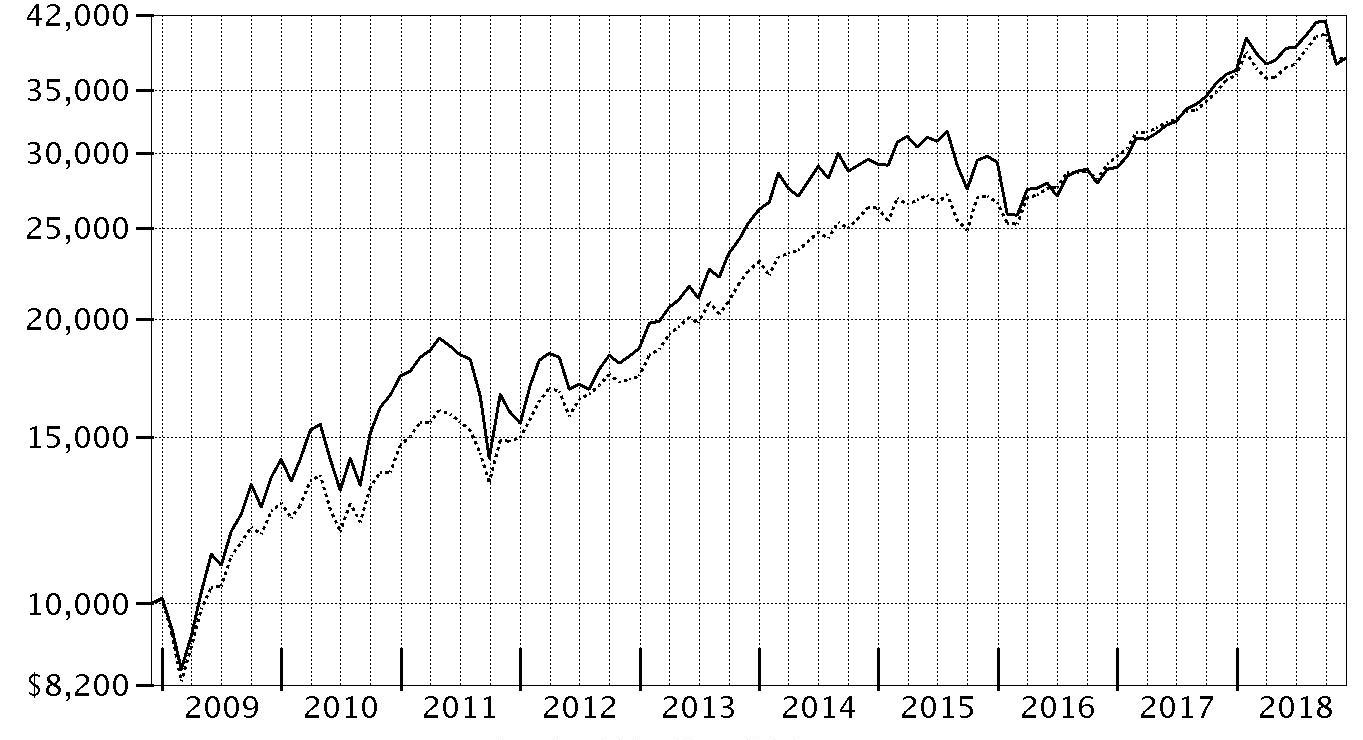
| Period Ending Values |
| $37,791 | Fidelity® Independence Fund - Class K |
| $38,109 | S&P 500® Index |
Management's Discussion of Fund Performance
Market Recap: The S&P 500
® index gained 6.27% for the 12 months ending November 30, 2018, as the U.S. equity bellwether declined sharply in October after climbing steadily beginning in May and achieving a record close in late September. Rising U.S. Treasury yields and concern about peaking corporate earnings growth sent many investors fleeing from risk assets at a time when they were still dealing with lingering uncertainty related to global trade and the U.S. Federal Reserve picking up the pace of interest rate hikes. The index returned -6.84% in October alone, its largest monthly drop in roughly seven years, and then endured a highly volatile November in which it gained 2.04%. For the full year, growth stocks within the index maintained a sizable advantage over their value counterparts, extending a trend that began in early 2017. A number of economically sensitive sectors dropped to the bottom of the 12-month performance scale, with materials (-7%) and energy (-2%) faring worst, followed by industrials (-1%) and financials (0%). In contrast, the defensive-oriented health care sector gained about 16% to lead the way. Consumer discretionary and information technology were rattled in October but earlier strength resulted in each advancing roughly 13% for the full 12 months. The newly reconstituted communication services sector, which includes dividend-rich telecom stocks, rose about 4%. Real estate (+5%), consumer staples (+3%) and utilities (+2%) also advanced but lagged the broader market.
Comments from Portfolio Manager Jeffrey Feingold: For the fiscal year, the fund’s share classes gained about 4%, trailing the benchmark S&P 500
® index. The fund's underperformance relative to the benchmark was primarily a function of security selection within the industrials, consumer discretionary and consumer staples sectors. Among industrials stocks, my decision to overweight a number of higher-quality defense companies hampered our relative result. In fact, the largest individual detractor was aerospace and defense technology company Northrop Grumman. Looking at the consumer sectors, untimely positioning in global retailer Walmart, which was sold prior to the end of the period, and an overweighted stake in apparel company PVH, hampered our relative result. On the plus side, the fund’s relative performance benefitted from overall exposure to growth stocks, as well as strong security selection within the technology sector this period. An out-of-benchmark stake in enterprise resource-planning software provider Workday was the top relative contributor, as the company continued to gain market share among cloud-based financial management firms. Lastly, within the newly reconstituted communications services sector, Netflix was the fund’s second-best contributor. This period, key metrics, including U.S. and international subscribers, remained extremely strong and above expectations.
The views expressed above reflect those of the portfolio manager(s) only through the end of the period as stated on the cover of this report and do not necessarily represent the views of Fidelity or any other person in the Fidelity organization. Any such views are subject to change at any time based upon market or other conditions and Fidelity disclaims any responsibility to update such views. These views may not be relied on as investment advice and, because investment decisions for a Fidelity fund are based on numerous factors, may not be relied on as an indication of trading intent on behalf of any Fidelity fund.
Investment Summary (Unaudited)
Top Ten Stocks as of November 30, 2018
| | % of fund's net assets |
| Microsoft Corp. | 6.7 |
| Alphabet, Inc. Class A | 4.9 |
| Amazon.com, Inc. | 4.1 |
| Apple, Inc. | 2.8 |
| UnitedHealth Group, Inc. | 2.7 |
| JPMorgan Chase & Co. | 2.2 |
| Home Depot, Inc. | 1.9 |
| American Tower Corp. | 1.9 |
| Northrop Grumman Corp. | 1.7 |
| Facebook, Inc. Class A | 1.7 |
| | 30.6 |
Top Five Market Sectors as of November 30, 2018
| | % of fund's net assets |
| Information Technology | 25.5 |
| Health Care | 16.1 |
| Financials | 11.9 |
| Industrials | 11.4 |
| Consumer Discretionary | 11.2 |
Asset Allocation (% of fund's net assets)
| As of November 30, 2018 * |
| | Stocks | 98.5% |
| | Convertible Securities | 0.4% |
| | Short-Term Investments and Net Other Assets (Liabilities) | 1.1% |

* Foreign investments - 6.7%
Schedule of Investments November 30, 2018
Showing Percentage of Net Assets
| Common Stocks - 98.5% | | | |
| | | Shares | Value (000s) |
| COMMUNICATION SERVICES - 8.4% | | | |
| Entertainment - 1.8% | | | |
| Activision Blizzard, Inc. | | 319,900 | $15,957 |
| Electronic Arts, Inc. (a) | | 165,800 | 13,939 |
| Netflix, Inc. (a) | | 125,100 | 35,795 |
| | | | 65,691 |
| Interactive Media & Services - 6.6% | | | |
| Alphabet, Inc.: | | | |
| Class A (a) | | 161,500 | 179,208 |
| Class C (a) | | 400 | 438 |
| Facebook, Inc. Class A (a) | | 436,440 | 61,368 |
| | | | 241,014 |
|
| TOTAL COMMUNICATION SERVICES | | | 306,705 |
|
| CONSUMER DISCRETIONARY - 11.2% | | | |
| Diversified Consumer Services - 0.4% | | | |
| Service Corp. International | | 349,300 | 16,138 |
| Hotels, Restaurants & Leisure - 2.0% | | | |
| Domino's Pizza, Inc. | | 36,000 | 9,984 |
| McDonald's Corp. | | 324,300 | 61,134 |
| | | | 71,118 |
| Household Durables - 0.3% | | | |
| D.R. Horton, Inc. | | 324,500 | 12,078 |
| Internet & Direct Marketing Retail - 4.1% | | | |
| Amazon.com, Inc. (a) | | 87,500 | 147,890 |
| Multiline Retail - 0.6% | | | |
| Dollar Tree, Inc. (a) | | 246,000 | 21,345 |
| Specialty Retail - 3.0% | | | |
| Best Buy Co., Inc. | | 294,900 | 19,048 |
| Home Depot, Inc. | | 386,700 | 69,730 |
| TJX Companies, Inc. | | 389,000 | 19,003 |
| | | | 107,781 |
| Textiles, Apparel & Luxury Goods - 0.8% | | | |
| PVH Corp. | | 279,300 | 30,865 |
|
| TOTAL CONSUMER DISCRETIONARY | | | 407,215 |
|
| CONSUMER STAPLES - 4.0% | | | |
| Beverages - 1.6% | | | |
| Constellation Brands, Inc. Class A (sub. vtg.) | | 110,600 | 21,651 |
| Fever-Tree Drinks PLC | | 127,939 | 3,900 |
| Monster Beverage Corp. (a) | | 535,200 | 31,941 |
| | | | 57,492 |
| Food & Staples Retailing - 0.9% | | | |
| Costco Wholesale Corp. | | 137,900 | 31,894 |
| Food Products - 0.7% | | | |
| Post Holdings, Inc. (a) | | 196,400 | 19,002 |
| The J.M. Smucker Co. | | 82,400 | 8,612 |
| | | | 27,614 |
| Personal Products - 0.8% | | | |
| elf Beauty, Inc. (a)(b) | | 865,100 | 11,039 |
| Unilever NV (Certificaten Van Aandelen) (Bearer) | | 336,100 | 18,652 |
| | | | 29,691 |
|
| TOTAL CONSUMER STAPLES | | | 146,691 |
|
| ENERGY - 5.3% | | | |
| Energy Equipment & Services - 0.2% | | | |
| Baker Hughes, a GE Co. Class A | | 415,800 | 9,489 |
| Oil, Gas & Consumable Fuels - 5.1% | | | |
| Anadarko Petroleum Corp. | | 758,200 | 40,109 |
| ConocoPhillips Co. | | 382,700 | 25,327 |
| Continental Resources, Inc. (a) | | 265,600 | 12,143 |
| Devon Energy Corp. | | 652,700 | 17,642 |
| Enterprise Products Partners LP | | 379,800 | 9,970 |
| EOG Resources, Inc. | | 463,100 | 47,843 |
| Pioneer Natural Resources Co. | | 94,900 | 14,021 |
| Suncor Energy, Inc. | | 537,900 | 17,344 |
| | | | 184,399 |
|
| TOTAL ENERGY | | | 193,888 |
|
| FINANCIALS - 11.9% | | | |
| Banks - 6.5% | | | |
| Bank of America Corp. | | 1,852,200 | 52,602 |
| Citigroup, Inc. | | 550,800 | 35,686 |
| JPMorgan Chase & Co. | | 727,000 | 80,835 |
| SunTrust Banks, Inc. | | 227,300 | 14,249 |
| Wells Fargo & Co. | | 1,009,100 | 54,774 |
| | | | 238,146 |
| Capital Markets - 3.5% | | | |
| BlackRock, Inc. Class A | | 63,800 | 27,307 |
| Charles Schwab Corp. | | 599,300 | 26,849 |
| MSCI, Inc. | | 132,300 | 20,783 |
| Northern Trust Corp. | | 135,300 | 13,426 |
| PJT Partners, Inc. | | 235,900 | 11,142 |
| S&P Global, Inc. | | 93,900 | 17,171 |
| The Blackstone Group LP | | 279,200 | 9,417 |
| | | | 126,095 |
| Insurance - 1.9% | | | |
| Chubb Ltd. | | 312,900 | 41,847 |
| The Travelers Companies, Inc. | | 220,400 | 28,734 |
| | | | 70,581 |
|
| TOTAL FINANCIALS | | | 434,822 |
|
| HEALTH CARE - 16.1% | | | |
| Biotechnology - 4.3% | | | |
| Acorda Therapeutics, Inc. (a) | | 345,700 | 7,063 |
| Alexion Pharmaceuticals, Inc. (a) | | 334,200 | 41,157 |
| Alnylam Pharmaceuticals, Inc. (a) | | 76,261 | 6,189 |
| Amgen, Inc. | | 215,900 | 44,961 |
| Amicus Therapeutics, Inc. (a)(b) | | 1,298,135 | 14,331 |
| Intercept Pharmaceuticals, Inc. (a) | | 149,900 | 16,625 |
| Regeneron Pharmaceuticals, Inc. (a) | | 39,000 | 14,260 |
| Vertex Pharmaceuticals, Inc. (a) | | 66,500 | 12,023 |
| | | | 156,609 |
| Health Care Equipment & Supplies - 3.1% | | | |
| Becton, Dickinson & Co. | | 149,800 | 37,862 |
| Boston Scientific Corp. (a) | | 1,449,300 | 54,595 |
| Danaher Corp. | | 184,100 | 20,166 |
| | | | 112,623 |
| Health Care Providers & Services - 5.8% | | | |
| CVS Health Corp. | | 462,500 | 37,093 |
| HCA Holdings, Inc. | | 171,900 | 24,752 |
| Humana, Inc. | | 136,900 | 45,104 |
| Ryman Healthcare Group Ltd. | | 628,252 | 5,005 |
| UnitedHealth Group, Inc. | | 348,100 | 97,941 |
| Wellcare Health Plans, Inc. (a) | | 7,300 | 1,861 |
| | | | 211,756 |
| Life Sciences Tools & Services - 1.5% | | | |
| Agilent Technologies, Inc. | | 200,200 | 14,484 |
| Thermo Fisher Scientific, Inc. | | 165,100 | 41,201 |
| | | | 55,685 |
| Pharmaceuticals - 1.4% | | | |
| AstraZeneca PLC sponsored ADR | | 565,700 | 22,526 |
| Jazz Pharmaceuticals PLC (a) | | 121,000 | 18,295 |
| Nektar Therapeutics (a) | | 211,816 | 8,555 |
| | | | 49,376 |
|
| TOTAL HEALTH CARE | | | 586,049 |
|
| INDUSTRIALS - 11.4% | | | |
| Aerospace & Defense - 7.5% | | | |
| General Dynamics Corp. | | 243,400 | 45,002 |
| Huntington Ingalls Industries, Inc. | | 160,700 | 34,631 |
| Lockheed Martin Corp. | | 103,100 | 30,974 |
| Northrop Grumman Corp. | | 241,500 | 62,761 |
| Raytheon Co. | | 248,200 | 43,519 |
| United Technologies Corp. | | 461,100 | 56,180 |
| | | | 273,067 |
| Air Freight & Logistics - 0.2% | | | |
| C.H. Robinson Worldwide, Inc. | | 69,000 | 6,371 |
| Airlines - 0.3% | | | |
| American Airlines Group, Inc. | | 290,300 | 11,658 |
| Commercial Services & Supplies - 0.3% | | | |
| Copart, Inc. (a) | | 206,600 | 10,574 |
| Construction & Engineering - 0.3% | | | |
| Fluor Corp. | | 318,800 | 13,048 |
| Machinery - 0.6% | | | |
| Xylem, Inc. | | 283,900 | 20,719 |
| Professional Services - 1.4% | | | |
| IHS Markit Ltd. (a) | | 956,575 | 51,052 |
| Road & Rail - 0.8% | | | |
| Norfolk Southern Corp. | | 164,800 | 28,138 |
|
| TOTAL INDUSTRIALS | | | 414,627 |
|
| INFORMATION TECHNOLOGY - 25.1% | | | |
| IT Services - 5.2% | | | |
| Accenture PLC Class A | | 178,000 | 29,285 |
| Adyen BV | | 2,100 | 1,087 |
| FleetCor Technologies, Inc. (a) | | 65,400 | 12,648 |
| GoDaddy, Inc. (a) | | 10,800 | 705 |
| MasterCard, Inc. Class A | | 223,200 | 44,879 |
| PayPal Holdings, Inc. (a) | | 298,300 | 25,597 |
| Shopify, Inc. Class A (a) | | 104,200 | 15,861 |
| Visa, Inc. Class A | | 404,600 | 57,336 |
| | | | 187,398 |
| Semiconductors & Semiconductor Equipment - 2.9% | | | |
| Broadcom, Inc. | | 116,400 | 27,635 |
| Lam Research Corp. | | 69,600 | 10,924 |
| NVIDIA Corp. | | 222,900 | 36,429 |
| Qualcomm, Inc. | | 513,300 | 29,905 |
| | | | 104,893 |
| Software - 14.2% | | | |
| 2U, Inc. (a) | | 234,100 | 13,669 |
| Adobe, Inc. (a) | | 175,100 | 43,931 |
| Autodesk, Inc. (a) | | 173,600 | 25,085 |
| Citrix Systems, Inc. | | 340,600 | 37,115 |
| DocuSign, Inc. | | 93,800 | 3,917 |
| HubSpot, Inc. (a) | | 22,169 | 3,082 |
| Intuit, Inc. | | 230,300 | 49,406 |
| Microsoft Corp. | | 2,189,100 | 242,747 |
| Nuance Communications, Inc. (a) | | 549,300 | 8,783 |
| Nutanix, Inc. Class A (a) | | 244,400 | 10,927 |
| Salesforce.com, Inc. (a) | | 261,100 | 37,275 |
| Tableau Software, Inc. (a) | | 152,700 | 19,033 |
| Tanium, Inc. Class B (a)(c)(d) | | 98,100 | 853 |
| Workday, Inc. Class A (a) | | 128,500 | 21,074 |
| | | | 516,897 |
| Technology Hardware, Storage & Peripherals - 2.8% | | | |
| Apple, Inc. | | 575,800 | 102,826 |
|
| TOTAL INFORMATION TECHNOLOGY | | | 912,014 |
|
| MATERIALS - 2.4% | | | |
| Chemicals - 1.8% | | | |
| CF Industries Holdings, Inc. | | 250,800 | 10,581 |
| DowDuPont, Inc. | | 593,200 | 34,317 |
| LyondellBasell Industries NV Class A | | 233,700 | 21,807 |
| | | | 66,705 |
| Metals & Mining - 0.6% | | | |
| Newmont Mining Corp. | | 627,600 | 20,297 |
|
| TOTAL MATERIALS | | | 87,002 |
|
| REAL ESTATE - 2.4% | | | |
| Equity Real Estate Investment Trusts (REITs) - 2.4% | | | |
| American Tower Corp. | | 414,300 | 68,148 |
| Crown Castle International Corp. | | 160,200 | 18,407 |
| | | | 86,555 |
| UTILITIES - 0.3% | | | |
| Electric Utilities - 0.3% | | | |
| Vistra Energy Corp. (a) | | 430,877 | 10,117 |
| TOTAL COMMON STOCKS | | | |
| (Cost $2,700,789) | | | 3,585,685 |
|
| Convertible Preferred Stocks - 0.4% | | | |
| CONSUMER DISCRETIONARY - 0.0% | | | |
| Hotels, Restaurants & Leisure - 0.0% | | | |
| Neutron Holdings, Inc. Series C (c)(d) | | 7,644,500 | 1,398 |
| INFORMATION TECHNOLOGY - 0.4% | | | |
| Internet Software & Services - 0.4% | | | |
| Lyft, Inc.: | | | |
| Series H (c)(d) | | 236,501 | 11,199 |
| Series I (c)(d) | | 42,235 | 2,000 |
| | | | 13,199 |
| TOTAL CONVERTIBLE PREFERRED STOCKS | | | |
| (Cost $12,798) | | | 14,597 |
|
| Money Market Funds - 1.2% | | | |
| Fidelity Cash Central Fund, 2.27% (e) | | 34,169,615 | 34,176 |
| Fidelity Securities Lending Cash Central Fund 2.27% (e)(f) | | 10,039,936 | 10,041 |
| TOTAL MONEY MARKET FUNDS | | | |
| (Cost $44,217) | | | 44,217 |
| TOTAL INVESTMENT IN SECURITIES - 100.1% | | | |
| (Cost $2,757,804) | | | 3,644,499 |
| NET OTHER ASSETS (LIABILITIES) - (0.1)% | | | (3,005) |
| NET ASSETS - 100% | | | $3,641,494 |
Legend
(a) Non-income producing
(b) Security or a portion of the security is on loan at period end.
(c) Restricted securities - Investment in securities not registered under the Securities Act of 1933 (excluding 144A issues). At the end of the period, the value of restricted securities (excluding 144A issues) amounted to $15,450,000 or 0.4% of net assets.
(d) Level 3 security
(e) Affiliated fund that is generally available only to investment companies and other accounts managed by Fidelity Investments. The rate quoted is the annualized seven-day yield of the fund at period end. A complete unaudited listing of the fund's holdings as of its most recent quarter end is available upon request. In addition, each Fidelity Central Fund's financial statements, which are not covered by the Fund's Report of Independent Registered Public Accounting Firm, are available on the SEC's website or upon request.
(f) Investment made with cash collateral received from securities on loan.
Additional information on each restricted holding is as follows:
| Security | Acquisition Date | Acquisition Cost (000s) |
| Lyft, Inc. Series H | 11/22/17 | $9,400 |
| Lyft, Inc. Series I | 6/27/18 | $2,000 |
| Neutron Holdings, Inc. Series C | 7/3/18 | $1,398 |
| Tanium, Inc. Class B | 4/21/17 | $487 |
Affiliated Central Funds
Information regarding fiscal year to date income earned by the Fund from investments in Fidelity Central Funds is as follows:
| Fund | Income earned |
| | (Amounts in thousands) |
| Fidelity Cash Central Fund | $503 |
| Fidelity Securities Lending Cash Central Fund | 994 |
| Total | $1,497 |
Amounts in the income column in the above table include any capital gain distributions from underlying funds, which are presented in the corresponding line-item in the Statement of Operations if applicable.
Investment Valuation
The following is a summary of the inputs used, as of November 30, 2018, involving the Fund's assets and liabilities carried at fair value. The inputs or methodology used for valuing securities may not be an indication of the risk associated with investing in those securities. For more information on valuation inputs, and their aggregation into the levels used below, please refer to the Investment Valuation section in the accompanying Notes to Financial Statements.
| | Valuation Inputs at Reporting Date: |
| Description | Total | Level 1 | Level 2 | Level 3 |
| (Amounts in thousands) | | | | |
| Investments in Securities: | | | | |
| Equities: | | | | |
| Communication Services | $306,705 | $306,705 | $-- | $-- |
| Consumer Discretionary | 408,613 | 407,215 | -- | 1,398 |
| Consumer Staples | 146,691 | 128,039 | 18,652 | -- |
| Energy | 193,888 | 193,888 | -- | -- |
| Financials | 434,822 | 434,822 | -- | -- |
| Health Care | 586,049 | 586,049 | -- | -- |
| Industrials | 414,627 | 414,627 | -- | -- |
| Information Technology | 925,213 | 911,161 | -- | 14,052 |
| Materials | 87,002 | 87,002 | -- | -- |
| Real Estate | 86,555 | 86,555 | -- | -- |
| Utilities | 10,117 | 10,117 | -- | -- |
| Money Market Funds | 44,217 | 44,217 | -- | -- |
| Total Investments in Securities: | $3,644,499 | $3,610,397 | $18,652 | $15,450 |
See accompanying notes which are an integral part of the financial statements.
Financial Statements
Statement of Assets and Liabilities
| Amounts in thousands (except per-share amounts) | | November 30, 2018 |
| Assets | | |
Investment in securities, at value (including securities loaned of $10,043) — See accompanying schedule:
Unaffiliated issuers (cost $2,713,587) | $3,600,282 | |
| Fidelity Central Funds (cost $44,217) | 44,217 | |
| Total Investment in Securities (cost $2,757,804) | | $3,644,499 |
| Receivable for investments sold | | 36,969 |
| Receivable for fund shares sold | | 270 |
| Dividends receivable | | 5,351 |
| Distributions receivable from Fidelity Central Funds | | 78 |
| Prepaid expenses | | 7 |
| Other receivables | | 154 |
| Total assets | | 3,687,328 |
| Liabilities | | |
| Payable for investments purchased | $29,287 | |
| Payable for fund shares redeemed | 4,895 | |
| Accrued management fee | 988 | |
| Other affiliated payables | 458 | |
| Other payables and accrued expenses | 171 | |
| Collateral on securities loaned | 10,035 | |
| Total liabilities | | 45,834 |
| Net Assets | | $3,641,494 |
| Net Assets consist of: | | |
| Paid in capital | | $2,394,036 |
| Total distributable earnings (loss) | | 1,247,458 |
| Net Assets | | $3,641,494 |
| Net Asset Value and Maximum Offering Price | | |
| Independence: | | |
| Net Asset Value, offering price and redemption price per share ($3,342,196 ÷ 87,079 shares) | | $38.38 |
| Class K: | | |
| Net Asset Value, offering price and redemption price per share ($299,298 ÷ 7,790 shares) | | $38.42 |
See accompanying notes which are an integral part of the financial statements.
Statement of Operations
| Amounts in thousands | | Year ended November 30, 2018 |
| Investment Income | | |
| Dividends | | $46,618 |
| Interest | | 1 |
| Income from Fidelity Central Funds | | 1,497 |
| Total income | | 48,116 |
| Expenses | | |
| Management fee | | |
| Basic fee | $21,281 | |
| Performance adjustment | (7,855) | |
| Transfer agent fees | 4,623 | |
| Accounting and security lending fees | 1,045 | |
| Custodian fees and expenses | 77 | |
| Independent trustees' fees and expenses | 20 | |
| Registration fees | 49 | |
| Audit | 72 | |
| Legal | 11 | |
| Miscellaneous | 26 | |
| Total expenses before reductions | 19,349 | |
| Expense reductions | (233) | |
| Total expenses after reductions | | 19,116 |
| Net investment income (loss) | | 29,000 |
| Realized and Unrealized Gain (Loss) | | |
| Net realized gain (loss) on: | | |
| Investment securities: | | |
| Unaffiliated issuers | 370,518 | |
| Fidelity Central Funds | 4 | |
| Foreign currency transactions | (23) | |
| Futures contracts | 3,190 | |
| Total net realized gain (loss) | | 373,689 |
| Change in net unrealized appreciation (depreciation) on: | | |
| Investment securities: | | |
| Unaffiliated issuers | (234,366) | |
| Fidelity Central Funds | (1) | |
| Assets and liabilities in foreign currencies | (12) | |
| Futures contracts | (2,863) | |
| Total change in net unrealized appreciation (depreciation) | | (237,242) |
| Net gain (loss) | | 136,447 |
| Net increase (decrease) in net assets resulting from operations | | $165,447 |
See accompanying notes which are an integral part of the financial statements.
Statement of Changes in Net Assets
| Amounts in thousands | Year ended November 30, 2018 | Year ended November 30, 2017 |
| Increase (Decrease) in Net Assets | | |
| Operations | | |
| Net investment income (loss) | $29,000 | $39,704 |
| Net realized gain (loss) | 373,689 | 459,249 |
| Change in net unrealized appreciation (depreciation) | (237,242) | 350,897 |
| Net increase (decrease) in net assets resulting from operations | 165,447 | 849,850 |
| Distributions to shareholders | (469,108) | – |
| Distributions to shareholders from net investment income | – | (18,779) |
| Distributions to shareholders from net realized gain | – | (191,464) |
| Total distributions | (469,108) | (210,243) |
| Share transactions - net increase (decrease) | 27,406 | (331,634) |
| Total increase (decrease) in net assets | (276,255) | 307,973 |
| Net Assets | | |
| Beginning of period | 3,917,749 | 3,609,776 |
| End of period | $3,641,494 | $3,917,749 |
| Other Information | | |
| Undistributed net investment income end of period | | $27,967 |
See accompanying notes which are an integral part of the financial statements.
Financial Highlights
Fidelity Independence Fund
| Years ended November 30, | 2018 | 2017 | 2016 | 2015 | 2014 |
| Selected Per–Share Data | | | | | |
| Net asset value, beginning of period | $41.90 | $35.38 | $39.08 | $40.89 | $35.10 |
| Income from Investment Operations | | | | | |
| Net investment income (loss)A | .29 | .40B | .20 | .05 | .10 |
| Net realized and unrealized gain (loss) | 1.25 | 8.21 | (1.44) | .13 | 5.80 |
| Total from investment operations | 1.54 | 8.61 | (1.24) | .18 | 5.90 |
| Distributions from net investment income | (.41) | (.18) | (.03) | (.04) | (.11) |
| Distributions from net realized gain | (4.65) | (1.91) | (2.43) | (1.95) | – |
| Total distributions | (5.06) | (2.09) | (2.46) | (1.99) | (.11) |
| Net asset value, end of period | $38.38 | $41.90 | $35.38 | $39.08 | $40.89 |
| Total ReturnC | 3.99% | 25.72% | (3.15)% | .63% | 16.87% |
| Ratios to Average Net AssetsD,E | | | | | |
| Expenses before reductions | .50% | .48% | .54% | .86% | .73% |
| Expenses net of fee waivers, if any | .50% | .48% | .54% | .86% | .73% |
| Expenses net of all reductions | .49% | .48% | .54% | .86% | .73% |
| Net investment income (loss) | .73% | 1.06%B | .59% | .12% | .27% |
| Supplemental Data | | | | | |
| Net assets, end of period (in millions) | $3,342 | $3,564 | $3,262 | $3,910 | $4,251 |
| Portfolio turnover rateF | 46% | 62% | 76% | 48% | 53% |
A Calculated based on average shares outstanding during the period.
B Net investment income per share reflects a large, non-recurring dividend which amounted to $.07 per share. Excluding this non-recurring dividend, the ratio of net investment income (loss) to average net assets would have been .89%.
C Total returns would have been lower if certain expenses had not been reduced during the applicable periods shown.
D Fees and expenses of any underlying Fidelity Central Funds are not included in the Fund's expense ratio. The Fund indirectly bears its proportionate share of the expenses of any underlying Fidelity Central Funds.
E Expense ratios reflect operating expenses of the class. Expenses before reductions do not reflect amounts reimbursed by the investment adviser or reductions from brokerage service arrangements or reductions from other expense offset arrangements and do not represent the amount paid by the class during periods when reimbursements or reductions occur. Expenses net of fee waivers reflect expenses after reimbursement by the investment adviser but prior to reductions from brokerage service arrangements or other expense offset arrangements. Expenses net of all reductions represent the net expenses paid by the class.
F Amount does not include the portfolio activity of any underlying Fidelity Central Funds.
See accompanying notes which are an integral part of the financial statements.
Fidelity Independence Fund Class K
| Years ended November 30, | 2018 | 2017 | 2016 | 2015 | 2014 |
| Selected Per–Share Data | | | | | |
| Net asset value, beginning of period | $41.94 | $35.41 | $39.12 | $40.93 | $35.14 |
| Income from Investment Operations | | | | | |
| Net investment income (loss)A | .32 | .43B | .23 | .08 | .14 |
| Net realized and unrealized gain (loss) | 1.25 | 8.22 | (1.45) | .14 | 5.79 |
| Total from investment operations | 1.57 | 8.65 | (1.22) | .22 | 5.93 |
| Distributions from net investment income | (.44) | (.22) | (.06) | (.08) | (.14) |
| Distributions from net realized gain | (4.65) | (1.91) | (2.43) | (1.95) | – |
| Total distributions | (5.09) | (2.12)C | (2.49) | (2.03) | (.14) |
| Net asset value, end of period | $38.42 | $41.94 | $35.41 | $39.12 | $40.93 |
| Total ReturnD | 4.08% | 25.84% | (3.08)% | .73% | 16.95% |
| Ratios to Average Net AssetsE,F | | | | | |
| Expenses before reductions | .42% | .40% | .45% | .78% | .64% |
| Expenses net of fee waivers, if any | .42% | .40% | .45% | .78% | .64% |
| Expenses net of all reductions | .41% | .39% | .45% | .77% | .64% |
| Net investment income (loss) | .81% | 1.15%B | .68% | .20% | .36% |
| Supplemental Data | | | | | |
| Net assets, end of period (in millions) | $299 | $354 | $348 | $493 | $668 |
| Portfolio turnover rateG | 46% | 62% | 76% | 48% | 53% |
A Calculated based on average shares outstanding during the period.
B Net investment income per share reflects a large, non-recurring dividend which amounted to $.07 per share. Excluding this non-recurring dividend, the ratio of net investment income (loss) to average net assets would have been .97%.
C Total distributions of $2.12 per share is comprised of distributions from net investment income of $.216 and distributions from net realized gain of $1.907 per share.
D Total returns would have been lower if certain expenses had not been reduced during the applicable periods shown.
E Fees and expenses of any underlying Fidelity Central Funds are not included in the Fund's expense ratio. The Fund indirectly bears its proportionate share of the expenses of any underlying Fidelity Central Funds.
F Expense ratios reflect operating expenses of the class. Expenses before reductions do not reflect amounts reimbursed by the investment adviser or reductions from brokerage service arrangements or reductions from other expense offset arrangements and do not represent the amount paid by the class during periods when reimbursements or reductions occur. Expenses net of fee waivers reflect expenses after reimbursement by the investment adviser but prior to reductions from brokerage service arrangements or other expense offset arrangements. Expenses net of all reductions represent the net expenses paid by the class.
G Amount does not include the portfolio activity of any underlying Fidelity Central Funds.
See accompanying notes which are an integral part of the financial statements.
Notes to Financial Statements
For the period ended November 30, 2018
(Amounts in thousands except percentages)
1. Organization.
Fidelity Independence Fund (the Fund) is a fund of Fidelity Financial Trust (the Trust) and is authorized to issue an unlimited number of shares. The Trust is registered under the Investment Company Act of 1940, as amended (the 1940 Act), as an open-end management investment company organized as a Massachusetts business trust. The Fund offers Independence and Class K shares, each of which has equal rights as to assets and voting privileges. Each class has exclusive voting rights with respect to matters that affect that class.
2. Investments in Fidelity Central Funds.
The Fund invests in Fidelity Central Funds, which are open-end investment companies generally available only to other investment companies and accounts managed by the investment adviser and its affiliates. The Fund's Schedule of Investments lists each of the Fidelity Central Funds held as of period end, if any, as an investment of the Fund, but does not include the underlying holdings of each Fidelity Central Fund. As an Investing Fund, the Fund indirectly bears its proportionate share of the expenses of the underlying Fidelity Central Funds.
The Money Market Central Funds seek preservation of capital and current income and are managed by Fidelity Investments Money Management, Inc. (FIMM), an affiliate of the investment adviser. Annualized expenses of the Money Market Central Funds as of their most recent shareholder report date are less than .005%.
A complete unaudited list of holdings for each Fidelity Central Fund is available upon request or at the Securities and Exchange Commission (the SEC) website at www.sec.gov. In addition, the financial statements of the Fidelity Central Funds, which are not covered by the Fund's Report of Independent Registered Public Accounting Firm, are available on the SEC website or upon request.
3. Significant Accounting Policies.
The Fund is an investment company and applies the accounting and reporting guidance of the Financial Accounting Standards Board (FASB) Accounting Standards Codification Topic 946 Financial Services – Investments Companies. The financial statements have been prepared in conformity with accounting principles generally accepted in the United States of America (GAAP), which require management to make certain estimates and assumptions at the date of the financial statements. Actual results could differ from those estimates. Subsequent events, if any, through the date that the financial statements were issued have been evaluated in the preparation of the financial statements. The following summarizes the significant accounting policies of the Fund:
Investment Valuation. Investments are valued as of 4:00 p.m. Eastern time on the last calendar day of the period. The Board of Trustees (the Board) has delegated the day to day responsibility for the valuation of the Fund's investments to the Fair Value Committee (the Committee) established by the Fund's investment adviser. In accordance with valuation policies and procedures approved by the Board, the Fund attempts to obtain prices from one or more third party pricing vendors or brokers to value its investments. When current market prices, quotations or currency exchange rates are not readily available or reliable, investments will be fair valued in good faith by the Committee, in accordance with procedures adopted by the Board. Factors used in determining fair value vary by investment type and may include market or investment specific events. The frequency with which these procedures are used cannot be predicted and they may be utilized to a significant extent. The Committee oversees the Fund's valuation policies and procedures and reports to the Board on the Committee's activities and fair value determinations. The Board monitors the appropriateness of the procedures used in valuing the Fund's investments and ratifies the fair value determinations of the Committee.
The Fund categorizes the inputs to valuation techniques used to value its investments into a disclosure hierarchy consisting of three levels as shown below:
- Level 1 – quoted prices in active markets for identical investments
- Level 2 – other significant observable inputs (including quoted prices for similar investments, interest rates, prepayment speeds, etc.)
- Level 3 – unobservable inputs (including the Fund's own assumptions based on the best information available)
Valuation techniques used to value the Fund's investments by major category are as follows:
Equity securities, including restricted securities, for which market quotations are readily available, are valued at the last reported sale price or official closing price as reported by a third party pricing vendor on the primary market or exchange on which they are traded and are categorized as Level 1 in the hierarchy. In the event there were no sales during the day or closing prices are not available, securities are valued at the last quoted bid price or may be valued using the last available price and are generally categorized as Level 2 in the hierarchy. For foreign equity securities, when market or security specific events arise, comparisons to the valuation of American Depositary Receipts (ADRs), futures contracts, Exchange-Traded Funds (ETFs) and certain indexes as well as quoted prices for similar securities may be used and would be categorized as Level 2 in the hierarchy. Utilizing these techniques may result in transfers between Level 1 and Level 2. For equity securities, including restricted securities, where observable inputs are limited, assumptions about market activity and risk are used and these securities may be categorized as Level 3 in the hierarchy.
Investments in open-end mutual funds, including the Fidelity Central Funds, are valued at their closing net asset value (NAV) each business day and are categorized as Level 1 in the hierarchy.
Changes in valuation techniques may result in transfers in or out of an assigned level within the disclosure hierarchy. The aggregate value of investments by input level as of November 30, 2018 is included at the end of the Fund's Schedule of Investments.
Foreign Currency. The Fund may use foreign currency contracts to facilitate transactions in foreign-denominated securities. Gains and losses from these transactions may arise from changes in the value of the foreign currency or if the counterparties do not perform under the contracts' terms.
Foreign-denominated assets, including investment securities, and liabilities are translated into U.S. dollars at the exchange rates at period end. Purchases and sales of investment securities, income and dividends received and expenses denominated in foreign currencies are translated into U.S. dollars at the exchange rate in effect on the transaction date.
The effects of exchange rate fluctuations on investments are included with the net realized and unrealized gain (loss) on investment securities. Other foreign currency transactions resulting in realized and unrealized gain (loss) are disclosed separately.
Investment Transactions and Income. For financial reporting purposes, the Fund's investment holdings and NAV include trades executed through the end of the last business day of the period. The NAV per share for processing shareholder transactions is calculated as of the close of business of the New York Stock Exchange (NYSE), normally 4:00 p.m. Eastern time and includes trades executed through the end of the prior business day. Gains and losses on securities sold are determined on the basis of identified cost and include proceeds received from litigation. Dividend income is recorded on the ex-dividend date, except for certain dividends from foreign securities where the ex-dividend date may have passed, which are recorded as soon as the Fund is informed of the ex-dividend date. Non-cash dividends included in dividend income, if any, are recorded at the fair market value of the securities received. Income and capital gain distributions from Fidelity Central Funds, if any, are recorded on the ex-dividend date. Certain distributions received by the Fund represent a return of capital or capital gain. The Fund determines the components of these distributions subsequent to the ex-dividend date, based upon receipt of tax filings or other correspondence relating to the underlying investment. These distributions are recorded as a reduction of cost of investments and/or as a realized gain. Interest income is accrued as earned and includes coupon interest and amortization of premium and accretion of discount on debt securities as applicable. Investment income is recorded net of foreign taxes withheld where recovery of such taxes is uncertain.
Class Allocations and Expenses. Investment income, realized and unrealized capital gains and losses, common expenses of the Fund, and certain fund-level expense reductions, if any, are allocated daily on a pro-rata basis to each class based on the relative net assets of each class to the total net assets of the Fund. Each class differs with respect to transfer agent fees incurred. Certain expense reductions may also differ by class. For the reporting period, the allocated portion of income and expenses to each class as a percent of its average net assets may vary due to the timing of recording these transactions in relation to fluctuating net assets of the classes. Expenses directly attributable to a fund are charged to that fund. Expenses attributable to more than one fund are allocated among the respective funds on the basis of relative net assets or other appropriate methods. Expense estimates are accrued in the period to which they relate and adjustments are made when actual amounts are known.
Deferred Trustee Compensation. Under a Deferred Compensation Plan (the Plan) for the Fund, certain independent Trustees have elected to defer receipt of a portion of their annual compensation. Deferred amounts are invested in a cross-section of Fidelity funds, are marked-to-market and remain in the Fund until distributed in accordance with the Plan. The investment of deferred amounts and the offsetting payable to the Trustees of $83 are included in the accompanying Statement of Assets and Liabilities in other receivables and other payables and accrued expenses, respectively.
Income Tax Information and Distributions to Shareholders. Each year, the Fund intends to qualify as a regulated investment company under Subchapter M of the Internal Revenue Code, including distributing substantially all of its taxable income and realized gains. As a result, no provision for U.S. Federal income taxes is required. As of November 30, 2018, the Fund did not have any unrecognized tax benefits in the financial statements; nor is the Fund aware of any tax positions for which it is reasonably possible that the total amounts of unrecognized tax benefits will significantly change in the next twelve months. The Fund files a U.S. federal tax return, in addition to state and local tax returns as required. The Fund's federal income tax returns are subject to examination by the Internal Revenue Service (IRS) for a period of three fiscal years after they are filed. State and local tax returns may be subject to examination for an additional fiscal year depending on the jurisdiction. Foreign taxes are provided for based on the Fund's understanding of the tax rules and rates that exist in the foreign markets in which it invests.
Distributions are declared and recorded on the ex-dividend date. Income and capital gain distributions are declared separately for each class. Income and capital gain distributions are determined in accordance with income tax regulations, which may differ from GAAP. In addition, the Fund claimed a portion of the payment made to redeeming shareholders as a distribution for income tax purposes.
Capital accounts within the financial statements are adjusted for permanent book-tax differences. These adjustments have no impact on net assets or the results of operations. Capital accounts are not adjusted for temporary book-tax differences which will reverse in a subsequent period.
Book-tax differences are primarily due to futures contracts, foreign currency transactions, market discount, partnerships, deferred trustees compensation and losses deferred due to wash sales.
As of period end, the cost and unrealized appreciation (depreciation) in securities, and derivatives if applicable, for federal income tax purposes were as follows:
| Gross unrealized appreciation | $989,067 |
| Gross unrealized depreciation | (102,742) |
| Net unrealized appreciation (depreciation) | $886,325 |
| Tax Cost | $2,758,174 |
The tax-based components of distributable earnings as of period end were as follows:
| Undistributed ordinary income | $18,643 |
| Undistributed long-term capital gain | $345,052 |
| Net unrealized appreciation (depreciation) on securities and other investments | $883,846 |
The tax character of distributions paid was as follows:
| | November 30, 2018 | November 30, 2017 |
| Ordinary Income | $45,415 | $ 19,783 |
| Long-term Capital Gains | 423,693 | 190,460 |
| Total | $469,108 | $ 210,243 |
Restricted Securities. The Fund may invest in securities that are subject to legal or contractual restrictions on resale. These securities generally may be resold in transactions exempt from registration or to the public if the securities are registered. Disposal of these securities may involve time-consuming negotiations and expense, and prompt sale at an acceptable price may be difficult. Information regarding restricted securities is included at the end of the Fund's Schedule of Investments.
New Rule Issuance. During August 2018, the U.S. Securities and Exchange Commission issued Final Rule Release No. 33-10532, Disclosure Update and Simplification. This Final Rule includes amendments specific to registered investment companies that are intended to eliminate overlap in disclosure requirements between Regulation S-X and GAAP. In accordance with these amendments, certain line-items in the Fund's financial statements have been combined or removed for the current period as outlined in the table below.
| Financial Statement | Current Line-Item Presentation | Prior Line-Item Presentation |
| Statement of Assets and Liabilities | Total distributable earnings (loss) | Undistributed/Distributions in excess of/Accumulated net investment income (loss)
Accumulated/Undistributed net realized gain (loss)
Net unrealized appreciation (depreciation) |
| Statement of Changes in Net Assets | N/A - removed | Undistributed/Distributions in excess of/Accumulated net investment income (loss) end of period |
| Statement of Changes in Net Assets | Distributions to shareholders | Distributions to shareholders from net investment income
Distributions to shareholders from net realized gain |
| Distributions to Shareholders Note to Financial Statements | Distributions to shareholders | Distributions to shareholders from net investment income
Distributions to shareholders from net realized gain |
4. Derivative Instruments.
Risk Exposures and the Use of Derivative Instruments. The Fund's investment objective allows the Fund to enter into various types of derivative contracts, including futures contracts. Derivatives are investments whose value is primarily derived from underlying assets, indices or reference rates and may be transacted on an exchange or over-the-counter (OTC). Derivatives may involve a future commitment to buy or sell a specified asset based on specified terms, to exchange future cash flows at periodic intervals based on a notional principal amount, or for one party to make one or more payments upon the occurrence of specified events in exchange for periodic payments from the other party.
The Fund used derivatives to increase returns and to manage exposure to certain risks as defined below. The success of any strategy involving derivatives depends on analysis of numerous economic factors, and if the strategies for investment do not work as intended, the Fund may not achieve its objectives.
The Fund's use of derivatives increased or decreased its exposure to the following risks:
| Equity Risk | Equity risk relates to the fluctuations in the value of financial instruments as a result of changes in market prices (other than those arising from interest rate risk or foreign exchange risk), whether caused by factors specific to an individual investment, its issuer, or all factors affecting all instruments traded in a market or market segment.
|
The Fund is also exposed to additional risks from investing in derivatives, such as liquidity risk and counterparty credit risk. Liquidity risk is the risk that the Fund will be unable to close out the derivative in the open market in a timely manner. Counterparty credit risk is the risk that the counterparty will not be able to fulfill its obligation to the Fund. Counterparty credit risk related to exchange-traded futures contracts may be mitigated by the protection provided by the exchange on which they trade.
Investing in derivatives may involve greater risks than investing in the underlying assets directly and, to varying degrees, may involve risk of loss in excess of any initial investment and collateral received and amounts recognized in the Statement of Assets and Liabilities. In addition, there may be the risk that the change in value of the derivative contract does not correspond to the change in value of the underlying instrument.
Futures Contracts. A futures contract is an agreement between two parties to buy or sell a specified underlying instrument for a fixed price at a specified future date. The Fund used futures contracts to manage its exposure to the stock market.
Upon entering into a futures contract, a fund is required to deposit either cash or securities (initial margin) with a clearing broker in an amount equal to a certain percentage of the face value of the contract. Futures contracts are marked-to-market daily and subsequent daily payments (variation margin) are made or received by a fund depending on the daily fluctuations in the value of the futures contracts and are recorded as unrealized appreciation or (depreciation). This receivable and/or payable, if any, is included in daily variation margin on futures contracts in the Statement of Assets and Liabilities. Realized gain or (loss) is recorded upon the expiration or closing of a futures contract. The net realized gain (loss) and change in net unrealized appreciation (depreciation) on futures contracts during the period is presented in the Statement of Operations.
Any open futures contracts at period end are presented in the Schedule of Investments under the caption "Futures Contracts". The notional amount at value reflects each contract's exposure to the underlying instrument or index at period end.
5. Purchases and Sales of Investments.
Purchases and sales of securities, other than short-term securities, aggregated $1,793,355 and $2,200,355, respectively.
6. Fees and Other Transactions with Affiliates.
Management Fee. Fidelity Management & Research Company (the investment adviser) and its affiliates provide the Fund with investment management related services for which the Fund pays a monthly management fee. The management fee is the sum of an individual fund fee rate that is based on an annual rate of .30% of the Fund's average net assets and an annualized group fee rate that averaged .24% during the period. The group fee rate is based upon the average net assets of all the mutual funds advised by the investment adviser, including any mutual funds previously advised by the investment adviser that are currently advised by Fidelity SelectCo, LLC, an affiliate of the investment adviser. The group fee rate decreases as assets under management increase and increases as assets under management decrease. In addition, the management fee is subject to a performance adjustment (up to a maximum of +/- .20% of the Fund's average net assets over a 36 month performance period). The upward or downward adjustment to the management fee is based on the relative investment performance of Independence as compared to its benchmark index, the S&P 500 Index, over the same 36 month performance period. For the reporting period, the total annual management fee rate, including the performance adjustment, was .34% of the Fund's average net assets. The performance adjustment included in the management fee rate may be higher or lower than the maximum performance adjustment rate due to the difference between the average net assets for the reporting and performance periods.
Transfer Agent Fees. Fidelity Investments Institutional Operations Company, Inc., (FIIOC), an affiliate of the investment adviser, is the transfer, dividend disbursing and shareholder servicing agent for each class of the Fund. FIIOC receives account fees and asset-based fees that vary according to the account size and type of account of the shareholders of Independence, except for Class K. FIIOC receives an asset based fee of Class K's average net assets. FIIOC pays for typesetting, printing and mailing of shareholder reports, except proxy statements.
For the period, transfer agent fees for each class were as follows:
| | Amount | % of Class-Level Average Net Assets |
| Independence | $4,466 | .12 |
| Class K | 157 | .05 |
| | $4,623 | |
Accounting and Security Lending Fees. Fidelity Service Company, Inc. (FSC), an affiliate of the investment adviser, maintains the Fund's accounting records. The accounting fee is based on the level of average net assets for each month. Under a separate contract, FSC administers the security lending program. The security lending fee is based on the number and duration of lending transactions. For the period, the fees were equivalent to an annual rate of .03%.
Brokerage Commissions. The Fund placed a portion of its portfolio transactions with brokerage firms which are affiliates of the investment adviser. Brokerage commissions are included in net realized gain (loss) and change in net unrealized appreciation (depreciation) in the Statement of Operations. The commissions paid to these affiliated firms were $43 for the period.
Interfund Trades. The Fund may purchase from or sell securities to other Fidelity Funds under procedures adopted by the Board. The procedures have been designed to ensure these interfund trades are executed in accordance with Rule 17a-7 of the 1940 Act. Interfund trades are included within the respective purchases and sales amounts shown in the Purchases and Sales of Investments note.
Other. During the period, the investment adviser reimbursed the Fund for certain losses in the amount of $4.
7. Committed Line of Credit.
The Fund participates with other funds managed by the investment adviser or an affiliate in a $4.25 billion credit facility (the "line of credit") to be utilized for temporary or emergency purposes to fund shareholder redemptions or for other short-term liquidity purposes. The Fund has agreed to pay commitment fees on its pro-rata portion of the line of credit, which amounted to $11 and is reflected in Miscellaneous expenses on the Statement of Operations. During the period, the Fund did not borrow on this line of credit.
8. Security Lending.
The Fund lends portfolio securities through a lending agent from time to time in order to earn additional income. For equity securities, a lending agent is used and may loan securities to certain qualified borrowers, including Fidelity Capital Markets (FCM), a broker-dealer affiliated with the Fund. On the settlement date of the loan, the Fund receives collateral (in the form of U.S. Treasury obligations, letters of credit and/or cash) against the loaned securities and maintains collateral in an amount not less than 100% of the market value of the loaned securities during the period of the loan. The market value of the loaned securities is determined at the close of business of the Fund and any additional required collateral is delivered to the Fund on the next business day. The Fund or borrower may terminate the loan at any time, and if the borrower defaults on its obligation to return the securities loaned because of insolvency or other reasons, the Fund may apply collateral received from the borrower against the obligation. The Fund may experience delays and costs in recovering the securities loaned. Any cash collateral received is invested in the Fidelity Securities Lending Cash Central Fund. The value of loaned securities and cash collateral at period end are disclosed on the Fund's Statement of Assets and Liabilities. At period end, there were no security loans outstanding with FCM. Security lending income represents the income earned on investing cash collateral, less rebates paid to borrowers and any lending agent fees associated with the loan, plus any premium payments received for lending certain types of securities. Security lending income is presented in the Statement of Operations as a component of income from Fidelity Central Funds. Total security lending income during the period amounted to $994, including $115 from securities loaned to FCM.
9. Expense Reductions.
Commissions paid to certain brokers with whom the investment adviser, or its affiliates, places trades on behalf of the Fund include an amount in addition to trade execution, which may be rebated back to the Fund to offset certain expenses. This amount totaled $185 for the period. In addition, through arrangements with the Fund's custodian, credits realized as a result of certain uninvested cash balances were used to reduce the Fund's expenses. During the period, these credits reduced the Fund's custody expenses by $1.
During the period, these credits reduced each class' transfer agent expense as noted in the table below.
| | Transfer Agent expense reduction |
| Independence | $8 |
In addition, during the period the investment adviser reimbursed and/or waived a portion of fund-level operating expenses in the amount of $39.
10. Distributions to Shareholders.
Distributions to shareholders of each class were as follows:
| | Year ended
November 30, 2018 | Year ended
November 30, 2017 |
| Distributions to shareholders | | |
| Independence | $426,623 | $– |
| Class K | 42,485 | – |
| Total | $469,108 | $– |
| From net investment income | | |
| Independence | $– | $16,716 |
| Class K | – | 2,063 |
| Total | $– | $18,779 |
| From net realized gain | | |
| Independence | $– | $173,251 |
| Class K | – | 18,213 |
| Total | $– | $191,464 |
11. Share Transactions.
Share transactions for each class were as follows and may contain automatic conversions between classes or exchanges between affiliated funds:
| | Shares | Shares | Dollars | Dollars |
| | Year ended November 30, 2018 | Year ended November 30, 2017 | Year ended November 30, 2018 | Year ended November 30, 2017 |
| Independence | | | | |
| Shares sold | 1,442 | 1,414 | $57,236 | $52,592 |
| Reinvestment of distributions | 11,131 | 5,465 | 416,289 | 185,699 |
| Shares redeemed | (10,563) | (14,014) | (418,873) | (518,484) |
| Net increase (decrease) | 2,010 | (7,135) | $54,652 | $(280,193) |
| Class K | | | | |
| Shares sold | 760 | 1,192 | $30,044 | $44,637 |
| Reinvestment of distributions | 1,136 | 597 | 42,485 | 20,276 |
| Shares redeemed | (2,539) | (3,178) | (99,775) | (116,354) |
| Net increase (decrease) | (643) | (1,389) | $(27,246) | $(51,441) |
12. Other.
The Fund's organizational documents provide former and current trustees and officers with a limited indemnification against liabilities arising in connection with the performance of their duties to the Fund. In the normal course of business, the Fund may also enter into contracts that provide general indemnifications. The Fund's maximum exposure under these arrangements is unknown as this would be dependent on future claims that may be made against the Fund. The risk of material loss from such claims is considered remote.
Report of Independent Registered Public Accounting Firm
To the Board of Trustees of Fidelity Financial Trust and Shareholders of Fidelity Independence Fund:
Opinion on the Financial Statements
We have audited the accompanying statement of assets and liabilities, including the schedule of investments, of Fidelity Independence Fund (one of the funds constituting Fidelity Financial Trust, referred to hereafter as the "Fund") as of November 30, 2018, the related statement of operations for the year ended November 30, 2018, the statement of changes in net assets for each of the two years in the period ended November 30, 2018, including the related notes, and the financial highlights for each of the five years in the period ended November 30, 2018 (collectively referred to as the “financial statements”). In our opinion, the financial statements present fairly, in all material respects, the financial position of the Fund as of November 30, 2018, the results of its operations for the year then ended, the changes in its net assets for each of the two years in the period ended November 30, 2018 and the financial highlights for each of the five years in the period ended November 30, 2018 in conformity with accounting principles generally accepted in the United States of America.
Basis for Opinion
These financial statements are the responsibility of the Fund’s management. Our responsibility is to express an opinion on the Fund’s financial statements based on our audits. We are a public accounting firm registered with the Public Company Accounting Oversight Board (United States) (“PCAOB”) and are required to be independent with respect to the Fund in accordance with the U.S. federal securities laws and the applicable rules and regulations of the Securities and Exchange Commission and the PCAOB.
We conducted our audits of these financial statements in accordance with the standards of the PCAOB. Those standards require that we plan and perform the audit to obtain reasonable assurance about whether the financial statements are free of material misstatement, whether due to error or fraud.
Our audits included performing procedures to assess the risks of material misstatement of the financial statements, whether due to error or fraud, and performing procedures that respond to those risks. Such procedures included examining, on a test basis, evidence regarding the amounts and disclosures in the financial statements. Our audits also included evaluating the accounting principles used and significant estimates made by management, as well as evaluating the overall presentation of the financial statements. Our procedures included confirmation of securities owned as of November 30, 2018 by correspondence with the custodian and brokers; when replies were not received from brokers, we performed other auditing procedures. We believe that our audits provide a reasonable basis for our opinion.
PricewaterhouseCoopers LLP
Boston, Massachusetts
January 14, 2019
We have served as the auditor of one or more investment companies in the Fidelity group of funds since 1932.
Trustees and Officers
The Trustees, Members of the Advisory Board (if any), and officers of the trust and fund, as applicable, are listed below. The Board of Trustees governs the fund and is responsible for protecting the interests of shareholders. The Trustees are experienced executives who meet periodically throughout the year to oversee the fund's activities, review contractual arrangements with companies that provide services to the fund, oversee management of the risks associated with such activities and contractual arrangements, and review the fund's performance. Except for Michael E. Wiley, each of the Trustees oversees 281 funds. Mr. Wiley oversees 192 funds.
The Trustees hold office without limit in time except that (a) any Trustee may resign; (b) any Trustee may be removed by written instrument, signed by at least two-thirds of the number of Trustees prior to such removal; (c) any Trustee who requests to be retired or who has become incapacitated by illness or injury may be retired by written instrument signed by a majority of the other Trustees; and (d) any Trustee may be removed at any special meeting of shareholders by a two-thirds vote of the outstanding voting securities of the trust. Each Trustee who is not an interested person (as defined in the 1940 Act) of the trust and the fund is referred to herein as an Independent Trustee. Each Independent Trustee shall retire not later than the last day of the calendar year in which his or her 75th birthday occurs. The Independent Trustees may waive this mandatory retirement age policy with respect to individual Trustees. Officers and Advisory Board Members hold office without limit in time, except that any officer or Advisory Board Member may resign or may be removed by a vote of a majority of the Trustees at any regular meeting or any special meeting of the Trustees. Except as indicated, each individual has held the office shown or other offices in the same company for the past five years.
The fund’s Statement of Additional Information (SAI) includes more information about the Trustees. To request a free copy, call Fidelity at 1-800-835-5092.
Experience, Skills, Attributes, and Qualifications of the Trustees. The Governance and Nominating Committee has adopted a statement of policy that describes the experience, qualifications, attributes, and skills that are necessary and desirable for potential Independent Trustee candidates (Statement of Policy). The Board believes that each Trustee satisfied at the time he or she was initially elected or appointed a Trustee, and continues to satisfy, the standards contemplated by the Statement of Policy. The Governance and Nominating Committee also engages professional search firms to help identify potential Independent Trustee candidates who have the experience, qualifications, attributes, and skills consistent with the Statement of Policy. From time to time, additional criteria based on the composition and skills of the current Independent Trustees, as well as experience or skills that may be appropriate in light of future changes to board composition, business conditions, and regulatory or other developments, have also been considered by the professional search firms and the Governance and Nominating Committee. In addition, the Board takes into account the Trustees' commitment and participation in Board and committee meetings, as well as their leadership of standing and ad hoc committees throughout their tenure.
In determining that a particular Trustee was and continues to be qualified to serve as a Trustee, the Board has considered a variety of criteria, none of which, in isolation, was controlling. The Board believes that, collectively, the Trustees have balanced and diverse experience, qualifications, attributes, and skills, which allow the Board to operate effectively in governing the fund and protecting the interests of shareholders. Information about the specific experience, skills, attributes, and qualifications of each Trustee, which in each case led to the Board's conclusion that the Trustee should serve (or continue to serve) as a trustee of the fund, is provided below.
Board Structure and Oversight Function. James C. Curvey is an interested person and currently serves as Chairman. The Trustees have determined that an interested Chairman is appropriate and benefits shareholders because an interested Chairman has a personal and professional stake in the quality and continuity of services provided to the fund. Independent Trustees exercise their informed business judgment to appoint an individual of their choosing to serve as Chairman, regardless of whether the Trustee happens to be independent or a member of management. The Independent Trustees have determined that they can act independently and effectively without having an Independent Trustee serve as Chairman and that a key structural component for assuring that they are in a position to do so is for the Independent Trustees to constitute a substantial majority for the Board. The Independent Trustees also regularly meet in executive session. Ned C. Lautenbach serves as Chairman of the Independent Trustees and as such (i) acts as a liaison between the Independent Trustees and management with respect to matters important to the Independent Trustees and (ii) with management prepares agendas for Board meetings.
Fidelity® funds are overseen by different Boards of Trustees. The fund's Board oversees Fidelity's high income and certain equity funds, and other Boards oversee Fidelity's investment-grade bond, money market, asset allocation, and other equity funds. The asset allocation funds may invest in Fidelity® funds overseen by the fund's Board. The use of separate Boards, each with its own committee structure, allows the Trustees of each group of Fidelity® funds to focus on the unique issues of the funds they oversee, including common research, investment, and operational issues. On occasion, the separate Boards establish joint committees to address issues of overlapping consequences for the Fidelity® funds overseen by each Board.
The Trustees operate using a system of committees to facilitate the timely and efficient consideration of all matters of importance to the Trustees, the fund, and fund shareholders and to facilitate compliance with legal and regulatory requirements and oversight of the fund's activities and associated risks. The Board, acting through its committees, has charged FMR and its affiliates with (i) identifying events or circumstances the occurrence of which could have demonstrably adverse effects on the fund's business and/or reputation; (ii) implementing processes and controls to lessen the possibility that such events or circumstances occur or to mitigate the effects of such events or circumstances if they do occur; and (iii) creating and maintaining a system designed to evaluate continuously business and market conditions in order to facilitate the identification and implementation processes described in (i) and (ii) above. Because the day-to-day operations and activities of the fund are carried out by or through FMR, its affiliates, and other service providers, the fund's exposure to risks is mitigated but not eliminated by the processes overseen by the Trustees. While each of the Board's committees has responsibility for overseeing different aspects of the fund's activities, oversight is exercised primarily through the Operations, Audit, and Compliance Committees. In addition, the Independent Trustees have worked with Fidelity to enhance the Board's oversight of investment and financial risks, legal and regulatory risks, technology risks, and operational risks, including the development of additional risk reporting to the Board. Appropriate personnel, including but not limited to the fund's Chief Compliance Officer (CCO), FMR's internal auditor, the independent accountants, the fund's Treasurer and portfolio management personnel, make periodic reports to the Board's committees, as appropriate, including an annual review of Fidelity's risk management program for the Fidelity® funds. The responsibilities of each standing committee, including their oversight responsibilities, are described further under "Standing Committees of the Trustees."
Interested Trustees*:
Correspondence intended for a Trustee who is an interested person may be sent to Fidelity Investments, 245 Summer Street, Boston, Massachusetts 02210.
Name, Year of Birth; Principal Occupations and Other Relevant Experience+
James C. Curvey (1935)
Year of Election or Appointment: 2007
Trustee
Chairman of the Board of Trustees
Mr. Curvey also serves as Trustee of other Fidelity® funds. Mr. Curvey is Vice Chairman (2007-present) and Director of FMR LLC (diversified financial services company). In addition, Mr. Curvey is an Overseer Emeritus for the Boston Symphony Orchestra, a Director of Artis-Naples, and a Trustee of Brewster Academy in Wolfeboro, New Hampshire. Previously, Mr. Curvey served as a Director of Fidelity Research & Analysis Co. (investment adviser firm, 2009-2018), Director of Fidelity Investments Money Management, Inc. (investment adviser firm, 2009-2014) and a Director of FMR and FMR Co., Inc. (investment adviser firms, 2007-2014).
* Determined to be an “Interested Trustee” by virtue of, among other things, his or her affiliation with the trust or various entities under common control with FMR.
+ The information includes the Trustee's principal occupation during the last five years and other information relating to the experience, attributes, and skills relevant to the Trustee's qualifications to serve as a Trustee, which led to the conclusion that the Trustee should serve as a Trustee for the fund.
Independent Trustees:
Correspondence intended for an Independent Trustee may be sent to Fidelity Investments, P.O. Box 55235, Boston, Massachusetts 02205-5235.
Name, Year of Birth; Principal Occupations and Other Relevant Experience+
Dennis J. Dirks (1948)
Year of Election or Appointment: 2005
Trustee
Mr. Dirks also serves as Trustee of other Fidelity® funds. Prior to his retirement in May 2003, Mr. Dirks was Chief Operating Officer and a member of the Board of The Depository Trust & Clearing Corporation (DTCC). He also served as President, Chief Operating Officer, and Board member of The Depository Trust Company (DTC) and President and Board member of the National Securities Clearing Corporation (NSCC). In addition, Mr. Dirks served as Chief Executive Officer and Board member of the Government Securities Clearing Corporation, Chief Executive Officer and Board member of the Mortgage-Backed Securities Clearing Corporation, as a Trustee and a member of the Finance Committee of Manhattan College (2005-2008), as a Trustee and a member of the Finance Committee of AHRC of Nassau County (2006-2008), as a member of the Independent Directors Council (IDC) Governing Council (2010-2015), and as a member of the Board of Directors for The Brookville Center for Children’s Services, Inc. (2009-2017). Mr. Dirks is a member of the Finance Committee (2016-present) and Board of Directors (2017-present) and is Treasurer (2018-present) of the Asolo Repertory Theatre.
Donald F. Donahue (1950)
Year of Election or Appointment: 2018
Trustee
Mr. Donahue also serves as a Trustee of other Fidelity® funds. Mr. Donahue is President and Chief Executive Officer of Miranda Partners, LLC (risk consulting for the financial services industry, 2012-present). Previously, Mr. Donahue served as a Member of the Advisory Board of certain Fidelity® funds (2015-2018) and Chief Executive Officer (2006-2012), Chief Operating Officer (2003-2006), and Managing Director, Customer Marketing and Development (1999-2003) of The Depository Trust & Clearing Corporation (financial markets infrastructure). Mr. Donahue serves as a Member (2007-present) and Co-Chairman (2016-present) of the Board of Directors of United Way of New York, Member of the Board of Directors of NYC Leadership Academy (2012-present) and Member of the Board of Advisors of Ripple Labs, Inc. (financial services, 2015-present). He also served as Chairman (2010-2012) and Member of the Board of Directors (2012-2013) of Omgeo, LLC (financial services), Treasurer of United Way of New York (2012-2016), and Member of the Board of Directors of XBRL US (financial services non-profit, 2009-2012) and the International Securities Services Association (2009-2012).
Alan J. Lacy (1953)
Year of Election or Appointment: 2008
Trustee
Mr. Lacy also serves as Trustee of other Fidelity® funds. Mr. Lacy serves as a Director of Bristol-Myers Squibb Company (global pharmaceuticals, 2008-present). He is a Trustee of the California Chapter of The Nature Conservancy (2015-present) and a Director of the Center for Advanced Study in the Behavioral Sciences at Stanford University (2015-present). In addition, Mr. Lacy served as Senior Adviser (2007-2014) of Oak Hill Capital Partners, L.P. (private equity) and also served as Chief Executive Officer (2005) and Vice Chairman (2005-2006) of Sears Holdings Corporation (retail) and Chief Executive Officer and Chairman of the Board of Sears, Roebuck and Co. (retail, 2000-2005). Previously, Mr. Lacy served as Chairman (2014-2017) and a member (2010-2017) of the Board of Directors of Dave & Buster’s Entertainment, Inc. (restaurant and entertainment complexes), as Chairman (2008-2011) and a member (2006-2015) of the Board of Trustees of the National Parks Conservation Association, and as a member of the Board of Directors for The Hillman Companies, Inc. (hardware wholesalers, 2010-2014), Earth Fare, Inc. (retail grocery, 2010-2014), and The Western Union Company (global money transfer, 2006-2011).
Ned C. Lautenbach (1944)
Year of Election or Appointment: 2000
Trustee
Chairman of the Independent Trustees
Mr. Lautenbach also serves as Trustee of other Fidelity® funds. Mr. Lautenbach currently serves as Chair (2018-present) and Member (2013-present) of the Board of Governors, State University System of Florida and is a member of the Council on Foreign Relations (1994-present). He is also a member and has most recently served as Chairman of the Board of Directors of Artis-Naples (2012-present). Previously, Mr. Lautenbach served as a member and then Lead Director of the Board of Directors of Eaton Corporation (diversified industrial, 1997-2016). He was also a Partner and Advisory Partner at Clayton, Dubilier & Rice, LLC (private equity investment, 1998-2010), as well as a Director of Sony Corporation (2006-2007). In addition, Mr. Lautenbach also had a 30-year career with IBM (technology company) during which time he served as Senior Vice President and a member of the Corporate Executive Committee (1968-1998).
Joseph Mauriello (1944)
Year of Election or Appointment: 2008
Trustee
Mr. Mauriello also serves as Trustee of other Fidelity® funds. Prior to his retirement in January 2006, Mr. Mauriello served in numerous senior management positions including Deputy Chairman and Chief Operating Officer (2004-2005), and Vice Chairman of Financial Services (2002-2004) of KPMG LLP US (professional services, 1965-2005). Mr. Mauriello currently serves as a member of the Independent Directors Council (IDC) Governing Council (2015-present). Previously, Mr. Mauriello served as a member of the Board of Directors of XL Group plc. (global insurance and re-insurance, 2006-2018).
Cornelia M. Small (1944)
Year of Election or Appointment: 2005
Trustee
Ms. Small also serves as Trustee of other Fidelity® funds. Ms. Small is a member of the Board of Directors (2009-present) and Chair of the Investment Committee (2010-present) of the Teagle Foundation. Ms. Small also serves on the Investment Committee of the Berkshire Taconic Community Foundation (2008-present). Previously, Ms. Small served as Chairperson (2002-2008) and a member of the Investment Committee and Chairperson (2008-2012) and a member of the Board of Trustees of Smith College. In addition, Ms. Small served as Chief Investment Officer, Director of Global Equity Investments, and a member of the Board of Directors of Scudder, Stevens & Clark and Scudder Kemper Investments.
Garnett A. Smith (1947)
Year of Election or Appointment: 2018
Trustee
Mr. Smith also serves as Trustee of other Fidelity® funds. Prior to Mr. Smith's retirement, he served as Chairman and Chief Executive Officer of Inbrand Corp. (manufacturer of personal absorbent products, 1990-1997). He also served as President (1986-1990) of Inbrand Corp. Prior to his employment with Inbrand Corp., he was employed by a retail fabric chain and North Carolina National Bank. In addition, Mr. Smith served as a Member of the Advisory Board of certain Fidelity® funds (2012-2013) and as a board member of the Jackson Hole Land Trust (2009-2012).
David M. Thomas (1949)
Year of Election or Appointment: 2008
Trustee
Mr. Thomas also serves as Trustee of other Fidelity® funds. Mr. Thomas serves as Non-Executive Chairman of the Board of Directors of Fortune Brands Home and Security (home and security products, 2011-present) and as a member of the Board of Directors (2004-present) and Presiding Director (2013-present) of Interpublic Group of Companies, Inc. (marketing communication). Previously, Mr. Thomas served as Executive Chairman (2005-2006) and Chairman and Chief Executive Officer (2000-2005) of IMS Health, Inc. (pharmaceutical and healthcare information solutions), a Director of Fortune Brands, Inc. (consumer products, 2000-2011), and a member of the Board of Trustees of the University of Florida (2013-2018).
Michael E. Wiley (1950)
Year of Election or Appointment: 2018
Trustee
Mr. Wiley also serves as Trustee or Member of the Advisory Board of other Fidelity® funds. Mr. Wiley serves as a Director of High Point Resources (exploration and production, 2005-present). Previously, Mr. Wiley served as a Director of Andeavor Corporation (independent oil refiner and marketer, 2005-2018), a Director of Andeavor Logistics LP (natural resources logistics, 2015-2018), a Director of Post Oak Bank (privately-held bank, 2004-2018), a Director of Asia Pacific Exploration Consolidated (international oil and gas exploration and production, 2008-2013), a member of the Board of Trustees of the University of Tulsa (2000-2006; 2007-2010), a Senior Energy Advisor of Katzenbach Partners, LLC (consulting, 2006-2007), an Advisory Director of Riverstone Holdings (private investment), a Director of Spinnaker Exploration Company (exploration and production, 2001-2005) and Chairman, President, and CEO of Baker Hughes, Inc. (oilfield services, 2000-2004).
+ The information includes the Trustee's principal occupation during the last five years and other information relating to the experience, attributes, and skills relevant to the Trustee's qualifications to serve as a Trustee, which led to the conclusion that the Trustee should serve as a Trustee for the fund.
Advisory Board Members and Officers:
Correspondence intended for a Member of the Advisory Board (if any) may be sent to Fidelity Investments, P.O. Box 55235, Boston, Massachusetts 02205-5235. Correspondence intended for an officer or Peter S. Lynch may be sent to Fidelity Investments, 245 Summer Street, Boston, Massachusetts 02210. Officers appear below in alphabetical order.
Name, Year of Birth; Principal Occupation
Vicki L. Fuller (1957)
Year of Election or Appointment: 2018
Member of the Advisory Board
Ms. Fuller also serves as Member of the Advisory Board of other Fidelity® funds. Ms. Fuller serves as a member of the Board of Directors, Audit Committee, and Nominating and Governance Committee of The Williams Companies, Inc. (natural gas infrastructure, 2018-present). Previously, Ms. Fuller served as the Chief Investment Officer of the New York State Common Retirement Fund (2012-2018) and held a variety of positions at AllianceBernstein L.P. (global asset management, 1985-2012), including Managing Director (2006-2012) and Senior Vice President and Senior Portfolio Manager (2001-2006).
Peter S. Lynch (1944)
Year of Election or Appointment: 2003
Member of the Advisory Board
Mr. Lynch also serves as Member of the Advisory Board of other Fidelity® funds. Mr. Lynch is Vice Chairman and a Director of FMR (investment adviser firm) and FMR Co., Inc. (investment adviser firm). In addition, Mr. Lynch serves as a Trustee of Boston College and as the Chairman of the Inner-City Scholarship Fund. Previously, Mr. Lynch served on the Special Olympics International Board of Directors (1997-2006).
Carol B. Tomé (1957)
Year of Election or Appointment: 2018
Member of the Advisory Board
Ms. Tomé also serves as Member of the Advisory Board of other Fidelity® funds. Ms. Tomé is Chief Financial Officer (2001-present) and Executive Vice President of Corporate Services (2007-present) of The Home Depot, Inc. (home improvement retailer) and a Director (2003-present) and Chair of the Audit Committee (2004-present) of United Parcel Service, Inc. (package delivery and supply chain management). Previously, Ms. Tomé served as Trustee of certain Fidelity® funds (2017), Senior Vice President of Finance and Accounting/Treasurer (2000-2007) and Vice President and Treasurer (1995-2000) of The Home Depot, Inc. and Chair of the Board (2010-2012), Vice Chair of the Board (2009 and 2013), and a Director (2008-2013) of the Federal Reserve Bank of Atlanta. Ms. Tomé is also a director or trustee of many community and professional organizations.
Elizabeth Paige Baumann (1968)
Year of Election or Appointment: 2017
Anti-Money Laundering (AML) Officer
Ms. Baumann also serves as AML Officer of other funds. She is Chief AML Officer (2012-present) and Senior Vice President (2014-present) of FMR LLC (diversified financial services company) and is an employee of Fidelity Investments. Previously, Ms. Baumann served as AML Officer of the funds (2012-2016), and Vice President (2007-2014) and Deputy Anti-Money Laundering Officer (2007-2012) of FMR LLC.
John J. Burke III (1964)
Year of Election or Appointment: 2018
Chief Financial Officer
Mr. Burke also serves as Chief Financial Officer of other funds. Mr. Burke serves as Head of Investment Operations for Fidelity Fund and Investment Operations (2018-present) and is an employee of Fidelity Investments (1998-present). Previously Mr. Burke served as head of Asset Management Investment Operations (2012-2018).
William C. Coffey (1969)
Year of Election or Appointment: 2018
Secretary and Chief Legal Officer (CLO)
Mr. Coffey also serves as Secretary and CLO of other funds. Mr. Coffey serves as CLO, Secretary, and Senior Vice President of Fidelity Management & Research Company and FMR Co., Inc. (investment adviser firms, 2018-present); Secretary of Fidelity SelectCo, LLC and Fidelity Investments Money Management, Inc. (investment adviser firms, 2018-present); and CLO of Fidelity Management & Research (Hong Kong) Limited, FMR Investment Management (UK) Limited, and Fidelity Management & Research (Japan) Limited (investment adviser firms, 2018-present). He is Senior Vice President and Deputy General Counsel of FMR LLC (diversified financial services company, 2010-present), and is an employee of Fidelity Investments. Previously, Mr. Coffey served as Assistant Secretary of certain funds (2009-2018) and as Vice President and Associate General Counsel of FMR LLC (2005-2009).
Timothy M. Cohen (1969)
Year of Election or Appointment: 2018
Vice President
Mr. Cohen also serves as Vice President of other funds. Mr. Cohen serves as Co-Head of Global Equity Research (2016-present), a Director of Fidelity Management & Research (Japan) Limited (investment adviser firm, 2016-present), and is an employee of Fidelity Investments. Previously, Mr. Cohen served as Chief Investment Officer - Equity and a Director of Fidelity Management & Research (U.K.) Inc. (investment adviser firm, 2013-2015) and as a Director of Fidelity Management & Research (Hong Kong) Limited (investment adviser firm, 2017).
Jonathan Davis (1968)
Year of Election or Appointment: 2010
Assistant Treasurer
Mr. Davis also serves as Assistant Treasurer of other funds. Mr. Davis serves as Assistant Treasurer of FMR Capital, Inc. (2017-present) and is an employee of Fidelity Investments. Previously, Mr. Davis served as Vice President and Associate General Counsel of FMR LLC (diversified financial services company, 2003-2010).
Adrien E. Deberghes (1967)
Year of Election or Appointment: 2016
Assistant Treasurer
Mr. Deberghes also serves as an officer of other funds. He serves as Assistant Treasurer of FMR Capital, Inc. (2017-present), Executive Vice President of Fidelity Investments Money Management, Inc. (FIMM) (investment adviser firm, 2016-present), and is an employee of Fidelity Investments (2008-present). Previously, Mr. Deberghes served as President and Treasurer of certain Fidelity® funds (2013-2018). Prior to joining Fidelity Investments, Mr. Deberghes was Senior Vice President of Mutual Fund Administration at State Street Corporation (2007-2008), Senior Director of Mutual Fund Administration at Investors Bank & Trust (2005-2007), and Director of Finance for Dunkin' Brands (2000-2005). Previously, Mr. Deberghes served in other fund officer roles.
Laura M. Del Prato (1964)
Year of Election or Appointment: 2018
Assistant Treasurer
Ms. Del Prato also serves as an officer of other funds. Ms. Del Prato is an employee of Fidelity Investments (2017-present). Prior to joining Fidelity Investments, Ms. Del Prato served as a Managing Director and Treasurer of the JPMorgan Mutual Funds (2014-2017). Prior to JPMorgan, Ms. Del Prato served as a partner at Cohen Fund Audit Services (accounting firm, 2012-2013) and KPMG LLP (accounting firm, 2004-2012).
Colm A. Hogan (1973)
Year of Election or Appointment: 2016
Deputy Treasurer
Mr. Hogan also serves as an officer of other funds. Mr. Hogan serves as Assistant Treasurer of FMR Capital, Inc. (2017-present) and is an employee of Fidelity Investments (2005-present). Previously, Mr. Hogan served as Assistant Treasurer of certain Fidelity® funds (2016-2018).
Pamela R. Holding (1964)
Year of Election or Appointment: 2018
Vice President
Ms. Holding also serves as Vice President of other funds. Ms. Holding serves as Co-Head of Global Equity Research (2018-present) and is an employee of Fidelity Investments (2013-present).
Chris Maher (1972)
Year of Election or Appointment: 2013
Assistant Treasurer
Mr. Maher serves as Assistant Treasurer of other funds. Mr. Maher is Vice President of Valuation Oversight, serves as Assistant Treasurer of FMR Capital, Inc. (2017-present), and is an employee of Fidelity Investments. Previously, Mr. Maher served as Vice President of Asset Management Compliance (2013), Vice President of the Program Management Group of FMR (investment adviser firm, 2010-2013), and Vice President of Valuation Oversight (2008-2010).
Rieco E. Mello (1969)
Year of Election or Appointment: 2017
Assistant Treasurer
Mr. Mello also serves as Assistant Treasurer of other funds. Mr. Mello serves as Assistant Treasurer of FMR Capital, Inc. (2017-present) and is an employee of Fidelity Investments (1995-present).
Kenneth B. Robins (1969)
Year of Election or Appointment: 2016
Chief Compliance Officer
Mr. Robins also serves as an officer of other funds. Mr. Robins serves as Compliance Officer of Fidelity Management & Research Company and FMR Co., Inc. (investment adviser firms, 2016-present) and is an employee of Fidelity Investments (2004-present). Previously, Mr. Robins served as Executive Vice President of Fidelity Investments Money Management, Inc. (investment adviser firm, 2013-2016) and served in other fund officer roles.
Stacie M. Smith (1974)
Year of Election or Appointment: 2016
President and Treasurer
Ms. Smith also serves as an officer of other funds. Ms. Smith serves as Assistant Treasurer of FMR Capital, Inc. (2017-present), is an employee of Fidelity Investments (2009-present), and has served in other fund officer roles. Prior to joining Fidelity Investments, Ms. Smith served as Senior Audit Manager of Ernst & Young LLP (accounting firm, 1996-2009). Previously, Ms. Smith served as Assistant Treasurer (2013-2018) and Deputy Treasurer (2013-2016) of certain Fidelity® funds.
Marc L. Spector (1972)
Year of Election or Appointment: 2016
Assistant Treasurer
Mr. Spector also serves as an officer of other funds. Mr. Spector serves as Assistant Treasurer of FMR Capital, Inc. (2017-present) and is an employee of Fidelity Investments (2016-present). Prior to joining Fidelity Investments, Mr. Spector served as Director at the Siegfried Group (accounting firm, 2013-2016), and prior to Siegfried Group as audit senior manager at Deloitte & Touche (accounting firm, 2005-2013).
Shareholder Expense Example
As a shareholder of the Fund, you incur two types of costs: (1) transaction costs, and (2) ongoing costs, including management fees and other Fund expenses. This Example is intended to help you understand your ongoing costs (in dollars) of investing in the Fund and to compare these costs with the ongoing costs of investing in other mutual funds.
The Example is based on an investment of $1,000 invested at the beginning of the period and held for the entire period (June 1, 2018 to November 30, 2018).
Actual Expenses
The first line of the accompanying table for each class of the Fund provides information about actual account values and actual expenses. You may use the information in this line, together with the amount you invested, to estimate the expenses that you paid over the period. Simply divide your account value by $1,000.00 (for example, an $8,600 account value divided by $1,000.00 = 8.6), then multiply the result by the number in the first line for a class of the Fund under the heading entitled "Expenses Paid During Period" to estimate the expenses you paid on your account during this period. A small balance maintenance fee of $12.00 that is charged once a year may apply for certain accounts with a value of less than $2,000. This fee, which was eliminated effective August 1, 2018, is not included in the table below. If it was, the estimate of expenses you paid during the period would be higher, and your ending account value lower, by this amount. In addition, the Fund, as a shareholder in the underlying Fidelity Central Funds, will indirectly bear its pro-rata share of the fees and expenses incurred by the underlying Fidelity Central Funds. These fees and expenses are not included in the Fund's annualized expense ratio used to calculate the expense estimate in the table below.
Hypothetical Example for Comparison Purposes
The second line of the accompanying table for each class of the Fund provides information about hypothetical account values and hypothetical expenses based on a Class' actual expense ratio and an assumed rate of return of 5% per year before expenses, which is not the Class' actual return. The hypothetical account values and expenses may not be used to estimate the actual ending account balance or expenses you paid for the period. You may use this information to compare the ongoing costs of investing in the Fund and other funds. To do so, compare this 5% hypothetical example with the 5% hypothetical examples that appear in the shareholder reports of the other funds. A small balance maintenance fee of $12.00 that is charged once a year may apply for certain accounts with a value of less than $2,000. This fee, which was eliminated effective August 1, 2018, is not included in the table below. If it was, the estimate of expenses you paid during the period would be higher, and your ending account value lower, by this amount. In addition, the Fund, as a shareholder in the underlying Fidelity Central Funds, will indirectly bear its pro-rata share of the fees and expenses incurred by the underlying Fidelity Central Funds. These fees and expenses are not included in the Fund's annualized expense ratio used to calculate the expense estimate in the table below.
Please note that the expenses shown in the table are meant to highlight your ongoing costs only and do not reflect any transaction costs. Therefore, the second line of the table is useful in comparing ongoing costs only, and will not help you determine the relative total costs of owning different funds.
| | Annualized Expense Ratio-A | Beginning
Account Value
June 1, 2018 | Ending
Account Value
November 30, 2018 | Expenses Paid
During Period-B
June 1, 2018
to November 30, 2018 |
| Independence | .50% | | | |
| Actual | | $1,000.00 | $976.30 | $2.48 |
| Hypothetical-C | | $1,000.00 | $1,022.56 | $2.54 |
| Class K | .42% | | | |
| Actual | | $1,000.00 | $976.90 | $2.08 |
| Hypothetical-C | | $1,000.00 | $1,022.96 | $2.13 |
A Annualized expense ratio reflects expenses net of applicable fee waivers.
B Expenses are equal to each Class' annualized expense ratio, multiplied by the average account value over the period, multiplied by 183/365 (to reflect the one-half year period).
C 5% return per year before expenses
Distributions (Unaudited)
The Board of Trustees of Fidelity Independence Fund voted to pay to shareholders of record at the opening of business on record date, the following distributions per share derived from capital gains realized from sales of portfolio securities, and dividends derived from net investment income:
| | Pay Date | Record Date | Dividends | Capital Gains |
| Fidelity Independence Fund | | | | |
| Fidelity Independence Fund | 12/27/2018 | 12/26/2018 | $0.221 | $3.682 |
| Class K | 12/27/2018 | 12/26/2018 | $0.253 | $3.682 |
|
The fund hereby designates as a capital gain dividend with respect to the taxable year ended November 30, 2018, $369,600,574, or, if subsequently determined to be different, the net capital gain of such year.
Fidelity Independence Fund designates 100% and Class K designates 93% of the dividends distributed during the fiscal year as qualifying for the dividends–received deduction for corporate shareholders.
Fidelity Independence Fund and Class K designate 100% of the dividends distributed during the fiscal year as amounts which may be taken into account as a dividend for purposes of the maximum rate under section 1(h)(11) of the Internal Revenue Code.
The fund will notify shareholders in January 2019 of amounts for use in preparing 2018 income tax returns.
Board Approval of Investment Advisory Contracts
Fidelity Independence Fund
At its July 2018 meeting, the Board of Trustees, including the Independent Trustees (together, the Board), voted to continue the management contract with Fidelity Management & Research Company (FMR) and the sub-advisory agreements (together, the Advisory Contracts) for the fund for six months through January 31, 2019, in connection with the reunification of the Fidelity Equity High Income Funds Board, which oversees the fund, and the Sector Portfolios Board.
The Board considered that the approval of the fund's Advisory Contracts will not result in any changes in (i) the investment process or strategies employed in the management of the fund's assets; (ii) the fees and expenses paid by shareholders; (iii) the nature, extent or quality of services provided under the fund's Advisory Contracts; or (iv) the day-to-day management of the fund or the persons primarily responsible for such management. The Board concluded that the fund's Advisory Contracts are fair and reasonable, and that the fund's Advisory Contracts should be renewed, without modification, through January 31, 2019, with the understanding that the Board will consider the annual renewal for a full one year period in January 2019.
In connection with its consideration of future renewals of the fund's Advisory Contracts, the Board will consider: (i) the nature, extent and quality of services provided to the fund, including shareholder and administrative services and investment performance; (ii) the competitiveness of the management fee and total expenses for the fund; (iii) the costs of the services and profitability, including the revenues earned and the expenses incurred in conducting the business of developing, marketing, distributing, managing, administering, and servicing the fund and its shareholders, to the extent applicable, as well as potential fall-out benefits from Fidelity's non-fund businesses; and (iv) whether there have been economies of scale in respect of the Fidelity funds, whether the Fidelity funds (including the fund) have appropriately benefited from any such economies of scale, and whether there is the potential for realization of any further economies.
Based on its evaluation of all of the conclusions noted above, and after considering all factors it believed relevant, the Board ultimately concluded that the fund's management fee structure is fair and reasonable, and that the continuation of the fund's Advisory Contracts should be approved.
Corporate Headquarters
245 Summer St.
Boston, MA 02210
www.fidelity.com
FRE-K-ANN-0119
1.863215.110
Fidelity Advisor® Convertible Securities Fund - Class A, Class M, Class C, Class I and Class Z
Annual Report November 30, 2018 Class A, Class M, Class C, Class I and Class Z are classes of Fidelity® Convertible Securities Fund |
|
Beginning on January 1, 2021, as permitted by regulations adopted by the Securities and Exchange Commission, paper copies of a fund’s shareholder reports will no longer be sent by mail, unless you specifically request paper copies of the reports from the fund or from your financial intermediary, such as a financial advisor, broker-dealer or bank. Instead, the reports will be made available on a website, and you will be notified by mail each time a report is posted and provided with a website link to access the report.
If you already elected to receive shareholder reports electronically, you will not be affected by this change and you need not take any action. You may elect to receive shareholder reports and other communications from a fund electronically, by contacting your financial intermediary. For Fidelity customers, visit Fidelity's web site or call Fidelity using the contact information listed below.
You may elect to receive all future reports in paper free of charge. If you wish to continue receiving paper copies of your shareholder reports, you may contact your financial intermediary or, if you are a Fidelity customer, visit Fidelity’s website, or call Fidelity at the applicable toll-free number listed below. Your election to receive reports in paper will apply to all funds held with the fund complex/your financial intermediary.
| Account Type | Website | Phone Number |
| Brokerage, Mutual Fund, or Annuity Contracts: | fidelity.com/mailpreferences | 1-800-343-3548 |
| Employer Provided Retirement Accounts: | netbenefits.fidelity.com/preferences (choose 'no' under Required Disclosures to continue to print) | 1-800-343-0860 |
| Advisor Sold Accounts Serviced Through Your Financial Intermediary: | Contact Your Financial Intermediary | Your Financial Intermediary's phone number |
| Advisor Sold Accounts Serviced by Fidelity: | institutional.fidelity.com | 1-877-208-0098 |
Contents
To view a fund's proxy voting guidelines and proxy voting record for the 12-month period ended June 30, visit http://www.fidelity.com/proxyvotingresults or visit the Securities and Exchange Commission's (SEC) web site at http://www.sec.gov.
You may also call 1-877-208-0098 to request a free copy of the proxy voting guidelines.
Standard & Poor's, S&P and S&P 500 are registered service marks of The McGraw-Hill Companies, Inc. and have been licensed for use by Fidelity Distributors Corporation.
Other third-party marks appearing herein are the property of their respective owners.
All other marks appearing herein are registered or unregistered trademarks or service marks of FMR LLC or an affiliated company. © 2019 FMR LLC. All rights reserved.
This report and the financial statements contained herein are submitted for the general information of the shareholders of the Fund. This report is not authorized for distribution to prospective investors in the Fund unless preceded or accompanied by an effective prospectus.
A fund files its complete schedule of portfolio holdings with the SEC for the first and third quarters of each fiscal year on Form N-Q. Forms N-Q are available on the SEC’s web site at http://www.sec.gov. A fund's Forms N-Q may be reviewed and copied at the SEC’s Public Reference Room in Washington, DC. Information regarding the operation of the SEC's Public Reference Room may be obtained by calling 1-800-SEC-0330.
For a complete list of a fund's portfolio holdings, view the most recent holdings listing, semiannual report, or annual report on Fidelity's web site at http://www.fidelity.com, http://www.institutional.fidelity.com, or http://www.401k.com, as applicable.
NOT FDIC INSURED •MAY LOSE VALUE •NO BANK GUARANTEE
Neither the Fund nor Fidelity Distributors Corporation is a bank.
Performance: The Bottom Line
Average annual total return reflects the change in the value of an investment, assuming reinvestment of distributions from dividend income and capital gains (the profits earned upon the sale of securities that have grown in value, if any) and assuming a constant rate of performance each year. The hypothetical investment and the average annual total returns do not reflect the deduction of taxes that a shareholder would pay on fund distributions or the redemption of fund shares. During periods of reimbursement by Fidelity, a fund’s total return will be greater than it would be had the reimbursement not occurred. How a fund did yesterday is no guarantee of how it will do tomorrow.
Average Annual Total Returns
| For the periods ended November 30, 2018 | Past 1 year | Past 5 years | Past 10 years |
| Class A (incl. 5.75% sales charge) | (2.36)% | 2.44% | 11.91% |
| Class M (incl. 3.50% sales charge) | (0.31)% | 2.63% | 11.86% |
| Class C (incl. contingent deferred sales charge) | 1.83% | 2.88% | 11.73% |
| Class I | 3.87% | 3.93% | 12.86% |
| Class Z | 3.87% | 3.93% | 12.86% |
Class A shares bear a 0.25% 12b-1 fee. The initial offering of Class A shares took place on February 19, 2009. Returns prior to February 19, 2009, are those of Fidelity® Convertible Securities Fund, the original class of the fund, which has no 12b-1 fee. Had Class A's 12b-1 fee been reflected, returns prior to February 19, 2009, would have been lower.
Class M shares bear a 0.50% 12b-1 fee. The initial offering of Class M shares took place on February 19, 2009. Returns prior to February 19, 2009, are those of Fidelity® Convertible Securities Fund, the original class of the fund, which has no 12b-1 fee. Had Class M's 12b-1 fee been reflected, returns prior to February 19, 2009, would have been lower.
Class C shares bear a 1.00% 12b-1 fee. The initial offering of Class C shares took place on February 19, 2009. Returns prior to February 19, 2009, are those of Fidelity® Convertible Securities Fund, the original class of the fund, which has no 12b-1 fee. Had Class C's 12b-1 fee been reflected, returns prior to February 19, 2009, would have been lower.
Class C shares' contingent deferred sales charges included in the past one year, past five years and past ten years total return figures are 1%, 0% and 0%, respectively.
The initial offering of Class I shares took place on February 19, 2009. Returns prior to February 19, 2009 are those of Fidelity® Convertible Securities Fund, the original class of the fund.
The initial offering of Class Z shares took place on October 2, 2018. Returns prior to October 2, 2018, are those of Class I. Returns between February 19, 2009 and October 2, 2018, are those of Class I. Returns prior to February 19, 2009 are those of Fidelity Convertible Securities Fund, the original class of the fund.
$10,000 Over 10 Years
Let's say hypothetically that $10,000 was invested in Fidelity Advisor® Convertible Securities Fund - Class A on November 30, 2008, and the current 5.75% sales charge was paid.
The chart shows how the value of your investment would have changed, and also shows how the ICE® BofAML® All US Convertibles Index performed over the same period.
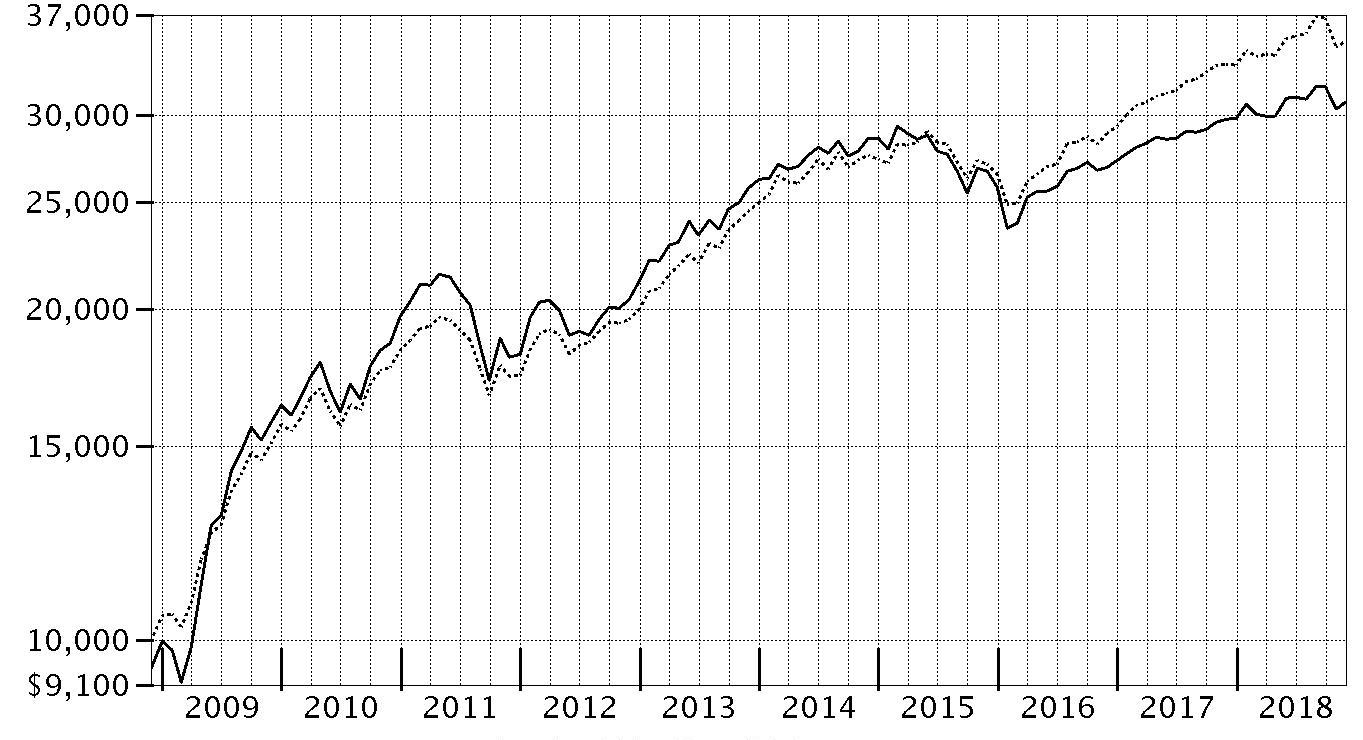
| Period Ending Values |
| $30,808 | Fidelity Advisor® Convertible Securities Fund - Class A |
| $34,991 | ICE® BofAML® All US Convertibles Index |
BofA Merrill Lynch benchmark indices were re-branded as ICE BofAML benchmark indices.
Management's Discussion of Fund Performance
Market Recap: For the 12 months ending November 30, 2018, the ICE BofAML
® All U.S. Convertibles Index gained 4.86%, benefiting for the first 10 months of the period from strong demand and constrained supply, as well as a rising stock market. Investors were drawn to convertible securities because of their limited sensitivity to higher interest rates and their mix of income and watered-down equity exposure. The information technology sector, which represented about 32% of the convertibles index this period, did particularly well. However, in October, uncertainty due to global trade, slowing global economic growth, rising U.S. interest rates and peaking corporate earnings growth led to a sizable decline in stocks, particularly tech securities, in turn pressuring convertibles. Within the convertibles index, tech rose about 9%, thanks to earlier strength. Other notable winners included health care (+11%) and utilities (+7%). By contrast, most other sectors in the index posted flat or slightly negative returns, with industrials (-5%) hardest hit. Within the index, convertible bonds gained roughly 6%, outpacing the 3% advance of convertible preferred stock. By comparison, the convertibles index lagged the 6.27% gain of the S&P 500
® index, but topped the 0.22% result of the ICE BofAML
® U.S. High Yield Constrained Index and the -1.34% return of taxable investment-grade bonds, as measured by the Bloomberg Barclays U.S. Aggregate Bond Index.
Comments from Portfolio Manager Adam Kramer: For the fiscal year, the fund’s share classes (excluding sales charges, if applicable) gained about 3% to 4%, trailing the benchmark ICE BofAML
® All US Convertibles Index. The fund struggled to keep pace with the benchmark from the beginning of the period through the end of August, due to underexposure to many top-performing, higher-growth, mid-cap software companies. The better news is that we outpaced the benchmark by about two percentage points in the final three months. By sector, health care, energy, consumer discretionary and consumer staples hurt relative performance most, largely due to weak issue selection. In terms of asset classes, our investment in convertible bonds – representing roughly two-thirds of the fund’s assets this period – lagged those in the benchmark and therefore detracted from our relative result. The largest individual detractor was a non-benchmark stake in converts and common stock issued by Scorpio Tankers, one of the world’s largest gasoline tanker companies. By contrast, sizable non-benchmark exposure to equities rose about 9%, aiding the fund’s relative result. From a sector perspective, the biggest boost came from security selection in tech. The top individual contributor was social messaging company Twitter. We reduced exposure to Twitter the past 12 months, but it remained a top position as of November 30.
The views expressed above reflect those of the portfolio manager(s) only through the end of the period as stated on the cover of this report and do not necessarily represent the views of Fidelity or any other person in the Fidelity organization. Any such views are subject to change at any time based upon market or other conditions and Fidelity disclaims any responsibility to update such views. These views may not be relied on as investment advice and, because investment decisions for a Fidelity fund are based on numerous factors, may not be relied on as an indication of trading intent on behalf of any Fidelity fund.
Investment Summary (Unaudited)
Top Ten Investments as of November 30, 2018
| (excluding cash equivalents) | % of fund's net assets |
| U.S. Treasury Notes 2.375% 5/15/27 | 7.5 |
| Vistra Energy Corp. 7.00% | 2.2 |
| Intel Corp. 3.25% 8/1/39 | 1.9 |
| Becton, Dickinson & Co. Series A, 6.125% | 1.9 |
| Micron Technology, Inc. 3% 11/15/43 | 1.8 |
| Microchip Technology, Inc. 1.625% 2/15/25 | 1.5 |
| Sempra Energy Series A, 6.00% | 1.5 |
| Twitter, Inc. 0.25% 6/15/24 | 1.4 |
| Wells Fargo & Co. 7.50% | 1.3 |
| Advanced Micro Devices, Inc. 2.125% 9/1/26 | 1.3 |
| | 22.3 |
Top Five Market Sectors as of November 30, 2018
| | % of fund's net assets |
| Information Technology | 33.4 |
| Health Care | 12.5 |
| Communication Services | 10.3 |
| Consumer Discretionary | 8.5 |
| Utilities | 7.7 |
Asset Allocation (% of fund's net assets)
| As of November 30, 2018 * |
| | Convertible Securities | 83.0% |
| | Stocks | 8.5% |
| | U.S. Government and U.S. Government Agency Obligations | 7.5% |
| | Short-Term Investments and Net Other Assets (Liabilities) | 1.0% |

* Foreign investments - 7.4%
Schedule of Investments November 30, 2018
Showing Percentage of Net Assets
| Convertible Bonds - 67.4% | | | |
| | | Principal Amount (000s) | Value (000s) |
| COMMUNICATION SERVICES - 8.6% | | | |
| Diversified Telecommunication Services - 0.6% | | | |
| Intelsat SA 4.5% 6/15/25 (a) | | $4,589 | $7,486 |
| Entertainment - 1.8% | | | |
| iQIYI, Inc. 3.75% 12/1/23 (a) | | 3,300 | 3,407 |
| Live Nation Entertainment, Inc.: | | | |
| 2.5% 5/15/19 | | 4,220 | 6,753 |
| 2.5% 3/15/23 (a) | | 5,050 | 5,392 |
| Pandora Media, Inc.: | | | |
| 1.75% 12/1/20 | | 1,789 | 1,706 |
| 1.75% 12/1/23 | | 4,943 | 5,332 |
| World Wrestling Entertainment, Inc. 3.375% 12/15/23 (a) | | 570 | 1,715 |
| | | | 24,305 |
| Interactive Media & Services - 2.0% | | | |
| Twitter, Inc.: | | | |
| 0.25% 6/15/24 (a) | | 20,837 | 18,779 |
| 1% 9/15/21 | | 900 | 824 |
| Weibo Corp. 1.25% 11/15/22 (a) | | 8,800 | 8,175 |
| | | | 27,778 |
| Media - 3.9% | | | |
| DISH Network Corp.: | | | |
| 2.375% 3/15/24 | | 4,240 | 3,524 |
| 3.375% 8/15/26 | | 18,098 | 15,888 |
| Gannett Co., Inc. 4.75% 4/15/24 (a) | | 1,700 | 1,791 |
| GCI Liberty, Inc. 1.75% 9/30/46 (a) | | 8,375 | 8,825 |
| Liberty Media Corp.: | | | |
| 1% 1/30/23 | | 8,620 | 8,816 |
| 1.375% 10/15/23 | | 9,170 | 10,206 |
| 2.125% 3/31/48 (a) | | 2,830 | 2,712 |
| 2.25% 12/1/48 (a) | | 1,300 | 1,346 |
| | | | 53,108 |
| Wireless Telecommunication Services - 0.3% | | | |
| Boingo Wireless, Inc. 1% 10/1/23 (a) | | 3,500 | 3,169 |
| Gogo, Inc. 3.75% 3/1/20 | | 1,300 | 1,225 |
| | | | 4,394 |
|
| TOTAL COMMUNICATION SERVICES | | | 117,071 |
|
| CONSUMER DISCRETIONARY - 6.2% | | | |
| Automobiles - 1.2% | | | |
| Tesla, Inc.: | | | |
| 1.25% 3/1/21 | | 2,300 | 2,634 |
| 2.375% 3/15/22 | | 10,605 | 13,117 |
| | | | 15,751 |
| Diversified Consumer Services - 0.1% | | | |
| Chegg, Inc. 0.25% 5/15/23 (a) | | 1,200 | 1,432 |
| Hotels, Restaurants & Leisure - 1.1% | | | |
| Caesars Entertainment Corp. 5% 10/1/24 | | 10,035 | 14,181 |
| Marriott Vacations Worldwide Corp. 1.5% 9/15/22 | | 1,400 | 1,273 |
| | | | 15,454 |
| Internet & Direct Marketing Retail - 3.8% | | | |
| Etsy, Inc. 0% 3/1/23 (a) | | 5,000 | 7,966 |
| Liberty Expedia Holdings, Inc. 1% 6/30/47 (a) | | 3,430 | 3,315 |
| MercadoLibre, Inc. 2% 8/15/28 (a) | | 17,125 | 17,185 |
| Quotient Technology, Inc. 1.75% 12/1/22 (a) | | 2,720 | 2,709 |
| The Booking Holdings, Inc.: | | | |
| 0.35% 6/15/20 | | 7,621 | 11,068 |
| 0.9% 9/15/21 | | 7,535 | 8,658 |
| | | | 50,901 |
|
| TOTAL CONSUMER DISCRETIONARY | | | 83,538 |
|
| CONSUMER STAPLES - 0.3% | | | |
| Personal Products - 0.2% | | | |
| Herbalife Nutrition Ltd.: | | | |
| 2% 8/15/19 | | 1,010 | 1,359 |
| 2.625% 3/15/24 (a) | | 1,767 | 1,933 |
| | | | 3,292 |
| Tobacco - 0.1% | | | |
| Vector Group Ltd. 2.5% 1/15/19 (b) | | 630 | 647 |
|
| TOTAL CONSUMER STAPLES | | | 3,939 |
|
| ENERGY - 3.2% | | | |
| Energy Equipment & Services - 0.7% | | | |
| Ensco Jersey Finance Ltd. 3% 1/31/24 | | 6,003 | 4,733 |
| Oil States International, Inc. 1.5% 2/15/23 (a) | | 3,000 | 2,733 |
| Transocean, Inc. 0.5% 1/30/23 | | 1,800 | 1,964 |
| Vantage Drilling Co. 5.5% 7/15/43 (a)(c)(d) | | 20,000 | 600 |
| | | | 10,030 |
| Oil, Gas & Consumable Fuels - 2.5% | | | |
| Chesapeake Energy Corp. 5.5% 9/15/26 | | 8,232 | 7,124 |
| Oasis Petroleum, Inc. 2.625% 9/15/23 | | 5,505 | 5,293 |
| PDC Energy, Inc. 1.125% 9/15/21 | | 1,800 | 1,655 |
| Scorpio Tankers, Inc. 3% 5/15/22 | | 15,627 | 12,915 |
| Ship Finance International Ltd. 4.875% 5/1/23 | | 1,600 | 1,541 |
| SM Energy Co. 1.5% 7/1/21 | | 4,150 | 4,042 |
| Teekay Corp. 5% 1/15/23 (a) | | 1,180 | 940 |
| | | | 33,510 |
|
| TOTAL ENERGY | | | 43,540 |
|
| FINANCIALS - 1.0% | | | |
| Banks - 0.0% | | | |
| Hope Bancorp, Inc. 2% 5/15/38 (a) | | 800 | 713 |
| Diversified Financial Services - 0.5% | | | |
| Alteryx, Inc. 0.5% 6/1/23 (a) | | 1,000 | 1,493 |
| IAC Financeco, Inc. 0.875% 10/1/22 (a) | | 3,910 | 5,065 |
| | | | 6,558 |
| Insurance - 0.3% | | | |
| AXA SA 7.25% 5/15/21 (a) | | 4,105 | 4,115 |
| Thrifts & Mortgage Finance - 0.2% | | | |
| LendingTree, Inc. 0.625% 6/1/22 | | 1,550 | 2,142 |
|
| TOTAL FINANCIALS | | | 13,528 |
|
| HEALTH CARE - 10.6% | | | |
| Biotechnology - 3.6% | | | |
| Acorda Therapeutics, Inc. 1.75% 6/15/21 | | 2,800 | 2,368 |
| Alder Biopharmaceuticals, Inc. 2.5% 2/1/25 | | 2,500 | 2,295 |
| Amicus Therapeutics, Inc. 3% 12/15/23 (a) | | 2,336 | 4,567 |
| BioMarin Pharmaceutical, Inc.: | | | |
| 0.599% 8/1/24 | | 640 | 672 |
| 1.5% 10/15/20 | | 565 | 678 |
| Clovis Oncology, Inc. 2.5% 9/15/21 | | 2,929 | 2,292 |
| Exact Sciences Corp. 1% 1/15/25 | | 4,850 | 5,938 |
| Flexion Therapeutics, Inc. 3.375% 5/1/24 | | 1,330 | 1,221 |
| Ironwood Pharmaceuticals, Inc. 2.25% 6/15/22 | | 2,350 | 2,518 |
| Ligand Pharmaceuticals, Inc. 0.75% 5/15/23 (a) | | 5,050 | 4,696 |
| Neurocrine Biosciences, Inc. 2.25% 5/15/24 | | 3,540 | 4,748 |
| Novavax, Inc. 3.75% 2/1/23 | | 3,200 | 2,014 |
| PTC Therapeutics, Inc. 3% 8/15/22 | | 600 | 604 |
| Repligen Corp. 2.125% 6/1/21 | | 775 | 1,592 |
| Retrophin, Inc. 2.5% 9/15/25 | | 2,200 | 2,027 |
| Sarepta Therapeutics, Inc. 1.5% 11/15/24 (a) | | 4,250 | 8,149 |
| TESARO, Inc. 3% 10/1/21 | | 1,700 | 2,522 |
| | | | 48,901 |
| Health Care Equipment & Supplies - 1.3% | | | |
| DexCom, Inc.: | | | |
| 0.75% 5/15/22 | | 4,260 | 6,135 |
| 0.75% 12/1/23 (a) | | 4,000 | 4,167 |
| Insulet Corp. 1.375% 11/15/24 (a) | | 3,440 | 3,752 |
| Nevro Corp. 1.75% 6/1/21 | | 850 | 788 |
| NuVasive, Inc. 2.25% 3/15/21 | | 2,600 | 3,078 |
| | | | 17,920 |
| Health Care Providers & Services - 1.4% | | | |
| Molina Healthcare, Inc. 1.125% 1/15/20 | | 2,317 | 7,804 |
| WellPoint, Inc. 2.75% 10/15/42 | | 2,817 | 11,261 |
| | | | 19,065 |
| Health Care Technology - 0.7% | | | |
| Evolent Health, Inc.: | | | |
| 1.5% 10/15/25 (a) | | 1,515 | 1,560 |
| 2% 12/1/21 | | 525 | 669 |
| Teladoc Health, Inc.: | | | |
| 1.375% 5/15/25 (a) | | 2,475 | 3,355 |
| 3% 12/15/22 | | 1,990 | 3,180 |
| | | | 8,764 |
| Life Sciences Tools & Services - 1.3% | | | |
| Accelerate Diagnostics, Inc. 2.5% 3/15/23 (a) | | 1,600 | 1,214 |
| Illumina, Inc.: | | | |
| 0% 8/15/23 (a) | | 5,119 | 5,481 |
| 0.5% 6/15/21 | | 7,623 | 10,852 |
| | | | 17,547 |
| Pharmaceuticals - 2.3% | | | |
| ANI Pharmaceuticals, Inc. 3% 12/1/19 | | 4,970 | 5,203 |
| Dermira, Inc. 3% 5/15/22 | | 1,720 | 1,425 |
| Innoviva, Inc.: | | | |
| 2.125% 1/15/23 | | 1,400 | 1,546 |
| 2.5% 8/15/25 | | 500 | 610 |
| Isis Pharmaceuticals, Inc. 1% 11/15/21 | | 5,224 | 5,781 |
| Jazz Investments I Ltd.: | | | |
| 1.5% 8/15/24 | | 3,600 | 3,487 |
| 1.875% 8/15/21 | | 6,790 | 6,998 |
| Pacira Pharmaceuticals, Inc. 2.375% 4/1/22 | | 800 | 836 |
| Supernus Pharmaceuticals, Inc. 0.625% 4/1/23 (a) | | 2,630 | 2,850 |
| Theravance Biopharma, Inc. 3.25% 11/1/23 | | 2,550 | 2,717 |
| | | | 31,453 |
|
| TOTAL HEALTH CARE | | | 143,650 |
|
| INDUSTRIALS - 2.4% | | | |
| Aerospace & Defense - 0.2% | | | |
| Aerojet Rocketdyne Holdings, Inc. 2.25% 12/15/23 | | 2,240 | 3,286 |
| Air Freight & Logistics - 0.2% | | | |
| Echo Global Logistics, Inc. 2.5% 5/1/20 | | 2,700 | 2,688 |
| Building Products - 0.1% | | | |
| Patrick Industries, Inc. 1% 2/1/23 (a) | | 1,150 | 927 |
| Construction & Engineering - 0.5% | | | |
| Dycom Industries, Inc. 0.75% 9/15/21 | | 6,758 | 6,679 |
| Electrical Equipment - 0.6% | | | |
| SolarCity Corp. 1.625% 11/1/19 | | 8,401 | 7,880 |
| Machinery - 0.5% | | | |
| Chart Industries, Inc. 1% 11/15/24 (a) | | 2,850 | 3,485 |
| Greenbrier Companies, Inc. 2.875% 2/1/24 | | 1,220 | 1,293 |
| Meritor, Inc. 3.25% 10/15/37 | | 634 | 568 |
| Navistar International Corp. New 4.75% 4/15/19 | | 1,080 | 1,077 |
| | | | 6,423 |
| Professional Services - 0.2% | | | |
| FTI Consulting, Inc. 2% 8/15/23 (a) | | 3,411 | 3,263 |
| Trading Companies & Distributors - 0.1% | | | |
| Kaman Corp. 3.25% 5/1/24 | | 1,900 | 2,023 |
|
| TOTAL INDUSTRIALS | | | 33,169 |
|
| INFORMATION TECHNOLOGY - 31.7% | | | |
| Communications Equipment - 2.1% | | | |
| CalAmp Corp. 2% 8/1/25 (a) | | 1,500 | 1,292 |
| InterDigital, Inc. 1.5% 3/1/20 | | 3,100 | 3,492 |
| Liberty Interactive LLC 1.75% 9/30/46 (a) | | 4,859 | 5,404 |
| Lumentum Holdings, Inc. 0.25% 3/15/24 | | 5,237 | 5,322 |
| Palo Alto Networks, Inc. 0.75% 7/1/23 (a) | | 13,325 | 12,714 |
| | | | 28,224 |
| Electronic Equipment & Components - 0.2% | | | |
| Knowles Corp. 3.25% 11/1/21 | | 1,900 | 2,070 |
| IT Services - 4.1% | | | |
| Akamai Technologies, Inc.: | | | |
| 0% 2/15/19 | | 657 | 651 |
| 0.125% 5/1/25 (a) | | 8,600 | 8,193 |
| Carbonite, Inc. 2.5% 4/1/22 | | 3,180 | 4,056 |
| Euronet Worldwide, Inc. 1.5% 10/1/44 | | 1,300 | 2,117 |
| MongoDB, Inc. 0.75% 6/15/24 (a) | | 1,500 | 2,037 |
| Okta, Inc. 0.25% 2/15/23 (a) | | 5,550 | 7,994 |
| Perficient, Inc. 2.375% 9/15/23 (a) | | 760 | 704 |
| Square, Inc.: | | | |
| 0.375% 3/1/22 | | 2,180 | 6,584 |
| 0.5% 5/15/23 (a) | | 9,002 | 10,359 |
| Twilio, Inc. 0.25% 6/1/23 (a) | | 4,114 | 6,084 |
| Unisys Corp. 5.5% 3/1/21 | | 1,700 | 2,653 |
| Wix.com Ltd. 0% 7/1/23 (a) | | 4,856 | 4,695 |
| | | | 56,127 |
| Semiconductors & Semiconductor Equipment - 11.6% | | | |
| Advanced Micro Devices, Inc. 2.125% 9/1/26 | | 6,393 | 17,584 |
| Cree, Inc. 0.875% 9/1/23 (a) | | 4,300 | 4,224 |
| Cypress Semiconductor Corp.: | | | |
| 2% 2/1/23 | | 660 | 636 |
| 4.5% 1/15/22 | | 3,010 | 3,703 |
| Inphi Corp.: | | | |
| 0.75% 9/1/21 | | 1,600 | 1,580 |
| 1.125% 12/1/20 | | 2,100 | 2,457 |
| Intel Corp. 3.25% 8/1/39 | | 10,788 | 25,905 |
| Microchip Technology, Inc.: | | | |
| 1.625% 2/15/25 | | 14,066 | 20,544 |
| 1.625% 2/15/27 | | 17,262 | 17,420 |
| 2.25% 2/15/37 | | 4,500 | 4,600 |
| Micron Technology, Inc. 3% 11/15/43 | | 18,153 | 24,044 |
| Novellus Systems, Inc. 2.625% 5/15/41 | | 2,272 | 10,726 |
| NXP Semiconductors NV 1% 12/1/19 | | 2,970 | 3,065 |
| ON Semiconductor Corp.: | | | |
| 1% 12/1/20 | | 4,868 | 5,800 |
| 1.625% 10/15/23 | | 8,806 | 10,154 |
| Rambus, Inc. 1.375% 2/1/23 | | 1,580 | 1,392 |
| Synaptics, Inc. 0.5% 6/15/22 | | 2,300 | 2,023 |
| Teradyne, Inc. 1.25% 12/15/23 | | 1,000 | 1,275 |
| | | | 157,132 |
| Software - 12.9% | | | |
| Atlassian, Inc. 0.625% 5/1/23 (a) | | 8,300 | 10,186 |
| Citrix Systems, Inc. 0.5% 4/15/19 | | 10,273 | 15,440 |
| Coupa Software, Inc. 0.375% 1/15/23 (a) | | 5,669 | 8,718 |
| DocuSign, Inc. 0.5% 9/15/23 (a) | | 9,400 | 8,766 |
| Everbridge, Inc. 1.5% 11/1/22 | | 2,120 | 3,585 |
| FireEye, Inc.: | | | |
| 0.875% 6/1/24 (a) | | 11,400 | 12,601 |
| 1.625% 6/1/35 | | 3,040 | 2,782 |
| Five9, Inc. 0.125% 5/1/23 (a) | | 2,000 | 2,401 |
| Guidewire Software, Inc. 1.25% 3/15/25 | | 3,000 | 3,092 |
| HubSpot, Inc. 0.25% 6/1/22 | | 3,770 | 5,808 |
| j2 Global, Inc. 3.25% 6/15/29 | | 2,250 | 2,674 |
| New Relic, Inc. 0.5% 5/1/23 (a) | | 4,700 | 4,824 |
| Nice Systems, Inc. 1.25% 1/15/24 | | 4,790 | 6,966 |
| Nuance Communications, Inc.: | | | |
| 1% 12/15/35 | | 5,790 | 5,262 |
| 1.25% 4/1/25 | | 1,383 | 1,328 |
| Nutanix, Inc. 0% 1/15/23 (a) | | 5,900 | 6,717 |
| PROS Holdings, Inc. 2% 6/1/47 | | 1,200 | 1,123 |
| Q2 Holdings, Inc. 0.75% 2/15/23 (a) | | 600 | 657 |
| Rapid7, Inc. 1.25% 8/1/23 (a) | | 1,300 | 1,325 |
| RealPage, Inc. 1.5% 11/15/22 | | 1,150 | 1,549 |
| Red Hat, Inc. 0.25% 10/1/19 | | 3,750 | 9,074 |
| RingCentral, Inc. 0% 3/15/23 (a) | | 4,610 | 5,454 |
| ServiceNow, Inc. 0% 6/1/22 | | 8,530 | 12,342 |
| Splunk, Inc.: | | | |
| 0.5% 9/15/23 (a) | | 10,475 | 10,499 |
| 1.125% 9/15/25 (a) | | 7,500 | 7,487 |
| Workday, Inc.: | | | |
| 0.25% 10/1/22 | | 11,150 | 13,903 |
| 1.5% 7/15/20 | | 1,820 | 3,677 |
| Zendesk, Inc. 0.25% 3/15/23 (a) | | 5,640 | 6,403 |
| | | | 174,643 |
| Technology Hardware, Storage & Peripherals - 0.8% | | | |
| Electronics for Imaging, Inc. 2.25% 11/15/23 (a) | | 1,400 | 1,420 |
| Pure Storage, Inc. 0.125% 4/15/23 (a) | | 5,820 | 5,766 |
| Western Digital Corp. 1.5% 2/1/24 (a) | | 3,557 | 2,955 |
| | | | 10,141 |
|
| TOTAL INFORMATION TECHNOLOGY | | | 428,337 |
|
| MATERIALS - 1.2% | | | |
| Metals & Mining - 1.2% | | | |
| Allegheny Technologies, Inc. 4.75% 7/1/22 | | 1,370 | 2,671 |
| Cleveland-Cliffs, Inc. 1.5% 1/15/25 | | 2,424 | 3,083 |
| Endeavour Mining Corp. 3% 2/15/23 (a) | | 4,260 | 3,693 |
| Royal Gold, Inc. 2.875% 6/15/19 | | 2,500 | 2,486 |
| SSR Mining, Inc. 2.875% 2/1/33 | | 4,185 | 4,120 |
| | | | 16,053 |
| REAL ESTATE - 0.9% | | | |
| Real Estate Management & Development - 0.9% | | | |
| Extra Space Storage LP 3.125% 10/1/35 (a) | | 8,600 | 9,572 |
| Redfin Corp. 1.75% 7/15/23 | | 2,470 | 2,103 |
| | | | 11,675 |
| UTILITIES - 1.3% | | | |
| Independent Power and Renewable Electricity Producers - 1.3% | | | |
| NextEra Energy Partners LP 1.5% 9/15/20 (a) | | 4,650 | 4,569 |
| NRG Energy, Inc. 2.75% 6/1/48 (a) | | 12,148 | 13,018 |
| | | | 17,587 |
| TOTAL CONVERTIBLE BONDS | | | |
| (Cost $903,689) | | | 912,087 |
|
| U.S. Treasury Obligations - 7.5% | | | |
| U.S. Treasury Notes 2.375% 5/15/27 | | | |
| (Cost $101,253) | | 106,000 | 101,284 |
| | | Shares | Value (000s) |
|
| Common Stocks - 8.5% | | | |
| COMMUNICATION SERVICES - 1.7% | | | |
| Diversified Telecommunication Services - 0.5% | | | |
| Verizon Communications, Inc. | | 103,400 | $6,235 |
| Interactive Media & Services - 0.7% | | | |
| Alphabet, Inc. Class A (e) | | 8,800 | 9,765 |
| Wireless Telecommunication Services - 0.5% | | | |
| T-Mobile U.S., Inc. (e) | | 98,484 | 6,741 |
|
| TOTAL COMMUNICATION SERVICES | | | 22,741 |
|
| CONSUMER DISCRETIONARY - 2.3% | | | |
| Internet & Direct Marketing Retail - 2.3% | | | |
| Amazon.com, Inc. (e) | | 8,400 | 14,197 |
| Yahoo!, Inc. (e) | | 262,500 | 17,217 |
| | | | 31,414 |
| ENERGY - 1.1% | | | |
| Oil, Gas & Consumable Fuels - 1.1% | | | |
| California Resources Corp. (e) | | 380,900 | 9,119 |
| Enterprise Products Partners LP | | 204,800 | 5,376 |
| | | | 14,495 |
| INDUSTRIALS - 1.2% | | | |
| Airlines - 0.5% | | | |
| Southwest Airlines Co. | | 126,500 | 6,908 |
| Professional Services - 0.3% | | | |
| Nielsen Holdings PLC | | 150,000 | 4,076 |
| Road & Rail - 0.4% | | | |
| Norfolk Southern Corp. | | 32,000 | 5,464 |
|
| TOTAL INDUSTRIALS | | | 16,448 |
|
| INFORMATION TECHNOLOGY - 1.7% | | | |
| Communications Equipment - 0.4% | | | |
| Cisco Systems, Inc. | | 109,900 | 5,261 |
| Semiconductors & Semiconductor Equipment - 0.4% | | | |
| Qualcomm, Inc. | | 100,000 | 5,826 |
| Technology Hardware, Storage & Peripherals - 0.9% | | | |
| Apple, Inc. | | 67,000 | 11,965 |
|
| TOTAL INFORMATION TECHNOLOGY | | | 23,052 |
|
| MATERIALS - 0.5% | | | |
| Chemicals - 0.5% | | | |
| DowDuPont, Inc. | | 116,000 | 6,711 |
| TOTAL COMMON STOCKS | | | |
| (Cost $109,226) | | | 114,861 |
|
| Convertible Preferred Stocks - 15.6% | | | |
| CONSUMER STAPLES - 1.8% | | | |
| Food Products - 1.8% | | | |
| Bunge Ltd. 4.875% | | 173,100 | 17,274 |
| Post Holdings, Inc. Series C, 2.50% | | 39,600 | 7,087 |
| | | | 24,361 |
| ENERGY - 0.4% | | | |
| Energy Equipment & Services - 0.0% | | | |
| Nabors Industries, Inc. Series A, 6.00% | | 4,100 | 109 |
| Oil, Gas & Consumable Fuels - 0.4% | | | |
| Hess Corp. Series A, 8.00% | | 90,000 | 5,413 |
|
| TOTAL ENERGY | | | 5,522 |
|
| FINANCIALS - 2.6% | | | |
| Banks - 2.6% | | | |
| Bank of America Corp. Series L, 7.25% | | 13,388 | 17,137 |
| Wells Fargo & Co. 7.50% | | 14,463 | 18,262 |
| | | | 35,399 |
| HEALTH CARE - 1.9% | | | |
| Health Care Equipment & Supplies - 1.9% | | | |
| Becton, Dickinson & Co. Series A, 6.125% | | 398,700 | 25,222 |
| INDUSTRIALS - 1.1% | | | |
| Electrical Equipment - 0.8% | | | |
| Fortive Corp. Series A, 5.00% | | 11,590 | 11,378 |
| Machinery - 0.3% | | | |
| Rexnord Corp. Series A, 5.75% | | 41,837 | 2,492 |
| Stanley Black & Decker, Inc. 5.375% | | 15,300 | 1,492 |
| | | | 3,984 |
|
| TOTAL INDUSTRIALS | | | 15,362 |
|
| MATERIALS - 0.4% | | | |
| Chemicals - 0.4% | | | |
| International Flavors & Fragrances, Inc. 6.00% | | 95,900 | 5,388 |
| REAL ESTATE - 1.0% | | | |
| Equity Real Estate Investment Trusts (REITs) - 1.0% | | | |
| Crown Castle International Corp. Series A, 6.875% | | 9,900 | 10,714 |
| Welltower, Inc. Series I, 6.50% | | 50,000 | 3,271 |
| | | | 13,985 |
| UTILITIES - 6.4% | | | |
| Electric Utilities - 3.0% | | | |
| NextEra Energy, Inc. 6.123% | | 165,600 | 9,913 |
| Vistra Energy Corp. 7.00% | | 322,100 | 30,111 |
| | | | 40,024 |
| Gas Utilities - 0.1% | | | |
| South Jersey Industries, Inc. 7.25% | | 28,000 | 1,432 |
| Multi-Utilities - 3.3% | | | |
| CenterPoint Energy, Inc.: | | | |
| 2.00% ZENS | | 220,150 | 9,684 |
| Series B, 7.00% | | 76,000 | 3,807 |
| Dominion Resources, Inc. Series A, 6.75% | | 207,600 | 10,054 |
| DTE Energy Co. 6.50% | | 18,000 | 988 |
| Sempra Energy Series A, 6.00% | | 200,700 | 20,401 |
| | | | 44,934 |
|
| TOTAL UTILITIES | | | 86,390 |
|
| TOTAL CONVERTIBLE PREFERRED STOCKS | | | |
| (Cost $196,757) | | | 211,629 |
|
| Money Market Funds - 0.4% | | | |
| Fidelity Cash Central Fund, 2.27% (f) | | | |
| (Cost $5,163) | | 5,161,702 | 5,163 |
| TOTAL INVESTMENT IN SECURITIES - 99.4% | | | |
| (Cost $1,316,088) | | | 1,345,024 |
| NET OTHER ASSETS (LIABILITIES) - 0.6% | | | 8,067 |
| NET ASSETS - 100% | | | $1,353,091 |
Legend
(a) Security exempt from registration under Rule 144A of the Securities Act of 1933. These securities may be resold in transactions exempt from registration, normally to qualified institutional buyers. At the end of the period, the value of these securities amounted to $351,193,000 or 26.0% of net assets.
(b) Coupon rates for floating and adjustable rate securities reflect the rates in effect at period end.
(c) Non-income producing - Security is in default.
(d) Level 3 security
(e) Non-income producing
(f) Affiliated fund that is generally available only to investment companies and other accounts managed by Fidelity Investments. The rate quoted is the annualized seven-day yield of the fund at period end. A complete unaudited listing of the fund's holdings as of its most recent quarter end is available upon request. In addition, each Fidelity Central Fund's financial statements, which are not covered by the Fund's Report of Independent Registered Public Accounting Firm, are available on the SEC's website or upon request.
Affiliated Central Funds
Information regarding fiscal year to date income earned by the Fund from investments in Fidelity Central Funds is as follows:
| Fund | Income earned |
| | (Amounts in thousands) |
| Fidelity Cash Central Fund | $239 |
| Fidelity Securities Lending Cash Central Fund | 2 |
| Total | $241 |
Amounts in the income column in the above table include any capital gain distributions from underlying funds, which are presented in the corresponding line-item in the Statement of Operations if applicable.
Investment Valuation
The following is a summary of the inputs used, as of November 30, 2018, involving the Fund's assets and liabilities carried at fair value. The inputs or methodology used for valuing securities may not be an indication of the risk associated with investing in those securities. For more information on valuation inputs, and their aggregation into the levels used below, please refer to the Investment Valuation section in the accompanying Notes to Financial Statements.
| | Valuation Inputs at Reporting Date: |
| Description | Total | Level 1 | Level 2 | Level 3 |
| (Amounts in thousands) | | | | |
| Investments in Securities: | | | | |
| Equities: | | | | |
| Communication Services | $22,741 | $22,741 | $-- | $-- |
| Consumer Discretionary | 31,414 | 31,414 | -- | -- |
| Consumer Staples | 24,361 | -- | 24,361 | -- |
| Energy | 20,017 | 14,495 | 5,522 | -- |
| Financials | 35,399 | -- | 35,399 | -- |
| Health Care | 25,222 | -- | 25,222 | -- |
| Industrials | 31,810 | 16,448 | 15,362 | -- |
| Information Technology | 23,052 | 23,052 | -- | -- |
| Materials | 12,099 | 6,711 | 5,388 | -- |
| Real Estate | 13,985 | -- | 13,985 | -- |
| Utilities | 86,390 | 988 | 85,402 | -- |
| Corporate Bonds | 912,087 | -- | 911,487 | 600 |
| U.S. Government and Government Agency Obligations | 101,284 | -- | 101,284 | -- |
| Money Market Funds | 5,163 | 5,163 | -- | -- |
| Total Investments in Securities: | $1,345,024 | $121,012 | $1,223,412 | $600 |
Other Information
The composition of credit quality ratings as a percentage of Total Net Assets is as follows (Unaudited):
| U.S. Government and U.S. Government Agency Obligations | 7.5% |
| AAA,AA,A | 4.1% |
| BBB | 4.2% |
| BB | 6.1% |
| B | 9.2% |
| CCC,CC,C | 0.2% |
| Not Rated | 43.6% |
| Equities | 24.1% |
| Short-Term Investments and Net Other Assets | 1.0% |
| | 100% |
We have used ratings from Moody's Investors Service, Inc. Where Moody's® ratings are not available, we have used S&P® ratings. All ratings are as of the date indicated and do not reflect subsequent changes.
See accompanying notes which are an integral part of the financial statements.
Financial Statements
Statement of Assets and Liabilities
| Amounts in thousands (except per-share amounts) | | November 30, 2018 |
| Assets | | |
Investment in securities, at value — See accompanying schedule:
Unaffiliated issuers (cost $1,310,925) | $1,339,861 | |
| Fidelity Central Funds (cost $5,163) | 5,163 | |
| Total Investment in Securities (cost $1,316,088) | | $1,345,024 |
| Receivable for investments sold | | 161,147 |
| Receivable for fund shares sold | | 198 |
| Dividends receivable | | 880 |
| Interest receivable | | 4,293 |
| Distributions receivable from Fidelity Central Funds | | 14 |
| Prepaid expenses | | 2 |
| Other receivables | | 52 |
| Total assets | | 1,511,610 |
| Liabilities | | |
| Payable for investments purchased | $156,947 | |
| Payable for fund shares redeemed | 982 | |
| Accrued management fee | 295 | |
| Distribution and service plan fees payable | 20 | |
| Other affiliated payables | 210 | |
| Other payables and accrued expenses | 65 | |
| Total liabilities | | 158,519 |
| Net Assets | | $1,353,091 |
| Net Assets consist of: | | |
| Paid in capital | | $1,265,037 |
| Total distributable earnings (loss) | | 88,054 |
| Net Assets | | $1,353,091 |
| Net Asset Value and Maximum Offering Price | | |
| Class A: | | |
| Net Asset Value and redemption price per share ($18,793 ÷ 669.53 shares) | | $28.07 |
| Maximum offering price per share (100/94.25 of $28.07) | | $29.78 |
| Class M: | | |
| Net Asset Value and redemption price per share ($6,008 ÷ 213.91 shares) | | $28.09 |
| Maximum offering price per share (100/96.50 of $28.09) | | $29.11 |
| Class C: | | |
| Net Asset Value and offering price per share ($16,828 ÷ 603.41 shares)(a) | | $27.89 |
| Convertible Securities: | | |
| Net Asset Value, offering price and redemption price per share ($1,278,124 ÷ 45,362.94 shares) | | $28.18 |
| Class I: | | |
| Net Asset Value, offering price and redemption price per share ($31,995 ÷ 1,137.26 shares) | | $28.13 |
| Class Z: | | |
| Net Asset Value, offering price and redemption price per share ($1,343 ÷ 47.73 shares) | | $28.14 |
(a) Redemption price per share is equal to net asset value less any applicable contingent deferred sales charge.
See accompanying notes which are an integral part of the financial statements.
Statement of Operations
| Amounts in thousands | | Year ended November 30, 2018 |
| Investment Income | | |
| Dividends | | $17,271 |
| Special dividends | | 9,658 |
| Interest | | 22,042 |
| Income from Fidelity Central Funds | | 241 |
| Total income | | 49,212 |
| Expenses | | |
| Management fee | | |
| Basic fee | $6,348 | |
| Performance adjustment | (2,552) | |
| Transfer agent fees | 2,184 | |
| Distribution and service plan fees | 273 | |
| Accounting and security lending fees | 454 | |
| Custodian fees and expenses | 33 | |
| Independent trustees' fees and expenses | 7 | |
| Registration fees | 86 | |
| Audit | 73 | |
| Legal | 4 | |
| Interest | 5 | |
| Miscellaneous | 10 | |
| Total expenses before reductions | 6,925 | |
| Expense reductions | (89) | |
| Total expenses after reductions | | 6,836 |
| Net investment income (loss) | | 42,376 |
| Realized and Unrealized Gain (Loss) | | |
| Net realized gain (loss) on: | | |
| Investment securities: | | |
| Unaffiliated issuers | 107,253 | |
| Fidelity Central Funds | (1) | |
| Foreign currency transactions | (2) | |
| Total net realized gain (loss) | | 107,250 |
| Change in net unrealized appreciation (depreciation) on investment securities | | (92,594) |
| Net gain (loss) | | 14,656 |
| Net increase (decrease) in net assets resulting from operations | | $57,032 |
See accompanying notes which are an integral part of the financial statements.
Statement of Changes in Net Assets
| Amounts in thousands | Year ended November 30, 2018 | Year ended November 30, 2017 |
| Increase (Decrease) in Net Assets | | |
| Operations | | |
| Net investment income (loss) | $42,376 | $46,697 |
| Net realized gain (loss) | 107,250 | 24,125 |
| Change in net unrealized appreciation (depreciation) | (92,594) | 91,806 |
| Net increase (decrease) in net assets resulting from operations | 57,032 | 162,628 |
| Distributions to shareholders | (76,808) | – |
| Distributions to shareholders from net investment income | – | (44,979) |
| Distributions to shareholders from net realized gain | – | (24,545) |
| Total distributions | (76,808) | (69,524) |
| Share transactions - net increase (decrease) | (154,490) | (183,817) |
| Total increase (decrease) in net assets | (174,266) | (90,713) |
| Net Assets | | |
| Beginning of period | 1,527,357 | 1,618,070 |
| End of period | $1,353,091 | $1,527,357 |
| Other Information | | |
| Undistributed net investment income end of period | | $13,282 |
See accompanying notes which are an integral part of the financial statements.
Financial Highlights
Fidelity Convertible Securities Fund Class A
| Years ended November 30, | 2018 | 2017 | 2016 | 2015 | 2014 |
| Selected Per–Share Data | | | | | |
| Net asset value, beginning of period | $28.49 | $26.85 | $29.56 | $33.42 | $30.79 |
| Income from Investment Operations | | | | | |
| Net investment income (loss)A | .76B | .75 | .81C | .66 | .51 |
| Net realized and unrealized gain (loss) | .25 | 2.02D | (.69) | (2.81) | 2.81E |
| Total from investment operations | 1.01 | 2.77 | .12 | (2.15) | 3.32 |
| Distributions from net investment income | (.85) | (.71) | (.83) | (.61) | (.48) |
| Distributions from net realized gain | (.58) | (.42) | (2.00) | (1.10) | (.21) |
| Total distributions | (1.43) | (1.13) | (2.83) | (1.71) | (.69) |
| Net asset value, end of period | $28.07 | $28.49 | $26.85 | $29.56 | $33.42 |
| Total ReturnF,G | 3.60% | 10.57%D | .83% | (6.60)% | 10.95%E |
| Ratios to Average Net AssetsH,I | | | | | |
| Expenses before reductions | .75% | .74% | .73% | .84% | .86% |
| Expenses net of fee waivers, if any | .75% | .74% | .73% | .84% | .85% |
| Expenses net of all reductions | .75% | .74% | .73% | .84% | .85% |
| Net investment income (loss) | 2.66%B | 2.71% | 3.08%C | 2.09% | 1.60% |
| Supplemental Data | | | | | |
| Net assets, end of period (in millions) | $19 | $21 | $29 | $56 | $150 |
| Portfolio turnover rateJ | 176% | 110% | 112% | 19% | 23% |
A Calculated based on average shares outstanding during the period.
B Net investment income per share reflects a large, non-recurring dividend which amounts to $.19 per share. Excluding this non-recurring dividend, the ratios of net investment income (loss) to average net assets would have been 1.99%.
C Net investment income per share reflects a large, non-recurring dividend which amounted to $.10 per share. Excluding this non-recurring dividend, the ratio of net investment income (loss) to average net assets would have been 2.71%.
D Net realized and unrealized gain (loss) per share reflects proceeds received from litigation which amounted to $.08 per share. Excluding these litigation proceeds, the total return would have been 10.28%.
E Net realized and unrealized gain (loss) per share reflects proceeds received from litigation which amounted to $.12 per share. Excluding these litigation proceeds, the total return would have been 10.58%.
F Total returns would have been lower if certain expenses had not been reduced during the applicable periods shown.
G Total returns do not include the effect of the sales charges.
H Fees and expenses of any underlying Fidelity Central Funds are not included in the Fund's expense ratio. The Fund indirectly bears its proportionate share of the expenses of any underlying Fidelity Central Funds.
I Expense ratios reflect operating expenses of the class. Expenses before reductions do not reflect amounts reimbursed by the investment adviser or reductions from brokerage service arrangements or reductions from other expense offset arrangements and do not represent the amount paid by the class during periods when reimbursements or reductions occur. Expenses net of fee waivers reflect expenses after reimbursement by the investment adviser but prior to reductions from brokerage service arrangements or other expense offset arrangements. Expenses net of all reductions represent the net expenses paid by the class.
J Amount does not include the portfolio activity of any underlying Fidelity Central Funds.
See accompanying notes which are an integral part of the financial statements.
Fidelity Convertible Securities Fund Class M
| Years ended November 30, | 2018 | 2017 | 2016 | 2015 | 2014 |
| Selected Per–Share Data | | | | | |
| Net asset value, beginning of period | $28.47 | $26.86 | $29.56 | $33.44 | $30.80 |
| Income from Investment Operations | | | | | |
| Net investment income (loss)A | .68B | .68 | .73C | .57 | .42 |
| Net realized and unrealized gain (loss) | .25 | 2.01D | (.68) | (2.82) | 2.82E |
| Total from investment operations | .93 | 2.69 | .05 | (2.25) | 3.24 |
| Distributions from net investment income | (.73) | (.66) | (.75) | (.53) | (.39) |
| Distributions from net realized gain | (.58) | (.42) | (2.00) | (1.10) | (.21) |
| Total distributions | (1.31) | (1.08) | (2.75) | (1.63) | (.60) |
| Net asset value, end of period | $28.09 | $28.47 | $26.86 | $29.56 | $33.44 |
| Total ReturnF,G | 3.31% | 10.26%D | .53% | (6.91)% | 10.67%E |
| Ratios to Average Net AssetsH,I | | | | | |
| Expenses before reductions | 1.04% | 1.01% | 1.04% | 1.12% | 1.14% |
| Expenses net of fee waivers, if any | 1.04% | 1.01% | 1.04% | 1.12% | 1.14% |
| Expenses net of all reductions | 1.03% | 1.01% | 1.04% | 1.12% | 1.14% |
| Net investment income (loss) | 2.38%B | 2.44% | 2.77%C | 1.81% | 1.32% |
| Supplemental Data | | | | | |
| Net assets, end of period (in millions) | $6 | $14 | $7 | $9 | $14 |
| Portfolio turnover rateJ | 176% | 110% | 112% | 19% | 23% |
A Calculated based on average shares outstanding during the period.
B Net investment income per share reflects a large, non-recurring divided which amounted to $.19 per share. Excluding this non-recurring dividend, the ratio of net investment income (loss) to average net assets would have been 1.71%.
C Net investment income per share reflects a large, non-recurring dividend which amounted to $.10 per share. Excluding this non-recurring dividend, the ratio of net investment income (loss) to average net assets would have been 2.40%.
D Net realized and unrealized gain (loss) per share reflects proceeds received from litigation which amounted to $.08 per share. Excluding these litigation proceeds, the total return would have been 9.97%.
E Net realized and unrealized gain (loss) per share reflects proceeds received from litigation which amounted to $.12 per share. Excluding these litigation proceeds, the total return would have been 10.30%.
F Total returns would have been lower if certain expenses had not been reduced during the applicable periods shown.
G Total returns do not include the effect of the sales charges.
H Fees and expenses of any underlying Fidelity Central Funds are not included in the Fund's expense ratio. The Fund indirectly bears its proportionate share of the expenses of any underlying Fidelity Central Funds.
I Expense ratios reflect operating expenses of the class. Expenses before reductions do not reflect amounts reimbursed by the investment adviser or reductions from brokerage service arrangements or reductions from other expense offset arrangements and do not represent the amount paid by the class during periods when reimbursements or reductions occur. Expenses net of fee waivers reflect expenses after reimbursement by the investment adviser but prior to reductions from brokerage service arrangements or other expense offset arrangements. Expenses net of all reductions represent the net expenses paid by the class.
J Amount does not include the portfolio activity of any underlying Fidelity Central Funds.
See accompanying notes which are an integral part of the financial statements.
Fidelity Convertible Securities Fund Class C
| Years ended November 30, | 2018 | 2017 | 2016 | 2015 | 2014 |
| Selected Per–Share Data | | | | | |
| Net asset value, beginning of period | $28.31 | $26.68 | $29.37 | $33.23 | $30.63 |
| Income from Investment Operations | | | | | |
| Net investment income (loss)A | .54B | .54 | .60C | .42 | .27 |
| Net realized and unrealized gain (loss) | .25 | 2.01D | (.67) | (2.80) | 2.80E |
| Total from investment operations | .79 | 2.55 | (.07) | (2.38) | 3.07 |
| Distributions from net investment income | (.63) | (.50) | (.62) | (.38) | (.26) |
| Distributions from net realized gain | (.58) | (.42) | (2.00) | (1.10) | (.21) |
| Total distributions | (1.21) | (.92) | (2.62) | (1.48) | (.47) |
| Net asset value, end of period | $27.89 | $28.31 | $26.68 | $29.37 | $33.23 |
| Total ReturnF,G | 2.82% | 9.75%D | .09% | (7.35)% | 10.13%E |
| Ratios to Average Net AssetsH,I | | | | | |
| Expenses before reductions | 1.50% | 1.50% | 1.50% | 1.60% | 1.62% |
| Expenses net of fee waivers, if any | 1.50% | 1.49% | 1.49% | 1.60% | 1.62% |
| Expenses net of all reductions | 1.49% | 1.49% | 1.49% | 1.59% | 1.62% |
| Net investment income (loss) | 1.92%B | 1.96% | 2.32%C | 1.33% | .84% |
| Supplemental Data | | | | | |
| Net assets, end of period (in millions) | $17 | $19 | $24 | $39 | $48 |
| Portfolio turnover rateJ | 176% | 110% | 112% | 19% | 23% |
A Calculated based on average shares outstanding during the period.
B Net investment income per share reflects a large, non-recurring dividend which amounted to $.19 per share. Excluding this non-recurring dividend, the ratio of net investment income (loss) to average net assets would have been 1.25%.
C Net investment income per share reflects a large, non-recurring dividend which amounted to $.10 per share. Excluding this non-recurring dividend, the ratio of net investment income (loss) to average net assets would have been 1.95%.
D Net realized and unrealized gain (loss) per share reflects proceeds received from litigation which amounted to $.08 per share. Excluding these litigation proceeds, the total return would have been 9.46%.
E Net realized and unrealized gain (loss) per share reflects proceeds received from litigation which amounted to $.12 per share. Excluding these litigation proceeds, the total return would have been 9.76%.
F Total returns would have been lower if certain expenses had not been reduced during the applicable periods shown.
G Total returns do not include the effect of the contingent deferred sales charge.
H Fees and expenses of any underlying Fidelity Central Funds are not included in the Fund's expense ratio. The Fund indirectly bears its proportionate share of the expenses of any underlying Fidelity Central Funds.
I Expense ratios reflect operating expenses of the class. Expenses before reductions do not reflect amounts reimbursed by the investment adviser or reductions from brokerage service arrangements or reductions from other expense offset arrangements and do not represent the amount paid by the class during periods when reimbursements or reductions occur. Expenses net of fee waivers reflect expenses after reimbursement by the investment adviser but prior to reductions from brokerage service arrangements or other expense offset arrangements. Expenses net of all reductions represent the net expenses paid by the class.
J Amount does not include the portfolio activity of any underlying Fidelity Central Funds.
See accompanying notes which are an integral part of the financial statements.
Fidelity Convertible Securities Fund
| Years ended November 30, | 2018 | 2017 | 2016 | 2015 | 2014 |
| Selected Per–Share Data | | | | | |
| Net asset value, beginning of period | $28.59 | $26.95 | $29.66 | $33.56 | $30.90 |
| Income from Investment Operations | | | | | |
| Net investment income (loss)A | .85B | .83 | .88C | .75 | .60 |
| Net realized and unrealized gain (loss) | .25 | 2.02D | (.68) | (2.83) | 2.83E |
| Total from investment operations | 1.10 | 2.85 | .20 | (2.08) | 3.43 |
| Distributions from net investment income | (.93) | (.80) | (.92) | (.72) | (.56) |
| Distributions from net realized gain | (.58) | (.42) | (2.00) | (1.10) | (.21) |
| Total distributions | (1.51) | (1.21)F | (2.91)G | (1.82) | (.77) |
| Net asset value, end of period | $28.18 | $28.59 | $26.95 | $29.66 | $33.56 |
| Total ReturnH | 3.93% | 10.88%D | 1.13% | (6.38)% | 11.28%E |
| Ratios to Average Net AssetsI,J | | | | | |
| Expenses before reductions | .46% | .45% | .45% | .56% | .58% |
| Expenses net of fee waivers, if any | .46% | .45% | .45% | .56% | .58% |
| Expenses net of all reductions | .45% | .45% | .45% | .56% | .58% |
| Net investment income (loss) | 2.96%B | 3.00% | 3.36%C | 2.37% | 1.88% |
| Supplemental Data | | | | | |
| Net assets, end of period (in millions) | $1,278 | $1,432 | $1,490 | $1,823 | $2,307 |
| Portfolio turnover rateK | 176% | 110% | 112% | 19% | 23% |
A Calculated based on average shares outstanding during the period.
B Net investment income per share reflects a large, non-recurring dividend which amounted to $.19 per share. Excluding this non-recurring dividend, the ratio of net investment income (loss) to average net assets would have been 2.29%.
C Net investment income per share reflects a large, non-recurring dividend which amounted to $.10 per share. Excluding this non-recurring dividend, the ratio of net investment income (loss) to average net assets would have been 2.99%.
D Net realized and unrealized gain (loss) per share reflects proceeds received from litigation which amounted to $.08 per share. Excluding these litigation proceeds, the total return would have been 10.59%.
E Net realized and unrealized gain (loss) per share reflects proceeds received from litigation which amounted to $.12 per share. Excluding these litigation proceeds, the total return would have been 10.91%.
F Total distributions of $1.21 per share is comprised of distributions from net investment income of $.799 and distributions from net realized gain of $.415 per share.
G Total distributions of $2.91 per share is comprised of distributions from net investment income of $.916 and distributions from net realized gain of $1.997 per share.
H Total returns would have been lower if certain expenses had not been reduced during the applicable periods shown.
I Fees and expenses of any underlying Fidelity Central Funds are not included in the Fund's expense ratio. The Fund indirectly bears its proportionate share of the expenses of any underlying Fidelity Central Funds.
J Expense ratios reflect operating expenses of the class. Expenses before reductions do not reflect amounts reimbursed by the investment adviser or reductions from brokerage service arrangements or reductions from other expense offset arrangements and do not represent the amount paid by the class during periods when reimbursements or reductions occur. Expenses net of fee waivers reflect expenses after reimbursement by the investment adviser but prior to reductions from brokerage service arrangements or other expense offset arrangements. Expenses net of all reductions represent the net expenses paid by the class.
K Amount does not include the portfolio activity of any underlying Fidelity Central Funds.
See accompanying notes which are an integral part of the financial statements.
Fidelity Convertible Securities Fund Class I
| Years ended November 30, | 2018 | 2017 | 2016 | 2015 | 2014 |
| Selected Per–Share Data | | | | | |
| Net asset value, beginning of period | $28.55 | $26.91 | $29.62 | $33.51 | $30.86 |
| Income from Investment Operations | | | | | |
| Net investment income (loss)A | .84B | .83 | .88C | .74 | .59 |
| Net realized and unrealized gain (loss) | .24 | 2.02D | (.68) | (2.82) | 2.83E |
| Total from investment operations | 1.08 | 2.85 | .20 | (2.08) | 3.42 |
| Distributions from net investment income | (.92) | (.79) | (.91) | (.71) | (.56) |
| Distributions from net realized gain | (.58) | (.42) | (2.00) | (1.10) | (.21) |
| Total distributions | (1.50) | (1.21) | (2.91) | (1.81) | (.77) |
| Net asset value, end of period | $28.13 | $28.55 | $26.91 | $29.62 | $33.51 |
| Total ReturnF | 3.87% | 10.87%D | 1.11% | (6.39)% | 11.25%E |
| Ratios to Average Net AssetsG,H | | | | | |
| Expenses before reductions | .47% | .47% | .47% | .58% | .61% |
| Expenses net of fee waivers, if any | .47% | .47% | .47% | .58% | .61% |
| Expenses net of all reductions | .47% | .47% | .47% | .58% | .61% |
| Net investment income (loss) | 2.94%B | 2.98% | 3.35%C | 2.35% | 1.85% |
| Supplemental Data | | | | | |
| Net assets, end of period (in millions) | $32 | $41 | $68 | $128 | $159 |
| Portfolio turnover rateI | 176% | 110% | 112% | 19% | 23% |
A Calculated based on average shares outstanding during the period.
B Net investment income per share reflects a large, non-recurring dividend which amounted to $.19 per share. Excluding this non-recurring dividend, the ratio of net investment income (loss) to average net assets would have been 2.27%.
C Net investment income per share reflects a large, non-recurring dividend which amounted to $.10 per share. Excluding this non-recurring dividend, the ratio of net investment income (loss) to average net assets would have been 2.98%.
D Net realized and unrealized gain (loss) per share reflects proceeds received from litigation which amounted to $.08 per share. Excluding these litigation proceeds, the total return would have been 10.58%.
E Net realized and unrealized gain (loss) per share reflects proceeds received from litigation which amounted to $.12 per share. Excluding these litigation proceeds, the total return would have been 10.88%.
F Total returns would have been lower if certain expenses had not been reduced during the applicable periods shown.
G Fees and expenses of any underlying Fidelity Central Funds are not included in the Fund's expense ratio. The Fund indirectly bears its proportionate share of the expenses of any underlying Fidelity Central Funds.
H Expense ratios reflect operating expenses of the class. Expenses before reductions do not reflect amounts reimbursed by the investment adviser or reductions from brokerage service arrangements or reductions from other expense offset arrangements and do not represent the amount paid by the class during periods when reimbursements or reductions occur. Expenses net of fee waivers reflect expenses after reimbursement by the investment adviser but prior to reductions from brokerage service arrangements or other expense offset arrangements. Expenses net of all reductions represent the net expenses paid by the class.
I Amount does not include the portfolio activity of any underlying Fidelity Central Funds.
See accompanying notes which are an integral part of the financial statements.
Fidelity Convertible Securities Fund Class Z
| Year ended November 30, | 2018 A |
| Selected Per–Share Data | |
| Net asset value, beginning of period | $29.30 |
| Income from Investment Operations | |
| Net investment income (loss)B | .10 |
| Net realized and unrealized gain (loss) | (.90) |
| Total from investment operations | (.80) |
| Distributions from net investment income | (.36) |
| Distributions from net realized gain | – |
| Total distributions | (.36) |
| Net asset value, end of period | $28.14 |
| Total ReturnC,D | (2.74)% |
| Ratios to Average Net AssetsE,F | |
| Expenses before reductions | .37%G |
| Expenses net of fee waivers, if any | .37%G |
| Expenses net of all reductions | .36%G |
| Net investment income (loss) | 2.35%G |
| Supplemental Data | |
| Net assets, end of period (in millions) | $1 |
| Portfolio turnover rateH | 176% |
A For the period October 2, 2018 (commencement of sale of shares) to November 30, 2018.
B Calculated based on average shares outstanding during the period.
C Total returns for periods of less than one year are not annualized.
D Total returns would have been lower if certain expenses had not been reduced during the applicable periods shown.
E Fees and expenses of any underlying Fidelity Central Funds are not included in the Fund's expense ratio. The Fund indirectly bears its proportionate share of the expenses of any underlying Fidelity Central Funds.
F Expense ratios reflect operating expenses of the class. Expenses before reductions do not reflect amounts reimbursed by the investment adviser or reductions from brokerage service arrangements or reductions from other expense offset arrangements and do not represent the amount paid by the class during periods when reimbursements or reductions occur. Expense ratios before reductions for start-up periods may not be representative of longer-term operating periods. Expenses net of fee waivers reflect expenses after reimbursement by the investment adviser but prior to reductions from brokerage service arrangements or other expense offset arrangements. Expenses net of all reductions represent the net expenses paid by the class.
G Annualized
H Amount does not include the portfolio activity of any underlying Fidelity Central Funds.
See accompanying notes which are an integral part of the financial statements.
Notes to Financial Statements
For the period ended November 30, 2018
(Amounts in thousands except percentages)
1. Organization.
Fidelity Convertible Securities Fund (the Fund) is a fund of Fidelity Financial Trust (the Trust) and is authorized to issue an unlimited number of shares. The Trust is registered under the Investment Company Act of 1940, as amended (the 1940 Act), as an open-end management investment company organized as a Massachusetts business trust. The Fund commenced sale of Class Z shares on October 2, 2018. The Fund offers Class A, Class M, Class C, Convertible Securities, Class I and Class Z shares, each of which has equal rights as to assets and voting privileges. Each class has exclusive voting rights with respect to matters that affect that class.
2. Investments in Fidelity Central Funds.
The Fund invests in Fidelity Central Funds, which are open-end investment companies generally available only to other investment companies and accounts managed by the investment adviser and its affiliates. The Fund's Schedule of Investments lists each of the Fidelity Central Funds held as of period end, if any, as an investment of the Fund, but does not include the underlying holdings of each Fidelity Central Fund. As an Investing Fund, the Fund indirectly bears its proportionate share of the expenses of the underlying Fidelity Central Funds.
The Money Market Central Funds seek preservation of capital and current income and are managed by Fidelity Investments Money Management, Inc. (FIMM), an affiliate of the investment adviser. Annualized expenses of the Money Market Central Funds as of their most recent shareholder report date are less than .005%.
A complete unaudited list of holdings for each Fidelity Central Fund is available upon request or at the Securities and Exchange Commission (the SEC) website at www.sec.gov. In addition, the financial statements of the Fidelity Central Funds, which are not covered by the Fund's Report of Independent Registered Public Accounting Firm, are available on the SEC website or upon request.
3. Significant Accounting Policies.
The Fund is an investment company and applies the accounting and reporting guidance of the Financial Accounting Standards Board (FASB) Accounting Standards Codification Topic 946 Financial Services – Investments Companies. The financial statements have been prepared in conformity with accounting principles generally accepted in the United States of America (GAAP), which require management to make certain estimates and assumptions at the date of the financial statements. Actual results could differ from those estimates. Subsequent events, if any, through the date that the financial statements were issued have been evaluated in the preparation of the financial statements. The following summarizes the significant accounting policies of the Fund:
Investment Valuation. Investments are valued as of 4:00 p.m. Eastern time on the last calendar day of the period. The Board of Trustees (the Board) has delegated the day to day responsibility for the valuation of the Fund's investments to the Fair Value Committee (the Committee) established by the Fund's investment adviser. In accordance with valuation policies and procedures approved by the Board, the Fund attempts to obtain prices from one or more third party pricing vendors or brokers to value its investments. When current market prices, quotations or currency exchange rates are not readily available or reliable, investments will be fair valued in good faith by the Committee, in accordance with procedures adopted by the Board. Factors used in determining fair value vary by investment type and may include market or investment specific events, changes in interest rates and credit quality. The frequency with which these procedures are used cannot be predicted and they may be utilized to a significant extent. The Committee oversees the Fund's valuation policies and procedures and reports to the Board on the Committee's activities and fair value determinations. The Board monitors the appropriateness of the procedures used in valuing the Fund's investments and ratifies the fair value determinations of the Committee.
The Fund categorizes the inputs to valuation techniques used to value its investments into a disclosure hierarchy consisting of three levels as shown below:
- Level 1 – quoted prices in active markets for identical investments
- Level 2 – other significant observable inputs (including quoted prices for similar investments, interest rates, prepayment speeds, etc.)
- Level 3 – unobservable inputs (including the Fund's own assumptions based on the best information available)
Valuation techniques used to value the Fund's investments by major category are as follows:
Equity securities, including restricted securities, for which market quotations are readily available, are valued at the last reported sale price or official closing price as reported by a third party pricing vendor on the primary market or exchange on which they are traded and are categorized as Level 1 in the hierarchy. In the event there were no sales during the day or closing prices are not available, securities are valued at the last quoted bid price or may be valued using the last available price and are generally categorized as Level 2 in the hierarchy. For foreign equity securities, when market or security specific events arise, comparisons to the valuation of American Depositary Receipts (ADRs), futures contracts, Exchange-Traded Funds (ETFs) and certain indexes as well as quoted prices for similar securities may be used and would be categorized as Level 2 in the hierarchy. Utilizing these techniques may result in transfers between Level 1 and Level 2. For equity securities, including restricted securities, where observable inputs are limited, assumptions about market activity and risk are used and these securities may be categorized as Level 3 in the hierarchy.
Debt securities, including restricted securities, are valued based on evaluated prices received from third party pricing vendors or from brokers who make markets in such securities. Corporate bonds and U.S. government and government agency obligations are valued by pricing vendors who utilize matrix pricing which considers yield or price of bonds of comparable quality, coupon, maturity and type or by broker-supplied prices. When independent prices are unavailable or unreliable, debt securities may be valued utilizing pricing methodologies which consider similar factors that would be used by third party pricing vendors. Debt securities are generally categorized as Level 2 in the hierarchy but may be Level 3 depending on the circumstances.
Investments in open-end mutual funds, including the Fidelity Central Funds, are valued at their closing net asset value (NAV) each business day and are categorized as Level 1 in the hierarchy.
Changes in valuation techniques may result in transfers in or out of an assigned level within the disclosure hierarchy. The aggregate value of investments by input level as of November 30, 2018 is included at the end of the Fund's Schedule of Investments.
Foreign Currency. The Fund may use foreign currency contracts to facilitate transactions in foreign-denominated securities. Gains and losses from these transactions may arise from changes in the value of the foreign currency or if the counterparties do not perform under the contracts' terms.
Foreign-denominated assets, including investment securities, and liabilities are translated into U.S. dollars at the exchange rates at period end. Purchases and sales of investment securities, income and dividends received and expenses denominated in foreign currencies are translated into U.S. dollars at the exchange rate in effect on the transaction date.
The effects of exchange rate fluctuations on investments are included with the net realized and unrealized gain (loss) on investment securities. Other foreign currency transactions resulting in realized and unrealized gain (loss) are disclosed separately.
Investment Transactions and Income. For financial reporting purposes, the Fund's investment holdings and NAV include trades executed through the end of the last business day of the period. The NAV per share for processing shareholder transactions is calculated as of the close of business of the New York Stock Exchange (NYSE), normally 4:00 p.m. Eastern time and includes trades executed through the end of the prior business day. Gains and losses on securities sold are determined on the basis of identified cost and include proceeds received from litigation. Dividend income is recorded on the ex-dividend date, except for certain dividends from foreign securities where the ex-dividend date may have passed, which are recorded as soon as the Fund is informed of the ex-dividend date. Non-cash dividends included in dividend income, if any, are recorded at the fair market value of the securities received. Income and capital gain distributions from Fidelity Central Funds, if any, are recorded on the ex-dividend date. Certain distributions received by the Fund represent a return of capital or capital gain. The Fund determines the components of these distributions subsequent to the ex-dividend date, based upon receipt of tax filings or other correspondence relating to the underlying investment. These distributions are recorded as a reduction of cost of investments and/or as a realized gain. Large, non-recurring dividends recognized by the Fund are presented separately on the Statement of Operations as "Special Dividends" and the impact of these dividends is presented in the Financial Highlights. Interest income is accrued as earned and includes coupon interest and amortization of premium and accretion of discount on debt securities as applicable. Investment income is recorded net of foreign taxes withheld where recovery of such taxes is uncertain. Debt obligations may be placed on non-accrual status and related interest income may be reduced by ceasing current accruals and writing off interest receivables when the collection of all or a portion of interest has become doubtful based on consistently applied procedures. A debt obligation is removed from non-accrual status when the issuer resumes interest payments or when collectability of interest is reasonably assured.
Class Allocations and Expenses. Investment income, realized and unrealized capital gains and losses, common expenses of the Fund, and certain fund-level expense reductions, if any, are allocated daily on a pro-rata basis to each class based on the relative net assets of each class to the total net assets of the Fund. Each class differs with respect to transfer agent and distribution and service plan fees incurred. Certain expense reductions may also differ by class. For the reporting period, the allocated portion of income and expenses to each class as a percent of its average net assets may vary due to the timing of recording these transactions in relation to fluctuating net assets of the classes. Expenses directly attributable to a fund are charged to that fund. Expenses attributable to more than one fund are allocated among the respective funds on the basis of relative net assets or other appropriate methods. Expense estimates are accrued in the period to which they relate and adjustments are made when actual amounts are known.
Income Tax Information and Distributions to Shareholders. Each year, the Fund intends to qualify as a regulated investment company under Subchapter M of the Internal Revenue Code, including distributing substantially all of its taxable income and realized gains. As a result, no provision for U.S. Federal income taxes is required. As of November 30, 2018, the Fund did not have any unrecognized tax benefits in the financial statements; nor is the Fund aware of any tax positions for which it is reasonably possible that the total amounts of unrecognized tax benefits will significantly change in the next twelve months. The Fund files a U.S. federal tax return, in addition to state and local tax returns as required. The Fund's federal income tax returns are subject to examination by the Internal Revenue Service (IRS) for a period of three fiscal years after they are filed. State and local tax returns may be subject to examination for an additional fiscal year depending on the jurisdiction. Foreign taxes are provided for based on the Fund's understanding of the tax rules and rates that exist in the foreign markets in which it invests.
Distributions are declared and recorded on the ex-dividend date. Income and capital gain distributions are declared separately for each class. Income and capital gain distributions are determined in accordance with income tax regulations, which may differ from GAAP. In addition, the Fund claimed a portion of the payment made to redeeming shareholders as a distribution for income tax purposes.
Capital accounts within the financial statements are adjusted for permanent book-tax differences. These adjustments have no impact on net assets or the results of operations. Capital accounts are not adjusted for temporary book-tax differences which will reverse in a subsequent period.
Book-tax differences are primarily due to foreign currency transactions, market discount, contingent interest, equity-debt classifications, certain conversion ratio adjustments, deferred trustees compensation, capital loss carryforwards, partnerships and losses deferred due to wash sales.
As of period end, the cost and unrealized appreciation (depreciation) in securities, and derivatives if applicable, for federal income tax purposes were as follows:
| Gross unrealized appreciation | $80,817 |
| Gross unrealized depreciation | (70,873) |
| Net unrealized appreciation (depreciation) | $9,944 |
| Tax Cost | $1,335,080 |
The tax-based components of distributable earnings as of period end were as follows:
| Undistributed ordinary income | $23,266 |
| Undistributed long-term capital gain | $54,952 |
| Net unrealized appreciation (depreciation) on securities and other investments | $9,944 |
The tax character of distributions paid was as follows:
| | November 30, 2018 | November 30, 2017 |
| Ordinary Income | $76,808 | $ 69,524 |
Restricted Securities. The Fund may invest in securities that are subject to legal or contractual restrictions on resale. These securities generally may be resold in transactions exempt from registration or to the public if the securities are registered. Disposal of these securities may involve time-consuming negotiations and expense, and prompt sale at an acceptable price may be difficult. Information regarding restricted securities is included at the end of the Fund's Schedule of Investments.
New Accounting Pronouncement. In March 2017, the Financial Accounting Standards Board (FASB) issued an Accounting Standards Update (ASU), ASU 2017-08, which amends the amortization period for certain callable debt securities that are held at a premium. The amendment requires the premium to be amortized to the earliest call date. The amendments do not require an accounting change for securities held at a discount. The ASU is effective for annual periods beginning after December 15, 2018. Management is currently evaluating the potential impact of these changes to the financial statements.
New Rule Issuance. During August 2018, the U.S. Securities and Exchange Commission issued Final Rule Release No. 33-10532, Disclosure Update and Simplification. This Final Rule includes amendments specific to registered investment companies that are intended to eliminate overlap in disclosure requirements between Regulation S-X and GAAP. In accordance with these amendments, certain line-items in the Fund's financial statements have been combined or removed for the current period as outlined in the table below.
| Financial Statement | Current Line-Item Presentation | Prior Line-Item Presentation |
| Statement of Assets and Liabilities | Total distributable earnings (loss) | Undistributed/Distributions in excess of/Accumulated net investment income (loss)
Accumulated/Undistributed net realized gain (loss)
Net unrealized appreciation (depreciation) |
| Statement of Changes in Net Assets | N/A - removed | Undistributed/Distributions in excess of/Accumulated net investment income (loss) end of period |
| Statement of Changes in Net Assets | Distributions to shareholders | Distributions to shareholders from net investment income
Distributions to shareholders from net realized gain |
| Distributions to Shareholders Note to Financial Statements | Distributions to shareholders | Distributions to shareholders from net investment income
Distributions to shareholders from net realized gain |
4. Purchases and Sales of Investments.
Purchases and sales of securities, other than short-term securities and U.S. government securities, aggregated $2,084,876 and $2,405,935, respectively.
5. Fees and Other Transactions with Affiliates.
Management Fee. Fidelity Management & Research Company (the investment adviser) and its affiliates provide the Fund with investment management related services for which the Fund pays a monthly management fee. The management fee is the sum of an individual fund fee rate that is based on an annual rate of .20% of the Fund's average net assets and an annualized group fee rate that averaged .24% during the period. The group fee rate is based upon the average net assets of all the mutual funds advised by the investment adviser, including any mutual funds previously advised by the investment adviser that are currently advised by Fidelity SelectCo, LLC, an affiliate of the investment adviser. The group fee rate decreases as assets under management increase and increases as assets under management decrease. In addition, the management fee is subject to a performance adjustment (up to a maximum of +/- .15% of the Fund's average net assets over a 36 month performance period). The upward or downward adjustment to the management fee is based on the relative investment performance of Convertible Securities as compared to its benchmark index, the ICE® BofAML® All US Convertibles Index, over the same 36 month performance period. For the reporting period, the total annual management fee rate, including the performance adjustment, was .26% of the Fund's average net assets. The performance adjustment included in the management fee rate may be higher or lower than the maximum performance adjustment rate due to the difference between the average net assets for the reporting and performance periods.
Distribution and Service Plan Fees. In accordance with Rule 12b-1 of the 1940 Act, the Fund has adopted separate Distribution and Service Plans for each class of shares. Certain classes pay Fidelity Distributors Corporation (FDC), an affiliate of the investment adviser, separate Distribution and Service Fees, each of which is based on an annual percentage of each class' average net assets. In addition, FDC may pay financial intermediaries for selling shares of the Fund and providing shareholder support services. For the period, the Distribution and Service Fee rates, total fees and amounts retained by FDC were as follows:
| | Distribution Fee | Service Fee | Total Fees | Retained by FDC |
| Class A | -% | .25% | $50 | $–(a) |
| Class M | .25% | .25% | 42 | –(a) |
| Class C | .75% | .25% | 181 | 7 |
| | | | $273 | $7 |
(a) In the amount of less than five hundred dollars.
Sales Load. FDC may receive a front-end sales charge of up to 5.75% for selling Class A shares and 3.50% for selling Class M shares, some of which is paid to financial intermediaries for selling shares of the Fund. Depending on the holding period, FDC may receive contingent deferred sales charges levied on Class A, Class M and Class C redemptions. The deferred sales charges are 1.00% for Class C shares, 1.00% for certain purchases of Class A shares and .25% for certain purchases of Class M shares.
For the period, sales charge amounts retained by FDC were as follows:
| | Retained by FDC |
| Class A | $8 |
| Class M | 1 |
| Class C(a) | 1 |
| | $10 |
(a) When Class C shares are initially sold, FDC pays commissions from its own resources to financial intermediaries through which the sales are made.
Transfer Agent Fees. Fidelity Investments Institutional Operations Company, Inc., (FIIOC), an affiliate of the investment adviser, is the transfer, dividend disbursing and shareholder servicing agent for each class of the Fund. FIIOC receives account fees and asset-based fees that vary according to the account size and type of account of the shareholders of the respective classes of the Fund, except for Class Z. FIIOC receives an asset-based fee of Class Z's average net assets. FIIOC pays for typesetting, printing and mailing of shareholder reports, except proxy statements.
For the period, transfer agent fees for each class were as follows:
| | Amount | % of Class-Level Average Net Assets |
| Class A | $39 | .19 |
| Class M | 19 | .22 |
| Class C | 34 | .19 |
| Convertible Securities | 2,036 | .15 |
| Class I | 56 | .17 |
| Class Z | –(a) | .05(b) |
| | $2,184 | |
(a) In the amount of less than five hundred dollars.
(b) Annualized.
Accounting and Security Lending Fees. Fidelity Service Company, Inc. (FSC), an affiliate of the investment adviser, maintains the Fund's accounting records. The accounting fee is based on the level of average net assets for each month. Under a separate contract, FSC administers the security lending program. The security lending fee is based on the number and duration of lending transactions. For the period, the fees were equivalent to an annual rate of .03%.
Brokerage Commissions. The Fund placed a portion of its portfolio transactions with brokerage firms which are affiliates of the investment adviser. Brokerage commissions are included in net realized gain (loss) and change in net unrealized appreciation (depreciation) in the Statement of Operations. The commissions paid to these affiliated firms were $24 for the period.
Interfund Lending Program. Pursuant to an Exemptive Order issued by the SEC, the Fund, along with other registered investment companies having management contracts with Fidelity Management & Research Company (FMR) or other affiliated entities of FMR, may participate in an interfund lending program. This program provides an alternative credit facility allowing the funds to borrow from, or lend money to, other participating affiliated funds. At period end, there were no interfund loans outstanding. The Fund's activity in this program during the period for which loans were outstanding was as follows:
| Borrower or Lender | Average Loan Balance | Weighted Average Interest Rate | Interest Expense |
| Borrower | $4,716 | 1.89% | $5 |
Interfund Trades. The Fund may purchase from or sell securities to other Fidelity Funds under procedures adopted by the Board. The procedures have been designed to ensure these interfund trades are executed in accordance with Rule 17a-7 of the 1940 Act. Interfund trades are included within the respective purchases and sales amounts shown in the Purchases and Sales of Investments note.
6. Committed Line of Credit.
The Fund participates with other funds managed by the investment adviser or an affiliate in a $4.25 billion credit facility (the "line of credit") to be utilized for temporary or emergency purposes to fund shareholder redemptions or for other short-term liquidity purposes. The Fund has agreed to pay commitment fees on its pro-rata portion of the line of credit, which amounted to $4 and is reflected in Miscellaneous expenses on the Statement of Operations. During the period, the Fund did not borrow on this line of credit.
7. Security Lending.
The Fund lends portfolio securities through a lending agent from time to time in order to earn additional income. For equity securities, a lending agent is used and may loan securities to certain qualified borrowers, including Fidelity Capital Markets (FCM), a broker-dealer affiliated with the Fund. On the settlement date of the loan, the Fund receives collateral (in the form of U.S. Treasury obligations, letters of credit and/or cash) against the loaned securities and maintains collateral in an amount not less than 100% of the market value of the loaned securities during the period of the loan. The market value of the loaned securities is determined at the close of business of the Fund and any additional required collateral is delivered to the Fund on the next business day. The Fund or borrower may terminate the loan at any time, and if the borrower defaults on its obligation to return the securities loaned because of insolvency or other reasons, the Fund may apply collateral received from the borrower against the obligation. The Fund may experience delays and costs in recovering the securities loaned. Any cash collateral received is invested in the Fidelity Securities Lending Cash Central Fund. At period end, there were no security loans outstanding. Security lending income represents the income earned on investing cash collateral, less rebates paid to borrowers and any lending agent fees associated with the loan, plus any premium payments received for lending certain types of securities. Security lending income is presented in the Statement of Operations as a component of income from Fidelity Central Funds. Total security lending income during the period amounted to $2. During the period, there were no securities loaned to FCM.
8. Expense Reductions.
Commissions paid to certain brokers with whom the investment adviser, or its affiliates, places trades on behalf of the Fund include an amount in addition to trade execution, which may be rebated back to the Fund to offset certain expenses. This amount totaled $70 for the period. Through arrangements with the Fund's custodian, credits realized as a result of certain uninvested cash balances were used to reduce the Fund's expenses. During the period, these credits reduced the Fund's custody by $4.
In addition, during the period the investment adviser reimbursed and/or waived a portion of fund-level operating expenses in the amount of $15.
9. Distributions to Shareholders.
Distributions to shareholders of each class were as follows:
| | Year ended
November 30, 2018(a) | Year ended
November 30, 2017 |
| Distributions to shareholders | | |
| Class A | $1,018 | $– |
| Class M | 500 | – |
| Class C | 778 | – |
| Convertible Securities | 72,625 | – |
| Class I | 1,886 | – |
| Class Z | 1 | – |
| Total | $76,808 | $– |
| From net investment income | | |
| Class A | $– | $630 |
| Class M | – | 267 |
| Class C | – | 395 |
| Convertible Securities | – | 42,192 |
| Class I | – | 1,495 |
| Total | $– | $44,979 |
| From net realized gain | | |
| Class A | $– | $444 |
| Class M | – | 102 |
| Class C | – | 357 |
| Convertible Securities | – | 22,674 |
| Class I | – | 968 |
| Total | $– | $24,545 |
(a) Distributions for Class Z are for the period October 2, 2018 (commencement of sale of shares) to November 30, 2018.
10. Share Transactions.
Share transactions for each class were as follows and may contain automatic conversions between classes or exchanges between affiliated funds:
| | Shares | Shares | Dollars | Dollars |
| | Year ended November 30, 2018(a) | Year ended November 30, 2017 | Year ended November 30, 2018(a) | Year ended November 30, 2017 |
| Class A | | | | |
| Shares sold | 99 | 106 | $2,856 | $2,921 |
| Reinvestment of distributions | 35 | 37 | 971 | 1,008 |
| Shares redeemed | (203) | (502) | (5,783) | (13,796) |
| Net increase (decrease) | (69) | (359) | $(1,956) | $(9,867) |
| Class M | | | | |
| Shares sold | 75 | 616 | $2,133 | $17,118 |
| Reinvestment of distributions | 18 | 13 | 496 | 364 |
| Shares redeemed | (388) | (366) | (10,794) | (10,224) |
| Net increase (decrease) | (295) | 263 | $(8,165) | $7,258 |
| Class C | | | | |
| Shares sold | 76 | 64 | $2,156 | $1,763 |
| Reinvestment of distributions | 26 | 25 | 731 | 686 |
| Shares redeemed | (181) | (308) | (5,103) | (8,438) |
| Net increase (decrease) | (79) | (219) | $(2,216) | $(5,989) |
| Convertible Securities | | | | |
| Shares sold | 1,930 | 3,155 | $55,256 | $86,877 |
| Reinvestment of distributions | 2,239 | 2,104 | 63,197 | 57,338 |
| Shares redeemed | (8,880) | (10,453) | (253,754) | (289,022) |
| Net increase (decrease) | (4,711) | (5,194) | $(135,301) | $(144,807) |
| Class I | | | | |
| Shares sold | 353 | 785 | $10,075 | $21,690 |
| Reinvestment of distributions | 61 | 73 | 1,710 | 1,977 |
| Shares redeemed | (703) | (1,970) | (19,963) | (54,079) |
| Net increase (decrease) | (289) | (1,112) | $(8,178) | $(30,412) |
| Class Z | | | | |
| Shares sold | 48 | – | $1,327 | $– |
| Reinvestment of distributions | –(b) | – | 1 | – |
| Shares redeemed | –(b) | – | (2) | – |
| Net increase (decrease) | 48 | – | $1,326 | $– |
(a) Share transactions for Class Z are for the period October 2, 2018 (commencement of sale of shares) to November 30, 2018
(b) Amount is less than five hundred shares
11. Other.
The Fund's organizational documents provide former and current trustees and officers with a limited indemnification against liabilities arising in connection with the performance of their duties to the Fund. In the normal course of business, the Fund may also enter into contracts that provide general indemnifications. The Fund's maximum exposure under these arrangements is unknown as this would be dependent on future claims that may be made against the Fund. The risk of material loss from such claims is considered remote.
Report of Independent Registered Public Accounting Firm
To the Board of Trustees of Fidelity Financial Trust and Shareholders of Fidelity Convertible Securities Fund:
Opinion on the Financial Statements
We have audited the accompanying statement of assets and liabilities, including the schedule of investments, of Fidelity Convertible Securities Fund (one of the funds constituting Fidelity Financial Trust, referred to hereafter as the "Fund") as of November 30, 2018, the related statement of operations for the year ended November 30, 2018, the statement of changes in net assets for each of the two years in the period ended November 30, 2018, including the related notes, and the financial highlights for each of the periods indicated therein (collectively referred to as the “financial statements”). In our opinion, the financial statements present fairly, in all material respects, the financial position of the Fund as of November 30, 2018, the results of its operations for the year then ended, the changes in its net assets for each of the two years in the period ended November 30, 2018 and the financial highlights for each of the periods indicated therein in conformity with accounting principles generally accepted in the United States of America.
Basis for Opinion
These financial statements are the responsibility of the Fund’s management. Our responsibility is to express an opinion on the Fund’s financial statements based on our audits. We are a public accounting firm registered with the Public Company Accounting Oversight Board (United States) (“PCAOB”) and are required to be independent with respect to the Fund in accordance with the U.S. federal securities laws and the applicable rules and regulations of the Securities and Exchange Commission and the PCAOB.
We conducted our audits of these financial statements in accordance with the standards of the PCAOB. Those standards require that we plan and perform the audit to obtain reasonable assurance about whether the financial statements are free of material misstatement, whether due to error or fraud.
Our audits included performing procedures to assess the risks of material misstatement of the financial statements, whether due to error or fraud, and performing procedures that respond to those risks. Such procedures included examining, on a test basis, evidence regarding the amounts and disclosures in the financial statements. Our audits also included evaluating the accounting principles used and significant estimates made by management, as well as evaluating the overall presentation of the financial statements. Our procedures included confirmation of securities owned as of November 30, 2018 by correspondence with the custodian and brokers; when replies were not received from brokers, we performed other auditing procedures. We believe that our audits provide a reasonable basis for our opinion.
PricewaterhouseCoopers LLP
Boston, Massachusetts
January 17, 2019
We have served as the auditor of one or more investment companies in the Fidelity group of funds since 1932.
Trustees and Officers
The Trustees, Members of the Advisory Board (if any), and officers of the trust and fund, as applicable, are listed below. The Board of Trustees governs the fund and is responsible for protecting the interests of shareholders. The Trustees are experienced executives who meet periodically throughout the year to oversee the fund's activities, review contractual arrangements with companies that provide services to the fund, oversee management of the risks associated with such activities and contractual arrangements, and review the fund's performance. Except for Michael E. Wiley, each of the Trustees oversees 281 funds. Mr. Wiley oversees 192 funds.
The Trustees hold office without limit in time except that (a) any Trustee may resign; (b) any Trustee may be removed by written instrument, signed by at least two-thirds of the number of Trustees prior to such removal; (c) any Trustee who requests to be retired or who has become incapacitated by illness or injury may be retired by written instrument signed by a majority of the other Trustees; and (d) any Trustee may be removed at any special meeting of shareholders by a two-thirds vote of the outstanding voting securities of the trust. Each Trustee who is not an interested person (as defined in the 1940 Act) of the trust and the fund is referred to herein as an Independent Trustee. Each Independent Trustee shall retire not later than the last day of the calendar year in which his or her 75th birthday occurs. The Independent Trustees may waive this mandatory retirement age policy with respect to individual Trustees. Officers and Advisory Board Members hold office without limit in time, except that any officer or Advisory Board Member may resign or may be removed by a vote of a majority of the Trustees at any regular meeting or any special meeting of the Trustees. Except as indicated, each individual has held the office shown or other offices in the same company for the past five years.
The fund’s Statement of Additional Information (SAI) includes more information about the Trustees. To request a free copy, call Fidelity at 1-877-208-0098.
Experience, Skills, Attributes, and Qualifications of the Trustees. The Governance and Nominating Committee has adopted a statement of policy that describes the experience, qualifications, attributes, and skills that are necessary and desirable for potential Independent Trustee candidates (Statement of Policy). The Board believes that each Trustee satisfied at the time he or she was initially elected or appointed a Trustee, and continues to satisfy, the standards contemplated by the Statement of Policy. The Governance and Nominating Committee also engages professional search firms to help identify potential Independent Trustee candidates who have the experience, qualifications, attributes, and skills consistent with the Statement of Policy. From time to time, additional criteria based on the composition and skills of the current Independent Trustees, as well as experience or skills that may be appropriate in light of future changes to board composition, business conditions, and regulatory or other developments, have also been considered by the professional search firms and the Governance and Nominating Committee. In addition, the Board takes into account the Trustees' commitment and participation in Board and committee meetings, as well as their leadership of standing and ad hoc committees throughout their tenure.
In determining that a particular Trustee was and continues to be qualified to serve as a Trustee, the Board has considered a variety of criteria, none of which, in isolation, was controlling. The Board believes that, collectively, the Trustees have balanced and diverse experience, qualifications, attributes, and skills, which allow the Board to operate effectively in governing the fund and protecting the interests of shareholders. Information about the specific experience, skills, attributes, and qualifications of each Trustee, which in each case led to the Board's conclusion that the Trustee should serve (or continue to serve) as a trustee of the fund, is provided below.
Board Structure and Oversight Function. James C. Curvey is an interested person and currently serves as Chairman. The Trustees have determined that an interested Chairman is appropriate and benefits shareholders because an interested Chairman has a personal and professional stake in the quality and continuity of services provided to the fund. Independent Trustees exercise their informed business judgment to appoint an individual of their choosing to serve as Chairman, regardless of whether the Trustee happens to be independent or a member of management. The Independent Trustees have determined that they can act independently and effectively without having an Independent Trustee serve as Chairman and that a key structural component for assuring that they are in a position to do so is for the Independent Trustees to constitute a substantial majority for the Board. The Independent Trustees also regularly meet in executive session. Ned C. Lautenbach serves as Chairman of the Independent Trustees and as such (i) acts as a liaison between the Independent Trustees and management with respect to matters important to the Independent Trustees and (ii) with management prepares agendas for Board meetings.
Fidelity® funds are overseen by different Boards of Trustees. The fund's Board oversees Fidelity's high income and certain equity funds, and other Boards oversee Fidelity's investment-grade bond, money market, asset allocation, and other equity funds. The asset allocation funds may invest in Fidelity® funds overseen by the fund's Board. The use of separate Boards, each with its own committee structure, allows the Trustees of each group of Fidelity® funds to focus on the unique issues of the funds they oversee, including common research, investment, and operational issues. On occasion, the separate Boards establish joint committees to address issues of overlapping consequences for the Fidelity® funds overseen by each Board.
The Trustees operate using a system of committees to facilitate the timely and efficient consideration of all matters of importance to the Trustees, the fund, and fund shareholders and to facilitate compliance with legal and regulatory requirements and oversight of the fund's activities and associated risks. The Board, acting through its committees, has charged FMR and its affiliates with (i) identifying events or circumstances the occurrence of which could have demonstrably adverse effects on the fund's business and/or reputation; (ii) implementing processes and controls to lessen the possibility that such events or circumstances occur or to mitigate the effects of such events or circumstances if they do occur; and (iii) creating and maintaining a system designed to evaluate continuously business and market conditions in order to facilitate the identification and implementation processes described in (i) and (ii) above. Because the day-to-day operations and activities of the fund are carried out by or through FMR, its affiliates, and other service providers, the fund's exposure to risks is mitigated but not eliminated by the processes overseen by the Trustees. While each of the Board's committees has responsibility for overseeing different aspects of the fund's activities, oversight is exercised primarily through the Operations, Audit, and Compliance Committees. In addition, the Independent Trustees have worked with Fidelity to enhance the Board's oversight of investment and financial risks, legal and regulatory risks, technology risks, and operational risks, including the development of additional risk reporting to the Board. Appropriate personnel, including but not limited to the fund's Chief Compliance Officer (CCO), FMR's internal auditor, the independent accountants, the fund's Treasurer and portfolio management personnel, make periodic reports to the Board's committees, as appropriate, including an annual review of Fidelity's risk management program for the Fidelity® funds. The responsibilities of each standing committee, including their oversight responsibilities, are described further under "Standing Committees of the Trustees."
Interested Trustees*:
Correspondence intended for a Trustee who is an interested person may be sent to Fidelity Investments, 245 Summer Street, Boston, Massachusetts 02210.
Name, Year of Birth; Principal Occupations and Other Relevant Experience+
James C. Curvey (1935)
Year of Election or Appointment: 2007
Trustee
Chairman of the Board of Trustees
Mr. Curvey also serves as Trustee of other Fidelity® funds. Mr. Curvey is Vice Chairman (2007-present) and Director of FMR LLC (diversified financial services company). In addition, Mr. Curvey is an Overseer Emeritus for the Boston Symphony Orchestra, a Director of Artis-Naples, and a Trustee of Brewster Academy in Wolfeboro, New Hampshire. Previously, Mr. Curvey served as a Director of Fidelity Research & Analysis Co. (investment adviser firm, 2009-2018), Director of Fidelity Investments Money Management, Inc. (investment adviser firm, 2009-2014) and a Director of FMR and FMR Co., Inc. (investment adviser firms, 2007-2014).
* Determined to be an “Interested Trustee” by virtue of, among other things, his or her affiliation with the trust or various entities under common control with FMR.
+ The information includes the Trustee's principal occupation during the last five years and other information relating to the experience, attributes, and skills relevant to the Trustee's qualifications to serve as a Trustee, which led to the conclusion that the Trustee should serve as a Trustee for the fund.
Independent Trustees:
Correspondence intended for an Independent Trustee may be sent to Fidelity Investments, P.O. Box 55235, Boston, Massachusetts 02205-5235.
Name, Year of Birth; Principal Occupations and Other Relevant Experience+
Dennis J. Dirks (1948)
Year of Election or Appointment: 2005
Trustee
Mr. Dirks also serves as Trustee of other Fidelity® funds. Prior to his retirement in May 2003, Mr. Dirks was Chief Operating Officer and a member of the Board of The Depository Trust & Clearing Corporation (DTCC). He also served as President, Chief Operating Officer, and Board member of The Depository Trust Company (DTC) and President and Board member of the National Securities Clearing Corporation (NSCC). In addition, Mr. Dirks served as Chief Executive Officer and Board member of the Government Securities Clearing Corporation, Chief Executive Officer and Board member of the Mortgage-Backed Securities Clearing Corporation, as a Trustee and a member of the Finance Committee of Manhattan College (2005-2008), as a Trustee and a member of the Finance Committee of AHRC of Nassau County (2006-2008), as a member of the Independent Directors Council (IDC) Governing Council (2010-2015), and as a member of the Board of Directors for The Brookville Center for Children’s Services, Inc. (2009-2017). Mr. Dirks is a member of the Finance Committee (2016-present) and Board of Directors (2017-present) and is Treasurer (2018-present) of the Asolo Repertory Theatre.
Donald F. Donahue (1950)
Year of Election or Appointment: 2018
Trustee
Mr. Donahue also serves as a Trustee of other Fidelity® funds. Mr. Donahue is President and Chief Executive Officer of Miranda Partners, LLC (risk consulting for the financial services industry, 2012-present). Previously, Mr. Donahue served as a Member of the Advisory Board of certain Fidelity® funds (2015-2018) and Chief Executive Officer (2006-2012), Chief Operating Officer (2003-2006), and Managing Director, Customer Marketing and Development (1999-2003) of The Depository Trust & Clearing Corporation (financial markets infrastructure). Mr. Donahue serves as a Member (2007-present) and Co-Chairman (2016-present) of the Board of Directors of United Way of New York, Member of the Board of Directors of NYC Leadership Academy (2012-present) and Member of the Board of Advisors of Ripple Labs, Inc. (financial services, 2015-present). He also served as Chairman (2010-2012) and Member of the Board of Directors (2012-2013) of Omgeo, LLC (financial services), Treasurer of United Way of New York (2012-2016), and Member of the Board of Directors of XBRL US (financial services non-profit, 2009-2012) and the International Securities Services Association (2009-2012).
Alan J. Lacy (1953)
Year of Election or Appointment: 2008
Trustee
Mr. Lacy also serves as Trustee of other Fidelity® funds. Mr. Lacy serves as a Director of Bristol-Myers Squibb Company (global pharmaceuticals, 2008-present). He is a Trustee of the California Chapter of The Nature Conservancy (2015-present) and a Director of the Center for Advanced Study in the Behavioral Sciences at Stanford University (2015-present). In addition, Mr. Lacy served as Senior Adviser (2007-2014) of Oak Hill Capital Partners, L.P. (private equity) and also served as Chief Executive Officer (2005) and Vice Chairman (2005-2006) of Sears Holdings Corporation (retail) and Chief Executive Officer and Chairman of the Board of Sears, Roebuck and Co. (retail, 2000-2005). Previously, Mr. Lacy served as Chairman (2014-2017) and a member (2010-2017) of the Board of Directors of Dave & Buster’s Entertainment, Inc. (restaurant and entertainment complexes), as Chairman (2008-2011) and a member (2006-2015) of the Board of Trustees of the National Parks Conservation Association, and as a member of the Board of Directors for The Hillman Companies, Inc. (hardware wholesalers, 2010-2014), Earth Fare, Inc. (retail grocery, 2010-2014), and The Western Union Company (global money transfer, 2006-2011).
Ned C. Lautenbach (1944)
Year of Election or Appointment: 2000
Trustee
Chairman of the Independent Trustees
Mr. Lautenbach also serves as Trustee of other Fidelity® funds. Mr. Lautenbach currently serves as Chair (2018-present) and Member (2013-present) of the Board of Governors, State University System of Florida and is a member of the Council on Foreign Relations (1994-present). He is also a member and has most recently served as Chairman of the Board of Directors of Artis-Naples (2012-present). Previously, Mr. Lautenbach served as a member and then Lead Director of the Board of Directors of Eaton Corporation (diversified industrial, 1997-2016). He was also a Partner and Advisory Partner at Clayton, Dubilier & Rice, LLC (private equity investment, 1998-2010), as well as a Director of Sony Corporation (2006-2007). In addition, Mr. Lautenbach also had a 30-year career with IBM (technology company) during which time he served as Senior Vice President and a member of the Corporate Executive Committee (1968-1998).
Joseph Mauriello (1944)
Year of Election or Appointment: 2008
Trustee
Mr. Mauriello also serves as Trustee of other Fidelity® funds. Prior to his retirement in January 2006, Mr. Mauriello served in numerous senior management positions including Deputy Chairman and Chief Operating Officer (2004-2005), and Vice Chairman of Financial Services (2002-2004) of KPMG LLP US (professional services, 1965-2005). Mr. Mauriello currently serves as a member of the Independent Directors Council (IDC) Governing Council (2015-present). Previously, Mr. Mauriello served as a member of the Board of Directors of XL Group plc. (global insurance and re-insurance, 2006-2018).
Cornelia M. Small (1944)
Year of Election or Appointment: 2005
Trustee
Ms. Small also serves as Trustee of other Fidelity® funds. Ms. Small is a member of the Board of Directors (2009-present) and Chair of the Investment Committee (2010-present) of the Teagle Foundation. Ms. Small also serves on the Investment Committee of the Berkshire Taconic Community Foundation (2008-present). Previously, Ms. Small served as Chairperson (2002-2008) and a member of the Investment Committee and Chairperson (2008-2012) and a member of the Board of Trustees of Smith College. In addition, Ms. Small served as Chief Investment Officer, Director of Global Equity Investments, and a member of the Board of Directors of Scudder, Stevens & Clark and Scudder Kemper Investments.
Garnett A. Smith (1947)
Year of Election or Appointment: 2018
Trustee
Mr. Smith also serves as Trustee of other Fidelity® funds. Prior to Mr. Smith's retirement, he served as Chairman and Chief Executive Officer of Inbrand Corp. (manufacturer of personal absorbent products, 1990-1997). He also served as President (1986-1990) of Inbrand Corp. Prior to his employment with Inbrand Corp., he was employed by a retail fabric chain and North Carolina National Bank. In addition, Mr. Smith served as a Member of the Advisory Board of certain Fidelity® funds (2012-2013) and as a board member of the Jackson Hole Land Trust (2009-2012).
David M. Thomas (1949)
Year of Election or Appointment: 2008
Trustee
Mr. Thomas also serves as Trustee of other Fidelity® funds. Mr. Thomas serves as Non-Executive Chairman of the Board of Directors of Fortune Brands Home and Security (home and security products, 2011-present) and as a member of the Board of Directors (2004-present) and Presiding Director (2013-present) of Interpublic Group of Companies, Inc. (marketing communication). Previously, Mr. Thomas served as Executive Chairman (2005-2006) and Chairman and Chief Executive Officer (2000-2005) of IMS Health, Inc. (pharmaceutical and healthcare information solutions), a Director of Fortune Brands, Inc. (consumer products, 2000-2011), and a member of the Board of Trustees of the University of Florida (2013-2018).
Michael E. Wiley (1950)
Year of Election or Appointment: 2018
Trustee
Mr. Wiley also serves as Trustee or Member of the Advisory Board of other Fidelity® funds. Mr. Wiley serves as a Director of High Point Resources (exploration and production, 2005-present). Previously, Mr. Wiley served as a Director of Andeavor Corporation (independent oil refiner and marketer, 2005-2018), a Director of Andeavor Logistics LP (natural resources logistics, 2015-2018), a Director of Post Oak Bank (privately-held bank, 2004-2018), a Director of Asia Pacific Exploration Consolidated (international oil and gas exploration and production, 2008-2013), a member of the Board of Trustees of the University of Tulsa (2000-2006; 2007-2010), a Senior Energy Advisor of Katzenbach Partners, LLC (consulting, 2006-2007), an Advisory Director of Riverstone Holdings (private investment), a Director of Spinnaker Exploration Company (exploration and production, 2001-2005) and Chairman, President, and CEO of Baker Hughes, Inc. (oilfield services, 2000-2004).
+ The information includes the Trustee's principal occupation during the last five years and other information relating to the experience, attributes, and skills relevant to the Trustee's qualifications to serve as a Trustee, which led to the conclusion that the Trustee should serve as a Trustee for the fund.
Advisory Board Members and Officers:
Correspondence intended for a Member of the Advisory Board (if any) may be sent to Fidelity Investments, P.O. Box 55235, Boston, Massachusetts 02205-5235. Correspondence intended for an officer or Peter S. Lynch may be sent to Fidelity Investments, 245 Summer Street, Boston, Massachusetts 02210. Officers appear below in alphabetical order.
Name, Year of Birth; Principal Occupation
Vicki L. Fuller (1957)
Year of Election or Appointment: 2018
Member of the Advisory Board
Ms. Fuller also serves as Member of the Advisory Board of other Fidelity® funds. Ms. Fuller serves as a member of the Board of Directors, Audit Committee, and Nominating and Governance Committee of The Williams Companies, Inc. (natural gas infrastructure, 2018-present). Previously, Ms. Fuller served as the Chief Investment Officer of the New York State Common Retirement Fund (2012-2018) and held a variety of positions at AllianceBernstein L.P. (global asset management, 1985-2012), including Managing Director (2006-2012) and Senior Vice President and Senior Portfolio Manager (2001-2006).
Peter S. Lynch (1944)
Year of Election or Appointment: 2003
Member of the Advisory Board
Mr. Lynch also serves as Member of the Advisory Board of other Fidelity® funds. Mr. Lynch is Vice Chairman and a Director of FMR (investment adviser firm) and FMR Co., Inc. (investment adviser firm). In addition, Mr. Lynch serves as a Trustee of Boston College and as the Chairman of the Inner-City Scholarship Fund. Previously, Mr. Lynch served on the Special Olympics International Board of Directors (1997-2006).
Carol B. Tomé (1957)
Year of Election or Appointment: 2018
Member of the Advisory Board
Ms. Tomé also serves as Member of the Advisory Board of other Fidelity® funds. Ms. Tomé is Chief Financial Officer (2001-present) and Executive Vice President of Corporate Services (2007-present) of The Home Depot, Inc. (home improvement retailer) and a Director (2003-present) and Chair of the Audit Committee (2004-present) of United Parcel Service, Inc. (package delivery and supply chain management). Previously, Ms. Tomé served as Trustee of certain Fidelity® funds (2017), Senior Vice President of Finance and Accounting/Treasurer (2000-2007) and Vice President and Treasurer (1995-2000) of The Home Depot, Inc. and Chair of the Board (2010-2012), Vice Chair of the Board (2009 and 2013), and a Director (2008-2013) of the Federal Reserve Bank of Atlanta. Ms. Tomé is also a director or trustee of many community and professional organizations.
Elizabeth Paige Baumann (1968)
Year of Election or Appointment: 2017
Anti-Money Laundering (AML) Officer
Ms. Baumann also serves as AML Officer of other funds. She is Chief AML Officer (2012-present) and Senior Vice President (2014-present) of FMR LLC (diversified financial services company) and is an employee of Fidelity Investments. Previously, Ms. Baumann served as AML Officer of the funds (2012-2016), and Vice President (2007-2014) and Deputy Anti-Money Laundering Officer (2007-2012) of FMR LLC.
John J. Burke III (1964)
Year of Election or Appointment: 2018
Chief Financial Officer
Mr. Burke also serves as Chief Financial Officer of other funds. Mr. Burke serves as Head of Investment Operations for Fidelity Fund and Investment Operations (2018-present) and is an employee of Fidelity Investments (1998-present). Previously Mr. Burke served as head of Asset Management Investment Operations (2012-2018).
William C. Coffey (1969)
Year of Election or Appointment: 2018
Secretary and Chief Legal Officer (CLO)
Mr. Coffey also serves as Secretary and CLO of other funds. Mr. Coffey serves as CLO, Secretary, and Senior Vice President of Fidelity Management & Research Company and FMR Co., Inc. (investment adviser firms, 2018-present); Secretary of Fidelity SelectCo, LLC and Fidelity Investments Money Management, Inc. (investment adviser firms, 2018-present); and CLO of Fidelity Management & Research (Hong Kong) Limited, FMR Investment Management (UK) Limited, and Fidelity Management & Research (Japan) Limited (investment adviser firms, 2018-present). He is Senior Vice President and Deputy General Counsel of FMR LLC (diversified financial services company, 2010-present), and is an employee of Fidelity Investments. Previously, Mr. Coffey served as Assistant Secretary of certain funds (2009-2018) and as Vice President and Associate General Counsel of FMR LLC (2005-2009).
Timothy M. Cohen (1969)
Year of Election or Appointment: 2018
Vice President
Mr. Cohen also serves as Vice President of other funds. Mr. Cohen serves as Co-Head of Global Equity Research (2016-present), a Director of Fidelity Management & Research (Japan) Limited (investment adviser firm, 2016-present), and is an employee of Fidelity Investments. Previously, Mr. Cohen served as Chief Investment Officer - Equity and a Director of Fidelity Management & Research (U.K.) Inc. (investment adviser firm, 2013-2015) and as a Director of Fidelity Management & Research (Hong Kong) Limited (investment adviser firm, 2017).
Jonathan Davis (1968)
Year of Election or Appointment: 2010
Assistant Treasurer
Mr. Davis also serves as Assistant Treasurer of other funds. Mr. Davis serves as Assistant Treasurer of FMR Capital, Inc. (2017-present) and is an employee of Fidelity Investments. Previously, Mr. Davis served as Vice President and Associate General Counsel of FMR LLC (diversified financial services company, 2003-2010).
Adrien E. Deberghes (1967)
Year of Election or Appointment: 2016
Assistant Treasurer
Mr. Deberghes also serves as an officer of other funds. He serves as Assistant Treasurer of FMR Capital, Inc. (2017-present), Executive Vice President of Fidelity Investments Money Management, Inc. (FIMM) (investment adviser firm, 2016-present), and is an employee of Fidelity Investments (2008-present). Previously, Mr. Deberghes served as President and Treasurer of certain Fidelity® funds (2013-2018). Prior to joining Fidelity Investments, Mr. Deberghes was Senior Vice President of Mutual Fund Administration at State Street Corporation (2007-2008), Senior Director of Mutual Fund Administration at Investors Bank & Trust (2005-2007), and Director of Finance for Dunkin' Brands (2000-2005). Previously, Mr. Deberghes served in other fund officer roles.
Laura M. Del Prato (1964)
Year of Election or Appointment: 2018
Assistant Treasurer
Ms. Del Prato also serves as an officer of other funds. Ms. Del Prato is an employee of Fidelity Investments (2017-present). Prior to joining Fidelity Investments, Ms. Del Prato served as a Managing Director and Treasurer of the JPMorgan Mutual Funds (2014-2017). Prior to JPMorgan, Ms. Del Prato served as a partner at Cohen Fund Audit Services (accounting firm, 2012-2013) and KPMG LLP (accounting firm, 2004-2012).
Colm A. Hogan (1973)
Year of Election or Appointment: 2016
Deputy Treasurer
Mr. Hogan also serves as an officer of other funds. Mr. Hogan serves as Assistant Treasurer of FMR Capital, Inc. (2017-present) and is an employee of Fidelity Investments (2005-present). Previously, Mr. Hogan served as Assistant Treasurer of certain Fidelity® funds (2016-2018).
Pamela R. Holding (1964)
Year of Election or Appointment: 2018
Vice President
Ms. Holding also serves as Vice President of other funds. Ms. Holding serves as Co-Head of Global Equity Research (2018-present) and is an employee of Fidelity Investments (2013-present).
Chris Maher (1972)
Year of Election or Appointment: 2013
Assistant Treasurer
Mr. Maher serves as Assistant Treasurer of other funds. Mr. Maher is Vice President of Valuation Oversight, serves as Assistant Treasurer of FMR Capital, Inc. (2017-present), and is an employee of Fidelity Investments. Previously, Mr. Maher served as Vice President of Asset Management Compliance (2013), Vice President of the Program Management Group of FMR (investment adviser firm, 2010-2013), and Vice President of Valuation Oversight (2008-2010).
Rieco E. Mello (1969)
Year of Election or Appointment: 2017
Assistant Treasurer
Mr. Mello also serves as Assistant Treasurer of other funds. Mr. Mello serves as Assistant Treasurer of FMR Capital, Inc. (2017-present) and is an employee of Fidelity Investments (1995-present).
Kenneth B. Robins (1969)
Year of Election or Appointment: 2016
Chief Compliance Officer
Mr. Robins also serves as an officer of other funds. Mr. Robins serves as Compliance Officer of Fidelity Management & Research Company and FMR Co., Inc. (investment adviser firms, 2016-present) and is an employee of Fidelity Investments (2004-present). Previously, Mr. Robins served as Executive Vice President of Fidelity Investments Money Management, Inc. (investment adviser firm, 2013-2016) and served in other fund officer roles.
Stacie M. Smith (1974)
Year of Election or Appointment: 2016
President and Treasurer
Ms. Smith also serves as an officer of other funds. Ms. Smith serves as Assistant Treasurer of FMR Capital, Inc. (2017-present), is an employee of Fidelity Investments (2009-present), and has served in other fund officer roles. Prior to joining Fidelity Investments, Ms. Smith served as Senior Audit Manager of Ernst & Young LLP (accounting firm, 1996-2009). Previously, Ms. Smith served as Assistant Treasurer (2013-2018) and Deputy Treasurer (2013-2016) of certain Fidelity® funds.
Marc L. Spector (1972)
Year of Election or Appointment: 2016
Assistant Treasurer
Mr. Spector also serves as an officer of other funds. Mr. Spector serves as Assistant Treasurer of FMR Capital, Inc. (2017-present) and is an employee of Fidelity Investments (2016-present). Prior to joining Fidelity Investments, Mr. Spector served as Director at the Siegfried Group (accounting firm, 2013-2016), and prior to Siegfried Group as audit senior manager at Deloitte & Touche (accounting firm, 2005-2013).
Shareholder Expense Example
As a shareholder of the Fund, you incur two types of costs: (1) transaction costs, including sales charges (loads) on purchase payments or redemption proceeds, and (2) ongoing costs, including management fees, distribution and/or service (12b-1) fees and other Fund expenses. This Example is intended to help you understand your ongoing costs (in dollars) of investing in the Fund and to compare these costs with the ongoing costs of investing in other mutual funds.
The actual expense Example is based on an investment of $1,000 invested at the beginning of the period and held for the entire period (June 1, 2018 to November 30, 2018) for Class A, Class M, Class C, Convertible Securities and Class I, and for the period (October 2, 2018 to November 30, 2018) for Class Z. The hypothetical expense Example is based on an investment of $1,000 invested for the one-half year period (June 1, 2018 to November 30, 2018).
Actual Expenses
The first line of the accompanying table for each class of the Fund provides information about actual account values and actual expenses. You may use the information in this line, together with the amount you invested, to estimate the expenses that you paid over the period. Simply divide your account value by $1,000.00 (for example, an $8,600 account value divided by $1,000.00 = 8.6), then multiply the result by the number in the first line for a class of the Fund under the heading entitled "Expenses Paid During Period" to estimate the expenses you paid on your account during this period. A small balance maintenance fee of $12.00 that is charged once a year may apply for certain accounts with a value of less than $2,000. This fee, which was eliminated effective August 1, 2018, is not included in the table below. If it was, the estimate of expenses you paid during the period would be higher, and your ending account value lower, by this amount. In addition, the Fund, as a shareholder in the underlying Fidelity Central Funds, will indirectly bear its pro-rata share of the fees and expenses incurred by the underlying Fidelity Central Funds. These fees and expenses are not included in the Fund's annualized expense ratio used to calculate the expense estimate in the table below.
Hypothetical Example for Comparison Purposes
The second line of the accompanying table for each class of the Fund provides information about hypothetical account values and hypothetical expenses based on a Class' actual expense ratio and an assumed rate of return of 5% per year before expenses, which is not the Class' actual return. The hypothetical account values and expenses may not be used to estimate the actual ending account balance or expenses you paid for the period. You may use this information to compare the ongoing costs of investing in the Fund and other funds. To do so, compare this 5% hypothetical example with the 5% hypothetical examples that appear in the shareholder reports of the other funds. A small balance maintenance fee of $12.00 that is charged once a year may apply for certain accounts with a value of less than $2,000. This fee, which was eliminated effective August 1, 2018, is not included in the table below. If it was, the estimate of expenses you paid during the period would be higher, and your ending account value lower, by this amount. In addition, the Fund, as a shareholder in the underlying Fidelity Central Funds, will indirectly bear its pro-rata share of the fees and expenses incurred by the underlying Fidelity Central Funds. These fees and expenses are not included in the Fund's annualized expense ratio used to calculate the expense estimate in the table below.
Please note that the expenses shown in the table are meant to highlight your ongoing costs only and do not reflect any transaction costs. Therefore, the second line of the table is useful in comparing ongoing costs only, and will not help you determine the relative total costs of owning different funds. In addition, if these transactional costs were included, your costs would have been higher.
| | Annualized Expense Ratio-A | Beginning
Account Value
| Ending
Account Value
November 30, 2018 | Expenses Paid
During Period
|
| Class A | .75% | | | |
| Actual | | $1,000.00 | $991.40 | $3.74-B |
| Hypothetical-C | | $1,000.00 | $1,021.31 | $3.80-D |
| Class M | 1.04% | | | |
| Actual | | $1,000.00 | $990.00 | $5.19-B |
| Hypothetical-C | | $1,000.00 | $1,019.85 | $5.27-D |
| Class C | 1.50% | | | |
| Actual | | $1,000.00 | $987.60 | $7.47-B |
| Hypothetical-C | | $1,000.00 | $1,017.55 | $7.59-D |
| Convertible Securities | .46% | | | |
| Actual | | $1,000.00 | $992.90 | $2.30-B |
| Hypothetical-C | | $1,000.00 | $1,022.76 | $2.33-D |
| Class I | .47% | | | |
| Actual | | $1,000.00 | $992.50 | $2.35-B |
| Hypothetical-C | | $1,000.00 | $1,022.71 | $2.38-D |
| Class Z | .37% | | | |
| Actual | | $1,000.00 | $972.60 | $.60-B |
| Hypothetical-C | | $1,000.00 | $1,023.21 | $1.88-D |
A Annualized expense ratio reflects expenses net of applicable fee waivers.
B Actual expenses are equal to each Class' annualized expense ratio, multiplied by the average account value over the period, multiplied by 183/365 (to reflect the one-half year period) for Class A, Class M, Class C, Convertible Securities and Class I, and multiplied by 60/365 (to reflect the period October 2, 2018 to November 30, 2018) for Class Z.
C 5% return per year before expenses
D Hypothetical expenses are equal to each Class' annualized expense ratio, multiplied by the average account value over the period, multiplied by 183/365 (to reflect the one-half year period).
Distributions (Unaudited)
The Board of Trustees of Fidelity Convertible Securities Fund voted to pay to shareholders of record at the opening of business on record date, the following distributions per share derived from capital gains realized from sales of portfolio securities, and dividends derived from net investment income:
| | Pay Date | Record Date | Dividends | Capital Gains |
| Fidelity Convertible Securities Fund | | | | |
| Class A | 12/27/18 | 12/26/18 | $0.171 | $1.509 |
| Class M | 12/27/18 | 12/26/18 | $0.152 | $1.509 |
| Class C | 12/27/18 | 12/26/18 | $0.117 | $1.509 |
| Convertible Securities | 12/27/18 | 12/26/18 | $0.193 | $1.509 |
| Class I | 12/27/18 | 12/26/18 | $0.192 | $1.509 |
| Class Z | 12/27/18 | 12/26/18 | $0.203 | $1.509 |
|
The fund hereby designates as a capital gain dividend with respect to the taxable year ended November 30, 2018, $54,951,523, or, if subsequently determined to be different, the net capital gain of such year.
A total of 4.90% of the dividends distributed during the fiscal year was derived from interest on U.S. Government securities which is generally exempt from state income tax.
The fund designates $19,399,278 of distributions paid during the period January 1, 2018 to November 30, 2018 as qualifying to be taxed as interest-related dividends for nonresident alien shareholders.
Class A designates 0%, 21%, 21%, and 20%; Class M designates 0%, 29%, 25%, and 21%; Class C designates 0%, 28%, 29%, and 24%; Convertible Securities designates 0%, 19%, 19%, and 19%; and Class I designates 0%, 19%, 19%, and 19%; of the dividends distributed in December 2017, April 2018, July 2018, and October 2018, respectively during the fiscal year; and Class Z designates 19% of the dividend distributed in October 2018 during the fiscal year as qualifying for the dividends–received deduction for corporate shareholders.
Class A designates 1%, 23%, 23%, and 22%; Class M designates 1%, 31%, 27%, and 24%; Class C designates 1%, 31%, 32%, and 26%; Convertible Securities designates 1%, 21%, 21%, and 21%; and Class I designates 1%, 21%, 21%, and 21%; of the dividends distributed in December 2017, April 2018, July 2018, and October 2018, respectively during the fiscal year; and Class Z designates 21% of the dividend distributed in October 2018 during the fiscal year as amounts which may be taken into account as a dividend for purposes of the maximum rate under section 1(h)(11) of the Internal Revenue Code.
The fund will notify shareholders in January 2019 of amounts for use in preparing 2018 income tax returns.
Board Approval of Investment Advisory Contracts
Fidelity Convertible Securities Fund
At its July 2018 meeting, the Board of Trustees, including the Independent Trustees (together, the Board), voted to continue the management contract with Fidelity Management & Research Company (FMR) and the sub-advisory agreements (together, the Advisory Contracts) for the fund for six months through January 31, 2019, in connection with the reunification of the Fidelity Equity High Income Funds Board, which oversees the fund, and the Sector Portfolios Board.
The Board considered that the approval of the fund's Advisory Contracts will not result in any changes in (i) the investment process or strategies employed in the management of the fund's assets; (ii) the fees and expenses paid by shareholders; (iii) the nature, extent or quality of services provided under the fund's Advisory Contracts; or (iv) the day-to-day management of the fund or the persons primarily responsible for such management. The Board concluded that the fund's Advisory Contracts are fair and reasonable, and that the fund's Advisory Contracts should be renewed, without modification, through January 31, 2019, with the understanding that the Board will consider the annual renewal for a full one year period in January 2019.
In connection with its consideration of future renewals of the fund's Advisory Contracts, the Board will consider: (i) the nature, extent and quality of services provided to the fund, including shareholder and administrative services and investment performance; (ii) the competitiveness of the management fee and total expenses for the fund; (iii) the costs of the services and profitability, including the revenues earned and the expenses incurred in conducting the business of developing, marketing, distributing, managing, administering, and servicing the fund and its shareholders, to the extent applicable, as well as potential fall-out benefits from Fidelity's non-fund businesses; and (iv) whether there have been economies of scale in respect of the Fidelity funds, whether the Fidelity funds (including the fund) have appropriately benefited from any such economies of scale, and whether there is the potential for realization of any further economies.
Based on its evaluation of all of the conclusions noted above, and after considering all factors it believed relevant, the Board ultimately concluded that the fund's management fee structure is fair and reasonable, and that the continuation of the fund's Advisory Contracts should be approved.
ACVS-ANN-0119
1.884067.109
Fidelity® Convertible Securities Fund
Annual Report November 30, 2018 |
|
Beginning on January 1, 2021, as permitted by regulations adopted by the Securities and Exchange Commission, paper copies of a fund’s shareholder reports will no longer be sent by mail, unless you specifically request paper copies of the reports from the fund or from your financial intermediary, such as a financial advisor, broker-dealer or bank. Instead, the reports will be made available on a website, and you will be notified by mail each time a report is posted and provided with a website link to access the report.
If you already elected to receive shareholder reports electronically, you will not be affected by this change and you need not take any action. You may elect to receive shareholder reports and other communications from a fund electronically, by contacting your financial intermediary. For Fidelity customers, visit Fidelity's web site or call Fidelity using the contact information listed below.
You may elect to receive all future reports in paper free of charge. If you wish to continue receiving paper copies of your shareholder reports, you may contact your financial intermediary or, if you are a Fidelity customer, visit Fidelity’s website, or call Fidelity at the applicable toll-free number listed below. Your election to receive reports in paper will apply to all funds held with the fund complex/your financial intermediary.
| Account Type | Website | Phone Number |
| Brokerage, Mutual Fund, or Annuity Contracts: | fidelity.com/mailpreferences | 1-800-343-3548 |
| Employer Provided Retirement Accounts: | netbenefits.fidelity.com/preferences (choose 'no' under Required Disclosures to continue to print) | 1-800-343-0860 |
| Advisor Sold Accounts Serviced Through Your Financial Intermediary: | Contact Your Financial Intermediary | Your Financial Intermediary's phone number |
| Advisor Sold Accounts Serviced by Fidelity: | institutional.fidelity.com | 1-877-208-0098 |
Contents
To view a fund's proxy voting guidelines and proxy voting record for the 12-month period ended June 30, visit http://www.fidelity.com/proxyvotingresults or visit the Securities and Exchange Commission's (SEC) web site at http://www.sec.gov.
You may also call 1-800-544-8544 to request a free copy of the proxy voting guidelines.
Standard & Poor's, S&P and S&P 500 are registered service marks of The McGraw-Hill Companies, Inc. and have been licensed for use by Fidelity Distributors Corporation.
Other third-party marks appearing herein are the property of their respective owners.
All other marks appearing herein are registered or unregistered trademarks or service marks of FMR LLC or an affiliated company. © 2019 FMR LLC. All rights reserved.
This report and the financial statements contained herein are submitted for the general information of the shareholders of the Fund. This report is not authorized for distribution to prospective investors in the Fund unless preceded or accompanied by an effective prospectus.
A fund files its complete schedule of portfolio holdings with the SEC for the first and third quarters of each fiscal year on Form N-Q. Forms N-Q are available on the SEC’s web site at http://www.sec.gov. A fund's Forms N-Q may be reviewed and copied at the SEC’s Public Reference Room in Washington, DC. Information regarding the operation of the SEC's Public Reference Room may be obtained by calling 1-800-SEC-0330.
For a complete list of a fund's portfolio holdings, view the most recent holdings listing, semiannual report, or annual report on Fidelity's web site at http://www.fidelity.com, http://www.institutional.fidelity.com, or http://www.401k.com, as applicable.
NOT FDIC INSURED •MAY LOSE VALUE •NO BANK GUARANTEE
Neither the Fund nor Fidelity Distributors Corporation is a bank.
Performance: The Bottom Line
Average annual total return reflects the change in the value of an investment, assuming reinvestment of distributions from dividend income and capital gains (the profits earned upon the sale of securities that have grown in value, if any) and assuming a constant rate of performance each year. The hypothetical investment and the average annual total returns do not reflect the deduction of taxes that a shareholder would pay on fund distributions or the redemption of fund shares. During periods of reimbursement by Fidelity, a fund’s total return will be greater than it would be had the reimbursement not occurred. How a fund did yesterday is no guarantee of how it will do tomorrow.
Average Annual Total Returns
| For the periods ended November 30, 2018 | Past 1 year | Past 5 years | Past 10 years |
| Fidelity® Convertible Securities Fund | 3.93% | 3.96% | 12.89% |
$10,000 Over 10 Years
Let's say hypothetically that $10,000 was invested in Fidelity® Convertible Securities Fund, a class of the fund, on November 30, 2008.
The chart shows how the value of your investment would have changed, and also shows how the ICE® BofAML® All US Convertibles Index performed over the same period.

| Period Ending Values |
| $33,609 | Fidelity® Convertible Securities Fund |
| $34,991 | ICE® BofAML® All US Convertibles Index |
BofA Merrill Lynch benchmark indices were re-branded as ICE BofAML benchmark indices.
Management's Discussion of Fund Performance
Market Recap: For the 12 months ending November 30, 2018, the ICE BofAML
® All U.S. Convertibles Index gained 4.86%, benefiting for the first 10 months of the period from strong demand and constrained supply, as well as a rising stock market. Investors were drawn to convertible securities because of their limited sensitivity to higher interest rates and their mix of income and watered-down equity exposure. The information technology sector, which represented about 32% of the convertibles index this period, did particularly well. However, in October, uncertainty due to global trade, slowing global economic growth, rising U.S. interest rates and peaking corporate earnings growth led to a sizable decline in stocks, particularly tech securities, in turn pressuring convertibles. Within the convertibles index, tech rose about 9%, thanks to earlier strength. Other notable winners included health care (+11%) and utilities (+7%). By contrast, most other sectors in the index posted flat or slightly negative returns, with industrials (-5%) hardest hit. Within the index, convertible bonds gained roughly 6%, outpacing the 3% advance of convertible preferred stock. By comparison, the convertibles index lagged the 6.27% gain of the S&P 500
® index, but topped the 0.22% result of the ICE BofAML
® U.S. High Yield Constrained Index and the -1.34% return of taxable investment-grade bonds, as measured by the Bloomberg Barclays U.S. Aggregate Bond Index.
Comments from Portfolio Manager Adam Kramer: For the fiscal year, the fund’s share classes (excluding sales charges, if applicable) gained about 3% to 4%, trailing the benchmark ICE BofAML
® All US Convertibles Index. The fund struggled to keep pace with the benchmark from the beginning of the period through the end of August, due to underexposure to many top-performing, higher-growth, mid-cap software companies. The better news is that we outpaced the benchmark by about two percentage points in the final three months. By sector, health care, energy, consumer discretionary and consumer staples hurt relative performance most, largely due to weak issue selection. In terms of asset classes, our investment in convertible bonds – representing roughly two-thirds of the fund’s assets this period – lagged those in the benchmark and therefore detracted from our relative result. The largest individual detractor was a non-benchmark stake in converts and common stock issued by Scorpio Tankers, one of the world’s largest gasoline tanker companies. By contrast, sizable non-benchmark exposure to equities rose about 9%, aiding the fund’s relative result. From a sector perspective, the biggest boost came from security selection in tech. The top individual contributor was social messaging company Twitter. We reduced exposure to Twitter the past 12 months, but it remained a top position as of November 30.
The views expressed above reflect those of the portfolio manager(s) only through the end of the period as stated on the cover of this report and do not necessarily represent the views of Fidelity or any other person in the Fidelity organization. Any such views are subject to change at any time based upon market or other conditions and Fidelity disclaims any responsibility to update such views. These views may not be relied on as investment advice and, because investment decisions for a Fidelity fund are based on numerous factors, may not be relied on as an indication of trading intent on behalf of any Fidelity fund.
Investment Summary (Unaudited)
Top Ten Investments as of November 30, 2018
| (excluding cash equivalents) | % of fund's net assets |
| U.S. Treasury Notes 2.375% 5/15/27 | 7.5 |
| Vistra Energy Corp. 7.00% | 2.2 |
| Intel Corp. 3.25% 8/1/39 | 1.9 |
| Becton, Dickinson & Co. Series A, 6.125% | 1.9 |
| Micron Technology, Inc. 3% 11/15/43 | 1.8 |
| Microchip Technology, Inc. 1.625% 2/15/25 | 1.5 |
| Sempra Energy Series A, 6.00% | 1.5 |
| Twitter, Inc. 0.25% 6/15/24 | 1.4 |
| Wells Fargo & Co. 7.50% | 1.3 |
| Advanced Micro Devices, Inc. 2.125% 9/1/26 | 1.3 |
| | 22.3 |
Top Five Market Sectors as of November 30, 2018
| | % of fund's net assets |
| Information Technology | 33.4 |
| Health Care | 12.5 |
| Communication Services | 10.3 |
| Consumer Discretionary | 8.5 |
| Utilities | 7.7 |
Asset Allocation (% of fund's net assets)
| As of November 30, 2018 * |
| | Convertible Securities | 83.0% |
| | Stocks | 8.5% |
| | U.S. Government and U.S. Government Agency Obligations | 7.5% |
| | Short-Term Investments and Net Other Assets (Liabilities) | 1.0% |

* Foreign investments - 7.4%
Schedule of Investments November 30, 2018
Showing Percentage of Net Assets
| Convertible Bonds - 67.4% | | | |
| | | Principal Amount (000s) | Value (000s) |
| COMMUNICATION SERVICES - 8.6% | | | |
| Diversified Telecommunication Services - 0.6% | | | |
| Intelsat SA 4.5% 6/15/25 (a) | | $4,589 | $7,486 |
| Entertainment - 1.8% | | | |
| iQIYI, Inc. 3.75% 12/1/23 (a) | | 3,300 | 3,407 |
| Live Nation Entertainment, Inc.: | | | |
| 2.5% 5/15/19 | | 4,220 | 6,753 |
| 2.5% 3/15/23 (a) | | 5,050 | 5,392 |
| Pandora Media, Inc.: | | | |
| 1.75% 12/1/20 | | 1,789 | 1,706 |
| 1.75% 12/1/23 | | 4,943 | 5,332 |
| World Wrestling Entertainment, Inc. 3.375% 12/15/23 (a) | | 570 | 1,715 |
| | | | 24,305 |
| Interactive Media & Services - 2.0% | | | |
| Twitter, Inc.: | | | |
| 0.25% 6/15/24 (a) | | 20,837 | 18,779 |
| 1% 9/15/21 | | 900 | 824 |
| Weibo Corp. 1.25% 11/15/22 (a) | | 8,800 | 8,175 |
| | | | 27,778 |
| Media - 3.9% | | | |
| DISH Network Corp.: | | | |
| 2.375% 3/15/24 | | 4,240 | 3,524 |
| 3.375% 8/15/26 | | 18,098 | 15,888 |
| Gannett Co., Inc. 4.75% 4/15/24 (a) | | 1,700 | 1,791 |
| GCI Liberty, Inc. 1.75% 9/30/46 (a) | | 8,375 | 8,825 |
| Liberty Media Corp.: | | | |
| 1% 1/30/23 | | 8,620 | 8,816 |
| 1.375% 10/15/23 | | 9,170 | 10,206 |
| 2.125% 3/31/48 (a) | | 2,830 | 2,712 |
| 2.25% 12/1/48 (a) | | 1,300 | 1,346 |
| | | | 53,108 |
| Wireless Telecommunication Services - 0.3% | | | |
| Boingo Wireless, Inc. 1% 10/1/23 (a) | | 3,500 | 3,169 |
| Gogo, Inc. 3.75% 3/1/20 | | 1,300 | 1,225 |
| | | | 4,394 |
|
| TOTAL COMMUNICATION SERVICES | | | 117,071 |
|
| CONSUMER DISCRETIONARY - 6.2% | | | |
| Automobiles - 1.2% | | | |
| Tesla, Inc.: | | | |
| 1.25% 3/1/21 | | 2,300 | 2,634 |
| 2.375% 3/15/22 | | 10,605 | 13,117 |
| | | | 15,751 |
| Diversified Consumer Services - 0.1% | | | |
| Chegg, Inc. 0.25% 5/15/23 (a) | | 1,200 | 1,432 |
| Hotels, Restaurants & Leisure - 1.1% | | | |
| Caesars Entertainment Corp. 5% 10/1/24 | | 10,035 | 14,181 |
| Marriott Vacations Worldwide Corp. 1.5% 9/15/22 | | 1,400 | 1,273 |
| | | | 15,454 |
| Internet & Direct Marketing Retail - 3.8% | | | |
| Etsy, Inc. 0% 3/1/23 (a) | | 5,000 | 7,966 |
| Liberty Expedia Holdings, Inc. 1% 6/30/47 (a) | | 3,430 | 3,315 |
| MercadoLibre, Inc. 2% 8/15/28 (a) | | 17,125 | 17,185 |
| Quotient Technology, Inc. 1.75% 12/1/22 (a) | | 2,720 | 2,709 |
| The Booking Holdings, Inc.: | | | |
| 0.35% 6/15/20 | | 7,621 | 11,068 |
| 0.9% 9/15/21 | | 7,535 | 8,658 |
| | | | 50,901 |
|
| TOTAL CONSUMER DISCRETIONARY | | | 83,538 |
|
| CONSUMER STAPLES - 0.3% | | | |
| Personal Products - 0.2% | | | |
| Herbalife Nutrition Ltd.: | | | |
| 2% 8/15/19 | | 1,010 | 1,359 |
| 2.625% 3/15/24 (a) | | 1,767 | 1,933 |
| | | | 3,292 |
| Tobacco - 0.1% | | | |
| Vector Group Ltd. 2.5% 1/15/19 (b) | | 630 | 647 |
|
| TOTAL CONSUMER STAPLES | | | 3,939 |
|
| ENERGY - 3.2% | | | |
| Energy Equipment & Services - 0.7% | | | |
| Ensco Jersey Finance Ltd. 3% 1/31/24 | | 6,003 | 4,733 |
| Oil States International, Inc. 1.5% 2/15/23 (a) | | 3,000 | 2,733 |
| Transocean, Inc. 0.5% 1/30/23 | | 1,800 | 1,964 |
| Vantage Drilling Co. 5.5% 7/15/43 (a)(c)(d) | | 20,000 | 600 |
| | | | 10,030 |
| Oil, Gas & Consumable Fuels - 2.5% | | | |
| Chesapeake Energy Corp. 5.5% 9/15/26 | | 8,232 | 7,124 |
| Oasis Petroleum, Inc. 2.625% 9/15/23 | | 5,505 | 5,293 |
| PDC Energy, Inc. 1.125% 9/15/21 | | 1,800 | 1,655 |
| Scorpio Tankers, Inc. 3% 5/15/22 | | 15,627 | 12,915 |
| Ship Finance International Ltd. 4.875% 5/1/23 | | 1,600 | 1,541 |
| SM Energy Co. 1.5% 7/1/21 | | 4,150 | 4,042 |
| Teekay Corp. 5% 1/15/23 (a) | | 1,180 | 940 |
| | | | 33,510 |
|
| TOTAL ENERGY | | | 43,540 |
|
| FINANCIALS - 1.0% | | | |
| Banks - 0.0% | | | |
| Hope Bancorp, Inc. 2% 5/15/38 (a) | | 800 | 713 |
| Diversified Financial Services - 0.5% | | | |
| Alteryx, Inc. 0.5% 6/1/23 (a) | | 1,000 | 1,493 |
| IAC Financeco, Inc. 0.875% 10/1/22 (a) | | 3,910 | 5,065 |
| | | | 6,558 |
| Insurance - 0.3% | | | |
| AXA SA 7.25% 5/15/21 (a) | | 4,105 | 4,115 |
| Thrifts & Mortgage Finance - 0.2% | | | |
| LendingTree, Inc. 0.625% 6/1/22 | | 1,550 | 2,142 |
|
| TOTAL FINANCIALS | | | 13,528 |
|
| HEALTH CARE - 10.6% | | | |
| Biotechnology - 3.6% | | | |
| Acorda Therapeutics, Inc. 1.75% 6/15/21 | | 2,800 | 2,368 |
| Alder Biopharmaceuticals, Inc. 2.5% 2/1/25 | | 2,500 | 2,295 |
| Amicus Therapeutics, Inc. 3% 12/15/23 (a) | | 2,336 | 4,567 |
| BioMarin Pharmaceutical, Inc.: | | | |
| 0.599% 8/1/24 | | 640 | 672 |
| 1.5% 10/15/20 | | 565 | 678 |
| Clovis Oncology, Inc. 2.5% 9/15/21 | | 2,929 | 2,292 |
| Exact Sciences Corp. 1% 1/15/25 | | 4,850 | 5,938 |
| Flexion Therapeutics, Inc. 3.375% 5/1/24 | | 1,330 | 1,221 |
| Ironwood Pharmaceuticals, Inc. 2.25% 6/15/22 | | 2,350 | 2,518 |
| Ligand Pharmaceuticals, Inc. 0.75% 5/15/23 (a) | | 5,050 | 4,696 |
| Neurocrine Biosciences, Inc. 2.25% 5/15/24 | | 3,540 | 4,748 |
| Novavax, Inc. 3.75% 2/1/23 | | 3,200 | 2,014 |
| PTC Therapeutics, Inc. 3% 8/15/22 | | 600 | 604 |
| Repligen Corp. 2.125% 6/1/21 | | 775 | 1,592 |
| Retrophin, Inc. 2.5% 9/15/25 | | 2,200 | 2,027 |
| Sarepta Therapeutics, Inc. 1.5% 11/15/24 (a) | | 4,250 | 8,149 |
| TESARO, Inc. 3% 10/1/21 | | 1,700 | 2,522 |
| | | | 48,901 |
| Health Care Equipment & Supplies - 1.3% | | | |
| DexCom, Inc.: | | | |
| 0.75% 5/15/22 | | 4,260 | 6,135 |
| 0.75% 12/1/23 (a) | | 4,000 | 4,167 |
| Insulet Corp. 1.375% 11/15/24 (a) | | 3,440 | 3,752 |
| Nevro Corp. 1.75% 6/1/21 | | 850 | 788 |
| NuVasive, Inc. 2.25% 3/15/21 | | 2,600 | 3,078 |
| | | | 17,920 |
| Health Care Providers & Services - 1.4% | | | |
| Molina Healthcare, Inc. 1.125% 1/15/20 | | 2,317 | 7,804 |
| WellPoint, Inc. 2.75% 10/15/42 | | 2,817 | 11,261 |
| | | | 19,065 |
| Health Care Technology - 0.7% | | | |
| Evolent Health, Inc.: | | | |
| 1.5% 10/15/25 (a) | | 1,515 | 1,560 |
| 2% 12/1/21 | | 525 | 669 |
| Teladoc Health, Inc.: | | | |
| 1.375% 5/15/25 (a) | | 2,475 | 3,355 |
| 3% 12/15/22 | | 1,990 | 3,180 |
| | | | 8,764 |
| Life Sciences Tools & Services - 1.3% | | | |
| Accelerate Diagnostics, Inc. 2.5% 3/15/23 (a) | | 1,600 | 1,214 |
| Illumina, Inc.: | | | |
| 0% 8/15/23 (a) | | 5,119 | 5,481 |
| 0.5% 6/15/21 | | 7,623 | 10,852 |
| | | | 17,547 |
| Pharmaceuticals - 2.3% | | | |
| ANI Pharmaceuticals, Inc. 3% 12/1/19 | | 4,970 | 5,203 |
| Dermira, Inc. 3% 5/15/22 | | 1,720 | 1,425 |
| Innoviva, Inc.: | | | |
| 2.125% 1/15/23 | | 1,400 | 1,546 |
| 2.5% 8/15/25 | | 500 | 610 |
| Isis Pharmaceuticals, Inc. 1% 11/15/21 | | 5,224 | 5,781 |
| Jazz Investments I Ltd.: | | | |
| 1.5% 8/15/24 | | 3,600 | 3,487 |
| 1.875% 8/15/21 | | 6,790 | 6,998 |
| Pacira Pharmaceuticals, Inc. 2.375% 4/1/22 | | 800 | 836 |
| Supernus Pharmaceuticals, Inc. 0.625% 4/1/23 (a) | | 2,630 | 2,850 |
| Theravance Biopharma, Inc. 3.25% 11/1/23 | | 2,550 | 2,717 |
| | | | 31,453 |
|
| TOTAL HEALTH CARE | | | 143,650 |
|
| INDUSTRIALS - 2.4% | | | |
| Aerospace & Defense - 0.2% | | | |
| Aerojet Rocketdyne Holdings, Inc. 2.25% 12/15/23 | | 2,240 | 3,286 |
| Air Freight & Logistics - 0.2% | | | |
| Echo Global Logistics, Inc. 2.5% 5/1/20 | | 2,700 | 2,688 |
| Building Products - 0.1% | | | |
| Patrick Industries, Inc. 1% 2/1/23 (a) | | 1,150 | 927 |
| Construction & Engineering - 0.5% | | | |
| Dycom Industries, Inc. 0.75% 9/15/21 | | 6,758 | 6,679 |
| Electrical Equipment - 0.6% | | | |
| SolarCity Corp. 1.625% 11/1/19 | | 8,401 | 7,880 |
| Machinery - 0.5% | | | |
| Chart Industries, Inc. 1% 11/15/24 (a) | | 2,850 | 3,485 |
| Greenbrier Companies, Inc. 2.875% 2/1/24 | | 1,220 | 1,293 |
| Meritor, Inc. 3.25% 10/15/37 | | 634 | 568 |
| Navistar International Corp. New 4.75% 4/15/19 | | 1,080 | 1,077 |
| | | | 6,423 |
| Professional Services - 0.2% | | | |
| FTI Consulting, Inc. 2% 8/15/23 (a) | | 3,411 | 3,263 |
| Trading Companies & Distributors - 0.1% | | | |
| Kaman Corp. 3.25% 5/1/24 | | 1,900 | 2,023 |
|
| TOTAL INDUSTRIALS | | | 33,169 |
|
| INFORMATION TECHNOLOGY - 31.7% | | | |
| Communications Equipment - 2.1% | | | |
| CalAmp Corp. 2% 8/1/25 (a) | | 1,500 | 1,292 |
| InterDigital, Inc. 1.5% 3/1/20 | | 3,100 | 3,492 |
| Liberty Interactive LLC 1.75% 9/30/46 (a) | | 4,859 | 5,404 |
| Lumentum Holdings, Inc. 0.25% 3/15/24 | | 5,237 | 5,322 |
| Palo Alto Networks, Inc. 0.75% 7/1/23 (a) | | 13,325 | 12,714 |
| | | | 28,224 |
| Electronic Equipment & Components - 0.2% | | | |
| Knowles Corp. 3.25% 11/1/21 | | 1,900 | 2,070 |
| IT Services - 4.1% | | | |
| Akamai Technologies, Inc.: | | | |
| 0% 2/15/19 | | 657 | 651 |
| 0.125% 5/1/25 (a) | | 8,600 | 8,193 |
| Carbonite, Inc. 2.5% 4/1/22 | | 3,180 | 4,056 |
| Euronet Worldwide, Inc. 1.5% 10/1/44 | | 1,300 | 2,117 |
| MongoDB, Inc. 0.75% 6/15/24 (a) | | 1,500 | 2,037 |
| Okta, Inc. 0.25% 2/15/23 (a) | | 5,550 | 7,994 |
| Perficient, Inc. 2.375% 9/15/23 (a) | | 760 | 704 |
| Square, Inc.: | | | |
| 0.375% 3/1/22 | | 2,180 | 6,584 |
| 0.5% 5/15/23 (a) | | 9,002 | 10,359 |
| Twilio, Inc. 0.25% 6/1/23 (a) | | 4,114 | 6,084 |
| Unisys Corp. 5.5% 3/1/21 | | 1,700 | 2,653 |
| Wix.com Ltd. 0% 7/1/23 (a) | | 4,856 | 4,695 |
| | | | 56,127 |
| Semiconductors & Semiconductor Equipment - 11.6% | | | |
| Advanced Micro Devices, Inc. 2.125% 9/1/26 | | 6,393 | 17,584 |
| Cree, Inc. 0.875% 9/1/23 (a) | | 4,300 | 4,224 |
| Cypress Semiconductor Corp.: | | | |
| 2% 2/1/23 | | 660 | 636 |
| 4.5% 1/15/22 | | 3,010 | 3,703 |
| Inphi Corp.: | | | |
| 0.75% 9/1/21 | | 1,600 | 1,580 |
| 1.125% 12/1/20 | | 2,100 | 2,457 |
| Intel Corp. 3.25% 8/1/39 | | 10,788 | 25,905 |
| Microchip Technology, Inc.: | | | |
| 1.625% 2/15/25 | | 14,066 | 20,544 |
| 1.625% 2/15/27 | | 17,262 | 17,420 |
| 2.25% 2/15/37 | | 4,500 | 4,600 |
| Micron Technology, Inc. 3% 11/15/43 | | 18,153 | 24,044 |
| Novellus Systems, Inc. 2.625% 5/15/41 | | 2,272 | 10,726 |
| NXP Semiconductors NV 1% 12/1/19 | | 2,970 | 3,065 |
| ON Semiconductor Corp.: | | | |
| 1% 12/1/20 | | 4,868 | 5,800 |
| 1.625% 10/15/23 | | 8,806 | 10,154 |
| Rambus, Inc. 1.375% 2/1/23 | | 1,580 | 1,392 |
| Synaptics, Inc. 0.5% 6/15/22 | | 2,300 | 2,023 |
| Teradyne, Inc. 1.25% 12/15/23 | | 1,000 | 1,275 |
| | | | 157,132 |
| Software - 12.9% | | | |
| Atlassian, Inc. 0.625% 5/1/23 (a) | | 8,300 | 10,186 |
| Citrix Systems, Inc. 0.5% 4/15/19 | | 10,273 | 15,440 |
| Coupa Software, Inc. 0.375% 1/15/23 (a) | | 5,669 | 8,718 |
| DocuSign, Inc. 0.5% 9/15/23 (a) | | 9,400 | 8,766 |
| Everbridge, Inc. 1.5% 11/1/22 | | 2,120 | 3,585 |
| FireEye, Inc.: | | | |
| 0.875% 6/1/24 (a) | | 11,400 | 12,601 |
| 1.625% 6/1/35 | | 3,040 | 2,782 |
| Five9, Inc. 0.125% 5/1/23 (a) | | 2,000 | 2,401 |
| Guidewire Software, Inc. 1.25% 3/15/25 | | 3,000 | 3,092 |
| HubSpot, Inc. 0.25% 6/1/22 | | 3,770 | 5,808 |
| j2 Global, Inc. 3.25% 6/15/29 | | 2,250 | 2,674 |
| New Relic, Inc. 0.5% 5/1/23 (a) | | 4,700 | 4,824 |
| Nice Systems, Inc. 1.25% 1/15/24 | | 4,790 | 6,966 |
| Nuance Communications, Inc.: | | | |
| 1% 12/15/35 | | 5,790 | 5,262 |
| 1.25% 4/1/25 | | 1,383 | 1,328 |
| Nutanix, Inc. 0% 1/15/23 (a) | | 5,900 | 6,717 |
| PROS Holdings, Inc. 2% 6/1/47 | | 1,200 | 1,123 |
| Q2 Holdings, Inc. 0.75% 2/15/23 (a) | | 600 | 657 |
| Rapid7, Inc. 1.25% 8/1/23 (a) | | 1,300 | 1,325 |
| RealPage, Inc. 1.5% 11/15/22 | | 1,150 | 1,549 |
| Red Hat, Inc. 0.25% 10/1/19 | | 3,750 | 9,074 |
| RingCentral, Inc. 0% 3/15/23 (a) | | 4,610 | 5,454 |
| ServiceNow, Inc. 0% 6/1/22 | | 8,530 | 12,342 |
| Splunk, Inc.: | | | |
| 0.5% 9/15/23 (a) | | 10,475 | 10,499 |
| 1.125% 9/15/25 (a) | | 7,500 | 7,487 |
| Workday, Inc.: | | | |
| 0.25% 10/1/22 | | 11,150 | 13,903 |
| 1.5% 7/15/20 | | 1,820 | 3,677 |
| Zendesk, Inc. 0.25% 3/15/23 (a) | | 5,640 | 6,403 |
| | | | 174,643 |
| Technology Hardware, Storage & Peripherals - 0.8% | | | |
| Electronics for Imaging, Inc. 2.25% 11/15/23 (a) | | 1,400 | 1,420 |
| Pure Storage, Inc. 0.125% 4/15/23 (a) | | 5,820 | 5,766 |
| Western Digital Corp. 1.5% 2/1/24 (a) | | 3,557 | 2,955 |
| | | | 10,141 |
|
| TOTAL INFORMATION TECHNOLOGY | | | 428,337 |
|
| MATERIALS - 1.2% | | | |
| Metals & Mining - 1.2% | | | |
| Allegheny Technologies, Inc. 4.75% 7/1/22 | | 1,370 | 2,671 |
| Cleveland-Cliffs, Inc. 1.5% 1/15/25 | | 2,424 | 3,083 |
| Endeavour Mining Corp. 3% 2/15/23 (a) | | 4,260 | 3,693 |
| Royal Gold, Inc. 2.875% 6/15/19 | | 2,500 | 2,486 |
| SSR Mining, Inc. 2.875% 2/1/33 | | 4,185 | 4,120 |
| | | | 16,053 |
| REAL ESTATE - 0.9% | | | |
| Real Estate Management & Development - 0.9% | | | |
| Extra Space Storage LP 3.125% 10/1/35 (a) | | 8,600 | 9,572 |
| Redfin Corp. 1.75% 7/15/23 | | 2,470 | 2,103 |
| | | | 11,675 |
| UTILITIES - 1.3% | | | |
| Independent Power and Renewable Electricity Producers - 1.3% | | | |
| NextEra Energy Partners LP 1.5% 9/15/20 (a) | | 4,650 | 4,569 |
| NRG Energy, Inc. 2.75% 6/1/48 (a) | | 12,148 | 13,018 |
| | | | 17,587 |
| TOTAL CONVERTIBLE BONDS | | | |
| (Cost $903,689) | | | 912,087 |
|
| U.S. Treasury Obligations - 7.5% | | | |
| U.S. Treasury Notes 2.375% 5/15/27 | | | |
| (Cost $101,253) | | 106,000 | 101,284 |
| | | Shares | Value (000s) |
|
| Common Stocks - 8.5% | | | |
| COMMUNICATION SERVICES - 1.7% | | | |
| Diversified Telecommunication Services - 0.5% | | | |
| Verizon Communications, Inc. | | 103,400 | $6,235 |
| Interactive Media & Services - 0.7% | | | |
| Alphabet, Inc. Class A (e) | | 8,800 | 9,765 |
| Wireless Telecommunication Services - 0.5% | | | |
| T-Mobile U.S., Inc. (e) | | 98,484 | 6,741 |
|
| TOTAL COMMUNICATION SERVICES | | | 22,741 |
|
| CONSUMER DISCRETIONARY - 2.3% | | | |
| Internet & Direct Marketing Retail - 2.3% | | | |
| Amazon.com, Inc. (e) | | 8,400 | 14,197 |
| Yahoo!, Inc. (e) | | 262,500 | 17,217 |
| | | | 31,414 |
| ENERGY - 1.1% | | | |
| Oil, Gas & Consumable Fuels - 1.1% | | | |
| California Resources Corp. (e) | | 380,900 | 9,119 |
| Enterprise Products Partners LP | | 204,800 | 5,376 |
| | | | 14,495 |
| INDUSTRIALS - 1.2% | | | |
| Airlines - 0.5% | | | |
| Southwest Airlines Co. | | 126,500 | 6,908 |
| Professional Services - 0.3% | | | |
| Nielsen Holdings PLC | | 150,000 | 4,076 |
| Road & Rail - 0.4% | | | |
| Norfolk Southern Corp. | | 32,000 | 5,464 |
|
| TOTAL INDUSTRIALS | | | 16,448 |
|
| INFORMATION TECHNOLOGY - 1.7% | | | |
| Communications Equipment - 0.4% | | | |
| Cisco Systems, Inc. | | 109,900 | 5,261 |
| Semiconductors & Semiconductor Equipment - 0.4% | | | |
| Qualcomm, Inc. | | 100,000 | 5,826 |
| Technology Hardware, Storage & Peripherals - 0.9% | | | |
| Apple, Inc. | | 67,000 | 11,965 |
|
| TOTAL INFORMATION TECHNOLOGY | | | 23,052 |
|
| MATERIALS - 0.5% | | | |
| Chemicals - 0.5% | | | |
| DowDuPont, Inc. | | 116,000 | 6,711 |
| TOTAL COMMON STOCKS | | | |
| (Cost $109,226) | | | 114,861 |
|
| Convertible Preferred Stocks - 15.6% | | | |
| CONSUMER STAPLES - 1.8% | | | |
| Food Products - 1.8% | | | |
| Bunge Ltd. 4.875% | | 173,100 | 17,274 |
| Post Holdings, Inc. Series C, 2.50% | | 39,600 | 7,087 |
| | | | 24,361 |
| ENERGY - 0.4% | | | |
| Energy Equipment & Services - 0.0% | | | |
| Nabors Industries, Inc. Series A, 6.00% | | 4,100 | 109 |
| Oil, Gas & Consumable Fuels - 0.4% | | | |
| Hess Corp. Series A, 8.00% | | 90,000 | 5,413 |
|
| TOTAL ENERGY | | | 5,522 |
|
| FINANCIALS - 2.6% | | | |
| Banks - 2.6% | | | |
| Bank of America Corp. Series L, 7.25% | | 13,388 | 17,137 |
| Wells Fargo & Co. 7.50% | | 14,463 | 18,262 |
| | | | 35,399 |
| HEALTH CARE - 1.9% | | | |
| Health Care Equipment & Supplies - 1.9% | | | |
| Becton, Dickinson & Co. Series A, 6.125% | | 398,700 | 25,222 |
| INDUSTRIALS - 1.1% | | | |
| Electrical Equipment - 0.8% | | | |
| Fortive Corp. Series A, 5.00% | | 11,590 | 11,378 |
| Machinery - 0.3% | | | |
| Rexnord Corp. Series A, 5.75% | | 41,837 | 2,492 |
| Stanley Black & Decker, Inc. 5.375% | | 15,300 | 1,492 |
| | | | 3,984 |
|
| TOTAL INDUSTRIALS | | | 15,362 |
|
| MATERIALS - 0.4% | | | |
| Chemicals - 0.4% | | | |
| International Flavors & Fragrances, Inc. 6.00% | | 95,900 | 5,388 |
| REAL ESTATE - 1.0% | | | |
| Equity Real Estate Investment Trusts (REITs) - 1.0% | | | |
| Crown Castle International Corp. Series A, 6.875% | | 9,900 | 10,714 |
| Welltower, Inc. Series I, 6.50% | | 50,000 | 3,271 |
| | | | 13,985 |
| UTILITIES - 6.4% | | | |
| Electric Utilities - 3.0% | | | |
| NextEra Energy, Inc. 6.123% | | 165,600 | 9,913 |
| Vistra Energy Corp. 7.00% | | 322,100 | 30,111 |
| | | | 40,024 |
| Gas Utilities - 0.1% | | | |
| South Jersey Industries, Inc. 7.25% | | 28,000 | 1,432 |
| Multi-Utilities - 3.3% | | | |
| CenterPoint Energy, Inc.: | | | |
| 2.00% ZENS | | 220,150 | 9,684 |
| Series B, 7.00% | | 76,000 | 3,807 |
| Dominion Resources, Inc. Series A, 6.75% | | 207,600 | 10,054 |
| DTE Energy Co. 6.50% | | 18,000 | 988 |
| Sempra Energy Series A, 6.00% | | 200,700 | 20,401 |
| | | | 44,934 |
|
| TOTAL UTILITIES | | | 86,390 |
|
| TOTAL CONVERTIBLE PREFERRED STOCKS | | | |
| (Cost $196,757) | | | 211,629 |
|
| Money Market Funds - 0.4% | | | |
| Fidelity Cash Central Fund, 2.27% (f) | | | |
| (Cost $5,163) | | 5,161,702 | 5,163 |
| TOTAL INVESTMENT IN SECURITIES - 99.4% | | | |
| (Cost $1,316,088) | | | 1,345,024 |
| NET OTHER ASSETS (LIABILITIES) - 0.6% | | | 8,067 |
| NET ASSETS - 100% | | | $1,353,091 |
Legend
(a) Security exempt from registration under Rule 144A of the Securities Act of 1933. These securities may be resold in transactions exempt from registration, normally to qualified institutional buyers. At the end of the period, the value of these securities amounted to $351,193,000 or 26.0% of net assets.
(b) Coupon rates for floating and adjustable rate securities reflect the rates in effect at period end.
(c) Non-income producing - Security is in default.
(d) Level 3 security
(e) Non-income producing
(f) Affiliated fund that is generally available only to investment companies and other accounts managed by Fidelity Investments. The rate quoted is the annualized seven-day yield of the fund at period end. A complete unaudited listing of the fund's holdings as of its most recent quarter end is available upon request. In addition, each Fidelity Central Fund's financial statements, which are not covered by the Fund's Report of Independent Registered Public Accounting Firm, are available on the SEC's website or upon request.
Affiliated Central Funds
Information regarding fiscal year to date income earned by the Fund from investments in Fidelity Central Funds is as follows:
| Fund | Income earned |
| | (Amounts in thousands) |
| Fidelity Cash Central Fund | $239 |
| Fidelity Securities Lending Cash Central Fund | 2 |
| Total | $241 |
Amounts in the income column in the above table include any capital gain distributions from underlying funds, which are presented in the corresponding line-item in the Statement of Operations if applicable.
Investment Valuation
The following is a summary of the inputs used, as of November 30, 2018, involving the Fund's assets and liabilities carried at fair value. The inputs or methodology used for valuing securities may not be an indication of the risk associated with investing in those securities. For more information on valuation inputs, and their aggregation into the levels used below, please refer to the Investment Valuation section in the accompanying Notes to Financial Statements.
| | Valuation Inputs at Reporting Date: |
| Description | Total | Level 1 | Level 2 | Level 3 |
| (Amounts in thousands) | | | | |
| Investments in Securities: | | | | |
| Equities: | | | | |
| Communication Services | $22,741 | $22,741 | $-- | $-- |
| Consumer Discretionary | 31,414 | 31,414 | -- | -- |
| Consumer Staples | 24,361 | -- | 24,361 | -- |
| Energy | 20,017 | 14,495 | 5,522 | -- |
| Financials | 35,399 | -- | 35,399 | -- |
| Health Care | 25,222 | -- | 25,222 | -- |
| Industrials | 31,810 | 16,448 | 15,362 | -- |
| Information Technology | 23,052 | 23,052 | -- | -- |
| Materials | 12,099 | 6,711 | 5,388 | -- |
| Real Estate | 13,985 | -- | 13,985 | -- |
| Utilities | 86,390 | 988 | 85,402 | -- |
| Corporate Bonds | 912,087 | -- | 911,487 | 600 |
| U.S. Government and Government Agency Obligations | 101,284 | -- | 101,284 | -- |
| Money Market Funds | 5,163 | 5,163 | -- | -- |
| Total Investments in Securities: | $1,345,024 | $121,012 | $1,223,412 | $600 |
Other Information
The composition of credit quality ratings as a percentage of Total Net Assets is as follows (Unaudited):
| U.S. Government and U.S. Government Agency Obligations | 7.5% |
| AAA,AA,A | 4.1% |
| BBB | 4.2% |
| BB | 6.1% |
| B | 9.2% |
| CCC,CC,C | 0.2% |
| Not Rated | 43.6% |
| Equities | 24.1% |
| Short-Term Investments and Net Other Assets | 1.0% |
| | 100% |
We have used ratings from Moody's Investors Service, Inc. Where Moody's® ratings are not available, we have used S&P® ratings. All ratings are as of the date indicated and do not reflect subsequent changes.
See accompanying notes which are an integral part of the financial statements.
Financial Statements
Statement of Assets and Liabilities
| Amounts in thousands (except per-share amounts) | | November 30, 2018 |
| Assets | | |
Investment in securities, at value — See accompanying schedule:
Unaffiliated issuers (cost $1,310,925) | $1,339,861 | |
| Fidelity Central Funds (cost $5,163) | 5,163 | |
| Total Investment in Securities (cost $1,316,088) | | $1,345,024 |
| Receivable for investments sold | | 161,147 |
| Receivable for fund shares sold | | 198 |
| Dividends receivable | | 880 |
| Interest receivable | | 4,293 |
| Distributions receivable from Fidelity Central Funds | | 14 |
| Prepaid expenses | | 2 |
| Other receivables | | 52 |
| Total assets | | 1,511,610 |
| Liabilities | | |
| Payable for investments purchased | $156,947 | |
| Payable for fund shares redeemed | 982 | |
| Accrued management fee | 295 | |
| Distribution and service plan fees payable | 20 | |
| Other affiliated payables | 210 | |
| Other payables and accrued expenses | 65 | |
| Total liabilities | | 158,519 |
| Net Assets | | $1,353,091 |
| Net Assets consist of: | | |
| Paid in capital | | $1,265,037 |
| Total distributable earnings (loss) | | 88,054 |
| Net Assets | | $1,353,091 |
| Net Asset Value and Maximum Offering Price | | |
| Class A: | | |
| Net Asset Value and redemption price per share ($18,793 ÷ 669.53 shares) | | $28.07 |
| Maximum offering price per share (100/94.25 of $28.07) | | $29.78 |
| Class M: | | |
| Net Asset Value and redemption price per share ($6,008 ÷ 213.91 shares) | | $28.09 |
| Maximum offering price per share (100/96.50 of $28.09) | | $29.11 |
| Class C: | | |
| Net Asset Value and offering price per share ($16,828 ÷ 603.41 shares)(a) | | $27.89 |
| Convertible Securities: | | |
| Net Asset Value, offering price and redemption price per share ($1,278,124 ÷ 45,362.94 shares) | | $28.18 |
| Class I: | | |
| Net Asset Value, offering price and redemption price per share ($31,995 ÷ 1,137.26 shares) | | $28.13 |
| Class Z: | | |
| Net Asset Value, offering price and redemption price per share ($1,343 ÷ 47.73 shares) | | $28.14 |
(a) Redemption price per share is equal to net asset value less any applicable contingent deferred sales charge.
See accompanying notes which are an integral part of the financial statements.
Statement of Operations
| Amounts in thousands | | Year ended November 30, 2018 |
| Investment Income | | |
| Dividends | | $17,271 |
| Special dividends | | 9,658 |
| Interest | | 22,042 |
| Income from Fidelity Central Funds | | 241 |
| Total income | | 49,212 |
| Expenses | | |
| Management fee | | |
| Basic fee | $6,348 | |
| Performance adjustment | (2,552) | |
| Transfer agent fees | 2,184 | |
| Distribution and service plan fees | 273 | |
| Accounting and security lending fees | 454 | |
| Custodian fees and expenses | 33 | |
| Independent trustees' fees and expenses | 7 | |
| Registration fees | 86 | |
| Audit | 73 | |
| Legal | 4 | |
| Interest | 5 | |
| Miscellaneous | 10 | |
| Total expenses before reductions | 6,925 | |
| Expense reductions | (89) | |
| Total expenses after reductions | | 6,836 |
| Net investment income (loss) | | 42,376 |
| Realized and Unrealized Gain (Loss) | | |
| Net realized gain (loss) on: | | |
| Investment securities: | | |
| Unaffiliated issuers | 107,253 | |
| Fidelity Central Funds | (1) | |
| Foreign currency transactions | (2) | |
| Total net realized gain (loss) | | 107,250 |
| Change in net unrealized appreciation (depreciation) on investment securities | | (92,594) |
| Net gain (loss) | | 14,656 |
| Net increase (decrease) in net assets resulting from operations | | $57,032 |
See accompanying notes which are an integral part of the financial statements.
Statement of Changes in Net Assets
| Amounts in thousands | Year ended November 30, 2018 | Year ended November 30, 2017 |
| Increase (Decrease) in Net Assets | | |
| Operations | | |
| Net investment income (loss) | $42,376 | $46,697 |
| Net realized gain (loss) | 107,250 | 24,125 |
| Change in net unrealized appreciation (depreciation) | (92,594) | 91,806 |
| Net increase (decrease) in net assets resulting from operations | 57,032 | 162,628 |
| Distributions to shareholders | (76,808) | – |
| Distributions to shareholders from net investment income | – | (44,979) |
| Distributions to shareholders from net realized gain | – | (24,545) |
| Total distributions | (76,808) | (69,524) |
| Share transactions - net increase (decrease) | (154,490) | (183,817) |
| Total increase (decrease) in net assets | (174,266) | (90,713) |
| Net Assets | | |
| Beginning of period | 1,527,357 | 1,618,070 |
| End of period | $1,353,091 | $1,527,357 |
| Other Information | | |
| Undistributed net investment income end of period | | $13,282 |
See accompanying notes which are an integral part of the financial statements.
Financial Highlights
Fidelity Convertible Securities Fund Class A
| Years ended November 30, | 2018 | 2017 | 2016 | 2015 | 2014 |
| Selected Per–Share Data | | | | | |
| Net asset value, beginning of period | $28.49 | $26.85 | $29.56 | $33.42 | $30.79 |
| Income from Investment Operations | | | | | |
| Net investment income (loss)A | .76B | .75 | .81C | .66 | .51 |
| Net realized and unrealized gain (loss) | .25 | 2.02D | (.69) | (2.81) | 2.81E |
| Total from investment operations | 1.01 | 2.77 | .12 | (2.15) | 3.32 |
| Distributions from net investment income | (.85) | (.71) | (.83) | (.61) | (.48) |
| Distributions from net realized gain | (.58) | (.42) | (2.00) | (1.10) | (.21) |
| Total distributions | (1.43) | (1.13) | (2.83) | (1.71) | (.69) |
| Net asset value, end of period | $28.07 | $28.49 | $26.85 | $29.56 | $33.42 |
| Total ReturnF,G | 3.60% | 10.57%D | .83% | (6.60)% | 10.95%E |
| Ratios to Average Net AssetsH,I | | | | | |
| Expenses before reductions | .75% | .74% | .73% | .84% | .86% |
| Expenses net of fee waivers, if any | .75% | .74% | .73% | .84% | .85% |
| Expenses net of all reductions | .75% | .74% | .73% | .84% | .85% |
| Net investment income (loss) | 2.66%B | 2.71% | 3.08%C | 2.09% | 1.60% |
| Supplemental Data | | | | | |
| Net assets, end of period (in millions) | $19 | $21 | $29 | $56 | $150 |
| Portfolio turnover rateJ | 176% | 110% | 112% | 19% | 23% |
A Calculated based on average shares outstanding during the period.
B Net investment income per share reflects a large, non-recurring dividend which amounts to $.19 per share. Excluding this non-recurring dividend, the ratios of net investment income (loss) to average net assets would have been 1.99%.
C Net investment income per share reflects a large, non-recurring dividend which amounted to $.10 per share. Excluding this non-recurring dividend, the ratio of net investment income (loss) to average net assets would have been 2.71%.
D Net realized and unrealized gain (loss) per share reflects proceeds received from litigation which amounted to $.08 per share. Excluding these litigation proceeds, the total return would have been 10.28%.
E Net realized and unrealized gain (loss) per share reflects proceeds received from litigation which amounted to $.12 per share. Excluding these litigation proceeds, the total return would have been 10.58%.
F Total returns would have been lower if certain expenses had not been reduced during the applicable periods shown.
G Total returns do not include the effect of the sales charges.
H Fees and expenses of any underlying Fidelity Central Funds are not included in the Fund's expense ratio. The Fund indirectly bears its proportionate share of the expenses of any underlying Fidelity Central Funds.
I Expense ratios reflect operating expenses of the class. Expenses before reductions do not reflect amounts reimbursed by the investment adviser or reductions from brokerage service arrangements or reductions from other expense offset arrangements and do not represent the amount paid by the class during periods when reimbursements or reductions occur. Expenses net of fee waivers reflect expenses after reimbursement by the investment adviser but prior to reductions from brokerage service arrangements or other expense offset arrangements. Expenses net of all reductions represent the net expenses paid by the class.
J Amount does not include the portfolio activity of any underlying Fidelity Central Funds.
See accompanying notes which are an integral part of the financial statements.
Fidelity Convertible Securities Fund Class M
| Years ended November 30, | 2018 | 2017 | 2016 | 2015 | 2014 |
| Selected Per–Share Data | | | | | |
| Net asset value, beginning of period | $28.47 | $26.86 | $29.56 | $33.44 | $30.80 |
| Income from Investment Operations | | | | | |
| Net investment income (loss)A | .68B | .68 | .73C | .57 | .42 |
| Net realized and unrealized gain (loss) | .25 | 2.01D | (.68) | (2.82) | 2.82E |
| Total from investment operations | .93 | 2.69 | .05 | (2.25) | 3.24 |
| Distributions from net investment income | (.73) | (.66) | (.75) | (.53) | (.39) |
| Distributions from net realized gain | (.58) | (.42) | (2.00) | (1.10) | (.21) |
| Total distributions | (1.31) | (1.08) | (2.75) | (1.63) | (.60) |
| Net asset value, end of period | $28.09 | $28.47 | $26.86 | $29.56 | $33.44 |
| Total ReturnF,G | 3.31% | 10.26%D | .53% | (6.91)% | 10.67%E |
| Ratios to Average Net AssetsH,I | | | | | |
| Expenses before reductions | 1.04% | 1.01% | 1.04% | 1.12% | 1.14% |
| Expenses net of fee waivers, if any | 1.04% | 1.01% | 1.04% | 1.12% | 1.14% |
| Expenses net of all reductions | 1.03% | 1.01% | 1.04% | 1.12% | 1.14% |
| Net investment income (loss) | 2.38%B | 2.44% | 2.77%C | 1.81% | 1.32% |
| Supplemental Data | | | | | |
| Net assets, end of period (in millions) | $6 | $14 | $7 | $9 | $14 |
| Portfolio turnover rateJ | 176% | 110% | 112% | 19% | 23% |
A Calculated based on average shares outstanding during the period.
B Net investment income per share reflects a large, non-recurring divided which amounted to $.19 per share. Excluding this non-recurring dividend, the ratio of net investment income (loss) to average net assets would have been 1.71%.
C Net investment income per share reflects a large, non-recurring dividend which amounted to $.10 per share. Excluding this non-recurring dividend, the ratio of net investment income (loss) to average net assets would have been 2.40%.
D Net realized and unrealized gain (loss) per share reflects proceeds received from litigation which amounted to $.08 per share. Excluding these litigation proceeds, the total return would have been 9.97%.
E Net realized and unrealized gain (loss) per share reflects proceeds received from litigation which amounted to $.12 per share. Excluding these litigation proceeds, the total return would have been 10.30%.
F Total returns would have been lower if certain expenses had not been reduced during the applicable periods shown.
G Total returns do not include the effect of the sales charges.
H Fees and expenses of any underlying Fidelity Central Funds are not included in the Fund's expense ratio. The Fund indirectly bears its proportionate share of the expenses of any underlying Fidelity Central Funds.
I Expense ratios reflect operating expenses of the class. Expenses before reductions do not reflect amounts reimbursed by the investment adviser or reductions from brokerage service arrangements or reductions from other expense offset arrangements and do not represent the amount paid by the class during periods when reimbursements or reductions occur. Expenses net of fee waivers reflect expenses after reimbursement by the investment adviser but prior to reductions from brokerage service arrangements or other expense offset arrangements. Expenses net of all reductions represent the net expenses paid by the class.
J Amount does not include the portfolio activity of any underlying Fidelity Central Funds.
See accompanying notes which are an integral part of the financial statements.
Fidelity Convertible Securities Fund Class C
| Years ended November 30, | 2018 | 2017 | 2016 | 2015 | 2014 |
| Selected Per–Share Data | | | | | |
| Net asset value, beginning of period | $28.31 | $26.68 | $29.37 | $33.23 | $30.63 |
| Income from Investment Operations | | | | | |
| Net investment income (loss)A | .54B | .54 | .60C | .42 | .27 |
| Net realized and unrealized gain (loss) | .25 | 2.01D | (.67) | (2.80) | 2.80E |
| Total from investment operations | .79 | 2.55 | (.07) | (2.38) | 3.07 |
| Distributions from net investment income | (.63) | (.50) | (.62) | (.38) | (.26) |
| Distributions from net realized gain | (.58) | (.42) | (2.00) | (1.10) | (.21) |
| Total distributions | (1.21) | (.92) | (2.62) | (1.48) | (.47) |
| Net asset value, end of period | $27.89 | $28.31 | $26.68 | $29.37 | $33.23 |
| Total ReturnF,G | 2.82% | 9.75%D | .09% | (7.35)% | 10.13%E |
| Ratios to Average Net AssetsH,I | | | | | |
| Expenses before reductions | 1.50% | 1.50% | 1.50% | 1.60% | 1.62% |
| Expenses net of fee waivers, if any | 1.50% | 1.49% | 1.49% | 1.60% | 1.62% |
| Expenses net of all reductions | 1.49% | 1.49% | 1.49% | 1.59% | 1.62% |
| Net investment income (loss) | 1.92%B | 1.96% | 2.32%C | 1.33% | .84% |
| Supplemental Data | | | | | |
| Net assets, end of period (in millions) | $17 | $19 | $24 | $39 | $48 |
| Portfolio turnover rateJ | 176% | 110% | 112% | 19% | 23% |
A Calculated based on average shares outstanding during the period.
B Net investment income per share reflects a large, non-recurring dividend which amounted to $.19 per share. Excluding this non-recurring dividend, the ratio of net investment income (loss) to average net assets would have been 1.25%.
C Net investment income per share reflects a large, non-recurring dividend which amounted to $.10 per share. Excluding this non-recurring dividend, the ratio of net investment income (loss) to average net assets would have been 1.95%.
D Net realized and unrealized gain (loss) per share reflects proceeds received from litigation which amounted to $.08 per share. Excluding these litigation proceeds, the total return would have been 9.46%.
E Net realized and unrealized gain (loss) per share reflects proceeds received from litigation which amounted to $.12 per share. Excluding these litigation proceeds, the total return would have been 9.76%.
F Total returns would have been lower if certain expenses had not been reduced during the applicable periods shown.
G Total returns do not include the effect of the contingent deferred sales charge.
H Fees and expenses of any underlying Fidelity Central Funds are not included in the Fund's expense ratio. The Fund indirectly bears its proportionate share of the expenses of any underlying Fidelity Central Funds.
I Expense ratios reflect operating expenses of the class. Expenses before reductions do not reflect amounts reimbursed by the investment adviser or reductions from brokerage service arrangements or reductions from other expense offset arrangements and do not represent the amount paid by the class during periods when reimbursements or reductions occur. Expenses net of fee waivers reflect expenses after reimbursement by the investment adviser but prior to reductions from brokerage service arrangements or other expense offset arrangements. Expenses net of all reductions represent the net expenses paid by the class.
J Amount does not include the portfolio activity of any underlying Fidelity Central Funds.
See accompanying notes which are an integral part of the financial statements.
Fidelity Convertible Securities Fund
| Years ended November 30, | 2018 | 2017 | 2016 | 2015 | 2014 |
| Selected Per–Share Data | | | | | |
| Net asset value, beginning of period | $28.59 | $26.95 | $29.66 | $33.56 | $30.90 |
| Income from Investment Operations | | | | | |
| Net investment income (loss)A | .85B | .83 | .88C | .75 | .60 |
| Net realized and unrealized gain (loss) | .25 | 2.02D | (.68) | (2.83) | 2.83E |
| Total from investment operations | 1.10 | 2.85 | .20 | (2.08) | 3.43 |
| Distributions from net investment income | (.93) | (.80) | (.92) | (.72) | (.56) |
| Distributions from net realized gain | (.58) | (.42) | (2.00) | (1.10) | (.21) |
| Total distributions | (1.51) | (1.21)F | (2.91)G | (1.82) | (.77) |
| Net asset value, end of period | $28.18 | $28.59 | $26.95 | $29.66 | $33.56 |
| Total ReturnH | 3.93% | 10.88%D | 1.13% | (6.38)% | 11.28%E |
| Ratios to Average Net AssetsI,J | | | | | |
| Expenses before reductions | .46% | .45% | .45% | .56% | .58% |
| Expenses net of fee waivers, if any | .46% | .45% | .45% | .56% | .58% |
| Expenses net of all reductions | .45% | .45% | .45% | .56% | .58% |
| Net investment income (loss) | 2.96%B | 3.00% | 3.36%C | 2.37% | 1.88% |
| Supplemental Data | | | | | |
| Net assets, end of period (in millions) | $1,278 | $1,432 | $1,490 | $1,823 | $2,307 |
| Portfolio turnover rateK | 176% | 110% | 112% | 19% | 23% |
A Calculated based on average shares outstanding during the period.
B Net investment income per share reflects a large, non-recurring dividend which amounted to $.19 per share. Excluding this non-recurring dividend, the ratio of net investment income (loss) to average net assets would have been 2.29%.
C Net investment income per share reflects a large, non-recurring dividend which amounted to $.10 per share. Excluding this non-recurring dividend, the ratio of net investment income (loss) to average net assets would have been 2.99%.
D Net realized and unrealized gain (loss) per share reflects proceeds received from litigation which amounted to $.08 per share. Excluding these litigation proceeds, the total return would have been 10.59%.
E Net realized and unrealized gain (loss) per share reflects proceeds received from litigation which amounted to $.12 per share. Excluding these litigation proceeds, the total return would have been 10.91%.
F Total distributions of $1.21 per share is comprised of distributions from net investment income of $.799 and distributions from net realized gain of $.415 per share.
G Total distributions of $2.91 per share is comprised of distributions from net investment income of $.916 and distributions from net realized gain of $1.997 per share.
H Total returns would have been lower if certain expenses had not been reduced during the applicable periods shown.
I Fees and expenses of any underlying Fidelity Central Funds are not included in the Fund's expense ratio. The Fund indirectly bears its proportionate share of the expenses of any underlying Fidelity Central Funds.
J Expense ratios reflect operating expenses of the class. Expenses before reductions do not reflect amounts reimbursed by the investment adviser or reductions from brokerage service arrangements or reductions from other expense offset arrangements and do not represent the amount paid by the class during periods when reimbursements or reductions occur. Expenses net of fee waivers reflect expenses after reimbursement by the investment adviser but prior to reductions from brokerage service arrangements or other expense offset arrangements. Expenses net of all reductions represent the net expenses paid by the class.
K Amount does not include the portfolio activity of any underlying Fidelity Central Funds.
See accompanying notes which are an integral part of the financial statements.
Fidelity Convertible Securities Fund Class I
| Years ended November 30, | 2018 | 2017 | 2016 | 2015 | 2014 |
| Selected Per–Share Data | | | | | |
| Net asset value, beginning of period | $28.55 | $26.91 | $29.62 | $33.51 | $30.86 |
| Income from Investment Operations | | | | | |
| Net investment income (loss)A | .84B | .83 | .88C | .74 | .59 |
| Net realized and unrealized gain (loss) | .24 | 2.02D | (.68) | (2.82) | 2.83E |
| Total from investment operations | 1.08 | 2.85 | .20 | (2.08) | 3.42 |
| Distributions from net investment income | (.92) | (.79) | (.91) | (.71) | (.56) |
| Distributions from net realized gain | (.58) | (.42) | (2.00) | (1.10) | (.21) |
| Total distributions | (1.50) | (1.21) | (2.91) | (1.81) | (.77) |
| Net asset value, end of period | $28.13 | $28.55 | $26.91 | $29.62 | $33.51 |
| Total ReturnF | 3.87% | 10.87%D | 1.11% | (6.39)% | 11.25%E |
| Ratios to Average Net AssetsG,H | | | | | |
| Expenses before reductions | .47% | .47% | .47% | .58% | .61% |
| Expenses net of fee waivers, if any | .47% | .47% | .47% | .58% | .61% |
| Expenses net of all reductions | .47% | .47% | .47% | .58% | .61% |
| Net investment income (loss) | 2.94%B | 2.98% | 3.35%C | 2.35% | 1.85% |
| Supplemental Data | | | | | |
| Net assets, end of period (in millions) | $32 | $41 | $68 | $128 | $159 |
| Portfolio turnover rateI | 176% | 110% | 112% | 19% | 23% |
A Calculated based on average shares outstanding during the period.
B Net investment income per share reflects a large, non-recurring dividend which amounted to $.19 per share. Excluding this non-recurring dividend, the ratio of net investment income (loss) to average net assets would have been 2.27%.
C Net investment income per share reflects a large, non-recurring dividend which amounted to $.10 per share. Excluding this non-recurring dividend, the ratio of net investment income (loss) to average net assets would have been 2.98%.
D Net realized and unrealized gain (loss) per share reflects proceeds received from litigation which amounted to $.08 per share. Excluding these litigation proceeds, the total return would have been 10.58%.
E Net realized and unrealized gain (loss) per share reflects proceeds received from litigation which amounted to $.12 per share. Excluding these litigation proceeds, the total return would have been 10.88%.
F Total returns would have been lower if certain expenses had not been reduced during the applicable periods shown.
G Fees and expenses of any underlying Fidelity Central Funds are not included in the Fund's expense ratio. The Fund indirectly bears its proportionate share of the expenses of any underlying Fidelity Central Funds.
H Expense ratios reflect operating expenses of the class. Expenses before reductions do not reflect amounts reimbursed by the investment adviser or reductions from brokerage service arrangements or reductions from other expense offset arrangements and do not represent the amount paid by the class during periods when reimbursements or reductions occur. Expenses net of fee waivers reflect expenses after reimbursement by the investment adviser but prior to reductions from brokerage service arrangements or other expense offset arrangements. Expenses net of all reductions represent the net expenses paid by the class.
I Amount does not include the portfolio activity of any underlying Fidelity Central Funds.
See accompanying notes which are an integral part of the financial statements.
Fidelity Convertible Securities Fund Class Z
| Year ended November 30, | 2018 A |
| Selected Per–Share Data | |
| Net asset value, beginning of period | $29.30 |
| Income from Investment Operations | |
| Net investment income (loss)B | .10 |
| Net realized and unrealized gain (loss) | (.90) |
| Total from investment operations | (.80) |
| Distributions from net investment income | (.36) |
| Distributions from net realized gain | – |
| Total distributions | (.36) |
| Net asset value, end of period | $28.14 |
| Total ReturnC,D | (2.74)% |
| Ratios to Average Net AssetsE,F | |
| Expenses before reductions | .37%G |
| Expenses net of fee waivers, if any | .37%G |
| Expenses net of all reductions | .36%G |
| Net investment income (loss) | 2.35%G |
| Supplemental Data | |
| Net assets, end of period (in millions) | $1 |
| Portfolio turnover rateH | 176% |
A For the period October 2, 2018 (commencement of sale of shares) to November 30, 2018.
B Calculated based on average shares outstanding during the period.
C Total returns for periods of less than one year are not annualized.
D Total returns would have been lower if certain expenses had not been reduced during the applicable periods shown.
E Fees and expenses of any underlying Fidelity Central Funds are not included in the Fund's expense ratio. The Fund indirectly bears its proportionate share of the expenses of any underlying Fidelity Central Funds.
F Expense ratios reflect operating expenses of the class. Expenses before reductions do not reflect amounts reimbursed by the investment adviser or reductions from brokerage service arrangements or reductions from other expense offset arrangements and do not represent the amount paid by the class during periods when reimbursements or reductions occur. Expense ratios before reductions for start-up periods may not be representative of longer-term operating periods. Expenses net of fee waivers reflect expenses after reimbursement by the investment adviser but prior to reductions from brokerage service arrangements or other expense offset arrangements. Expenses net of all reductions represent the net expenses paid by the class.
G Annualized
H Amount does not include the portfolio activity of any underlying Fidelity Central Funds.
See accompanying notes which are an integral part of the financial statements.
Notes to Financial Statements
For the period ended November 30, 2018
(Amounts in thousands except percentages)
1. Organization.
Fidelity Convertible Securities Fund (the Fund) is a fund of Fidelity Financial Trust (the Trust) and is authorized to issue an unlimited number of shares. The Trust is registered under the Investment Company Act of 1940, as amended (the 1940 Act), as an open-end management investment company organized as a Massachusetts business trust. The Fund commenced sale of Class Z shares on October 2, 2018. The Fund offers Class A, Class M, Class C, Convertible Securities, Class I and Class Z shares, each of which has equal rights as to assets and voting privileges. Each class has exclusive voting rights with respect to matters that affect that class.
2. Investments in Fidelity Central Funds.
The Fund invests in Fidelity Central Funds, which are open-end investment companies generally available only to other investment companies and accounts managed by the investment adviser and its affiliates. The Fund's Schedule of Investments lists each of the Fidelity Central Funds held as of period end, if any, as an investment of the Fund, but does not include the underlying holdings of each Fidelity Central Fund. As an Investing Fund, the Fund indirectly bears its proportionate share of the expenses of the underlying Fidelity Central Funds.
The Money Market Central Funds seek preservation of capital and current income and are managed by Fidelity Investments Money Management, Inc. (FIMM), an affiliate of the investment adviser. Annualized expenses of the Money Market Central Funds as of their most recent shareholder report date are less than .005%.
A complete unaudited list of holdings for each Fidelity Central Fund is available upon request or at the Securities and Exchange Commission (the SEC) website at www.sec.gov. In addition, the financial statements of the Fidelity Central Funds, which are not covered by the Fund's Report of Independent Registered Public Accounting Firm, are available on the SEC website or upon request.
3. Significant Accounting Policies.
The Fund is an investment company and applies the accounting and reporting guidance of the Financial Accounting Standards Board (FASB) Accounting Standards Codification Topic 946 Financial Services – Investments Companies. The financial statements have been prepared in conformity with accounting principles generally accepted in the United States of America (GAAP), which require management to make certain estimates and assumptions at the date of the financial statements. Actual results could differ from those estimates. Subsequent events, if any, through the date that the financial statements were issued have been evaluated in the preparation of the financial statements. The following summarizes the significant accounting policies of the Fund:
Investment Valuation. Investments are valued as of 4:00 p.m. Eastern time on the last calendar day of the period. The Board of Trustees (the Board) has delegated the day to day responsibility for the valuation of the Fund's investments to the Fair Value Committee (the Committee) established by the Fund's investment adviser. In accordance with valuation policies and procedures approved by the Board, the Fund attempts to obtain prices from one or more third party pricing vendors or brokers to value its investments. When current market prices, quotations or currency exchange rates are not readily available or reliable, investments will be fair valued in good faith by the Committee, in accordance with procedures adopted by the Board. Factors used in determining fair value vary by investment type and may include market or investment specific events, changes in interest rates and credit quality. The frequency with which these procedures are used cannot be predicted and they may be utilized to a significant extent. The Committee oversees the Fund's valuation policies and procedures and reports to the Board on the Committee's activities and fair value determinations. The Board monitors the appropriateness of the procedures used in valuing the Fund's investments and ratifies the fair value determinations of the Committee.
The Fund categorizes the inputs to valuation techniques used to value its investments into a disclosure hierarchy consisting of three levels as shown below:
- Level 1 – quoted prices in active markets for identical investments
- Level 2 – other significant observable inputs (including quoted prices for similar investments, interest rates, prepayment speeds, etc.)
- Level 3 – unobservable inputs (including the Fund's own assumptions based on the best information available)
Valuation techniques used to value the Fund's investments by major category are as follows:
Equity securities, including restricted securities, for which market quotations are readily available, are valued at the last reported sale price or official closing price as reported by a third party pricing vendor on the primary market or exchange on which they are traded and are categorized as Level 1 in the hierarchy. In the event there were no sales during the day or closing prices are not available, securities are valued at the last quoted bid price or may be valued using the last available price and are generally categorized as Level 2 in the hierarchy. For foreign equity securities, when market or security specific events arise, comparisons to the valuation of American Depositary Receipts (ADRs), futures contracts, Exchange-Traded Funds (ETFs) and certain indexes as well as quoted prices for similar securities may be used and would be categorized as Level 2 in the hierarchy. Utilizing these techniques may result in transfers between Level 1 and Level 2. For equity securities, including restricted securities, where observable inputs are limited, assumptions about market activity and risk are used and these securities may be categorized as Level 3 in the hierarchy.
Debt securities, including restricted securities, are valued based on evaluated prices received from third party pricing vendors or from brokers who make markets in such securities. Corporate bonds and U.S. government and government agency obligations are valued by pricing vendors who utilize matrix pricing which considers yield or price of bonds of comparable quality, coupon, maturity and type or by broker-supplied prices. When independent prices are unavailable or unreliable, debt securities may be valued utilizing pricing methodologies which consider similar factors that would be used by third party pricing vendors. Debt securities are generally categorized as Level 2 in the hierarchy but may be Level 3 depending on the circumstances.
Investments in open-end mutual funds, including the Fidelity Central Funds, are valued at their closing net asset value (NAV) each business day and are categorized as Level 1 in the hierarchy.
Changes in valuation techniques may result in transfers in or out of an assigned level within the disclosure hierarchy. The aggregate value of investments by input level as of November 30, 2018 is included at the end of the Fund's Schedule of Investments.
Foreign Currency. The Fund may use foreign currency contracts to facilitate transactions in foreign-denominated securities. Gains and losses from these transactions may arise from changes in the value of the foreign currency or if the counterparties do not perform under the contracts' terms.
Foreign-denominated assets, including investment securities, and liabilities are translated into U.S. dollars at the exchange rates at period end. Purchases and sales of investment securities, income and dividends received and expenses denominated in foreign currencies are translated into U.S. dollars at the exchange rate in effect on the transaction date.
The effects of exchange rate fluctuations on investments are included with the net realized and unrealized gain (loss) on investment securities. Other foreign currency transactions resulting in realized and unrealized gain (loss) are disclosed separately.
Investment Transactions and Income. For financial reporting purposes, the Fund's investment holdings and NAV include trades executed through the end of the last business day of the period. The NAV per share for processing shareholder transactions is calculated as of the close of business of the New York Stock Exchange (NYSE), normally 4:00 p.m. Eastern time and includes trades executed through the end of the prior business day. Gains and losses on securities sold are determined on the basis of identified cost and include proceeds received from litigation. Dividend income is recorded on the ex-dividend date, except for certain dividends from foreign securities where the ex-dividend date may have passed, which are recorded as soon as the Fund is informed of the ex-dividend date. Non-cash dividends included in dividend income, if any, are recorded at the fair market value of the securities received. Income and capital gain distributions from Fidelity Central Funds, if any, are recorded on the ex-dividend date. Certain distributions received by the Fund represent a return of capital or capital gain. The Fund determines the components of these distributions subsequent to the ex-dividend date, based upon receipt of tax filings or other correspondence relating to the underlying investment. These distributions are recorded as a reduction of cost of investments and/or as a realized gain. Large, non-recurring dividends recognized by the Fund are presented separately on the Statement of Operations as "Special Dividends" and the impact of these dividends is presented in the Financial Highlights. Interest income is accrued as earned and includes coupon interest and amortization of premium and accretion of discount on debt securities as applicable. Investment income is recorded net of foreign taxes withheld where recovery of such taxes is uncertain. Debt obligations may be placed on non-accrual status and related interest income may be reduced by ceasing current accruals and writing off interest receivables when the collection of all or a portion of interest has become doubtful based on consistently applied procedures. A debt obligation is removed from non-accrual status when the issuer resumes interest payments or when collectability of interest is reasonably assured.
Class Allocations and Expenses. Investment income, realized and unrealized capital gains and losses, common expenses of the Fund, and certain fund-level expense reductions, if any, are allocated daily on a pro-rata basis to each class based on the relative net assets of each class to the total net assets of the Fund. Each class differs with respect to transfer agent and distribution and service plan fees incurred. Certain expense reductions may also differ by class. For the reporting period, the allocated portion of income and expenses to each class as a percent of its average net assets may vary due to the timing of recording these transactions in relation to fluctuating net assets of the classes. Expenses directly attributable to a fund are charged to that fund. Expenses attributable to more than one fund are allocated among the respective funds on the basis of relative net assets or other appropriate methods. Expense estimates are accrued in the period to which they relate and adjustments are made when actual amounts are known.
Income Tax Information and Distributions to Shareholders. Each year, the Fund intends to qualify as a regulated investment company under Subchapter M of the Internal Revenue Code, including distributing substantially all of its taxable income and realized gains. As a result, no provision for U.S. Federal income taxes is required. As of November 30, 2018, the Fund did not have any unrecognized tax benefits in the financial statements; nor is the Fund aware of any tax positions for which it is reasonably possible that the total amounts of unrecognized tax benefits will significantly change in the next twelve months. The Fund files a U.S. federal tax return, in addition to state and local tax returns as required. The Fund's federal income tax returns are subject to examination by the Internal Revenue Service (IRS) for a period of three fiscal years after they are filed. State and local tax returns may be subject to examination for an additional fiscal year depending on the jurisdiction. Foreign taxes are provided for based on the Fund's understanding of the tax rules and rates that exist in the foreign markets in which it invests.
Distributions are declared and recorded on the ex-dividend date. Income and capital gain distributions are declared separately for each class. Income and capital gain distributions are determined in accordance with income tax regulations, which may differ from GAAP. In addition, the Fund claimed a portion of the payment made to redeeming shareholders as a distribution for income tax purposes.
Capital accounts within the financial statements are adjusted for permanent book-tax differences. These adjustments have no impact on net assets or the results of operations. Capital accounts are not adjusted for temporary book-tax differences which will reverse in a subsequent period.
Book-tax differences are primarily due to foreign currency transactions, market discount, contingent interest, equity-debt classifications, certain conversion ratio adjustments, deferred trustees compensation, capital loss carryforwards, partnerships and losses deferred due to wash sales.
As of period end, the cost and unrealized appreciation (depreciation) in securities, and derivatives if applicable, for federal income tax purposes were as follows:
| Gross unrealized appreciation | $80,817 |
| Gross unrealized depreciation | (70,873) |
| Net unrealized appreciation (depreciation) | $9,944 |
| Tax Cost | $1,335,080 |
The tax-based components of distributable earnings as of period end were as follows:
| Undistributed ordinary income | $23,266 |
| Undistributed long-term capital gain | $54,952 |
| Net unrealized appreciation (depreciation) on securities and other investments | $9,944 |
The tax character of distributions paid was as follows:
| | November 30, 2018 | November 30, 2017 |
| Ordinary Income | $76,808 | $ 69,524 |
Restricted Securities. The Fund may invest in securities that are subject to legal or contractual restrictions on resale. These securities generally may be resold in transactions exempt from registration or to the public if the securities are registered. Disposal of these securities may involve time-consuming negotiations and expense, and prompt sale at an acceptable price may be difficult. Information regarding restricted securities is included at the end of the Fund's Schedule of Investments.
New Accounting Pronouncement. In March 2017, the Financial Accounting Standards Board (FASB) issued an Accounting Standards Update (ASU), ASU 2017-08, which amends the amortization period for certain callable debt securities that are held at a premium. The amendment requires the premium to be amortized to the earliest call date. The amendments do not require an accounting change for securities held at a discount. The ASU is effective for annual periods beginning after December 15, 2018. Management is currently evaluating the potential impact of these changes to the financial statements.
New Rule Issuance. During August 2018, the U.S. Securities and Exchange Commission issued Final Rule Release No. 33-10532, Disclosure Update and Simplification. This Final Rule includes amendments specific to registered investment companies that are intended to eliminate overlap in disclosure requirements between Regulation S-X and GAAP. In accordance with these amendments, certain line-items in the Fund's financial statements have been combined or removed for the current period as outlined in the table below.
| Financial Statement | Current Line-Item Presentation | Prior Line-Item Presentation |
| Statement of Assets and Liabilities | Total distributable earnings (loss) | Undistributed/Distributions in excess of/Accumulated net investment income (loss)
Accumulated/Undistributed net realized gain (loss)
Net unrealized appreciation (depreciation) |
| Statement of Changes in Net Assets | N/A - removed | Undistributed/Distributions in excess of/Accumulated net investment income (loss) end of period |
| Statement of Changes in Net Assets | Distributions to shareholders | Distributions to shareholders from net investment income
Distributions to shareholders from net realized gain |
| Distributions to Shareholders Note to Financial Statements | Distributions to shareholders | Distributions to shareholders from net investment income
Distributions to shareholders from net realized gain |
4. Purchases and Sales of Investments.
Purchases and sales of securities, other than short-term securities and U.S. government securities, aggregated $2,084,876 and $2,405,935, respectively.
5. Fees and Other Transactions with Affiliates.
Management Fee. Fidelity Management & Research Company (the investment adviser) and its affiliates provide the Fund with investment management related services for which the Fund pays a monthly management fee. The management fee is the sum of an individual fund fee rate that is based on an annual rate of .20% of the Fund's average net assets and an annualized group fee rate that averaged .24% during the period. The group fee rate is based upon the average net assets of all the mutual funds advised by the investment adviser, including any mutual funds previously advised by the investment adviser that are currently advised by Fidelity SelectCo, LLC, an affiliate of the investment adviser. The group fee rate decreases as assets under management increase and increases as assets under management decrease. In addition, the management fee is subject to a performance adjustment (up to a maximum of +/- .15% of the Fund's average net assets over a 36 month performance period). The upward or downward adjustment to the management fee is based on the relative investment performance of Convertible Securities as compared to its benchmark index, the ICE® BofAML® All US Convertibles Index, over the same 36 month performance period. For the reporting period, the total annual management fee rate, including the performance adjustment, was .26% of the Fund's average net assets. The performance adjustment included in the management fee rate may be higher or lower than the maximum performance adjustment rate due to the difference between the average net assets for the reporting and performance periods.
Distribution and Service Plan Fees. In accordance with Rule 12b-1 of the 1940 Act, the Fund has adopted separate Distribution and Service Plans for each class of shares. Certain classes pay Fidelity Distributors Corporation (FDC), an affiliate of the investment adviser, separate Distribution and Service Fees, each of which is based on an annual percentage of each class' average net assets. In addition, FDC may pay financial intermediaries for selling shares of the Fund and providing shareholder support services. For the period, the Distribution and Service Fee rates, total fees and amounts retained by FDC were as follows:
| | Distribution Fee | Service Fee | Total Fees | Retained by FDC |
| Class A | -% | .25% | $50 | $–(a) |
| Class M | .25% | .25% | 42 | –(a) |
| Class C | .75% | .25% | 181 | 7 |
| | | | $273 | $7 |
(a) In the amount of less than five hundred dollars.
Sales Load. FDC may receive a front-end sales charge of up to 5.75% for selling Class A shares and 3.50% for selling Class M shares, some of which is paid to financial intermediaries for selling shares of the Fund. Depending on the holding period, FDC may receive contingent deferred sales charges levied on Class A, Class M and Class C redemptions. The deferred sales charges are 1.00% for Class C shares, 1.00% for certain purchases of Class A shares and .25% for certain purchases of Class M shares.
For the period, sales charge amounts retained by FDC were as follows:
| | Retained by FDC |
| Class A | $8 |
| Class M | 1 |
| Class C(a) | 1 |
| | $10 |
(a) When Class C shares are initially sold, FDC pays commissions from its own resources to financial intermediaries through which the sales are made.
Transfer Agent Fees. Fidelity Investments Institutional Operations Company, Inc., (FIIOC), an affiliate of the investment adviser, is the transfer, dividend disbursing and shareholder servicing agent for each class of the Fund. FIIOC receives account fees and asset-based fees that vary according to the account size and type of account of the shareholders of the respective classes of the Fund, except for Class Z. FIIOC receives an asset-based fee of Class Z's average net assets. FIIOC pays for typesetting, printing and mailing of shareholder reports, except proxy statements.
For the period, transfer agent fees for each class were as follows:
| | Amount | % of Class-Level Average Net Assets |
| Class A | $39 | .19 |
| Class M | 19 | .22 |
| Class C | 34 | .19 |
| Convertible Securities | 2,036 | .15 |
| Class I | 56 | .17 |
| Class Z | –(a) | .05(b) |
| | $2,184 | |
(a) In the amount of less than five hundred dollars.
(b) Annualized.
Accounting and Security Lending Fees. Fidelity Service Company, Inc. (FSC), an affiliate of the investment adviser, maintains the Fund's accounting records. The accounting fee is based on the level of average net assets for each month. Under a separate contract, FSC administers the security lending program. The security lending fee is based on the number and duration of lending transactions. For the period, the fees were equivalent to an annual rate of .03%.
Brokerage Commissions. The Fund placed a portion of its portfolio transactions with brokerage firms which are affiliates of the investment adviser. Brokerage commissions are included in net realized gain (loss) and change in net unrealized appreciation (depreciation) in the Statement of Operations. The commissions paid to these affiliated firms were $24 for the period.
Interfund Lending Program. Pursuant to an Exemptive Order issued by the SEC, the Fund, along with other registered investment companies having management contracts with Fidelity Management & Research Company (FMR) or other affiliated entities of FMR, may participate in an interfund lending program. This program provides an alternative credit facility allowing the funds to borrow from, or lend money to, other participating affiliated funds. At period end, there were no interfund loans outstanding. The Fund's activity in this program during the period for which loans were outstanding was as follows:
| Borrower or Lender | Average Loan Balance | Weighted Average Interest Rate | Interest Expense |
| Borrower | $4,716 | 1.89% | $5 |
Interfund Trades. The Fund may purchase from or sell securities to other Fidelity Funds under procedures adopted by the Board. The procedures have been designed to ensure these interfund trades are executed in accordance with Rule 17a-7 of the 1940 Act. Interfund trades are included within the respective purchases and sales amounts shown in the Purchases and Sales of Investments note.
6. Committed Line of Credit.
The Fund participates with other funds managed by the investment adviser or an affiliate in a $4.25 billion credit facility (the "line of credit") to be utilized for temporary or emergency purposes to fund shareholder redemptions or for other short-term liquidity purposes. The Fund has agreed to pay commitment fees on its pro-rata portion of the line of credit, which amounted to $4 and is reflected in Miscellaneous expenses on the Statement of Operations. During the period, the Fund did not borrow on this line of credit.
7. Security Lending.
The Fund lends portfolio securities through a lending agent from time to time in order to earn additional income. For equity securities, a lending agent is used and may loan securities to certain qualified borrowers, including Fidelity Capital Markets (FCM), a broker-dealer affiliated with the Fund. On the settlement date of the loan, the Fund receives collateral (in the form of U.S. Treasury obligations, letters of credit and/or cash) against the loaned securities and maintains collateral in an amount not less than 100% of the market value of the loaned securities during the period of the loan. The market value of the loaned securities is determined at the close of business of the Fund and any additional required collateral is delivered to the Fund on the next business day. The Fund or borrower may terminate the loan at any time, and if the borrower defaults on its obligation to return the securities loaned because of insolvency or other reasons, the Fund may apply collateral received from the borrower against the obligation. The Fund may experience delays and costs in recovering the securities loaned. Any cash collateral received is invested in the Fidelity Securities Lending Cash Central Fund. At period end, there were no security loans outstanding. Security lending income represents the income earned on investing cash collateral, less rebates paid to borrowers and any lending agent fees associated with the loan, plus any premium payments received for lending certain types of securities. Security lending income is presented in the Statement of Operations as a component of income from Fidelity Central Funds. Total security lending income during the period amounted to $2. During the period, there were no securities loaned to FCM.
8. Expense Reductions.
Commissions paid to certain brokers with whom the investment adviser, or its affiliates, places trades on behalf of the Fund include an amount in addition to trade execution, which may be rebated back to the Fund to offset certain expenses. This amount totaled $70 for the period. Through arrangements with the Fund's custodian, credits realized as a result of certain uninvested cash balances were used to reduce the Fund's expenses. During the period, these credits reduced the Fund's custody by $4.
In addition, during the period the investment adviser reimbursed and/or waived a portion of fund-level operating expenses in the amount of $15.
9. Distributions to Shareholders.
Distributions to shareholders of each class were as follows:
| | Year ended
November 30, 2018(a) | Year ended
November 30, 2017 |
| Distributions to shareholders | | |
| Class A | $1,018 | $– |
| Class M | 500 | – |
| Class C | 778 | – |
| Convertible Securities | 72,625 | – |
| Class I | 1,886 | – |
| Class Z | 1 | – |
| Total | $76,808 | $– |
| From net investment income | | |
| Class A | $– | $630 |
| Class M | – | 267 |
| Class C | – | 395 |
| Convertible Securities | – | 42,192 |
| Class I | – | 1,495 |
| Total | $– | $44,979 |
| From net realized gain | | |
| Class A | $– | $444 |
| Class M | – | 102 |
| Class C | – | 357 |
| Convertible Securities | – | 22,674 |
| Class I | – | 968 |
| Total | $– | $24,545 |
(a) Distributions for Class Z are for the period October 2, 2018 (commencement of sale of shares) to November 30, 2018.
10. Share Transactions.
Share transactions for each class were as follows and may contain automatic conversions between classes or exchanges between affiliated funds:
| | Shares | Shares | Dollars | Dollars |
| | Year ended November 30, 2018(a) | Year ended November 30, 2017 | Year ended November 30, 2018(a) | Year ended November 30, 2017 |
| Class A | | | | |
| Shares sold | 99 | 106 | $2,856 | $2,921 |
| Reinvestment of distributions | 35 | 37 | 971 | 1,008 |
| Shares redeemed | (203) | (502) | (5,783) | (13,796) |
| Net increase (decrease) | (69) | (359) | $(1,956) | $(9,867) |
| Class M | | | | |
| Shares sold | 75 | 616 | $2,133 | $17,118 |
| Reinvestment of distributions | 18 | 13 | 496 | 364 |
| Shares redeemed | (388) | (366) | (10,794) | (10,224) |
| Net increase (decrease) | (295) | 263 | $(8,165) | $7,258 |
| Class C | | | | |
| Shares sold | 76 | 64 | $2,156 | $1,763 |
| Reinvestment of distributions | 26 | 25 | 731 | 686 |
| Shares redeemed | (181) | (308) | (5,103) | (8,438) |
| Net increase (decrease) | (79) | (219) | $(2,216) | $(5,989) |
| Convertible Securities | | | | |
| Shares sold | 1,930 | 3,155 | $55,256 | $86,877 |
| Reinvestment of distributions | 2,239 | 2,104 | 63,197 | 57,338 |
| Shares redeemed | (8,880) | (10,453) | (253,754) | (289,022) |
| Net increase (decrease) | (4,711) | (5,194) | $(135,301) | $(144,807) |
| Class I | | | | |
| Shares sold | 353 | 785 | $10,075 | $21,690 |
| Reinvestment of distributions | 61 | 73 | 1,710 | 1,977 |
| Shares redeemed | (703) | (1,970) | (19,963) | (54,079) |
| Net increase (decrease) | (289) | (1,112) | $(8,178) | $(30,412) |
| Class Z | | | | |
| Shares sold | 48 | – | $1,327 | $– |
| Reinvestment of distributions | –(b) | – | 1 | – |
| Shares redeemed | –(b) | – | (2) | – |
| Net increase (decrease) | 48 | – | $1,326 | $– |
(a) Share transactions for Class Z are for the period October 2, 2018 (commencement of sale of shares) to November 30, 2018
(b) Amount is less than five hundred shares
11. Other.
The Fund's organizational documents provide former and current trustees and officers with a limited indemnification against liabilities arising in connection with the performance of their duties to the Fund. In the normal course of business, the Fund may also enter into contracts that provide general indemnifications. The Fund's maximum exposure under these arrangements is unknown as this would be dependent on future claims that may be made against the Fund. The risk of material loss from such claims is considered remote.
Report of Independent Registered Public Accounting Firm
To the Board of Trustees of Fidelity Financial Trust and Shareholders of Fidelity Convertible Securities Fund:
Opinion on the Financial Statements
We have audited the accompanying statement of assets and liabilities, including the schedule of investments, of Fidelity Convertible Securities Fund (one of the funds constituting Fidelity Financial Trust, referred to hereafter as the "Fund") as of November 30, 2018, the related statement of operations for the year ended November 30, 2018, the statement of changes in net assets for each of the two years in the period ended November 30, 2018, including the related notes, and the financial highlights for each of the periods indicated therein (collectively referred to as the “financial statements”). In our opinion, the financial statements present fairly, in all material respects, the financial position of the Fund as of November 30, 2018, the results of its operations for the year then ended, the changes in its net assets for each of the two years in the period ended November 30, 2018 and the financial highlights for each of the periods indicated therein in conformity with accounting principles generally accepted in the United States of America.
Basis for Opinion
These financial statements are the responsibility of the Fund’s management. Our responsibility is to express an opinion on the Fund’s financial statements based on our audits. We are a public accounting firm registered with the Public Company Accounting Oversight Board (United States) (“PCAOB”) and are required to be independent with respect to the Fund in accordance with the U.S. federal securities laws and the applicable rules and regulations of the Securities and Exchange Commission and the PCAOB.
We conducted our audits of these financial statements in accordance with the standards of the PCAOB. Those standards require that we plan and perform the audit to obtain reasonable assurance about whether the financial statements are free of material misstatement, whether due to error or fraud.
Our audits included performing procedures to assess the risks of material misstatement of the financial statements, whether due to error or fraud, and performing procedures that respond to those risks. Such procedures included examining, on a test basis, evidence regarding the amounts and disclosures in the financial statements. Our audits also included evaluating the accounting principles used and significant estimates made by management, as well as evaluating the overall presentation of the financial statements. Our procedures included confirmation of securities owned as of November 30, 2018 by correspondence with the custodian and brokers; when replies were not received from brokers, we performed other auditing procedures. We believe that our audits provide a reasonable basis for our opinion.
PricewaterhouseCoopers LLP
Boston, Massachusetts
January 17, 2019
We have served as the auditor of one or more investment companies in the Fidelity group of funds since 1932.
Trustees and Officers
The Trustees, Members of the Advisory Board (if any), and officers of the trust and fund, as applicable, are listed below. The Board of Trustees governs the fund and is responsible for protecting the interests of shareholders. The Trustees are experienced executives who meet periodically throughout the year to oversee the fund's activities, review contractual arrangements with companies that provide services to the fund, oversee management of the risks associated with such activities and contractual arrangements, and review the fund's performance. Except for Michael E. Wiley, each of the Trustees oversees 281 funds. Mr. Wiley oversees 192 funds.
The Trustees hold office without limit in time except that (a) any Trustee may resign; (b) any Trustee may be removed by written instrument, signed by at least two-thirds of the number of Trustees prior to such removal; (c) any Trustee who requests to be retired or who has become incapacitated by illness or injury may be retired by written instrument signed by a majority of the other Trustees; and (d) any Trustee may be removed at any special meeting of shareholders by a two-thirds vote of the outstanding voting securities of the trust. Each Trustee who is not an interested person (as defined in the 1940 Act) of the trust and the fund is referred to herein as an Independent Trustee. Each Independent Trustee shall retire not later than the last day of the calendar year in which his or her 75th birthday occurs. The Independent Trustees may waive this mandatory retirement age policy with respect to individual Trustees. Officers and Advisory Board Members hold office without limit in time, except that any officer or Advisory Board Member may resign or may be removed by a vote of a majority of the Trustees at any regular meeting or any special meeting of the Trustees. Except as indicated, each individual has held the office shown or other offices in the same company for the past five years.
The fund’s Statement of Additional Information (SAI) includes more information about the Trustees. To request a free copy, call Fidelity at 1-800-544-8544.
Experience, Skills, Attributes, and Qualifications of the Trustees. The Governance and Nominating Committee has adopted a statement of policy that describes the experience, qualifications, attributes, and skills that are necessary and desirable for potential Independent Trustee candidates (Statement of Policy). The Board believes that each Trustee satisfied at the time he or she was initially elected or appointed a Trustee, and continues to satisfy, the standards contemplated by the Statement of Policy. The Governance and Nominating Committee also engages professional search firms to help identify potential Independent Trustee candidates who have the experience, qualifications, attributes, and skills consistent with the Statement of Policy. From time to time, additional criteria based on the composition and skills of the current Independent Trustees, as well as experience or skills that may be appropriate in light of future changes to board composition, business conditions, and regulatory or other developments, have also been considered by the professional search firms and the Governance and Nominating Committee. In addition, the Board takes into account the Trustees' commitment and participation in Board and committee meetings, as well as their leadership of standing and ad hoc committees throughout their tenure.
In determining that a particular Trustee was and continues to be qualified to serve as a Trustee, the Board has considered a variety of criteria, none of which, in isolation, was controlling. The Board believes that, collectively, the Trustees have balanced and diverse experience, qualifications, attributes, and skills, which allow the Board to operate effectively in governing the fund and protecting the interests of shareholders. Information about the specific experience, skills, attributes, and qualifications of each Trustee, which in each case led to the Board's conclusion that the Trustee should serve (or continue to serve) as a trustee of the fund, is provided below.
Board Structure and Oversight Function. James C. Curvey is an interested person and currently serves as Chairman. The Trustees have determined that an interested Chairman is appropriate and benefits shareholders because an interested Chairman has a personal and professional stake in the quality and continuity of services provided to the fund. Independent Trustees exercise their informed business judgment to appoint an individual of their choosing to serve as Chairman, regardless of whether the Trustee happens to be independent or a member of management. The Independent Trustees have determined that they can act independently and effectively without having an Independent Trustee serve as Chairman and that a key structural component for assuring that they are in a position to do so is for the Independent Trustees to constitute a substantial majority for the Board. The Independent Trustees also regularly meet in executive session. Ned C. Lautenbach serves as Chairman of the Independent Trustees and as such (i) acts as a liaison between the Independent Trustees and management with respect to matters important to the Independent Trustees and (ii) with management prepares agendas for Board meetings.
Fidelity® funds are overseen by different Boards of Trustees. The fund's Board oversees Fidelity's high income and certain equity funds, and other Boards oversee Fidelity's investment-grade bond, money market, asset allocation, and other equity funds. The asset allocation funds may invest in Fidelity® funds overseen by the fund's Board. The use of separate Boards, each with its own committee structure, allows the Trustees of each group of Fidelity® funds to focus on the unique issues of the funds they oversee, including common research, investment, and operational issues. On occasion, the separate Boards establish joint committees to address issues of overlapping consequences for the Fidelity® funds overseen by each Board.
The Trustees operate using a system of committees to facilitate the timely and efficient consideration of all matters of importance to the Trustees, the fund, and fund shareholders and to facilitate compliance with legal and regulatory requirements and oversight of the fund's activities and associated risks. The Board, acting through its committees, has charged FMR and its affiliates with (i) identifying events or circumstances the occurrence of which could have demonstrably adverse effects on the fund's business and/or reputation; (ii) implementing processes and controls to lessen the possibility that such events or circumstances occur or to mitigate the effects of such events or circumstances if they do occur; and (iii) creating and maintaining a system designed to evaluate continuously business and market conditions in order to facilitate the identification and implementation processes described in (i) and (ii) above. Because the day-to-day operations and activities of the fund are carried out by or through FMR, its affiliates, and other service providers, the fund's exposure to risks is mitigated but not eliminated by the processes overseen by the Trustees. While each of the Board's committees has responsibility for overseeing different aspects of the fund's activities, oversight is exercised primarily through the Operations, Audit, and Compliance Committees. In addition, the Independent Trustees have worked with Fidelity to enhance the Board's oversight of investment and financial risks, legal and regulatory risks, technology risks, and operational risks, including the development of additional risk reporting to the Board. Appropriate personnel, including but not limited to the fund's Chief Compliance Officer (CCO), FMR's internal auditor, the independent accountants, the fund's Treasurer and portfolio management personnel, make periodic reports to the Board's committees, as appropriate, including an annual review of Fidelity's risk management program for the Fidelity® funds. The responsibilities of each standing committee, including their oversight responsibilities, are described further under "Standing Committees of the Trustees."
Interested Trustees*:
Correspondence intended for a Trustee who is an interested person may be sent to Fidelity Investments, 245 Summer Street, Boston, Massachusetts 02210.
Name, Year of Birth; Principal Occupations and Other Relevant Experience+
James C. Curvey (1935)
Year of Election or Appointment: 2007
Trustee
Chairman of the Board of Trustees
Mr. Curvey also serves as Trustee of other Fidelity® funds. Mr. Curvey is Vice Chairman (2007-present) and Director of FMR LLC (diversified financial services company). In addition, Mr. Curvey is an Overseer Emeritus for the Boston Symphony Orchestra, a Director of Artis-Naples, and a Trustee of Brewster Academy in Wolfeboro, New Hampshire. Previously, Mr. Curvey served as a Director of Fidelity Research & Analysis Co. (investment adviser firm, 2009-2018), Director of Fidelity Investments Money Management, Inc. (investment adviser firm, 2009-2014) and a Director of FMR and FMR Co., Inc. (investment adviser firms, 2007-2014).
* Determined to be an “Interested Trustee” by virtue of, among other things, his or her affiliation with the trust or various entities under common control with FMR.
+ The information includes the Trustee's principal occupation during the last five years and other information relating to the experience, attributes, and skills relevant to the Trustee's qualifications to serve as a Trustee, which led to the conclusion that the Trustee should serve as a Trustee for the fund.
Independent Trustees:
Correspondence intended for an Independent Trustee may be sent to Fidelity Investments, P.O. Box 55235, Boston, Massachusetts 02205-5235.
Name, Year of Birth; Principal Occupations and Other Relevant Experience+
Dennis J. Dirks (1948)
Year of Election or Appointment: 2005
Trustee
Mr. Dirks also serves as Trustee of other Fidelity® funds. Prior to his retirement in May 2003, Mr. Dirks was Chief Operating Officer and a member of the Board of The Depository Trust & Clearing Corporation (DTCC). He also served as President, Chief Operating Officer, and Board member of The Depository Trust Company (DTC) and President and Board member of the National Securities Clearing Corporation (NSCC). In addition, Mr. Dirks served as Chief Executive Officer and Board member of the Government Securities Clearing Corporation, Chief Executive Officer and Board member of the Mortgage-Backed Securities Clearing Corporation, as a Trustee and a member of the Finance Committee of Manhattan College (2005-2008), as a Trustee and a member of the Finance Committee of AHRC of Nassau County (2006-2008), as a member of the Independent Directors Council (IDC) Governing Council (2010-2015), and as a member of the Board of Directors for The Brookville Center for Children’s Services, Inc. (2009-2017). Mr. Dirks is a member of the Finance Committee (2016-present) and Board of Directors (2017-present) and is Treasurer (2018-present) of the Asolo Repertory Theatre.
Donald F. Donahue (1950)
Year of Election or Appointment: 2018
Trustee
Mr. Donahue also serves as a Trustee of other Fidelity® funds. Mr. Donahue is President and Chief Executive Officer of Miranda Partners, LLC (risk consulting for the financial services industry, 2012-present). Previously, Mr. Donahue served as a Member of the Advisory Board of certain Fidelity® funds (2015-2018) and Chief Executive Officer (2006-2012), Chief Operating Officer (2003-2006), and Managing Director, Customer Marketing and Development (1999-2003) of The Depository Trust & Clearing Corporation (financial markets infrastructure). Mr. Donahue serves as a Member (2007-present) and Co-Chairman (2016-present) of the Board of Directors of United Way of New York, Member of the Board of Directors of NYC Leadership Academy (2012-present) and Member of the Board of Advisors of Ripple Labs, Inc. (financial services, 2015-present). He also served as Chairman (2010-2012) and Member of the Board of Directors (2012-2013) of Omgeo, LLC (financial services), Treasurer of United Way of New York (2012-2016), and Member of the Board of Directors of XBRL US (financial services non-profit, 2009-2012) and the International Securities Services Association (2009-2012).
Alan J. Lacy (1953)
Year of Election or Appointment: 2008
Trustee
Mr. Lacy also serves as Trustee of other Fidelity® funds. Mr. Lacy serves as a Director of Bristol-Myers Squibb Company (global pharmaceuticals, 2008-present). He is a Trustee of the California Chapter of The Nature Conservancy (2015-present) and a Director of the Center for Advanced Study in the Behavioral Sciences at Stanford University (2015-present). In addition, Mr. Lacy served as Senior Adviser (2007-2014) of Oak Hill Capital Partners, L.P. (private equity) and also served as Chief Executive Officer (2005) and Vice Chairman (2005-2006) of Sears Holdings Corporation (retail) and Chief Executive Officer and Chairman of the Board of Sears, Roebuck and Co. (retail, 2000-2005). Previously, Mr. Lacy served as Chairman (2014-2017) and a member (2010-2017) of the Board of Directors of Dave & Buster’s Entertainment, Inc. (restaurant and entertainment complexes), as Chairman (2008-2011) and a member (2006-2015) of the Board of Trustees of the National Parks Conservation Association, and as a member of the Board of Directors for The Hillman Companies, Inc. (hardware wholesalers, 2010-2014), Earth Fare, Inc. (retail grocery, 2010-2014), and The Western Union Company (global money transfer, 2006-2011).
Ned C. Lautenbach (1944)
Year of Election or Appointment: 2000
Trustee
Chairman of the Independent Trustees
Mr. Lautenbach also serves as Trustee of other Fidelity® funds. Mr. Lautenbach currently serves as Chair (2018-present) and Member (2013-present) of the Board of Governors, State University System of Florida and is a member of the Council on Foreign Relations (1994-present). He is also a member and has most recently served as Chairman of the Board of Directors of Artis-Naples (2012-present). Previously, Mr. Lautenbach served as a member and then Lead Director of the Board of Directors of Eaton Corporation (diversified industrial, 1997-2016). He was also a Partner and Advisory Partner at Clayton, Dubilier & Rice, LLC (private equity investment, 1998-2010), as well as a Director of Sony Corporation (2006-2007). In addition, Mr. Lautenbach also had a 30-year career with IBM (technology company) during which time he served as Senior Vice President and a member of the Corporate Executive Committee (1968-1998).
Joseph Mauriello (1944)
Year of Election or Appointment: 2008
Trustee
Mr. Mauriello also serves as Trustee of other Fidelity® funds. Prior to his retirement in January 2006, Mr. Mauriello served in numerous senior management positions including Deputy Chairman and Chief Operating Officer (2004-2005), and Vice Chairman of Financial Services (2002-2004) of KPMG LLP US (professional services, 1965-2005). Mr. Mauriello currently serves as a member of the Independent Directors Council (IDC) Governing Council (2015-present). Previously, Mr. Mauriello served as a member of the Board of Directors of XL Group plc. (global insurance and re-insurance, 2006-2018).
Cornelia M. Small (1944)
Year of Election or Appointment: 2005
Trustee
Ms. Small also serves as Trustee of other Fidelity® funds. Ms. Small is a member of the Board of Directors (2009-present) and Chair of the Investment Committee (2010-present) of the Teagle Foundation. Ms. Small also serves on the Investment Committee of the Berkshire Taconic Community Foundation (2008-present). Previously, Ms. Small served as Chairperson (2002-2008) and a member of the Investment Committee and Chairperson (2008-2012) and a member of the Board of Trustees of Smith College. In addition, Ms. Small served as Chief Investment Officer, Director of Global Equity Investments, and a member of the Board of Directors of Scudder, Stevens & Clark and Scudder Kemper Investments.
Garnett A. Smith (1947)
Year of Election or Appointment: 2018
Trustee
Mr. Smith also serves as Trustee of other Fidelity® funds. Prior to Mr. Smith's retirement, he served as Chairman and Chief Executive Officer of Inbrand Corp. (manufacturer of personal absorbent products, 1990-1997). He also served as President (1986-1990) of Inbrand Corp. Prior to his employment with Inbrand Corp., he was employed by a retail fabric chain and North Carolina National Bank. In addition, Mr. Smith served as a Member of the Advisory Board of certain Fidelity® funds (2012-2013) and as a board member of the Jackson Hole Land Trust (2009-2012).
David M. Thomas (1949)
Year of Election or Appointment: 2008
Trustee
Mr. Thomas also serves as Trustee of other Fidelity® funds. Mr. Thomas serves as Non-Executive Chairman of the Board of Directors of Fortune Brands Home and Security (home and security products, 2011-present) and as a member of the Board of Directors (2004-present) and Presiding Director (2013-present) of Interpublic Group of Companies, Inc. (marketing communication). Previously, Mr. Thomas served as Executive Chairman (2005-2006) and Chairman and Chief Executive Officer (2000-2005) of IMS Health, Inc. (pharmaceutical and healthcare information solutions), a Director of Fortune Brands, Inc. (consumer products, 2000-2011), and a member of the Board of Trustees of the University of Florida (2013-2018).
Michael E. Wiley (1950)
Year of Election or Appointment: 2018
Trustee
Mr. Wiley also serves as Trustee or Member of the Advisory Board of other Fidelity® funds. Mr. Wiley serves as a Director of High Point Resources (exploration and production, 2005-present). Previously, Mr. Wiley served as a Director of Andeavor Corporation (independent oil refiner and marketer, 2005-2018), a Director of Andeavor Logistics LP (natural resources logistics, 2015-2018), a Director of Post Oak Bank (privately-held bank, 2004-2018), a Director of Asia Pacific Exploration Consolidated (international oil and gas exploration and production, 2008-2013), a member of the Board of Trustees of the University of Tulsa (2000-2006; 2007-2010), a Senior Energy Advisor of Katzenbach Partners, LLC (consulting, 2006-2007), an Advisory Director of Riverstone Holdings (private investment), a Director of Spinnaker Exploration Company (exploration and production, 2001-2005) and Chairman, President, and CEO of Baker Hughes, Inc. (oilfield services, 2000-2004).
+ The information includes the Trustee's principal occupation during the last five years and other information relating to the experience, attributes, and skills relevant to the Trustee's qualifications to serve as a Trustee, which led to the conclusion that the Trustee should serve as a Trustee for the fund.
Advisory Board Members and Officers:
Correspondence intended for a Member of the Advisory Board (if any) may be sent to Fidelity Investments, P.O. Box 55235, Boston, Massachusetts 02205-5235. Correspondence intended for an officer or Peter S. Lynch may be sent to Fidelity Investments, 245 Summer Street, Boston, Massachusetts 02210. Officers appear below in alphabetical order.
Name, Year of Birth; Principal Occupation
Vicki L. Fuller (1957)
Year of Election or Appointment: 2018
Member of the Advisory Board
Ms. Fuller also serves as Member of the Advisory Board of other Fidelity® funds. Ms. Fuller serves as a member of the Board of Directors, Audit Committee, and Nominating and Governance Committee of The Williams Companies, Inc. (natural gas infrastructure, 2018-present). Previously, Ms. Fuller served as the Chief Investment Officer of the New York State Common Retirement Fund (2012-2018) and held a variety of positions at AllianceBernstein L.P. (global asset management, 1985-2012), including Managing Director (2006-2012) and Senior Vice President and Senior Portfolio Manager (2001-2006).
Peter S. Lynch (1944)
Year of Election or Appointment: 2003
Member of the Advisory Board
Mr. Lynch also serves as Member of the Advisory Board of other Fidelity® funds. Mr. Lynch is Vice Chairman and a Director of FMR (investment adviser firm) and FMR Co., Inc. (investment adviser firm). In addition, Mr. Lynch serves as a Trustee of Boston College and as the Chairman of the Inner-City Scholarship Fund. Previously, Mr. Lynch served on the Special Olympics International Board of Directors (1997-2006).
Carol B. Tomé (1957)
Year of Election or Appointment: 2018
Member of the Advisory Board
Ms. Tomé also serves as Member of the Advisory Board of other Fidelity® funds. Ms. Tomé is Chief Financial Officer (2001-present) and Executive Vice President of Corporate Services (2007-present) of The Home Depot, Inc. (home improvement retailer) and a Director (2003-present) and Chair of the Audit Committee (2004-present) of United Parcel Service, Inc. (package delivery and supply chain management). Previously, Ms. Tomé served as Trustee of certain Fidelity® funds (2017), Senior Vice President of Finance and Accounting/Treasurer (2000-2007) and Vice President and Treasurer (1995-2000) of The Home Depot, Inc. and Chair of the Board (2010-2012), Vice Chair of the Board (2009 and 2013), and a Director (2008-2013) of the Federal Reserve Bank of Atlanta. Ms. Tomé is also a director or trustee of many community and professional organizations.
Elizabeth Paige Baumann (1968)
Year of Election or Appointment: 2017
Anti-Money Laundering (AML) Officer
Ms. Baumann also serves as AML Officer of other funds. She is Chief AML Officer (2012-present) and Senior Vice President (2014-present) of FMR LLC (diversified financial services company) and is an employee of Fidelity Investments. Previously, Ms. Baumann served as AML Officer of the funds (2012-2016), and Vice President (2007-2014) and Deputy Anti-Money Laundering Officer (2007-2012) of FMR LLC.
John J. Burke III (1964)
Year of Election or Appointment: 2018
Chief Financial Officer
Mr. Burke also serves as Chief Financial Officer of other funds. Mr. Burke serves as Head of Investment Operations for Fidelity Fund and Investment Operations (2018-present) and is an employee of Fidelity Investments (1998-present). Previously Mr. Burke served as head of Asset Management Investment Operations (2012-2018).
William C. Coffey (1969)
Year of Election or Appointment: 2018
Secretary and Chief Legal Officer (CLO)
Mr. Coffey also serves as Secretary and CLO of other funds. Mr. Coffey serves as CLO, Secretary, and Senior Vice President of Fidelity Management & Research Company and FMR Co., Inc. (investment adviser firms, 2018-present); Secretary of Fidelity SelectCo, LLC and Fidelity Investments Money Management, Inc. (investment adviser firms, 2018-present); and CLO of Fidelity Management & Research (Hong Kong) Limited, FMR Investment Management (UK) Limited, and Fidelity Management & Research (Japan) Limited (investment adviser firms, 2018-present). He is Senior Vice President and Deputy General Counsel of FMR LLC (diversified financial services company, 2010-present), and is an employee of Fidelity Investments. Previously, Mr. Coffey served as Assistant Secretary of certain funds (2009-2018) and as Vice President and Associate General Counsel of FMR LLC (2005-2009).
Timothy M. Cohen (1969)
Year of Election or Appointment: 2018
Vice President
Mr. Cohen also serves as Vice President of other funds. Mr. Cohen serves as Co-Head of Global Equity Research (2016-present), a Director of Fidelity Management & Research (Japan) Limited (investment adviser firm, 2016-present), and is an employee of Fidelity Investments. Previously, Mr. Cohen served as Chief Investment Officer - Equity and a Director of Fidelity Management & Research (U.K.) Inc. (investment adviser firm, 2013-2015) and as a Director of Fidelity Management & Research (Hong Kong) Limited (investment adviser firm, 2017).
Jonathan Davis (1968)
Year of Election or Appointment: 2010
Assistant Treasurer
Mr. Davis also serves as Assistant Treasurer of other funds. Mr. Davis serves as Assistant Treasurer of FMR Capital, Inc. (2017-present) and is an employee of Fidelity Investments. Previously, Mr. Davis served as Vice President and Associate General Counsel of FMR LLC (diversified financial services company, 2003-2010).
Adrien E. Deberghes (1967)
Year of Election or Appointment: 2016
Assistant Treasurer
Mr. Deberghes also serves as an officer of other funds. He serves as Assistant Treasurer of FMR Capital, Inc. (2017-present), Executive Vice President of Fidelity Investments Money Management, Inc. (FIMM) (investment adviser firm, 2016-present), and is an employee of Fidelity Investments (2008-present). Previously, Mr. Deberghes served as President and Treasurer of certain Fidelity® funds (2013-2018). Prior to joining Fidelity Investments, Mr. Deberghes was Senior Vice President of Mutual Fund Administration at State Street Corporation (2007-2008), Senior Director of Mutual Fund Administration at Investors Bank & Trust (2005-2007), and Director of Finance for Dunkin' Brands (2000-2005). Previously, Mr. Deberghes served in other fund officer roles.
Laura M. Del Prato (1964)
Year of Election or Appointment: 2018
Assistant Treasurer
Ms. Del Prato also serves as an officer of other funds. Ms. Del Prato is an employee of Fidelity Investments (2017-present). Prior to joining Fidelity Investments, Ms. Del Prato served as a Managing Director and Treasurer of the JPMorgan Mutual Funds (2014-2017). Prior to JPMorgan, Ms. Del Prato served as a partner at Cohen Fund Audit Services (accounting firm, 2012-2013) and KPMG LLP (accounting firm, 2004-2012).
Colm A. Hogan (1973)
Year of Election or Appointment: 2016
Deputy Treasurer
Mr. Hogan also serves as an officer of other funds. Mr. Hogan serves as Assistant Treasurer of FMR Capital, Inc. (2017-present) and is an employee of Fidelity Investments (2005-present). Previously, Mr. Hogan served as Assistant Treasurer of certain Fidelity® funds (2016-2018).
Pamela R. Holding (1964)
Year of Election or Appointment: 2018
Vice President
Ms. Holding also serves as Vice President of other funds. Ms. Holding serves as Co-Head of Global Equity Research (2018-present) and is an employee of Fidelity Investments (2013-present).
Chris Maher (1972)
Year of Election or Appointment: 2013
Assistant Treasurer
Mr. Maher serves as Assistant Treasurer of other funds. Mr. Maher is Vice President of Valuation Oversight, serves as Assistant Treasurer of FMR Capital, Inc. (2017-present), and is an employee of Fidelity Investments. Previously, Mr. Maher served as Vice President of Asset Management Compliance (2013), Vice President of the Program Management Group of FMR (investment adviser firm, 2010-2013), and Vice President of Valuation Oversight (2008-2010).
Rieco E. Mello (1969)
Year of Election or Appointment: 2017
Assistant Treasurer
Mr. Mello also serves as Assistant Treasurer of other funds. Mr. Mello serves as Assistant Treasurer of FMR Capital, Inc. (2017-present) and is an employee of Fidelity Investments (1995-present).
Kenneth B. Robins (1969)
Year of Election or Appointment: 2016
Chief Compliance Officer
Mr. Robins also serves as an officer of other funds. Mr. Robins serves as Compliance Officer of Fidelity Management & Research Company and FMR Co., Inc. (investment adviser firms, 2016-present) and is an employee of Fidelity Investments (2004-present). Previously, Mr. Robins served as Executive Vice President of Fidelity Investments Money Management, Inc. (investment adviser firm, 2013-2016) and served in other fund officer roles.
Stacie M. Smith (1974)
Year of Election or Appointment: 2016
President and Treasurer
Ms. Smith also serves as an officer of other funds. Ms. Smith serves as Assistant Treasurer of FMR Capital, Inc. (2017-present), is an employee of Fidelity Investments (2009-present), and has served in other fund officer roles. Prior to joining Fidelity Investments, Ms. Smith served as Senior Audit Manager of Ernst & Young LLP (accounting firm, 1996-2009). Previously, Ms. Smith served as Assistant Treasurer (2013-2018) and Deputy Treasurer (2013-2016) of certain Fidelity® funds.
Marc L. Spector (1972)
Year of Election or Appointment: 2016
Assistant Treasurer
Mr. Spector also serves as an officer of other funds. Mr. Spector serves as Assistant Treasurer of FMR Capital, Inc. (2017-present) and is an employee of Fidelity Investments (2016-present). Prior to joining Fidelity Investments, Mr. Spector served as Director at the Siegfried Group (accounting firm, 2013-2016), and prior to Siegfried Group as audit senior manager at Deloitte & Touche (accounting firm, 2005-2013).
Shareholder Expense Example
As a shareholder of the Fund, you incur two types of costs: (1) transaction costs, including sales charges (loads) on purchase payments or redemption proceeds, and (2) ongoing costs, including management fees, distribution and/or service (12b-1) fees and other Fund expenses. This Example is intended to help you understand your ongoing costs (in dollars) of investing in the Fund and to compare these costs with the ongoing costs of investing in other mutual funds.
The actual expense Example is based on an investment of $1,000 invested at the beginning of the period and held for the entire period (June 1, 2018 to November 30, 2018) for Class A, Class M, Class C, Convertible Securities and Class I, and for the period (October 2, 2018 to November 30, 2018) for Class Z. The hypothetical expense Example is based on an investment of $1,000 invested for the one-half year period (June 1, 2018 to November 30, 2018).
Actual Expenses
The first line of the accompanying table for each class of the Fund provides information about actual account values and actual expenses. You may use the information in this line, together with the amount you invested, to estimate the expenses that you paid over the period. Simply divide your account value by $1,000.00 (for example, an $8,600 account value divided by $1,000.00 = 8.6), then multiply the result by the number in the first line for a class of the Fund under the heading entitled "Expenses Paid During Period" to estimate the expenses you paid on your account during this period. A small balance maintenance fee of $12.00 that is charged once a year may apply for certain accounts with a value of less than $2,000. This fee, which was eliminated effective August 1, 2018, is not included in the table below. If it was, the estimate of expenses you paid during the period would be higher, and your ending account value lower, by this amount. In addition, the Fund, as a shareholder in the underlying Fidelity Central Funds, will indirectly bear its pro-rata share of the fees and expenses incurred by the underlying Fidelity Central Funds. These fees and expenses are not included in the Fund's annualized expense ratio used to calculate the expense estimate in the table below.
Hypothetical Example for Comparison Purposes
The second line of the accompanying table for each class of the Fund provides information about hypothetical account values and hypothetical expenses based on a Class' actual expense ratio and an assumed rate of return of 5% per year before expenses, which is not the Class' actual return. The hypothetical account values and expenses may not be used to estimate the actual ending account balance or expenses you paid for the period. You may use this information to compare the ongoing costs of investing in the Fund and other funds. To do so, compare this 5% hypothetical example with the 5% hypothetical examples that appear in the shareholder reports of the other funds. A small balance maintenance fee of $12.00 that is charged once a year may apply for certain accounts with a value of less than $2,000. This fee, which was eliminated effective August 1, 2018, is not included in the table below. If it was, the estimate of expenses you paid during the period would be higher, and your ending account value lower, by this amount. In addition, the Fund, as a shareholder in the underlying Fidelity Central Funds, will indirectly bear its pro-rata share of the fees and expenses incurred by the underlying Fidelity Central Funds. These fees and expenses are not included in the Fund's annualized expense ratio used to calculate the expense estimate in the table below.
Please note that the expenses shown in the table are meant to highlight your ongoing costs only and do not reflect any transaction costs. Therefore, the second line of the table is useful in comparing ongoing costs only, and will not help you determine the relative total costs of owning different funds. In addition, if these transactional costs were included, your costs would have been higher.
| | Annualized Expense Ratio-A | Beginning
Account Value
| Ending
Account Value
November 30, 2018 | Expenses Paid
During Period
|
| Class A | .75% | | | |
| Actual | | $1,000.00 | $991.40 | $3.74-B |
| Hypothetical-C | | $1,000.00 | $1,021.31 | $3.80-D |
| Class M | 1.04% | | | |
| Actual | | $1,000.00 | $990.00 | $5.19-B |
| Hypothetical-C | | $1,000.00 | $1,019.85 | $5.27-D |
| Class C | 1.50% | | | |
| Actual | | $1,000.00 | $987.60 | $7.47-B |
| Hypothetical-C | | $1,000.00 | $1,017.55 | $7.59-D |
| Convertible Securities | .46% | | | |
| Actual | | $1,000.00 | $992.90 | $2.30-B |
| Hypothetical-C | | $1,000.00 | $1,022.76 | $2.33-D |
| Class I | .47% | | | |
| Actual | | $1,000.00 | $992.50 | $2.35-B |
| Hypothetical-C | | $1,000.00 | $1,022.71 | $2.38-D |
| Class Z | .37% | | | |
| Actual | | $1,000.00 | $972.60 | $.60-B |
| Hypothetical-C | | $1,000.00 | $1,023.21 | $1.88-D |
A Annualized expense ratio reflects expenses net of applicable fee waivers.
B Actual expenses are equal to each Class' annualized expense ratio, multiplied by the average account value over the period, multiplied by 183/365 (to reflect the one-half year period) for Class A, Class M, Class C, Convertible Securities and Class I, and multiplied by 60/365 (to reflect the period October 2, 2018 to November 30, 2018) for Class Z.
C 5% return per year before expenses
D Hypothetical expenses are equal to each Class' annualized expense ratio, multiplied by the average account value over the period, multiplied by 183/365 (to reflect the one-half year period).
Distributions (Unaudited)
The Board of Trustees of Fidelity Convertible Securities Fund voted to pay to shareholders of record at the opening of business on record date, the following distributions per share derived from capital gains realized from sales of portfolio securities, and dividends derived from net investment income:
| | Pay Date | Record Date | Dividends | Capital Gains |
| Fidelity Convertible Securities Fund | | | | |
| Class A | 12/27/18 | 12/26/18 | $0.171 | $1.509 |
| Class M | 12/27/18 | 12/26/18 | $0.152 | $1.509 |
| Class C | 12/27/18 | 12/26/18 | $0.117 | $1.509 |
| Convertible Securities | 12/27/18 | 12/26/18 | $0.193 | $1.509 |
| Class I | 12/27/18 | 12/26/18 | $0.192 | $1.509 |
| Class Z | 12/27/18 | 12/26/18 | $0.203 | $1.509 |
|
The fund hereby designates as a capital gain dividend with respect to the taxable year ended November 30, 2018, $54,951,523, or, if subsequently determined to be different, the net capital gain of such year.
A total of 4.90% of the dividends distributed during the fiscal year was derived from interest on U.S. Government securities which is generally exempt from state income tax.
The fund designates $19,399,278 of distributions paid during the period January 1, 2018 to November 30, 2018 as qualifying to be taxed as interest-related dividends for nonresident alien shareholders.
Class A designates 0%, 21%, 21%, and 20%; Class M designates 0%, 29%, 25%, and 21%; Class C designates 0%, 28%, 29%, and 24%; Convertible Securities designates 0%, 19%, 19%, and 19%; and Class I designates 0%, 19%, 19%, and 19%; of the dividends distributed in December 2017, April 2018, July 2018, and October 2018, respectively during the fiscal year; and Class Z designates 19% of the dividend distributed in October 2018 during the fiscal year as qualifying for the dividends–received deduction for corporate shareholders.
Class A designates 1%, 23%, 23%, and 22%; Class M designates 1%, 31%, 27%, and 24%; Class C designates 1%, 31%, 32%, and 26%; Convertible Securities designates 1%, 21%, 21%, and 21%; and Class I designates 1%, 21%, 21%, and 21%; of the dividends distributed in December 2017, April 2018, July 2018, and October 2018, respectively during the fiscal year; and Class Z designates 21% of the dividend distributed in October 2018 during the fiscal year as amounts which may be taken into account as a dividend for purposes of the maximum rate under section 1(h)(11) of the Internal Revenue Code.
The fund will notify shareholders in January 2019 of amounts for use in preparing 2018 income tax returns.
Board Approval of Investment Advisory Contracts
Fidelity Convertible Securities Fund
At its July 2018 meeting, the Board of Trustees, including the Independent Trustees (together, the Board), voted to continue the management contract with Fidelity Management & Research Company (FMR) and the sub-advisory agreements (together, the Advisory Contracts) for the fund for six months through January 31, 2019, in connection with the reunification of the Fidelity Equity High Income Funds Board, which oversees the fund, and the Sector Portfolios Board.
The Board considered that the approval of the fund's Advisory Contracts will not result in any changes in (i) the investment process or strategies employed in the management of the fund's assets; (ii) the fees and expenses paid by shareholders; (iii) the nature, extent or quality of services provided under the fund's Advisory Contracts; or (iv) the day-to-day management of the fund or the persons primarily responsible for such management. The Board concluded that the fund's Advisory Contracts are fair and reasonable, and that the fund's Advisory Contracts should be renewed, without modification, through January 31, 2019, with the understanding that the Board will consider the annual renewal for a full one year period in January 2019.
In connection with its consideration of future renewals of the fund's Advisory Contracts, the Board will consider: (i) the nature, extent and quality of services provided to the fund, including shareholder and administrative services and investment performance; (ii) the competitiveness of the management fee and total expenses for the fund; (iii) the costs of the services and profitability, including the revenues earned and the expenses incurred in conducting the business of developing, marketing, distributing, managing, administering, and servicing the fund and its shareholders, to the extent applicable, as well as potential fall-out benefits from Fidelity's non-fund businesses; and (iv) whether there have been economies of scale in respect of the Fidelity funds, whether the Fidelity funds (including the fund) have appropriately benefited from any such economies of scale, and whether there is the potential for realization of any further economies.
Based on its evaluation of all of the conclusions noted above, and after considering all factors it believed relevant, the Board ultimately concluded that the fund's management fee structure is fair and reasonable, and that the continuation of the fund's Advisory Contracts should be approved.
Corporate Headquarters
245 Summer St.
Boston, MA 02210
www.fidelity.com
CVS-ANN-0119
1.539184.121
Fidelity® Equity Dividend Income Fund
Annual Report November 30, 2018 |
|
Beginning on January 1, 2021, as permitted by regulations adopted by the Securities and Exchange Commission, paper copies of a fund’s shareholder reports will no longer be sent by mail, unless you specifically request paper copies of the reports from the fund or from your financial intermediary, such as a financial advisor, broker-dealer or bank. Instead, the reports will be made available on a website, and you will be notified by mail each time a report is posted and provided with a website link to access the report.
If you already elected to receive shareholder reports electronically, you will not be affected by this change and you need not take any action. You may elect to receive shareholder reports and other communications from a fund electronically, by contacting your financial intermediary. For Fidelity customers, visit Fidelity's web site or call Fidelity using the contact information listed below.
You may elect to receive all future reports in paper free of charge. If you wish to continue receiving paper copies of your shareholder reports, you may contact your financial intermediary or, if you are a Fidelity customer, visit Fidelity’s website, or call Fidelity at the applicable toll-free number listed below. Your election to receive reports in paper will apply to all funds held with the fund complex/your financial intermediary.
| Account Type | Website | Phone Number |
| Brokerage, Mutual Fund, or Annuity Contracts: | fidelity.com/mailpreferences | 1-800-343-3548 |
| Employer Provided Retirement Accounts: | netbenefits.fidelity.com/preferences (choose 'no' under Required Disclosures to continue to print) | 1-800-343-0860 |
| Advisor Sold Accounts Serviced Through Your Financial Intermediary: | Contact Your Financial Intermediary | Your Financial Intermediary's phone number |
| Advisor Sold Accounts Serviced by Fidelity: | institutional.fidelity.com | 1-877-208-0098 |
Contents
To view a fund's proxy voting guidelines and proxy voting record for the 12-month period ended June 30, visit http://www.fidelity.com/proxyvotingresults or visit the Securities and Exchange Commission's (SEC) web site at http://www.sec.gov.
You may also call 1-800-544-8544 to request a free copy of the proxy voting guidelines.
Standard & Poor's, S&P and S&P 500 are registered service marks of The McGraw-Hill Companies, Inc. and have been licensed for use by Fidelity Distributors Corporation.
Other third-party marks appearing herein are the property of their respective owners.
All other marks appearing herein are registered or unregistered trademarks or service marks of FMR LLC or an affiliated company. © 2019 FMR LLC. All rights reserved.
This report and the financial statements contained herein are submitted for the general information of the shareholders of the Fund. This report is not authorized for distribution to prospective investors in the Fund unless preceded or accompanied by an effective prospectus.
A fund files its complete schedule of portfolio holdings with the SEC for the first and third quarters of each fiscal year on Form N-Q. Forms N-Q are available on the SEC’s web site at http://www.sec.gov. A fund's Forms N-Q may be reviewed and copied at the SEC’s Public Reference Room in Washington, DC. Information regarding the operation of the SEC's Public Reference Room may be obtained by calling 1-800-SEC-0330.
For a complete list of a fund's portfolio holdings, view the most recent holdings listing, semiannual report, or annual report on Fidelity's web site at http://www.fidelity.com, http://www.institutional.fidelity.com, or http://www.401k.com, as applicable.
NOT FDIC INSURED •MAY LOSE VALUE •NO BANK GUARANTEE
Neither the Fund nor Fidelity Distributors Corporation is a bank.
Performance: The Bottom Line
Average annual total return reflects the change in the value of an investment, assuming reinvestment of distributions from dividend income and capital gains (the profits earned upon the sale of securities that have grown in value, if any) and assuming a constant rate of performance each year. The hypothetical investment and the average annual total returns do not reflect the deduction of taxes that a shareholder would pay on fund distributions or the redemption of fund shares. During periods of reimbursement by Fidelity, a fund’s total return will be greater than it would be had the reimbursement not occurred. How a fund did yesterday is no guarantee of how it will do tomorrow.
Average Annual Total Returns
| For the periods ended November 30, 2018 | Past 1 year | Past 5 years | Past 10 years |
| Fidelity® Equity Dividend Income Fund | 1.28% | 7.98% | 11.40% |
$10,000 Over 10 Years
Let's say hypothetically that $10,000 was invested in Fidelity® Equity Dividend Income Fund, a class of the fund, on November 30, 2008.
The chart shows how the value of your investment would have changed, and also shows how the Russell 3000® Value Index performed over the same period.
See above for additional information regarding the performance of Fidelity® Equity Dividend Income Fund.

| Period Ending Values |
| $29,430 | Fidelity® Equity Dividend Income Fund |
| $32,382 | Russell 3000® Value Index |
Management's Discussion of Fund Performance
Market Recap: The S&P 500
® index gained 6.27% for the 12 months ending November 30, 2018, as the U.S. equity bellwether declined sharply in October after climbing steadily beginning in May and achieving a record close in late September. Rising U.S. Treasury yields and concern about peaking corporate earnings growth sent many investors fleeing from risk assets at a time when they were still dealing with lingering uncertainty related to global trade and the U.S. Federal Reserve picking up the pace of interest rate hikes. The index returned -6.84% in October alone, its largest monthly drop in roughly seven years, and then endured a highly volatile November in which it gained 2.04%. For the full year, growth stocks within the index maintained a sizable advantage over their value counterparts, extending a trend that began in early 2017. A number of economically sensitive sectors dropped to the bottom of the 12-month performance scale, with materials (-7%) and energy (-2%) faring worst, followed by industrials (-1%) and financials (0%). In contrast, the defensive-oriented health care sector gained about 16% to lead the way. Consumer discretionary and information technology were rattled in October but earlier strength resulted in each advancing roughly 13% for the full 12 months. The newly reconstituted communication services sector, which includes dividend-rich telecom stocks, rose about 4%. Real estate (+5%), consumer staples (+3%) and utilities (+2%) also advanced but lagged the broader market.
Comments from Portfolio Manager John Sheehy: For the fiscal year, the fund’s share classes gained roughly 1%, trailing the 2.62% return of the benchmark Russell 3000
® Value Index. Versus the benchmark, positioning within the food, beverage & tobacco segment of the consumer staples sector detracted most. Stock selection in health care and materials also notably hurt. A large out-of-benchmark stake in British American Tobacco was by far the fund’s biggest detractor this period. Competition from e-cigarette products disrupted the industry, while regulatory headwinds increased. In health care, relative performance was hurt by avoiding big pharma names and benchmark components Merck and Pfizer, given their strength the past 12 months. Bank OZK – formerly Bank of the Ozarks – was an overweighting that detracted. Conversely, positioning in communication services and information technology lifted relative performance most. In the former group, fund performance benefited from overweighting Verizon Communications, the fund’s largest holding at period end, and underweighting AT&T. Biotechnology leader Amgen rewarded our sizable overweighting, while timely positioning in networking equipment maker Cisco Systems also was helpful.
The views expressed above reflect those of the portfolio manager(s) only through the end of the period as stated on the cover of this report and do not necessarily represent the views of Fidelity or any other person in the Fidelity organization. Any such views are subject to change at any time based upon market or other conditions and Fidelity disclaims any responsibility to update such views. These views may not be relied on as investment advice and, because investment decisions for a Fidelity fund are based on numerous factors, may not be relied on as an indication of trading intent on behalf of any Fidelity fund.
Note to shareholders: On December 30, 2017, former Portfolio Manager Scott Offen retired from Fidelity, leaving John Sheehy as sole Portfolio Manager of the fund.
Investment Summary (Unaudited)
Top Ten Stocks as of November 30, 2018
| | % of fund's net assets |
| Verizon Communications, Inc. | 4.3 |
| Wells Fargo & Co. | 4.1 |
| Chevron Corp. | 3.5 |
| Johnson & Johnson | 3.0 |
| United Technologies Corp. | 2.9 |
| Amgen, Inc. | 2.4 |
| Comcast Corp. Class A | 2.2 |
| Chubb Ltd. | 2.2 |
| Bank of America Corp. | 2.1 |
| British American Tobacco PLC sponsored ADR | 1.9 |
| | 28.6 |
Top Five Market Sectors as of November 30, 2018
| | % of fund's net assets |
| Financials | 21.9 |
| Health Care | 14.6 |
| Communication Services | 12.2 |
| Energy | 9.9 |
| Industrials | 9.0 |
Asset Allocation (% of fund's net assets)
| As of November 30, 2018 * |
| | Stocks | 97.6% |
| | Short-Term Investments and Net Other Assets (Liabilities) | 2.4% |

* Foreign investments - 17.1%
Schedule of Investments November 30, 2018
Showing Percentage of Net Assets
| Common Stocks - 97.6% | | | |
| | | Shares | Value (000s) |
| COMMUNICATION SERVICES - 12.2% | | | |
| Diversified Telecommunication Services - 4.8% | | | |
| AT&T, Inc. | | 883,180 | $27,591 |
| Verizon Communications, Inc. | | 3,634,400 | 219,160 |
| | | | 246,751 |
| Entertainment - 2.4% | | | |
| Cinemark Holdings, Inc. | | 1,126,400 | 43,220 |
| The Walt Disney Co. | | 660,000 | 76,223 |
| | | | 119,443 |
| Media - 5.0% | | | |
| Comcast Corp. Class A | | 2,906,800 | 113,394 |
| Informa PLC | | 3,614,601 | 31,836 |
| Interpublic Group of Companies, Inc. | | 1,804,400 | 42,403 |
| Omnicom Group, Inc. | | 882,600 | 67,934 |
| | | | 255,567 |
|
| TOTAL COMMUNICATION SERVICES | | | 621,761 |
|
| CONSUMER DISCRETIONARY - 2.5% | | | |
| Automobiles - 0.3% | | | |
| Subaru Corp. | | 588,700 | 13,085 |
| Hotels, Restaurants & Leisure - 1.7% | | | |
| Six Flags Entertainment Corp. | | 581,300 | 35,669 |
| Wyndham Destinations, Inc. | | 793,300 | 32,898 |
| Wyndham Hotels & Resorts, Inc. | | 388,500 | 19,476 |
| | | | 88,043 |
| Specialty Retail - 0.4% | | | |
| Lowe's Companies, Inc. | | 226,400 | 21,365 |
| Textiles, Apparel & Luxury Goods - 0.1% | | | |
| Tapestry, Inc. | | 135,100 | 5,259 |
|
| TOTAL CONSUMER DISCRETIONARY | | | 127,752 |
|
| CONSUMER STAPLES - 8.3% | | | |
| Beverages - 0.8% | | | |
| Molson Coors Brewing Co. Class B | | 614,200 | 40,396 |
| Food Products - 2.2% | | | |
| General Mills, Inc. | | 904,750 | 38,280 |
| Kellogg Co. | | 227,800 | 14,499 |
| The J.M. Smucker Co. | | 550,500 | 57,533 |
| | | | 110,312 |
| Household Products - 0.6% | | | |
| Reckitt Benckiser Group PLC | | 366,600 | 30,516 |
| Personal Products - 1.2% | | | |
| Unilever NV (NY Reg.) | | 1,085,200 | 60,239 |
| Tobacco - 3.5% | | | |
| Altria Group, Inc. | | 1,178,600 | 64,623 |
| British American Tobacco PLC sponsored ADR | | 2,767,400 | 96,499 |
| Imperial Tobacco Group PLC | | 617,337 | 18,958 |
| | | | 180,080 |
|
| TOTAL CONSUMER STAPLES | | | 421,543 |
|
| ENERGY - 9.9% | | | |
| Energy Equipment & Services - 0.5% | | | |
| Baker Hughes, a GE Co. Class A | | 1,183,600 | 27,010 |
| Oil, Gas & Consumable Fuels - 9.4% | | | |
| BP PLC sponsored ADR | | 932,500 | 37,626 |
| Chevron Corp. | | 1,492,870 | 177,562 |
| Enterprise Products Partners LP | | 2,386,100 | 62,635 |
| Suncor Energy, Inc. (a) | | 2,097,800 | 67,640 |
| Targa Resources Corp. | | 300,200 | 13,398 |
| The Williams Companies, Inc. | | 2,901,200 | 73,458 |
| Valero Energy Corp. | | 581,300 | 46,446 |
| | | | 478,765 |
|
| TOTAL ENERGY | | | 505,775 |
|
| FINANCIALS - 21.9% | | | |
| Banks - 10.1% | | | |
| Bank of America Corp. | | 3,864,200 | 109,743 |
| Bank of the Ozarks, Inc. | | 953,700 | 25,845 |
| First Hawaiian, Inc. | | 657,500 | 17,108 |
| Huntington Bancshares, Inc. | | 1,933,000 | 28,202 |
| JPMorgan Chase & Co. | | 759,722 | 84,473 |
| PNC Financial Services Group, Inc. | | 293,500 | 39,851 |
| Wells Fargo & Co. | | 3,840,208 | 208,446 |
| | | | 513,668 |
| Capital Markets - 3.9% | | | |
| Apollo Global Management LLC Class A | | 1,739,900 | 49,048 |
| Lazard Ltd. Class A | | 406,600 | 16,313 |
| Northern Trust Corp. | | 317,700 | 31,525 |
| OM Asset Management Ltd. | | 736,800 | 9,704 |
| State Street Corp. | | 915,400 | 66,843 |
| The Blackstone Group LP | | 722,100 | 24,356 |
| | | | 197,789 |
| Consumer Finance - 2.3% | | | |
| Capital One Financial Corp. | | 709,000 | 63,583 |
| Discover Financial Services | | 545,900 | 38,923 |
| Synchrony Financial | | 648,500 | 16,848 |
| | | | 119,354 |
| Insurance - 5.1% | | | |
| Chubb Ltd. | | 832,379 | 111,322 |
| First American Financial Corp. | | 417,300 | 20,168 |
| FNF Group | | 730,500 | 24,545 |
| Principal Financial Group, Inc. | | 465,600 | 22,963 |
| The Travelers Companies, Inc. | | 606,600 | 79,082 |
| | | | 258,080 |
| Mortgage Real Estate Investment Trusts - 0.5% | | | |
| AGNC Investment Corp. | | 1,581,100 | 27,985 |
|
| TOTAL FINANCIALS | | | 1,116,876 |
|
| HEALTH CARE - 14.6% | | | |
| Biotechnology - 2.4% | | | |
| Amgen, Inc. | | 586,800 | 122,201 |
| Health Care Equipment & Supplies - 0.6% | | | |
| Becton, Dickinson & Co. | | 124,300 | 31,417 |
| Health Care Providers & Services - 4.6% | | | |
| AmerisourceBergen Corp. | | 359,700 | 31,977 |
| CVS Health Corp. | | 1,146,826 | 91,975 |
| McKesson Corp. | | 364,600 | 45,393 |
| UnitedHealth Group, Inc. | | 236,100 | 66,429 |
| | | | 235,774 |
| Pharmaceuticals - 7.0% | | | |
| Bayer AG | | 259,400 | 19,035 |
| GlaxoSmithKline PLC | | 3,311,675 | 68,651 |
| Johnson & Johnson | | 1,049,666 | 154,196 |
| Roche Holding AG (participation certificate) | | 189,987 | 49,318 |
| Sanofi SA sponsored ADR | | 1,419,900 | 64,392 |
| | | | 355,592 |
|
| TOTAL HEALTH CARE | | | 744,984 |
|
| INDUSTRIALS - 9.0% | | | |
| Aerospace & Defense - 5.0% | | | |
| General Dynamics Corp. | | 511,900 | 94,645 |
| Northrop Grumman Corp. | | 47,000 | 12,214 |
| United Technologies Corp. | | 1,228,030 | 149,623 |
| | | | 256,482 |
| Industrial Conglomerates - 0.7% | | | |
| General Electric Co. | | 4,919,597 | 36,897 |
| Machinery - 2.9% | | | |
| Allison Transmission Holdings, Inc. | | 285,900 | 13,469 |
| Cummins, Inc. | | 157,300 | 23,762 |
| Deere & Co. | | 235,700 | 36,505 |
| Minebea Mitsumi, Inc. | | 685,300 | 11,120 |
| Snap-On, Inc. | | 129,400 | 21,511 |
| Stanley Black & Decker, Inc. | | 335,600 | 43,913 |
| | | | 150,280 |
| Professional Services - 0.4% | | | |
| Intertrust NV (b) | | 964,830 | 15,478 |
| Nielsen Holdings PLC | | 112,600 | 3,059 |
| | | | 18,537 |
|
| TOTAL INDUSTRIALS | | | 462,196 |
|
| INFORMATION TECHNOLOGY - 6.9% | | | |
| Communications Equipment - 1.8% | | | |
| Cisco Systems, Inc. | | 1,925,500 | 92,174 |
| Electronic Equipment & Components - 0.8% | | | |
| TE Connectivity Ltd. | | 562,600 | 43,281 |
| IT Services - 2.0% | | | |
| Amdocs Ltd. | | 933,700 | 60,606 |
| Capgemini SA | | 339,300 | 39,584 |
| | | | 100,190 |
| Semiconductors & Semiconductor Equipment - 0.3% | | | |
| Qualcomm, Inc. | | 302,551 | 17,627 |
| Software - 1.3% | | | |
| Microsoft Corp. | | 575,826 | 63,853 |
| Technology Hardware, Storage & Peripherals - 0.7% | | | |
| Apple, Inc. | | 189,200 | 33,787 |
|
| TOTAL INFORMATION TECHNOLOGY | | | 350,912 |
|
| MATERIALS - 4.3% | | | |
| Chemicals - 1.7% | | | |
| DowDuPont, Inc. | | 1,491,698 | 86,295 |
| Containers & Packaging - 2.6% | | | |
| Graphic Packaging Holding Co. | | 3,879,900 | 46,520 |
| Silgan Holdings, Inc. | | 1,167,500 | 30,063 |
| WestRock Co. | | 1,175,431 | 55,375 |
| | | | 131,958 |
|
| TOTAL MATERIALS | | | 218,253 |
|
| REAL ESTATE - 3.2% | | | |
| Equity Real Estate Investment Trusts (REITs) - 3.2% | | | |
| Brandywine Realty Trust (SBI) | | 2,007,700 | 28,650 |
| CorePoint Lodging, Inc. | | 632,800 | 8,903 |
| Outfront Media, Inc. | | 567,600 | 11,795 |
| Potlatch Corp. | | 635,300 | 23,570 |
| SL Green Realty Corp. | | 387,400 | 37,353 |
| VEREIT, Inc. | | 4,829,400 | 36,945 |
| WP Carey, Inc. | | 255,400 | 17,303 |
| | | | 164,519 |
| UTILITIES - 4.8% | | | |
| Electric Utilities - 4.5% | | | |
| Duke Energy Corp. | | 655,800 | 58,084 |
| Exelon Corp. | | 1,948,300 | 90,382 |
| PPL Corp. | | 1,621,100 | 49,589 |
| Xcel Energy, Inc. | | 606,000 | 31,785 |
| | | | 229,840 |
| Independent Power and Renewable Electricity Producers - 0.3% | | | |
| NRG Yield, Inc. Class C | | 904,400 | 16,514 |
|
| TOTAL UTILITIES | | | 246,354 |
|
| TOTAL COMMON STOCKS | | | |
| (Cost $4,528,173) | | | 4,980,925 |
|
| Money Market Funds - 2.3% | | | |
| Fidelity Cash Central Fund, 2.27% (c) | | 112,607,405 | 112,630 |
| Fidelity Securities Lending Cash Central Fund 2.27% (c)(d) | | 1,313,654 | 1,314 |
| TOTAL MONEY MARKET FUNDS | | | |
| (Cost $113,944) | | | 113,944 |
| TOTAL INVESTMENT IN SECURITIES - 99.9% | | | |
| (Cost $4,642,117) | | | 5,094,869 |
| NET OTHER ASSETS (LIABILITIES) - 0.1% | | | 7,315 |
| NET ASSETS - 100% | | | $5,102,184 |
Legend
(a) Security or a portion of the security is on loan at period end.
(b) Security exempt from registration under Rule 144A of the Securities Act of 1933. These securities may be resold in transactions exempt from registration, normally to qualified institutional buyers. At the end of the period, the value of these securities amounted to $15,478,000 or 0.3% of net assets.
(c) Affiliated fund that is generally available only to investment companies and other accounts managed by Fidelity Investments. The rate quoted is the annualized seven-day yield of the fund at period end. A complete unaudited listing of the fund's holdings as of its most recent quarter end is available upon request. In addition, each Fidelity Central Fund's financial statements, which are not covered by the Fund's Report of Independent Registered Public Accounting Firm, are available on the SEC's website or upon request.
(d) Investment made with cash collateral received from securities on loan.
Affiliated Central Funds
Information regarding fiscal year to date income earned by the Fund from investments in Fidelity Central Funds is as follows:
| Fund | Income earned |
| | (Amounts in thousands) |
| Fidelity Cash Central Fund | $1,443 |
| Fidelity Securities Lending Cash Central Fund | 132 |
| Total | $1,575 |
Amounts in the income column in the above table include any capital gain distributions from underlying funds, which are presented in the corresponding line-item in the Statement of Operations if applicable.
Investment Valuation
The following is a summary of the inputs used, as of November 30, 2018, involving the Fund's assets and liabilities carried at fair value. The inputs or methodology used for valuing securities may not be an indication of the risk associated with investing in those securities. For more information on valuation inputs, and their aggregation into the levels used below, please refer to the Investment Valuation section in the accompanying Notes to Financial Statements.
| | Valuation Inputs at Reporting Date: |
| Description | Total | Level 1 | Level 2 | Level 3 |
| (Amounts in thousands) | | | | |
| Investments in Securities: | | | | |
| Equities: | | | | |
| Communication Services | $621,761 | $621,761 | $-- | $-- |
| Consumer Discretionary | 127,752 | 127,752 | -- | -- |
| Consumer Staples | 421,543 | 391,027 | 30,516 | -- |
| Energy | 505,775 | 505,775 | -- | -- |
| Financials | 1,116,876 | 1,116,876 | -- | -- |
| Health Care | 744,984 | 607,980 | 137,004 | -- |
| Industrials | 462,196 | 462,196 | -- | -- |
| Information Technology | 350,912 | 350,912 | -- | -- |
| Materials | 218,253 | 218,253 | -- | -- |
| Real Estate | 164,519 | 164,519 | -- | -- |
| Utilities | 246,354 | 246,354 | -- | -- |
| Money Market Funds | 113,944 | 113,944 | -- | -- |
| Total Investments in Securities: | $5,094,869 | $4,927,349 | $167,520 | $-- |
Other Information
Distribution of investments by country or territory of incorporation, as a percentage of Total Net Assets, is as follows (Unaudited):
| United States of America | 82.9% |
| United Kingdom | 5.8% |
| Switzerland | 4.0% |
| France | 2.1% |
| Netherlands | 1.5% |
| Canada | 1.3% |
| Bailiwick of Guernsey | 1.2% |
| Others (Individually Less Than 1%) | 1.2% |
| | 100.0% |
See accompanying notes which are an integral part of the financial statements.
Financial Statements
Statement of Assets and Liabilities
| Amounts in thousands (except per-share amounts) | | November 30, 2018 |
| Assets | | |
Investment in securities, at value (including securities loaned of $1,229) — See accompanying schedule:
Unaffiliated issuers (cost $4,528,173) | $4,980,925 | |
| Fidelity Central Funds (cost $113,944) | 113,944 | |
| Total Investment in Securities (cost $4,642,117) | | $5,094,869 |
| Foreign currency held at value (cost $226) | | 226 |
| Receivable for investments sold | | 22,933 |
| Receivable for fund shares sold | | 936 |
| Dividends receivable | | 16,801 |
| Distributions receivable from Fidelity Central Funds | | 204 |
| Prepaid expenses | | 9 |
| Other receivables | | 119 |
| Total assets | | 5,136,097 |
| Liabilities | | |
| Payable for investments purchased | $24,993 | |
| Payable for fund shares redeemed | 4,971 | |
| Accrued management fee | 1,861 | |
| Other affiliated payables | 681 | |
| Other payables and accrued expenses | 93 | |
| Collateral on securities loaned | 1,314 | |
| Total liabilities | | 33,913 |
| Net Assets | | $5,102,184 |
| Net Assets consist of: | | |
| Paid in capital | | $4,189,211 |
| Total distributable earnings (loss) | | 912,973 |
| Net Assets | | $5,102,184 |
| Net Asset Value and Maximum Offering Price | | |
| Equity Dividend Income: | | |
| Net Asset Value, offering price and redemption price per share ($4,881,694 ÷ 179,637 shares) | | $27.18 |
| Class K: | | |
| Net Asset Value, offering price and redemption price per share ($220,490 ÷ 8,113 shares) | | $27.18 |
See accompanying notes which are an integral part of the financial statements.
Statement of Operations
| Amounts in thousands | | Year ended November 30, 2018 |
| Investment Income | | |
| Dividends | | $159,805 |
| Income from Fidelity Central Funds | | 1,575 |
| Total income | | 161,380 |
| Expenses | | |
| Management fee | $23,736 | |
| Transfer agent fees | 7,292 | |
| Accounting and security lending fees | 1,102 | |
| Custodian fees and expenses | 97 | |
| Independent trustees' fees and expenses | 28 | |
| Registration fees | 105 | |
| Audit | 72 | |
| Legal | 11 | |
| Miscellaneous | 37 | |
| Total expenses before reductions | 32,480 | |
| Expense reductions | (418) | |
| Total expenses after reductions | | 32,062 |
| Net investment income (loss) | | 129,318 |
| Realized and Unrealized Gain (Loss) | | |
| Net realized gain (loss) on: | | |
| Investment securities: | | |
| Unaffiliated issuers | 480,802 | |
| Fidelity Central Funds | 3 | |
| Foreign currency transactions | 59 | |
| Total net realized gain (loss) | | 480,864 |
| Change in net unrealized appreciation (depreciation) on: | | |
| Investment securities: | | |
| Unaffiliated issuers | (552,649) | |
| Fidelity Central Funds | (1) | |
| Assets and liabilities in foreign currencies | (92) | |
| Total change in net unrealized appreciation (depreciation) | | (552,742) |
| Net gain (loss) | | (71,878) |
| Net increase (decrease) in net assets resulting from operations | | $57,440 |
See accompanying notes which are an integral part of the financial statements.
Statement of Changes in Net Assets
| Amounts in thousands | Year ended November 30, 2018 | Year ended November 30, 2017 |
| Increase (Decrease) in Net Assets | | |
| Operations | | |
| Net investment income (loss) | $129,318 | $132,091 |
| Net realized gain (loss) | 480,864 | 455,867 |
| Change in net unrealized appreciation (depreciation) | (552,742) | 175,691 |
| Net increase (decrease) in net assets resulting from operations | 57,440 | 763,649 |
| Distributions to shareholders | (534,622) | – |
| Distributions to shareholders from net investment income | – | (127,695) |
| Distributions to shareholders from net realized gain | – | (223,485) |
| Total distributions | (534,622) | (351,180) |
| Share transactions - net increase (decrease) | (6,630) | (420,557) |
| Total increase (decrease) in net assets | (483,812) | (8,088) |
| Net Assets | | |
| Beginning of period | 5,585,996 | 5,594,084 |
| End of period | $5,102,184 | $5,585,996 |
| Other Information | | |
| Undistributed net investment income end of period | | $30,373 |
See accompanying notes which are an integral part of the financial statements.
Financial Highlights
Fidelity Equity Dividend Income Fund
| Years ended November 30, | 2018 | 2017 | 2016 | 2015 | 2014 |
| Selected Per–Share Data | | | | | |
| Net asset value, beginning of period | $29.62 | $27.50 | $26.01 | $26.99 | $24.15 |
| Income from Investment Operations | | | | | |
| Net investment income (loss)A | .66 | .65 | .57 | .64 | .70B |
| Net realized and unrealized gain (loss) | (.27) | 3.20 | 2.26 | (.95)C | 2.77 |
| Total from investment operations | .39 | 3.85 | 2.83 | (.31) | 3.47 |
| Distributions from net investment income | (.66) | (.63) | (.51) | (.58) | (.63) |
| Distributions from net realized gain | (2.18) | (1.10) | (.83) | (.08) | – |
| Total distributions | (2.83)D | (1.73) | (1.34) | (.67)E | (.63) |
| Net asset value, end of period | $27.18 | $29.62 | $27.50 | $26.01 | $26.99 |
| Total ReturnF | 1.28% | 14.61% | 11.60% | (1.13)%C | 14.60% |
| Ratios to Average Net AssetsG,H | | | | | |
| Expenses before reductions | .61% | .62% | .63% | .63% | .63% |
| Expenses net of fee waivers, if any | .61% | .62% | .63% | .63% | .63% |
| Expenses net of all reductions | .60% | .61% | .62% | .62% | .63% |
| Net investment income (loss) | 2.39% | 2.35% | 2.23% | 2.42% | 2.78%B |
| Supplemental Data | | | | | |
| Net assets, end of period (in millions) | $4,882 | $5,351 | $5,296 | $4,819 | $5,253 |
| Portfolio turnover rateI | 56% | 52% | 55% | 49% | 52% |
A Calculated based on average shares outstanding during the period.
B Net investment income per share reflects a large, non-recurring dividend which amounted to $.12 per share. Excluding this non-recurring dividends, the ratio of net investment income (loss) to average net assets would have been 2.31%.
C Net realized and unrealized gain (loss) per share reflects proceeds received from litigation which amounted to $.02 per share. Excluding these litigation proceeds, the total return would have been (1.22)%
D Total distributions of $2.83 per share is comprised of distributions from net investment income of $.658 and distributions from net realized gain of $2.176 per share.
E Total distributions of $.67 per share is comprised of distributions from net investment income of $.582 and distributions from net realized gain of $.084 per share.
F Total returns would have been lower if certain expenses had not been reduced during the applicable periods shown.
G Fees and expenses of any underlying Fidelity Central Funds are not included in the Fund's expense ratio. The Fund indirectly bears its proportionate share of the expenses of any underlying Fidelity Central Funds.
H Expense ratios reflect operating expenses of the class. Expenses before reductions do not reflect amounts reimbursed by the investment adviser or reductions from brokerage service arrangements or reductions from other expense offset arrangements and do not represent the amount paid by the class during periods when reimbursements or reductions occur. Expenses net of fee waivers reflect expenses after reimbursement by the investment adviser but prior to reductions from brokerage service arrangements or other expense offset arrangements. Expenses net of all reductions represent the net expenses paid by the class.
I Amount does not include the portfolio activity of any underlying Fidelity Central Funds.
See accompanying notes which are an integral part of the financial statements.
Fidelity Equity Dividend Income Fund Class K
| Years ended November 30, | 2018 | 2017 | 2016 | 2015 | 2014 |
| Selected Per–Share Data | | | | | |
| Net asset value, beginning of period | $29.62 | $27.50 | $26.01 | $26.99 | $24.15 |
| Income from Investment Operations | | | | | |
| Net investment income (loss)A | .69 | .68 | .59 | .67 | .73B |
| Net realized and unrealized gain (loss) | (.27) | 3.20 | 2.27 | (.96)C | 2.76 |
| Total from investment operations | .42 | 3.88 | 2.86 | (.29) | 3.49 |
| Distributions from net investment income | (.69) | (.66) | (.54) | (.61) | (.65) |
| Distributions from net realized gain | (2.18) | (1.10) | (.83) | (.08) | – |
| Total distributions | (2.86)D | (1.76) | (1.37) | (.69) | (.65) |
| Net asset value, end of period | $27.18 | $29.62 | $27.50 | $26.01 | $26.99 |
| Total ReturnE | 1.39% | 14.73% | 11.72% | (1.03)%C | 14.72% |
| Ratios to Average Net AssetsF,G | | | | | |
| Expenses before reductions | .51% | .52% | .52% | .52% | .52% |
| Expenses net of fee waivers, if any | .51% | .52% | .52% | .52% | .52% |
| Expenses net of all reductions | .50% | .51% | .52% | .52% | .52% |
| Net investment income (loss) | 2.49% | 2.45% | 2.33% | 2.52% | 2.89%B |
| Supplemental Data | | | | | |
| Net assets, end of period (in millions) | $220 | $235 | $298 | $277 | $394 |
| Portfolio turnover rateH | 56% | 52% | 55% | 49% | 52% |
A Calculated based on average shares outstanding during the period.
B Net investment income per share reflects a large, non-recurring dividend which amounted to $.12 per share. Excluding this non-recurring dividends, the ratio of net investment income (loss) to average net assets would have been 2.42%.
C Net realized and unrealized gain (loss) per share reflects proceeds received from litigation which amounted to $.02 per share. Excluding these litigation proceeds, the total return would have been (1.12)%
D Total distributions of $2.86 per share is comprised of distributions from net investment income of $.686 and distributions from net realized gain of $2.176 per share.
E Total returns would have been lower if certain expenses had not been reduced during the applicable periods shown.
F Fees and expenses of any underlying Fidelity Central Funds are not included in the Fund's expense ratio. The Fund indirectly bears its proportionate share of the expenses of any underlying Fidelity Central Funds.
G Expense ratios reflect operating expenses of the class. Expenses before reductions do not reflect amounts reimbursed by the investment adviser or reductions from brokerage service arrangements or reductions from other expense offset arrangements and do not represent the amount paid by the class during periods when reimbursements or reductions occur. Expenses net of fee waivers reflect expenses after reimbursement by the investment adviser but prior to reductions from brokerage service arrangements or other expense offset arrangements. Expenses net of all reductions represent the net expenses paid by the class.
H Amount does not include the portfolio activity of any underlying Fidelity Central Funds.
See accompanying notes which are an integral part of the financial statements.
Notes to Financial Statements
For the period ended November 30, 2018
(Amounts in thousands except percentages)
1. Organization.
Fidelity Equity Dividend Income Fund (the Fund) is a fund of Fidelity Financial Trust (the Trust) and is authorized to issue an unlimited number of shares. The Trust is registered under the Investment Company Act of 1940, as amended (the 1940 Act), as an open-end management investment company organized as a Massachusetts business trust. The Fund offers Equity Dividend Income and Class K shares, each of which has equal rights as to assets and voting privileges. Each class has exclusive voting rights with respect to matters that affect that class.
2. Investments in Fidelity Central Funds.
The Fund invests in Fidelity Central Funds, which are open-end investment companies generally available only to other investment companies and accounts managed by the investment adviser and its affiliates. The Fund's Schedule of Investments lists each of the Fidelity Central Funds held as of period end, if any, as an investment of the Fund, but does not include the underlying holdings of each Fidelity Central Fund. As an Investing Fund, the Fund indirectly bears its proportionate share of the expenses of the underlying Fidelity Central Funds.
The Money Market Central Funds seek preservation of capital and current income and are managed by Fidelity Investments Money Management, Inc. (FIMM), an affiliate of the investment adviser. Annualized expenses of the Money Market Central Funds as of their most recent shareholder report date are less than .005%.
A complete unaudited list of holdings for each Fidelity Central Fund is available upon request or at the Securities and Exchange Commission (the SEC) website at www.sec.gov. In addition, the financial statements of the Fidelity Central Funds, which are not covered by the Fund's Report of Independent Registered Public Accounting Firm, are available on the SEC website or upon request.
3. Significant Accounting Policies.
The Fund is an investment company and applies the accounting and reporting guidance of the Financial Accounting Standards Board (FASB) Accounting Standards Codification Topic 946 Financial Services – Investments Companies. The financial statements have been prepared in conformity with accounting principles generally accepted in the United States of America (GAAP), which require management to make certain estimates and assumptions at the date of the financial statements. Actual results could differ from those estimates. Subsequent events, if any, through the date that the financial statements were issued have been evaluated in the preparation of the financial statements. The following summarizes the significant accounting policies of the Fund:
Investment Valuation. Investments are valued as of 4:00 p.m. Eastern time on the last calendar day of the period. The Board of Trustees (the Board) has delegated the day to day responsibility for the valuation of the Fund's investments to the Fair Value Committee (the Committee) established by the Fund's investment adviser. In accordance with valuation policies and procedures approved by the Board, the Fund attempts to obtain prices from one or more third party pricing vendors or brokers to value its investments. When current market prices, quotations or currency exchange rates are not readily available or reliable, investments will be fair valued in good faith by the Committee, in accordance with procedures adopted by the Board. Factors used in determining fair value vary by investment type and may include market or investment specific events. The frequency with which these procedures are used cannot be predicted and they may be utilized to a significant extent. The Committee oversees the Fund's valuation policies and procedures and reports to the Board on the Committee's activities and fair value determinations. The Board monitors the appropriateness of the procedures used in valuing the Fund's investments and ratifies the fair value determinations of the Committee.
The Fund categorizes the inputs to valuation techniques used to value its investments into a disclosure hierarchy consisting of three levels as shown below:
- Level 1 – quoted prices in active markets for identical investments
- Level 2 – other significant observable inputs (including quoted prices for similar investments, interest rates, prepayment speeds, etc.)
- Level 3 – unobservable inputs (including the Fund's own assumptions based on the best information available)
Valuation techniques used to value the Fund's investments by major category are as follows:
Equity securities, including restricted securities, for which market quotations are readily available, are valued at the last reported sale price or official closing price as reported by a third party pricing vendor on the primary market or exchange on which they are traded and are categorized as Level 1 in the hierarchy. In the event there were no sales during the day or closing prices are not available, securities are valued at the last quoted bid price or may be valued using the last available price and are generally categorized as Level 2 in the hierarchy. For foreign equity securities, when market or security specific events arise, comparisons to the valuation of American Depositary Receipts (ADRs), futures contracts, Exchange-Traded Funds (ETFs) and certain indexes as well as quoted prices for similar securities may be used and would be categorized as Level 2 in the hierarchy. Utilizing these techniques may result in transfers between Level 1 and Level 2. For equity securities, including restricted securities, where observable inputs are limited, assumptions about market activity and risk are used and these securities may be categorized as Level 3 in the hierarchy.
Investments in open-end mutual funds, including the Fidelity Central Funds, are valued at their closing net asset value (NAV) each business day and are categorized as Level 1 in the hierarchy.
Changes in valuation techniques may result in transfers in or out of an assigned level within the disclosure hierarchy. The aggregate value of investments by input level as of November 30, 2018 is included at the end of the Fund's Schedule of Investments.
Foreign Currency. The Fund may use foreign currency contracts to facilitate transactions in foreign-denominated securities. Gains and losses from these transactions may arise from changes in the value of the foreign currency or if the counterparties do not perform under the contracts' terms.
Foreign-denominated assets, including investment securities, and liabilities are translated into U.S. dollars at the exchange rates at period end. Purchases and sales of investment securities, income and dividends received and expenses denominated in foreign currencies are translated into U.S. dollars at the exchange rate in effect on the transaction date.
The effects of exchange rate fluctuations on investments are included with the net realized and unrealized gain (loss) on investment securities. Other foreign currency transactions resulting in realized and unrealized gain (loss) are disclosed separately.
Investment Transactions and Income. For financial reporting purposes, the Fund's investment holdings and NAV include trades executed through the end of the last business day of the period. The NAV per share for processing shareholder transactions is calculated as of the close of business of the New York Stock Exchange (NYSE), normally 4:00 p.m. Eastern time and includes trades executed through the end of the prior business day. Gains and losses on securities sold are determined on the basis of identified cost and include proceeds received from litigation. Dividend income is recorded on the ex-dividend date, except for certain dividends from foreign securities where the ex-dividend date may have passed, which are recorded as soon as the Fund is informed of the ex-dividend date. Non-cash dividends included in dividend income, if any, are recorded at the fair market value of the securities received. Income and capital gain distributions from Fidelity Central Funds, if any, are recorded on the ex-dividend date. Certain distributions received by the Fund represent a return of capital or capital gain. The Fund determines the components of these distributions subsequent to the ex-dividend date, based upon receipt of tax filings or other correspondence relating to the underlying investment. These distributions are recorded as a reduction of cost of investments and/or as a realized gain. Investment income is recorded net of foreign taxes withheld where recovery of such taxes is uncertain.
Class Allocations and Expenses. Investment income, realized and unrealized capital gains and losses, common expenses of the Fund, and certain fund-level expense reductions, if any, are allocated daily on a pro-rata basis to each class based on the relative net assets of each class to the total net assets of the Fund. Each class differs with respect to transfer agent fees incurred. Certain expense reductions may also differ by class. For the reporting period, the allocated portion of income and expenses to each class as a percent of its average net assets may vary due to the timing of recording these transactions in relation to fluctuating net assets of the classes. Expenses directly attributable to a fund are charged to that fund. Expenses attributable to more than one fund are allocated among the respective funds on the basis of relative net assets or other appropriate methods. Expense estimates are accrued in the period to which they relate and adjustments are made when actual amounts are known.
Income Tax Information and Distributions to Shareholders. Each year, the Fund intends to qualify as a regulated investment company under Subchapter M of the Internal Revenue Code, including distributing substantially all of its taxable income and realized gains. As a result, no provision for U.S. Federal income taxes is required. As of November 30, 2018, the Fund did not have any unrecognized tax benefits in the financial statements; nor is the Fund aware of any tax positions for which it is reasonably possible that the total amounts of unrecognized tax benefits will significantly change in the next twelve months. The Fund files a U.S. federal tax return, in addition to state and local tax returns as required. The Fund's federal income tax returns are subject to examination by the Internal Revenue Service (IRS) for a period of three fiscal years after they are filed. State and local tax returns may be subject to examination for an additional fiscal year depending on the jurisdiction. Foreign taxes are provided for based on the Fund's understanding of the tax rules and rates that exist in the foreign markets in which it invests.
Distributions are declared and recorded on the ex-dividend date. Income and capital gain distributions are declared separately for each class. Income and capital gain distributions are determined in accordance with income tax regulations, which may differ from GAAP. In addition, the Fund claimed a portion of the payment made to redeeming shareholders as a distribution for income tax purposes.
Capital accounts within the financial statements are adjusted for permanent book-tax differences. These adjustments have no impact on net assets or the results of operations. Capital accounts are not adjusted for temporary book-tax differences which will reverse in a subsequent period.
Book-tax differences are primarily due to foreign currency transactions, partnerships, deferred trustees compensation, and losses deferred due to wash sales.
As of period end, the cost and unrealized appreciation (depreciation) in securities, and derivatives if applicable, for federal income tax purposes were as follows:
| Gross unrealized appreciation | $753,124 |
| Gross unrealized depreciation | (324,219) |
| Net unrealized appreciation (depreciation) | $428,905 |
| Tax Cost | $4,665,964 |
The tax-based components of distributable earnings as of period end were as follows:
| Undistributed ordinary income | $25,238 |
| Undistributed long-term capital gain | $458,862 |
| Net unrealized appreciation (depreciation) on securities and other investments | $428,872 |
The tax character of distributions paid was as follows:
| | November 30, 2018 | November 30, 2017 |
| Ordinary Income | $174,692 | $ 129,532 |
| Long-term Capital Gains | 359,930 | 221,648 |
| Total | $534,622 | $ 351,180 |
Restricted Securities. The Fund may invest in securities that are subject to legal or contractual restrictions on resale. These securities generally may be resold in transactions exempt from registration or to the public if the securities are registered. Disposal of these securities may involve time-consuming negotiations and expense, and prompt sale at an acceptable price may be difficult. Information regarding restricted securities is included at the end of the Fund's Schedule of Investments.
New Rule Issuance. During August 2018, the U.S. Securities and Exchange Commission issued Final Rule Release No. 33-10532, Disclosure Update and Simplification. This Final Rule includes amendments specific to registered investment companies that are intended to eliminate overlap in disclosure requirements between Regulation S-X and GAAP. In accordance with these amendments, certain line-items in the Fund's financial statements have been combined or removed for the current period as outlined in the table below.
| Financial Statement | Current Line-Item Presentation | Prior Line-Item Presentation |
| Statement of Assets and Liabilities | Total distributable earnings (loss) | Undistributed/Distributions in excess of/Accumulated net investment income (loss)
Accumulated/Undistributed net realized gain (loss)
Net unrealized appreciation (depreciation) |
| Statement of Changes in Net Assets | N/A - removed | Undistributed/Distributions in excess of/Accumulated net investment income (loss) end of period |
| Statement of Changes in Net Assets | Distributions to shareholders | Distributions to shareholders from net investment income
Distributions to shareholders from net realized gain |
| Distributions to Shareholders Note to Financial Statements | Distributions to shareholders | Distributions to shareholders from net investment income
Distributions to shareholders from net realized gain |
4. Purchases and Sales of Investments.
Purchases and sales of securities other than short-term securities, aggregated $2,948,614 and $3,387,800, respectively.
5. Fees and Other Transactions with Affiliates.
Management Fee. Fidelity Management & Research Company (the investment adviser) and its affiliates provide the Fund with investment management related services for which the Fund pays a monthly management fee. The management fee is the sum of an individual fund fee rate that is based on an annual rate of .20% of the Fund's average net assets and an annualized group fee rate that averaged .24% during the period. The group fee rate is based upon the average net assets of all the mutual funds advised by the investment adviser, including any mutual funds previously advised by the investment adviser that are currently advised by Fidelity SelectCo, LLC, an affiliate of the investment adviser. The group fee rate decreases as assets under management increase and increases as assets under management decrease. For the reporting period, the total annual management fee rate was .44% of the Fund's average net assets.
Transfer Agent Fees. Fidelity Investments Institutional Operations Company, Inc., (FIIOC), an affiliate of the investment adviser, is the transfer, dividend disbursing and shareholder servicing agent for each class of the Fund. FIIOC receives account fees and asset-based fees that vary according to the account size and type of account of the shareholders of Equity Dividend Income, except for Class K. FIIOC receives an asset-based fee of Class K's average net assets. FIIOC pays for typesetting, printing and mailing of shareholder reports, except proxy statements.
For the period, transfer agent fees for each class were as follows:
| | Amount | % of Class-Level Average Net Assets |
| Equity Dividend Income | $7,188 | .14 |
| Class K | 104 | .05 |
| | $7,292 | |
Accounting and Security Lending Fees. Fidelity Service Company, Inc. (FSC), an affiliate of the investment adviser, maintains the Fund's accounting records. The accounting fee is based on the level of average net assets for each month. Under a separate contract, FSC administers the security lending program. The security lending fee is based on the number and duration of lending transactions. For the period, the fees were equivalent to an annual rate of .02%.
Brokerage Commissions. The Fund placed a portion of its portfolio transactions with brokerage firms which are affiliates of the investment adviser. Brokerage commissions are included in net realized gain (loss) and change in net unrealized appreciation (depreciation) in the Statement of Operations. The commissions paid to these affiliated firms were $68 for the period.
Interfund Trades. The Fund may purchase from or sell securities to other Fidelity Funds under procedures adopted by the Board. The procedures have been designed to ensure these interfund trades are executed in accordance with Rule 17a-7 of the 1940 Act. Interfund trades are included within the respective purchases and sales amounts shown in the Purchases and Sales of Investments note.
Other. During the period, the investment adviser reimbursed the Fund for certain losses in the amount of $144.
6. Committed Line of Credit.
The Fund participates with other funds managed by the investment adviser or an affiliate in a $4.25 billion credit facility (the "line of credit") to be utilized for temporary or emergency purposes to fund shareholder redemptions or for other short-term liquidity purposes. The Fund has agreed to pay commitment fees on its pro-rata portion of the line of credit, which amounted to $14 and is reflected in Miscellaneous expenses on the Statement of Operations. During the period, the Fund did not borrow on this line of credit.
7. Security Lending.
The Fund lends portfolio securities through a lending agent from time to time in order to earn additional income. For equity securities, a lending agent is used and may loan securities to certain qualified borrowers, including Fidelity Capital Markets (FCM), a broker-dealer affiliated with the Fund. On the settlement date of the loan, the Fund receives collateral (in the form of U.S. Treasury obligations, letters of credit and/or cash) against the loaned securities and maintains collateral in an amount not less than 100% of the market value of the loaned securities during the period of the loan. The market value of the loaned securities is determined at the close of business of the Fund and any additional required collateral is delivered to the Fund on the next business day. The Fund or borrower may terminate the loan at any time, and if the borrower defaults on its obligation to return the securities loaned because of insolvency or other reasons, the Fund may apply collateral received from the borrower against the obligation. The Fund may experience delays and costs in recovering the securities loaned. Any cash collateral received is invested in the Fidelity Securities Lending Cash Central Fund. The value of loaned securities and cash collateral at period end are disclosed on the Fund's Statement of Assets and Liabilities. At period end, there were no security loans outstanding with FCM. Security lending income represents the income earned on investing cash collateral, less rebates paid to borrowers and any lending agent fees associated with the loan, plus any premium payments received for lending certain types of securities. Security lending income is presented in the Statement of Operations as a component of income from Fidelity Central Funds. Total security lending income during the period amounted to $132. During the period, there were no securities loaned to FCM.
8. Expense Reductions.
Commissions paid to certain brokers with whom the investment adviser, or its affiliates, places trades on behalf of the Fund include an amount in addition to trade execution, which may be rebated back to the Fund to offset certain expenses. This amount totaled $355 for the period. In addition, through arrangements with the Fund's custodian, credits realized as a result of certain uninvested cash balances were used to reduce the Fund's expenses. During the period, these credits reduced the Fund's custody expenses by $7.
In addition, during the period the investment adviser reimbursed and/or waived a portion of fund-level operating expenses in the amount of $56.
9. Distributions to Shareholders.
Distributions to shareholders of each class were as follows:
| | Year ended
November 30, 2018 | Year ended
November 30, 2017 |
| Distributions to shareholders | | |
| Equity Dividend Income | $511,773 | $– |
| Class K | 22,849 | – |
| Total | $534,622 | $– |
| From net investment income | | |
| Equity Dividend Income | $– | $121,249 |
| Class K | – | 6,446 |
| Total | $– | $127,695 |
| From net realized gain | | |
| Equity Dividend Income | $– | $211,696 |
| Class K | – | 11,789 |
| Total | $– | $223,485 |
10. Share Transactions.
Share transactions for each class were as follows and may contain automatic conversions between classes or exchanges between affiliated funds:
| | Shares | Shares | Dollars | Dollars |
| | Year ended November 30, 2018 | Year ended November 30, 2017 | Year ended November 30, 2018 | Year ended November 30, 2017 |
| Equity Dividend Income | | | | |
| Shares sold | 14,802 | 14,616 | $413,851 | $406,124 |
| Reinvestment of distributions | 17,294 | 11,480 | 479,230 | 313,561 |
| Shares redeemed | (33,103) | (38,036) | (905,388) | (1,060,571) |
| Net increase (decrease) | (1,007) | (11,940) | $(12,307) | $(340,886) |
| Class K | | | | |
| Shares sold | 1,531 | 1,803 | $42,769 | $49,981 |
| Reinvestment of distributions | 825 | 668 | 22,849 | 18,235 |
| Shares redeemed | (2,178) | (5,377) | (59,941) | (147,887) |
| Net increase (decrease) | 178 | (2,906) | $5,677 | $(79,671) |
11. Other.
The Fund's organizational documents provide former and current trustees and officers with a limited indemnification against liabilities arising in connection with the performance of their duties to the Fund. In the normal course of business, the Fund may also enter into contracts that provide general indemnifications. The Fund's maximum exposure under these arrangements is unknown as this would be dependent on future claims that may be made against the Fund. The risk of material loss from such claims is considered remote.
Report of Independent Registered Public Accounting Firm
To the Board of Trustees of Fidelity Financial Trust and Shareholders of Fidelity Equity Dividend Income Fund:
Opinion on the Financial Statements
We have audited the accompanying statement of assets and liabilities, including the schedule of investments, of Fidelity Equity Dividend Income Fund (one of the funds constituting Fidelity Financial Trust, referred to hereafter as the "Fund") as of November 30, 2018, the related statement of operations for the year ended November 30, 2018, the statement of changes in net assets for each of the two years in the period ended November 30, 2018, including the related notes, and the financial highlights for each of the five years in the period ended November 30, 2018 (collectively referred to as the “financial statements”). In our opinion, the financial statements present fairly, in all material respects, the financial position of the Fund as of November 30, 2018, the results of its operations for the year then ended, the changes in its net assets for each of the two years in the period ended November 30, 2018 and the financial highlights for each of the five years in the period ended November 30, 2018 in conformity with accounting principles generally accepted in the United States of America.
Basis for Opinion
These financial statements are the responsibility of the Fund’s management. Our responsibility is to express an opinion on the Fund’s financial statements based on our audits. We are a public accounting firm registered with the Public Company Accounting Oversight Board (United States) (“PCAOB”) and are required to be independent with respect to the Fund in accordance with the U.S. federal securities laws and the applicable rules and regulations of the Securities and Exchange Commission and the PCAOB.
We conducted our audits of these financial statements in accordance with the standards of the PCAOB. Those standards require that we plan and perform the audit to obtain reasonable assurance about whether the financial statements are free of material misstatement, whether due to error or fraud.
Our audits included performing procedures to assess the risks of material misstatement of the financial statements, whether due to error or fraud, and performing procedures that respond to those risks. Such procedures included examining, on a test basis, evidence regarding the amounts and disclosures in the financial statements. Our audits also included evaluating the accounting principles used and significant estimates made by management, as well as evaluating the overall presentation of the financial statements. Our procedures included confirmation of securities owned as of November 30, 2018 by correspondence with the custodian and brokers; when replies were not received from brokers, we performed other auditing procedures. We believe that our audits provide a reasonable basis for our opinion.
PricewaterhouseCoopers LLP
Boston, Massachusetts
January 14, 2019
We have served as the auditor of one or more investment companies in the Fidelity group of funds since 1932.
Trustees and Officers
The Trustees, Members of the Advisory Board (if any), and officers of the trust for central funds housed in an LLC: and fund, as applicable, are listed below. The Board of Trustees governs the fund and is responsible for protecting the interests of shareholders. The Trustees are experienced executives who meet periodically throughout the year to oversee the fund's activities, review contractual arrangements with companies that provide services to the fund, oversee management of the risks associated with such activities and contractual arrangements, and review the fund's performance. Except for Michael Wiley, each of the Trustees oversees 281 funds. Mr. Wiley oversees 192 funds.
The Trustees hold office without limit in time except that (a) any Trustee may resign; (b) any Trustee may be removed by written instrument, signed by at least two-thirds of the number of Trustees prior to such removal; (c) any Trustee who requests to be retired or who has become incapacitated by illness or injury may be retired by written instrument signed by a majority of the other Trustees; and (d) any Trustee may be removed at any special meeting of shareholders by a two-thirds vote of the outstanding voting securities of the trust. Each Trustee who is not an interested person (as defined in the 1940 Act) of the trust and the fund is referred to herein as an Independent Trustee. Each Independent Trustee shall retire not later than the last day of the calendar year in which his or her 75th birthday occurs. The Independent Trustees may waive this mandatory retirement age policy with respect to individual Trustees. Officers and Advisory Board Members hold office without limit in time, except that any officer or Advisory Board Member may resign or may be removed by a vote of a majority of the Trustees at any regular meeting or any special meeting of the Trustees. Except as indicated, each individual has held the office shown or other offices in the same company for the past five years.
The fund’s Statement of Additional Information (SAI) includes more information about the Trustees. To request a free copy, call Fidelity at 1-800-544-8544.
Experience, Skills, Attributes, and Qualifications of the Trustees. The Governance and Nominating Committee has adopted a statement of policy that describes the experience, qualifications, attributes, and skills that are necessary and desirable for potential Independent Trustee candidates (Statement of Policy). The Board believes that each Trustee satisfied at the time he or she was initially elected or appointed a Trustee, and continues to satisfy, the standards contemplated by the Statement of Policy. The Governance and Nominating Committee also engages professional search firms to help identify potential Independent Trustee candidates who have the experience, qualifications, attributes, and skills consistent with the Statement of Policy. From time to time, additional criteria based on the composition and skills of the current Independent Trustees, as well as experience or skills that may be appropriate in light of future changes to board composition, business conditions, and regulatory or other developments, have also been considered by the professional search firms and the Governance and Nominating Committee. In addition, the Board takes into account the Trustees' commitment and participation in Board and committee meetings, as well as their leadership of standing and ad hoc committees throughout their tenure.
In determining that a particular Trustee was and continues to be qualified to serve as a Trustee, the Board has considered a variety of criteria, none of which, in isolation, was controlling. The Board believes that, collectively, the Trustees have balanced and diverse experience, qualifications, attributes, and skills, which allow the Board to operate effectively in governing the fund and protecting the interests of shareholders. Information about the specific experience, skills, attributes, and qualifications of each Trustee, which in each case led to the Board's conclusion that the Trustee should serve (or continue to serve) as a trustee of the fund, is provided below.
Board Structure and Oversight Function. James C. Curvey is an interested person and currently serves as Chairman. The Trustees have determined that an interested Chairman is appropriate and benefits shareholders because an interested Chairman has a personal and professional stake in the quality and continuity of services provided to the fund. Independent Trustees exercise their informed business judgment to appoint an individual of their choosing to serve as Chairman, regardless of whether the Trustee happens to be independent or a member of management. The Independent Trustees have determined that they can act independently and effectively without having an Independent Trustee serve as Chairman and that a key structural component for assuring that they are in a position to do so is for the Independent Trustees to constitute a substantial majority for the Board. The Independent Trustees also regularly meet in executive session. Ned C. Lautenbach serves as Chairman of the Independent Trustees and as such (i) acts as a liaison between the Independent Trustees and management with respect to matters important to the Independent Trustees and (ii) with management prepares agendas for Board meetings.
Fidelity® funds are overseen by different Boards of Trustees. The fund's Board oversees Fidelity's high income and certain equity funds, and other Boards oversee Fidelity's investment-grade bond, money market, asset allocation, and other equity funds. The asset allocation funds may invest in Fidelity® funds overseen by the fund's Board. The use of separate Boards, each with its own committee structure, allows the Trustees of each group of Fidelity® funds to focus on the unique issues of the funds they oversee, including common research, investment, and operational issues. On occasion, the separate Boards establish joint committees to address issues of overlapping consequences for the Fidelity® funds overseen by each Board.
The Trustees operate using a system of committees to facilitate the timely and efficient consideration of all matters of importance to the Trustees, the fund, and fund shareholders and to facilitate compliance with legal and regulatory requirements and oversight of the fund's activities and associated risks. The Board, acting through its committees, has charged FMR and its affiliates with (i) identifying events or circumstances the occurrence of which could have demonstrably adverse effects on the fund's business and/or reputation; (ii) implementing processes and controls to lessen the possibility that such events or circumstances occur or to mitigate the effects of such events or circumstances if they do occur; and (iii) creating and maintaining a system designed to evaluate continuously business and market conditions in order to facilitate the identification and implementation processes described in (i) and (ii) above. Because the day-to-day operations and activities of the fund are carried out by or through FMR, its affiliates, and other service providers, the fund's exposure to risks is mitigated but not eliminated by the processes overseen by the Trustees. While each of the Board's committees has responsibility for overseeing different aspects of the fund's activities, oversight is exercised primarily through the Operations, Audit, and Compliance Committees. In addition, the Independent Trustees have worked with Fidelity to enhance the Board's oversight of investment and financial risks, legal and regulatory risks, technology risks, and operational risks, including the development of additional risk reporting to the Board. Appropriate personnel, including but not limited to the fund's Chief Compliance Officer (CCO), FMR's internal auditor, the independent accountants, the fund's Treasurer and portfolio management personnel, make periodic reports to the Board's committees, as appropriate, including an annual review of Fidelity's risk management program for the Fidelity® funds. The responsibilities of each standing committee, including their oversight responsibilities, are described further under "Standing Committees of the Trustees."
Interested Trustees*:
Correspondence intended for a Trustee who is an interested person may be sent to Fidelity Investments, 245 Summer Street, Boston, Massachusetts 02210.
Name, Year of Birth; Principal Occupations and Other Relevant Experience+
James C. Curvey (1935)
Year of Election or Appointment: 2007
Trustee
Chairman of the Board of Trustees
Mr. Curvey also serves as Trustee of other Fidelity® funds. Mr. Curvey is Vice Chairman (2007-present) and Director of FMR LLC (diversified financial services company). In addition, Mr. Curvey is an Overseer Emeritus for the Boston Symphony Orchestra, a Director of Artis-Naples, and a Trustee of Brewster Academy in Wolfeboro, New Hampshire. Previously, Mr. Curvey served as a Director of Fidelity Research & Analysis Co. (investment adviser firm, 2009-2018), Director of Fidelity Investments Money Management, Inc. (investment adviser firm, 2009-2014) and a Director of FMR and FMR Co., Inc. (investment adviser firms, 2007-2014).
* Determined to be an “Interested Trustee” by virtue of, among other things, his or her affiliation with the trust or various entities under common control with FMR.
+ The information includes the Trustee's principal occupation during the last five years and other information relating to the experience, attributes, and skills relevant to the Trustee's qualifications to serve as a Trustee, which led to the conclusion that the Trustee should serve as a Trustee for the fund.
Independent Trustees:
Correspondence intended for an Independent Trustee may be sent to Fidelity Investments, P.O. Box 55235, Boston, Massachusetts 02205-5235.
Name, Year of Birth; Principal Occupations and Other Relevant Experience+
Dennis J. Dirks (1948)
Year of Election or Appointment: 2005
Trustee
Mr. Dirks also serves as Trustee of other Fidelity® funds. Prior to his retirement in May 2003, Mr. Dirks was Chief Operating Officer and a member of the Board of The Depository Trust & Clearing Corporation (DTCC). He also served as President, Chief Operating Officer, and Board member of The Depository Trust Company (DTC) and President and Board member of the National Securities Clearing Corporation (NSCC). In addition, Mr. Dirks served as Chief Executive Officer and Board member of the Government Securities Clearing Corporation, Chief Executive Officer and Board member of the Mortgage-Backed Securities Clearing Corporation, as a Trustee and a member of the Finance Committee of Manhattan College (2005-2008), as a Trustee and a member of the Finance Committee of AHRC of Nassau County (2006-2008), as a member of the Independent Directors Council (IDC) Governing Council (2010-2015), and as a member of the Board of Directors for The Brookville Center for Children’s Services, Inc. (2009-2017). Mr. Dirks is a member of the Finance Committee (2016-present) and Board of Directors (2017-present) and is Treasurer (2018-present) of the Asolo Repertory Theatre.
Donald F. Donahue (1950)
Year of Election or Appointment: 2018
Trustee
Mr. Donahue also serves as a Trustee of other Fidelity® funds. Mr. Donahue is President and Chief Executive Officer of Miranda Partners, LLC (risk consulting for the financial services industry, 2012-present). Previously, Mr. Donahue served as a Member of the Advisory Board of certain Fidelity® funds (2015-2018) and Chief Executive Officer (2006-2012), Chief Operating Officer (2003-2006), and Managing Director, Customer Marketing and Development (1999-2003) of The Depository Trust & Clearing Corporation (financial markets infrastructure). Mr. Donahue serves as a Member (2007-present) and Co-Chairman (2016-present) of the Board of Directors of United Way of New York, Member of the Board of Directors of NYC Leadership Academy (2012-present) and Member of the Board of Advisors of Ripple Labs, Inc. (financial services, 2015-present). He also served as Chairman (2010-2012) and Member of the Board of Directors (2012-2013) of Omgeo, LLC (financial services), Treasurer of United Way of New York (2012-2016), and Member of the Board of Directors of XBRL US (financial services non-profit, 2009-2012) and the International Securities Services Association (2009-2012).
Alan J. Lacy (1953)
Year of Election or Appointment: 2008
Trustee
Mr. Lacy also serves as Trustee of other Fidelity® funds. Mr. Lacy serves as a Director of Bristol-Myers Squibb Company (global pharmaceuticals, 2008-present). He is a Trustee of the California Chapter of The Nature Conservancy (2015-present) and a Director of the Center for Advanced Study in the Behavioral Sciences at Stanford University (2015-present). In addition, Mr. Lacy served as Senior Adviser (2007-2014) of Oak Hill Capital Partners, L.P. (private equity) and also served as Chief Executive Officer (2005) and Vice Chairman (2005-2006) of Sears Holdings Corporation (retail) and Chief Executive Officer and Chairman of the Board of Sears, Roebuck and Co. (retail, 2000-2005). Previously, Mr. Lacy served as Chairman (2014-2017) and a member (2010-2017) of the Board of Directors of Dave & Buster’s Entertainment, Inc. (restaurant and entertainment complexes), as Chairman (2008-2011) and a member (2006-2015) of the Board of Trustees of the National Parks Conservation Association, and as a member of the Board of Directors for The Hillman Companies, Inc. (hardware wholesalers, 2010-2014), Earth Fare, Inc. (retail grocery, 2010-2014), and The Western Union Company (global money transfer, 2006-2011).
Ned C. Lautenbach (1944)
Year of Election or Appointment: 2000
Trustee
Chairman of the Independent Trustees
Mr. Lautenbach also serves as Trustee of other Fidelity® funds. Mr. Lautenbach currently serves as Chair (2018-present) and Member (2013-present) of the Board of Governors, State University System of Florida and is a member of the Council on Foreign Relations (1994-present). He is also a member and has most recently served as Chairman of the Board of Directors of Artis-Naples (2012-present). Previously, Mr. Lautenbach served as a member and then Lead Director of the Board of Directors of Eaton Corporation (diversified industrial, 1997-2016). He was also a Partner and Advisory Partner at Clayton, Dubilier & Rice, LLC (private equity investment, 1998-2010), as well as a Director of Sony Corporation (2006-2007). In addition, Mr. Lautenbach also had a 30-year career with IBM (technology company) during which time he served as Senior Vice President and a member of the Corporate Executive Committee (1968-1998).
Joseph Mauriello (1944)
Year of Election or Appointment: 2008
Trustee
Mr. Mauriello also serves as Trustee of other Fidelity® funds. Prior to his retirement in January 2006, Mr. Mauriello served in numerous senior management positions including Deputy Chairman and Chief Operating Officer (2004-2005), and Vice Chairman of Financial Services (2002-2004) of KPMG LLP US (professional services, 1965-2005). Mr. Mauriello currently serves as a member of the Independent Directors Council (IDC) Governing Council (2015-present). Previously, Mr. Mauriello served as a member of the Board of Directors of XL Group plc. (global insurance and re-insurance, 2006-2018).
Cornelia M. Small (1944)
Year of Election or Appointment: 2005
Trustee
Ms. Small also serves as Trustee of other Fidelity® funds. Ms. Small is a member of the Board of Directors (2009-present) and Chair of the Investment Committee (2010-present) of the Teagle Foundation. Ms. Small also serves on the Investment Committee of the Berkshire Taconic Community Foundation (2008-present). Previously, Ms. Small served as Chairperson (2002-2008) and a member of the Investment Committee and Chairperson (2008-2012) and a member of the Board of Trustees of Smith College. In addition, Ms. Small served as Chief Investment Officer, Director of Global Equity Investments, and a member of the Board of Directors of Scudder, Stevens & Clark and Scudder Kemper Investments.
Garnett A. Smith (1947)
Year of Election or Appointment: 2018
Trustee
Mr. Smith also serves as Trustee of other Fidelity® funds. Prior to Mr. Smith's retirement, he served as Chairman and Chief Executive Officer of Inbrand Corp. (manufacturer of personal absorbent products, 1990-1997). He also served as President (1986-1990) of Inbrand Corp. Prior to his employment with Inbrand Corp., he was employed by a retail fabric chain and North Carolina National Bank. In addition, Mr. Smith served as a Member of the Advisory Board of certain Fidelity® funds (2012-2013) and as a board member of the Jackson Hole Land Trust (2009-2012).
David M. Thomas (1949)
Year of Election or Appointment: 2008
Trustee
Mr. Thomas also serves as Trustee of other Fidelity® funds. Mr. Thomas serves as Non-Executive Chairman of the Board of Directors of Fortune Brands Home and Security (home and security products, 2011-present) and as a member of the Board of Directors (2004-present) and Presiding Director (2013-present) of Interpublic Group of Companies, Inc. (marketing communication). Previously, Mr. Thomas served as Executive Chairman (2005-2006) and Chairman and Chief Executive Officer (2000-2005) of IMS Health, Inc. (pharmaceutical and healthcare information solutions), a Director of Fortune Brands, Inc. (consumer products, 2000-2011), and a member of the Board of Trustees of the University of Florida (2013-2018).
Michael E. Wiley (1950)
Year of Election or Appointment: 2018
Trustee
Mr. Wiley also serves as Trustee or Member of the Advisory Board of other Fidelity® funds. Mr. Wiley serves as a Director of High Point Resources (exploration and production, 2005-present). Previously, Mr. Wiley served as a Director of Andeavor Corporation (independent oil refiner and marketer, 2005-2018), a Director of Andeavor Logistics LP (natural resources logistics, 2015-2018), a Director of Post Oak Bank (privately-held bank, 2004-2018), a Director of Asia Pacific Exploration Consolidated (international oil and gas exploration and production, 2008-2013), a member of the Board of Trustees of the University of Tulsa (2000-2006; 2007-2010), a Senior Energy Advisor of Katzenbach Partners, LLC (consulting, 2006-2007), an Advisory Director of Riverstone Holdings (private investment), a Director of Spinnaker Exploration Company (exploration and production, 2001-2005) and Chairman, President, and CEO of Baker Hughes, Inc. (oilfield services, 2000-2004).
+ The information includes the Trustee's principal occupation during the last five years and other information relating to the experience, attributes, and skills relevant to the Trustee's qualifications to serve as a Trustee, which led to the conclusion that the Trustee should serve as a Trustee for the fund.
Advisory Board Members and Officers:
Correspondence intended for a Member of the Advisory Board (if any) may be sent to Fidelity Investments, P.O. Box 55235, Boston, Massachusetts 02205-5235. Correspondence intended for an officer or Peter S. Lynch may be sent to Fidelity Investments, 245 Summer Street, Boston, Massachusetts 02210. Officers appear below in alphabetical order.
Name, Year of Birth; Principal Occupation
Vicki L. Fuller (1957)
Year of Election or Appointment: 2018
Member of the Advisory Board
Ms. Fuller also serves as Member of the Advisory Board of other Fidelity® funds. Ms. Fuller serves as a member of the Board of Directors, Audit Committee, and Nominating and Governance Committee of The Williams Companies, Inc. (natural gas infrastructure, 2018-present). Previously, Ms. Fuller served as the Chief Investment Officer of the New York State Common Retirement Fund (2012-2018) and held a variety of positions at AllianceBernstein L.P. (global asset management, 1985-2012), including Managing Director (2006-2012) and Senior Vice President and Senior Portfolio Manager (2001-2006).
Peter S. Lynch (1944)
Year of Election or Appointment: 2003
Member of the Advisory Board
Mr. Lynch also serves as Member of the Advisory Board of other Fidelity® funds. Mr. Lynch is Vice Chairman and a Director of FMR (investment adviser firm) and FMR Co., Inc. (investment adviser firm). In addition, Mr. Lynch serves as a Trustee of Boston College and as the Chairman of the Inner-City Scholarship Fund. Previously, Mr. Lynch served on the Special Olympics International Board of Directors (1997-2006).
Carol B. Tomé (1957)
Year of Election or Appointment: 2018
Member of the Advisory Board
Ms. Tomé also serves as Member of the Advisory Board of other Fidelity® funds. Ms. Tomé is Chief Financial Officer (2001-present) and Executive Vice President of Corporate Services (2007-present) of The Home Depot, Inc. (home improvement retailer) and a Director (2003-present) and Chair of the Audit Committee (2004-present) of United Parcel Service, Inc. (package delivery and supply chain management). Previously, Ms. Tomé served as Trustee of certain Fidelity® funds (2017), Senior Vice President of Finance and Accounting/Treasurer (2000-2007) and Vice President and Treasurer (1995-2000) of The Home Depot, Inc. and Chair of the Board (2010-2012), Vice Chair of the Board (2009 and 2013), and a Director (2008-2013) of the Federal Reserve Bank of Atlanta. Ms. Tomé is also a director or trustee of many community and professional organizations.
Elizabeth Paige Baumann (1968)
Year of Election or Appointment: 2017
Anti-Money Laundering (AML) Officer
Ms. Baumann also serves as AML Officer of other funds. She is Chief AML Officer (2012-present) and Senior Vice President (2014-present) of FMR LLC (diversified financial services company) and is an employee of Fidelity Investments. Previously, Ms. Baumann served as AML Officer of the funds (2012-2016), and Vice President (2007-2014) and Deputy Anti-Money Laundering Officer (2007-2012) of FMR LLC.
John J. Burke III (1964)
Year of Election or Appointment: 2018
Chief Financial Officer
Mr. Burke also serves as Chief Financial Officer of other funds. Mr. Burke serves as Head of Investment Operations for Fidelity Fund and Investment Operations (2018-present) and is an employee of Fidelity Investments (1998-present). Previously Mr. Burke served as head of Asset Management Investment Operations (2012-2018).
William C. Coffey (1969)
Year of Election or Appointment: 2018
Secretary and Chief Legal Officer (CLO)
Mr. Coffey also serves as Secretary and CLO of other funds. Mr. Coffey serves as CLO, Secretary, and Senior Vice President of Fidelity Management & Research Company and FMR Co., Inc. (investment adviser firms, 2018-present); Secretary of Fidelity SelectCo, LLC and Fidelity Investments Money Management, Inc. (investment adviser firms, 2018-present); and CLO of Fidelity Management & Research (Hong Kong) Limited, FMR Investment Management (UK) Limited, and Fidelity Management & Research (Japan) Limited (investment adviser firms, 2018-present). He is Senior Vice President and Deputy General Counsel of FMR LLC (diversified financial services company, 2010-present), and is an employee of Fidelity Investments. Previously, Mr. Coffey served as Assistant Secretary of certain funds (2009-2018) and as Vice President and Associate General Counsel of FMR LLC (2005-2009).
Timothy M. Cohen (1969)
Year of Election or Appointment: 2018
Vice President
Mr. Cohen also serves as Vice President of other funds. Mr. Cohen serves as Co-Head of Global Equity Research (2016-present), a Director of Fidelity Management & Research (Japan) Limited (investment adviser firm, 2016-present), and is an employee of Fidelity Investments. Previously, Mr. Cohen served as Chief Investment Officer - Equity and a Director of Fidelity Management & Research (U.K.) Inc. (investment adviser firm, 2013-2015) and as a Director of Fidelity Management & Research (Hong Kong) Limited (investment adviser firm, 2017).
Jonathan Davis (1968)
Year of Election or Appointment: 2010
Assistant Treasurer
Mr. Davis also serves as Assistant Treasurer of other funds. Mr. Davis serves as Assistant Treasurer of FMR Capital, Inc. (2017-present) and is an employee of Fidelity Investments. Previously, Mr. Davis served as Vice President and Associate General Counsel of FMR LLC (diversified financial services company, 2003-2010).
Adrien E. Deberghes (1967)
Year of Election or Appointment: 2016
Assistant Treasurer
Mr. Deberghes also serves as an officer of other funds. He serves as Assistant Treasurer of FMR Capital, Inc. (2017-present), Executive Vice President of Fidelity Investments Money Management, Inc. (FIMM) (investment adviser firm, 2016-present), and is an employee of Fidelity Investments (2008-present). Previously, Mr. Deberghes served as President and Treasurer of certain Fidelity® funds (2013-2018). Prior to joining Fidelity Investments, Mr. Deberghes was Senior Vice President of Mutual Fund Administration at State Street Corporation (2007-2008), Senior Director of Mutual Fund Administration at Investors Bank & Trust (2005-2007), and Director of Finance for Dunkin' Brands (2000-2005). Previously, Mr. Deberghes served in other fund officer roles.
Laura M. Del Prato (1964)
Year of Election or Appointment: 2018
Assistant Treasurer
Ms. Del Prato also serves as an officer of other funds. Ms. Del Prato is an employee of Fidelity Investments (2017-present). Prior to joining Fidelity Investments, Ms. Del Prato served as a Managing Director and Treasurer of the JPMorgan Mutual Funds (2014-2017). Prior to JPMorgan, Ms. Del Prato served as a partner at Cohen Fund Audit Services (accounting firm, 2012-2013) and KPMG LLP (accounting firm, 2004-2012).
Colm A. Hogan (1973)
Year of Election or Appointment: 2016
Deputy Treasurer
Mr. Hogan also serves as an officer of other funds. Mr. Hogan serves as Assistant Treasurer of FMR Capital, Inc. (2017-present) and is an employee of Fidelity Investments (2005-present). Previously, Mr. Hogan served as Assistant Treasurer of certain Fidelity® funds (2016-2018).
Pamela R. Holding (1964)
Year of Election or Appointment: 2018
Vice President
Ms. Holding also serves as Vice President of other funds. Ms. Holding serves as Co-Head of Global Equity Research (2018-present) and is an employee of Fidelity Investments (2013-present).
Chris Maher (1972)
Year of Election or Appointment: 2013
Assistant Treasurer
Mr. Maher serves as Assistant Treasurer of other funds. Mr. Maher is Vice President of Valuation Oversight, serves as Assistant Treasurer of FMR Capital, Inc. (2017-present), and is an employee of Fidelity Investments. Previously, Mr. Maher served as Vice President of Asset Management Compliance (2013), Vice President of the Program Management Group of FMR (investment adviser firm, 2010-2013), and Vice President of Valuation Oversight (2008-2010).
Rieco E. Mello (1969)
Year of Election or Appointment: 2017
Assistant Treasurer
Mr. Mello also serves as Assistant Treasurer of other funds. Mr. Mello serves as Assistant Treasurer of FMR Capital, Inc. (2017-present) and is an employee of Fidelity Investments (1995-present).
Kenneth B. Robins (1969)
Year of Election or Appointment: 2016
Chief Compliance Officer
Mr. Robins also serves as an officer of other funds. Mr. Robins serves as Compliance Officer of Fidelity Management & Research Company and FMR Co., Inc. (investment adviser firms, 2016-present) and is an employee of Fidelity Investments (2004-present). Previously, Mr. Robins served as Executive Vice President of Fidelity Investments Money Management, Inc. (investment adviser firm, 2013-2016) and served in other fund officer roles.
Stacie M. Smith (1974)
Year of Election or Appointment: 2016
President and Treasurer
Ms. Smith also serves as an officer of other funds. Ms. Smith serves as Assistant Treasurer of FMR Capital, Inc. (2017-present), is an employee of Fidelity Investments (2009-present), and has served in other fund officer roles. Prior to joining Fidelity Investments, Ms. Smith served as Senior Audit Manager of Ernst & Young LLP (accounting firm, 1996-2009). Previously, Ms. Smith served as Assistant Treasurer (2013-2018) and Deputy Treasurer (2013-2016) of certain Fidelity® funds.
Marc L. Spector (1972)
Year of Election or Appointment: 2016
Assistant Treasurer
Mr. Spector also serves as an officer of other funds. Mr. Spector serves as Assistant Treasurer of FMR Capital, Inc. (2017-present) and is an employee of Fidelity Investments (2016-present). Prior to joining Fidelity Investments, Mr. Spector served as Director at the Siegfried Group (accounting firm, 2013-2016), and prior to Siegfried Group as audit senior manager at Deloitte & Touche (accounting firm, 2005-2013).
Shareholder Expense Example
As a shareholder of the Fund, you incur two types of costs: (1) transaction costs and (2) ongoing costs, including management fees and other Fund expenses. This Example is intended to help you understand your ongoing costs (in dollars) of investing in the Fund and to compare these costs with the ongoing costs of investing in other mutual funds.
The Example is based on an investment of $1,000 invested at the beginning of the period and held for the entire period (June 1, 2018 to November 30, 2018).
Actual Expenses
The first line of the accompanying table for each class of the Fund provides information about actual account values and actual expenses. You may use the information in this line, together with the amount you invested, to estimate the expenses that you paid over the period. Simply divide your account value by $1,000.00 (for example, an $8,600 account value divided by $1,000.00 = 8.6), then multiply the result by the number in the first line for a class of the Fund under the heading entitled "Expenses Paid During Period" to estimate the expenses you paid on your account during this period. A small balance maintenance fee of $12.00 that is charged once a year may apply for certain accounts with a value of less than $2,000. This fee, which was eliminated effective August 1, 2018, is not included in the table below. If it was, the estimate of expenses you paid during the period would be higher, and your ending account value lower, by this amount. In addition, the Fund, as a shareholder in the underlying Fidelity Central Funds, will indirectly bear its pro-rata share of the fees and expenses incurred by the underlying Fidelity Central Funds. These fees and expenses are not included in the Fund's annualized expense ratio used to calculate the expense estimate in the table below.
Hypothetical Example for Comparison Purposes
The second line of the accompanying table for each class of the Fund provides information about hypothetical account values and hypothetical expenses based on a Class' actual expense ratio and an assumed rate of return of 5% per year before expenses, which is not the Class' actual return. The hypothetical account values and expenses may not be used to estimate the actual ending account balance or expenses you paid for the period. You may use this information to compare the ongoing costs of investing in the Fund and other funds. To do so, compare this 5% hypothetical example with the 5% hypothetical examples that appear in the shareholder reports of the other funds. A small balance maintenance fee of $12.00 that is charged once a year may apply for certain accounts with a value of less than $2,000. This fee, which was eliminated effective August 1, 2018, is not included in the table below. If it was, the estimate of expenses you paid during the period would be higher, and your ending account value lower, by this amount. In addition, the Fund, as a shareholder in the underlying Fidelity Central Funds, will indirectly bear its pro-rata share of the fees and expenses incurred by the underlying Fidelity Central Funds. These fees and expenses are not included in the Fund's annualized expense ratio used to calculate the expense estimate in the table below.
Please note that the expenses shown in the table are meant to highlight your ongoing costs only and do not reflect any transaction costs. Therefore, the second line of the table is useful in comparing ongoing costs only, and will not help you determine the relative total costs of owning different funds.
| | Annualized Expense Ratio-A | Beginning
Account Value
June 1, 2018 | Ending
Account Value
November 30, 2018 | Expenses Paid
During Period-B
June 1, 2018
to November 30, 2018 |
| Equity Dividend Income | .60% | | | |
| Actual | | $1,000.00 | $1,025.30 | $3.05 |
| Hypothetical-C | | $1,000.00 | $1,022.06 | $3.04 |
| Class K | .51% | | | |
| Actual | | $1,000.00 | $1,025.80 | $2.59 |
| Hypothetical-C | | $1,000.00 | $1,022.51 | $2.59 |
A Annualized expense ratio reflects expenses net of applicable fee waivers.
B Expenses are equal to each Class' annualized expense ratio, multiplied by the average account value over the period, multiplied by 183/365 (to reflect the one-half year period).
C 5% return per year before expenses
Distributions (Unaudited)
The Board of Trustees of Fidelity Equity Dividend Income Fund voted to pay to shareholders of record at the opening of business on record date, the following distributions per share derived from capital gains realized from sales of portfolio securities, and dividends derived from net investment income:
| | Pay Date | Record Date | Dividends | Capital Gains |
| Fidelity Equity Dividend Income Fund | | | | |
| Fidelity Equity Dividend Income Fund | 12/27/18 | 12/26/18 | $0.195 | $2.491 |
| Class K | 12/27/18 | 12/26/18 | $0.202 | $2.491 |
|
The fund hereby designates as a capital gain dividend with respect to the taxable year ended November 30, 2018, $479,502,889, or, if subsequently determined to be different, the net capital gain of such year.
A total of 0.23% of the dividends distributed during the fiscal year was derived from interest on U.S. Government securities which is generally exempt from state income tax.
Fidelity Equity Dividend Income Fund designates 42%, 100%, 100%, and 100%; Class K designates 41%, 100%, 100%, and 100% of the dividends distributed in December, April, July and October, respectively during the fiscal year as qualifying for the dividends–received deduction for corporate shareholders.
Fidelity Equity Dividend Income Fund designates 68%, 100%, 100%, and 100%; Class K designates 67%, 100%, 100%, and 100% of the dividends distributed in December, April, July and October, respectively during the fiscal year as amounts which may be taken into account as a dividend for purposes of the maximum rate under section 1(h)(11) of the Internal Revenue Code.
The fund will notify shareholders in January 2019 of amounts for use in preparing 2018 income tax returns.
Board Approval of Investment Advisory Contracts
Fidelity Equity Dividend Income Fund
At its July 2018 meeting, the Board of Trustees, including the Independent Trustees (together, the Board), voted to continue the management contract with Fidelity Management & Research Company (FMR) and the sub-advisory agreements (together, the Advisory Contracts) for the fund for six months through January 31, 2019, in connection with the reunification of the Fidelity Equity High Income Funds Board, which oversees the fund, and the Sector Portfolios Board.
The Board considered that the approval of the fund's Advisory Contracts will not result in any changes in (i) the investment process or strategies employed in the management of the fund's assets; (ii) the fees and expenses paid by shareholders; (iii) the nature, extent or quality of services provided under the fund's Advisory Contracts; or (iv) the day-to-day management of the fund or the persons primarily responsible for such management. The Board concluded that the fund's Advisory Contracts are fair and reasonable, and that the fund's Advisory Contracts should be renewed, without modification, through January 31, 2019, with the understanding that the Board will consider the annual renewal for a full one year period in January 2019.
In connection with its consideration of future renewals of the fund's Advisory Contracts, the Board will consider: (i) the nature, extent and quality of services provided to the fund, including shareholder and administrative services and investment performance; (ii) the competitiveness of the management fee and total expenses for the fund; (iii) the costs of the services and profitability, including the revenues earned and the expenses incurred in conducting the business of developing, marketing, distributing, managing, administering, and servicing the fund and its shareholders, to the extent applicable, as well as potential fall-out benefits from Fidelity's non-fund businesses; and (iv) whether there have been economies of scale in respect of the Fidelity funds, whether the Fidelity funds (including the fund) have appropriately benefited from any such economies of scale, and whether there is the potential for realization of any further economies.
Based on its evaluation of all of the conclusions noted above, and after considering all factors it believed relevant, the Board ultimately concluded that the fund's management fee structure is fair and reasonable, and that the continuation of the fund's Advisory Contracts should be approved.
Corporate Headquarters
245 Summer St.
Boston, MA 02210
www.fidelity.com
EII-ANN-0119
1.539196.121
Fidelity® Equity Dividend Income Fund Class K
Annual Report November 30, 2018 |
|
Beginning on January 1, 2021, as permitted by regulations adopted by the Securities and Exchange Commission, paper copies of a fund’s shareholder reports will no longer be sent by mail, unless you specifically request paper copies of the reports from the fund or from your financial intermediary, such as a financial advisor, broker-dealer or bank. Instead, the reports will be made available on a website, and you will be notified by mail each time a report is posted and provided with a website link to access the report.
If you already elected to receive shareholder reports electronically, you will not be affected by this change and you need not take any action. You may elect to receive shareholder reports and other communications from a fund electronically, by contacting your financial intermediary. For Fidelity customers, visit Fidelity's web site or call Fidelity using the contact information listed below.
You may elect to receive all future reports in paper free of charge. If you wish to continue receiving paper copies of your shareholder reports, you may contact your financial intermediary or, if you are a Fidelity customer, visit Fidelity’s website, or call Fidelity at the applicable toll-free number listed below. Your election to receive reports in paper will apply to all funds held with the fund complex/your financial intermediary.
| Account Type | Website | Phone Number |
| Brokerage, Mutual Fund, or Annuity Contracts: | fidelity.com/mailpreferences | 1-800-343-3548 |
| Employer Provided Retirement Accounts: | netbenefits.fidelity.com/preferences (choose 'no' under Required Disclosures to continue to print) | 1-800-343-0860 |
| Advisor Sold Accounts Serviced Through Your Financial Intermediary: | Contact Your Financial Intermediary | Your Financial Intermediary's phone number |
| Advisor Sold Accounts Serviced by Fidelity: | institutional.fidelity.com | 1-877-208-0098 |
Contents
To view a fund's proxy voting guidelines and proxy voting record for the 12-month period ended June 30, visit http://www.fidelity.com/proxyvotingresults or visit the Securities and Exchange Commission's (SEC) web site at http://www.sec.gov.
You may also call 1-800-835-5092 to request a free copy of the proxy voting guidelines.
Standard & Poor's, S&P and S&P 500 are registered service marks of The McGraw-Hill Companies, Inc. and have been licensed for use by Fidelity Distributors Corporation.
Other third-party marks appearing herein are the property of their respective owners.
All other marks appearing herein are registered or unregistered trademarks or service marks of FMR LLC or an affiliated company. © 2019 FMR LLC. All rights reserved.
This report and the financial statements contained herein are submitted for the general information of the shareholders of the Fund. This report is not authorized for distribution to prospective investors in the Fund unless preceded or accompanied by an effective prospectus.
A fund files its complete schedule of portfolio holdings with the SEC for the first and third quarters of each fiscal year on Form N-Q. Forms N-Q are available on the SEC’s web site at http://www.sec.gov. A fund's Forms N-Q may be reviewed and copied at the SEC’s Public Reference Room in Washington, DC. Information regarding the operation of the SEC's Public Reference Room may be obtained by calling 1-800-SEC-0330.
For a complete list of a fund's portfolio holdings, view the most recent holdings listing, semiannual report, or annual report on Fidelity's web site at http://www.fidelity.com, http://www.institutional.fidelity.com, or http://www.401k.com, as applicable.
NOT FDIC INSURED •MAY LOSE VALUE •NO BANK GUARANTEE
Neither the Fund nor Fidelity Distributors Corporation is a bank.
Performance: The Bottom Line
Average annual total return reflects the change in the value of an investment, assuming reinvestment of distributions from dividend income and capital gains (the profits earned upon the sale of securities that have grown in value, if any) and assuming a constant rate of performance each year. The hypothetical investment and the average annual total returns do not reflect the deduction of taxes that a shareholder would pay on fund distributions or the redemption of fund shares. During periods of reimbursement by Fidelity, a fund’s total return will be greater than it would be had the reimbursement not occurred. How a fund did yesterday is no guarantee of how it will do tomorrow.
Average Annual Total Returns
| For the periods ended November 30, 2018 | Past 1 year | Past 5 years | Past 10 years |
| Class K | 1.39% | 8.09% | 11.54% |
The initial offering of Class K shares took place on May 9, 2008. Returns prior to May 9, 2008 are those of Fidelity® Equity Dividend Income Fund, the original class of the fund.
$10,000 Over 10 Years
Let's say hypothetically that $10,000 was invested in Fidelity® Equity Dividend Income Fund - Class K on November 30, 2008.
The chart shows how the value of your investment would have changed, and also shows how the Russell 3000® Value Index performed over the same period.
See above for additional information regarding the performance of Class K.

| Period Ending Values |
| $29,805 | Fidelity® Equity Dividend Income Fund - Class K |
| $32,382 | Russell 3000® Value Index |
Management's Discussion of Fund Performance
Market Recap: The S&P 500
® index gained 6.27% for the 12 months ending November 30, 2018, as the U.S. equity bellwether declined sharply in October after climbing steadily beginning in May and achieving a record close in late September. Rising U.S. Treasury yields and concern about peaking corporate earnings growth sent many investors fleeing from risk assets at a time when they were still dealing with lingering uncertainty related to global trade and the U.S. Federal Reserve picking up the pace of interest rate hikes. The index returned -6.84% in October alone, its largest monthly drop in roughly seven years, and then endured a highly volatile November in which it gained 2.04%. For the full year, growth stocks within the index maintained a sizable advantage over their value counterparts, extending a trend that began in early 2017. A number of economically sensitive sectors dropped to the bottom of the 12-month performance scale, with materials (-7%) and energy (-2%) faring worst, followed by industrials (-1%) and financials (0%). In contrast, the defensive-oriented health care sector gained about 16% to lead the way. Consumer discretionary and information technology were rattled in October but earlier strength resulted in each advancing roughly 13% for the full 12 months. The newly reconstituted communication services sector, which includes dividend-rich telecom stocks, rose about 4%. Real estate (+5%), consumer staples (+3%) and utilities (+2%) also advanced but lagged the broader market.
Comments from Portfolio Manager John Sheehy: For the fiscal year, the fund’s share classes gained roughly 1%, trailing the 2.62% return of the benchmark Russell 3000
® Value Index. Versus the benchmark, positioning within the food, beverage & tobacco segment of the consumer staples sector detracted most. Stock selection in health care and materials also notably hurt. A large out-of-benchmark stake in British American Tobacco was by far the fund’s biggest detractor this period. Competition from e-cigarette products disrupted the industry, while regulatory headwinds increased. In health care, relative performance was hurt by avoiding big pharma names and benchmark components Merck and Pfizer, given their strength the past 12 months. Bank OZK – formerly Bank of the Ozarks – was an overweighting that detracted. Conversely, positioning in communication services and information technology lifted relative performance most. In the former group, fund performance benefited from overweighting Verizon Communications, the fund’s largest holding at period end, and underweighting AT&T. Biotechnology leader Amgen rewarded our sizable overweighting, while timely positioning in networking equipment maker Cisco Systems also was helpful.
The views expressed above reflect those of the portfolio manager(s) only through the end of the period as stated on the cover of this report and do not necessarily represent the views of Fidelity or any other person in the Fidelity organization. Any such views are subject to change at any time based upon market or other conditions and Fidelity disclaims any responsibility to update such views. These views may not be relied on as investment advice and, because investment decisions for a Fidelity fund are based on numerous factors, may not be relied on as an indication of trading intent on behalf of any Fidelity fund.
Note to shareholders: On December 30, 2017, former Portfolio Manager Scott Offen retired from Fidelity, leaving John Sheehy as sole Portfolio Manager of the fund.
Investment Summary (Unaudited)
Top Ten Stocks as of November 30, 2018
| | % of fund's net assets |
| Verizon Communications, Inc. | 4.3 |
| Wells Fargo & Co. | 4.1 |
| Chevron Corp. | 3.5 |
| Johnson & Johnson | 3.0 |
| United Technologies Corp. | 2.9 |
| Amgen, Inc. | 2.4 |
| Comcast Corp. Class A | 2.2 |
| Chubb Ltd. | 2.2 |
| Bank of America Corp. | 2.1 |
| British American Tobacco PLC sponsored ADR | 1.9 |
| | 28.6 |
Top Five Market Sectors as of November 30, 2018
| | % of fund's net assets |
| Financials | 21.9 |
| Health Care | 14.6 |
| Communication Services | 12.2 |
| Energy | 9.9 |
| Industrials | 9.0 |
Asset Allocation (% of fund's net assets)
| As of November 30, 2018* |
| | Stocks | 97.6% |
| | Short-Term Investments and Net Other Assets (Liabilities) | 2.4% |

* Foreign investments - 17.1%
Schedule of Investments November 30, 2018
Showing Percentage of Net Assets
| Common Stocks - 97.6% | | | |
| | | Shares | Value (000s) |
| COMMUNICATION SERVICES - 12.2% | | | |
| Diversified Telecommunication Services - 4.8% | | | |
| AT&T, Inc. | | 883,180 | $27,591 |
| Verizon Communications, Inc. | | 3,634,400 | 219,160 |
| | | | 246,751 |
| Entertainment - 2.4% | | | |
| Cinemark Holdings, Inc. | | 1,126,400 | 43,220 |
| The Walt Disney Co. | | 660,000 | 76,223 |
| | | | 119,443 |
| Media - 5.0% | | | |
| Comcast Corp. Class A | | 2,906,800 | 113,394 |
| Informa PLC | | 3,614,601 | 31,836 |
| Interpublic Group of Companies, Inc. | | 1,804,400 | 42,403 |
| Omnicom Group, Inc. | | 882,600 | 67,934 |
| | | | 255,567 |
|
| TOTAL COMMUNICATION SERVICES | | | 621,761 |
|
| CONSUMER DISCRETIONARY - 2.5% | | | |
| Automobiles - 0.3% | | | |
| Subaru Corp. | | 588,700 | 13,085 |
| Hotels, Restaurants & Leisure - 1.7% | | | |
| Six Flags Entertainment Corp. | | 581,300 | 35,669 |
| Wyndham Destinations, Inc. | | 793,300 | 32,898 |
| Wyndham Hotels & Resorts, Inc. | | 388,500 | 19,476 |
| | | | 88,043 |
| Specialty Retail - 0.4% | | | |
| Lowe's Companies, Inc. | | 226,400 | 21,365 |
| Textiles, Apparel & Luxury Goods - 0.1% | | | |
| Tapestry, Inc. | | 135,100 | 5,259 |
|
| TOTAL CONSUMER DISCRETIONARY | | | 127,752 |
|
| CONSUMER STAPLES - 8.3% | | | |
| Beverages - 0.8% | | | |
| Molson Coors Brewing Co. Class B | | 614,200 | 40,396 |
| Food Products - 2.2% | | | |
| General Mills, Inc. | | 904,750 | 38,280 |
| Kellogg Co. | | 227,800 | 14,499 |
| The J.M. Smucker Co. | | 550,500 | 57,533 |
| | | | 110,312 |
| Household Products - 0.6% | | | |
| Reckitt Benckiser Group PLC | | 366,600 | 30,516 |
| Personal Products - 1.2% | | | |
| Unilever NV (NY Reg.) | | 1,085,200 | 60,239 |
| Tobacco - 3.5% | | | |
| Altria Group, Inc. | | 1,178,600 | 64,623 |
| British American Tobacco PLC sponsored ADR | | 2,767,400 | 96,499 |
| Imperial Tobacco Group PLC | | 617,337 | 18,958 |
| | | | 180,080 |
|
| TOTAL CONSUMER STAPLES | | | 421,543 |
|
| ENERGY - 9.9% | | | |
| Energy Equipment & Services - 0.5% | | | |
| Baker Hughes, a GE Co. Class A | | 1,183,600 | 27,010 |
| Oil, Gas & Consumable Fuels - 9.4% | | | |
| BP PLC sponsored ADR | | 932,500 | 37,626 |
| Chevron Corp. | | 1,492,870 | 177,562 |
| Enterprise Products Partners LP | | 2,386,100 | 62,635 |
| Suncor Energy, Inc. (a) | | 2,097,800 | 67,640 |
| Targa Resources Corp. | | 300,200 | 13,398 |
| The Williams Companies, Inc. | | 2,901,200 | 73,458 |
| Valero Energy Corp. | | 581,300 | 46,446 |
| | | | 478,765 |
|
| TOTAL ENERGY | | | 505,775 |
|
| FINANCIALS - 21.9% | | | |
| Banks - 10.1% | | | |
| Bank of America Corp. | | 3,864,200 | 109,743 |
| Bank of the Ozarks, Inc. | | 953,700 | 25,845 |
| First Hawaiian, Inc. | | 657,500 | 17,108 |
| Huntington Bancshares, Inc. | | 1,933,000 | 28,202 |
| JPMorgan Chase & Co. | | 759,722 | 84,473 |
| PNC Financial Services Group, Inc. | | 293,500 | 39,851 |
| Wells Fargo & Co. | | 3,840,208 | 208,446 |
| | | | 513,668 |
| Capital Markets - 3.9% | | | |
| Apollo Global Management LLC Class A | | 1,739,900 | 49,048 |
| Lazard Ltd. Class A | | 406,600 | 16,313 |
| Northern Trust Corp. | | 317,700 | 31,525 |
| OM Asset Management Ltd. | | 736,800 | 9,704 |
| State Street Corp. | | 915,400 | 66,843 |
| The Blackstone Group LP | | 722,100 | 24,356 |
| | | | 197,789 |
| Consumer Finance - 2.3% | | | |
| Capital One Financial Corp. | | 709,000 | 63,583 |
| Discover Financial Services | | 545,900 | 38,923 |
| Synchrony Financial | | 648,500 | 16,848 |
| | | | 119,354 |
| Insurance - 5.1% | | | |
| Chubb Ltd. | | 832,379 | 111,322 |
| First American Financial Corp. | | 417,300 | 20,168 |
| FNF Group | | 730,500 | 24,545 |
| Principal Financial Group, Inc. | | 465,600 | 22,963 |
| The Travelers Companies, Inc. | | 606,600 | 79,082 |
| | | | 258,080 |
| Mortgage Real Estate Investment Trusts - 0.5% | | | |
| AGNC Investment Corp. | | 1,581,100 | 27,985 |
|
| TOTAL FINANCIALS | | | 1,116,876 |
|
| HEALTH CARE - 14.6% | | | |
| Biotechnology - 2.4% | | | |
| Amgen, Inc. | | 586,800 | 122,201 |
| Health Care Equipment & Supplies - 0.6% | | | |
| Becton, Dickinson & Co. | | 124,300 | 31,417 |
| Health Care Providers & Services - 4.6% | | | |
| AmerisourceBergen Corp. | | 359,700 | 31,977 |
| CVS Health Corp. | | 1,146,826 | 91,975 |
| McKesson Corp. | | 364,600 | 45,393 |
| UnitedHealth Group, Inc. | | 236,100 | 66,429 |
| | | | 235,774 |
| Pharmaceuticals - 7.0% | | | |
| Bayer AG | | 259,400 | 19,035 |
| GlaxoSmithKline PLC | | 3,311,675 | 68,651 |
| Johnson & Johnson | | 1,049,666 | 154,196 |
| Roche Holding AG (participation certificate) | | 189,987 | 49,318 |
| Sanofi SA sponsored ADR | | 1,419,900 | 64,392 |
| | | | 355,592 |
|
| TOTAL HEALTH CARE | | | 744,984 |
|
| INDUSTRIALS - 9.0% | | | |
| Aerospace & Defense - 5.0% | | | |
| General Dynamics Corp. | | 511,900 | 94,645 |
| Northrop Grumman Corp. | | 47,000 | 12,214 |
| United Technologies Corp. | | 1,228,030 | 149,623 |
| | | | 256,482 |
| Industrial Conglomerates - 0.7% | | | |
| General Electric Co. | | 4,919,597 | 36,897 |
| Machinery - 2.9% | | | |
| Allison Transmission Holdings, Inc. | | 285,900 | 13,469 |
| Cummins, Inc. | | 157,300 | 23,762 |
| Deere & Co. | | 235,700 | 36,505 |
| Minebea Mitsumi, Inc. | | 685,300 | 11,120 |
| Snap-On, Inc. | | 129,400 | 21,511 |
| Stanley Black & Decker, Inc. | | 335,600 | 43,913 |
| | | | 150,280 |
| Professional Services - 0.4% | | | |
| Intertrust NV (b) | | 964,830 | 15,478 |
| Nielsen Holdings PLC | | 112,600 | 3,059 |
| | | | 18,537 |
|
| TOTAL INDUSTRIALS | | | 462,196 |
|
| INFORMATION TECHNOLOGY - 6.9% | | | |
| Communications Equipment - 1.8% | | | |
| Cisco Systems, Inc. | | 1,925,500 | 92,174 |
| Electronic Equipment & Components - 0.8% | | | |
| TE Connectivity Ltd. | | 562,600 | 43,281 |
| IT Services - 2.0% | | | |
| Amdocs Ltd. | | 933,700 | 60,606 |
| Capgemini SA | | 339,300 | 39,584 |
| | | | 100,190 |
| Semiconductors & Semiconductor Equipment - 0.3% | | | |
| Qualcomm, Inc. | | 302,551 | 17,627 |
| Software - 1.3% | | | |
| Microsoft Corp. | | 575,826 | 63,853 |
| Technology Hardware, Storage & Peripherals - 0.7% | | | |
| Apple, Inc. | | 189,200 | 33,787 |
|
| TOTAL INFORMATION TECHNOLOGY | | | 350,912 |
|
| MATERIALS - 4.3% | | | |
| Chemicals - 1.7% | | | |
| DowDuPont, Inc. | | 1,491,698 | 86,295 |
| Containers & Packaging - 2.6% | | | |
| Graphic Packaging Holding Co. | | 3,879,900 | 46,520 |
| Silgan Holdings, Inc. | | 1,167,500 | 30,063 |
| WestRock Co. | | 1,175,431 | 55,375 |
| | | | 131,958 |
|
| TOTAL MATERIALS | | | 218,253 |
|
| REAL ESTATE - 3.2% | | | |
| Equity Real Estate Investment Trusts (REITs) - 3.2% | | | |
| Brandywine Realty Trust (SBI) | | 2,007,700 | 28,650 |
| CorePoint Lodging, Inc. | | 632,800 | 8,903 |
| Outfront Media, Inc. | | 567,600 | 11,795 |
| Potlatch Corp. | | 635,300 | 23,570 |
| SL Green Realty Corp. | | 387,400 | 37,353 |
| VEREIT, Inc. | | 4,829,400 | 36,945 |
| WP Carey, Inc. | | 255,400 | 17,303 |
| | | | 164,519 |
| UTILITIES - 4.8% | | | |
| Electric Utilities - 4.5% | | | |
| Duke Energy Corp. | | 655,800 | 58,084 |
| Exelon Corp. | | 1,948,300 | 90,382 |
| PPL Corp. | | 1,621,100 | 49,589 |
| Xcel Energy, Inc. | | 606,000 | 31,785 |
| | | | 229,840 |
| Independent Power and Renewable Electricity Producers - 0.3% | | | |
| NRG Yield, Inc. Class C | | 904,400 | 16,514 |
|
| TOTAL UTILITIES | | | 246,354 |
|
| TOTAL COMMON STOCKS | | | |
| (Cost $4,528,173) | | | 4,980,925 |
|
| Money Market Funds - 2.3% | | | |
| Fidelity Cash Central Fund, 2.27% (c) | | 112,607,405 | 112,630 |
| Fidelity Securities Lending Cash Central Fund 2.27% (c)(d) | | 1,313,654 | 1,314 |
| TOTAL MONEY MARKET FUNDS | | | |
| (Cost $113,944) | | | 113,944 |
| TOTAL INVESTMENT IN SECURITIES - 99.9% | | | |
| (Cost $4,642,117) | | | 5,094,869 |
| NET OTHER ASSETS (LIABILITIES) - 0.1% | | | 7,315 |
| NET ASSETS - 100% | | | $5,102,184 |
Legend
(a) Security or a portion of the security is on loan at period end.
(b) Security exempt from registration under Rule 144A of the Securities Act of 1933. These securities may be resold in transactions exempt from registration, normally to qualified institutional buyers. At the end of the period, the value of these securities amounted to $15,478,000 or 0.3% of net assets.
(c) Affiliated fund that is generally available only to investment companies and other accounts managed by Fidelity Investments. The rate quoted is the annualized seven-day yield of the fund at period end. A complete unaudited listing of the fund's holdings as of its most recent quarter end is available upon request. In addition, each Fidelity Central Fund's financial statements, which are not covered by the Fund's Report of Independent Registered Public Accounting Firm, are available on the SEC's website or upon request.
(d) Investment made with cash collateral received from securities on loan.
Affiliated Central Funds
Information regarding fiscal year to date income earned by the Fund from investments in Fidelity Central Funds is as follows:
| Fund | Income earned |
| | (Amounts in thousands) |
| Fidelity Cash Central Fund | $1,443 |
| Fidelity Securities Lending Cash Central Fund | 132 |
| Total | $1,575 |
Amounts in the income column in the above table include any capital gain distributions from underlying funds, which are presented in the corresponding line-item in the Statement of Operations if applicable.
Investment Valuation
The following is a summary of the inputs used, as of November 30, 2018, involving the Fund's assets and liabilities carried at fair value. The inputs or methodology used for valuing securities may not be an indication of the risk associated with investing in those securities. For more information on valuation inputs, and their aggregation into the levels used below, please refer to the Investment Valuation section in the accompanying Notes to Financial Statements.
| | Valuation Inputs at Reporting Date: |
| Description | Total | Level 1 | Level 2 | Level 3 |
| (Amounts in thousands) | | | | |
| Investments in Securities: | | | | |
| Equities: | | | | |
| Communication Services | $621,761 | $621,761 | $-- | $-- |
| Consumer Discretionary | 127,752 | 127,752 | -- | -- |
| Consumer Staples | 421,543 | 391,027 | 30,516 | -- |
| Energy | 505,775 | 505,775 | -- | -- |
| Financials | 1,116,876 | 1,116,876 | -- | -- |
| Health Care | 744,984 | 607,980 | 137,004 | -- |
| Industrials | 462,196 | 462,196 | -- | -- |
| Information Technology | 350,912 | 350,912 | -- | -- |
| Materials | 218,253 | 218,253 | -- | -- |
| Real Estate | 164,519 | 164,519 | -- | -- |
| Utilities | 246,354 | 246,354 | -- | -- |
| Money Market Funds | 113,944 | 113,944 | -- | -- |
| Total Investments in Securities: | $5,094,869 | $4,927,349 | $167,520 | $-- |
Other Information
Distribution of investments by country or territory of incorporation, as a percentage of Total Net Assets, is as follows (Unaudited):
| United States of America | 82.9% |
| United Kingdom | 5.8% |
| Switzerland | 4.0% |
| France | 2.1% |
| Netherlands | 1.5% |
| Canada | 1.3% |
| Bailiwick of Guernsey | 1.2% |
| Others (Individually Less Than 1%) | 1.2% |
| | 100.0% |
See accompanying notes which are an integral part of the financial statements.
Financial Statements
Statement of Assets and Liabilities
| Amounts in thousands (except per-share amounts) | | November 30, 2018 |
| Assets | | |
Investment in securities, at value (including securities loaned of $1,229) — See accompanying schedule:
Unaffiliated issuers (cost $4,528,173) | $4,980,925 | |
| Fidelity Central Funds (cost $113,944) | 113,944 | |
| Total Investment in Securities (cost $4,642,117) | | $5,094,869 |
| Foreign currency held at value (cost $226) | | 226 |
| Receivable for investments sold | | 22,933 |
| Receivable for fund shares sold | | 936 |
| Dividends receivable | | 16,801 |
| Distributions receivable from Fidelity Central Funds | | 204 |
| Prepaid expenses | | 9 |
| Other receivables | | 119 |
| Total assets | | 5,136,097 |
| Liabilities | | |
| Payable for investments purchased | $24,993 | |
| Payable for fund shares redeemed | 4,971 | |
| Accrued management fee | 1,861 | |
| Other affiliated payables | 681 | |
| Other payables and accrued expenses | 93 | |
| Collateral on securities loaned | 1,314 | |
| Total liabilities | | 33,913 |
| Net Assets | | $5,102,184 |
| Net Assets consist of: | | |
| Paid in capital | | $4,189,211 |
| Total distributable earnings (loss) | | 912,973 |
| Net Assets | | $5,102,184 |
| Net Asset Value and Maximum Offering Price | | |
| Equity Dividend Income: | | |
| Net Asset Value, offering price and redemption price per share ($4,881,694 ÷ 179,637 shares) | | $27.18 |
| Class K: | | |
| Net Asset Value, offering price and redemption price per share ($220,490 ÷ 8,113 shares) | | $27.18 |
See accompanying notes which are an integral part of the financial statements.
Statement of Operations
| Amounts in thousands | | Year ended November 30, 2018 |
| Investment Income | | |
| Dividends | | $159,805 |
| Income from Fidelity Central Funds | | 1,575 |
| Total income | | 161,380 |
| Expenses | | |
| Management fee | $23,736 | |
| Transfer agent fees | 7,292 | |
| Accounting and security lending fees | 1,102 | |
| Custodian fees and expenses | 97 | |
| Independent trustees' fees and expenses | 28 | |
| Registration fees | 105 | |
| Audit | 72 | |
| Legal | 11 | |
| Miscellaneous | 37 | |
| Total expenses before reductions | 32,480 | |
| Expense reductions | (418) | |
| Total expenses after reductions | | 32,062 |
| Net investment income (loss) | | 129,318 |
| Realized and Unrealized Gain (Loss) | | |
| Net realized gain (loss) on: | | |
| Investment securities: | | |
| Unaffiliated issuers | 480,802 | |
| Fidelity Central Funds | 3 | |
| Foreign currency transactions | 59 | |
| Total net realized gain (loss) | | 480,864 |
| Change in net unrealized appreciation (depreciation) on: | | |
| Investment securities: | | |
| Unaffiliated issuers | (552,649) | |
| Fidelity Central Funds | (1) | |
| Assets and liabilities in foreign currencies | (92) | |
| Total change in net unrealized appreciation (depreciation) | | (552,742) |
| Net gain (loss) | | (71,878) |
| Net increase (decrease) in net assets resulting from operations | | $57,440 |
See accompanying notes which are an integral part of the financial statements.
Statement of Changes in Net Assets
| Amounts in thousands | Year ended November 30, 2018 | Year ended November 30, 2017 |
| Increase (Decrease) in Net Assets | | |
| Operations | | |
| Net investment income (loss) | $129,318 | $132,091 |
| Net realized gain (loss) | 480,864 | 455,867 |
| Change in net unrealized appreciation (depreciation) | (552,742) | 175,691 |
| Net increase (decrease) in net assets resulting from operations | 57,440 | 763,649 |
| Distributions to shareholders | (534,622) | – |
| Distributions to shareholders from net investment income | – | (127,695) |
| Distributions to shareholders from net realized gain | – | (223,485) |
| Total distributions | (534,622) | (351,180) |
| Share transactions - net increase (decrease) | (6,630) | (420,557) |
| Total increase (decrease) in net assets | (483,812) | (8,088) |
| Net Assets | | |
| Beginning of period | 5,585,996 | 5,594,084 |
| End of period | $5,102,184 | $5,585,996 |
| Other Information | | |
| Undistributed net investment income end of period | | $30,373 |
See accompanying notes which are an integral part of the financial statements.
Financial Highlights
Fidelity Equity Dividend Income Fund
| Years ended November 30, | 2018 | 2017 | 2016 | 2015 | 2014 |
| Selected Per–Share Data | | | | | |
| Net asset value, beginning of period | $29.62 | $27.50 | $26.01 | $26.99 | $24.15 |
| Income from Investment Operations | | | | | |
| Net investment income (loss)A | .66 | .65 | .57 | .64 | .70B |
| Net realized and unrealized gain (loss) | (.27) | 3.20 | 2.26 | (.95)C | 2.77 |
| Total from investment operations | .39 | 3.85 | 2.83 | (.31) | 3.47 |
| Distributions from net investment income | (.66) | (.63) | (.51) | (.58) | (.63) |
| Distributions from net realized gain | (2.18) | (1.10) | (.83) | (.08) | – |
| Total distributions | (2.83)D | (1.73) | (1.34) | (.67)E | (.63) |
| Net asset value, end of period | $27.18 | $29.62 | $27.50 | $26.01 | $26.99 |
| Total ReturnF | 1.28% | 14.61% | 11.60% | (1.13)%C | 14.60% |
| Ratios to Average Net AssetsG,H | | | | | |
| Expenses before reductions | .61% | .62% | .63% | .63% | .63% |
| Expenses net of fee waivers, if any | .61% | .62% | .63% | .63% | .63% |
| Expenses net of all reductions | .60% | .61% | .62% | .62% | .63% |
| Net investment income (loss) | 2.39% | 2.35% | 2.23% | 2.42% | 2.78%B |
| Supplemental Data | | | | | |
| Net assets, end of period (in millions) | $4,882 | $5,351 | $5,296 | $4,819 | $5,253 |
| Portfolio turnover rateI | 56% | 52% | 55% | 49% | 52% |
A Calculated based on average shares outstanding during the period.
B Net investment income per share reflects a large, non-recurring dividend which amounted to $.12 per share. Excluding this non-recurring dividends, the ratio of net investment income (loss) to average net assets would have been 2.31%.
C Net realized and unrealized gain (loss) per share reflects proceeds received from litigation which amounted to $.02 per share. Excluding these litigation proceeds, the total return would have been (1.22)%
D Total distributions of $2.83 per share is comprised of distributions from net investment income of $.658 and distributions from net realized gain of $2.176 per share.
E Total distributions of $.67 per share is comprised of distributions from net investment income of $.582 and distributions from net realized gain of $.084 per share.
F Total returns would have been lower if certain expenses had not been reduced during the applicable periods shown.
G Fees and expenses of any underlying Fidelity Central Funds are not included in the Fund's expense ratio. The Fund indirectly bears its proportionate share of the expenses of any underlying Fidelity Central Funds.
H Expense ratios reflect operating expenses of the class. Expenses before reductions do not reflect amounts reimbursed by the investment adviser or reductions from brokerage service arrangements or reductions from other expense offset arrangements and do not represent the amount paid by the class during periods when reimbursements or reductions occur. Expenses net of fee waivers reflect expenses after reimbursement by the investment adviser but prior to reductions from brokerage service arrangements or other expense offset arrangements. Expenses net of all reductions represent the net expenses paid by the class.
I Amount does not include the portfolio activity of any underlying Fidelity Central Funds.
See accompanying notes which are an integral part of the financial statements.
Fidelity Equity Dividend Income Fund Class K
| Years ended November 30, | 2018 | 2017 | 2016 | 2015 | 2014 |
| Selected Per–Share Data | | | | | |
| Net asset value, beginning of period | $29.62 | $27.50 | $26.01 | $26.99 | $24.15 |
| Income from Investment Operations | | | | | |
| Net investment income (loss)A | .69 | .68 | .59 | .67 | .73B |
| Net realized and unrealized gain (loss) | (.27) | 3.20 | 2.27 | (.96)C | 2.76 |
| Total from investment operations | .42 | 3.88 | 2.86 | (.29) | 3.49 |
| Distributions from net investment income | (.69) | (.66) | (.54) | (.61) | (.65) |
| Distributions from net realized gain | (2.18) | (1.10) | (.83) | (.08) | – |
| Total distributions | (2.86)D | (1.76) | (1.37) | (.69) | (.65) |
| Net asset value, end of period | $27.18 | $29.62 | $27.50 | $26.01 | $26.99 |
| Total ReturnE | 1.39% | 14.73% | 11.72% | (1.03)%C | 14.72% |
| Ratios to Average Net AssetsF,G | | | | | |
| Expenses before reductions | .51% | .52% | .52% | .52% | .52% |
| Expenses net of fee waivers, if any | .51% | .52% | .52% | .52% | .52% |
| Expenses net of all reductions | .50% | .51% | .52% | .52% | .52% |
| Net investment income (loss) | 2.49% | 2.45% | 2.33% | 2.52% | 2.89%B |
| Supplemental Data | | | | | |
| Net assets, end of period (in millions) | $220 | $235 | $298 | $277 | $394 |
| Portfolio turnover rateH | 56% | 52% | 55% | 49% | 52% |
A Calculated based on average shares outstanding during the period.
B Net investment income per share reflects a large, non-recurring dividend which amounted to $.12 per share. Excluding this non-recurring dividends, the ratio of net investment income (loss) to average net assets would have been 2.42%.
C Net realized and unrealized gain (loss) per share reflects proceeds received from litigation which amounted to $.02 per share. Excluding these litigation proceeds, the total return would have been (1.12)%
D Total distributions of $2.86 per share is comprised of distributions from net investment income of $.686 and distributions from net realized gain of $2.176 per share.
E Total returns would have been lower if certain expenses had not been reduced during the applicable periods shown.
F Fees and expenses of any underlying Fidelity Central Funds are not included in the Fund's expense ratio. The Fund indirectly bears its proportionate share of the expenses of any underlying Fidelity Central Funds.
G Expense ratios reflect operating expenses of the class. Expenses before reductions do not reflect amounts reimbursed by the investment adviser or reductions from brokerage service arrangements or reductions from other expense offset arrangements and do not represent the amount paid by the class during periods when reimbursements or reductions occur. Expenses net of fee waivers reflect expenses after reimbursement by the investment adviser but prior to reductions from brokerage service arrangements or other expense offset arrangements. Expenses net of all reductions represent the net expenses paid by the class.
H Amount does not include the portfolio activity of any underlying Fidelity Central Funds.
See accompanying notes which are an integral part of the financial statements.
Notes to Financial Statements
For the period ended November 30, 2018
(Amounts in thousands except percentages)
1. Organization.
Fidelity Equity Dividend Income Fund (the Fund) is a fund of Fidelity Financial Trust (the Trust) and is authorized to issue an unlimited number of shares. The Trust is registered under the Investment Company Act of 1940, as amended (the 1940 Act), as an open-end management investment company organized as a Massachusetts business trust. The Fund offers Equity Dividend Income and Class K shares, each of which has equal rights as to assets and voting privileges. Each class has exclusive voting rights with respect to matters that affect that class.
2. Investments in Fidelity Central Funds.
The Fund invests in Fidelity Central Funds, which are open-end investment companies generally available only to other investment companies and accounts managed by the investment adviser and its affiliates. The Fund's Schedule of Investments lists each of the Fidelity Central Funds held as of period end, if any, as an investment of the Fund, but does not include the underlying holdings of each Fidelity Central Fund. As an Investing Fund, the Fund indirectly bears its proportionate share of the expenses of the underlying Fidelity Central Funds.
The Money Market Central Funds seek preservation of capital and current income and are managed by Fidelity Investments Money Management, Inc. (FIMM), an affiliate of the investment adviser. Annualized expenses of the Money Market Central Funds as of their most recent shareholder report date are less than .005%.
A complete unaudited list of holdings for each Fidelity Central Fund is available upon request or at the Securities and Exchange Commission (the SEC) website at www.sec.gov. In addition, the financial statements of the Fidelity Central Funds, which are not covered by the Fund's Report of Independent Registered Public Accounting Firm, are available on the SEC website or upon request.
3. Significant Accounting Policies.
The Fund is an investment company and applies the accounting and reporting guidance of the Financial Accounting Standards Board (FASB) Accounting Standards Codification Topic 946 Financial Services – Investments Companies. The financial statements have been prepared in conformity with accounting principles generally accepted in the United States of America (GAAP), which require management to make certain estimates and assumptions at the date of the financial statements. Actual results could differ from those estimates. Subsequent events, if any, through the date that the financial statements were issued have been evaluated in the preparation of the financial statements. The following summarizes the significant accounting policies of the Fund:
Investment Valuation. Investments are valued as of 4:00 p.m. Eastern time on the last calendar day of the period. The Board of Trustees (the Board) has delegated the day to day responsibility for the valuation of the Fund's investments to the Fair Value Committee (the Committee) established by the Fund's investment adviser. In accordance with valuation policies and procedures approved by the Board, the Fund attempts to obtain prices from one or more third party pricing vendors or brokers to value its investments. When current market prices, quotations or currency exchange rates are not readily available or reliable, investments will be fair valued in good faith by the Committee, in accordance with procedures adopted by the Board. Factors used in determining fair value vary by investment type and may include market or investment specific events. The frequency with which these procedures are used cannot be predicted and they may be utilized to a significant extent. The Committee oversees the Fund's valuation policies and procedures and reports to the Board on the Committee's activities and fair value determinations. The Board monitors the appropriateness of the procedures used in valuing the Fund's investments and ratifies the fair value determinations of the Committee.
The Fund categorizes the inputs to valuation techniques used to value its investments into a disclosure hierarchy consisting of three levels as shown below:
- Level 1 – quoted prices in active markets for identical investments
- Level 2 – other significant observable inputs (including quoted prices for similar investments, interest rates, prepayment speeds, etc.)
- Level 3 – unobservable inputs (including the Fund's own assumptions based on the best information available)
Valuation techniques used to value the Fund's investments by major category are as follows:
Equity securities, including restricted securities, for which market quotations are readily available, are valued at the last reported sale price or official closing price as reported by a third party pricing vendor on the primary market or exchange on which they are traded and are categorized as Level 1 in the hierarchy. In the event there were no sales during the day or closing prices are not available, securities are valued at the last quoted bid price or may be valued using the last available price and are generally categorized as Level 2 in the hierarchy. For foreign equity securities, when market or security specific events arise, comparisons to the valuation of American Depositary Receipts (ADRs), futures contracts, Exchange-Traded Funds (ETFs) and certain indexes as well as quoted prices for similar securities may be used and would be categorized as Level 2 in the hierarchy. Utilizing these techniques may result in transfers between Level 1 and Level 2. For equity securities, including restricted securities, where observable inputs are limited, assumptions about market activity and risk are used and these securities may be categorized as Level 3 in the hierarchy.
Investments in open-end mutual funds, including the Fidelity Central Funds, are valued at their closing net asset value (NAV) each business day and are categorized as Level 1 in the hierarchy.
Changes in valuation techniques may result in transfers in or out of an assigned level within the disclosure hierarchy. The aggregate value of investments by input level as of November 30, 2018 is included at the end of the Fund's Schedule of Investments.
Foreign Currency. The Fund may use foreign currency contracts to facilitate transactions in foreign-denominated securities. Gains and losses from these transactions may arise from changes in the value of the foreign currency or if the counterparties do not perform under the contracts' terms.
Foreign-denominated assets, including investment securities, and liabilities are translated into U.S. dollars at the exchange rates at period end. Purchases and sales of investment securities, income and dividends received and expenses denominated in foreign currencies are translated into U.S. dollars at the exchange rate in effect on the transaction date.
The effects of exchange rate fluctuations on investments are included with the net realized and unrealized gain (loss) on investment securities. Other foreign currency transactions resulting in realized and unrealized gain (loss) are disclosed separately.
Investment Transactions and Income. For financial reporting purposes, the Fund's investment holdings and NAV include trades executed through the end of the last business day of the period. The NAV per share for processing shareholder transactions is calculated as of the close of business of the New York Stock Exchange (NYSE), normally 4:00 p.m. Eastern time and includes trades executed through the end of the prior business day. Gains and losses on securities sold are determined on the basis of identified cost and include proceeds received from litigation. Dividend income is recorded on the ex-dividend date, except for certain dividends from foreign securities where the ex-dividend date may have passed, which are recorded as soon as the Fund is informed of the ex-dividend date. Non-cash dividends included in dividend income, if any, are recorded at the fair market value of the securities received. Income and capital gain distributions from Fidelity Central Funds, if any, are recorded on the ex-dividend date. Certain distributions received by the Fund represent a return of capital or capital gain. The Fund determines the components of these distributions subsequent to the ex-dividend date, based upon receipt of tax filings or other correspondence relating to the underlying investment. These distributions are recorded as a reduction of cost of investments and/or as a realized gain. Investment income is recorded net of foreign taxes withheld where recovery of such taxes is uncertain.
Class Allocations and Expenses. Investment income, realized and unrealized capital gains and losses, common expenses of the Fund, and certain fund-level expense reductions, if any, are allocated daily on a pro-rata basis to each class based on the relative net assets of each class to the total net assets of the Fund. Each class differs with respect to transfer agent fees incurred. Certain expense reductions may also differ by class. For the reporting period, the allocated portion of income and expenses to each class as a percent of its average net assets may vary due to the timing of recording these transactions in relation to fluctuating net assets of the classes. Expenses directly attributable to a fund are charged to that fund. Expenses attributable to more than one fund are allocated among the respective funds on the basis of relative net assets or other appropriate methods. Expense estimates are accrued in the period to which they relate and adjustments are made when actual amounts are known.
Income Tax Information and Distributions to Shareholders. Each year, the Fund intends to qualify as a regulated investment company under Subchapter M of the Internal Revenue Code, including distributing substantially all of its taxable income and realized gains. As a result, no provision for U.S. Federal income taxes is required. As of November 30, 2018, the Fund did not have any unrecognized tax benefits in the financial statements; nor is the Fund aware of any tax positions for which it is reasonably possible that the total amounts of unrecognized tax benefits will significantly change in the next twelve months. The Fund files a U.S. federal tax return, in addition to state and local tax returns as required. The Fund's federal income tax returns are subject to examination by the Internal Revenue Service (IRS) for a period of three fiscal years after they are filed. State and local tax returns may be subject to examination for an additional fiscal year depending on the jurisdiction. Foreign taxes are provided for based on the Fund's understanding of the tax rules and rates that exist in the foreign markets in which it invests.
Distributions are declared and recorded on the ex-dividend date. Income and capital gain distributions are declared separately for each class. Income and capital gain distributions are determined in accordance with income tax regulations, which may differ from GAAP. In addition, the Fund claimed a portion of the payment made to redeeming shareholders as a distribution for income tax purposes.
Capital accounts within the financial statements are adjusted for permanent book-tax differences. These adjustments have no impact on net assets or the results of operations. Capital accounts are not adjusted for temporary book-tax differences which will reverse in a subsequent period.
Book-tax differences are primarily due to foreign currency transactions, partnerships, deferred trustees compensation, and losses deferred due to wash sales.
As of period end, the cost and unrealized appreciation (depreciation) in securities, and derivatives if applicable, for federal income tax purposes were as follows:
| Gross unrealized appreciation | $753,124 |
| Gross unrealized depreciation | (324,219) |
| Net unrealized appreciation (depreciation) | $428,905 |
| Tax Cost | $4,665,964 |
The tax-based components of distributable earnings as of period end were as follows:
| Undistributed ordinary income | $25,238 |
| Undistributed long-term capital gain | $458,862 |
| Net unrealized appreciation (depreciation) on securities and other investments | $428,872 |
The tax character of distributions paid was as follows:
| | November 30, 2018 | November 30, 2017 |
| Ordinary Income | $174,692 | $ 129,532 |
| Long-term Capital Gains | 359,930 | 221,648 |
| Total | $534,622 | $ 351,180 |
Restricted Securities. The Fund may invest in securities that are subject to legal or contractual restrictions on resale. These securities generally may be resold in transactions exempt from registration or to the public if the securities are registered. Disposal of these securities may involve time-consuming negotiations and expense, and prompt sale at an acceptable price may be difficult. Information regarding restricted securities is included at the end of the Fund's Schedule of Investments.
New Rule Issuance. During August 2018, the U.S. Securities and Exchange Commission issued Final Rule Release No. 33-10532, Disclosure Update and Simplification. This Final Rule includes amendments specific to registered investment companies that are intended to eliminate overlap in disclosure requirements between Regulation S-X and GAAP. In accordance with these amendments, certain line-items in the Fund's financial statements have been combined or removed for the current period as outlined in the table below.
| Financial Statement | Current Line-Item Presentation | Prior Line-Item Presentation |
| Statement of Assets and Liabilities | Total distributable earnings (loss) | Undistributed/Distributions in excess of/Accumulated net investment income (loss)
Accumulated/Undistributed net realized gain (loss)
Net unrealized appreciation (depreciation) |
| Statement of Changes in Net Assets | N/A - removed | Undistributed/Distributions in excess of/Accumulated net investment income (loss) end of period |
| Statement of Changes in Net Assets | Distributions to shareholders | Distributions to shareholders from net investment income
Distributions to shareholders from net realized gain |
| Distributions to Shareholders Note to Financial Statements | Distributions to shareholders | Distributions to shareholders from net investment income
Distributions to shareholders from net realized gain |
4. Purchases and Sales of Investments.
Purchases and sales of securities other than short-term securities, aggregated $2,948,614 and $3,387,800, respectively.
5. Fees and Other Transactions with Affiliates.
Management Fee. Fidelity Management & Research Company (the investment adviser) and its affiliates provide the Fund with investment management related services for which the Fund pays a monthly management fee. The management fee is the sum of an individual fund fee rate that is based on an annual rate of .20% of the Fund's average net assets and an annualized group fee rate that averaged .24% during the period. The group fee rate is based upon the average net assets of all the mutual funds advised by the investment adviser, including any mutual funds previously advised by the investment adviser that are currently advised by Fidelity SelectCo, LLC, an affiliate of the investment adviser. The group fee rate decreases as assets under management increase and increases as assets under management decrease. For the reporting period, the total annual management fee rate was .44% of the Fund's average net assets.
Transfer Agent Fees. Fidelity Investments Institutional Operations Company, Inc., (FIIOC), an affiliate of the investment adviser, is the transfer, dividend disbursing and shareholder servicing agent for each class of the Fund. FIIOC receives account fees and asset-based fees that vary according to the account size and type of account of the shareholders of Equity Dividend Income, except for Class K. FIIOC receives an asset-based fee of Class K's average net assets. FIIOC pays for typesetting, printing and mailing of shareholder reports, except proxy statements.
For the period, transfer agent fees for each class were as follows:
| | Amount | % of Class-Level Average Net Assets |
| Equity Dividend Income | $7,188 | .14 |
| Class K | 104 | .05 |
| | $7,292 | |
Accounting and Security Lending Fees. Fidelity Service Company, Inc. (FSC), an affiliate of the investment adviser, maintains the Fund's accounting records. The accounting fee is based on the level of average net assets for each month. Under a separate contract, FSC administers the security lending program. The security lending fee is based on the number and duration of lending transactions. For the period, the fees were equivalent to an annual rate of .02%.
Brokerage Commissions. The Fund placed a portion of its portfolio transactions with brokerage firms which are affiliates of the investment adviser. Brokerage commissions are included in net realized gain (loss) and change in net unrealized appreciation (depreciation) in the Statement of Operations. The commissions paid to these affiliated firms were $68 for the period.
Interfund Trades. The Fund may purchase from or sell securities to other Fidelity Funds under procedures adopted by the Board. The procedures have been designed to ensure these interfund trades are executed in accordance with Rule 17a-7 of the 1940 Act. Interfund trades are included within the respective purchases and sales amounts shown in the Purchases and Sales of Investments note.
Other. During the period, the investment adviser reimbursed the Fund for certain losses in the amount of $144.
6. Committed Line of Credit.
The Fund participates with other funds managed by the investment adviser or an affiliate in a $4.25 billion credit facility (the "line of credit") to be utilized for temporary or emergency purposes to fund shareholder redemptions or for other short-term liquidity purposes. The Fund has agreed to pay commitment fees on its pro-rata portion of the line of credit, which amounted to $14 and is reflected in Miscellaneous expenses on the Statement of Operations. During the period, the Fund did not borrow on this line of credit.
7. Security Lending.
The Fund lends portfolio securities through a lending agent from time to time in order to earn additional income. For equity securities, a lending agent is used and may loan securities to certain qualified borrowers, including Fidelity Capital Markets (FCM), a broker-dealer affiliated with the Fund. On the settlement date of the loan, the Fund receives collateral (in the form of U.S. Treasury obligations, letters of credit and/or cash) against the loaned securities and maintains collateral in an amount not less than 100% of the market value of the loaned securities during the period of the loan. The market value of the loaned securities is determined at the close of business of the Fund and any additional required collateral is delivered to the Fund on the next business day. The Fund or borrower may terminate the loan at any time, and if the borrower defaults on its obligation to return the securities loaned because of insolvency or other reasons, the Fund may apply collateral received from the borrower against the obligation. The Fund may experience delays and costs in recovering the securities loaned. Any cash collateral received is invested in the Fidelity Securities Lending Cash Central Fund. The value of loaned securities and cash collateral at period end are disclosed on the Fund's Statement of Assets and Liabilities. At period end, there were no security loans outstanding with FCM. Security lending income represents the income earned on investing cash collateral, less rebates paid to borrowers and any lending agent fees associated with the loan, plus any premium payments received for lending certain types of securities. Security lending income is presented in the Statement of Operations as a component of income from Fidelity Central Funds. Total security lending income during the period amounted to $132. During the period, there were no securities loaned to FCM.
8. Expense Reductions.
Commissions paid to certain brokers with whom the investment adviser, or its affiliates, places trades on behalf of the Fund include an amount in addition to trade execution, which may be rebated back to the Fund to offset certain expenses. This amount totaled $355 for the period. In addition, through arrangements with the Fund's custodian, credits realized as a result of certain uninvested cash balances were used to reduce the Fund's expenses. During the period, these credits reduced the Fund's custody expenses by $7.
In addition, during the period the investment adviser reimbursed and/or waived a portion of fund-level operating expenses in the amount of $56.
9. Distributions to Shareholders.
Distributions to shareholders of each class were as follows:
| | Year ended
November 30, 2018 | Year ended
November 30, 2017 |
| Distributions to shareholders | | |
| Equity Dividend Income | $511,773 | $– |
| Class K | 22,849 | – |
| Total | $534,622 | $– |
| From net investment income | | |
| Equity Dividend Income | $– | $121,249 |
| Class K | – | 6,446 |
| Total | $– | $127,695 |
| From net realized gain | | |
| Equity Dividend Income | $– | $211,696 |
| Class K | – | 11,789 |
| Total | $– | $223,485 |
10. Share Transactions.
Share transactions for each class were as follows and may contain automatic conversions between classes or exchanges between affiliated funds:
| | Shares | Shares | Dollars | Dollars |
| | Year ended November 30, 2018 | Year ended November 30, 2017 | Year ended November 30, 2018 | Year ended November 30, 2017 |
| Equity Dividend Income | | | | |
| Shares sold | 14,802 | 14,616 | $413,851 | $406,124 |
| Reinvestment of distributions | 17,294 | 11,480 | 479,230 | 313,561 |
| Shares redeemed | (33,103) | (38,036) | (905,388) | (1,060,571) |
| Net increase (decrease) | (1,007) | (11,940) | $(12,307) | $(340,886) |
| Class K | | | | |
| Shares sold | 1,531 | 1,803 | $42,769 | $49,981 |
| Reinvestment of distributions | 825 | 668 | 22,849 | 18,235 |
| Shares redeemed | (2,178) | (5,377) | (59,941) | (147,887) |
| Net increase (decrease) | 178 | (2,906) | $5,677 | $(79,671) |
11. Other.
The Fund's organizational documents provide former and current trustees and officers with a limited indemnification against liabilities arising in connection with the performance of their duties to the Fund. In the normal course of business, the Fund may also enter into contracts that provide general indemnifications. The Fund's maximum exposure under these arrangements is unknown as this would be dependent on future claims that may be made against the Fund. The risk of material loss from such claims is considered remote.
Report of Independent Registered Public Accounting Firm
To the Board of Trustees of Fidelity Financial Trust and Shareholders of Fidelity Equity Dividend Income Fund:
Opinion on the Financial Statements
We have audited the accompanying statement of assets and liabilities, including the schedule of investments, of Fidelity Equity Dividend Income Fund (one of the funds constituting Fidelity Financial Trust, referred to hereafter as the "Fund") as of November 30, 2018, the related statement of operations for the year ended November 30, 2018, the statement of changes in net assets for each of the two years in the period ended November 30, 2018, including the related notes, and the financial highlights for each of the five years in the period ended November 30, 2018 (collectively referred to as the “financial statements”). In our opinion, the financial statements present fairly, in all material respects, the financial position of the Fund as of November 30, 2018, the results of its operations for the year then ended, the changes in its net assets for each of the two years in the period ended November 30, 2018 and the financial highlights for each of the five years in the period ended November 30, 2018 in conformity with accounting principles generally accepted in the United States of America.
Basis for Opinion
These financial statements are the responsibility of the Fund’s management. Our responsibility is to express an opinion on the Fund’s financial statements based on our audits. We are a public accounting firm registered with the Public Company Accounting Oversight Board (United States) (“PCAOB”) and are required to be independent with respect to the Fund in accordance with the U.S. federal securities laws and the applicable rules and regulations of the Securities and Exchange Commission and the PCAOB.
We conducted our audits of these financial statements in accordance with the standards of the PCAOB. Those standards require that we plan and perform the audit to obtain reasonable assurance about whether the financial statements are free of material misstatement, whether due to error or fraud.
Our audits included performing procedures to assess the risks of material misstatement of the financial statements, whether due to error or fraud, and performing procedures that respond to those risks. Such procedures included examining, on a test basis, evidence regarding the amounts and disclosures in the financial statements. Our audits also included evaluating the accounting principles used and significant estimates made by management, as well as evaluating the overall presentation of the financial statements. Our procedures included confirmation of securities owned as of November 30, 2018 by correspondence with the custodian and brokers; when replies were not received from brokers, we performed other auditing procedures. We believe that our audits provide a reasonable basis for our opinion.
PricewaterhouseCoopers LLP
Boston, Massachusetts
January 14, 2019
We have served as the auditor of one or more investment companies in the Fidelity group of funds since 1932.
Trustees and Officers
The Trustees, Members of the Advisory Board (if any), and officers of the trust for central funds housed in an LLC: and fund, as applicable, are listed below. The Board of Trustees governs the fund and is responsible for protecting the interests of shareholders. The Trustees are experienced executives who meet periodically throughout the year to oversee the fund's activities, review contractual arrangements with companies that provide services to the fund, oversee management of the risks associated with such activities and contractual arrangements, and review the fund's performance. Except for Michael Wiley, each of the Trustees oversees 281 funds. Mr. Wiley oversees 192 funds.
The Trustees hold office without limit in time except that (a) any Trustee may resign; (b) any Trustee may be removed by written instrument, signed by at least two-thirds of the number of Trustees prior to such removal; (c) any Trustee who requests to be retired or who has become incapacitated by illness or injury may be retired by written instrument signed by a majority of the other Trustees; and (d) any Trustee may be removed at any special meeting of shareholders by a two-thirds vote of the outstanding voting securities of the trust. Each Trustee who is not an interested person (as defined in the 1940 Act) of the trust and the fund is referred to herein as an Independent Trustee. Each Independent Trustee shall retire not later than the last day of the calendar year in which his or her 75th birthday occurs. The Independent Trustees may waive this mandatory retirement age policy with respect to individual Trustees. Officers and Advisory Board Members hold office without limit in time, except that any officer or Advisory Board Member may resign or may be removed by a vote of a majority of the Trustees at any regular meeting or any special meeting of the Trustees. Except as indicated, each individual has held the office shown or other offices in the same company for the past five years.
The fund’s Statement of Additional Information (SAI) includes more information about the Trustees. To request a free copy, call Fidelity at 1-800-835-5092.
Experience, Skills, Attributes, and Qualifications of the Trustees. The Governance and Nominating Committee has adopted a statement of policy that describes the experience, qualifications, attributes, and skills that are necessary and desirable for potential Independent Trustee candidates (Statement of Policy). The Board believes that each Trustee satisfied at the time he or she was initially elected or appointed a Trustee, and continues to satisfy, the standards contemplated by the Statement of Policy. The Governance and Nominating Committee also engages professional search firms to help identify potential Independent Trustee candidates who have the experience, qualifications, attributes, and skills consistent with the Statement of Policy. From time to time, additional criteria based on the composition and skills of the current Independent Trustees, as well as experience or skills that may be appropriate in light of future changes to board composition, business conditions, and regulatory or other developments, have also been considered by the professional search firms and the Governance and Nominating Committee. In addition, the Board takes into account the Trustees' commitment and participation in Board and committee meetings, as well as their leadership of standing and ad hoc committees throughout their tenure.
In determining that a particular Trustee was and continues to be qualified to serve as a Trustee, the Board has considered a variety of criteria, none of which, in isolation, was controlling. The Board believes that, collectively, the Trustees have balanced and diverse experience, qualifications, attributes, and skills, which allow the Board to operate effectively in governing the fund and protecting the interests of shareholders. Information about the specific experience, skills, attributes, and qualifications of each Trustee, which in each case led to the Board's conclusion that the Trustee should serve (or continue to serve) as a trustee of the fund, is provided below.
Board Structure and Oversight Function. James C. Curvey is an interested person and currently serves as Chairman. The Trustees have determined that an interested Chairman is appropriate and benefits shareholders because an interested Chairman has a personal and professional stake in the quality and continuity of services provided to the fund. Independent Trustees exercise their informed business judgment to appoint an individual of their choosing to serve as Chairman, regardless of whether the Trustee happens to be independent or a member of management. The Independent Trustees have determined that they can act independently and effectively without having an Independent Trustee serve as Chairman and that a key structural component for assuring that they are in a position to do so is for the Independent Trustees to constitute a substantial majority for the Board. The Independent Trustees also regularly meet in executive session. Ned C. Lautenbach serves as Chairman of the Independent Trustees and as such (i) acts as a liaison between the Independent Trustees and management with respect to matters important to the Independent Trustees and (ii) with management prepares agendas for Board meetings.
Fidelity® funds are overseen by different Boards of Trustees. The fund's Board oversees Fidelity's high income and certain equity funds, and other Boards oversee Fidelity's investment-grade bond, money market, asset allocation, and other equity funds. The asset allocation funds may invest in Fidelity® funds overseen by the fund's Board. The use of separate Boards, each with its own committee structure, allows the Trustees of each group of Fidelity® funds to focus on the unique issues of the funds they oversee, including common research, investment, and operational issues. On occasion, the separate Boards establish joint committees to address issues of overlapping consequences for the Fidelity® funds overseen by each Board.
The Trustees operate using a system of committees to facilitate the timely and efficient consideration of all matters of importance to the Trustees, the fund, and fund shareholders and to facilitate compliance with legal and regulatory requirements and oversight of the fund's activities and associated risks. The Board, acting through its committees, has charged FMR and its affiliates with (i) identifying events or circumstances the occurrence of which could have demonstrably adverse effects on the fund's business and/or reputation; (ii) implementing processes and controls to lessen the possibility that such events or circumstances occur or to mitigate the effects of such events or circumstances if they do occur; and (iii) creating and maintaining a system designed to evaluate continuously business and market conditions in order to facilitate the identification and implementation processes described in (i) and (ii) above. Because the day-to-day operations and activities of the fund are carried out by or through FMR, its affiliates, and other service providers, the fund's exposure to risks is mitigated but not eliminated by the processes overseen by the Trustees. While each of the Board's committees has responsibility for overseeing different aspects of the fund's activities, oversight is exercised primarily through the Operations, Audit, and Compliance Committees. In addition, the Independent Trustees have worked with Fidelity to enhance the Board's oversight of investment and financial risks, legal and regulatory risks, technology risks, and operational risks, including the development of additional risk reporting to the Board. Appropriate personnel, including but not limited to the fund's Chief Compliance Officer (CCO), FMR's internal auditor, the independent accountants, the fund's Treasurer and portfolio management personnel, make periodic reports to the Board's committees, as appropriate, including an annual review of Fidelity's risk management program for the Fidelity® funds. The responsibilities of each standing committee, including their oversight responsibilities, are described further under "Standing Committees of the Trustees."
Interested Trustees*:
Correspondence intended for a Trustee who is an interested person may be sent to Fidelity Investments, 245 Summer Street, Boston, Massachusetts 02210.
Name, Year of Birth; Principal Occupations and Other Relevant Experience+
James C. Curvey (1935)
Year of Election or Appointment: 2007
Trustee
Chairman of the Board of Trustees
Mr. Curvey also serves as Trustee of other Fidelity® funds. Mr. Curvey is Vice Chairman (2007-present) and Director of FMR LLC (diversified financial services company). In addition, Mr. Curvey is an Overseer Emeritus for the Boston Symphony Orchestra, a Director of Artis-Naples, and a Trustee of Brewster Academy in Wolfeboro, New Hampshire. Previously, Mr. Curvey served as a Director of Fidelity Research & Analysis Co. (investment adviser firm, 2009-2018), Director of Fidelity Investments Money Management, Inc. (investment adviser firm, 2009-2014) and a Director of FMR and FMR Co., Inc. (investment adviser firms, 2007-2014).
* Determined to be an “Interested Trustee” by virtue of, among other things, his or her affiliation with the trust or various entities under common control with FMR.
+ The information includes the Trustee's principal occupation during the last five years and other information relating to the experience, attributes, and skills relevant to the Trustee's qualifications to serve as a Trustee, which led to the conclusion that the Trustee should serve as a Trustee for the fund.
Independent Trustees:
Correspondence intended for an Independent Trustee may be sent to Fidelity Investments, P.O. Box 55235, Boston, Massachusetts 02205-5235.
Name, Year of Birth; Principal Occupations and Other Relevant Experience+
Dennis J. Dirks (1948)
Year of Election or Appointment: 2005
Trustee
Mr. Dirks also serves as Trustee of other Fidelity® funds. Prior to his retirement in May 2003, Mr. Dirks was Chief Operating Officer and a member of the Board of The Depository Trust & Clearing Corporation (DTCC). He also served as President, Chief Operating Officer, and Board member of The Depository Trust Company (DTC) and President and Board member of the National Securities Clearing Corporation (NSCC). In addition, Mr. Dirks served as Chief Executive Officer and Board member of the Government Securities Clearing Corporation, Chief Executive Officer and Board member of the Mortgage-Backed Securities Clearing Corporation, as a Trustee and a member of the Finance Committee of Manhattan College (2005-2008), as a Trustee and a member of the Finance Committee of AHRC of Nassau County (2006-2008), as a member of the Independent Directors Council (IDC) Governing Council (2010-2015), and as a member of the Board of Directors for The Brookville Center for Children’s Services, Inc. (2009-2017). Mr. Dirks is a member of the Finance Committee (2016-present) and Board of Directors (2017-present) and is Treasurer (2018-present) of the Asolo Repertory Theatre.
Donald F. Donahue (1950)
Year of Election or Appointment: 2018
Trustee
Mr. Donahue also serves as a Trustee of other Fidelity® funds. Mr. Donahue is President and Chief Executive Officer of Miranda Partners, LLC (risk consulting for the financial services industry, 2012-present). Previously, Mr. Donahue served as a Member of the Advisory Board of certain Fidelity® funds (2015-2018) and Chief Executive Officer (2006-2012), Chief Operating Officer (2003-2006), and Managing Director, Customer Marketing and Development (1999-2003) of The Depository Trust & Clearing Corporation (financial markets infrastructure). Mr. Donahue serves as a Member (2007-present) and Co-Chairman (2016-present) of the Board of Directors of United Way of New York, Member of the Board of Directors of NYC Leadership Academy (2012-present) and Member of the Board of Advisors of Ripple Labs, Inc. (financial services, 2015-present). He also served as Chairman (2010-2012) and Member of the Board of Directors (2012-2013) of Omgeo, LLC (financial services), Treasurer of United Way of New York (2012-2016), and Member of the Board of Directors of XBRL US (financial services non-profit, 2009-2012) and the International Securities Services Association (2009-2012).
Alan J. Lacy (1953)
Year of Election or Appointment: 2008
Trustee
Mr. Lacy also serves as Trustee of other Fidelity® funds. Mr. Lacy serves as a Director of Bristol-Myers Squibb Company (global pharmaceuticals, 2008-present). He is a Trustee of the California Chapter of The Nature Conservancy (2015-present) and a Director of the Center for Advanced Study in the Behavioral Sciences at Stanford University (2015-present). In addition, Mr. Lacy served as Senior Adviser (2007-2014) of Oak Hill Capital Partners, L.P. (private equity) and also served as Chief Executive Officer (2005) and Vice Chairman (2005-2006) of Sears Holdings Corporation (retail) and Chief Executive Officer and Chairman of the Board of Sears, Roebuck and Co. (retail, 2000-2005). Previously, Mr. Lacy served as Chairman (2014-2017) and a member (2010-2017) of the Board of Directors of Dave & Buster’s Entertainment, Inc. (restaurant and entertainment complexes), as Chairman (2008-2011) and a member (2006-2015) of the Board of Trustees of the National Parks Conservation Association, and as a member of the Board of Directors for The Hillman Companies, Inc. (hardware wholesalers, 2010-2014), Earth Fare, Inc. (retail grocery, 2010-2014), and The Western Union Company (global money transfer, 2006-2011).
Ned C. Lautenbach (1944)
Year of Election or Appointment: 2000
Trustee
Chairman of the Independent Trustees
Mr. Lautenbach also serves as Trustee of other Fidelity® funds. Mr. Lautenbach currently serves as Chair (2018-present) and Member (2013-present) of the Board of Governors, State University System of Florida and is a member of the Council on Foreign Relations (1994-present). He is also a member and has most recently served as Chairman of the Board of Directors of Artis-Naples (2012-present). Previously, Mr. Lautenbach served as a member and then Lead Director of the Board of Directors of Eaton Corporation (diversified industrial, 1997-2016). He was also a Partner and Advisory Partner at Clayton, Dubilier & Rice, LLC (private equity investment, 1998-2010), as well as a Director of Sony Corporation (2006-2007). In addition, Mr. Lautenbach also had a 30-year career with IBM (technology company) during which time he served as Senior Vice President and a member of the Corporate Executive Committee (1968-1998).
Joseph Mauriello (1944)
Year of Election or Appointment: 2008
Trustee
Mr. Mauriello also serves as Trustee of other Fidelity® funds. Prior to his retirement in January 2006, Mr. Mauriello served in numerous senior management positions including Deputy Chairman and Chief Operating Officer (2004-2005), and Vice Chairman of Financial Services (2002-2004) of KPMG LLP US (professional services, 1965-2005). Mr. Mauriello currently serves as a member of the Independent Directors Council (IDC) Governing Council (2015-present). Previously, Mr. Mauriello served as a member of the Board of Directors of XL Group plc. (global insurance and re-insurance, 2006-2018).
Cornelia M. Small (1944)
Year of Election or Appointment: 2005
Trustee
Ms. Small also serves as Trustee of other Fidelity® funds. Ms. Small is a member of the Board of Directors (2009-present) and Chair of the Investment Committee (2010-present) of the Teagle Foundation. Ms. Small also serves on the Investment Committee of the Berkshire Taconic Community Foundation (2008-present). Previously, Ms. Small served as Chairperson (2002-2008) and a member of the Investment Committee and Chairperson (2008-2012) and a member of the Board of Trustees of Smith College. In addition, Ms. Small served as Chief Investment Officer, Director of Global Equity Investments, and a member of the Board of Directors of Scudder, Stevens & Clark and Scudder Kemper Investments.
Garnett A. Smith (1947)
Year of Election or Appointment: 2018
Trustee
Mr. Smith also serves as Trustee of other Fidelity® funds. Prior to Mr. Smith's retirement, he served as Chairman and Chief Executive Officer of Inbrand Corp. (manufacturer of personal absorbent products, 1990-1997). He also served as President (1986-1990) of Inbrand Corp. Prior to his employment with Inbrand Corp., he was employed by a retail fabric chain and North Carolina National Bank. In addition, Mr. Smith served as a Member of the Advisory Board of certain Fidelity® funds (2012-2013) and as a board member of the Jackson Hole Land Trust (2009-2012).
David M. Thomas (1949)
Year of Election or Appointment: 2008
Trustee
Mr. Thomas also serves as Trustee of other Fidelity® funds. Mr. Thomas serves as Non-Executive Chairman of the Board of Directors of Fortune Brands Home and Security (home and security products, 2011-present) and as a member of the Board of Directors (2004-present) and Presiding Director (2013-present) of Interpublic Group of Companies, Inc. (marketing communication). Previously, Mr. Thomas served as Executive Chairman (2005-2006) and Chairman and Chief Executive Officer (2000-2005) of IMS Health, Inc. (pharmaceutical and healthcare information solutions), a Director of Fortune Brands, Inc. (consumer products, 2000-2011), and a member of the Board of Trustees of the University of Florida (2013-2018).
Michael E. Wiley (1950)
Year of Election or Appointment: 2018
Trustee
Mr. Wiley also serves as Trustee or Member of the Advisory Board of other Fidelity® funds. Mr. Wiley serves as a Director of High Point Resources (exploration and production, 2005-present). Previously, Mr. Wiley served as a Director of Andeavor Corporation (independent oil refiner and marketer, 2005-2018), a Director of Andeavor Logistics LP (natural resources logistics, 2015-2018), a Director of Post Oak Bank (privately-held bank, 2004-2018), a Director of Asia Pacific Exploration Consolidated (international oil and gas exploration and production, 2008-2013), a member of the Board of Trustees of the University of Tulsa (2000-2006; 2007-2010), a Senior Energy Advisor of Katzenbach Partners, LLC (consulting, 2006-2007), an Advisory Director of Riverstone Holdings (private investment), a Director of Spinnaker Exploration Company (exploration and production, 2001-2005) and Chairman, President, and CEO of Baker Hughes, Inc. (oilfield services, 2000-2004).
+ The information includes the Trustee's principal occupation during the last five years and other information relating to the experience, attributes, and skills relevant to the Trustee's qualifications to serve as a Trustee, which led to the conclusion that the Trustee should serve as a Trustee for the fund.
Advisory Board Members and Officers:
Correspondence intended for a Member of the Advisory Board (if any) may be sent to Fidelity Investments, P.O. Box 55235, Boston, Massachusetts 02205-5235. Correspondence intended for an officer or Peter S. Lynch may be sent to Fidelity Investments, 245 Summer Street, Boston, Massachusetts 02210. Officers appear below in alphabetical order.
Name, Year of Birth; Principal Occupation
Vicki L. Fuller (1957)
Year of Election or Appointment: 2018
Member of the Advisory Board
Ms. Fuller also serves as Member of the Advisory Board of other Fidelity® funds. Ms. Fuller serves as a member of the Board of Directors, Audit Committee, and Nominating and Governance Committee of The Williams Companies, Inc. (natural gas infrastructure, 2018-present). Previously, Ms. Fuller served as the Chief Investment Officer of the New York State Common Retirement Fund (2012-2018) and held a variety of positions at AllianceBernstein L.P. (global asset management, 1985-2012), including Managing Director (2006-2012) and Senior Vice President and Senior Portfolio Manager (2001-2006).
Peter S. Lynch (1944)
Year of Election or Appointment: 2003
Member of the Advisory Board
Mr. Lynch also serves as Member of the Advisory Board of other Fidelity® funds. Mr. Lynch is Vice Chairman and a Director of FMR (investment adviser firm) and FMR Co., Inc. (investment adviser firm). In addition, Mr. Lynch serves as a Trustee of Boston College and as the Chairman of the Inner-City Scholarship Fund. Previously, Mr. Lynch served on the Special Olympics International Board of Directors (1997-2006).
Carol B. Tomé (1957)
Year of Election or Appointment: 2018
Member of the Advisory Board
Ms. Tomé also serves as Member of the Advisory Board of other Fidelity® funds. Ms. Tomé is Chief Financial Officer (2001-present) and Executive Vice President of Corporate Services (2007-present) of The Home Depot, Inc. (home improvement retailer) and a Director (2003-present) and Chair of the Audit Committee (2004-present) of United Parcel Service, Inc. (package delivery and supply chain management). Previously, Ms. Tomé served as Trustee of certain Fidelity® funds (2017), Senior Vice President of Finance and Accounting/Treasurer (2000-2007) and Vice President and Treasurer (1995-2000) of The Home Depot, Inc. and Chair of the Board (2010-2012), Vice Chair of the Board (2009 and 2013), and a Director (2008-2013) of the Federal Reserve Bank of Atlanta. Ms. Tomé is also a director or trustee of many community and professional organizations.
Elizabeth Paige Baumann (1968)
Year of Election or Appointment: 2017
Anti-Money Laundering (AML) Officer
Ms. Baumann also serves as AML Officer of other funds. She is Chief AML Officer (2012-present) and Senior Vice President (2014-present) of FMR LLC (diversified financial services company) and is an employee of Fidelity Investments. Previously, Ms. Baumann served as AML Officer of the funds (2012-2016), and Vice President (2007-2014) and Deputy Anti-Money Laundering Officer (2007-2012) of FMR LLC.
John J. Burke III (1964)
Year of Election or Appointment: 2018
Chief Financial Officer
Mr. Burke also serves as Chief Financial Officer of other funds. Mr. Burke serves as Head of Investment Operations for Fidelity Fund and Investment Operations (2018-present) and is an employee of Fidelity Investments (1998-present). Previously Mr. Burke served as head of Asset Management Investment Operations (2012-2018).
William C. Coffey (1969)
Year of Election or Appointment: 2018
Secretary and Chief Legal Officer (CLO)
Mr. Coffey also serves as Secretary and CLO of other funds. Mr. Coffey serves as CLO, Secretary, and Senior Vice President of Fidelity Management & Research Company and FMR Co., Inc. (investment adviser firms, 2018-present); Secretary of Fidelity SelectCo, LLC and Fidelity Investments Money Management, Inc. (investment adviser firms, 2018-present); and CLO of Fidelity Management & Research (Hong Kong) Limited, FMR Investment Management (UK) Limited, and Fidelity Management & Research (Japan) Limited (investment adviser firms, 2018-present). He is Senior Vice President and Deputy General Counsel of FMR LLC (diversified financial services company, 2010-present), and is an employee of Fidelity Investments. Previously, Mr. Coffey served as Assistant Secretary of certain funds (2009-2018) and as Vice President and Associate General Counsel of FMR LLC (2005-2009).
Timothy M. Cohen (1969)
Year of Election or Appointment: 2018
Vice President
Mr. Cohen also serves as Vice President of other funds. Mr. Cohen serves as Co-Head of Global Equity Research (2016-present), a Director of Fidelity Management & Research (Japan) Limited (investment adviser firm, 2016-present), and is an employee of Fidelity Investments. Previously, Mr. Cohen served as Chief Investment Officer - Equity and a Director of Fidelity Management & Research (U.K.) Inc. (investment adviser firm, 2013-2015) and as a Director of Fidelity Management & Research (Hong Kong) Limited (investment adviser firm, 2017).
Jonathan Davis (1968)
Year of Election or Appointment: 2010
Assistant Treasurer
Mr. Davis also serves as Assistant Treasurer of other funds. Mr. Davis serves as Assistant Treasurer of FMR Capital, Inc. (2017-present) and is an employee of Fidelity Investments. Previously, Mr. Davis served as Vice President and Associate General Counsel of FMR LLC (diversified financial services company, 2003-2010).
Adrien E. Deberghes (1967)
Year of Election or Appointment: 2016
Assistant Treasurer
Mr. Deberghes also serves as an officer of other funds. He serves as Assistant Treasurer of FMR Capital, Inc. (2017-present), Executive Vice President of Fidelity Investments Money Management, Inc. (FIMM) (investment adviser firm, 2016-present), and is an employee of Fidelity Investments (2008-present). Previously, Mr. Deberghes served as President and Treasurer of certain Fidelity® funds (2013-2018). Prior to joining Fidelity Investments, Mr. Deberghes was Senior Vice President of Mutual Fund Administration at State Street Corporation (2007-2008), Senior Director of Mutual Fund Administration at Investors Bank & Trust (2005-2007), and Director of Finance for Dunkin' Brands (2000-2005). Previously, Mr. Deberghes served in other fund officer roles.
Laura M. Del Prato (1964)
Year of Election or Appointment: 2018
Assistant Treasurer
Ms. Del Prato also serves as an officer of other funds. Ms. Del Prato is an employee of Fidelity Investments (2017-present). Prior to joining Fidelity Investments, Ms. Del Prato served as a Managing Director and Treasurer of the JPMorgan Mutual Funds (2014-2017). Prior to JPMorgan, Ms. Del Prato served as a partner at Cohen Fund Audit Services (accounting firm, 2012-2013) and KPMG LLP (accounting firm, 2004-2012).
Colm A. Hogan (1973)
Year of Election or Appointment: 2016
Deputy Treasurer
Mr. Hogan also serves as an officer of other funds. Mr. Hogan serves as Assistant Treasurer of FMR Capital, Inc. (2017-present) and is an employee of Fidelity Investments (2005-present). Previously, Mr. Hogan served as Assistant Treasurer of certain Fidelity® funds (2016-2018).
Pamela R. Holding (1964)
Year of Election or Appointment: 2018
Vice President
Ms. Holding also serves as Vice President of other funds. Ms. Holding serves as Co-Head of Global Equity Research (2018-present) and is an employee of Fidelity Investments (2013-present).
Chris Maher (1972)
Year of Election or Appointment: 2013
Assistant Treasurer
Mr. Maher serves as Assistant Treasurer of other funds. Mr. Maher is Vice President of Valuation Oversight, serves as Assistant Treasurer of FMR Capital, Inc. (2017-present), and is an employee of Fidelity Investments. Previously, Mr. Maher served as Vice President of Asset Management Compliance (2013), Vice President of the Program Management Group of FMR (investment adviser firm, 2010-2013), and Vice President of Valuation Oversight (2008-2010).
Rieco E. Mello (1969)
Year of Election or Appointment: 2017
Assistant Treasurer
Mr. Mello also serves as Assistant Treasurer of other funds. Mr. Mello serves as Assistant Treasurer of FMR Capital, Inc. (2017-present) and is an employee of Fidelity Investments (1995-present).
Kenneth B. Robins (1969)
Year of Election or Appointment: 2016
Chief Compliance Officer
Mr. Robins also serves as an officer of other funds. Mr. Robins serves as Compliance Officer of Fidelity Management & Research Company and FMR Co., Inc. (investment adviser firms, 2016-present) and is an employee of Fidelity Investments (2004-present). Previously, Mr. Robins served as Executive Vice President of Fidelity Investments Money Management, Inc. (investment adviser firm, 2013-2016) and served in other fund officer roles.
Stacie M. Smith (1974)
Year of Election or Appointment: 2016
President and Treasurer
Ms. Smith also serves as an officer of other funds. Ms. Smith serves as Assistant Treasurer of FMR Capital, Inc. (2017-present), is an employee of Fidelity Investments (2009-present), and has served in other fund officer roles. Prior to joining Fidelity Investments, Ms. Smith served as Senior Audit Manager of Ernst & Young LLP (accounting firm, 1996-2009). Previously, Ms. Smith served as Assistant Treasurer (2013-2018) and Deputy Treasurer (2013-2016) of certain Fidelity® funds.
Marc L. Spector (1972)
Year of Election or Appointment: 2016
Assistant Treasurer
Mr. Spector also serves as an officer of other funds. Mr. Spector serves as Assistant Treasurer of FMR Capital, Inc. (2017-present) and is an employee of Fidelity Investments (2016-present). Prior to joining Fidelity Investments, Mr. Spector served as Director at the Siegfried Group (accounting firm, 2013-2016), and prior to Siegfried Group as audit senior manager at Deloitte & Touche (accounting firm, 2005-2013).
Shareholder Expense Example
As a shareholder of the Fund, you incur two types of costs: (1) transaction costs and (2) ongoing costs, including management fees and other Fund expenses. This Example is intended to help you understand your ongoing costs (in dollars) of investing in the Fund and to compare these costs with the ongoing costs of investing in other mutual funds.
The Example is based on an investment of $1,000 invested at the beginning of the period and held for the entire period (June 1, 2018 to November 30, 2018).
Actual Expenses
The first line of the accompanying table for each class of the Fund provides information about actual account values and actual expenses. You may use the information in this line, together with the amount you invested, to estimate the expenses that you paid over the period. Simply divide your account value by $1,000.00 (for example, an $8,600 account value divided by $1,000.00 = 8.6), then multiply the result by the number in the first line for a class of the Fund under the heading entitled "Expenses Paid During Period" to estimate the expenses you paid on your account during this period. A small balance maintenance fee of $12.00 that is charged once a year may apply for certain accounts with a value of less than $2,000. This fee, which was eliminated effective August 1, 2018, is not included in the table below. If it was, the estimate of expenses you paid during the period would be higher, and your ending account value lower, by this amount. In addition, the Fund, as a shareholder in the underlying Fidelity Central Funds, will indirectly bear its pro-rata share of the fees and expenses incurred by the underlying Fidelity Central Funds. These fees and expenses are not included in the Fund's annualized expense ratio used to calculate the expense estimate in the table below.
Hypothetical Example for Comparison Purposes
The second line of the accompanying table for each class of the Fund provides information about hypothetical account values and hypothetical expenses based on a Class' actual expense ratio and an assumed rate of return of 5% per year before expenses, which is not the Class' actual return. The hypothetical account values and expenses may not be used to estimate the actual ending account balance or expenses you paid for the period. You may use this information to compare the ongoing costs of investing in the Fund and other funds. To do so, compare this 5% hypothetical example with the 5% hypothetical examples that appear in the shareholder reports of the other funds. A small balance maintenance fee of $12.00 that is charged once a year may apply for certain accounts with a value of less than $2,000. This fee, which was eliminated effective August 1, 2018, is not included in the table below. If it was, the estimate of expenses you paid during the period would be higher, and your ending account value lower, by this amount. In addition, the Fund, as a shareholder in the underlying Fidelity Central Funds, will indirectly bear its pro-rata share of the fees and expenses incurred by the underlying Fidelity Central Funds. These fees and expenses are not included in the Fund's annualized expense ratio used to calculate the expense estimate in the table below.
Please note that the expenses shown in the table are meant to highlight your ongoing costs only and do not reflect any transaction costs. Therefore, the second line of the table is useful in comparing ongoing costs only, and will not help you determine the relative total costs of owning different funds.
| | Annualized Expense Ratio-A | Beginning
Account Value
June 1, 2018 | Ending
Account Value
November 30, 2018 | Expenses Paid
During Period-B
June 1, 2018
to November 30, 2018 |
| Equity Dividend Income | .60% | | | |
| Actual | | $1,000.00 | $1,025.30 | $3.05 |
| Hypothetical-C | | $1,000.00 | $1,022.06 | $3.04 |
| Class K | .51% | | | |
| Actual | | $1,000.00 | $1,025.80 | $2.59 |
| Hypothetical-C | | $1,000.00 | $1,022.51 | $2.59 |
A Annualized expense ratio reflects expenses net of applicable fee waivers.
B Expenses are equal to each Class' annualized expense ratio, multiplied by the average account value over the period, multiplied by 183/365 (to reflect the one-half year period).
C 5% return per year before expenses
Distributions (Unaudited)
The Board of Trustees of Fidelity Equity Dividend Income Fund voted to pay to shareholders of record at the opening of business on record date, the following distributions per share derived from capital gains realized from sales of portfolio securities, and dividends derived from net investment income:
| | Pay Date | Record Date | Dividends | Capital Gains |
| Fidelity Equity Dividend Income Fund | | | | |
| Fidelity Equity Dividend Income Fund | 12/27/18 | 12/26/18 | $0.195 | $2.491 |
| Class K | 12/27/18 | 12/26/18 | $0.202 | $2.491 |
|
The fund hereby designates as a capital gain dividend with respect to the taxable year ended November 30, 2018, $479,502,889, or, if subsequently determined to be different, the net capital gain of such year.
A total of 0.23% of the dividends distributed during the fiscal year was derived from interest on U.S. Government securities which is generally exempt from state income tax.
Fidelity Equity Dividend Income Fund designates 42%, 100%, 100%, and 100%; Class K designates 41%, 100%, 100%, and 100% of the dividends distributed in December, April, July and October, respectively during the fiscal year as qualifying for the dividends–received deduction for corporate shareholders.
Fidelity Equity Dividend Income Fund designates 68%, 100%, 100%, and 100%; Class K designates 67%, 100%, 100%, and 100% of the dividends distributed in December, April, July and October, respectively during the fiscal year as amounts which may be taken into account as a dividend for purposes of the maximum rate under section 1(h)(11) of the Internal Revenue Code.
The fund will notify shareholders in January 2019 of amounts for use in preparing 2018 income tax returns.
Board Approval of Investment Advisory Contracts
Fidelity Equity Dividend Income Fund
At its July 2018 meeting, the Board of Trustees, including the Independent Trustees (together, the Board), voted to continue the management contract with Fidelity Management & Research Company (FMR) and the sub-advisory agreements (together, the Advisory Contracts) for the fund for six months through January 31, 2019, in connection with the reunification of the Fidelity Equity High Income Funds Board, which oversees the fund, and the Sector Portfolios Board.
The Board considered that the approval of the fund's Advisory Contracts will not result in any changes in (i) the investment process or strategies employed in the management of the fund's assets; (ii) the fees and expenses paid by shareholders; (iii) the nature, extent or quality of services provided under the fund's Advisory Contracts; or (iv) the day-to-day management of the fund or the persons primarily responsible for such management. The Board concluded that the fund's Advisory Contracts are fair and reasonable, and that the fund's Advisory Contracts should be renewed, without modification, through January 31, 2019, with the understanding that the Board will consider the annual renewal for a full one year period in January 2019.
In connection with its consideration of future renewals of the fund's Advisory Contracts, the Board will consider: (i) the nature, extent and quality of services provided to the fund, including shareholder and administrative services and investment performance; (ii) the competitiveness of the management fee and total expenses for the fund; (iii) the costs of the services and profitability, including the revenues earned and the expenses incurred in conducting the business of developing, marketing, distributing, managing, administering, and servicing the fund and its shareholders, to the extent applicable, as well as potential fall-out benefits from Fidelity's non-fund businesses; and (iv) whether there have been economies of scale in respect of the Fidelity funds, whether the Fidelity funds (including the fund) have appropriately benefited from any such economies of scale, and whether there is the potential for realization of any further economies.
Based on its evaluation of all of the conclusions noted above, and after considering all factors it believed relevant, the Board ultimately concluded that the fund's management fee structure is fair and reasonable, and that the continuation of the fund's Advisory Contracts should be approved.
Corporate Headquarters
245 Summer St.
Boston, MA 02210
www.fidelity.com
EII-K-ANN-0119
1.863193.110
Item 2.
Code of Ethics
As of the end of the period, November 30, 2018, Fidelity Financial Trust (the trust) has adopted a code of ethics, as defined in Item 2 of Form N-CSR, that applies to its President and Treasurer and its Chief Financial Officer. A copy of the code of ethics is filed as an exhibit to this Form N-CSR.
Item 3.
Audit Committee Financial Expert
The Board of Trustees of the trust has determined that Joseph Mauriello is an audit committee financial expert, as defined in Item 3 of Form N-CSR. Mr. Mauriello is independent for purposes of Item 3 of Form N-CSR.
Item 4.
Principal Accountant Fees and Services
Fees and Services
The following table presents fees billed by PricewaterhouseCoopers LLP (“PwC”) in each of the last two fiscal years for services rendered to Fidelity Convertible Securities Fund, Fidelity Equity Dividend Income Fund, and Fidelity Independence Fund (the “Funds”):
Services Billed by PwC
November 30, 2018 FeesA
| | | | |
| Audit Fees | Audit-Related Fees | Tax Fees | All Other Fees |
Fidelity Convertible Securities Fund | $61,000 | $5,400 | $3,300 | $2,700 |
Fidelity Equity Dividend Income Fund | $58,000 | $5,000 | $4,400 | $2,500 |
Fidelity Independence Fund | $58,000 | $4,900 | $3,300 | $2,500 |
| | | | |
| Audit Fees | Audit-Related Fees | Tax Fees | All Other Fees |
Fidelity Convertible Securities Fund | $72,000 | $6,600 | $3,500 | $3,100 |
Fidelity Equity Dividend Income Fund | $58,000 | $5,400 | $5,700 | $2,600 |
Fidelity Independence Fund | $59,000 | $5,300 | $4,600 | $2,600 |
AAmounts may reflect rounding.
The following table presents fees billed by PwC that were required to be approved by the Audit Committee for services that relate directly to the operations and financial reporting of the Funds and that are rendered on behalf of Fidelity Management & Research Company (“FMR”) and entities controlling, controlled by, or under common control with FMR (not including any sub-adviser whose role is primarily portfolio management and is subcontracted with or overseen by another investment adviser) that provide ongoing services to the Funds (“Fund Service Providers”):
Services Billed by PwC
| | |
| November 30, 2018A | November 30, 2017A |
Audit-Related Fees | $7,745,000 | $9,220,000 |
Tax Fees | $20,000 | $150,000 |
All Other Fees | $- | $- |
A Amounts may reflect rounding.
“Audit-Related Fees” represent fees billed for assurance and related services that are reasonably related to the performance of the fund audit or the review of the fund's financial statements and that are not reported under Audit Fees.
“Tax Fees” represent fees billed for tax compliance, tax advice or tax planning that relate directly to the operations and financial reporting of the fund.
“All Other Fees” represent fees billed for services provided to the fund or Fund Service Provider, a significant portion of which are assurance related, that relate directly to the operations and financial reporting of the fund, excluding those services that are reported under Audit Fees, Audit-Related Fees or Tax Fees.
Assurance services must be performed by an independent public accountant.
* * *
The aggregate non-audit fees billed by PwC for services rendered to the Funds, FMR (not including any sub-adviser whose role is primarily portfolio management and is subcontracted with or overseen by another investment adviser), and any Fund Service Provider for each of the last two fiscal years of the Funds are as follows:
| | |
Billed By | November 30, 2018A | November 30, 2017A |
PwC | $10,975,000 | $11,715,000 |
A Amounts may reflect rounding.
The trust's Audit Committee has considered non-audit services that were not pre-approved that were provided by PwC to Fund Service Providers to be compatible with maintaining the independence of PwC in its audit of the Funds, taking into account representations from PwC, in accordance with Public Company Accounting Oversight Board rules, regarding its independence from the Funds and their related entities and FMR’s review of the appropriateness and permissibility under applicable law of such non-audit services prior to their provision to the Fund Service Providers.
Audit Committee Pre-Approval Policies and Procedures
The trust’s Audit Committee must pre-approve all audit and non-audit services provided by a fund’s independent registered public accounting firm relating to the operations or financial reporting of the fund. Prior to the commencement of any audit or non-audit services to a fund, the Audit Committee reviews the services to determine whether they are appropriate and permissible under applicable law.
The Audit Committee has adopted policies and procedures to, among other purposes, provide a framework for the Committee’s consideration of non-audit services by the audit firms that audit the Fidelity funds. The policies and procedures require that any non-audit service provided by a fund audit firm to a Fidelity fund and any non-audit service provided by a fund auditor to a Fund Service Provider that relates directly to the operations and financial reporting of a Fidelity fund (“Covered Service”) are subject to approval by the Audit Committee before such service is provided.
All Covered Services must be approved in advance of provision of the service either: (i) by formal resolution of the Audit Committee, or (ii) by oral or written approval of the service by the Chair of the Audit Committee (or if the Chair is unavailable, such other member of the Audit Committee as may be designated by the Chair to act in the Chair’s absence). The approval contemplated by (ii) above is permitted where the Treasurer determines that action on such an engagement is necessary before the next meeting of the Audit Committee.
Non-audit services provided by a fund audit firm to a Fund Service Provider that do not relate directly to the operations and financial reporting of a Fidelity fund are reported to the Audit Committee periodically.
Non-Audit Services Approved Pursuant to Rule 2-01(c)(7)(i)(C) and (ii) of Regulation S-X (“De Minimis Exception”)
There were no non-audit services approved or required to be approved by the Audit Committee pursuant to the De Minimis Exception during the Funds’ last two fiscal years relating to services provided to (i) the Funds or (ii) any Fund Service Provider that relate directly to the operations and financial reporting of the Funds.
Item 5.
Audit Committee of Listed Registrants
Not applicable.
Item 6.
Investments
(a)
Not applicable.
(b)
Not applicable
Item 7.
Disclosure of Proxy Voting Policies and Procedures for Closed-End Management Investment Companies
Not applicable.
Item 8.
Portfolio Managers of Closed-End Management Investment Companies
Not applicable.
Item 9.
Purchase of Equity Securities by Closed-End Management Investment Company and Affiliated Purchasers
Not applicable.
Item 10.
Submission of Matters to a Vote of Security Holders
There were no material changes to the procedures by which shareholders may recommend nominees to the trust’s Board of Trustees.
Item 11.
Controls and Procedures
(a)(i) The President and Treasurer and the Chief Financial Officer have concluded that the trust’s disclosure controls and procedures (as defined in Rule 30a-3(c) under the Investment Company Act) provide reasonable assurances that material information relating to the trust is made known to them by the appropriate persons, based on their evaluation of these controls and procedures as of a date within 90 days of the filing date of this report.
(a)(ii) There was no change in the trust’s internal control over financial reporting (as defined in Rule 30a-3(d) under the Investment Company Act) that occurred during the period covered by this report that has materially affected, or is reasonably likely to materially affect, the trust’s internal control over financial reporting.
Item 12.
Disclosure of Securities Lending Activities for Closed-End Management
Investment Companies
Not applicable.
Item 13.
Exhibits
| | |
(a) | (1) | Code of Ethics pursuant to Item 2 of Form N-CSR is filed and attached hereto as EX-99.CODE ETH. |
(a) | (2) | Certification pursuant to Rule 30a-2(a) under the Investment Company Act of 1940 (17 CFR 270.30a-2(a)) is filed and attached hereto as Exhibit 99.CERT. |
(a) | (3) | Not applicable. |
(b) | | Certification pursuant to Rule 30a-2(b) under the Investment Company Act of 1940 (17 CFR 270.30a-2(b)) is furnished and attached hereto as Exhibit 99.906CERT. |
SIGNATURES
Pursuant to the requirements of the Securities Exchange Act of 1934 and the Investment Company Act of 1940, the registrant has duly caused this report to be signed on its behalf by the undersigned, thereunto duly authorized.
Fidelity Financial Trust
| |
By: | /s/Stacie M. Smith |
| Stacie M. Smith |
| President and Treasurer |
| |
Date: | January 24, 2019 |
Pursuant to the requirements of the Securities Exchange Act of 1934 and the Investment Company Act of 1940, this report has been signed below by the following persons on behalf of the registrant and in the capacities and on the dates indicated.
| |
By: | /s/Stacie M. Smith |
| Stacie M. Smith |
| President and Treasurer |
| |
Date: | January 24, 2019 |
| |
By: | /s/John J. Burke III |
| John J. Burke III |
| Chief Financial Officer |
| |
Date: | January 24, 2019 |