UNITED STATES
SECURITIES AND EXCHANGE COMMISSION
Washington, D.C. 20549
FORM N-CSR
CERTIFIED SHAREHOLDER REPORT OF REGISTERED
MANAGEMENT INVESTMENT COMPANIES
Investment Company Act file number 811-03587
Fidelity Financial Trust
(Exact name of registrant as specified in charter)
245 Summer St., Boston, Massachusetts 02210
(Address of principal executive offices) (Zip code)
Cynthia Lo Bessette, Secretary
245 Summer St.
Boston, Massachusetts 02210
(Name and address of agent for service)
Registrant's telephone number, including area code:
617-563-7000
| |
Date of fiscal year end: | November 30 |
|
|
Date of reporting period: | November 30, 2020 |
Item 1.
Reports to Stockholders
Fidelity® Independence Fund
Annual Report
November 30, 2020


Contents
To view a fund's proxy voting guidelines and proxy voting record for the 12-month period ended June 30, visit http://www.fidelity.com/proxyvotingresults or visit the Securities and Exchange Commission's (SEC) web site at http://www.sec.gov.
You may also call 1-800-544-8544 if you’re an individual investing directly with Fidelity, call 1-800-835-5092 if you’re a plan sponsor or participant with Fidelity as your recordkeeper or call 1-877-208-0098 on institutional accounts or if you’re an advisor or invest through one to request a free copy of the proxy voting guidelines.
Standard & Poor's, S&P and S&P 500 are registered service marks of The McGraw-Hill Companies, Inc. and have been licensed for use by Fidelity Distributors Corporation.
Other third-party marks appearing herein are the property of their respective owners.
All other marks appearing herein are registered or unregistered trademarks or service marks of FMR LLC or an affiliated company. © 2021 FMR LLC. All rights reserved.
This report and the financial statements contained herein are submitted for the general information of the shareholders of the Fund. This report is not authorized for distribution to prospective investors in the Fund unless preceded or accompanied by an effective prospectus.
A fund files its complete schedule of portfolio holdings with the SEC for the first and third quarters of each fiscal year on Form N-PORT. Forms N-PORT are available on the SEC’s web site at http://www.sec.gov. A fund's Forms N-PORT may be reviewed and copied at the SEC’s Public Reference Room in Washington, DC. Information regarding the operation of the SEC's Public Reference Room may be obtained by calling 1-800-SEC-0330.
For a complete list of a fund's portfolio holdings, view the most recent holdings listing, semiannual report, or annual report on Fidelity's web site at http://www.fidelity.com, http://www.institutional.fidelity.com, or http://www.401k.com, as applicable.
NOT FDIC INSURED •MAY LOSE VALUE •NO BANK GUARANTEE
Neither the Fund nor Fidelity Distributors Corporation is a bank.
Note to Shareholders:
Early in 2020, the outbreak and spread of a new coronavirus emerged as a public health emergency that had a major influence on financial markets, primarily based on its impact on the global economy and the outlook for corporate earnings. The virus causes a respiratory disease known as COVID-19. On March 11, the World Health Organization declared the COVID-19 outbreak a pandemic, citing sustained risk of further global spread.
In the weeks following, as the crisis worsened, we witnessed an escalating human tragedy with wide-scale social and economic consequences from coronavirus-containment measures. The outbreak of COVID-19 prompted a number of measures to limit the spread, including travel and border restrictions, quarantines, and restrictions on large gatherings. In turn, these resulted in lower consumer activity, diminished demand for a wide range of products and services, disruption in manufacturing and supply chains, and – given the wide variability in outcomes regarding the outbreak – significant market uncertainty and volatility. Amid the turmoil, global governments and central banks took unprecedented action to help support consumers, businesses, and the broader economies, and to limit disruption to financial systems.
The situation continues to unfold, and the extent and duration of its impact on financial markets and the economy remain highly uncertain. Extreme events such as the coronavirus crisis are “exogenous shocks” that can have significant adverse effects on mutual funds and their investments. Although multiple asset classes may be affected by market disruption, the duration and impact may not be the same for all types of assets.
Fidelity is committed to helping you stay informed amid news about COVID-19 and during increased market volatility, and we’re taking extra steps to be responsive to customer needs. We encourage you to visit our websites, where we offer ongoing updates, commentary, and analysis on the markets and our funds.
Performance: The Bottom Line
Average annual total return reflects the change in the value of an investment, assuming reinvestment of distributions from dividend income and capital gains (the profits earned upon the sale of securities that have grown in value, if any) and assuming a constant rate of performance each year. The hypothetical investment and the average annual total returns do not reflect the deduction of taxes that a shareholder would pay on fund distributions or the redemption of fund shares. During periods of reimbursement by Fidelity, a fund’s total return will be greater than it would be had the reimbursement not occurred. How a fund did yesterday is no guarantee of how it will do tomorrow.
Average Annual Total Returns
| For the periods ended November 30, 2020 | Past 1 year | Past 5 years | Past 10 years |
| Fidelity® Independence Fund | 27.00% | 13.48% | 12.85% |
| Class K | 27.08% | 13.57% | 12.96% |
$10,000 Over 10 Years
Let's say hypothetically that $10,000 was invested in Fidelity® Independence Fund, a class of the fund, on November 30, 2010.
The chart shows how the value of your investment would have changed, and also shows how the S&P 500® Index performed over the same period.
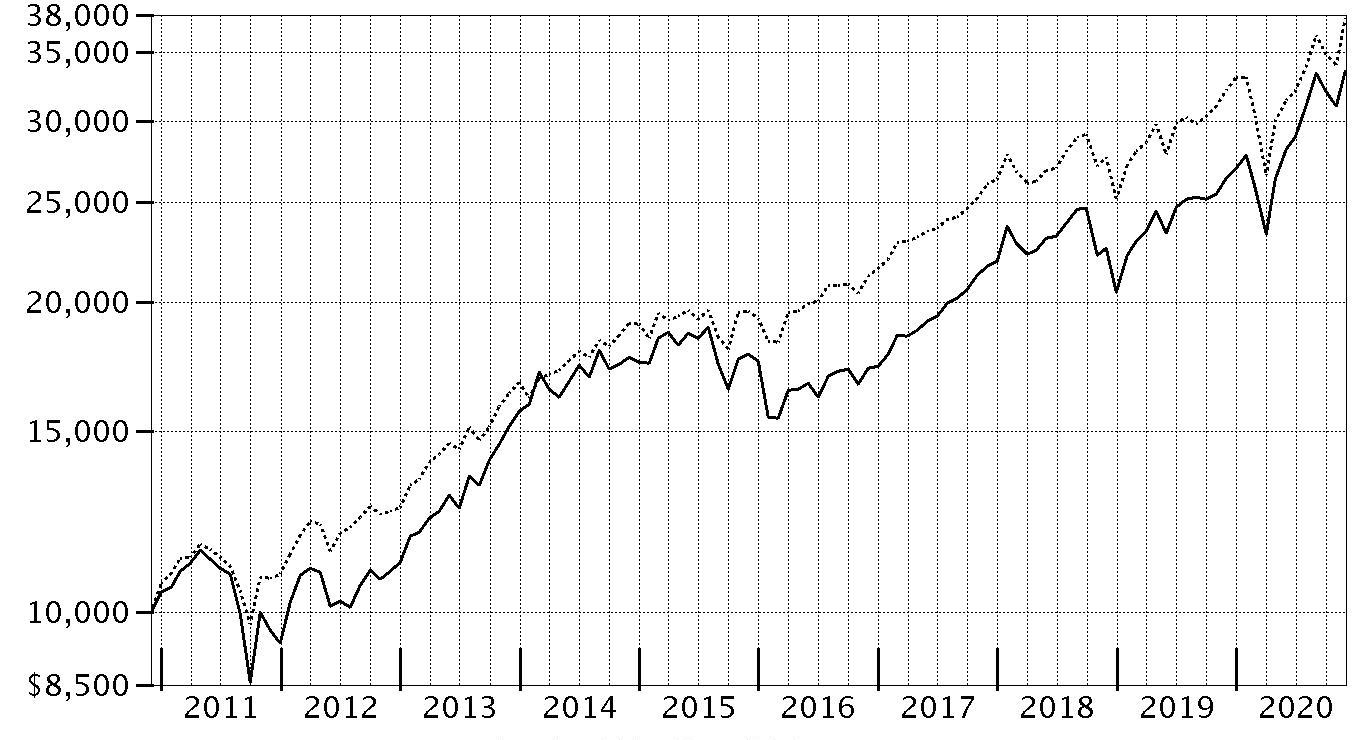
| Period Ending Values |
| $33,502 | Fidelity® Independence Fund |
| $37,703 | S&P 500® Index |
Management's Discussion of Fund Performance
Market Recap: The S&P 500
® index gained 17.46% for the year ending November 30, 2020, a volatile period marked by a steep but brief decline due to the early-2020 outbreak and spread of the coronavirus, followed by a historic rebound. Declared a pandemic on March 11, the COVID-19 crisis and containment efforts caused broad contraction in economic activity, along with extreme uncertainty, volatility and dislocation in financial markets. A rapid and expansive U.S. monetary/fiscal-policy response provided a partial offset to the economic disruption and fueled a sharp uptrend beginning March 24. Other supporting factors included resilient corporate earnings, near-term potential for a COVID-19 vaccine breakthrough and traction on a broader economic reopening. The rally lasted until September 2, when the S&P 500 began a two-month retreat. The loss of momentum reflected Congress’s inability to reach a deal on additional fiscal stimulus, as well as concerns about election uncertainty, indications the U.S. economic recovery was stalling and a new wave of COVID-19 cases. November was a much different story, as investors reacted favorably to election results and encouraging updates on the efficacy of two COVID-19 vaccine candidates. The index rose 11%, one of its biggest monthly gains ever. By sector for the full year, information technology (+42%) and consumer discretionary (+34%) led, driven by a handful of large growth stocks. In contrast, energy shares (-33%) struggled along with global oil demand and pricing.
Comments from Portfolio Manager Sammy Simnegar: For the fiscal year ending November 30, 2020, the fund's share classes gained about 27%, outperforming the 17.46% result of the benchmark S&P 500
® Index. The primary contributor to performance versus the benchmark was an overweighting in the market-leading information technology sector, especially within the software & services industry. The portfolio’s positioning among financial stocks also helped considerably. Security selection in health care and an underweighting in energy further lifted performance. Not owning Exxon Mobil, a benchmark component that returned roughly -40%, was the biggest individual relative contributor. Similarly, within financials, avoiding Wells Fargo, a benchmark component that returned -48%, proved beneficial as well. Another notable relative contributor was an outsized stake in PayPal (+100%). Conversely, the largest detractor from performance versus the benchmark was positioning in the industrials sector. An overweighting in real estate also hampered the fund's relative result. Also weighing on performance was an underweighting in the consumer staples sector, especially within the household & personal products industry. The biggest individual relative detractor was an overweight stake in Vertex Pharmaceuticals (-21%), a position not held at the end of this period. A second notable relative detractor was our overweighting in TransDigm Group (-57%), a position that was sold the past 12 months. Also holding back performance was our decision to avoid Lowe's (+35%) earlier in the period. Notable changes in positioning include decreased exposure to the real estate sector and a higher allocation to communication services.
The views expressed above reflect those of the portfolio manager(s) only through the end of the period as stated on the cover of this report and do not necessarily represent the views of Fidelity or any other person in the Fidelity organization. Any such views are subject to change at any time based upon market or other conditions and Fidelity disclaims any responsibility to update such views. These views may not be relied on as investment advice and, because investment decisions for a Fidelity fund are based on numerous factors, may not be relied on as an indication of trading intent on behalf of any Fidelity fund.
Notes to shareholders: On January 1, 2020, Jeff Feingold retired from Fidelity, leaving Sammy Simnegar as sole portfolio manager. On January 1, 2021, the fund closed to new accounts.
Investment Summary (Unaudited)
Top Ten Stocks as of November 30, 2020
| | % of fund's net assets |
| Apple, Inc. | 7.2 |
| Microsoft Corp. | 6.3 |
| Amazon.com, Inc. | 5.4 |
| Facebook, Inc. Class A | 3.1 |
| Alphabet, Inc. Class C | 2.2 |
| Alphabet, Inc. Class A | 2.2 |
| Visa, Inc. Class A | 2.0 |
| Procter & Gamble Co. | 2.0 |
| UnitedHealth Group, Inc. | 1.9 |
| NVIDIA Corp. | 1.9 |
| | 34.2 |
Top Five Market Sectors as of November 30, 2020
| | % of fund's net assets |
| Information Technology | 35.5 |
| Communication Services | 13.3 |
| Consumer Discretionary | 10.9 |
| Health Care | 10.1 |
| Industrials | 8.0 |
Asset Allocation (% of fund's net assets)
| As of November 30, 2020* |
| | Stocks | 99.1% |
| | Short-Term Investments and Net Other Assets (Liabilities) | 0.9% |

* Foreign investments - 4.5%
Schedule of Investments November 30, 2020
Showing Percentage of Net Assets
| Common Stocks - 99.1% | | | |
| | | Shares | Value (000s) |
| COMMUNICATION SERVICES - 13.3% | | | |
| Entertainment - 1.5% | | | |
| Netflix, Inc. (a) | | 135,000 | $66,245 |
| Interactive Media & Services - 8.4% | | | |
| Alphabet, Inc.: | | | |
| Class A (a) | | 53,400 | 93,685 |
| Class C (a) | | 53,700 | 94,552 |
| Facebook, Inc. Class A (a) | | 477,440 | 132,237 |
| Match Group, Inc. (a) | | 275,200 | 38,311 |
| | | | 358,785 |
| Media - 3.4% | | | |
| Cable One, Inc. | | 17,200 | 34,068 |
| Charter Communications, Inc. Class A (a) | | 73,800 | 48,117 |
| Comcast Corp. Class A | | 1,240,400 | 62,318 |
| | | | 144,503 |
|
| TOTAL COMMUNICATION SERVICES | | | 569,533 |
|
| CONSUMER DISCRETIONARY - 10.9% | | | |
| Internet & Direct Marketing Retail - 5.4% | | | |
| Amazon.com, Inc. (a) | | 73,280 | 232,154 |
| Multiline Retail - 1.0% | | | |
| Dollar General Corp. | | 196,175 | 42,880 |
| Specialty Retail - 3.0% | | | |
| Lowe's Companies, Inc. | | 334,500 | 52,122 |
| The Home Depot, Inc. | | 279,500 | 77,536 |
| | | | 129,658 |
| Textiles, Apparel & Luxury Goods - 1.5% | | | |
| NIKE, Inc. Class B | | 457,900 | 61,679 |
|
| TOTAL CONSUMER DISCRETIONARY | | | 466,371 |
|
| CONSUMER STAPLES - 5.9% | | | |
| Food & Staples Retailing - 2.9% | | | |
| Costco Wholesale Corp. | | 153,300 | 60,058 |
| Walmart, Inc. | | 424,500 | 64,859 |
| | | | 124,917 |
| Household Products - 2.0% | | | |
| Procter & Gamble Co. | | 608,800 | 84,544 |
| Personal Products - 1.0% | | | |
| Estee Lauder Companies, Inc. Class A | | 174,200 | 42,735 |
|
| TOTAL CONSUMER STAPLES | | | 252,196 |
|
| FINANCIALS - 5.9% | | | |
| Capital Markets - 4.1% | | | |
| Intercontinental Exchange, Inc. | | 409,600 | 43,217 |
| Moody's Corp. | | 147,900 | 41,758 |
| MSCI, Inc. | | 103,500 | 42,375 |
| S&P Global, Inc. | | 134,300 | 47,244 |
| | | | 174,594 |
| Insurance - 1.8% | | | |
| Arthur J. Gallagher & Co. | | 328,600 | 37,924 |
| Marsh & McLennan Companies, Inc. | | 364,000 | 41,729 |
| | | | 79,653 |
|
| TOTAL FINANCIALS | | | 254,247 |
|
| HEALTH CARE - 10.1% | | | |
| Health Care Equipment & Supplies - 3.3% | | | |
| Danaher Corp. | | 244,000 | 54,810 |
| Intuitive Surgical, Inc. (a) | | 63,600 | 46,177 |
| Stryker Corp. | | 172,300 | 40,215 |
| | | | 141,202 |
| Health Care Providers & Services - 1.9% | | | |
| UnitedHealth Group, Inc. | | 241,600 | 81,260 |
| Health Care Technology - 0.7% | | | |
| Veeva Systems, Inc. Class A (a) | | 112,900 | 31,259 |
| Life Sciences Tools & Services - 2.1% | | | |
| Mettler-Toledo International, Inc. (a) | | 25,944 | 29,837 |
| Thermo Fisher Scientific, Inc. | | 129,000 | 59,982 |
| | | | 89,819 |
| Pharmaceuticals - 2.1% | | | |
| Eli Lilly & Co. | | 278,000 | 40,491 |
| Horizon Therapeutics PLC (a) | | 89,977 | 6,337 |
| Zoetis, Inc. Class A | | 281,500 | 45,147 |
| | | | 91,975 |
|
| TOTAL HEALTH CARE | | | 435,515 |
|
| INDUSTRIALS - 8.0% | | | |
| Aerospace & Defense - 0.2% | | | |
| HEICO Corp. Class A | | 67,407 | 7,465 |
| Commercial Services & Supplies - 0.8% | | | |
| Waste Connection, Inc. (United States) | | 311,300 | 32,369 |
| Electrical Equipment - 0.9% | | | |
| AMETEK, Inc. | | 341,471 | 40,475 |
| Industrial Conglomerates - 0.9% | | | |
| Roper Technologies, Inc. | | 95,600 | 40,821 |
| Professional Services - 3.9% | | | |
| CoStar Group, Inc. (a) | | 35,900 | 32,689 |
| Equifax, Inc. | | 141,547 | 23,624 |
| IHS Markit Ltd. | | 411,675 | 40,945 |
| TransUnion Holding Co., Inc. | | 354,955 | 32,333 |
| Verisk Analytics, Inc. | | 183,415 | 36,373 |
| | | | 165,964 |
| Road & Rail - 1.3% | | | |
| Union Pacific Corp. | | 277,200 | 56,571 |
|
| TOTAL INDUSTRIALS | | | 343,665 |
|
| INFORMATION TECHNOLOGY - 35.5% | | | |
| IT Services - 8.8% | | | |
| Accenture PLC Class A | | 232,200 | 57,839 |
| Black Knight, Inc. (a) | | 380,000 | 34,816 |
| Global Payments, Inc. | | 227,900 | 44,484 |
| MasterCard, Inc. Class A | | 232,500 | 78,239 |
| PayPal Holdings, Inc. (a) | | 352,600 | 75,499 |
| Visa, Inc. Class A | | 415,700 | 87,442 |
| | | | 378,319 |
| Semiconductors & Semiconductor Equipment - 4.0% | | | |
| KLA-Tencor Corp. | | 174,500 | 43,969 |
| Lam Research Corp. | | 103,600 | 46,896 |
| NVIDIA Corp. | | 150,100 | 80,463 |
| | | | 171,328 |
| Software - 15.5% | | | |
| Adobe, Inc. (a) | | 140,900 | 67,416 |
| ANSYS, Inc. (a) | | 107,900 | 36,477 |
| Autodesk, Inc. (a) | | 163,900 | 45,930 |
| Cadence Design Systems, Inc. (a) | | 348,900 | 40,577 |
| Intuit, Inc. | | 135,500 | 47,699 |
| Microsoft Corp. | | 1,270,100 | 271,890 |
| Salesforce.com, Inc. (a) | | 256,900 | 63,146 |
| ServiceNow, Inc. (a) | | 96,700 | 51,691 |
| Synopsys, Inc. (a) | | 173,000 | 39,358 |
| | | | 664,184 |
| Technology Hardware, Storage & Peripherals - 7.2% | | | |
| Apple, Inc. | | 2,610,400 | 310,762 |
|
| TOTAL INFORMATION TECHNOLOGY | | | 1,524,593 |
|
| MATERIALS - 2.3% | | | |
| Chemicals - 2.3% | | | |
| Linde PLC | | 212,500 | 54,489 |
| Sherwin-Williams Co. | | 61,800 | 46,204 |
| | | | 100,693 |
| REAL ESTATE - 5.0% | | | |
| Equity Real Estate Investment Trusts (REITs) - 5.0% | | | |
| American Tower Corp. | | 209,800 | 48,506 |
| Crown Castle International Corp. | | 253,900 | 42,546 |
| Equinix, Inc. | | 60,200 | 42,007 |
| Prologis (REIT), Inc. | | 442,570 | 44,279 |
| SBA Communications Corp. Class A | | 134,700 | 38,683 |
| | | | 216,021 |
| UTILITIES - 2.2% | | | |
| Electric Utilities - 1.3% | | | |
| NextEra Energy, Inc. | | 768,900 | 56,583 |
| Water Utilities - 0.9% | | | |
| American Water Works Co., Inc. | | 251,347 | 38,552 |
|
| TOTAL UTILITIES | | | 95,135 |
|
| TOTAL COMMON STOCKS | | | |
| (Cost $2,345,367) | | | 4,257,969 |
|
| Convertible Preferred Stocks - 0.0% | | | |
| INFORMATION TECHNOLOGY - 0.0% | | | |
| Software - 0.0% | | | |
| Bird Rides, Inc. Series C (a)(b)(c) | | | |
| (Cost $1,400) | | 119,195 | 1,408 |
|
| Money Market Funds - 0.0% | | | |
| Fidelity Cash Central Fund 0.09% (d) | | | |
| (Cost $32) | | 32,450 | 32 |
| TOTAL INVESTMENT IN SECURITIES - 99.1% | | | |
| (Cost $2,346,799) | | | 4,259,409 |
| NET OTHER ASSETS (LIABILITIES) - 0.9% | | | 37,082 |
| NET ASSETS - 100% | | | $4,296,491 |
Legend
(a) Non-income producing
(b) Restricted securities (including private placements) - Investment in securities not registered under the Securities Act of 1933 (excluding 144A issues). At the end of the period, the value of restricted securities (excluding 144A issues) amounted to $1,408,000 or 0.0% of net assets.
(c) Level 3 security
(d) Affiliated fund that is generally available only to investment companies and other accounts managed by Fidelity Investments. The rate quoted is the annualized seven-day yield of the fund at period end. A complete unaudited listing of the fund's holdings as of its most recent quarter end is available upon request. In addition, each Fidelity Central Fund's financial statements, which are not covered by the Fund's Report of Independent Registered Public Accounting Firm, are available on the SEC's website or upon request.
Additional information on each restricted holding is as follows:
| Security | Acquisition Date | Acquisition Cost (000s) |
| Bird Rides, Inc. Series C | 12/21/18 | $1,400 |
Affiliated Central Funds
Information regarding fiscal year to date income earned by the Fund from investments in Fidelity Central Funds is as follows:
| Fund | Income earned |
| | (Amounts in thousands) |
| Fidelity Cash Central Fund | $192 |
| Fidelity Securities Lending Cash Central Fund | 153 |
| Total | $345 |
Amounts in the income column in the above table include any capital gain distributions from underlying funds, which are presented in the corresponding line-item in the Statement of Operations, if applicable. Amount for Fidelity Securities Lending Cash Central Fund represents the income earned on investing cash collateral, less rebates paid to borrowers and any lending agent fees associated with the loan, plus any premium payments received for lending certain types of securities.
Investment Valuation
The following is a summary of the inputs used, as of November 30, 2020, involving the Fund's assets and liabilities carried at fair value. The inputs or methodology used for valuing securities may not be an indication of the risk associated with investing in those securities. For more information on valuation inputs, and their aggregation into the levels used below, please refer to the Investment Valuation section in the accompanying Notes to Financial Statements.
| | Valuation Inputs at Reporting Date: |
| Description | Total | Level 1 | Level 2 | Level 3 |
| (Amounts in thousands) | | | | |
| Investments in Securities: | | | | |
| Equities: | | | | |
| Communication Services | $569,533 | $569,533 | $-- | $-- |
| Consumer Discretionary | 466,371 | 466,371 | -- | -- |
| Consumer Staples | 252,196 | 252,196 | -- | -- |
| Financials | 254,247 | 254,247 | -- | -- |
| Health Care | 435,515 | 435,515 | -- | -- |
| Industrials | 343,665 | 343,665 | -- | -- |
| Information Technology | 1,526,001 | 1,524,593 | -- | 1,408 |
| Materials | 100,693 | 100,693 | -- | -- |
| Real Estate | 216,021 | 216,021 | -- | -- |
| Utilities | 95,135 | 95,135 | -- | -- |
| Money Market Funds | 32 | 32 | -- | -- |
| Total Investments in Securities: | $4,259,409 | $4,258,001 | $-- | $1,408 |
See accompanying notes which are an integral part of the financial statements.
Financial Statements
Statement of Assets and Liabilities
| Amounts in thousands (except per-share amounts) | | November 30, 2020 |
| Assets | | |
Investment in securities, at value — See accompanying schedule:
Unaffiliated issuers (cost $2,346,767) | $4,259,377 | |
| Fidelity Central Funds (cost $32) | 32 | |
| Total Investment in Securities (cost $2,346,799) | | $4,259,409 |
| Receivable for investments sold | | 50,522 |
| Receivable for fund shares sold | | 661 |
| Dividends receivable | | 2,638 |
| Distributions receivable from Fidelity Central Funds | | 4 |
| Prepaid expenses | | 6 |
| Other receivables | | 48 |
| Total assets | | 4,313,288 |
| Liabilities | | |
| Payable for investments purchased | $12,001 | |
| Payable for fund shares redeemed | 1,806 | |
| Accrued management fee | 2,426 | |
| Other affiliated payables | 470 | |
| Other payables and accrued expenses | 94 | |
| Total liabilities | | 16,797 |
| Net Assets | | $4,296,491 |
| Net Assets consist of: | | |
| Paid in capital | | $2,333,676 |
| Total accumulated earnings (loss) | | 1,962,815 |
| Net Assets | | $4,296,491 |
| Net Asset Value and Maximum Offering Price | | |
| Independence: | | |
| Net Asset Value, offering price and redemption price per share ($4,044,513 ÷ 89,000 shares) | | $45.44 |
| Class K: | | |
| Net Asset Value, offering price and redemption price per share ($251,978 ÷ 5,541 shares) | | $45.48 |
See accompanying notes which are an integral part of the financial statements.
Statement of Operations
| Amounts in thousands | | Year ended November 30, 2020 |
| Investment Income | | |
| Dividends | | $34,587 |
| Income from Fidelity Central Funds (including $153 from security lending) | | 345 |
| Total income | | 34,932 |
| Expenses | | |
| Management fee | | |
| Basic fee | $20,767 | |
| Performance adjustment | 6,504 | |
| Transfer agent fees | 4,290 | |
| Accounting fees | 1,029 | |
| Custodian fees and expenses | 56 | |
| Independent trustees' fees and expenses | 21 | |
| Registration fees | 71 | |
| Audit | 71 | |
| Legal | 8 | |
| Interest | 5 | |
| Miscellaneous | 44 | |
| Total expenses before reductions | 32,866 | |
| Expense reductions | (57) | |
| Total expenses after reductions | | 32,809 |
| Net investment income (loss) | | 2,123 |
| Realized and Unrealized Gain (Loss) | | |
| Net realized gain (loss) on: | | |
| Investment securities: | | |
| Unaffiliated issuers | 59,963 | |
| Fidelity Central Funds | (1) | |
| Total net realized gain (loss) | | 59,962 |
| Change in net unrealized appreciation (depreciation) on: | | |
| Investment securities: | | |
| Unaffiliated issuers | 872,003 | |
| Assets and liabilities in foreign currencies | 2 | |
| Total change in net unrealized appreciation (depreciation) | | 872,005 |
| Net gain (loss) | | 931,967 |
| Net increase (decrease) in net assets resulting from operations | | $934,090 |
See accompanying notes which are an integral part of the financial statements.
Statement of Changes in Net Assets
| Amounts in thousands | Year ended November 30, 2020 | Year ended November 30, 2019 |
| Increase (Decrease) in Net Assets | | |
| Operations | | |
| Net investment income (loss) | $2,123 | $19,884 |
| Net realized gain (loss) | 59,962 | 401,016 |
| Change in net unrealized appreciation (depreciation) | 872,005 | 153,910 |
| Net increase (decrease) in net assets resulting from operations | 934,090 | 574,810 |
| Distributions to shareholders | (398,958) | (367,006) |
| Share transactions - net increase (decrease) | (127,642) | 39,703 |
| Total increase (decrease) in net assets | 407,490 | 247,507 |
| Net Assets | | |
| Beginning of period | 3,889,001 | 3,641,494 |
| End of period | $4,296,491 | $3,889,001 |
See accompanying notes which are an integral part of the financial statements.
Financial Highlights
Fidelity Independence Fund
| Years ended November 30, | 2020 | 2019 | 2018 | 2017 | 2016 |
| Selected Per–Share Data | | | | | |
| Net asset value, beginning of period | $39.79 | $38.38 | $41.90 | $35.38 | $39.08 |
| Income from Investment Operations | | | | | |
| Net investment income (loss)A | .02 | .20 | .29 | .40B | .20 |
| Net realized and unrealized gain (loss) | 9.75 | 5.11 | 1.25 | 8.21 | (1.44) |
| Total from investment operations | 9.77 | 5.31 | 1.54 | 8.61 | (1.24) |
| Distributions from net investment income | (.21) | (.22) | (.41) | (.18) | (.03) |
| Distributions from net realized gain | (3.91) | (3.68) | (4.65) | (1.91) | (2.43) |
| Total distributions | (4.12) | (3.90) | (5.06) | (2.09) | (2.46) |
| Net asset value, end of period | $45.44 | $39.79 | $38.38 | $41.90 | $35.38 |
| Total ReturnC | 27.00% | 17.01% | 3.99% | 25.72% | (3.15)% |
| Ratios to Average Net AssetsD,E | | | | | |
| Expenses before reductions | .85% | .67% | .50% | .48% | .54% |
| Expenses net of fee waivers, if any | .85% | .67% | .50% | .48% | .54% |
| Expenses net of all reductions | .84% | .67% | .49% | .48% | .54% |
| Net investment income (loss) | .05% | .54% | .73% | 1.06%B | .59% |
| Supplemental Data | | | | | |
| Net assets, end of period (in millions) | $4,045 | $3,534 | $3,342 | $3,564 | $3,262 |
| Portfolio turnover rateF | 61% | 100% | 46% | 62% | 76% |
A Calculated based on average shares outstanding during the period.
B Net investment income per share reflects one or more large, non-recurring dividend(s) which amounted to $.07 per share. Excluding such non-recurring dividend(s), the ratio of net investment income (loss) to average net assets would have been .89%.
C Total returns would have been lower if certain expenses had not been reduced during the applicable periods shown.
D Fees and expenses of any underlying mutual funds or exchange-traded funds (ETFs) are not included in the Fund's expense ratio. The Fund indirectly bears its proportionate share of these expenses. For additional expense information related to investments in Fidelity Central Funds, please refer to the "Investments in Fidelity Central Funds" note found in the Notes to Financial Statements section of the most recent Annual or Semi-Annual report.
E Expense ratios reflect operating expenses of the class. Expenses before reductions do not reflect amounts reimbursed, waived, or reduced through arrangements with the investment adviser, brokerage services, or other offset arrangements, if applicable, and do not represent the amount paid by the class during periods when reimbursements, waivers or reductions occur.
F Amount does not include the portfolio activity of any underlying mutual funds or exchange-traded funds (ETFs).
See accompanying notes which are an integral part of the financial statements.
Fidelity Independence Fund Class K
| Years ended November 30, | 2020 | 2019 | 2018 | 2017 | 2016 |
| Selected Per–Share Data | | | | | |
| Net asset value, beginning of period | $39.83 | $38.42 | $41.94 | $35.41 | $39.12 |
| Income from Investment Operations | | | | | |
| Net investment income (loss)A | .05 | .22 | .32 | .43B | .23 |
| Net realized and unrealized gain (loss) | 9.75 | 5.13 | 1.25 | 8.22 | (1.45) |
| Total from investment operations | 9.80 | 5.35 | 1.57 | 8.65 | (1.22) |
| Distributions from net investment income | (.24) | (.25) | (.44) | (.22) | (.06) |
| Distributions from net realized gain | (3.91) | (3.68) | (4.65) | (1.91) | (2.43) |
| Total distributions | (4.15) | (3.94)C | (5.09) | (2.12)C | (2.49) |
| Net asset value, end of period | $45.48 | $39.83 | $38.42 | $41.94 | $35.41 |
| Total ReturnD | 27.08% | 17.12% | 4.08% | 25.84% | (3.08)% |
| Ratios to Average Net AssetsE,F | | | | | |
| Expenses before reductions | .77% | .60% | .42% | .40% | .45% |
| Expenses net of fee waivers, if any | .77% | .60% | .42% | .40% | .45% |
| Expenses net of all reductions | .77% | .59% | .41% | .39% | .45% |
| Net investment income (loss) | .12% | .62% | .81% | 1.15%B | .68% |
| Supplemental Data | | | | | |
| Net assets, end of period (in millions) | $252 | $355 | $299 | $354 | $348 |
| Portfolio turnover rateG | 61% | 100% | 46% | 62% | 76% |
A Calculated based on average shares outstanding during the period.
B Net investment income per share reflects one or more large, non-recurring dividend(s) which amounted to $.07 per share. Excluding such non-recurring dividend(s), the ratio of net investment income (loss) to average net assets would have been .97%.
C Total distributions per share do not sum due to rounding.
D Total returns would have been lower if certain expenses had not been reduced during the applicable periods shown.
E Fees and expenses of any underlying mutual funds or exchange-traded funds (ETFs) are not included in the Fund's expense ratio. The Fund indirectly bears its proportionate share of these expenses. For additional expense information related to investments in Fidelity Central Funds, please refer to the "Investments in Fidelity Central Funds" note found in the Notes to Financial Statements section of the most recent Annual or Semi-Annual report.
F Expense ratios reflect operating expenses of the class. Expenses before reductions do not reflect amounts reimbursed, waived, or reduced through arrangements with the investment adviser, brokerage services, or other offset arrangements, if applicable, and do not represent the amount paid by the class during periods when reimbursements, waivers or reductions occur.
G Amount does not include the portfolio activity of any underlying mutual funds or exchange-traded funds (ETFs).
See accompanying notes which are an integral part of the financial statements.
Notes to Financial Statements
For the period ended November 30, 2020
(Amounts in thousands except percentages)
1. Organization.
Fidelity Independence Fund (the Fund) is a fund of Fidelity Financial Trust (the Trust) and is authorized to issue an unlimited number of shares. The Trust is registered under the Investment Company Act of 1940, as amended (the 1940 Act), as an open-end management investment company organized as a Massachusetts business trust. The Fund offers Independence and Class K shares, each of which has equal rights as to assets and voting privileges. Each class has exclusive voting rights with respect to matters that affect that class.
Effective January 1, 2020:
Investment advisers Fidelity Investments Money Management, Inc., FMR Co., Inc., and Fidelity SelectCo, LLC, merged with and into Fidelity Management & Research Company. In connection with the merger transactions, the resulting, merged investment adviser was then redomiciled from Massachusetts to Delaware, changed its corporate structure from a corporation to a limited liability company, and changed its name to "Fidelity Management & Research Company LLC".
Fidelity Investments Institutional Operations Company, Inc. converted from a Massachusetts corporation to a Massachusetts LLC, and changed its name to "Fidelity Investments Institutional Operations Company LLC".
Effective January 1, 2021, the Fund was closed to new accounts with certain exceptions.
2. Investments in Fidelity Central Funds.
The Fund invests in Fidelity Central Funds, which are open-end investment companies generally available only to other investment companies and accounts managed by the investment adviser and its affiliates. The Fund's Schedule of Investments lists each of the Fidelity Central Funds held as of period end, if any, as an investment of the Fund, but does not include the underlying holdings of each Fidelity Central Fund. As an Investing Fund, the Fund indirectly bears its proportionate share of the expenses of the underlying Fidelity Central Funds.
The Money Market Central Funds seek preservation of capital and current income and are managed by the investment adviser. Annualized expenses of the Money Market Central Funds as of their most recent shareholder report date ranged from less than .005% to .01%.
A complete unaudited list of holdings for each Fidelity Central Fund is available upon request or at the Securities and Exchange Commission (the SEC) website at www.sec.gov. In addition, the financial statements of the Fidelity Central Funds, which are not covered by the Fund's Report of Independent Registered Public Accounting Firm, are available on the SEC website or upon request.
3. Significant Accounting Policies.
The Fund is an investment company and applies the accounting and reporting guidance of the Financial Accounting Standards Board (FASB) Accounting Standards Codification Topic 946 Financial Services – Investment Companies. The financial statements have been prepared in conformity with accounting principles generally accepted in the United States of America (GAAP), which require management to make certain estimates and assumptions at the date of the financial statements. Actual results could differ from those estimates. Subsequent events, if any, through the date that the financial statements were issued have been evaluated in the preparation of the financial statements. The following summarizes the significant accounting policies of the Fund:
Investment Valuation. Investments are valued as of 4:00 p.m. Eastern time on the last calendar day of the period. The Board of Trustees (the Board) has delegated the day to day responsibility for the valuation of the Fund's investments to the Fair Value Committee (the Committee) established by the Fund's investment adviser. In accordance with valuation policies and procedures approved by the Board, the Fund attempts to obtain prices from one or more third party pricing vendors or brokers to value its investments. When current market prices, quotations or currency exchange rates are not readily available or reliable, investments will be fair valued in good faith by the Committee, in accordance with procedures adopted by the Board. Factors used in determining fair value vary by investment type and may include market or investment specific events. The frequency with which these procedures are used cannot be predicted and they may be utilized to a significant extent. The Committee oversees the Fund's valuation policies and procedures and reports to the Board on the Committee's activities and fair value determinations. The Board monitors the appropriateness of the procedures used in valuing the Fund's investments and ratifies the fair value determinations of the Committee.
The Fund categorizes the inputs to valuation techniques used to value its investments into a disclosure hierarchy consisting of three levels as shown below:
- Level 1 – quoted prices in active markets for identical investments
- Level 2 – other significant observable inputs (including quoted prices for similar investments, interest rates, prepayment speeds, etc.)
- Level 3 – unobservable inputs (including the Fund's own assumptions based on the best information available)
Valuation techniques used to value the Fund's investments by major category are as follows:
Equity securities, including restricted securities, for which market quotations are readily available, are valued at the last reported sale price or official closing price as reported by a third party pricing vendor on the primary market or exchange on which they are traded and are categorized as Level 1 in the hierarchy. In the event there were no sales during the day or closing prices are not available, securities are valued at the last quoted bid price or may be valued using the last available price and are generally categorized as Level 2 in the hierarchy. For foreign equity securities, when market or security specific events arise, comparisons to the valuation of American Depositary Receipts (ADRs), futures contracts, Exchange-Traded Funds (ETFs) and certain indexes as well as quoted prices for similar securities may be used and would be categorized as Level 2 in the hierarchy. For equity securities, including restricted securities, where observable inputs are limited, assumptions about market activity and risk are used and these securities may be categorized as Level 3 in the hierarchy.
Investments in open-end mutual funds, including the Fidelity Central Funds, are valued at their closing net asset value (NAV) each business day and are categorized as Level 1 in the hierarchy.
Changes in valuation techniques may result in transfers in or out of an assigned level within the disclosure hierarchy. The aggregate value of investments by input level as of November 30, 2020 is included at the end of the Fund's Schedule of Investments.
Foreign Currency. Certain Funds may use foreign currency contracts to facilitate transactions in foreign-denominated securities. Gains and losses from these transactions may arise from changes in the value of the foreign currency or if the counterparties do not perform under the contracts' terms.
Foreign-denominated assets, including investment securities, and liabilities are translated into U.S. dollars at the exchange rates at period end. Purchases and sales of investment securities, income and dividends received, and expenses denominated in foreign currencies are translated into U.S. dollars at the exchange rate in effect on the transaction date.
The effects of exchange rate fluctuations on investments are included with the net realized and unrealized gain (loss) on investment securities. Other foreign currency transactions resulting in realized and unrealized gain (loss) are disclosed separately.
Investment Transactions and Income. For financial reporting purposes, the Fund's investment holdings and NAV include trades executed through the end of the last business day of the period. The NAV per share for processing shareholder transactions is calculated as of the close of business of the New York Stock Exchange (NYSE), normally 4:00 p.m. Eastern time and includes trades executed through the end of the prior business day. Gains and losses on securities sold are determined on the basis of identified cost and include proceeds received from litigation. Dividend income is recorded on the ex-dividend date, except for certain dividends from foreign securities where the ex-dividend date may have passed, which are recorded as soon as the Fund is informed of the ex-dividend date. Non-cash dividends included in dividend income, if any, are recorded at the fair market value of the securities received. Income and capital gain distributions from Fidelity Central Funds, if any, are recorded on the ex-dividend date. Certain distributions received by the Fund represent a return of capital or capital gain. The Fund determines the components of these distributions subsequent to the ex-dividend date, based upon receipt of tax filings or other correspondence relating to the underlying investment. These distributions are recorded as a reduction of cost of investments and/or as a realized gain. Investment income is recorded net of foreign taxes withheld where recovery of such taxes is uncertain.
Class Allocations and Expenses. Investment income, realized and unrealized capital gains and losses, common expenses of the Fund, and certain fund-level expense reductions, if any, are allocated daily on a pro-rata basis to each class based on the relative net assets of each class to the total net assets of the Fund. Each class differs with respect to transfer agent fees incurred. Certain expense reductions may also differ by class. For the reporting period, the allocated portion of income and expenses to each class as a percent of its average net assets may vary due to the timing of recording these transactions in relation to fluctuating net assets of the classes. Expenses directly attributable to a fund are charged to that fund. Expenses attributable to more than one fund are allocated among the respective funds on the basis of relative net assets or other appropriate methods. Expense estimates are accrued in the period to which they relate and adjustments are made when actual amounts are known.
Deferred Trustee Compensation. Under a Deferred Compensation Plan (the Plan) for certain Funds, certain independent Trustees have elected to defer receipt of a portion of their annual compensation. Deferred amounts are invested in affiliated mutual funds, are marked-to-market and remain in a fund until distributed in accordance with the Plan. The investment of deferred amounts and the offsetting payable to the Trustees presented below are included in the accompanying Statement of Assets and Liabilities in other receivables and other payables and accrued expenses, as applicable.
| Fidelity Independence Fund | $30 |
Income Tax Information and Distributions to Shareholders. Each year, the Fund intends to qualify as a regulated investment company under Subchapter M of the Internal Revenue Code, including distributing substantially all of its taxable income and realized gains. As a result, no provision for U.S. Federal income taxes is required. As of November 30, 2020, the Fund did not have any unrecognized tax benefits in the financial statements; nor is the Fund aware of any tax positions for which it is reasonably possible that the total amounts of unrecognized tax benefits will significantly change in the next twelve months. The Fund files a U.S. federal tax return, in addition to state and local tax returns as required. The Fund's federal income tax returns are subject to examination by the Internal Revenue Service (IRS) for a period of three fiscal years after they are filed. State and local tax returns may be subject to examination for an additional fiscal year depending on the jurisdiction. Foreign taxes are provided for based on the Fund's understanding of the tax rules and rates that exist in the foreign markets in which it invests.
Distributions are declared and recorded on the ex-dividend date. Income and capital gain distributions are declared separately for each class. Income and capital gain distributions are determined in accordance with income tax regulations, which may differ from GAAP. In addition, the Fund claimed a portion of the payment made to redeeming shareholders as a distribution for income tax purposes.
Capital accounts within the financial statements are adjusted for permanent book-tax differences. These adjustments have no impact on net assets or the results of operations. Capital accounts are not adjusted for temporary book-tax differences which will reverse in a subsequent period.
Book-tax differences are primarily due to foreign currency transactions, passive foreign investment companies (PFIC), deferred trustees compensation, losses deferred due to wash sales and excise tax regulations.
As of period end, the cost and unrealized appreciation (depreciation) in securities, and derivatives if applicable, for federal income tax purposes were as follows:
| Gross unrealized appreciation | $1,920,328 |
| Gross unrealized depreciation | (10,852) |
| Net unrealized appreciation (depreciation) | $1,909,476 |
| Tax Cost | $2,349,933 |
The tax-based components of distributable earnings as of period end were as follows:
| Undistributed long-term capital gain | $55,784 |
| Net unrealized appreciation (depreciation) on securities and other investments | $1,909,477 |
The Fund intends to elect to defer to its next fiscal year $2,417 of ordinary losses recognized during the period January 1, 2020 to November 30, 2020.
The tax character of distributions paid was as follows:
| | November 30, 2020 | November 30, 2019 |
| Ordinary Income | $20,327 | $ 21,953 |
| Long-term Capital Gains | 378,631 | 345,053 |
| Total | $398,958 | $ 367,006 |
Restricted Securities (including Private Placements). The Fund may invest in securities that are subject to legal or contractual restrictions on resale. These securities generally may be resold in transactions exempt from registration or to the public if the securities are registered. Disposal of these securities may involve time-consuming negotiations and expense, and prompt sale at an acceptable price may be difficult. Information regarding restricted securities is included at the end of the Fund's Schedule of Investments.
4. Purchases and Sales of Investments.
Purchases and sales of securities, other than short-term securities are noted in the table below.
| | Purchases ($) | Sales ($) |
| Fidelity Independence Fund | 2,372,869 | 2,917,019 |
5. Fees and Other Transactions with Affiliates.
Management Fee. Fidelity Management & Research Company LLC (the investment adviser) and its affiliates provide the Fund with investment management related services for which the Fund pays a monthly management fee. The management fee is the sum of an individual fund fee rate that is based on an annual rate of .30% of the Fund's average net assets and an annualized group fee rate that averaged .23% during the period. The group fee rate is based upon the monthly average net assets of a group of registered investment companies with which the investment adviser has management contracts. The group fee rate decreases as assets under management increase and increases as assets under management decrease. In addition, the management fee is subject to a performance adjustment (up to a maximum of +/- .20% of the Fund's average net assets over a 36 month performance period). The upward or downward adjustment to the management fee is based on the relative investment performance of Independence as compared to its benchmark index, the S&P 500 Index, over the same 36 month performance period. For the reporting period, the total annual management fee rate, including the performance adjustment, was .70% of the Fund's average net assets. The performance adjustment included in the management fee rate may be higher or lower than the maximum performance adjustment rate due to the difference between the average net assets for the reporting and performance periods.
Transfer Agent Fees. Fidelity Investments Institutional Operations Company LLC (FIIOC), an affiliate of the investment adviser, is the transfer, dividend disbursing and shareholder servicing agent for each class of the Fund. FIIOC receives account fees and asset-based fees that vary according to the account size and type of account of the shareholders of Independence, except for Class K FIIOC receives an asset-based fee of Class K's average net assets. FIIOC pays for typesetting, printing and mailing of shareholder reports, except proxy statements. Effective February 1, 2020, the Board approved to change the fee for Class K from .046% to .044%.
For the period, transfer agent fees for each class were as follows:
| | Amount | % of Class-Level Average Net Assets |
| Independence | $4,175 | .11 |
| Class K | 115 | .04 |
| | $4,290 | |
Accounting Fees. Fidelity Service Company, Inc. (FSC), an affiliate of the investment adviser, maintains the Fund's accounting records. The accounting fee is based on the level of average net assets for each month. For the period, the fees were equivalent to the following annual rates:
| | % of Average Net Assets |
| Fidelity Independence Fund | .03 |
Brokerage Commissions. A portion of portfolio transactions were placed with brokerage firms which are affiliates of the investment adviser. Brokerage commissions are included in net realized gain (loss) and change in net unrealized appreciation (depreciation) in the Statement of Operations. The commissions paid to these affiliated firms were as follows:
| | Amount |
| Fidelity Independence Fund | $36 |
Interfund Lending Program. Pursuant to an Exemptive Order issued by the SEC, the Fund, along with other registered investment companies having management contracts with Fidelity Management & Research Company LLC (FMR), or other affiliated entities of FMR, may participate in an interfund lending program. This program provides an alternative credit facility allowing the Fund to borrow from, or lend money to, other participating affiliated funds. At period end, there were no interfund loans outstanding. Activity in this program during the period for which loans were outstanding was as follows:
| | Borrower or Lender | Average Loan Balance | Weighted Average Interest Rate | Interest Expense |
| Fidelity Independence Fund | Borrower | $23,298 | 1.23% | $5 |
Interfund Trades. Funds may purchase from or sell securities to other Fidelity Funds under procedures adopted by the Board. The procedures have been designed to ensure these interfund trades are executed in accordance with Rule 17a-7 of the 1940 Act. Interfund trades are included within the respective purchases and sales amounts shown in the Purchases and Sales of Investments note.
6. Committed Line of Credit.
Certain Funds participate with other funds managed by the investment adviser or an affiliate in a $4.25 billion credit facility (the "line of credit") to be utilized for temporary or emergency purposes to fund shareholder redemptions or for other short-term liquidity purposes. The participating funds have agreed to pay commitment fees on their pro-rata portion of the line of credit, which are reflected in Miscellaneous expenses on the Statement of Operations, and are as follows:
| | Amount |
| Fidelity Independence Fund | $9 |
During the period, there were no borrowings on this line of credit.
7. Security Lending.
Funds lend portfolio securities from time to time in order to earn additional income. Lending agents are used, including National Financial Services (NFS), an affiliate of the investment adviser. Pursuant to a securities lending agreement, NFS will receive a fee, which is capped at 9.9% of a fund's daily lending revenue, for its services as lending agent. A fund may lend securities to certain qualified borrowers, including NFS. On the settlement date of the loan, a fund receives collateral (in the form of U.S. Treasury obligations, letters of credit and/or cash) against the loaned securities and maintains collateral in an amount not less than 100% of the market value of the loaned securities during the period of the loan. The market value of the loaned securities is determined at the close of business of a fund and any additional required collateral is delivered to a fund on the next business day. A fund or borrower may terminate the loan at any time, and if the borrower defaults on its obligation to return the securities loaned because of insolvency or other reasons, a fund may apply collateral received from the borrower against the obligation. A fund may experience delays and costs in recovering the securities loaned. Any cash collateral received is invested in the Fidelity Securities Lending Cash Central Fund. Any loaned securities are identified as such in the Schedule of Investments, and the value of loaned securities and cash collateral at period end, as applicable, are presented in the Statement of Assets and Liabilities. Security lending income represents the income earned on investing cash collateral, less rebates paid to borrowers and any lending agent fees associated with the loan, plus any premium payments received for lending certain types of securities. Security lending income is presented in the Statement of Operations as a component of income from Fidelity Central Funds. Affiliated security lending activity, if any, was as follows:
| | Total Security Lending Income Fees Paid to NFS | Security Lending Income From Securities Loaned to NFS | Value of Securities Loaned to NFS at Period End |
| Fidelity Independence Fund | $14 | $– | $– |
8. Expense Reductions.
Commissions paid to certain brokers with whom the investment adviser, or its affiliates, places trades on behalf of the Fund include an amount in addition to trade execution, which may be rebated back to the Fund to offset certain expenses. This amount totaled $38 for the period. In addition, through arrangements with the Fund's custodian, credits realized as a result of certain uninvested cash balances were used to reduce the Fund's expenses. During the period, custodian credits reduced the Fund's expenses by amount less than five hundred dollars. During the period, transfer agent credits reduced each class' expenses as noted in the table below.
| | Expense reduction |
| Independence | $3 |
In addition, during the period the investment adviser or an affiliate reimbursed and/or waived a portion of fund-level operating expenses in the amount of $16.
9. Distributions to Shareholders.
Distributions to shareholders of each class were as follows:
| | Year ended
November 30, 2020 | Year ended
November 30, 2019 |
| Distributions to shareholders | | |
| Independence | $362,437 | $336,666 |
| Class K | 36,521 | 30,340 |
| Total | $398,958 | $367,006 |
10. Share Transactions.
Share transactions for each class were as follows and may contain automatic conversions between classes or exchanges between affiliated funds:
| | Shares | Shares | Dollars | Dollars |
| | Year ended November 30, 2020 | Year ended November 30, 2019 | Year ended November 30, 2020 | Year ended November 30, 2019 |
| Independence | | | | |
| Shares sold | 1,734 | 1,023 | $65,939 | $36,920 |
| Reinvestment of distributions | 9,634 | 10,842 | 353,953 | 328,824 |
| Shares redeemed | (11,181) | (10,131) | (426,843) | (367,515) |
| Net increase (decrease) | 187 | 1,734 | $(6,951) | $(1,771) |
| Class K | | | | |
| Shares sold | 807 | 3,271 | $31,311 | $122,930 |
| Reinvestment of distributions | 994 | 1,000 | 36,521 | 30,340 |
| Shares redeemed | (5,173) | (3,148) | (188,523) | (111,796) |
| Net increase (decrease) | (3,372) | 1,123 | $(120,691) | $41,474 |
11. Other.
The Fund's organizational documents provide former and current trustees and officers with a limited indemnification against liabilities arising in connection with the performance of their duties to the Fund. In the normal course of business, the Fund may also enter into contracts that provide general indemnifications. The Fund's maximum exposure under these arrangements is unknown as this would be dependent on future claims that may be made against the Fund. The risk of material loss from such claims is considered remote.
12. Coronavirus (COVID-19) Pandemic.
An outbreak of COVID-19 first detected in China during December 2019 has since spread globally and was declared a pandemic by the World Health Organization during March 2020. Developments that disrupt global economies and financial markets, such as the COVID-19 pandemic, may magnify factors that affect the Fund's performance.
13. Proposed Reorganization.
The Board of Trustees of the Fund approved an Agreement and Plan of Reorganization (the Agreement) between the Fund and Fidelity Magellan Fund. The Agreement provides for the transfer of all the assets and the assumption of all the liabilities of the Fund in exchange for corresponding shares of Fidelity Magellan Fund equal in value to the net assets of the Fund on the day the reorganization is effective.
A meeting of shareholders of the Fund is expected to be held during the second quarter of 2021 to vote on the reorganization. If approved by shareholders, the reorganization is expected to become effective on or about May 14, 2021. The reorganization is expected to qualify as a tax-free transaction for federal income tax purposes with no gain or loss recognized by the funds or their shareholders.
Report of Independent Registered Public Accounting Firm
To the Board of Trustees of Fidelity Financial Trust and Shareholders of Fidelity Independence Fund
Opinion on the Financial Statements
We have audited the accompanying statement of assets and liabilities, including the schedule of investments, of Fidelity Independence Fund (one of the funds constituting Fidelity Financial Trust, referred to hereafter as the “Fund”) as of November 30, 2020, the related statement of operations for the year ended November 30, 2020, the statement of changes in net assets for each of the two years in the period ended November 30, 2020, including the related notes, and the financial highlights for each of the five years in the period ended November 30, 2020 (collectively referred to as the “financial statements”). In our opinion, the financial statements present fairly, in all material respects, the financial position of the Fund as of November 30, 2020, the results of its operations for the year then ended, the changes in its net assets for each of the two years in the period ended November 30, 2020 and the financial highlights for each of the five years in the period ended November 30, 2020 in conformity with accounting principles generally accepted in the United States of America.
Basis for Opinion
These financial statements are the responsibility of the Fund’s management. Our responsibility is to express an opinion on the Fund’s financial statements based on our audits. We are a public accounting firm registered with the Public Company Accounting Oversight Board (United States) (PCAOB) and are required to be independent with respect to the Fund in accordance with the U.S. federal securities laws and the applicable rules and regulations of the Securities and Exchange Commission and the PCAOB.
We conducted our audits of these financial statements in accordance with the standards of the PCAOB. Those standards require that we plan and perform the audit to obtain reasonable assurance about whether the financial statements are free of material misstatement, whether due to error or fraud.
Our audits included performing procedures to assess the risks of material misstatement of the financial statements, whether due to error or fraud, and performing procedures that respond to those risks. Such procedures included examining, on a test basis, evidence regarding the amounts and disclosures in the financial statements. Our audits also included evaluating the accounting principles used and significant estimates made by management, as well as evaluating the overall presentation of the financial statements. Our procedures included confirmation of securities owned as of November 30, 2020 by correspondence with the custodian, issuers of privately offered securities and brokers; when replies were not received from brokers, we performed other auditing procedures. We believe that our audits provide a reasonable basis for our opinion.
/s/ PricewaterhouseCoopers LLP
Boston, Massachusetts
January 12, 2021
We have served as the auditor of one or more investment companies in the Fidelity group of funds since 1932.
Trustees and Officers
The Trustees, Members of the Advisory Board (if any), and officers of the trust and fund, as applicable, are listed below. The Board of Trustees governs the fund and is responsible for protecting the interests of shareholders. The Trustees are experienced executives who meet periodically throughout the year to oversee the fund's activities, review contractual arrangements with companies that provide services to the fund, oversee management of the risks associated with such activities and contractual arrangements, and review the fund's performance. Except for Bettina Doulton, each of the Trustees oversees 305 funds. Ms. Doulton oversees 204 funds.
The Trustees hold office without limit in time except that (a) any Trustee may resign; (b) any Trustee may be removed by written instrument, signed by at least two-thirds of the number of Trustees prior to such removal; (c) any Trustee who requests to be retired or who has become incapacitated by illness or injury may be retired by written instrument signed by a majority of the other Trustees; and (d) any Trustee may be removed at any special meeting of shareholders by a two-thirds vote of the outstanding voting securities of the trust. Each Trustee who is not an interested person (as defined in the 1940 Act) of the trust and the fund is referred to herein as an Independent Trustee. Each Independent Trustee shall retire not later than the last day of the calendar year in which his or her 75th birthday occurs. The Independent Trustees may waive this mandatory retirement age policy with respect to individual Trustees. Officers and Advisory Board Members hold office without limit in time, except that any officer or Advisory Board Member may resign or may be removed by a vote of a majority of the Trustees at any regular meeting or any special meeting of the Trustees. Except as indicated, each individual has held the office shown or other offices in the same company for the past five years.
The fund's Statement of Additional Information (SAI) includes more information about the Trustees. To request a free copy, call Fidelity at 1-800-544-8544 if you’re an individual investing directly with Fidelity, call 1-800-835-5092 if you’re a plan sponsor or participant with Fidelity as your recordkeeper or call 1-877-208-0098 on institutional accounts or if you’re an advisor or invest through one.
Experience, Skills, Attributes, and Qualifications of the Trustees. The Governance and Nominating Committee has adopted a statement of policy that describes the experience, qualifications, attributes, and skills that are necessary and desirable for potential Independent Trustee candidates (Statement of Policy). The Board believes that each Trustee satisfied at the time he or she was initially elected or appointed a Trustee, and continues to satisfy, the standards contemplated by the Statement of Policy. The Governance and Nominating Committee also engages professional search firms to help identify potential Independent Trustee candidates who have the experience, qualifications, attributes, and skills consistent with the Statement of Policy. From time to time, additional criteria based on the composition and skills of the current Independent Trustees, as well as experience or skills that may be appropriate in light of future changes to board composition, business conditions, and regulatory or other developments, have also been considered by the professional search firms and the Governance and Nominating Committee. In addition, the Board takes into account the Trustees' commitment and participation in Board and committee meetings, as well as their leadership of standing and ad hoc committees throughout their tenure.
In determining that a particular Trustee was and continues to be qualified to serve as a Trustee, the Board has considered a variety of criteria, none of which, in isolation, was controlling. The Board believes that, collectively, the Trustees have balanced and diverse experience, qualifications, attributes, and skills, which allow the Board to operate effectively in governing the fund and protecting the interests of shareholders. Information about the specific experience, skills, attributes, and qualifications of each Trustee, which in each case led to the Board's conclusion that the Trustee should serve (or continue to serve) as a trustee of the fund, is provided below.
Board Structure and Oversight Function. Robert A. Lawrence is an interested person and currently serves as Acting Chairman. The Trustees have determined that an interested Chairman is appropriate and benefits shareholders because an interested Chairman has a personal and professional stake in the quality and continuity of services provided to the fund. Independent Trustees exercise their informed business judgment to appoint an individual of their choosing to serve as Chairman, regardless of whether the Trustee happens to be independent or a member of management. The Independent Trustees have determined that they can act independently and effectively without having an Independent Trustee serve as Chairman and that a key structural component for assuring that they are in a position to do so is for the Independent Trustees to constitute a substantial majority for the Board. The Independent Trustees also regularly meet in executive session. David M. Thomas serves as Lead Independent Trustee and as such (i) acts as a liaison between the Independent Trustees and management with respect to matters important to the Independent Trustees and (ii) with management prepares agendas for Board meetings.
Fidelity® funds are overseen by different Boards of Trustees. The fund's Board oversees Fidelity's high income and certain equity funds, and other Boards oversee Fidelity's investment-grade bond, money market, asset allocation, and other equity funds. The asset allocation funds may invest in Fidelity® funds overseen by the fund's Board. The use of separate Boards, each with its own committee structure, allows the Trustees of each group of Fidelity® funds to focus on the unique issues of the funds they oversee, including common research, investment, and operational issues. On occasion, the separate Boards establish joint committees to address issues of overlapping consequences for the Fidelity® funds overseen by each Board.
The Trustees operate using a system of committees to facilitate the timely and efficient consideration of all matters of importance to the Trustees, the fund, and fund shareholders and to facilitate compliance with legal and regulatory requirements and oversight of the fund's activities and associated risks. The Board, acting through its committees, has charged FMR and its affiliates with (i) identifying events or circumstances the occurrence of which could have demonstrably adverse effects on the fund's business and/or reputation; (ii) implementing processes and controls to lessen the possibility that such events or circumstances occur or to mitigate the effects of such events or circumstances if they do occur; and (iii) creating and maintaining a system designed to evaluate continuously business and market conditions in order to facilitate the identification and implementation processes described in (i) and (ii) above. Because the day-to-day operations and activities of the fund are carried out by or through FMR, its affiliates, and other service providers, the fund's exposure to risks is mitigated but not eliminated by the processes overseen by the Trustees. While each of the Board's committees has responsibility for overseeing different aspects of the fund's activities, oversight is exercised primarily through the Operations, Audit, and Compliance Committees. Appropriate personnel, including but not limited to the fund's Chief Compliance Officer (CCO), FMR's internal auditor, the independent accountants, the fund's Treasurer and portfolio management personnel, make periodic reports to the Board's committees, as appropriate, including an annual review of Fidelity's risk management program for the Fidelity® funds. The responsibilities of each standing committee, including their oversight responsibilities, are described further under "Standing Committees of the Trustees."
Interested Trustees*:
Correspondence intended for a Trustee who is an interested person may be sent to Fidelity Investments, 245 Summer Street, Boston, Massachusetts 02210.
Name, Year of Birth; Principal Occupations and Other Relevant Experience+
Bettina Doulton (1964)
Year of Election or Appointment: 2020
Trustee
Ms. Doulton also serves as Trustee of other Fidelity® funds. Prior to her retirement, Ms. Doulton served in a variety of positions at Fidelity Investments, including as a managing director of research (2006-2007), portfolio manager to certain Fidelity® funds (1993-2005), equity analyst and portfolio assistant (1990-1993), and research assistant (1987-1990). Ms. Doulton currently owns and operates Phi Builders + Architects and Cellardoor Winery. Previously, Ms. Doulton served as a member of the Board of Brown Capital Management, LLC (2013-2018).
Robert A. Lawrence (1952)
Year of Election or Appointment: 2020
Trustee
Acting Chairman of the Board of Trustees
Mr. Lawrence also serves as Trustee of other funds. Previously, Mr. Lawrence served as a Member of the Advisory Board of certain funds. Prior to his retirement in 2008, Mr. Lawrence served as Vice President of certain Fidelity® funds (2006-2008), Senior Vice President, Head of High Income Division of Fidelity Management & Research Company (investment adviser firm, 2006-2008), and President of Fidelity Strategic Investments (investment adviser firm, 2002-2005).
* Determined to be an “Interested Trustee” by virtue of, among other things, his or her affiliation with the trust or various entities under common control with FMR.
+ The information includes the Trustee's principal occupation during the last five years and other information relating to the experience, attributes, and skills relevant to the Trustee's qualifications to serve as a Trustee, which led to the conclusion that the Trustee should serve as a Trustee for the fund.
Independent Trustees:
Correspondence intended for an Independent Trustee may be sent to Fidelity Investments, P.O. Box 55235, Boston, Massachusetts 02205-5235.
Name, Year of Birth; Principal Occupations and Other Relevant Experience+
Dennis J. Dirks (1948)
Year of Election or Appointment: 2005
Trustee
Mr. Dirks also serves as Trustee of other Fidelity® funds. Prior to his retirement in May 2003, Mr. Dirks served as Chief Operating Officer and as a member of the Board of The Depository Trust & Clearing Corporation (financial markets infrastructure), President, Chief Operating Officer and a member of the Board of The Depository Trust Company (DTC), President and a member of the Board of the National Securities Clearing Corporation (NSCC), Chief Executive Officer and a member of the Board of the Government Securities Clearing Corporation and Chief Executive Officer and a member of the Board of the Mortgage-Backed Securities Clearing Corporation. Mr. Dirks currently serves as a member of the Finance Committee (2016-present) and Board (2017-present) and is Treasurer (2018-present) of the Asolo Repertory Theatre.
Donald F. Donahue (1950)
Year of Election or Appointment: 2018
Trustee
Mr. Donahue also serves as Trustee of other Fidelity® funds. Mr. Donahue serves as President and Chief Executive Officer of Miranda Partners, LLC (risk consulting for the financial services industry, 2012-present). Previously, Mr. Donahue served as Chief Executive Officer (2006-2012), Chief Operating Officer (2003-2006) and Managing Director, Customer Marketing and Development (1999-2003) of The Depository Trust & Clearing Corporation (financial markets infrastructure). Mr. Donahue currently serves as a member (2007-present) and Co-Chairman (2016-present) of the Board of United Way of New York, a member of the Board of NYC Leadership Academy (2012-present) and a member of the Board of Advisors of Ripple Labs, Inc. (financial services, 2015-present). Mr. Donahue previously served as a member of the Advisory Board of certain Fidelity® funds (2015-2018).
Vicki L. Fuller (1957)
Year of Election or Appointment: 2020
Trustee
Ms. Fuller also serves as Trustee of other Fidelity® funds. Previously, Ms. Fuller served as a member of the Advisory Board of certain Fidelity® funds (2018-2020), Chief Investment Officer of the New York State Common Retirement Fund (2012-2018) and held a variety of positions at AllianceBernstein L.P. (global asset management, 1985-2012), including Managing Director (2006-2012) and Senior Vice President and Senior Portfolio Manager (2001-2006). Ms. Fuller currently serves as a member of the Board, Audit Committee and Nominating and Governance Committee of The Williams Companies, Inc. (natural gas infrastructure, 2018-present), as a member of the Board, Audit Committee and Nominating and Governance Committee of two Blackstone business development companies (2020-present) and as a member of the Board of Treliant, LLC (consulting, 2019-present).
Patricia L. Kampling (1959)
Year of Election or Appointment: 2020
Trustee
Ms. Kampling also serves as Trustee of other Fidelity® funds. Prior to her retirement, Ms. Kampling served as Chairman of the Board and Chief Executive Officer (2012-2019), President and Chief Operating Officer (2011-2012) and Executive Vice President and Chief Financial Officer (2010-2011) of Alliant Energy Corporation. Ms. Kampling currently serves as a member of the Board, Compensation Committee and Executive Committee and as Chair of the Audit Committee of Briggs & Stratton Corporation (manufacturing, 2011-present) and as a member of the Board, Audit, Finance and Risk Committee and Safety, Environmental, Technology and Operations Committee of American Water Works Company, Inc. (utilities company, 2019-present). In addition, Ms. Kampling currently serves as a member of the Board of the Nature Conservancy, Wisconsin Chapter (2019-present). Previously, Ms. Kampling served as a Member of the Advisory Board of certain Fidelity® funds (2020), a member of the Board of Interstate Power and Light Company (2012-2019) and Wisconsin Power and Light Company (2012-2019) (each a subsidiary of Alliant Energy Corporation) and as a member of the Board and Workforce Development Committee of the Business Roundtable (2018-2019).
Thomas A. Kennedy (1955)
Year of Election or Appointment: 2021
Trustee
Mr. Kennedy also serves as Trustee of other Fidelity® funds. Previously, Mr. Kennedy served as a Member of the Advisory Board of certain Fidelity® funds (2020) and held a variety of positions at Raytheon Company (aerospace and defense, 1983-2020), including Chairman and Chief Executive Officer (2014-2020) and Executive Vice President and Chief Operating Officer (2013-2014). Mr. Kennedy currently serves as Executive Chairman of the Board of Directors of Raytheon Technologies Corporation (aerospace and defense, 2020-present). He is also a member of the Rutgers School of Engineering Industry Advisory Board (2011-present) and a member of the UCLA Engineering Dean’s Executive Board (2016-present).
Garnett A. Smith (1947)
Year of Election or Appointment: 2018
Trustee
Mr. Smith also serves as Trustee of other Fidelity® funds. Prior to his retirement, Mr. Smith served as Chairman and Chief Executive Officer (1990-1997) and President (1986-1990) of Inbrand Corp. (manufacturer of personal absorbent products). Prior to his employment with Inbrand Corp., he was employed by a retail fabric chain and North Carolina National Bank (now Bank of America). Mr. Smith previously served as a member of the Advisory Board of certain Fidelity® funds (2012-2013).
David M. Thomas (1949)
Year of Election or Appointment: 2008
Trustee
Lead Independent Trustee
Mr. Thomas also serves as Trustee of other Fidelity® funds. Previously, Mr. Thomas served as Executive Chairman (2005-2006) and Chairman and Chief Executive Officer (2000-2005) of IMS Health, Inc. (pharmaceutical and healthcare information solutions). Mr. Thomas currently serves as Non-Executive Chairman of the Board of Fortune Brands Home and Security (home and security products, 2011-present), and a member of the Board (2004-present) and Presiding Director (2013-present) of Interpublic Group of Companies, Inc. (marketing communication).
Susan Tomasky (1953)
Year of Election or Appointment: 2020
Trustee
Ms. Tomasky also serves as Trustee of other Fidelity® funds. Prior to her retirement, Ms. Tomasky served in various executive officer positions at American Electric Power Company, Inc. (1998-2011), including most recently as President of AEP Transmission (2007-2011). Ms. Tomasky currently serves as a member of the Board and Sustainability Committee and as Chair of the Audit Committee of Marathon Petroleum Corporation (2018-present) and as a member of the Board, Corporate Governance Committee and Organization and Compensation Committee and as Chair of the Audit Committee of Public Service Enterprise Group, Inc. (utilities company, 2012-present). In addition, Ms. Tomasky currently serves as a member of the Board of the Columbus Regional Airport Authority (2007-present), as a member of the Board of the Royal Shakespeare Company – America (2009-present), as a member of the Board of the Columbus Association for the Performing Arts (2011-present) and as a member of the Board of Kenyon College (2016-present). Previously, Ms. Tomasky served as a Member of the Advisory Board of certain Fidelity® funds (2020), a member of the Board (2011-2019) and as Lead Independent Director (2015-2018) of Andeavor Corporation (previously Tesoro Corporation) (independent oil refiner and marketer) and as a member of the Board of Summit Midstream Partners LP (energy, 2012-2018).
Michael E. Wiley (1950)
Year of Election or Appointment: 2018
Trustee
Mr. Wiley also serves as Trustee of other Fidelity® funds. Previously, Mr. Wiley served as a member of the Advisory Board of certain Fidelity® funds (2018-2020), Chairman, President and CEO of Baker Hughes, Inc. (oilfield services, 2000-2004). Mr. Wiley also previously served as a member of the Board of Andeavor Corporation (independent oil refiner and marketer, 2005-2018), a member of the Board of Andeavor Logistics LP (natural resources logistics, 2015-2018) and a member of the Board of High Point Resources (exploration and production, 2005-2020).
+ The information includes the Trustee's principal occupation during the last five years and other information relating to the experience, attributes, and skills relevant to the Trustee's qualifications to serve as a Trustee, which led to the conclusion that the Trustee should serve as a Trustee for the fund.
Advisory Board Members and Officers:
Correspondence intended for a Member of the Advisory Board (if any) may be sent to Fidelity Investments, P.O. Box 55235, Boston, Massachusetts 02205-5235. Correspondence intended for an officer or Peter S. Lynch may be sent to Fidelity Investments, 245 Summer Street, Boston, Massachusetts 02210. Officers appear below in alphabetical order.
Name, Year of Birth; Principal Occupation
Ned C. Lautenbach (1944)
Year of Election or Appointment: 2021
Member of the Advisory Board
Mr. Lautenbach also serves as a Member of the Advisory Board of other Fidelity® funds. Mr. Lautenbach currently serves as Chair of the Board of Governors, State University System of Florida (2013-present) and is a member of the Council on Foreign Relations (1994-present). He is also a member and has in the past served as Chairman of the Board of Directors of Artis-Naples (2012-present). Previously, Mr. Lautenbach served as a Trustee of certain Fidelity® funds (2000-2020) and a member and then Lead Director of the Board of Directors of Eaton Corporation (diversified industrial, 1997-2016). He was also a Partner at Clayton, Dubilier & Rice, LLC (private equity investment, 1998-2010); as well as Director of Sony Corporation (2006-2007). In addition, Mr. Lautenbach had a 30-year career with IBM (technology company), during which time he served as Senior Vice President and as a member of the Corporate Executive Committee (1968-1998).
Peter S. Lynch (1944)
Year of Election or Appointment: 2003
Member of the Advisory Board
Mr. Lynch also serves as a Member of the Advisory Board of other Fidelity® funds. Mr. Lynch is Vice Chairman and a Director of Fidelity Management & Research Company LLC (investment adviser firm). In addition, Mr. Lynch serves as a Trustee of Boston College and as the Chairman of the Inner-City Scholarship Fund. Previously, Mr. Lynch served as Vice Chairman and a Director of FMR Co., Inc. (investment adviser firm) and on the Special Olympics International Board of Directors (1997-2006).
Craig S. Brown (1977)
Year of Election or Appointment: 2019
Assistant Treasurer
Mr. Brown also serves as Assistant Treasurer of other funds. Mr. Brown is an employee of Fidelity Investments (2013-present).
John J. Burke III (1964)
Year of Election or Appointment: 2018
Chief Financial Officer
Mr. Burke also serves as Chief Financial Officer of other funds. Mr. Burke serves as Head of Investment Operations for Fidelity Fund and Investment Operations (2018-present) and is an employee of Fidelity Investments (1998-present). Previously Mr. Burke served as head of Asset Management Investment Operations (2012-2018).
William C. Coffey (1969)
Year of Election or Appointment: 2019
Assistant Secretary
Mr. Coffey also serves as Assistant Secretary of other funds. He is Senior Vice President and Deputy General Counsel of FMR LLC (diversified financial services company, 2010-present), and is an employee of Fidelity Investments. Previously, Mr. Coffey served as Secretary and CLO of certain funds (2018-2019); CLO, Secretary, and Senior Vice President of Fidelity Management & Research Company and FMR Co., Inc. (investment adviser firms, 2018-2019); Secretary of Fidelity SelectCo, LLC and Fidelity Investments Money Management, Inc. (investment adviser firms, 2018-2019); CLO of Fidelity Management & Research (Hong Kong) Limited, FMR Investment Management (UK) Limited, and Fidelity Management & Research (Japan) Limited (investment adviser firms, 2018-2019); and Assistant Secretary of certain funds (2009-2018).
Timothy M. Cohen (1969)
Year of Election or Appointment: 2018
Vice President
Mr. Cohen also serves as Vice President of other funds. Mr. Cohen serves as Co-Head of Equity (2018-present), a Director of Fidelity Management & Research (Japan) Limited (investment adviser firm, 2016-present), and is an employee of Fidelity Investments. Previously, Mr. Cohen served as Executive Vice President of Fidelity SelectCo, LLC (2019), Head of Global Equity Research (2016-2018), Chief Investment Officer - Equity and a Director of Fidelity Management & Research (U.K.) Inc. (investment adviser firm, 2013-2015) and as a Director of Fidelity Management & Research (Hong Kong) Limited (investment adviser firm, 2017).
Jonathan Davis (1968)
Year of Election or Appointment: 2010
Assistant Treasurer
Mr. Davis also serves as Assistant Treasurer of other funds. Mr. Davis serves as Assistant Treasurer of FMR Capital, Inc. (2017-present) and is an employee of Fidelity Investments. Previously, Mr. Davis served as Vice President and Associate General Counsel of FMR LLC (diversified financial services company, 2003-2010).
Laura M. Del Prato (1964)
Year of Election or Appointment: 2018
Assistant Treasurer
Ms. Del Prato also serves as an officer of other funds. Ms. Del Prato is an employee of Fidelity Investments (2017-present). Previously, Ms. Del Prato served as President and Treasurer of The North Carolina Capital Management Trust: Cash Portfolio and Term Portfolio (2018-2020). Prior to joining Fidelity Investments, Ms. Del Prato served as a Managing Director and Treasurer of the JPMorgan Mutual Funds (2014-2017). Prior to JPMorgan, Ms. Del Prato served as a partner at Cohen Fund Audit Services (accounting firm, 2012-2013) and KPMG LLP (accounting firm, 2004-2012).
Colm A. Hogan (1973)
Year of Election or Appointment: 2020
Assistant Treasurer
Mr. Hogan also serves as an officer of other funds. Mr. Hogan serves as Assistant Treasurer of FMR Capital, Inc. (2017-present) and is an employee of Fidelity Investments (2005-present). Previously, Mr. Hogan served as Deputy Treasurer of certain Fidelity® funds (2016-2020) and Assistant Treasurer of certain Fidelity® funds (2016-2018).
Pamela R. Holding (1964)
Year of Election or Appointment: 2018
Vice President
Ms. Holding also serves as Vice President of other funds. Ms. Holding serves as Co-Head of Equity (2018-present) and is an employee of Fidelity Investments (2013-present). Previously, Ms. Holding served as Executive Vice President of Fidelity SelectCo, LLC (2019) and as Chief Investment Officer of Fidelity Institutional Asset Management (2013-2018).
Cynthia Lo Bessette (1969)
Year of Election or Appointment: 2019
Secretary and Chief Legal Officer (CLO)
Ms. Lo Bessette also serves as an officer of other funds. Ms. Lo Bessette serves as CLO, Secretary, and Senior Vice President of Fidelity Management & Research Company LLC (investment adviser firm, 2019-present); and CLO of Fidelity Management & Research (Hong Kong) Limited, FMR Investment Management (UK) Limited, and Fidelity Management & Research (Japan) Limited (investment adviser firms, 2019-present). She is a Senior Vice President and Deputy General Counsel of FMR LLC (diversified financial services company, 2019-present), and is an employee of Fidelity Investments. Previously, Ms. Lo Bessette served as CLO, Secretary, and Senior Vice President of FMR Co., Inc. (investment adviser firm, 2019); Secretary of Fidelity SelectCo, LLC and Fidelity Investments Money Management, Inc. (investment adviser firms, 2019). Prior to joining Fidelity Investments, Ms. Lo Bessette was Executive Vice President, General Counsel (2016-2019) and Senior Vice President, Deputy General Counsel (2015-2016) of OppenheimerFunds (investment management company) and Deputy Chief Legal Officer (2013-2015) of Jennison Associates LLC (investment adviser firm).
Chris Maher (1972)
Year of Election or Appointment: 2020
Deputy Treasurer
Mr. Maher also serves as an officer of other funds. Mr. Maher serves as Assistant Treasurer of FMR Capital, Inc. (2017-present), and is an employee of Fidelity Investments (2008-present). Previously, Mr. Maher served as Assistant Treasurer of certain funds (2013-2020); Vice President of Asset Management Compliance (2013), Vice President of the Program Management Group of FMR (investment adviser firm, 2010-2013), and Vice President of Valuation Oversight (2008-2010).
Jason P. Pogorelec (1975)
Year of Election or Appointment: 2020
Chief Compliance Officer
Mr. Pogorelec also serves as Chief Compliance Officer of other funds. Mr. Pogorelec is a senior Vice President of Asset Management Compliance for Fidelity Investments and is an employee of Fidelity Investments (2006-present). Previously, Mr. Pogorelec served as Vice President, Associate General Counsel for Fidelity Investments (2010-2020) and Assistant Secretary of certain Fidelity funds (2015-2020).
Brett Segaloff (1972)
Year of Election or Appointment: 2021
Anti-Money Laundering (AML) Officer
Mr. Segaloff also serves as an AML Officer of other funds and other related entities. He is Director, Anti-Money Laundering (2007-present) of FMR LLC (diversified financial services company) and is an employee of Fidelity Investments (1996-present).
Stacie M. Smith (1974)
Year of Election or Appointment: 2016
President and Treasurer
Ms. Smith also serves as an officer of other funds. Ms. Smith serves as Assistant Treasurer of FMR Capital, Inc. (2017-present), is an employee of Fidelity Investments (2009-present), and has served in other fund officer roles. Prior to joining Fidelity Investments, Ms. Smith served as Senior Audit Manager of Ernst & Young LLP (accounting firm, 1996-2009). Previously, Ms. Smith served as Assistant Treasurer (2013-2019) and Deputy Treasurer (2013-2016) of certain Fidelity® funds.
Marc L. Spector (1972)
Year of Election or Appointment: 2016
Assistant Treasurer
Mr. Spector also serves as an officer of other funds. Mr. Spector serves as Assistant Treasurer of FMR Capital, Inc. (2017-present) and is an employee of Fidelity Investments (2016-present). Prior to joining Fidelity Investments, Mr. Spector served as Director at the Siegfried Group (accounting firm, 2013-2016), and prior to Siegfried Group as audit senior manager at Deloitte & Touche LLP (accounting firm, 2005-2013).
Jim Wegmann (1979)
Year of Election or Appointment: 2019
Assistant Treasurer
Mr. Wegmann also serves as Assistant Treasurer of other funds. Mr. Wegmann is an employee of Fidelity Investments (2011-present).
Shareholder Expense Example
As a shareholder, you incur two types of costs: (1) transaction costs, which may include sales charges (loads) on purchase payments or redemption proceeds, as applicable and (2) ongoing costs, which generally include management fees, distribution and/or service (12b-1) fees and other Fund expenses. This Example is intended to help you understand your ongoing costs (in dollars) of investing in a fund and to compare these costs with the ongoing costs of investing in other mutual funds.
The Example is based on an investment of $1,000 invested at the beginning of the period and held for the entire period (June 1, 2020 to November 30, 2020).
Actual Expenses
The first line of the accompanying table provides information about actual account values and actual expenses. You may use the information in this line, together with the amount you invested, to estimate the expenses that you paid over the period. Simply divide your account value by $1,000.00 (for example, an $8,600 account value divided by $1,000.00 = 8.6), then multiply the result by the number in the first line for a class/Fund under the heading entitled "Expenses Paid During Period" to estimate the expenses you paid on your account during this period. If any fund is a shareholder of any underlying mutual funds or exchange-traded funds (ETFs) (the Underlying Funds), such fund indirectly bears its proportional share of the expenses of the Underlying Funds in addition to the direct expenses incurred presented in the table. These fees and expenses are not included in the annualized expense ratio used to calculate the expense estimate in the table below.
Hypothetical Example for Comparison Purposes
The second line of the accompanying table provides information about hypothetical account values and hypothetical expenses based on the actual expense ratio and an assumed rate of return of 5% per year before expenses, which is not the actual return. The hypothetical account values and expenses may not be used to estimate the actual ending account balance or expenses you paid for the period. You may use this information to compare the ongoing costs of investing in the Fund and other funds. To do so, compare this 5% hypothetical example with the 5% hypothetical examples that appear in the shareholder reports of the other funds. If any fund is a shareholder of any Underlying Funds, such fund indirectly bears its proportional share of the expenses of the Underlying Funds in addition to the direct expenses as presented in the table. These fees and expenses are not included in the annualized expense ratio used to calculate the expense estimate in the table below.
Please note that the expenses shown in the table are meant to highlight your ongoing costs only and do not reflect any transaction costs. Therefore, the second line of the table is useful in comparing ongoing costs only, and will not help you determine the relative total costs of owning different funds.
| | Annualized Expense Ratio-A | Beginning
Account Value
June 1, 2020 | Ending
Account Value
November 30, 2020 | Expenses Paid
During Period-B
June 1, 2020
to November 30, 2020 |
| Fidelity Independence Fund | | | | |
| Independence | .85% | | | |
| Actual | | $1,000.00 | $1,189.50 | $4.65 |
| Hypothetical-C | | $1,000.00 | $1,020.75 | $4.29 |
| Class K | .78% | | | |
| Actual | | $1,000.00 | $1,190.00 | $4.27 |
| Hypothetical-C | | $1,000.00 | $1,021.10 | $3.94 |
A Annualized expense ratio reflects expenses net of applicable fee waivers.
B Expenses are equal to the annualized expense ratio, multiplied by the average account value over the period, multiplied by 183/ 366 (to reflect the one-half year period). The fees and expenses of any Underlying Funds are not included in each annualized expense ratio.
C 5% return per year before expenses
Distributions (Unaudited)
The Board of Trustees of Fidelity Independence Fund voted to pay to shareholders of record at the opening of business on record date, the following distributions per share derived from capital gains realized from sales of portfolio securities:
| | Pay Date | Record Date | Capital Gains |
| Fidelity Independence Fund | | | |
| Independence | 12/30/2020 | 12/29/2020 | $0.596 |
| Class K | 12/30/2020 | 12/29/2020 | $0.596 |
|
The fund hereby designates as a capital gain dividend with respect to the taxable year ended November 30, 2020, $60,818,823, or, if subsequently determined to be different, the net capital gain of such year.
Independence designates 95% and Class K designates 82% of the dividend distributed during the fiscal year as qualifying for the dividends–received deduction for corporate shareholders.
Independence designates 97% and Class K designates 84% of the dividend distributed during the fiscal year as amounts which may be taken into account as a dividend for purposes of the maximum rate under section 1(h)(11) of the Internal Revenue Code.
Independence and Class K designates 4% of the dividend distributed during the fiscal year as a section 199A dividend.
The fund will notify shareholders in January 2021 of amounts for use in preparing 2020 income tax returns.
Proxy Voting Results
A special meeting of shareholders was held on June 9, 2020. The results of votes taken among shareholders on the proposals before them are reported below. Each vote reported represents one dollar of net asset value held on the record date for the meeting.
PROPOSAL 1
To elect a Board of Trustees.
| | # of
Votes | % of
Votes |
| Dennis J. Dirks |
| Affirmative | 5,461,721,297.052 | 92.309 |
| Withheld | 455,079,082.626 | 7.691 |
| TOTAL | 5,916,800,379.678 | 100.000 |
| Donald F. Donahue |
| Affirmative | 5,462,265,876.052 | 92.318 |
| Withheld | 454,534,503.626 | 7.682 |
| TOTAL | 5,916,800,379.678 | 100.000 |
| Bettina Doulton |
| Affirmative | 5,467,748,446.673 | 92.411 |
| Withheld | 449,051,933.005 | 7.589 |
| TOTAL | 5,916,800,379.678 | 100.000 |
| Vicki L. Fuller |
| Affirmative | 5,499,183,624.435 | 92.942 |
| Withheld | 417,616,755.243 | 7.058 |
| TOTAL | 5,916,800,379.678 | 100.00 |
| Patricia L. Kampling |
| Affirmative | 5,454,818,211.998 | 92.192 |
| Withheld | 461,982,167.680 | 7.808 |
| TOTAL | 5,916,800,379.678 | 100.000 |
| Alan J. Lacy |
| Affirmative | 5,424,711,025.435 | 91.683 |
| Withheld | 492,089,354.243 | 8.317 |
| TOTAL | 5,916,800,379.678 | 100.000 |
| Ned C. Lautenbach |
| Affirmative | 5,421,052,451.283 | 91.621 |
| Withheld | 495,747,928.395 | 8.379 |
| TOTAL | 5,916,800,379.678 | 100.000 |
| Robert A. Lawrence |
| Affirmative | 5,431,197,461.723 | 91.793 |
| Withheld | 485,602,917.955 | 8.207 |
| TOTAL | 5,916,800,379.678 | 100.000 |
| Joseph Mauriello |
| Affirmative | 5,416,731,329.280 | 91.548 |
| Withheld | 500,069,050.398 | 8.452 |
| TOTAL | 5,916,800,379.678 | 100.000 |
| Cornelia M. Small |
| Affirmative | 5,429,962,996.961 | 91.772 |
| Withheld | 486,837,382.717 | 8.228 |
| TOTAL | 5,916,800,379.678 | 100.000 |
| Garnett A. Smith |
| Affirmative | 5,416,275,471.636 | 91.541 |
| Withheld | 500,524,908.042 | 8.459 |
| TOTAL | 5,916,800,379.678 | 100.000 |
| David M. Thomas |
| Affirmative | 5,439,984,159.284 | 91.941 |
| Withheld | 476,816,220.393 | 8.059 |
| TOTAL | 5,916,800,379.678 | 100.000 |
| Susan Tomasky |
| Affirmative | 5,451,110,692.583 | 92.129 |
| Withheld | 465,689,687.095 | 7.871 |
| TOTAL | 5,916,800,379.678 | 100.000 |
| Michael E. Wiley |
| Affirmative | 5,426,567,139.987 | 91.715 |
| Withheld | 490,233,239.691 | 8.285 |
| TOTAL | 5,916,800,379.678 | 100.000 |
PROPOSAL 2
To convert a fundamental investment policy to a non-fundamental investment policy.
| | # of
Votes | % of
Votes |
| Affirmative | 1,939,389,723.770 | 70.071 |
| Against | 432,835,291.558 | 15.638 |
| Abstain | 343,422,190.904 | 12.408 |
| Broker Non-Vote | 52,108,467.390 | 1.883 |
| TOTAL | 2,767,755,673.622 | 100.000 |
PROPOSAL 5
A shareholder proposal to institute procedures to avoid holding investments in companies that contribute to genocide or crimes against humanity.
| | # of
Votes | % of
Votes |
| Affirmative | 961,709,188.797 | 34.747 |
| Against | 1,540,793,012.515 | 55.669 |
| Abstain | 212,561,772.107 | 7.680 |
| Broker Non-Vote | 52,691,700.203 | 1.904 |
| TOTAL | 2,767,755,673.622 | 100.000 |
| Proposal 1 reflects trust wide proposal and voting results. |
| Proposal 5 was not approved by shareholders. |

FRE-ANN-0121
1.539094.123
Fidelity® Convertible Securities Fund
Annual Report
November 30, 2020
Includes Fidelity and Fidelity Advisor share classes
Contents
To view a fund's proxy voting guidelines and proxy voting record for the 12-month period ended June 30, visit http://www.fidelity.com/proxyvotingresults or visit the Securities and Exchange Commission's (SEC) web site at http://www.sec.gov.
You may also call 1-800-544-8544 if you’re an individual investing directly with Fidelity, call 1-800-835-5092 if you’re a plan sponsor or participant with Fidelity as your recordkeeper or call 1-877-208-0098 on institutional accounts or if you’re an advisor or invest through one to request a free copy of the proxy voting guidelines.
Standard & Poor's, S&P and S&P 500 are registered service marks of The McGraw-Hill Companies, Inc. and have been licensed for use by Fidelity Distributors Corporation.
Other third-party marks appearing herein are the property of their respective owners.
All other marks appearing herein are registered or unregistered trademarks or service marks of FMR LLC or an affiliated company. © 2021 FMR LLC. All rights reserved.
This report and the financial statements contained herein are submitted for the general information of the shareholders of the Fund. This report is not authorized for distribution to prospective investors in the Fund unless preceded or accompanied by an effective prospectus.
A fund files its complete schedule of portfolio holdings with the SEC for the first and third quarters of each fiscal year on Form N-PORT. Forms N-PORT are available on the SEC’s web site at http://www.sec.gov. A fund's Forms N-PORT may be reviewed and copied at the SEC’s Public Reference Room in Washington, DC. Information regarding the operation of the SEC's Public Reference Room may be obtained by calling 1-800-SEC-0330.
For a complete list of a fund's portfolio holdings, view the most recent holdings listing, semiannual report, or annual report on Fidelity's web site at http://www.fidelity.com, http://www.institutional.fidelity.com, or http://www.401k.com, as applicable.
NOT FDIC INSURED •MAY LOSE VALUE •NO BANK GUARANTEE
Neither the Fund nor Fidelity Distributors Corporation is a bank.
Note to Shareholders:
Early in 2020, the outbreak and spread of a new coronavirus emerged as a public health emergency that had a major influence on financial markets, primarily based on its impact on the global economy and the outlook for corporate earnings. The virus causes a respiratory disease known as COVID-19. On March 11, the World Health Organization declared the COVID-19 outbreak a pandemic, citing sustained risk of further global spread.
In the weeks following, as the crisis worsened, we witnessed an escalating human tragedy with wide-scale social and economic consequences from coronavirus-containment measures. The outbreak of COVID-19 prompted a number of measures to limit the spread, including travel and border restrictions, quarantines, and restrictions on large gatherings. In turn, these resulted in lower consumer activity, diminished demand for a wide range of products and services, disruption in manufacturing and supply chains, and – given the wide variability in outcomes regarding the outbreak – significant market uncertainty and volatility. Amid the turmoil, global governments and central banks took unprecedented action to help support consumers, businesses, and the broader economies, and to limit disruption to financial systems.
The situation continues to unfold, and the extent and duration of its impact on financial markets and the economy remain highly uncertain. Extreme events such as the coronavirus crisis are “exogenous shocks” that can have significant adverse effects on mutual funds and their investments. Although multiple asset classes may be affected by market disruption, the duration and impact may not be the same for all types of assets.
Fidelity is committed to helping you stay informed amid news about COVID-19 and during increased market volatility, and we’re taking extra steps to be responsive to customer needs. We encourage you to visit our websites, where we offer ongoing updates, commentary, and analysis on the markets and our funds.
Performance: The Bottom Line
Average annual total return reflects the change in the value of an investment, assuming reinvestment of distributions from dividend income and capital gains (the profits earned upon the sale of securities that have grown in value, if any) and assuming a constant rate of performance each year. The hypothetical investment and the average annual total returns do not reflect the deduction of taxes that a shareholder would pay on fund distributions or the redemption of fund shares. During periods of reimbursement by Fidelity, a fund’s total return will be greater than it would be had the reimbursement not occurred. How a fund did yesterday is no guarantee of how it will do tomorrow.
Average Annual Total Returns
| For the periods ended November 30, 2020 | Past 1 year | Past 5 years | Past 10 years |
| Class A (incl. 5.75% sales charge) | 28.58% | 12.01% | 9.72% |
| Class M (incl. 3.50% sales charge) | 31.33% | 12.22% | 9.65% |
| Class C (incl. contingent deferred sales charge) | 34.42% | 12.50% | 9.53% |
| Fidelity® Convertible Securities Fund | 36.88% | 13.69% | 10.68% |
| Class I | 36.84% | 13.66% | 10.66% |
| Class Z | 37.01% | 13.71% | 10.68% |
The initial offering of Class Z shares took place on October 2, 2018. Returns prior to October 2, 2018, are those of Class I.
$10,000 Over 10 Years
Let's say hypothetically that $10,000 was invested in Fidelity® Convertible Securities Fund, a class of the fund, on November 30, 2010.
The chart shows how the value of your investment would have changed, and also shows how the ICE® BofA® All US Convertibles Index performed over the same period.

| Period Ending Values |
| $27,597 | Fidelity® Convertible Securities Fund |
| $31,701 | ICE® BofA® All US Convertibles Index |
Management's Discussion of Fund Performance
Market Recap: The ICE BofA
® All US Convertibles Index gained 39.99% for the 12 months ending November 30, 2020, a volatile period marked by a steep but brief decline due to the early-2020 outbreak and spread of the coronavirus, followed by a historic rebound. Declared a pandemic on March 11, the COVID-19 crisis and containment efforts caused broad contraction in economic activity, along with extreme uncertainty, volatility and dislocation in financial markets. A rapid and expansive U.S. monetary/fiscal-policy response provided a partial offset to the economic disruption and fueled a sharp uptrend beginning in mid-March. Other supporting factors included resilient corporate earnings, near-term potential for a COVID-19 vaccine breakthrough and traction on a broader economic reopening. Converts rose roughly 13% in November, as investors reacted favorably to election results and encouraging updates on the efficacy of two COVID-19 vaccine candidates. In general, the index was driven by its heavy exposure to businesses with products and services that saw higher demand amid the pandemic, including software, e-commerce and health care companies. This bias aided issuers in the consumer discretionary (+186%) sector, especially the automobiles & components industry, led by Tesla. Information technology (+42%) also stood out. In contrast, energy returned -29%, struggling along with global oil demand and pricing. By comparison, converts soundly topped large-cap stocks (+17%), taxable investment-grade bonds (+7%) and high-yield debt (+6%).
Comments from Portfolio Manager Adam Kramer: For the fiscal year, the fund’s share classes (excluding sales charges, if applicable) gained about 35% to 37%, trailing the benchmark, the ICE BofA
® All US Convertibles Index. By asset class, the fund’s underweighting in convertible bonds – representing 68% of assets at period end – and a non-benchmark stake in equities (roughly 12% of assets) detracted versus the benchmark, as converts handily outperformed equities. Other notable relative detractors included an overweighting and security selection in the energy sector and an underweighting in convertible bonds issued by electric-car maker Tesla, as this large benchmark component posted a steep gain. Non-benchmark exposure to oil tanker companies Scorpio Tankers (-53%), DHT Holdings (-17%) and Euronav (-11%) hurt because demand for storage was much weaker than expected. Scorpio was not in the portfolio at period end. Conversely, the fund’s investments in convertible bonds and convertible preferred stock outperformed the benchmark, helping our relative result. By sector, the biggest boost versus the benchmark came from a sizable underweighting in the lagging financials sector. Top individual contributors were timely trading in convertible bonds issued by cruise line operator Carnival (+111), a non-benchmark stake in stock issued by software company Kambi (+259%) and an overweighting in convertible bonds issued by telemedicine provider Teladoc Health (124%).
The views expressed above reflect those of the portfolio manager(s) only through the end of the period as stated on the cover of this report and do not necessarily represent the views of Fidelity or any other person in the Fidelity organization. Any such views are subject to change at any time based upon market or other conditions and Fidelity disclaims any responsibility to update such views. These views may not be relied on as investment advice and, because investment decisions for a Fidelity fund are based on numerous factors, may not be relied on as an indication of trading intent on behalf of any Fidelity fund.
Investment Summary (Unaudited)
Top Ten Investments as of November 30, 2020
| (excluding cash equivalents) | % of fund's net assets |
| Tesla, Inc. 2% 5/15/24 | 6.4 |
| DHT Holdings, Inc. | 2.4 |
| T-Mobile U.S., Inc. | 2.3 |
| Broadcom, Inc. Series A 8.00% | 2.3 |
| Microchip Technology, Inc. 1.625% 2/15/25 | 1.7 |
| NextEra Energy, Inc. 4.872% | 1.6 |
| DISH Network Corp. 3.375% 8/15/26 | 1.5 |
| Tesla, Inc. 2.375% 3/15/22 | 1.1 |
| Danaher Corp. 4.75% | 1.1 |
| PG&E Corp. | 1.0 |
| | 21.4 |
Top Five Market Sectors as of November 30, 2020
| | % of fund's net assets |
| Information Technology | 31.8 |
| Consumer Discretionary | 18.4 |
| Health Care | 13.6 |
| Communication Services | 12.2 |
| Utilities | 7.0 |
Asset Allocation (% of fund's net assets)
| As of November 30, 2020 * |
| | Convertible Securities | 87.4% |
| | Stocks | 12.2% |
| | Nonconvertible Bonds | 0.6% |
| | Short-Term Investments and Net Other Assets (Liabilities)** | (0.2)% |

* Foreign investments – 9.9%
** Short-Term Investments and Net Other Assets (Liabilities) are not included in the pie chart
Schedule of Investments November 30, 2020
Showing Percentage of Net Assets
| Corporate Bonds - 68.7% | | | |
| | | Principal Amount (000s) | Value (000s) |
| Convertible Bonds - 68.1% | | | |
| COMMUNICATION SERVICES - 8.4% | | | |
| Diversified Telecommunication Services - 0.3% | | | |
| Bandwidth, Inc. 0.25% 3/1/26 (a) | | $2,400 | $4,235 |
| Liberty Latin America Ltd. 2% 7/15/24 | | 250 | 229 |
| Liberty Media Corp. 2.25% 9/30/46 | | 370 | 173 |
| Vonage Holdings Corp. 1.75% 6/1/24 | | 280 | 298 |
| | | | 4,935 |
| Entertainment - 1.3% | | | |
| Liberty Media Corp.: | | | |
| 0.5% 12/1/50 (a) | | 2,800 | 2,831 |
| 1% 1/30/23 | | 2,836 | 3,644 |
| 1.375% 10/15/23 | | 4,463 | 5,512 |
| 2.25% 12/1/48 (a) | | 1,366 | 1,574 |
| Live Nation Entertainment, Inc.: | | | |
| 2% 2/15/25 (a) | | 225 | 220 |
| 2.5% 3/15/23 | | 781 | 927 |
| Pandora Media, Inc. 1.75% 12/1/23 | | 843 | 994 |
| World Wrestling Entertainment, Inc. 3.375% 12/15/23 | | 104 | 193 |
| Zynga, Inc. 0.25% 6/1/24 | | 8,856 | 10,652 |
| | | | 26,547 |
| Interactive Media & Services - 3.7% | | | |
| Eventbrite, Inc. 5% 12/1/25 (a) | | 160 | 244 |
| IAC FinanceCo 2, Inc. 0.875% 6/15/26 (a) | | 4,445 | 7,578 |
| IAC FinanceCo 3, Inc. 2% 1/15/30 (a) | | 4,195 | 7,596 |
| IAC FinanceCo, Inc. 0.875% 10/1/22(a) | | 3,586 | 11,364 |
| Snap, Inc.: | | | |
| 0.25% 5/1/25 (a) | | 4,500 | 9,549 |
| 0.75% 8/1/26 | | 3,302 | 6,794 |
| Twitter, Inc. 0.25% 6/15/24 | | 4,130 | 4,653 |
| Zillow Group, Inc.: | | | |
| 0.75% 9/1/24 | | 2,840 | 7,127 |
| 1.375% 9/1/26 | | 1,533 | 3,881 |
| 1.5% 7/1/23 | | 1,350 | 1,998 |
| 2% 12/1/21 | | 1,750 | 3,603 |
| 2.75% 5/15/25 | | 4,826 | 8,699 |
| | | | 73,086 |
| Media - 3.0% | | | |
| Cardlytics, Inc. 1% 9/15/25 (a) | | 160 | 251 |
| DISH Network Corp.: | | | |
| 2.375% 3/15/24 | | 8,874 | 8,408 |
| 3.375% 8/15/26 | | 29,395 | 29,304 |
| Gannett Co., Inc. 4.75% 4/15/24 | | 1,450 | 1,328 |
| GCI Liberty, Inc. 1.75% 9/30/46 (a) | | 4,323 | 7,830 |
| Liberty Broadband Corp.: | | | |
| 1.25% 9/30/50 (a) | | 210 | 213 |
| 2.75% 9/30/50 (a) | | 4,410 | 4,716 |
| Liberty Interactive LLC 1.75% 9/30/46 (a) | | 2,348 | 4,521 |
| Liberty Media Corp. 2.125% 3/31/48 (a) | | 2,330 | 2,426 |
| | | | 58,997 |
| Wireless Telecommunication Services - 0.1% | | | |
| Boingo Wireless, Inc. 1% 10/1/23 | | 2,350 | 2,097 |
| TOTAL COMMUNICATION SERVICES | | | 165,662 |
| CONSUMER DISCRETIONARY - 15.4% | | | |
| Auto Components - 0.2% | | | |
| Patrick Industries, Inc. 1% 2/1/23 | | 3,180 | 3,258 |
| Veoneer, Inc. 4% 6/1/24 | | 201 | 231 |
| | | | 3,489 |
| Automobiles - 8.0% | | | |
| Tesla, Inc.: | | | |
| 1.25% 3/1/21 | | 1,187 | 9,349 |
| 2% 5/15/24 | | 13,670 | 125,066 |
| 2.375% 3/15/22 | | 2,571 | 22,254 |
| | | | 156,669 |
| Diversified Consumer Services - 0.4% | | | |
| Chegg, Inc.: | | | |
| 0% 9/1/26 (a) | | 140 | 145 |
| 0.125% 3/15/25 | | 4,709 | 7,601 |
| 0.25% 5/15/23 | | 72 | 209 |
| K12, Inc. 1.125% 9/1/27 (a) | | 160 | 132 |
| | | | 8,087 |
| Hotels, Restaurants & Leisure - 2.1% | | | |
| Bloomin' Brands, Inc. 5% 5/1/25 (a) | | 93 | 156 |
| Carnival Corp. 5.75% 4/1/23 (a) | | 5,367 | 11,934 |
| Marriott Vacations Worldwide Corp. 1.5% 9/15/22 | | 1,950 | 2,140 |
| NCL Corp. Ltd.: | | | |
| 5.375% 8/1/25 (a) | | 150 | 231 |
| 6% 5/15/24 (a) | | 119 | 229 |
| Penn National Gaming, Inc. 2.75% 5/15/26 | | 5,258 | 16,341 |
| Royal Caribbean Cruises Ltd.: | | | |
| 2.875% 11/15/23 (a) | | 2,410 | 2,970 |
| 4.25% 6/15/23 (a) | | 5,400 | 7,420 |
| | | | 41,421 |
| Internet & Direct Marketing Retail - 2.9% | | | |
| Etsy, Inc.: | | | |
| 0.125% 10/1/26 | | 6,847 | 13,320 |
| 0.125% 9/1/27 (a) | | 4,220 | 4,952 |
| Farfetch Ltd. 3.75% 5/1/27 (a) | | 1,524 | 5,370 |
| Fiverr International Ltd. 0% 11/1/25 (a) | | 2,250 | 2,723 |
| MercadoLibre, Inc. 2% 8/15/28 | | 2,638 | 9,310 |
| Quotient Technology, Inc. 1.75% 12/1/22 | | 210 | 201 |
| The Booking Holdings, Inc.: | | | |
| 0.75% 5/1/25 (a) | | 13,436 | 18,730 |
| 0.9% 9/15/21 | | 162 | 180 |
| The RealReal, Inc. 3% 6/15/25 (a) | | 1,952 | 2,146 |
| Wayfair LLC: | | | |
| 0.375% 9/1/22 | | 110 | 266 |
| 1.125% 11/1/24 | | 120 | 269 |
| | | | 57,467 |
| Leisure Products - 0.5% | | | |
| Callaway Golf Co. 2.75% 5/1/26 (a) | | 7,440 | 10,722 |
| Specialty Retail - 1.2% | | | |
| American Eagle Outfitters, Inc. 3.75% 4/15/25 (a) | | 1,081 | 2,376 |
| Burlington Stores, Inc. 2.25% 4/15/25 (a) | | 5,890 | 7,280 |
| Dick's Sporting Goods, Inc. 3.25% 4/15/25 (a) | | 5,196 | 9,360 |
| National Vision Holdings, Inc. 2.5% 5/15/25 (a) | | 2,920 | 4,519 |
| | | | 23,535 |
| Textiles, Apparel & Luxury Goods - 0.1% | | | |
| Under Armour, Inc. 1.5% 6/1/24 (a) | | 700 | 1,137 |
| TOTAL CONSUMER DISCRETIONARY | | | 302,527 |
| CONSUMER STAPLES - 0.1% | | | |
| Food & Staples Retailing - 0.1% | | | |
| Chefs' Warehouse Holdings 1.875% 12/1/24 (a) | | 3,054 | 2,857 |
| ENERGY - 1.1% | | | |
| Energy Equipment & Services - 0.0% | | | |
| Vantage Drilling Co. 0% 7/15/43 (a)(b)(c) | | 20,000 | 451 |
| Oil, Gas & Consumable Fuels - 1.1% | | | |
| Antero Resources Corp. 4.25% 9/1/26 (a) | | 3,010 | 3,381 |
| CNX Resources Corp. 2.25% 5/1/26 (a) | | 2,459 | 2,600 |
| EQT Corp. 1.75% 5/1/26 (a) | | 1,716 | 2,204 |
| Pioneer Natural Resources Co. 0.25% 5/15/25 (a) | | 9,981 | 12,054 |
| Teekay Corp. 5% 1/15/23 | | 180 | 150 |
| | | | 20,389 |
| TOTAL ENERGY | | | 20,840 |
| FINANCIALS - 1.2% | | | |
| Banks - 0.0% | | | |
| Hope Bancorp, Inc. 2% 5/15/38 | | 200 | 181 |
| Consumer Finance - 0.3% | | | |
| LendingTree, Inc.: | | | |
| 0.5% 7/15/25 (a) | | 160 | 148 |
| 0.625% 6/1/22 | | 159 | 215 |
| PRA Group, Inc. 3.5% 6/1/23 | | 4,206 | 4,656 |
| | | | 5,019 |
| Diversified Financial Services - 0.3% | | | |
| AXA SA 7.25% 5/15/21 (a) | | 5,343 | 6,061 |
| Mortgage Real Estate Investment Trusts - 0.6% | | | |
| Arbor Realty Trust, Inc. 4.75% 11/1/22 | | 180 | 175 |
| Blackstone Mortgage Trust, Inc.: | | | |
| 4.375% 5/5/22 | | 1,376 | 1,365 |
| 4.75% 3/15/23 | | 808 | 795 |
| Exantas Capital Corp. 4.5% 8/15/22 | | 202 | 183 |
| Hannon Armstrong Sustainable Infrastructure Capital, Inc.: | | | |
| 0% 8/15/23 | | 180 | 220 |
| 4.125% 9/1/22 | | 4,028 | 8,152 |
| Starwood Property Trust, Inc. 4.375% 4/1/23 | | 1,000 | 990 |
| | | | 11,880 |
| TOTAL FINANCIALS | | | 23,141 |
| HEALTH CARE - 9.7% | | | |
| Biotechnology - 3.6% | | | |
| Apellis Pharmaceuticals, Inc. 3.5% 9/15/26 | | 1,900 | 2,722 |
| BioMarin Pharmaceutical, Inc.: | | | |
| 0.599% 8/1/24 | | 164 | 171 |
| 1.25% 5/15/27 (a) | | 185 | 183 |
| Bridgebio Pharma, Inc. 2.5% 3/15/27 (a) | | 1,400 | 1,946 |
| Clovis Oncology, Inc.: | | | |
| 2.5% 9/15/21 | | 204 | 188 |
| 4.5% 8/1/24 | | 750 | 652 |
| Coherus BioSciences, Inc. 1.5% 4/15/26 (a) | | 1,250 | 1,477 |
| Esperion Therapeutics, Inc. 4% 11/15/25 (a) | | 4,530 | 4,409 |
| Exact Sciences Corp.: | | | |
| 0.375% 3/15/27 | | 5,153 | 6,722 |
| 0.375% 3/1/28 | | 6,010 | 7,362 |
| 1% 1/15/25 | | 4,300 | 7,559 |
| Flexion Therapeutics, Inc. 3.375% 5/1/24 | | 237 | 200 |
| Halozyme Therapeutics, Inc. 1.25% 12/1/24 (a) | | 480 | 830 |
| Inovio Pharmaceuticals, Inc. 6.5% 3/1/24 | | 299 | 677 |
| Intercept Pharmaceuticals, Inc.: | | | |
| 2% 5/15/26 | | 102 | 65 |
| 3.25% 7/1/23 | | 5,336 | 4,090 |
| Invitae Corp. 2% 9/1/24 | | 505 | 923 |
| Ironwood Pharmaceuticals, Inc.: | | | |
| 0.75% 6/15/24 | | 800 | 876 |
| 1.5% 6/15/26 | | 800 | 901 |
| 2.25% 6/15/22 | | 750 | 810 |
| Isis Pharmaceuticals, Inc. 1% 11/15/21 | | 3,397 | 3,565 |
| Natera, Inc. 2.25% 5/1/27 (a) | | 1,675 | 4,050 |
| Neurocrine Biosciences, Inc. 2.25% 5/15/24 | | 2,754 | 3,792 |
| Novavax, Inc. 3.75% 2/1/23 | | 7,142 | 10,038 |
| PTC Therapeutics, Inc.: | | | |
| 1.5% 9/15/26 (a) | | 150 | 207 |
| 3% 8/15/22 | | 100 | 129 |
| Sarepta Therapeutics, Inc. 1.5% 11/15/24 | | 2,997 | 6,200 |
| Travere Therapeutics, Inc. 2.5% 9/15/25 | | 200 | 188 |
| | | | 70,932 |
| Health Care Equipment & Supplies - 3.5% | | | |
| Cantel Medical Corp. 3.25% 5/15/25 (a) | | 125 | 199 |
| CONMED Corp. 2.625% 2/1/24 | | 1,646 | 2,151 |
| DexCom, Inc.: | | | |
| 0.25% 11/15/25 (a) | | 8,612 | 8,303 |
| 0.75% 12/1/23 | | 5,062 | 10,065 |
| Envista Holdings Corp. 2.375% 6/1/25 (a) | | 3,650 | 5,770 |
| Glaukos Corp. 2.75% 6/15/27 (a) | | 2,050 | 2,922 |
| Insulet Corp.: | | | |
| 0.375% 9/1/26 | | 4,831 | 6,485 |
| 1.375% 11/15/24 | | 2,298 | 6,348 |
| Integra LifeSciences Holdings Corp. 0.5% 8/15/25 (a) | | 2,430 | 2,447 |
| Livanova U.S.A., Inc. 3% 12/15/25 (a) | | 4,024 | 4,621 |
| Mesa Laboratories, Inc. 1.375% 8/15/25 | | 1,970 | 2,273 |
| Nevro Corp.: | | | |
| 1.75% 6/1/21 | | 730 | 1,232 |
| 2.75% 4/1/25 | | 1,448 | 2,478 |
| Novocure Ltd. 0% 11/1/25 (a) | | 1,450 | 1,557 |
| NuVasive, Inc.: | | | |
| 0.375% 3/15/25 (a) | | 200 | 179 |
| 1% 6/1/23 (a) | | 175 | 170 |
| 2.25% 3/15/21 | | 250 | 250 |
| Tandem Diabetes Care, Inc. 1.5% 5/1/25 (a) | | 4,078 | 4,699 |
| Varex Imaging Corp. 4% 6/1/25 (a) | | 190 | 201 |
| Wright Medical Group NV 2.25% 11/15/21 | | 2,065 | 2,999 |
| Wright Medical Group, Inc. 1.625% 6/15/23 | | 3,465 | 3,668 |
| | | | 69,017 |
| Health Care Providers & Services - 0.5% | | | |
| 1Life Healthcare, Inc. 3% 6/15/25 (a) | | 1,900 | 2,065 |
| Anthem, Inc. 2.75% 10/15/42 | | 1,099 | 4,774 |
| Guardant Health, Inc. 0% 11/15/27 (a) | | 2,470 | 2,732 |
| PetIQ, Inc. 4% 6/1/26 (a) | | 150 | 186 |
| | | | 9,757 |
| Health Care Technology - 1.2% | | | |
| Allscripts Healthcare Solutions, Inc. 0.875% 1/1/27 (a) | | 900 | 1,090 |
| Health Catalyst, Inc. 2.5% 4/15/25 (a) | | 1,900 | 2,606 |
| Livongo Health, Inc. 0.875% 6/1/25 (a) | | 3,140 | 5,681 |
| Omnicell, Inc. 0.25% 9/15/25 (a) | | 2,550 | 3,173 |
| Tabula Rasa HealthCare, Inc. 1.75% 2/15/26 (a) | | 204 | 174 |
| Teladoc Health, Inc.: | | | |
| 1.25% 6/1/27 (a) | | 5,393 | 6,363 |
| 1.375% 5/15/25 | | 1,146 | 4,236 |
| | | | 23,323 |
| Life Sciences Tools & Services - 0.6% | | | |
| Illumina, Inc.: | | | |
| 0% 8/15/23 | | 2,234 | 2,382 |
| 0.5% 6/15/21 | | 1,813 | 2,370 |
| Nanostring Technologies, Inc. 2.625% 3/1/25 (a) | | 750 | 971 |
| NeoGenomics, Inc. 1.25% 5/1/25 | | 1,500 | 2,201 |
| Repligen Corp. 0.375% 7/15/24 | | 2,430 | 4,221 |
| | | | 12,145 |
| Pharmaceuticals - 0.3% | | | |
| Aerie Pharmaceuticals, Inc. 1.5% 10/1/24 | | 173 | 153 |
| Collegium Pharmaceutical, Inc. 2.625% 2/15/26 | | 910 | 850 |
| Innoviva, Inc.: | | | |
| 2.125% 1/15/23 | | 200 | 194 |
| 2.5% 8/15/25 | | 150 | 150 |
| Jazz Investments I Ltd.: | | | |
| 1.5% 8/15/24 | | 85 | 87 |
| 1.875% 8/15/21 | | 172 | 172 |
| 2% 6/15/26 (a) | | 170 | 202 |
| Omeros Corp. 5.25% 2/15/26 | | 170 | 149 |
| Pacira Biosciences, Inc.: | | | |
| 0.75% 8/1/25 (a) | | 1,640 | 1,829 |
| 2.375% 4/1/22 | | 800 | 922 |
| Revance Therapeutics, Inc. 1.75% 2/15/27 (a) | | 178 | 182 |
| Supernus Pharmaceuticals, Inc. 0.625% 4/1/23 | | 180 | 165 |
| Theravance Biopharma, Inc. 3.25% 11/1/23 | | 170 | 156 |
| Tricida, Inc. 3.5% 5/15/27 (a) | | 274 | 143 |
| Zogenix, Inc. 2.75% 10/1/27 (a) | | 170 | 194 |
| | | | 5,548 |
| TOTAL HEALTH CARE | | | 190,722 |
| INDUSTRIALS - 4.0% | | | |
| Aerospace & Defense - 0.5% | | | |
| Aerojet Rocketdyne Holdings, Inc. 2.25% 12/15/23 | | 2,440 | 3,602 |
| Kaman Corp. 3.25% 5/1/24 | | 175 | 192 |
| Parsons Corp. 0.25% 8/15/25 (a) | | 5,899 | 5,910 |
| | | | 9,704 |
| Air Freight & Logistics - 0.9% | | | |
| Air Transport Services Group, Inc. 1.125% 10/15/24 | | 12,433 | 14,369 |
| Atlas Air Worldwide Holdings, Inc. 1.875% 6/1/24 | | 3,230 | 3,737 |
| | | | 18,106 |
| Airlines - 1.1% | | | |
| Southwest Airlines Co. 1.25% 5/1/25 | | 12,888 | 19,010 |
| Spirit Airlines, Inc. 4.75% 5/15/25 | | 1,496 | 2,995 |
| | | | 22,005 |
| Construction & Engineering - 0.3% | | | |
| Dycom Industries, Inc. 0.75% 9/15/21 | | 2,458 | 2,414 |
| Granite Construction, Inc. 2.75% 11/1/24 | | 2,851 | 2,875 |
| | | | 5,289 |
| Electrical Equipment - 0.5% | | | |
| Bloom Energy Corp. 2.5% 8/15/25 (a) | | 160 | 267 |
| Plug Power, Inc. 3.75% 6/1/25 (a) | | 1,890 | 9,901 |
| | | | 10,168 |
| Machinery - 0.3% | | | |
| Chart Industries, Inc. 1% 11/15/24 (a) | | 1,700 | 3,169 |
| Fortive Corp. 0.875% 2/15/22 | | 147 | 149 |
| Greenbrier Companies, Inc. 2.875% 2/1/24 | | 151 | 149 |
| Meritor, Inc. 3.25% 10/15/37 | | 634 | 706 |
| Middleby Corp. 1% 9/1/25 (a) | | 2,180 | 2,743 |
| | | | 6,916 |
| Professional Services - 0.2% | | | |
| FTI Consulting, Inc. 2% 8/15/23 | | 2,580 | 3,145 |
| Road & Rail - 0.2% | | | |
| Lyft, Inc. 1.5% 5/15/25 (a) | | 2,950 | 3,715 |
| TOTAL INDUSTRIALS | | | 79,048 |
| INFORMATION TECHNOLOGY - 26.7% | | | |
| Communications Equipment - 0.8% | | | |
| Applied Optoelectronics, Inc. 5% 3/15/24 | | 239 | 193 |
| CalAmp Corp. 2% 8/1/25 | | 189 | 156 |
| Inseego Corp. 3.25% 5/1/25 | | 150 | 144 |
| InterDigital, Inc. 2% 6/1/24 | | 160 | 167 |
| Liberty Media Corp. 3.5% 1/15/31 | | 4,050 | 3,703 |
| Lumentum Holdings, Inc.: | | | |
| 0.25% 3/15/24 | | 2,703 | 4,192 |
| 0.5% 12/15/26 (a) | | 6,205 | 7,133 |
| Viavi Solutions, Inc.: | | | |
| 1% 3/1/24 | | 120 | 146 |
| 1.75% 6/1/23 | | 150 | 178 |
| | | | 16,012 |
| Electronic Equipment & Components - 0.3% | | | |
| II-VI, Inc. 0.25% 9/1/22 | | 1,665 | 2,536 |
| Insight Enterprises, Inc. 0.75% 2/15/25 | | 1,764 | 2,129 |
| Knowles Corp. 3.25% 11/1/21 | | 198 | 218 |
| TTM Technologies, Inc. 1.75% 12/15/20 | | 155 | 202 |
| | | | 5,085 |
| IT Services - 4.4% | | | |
| Akamai Technologies, Inc.: | | | |
| 0.125% 5/1/25 | | 7,668 | 9,413 |
| 0.375% 9/1/27 | | 7,039 | 7,792 |
| Euronet Worldwide, Inc. 0.75% 3/15/49 | | 176 | 187 |
| i3 Verticals LLC 1% 2/15/25 (a) | | 175 | 164 |
| KBR, Inc. 2.5% 11/1/23 | | 1,533 | 1,951 |
| Limelight Networks, Inc. 3.5% 8/1/25 (a) | | 135 | 123 |
| MongoDB, Inc.: | | | |
| 0.25% 1/15/26 (a) | | 3,736 | 5,680 |
| 0.75% 6/15/24 | | 415 | 1,739 |
| Okta, Inc.: | | | |
| 0.125% 9/1/25 | | 6,382 | 9,254 |
| 0.375% 6/15/26 (a) | | 6,480 | 8,044 |
| Perficient, Inc. 1.25% 8/1/25 (a) | | 730 | 809 |
| Sabre GLBL, Inc. 4% 4/15/25 (a) | | 96 | 162 |
| Shopify, Inc. 0.125% 11/1/25 | | 2,160 | 2,465 |
| Square, Inc.: | | | |
| 0% 5/1/26 (a) | | 170 | 181 |
| 0.125% 3/1/25 (a) | | 5,298 | 9,774 |
| 0.25% 11/1/27 (a) | | 170 | 184 |
| 0.375% 3/1/22 | | 418 | 3,842 |
| 0.5% 5/15/23 | | 3,847 | 10,494 |
| Twilio, Inc. 0.25% 6/1/23 | | 1,596 | 7,184 |
| Unisys Corp. 5.5% 3/1/21 | | 121 | 181 |
| Wix.com Ltd.: | | | |
| 0% 7/1/23 | | 2,623 | 4,931 |
| 0% 8/15/25 (a) | | 2,785 | 2,782 |
| | | | 87,336 |
| Semiconductors & Semiconductor Equipment - 6.9% | | | |
| Advanced Micro Devices, Inc. 2.125% 9/1/26 | | 1,217 | 14,078 |
| Cree, Inc.: | | | |
| 0.875% 9/1/23 | | 3,385 | 5,386 |
| 1.75% 5/1/26 (a) | | 3,331 | 6,730 |
| Enphase Energy, Inc. 0.25% 3/1/25 (a) | | 2,075 | 3,767 |
| Impinj, Inc. 2% 12/15/26 (a) | | 220 | 304 |
| Inphi Corp.: | | | |
| 0.75% 9/1/21 | | 900 | 2,476 |
| 0.75% 4/15/25 (a) | | 4,440 | 6,058 |
| Microchip Technology, Inc.: | | | |
| 1.625% 2/15/25 | | 11,418 | 33,555 |
| 1.625% 2/15/27 | | 5,475 | 10,731 |
| 2.25% 2/15/37 | | 4,332 | 8,542 |
| Micron Technology, Inc. 3.125% 5/1/32 | | 1,508 | 9,491 |
| Nova Measuring Instruments Ltd. 0% 10/15/25 (a) | | 1,840 | 1,980 |
| ON Semiconductor Corp. 1.625% 10/15/23 | | 7,931 | 12,277 |
| Rambus, Inc. 1.375% 2/1/23 | | 780 | 837 |
| Silicon Laboratories, Inc. 1.375% 3/1/22 | | 120 | 158 |
| SMART Global Holdings, Inc. 2.25% 2/15/26 (a) | | 200 | 195 |
| SolarEdge Technologies, Inc. 0% 9/15/25 (a) | | 7,240 | 9,203 |
| Synaptics, Inc. 0.5% 6/15/22 | | 800 | 976 |
| Teradyne, Inc. 1.25% 12/15/23 | | 2,195 | 7,662 |
| Veeco Instruments, Inc. 3.75% 6/1/27 (a) | | 150 | 210 |
| | | | 134,616 |
| Software - 14.3% | | | |
| 2U, Inc. 2.25% 5/1/25 (a) | | 2,500 | 3,492 |
| 8x8, Inc. 0.5% 2/1/24 | | 194 | 199 |
| Altair Engineering, Inc. 0.25% 6/1/24 | | 3,124 | 4,062 |
| Alteryx, Inc.: | | | |
| 0.5% 8/1/24 | | 1,762 | 1,820 |
| 1% 8/1/26 | | 2,120 | 2,188 |
| Atlassian, Inc. 0.625% 5/1/23 | | 4,551 | 12,580 |
| Avaya Holdings Corp. 2.25% 6/15/23 | | 180 | 185 |
| Benefitfocus, Inc. 1.25% 12/15/23 | | 214 | 186 |
| Bill.Com Holdings, Inc. 0% 12/1/25 (a) | | 200 | 212 |
| BlackLine, Inc. 0.125% 8/1/24 | | 2,579 | 4,525 |
| Cerence, Inc. 3% 6/1/25 (a) | | 1,776 | 4,503 |
| Cloudflare, Inc. 0.75% 5/15/25 (a) | | 540 | 1,137 |
| Coupa Software, Inc.: | | | |
| 0.125% 6/15/25 | | 3,175 | 6,721 |
| 0.375% 6/15/26 (a) | | 8,526 | 11,279 |
| CyberArk Software Ltd. 0% 11/15/24 | | 81 | 83 |
| Datadog, Inc. 0.125% 6/15/25 (a) | | 3,700 | 4,838 |
| DocuSign, Inc. 0.5% 9/15/23 | | 2,631 | 8,399 |
| Everbridge, Inc.: | | | |
| 0.125% 12/15/24 (a) | | 3,373 | 4,447 |
| 1.5% 11/1/22 | | 631 | 2,375 |
| FireEye, Inc.: | | | |
| 0.875% 6/1/24 | | 5,547 | 5,606 |
| 1.625% 6/1/35 | | 3,690 | 3,607 |
| Five9, Inc.: | | | |
| 0.125% 5/1/23 | | 51 | 191 |
| 0.5% 6/1/25 (a) | | 4,450 | 5,958 |
| Guidewire Software, Inc. 1.25% 3/15/25 | | 2,797 | 3,503 |
| HubSpot, Inc.: | | | |
| 0.25% 6/1/22 | | 796 | 3,302 |
| 0.375% 6/1/25 (a) | | 2,930 | 4,490 |
| j2 Global, Inc.: | | | |
| 1.75% 11/1/26 (a) | | 188 | 185 |
| 3.25% 6/15/29 | | 131 | 177 |
| LivePerson, Inc. 0.75% 3/1/24 | | 6,372 | 10,670 |
| Medallia, Inc. 0.125% 9/15/25 (a) | | 160 | 182 |
| Model N, Inc. 2.625% 6/1/25 (a) | | 2,875 | 3,657 |
| New Relic, Inc. 0.5% 5/1/23 | | 70 | 68 |
| Nuance Communications, Inc.: | | | |
| 1% 12/15/35 | | 6,255 | 11,429 |
| 1.25% 4/1/25 | | 5,024 | 11,197 |
| Nutanix, Inc. 0% 1/15/23 | | 361 | 352 |
| Pagerduty, Inc. 1.25% 7/1/25 (a) | | 3,120 | 3,503 |
| Palo Alto Networks, Inc.: | | | |
| 0.375% 6/1/25 (a) | | 9,347 | 10,922 |
| 0.75% 7/1/23 | | 9,492 | 11,791 |
| Pegasystems, Inc. 0.75% 3/1/25 (a) | | 4,693 | 5,529 |
| Pluralsight, Inc. 0.375% 3/1/24 | | 200 | 180 |
| Proofpoint, Inc. 0.25% 8/15/24 | | 4,592 | 4,545 |
| Q2 Holdings, Inc.: | | | |
| 0.75% 2/15/23 | | 1,585 | 3,129 |
| 0.75% 6/1/26 | | 6,868 | 9,723 |
| Rapid7, Inc.: | | | |
| 1.25% 8/1/23 | | 2,145 | 3,929 |
| 2.25% 5/1/25 (a) | | 2,300 | 3,249 |
| RealPage, Inc.: | | | |
| 1.5% 11/15/22 | | 1,896 | 3,205 |
| 1.5% 5/15/25 | | 2,220 | 2,535 |
| RingCentral, Inc.: | | | |
| 0% 3/15/23 | | 544 | 1,983 |
| 0% 3/1/25 (a) | | 5,867 | 6,601 |
| 0% 3/15/26 (a) | | 180 | 185 |
| SailPoint Technologies Holding, Inc. 0.125% 9/15/24 | | 5,152 | 8,962 |
| ServiceNow, Inc. 0% 6/1/22 | | 2,521 | 9,952 |
| Slack Technologies, Inc. 0.5% 4/15/25 (a) | | 5,225 | 7,775 |
| Splunk, Inc.: | | | |
| 0.5% 9/15/23 | | 5,100 | 7,523 |
| 1.125% 9/15/25 | | 3,992 | 6,071 |
| 1.125% 6/15/27 (a) | | 2,540 | 2,860 |
| Varonis Systems, Inc. 1.25% 8/15/25 (a) | | 1,200 | 1,764 |
| Verint Systems, Inc. 1.5% 6/1/21 | | 300 | 311 |
| Workday, Inc. 0.25% 10/1/22 | | 7,655 | 12,223 |
| Workiva, Inc. 1.125% 8/15/26 | | 943 | 1,114 |
| Zendesk, Inc.: | | | |
| 0.25% 3/15/23 | | 109 | 233 |
| 0.625% 6/15/25 (a) | | 6,900 | 9,626 |
| Zscaler, Inc. 0.125% 7/1/25 (a) | | 2,600 | 3,281 |
| | | | 280,509 |
| Technology Hardware, Storage & Peripherals - 0.0% | | | |
| Pure Storage, Inc. 0.125% 4/15/23 | | 130 | 132 |
| Western Digital Corp. 1.5% 2/1/24 | | 217 | 212 |
| | | | 344 |
| TOTAL INFORMATION TECHNOLOGY | | | 523,902 |
| MATERIALS - 1.0% | | | |
| Chemicals - 0.2% | | | |
| Livent Corp. 4.125% 7/15/25 (a) | | 2,410 | 4,595 |
| Metals & Mining - 0.8% | | | |
| Allegheny Technologies, Inc. 3.5% 6/15/25 (a) | | 170 | 204 |
| Cleveland-Cliffs, Inc. 1.5% 1/15/25 | | 174 | 267 |
| Endeavour Mining Corp. 3% 2/15/23 (a) | | 3,760 | 4,465 |
| SSR Mining, Inc. 2.5% 4/1/39 | | 3,335 | 4,365 |
| United States Steel Corp. 5% 11/1/26 | | 4,282 | 5,496 |
| | | | 14,797 |
| TOTAL MATERIALS | | | 19,392 |
| REAL ESTATE - 0.3% | | | |
| Equity Real Estate Investment Trusts (REITs) - 0.3% | | | |
| CorEnergy Infrastructure Trust, Inc. 5.875% 8/15/25 | | 230 | 162 |
| IH Merger Sub LLC 3.5% 1/15/22 | | 1,900 | 2,482 |
| iStar Financial, Inc. 3.125% 9/15/22 | | 1,700 | 1,954 |
| National Health Investors, Inc. 3.25% 4/1/21 | | 150 | 157 |
| Uniti Fiber Holdings, Inc. 4% 6/15/24 (a) | | 250 | 283 |
| | | | 5,038 |
| Real Estate Management & Development - 0.0% | | | |
| Redfin Corp.: | | | |
| 0% 10/15/25 (a) | | 150 | 149 |
| 1.75% 7/15/23 | | 270 | 453 |
| | | | 602 |
| TOTAL REAL ESTATE | | | 5,640 |
| UTILITIES - 0.2% | | | |
| Electric Utilities - 0.1% | | | |
| NRG Energy, Inc. 2.75% 6/1/48 | | 2,734 | 2,952 |
| Independent Power and Renewable Electricity Producers - 0.1% | | | |
| Atlantica Sustainable Infrastructure PLC 4% 7/15/25 (a) | | 1,160 | 1,294 |
| TOTAL UTILITIES | | | 4,246 |
|
| TOTAL CONVERTIBLE BONDS | | | 1,337,977 |
|
| Nonconvertible Bonds - 0.6% | | | |
| ENERGY - 0.3% | | | |
| Oil, Gas & Consumable Fuels - 0.3% | | | |
| Northern Oil & Gas, Inc. 8.5% 5/15/23 pay-in-kind | | 7,433 | 6,262 |
| INDUSTRIALS - 0.3% | | | |
| Marine - 0.3% | | | |
| Navios Maritime Acquisition Corp./Navios Acquisition Finance U.S., Inc. 8.125% 11/15/21 (a) | | 8,185 | 5,361 |
|
| TOTAL NONCONVERTIBLE BONDS | | | 11,623 |
|
| TOTAL CORPORATE BONDS | | | |
| (Cost $910,703) | | | 1,349,600 |
| | | Shares | Value (000s) |
|
| Common Stocks - 12.2% | | | |
| COMMUNICATION SERVICES - 1.5% | | | |
| Entertainment - 0.3% | | | |
| Activision Blizzard, Inc. | | 79,200 | 6,295 |
| Interactive Media & Services - 0.5% | | | |
| Alphabet, Inc. Class A (d) | | 5,600 | 9,825 |
| Media - 0.4% | | | |
| Fox Corp. Class A | | 236,000 | 6,806 |
| Wireless Telecommunication Services - 0.3% | | | |
| Rogers Communications, Inc. Class B | | 130,600 | 6,154 |
|
| TOTAL COMMUNICATION SERVICES | | | 29,080 |
|
| CONSUMER DISCRETIONARY - 1.8% | | | |
| Hotels, Restaurants & Leisure - 1.4% | | | |
| Boyd Gaming Corp. | | 101,300 | 3,899 |
| Caesars Entertainment, Inc. (d) | | 237,294 | 16,164 |
| Kambi Group PLC (d) | | 188,141 | 7,278 |
| | | | 27,341 |
| Leisure Products - 0.4% | | | |
| Vista Outdoor, Inc. (d) | | 421,340 | 8,692 |
|
| TOTAL CONSUMER DISCRETIONARY | | | 36,033 |
|
| CONSUMER STAPLES - 0.9% | | | |
| Beverages - 0.2% | | | |
| Constellation Brands, Inc. Class A (sub. vtg.) | | 24,000 | 4,940 |
| Food & Staples Retailing - 0.7% | | | |
| Costco Wholesale Corp. | | 8,700 | 3,408 |
| Walmart, Inc. | | 62,500 | 9,549 |
| | | | 12,957 |
|
| TOTAL CONSUMER STAPLES | | | 17,897 |
|
| ENERGY - 4.0% | | | |
| Oil, Gas & Consumable Fuels - 4.0% | | | |
| DHT Holdings, Inc. (e) | | 9,326,893 | 47,660 |
| Enterprise Products Partners LP | | 849,900 | 16,488 |
| Euronav NV (f) | | 1,738,742 | 13,736 |
| | | | 77,884 |
| FINANCIALS - 0.5% | | | |
| Capital Markets - 0.5% | | | |
| Lazard Ltd. Class A | | 271,200 | 10,121 |
| HEALTH CARE - 0.3% | | | |
| Biotechnology - 0.2% | | | |
| Alder Biopharmaceuticals, Inc. rights (c)(d) | | 103,495 | 91 |
| Regeneron Pharmaceuticals, Inc. (d) | | 7,900 | 4,077 |
| | | | 4,168 |
| Health Care Equipment & Supplies - 0.1% | | | |
| DexCom, Inc. (d) | | 7,568 | 2,419 |
|
| TOTAL HEALTH CARE | | | 6,587 |
|
| INFORMATION TECHNOLOGY - 2.5% | | | |
| IT Services - 0.2% | | | |
| Nuvei Corp. (a) | | 95,600 | 4,462 |
| Semiconductors & Semiconductor Equipment - 2.0% | | | |
| Array Technologies, Inc. | | 13,900 | 634 |
| Inphi Corp. (d) | | 1,154 | 179 |
| Microchip Technology, Inc. | | 28,235 | 3,795 |
| Micron Technology, Inc. (d) | | 144,300 | 9,248 |
| NVIDIA Corp. | | 22,600 | 12,115 |
| NXP Semiconductors NV | | 84,223 | 13,343 |
| | | | 39,314 |
| Software - 0.3% | | | |
| Microsoft Corp. | | 27,500 | 5,887 |
|
| TOTAL INFORMATION TECHNOLOGY | | | 49,663 |
|
| MATERIALS - 0.2% | | | |
| Containers & Packaging - 0.2% | | | |
| WestRock Co. | | 100,000 | 4,221 |
| REAL ESTATE - 0.3% | | | |
| Equity Real Estate Investment Trusts (REITs) - 0.3% | | | |
| Crown Castle International Corp. | | 27,591 | 4,623 |
| UTILITIES - 0.2% | | | |
| Independent Power and Renewable Electricity Producers - 0.2% | | | |
| Vistra Corp. | | 181,144 | 3,384 |
| TOTAL COMMON STOCKS | | | |
| (Cost $211,709) | | | 239,493 |
|
| Convertible Preferred Stocks - 19.3% | | | |
| COMMUNICATION SERVICES - 2.3% | | | |
| Wireless Telecommunication Services - 2.3% | | | |
| T-Mobile U.S., Inc. (a) | | 37,700 | 45,700 |
| CONSUMER DISCRETIONARY - 1.2% | | | |
| Auto Components - 0.6% | | | |
| Aptiv PLC Series A 5.50% | | 87,100 | 12,203 |
| Internet & Direct Marketing Retail - 0.6% | | | |
| Chewy, Inc. 6.50% (a) | | 6,100 | 10,802 |
|
| TOTAL CONSUMER DISCRETIONARY | | | 23,005 |
|
| CONSUMER STAPLES - 0.2% | | | |
| Food Products - 0.2% | | | |
| Bunge Ltd. 4.875% | | 42,600 | 4,385 |
| Household Products - 0.0% | | | |
| Energizer Holdings, Inc. 7.50% (d) | | 3,800 | 344 |
|
| TOTAL CONSUMER STAPLES | | | 4,729 |
|
| FINANCIALS - 0.6% | | | |
| Banks - 0.0% | | | |
| Bank of America Corp. Series L, 7.25% | | 89 | 132 |
| Wells Fargo & Co. 7.50% | | 143 | 201 |
| | | | 333 |
| Capital Markets - 0.6% | | | |
| KKR & Co. LP Series C 6.00% | | 203,600 | 11,243 |
| Mortgage Real Estate Investment Trusts - 0.0% | | | |
| Great Ajax Corp. 7.25% | | 9,800 | 242 |
|
| TOTAL FINANCIALS | | | 11,818 |
|
| HEALTH CARE - 3.6% | | | |
| Health Care Equipment & Supplies - 2.9% | | | |
| Becton, Dickinson & Co. 6.50% | | 276,400 | 14,445 |
| Boston Scientific Corp. Series A 5.50% | | 70,200 | 7,064 |
| Danaher Corp.: | | | |
| 4.75% (d) | | 14,300 | 22,052 |
| Series B 5.00% | | 10,350 | 13,496 |
| | | | 57,057 |
| Health Care Technology - 0.1% | | | |
| Change Healthcare, Inc. 6.00% (d) | | 39,200 | 2,407 |
| Life Sciences Tools & Services - 0.6% | | | |
| Avantor, Inc. Series A 6.25% | | 120,200 | 10,420 |
| Pharmaceuticals - 0.0% | | | |
| Elanco Animal Health, Inc. 5.00% | | 4,400 | 209 |
|
| TOTAL HEALTH CARE | | | 70,093 |
|
| INDUSTRIALS - 0.8% | | | |
| Machinery - 0.8% | | | |
| Colfax Corp. 5.75% | | 32,400 | 4,900 |
| Fortive Corp. Series A, 5.00% | | 4,490 | 4,512 |
| Stanley Black & Decker, Inc. Series D 5.25% | | 66,300 | 7,408 |
| | | | 16,820 |
| INFORMATION TECHNOLOGY - 2.6% | | | |
| Electronic Equipment & Components - 0.3% | | | |
| II-VI, Inc. Series A 6.00% | | 17,900 | 5,175 |
| IT Services - 0.0% | | | |
| Sabre Corp. Series A 6.50% | | 2,000 | 293 |
| Semiconductors & Semiconductor Equipment - 2.3% | | | |
| Broadcom, Inc. Series A 8.00% | | 33,900 | 45,183 |
|
| TOTAL INFORMATION TECHNOLOGY | | | 50,651 |
|
| MATERIALS - 1.2% | | | |
| Chemicals - 0.4% | | | |
| International Flavors & Fragrances, Inc. 6.00% | | 162,870 | 6,734 |
| Metals & Mining - 0.8% | | | |
| ArcelorMittal SA 5.50% | | 367,300 | 16,297 |
|
| TOTAL MATERIALS | | | 23,031 |
|
| REAL ESTATE - 0.2% | | | |
| Equity Real Estate Investment Trusts (REITs) - 0.2% | | | |
| QTS Realty Trust, Inc. 6.50% | | 24,500 | 3,313 |
| UTILITIES - 6.6% | | | |
| Electric Utilities - 4.7% | | | |
| American Electric Power Co., Inc.: | | | |
| 6.125% | | 29,900 | 1,509 |
| 6.125% | | 135,200 | 6,740 |
| NextEra Energy, Inc.: | | | |
| 4.872% | | 539,800 | 30,526 |
| 5.279% | | 359,800 | 17,537 |
| 6.219% | | 178,000 | 8,710 |
| PG&E Corp. | | 161,200 | 20,023 |
| Southern Co. 6.75% | | 137,000 | 6,823 |
| | | | 91,868 |
| Gas Utilities - 0.0% | | | |
| South Jersey Industries, Inc. 7.25% | | 4,600 | 182 |
| Multi-Utilities - 1.8% | | | |
| CenterPoint Energy, Inc.: | | | |
| 2.00% ZENS (d) | | 75,650 | 4,596 |
| Series B, 7.00% | | 5,100 | 215 |
| Dominion Energy, Inc. 7.25% | | 121,500 | 12,213 |
| DTE Energy Co. 6.25% | | 127,800 | 6,152 |
| Sempra Energy: | | | |
| 6.75% | | 43,100 | 4,457 |
| Series A, 6.00% (d) | | 84,500 | 8,672 |
| | | | 36,305 |
| Water Utilities - 0.1% | | | |
| Essential Utilities, Inc. 6.00% | | 24,500 | 1,438 |
|
| TOTAL UTILITIES | | | 129,793 |
|
| TOTAL CONVERTIBLE PREFERRED STOCKS | | | |
| (Cost $324,575) | | | 378,953 |
|
| Money Market Funds - 0.3% | | | |
| Fidelity Cash Central Fund 0.09% (g) | | 1,526,854 | 1,527 |
| Fidelity Securities Lending Cash Central Fund 0.09% (g)(h) | | 4,499,091 | 4,500 |
| TOTAL MONEY MARKET FUNDS | | | |
| (Cost $6,027) | | | 6,027 |
| TOTAL INVESTMENT IN SECURITIES - 100.5% | | | |
| (Cost $1,453,014) | | | 1,974,073 |
| NET OTHER ASSETS (LIABILITIES) - (0.5)% | | | (9,076) |
| NET ASSETS - 100% | | | $1,964,997 |
Legend
(a) Security exempt from registration under Rule 144A of the Securities Act of 1933. These securities may be resold in transactions exempt from registration, normally to qualified institutional buyers. At the end of the period, the value of these securities amounted to $525,375,000 or 26.7% of net assets.
(b) Non-income producing - Security is in default.
(c) Level 3 security
(d) Non-income producing
(e) Affiliated company
(f) Security or a portion of the security is on loan at period end.
(g) Affiliated fund that is generally available only to investment companies and other accounts managed by Fidelity Investments. The rate quoted is the annualized seven-day yield of the fund at period end. A complete unaudited listing of the fund's holdings as of its most recent quarter end is available upon request. In addition, each Fidelity Central Fund's financial statements, which are not covered by the Fund's Report of Independent Registered Public Accounting Firm, are available on the SEC's website or upon request.
(h) Investment made with cash collateral received from securities on loan.
Affiliated Central Funds
Information regarding fiscal year to date income earned by the Fund from investments in Fidelity Central Funds is as follows:
| Fund | Income earned |
| | (Amounts in thousands) |
| Fidelity Cash Central Fund | $374 |
| Fidelity Securities Lending Cash Central Fund | 87 |
| Total | $461 |
Amounts in the income column in the above table include any capital gain distributions from underlying funds, which are presented in the corresponding line-item in the Statement of Operations, if applicable. Amount for Fidelity Securities Lending Cash Central Fund represents the income earned on investing cash collateral, less rebates paid to borrowers and any lending agent fees associated with the loan, plus any premium payments received for lending certain types of securities.
Other Affiliated Issuers
An affiliated company is a company in which the Fund has ownership of at least 5% of the voting securities. Fiscal year to date transactions with companies which are or were affiliates are as follows:
| Affiliate (Amounts in thousands) | Value, beginning of period | Purchases | Sales Proceeds | Dividend Income | Realized Gain (loss) | Change in Unrealized appreciation (depreciation) | Value, end of period |
| DHT Holdings, Inc. | $14,521 | $28,693 | $-- | $8,360 | $-- | $(9,334) | $47,660 |
| Total | $14,521 | $28,693 | $-- | $8,360 | $-- | $(9,334) | $47,660 |
Investment Valuation
The following is a summary of the inputs used, as of November 30, 2020, involving the Fund's assets and liabilities carried at fair value. The inputs or methodology used for valuing securities may not be an indication of the risk associated with investing in those securities. For more information on valuation inputs, and their aggregation into the levels used below, please refer to the Investment Valuation section in the accompanying Notes to Financial Statements.
| | Valuation Inputs at Reporting Date: |
| Description | Total | Level 1 | Level 2 | Level 3 |
| (Amounts in thousands) | | | | |
| Investments in Securities: | | | | |
| Equities: | | | | |
| Communication Services | $74,780 | $29,080 | $45,700 | $-- |
| Consumer Discretionary | 59,038 | 28,755 | 30,283 | -- |
| Consumer Staples | 22,626 | 17,897 | 4,729 | -- |
| Energy | 77,884 | 77,884 | -- | -- |
| Financials | 21,939 | 21,364 | 575 | -- |
| Health Care | 76,680 | 6,496 | 70,093 | 91 |
| Industrials | 16,820 | -- | 16,820 | -- |
| Information Technology | 100,314 | 49,663 | 50,651 | -- |
| Materials | 27,252 | 4,221 | 23,031 | -- |
| Real Estate | 7,936 | 4,623 | 3,313 | -- |
| Utilities | 133,177 | 3,384 | 129,793 | -- |
| Corporate Bonds | 1,349,600 | -- | 1,349,149 | 451 |
| Money Market Funds | 6,027 | 6,027 | -- | -- |
| Total Investments in Securities: | $1,974,073 | $249,394 | $1,724,137 | $542 |
Other Information
The composition of credit quality ratings as a percentage of Total Net Assets is as follows (Unaudited):
| AAA,AA,A | 1.3% |
| BBB | 2.8% |
| BB | 11.5% |
| B | 3.8% |
| CCC,CC,C | 0.6% |
| Not Rated | 48.7% |
| Equities | 31.5% |
| Short-Term Investments and Net Other Assets | (0.2)% |
| Total | 100% |
See accompanying notes which are an integral part of the financial statements.
Financial Statements
Statement of Assets and Liabilities
| Amounts in thousands (except per-share amounts) | | November 30, 2020 |
| Assets | | |
Investment in securities, at value (including securities loaned of $4,182) — See accompanying schedule:
Unaffiliated issuers (cost $1,392,505) | $1,920,386 | |
| Fidelity Central Funds (cost $6,027) | 6,027 | |
| Other affiliated issuers (cost $54,482) | 47,660 | |
| Total Investment in Securities (cost $1,453,014) | | $1,974,073 |
| Receivable for investments sold | | 5,844 |
| Receivable for fund shares sold | | 2,520 |
| Dividends receivable | | 2,698 |
| Interest receivable | | 3,104 |
| Distributions receivable from Fidelity Central Funds | | 4 |
| Prepaid expenses | | 2 |
| Other receivables | | 27 |
| Total assets | | 1,988,272 |
| Liabilities | | |
| Payable for investments purchased | $16,674 | |
| Payable for fund shares redeemed | 1,079 | |
| Accrued management fee | 690 | |
| Distribution and service plan fees payable | 31 | |
| Other affiliated payables | 249 | |
| Other payables and accrued expenses | 52 | |
| Collateral on securities loaned | 4,500 | |
| Total liabilities | | 23,275 |
| Net Assets | | $1,964,997 |
| Net Assets consist of: | | |
| Paid in capital | | $1,274,834 |
| Total accumulated earnings (loss) | | 690,163 |
| Net Assets | | $1,964,997 |
| Net Asset Value and Maximum Offering Price | | |
| Class A: | | |
| Net Asset Value and redemption price per share ($40,339 ÷ 991.11 shares)(a) | | $40.70 |
| Maximum offering price per share (100/94.25 of $40.70) | | $43.18 |
| Class M: | | |
| Net Asset Value and redemption price per share ($9,323 ÷ 228.88 shares)(a) | | $40.73 |
| Maximum offering price per share (100/96.50 of $40.73) | | $42.21 |
| Class C: | | |
| Net Asset Value and offering price per share ($24,018 ÷ 594.19 shares)(a) | | $40.42 |
| Convertible Securities: | | |
| Net Asset Value, offering price and redemption price per share ($1,790,883 ÷ 43,799.75 shares) | | $40.89 |
| Class I: | | |
| Net Asset Value, offering price and redemption price per share ($65,149 ÷ 1,596.06 shares) | | $40.82 |
| Class Z: | | |
| Net Asset Value, offering price and redemption price per share ($35,285 ÷ 864.61 shares) | | $40.81 |
(a) Redemption price per share is equal to net asset value less any applicable contingent deferred sales charge.
See accompanying notes which are an integral part of the financial statements.
Statement of Operations
| Amounts in thousands | | Year ended November 30, 2020 |
| Investment Income | | |
| Dividends (including $8,360 earned from other affiliated issuers) | | $31,568 |
| Interest | | 16,890 |
| Income from Fidelity Central Funds (including $87 from security lending) | | 461 |
| Total income | | 48,919 |
| Expenses | | |
| Management fee | | |
| Basic fee | $6,964 | |
| Performance adjustment | 211 | |
| Transfer agent fees | 2,198 | |
| Distribution and service plan fees | 304 | |
| Accounting fees | 501 | |
| Custodian fees and expenses | 30 | |
| Independent trustees' fees and expenses | 9 | |
| Registration fees | 124 | |
| Audit | 68 | |
| Legal | 2 | |
| Miscellaneous | 27 | |
| Total expenses before reductions | 10,438 | |
| Expense reductions | (110) | |
| Total expenses after reductions | | 10,328 |
| Net investment income (loss) | | 38,591 |
| Realized and Unrealized Gain (Loss) | | |
| Net realized gain (loss) on: | | |
| Investment securities: | | |
| Unaffiliated issuers | 191,171 | |
| Fidelity Central Funds | 7 | |
| Foreign currency transactions | (12) | |
| Total net realized gain (loss) | | 191,166 |
| Change in net unrealized appreciation (depreciation) on: | | |
| Investment securities: | | |
| Unaffiliated issuers | 310,040 | |
| Affiliated issuers | (9,334) | |
| Total change in net unrealized appreciation (depreciation) | | 300,706 |
| Net gain (loss) | | 491,872 |
| Net increase (decrease) in net assets resulting from operations | | $530,463 |
See accompanying notes which are an integral part of the financial statements.
Statement of Changes in Net Assets
| Amounts in thousands | Year ended November 30, 2020 | Year ended November 30, 2019 |
| Increase (Decrease) in Net Assets | | |
| Operations | | |
| Net investment income (loss) | $38,591 | $26,399 |
| Net realized gain (loss) | 191,166 | 36,205 |
| Change in net unrealized appreciation (depreciation) | 300,706 | 191,417 |
| Net increase (decrease) in net assets resulting from operations | 530,463 | 254,021 |
| Distributions to shareholders | (63,309) | (95,182) |
| Share transactions - net increase (decrease) | (71,619) | 57,532 |
| Total increase (decrease) in net assets | 395,535 | 216,371 |
| Net Assets | | |
| Beginning of period | 1,569,462 | 1,353,091 |
| End of period | $1,964,997 | $1,569,462 |
See accompanying notes which are an integral part of the financial statements.
Financial Highlights
Fidelity Convertible Securities Fund Class A
| Years ended November 30, | 2020 | 2019 | 2018 | 2017 | 2016 |
| Selected Per–Share Data | | | | | |
| Net asset value, beginning of period | $30.97 | $28.07 | $28.49 | $26.85 | $29.56 |
| Income from Investment Operations | | | | | |
| Net investment income (loss)A | .70 | .43 | .76B | .75 | .81C |
| Net realized and unrealized gain (loss) | 10.23 | 4.38 | .25 | 2.02D | (.69) |
| Total from investment operations | 10.93 | 4.81 | 1.01 | 2.77 | .12 |
| Distributions from net investment income | (.63) | (.40) | (.85) | (.71) | (.83) |
| Distributions from net realized gain | (.57) | (1.51) | (.58) | (.42) | (2.00) |
| Total distributions | (1.20) | (1.91) | (1.43) | (1.13) | (2.83) |
| Net asset value, end of period | $40.70 | $30.97 | $28.07 | $28.49 | $26.85 |
| Total ReturnE,F | 36.42% | 18.75% | 3.60% | 10.57%D | .83% |
| Ratios to Average Net AssetsG,H | | | | | |
| Expenses before reductions | .93% | .81% | .75% | .74% | .73% |
| Expenses net of fee waivers, if any | .92% | .80% | .75% | .74% | .73% |
| Expenses net of all reductions | .92% | .80% | .75% | .74% | .73% |
| Net investment income (loss) | 2.11% | 1.52% | 2.66%B | 2.71% | 3.08%C |
| Supplemental Data | | | | | |
| Net assets, end of period (in millions) | $40 | $25 | $19 | $21 | $29 |
| Portfolio turnover rateI | 147% | 151% | 176% | 110% | 112% |
A Calculated based on average shares outstanding during the period.
B Net investment income per share reflects one or more large, non-recurring dividend(s) which amounted to $.19 per share. Excluding such non-recurring dividend(s), the ratio of net investment income (loss) to average net assets would have been 1.99%.
C Net investment income per share reflects one or more large, non-recurring dividend(s) which amounted to $.10 per share. Excluding such non-recurring dividend(s), the ratio of net investment income (loss) to average net assets would have been 2.71%.
D Net realized and unrealized gain (loss) per share reflects proceeds received from litigation which amounted to $.08 per share. Excluding these litigation proceeds, the total return would have been 10.28%.
E Total returns would have been lower if certain expenses had not been reduced during the applicable periods shown.
F Total returns do not include the effect of the sales charges.
G Fees and expenses of any underlying mutual funds or exchange-traded funds (ETFs) are not included in the Fund's expense ratio. The Fund indirectly bears its proportionate share of these expenses. For additional expense information related to investments in Fidelity Central Funds, please refer to the "Investments in Fidelity Central Funds" note found in the Notes to Financial Statements section of the most recent Annual or Semi-Annual report.
H Expense ratios reflect operating expenses of the class. Expenses before reductions do not reflect amounts reimbursed, waived, or reduced through arrangements with the investment adviser, brokerage services, or other offset arrangements, if applicable, and do not represent the amount paid by the class during periods when reimbursements, waivers or reductions occur.
I Amount does not include the portfolio activity of any underlying mutual funds or exchange-traded funds (ETFs).
See accompanying notes which are an integral part of the financial statements.
Fidelity Convertible Securities Fund Class M
| Years ended November 30, | 2020 | 2019 | 2018 | 2017 | 2016 |
| Selected Per–Share Data | | | | | |
| Net asset value, beginning of period | $30.98 | $28.09 | $28.47 | $26.86 | $29.56 |
| Income from Investment Operations | | | | | |
| Net investment income (loss)A | .61 | .35 | .68B | .68 | .73C |
| Net realized and unrealized gain (loss) | 10.26 | 4.36 | .25 | 2.01D | (.68) |
| Total from investment operations | 10.87 | 4.71 | .93 | 2.69 | .05 |
| Distributions from net investment income | (.55) | (.32) | (.73) | (.66) | (.75) |
| Distributions from net realized gain | (.57) | (1.51) | (.58) | (.42) | (2.00) |
| Total distributions | (1.12) | (1.82)E | (1.31) | (1.08) | (2.75) |
| Net asset value, end of period | $40.73 | $30.98 | $28.09 | $28.47 | $26.86 |
| Total ReturnF,G | 36.10% | 18.34% | 3.31% | 10.26%D | .53% |
| Ratios to Average Net AssetsH,I | | | | | |
| Expenses before reductions | 1.19% | 1.09% | 1.04% | 1.01% | 1.04% |
| Expenses net of fee waivers, if any | 1.19% | 1.09% | 1.04% | 1.01% | 1.04% |
| Expenses net of all reductions | 1.19% | 1.08% | 1.03% | 1.01% | 1.04% |
| Net investment income (loss) | 1.84% | 1.24% | 2.38%B | 2.44% | 2.77%C |
| Supplemental Data | | | | | |
| Net assets, end of period (in millions) | $9 | $6 | $6 | $14 | $7 |
| Portfolio turnover rateJ | 147% | 151% | 176% | 110% | 112% |
A Calculated based on average shares outstanding during the period.
B Net investment income per share reflects one or more large, non-recurring dividend(s) which amounted to $.19 per share. Excluding such non-recurring dividend(s), the ratio of net investment income (loss) to average net assets would have been 1.71%.
C Net investment income per share reflects one or more large, non-recurring dividend(s) which amounted to $.10 per share. Excluding such non-recurring dividend(s), the ratio of net investment income (loss) to average net assets would have been 2.40%.
D Net realized and unrealized gain (loss) per share reflects proceeds received from litigation which amounted to $.08 per share. Excluding these litigation proceeds, the total return would have been 9.97%.
E Total distributions per share do not sum due to rounding.
F Total returns would have been lower if certain expenses had not been reduced during the applicable periods shown.
G Total returns do not include the effect of the sales charges.
H Fees and expenses of any underlying mutual funds or exchange-traded funds (ETFs) are not included in the Fund's expense ratio. The Fund indirectly bears its proportionate share of these expenses. For additional expense information related to investments in Fidelity Central Funds, please refer to the "Investments in Fidelity Central Funds" note found in the Notes to Financial Statements section of the most recent Annual or Semi-Annual report.
I Expense ratios reflect operating expenses of the class. Expenses before reductions do not reflect amounts reimbursed, waived, or reduced through arrangements with the investment adviser, brokerage services, or other offset arrangements, if applicable, and do not represent the amount paid by the class during periods when reimbursements, waivers or reductions occur.
J Amount does not include the portfolio activity of any underlying mutual funds or exchange-traded funds (ETFs).
See accompanying notes which are an integral part of the financial statements.
Fidelity Convertible Securities Fund Class C
| Years ended November 30, | 2020 | 2019 | 2018 | 2017 | 2016 |
| Selected Per–Share Data | | | | | |
| Net asset value, beginning of period | $30.76 | $27.89 | $28.31 | $26.68 | $29.37 |
| Income from Investment Operations | | | | | |
| Net investment income (loss)A | .44 | .22 | .54B | .54 | .60C |
| Net realized and unrealized gain (loss) | 10.19 | 4.34 | .25 | 2.01D | (.67) |
| Total from investment operations | 10.63 | 4.56 | .79 | 2.55 | (.07) |
| Distributions from net investment income | (.40) | (.18) | (.63) | (.50) | (.62) |
| Distributions from net realized gain | (.57) | (1.51) | (.58) | (.42) | (2.00) |
| Total distributions | (.97) | (1.69) | (1.21) | (.92) | (2.62) |
| Net asset value, end of period | $40.42 | $30.76 | $27.89 | $28.31 | $26.68 |
| Total ReturnE,F | 35.42% | 17.82% | 2.82% | 9.75%D | .09% |
| Ratios to Average Net AssetsG,H | | | | | |
| Expenses before reductions | 1.69% | 1.55% | 1.50% | 1.50% | 1.50% |
| Expenses net of fee waivers, if any | 1.69% | 1.55% | 1.50% | 1.49% | 1.49% |
| Expenses net of all reductions | 1.68% | 1.55% | 1.49% | 1.49% | 1.49% |
| Net investment income (loss) | 1.35% | .77% | 1.92%B | 1.96% | 2.32%C |
| Supplemental Data | | | | | |
| Net assets, end of period (in millions) | $24 | $17 | $17 | $19 | $24 |
| Portfolio turnover rateI | 147% | 151% | 176% | 110% | 112% |
A Calculated based on average shares outstanding during the period.
B Net investment income per share reflects one or more large, non-recurring dividend(s) which amounted to $.19 per share. Excluding such non-recurring dividend(s), the ratio of net investment income (loss) to average net assets would have been 1.25%.
C Net investment income per share reflects one or more large, non-recurring dividend(s) which amounted to $.10 per share. Excluding such non-recurring dividend(s), the ratio of net investment income (loss) to average net assets would have been 1.95%.
D Net realized and unrealized gain (loss) per share reflects proceeds received from litigation which amounted to $.08 per share. Excluding these litigation proceeds, the total return would have been 9.46%.
E Total returns would have been lower if certain expenses had not been reduced during the applicable periods shown.
F Total returns do not include the effect of the contingent deferred sales charge.
G Fees and expenses of any underlying mutual funds or exchange-traded funds (ETFs) are not included in the Fund's expense ratio. The Fund indirectly bears its proportionate share of these expenses. For additional expense information related to investments in Fidelity Central Funds, please refer to the "Investments in Fidelity Central Funds" note found in the Notes to Financial Statements section of the most recent Annual or Semi-Annual report.
H Expense ratios reflect operating expenses of the class. Expenses before reductions do not reflect amounts reimbursed, waived, or reduced through arrangements with the investment adviser, brokerage services, or other offset arrangements, if applicable, and do not represent the amount paid by the class during periods when reimbursements, waivers or reductions occur.
I Amount does not include the portfolio activity of any underlying mutual funds or exchange-traded funds (ETFs).
See accompanying notes which are an integral part of the financial statements.
Fidelity Convertible Securities Fund
| Years ended November 30, | 2020 | 2019 | 2018 | 2017 | 2016 |
| Selected Per–Share Data | | | | | |
| Net asset value, beginning of period | $31.09 | $28.18 | $28.59 | $26.95 | $29.66 |
| Income from Investment Operations | | | | | |
| Net investment income (loss)A | .80 | .52 | .85B | .83 | .88C |
| Net realized and unrealized gain (loss) | 10.29 | 4.38 | .25 | 2.02D | (.68) |
| Total from investment operations | 11.09 | 4.90 | 1.10 | 2.85 | .20 |
| Distributions from net investment income | (.72) | (.48) | (.93) | (.80) | (.92) |
| Distributions from net realized gain | (.57) | (1.51) | (.58) | (.42) | (2.00) |
| Total distributions | (1.29) | (1.99) | (1.51) | (1.21)E | (2.91)E |
| Net asset value, end of period | $40.89 | $31.09 | $28.18 | $28.59 | $26.95 |
| Total ReturnF | 36.88% | 19.04% | 3.93% | 10.88%D | 1.13% |
| Ratios to Average Net AssetsG,H | | | | | |
| Expenses before reductions | .63% | .51% | .46% | .45% | .45% |
| Expenses net of fee waivers, if any | .63% | .51% | .46% | .45% | .45% |
| Expenses net of all reductions | .62% | .51% | .45% | .45% | .45% |
| Net investment income (loss) | 2.41% | 1.81% | 2.96%B | 3.00% | 3.36%C |
| Supplemental Data | | | | | |
| Net assets, end of period (in millions) | $1,791 | $1,429 | $1,278 | $1,432 | $1,490 |
| Portfolio turnover rateI | 147% | 151% | 176% | 110% | 112% |
A Calculated based on average shares outstanding during the period.
B Net investment income per share reflects one or more large, non-recurring dividend(s) which amounted to $.19 per share. Excluding such non-recurring dividend(s), the ratio of net investment income (loss) to average net assets would have been 2.29%.
C Net investment income per share reflects one or more large, non-recurring dividend(s) which amounted to $.10 per share. Excluding such non-recurring dividend(s), the ratio of net investment income (loss) to average net assets would have been 2.99%.
D Net realized and unrealized gain (loss) per share reflects proceeds received from litigation which amounted to $.08 per share. Excluding these litigation proceeds, the total return would have been 10.59%.
E Total distributions per share do not sum due to rounding.
F Total returns would have been lower if certain expenses had not been reduced during the applicable periods shown.
G Fees and expenses of any underlying mutual funds or exchange-traded funds (ETFs) are not included in the Fund's expense ratio. The Fund indirectly bears its proportionate share of these expenses. For additional expense information related to investments in Fidelity Central Funds, please refer to the "Investments in Fidelity Central Funds" note found in the Notes to Financial Statements section of the most recent Annual or Semi-Annual report.
H Expense ratios reflect operating expenses of the class. Expenses before reductions do not reflect amounts reimbursed, waived, or reduced through arrangements with the investment adviser, brokerage services, or other offset arrangements, if applicable, and do not represent the amount paid by the class during periods when reimbursements, waivers or reductions occur.
I Amount does not include the portfolio activity of any underlying mutual funds or exchange-traded funds (ETFs).
See accompanying notes which are an integral part of the financial statements.
Fidelity Convertible Securities Fund Class I
| Years ended November 30, | 2020 | 2019 | 2018 | 2017 | 2016 |
| Selected Per–Share Data | | | | | |
| Net asset value, beginning of period | $31.04 | $28.13 | $28.55 | $26.91 | $29.62 |
| Income from Investment Operations | | | | | |
| Net investment income (loss)A | .79 | .52 | .84B | .83 | .88C |
| Net realized and unrealized gain (loss) | 10.27 | 4.38 | .24 | 2.02D | (.68) |
| Total from investment operations | 11.06 | 4.90 | 1.08 | 2.85 | .20 |
| Distributions from net investment income | (.71) | (.48) | (.92) | (.79) | (.91) |
| Distributions from net realized gain | (.57) | (1.51) | (.58) | (.42) | (2.00) |
| Total distributions | (1.28) | (1.99) | (1.50) | (1.21) | (2.91) |
| Net asset value, end of period | $40.82 | $31.04 | $28.13 | $28.55 | $26.91 |
| Total ReturnE | 36.84% | 19.07% | 3.87% | 10.87%D | 1.11% |
| Ratios to Average Net AssetsF,G | | | | | |
| Expenses before reductions | .65% | .52% | .47% | .47% | .47% |
| Expenses net of fee waivers, if any | .65% | .52% | .47% | .47% | .47% |
| Expenses net of all reductions | .64% | .52% | .47% | .47% | .47% |
| Net investment income (loss) | 2.39% | 1.80% | 2.94%B | 2.98% | 3.35%C |
| Supplemental Data | | | | | |
| Net assets, end of period (in millions) | $65 | $61 | $32 | $41 | $68 |
| Portfolio turnover rateH | 147% | 151% | 176% | 110% | 112% |
A Calculated based on average shares outstanding during the period.
B Net investment income per share reflects one or more large, non-recurring dividend(s) which amounted to $.19 per share. Excluding such non-recurring dividend(s), the ratio of net investment income (loss) to average net assets would have been 2.27%.
C Net investment income per share reflects one or more large, non-recurring dividend(s) which amounted to $.10 per share. Excluding such non-recurring dividend(s), the ratio of net investment income (loss) to average net assets would have been 2.98%.
D Net realized and unrealized gain (loss) per share reflects proceeds received from litigation which amounted to $.08 per share. Excluding these litigation proceeds, the total return would have been 10.58%.
E Total returns would have been lower if certain expenses had not been reduced during the applicable periods shown.
F Fees and expenses of any underlying mutual funds or exchange-traded funds (ETFs) are not included in the Fund's expense ratio. The Fund indirectly bears its proportionate share of these expenses. For additional expense information related to investments in Fidelity Central Funds, please refer to the "Investments in Fidelity Central Funds" note found in the Notes to Financial Statements section of the most recent Annual or Semi-Annual report.
G Expense ratios reflect operating expenses of the class. Expenses before reductions do not reflect amounts reimbursed, waived, or reduced through arrangements with the investment adviser, brokerage services, or other offset arrangements, if applicable, and do not represent the amount paid by the class during periods when reimbursements, waivers or reductions occur.
H Amount does not include the portfolio activity of any underlying mutual funds or exchange-traded funds (ETFs).
See accompanying notes which are an integral part of the financial statements.
Fidelity Convertible Securities Fund Class Z
| Years ended November 30, | 2020 | 2019 | 2018 A |
| Selected Per–Share Data | | | |
| Net asset value, beginning of period | $31.03 | $28.14 | $29.30 |
| Income from Investment Operations | | | |
| Net investment income (loss)B | .83 | .56 | .10 |
| Net realized and unrealized gain (loss) | 10.27 | 4.35 | (.90) |
| Total from investment operations | 11.10 | 4.91 | (.80) |
| Distributions from net investment income | (.75) | (.51) | (.36) |
| Distributions from net realized gain | (.57) | (1.51) | – |
| Total distributions | (1.32) | (2.02) | (.36) |
| Net asset value, end of period | $40.81 | $31.03 | $28.14 |
| Total ReturnC,D | 37.01% | 19.15% | (2.74)% |
| Ratios to Average Net AssetsE,F | | | |
| Expenses before reductions | .53% | .41% | .37%G |
| Expenses net of fee waivers, if any | .53% | .41% | .37%G |
| Expenses net of all reductions | .53% | .41% | .36%G |
| Net investment income (loss) | 2.50% | 1.91% | 2.35%G |
| Supplemental Data | | | |
| Net assets, end of period (in millions) | $35 | $32 | $1 |
| Portfolio turnover rateH | 147% | 151% | 176% |
A For the period October 2, 2018 (commencement of sale of shares) to November 30, 2018.
B Calculated based on average shares outstanding during the period.
C Total returns for periods of less than one year are not annualized.
D Total returns would have been lower if certain expenses had not been reduced during the applicable periods shown.
E Fees and expenses of any underlying mutual funds or exchange-traded funds (ETFs) are not included in the Fund's expense ratio. The Fund indirectly bears its proportionate share of these expenses. For additional expense information related to investments in Fidelity Central Funds, please refer to the "Investments in Fidelity Central Funds" note found in the Notes to Financial Statements section of the most recent Annual or Semi-Annual report.
F Expense ratios reflect operating expenses of the class. Expenses before reductions do not reflect amounts reimbursed, waived, or reduced through arrangements with the investment adviser, brokerage services, or other offset arrangements, if applicable, and do not represent the amount paid by the class during periods when reimbursements, waivers or reductions occur.
G Annualized
H Amount does not include the portfolio activity of any underlying mutual funds or exchange-traded funds (ETFs).
See accompanying notes which are an integral part of the financial statements.
Notes to Financial Statements
For the period ended November 30, 2020
(Amounts in thousands except percentages)
1. Organization.
Fidelity Convertible Securities Fund (the Fund) is a fund of Fidelity Financial Trust (the Trust) and is authorized to issue an unlimited number of shares. The Trust is registered under the Investment Company Act of 1940, as amended (the 1940 Act), as an open-end management investment company organized as a Massachusetts business trust. The Fund offers Class A, Class M, Class C, Convertible Securities, Class I and Class Z shares, each of which has equal rights as to assets and voting privileges. Each class has exclusive voting rights with respect to matters that affect that class. Class C shares will automatically convert to Class A shares after a holding period of ten years from the initial date of purchase, with certain exceptions.
Effective January 1, 2020:
Investment advisers Fidelity Investments Money Management, Inc., FMR Co., Inc., and Fidelity SelectCo, LLC, merged with and into Fidelity Management & Research Company. In connection with the merger transactions, the resulting, merged investment adviser was then redomiciled from Massachusetts to Delaware, changed its corporate structure from a corporation to a limited liability company, and changed its name to "Fidelity Management & Research Company LLC".
Broker-dealer Fidelity Distributors Corporation merged with and into Fidelity Investments Institutional Services Company, Inc. ("FIISC"). FIISC was then redomiciled from Massachusetts to Delaware, changed its corporate structure from a corporation to a limited liability company, and changed its name to "Fidelity Distributors Company LLC".
Fidelity Investments Institutional Operations Company, Inc. converted from a Massachusetts corporation to a Massachusetts LLC, and changed its name to "Fidelity Investments Institutional Operations Company LLC".
2. Investments in Fidelity Central Funds.
The Fund invests in Fidelity Central Funds, which are open-end investment companies generally available only to other investment companies and accounts managed by the investment adviser and its affiliates. The Fund's Schedule of Investments lists each of the Fidelity Central Funds held as of period end, if any, as an investment of the Fund, but does not include the underlying holdings of each Fidelity Central Fund. As an Investing Fund, the Fund indirectly bears its proportionate share of the expenses of the underlying Fidelity Central Funds.
The Money Market Central Funds seek preservation of capital and current income and are managed by the investment adviser. Annualized expenses of the Money Market Central Funds as of their most recent shareholder report date ranged from less than .005% to .01%.
A complete unaudited list of holdings for each Fidelity Central Fund is available upon request or at the Securities and Exchange Commission (the SEC) website at www.sec.gov. In addition, the financial statements of the Fidelity Central Funds, which are not covered by the Fund's Report of Independent Registered Public Accounting Firm, are available on the SEC website or upon request.
3. Significant Accounting Policies.
The Fund is an investment company and applies the accounting and reporting guidance of the Financial Accounting Standards Board (FASB) Accounting Standards Codification Topic 946 Financial Services – Investment Companies. The financial statements have been prepared in conformity with accounting principles generally accepted in the United States of America (GAAP), which require management to make certain estimates and assumptions at the date of the financial statements. Actual results could differ from those estimates. Subsequent events, if any, through the date that the financial statements were issued have been evaluated in the preparation of the financial statements. The following summarizes the significant accounting policies of the Fund:
Investment Valuation. Investments are valued as of 4:00 p.m. Eastern time on the last calendar day of the period. The Board of Trustees (the Board) has delegated the day to day responsibility for the valuation of the Fund's investments to the Fair Value Committee (the Committee) established by the Fund's investment adviser. In accordance with valuation policies and procedures approved by the Board, the Fund attempts to obtain prices from one or more third party pricing vendors or brokers to value its investments. When current market prices, quotations or currency exchange rates are not readily available or reliable, investments will be fair valued in good faith by the Committee, in accordance with procedures adopted by the Board. Factors used in determining fair value vary by investment type and may include market or investment specific events. The frequency with which these procedures are used cannot be predicted and they may be utilized to a significant extent. The Committee oversees the Fund's valuation policies and procedures and reports to the Board on the Committee's activities and fair value determinations. The Board monitors the appropriateness of the procedures used in valuing the Fund's investments and ratifies the fair value determinations of the Committee.
The Fund categorizes the inputs to valuation techniques used to value its investments into a disclosure hierarchy consisting of three levels as shown below:
- Level 1 – quoted prices in active markets for identical investments
- Level 2 – other significant observable inputs (including quoted prices for similar investments, interest rates, prepayment speeds, etc.)
- Level 3 – unobservable inputs (including the Fund's own assumptions based on the best information available)
Valuation techniques used to value the Fund's investments by major category are as follows:
Equity securities, including restricted securities, for which market quotations are readily available, are valued at the last reported sale price or official closing price as reported by a third party pricing vendor on the primary market or exchange on which they are traded and are categorized as Level 1 in the hierarchy. In the event there were no sales during the day or closing prices are not available, securities are valued at the last quoted bid price or may be valued using the last available price and are generally categorized as Level 2 in the hierarchy. For foreign equity securities, when market or security specific events arise, comparisons to the valuation of American Depositary Receipts (ADRs), futures contracts, Exchange-Traded Funds (ETFs) and certain indexes as well as quoted prices for similar securities may be used and would be categorized as Level 2 in the hierarchy. For equity securities, including restricted securities, where observable inputs are limited, assumptions about market activity and risk are used and these securities may be categorized as Level 3 in the hierarchy.
Debt securities, including restricted securities, are valued based on evaluated prices received from third party pricing vendors or from brokers who make markets in such securities. Corporate bonds are valued by pricing vendors who utilize matrix pricing which considers yield or price of bonds of comparable quality, coupon, maturity and type or by broker-supplied prices. When independent prices are unavailable or unreliable, debt securities may be valued utilizing pricing methodologies which consider similar factors that would be used by third party pricing vendors. Debt securities are generally categorized as Level 2 in the hierarchy but may be Level 3 depending on the circumstances.
Investments in open-end mutual funds, including the Fidelity Central Funds, are valued at their closing net asset value (NAV) each business day and are categorized as Level 1 in the hierarchy.
Changes in valuation techniques may result in transfers in or out of an assigned level within the disclosure hierarchy. The aggregate value of investments by input level as of November 30, 2020 is included at the end of the Fund's Schedule of Investments.
Foreign Currency. Certain Funds may use foreign currency contracts to facilitate transactions in foreign-denominated securities. Gains and losses from these transactions may arise from changes in the value of the foreign currency or if the counterparties do not perform under the contracts' terms.
Foreign-denominated assets, including investment securities, and liabilities are translated into U.S. dollars at the exchange rates at period end. Purchases and sales of investment securities, income and dividends received, and expenses denominated in foreign currencies are translated into U.S. dollars at the exchange rate in effect on the transaction date.
The effects of exchange rate fluctuations on investments are included with the net realized and unrealized gain (loss) on investment securities. Other foreign currency transactions resulting in realized and unrealized gain (loss) are disclosed separately.
Investment Transactions and Income. For financial reporting purposes, the Fund's investment holdings and NAV include trades executed through the end of the last business day of the period. The NAV per share for processing shareholder transactions is calculated as of the close of business of the New York Stock Exchange (NYSE), normally 4:00 p.m. Eastern time and includes trades executed through the end of the prior business day. Gains and losses on securities sold are determined on the basis of identified cost and include proceeds received from litigation. Dividend income is recorded on the ex-dividend date, except for certain dividends from foreign securities where the ex-dividend date may have passed, which are recorded as soon as the Fund is informed of the ex-dividend date. Non-cash dividends included in dividend income, if any, are recorded at the fair market value of the securities received. Income and capital gain distributions from Fidelity Central Funds, if any, are recorded on the ex-dividend date. Certain distributions received by the Fund represent a return of capital or capital gain. The Fund determines the components of these distributions subsequent to the ex-dividend date, based upon receipt of tax filings or other correspondence relating to the underlying investment. These distributions are recorded as a reduction of cost of investments and/or as a realized gain. Interest income is accrued as earned and includes coupon interest and amortization of premium and accretion of discount on debt securities as applicable. Paid in Kind (PIK) income is recorded at the fair market value of the securities received. Investment income is recorded net of foreign taxes withheld where recovery of such taxes is uncertain. Debt obligations may be placed on non-accrual status and related interest income may be reduced by ceasing current accruals and writing off interest receivables when the collection of all or a portion of interest has become doubtful based on consistently applied procedures. A debt obligation is removed from non-accrual status when the issuer resumes interest payments or when collectability of interest is reasonably assured.
Class Allocations and Expenses. Investment income, realized and unrealized capital gains and losses, common expenses of the Fund, and certain fund-level expense reductions, if any, are allocated daily on a pro-rata basis to each class based on the relative net assets of each class to the total net assets of the Fund. Each class differs with respect to transfer agent and distribution and service plan fees incurred. Certain expense reductions may also differ by class. For the reporting period, the allocated portion of income and expenses to each class as a percent of its average net assets may vary due to the timing of recording these transactions in relation to fluctuating net assets of the classes. Expenses directly attributable to a fund are charged to that fund. Expenses attributable to more than one fund are allocated among the respective funds on the basis of relative net assets or other appropriate methods. Expense estimates are accrued in the period to which they relate and adjustments are made when actual amounts are known.
Income Tax Information and Distributions to Shareholders. Each year, the Fund intends to qualify as a regulated investment company under Subchapter M of the Internal Revenue Code, including distributing substantially all of its taxable income and realized gains. As a result, no provision for U.S. Federal income taxes is required. As of November 30, 2020, the Fund did not have any unrecognized tax benefits in the financial statements; nor is the Fund aware of any tax positions for which it is reasonably possible that the total amounts of unrecognized tax benefits will significantly change in the next twelve months. The Fund files a U.S. federal tax return, in addition to state and local tax returns as required. The Fund's federal income tax returns are subject to examination by the Internal Revenue Service (IRS) for a period of three fiscal years after they are filed. State and local tax returns may be subject to examination for an additional fiscal year depending on the jurisdiction. Foreign taxes are provided for based on the Fund's understanding of the tax rules and rates that exist in the foreign markets in which it invests.
Distributions are declared and recorded on the ex-dividend date. Income and capital gain distributions are declared separately for each class. Income and capital gain distributions are determined in accordance with income tax regulations, which may differ from GAAP. In addition, the Fund claimed a portion of the payment made to redeeming shareholders as a distribution for income tax purposes.
Capital accounts within the financial statements are adjusted for permanent book-tax differences. These adjustments have no impact on net assets or the results of operations. Capital accounts are not adjusted for temporary book-tax differences which will reverse in a subsequent period.
Book-tax differences are primarily due to foreign currency transactions, market discount, contingent interest, equity-debt classifications, certain conversion ratio adjustments, partnerships and losses deferred due to wash sales.
As of period end, the cost and unrealized appreciation (depreciation) in securities, and derivatives if applicable, for federal income tax purposes were as follows:
| Gross unrealized appreciation | $526,495 |
| Gross unrealized depreciation | (14,615) |
| Net unrealized appreciation (depreciation) | $511,880 |
| Tax Cost | $1,462,193 |
The tax-based components of distributable earnings as of period end were as follows:
| Undistributed ordinary income | $67,058 |
| Undistributed long-term capital gain | $111,510 |
| Net unrealized appreciation (depreciation) on securities and other investments | $511,880 |
The tax character of distributions paid was as follows:
| | November 30, 2020 | November 30, 2019 |
| Ordinary Income | $38,919 | $ 40,261 |
| Long-term Capital Gains | 24,390 | 54,921 |
| Total | $63,309 | $ 95,182 |
Restricted Securities (including Private Placements). The Fund may invest in securities that are subject to legal or contractual restrictions on resale. These securities generally may be resold in transactions exempt from registration or to the public if the securities are registered. Disposal of these securities may involve time-consuming negotiations and expense, and prompt sale at an acceptable price may be difficult. Information regarding restricted securities is included at the end of the Fund's Schedule of Investments.
4. Purchases and Sales of Investments.
Purchases and sales of securities, other than short-term securities, are noted in the table below.
| | Purchases ($) | Sales ($) |
| Fidelity Convertible Securities Fund | 2,322,492 | 2,369,748 |
5. Fees and Other Transactions with Affiliates.
Management Fee. Fidelity Management & Research Company LLC (the investment adviser) and its affiliates provide the Fund with investment management related services for which the Fund pays a monthly management fee. The management fee is the sum of an individual fund fee rate that is based on an annual rate of .20% of the Fund's average net assets and an annualized group fee rate that averaged .23% during the period. The group fee rate is based upon the monthly average net assets of a group of registered investment companies with which the investment adviser has management contracts. The group fee rate decreases as assets under management increase and increases as assets under management decrease. In addition, the management fee is subject to a performance adjustment (up to a maximum of +/-.15% of the Fund's average net assets over a 36 month performance period). The upward or downward adjustment to the management fee is based on the relative investment performance of Convertible Securities as compared to its benchmark index, the ICE® BofAML® All US Convertibles Index, over the same 36 month performance period. For the reporting period, the total annual management fee rate, including the performance adjustment, was .44% of the Fund's average net assets. The performance adjustment included in the management fee rate may be higher or lower than the maximum performance adjustment rate due to the difference between the average net assets for the reporting and performance periods.
Distribution and Service Plan Fees. In accordance with Rule 12b-1 of the 1940 Act, the Fund has adopted separate Distribution and Service Plans for each class of shares. Certain classes pay Fidelity Distributors Company LLC (FDC), an affiliate of the investment adviser, separate Distribution and Service Fees, each of which is based on an annual percentage of each class' average net assets. In addition, FDC may pay financial intermediaries for selling shares of the Fund and providing shareholder support services. For the period, the Distribution and Service Fee rates, total fees and amounts retained by FDC were as follows:
| | Distribution Fee | Service Fee | Total Fees | Retained by FDC |
| Class A | -% | .25% | $73 | $2 |
| Class M | .25% | .25% | 35 | – |
| Class C | .75% | .25% | 196 | 18 |
| | | | $304 | $20 |
Sales Load. FDC may receive a front-end sales charge of up to 5.75% for selling Class A shares and 3.50% for selling Class M shares, some of which is paid to financial intermediaries for selling shares of the Fund. Depending on the holding period, FDC may receive contingent deferred sales charges levied on Class A, Class M and Class C redemptions. The deferred sales charges are 1.00% for Class C shares, 1.00% for certain purchases of Class A shares and .25% for certain purchases of Class M shares.
For the period, sales charge amounts retained by FDC were as follows:
| | Retained by FDC |
| Class A | $21 |
| Class M | 3 |
| Class C(a) | 1 |
| | $25 |
(a) When Class C shares are initially sold, FDC pays commissions from its own resources to financial intermediaries through which the sales are made.
Transfer Agent Fees. Fidelity Investments Institutional Operations Company LLC (FIIOC), an affiliate of the investment adviser, is the transfer, dividend disbursing and shareholder servicing agent for each class of the Fund. FIIOC receives account fees and asset-based fees that vary according to the account size and type of account of the shareholders of the respective classes of the Fund, except for Class Z. FIIOC receives an asset-based fee of Class Z's average net assets. FIIOC pays for typesetting, printing and mailing of shareholder reports, except proxy statements. Effective February 1, 2020, the Board approved to change the fee for Class Z from .046% to .044%.
For the period, transfer agent fees for each class were as follows:
| | Amount | % of Class-Level Average Net Assets |
| Class A | $54 | .18 |
| Class M | 14 | .20 |
| Class C | 38 | .20 |
| Convertible Securities | 1,985 | .13 |
| Class I | 95 | .16 |
| Class Z | 12 | .04 |
| | $2,198 | |
Accounting Fees. Fidelity Service Company, Inc. (FSC), an affiliate of the investment adviser, maintains the Fund's accounting records. The accounting fee is based on the level of average net assets for each month. For the period, the fees were equivalent to the following annual rates:
| | % of Average Net Assets |
| Fidelity Convertible Securities Fund | .03 |
Brokerage Commissions. A portion of portfolio transactions were placed with brokerage firms which are affiliates of the investment adviser. Brokerage commissions are included in net realized gain (loss) and change in net unrealized appreciation (depreciation) in the Statement of Operations. The commissions paid to these affiliated firms were as follows:
| | Amount |
| Fidelity Convertible Securities Fund | $26 |
Interfund Trades. Funds may purchase from or sell securities to other Fidelity Funds under procedures adopted by the Board. The procedures have been designed to ensure these interfund trades are executed in accordance with Rule 17a-7 of the 1940 Act. Interfund trades are included within the respective purchases and sales amounts shown in the Purchases and Sales of Investments note.
Other. During the period, the investment adviser reimbursed the Fund for certain losses in the amount of $8.
6. Committed Line of Credit.
Certain Funds participate with other funds managed by the investment adviser or an affiliate in a $4.25 billion credit facility (the "line of credit") to be utilized for temporary or emergency purposes to fund shareholder redemptions or for other short-term liquidity purposes. The participating funds have agreed to pay commitment fees on their pro-rata portion of the line of credit, which are reflected in Miscellaneous expenses on the Statement of Operations, and are as follows:
| | Amount |
| Fidelity Convertible Securities Fund | $4 |
During the period, there were no borrowings on this line of credit.
7. Security Lending.
Funds lend portfolio securities from time to time in order to earn additional income. Lending agents are used, including National Financial Services (NFS), an affiliate of the investment adviser. Pursuant to a securities lending agreement, NFS will receive a fee, which is capped at 9.9% of a fund's daily lending revenue, for its services as lending agent. A fund may lend securities to certain qualified borrowers, including NFS. On the settlement date of the loan, a fund receives collateral (in the form of U.S. Treasury obligations, letters of credit and/or cash) against the loaned securities and maintains collateral in an amount not less than 100% of the market value of the loaned securities during the period of the loan. The market value of the loaned securities is determined at the close of business of a fund and any additional required collateral is delivered to a fund on the next business day. A fund or borrower may terminate the loan at any time, and if the borrower defaults on its obligation to return the securities loaned because of insolvency or other reasons, a fund may apply collateral received from the borrower against the obligation. A fund may experience delays and costs in recovering the securities loaned. Any cash collateral received is invested in the Fidelity Securities Lending Cash Central Fund. Any loaned securities are identified as such in the Schedule of Investments, and the value of loaned securities and cash collateral at period end, as applicable, are presented in the Statement of Assets and Liabilities. Security lending income represents the income earned on investing cash collateral, less rebates paid to borrowers and any lending agent fees associated with the loan, plus any premium payments received for lending certain types of securities. Security lending income is presented in the Statement of Operations as a component of income from Fidelity Central Funds. Affiliated security lending activity, if any, was as follows:
| | Total Security Lending Income Fees Paid to NFS | Security Lending Income From Securities Loaned to NFS | Value of Securities Loaned to NFS at Period End |
| Fidelity Convertible Securities Fund | $9 | $2 | $– |
8. Expense Reductions.
Commissions paid to certain brokers with whom the investment adviser, or its affiliates, places trades on behalf of the Fund include an amount in addition to trade execution, which may be rebated back to the Fund to offset certain expenses. This amount totaled $90 for the period. In addition, through arrangements with the Fund's custodian and each class' transfer agent, credits realized as a result of certain uninvested cash balances were used to reduce the Fund's expenses. During the period, custodian credits reduced the Fund's expenses by $7.
In addition, during the period the investment adviser or an affiliate reimbursed and/or waived a portion of fund-level operating expenses in the amount of $6.
In addition, during the period the investment adviser or an affiliate reimbursed the Fund $7 for an operational error which is included in the accompanying Statement of Operations.
9. Distributions to Shareholders.
Distributions to shareholders of each class were as follows:
| | Year ended
November 30, 2020 | Year ended
November 30, 2019 |
| Distributions to shareholders | | |
| Class A | $1,026 | $1,285 |
| Class M | 229 | 390 |
| Class C | 536 | 1,005 |
| Convertible Securities | 57,838 | 89,863 |
| Class I | 2,439 | 2,395 |
| Class Z | 1,241 | 244 |
| Total | $63,309 | $95,182 |
10. Share Transactions.
Share transactions for each class were as follows and may contain automatic conversions between classes or exchanges between affiliated funds:
| | Shares | Shares | Dollars | Dollars |
| | Year ended November 30, 2020 | Year ended November 30, 2019 | Year ended November 30, 2020 | Year ended November 30, 2019 |
| Class A | | | | |
| Shares sold | 347 | 283 | $11,536 | $8,137 |
| Reinvestment of distributions | 31 | 49 | 981 | 1,226 |
| Shares redeemed | (195) | (194) | (6,296) | (5,497) |
| Net increase (decrease) | 183 | 138 | $6,221 | $3,866 |
| Class M | | | | |
| Shares sold | 56 | 21 | $1,857 | $582 |
| Reinvestment of distributions | 7 | 15 | 227 | 384 |
| Shares redeemed | (40) | (44) | (1,280) | (1,222) |
| Net increase (decrease) | 23 | (8) | $804 | $(256) |
| Class C | | | | |
| Shares sold | 212 | 97 | $6,944 | $2,732 |
| Reinvestment of distributions | 16 | 38 | 508 | 944 |
| Shares redeemed | (174) | (198) | (5,621) | (5,512) |
| Net increase (decrease) | 54 | (63) | $1,831 | $(1,836) |
| Convertible Securities | | | | |
| Shares sold | 6,045 | 5,781 | $195,871 | $163,102 |
| Reinvestment of distributions | 1,572 | 3,077 | 50,341 | 78,217 |
| Shares redeemed | (9,778) | (8,260) | (312,821) | (237,584) |
| Net increase (decrease) | (2,161) | 598 | $(66,609) | $3,735 |
| Class I | | | | |
| Shares sold | 1,234 | 1,803 | $39,411 | $51,954 |
| Reinvestment of distributions | 70 | 91 | 2,256 | 2,322 |
| Shares redeemed | (1,658) | (1,081) | (52,233) | (31,168) |
| Net increase (decrease) | (354) | 813 | $(10,566) | $23,108 |
| Class Z | | | | |
| Shares sold | 582 | 1,047 | $19,146 | $30,771 |
| Reinvestment of distributions | 36 | 8 | 1,158 | 219 |
| Shares redeemed | (785) | (71) | (23,604) | (2,075) |
| Net increase (decrease) | (167) | 984 | $(3,300) | $28,915 |
11. Other.
The Fund's organizational documents provide former and current trustees and officers with a limited indemnification against liabilities arising in connection with the performance of their duties to the Fund. In the normal course of business, the Fund may also enter into contracts that provide general indemnifications. The Fund's maximum exposure under these arrangements is unknown as this would be dependent on future claims that may be made against the Fund. The risk of material loss from such claims is considered remote.
12. Coronavirus (COVID-19) Pandemic.
An outbreak of COVID-19 first detected in China during December 2019 has since spread globally and was declared a pandemic by the World Health Organization during March 2020. Developments that disrupt global economies and financial markets, such as the COVID-19 pandemic, may magnify factors that affect the Fund's performance.
Report of Independent Registered Public Accounting Firm
To the Board of Trustees of Fidelity Financial Trust and Shareholders of Fidelity Convertible Securities Fund
Opinion on the Financial Statements
We have audited the accompanying statement of assets and liabilities, including the schedule of investments, of Fidelity Convertible Securities Fund (one of the funds constituting Fidelity Financial Trust, referred to hereafter as the “Fund”) as of November 30, 2020, the related statement of operations for the year ended November 30, 2020, the statement of changes in net assets for each of the two years in the period ended November 30, 2020, including the related notes, and the financial highlights for each of the periods indicated therein (collectively referred to as the “financial statements”). In our opinion, the financial statements present fairly, in all material respects, the financial position of the Fund as of November 30, 2020, the results of its operations for the year then ended, the changes in its net assets for each of the two years in the period ended November 30, 2020 and the financial highlights for each of the periods indicated therein in conformity with accounting principles generally accepted in the United States of America.
Basis for Opinion
These financial statements are the responsibility of the Fund’s management. Our responsibility is to express an opinion on the Fund’s financial statements based on our audits. We are a public accounting firm registered with the Public Company Accounting Oversight Board (United States) (PCAOB) and are required to be independent with respect to the Fund in accordance with the U.S. federal securities laws and the applicable rules and regulations of the Securities and Exchange Commission and the PCAOB.
We conducted our audits of these financial statements in accordance with the standards of the PCAOB. Those standards require that we plan and perform the audit to obtain reasonable assurance about whether the financial statements are free of material misstatement, whether due to error or fraud.
Our audits included performing procedures to assess the risks of material misstatement of the financial statements, whether due to error or fraud, and performing procedures that respond to those risks. Such procedures included examining, on a test basis, evidence regarding the amounts and disclosures in the financial statements. Our audits also included evaluating the accounting principles used and significant estimates made by management, as well as evaluating the overall presentation of the financial statements. Our procedures included confirmation of securities owned as of November 30, 2020 by correspondence with the custodian and brokers; when replies were not received from brokers, we performed other auditing procedures. We believe that our audits provide a reasonable basis for our opinion.
/s/ PricewaterhouseCoopers LLP
Boston, Massachusetts
January 12, 2021
Trustees and Officers
The Trustees, Members of the Advisory Board (if any), and officers of the trust and fund, as applicable, are listed below. The Board of Trustees governs the fund and is responsible for protecting the interests of shareholders. The Trustees are experienced executives who meet periodically throughout the year to oversee the fund's activities, review contractual arrangements with companies that provide services to the fund, oversee management of the risks associated with such activities and contractual arrangements, and review the fund's performance. Each of the Trustees oversees 305 funds.
The Trustees hold office without limit in time except that (a) any Trustee may resign; (b) any Trustee may be removed by written instrument, signed by at least two-thirds of the number of Trustees prior to such removal; (c) any Trustee who requests to be retired or who has become incapacitated by illness or injury may be retired by written instrument signed by a majority of the other Trustees; and (d) any Trustee may be removed at any special meeting of shareholders by a two-thirds vote of the outstanding voting securities of the trust. Each Trustee who is not an interested person (as defined in the 1940 Act) of the trust and the fund is referred to herein as an Independent Trustee. Each Independent Trustee shall retire not later than the last day of the calendar year in which his or her 75th birthday occurs. The Independent Trustees may waive this mandatory retirement age policy with respect to individual Trustees. Officers and Advisory Board Members hold office without limit in time, except that any officer or Advisory Board Member may resign or may be removed by a vote of a majority of the Trustees at any regular meeting or any special meeting of the Trustees. Except as indicated, each individual has held the office shown or other offices in the same company for the past five years.
The fund's Statement of Additional Information (SAI) includes more information about the Trustees. To request a free copy, call Fidelity at 1-800-544-8544 if you’re an individual investing directly with Fidelity, call 1-800-835-5092 if you’re a plan sponsor or participant with Fidelity as your recordkeeper or call 1-877-208-0098 on institutional accounts or if you’re an advisor or invest through one.
Experience, Skills, Attributes, and Qualifications of the Trustees. The Governance and Nominating Committee has adopted a statement of policy that describes the experience, qualifications, attributes, and skills that are necessary and desirable for potential Independent Trustee candidates (Statement of Policy). The Board believes that each Trustee satisfied at the time he or she was initially elected or appointed a Trustee, and continues to satisfy, the standards contemplated by the Statement of Policy. The Governance and Nominating Committee also engages professional search firms to help identify potential Independent Trustee candidates who have the experience, qualifications, attributes, and skills consistent with the Statement of Policy. From time to time, additional criteria based on the composition and skills of the current Independent Trustees, as well as experience or skills that may be appropriate in light of future changes to board composition, business conditions, and regulatory or other developments, have also been considered by the professional search firms and the Governance and Nominating Committee. In addition, the Board takes into account the Trustees' commitment and participation in Board and committee meetings, as well as their leadership of standing and ad hoc committees throughout their tenure.
In determining that a particular Trustee was and continues to be qualified to serve as a Trustee, the Board has considered a variety of criteria, none of which, in isolation, was controlling. The Board believes that, collectively, the Trustees have balanced and diverse experience, qualifications, attributes, and skills, which allow the Board to operate effectively in governing the fund and protecting the interests of shareholders. Information about the specific experience, skills, attributes, and qualifications of each Trustee, which in each case led to the Board's conclusion that the Trustee should serve (or continue to serve) as a trustee of the fund, is provided below.
Board Structure and Oversight Function. Robert A. Lawrence is an interested person and currently serves as Acting Chairman. The Trustees have determined that an interested Chairman is appropriate and benefits shareholders because an interested Chairman has a personal and professional stake in the quality and continuity of services provided to the fund. Independent Trustees exercise their informed business judgment to appoint an individual of their choosing to serve as Chairman, regardless of whether the Trustee happens to be independent or a member of management. The Independent Trustees have determined that they can act independently and effectively without having an Independent Trustee serve as Chairman and that a key structural component for assuring that they are in a position to do so is for the Independent Trustees to constitute a substantial majority for the Board. The Independent Trustees also regularly meet in executive session. David M. Thomas serves as Lead Independent Trustee and as such (i) acts as a liaison between the Independent Trustees and management with respect to matters important to the Independent Trustees and (ii) with management prepares agendas for Board meetings.
Fidelity® funds are overseen by different Boards of Trustees. The fund's Board oversees Fidelity's high income and certain equity funds, and other Boards oversee Fidelity's investment-grade bond, money market, asset allocation, and other equity funds. The asset allocation funds may invest in Fidelity® funds overseen by the fund's Board. The use of separate Boards, each with its own committee structure, allows the Trustees of each group of Fidelity® funds to focus on the unique issues of the funds they oversee, including common research, investment, and operational issues. On occasion, the separate Boards establish joint committees to address issues of overlapping consequences for the Fidelity® funds overseen by each Board.
The Trustees operate using a system of committees to facilitate the timely and efficient consideration of all matters of importance to the Trustees, the fund, and fund shareholders and to facilitate compliance with legal and regulatory requirements and oversight of the fund's activities and associated risks. The Board, acting through its committees, has charged FMR and its affiliates with (i) identifying events or circumstances the occurrence of which could have demonstrably adverse effects on the fund's business and/or reputation; (ii) implementing processes and controls to lessen the possibility that such events or circumstances occur or to mitigate the effects of such events or circumstances if they do occur; and (iii) creating and maintaining a system designed to evaluate continuously business and market conditions in order to facilitate the identification and implementation processes described in (i) and (ii) above. Because the day-to-day operations and activities of the fund are carried out by or through FMR, its affiliates, and other service providers, the fund's exposure to risks is mitigated but not eliminated by the processes overseen by the Trustees. While each of the Board's committees has responsibility for overseeing different aspects of the fund's activities, oversight is exercised primarily through the Operations, Audit, and Compliance Committees. Appropriate personnel, including but not limited to the fund's Chief Compliance Officer (CCO), FMR's internal auditor, the independent accountants, the fund's Treasurer and portfolio management personnel, make periodic reports to the Board's committees, as appropriate, including an annual review of Fidelity's risk management program for the Fidelity® funds. The responsibilities of each standing committee, including their oversight responsibilities, are described further under "Standing Committees of the Trustees."
Interested Trustees*:
Correspondence intended for a Trustee who is an interested person may be sent to Fidelity Investments, 245 Summer Street, Boston, Massachusetts 02210.
Name, Year of Birth; Principal Occupations and Other Relevant Experience+
Bettina Doulton (1964)
Year of Election or Appointment: 2020
Trustee
Ms. Doulton also serves as Trustee of other Fidelity® funds. Prior to her retirement, Ms. Doulton served in a variety of positions at Fidelity Investments, including as a managing director of research (2006-2007), portfolio manager to certain Fidelity® funds (1993-2005), equity analyst and portfolio assistant (1990-1993), and research assistant (1987-1990). Ms. Doulton currently owns and operates Phi Builders + Architects and Cellardoor Winery. Previously, Ms. Doulton served as a member of the Board of Brown Capital Management, LLC (2013-2018).
Robert A. Lawrence (1952)
Year of Election or Appointment: 2020
Trustee
Acting Chairman of the Board of Trustees
Mr. Lawrence also serves as Trustee of other funds. Previously, Mr. Lawrence served as a Member of the Advisory Board of certain funds. Prior to his retirement in 2008, Mr. Lawrence served as Vice President of certain Fidelity® funds (2006-2008), Senior Vice President, Head of High Income Division of Fidelity Management & Research Company (investment adviser firm, 2006-2008), and President of Fidelity Strategic Investments (investment adviser firm, 2002-2005).
* Determined to be an “Interested Trustee” by virtue of, among other things, his or her affiliation with the trust or various entities under common control with FMR.
+ The information includes the Trustee's principal occupation during the last five years and other information relating to the experience, attributes, and skills relevant to the Trustee's qualifications to serve as a Trustee, which led to the conclusion that the Trustee should serve as a Trustee for the fund.
Independent Trustees:
Correspondence intended for an Independent Trustee may be sent to Fidelity Investments, P.O. Box 55235, Boston, Massachusetts 02205-5235.
Name, Year of Birth; Principal Occupations and Other Relevant Experience+
Dennis J. Dirks (1948)
Year of Election or Appointment: 2005
Trustee
Mr. Dirks also serves as Trustee of other Fidelity® funds. Prior to his retirement in May 2003, Mr. Dirks served as Chief Operating Officer and as a member of the Board of The Depository Trust & Clearing Corporation (financial markets infrastructure), President, Chief Operating Officer and a member of the Board of The Depository Trust Company (DTC), President and a member of the Board of the National Securities Clearing Corporation (NSCC), Chief Executive Officer and a member of the Board of the Government Securities Clearing Corporation and Chief Executive Officer and a member of the Board of the Mortgage-Backed Securities Clearing Corporation. Mr. Dirks currently serves as a member of the Finance Committee (2016-present) and Board (2017-present) and is Treasurer (2018-present) of the Asolo Repertory Theatre.
Donald F. Donahue (1950)
Year of Election or Appointment: 2018
Trustee
Mr. Donahue also serves as Trustee of other Fidelity® funds. Mr. Donahue serves as President and Chief Executive Officer of Miranda Partners, LLC (risk consulting for the financial services industry, 2012-present). Previously, Mr. Donahue served as Chief Executive Officer (2006-2012), Chief Operating Officer (2003-2006) and Managing Director, Customer Marketing and Development (1999-2003) of The Depository Trust & Clearing Corporation (financial markets infrastructure). Mr. Donahue currently serves as a member (2007-present) and Co-Chairman (2016-present) of the Board of United Way of New York, a member of the Board of NYC Leadership Academy (2012-present) and a member of the Board of Advisors of Ripple Labs, Inc. (financial services, 2015-present). Mr. Donahue previously served as a member of the Advisory Board of certain Fidelity® funds (2015-2018).
Vicki L. Fuller (1957)
Year of Election or Appointment: 2020
Trustee
Ms. Fuller also serves as Trustee of other Fidelity® funds. Previously, Ms. Fuller served as a member of the Advisory Board of certain Fidelity® funds (2018-2020), Chief Investment Officer of the New York State Common Retirement Fund (2012-2018) and held a variety of positions at AllianceBernstein L.P. (global asset management, 1985-2012), including Managing Director (2006-2012) and Senior Vice President and Senior Portfolio Manager (2001-2006). Ms. Fuller currently serves as a member of the Board, Audit Committee and Nominating and Governance Committee of The Williams Companies, Inc. (natural gas infrastructure, 2018-present), as a member of the Board, Audit Committee and Nominating and Governance Committee of two Blackstone business development companies (2020-present) and as a member of the Board of Treliant, LLC (consulting, 2019-present).
Patricia L. Kampling (1959)
Year of Election or Appointment: 2020
Trustee
Ms. Kampling also serves as Trustee of other Fidelity® funds. Prior to her retirement, Ms. Kampling served as Chairman of the Board and Chief Executive Officer (2012-2019), President and Chief Operating Officer (2011-2012) and Executive Vice President and Chief Financial Officer (2010-2011) of Alliant Energy Corporation. Ms. Kampling currently serves as a member of the Board, Compensation Committee and Executive Committee and as Chair of the Audit Committee of Briggs & Stratton Corporation (manufacturing, 2011-present) and as a member of the Board, Audit, Finance and Risk Committee and Safety, Environmental, Technology and Operations Committee of American Water Works Company, Inc. (utilities company, 2019-present). In addition, Ms. Kampling currently serves as a member of the Board of the Nature Conservancy, Wisconsin Chapter (2019-present). Previously, Ms. Kampling served as a Member of the Advisory Board of certain Fidelity® funds (2020), a member of the Board of Interstate Power and Light Company (2012-2019) and Wisconsin Power and Light Company (2012-2019) (each a subsidiary of Alliant Energy Corporation) and as a member of the Board and Workforce Development Committee of the Business Roundtable (2018-2019).
Thomas A. Kennedy (1955)
Year of Election or Appointment: 2021
Trustee
Mr. Kennedy also serves as Trustee of other Fidelity® funds. Previously, Mr. Kennedy served as a Member of the Advisory Board of certain Fidelity® funds (2020) and held a variety of positions at Raytheon Company (aerospace and defense, 1983-2020), including Chairman and Chief Executive Officer (2014-2020) and Executive Vice President and Chief Operating Officer (2013-2014). Mr. Kennedy currently serves as Executive Chairman of the Board of Directors of Raytheon Technologies Corporation (aerospace and defense, 2020-present). He is also a member of the Rutgers School of Engineering Industry Advisory Board (2011-present) and a member of the UCLA Engineering Dean’s Executive Board (2016-present).
Garnett A. Smith (1947)
Year of Election or Appointment: 2018
Trustee
Mr. Smith also serves as Trustee of other Fidelity® funds. Prior to his retirement, Mr. Smith served as Chairman and Chief Executive Officer (1990-1997) and President (1986-1990) of Inbrand Corp. (manufacturer of personal absorbent products). Prior to his employment with Inbrand Corp., he was employed by a retail fabric chain and North Carolina National Bank (now Bank of America). Mr. Smith previously served as a member of the Advisory Board of certain Fidelity® funds (2012-2013).
David M. Thomas (1949)
Year of Election or Appointment: 2008
Trustee
Lead Independent Trustee
Mr. Thomas also serves as Trustee of other Fidelity® funds. Previously, Mr. Thomas served as Executive Chairman (2005-2006) and Chairman and Chief Executive Officer (2000-2005) of IMS Health, Inc. (pharmaceutical and healthcare information solutions). Mr. Thomas currently serves as Non-Executive Chairman of the Board of Fortune Brands Home and Security (home and security products, 2011-present), and a member of the Board (2004-present) and Presiding Director (2013-present) of Interpublic Group of Companies, Inc. (marketing communication).
Susan Tomasky (1953)
Year of Election or Appointment: 2020
Trustee
Ms. Tomasky also serves as Trustee of other Fidelity® funds. Prior to her retirement, Ms. Tomasky served in various executive officer positions at American Electric Power Company, Inc. (1998-2011), including most recently as President of AEP Transmission (2007-2011). Ms. Tomasky currently serves as a member of the Board and Sustainability Committee and as Chair of the Audit Committee of Marathon Petroleum Corporation (2018-present) and as a member of the Board, Corporate Governance Committee and Organization and Compensation Committee and as Chair of the Audit Committee of Public Service Enterprise Group, Inc. (utilities company, 2012-present). In addition, Ms. Tomasky currently serves as a member of the Board of the Columbus Regional Airport Authority (2007-present), as a member of the Board of the Royal Shakespeare Company – America (2009-present), as a member of the Board of the Columbus Association for the Performing Arts (2011-present) and as a member of the Board of Kenyon College (2016-present). Previously, Ms. Tomasky served as a Member of the Advisory Board of certain Fidelity® funds (2020), a member of the Board (2011-2019) and as Lead Independent Director (2015-2018) of Andeavor Corporation (previously Tesoro Corporation) (independent oil refiner and marketer) and as a member of the Board of Summit Midstream Partners LP (energy, 2012-2018).
Michael E. Wiley (1950)
Year of Election or Appointment: 2018
Trustee
Mr. Wiley also serves as Trustee of other Fidelity® funds. Previously, Mr. Wiley served as a member of the Advisory Board of certain Fidelity® funds (2018-2020), Chairman, President and CEO of Baker Hughes, Inc. (oilfield services, 2000-2004). Mr. Wiley also previously served as a member of the Board of Andeavor Corporation (independent oil refiner and marketer, 2005-2018), a member of the Board of Andeavor Logistics LP (natural resources logistics, 2015-2018) and a member of the Board of High Point Resources (exploration and production, 2005-2020).
+ The information includes the Trustee's principal occupation during the last five years and other information relating to the experience, attributes, and skills relevant to the Trustee's qualifications to serve as a Trustee, which led to the conclusion that the Trustee should serve as a Trustee for the fund.
Advisory Board Members and Officers:
Correspondence intended for a Member of the Advisory Board (if any) may be sent to Fidelity Investments, P.O. Box 55235, Boston, Massachusetts 02205-5235. Correspondence intended for an officer or Peter S. Lynch may be sent to Fidelity Investments, 245 Summer Street, Boston, Massachusetts 02210. Officers appear below in alphabetical order.
Name, Year of Birth; Principal Occupation
Ned C. Lautenbach (1944)
Year of Election or Appointment: 2021
Member of the Advisory Board
Mr. Lautenbach also serves as a Member of the Advisory Board of other Fidelity® funds. Mr. Lautenbach currently serves as Chair of the Board of Governors, State University System of Florida (2013-present) and is a member of the Council on Foreign Relations (1994-present). He is also a member and has in the past served as Chairman of the Board of Directors of Artis-Naples (2012-present). Previously, Mr. Lautenbach served as a Trustee of certain Fidelity® funds (2000-2020) and a member and then Lead Director of the Board of Directors of Eaton Corporation (diversified industrial, 1997-2016). He was also a Partner at Clayton, Dubilier & Rice, LLC (private equity investment, 1998-2010); as well as Director of Sony Corporation (2006-2007). In addition, Mr. Lautenbach had a 30-year career with IBM (technology company), during which time he served as Senior Vice President and as a member of the Corporate Executive Committee (1968-1998).
Peter S. Lynch (1944)
Year of Election or Appointment: 2003
Member of the Advisory Board
Mr. Lynch also serves as a Member of the Advisory Board of other Fidelity® funds. Mr. Lynch is Vice Chairman and a Director of Fidelity Management & Research Company LLC (investment adviser firm). In addition, Mr. Lynch serves as a Trustee of Boston College and as the Chairman of the Inner-City Scholarship Fund. Previously, Mr. Lynch served as Vice Chairman and a Director of FMR Co., Inc. (investment adviser firm) and on the Special Olympics International Board of Directors (1997-2006).
Craig S. Brown (1977)
Year of Election or Appointment: 2019
Assistant Treasurer
Mr. Brown also serves as Assistant Treasurer of other funds. Mr. Brown is an employee of Fidelity Investments (2013-present).
John J. Burke III (1964)
Year of Election or Appointment: 2018
Chief Financial Officer
Mr. Burke also serves as Chief Financial Officer of other funds. Mr. Burke serves as Head of Investment Operations for Fidelity Fund and Investment Operations (2018-present) and is an employee of Fidelity Investments (1998-present). Previously Mr. Burke served as head of Asset Management Investment Operations (2012-2018).
William C. Coffey (1969)
Year of Election or Appointment: 2019
Assistant Secretary
Mr. Coffey also serves as Assistant Secretary of other funds. He is Senior Vice President and Deputy General Counsel of FMR LLC (diversified financial services company, 2010-present), and is an employee of Fidelity Investments. Previously, Mr. Coffey served as Secretary and CLO of certain funds (2018-2019); CLO, Secretary, and Senior Vice President of Fidelity Management & Research Company and FMR Co., Inc. (investment adviser firms, 2018-2019); Secretary of Fidelity SelectCo, LLC and Fidelity Investments Money Management, Inc. (investment adviser firms, 2018-2019); CLO of Fidelity Management & Research (Hong Kong) Limited, FMR Investment Management (UK) Limited, and Fidelity Management & Research (Japan) Limited (investment adviser firms, 2018-2019); and Assistant Secretary of certain funds (2009-2018).
Timothy M. Cohen (1969)
Year of Election or Appointment: 2018
Vice President
Mr. Cohen also serves as Vice President of other funds. Mr. Cohen serves as Co-Head of Equity (2018-present), a Director of Fidelity Management & Research (Japan) Limited (investment adviser firm, 2016-present), and is an employee of Fidelity Investments. Previously, Mr. Cohen served as Executive Vice President of Fidelity SelectCo, LLC (2019), Head of Global Equity Research (2016-2018), Chief Investment Officer - Equity and a Director of Fidelity Management & Research (U.K.) Inc. (investment adviser firm, 2013-2015) and as a Director of Fidelity Management & Research (Hong Kong) Limited (investment adviser firm, 2017).
Jonathan Davis (1968)
Year of Election or Appointment: 2010
Assistant Treasurer
Mr. Davis also serves as Assistant Treasurer of other funds. Mr. Davis serves as Assistant Treasurer of FMR Capital, Inc. (2017-present) and is an employee of Fidelity Investments. Previously, Mr. Davis served as Vice President and Associate General Counsel of FMR LLC (diversified financial services company, 2003-2010).
Laura M. Del Prato (1964)
Year of Election or Appointment: 2018
Assistant Treasurer
Ms. Del Prato also serves as an officer of other funds. Ms. Del Prato is an employee of Fidelity Investments (2017-present). Previously, Ms. Del Prato served as President and Treasurer of The North Carolina Capital Management Trust: Cash Portfolio and Term Portfolio (2018-2020). Prior to joining Fidelity Investments, Ms. Del Prato served as a Managing Director and Treasurer of the JPMorgan Mutual Funds (2014-2017). Prior to JPMorgan, Ms. Del Prato served as a partner at Cohen Fund Audit Services (accounting firm, 2012-2013) and KPMG LLP (accounting firm, 2004-2012).
Colm A. Hogan (1973)
Year of Election or Appointment: 2020
Assistant Treasurer
Mr. Hogan also serves as an officer of other funds. Mr. Hogan serves as Assistant Treasurer of FMR Capital, Inc. (2017-present) and is an employee of Fidelity Investments (2005-present). Previously, Mr. Hogan served as Deputy Treasurer of certain Fidelity® funds (2016-2020) and Assistant Treasurer of certain Fidelity® funds (2016-2018).
Pamela R. Holding (1964)
Year of Election or Appointment: 2018
Vice President
Ms. Holding also serves as Vice President of other funds. Ms. Holding serves as Co-Head of Equity (2018-present) and is an employee of Fidelity Investments (2013-present). Previously, Ms. Holding served as Executive Vice President of Fidelity SelectCo, LLC (2019) and as Chief Investment Officer of Fidelity Institutional Asset Management (2013-2018).
Cynthia Lo Bessette (1969)
Year of Election or Appointment: 2019
Secretary and Chief Legal Officer (CLO)
Ms. Lo Bessette also serves as an officer of other funds. Ms. Lo Bessette serves as CLO, Secretary, and Senior Vice President of Fidelity Management & Research Company LLC (investment adviser firm, 2019-present); and CLO of Fidelity Management & Research (Hong Kong) Limited, FMR Investment Management (UK) Limited, and Fidelity Management & Research (Japan) Limited (investment adviser firms, 2019-present). She is a Senior Vice President and Deputy General Counsel of FMR LLC (diversified financial services company, 2019-present), and is an employee of Fidelity Investments. Previously, Ms. Lo Bessette served as CLO, Secretary, and Senior Vice President of FMR Co., Inc. (investment adviser firm, 2019); Secretary of Fidelity SelectCo, LLC and Fidelity Investments Money Management, Inc. (investment adviser firms, 2019). Prior to joining Fidelity Investments, Ms. Lo Bessette was Executive Vice President, General Counsel (2016-2019) and Senior Vice President, Deputy General Counsel (2015-2016) of OppenheimerFunds (investment management company) and Deputy Chief Legal Officer (2013-2015) of Jennison Associates LLC (investment adviser firm).
Chris Maher (1972)
Year of Election or Appointment: 2020
Deputy Treasurer
Mr. Maher also serves as an officer of other funds. Mr. Maher serves as Assistant Treasurer of FMR Capital, Inc. (2017-present), and is an employee of Fidelity Investments (2008-present). Previously, Mr. Maher served as Assistant Treasurer of certain funds (2013-2020); Vice President of Asset Management Compliance (2013), Vice President of the Program Management Group of FMR (investment adviser firm, 2010-2013), and Vice President of Valuation Oversight (2008-2010).
Jason P. Pogorelec (1975)
Year of Election or Appointment: 2020
Chief Compliance Officer
Mr. Pogorelec also serves as Chief Compliance Officer of other funds. Mr. Pogorelec is a senior Vice President of Asset Management Compliance for Fidelity Investments and is an employee of Fidelity Investments (2006-present). Previously, Mr. Pogorelec served as Vice President, Associate General Counsel for Fidelity Investments (2010-2020) and Assistant Secretary of certain Fidelity funds (2015-2020).
Brett Segaloff (1972)
Year of Election or Appointment: 2021
Anti-Money Laundering (AML) Officer
Mr. Segaloff also serves as an AML Officer of other funds and other related entities. He is Director, Anti-Money Laundering (2007-present) of FMR LLC (diversified financial services company) and is an employee of Fidelity Investments (1996-present).
Stacie M. Smith (1974)
Year of Election or Appointment: 2016
President and Treasurer
Ms. Smith also serves as an officer of other funds. Ms. Smith serves as Assistant Treasurer of FMR Capital, Inc. (2017-present), is an employee of Fidelity Investments (2009-present), and has served in other fund officer roles. Prior to joining Fidelity Investments, Ms. Smith served as Senior Audit Manager of Ernst & Young LLP (accounting firm, 1996-2009). Previously, Ms. Smith served as Assistant Treasurer (2013-2019) and Deputy Treasurer (2013-2016) of certain Fidelity® funds.
Marc L. Spector (1972)
Year of Election or Appointment: 2016
Assistant Treasurer
Mr. Spector also serves as an officer of other funds. Mr. Spector serves as Assistant Treasurer of FMR Capital, Inc. (2017-present) and is an employee of Fidelity Investments (2016-present). Prior to joining Fidelity Investments, Mr. Spector served as Director at the Siegfried Group (accounting firm, 2013-2016), and prior to Siegfried Group as audit senior manager at Deloitte & Touche LLP (accounting firm, 2005-2013).
Jim Wegmann (1979)
Year of Election or Appointment: 2019
Assistant Treasurer
Mr. Wegmann also serves as Assistant Treasurer of other funds. Mr. Wegmann is an employee of Fidelity Investments (2011-present).
Shareholder Expense Example
As a shareholder, you incur two types of costs: (1) transaction costs, which may include sales charges (loads) on purchase payments or redemption proceeds, as applicable and (2) ongoing costs, which generally include management fees, distribution and/or service (12b-1) fees and other Fund expenses. This Example is intended to help you understand your ongoing costs (in dollars) of investing in a fund and to compare these costs with the ongoing costs of investing in other mutual funds.
The Example is based on an investment of $1,000 invested at the beginning of the period and held for the entire period (June 1, 2020 to November 30, 2020).
Actual Expenses
The first line of the accompanying table provides information about actual account values and actual expenses. You may use the information in this line, together with the amount you invested, to estimate the expenses that you paid over the period. Simply divide your account value by $1,000.00 (for example, an $8,600 account value divided by $1,000.00 = 8.6), then multiply the result by the number in the first line for a class/Fund under the heading entitled "Expenses Paid During Period" to estimate the expenses you paid on your account during this period. If any fund is a shareholder of any underlying mutual funds or exchange-traded funds (ETFs) (the Underlying Funds), such fund indirectly bears its proportional share of the expenses of the Underlying Funds in addition to the direct expenses incurred presented in the table. These fees and expenses are not included in the annualized expense ratio used to calculate the expense estimate in the table below.
Hypothetical Example for Comparison Purposes
The second line of the accompanying table provides information about hypothetical account values and hypothetical expenses based on the actual expense ratio and an assumed rate of return of 5% per year before expenses, which is not the actual return. The hypothetical account values and expenses may not be used to estimate the actual ending account balance or expenses you paid for the period. You may use this information to compare the ongoing costs of investing in the Fund and other funds. To do so, compare this 5% hypothetical example with the 5% hypothetical examples that appear in the shareholder reports of the other funds. If any fund is a shareholder of any Underlying Funds, such fund indirectly bears its proportional share of the expenses of the Underlying Funds in addition to the direct expenses as presented in the table. These fees and expenses are not included in the annualized expense ratio used to calculate the expense estimate in the table below.
Please note that the expenses shown in the table are meant to highlight your ongoing costs only and do not reflect any transaction costs. Therefore, the second line of the table is useful in comparing ongoing costs only, and will not help you determine the relative total costs of owning different funds. In addition, if these transactional costs were included, your costs would have been higher.
| | Annualized Expense Ratio-A | Beginning
Account Value
June 1, 2020 | Ending
Account Value
November 30, 2020 | Expenses Paid
During Period-B
June 1, 2020
to November 30, 2020 |
| Fidelity Convertible Securities Fund | | | | |
| Class A | .93% | | | |
| Actual | | $1,000.00 | $1,291.60 | $5.33 |
| Hypothetical-C | | $1,000.00 | $1,020.35 | $4.70 |
| Class M | 1.20% | | | |
| Actual | | $1,000.00 | $1,289.80 | $6.87 |
| Hypothetical-C | | $1,000.00 | $1,019.00 | $6.06 |
| Class C | 1.69% | | | |
| Actual | | $1,000.00 | $1,286.70 | $9.66 |
| Hypothetical-C | | $1,000.00 | $1,016.55 | $8.52 |
| Convertible Securities | .63% | | | |
| Actual | | $1,000.00 | $1,293.90 | $3.61 |
| Hypothetical-C | | $1,000.00 | $1,021.85 | $3.18 |
| Class I | .65% | | | |
| Actual | | $1,000.00 | $1,293.70 | $3.73 |
| Hypothetical-C | | $1,000.00 | $1,021.75 | $3.29 |
| Class Z | .54% | | | |
| Actual | | $1,000.00 | $1,294.40 | $3.10 |
| Hypothetical-C | | $1,000.00 | $1,022.30 | $2.73 |
A Annualized expense ratio reflects expenses net of applicable fee waivers.
B Expenses are equal to the annualized expense ratio, multiplied by the average account value over the period, multiplied by 183/ 366 (to reflect the one-half year period). The fees and expenses of any Underlying Funds are not included in each annualized expense ratio.
C 5% return per year before expenses
Distributions (Unaudited)
The Board of Trustees of Fidelity Convertible Securities Fund voted to pay to shareholders of record at the opening of business on record date, the following distributions per share derived from capital gains realized from sales of portfolio securities, and dividends derived from net investment income:
| | Pay Date | Record Date | Dividends | Capital Gains |
| Fidelity Convertible Securities Fund | | | | |
| Class A | 12/30/20 | 12/29/20 | $0.577 | $3.138 |
| Class M | 12/30/20 | 12/29/20 | $0.548 | $3.138 |
| Class C | 12/30/20 | 12/29/20 | $0.494 | $3.138 |
| Convertible Securities | 12/30/20 | 12/29/20 | $0.608 | $3.138 |
| Class I | 12/30/20 | 12/29/20 | $0.602 | $3.138 |
| Class Z | 12/30/20 | 12/29/20 | $0.618 | $3.138 |
The fund hereby designates as a capital gain dividend with respect to the taxable year ended November 30, 2020, $111,516,971, or, if subsequently determined to be different, the net capital gain of such year.
A total of 0.28% of the dividends distributed during the fiscal year was derived from interest on U.S. Government securities which is generally exempt from state income tax.
The fund designates $9,506,832 of distributions paid during the period January 1, 2020 to November 30, 2020 as qualifying to be taxed as interest-related dividends for nonresident alien shareholders.
Class A designates 10%, 59%, 54%, and 54%; Class M designates 11%, 74%, 61%, and 60%; Class C designates 13%, 100%, 82%, and 78%; Convertible Securities designates 9%, 49%, 49%, and 49%; Class I designates 9%, 52%, 48%, and 49%; and Class Z designates 9%, 46%, 47%, and 47%; of the dividends distributed in December 2019, April 2020, July 2020, and October 2020, respectively during the fiscal year as qualifying for the dividends–received deduction for corporate shareholders.
Class A designates 11%, 100%, 98%, and 97%; Class M designates 13%, 100%, 100%, and 100%; Class C designates 15%, 100%, 100%, and 100%; Convertible Securities designates 11%, 87%, 87%, and 87%; Class I designates 10%, 93%, 87%, and 88%; and Class Z designates 10%, 83%, 84%, and 85%; of the dividends distributed in December 2019, April 2020, July 2020, and October 2020, respectively during the fiscal year as amounts which may be taken into account as a dividend for purposes of the maximum rate under section 1(h)(11) of the Internal Revenue Code.
Class A designates 1%, 0%, 2%, and 2%; Class M designates 1%, 0%, 0%, and 0%; Class C designates 1%, 0%, 0%, and 0%; Convertible Securities designates 1%, 2%, 2%, and 2%; Class I designates 1%, 2%, 2%, and 2%; and Class Z designates 1%, 2%, 2%, and 2%; of the dividends distributed in December 2019, April 2020, July 2020, and October 2020, respectively during the fiscal year as a section 199A dividend.
The fund will notify shareholders in January 2021 of amounts for use in preparing 2020 income tax returns.
Proxy Voting Results
A special meeting of shareholders was held on June 9, 2020. The results of votes taken among shareholders on the proposals before them are reported below. Each vote reported represents one dollar of net asset value held on the record date for the meeting.
PROPOSAL 1
To elect a Board of Trustees.
| | # of
Votes | % of
Votes |
| Dennis J. Dirks |
| Affirmative | 5,461,721,297.052 | 92.309 |
| Withheld | 455,079,082.626 | 7.691 |
| TOTAL | 5,916,800,379.678 | 100.000 |
| Donald F. Donahue |
| Affirmative | 5,462,265,876.052 | 92.318 |
| Withheld | 454,534,503.626 | 7.682 |
| TOTAL | 5,916,800,379.678 | 100.000 |
| Bettina Doulton |
| Affirmative | 5,467,748,446.673 | 92.411 |
| Withheld | 449,051,933.005 | 7.589 |
| TOTAL | 5,916,800,379.678 | 100.000 |
| Vicki L. Fuller |
| Affirmative | 5,499,183,624.435 | 92.942 |
| Withheld | 417,616,755.243 | 7.058 |
| TOTAL | 5,916,800,379.678 | 100.00 |
| Patricia L. Kampling |
| Affirmative | 5,454,818,211.998 | 92.192 |
| Withheld | 461,982,167.680 | 7.808 |
| TOTAL | 5,916,800,379.678 | 100.000 |
| Alan J. Lacy |
| Affirmative | 5,424,711,025.435 | 91.683 |
| Withheld | 492,089,354.243 | 8.317 |
| TOTAL | 5,916,800,379.678 | 100.000 |
| Ned C. Lautenbach |
| Affirmative | 5,421,052,451.283 | 91.621 |
| Withheld | 495,747,928.395 | 8.379 |
| TOTAL | 5,916,800,379.678 | 100.000 |
| Robert A. Lawrence |
| Affirmative | 5,431,197,461.723 | 91.793 |
| Withheld | 485,602,917.955 | 8.207 |
| TOTAL | 5,916,800,379.678 | 100.000 |
| Joseph Mauriello |
| Affirmative | 5,416,731,329.280 | 91.548 |
| Withheld | 500,069,050.398 | 8.452 |
| TOTAL | 5,916,800,379.678 | 100.000 |
| Cornelia M. Small |
| Affirmative | 5,429,962,996.961 | 91.772 |
| Withheld | 486,837,382.717 | 8.228 |
| TOTAL | 5,916,800,379.678 | 100.000 |
| Garnett A. Smith |
| Affirmative | 5,416,275,471.636 | 91.541 |
| Withheld | 500,524,908.042 | 8.459 |
| TOTAL | 5,916,800,379.678 | 100.000 |
| David M. Thomas |
| Affirmative | 5,439,984,159.284 | 91.941 |
| Withheld | 476,816,220.393 | 8.059 |
| TOTAL | 5,916,800,379.678 | 100.000 |
| Susan Tomasky |
| Affirmative | 5,451,110,692.583 | 92.129 |
| Withheld | 465,689,687.095 | 7.871 |
| TOTAL | 5,916,800,379.678 | 100.000 |
| Michael E. Wiley |
| Affirmative | 5,426,567,139.987 | 91.715 |
| Withheld | 490,233,239.691 | 8.285 |
| TOTAL | 5,916,800,379.678 | 100.000 |
PROPOSAL 5
A shareholder proposal to institute procedures to avoid holding investments in companies that contribute to genocide or crimes against humanity.
| | # of
Votes | % of
Votes |
| Affirmative | 193,843,534.726 | 28.023 |
| Against | 363,549,651.580 | 52.556 |
| Abstain | 48,684,429.583 | 7.038 |
| Broker Non-Vote | 85,664,651.764 | 12.384 |
| TOTAL | 691,742,267.653 | 100.000 |
| Proposal 1 reflects trust wide proposal and voting results. |
| Proposal 5 was not approved by shareholders. |
CVS-ANN-0121
1.539184.123
Fidelity® Equity Dividend Income Fund
Annual Report
November 30, 2020
Contents
To view a fund's proxy voting guidelines and proxy voting record for the 12-month period ended June 30, visit http://www.fidelity.com/proxyvotingresults or visit the Securities and Exchange Commission's (SEC) web site at http://www.sec.gov.
You may also call 1-800-544-8544 if you’re an individual investing directly with Fidelity, call 1-800-835-5092 if you’re a plan sponsor or participant with Fidelity as your recordkeeper or call 1-877-208-0098 on institutional accounts or if you’re an advisor or invest through one to request a free copy of the proxy voting guidelines.
Standard & Poor's, S&P and S&P 500 are registered service marks of The McGraw-Hill Companies, Inc. and have been licensed for use by Fidelity Distributors Corporation.
Other third-party marks appearing herein are the property of their respective owners.
All other marks appearing herein are registered or unregistered trademarks or service marks of FMR LLC or an affiliated company. © 2021 FMR LLC. All rights reserved.
This report and the financial statements contained herein are submitted for the general information of the shareholders of the Fund. This report is not authorized for distribution to prospective investors in the Fund unless preceded or accompanied by an effective prospectus.
A fund files its complete schedule of portfolio holdings with the SEC for the first and third quarters of each fiscal year on Form N-PORT. Forms N-PORT are available on the SEC’s web site at http://www.sec.gov. A fund's Forms N-PORT may be reviewed and copied at the SEC’s Public Reference Room in Washington, DC. Information regarding the operation of the SEC's Public Reference Room may be obtained by calling 1-800-SEC-0330.
For a complete list of a fund's portfolio holdings, view the most recent holdings listing, semiannual report, or annual report on Fidelity's web site at http://www.fidelity.com, http://www.institutional.fidelity.com, or http://www.401k.com, as applicable.
NOT FDIC INSURED •MAY LOSE VALUE •NO BANK GUARANTEE
Neither the Fund nor Fidelity Distributors Corporation is a bank.
Note to Shareholders:
Early in 2020, the outbreak and spread of a new coronavirus emerged as a public health emergency that had a major influence on financial markets, primarily based on its impact on the global economy and the outlook for corporate earnings. The virus causes a respiratory disease known as COVID-19. On March 11, the World Health Organization declared the COVID-19 outbreak a pandemic, citing sustained risk of further global spread.
In the weeks following, as the crisis worsened, we witnessed an escalating human tragedy with wide-scale social and economic consequences from coronavirus-containment measures. The outbreak of COVID-19 prompted a number of measures to limit the spread, including travel and border restrictions, quarantines, and restrictions on large gatherings. In turn, these resulted in lower consumer activity, diminished demand for a wide range of products and services, disruption in manufacturing and supply chains, and – given the wide variability in outcomes regarding the outbreak – significant market uncertainty and volatility. Amid the turmoil, global governments and central banks took unprecedented action to help support consumers, businesses, and the broader economies, and to limit disruption to financial systems.
The situation continues to unfold, and the extent and duration of its impact on financial markets and the economy remain highly uncertain. Extreme events such as the coronavirus crisis are “exogenous shocks” that can have significant adverse effects on mutual funds and their investments. Although multiple asset classes may be affected by market disruption, the duration and impact may not be the same for all types of assets.
Fidelity is committed to helping you stay informed amid news about COVID-19 and during increased market volatility, and we’re taking extra steps to be responsive to customer needs. We encourage you to visit our websites, where we offer ongoing updates, commentary, and analysis on the markets and our funds.
Performance: The Bottom Line
Average annual total return reflects the change in the value of an investment, assuming reinvestment of distributions from dividend income and capital gains (the profits earned upon the sale of securities that have grown in value, if any) and assuming a constant rate of performance each year. The hypothetical investment and the average annual total returns do not reflect the deduction of taxes that a shareholder would pay on fund distributions or the redemption of fund shares. During periods of reimbursement by Fidelity, a fund’s total return will be greater than it would be had the reimbursement not occurred. How a fund did yesterday is no guarantee of how it will do tomorrow.
Average Annual Total Returns
| For the periods ended November 30, 2020 | Past 1 year | Past 5 years | Past 10 years |
| Fidelity® Equity Dividend Income Fund | 0.76% | 7.91% | 9.76% |
| Class K | 0.84% | 8.01% | 9.87% |
$10,000 Over 10 Years
Let's say hypothetically that $10,000 was invested in Fidelity® Equity Dividend Income Fund, a class of the fund, on November 30, 2010.
The chart shows how the value of your investment would have changed, and also shows how the Russell 3000® Value Index performed over the same period.
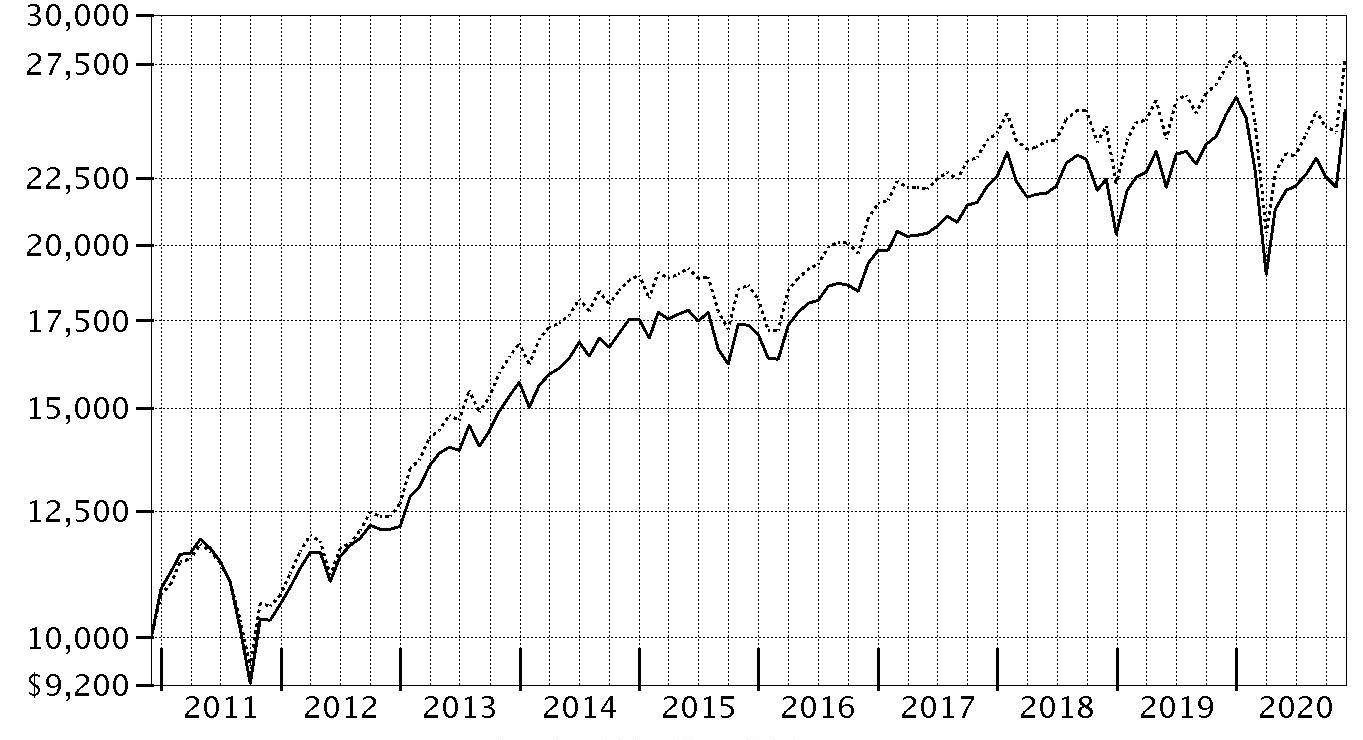
| Period Ending Values |
| $25,374 | Fidelity® Equity Dividend Income Fund |
| $27,779 | Russell 3000® Value Index |
Management's Discussion of Fund Performance
Market Recap: The S&P 500
® index gained 17.46% for the year ending November 30, 2020, a volatile period marked by a steep but brief decline due to the early-2020 outbreak and spread of the coronavirus, followed by a historic rebound. Declared a pandemic on March 11, the COVID-19 crisis and containment efforts caused broad contraction in economic activity, along with extreme uncertainty, volatility and dislocation in financial markets. A rapid and expansive U.S. monetary/fiscal-policy response provided a partial offset to the economic disruption and fueled a sharp uptrend beginning March 24. Other supporting factors included resilient corporate earnings, near-term potential for a COVID-19 vaccine breakthrough and traction on a broader economic reopening. The rally lasted until September 2, when the S&P 500 began a two-month retreat. The loss of momentum reflected Congress’s inability to reach a deal on additional fiscal stimulus, as well as concerns about election uncertainty, indications the U.S. economic recovery was stalling and a new wave of COVID-19 cases. November was a much different story, as investors reacted favorably to election results and encouraging updates on the efficacy of two COVID-19 vaccine candidates. The index rose 11%, one of its biggest monthly gains ever. By sector for the full year, information technology (+42%) and consumer discretionary (+34%) led, driven by a handful of large growth stocks. In contrast, energy shares (-33%) struggled along with global oil demand and pricing.
Comments from Portfolio Manager John Sheehy: For the fiscal year ending November 30, 2020, the fund's share classes gained about 1%, underperforming the 1.60% advance of the benchmark Russell 3000
® Value Index. Versus the benchmark, security selection was the primary detractor, especially within the financials sector, banks in particular. An overweighting in energy also hurt. Further weighing on performance were picks among industrials stocks, namely in the capital goods industry. Moreover, the fund’s foreign holdings detracted, despite the tailwind of a broadly weaker U.S. dollar. The biggest individual relative detractor was an overweight position in Wells Fargo (-48%), one of the fund's largest holdings. Our second-biggest relative detractor this period was a non-benchmark stake in BP, which returned roughly -43%. Also hurting performance was our outsized stake in Cinemark Holdings, which returned -49%. We decreased our stake in Cinemark the past year. In contrast, the top contributor to performance versus the benchmark was an overweighting in health care, followed by stock selection in energy. The fund's top individual relative contributor was an overweighting in AbbVie, which gained 27% the past 12 months. The company was among the fund's biggest holdings on November 30. The fund's non-benchmark stake in UnitedHealth Group added value as well, gaining about 23%. Another key contributor was our out-of-benchmark position in Kroger. We decreased our stake the past 12 months. Notable changes in positioning include increased exposure to the information technology sector and a lower allocation to energy.
The views expressed above reflect those of the portfolio manager(s) only through the end of the period as stated on the cover of this report and do not necessarily represent the views of Fidelity or any other person in the Fidelity organization. Any such views are subject to change at any time based upon market or other conditions and Fidelity disclaims any responsibility to update such views. These views may not be relied on as investment advice and, because investment decisions for a Fidelity fund are based on numerous factors, may not be relied on as an indication of trading intent on behalf of any Fidelity fund.
Investment Summary (Unaudited)
Top Ten Stocks as of November 30, 2020
| | % of fund's net assets |
| Bristol-Myers Squibb Co. | 3.1 |
| Verizon Communications, Inc. | 3.0 |
| Wells Fargo & Co. | 2.8 |
| Amdocs Ltd. | 2.3 |
| The Travelers Companies, Inc. | 2.2 |
| AbbVie, Inc. | 2.1 |
| Duke Energy Corp. | 1.8 |
| Johnson & Johnson | 1.8 |
| Capgemini SA | 1.6 |
| Philip Morris International, Inc. | 1.6 |
| | 22.3 |
Top Five Market Sectors as of November 30, 2020
| | % of fund's net assets |
| Health Care | 18.7 |
| Financials | 16.3 |
| Information Technology | 12.0 |
| Industrials | 10.9 |
| Consumer Staples | 10.5 |
Asset Allocation (% of fund's net assets)
| As of November 30, 2020 * |
| | Stocks | 97.1% |
| | Short-Term Investments and Net Other Assets (Liabilities) | 2.9% |

* Foreign investments - 15.7%
Schedule of Investments November 30, 2020
Showing Percentage of Net Assets
| Common Stocks - 97.1% | | | |
| | | Shares | Value (000s) |
| COMMUNICATION SERVICES - 7.8% | | | |
| Diversified Telecommunication Services - 3.0% | | | |
| Verizon Communications, Inc. | | 2,517,100 | $152,058 |
| Entertainment - 1.5% | | | |
| Cinemark Holdings, Inc. (a) | | 326,100 | 5,038 |
| The Walt Disney Co. | | 501,000 | 74,153 |
| | | | 79,191 |
| Media - 3.3% | | | |
| Comcast Corp. Class A | | 1,384,800 | 69,572 |
| Interpublic Group of Companies, Inc. | | 2,458,100 | 54,766 |
| Omnicom Group, Inc. | | 715,700 | 45,089 |
| | | | 169,427 |
|
| TOTAL COMMUNICATION SERVICES | | | 400,676 |
|
| CONSUMER DISCRETIONARY - 3.2% | | | |
| Internet & Direct Marketing Retail - 1.1% | | | |
| eBay, Inc. | | 1,132,100 | 57,092 |
| Multiline Retail - 0.4% | | | |
| Nordstrom, Inc. (a) | | 785,900 | 20,371 |
| Specialty Retail - 0.9% | | | |
| Lowe's Companies, Inc. | | 281,000 | 43,785 |
| Textiles, Apparel & Luxury Goods - 0.8% | | | |
| PVH Corp. | | 171,900 | 13,664 |
| Tapestry, Inc. | | 1,003,000 | 28,405 |
| | | | 42,069 |
|
| TOTAL CONSUMER DISCRETIONARY | | | 163,317 |
|
| CONSUMER STAPLES - 10.5% | | | |
| Beverages - 2.8% | | | |
| Coca-Cola European Partners PLC | | 840,400 | 37,549 |
| Keurig Dr. Pepper, Inc. | | 1,518,800 | 46,247 |
| The Coca-Cola Co. | | 1,124,000 | 57,998 |
| | | | 141,794 |
| Food & Staples Retailing - 0.8% | | | |
| Kroger Co. | | 1,151,000 | 37,983 |
| Food Products - 0.5% | | | |
| The J.M. Smucker Co. | | 223,600 | 26,206 |
| Household Products - 1.2% | | | |
| Kimberly-Clark Corp. | | 231,700 | 32,278 |
| Reynolds Consumer Products, Inc. | | 1,012,500 | 30,719 |
| | | | 62,997 |
| Personal Products - 1.3% | | | |
| Unilever PLC sponsored ADR | | 1,103,100 | 67,355 |
| Tobacco - 3.9% | | | |
| Altria Group, Inc. | | 1,638,200 | 65,250 |
| British American Tobacco PLC sponsored ADR | | 830,000 | 29,307 |
| Imperial Brands PLC | | 1,163,137 | 20,997 |
| Philip Morris International, Inc. | | 1,082,600 | 82,007 |
| | | | 197,561 |
|
| TOTAL CONSUMER STAPLES | | | 533,896 |
|
| ENERGY - 4.9% | | | |
| Oil, Gas & Consumable Fuels - 4.9% | | | |
| BP PLC sponsored ADR | | 2,128,700 | 41,637 |
| ConocoPhillips Co. | | 1,178,000 | 46,602 |
| Enterprise Products Partners LP | | 1,432,300 | 27,787 |
| Exxon Mobil Corp. | | 1,862,600 | 71,021 |
| HollyFrontier Corp. | | 580,200 | 13,571 |
| Suncor Energy, Inc. | | 1,352,500 | 21,630 |
| Valero Energy Corp. | | 371,000 | 19,949 |
| Viper Energy Partners LP | | 546,000 | 6,115 |
| | | | 248,312 |
| FINANCIALS - 16.3% | | | |
| Banks - 5.7% | | | |
| Bank OZK | | 720,000 | 20,131 |
| Citigroup, Inc. | | 466,900 | 25,712 |
| East West Bancorp, Inc. | | 389,400 | 16,635 |
| Huntington Bancshares, Inc. | | 3,026,000 | 36,554 |
| M&T Bank Corp. | | 435,900 | 50,778 |
| Wells Fargo & Co. | | 5,094,608 | 139,338 |
| | | | 289,148 |
| Capital Markets - 2.6% | | | |
| Bank of New York Mellon Corp. | | 716,400 | 28,026 |
| Goldman Sachs Group, Inc. | | 222,500 | 51,304 |
| State Street Corp. | | 776,000 | 54,692 |
| | | | 134,022 |
| Consumer Finance - 0.9% | | | |
| Capital One Financial Corp. | | 290,700 | 24,896 |
| Synchrony Financial | | 674,800 | 20,561 |
| | | | 45,457 |
| Insurance - 7.1% | | | |
| Assurant, Inc. | | 330,500 | 42,674 |
| AXA SA | | 1,313,600 | 30,711 |
| Chubb Ltd. | | 452,779 | 66,934 |
| Fairfax Financial Holdings Ltd. (sub. vtg.) | | 71,700 | 24,590 |
| First American Financial Corp. | | 665,800 | 32,251 |
| Hartford Financial Services Group, Inc. | | 416,300 | 18,400 |
| Old Republic International Corp. | | 2,124,700 | 38,075 |
| The Travelers Companies, Inc. | | 858,900 | 111,356 |
| | | | 364,991 |
|
| TOTAL FINANCIALS | | | 833,618 |
|
| HEALTH CARE - 18.7% | | | |
| Biotechnology - 3.1% | | | |
| AbbVie, Inc. | | 1,042,400 | 109,014 |
| Amgen, Inc. | | 228,900 | 50,825 |
| | | | 159,839 |
| Health Care Providers & Services - 5.6% | | | |
| Anthem, Inc. | | 198,200 | 61,743 |
| Cigna Corp. | | 314,400 | 65,754 |
| CVS Health Corp. | | 787,226 | 53,366 |
| Humana, Inc. | | 45,500 | 18,224 |
| McKesson Corp. | | 215,800 | 38,825 |
| UnitedHealth Group, Inc. | | 136,300 | 45,843 |
| | | | 283,755 |
| Pharmaceuticals - 10.0% | | | |
| Bristol-Myers Squibb Co. | | 2,553,700 | 159,352 |
| GlaxoSmithKline PLC | | 1,475,000 | 26,771 |
| Johnson & Johnson | | 615,266 | 89,017 |
| Merck & Co., Inc. | | 943,100 | 75,816 |
| Roche Holding AG (participation certificate) | | 205,767 | 67,584 |
| Royalty Pharma PLC | | 338,300 | 14,412 |
| Sanofi SA sponsored ADR | | 1,525,900 | 76,600 |
| | | | 509,552 |
|
| TOTAL HEALTH CARE | | | 953,146 |
|
| INDUSTRIALS - 10.9% | | | |
| Aerospace & Defense - 2.9% | | | |
| General Dynamics Corp. | | 427,700 | 63,877 |
| Harris Corp. | | 135,600 | 26,034 |
| Northrop Grumman Corp. | | 91,200 | 27,566 |
| Raytheon Technologies Corp. | | 442,130 | 31,710 |
| | | | 149,187 |
| Commercial Services & Supplies - 0.1% | | | |
| Waste Management, Inc. | | 41,300 | 4,920 |
| Electrical Equipment - 1.5% | | | |
| Hubbell, Inc. Class B | | 293,300 | 47,394 |
| Regal Beloit Corp. | | 244,200 | 29,070 |
| | | | 76,464 |
| Industrial Conglomerates - 1.8% | | | |
| 3M Co. | | 310,100 | 53,564 |
| General Electric Co. | | 3,949,397 | 40,205 |
| | | | 93,769 |
| Machinery - 3.0% | | | |
| Allison Transmission Holdings, Inc. | | 1,368,700 | 56,185 |
| ITT, Inc. | | 358,600 | 26,045 |
| Otis Worldwide Corp. | | 729,765 | 48,850 |
| Stanley Black & Decker, Inc. | | 114,500 | 21,103 |
| | | | 152,183 |
| Professional Services - 1.0% | | | |
| Intertrust NV (b) | | 1,708,800 | 29,323 |
| Manpower, Inc. | | 254,900 | 22,087 |
| | | | 51,410 |
| Trading Companies & Distributors - 0.6% | | | |
| HD Supply Holdings, Inc. (c) | | 497,600 | 27,756 |
|
| TOTAL INDUSTRIALS | | | 555,689 |
|
| INFORMATION TECHNOLOGY - 12.0% | | | |
| Communications Equipment - 1.6% | | | |
| Cisco Systems, Inc. | | 1,885,300 | 81,106 |
| IT Services - 7.8% | | | |
| Amdocs Ltd. | | 1,799,500 | 118,425 |
| CACI International, Inc. Class A (c) | | 43,300 | 10,275 |
| Capgemini SA | | 596,900 | 83,044 |
| Cognizant Technology Solutions Corp. Class A | | 276,900 | 21,634 |
| Fidelity National Information Services, Inc. | | 268,200 | 39,804 |
| Fiserv, Inc. (c) | | 296,400 | 34,139 |
| Genpact Ltd. | | 343,100 | 13,947 |
| IBM Corp. | | 432,100 | 53,373 |
| Maximus, Inc. | | 173,900 | 12,488 |
| Science Applications International Corp. | | 123,000 | 11,382 |
| | | | 398,511 |
| Semiconductors & Semiconductor Equipment - 0.2% | | | |
| Broadcom, Inc. | | 32,800 | 13,172 |
| Software - 1.8% | | | |
| Nortonlifelock, Inc. | | 678,100 | 12,362 |
| Open Text Corp. | | 474,400 | 20,942 |
| Oracle Corp. | | 433,000 | 24,993 |
| SS&C Technologies Holdings, Inc. | | 459,600 | 31,662 |
| | | | 89,959 |
| Technology Hardware, Storage & Peripherals - 0.6% | | | |
| Samsung Electronics Co. Ltd. | | 499,300 | 30,043 |
|
| TOTAL INFORMATION TECHNOLOGY | | | 612,791 |
|
| MATERIALS - 2.5% | | | |
| Chemicals - 1.5% | | | |
| CF Industries Holdings, Inc. | | 743,100 | 27,718 |
| DuPont de Nemours, Inc. | | 796,699 | 50,543 |
| | | | 78,261 |
| Containers & Packaging - 0.6% | | | |
| WestRock Co. | | 790,031 | 33,347 |
| Metals & Mining - 0.4% | | | |
| Newmont Corp. | | 309,200 | 18,187 |
|
| TOTAL MATERIALS | | | 129,795 |
|
| REAL ESTATE - 2.1% | | | |
| Equity Real Estate Investment Trusts (REITs) - 2.1% | | | |
| Corporate Office Properties Trust (SBI) | | 1,227,400 | 32,686 |
| Douglas Emmett, Inc. | | 626,700 | 19,409 |
| Highwoods Properties, Inc. (SBI) | | 1,015,400 | 38,890 |
| Ryman Hospitality Properties, Inc. | | 226,300 | 14,526 |
| | | | 105,511 |
| UTILITIES - 8.2% | | | |
| Electric Utilities - 6.2% | | | |
| Duke Energy Corp. | | 980,500 | 90,853 |
| Edison International | | 898,194 | 55,113 |
| Entergy Corp. | | 207,400 | 22,575 |
| Exelon Corp. | | 1,243,700 | 51,079 |
| FirstEnergy Corp. | | 612,600 | 16,271 |
| Pinnacle West Capital Corp. | | 394,700 | 32,306 |
| Southern Co. | | 768,700 | 46,007 |
| | | | 314,204 |
| Independent Power and Renewable Electricity Producers - 0.4% | | | |
| Vistra Corp. | | 1,049,900 | 19,612 |
| Multi-Utilities - 1.6% | | | |
| CenterPoint Energy, Inc. | | 3,059,800 | 70,957 |
| Dominion Energy, Inc. | | 163,600 | 12,841 |
| | | | 83,798 |
|
| TOTAL UTILITIES | | | 417,614 |
|
| TOTAL COMMON STOCKS | | | |
| (Cost $4,528,647) | | | 4,954,365 |
|
| Money Market Funds - 3.1% | | | |
| Fidelity Cash Central Fund 0.09% (d) | | 136,134,124 | 136,161 |
| Fidelity Securities Lending Cash Central Fund 0.09% (d)(e) | | 23,066,362 | 23,069 |
| TOTAL MONEY MARKET FUNDS | | | |
| (Cost $159,230) | | | 159,230 |
| TOTAL INVESTMENT IN SECURITIES - 100.2% | | | |
| (Cost $4,687,877) | | | 5,113,595 |
| NET OTHER ASSETS (LIABILITIES) - (0.2)% | | | (8,055) |
| NET ASSETS - 100% | | | $5,105,540 |
Legend
(a) Security or a portion of the security is on loan at period end.
(b) Security exempt from registration under Rule 144A of the Securities Act of 1933. These securities may be resold in transactions exempt from registration, normally to qualified institutional buyers. At the end of the period, the value of these securities amounted to $29,323,000 or 0.6% of net assets.
(c) Non-income producing
(d) Affiliated fund that is generally available only to investment companies and other accounts managed by Fidelity Investments. The rate quoted is the annualized seven-day yield of the fund at period end. A complete unaudited listing of the fund's holdings as of its most recent quarter end is available upon request. In addition, each Fidelity Central Fund's financial statements which are not covered by the Fund's Report of Independent Registered Public Accounting Firm are available on the SEC's website or upon request.
(e) Investment made with cash collateral received from securities on loan.
Affiliated Central Funds
Information regarding fiscal year to date income earned by the Fund from investments in Fidelity Central Funds is as follows:
| Fund | Income earned |
| | (Amounts in thousands) |
| Fidelity Cash Central Fund | $867 |
| Fidelity Securities Lending Cash Central Fund | 339 |
| Total | $1,206 |
Amounts in the income column in the above table include any capital gain distributions from underlying funds, which are presented in the corresponding line-item in the Statement of Operations, if applicable. Amount for Fidelity Securities Lending Cash Central Fund represents the income earned on investing cash collateral, less rebates paid to borrowers and any lending agent fees associated with the loan, plus any premium payments received for lending certain types of securities.
Investment Valuation
The following is a summary of the inputs used, as of November 30, 2020, involving the Fund's assets and liabilities carried at fair value. The inputs or methodology used for valuing securities may not be an indication of the risk associated with investing in those securities. For more information on valuation inputs, and their aggregation into the levels used below, please refer to the Investment Valuation section in the accompanying Notes to Financial Statements.
| | Valuation Inputs at Reporting Date: |
| Description | Total | Level 1 | Level 2 | Level 3 |
| (Amounts in thousands) | | | | |
| Investments in Securities: | | | | |
| Equities: | | | | |
| Communication Services | $400,676 | $400,676 | $-- | $-- |
| Consumer Discretionary | 163,317 | 163,317 | -- | -- |
| Consumer Staples | 533,896 | 512,899 | 20,997 | -- |
| Energy | 248,312 | 248,312 | -- | -- |
| Financials | 833,618 | 802,907 | 30,711 | -- |
| Health Care | 953,146 | 858,791 | 94,355 | -- |
| Industrials | 555,689 | 526,366 | 29,323 | -- |
| Information Technology | 612,791 | 529,747 | 83,044 | -- |
| Materials | 129,795 | 129,795 | -- | -- |
| Real Estate | 105,511 | 105,511 | -- | -- |
| Utilities | 417,614 | 417,614 | -- | -- |
| Money Market Funds | 159,230 | 159,230 | -- | -- |
| Total Investments in Securities: | $5,113,595 | $4,855,165 | $258,430 | $-- |
Other Information
Distribution of investments by country or territory of incorporation, as a percentage of Total Net Assets, is as follows (Unaudited):
| United States of America | 84.3% |
| United Kingdom | 4.3% |
| France | 3.7% |
| Switzerland | 2.6% |
| Bailiwick of Guernsey | 2.3% |
| Canada | 1.3% |
| Others (Individually Less Than 1%) | 1.5% |
| | 100.0% |
See accompanying notes which are an integral part of the financial statements.
Financial Statements
Statement of Assets and Liabilities
| Amounts in thousands (except per-share amounts) | | November 30, 2020 |
| Assets | | |
Investment in securities, at value (including securities loaned of $21,630) — See accompanying schedule:
Unaffiliated issuers (cost $4,528,647) | $4,954,365 | |
| Fidelity Central Funds (cost $159,230) | 159,230 | |
| Total Investment in Securities (cost $4,687,877) | | $5,113,595 |
| Cash | | 152 |
| Receivable for investments sold | | 8,158 |
| Receivable for fund shares sold | | 3,077 |
| Dividends receivable | | 17,264 |
| Distributions receivable from Fidelity Central Funds | | 31 |
| Prepaid expenses | | 7 |
| Other receivables | | 92 |
| Total assets | | 5,142,376 |
| Liabilities | | |
| Payable for investments purchased | $7,891 | |
| Payable for fund shares redeemed | 3,435 | |
| Accrued management fee | 1,779 | |
| Other affiliated payables | 588 | |
| Other payables and accrued expenses | 74 | |
| Collateral on securities loaned | 23,069 | |
| Total liabilities | | 36,836 |
| Net Assets | | $5,105,540 |
| Net Assets consist of: | | |
| Paid in capital | | $4,653,285 |
| Total accumulated earnings (loss) | | 452,255 |
| Net Assets | | $5,105,540 |
| Net Asset Value and Maximum Offering Price | | |
| Equity Dividend Income: | | |
| Net Asset Value, offering price and redemption price per share ($4,409,466 ÷ 178,695 shares) | | $24.68 |
| Class K: | | |
| Net Asset Value, offering price and redemption price per share ($696,074 ÷ 28,215 shares) | | $24.67 |
See accompanying notes which are an integral part of the financial statements.
Statement of Operations
| Amounts in thousands | | Year ended November 30, 2020 |
| Investment Income | | |
| Dividends | | $153,074 |
| Income from Fidelity Central Funds (including $339 from security lending) | | 1,206 |
| Total income | | 154,280 |
| Expenses | | |
| Management fee | $20,135 | |
| Transfer agent fees | 6,055 | |
| Accounting fees | 1,067 | |
| Custodian fees and expenses | 87 | |
| Independent trustees' fees and expenses | 26 | |
| Registration fees | 97 | |
| Audit | 68 | |
| Legal | 6 | |
| Miscellaneous | 73 | |
| Total expenses before reductions | 27,614 | |
| Expense reductions | (373) | |
| Total expenses after reductions | | 27,241 |
| Net investment income (loss) | | 127,039 |
| Realized and Unrealized Gain (Loss) | | |
| Net realized gain (loss) on: | | |
| Investment securities: | | |
| Unaffiliated issuers | 10,929 | |
| Fidelity Central Funds | 3 | |
| Foreign currency transactions | (37) | |
| Total net realized gain (loss) | | 10,895 |
| Change in net unrealized appreciation (depreciation) on: | | |
| Investment securities: | | |
| Unaffiliated issuers | (134,381) | |
| Assets and liabilities in foreign currencies | 111 | |
| Total change in net unrealized appreciation (depreciation) | | (134,270) |
| Net gain (loss) | | (123,375) |
| Net increase (decrease) in net assets resulting from operations | | $3,664 |
See accompanying notes which are an integral part of the financial statements.
Statement of Changes in Net Assets
| Amounts in thousands | Year ended November 30, 2020 | Year ended November 30, 2019 |
| Increase (Decrease) in Net Assets | | |
| Operations | | |
| Net investment income (loss) | $127,039 | $130,278 |
| Net realized gain (loss) | 10,895 | 320,585 |
| Change in net unrealized appreciation (depreciation) | (134,270) | 107,353 |
| Net increase (decrease) in net assets resulting from operations | 3,664 | 558,216 |
| Distributions to shareholders | (419,333) | (583,658) |
| Share transactions - net increase (decrease) | 272,486 | 171,981 |
| Total increase (decrease) in net assets | (143,183) | 146,539 |
| Net Assets | | |
| Beginning of period | 5,248,723 | 5,102,184 |
| End of period | $5,105,540 | $5,248,723 |
See accompanying notes which are an integral part of the financial statements.
Financial Highlights
Fidelity Equity Dividend Income Fund
| Years ended November 30, | 2020 | 2019 | 2018 | 2017 | 2016 |
| Selected Per–Share Data | | | | | |
| Net asset value, beginning of period | $26.64 | $27.18 | $29.62 | $27.50 | $26.01 |
| Income from Investment Operations | | | | | |
| Net investment income (loss)A | .62 | .65 | .66 | .65 | .57 |
| Net realized and unrealized gain (loss) | (.46) | 1.92 | (.27) | 3.20 | 2.26 |
| Total from investment operations | .16 | 2.57 | .39 | 3.85 | 2.83 |
| Distributions from net investment income | (.63) | (.62) | (.66) | (.63) | (.51) |
| Distributions from net realized gain | (1.50) | (2.49) | (2.18) | (1.10) | (.83) |
| Total distributions | (2.12)B | (3.11) | (2.83)B | (1.73) | (1.34) |
| Net asset value, end of period | $24.68 | $26.64 | $27.18 | $29.62 | $27.50 |
| Total ReturnC | .76% | 12.07% | 1.28% | 14.61% | 11.60% |
| Ratios to Average Net AssetsD,E | | | | | |
| Expenses before reductions | .60% | .60% | .61% | .62% | .63% |
| Expenses net of fee waivers, if any | .60% | .60% | .61% | .62% | .63% |
| Expenses net of all reductions | .59% | .60% | .60% | .61% | .62% |
| Net investment income (loss) | 2.72% | 2.65% | 2.39% | 2.35% | 2.23% |
| Supplemental Data | | | | | |
| Net assets, end of period (in millions) | $4,409 | $4,949 | $4,882 | $5,351 | $5,296 |
| Portfolio turnover rateF | 71% | 52% | 56% | 52% | 55% |
A Calculated based on average shares outstanding during the period.
B Total distributions per share do not sum due to rounding.
C Total returns would have been lower if certain expenses had not been reduced during the applicable periods shown.
D Fees and expenses of any underlying mutual funds or exchange-traded funds (ETFs) are not included in the Fund's expense ratio. The Fund indirectly bears its proportionate share of these expenses. For additional expense information related to investments in Fidelity Central Funds, please refer to the "Investments in Fidelity Central Funds" note found in the Notes to Financial Statements section of the most recent Annual or Semi-Annual report.
E Expense ratios reflect operating expenses of the class. Expenses before reductions do not reflect amounts reimbursed, waived, or reduced through arrangements with the investment adviser, brokerage services, or other offset arrangements, if applicable, and do not represent the amount paid by the class during periods when reimbursements, waivers or reductions occur.
F Amount does not include the portfolio activity of any underlying mutual funds or exchange-traded funds (ETFs).
See accompanying notes which are an integral part of the financial statements.
Fidelity Equity Dividend Income Fund Class K
| Years ended November 30, | 2020 | 2019 | 2018 | 2017 | 2016 |
| Selected Per–Share Data | | | | | |
| Net asset value, beginning of period | $26.64 | $27.18 | $29.62 | $27.50 | $26.01 |
| Income from Investment Operations | | | | | |
| Net investment income (loss)A | .63 | .68 | .69 | .68 | .59 |
| Net realized and unrealized gain (loss) | (.45) | 1.91 | (.27) | 3.20 | 2.27 |
| Total from investment operations | .18 | 2.59 | .42 | 3.88 | 2.86 |
| Distributions from net investment income | (.65) | (.64) | (.69) | (.66) | (.54) |
| Distributions from net realized gain | (1.50) | (2.49) | (2.18) | (1.10) | (.83) |
| Total distributions | (2.15) | (3.13) | (2.86)B | (1.76) | (1.37) |
| Net asset value, end of period | $24.67 | $26.64 | $27.18 | $29.62 | $27.50 |
| Total ReturnC | .84% | 12.18% | 1.39% | 14.73% | 11.72% |
| Ratios to Average Net AssetsD,E | | | | | |
| Expenses before reductions | .51% | .51% | .51% | .52% | .52% |
| Expenses net of fee waivers, if any | .51% | .51% | .51% | .52% | .52% |
| Expenses net of all reductions | .50% | .51% | .50% | .51% | .52% |
| Net investment income (loss) | 2.81% | 2.74% | 2.49% | 2.45% | 2.33% |
| Supplemental Data | | | | | |
| Net assets, end of period (in millions) | $696 | $300 | $220 | $235 | $298 |
| Portfolio turnover rateF | 71% | 52% | 56% | 52% | 55% |
A Calculated based on average shares outstanding during the period.
B Total distributions per share do not sum due to rounding.
C Total returns would have been lower if certain expenses had not been reduced during the applicable periods shown.
D Fees and expenses of any underlying mutual funds or exchange-traded funds (ETFs) are not included in the Fund's expense ratio. The Fund indirectly bears its proportionate share of these expenses. For additional expense information related to investments in Fidelity Central Funds, please refer to the "Investments in Fidelity Central Funds" note found in the Notes to Financial Statements section of the most recent Annual or Semi-Annual report.
E Expense ratios reflect operating expenses of the class. Expenses before reductions do not reflect amounts reimbursed, waived, or reduced through arrangements with the investment adviser, brokerage services, or other offset arrangements, if applicable, and do not represent the amount paid by the class during periods when reimbursements, waivers or reductions occur.
F Amount does not include the portfolio activity of any underlying mutual funds or exchange-traded funds (ETFs).
See accompanying notes which are an integral part of the financial statements.
Notes to Financial Statements
For the period ended November 30, 2020
(Amounts in thousands except percentages)
1. Organization.
Fidelity Equity Dividend Income Fund (the Fund) is a fund of Fidelity Financial Trust (the Trust) and is authorized to issue an unlimited number of shares. The Trust is registered under the Investment Company Act of 1940, as amended (the 1940 Act), as an open-end management investment company organized as a Massachusetts business trust. The Fund offers Equity Dividend Income and Class K shares, each of which has equal rights as to assets and voting privileges. Each class has exclusive voting rights with respect to matters that affect that class.
Effective January 1, 2020:
Investment advisers Fidelity Investments Money Management, Inc., FMR Co., Inc., and Fidelity SelectCo, LLC, merged with and into Fidelity Management & Research Company. In connection with the merger transactions, the resulting, merged investment adviser was then redomiciled from Massachusetts to Delaware, changed its corporate structure from a corporation to a limited liability company, and changed its name to "Fidelity Management & Research Company LLC".
Fidelity Investments Institutional Operations Company, Inc. converted from a Massachusetts corporation to a Massachusetts LLC, and changed its name to "Fidelity Investments Institutional Operations Company LLC".
2. Investments in Fidelity Central Funds.
The Fund invests in Fidelity Central Funds, which are open-end investment companies generally available only to other investment companies and accounts managed by the investment adviser and its affiliates. The Fund's Schedule of Investments lists each of the Fidelity Central Funds held as of period end, if any, as an investment of the Fund, but does not include the underlying holdings of each Fidelity Central Fund. As an Investing Fund, the Fund indirectly bears its proportionate share of the expenses of the underlying Fidelity Central Funds.
The Money Market Central Funds seek preservation of capital and current income and are managed by the investment adviser. Annualized expenses of the Money Market Central Funds as of their most recent shareholder report date ranged from less than .005% to .01%.
A complete unaudited list of holdings for each Fidelity Central Fund is available upon request or at the Securities and Exchange Commission (the SEC) website at www.sec.gov. In addition, the financial statements of the Fidelity Central Funds, which are not covered by the Fund's Report of Independent Registered Public Accounting Firm, are available on the SEC website or upon request.
3. Significant Accounting Policies.
The Fund is an investment company and applies the accounting and reporting guidance of the Financial Accounting Standards Board (FASB) Accounting Standards Codification Topic 946 Financial Services – Investment Companies. The financial statements have been prepared in conformity with accounting principles generally accepted in the United States of America (GAAP), which require management to make certain estimates and assumptions at the date of the financial statements. Actual results could differ from those estimates. Subsequent events, if any, through the date that the financial statements were issued have been evaluated in the preparation of the financial statements. The following summarizes the significant accounting policies of the Fund:
Investment Valuation. Investments are valued as of 4:00 p.m. Eastern time on the last calendar day of the period. The Board of Trustees (the Board) has delegated the day to day responsibility for the valuation of the Fund's investments to the Fair Value Committee (the Committee) established by the Fund's investment adviser. In accordance with valuation policies and procedures approved by the Board, the Fund attempts to obtain prices from one or more third party pricing vendors or brokers to value its investments. When current market prices, quotations or currency exchange rates are not readily available or reliable, investments will be fair valued in good faith by the Committee, in accordance with procedures adopted by the Board. Factors used in determining fair value vary by investment type and may include market or investment specific events. The frequency with which these procedures are used cannot be predicted and they may be utilized to a significant extent. The Committee oversees the Fund's valuation policies and procedures and reports to the Board on the Committee's activities and fair value determinations. The Board monitors the appropriateness of the procedures used in valuing the Fund's investments and ratifies the fair value determinations of the Committee.
The Fund categorizes the inputs to valuation techniques used to value its investments into a disclosure hierarchy consisting of three levels as shown below:
- Level 1 – quoted prices in active markets for identical investments
- Level 2 – other significant observable inputs (including quoted prices for similar investments, interest rates, prepayment speeds, etc.)
- Level 3 – unobservable inputs (including the Fund's own assumptions based on the best information available)
Valuation techniques used to value the Fund's investments by major category are as follows:
Equity securities, including restricted securities, for which market quotations are readily available, are valued at the last reported sale price or official closing price as reported by a third party pricing vendor on the primary market or exchange on which they are traded and are categorized as Level 1 in the hierarchy. In the event there were no sales during the day or closing prices are not available, securities are valued at the last quoted bid price or may be valued using the last available price and are generally categorized as Level 2 in the hierarchy. For foreign equity securities, when market or security specific events arise, comparisons to the valuation of American Depositary Receipts (ADRs)futures contracts, Exchange-Traded Funds (ETFs)and certain indexes as well as quoted prices for similar securities may be used and would be categorized as Level 2 in the hierarchy. For equity securities, including restricted securities, where observable inputs are limited, assumptions about market activity and risk are used and these securities may be categorized as Level 3 in the hierarchy.
Investments in open-end mutual funds ,including the Fidelity Central Funds, are valued at their closing net asset value (NAV) each business day and are categorized as Level 1 in the hierarchy.
Changes in valuation techniques may result in transfers in or out of an assigned level within the disclosure hierarchy. The aggregate value of investments by input level as of November 30, 2020 is included at the end of the Fund's Schedule of Investments.
Foreign Currency. Certain Funds may use foreign currency contracts to facilitate transactions in foreign-denominated securities. Gains and losses from these transactions may arise from changes in the value of the foreign currency or if the counterparties do not perform under the contracts' terms.
Foreign-denominated assets, including investment securities, and liabilities are translated into U.S. dollars at the exchange rates at period end. Purchases and sales of investment securities, income and dividends received, and expenses denominated in foreign currencies are translated into U.S. dollars at the exchange rate in effect on the transaction date.
The effects of exchange rate fluctuations on investments are included with the net realized and unrealized gain (loss) on investment securities. Other foreign currency transactions resulting in realized and unrealized gain (loss) are disclosed separately.
Investment Transactions and Income. For financial reporting purposes, the Fund's investment holdings and NAV include trades executed through the end of the last business day of the period. The NAV per share for processing shareholder transactions is calculated as of the close of business of the New York Stock Exchange (NYSE), normally 4:00 p.m. Eastern time and includes trades executed through the end of the prior business day. Gains and losses on securities sold are determined on the basis of identified cost and include proceeds received from litigation. Dividend income is recorded on the ex-dividend date, except for certain dividends from foreign securities where the ex-dividend date may have passed, which are recorded as soon as the Fund is informed of the ex-dividend date. Non-cash dividends included in dividend income, if any, are recorded at the fair market value of the securities received. Income and capital gain distributions from Fidelity Central Funds, if any, are recorded on the ex-dividend date. Certain distributions received by the Fund represent a return of capital or capital gain. The Fund determines the components of these distributions subsequent to the ex-dividend date, based upon receipt of tax filings or other correspondence relating to the underlying investment. These distributions are recorded as a reduction of cost of investments and/or as a realized gain. Investment income is recorded net of foreign taxes withheld where recovery of such taxes is uncertain.
Class Allocations and Expenses. Investment income, realized and unrealized capital gains and losses, common expenses of the Fund, and certain fund-level expense reductions, if any, are allocated daily on a pro-rata basis to each class based on the relative net assets of each class to the total net assets of the Fund. Each class differs with respect to transfer agent fees incurred. Certain expense reductions may also differ by class. For the reporting period, the allocated portion of income and expenses to each class as a percent of its average net assets may vary due to the timing of recording these transactions in relation to fluctuating net assets of the classes. Expenses directly attributable to a fund are charged to that fund. Expenses attributable to more than one fund are allocated among the respective funds on the basis of relative net assets or other appropriate methods. Expense estimates are accrued in the period to which they relate and adjustments are made when actual amounts are known.
Income Tax Information and Distributions to Shareholders. Each year, the Fund intends to qualify as a regulated investment company under Subchapter M of the Internal Revenue Code, including distributing substantially all of its taxable income and realized gains. As a result, no provision for U.S. Federal income taxes is required. As of November 30, 2020, the Fund did not have any unrecognized tax benefits in the financial statements; nor is the Fund aware of any tax positions for which it is reasonably possible that the total amounts of unrecognized tax benefits will significantly change in the next twelve months. The Fund files a U.S. federal tax return, in addition to state and local tax returns as required. The Fund's federal income tax returns are subject to examination by the Internal Revenue Service (IRS) for a period of three fiscal years after they are filed. State and local tax returns may be subject to examination for an additional fiscal year depending on the jurisdiction. Foreign taxes are provided for based on the Fund's understanding of the tax rules and rates that exist in the foreign markets in which it invests.
Distributions are declared and recorded on the ex-dividend date. Income and capital gain distributions are declared separately for each class. Income and capital gain distributions are determined in accordance with income tax regulations, which may differ from GAAP. In addition, the Fund claimed a portion of the payment made to redeeming shareholders as a distribution for income tax purposes.
Capital accounts within the financial statements are adjusted for permanent book-tax differences. These adjustments have no impact on net assets or the results of operations. Capital accounts are not adjusted for temporary book-tax differences which will reverse in a subsequent period.
Book-tax differences are primarily due to foreign currency transactions, partnerships, passive foreign investment companies (PFIC) and losses deferred due to wash sales.
As of period end, the cost and unrealized appreciation (depreciation) in securities, and derivatives if applicable, for federal income tax purposes were as follows:
| Gross unrealized appreciation | $732,119 |
| Gross unrealized depreciation | (307,065) |
| Net unrealized appreciation (depreciation) | $425,054 |
| Tax Cost | $4,688,541 |
The tax-based components of distributable earnings as of period end were as follows:
| Undistributed ordinary income | $38,311 |
| Net unrealized appreciation (depreciation) on securities and other investments | $413,943 |
The tax character of distributions paid was as follows:
| | November 30, 2020 | November 30, 2019 |
| Ordinary Income | $125,913 | $ 124,868 |
| Long-term Capital Gains | 293,420 | 458,790 |
| Total | $419,333 | $ 583,658 |
Restricted Securities (including Private Placements). The Fund may invest in securities that are subject to legal or contractual restrictions on resale. These securities generally may be resold in transactions exempt from registration or to the public if the securities are registered. Disposal of these securities may involve time-consuming negotiations and expense, and prompt sale at an acceptable price may be difficult. Information regarding restricted securities is included at the end of the Fund's Schedule of Investments.
4. Purchases and Sales of Investments.
Purchases and sales of securities, other than short-term securities, are noted in the table below.
| | Purchases ($) | Sales ($) |
| Fidelity Equity Dividend Income Fund | 3,270,765 | 3,220,829 |
5. Fees and Other Transactions with Affiliates.
Management Fee. Fidelity Management & Research Company LLC (the investment adviser) and its affiliates provide the Fund with investment management related services for which the Fund pays a monthly management fee. The management fee is the sum of an individual fund fee rate that is based on an annual rate of .20% of the Fund's average net assets and an annualized group fee rate that averaged .23% during the period. The group fee rate is based upon the monthly average net assets of a group of registered investment companies with which the investment adviser has management contracts. The group fee rate decreases as assets under management increase and increases as assets under management decrease. For the reporting period, the total annual management fee rate was .43% of the Fund's average net assets.
Transfer Agent Fees. Fidelity Investments Institutional Operations Company LLC (FIIOC), an affiliate of the investment adviser, is the transfer, dividend disbursing and shareholder servicing agent for each class of the Fund. FIIOC receives account fees and asset-based fees that vary according to the account size and type of account of the shareholders of Equity Dividend Income, except for Class K. FIIOC receives an asset-based fee of Class K's average net assets. FIIOC pays for typesetting, printing and mailing of shareholder reports, except proxy statements. Effective February 1, 2020, the Board approved to change the fee for Class K from .046% to .044%.
For the period, transfer agent fees for each class were as follows:
| | Amount | % of Class-Level Average Net Assets |
| Equity Dividend Income | $5,876 | .14 |
| Class K | 179 | .04 |
| | $6,055 | |
Accounting Fees. Fidelity Service Company, Inc. (FSC), an affiliate of the investment adviser, maintains the Fund's accounting records. The accounting fee is based on the level of average net assets for each month. For the period, the fees were equivalent to the following annual rates:
| | % of Average Net Assets |
| Fidelity Equity Dividend Income Fund | .02 |
Brokerage Commissions. A portion of portfolio transactions were placed with brokerage firms which are affiliates of the investment adviser. Brokerage commissions are included in net realized gain (loss) and change in net unrealized appreciation (depreciation) in the Statement of Operations. The commissions paid to these affiliated firms were as follows:
| | Amount |
| Fidelity Equity Dividend Income Fund | $91 |
Interfund Trades. Funds may purchase from or sell securities to other Fidelity Funds under procedures adopted by the Board. The procedures have been designed to ensure these interfund trades are executed in accordance with Rule 17a-7 of the 1940 Act. Interfund trades are included within the respective purchases and sales amounts shown in the Purchases and Sales of Investments note.
Other. During the period, the investment adviser reimbursed the Fund for certain losses in the amount of $16.
6. Committed Line of Credit.
Certain Funds participate with other funds managed by the investment adviser or an affiliate in a $4.25 billion credit facility (the "line of credit") to be utilized for temporary or emergency purposes to fund shareholder redemptions or for other short-term liquidity purposes. The participating funds have agreed to pay commitment fees on their pro-rata portion of the line of credit, which are reflected in Miscellaneous expenses on the Statement of Operations, and are as follows:
| | Amount |
| Fidelity Equity Dividend Income Fund | $11 |
During the period, there were no borrowings on this line of credit.
7. Security Lending.
Funds lend portfolio securities from time to time in order to earn additional income. Lending agents are used, including National Financial Services (NFS), an affiliate of the investment adviser. Pursuant to a securities lending agreement, NFS will receive a fee, which is capped at 9.9% of a fund's daily lending revenue, for its services as lending agent. A fund may lend securities to certain qualified borrowers, including NFS. On the settlement date of the loan, a fund receives collateral (in the form of U.S. Treasury obligations, letters of credit and/or cash) against the loaned securities and maintains collateral in an amount not less than 100% of the market value of the loaned securities during the period of the loan. The market value of the loaned securities is determined at the close of business of a fund and any additional required collateral is delivered to a fund on the next business day. A fund or borrower may terminate the loan at any time, and if the borrower defaults on its obligation to return the securities loaned because of insolvency or other reasons, a fund may apply collateral received from the borrower against the obligation. A fund may experience delays and costs in recovering the securities loaned. Any cash collateral received is invested in the Fidelity Securities Lending Cash Central Fund. Any loaned securities are identified as such in the Schedule of Investments, and the value of loaned securities and cash collateral at period end, as applicable, are presented in the Statement of Assets and Liabilities. Security lending income represents the income earned on investing cash collateral, less rebates paid to borrowers and any lending agent fees associated with the loan, plus any premium payments received for lending certain types of securities. Security lending income is presented in the Statement of Operations as a component of income from Fidelity Central Funds. Affiliated security lending activity, if any, was as follows:
| | Total Security Lending Income Fees Paid to NFS | Security Lending Income From Securities Loaned to NFS | Value of Securities Loaned to NFS at Period End |
| Fidelity Equity Dividend Income Fund | $20 | $– | $– |
8. Expense Reductions.
Commissions paid to certain brokers with whom the investment adviser, or its affiliates, places trades on behalf of the Fund include an amount in addition to trade execution, which may be rebated back to the Fund to offset certain expenses. This amount totaled $350 for the period. In addition, through arrangements with the Fund's custodian and each class' transfer agent, credits realized as a result of certain uninvested cash balances were used to reduce the Fund's expenses. During the period, custodian credits reduced the Fund's expenses by $2.
In addition, during the period the investment adviser or an affiliate reimbursed and/or waived a portion of fund-level operating expenses in the amount of $21.
9. Distributions to Shareholders.
Distributions to shareholders of each class were as follows:
| | Year ended
November 30, 2020 | Year ended
November 30, 2019 |
| Distributions to shareholders | | |
| Equity Dividend Income | $392,089 | $558,636 |
| Class K | 27,244 | 25,022 |
| Total | $419,333 | $583,658 |
10. Share Transactions.
Share transactions for each class were as follows and may contain automatic conversions between classes or exchanges between affiliated funds:
| | Shares | Shares | Dollars | Dollars |
| | Year ended November 30, 2020 | Year ended November 30, 2019 | Year ended November 30, 2020 | Year ended November 30, 2019 |
| Equity Dividend Income | | | | |
| Shares sold | 8,238 | 7,139 | $189,816 | $176,457 |
| Reinvestment of distributions | 14,960 | 23,757 | 367,865 | 523,845 |
| Shares redeemed | (30,241) | (24,795) | (673,236) | (609,879) |
| Net increase (decrease) | (7,043) | 6,101 | $(115,555) | $90,423 |
| Class K | | | | |
| Shares sold | 20,905 | 4,678 | $475,740 | $120,880 |
| Reinvestment of distributions | 1,134 | 1,136 | 27,244 | 25,022 |
| Shares redeemed | (5,084) | (2,667) | (114,943) | (64,344) |
| Net increase (decrease) | 16,955 | 3,147 | $388,041 | $81,558 |
11. Other.
The Fund's organizational documents provide former and current trustees and officers with a limited indemnification against liabilities arising in connection with the performance of their duties to the Fund. In the normal course of business, the Fund may also enter into contracts that provide general indemnifications. The Fund's maximum exposure under these arrangements is unknown as this would be dependent on future claims that may be made against the Fund. The risk of material loss from such claims is considered remote.
12. Coronavirus (COVID-19) Pandemic.
An outbreak of COVID-19 first detected in China during December 2019 has since spread globally and was declared a pandemic by the World Health Organization during March 2020. Developments that disrupt global economies and financial markets, such as the COVID-19 pandemic, may magnify factors that affect the Fund's performance.
Report of Independent Registered Public Accounting Firm
To the Board of Trustees of Fidelity Financial Trust and Shareholders of Fidelity Equity Dividend Income Fund
Opinion on the Financial Statements
We have audited the accompanying statement of assets and liabilities, including the schedule of investments, of Fidelity Equity Dividend Income Fund (one of the funds constituting Fidelity Financial Trust, referred to hereafter as the “Fund”) as of November 30, 2020, the related statement of operations for the year ended November 30, 2020, the statement of changes in net assets for each of the two years in the period ended November 30, 2020, including the related notes, and the financial highlights for each of the five years in the period ended November 30, 2020 (collectively referred to as the “financial statements”). In our opinion, the financial statements present fairly, in all material respects, the financial position of the Fund as of November 30, 2020, the results of its operations for the year then ended, the changes in its net assets for each of the two years in the period ended November 30, 2020 and the financial highlights for each of the five years in the period ended November 30, 2020 in conformity with accounting principles generally accepted in the United States of America.
Basis for Opinion
These financial statements are the responsibility of the Fund’s management. Our responsibility is to express an opinion on the Fund’s financial statements based on our audits. We are a public accounting firm registered with the Public Company Accounting Oversight Board (United States) (PCAOB) and are required to be independent with respect to the Fund in accordance with the U.S. federal securities laws and the applicable rules and regulations of the Securities and Exchange Commission and the PCAOB.
We conducted our audits of these financial statements in accordance with the standards of the PCAOB. Those standards require that we plan and perform the audit to obtain reasonable assurance about whether the financial statements are free of material misstatement, whether due to error or fraud.
Our audits included performing procedures to assess the risks of material misstatement of the financial statements, whether due to error or fraud, and performing procedures that respond to those risks. Such procedures included examining, on a test basis, evidence regarding the amounts and disclosures in the financial statements. Our audits also included evaluating the accounting principles used and significant estimates made by management, as well as evaluating the overall presentation of the financial statements. Our procedures included confirmation of securities owned as of November 30, 2020 by correspondence with the custodian and brokers; when replies were not received from brokers, we performed other auditing procedures. We believe that our audits provide a reasonable basis for our opinion.
/s/ PricewaterhouseCoopers LLP
Boston, Massachusetts
January 12, 2021
We have served as the auditor of one or more investment companies in the Fidelity group of funds since 1932.
Trustees and Officers
The Trustees, Members of the Advisory Board (if any), and officers of the trust and fund, as applicable, are listed below. The Board of Trustees governs the fund and is responsible for protecting the interests of shareholders. The Trustees are experienced executives who meet periodically throughout the year to oversee the fund's activities, review contractual arrangements with companies that provide services to the fund, oversee management of the risks associated with such activities and contractual arrangements, and review the fund's performance. Each of the Trustees oversees 305 funds.
The Trustees hold office without limit in time except that (a) any Trustee may resign; (b) any Trustee may be removed by written instrument, signed by at least two-thirds of the number of Trustees prior to such removal; (c) any Trustee who requests to be retired or who has become incapacitated by illness or injury may be retired by written instrument signed by a majority of the other Trustees; and (d) any Trustee may be removed at any special meeting of shareholders by a two-thirds vote of the outstanding voting securities of the trust. Each Trustee who is not an interested person (as defined in the 1940 Act) of the trust and the fund is referred to herein as an Independent Trustee. Each Independent Trustee shall retire not later than the last day of the calendar year in which his or her 75th birthday occurs. The Independent Trustees may waive this mandatory retirement age policy with respect to individual Trustees. Officers and Advisory Board Members hold office without limit in time, except that any officer or Advisory Board Member may resign or may be removed by a vote of a majority of the Trustees at any regular meeting or any special meeting of the Trustees. Except as indicated, each individual has held the office shown or other offices in the same company for the past five years.
The fund's Statement of Additional Information (SAI) includes more information about the Trustees. To request a free copy, call Fidelity at 1-800-544-8544 if you’re an individual investing directly with Fidelity, call 1-800-835-5092 if you’re a plan sponsor or participant with Fidelity as your recordkeeper or call 1-877-208-0098 on institutional accounts or if you’re an advisor or invest through one.
Experience, Skills, Attributes, and Qualifications of the Trustees. The Governance and Nominating Committee has adopted a statement of policy that describes the experience, qualifications, attributes, and skills that are necessary and desirable for potential Independent Trustee candidates (Statement of Policy). The Board believes that each Trustee satisfied at the time he or she was initially elected or appointed a Trustee, and continues to satisfy, the standards contemplated by the Statement of Policy. The Governance and Nominating Committee also engages professional search firms to help identify potential Independent Trustee candidates who have the experience, qualifications, attributes, and skills consistent with the Statement of Policy. From time to time, additional criteria based on the composition and skills of the current Independent Trustees, as well as experience or skills that may be appropriate in light of future changes to board composition, business conditions, and regulatory or other developments, have also been considered by the professional search firms and the Governance and Nominating Committee. In addition, the Board takes into account the Trustees' commitment and participation in Board and committee meetings, as well as their leadership of standing and ad hoc committees throughout their tenure.
In determining that a particular Trustee was and continues to be qualified to serve as a Trustee, the Board has considered a variety of criteria, none of which, in isolation, was controlling. The Board believes that, collectively, the Trustees have balanced and diverse experience, qualifications, attributes, and skills, which allow the Board to operate effectively in governing the fund and protecting the interests of shareholders. Information about the specific experience, skills, attributes, and qualifications of each Trustee, which in each case led to the Board's conclusion that the Trustee should serve (or continue to serve) as a trustee of the fund, is provided below.
Board Structure and Oversight Function. Robert A. Lawrence is an interested person and currently serves as Acting Chairman. The Trustees have determined that an interested Chairman is appropriate and benefits shareholders because an interested Chairman has a personal and professional stake in the quality and continuity of services provided to the fund. Independent Trustees exercise their informed business judgment to appoint an individual of their choosing to serve as Chairman, regardless of whether the Trustee happens to be independent or a member of management. The Independent Trustees have determined that they can act independently and effectively without having an Independent Trustee serve as Chairman and that a key structural component for assuring that they are in a position to do so is for the Independent Trustees to constitute a substantial majority for the Board. The Independent Trustees also regularly meet in executive session. David M. Thomas serves as Lead Independent Trustee and as such (i) acts as a liaison between the Independent Trustees and management with respect to matters important to the Independent Trustees and (ii) with management prepares agendas for Board meetings.
Fidelity® funds are overseen by different Boards of Trustees. The fund's Board oversees Fidelity's high income and certain equity funds, and other Boards oversee Fidelity's investment-grade bond, money market, asset allocation, and other equity funds. The asset allocation funds may invest in Fidelity® funds overseen by the fund's Board. The use of separate Boards, each with its own committee structure, allows the Trustees of each group of Fidelity® funds to focus on the unique issues of the funds they oversee, including common research, investment, and operational issues. On occasion, the separate Boards establish joint committees to address issues of overlapping consequences for the Fidelity® funds overseen by each Board.
The Trustees operate using a system of committees to facilitate the timely and efficient consideration of all matters of importance to the Trustees, the fund, and fund shareholders and to facilitate compliance with legal and regulatory requirements and oversight of the fund's activities and associated risks. The Board, acting through its committees, has charged FMR and its affiliates with (i) identifying events or circumstances the occurrence of which could have demonstrably adverse effects on the fund's business and/or reputation; (ii) implementing processes and controls to lessen the possibility that such events or circumstances occur or to mitigate the effects of such events or circumstances if they do occur; and (iii) creating and maintaining a system designed to evaluate continuously business and market conditions in order to facilitate the identification and implementation processes described in (i) and (ii) above. Because the day-to-day operations and activities of the fund are carried out by or through FMR, its affiliates, and other service providers, the fund's exposure to risks is mitigated but not eliminated by the processes overseen by the Trustees. While each of the Board's committees has responsibility for overseeing different aspects of the fund's activities, oversight is exercised primarily through the Operations, Audit, and Compliance Committees. Appropriate personnel, including but not limited to the fund's Chief Compliance Officer (CCO), FMR's internal auditor, the independent accountants, the fund's Treasurer and portfolio management personnel, make periodic reports to the Board's committees, as appropriate, including an annual review of Fidelity's risk management program for the Fidelity® funds. The responsibilities of each standing committee, including their oversight responsibilities, are described further under "Standing Committees of the Trustees."
Interested Trustees*:
Correspondence intended for a Trustee who is an interested person may be sent to Fidelity Investments, 245 Summer Street, Boston, Massachusetts 02210.
Name, Year of Birth; Principal Occupations and Other Relevant Experience+
Bettina Doulton (1964)
Year of Election or Appointment: 2020
Trustee
Ms. Doulton also serves as Trustee of other Fidelity® funds. Prior to her retirement, Ms. Doulton served in a variety of positions at Fidelity Investments, including as a managing director of research (2006-2007), portfolio manager to certain Fidelity® funds (1993-2005), equity analyst and portfolio assistant (1990-1993), and research assistant (1987-1990). Ms. Doulton currently owns and operates Phi Builders + Architects and Cellardoor Winery. Previously, Ms. Doulton served as a member of the Board of Brown Capital Management, LLC (2013-2018).
Robert A. Lawrence (1952)
Year of Election or Appointment: 2020
Trustee
Acting Chairman of the Board of Trustees
Mr. Lawrence also serves as Trustee of other funds. Previously, Mr. Lawrence served as a Member of the Advisory Board of certain funds. Prior to his retirement in 2008, Mr. Lawrence served as Vice President of certain Fidelity® funds (2006-2008), Senior Vice President, Head of High Income Division of Fidelity Management & Research Company (investment adviser firm, 2006-2008), and President of Fidelity Strategic Investments (investment adviser firm, 2002-2005).
* Determined to be an “Interested Trustee” by virtue of, among other things, his or her affiliation with the trust or various entities under common control with FMR.
+ The information includes the Trustee's principal occupation during the last five years and other information relating to the experience, attributes, and skills relevant to the Trustee's qualifications to serve as a Trustee, which led to the conclusion that the Trustee should serve as a Trustee for the fund.
Independent Trustees:
Correspondence intended for an Independent Trustee may be sent to Fidelity Investments, P.O. Box 55235, Boston, Massachusetts 02205-5235.
Name, Year of Birth; Principal Occupations and Other Relevant Experience+
Dennis J. Dirks (1948)
Year of Election or Appointment: 2005
Trustee
Mr. Dirks also serves as Trustee of other Fidelity® funds. Prior to his retirement in May 2003, Mr. Dirks served as Chief Operating Officer and as a member of the Board of The Depository Trust & Clearing Corporation (financial markets infrastructure), President, Chief Operating Officer and a member of the Board of The Depository Trust Company (DTC), President and a member of the Board of the National Securities Clearing Corporation (NSCC), Chief Executive Officer and a member of the Board of the Government Securities Clearing Corporation and Chief Executive Officer and a member of the Board of the Mortgage-Backed Securities Clearing Corporation. Mr. Dirks currently serves as a member of the Finance Committee (2016-present) and Board (2017-present) and is Treasurer (2018-present) of the Asolo Repertory Theatre.
Donald F. Donahue (1950)
Year of Election or Appointment: 2018
Trustee
Mr. Donahue also serves as Trustee of other Fidelity® funds. Mr. Donahue serves as President and Chief Executive Officer of Miranda Partners, LLC (risk consulting for the financial services industry, 2012-present). Previously, Mr. Donahue served as Chief Executive Officer (2006-2012), Chief Operating Officer (2003-2006) and Managing Director, Customer Marketing and Development (1999-2003) of The Depository Trust & Clearing Corporation (financial markets infrastructure). Mr. Donahue currently serves as a member (2007-present) and Co-Chairman (2016-present) of the Board of United Way of New York, a member of the Board of NYC Leadership Academy (2012-present) and a member of the Board of Advisors of Ripple Labs, Inc. (financial services, 2015-present). Mr. Donahue previously served as a member of the Advisory Board of certain Fidelity® funds (2015-2018).
Vicki L. Fuller (1957)
Year of Election or Appointment: 2020
Trustee
Ms. Fuller also serves as Trustee of other Fidelity® funds. Previously, Ms. Fuller served as a member of the Advisory Board of certain Fidelity® funds (2018-2020), Chief Investment Officer of the New York State Common Retirement Fund (2012-2018) and held a variety of positions at AllianceBernstein L.P. (global asset management, 1985-2012), including Managing Director (2006-2012) and Senior Vice President and Senior Portfolio Manager (2001-2006). Ms. Fuller currently serves as a member of the Board, Audit Committee and Nominating and Governance Committee of The Williams Companies, Inc. (natural gas infrastructure, 2018-present), as a member of the Board, Audit Committee and Nominating and Governance Committee of two Blackstone business development companies (2020-present) and as a member of the Board of Treliant, LLC (consulting, 2019-present).
Patricia L. Kampling (1959)
Year of Election or Appointment: 2020
Trustee
Ms. Kampling also serves as Trustee of other Fidelity® funds. Prior to her retirement, Ms. Kampling served as Chairman of the Board and Chief Executive Officer (2012-2019), President and Chief Operating Officer (2011-2012) and Executive Vice President and Chief Financial Officer (2010-2011) of Alliant Energy Corporation. Ms. Kampling currently serves as a member of the Board, Compensation Committee and Executive Committee and as Chair of the Audit Committee of Briggs & Stratton Corporation (manufacturing, 2011-present) and as a member of the Board, Audit, Finance and Risk Committee and Safety, Environmental, Technology and Operations Committee of American Water Works Company, Inc. (utilities company, 2019-present). In addition, Ms. Kampling currently serves as a member of the Board of the Nature Conservancy, Wisconsin Chapter (2019-present). Previously, Ms. Kampling served as a Member of the Advisory Board of certain Fidelity® funds (2020), a member of the Board of Interstate Power and Light Company (2012-2019) and Wisconsin Power and Light Company (2012-2019) (each a subsidiary of Alliant Energy Corporation) and as a member of the Board and Workforce Development Committee of the Business Roundtable (2018-2019).
Thomas A. Kennedy (1955)
Year of Election or Appointment: 2021
Trustee
Mr. Kennedy also serves as Trustee of other Fidelity® funds. Previously, Mr. Kennedy served as a Member of the Advisory Board of certain Fidelity® funds (2020) and held a variety of positions at Raytheon Company (aerospace and defense, 1983-2020), including Chairman and Chief Executive Officer (2014-2020) and Executive Vice President and Chief Operating Officer (2013-2014). Mr. Kennedy currently serves as Executive Chairman of the Board of Directors of Raytheon Technologies Corporation (aerospace and defense, 2020-present). He is also a member of the Rutgers School of Engineering Industry Advisory Board (2011-present) and a member of the UCLA Engineering Dean’s Executive Board (2016-present).
Garnett A. Smith (1947)
Year of Election or Appointment: 2018
Trustee
Mr. Smith also serves as Trustee of other Fidelity® funds. Prior to his retirement, Mr. Smith served as Chairman and Chief Executive Officer (1990-1997) and President (1986-1990) of Inbrand Corp. (manufacturer of personal absorbent products). Prior to his employment with Inbrand Corp., he was employed by a retail fabric chain and North Carolina National Bank (now Bank of America). Mr. Smith previously served as a member of the Advisory Board of certain Fidelity® funds (2012-2013).
David M. Thomas (1949)
Year of Election or Appointment: 2008
Trustee
Lead Independent Trustee
Mr. Thomas also serves as Trustee of other Fidelity® funds. Previously, Mr. Thomas served as Executive Chairman (2005-2006) and Chairman and Chief Executive Officer (2000-2005) of IMS Health, Inc. (pharmaceutical and healthcare information solutions). Mr. Thomas currently serves as Non-Executive Chairman of the Board of Fortune Brands Home and Security (home and security products, 2011-present), and a member of the Board (2004-present) and Presiding Director (2013-present) of Interpublic Group of Companies, Inc. (marketing communication).
Susan Tomasky (1953)
Year of Election or Appointment: 2020
Trustee
Ms. Tomasky also serves as Trustee of other Fidelity® funds. Prior to her retirement, Ms. Tomasky served in various executive officer positions at American Electric Power Company, Inc. (1998-2011), including most recently as President of AEP Transmission (2007-2011). Ms. Tomasky currently serves as a member of the Board and Sustainability Committee and as Chair of the Audit Committee of Marathon Petroleum Corporation (2018-present) and as a member of the Board, Corporate Governance Committee and Organization and Compensation Committee and as Chair of the Audit Committee of Public Service Enterprise Group, Inc. (utilities company, 2012-present). In addition, Ms. Tomasky currently serves as a member of the Board of the Columbus Regional Airport Authority (2007-present), as a member of the Board of the Royal Shakespeare Company – America (2009-present), as a member of the Board of the Columbus Association for the Performing Arts (2011-present) and as a member of the Board of Kenyon College (2016-present). Previously, Ms. Tomasky served as a Member of the Advisory Board of certain Fidelity® funds (2020), a member of the Board (2011-2019) and as Lead Independent Director (2015-2018) of Andeavor Corporation (previously Tesoro Corporation) (independent oil refiner and marketer) and as a member of the Board of Summit Midstream Partners LP (energy, 2012-2018).
Michael E. Wiley (1950)
Year of Election or Appointment: 2018
Trustee
Mr. Wiley also serves as Trustee of other Fidelity® funds. Previously, Mr. Wiley served as a member of the Advisory Board of certain Fidelity® funds (2018-2020), Chairman, President and CEO of Baker Hughes, Inc. (oilfield services, 2000-2004). Mr. Wiley also previously served as a member of the Board of Andeavor Corporation (independent oil refiner and marketer, 2005-2018), a member of the Board of Andeavor Logistics LP (natural resources logistics, 2015-2018) and a member of the Board of High Point Resources (exploration and production, 2005-2020).
+ The information includes the Trustee's principal occupation during the last five years and other information relating to the experience, attributes, and skills relevant to the Trustee's qualifications to serve as a Trustee, which led to the conclusion that the Trustee should serve as a Trustee for the fund.
Advisory Board Members and Officers:
Correspondence intended for a Member of the Advisory Board (if any) may be sent to Fidelity Investments, P.O. Box 55235, Boston, Massachusetts 02205-5235. Correspondence intended for an officer or Peter S. Lynch may be sent to Fidelity Investments, 245 Summer Street, Boston, Massachusetts 02210. Officers appear below in alphabetical order.
Name, Year of Birth; Principal Occupation
Ned C. Lautenbach (1944)
Year of Election or Appointment: 2021
Member of the Advisory Board
Mr. Lautenbach also serves as a Member of the Advisory Board of other Fidelity® funds. Mr. Lautenbach currently serves as Chair of the Board of Governors, State University System of Florida (2013-present) and is a member of the Council on Foreign Relations (1994-present). He is also a member and has in the past served as Chairman of the Board of Directors of Artis-Naples (2012-present). Previously, Mr. Lautenbach served as a Trustee of certain Fidelity® funds (2000-2020) and a member and then Lead Director of the Board of Directors of Eaton Corporation (diversified industrial, 1997-2016). He was also a Partner at Clayton, Dubilier & Rice, LLC (private equity investment, 1998-2010); as well as Director of Sony Corporation (2006-2007). In addition, Mr. Lautenbach had a 30-year career with IBM (technology company), during which time he served as Senior Vice President and as a member of the Corporate Executive Committee (1968-1998).
Peter S. Lynch (1944)
Year of Election or Appointment: 2003
Member of the Advisory Board
Mr. Lynch also serves as a Member of the Advisory Board of other Fidelity® funds. Mr. Lynch is Vice Chairman and a Director of Fidelity Management & Research Company LLC (investment adviser firm). In addition, Mr. Lynch serves as a Trustee of Boston College and as the Chairman of the Inner-City Scholarship Fund. Previously, Mr. Lynch served as Vice Chairman and a Director of FMR Co., Inc. (investment adviser firm) and on the Special Olympics International Board of Directors (1997-2006).
Craig S. Brown (1977)
Year of Election or Appointment: 2019
Assistant Treasurer
Mr. Brown also serves as Assistant Treasurer of other funds. Mr. Brown is an employee of Fidelity Investments (2013-present).
John J. Burke III (1964)
Year of Election or Appointment: 2018
Chief Financial Officer
Mr. Burke also serves as Chief Financial Officer of other funds. Mr. Burke serves as Head of Investment Operations for Fidelity Fund and Investment Operations (2018-present) and is an employee of Fidelity Investments (1998-present). Previously Mr. Burke served as head of Asset Management Investment Operations (2012-2018).
William C. Coffey (1969)
Year of Election or Appointment: 2019
Assistant Secretary
Mr. Coffey also serves as Assistant Secretary of other funds. He is Senior Vice President and Deputy General Counsel of FMR LLC (diversified financial services company, 2010-present), and is an employee of Fidelity Investments. Previously, Mr. Coffey served as Secretary and CLO of certain funds (2018-2019); CLO, Secretary, and Senior Vice President of Fidelity Management & Research Company and FMR Co., Inc. (investment adviser firms, 2018-2019); Secretary of Fidelity SelectCo, LLC and Fidelity Investments Money Management, Inc. (investment adviser firms, 2018-2019); CLO of Fidelity Management & Research (Hong Kong) Limited, FMR Investment Management (UK) Limited, and Fidelity Management & Research (Japan) Limited (investment adviser firms, 2018-2019); and Assistant Secretary of certain funds (2009-2018).
Timothy M. Cohen (1969)
Year of Election or Appointment: 2018
Vice President
Mr. Cohen also serves as Vice President of other funds. Mr. Cohen serves as Co-Head of Equity (2018-present), a Director of Fidelity Management & Research (Japan) Limited (investment adviser firm, 2016-present), and is an employee of Fidelity Investments. Previously, Mr. Cohen served as Executive Vice President of Fidelity SelectCo, LLC (2019), Head of Global Equity Research (2016-2018), Chief Investment Officer - Equity and a Director of Fidelity Management & Research (U.K.) Inc. (investment adviser firm, 2013-2015) and as a Director of Fidelity Management & Research (Hong Kong) Limited (investment adviser firm, 2017).
Jonathan Davis (1968)
Year of Election or Appointment: 2010
Assistant Treasurer
Mr. Davis also serves as Assistant Treasurer of other funds. Mr. Davis serves as Assistant Treasurer of FMR Capital, Inc. (2017-present) and is an employee of Fidelity Investments. Previously, Mr. Davis served as Vice President and Associate General Counsel of FMR LLC (diversified financial services company, 2003-2010).
Laura M. Del Prato (1964)
Year of Election or Appointment: 2018
Assistant Treasurer
Ms. Del Prato also serves as an officer of other funds. Ms. Del Prato is an employee of Fidelity Investments (2017-present). Previously, Ms. Del Prato served as President and Treasurer of The North Carolina Capital Management Trust: Cash Portfolio and Term Portfolio (2018-2020). Prior to joining Fidelity Investments, Ms. Del Prato served as a Managing Director and Treasurer of the JPMorgan Mutual Funds (2014-2017). Prior to JPMorgan, Ms. Del Prato served as a partner at Cohen Fund Audit Services (accounting firm, 2012-2013) and KPMG LLP (accounting firm, 2004-2012).
Colm A. Hogan (1973)
Year of Election or Appointment: 2020
Assistant Treasurer
Mr. Hogan also serves as an officer of other funds. Mr. Hogan serves as Assistant Treasurer of FMR Capital, Inc. (2017-present) and is an employee of Fidelity Investments (2005-present). Previously, Mr. Hogan served as Deputy Treasurer of certain Fidelity® funds (2016-2020) and Assistant Treasurer of certain Fidelity® funds (2016-2018).
Pamela R. Holding (1964)
Year of Election or Appointment: 2018
Vice President
Ms. Holding also serves as Vice President of other funds. Ms. Holding serves as Co-Head of Equity (2018-present) and is an employee of Fidelity Investments (2013-present). Previously, Ms. Holding served as Executive Vice President of Fidelity SelectCo, LLC (2019) and as Chief Investment Officer of Fidelity Institutional Asset Management (2013-2018).
Cynthia Lo Bessette (1969)
Year of Election or Appointment: 2019
Secretary and Chief Legal Officer (CLO)
Ms. Lo Bessette also serves as an officer of other funds. Ms. Lo Bessette serves as CLO, Secretary, and Senior Vice President of Fidelity Management & Research Company LLC (investment adviser firm, 2019-present); and CLO of Fidelity Management & Research (Hong Kong) Limited, FMR Investment Management (UK) Limited, and Fidelity Management & Research (Japan) Limited (investment adviser firms, 2019-present). She is a Senior Vice President and Deputy General Counsel of FMR LLC (diversified financial services company, 2019-present), and is an employee of Fidelity Investments. Previously, Ms. Lo Bessette served as CLO, Secretary, and Senior Vice President of FMR Co., Inc. (investment adviser firm, 2019); Secretary of Fidelity SelectCo, LLC and Fidelity Investments Money Management, Inc. (investment adviser firms, 2019). Prior to joining Fidelity Investments, Ms. Lo Bessette was Executive Vice President, General Counsel (2016-2019) and Senior Vice President, Deputy General Counsel (2015-2016) of OppenheimerFunds (investment management company) and Deputy Chief Legal Officer (2013-2015) of Jennison Associates LLC (investment adviser firm).
Chris Maher (1972)
Year of Election or Appointment: 2020
Deputy Treasurer
Mr. Maher also serves as an officer of other funds. Mr. Maher serves as Assistant Treasurer of FMR Capital, Inc. (2017-present), and is an employee of Fidelity Investments (2008-present). Previously, Mr. Maher served as Assistant Treasurer of certain funds (2013-2020); Vice President of Asset Management Compliance (2013), Vice President of the Program Management Group of FMR (investment adviser firm, 2010-2013), and Vice President of Valuation Oversight (2008-2010).
Jason P. Pogorelec (1975)
Year of Election or Appointment: 2020
Chief Compliance Officer
Mr. Pogorelec also serves as Chief Compliance Officer of other funds. Mr. Pogorelec is a senior Vice President of Asset Management Compliance for Fidelity Investments and is an employee of Fidelity Investments (2006-present). Previously, Mr. Pogorelec served as Vice President, Associate General Counsel for Fidelity Investments (2010-2020) and Assistant Secretary of certain Fidelity funds (2015-2020).
Brett Segaloff (1972)
Year of Election or Appointment: 2021
Anti-Money Laundering (AML) Officer
Mr. Segaloff also serves as an AML Officer of other funds and other related entities. He is Director, Anti-Money Laundering (2007-present) of FMR LLC (diversified financial services company) and is an employee of Fidelity Investments (1996-present).
Stacie M. Smith (1974)
Year of Election or Appointment: 2016
President and Treasurer
Ms. Smith also serves as an officer of other funds. Ms. Smith serves as Assistant Treasurer of FMR Capital, Inc. (2017-present), is an employee of Fidelity Investments (2009-present), and has served in other fund officer roles. Prior to joining Fidelity Investments, Ms. Smith served as Senior Audit Manager of Ernst & Young LLP (accounting firm, 1996-2009). Previously, Ms. Smith served as Assistant Treasurer (2013-2019) and Deputy Treasurer (2013-2016) of certain Fidelity® funds.
Marc L. Spector (1972)
Year of Election or Appointment: 2016
Assistant Treasurer
Mr. Spector also serves as an officer of other funds. Mr. Spector serves as Assistant Treasurer of FMR Capital, Inc. (2017-present) and is an employee of Fidelity Investments (2016-present). Prior to joining Fidelity Investments, Mr. Spector served as Director at the Siegfried Group (accounting firm, 2013-2016), and prior to Siegfried Group as audit senior manager at Deloitte & Touche LLP (accounting firm, 2005-2013).
Jim Wegmann (1979)
Year of Election or Appointment: 2019
Assistant Treasurer
Mr. Wegmann also serves as Assistant Treasurer of other funds. Mr. Wegmann is an employee of Fidelity Investments (2011-present).
Shareholder Expense Example
As a shareholder, you incur two types of costs: (1) transaction costs, which may include sales charges (loads) on purchase payments or redemption proceeds, as applicable and (2) ongoing costs, which generally include management fees, distribution and/or service (12b-1) fees and other Fund expenses. This Example is intended to help you understand your ongoing costs (in dollars) of investing in a fund and to compare these costs with the ongoing costs of investing in other mutual funds.
The Example is based on an investment of $1,000 invested at the beginning of the period and held for the entire period (June 1, 2020 to November 30, 2020).
Actual Expenses
The first line of the accompanying table provides information about actual account values and actual expenses. You may use the information in this line, together with the amount you invested, to estimate the expenses that you paid over the period. Simply divide your account value by $1,000.00 (for example, an $8,600 account value divided by $1,000.00 = 8.6), then multiply the result by the number in the first line for a class/Fund under the heading entitled "Expenses Paid During Period" to estimate the expenses you paid on your account during this period. If any fund is a shareholder of any underlying mutual funds or exchange-traded funds (ETFs) (the Underlying Funds), such fund indirectly bears its proportional share of the expenses of the Underlying Funds in addition to the direct expenses incurred presented in the table. These fees and expenses are not included in the annualized expense ratio used to calculate the expense estimate in the table below.
Hypothetical Example for Comparison Purposes
The second line of the accompanying table provides information about hypothetical account values and hypothetical expenses based on the actual expense ratio and an assumed rate of return of 5% per year before expenses, which is not the actual return. The hypothetical account values and expenses may not be used to estimate the actual ending account balance or expenses you paid for the period. You may use this information to compare the ongoing costs of investing in the Fund and other funds. To do so, compare this 5% hypothetical example with the 5% hypothetical examples that appear in the shareholder reports of the other funds. If any fund is a shareholder of any Underlying Funds, such fund indirectly bears its proportional share of the expenses of the Underlying Funds in addition to the direct expenses as presented in the table. These fees and expenses are not included in the annualized expense ratio used to calculate the expense estimate in the table below.
Please note that the expenses shown in the table are meant to highlight your ongoing costs only and do not reflect any transaction costs. Therefore, the second line of the table is useful in comparing ongoing costs only, and will not help you determine the relative total costs of owning different funds.
| | Annualized Expense Ratio-A | Beginning
Account Value
June 1, 2020 | Ending
Account Value
November 30, 2020 | Expenses Paid
During Period-B
June 1, 2020
to November 30, 2020 |
| Fidelity Equity Dividend Income Fund | | | | |
| Equity Dividend Income | .60% | | | |
| Actual | | $1,000.00 | $1,152.70 | $3.23 |
| Hypothetical-C | | $1,000.00 | $1,022.00 | $3.03 |
| Class K | .51% | | | |
| Actual | | $1,000.00 | $1,153.30 | $2.75 |
| Hypothetical-C | | $1,000.00 | $1,022.45 | $2.58 |
A Annualized expense ratio reflects expenses net of applicable fee waivers.
B Expenses are equal to the annualized expense ratio, multiplied by the average account value over the period, multiplied by 183/ 366 (to reflect the one-half year period). The fees and expenses of any Underlying Funds are not included in each annualized expense ratio.
C 5% return per year before expenses
Distributions (Unaudited)
The Board of Trustees of Fidelity Equity Dividend Income Fund voted to pay to shareholders of record at the opening of business on record date, the following distributions per share derived from capital gains realized from sales of portfolio securities, and dividends derived from net investment income:
| | Pay Date | Record Date | Dividends | Capital Gains |
| Fidelity Equity Dividend Income Fund | | | | |
| Fidelity Equity Dividend Income Fund | 12/30/20 | 12/29/20 | $0.219 | $0.013 |
| Class K | 12/30/20 | 12/29/20 | $0.225 | $0.013 |
|
A total of 0.18% of the dividends distributed during the fiscal year was derived from interest on U.S. Government securities which is generally exempt from state income tax.
Fidelity Equity Dividend Income Fund designates 67%, 100%, 100%, and 100%; and Class K designates 65%, 100%, 100%, and 100%; of the dividends distributed in December, April, July, and October, respectively during the fiscal year as qualifying for the dividends–received deduction for corporate shareholders.
Fidelity Equity Dividend Income Fund and Class K designate 100% of the dividends distributed during the fiscal year as amounts which may be taken into account as a dividend for purposes of the maximum rate under section 1(h)(11) of the Internal Revenue Code.
The fund will notify shareholders in January 2021 of amounts for use in preparing 2020 income tax returns.
Proxy Voting Results
A special meeting of shareholders was held on June 9, 2020. The results of votes taken among shareholders on the proposals before them are reported below. Each vote reported represents one dollar of net asset value held on the record date for the meeting.
PROPOSAL 1
To elect a Board of Trustees.
| | # of
Votes | % of
Votes |
| Dennis J. Dirks |
| Affirmative | 5,461,721,297.052 | 92.309 |
| Withheld | 455,079,082.626 | 7.691 |
| TOTAL | 5,916,800,379.678 | 100.000 |
| Donald F. Donahue |
| Affirmative | 5,462,265,876.052 | 92.318 |
| Withheld | 454,534,503.626 | 7.682 |
| TOTAL | 5,916,800,379.678 | 100.000 |
| Bettina Doulton |
| Affirmative | 5,467,748,446.673 | 92.411 |
| Withheld | 449,051,933.005 | 7.589 |
| TOTAL | 5,916,800,379.678 | 100.000 |
| Vicki L. Fuller |
| Affirmative | 5,499,183,624.435 | 92.942 |
| Withheld | 417,616,755.243 | 7.058 |
| TOTAL | 5,916,800,379.678 | 100.00 |
| Patricia L. Kampling |
| Affirmative | 5,454,818,211.998 | 92.192 |
| Withheld | 461,982,167.680 | 7.808 |
| TOTAL | 5,916,800,379.678 | 100.000 |
| Alan J. Lacy |
| Affirmative | 5,424,711,025.435 | 91.683 |
| Withheld | 492,089,354.243 | 8.317 |
| TOTAL | 5,916,800,379.678 | 100.000 |
| Ned C. Lautenbach |
| Affirmative | 5,421,052,451.283 | 91.621 |
| Withheld | 495,747,928.395 | 8.379 |
| TOTAL | 5,916,800,379.678 | 100.000 |
| Robert A. Lawrence |
| Affirmative | 5,431,197,461.723 | 91.793 |
| Withheld | 485,602,917.955 | 8.207 |
| TOTAL | 5,916,800,379.678 | 100.000 |
| Joseph Mauriello |
| Affirmative | 5,416,731,329.280 | 91.548 |
| Withheld | 500,069,050.398 | 8.452 |
| TOTAL | 5,916,800,379.678 | 100.000 |
| Cornelia M. Small |
| Affirmative | 5,429,962,996.961 | 91.772 |
| Withheld | 486,837,382.717 | 8.228 |
| TOTAL | 5,916,800,379.678 | 100.000 |
| Garnett A. Smith |
| Affirmative | 5,416,275,471.636 | 91.541 |
| Withheld | 500,524,908.042 | 8.459 |
| TOTAL | 5,916,800,379.678 | 100.000 |
| David M. Thomas |
| Affirmative | 5,439,984,159.284 | 91.941 |
| Withheld | 476,816,220.393 | 8.059 |
| TOTAL | 5,916,800,379.678 | 100.000 |
| Susan Tomasky |
| Affirmative | 5,451,110,692.583 | 92.129 |
| Withheld | 465,689,687.095 | 7.871 |
| TOTAL | 5,916,800,379.678 | 100.000 |
| Michael E. Wiley |
| Affirmative | 5,426,567,139.987 | 91.715 |
| Withheld | 490,233,239.691 | 8.285 |
| TOTAL | 5,916,800,379.678 | 100.000 |
PROPOSAL 2
To convert a fundamental investment policy to a non-fundamental investment policy.
| | # of
Votes | % of
Votes |
| Affirmative | 1,764,135,821.660 | 71.792 |
| Against | 356,416,776.714 | 14.504 |
| Abstain | 251,138,906.429 | 10.220 |
| Broker Non-Vote | 85,610,933.600 | 3.484 |
| TOTAL | 2,457,302,438.403 | 100.000 |
PROPOSAL 5
A shareholder proposal to institute procedures to avoid holding investments in companies that contribute to genocide or crimes against humanity.
| | # of
Votes | % of
Votes |
| Affirmative | 756,549,264.071 | 30.788 |
| Against | 1,416,388,530.312 | 57.640 |
| Abstain | 198,070,667.271 | 8.060 |
| Broker Non-Vote | 86,293,976.750 | 3.512 |
| TOTAL | 2,457,302,438.403 | 100.000 |
| Proposal 1 reflects trust wide proposal and voting results. |
| Proposal 5 was not approved by shareholders. |
EII-ANN-0121
1.539196.123
Item 2.
Code of Ethics
As of the end of the period, November 30, 2020, Fidelity Financial Trust (the trust) has adopted a code of ethics, as defined in Item 2 of Form N-CSR, that applies to its President and Treasurer and its Chief Financial Officer. A copy of the code of ethics is filed as an exhibit to this Form N-CSR.
Item 3.
Audit Committee Financial Expert
The Board of Trustees of the trust has determined that Donald F. Donahue is an audit committee financial expert, as defined in Item 3 of Form N-CSR. Mr. Donahue is independent for purposes of Item 3 of Form N-CSR.
Item 4.
Principal Accountant Fees and Services
Fees and Services
The following table presents fees billed by PricewaterhouseCoopers LLP (“PwC”) in each of the last two fiscal years for services rendered to Fidelity Convertible Securities Fund, Fidelity Equity Dividend Income Fund, and Fidelity Independence Fund (the “Funds”):
Services Billed by PwC
November 30, 2020 FeesA
| | | | |
| Audit Fees | Audit-Related Fees | Tax Fees | All Other Fees |
Fidelity Convertible Securities Fund | $47,700 | $4,700 | $12,400 | $1,900 |
Fidelity Equity Dividend Income Fund | $46,900 | $4,600 | $11,800 | $1,800 |
Fidelity Independence Fund | $48,900 | $4,500 | $8,900 | $1,800 |
| | | | |
| Audit Fees | Audit-Related Fees | Tax Fees | All Other Fees |
Fidelity Convertible Securities Fund | $65,000 | $4,700 | $3,500 | $2,100 |
Fidelity Equity Dividend Income Fund | $56,000 | $4,600 | $6,200 | $2,000 |
Fidelity Independence Fund | $55,000 | $4,400 | $3,500 | $2,000 |
A Amounts may reflect rounding.
The following table(s) present(s) fees billed by PwC that were required to be approved by the Audit Committee for services that relate directly to the operations and financial reporting of the Fund(s) and that are rendered on behalf of Fidelity Management & Research Company LLC ("FMR") and entities controlling, controlled by, or under common control with FMR (not including any sub-adviser whose role is primarily portfolio management and is subcontracted with or overseen by another investment adviser) that provide ongoing services to the Fund(s) (“Fund Service Providers”):
Services Billed by PwC
| | |
| November 30, 2020A | November 30, 2019A |
Audit-Related Fees | $9,377,400 | $7,890,000 |
Tax Fees | $30,000 | $10,000 |
All Other Fees | $- | $- |
A Amounts may reflect rounding
“Audit-Related Fees” represent fees billed for assurance and related services that are reasonably related to the performance of the fund audit or the review of the fund's financial statements and that are not reported under Audit Fees.
“Tax Fees” represent fees billed for tax compliance, tax advice or tax planning that relate directly to the operations and financial reporting of the fund.
“All Other Fees” represent fees billed for services provided to the fund or Fund Service Provider, a significant portion of which are assurance related, that relate directly to the operations and financial reporting of the fund, excluding those services that are reported under Audit Fees, Audit-Related Fees or Tax Fees.
Assurance services must be performed by an independent public accountant.
* * *
The aggregate non-audit fees billed by PwC for services rendered to the Fund(s), FMR (not including any sub-adviser whose role is primarily portfolio management and is subcontracted with or overseen by another investment adviser), and any Fund Service Provider for each of the last two fiscal years of the Fund(s) are as follows:
| | |
Billed By | November 30, 2020A | November 30, 2019A |
PwC | $14,534,700 | $12,575,000 |
A Amounts may reflect rounding.
The trust's Audit Committee has considered non-audit services that were not pre-approved that were provided by PwC to Fund Service Providers to be compatible with maintaining the independence of PwC in its(their) audit of the Fund(s), taking into account representations from PwC, in accordance with Public Company Accounting Oversight Board rules, regarding its independence from the Fund(s) and its(their) related entities and FMR’s review of the appropriateness and permissibility under applicable law of such non-audit services prior to their provision to the Fund(s) Service Providers.
Audit Committee Pre-Approval Policies and Procedures
The trust’s Audit Committee must pre-approve all audit and non-audit services provided by a fund’s independent registered public accounting firm relating to the operations or financial reporting of the fund. Prior to the commencement of any audit or non-audit services to a fund, the Audit Committee reviews the services to determine whether they are appropriate and permissible under applicable law.
The Audit Committee has adopted policies and procedures to, among other purposes, provide a framework for the Committee’s consideration of non-audit services by the audit firms that audit the Fidelity funds. The policies and procedures require that any non-audit service provided by a fund audit firm to a Fidelity fund and any non-audit service provided by a fund auditor to a Fund Service Provider that relates directly to the operations and financial reporting of a Fidelity fund (“Covered Service”) are subject to approval by the Audit Committee before such service is provided.
All Covered Services must be approved in advance of provision of the service either: (i) by formal resolution of the Audit Committee, or (ii) by oral or written approval of the service by the Chair of the Audit Committee (or if the Chair is unavailable, such other member of the Audit Committee as may be designated by the Chair to act in the Chair’s absence). The approval contemplated by (ii) above is permitted where the Treasurer determines that action on such an engagement is necessary before the next meeting of the Audit Committee.
Non-audit services provided by a fund audit firm to a Fund Service Provider that do not relate directly to the operations and financial reporting of a Fidelity fund are reported to the Audit Committee periodically.
Non-Audit Services Approved Pursuant to Rule 2-01(c)(7)(i)(C) and (ii) of Regulation S-X (“De Minimis Exception”)
There were no non-audit services approved or required to be approved by the Audit Committee pursuant to the De Minimis Exception during the Fund’s(s’) last two fiscal
years relating to services provided to (i) the Fund(s) or (ii) any Fund Service Provider that relate directly to the operations and financial reporting of the Fund(s).
Item 5.
Audit Committee of Listed Registrants
Not applicable.
Item 6.
Investments
(a)
Not applicable.
(b)
Not applicable.
Item 7.
Disclosure of Proxy Voting Policies and Procedures for Closed-End Management Investment Companies
Not applicable.
Item 8.
Portfolio Managers of Closed-End Management Investment Companies
Not applicable.
Item 9.
Purchase of Equity Securities by Closed-End Management Investment Company and Affiliated Purchasers
Not applicable.
Item 10.
Submission of Matters to a Vote of Security Holders
There were no material changes to the procedures by which shareholders may recommend nominees to the trust’s Board of Trustees.
Item 11.
Controls and Procedures
(a)(i) The President and Treasurer and the Chief Financial Officer have concluded that the trust’s disclosure controls and procedures (as defined in Rule 30a-3(c) under the Investment Company Act) provide reasonable assurances that material information relating to the trust is made known to them by the appropriate persons, based on their evaluation of these controls and procedures as of a date within 90 days of the filing date of this report.
(a)(ii) There was no change in the trust’s internal control over financial reporting (as defined in Rule 30a-3(d) under the Investment Company Act) that occurred during the period covered by this report that has materially affected, or is reasonably likely to materially affect, the trust’s internal control over financial reporting.
Item 12.
Disclosure of Securities Lending Activities for Closed-End Management
Investment Companies
Not applicable.
Item 13.
Exhibits
SIGNATURES
Pursuant to the requirements of the Securities Exchange Act of 1934 and the Investment Company Act of 1940, the registrant has duly caused this report to be signed on its behalf by the undersigned, thereunto duly authorized.
Fidelity Financial Trust
| |
By: | /s/Stacie M. Smith |
| Stacie M. Smith |
| President and Treasurer |
|
|
Date: | January 22, 2021 |
Pursuant to the requirements of the Securities Exchange Act of 1934 and the Investment Company Act of 1940, this report has been signed below by the following persons on behalf of the registrant and in the capacities and on the dates indicated.
| |
By: | /s/Stacie M. Smith |
| Stacie M. Smith |
| President and Treasurer |
|
|
Date: | January 22, 2021 |
| |
By: | /s/John J. Burke III |
| John J. Burke III |
| Chief Financial Officer |
|
|
Date: | January 22, 2021 |