UNITED STATES
SECURITIES AND EXCHANGE COMMISSION
Washington, D.C. 20549
________________________
FORM 10-K
________________________
(Mark One)
| | | | | |
| ☑ | ANNUAL REPORT PURSUANT TO SECTION 13 OR 15(d) OF THE SECURITIES EXCHANGE ACT OF 1934 |
| | | | | |
| For the fiscal year ended December 31, 2024 |
| | | | | |
| o | TRANSITION REPORT PURSUANT TO SECTION 13 OR 15(d) OF THE SECURITIES EXCHANGE ACT OF 1934
For the transition period from ____________ to ____________ |
| | | | | |
| Commission File Number: 001-00395 |
________________________
NCR VOYIX CORPORATION
(Exact name of registrant as specified in its charter)
________________________
| | | | | | | | |
| Maryland | | 31-0387920 |
(State or other jurisdiction of
incorporation or organization) | | (I.R.S. Employer
Identification No.) |
864 Spring Street NW
Atlanta, GA 30308
(Address of principal executive offices) (Zip Code)
Registrant’s telephone number, including area code: (800) 225-5627
Securities registered pursuant to Section 12(b) of the Act:
| | | | | | | | |
| Title of each class | Trading Symbol(s) | Name of each exchange on which registered |
| Common Stock, par value $0.01 per share | VYX | New York Stock Exchange |
Securities registered pursuant to Section 12(g) of the Act: None
________________________
Indicate by check mark if the registrant is a well-known seasoned issuer, as defined in Rule 405 of the Securities Act. Yes þ No o
Indicate by check mark if the registrant is not required to file reports pursuant to Section 13 or Section 15(d) of the Act. Yes o No þ
Indicate by check mark whether the registrant (1) has filed all reports required to be filed by Section 13 or 15(d) of the Securities Exchange Act of 1934 during the preceding 12 months (or for such shorter period that the registrant was required to file such reports), and (2) has been subject to such filing requirements for the past 90 days. Yes þ No o
Indicate by check mark whether the registrant has submitted electronically every Interactive Data File required to be submitted pursuant to Rule 405 of Regulation S-T (§ 232.405 of this chapter) during the preceding 12 months (or for such shorter period that the registrant was required to submit such files). Yes þ No o
Indicate by check mark whether the registrant is a large accelerated filer, an accelerated filer, a non-accelerated filer, a smaller reporting company, or an emerging growth company. See the definitions of “large accelerated filer,” “accelerated filer,” “smaller reporting company,” and “emerging growth company” in Rule 12b-2 of the Exchange Act.
| | | | | | | | | | | | | | | | | |
| Large accelerated filer | þ | | | Accelerated filer | o |
| Non-accelerated filer | o | | | Smaller reporting company | o |
| | | | Emerging growth company | o |
If an emerging growth company, indicate by check mark if the registrant has elected not to use the extended transition period for complying with any new or revised financial accounting standards provided pursuant to Section 13(a) of the Exchange Act. o
Indicate by check mark whether the registrant has filed a report on and attestation to its management’s assessment of the effectiveness of its internal control over financial reporting under Section 404(b) of the Sarbanes-Oxley Act (15 U.S.C. 7262(b)) by the registered public accounting firm that prepared or issued its audit report. þ
If securities are registered pursuant to Section 12(b) of the Act, indicate by check mark whether the financial statements of the registrant included in the filing reflect the correction of an error to previously issued financial statements. o
Indicate by check mark whether any of those error corrections are restatements that required a recovery analysis of incentive-based compensation received by any of the registrant’s executive officers during the relevant recovery period pursuant to §240.10D-1(b). o
Indicate by check mark whether the registrant is a shell company (as defined in Rule 12b-2 of the Act). Yes ☐ No þ
The aggregate market value of voting and non-voting common equity held by non-affiliates of the registrant as of June 30, 2024, the last business day of NCR Voyix Corporation’s most recently completed second fiscal quarter, was approximately $1.8 billion.
As of February 21, 2025, there were 138,882,586 shares of common stock issued and outstanding.
DOCUMENTS INCORPORATED BY REFERENCE
| | | | | |
| Part III: | Portions of the Registrant’s Definitive Proxy Statement for its Annual Meeting of Stockholders to be filed pursuant to Regulation 14A within 120 days after the Registrant’s fiscal year end of December 31, 2024 are incorporated by reference into Part III of this Report. |
TABLE OF CONTENTS
| | | | | | | | |
| | |
| Item | Description | Page |
| | |
| | |
| | |
| PART I | |
| 1. | | |
| 1A. | | |
| 1B. | | |
| 1C. | | |
| 2. | | |
| 3. | | |
| 4. | | |
| | |
| PART II | |
| | |
| 5. | | |
| 6. | | |
| 7. | | |
| 7A. | | |
| 8. | | |
| | |
| 9. | | |
| 9A. | | |
| 9B. | | |
| 9C. | | |
| | |
| PART III | |
| | |
| 10. | | |
| 11. | | |
| 12. | | |
| 13. | | |
| 14. | | |
| | |
| PART IV | |
| | |
| 15. | | |
| 16. | | |
This Report contains trademarks, service marks and registered marks of NCR Voyix Corporation and its subsidiaries, and of other companies, as indicated. Unless otherwise indicated, the terms “NCR Voyix,” “NCR,” the “Company,” “we,” “us,” and “our” refer to NCR Voyix Corporation and its subsidiaries.
CAUTIONARY NOTICE REGARDING FORWARD-LOOKING STATEMENTS
This Annual Report on Form 10-K contains “forward-looking statements” within the meaning of Section 27A of the Securities Act of 1933, as amended, and Section 21E of the Securities Exchange Act of 1934, as amended, pursuant to the safe harbor provisions of the Private Securities Litigation Reform Act of 1995 (the “Act”). Forward-looking statements use words such as “expect,” “anticipate,” “outlook,” “intend,” “plan,” “confident,” “believe,” “will,” “should,” “would,” “potential,” “positioning,” “proposed,” “planned,” “objective,” “likely,” “could,” “may,” and words of similar meaning, as well as other words or expressions referencing future events, conditions or circumstances. We intend these forward-looking statements to be covered by the safe harbor provisions for forward-looking statements contained in the Act. Statements that describe or relate to the Company’s plans, goals, intentions, strategies, or financial outlook, and statements that do not relate to historical or current fact, are examples of forward-looking statements. Examples of forward-looking statements in this Annual Report include, without limitation, statements regarding: the Company’s plans, strategies or objectives for future operations; expectations regarding the Digital Banking Sale and the Hardware Business Transition, including, but not limited to, statements regarding the results of the future commercial or financial performance of the Company following such transactions and value creation and the ability to innovate and drive growth generally as a result of such transactions; the estimated or anticipated future results and benefits of the Company’s plans and operations; the Company’s expectations of demand for its solutions and the impact thereof on the Company’s financial results in 2025; the Company’s ability to deliver increased value to customers and stockholders; and statements regarding the spin-off of NCR Atleos. Forward-looking statements are based on our current beliefs, expectations and assumptions, which may not prove to be accurate, and involve a number of known and unknown risks and uncertainties, many of which are out of the Company’s control. Forward-looking statements are not guarantees of future performance, and there are a number of important factors that could cause actual outcomes and results to differ materially from the results contemplated by such forward-looking statements, including those factors relating to:
•Strategy: challenges associated with successfully executing our growth strategy, including our ability to attract new customers, increase use of our platform by existing customers and cross-sell additional products and solutions; development and introduction of new, competitive solutions on a timely, cost-effective basis; our ability to maintain a consistently high level of customer service; our ability to successfully manage our profitability and cost reduction initiatives; our strategic relationships with third parties; integration of acquisitions and management of other strategic transactions; any unforeseen liabilities resulting from the sale of our digital banking business; the anticipated cost savings or other benefits related to the transition of our hardware business to an outsourced design and manufacturing business model may not be realized on a timely basis or at all;
•Business Operations: our ability to compete effectively against new and existing competitors; disruptions in our data center hosting and public cloud facilities; defects, errors, installation difficulties or development delays; difficulties and risks associated with developing and selling complex new solutions and enhancements, including those using artificial intelligence; our reliance on the availability of third-party licenses; changes in U.S. or foreign trade policies; domestic and global economic conditions; any failures or delays in our efforts to modernize our information technology infrastructure; retention and attraction of key employees; failure of third-party suppliers; uncertainties regarding regulations, lawsuits and other related matters; risks and uncertainties associated with our payments-related business; changes to our tax rates and additional income tax liabilities; risks associated with our international business operations; our risk management efforts; a major natural disaster or catastrophic event; geopolitical and macroeconomic challenges or events or acts of terrorism; environmental exposures from historical manufacturing activities;
•Spin-Off of NCR Atleos: any unforeseen tax liabilities or impacts resulting from the spin-off; requests, requirements or penalties imposed by any governmental authorities related to certain existing liabilities;
•Cybersecurity, Data Privacy & Intellectual Property: the impact of cybersecurity incidents on our business and efforts to prevent or mitigate such incidents and any related impacts on our operations; efforts to comply with applicable data protection and data privacy laws; protection of our intellectual property; allegations or claims by third parties that our products or services infringe on intellectual property rights of others, including claims against our customers and claims by our customers to defend and indemnify them with respect to such claims;
•Finance and Accounting: our level of indebtedness; the terms governing our indebtedness; incurrence of additional debt or other liabilities or obligations; our cash flow sufficiency to service our indebtedness; the impact of certain changes in control relating to acceleration of our indebtedness, our obligations under other financing arrangements, or required repurchase of our senior unsecured notes; any lowering or withdrawal of the ratings assigned to our debt securities by rating agencies; unforeseen tax liabilities or changes in tax law; our failure to maintain effective internal control over financial reporting and disclosure controls and procedures and our ability to remediate material weaknesses in our internal control over financial reporting;
•Governance: rights, preferences and privileges of our Series A Convertible Preferred (“Series A”) stockholders compared to the rights of our common stockholders; the impact of the terms of our Series A stock relating to voting power, share
dilution and market price of our common stock; and actions or proposals from stockholders that do not align with our business strategies or the interests of our other stockholders.
Should one or more of these risks or uncertainties materialize, or should underlying assumptions prove incorrect, actual results may vary materially from those set forth in the forward-looking statements. Additional information concerning these and other factors can be found in the Company’s filings with the U.S. Securities and Exchange Commission, including this annual report on Form 10-K, quarterly reports on Form 10-Q and current reports on Form 8-K. Any forward-looking statement speaks only as of the date on which it is made. The Company does not undertake any obligation to publicly update or revise any forward-looking statements, whether as a result of new information, future events or otherwise, except as required by law.
PART I
Unless the context indicates otherwise, references in this report to “we,” “us,” “our,” the “Company,” and “NCR Voyix” mean NCR Voyix Corporation and its consolidated subsidiaries and references to “NCR Atleos” mean NCR Atleos Corporation and NCR Atleos’s consolidated subsidiaries.
Item 1. BUSINESS
General
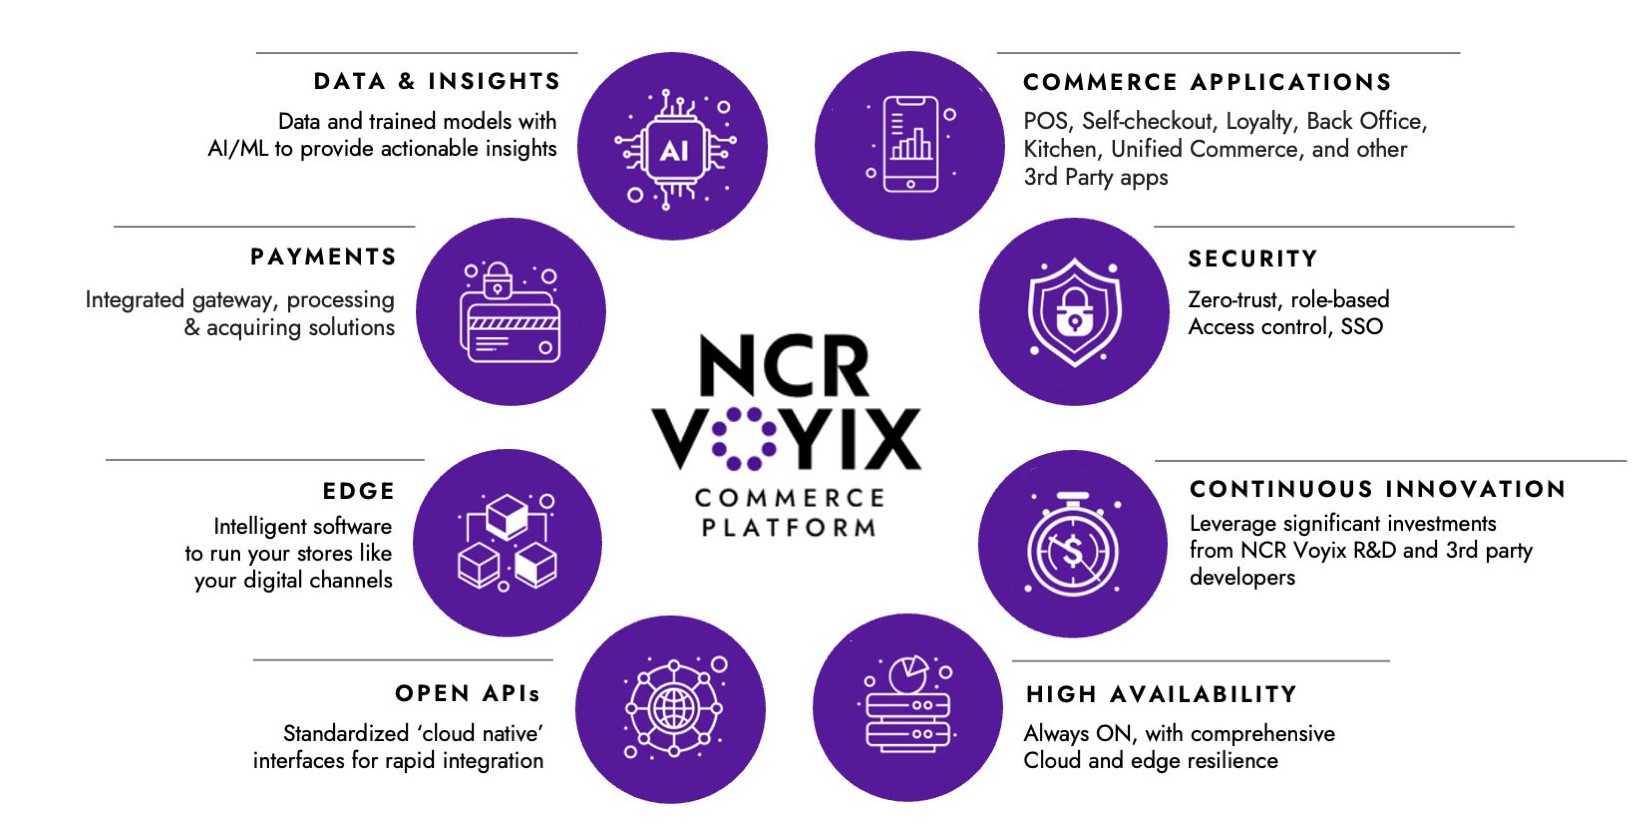
NCR Voyix is a leading global provider of digital commerce solutions for retail stores and restaurants. Headquartered in Atlanta, Georgia with approximately 14,000 employees across 30 countries, we are a software and services-led technology provider of run-the-store and digital channel capabilities for retail and restaurants, serving businesses of all sizes. Our platform, which runs in the cloud and includes microservices and application programming interfaces (“APIs”) that integrate with our customers’ systems, combines with our services and hardware offerings to enable end-to-end technology-based capabilities for our customers. Our offerings include platform-based software and services for retailers and restaurants, as well as payment acceptance solutions, multi-vendor connected device services, self-checkout (“SCO”) kiosks and related technologies, along with other self-service technologies. Our solutions are designed to meet the unique needs of retailers and restaurants, ranging from small and medium-sized businesses to multinational enterprises, enabling them to seamlessly transact and engage with their end customers while driving efficiencies within their operations.
On October 16, 2023, we completed the spin-off of our ATM-focused business, which included our self-service banking, payments & network and telecommunications and technology businesses, into an independent publicly traded company, NCR Atleos Corporation (“NCR Atleos”), which was effected through a pro rata distribution of all outstanding shares of NCR Atleos common stock to holders of the Company’s common stock as of the close of business on October 2, 2023 (such transaction, the “Spin-Off”). In connection with the Spin-Off, the Company changed its name from NCR Corporation to NCR Voyix Corporation and our common stock began trading on the New York Stock Exchange under the stock symbol “VYX” on October 17, 2023. The Company retains no ownership interest in NCR Atleos. The historical financial results of NCR Atleos are reflected as discontinued operations in the Company’s consolidated financial statements.
On September 30, 2024, we completed the sale of our Digital Banking segment businesses (the “Digital Banking Sale”) to an affiliate of The Veritas Capital Fund VIII, L.P. (the “Buyer”). The purchase price for the transaction was $2.45 billion in cash, subject to a post-closing adjustment, as well as contingent consideration of up to an additional $100 million in cash upon the achievement of a specified return on the Buyer’s invested capital at the time of any future sale. The historical financial results of the Digital Banking segment businesses are reflected as discontinued operations in the Company’s consolidated financial statements.
On August 6, 2024, we announced our entry into a commercial agreement with Ennoconn Corporation (“Ennoconn”) to transition our self-checkout and point-of-sale hardware businesses to an outsourced design and manufacturing model, including the sale of certain assets relating to these businesses (the “Hardware Business Transition”). Under the terms of the agreement, Ennoconn will design, manufacture, warrant, supply, and ship self-checkout and point-of sale hardware directly to our customers and we will sell hardware to our customers as a sales agent for Ennoconn and continue to provide our point-of sale and self-checkout software as well as key support and maintenance services. As a result of the Hardware Business Transition, we expect to record commission revenue from point-of-sale and self-checkout hardware sales as an agent for Ennoconn on a net basis, excluding the costs paid to Ennoconn. We are working with Ennoconn to implement the new hardware model, including the migration of aspects of our hardware business, and we expect the Hardware Business Transition to become effective during 2025.
Operating Segments
Prior to the Spin-Off, the Company managed and reported operations in the following segments: Retail, Hospitality, Digital Banking, Payments & Network, and Self-Service Banking. Subsequent to the Spin-Off, the Company managed and reported operations in three reportable segments – Retail, Restaurants (formerly reported as Hospitality), and Digital Banking. Following the Digital Banking Sale, the Company manages and reports operations in two reportable segments – Retail and Restaurants.
•Retail - Our Retail segment is focused on serving enterprise and mid-market retailers across the Convenience Fuel Retail, Food Drug Mass Merchant (“FDMM”), and Department Specialty Retail industries. Our FDMM customers include grocery stores, drug stores, and big box retailers. We offer end-to-end software, services and hardware solutions that meet the unique needs of retailers, depending on the size of their establishment and the industry in which they operate, ultimately driving operational efficiency, elevated customer experiences and enhanced service levels.
•Restaurants - Our Restaurants segment is focused on serving restaurants and food service establishments of all sizes, including quick service, table service and fast casual restaurants. Our restaurant software solutions, including our platform and related technology, are designed to streamline order and transaction processing, increase consumer engagement, increase kitchen productivity, and reduce operating costs. Our end-to-end service offerings further support restaurant operations and differentiate us within the market.
Corporate and Other includes income and expenses related to corporate functions that are not specifically attributable to any of our two individual reportable segments. In addition, Corporate and Other includes certain non-strategic businesses that are considered immaterial operating segment(s) and certain legacy ATM operations in foreign countries that are expected to transfer to NCR Atleos in 2025, as well as commercial agreements with NCR Atleos.
Following the strategic actions executed by the Company in 2024 to improve the balance sheet, streamline operations and improve cash flows, we are now focused on driving subscription-based (recurring) revenue and earnings growth through converting existing software customers to our platform and expanding their use of our proprietary cloud solutions, managed services and attached payment solutions, as well as signing new software and services customers to our platform. Our strategy is built on the following key pillars:
•Focus on our customer needs. We encourage our employees to treat every customer as if they are our only customer. If we provide superior service and quality products than our competitors, we believe that our customers will be more likely to buy more from NCR Voyix. We act as strategic advisors to our customers, helping them reshape and reinvent their business. This customer focus leads to increased access to higher level customer contacts, earlier entrance into the sales cycles, and additional opportunities for upselling and cross-selling software, services and payments to our existing customer base. Our customer engagement teams consult with our clients to identify their most urgent business needs and to develop ROI-driven models with targeted delivery of additional software solutions or services for both new and existing customers.
•Leverage our brand (and global distribution) to enhance our go-to-market. Following the Spin-Off, we rebranded from NCR to NCR Voyix, leveraging one of the best-known and respected brands in the industries we serve. We bring over 140 years of experience across restaurants and retail, and our brand represents our industry-specific expertise and longevity as enterprise technology experts. We invest in our brand and go-to-market strategies with software-as-a-service (“SaaS”) and packaging solutions as all-in-one bundles designed around our platform, making it easier for our customers to buy and for our teams to sell. These investments enable us to maintain our strong competitive differentiation and significant equity in the global markets in which we operate.
•Invest in innovative products and leading managed services. We invest in research and development to bring new solutions to market and elevate product quality and to enhance our platform, which enables our next-generation architecture, including our unique cloud-based point-of-sale and self-checkout solutions, and our bundled software solutions. Customer needs drive the investment in innovative proprietary solutions and partner integrations. We also invest in our broad services offering including 24/7 service desks and hardware maintenance and installation, to provide both remote and on-site support throughout the year, including during critical holiday periods.
•Allocate our capital strategically through a cost-disciplined approach to operations. We prioritize the allocation of capital to the prospects that provide the best opportunities to attract and retain customers, deliver long-term growth for the company and deliver strategic value for shareholders. Based on our strategy, we will prioritize maintaining a stable leverage ratio with ample liquidity, investments in our platform and related next-generation technology, and the repurchase of stock, including our Series A Convertible Preferred Stock and common stock. We may also pursue acquisitions and/or divestitures. Similarly, we seek to be disciplined in our cost management through ongoing initiatives that benefit both our long-term relationships with our customers as well as our profitability targets through streamlining and simplifying our product offering, increasing process automation and workforce optimization.
Products and Services
Platform & Edge
•Platform. Our cloud-native API platform powers an integrated in-store and digital solution for retail and restaurant customers. Our highly reliable and secure platform enables our customers to easily and efficiently manage their technology stacks, use data for more effective decision making, reduce the cost of IT efforts, and rapidly innovate and test new technology. Designed to drive digital transformation and innovation at scale for retailers and restaurants, our platform provides our customers:
◦A robust set of NCR Voyix software applications that are designed to be omnichannel and POS agnostic;
◦A single source and access point for all operational data including real time transaction data;
◦System integration across their entire in-store and digital technology stack including third parties; and
◦Software components and APIs to more efficiently power and integrate their own software development efforts.
•Edge. Edge is a modern software infrastructure for in-store applications (e.g POS, SCO). Edge enables retailers to run applications in physical stores with the agility and insight of digital channels. Retailers can make software changes across their estate in response to market and shopper behavior at a faster pace with lower cost. Edge replaces traditional operating systems such as Microsoft Windows running on POS or SCO devices, using open container standards, and creates a zero-trust security environment. As well as critical systems such as POS, SCO and Kiosk, Edge is an enabler of network intensive applications on store servers, such as high bandwidth video analytics, AI, and real time fraud detection.
Front-of-store Solutions
•Point-of-sale (POS). Our unified cloud-based and hybrid cloud point-of-sale software solutions enables both front and back-of-house capabilities for our retailers and restaurants of all sizes, ranging from small- and medium-sized businesses to international and multinational enterprises. We offer a consistent experience across all touch points of a restaurant or retail store, including operations, customer experience, staff and employee management, no matter how restaurants and retailers choose to engage with consumers, allowing restaurants and retailers to simultaneously drive operational efficiencies, increase profitability, and elevate the guest experience.
•Self-checkout (SCO). Our self-checkout solutions, including our next-generation technology, enable retail guests to transact independently, reducing the staff required for traditional processes. Our self-checkout technology integrates bar code scanning, computer vision, RFID and more to reduce shopper friction and improve the guest experience. We offer self-
checkout for standalone units or in a hybrid modality, allowing retailers to pivot quickly between assisted and self-checkout lanes or cash and cashless lanes, depending on their store needs.
Back-Office Solutions
•Payments. We offer secure payment acceptance solutions, including gateway, processing and acquiring, to enable restaurants and retailers to accept electronic payments online and at the physical point-of-sale.
•Data & Analytics. We offer an analytics platform that provides our customers with meaningful, near real-time insights to improve efficiency and decision-making. It features a streamlined, cloud-native data pipeline designed to reduce processing time and transmission failures. Additionally, our platform includes cloud-native monitoring and alert capabilities, as well as scaling and resource management. Our platform enables analytics and reporting, data visualization, mobile readiness, seamless integration, and customization.
•Inventory. Our inventory solutions allow restaurants and retailers to measure, control and reduce expenses, and increase profitability. These solutions use both trends and delivery schedules to recommend purchases, negotiate contract pricing and streamline communications with suppliers, taking the guesswork out of ordering, and solution data.
•Scheduling & Labor Management. Our scheduling and labor management solutions help restaurants and retailers manage employees efficiently, with summary reports, easy-to-read, interactive schedules, mobile scheduling notifications and custom payroll data. Our operational intelligence features can improve employee productivity and enable our customers to forecast future accurately while enforcing company labor standards.
Digital Channel
•Online Ordering. We offer the infrastructure and pre-built componentry on our platform that enables restaurants to build their own web and digital applications to own the consumer experience and collect crucial data points that help improve guest satisfaction. Additionally, restaurants can offer direct ordering for curbside pickup and delivery, enable guests to order and pay on their own devices using QR codes in the restaurant, and create specific menus for dine-in, pickup and delivery to manage volume and streamline orders.
•Digital and Mobile Applications. We offer white-labeled websites and mobile applications to retailers and restaurants that allow them to own their guest relationships and integrate with NCR Voyix systems for an efficient and consistent guest experience across the physical and digital channels.
Marketing & Loyalty
•Consumer Marketing. NCR Voyix Consumer Marketing solution integrates data management, loyalty, campaign management, reporting and insights, mobile and email capabilities, enabling retailers and restaurants to elevate the guest experience and transform their brands. Enriched and continuously informed by data, the NCR Voyix Consumer Marketing solution allows users to optimize and automate marketing campaigns, focus marketing efforts on high value customers and unify store data to drive loyalty and revenue.
Add on Solutions
•Partner Ecosystem. Our partner ecosystem allows restaurants and retailers to connect their proprietary systems and third-party services to our platform through partnerships and the use of open APIs. Our customers have access to our solution partners when connected to our platform, allowing them to leverage a rich suite of add-on applications to drive increased consumer engagement. Our key solution partners’ business areas include pharmacy, shrink management, digital coupons, digital commerce and third-party delivery services.
•Aloha Kiosk. Our self-service kiosk solutions enable restaurant guests to place orders independently, allowing guests to control their dining experience and reducing the staff required for traditional order-taking and checkout processes. The Aloha Kiosk solution enables restaurants to enhance the in-store ordering process, reduce labor expenses and drive operational efficiency.
•Aloha Pay-at-Table. Aloha Pay-at-Table dramatically improves operations for all restaurant team members, from servers to accounting personnel. With Aloha Pay-at-Table restaurant guests can split and pay their checks, add customized tips and rate their service - all by just scanning a QR code at the table.
Services
•Professional Services. We work with our customers on the co-innovation and ongoing management of software solutions and related applications and operate their business processes. We offer software implementation, integration, localization and optimization services, to help restaurants and retailers transform operations, elevate the guest experience and maximize the value of their technology.
•Field Break-Fix Services. Our global field services team provides preventative maintenance and break fix services for our customer’s incidents that cannot be solved remotely by our customer support desk.
•Connected Service Desk: Our 24/7 customer support desk service delivers ITIL-based services for both NCR Voyix and non-NCR Voyix technology, providing a single point-of-contact for service desk needs. Our comprehensive system management solutions, which include incident management, problem management and change management, help customers increase technology availability and stability and manage in-store technology. Our approach is grounded on digitally connecting to our customers sites to enable high remote resolution.
•Restaurant Managed Services. We offer services within our Restaurant portfolio to manage the high frequency, volumes and complexity of menu options and pricing changes for our customers across their locations.
•Installation Services. Our global field services team installs both software and hardware at our customers’ sites including both NCR Voyix branded hardware and non-NCR Voyix hardware.
Hardware
•Point-of-Sale hardware: We offer restaurants and retailers fixed and mobile point-of-sale and consumer display terminals, that are durable and high functioning, scalable and easily integrated.
•Self-Checkout hardware: Our self-checkout hardware is flexible and configurable to fit retailers’ store needs and deliver the frictionless experience their guests expect. Retailers can choose from card-only machines, machines that support cash transactions, tabletop devices, or full-function hardware, depending on their specific store needs.
•In-store peripherals: We offer in-store peripherals, including kiosks, kitchen display systems, printers and ordering kiosks. We also partner with third parties to deliver payment devices, enabling us to provide restaurants and retailers with a comprehensive end-to-end solution.
Sales and Marketing
Leveraging our brand recognition and our global distribution network, we target both new and existing customers representing a wide variety of sizes, industries and geographies. We make strategic investments in new products, capabilities and market-leading services to maintain the competitiveness of our offering. We have established a strong network of direct sales and indirect channel relationships, such as value-added resellers and systems integrators, that leverages our market-leading products and services to drive growth.
Competition
We compete with a diverse array of companies in the retail and restaurants industries in which we sell our portfolio of software, services, payments and hardware solutions. The competitive landscape varies by geographic area where we operate around the world, but common factors include product value and quality, total cost of ownership, industry expertise, end-to-end solution support, system integration capabilities, strategic alignment with the customers and service quality.
We face a variety of competitors across all geographies in which we operate. Our competitors vary by market segment, product, service offering and geographic area. Key competitors include Aptos, Inc., Block Inc., Diebold Nixdorf, Inc., Fiserv Inc., Flooid, Fujitsu Limited, GK Software SE, Global Payments Inc., HP Inc., Lightspeed, Olo Inc., Oracle Corporation, PAR Technology Corporation, SAP SE, Toast, Inc., Toshiba Tec Corporation, among others. We also compete with certain global enterprise technology companies including IBM Corporation and CompuCom to provide technology and support services.
Research and Development
We remain focused on designing and developing solutions that anticipate our customers’ evolving needs and consumer preferences. Our expenses for research and development were $157 million in 2024, $139 million in 2023, and $116 million in 2022. We anticipate that we will continue to have significant research and development expenditures in the future to provide a continuing flow of innovative, high-quality products and services and to help maintain and enhance our competitive position. Information regarding
the accounting and costs included in research and development activities is included in Note 1, “Basis of Presentation and Significant Accounting Policies”, of the Notes to Consolidated Financial Statements in Item 8 of Part II of this Report under “Research and Development Costs,” and is incorporated herein by reference.
Intellectual Property
We seek patent protection for our innovations, especially those related to our software, services, products and solutions, where such protection is likely to provide meaningful value to us. We own approximately 875 patents in the United States and many other patents in foreign countries. Our foreign patents are generally counterparts of our U.S. patents. We also have many patent applications pending in the United States and in foreign countries. Our portfolio of patents and patent applications is of significant value to us. As appropriate, we look to drive additional value from our patent portfolio.
We have registered and unregistered trademarks, including service marks, in the United States and in foreign countries. We consider our “NCR Voyix” trademarks, as well as our other trademarks, to have significant value to us. Loss of our right to use “NCR Voyix” or our “NCR Voyix” trademark or failure to register that trademark could be material.
We license intellectual property from third parties as we deem appropriate. We also license our intellectual property to others when, and to the extent, we consider doing so to be in our interest.
Seasonality
Our sales have been historically seasonal, with lower revenue in the first half and higher revenue in the second half of each year. Such seasonality, as well as recurring annual cash-related items also cause our working capital cash flow requirements to vary from quarter to quarter depending on variability in the volume, timing and mix of sales. In addition, revenue in the third month of each quarter is typically higher than in the first and second months. However, as we continue to transition our revenue mix towards more recurring software and services revenue, we expect that our sales will become more linear over time.
Supply
In most cases, there are a number of vendors providing the services and producing the parts and components that we utilize. However, there are some services and components that are purchased from single sources due to price, quality, technology or other reasons. In the past, we have been able to obtain an adequate supply of raw materials and components for virtually all materials used in the production process. We currently believe we have adequate resources of raw materials and components and that our portfolio of vendors providing services and producing parts has the resources and facilities to overcome most unforeseen interruptions of supply.
Historically, we have leveraged a network of third-party partners across the globe to manufacture our hardware products. Following the Hardware Business Transition, which we expect to complete during 2025, we will utilize Ennoconn as our single-source partner to supply and manufacture substantially all of our hardware products.
For additional information regarding the potential impact of these relationships on our business operations, and regarding sources and availability of raw materials, refer to the risks described under “If third-party suppliers upon which we rely to manufacture our products and to supply key components necessary for our products and services are not able to fulfill our needs, our ability to timely bring our products to market could be affected” in Part I, Item 1A of this Annual Report.
Products and Services Backlog
Backlog includes orders confirmed for products scheduled to be shipped, as well as certain professional and transaction services to be provided. Although we believe that the orders included in the backlog are firm commitments, we may allow some orders to be canceled by the customer without penalty. Even when penalties for cancellation are provided for in a customer contract, we may elect to permit cancellation of orders without penalty where we believe it is in our best interest to do so. Further, we have product revenue derived from term-based software license arrangements that include customer termination rights and services revenue that is recurring or transaction-based business and we do not measure backlog information for these types of transactions. Therefore, we do not believe that our backlog, as of any particular date, is necessarily indicative of revenue for any future period. However, backlog is included as a component of our remaining performance obligation to the extent we determine that the orders are non-cancelable. Refer to Note 1, “Basis of Presentation and Significant Accounting Policies”, of the Notes to Consolidated Financial Statements in Item 8 of Part II of this Report for additional information on remaining performance obligations.
Human Capital Management
The strength and talent of our workforce are critical to our success and we strive to attract, develop and retain personnel commensurate with the needs of our businesses. As of December 31, 2024, we had nearly 14,000 full-time employees worldwide, with approximately 27% in the Asia Pacific and Japan region; 40% in the Europe, Middle East and Africa regions; 4% in the Americas, excluding the United States; and 29% in the United States. We also engage consultants and contractors as needed to supplement our permanent workforce. We manage our workforce levels to align with our business strategy and management believes it has sufficient human capital to operate our businesses successfully. During fiscal 2024, our overall headcount decreased as we continued to execute on our strategy and improve organizational effectiveness.
We continuously invest in our workforce by seeking to create an inclusive environment where diversity is celebrated, and our employees feel valued and respected. We believe that providing a work environment based on respect, trust, and collaboration creates an exceptional employee experience where employees can bring their whole selves to work and thrive in their careers. We seek to include everyone, lead with empathy, and make our communities better.
We continue to review our policies, practices and programs to identify opportunities for new inclusive initiatives.
Our current initiatives in this space include the following:
•Development of diverse talent through sponsorship initiatives and targeted development
•Our targeted university diversity network to attract, hire, and grow diverse talent through key partnerships
•Continued funding and investment in our Business Resource Groups (“BRG”) through our BRG leadership council focused on global inclusion with the mission to inspire action that attracts, develops and retains top diverse talent and fosters an inclusive work environment
Government Regulation
We are subject to a variety of laws and regulations in the United States and other jurisdictions in which we operate or where our products or services are offered. Many of these regulations and laws are evolving and their applicability and scope, as interpreted by courts and regulators, remain uncertain. These regulations and laws involve a variety of matters, including privacy and information security, data and personal information protection, consumer protection laws, anti-corruption laws such as the United States Foreign Corrupt Practices Act and United Kingdom Bribery Act, employee matters, import and export controls, tax, and environmental sustainability (including climate change).
Any actual or perceived failure to comply with these requirements may result in, among other things, private litigation, regulatory or governmental investigations, administrative enforcement actions, sanctions, civil and criminal liability, monetary penalties, and constraints on our ability to continue to operate our businesses. It is also possible that current or future laws or regulations could be interpreted or applied in a manner that would prohibit, alter, or impair our existing offerings, or that could require costly, time-consuming, or otherwise burdensome compliance measures from us. As we continue to grow our business, additional laws, rules and regulations may become relevant. For additional information about government regulation and laws applicable to our business, refer to the risks described in Part I, Item 1A of this Annual Report.
Our historical manufacturing activities and operations are subject to a wide range of environmental protection laws and we have investigatory and remedial activities underway at a number of facilities that we currently own or formerly owned or operated, to comply, or to determine compliance, with such laws. A detailed discussion of the regulatory and remedial environmental protection actions that impact the Company, including estimates regarding the potential financial impact of these matters, particularly the Fox River and Kalamazoo River matters, is included in Item 8 of Part II of this Report as part of Note 11, “Commitments and Contingencies”, of the Notes to Consolidated Financial Statements and is incorporated herein by reference. Further information regarding the potential impact of compliance with environmental laws and regulations is also included in Part I, Item 1A of this Report.
Available Information
The Company makes available through its website at https://investor.ncrvoyix.com, free of charge, the reports it files with the Securities and Exchange Commission (the “SEC”), including its Annual Report on Form 10-K, Quarterly Reports on Form 10-Q, definitive proxy statements on Schedule 14A and Current Reports on Form 8-K, and all amendments to such reports and schedules, as soon as reasonably practicable after these reports are electronically filed or furnished to the SEC pursuant to Section 13(a) or 15(d) of the Securities Exchange Act of 1934 (the “Exchange Act”). The SEC also maintains a website (http://www.sec.gov) that contains the reports, proxy statements and information statements, and other information regarding issuers that file or furnish
electronically with the SEC. The Company will furnish, without charge to a security holder upon written request, the Notice of Meeting and Proxy Statement for the 2025 Annual Meeting of Stockholders (the 2025 Proxy Statement), portions of which are incorporated herein by reference.
Certain materials relating to our corporate governance, including our Code of Conduct applicable to our directors, senior financial officers and other employees, are also available on the corporate governance section of our website at https://www.ncrvoyix.com/company/corporate-governance. Copies of our filings, specified exhibits and corporate governance materials are also available, free of charge by calling or writing to:
NCR Voyix—Investor Relations
864 Spring Street NW
Atlanta, GA 30308
Phone: 800-225-5627
E-Mail: investor.relations@ncrvoyix.com
Website: https://investor.ncrvoyix.com
The Company’s website, www.ncrvoyix.com, contains a significant amount of information about the Company, including financial and other information for investors. NCR Voyix encourages investors to visit its website regularly, as information may be updated and new information may be posted at any time. The contents of the Company’s website are not incorporated by reference into this Form 10-K and shall not be deemed “filed” under the Exchange Act.
Item 1A. RISK FACTORS
The risks and uncertainties described below are certain of the risks and uncertainties facing our business. These risks and uncertainties, together with other risks and uncertainties not currently known or not currently deemed material, could materially and adversely affect our business, financial condition, results of operations, could cause actual results to differ materially from our expectations and projections, and could cause the market value of our stock to decline. You should consider these risk factors when reading the rest of this Annual Report on Form 10-K, including “Management’s Discussion and Analysis of Financial Condition and Results of Operations” and our financial statements and related notes included elsewhere in this document. These risk factors may not include all of the important factors that could affect our business or our industry or that could cause our future financial results to differ materially from historic or expected results or cause the market price of our common stock to fluctuate or decline.
RISK FACTOR SUMMARY
The following is a summary of certain risks and uncertainties that could materially and adversely affect our business, financial condition, and results of operations. You should read this summary together with the more detailed description of each risk factor contained below.
Risks Associated with our Strategy
•If we do not successfully execute our growth strategy, our operating results could be negatively impacted.
•If we do not successfully develop new solutions that achieve market acceptance and keep pace with technological developments, our business, results of operations and financial condition could be harmed.
•If we fail to maintain a consistently high level of customer service or if we fail to manage our reputation, our brand, business and financial results may be harmed.
•We may not achieve some or all of the expected benefits of our cost reduction initiatives and our operating results could be adversely affected.
•Our growth depends in part on the success of our strategic relationships with third parties and our ability to integrate with third-party applications and software.
•Our acquisitions, divestitures and other strategic transactions or future acquisitions may not produce anticipated results, which could have a material adverse effect on our business, financial condition or results of operations.
•We may be held liable to the buyer of our Digital Banking business if we fail to perform under our agreements and the performance of such services may negatively affect our business and operations.
•We may not realize the anticipated cost savings or other benefits related to the Hardware Business Transition on a timely basis or at all.
Risks Associated with the Spin-Off of NCR Atleos
•If the Spin-Off fails to qualify for tax-free treatment, it could result in substantial tax liability for us and our stockholders.
•We may be held liable to NCR Atleos if we fail to perform under our agreements with NCR Atleos, and the performance of such services may negatively affect our business and operations.
•Potential indemnification obligations to NCR Atleos or a refusal of NCR Atleos to indemnify us pursuant to agreements executed in the Spin-Off could materially adversely affect us.
Risks Related to Cybersecurity, Data Privacy and Intellectual Property
•Our inability to protect our systems and data from cybersecurity threats or other technological risks could adversely affect our business operations or stock price and damage our brand and reputation.
•We are subject to evolving global laws and regulations relating to data privacy, data protection and information security, which may require us to incur substantial compliance costs or harm our business operations.
•Our intellectual property is valuable and our inability to protect it could reduce the value of our products, services and brand and harm our competitive position.
•Claims by others that we infringe upon, misappropriate or otherwise violate their intellectual property or other proprietary technology could have a material and adverse effect on our business, results of operations and financial condition.
Risks Associated with our Business & Operations
•We face extensive competition in our markets and if we do not compete effectively, we may not be successful.
•Disruptions in our data center hosting and public cloud facilities could adversely affect our business.
•Defects, errors, installation difficulties or development delays could expose us to potential liability, harm our reputation and negatively impact our business.
•Our artificial intelligence capabilities may not operate as anticipated, which could adversely affect our reputation, revenues and profitability.
•We rely on the availability of third-party licenses, and our inability to maintain those licenses could harm our business.
•Changes in U.S. or foreign trade policies and other factors beyond our control may adversely impact our business and operating results.
•If we are unable to maintain and update our information technology systems to meet the needs of our business, our business could be adversely impacted.
•If we do not retain key employees, or if we are unable to recruit, develop and retain qualified employees, we may not be able to meet our business objectives.
•If third-party suppliers upon which we rely to manufacture our products and to supply key components necessary for our products and services are not able to fulfill our needs, our ability to timely bring our products to market could be affected.
•We face uncertainties with regard to regulations, lawsuits and other related matters.
•Our payments-related business subjects us to additional regulatory requirements and other risks and uncertainties that could be costly and difficult to comply with or that could harm our business.
•Changes to our tax rates and additional income tax liabilities could impact profitability.
•Our international operations subject us to additional risks that can adversely affect our business, financial condition and results of operations.
•Our risk management efforts may not be fully effective in mitigating our risk exposure, which could expose us to losses and liability and otherwise harm our business.
•A major natural disaster or catastrophic event could have a materially adverse effect on our business, financial condition and results of operations, or have other adverse consequences.
•Our historical manufacturing activities subject us to environmental exposures.
Risks Associated with our Finance & Accounting
•Our level of indebtedness could limit our financial and operating activities and adversely affect our ability to incur additional debt to fund future needs.
•The terms of the documents governing our indebtedness include financial and other covenants that could restrict or limit our financial and business operations.
•Despite our current levels of debt, we may still incur substantially more debt, including secured debt, and other liabilities, which would increase the risks described in these risk factors relating to indebtedness.
•If we are unable to continue to access or renew financing sources and obtain capital, our ability to maintain and grow our business may be impaired.
•Our cash flows may not be sufficient to service our indebtedness, and if we are unable to satisfy our obligations under our indebtedness, we may be required to seek other financing alternatives, which may not be successful.
•Certain changes in control may result in an acceleration of our indebtedness or our obligations under other financing arrangements, or may require us to repurchase our senior unsecured notes or our Series A Convertible Preferred Stock.
•A lowering or withdrawal of the ratings assigned to us or our debt securities by rating agencies may increase our future capital costs and reduce our access to capital.
•We may be required to write down the value of certain significant assets, which would adversely affect our operating results.
•Our failure to maintain effective internal control over financial reporting or our failure to remediate our material weaknesses in our internal control over financial reporting, could have a material adverse effect on our results of operations, financial condition and cash flows.
Risks Associated with our Governance
•Our Series A Convertible Preferred Stock has rights, preferences and privileges that are not held by, and are preferential to, the rights of our common stockholders, which could adversely affect our liquidity and financial condition, and may result in the interests of the holders of our Series A Convertible Preferred Stock differing from those of our common stockholders.
•The issuance of shares of our Series A Convertible Preferred Stock reduces the relative voting power of holders of our common stock, and the conversion and sale of those shares would dilute the ownership of such holders and may adversely affect the market price of our common stock.
•We could be subject to actions or proposals from stockholders that do not align with our business strategies or the interests of our other stockholders.
RISKS ASSOCIATED WITH OUR STRATEGY
If we do not successfully execute our growth strategy, our operating results could be negatively impacted. We have taken significant steps, including the Spin-Off of our ATM-focused business and the sale of our Digital Banking business, to transform the Company to a platform-led software and services provider for the retail and restaurant industries and have shifted our strategic focus
towards accelerating the adoption of our platform. Successful execution of our growth strategy depends on a number of different factors including, among others, our ability to convert existing customers to our platform and attract new customers; to develop and deploy new or enhanced software solutions and technologies; to facilitate adoption by our customers of our payment solutions; to expand our services capabilities and geographic coverage; to transform our services performance, capabilities and coverage to improve efficiency; to incorporate remote diagnostic and other technologies that align with and support our solutions; and to cross-sell additional products and services to our existing customer base.
In addition, we continue to pursue growth with small- and medium-sized and mid-market customers by increasing our use of indirect sales channels, and by developing, marketing and selling solutions aimed for such businesses. It is not yet certain whether these initiatives will yield the anticipated benefits, or whether our solutions will be compelling and attractive to small- and medium-sized businesses.
If we are not successful in attracting customers to our platform, expanding our customer base at the rate that we anticipate, or if the costs to complete these initiatives is higher than anticipated, we may not meet our growth and gross margin projections, and operating results could be negatively impacted.
If we do not successfully develop new solutions that achieve market acceptance and keep pace with technological developments, our business, results of operations and financial condition could be harmed. The retail and restaurant markets in which we compete are characterized by rapid technological advancement, increasingly sophisticated consumer needs and preferences, evolving security technology and industry standards, and frequent new product introductions and enhancements. Our success depends in part on our ability to develop new or sufficiently differentiated solutions and introduce enhancements to our product offerings on a timely and cost-effective basis. The development process for our solutions requires high levels of innovation from our product development teams as well as suppliers of the components embedded or incorporated in our solutions. To support our growth, we expect to continue to spend capital and may need to increase our capital expenditures to enhance our products and platform capabilities. In addition, certain of our solutions, including our cloud solutions, may require us to build, lease, expand, and maintain, infrastructure (such as hosting centers) to support them. The development process can be lengthy and costly, and requires us to commit a significant amount of resources to bring our business solutions to market. In addition, our success may be impacted by safety and security technology and industry standards. We may not be able to anticipate our customers’ needs and technological and industry trends accurately, or to complete development of new solutions efficiently. Further, once we have developed new solutions, if we cannot successfully market and sell those solutions, our business and operating results could be negatively impacted.
In addition, contract terms, market conditions or customer preferences may affect our ability to limit, sunset or end-of-life our older products in a timely or cost-effective fashion. We sometimes make assurances to customers regarding the operability and specifications of new technologies, and our results could be impacted if we are unable to deliver such technologies, or if such technologies do not perform as planned.
If we fail to maintain a consistently high level of customer service or if we fail to manage our reputation, our brand, business and financial results may be harmed. We believe our focus on customer service and support is critical to attract and onboard new customers, retain our existing customers and grow our business. If we are unable to maintain a consistently high level of customer service, including through our use of third-party service providers or by leveraging evolving technology such as artificial intelligence, our business may be negatively impacted. In addition, in order to maintain adequate levels of service, we may need to hire additional support personnel, which could increase our costs. Our sales are highly dependent on our business reputation and on positive recommendations from our existing customers. Any failure to maintain high-quality customer support, or a market perception that we do not maintain high-quality customer support, could adversely affect our reputation and brand, our ability to benefit from referrals by existing customers, our ability to cross-sell our products and services to existing and prospective customers, and our business, financial condition, or results of operations. In addition, certain of our customer agreements include service level commitments or milestones. If we fail to meet these contractual commitments, or if we suffer extended periods of unavailability for our solutions, we could face contract terminations or, as a result of such failures, pay damages or issue credits to our customers. Moreover, our failure to meet our commitments could result in customer dissatisfaction, reputational harm, or the loss of customers, and adversely affect our business and results of operations.
We may not achieve some or all of the expected benefits of our cost reduction initiatives and our operating results could be adversely affected. As part of our growth strategy, we have undertaken and may undertake in the future cost reduction actions in order to reduce costs. We may not obtain the anticipated cost savings or operational improvements or realize the benefits that were anticipated in connection with these initiatives within the projected timing or at all. Further, such benefits may be realized later than expected, and the difficulties in implementing these measures may be greater than anticipated, which could cause us to incur additional costs or result in business disruptions. Additionally, as a result of restructuring initiatives, we may experience a loss of continuity, loss of accumulated knowledge, loss of key employees and/or other retention issues or inefficiencies during transitional periods. Cost reduction initiatives can require a significant amount of time and focus, which may divert attention from operating and
growing our business. Moreover, projections of any cost savings or other benefits associated with our initiatives are based on a number of assumptions and subject to economic, competitive, and other uncertainties, some of which are beyond our control. If we are unable to execute these initiatives as planned, we may not realize all or any of the anticipated benefits, which could have an adverse effect on our business, financial condition, results of operations and cash flows.
Our growth depends in part on the success of our strategic relationships with third parties and our ability to integrate with third-party applications and software. The success of our platform depends, in part, on our ability to integrate third-party applications, software, and other offerings into our platform and we anticipate that the growth of our business will continue to depend on these third-party relationships, including relationships with ordering service providers, payment processors, loyalty providers, and other partners. Integrating third-party content and technology requires significant time and resources, and third-party providers may choose to change the economics of or terminate their relationships with us, to compete directly against us, to enter into exclusive arrangements with our competitors, or to make material changes to their businesses, solutions, or services that could be detrimental to our business. Third-party developers may change the features of their applications and software or alter the terms governing the use of their offerings in a manner that is adverse to us. We may also be unable to maintain our relationships with certain third parties if we are unable to integrate their offerings into our platform. In addition, third parties may refuse to partner with us or limit or restrict our access to their offerings. We may not be able to adapt to the data transfer requirements of third-party offerings. If we fail to integrate new third-party offerings into our platform that our customers need to operate their businesses, or to provide the proper support or ease of third-party integrations our customers require, we may lose business or be unable to compete. If we lose access to solutions or services from a particular partner, or experience a significant reduction or disruption in the supply of services from a current partner, it could have an adverse effect on our business and operating results.
Our acquisitions, divestitures and other strategic transactions or future acquisitions may not produce anticipated results, which could have a material adverse effect on our business, financial condition or results of operations. We have made and expect to continue to make acquisitions, divestitures and other strategic transactions to strengthen our business and grow our Company. For example, in October 2023 we completed the Spin-Off of NCR Atleos and in September 2024, we completed the sale of our Digital Banking segment. We may not be able to achieve the expected strategic, financial, operational, and other benefits from the Spin-Off or Digital Banking Sale, or such benefits may be delayed. We cannot predict with certainty when the benefits expected from the Spin-Off or Digital Banking Sale will occur or the extent to which they will be achieved, or that the costs or dis-synergies of the transactions will not exceed the anticipated amounts. Further, the impact of the divestitures (or other acquisitions or dispositions) on our financial performance may be larger than projected.
Following the Spin-Off and Digital Banking Sale, we are a smaller company with a less diversified product portfolio and a narrower business focus. As a result, we may be more vulnerable to changing market conditions and the other risks impacting our operations, which could materially and adversely affect our business, financial condition and results of operations.
In addition, we may continue to expand our business through acquisitions of complementary products and technologies. Acquisition transactions present significant challenges and risks, especially in light of a highly competitive market and industry consolidation, which may affect our ability to complete such transactions. If we are unable to complete strategic acquisitions or if such opportunities do not arise, our growth opportunities could be adversely affected. If such transactions are completed, the anticipated growth and other strategic objectives may not be fully realized or may take longer to realize than expected, and a variety of factors (such as business disruption, integration, talent loss, misallocation of resources and transaction costs, among others) may adversely affect any anticipated benefits from such transactions.
The failure of acquisitions, divestitures and other strategic transactions to perform or deliver results as expected could have a material adverse effect on our business, financial condition or results of operations.
We may be held liable to the Buyer of our former Digital Banking Business if we fail to perform under our agreements with the Buyer, and the performance of transition services to the Buyer may negatively affect our business and operations. In connection with the Digital Banking Sale, we and the Buyer entered into certain agreements, including a transition services agreement, providing for the performance of certain services by us for the benefit of the Buyer for a period of time after the Digital Banking Sale. If we do not satisfactorily perform our obligations under these agreements, we may be held liable for certain losses incurred by the Buyer. In addition, during the transition services period, our management and employees may be required to divert their attention away from our business in order to provide services to the Buyer, which could adversely impact our business.
Further, as a result of these transition services, our counterparty will have access to certain of our information technology systems and shared information technology infrastructure during the transition services period. Any disruption, degradation, destruction or manipulation of our information technology systems as a result of such access, whether accidental or intentional, may cause
cybersecurity, data protection or privacy incidents or failures, which could in turn interrupt or adversely impact our operations or our reputation.
We may not realize the anticipated cost savings or other benefits related to the transition of our Hardware Business to an outsourced design and manufacturing (ODM) model on a timely basis or at all. In August 2024, we announced our entry into a commercial agreement with Ennoconn Corp. (“Ennoconn”) to transition our point-of-sale and self-checkout hardware businesses to an outsourced design and manufacturing model (the “Hardware Business Transition”). We and Ennoconn are working to implement the Hardware Business Transition. We have experienced delays, and may experience additional unanticipated delays, in migrating certain aspects of our hardware business to Ennoconn. We expect the Hardware Business Transition to be completed in 2025; however, the Hardware Business Transition may not be implemented successfully or within the anticipated timeline. We anticipate that, once the Hardware Business Transition is implemented, we will record revenue from point-of-sale and self-checkout hardware sales on a net basis, excluding the costs paid to Ennoconn. Until the implementation of the Hardware Business Transition, the substantial majority of the revenue from our hardware business is attributable to point-of-sale and self-checkout hardware. Under our new business model following the Hardware Business Transition, a substantial majority of the revenue related to the sale of hardware will no longer be recognized by us and will instead be recognized by our counterparty. This will result in a substantial decrease to our hardware-related revenue and could have an adverse impact on our business and results of operations.
We also expect to reduce hardware-related costs in connection with the Hardware Business Transition. If we are unable to reduce costs in connection with the Hardware Business Transition or if the Hardware Business Transition has an adverse impact on our hardware sales or customer relationships, this could have an adverse impact on our future operating results and financial condition.
In addition, as a result of the Hardware Business Transition, a third party will design, manufacture, warrant, supply, and ship self-checkout and point-of sale hardware directly to our customers. If our counterparty fails to deliver on their commitments or otherwise breaches their obligations to our customers, our reputation and our relationship with our customers may be harmed which may adversely impact our results of operations and financial condition.
RISKS ASSOCIATED WITH THE SPIN-OFF OF NCR ATLEOS
If the Spin-Off fails to qualify for tax-free treatment, it could result in substantial tax liability for us and our stockholders. We received an opinion of counsel to the effect that, for U.S. federal income tax purposes, the Spin-Off qualifies for tax-free treatment under certain sections of the Internal Revenue Code. However, the opinion relies on certain facts, assumptions, representations and undertakings from us and NCR Atleos, including those regarding the past and future conduct of the companies’ respective businesses and other matters, and the opinion would not be valid if such assumptions, representations and undertakings were incorrect. Furthermore, the opinion is not binding on the Internal Revenue Service (“IRS”) or the courts. If the Spin-Off is determined to be taxable for U.S. federal income tax purposes, we and our stockholders that are subject to U.S. federal income tax could incur significant U.S. federal income tax liabilities. Even if the Spin-Off otherwise qualifies as a tax-free transaction, the distribution would be taxable to us (but not to our stockholders) in certain circumstances if future significant acquisitions of our stock or the stock of NCR Atleos are determined to be part of a plan or series of related transactions that included the Spin-Off. In this event, the resulting tax liability could be substantial. In connection with the Spin-Off, we entered into a Tax Matters Agreement with NCR Atleos, pursuant to which NCR Atleos agreed to not enter into any transaction that could cause the Spin-Off or any related transactions to be taxable to us without our consent and to indemnify us for any tax liability resulting from any such transaction. In addition, these potential tax liabilities may discourage, delay or prevent a change of control of us.
We may be held liable to NCR Atleos if we fail to perform under our agreements with NCR Atleos, and the performance of such services may negatively affect our business and operations. In connection with the Spin-Off, we and NCR Atleos entered into a separation and distribution agreement and various other agreements (including a transition services agreement, tax matters agreement, employee matters agreement, patent and technology cross-license agreement, trademark license and use agreement, master services agreement) that provide for the performance of certain services by each company for the benefit of the other for a period of time after the Spin-Off. If we do not satisfactorily perform our obligations under these agreements, we may be held liable for any resulting losses suffered by NCR Atleos, subject to certain limits. In addition, during the transition services periods under these agreements, our management and employees may be required to divert their attention away from our business in order to provide services to NCR Atleos, which could adversely affect our business.
Potential indemnification obligations to NCR Atleos or a refusal of NCR Atleos to indemnify us pursuant to agreements executed in the Spin-Off could materially adversely affect us. Pursuant to the separation and distribution agreement and certain other agreements we entered into with NCR Atleos in connection with the Spin-Off, the Company and NCR Atleos agree to indemnify the other for certain liabilities. The indemnities from NCR Atleos for our benefit may not be sufficient to protect us against the full amount of such liabilities, and NCR Atleos may not be able to fully satisfy its indemnification obligations.
Moreover, even if we ultimately succeed in recovering from NCR Atleos any amounts for which we are held liable, we may be temporarily required to bear these losses ourselves. In addition, our indemnity obligations to NCR Atleos may be significant. Each of these risks could negatively affect our business, financial condition or results of operations.
RISKS RELATED TO CYBERSECURITY, DATA PRIVACY AND INTELLECTUAL PROPERTY
Our inability to protect our systems and data from cybersecurity threats or other technological risks could adversely affect our business operations or stock price and damage our brand and reputation. In the course of our business, we obtain, process and store large amounts of sensitive business and personal information, including information related to our customers, their end-users and their transactions. We also have access to certain transaction and personal data of our customers and their consumers through or in the course of servicing our products or third-party products. Additionally, we collect, use and store personal data of our employees and the personnel of our business partners in the ordinary course of business. We face risks, including to our reputation as a trusted brand, in the handling, securing, and protection of this information, and these risks will increase as our business continues to expand to include new products and technologies.
While we have programs and measures in place designed to protect and safeguard our data and third party data we collect, store or process, and while we have implemented access controls designed to limit the risk of unauthorized use or disclosure by employees and contractors, the techniques used to obtain unauthorized access to data are complex and evolving as threat actors adopt new and emerging technologies (including artificial intelligence and machine learning). Cybersecurity threat actors are increasingly sophisticated and are increasingly targeting employees, contractors, service providers and third parties through evolving techniques, including through social engineering and/or misrepresentation (such as phishing attempts and similar techniques). An attack, disruption, intrusion, denial of service, theft or other breach, or an inadvertent act by an employee or contractor, could result in unauthorized access to, or disclosure of, our data or third-party data we collect, store or process, resulting in claims, costs and reputational harm that could negatively affect our operating results or stock price.
Like most companies, we are regularly subject to attempts by third parties (which may include individuals or groups of hackers and sophisticated organizations, such as state-sponsored organizations, nation-states and individuals sponsored by them) to identify and exploit system vulnerabilities or to penetrate or bypass our security measures, in order to gain unauthorized access to our networks and systems. Successful attempts by one of these malicious actors could lead to the compromise of personal information or the confidential data of us or our customers. Attempts of this nature typically involve technology-related viruses, worms, and other malicious software programs that attack networks, systems, products and services, exploit potential security vulnerabilities, create system disruptions and cause shutdowns or denials of service. Our products and services may also be accessed or modified improperly as a result of customer, partner, employee, contractor or supplier error or malfeasance.
We have administrative, technical, organizational, and physical security measures in place to defend against intrusion and attack and to protect our information. Most cyberattacks are detected, prevented or mitigated by our various information technology and data protections, including but not limited to firewalls, intrusion prevention systems, denial of service detection, anomaly-based detection, anti-virus/anti-malware, endpoint encryption and detection and response software, Security Information and Event Management system, identity management technology, security analytics, encryption and multi-factor authentication. However, we have experienced security incidents in the past, and we may face additional security incidents in the future.
In April 2023, we determined that a single data center outage impacting certain of our customers was caused by a cyber ransomware incident. Upon such determination, we immediately started contacting customers, enacted our cybersecurity protocol and engaged outside experts to contain the incident and begin the recovery process. Following an extensive investigation which included Company experts, external forensic cybersecurity experts and federal law enforcement, among others, we concluded that the incident impacted operations for some customers only with respect to specific Aloha cloud-based services and Counterpoint. Functionality was fully restored to all impacted customers, and we built a new cloud environment to host the affected applications.
We have incurred certain expenses related to the cyber ransomware incident and may incur additional costs relating to this incident in the future, including payment of damages or other costs to customers or others. At this time we do not believe additional costs incurred as a result of the incident will ultimately have a material adverse effect on our business, results of operations or financial condition; however, we remain subject to risks and uncertainties as a result of the incident.
Because the techniques used to obtain unauthorized access to, or sabotage technology systems, change frequently, grow more complex over time, and generally are not recognized until launched against a target, we may be unable to anticipate or implement adequate measures to prevent such techniques. In addition, it is not uncommon for security breaches to remain undetected for extended periods of time. There can be no assurance that we or our partners and advisors will be able to prevent or remediate all future incidents or that the cost associated with responding to any such incident will not be significant.
If any security breach or significant denial-of-service attack or other cyberattack involving our systems or the systems of third parties that store or process our data occurs or is believed to have occurred, our reputation and brand could be damaged and we could be required to expend significant capital and other resources to address problems caused by any such actual or perceived event and to remediate our systems. In addition, we could be exposed to business losses, litigation, regulatory action or other liabilities and our ability to operate our business may be impaired. While we maintain cybersecurity insurance, there can be no assurance that our insurance will cover losses we incur in connection with any cybersecurity incident.
We are subject to evolving global laws and regulations relating to data privacy, data protection and information security, which may require us to incur substantial compliance costs or harm our business operations. In addition to the risks described above relating to cybersecurity threats or other technology risks, our data processing activities subject us to numerous data privacy and security laws and regulations of many jurisdictions. In the United States, federal, state, and local governments have enacted numerous data privacy and security laws, including data breach notification laws, personal data privacy laws, consumer protection laws, and other similar laws. For example, the California Consumer Privacy Act of 2018, as amended by the California Privacy Rights Act of 2020 (collectively, “CCPA”) applies to personal information of consumers, business representatives, and employees who are California residents, and requires businesses to provide specific disclosures in privacy notices and honor requests of such individuals to exercise certain privacy rights. The CCPA provides for administrative fines of up to $7,500 per violation and allows private litigants affected by certain data breaches to recover significant statutory damages. Numerous other states, such as Virginia and Colorado, have also passed comprehensive privacy laws, and similar laws are being considered in several other states, as well as at the federal and local levels.
Outside the U.S., an increasing number of laws, regulations and industry standards govern data privacy and security. The European Union’s General Data Protection Regulation, (“EU GDPR”), the United Kingdom’s GDPR, and the Brazilian General Data Protection Law impose strict requirements for processing the personal data of individuals. In addition, violations of these laws can result in significant fines, penalties, claims by regulators or other third-party lawsuits alleging significant damages, and damage to our brand and business. For example, under EU GDPR, the authorities may impose fines of up to the greater of €20 million or 4% of an organization’s global revenue or impose limits on an organization’s ability to operate by limiting the ability to process personal data.
Additional jurisdictions continue to enact and modify their data privacy laws, which increases the complexity of the data privacy landscape. It is possible that these laws may be interpreted and applied in a manner that is inconsistent with our existing practices or the features of our products or services. Complying with these requirements and changing our policies and practices may be onerous and costly, and we may not be able to respond quickly or effectively to regulatory, legislative, and other developments. These changes may in turn impair our ability to offer existing or planned features, products, and services, and also may increase our cost of doing business. In addition, any failure or perceived failure by us, or any third parties with which we do business, to comply with our posted privacy statements or notices, changing consumer expectations, evolving laws, rules and regulations, industry standards, or contractual obligations, may result in actions or other claims against us by governmental entities or private actors, or the incurrence of significant fines, penalties, or other liabilities. Any such actions, particularly to the extent we were found to have engaged in violations or otherwise liable for damages, could result in the expenditure of substantial resources and could also adversely affect our business, financial condition, and results of operations.
Our intellectual property is valuable, and our inability to protect it could reduce the value of our products, services and brand and harm our competitive position. Our copyrights, trade secrets, trademarks, patents, and other intellectual property are important assets for us and it is critical to our strategy that we protect and can leverage our intellectual property, including our intellectual property rights. We own approximately 875 patents in the United States and many other patents in foreign countries. We own the trademark for “NCR Voyix” and certain variants thereof, as well as certain other trademarks relating to our products and services. We rely on, and expect to continue to rely on, copyright, trademark, patent and trade secret laws in the United States and internationally to protect our intellectual property and brand. We also rely on agreements with our employees, contractors and other third parties who have access to our confidential information (including trade secrets and know-how) to protect that intellectual property. Such agreements and laws may be insufficient or otherwise fail to prevent unauthorized use or disclosure of our confidential information, intellectual property (including technology), and may not provide an adequate remedy in the event of unauthorized use or disclosure of our confidential information, technology, and other intellectual property.
In addition, various factors outside our control pose a threat to our intellectual property, including to our technology. For example, we may fail to obtain or maintain effective intellectual property protection, or the efforts we have taken to protect our intellectual property may not be sufficient or effective, and any of our intellectual property rights may be challenged, which could result in them being narrowed in scope or declared invalid or enforceable. Despite our efforts to protect our intellectual property, there can be no assurance that our intellectual property rights will be sufficient to protect against others offering products or services that are
substantially similar to ours to compete with our business or that unauthorized parties will not attempt to copy aspects of our technology or use, misappropriate or disclose information that we consider confidential or proprietary. For example, it is possible that third parties, including our competitors, may obtain patents relating to innovations that overlap or compete with our products or services. If third parties obtain patent protection with respect to such innovations or technologies, they may assert, and have in the past asserted, that our products or services infringe their patents and seek to charge us a licensing fee or otherwise preclude the use of our products or services or file suit against us. Additionally, unauthorized third parties may try to copy or reverse engineer portions of our products or otherwise obtain and use our intellectual property and other information that we regard as proprietary to create products and services that compete with ours.
Investment in protecting our intellectual property, especially through patents, is expensive and time-consuming. We may not be able to obtain protection for our technology, and even if we are successful in obtaining effective protection, it is expensive to maintain these rights, both in terms of application and maintenance costs, and the time and cost required to defend our rights could be substantial. Moreover, our failure to develop and properly manage and protect new intellectual property could hurt our market position and business opportunities. Possible future changes to U.S. or foreign intellectual property laws and regulations may jeopardize the enforceability, validity or scope of our intellectual property rights and harm our ability to obtain protection. We may be unable to obtain trademark protection for our products and brands, and our existing trademark registrations and applications, and any trademarks that may be used in the future, may not provide us with competitive advantages or distinguish our products and services from those of our competitors. In addition, our trademarks may be contested or found to be unenforceable, weak or invalid, and we may not be able to prevent third parties from infringing or otherwise violating them.
We will not be able to protect our intellectual property if we are unable to enforce our rights or if we do not detect unauthorized use of our intellectual property rights. Additionally, effective intellectual property protection may not be available in every country in which we offer our products and services, and the laws of certain non-U.S. countries where we do business or may do business in the future may not recognize certain intellectual property rights or protect them to the same extent as the laws of the United States. In addition, any changes in, or unexpected interpretations of, intellectual property laws may compromise our ability to enforce our intellectual property rights. Failure to obtain or maintain protection of our confidential information (including trade secrets) or other proprietary information could harm our competitive position and materially and adversely affect our business, financial condition and results of operations. In addition to registered intellectual property rights, we rely on non-registered intellectual property rights, such as copyrights and trade secrets, including to protect our confidential information, know-how and technical information. In order to protect our confidential and proprietary information and technology, we rely in part on non-disclosure or confidentiality agreements with parties who have access to our confidential information (including trade secrets and know-how), including our employees, contractors and other third parties, which place restrictions on the use and disclosure of this intellectual property. We also enter into intellectual property assignment agreements with our employees, contractors and consultants. We cannot guarantee that we have entered into such agreements with each party that may have or have had access to our confidential or proprietary information or otherwise developed intellectual property for us, including our technology and processes. Individuals not subject to intellectual property assignment agreements may make adverse ownership claims to our current and future intellectual property. Additionally, these agreements may be insufficient or breached, or this intellectual property, including trade secrets, may otherwise be disclosed or become known to our competitors, which could cause us to lose any competitive advantage resulting from this intellectual property. We may not be able to obtain adequate remedies for such breaches. Additionally, to the extent that our employees, contractors or other third parties with whom we do business use intellectual property owned by others in their work for us, disputes may arise as to the rights in such work The loss of trade secret and other confidential information protection could make it easier for third parties to compete with our products and services by copying our technology, including features and functionality.
To counter infringement or unauthorized use of our intellectual property, we may deem it necessary to file infringement claims, which can be expensive, time consuming and distracting to management. Our efforts to enforce our intellectual property rights in this manner may be met with defenses, counterclaims and countersuits attacking the validity and enforceability of our intellectual property rights. Furthermore, because of the substantial amount of discovery required in connection with intellectual property litigation, there is a risk that some of our confidential information could be compromised during this type of litigation.
Claims by others that we infringe, misappropriate or otherwise violate their intellectual property rights, even those without merit, could result in significant costs and adversely affect our business and results of operations. A large number of patents and other intellectual property rights exist in our industry and technology companies frequently enter into litigation based on allegations of patent infringement or other violations of intellectual property rights. We are subject to, and may be subject in the future, to claims by third parties that we have infringed, misappropriated, or otherwise violated their intellectual property rights. As we face increasing competition, the possibility of intellectual property rights claims against us may increase. This risk has been amplified by the increase in patent holding companies that seek to monetize patents they have purchased or otherwise obtained and whose sole or primary business is to assert such claims.
Any claim of infringement, misappropriation or other violation of intellectual property rights made by a third party, even those without merit and regardless of the outcome, could cause us to incur substantial costs defending against the claim and could distract our management from our business. The outcome of any allegation is often uncertain and there can be no assurance that we will successfully defend third-party intellectual property claims. An adverse outcome of an intellectual property dispute may require us to pay substantial monetary damages or enter into royalty and licensing agreements that we would not normally find acceptable, cause a delay to the development of our products and services, require us to stop selling all or a portion of our products and services, and could require us to redesign certain components of our platform, products or services using alternative non-infringing technology or practices, which could require significant effort and expense. Any of the foregoing events could adversely affect our business and results of operations.
Additionally, in certain of our agreements with customers, we agree to indemnify them with respect to claims by third parties that our products or services infringe, misappropriates or violates the intellectual property of such third party. From time to time, customers have requested, and may in the future request, us to indemnify them for such infringement, misappropriation or violation. The obligations, liability and risks we could face depend on the scope and limitations of the indemnification we have provided. Any legal claims from our customers could result in substantial liabilities, reputational harm, or the delay or loss of market acceptance of our products, which could have adverse effects on our relationships with such customers.
RISKS ASSOCIATED WITH OUR BUSINESS AND OPERATIONS
We face extensive competition in our markets and if we do not compete effectively, we may not be successful. We face intense competition in the retail and restaurant markets in which we offer our products. Our competitors and potential competitors range from large and established entities to emerging start-ups. Our competitors also include other large companies in the information technology industry, many of which have more financial and technical resources than we do. Our competitors may introduce superior products and services, successfully use and deploy new technologies such as artificial intelligence that may reduce customer demand for our products or services, reduce prices, have greater technical, marketing and other resources, have greater name recognition, have larger installed bases of customers, have well-established relationships with our current and potential customers, advertise aggressively or beat us to market with new products and services.
Our business and operating performance also could be impacted by changes to our competitive landscape, such as industry consolidation, and the entry of new competitors and technologies into our existing product and geographic markets. In addition, our customers sometimes finance our product sales through third-party financing companies, and in the case of customer default, these financing companies may be forced to resell this equipment at discounted prices, competing with us and impacting our ability to sell incremental units. The impact of these product and pricing pressures could include lower customer satisfaction, decreased demand for our solutions, loss of market share and reduction of operating profits.
Disruptions in our data center hosting and public cloud facilities could adversely affect our business. Our products and services are increasingly being offered and provided on a cloud or other hosted basis through data centers operated by us or third parties in the United States and other countries. In addition, certain applications and data that we use in our services offerings and our operations may be hosted or stored at such facilities. These facilities may be vulnerable to cybersecurity attacks or incidents (such as the ransomware incident we experienced in April 2023), logical security and physical security events, hardware or software failures, human error, natural disasters, telecommunications failures and similar events, or to armed hostilities or intentional acts of misconduct, or interference (including by disgruntled employees, former employees or contractors). The occurrence of these events or acts, or any other unanticipated problems, at these facilities could result in damage to, lockout of, or the unavailability of these cloud hosting facilities. Such damage or unavailability could, despite existing disaster recovery and business continuity arrangements, interrupt the availability of our cloud offerings for our customers which could severely impact the operations of our customers. Our business operations and those of our customers rely heavily on the continuous availability and proper functioning of our platform and network. Any significant disruption, system downtime, or network lockout could have significant consequences, impacting important operations for our customers. We have experienced such interruptions and unavailability which has affected the availability of our applications and data. Interruptions in the availability of our data center or cloud offerings o could cause us to fail to meet contracted up-time or service level thresholds, which could cause us to issue credits or pay damages or penalties to customer or cause customers to terminate or not renew their contracts. Interruptions could also expose us to other liability claims from customers and others, payment of damages or other amounts, negative publicity and the need to engage in costly remediation efforts, any of which could impact our business and reduce our revenue. Although we have implemented disaster recovery plans and other measures to mitigate these risks, we can provide no assurance that these measures would be sufficient to prevent or mitigate the impact of a prolonged disruption or that we would not experience material losses if such an event was to occur.
Defects, errors, installation difficulties or development delays could expose us to potential liability, harm our reputation and negatively impact our business. Many of our products are sophisticated and complex, and may incorporate or rely upon third-party
hardware, software and data. Despite testing and quality control, we cannot be certain that defects or errors will not be found in our products. If our products contain undetected defects or errors, or otherwise fail to perform as intended or to meet our customers’ expectations, we could lose customers and/or incur contractual liabilities and additional development costs. If defects or errors delay or complicate product installations, we could experience delays in customer acceptance or an increase in our incremental costs. In addition, customers license and deploy our software in both standard and non-standard configurations and across a variety of different environments, computer platforms, system management software, and equipment and networking configurations, any of which could increase the likelihood of technical difficulties. Our products may be integrated with other components or software, and, in the event that there are defects or errors, it may be difficult to determine the origin of such defects or errors. If any of these risks materialize, they could result in additional costs and expenses, exposure to liability claims, diversion of technical and other resources, and loss of customers or negative publicity, each of which could negatively impact our business and operating results.
Our use of artificial intelligence in our products and operations, as well as our potential failure to effectively implement, use and market these technologies, may result in reputational harm or liability or could adversely affect our revenues and profitability. We are increasingly incorporating artificial intelligence (AI) capabilities in our product and solutions offerings, as well as in our own business operations. AI technology is complex and rapidly evolving, and may subject us to significant competitive, legal, regulatory, operational and other risks. The implementation of AI can be costly, and there is no guarantee that our use of AI will enhance our technologies, benefit our business operations, or produce products and services that are competitive. Our competitors may incorporate AI technology into their products, offerings, and solutions more quickly or more successfully than we do, which could impair our ability to compete effectively. Further, our products and solutions which incorporate AI technologies may not function as designed or have unintended consequences, any of which could subject us to new or enhanced competitive harm, legal liability, regulatory or public scrutiny or reputational harm.
In addition, our use of AI is subject to various risks including the use of personal information, flaws in our models or datasets that may result in biased or inaccurate results, ethical considerations regarding AI, and our ability to safely deploy and implement governance and controls for AI systems. Additionally, laws and regulations related to automated decision making, AI and machine learning are still evolving and there is uncertainty as to new laws and regulations that will be adopted and the application of existing laws and regulations. For example, the European Union has adopted the EU Artificial Intelligence Act and in the United States, new AI-related laws and rulemakings are underway or being proposed at the federal, state, and local levels. The EU Artificial Intelligence Act and any other new regulations could require us to comply with various burdensome requirements depending on the nature and categorization of AI. This may result in expending resources and additional costs to comply with these requirements or changing our products or features, which could harm our business.
The intellectual property ownership and license rights, including copyright, surrounding AI technologies have not been fully addressed by regulations, laws or courts and the adoption of third-party AI technologies into our business operations, products and services may result in exposure to claims of copyright infringement or other intellectual property misappropriation, as well as potential liability to customers. Adverse consequences of these risks related to artificial intelligence could subject us to competitive harm, legal liability, heightened regulatory scrutiny and brand or reputational harm.
We rely on the availability of third-party licenses, and our inability to maintain those licenses could harm our business. Many of our products and solutions include software or other intellectual property licensed from third parties. It may be necessary in the future to renew such third party licenses or to seek new licenses for existing or new products. The necessary licenses may not be available on acceptable terms, if at all. In addition, our products and services are dependent upon the use of certain open-source software and we intend to continue our use of open-source software in the future. This software is generally licensed by its authors or other third parties under open-source licenses.
The inability to obtain certain licenses or other rights or to obtain such licenses or rights on reasonable terms or any third party disputes that may arise regarding these matters, could result in delays in product releases until equivalent technology can be identified, licensed or developed, if at all, and integrated into our products. In addition, such events may cause us to incur significant license fees which could have an adverse effect on our business, operating results, and financial condition.
If an author or other third party or one of our license counterparties were to allege that we had not complied with the conditions of a license, we could be required to incur significant legal expenses, be subject to damages or equitable remedies, be required to purchase a costly license, or be required to devote additional development resources to change our software.
Changes in U.S. or foreign trade policies and other factors beyond our control may adversely impact our business and operating results. Geopolitical tensions and trade disputes can disrupt supply chains and increase the costs of our products. This could cause our products to be more expensive for customers, which could reduce the demand for our products. In addition, a geopolitical conflict in a region where we operate could disrupt our ability to conduct business operations in that region. Countries also could
adopt restrictive trade measures, such as tariffs, laws and regulations concerning investments and limitations on foreign ownership of businesses, taxation, foreign exchange controls, capital controls, employment regulations, the repatriation of earnings, and import and export controls o, any of which could adversely affect our operations and supply chain and limit our ability to offer our products and services as intended. Changes in laws or policies governing the terms of foreign trade, and in particular increased trade restrictions, tariffs or taxes on imports from countries where our products are manufactured or assembled or from where we import products or raw materials (either directly or through our suppliers) could have an impact on our competitive position, business operations and financial results. For example, the new U.S. presidential administration has proposed the implementation of a number of tariffs, including a 25% tariff on imports from Canada and Mexico, as well as tariffs on imports from BRICS nations (Brazil, Russia, India, China and South Africa). Similar restrictive trade actions, including tariffs, export controls, sanctions, legislation favoring domestic investment and other actions impacting the import and export of goods, foreign investments and foreign operations in jurisdictions in which we operate could be adopted with little to no advanced notice, and we may not be able to effectively mitigate the adverse impacts from such measures. Political uncertainty surrounding trade or other international disputes also could have a negative impact on customer confidence and willingness to spend money, which could impair our future growth. Any of these events could increase the cost of our products, create disruptions to our supply chain and impair our ability to effectively operate and compete in the countries where we do business.
Our business may be negatively affected by domestic and global economic conditions. Our business is sensitive to the strength of domestic and global economic conditions, particularly as they affect, either directly or indirectly, the retail and restaurant sectors of the economy. Economic conditions are influenced by a number of factors, including political conditions, consumer confidence, unemployment levels, interest rates, tax rates, commodity prices, and government actions to stimulate economic growth. The imposition or threat of protectionist trade policies or import or export tariffs, global and regional market conditions, spending trends in the retail and restaurant industries, tax legislation, modified or new global or regional trade agreements, fluctuations in oil and commodity prices, among other things, have created a challenging and unpredictable environment in which to market our products and services across our different geographies and industries. The retail and restaurant industries depend on consumer discretionary spending and consumer confidence, which is influenced, in part, by general economic conditions. A material decline in consumer confidence could impact the ability or willingness of our customers to make expenditures, thereby affecting their decision to purchase our products or services or to pay us for our products and services. A material decline in consumer confidence could result in consumers choosing to dine out less frequently or reduce the amount they spend while dining out, which could negatively impact our Restaurant segment. Negative or unpredictable global economic conditions also may have an adverse effect on our customers’ ability to obtain financing for the purchase of our products and services from third party financing companies or on the number of payment processing transactions which could negatively impact our operating results.
In addition, international, regional or domestic political unrest and the related potential impact on global stability, terrorist attacks and the potential for hostilities in various parts of the world, public health crises and natural disasters can create or contribute to a climate of economic and political uncertainty that adversely impacts our results of operations and financial condition, including our revenue growth and profitability.
If we are unable to maintain and update our information technology systems to meet the needs of our business, our business could be adversely impacted. We rely on our information technology systems and certain third-party systems to effectively operate our business. We have continued to review and modernize certain of our information technology systems and processes in order to simplify and improve our operations. There is a risk, however, that these efforts could materially and adversely disrupt our operations, could occur over a period longer than planned, or could require greater than expected investments or utilization of internal and external resources. It may take longer than expected to realize the intended benefits from these efforts. Our failure to properly and efficiently maintain and update our information technology systems, or the failure of our information technology systems to perform as we anticipate, could hinder our ability to operate or to attract and support customers, or could cause us to incur legal liability, contractual penalties or cause us to lose existing customers, each of which could have a material adverse effect on our business, results of operations and financial condition.
If we do not retain key employees, or if we are unable to recruit, develop and retain qualified employees, we may not be able to meet our business objectives. Our ability to successfully execute on our growth strategy and achieve our business objectives is dependent on our ability to retain our key business leaders and our highly skilled software development, technical, sales, consulting and other key personnel. The market for highly skilled workers and leaders in our industry is extremely competitive, and we may need to invest significant amounts of cash and equity to attract and retain these employees. We may never realize returns on these investments. Key employees may decide to leave the Company for other opportunities. Changes of key business leaders could be disruptive to our business or delay the execution of our strategy. In addition, as our business model evolves, we need to attract employees with different skill sets, experience and attributes. If we are unable to retain our key personnel, or we are unable to attract highly qualified new and replacement employees by offering competitive compensation, attractive work environments, and leadership opportunities, our business and operating results could be negatively impacted.
If third party suppliers upon which we rely to manufacture our products, supply key components, and provide other technologies and services necessary for our offerings are not able to fulfill our needs, our ability to bring our products to market could be affected. There are a number of vendors providing the services and producing the parts and components that we utilize in connection with our products. However, there are some services and components that are licensed or purchased from single sources due to price, quality, technology, functionality or other reasons. For example, we depend on transaction processing services from Accenture, computer chips and microprocessors from Intel and operating systems from Microsoft. We also rely on key technology providers with respect to our payments offerings. If we were unable to secure the necessary services or products from a particular vendor, and we had to find an alternative supplier, product shipments and solution deliveries, or the provision of services, could be delayed or our customers’ operations could be affected, impacting our business and operating results.
In 2024, we announced our entry into a commercial agreement with Ennoconn to transition our point-of-sale and self-checkout hardware businesses to an outsourced design and manufacturing model (the “Hardware Business Transition”). As a result of the Hardware Business Transition, we will utilize Ennoconn as our single-source partner to supply and manufacture substantially all of our hardware products. Once implemented, this arrangement involves a number of risks, including decreased control over the production process, which could lead to production delays or interruptions and inferior product quality control. If Ennoconn experiences any significant difficulties in its manufacturing processes, or becomes insolvent or unwilling to continue to manufacture products of acceptable quality and in a timely manner or otherwise does not comply with their agreement with us, we could experience significant interruptions in the supply of our products.
We face uncertainties with regard to regulations, lawsuits and other related matters. In the normal course of business, we are subject to proceedings, lawsuits, claims and other matters, including, for example, those that relate to the environment, health and safety, labor and employment, employee benefits, import/export compliance, intellectual property, data privacy and security, payments services (such as payment processing and settlement services), product liability, commercial disputes and regulatory compliance, among others. Because such matters are subject to many uncertainties, their outcomes are not predictable and we must make certain estimates and assumptions in our financial statements. While we believe that amounts reflected in our Consolidated Financial Statements with respect to such matters are currently adequate, there can be no assurances that our estimates will align with the actual amount of any losses or liabilities relating to these matters or that the funding required to ultimately satisfy the liabilities from such matters will not impact future operating results. Many of the diverse and complex regulations we are subject to, including those relating to corporate governance, public disclosure and reporting, securities laws, taxes, accounting, environmental safety and the discharge of materials into the environment, product safety, import and export compliance, data privacy and security, antitrust and competition, anti-corruption, and labor and human resources, can be subject to rapid and substantial change and may continue to be subject to material changes in the future. Compliance with these regulations, could create a substantial burden on us and materially increase our costs or could otherwise impact on our future operating results.
Additionally, our global footprint requires us to comply with the laws and regulations of the U.S. government and various international jurisdictions. For example, our international operations are subject to United States and foreign anti-corruption laws and regulations, such as the Foreign Corrupt Practices Act (“FCPA”) and the U.K. Bribery Act. Our international operations are also subject to economic sanction programs administered by the U.S. Treasury Department’s Office of Foreign Assets Control (“OFAC”). If we are not in compliance with such laws and regulations, we may be subject to criminal and civil penalties, which may cause harm to our reputation and to our brand and could have an adverse effect on our business, financial condition and results of operations.
Our payments-related business subjects us to additional regulatory requirements and other risks and uncertainties that could be costly and difficult to comply with or that could harm our business. The majority of the payment networks over which transactions are conducted require sponsorship by a bank, and the financial condition and results of operations of any sponsor bank and/or the inability to find a replacement sponsor bank may cause disruptions to our operations. In addition, bank sponsorship is required to process transactions over certain payment networks and our payments solutions depend on our ability to secure these “sponsor” arrangements with financial institutions.
Our ability to process certain card transactions is contingent upon our continued registration with the applicable card brands. Non-compliance with established rules and regulations of the card brands with which we are registered could expose us to fines, penalties or other liabilities and could result in the revocation of our registration, all of which could negatively impact results of our operations. In addition, card brands could enact new rules and regulations that could require a significant investment of resources to maintain our compliance.
Increases in interchange rates or other payment network fees, over which we have minimal or no control, could cause a decline in merchant acceptance of card and digital payments and/or in consumers’ use of card and digital payments, causing an adverse impact on our operations and cash flows. Merchant attrition due to these or other factors could adversely impact our financial results.
Further, errors, omissions or disputes in the settlement of merchant funds could damage relationships with customers and expose us to liability. We are responsible for maintaining accurate bank account information for certain merchant customers and accurate settlements of funds into these accounts based on the underlying transaction activity. In addition, we may incur losses when our merchants fail to reimburse us for chargebacks resolved in favor of their customers. Fraud by our merchants or others could also have an adverse effect on our operations and cash flows.
Changes to laws, regulations, the Payment Card Industry Data Security Standard or other industry standards affecting our business may require significant development and compliance investments or have an unfavorable effect on our ability to offer certain services or on our financial performance. Further, we are subject to certain consumer protection requirements such as oversight by the Consumer Financial Protection Bureau (CFPB) and Federal Trade Commission (FTC) and the customer-facing nature of our payments-related business subjects us to increased risks of disputes with consumers, including litigation and class action litigation, and significant costs to address such matters.
Changes to our tax rates and additional income tax liabilities could impact profitability. We are a United States based multinational company subject to income taxes in the United States and a number of foreign jurisdictions. Our domestic and international tax liabilities are dependent on the distribution of our earnings across different jurisdictions, and our provision for income taxes and cash tax liability could be adversely affected if the distribution of earnings is higher than expected in jurisdictions with higher statutory tax rates.
In addition, changes in United States or foreign tax laws and regulations or tax rulings could affect our financial position and results of operations. For example, in light of continuing global fiscal challenges, various levels of government and international organizations such as the Organization for Economic Co-operation and Development (“OECD”) and EU are focused on tax reform and other legislative or regulatory action to increase tax revenue and establish minimum levels of corporate income tax. These tax reform efforts, such as the OECD-led Base Erosion and Profit Shifting project (“BEPS”), are designed to ensure that corporate entities are taxed on a larger percentage of their earnings. Although some countries have passed tax laws based on findings from the BEPS project, the final nature, timing and extent of any such tax reforms or other legislative or regulatory actions is unpredictable, and it is difficult to assess their overall effect. Additionally, tax law changes that could significantly reduce or limit our ability to utilize our deferred tax assets could have a material impact on our tax rate and cash tax payments. Any of these potential changes could increase our effective tax rate, increase cash tax payments and adversely impact our financial results.
We are also subject to audits of our income tax returns in various jurisdictions both in the United States and internationally. While we believe that our tax positions are sustainable, the outcomes of such audits could result in the assessment of additional taxes, which could adversely impact our cash flows and financial results.
Our international operations subject us to additional risks that can adversely affect our business, financial condition and results of operations. For the years ended December 31, 2024 and 2023, the percentage of our revenue from outside of the United States was 40% and 35%, respectively. Our international operations subject us to a variety of risks and challenges, including:
•the impact of ongoing and future economic conditions on the stability of national and regional economies and industries within those economies;
•political conditions and local regulations that could adversely affect demand for our solutions, our ability to access funds and resources, or our ability to sell products in these markets;
•the impact of a downturn in the global economy, or in regional economies, on demand for our products;
•competitive labor markets and increasing wages in markets that we operate in;
•varied employee/employer relationships, existence of works councils and differing labor practices, and other challenges caused by distance, language, local expertise, and cultural differences, increasing the complexity of doing business in multiple jurisdictions;
•currency exchange rate fluctuations that could result in lower demand for our products as well as generate currency translation losses;
•limited availability of local currencies to pay vendors, employees and third parties and to distribute funds outside of the country;
•changes to global or regional trade agreements that could limit our ability to sell products in these markets;
•the imposition of import or export tariffs, taxes, trade policies or import and export controls that could increase the expense of, or limit demand for our products;
•changes to and compliance with a variety of laws and regulations that may increase our cost of doing business or otherwise prevent us from effectively competing internationally or that may impose burdensome reporting requirements on us or impose restrictions on our operations or offerings;
•government uncertainty or limitations on the ability to enforce legal rights and remedies, including as a result of new, or changes to, laws and regulations;
•reduced protection for intellectual property rights in certain countries;
•implementing and managing systems, procedures and controls to monitor our operations in foreign markets;
•changing competitive requirements and deliverables in developing and emerging markets;
•longer collection cycles and the financial viability and reliability of contracting partners and customers;
•managing a geographically dispersed workforce, work stoppages and other labor conditions or issues;
•disruptions in transportation and shipping infrastructure; and
•the impact of natural disasters, catastrophic events, civil unrest, war and terrorist activity on supply chains, the economy or markets in general, or on our ability, or that of our suppliers, to meet commitments.
These risks and challenges could result in an increase in our cost of doing business internationally, including shortages and increased costs of products and components, shipping delays, longer payment cycles, increased taxes, and restrictions on the repatriation of funds to the United States. In addition, our business is exposed to health epidemics and pandemics (such as the COVID-19 pandemic), war, terrorism, civil insurrection or social unrest, and other significant business interruptions that could lead to disruption, instability and volatility in the global economy and negatively impact us, and our suppliers, partners, and customers. We have employees and third-party consultants outside of the U.S. that provide software development and support services. A sustained loss of the software development services provided by international employees and third-party consultants could negatively impact our software development efforts, adversely affect our competitive position, harm our reputation, impede our ability to achieve and maintain profitability, and negatively impact our business, financial condition, and results of operations.
Our risk management efforts may not be fully effective in mitigating our risk exposure, which could expose us to losses and liability and otherwise harm our business. We have transformed our business to become a leading global provider of digital commerce solutions with a focus on retail and restaurants. As a result of our strategic transformation, our risk management policies, procedures, techniques, and processes may not be sufficient to identify all of the risks to which we are exposed, to enable us to mitigate the risks we have identified, or to identify additional risks to which we may become subject in the future as we expand our product and services offerings. If any of our risk management policies and processes are ineffective, or if we are not successful in identifying and mitigating all risks to which we are or may be exposed, we may suffer losses or harm to our reputation, or be subject to litigation or regulatory actions, any of which could adversely affect our business, financial condition, and results of operations.
A major natural disaster or catastrophic event could have a materially adverse effect on our business, financial condition and results of operations, or have other adverse consequences. Our business, financial condition, results of operations, access to capital markets and borrowing costs may be adversely affected by a major natural disaster or catastrophic event, including civil unrest, geopolitical instability, war, terrorist attack, pandemics or other (actual or threatened) public health emergencies such as the COVID-19 outbreak, or other events beyond our control, and measures taken in response thereto.
A significant natural disaster, such as an earthquake, fire, flood or hurricane could have a material and adverse effect on our business and our insurance coverage may be insufficient to compensate us for losses that may occur. Global climate change is resulting in certain types of natural disasters occurring more frequently or with more intense effects. We have operations all over the world and our sites in California, Texas, Florida, and India are particularly vulnerable to climate change effects. Acts of terrorism could also cause disruptions in our businesses or those of our customers, and could negatively impact consumer demand or the economy as a whole. We may not have sufficient continuity or recovery plans to mitigate the impact of any such event. Despite any precautions we may take, the occurrence of a natural disaster or other unanticipated catastrophic event at our headquarters or other key facilities could result in lengthy interruptions in access to, or functionality of, our platform and other offerings or could expose us to other liabilities, and our business, financial condition or results of operations could be adversely affected.
Our historical manufacturing activities subject us to environmental exposures. Certain of our facilities, properties and operations are subject to a wide range of environmental protection laws, and we have investigatory and remedial activities underway at a number of facilities that we currently own, or formerly owned or operated, to comply with such laws. In addition, our products are subject to environmental laws in a number of jurisdictions. There can be no assurance that the costs required to comply with applicable environmental laws will not negatively impact our financial condition or future operating results. We have also been
identified as a potentially responsible party in connection with certain environmental matters, including the Kalamazoo River matter, as further described in Note 11, “Commitments and Contingencies”, of the Notes to Consolidated Financial Statements included in Item 8 of Part II of this Report; in “Government Regulations” within Item 1 of Part I of this Report; and in “Environmental and Legal Contingencies” within the “Critical Accounting Estimates” section of “Management’s Discussion and Analysis of Financial Condition and Results of Operations” included in Item 7 of Part II of this Report, and we incorporate such disclosures by reference and make them a part of this discussion of risk factors.
RISKS ASSOCIATED WITH OUR FINANCE & ACCOUNTING
Our level of indebtedness could limit our financial and operating activities and adversely affect our ability to incur additional debt to fund future needs. At December 31, 2024, we had approximately $1.1 billion of total indebtedness outstanding with an additional $480 million of borrowings available under our senior secured revolving credit facility. Our current level of indebtedness could:
•require us to dedicate a substantial portion of our cash flow to the payment of principal and interest, thereby reducing the funds available for operations and future business opportunities;
•make it more difficult for us to satisfy our obligations with respect to our outstanding debt, including obligations to repurchase our senior unsecured notes under our indentures following the occurrence of certain changes in control;
•limit our ability to borrow money or otherwise enter into financing arrangements that would provide us with additional capital if needed for other purposes, including working capital, capital expenditures, debt service requirements, acquisitions and general corporate purposes, on satisfactory terms or at all;
•limit our ability to adjust to changing economic, business and competitive conditions;
•place us at a competitive disadvantage with competitors who may have less indebtedness or greater access to financing or access to financing on preferential terms;
•make us more vulnerable to an increase in interest rates, a downturn in our operating performance or a decline in general economic, business and other conditions; and
•make us more susceptible to adverse changes in our credit ratings and those of our debt securities, which could impact our ability to obtain financing in the future and increase the cost of such financing.
If compliance with our obligations under our debt and other financing agreements materially limits our financial or operating activities, or hinders our ability to adapt to changing industry conditions, we may lose market share, our revenue may decline and our operating results may be negatively affected.
We may, from time to time, seek to opportunistically refinance, amend, reprice and/or otherwise replace any of our debt, obtain additional debt financing or enter into other financing arrangements, reduce or extend our debt, lower our interest payments or the cost of capital available to us under certain types of financing arrangements, or otherwise seek to improve our financial position or the terms of our debt or other financing agreements. These actions may include open market debt repurchases, negotiated repurchases, or other repayments, redemptions or retirements of our debt or other financing arrangements. The amount of debt that may be borrowed or issued, refinanced, and/or repurchased, repaid, redeemed or otherwise retired, if any, will depend on market conditions, trading levels of our debt, our cash position, compliance with our debt covenants and other considerations. Any such actions could impact our financial condition or results of operations.
The terms of the documents governing our indebtedness include financial and other covenants that could restrict or limit our financial and business operations. Our credit agreement governing the senior secured credit facilities and the indentures for our senior unsecured notes include restrictive covenants that, subject to certain exceptions and qualifications, restrict or otherwise limit our ability and the ability of our subsidiaries to, among other things:
•incur additional indebtedness;
•create liens on, sell or otherwise dispose of, our assets;
•engage in certain fundamental corporate changes or changes to our business activities;
•make certain investments (including acquisitions);
•engage in sale-leaseback or hedging transactions;
•repurchase our common stock, pay dividends or make similar distributions on our capital stock;
•repay certain indebtedness;
•engage in certain affiliate transactions; and
•enter into agreements that restrict our ability to create liens, pay dividends or make loan repayments.
The senior secured credit agreement and the indentures governing our senior unsecured notes also contain certain affirmative covenants, and the senior secured credit agreement requires us to comply with a leverage ratio that measures our debt relative to our Consolidated EBITDA (as defined in the senior secured credit agreement).
These covenants and restrictions could affect our ability to operate our business and may limit our ability to react to market conditions or take advantage of potential business opportunities as they arise. Additionally, our ability to comply with these covenants may be affected by events beyond our control, including general economic and credit conditions and industry downturns.
If we fail to comply with these covenants and are unable to obtain a waiver or amendment from the applicable debtholders, an event of default would result under the applicable agreements and under other agreements containing related cross-default provisions.
Upon an event of default under the senior secured credit agreement, the administrative agent or the required lenders could, among other things, declare outstanding amounts due and payable, terminate the commitments under the senior secured credit agreement, or require us to deposit cash collateral in respect of outstanding letters of credit. Upon a bankruptcy or insolvency event of default under the senior secured credit agreement, all outstanding amounts thereunder become due and payable and all commitments thereunder automatically terminate. If we were unable to repay or pay the amounts due, the administrative agent or the lenders could, among other things, proceed against the collateral granted to them to secure such indebtedness, which includes certain of our domestic assets and the equity interests of certain of our domestic and foreign subsidiaries. Upon an event of default under the indentures governing our senior unsecured notes, the related trustee or the holders of our senior unsecured notes could declare all outstanding amounts immediately due and payable.
Our cash flows may not be sufficient to service our indebtedness, and if we are unable to satisfy our obligations under our indebtedness, we may be required to seek other financing alternatives, which may not be successful. Our ability to make timely payments of principal and interest on our debt obligations depends on our ability to generate positive cash flows from operations, which is subject to general economic conditions, competitive pressures and certain financial, business and other factors, which may include factors beyond our control. If our cash flows and capital resources are insufficient to make these payments, we may be required to seek additional financing sources, reduce or delay capital expenditures, sell assets or operations or refinance our indebtedness. These actions could have an adverse effect on our business, financial condition and results of operations. In addition, we may not be able to take any of these actions, and, even if successful, these actions may not permit us to meet our scheduled debt service obligations. Our ability to restructure or refinance our outstanding indebtedness will depend on, among other things, the condition of the capital markets and our financial condition at such time. There can be no assurance that we will be able to restructure or refinance any of our indebtedness on commercially reasonable terms or at all. If we cannot make scheduled payments on our debt, we will be in default and the outstanding principal and interest on our debt could be declared to be due and payable, in which case we could be forced into bankruptcy or liquidation or required to substantially restructure or alter our business operations or debt obligations.
Certain change in control transactions may result in an acceleration of our indebtedness or our obligations under other financing arrangements, or may require us to repurchase our senior unsecured notes or our Series A Convertible Preferred Stock. Upon the occurrence of a change in control under the applicable indenture governing our senior unsecured notes, holders of those notes may require us to repurchase their notes. In addition, upon certain change of control events involving the Company, holders of Series A Convertible Preferred Stock can require us, subject to certain exceptions, to repurchase any or all of their Series A Convertible Preferred Stock. On any date during the three months commencing on and immediately following March 16, 2027,
March 16, 2030 and March 16, 2033, holders of our Series A Convertible Preferred Stock will have the right to require us to repurchase any or all of our outstanding Series A Convertible Preferred Stock.
We may not have sufficient funds in the event that we are required to repurchase any of our senior unsecured notes or Series A Convertible Preferred Stock (or both). There can be no assurance that we will have sufficient financial resources, or will be able to arrange financing, to pay the repurchase price in cash with respect to any our senior unsecured notes or Series A Convertible Preferred Stock upon a change in control or scheduled redemption. Our failure to repurchase a series of senior unsecured notes when required would result in an event of default with respect to such notes which could, in turn, constitute a default under the terms of our other indebtedness. If we are unable to repurchase all shares of Series A Convertible Preferred Stock that holders have requested to be purchased, then we are required to pay dividends on the shares not repurchased at a rate equal to 8.0% per annum, accruing daily from such date until the full purchase price, plus all accrued dividends, are paid in full in respect of such shares of Series A Convertible Preferred Stock.
In addition, a change in control (i) may constitute an event of default under our senior secured credit agreement that would permit the lenders to accelerate the maturity of the borrowings thereunder and/or terminate the commitments under the senior secured revolving credit facility and (ii) may require us to make a similar change in control offer to holders of our existing senior unsecured notes.
Certain important corporate events, such as leveraged recapitalization that would increase the level of our indebtedness, may not constitute a change in control under the indentures governing our unsecured notes or the terms of our Series A Convertible Preferred Stock.
A lowering or withdrawal of the ratings assigned to our debt securities by rating agencies may increase our future capital costs and reduce our access to capital. Any rating assigned to our debt could be lowered or withdrawn entirely by a rating agency if, in that rating agency’s judgment, future circumstances justify any such change. Any future lowering of our ratings would make it more difficult or more expensive for us to obtain additional debt financing or capital from other financing arrangements.
We may be required to write down the value of certain significant assets, which would adversely affect our operating results. We have a number of significant assets on our balance sheet as of December 31, 2024 and the value of these assets can be adversely impacted by factors related to our business and operating performance, as well as factors outside of our control. We recognize deferred tax assets and liabilities based on the differences between the financial statement carrying amounts and the tax basis of assets and liabilities. Our deferred tax assets, net of valuation allowances, totaled approximately $321 million and $406 million at December 31, 2024 and 2023, respectively. We regularly review our deferred tax assets for recoverability and establish a valuation allowance if it is more likely than not that some portion or all of a deferred tax asset will not be realized. If we are unable to generate sufficient future taxable income, if there is a material change in the actual effective tax rates or if there is a change to the time period within which the underlying temporary differences become taxable or deductible, then we could be required to increase our valuation allowance against our deferred tax assets, which could result in a material increase in our effective tax rate.
We have previously recorded valuation allowances related to certain deferred tax assets due to the uncertainty of the ultimate realization of the future benefits from those assets. The recorded valuation allowances cover deferred tax assets, including tax loss carryforwards, interest expense carryforwards and foreign tax credits, in tax jurisdictions where there is uncertainty as to the ultimate realization of those tax assets. If we are unable to generate sufficient future taxable income of the proper source in the time period within which the temporary differences underlying our deferred tax assets become deductible, or before the expiration of our loss and credit carryforwards, additional valuation allowances could be required in the future.
Failure to maintain an effective system of disclosure controls and procedures and internal control over financial reporting could have a material adverse effect on our results of operations, financial condition and cash flows. As a public reporting company, we are required to establish and periodically evaluate our disclosure controls and procedures with respect to information we file with or submit to the SEC and our internal control over financial reporting with respect to our financial statements and related disclosures. In particular, we are required to assess the effectiveness of our internal control over financial reporting at the end of each fiscal year pursuant to Section 404 of the Sarbanes-Oxley Act. If we identify deficiencies in our internal control over financial reporting, we may be unable to accurately report our financial results or to report them within the timeframes required by the SEC. The presence of deficiencies in our disclosure controls or internal control over financial reporting and the remediation of material weaknesses or any regulatory actions resulting from such material weaknesses could impair our business, restrict our access to capital markets, and adversely impact our stock price. In additional the occurrence of any of the foregoing could cause investors and others that rely on our financial statements to lose confidence in the accuracy and completeness of our financial reports.
We have identified material weaknesses in our internal control over financial reporting in the past and may identify other material weaknesses in the future. A material weakness is a deficiency, or a combination of deficiencies, in internal control over financial reporting, such that there is a reasonable possibility that a material misstatement of our financial statements will not be prevented or detected on a timely basis.
As described more fully in Item 9A, “Controls and Procedures,” we executed a remediation plan with respect to the previously identified material weaknesses and, as a result determined that, as of December 31, 2024, such material weaknesses have been remediated. Completion of remediation does not provide assurance that our remediation or other controls will continue to operate properly or remain adequate and if additional material weaknesses in our internal control over financial reporting are identified or occur in the future, our financial statements may contain material misstatements and we could be required to restate our financial results, which could materially and adversely affect our business, results of operations and financial condition, restrict our ability to access capital markets, require us to expend significant resources to correct the material weaknesses, subject us to fines, penalties or judgments, harm our reputation or otherwise cause a decline in investor confidence. See Item 9A of this Report for more information, which is incorporated herein by reference.
RISKS ASSOCIATED WITH OUR GOVERNANCE
Our Series A Convertible Preferred Stock has rights, preferences and privileges that are not held by, and are preferential to, the rights of our common stockholders, which could adversely affect our liquidity and financial condition, and may result in the interests of the holders of our Series A Convertible Preferred Stock differing from those of our common stockholders. The holders of our Series A Convertible Preferred Stock have the right to receive a liquidation preference entitling them to be paid out of our assets available for distribution to stockholders before any payment may be made to holders of any other class or series of capital stock, an amount equal to the greater of (a) 100% of the liquidation preference thereof plus all accrued dividends or (b) the amount that such holder would have been entitled to receive upon our liquidation, dissolution and winding up if all outstanding shares of Series A Convertible Preferred Stock had been converted into common stock immediately prior to such liquidation, dissolution or winding up.
In addition, dividends on the Series A Convertible Preferred Stock accrue cumulatively at the rate of 5.5% per annum, payable quarterly in arrears. If we fail to timely declare and pay a dividend, the dividend rate will increase to 8.0% per annum until such time as all accrued but unpaid dividends have been paid in full. The dividends were payable in-kind for the first sixteen dividend payments, after which, beginning in the first quarter of 2020, dividends are payable in cash or in-kind at the option of the Company.
The holders of our Series A Convertible Preferred Stock also have certain redemption rights or put rights, including the right to require us to repurchase all or any portion of the Series A Convertible Preferred Stock on any date during the three months commencing on and immediately following March 16, 2027, March 16, 2030 and March 16, 2033, at 100% of the liquidation preference thereof plus all accrued but unpaid dividends, and the right, subject to certain exceptions, to require us to repurchase all or any portion of the Series A Convertible Preferred Stock upon certain change of control events at the greater of (a) 100% of the liquidation preference thereof plus all accrued but unpaid dividends and (b) the consideration the holders would have received if they had converted their shares of Series A Convertible Preferred Stock into common stock immediately prior to the change of control event.
These dividend and share repurchase obligations could impact our liquidity and reduce the amount of cash flows available for working capital, capital expenditures, growth opportunities, acquisitions, and other general corporate purposes. Our obligations to the holders of our Series A Convertible Preferred Stock could also limit our ability to obtain additional financing or increase our borrowing costs, which could have an adverse effect on our financial condition. The preferential rights could also result in divergent interests between the holders of our Series A Convertible Preferred Stock and holders of our common stock.
The issuance of shares of our Series A Convertible Preferred Stock reduces the relative voting power of holders of our common stock, and the conversion and sale of those shares would dilute the ownership of such holders and may adversely affect the market price of our common stock. As of December 31, 2024, approximately 0.3 million shares of our Series A Convertible Preferred Stock were outstanding, representing approximately 10% of our outstanding common stock, including the Series A Convertible Preferred Stock on an as-converted basis. Holders of Series A Convertible Preferred Stock are entitled to a cumulative dividend at the rate of 5.5% per annum, which was payable quarterly in arrears and payable in-kind for the first sixteen dividend payments, after which, beginning in the first quarter of 2020, are payable in cash or in-kind at the option of the Company. If we fail to timely declare and pay a dividend, the dividend rate will increase to 8.0% per annum until such time as all accrued but unpaid dividends have been paid in full.
As holders of our Series A Convertible Preferred Stock are entitled to vote, on an as-converted basis, together with holders of our common stock on all matters submitted to a vote of the holders of our common stock, the Series A Convertible Preferred Stock, and the subsequent issuance of additional shares of Series A Convertible Preferred Stock through the payment of in-kind dividends, effectively reduces the relative voting power of the holders of our common stock.
In addition, the conversion of the Series A Convertible Preferred Stock to common stock would dilute the ownership interest of existing holders of our common stock, and any sales in the public market of the common stock issuable upon conversion of the Series A Convertible Preferred Stock would increase the number of shares of our common stock available for public trading, and could adversely affect prevailing market prices of our common stock.
We could be subject to actions or proposals from stockholders that do not align with our business strategies or the interests of our other stockholders. While we seek to actively engage with stockholders and consider their views on business, strategy, and environmental, social and governance issues, responding to these stockholders could be costly and time-consuming. Stockholder activists may also seek to involve themselves in the governance, strategic direction and operations of the Company through stockholder proposals or otherwise. Such proposals may disrupt our business and divert the attention of our management and employees, and any perceived uncertainties as to our future direction resulting from such a situation could interfere with our ability to effectively execute our strategic plans or could result in the loss of potential business opportunities, the perception that we need a change in the direction of our business, or the perception that we are unstable or lack continuity, which may be exploited by our competitors, cause concern to our current or potential customers, and make it more difficult for us to attract and retain qualified personnel and business partners, which could adversely affect our business. In addition, actions of activist stockholders may cause significant fluctuations in our stock price based on temporary or speculative market perceptions or other factors that do not necessarily reflect the underlying fundamentals and prospects of our business.
Item 1B. UNRESOLVED STAFF COMMENTS
None.
Item 1C. CYBERSECURITY
The Company recognizes the importance of maintaining cybersecurity measures that are designed to safeguard our information systems and to protect the confidentiality and integrity of data gathered on our people, partners, customers, and business assets.
Our information security program is enterprise-wide and includes cross-functional coordination between various departments across the Company including Information Security, Technology, Privacy, Enterprise Risk Management, and Internal Audit. The structure of our information security program is informed by the National Institute of Standards and Technology (NIST) Cybersecurity Framework to organize processes and tools to identify, protect, detect, respond, and recover from threats and events.
Our information security program employs various information technology and protection methods designed to promote data security including firewalls, intrusion prevention systems, denial of service detection, anomaly-based detection, anti-virus/anti-malware, endpoint encryption and detection and response software, Security Information and Event Management system, identity management technology, security analytics, encryption and multi-factor authentication. Further, we recognize the risks associated with the use of third-party service providers and have processes designed to identify material risks related to third parties.
We conduct periodic reviews and tests of our information security program and also leverage audits by our internal audit team, tabletop exercises, penetration and vulnerability testing, simulations, and other exercises to evaluate the effectiveness of our information security program and attempt to improve our security measures and planning. We collaborate with external experts, including consultants and auditors, in evaluating and testing our information security program. Our employees and certain of our contractors are required to participate in security awareness training at least annually.
Our Chief Technology Officer (CTO) is responsible for oversight of our information security strategy, program, and operations. The CTO has over 25 years of information technology experience, including leadership experience managing global information security, IT infrastructure and engineering. He holds a doctorate in Business Administration, Master of Business Administration, and Bachelor of Engineering in Electrical and Electronics Engineering / Information Systems. In previous roles at large scale fintech and cybersecurity companies, the CTO has designed comprehensive cybersecurity programs and managed and mitigated high profile cybersecurity incidents to ensure business continuity.
Our Chief Information Security Officer (CISO), who reports directly to the CTO, is responsible for day-to-day assessment and management of cybersecurity risk. Our CISO has over 20 years of experience in various roles related to information security and related technology, including previously serving as Vice President of Information Technology and Senior Vice President of Information Technology at other companies, and holds a Bachelor of Science in Math and a Master of Business Administration in
Computer Information Systems and Information Technology. The CISO’s responsibilities in prior roles at large, global fintech and healthcare companies has included initiatives to identify and reduce cybersecurity vulnerabilities.
The Company’s cybersecurity risk management policies and procedures include internal notification procedures which, depending on the level of severity assigned to the event, may include direct notice to, among others, the Company's General Counsel and Chief Privacy Officer. Members of the Company’s legal department support efforts to evaluate the materiality of any incidents, determine whether notice to third parties such as regulators, customers or vendors is required, determine whether any prohibition on insider trading is appropriate, and assess whether disclosure to stockholders or governmental filings, including with the SEC, are required. Our internal notification procedures also include notifying various Company information technology services managers, subject matter experts in the Company’s software department and other senior executives, depending on the level of severity assigned to the event.
Our CTO attends regular meetings of the executive officer team, including our Chief Executive Officer, Chief Financial Officer and other senior executive officers, and reports on cybersecurity matters as appropriate.
Our Board of Directors exercises oversight over our risk management process directly, as well as through its various standing committees that address risks inherent in their respective areas of oversight. In particular, our Board of Directors delegates cybersecurity risk management oversight to the Risk Committee of the Board of Directors. The Risk Committee oversees our cybersecurity processes and policies on risk identification, management, and assessment. The Risk Committee also reviews the adequacy and effectiveness of such policies, as well as the steps taken by management to mitigate or otherwise control these cybersecurity exposures and to identify future risks. Our CTO reports regularly to the Risk Committee on cybersecurity and information security and the full Board reviews significant cybersecurity matters as appropriate.
For a description of risks from known cybersecurity threats, including as a result of any prior cybersecurity incidents, that have materially affected or are reasonably likely to materially affect us, including our operations, business strategy, results of operations, or financial condition, see the risk factor “Our inability to protect our systems and data from cybersecurity threats or other technological risks could adversely affect our business operations, or stock price and damage our brand and reputation” in Item 1A of Part I of this Report.
Item 2. PROPERTIES
As of December 31, 2024, NCR Voyix operated 70 facilities consisting of approximately 3.0 million square feet in 24 countries throughout the world, which are generally used by both of NCR Voyix’s operating segments. On a square footage basis, 8% of these facilities are owned and 92% are leased. Within the total facility portfolio, the Company operates 4 research and development facilities totaling 0.2 million square feet, 100% of which is leased. The remaining 2.8 million square feet of space includes office, repair, and warehousing space and other miscellaneous sites, and is 84% leased.
NCR Voyix is headquartered in Atlanta, Georgia, USA. Our address at our corporate headquarters is 864 Spring Street Northwest, Atlanta Georgia, 30308, USA.
Item 3. LEGAL PROCEEDINGS
Information regarding legal proceedings is included in Item 8 of Part II of this Report as part of Note 11, “Commitments and Contingencies”, of the Notes to Consolidated Financial Statements and is incorporated herein by reference.
Item 4. MINE SAFETY DISCLOSURES
Not applicable.
PART II
Item 5. MARKET FOR THE REGISTRANT’S COMMON EQUITY, RELATED STOCKHOLDER MATTERS AND ISSUER PURCHASES OF EQUITY SECURITIES
Market Information
NCR Voyix common stock is listed on the New York Stock Exchange (NYSE) and trades under the symbol “VYX”. There were approximately 65,537 stockholders of record of NCR Voyix common stock as of February 21, 2025.
Dividends
Historically, NCR Voyix has not paid cash dividends and does not anticipate the payment of cash dividends on NCR Voyix common stock in the immediate future. The declaration of dividends is restricted under our senior secured revolving credit facility and the terms of the indentures governing our senior unsecured notes, and would be further subject to the discretion of NCR Voyix’s Board of Directors.
Stock Performance Graph
The following graph compares the relative investment performance of NCR Voyix stock, the Standard & Poor’s MidCap 400 Stock Index, Standard & Poor’s 500 Information Technology Sector and the Standard & Poor’s 500 Stock Index. This graph covers the five-year period from December 31, 2019 through December 31, 2024.
| | | | | | | | | | | | | | | | | | | | | | | | | | | | | | | | |
| Company / Index | | 2020 | | 2021 | | 2022 | | 2023 | | 2024 |
| NCR Voyix Corporation | | $ | 107 | | | $ | 114 | | | $ | 67 | | | $ | 79 | | | $ | 65 | |
| S&P 500 Stock Index | | $ | 118 | | | $ | 152 | | | $ | 125 | | | $ | 158 | | | $ | 197 | |
| S&P 500 Information Technology Sector | | $ | 144 | | | $ | 194 | | | $ | 139 | | | $ | 219 | | | $ | 300 | |
| S&P MidCap 400 Stock Index | | $ | 114 | | | $ | 142 | | | $ | 123 | | | $ | 144 | | | $ | 164 | |
(1)In each case, assumes a $100 investment on December 31, 2019, and reinvestment of all dividends, if any.
Purchase of Company Common Stock
In March 2017, the Board approved a share repurchase program, with no expiration from the date of authorization, that provided for the repurchase of up to $300 million of the Company’s common stock (the “Repurchase Program”). In July 2018, the Board authorized an incremental $200 million of share repurchases under the Repurchase Program. As of December 31, 2024, the Repurchase Program had an existing aggregate remaining repurchase authority of $97 million. The Company purchased an additional $44 million of common stock in January and February 2025 under the Repurchase Program.
The timing and amount of repurchases under the Repurchase Program will depend upon market conditions, and may be made from time to time in open market purchases, privately negotiated transactions, accelerated stock repurchase programs, issuer self-tender offers or otherwise. The repurchases will be made in compliance with applicable securities laws and may be discontinued at any time.
In October 2016, the Board approved a share repurchase program, with no expiration from the date of authorization, for the repurchase of the Company’s common stock to offset the dilutive effects of the Company’s employee stock purchase plan, equity awards and in-kind dividends on the Company’s Series A Convertible Preferred Stock (the “Dilution Offset Program”). In November 2024, the Board terminated the Dilution Offset Program.
The Company’s 2017 Stock Incentive Plan allows shares to be surrendered to the Company to satisfy tax withholding obligations associated with the vesting of restricted stock units. The following table sets forth information with respect to our repurchases of shares of common stock (including shares surrendered to satisfy tax withholding) during the three months ended December 31, 2024.
| | | | | | | | | | | | | | | |
| Period | Total number of shares purchased(1) | Average price paid per share | Total number of shares purchased as part of publicly announced plans or programs | Approximate dollar value of shares that may yet be purchased under the plans or programs (in millions)(2) | |
| 10/1/2024 - 10/31/2024 | 5,441 | | $ | 13.33 | | — | | $ | 153 | | |
| 11/1/2024 - 11/30/2024 | 1,438,869 | | $ | 14.32 | | 1,432,154 | | $ | 132 | | |
| 12/1/2024 - 12/31/2024 | 2,464,426 | | $ | 14.34 | | 2,461,517 | | $ | 97 | | |
| | | | | |
(1) For the three months ended December 31, 2024, approximately 15,065 shares were surrendered to the Company to satisfy tax withholding obligations associated with the vesting of restricted stock units issued to employees under the 2017 Stock Incentive Plan. With respect to these surrendered shares, the price paid per share is based on the fair value at the time of surrender.
(2) Represents amounts available for repurchases under the Repurchase Program. The Company’s Dilution Offset Program was terminated in November 2024. Accordingly, historic accrued availability under the Dilution Offset Program of approximately $959 million prior to the program’s termination has been omitted from the table.
The Company’s ability to repurchase its common stock is subject to (i) certain restrictions under the terms of the Company’s senior secured revolving credit facility and the indentures governing its senior unsecured notes and (ii) the discretion of the Company’s Board of Directors.
Item 6. [Reserved]
None.
Index to Management’s Discussion and Analysis of Financial Condition and Results of Operations (MD&A)
Item 7. MANAGEMENT’S DISCUSSION AND ANALYSIS OF FINANCIAL CONDITION AND RESULTS OF OPERATIONS (MD&A)
This section should be read in conjunction with the audited Consolidated Financial Statements and related Notes included in Item 8 of Part II of this Report. Management’s Discussion and Analysis of Financial Condition and Results of Operations contains forward-looking statements. See “Forward-Looking Statements” and “Risk Factors” in Item 1A of this Annual Report for a discussion of the uncertainties, risks and assumptions associated with these forward-looking statements that could cause future results to differ materially from those reflected in this section.
Our discussion within MD&A is organized as follows:
•Overview. This section contains background information on our company, summary of significant themes and events during the year as well as strategic initiatives and trends in order to provide context for management’s discussion and analysis of our financial condition and results of operations.
•Results of operations. This section contains an analysis of our results of operations presented in the accompanying Consolidated Statements of Operations by comparing the results for the year ended December 31, 2024 to the results for the year ended December 31, 2023 as well as a comparison of the results for the year ended December 31, 2023 to the results for the year ended December 31, 2022.
•Liquidity and capital resources. This section provides an analysis of our cash flows and a discussion of our contractual obligations at December 31, 2024.
•Critical accounting estimates. This section contains a discussion of the accounting policies that we believe are important to our financial condition and results of operations and that require judgment and estimates on the part of management in their application. In addition, all of our significant accounting policies, including critical accounting policies, are summarized in Note 1, “Basis of Presentation and Significant Accounting Policies”, in the Notes to Consolidated Financial Statements in Item 8 of Part II of this Report.
SIGNIFICANT THEMES AND EVENTS
As more fully discussed in later sections of this MD&A, the following were highlights for the year ended December 31, 2024:
•Revenue was $2.8 billion, a decrease of 11% compared to prior year
◦Recurring revenue increased 1% from the prior year and comprised 58% of total consolidated revenue
◦Software and services revenue, decreased 3% from the prior year and comprised 73% of total consolidated revenue
•Adjusted EBITDA of $347 million, up 3% compared to prior year
STRATEGIC INITIATIVES
As a leading technology company, we seek to maintain our market position by expanding our share of wallet among existing customers and attracting new customers, leveraging our cloud-based, platform-enabled software and services offerings. We believe there is considerable opportunity to grow with new and existing customers as retailers and restaurants are increasingly adopting technology and support services to enhance and transform their operations. As digital adoption becomes increasingly important for businesses to engage with their end-users, we are investing in innovation to attract and retain customers across our retail and restaurant segments. Our ability to create experiences that ultimately improve end-user satisfaction through a combination of innovation and service is a competitive strength of the Company. In order to provide long-term value to all our stakeholders, we set complementary business goals and financial strategies. Execution of these is driven by the following key pillars: (i) focus on our customer needs; (ii) leverage our brand (and global distribution) to enhance our go-to-market; (iii) invest in innovative products and leading managed services; and (iv) allocate our capital strategically through a cost-disciplined approach to operations. We also plan to continue to improve our execution to drive solid returns and to transform our business to enhance value for all stockholders.
OVERVIEW
BUSINESS OVERVIEW
NCR Voyix is a leading global provider of digital commerce solutions for retail stores and restaurants. Headquartered in Atlanta, Georgia with approximately 14,000 employees across 30 countries, we are a software and services-led technology provider of run-the-store and digital channel capabilities for retail and restaurants, serving businesses of all sizes. Our software platform, which runs in the cloud and includes microservices and APIs that integrate with our customers’ systems, together with our services and
hardware offerings enable end-to-end technology-based capabilities for our customers. Our offerings include platform-based software and services for retailers and restaurants, as well as payment acceptance solutions, multi-vendor connected device services, self-checkout (“SCO”) kiosks and related technologies and other self-service technologies. Our solutions are designed to meet the unique needs of retailers and restaurants, ranging from small and medium-sized businesses to multinational enterprises, enabling them to seamlessly transact and engage with their end customers while driving efficiencies within their operations.
Completion of NCR Atleos Spin-Off Transaction
On October 16, 2023, the Company completed the spin-off (“Spin-Off”) of its ATM-focused businesses, including the self-service banking, payments & network and telecommunications and technology businesses, into an independent, publicly traded company, NCR Atleos, on a tax-free basis. Accordingly, the historical financial results of NCR Atleos are reflected as discontinued operations in the Company’s consolidated financial statements. Refer to Note 2, “Discontinued Operations”, in the Notes to Consolidated Financial Statements in Item 8 of Part II of this Report, for additional information.
Sale of Digital Banking Business
On September 30, 2024, the Company completed the sale of its Digital Banking segment businesses (the “Digital Banking Sale”) to an affiliate of The Veritas Capital Fund VIII, L.P. (the “Buyer”). The purchase price for the transaction was $2.45 billion in cash, subject to a post-closing adjustment, as well as contingent consideration of up to an additional $100 million in cash upon the achievement of a specified return on the Buyer’s invested capital at the time of any future sale. The accounting requirements for reporting the sale of Digital Banking as a discontinued operation were met when the definitive agreement was signed on August 6, 2024. Accordingly, the financial results for Digital Banking are reflected as discontinued operations in the Company’s consolidated financial statements. Refer to Note 2, “Discontinued Operations”, in the Notes to Consolidated Financial Statements in Item 8 of Part II of this Report, for additional information.
Transition of Hardware Business to ODM Model
On August 6, 2024, the Company announced its entry into a commercial agreement with Ennoconn Corporation (“Ennoconn”) to transition its self-checkout and point-of-sale hardware businesses to an outsourced design and manufacturing model including the sale of certain assets relating to these businesses (the “Hardware Business Transition”). Under the terms of the agreement, Ennoconn will design, manufacture, warrant, supply, and ship self-checkout and point-of sale hardware directly to the Company’s customers and the Company will sell hardware to its customers as a sales agent for Ennoconn and continue to provide its point-of sale and self-checkout software as well as key support and maintenance services. As a result of the Hardware Business Transition, the Company will record commission revenue from point-of-sale and self-checkout hardware sales as an agent for Ennoconn on a net basis, excluding the costs paid to Ennoconn. The Company expects the Hardware Business Transition to become effective during 2025.
Ongoing Business Trends
Retail and Restaurants
The global retail and restaurant technology landscape is characterized by rapid advancement and evolution. As a result, competition continues to intensify in these industries. Business and consumer expectations are high, with a focus on speed, convenience, choice and security. To meet these expectations, software and payments companies are focused on investing in their technology, expanding the use of data and enhancing the customer experience.
NCR Voyix serves customers of all sizes, from small- and medium-sized to large, blue-chip companies that represent some of the world’s leading consumer brands. The restaurant and retail industry are facing a similar challenge of differentiating their customers’ experiences to win in the markets they serve. Creating differentiated experiences depends upon complex technology and services. The Company’s portfolio for its Retail and Restaurant segments will start with the point-of-sale as the core for all transaction data, inventory data, customer data, pricing and promotions. Modernizing the point-of-sale and connecting to our commerce platform is the critical path for technology modernization and enhanced offerings in our segments. As we transition customers from legacy technology solutions to a modern cloud-based software platform, we provide end-to-end capabilities to simplify their technology infrastructure and more effectively run their store or restaurant.
NCR Voyix’s platform-driven technology is comprised largely of a SaaS- and Services-based model and marks a shift from the largely hardware-driven business model of the past. This business model enables NCR Voyix to better serve customers by providing a breadth of purpose-built solutions that are tailored to the unique needs of our Retail and Restaurant customers.
Cyber Ransomware Incident
As previously disclosed, in April 2023 the Company determined that a single data center outage impacting certain of its commerce customers was caused by a cyber ransomware incident. Following investigation, the Company concluded that the incident impacted operations for some customers only with respect to specific Aloha cloud-based services and Counterpoint. Functionality was fully restored to all impacted customers, and we built a new cloud environment to host the affected applications.
As of December 31, 2024, the Company has incurred $47 million of expenses related to the cyber ransomware incident and has recovered $36 million under our insurance policies.
For further information see Item 1C “Cybersecurity” of this Form 10-K.
Out-of-period Adjustments
In the first quarter of 2023, the Company recorded a $10 million out-of-period adjustment to increase operating expenses and an employee-related liability in order to correct for an understatement of such same balances during the fourth quarter of 2022.
In the second quarter of 2024, the Company recorded an out-of-period correction to decrease revenue by $10 million, decrease accounts receivable by $5 million, and increase contract liabilities by $5 million. The amount related to periods prior to 2024 was $4 million of revenue.
During the third quarter of 2024, the Company recorded an out-of-period correction related to foreign currency to increase other expense, net by approximately $8 million, increase other current liabilities by approximately $4 million and increase accumulated other comprehensive income (loss) by approximately $4 million. The amount related to 2023 was $2 million of other expense, net.
During 2024, the Company recorded corrections related to the Spin-Off. As of December 31, 2023, total assets were understated by approximately $9 million, total liabilities were overstated by approximately $7 million and total equity was understated by approximately $16 million, which is included in the “Spin-Off of NCR Atleos” line in the Statements of Changes in Stockholders’ Equity (Deficit).
The Company evaluated the impact of the out-of-period adjustments and concluded they are not material to the consolidated financial statements for any of the periods presented.
ACH Disbursements
In February 2024, the Company identified fraudulent automated clearing house “ACH” disbursements from a Company bank account. The cumulative amount of these disbursements total $34 million, and during year ended December 31, 2024, we recovered $16 million related to this matter. The Company is pursuing insurance recoveries in connection with this matter; however, there can be no assurance that the Company will be successful in recovering additional amounts of the unauthorized ACH disbursements from the Company’s insurance providers. Although not materially impacting any previously reported periods, the misstatements resulted in the revision of interim periods in 2023.
For further information on potential risks and uncertainties see Part I, Item 1A “Risk Factors” and Part II, Item 9A “Controls and Procedures” of this Annual Report.
Macroeconomic Trends
Given the multinational nature of our business, we are subject to risks and exposures from the evolving macroeconomic environment, including the effects of increased global inflationary pressures and interest rates, fluctuations in foreign currency exchange rates, economic slowdowns or recessions and geopolitical pressures, including the unknown impacts of current and future trade regulations. We continuously monitor the direct and indirect impacts of these circumstances on our business and financial results, as well as the overall global economy and geopolitical landscape. For example, foreign currency exchange rate fluctuations negatively impacted our revenue during fiscal 2024 and may continue to negatively impact our financial results in fiscal 2025.
As we continue to execute on our strategy to shift to recurring revenue, our revenues and earnings will become more predictable; however, the broader implications of these macroeconomic events on our business, results of operations and overall financial position, particularly in the short term, remain uncertain.
For further discussion of trends, uncertainties and other factors that could affect our operating results, see the section entitled “Risk Factors” in Part I, Item 1A of this Form 10-K. For further information on exposures to foreign exchange risk, refer to Item 7A, “Quantitative and Qualitative Disclosures about Market Risk”, in this Report.
RESULTS OF OPERATIONS
The following results of operations present the continuing operations of NCR Voyix for the years ended December 31, 2024, 2023 and 2022. All results from Digital Banking and NCR Atleos are presented within income (loss) from discontinued operations for these periods.
Key Strategic Financial Metrics
The following tables show our key strategic financial metrics for the years ended December 31, the relative percentage that those amounts represent to total revenue, and the change in those amounts year-over-year.
Recurring revenue as a percentage of total revenue
| | | | | | | | | | | | | | | | | | | | | | | | | | | | | | | | | | | | | | | | | | | | | | | | | | |
| | | | | | | | Percentage of Total Revenue | | Increase (Decrease) |
| In millions | | 2024 | | 2023 | | 2022 | | 2024 | | 2023 | | 2022 | | 2024 v 2023 | | 2023 v 2022 |
Recurring revenue(1) | | $ | 1,634 | | | $ | 1,617 | | | $ | 1,579 | | | 57.8 | % | | 50.9 | % | | 49.7 | % | | 1 | % | | 2 | % |
| All other revenue | | 1,192 | | | 1,561 | | | 1,595 | | | 42.2 | % | | 49.1 | % | | 50.3 | % | | (24) | % | | (2) | % |
| Total Revenue | | $ | 2,826 | | | $ | 3,178 | | | $ | 3,174 | | | 100.0 | % | | 100.0 | % | | 100.0 | % | | (11) | % | | — | % |
(1) Recurring revenue includes all revenue streams from contracts where there is a predictable revenue pattern that will occur at regular intervals with a relatively high degree of certainty. This includes hardware and software maintenance revenue, cloud revenue, payment processing revenue, and certain professional services arrangements as well as term-based software license arrangements that include customer termination rights.
Revenue by type
| | | | | | | | | | | | | | | | | | | | | | | | | | | | | | | | | | | | | | | | | | | | | | | | | | |
| | | | | | | | Percentage of Total Revenue | | Increase (Decrease) |
| In millions | | 2024 | | 2023 | | 2022 | | 2024 | | 2023 | | 2022 | | 2024 v 2023 | | 2023 v 2022 |
| Software and services revenue | | $ | 2,055 | | | $ | 2,115 | | | $ | 2,042 | | | 72.7 | % | | 66.6 | % | | 64.3 | % | | (3) | % | | 4 | % |
| Hardware revenue | | 771 | | | 1,063 | | | 1,132 | | | 27.3 | % | | 33.4 | % | | 35.7 | % | | (27) | % | | (6) | % |
| Total Revenue | | $ | 2,826 | | | $ | 3,178 | | | $ | 3,174 | | | 100.0 | % | | 100.0 | % | | 100.0 | % | | (11) | % | | — | % |
Revenue by geography
| | | | | | | | | | | | | | | | | | | | | | | | | | | | | | | | | | | | | | |
| | | | | | | | | | | | |
| In millions | | 2024 | | % | | 2023 | | % | | 2022 | | % |
| | | | | | | | | | | | |
| United States | | $ | 1,706 | | | 60 | % | | $ | 2,056 | | | 65 | % | | $ | 2,014 | | | 63 | % |
| Americas (excluding United States) | | 239 | | | 9 | % | | 230 | | | 7 | % | | 225 | | | 7 | % |
| | | | | | | | | | | | |
| Europe, Middle East and Africa | | 574 | | | 20 | % | | 543 | | | 17 | % | | 555 | | | 18 | % |
| Asia Pacific | | 307 | | | 11 | % | | 349 | | | 11 | % | | 380 | | | 12 | % |
| | | | | | | | | | | | |
| Total revenue | | $ | 2,826 | | | 100 | % | | $ | 3,178 | | | 100 | % | | $ | 3,174 | | | 100 | % |
Net income (loss) from continuing operations attributable to NCR Voyix and Adjusted EBITDA(2) as a percentage of total revenue
| | | | | | | | | | | | | | | | | | | | | | | | | | | | | | | | | | | | | | | | | | | | | | | | | | |
| | | | | | | | Percentage of Total Revenue | | Increase (Decrease) |
| In millions | | 2024 | | 2023 | | 2022 | | 2024 | | 2023 | | 2022 | | 2024 v 2023 | | 2023 v 2022 |
| | | | | | | | | | | | | | | | |
| | | | | | | | | | | | | | | | |
| Net income (loss) from continuing operations attributable to NCR Voyix | | $ | (202) | | | $ | (729) | | | $ | (369) | | | (7.1) | % | | (22.9) | % | | (11.6) | % | | (72) | % | | 98 | % |
Adjusted EBITDA(2) | | $ | 347 | | | $ | 337 | | | $ | 324 | | | 12.3 | % | | 10.6 | % | | 10.2 | % | | 3 | % | | 4 | % |
(2) Refer to our definition of Adjusted EBITDA in the section entitled “Non-GAAP Financial Measures and Use of Certain Terms” below.
Non-GAAP Financial Measures and Use of Certain Terms:
Adjusted Earnings Before Interest, Taxes, Depreciation and Amortization (“Adjusted EBITDA”) Our management uses the non-GAAP measure Adjusted EBITDA because it provides useful information to investors as an indicator of strength and performance of the Company’s ongoing business operations, including funding discretionary spending such as capital expenditures, strategic acquisitions, and other investments. We determine Adjusted EBITDA based on GAAP net income (loss) from continuing operations attributable to NCR Voyix plus interest expense, net; plus income tax expense (benefit); plus depreciation and amortization (excluding acquisition-related amortization of intangibles); plus stock-based compensation expense; plus pension mark-to-market adjustments and other special items, including amortization of acquisition-related intangibles, acquisition-related costs, loss (gain) on disposal of businesses, separation-related costs, cyber ransomware incident recovery costs net of insurance recoveries, fraudulent ACH disbursements costs net of recoveries, foreign currency devaluation, transformation and restructuring charges (which includes integration, severance and other exit and disposal costs), and strategic initiative costs, among others. The special items are considered non-operational or non-recurring in nature, so are excluded from the Adjusted EBITDA metric utilized by our chief operating decision maker in evaluating segment performance and are separately delineated to reconcile back to total reported income (loss) from continuing operations attributable to NCR Voyix. This format is useful to investors because it allows analysis and comparability of operating trends. It also includes the same information that is used by our management to make decisions regarding the segments and to assess our financial performance. Refer to the table below for the reconciliations of net income (loss) from continuing operations attributable to NCR Voyix (GAAP) to Adjusted EBITDA (non-GAAP).
Our definitions and calculations of these non-GAAP measures may differ from similarly-titled measures reported by other companies and cannot, therefore, be compared with similarly-titled measures of other companies. These non-GAAP measures should not be considered as substitutes for, or superior to, results determined in accordance with GAAP.
| | | | | | | | | | | | | | | | | |
| In millions | 2024 | | 2023 | | 2022 |
| Net income (loss) from continuing operations attributable to NCR Voyix (GAAP) | $ | (202) | | | $ | (729) | | | $ | (369) | |
| Pension mark-to-market adjustments | (12) | | | 7 | | | (41) | |
| Depreciation and amortization | 206 | | | 190 | | | 189 | |
| Acquisition-related amortization of intangibles | 28 | | | 41 | | | 40 | |
| | | | | |
| | | | | |
Interest expense(1) | 134 | | | 294 | | | 285 | |
| Interest income | (9) | | | (12) | | | (13) | |
Acquisition-related costs(2) | — | | | 1 | | | 2 | |
| Loss (gain) on debt extinguishment | (8) | | | 46 | | | — | |
| Income tax expense (benefit) | 4 | | | 184 | | | 52 | |
| Stock-based compensation expense | 40 | | | 140 | | | 84 | |
Transformation and restructuring costs(3) | 125 | | | 28 | | | 95 | |
Separation costs(4) | 10 | | | 95 | | | — | |
| Loss (gain) on disposal of businesses | (14) | | | 12 | | | — | |
Foreign currency devaluation(5) | 15 | | | — | | | — | |
Fraudulent ACH disbursements(6) | (5) | | | 23 | | | — | |
Cyber ransomware incident recovery costs(7) | (13) | | | 17 | | | — | |
Strategic initiatives(8) | 48 | | | — | | | — | |
| | | | | |
| Adjusted EBITDA (Non-GAAP) | $ | 347 | | | $ | 337 | | | $ | 324 | |
(1) During the three months ended September 30, 2023, it was determined that the transactions underlying the unrealized gains on terminated interest rate swap and cap agreements reported in Accumulated other comprehensive income were probable of not occurring under ASC 815, Derivatives and Hedging. As such, $18 million of unrealized gains were recognized in Interest expense. Refer to Note 15, “Derivatives and Hedging Instruments” in the Notes to Consolidated Financial Statements in Item 8 of Part II of this Report.
(2) Represents professional fees, retention bonuses, and other costs incurred related to acquisitions, which are considered non-operational in nature.
(3) Represents integration, severance, and other exit and disposal costs, which are considered non-operational in nature.
(4) Represents costs incurred as a result of the Spin-Off. Professional fees to effect the Spin-Off including separation management, organizational design, and legal fees have been classified within discontinued operations through October 16, 2023, the separation date.
(5) Represents gains and losses recognized during the year due to changes in valuation of the Lebanese pound and the Egyptian pound.
(6) Represents company identified fraudulent ACH disbursements from a company bank account. Additional details regarding this item are discussed in Note 1, “Basis of Presentation and Significant Accounting Policies” in the Notes to Consolidated Financial Statements in Item 8 of Part II of this Report.
(7) Represents expenses to respond to, remediate and investigate the April 13, 2023 cyber ransomware incident, net of insurance recoveries, which is considered a nonrecurring special item. Additional details regarding this cyber ransomware incident are discussed in Note 1, “Basis of Presentation and Significant Accounting Policies” in the Notes to Consolidated Financial Statements in Item 8 of Part II of this Report.
(8) Represents professional fees related to strategic initiatives which are considered non-operational in nature, as well as certain costs incurred related to the Hardware Business transition.
Other Performance Metrics
Adjusted free cash flow-unrestricted and Conversion Rate. NCR Voyix management uses the non-GAAP measure called “adjusted free cash flow-unrestricted” to assess the financial performance of the Company. We define adjusted free cash flow-unrestricted as net cash provided by (used in) operating activities less capital expenditures for property, plant and equipment, less additions to capitalized software, plus/minus collections of previously sold trade receivables purchased from third parties, restricted cash settlement activity, NCR Atleos settlement activity, cash taxes paid for the Digital Banking Sale, cash activity related to environmental discontinued operations plus acquisition-related items, and plus pension contributions and settlements. NCR Atleos settlement activity relates to changes in amounts owed to and amounts due from NCR Atleos for activity related to items governed by the separation and distribution agreement. Activity from the commercial and transition services agreements are not included in this adjustment.
We believe adjusted free cash flow-unrestricted information is useful for investors because it relates the operating cash flows from the Company’s continuing and discontinued operations to the capital that is spent to continue and improve business operations. In particular, adjusted free cash flow-unrestricted indicates the amount of cash available after capital expenditures for, among other things, investments in the Company’s existing businesses, strategic acquisitions, and repayment of debt obligations. Adjusted free cash flow does not represent the residual cash flow available for discretionary expenditures, since there may be other non-discretionary expenditures that are not deducted from the measure. Adjusted free cash flow-unrestricted does not have a uniform definitions under GAAP, and therefore the Company’s definition may differ from other companies’ definitions of this measure. These non-GAAP measures should not be considered a substitute for, or superior to, cash flows from operating activities under GAAP.
Refer to the section titled “Financial Condition, Liquidity and Capital Resources” in Part I, Item 7 of this Form 10-K for additional information.
Annualized Recurring Revenue (“ARR”). ARR is calculated using recurring revenue, excluding software licenses sold as a subscription, for the last three months times four, plus the rolling four quarters for term-based software license arrangements that include customer termination rights. The Company believes this metric may be useful to investors in evaluating the achievement of strategic goals related to the conversion of the Retail and Restaurant businesses to recurring revenue streams over time. ARR is an operating metric and does not necessarily reflect the pattern of revenue recognition in accordance with GAAP and should not be considered a substitute for GAAP revenue. ARR does not have a uniform definition and, therefore, the Company’s definitions may differ from other companies’ definitions of this measure.
| | | | | | | | | | | | | | | | | | | | | | |
| In millions | | 2024 | | 2023 | | 2024 v 2023 | | |
| Retail | | | | | | | | |
| Annualized recurring revenue | | $ | 1,078 | | | $ | 1,020 | | | 6 | % | | |
| | | | | | | | |
| | | | | | | | |
| Restaurants | | | | | | | | |
| Annualized recurring revenue | | $ | 562 | | | $ | 540 | | | 4 | % | | |
| | | | | | | | |
| | | | | | | | |
Consolidated Results
The following table shows our results for the years December 31, the relative percentage that those amounts represent to revenue, and the change in those amounts year-over-year.
| | | | | | | | | | | | | | | | | | | | | | | | | | | | | | | | | | | | | | | | | | | | | | | |
| | | | | | | Percentage of Revenue(1) | | Increase (Decrease) |
| In millions | 2024 | | 2023 | | 2022 | | 2024 | | 2023 | | 2022 | | 2024 v 2023 | | 2023 v 2022 |
| Product revenue | $ | 870 | | | $ | 1,168 | | | $ | 1,204 | | | 30.8 | % | | 36.8 | % | | 37.9 | % | | (26) | % | | (3) | % |
| Service revenue | 1,956 | | | 2,010 | | | 1,970 | | | 69.2 | % | | 63.2 | % | | 62.1 | % | | (3) | % | | 2 | % |
| Total revenue | 2,826 | | | 3,178 | | | 3,174 | | | 100.0 | % | | 100.0 | % | | 100.0 | % | | (11) | % | | — | % |
| Product gross margin | 100 | | | 119 | | | 101 | | | 11.5 | % | | 10.2 | % | | 8.4 | % | | (16) | % | | 18 | % |
| Service gross margin | 479 | | | 550 | | | 583 | | | 24.5 | % | | 27.4 | % | | 29.6 | % | | (13) | % | | (6) | % |
| Total gross margin | 579 | | | 669 | | | 684 | | | 20.5 | % | | 21.1 | % | | 21.6 | % | | (13) | % | | (2) | % |
| Selling, general and administrative expenses | 459 | | | 659 | | | 618 | | | 16.2 | % | | 20.7 | % | | 19.5 | % | | (30) | % | | 7 | % |
| Research and development expenses | 157 | | | 139 | | | 116 | | | 5.6 | % | | 4.4 | % | | 3.7 | % | | 13 | % | | 20 | % |
| Income (loss) from operations | $ | (37) | | | $ | (129) | | | $ | (50) | | | (1.3) | % | | (4.1) | % | | (1.6) | % | | (71) | % | | 158 | % |
(1) The percentage of revenue is calculated for each line item divided by total revenue, except for product gross margin, service gross margin and total gross margin, which are divided by the related component of revenue.
Revenue
| | | | | | | | | | | | | | | | | | | | | | | | | | | | | | | | | | | | | | | | | | | | | | | |
| | | | | | | Percentage of Total Revenue | | Increase (Decrease) |
| In millions | 2024 | | 2023 | | 2022 | | 2024 | | 2023 | | 2022 | | 2024 v 2023 | | 2023 v 2022 |
| Product revenue | $ | 870 | | | $ | 1,168 | | | $ | 1,204 | | | 30.8 | % | | 36.8 | % | | 37.9 | % | | (26) | % | | (3) | % |
| Service revenue | 1,956 | | | 2,010 | | | 1,970 | | | 69.2 | % | | 63.2 | % | | 62.1 | % | | (3) | % | | 2 | % |
| Total revenue | $ | 2,826 | | | $ | 3,178 | | | $ | 3,174 | | | 100.0 | % | | 100.0 | % | | 100.0 | % | | (11) | % | | — | % |
Product revenue includes our hardware and software license revenue streams. Service revenue includes hardware and software maintenance revenue, implementation services revenue, cloud revenue, payments processing revenue as well as professional services revenue.
Total revenue decreased 11% for the year ended December 31, 2024 compared to the year ended December 31, 2023. Product revenue decreased 26% due to a decline in SCO and POS hardware revenues, as well as a decrease in software license revenue for one-time revenue recognized in 2023. Service revenue decreased 3% due to a decrease in payment processing service revenue due to the divestiture at the end of 2023. The decline in service revenue was also related to revenue from non-recurring implementation services in 2023, slightly offset by an increase in hardware maintenance and professional services revenue.
Total revenue was flat for the year ended December 31, 2023 compared to the year ended December 31, 2022. Product revenue decreased 3% due to a decrease in SCO and POS hardware revenues partially offset by an increase in software license revenue. Service revenue increased 2% comparing the year ended 2023 to 2022 due primarily to growth in cloud services revenue, hardware maintenance revenue and recurring software related services.
Gross Margin
| | | | | | | | | | | | | | | | | | | | | | | | | | | | | | | | | | | | | | | | | | | | | | | |
| | | | | | | Percentage of Revenue(1) | | Increase (Decrease) |
| In millions | 2024 | | 2023 | | 2022 | | 2024 | | 2023 | | 2022 | | 2024 v 2023 | | 2023 v 2022 |
| Product gross margin | $ | 100 | | | $ | 119 | | | $ | 101 | | | 11.5 | % | | 10.2 | % | | 8.4 | % | | (16) | % | | 18 | % |
| Service gross margin | 479 | | | 550 | | | 583 | | | 24.5 | % | | 27.4 | % | | 29.6 | % | | (13) | % | | (6) | % |
| Total gross margin | $ | 579 | | | $ | 669 | | | $ | 684 | | | 20.5 | % | | 21.1 | % | | 21.6 | % | | (13) | % | | (2) | % |
(1) The percentage of revenue is calculated for each line item divided by the related component of revenue.
Gross margin as a percentage of revenue was 20.5% in 2024 compared to 21.1% in 2023 due to a decline in gross margin related to payments processing services from the divestiture at the end of 2023, as well as the one-time software license revenue and non-
recurring implementation service revenue recognized in 2023, as discussed above. Additionally, gross margin for the year ended December 31, 2024 included $46 million related to transformation and restructuring costs, $20 million of strategic initiative costs, $10 million of stock-based compensation expense, $14 million related to amortization of acquisition-related intangible assets, offset by $5 million of cyber ransomware incident recoveries. Gross margin for the year ended December 31, 2023 included $4 million related to transformation and restructuring costs, $15 million of stock-based compensation expense, $33 million related to amortization of acquisition-related intangible assets, $31 million in separation-related costs and $16 million in cyber ransomware recovery costs.
Gross margin as a percentage of revenue was 21.1% in 2023 compared to 21.6% in 2022. Gross margin for the year ended December 31, 2023 included $4 million related to transformation and restructuring costs, $15 million of stock-based compensation expense, $33 million related to amortization of acquisition-related intangible assets, $31 million in separation-related costs and $16 million in cyber ransomware recovery costs. Gross margin for the year ended December 31, 2022 included $28 million related to transformation and restructuring costs, $14 million of stock-based compensation expense and $36 million related to amortization of acquisition-related intangible assets.
Selling, General and Administrative Expenses
| | | | | | | | | | | | | | | | | | | | | | | | | | | | | | | | | | | | | | | | | | | | | | | |
| | | | | | | Percentage of Total Revenue | | Increase (Decrease) |
| In millions | 2024 | | 2023 | | 2022 | | 2024 | | 2023 | | 2022 | | 2024 v 2023 | | 2023 v 2022 |
| Selling, general and administrative expenses | $ | 459 | | | $ | 659 | | | $ | 618 | | | 16.2 | % | | 20.7 | % | | 19.5 | % | | (30) | % | | 7 | % |
Selling, general, and administrative expenses were $459 million in 2024 as compared to $659 million in 2023. As a percentage of revenue, selling, general and administrative expenses were 16.2% in 2024 and 20.7% in 2023. In 2024, selling, general and administrative expenses included $55 million of transformation and restructuring costs, $26 million of strategic initiative costs, $20 million of stock-based compensation expense, $14 million of acquisition-related amortization of intangibles and $8 million in separation-related costs, offset by $5 million in recoveries related to the fraudulent ACH matter and $8 million of cyber ransomware incident recoveries. In 2023, selling, general and administrative expenses included $21 million of transformation and restructuring costs, $113 million of stock-based compensation expense, $8 million of acquisition-related amortization of intangibles, $23 million in ACH disbursement costs, $1 million of acquisition-related costs, $54 million in separation-related costs and $2 million of costs related to the divestitures of certain non-strategic businesses. Excluding these items, selling, general and administrative expenses decreased from 2023 to 2024 due to cost mitigation actions implemented, including a reduction in employee-related costs.
Selling, general, and administrative expenses were $659 million in 2023, compared to $618 million in 2022. In 2023, selling, general and administrative expenses included $21 million of transformation and restructuring costs, $113 million of stock-based compensation expense, $8 million of acquisition-related amortization of intangibles, $23 million in fraudulent ACH disbursement costs, $1 million of acquisition-related cost, $54 million in separation-related costs and $2 million of costs related to the divestitures of certain non-strategic businesses. In 2022, selling, general and administrative expenses included $39 million of transformation and restructuring costs, $61 million of stock-based compensation expense, $4 million of acquisition-related amortization of intangibles and $2 million of acquisition-related costs. Excluding these items, selling, general and administrative expenses decreased from 2022 to 2023 related to cost actions implemented, partially offset by an increase in employee-related costs.
Research and Development Expenses
| | | | | | | | | | | | | | | | | | | | | | | | | | | | | | | | | | | | | | | | | | | | | | | |
| | | | | | | Percentage of Total Revenue | | Increase (Decrease) |
| In millions | 2024 | | 2023 | | 2022 | | 2024 | | 2023 | | 2022 | | 2024 v 2023 | | 2023 v 2022 |
| Research and development expenses | $ | 157 | | | $ | 139 | | | $ | 116 | | | 5.6 | % | | 4.4 | % | | 3.7 | % | | 13 | % | | 20 | % |
Research and development expenses were $157 million in 2024, compared to $139 million in 2023. As a percentage of revenue, these costs were 5.6% in 2024 and 4.4% in 2023. In 2024, research and development expenses included $7 million of costs related to our transformation and restructuring initiatives, $3 million of separation related costs and $10 million of stock-based compensation expense. In 2023, research and development expenses included $3 million of transformation and restructuring costs, $7 million of separation related costs, $12 million of stock-based compensation expense and $1 million in cyber ransomware recovery costs. Excluding these items, research and development expenses increased from 2023 to 2024 as the Company continues to invest in research and development activities related to our platform.
Research and development expenses were $139 million in 2023, compared to $116 million in 2022. In 2023, research and development expenses included $3 million of transformation and restructuring costs, $7 million of separation related costs, $12 million of stock-based compensation expense and $1 million in cyber ransomware recovery costs. In 2022, research and development expenses included $20 million of costs related to our transformation and restructuring initiatives and $9 million of stock-based compensation expense. Excluding these items, research and development expenses increased from 2022 to 2023 related to an increase in employee-related costs.
Gain (loss) on Extinguishment of Debt
| | | | | | | | | | | | | | | | | | | | | | | | | | | | | |
| | | | | | | Increase (Decrease) |
| In millions | 2024 | | 2023 | | 2022 | | 2024 v 2023 | | 2023 v 2022 |
| Gain (loss) on extinguishment of debt | $ | 8 | | | (46) | | | — | | | (117) | % | | (100) | % |
The gain on extinguishment of debt of $8 million in 2024 is related to the redemption discount on the 5.250% senior notes due 2030 and the 5.125% senior notes due 2029 of $18 million, offset by the write-off of the related deferred financing fees of $10 million.
The loss on extinguishment of debt was $46 million in 2023 related to the premium paid for early redemption of $24 million of the 5.750% senior notes due 2027 and the 6.125% senior notes due 2029, as well as the write-off of deferred financing fees of $22 million related to the senior unsecured notes and the senior secured credit facilities.
Refer to Note 6, “Debt Obligations” of the Notes to Consolidated Financial Statements in Item 8 of Part II of this Report for additional discussion on the financing transactions.
Interest Expense
| | | | | | | | | | | | | | | | | | | | | | | | | | | | | |
| | | | | | | Increase (Decrease) |
| In millions | 2024 | | 2023 | | 2022 | | 2024 v 2023 | | 2023 v 2022 |
| Interest expense | $ | (134) | | | $ | (294) | | | $ | (285) | | | (54) | % | | 3 | % |
Interest expense was $134 million in 2024 compared to $294 million in 2023. Interest expense is primarily related to our senior unsecured notes and borrowings under the senior secured credit facilities. The decrease in interest expense was due to the decrease in total debt outstanding.
Interest expense was $294 million in 2023 compared to $285 million in 2022. Interest expense is primarily related to our senior unsecured notes and borrowings under the senior secured credit facilities. The increase in interest expense was due to the significant increase in variable interest rates on the senior secured credit facilities, partially offset by the recognition of $18 million of unrealized gains on terminated interest rate derivative contracts included in Accumulated other comprehensive loss due to the determination that the underlying transactions were no longer probable of occurring as a result of the Spin-Off of NCR Atleos from the Company.
Other Income (Expense), net
Other income (expense), net was expense of $36 million in 2024, expense of $76 million in 2023 and income of $18 million in 2022, with the components reflected in the following table:
| | | | | | | | | | | | | | | | | |
| In millions | 2024 | | 2023 | | 2022 |
| Interest income | $ | 9 | | | $ | 12 | | | $ | 13 | |
| Foreign currency fluctuations and foreign exchange contracts | (30) | | | (28) | | | (17) | |
| Bank-related fees | (24) | | | (28) | | | (9) | |
| Employee benefit plans | 9 | | | (8) | | | 40 | |
| | | | | |
| | | | | |
| | | | | |
| Other, net | — | | | (24) | | | (9) | |
| Other income (expense), net | $ | (36) | | | $ | (76) | | | $ | 18 | |
Employee benefit plans within other income (expense) net includes the components of pension, postemployment expense, other than service cost, as well as actuarial gains and losses from the annual pension mark-to-market adjustment. In 2024, there was an actuarial gain of $12 million compared to an actuarial loss of $7 million in 2023. The net actuarial gain in 2024 was primarily due to
plan experience gains as well as an increase in discount rates and favorable returns on plan assets. The actuarial loss in 2023 was primarily due to plan experience losses as well as a decrease in discount rates, partially offset by favorable returns on plan asset. The actuarial gain in 2022 was $41 million primarily due to an increase in discount rates, partially offset by unfavorable returns on the fair value of plan assets.
In 2023, Other, net includes a $9 million loss recognized on the divestitures of certain non-strategic businesses. In 2022, Other, net includes a $9 million loss recognized on the divestiture of a non-strategic business.
In 2024, the Company incurred bank-related fees of $24 million compared to $28 million and $9 million in 2023 and 2022, respectively. Higher costs were incurred in 2023 than 2022 related to higher interest rates on the trade receivables facility compared to prior years. The trade receivables facility was terminated during the third quarter of 2024.
Foreign currency fluctuations and foreign exchange contracts within Other income (expense), net, includes a net loss of $15 million due to the impact of changes in the Lebanese pound and the Egyptian pound during 2024. As of March 31, 2024, the operations of Lebanon and Egypt have transferred to NCR Atleos; however, the Company retained certain assets and liabilities under the separation and disclosure agreement which were impacted by the changes in foreign currency fluctuations.
Income Taxes
| | | | | | | | | | | | | | | | | | | | | | | | | | | | | |
| | | | | | | Increase (Decrease) |
| In millions | 2024 | | 2023 | | 2022 | | 2024 v 2023 | | 2023 v 2022 |
| Income tax expense (benefit) | $ | 4 | | | $ | 184 | | | $ | 52 | | | (98) | % | | 254 | % |
Our effective tax rate was (2)% in 2024, (34)% in 2023, and (16)% in 2022. During 2024, our tax rate was impacted by a $57 million expense from recording a valuation allowance against deferred tax assets. During 2023, our tax rate was impacted by a net $226 million expense related to the Spin-Off of NCR Atleos. Also during 2023, our tax rate was impacted by a $31 million expense from recording a valuation allowance against deferred tax assets and a $17 million expense from nondeductible executive compensation. During 2022, our tax rate was impacted by a $117 million expense from recording a valuation allowance against deferred tax assets in the United Kingdom and other jurisdictions.
While we are subject to numerous federal, state and foreign tax audits, we believe that appropriate reserves exist for issues that might arise from these audits. Should these audits be settled, the resulting tax effect could impact the tax provision and cash flows in future periods. During 2025, the Company expects to resolve certain tax matters related to U.S. and foreign jurisdictions. These resolutions could have a material impact on the effective tax rate in 2025.
We regularly review our deferred tax assets for recoverability and establish a valuation allowance if it is more likely than not that some portion or all of a deferred tax asset will not be realized. The determination as to whether a deferred tax asset will be realized is made on a jurisdictional basis and is based on the evaluation of positive and negative evidence. This evidence includes historical taxable income/loss, projected future taxable income, the expected timing of the reversal of existing temporary differences and the implementation of tax planning strategies.
Income (Loss) from Discontinued Operations, net of tax
| | | | | | | | | | | | | | | | | | | | | | | | | | | | | |
| | | | | | | Increase (Decrease) |
| In millions | 2024 | | 2023 | | 2022 | | 2024 v 2023 | | 2023 v 2022 |
| Income (loss) from discontinued operations, net of tax | $ | 1,160 | | | $ | 306 | | | $ | 428 | | | 279 | % | | (29) | % |
In 2024, the income from discontinued operations was $1,160 million, net of tax, of which $1,178 million related to income from discontinued operations, net of tax, for the Digital Banking Sale, $8 million loss from discontinued operations, net of tax related to NCR Atleos, and a loss from discontinued operations, net of tax, of $10 million related to the Company’s environmental remediation matters.
In 2023, the income from discontinued operations was $306 million, net of tax, of which of which $115 million related to income from discontinued operations, net of tax, for the Digital Banking Sale, $241 million related to income from discontinued operations, net of tax, related to NCR Atleos, and a loss from discontinued operations, net of tax, of $50 million related to the Company’s environmental remediation matters.
In 2022, the income from discontinued operations was $428 million, net of tax, of which $138 million related to income from discontinued operations, net of tax, for the Digital Banking Sale, $294 million related to income from discontinued operations, net of tax, related to NCR Atleos, and a loss from discontinued operations, net of tax, of $4 million related to the Company’s environmental remediation matters.
Refer to Note 2, “Discontinued Operations” of the Notes to Consolidated Financial Statements in Item 8 of Part II of this Report for additional information.
Revenue and Adjusted EBITDA by Segment
The Company manages and reports its businesses in the following segments: Retail and Restaurants. Segments are measured for profitability by the Company’s chief operating decision maker based on revenue and segment Adjusted EBITDA. Refer to the section above entitled “Non-GAAP Financial Measures and Use of Certain Terms” for our definition of Adjusted EBITDA and the reconciliation of net income (loss) from continuing operations attributable to NCR Voyix (GAAP) to Adjusted EBITDA (non-GAAP).
Corporate and Other includes income and expenses related to corporate functions that are not specifically attributable to any of our two individual reportable segments along with certain non-strategic businesses that are considered immaterial operating segment(s) and certain countries expected to transfer to NCR Atleos subsequent to 2024, as well as commercial agreements with NCR Atleos.
The following table shows our segment revenue and Adjusted EBITDA for the years ended December 31, the relative percentage that those amounts represent to revenue, and the change in those amounts year-over-year.
| | | | | | | | | | | | | | | | | | | | | | | | | | | | | | | | | | | | | | | | | | | | | | | |
| | | | | | | Percentage of Revenue(1) | | Increase (Decrease) |
| In millions | 2024 | | 2023 | | 2022 | | 2024 | | 2023 | | 2022 | | 2024 v 2023 | | 2023 v 2022 |
| Revenue | | | | | | | | | | | | | | | |
| Retail | $ | 1,956 | | | $ | 2,177 | | | $ | 2,182 | | | 69.2 | % | | 68.5 | % | | 68.8 | % | | (10) | % | | — | % |
| Restaurants | 825 | | | 886 | | | 857 | | | 29.2 | % | | 27.9 | % | | 27.0 | % | | (7) | % | | 3 | % |
| Total Segment Revenue | 2,781 | | | 3,063 | | | 3,039 | | | 98.4 | % | | 96.4 | % | | 95.8 | % | | (9) | % | | 1 | % |
| | | | | | | | | | | | | | | |
| Other | 45 | | | 115 | | | 135 | | | 1.6 | % | | 3.6 | % | | 4.2 | % | | (61) | % | | (15) | % |
| | | | | | | | | | | | | | | |
| Total Revenue | $ | 2,826 | | | $ | 3,178 | | | $ | 3,174 | | | 100.0 | % | | 100.0 | % | | 100.0 | % | | (11) | % | | — | % |
| | | | | | | | | | | | | | | |
| | | | | | | | | | | | | | | |
| | | | | | | | | | | | | | | |
| Adjusted EBITDA by segment | | | | | | | | | | | | | | | |
| Retail | $ | 383 | | | $ | 411 | | | $ | 384 | | | 19.6 | % | | 18.9 | % | | 17.6 | % | | (7) | % | | 7 | % |
| Restaurants | $ | 251 | | | $ | 197 | | | $ | 160 | | | 30.4 | % | | 22.2 | % | | 18.7 | % | | 27 | % | | 23 | % |
| | | | | | | | | | | | | | | |
| | | | | | | | | | | | | | | |
| | | | | | | | | | | | | | | |
| | | | | | | | | | | | | | | |
| | | | | | | | | | | | | | | |
(1) The percentage of revenue is calculated for each line item divided by total revenue, except for Adjusted EBITDA, which are divided by the related component of revenue.
Segment Revenue
For the year ended December 31, 2024 compared to the year ended December 31, 2023
Retail revenue decreased 10% for the year ended December 31, 2024 compared to the prior year period. The change in revenue compared to the prior year relates to declines in hardware revenue and one-time perpetual licenses and installation revenue offset by increases in hardware maintenance revenue and professional services revenue.
Restaurants revenue decreased 7% for the year ended December 31, 2024 compared to the prior year period driven by declines in one-time hardware and installation revenue, partially offset by an increase in software and services revenue, driven by platform conversions and payments processing growth.
For the operations grouped as Other, revenue decreased 61% for the year ended December 31, 2024 compared to the prior year period due to the divestiture of a non-strategic business and declines in revenues not attributable to a reportable segment.
For the year ended December 31, 2023 compared to the year ended December 31, 2022
Retail revenue was flat for the year ended December 31, 2023 compared to the prior year period. The change in revenue compared to the prior period includes increases in software license revenue and transaction services revenue, offset by declines in hardware revenue.
Restaurants revenue increased 3% for the year ended December 31, 2023 compared to the prior year period driven by an increase in software and services revenue, driven by connecting to the platform and payments processing growth, partially offset by declines in hardware revenue.
For the operations grouped as Other, revenue decreased 15% for the year ended December 31, 2023 compared to the prior year period due to the divestiture of a non-strategic business and declines in revenues not attributable to a reportable segment, offset by revenues from commercial agreements in 2023 with NCR Atleos following the Spin-Off.
Segment Adjusted EBITDA
For the year ended December 31, 2024 compared to the year ended December 31, 2023
Retail Adjusted EBITDA decreased 7% for the year ended December 31, 2024 compared to the prior year period. The decrease in Adjusted EBITDA compared to the prior year period is driven by the decrease in hardware revenue, one-time perpetual license revenue and one-time installation revenue recognized in 2023, partially offset by cost mitigation actions implemented in 2024.
Restaurants Adjusted EBITDA increased 27% for the year ended December 31, 2024 compared to the prior year period driven by favorable software and services revenue mix, along with cost mitigation actions around cost of goods and service delivery costs taken during 2024.
For the year ended December 31, 2023 compared to the year ended December 31, 2022
Retail Adjusted EBITDA increased 7% for the year ended December 31, 2023 compared to the prior year period. The increase in Adjusted EBITDA compared to the prior year period is driven by improved revenue mix from growth in software and services as well as operating efficiencies and productivity improvements.
Restaurants Adjusted EBITDA increased 23% for the year ended December 31, 2023 compared to the period year period driven by positive revenue mix and growth in services offsetting the impact of higher labor costs.
FINANCIAL CONDITION, LIQUIDITY AND CAPITAL RESOURCES
General Our primary liquidity needs in the ordinary course of business are: (i) normal operating expenses; (ii) interest and principal requirements of our outstanding indebtedness; (iii) capital expenditures and lease payments; (iv) remediation payments related to environmental matters; (v) pension and postemployment plan contributions; and (vi) transformation and restructuring initiatives. We believe these needs will be satisfied in both the short and long term based on our current cash position, cash flows generated by our operations, and existing financing arrangements.
As of December 31, 2024, our cash and cash equivalents totaled $724 million and our total debt was $1.1 billion. Our borrowing capacity under our senior secured credit facilities was $480 million at December 31, 2024. Our ability to generate positive cash flows from operations is dependent on general economic conditions, and the competitive environment in our industry, and is subject to the business and other risk factors described in Item 1A of Part I of this Report. If we are unable to generate sufficient cash flows from operations, or otherwise comply with the terms of our credit facilities, we may be required to seek additional financing alternatives.
The following table summarizes our cash flows from operating activities, investing activities and financing activities. The Consolidated Statements of Cash Flows include the results of continuing and discontinued operations.
| | | | | | | | | | | | | | | | | |
| | | | | |
| For the year ended December 31 |
| In millions | 2024 | | 2023 | | 2022 |
| Net cash provided by (used in) operating activities | $ | (132) | | | $ | 694 | | | $ | 427 | |
| Net cash provided by (used in) investing activities | 2,189 | | | (290) | | | (387) | |
| Net cash provided by (used in) financing activities | (1,560) | | | (839) | | | 1 | |
The following table summarizes information related to cash flows from discontinued operations related to the Digital Banking Sale and the Spin-Off of NCR Atleos:
| | | | | | | | | | | | | | | | | |
| For the year ended December 31 |
| In millions | 2024 | | 2023 | | 2022 |
| Net cash provided by/(used in) operating activities | $ | (296) | | | $ | 578 | | | $ | 482 | |
| Net cash provided by/(used in) investing activities | (57) | | | (189) | | | (216) | |
| Net cash provided by/(used in) financing activities | — | | | 1 | | | 10 | |
Net cash used in operating activities of discontinued operations related to environmental obligations were $20 million, $19 million and $20 million for fiscal years 2024, 2023 and 2022, respectively.
Operating Activities Cash used in operating activities was $132 million for the year ended December 31, 2024 compared to cash provided by operating activities of $694 million for the year ended December 31, 2023. The decrease in cash provided by operating activities was driven by discontinued operations, movement in the net working capital accounts and employee related payments in 2024.
Cash provided by operating activities was $694 million for the year ended December 31, 2023 compared to cash provided by operating activities of $427 million for the year ended December 31, 2022. The increase in cash provided by operating activities was driven by the favorable movement in net working capital accounts.
Capital Expenditures and Other Investing Activities Our principal capital expenditures are for software (purchased and internally developed) and additions to property and equipment. We invested approximately $217 million, $377 million and $377 million in capital expenditures during 2024, 2023 and 2022, respectively. We expect to continue investing in property and equipment, purchased software and internally developed software to support our business. During 2024, the Company disposed of certain corporate-owned life insurance policies and received proceeds of $36 million. Additionally, during 2024, the Company paid $300 million to terminate its trade receivables facility and reacquired all of the outstanding trade receivables that had previously been sold by it. The Company collected $212 million of the purchased trade receivables during the year. Additionally, due to the Digital Banking Sale, the company received proceeds of $2.5 billion.
Financing Activities Financing activities mainly related to borrowings and repayments under our senior secured credit facilities as well as our unsecured senior notes. Financing activities also included dividends paid on the Series A preferred stock, proceeds from employee stock plans as well as payments made for share repurchases and tax withholding payments on behalf of employees for stock based awards that vested.
Adjusted free cash flow-unrestricted NCR Voyix management uses a non-GAAP measure called “adjusted free cash flow-unrestricted” to assess the financial performance of the Company. We define adjusted free cash flow-unrestricted within the section titled “Non-GAAP Financial Measures and Use of Certain Terms” in Part I, Item 7 of this Form 10-K. The table below reconciles net cash provided by operating activities to NCR Voyix’s non-GAAP measure of adjusted free cash flow-unrestricted for the twelve months ended December 31, 2024:
| | | | | |
| In millions | Twelve months ended December 31, 2024(1) |
| Net cash provided by (used in) operating activities (GAAP) | $ | (132) | |
| Expenditures for property, plant and equipment | (30) | |
| Additions to capitalized software | (187) | |
| Restricted cash settlement activity | 10 | |
| NCR Atleos settlement activity | (3) | |
| |
| Cash taxes paid for the Digital Banking Sale | 20 | |
| Pension contributions | 12 | |
| Collections on purchased trade receivables | 212 | |
| Cash activity related to environmental discontinued operations | 20 | |
| Adjusted free cash flow-unrestricted (non-GAAP) | $ | (78) | |
| |
(1)Adjusted free cash flow-unrestricted for 2023 is not meaningful for comparison purposes given the presentation of cash flows due to the Spin-Off of NCR Atleos.
Long Term Borrowings The senior secured credit facilities include a term loan facility in an initial aggregate principal amount of $200 million, of which there was no outstanding balance as of December 31, 2024. Additionally, the senior secured credit facilities include a five-year Revolving Credit Facility with an aggregate principal amount of $500 million, of which there was no outstanding balance as of December 31, 2024. The Revolving Credit Facility also contains a sub-facility to be used for letters of credit, and as of December 31, 2024, there were $20 million letters of credit outstanding.
As of December 31, 2024, we had outstanding $650 million aggregate principal balance of 5.000% senior unsecured notes due in 2028, $403 million in aggregate principal balance of 5.125% senior unsecured notes due in 2029 and $52 million in aggregate principal balance of 5.250% senior unsecured notes due in 2030.
See Note 6, “Debt Obligations”, of the Notes to Consolidated Financial Statements included in Item 8 of this Report for further information on the senior secured credit facilities and senior unsecured notes.
Employee Benefit Plans In 2025, we expect to make contributions of $13 million to our international pension plans and $13 million to our postemployment plan. See Note 10, “Employee Benefit Plans”, of the Notes to Consolidated Financial Statements included in Item 8 of Part II of this Report for additional discussion on our pension and postemployment plans.
Series A Convertible Preferred Stock In 2015, the Company issued 820,000 shares of Series A Convertible Preferred Stock. As of December 31, 2024, there were approximately 300,000 shares that remained issued and outstanding with a redemption value of approximately $276 million. Holders of Series A Convertible Preferred Stock are entitled to a cumulative dividend at the rate of 5.5% per annum, which are payable in cash or in-kind at the option of the Company. During the years ended December 31, 2024, the Company paid cash dividends of $15 million. The holders also have certain redemption rights or put rights, including the right to require us to repurchase all or any portion of the Series A Convertible Preferred Stock on any date during the three months commencing on and immediately following March 16, 2024 and the three months commencing on and immediately following every third anniversary of such date, at 100% of the liquidation preference plus all accrued but unpaid dividends.
Prior to the close of business on October 17, 2023, the Series A Convertible Preferred Stock was convertible at the option of the holders at any time into shares of common stock at a conversion price of $30.00 per share, or a conversion rate of 33.333 shares of common stock per share of Series A Convertible Preferred Stock. As a result of the Spin-Off, the conversion rate of the Series A Convertible Preferred Stock was adjusted pursuant to its terms to 57.560 shares of common stock per share of Series A Convertible Preferred Stock, effective immediately after the close of business on October 17, 2023. As of December 31, 2024, the maximum number of common shares that could be required to be issued upon conversion of the outstanding shares of the Series A Convertible Preferred Stock was 15.9 million shares, which would represent approximately 10% of our outstanding common stock as of December 31, 2024, including the preferred shares on an as-converted basis.
Cash and Cash Equivalents Held by Foreign Subsidiaries Cash and cash equivalents held by the Company’s foreign subsidiaries were $134 million and $190 million at December 31, 2024 and 2023, respectively. Under current tax laws and regulations, if cash and cash equivalents and short-term investments held outside the U.S. are distributed to the U.S. in the form of dividends or otherwise, we may be subject to additional U.S. income taxes and foreign withholding taxes, which could be significant.
Material Cash Requirements from Contractual and Other Obligations In the normal course of business, we enter into various contractual obligations that impact, or could impact, the liquidity of our operations. The following table and discussion outlines our material obligations as of December 31, 2024 on an undiscounted basis, with projected cash payments in the years shown:
| | | | | | | | | | | | | | | | | | |
| In millions | Total Amounts | 2025 | 2026-2027 | 2028-2029 | 2030 & Thereafter | |
| Debt obligations | $ | 1,105 | | $ | — | | $ | — | | $ | 1,053 | | $ | 52 | | |
| Interest on debt obligations | 240 | | 56 | | 112 | | 69 | | 3 | | |
| Estimated environmental liability payments | 173 | | 52 | | 83 | | 38 | | — | | |
| Lease obligations | 378 | | 67 | | 98 | | 82 | | 131 | | |
| Purchase obligations | 487 | | 487 | | — | | — | | — | | |
| | | | | | |
| Total obligations | $ | 2,383 | | $ | 662 | | $ | 293 | | $ | 1,242 | | $ | 186 | | |
For purposes of this table, we used interest rates as of December 31, 2024 to estimate the future interest on debt obligations outstanding as of December 31, 2024 and have assumed no voluntary prepayments of existing debt. See Note 6, “Debt Obligations” of the Notes to Consolidated Financial Statements included in Item 8 of Part II of this Report for additional disclosure related to our debt obligations and the related interest rate terms.
The estimated environmental liability payments included in the table of material cash requirements shown above are related primarily to the Kalamazoo River environmental matter. As of December 31, 2024, all of the Company’s remedial obligations for the Fox River and Ebina matters have been completed. For the Kalamazoo River matter, the amounts shown are our expected payments, net of the payment obligations of co-obligors and an estimate for payments to be received from indemnification parties. Following the Spin-Off, the Company retained the responsibility to manage the identified environmental liabilities and remediation, subject however to an indemnity obligation by NCR Atleos to contribute 50% of the costs of certain environmental liabilities after an annual $15 million funding threshold is met. However, given the uncertainty of timing and amount of the indemnity payments, these amounts are not reflected within the table above. For additional information, refer to Note 11, “Commitments and Contingencies”, of the Notes to Consolidated Financial Statements included in Item 8 of Part II of this Report.
Our lease obligations are primarily for future rental amounts for our world headquarters in Atlanta, Georgia, as well as for certain sales facilities in various domestic and international locations and leases related to equipment and vehicles.
Purchase obligations represent committed purchase orders and other contractual commitments for goods or services. The purchase obligation amounts were determined through information in our procurement systems and payment schedules for significant contracts. Included in the amounts are committed payments in relation to the long-term service agreement with Accenture under which the Company’s transaction processing activities and functions are performed.
We have a liability related to our uncertain tax positions. Due to the nature of the underlying liabilities and the extended time often needed to resolve income tax uncertainties, we cannot make reliable estimates of the amount or timing of cash payments that may be required to settle these liabilities. Additionally, the Company’s current tax liability was $336 million and $31 million as of December 31, 2024 and December 31, 2023, respectively, presented within Other current liabilities on the Consolidated Balance Sheets. The increase in the expected current tax liability relates to taxes for the Digital Banking Sale and will be paid within the next 12 months. For additional information, refer to Note 8, “Income Taxes”, of the Notes to Consolidated Financial Statements included in Item 8 of Part II of this Report.
Our international employee benefit plans, which are described in Note 10, “Employee Benefit Plans”, of the Notes to Consolidated Financial Statements included in Item 8 of Part II of this Report, could require significant future cash payments. Our international retirement plans were in an underfunded position of $104 million as of December 31, 2024, as compared to an underfunded position of $136 million as of December 31, 2023. The decrease in our underfunded position of international plans is primarily attributable to an increase in the fair value of plan assets, partially offset by an increase in the discount rates used to measure the benefit obligation. Contributions to international pension plans are expected to be approximately $13 million in 2025. Following the Spin-Off, NCR Atleos assumed the U.S. and certain international pension plan assets and liabilities, along with the associated deferred costs in accumulated other comprehensive loss, which were previously sponsored by the Company. Pursuant to the terms of the Spin-Off
transaction documents, the Company is required to contribute 50% of the annual costs of the NCR Atleos U.S. pension plan to the extent NCR Atleos contributes more than $40 million on an annual basis beginning with the plan year ending December 31, 2024.
We also have product warranties that may affect future cash flows. These items are not included in the table of obligations shown above, but are described in detail in Note 11, “Commitments and Contingencies”, of the Notes to Consolidated Financial Statements included in Item 8 of Part II of this Report.
The senior secured revolving credit facility contains customary representations and warranties, affirmative covenants, and negative covenants. The negative covenants limit the Company’s and its subsidiaries’ ability to, among other things, incur indebtedness, create liens on the Company’s or its subsidiaries’ assets, engage in fundamental changes, make investments, sell or otherwise dispose of assets, engage in sale-leaseback transactions, make restricted payments, repay subordinated indebtedness, engage in certain transactions with affiliates and enter into agreements restricting the ability of the Company’s subsidiaries to make distributions to the Company or incur liens on their assets.
The senior secured revolving credit facility also contains a financial covenant that does not permit the Company to allow its consolidated leverage ratio to exceed (i) in the case of any fiscal quarter ending on or following September 30, 2024 and prior to September 30, 2025, 4.50 to 1.00 and (ii) in the case of any fiscal quarter ending on or following September 30, 2025, 4.25 to 1.00, in each case subject, to (x) increases of 0.25 in connection with the consummation of any material acquisition and applicable to the fiscal quarter in which such acquisition is consummated and the three consecutive fiscal quarters thereafter, and (y) a maximum cap of 5.00 to 1.00.
The senior secured revolving credit facility also includes provisions for events of default, which are customary for similar financings. Upon the occurrence of an event of default, the lenders may, among other things, terminate the loan commitments, accelerate all loans and require cash collateral deposits in respect of outstanding letters of credit. If the Company is unable to pay or repay the amounts due, the lenders could, among other things, proceed against the collateral granted to them to secure such indebtedness.
CRITICAL ACCOUNTING ESTIMATES
Our consolidated financial statements are prepared in accordance with GAAP. In connection with the preparation of these financial statements, we are required to make assumptions, estimates and judgments that affect the reported amounts of assets, liabilities, revenue, expenses and the related disclosure of contingent liabilities. These assumptions, estimates and judgments are based on historical experience and are believed to be reasonable at the time. However, because future events and their effects cannot be determined with certainty, the determination of estimates requires the exercise of judgment. Our critical accounting policies are those that require assumptions to be made about matters that are highly uncertain. Different estimates could have a material impact on our financial results. Judgments and uncertainties affecting the application of these policies and estimates may result in materially different amounts being reported under different conditions or circumstances. Our management continually reviews these assumptions, estimates and judgments to ensure that our financial statements are presented fairly and are materially correct.
In many cases, the accounting treatment of a particular transaction is specifically dictated by GAAP and does not require significant management judgment in its application. There are also areas in which management’s judgment in selecting among available alternatives would not produce a materially different result. The significant accounting policies and estimates that we believe are the most critical to aid in fully understanding and evaluating our reported financial results are discussed in the paragraphs below. Our senior management has reviewed these critical accounting estimates and related disclosures with our independent registered public accounting firm and the Audit Committee of our Board of Directors. See Note 1, “Basis of Presentation and Significant Accounting Policies”, of the Notes to Consolidated Financial Statements in Item 8 of Part II of this Report, which contains additional information regarding our accounting policies and other disclosures required by GAAP.
Revenue Recognition We enter into contracts to sell our products and services, which may be sold separately or bundled with other products and services. As a result, interpretation and judgment are sometimes required to determine the appropriate accounting for these transactions, including: (1) whether performance obligations are considered distinct that should be accounted for separately versus combined, how the transaction price should be allocated among the performance obligations, and when to recognize revenue for each performance obligation; (2) developing an estimate of the stand-alone selling price, or SSP, of each distinct performance obligation; (3) combining multiple contracts that may impact the allocation of the transaction price between product and services; and (4) estimating and accounting for variable consideration, including rights of return, rebates, expected penalties or other price concessions as a reduction of the transaction price.
Our estimates of SSP for each performance obligation require judgment that considers multiple factors, including, but not limited to, historical discounting trends for products and services, pricing practices in different geographies and industries, gross margin objectives, and internal costs. Our estimates for rights of return and rebates are based on historical sales returns and credits, specific criteria outlined in customer contracts or rebate agreements, and other factors known at the time. Our estimates for expected penalties and other price concessions are based on historical trends and expectations regarding future occurrence.
Changes in judgments with respect to these assumptions and estimates could impact the timing or amount of revenue recognition. Additional information regarding our revenue recognition policy is included in Note 1, “Basis of Presentation and Significant Accounting Policies”, in the Notes to Consolidated Financial Statements in Item 8 of Part II of this Report.
Inventory Valuation We assess the valuation of our inventory on a periodic basis and make adjustments to the value to properly provide for potential exposure due to slow-moving, excess, obsolete or unusable inventory. Inventories are written down to net realizable value based on forecasted usage of part, sales orders, technological obsolescence and inventory aging. These factors can be impacted by market conditions, technology changes, changes in strategic direction, and customer demand and require estimates and management judgment that may include elements that are uncertain. On a quarterly basis, we review the current net realizable value of inventory and adjust for any inventory exposure due to age, obsolescence, or excess of cost over net realizable value.
Goodwill Goodwill is tested at the reporting unit level for impairment on an annual basis during the fourth quarter or more frequently if certain events occur indicating that the carrying value of goodwill may be impaired. A significant amount of judgment is involved in determining if an indicator of impairment has occurred. Such indicators may include a decline in expected cash flows, a significant adverse change in legal factors or in the business climate, a decision to sell a business, unanticipated competition, or slower growth rates, among others. Consistent with the examples of such events and circumstances given in the accounting guidance, we believe that a goodwill impairment test should be performed immediately before and after a reorganization of our reporting structure when the reorganization would affect the composition of one or more of our reporting units. In this circumstance, performing the impairment test immediately before and after the reorganization would help to confirm that the reorganization is not potentially masking a goodwill impairment charge.
In the evaluation of goodwill for impairment, we have the option to perform a qualitative assessment to determine whether further impairment testing is necessary or to perform a quantitative assessment by comparing the fair value of a reporting unit to its carrying amount, including goodwill. Under the qualitative assessment, an entity is not required to calculate the fair value of a reporting unit unless the entity determines that it is more likely than not that its fair value is less than its carrying amount. If under the quantitative assessment the fair value of a reporting unit is less than its carrying amount, then the amount of the impairment loss, if any, is determined based on the amount by which the carrying amount exceeds the fair value up to the total value of goodwill assigned to the reporting unit. Fair values of the reporting units are estimated using a weighted methodology considering the output from both the income and market approaches. The income approach incorporates the use of a discounted cash flow (“DCF”) analysis. A number of significant assumptions and estimates are involved in the application of the DCF model to forecast operating cash flows, including revenue growth rates, EBITDA margins and discount rates. Several of these assumptions vary among reporting units. The cash flow forecasts are generally based on approved strategic operating plans. The market approach is performed using the Guideline Public Companies (“GPC”) method which is based on earnings multiple data. We perform a reconciliation between our market capitalization and our estimate of the aggregate fair value of the reporting units, including consideration of a control premium. Refer to Note 4, “Goodwill and Purchased Intangible Assets” in the Notes to Consolidated Financial Statements in Item 8 of Part II of this Report for additional information.
Valuation of Long-lived Assets and Amortizable Other Intangible Assets We perform impairment tests for our long-lived assets if an event or circumstance indicates that the carrying amount of our long-lived assets may not be recoverable. In response to changes in industry and market conditions, we may also strategically realign our resources and consider restructuring, disposing of, or otherwise exiting businesses. Such activities could result in impairment of our long-lived assets or other intangible assets. We also are subject to the possibility of impairment of long-lived assets arising in the ordinary course of business. We consider the likelihood of impairment if certain events occur indicating that the carrying value of the long-lived assets may be impaired and we may recognize impairment if the carrying amount of a long-lived asset or intangible asset is not recoverable from its undiscounted cash flows. Impairment is measured as the difference between the carrying amount and the fair value of the asset. We use both the income approach and market approach to estimate fair value. Our estimates of fair value are subject to a high degree of judgment since they include a long-term forecast of future operations. Accordingly, any value ultimately derived from our long-lived assets may differ from our estimate of fair value.
We make strategic acquisitions that may have a material impact on our consolidated results of operations or financial position. We allocate the purchase price of acquired businesses to the assets acquired and liabilities assumed in the transaction at their estimated fair values. The estimates used to determine the fair value of long-lived assets, such as intangible assets, can be complex and require
significant judgments. We use information available to us to make fair value determinations and engage independent valuation specialists, when necessary, to assist in the fair value determination of significant acquired long-lived assets. The determination of fair value requires estimates about cash flow forecasts, discount rates, revenue growth rates, EBITDA margin, customer attrition rate, and other future events that are judgmental in nature. While we use our best estimates and assumptions as a part of the purchase price allocation process, our estimates are inherently uncertain and subject to refinement. As a result, during the measurement period, which may be up to one year from the acquisition date, we may record adjustments to the assets acquired and liabilities assumed, with the corresponding offset to goodwill. Any adjustments subsequent to the measurement period are recorded to our consolidated statements of income. We are also required to estimate the useful lives of intangible assets to determine the amount of acquisition-related intangible asset amortization expense to record in future periods. Additional information regarding our acquisitions is included in Note 3, “Business Combinations and Divestitures”, in Notes to Consolidated Financial Statements in Item 8 of Part II of this Report.
Pension and Postemployment Benefits We sponsor foreign defined benefit pension and foreign and domestic postemployment plans. As a result, we have significant pension and postemployment benefit costs, which are developed from actuarial valuations. Actuarial assumptions attempt to anticipate future events and are used in calculating the expense and liability relating to these plans. These factors include assumptions we make about interest rates, expected investment return on plan assets, involuntary turnover rates, and rates of future compensation increases. In addition, our actuarial consultants advise us about subjective factors such as withdrawal rates and mortality rates to use in our valuations. We generally review and update these assumptions on an annual basis at the end of each fiscal year. We are required to consider current market conditions, including changes in interest rates, in making these assumptions. The actuarial assumptions that we use may differ materially from actual results due to changing market and economic conditions, higher or lower withdrawal rates, or longer or shorter life spans of participants. These differences may result in a significant impact to the amount of pension or postemployment benefits expense we have recorded or may record. Ongoing pension and postemployment expense impacts all of our segments. Pension mark-to-market adjustments, settlements, curtailments and special termination benefits are excluded from our segment results as those items are not included in the evaluation of segment performance. See Note 5, “Segment Information and Concentrations”, in the Notes to Consolidated Financial Statements in Item 8 of Part II of this Report for a reconciliation of our segment results to income from operations.
The key assumptions used in developing our 2024 expense were discount rates of 3.2% for our German pension plan and 1.2% for our Japanese pension plan, and an expected return on assets assumption of 5.0% for our Japanese pension plan in 2024. The German and Japanese plans represented 97% of the pension obligation as of December 31, 2024. Holding all other assumptions constant, a 0.25% change in the discount rate used for the German and the Japanese pension plans would have increased or decreased 2024 ongoing pension expense by less than $1 million. A 0.25% change in the expected rate of return on plan assets assumption for the Japanese pension plan would have increased or decreased 2024 ongoing pension expense by less than $1 million. Our expected return on plan assets has historically been and will likely continue to be material to net income. For 2025, we intend to use discount rates of 3.4% in determining the German pension plan and 1.6% in determining the Japanese pension expense. We intend to use an expected rate of return on assets assumption of 5.0% for the Japanese pension plan.
We recognize additional changes in the fair value of plan assets and net actuarial gains or losses of our pension plans upon remeasurement, which occurs at least annually in the fourth quarter of each year. The remaining components of pension expense, primarily net service cost, interest cost, and the expected return on plan assets, are recorded on a quarterly basis as ongoing pension expense. While it is required that we review our actuarial assumptions each year at the measurement date, we generally do not change them between measurement dates. We use a measurement date of December 31 for all of our plans. Changes in assumptions or asset values may have a significant effect on the annual measurement of expense or income in the fourth quarter.
The most significant assumption used in developing our 2024 postemployment plan expense is the assumed rate of involuntary turnover of 3.8%. The involuntary turnover rate is based on historical trends and projections of involuntary turnover in the future. A 0.25% change in the rate of involuntary turnover would have increased or decreased 2024 expense by less than $1 million. The sensitivity of the assumptions described above is specific to each individual plan and not to our pension and postemployment plans in the aggregate. We intend to use an involuntary turnover assumption of 3.8% in determining the 2025 postemployment expense.
Environmental and Legal Contingencies Each quarter, we review the status of each claim and legal proceeding and assess our potential financial exposure. If the potential loss from any claim or legal proceeding would be material and is considered probable and the amount can be reasonably estimated, we accrue a liability for the estimated loss. To the extent that the amount of such a probable loss is estimable only by reference to a range of equally likely outcomes, and no amount within the range appears to be a better estimate than any other amount, we accrue the amount at the low end of the range. Because of uncertainties related to these matters, the use of estimates, assumptions and judgments, and external factors beyond our control, accruals are based on the best information available at the time. At environmental sites, or portions of environmental sites, where liability is determined to be probable but a remedy has not yet been determined, we accrue for the costs of investigations and studies for the affected areas but
not for the costs of remediation. As additional information becomes available, we reassess the potential liability related to our pending claims and litigation and may revise our estimates. Such revisions in the estimates of the potential liabilities could have a material impact on our results of operations and financial position. When insurance carriers or third parties have agreed to pay any amounts related to costs, and we believe that it is probable that we can collect such amounts, those amounts are reflected as receivables in our Consolidated Balance Sheet.
The most significant legal contingencies impacting our Company are the Fox River and Kalamazoo River matters, which are further described in detail in Note 11, “Commitments and Contingencies”, in the Notes to Consolidated Financial Statements in Item 8 of Part II of this Report. The Company has been identified as a potentially responsible party (“PRP”) at both the Fox River and Kalamazoo River sites.
As described below and in Note 11, “Commitments and Contingencies”, in the Notes to Consolidated Financial Statements in Item 8 of Part II of this Report, while litigation activities have been concluded with respect to the Fox River matter and regulatory compliance activities have been completed with respect to the Ebina matter, the extent of our potential liabilities continues to be subject to significant uncertainties. The uncertainties related to the Kalamazoo River matter include the total cost of clean-up as well as the solvency and willingness of the co-obligors or indemnitors, and other responsible parties, to pay. As relates to Fox River, uncertainties remain with respect to the final reconciliation of the indemnitors’ payment obligations.
Our net reserves for the Fox River matter and the Kalamazoo River matter, as of December 31, 2024 were approximately $23 million and $148 million, respectively, as further discussed in Note 11, “Commitments and Contingencies”, in the Notes to Consolidated Financial Statements in Item 8 of Part II of this Report. The Company regularly re-evaluates the assumptions used in determining the appropriate reserve for these matters as additional information becomes available and, when warranted, makes appropriate adjustments.
Income Taxes We recognize deferred tax assets and liabilities based on the differences between the financial statement carrying amounts and the tax basis of assets and liabilities. The deferred tax assets and liabilities are determined based on the enacted tax rates expected to apply in the periods in which the deferred tax assets or liabilities are anticipated to be settled or realized.
We regularly review our deferred tax assets for recoverability and establish a valuation allowance if it is more likely than not that some portion or all of a deferred tax asset will not be realized. The determination as to whether a deferred tax asset will be realized is made on a jurisdictional basis and is based on the evaluation of positive and negative evidence. This evidence includes historical taxable income, projected future taxable income, the expected timing of the reversal of existing temporary differences and the implementation of tax planning strategies. Projected future taxable income is based on our expected results and assumptions as to the jurisdiction in which the income will be earned. The expected timing of the reversals of existing temporary differences is based on current tax law and our tax methods of accounting. As a result of this determination, we had valuation allowances of $153 million as of December 31, 2024 and $211 million as of December 31, 2023, related to certain deferred income tax assets, tax loss carryforwards, including interest expense carryforwards and foreign tax credits in jurisdictions where there is uncertainty as to the ultimate realization of a benefit from those tax assets.
If we are unable to generate sufficient future taxable income, or if there is a material change in the actual effective tax rates or the time period within which the underlying temporary differences become taxable or deductible, or if the tax laws change unfavorably, then we could be required to increase our valuation allowance against our deferred tax assets, resulting in an increase in our effective tax rate.
The Company recognizes the tax benefit from an uncertain tax position only if it is more likely than not that the tax position will be sustained on examination by the taxing authorities, based on the technical merits of the position. The tax benefits recognized in the consolidated financial statements from such a position are measured based on the largest benefit that has a greater than fifty percent likelihood of being realized upon settlement. Interest and penalties related to uncertain tax positions are recognized as part of the provision for income taxes and are accrued beginning in the period that such interest and penalties would be applicable under relevant tax law until such time that the related tax benefits are recognized. As described in Note 1, “Basis of Presentation and Significant Accounting Policies” and Note 8, “Income Taxes”, in the Notes to Consolidated Financial Statements in Item 8 of Part II of this Report for disclosures, on October 16, 2023, in connection with the Spin-Off, the Company completed a series of legal entity restructurings including both an internal and external spin-off transaction. These transactions are subject to tax laws in the U.S. and non-U.S. jurisdictions, which resulted in the use of significant judgments by management as it pertains to the interpretation and application of tax laws in the U.S. and non-U.S. jurisdictions to determine the potential taxability of the transactions.
The provision for income taxes may change period-to-period based on non-recurring events, such as the settlement of income tax audits and changes in tax laws, as well as recurring factors including the geographic mix of income before taxes, state and local
taxes and the effects of various global income tax strategies. As of December 31, 2024, we did not provide for U.S. federal income taxes or foreign withholding taxes on approximately $295 million of undistributed earnings of our foreign subsidiaries as such earnings are expected to be reinvested indefinitely. The amount of unrecognized deferred tax liability associated with these indefinitely reinvested earnings is approximately $32 million.
Refer to Note 8, “Income Taxes”, in the Notes to Consolidated Financial Statements in Item 8 of Part II of this Report for disclosures related to foreign and domestic pretax income, foreign and domestic income tax (benefit) expense and the effect foreign taxes have on our overall effective tax rate.
RECENTLY ISSUED ACCOUNTING PRONOUNCEMENTS
A discussion of recently issued accounting pronouncements is described in Note 1, “Basis of Presentation and Significant Accounting Policies”, of the Notes to Consolidated Financial Statements in Item 8 of Part II of this Report, and we incorporate by reference such discussion in this MD&A.
Item 7A. QUANTITATIVE AND QUALITATIVE DISCLOSURES ABOUT MARKET RISK
Market Risk
We are exposed to market risks primarily from changes in foreign currency exchange rates and interest rates. It is our policy to manage our foreign exchange exposure and debt structure in order to manage capital costs, control financial risks and maintain financial flexibility over the long term. In managing market risks, we may employ derivatives according to documented policies and procedures, including foreign currency contracts and interest rate swaps. We do not use derivatives for trading or speculative purposes.
Foreign Exchange Risk
Since a portion of our operations and revenue occur outside the United States, and in currencies other than the U.S. Dollar, our results can be significantly impacted by changes in foreign currency exchange rates. We have exposure to approximately 30 functional currencies and are exposed to foreign currency exchange risk with respect to our sales, profits and assets and liabilities denominated in currencies other than the U.S. Dollar. Although we use financial instruments to hedge certain foreign currency risks, we are not fully protected against foreign currency fluctuations and our reported results of operations could be affected by changes in foreign currency exchange rates. To manage our exposures and mitigate the impact of currency fluctuations on the operations of our foreign subsidiaries, we hedge our main transactional exposures through the use of foreign exchange forward contracts. Historically, if these contracts are designated as highly effective cash flow hedges, the gains or losses are deferred into accumulated other comprehensive income (“AOCI”). We use derivatives not designated as hedging instruments consisting primarily of forward contracts to hedge foreign currency denominated balance sheet exposures. For these derivatives we recognize gains and losses in the same period as the remeasurement losses and gains of the related foreign currency-denominated exposures.
For purposes of analyzing potential risk, we use sensitivity analysis to quantify potential impacts that market rate changes may have on the fair values of our hedge portfolio. The sensitivity analysis represents the hypothetical changes in value of the hedge position and does not reflect the related gain or loss on the forecasted underlying transaction. A 10% appreciation in the value of the U.S. Dollar against foreign currencies from the prevailing market rates would have resulted in a corresponding decrease in the fair value of the hedge portfolio of $2 million as of December 31, 2024. A 10% depreciation in the value of the U.S. Dollar against foreign currencies from the prevailing market rates would have resulted in a corresponding increase in the fair value of the hedge portfolio of $3 million as of December 31, 2024. The Company expects that any increase or decrease in the fair value of the portfolio would be substantially offset by increases or decreases in the underlying exposures being hedged.
The U.S. Dollar was stronger in 2024 compared to 2023 based on comparable weighted averages for our functional currencies. This had an unfavorable revenue impact of less than 1% on 2024 compared to 2023. This excludes the effects of our hedging activities and, therefore, does not reflect the actual impact of fluctuations in exchange rates on our operating income.
Interest Rate Risk
Approximately 100% of our borrowings were on a fixed rate basis as of December 31, 2024 and we did not have any outstanding interest rate derivative contracts as of December 31, 2024. We are subject to interest rate risk related to variable-rate debt when we borrow from our Revolving Credit Facility. As of December 31, 2024, we had no borrowings under the facility.
The increase in pre-tax interest expense for the year ended December 31, 2024 from a hypothetical 100 basis point increase in variable interest rates would be approximately $3 million.
Historically, we utilized interest rate swap contracts and interest rate cap agreements to add stability to interest expense and to manage exposure to interest rate movements as part of our interest rate risk management strategy. Payments and receipts related to interest rate cap agreements and interest rate swap contracts are included in cash flows from operating activities in the Consolidated Statements of Cash Flows. Refer to Note 15, “Derivatives and Hedging Instruments”, for further information.
Concentrations of Credit Risk
We are potentially subject to concentrations of credit risk on accounts receivable and financial instruments, such as hedging instruments and cash and cash equivalents. Credit risk includes the risk of nonperformance by counterparties. The maximum potential loss may exceed the amount recognized on the balance sheet. Exposure to credit risk is managed through credit approvals, credit limits, selecting major international financial institutions as counterparties to hedging transactions, and monitoring procedures. Our business often involves large transactions with customers for which we do not require collateral. If one or more of those customers were to default in its obligations under applicable contractual arrangements, we could be exposed to potentially significant losses. Moreover, a prolonged downturn in the global economy could have an adverse impact on the ability of our customers to pay their obligations on a timely basis. We believe that the reserves for potential losses are adequate. As of December 31, 2024, we did not have any significant concentration of credit risk related to financial instruments.
Index to Financial Statements and Supplemental Data
Item 8. FINANCIAL STATEMENTS AND SUPPLEMENTAL DATA
Report of Independent Registered Public Accounting Firm
To the Board of Directors and Stockholders of NCR Voyix Corporation
Opinions on the Financial Statements and Internal Control over Financial Reporting
We have audited the consolidated financial statements, including the related notes, as listed in the index appearing under Item 15(a)(1), and the financial statement schedule listed in the index appearing under Item 15(a)(2), of NCR Voyix Corporation and its subsidiaries (the “Company”) (collectively referred to as the “consolidated financial statements”). We also have audited the Company’s internal control over financial reporting as of December 31, 2024, based on criteria established in Internal Control - Integrated Framework (2013) issued by the Committee of Sponsoring Organizations of the Treadway Commission (COSO).
In our opinion, the consolidated financial statements referred to above present fairly, in all material respects, the financial position of the Company as of December 31, 2024 and 2023, and the results of its operations and its cash flows for each of the three years in the period ended December 31, 2024 in conformity with accounting principles generally accepted in the United States of America. Also in our opinion, the Company maintained, in all material respects, effective internal control over financial reporting as of December 31, 2024, based on criteria established in Internal Control - Integrated Framework (2013) issued by the COSO.
Basis for Opinions
The Company’s management is responsible for these consolidated financial statements, for maintaining effective internal control over financial reporting, and for its assessment of the effectiveness of internal control over financial reporting, included in Management’s Report on Internal Control over Financial Reporting appearing under Item 9A. Our responsibility is to express opinions on the Company’s consolidated financial statements and on the Company’s internal control over financial reporting based on our audits. We are a public accounting firm registered with the Public Company Accounting Oversight Board (United States) (PCAOB) and are required to be independent with respect to the Company in accordance with the U.S. federal securities laws and the applicable rules and regulations of the Securities and Exchange Commission and the PCAOB.
We conducted our audits in accordance with the standards of the PCAOB. Those standards require that we plan and perform the audits to obtain reasonable assurance about whether the consolidated financial statements are free of material misstatement, whether due to error or fraud, and whether effective internal control over financial reporting was maintained in all material respects.
Our audits of the consolidated financial statements included performing procedures to assess the risks of material misstatement of the consolidated financial statements, whether due to error or fraud, and performing procedures that respond to those risks. Such procedures included examining, on a test basis, evidence regarding the amounts and disclosures in the consolidated financial statements. Our audits also included evaluating the accounting principles used and significant estimates made by management, as well as evaluating the overall presentation of the consolidated financial statements. Our audit of internal control over financial reporting included obtaining an understanding of internal control over financial reporting, assessing the risk that a material weakness exists, and testing and evaluating the design and operating effectiveness of internal control based on the assessed risk. Our audits also included performing such other procedures as we considered necessary in the circumstances. We believe that our audits provide a reasonable basis for our opinions.
Definition and Limitations of Internal Control over Financial Reporting
A company’s internal control over financial reporting is a process designed to provide reasonable assurance regarding the reliability of financial reporting and the preparation of financial statements for external purposes in accordance with generally accepted accounting principles. A company’s internal control over financial reporting includes those policies and procedures that (i) pertain to the maintenance of records that, in reasonable detail, accurately and fairly reflect the transactions and dispositions of the assets of the company; (ii) provide reasonable assurance that transactions are recorded as necessary to permit preparation of financial statements in accordance with generally accepted accounting principles, and that receipts and expenditures of the company are being made only in accordance with authorizations of management and directors of the company; and (iii) provide reasonable assurance regarding prevention or timely detection of unauthorized acquisition, use or disposition of the company’s assets that could have a material effect on the financial statements.
Because of its inherent limitations, internal control over financial reporting may not prevent or detect misstatements. Also, projections of any evaluation of effectiveness to future periods are subject to the risk that controls may become inadequate because of changes in conditions, or that the degree of compliance with the policies or procedures may deteriorate.
Critical Audit Matters
The critical audit matter communicated below is a matter arising from the current period audit of the consolidated financial statements that was communicated or required to be communicated to the audit committee and that (i) relates to accounts or disclosures that are material to the consolidated financial statements and (ii) involved our especially challenging, subjective, or complex judgments. The communication of critical audit matters does not alter in any way our opinion on the consolidated financial statements, taken as a whole, and we are not, by communicating the critical audit matter below, providing a separate opinion on the critical audit matter or on the accounts or disclosures to which it relates.
Revenue Recognition
As described in Notes 1 and 5 to the consolidated financial statements, the Company’s consolidated total revenue was $2.8 billion for the year ended December 31, 2024. The Company records revenue when, or as, performance obligations are satisfied by transferring control of a promised good or service to the customer, in an amount that reflects the consideration the Company expects to be entitled to in exchange for products and services. The Company evaluates the transfer of control primarily from the customer’s perspective where the customer has the ability to direct the use of, and obtain substantially all of, the remaining benefits from that good or service. The Company enters contracts that include multiple distinct performance obligations, including hardware, software, professional consulting and managed services, payment processing services, installation services and maintenance support services. For these arrangements, the Company allocates the transaction price, at contract inception, to each distinct performance obligation on a relative standalone selling price basis.
The principal considerations for our determination that performing procedures relating to revenue recognition is a critical audit matter are a high degree of auditor effort in performing procedures and evaluating audit evidence related to the Company’s revenue recognition.
Addressing the matter involved performing procedures and evaluating audit evidence in connection with forming our overall opinion on the consolidated financial statements. These procedures included testing the effectiveness of controls relating to the revenue recognition process. These procedures also included, among others, for a sample of revenue transactions (i) testing revenue recognized by obtaining and inspecting source documents, such as contracts, purchase orders, invoices, and proof of shipment, delivery or service; (ii) testing management’s allocation of the transaction price to identified performance obligations; and (iii) recalculating revenue recognized. The procedures performed also included (i) testing the completeness and accuracy of the data used by management in the determination of the standalone selling price and (ii) testing a sample of outstanding customer invoice balances as of December 31, 2024 by obtaining and inspecting subsequent cash receipts and, for invoices not yet paid, obtaining and inspecting source documents, such as contracts, purchase orders, invoices, and proof of shipment, delivery or service.
/s/ PricewaterhouseCoopers LLP
Atlanta, Georgia
February 27, 2025
We have served as the Company’s auditor since 1993.
NCR Voyix Corporation
Consolidated Statements of Operations
| | | | | | | | | | | | | | | | | |
| For the years ended December 31, (in millions, except per share amounts) | 2024 | | 2023 | | 2022 |
| Product revenue | $ | 870 | | | $ | 1,168 | | | $ | 1,204 | |
| Service revenue | 1,956 | | | 2,010 | | | 1,970 | |
| Total revenue | 2,826 | | | 3,178 | | | 3,174 | |
| Cost of products | 770 | | | 1,049 | | | 1,103 | |
| Cost of services | 1,477 | | | 1,460 | | | 1,387 | |
| Selling, general and administrative expenses | 459 | | | 659 | | | 618 | |
| Research and development expenses | 157 | | | 139 | | | 116 | |
| | | | | |
| Total operating expenses | 2,863 | | | 3,307 | | | 3,224 | |
| Income (loss) from operations | (37) | | | (129) | | | (50) | |
| Gain (loss) on extinguishment of debt | 8 | | | (46) | | | — | |
| Interest expense | (134) | | | (294) | | | (285) | |
| Other income (expense), net | (36) | | | (76) | | | 18 | |
| Income (loss) from continuing operations before income taxes | (199) | | | (545) | | | (317) | |
| Income tax expense (benefit) | 4 | | | 184 | | | 52 | |
| Income (loss) from continuing operations | (203) | | | (729) | | | (369) | |
| Income (loss) from discontinued operations, net of tax | 1,160 | | | 306 | | | 428 | |
| Net income (loss) | 957 | | | (423) | | | 59 | |
| Net income (loss) attributable to noncontrolling interests | (1) | | | — | | | — | |
| Net income (loss) attributable to noncontrolling interests of discontinued operations | — | | | — | | | (1) | |
| Net income (loss) attributable to NCR Voyix | $ | 958 | | | $ | (423) | | | $ | 60 | |
| Amounts attributable to NCR Voyix common stockholders: | | | | | |
| Income (loss) from continuing operations | $ | (202) | | | $ | (729) | | | $ | (369) | |
| Series A convertible preferred stock dividends | (15) | | | (16) | | | (16) | |
| Income (loss) from continuing operations attributable to NCR Voyix | (217) | | | (745) | | | (385) | |
| Income (loss) from discontinued operations, net of tax | 1,160 | | | 306 | | | 429 | |
| Net income (loss) attributable to NCR Voyix common stockholders | $ | 943 | | | $ | (439) | | | $ | 44 | |
| Income (loss) per share attributable to NCR Voyix common stockholders: | | | | | |
| Income (loss) per common share from continuing operations | | | | | |
| Basic | $ | (1.50) | | | $ | (5.30) | | | $ | (2.82) | |
| Diluted | $ | (1.50) | | | $ | (5.30) | | | $ | (2.82) | |
| Net income (loss) per common share | | | | | |
| Basic | $ | 6.52 | | | $ | (3.12) | | | $ | 0.32 | |
| Diluted | $ | 6.52 | | | $ | (3.12) | | | $ | 0.32 | |
| Weighted average common shares outstanding | | | | | |
| Basic | 144.7 | | | 140.6 | | | 136.7 | |
| Diluted | 144.7 | | | 140.6 | | | 136.7 | |
The accompanying notes are an integral part of the Consolidated Financial Statements.
NCR Voyix Corporation
Consolidated Statements of Comprehensive Income (Loss)
| | | | | | | | | | | | | | | | | |
| For the years ended December 31 (in millions) | 2024 | | 2023 | | 2022 |
| Net income (loss) | $ | 957 | | | $ | (423) | | | $ | 59 | |
| Other comprehensive income (loss): | | | | | |
| Currency translation adjustments | | | | | |
| Currency translation adjustments gain (loss) | (45) | | | 85 | | | (132) | |
| Derivatives | | | | | |
| Unrealized gain (loss) on derivatives | — | | | — | | | 152 | |
| Loss (gain) on derivatives arising during the period | — | | | (31) | | | (18) | |
| Less income tax benefit (expense) | — | | | 7 | | | (33) | |
| | | | | |
| | | | | |
| | | | | |
| | | | | |
| Employee benefit plans | | | | | |
| Prior service benefit | — | | | — | | | — | |
| Amortization of prior service cost | (1) | | | (1) | | | (2) | |
| Net gain (loss) arising during the period | (7) | | | (9) | | | 25 | |
| Amortization of actuarial (loss) gain | — | | | (1) | | | — | |
| Less income tax benefit (expense) | 2 | | | 3 | | | (4) | |
| Other comprehensive income (loss) | (51) | | | 53 | | | (12) | |
| Total comprehensive income (loss) | 906 | | | (370) | | | 47 | |
| Less comprehensive income (loss) attributable to noncontrolling interests: | | | | | |
| Net income | (1) | | | — | | | (1) | |
| Currency translation adjustments | (1) | | | — | | | (3) | |
| Amounts attributable to noncontrolling interests | (2) | | | — | | | (4) | |
| Comprehensive income (loss) attributable to NCR Voyix common stockholders | $ | 908 | | | $ | (370) | | | $ | 51 | |
The accompanying notes are an integral part of the Consolidated Financial Statements.
NCR Voyix Corporation
Consolidated Balance Sheets
| | | | | | | | | | | |
| | | |
| As of December 31 (in millions except per share amounts) | 2024 | | 2023 |
| Assets | | | |
| Current assets | | | |
| Cash and cash equivalents | $ | 724 | | | $ | 259 | |
| Accounts receivable, net of allowances of $26 and $29 as of December 31, 2024 and 2023, respectively | 539 | | 414 | |
| Inventories | 208 | | 250 | |
| Restricted cash | 31 | | 21 | |
| Prepaid and other current assets | 169 | | 178 | |
| Current assets of discontinued operations | — | | 84 | |
| Total current assets | 1,671 | | 1,206 | |
| Property, plant and equipment, net | 192 | | 207 | |
| Goodwill | 1,516 | | 1,519 | |
| Intangibles, net | 94 | | 123 | |
| Operating lease assets | 229 | | 231 | |
| Prepaid pension cost | 47 | | 43 | |
| Deferred income taxes | 189 | | 239 | |
| Other assets | 514 | | 532 | |
| Noncurrent assets of discontinued operations | — | | | 890 | |
| Total assets | $ | 4,452 | | | $ | 4,990 | |
| Liabilities and stockholders’ equity | | | |
| Current liabilities | | | |
| Short-term borrowings | $ | — | | | $ | 15 | |
| Accounts payable | 332 | | 440 | |
| Payroll and benefits liabilities | 104 | | 126 | |
| Contract liabilities | 211 | | 157 | |
| Settlement liabilities | 47 | | 39 | |
| Other current liabilities | 726 | | 421 | |
| Current liabilities of discontinued operations | — | | 135 | |
| Total current liabilities | 1,420 | | 1,333 | |
| Long-term debt | 1,098 | | 2,563 | |
| Pension and indemnity plan liabilities | 144 | | 160 | |
| Postretirement and postemployment benefits liabilities | 41 | | 43 | |
| Income tax accruals | 52 | | 64 | |
| Operating lease liabilities | 248 | | 251 | |
| Other liabilities | 242 | | 253 | |
| Noncurrent liabilities of discontinued operations | — | | 22 | |
| Total liabilities | 3,245 | | 4,689 | |
| Commitments and Contingencies (Note 11) | | | |
| Series A convertible preferred stock: par value $0.01 per share, 3.0 shares authorized, 0.3 shares issued and outstanding as of December 31, 2024 and 2023; redemption amount and liquidation preference of $276 as of December 31, 2024 and 2023 | 276 | | 276 | |
| Stockholders’ equity | | | |
| NCR Voyix stockholders’ equity | | | |
| Preferred stock: par value $0.01 per share, 100.0 shares authorized, no shares issued and outstanding as of December 31, 2024 and 2023, respectively | — | | | — | |
| Common stock: par value $0.01 per share, 500.0 shares authorized, 142.1 and 142.6 shares issued and outstanding as of December 31, 2024 and 2023, respectively | 1 | | | 1 | |
| Paid-in capital | 866 | | | 874 | |
| Retained earnings (deficit) | 535 | | | (421) | |
| Accumulated other comprehensive loss | (469) | | | (429) | |
| Total NCR Voyix stockholders’ equity | 933 | | | 25 | |
| Noncontrolling interests in subsidiaries | (2) | | | — | |
| Noncontrolling interests of discontinued operations | — | | | — | |
| Total stockholders’ equity | 931 | | | 25 | |
| Total liabilities and stockholders’ equity | $ | 4,452 | | | $ | 4,990 | |
The accompanying notes are an integral part of the Consolidated Financial Statements.
NCR Voyix Corporation
Consolidated Statements of Cash Flows
| | | | | | | | | | | | | | | | | |
| For the years ended December 31 (in millions) | 2024 | | 2023 | | 2022 |
| Operating activities | | | | | |
| Net income (loss) | $ | 957 | | | $ | (423) | | | $ | 59 | |
| Adjustments to reconcile net income (loss) to net cash provided by (used in) operating activities: | | | | | |
| | | | | |
| Loss (gain) on debt extinguishment | (8) | | | 46 | | | — | |
| Depreciation and amortization | 297 | | | 559 | | | 610 | |
| Stock-based compensation expense | 47 | | | 177 | | | 125 | |
| Deferred income taxes | 43 | | | 140 | | | 60 | |
| Loss (gain) on disposal of property, plant and equipment and other assets | — | | | (2) | | | (10) | |
| Loss (gain) on divestiture | (1,544) | | | 12 | | | 9 | |
| Impairment of other assets | 11 | | | 8 | | | — | |
| Gain on terminated interest rate derivative agreements | — | | | (103) | | | — | |
| | | | | |
| Changes in assets and liabilities, net of effects of business acquired: | | | | | |
| Receivables | (57) | | | 47 | | | (216) | |
| Inventories | 39 | | | 9 | | | (188) | |
| Current payables and accrued expenses | (115) | | | 108 | | | 29 | |
| Contract liabilities | 67 | | | (24) | | | (1) | |
| Employee benefit plans | (38) | | | (6) | | | (61) | |
| Other assets and liabilities | 169 | | | 146 | | | 11 | |
| Net cash provided by (used in) operating activities | $ | (132) | | | $ | 694 | | | $ | 427 | |
| Investing activities | | | | | |
| Expenditures for property, plant and equipment | $ | (30) | | | $ | (130) | | | $ | (92) | |
| Proceeds from sale of property, plant and equipment and other assets | — | | | 8 | | | 10 | |
| Additions to capitalized software | (187) | | | (247) | | | (285) | |
| Business acquisitions, net of cash acquired | — | | | (7) | | | (13) | |
| Proceeds from divestiture, net | 2,458 | | | 96 | | | (2) | |
| Purchases of investments | — | | | (10) | | | — | |
| Proceeds from disposition of corporate-owned life insurance policies | 36 | | | — | | | — | |
| Termination of trade receivable facility | (300) | | | — | | | — | |
| Collections on purchased trade receivables | 212 | | | — | | | — | |
| | | | | |
| Other investing activities, net | — | | | — | | | (5) | |
| Net cash provided by (used in) investing activities | $ | 2,189 | | | $ | (290) | | | $ | (387) | |
| Financing activities | | | | | |
| Short term borrowings, net | $ | — | | | $ | — | | | $ | 1 | |
| Payments on term credit facilities | (200) | | | (1,878) | | | (63) | |
| Borrowings on term credit facilities | — | | | 200 | | | — | |
| Payments on revolving credit facilities | (699) | | | (2,855) | | | (1,192) | |
| Borrowings on revolving credit facilities | 600 | | | 2,430 | | | 1,333 | |
| Payments of senior unsecured notes | (1,177) | | | (1,000) | | | — | |
| Proceeds from issuance of senior unsecured notes | — | | | — | | | 12 | |
| Payments on other financing arrangements | — | | | (2) | | | — | |
| Debt issuance costs and bridge commitment fees | — | | | (5) | | | — | |
| Call premium on debt extinguishment | — | | | (24) | | | — | |
| Cash dividend paid for Series A preferred share dividends | (15) | | | (15) | | | (15) | |
| Repurchases of common stock | (56) | | | — | | | — | |
| Tax withholding payments on behalf of employees | (12) | | | (34) | | | (59) | |
| Proceeds from employee stock plans | 13 | | | 27 | | | 31 | |
| Net change in client funds obligations | — | | | — | | | (28) | |
| | | | | |
| Principal payments for finance lease obligations | (14) | | | (15) | | | (15) | |
| Proceeds from long-term debt related to debt transferred to NCR Atleos at separation | — | | | 3,016 | | | — | |
| Cash transferred to NCR Atleos at separation | — | | | (684) | | | — | |
| Other financing activities | — | | | — | | | (4) | |
| Net cash provided by (used in) financing activities | $ | (1,560) | | | $ | (839) | | | $ | 1 | |
| | | | | |
| | | | | |
| Effect of exchange rate changes on cash, cash equivalents and restricted cash | (24) | | | (20) | | | (50) | |
| Increase (decrease) in cash, cash equivalents and restricted cash | 473 | | | (455) | | | (9) | |
| Cash, cash equivalents and restricted cash at beginning of period | 285 | | | 740 | | | 749 | |
| Cash, cash equivalents and restricted cash at end of period | $ | 758 | | | $ | 285 | | | $ | 740 | |
| | | | | |
The accompanying notes are an integral part of the Consolidated Financial Statements.
NCR Voyix Corporation
Consolidated Statements of Changes in Stockholders’ Equity
| | | | | | | | | | | | | | | | | | | | | | | | | | | | | | | | | | | | | | | | | | | | |
| | NCR Stockholders | | | | |
| | Common Stock | | | | | | Accumulated Other Comprehensive (Loss) Income | | Noncontrolling Interests in Subsidiaries | | |
| In millions | | Shares | | Amount | | Paid-in Capital | | Retained Earnings
(Deficit) | | | | Total |
| December 31, 2021 | | 132 | | | $ | 1 | | | $ | 515 | | | $ | 1,031 | | | $ | (291) | | | $ | 3 | | | $ | 1,259 | |
| Comprehensive income (loss): | | | | | | | | | | | | | | |
| Net income (loss) | | — | | | — | | | — | | | 60 | | | — | | | (1) | | | 59 | |
| Other comprehensive income (loss) | | — | | | — | | | — | | | — | | | (9) | | | (3) | | | (12) | |
| Total comprehensive income (loss) | | — | | | — | | | — | | | 60 | | | (9) | | | (4) | | | 47 | |
| Employee stock purchase and stock compensation plans | | 5 | | | — | | | 121 | | | — | | | — | | | — | | | 121 | |
| Stock issued in acquisition of LibertyX | | 1 | | | — | | | 68 | | | — | | | — | | | — | | | 68 | |
| | | | | | | | | | | | | | |
| Series A convertible preferred stock dividends | | — | | | — | | | — | | | (16) | | | — | | | — | | | (16) | |
| | | | | | | | | | | | | | |
| December 31, 2022 | | 138 | | | $ | 1 | | | $ | 704 | | | $ | 1,075 | | | $ | (300) | | | $ | (1) | | | $ | 1,479 | |
| Comprehensive income (loss): | | | | | | | | | | | | | | |
| Net income (loss) | | — | | | — | | | — | | | (423) | | | — | | | — | | | (423) | |
| Other comprehensive income (loss) | | — | | | — | | | — | | | — | | | 53 | | | — | | | 53 | |
| Total comprehensive income (loss) | | — | | | — | | | — | | | (423) | | | 53 | | | — | | | (370) | |
| Employee stock purchase and stock compensation plans | | 5 | | | — | | | 170 | | | — | | | — | | | — | | | 170 | |
| | | | | | | | | | | | | | |
| | | | | | | | | | | | | | |
| Series A convertible preferred stock dividends | | — | | | — | | | — | | | (16) | | | — | | | — | | | (16) | |
| Spin-Off of NCR Atleos | | — | | | — | | | — | | | (1,057) | | | (182) | | | 1 | | | (1,238) | |
| December 31, 2023 | | 143 | | | $ | 1 | | | $ | 874 | | | $ | (421) | | | $ | (429) | | | $ | — | | | $ | 25 | |
| Comprehensive income (loss): | | | | | | | | | | | | | | |
| Net income (loss) | | — | | | — | | | — | | | 958 | | | — | | | (1) | | | 957 | |
| Other comprehensive income (loss) | | — | | | — | | | — | | | — | | | (50) | | | (1) | | | (51) | |
| Total comprehensive income (loss) | | — | | | — | | | — | | | 958 | | | (50) | | | (2) | | | 906 | |
| Employee stock purchase and stock compensation plans | | 3 | | | — | | | 48 | | | — | | | — | | | — | | | 48 | |
| | | | | | | | | | | | | | |
| Series A convertible preferred stock dividends | | — | | | — | | | — | | | (15) | | | — | | | — | | | (15) | |
| Spin-Off of NCR Atleos | | — | | | — | | | — | | | 13 | | | 10 | | | — | | | 23 | |
| Repurchase of Company common stock | | (4) | | | — | | | (56) | | | — | | | — | | | — | | | (56) | |
| December 31, 2024 | | 142 | | | $ | 1 | | | $ | 866 | | | $ | 535 | | | $ | (469) | | | $ | (2) | | | $ | 931 | |
| | | | | | | | | | | | | | |
| | | | | | | | | | | | | | |
The accompanying notes are an integral part of the Consolidated Financial Statements.
NCR Voyix Corporation
Notes to Consolidated Financial Statements
1. BASIS OF PRESENTATION AND SIGNIFICANT ACCOUNTING POLICIES
Description of Business NCR Voyix Corporation (“NCR Voyix”, “NCR”, the “Company”, “we” or “us”), which, prior to its name change effective October 13, 2023 was known as NCR Corporation, was originally incorporated in 1884 and is a software and services-led enterprise technology provider of run-the-store capabilities for retail and restaurants, serving businesses of all sizes. Our platform, which runs in the cloud and includes microservices and application programming interfaces (“APIs”) that integrate with our customers’ systems, combines with our services and hardware offerings to enable end-to-end technology-based capabilities for our customers. Our offerings include cloud-based software and services offerings for retailers and restaurants, as well as payments acceptance solutions, multi-vendor connected device services, self-checkout (“SCO”) kiosks and related technologies, point of sale (“POS”) terminals and other self-service technologies. Our solutions are designed to enable retailers and restaurants to seamlessly transact and engage with their customers and end users.
Spin-off of NCR Atleos On October 16, 2023, the Company completed the separation of its ATM-focused business, including its self-service banking, payments & network and telecommunications and technology businesses, through the spin-off of its wholly owned subsidiary, NCR Atleos Corporation (“NCR Atleos”), (the “Spin-Off”). The Spin-Off was effected through a pro rata distribution of all outstanding shares of NCR Atleos common stock to holders of NCR Voyix common stock as of the close of business on October 2, 2023 (the “record date”). The Company distributed one share of NCR Atleos common stock for every two common shares of NCR Voyix outstanding as of the record date. Shareholders received cash in lieu of fractional shares of Atleos common stock. The Spin-Off is expected to qualify as a tax-free distribution for U.S. federal income tax purposes. The Company retains no ownership interest in NCR Atleos. The accounting requirements for reporting the Spin-Off of NCR Atleos as a discontinued operation were met when the separation was completed. Accordingly, the financial results for NCR Atleos for the years ended December 31, 2024, 2023 and 2022 are presented as net income (loss) from discontinued operations, net of tax on the Consolidated Statements of Operations and its assets and liabilities as of December 31, 2023 are reclassified as discontinued operations in the Consolidated Balance Sheets. Refer to Note 2, “Discontinued Operations” for additional information.
In connection with the Spin-Off, the Company and NCR Atleos entered into various agreements to effect the Spin-Off and provide a framework for the relationship between the Company and NCR Atleos after the Spin-Off. Such agreements include the separation and distribution agreement, as well as the following ongoing agreements: a transition services agreement, tax matters agreement, employee matters agreement, patent and technology cross-license agreement, trademark license and use agreement, master services agreement and various other transaction agreements. Under these agreements, the Company continues to provide certain products and services to NCR Atleos and receives certain products and services from NCR Atleos following the Spin-Off.
Sale of Digital Banking On August 6, 2024, the Company entered into a definitive purchase agreement with an affiliate of The Veritas Capital Fund VIII, L.P. (the “Buyer”) pursuant to which the Buyer agreed to purchase the Company’s Digital Banking segment businesses (the “Digital Banking Sale”). On September 30, 2024, the Company completed the Digital Banking Sale pursuant to the purchase agreement. The purchase price for the transaction was $2.45 billion in cash, subject to a post-closing adjustment, as well as contingent consideration of up to an additional $100 million in cash upon the achievement of a specified return on the Buyer’s invested capital at the time of any future sale. The Company records contingent consideration at fair value based on the consideration expected to be transferred, which was estimated to be zero as of December 31, 2024. The accounting requirements for reporting the Digital Banking Sale as a discontinued operation were met when the definitive agreement was signed. Accordingly, the financial results for Digital Banking for the years ended December 31, 2024, 2023 and 2022 are presented as net income (loss) from discontinued operations, net of tax on the Consolidated Statements of Operations. Refer to Note 2, “Discontinued Operations” for additional information. In connection with the Digital Banking Sale, the Company and the Buyer entered into certain agreements, including a transition services agreement, providing for the performance of certain services by the Company for the benefit of the Buyer for a period of time after the Digital Banking Sale.
Transition of Hardware Business to ODM Model On August 6, 2024, the Company announced its entry into a commercial agreement with Ennoconn Corporation (“Ennoconn”) to transition its self-checkout and point-of-sale hardware businesses to an outsourced design and manufacturing model including the sale of certain assets relating to these businesses (the “Hardware Business Transition”). Under the terms of the agreement, Ennoconn will design, manufacture, warrant, supply, and ship self-checkout and point-of sale hardware directly to the Company’s customers and the Company will sell hardware to its customers as a sales agent for Ennoconn and continue to provide its point-of sale and self-checkout software as well as key support and
maintenance services. As a result of the anticipated Hardware Business Transition, the Company expects to record commission revenue from point-of-sale and self-checkout hardware sales as an agent for Ennoconn on a net basis, excluding the costs paid to Ennoconn.
Use of Estimates The preparation of financial statements in accordance with generally accepted accounting principles in the United States (“GAAP”) requires management to make estimates and judgments that affect the reported amounts of assets and liabilities, the disclosure of contingent assets and liabilities at the date of the financial statements, and revenue and expenses during the periods reported.
Although our estimates contemplate current and expected future conditions, as applicable, it is reasonably possible that actual conditions could differ from our expectations, which could materially affect our results of operations and financial position. In particular, a number of estimates have been and will continue to be affected by macroeconomic pressures and geopolitical challenges. The ultimate impact on our overall financial condition and operating results will depend on supply chain challenges and cost escalations including materials, interest, labor and freight, and any additional governmental and public actions taken in response. As a result, our accounting estimates and assumptions may change over time as a consequence of the effects these external factors. Such changes could result in future impairments of goodwill, intangible assets, long-lived assets, incremental credit losses on accounts receivable and decreases in the carrying amount of our tax assets.
Evaluation of Subsequent Events The Company evaluated subsequent events through the date that our Consolidated Financial Statements were issued. Other than the items discussed within the Notes to Consolidated Financial Statements, no matters were identified that required adjustment of the Consolidated Financial Statements or additional disclosure.
Basis of Consolidation The consolidated financial statements include the accounts of NCR Voyix and its majority-owned subsidiaries. Long-term investments in affiliated companies in which NCR Voyix owns between 20% and 50%, and therefore, exercises significant influence, but which it does not control, are accounted for using the equity method. Investments in which NCR Voyix does not exercise significant influence (generally, when the Company has an investment of less than 20% and no significant influence, such as representation on the investee’s board of directors) are accounted for using the cost method. All significant inter-company transactions and accounts have been eliminated. In addition, the Company is required to determine whether it is the primary beneficiary of economic income or losses that may be generated by variable interest entities in which the Company has such an interest. In circumstances where the Company determined it is the primary beneficiary, consolidation of that entity would be required. For the periods presented, no variable interest entities have been consolidated.
Cyber ransomware incident On April 13, 2023, the Company determined that a single data center outage impacting certain of its commerce customers was caused by a cyber ransomware incident. Upon such determination, the Company immediately started contacting customers, enacted its cybersecurity protocol and engaged outside experts to contain the incident and begin the recovery process. We concluded that this incident impacted operations for some customers only with respect to specific Aloha cloud-based services and Counterpoint. Our investigation also concluded no financial reporting systems were impacted. As of December 31, 2024, the Company has incurred $47 million of expenses related to the cyber ransomware incident and has recovered $36 million of these costs under our insurance policies. We are still pursuing insurance recoveries in connection with this matter. We may incur additional costs relating to this incident in the future, including expenses to respond to this matter, payment of damages or other costs to customers or others. At this time we do not believe additional costs incurred as a result of the incident will ultimately have a material adverse effect on our business, results of operations or financial condition; however, we remain subject to risks and uncertainties as a result of the incident.
Reclassifications Certain prior-period amounts have been reclassified in the accompanying Consolidated Financial Statements and Notes thereto in order to conform to the current period presentation.
Out-of-period adjustments In the first quarter of 2023, the Company recorded a $10 million out-of-period adjustment to increase operating expenses and an employee-related liability in order to correct for an understatement of such same balances during the fourth quarter of 2022.
In the second quarter of 2024, the Company recorded an out-of-period correction to decrease revenue by $10 million, decrease accounts receivable by $5 million, and increase contract liabilities by $5 million. The amount related to periods prior to 2024 was $4 million of revenue.
During the third quarter of 2024, the Company recorded an out-of-period correction related to foreign currency to increase other expense, net by approximately $8 million, increase other current liabilities by approximately $4 million and increase
accumulated other comprehensive income (loss) by approximately $4 million. The amount related to 2023 was $2 million of other expense, net.
During 2024, the Company recorded corrections related to the Spin-Off. As of December 31, 2023, total assets were understated by approximately $9 million, total liabilities were overstated by approximately $7 million and total equity was understated by approximately $16 million, which is included in the “Spin-Off of NCR Atleos” line in the Statements of Changes in Stockholders’ Equity (Deficit).
The Company evaluated the impact of the out-of-period adjustments and concluded they are not material to the consolidated financial statements for any of the periods presented.
ACH disbursements In February 2024, the Company identified fraudulent automated clearing house (“ACH”) disbursements from a Company bank account. The cumulative amount of these disbursements total $34 million. As of December 31, 2024, the Company has recovered approximately $16 million of fraudulent disbursements from the Company’s banks and continues to pursue insurance recoveries in connection with this matter. The amount of these disbursements through December 31, 2023 was $23 million. Through September 30, 2023, the Company had incorrectly recorded approximately $11 million in an accounts receivable clearing account instead of as operating expenses, of which approximately $2 million related to annual periods prior to 2023. As a result, in the fourth quarter of 2023, the Company recorded a $2 million out-of-period adjustment to increase operating expenses and decrease accounts receivable in order to correct for the errors.
The Company evaluated the impact of the errors and out-of-period adjustments and concluded they are not material to any previously issued consolidated financial statements and the correction of the errors is not material to the consolidated financial statements for the year ended December 31, 2023.
Revenue Recognition The Company records revenue, net of sales tax, when the following five steps have been completed:
•Identification of the contract(s) with a customer
•Identification of the performance obligation(s) in the contract
•Determination of the transaction price
•Allocation of the transaction price to the performance obligations in the contract
•Recognition of revenue when, or as, we satisfy performance obligations
The Company records revenue when, or as, performance obligations are satisfied by transferring control of a promised good or service to the customer, in an amount that reflects the consideration we expect to be entitled to in exchange for products and services. The Company evaluates the transfer of control primarily from the customer’s perspective where the customer has the ability to direct the use of and obtain substantially all of the remaining benefits from that good or service. The Company does not adjust the transaction price for taxes collected from customers, as those amounts are netted against amounts remitted to government authorities.
The Company enters contracts that include multiple distinct performance obligations, including hardware, software, professional consulting and managed services, payment processing services, installation services and maintenance support services. A promise to a customer is considered distinct when the product or service is both capable of being distinct, and distinct in the context of the contract. For these arrangements, the Company allocates the transaction price, at contract inception, to each distinct performance obligation on a relative standalone selling price basis. The primary method used to estimate standalone selling price is the price that the Company charges for that good or service when the Company sells it separately in similar circumstances to similar customers.
For hardware products, control is generally transferred when the customer has the ability to direct the use of and obtain substantially all of the remaining benefits of the products, which generally coincides with when the customer has assumed title and risk of loss of the goods sold. In certain instances, customer acceptance is required prior to the passage of title and risk of loss of the delivered products. In such cases, revenue is not recognized until the customer acceptance is obtained. Delivery, acceptance, and transfer of title and risk of loss generally occur in the same reporting period. The Company’s customers may request that delivery and passage of title and risk of loss occur on a bill and hold basis. For the periods ending December 31, 2024, 2023, and 2022, the revenue recognized from bill and hold transactions approximated less than 2% of total revenue, respectively. Hardware products may also be included in an As-a-service package and sold in a bundle with managed services. In these packages, title to the hardware is not transferred to the customer and revenue is recognized in consideration of lease accounting standards, depending on the terms and conditions in the contract. Most hardware leases embedded in our As-a-
service contracts qualify for classification as operating leases. Revenue from the hardware operating leases in an As-a-service package is recognized over the term of the contract, which is the same pattern and timing as the services in the contract.
Software products may be sold as perpetual licenses, term-based licenses, cloud-enabled and software as a service (“SaaS”). Perpetual license revenue is recognized at a point in time when control transfers to the customer and is reported within product revenue. Control is typically transferred when the customer takes possession of, or has access to, the software. Term-based license revenue is recognized at a point in time upon the commencement of the committed term of the contract, concurrent with the possession of the license, and reported within product revenue. The committed term of the contract is typically one month to one year due to customer termination rights. If the amount of consideration the Company expects to be paid in exchange for the licenses depends on customer usage, revenue is recognized when the usage occurs.
SaaS primarily consists of fees to provide our customers access to our platform and cloud-based applications for a specified contract term. Revenue from SaaS contracts is recognized as variable consideration directly allocated based on customer usage or on a ratable basis over the contract term beginning on the date that our service is made available to the customer. SaaS is reported as part of our services revenue.
The Company sells some product solutions that include a combination of cloud-enabled and on-premise term-based software licenses for a specified contract term. Significant judgment is required to determine if the products and services represent distinct promises to the customer or if they should be combined into one performance obligation. When they are combined into one performance obligation, revenue is recognized ratably over the contract term for which the service is provided.
In addition to SaaS, our services revenue includes professional consulting, payment processing revenue, managed services, installation and maintenance support. Professional consulting primarily consists of software implementation, integration, customization and optimization services. Revenue from professional consulting contracts is recognized when the services are completed or customer acceptance of the service is received, if required. For installation and maintenance, control is transferred as the services are provided or ratably over the service period, or, if applicable, after customer acceptance of the service. For recurring services that we perform over a contract term, we analyze if the services are performed evenly throughout the term for fixed consideration. If so, we ratably recognize the corresponding consideration over the committed term. Otherwise, we apply the ‘as invoiced’ practical expedient, for performance obligations satisfied over time, if the amount we may invoice corresponds directly with the value to the customer of the Company’s performance to date. This expedient permits us to recognize revenue in the amount we invoice the customer.
Payment processing revenue includes surcharge and other fees paid by cardholders and/or the cardholder’s financial institutions for the use of processing services. Surcharge revenues are recognized daily as the associated transactions are processed. Relative to credit card processing, revenue is comprised of fees charged to the Company’s customers, net of interchange fees and assessments charged by the credit card associations and payment networks, which are pass-through charges collected on behalf of the card issuers and payment networks.
Under our managed service agreements, the Company provides various forms of services, including customer service, processing and other services, under one contract package. The Company typically receives a monthly service fee, fee per transaction, or fee per service provided in return for providing the agreed-upon services. The managed services fees are recognized as the related services are provided to the customers.
The nature of our arrangements gives rise to several types of variable consideration including service level agreement credits, stock rotation rights, trade-in credits and volume-based rebates. At contract inception, we include this variable consideration in our transaction price when there is a basis to reasonably estimate the amount of the fee and it is probable there will not be a significant reversal. These estimates are generally made using the expected value method and a portfolio approach, based on historical experience, anticipated performance and our best judgment at the time. These estimates are reassessed at each reporting date. Because of our confidence in estimating these amounts, they are included in the transaction price of our contracts and the associated remaining performance obligations.
Payment terms with our customers are established based on industry and regional practices and generally do not exceed 30 days. We do not typically include extended payment terms in our contracts with customers. As a practical expedient, we do not adjust the promised amount of consideration for the effects of a significant financing component when we expect, at contract inception, that the period between our transfer of a promised product or service to a customer and when the customer pays for that product or service will be one year or less. If the period between transfer of the promised product or service and payment is more than one year, the Company analyzes whether a significant financing component is present. If so, the Company adjusts the
total consideration to reflect the significant financing component.
We account for shipping and handling activities related to contracts with customers as costs to fulfill our promise to transfer the associated products, rather than as a separate performance obligation. Accordingly, we record amounts billed for shipping and handling costs as a component of net product sales, and classify such costs as a component of cost of products.
In addition to the standard product warranty, the Company periodically offers extended warranties to its customers in the form of product maintenance services. For maintenance contracts that have been combined with product contracts under the revenue guidance, the Company defers revenue at an amount based on the relative standalone selling price allocation, and recognizes the deferred revenue over the service term. For non-combined maintenance contracts, the Company defers the stated amount of the separately priced service and recognizes the deferred revenue over the service term.
Remaining Performance Obligations Remaining performance obligations represent the transaction price of contracts for which products have not been delivered or services have not been performed. As of December 31, 2024, the aggregate amount of the transaction price allocated to remaining performance obligations was approximately $1.1 billion. The Company expects to recognize revenue on approximately three-quarters of the remaining performance obligations over the next 12 months, with the remainder recognized thereafter. The majority of our professional services are expected to be recognized over the next 12 months but this is contingent upon a number of factors, including customers’ needs and schedules.
The Company has made three elections which affect the value of remaining performance obligations described above. We do not disclose remaining performance obligations for contracts where variable consideration is directly allocated based on usage or when the original expected duration is one year or less. Additionally, we do not disclose remaining performance obligations for contracts where we recognize revenue from the satisfaction of the performance obligation in accordance with the ‘right to invoice’ practical expedient.
Warranty and Sales Returns Provisions for product warranties and sales returns and allowances are recorded in the period in which the Company becomes obligated to honor the related right, which generally is the period in which the related product revenue is recognized. The Company accrues warranty reserves based upon historical factors such as labor rates, average repair time, travel time, number of service calls per machine and cost of replacement parts. When a sale is consummated, a warranty reserve is recorded based upon the estimated cost to provide the service over the warranty period. The Company accrues sales returns and allowances using percentages of revenue to reflect the Company’s historical average of sales return claims.
Research and Development Costs Research and development costs primarily include payroll and benefit-related costs, contractor fees, facilities costs, infrastructure costs, and administrative expenses directly related to research and development support and are expensed as incurred, except certain software development costs are capitalized after technological feasibility of the software is established.
Advertising Advertising costs are recognized in selling, general and administrative expenses when incurred.
Stock-based Compensation Stock-based compensation represents the costs related to share-based awards granted to employees and non-employee directors. The Company’s outstanding stock-based compensation awards are classified as equity. The Company measures stock-based compensation cost at the grant date, based on the estimated fair value of the award and recognizes the cost over the requisite service period. Forfeitures are recognized as they occur. See Note 9, “Stock Compensation Plans”, for further information on the Company’s stock-based compensation plans.
Income Taxes Income tax expense is provided based on income before income taxes. Deferred income taxes reflect the impact of temporary differences between assets and liabilities recognized for financial reporting purposes and such amounts recognized for tax purposes. These deferred taxes are determined based on the enacted tax rates expected to apply in the periods in which the deferred assets or liabilities are expected to be settled or realized. The Company records valuation allowances related to its deferred income tax assets when it is more likely than not that some portion or all of the deferred income tax assets will not be realized.
The Company recognizes the tax benefit from an uncertain tax position only if it is more likely than not that the tax position will be sustained on examination by the taxing authorities, based on the technical merits of the position. The tax benefits recognized in the consolidated financial statements from such a position are measured based on the largest benefit that has a greater than fifty percent likelihood of being sustained upon examination by authorities. Interest and penalties related to uncertain tax positions are recognized as part of the provision for income taxes and are accrued beginning in the period that
such interest and penalties would be applicable under relevant tax law and until such time that the related tax benefits are recognized.
Cash, Cash Equivalents, and Restricted Cash All short-term, highly liquid investments having original maturities of three months or less, including time deposits, are considered to be cash equivalents. As of December 31, 2024, 2023 and 2022, the Company has restricted cash on deposit with a bank as collateral for letters of credit as well as cash included in settlement processing assets.
The reconciliation of cash, cash equivalents and restricted cash in the Consolidated Statements of Cash Flows is as follows:
| | | | | | | | | | | | | | | | | | | | | | | | | | |
| In millions | | Balance Sheet Location | | December 31, 2024 | | December 31, 2023 | | December 31, 2022 |
| Cash and cash equivalents | | Cash and cash equivalents | | $ | 724 | | | $ | 259 | | | $ | 218 | |
| Short term restricted cash | | Restricted cash | | — | | | — | | | 1 | |
| Long term restricted cash | | Other assets | | 3 | | | 2 | | | — | |
| | | | | | | | |
| Cash included in settlement processing assets | | Restricted cash | | 31 | | | 21 | | | 16 | |
| Total cash, cash equivalents and restricted cash | | | | $ | 758 | | | $ | 282 | | | $ | 235 | |
| Cash, cash equivalents and restricted cash of discontinued operations | | | | — | | | 3 | | | 505 | |
| Total cash, cash equivalents and restricted cash | | | | $ | 758 | | | $ | 285 | | | $ | 740 | |
Supplemental cash flow information Interest paid in cash was $145 million, $365 million, and $268 million for fiscal years 2024, 2023 and 2022, respectively. Income taxes paid in cash were $54 million, $92 million and $56 million for fiscal years 2024, 2023 and 2022, respectively.
Supplemental disclosures of noncash investing and financing activities During the twelve months ended December 31, 2022, we issued shares of the Company’s common stock and assumed unvested outstanding option awards in the acquisition of Moon Inc., dba LibertyX, for total non-cash consideration of $68 million. In connection with the acquisition, we also assumed debt of $2 million. Refer to Note 2, “Discontinued Operations”, for additional information on the LibertyX acquisition.
Accounts Receivable, net Accounts receivable, net includes amounts billed and currently due from customers as well as amounts unbilled that typically result from sales under contracts where revenue recognized exceeds the amount billed to the customer and where the Company has an unconditional right to consideration. The amounts due are stated at their net estimated realizable value.
The components of accounts receivable are summarized as follows:
| | | | | | | | | | | |
| In millions | December 31, 2024 | | December 31, 2023 |
| Accounts receivable | | | |
| Trade | $ | 505 | | | $ | 305 | |
| Other | 60 | | | 138 | |
| Accounts receivable, gross | 565 | | | 443 | |
| Less: allowance for credit losses | (26) | | | (29) | |
| Total accounts receivable, net | $ | 539 | | | $ | 414 | |
Allowance for Credit Losses on Accounts Receivable Allowances for credit losses on accounts receivable are recognized when reasonable and supportable forecasts affect the expected collectability. This requires us to make our best estimate of the current expected losses inherent in our accounts receivable at each balance sheet date. These estimates require consideration of historical loss experience, adjusted for current conditions, forward looking indicators, trends in customer payment frequency and judgments about the probable effects of relevant observable data, including present and future economic conditions and the financial health of specific customers and market sectors. This policy is applied consistently among all of our operating segments. We continue to evaluate our reserves in light of the age and quality of our outstanding accounts receivable and risks to specific industries or countries and adjust the reserves accordingly.
Our allowance for credit losses as of December 31, 2024 and December 31, 2023 was $26 million and $29 million, respectively. For the year ending December 31, 2024, our allowance for credit losses charged to expense was $15 million. The
Company recorded $18 million of write-offs against the reserve for the year ended December 31, 2024. For the year ending December 31, 2023, our allowance for credit losses charged to expense was $26 million and the Company recorded $15 million of write-offs against the reserve.
Inventories Inventories are stated at the lower of cost or net realizable value, using the average cost method. Cost includes materials, labor and manufacturing overhead related to the purchase and production of inventories. Service parts are included in inventories and include reworkable and non-reworkable service parts. The Company regularly reviews inventory quantities on hand, future purchase commitments with suppliers and the estimated utility of inventory. If the review indicates a reduction in utility below carrying value, inventory is reduced to a new cost basis. Excess and obsolete write-offs are established based on forecasted usage, orders, technological obsolescence and inventory aging.
Contract Assets and Liabilities Contract assets include unbilled amounts where the right to payment is not solely subject to the passage of time. Amounts may not exceed their net realizable value. Contract liabilities consist of advance payments, billings in excess of revenue recognized and deferred revenue.
Our contract assets and liabilities are reported in a net position on a contract-by-contract basis at the end of each reporting period. If the net position is a contract asset, the current portion is included in Prepaid and other current assets and the non-current portion is included in Other assets in the Consolidated Balance Sheet. If the net position is a contract liability, the current portion is included in Contract liabilities and the non-current portion is included in Other liabilities in the Consolidated Balance Sheet. As of December 31, 2024 and 2023, no contracts were in a net asset position.
The following table presents the net contract asset and contract liability balances:
| | | | | | | | | | | | | | | | | |
| In millions | Location in the Consolidated Balance Sheet | | December 31, 2024 | | December 31, 2023 |
| | | | | |
| Current portion of contract liabilities | Contract liabilities | | $ | 211 | | | $ | 157 | |
| Non-current portion of contract liabilities | Other liabilities | | $ | 13 | | | $ | 12 | |
During the twelve months ended December 31, 2024, 2023, and 2022 the Company recognized $144 million, $118 million, and $127 million, respectively, in revenue that was included in contract liabilities as of December 31, 2023, 2022, and 2021, respectively.
Deferred Commissions Our incremental costs of obtaining a contract, which consist of certain sales commissions, primarily for our SaaS revenue, are deferred and amortized on a straight-line basis over the period of expected benefit. We determined the period of expected benefit by taking into consideration customer contracts, the estimated life of the customer relationship, including renewals when the renewal commission is not commensurate with the initial commission, the expected life of the underlying technology and other factors. We classify deferred commissions as current or non-current based on the timing of when we expect to recognize the expense. The current and non-current portions of deferred commissions are included in Prepaid and other current assets and Other assets, respectively, in the Consolidated Balance Sheets. Amortization of deferred commissions is included in Selling, general and administrative expenses in the Consolidated Statements of Operations.
Settlement Processing Assets and Obligations Funds settlement refers to the process of transferring funds for sales and credits between card issuers and merchants. Depending on the type of transaction, either the credit card interchange system or the debit network is used to transfer the information and funds in either direction between the sponsoring bank and card issuing bank to complete the link between merchants and card issuers. In certain of our processing arrangements, merchant funding occurs after the sponsoring bank or the Company receives the funds from the card issuer through the card networks, creating a settlement obligation to the merchant on the Company’s Consolidated Balance Sheet. In a limited number of other arrangements, the sponsoring bank funds the merchants before it receives the net settlement funds from the card networks, creating a settlement asset on the Company’s Consolidated Balance Sheet. Additionally, relative to credit card transactions, the Company’s sponsoring bank collects the gross revenue from the merchants, pays the interchange fees and assessments to the credit card associations, collects its fees for processing and pays the Company a net residual payment representing the Company’s fees for the services. In these instances, the Company does not reflect the related settlement processing assets and obligations in its Consolidated Balance Sheet.
Settlement processing assets consist of settlement assets due from customers and receivables from merchants corresponding to the discount fee related to reimbursement of the interchange expense, our receivables from the processing bank or Electronic Funds Transfer (“EFT”) network for transactions that have occurred and have been funded to merchants in advance of receipt
of card association funding, restricted cash balances that are not yet due to merchants, merchant reserves held, sponsoring bank reserves and exception items, such as customer chargeback amounts receivable from merchants. Settlement processing obligations consist primarily of merchant reserves, our liability to the processing bank or merchant for transactions for which we have received funding from the members or networks but have not funded merchants as well as certain exception items. Settlement processing assets other than restricted cash are recorded within Prepaid and other current assets and settlement processing liabilities are recorded within Settlement liabilities in the Consolidated Balance Sheet. Cash related to settlement processing is recorded within Restricted cash in the Consolidated Balance Sheet. As of December 31, 2024 and 2023, settlement processing assets were $50 million and $46 million, respectively, and settlement processing liabilities were $47 million and $39 million, respectively. Settlement receivables are generally collected within four business days. Settlement obligations are generally paid within three business days, regardless of when the related settlement receivables are collected.
Capitalized Software Certain direct development costs associated with internal-use software are capitalized within Other assets and amortized over the estimated useful lives of the resulting software. The Company typically amortizes capitalized internal-use software on a straight-line basis over four to seven years beginning when the asset is substantially ready for use, as this is considered to approximate the usage pattern of the software. When it becomes probable that internal-use software being developed will not be completed or placed into service, the internal-use software is reported at the lower of the carrying amount or fair value.
Costs incurred for the development of software that will be sold, leased or otherwise marketed are capitalized when technological feasibility has been established. These costs are included within Other assets and are amortized on a sum-of-the-years’ digits or straight-line basis over the estimated useful lives ranging from three to five years, using the method that most closely approximates the sales pattern of the software. Amortization begins when the product is available for general release. Costs capitalized include direct labor and related overhead costs. Costs incurred prior to technological feasibility or after general release are expensed as incurred. The Company performs periodic reviews to ensure that unamortized program costs remain recoverable from future revenue. If future revenue does not support the unamortized program costs, the amount by which the unamortized capitalized cost of a software product exceeds the net realizable value is written off.
The following table identifies the activity relating to total capitalized software:
| | | | | | | | | | | | | | | | | |
| In millions | 2024 | | 2023 | | 2022 |
| Beginning balance as of January 1 | $ | 317 | | | $ | 323 | | | $ | 293 | |
| Capitalization | 130 | | | 140 | | | 155 | |
| Amortization | (139) | | | (136) | | | (122) | |
| Impairment | (6) | | | (1) | | | — | |
| Capitalized software acquired or disposed of and other adjustments | — | | | (9) | | | (3) | |
| Ending balance as of December 31 | $ | 302 | | | $ | 317 | | | $ | 323 | |
During the year ended December 31, 2023, other adjustments includes the write-off of certain capitalized software related to the divested business. During the year ended December 31, 2022, we recorded the write-off of certain internal and external-use software capitalization projects that are no longer considered strategic and as a result, the projects have been abandoned.
Goodwill and Other Intangible Assets Goodwill represents the excess of purchase price over the fair value of the net tangible and identifiable intangible assets of businesses acquired. Goodwill is tested at the reporting unit level for impairment on an annual basis during the fourth quarter or more frequently if certain events occur indicating that the carrying value of goodwill may be impaired. A significant amount of judgment is involved in determining if an indicator of impairment has occurred. Such indicators may include a decline in expected cash flows, a significant adverse change in legal factors or in the business climate, a decision to sell a business, unanticipated competition, or slower growth rates, among others. Consistent with the examples of such events and circumstances given in the accounting guidance, we believe that a goodwill impairment test should be performed immediately before and after a reorganization of our reporting structure when the reorganization would affect the composition of one or more of our reporting units. In this circumstance, performing the impairment test immediately before and after the reorganization would help to confirm that the reorganization is not potentially masking a goodwill impairment charge.
In the evaluation of goodwill for impairment, we have the option to perform a qualitative assessment to determine whether further impairment testing is necessary or to perform a quantitative assessment by comparing the fair value of a reporting unit to its carrying amount, including goodwill. Under the qualitative assessment, an entity is not required to calculate the fair value of a reporting unit unless the entity determines that it is more likely than not that its fair value is less than its carrying amount. If,
under the quantitative assessment, the fair value of a reporting unit is less than its carrying amount, then the amount of the impairment loss, if any, is determined based on the amount by which the carrying amount exceeds the fair value up to the total value of goodwill assigned to the reporting unit. Fair values of the reporting units are estimated using a weighted methodology considering the output from both the income and market approaches. The income approach incorporates the use of discounted cash flow (“DCF”) analysis. A number of significant assumptions and estimates are involved in the application of the DCF model to forecast operating cash flows, including revenue growth rates, EBITDA margins and discount rates. Several of these assumptions vary among reporting units. The cash flow forecasts are generally based on approved strategic operating plans. The market approach is performed using the Guideline Public Companies (“GPC”) method which is based on earnings multiple data. We perform a reconciliation between our market capitalization and our estimate of the aggregate fair value of the reporting units, including consideration of a control premium. Refer to Note 4, “Goodwill and Purchased Intangible Assets”, for further discussion.
Acquired intangible assets other than goodwill are amortized over their weighted average amortization period unless they are determined to be indefinite. Acquired intangible assets are carried at cost, less accumulated amortization. For intangible assets purchased in a business combination, the estimated fair values of the assets received are used to establish the carrying value. The fair value of acquired intangible assets is determined using common techniques, and the Company employs assumptions developed using the perspective of a market participant. The Company makes judgments about the recoverability of intangible assets whenever events or changes in circumstances indicate that impairment may exist. If such facts and circumstances exist, the Company assesses the recoverability by comparing the projected undiscounted net cash flows associated with the related asset or group of assets over their remaining lives against their respective carrying amounts. Impairments, if any, are based on the excess of the carrying amount over the fair value of those assets. If the useful life is shorter than originally estimated, the Company would accelerate the rate of amortization and amortize the remaining carrying value over the new shorter useful life. For further discussion of identified intangible assets, see Note 4, “Goodwill and Purchased Intangible Assets”.
Property, Plant and Equipment Property, plant and equipment and leasehold improvements are stated at cost less accumulated depreciation. Depreciation is computed over the estimated useful lives of the related assets primarily on a straight-line basis. Machinery and other equipment are depreciated over 3 to 20 years and buildings over 25 to 45 years. Leasehold improvements are depreciated over the life of the lease or the asset, whichever is shorter. Assets classified as held for sale are not depreciated. Upon retirement or disposition of property, plant and equipment, the related cost and accumulated depreciation or amortization are removed from the Company’s accounts, and a gain or loss is recorded. Depreciation expense related to property, plant and equipment was $55 million for each of the years ending December 31, 2024, 2023, and 2022.
Valuation of Long-Lived Assets Long-lived assets such as property, plant and equipment and finite-lived intangible assets are reviewed for impairment when events or changes in circumstances indicate that the carrying amount of the assets may not be recoverable or in the period in which the held for sale criteria are met. For assets held and used, this analysis consists of comparing the asset’s carrying value to the expected future cash flows to be generated from the asset on an undiscounted basis. If the carrying amount of the asset is determined not to be recoverable, a write-down to fair value is recorded. Fair values are determined based on quoted market values, discounted cash flows, or external appraisals, as applicable. Long-lived assets are reviewed for impairment at the individual asset or the asset group level for which the lowest level of independent cash flows can be identified. Refer to Note 4, “Goodwill and Purchased Intangible Assets”, for further discussion.
Leasing The Company determines whether an arrangement is a lease at the inception of the arrangement based on the terms and conditions in the contract. A contract contains a lease if there is an identified asset and the Company has the right to control the asset.
Lessee We lease property, vehicles and equipment under operating and financing leases. For leases with terms greater than 12 months, we record the related asset and obligation at the present value of lease payments over the term. We determine the lease term by assuming the exercise of renewal options that are reasonably certain. Leases with a lease term of 12 months or less at inception are not recorded on our Consolidated Balance Sheet and are expensed on a straight-line basis over the lease term in our Consolidated Statement of Operations. Our leases may include rental escalation clauses, renewal options and/or termination options that are factored into our determination of lease payments when appropriate. When available, we use the rate implicit in the lease to discount lease payments to present value; however, most of our leases do not provide a readily determinable implicit rate. Therefore, we must estimate our incremental borrowing rate to discount the lease payments based on information available at lease commencement. Our incremental borrowing rate is based on a credit-adjusted risk-free rate at commencement date, which best approximates a secured rate over a similar term of lease. Additionally, we do not separate lease and non-lease components for any asset classes, except for those leases embedded in certain service arrangements. Fixed and in-substance fixed payments are included in the recognition of the operating and financing assets and lease liabilities, however, variable lease
payments, other than those based on a rate or index, are recognized in the Consolidated Statements of Operations in the period in which the obligation for those payments is incurred. The Company’s variable lease payments generally relate to payments tied to various indices, non-lease components and payments above a contractual minimum fixed payment.
Lessor We have various arrangements for certain point-of-sale equipment under which we are the lessor. These leases meet the criteria for operating lease classification. Lease income associated with these leases is not material.
Pension and Postemployment Benefits The Company has significant pension and postemployment benefit costs, which are developed from actuarial valuations. Actuarial assumptions are established to anticipate future events and are used in calculating the expense and liabilities relating to these plans. These factors include assumptions the Company makes about interest rates, expected investment return on plan assets, rate of increase in healthcare costs, involuntary turnover rates, and rates of future compensation increases. In addition, the Company also uses subjective factors, such as withdrawal rates and mortality rates to develop the Company’s valuations. The Company generally reviews and updates these assumptions on an annual basis. The Company is required to consider current market conditions, including changes in interest rates, in making these assumptions. The actuarial assumptions that the Company uses may differ materially from actual results due to changing market and economic conditions, higher or lower withdrawal rates, or longer or shorter life spans of participants. These differences may result in a significant impact to the amount of pension or postemployment benefits expense, and the related assets and liabilities, the Company has recorded or may record.
Environmental and Legal Contingencies In the normal course of business, the Company is subject to various proceedings, lawsuits, claims and other matters, including, for example, those that relate to the environment and health and safety, labor and employment, employee benefits, import/export compliance, intellectual property, data privacy and security, product liability, commercial disputes and regulatory compliance, among others. Additionally, the Company is subject to diverse and complex laws, regulations, and standards including those relating to corporate governance, public disclosure and reporting, environmental safety and the discharge of materials into the environment, product safety, import and export compliance, data privacy and security, antitrust and competition, government contracting, anti-corruption, and labor and human resources, which are rapidly changing and subject to many possible changes in the future. Compliance with these laws and regulations, as well as changes in accounting standards, taxation requirements, and federal securities laws, among others, may create a substantial burden on, and substantially increase the costs to the Company or could have an impact on the Company’s future operating results. The Company believes that the amounts provided in its Consolidated Financial Statements are adequate. However, there can be no assurances that the actual amounts required to satisfy alleged liabilities from various lawsuits, claims, legal proceedings and other matters, including the Fox River and Kalamazoo River environmental matters discussed in Note 11, “Commitments and Contingencies”, and to comply with applicable laws and regulations, will not exceed the amounts reflected in the Company’s Consolidated Financial Statements or will not have a material adverse effect on the Company’s consolidated results of operations, financial condition or cash flows. Any costs that may be incurred in excess of those amounts provided as of December 31, 2024 cannot currently be reasonably determined or are not currently considered probable. The costs and insurance recoveries relating to certain environmental obligations associated with discontinued operations, including those relating to the Fox River, Kalamazoo River and Ebina matters, are presented in Income (loss) from discontinued operations, net of tax, in the Consolidated Statements of Operations.
Legal fees and expenses related to loss contingencies are typically expensed as incurred, except for certain costs associated with the Company’s environmental remediation obligations. Costs and fees associated with litigating the extent and type of required remedial actions and the allocation of remediation costs among potentially responsible parties are typically included in the measurement of the environmental remediation liabilities.
Foreign Currency For many of the Company’s international operations, the local currency is designated as the functional currency. Accordingly, assets and liabilities are translated into U.S. Dollars at year-end exchange rates, and revenue and expenses are translated at average exchange rates prevailing during the year. Currency translation adjustments from local functional currency countries resulting from fluctuations in exchange rates are recorded in Other comprehensive income. Remeasurement adjustments are recorded in Other income (expense), net.
Repurchase of Common Stock The Company applies the par value method of accounting for repurchases of common stock. In March 2017, the Board approved a share repurchase program, with no expiration from the date of authorization, that provided for the repurchase of up to $300 million of the Company’s common stock (the “Repurchase Program”). In July 2018, the Board authorized an incremental $200 million of share repurchases under the Repurchase Program. The Company has repurchased $56 million through December 31, 2024 under the Repurchase Program. An additional $44 million was repurchased in January and February 2025 under the Repurchase Program.
Derivative Instruments In the normal course of business, the Company enters into various financial instruments, including derivative financial instruments. The Company accounts for derivatives as either assets or liabilities in the Consolidated Balance Sheets at fair value and recognizes the resulting gains or losses as adjustments to earnings or other comprehensive income. For derivative instruments that are designated and qualify as hedging instruments, the Company formally documents the relationship between hedging instruments and hedged items, as well as the risk management objective and strategy for undertaking various hedge transactions. Hedging activities are transacted only with highly rated institutions, reducing exposure to credit risk in the event of nonperformance. Additionally, the Company completes assessments related to the risk of counterparty nonperformance on a regular basis.
The accounting for changes in fair value of a derivative instrument depends on whether it has been designated and qualifies as part of a hedging relationship, and further, on the type of hedging relationship. For those derivative instruments that are designated and qualify as hedging instruments, the Company has designated the hedging instrument, based on the exposure being hedged, as a fair value hedge, a cash flow hedge or a hedge of a net investment in a foreign operation. For derivative instruments designated as fair value hedges, the effective portion of the hedge is recorded as an offset to the change in the fair value of the hedged item, and the ineffective portion of the hedge, if any, is recorded in the Consolidated Statement of Operations. For derivative instruments designated as cash flow hedges and determined to be highly effective, the gains or losses are deferred in Accumulated other comprehensive loss and recognized in the determination of income as adjustments of carrying amounts when the underlying hedged transaction is realized, canceled or otherwise terminated. When hedging certain foreign currency transactions of a long-term investment nature (net investments in foreign operations), gains and losses are recorded in the currency translation adjustment component of Accumulated other comprehensive loss. Gains and losses on foreign exchange contracts that are not used to hedge currency transactions of a long-term investment nature, or that are not designated as cash flow or fair value hedges, are recognized in Other income (expense), net as exchange rates change.
Fair Value of Assets and Liabilities Fair value is defined as an exit price, representing an amount that would be received to sell an asset or the amount paid to transfer a liability in an orderly transaction between market participants at the measurement date. As such, fair value is a market-based measurement determined based on assumptions that market participants would use in pricing an asset or liability. As a basis for considering such assumptions, the accounting guidance prioritizes the inputs used to measure fair value into the following three-tier fair value hierarchy:
•Level 1: Unadjusted quoted prices in active markets for identical assets or liabilities
•Level 2: Unadjusted quoted prices in active markets for similar assets or liabilities, unadjusted quoted prices for identical or similar assets or liabilities in markets that are not active or inputs, other than quoted prices in active markets, that are observable either directly or indirectly
•Level 3: Unobservable inputs for which there is little or no market data
Assets and liabilities are classified based on the lowest level of input that is significant to the fair value measurements. The Company reviews the fair value hierarchy classification on a quarterly basis. Changes to the observability of valuation inputs may result in a reclassification of levels for certain securities within the fair value hierarchy.
The Company measures its financial assets and financial liabilities at fair value based on one or more of the following three valuation techniques:
•Market approach: Prices and other relevant information generated by market transactions involving identical or comparable assets or liabilities.
•Cost approach: Amount that would be required to replace the service capacity of an asset (replacement cost).
•Income approach: Techniques to convert future amounts to a single present amount based upon market expectations (including present value techniques, option pricing and excess earnings models).
We regularly review our investments to determine whether a decline in fair value, if any, below the cost basis is other than temporary. If the decline in the fair value is determined to be other than temporary, the cost basis of the security is written down to fair value and the amount of the write-down is included in the Consolidated Statement of Operations. For qualifying investments in debt or equity securities, a temporary impairment charge would be recognized in Other comprehensive income (loss).
Recent Accounting Pronouncements
Adoption of New Accounting Pronouncements
In November 2023, the FASB issued ASU 2023-07, Segment Reporting (Topic 280): Improvements to Reportable Segment Disclosures. The amendment enhances disclosures of significant segment expenses by requiring disclosure of significant segment expenses regularly provided to the chief operating decision maker (“CODM”), extend certain annual disclosures to interim periods, and permit more than one measure of segment profit or loss to be reported under certain conditions. The amendment is effective for the Company in fiscal years beginning after December 15, 2023, and interim periods within fiscal years beginning after December 15, 2024. The Company has adopted ASU 2023-07 and conformed to the applicable disclosure retrospectively for the Annual Report on Form 10-K for the year ending December 31, 2024. Refer to Note 5, “Segment Information and Concentrations” for additional details.
Although there are other new accounting pronouncements issued by the FASB and adopted by or effective for the Company, the Company does not believe any of these accounting pronouncements had a material impact on its consolidated financial statements.
Accounting Pronouncements Issued But Not Yet Adopted
In November 2024, the FASB issued ASU 2024-03, Income Statement – Reporting Comprehensive Income – Expense Disaggregation Disclosures (Topic 220): Disaggregation of Income Statement Expenses and ASU 2025-01, Income Statement - Reporting Comprehensive Income - Expense Disaggregation Disclosures (Topic 220): Clarifying the Effective Date. This guidance requires additional disclosure of certain amounts included in the expense captions presented on the Statement of Operations as well as disclosures about selling expenses. The ASU is effective on a prospective basis, with the option for retrospective application, for annual periods beginning after December 15, 2026 and interim reporting periods within annual reporting periods beginning after December 15, 2027. Early adoption is permitted for annual financial statements that have not yet been issued. The Company is in the process of assessing the impact the adoption of this guidance will have on the Company’s financial statement disclosures.
In December 2023, the FASB issued ASU 2023-09, Income Taxes (Topic 740): Improvements to Income Tax Disclosures. This guidance requires disclosure of specific categories in the rate reconciliation and provides additional information for reconciling items that meet a specified quantitative threshold. The guidance is effective for fiscal years beginning after December 15, 2024, with early adoption permitted. Other than the new disclosure requirements, the adoption of this guidance is not expected to have a significant impact on the Company’s consolidated financial statements.
Although there are other new accounting pronouncements issued by the FASB and not yet adopted by or effective for the Company, the Company does not believe any of these accounting pronouncements will have a material impact on its consolidated financial statements.
2. DISCONTINUED OPERATIONS
Digital Banking Sale
On September 30, 2024, the Company completed the Digital Banking Sale. Refer to Note 1, “Basis of Presentation and Significant Accounting Policies” for additional information. The historical results of the Digital Banking businesses have been presented as discontinued operations for all periods presented. The Company’s presentation of discontinued operations excludes general corporate overhead costs that did not meet the requirements to be presented as discontinued operations. The Company recognized a pre-tax gain of approximately $1.5 billion, which was recognized in Net income (loss) from discontinued operations.
The following table presents the major categories of income (loss) from discontinued operations related to the Digital Banking Sale:
| | | | | | | | | | | | | | | | | |
| For the year ended December 31 |
| In millions | 2024 | | 2023 | | 2022 |
| Product revenue | $ | 38 | | | $ | 53 | | | $ | 55 | |
| Service revenue | 419 | | | 526 | | | 492 | |
| Total revenue | 457 | | | 579 | | | 547 | |
| Cost of products | 31 | | | 43 | | | 38 | |
| Cost of services | 221 | | | 280 | | | 256 | |
| Selling, general and administrative expenses | 84 | | | 77 | | | 73 | |
| Research and development expenses | 37 | | | 46 | | | 31 | |
| Total operating expenses | 373 | | | 446 | | | 398 | |
| Income from discontinued operations | 84 | | | 133 | | | 149 | |
| | | | | |
| Other income (expense), net | (48) | | | (5) | | | — | |
| Income (loss) from discontinued operations before gain on sale of business and income taxes | 36 | | | 128 | | | 149 | |
| Gain on sale of business | 1,530 | | | — | | | — | |
| Income (loss) from discontinued operations before income taxes | 1,566 | | | 128 | | | 149 | |
| Income tax expense (benefit) | 388 | | | 13 | | | 11 | |
| | | | | |
| | | | | |
| Net income (loss) from discontinued operations related to Digital Banking | $ | 1,178 | | | $ | 115 | | | $ | 138 | |
The following table presents the major classes of assets and liabilities of discontinued operations related to the Digital Banking Sale:
| | | | | |
| In millions | December 31, 2023 |
| Assets | |
| Current assets | |
| Cash and cash equivalents | $ | 2 | |
| Accounts receivable, net of allowances | 58 | |
| |
| |
| Prepaid and other current assets | 9 | |
| Total current assets | 69 | |
| Property, plant and equipment, net | 5 | |
| Goodwill | 521 | |
| Intangibles, net | 168 | |
| Operating lease assets | 5 | |
| |
| |
| Other assets | 183 | |
| Noncurrent assets | 882 | |
| Total assets of discontinued operations | $ | 951 | |
| |
| Liabilities | |
| Current liabilities | |
| |
| Accounts payable | $ | 64 | |
| Payroll and benefits liabilities | 22 | |
| Contract liabilities | 30 | |
| |
| Other current liabilities | 4 | |
| Total current liabilities | 120 | |
| |
| |
| |
| |
| Operating lease liabilities | 3 | |
| Other liabilities | 7 | |
| Noncurrent liabilities | 10 | |
| Total liabilities of discontinued operations | $ | 130 | |
| $ | 130 | |
The following table presents selected financial information related to cash flows from discontinued operations related to the Digital Banking Sale:
| | | | | | | | | | | | | | | | | |
| For the year ended December 31 |
| In millions | 2024 | | 2023 | | 2022 |
| Net cash provided by/(used in) operating activities | $ | (288) | | | $ | 242 | | | $ | 210 | |
| Net cash provided by/(used in) investing activities | (57) | | | (96) | | | (93) | |
| Net cash provided by/(used in) financing activities | — | | | — | | | — | |
Spin-Off of NCR Atleos
On October 16, 2023, the Company completed the Spin-Off of NCR Atleos into an independent publicly traded company. Refer to Note 1, “Basis of Presentation and Significant Accounting Policies” for additional information regarding the Spin-Off. The historical results of NCR Atleos have been presented as discontinued operations. The Company’s presentation of discontinued operations excludes general corporate overhead costs that did not meet the requirements to be presented as discontinued operation. The 2023 and 2022 presentation of discontinued operations has been updated to reflect the results of operations for the countries that transferred to NCR Atleos during 2024 and excludes the countries that have not yet transferred to NCR Atleos as of December 31, 2024. The results of operations for the countries that have not yet transferred will be presented as part of discontinued operations as of the date of their separation. As of December 31, 2024, there were two countries that had not yet transferred to NCR Atleos.
The following table presents the major categories of income (loss) from discontinued operations related to the Spin-Off of NCR Atleos:
| | | | | | | | | | | | | | | | | |
| For the year ended December 31 |
| In millions | 2024 | | 2023 | | 2022 |
| Product revenue | $ | — | | | $ | 802 | | | $ | 1,092 | |
| Service revenue | 5 | | | 2,519 | | | 3,031 | |
| Total revenue | 5 | | | 3,321 | | | 4,123 | |
| Cost of products | — | | | 651 | | | 956 | |
| Cost of services | 4 | | | 1,733 | | | 2,246 | |
| Selling, general and administrative expenses | 1 | | | 540 | | | 461 | |
| Research and development expenses | — | | | 52 | | | 70 | |
| Total operating expenses | 5 | | | 2,976 | | | 3,733 | |
| Income from discontinued operations | — | | | 345 | | | 390 | |
| | | | | |
| Interest expense | — | | | (6) | | | — | |
| Other income (expense), net | — | | | (22) | | | (11) | |
| Income (loss) from discontinued operations before income taxes | — | | | 317 | | | 379 | |
| Income tax expense (benefit) | 8 | | | 76 | | | 85 | |
| Net income (loss) from discontinued operations | (8) | | | 241 | | | 294 | |
| Net income (loss) attributable to noncontrolling interests | — | | | — | | | (1) | |
| Net income (loss) from discontinued operations related to NCR Atleos | $ | (8) | | | $ | 241 | | | $ | 295 | |
The following table represents the major classes of assets and liabilities of discontinued operations:
| | | | | | |
| In millions | December 31, 2023 | |
| Assets | | |
| Current assets | | |
| Cash and cash equivalents | $ | 1 | | |
| Accounts receivable, net of allowances | 9 | | |
| Inventories | 4 | | |
| | |
| Prepaid and other current assets | 1 | | |
| Total current assets | 15 | | |
| | |
| | |
| | |
| | |
| | |
| | |
| Other assets | 8 | | |
| Noncurrent assets | 8 | | |
| Total assets of discontinued operations | $ | 23 | | |
| | |
| Liabilities and stockholder's equity | | |
| Current liabilities | | |
| | |
| Accounts payable | $ | 1 | | |
| Payroll and benefits liabilities | 1 | | |
| Contract liabilities | 10 | | |
| | |
| Other current liabilities | 3 | | |
| Total current liabilities | 15 | | |
| | |
| Pension and indemnity plan liabilities | 7 | | |
| | |
| | |
| | |
| Other liabilities | 5 | | |
| Noncurrent liabilities | 12 | | |
| Total liabilities of discontinued operations | $ | 27 | | |
| | |
The total net impact to stockholder’s equity as a result of the separation was a reduction of $1,238 million, which has been reflected as a reduction of $1,057 million and $182 million to retained earnings and accumulated other comprehensive income, respectively, and an increase of $1 million to noncontrolling interest, in the Consolidated Statement of Equity as of December 31, 2023.
The following table presents selected financial information related to cash flows from discontinued operations related to the Spin-off of NCR Atleos:
| | | | | | | | | | | | | | | | | |
| For the year ended December 31 |
| In millions | 2024 | | 2023 | | 2022 |
| Net cash provided by/(used in) operating activities | $ | (8) | | | $ | 336 | | | $ | 272 | |
| Net cash provided by/(used in) investing activities | — | | | (93) | | | (123) | |
| Net cash provided by/(used in) financing activities | — | | | 1 | | | 10 | |
The following transactions have been included as part of discontinued operations for all of the periods presented.
Acquisition of LibertyX (2022)
On January 5, 2022, the Company completed its acquisition of Moon Inc., dba LibertyX, a leading cryptocurrency software provider, with the goal of enabling the Company to provide a complete digital currency solution, including the ability to buy and sell cryptocurrency, conduct cross-border remittance, and accept digital currency payments across digital and physical channels. The Company purchased all outstanding shares of LibertyX for $1 million cash consideration and approximately 1.4 million shares of the Company’s common stock at a price of $42.13 per share. The Company also converted approximately 0.2 million outstanding unvested LibertyX option awards into the Company’s awards pursuant to an exchange ratio as defined in the acquisition agreement. LibertyX stock option awards were converted into the Company’s stock option awards with an exercise price per share for option awards equal to the exercise price per share of such stock option award immediately prior to the completion of the acquisition divided by the exchange ratio, and vested immediately. The value of the option awards was deemed attributable to services already rendered and was included as a portion of the purchase price. Total purchase consideration for the LibertyX acquisition was approximately $69 million. As a result of the acquisition, LibertyX became a wholly-owned subsidiary of the Company.
The operating results of LibertyX are part of Income (loss) from discontinued operations, net of tax within the Company’s results since the closing date of the acquisition.
Supplemental Information
Conflict in Eastern Europe The war in Eastern Europe and related sanctions imposed on Russia and related actors by the United States and other jurisdictions required us to commence the orderly wind down of our operations in Russia beginning in the first quarter of 2022. As of December 31, 2022, we ceased operations in Russia and our only subsidiary in Russia was formally dissolved as of December 20, 2023. We recognized a pre-tax net loss of $22 million for the year ended December 31, 2022 related to these actions which is included in Income (loss) from discontinued operations, net of tax within the Company’s results. NCR Voyix has no operations in Russia.
Environmental Matters
The costs and insurance recoveries relating to certain environmental obligations associated with discontinued operations, including those relating to the Fox River, Kalamazoo River and Ebina matters, are presented in Income (loss) from discontinued operations, net of tax, in the Consolidated Statements of Operations. Income (loss) from discontinued operations, net of tax, related to environmental matters was a loss of $10 million, $50 million and $4 million, for the years ended December 31, 2024, 2023 and 2022, respectively. Net cash used in operating activities of discontinued operations related to environmental obligations was $20 million, $19 million and $20 million for fiscal years 2024, 2023 and 2022, respectively. Refer to Note 11, “Commitments and Contingencies” for further information.
3. BUSINESS COMBINATIONS AND DIVESTITURES
Divestitures
On September 30, 2024, the Company completed the Digital Banking Sale. Refer to Note 1, “Basis of Presentation and Significant Accounting Policies” and Note 2, “Discontinued Operations” for additional information.
On October 19, 2023, the Company divested of a portion of the assets that were deemed non-strategic to its payments business, consisting primarily of merchant contracts, our front end authorization platform and certain relevant intellectual property for cash proceeds of $82 million.
4. GOODWILL AND PURCHASED INTANGIBLE ASSETS
Goodwill by Segment The carrying amounts of goodwill by segment as of December 31, 2024 and 2023 are included in the tables below. Foreign currency fluctuations are included within other adjustments.
| | | | | | | | | | | | | | | | | | | | | | | | | | | | | | | | | | | | | | | | | |
| December 31, 2023 | | | | | | | | December 31, 2024 |
| In millions | Goodwill | Accumulated Impairment | Total | | Additions | | Impairment | | Other | | Goodwill | Accumulated Impairment | Total |
| Retail | $ | 1,081 | | $ | (34) | | $ | 1,047 | | | $ | — | | | $ | — | | | $ | (2) | | | $ | 1,079 | | $ | (34) | | $ | 1,045 | |
| Restaurants | 495 | | (23) | | 472 | | | — | | | — | | | (1) | | | 494 | | (23) | | 471 | |
| | | | | | | | | | | | | |
| | | | | | | | | | | | | |
| Total goodwill | $ | 1,576 | | $ | (57) | | $ | 1,519 | | | $ | — | | | $ | — | | | $ | (3) | | | $ | 1,573 | | $ | (57) | | $ | 1,516 | |
Identifiable Intangible Assets NCR Voyix’s purchased intangible assets, reported in Intangibles, net in the Consolidated Balance Sheets, were specifically identified when acquired, and are deemed to have finite lives. The gross carrying amount and accumulated amortization for the Company’s identifiable intangible assets were as set forth in the table below.
| | | | | | | | | | | | | | | | | | | | | | | | | | | | | |
| Amortization
Period
(in Years) | | December 31, 2024 | | December 31, 2023 |
| In millions | | Gross Carrying Amount | | Accumulated Amortization | | Gross Carrying Amount | | Accumulated Amortization |
| Identifiable intangible assets | | | | | | | | | |
| Reseller & customer relationships | 1 - 20 | | $ | 321 | | | $ | (268) | | | $ | 322 | | | $ | (251) | |
| Intellectual property | 2 - 8 | | 346 | | | (307) | | | 346 | | | (296) | |
| | | | | | | | | |
| Tradenames | 1 - 10 | | 64 | | | (62) | | | 64 | | | (62) | |
| Total identifiable intangible assets | | | $ | 731 | | | $ | (637) | | | $ | 732 | | | $ | (609) | |
Amortization expense related to identifiable intangible assets was $28 million, $41 million, and $40 million for the years ended December 31, 2024, 2023 and 2022, respectively.
The aggregate amortization expense (estimated) for identifiable intangible assets for the following periods is:
| | | | | | | | | | | | | | | | | | | | | | | | | | | | | | | | | | |
| | | | For the years ended December 31 (estimated) |
| In millions | | | 2025 | | 2026 | | 2027 | | 2028 | | 2029 |
| Amortization expense | | | | $ | 25 | | | $ | 23 | | | $ | 19 | | | $ | 9 | | | $ | 5 | |
5. SEGMENT INFORMATION AND CONCENTRATIONS
Subsequent to the Digital Banking Sale and the Spin-Off, as described in Note 1, “Basis of Presentation and Significant Accounting Policies”, the Company manages and reports the following segments:
•Retail - We offer software-led solutions to customers in the retail industry, leading with digital to connect retail operations end to end to integrate all aspects of a customer’s operations in indoor and outdoor settings from POS, to payments, inventory management, fraud and loss prevention applications, loyalty and consumer engagement. These
solutions include retail-oriented technologies such as comprehensive API-point of sale retail software platforms and applications, hardware terminals, self-service kiosks including self-checkout (“SCO”), payment processing and merchant acquiring solutions, and bar-code scanners.
•Restaurants - We offer technology solutions to customers in the restaurant industry, including table-service, quick-service and fast casual restaurants of all sizes, that are designed to improve operational efficiency, increase customer satisfaction, streamline order and transaction processing and reduce operating costs. Our solutions include POS hardware and software solutions, payment processing and merchant acquiring services, installation, maintenance, as well as managed and professional services.
Corporate and Other includes income and expenses related to corporate functions that are not specifically attributable to any of our two individual reportable segments. In addition, Corporate and Other includes certain non-strategic businesses that are considered immaterial operating segment(s) and certain legacy ATM operations in foreign countries that are expected to transfer to NCR Atleos in 2025, as well as commercial agreements with NCR Atleos.
These segments represent components of the Company for which separate financial information is available that is utilized on a regular basis by the chief operating decision maker (“CODM”), the CEO. The CODM considers the budget-to-actual and forecast-to-actual variances for revenue and segment Adjusted EBITDA on a periodic basis in assessing segment performance and in allocating the Company’s resources. Adjusted EBITDA is defined as GAAP net income (loss) from continuing operations attributable to NCR Voyix plus interest expense, net; plus income tax expense (benefit); plus depreciation and amortization; plus stock-based compensation expense; plus pension mark-to-market adjustments and other special items, including amortization of acquisition-related intangibles, acquisition-related costs, separation-related costs, cyber ransomware incident recovery costs net of insurance recoveries, fraudulent ACH disbursements costs net of recoveries, foreign currency devaluation, transformation and restructuring charges (which includes integration, severance and other exit and disposal costs), and strategic initiative costs, among others. The special items are considered non-operational or non-recurring in nature, so are excluded from the Adjusted EBITDA metric utilized by our chief operating decision maker in evaluating segment performance and are separately delineated to reconcile back to total reported GAAP net income (loss) from continuing operations attributable to the Company.
Assets are not allocated to segments, and thus are not included in the assessment of segment performance. Consequently, we do not disclose total assets by reportable segment. The accounting policies used to determine the results of the operating segments are the same as those utilized for the consolidated financial statements as a whole. Intersegment sales and transfers are not material.
The following table presents summarized financial information for the Company’s reportable segments for the year ended December 31, 2024:
| | | | | | | | | | | | | | | | | | | | | |
| In millions | | Retail | | Restaurants | | | Total |
| Revenue by Segment | | $ | 1,956 | | | $ | 825 | | | | $ | 2,781 | |
| Other | | | | | | | 45 | |
| Total Revenue | | | | | | | $ | 2,826 | |
| Cost of Revenue | | 1,386 | | | 424 | | | | |
Other segment items(1) | | 187 | | | 150 | | | | |
| Segment Adjusted EBITDA | | $ | 383 | | | $ | 251 | | | | $ | 634 | |
The following table presents summarized financial information for the Company’s reportable segments for the year ended December 31, 2023:
| | | | | | | | | | | | | | | | | | | | | | |
| In millions | | Retail | | Restaurants | | | | Total |
| Revenue by Segment | | $ | 2,177 | | | $ | 886 | | | | | $ | 3,063 | |
| Other | | | | | | | | 115 | |
| Total Revenue | | | | | | | | $ | 3,178 | |
| Cost of Revenue | | 1,556 | | | 539 | | | | | |
Other segment items(1) | | 210 | | | 150 | | | | | |
| Segment Adjusted EBITDA | | $ | 411 | | | $ | 197 | | | | | $ | 608 | |
The following table presents summarized financial information for the Company’s reportable segments for the year ended December 31, 2022:
| | | | | | | | | | | | | | | | | | | | | | |
| In millions | | Retail | | Restaurants | | | | Total |
| Revenue by Segment | | $ | 2,182 | | | $ | 857 | | | | | $ | 3,039 | |
| Other | | | | | | | | 135 | |
| Total Revenue | | | | | | | | $ | 3,174 | |
| Cost of Revenue | | 1,618 | | | 528 | | | | | |
Other segment items(1) | | 180 | | | 169 | | | | | |
| Segment Adjusted EBITDA | | $ | 384 | | | $ | 160 | | | | | $ | 544 | |
(1) Other segment items primarily includes selling, general and administrative expenses and research and development expenses.
The following table reconciles Segment Adjusted EBITDA to Net income (loss) from continuing operations attributable to NCR Voyix:
| | | | | | | | | | | | | | | | | | | | |
| In millions | | 2024 | | 2023 | | 2022 |
| Segment Adjusted EBITDA | | $ | 634 | | | $ | 608 | | | $ | 544 | |
| Corporate and other income and expenses not allocated to segments | | 287 | | | 271 | | | 220 | |
| Depreciation and amortization | | 206 | | | 190 | | | 189 | |
| Acquisition-related amortization of intangibles | | 28 | | | 41 | | | 40 | |
Interest expense(1) | | 134 | | | 294 | | | 285 | |
| Interest income | | (9) | | | (12) | | | (13) | |
Acquisition-related costs(2) | | — | | | 1 | | | 2 | |
| Loss (gain) on debt extinguishment | | (8) | | | 46 | | | — | |
| Income tax expense | | 4 | | | 184 | | | 52 | |
| Stock-based compensation expense | | 40 | | | 140 | | | 84 | |
| Pension mark-to-market adjustments | | (12) | | | 7 | | | (41) | |
Transformation and restructuring costs(3) | | 125 | | | 28 | | | 95 | |
Separation costs(4) | | 10 | | | 95 | | | — | |
| Loss (gain) on disposal of businesses | | (14) | | | 12 | | | — | |
Foreign currency devaluation(5) | | 15 | | | — | | | — | |
Fraudulent ACH disbursements(6) | | (5) | | | 23 | | | — | |
| | | | | | |
Cyber ransomware incident recovery costs(7) | | (13) | | | 17 | | | — | |
Strategic initiatives(8) | | 48 | | | — | | | — | |
| Net income (loss) from continuing operations attributable to NCR Voyix | | $ | (202) | | | $ | (729) | | | $ | (369) | |
| | | | | | |
(1) During the three months ended September 30, 2023, it was determined that the transactions underlying the unrealized gains on terminated interest rate swap and cap agreements reported in Accumulated other comprehensive income were probable of not occurring under ASC 815, Derivatives and Hedging. As such, $18 million of unrealized gains were recognized in Interest expense. Refer to Note 15, “Derivatives and Hedging Instruments”.
(2) Represents professional fees, retention bonuses, and other costs incurred related to acquisitions, which are considered non-operational in nature.
(3) Represents integration, severance, and other exit and disposal costs, which are considered non-operational in nature.
(4) Represents costs incurred as a result of the Spin-Off. Professional fees to effect the Spin-Off including separation management, organizational design, and legal fees have been classified within discontinued operations through October 16, 2023, the separation date.
(5) Represents gains and losses recognized during the year due to changes in valuation of the Lebanese pound and the Egyptian pound.
(6) Represents company identified fraudulent ACH disbursements from a company bank account. Additional details regarding this item are discussed in Note 1, “Basis of Presentation and Significant Accounting Policies”.
(7) Represents expenses to respond to, remediate and investigate the April 13, 2023 cyber ransomware incident net of insurance recoveries, which is considered a nonrecurring special item. Additional details regarding this cyber ransomware incident are discussed in Note 1, “Basis of Presentation and Significant Accounting Policies”.
(8) Represents professional fees related to strategic initiatives which are considered non-operational in nature, as well as certain costs incurred related to the Hardware Business transition.
The following table presents recurring revenue and all other products and services that is recognized at a point in time for the Company for the years ended December 31:
| | | | | | | | | | | | | | | | | | | | |
| In millions | | 2024 | | 2023 | | 2022 |
Recurring revenue(1) | | $ | 1,634 | | | $ | 1,617 | | | $ | 1,579 | |
| All other products and services | | 1,192 | | | 1,561 | | | 1,595 | |
| Total revenue | | $ | 2,826 | | | $ | 3,178 | | | $ | 3,174 | |
(1) Recurring revenue includes all revenue streams from contracts where there is a predictable revenue pattern that will occur at regular intervals with a relatively high degree of certainty. This includes hardware and software maintenance revenue, cloud revenue, payment processing revenue, interchange and network revenue, and certain professional services arrangements, as well as term-based software license arrangements that include customer termination rights.
Revenue is attributed to the geographic area to which the product is delivered or in which the service is provided. The following table presents revenue by geographic area for the Company for the years ended December 31:
| | | | | | | | | | | | | | | | | | | | | | | | | | | | | | | | | | | | | | |
| | | | | | | | | | | | |
| In millions | | 2024 | | % | | 2023 | | % | | 2022 | | % |
| | | | | | | | | | | | |
| United States | | $ | 1,706 | | | 60 | % | | $ | 2,056 | | | 65 | % | | $ | 2,014 | | | 63 | % |
| Americas (excluding United States) | | 239 | | | 9 | % | | 230 | | | 7 | % | | 225 | | | 7 | % |
| | | | | | | | | | | | |
| Europe, Middle East and Africa | | 574 | | | 20 | % | | 543 | | | 17 | % | | 555 | | | 18 | % |
| Asia Pacific | | 307 | | | 11 | % | | 349 | | | 11 | % | | 380 | | | 12 | % |
| | | | | | | | | | | | |
| Total revenue | | $ | 2,826 | | | 100 | % | | $ | 3,178 | | | 100 | % | | $ | 3,174 | | | 100 | % |
The following table presents property, plant and equipment by geographic area as of December 31:
| | | | | | | | | | | | | | |
| In millions | | 2024 | | 2023 |
| Property, plant and equipment, net | | | | |
| United States | | $ | 160 | | | $ | 172 | |
| Americas (excluding United States) | | 2 | | | 2 | |
| Europe, Middle East and Africa | | 24 | | | 29 | |
| Asia Pacific | | 6 | | | 4 | |
| Consolidated property, plant and equipment, net | | $ | 192 | | | $ | 207 | |
Concentrations One customer accounted for approximately 13%, 16% and 12% of our consolidated operating revenues during the years ended December 31, 2024, 2023 and 2022 respectively, and is included in our Retail segment. As of December 31, 2024, 2023 and 2022, the Company is not aware of any other significant concentration of business transacted with a particular customer that could, if suddenly eliminated, have a material adverse effect on the Company’s operations. NCR Voyix does not have a concentration of available sources of labor, services, licenses or other rights that could, if suddenly eliminated, have a material adverse effect on its operations.
A number of NCR Voyix’s products, systems and solutions rely primarily on specific suppliers for microprocessors and other component products, manufactured assemblies, operating systems, commercial software and other central components. The Company also utilizes contract manufacturers in order to complete manufacturing activities. There can be no assurances that any sudden impact to the availability or cost of these technologies or services would not have a material adverse effect on the Company’s operations.
6. DEBT OBLIGATIONS
The following table summarizes the Company’s short-term borrowings and long-term debt:
| | | | | | | | | | | | | | | | | | | | |
| December 31, 2024 | | December 31, 2023 |
| In millions, except percentages | Amount | Weighted-Average Interest Rate | | Amount | Weighted-Average Interest Rate |
| Short-Term Borrowings | | | | | |
Current portion of Senior Secured Credit Facility(1) | $ | — | | —% | | $ | 15 | | 8.46% |
| | | | | |
| | | | | |
| Total short-term borrowings | $ | — | | | | $ | 15 | | |
| Long-Term Debt | | | | | |
| Senior Secured Credit Facility: | | | | | |
| Term loan facilities(1) | $ | — | | —% | | $ | 185 | | 8.46% |
| Revolving credit facility(1) | — | | —% | | 98 | | 9.07% |
| Senior Notes: | | | | | |
| | | | | | |
| | | | | | |
| | | | | | |
| | | | | | |
| 5.000% Senior Notes due 2028 | 650 | | | | 650 | | |
| 5.125% Senior Notes due 2029 | 403 | | | | 1,200 | | |
| | | | | | |
| 5.250% Senior Notes due 2030 | 52 | | | | 450 | | |
| Deferred financing fees | (7) | | | | (20) | | |
| | | | | |
| Total long-term debt | $ | 1,098 | | | | $ | 2,563 | | |
(1)Interest rates are weighted average interest rates as of December 31, 2024 and 2023.
Senior Secured Credit Facilities On October 16, 2023, the Company entered into a senior secured credit agreement, with certain subsidiaries of the Company party thereto as foreign borrowers, the lenders party thereto and Bank of America, N.A., as administrative agent (in such capacity, the “Administrative Agent”). This credit agreement provides for senior secured credit facilities in an aggregate principal amount of $700 million, comprised of (i) a five-year multicurrency revolving credit facility in the aggregate principal amount of $500 million (including (a) a letter of credit sub-facility in an aggregate principal amount of up to $75 million and (b) a sub-facility in an aggregate principal amount of up to $200 million for borrowings and letters of credit in certain agreed foreign currencies) (the “Revolving Credit Facility,” and the loans thereunder, the “Revolving Loans”) and (ii) a five-year term loan “A” facility in the aggregate principal amount of $200 million (the “Term Loan A Facility,” and the loans thereunder, the “Term A Loans” and, the Term Loan A Facility, together with the Revolving Credit Facility, the “Senior Secured Credit Facilities”).
The Revolving Loans bear interest based on SOFR (or an alternative reference rate for amounts denominated in a currency other than Dollars), or, at the Company’s option, in the case of amounts denominated in Dollars, at a base reference rate equal to the highest of (a) the federal funds rate plus 0.50%, (b) the rate of interest last quoted by the Administrative Agent as its “prime rate” and (c) the one-month SOFR rate plus 1.00% (the “Base Rate”), plus, as applicable, a margin ranging from 2.25% to 3.25% per annum for SOFR-based Revolving Loans and ranging from 1.25% to 2.25% per annum for Base Rate-based Revolving Loans, in each case, depending on the Company’s consolidated leverage ratio. The Revolving Credit Facility is not subject to amortization and will mature on the fifth anniversary of the Closing Date.
On September 30, 2024, using a portion of the proceeds from the Digital Banking Sale, the Company repaid all loans outstanding under the Senior Secured Credit Facilities (but did not reduce the principal amount of the commitments under the Revolving Loans).
The obligations under the Revolving Credit Facility are guaranteed by certain of the Company’s material subsidiaries (the “Guarantors”). The obligations under the Revolving Credit Facility and the above described guarantee are secured by a first priority lien and security interest in certain equity interests owned by the Company and the Guarantors in certain of their respective domestic and foreign subsidiaries, and a first priority lien and security interest in substantially all of the assets of the Company and the Guarantors, subject to certain exclusions.
The Revolving Credit Facility contains customary representations and warranties, affirmative covenants, and negative covenants. The negative covenants limit the Company’s and its subsidiaries’ ability to, among other things, incur indebtedness, create liens on the Company’s or its subsidiaries’ assets, engage in fundamental changes, make investments, sell or otherwise dispose of assets, engage in sale-leaseback transactions, make restricted payments, repay subordinated indebtedness, engage in
certain transactions with affiliates and enter into agreements restricting the ability of the Company’s subsidiaries to make distributions to the Company or incur liens on their assets.
The Revolving Credit Facility also contains a financial covenant that does not permit the Company to allow its consolidated leverage ratio to exceed (i) in the case of any fiscal quarter ending on or following September 30, 2024 and prior to September 30, 2025, 4.50 to 1.00 and (ii) in the case of any fiscal quarter ending on or following September 30, 2025, 4.25 to 1.00, in each case subject, to (x) increases of 0.25 in connection with the consummation of any material acquisition and applicable to the fiscal quarter in which such acquisition is consummated and the three consecutive fiscal quarters thereafter, and (y) a maximum cap of 5.00 to 1.00.
The Revolving Credit Facility also includes provisions for events of default which are customary for similar financings. Upon the occurrence of an event of default, the lenders may, among other things, terminate the loan commitments, accelerate all loans and require cash collateral deposits in respect of outstanding letters of credit. If the Company is unable to pay or repay the amounts due, the lenders could, among other things, proceed against the collateral granted to them to secure such indebtedness.
Senior Unsecured Notes On August 20, 2020, the Company issued $650 million aggregate principal amount of 5.000% senior unsecured notes due in 2028 (the “5.000% Notes”) and $450 million aggregate principal amount of 5.250% senior unsecured notes due in 2030 (the “5.250% Notes”). Interest is payable on the 5.000% and 5.250% Notes semi-annually in arrears on April 1 and October 1. The 5.000% and 5.250% Notes were sold at 100% of the principal amount and mature on October 1, 2028 and October 1, 2030, respectively.
Prior to October 1, 2025, with respect to the 5.250% Notes, the Company may redeem some or all of such series of Notes by paying a redemption price equal to 100% of the principal amount of the Notes to be redeemed plus the Applicable Premium, as defined in the indenture governing the applicable series of notes, plus accrued and unpaid interest to, but excluding, the redemption date (subject to the right of holders of record of the Notes on the relevant record date to receive interest due on the relevant interest payment date).
The Company has the option to redeem the 5.000% Notes, in whole or in part, at any time on or after October 1, 2023, at a redemption price of 101.250%, and 100% during the 12-month periods commencing on October 1, 2024 and 2025 and thereafter, respectively, plus accrued and unpaid interest to the redemption date.
The Company has the option to redeem the 5.250% Notes, in whole or in part, at any time on or after October 1, 2025, at a redemption price of 102.625%, 101.750%, 100.875%, and 100% during the 12-month periods commencing on October 1, 2025, 2026, 2027 and 2028 and thereafter, respectively, plus accrued and unpaid interest to the redemption date.
On April 6, 2021, the Company issued $1.2 billion aggregate principal amount of 5.125% senior unsecured notes due 2029 (the “5.125% Notes”). Interest is payable on the 5.125% Notes semi-annually in arrears on April 15 and October 15 of each year. The 5.125% Notes will mature on April 15, 2029.
The Company has the option to redeem the 5.125% Notes, at whole or in part, on or after April 15, 2024, at a redemption price of 102.563%, 101.281% and 100% during the 12-month periods commencing on or after April 15, 2024, 2025 and 2026 and thereafter, respectively, plus accrued and unpaid interest to the redemption date.
The senior unsecured notes are the Company’s senior unsecured obligations and are jointly and severally unconditionally guaranteed on a senior unsecured basis by the Company’s domestic material subsidiaries, subject to certain limitations, that guarantee the Company’s Senior Secured Credit Facilities pursuant to supplemental indentures governing each applicable series of senior unsecured notes. The indentures governing the senior unsecured notes contain customary events of default, including, among other things, payment default, exchange default, failure to provide certain notices thereunder and certain provisions related to bankruptcy events. The indentures governing the senior unsecured notes also contains customary high yield affirmative and negative covenants, including negative covenants that, among other things, limit the Company and its restricted subsidiaries’ ability to incur additional indebtedness, create liens on, sell or otherwise dispose of assets, engage in certain fundamental corporate changes or changes to lines of business activities, make certain investments or material acquisitions, engage in sale-leaseback or hedging transactions, repurchase common stock, pay dividends or make similar distributions on capital stock, repay certain indebtedness, engage in certain affiliate transactions and enter into agreements that restrict their ability to create liens, pay dividends or make loan repayments. If the senior unsecured notes are assigned an “investment grade” rating by Moody’s or S&P and no default has occurred or is continuing, certain covenants will be terminated.
On September 30, 2024, a portion of the proceeds from the Digital Banking Sale were used to settle the Company’s previously announced tender offers to purchase up to $1.2 billion aggregate purchase price, excluding accrued and unpaid interest, of the Company’s senior unsecured notes, subject to prioritized acceptance levels and proration. Pursuant to the terms of the tender offers and the final settlement, the Company purchased approximately $398 million aggregate principal amount of the 5.250% Notes and $797 million aggregate principal amount of the 5.125% Notes. The Company recognized a gain on extinguishment of debt of $8 million related to the redemption discount of $18 million on the settlement of the 5.250% Notes and 5.125% Notes offset by the write-off of the related deferred financing fees of $10 million.
Debt Maturities Maturities of debt outstanding, in principal amounts, at December 31, 2024 are summarized below:
| | | | | | | | | | | | | | | | | | | | | | | | | | | | | | | | | | | | | | | | | | | | |
| | | | For the years ended December 31 | | |
| In millions | | Total | | 2025 | | 2026 | | 2027 | | 2028 | | 2029 | | Thereafter |
| Debt maturities | | $ | 1,105 | | | $ | — | | | $ | — | | | $ | — | | | $ | 650 | | | $ | 403 | | | $ | 52 | |
Fair Value of Debt The Company utilized Level 2 inputs, as defined in the fair value hierarchy, to measure the fair value of the long-term debt, which, as of December 31, 2024 and 2023 was $1.06 billion and $2.47 billion, respectively. Management’s fair value estimates were based on quoted prices for recent trades of the Company’s long-term debt, quoted prices for similar instruments, and inquiries with certain investment communities.
7. TRADE RECEIVABLES FACILITY
Prior to September 30, 2024, the Company maintained a trade receivables facility (the “T/R Facility”) pursuant to which a wholly-owned, bankruptcy-remote subsidiary of the Company (the “U.S. SPE”) and a wholly-owned, bankruptcy remote subsidiary of a Canadian affiliate of the Company (the “Canadian SPE,” and together with the U.S. SPE, the “SPEs”) continuously acquired all of the trade receivables originated by the Company and the Canadian affiliate (and certain other affiliates from time to time party to the T/R Facility). The SPEs in turn either sold or pledged those trade receivables to unaffiliated purchasers party to the T/R Facility (the “Purchasers”). On September 1, 2024, the Company voluntarily repaid a portion of the amounts outstanding under the T/R Facility to reduce the commitment of the Purchasers from $300 million to $252 million and to reacquire all outstanding trade receivables related to the Digital Banking business. On September 30, 2024, the Company used a portion of the proceeds from the Digital Banking Sale to voluntarily pay all remaining amounts outstanding under the T/R Facility. In connection with the payment of such amounts, the Company terminated the T/R Facility and reacquired all of the outstanding trade receivables that had previously been sold by it (and by its affiliates then party to the T/R Facility) to the SPEs (including any outstanding trade receivables that had been further sold on to the Purchasers) and these amounts are included in Accounts receivable, net in the Company’s Consolidated Balance Sheets.
Prior to the termination of the T/R Facility, the total outstanding balance of trade receivables sold to the Purchasers could be up to $252 million (or prior to September 1, 2024, up to $300 million) at any one time, which represented the maximum purchase commitment from the Purchasers. The actual outstanding balance of trade receivables that were sold varied based on the level of activity and other factors and could be less than the maximum purchase commitment. The total outstanding balance of trade receivables that were sold to the Purchasers and derecognized by the U.S. SPE was approximately zero and $288 million as of December 31, 2024 and December 31, 2023, respectively. Excluding the trade receivables sold to the Purchasers, the SPEs collectively owned zero and $107 million of trade receivables as of December 31, 2024 and December 31, 2023, respectively, and these amounts are included in Accounts receivable, net in the Company’s Consolidated Balance Sheets.
Cash activity related to the termination of the T/R Facility is reflected in Net cash provided by investing activities in the Consolidated Statements of Cash Flows. Prior to the termination of the T/R Facility, continuous cash activity was reflected in Net cash provided by operating activities. The U.S. SPE incurred fees under the T/R Facility, including fees due and payable to the Purchasers. Those fees, which are immaterial, are recorded within Other income (expense), net in the Consolidated Statements of Operations. In addition, each of the SPEs had provided a full recourse guarantee in favor of the Purchasers of the full and timely payment of all trade receivables sold to them by the U.S. SPE. The guarantee was secured by all the trade receivables owned by each of the SPEs that had not been sold to the Purchasers. The reserve recognized for this recourse obligation as of December 31, 2024 was not material.
8. INCOME TAXES
For the years ended December 31, income (loss) from continuing operations before income taxes consisted of the following:
| | | | | | | | | | | | | | | | | | | | |
| In millions | | 2024 | | 2023 | | 2022 |
| Income (loss) before income taxes | | | | | | |
| United States | | $ | (249) | | | $ | (451) | | | $ | (351) | |
| Foreign | | 50 | | | (94) | | | 34 | |
| Total income (loss) from continuing operations before income taxes | | $ | (199) | | | $ | (545) | | | $ | (317) | |
For the years ended December 31, income tax expense (benefit) consisted of the following:
| | | | | | | | | | | | | | | | | | | | |
| In millions | | 2024 | | 2023 | | 2022 |
| Income tax expense (benefit) | | | | | | |
| Current | | | | | | |
| Federal | | $ | (9) | | | $ | 26 | | | $ | 1 | |
| State | | 2 | | | — | | | 2 | |
| Foreign | | 26 | | | 31 | | | 25 | |
| Deferred | | | | | | |
| Federal | | (19) | | | (48) | | | (17) | |
| State | | 1 | | | (3) | | | 1 | |
| Foreign | | 3 | | | 178 | | | 40 | |
| Total income tax expense (benefit) | | $ | 4 | | | $ | 184 | | | $ | 52 | |
The following table presents the principal components of the difference between the effective tax rate and the U.S. federal statutory income tax rate for the years ended December 31:
| | | | | | | | | | | | | | | | | | | | |
| In millions | | 2024 | | 2023 | | 2022 |
| Income tax (benefit) expense at the U.S. federal tax rate of 21% | | $ | (42) | | | $ | (114) | | | $ | (67) | |
| Foreign income tax differential | | 8 | | | 1 | | | (4) | |
| Additional U.S. tax on foreign income | | (6) | | | 14 | | | (2) | |
| State and local income taxes (net of federal effect) | | 2 | | | (3) | | | 2 | |
| Other U.S. permanent book/tax differences | | 1 | | | 4 | | | 4 | |
| Meals and entertainment expense | | 1 | | | 2 | | | 1 | |
| Cash surrender value received as income | | 4 | | | — | | | — | |
| Nondeductible transaction costs | | — | | | 2 | | | 1 | |
| Nondeductible executive compensation | | (1) | | | 17 | | | 9 | |
| | | | | | |
| Dispositions | | — | | | 16 | | | — | |
| Spin-off of NCR Atleos | | — | | | 226 | | | — | |
| Gains/losses on internal entity restructuring | | (4) | | | — | | | — | |
| | | | | | |
| Excess (benefit)/deficit from share-based payments | | 8 | | | 2 | | | — | |
| | | | | | |
| Research and development tax credits | | (3) | | | (2) | | | (5) | |
| Foreign tax law changes | | (7) | | | (8) | | | 3 | |
| Valuation allowances | | 57 | | | 31 | | | 117 | |
| Change in liability for unrecognized tax benefits | | (9) | | | 3 | | | (15) | |
| Change in tax estimates for prior periods | | (6) | | | (5) | | | 4 | |
| Other, net | | 1 | | | (2) | | | 4 | |
| Total income tax (benefit) expense | | $ | 4 | | | $ | 184 | | | $ | 52 | |
The Company’s tax provisions include a provision for income taxes in certain tax jurisdictions where its subsidiaries are profitable, but reflect only a portion of the tax benefits related to certain foreign subsidiaries’ tax losses due to the uncertainty of the ultimate realization of future benefits from these losses. During 2024, our tax rate was impacted by a $57 million expense from recording a valuation allowance against deferred tax assets. During 2023, our tax rate was impacted by a net $226 million expense related to the Spin-Off of NCR Atleos. Also during 2023, our tax rate was impacted by a $31 million expense from recording a valuation allowance against deferred tax assets and a $17 million expense from nondeductible executive compensation. During 2022, our tax rate was impacted by a $117 million expense from recording a valuation allowance against deferred tax assets in the United Kingdom and other jurisdictions.
As described in Note 1, “Basis of Presentation and Significant Accounting Policies”, on October 16, 2023, in connection with the Spin-Off, the Company completed a series of legal entity restructurings including both an internal and external spin-off transaction. These transactions are subject to tax laws in the U.S. and non-U.S. jurisdictions, which resulted in the use of significant judgments by management as it pertains to the interpretation and application of tax laws in the U.S. and non-U.S. jurisdictions to determine the potential taxability of the transactions.
The Company did not provide additional U.S. income tax or foreign withholding taxes, if any, on approximately $295 million of undistributed earnings of its foreign subsidiaries, given the intention continues to be that those earnings are reinvested indefinitely. The amount of unrecognized deferred tax liability associated with these indefinitely reinvested earnings is approximately $32 million. The unrecognized deferred tax liability is made up of a combination of U.S. and state income taxes and foreign withholding taxes.
We regularly review our deferred tax assets for recoverability and establish a valuation allowance if it is more likely than not that some portion or all of the deferred tax asset will not be realized. The determination as to whether a deferred tax asset will be realized is made on a jurisdictional basis and is based on the evaluation of positive and negative evidence. This evidence includes historical taxable income/loss, projected future taxable income, the expected timing of the reversal of existing temporary differences and the implementation of tax planning strategies.
Deferred income tax assets and liabilities included in the Consolidated Balance Sheets as of December 31 were as follows:
| | | | | | | | | | | | | | |
| In millions | | 2024 | | 2023 |
| Deferred income tax assets | | | | |
| Employee pensions and other benefits | | $ | 15 | | | $ | 7 | |
| Other balance sheet reserves and allowances | | 104 | | | 197 | |
| Tax loss and credit carryforwards | | 156 | | | 248 | |
| Capitalized research and development | | 78 | | | 51 | |
| Property, plant and equipment | | 1 | | | 17 | |
| Lease liabilities | | 54 | | | 56 | |
| Capitalized software | | 50 | | | 15 | |
| Other | | 16 | | | 26 | |
| Total deferred income tax assets | | $ | 474 | | | $ | 617 | |
| Valuation allowance | | (153) | | | (211) | |
| Net deferred income tax assets | | $ | 321 | | | $ | 406 | |
| Deferred income tax liabilities | | | | |
| Intangibles | | $ | 82 | | | $ | 119 | |
| Right of use assets | | 57 | | | 57 | |
| Capitalized software | | — | | | — | |
| | | | |
| Total deferred income tax liabilities | | $ | 139 | | | $ | 176 | |
| Total net deferred income tax assets | | $ | 182 | | | $ | 230 | |
The Company has previously recorded valuation allowances related to certain deferred tax assets due to the uncertainty of the ultimate realization of the future benefits from those assets. The recorded valuation allowances cover deferred tax assets, including tax loss carryforwards, interest expense carryforwards, and foreign tax credits in tax jurisdictions where there is uncertainty as to the ultimate realization of those tax assets. If we are unable to generate sufficient future taxable income of the
proper source in the time period within which the temporary differences underlying our deferred tax assets become deductible, or before the expiration of our loss and credit carryforwards, additional valuation allowances could be required.
As of December 31, 2024, the Company had U.S. federal, U.S. state (tax effected), and foreign tax attribute carryforwards of approximately $571 million. The net operating loss carryforwards that are subject to expiration will expire in the years 2025 through 2044. The attributes include U.S. tax credit carryforwards of $27 million, which expire in the years 2028 through 2034.
The Company’s current tax liability was $336 million and $31 million as of December 31, 2024 and December 31, 2023, respectively, presented within Other current liabilities on the Consolidated Balance Sheets. The increase in the expected current tax liability relates to taxes for the Digital Banking Sale which is expected to be paid within the next 12 months.
The aggregate changes in the balance of our gross unrecognized tax benefits were as follows for the years ended December 31:
| | | | | | | | | | | | | | | | | | | | |
| In millions | | 2024 | | 2023 | | 2022 |
| Gross unrecognized tax benefits - January 1 | | $ | 58 | | | $ | 87 | | | $ | 121 | |
| Increases related to tax positions from prior years | | 1 | | | 1 | | | 3 | |
| Decreases related to tax positions from prior years | | (5) | | | (1) | | | (15) | |
| Increases related to tax provisions taken during the current year | | 1 | | | 2 | | | 7 | |
| Settlements with tax authorities | | (4) | | | — | | | (22) | |
| Lapses of statutes of limitation | | (5) | | | (1) | | | (7) | |
| Distributions to NCR Atleos | | — | | | (30) | | | — | |
| Total gross unrecognized tax benefits - December 31 | | $ | 46 | | | $ | 58 | | | $ | 87 | |
Of the total amount of gross unrecognized tax benefits as of December 31, 2024, $42 million would affect the Company’s effective tax rate if realized. The Company’s liability arising from uncertain tax positions is recorded in Income tax accruals and Other current liabilities in the Consolidated Balance Sheets.
We recognized interest and penalties associated with uncertain tax positions as part of the provision for income taxes in our Consolidated Statements of Operations of zero, $4 million of expense, and $1 million of benefit for the years ended December 31, 2024, 2023, and 2022, respectively. The gross amount of interest and penalties accrued as of December 31, 2024 and 2023 was $16 million and $18 million, respectively.
In the United States, the Company files consolidated federal and state income tax returns, with statutes of limitations generally ranging from three to five years. In 2022, the IRS commenced an examination of our 2019 income tax return, which concluded during the third quarter of 2024 with no changes made to our reported tax. U.S. federal tax years remain open from 2020 forward. Years beginning on or after 2010 are still open to examination by certain foreign taxing authorities.
The Company engages in discussions and negotiations with taxing authorities regarding tax matters, and the Company has determined that over the next 12 months it expects to resolve certain tax matters related to U.S. and foreign jurisdictions. As a result, as of December 31, 2024, we estimate that it is reasonably possible that unrecognized tax benefits may decrease by $11 million to $14 million in the next 12 months.
9. STOCK COMPENSATION PLANS
As disclosed in Note 1, “Basis of Presentation and Significant Accounting Policies”, outstanding restricted stock units and stock options were adjusted to maintain the economic value of those awards before and after the Spin-Off. Generally, continuing NCR Voyix employees retained the number of outstanding restricted stock units held by them as of the Spin-Off and received additional NCR Voyix restricted stock units to reflect the Spin-Off, while continuing NCR Atleos employees had their outstanding restricted stock units held by them as of the Spin-Off converted solely into equivalent restricted stock units of NCR Atleos, and any outstanding restricted stock units held by them as of the Spin-Off were cancelled. Outstanding stock options at the time of the Spin-Off, regardless of the holder, were converted into stock options of both NCR Voyix and NCR Atleos. In addition, outstanding restricted stock units held by certain key equity holders as of the Spin-Off (including directors and certain former employees) were converted into restricted stock units of both NCR Voyix and NCR Atleos. The share information included below has been adjusted for the Spin-Off. The modification of the Company’s awards did not result in material stock-based compensation cost during the year ended December 31, 2023.
The Company recognizes all share-based payments as compensation expense in its financial statements based on their fair value. As of December 31, 2024, the Company’s stock-based compensation consisted of restricted stock units, employee stock purchase plan and stock options. The Company recorded stock-based compensation expense in income (loss) from continuing operations for the years ended December 31 as follows:
| | | | | | | | | | | | | | | | | |
| In millions | 2024 | | 2023 | | 2022 |
| Restricted stock units | $ | 36 | | | 131 | | | 60 | |
| Stock options | — | | | 3 | | | 15 | |
| Employee stock purchase plan | 4 | | | 6 | | | 9 | |
| Stock-based compensation expense | $ | 40 | | | $ | 140 | | | $ | 84 | |
| Tax benefit | (4) | | (7) | | | (5) | |
| Total stock-based compensation (net of tax) | $ | 36 | | | 133 | | | 79 | |
Approximately 36 million shares (i) remain available for future issuance and (ii) are issuable upon the exercise or settlement of outstanding awards under the 2017 Stock Incentive Plan (“SIP”). Details of the Company’s stock-based compensation plans are discussed below.
Restricted Stock Units
The SIP provides for the grant of several different forms of stock-based compensation, including restricted stock units. Restricted stock units can have service-based and/or performance-based vesting with performance goals being established by the Compensation and Human Resource Committee of the Company’s Board of Directors. Any grant of restricted stock units is generally subject to a vesting period of 12 months to 48 months, to the extent permitted by the SIP. Performance-based grants conditionally vest upon achievement of future performance goals based on performance criteria such as the Company’s achievement of specific return on capital and/or other financial metrics (as defined in the SIP) during the performance period. Performance-based grants must be earned, based on performance, before the actual number of shares to be awarded is known. The Compensation and Human Resource Committee considers the likelihood of meeting the performance criteria based upon estimates and other relevant data, and certifies performance based on its analysis of achievement against the performance criteria. A recipient of restricted stock units does not have the rights of a stockholder and is subject to restrictions on transferability and risk of forfeiture. Other terms and conditions applicable to any award of restricted stock units will be determined by the Compensation and Human Resource Committee and set forth in the agreement relating to that award.
The following table reports restricted stock unit activity during the year ended December 31, 2024:
| | | | | | | | | | | | | | |
| Shares in thousands | | Number of Units | | Weighted Average Grant-Date Fair Value per Unit |
| Unvested shares as of January 1 | | 7,222 | | | $ | 19.96 | |
| Shares granted | | 5,665 | | | $ | 12.97 | |
| Shares vested | | (3,260) | | | $ | 18.73 | |
| Shares forfeited | | (1,562) | | | $ | 14.82 | |
| | | | |
| Unvested shares as of December 31 | | 8,065 | | | $ | 16.31 | |
Stock-based compensation expense is recognized in the financial statements based upon fair value. The total fair value of units vested and distributed in the form of the Company’s common stock was $61 million in 2024, $132 million in 2023, and $121 million in 2022. As of December 31, 2024, there was $59 million of unrecognized compensation cost related to unvested restricted stock unit grants. The unrecognized compensation cost is expected to be recognized over a remaining weighted-average period of 1 year. The weighted average grant date fair value for restricted stock unit awards granted in 2023 and 2022 was $16.25 and $35.08, respectively.
The following table represents the composition of restricted stock unit grants in 2024:
| | | | | | | | | | | | | | |
| Shares in thousands | | Number of Units | | Weighted Average Grant-Date Fair Value |
| Service-based units | | 3,723 | | | $ | 12.49 | |
| Performance-based units | | 1,942 | | | $ | 13.82 | |
| Total restricted stock units | | 5,665 | | | $ | 12.97 | |
On November 8, 2024, the Company granted market-based restricted stock units vesting on November 8, 2027. The number of awards that vest are subject to the satisfaction of performance-based vesting conditions tied to the Company’s common stock price. The performance-based vesting conditions require that at any time during the 3-year performance period prior to November 8, 2027, the twenty-trading day trailing average price for the Company’s common stock must equal or exceed a stock price threshold of $22.00 for twenty consecutive trading days. In addition, should the twenty-trading day trailing average price for the Company’s common stock equal or exceed $24.00 at any time during the performance period for twenty consecutive trading days, the payout will be 125% and should the twenty-trading day trailing average price for the Company’s common stock equal or exceed $26.00 at any time during the performance period for twenty consecutive trading days, the payout will be 150%. Payouts for stock prices between prices provided herein shall be calculated applying linear interpolation. The fair value of the awards was determined based on the grant date fair value and will be recognized over the requisite service period.
The table below details the significant assumptions used in determining the fair value of the market-based restricted stock units granted on November 8, 2024:
| | | | | |
| Dividend yield | — | % |
| Risk-free interest rate | 4.09 | % |
| Expected volatility | 46.53 | % |
Expected volatility for these restricted stock units is calculated as the historical volatility of the Company’s stock over a period of approximately three years, as management believes this is the best representation of prospective trends. The risk-free interest rate was determined based on a three year U.S. Treasury yield curve in effect at the time of the grant.
On March 15, 2024, the Company granted market-based restricted stock units vesting on March 15, 2027. The fair value of the awards was determined based on the grant date fair value and will be recognized over the requisite service period.
The table below details the significant assumptions used in determining the fair value of the market-based restricted stock units granted on March 15, 2024:
| | | | | |
| Dividend yield | — | % |
| Risk-free interest rate | 4.44 | % |
| Expected volatility | 60.37 | % |
Expected volatility for these restricted stock units is calculated as the historical volatility of the Company’s stock over a period of approximately three years, as management believes this is the best representation of prospective trends. The risk-free interest rate was determined based on a three year U.S. Treasury yield curve in effect at the time of the grant.
On February 13, 2023, the Company granted market-based restricted stock units vesting on December 31, 2025. The number of awards that vest are subject to the compound annual growth rate (“CAGR”) of the Company’s stock price from January 1, 2023 to December 31, 2025 (the “performance period”), subject to an alternative level of achievement based on the Company’s relative total shareholder return ranking among a comparison group. The fair value of the awards was determined to be $35.04 per share based on using a Monte-Carlo simulation model and will be recognized over the requisite service period.
Approximately 50% of these market-based restricted stock units included an accelerated vesting provision if a Qualified Transaction, as defined in the award agreement, took place during the performance period (with a minimum vesting period of one year from the grant date). Upon the occurrence of a Qualified Transaction, the number of shares that would vest based on the Company’s 20-day volume-weighted average closing stock price immediately preceding the transaction date. The Spin-Off resulted in a Qualified Transaction and as such, these market-based restricted stock units were subject to accelerated vesting as defined in the award agreement.
The table below details the significant assumptions used in determining the fair value of the market-based restricted stock units granted on February 13, 2023:
| | | | | |
| Dividend yield | — | % |
| Risk-free interest rate | 4.15 | % |
| Expected volatility | 55.90 | % |
Expected volatility for these restricted stock units is calculated as the historical volatility of the Company’s stock over a period of approximately three years, as management believes this is the best representation of prospective trends. The risk-free interest rate was determined based on a three year U.S. Treasury yield curve in effect at the time of the grant.
On February 25, 2022, the Company granted market-based restricted stock units vesting on December 31, 2024. The number of awards that vest are subject to the performance of the Company’s stock price from the date of grant to December 31, 2024. The fair value was determined to be $57.67 per share based on using a Monte-Carlo simulation model and will be recognized over the requisite service period. The table below details the assumptions used in determining the fair value of the market-based restricted stock units.
| | | | | |
| |
| Dividend yield | — | % |
| Risk-free interest rate | 1.73 | % |
| Expected volatility | 59.26 | % |
Expected volatility for the market-based restricted stock units is calculated as the historical volatility of the Company’s stock over a period of three years, as management believes this is the best representation of prospective trends. The risk-free interest rate was determined based on a three year U.S. Treasury yield curve in effect at the time of the grant.
On December 21, 2022, the Company granted market-based restricted stock units vesting on December 31, 2025. The number of awards that vest are subject to the compound annual growth rate (“CAGR”) of the Company’s stock price from January 1, 2023 to December 31, 2025 (the “performance period”), subject to an alternative level of achievement based on the Company’s relative total shareholder return ranking among a comparison group. The fair value of the awards was determined to be $29.66 per share based on using a Monte-Carlo simulation model and will be recognized over the requisite service period.
Approximately 50% of these market-based restricted stock units included an accelerated vesting provision if a Qualified Transaction, as defined in the award agreement, took place during the performance period (with a minimum vesting period of one year from the grant date). Upon the occurrence of a Qualified Transaction, the number of shares that would vest based on the Company’s 20-day volume-weighted average closing stock price immediately preceding the transaction date. The Spin-Off resulted in a Qualified Transaction and as such, these market-based restricted stock units were subject to accelerated vesting as defined in the award agreement.
The table below details the significant assumptions used in determining the fair value of the market-based restricted stock units granted on December 21, 2022:
| | | | | |
| Dividend yield | — | % |
| Risk-free interest rate | 3.90 | % |
| Expected volatility | 64.93 | % |
Expected volatility for these restricted stock units is calculated as the historical volatility of the Company’s stock over a period of approximately three years, as management believes this is the best representation of prospective trends. The risk-free interest rate was determined based on a three year U.S. Treasury yield curve in effect at the time of the grant.
Stock Options
The SIP also provides for the grant of stock options to purchase shares of the Company’s common stock. The Compensation and Human Resource Committee has discretion to determine the material terms and conditions of option awards under the SIP, provided that (i) the exercise price must be no less than the fair market value of the Company’s common stock (defined as the closing price) on the date of grant, (ii) the term must be no longer than ten years, and (iii) in no event shall the normal vesting schedule provide for vesting in less than one year. Other terms and conditions of an award of stock options will be determined
by the Compensation and Human Resource Committee as set forth in the applicable stock option award. The Compensation and Human Resource Committee has authority to administer the SIP, except that the Committee on Directors and Governance of the Company’s Board of Directors will administer the SIP with respect to non-employee members of the Board of Directors. New shares of the Company’s common stock are issued as a result of stock option exercises.
During the years ended December 31, 2024 and December 31, 2023, the Company did not grant any stock options. During the year ended December 31, 2022, as discussed in Note 2, “Discontinued Operations”, the Company converted certain outstanding unvested LibertyX awards into the Company’s awards. LibertyX stock option awards were converted into the Company’s stock option awards with an exercise price per share for option awards equal to the exercise price per share of such stock option award immediately prior to the completion of the acquisition divided by the exchange ratio (as defined in the acquisition agreement), and vested immediately. The value of the option awards was deemed attributable to services already rendered and was included as a portion of the purchase price.
The following table summarizes the Company’s stock option activity for the year ended December 31, 2024:
| | | | | | | | | | | | | | | | | | | | | | | | | | |
| Shares in thousands | | Shares Under Option | | Weighted Average Exercise Price per Share | | Weighted Average Remaining Contractual Term (in years) | | Aggregate Intrinsic Value
(in millions) |
| Outstanding as of January 1 | | 8,326 | | | $ | 19.09 | | | | | |
| Granted | | — | | | — | | | | | |
| | | | | | | | |
| Exercised | | (354) | | | 11.51 | | | | | |
| Forfeited or expired | | (1,200) | | | 20.63 | | | | | |
| | | | | | | | |
| Outstanding as of December 31 | | 6,772 | | | $ | 19.18 | | | 1.41 | | $ | 1.03 | |
| Fully vested and expected to vest as of December 31 | | 6,772 | | | $ | 19.18 | | | 1.41 | | $ | 1.03 | |
| Exercisable as of December 31 | | 6,772 | | | $ | 19.18 | | | 1.41 | | $ | 1.03 | |
As of December 31, 2024, there was no unrecognized compensation cost related to unvested stock option grants.
The total intrinsic value of all options exercised was $1 million in 2024, $1 million in 2023, and $7 million in 2022. Cash received from option exercises under all share-based payment arrangements was $4 million in 2024, $2 million in 2023, and $1 million in 2022. There was $1 million of tax benefits realized from option exercises in 2022. There was no tax benefit realized from stock options exercised in 2024 or 2023.
Employee Stock Purchase Plan
The Company’s amended Employee Stock Purchase Plan (“ESPP”) provides employees a 15% discount on stock purchases using a three-month look-back feature where the discount is applied to the stock price that represents the lower of the Company’s closing stock price on either the first day or the last day of each calendar quarter. Participants can contribute between 1% and 10% of their compensation. The amended ESPP was approved by the Company’s stockholders in 2016 and became effective January 1, 2017.
Employees purchased approximately 1.1 million shares in 2024, 0.9 million shares in 2023, and 1.3 million shares in 2022, for approximately $11 million in 2024, $19 million in 2023 and $29 million in 2022. A total of 4 million shares were originally authorized to be issued under the ESPP before its amendment. Under the amended ESPP, 10 million shares were newly authorized to be issued, plus any shares remaining unissued under the prior ESPP after the last 2016 purchase date. Approximately 3.5 million authorized shares remain unissued under our amended ESPP as of December 31, 2024.
10. EMPLOYEE BENEFIT PLANS
Pension and Postemployment Plans The Company sponsors defined benefit pension plans. Following the Spin-Off, NCR Atleos assumed the U.S. and certain international pension plan assets and liabilities, along with the associated deferred costs in accumulated other comprehensive loss, which were previously sponsored by the Company. Pursuant to the terms of the Spin-Off transaction documents, the Company is required to contribute 50% of the annual costs of the NCR Atleos U.S. pension plan
to the extent NCR Atleos contributes more than $40 million on an annual basis beginning with the plan year ending December 31, 2024. The contribution threshold was not met by NCR Atleos during the year ended December 31, 2024.
Internationally, the defined benefit plans are based primarily upon compensation and years of service. Certain international plans also no longer offer additional benefits and are closed to new participants. The Company’s funding policy is to contribute annually no less than the minimum required by applicable laws and regulations. Assets of the Company’s defined benefit plans are primarily invested in common and commingled trusts.
The Company recognizes the funded status of each applicable plan on the Consolidated Balance Sheets. Each overfunded plan is recognized as an asset and each underfunded plan is recognized as a liability. For pension plans, changes in the fair value of plan assets and net actuarial gains or losses are recognized upon remeasurement, which is at least annually in the fourth quarter of each year. For postemployment plans, changes to the funded status are recognized as a component of other comprehensive loss in stockholders’ equity.
Non-U.S. employees are typically covered under government-sponsored programs, and the Company generally does not provide postretirement benefits other than pensions to non-U.S. retirees. The Company generally funds these benefits on a pay-as-you-go basis.
The Company offers various postemployment benefits to involuntarily terminated and certain inactive employees after employment but before retirement. These benefits are paid in accordance with the Company’s established postemployment benefit practices and policies. Postemployment benefits include mainly severance as well as continuation of healthcare benefits and life insurance coverage while on disability. The Company provides appropriate accruals for these postemployment benefits. These postemployment benefits are funded on a pay-as-you-go basis.
Pension Plans Reconciliation of the beginning and ending balances of the benefit obligations for the Company’s pension plans are as follows:
| | | | | | | | | | | | | | | | | | | | | | |
| | | | International Pension Benefits | | |
| In millions | | | | | | 2024 | | 2023 | | | | |
| Change in benefit obligation | | | | | | | | | | | | |
| Benefit obligation as of January 1 | | | | | | $ | 192 | | | $ | 178 | | | | | |
| Net service cost | | | | | | 1 | | | 2 | | | | | |
| Interest cost | | | | | | 5 | | | 6 | | | | | |
| | | | | | | | | | | | |
| Actuarial (gain) loss | | | | | | (10) | | | 15 | | | | | |
| Benefits paid | | | | | | (11) | | | (14) | | | | | |
| | | | | | | | | | | | |
| Plan participant contributions | | | | | | (3) | | | — | | | | | |
| Currency translation adjustments | | | | | | (12) | | | 5 | | | | | |
| Benefit obligation as of December 31 | | | | | | $ | 162 | | | $ | 192 | | | | | |
| Accumulated benefit obligation as of December 31 | | | | | | $ | 161 | | | $ | 191 | | | | | |
A reconciliation of the beginning and ending balances of the fair value of the plan assets of the Company’s pension plans are as follows:
| | | | | | | | | | | | | | | | | | | | | | |
| | | | International Pension Benefits | | |
| In millions | | | | | | 2024 | | 2023 | | | | |
| Change in plan assets | | | | | | | | | | | | |
| Fair value of plan assets as of January 1 | | | | | | $ | 56 | | | $ | 51 | | | | | |
| Actual return on plan assets | | | | | | 9 | | | 10 | | | | | |
| Company contributions | | | | | | 12 | | | 13 | | | | | |
| Benefits paid | | | | | | (11) | | | (14) | | | | | |
| Settlement | | | | | | (3) | | | — | | | | | |
| Currency translation adjustments | | | | | | (5) | | | (4) | | | | | |
| Plan participant contributions | | | | | | — | | | — | | | | | |
| Fair value of plan assets as of December 31 | | | | | | $ | 58 | | | $ | 56 | | | | | |
The following table presents the funded status and the reconciliation of the funded status to amounts recognized in the Consolidated Balance Sheets and in Accumulated other comprehensive loss as of December 31:
| | | | | | | | | | | | | | | | | | | | | | |
| | | | International Pension Benefits | | |
| In millions | | | | | | 2024 | | 2023 | | | | |
| Funded Status | | | | | | $ | (104) | | | $ | (136) | | | | | |
| Amounts recognized in the Consolidated Balance Sheets | | | | | | | | | | | | |
| Noncurrent assets | | | | | | $ | 47 | | | $ | 43 | | | | | |
| Current liabilities | | | | | | (11) | | | (12) | | | | | |
| Noncurrent liabilities | | | | | | (140) | | | (167) | | | | | |
| Net amounts recognized | | | | | | $ | (104) | | | $ | (136) | | | | | |
| Amounts recognized in accumulated other comprehensive loss | | | | | | | | | | | | |
| Prior service cost | | | | | | — | | | — | | | | | |
| Total | | | | | | $ | — | | | $ | — | | | | | |
For pension plans with accumulated benefit obligations in excess of plan assets, the projected benefit obligation and accumulated benefit obligation were $142 million and $141 million, respectively, as of December 31, 2024, and $163 million and $162 million, respectively, as of December 31, 2023. The fair value of assets was zero as of both December 31, 2024 and December 31, 2023.
The net periodic benefit (income) cost of the pension plans for the years ended December 31 was as follows:
| | | | | | | | | | | | | | | | | | | | | | | | | | | | | | | |
| In millions | | | International Pension Benefits | | |
| | | | | | 2024 | | 2023 | | 2022 | | | | | | |
| Net service cost | | | | | | | $ | 1 | | | $ | 2 | | | $ | 2 | | | | | | | |
| Interest cost | | | | | | | 5 | | | 6 | | | 2 | | | | | | | |
| Expected return on plan assets | | | | | | | (2) | | | (2) | | | (1) | | | | | | | |
| Amortization of prior service cost | | | | | | | — | | | — | | | — | | | | | | | |
| | | | | | | | | | | | | | | | | |
| | | | | | | | | | | | | | | | | |
| Actuarial (gain) loss | | | | | | | (12) | | | 7 | | | (41) | | | | | | | |
| Net periodic benefit (income) cost | | | | | | | $ | (8) | | | $ | 13 | | | $ | (38) | | | | | | | |
The net actuarial gain in 2024 was primarily due to plan experience gains as well as an increase in discount rates and favorable returns on plan assets. The net actuarial loss in 2023 was primarily due to plan experience losses as well as a decrease in discount rates, partially offset by favorable returns on plan assets. Actuarial gains in 2022 were primarily due to an increase in discount rates partially offset by unfavorable returns on the fair value of plan assets.
The weighted average rates and assumptions used to determine benefit obligations as of December 31 were as follows:
| | | | | | | | | | | | | | | | | | | | | | |
| | | | International Pension Benefits | | |
| | | | | | 2024 | | 2023 | | | | |
| Discount rate | | | | | | 3.2 | % | | 3.0 | % | | | | |
| Rate of compensation increase | | | | | | 2.5 | % | | 2.4 | % | | | | |
The weighted average rates and assumptions used to determine net periodic benefit (income) cost for the years ended December 31 were as follows:
| | | | | | | | | | | | | | | | | | | | | | | | | | | | | | | | |
| | | | International Pension Benefits | | |
| | | | | | | | 2024 | | 2023 | | 2022 | | | | | | |
| Discount rate - Service Cost | | | | | | | | 2.0 | % | | 1.8 | % | | 0.8 | % | | | | | | |
| Discount rate - Interest Cost | | | | | | | | 3.0 | % | | 3.4 | % | | 0.7 | % | | | | | | |
| Expected return on plan assets | | | | | | | | 5.0 | % | | 5.0 | % | | 2.1 | % | | | | | | |
| Rate of compensation increase | | | | | | | | 2.5 | % | | 1.0 | % | | 0.9 | % | | | | | | |
The weighted-average cash balance interest crediting rate for the Company’s cash balance defined benefit plans was 1.5% and 1.4% for the years ended December 31, 2024 and 2023, respectively.
The discount rate used to determine the International plans benefit obligations as of December 31, 2024 were derived by examining interest rate levels and trends within each country, particularly yields on high-quality, long-term corporate bonds, relative to our future expected cash flows.
The Company employs a building block approach as its primary approach in determining the long-term expected rate of return assumptions for plan assets. Historical market returns are studied and long-term relationships between equities and fixed income are preserved consistent with the widely accepted capital market principle that assets with higher volatilities generate higher returns over the long run. Current market factors, such as inflation and interest rates are evaluated before long-term capital market assumptions are determined. The expected long-term portfolio return is established for each plan via a building block approach with proper rebalancing consideration. The result is then adjusted to reflect additional expected return from active management net of plan expenses. Historical plan returns, the expectations of other capital market participants, and peer data may be used to review and assess the results for reasonableness and appropriateness.
Plan Assets The weighted average asset allocations as of December 31, 2024 and 2023 by asset category are as follows:
| | | | | | | | | | | | | | | | | | | | | | | | | | |
| | | | International Pension Fund |
| | | | | | Actual Allocation of Plan Assets as of December 31 | | Target Asset Allocation |
| | | | | | | 2024 | | 2023 | |
Equity and other investments(1) | | | | | | | | 66 | % | | 66 | % | | 62.5% |
Debt securities(2) | | | | | | | | 33 | % | | 33 | % | | 37.2% |
| | | | | | | | | | | | |
| Other | | | | | | | | 1 | % | | 1 | % | | 0.3% |
| Total | | | | | | | | 100 | % | | 100 | % | | |
(1) Includes equity securities and equities held in comingled trusts.
(2) Includes debt securities and debt held in comingled trusts.
The fair value of plan assets as of December 31, 2024 and 2023 by asset category is as follows:
| | | | | | | | | | | | | | | | | | | | | | | | | | |
| | | | International |
| In millions | Notes | | | | | | | Fair Value as of December 31, 2024 | Quoted Prices in Active Markets for Identical Assets (Level 1) | Significant Other Observable Inputs (Level 2) | Significant Unobservable Inputs
(Level 3) | Not Subject to Leveling |
| Assets | | | | | | | | | | | | |
| Equity securities and other investments: | | | | | | | | | | | | |
| | | | | | | | | | | | |
| Common and commingled trusts - Equities | 1 | | | | | | | | $ | 39 | | $ | — | | $ | — | | $ | — | | $ | 39 | |
| Fixed income securities: | | | | | | | | | | | | |
| | | | | | | | | | | | |
| | | | | | | | | | | | |
| Common and commingled trusts - Bonds | 1 | | | | | | | | 19 | | — | | — | | — | | 19 | |
| | | | | | | | | | | | |
| | | | | | | | | | | | |
| | | | | | | | | | | | |
| | | | | | | | | | | | |
| | | | | | | | | | | | |
| | | | | | | | | | | | |
| | | | | | | | | | | | |
| | | | | | | | | | | | |
| | | | | | | | | | | | |
| | | | | | | | | | | | |
| | | | | | | | | | | | |
| Total | | | | | | | | $ | 58 | | $ | — | | $ | — | | $ | — | | $ | 58 | |
| | | | | | | | | | | | | | | | | | | | | | | | | | |
| | | | International |
| In millions | Notes | | | | | | | Fair Value as of December 31, 2023 | Quoted Prices in Active Markets for Identical Assets (Level 1) | Significant Other Observable Inputs (Level 2) | Significant Unobservable Inputs
(Level 3) | Not Subject to Leveling |
| Assets | | | | | | | | | | | | |
| Equity securities and other investments: | | | | | | | | | | | | |
| | | | | | | | | | | | |
| Common and commingled trusts - Equities | 1 | | | | | | | | $ | 37 | | $ | — | | $ | — | | $ | — | | $ | 37 | |
| Fixed income securities: | | | | | | | | | | | | |
| | | | | | | | | | | | |
| | | | | | | | | | | | |
| Common and commingled trusts - Bonds | 1 | | | | | | | | 19 | | — | | — | | — | | 19 | |
| | | | | | | | | | | | |
| | | | | | | | | | | | |
| | | | | | | | | | | | |
| | | | | | | | | | | | |
| | | | | | | | | | | | |
| | | | | | | | | | | | |
| | | | | | | | | | | | |
| | | | | | | | | | | | |
| | | | | | | | | | | | |
| | | | | | | | | | | | |
| | | | | | | | | | | | |
| Total | | | | | | | | $ | 56 | | $ | — | | $ | — | | $ | — | | $ | 56 | |
Notes:
1.Common/collective trusts and registered investment companies (RICs) such as mutual funds are valued using a Net Asset Value (NAV) provided by the manager of each fund. The NAV is based on the underlying net assets owned by the fund, divided by the number of shares or units outstanding. The fair value of the underlying securities within the fund, which are generally traded on an active market, are valued at the closing price reported on the active market on which those individual securities are traded. For investments not traded on an active market, or for which a quoted price is not publicly available, a variety of unobservable valuation methodologies, including discounted cash flow, market multiple and cost valuation approaches, are employed by the fund manager or independent third party to value investments.
Investment Strategy The Company has historically employed a total return investment approach, whereby a mix of fixed-income, equities and real estate investments are used to maximize the long-term return of plan assets subject to a prudent level of risk. The risk tolerance is established for each plan through a careful consideration of plan liabilities, plan funded status and corporate financial condition. When considering assets for investment, the Company considers the expected rate of return and the risk of return, among others, of each potential investment. Investment risk is measured and monitored on an ongoing basis through regular performance reporting, investment manager reviews, actuarial liability measurements and periodic investment strategy reviews.
Postemployment Benefits Reconciliation of the beginning and ending balances of the benefit obligation for the Company’s postemployment plan was:
| | | | | | | | | | | | | | |
| | Postemployment Benefits |
| In millions | | 2024 | | 2023 |
| Change in benefit obligation | | | | |
| Benefit obligation as of January 1 | | $ | 65 | | | $ | 93 | |
| | | | |
| Service cost | | 36 | | | 15 | |
| Interest cost | | 2 | | | 2 | |
| Amendments | | — | | | — | |
| Benefits paid | | (55) | | | (54) | |
| | | | |
| Foreign currency exchange | | — | | | — | |
| Actuarial (gain) loss | | 7 | | | 9 | |
| Benefit obligation as of December 31 | | $ | 55 | | | $ | 65 | |
| | | | |
The following table presents the funded status and the reconciliation of the unfunded status to amounts recognized in the Consolidated Balance Sheets and in Accumulated other comprehensive loss at December 31:
| | | | | | | | | | | | | | |
| | Postemployment Benefits |
| In millions | | 2024 | | 2023 |
| Benefit obligation | | $ | 55 | | | $ | 65 | |
| Amounts recognized in the Consolidated Balance Sheets | | | | |
| Current liabilities | | $ | 14 | | | $ | 22 | |
| Noncurrent liabilities | | 41 | | | 43 | |
| Net amounts recognized | | $ | 55 | | | $ | 65 | |
| Amounts recognized in Accumulated other comprehensive loss | | | | |
| Net actuarial (gain) loss | | $ | 7 | | | $ | 9 | |
| Amortization of gain (loss) | | — | | | 1 | |
| Amortization of prior service cost | | 1 | | | 1 | |
| Total | | $ | 8 | | | $ | 11 | |
The net periodic benefit cost of the postemployment plan for the years ended December 31 was:
| | | | | | | | | | | | | | | | | |
| In millions | Postemployment Benefits |
| 2024 | | 2023 | | 2022 |
| Service cost | $ | 36 | | | 15 | | | 58 | |
| Interest cost | 2 | | | 2 | | | 1 | |
| Amortization of: | | | | | |
| Prior service benefit | (1) | | | (1) | | | (1) | |
| Actuarial gain | — | | | (1) | | | — | |
| Net periodic benefit cost | $ | 37 | | | $ | 15 | | | $ | 58 | |
The weighted average assumptions utilized in accounting for postemployment benefit obligations as of December 31 and for postemployment benefit costs for the years ended December 31 were:
| | | | | | | | | | | | | | | | | | | | | | | | | | | | | | | | |
| | Postemployment Benefit Obligations | | Postemployment Benefit Costs |
| | 2024 | | 2023 | | 2024 | | 2023 | | 2022 |
| Discount rate for severance plan | | 3.9 | % | | 4.1 | % | | 4.1 | % | | 5.1 | % | | 2.3 | % |
| | | | | | | | | | |
| Salary increase rate | | 3.5 | % | | 3.4 | % | | 3.4 | % | | 3.1 | % | | 2.6 | % |
| Involuntary turnover rate | | 3.8 | % | | 3.8 | % | | 3.8 | % | | 3.8 | % | | 3.8 | % |
Cash Flows Related to Employee Benefit Plans
Cash Contributions The Company plans to contribute approximately $13 million to the international pension plans in 2025. The Company also plans to make contributions of approximately $13 million to the postemployment plan in 2025.
Estimated Future Benefit Payments The Company expects to make the following benefit payments reflecting past and future service from its pension and postemployment plans:
| | | | | | | | | | | | | | | | | | | | |
| In millions | | | | International Pension Benefits | | | | | | Postemployment Benefits |
| Year | | | | | | | | | | |
| 2025 | | | | $ | 13 | | | | | | | $ | 13 | |
| 2026 | | | | $ | 13 | | | | | | | $ | 7 | |
| 2027 | | | | $ | 13 | | | | | | | $ | 7 | |
| 2028 | | | | $ | 13 | | | | | | | $ | 7 | |
| 2029 | | | | $ | 13 | | | | | | | $ | 7 | |
| 2030-2034 | | | | $ | 52 | | | | | | | $ | 31 | |
Savings Plans U.S. employees and many international employees participate in defined contribution savings plans. These plans generally provide either a specified percent of pay or a matching contribution on participating employees’ voluntary elections. The Company’s matching contributions typically are subject to a maximum percentage or level of compensation. Employee contributions can be made pre-tax, after-tax or a combination thereof. The expense under the U.S. plan was approximately $21 million in 2024, $22 million in 2023, and $26 million in 2022. The expense under international and subsidiary savings plans was $14 million in 2024, $11 million in 2023, and $11 million in 2022.
Amounts to be Recognized The amounts in Accumulated other comprehensive loss that are expected to be recognized as components of net periodic benefit cost (income) during 2025 are less than $1 million.
11. COMMITMENTS AND CONTINGENCIES
In the normal course of business, the Company is subject to various proceedings, lawsuits, claims and other matters, including, for example, those that relate to the environment and health and safety, labor and employment, employee benefits, import/export compliance, patents or other intellectual property, data privacy and security, product liability, commercial disputes and regulatory compliance, among others. Additionally, the Company is subject to diverse and complex laws and regulations,
including those relating to corporate governance, public disclosure and reporting, environmental safety and the discharge of materials into the environment, product safety, import and export compliance, data privacy and security, antitrust and competition, government contracting, anti-corruption, and labor and human resources, which are rapidly changing and subject to many possible changes in the future. Compliance with these laws and regulations, as well as changes in accounting standards, taxation requirements, and federal securities laws among others, may create a substantial burden on, and substantially increase costs to the Company or could have an impact on the Company’s future operating results. The Company has reflected all liabilities when a loss is considered probable and reasonably estimable in the Consolidated Financial Statements. We do not believe there is a reasonable possibility that losses exceeding amounts already recognized have been incurred, but there can be no assurances that the amounts required to satisfy alleged liabilities from such matters will not impact future operating results. Other than as stated below, the Company does not currently expect to incur material costs related to such matters. However, there can be no assurances that the actual amounts required to satisfy alleged liabilities from various lawsuits, claims, legal proceedings and other matters, including, but not limited to the Kalamazoo River environmental matter and other matters discussed above and below, and to comply with applicable laws and regulations, will not exceed the amounts reflected in the Company’s Consolidated Financial Statements or will not have a material adverse effect on our consolidated results of operations, capital expenditures, competitive position, financial condition or cash flows.
Other Litigation In November 2015, several participants and beneficiaries in five “nonqualified” deferred compensation retirement plans sponsored by the Company (collectively, the “Plans”) filed a putative class action lawsuit against the Company and other named defendants. The plaintiffs alleged, among other things, that the Company breached the terms of the Plan agreements when, upon termination of the Plans, the Company paid lump sum payments based on mortality tables and actuarial calculations. In September 2017, the court certified a class.
On February 6, 2024, the court entered summary judgment in favor of the plaintiffs, finding that the Company breached the terms of the Plans when it paid the lump sums in lieu of actuarially equivalent replacement life annuities and ordered that the Company provide class members the amount reflecting the difference between the lump sums they received and the cost of the replacement life annuities. The court further ordered the parties to brief as to what the appropriate relief should have been based on the benefits due to each Plan participant (the “Requested Relief Order”). On April 16, 2024, the Company filed its position on the Requested Relief Order.
On June 10, 2024, the Court ruled against the Company’s position to the Requested Relief Order, entered a final judgment against the Company, and ordered the Company to calculate the “benefits due” to the Plan participants, including pre-judgment interest, based on the sum that would have been sufficient to allow each participant to purchase a replacement annuity using discount rates prescribed by the Pension Benefit Guaranty Corporation in effect as of the February 25, 2013 termination date.
The Company is contesting this matter vigorously. On July 2, 2024, the Company filed a notice of appeal. Given that an estimate or range of possible loss was not ordered in this equitable judgment and moreover cannot be determined at this time in light of the uncertainty regarding the ultimate form of relief and complexities in the methodology and quantification of loss, if any, the parties stipulated to a $45 million supersedeas bond, which is an amount the Company believes may not be correlated to the actual loss (if any). On September 12, 2024, the supersedeas bond was filed and the judgment is currently stayed pending appeal. Any amount sustained following an appeal of this matter is subject to an indemnity obligation by NCR Atleos to contribute 50% of any award. The Company has concluded that, as of December 31, 2024, a loss is reasonably possible but that an estimate or range of possible loss cannot be determined at this time given uncertainty regarding the ultimate form of relief and complexities in the methodology and quantification of damages, if any.
Environmental Matters The Company’s facilities and operations are subject to a wide range of environmental protection laws, and the Company has investigatory and remedial activities underway at a number of facilities that it currently owns, or formerly owned or operated, to comply, or to determine compliance, with such laws. Also, the Company has been identified, either by a government agency or by a private party seeking contribution to site clean-up costs, as a potentially responsible party (“PRP”) at a number of sites pursuant to various state and federal laws, including the Federal Water Pollution Control Act, the Comprehensive Environmental Response, Compensation and Liability Act (“CERCLA”) and comparable state statutes. Following the Spin-Off, the Company retains the responsibility to manage the identified environmental liabilities and remediations, subject however to an indemnity obligation by NCR Atleos to contribute 50% of the costs of certain environmental liabilities after an annual $15 million funding threshold is met. Other than the Kalamazoo River matter discussed below, we currently do not anticipate material expenses and liabilities from these environmental matters.
Fox River The Company was one of eight entities that was formally notified by governmental and other entities that it was a PRP for environmental claims (under CERCLA and other statutes) arising out of the presence of polychlorinated biphenyls (“PCBs”) in sediments in the lower Fox River and in the Bay of Green Bay in Wisconsin. The Company was identified as a
PRP because of alleged PCB discharges from two carbonless copy paper manufacturing facilities it previously owned, which were located along the Fox River, and carbonless copy paper “broke” the Company allegedly sold to other mills as raw material. In 2017, the Company entered into a Consent Decree with the federal and state governments for the clean-up of the Fox River, which was approved on August 22, 2017 by the federal district court in Wisconsin presiding over this matter. The Consent Decree resolved the Company’s disputes with the enforcement agencies as well as the other PRPs.
All litigation relating to the contribution and enforcement of remediation obligations on the Fox River has been concluded. On October 3, 2022, the Environmental Protection Agency issued the Company a Certificate of Completion certifying that all of the Company’s remedial obligations under the Consent Decree have been completed.
The cost of the Fox River remediation has been shared with three parties (Appvion, Inc. having fully satisfied its obligations in 2016 and is now bankrupt), B.A.T. Industries p.l.c. (“BAT”) as co-obligor, and AT&T Corp. (“AT&T”) and Nokia (as the successor to Lucent Technologies and Alcatel-Lucent USA) as indemnitors. Under a 1998 Cost Sharing Agreement and subsequent 2005 arbitration award (collectively, the “Cost Sharing Agreement”), from 2008 through 2014, BAT paid 60% of the cost of the Fox River clean-up and natural resource damages. Pursuant to a September 30, 2014 Funding Agreement (the “Funding Agreement”), BAT funded 50% of the Company’s Fox River remediation costs from October 1, 2014 forward; the Funding Agreement also provides the Company contractual avenues for a future payment of, via direct and third-party sources, (1) the difference between BAT’s 60% obligation under the Cost Sharing Agreement on the one hand and their ongoing (since September 2014) 50% payments under the Funding Agreement on the other, as well as (2) the difference between the amount the Company received under the Funding Agreement and the amount owed to it under the Cost Sharing Agreement for the period from April 2012 through September 2014 (collectively, the “Funding Agreement Receivable”). Pursuant to a June 12, 2015 Letter Agreement, the Company’s contractual avenue for direct payment by BAT was effectively stayed pending completion of other unrelated lawsuits by BAT against third-parties. As of December 31, 2024 and 2023, the Funding Agreement Receivable was approximately $54 million and was included in Other assets in the Consolidated Balance Sheets. The timing of collection of sums related to the receivable is uncertain and is subject and pursuant to the terms of the Funding Agreement and related agreements. This receivable is not taken into account in calculating the Company’s remaining reserve for the Fox River.
Additionally, under a 1996 Divestiture Agreement, the Company, AT&T and Nokia have mutual several (not joint) responsibility for indemnifying each other for certain environmental matters, including the Fox River and the Kalamazoo River discussed below, after defined dollar expenditures are met. AT&T and Nokia have been reimbursing the Company for certain portions of the amounts paid by the Company for the Fox River matter over the defined threshold for Fox River subject to certain offsets for insurance recoveries and net tax benefits (the “Divestiture Agreement Offsets”), if any. The Divestiture Agreement governs certain aspects of AT&T’s divestiture of the Company and of what was then known as Lucent Technologies. Those companies have generally made the payments requested of them by the Company on an ongoing basis. The Company, AT&T and Nokia are currently discussing a final reconciliation of the Divestiture Agreement Offsets, but the timing for a final reconciliation is uncertain.
The final reconciliation of the Funding Agreement Receivable and the Divestiture Agreement Offsets could result in additional expenditures and liabilities for the Company that could be material. As of December 31, 2024, we have no remaining liability for remedial obligations for the Fox River matter. As of December 31, 2024 and 2023, the liability subject to final reconciliation with indemnitors under the Divestiture Agreement was approximately $23 million and $22 million, respectively.
Kalamazoo River In November 2010, The United States Environmental Protection Agency (“USEPA”) issued a “general notice letter” to the Company with respect to the Allied Paper, Inc./Portage Creek/Kalamazoo River Superfund Site (“Kalamazoo River site”) in Michigan. USEPA asserted that the site is contaminated by various substances, primarily PCBs, as a result of discharges by various paper mills located along the river. USEPA did not claim that the Company made direct discharges into the Kalamazoo River, and the Company never had facilities at or near the Kalamazoo River site, but USEPA indicated that “NCR may be liable under Section 107 of CERCLA ... as an arranger, who by contract or agreement, arranged for the disposal, treatment and/or transportation of hazardous substances at the Site.” USEPA stated that it “may issue special notice letters to [NCR] and other PRPs for future RI/FS [remedial investigation / feasibility studies] and RD/RA [remedial design / remedial action] negotiations.”
In December 2010, the Company, along with two other defendants, was sued in federal court by three Georgia-Pacific (“GP”) affiliate corporations in a private-party contribution and cost recovery action for alleged pollution at the Kalamazoo River site. On September 26, 2013, the court issued a decision that held the Company was liable as an “arranger” as of at least March 1969. (PCB-containing carbonless copy paper was produced from approximately 1954 to April 1971, and the majority of
contamination at the Kalamazoo River site had occurred prior to 1969). In a ruling following a second trial on the allocation of liability issued on March 29, 2018, the court fixed the past cost amount at approximately $50 million (plus interest to be determined) and the Company and GP were each assigned a 40% share of those costs, and the other two companies were assigned 15% and 5% as their allocations. The court entered final judgment in the case on June 19, 2018, in which it indicated that it would not allocate future costs, but would enter a declaratory judgment that the four companies together had responsibility for future costs, in amounts and shares to be determined.
In July 2018, the Company appealed to the United States Court of Appeals for the Sixth Circuit both the 2013 court decision and the 2018 court decision on various legal grounds. The Company filed a bond to stay execution of the judgment pending appeal and execution of the judgment was stayed until the Company filed its dismissal of the appeal on December 31, 2020 pursuant to the Consent Decree noted below.
During the pendency of the Sixth Circuit stay, the Company negotiated a settlement of the Kalamazoo River matter with the USEPA and other government agencies having oversight over the river.
On December 5, 2019, the Company entered into a Consent Decree with the United States Environmental Protection Agency (“USEPA”) and other government agencies having oversight over the Kalamazoo River and the District Court having jurisdiction over this matter approved the Consent Decree later that month. The Consent Decree requires the Company to pay GP a 40% share of past costs, to pay the USEPA and state agencies their past and future administrative costs, and take responsibility for the remediation of a portion, but not all, of the Kalamazoo River. The Consent Decree further required the Company to dismiss the pending Sixth Circuit appeal. The Consent Decree provides the Company protection from other potentially responsible parties, including GP, seeking contribution for their costs associated with the clean-up anywhere on the Kalamazoo River, thereby resolving the allocation of future costs left unresolved by prior litigation.
The Company believes it has meritorious claims against BAT under the Cost Sharing Agreement, discussed above, for the Kalamazoo River remediation expenses as a so-called “future site.” To date, BAT disputes that the Kalamazoo River is a “future site.” In February 2023, the Company filed an action against BAT in the Southern District of New York seeking a declaration that the Kalamazoo River is indeed a “future site” under the Cost Sharing Agreement. In June 2023, BAT filed an answer asserting counterclaims in the proceedings. On September 14, 2024, the Court entered an opinion stating that the Kalamazoo River is a “future site” within the meaning of the Cost Sharing Agreement. The case remains pending with respect to BAT’s remaining counterclaims and affirmative defenses. In December 2022, the Company met the contractual threshold set forth in the 1996 Divestiture Agreement for the Kalamazoo River matter and as a result also has indemnity or reimbursement claims against AT&T and Nokia.
In November 2023, the USEPA issued a conditional approval for a work plan to remediate one area of the Kalamazoo River (referred to by USEPA as Area 4) for which the Company has remediation responsibility. The conditional approval provided the Company with sufficient information to estimate the cost of the first phase of remediation for this area of the river and necessitated an increase in the Kalamazoo reserve. Subsequently, USEPA provided further clarification about the conditions with respect to completing the second phase of the work plan that could substantially increase the costs of remediation. The Company does not believe the scope of work for this second phase is its responsibility under the Consent Decree or the National Contingency Plan. In March 2024, the Company filed a Notice of Dispute with the USEPA objecting to the scope of work for Area 4 as being inconsistent with the National Contingency Plan and contrary to the requirements of the Consent Decree. In June 2024, the Company reached a tentative agreement with the USEPA that will satisfactorily address the Company’s cost concerns and in October 2024, the Company submitted a work plan to the USEPA for approval. In connection with the submittal of the work plan, an updated engineering estimate was developed, which necessitated an increase in the Kalamazoo reserve. The submitted work plan is subject to USEPA approval and if an Area 4 work plan cannot be finalized, the costs to remediate Area 4 could increase substantially.
As of December 31, 2024 and 2023, the total reserve for the Kalamazoo River was $148 million and $141 million, respectively. The reserve is reported on a basis that is net of expected contributions from the Company’s co-obligors and indemnitors, subject to when the applicable threshold is reached. While the Company believes its co-obligors’ and indemnitors’ obligations are as previously reported, the reserve may be adjusted from time to time to reflect changes in our estimates of remediation costs and recoverability from co-obligors and indemnitors with respect to the Kalamazoo River.
As many aspects of the costs of remediation will not be determined for several years (and thus the high end of a range of possible costs for many areas of the site cannot be quantified at this time), the Company has made what it considers to be reasonable estimates of the low end of a range for such costs where remedies are identified, and/or estimates of the costs of
investigations and studies for areas of the Kalamazoo River where remedies have not yet been determined, and the reserve is informed by those estimates. The extent of the Company’s potential liability remains subject to many uncertainties, notwithstanding the Consent Decree noted above, particularly in as much as remedy decisions and cost estimates will not be generated until future time periods and as most of the work to be performed will take place through the 2030s. Under other assumptions and estimates for possible costs of remediation, which the Company does not at this point consider to be reasonably estimable or verifiable, it is possible that the reserve the Company has taken to discontinued operations with respect to the Kalamazoo River could more than approximately double the reflected reserve.
Ebina The Company has completed all regulatory compliance activities in connection with certain environmental contaminants generated in its past operations in Japan. The Company once had quantities of PCB and other wastes primarily from its former plant at Oiso, Japan, including capsulated undiluted solutions manufactured in the past, capacitors, light ballasts and PCB-affected soil from the Oiso plant that was excavated and placed in steel drums. These wastes were stored in a facility at Ebina, Japan in accordance with Japanese regulations governing such materials.
The reserve as of both December 31, 2024 and 2023 was zero. The Japan environmental waste issue is treated as a compliance matter and not as litigation or enforcement, and the Company has received no threats of litigation or enforcement. NCR Atleos does not have any indemnification obligations to the Company in connection with the Ebina matter, and this remediation was completed during 2024.
Environmental-Related Insurance Recoveries In connection with the Fox River, Kalamazoo River and other environmental sites, through December 31, 2024, the Company has received a combined gross total of approximately $212 million in settlements reached with various of its insurance carriers. Some of the settlements cover not only the Fox River but also other environmental sites; some are limited to either the Fox River or the Kalamazoo River site. Some of the settlements are directed to defense costs and some are directed to indemnity; some settlements cover both defense costs and indemnity. The Company does not anticipate that further material insurance recoveries specific to Kalamazoo River remediation costs will be available in the future.
Environmental Remediation Estimates It is difficult to estimate the future financial impact of environmental laws, including potential liabilities. The Company records environmental provisions when it is probable that a liability has been incurred and the amount or range of the liability is reasonably estimable; in accordance with accounting guidance, where liabilities are not expected to be quantifiable or estimable for a period of years, the estimated costs of investigating those liabilities are recorded as a component of the reserve for that particular site. Provisions for estimated losses from environmental restoration and remediation are, depending on the site, based generally on internal and third-party environmental studies, estimates as to the number and participation level of other PRPs, the extent of contamination, estimated amounts for attorney and other fees, and the nature of required clean-up and restoration actions. Reserves are adjusted as further information develops or circumstances change. Management expects that the amounts reserved from time to time will be paid out over the period of investigation, negotiation, remediation and restoration for the applicable sites. The amounts recorded for environmental matters in the Company’s Consolidated Financial Statements are the estimated gross undiscounted amounts of such liabilities, without deductions for indemnity insurance, third-party indemnity claims or recoveries from other PRPs, except in the event certain criteria supporting the probability of receipt of payment from such third parties is met. For the Fox River and Kalamazoo River sites, as described above, assets relating to the AT&T and Nokia indemnities and to the BAT obligations are recorded as payments are supported by contractual agreements, public filings, payment history, and other factors.
Guarantees and Product Warranties In the ordinary course of business, the Company may issue performance guarantees on behalf of its subsidiaries to certain of its customers and other parties. Some of those guarantees may be backed by standby letters of credit, surety bonds, or similar instruments. In general, under the guarantees, the Company would be obligated to perform, or cause performance, over the term of the underlying contract in the event of an unexcused, uncured breach by its subsidiary, or some other specified triggering event, in each case as defined by the applicable guarantee. The Company believes the likelihood of having to perform under any such guarantee is remote. As of December 31, 2024 and 2023, the Company had no material obligations related to such guarantees, and therefore its Consolidated Financial Statements do not have any associated liability balance.
The Company provides its customers a standard manufacturer’s warranty and records, at the time of the sale, a corresponding estimated liability for potential warranty costs. Estimated future obligations due to warranty claims are based upon historical factors, such as labor rates, average repair time, travel time, number of service calls per machine and cost of replacement parts. When a sale is consummated, the total customer revenue is recognized, provided that all revenue recognition criteria are otherwise satisfied, and the associated warranty liability is recorded using pre-established warranty percentages for the
respective product classes. Warranty reserve liabilities are presented in Other current liabilities and Other liabilities in the Consolidated Balance Sheets.
From time to time, product design or quality corrections are accomplished through modification programs. When identified, associated costs of labor and parts for such programs are estimated and accrued as part of the warranty reserve.
In addition, the Company provides its customers with certain indemnification rights, subject to certain limitations and exceptions. In some cases, the Company agrees to defend and indemnify its customers from third-party lawsuits alleging patent or other infringement of Company solutions based on its customers’ use of them. On limited occasions the Company will undertake to indemnify a customer for business, rather than contractual, reasons. From time to time, the Company also enters into agreements in connection with its acquisition and divestiture activities that include indemnification obligations by the Company. The fair value of these indemnification obligations is not readily determinable due to the conditional nature of the Company’s potential obligations, certain limitations to liability and indemnity exclusions that appear in certain of the Company’s agreements, and the specific facts and circumstances involved with each particular agreement. Historically, the Company has not recorded a liability in connection with these indemnifications. From time to time the Company has provided indemnification under these circumstances, none of which has resulted in material liabilities, and the Company expects these indemnities will continue to arise in the future.
Purchase Commitments The Company has purchase commitments for materials, supplies, services, and property, plant and equipment as part of the normal course of business. This includes a long-term service agreement with Accenture, under which many of the Company’s key transaction processing activities and functions are performed.
12. LEASING
The following table presents our lease balances as of December 31:
| | | | | | | | | | | | | | | |
| In millions | Location in the Consolidated Balance Sheet | | December 31, 2024 | December 31, 2023 | |
| Assets | | | | | |
| Operating lease assets | Operating lease assets | | $ | 229 | | $ | 231 | | |
| Finance lease assets | Property, plant and equipment, net | | 81 | | 71 | | |
| Accumulated Amortization of Finance lease assets | Property, plant and equipment, net | | (70) | | (57) | | |
| Total leased assets | | | $ | 240 | | $ | 245 | | |
| Liabilities | | | | | |
| Current | | | | | |
| Operating lease liabilities | Other current liabilities | | $ | 40 | | $ | 40 | | |
| Finance lease liabilities | Other current liabilities | | 11 | | 8 | | |
| Noncurrent | | | | | |
| Operating lease liabilities | Operating lease liabilities | | 248 | | 251 | | |
| Finance lease liabilities | Other liabilities | | 3 | | 7 | | |
| Total lease liabilities | | | $ | 302 | | $ | 306 | | |
| | | | | |
The following table presents our lease costs for operating and finance leases:
| | | | | | | | | | | |
| In millions | For the year ended December 31, 2024 | For the year ended December 31, 2023 | For the year ended December 31, 2022 |
| Operating lease cost | $ | 63 | | $ | 72 | | $ | 76 | |
| Finance lease cost | | | |
| Amortization of leased assets | 13 | | 13 | | 13 | |
| Interest on lease liabilities | 1 | | 1 | | 1 | |
| Short-Term lease cost | — | | — | | 3 | |
| Variable lease cost | 26 | | 27 | | 23 | |
| Sublease income | (5) | | (3) | | — | |
| Total lease cost | $ | 98 | | $ | 110 | | $ | 116 | |
The following table presents the supplemental cash flow information:
| | | | | | | | | | | |
| In millions | For the year ended December 31, 2024 | For the year ended December 31, 2023 | For the year ended December 31, 2022 |
| Cash paid for amounts included in the measurement of lease liabilities: | | | |
| Operating cash flows from operating leases | $ | 66 | | $ | 76 | | $ | 82 | |
| Operating cash flows from finance leases | $ | 1 | | $ | 1 | | $ | 1 | |
| Financing cash flows from finance leases | $ | 14 | | $ | 14 | | $ | 13 | |
| Lease Assets Obtained in Exchange for Lease Obligations | | | |
| Operating Leases | $ | 29 | | $ | 16 | | $ | 4 | |
| Finance Leases | $ | 2 | | $ | (1) | | $ | — | |
The following table reconciles the undiscounted cash flows for each of the first five years and total of the remaining years to the finance lease liabilities and operating lease liabilities recorded on the Consolidated Balance Sheet as of December 31, 2024:
| | | | | | | | | | | | | | |
| In millions | | Operating Leases | | Finance Leases |
| 2025 | | $ | 56 | | | $ | 11 | |
| 2026 | | 48 | | | 2 | |
| 2027 | | 47 | | | 1 | |
| 2028 | | 43 | | | — | |
| 2029 | | 39 | | | — | |
| Thereafter | | 131 | | | — | |
| Total lease payments | | 364 | | | 14 | |
| Less: Amount representing interest | | 76 | | | — | |
| Present value of lease liabilities | | $ | 288 | | | $ | 14 | |
As of December 31, 2024, all material operating leases had commenced.
The following table presents the weighted average remaining lease term and interest rates:
| | | | | | | | | | | | |
| | December 31, 2024 | December 31, 2023 | |
| Weighted average lease term: | | | | |
| Operating leases | | 7.6 years | 8.3 years | |
| Finance leases | | 1.5 years | 2.2 years | |
| Weighted average interest rates: | | | | |
| Operating leases | | 6.17 | % | 6.12 | % | |
| Finance leases | | 3.91 | % | 3.38 | % | |
13. SERIES A PREFERRED STOCK
On December 4, 2015, the Company issued 820,000 shares of Series A Convertible Preferred Stock to certain entities affiliated with the Blackstone Group L.P. (collectively, “Blackstone”) for an aggregate purchase price of $820 million, or $1,000 per share, pursuant to an Investment Agreement between the Company and Blackstone, dated November 11, 2015. In connection with the issuance of the Series A Convertible Preferred Stock, the Company incurred direct and incremental expenses of $26 million, including financial advisory fees, closing costs, legal expenses and other offering-related expenses. These direct and incremental expenses originally reduced the Series A Convertible Preferred Stock and will be accreted through retained earnings as a deemed dividend from the date of issuance through the first possible known redemption date, March 16, 2024.
In 2017, in connection with the early release of the lock-up included in the Investment Agreement, Blackstone offered for sale 342,000 shares of Series A Convertible Preferred Stock in an underwritten public offering. In addition, Blackstone converted 90,000 shares of Series A Convertible Preferred Stock into shares of our common stock and we repurchased those shares of common stock for $48.47 per share. The underwritten offering and the stock repurchase were consummated on March 17, 2017.
On September 18, 2019, the Company entered into an agreement to repurchase and convert the outstanding 512,221 shares of Series A Convertible Preferred Stock owned by Blackstone. The Company repurchased 237,673 shares of Series A Convertible Preferred Stock for total cash consideration of $302 million. The remaining shares of Blackstone’s Series A Convertible Preferred Stock, including accrued dividends, were converted to approximately 9.2 million shares of common stock at a conversion price of $30.00 per share.
For the repurchase of Series A Convertible Preferred Stock, the excess of the fair value of consideration transferred over the carrying value was approximately $67 million, and has been included as a deemed dividend in adjusting the income from common stockholders in calculating earnings per share. In this analysis, we determined the fair value of the consideration transferred was not in excess of the fair value of the redeemed Series A Convertible Preferred Stock. As a result, there was no inducement provided to Blackstone for the conversion of the remaining preferred shares into common stock.
On October 6, 2020, the Company entered into a definitive agreement to repurchase 67,000 shares of Series A Convertible Preferred Stock from two affiliated shareholders for a total cash consideration of $72 million. The transaction closed on October 7, 2020. On October 12, 2020, the Company entered into a definitive agreement to repurchase 65,365 shares of Series A Convertible Preferred Stock owned by two affiliated shareholders for a total cash consideration of $72 million. The transaction closed on October 13, 2020. The excess of the fair value of consideration transferred over the carrying value was approximately $12 million, and has been included as a deemed dividend in adjusting the income from common stockholders in calculating earnings per share.
Dividend Rights The Series A Convertible Preferred Stock ranks senior to the shares of the Company’s common stock, with respect to dividend rights and rights on the distribution of assets on any voluntary or involuntary liquidation, dissolution or winding up of the affairs of the Company. The Series A Convertible Preferred Stock has a liquidation preference of $1,000 per share. Holders of Series A Convertible Preferred Stock are entitled to a cumulative dividend at the rate of 5.5% per annum, which was payable quarterly in arrears. Beginning in the first quarter of 2020, dividends are payable in cash or in-kind at the option of the Company. If the Company does not declare and pay a dividend, the dividend rate will increase to 8.0% per annum until all accrued but unpaid dividends have been paid in full. During the years ended December 31, 2024, 2023 and 2022, the Company did not pay dividends-in-kind associated with the Series A Convertible Preferred Stock. Cash dividends of $15 million were declared during the years ended December 31, 2024, 2023 and 2022.
Conversion Features Prior to the close of business on October 17, 2023, the Series A Convertible Preferred Stock was convertible at the option of the holders at any time into shares of common stock at a conversion price of $30.00 per share or a conversion rate of 33.333 shares of common stock per share of Series A Convertible Preferred Stock. As a result of the Spin-Off, the conversion rate of the Series A Convertible Preferred Stock was adjusted pursuant to its terms to 57.560 shares of common stock per share of Series A Convertible Preferred Stock, effective immediately after the close of business on October 17, 2023. As of December 31, 2024 and 2023, the maximum number of common shares that could be required to be issued upon conversion of the outstanding shares of Series A Convertible Preferred Stock was 15.9 million shares. The conversion rate is subject to the following customary anti-dilution and other adjustments:
•the issuance of common stock as a dividend or the subdivision, combination, or reclassification of common stock into a greater or lesser number of shares of common stock;
•the dividend, distribution or other issuance of rights, options or warrants to holders of Common Stock entitling them to subscribe for or purchase shares of common stock at a price per share that is less than the volume-weighted average price per share of common stock;
•the completion of a tender offer or exchange offer of shares of common stock at a premium to the volume-weighted average price per share of common stock and certain other above-market purchases of common stock;
•the issuance of a dividend or similar distribution in-kind, which can include shares of any class of capital stock, evidences of the Company’s indebtedness, assets or other property or securities, to holders of common stock;
•a transaction in which a subsidiary of the Company ceases to be a subsidiary of the Company as a result of the distribution of the equity interests of the subsidiary to the holders of the Company’s common stock; and
•the payment of a cash dividend to the holders of common stock.
All outstanding shares of Series A Convertible Preferred Stock are convertible at the option of the Company if the volume-weighted average price of the common stock exceeds $54.00 for at least 30 trading days in any period of 45 consecutive trading days. The $54.00 may be adjusted pursuant to the anti-dilution provisions above.
The Series A Convertible Preferred Stock, and the associated dividends for the first sixteen payments, did not generate a beneficial conversion feature (“BCF”) upon issuance as the fair value of the Company’s common stock was greater than the conversion price. The Company will determine and, if required, measure a BCF based on the fair value of our stock price on the date dividends are declared subsequent to the sixteenth dividend. If a BCF is recognized, a reduction to retained earnings and the Series A Convertible Preferred Stock will be recorded, and then subsequently accreted through the first redemption date.
Additionally, the Company determined that the nature of the Series A Convertible Preferred Stock was more akin to an equity instrument and that the economic characteristics and risks of the embedded conversion options were clearly and closely related to the Series A Convertible Preferred Stock. As such, the conversion options were not required to be bifurcated from the host under ASC 815, Derivatives and Hedging.
Redemption Rights On any date during the three months commencing on and immediately following March 16, 2024 and the three months commencing on and immediately following every third anniversary of March 16, 2024, holders of Series A Convertible Preferred Stock have the right to require the Company to repurchase all or any portion of the Series A Convertible Preferred Stock at 100% of the liquidation preference thereof plus all accrued but unpaid dividends. Upon certain change of control events involving the Company, holders of Series A Convertible Preferred Stock can require the Company to repurchase, subject to certain exceptions, all or any portion of the Series A Convertible Preferred Stock at the greater of (1) an amount in cash equal to 100% of the liquidation preference thereof plus all accrued but unpaid dividends and (2) the consideration the holders would have received if they had converted their shares of Series A Convertible Preferred Stock into common stock immediately prior to the change of control event.
The Company has the right, upon certain change of control events involving the Company, to redeem the Series A Convertible Preferred Stock at the greater of (1) an amount in cash equal to the sum of the liquidation preference of the Series A Convertible Preferred Stock, all accrued but unpaid dividends and the present value, discounted at a rate of 10%, of any remaining scheduled dividends through the fifth anniversary of the first dividend payment date, assuming the Company chose to pay such dividends in cash (the “make-whole provision”) and (2) the consideration the holders would have received if they had converted their shares of Series A Convertible Preferred Stock into common stock immediately prior to the change of control event.
Since the redemption of the Series A Convertible Preferred Stock is contingently or optionally redeemable and therefore not certain to occur, the Series A Convertible Preferred Stock is not required to be classified as a liability under ASC 480, Distinguishing Liabilities from Equity. As the Series A Convertible Preferred Stock is redeemable in certain circumstances
at the option of the holder and is redeemable in certain circumstances upon the occurrence of an event that is not solely within our control, we have classified the Series A Convertible Preferred Stock in mezzanine equity in the Consolidated Balance Sheets.
As noted above, the Company determined that the nature of the Series A Convertible Preferred Stock was more akin to an equity instrument. However, the Company determined that the economic characteristics and risks of the embedded put options, call option and make-whole provision were not clearly and closely related to the Series A Convertible Preferred Stock. Therefore, the Company assessed the put and call options further, and determined they did not meet the definition of a derivative under ASC 815, Derivatives and Hedging. Under the same analysis, the Company determined the make-whole provision did meet the definition of a derivative, but that the value of the derivative was minimal due to the expectations surrounding the scenarios under which the call option and make-whole provision would be exercised.
Voting Rights Holders of Series A Convertible Preferred Stock are entitled to vote with the holders of the common stock on an as-converted basis. Holders of Series A Convertible Preferred Stock are entitled to a separate class vote with respect to amendments to the Company’s organizational documents that have an adverse effect on the Series A Convertible Preferred Stock and issuances by the Company of securities that are senior to, or equal in priority with, the Series A Convertible Preferred Stock.
14. EARNINGS PER SHARE
Basic earnings per share (“EPS”) is calculated by dividing net income or loss attributable to NCR Voyix, less any dividends (declared or cumulative undeclared), deemed dividends, accretion or decretion, redemption or induced conversion on our Series A Convertible Preferred Stock, by the weighted average number of shares outstanding during the period.
In computing diluted EPS, we evaluate and reflect the maximum potential dilution, for each issue or series of issues of potential common shares in sequence from the most dilutive to the least dilutive. We adjust the numerator used in the basic EPS computation, subject to anti-dilution requirements, to add back the dividends (declared or cumulative undeclared) applicable to the Series A Convertible Preferred Stock. Such add-back would also include any adjustments to equity in the period to accrete the Series A Convertible Preferred Stock to its redemption price, or recorded upon a redemption or induced conversion. We adjust the denominator used in the basic EPS computation, subject to anti-dilution requirements, to include the dilution from potential shares resulting from the issuance of the Series A Convertible Preferred Stock, restricted stock units, and stock options.
The holders of Series A Convertible Preferred Stock, unvested restricted stock units and stock options do not have non-forfeitable rights to common stock dividends or common stock dividend equivalents. Accordingly, the Series A Convertible Preferred Stock, unvested restricted stock units and stock options do not qualify as participating securities. See Note 9, “Stock Compensation Plans”, for share information on NCR Voyix’s stock compensation plans.
The components of basic and diluted earnings (loss) per share are as follows:
| | | | | | | | | | | | | | | | | |
| In millions, except per share amounts | Year ended December 31 |
| 2024 | | 2023 | | 2022 |
| Numerator: | | | | | |
| Income (loss) from continuing operations | $ | (202) | | | $ | (729) | | | $ | (369) | |
| Series A convertible preferred stock dividends | (15) | | | (16) | | | (16) | |
| Net income (loss) from continuing operations attributable to NCR Voyix common stockholders | (217) | | | (745) | | | (385) | |
| Income (loss) from discontinued operations, net of tax | 1,160 | | | 306 | | | 429 | |
| Net income (loss) attributable to NCR Voyix common stockholders | $ | 943 | | | $ | (439) | | | $ | 44 | |
| | | | | |
| Denominator: | | | | | |
| Basic and diluted weighted average number of shares outstanding | 144.7 | | | 140.6 | | | 136.7 | |
| | | | | |
| Basic and diluted earnings (loss) per share: | | | | | |
| From continuing operations | $ | (1.50) | | | $ | (5.30) | | | $ | (2.82) | |
| From discontinued operations | 8.02 | | | 2.18 | | | 3.14 | |
| Total basic and diluted earnings per share | $ | 6.52 | | | $ | (3.12) | | | $ | 0.32 | |
For 2024, due to the net loss from continuing operations attributable to NCR Voyix common stockholders, potential common shares that would cause dilution, such as Series A Convertible Preferred Stock, restricted stock units and stock options, were excluded from the diluted share count because their effect would have been anti-dilutive. The weighted average outstanding shares of common stock were not adjusted by 15.9 million for the as-if converted Series A Convertible Preferred Stock because the effect would be anti-dilutive. Additionally, for 2024, weighted average restricted stock units and stock options of 10.1 million were excluded from the diluted share count because their effect would have been anti-dilutive. Refer to Note 13, “Series A Convertible Preferred Stock”, for additional discussion related to the transaction impacting the Series A Convertible Preferred Stock.
For 2023, due to the net loss from continuing operations attributable to NCR Voyix common stockholders, potential common shares that would cause dilution, such as Series A Convertible Preferred Stock, restricted stock units and stock options, were excluded from the diluted share count because their effect would have been anti-dilutive. The weighted average outstanding shares of common stock were not adjusted by 10.6 million for the as-if converted Series A Convertible Preferred Stock because the effect would be anti-dilutive. Additionally, for 2023, weighted average restricted stock units and stock options of 12.1 million were excluded from the diluted share count because their effect would have been anti-dilutive.
For 2022, due to the net loss from continuing operations attributable to NCR Voyix common stockholders, potential common shares that would cause dilution, such as Series A Convertible Preferred Stock, restricted stock units and stock options, were excluded from the diluted share count because their effect would have been anti-dilutive. The weighted average outstanding shares of common stock were not adjusted by 9.2 million for the as-if converted Series A Convertible Preferred Stock because the effect would have been anti-dilutive. Additionally, for 2022, weighted average restricted stock units and stock options of 11.0 million were excluded from the diluted share count because their effect would have been anti-dilutive.
15. DERIVATIVES AND HEDGING INSTRUMENTS
The Company is exposed to certain risks arising from both our business operations and economic conditions. We principally manage exposures to a wide variety of business and operational risk through management of core business activities. We manage interest rate risk by managing the amount, sources, and duration of debt funding. The Company has historically used interest rate cap agreements or interest rate swap contracts (“Interest Rate Derivatives”) to manage differences in the amount, timing and duration of known or expected cash payments related to our floating rate-debt agreements.
Further, a portion of our operations and revenue occur outside the United States and, as such, the Company has exposure to approximately 30 functional currencies. Our results can be significantly impacted, both positively and negatively, by changes in
foreign currency exchange rates. The Company seeks to mitigate such impact by hedging its foreign currency transaction exposure using foreign currency forward and option contracts. We do not enter into hedges for speculative purposes.
Foreign Currency Exchange Risk We utilize foreign exchange contracts to hedge our exposure of assets and liabilities denominated in non-functional currencies. We recognize the gains and losses on these types of hedges in earnings as exchange rates change.
Historically, our risk management strategy included hedging, on behalf of certain subsidiaries, a portion of our forecasted, non-functional currency denominated cash flows for a period of up to 15 months. If the hedge was designated as a highly effective cash flow hedge, the gains or losses were deferred into accumulated other comprehensive income (“AOCI”). The gains or losses from derivative contracts that were designated as highly effective cash flow hedges related to inventory purchases were recorded in cost of products when the inventory is sold to an unrelated third party. Otherwise, they were recorded in earnings when the exchange rates change. As of December 31, 2024 and 2023, the balance in AOCI related to foreign exchange derivative transactions was zero.
The accounting guidance for derivatives and hedging requires companies to recognize all derivative instruments as either assets or liabilities at fair value in the Consolidated Balance Sheets. The Company designates foreign exchange contracts as cash flow hedges of forecasted transactions when they are determined to be highly effective at inception.
Interest Rate Risk We historically utilized interest rate swap contracts or interest rate cap agreements to add stability to interest cost and to manage exposure to interest rate movements as part of our interest rate risk management strategy.
The Company designates Interest Rate Derivative contracts as cash flow hedges of forecasted transactions when they are determined to be highly effective at inception. Payments and receipts related to Interest Rate Derivatives are included in cash flows from operating activities in the Consolidated Statements of Cash Flows.
In March 2022, the Company terminated the outstanding $2 billion notional amount interest rate cap agreements maturing in 2024 for proceeds of $64 million.
In March 2022, the Company executed $2.2 billion aggregate notional amount interest rate swap contracts that began April 1, 2022 and had an original termination date of April 1, 2025. These interest rate swap contracts had fixed rates ranging from 2.078% to 2.443%, and were designated as cash flow hedges of the floating rate interest associated with the Company’s previous TLA Facility.
In June 2022, the Company terminated the outstanding $2.4 billion aggregate notional interest rate swap contracts maturing in 2025 for proceeds of $55 million.
As of September 30, 2023, it was determined that the transactions underlying the unrealized gains on terminated interest rate swap agreement for the previous TLA facility reported in Accumulated other comprehensive income were probable of not occurring under ASC 815, Derivatives and Hedging. As such, $18 million of unrealized gains were recognized in Interest Expense in the Consolidated Statements of Operations for the year ended December 31, 2023. As of December 31, 2024 and December 31, 2023, the balance in AOCI related to Interest Rate Derivatives was zero.
The following tables provide information on the location and amounts of derivative fair values in the Consolidated Balance Sheets:
| | | | | | | | | | | | | | | | | | | | | | | | | | | | | | | | | | | |
| Fair Values of Derivative Instruments |
| December 31, 2024 |
| In millions | Balance Sheet Location | | Notional
Amount | | Fair
Value | | Balance Sheet Location | | Notional
Amount | | Fair
Value |
| | | | | | | | | | | |
| | | | | | | | | | | |
| | | | | | | | | | | |
| | | | | | | | | | | |
| Derivatives not designated as hedging instruments | | | | | | | | | | | |
| Foreign exchange contracts | Prepaid and other current assets | | | | $ | — | | | Other current liabilities | | | | $ | — | |
| Total derivatives not designated as hedging instruments | | | $ | 89 | | | $ | — | | | | | $ | 126 | | | $ | — | |
| Total derivatives | | | | | $ | — | | | | | | | $ | — | |
| | | | | | | | | | | |
| | Fair Values of Derivative Instruments |
| | December 31, 2023 |
| In millions | Balance Sheet Location | | Notional
Amount | | Fair
Value | | Balance Sheet Location | | Notional
Amount | | Fair
Value |
| | | | | | | | | | | |
| | | | | | | | | | | |
| | | | | | | | | | | |
| | | | | | | | | | | |
| | | | | | | | | | | |
| Derivatives not designated as hedging instruments | | | | | | | | | | | |
| Foreign exchange contracts | Prepaid and other current assets | | | | $ | 5 | | | Other current liabilities | | | | $ | (4) | |
| Total derivatives not designated as hedging instruments | | | $ | 402 | | | $ | 5 | | | | | $ | 207 | | | $ | (4) | |
| Total derivatives | | | | | $ | 5 | | | | | | | $ | (4) | |
The effects of derivative instruments on the Consolidated Statements of Operations and Consolidated Statements of Comprehensive Income for the years ended December 31, 2024, 2023, and 2022 were as follows:
| | | | | | | | | | | | | | | | | | | | | | | | | | | | | | | | | | | | | | | | | |
| | | | | | | | | |
| | | | | | | | | | | | | |
| | | | | | | | | | | | | |
| | | | | | | | | | | | | |
| | | | | | | | | | | | | |
| | | | | | | | | | | | | |
| | | | | | | | | |
| | | | | | | | | | | | | |
| | | | | | | | | | | | | |
| | | | | | | | | | | | | |
| | | | | | | | | | | | | |
| In millions | Amount of Gain (Loss) Recognized in Other Comprehensive Income (OCI) on Derivative | | | | Amount of (Gain) Loss Reclassified from AOCI into the Consolidated Statements of Operations |
| For the year ended December 31, 2024 | | For the year ended December 31, 2023 | | For the year ended December 31, 2022 | | Location of (Gain) Loss Reclassified from AOCI into the Consolidated Statements of Operations | | For the year ended December 31, 2024 | | For the year ended December 31, 2023 | | For the year ended December 31, 2022 |
| Interest rate contracts | $ | — | | | $ | — | | | $ | 116 | | | Cost of services | | $ | — | | | $ | — | | | $ | (8) | |
| Interest rate contracts | $ | — | | | $ | — | | | $ | 36 | | | Interest expense | | $ | — | | | $ | (31) | | | $ | (10) | |
| | | | | | | | | | | | | |
| | | | | | | | | | | | | |
| | | | | | | | | | | | | | | | | | | | | | | |
| In millions | | | Amount of Gain (Loss) Recognized in the Consolidated Statements of Operations |
| Derivatives not Designated as Hedging Instruments | Location of Gain (Loss) Recognized in the Consolidated Statements of Operations | | For the year ended December 31, 2024 | | For the year ended December 31, 2023 | | For the year ended December 31, 2022 |
| Foreign exchange contracts | Other income (expense), net | | $ | (8) | | | $ | (8) | | | $ | (15) | |
| | | | | | | |
The following tables show the impact of the Company’s cash flow hedge accounting relationships on the Consolidated Statement of Operations for the years ended December 31, 2024, 2023, and 2022.
| | | | | | | | | | | | | | | | | | | | | | | | | | | | | | | | | | | | | | |
| | Location and Amount of (Gain) Loss Recognized in Income on Cash Flow Hedging Relationships for the years ended December 31: |
| In millions | | Cost of Services | | Cost of Products | | Interest Expense |
| | 2024 | 2023 | 2022 | | 2024 | 2023 | 2022 | | 2024 | 2023 | 2022 |
| Total amount of expense presented in the Consolidated Statements of Operations in which the effects of cash flow hedges are recorded | | $ | 1,477 | | $ | 1,460 | | $ | 1,387 | | | $ | 770 | | $ | 1,049 | | $ | 1,103 | | | $ | (134) | | $ | (294) | | $ | (285) | |
| | | | | | | | | | | | |
| Amount of (gain) loss reclassified from Accumulated other comprehensive loss, net of expense | | $ | — | | $ | — | | $ | (8) | | | $ | — | | $ | — | | $ | — | | | $ | — | | $ | (31) | | $ | (10) | |
Refer to Note 16, “Fair Value of Assets and Liabilities”, for further information on derivative assets and liabilities recorded at fair value on a recurring basis.
Concentration of Credit Risk
The Company is potentially subject to concentrations of credit risk on accounts receivable and financial instruments such as hedging instruments and cash and cash equivalents. Credit risk includes the risk of nonperformance by counterparties. The maximum potential loss may exceed the amount recognized on the Consolidated Balance Sheets. Exposure to credit risk is managed through credit approvals, credit limits, selecting major international financial institutions as counterparties to hedging transactions and monitoring procedures. The Company’s business often involves large transactions with customers, and if one or more of those customers were to default on its obligations under applicable contractual arrangements, the Company could be exposed to potentially significant losses. However, management believes that the reserves for potential losses are adequate. As of December 31, 2024 and 2023, the Company did not have any major concentration of credit risk related to financial instruments.
16. FAIR VALUE OF ASSETS AND LIABILITIES
Assets and Liabilities Measured at Fair Value on a Recurring Basis
Assets and liabilities recorded at fair value on a recurring basis as of December 31, 2024 and 2023 are set forth as follows:
| | | | | | | | | | | | | | | | | | | | | | | | | | | | | | | | | | | |
| | | December 31, 2024 | | | | December 31, 2023 |
| | | Fair Value Measurements Using | | | | Fair Value Measurements Using |
| In millions | December 31, 2024 | | Quoted Prices
in Active
Markets
for Identical Assets
(Level 1) | | Significant Other
Observable Inputs
(Level 2) | | Significant
Unobservable Inputs
(Level 3) | | December 31, 2023 | | Quoted Prices
in Active
Markets
for Identical Assets
(Level 1) | | Significant Other
Observable Inputs
(Level 2) | | Significant
Unobservable Inputs
(Level 3) |
| Assets: | | | | | | | | | | | | | | | |
| | | | | | | | | | | | | | | |
| | | | | | | | | | | | | | | |
Foreign exchange contracts(1) | $ | — | | | $ | — | | | $ | — | | | $ | — | | | $ | 5 | | | $ | — | | | $ | 5 | | | $ | — | |
| | | | | | | | | | | | | | | |
| Total | $ | — | | | $ | — | | | $ | — | | | $ | — | | | $ | 5 | | | $ | — | | | $ | 5 | | | $ | — | |
| Liabilities: | | | | | | | | | | | | | | | |
| | | | | | | | | | | | | | | |
Foreign exchange contracts(2) | $ | — | | | $ | — | | | $ | — | | | $ | — | | | $ | 4 | | | $ | — | | | $ | 4 | | | $ | — | |
| Total | $ | — | | | $ | — | | | $ | — | | | $ | — | | | $ | 4 | | | $ | — | | | $ | 4 | | | $ | — | |
(1) Included in Prepaid and other current assets in the Consolidated Balance Sheets.
(2) Included in Other current liabilities in the Consolidated Balance Sheets.
Foreign Exchange Contracts As a result of our global operating activities, we are exposed to risks from changes in foreign currency exchange rates, which may adversely affect our financial condition. To manage our exposures and mitigate the impact of currency fluctuations on our financial results, we hedge our primary transactional exposures through the use of foreign exchange forward and option contracts. The foreign exchange contracts are valued using the market approach based on observable market transactions of forward rates and are classified within Level 2 of the valuation hierarchy.
We incorporate credit valuation adjustments to appropriately reflect both our own nonperformance risk and the respective counterparty’s nonperformance risk in the fair value measurements. In adjusting the fair value of our derivative contracts for the effect of nonperformance risk, we consider the impact of netting and any applicable credit enhancements. We measure the credit risk of our derivative financial instruments that are subject to master netting agreements on a net basis by counterparty portfolio.
Although we have determined that the majority of the inputs used to value our derivatives fall within Level 2 of the fair value hierarchy, the credit valuation adjustments utilize Level 3 inputs to evaluate the likelihood of both our own default and counterparty default. As of December 31, 2024, we determined that the credit valuation adjustments are not significant to the overall valuation of our derivatives and therefore, the valuations are classified in Level 2 of the fair value hierarchy.
Assets Measured at Fair Value on a Non-recurring Basis
From time to time, certain assets are measured at fair value on a nonrecurring basis using significant unobservable inputs (Level 3). The Company measures certain assets, including intangible assets and cost and equity method investments, at fair value on a non-recurring basis. These assets are recognized at fair value when initially valued and when deemed to be impaired. Additionally, the Company reviews the carrying values of investments when events and circumstances warrant and considers all available evidence in evaluating when declines in fair value are other-than-temporary declines. The Company carries equity investments in privately-held companies at cost or at fair value when the Company recognizes an other-than-temporary impairment charge. No material impairment charges or non-recurring fair value adjustments were recorded during the years ended December 31, 2024, December 31, 2023 and December 31, 2022.
17. ACCUMULATED OTHER COMPREHENSIVE INCOME
Changes in Accumulated Other Comprehensive Income (“AOCI”) by Component
The changes in AOCI for the years ended December 31 are as follows:
| | | | | | | | | | | | | | | | | | | | | | | |
| In millions | Currency Translation Adjustments | | Changes in Employee Benefit Plans | | Changes in Fair Value of Effective Cash Flow Hedges | | Total |
| | | | | | | |
| | | | | | | |
| | | | | | | |
| | | | | | | |
| Balance at December 31, 2021 | $ | (275) | | | $ | (24) | | | $ | 8 | | | $ | (291) | |
| Other comprehensive (loss) income before reclassifications | (129) | | | 21 | | | 117 | | | 9 | |
| Amounts reclassified from AOCI | — | | | (2) | | | (16) | | | (18) | |
| Net current period other comprehensive (loss) income | $ | (129) | | | $ | 19 | | | $ | 101 | | | $ | (9) | |
| Balance at December 31, 2022 | $ | (404) | | | $ | (5) | | | $ | 109 | | | $ | (300) | |
| Other comprehensive (loss) income before reclassifications | 85 | | | (7) | | | — | | | 78 | |
| Amounts reclassified from AOCI | — | | | (1) | | | (24) | | | (25) | |
| Net current period other comprehensive (loss) income | $ | 85 | | | $ | (8) | | | $ | (24) | | | $ | 53 | |
| Spin-Off of NCR Atleos | (105) | | | 8 | | | (85) | | | (182) | |
| Balance at December 31, 2023 | $ | (424) | | | $ | (5) | | | $ | — | | | $ | (429) | |
| Other comprehensive (loss) income before reclassifications | $ | (44) | | | $ | (5) | | | $ | — | | | $ | (49) | |
| Amounts reclassified from AOCI | — | | | (1) | | | — | | | (1) | |
| Net current period other comprehensive (loss) income | $ | (44) | | | $ | (6) | | | $ | — | | | $ | (50) | |
| Spin-Off of NCR Atleos | — | | | 10 | | | — | | | 10 | |
| Balance at December 31, 2024 | $ | (468) | | | $ | (1) | | | $ | — | | | $ | (469) | |
Reclassifications Out of AOCI
The reclassifications out of AOCI for the years ended December 31 are as follows:
| | | | | | | | | | | | | | | | | | | | | | | | | | |
| | For the year ended December 31, 2024 |
| Employee Benefit Plans | | | | |
| In millions | Actuarial Losses Recognized | | Amortization of Prior Service Benefit | | Effective Cash Flow Hedges | | Total |
| Affected line in Consolidated Statement of Operations: | | | | | | | |
| Cost of products | $ | — | | | $ | — | | | $ | — | | | $ | — | |
| Cost of services | — | | | (1) | | | — | | | (1) | |
| Selling, general and administrative expenses | — | | | — | | | — | | | — | |
| Research and development expenses | — | | | — | | | — | | | — | |
| Interest expense | — | | | — | | | — | | | — | |
| Total before tax | $ | — | | | $ | (1) | | | $ | — | | | $ | (1) | |
| Tax expense | | | | | | | — | |
| Total reclassifications, net of tax | | | | | | | $ | (1) | |
| | | | | | | | | | | | | | | | | | | | | | | | | | |
| | For the year ended December 31, 2023 |
| Employee Benefit Plans | | | | |
| In millions | Actuarial Losses Recognized | | Amortization of Prior Service Benefit | | Effective Cash Flow Hedges | | Total |
| Affected line in Consolidated Statement of Operations: | | | | | | | |
| Cost of products | $ | — | | | $ | — | | | $ | — | | | $ | — | |
| Cost of services | (1) | | | (1) | | | — | | | (2) | |
| Selling, general and administrative expenses | — | | | — | | | — | | | — | |
| Research and development expenses | — | | | — | | | — | | | — | |
| Interest expense | — | | | — | | | (31) | | | (31) | |
| Total before tax | $ | (1) | | | $ | (1) | | | $ | (31) | | | $ | (33) | |
| Tax expense | | | | | | | 8 | |
| Total reclassifications, net of tax | | | | | | | $ | (25) | |
| | | | | | | | | | | | | | | | | | | | | | | | | | |
| | For the year ended December 31, 2022 |
| | Employee Benefit Plans | | | | |
| In millions | Actuarial Losses Recognized | | Amortization of Prior Service Benefit | | Effective Cash Flow Hedges | | Total |
| Affected line in Consolidated Statement of Operations: | | | | | | | |
| Cost of products | $ | — | | | $ | — | | | $ | — | | | $ | — | |
| Cost of services | (1) | | | (1) | | | (8) | | | (10) | |
| Selling, general and administrative expenses | 1 | | | (1) | | | — | | | — | |
| Research and development expenses | — | | | — | | | — | | | — | |
| Interest expense | — | | | — | | | (10) | | — | (10) | |
| Total before tax | $ | — | | | $ | (2) | | | $ | (18) | | | $ | (20) | |
| Tax expense | | | | | | | 2 | |
| Total reclassifications, net of tax | | | | | | | $ | (18) | |
18. SUPPLEMENTAL FINANCIAL INFORMATION
The components of Other income (expense), net are summarized as follows for the years ended December 31:
| | | | | | | | | | | | | | | | | | | | |
| In millions | | 2024 | | 2023 | | 2022 |
| Other income (expense), net | | | | | | |
| Interest income | | $ | 9 | | | $ | 12 | | | $ | 13 | |
| Foreign currency fluctuations and foreign exchange contracts | | (30) | | | (28) | | | (17) | |
| Bank-related fees | | (24) | | | (28) | | | (9) | |
Employee benefit plans(1) | | 9 | | | (8) | | | 40 | |
| | | | | | |
| | | | | | |
| | | | | | |
| Other, net | | — | | | (24) | | | (9) | |
| Total other income (expense), net | | $ | (36) | | | $ | (76) | | | $ | 18 | |
(1) For the year ended December 31, 2024, the actuarial gain related to the remeasurement of our pension plan assets and liabilities was $12 million. For the year ended December 31, 2023, the actuarial loss related to the remeasurement of our pension plan assets and liabilities was $7 million. For the year ended December 31, 2022, the actuarial gain related to the remeasurement of our pension plan assets and liabilities was $41 million.
The components of inventory are summarized as follows:
| | | | | | | | | | | |
| In millions | December 31, 2024 | | December 31, 2023 |
| Inventories | | | |
| Work in process and raw materials | $ | 6 | | | $ | 14 | |
| Finished goods | 83 | | | 109 | |
| Service parts | 119 | | | 127 | |
| Total inventories | $ | 208 | | | $ | 250 | |
The components of property, plant and equipment, net are summarized as follows:
| | | | | | | | | | | |
| In millions | December 31, 2024 | | December 31, 2023 |
| Property, plant and equipment | | | |
| Land and improvements | $ | 2 | | | $ | 1 | |
| Buildings and improvements | 227 | | | 206 | |
| Machinery and other equipment | 493 | | | 423 | |
| Finance lease assets | 81 | | | 71 | |
| Property, plant and equipment, gross | 803 | | | 701 | |
| Less: accumulated depreciation | (611) | | | (494) | |
| Total property, plant and equipment, net | $ | 192 | | | $ | 207 | |
| | | |
19. QUARTERLY FINANCIAL INFORMATION (UNAUDITED)
The following table sets forth the Company’s unaudited results of operations for each of the quarters in the fiscal years 2024 and 2023, which has been retrospectively adjusted to reflect the Digital Banking and NCR Atleos historical financial results as discontinued operations. The following quarterly financial data should be read in conjunction with our consolidated financial statements included elsewhere in this Annual Report on Form 10-K.
| | | | | | | | | | | | | | | | | | | | | | | | | | |
| | | | |
| In millions, except per share amounts | | First Quarter | | Second Quarter | | Third Quarter | | Fourth Quarter |
| 2024 | | | | | | | | |
| Total revenue | | $ | 711 | | | $ | 722 | | | $ | 711 | | | $ | 682 | |
| Gross margin | | 138 | | | 126 | | | 166 | | | 149 | |
| Income (loss) from operations | | (19) | | | (35) | | | 15 | | | 2 | |
| Income from continuing operations | | (72) | | | (91) | | | (31) | | | (9) | |
| Income (loss) from discontinued operations, net of taxes | | 31 | | | 18 | | | 1,113 | | | (2) | |
| Net income (loss) | | (41) | | | (73) | | | 1,082 | | | (11) | |
| Net (loss) income attributable to common stockholders | | (44) | | | (77) | | | 1,078 | | | (14) | |
| Income (loss) per share attributable to common stockholders: | | | | | | | | |
| Continuing operations | | $ | (0.52) | | | $ | (0.66) | | | $ | (0.24) | | | $ | (0.08) | |
| Discontinued operations | | 0.21 | | | 0.13 | | | 7.65 | | | (0.02) | |
| Basic earnings per share attributable to common stockholders | | $ | (0.31) | | | $ | (0.53) | | | $ | 7.41 | | | $ | (0.10) | |
| Diluted earnings (loss) per share: | | | | | | | | |
| Continuing operations | | $ | (0.52) | | | $ | (0.66) | | | $ | (0.24) | | | $ | (0.08) | |
| Discontinued operations | | 0.21 | | | 0.13 | | | 7.65 | | | (0.02) | |
| Diluted earnings per share attributable to common stockholders | | $ | (0.31) | | | $ | (0.53) | | | $ | 7.41 | | | $ | (0.10) | |
| | | | | | | | |
| 2023 | | | | | | | | |
| Total revenue | | $ | 768 | | | $ | 805 | | | $ | 809 | | | $ | 796 | |
| Gross margin | | 161 | | | 202 | | | 195 | | | 111 | |
| Income (loss) from operations | | (12) | | | 21 | | | 24 | | | (162) | |
| Income from continuing operations | | (103) | | | (88) | | | (266) | | | (272) | |
| Income (loss) from discontinued operations, net of taxes | | 111 | | | 104 | | | 138 | | | (47) | |
| Net income (loss) | | 8 | | | 16 | | | (128) | | | (319) | |
| Net (loss) income attributable to common stockholders | | 3 | | | 13 | | | (133) | | | (322) | |
| Income (loss) per share attributable to common stockholders: | | | | | | | | |
| Continuing operations | | $ | (0.77) | | | $ | (0.66) | | | $ | (1.92) | | | $ | (1.95) | |
| Discontinued operations | | 0.79 | | | 0.75 | | | 0.98 | | | (0.33) | |
| Basic earnings per share attributable to common stockholders | | $ | 0.02 | | | $ | 0.09 | | | $ | (0.94) | | | $ | (2.28) | |
| Diluted earnings (loss) per share: | | | | | | | | |
| Continuing operations | | $ | (0.77) | | | $ | (0.66) | | | $ | (1.92) | | | $ | (1.95) | |
| Discontinued operations | | 0.79 | | | 0.75 | | | 0.98 | | | (0.33) | |
| Diluted earnings per share attributable to common stockholders | | $ | 0.02 | | | $ | 0.09 | | | $ | (0.94) | | | $ | (2.28) | |
| | | | | | | | |
| | | | | | | | |
| | | | | | | | |
| | | | | | | | |
| | | | | | | | |
| | | | | | | | |
| | | | | | | | |
| | | | | | | | |
| | | | | | | | |
| | | | | | | | |
| | | | | | | | |
| | | | | | | | |
| | | | | | | | |
| | | | | | | | |
| | | | | | | | |
| | | | | | | | |
| | | | | | | | |
| | | | | | | | |
| | | | | | | | |
| | | | | | | | |
Item 9. CHANGES IN AND DISAGREEMENTS WITH ACCOUNTANTS ON ACCOUNTING AND FINANCIAL DISCLOSURE
None.
Item 9A. CONTROLS AND PROCEDURES
Evaluation of Disclosure Controls and Procedures
The Company has established disclosure controls and procedures (as defined in Rules 13a-15(e) and 15d-15(e) of the Securities Exchange Act of 1934, as amended (the Exchange Act)). The Company’s management carried out an evaluation, under the supervision and with the participation of its Chief Executive and Chief Financial Officers, of the effectiveness of the design and operation of the Company’s disclosure controls and procedures as of December 31, 2024. Based on this evaluation, the Company’s Chief Executive and Chief Financial Officers have concluded that the Company’s disclosure controls and procedures were effective as of December 31, 2024 to provide reasonable assurance that the information required to be disclosed by the Company in reports that it files or submits under the Exchange Act is (i) recorded, processed, summarized and reported within the time periods specified in the SEC rules and forms and (ii) accumulated and communicated to management, including the Company’s Chief Executive and Chief Financial Officers, as appropriate, to allow timely decisions regarding required disclosure.
Management’s Report on Internal Control over Financial Reporting
Management is responsible for establishing and maintaining adequate internal control over financial reporting as defined in Rules 13a-15(f) and 15d-15(f) under the Exchange Act. Our internal control over financial reporting is a process designed to provide reasonable assurance regarding the reliability of financial reporting and the preparation of financial statements for external purposes in accordance with generally accepted accounting principles. A company’s internal control over financial reporting includes those policies and procedures that (i) pertain to the maintenance of records that, in reasonable detail, accurately and fairly reflect the transactions and dispositions of the assets of the company; (ii) provide reasonable assurance that transactions are recorded as necessary to permit preparation of financial statements in accordance with generally accepted accounting principles, and that receipts and expenditures of the company are being made only in accordance with authorizations of management and directors of the company; and (iii) provide reasonable assurance regarding prevention or timely detection of unauthorized acquisition, use, or disposition of the company’s assets that could have a material effect on the financial statements.
Because of its inherent limitations, internal control over financial reporting may not prevent or detect misstatements. Also, projections of any evaluation of effectiveness to future periods are subject to the risk that controls may become inadequate because of changes in conditions, or that the degree of compliance with the policies or procedures may deteriorate.
Management assessed, under the supervision and with the participation of the Company’s Chief Executive and Chief Financial Officers, the effectiveness of the Company’s internal control over financial reporting as of December 31, 2024. In making this assessment, management used the criteria set forth by the Committee of Sponsoring Organizations of the Treadway Commission (COSO) in the 2013 Internal Control-Integrated Framework. Based on this assessment, management, including the Company’s Chief Executive and Chief Financial Officers, concluded that the Company’s internal control over financial reporting was effective as of December 31, 2024 based on those criteria.
PricewaterhouseCoopers LLP, our independent registered public accounting firm, has audited the effectiveness of our internal control over financial reporting as of December 31, 2024 as stated in their report which appears in Item 8 of this report.
Remediation of Previously Reported Material Weaknesses
A material weakness is a deficiency, or a combination of deficiencies, in internal control over financial reporting, such that there is a reasonable possibility that a material misstatement of the Company’s annual or interim financial statements will not be prevented or detected on a timely basis.
As previously reported in Part II, Item 9A, “Controls and Procedures” in the Company’s Annual Report on Form 10-K for the year ended December 31, 2023, management identified the following material weaknesses in the Company’s internal control over financial reporting as of December 31, 2023:
•The Company did not design and maintain effective controls to prevent or timely detect unauthorized Automated Clearing House (“ACH”) disbursements; and
•The Company did not design and maintain effective controls related to accounts receivable and accounts payable clearing accounts. Specifically, controls were not designed at a sufficient level of precision to timely reconcile and
review the reasonableness and supportability of clearing account balances, including review of the nature and aging of the individual clearing account balances.
During the year ended December 31, 2024, management executed upon its previously disclosed remediation plan, which included the design and implementation of measures to remediate the material weaknesses described above, including:
•Designed and implemented a monitoring control to (i) perform at least an annual review of all Company bank account attributes and (ii) regularly review bank account activity for large and/or unusual transactions for all bank accounts permitting ACH direct debit transactions.
•Designed and implemented monthly controls, with a sufficient level of precision, to timely reconcile and review the reasonableness and supportability of accounts receivable and accounts payable clearing account balances, including a review of the nature and aging of the individual clearing account balances.
•Designed and implemented enhanced review controls specific to accounts receivable and accounts payable clearing accounts to ensure clear and precise escalation protocols for unreconciled items and the timely resolution of any matters escalated.
•Supplemented our existing training materials regarding fraud prevention and detection and incident escalation and resolution procedures.
We determined that the remediated controls described above are designed effectively and have operated for a sufficient period of time to appropriately address the material weaknesses described above. Additionally, management has concluded, through testing, that these controls are operating effectively and the material weaknesses described above have been remediated as of December 31, 2024.
As previously reported in Part I, Item 4, “Controls and Procedures” in the Company’s Quarterly Report on Form 10-Q for the quarter ended September 30, 2024, management concluded that the Company did not maintain effective controls over the review of manual journal entries related to foreign currency transactions. The Company has reviewed the related controls and completed its testing of the operating effectiveness of the related controls and management has concluded that this material weakness has been remediated as of December 31, 2024.
Changes in Internal Control over Financial Reporting
There have been no changes in the Company’s internal control over financial reporting that occurred during the three months ended December 31, 2024 that have materially affected, or are reasonably likely to materially affect, the Company’s internal control over financial reporting.
Item 9B. OTHER INFORMATION
Adoption or Termination of 10b5-1 Trading Plans
During the fiscal quarter ended December 31, 2024, no director or officer of the Company adopted or terminated a “Rule 10b5-1 trading arrangement” or “non-Rule 10b5-1 trading arrangement,” as each term is defined in Item 408(a) of the SEC’s Regulation S-K.
Item 9C. DISCLOSURE REGARDING FOREIGN JURISDICTIONS THAT PREVENT INSPECTIONS
Not applicable.
PART III
Item 10. DIRECTORS, EXECUTIVE OFFICERS AND CORPORATE GOVERNANCE
Except as set forth below, the information required by this Item 10 is incorporated herein by reference to the Company’s Proxy Statement for the 2025 Annual Meeting of Stockholders to be filed with the SEC within 120 days after the end of our fiscal 2024 year (“2025 Proxy Statement”).
We have a Code of Conduct that sets the standard for ethics and compliance for all of our directors and employees, including our principal executive officer, our principal financial officer and our principal accounting officer. Our Code of Conduct is available on the Corporate Governance page at our website at http://www.ncrvoyix.com/company/corporate-governance/code-of-conduct under the heading “Code of Conduct.” We intend to satisfy the disclosure requirement under Item 5.05 of Form 8-K regarding an amendment to, or a waiver from, a provision of our Code of Conduct by posting such information on our website at the address and location set forth above.
The Company has adopted an insider trading policy and program applicable to the Company’s directors, officers and employees, as well as the Company itself, that the Company believes is reasonably designed to promote compliance with insider trading laws, rules and regulations and the New York Stock Exchange listing standards. The foregoing summary of the Company’s insider trading policy does not purport to be complete and is qualified in its entirety by reference to the full text thereof attached hereto as Exhibit 19.
Item 11. EXECUTIVE COMPENSATION
We incorporate by reference in this Item 11 the information relating to executive and director compensation and the report of the Compensation Committee contained under the headings “Compensation Discussion & Analysis” and “Board and Corporate Governance - Director Compensation” from our 2025 Proxy Statement.
Item 12. SECURITY OWNERSHIP OF CERTAIN BENEFICIAL OWNERS AND MANAGEMENT AND RELATED STOCKHOLDER MATTERS
We incorporate by reference the information required by this Item 12 under the headings “Security Ownership of Certain Beneficial Owners and Management” and “Equity Compensation Plan Information Table” from our 2025 Proxy Statement.
Item 13. CERTAIN RELATIONSHIPS AND RELATED TRANSACTIONS AND DIRECTOR INDEPENDENCE
We incorporate by reference in this Item 13 the information regarding certain relationships and related transactions between us and our affiliates and the independence of our directors contained under the headings “Additional Information - Relationships and Related Party Transactions” and “Board and Corporate Governance - Board Independence” from our 2025 Proxy Statement.
Item 14. PRINCIPAL ACCOUNTANT FEES AND SERVICES
We incorporate by reference in this Item 14 the information regarding principal accounting fees and services contained under the heading “Proposal Three: Ratification of Reappointment of Auditors” from our 2025 Proxy Statement.
PART IV
Item 15. EXHIBITS AND FINANCIAL STATEMENT SCHEDULE
(a)(1) Financial Statements: The following is an index of the consolidated financial statements of the Company and the Report of Independent Registered Public Accounting Firm filed as part of this Form 10-K:
(2) Financial Statement Schedule: Financial Statement Schedule II—Valuation and Qualifying Accounts for the years ended December 31, 2024, 2023 and 2022 is included in this Form 10-K on page 128. All other schedules to our consolidated financial statements have been omitted because they are not required under the related instruction or are inapplicable, or because we have included the required information in our consolidated financial statements or related notes.
(3) Exhibits: See Index of Exhibits below for a listing of all exhibits to this Form 10-K. The management contracts and compensatory plans or arrangements required to be filed as an exhibit to this Form 10-K are identified in the Index of Exhibits by an asterisk (*).
(b) The following is an index of all exhibits to this Form 10-K. Exhibits identified in parentheses in the index below, on file with the SEC, are incorporated herein by reference as exhibits hereto.
| | | | | | | | |
| | Separation and Distribution Agreement, dated as of October 16, 2023, by and between NCR Voyix Corporation and NCR Atleos Corporation (Exhibit 2.1 to the Company’s Current Report on Form 8-K filed on October 17, 2023 (the “October 17, 2023 8-K”)) |
| | |
| | Purchase Agreement, dated August 5, 2024, by and between NCR Voyix Corporation, Digital First Holdings II LLC and Dragon Buyer, Inc. (Exhibit 10.1 to the Company’s Current Report on Form 8-K filed on August 6, 2024). |
| | |
| | Articles of Amendment to the Articles of Incorporation of NCR Voyix Corporation, dated as of October 16, 2023 (Exhibit 3.1 to the October 17, 2023 8-K) |
| |
| | Articles of Amendment and Restatement of NCR Corporation (Exhibit 3.1 to the NCR Corporation Quarterly Report on Form 10-Q for the quarter ended June 30, 2019 (the “Second Quarter 2019 Quarterly Report”)). |
| | |
| | Amended and Restated By-laws of NCR Voyix Corporation, dated as of October 16, 2023 (Exhibit 3.3 to the October 17, 2023 8-K) |
| |
| | Redline of Amended and Restated By-laws of NCR Voyix Corporation, dated as of October 16, 2023 (Exhibit 3.4 to the October 17, 2023 8-K) |
| |
| 4.1 | | Common Stock Certificate of NCR Corporation (Exhibit 4.1 to the NCR Corporation Annual Report on Form 10-K for the year ended December 31, 1999). |
| |
| | Indenture, dated as of August 21, 2019, among NCR Corporation, NCR International, Inc. and Wells Fargo Bank, National Association (Exhibit 4.1 to the Current Report on Form 8-K of NCR Corporation dated August 21, 2019 (the “August 21, 2019 Form 8-K”)). |
| | |
| | Supplemental Indenture, dated as of October 14, 2021 (relating to the Indenture dated as of August 21, 2019), among ATM National, LLC, Cardtronics Holdings, LLC, Cardtronics, Inc., Cardtronics USA, Inc., CATM Holdings LLC, NCR Corporation, NCR International, Inc., and Wells Fargo Bank, National Association. |
| | | | | | | | |
| | |
| | Indenture, dated as of August 21, 2019, among NCR Corporation, NCR International, Inc. and Wells Fargo Bank, National Association (Exhibit 4.3 to the August 21, 2019 Form 8-K). |
| | |
| | Supplemental Indenture, dated as of October 14, 2021 (relating to the Indenture dated as of August 21, 2019), among ATM National, LLC, Cardtronics Holdings, LLC, Cardtronics, Inc., Cardtronics USA, Inc., CATM Holdings LLC, NCR Corporation, NCR International, Inc., and Wells Fargo Bank, National Association. |
| | |
| | Indenture, dated as of August 20, 2020, among NCR Corporation, NCR International, Inc. and Wells Fargo Bank, National Association (Exhibit 4.1 to Current Report on Form 8-K of NCR Corporation dated August 20, 2020 (the “August 20, 2020 Form 8-K”)). |
| | |
| | Supplemental Indenture, dated as of October 14, 2021 (relating to the Indenture dated as of August 20, 2020), among ATM National, LLC, Cardtronics Holdings, LLC, Cardtronics, Inc., Cardtronics USA, Inc., CATM Holdings LLC, NCR Corporation, NCR International, Inc., and Wells Fargo Bank, National Association, as trustee. |
| | |
| | Indenture, dated as of August 20, 2020, among NCR Corporation, NCR International, Inc. and Wells Fargo Bank, National Association (Exhibit 4.3 to the August 20, 2020 Form 8-K). |
| | |
| | Supplemental Indenture, dated as of October 14, 2021 (relating to the Indenture dated as of August 20, 2020), among ATM National, LLC, Cardtronics Holdings, LLC, Cardtronics, Inc., Cardtronics USA, Inc., CATM Holdings LLC, NCR Corporation, NCR International, Inc., and Wells Fargo Bank, National Association, as trustee. |
| | |
| | Indenture, dated as of April 6, 2021, among NCR Corporation, NCR International, Inc. and U.S. Bank National Association (Exhibit 4.1 to Current Report on Form 8-K of NCR Corporation dated April 6, 2021). |
| | |
| | Supplemental Indenture, dated as of October 14, 2021 (relating to the Indenture dated as of April 6, 2021), among ATM National, LLC, Cardtronics Holdings, LLC, Cardtronics, Inc., Cardtronics USA, Inc., CATM Holdings LLC, NCR International, Inc., and U.S. Bank National Association, as trustee. |
| | |
| | Description of Registrant’s Securities Registered Under Section 12 of the Exchange Act. |
| | |
| | Indenture relating to the Notes, dated September 27, 2023, between NCR Atleos Escrow Corporation and Citibank, N.A. (Exhibit 4.1 to the Company’s Current Report on 8-K filed on September 28, 2023 (the “September 28, 2023 8-K”) |
| | |
| | Form of 9.500% Senior Secured Notes due 2029 (included in Exhibit 4.1) (Exhibit 4.2 to the September 28, 2023 8-K) |
| | |
| | Second Supplemental Indenture, dated as of September 14, 2023, among NCR Corporation, NCR Atleos, LLC, ATM National, LLC, Cardtronics Holdings, LLC, Cardtronics, Inc., Cardtronics USA, Inc., CATM Holdings LLC, NCR International, Inc., and Computershare Trust Company, N.A. (as successor to Wells Fargo Bank, National Association), as trustee, relating to Registrant's 5.000% Notes due 2028 (Exhibit 4.3 to the Company’s Quarterly Report on Form 10-Q filed November 14, 2023) |
| | |
| | Second Supplemental Indenture, dated as of September 14, 2023, among NCR Corporation, NCR Atleos, LLC, ATM National, LLC, Cardtronics Holdings, LLC, Cardtronics, Inc., Cardtronics USA, Inc., CATM Holdings LLC, NCR International, Inc., and Computershare Trust Company, N.A. (as successor to Wells Fargo Bank, National Association), as trustee, relating to Registrant's 5.125% Notes due 2029 (Exhibit 4.4 to the Company’s Quarterly Report on Form 10-Q filed November 14, 2023). |
| | |
| | Second Supplemental Indenture, dated as of September 14, 2023, among NCR Corporation, NCR Atleos, LLC, ATM National, LLC, Cardtronics Holdings, LLC, Cardtronics, Inc., Cardtronics USA, Inc., CATM Holdings LLC, NCR International, Inc., and Computershare Trust Company, N.A. (as successor to Wells Fargo Bank, National Association), as trustee, relating to Registrant's 5.250% Notes due 2030 (Exhibit 4.5 to the Company’s Quarterly Report on Form 10-Q filed November 14, 2023). |
| | |
| | | | | | | | |
| | Second Supplemental Indenture, dated as of September 14, 2023, among NCR Corporation, NCR Atleos, LLC, ATM National, LLC, Cardtronics Holdings, LLC, Cardtronics, Inc., Cardtronics USA, Inc., CATM Holdings LLC, NCR International, Inc., and Computershare Trust Company, N.A. (as successor to Wells Fargo Bank, National Association), as trustee, relating to Registrant’s 5.750% Notes due 2027 (Exhibit 4.6 to the Company’s Quarterly Report on Form 10-Q filed November 14, 2023). |
| | |
| | Second Supplemental Indenture, dated as of September 14, 2023, among NCR Corporation, NCR Atleos, LLC, ATM National, LLC, Cardtronics Holdings, LLC, Cardtronics, Inc., Cardtronics USA, Inc., CATM Holdings LLC, NCR International, Inc., and Computershare Trust Company, N.A. (as successor to Wells Fargo Bank, National Association), as trustee, relating to Registrant's 6.125% Notes due 2029 (Exhibit 4.7 to the Company’s Quarterly Report on Form 10-Q filed November 14, 2023). |
| | |
| | NCR Voyix Corporation 2024 Executive Severance Plan adopted March 13, 2024 (Exhibit 10.1.3 to the Company’s Annual Report on Form 10-K filed March 14, 2024).* |
| | |
| | NCR Director Compensation Program effective April 23, 2013, as amended effective February 24, 2014 (the “2013 NCR Director Compensation Program”) (Exhibit 10.42 to the 2014 Annual Report). * |
| | |
| | NCR Employee Stock Purchase Plan, as amended and restated effective January 1, 2017 (Appendix A to the NCR Corporation Proxy Statement on Schedule 14A for the NCR Corporation 2016 Annual Meeting of Stockholders). * |
| | |
| | Incremental Revolving Facility Agreement (TLA-2 Conversion), dated as of June 24, 2021, among NCR Corporation, the Foreign Borrowers thereto, the Subsidiary Loan Parties thereto, the Incremental Revolving Lenders thereto, and JPMorgan Chase Bank, N.A., as Administrative Agent, including, as Exhibit A thereto, the Amended Credit Agreement, dated as of June 24, 2021, among NCR Corporation, the Foreign Borrowers party thereto, the Lenders party thereto and JPMorgan Chase Bank, N.A., as Administrative Agent (Exhibit 10.1 to Current Report on Form 8-K of NCR Corporation dated June 21, 2021 (the “June 21, 2021 Form 8-K”)). |
| | |
| | Fifth Amendment to the Credit Agreement, dated as of December 27, 2022, by and among NCR Corporation, the lenders party thereto and JPMorgan Chase Bank, N.A., as administrative agent. (Exhibit 10.1 to the Current Report on Form 8-K of NCR Corporation dated December 27, 2022) * |
| | |
| | Reaffirmation Agreement, dated as of June 21, 2021, among NCR Corporation, certain foreign and domestic subsidiaries of NCR Corporation party thereto and JPMorgan Chase Bank, N.A., as Administrative Agent (Exhibit 10.2 to the June 21, 2021 Form 8-K). |
| | |
| | Amended and Restated Guarantee and Collateral Agreement, dated as of August 22, 2011, as amended and restated as of January 6, 2014, as further amended and restated as of March 31, 2016, by and among NCR Corporation, the Foreign Borrowers party thereto, the subsidiaries of NCR Corporation identified therein and JPMorgan Chase Bank, N.A., as Administrative Agent (Exhibit 10.2 to the April 4, 2016 Form 8-K). |
| | |
| | Supplement No. 1, dated as of September 30, 2021, to the Amended and Restated Guarantee and Collateral Agreement, dated as of August 22, 2011, as amended and restated as of January 6, 2014, as further amended and restated as of March 31, 2016, among NCR Corporation, the Foreign Borrowers from time to time party thereto, the Subsidiary Loan Parties from time to time party thereto and JPMorgan Chase Bank, N.A., as Administrative Agent (Exhibit 10.5 to the Quarterly Report on Form 10-Q of NCR Corporation for the quarter ended September 30, 2021). |
| | |
| | Annex A to Credit Agreement dated as of August 22, 2011, as amended and restated as of July 25, 2013, as further amended and restated as of March 31, 2016, among NCR Corporation, the Foreign Borrowers party thereto, the Lenders party thereto and JPMorgan Chase Bank, N.A. (Exhibit 10.1 to the Second Quarter 2016 Quarterly Report). |
| | |
| | Second Amended and Restated NCR Management Incentive Plan (Appendix A to the NCR Corporation Proxy Statement on Schedule 14A for the NCR Corporation 2017 Annual Meeting of Stockholders (the “2017 Proxy Statement”). * |
| | |
| | NCR Corporation 2017 Stock Incentive Plan (the “2017 Stock Incentive Plan”) (Appendix B to the 2017 Proxy Statement). * |
| | | | | | | | |
| | |
| | Form of 2018 Stock Option Award Agreement under the NCR Corporation 2017 Stock Incentive Plan (the “2017 Stock Incentive Plan”) (Exhibit 10.1 to the Quarterly Report on Form 10-Q of NCR Corporation for the quarter ended March 31, 2018). * |
| | |
| | Form of 2019 Stock Option Award Agreement under the 2017 Stock Incentive Plan (Exhibit 10.1 to the Quarterly Report on Form 10-Q of NCR Corporation for the quarter ended March 31, 2019 (the “First Quarter 2019 Quarterly Report”)). * |
| | |
| | Form of 2020 Premium-Priced Option Award Agreement under the 2017 Stock Incentive Plan (Exhibit 10.1 to the Quarterly Report on Form 10-Q of NCR Corporation for the quarter ended March 31, 2020 (the “First Quarter 2020 Quarterly Report”)). * |
| | |
| | Form of 2020 Premium-Priced Option Award Agreement under the 2017 Stock Incentive Plan (Executive Chairman; President and Chief Executive Officer) (Exhibit 10.2 to the First Quarter 2020 Quarterly Report). * |
| | |
| | Form of 2020 Director Restricted Stock Unit Grant Statement under the 2017 Stock Incentive Plan (Exhibit 10.1 to the Quarterly Report on Form 10-Q of NCR Corporation for the quarter ended June 30, 2020 (the “Second Quarter 2020 Quarterly Report”)). * |
| | |
| | First Amendment to the 2017 Stock Incentive Plan (Appendix A to the NCR Corporation Proxy Statement on Schedule 14A for the NCR Corporation 2020 Annual Meeting of Stockholders). * |
| | |
| | Form of Senior Executive Team 2022 Performance-Based Restricted Stock Unit Award Agreement (With Relative TSR Metric) under the NCR Corporation 2017 Stock Incentive Plan. (Exhibit 10.1 to the Quarterly Report on Form 10-Q of NCR Corporation for the quarter ended March 31, 2022 (the “First Quarter 2022 Quarterly Report”)). * |
| | |
| | Form of Senior Executive Team 2022 Performance-Based Restricted Stock Unit Award Agreement (with LTI EBITDA and LTI Recurring Revenue Metric) under the NCR Corporation 2017 Stock Incentive Plan (Exhibit 10.9.8 to the Annual Report on Form 10-K of NCR Corporation for the year ended December 31, 2022).* |
| | |
| | Form of Senior Executive Team Qualified Transaction 2023 Performance-Based Restricted Stock Unit Award Agreement (with Relative TSR Metric) under the NCR Corporation 2017 Stock Incentive Plan (Exhibit 10.9.9 to the Annual Report on Form 10-K of NCR Corporation for the year ended December 31, 2022).* |
| | |
| | Form of Senior Executive Team 2023 Performance-Based Restricted Stock Unit Award Agreement (with Relative TSR Metric) under the NCR Corporation 2017 Stock Incentive Plan (Exhibit 10.9.10 to the Annual Report on Form 10-K of NCR Corporation for the year ended December 31, 2022).* |
| | |
| | Form of Senior Executive Team 2021 Performance-Based Restricted Stock Unit Award Agreement under the NCR Corporation 2017 Stock Incentive Plan (Exhibit 10.9.11 to the Annual Report on Form 10-K of NCR Corporation for the year ended December 31, 2022).* |
| | |
| | Form of the Senior Executive Team 2021 Market Stock Unit Award Agreement under the NCR Corporation 2017 Stock Incentive Plan (Exhibit 10.9.12 to the Annual Report on Form 10-K of NCR Corporation for the year ended December 31, 2022). * |
| | |
| | Form of Senior Executive Team 2024 Time-Based Restricted Stock Unit Award Agreement under the NCR Corporation 2017 Stock Incentive Plan (Exhibit 10.6 to the Quarterly Report on Form 10-Q for the quarter ended June 30, 2024).* |
| | |
| | Form of Senior Executive Team 2024 Performance-Based Restricted Stock Unit Award Agreement under the NCR Corporation 2017 Stock Incentive Plan. *(Exhibit 10.7 to the Quarterly Report on Form 10-Q for the quarter ended June 30, 2024).* |
| | |
| | Form of Executive Chair Performance-Based Restricted Stock Unit Award Agreement under the NCR Corporation 2017 Stock Incentive Plan (November 2024).* |
| | |
| | | | | | | | |
| | Form of Senior Executive Team Performance-Based Restricted Stock Unit Award Agreement under the NCR Corporation 2017 Stock Incentive Plan (November 2024).* |
| | |
| | Form of Executive Chair 2024 Performance-Based Restricted Stock Unit Award Agreement under the NCR Corporation 2017 Stock Incentive Plan (Exhibit 10.3 to the Quarterly Report on Form 10-Q for the quarter ended June 30, 2024).* |
| | |
| | Form of Executive Chair 2024 Time-Based Restricted Stock Unit Award Agreement under the NCR Corporation 2017 Stock Incentive Plan (Exhibit 10.4 to the Quarterly Report on Form 10-Q for the quarter ended June 30, 2024).* |
| | |
| | NCR Director Compensation Program effective May 1, 2017 (Exhibit 10.1 to the Quarterly Report on Form 10-Q of NCR Corporation for the quarter ended September 30, 2017). * |
| | |
| | NCR Corporation Deferred Compensation Plan (Exhibit 10.30 to 2020 Annual Report). * |
| | |
| | Employment Agreement, dated September 25, 2023, between David Wilkinson and NCR Corporation (Exhibit 10.17 to the Company’s Quarterly Report filed on November 14, 2023).* |
| | |
| | Amendment to Employment Agreement, dated March 13, 2024, between David Wilkinson and NCR Voyix Corporation (Exhibit 10.17.1 to the Annual Report on Form 10-K of NCR Voyix Corporation for the year ended December 31, 2023 (the “2023 Form 10-K”)). * |
| | |
| | Letter Agreement, dated June 9, 2023, between Brian Webb-Walsh and NCR Corporation (Exhibit 10.18 to the 2023 Form 10-K).* |
| | |
| | Amendment to Letter Agreement, dated March 13, 2024, between Brian Webb-Walsh and NCR Voyix Corporation (Exhibit 10.18.1 to the 2023 Form 10-K).* |
| | |
| | Letter Agreement, dated July 26, 2023, between Kelli Sterrett and NCR Corporation (Exhibit 10.19 to the 2023 Form 10-K).* |
| | |
| | Letter Agreement, dated October 21, 2016, between Eric Schoch and NCR Corporation (Exhibit 10.21 to the Annual Report on Form 10-K of NCR Voyix Corporation for the year ended December 31, 2023).* |
| | |
| | Amendment to Letter Agreement, dated September 15, 2023, between Eric Schoch and NCR Corporation (Exhibit 10.21.1 to the 2023 Form 10-K).* |
| | |
| | Amended and Restated Management Incentive Plan (Exhibit 10.1 to the Quarterly Report on Form 10-Q for the quarter ended June 30, 2024).* |
| | |
| | Offer Letter Agreement, dated May 8, 2024, between James G. Kelly and NCR Voyix Corporation (Exhibit 10.2 to the Quarterly Report on Form 10-Q for the quarter ended June 30, 2024).* |
| | |
| | Offer Letter Agreement, dated May 13, 2024, between Anthony Radesca and NCR Voyix Corporation (Exhibit 10.5 to the Quarterly Report on Form 10-Q for the quarter ended June 30, 2024).* |
| | |
| | Offer Letter, dated February 4, 2025, between the Company and James Kelly (Exhibit 10.1 to Current Report on Form 8-K of NCR Voyix Corporation dated February 5, 2025 (the “February 5, 2025 Form 8-K”). |
| | |
| | Separation Agreement and General Waiver and Release, dated February 4, 2025, between the Company and David Wilkinson (Exhibit 10.2 to the February 5, 2025 Form 8-K). |
| | |
| | NCR Voyix Director and Officer Form Indemnification Agreement |
| | |
| | Credit Agreement, dated as of September 27, 2023, among NCR Atleos LLC, NCR Atleos Escrow Corporation, the lenders party thereto, any foreign borrower party thereto and Bank of America, N.A., as administrative agent (Exhibit 10.1 to the September 28, 2023 8-K) |
| | |
| | | | | | | | |
| | Transition Services Agreement, dated as of October 16, 2023, by and between NCR Voyix Corporation and NCR Atleos Corporation (Exhibit 10.1 to the October 17, 2023 8-K) |
| | |
| | Tax Matters Agreement, dated as of October 16, 2023, by and between NCR Voyix Corporation and NCR Atleos Corporation (Exhibit 10.2 to the October 17, 2023 8-K) |
| | |
| | Employee Matters Agreement, dated as of October 16, 2023, by and between NCR Voyix Corporation and NCR Atleos Corporation (Exhibit 10.3 to the October 17, 2023 8-K) |
| | |
| | Patent and Technology Cross-License Agreement, dated as of October 16, 2023, by and between NCR Voyix Corporation and NCR Atleos Corporation (Exhibit 10.4 to the October 17, 2023 8-K) |
| | |
| | Trademark License and Use Agreement, dated as of October 16 ,2023, by and between NCR Voyix Corporation and NCR Atleos Corporation (Exhibit 10.5 to the October 17, 2023 8-K) |
| | |
| | Master Services Agreement, dated October 16, 2023, by and between NCR Voyix Corporation and Cardtronics USA, Inc. (Exhibit 10.6 to the October 17, 2023 8-K) |
| | |
| | Manufacturing Services Agreement, dated October 16, 2023, by and between NCR Voyix Corporation and Terafina Software Solutions Private Limited and NCR Corporation India Private Limited (Exhibit 10.7 to the October 17, 2023 8-K) |
| | |
| | Credit Agreement, dated as of October 16, 2023, by and between NCR Voyix Corporation, the foreign borrowers party thereto, the lenders and issuing banks party thereto and Bank of America, N.A., as administrative agent (Exhibit 10.8 to the October 17, 2023 8-K) |
| | |
| | Seventh Amendment dated as of August 31, 2023, among NCR Corporation, the lenders party thereto, and JPMorgan Chase Bank, N.A., as administrative agent (Exhibit 10.1 to the Company’s Current Report on Form 8-K filed on September 7, 2023) |
| | |
| | NCR Voyix Corporation Insider Trading Policy. |
| | |
| | Subsidiaries of the Registrant. |
| | |
| | Consent of Independent Registered Public Accounting Firm. |
| | |
| | Certification pursuant to Rule 13a-14(a) and Rule 15d-14(a) of the Securities Exchange Act of 1934. |
| |
| | Certification pursuant to Rule 13a-14(a) and Rule 15d-14(a) of the Securities Exchange Act of 1934. |
| |
| | Certification pursuant to 18 U.S.C. Section 1350 as adopted pursuant to Section 906 of the Sarbanes-Oxley Act of 2002. |
| |
| | NCR Voyix Corporation Clawback Policy (Exhibit 97 to the 2023 Form 10-K). |
| | |
| 101 | | The following materials from NCR Voyix Corporation’s Annual Report on Form 10-K for the year ended December 31, 2024, formatted in iXBRL (Inline Extensible Business Reporting Language): (i) consolidated statements of operations for the fiscal years ended December 31, 2024, 2023 and 2022; (ii) consolidated statements of comprehensive income for the fiscal years ended December 31, 2024, 2023 and 2022; (iii) consolidated balance sheets as of December 31, 2024 and 2023; (iv) consolidated statements of cash flows for the fiscal years ended December 31, 2024, 2023 and 2022; (v) consolidated statements of changes in stockholders’ equity for fiscal years ended December 31, 2024, 2023 and 2022; and (vi) the notes to the consolidated financial statements. |
| | |
| 104 | | Cover Page Interactive Data File, formatted in inline XBRL and contained in Exhibit 101. |
| | |
| | |
| | |
| | |
* Management contracts or compensatory plans/arrangements.
Item 16. FORM 10-K SUMMARY
None.
NCR Voyix Corporation
SCHEDULE II--VALUATION AND QUALIFYING ACCOUNTS
(In millions)
| | | | | | | | | | | | | | | | | | | | | | | | | | | | | | | | |
| Column A | | Column B | | Column C | | Column D | | Column E |
| | | | Additions | | | | |
| Description | | Balance at Beginning of Period | | Charged to Costs & Expenses | | Charged to Other Accounts | | Deductions | | Balance at End of Period |
| Year Ended December 31, 2024 | | | | | | | | | | |
| Allowance for doubtful accounts | | $29 | | $15 | | $— | | $18 | | $26 |
| Deferred tax asset valuation allowance | | $211 | | $29 | | $— | | $87 | | $153 |
| | | | | | | | | | |
| Year Ended December 31, 2023 | | | | | | | | | | |
| Allowance for doubtful accounts | | $18 | | $26 | | $— | | $15 | | $29 |
| Deferred tax asset valuation allowance | | $274 | | $25 | | $5 | | $93 | | $211 |
| | | | | | | | | | |
| Year Ended December 31, 2022 | | | | | | | | | | |
| Allowance for doubtful accounts | | $16 | | $15 | | $— | | $13 | | $18 |
| Deferred tax asset valuation allowance | | $225 | | $81 | | $14 | | $46 | | $274 |
| | | | | | | | | | |
| | | | | | | | | | |
| | | | | | | | | | |
| | | | | | | | | | |
SIGNATURES
Pursuant to the requirements of Section 13 or 15 (d) of the Securities Exchange Act of 1934, the registrant has duly caused this report to be signed on its behalf by the undersigned, thereunto duly authorized.
| | | | | | | | | | | | | | |
| | NCR CORPORATION |
| | | |
| Date: | February 27, 2025 | By: | | /s/ Brian Webb-Walsh |
| | | | Brian Webb-Walsh
Executive Vice President and Chief Financial Officer |
Pursuant to the requirements of the Securities Exchange Act of 1934, this report has been signed below by the following persons on behalf of the registrant and in the capacities and on the date indicated.
| | | | | | | | |
| Signature | Title |
| | |
| /s/ James Kelly | Chief Executive Officer and Director |
| James Kelly | (Principal Executive Officer) |
| | |
| /s/ Brian Webb-Walsh | Executive Vice President and Chief Financial Officer |
| Brian Webb-Walsh | (Principal Financial Officer) |
| | |
| /s/ Anthony Radesca | Chief Accounting Officer |
| Anthony Radesca | (Principal Accounting Officer) |
| | |
| /s/ Kevin Reddy | Independent Chair of the Board |
| Kevin Reddy | |
| | |
| /s/ Catherine L. Burke | Director |
| Catherine L. Burke | |
| | |
| /s/ Janet Haugen | Director |
| Janet Haugen | |
| | |
| /s/ Irv Henderson | Director |
| Irv Henderson | |
| | |
| /s/ Kirk Larsen | Director |
| Kirk Larsen | |
| | |
| /s/ Laura Miller | Director |
| Laura Miller | |
| | |
| /s/ Laura Sen | Director |
| Laura Sen | |
| | |
| Date: | February 27, 2025 | |