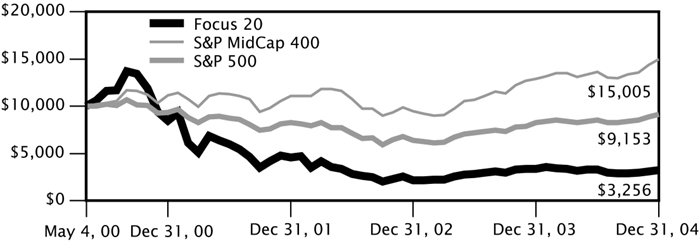
The Focus 20 Portfolio returned -2.99% for the twelve months ended December 31, 2004. This compares to 10.88% for the benchmark S&P 500 Index and 16.48% for the benchmark S&P MidCap 400 Index. (1)
The Portfolio underperformed in 2004 due to its lack of exposure to the Energy, Materials and Industrial sectors. These sectors benefited from the sharp rise in commodity prices that typically occurs in the early stages of an economic recovery. Oak does not manage the portfolio in relationship to a benchmark and, therefore, did not have exposure to these groups. Oak has avoided these sectors as we believe their performance is tied to the short-term rein-flation of commodities — something which is inconsistent with our 3-5 year investment time horizon.
Performance difference was also exacerbated by Oak’s overweight in technology compared to the benchmark. Within Technology, semiconductor stocks in particular weighed on performance as companies such as PMC-Sierra, Intersil and Xilinx suffered from inventory concerns following a robust 2003. Storage software vendor Veritas Software also hampered performance after the company reported weak second quarter sales. This announcement was not well received following recent management turnover in the company and concerns over their credibility. Veritas was ultimately sold from the Portfolio.
Additionally, despite being underweight in Health Care compared to the benchmark, weakness in Cardinal Health caused Oak’s Health Care weighting to underperform the benchmark. This drug distribution company has struggled not only with meeting earnings forecasts, but also with the transition to a fee-for-service business model. Pfizer also suffered after the FDA's concerns over the Cox-2 class of drugs dragged down the large-cap pharmaceutical companies.
On a positive note, online auctioneer eBay helped offset the weaknesses in Tech and Health Care by propelling the consumer discretionary sector performance significantly higher than the benchmark.
The holdings which most enhanced the return of the Portfolio included eBay, Inc., Juniper Networks, Inc., Electronic Arts, Inc., EMC Corp. and Dell, Inc.
The holdings which had the greatest negative impact on Portfolio performance included PMC-Sierra, Inc., Veritas Software Co., Intersil Corp., Xilinx, Inc. and Cardinal Health, Inc.
All of the names that detracted from performance were sold. They were not sold for the sole reason of poor performance but for better relative opportunities in some of the new names that we added to the portfolio.
We are optimistic about the economy and the stock market in 2005. For the first three quarters of 2004, the US equity markets suffered from concerns over the political elections, interest rate increases, possible inflation and their resulting impact on the economy. In 2005, investors will refocus on the potential for solid earnings growth, the end to the Federal Reserve’s interest rate tightening cycle and eventual reacceleration of earnings that might occur in 2006.
For the market as a whole, stocks appear rather attractive, particularly with long-term interest rates at low levels. With the ten-year Treasury yielding around 4.25%, there is certainly room for upside in stock multiples, which are currently trading at less than 17 times 2005 expected earnings per share. We believe growth stocks are especially attractive and should do well. The growth style of investing has underperformed a value discipline for five consecutive years. This type of trend eventually must reverse, and we would argue that the longer it takes to reverse, the more powerful the reversal will be when it occurs.
We expect the Fed to continue tightening interest rates but don’t necessarily see this leading to higher long-term rates. As a result, the yield curve may flatten. Normalizing the interest-rate environment ensures the Federal Reserve will maintain its ability to tweak the economy as needed.
Merger and acquisition activity, which has already picked up, should continue to be strong with corporate cash at high levels. This strong cash position could also lead to a jump in capital spending. Both of which benefit our financial holdings and technology stocks.
In our opinion, Technology remains the most attractive sector, given the long-term growth prospects of many of its sub-sectors. Technology is a broad area, and we continue to look for new areas of growth within the sector. In a very competitive global economy, businesses must seek to remain productive or risk succumbing to their competition. Technology companies remain key suppliers of productivity enhancing or cost-saving equipment that helps other companies achieve earnings growth in the tough global marketplace.
From our perspective, we think things look pretty good for 2005 and believe that the market could surprise some people.
Oak Associates, ltd.
The accompanying notes are an integral part of these financial statements.
40|86 Series Trust | |
Schedule of Investments | | December 31, 2004 |
| Focus 20 Portfolio | | |
SHARES OR PRINCIPAL AMOUNT | | VALUE |
| | |
Semiconductor & Semiconductor Equipment (11.8%) | |
| 3,500 | | Applied Materials, Inc. (a) | $ 59,850 |
| 1,600 | | Linear Technology Corp. | 62,016 |
| 1,500 | | Maxim Integrated Products, Inc. | 63,585 |
| | | | 185,451 |
| | | |
Software (13.3%) | | |
| 1,300 | | Electronic Arts, Inc. (a) | 80,184 |
| 2,300 | | Microsoft Corp. | 61,433 |
| 2,600 | | Symantec Corp. (a) | 66,976 |
| | | | 208,593 |
| | | Total common stocks (cost $1,398,771) | 1,494,580 |
| | | |
SHORT TERM INVESTMENTS (5.0%) | | |
| $ 70,000 | | AIM Liquid Asset Portfolio. | 70,000 |
| 8,000 | | Nations Treasury Reserve. | 8,000 |
| | | Total short term investments (cost $78,000) | 78,000 |
| | | | |
| | | Total investments (cost $1,476,771) (100.4%) | 1,572,580 |
| | | Liabilities in excess of other assets (0.4%) | (6,722) |
| | | Total net assets (100.0%) | $1,565,858 |
| | | | |
| | | | |
| (a) | Non-income producing security. |
The accompanying notes are an integral part of these financial statements.
40|86 Series Trust | |
| Portfolio Manager’s Review (unaudited) | | December 31, 2004 |
Equity Portfolio
How did the Portfolio perform relative to its benchmark?
The Equity Portfolio posted a return of 20.94% for the one year ending December 31, 2004. The benchmark S&P 500 Index returned 10.88% over the same period.(1)
What caused the variance in performance between the Portfolio and its benchmark?
After the benchmark’s 2003 28% total return, we consider 2004 to be a return to normalcy in terms of economic growth, earnings, and market performance. However, there were several emotional factors that made 2004 a tough year: re-emergence of the twin deficit story, weakening U.S. dollar, $55 crude oil (at peak), persistently depressing news from Iraq, and a contentious election. Throughout the year, we saw a pick-up in Mergers & Acquisitions and Initial Public Offering activity, as the global volume of announced mergers totaled $1.95 trillion, up 41% from 2003. Some 238 companies went public in 2004, up 180% from 2003, and $43.5 billion was raised. And last, low volatility was a theme that played throughout the year, as most indices traded in a tight range throughout the year. Of the three broad factors in our model (Value, Quality, Earnings Expectations), the Value factors, which include statistics such as price/earnings, price/book, price/cash flow, have provided the greatest amount of alpha this year. Earnings Expectation (Momentum) factors strengthened in the second half of the year.
Which portfolio holdings enhanced the Portfolio’s performance?
In terms of performance during the year, stock selection in Industrial, Technology, and Utility sectors were the largest contributors relative to the benchmark. The largest contributors relative to the benchmark were over-weight positions (relative to benchmark weight) in TXU Corp., Cree, Inc., and Adobe Systems, Inc.
Which holdings detracted from performance?
Within the Portfolio, stock selection in the Financial, Telecom, and Materials sectors detracted the most in 2004 relative to the benchmark. The largest detractors relative to the benchmark were an underweight position (relative to the benchmark weight) in Apple Computer, Inc., and overweight positions in Foundry Networks, Inc., and Cypress Semiconductor Corp.
What is your outlook for the next fiscal year?
For 2005, we believe that low volatility, and moderate economic and profit growth will be positive for the stock market. These elements lay the foundation for a rational market. In such an environment, investors tend to focus on long term fundamentals which bode well for our disciplined philosophy and process. Overall, our philosophy will not change based on short-term trends or conditions in the market. Our goal is to add value through security selection, while attempting to neutralize other risk factors, such as market timing and sector rotation, for which there is not adequate compensation by the market.
Chicago Equity Partners, LLC
40|86 Series Trust | |
| Portfolio Manager’s Review (unaudited) | | December 31, 2004 |
GROWTH OF $10,000
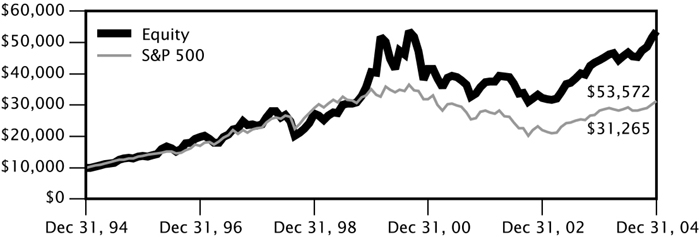
The growth of $10,000 chart is a comparison of the change in value of a $10,000 investment with dividends and capital gains reinvested for the 10-year period ended 12/31/04. Past performance is no guarantee of future results.
AVERAGE ANNUAL TOTAL RETURN(1) (as of 12/31/04)
| | | | 1 YEAR | | 5 YEARS | | 10 YEARS |
| Equity Portfolio | | | 20.94 | % | | 5.76 | % | | 18.28 | % |
| S&P 500 Index | | | 10.88 | % | | -2.29 | % | | 12.07 | % |
| (1) | Past performance does not guarantee future results. Your investment return and principal will fluctuate, and your shares may be worth more or less than their original cost. Total return is provided in accordance with SEC guidelines for comparative purposes and reflects certain contractual expense reimbursements through April 30, 2005. If the expense reimbursements were not in place, the portfolio's return would have been lower. The total returns shown do not include separate account expenses or the deduction of taxes that a contractholder would pay on portfolio distributions or the redemption of portfolio shares. The S&P 500 Index is an unmanaged index considered to be representative of the U.S. stock market in general. Investors cannot actually invest in an index. |
40|86 Series Trust | |
Schedule of Investments | December 31, 2004 |
| Equity Portfolio | |
SHARES OR PRINCIPAL AMOUNT | | VALUE |
| | | |
COMMON STOCKS (99.8%) | |
| | | |
Aerospace & Defense (0.7%) | |
| 28,400 | | Rockwell Collins, Inc. | $ 1,120,096 |
| | | |
Air Freight & Logistics (0.8%) | | |
| 29,800 | | Ryder System, Inc. | 1,423,546 |
| | | |
Auto Components (1.4%) | | |
| 22,900 | | Autoliv, Inc. | 1,106,070 |
| 21,700 | | BorgWarner, Inc. (b) | 1,175,489 |
| | | | 2,281,559 |
Beverages (0.7%) | | |
| 14,800 | | Constellation Brands, Inc. — Class A (a)(b) | 688,348 |
| 23,700 | | PepsiAmericas, Inc. | 503,388 |
| | | | 1,191,736 |
Biotechnology (1.9%) | | |
| 19,000 | | Charles River Laboratories International, Inc. (a)(b) | 874,190 |
| 19,500 | | Genzyme Corp. (a)(b) | 1,132,365 |
| 16,900 | | Invitrogen Corp. (a)(b) | 1,134,497 |
| | | | 3,141,052 |
Capital Markets (2.2%) | | |
| 40,000 | | SEI Investments Co. | 1,677,200 |
| 20,200 | | The Bear Stearns Companies Inc. (b) | 2,066,662 |
| | | | 3,743,862 |
Chemicals (2.9%) | | |
| 27,800 | | Ecolab, Inc. (b) | 976,614 |
| 23,700 | | PPG Industries, Inc. | 1,615,392 |
| 27,800 | | Praxair, Inc. | 1,227,370 |
| 19,000 | | Sigma-Aldrich Corp. (b) | 1,148,740 |
| | | | 4,968,116 |
Commercial Banks (5.7%) | | |
| 53,800 | | Associated Banc-Corp | 1,786,698 |
| 28,400 | | Comerica, Inc. (b) | 1,732,968 |
| 27,100 | | Hibernia Corp. | 799,721 |
| 32,600 | | Huntington Bancshares, Inc. (b) | 807,828 |
| 35,200 | | Marshall & Ilsley Corp. (b) | 1,555,840 |
| 44,600 | | Regions Financial Corp. | 1,587,314 |
| 21,700 | | UnionBanCal Corp. | 1,399,216 |
| | | | 9,669,585 |
Commercial Services & Supplies (2.0%) | | |
| 23,800 | | Copart, Inc. (a) | 626,416 |
| 12,900 | | Dun & Bradstreet Corp. (a) | 769,485 |
| 28,400 | | Republic Services, Inc. | 952,536 |
| 30,200 | | RR Donnelley & SonsCo. (b) | 1,065,758 |
| | | 3,414,195 |
The accompanying notes are an integral part of these financial statements.
40|86 Series Trust | |
Schedule of Investments | December 31, 2004 |
| Equity Portfolio | |
SHARES OR PRINCIPAL AMOUNT | | VALUE |
| | | |
Communications Equipment (1.9%) | |
| 25,100 | | Harris Corp. | $ 1,550,929 |
| 44,700 | | Polycom, Inc. (a) | 1,042,404 |
| 19,400 | | Scientific-Atlanta, Inc. (b) | 640,394 |
| | | | 3,233,727 |
Computers & Peripherals (3.0%) | | |
| 12,200 | | Lexmark International, Inc. (a) | 1,037,000 |
| 25,100 | | NCR Corp. (a) | 1,737,673 |
| 18,900 | | QLogic Corp. (a) | 694,197 |
| 36,600 | | Storage Technology Corp. (a) | 1,156,926 |
| 48,300 | | Western Digital Corp. (a) | 523,572 |
| | | | 5,149,368 |
Consumer Finance (0.8%) | | |
| 57,700 | | AmeriCredit Corp. (a)(b) | 1,410,765 |
| | | |
Containers & Packaging (0.4%) | | |
| 23,000 | | Bemis Co. | 669,070 |
| | | |
Diversified Financial Services (2.2%) | | |
| 52,800 | | CIT Group, Inc. | 2,419,296 |
| 14,800 | | Moody's Corp. | 1,285,380 |
| | | | 3,704,676 |
Diversified Telecommunication Services (0.7%) | | |
| 22,400 | | Commonwealth Telephone Enterprises, Inc. (a) | 1,112,384 |
| | | |
Electric Utilities (4.4%) | | |
| 108,000 | | PG&E Corp. (a)(b) | 3,594,240 |
| 60,300 | | TXU Corp. (b) | 3,892,968 |
| | | | 7,487,208 |
Electronic Equipment & Instruments (1.1%) | | |
| 29,100 | | Avnet, Inc. (a)(b) | 530,784 |
| 34,900 | | Ingram Micro, Inc. (a) | 725,920 |
| 41,300 | | Vishay Intertechnology, Inc. (a) | 620,326 |
| | | | 1,877,030 |
Energy Equipment & Services (1.6%) | | |
| 31,800 | | Baker Hughes, Inc. | 1,356,906 |
| 48,900 | | Varco International, Inc. (a) | 1,425,435 |
| | | | 2,782,341 |
Food & Staples Retailing (1.3%) | | |
| 27,800 | | Albertson's, Inc. (b) | 663,864 |
| 43,300 | | Supervalu, Inc. (b) | 1,494,716 |
| | | | 2,158,580 |
The accompanying notes are an integral part of these financial statements.
40|86 Series Trust | |
Schedule of Investments | December 31, 2004 |
| Equity Portfolio | |
SHARES OR PRINCIPAL AMOUNT | | VALUE |
| | | |
Food Products (1.5%) | |
| 16,300 | | Hershey Foods Corp. | $ 905,302 |
| 88,700 | | Tyson Foods, Inc. (b) | 1,632,080 |
| | | | 2,537,382 |
Health Care Equipment & Supplies (2.9%) | | |
| 10,800 | | Bausch & Lomb, Inc. (b) | 696,168 |
| 19,600 | | Becton, Dickinson & Co. | 1,113,280 |
| 16,300 | | C.R. Bard, Inc. | 1,042,874 |
| 33,900 | | Cytyc Corp. (a) | 934,623 |
| 34,700 | | Thermo Electron Corp. (a) | 1,047,593 |
| | | | 4,834,538 |
Health Care Providers & Services (4.8%) | | |
| 21,700 | | Aetna, Inc. | 2,707,075 |
| 12,100 | | AmerisourceBergen Corp. (b) | 710,028 |
| 35,900 | | Apria Healthcare Group, Inc. (a)(b) | 1,182,905 |
| 30,800 | | Coventry Health Care, Inc. (a) | 1,634,864 |
| 23,700 | | Laboratory Corp Of America Holdings (a) | 1,180,734 |
| 20,350 | | Renal Care Group, Inc. (a) | 732,397 |
| | | | 8,148,003 |
Hotels Restaurants & Leisure (2.6%) | | |
| 43,000 | | Caesars Entertainment, Inc. (a)(b) | 866,020 |
| 58,200 | | Darden Restaurants, Inc. | 1,614,468 |
| 33,700 | | GTECH Holdings Corp. | 874,515 |
| 21,300 | | Yum! Brands, Inc. | 1,004,934 |
| | | | 4,359,937 |
Household Durables (3.6%) | | |
| 14,900 | | Fortune Brands, Inc. | 1,149,982 |
| 4,600 | | NVR, Inc. (a)(b) | 3,539,240 |
| 14,900 | | The Black & Decker Corp. (b) | 1,316,117 |
| | | | 6,005,339 |
Household Products (0.6%) | | |
| 17,600 | | Clorox Co. | 1,037,168 |
| | | |
Insurance (4.3%) | | |
| 33,100 | | Allmerica Financial Corp. (a) | 1,086,673 |
| 43,300 | | American Financial Group Inc. | 1,355,723 |
| 32,500 | | Genworth Financial, Inc. | 877,500 |
| 18,300 | | Lincoln National Corp. | 854,244 |
| 31,100 | | Protective Life Corp. | 1,327,659 |
| 32,500 | | Safeco Corp. (b) | 1,697,800 |
| | | | 7,199,599 |
IT Services (1.7%) | | |
| 14,200 | | Affiliated Computer Services, Inc. (a)(b) | 854,698 |
| 35,200 | | Computer Sciences Corp. (a)(b) | 1,984,224 |
| | | | 2,838,922 |
The accompanying notes are an integral part of these financial statements.
40|86 Series Trust | |
Schedule of Investments | December 31, 2004 |
| Equity Portfolio | |
SHARES OR PRINCIPAL AMOUNT | | VALUE |
| | | |
Leisure Equipment & Products (1.9%) | |
| 35,900 | | Eastman Kodak Co. (b) | $ 1,157,775 |
| 29,800 | | Polaris Industries, Inc. (b) | 2,026,996 |
| | | | 3,184,771 |
Machinery (2.3%) | | |
| 20,900 | | Cummins, Inc. (b) | 1,751,211 |
| 25,675 | | Paccar, Inc. | 2,066,324 |
| | | | 3,817,535 |
Media (2.2%) | | |
| 44,400 | | Harte-Hanks, Inc. (b) | 1,153,512 |
| 13,500 | | McClatchy Co. | 969,435 |
| 44,900 | | Valassis Communications, Inc. (a) | 1,571,949 |
| | | | 3,694,896 |
Metals & Mining (2.2%) | | |
| 51,400 | | Nucor Corp. (b) | 2,690,276 |
| 10,800 | | Phelps Dodge Corp. (b) | 1,068,336 |
| | | | 3,758,612 |
Multiline Retail (2.5%) | | |
| 35,900 | | Federated Department Stores | 2,074,661 |
| 36,100 | | J.C. Penney Co. Inc. Holding Co. | 1,494,540 |
| 11,500 | | Sears Roebuck and Co. | 586,845 |
| | | | 4,156,046 |
Multi-Utilities & Unregulated Power (3.8%) | | |
| 104,700 | | Oneok, Inc. | 2,975,574 |
| 37,900 | | Questar Corp. | 1,931,384 |
| 114,400 | | Reliant Energy, Inc. (a)(b) | 1,561,560 |
| | | | 6,468,518 |
Oil & Gas (3.2%) | | |
| 10,800 | | Amerada Hess Corp. (b) | 889,704 |
| 18,300 | | Newfield Exploration Co. (a) | 1,080,615 |
| 27,800 | | Pogo Producing Co. | 1,348,022 |
| 47,600 | | Valero Energy Corp. | 2,161,040 |
| | | | 5,479,381 |
Paper & Forest Products (0.5%) | | |
| 23,800 | | MeadWestvaco Corp. | 806,582 |
| | | |
Pharmaceuticals (1.1%) | | |
| 37,600 | | Eon Labs, Inc. (a) | 1,015,200 |
| 45,400 | | Perrigo Co. | 784,058 |
| | | | 1,799,258 |
The accompanying notes are an integral part of these financial statements.
40|86 Series Trust | |
Schedule of Investments | December 31, 2004 |
| Equity Portfolio | |
SHARES OR PRINCIPAL AMOUNT | | VALUE |
| | | |
Real Estate (5.9%) | |
| 23,000 | | AvalonBay Communities, Inc. | $ 1,731,900 |
| 20,200 | | CBL & Associates Properties, Inc. | 1,542,270 |
| 49,700 | | General Growth Properties, Inc. | 1,797,152 |
| 144,000 | | HRPT Properties Trust | 1,847,520 |
| 27,100 | | LNR Property Corp. (b) | 1,704,861 |
| 27,800 | | Mack-Cali Realty Corp. | 1,279,634 |
| | | | 9,903,337 |
Road & Rail (1.5%) | | |
| 34,500 | | Burlington Northern Santa Fe Corp. | 1,632,195 |
| 19,000 | | JB Hunt Transport Services, Inc. | 852,150 |
| | | | 2,484,345 |
Semiconductor & Semiconductor Equipment (3.0%) | | |
| 69,100 | | Cree, Inc. (a)(b) | 2,769,528 |
| 100,500 | | MEMC Electronic Materials, Inc. (a) | 1,331,625 |
| 52,100 | | National Semiconductor Corp. (b) | 935,195 |
| | | | 5,036,348 |
Software (3.3%) | | |
| 33,200 | | Activision, Inc. (a) | 669,976 |
| 61,600 | | Adobe Systems, Inc. | 3,864,784 |
| 29,800 | | Autodesk, Inc. | 1,130,910 |
| | | | 5,665,670 |
Specialty Retail (4.5%) | | |
| 40,600 | | Abercrombie & Fitch Co. — Class A | 1,906,170 |
| 47,900 | | American Eagle Outfitters (b) | 2,256,090 |
| 53,600 | | Circuit City Stores, Inc. | 838,304 |
| 24,800 | | RadioShack Corp. | 815,424 |
| 16,400 | | Rent-A-Center, Inc. (a) | 434,600 |
| 29,800 | | The Sherwin-Williams Co. | 1,329,974 |
| | | | 7,580,562 |
Textiles, Apparel & Luxury Goods (1.0%) | | |
| 15,600 | | Coach, Inc. (a) | 879,840 |
| 12,900 | | Timberland Co. (a) | 808,443 |
| | | | 1,688,283 |
Thrifts & Mortgage Finance (0.7%) | | |
| 19,000 | | Astoria Financial Corp. (b) | 759,430 |
| 14,200 | | IndyMac Bancorp, Inc. (b) | 489,190 |
| | | | 1,248,620 |
Tobacco (0.8%) | | |
| 16,900 | | Reynolds American, Inc. (b) | 1,328,340 |
The accompanying notes are an integral part of these financial statements.
40|86 Series Trust | |
Schedule of Investments | December 31, 2004 |
| Equity Portfolio | |
SHARES OR PRINCIPAL AMOUNT | | VALUE |
| | | |
Trading Companies & Distributors (1.1%) |
| 20,400 | | Hughes Supply, Inc. | $ 659,940 |
| 18,800 | | W.W. Grainger, Inc. | 1,252,456 |
| | | | 1,912,396 |
Wireless Telecommunication Services (0.6%) |
| 33,400 | | Western Wireless Corp. (a) | 978,620 |
| | | Total common stocks (cost $130,538,845) | 168,491,904 |
| |
INVESTMENTS PURCHASED WITH CASH PROCEEDS FROM SECURITIES LENDING (22.4%) |
| $ 1,800,000 | | Amsterdam Funding Commercial Paper, 2.355%, due 01/25/2005 | 1,796,801 |
| 2,000,000 | | AIG Sunamerica Global Finance XXV Note, 2.550% due 03/11/2005 | 2,002,717 |
| 1,500,000 | | Bank of Ireland Commercial Paper, 2.352%, due 01/12/2005 | 1,498,923 |
| 17,629,000 | | Bank of New York Institutional Cash Reserve Fund | 17,629,000 |
| 1,800,000 | | Clipper Receivables Corp. Commercial Paper, 2.356%, due 01/28/2005 | 1,796,445 |
| 1,800,000 | | Fairway Finance Corp. Commercial Paper, 2.355%, due 01/20/2005 | 1,797,393 |
| 1,500,000 | | Ivory Funding Corp. Commercial Paper, 2.364%, due 01/25/2005 | 1,497,334 |
| 1,800,000 | | Liberty Street Funding Corp. Commercial Paper, 2.355%, due 01/28/2005 | 1,796,445 |
| 1,800,000 | | Mane Funding Corp. Commercial Paper, 2.355%, due 01/20/2005 | 1,797,439 |
| 915,000 | | Three Pillars Funding Inc. Commercial Paper, 2.354%, due 01/26/2005 | 913,314 |
| 1,000,000 | | TIAA Global Markets Note, 2.203%, due 01/13/2005 | 1,005,343 |
| 1,500,000 | | Wells Fargo Bank Certificate of Deposit, 2.350%, due 01/28/2005 | 1,500,000 |
| 1,000,000 | | White Pine Finance Note, 2.413%, due 01/20/2005 | 999,940 |
| 1,800,000 | | Windmill Funding Corp. Commercial Paper, 2.355%, due 01/24/2005 | 1,796,918 |
| | | Total investments purchased with cash proceeds from securities lending (cost $37,828,012) | 37,828,012 |
| |
SHORT TERM INVESTMENTS (0.3%) |
| 568,000 | | AIM Liquid Asset Portfolio | 568,000 |
| | | Total short term investments (cost $568,000) | 568,000 |
| | | | |
| | | Total investments (cost $168,934,857) (122.5%) | 206,887,916 |
| | | Liabilities in excess of other assets (22.5%) | (37,986,926) |
| | | Total net assets (100.0%) | $168,900,990 |
| | | | |
| (a) | Non-income producing security. |
| (b) | Securities (partial/entire) out on loan. |
The accompanying notes are an integral part of these financial statements.
40|86 Series Trust | |
Portfolio Managers’ Review (unaudited) | December 31, 2004 |
Balanced Portfolio
How did the Portfolio perform relative to its benchmarks?
The Balanced Portfolio posted a return of 10.84% for the one year ended December 31, 2004. The benchmarks, the S&P 500 Index and the Lehman Brothers Government/Credit Index, returned 10.88% and 4.19%, respectively. (1)
What caused the variance in performance between the Portfolio and its benchmarks?
After 2003, we consider 2004 to be a return to normalcy in terms of economic growth, earnings, and market performance on the equity side. However, there were several emotional factors that made 2004 a tough year: re-emergence of the twin deficit story, weakening U.S. dollar, $55 crude oil (at peak), persistently depressing news from Iraq, and a contentious election. Throughout the year, we saw a pick-up in Mergers & Acquisitions (“M&A”) and Initial Public Offering activity, as the global volume of announced mergers totaled $1.95 trillion, up 41% from 2003. Some 238 companies went public in 2004, up 180% from 2003, and $43.5 billion was raised. And last, low volatility was a theme that played throughout the year, as most indices traded in a tight range throughout the year. Of the three broad factors in our model (Value, Quality, Earnings Expectations), the Value factors, which include statistics such as price/earnings, price/book, price/cash flow, have provided the greatest amount of alpha this year. Earnings Expectation (Momentum) factors strengthened in the second half of the year.
For the fixed income portion of the Portfolio, we maintained a short duration bias and a barbell structure in the portfolio versus the benchmark, which included holding an above average cash position. This helped the performance of the portfolio as the yield curve flattened during the fourth quarter. The yield differential between the 2-year Treasury note and the 30-year Treasury bond reduced from 229 bps to 176 bps in the fourth quarter. The High Yield sector was the best performing sector by far, followed by the Credit sector and the Mortgage-Backed Security (“MBS”) sector. However, the underweight to the MBS sector hurt the performance.
Which portfolio holdings enhanced the Portfolio’s performance?
In terms of equity performance during the year, stock selection in Utility, Financial, and Consumer Staples sectors were the largest contributors relative to the benchmark. The largest contributors relative to the benchmark were over-weight positions (relative to benchmark weight) in TXU Corp., Adobe Systems, Inc. and Tyco International Ltd.
On the fixed income side, holdings that enhanced the Portfolio’s performance for the period were Time Warner Inc., Sprint Capital Corp., Comcast Corp. and Nextel Communication.
Which holdings detracted from performance?
Within the Portfolio, stock selection in the Telecom, Health Care, and Technology sectors detracted the most in 2004 relative to the index. The largest detractors relative to the benchmark were an under-weight position (relative to the benchmark weight) in General Electric and over-weight positions in Merck & Co. and Pfizer.
On the fixed income side, holdings that detracted from the Portfolio’s performance for the period include General Motors and Health Care REIT, Inc.
What is your outlook for the next fiscal year?
On the equity side, we believe that low volatility, and moderate economic and profit growth will be positive for the stock market in 2005. These elements lay the foundation for a rational market. In such an environment, investors tend to focus on long term fundamentals which bode well for our disciplined philosophy and process. Overall, our philosophy will not change based on short-term trends or conditions in the market. Our goal is to add value through security selection, while attempting to neutralize other risk factors, such as market timing and sector rotation, for which there is not adequate compensation by the market.
On the fixed income side of the Portfolio, low bond yields and a range bound interest rate environment suggest that investors are still concerned about the economy. However, this is inconsistent with the performance of the stock market, commodity prices, and business surveys. As we interpret economic data and investor sentiment during 2005, we will draw on several themes, which we describe below.
| · | The Yield Curve Will Continue to Flatten — The Fed will continue to raise short-term interest rates until Fed Funds reach a more normalized rate (between 3.0 and 3.5%). Short-term interest rates will rise faster than long-term interest rates resulting in a flatter yield curve. In this environment, investors will be rewarded more for investing in a portfolio that owns a combination of long and short maturities (such as the 2-year and 30-year U.S. Treasury bonds) rather than a similar duration portfolio that owns one security (such as the 10-year U.S. Treasury note). |
| · | Credit Risk Is Overvalued — Credit spreads are at the tightest levels we have seen since 1996 and 1997. With the improvement in credit fundamentals, corporations now have excess cash flow that needs to be put to work. We are seeing an increase in stock buy-backs, special dividends, and M&As. These are all negative for corporate credit. Even though corporate default rates are at their lowest levels in 20 years, all the good news may be behind us. We remain concerned with the deterioration in the domestic |
40|86 Series Trust | |
Portfolio Managers’ Review (unaudited) | December 31, 2004 |
auto sector and will continue to view the debt of GeneralMotors and Ford as short-term holdings over the coming year.With the contraction in credit spreads, we are looking for everyopportunity to move up in credit quality. Avoiding credit blowupswill be extremely important to outperforming the benchmarkin 2005. Expect to see lower excess returns in all spreadsectors for 2005.
| · | Interest Rates Will Rise in 2005 — The yield on the 30-yearU.S. Treasury finished the year pretty much where it started, inspite of tighter monetary policy, healthy productivity gains,high consumer and government debt levels, and strong realGross Domestic Product (GDP) growth. While we still believeinterest rates are too low, given the rate of domestic growth, ourcapital markets are still attractive for foreign investors on aglobal basis. At some point, economic fundamentals will matterand interest rates will rise. Our portfolio strategies willcontinue to recognize a range bound market and a bias towardrising rates. Expect to see more callable bonds in the Portfolio.In a range bound interest rate environment, callable bonds willoutperform. |
| · | Inflation Will Inch Higher — During 2003, the Fed orchestratedthe lowest levels of short-term interest rates seen in fifty years.An acceleration in inflation often results from an overly stimulativemonetary policy. However, slack resources, excess capacity,and slow wage growth will contain any pick-up in inflation.Excess global capital and strong retirement investment by agingpopulations will help keep interest rates from rising too much.In the fourth quarter of 2004, we saw a pick-up in the ConsumerPrice Index (CPI) to 3.5%. During 2004, Treasury InflationProtected Securities (TIPS) outperformed other Treasury securitiesas expectations for inflation increased. We expect TIPS tocontinue to outperform in 2005, and we will be looking foropportunities to add TIPS selectively to the Portfolio during theyear. |
| · | The Financial Markets Eventually Will Need to Reprice Risk —Low levels of interest rates over the past several years havehelped compress risk spreads across the major asset sectors. Asan example, high yield bond spreads are marginally wider thaninvestment grade spreads. At some point, probably sometimein 2005, the market will be forced to reprice risk. The result willbe significant underperformance to the risk sectors over a shortperiod of time. The challenge portfolio managers face, is to bepatient enough to stick to a discipline designed to control portfoliovolatility. |
Once again we are at an interesting time in our financial markethistory. Financial assets, including bonds and equities, appearovervalued by almost every measure. At some point, the financialmarkets will reprice the level of risk in the bond markets, causinga dislocation that will impair performance and liquidity. Weexpect 2005 to be a difficult year for financial assets. While a bullishoutlook is always more pleasant to the reader, we believe thatour job is to directly communicate a realistic view of the opportunitiesand risks inherent in the financial markets.
Gregory J. Hahn, CFA Chicago Equity Partners, LLC
Chief Investment Officer
40|86 Advisors, Inc.
40|86 Series Trust | |
| Portfolio Manager’s Review (unaudited) | | December 31, 2004 |
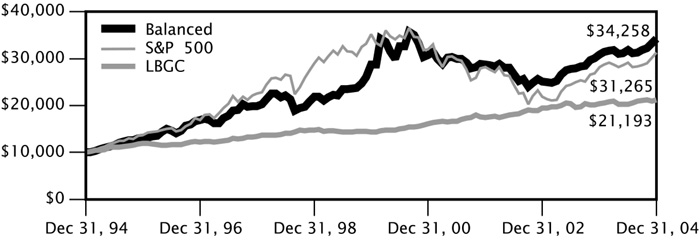
The growth of $10,000 chart is a comparison of the change in value of a $10,000 investment with dividends and capital gains reinvested for the 10-year period ended 12/31/04. Past performance is no guarantee of future results.
AVERAGE ANNUAL TOTAL RETURN(1) (as of 12/31/04)
| | | | 1 YEAR | | 5 YEARS | | 10 YEARS |
| Balanced Portfolio | | | 10.84 | % | | 3.59 | % | | 13.10 | % |
| S&P 500 Index | | | 10.88 | % | | -2.29 | % | | 12.07 | % |
| LBGC Index | | | 4.19 | % | | 8.00 | % | | 7.80 | % |
| (1) | Past performance does not guarantee future results. Your investment return and principal will fluctuate, and your shares may be worth more or less than their original cost. Total return is provided in accordance with SEC guidelines for comparative purposes and reflects certain contractual expense reimbursements through April 30, 2005. If the expense reimbursements were not in place, the portfolio's return would have been lower. The total returns shown do not include separate account expenses or the deduction of taxes that a contractholder would pay on portfolio distributions or the redemption of portfolio shares. The S&P 500 Index is an unmanaged index considered to be representative of the U.S. stock market in general. The Lehman Brothers Government/Credit ("LBGC") Index is an unmanaged index considered to be representative of government and corporate fixed-rate debt issues in general. Investors cannot actually invest in an index. |
40|86 Series Trust | |
Schedule of Investments | December 31, 2004 |
| Balanced Portfolio | |
| |
SHARES OR PRINCIPAL AMOUNT | | VALUE |
| | |
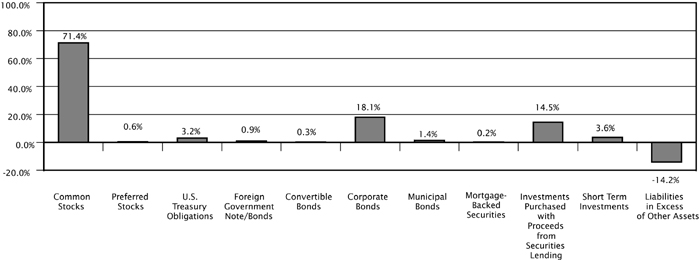
COMMON STOCKS (71.4%) | |
Aerospace & Defense (1.2%) | |
| 2,4002,400 | | General Dynamics Corp. | $ 251,040 |
| 5,600 | | Northrop Grumman Corp. (e) | 304,416 |
| | | | 555,456 |
Air Freight & Logistics (0.6%) | | |
| 6,300 | | Ryder System, Inc. | 300,951 |
| | | |
Automobiles (0.5%) | | |
| 16,000 | | Ford Motor Co. | 234,240 |
| | | |
Beverages (1.4%) | | |
| 900 | | Adolph Coors Co. — Class B (e) | 68,103 |
| 4,600 | | Constellation Brands, Inc. — Class A (a)(e) | 213,946 |
| 6,860 | | PepsiCo, Inc. | 358,092 |
| | | | 640,141 |
Biotechnology (1.3%) | | |
| 4,800 | | Amgen, Inc. (a) | 307,920 |
| 600 | | Cephalon, Inc. (a)(e) | 30,528 |
| 2,300 | | Charles River Laboratories International, Inc. (a) | 105,823 |
| 2,900 | | Genentech, Inc. (a) | 157,876 |
| | | | 602,147 |
Building Products (0.5%) | | |
| 6,200 | | Masco Corp. (e) | 226,486 |
| | | |
Capital Markets (2.4%) | | |
| 3,500 | | The Bear Stearns Companies Inc. (e) | 358,085 |
| 2,500 | | The Goldman Sachs Group, Inc. | 260,100 |
| 4,700 | | Merrill Lynch & Co, Inc. | 280,919 |
| 5,600 | | SEI Investments Co. | 234,808 |
| | | | 1,133,912 |
Chemicals (1.2%) | | |
| 6,100 | | PPG Industries, Inc. | 415,776 |
| 2,100 | | Sigma-Aldrich Corp. (e) | 126,966 |
| | | | 542,742 |
| | | |
Commercial Banks (5.4%) | | |
| 23,600 | | Bank of America Corp. | 1,108,964 |
| 4,100 | | Comerica, Inc. | 250,182 |
| 5,200 | | Huntington Bancshares, Inc. | 128,856 |
| 6,900 | | KeyCorp. | 233,910 |
| 15,500 | | Wachovia Corp. | 815,300 |
| | | | 2,537,212 |
| | | |
Commercial Services & Supplies (0.3%) | | |
| 1,795 | | Apollo Group, Inc. (a)(e) | 144,875 |
The accompanying notes are an integral part of these financial statements.
40|86 Series Trust | |
Schedule of Investments | December 31, 2004 |
| Balanced Portfolio |
SHARES OR PRINCIPAL AMOUNT | | VALUE |
| | |
Communications Equipment (2.3%) | |
| 24,770 | | Cisco Systems, Inc. (a) | $ 478,061 |
| 1,900 | | Harris Corp. | 117,401 |
| 13,600 | | Motorola, Inc. | 233,920 |
| 4,400 | | QUALCOMM, Inc. | 186,560 |
| 1,400 | | Scientific-Atlanta, Inc. | 46,214 |
| | | | 1,062,156 |
Communications Services (2.4%) | | |
| 19,300 | | AT&T Corp. (e) | 367,858 |
| 12,400 | | Sprint Corp. | 308,140 |
| 11,200 | | Verizon Communications, Inc. | 453,712 |
| | | | 1,129,710 |
Computers & Peripherals (2.9%) | | |
| 11,300 | | Dell, Inc. (a) | 476,182 |
| 16,288 | | Hewlett-Packard Co. | 341,559 |
| 2,250 | | International Business Machines Corp. | 221,805 |
| 1,300 | | Lexmark International, Inc. (a) | 110,500 |
| 1,900 | | NCR Corp. (a) | 131,537 |
| 2,100 | | Qlogic Corp. (a) | 77,133 |
| | | | 1,358,716 |
Consumer Finance (0.6%) | | |
| 3,600 | | Capital One Financial Corp. (e) | 303,156 |
| | | |
Diversified Financial Services (2.6%) | | |
| 4,100 | | CIT Group, Inc. | 187,862 |
| 7,132 | | Citigroup, Inc. (e) | 343,620 |
| 4,840 | | J.P. Morgan Chase & Co. | 188,808 |
| 4,200 | | Moody’s Corp. | 364,770 |
| 3,400 | | Principal Financial Group, Inc. | 139,196 |
| | | | 1,224,256 |
Electric Utilities (1.6%) | | |
| 11,700 | | TXU Corp. (e) | 755,352 |
| | | |
Electronic Equipment & Instruments (1.8%) | | |
| 6,300 | | Ingram Micro, Inc. (a) | 131,040 |
| 17,600 | | Tyco International Ltd. (c)(e) | 629,024 |
| 5,300 | | Vishay Intertechnology, Inc. (a) | 79,606 |
| | | | 839,670 |
Energy Equipment & Services (0.5%) | | |
| 5,000 | | Baker Hughes, Inc. | 213,350 |
| | | |
Food & Staples Retailing (0.6%) | | |
| 2,400 | | CVS Corp. | 108,168 |
| 5,500 | | Supervalu, Inc. | 189,860 |
| | | | 298,028 |
The accompanying notes are an integral part of these financial statements.
40|86 Series Trust | |
Schedule of Investments | December 31, 2004 |
| Balanced Portfolio |
SHARES OR PRINCIPAL AMOUNT | | VALUE |
| | |
Food Products (1.0%) | |
| 4,000 | | Hershey Foods Corp. | $ 222,160 |
| 12,200 | | Tyson Foods, Inc. | 224,480 |
| | | | 446,640 |
Health Care Equipment & Supplies (1.5%) | | |
| 5,200 | | Becton, Dickinson & Co. | 295,360 |
| 4,100 | | C.R. Bard, Inc. | 262,318 |
| 3,200 | | Varian Medical Systems, Inc. (a) | 138,368 |
| | | | 696,046 |
Health Care Providers & Services (1.9%) | | |
| 1,500 | | AmerisourceBergen Corp. | 88,020 |
| 3,650 | | Coventry Health Care, Inc. (a) | 193,742 |
| 9,500 | | Humana, Inc. (a) | 282,055 |
| 3,600 | | Laboratory Corp Of America Holdings (a) | 179,352 |
| 3,696 | | Medco Health Solutions, Inc. (a) | 153,754 |
| | | | 896,923 |
Hotels Restaurants & Leisure (1.3%) | | |
| 7,100 | | Darden Restaurants, Inc. | 196,954 |
| 13,000 | | McDonald’s Corp. | 416,780 |
| | | | 613,734 |
Household Durables (0.5%) | | |
| 1,600 | | Fortune Brands, Inc. | 123,488 |
| 170 | | NVR, Inc. (a)(e) | 130,798 |
| | | | 254,286 |
Household Products (0.6%) | | |
| 2,100 | | Clorox Co. | 123,753 |
| 3,000 | | Procter & Gamble Co. | 165,240 |
| | | | 288,993 |
Industrial Conglomerates (1.3%) | | |
| 8,200 | | Textron, Inc. | 605,160 |
| | | |
Insurance (3.0%) | | |
| 11,400 | | The Allstate Corp. | 589,608 |
| 6,800 | | Genworth Financial, Inc. | 183,600 |
| 2,900 | | Lincoln National Corp. | 135,372 |
| 6,600 | | Metlife, Inc. | 267,366 |
| 4,300 | | Prudential Financial, Inc. | 236,328 |
| | | | 1,412,274 |
IT Services (0.7%) | | |
| 6,100 | | Computer Sciences Corp. (a) | 343,857 |
| | | |
Machinery (1.0%) | | |
| 3,600 | | Cummins, Inc. (e) | 301,644 |
| 4,900 | | Graco, Inc. | 183,015 |
| | | | 484,659 |
The accompanying notes are an integral part of these financial statements.
40|86 Series Trust | |
Schedule of Investments | December 31, 2004 |
| Balanced Portfolio |
SHARES OR PRINCIPAL AMOUNT | | VALUE |
| | |
Media (3.3%) | |
| 2,600 | | Harte-Hanks, Inc. | $ 67,548 |
| 3,525 | | The McGraw-Hill Companies, Inc. | 322,679 |
| 19,330 | | Time Warner, Inc. (a) | 375,775 |
| 9,200 | | Viacom, Inc. — Class B. | 334,788 |
| 15,700 | | The Walt Disney Co. | 436,460 |
| | | | 1,537,250 |
Metals & Mining (0.4%) | | |
| 3,700 | | Nucor Corp. | 193,658 |
| | | |
Multiline Retail (1.2%) | | |
| 4,800 | | Federated Department Stores. | 277,392 |
| 5,800 | | JC Penney Co Inc Holding Co. | 240,120 |
| 900 | | Sears Roebuck and Co. | 45,927 |
| | | | 563,439 |
Multi-Utilities & Unregulated Power (0.9%) | | |
| 8,900 | | Oneok, Inc. (e) | 252,938 |
| 2,900 | | Questar Corp. | 147,784 |
| | | | 400,722 |
Oil & Gas (4.1%) | | |
| 2,900 | | Amerada Hess Corp. | 238,902 |
| 5,300 | | Burlington Resources, Inc. | 230,550 |
| 9,734 | | ChevronTexaco Corp. | 511,132 |
| 9,840 | | Exxon Mobil Corp. | 504,399 |
| 2,900 | | Newfield Exploration Co. (a) | 171,245 |
| 4,900 | | Occidental Petroleum Corp. | 285,964 |
| | | | 1,942,192 |
Paper & Forest Products (0.7%) | | |
| 12,600 | | Louisiana-Pacific Corp. | 336,924 |
| | | |
Personal Products (0.9%) | | |
| 3,400 | | Avon Products, Inc. | 131,580 |
| 6,600 | | The Gillette Co. | 295,548 |
| | | | 427,128 |
Pharmaceuticals (4.7%) | | |
| 2,400 | | Eon Labs, Inc. (a) | 64,800 |
| 4,100 | | Forest Laboratories, Inc. (a)(e) | 183,926 |
| 16,480 | | Johnson & Johnson. | 1,045,161 |
| 29,540 | | Pfizer, Inc. | 794,331 |
| 3,000 | | Wyeth. | 127,770 |
| | | | 2,215,988 |
Photographic Equipment And Supplies (0.2%) | | |
| 2,800 | | Eastman Kodak Co. | 90,300 |
The accompanying notes are an integral part of these financial statements.
40|86 Series Trust | |
Schedule of Investments | December 31, 2004 |
| Balanced Portfolio |
SHARES OR PRINCIPAL AMOUNT | | VALUE |
| | |
Real Estate Investment Trusts (1.2%) | |
| 900 | | AvalonBay Communities, Inc. | $ 67,770 |
| 5,400 | | CarrAmerica Realty Corp. | 178,200 |
| 9,100 | | General Growth Properties, Inc. | 329,056 |
| | | | 575,026 |
Road & Rail (0.4%) | | |
| 4,300 | | JB Hunt Transport Services, Inc. | 192,855 |
| | | |
Semiconductor & Semiconductor Equipment (1.8%) | | |
| 1,900 | | Cree, Inc. (a)(e) | 76,152 |
| 23,880 | | Intel Corp. | 558,553 |
| 9,700 | | MEMC Electronic Materials, Inc. (a) | 128,525 |
| 5,100 | | National Semiconductor Corp. (e) | 91,545 |
| | | | 854,775 |
Software (3.1%) | | |
| 7,000 | | Adobe Systems, Inc. | 439,180 |
| 22,140 | | Microsoft Corp. | 591,359 |
| 30,300 | | Oracle Corp. (a) | 415,716 |
| | | | 1,446,255 |
Specialty Retail (2.5%) | | |
| 4,500 | | Abercrombie & Fitch Co. — Class A (e) | 211,275 |
| 10,000 | | Circuit City Stores, Inc. (e) | 156,400 |
| 16,490 | | Home Depot, Inc. | 704,783 |
| 4,700 | | Limited Brands | 108,194 |
| | | | 1,180,652 |
Textiles, Apparel & Luxury Goods (0.1%) | | |
| 1,100 | | Timberland Co. (a) | 68,937 |
| | | |
Thrifts & Mortgage Finance (1.3%) | | |
| 3,998 | | Countrywide Financial Corp. | 147,966 |
| 4,300 | | Freddie Mac. | 316,910 |
| 2,200 | | Golden West Financial Corp. | 135,124 |
| | | | 600,000 |
Tobacco (1.1%) | | |
| 6,610 | | Altria Group, Inc. | 403,871 |
| 1,400 | | Reynolds American, Inc. (e) | 110,040 |
| | | | 513,911 |
Trading Companies & Distributors (0.6%) | | |
| 4,500 | | W.W. Grainger, Inc. | 299,790 |
| | | Total common stocks (cost $27,585,694) | 33,584,930 |
The accompanying notes are an integral part of these financial statements.
40|86 Series Trust | |
Schedule of Investments | December 31, 2004 |
| Balanced Portfolio |
SHARES OR PRINCIPAL AMOUNT | | VALUE |
| | |
PREFERRED STOCKS (0.6%) | |
Communications Services (0.4%) | |
| 145 | | Centaur Funding Corp., (b) Cost — $171,062; Acquired — 07/22/2003 (a) | $ 191,355 |
| | | |
Men's And Boy's Clothing And Furnishings (0.2%) | | |
| 4,000 | | Tommy Hilfiger USA, 9.000%, due 12/01/2031 | 102,320 |
| | | Total preferred stocks (cost $273,002) | 293,675 |
| | | |
U.S. TREASURY OBLIGATIONS (3.2%) | | |
| $ 465,000 | | 3.500%, due 12/15/2009 (e) | 462,893 |
| 465,000 | | 4.250%, due 11/15/2014 (e) | 466,362 |
| 525,000 | | 5.375%, due 02/15/2031 (e) | 567,862 |
| | | Total U.S. treasury obligations (cost $1,498,258) | 1,497,117 |
| | | |
FOREIGN GOVERNMENT NOTE/BONDS (0.9%) | | |
| 155,000 | | Export-Import Bank of Korea, 4.500%, due 08/12/2009 (c) | 156,489 |
| 205,000 | | United Mexican States, 9.875%, due 02/01/2010 (c) | 252,457 |
| | | Total foreign government note/bonds (cost $411,940) | 408,946 |
| | | |
CONVERTIBLE BONDS (0.3%) | | |
Electronic Equipment & Instruments (0.3%) | | |
| 280,000 | | Celestica, Inc., 0.000%, due 08/01/2020 (c)(d) | 156,100 |
| | | Total convertible bonds (cost $137,808) | 156,100 |
| | | |
CORPORATE BONDS (18.1%) | | |
Aircraft (0.3%) | | |
| 150,000 | | Boeing Capital Corp., 4.750%, due 08/25/2008 (e) | 155,266 |
| | | |
Apparel (0.1%) | | |
| 55,000 | | Jones Apparel Group Inc ., 5.125%, due 11/15/2014, (b) Cost — $54,954; Acquired — 11/17/2004 | 54,620 |
| | | |
Automobiles (0.7%) | | |
| 200,000 | | General Motors Corp., 7.125%, due 07/15/2013 (e) | 204,992 |
| 100,000 | | General Motors Corp., 8.375%, due 07/15/2033 (e) | 103,895 |
| | | | 308,887 |
Chemicals (1.0%) | | |
| 80,000 | | Lyondell Chemical Co., 11.125%, due 07/15/2012 | 95,400 |
| 190,000 | | Terra Capital, Inc., 12.875%, due 10/15/2008 | 238,450 |
| 120,000 | | Union Carbide Corp., 6.790%, due 06/01/2025 (e) | 122,700 |
| | | | 456,550 |
The accompanying notes are an integral part of these financial statements.
40|86 Series Trust | |
Schedule of Investments | December 31, 2004 |
| Balanced Portfolio |
SHARES OR PRINCIPAL AMOUNT | | VALUE |
| | |
Communications Services (2.6%) | |
| $ 365,000 | | British Telecommunications PLC, 7.875%, due 12/15/2005 (c) | $ 380,778 |
| 155,000 | | Charter Communications, Inc., 8.000%, due 04/30/2012, (b) Cost — $155,180; Acquired — 04/21/2004 | 161,975 |
| 105,000 | | DirecTV Holdings LLC, 8.375%, due 03/15/2013 | 118,256 |
| 100,000 | | Echostar DBS Corp., 6.625%, due 10/01/2014, (b) Cost — $99,118; Acquired — 09/20/2004 | 101,750 |
| 125,000 | | News America, Inc., 6.200%, due 12/15/2034, (b) Cost — $124,000; Acquired — 11/30/2004 | 127,123 |
| 190,000 | | Sprint Capital Corp., 6.875%, due 11/15/2028 | 208,644 |
| 84,000 | | TELUS Corp., 8.000%, due 06/01/2011 (c) | 99,675 |
| | | | 1,198,201 |
Containers & Packaging (0.9%) | | |
| 375,000 | | Owens-Brockway, 8.875%, due 02/15/2009 | 409,219 |
| | | |
Electric And Other Services Combined (0.4%) | | |
| 195,000 | | Pacific Gas & Electric Co., 6.050%, due 03/01/2034. | 203,236 |
| | | |
Electronic Equipment & Instruments (0.9%) | | |
| 35,000 | | Jabil Circuit, Inc., 5.875%, due 07/15/2010 (e) | 36,885 |
| 70,000 | | Nortel Networks Ltd., 6.125%, due 02/15/2006 (c)(e) | 71,575 |
| 100,000 | | Tyco International Group SA, 6.000%, due 11/15/2013 (c) | 109,135 |
| 200,000 | | Tyco International Group SA, 6.875%, due 01/15/2029 (c) | 229,819 |
| | | | 447,414 |
Food Products (0.6%) | | |
| 280,000 | | Kraft Foods, Inc., 5.250%, due 10/01/2013 | 288,581 |
| | | |
Health Care Equipment & Supplies (0.8%) | | |
| 105,000 | | Guidant Corp., 6.150%, due 02/15/2006 | 108,308 |
| 270,000 | | Hillenbrand Industries, Inc., 4.500%, due 06/15/2009 | 273,408 |
| | | | 381,716 |
Health Care Providers & Services (0.4%) | | |
| 45,000 | | AmerisourceBergen Corp., 7.250%, due 11/15/2012 | 50,512 |
| 155,000 | | Service Corp International, 6.875%, due 10/01/2007 | 162,169 |
| | | | 212,681 |
Hotels Restaurants & Leisure (0.9%) | | |
| 150,000 | | Caesars Entertainment, Inc., 8.125%, due 05/15/2011 | 174,000 |
| 77,500 | | Carnival Corp., 6.150%, due 04/15/2008 (c) | 83,071 |
| 155,000 | | Hyatt Equities LLC, 6.875%, due 06/15/2007, (b) Cost — $154,804; Acquired — 06/12/2002 | 163,173 |
| | | | 420,244 |
Household Durables (0.9%) | | |
| 175,000 | | KB Home, 5.750%, due 02/01/2014 | 174,125 |
| 240,000 | | NVR, Inc., 5.000%, due 06/15/2010 (e) | 241,200 |
| | | | 415,325 |
Insurance (0.6%) | | |
| 60,000 | | Assured Guaranty US Holdings, Inc., 7.000%, due 06/01/2034 | 66,059 |
| 60,000 | | Liberty Mutual Group, 5.750%, due 03/15/2014, (b) Cost — $59,072; Acquired — 11/15/2004 | 59,091 |
| 225,000 | | RenaissanceRe Holdings Ltd., 7.000%, due 07/15/2008 (c) | 243,675 |
| | | | 368,825 |
The accompanying notes are an integral part of these financial statements.
40|86 Series Trust | |
Schedule of Investments | December 31, 2004 |
| Balanced Portfolio |
SHARES OR PRINCIPAL AMOUNT | | VALUE |
| | |
Liquefied Petroleum Gas Dealers (0.2%) | |
| $ 87,020 | | Ras Laffan Liquefied Natural Gas Co. Ltd., 3.437%, due 09/15/2009 (b) Cost — $85,653; Acquired — 07/02/2004 (c) | $ 85,542 |
| | | | |
Media (0.5%) | | |
| 200,000 | | Quebecor Media, Inc., 11.125%, due 07/15/2011 (c) | 229,500 |
| | | |
Miscellaneous Retail Stores (0.2%) | | |
| 75,000 | | JC Penney Co Inc., 8.000%, due 03/01/2010 | 86,062 |
| | | |
National Commercial Banks (0.1%) | | |
| 40,000 | | Union Planters Bank NA, 6.500%, due 03/15/2018 | 43,216 |
| | | |
Natural Gas Transmission (0.3%) | | |
| 110,000 | | Southern Natural Gas Co., 8.875%, due 03/15/2010 (e) | 123,750 |
| | | |
Paper & Forest Products (0.7%) | | |
| 95,000 | | Boise Cascade LLC, 7.125%, due 10/15/2014, (b) Cost — $95,000; Acquired — 10/15/2004 | 100,937 |
| 180,000 | | Georgia-Pacific Corp., 7.700%, due 06/15/2015 | 206,550 |
| | | | 307,487 |
Personal Credit Institutions (0.4%) | | |
| 200,000 | | Household Finance Corp., 4.125%, due 11/16/2009 | 199,142 |
| | | |
Photographic Equipment And Supplies (0.4%) | | |
| 170,000 | | Eastman Kodak Co., 7.250%, due 06/15/2005 (e) | 172,965 |
| | | |
Radiotelephone Communications (0.2%) | | |
| 75,000 | | L-3 Communications Corp., 5.875%, due 01/15/2015, (b) Cost — $75,188; Acquired — 11/02/2004 | 75,187 |
| | | |
Real Estate Investment Trusts (1.9%) | | |
| 70,000 | | Colonial Realty Limited Partnership, 6.250%, due 06/15/2014 | 73,716 |
| 250,000 | | Health Care REIT, Inc., 7.500%, due 08/15/2007 | 270,650 |
| 215,000 | | Hospitality Properties Trust, 6.750%, due 02/15/2013 | 237,777 |
| 55,000 | | iStar Financial, Inc., 8.750%, due 08/15/2008 | 62,767 |
| 200,000 | | Senior Housing Properties Trust, 8.625%, due 01/15/2012 | 229,500 |
| | | | 874,410 |
Refuse Systems (0.7%) | | |
| 120,000 | | Allied Waste North America, 8.875%, due 04/01/2008 | 129,000 |
| 200,000 | | Waste Management Inc., 7.000%, due 05/15/2005 | 202,102 |
| | | | 331,102 |
Special Purpose Entity (0.2%) | | |
| 119,656 | | PLC Trust, 2.709%, due 03/31/2006, (b) Cost — $119,656; Acquired — 12/12/2003 | 119,187 |
| | | |
Steel Foundries (0.1%) | | |
| 65,000 | | International Steel Group, Inc., 6.500%, due 04/15/2014 | 70,037 |
| | | |
Wireless Telecommunication Services (1.1%) | | |
| 155,000 | | AT&T Wireless Services, Inc., 8.750%, due 03/01/2031 | 209,626 |
| 270,000 | | Nextel Communications, Inc., 6.875%, due 10/31/2013 | 294,300 |
| | | | 503,926 |
| | | Total corporate bonds (cost $8,015,665) | 8,542,278 |
The accompanying notes are an integral part of these financial statements.
40|86 Series Trust | |
Schedule of Investments | December 31, 2004 |
| Balanced Portfolio |
SHARES OR PRINCIPAL AMOUNT | | VALUE |
| | |
MUNICIPAL BONDS (1.4%) | |
| $ 190,000 | | California County TOB Securitization Agency, 7.500%, due 06/01/2019 | $ 192,926 |
| 180,716 | | Louisiana Tobacco Settlement Financing Corp., 6.360%, due 05/15/2025 | 178,112 |
| 175,000 | | Rhode Island Tobacco Settlement Financing Corp., 5.920%, due 06/01/2012. | 174,417 |
| 140,922 | | South Dakota Educational Enhancement Funding Corp., 6.720%, due 06/01/2025 | 135,416 |
| | | Total municipal bonds (cost $688,007) | 680,871 |
| | | |
MORTGAGE BACKED SECURITIES (0.2%) | | |
| 72,159 | | First Union National Bank Commercial Mortgage, Series # 1999-C4 A1, 7.184%, due 12/15/2031 | 76,013 |
| | | Total mortgage backed securities (cost $72,462) | 76,013 |
| | | |
INVESTMENTS PURCHASED WITH CASH PROCEEDS FROM SECURITIES LENDING (14.5%) | | |
| 300,000 | | Amsterdam Funding Commercial Paper, 2.355%, due 01/25/2005 | 299,467 |
| 200,000 | | AIG Sunamerica Global Finance XXV Note, 2.550% due 03/11/2005 | 200,272 |
| 300,000 | | Atlantic Asset Securitization Commercial Paper, due 01/24/2005 | 299,486 |
| 200,000 | | Bank of Ireland Commercial Paper, 2.352%, due 01/12/2005. | 199,856 |
| 3,417,000 | | Bank of New York Institutional Cash Reserve Fund | 3,417,000 |
| 300,000 | | Clipper Receivables Corp. Commercial Paper, 2.356%, due 01/28/2005 | 299,408 |
| 300,000 | | Fairway Finance Corp. Commercial Paper, 2.355%, due 01/20/2005 | 299,565 |
| 300,000 | | Ivory Funding Corp. Commercial Paper, 2.364%, due 01/25/2005 | 299,467 |
| 300,000 | | Liberty Street Funding Corp. Commercial Paper, 2.355%, due 01/28/2005 | 299,408 |
| 300,000 | | Mane Funding Corp. Commercial Paper, 2.355%, due 01/20/2005 | 299,573 |
| 300,000 | | Three Pillars Funding Inc. Commercial Paper, 2.354%, due 01/26/2005 | 299,447 |
| 300,000 | | Wells Fargo Bank Certificate of Deposit, 2.350%, due 01/28/2005. | 300,000 |
| 300,000 | | Windmill Funding Corp. Commercial Paper, 2.355%, due 01/24/2005 | 299,486 |
| | | Total investments purchased with cash proceeds from securities lending (cost $6,812,435) | 6,812,435 |
| | | |
SHORT TERM INVESTMENTS (3.6%) | | |
| 1,678,000 | | AIM Liquid Asset Portfolio. | 1,678,000 |
| | | Total short term investments (cost $1,678,000) | 1,678,000 |
| | | | |
| | | Total investments (cost $47,173,271) (114.2%) | 53,730,365 |
| | | Liabilities in excess of other assets (14.2%) | (6,674,229) |
| | | Total net assets (100.0%) | $47,056,136 |
___________
| (a) | Non-income producing security. |
| (b) | Restricted under Rule 144A of the Securities Act of 1933. |
| (c) | Foreign security or a U.S. security of a foreign company. |
| (d) | Zero Coupon — Bonds that make no interest payments. |
| (e) | Securities (partial/entire) out on loan. |
The accompanying notes are an integral part of these financial statements.
40|86 Series Trust | |
Portfolio Managers’ Review (unaudited) | December 31, 2004 |
High Yield Portfolio
How did the Portfolio perform relative to its benchmark?
The High Yield Portfolio returned 10.69% for the twelve months ended December 31, 2004. This compares to 10.87% for the benchmark
Merrill Lynch High Yield Master II Index. (1)
What caused the variance in performance between the Portfolio and its benchmark?
During 2004, Portfolio performance was driven in large part by our migration to high single B and low BB rated securities starting at the
beginning of the second half of the year. In addition, our bottom-up research efforts resulted in excellent relative value credit selections during
the year.
What portfolio holdings enhanced the Portfolio’s performance?
For the twelve months ended December 31, 2004, Portfolio performance was driven by our holdings in the Energy, Wireless Communications
and the Leisure sectors, specifically El Paso Production Holdings, Starwood Hotels, Hilton Hotels, Airgate PCS and Qwest Communications.
Which holdings detracted from performance?
For the twelve months ended December 31, 2004, Portfolio performance was negatively impacted by investments in the Technology
and Homebuilder sectors, specifically Amkor Technologies, William Lyons Homes, and Hovnanian Enterprises.
What is your outlook for the next fiscal year?
We anticipate that interest rates will continue to rise during 2005, although the rate of increase will be slow and the amount, potentially modest except for short-term rates. As a result of this environment, we don’t expect that we will see inflows into fixed income products and most likely will continue to experience outflows that started in mid-2004. Higher interest rates and investment outflows will put pressure on high yield returns during 2005.
Investors may recall in our semi-annual report we described our plan of action to mitigate the potential impact of increasing interest rates. We moved from a barbell approach, meaning that we had a portion of high quality, lower yield investments also known as "crossover" credits on one end, and higher risk, high yield credits on the other. The plan we implemented was a general migration to the middle of the high yield market or high single B and low BB credits.
Our strategy has worked well and we intend to maintain this plan going into 2005 for several reasons. First, we believe higher interest rates will negatively impact crossover issuers, as they are more likely to trade on spread and not dollar price. Secondly, we believe that lower quality issuers will be negatively impacted by the higher costs of capital, lowering earnings and, in turn, a decline in credit quality.
We have selected credits in the middle of the high yield market based on the recommendations of our credit research team. We focused on those credits that have stronger balance sheets, manageable maturity schedules, and positive business prospects. Specifically, these include Blount Inc., HealthSouth Corporation, Chesapeake Energy Corp., and Boise Cascade Corp. Our intensive credit process historically has served us well. As we enter a period of rising interest rates, credit selection based on bottom-up analysis will continue to guide our investment decisions. Our proprietary portfolio structuring tools help us measure risk and return as compared to our performance benchmark to help ensure that we focus on relative value. We believe this will continue to deliver competitive risk adjusted returns over time.
| Gregory J. Hahn, CFA | Leo J. Dierckman |
| Chief Investment Officer | Second Vice President |
| 40|86 Advisors, Inc. | 40|86 Advisors, Inc. |
The accompanying notes are an integral part of these financial statements.
40|86 Series Trust | |
| Portfolio Manager’s Review (unaudited) | | December 31, 2004 |
GROWTH OF $10,000
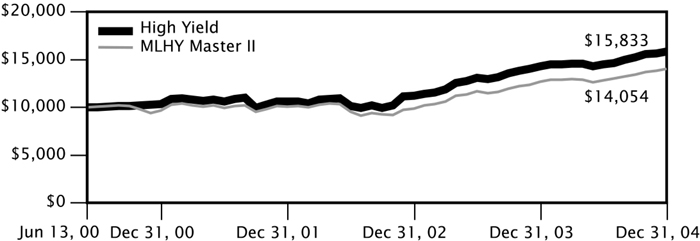
The growth of $10,000 chart is a comparison of the change in value of a $10,000 investment with dividends and capital gains reinvested for the period from inception of the Portfolio through 12/31/04. Past performance is no guarantee of future results.
AVERAGE ANNUAL TOTAL RETURN(1) (as of 12/31/04)
| | | | 1 YEAR | | 5 YEARS | | SINCE INCEPTION |
| High Yield Portfolio | | | 10.69 | % | | n/a | | | 10.63 | % |
| MLHY Master II Index | | | 10.87 | % | | n/a | | | 7.71 | % |
| (1) | The inception date of this portfolio was June 13, 2000. Past performance does not guarantee future results. Your investment return and principal will fluctuate, and your shares may be worth more or less than their original cost. Total return is provided in accordance with SEC guidelines for comparative purposes and reflects certain contractual expense reimbursements through April 30, 2005. If the expense reimbursements were not in place, the portfolio's return would have been lower. The total returns shown do not include separate account expenses or the deduction of taxes that a contractholder would pay on portfolio distributions or the redemption of portfolio shares. The Merrill Lynch High Yield ("MLHY") Master II Index is an unmanaged market capitalization weighted index of all domestic and Yankee high yield bonds. Investors cannot actually invest in an index. |
40|86 Series Trust | |
Schedule of Investments | December 31, 2004 |
| High Yield Portfolio | |
SHARES OR PRINCIPAL AMOUNT | | | | VALUE |
| |
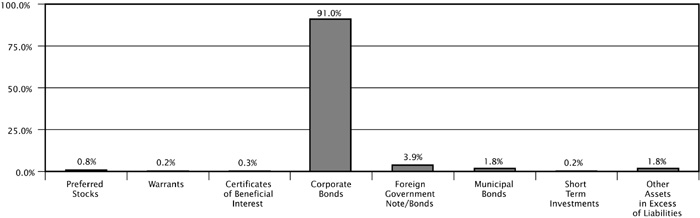
PREFERRED STOCKS (0.8%) |
Men’s And Boy’s Clothing And Furnishings (0.8%) |
| 2,768 | | Tommy Hilfiger USA, 9.000%, due 12/01/2031 | | $ 70,806 |
| | | Total preferred stocks (cost $69,222) | | 70,806 |
| |
WARRANTS (0.2%) |
| 121 | | Huntsman LLC, (b) Cost — $5,972; Acquired — 07/02/2004 (a) | | 20,232 |
| | | Total warrants (cost $5,972) | | 20,232 |
| |
CERTIFICATES OF BENEFICIAL INTEREST (0.3%) |
| 89,915 | | 1989 US Airways ETC, (b) Cost — $5,311; Acquired — 06/10/2004 (a)(f)(g) | | 2,698 |
| 89,915 | | 1989 US Airways ETC, (b) Cost — $5,311; Acquired — 06/10/2004 (a)(f)(g) | | 2,698 |
| 89,915 | | 1989 US Airways ETC, (b) Cost — $5,311; Acquired — 06/10/2004 (a)(f)(g) | | 2,698 |
| 89,915 | | 1989 US Airways ETC, (b) Cost — $5,311; Acquired — 06/10/2004 (a)(f)(g) | | 2,698 |
| 89,915 | | 1989 US Airways ETC, (b) Cost — $5,310; Acquired — 06/10/2004 (a)(f)(g) | | 2,697 |
| 89,915 | | 1989 US Airways ETC, (b) Cost — $5,310; Acquired — 06/10/2004 (a)(f)(g) | | 2,697 |
| 89,915 | | 1989 US Airways ETC, (b) Cost — $5,310; Acquired — 06/10/2004 (a)(f)(g) | | 2,697 |
| 89,915 | | 1989 US Airways ETC, (b) Cost — $5,310; Acquired — 06/10/2004 (a)(f)(g) | | 2,697 |
| 89,915 | | 1989 US Airways ETC, (b) Cost — $5,310; Acquired — 06/10/2004 (a)(f)(g) | | 2,697 |
| 89,915 | | 1989 US Airways ETC, (b) Cost — $5,310; Acquired — 06/10/2004 (a)(f)(g) | | 2,697 |
| 89,915 | | 1989 US Airways ETC, (b) Cost — $5,310; Acquired — 06/10/2004 (a)(f)(g) | | 2,697 |
| | | Total certificates of beneficial interest (cost $58,414) | | 29,671 |
CORPORATE BONDS (91.0%) |
Aerospace & Defense (0.8%) |
| $ 70,000 | | DRS Technologies, Inc., 6.875%, due 11/01/2013 | | 73,500 |
| |
Air-conditioning And Warm Air Heating Equipment And Commercial (2.9%) |
| 155,000 | | Goodman Global Hldgs, Inc., 7.875%, due 12/15/2012, (b) Cost — $155,000; Acquired — 12/15/2004 | | 154,225 |
| 95,000 | | THL Buildco, Inc., 8.500%, due 09/01/2014, (b) Cost — $95,000; Acquired — 08/12/2004 | | 99,750 |
| | | | | 253,975 |
| |
Building Products (0.6%) |
| 50,000 | | Jacuzzi Brands, Inc., 9.625%, due 07/01/2010 | | 55,750 |
| |
Chemicals (3.6%) |
| 100,000 | | Huntsman International LLC, 7.375%, due 01/01/2015, (b) Cost — $100,000; Acquired — 12/03/2004 | | 100,750 |
| 75,000 | | Lyondell Chemical Co., 11.125%, due 07/15/2012 | | 89,438 |
| 70,000 | | Rockwood Specialties Group, Inc., 10.625%, due 05/15/2011 | | 80,850 |
| 40,000 | | Terra Capital, Inc., 12.875%, due 10/15/2008 | | 50,200 |
| | | | | 321,238 |
| |
| |
Commercial Services & Supplies (1.7%) |
| 145,000 | | Adesa, Inc., 7.625%, due 06/15/2012 | | 153,700 |
| |
Communications Services (9.9%) |
| 105,000 | | Charter Communications, 8.375%, due 04/30/2014, (b) Cost — $106,575; Acquired — 11/05/2004 | | 111,300 |
| 100,000 | | Cincinnati Bell, Inc., 8.375%, due 01/15/2014 | | 101,750 |
| 105,000 | | Echostar DBS Corp., 6.625%, due 10/01/2014, (b) Cost — $104,074; Acquired — 09/20/2004 | | 106,837 |
| 60,000 | | Fairpoint Communications, Inc., 12.500%, due 05/01/2010 | | 65,100 |
The accompanying notes are an integral part of these financial statements.
40|86 Series Trust | |
Schedule of Investments | December 31, 2004 |
| High Yield Portfolio | |
SHARES OR PRINCIPAL AMOUNT | | | | VALUE |
| |
Communications Services (continued) |
| $ 105,000 | | Innova S de RL, 9.375%, due 09/19/2013 (c) | | $ 119,962 |
| 94,000 | | PanAmSat Corp., 9.000%, due 08/15/2014, (b) Cost — $94,000; Acquired — 08/02/2004 | | 105,398 |
| 110,000 | | Qwest Communications International, 7.250%, due 02/15/2011, (b) Cost — $109,326; Acquired — 01/30/2004 | | 113,300 |
| 45,000 | | Superior Essex Communications, 9.000%, due 04/15/2012 | | 46,575 |
| 110,000 | | Warner Music Group, 7.375%, due 04/15/2014, (b) Cost — $108,655; Acquired — 04/01/2004 & 07/21/2004 | | 113,300 |
| | | | | 883,522 |
| | | | | |
Computers & Peripherals (0.7%) |
| 60,000 | | UNOVA, Inc., 7.000%, due 03/15/2008 | | 61,950 |
| |
Construction Materials (1.5%) |
| 120,000 | | US Concrete, Inc., 8.375%, due 04/01/2014 | | 129,900 |
| |
Containers & Packaging (2.6%) |
| 100,000 | | Owens-Brockway, 8.250%, due 05/15/2013 | | 110,500 |
| 110,000 | | Stone Container Finance Holdings, 7.375%, due 07/15/2014 (c) | | 117,700 |
| | | | | 228,200 |
Electric Services (3.0%) |
| 75,000 | | Midwest Generation LLC, 8.560%, due 01/02/2016 | | 83,297 |
| 55,000 | | Nevada Power Co., 5.875%, due 01/15/2015, (b) Cost — $55,000; Acquired — 11/09/2004 | | 55,688 |
| 20,000 | | Reliant Energy, Inc., 6.750%, due 12/15/2014 | | 19,975 |
| 100,000 | | Texas Genco LLC, 6.875%, due 12/15/2014, (b) Cost — $100,000; Acquired — 12/08/2004 | | 103,875 |
| | | | | 262,835 |
Electronic Equipment & Instruments (4.5%) |
| 75,000 | | Celestica, Inc., 7.875%, due 07/01/2011 (c) | | 80,812 |
| 105,000 | | Flextronics International Ltd., 6.250%, due 11/15/2014, (b) Cost — $105,000; Acquired — 11/09/2004 (c) | | 104,475 |
| 100,000 | | IPC Acquisition Corp., 11.500%, due 12/15/2009 | | 110,000 |
| 90,000 | | ITT Corp., 7.375%, due 11/15/2015 | | 100,575 |
| | | | | 395,862 |
General Contractors (2.6%) |
| 160,000 | | Blount, Inc., 8.875%, due 08/01/2012 | | 174,400 |
| 55,000 | | William Lyon Homes, Inc., 7.625%, due 12/15/2012, (b) Cost — $55,000; Acquired — 11/15/2004 | | 53,969 |
| | | | | 228,369 |
Health Care Equipment & Supplies (2.9%) |
| 43,000 | | HMP Equity Holdings Corp., 0.000%, due 05/15/2008 (e) | | 28,649 |
| 110,000 | | Fisher Scientific International, 6.750%, due 08/15/2014, (b) Cost — $110,225; Acquired — 07/22/2004 | | 118,525 |
| 105,000 | | Universal Hospital Services, Inc., 10.125%, due 11/01/2011 | | 109,725 |
| | | | | 256,899 |
Health Care Providers & Services (2.5%) |
| 50,000 | | Healthsouth Corp., 7.375%, due 10/01/2006 | | 51,375 |
| 110,000 | | Healthsouth Corp., 10.750%, due 10/01/2008 | | 116,600 |
| 55,000 | | Omnicare, Inc., 6.125%, due 06/01/2013 | | 55,550 |
| | | | | 223,525 |
The accompanying notes are an integral part of these financial statements.
40|86 Series Trust | |
Schedule of Investments | December 31, 2004 |
| High Yield Portfolio | |
SHARES OR PRINCIPAL AMOUNT | | | | VALUE |
| |
Hotels, Restaurants, & Leisure (8.2%) |
| $ 90,000 | | Caesars Entertainment, Inc., 8.125%, due 05/15/2011 | | $ 104,400 |
| 80,000 | | Hilton Hotels Corp., 7.500%, due 12/15/2017 | | 93,736 |
| 95,000 | | Host Marriott LP, 7.000%, due 08/15/2012, (b) Cost — $93,620; Acquired — 07/27/2004 | | 100,938 |
| 80,000 | | MGM Mirage, 8.500%, due 09/15/2010 | | 91,400 |
| 105,000 | | Pinnacle Entertainment, Inc., 8.250%, due 03/15/2012 | | 112,087 |
| 95,000 | | Vail Resorts, Inc., 6.750%, due 02/15/2014 | | 97,138 |
| 125,000 | | Wynn Las Vegas LLC, 6.625%, due 12/01/2014, (b) Cost — $124,276; Acquired — 12/17/2004 | | 124,375 |
| | | | | 724,074 |
Household Products (1.3%) |
| 45,000 | | Church & Dwight, Inc., 6.000%, due 12/15/2012, (b) Cost — $45,000; Acquired — 12/15/2004 | | 46,012 |
| 60,000 | | Rayovac Corp., 8.500%, due 10/01/2013 | | 66,900 |
| | | | | 112,912 |
Leisure Equipment & Products (1.0%) |
| 85,000 | | K2, Inc., 7.375%, due 07/01/2014, (b) Cost — $86,913; Acquired — 07/28/2004 | | 93,500 |
| |
Machinery (0.7%) |
| 60,000 | | Terex Corp., 7.375%, due 01/15/2014 | | 64,650 |
| |
Manufacturing Industries (0.4%) |
| 35,000 | | Polypore, Inc., 8.750%, due 05/15/2012 | | 36,750 |
| |
Mechanical Power Transmission Equipment (0.3%) |
| 23,000 | | Rexnord Corp., 10.125%, due 12/15/2012 | | 26,105 |
| | | | | |
Media (3.8%) | | | | |
| 80,000 | | Cablevision Systems Corp., 8.000%, due 04/15/2012, (b) Cost — $80,000; Acquired — 03/30/2004 | | 85,800 |
| 110,000 | | Insight Communications Co, Inc., 0.000%/12.500%, due 02/15/2011 (d) | | 107,525 |
| 85,000 | | Sinclair Broadcast Group, Inc., 8.000%, due 03/15/2012 | | 90,737 |
| 45,000 | | Sun Media Corp., 7.625%, due 02/15/2013 (c) | | 49,331 |
| | | | | 333,393 |
Miscellaneous Fabricated Products (0.7%) |
| 55,000 | | FastenTech, Inc., 11.500%, due 05/01/2011, (b) Cost — $60,897; Acquired — 07/27/2004 | | 63,525 |
| |
Motor Vehicle Supplies And New Parts (1.3%) |
| 10,000 | | Cooper-Standard Automotive, Inc., 7.000%, due 12/15/2012, (b) Cost — $10,000; Acquired — 12/16/2004 | | 10,200 |
| 35,000 | | Cooper-Standard Automotive, Inc., 8.375%, due 12/15/2014, (b) Cost — $35,000; Acquired — 12/16/2004 | | 35,087 |
| 60,000 | | United Components, Inc., 9.375%, due 06/15/2013 | | 65,400 |
| | | | | 110,687 |
Offices Of Holding Companies (0.3%) |
| 25,000 | | Affinia Group, Inc., 9.000%, due 11/30/2014, (b) Cost — $25,000; Acquired — 11/12/2004 | | 26,187 |
| |
Oil & Gas (4.3%) |
| 45,000 | | Chesapeake Energy Corp., 6.375%, due 06/15/2015, (b) Cost — $44,576; Acquired — 12/01/2004 | | 46,462 |
| 60,000 | | Chesapeake Energy Corp., 6.875%, due 01/15/2016 | | 63,150 |
| 40,000 | | Dynegy Holdings, Inc., 10.125%, due 07/15/2013, (b) Cost — $39,709; Acquired — 08/01/2003 | | 46,000 |
The accompanying notes are an integral part of these financial statements.
40|86 Series Trust | |
Schedule of Investments | December 31, 2004 |
| High Yield Portfolio | |
SHARES OR PRINCIPAL AMOUNT | | | | VALUE |
| |
Oil & Gas (continued) |
| $ 55,000 | | El Paso Production Holding Co., 7.750%, due 06/01/2013 | | $ 57,888 |
| 60,000 | | Houston Exploration Co., 7.000%, due 06/15/2013 | | 63,900 |
| 100,000 | | Transmontaigne, Inc., 9.125%, due 06/01/2010 | | 109,000 |
| | | | | 386,400 |
Paper & Forest Products (6.1%) |
| 95,000 | | Ainsworth Lumber Co Ltd., 6.750%, due 03/15/2014 (c) | | 93,456 |
| 105,000 | | Boise Cascade LLC, 7.125%, due 10/15/2014, (b) Cost — $105,000; Acquired — 10/15/2004 | | 111,562 |
| 35,000 | | Cenveo Corp., 7.875%, due 12/01/2013 | | 32,725 |
| 75,000 | | Cenveo Corp., 9.625%, due 03/15/2012 | | 82,688 |
| 75,000 | | Georgia-Pacific Corp., 7.700%, due 06/15/2015 | | 86,062 |
| 95,000 | | Graphic Packaging International Corp., 9.500%, due 08/15/2013 | | 108,538 |
| 25,000 | | Neenah Paper, Inc., 7.375%, due 11/15/2014, (b) Cost — $25,000; Acquired — 11/18/2004 | | 25,500 |
| | | | | 540,531 |
Personal Products (1.2%) |
| 100,000 | | Elizabeth Arden, Inc., 7.750%, due 01/15/2014 | | 106,500 |
| |
Plastics Products (2.5%) |
| 80,000 | | Graham Packaging Co. LP, 8.500%, due 10/15/2012, (b) Cost — $81,031; Acquired — 09/29/2004 | | 84,400 |
| 135,000 | | Park Ohio Industries Inc., 8.375%, due 11/15/2014, (b) Cost — $135,550; Acquired — 11/19/2004 | | 135,675 |
| | | | | 220,075 |
Radiotelephone Communications (3.6%) |
| 32,000 | | Alamosa Delaware, Inc., 11.000%, due 07/31/2010 | | 37,840 |
| 100,000 | | L-3 Communications Corp., 5.875%, due 01/15/2015, (b) Cost — $100,000; Acquired — 11/01/2004 | | 100,250 |
| 25,000 | | New Skies Satellites NV, 9.125%, due 11/01/2012, (b) Cost — $25,000; Acquired — 10/22/2004 (c) | | 25,625 |
| 40,000 | | Rogers Wireless Communications, Inc., 9.625%, due 05/01/2011 (c) | | 47,100 |
| 50,000 | | Rogers Wireless, Inc., 7.500%, due 03/15/2015, (b) Cost — $50,000; Acquired — 11/19/2004 (c) | | 53,000 |
| 50,000 | | Rural Cellular Corp., 8.250%, due 03/15/2012 | | 53,125 |
| | | | | 316,940 |
Real Estate Investment Trusts (1.9%) |
| 80,000 | | Senior Housing Properties Trust, 7.875%, due 04/15/2015 | | 88,600 |
| 20,000 | | Senior Housing Properties Trust, 8.625%, due 01/15/2012 | | 22,950 |
| 55,000 | | Ventas Realty Limited Partnership, 6.625%, due 10/15/2014, (b) Cost — $55,000; Acquired — 10/08/2004 | | 56,513 |
| | | | | 168,063 |
Refrigerated Warehousing And Storage (0.6%) |
| 50,000 | | Reddy Ice Group, Inc., 8.875%, due 08/01/2011 | | 54,250 |
| |
Specialty Retail (2.6%) |
| 125,000 | | Blockbuster, Inc., 9.000%, due 09/01/2012, (b) Cost — $127,611; Acquired — 08/13/2004, | | |
| | | 09/29/2004, & 11/12/2004 | | 124,062 |
| 100,000 | | Jean Coutu Group, Inc., 7.625%, due 08/01/2012, (b) Cost — $102,438; Acquired — 07/22/2004 & 09/14/2004 (c) | | 106,250 |
| | | | | 230,312 |
The accompanying notes are an integral part of these financial statements.
40|86 Series Trust | |
Schedule of Investments | December 31, 2004 |
| High Yield Portfolio | |
SHARES OR PRINCIPAL AMOUNT | | | VALUE |
| |
Sporting And Athletic Goods ( 0.9%) |
| $ 80,000 | | Riddell Bell Hldgs, Inc., 8.375%, due 10/01/2012, (b) Cost — $81,219; Acquired — 09/23/2004 | $ 83,200 |
| |
Textiles, Apparel & Luxury Goods (2.3%) |
| 75,000 | | Phillips-Van Heusen, 7.250%, due 02/15/2011 | 79,125 |
| 115,000 | | Russell Corp., 9.250%, due 05/01/2010 | 123,913 |
| | | | 203,038 |
| |
Tobacco (1.2%) |
| 100,000 | | DIMON, Inc., 7.750%, due 06/01/2013 | 105,500 |
| |
Wireless Telecommunication Services (6.0%) |
| 69,300 | | AirGate PCS, Inc., 9.375%, due 09/01/2009, (b) Cost — $60,107; Acquired — 02/13/2004 | 75,017 |
| 110,000 | | American Tower Corp., 7.125%, due 10/15/2012, (b) Cost — $110,069; Acquired — 09/28/2004 & 09/29/2004 | 113,025 |
| 80,000 | | Crown Castle International Corp., 7.500%, due 12/01/2013 | 86,400 |
| 105,000 | | LG Telecom Ltd., 8.250%, due 07/15/2009, (b) Cost — $104,340; Acquired — 07/09/2004 & 07/28/2004 (c) | 113,954 |
| 60,000 | | Nextel Communications, Inc., 6.875%, due 10/31/2013 | 65,400 |
| 25,000 | | Spectrasite, Inc., 8.250%, due 05/15/2010 | 26,812 |
| 45,000 | | Spectrasite, Inc., 8.250%, due 05/15/2010, (b) Cost — $45,150; Acquired — 05/16/2004 & 05/19/2004 | 48,263 |
| | | | 528,871 |
| | | Total corporate bonds (cost $7,655,145) | 8,064,688 |
| |
FOREIGN GOVERNMENT NOTE/BONDS (3.9%) |
| 55,000 | | Republic of Panama, 7.250%, due 03/15/2015 (c) | 57,475 |
| 75,000 | | Republic of Turkey, 7.250%, due 03/15/2015 (c) | 77,438 |
| 130,000 | | Republic of Brazil, 10.500%, due 07/14/2014 (c) | 154,375 |
| 55,000 | | Russian Federation, 0.000%/7.500%, due 03/31/2030, (b) Cost — $53,016; Acquired — 09/29/2004 (c)(d) | 56,925 |
| | | Total foreign government note/bonds (cost $322,760) | 346,213 |
| |
MUNICIPAL BONDS (1.8%) |
| 60,000 | | Academica Charter Schools, 8.100%, due 08/15/2024, (b) Cost — $60,000; Acquired — 08/18/2004 | 61,809 |
| 100,398 | | Tobacco Settlement Financing Corp., 6.360%, due 05/15/2025 | 98,951 |
| | | Total municipal bonds (cost $159,120) | 160,760 |
| |
SHORT TERM INVESTMENTS (0.2%) |
| 20,000 | | AIM Liquid Asset Portfolio | 20,000 |
| | | Total short term investments (cost $20,000) | 20,000 |
| | | | |
| | | Total investments (cost $8,290,633) (98.2%) | 8,712,370 |
| | | Other assets in excess of liabilities 1.8% | 163,399 |
| | | Total net assets (100.0%) | $8,875,769 |
____________
| (a) | Non-Income Producing Security. |
| (b) | Restricted under Rule 144A of the Securities Act of 1933. |
| (c) | Foreign Security or U.S. Security of a foreign company. |
| (d) | STEP — Bonds where the coupon increases or steps up at a predetermined rate. |
| (e) | Zero coupon — Bonds that make no interest payments. |
| (g) | Security is fair valued. |
The accompanying notes are an integral part of these financial statements.
40|86 Series Trust | |
Portfolio Managers’ Review (unaudited) | December 31, 2004 |
Fixed Income Portfolio
How did the Portfolio perform relative to its benchmark?
The Fixed Income Portfolio returned 4.74% for the year ended December 31, 2004. This compares to 4.19% for the benchmark Lehman Brothers Government/Credit Index. (1)
What caused the variance in performance between the Portfolio and its benchmark?
We maintained a short duration bias and a barbell structure in the portfolio versus the benchmark, which included holding an above average cash position. This helped the performance of the portfolio as the yield curve flattened during the fourth quarter. The yield differential between the 2-year Treasury note and the 30-year Treasury bond reduced from 229 bps to 176 bps in the fourth quarter. The High Yield sector was the best performing sector by far, followed by the Credit sector and the Mortgage-Backed Securities (“MBS”) sector. The Portfolio’s 10.78% position in High Yield and its overweight to the Credit sector helped its performance. However, the underweight to the MBS sector hurt the performance.
Which portfolio holdings most enhanced the Portfolio's performance?
Holdings that enhanced the Portfolio’s performance for the period were Time Warner Inc., Sprint Capital Corp., Comcast Corp. and Nextel Communication.
Which holdings detracted from performance?
Holdings that detracted from the Portfolio’s performance for the period include General Motors and Health Care REIT, Inc.
What is your outlook for the next fiscal year?
Low bond yields and a range bound interest rate environment suggest that investors are still concerned about the economy. However, this is inconsistent with the performance of the stock market, commodity prices, and business surveys. As we interpret economic data and investor sentiment during 2005, we will draw on several themes, which we describe below.
| · | The Yield Curve Will Continue to Flatten — The Fed will continue to raise short-term interest rates until Fed Funds reach a more normalized rate (between 3.0% and 3.5%). Short-term interest rates will rise faster than long-term interest rates resulting in a flatter yield curve. In this environment, investors will be rewarded more for investing in a portfolio that owns a combination of long and short maturities (such as the 2-year and 30-year U.S. Treasury bonds) rather than a similar duration portfolio that owns one security (such as the 10-year U.S. Treasury note). |
| · | Credit Risk Is Overvalued — Credit spreads are at the tightest levels we have seen since 1996 and 1997. With the improvement in credit fundamentals, corporations now have excess cash flow that needs to be put to work. We are seeing an increase in stock buy-backs, special dividends, and mergers and acquisitions These are all negative for corporate credit. Even though corpo rate default rates are at their lowest levels in 20 years, all the good news may be behind us. We remain concerned with the deterioration in the domestic auto sector and will continue to view the debt of General Motors and Ford as short-term hold ings over the coming year. With the contraction in credit spreads, we are looking for every opportunity to move up in credit quality. Avoiding credit blow-ups will be extremely important to outperforming the benchmark in 2005. Expect to see lower excess returns in all spread sectors for 2005. |
| · | Interest Rates Will Rise in 2005 — The yield on the 30-year U.S. Treasury finished the year pretty much where it started, in spite of tighter monetary policy, healthy productivity gains, high consumer and government debt levels, and strong real Gross Domestic Product (GDP) growth. While we still believe interest rates are too low, given the rate of domestic growth, our capital markets are still attractive for foreign investors on a global basis. At some point, economic fundamentals will mat ter and interest rates will rise. Our portfolio strategies will con tinue to recognize a range bound market and a bias toward ris ing rates. Expect to see more callable bonds in the Portfolio. In a range bound interest rate environment, callable bonds will outperform. |
| · | The Financial Markets Eventually Will Need to Reprice Risk —Low levels of interest rates over the past several years have helped compress risk spreads across the major asset sectors. As an example, high yield bond spreads are marginally wider than investment grade spreads. At some point, probably sometime in 2005, the market will be forced to reprice risk. The result will be significant underperformance to the risk sectors over a short period of time. The challenge portfolio managers face, is to be patient enough to stick to a discipline designed to control portfolio volatility. |
40|86 Series Trust | |
Portfolio Managers’ Review (unaudited) | December 31, 2004 |
Once again we are at an interesting time in our financial market history. Financial assets, including bonds and equities, appear overvalued by almost every measure. Upward pressure on interest rates will only hamper equity valuations further. At some point, the financial markets will reprice the level of risk in the bond markets, causing a dislocation that will impair performance and liquidity. We expect 2005 to be a difficult year for financial assets. While a bullish outlook is always more pleasant to the reader, we believe that our job is to directly communicate a realistic view of the opportunities and risks inherent in the financial markets.
| Gregory J. Hahn, CFA | Michael D. Richman, CFA |
| Chief Investment Officer | Second Vice President |
| 40|86 Advisors, Inc. | 40|86 Advisors, Inc. |
GROWTH OF $10,000
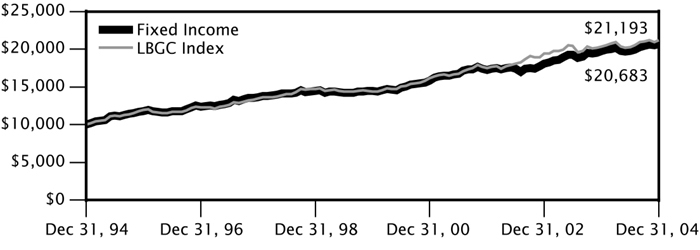
The growth of $10,000 chart is a comparison of the change in value of a $10,000 investment with dividends and capital gains reinvested for the period from inception of the Fund through 12/31/04. Past performance is no guarantee of future results.
AVERAGE ANNUAL TOTAL RETURN(1) (as of 12/31/04)
| | | | 1 YEAR | | 5 YEARS | | 10 YEARS |
| Fixed Income Portfolio | | | 4.74 | % | | 7.46 | % | | 7.54 | % |
| LBGC Index | | | 4.19 | % | | 8.00 | % | | 7.80 | % |
| (1) | Past performance does not guarantee future results. Your investment return and principal will fluctuate, and your shares may be worth more or less than their original cost. Total return is provided in accordance with SEC guidelines for comparative purposes and reflects certain contractual expense reimbursements through April 30, 2005. If the expense reimbursements were not in place, the portfolio's return would have been lower. The total returns shown do not include separate account expenses or the deduction of taxes that a contractholder would pay on portfolio distributions or the redemption of portfolio shares. The Lehman Brothers Government/Credit (“LBGC”) Index is an unmanaged index considered to be representative of government and corporate fixed-rate debt issues in general. Investors cannot actually invest in an index. |
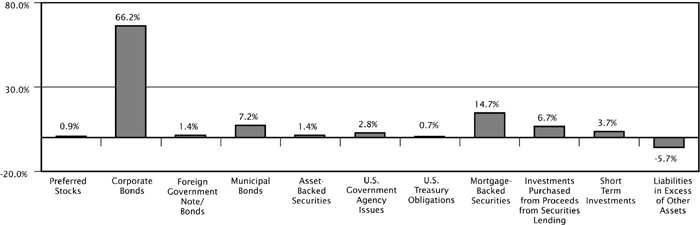
.
40|86 Series Trust | |
Schedule of Investments | December 31, 2004 |
| Fixed Income Portfolio | |
SHARES OR PRINCIPAL AMOUNT | | | VALUE |
| |
PREFERRED STOCKS (0.9%) |
Communications Services (0.6%) |
| 130 | | Centaur Funding Corp., (b) Cost — $153,366; Acquired — 07/22/2003 | $ 171,559 |
| |
Men's And Boy's Clothing And Furnishings (0.3%) |
| 3,500 | | Tommy Hilfiger USA, 9.000%, due 12/01/2031 | 89,530 |
| | | Total preferred stocks (cost $242,562) | 261,089 |
| |
CORPORATE BONDS (66.2%) |
Aircraft (0.4%) |
| $95,000 | | Boeing Capital Corp., 4.750%, due 08/25/2008 (d) | 98,335 |
| |
Apparel (0.5%) |
| 150,000 | | Jones Apparel Group Inc., 5.125%, due 11/15/2014, (b) Cost — $149,875; Acquired — 11/17/2004 | 148,962 |
| |
Auto Components (0.4%) |
| 100,000 | | Lear Corp., 8.110%, due 05/15/2009 | 113,521 |
Automobiles (1.6%) |
| 215,000 | | General Motors Corp., 7.125%, due 07/15/2013 (d) | 220,366 |
| 220,000 | | General Motors Corp., 8.375%, due 07/15/2033 (d) | 228,569 |
| | | | 448,935 |
Capital Markets (0.8%) |
| 65,000 | | Lehman Brothers Holdings, Inc., 3.600%, due 03/13/2009 (d) | 64,053 |
| 145,000 | | Merrill Lynch & Co, Inc., 6.000%, due 07/15/2005 | 147,220 |
| | | | 211,273 |
Chemicals (1.0%) |
| 75,000 | | Lyondell Chemical Co., 11.125%, due 07/15/2012 | 89,438 |
| 80,000 | | Terra Capital, Inc., 12.875%, due 10/15/2008 | 100,400 |
| 80,000 | | Union Carbide Corp., 6.790%, due 06/01/2025 (d) | 81,800 |
| | | | 271,638 |
Communications Services (9.2%) |
| 80,000 | | Ameritech Capital Funding, 7.500%, due 04/01/2005 | 80,871 |
| 260,000 | | British Telecommunications PLC, 7.875%, due 12/15/2005 (c) | 271,239 |
| 100,000 | | Charter Communications Inc., 8.000%, due 04/30/2012, (b) Cost — $100,116; Acquired — 04/21/2004 | 104,500 |
| 300,000 | | Deutsche Telekom International Finance BV, 8.750%, due 06/15/2030 (c) | 397,320 |
| 90,000 | | DirecTV Holdings LLC, 8.375%, due 03/15/2013 | 101,363 |
| 100,000 | | Echostar DBS Corp., 6.625%, due 10/01/2014, (b) Cost — $99,118; Acquired — 09/20/2004 | 101,750 |
| 290,000 | | News America, Inc., 6.200%, due 12/15/2034, (b) Cost — $287,680; Acquired — 11/30/2004 | 294,925 |
| 110,000 | | News America Holdings, 7.700%, due 10/30/2025 | 130,860 |
| 215,000 | | Sprint Capital Corp., 6.875%, due 11/15/2028 | 236,098 |
| 75,000 | | Tele-Communications-TCI Group, 9.800%, due 02/01/2012 | 96,804 |
| 445,000 | | TELUS Corp., 8.000%, due 06/01/2011 (c) | 528,038 |
| 180,000 | | Verizon Wireless Capital LLC, 5.375%, due 12/15/2006 | 186,531 |
| | | | 2,530,299 |
The accompanying notes are an integral part of these financial statements.
40|86 Series Trust | |
Schedule of Investments | December 31, 2004 |
| Fixed Income Portfolio | |
SHARES OR PRINCIPAL AMOUNT | | | VALUE |
| |
Computers & Peripherals (0.3%) |
| $ 70,000 | | NCR Corp., 7.125%, due 06/15/2009 | $ 77,365 |
| |
Crude Petroleum And Natural Gas (0.7%) |
| 200,000 | | Petroleos Mexicanos, 6.500%, due 02/01/2005 (c) | 200,640 |
| |
Electric Services (8.5%) |
| 200,000 | | AmerenEnergy Generating Co., 7.750%, due 11/01/2005 | 207,281 |
| 135,000 | | Cilcorp Inc., 8.700%, due 10/15/2009 | 159,232 |
| 145,000 | | Consolidated Edison, Inc., 3.625%, due 08/01/2008 (d) | 143,765 |
| 150,000 | | Detroit Edison Co., 5.050%, due 10/01/2005 | 152,319 |
| 65,000 | | Entergy Gulf States, Inc., 6.770%, due 08/01/2005 | 66,373 |
| 310,000 | | FirstEnergy Corp., 7.375%, due 11/15/2031 | 355,126 |
| 225,000 | | Kansas City Power & Light Co., 7.125%, due 12/15/2005 | 233,150 |
| 155,000 | | Nisource Finance Corp., 7.875%, due 11/15/2010 | 182,433 |
| 220,000 | | Pacific Gas & Electric Co., 6.050%, due 03/01/2034 | 229,292 |
| 330,000 | | PSI Energy, Inc., 6.650%, due 06/15/2006 | 344,419 |
| 265,000 | | Southwestern Public Service Co., 5.125%, due 11/01/2006 | 272,269 |
| | | | 2,345,659 |
Electrical Equipment (0.6%) |
| 150,000 | | Cooper Industries, Inc., 5.500%, due 11/01/2009 | 158,854 |
| |
Electronic Equipment & Instruments (2.7%) |
| 80,000 | | Jabil Circuit, Inc., 5.875%, due 07/15/2010 | 84,309 |
| 50,000 | | Nortel Networks Ltd., 6.125%, due 02/15/2006 (c)(d) | 51,125 |
| 525,000 | | Tyco International Group SA, 6.875%, due 01/15/2029 (c) | 603,274 |
| | | | 738,708 |
Food Products (1.6%) |
| 125,000 | | Corn Products International, Inc., 8.450%, due 08/15/2009 | 145,137 |
| 285,000 | | Kraft Foods, Inc., 5.250%, due 10/01/2013 | 293,734 |
| | | | 438,871 |
Health Care Equipment & Supplies (0.4%) |
| 95,000 | | Guidant Corp., 6.150%, due 02/15/2006 | 97,993 |
| |
Health Care Providers & Services (1.9%) |
| 110,000 | | AmerisourceBergen Corp., 7.250%, due 11/15/2012 | 123,475 |
| 185,000 | | Medco Health Solutions, Inc., 7.250%, due 08/15/2013 | 207,287 |
| 165,000 | | Service Corp. International, 7.700%, due 04/15/2009 | 179,025 |
| | | | 509,787 |
Hotels Restaurants & Leisure (1.3%) |
| 100,000 | | Caesars Entertainment, Inc., 8.125%, due 05/15/2011 | 116,000 |
| 80,000 | | Carnival Corp., 6.150%, due 04/15/2008 (c) | 85,751 |
| 135,000 | | Hyatt Equities LLC, 6.875%, due 06/15/2007, (b) Cost — $134,829; Acquired — 06/12/2002 | 142,118 |
| | | | 343,869 |
The accompanying notes are an integral part of these financial statements.
40|86 Series Trust | |
Schedule of Investments | December 31, 2004 |
| Fixed Income Portfolio | |
SHARES OR PRINCIPAL AMOUNT | | | VALUE |
| |
Household Durables (1.6%) |
| $ 110,000 | | KB Home, 5.750%, due 02/01/2014 | $ 109,450 |
| 155,000 | | NVR, Inc., 5.000%, due 06/15/2010 (d) | 155,775 |
| 175,000 | | Ryland Group, Inc., 5.375%, due 06/01/2008 | 182,875 |
| | | | 448,100 |
Insurance (6.0%) |
| 135,000 | | Assured Guaranty US Holdings, Inc., 7.000%, due 06/01/2034 | 148,634 |
| 30,000 | | Citizens Property Insurance Corp., 6.850%, due 08/25/2007 | 32,241 |
| 200,000 | | Everest Reinsurance Holdings, Inc., 8.500%, due 03/15/2005 (c) | 201,887 |
| 150,000 | | Liberty Mutual Group, 5.750%, due 03/15/2014, (b) Cost — $147,680; Acquired — 11/15/2004 | 147,728 |
| 220,000 | | Monumental Global Funding II, 2.800%, due 07/15/2008, (b) Cost — $212,661; Acquired — 12/09/2003 | 212,225 |
| 505,000 | | Protective Life US Funding Trust, 5.875%, due 08/15/2006, (b) Cost — $505,513; | |
| | | Acquired — 08/06/2001 & 08/28/2001 | 524,905 |
| 325,000 | | RenaissanceRe Holdings Ltd., 7.000%, due 07/15/2008 (c) | 351,975 |
| 35,000 | | Transamerica Corp., 6.750%, due 11/15/2006 | 36,874 |
| | | | 1,656,469 |
Liquefied Petroleum Gas Dealers ( 0.5%) |
| 132,820 | | Ras Laffan Liquefied Natural Gas Co Ltd., 3.437%, due 09/15/2009, (b) Cost — $132,820; | |
| | | Acquired — 03/02/2004 (c) | 130,564 |
Machinery (0.3%) |
| 80,000 | | Kennametal, Inc., 7.200%, due 06/15/2012 | 89,028 |
| |
Media (3.8%) |
| 90,000 | | Clear Channel Communications, Inc., 6.625%, due 06/15/2008 | 96,268 |
| 185,000 | | Clear Channel Communications, Inc., 8.000%, due 11/01/2008 | 207,888 |
| 185,000 | | Comcast Corp., 7.050%, due 03/15/2033 (d) | 212,379 |
| 125,000 | | Insight Midwest LP/Insight Capital, Inc., 10.500%, due 11/01/2010 | 137,500 |
| 145,000 | | Quebecor Media, Inc., 11.125%, due 07/15/2011 (c) | 166,387 |
| 185,000 | | Time Warner, Inc., 7.700%, due 05/01/2032 | 226,999 |
| | | | 1,047,421 |
Miscellaneous Business Credit Institutions (0.2%) |
| 50,000 | | Bunge Ltd Finance Corp., 4.375%, due 12/15/2008 | 50,429 |
| | | | |
Multiline Retail (0.2%) | |
| 65,000 | | The May Department Stores Co., 6.875%, due 11/01/2005 | 66,878 |
| |
National Commercial Banks (2.4%) |
| 138,000 | | Bank of America Corp., 6.875%, due 02/15/2005 | 138,621 |
| 170,000 | | Citicorp, 6.750%, due 08/15/2005 | 173,956 |
| 145,000 | | Huntington National Bank, 3.125%, due 05/15/2008 | 141,915 |
| 185,000 | | Union Planters Bank NA, 6.500%, due 03/15/2018 | 199,874 |
| | | | 654,366 |
Natural Gas Transmission (1.1%) |
| 100,000 | | Southern Natural Gas Co., 8.875%, due 03/15/2010 (d) | 112,500 |
| 170,000 | | Texas Eastern Transmission LP, 7.000%, due 07/15/2032 | 195,936 |
| | | | 308,436 |
The accompanying notes are an integral part of these financial statements.
40|86 Series Trust | |
Schedule of Investments | December 31, 2004 |
| Fixed Income Portfolio | |
SHARES OR PRINCIPAL AMOUNT | | | VALUE |
| | |
Paper & Forest Products (14%) | |
| $ 205,000 | | Boise Cascade LLC, 7.125%, due 10/15/2014, (b) Cost — $205,000; Acquired — 10/15/2004 | $ 217,812 |
| 135,000 | | Georgia-Pacific Corp., 7.700%, due 06/15/2015 | 154,913 |
| | | | 372,725 |
Personal Credit Institutions (30%) | |
| 165,000 | | Ford Motor Credit Co., 5.700%, due 01/15/2010 | 166,682 |
| 195,000 | | General Motors Acceptance Corp., 5.850%, due 01/14/2009 (d) | 197,743 |
| 270,000 | | General Motors Acceptance Corp., 6.750%, due 12/01/2014 | 270,853 |
| 185,000 | | Household Finance Corp., 4.125%, due 11/16/2009 | 184,206 |
| | | | 819,484 |
Pharmaceuticals (10%) | |
| 220,000 | | Bristol-Myers Squibb Co., 4.750%, due 10/01/2006 | 225,049 |
| 60,000 | | Wyeth, 5.500%, due 03/15/2013 | 62,462 |
| | | | 287,511 |
Photographic Equipment And Supplies (04%) | |
| 110,000 | | Eastman Kodak Co., 7.250%, due 06/15/2005 (d) | 111,918 |
| | |
Plastics Products (02%) | |
| 60,000 | | Rubbermaid, Inc., 6.600%, due 11/15/2006 | 63,382 |
| | |
Radiotelephone Communications (16%) | |
| 175,000 | | L-3 Communications Corp., 5.875%, due 01/15/2015, (b) Cost — $175,438; Acquired — 11/02/2004 | 175,438 |
| 50,000 | | Rogers Wireless, Inc., 7.500%, due 03/15/2015, (b) Cost — $50,000; Acquired — 11/19/2004 (c) | 53,000 |
| 186,000 | | TeleCorp PCS, Inc., 10.625%, due 07/15/2010 | 202,750 |
| | | | 431,188 |
Real Estate Investment Trusts (64%) | |
| 165,000 | | Colonial Realty Limited Partnership, 6.250%, due 06/15/2014 | 173,759 |
| 85,000 | | Developers Diversified Realty Corp., 3.875%, due 01/30/2009 | 83,490 |
| 170,000 | | Duke Realty LP, 3.500%, due 11/01/2007 | 169,609 |
| 160,000 | | Equity One, Inc., 3.875%, due 04/15/2009 | 155,419 |
| 130,000 | | Health Care Property Investors, Inc., 6.875%, due 06/08/2015 (a) | 132,044 |
| 200,000 | | Health Care REIT, Inc., 7.500%, due 08/15/2007 | 216,520 |
| 175,000 | | Hospitality Properties Trust, 6.750%, due 02/15/2013 | 193,539 |
| 65,000 | | iStar Financial, Inc., 8.750%, due 08/15/2008 | 74,179 |
| 300,000 | | Post Apartment Homes LP, 6.850%, due 03/16/2015 | 301,475 |
| 150,000 | | Senior Housing Properties Trust, 8.625%, due 01/15/2012 | 172,125 |
| 90,000 | | United Dominion Realty Trust, Inc., 6.500%, due 06/15/2009 | 97,248 |
| | | | 1,769,407 |
Refined Petroleum Pipelines (04%) | |
| 115,000 | | TGT Pipeline LLC, 5.200%, due 06/01/2018 | 110,227 |
| | |
Refuse Systems (05%) | |
| 115,000 | | Allied Waste North America, 8.875%, due 04/01/2008 | 123,625 |
| | |
Special Purpose Entity (03%) | |
| 87,441 | | PLC Trust, 2.709%, due 03/31/2006, (b) Cost — $87,441; Acquired — 12/12/2003 | 87,098 |
The accompanying notes are an integral part of these financial statements.
40|86 Series Trust | |
Schedule of Investments | December 31, 2004 |
| Fixed Income Portfolio | |
SHARES OR PRINCIPAL AMOUNT | | | VALUE |
| |
Steel Foundries (0.6%) |
| $ 145,000 | | International Steel Group, Inc., 6.500%, due 04/15/2014 | $ 156,237 |
| |
Tobacco (1.3%) |
| 145,000 | | DIMON, Inc., 9.625%, due 10/15/2011 | 159,500 |
| 185,000 | | Universal Corp., 5.200%, due 10/15/2013 | 184,358 |
| | | | 343,858 |
Wireless Telecommunication Services (1.1%) |
| 115,000 | | AT&T Wireless Services, Inc., 8.750%, due 03/01/2031 | 155,529 |
| 125,000 | | Nextel Communications, Inc., 6.875%, due 10/31/2013 | 136,250 |
| | | | 291,779 |
| | | Total corporate bonds (cost $17,175,816) | 18,154,839 |
| |
FOREIGN GOVERNMENT NOTE/BONDS (1.4%) |
| 215,000 | | Export-Import Bank Of Korea, 4.500%, due 08/12/2009 (c) | 217,065 |
| 140,000 | | United Mexican States, 9.875%, due 02/01/2010 (c) | 172,410 |
| | | Total foreign government note/bonds (cost $389,723) | 389,475 |
| |
MUNICIPAL BONDS (7.2%) |
| 110,000 | | Academica Charter Schools, 8.100%, due 08/15/2024, (b) Cost — $110,000; Acquired — 08/18/2004 | 113,317 |
| 95,000 | | Bay Area Goverment Assn. California Revenue Tax Allocation Note, 4.290%, due 09/01/2009 | 95,553 |
| 175,000 | | California County TOB Securitization Agency, 7.500%, due 06/01/2019 | 177,695 |
| 130,000 | | Decatur Hospital Authority, 7.750%, due 09/01/2009 | 144,018 |
| 70,000 | | Harrisburg PA Rescue and Recovery Revenue Notes, 3.090%, due 11/01/2022 | 69,667 |
| 70,000 | | Heart of Texas Education Finance Corp., 5.000%, due 02/15/2013 | 68,311 |
| 90,000 | | Indiana Development Finance Authority, 5.500%, due 01/01/2033 | 93,018 |
| 140,000 | | Indianapolis IN Refunding Bonds, 3.000%, due 10/15/2005 | 140,189 |
| 140,557 | | Louisiana Tobacco Settlement Financing Corp., 6.360%, due 05/15/2025 | 138,531 |
| 100,000 | | New Jersey Economic Development Authority, 3.250%, due 09/15/2006 | 99,866 |
| 505,000 | | North Carolina Eastern Municipal Power Agency, 7.050%, due 01/01/2007 | 530,018 |
| 185,000 | | Rhode Island Tobacco Settlement Financing Corp., 5.920%, due 06/01/2012 | 184,384 |
| 118,193 | | South Dakota Educational Enhancement Funding Corp., 6.720%, due 06/01/2025 | 113,575 |
| | | Total municipal bonds (cost $1,918,925) | 1,968,142 |
| |
ASSET BACKED SECURITIES (1.4%) |
| 198,979 | | Centex Home Equity, Series # 2001-A A6, 6.250%, due 04/25/2031 | 202,634 |
| 115,000 | | Centex Home Equity, Series # 2004-A AF6, 4.270%, due 01/25/2034 | 113,927 |
| 9,260 | | Equity One ABS, Inc., Series # 2002-1 AF2, 5.523%, due 08/25/2032 | 9,415 |
| 52,224 | | Residential Asset Mortgage Products, Inc., Series # 2002RZ3 A4, 4.730%, due 12/25/2031 | 52,355 |
| | | Total asset backed securities (cost $377,356) | 378,331 |
| |
U.S. GOVERNMENT AGENCY ISSUES (2.8%) |
| 275,000 | | Federal Home Loan Mortgage Corp., 2.850%, due 01/05/2007 | 272,972 |
| 275,000 | | Federal National Mortgage Assn., 2.750%, due 08/11/2006 (d) | 273,326 |
| 215,000 | | Federal National Mortgage Assn., 3.000%, due 12/15/2006 | 212,496 |
| | | Total U.S. government agency issues (cost $765,017) | 758,794 |
The accompanying notes are an integral part of these financial statements.
40|86 Series Trust | |
Schedule of Investments | December 31, 2004 |
| Fixed Income Portfolio | |
SHARES OR PRINCIPAL AMOUNT | | | VALUE |
| |
U.S. TREASURY OBLIGATIONS (0.7%) |
| $ 196,266 | | 2.000%, due 01/15/2014 | $ 203,197 |
| | | Total U.S. treasury obligations (cost $203,848) | 203,197 |
| |
MORTGAGE BACKED SECURITIES (14.7%) |
| 261,407 | | Bank of America Mortgage Securities, Series # 2004-7 5A10, 5.250%, due 08/25/2034 | 262,160 |
| 97,404 | | Bear Stearns Commercial Mortgage Securities, Series # 1999-C1 A1, 5.910%, due 02/14/2031 | 101,203 |
| 250,000 | | Bear Stearns Commercial Mortgage Securities, Series # 2002-TOP6 A2, 6.460%, due 10/15/2036 | 278,560 |
| 72,116 | | Commercial Mortgage Asset Trust, Series # 1999-C1 A1, 6.250%, due 01/17/2032 | 73,431 |
| 115,000 | | CS First Boston Mortgage Securities Corp., Series # 2001-CKN5 A3, 5.107%, due 09/15/2034 | 118,738 |
| 277,998 | | Deutsche Mortgage and Asset Receiving Corp., Series # 1998-C1 A2, 6.538%, due 06/15/2031 | 295,840 |
| 21,765 | | DLJ Commercial Mortgage Corp., Series # 1999-CG3 A1A, 7.120%, due 10/10/2032 | 23,050 |
| 89,488 | | Federal Home Loan Mortgage Corp., Series # 2407BJ, 6.500%, due 01/15/2032 | 93,615 |
| 165,000 | | Federal Home Loan Mortgage Corp., Series # 2517VH, 6.000%, due 03/15/2019 | 173,303 |
| 152,497 | | Federal Home Loan Mortgage Corp., Series # 2614CH, 3.500%, due 12/15/2010 | 152,831 |
| 135,000 | | Federal Home Loan Mortgage Corp., Series # 2614TD, 3.500%, due 05/15/2016 | 130,946 |
| 97,243 | | Federal Home Loan Mortgage Corp., Series # 2638KA, 3.000%, due 07/15/2009 | 97,220 |
| 131,819 | | Federal Home Loan Mortgage Corp., Series # 2638NA, 3.000%, due 02/15/2015 | 131,470 |
| 3,703 | | Federal Home Loan Mortgage Corp., Gold Pool # C00712, 6.500%, due 02/01/2029 | 3,894 |
| 45,730 | | Federal Home Loan Mortgage Corp., Gold Pool # C50964, 6.500%, due 05/01/2031 | 48,044 |
| 25,228 | | Federal Home Loan Mortgage Corp., Gold Pool # C60697, 6.000%, due 11/01/2031 | 26,104 |
| 26,290 | | Federal Home Loan Mortgage Corp., Gold Pool # G00479, 9.000%, due 04/01/2025 | 29,315 |
| 42,173 | | Federal Home Loan Mortgage Corp., Gold Pool # G00943, 6.000%, due 07/01/2028 | 43,728 |
| 3,877 | | Federal National Mortgage Assn., Pool # 062289, 3.696% due 03/01/2028 | 3,903 |
| 11,228 | | Federal National Mortgage Assn., Pool # 349410, 7.000%, due 08/01/2026 | 11,955 |
| 111,658 | | Federal National Mortgage Assn., Pool # 545449, 6.500%, due 02/01/2017 | 118,460 |
| 150,000 | | Federal National Mortgage Assn., Series # 200180, 6.000%, due 07/25/2029 | 156,779 |
| 84,508 | | Federal National Mortgage Assn., Series # 200318, 4.500%, due 11/25/2014 | 84,529 |
| 220,000 | | Federal National Mortgage Assn., Series # 200336, 4.500%, due 07/25/2022 | 221,301 |
| 165,000 | | Federal National Mortgage Assn., Series # 200357, 4.500%, due 12/25/2012 | 167,418 |
| 14,021 | | First Union — Chase Commercial Mortgage Series # 1999-C2 A1, 6.363%, due 06/15/2031 | 14,314 |
| 152,883 | | GMAC Commercial Mortgage Securities, Inc., Series # 1999-C1 A1, 5.830%, due 05/15/2033 | 156,916 |
| 16,175 | | GMAC Commercial Mortgage Securities, Inc., Series # 1999-C2 A1, 6.570%, due 09/15/2033 | 16,443 |
| 485 | | Government National Mortgage Assn., Pool # 051699, 15.000%, due 07/15/2011 | 569 |
| 2,781 | | Government National Mortgage Assn., Pool # 354859, 9.000%, due 07/15/2024 | 3,128 |
| 460,000 | | JP Morgan Chase Commercial Mortgage Securities Corp., Series #2001-CIB3 A2, 6.044%, due 11/15/2035 | 489,445 |
| 465,000 | | Salomon Brothers Mortgage Securities VII, Series # 2001-C2 A2, 6.168%, due 02/13/2010 | 497,408 |
| | | Total mortgage backed securities (cost $4,032,011) | 4,026,020 |
The accompanying notes are an integral part of these financial statements.
40|86 Series Trust | |
Schedule of Investments | December 31, 2004 |
| Fixed Income Portfolio | |
SHARES OR PRINCIPAL AMOUNT | | | VALUE |
| |
INVESTMENTS PURCHASED WITH CASH PROCEEDS FROM SECURITIES LENDING (6.7%) |
| $ 100,000 | | Amsterdam Funding Commercial Paper, 2.355%, due 01/25/2005 | $ 99,822 |
| 100,000 | | AIG Sunamerica Global Finance XXV Note, 2.550% due 03/11/2005 | 100,136 |
| 937,000 | | Bank of New York Institutional Cash Reserve Fund | 937,000 |
| 100,000 | | Clipper Receivables Corp. Commercial Paper, 2.356%, due 01/28/2005 | 99,802 |
| 100,000 | | Fairway Finance Corp. Commercial Paper, 2.355%, due 01/20/2005 | 99,855 |
| 100,000 | | Ivory Funding Corp. Commercial Paper, 2.364%, due 01/25/2005 | 99,822 |
| 100,000 | | Liberty Street Funding Corp. Commercial Paper, 2.355%, due 01/28/2005 | 99,803 |
| 100,000 | | Mane Funding Corp. Commercial Paper, 2.355%, due 01/20/2005 | 99,858 |
| 100,000 | | Wells Fargo Bank Certificate of Deposit, 2.350%, due 01/28/2005 | 100,000 |
| 100,000 | | Windmill Funding Corp. Commercial Paper, 2.355%, due 01/24/2005 | 99,829 |
| | | Total investments purchased with cash proceeds from securities lending (cost $1,835,927) | 1,835,927 |
| |
SHORT TERM INVESTMENTS (3.7%) |
| 1,025,000 | | AIM Liquid Asset Portfolio | 1,025,000 |
| | | Total short term investments (cost $1,025,000) | 1,025,000 |
| | | Total investments (cost $27,966,185) (105.7%) | 29,000,814 |
| | | Liabilities in excess of other assets (5.7%) | (1,553,269) |
| | | Total net assets (100.0%) | $27,447,545 |
| | | | |
| | | | |
| (a) | Variable-Coupon Rate — The rate is the rate in effect as of December 31, 2004. |
| (b) | Restricted under Rule 144A of the Securities Act of 1933. |
| (c) | Foreign security or a U.S. security of a foreign company. |
| (d) | Securities (partial/entire) out on loan. |
The accompanying notes are an integral part of these financial statements.
40|86 Series Trust | |
Portfolio Managers’ Review (unaudited) | December 31, 2004 |
Government Securities Portfolio
How did the Portfolio perform relative to its benchmarks?
The Government Securities Portfolio returned 2.48% for the year ended December 31, 2004. This compares to 3.48% and 4.70% for the benchmarks Lehman Brothers Government Bond Index and Lehman Brothers Mortgage-Backed Securities (“MBS”) Index, respectively. (1)
What caused the variance in performance between the Portfolio and its benchmarks?
The weighted average duration of the Portfolio was shorter than the benchmark Lehman Brothers Government Bond Index and the Lehman Brothers MBS Index. In addition, the Portfolio maintained a higher weighting to U.S. Treasury securities during the year which underperformed the general mortgage-backed securities sector.
Which portfolio holdings enhanced the Portfolio’s performance?
Two sectors which contributed to the Portfolio’s performance were mortgage pass-throughs and U.S. government agency bonds. Within the MBS sector, the Portfolio maintained holdings of FHLMC 6.50% bonds and FNMA 6.00% bonds during the year. Within the U.S. agency sector, the Portfolio held obligations of the Federal Farm Credit Bank during the year.
Which holdings detracted from performance?
Securities that had a negative impact to Portfolio performance during the year were 5- and 10-year maturity U.S. Treasury securities.
What is your outlook for the rest of fiscal year?
Mortgage convexity will remain a key issue over the coming months. Risk/reward favors a shorter duration mortgage position in this market environment. Implied volatility is at its lowest levels in several years and is biased to spike higher. While housing turnover, over the coming months is likely to be faster than we experienced in 1999—2000, the real driver of mortgage valuations is the longer-term turnover, which could be significantly slower. We expect the Portfolio will continue to stay short the benchmark duration and look to add higher yielding assets with limited extension risk in the short end.
| Gregory J. Hahn, CFA | Michael J. Dunlop |
| Chief Investment Officer | Vice President |
| 40|86 Advisors, Inc. | 40|86 Advisors, Inc. |
40|86 Series Trust | |
| Portfolio Manager’s Review (unaudited) | | December 31, 2004 |

The growth of $10,000 chart is a comparison of the change in value of a $10,000 investment with dividends and capital gains reinvested for the the 10-year period ended 12/31/04. Past performance is no guarantee of future results.
AVERAGE ANNUAL TOTAL RETURN(1) (as of 12/31/04)
| | | | 1 YEAR | | 5 YEARS | | 10 YEARS |
| Government Securities Portfolio | | | 2.48 | % | | 6.13 | % | | 6.26 | % |
| LB Government Index | | | 3.48 | % | | 7.48 | % | | 7.46 | % |
| LB MBS Index | | | 4.70 | % | | 7.14 | % | | 7.56 | % |
| (1) | Past performance does not guarantee future results. Your investment return and principal will fluctuate, and your shares may be worth more or less than their original cost. Total return is provided in accordance with SEC guidelines for comparative purposes and reflects certain contractual expense reimbursements through April 30, 2005. If the expense reimbursements were not in place, the portfolio's return would have been lower. The total returns shown do not include separate account expenses or the deduction of taxes that a contractholder would pay on portfolio distributions or the redemption of portfolio shares. The Lehman Brothers (“LB”) Government Index is an unmanaged index considered to be representative of bonds issued by the U.S. government or its agencies. The LB Mortgage-Backed Securities (“MBS”) Index is an unmanaged index composed of all fixed securities mortgage pools by GNMA, FNMA and the FHLMC, including GNMA Graduated Payment Mortgages. Investors cannot actually invest in an index. |
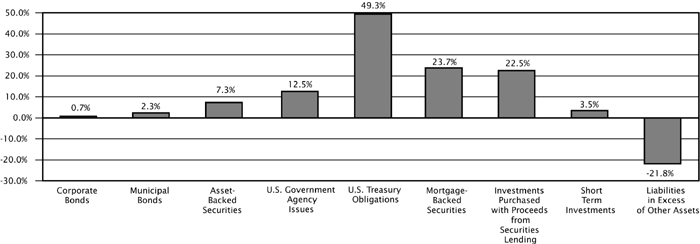
40|86 Series Trust | |
Schedule of Investments | December 31, 2004 |
| Government Securities Portfolio | |
SHARES OR PRINCIPAL AMOUNT | | | VALUE |
| | |
CORPORATE BONDS (0.7%) | |
Insurance (0.7%) | |
| $ 95,000 | | MGIC Investment Corp., 6.000%, due 03/15/2007 | $ 99,816 |
| | | Total corporate bonds (cost $94,998) | 99,816 |
| | |
MUNICIPAL BONDS (2.3%) | |
| 190,000 | | Alaska Industrial Development & Export Auth., 6.625%, due 05/01/2006 | 195,803 |
| 145,000 | | Tobacco Settlement Financing Corp., 5.920%, due 06/01/2012 | 144,517 |
| | | Total municipal bonds (cost $334,448) | 340,320 |
| | |
ASSET BACKED SECURITIES (7.3%) | |
| 75,000 | | Atlantic City Electric Transition Funding LLC, 2002-1, 5.550%, due 10/20/2023 | 78,964 |
| 20,074 | | Centex Home Equity, 2001-A, 6.470%, due 07/25/2029 | 20,401 |
| 145,187 | | Countrywide Asset-Backed Certificates, 2002S1, 5.960%/6.460%, due 11/25/2016 (b) | 145,400 |
| 70,000 | | MBNA Credit Card Master Note Trust, 2002—1, 6.800%, due 07/15/2014 | 77,752 |
| 46,726 | | Residential Asset Mortgage Products, Inc., 2002RZ, 4.730%, due 12/25/2031 | 46,844 |
| 163,916 | | Residential Asset Securities Corp., 1999KS, 7.150%, due 07/25/2030 | 166,423 |
| 214,685 | | Residential Asset Securities Corp., 2000KS, 7.810%, due 07/25/2031 | 221,454 |
| 300,000 | | The Money Store Home Equity Trust, 1998-B, 6.335%, due 08/15/2039 | 308,176 |
| | | Total asset backed securities (cost $1,072,315) | 1,065,414 |
| | |
U.S. GOVERNMENT AGENCY ISSUES (12.5%) | |
| 250,000 | | Federal Farm Credit Bank, 6.000%, due 06/14/2012 | 253,204 |
| 500,000 | | Federal Home Loan Mortgage Corp., 6.250%, due 03/05/2012 | 523,029 |
| 1,000,000 | | Federal National Mortgage Assn., 5.250%, due 08/01/2012 | 1,039,247 |
| | | Total U.S. government agency issues (cost $1,799,552) | 1,815,480 |
| | |
U.S. TREASURY OBLIGATIONS (49.3%) | |
| 700,000 | | 2.375%, due 08/31/2006 (a) | 693,246 |
| 1,500,000 | | 3.875%, due 05/15/2009 (a) | 1,522,560 |
| 1,300,000 | | 4.000%, due 02/15/2014 (a) | 1,282,481 |
| 500,000 | | 5.500%, due 02/15/2008 (a) | 532,930 |
| 2,000,000 | | 11.250%, due 02/15/2015 | 3,144,454 |
| | | Total U.S. treasury obligations (cost $7,073,703) | 7,175,671 |
| | |
MORTGAGE BACKED SECURITIES (23.7%) | |
| 24,350 | | Bear Stearns Commercial Mortgage Securities, Pool # 0C10A1, 5.910%, due 02/14/2031 | 25,300 |
| 76,924 | | Commercial Mortgage Asset Trust, Pool # 1999CA, 6.250%, due 01/17/2032 | 78,327 |
| 59,853 | | DLJ Commercial Mortgage Corp., Pool # 1999CG, 7.120%, due 10/10/2032 | 63,387 |
| 58,933 | | Federal Home Loan Mortgage Corp., Pool # 002692, 5.000%, due 10/15/2022 | 57,866 |
| 813,530 | | Federal Home Loan Mortgage Corp., Pool # 2407BJ, 6.500%, due 01/15/2032 | 851,045 |
| 31,478 | | Federal Home Loan Mortgage Corp., Gold Pool # C01131, 6.500%, due 01/01/2031 | 33,080 |
| 33,049 | | Federal Home Loan Mortgage Corp., Gold Pool # C01148, 6.500%, due 02/01/2031 | 34,730 |
| 97,336 | | Federal Home Loan Mortgage Corp., Gold Pool # C01184, 6.500%, due 06/01/2031 | 102,262 |
| 90,079 | | Federal Home Loan Mortgage Corp., Gold Pool # C01186, 6.000%, due 06/01/2031 | 93,209 |
| 36,957 | | Federal Home Loan Mortgage Corp., Gold Pool # C28063, 6.500%, due 07/01/2029 | 38,847 |
| 17,246 | | Federal Home Loan Mortgage Corp., Gold Pool # C29168, 6.500%, due 07/01/2029 | 18,129 |
| 6,294 | | Federal Home Loan Mortgage Corp., Gold Pool # D66012, 7.000%, due 11/01/2025 | 6,704 |
| 5,612 | | Federal Home Loan Mortgage Corp., Gold Pool # E00441, 7.500%, due 07/01/2011 | 5,954 |
The accompanying notes are an integral part of these financial statements.
40|86 Series Trust | |
Schedule of Investments | December 31, 2004 |
| Government Securities Portfolio | |
SHARES OR PRINCIPAL AMOUNT | | | VALUE |
| |
MORTGAGE BACKED SECURITIES (continued) |
| $ 100,000 | | Federal National Mortgage Assn., Pool # 200180, 6.000%, due 07/25/2029 | $ 104,519 |
| 494,046 | | Federal National Mortgage Assn., Pool # 200491, 4.500%, due 05/25/2029 | 497,855 |
| 227,432 | | Federal National Mortgage Assn., Pool # 253845, 6.000%, due 06/01/2016 | 238,540 |
| 37,194 | | Federal National Mortgage Assn., Pool # 254091, 6.000%, due 12/01/2031 | 38,523 |
| 6,292 | | Federal National Mortgage Assn., Pool # 303780, 7.000%, due 03/01/2026 | 6,703 |
| 35,324 | | Federal National Mortgage Assn., Pool # 320582, 6.500%, due 01/01/2011 | 37,515 |
| 78,438 | | Federal National Mortgage Assn., Pool # 336290, 6.500%, due 04/01/2011 | 83,306 |
| 38,105 | | Federal National Mortgage Assn., Pool # 535837, 6.000%, due 04/01/2031 | 39,467 |
| 140,370 | | Federal National Mortgage Assn., Pool # 545449, 6.500%, due 02/01/2017 | 148,921 |
| 8,230 | | Federal National Mortgage Assn., Pool # 609583, 6.000%, due 11/01/2031 | 8,524 |
| 234,362 | | Federal National Mortgage Assn., Pool # 645649, 6.000%, due 06/01/2017 | 245,795 |
| 34,167 | | Federal National Mortgage Assn. Grantor Trust, Pool # 1999T2, 7.500%, due 01/19/2029 | 36,608 |
| 75,000 | | First Union National Bank Commercial Mortgage, Pool # 1999C4, 7.390%, due 12/15/2031 | 85,047 |
| 17,330 | | GMAC Commercial Mortgage Securities, Inc., Pool # 1999C2, 6.570%, due 09/15/2033 | 17,618 |
| 3,782 | | Government National Mortgage Assn., Pool # 119896, 13.000%, due 11/15/2014 | 4,365 |
| 55,645 | | Government National Mortgage Assn., Pool # 408675, 7.500%, due 01/15/2026 | 59,947 |
| 13,972 | | Housing Securities, Inc., Pool # 002-A1, 6.500%, due 07/25/2009 | 13,956 |
| 365,157 | | JP Morgan Commercial Mortgage Finance Corp., Pool # 2000C9, 7.590%, due 10/15/2032 | 379,105 |
| | | Total mortgage backed securities (cost $3,425,781) | 3,455,154 |
| | |
INVESTMENTS PURCHASED WITH CASH PROCEEDS FROM SECURITIES LENDING (22.5%) |
| 200,000 | | Amsterdam Funding Commercial Paper, 2.355%, due 01/25/2005 | 199,645 |
| 2,273,000 | | Bank of New York Institutional Cash Reserve Fund | 2,273,000 |
| 200,000 | | Clipper Receivables Corp. Commercial Paper, 2.356%, due 01/28/2005 | 199,605 |
| 200,000 | | Fairway Finance Corp. Commercial Paper, 2.355%, due 01/20/2005 | 199,710 |
| 200,000 | | Mane Funding Corp. Commercial Paper, 2.355%, due 01/20/2005 | 199,715 |
| 200,000 | | Windmill Funding Corp. Commercial Paper, 2.355%, due 01/24/2005 | 199,658 |
| | | Total investments purchased with cash proceeds from securities lending (cost $3,271,333) | 3,271,333 |
| | |
SHORT TERM INVESTMENTS (3.5%) |
| 516,000 | | AIM Liquid Asset Portfolio | 516,000 |
| | | Total short term investments (cost $516,000) | 516,000 |
| | | | |
| | | Total investments (cost $17,588,130) (121.8%) | 17,739,188 |
| | | Liabilities in excess of other assets (21.8%) | (3,174,636) |
| | | Total net assets (100.0%) | 14,564,552 |
| (a) | Securities (entire/partial) out on loan. |
| (b) | STEP — Bonds where the coupon increases or steps up at a predetermined rate. |
The accompanying notes are an integral part of these financial statements.
40|86 Series Trust | |
Portfolio Managers’ Review (unaudited) | December 31, 2004 |
Money Market Portfolio
The U.S. economy saw a modest recovery in 2004, with the 3rd quarter GDP number indicating a 4% annualized growth, enough to prompt the Fed to raise short-term interest rates. The Fed raised rates 25 bps at each of the last five meetings starting in June, with the Fed Funds rate reaching 2.25% by December. Throughout the year, the bond market has been pricing in the Fed rate hikes earlier and yields in the front end have risen steadily.
The money market yield curve (1-month to 1-year) steepened in the first half of the year by 77 bps. However, as the Fed started raising rates the money market yield curve started to flatten with the 1-month to 1-year yield differential reducing by 40 bps in the latter half of 2004.
With the yield curve flattening and further rate hikes in the pipeline, we have steadily reduced the duration of the Portfolio to 25.4 days as of year end. At year-end, we have 88% of the Portfolio invested in securities with 60 days maturities or less. We have approximately 39% of the Portfolio allocated to Variable Rate Demand Notes (VRDNs) which have floating rate coupons that reset weekly , thereby reducing the interest rate risk of the investment. In this rising interest rate environment, coupons of VRDNs should reset to a higher rate as rates move up. Also, these bonds are putable at par and they offer higher yields versus 1-week Tier-1 Non-Asset-Backed paper. As of December 31, 2004 the weighted average maturity of the Portfolio was 25.4 days (0.07 years) and the weighted average yield to maturity of the Portfolio was 2.334%.
We expect the Fed to keep their "measured" pace of rate hikes until rates achieve a level where economic growth is balanced against the risk of inflation. Therefore, we intend to maintain the short duration of the Portfolio, adding yield by increasing exposure to VRDNs and investment grade corporate securities (while keeping this sector below 5%). Once we believe that the interest rates have risen to levels we perceive as more representative of the current economic scenario, we will start lengthening the portfolio duration to take advantage of the higher yields.
Gregory J. Hahn, CFA
Chief Investment Officer
40|86 Advisors, Inc.
40|86 Series Trust | |
Schedule of Investments | December 31, 2004 |
| Money Market Portfolio | |
SHARES OR PRINCIPAL AMOUNT | | | VALUE |
CORPORATE BONDS (6.4%) |
Capital Markets (1.2%) |
| $ 400,000 | | Goldman Sachs Group, Inc., 7.500%, due 01/28/2005 | $ 401,777 |
Motor Vehicles And Passenger Car Bodies (2.2%) |
| 500,000 | | DaimlerChrysler NA Holding Corp., 7.400%, due 01/20/2005 | 501,494 |
| 235,000 | | Ford Motor Credit Co., 7.750%, due 03/15/2005 | 237,470 |
| | | | 738,964 |
Real Estate (1.4%) |
| 490,000 | | Kuehn Enterprises LLC, 2.420%, due 01/07/2005 (a)(b) | 490,000 |
| |
Trusts, Except Educational, Religious, And Charitable (1.6%) |
| 545,000 | | Cunat Capital Corp., 2.710%, due 01/30/2005 (a)(b) | 545,000 |
| | | Total corporate bonds (cost $2,175,741) | 2,175,741 |
| |
MUNICIPAL BONDS (38.6%) |
| 100,000 | | ABAG Financial Authorities for Nonprofit Corps, 2.660%, due 01/07/2005 (a)(b) (CS: Federal National Mortgage Assn.) | 100,000 |
| 1,400,000 | | California Housing Finance Agency, 2.420%, due 01/07/2005 (a)(b) | 1,400,000 |
| 500,000 | | City of Wilkes-Barre PA, 6.250%, due 03/01/2005 (CS: Ambac Financial Group) | 503,959 |
| 100,000 | | Colorado Housing & Finance Authority, 2.420%, due 01/07/2005 (a)(b) | |
| | | (CS: Federal National Mortgage Assn.) | 100,000 |
| 1,000,000 | | Colorado Housing & Finance Authority, 2.420%, due 01/07/2005 (a)(b) (SPA: Dexia Credit Local) | 1,000,000 |
| 1,000,000 | | Los Angeles County California Pension Obligation Taxable, 6.770%, due 06/30/2005 (CS: MBIA, Inc.) | 1,020,331 |
| 900,000 | | Louisiana Public Facilities Authority, 2.500%, 01/07/2005 (a)(b) | 900,000 |
| 1,395,000 | | Philadelphia Authority For Industrial Development, 2.510%, due 01/07/2005 (a)(b) | 1,395,000 |
| 805,000 | | St. Francis Healthcare Foundation Hawaii, 3.000%, due 01/07/2005 (a)(b) (LOC: First Hawaiian Bank) | 805,000 |
| 1,000,000 | | St. John's County Florida Industrial Development Authority, 2.420%, due 01/07/2005 (a)(b) | |
| | | (LOC: Allied Irish Bank PLC) | 1,000,000 |
| 2,000,000 | | Student Loan Finance Association, 2.390%, due 01/30/2005 (a)(b) | 2,000,000 |
| 150,000 | | Township of Woodbridge New Jersey, 2.250%, due 03/15/2005 (CS: MBIA, Inc.) | 150,237 |
| 1,000,000 | | University of Minnesota, 2.420%, due 01/07/2005 (a)(b) | 1,000,000 |
| 1,000,000 | | Utah Housing Finance Agency, 2.420%, due 01/07/2005 (a)(b) (SPA: Bayerische Landesbank) | 1,000,000 |
| 140,000 | | Weslaco Texas Economic Development Corp., 2.500%, due 02/15/2005 (CS: MBIA, Inc.) | 140,178 |
| 500,000 | | Westminster Colorado Economic Development Authority, 2.500%, due 01/07/2005 (a)(b) (LOC: HSH Nordbank) | 500,000 |
| | | Total municipal bonds (cost $13,014,705) | 13,014,705 |
| |
U.S. GOVERNMENT AGENCY ISSUES (11.8%) |
| 3,000,000 | | Federal Home Loan Bank, 2.310%, due 02/09/2005 | 2,992,493 |
| 1,000,000 | | Federal National Mortgage Assn., 2.320%, due 02/14/2005 | 997,164 |
| | | Total U.S. government agency issues (cost $3,989,657) | 3,989,657 |
| |
COMMERCIAL PAPER (47.1%) |
Air Freight & Logistics (3.0%) |
| 1,000,000 | | United Parcel Service, Inc., 1.800%, due 01/03/2005 | 999,900 |
The accompanying notes are an integral part of these financial statements.
40|86 Series Trust | |
Schedule of Investments | December 31, 2004 |
| Money Market Portfolio | |
SHARES OR PRINCIPAL AMOUNT | | | VALUE |
| |
Automobiles (3.0%) |
| $ 1,000,000 | | BMW U.S. Capital, 2.200%, due 01/03/2005 | $ 999,878 |
| |
Banks (8.9%) |
| 1,000,000 | | Lloyds TSB Bank PLC, 2.030%, due 01/03/2005 | 996,166 |
| 1,000,000 | | Rabobank USA, 2.170%, due 01/03/2005 | 999,879 |
| 1,000,000 | | UBS Americas, 2.200%, due 01/03/2005 | 999,878 |
| | | | 2,995,923 |
Cosmetics & Toiletries (3.0%) |
| 1,000,000 | | Gillette Co., 2.120%, due 01/03/2005 | 999,882 |
| |
Insurance (5.9%) |
| 1,000,000 | | Genworth Financial, Inc., 2.370%, due 02/08/2005 | 997,498 |
| 1,000,000 | | MGIC Investment Corp., 2.360%, due 01/18/2005 | 998,886 |
| | | | 1,996,384 |
Oil & Gas (5.9%) |
| 1,000,000 | | BP Capital Markets, 2.100%, due 01/03/2005 | 999,883 |
| 1,000,000 | | Statoil, 2.350%, due 01/24/2005 | 998,499 |
| | | | 1,998,382 |
Pharmaceuticals (2.9%) |
| 1,000,000 | | Pfizer, Inc., 2.050%, due 04/01/2005 | 994,875 |
| |
Schools (3.0%) |
| 1,000,000 | | Harvard University, 2.100%, due 01/03/2005 | 999,883 |
| |
Security Brokers (5.6%) |
| 908,000 | | JP Morgan Chase, 2.100%, due 03/21/2005 | 903,816 |
| 1,000,000 | | Morgan Stanley, 2.340%, due 01/18/2005 | 998,895 |
| | | | 1,902,711 |
Telecommunications (2.9%) |
| 1,000,000 | | SBC Communications, 2.350%, due 02/14/2005 | 997,128 |
| |
Utilities (3.0%) |
| 1,000,000 | | National Rural Utilities, 2.350%, due 01/24/2005 | 998,498 |
| | | Total commercial paper (cost $15,883,444) | 15,883,444 |
| |
SHORT TERM INVESTMENTS (1.7%) |
| 567,000 | | AIM Liquid Asset Portfolio | 567,000 |
| | | Total short term investments (cost $567,000) | 567,000 |
| | | Total investments (cost $35,630,547) (105.6%) | 35,630,547 |
| | | Liabilities in excess of other assets (5.6%) | (1,875,518) |
| | | Total net assets (100.0%) | $33,755,029 |
| | | | |
| (a) | Variable Coupon Rate — The rate reported is the rate in effect as of December 31, 2004. |
| (b) | Maturity date represents first available put date. |
| SPA | — Standby Purchase Agreement. |
The accompanying notes are an integral part of these financial statements.
40|86 Series Trust | |
Notes to Financial Statements | December 31, 2004 |
(1) GENERAL
40|86 Series Trust (the “Trust”) is an open-end management investment company registered with the Securities and Exchange Commission under the Investment Company Act of 1940, as amended (the “Act”), and was organized as a Massachusetts Trust effective November 15, 1982. The Trust is a “series” type of mutual fund which issues separate series of shares, each of which currently represents a separate portfolio of investments. The Trust consists of seven series (“Portfolios”) each with its own investment objective and investment policies. The Portfolios are the Focus 20, Equity, Balanced, High Yield, Fixed Income, Government Securities and Money Market. The Trust offers shares to affiliated and unaffiliated life insurance company separate accounts (registered as unit investment trusts under the Act) to fund the benefits under variable annuity and variable life contracts.
(2) SUMMARY OF SIGNIFICANT ACCOUNTING POLICIES
SECURITY VALUATION, TRANSACTIONS, AND RELATED INVESTMENT INCOME
The investments in each Portfolio are valued at the close of regular trading on the New York Stock Exchange on each business day. Investment transactions are accounted for on trade date (the date the order to buy or sell is executed). Dividend income is recorded on the ex-dividend date and interest income is accrued daily. The cost of investments sold is determined on the specific identification basis. The following summarizes the investments, which carry certain restrictions as to resale from the Trust to certain qualified buyers:
Portfolio | | Cost | | Value | | % of Net Assets |
| Balanced Portfolio— bonds | | $ | 1,193,687 | | $ | 1,239,940 | | | 2.64 | % |
| High Yield Portfolio—bonds | | | 3,327,763 | | | 3,444,411 | | | 38.81 | % |
| Fixed Income Portfolio —bonds | | | 2,551,538 | | | 2,625,901 | | | 9.57 | % |
These securities are eligible for resale to qualified institutional buyers in transactions exempt from registration under Rule 144A of the Securities Act of 1933. In addition, 40|86 Advisors, Inc. (the “Adviser”), a wholly-owned subsidiary of Conseco, Inc. (“Conseco”), which serves as investment adviser to the Portfolios, has determined that the securities are liquid securities through a procedure approved by the Board of Trustees of the Trust (the “Trustees”).
The Trustees determined that the Money Market Portfolio will value investments at amortized cost, which is conditioned on the Trust’s compliance with certain conditions contained in Rule 2a-7 of the Act. The Adviser of the Trust continuously reviews this method of valuation and recommends changes to the Trustees, if necessary, to ensure that the Money Market Portfolio investments are valued at fair value (as determined by the Trustees in good faith).
In all Portfolios of the Trust, except for the Money Market Portfolio, securities that are traded on stock exchanges, excluding the NASDAQ national market system, are valued at the last sale price as of the close of business on the day the securities are being valued, or lacking any sales, at the mean between the closing bid and asked prices. Securities that are principally traded on the NASDAQ national market system are generally valued at the NASDAQ Official Closing Price (“NOCP”). Securities traded in the over-the-counter market are valued at the mean between the bid and asked prices obtained from a pricing service or brokers. Prices for fixed income securities may be obtained from an independent pricing source that uses information provided by market makers or estimates of market value obtained from yield data relating to investments or securities with similar characteristics. Portfolio securities that are traded both in the over-the-counter market and on a stock exchange are valued according to the broadest and most representative market, and it is expected that for debt securities this ordinarily will be the over-the-counter market. Debt securities with maturities of sixty (60) days or less are valued at amortized cost that approximates value.
Under the direction of the Trustees, the Adviser may use a practice known as fair value pricing under certain circumstances. These may include, but are not limited to, securities and assets for which market quotations are not readily avaiable, situations where events occur after an exchange closes are likely to affect the value of the security or the Adviser deems that the market price is not reflective of a security’s appropriate price. The Adviser may consider many factors when determining fair values, including but not limited to, the type of security, the financial statements of the issuer, the cost at date of purchase, the size of holdings and information as to any transactions or offers with respect to the security, existence of merger proposals or tender offers with respect to the security. These general and specific factors listed do not provide all the criteria, which may be considered when using the fair value method. When using the fair value method, the Adviser will take into consideration all indications of value available to them in determining the “fair value” assigned to a particular security.
If an investment owned by a Portfolio experiences a default and has accrued interest from purchase or has recorded accrued interest during the period it is owned, the Portfolio’s policy is to cease interest accruals from the time the investments are traded as “flat” in the market. The Portfolio evaluates the collectibility of purchased accrued interest and previously recorded interest on an investment-by-investment basis.
FEDERAL INCOME TAXES
Each Portfolio is treated as a separate taxable entity for federal income tax purposes and intends to qualify as a regulated investment company under Subchapter M of the Internal Revenue Code. The Trust intends to distribute substantially all taxable income and net realized gains to shareholders annually, and otherwise comply with the requirements for regulated investment companies. Therefore, no provision has been made for federal income taxes.
Net investment income and net realized gains (losses) may differ for financial statement and tax purposes because of temporary or permanent book/tax differences. To the extent these differences are permanent, reclassifications are made to the appropriate equity accounts in the period the difference arises.
40|86 Series Trust | |
Notes to Financial Statements | December 31, 2004 |
On the Statement of Assets and Liabilities, the following reclassifications were made:
Portfolio | | | Accumulated Net Realized Gain (Loss) | | | Undistributed Investment Income | | | Paid-in Capital | |
| Focus 20 | | $ | 35,223 | | $ | 5,166 | | $ | (40,389 | ) |
| Equity | | | (2,693 | ) | | 2,693 | | | — | |
| Balanced | | | 1,358 | | | 2,371 | | | (3,729 | ) |
| High Yield | | | (27,545 | ) | | 12,531 | | | 15,014 | |
| Fixed Income | | | (1,264 | ) | | 4,173 | | | (2,909 | ) |
| Government Securities | | | 550 | | | (550 | ) | | — | |
DIVIDENDS TO SHAREHOLDERS
Dividends are declared and reinvested from net investment income on a daily basis in the Money Market Portfolio, on a monthly basis in the Government Securities, Fixed Income and High Yield Portfolios, on a quarterly basis in the Balanced Portfolio and on an annual basis in the Focus 20 and Equity Portfolios. Distributions of net short-term capital gains and losses are declared and reinvested on an annual basis as a component of net realized gains (losses).
Dividends to shareholders from net investment income are determined in accordance with income tax regulations which may differ from accounting principles generally accepted in the United States of America. Permanent book and tax differences relating to dividends to shareholders may result in reclassifications to paid-in capital and may effect per-share allocation between net investment income and realized and unrealized gains (losses). Any taxable income or gain of the Trust remaining at fiscal year end will be declared and distributed in the following year to the shareholders of the Portfolio or Portfolios to which such gains are attributable.
SECURITIES LENDING
The Portfolios have entered into a Securities Lending Agreement (the “Agreement”) with the Bank of New York. Under terms of the Agreement, the Portfolios may lend portfolio securities to qualified institutional borrowers in order to earn additional income. The Agreement requires that loans are collateralized at all times in an amount equal to at least 102% of the market value of any loaned securities, plus accrued interest. Cash collateral is invested in short-term securities or variable rate bonds and Certificates of Deposit that are included in the respective Portfolio’s Schedule of Investments.
At December 31, 2004, the Equity, Balanced, Fixed Income and Government Securities Portfolios had securities with a market value of $38,439,883, $7,319,091, $1,799,323, and $4,038,117, respectively, on loan (included within Investments in securities in the Statements of Assets and Liabilities) and had received $39,482,903, $7,529,373, $1,835,927 and $4,113,548, respectively, in collateral. Amounts earned as interest on investments of cash collateral, net of rebates and other securities lending expenses, are included in Securities lending income in the Statements of Operations. For the year ended December 31, 2004, the securities lending income totaled $42,373, $9,627, $7,477, and $16,099, respectively.
The primary risk associated with securities lending is if the borrower defaults on its obligation to return the securities loaned because of insolvency or other reasons. The Portfolios could experience delays and costs in recovering securities loaned or in gaining access to the collateral.
USE OF ESTIMATES
The preparation of financial statements in conformity with accounting principles generally accepted in the United States of America requires management to make estimates and assumptions that affect the reported amount of assets and liabilities, and disclosure of contingent assets and liabilities as of the date of the financial statements and the reported amounts of increases and decreases in net assets from operations during the reporting period. Actual results may differ from these estimates.
(3) TRANSACTIONS WITH AFFILIATES
INVESTMENT ADVISORY AGREEMENT
The Adviser provides investment advice and, in general, supervises the Trust’s management and investment program, furnishes office space, prepares Portfolio reports for the Trust, monitors Portfolio compliance by the Trust in its investment activities and pays compensation of officers and Trustees of the Trust who are affiliated persons of the Adviser. The Trust pays all other expenses incurred in the operation of the Trust, including fees and expenses of unaffiliated Trustees of the Trust.
Under the Investment Advisory Agreement, the Adviser receives an investment advisory fee based on the daily net asset value at an annual rate of 0.70 percent for the Focus 20 and High Yield Portfolios, 0.65 percent for the Equity and Balanced Portfolios, and 0.50 percent for the Fixed Income, Government Securities, and Money Market Portfolios. The Adviser has voluntarily reduced its advisory fee to 0.25 percent of the average daily net assets of the Money Market Portfolio. The total fees incurred for such services were $1,851,251 for the year ended December 31, 2004.
The Adviser has entered into Subadvisory Agreements for the management of the investments in the Focus 20 Portfolio, Equity Portfolio and the equity portion of the Balanced Portfolio. The Adviser is solely responsible for the payment of all fees to the Subadviser. The Subadviser for the Focus 20 Portfolio is Oak Associates, ltd. The Subadviser for the Equity Portfolio and the equity portion of the Balanced Portfolio is Chicago Equity Partners, LLC.
The Adviser has contractually agreed to waive its investment advisory fee and/or reimburse the Portfolios through April 30, 2005 to the extent that the ratio of expenses to net assets on an annual basis exceed the following:
Portfolio | |
| Focus 20 | 1.15% |
| Equity | 1.10% |
| Balanced | 1.10% |
| High Yield | 1.15% |
| Fixed Income | 0.95% |
| Government Securities | 0.95% |
| Money Market | 0.45% |
40|86 Series Trust | |
Notes to Financial Statements | December 31, 2004 |
The Adviser may discontinue these contractual limits at any time after April 30, 2005. After this date the Adviser may elect to continue, modify, or terminate the limitation on Portfolio operating expenses. Further, under the terms of this agreement any Portfolio expenses waived or reimbursed may be recouped by the Adviser from the Portfolio to the extent actual operating expenses for a period are less than the expense limitation caps. The Adviser may only be entitled to recoup such amounts for a period of three years from the fiscal year that they were waived or reimbursed. Reimbursed/absorbed expenses subject to potential recovery by year of expiration are as follows:
| | | Year of Expiration |
| | December 31, |
| | | | 2005 | | | 2006 | | | 2007 | |
| Focus 20 | | $ | 19,034 | | $ | 4,298 | | $ | 1,349 | |
| Equity | | | 98,019 | | | 64,540 | | | 42,025 | |
| Balanced | | | 49,725 | | | 21,956 | | | 18,765 | |
| High Yield | | | 22,304 | | | 8,570 | | | 8,536 | |
| Fixed Income | | | 36,301 | | | 20,431 | | | 8,208 | |
| Government Securities | | | 10,671 | | | 31,927 | | | — | |
| Money Market | | | 335,352 | | | 237,653 | | | 103,777 | |
ADMINISTRATIVE AGREEMENT
Conseco Services, LLC (the “Administrator”), a wholly-owned subsidiary of Conseco, supervises the preparation and filing of regulatory documents required for compliance by the Portfolios with applicable laws and regulations, supervises the maintenance of books and records of the Portfolios and provides other general and administrative services. Effective May 1, 2001, the Administrator receives an annual fee, for providing these services, equal to 0.15 percent for the first $200 million of average daily net assets of the Trust; 0.10 percent of the next $300 million of average daily net assets of the Trust; and 0.08 percent of the average daily net assets in excess of $500 million of the Trust. The total fees under this Agreement for the year ended December 31, 2004 were $401,623. The Administrator has contractually agreed to waive its administration fee and/or reimburse the Portfolios through April 30, 2005 to the extent that the ratio of expenses to net assets on an annual basis exceeds the expense limitations as stated above for the Investment Advisory Agreement. The Administrator may discontinue these contractual limits at any time after April 30, 2005.
DISTRIBUTION AGREEMENT
Conseco Equity Sales, Inc. (the “Distributor”), a wholly-owned subsidiary of Conseco, serves as the principal underwriter for each Portfolio pursuant to an Underwriting Agreement, approved by the Trustees. The Distributor is a registered broker-dealer and a member of the National Association of Securities Dealers, Inc. (“NASD”). Shares of each Portfolio will be continuously offered to life insurance company separate accounts to fund the benefits under variable annuity and variable life contracts. The Distributor bears all the expenses of providing services pursuant to the Underwriting Agreement including the payment of the expenses relating to the distribution of prospectuses for sales purposes, as well as, any advertising or sales literature.
The Trust adopted a Distribution and Service Plan pursuant to Rule 12b-1 (the “Plan”), dated May 1, 2001, for the Focus 20, Equity, Balanced, High Yield, Fixed Income and Government Securities Portfolios in accordance with the requirements of Rule 12b-1 under the 1940 Act and the requirements of the applicable rules of the NASD regarding asset based sales charges. Pursuant to the Plan, a Portfolio may compensate the Distributor for its expenditures in financing any activity primarily intended to result in the sale of shares of the Portfolio and for account maintenance provided to shareholders. The Plan authorizes payments to the Distributor at 0.25 percent annually of each Portfolio’s average daily net assets. The Plan provides for periodic payments by the Distributor to financial intermediaries for providing shareholder services to accounts that hold shares and for promotional and other sales related costs. The total fees incurred by the Trust for such services for the year ended December 31, 2004, were $659,576.
4. INVESTMENT TRANSACTIONS
The aggregate cost of purchases and the aggregate proceeds from sales of investments for year ended December 31, 2004 are shown below:
| | | | | | | EQUITY PORTFOLIO | | | BALANCED PORTFOLIO | | | HIGH YIELD PORTFOLIO | | | FIXED INCOME PORTFOLIO | | | GOVERNMENT SECURITIES PORTFOLIO | |
| Purchases: | | | | | | | | | | | | | | | | | | | |
| U.S. Government | | $ | — | | $ | — | | $ | 11,257,791 | | $ | — | | $ | 23,493,641 | | $ | 41,920,627 | |
| Other | | | 1,195,724 | | | 138,189,373 | | | 32,679,490 | | | 15,850,518 | | | 40,511,979 | | | 301,487 | |
| Sales: | | | | | | | | | | | | | | | | | | | |
| U.S. Government | | $ | — | | $ | — | | $ | 11,722,256 | | $ | — | | | 26,696,443 | | $ | 46,231,985 | |
| Other | | | 4,393,016 | | | 162,306,452 | | | 37,681,565 | | $ | 16,424,500 | | $ | 42,848,301 | | | 2,352,318 | |
40|86 Series Trust | |
Notes to Financial Statements | December 31, 2004 |
5. FEDERAL INCOME TAXES
The following information for the Portfolios is presented on an income tax basis as of December 31, 2004:
| | | | | | | EQUITY PORTFOLIO | | | BALANCED PORTFOLIO | | | HIGH YIELD PORTFOLIO | | | FIXED INCOME PORTFOLIO | | | GOVERNMENT SECURITIES PORTFOLIO | |
| Cost of investments (a) | | $ | 1,484,177 | | $ | 169,008,020 | | $ | 47,570,642 | | $ | 8,290,633 | | $ | 28,018,993 | | $ | 17,588,786 | |
| Gross unrealized appreciation | | $ | 35,362 | | $ | 38,412,742 | | $ | 6,744,657 | | $ | 465,693 | | $ | 1,104,954 | | $ | 235,880 | |
| Gross unrealized depreciation | | | (46,959 | ) | | (532,846 | ) | | (584,934 | ) | | (43,956 | ) | | (123,133 | ) | | (85,478 | ) |
| Net unrealized appreciationon investments: | | $ | 8,403 | | $ | 37,879,896 | | $ | 6,159,723 | | | 421,737 | | $ | 981,821 | | $ | 150,402 | |
| (a) | Represents cost for federal income tax purposes and differs from the cost for financial reporting purposes by the amount of losses recognized for the financial reporting purposes in excess of federal income tax purposes. |
As of December 31, 2004, the components of accumulated earnings (deficit) on a tax basis were:
| | | | | | | EQUITY PORTFOLIO | | | BALANCED PORTFOLIO | | | HIGH YIELD PORTFOLIO | | | FIXED INCOME PORTFOLIO | | | GOVERNMENT SECURITIES PORTFOLIO | | | MONEY MARKET PORTFOLIO | |
| Distributable ordinary income | | $ | 107,534 | | $ | — | | $ | — | | $ | 131,312 | | $ | — | | $ | 1,275 | | $ | 9,296 | |
| Distributable long-term gains | | | — | | | 15,930,340 | | | — | | | 323,316 | | | — | | | — | | | — | |
| Accumulated earnings | | | 107,534 | | | 15,930,340 | | | — | | | 454,628 | | | — | | | 1,275 | | | 9,296 | |
| Accumulated capital and post- October losses | | | (274,917 | ) | | (28,393,992 | ) | | (13,845,300 | ) | | (530,199 | ) | | (869,533 | ) | | (216,567 | ) | | (9,296 | ) |
| Unrealized appreciation | | | 88,403 | | | 37,879,896 | | | 6,159,723 | | | 421,737 | | | 981,821 | | | 150,402 | | | — | |
| Total accumulated earnings (deficit) | | $ | (78,980 | ) | $ | 25,416,244 | | $ | (7,685,577 | ) | $ | 346,166 | | $ | 112,288 | | $ | (64,890 | ) | $ | — | |
The tax character of dividends paid during the years ended December 31, 2004 and December 31, 2003 were as follows:
| | | | FOCUS 20 PORTFOLIO | | | EQUITY PORTFOLIO | | | BALANCED PORTFOLIO | | | HIGH YIELD PORTFOLIO | | | FIXED INCOME PORTFOLIO | | | GOVERNMENT SECURITIES PORTFOLIO | | | MONEY MARKET PORTFOLIO | |
| Ordinary Income dividends | | | | | | | | | | | | | | | | | | | | | | |
| December 31, 2004 | | $ | — | | $ | 546,828 | | $ | 919,319 | | $ | 888,049 | | $ | 1,327,299 | | $ | 630,280 | | $ | 362,228 | |
| December 31, 2003 | | | — | | | 371,095 | | | 1,040,088 | | | 565,486 | | | 1,849,081 | | | 1,190,887 | | | 491,400 | |
| Long-term capital gain distributions | | | | | | | | | | | | | | | | | | | | | | |
| December 31, 2004 | | $ | — | | $ | 590,150 | | $ | — | | $ | 140,663 | | $ | — | | $ | — | | $ | — | |
| December 31, 2003 | | | — | | | — | | | — | | | — | | | — | | | 172,058 | | | — | |
As of December 31, 2004, the following Portfolios have capital loss carryforwards available to offset capital gains in the future, if any:
| | | AMOUNT | | EXPIRES | |
| Balanced Portfolio | $ | 1,887,956 | | 2010 | |
| Balanced Portfolio | | 1,556,918 | | 2011 | |
| Fixed Income Portfolio | | 435,737 | | 2010 | |
| Government Securities Portfolio | | 200,502 | | 2012 | |
| Money Market Portfolio | | 4,462 | | 2010 | |
| Money Market Portfolio | | 80 | | 2011 | |
| Money Market Portfolio | | 4,754 | | 2012 | |
40|86 Series Trust | |
Notes to Financial Statements | December 31, 2004 |
As of the tax year end December 31, 2004, the following Portfolios had additional net capital loss carryforwards, subject to certain limitations on availability, to offset future net capital gains, if any. To the extent that these carryovers are used to offset future capital gains, it is probable that the gains so offset will not be distributed to shareholders:
| | AMOUNT | | EXPIRES | |
| Focus 20 Portfolio | $ | 201,943 | | | 2009 | |
| Focus 20 Portfolio | | 40,389 | | | 2010 | |
| Equity Portfolio | | 22,371,666 | | | 2009 | |
| Equity Portfolio | | 6,022,326 | | | 2010 | |
| Balanced Portfolio | | 2,444,046 | | | 2009 | |
| Balanced Portfolio | | 7,956,380 | | | 2010 | |
| High Yield Portfolio | | 71,041 | | | 2009 | |
| High Yield Portfolio | | 420,330 | | | 2010 | |
| High Yield Portfolio | | 38,828 | | | 2011 | |
| Fixed Income Portfolio | | 433,796 | | | 2010 | |
Net realized gains or losses may differ from Federal income tax purposes primarily as a result of wash sales and post-October losses which may not be recognized for tax purposes until the first of the following fiscal year. Such amounts may be used to offset future capital gains.
The following summarizes the amount of post-October losses deferred, on a tax basis, for the year ended December 31, 2004.
| | | | AMOUNT | |
| Focus 20 Portfolio | | $ | 32,585 | |
| Government Securities Portfolio | | | 15,644 | |
6. INDEMNIFICATIONS
Under the Trust’s organizational documents, its officers and trustees are indemnified against certain liabilities arising out of the performance of their duties to the Trust. In addition, in the normal course of business, the Trust enters into contacts with its vendors and others that may provide for general indemnifications. The Trust’s maximum exposure under these arrangements is unknown as this would involve future claims be made against the Trust. However, based on experience, the Trust expects the risk of loss to be remote.
7. SUBSEQUENT EVENT
On February 17, 2005, the Board voted to approve the Plan of Liquidation of the Focus 20 Portfolio. The Board authorized the officers of the Trust to prepare and file the necessary Proxy Materials to call a Special Meeting of Shareholders to approve the Plan of Liquidation to liquidate the assets of the Focus 20 Portfolio and distribute the liquidation proceeds to the Focus 20 Portfolio's shareholders.
40|86 Series Trust | |
Financial Highlights | December 31, 2004 |
| For a share outstanding through the each year or period ended December 31, | |
| | | FOCUS 20 PORTFOLIO | |
| | | 2004 | | 2003 | | 2002 | | 2001 | | 2000 (c) | |
| Net asset value per share, beginning of period | | $ | 3.35 | | $ | 2.18 | | $ | 4.58 | | $ | 8.48 | | $ | 10.00 | |
| Income from investment operations: | | | | | | | | | | | | | | | | |
| Net investment income (loss) | | | (0.01 | ) | | (0.01 | ) | | (0.03 | ) | | (0.02 | ) | | 0.02 | |
Net realized gains (losses) and change in unrealized appreciation or depreciation on investments | | | (0.09 | ) | | 1.18 | | | (2.37 | ) | | (3.88 | ) | | (1.52 | ) |
| Total income (loss) from investment | | | (0.10 | ) | | 1.17 | | | (2.40 | ) | | (3.90 | ) | | (1.50 | ) |
| Distributions: | | | | | | | | | | | | | | | | |
| Dividends from net investment income | | | — | | | — | | | — | | | — | | | (0.02 | ) |
| Distributions of net realized gains | | | — | | | — | | | — | | | — | | | — | |
| Total distributions | | | — | | | — | | | — | | | — | | | (0.02 | ) |
| Net asset value per share, end of period | | $ | 3.25 | | $ | 3.35 | | $ | 2.18 | | $ | 4.58 | | $ | 8.48 | |
| Total return (a)(b)(d) | | | (2.99 | %) | | 53.67 | % | | (52.40 | %) | | (46.00 | %) | | (15.04 | %) |
| | | | | | | | | | | | | | | | | |
| Ratios/supplemental data: | | | | | | | | | | | | | | | | |
| Net assets (dollars in thousands), end of period | | $ | 1,566 | | $ | 5,099 | | $ | 898 | | $ | 3,062 | | $ | 3,681 | |
| Ratio of expenses to average net assets (b)(e): | | | | | | | | | | | | | | | | |
| Before expense reimbursement and recoveries | | | 1.20 | % | | 1.30 | % | | 1.96 | % | | 1.10 | % | | 0.90 | % |
| After expense reimbursement and recoveries | | | 1.15 | % | | 1.15 | % | | 1.15 | % | | 1.09 | % | | 0.90 | % |
| Ratio of net investment income (loss) to average net assets (b)(e) | | | (0.14 | %) | | (0.55 | %) | | (0.57 | %) | | (0.34 | %) | | 0.33 | % |
| Portfolio turnover rate (d) | | | 44.78 | % | | 179.09 | % | | 412.37 | % | | 280.48 | % | | 351.37 | % |
| (a) | Total return represents performance of the Portfolio only and does not include mortality and expense deductions in separate accounts. |
| (b) | The Adviser and Administrator have contractually agreed to reimburse Portfolio expenses to the extent that the ratio of expenses to average net assets exceeds, on an annual basis, the net expenses defined in Note 3. These contractual limits may be discontinued at any time after April 30, 2005. |
| (c) | For the period from May 4, 2000 (commencement of operations) through December 31, 2000. |
| (d) | Not annualized for periods of less than one full year. |
| (e) | Annualized for periods of less than one full year. |
The accompanying notes are an integral part of these financial statements.
40|86 Series Trust | |
Financial Highlights | December 31, 2004 |
| For a share outstanding through the each year ended December 31, | |
| | | EQUITY PORTFOLIO | |
| | | | 2004 | | | 2003 | | | 2002 | | | 2001 | | | 2000 | |
| Net asset value per share, beginning of period | | $ | 20.42 | | $ | 14.92 | | $ | 17.30 | | $ | 19.43 | | $ | 23.18 | |
| Income from investment operations: | | | | | | | | | | | | | | | | |
| Net investment income (loss) | | | 0.08 | | | 0.06 | | | 0.06 | | | 0.07 | | | 0.00(c | ) |
Net realized gains (losses) and change in unrealized appreciation or depreciation on investments | | | 4.20 | | | 5.49 | | | (2.38 | ) | | (2.07 | ) | | 0.63 | |
| Total income (loss) from investment | | | 4.28 | | | 5.55 | | | (2.32 | ) | | (2.00 | ) | | 0.63 | |
| Distributions: | | | | | | | | | | | | | | | | |
| Dividends from net investment income | | | (0.08 | ) | | (0.05 | ) | | (0.06 | ) | | (0.07 | ) | | (0.00)(c | ) |
| Distributions of net realized gains | | | (0.09 | ) | | — | | | — | | | (0.06 | ) | | (4.38 | ) |
| Total distributions | | | (0.17 | ) | | (0.05 | ) | | (0.06 | ) | | (0.13 | ) | | (4.38 | ) |
| Net asset value per share, end of period | | $ | 24.53 | | $ | 20.42 | | $ | 14.92 | | $ | 17.30 | | $ | 19.43 | |
| Total return (a)(b) | | | 20.94 | % | | 37.17 | % | | (13.42 | %) | | (10.30 | %) | | 2.71 | % |
| | | | | | | | | | | | | | | | | |
| Ratios/supplemental data: | | | | | | | | | | | | | | | | |
| Net assets (dollars in thousands), end of period | | $ | 168,901 | | $ | 165,798 | | $ | 148,881 | | $ | 233,983 | | $ | 309,201 | |
| Ratio of expenses to average net assets (b): | | | | | | | | | | | | | | | | |
| Before expense reimbursement and recoveries | | | 1.13 | % | | 1.14 | % | | 1.15 | % | | 1.02 | % | | 0.81 | % |
| After expense reimbursement and recoveries | | | 1.10 | % | | 1.10 | % | | 1.10 | % | | 1.02 | % | | 0.78 | % |
| Ratio of net investment income (loss) to average net assets (b) | | | 0.38 | % | | 0.28 | % | | 0.32 | % | | 0.38 | % | | (0.02 | %) |
| Portfolio turnover rate | | | 89.43 | % | | 106.74 | % | | 101.94 | % | | 132.69 | % | | 431.14 | % |
__________
| (a) | Total return represents performance of the Portfolio only and does not include mortality and expense deductions in separate accounts. |
| (b) | The Adviser and Administrator have contractually agreed to reimburse Portfolio expenses the extent that the ratio of expenses to average net assets exceeds, on an annual basis, the net expenses defined in Note 3. These contractual limits may be discontinued at any time after April 30, 2005. |
| (c) | Amount calculated is less than $0.005 per share. |
The accompanying notes are an integral part of these financial statements.
40|86 Series Trust | |
Financial Highlights | December 31, 2004 |
| For a share outstanding through the each year ended December 31, | |
| | | BALANCED PORTFOLIO |
| | | 2004 | | | 2003 | | | 2002 | | | 2001 | | | 2000 | |
| Net asset value per share, beginning of period | | $ | 12.35 | | $ | 10.25 | | $ | 12.16 | | $ | 13.45 | | $ | 14.65 | |
| Income from investment operations: | | | | | | | | | | | | | | | | |
| Net investment income (loss) | | | 0.26 | | | 0.27 | | | 0.36 | | | 0.40 | | | 0.43 | |
Net realized gains (losses) and change in unrealized appreciation or depreciation on investments | | | 1.07 | | | 2.09 | | | (1.91 | ) | | (1.29 | ) | | 0.67 | |
| Total income (loss) from investment | | | 1.33 | | | 2.36 | | | (1.55 | ) | | (0.89 | ) | | 1.10 | |
| Distributions: | | | | | | | | | | | | | | | | |
| Dividends from net investment income | | | (0.26 | ) | | (0.26 | ) | | (0.36 | ) | | (0.40 | ) | | (0.43 | ) |
| Distributions of net realized gains | | | — | | | — | | | — | | | (0.00)(c | ) | | (1.87 | ) |
| Total distributions | | | (0.26 | ) | | (0.26 | ) | | (0.36 | ) | | (0.40 | ) | | (2.30 | ) |
| Net asset value per share, end of period | | $ | 13.42 | | $ | 12.35 | | $ | 10.25 | | $ | 12.16 | | $ | 13.45 | |
| Total return (a)(b) | | | 10.84 | % | | 23.29 | % | | (12.87 | %) | | (6.60 | %) | | 7.29 | % |
| | | | | | | | | | | | | | | | | |
| Ratios/supplemental data: | | | | | | | | | | | | | | | | |
| Net assets (dollars in thousands), end of period | | $ | 47,056 | | $ | 48,282 | | $ | 44,455 | | $ | 71,635 | | $ | 75,355 | |
| Ratio of expenses to average net assets (b): | | | | | | | | | | | | | | | | |
| Before expense reimbursement and recoveries | | | 1.14 | % | | 1.15 | % | | 1.18 | % | | 1.04 | % | | 0.83 | % |
| After expense reimbursement and recoveries | | | 1.10 | % | | 1.10 | % | | 1.10 | % | | 1.04 | % | | 0.78 | % |
| Ratio of net investment income (loss) to average net assets (b) | | | 2.03 | % | | 2.27 | % | | 3.11 | % | | 3.16 | % | | 2.77 | % |
| Portfolio turnover rate | | | 97.35 | % | | 99.96 | % | | 180.27 | % | | 238.63 | % | | 334.36 | % |
__________
| (a) | Total return represents performance of the Portfolio only and does not include mortality and expense deductions in separate accounts. |
| (b) | The Adviser and Administrator have contractually agreed to reimburse Portfolio expenses to the extent that the ratio of expenses to average net assets exceeds, on an annual basis, the net expenses defined in Note 3. These contractual limits may be discontinued at any time after April 30, 2005. |
| (c) | Amount calculated is less than $0.005 per share. |
The accompanying notes are an integral part of these financial statements.
40|86 Series Trust | |
Financial Highlights | December 31, 2004 |
| For a share outstanding through the each year or period ended December 31, | |
| | | HIGH YIELD PORTFOLIO |
| | | | 2004 | | | 2003 | | | 2002 | | | 2001 | | | 2000 (c) | |
| Net asset value per share, beginning of period | | $ | 10.53 | | $ | 8.86 | | $ | 9.28 | | $ | 10.07 | | $ | 10.00 | |
| Income from investment operations: | | | | | | | | | | | | | | | | |
| Net investment income (loss) | | | 0.71 | | | 0.67 | | | 0.86 | | | 1.10 | | | 0.24 | |
Net realized gains (losses) and change in unrealized appreciation or depreciation on investments | | | 0.37 | | | 1.68 | | | (0.42 | ) | | (0.78 | ) | | 0.07 | |
| Total income (loss) from investment | | | 1.08 | | | 2.35 | | | 0.44 | | | 0.32 | | | 0.31 | |
| Distributions: | | | | | | | | | | | | | | | | |
| Dividends from net investment income | | | (0.70 | ) | | (0.68 | ) | | (0.86 | ) | | (1.11 | ) | | (0.24 | ) |
| Distributions of net realized gains | | | (0.51 | ) | | — | | | — | | | — | | | — | |
| Total distributions | | | (1.21 | ) | | (0.68 | ) | | (0.86 | ) | | (1.11 | ) | | (0.24 | ) |
| Net asset value per share, end of period | | $ | 10.40 | | $ | 10.53 | | $ | 8.86 | | $ | 9.28 | | $ | 10.07 | |
| Total return (a)(b)(d) | | | 10.69 | % | | 27.38 | % | | 5.47 | % | | 3.17 | % | | 3.20 | % |
| | | | | | | | | | | | | | | | | |
| Ratios/supplemental data: | | | | | | | | | | | | | | | | |
| Net assets (dollars in thousands), end of period | | $ | 8,876 | | $ | 10,941 | | | 9,202 | | $ | 7,091 | | $ | 4,040 | |
| Ratio of expenses to average net assets (b)(e): | | | | | | | | | | | | | | | | |
| Before expense reimbursement and recoveries | | | 1.24 | % | | 1.25 | % | | 1.47 | % | | 1.11 | % | | 0.90 | % |
| After expense reimbursement and recoveries | | | 1.15 | % | | 1.15 | % | | 1.15 | % | | 1.11 | % | | 0.90 | % |
| Ratio of net investment income (loss) to average net assets (b)(e) | | | 6.53 | % | | 6.53 | % | | 8.95 | % | | 11.12 | % | | 3.31 | % |
| Portfolio turnover rate (d) | | | 176.55 | % | | 125.73 | % | | 257.92 | % | | 232.18 | % | | 1.02 | % |
__________
| (a) | Total return represents performance of the Portfolio only and does not include mortality and expense deductions in separate accounts. |
| (b) | The Adviser and Administrator have contractually agreed to reimburse Portfolio expenses to the extent that the ratio of expenses to average net assets exceeds, on an annual basis, the net expenses defined in Note 3. These contractual limits may be discontinued at any time after April 30, 2005. |
| (c) | For the period from June 13, 2000 (commencement of operations) through December 31, 2000. |
| (d) | Not annualized for periods of less than one full year. |
| (e) | Annualized for periods of less than one full year. |
The accompanying notes are an integral part of these financial statements.
40|86 Series Trust | |
Financial Highlights | December 31, 2004 |
| For a share outstanding through the each year ended December 31, | |
| | | FIXED INCOME PORTFOLIO |
| | | | 2004 | | | 2003 | | | 2002 | | | 2001 | | | 2000 | |
| Net asset value per share, beginning of period | | $ | 10.08 | | $ | 9.66 | | $ | 9.88 | | $ | 9.63 | | $ | 9.39 | |
| Income from investment operations: | | | | | | | | | | | | | | | | |
| Net investment income (loss) | | | 0.44 | | | 0.46 | | | 0.58 | | | 0.59 | | | 0.65 | |
Net realized gains (losses) and change in unrealized appreciation or depreciation on investments | | | 0.02 | | | 0.42 | | | (0.13 | ) | | 0.25 | | | 0.24 | |
| Total income (loss) from investment | | | 0.46 | | | 0.88 | | | 0.45 | | | 0.84 | | | 0.89 | |
| Distributions: | | | | | | | | | | | | | | | | |
| Dividends from net investment income | | | (0.44 | ) | | (0.46 | ) | | (0.58 | ) | | (0.59 | ) | | (0.65 | ) |
| Distributions of net realized gains | | | — | | | — | | | (0.09 | ) | | — | | | — | |
| Total distributions | | | (0.44 | ) | | (0.46 | ) | | (0.67 | ) | | (0.59 | ) | | (0.65 | ) |
| Net asset value per share, end of period | | $ | 10.10 | | $ | 10.08 | | $ | 9.66 | | $ | 9.88 | | $ | 9.63 | |
| Total return (a)(b) | | | 4.74 | % | | 9.33 | % | | 4.68 | % | | 8.84 | % | | 9.87 | % |
| | | | | | | | | | | | | | | | | |
| Ratios/supplemental data: | | | | | | | | | | | | | | | | |
| Net assets (dollars in thousands), end of period | | $ | 27,448 | | $ | 35,068 | | $ | 41,957 | | $ | 60,649 | | $ | 37,433 | |
| Ratio of expenses to average net assets (b): | | | | | | | | | | | | | | | | |
| Before expense reimbursement and recoveries | | | 0.98 | % | | 1.00 | % | | 1.02 | % | | 0.91 | % | | 0.67 | % |
| After expense reimbursement and recoveries | | | 0.95 | % | | 0.95 | % | | 0.95 | % | | 0.91 | % | | 0.67 | % |
| Ratio of net investment income (loss) to average net assets (b) | | | 4.40 | % | | 4.61 | % | | 5.86 | % | | 5.96 | % | | 6.87 | % |
| Portfolio turnover rate | | | 226.26 | % | | 306.65 | % | | 370.92 | % | | 515.02 | % | | 280.73 | % |
__________
| (a) | Total return represents performance of the Portfolio only and does not include mortality and expense deductions in separate accounts. |
| (b) | The Adviser and Administrator have contractually agreed to reimburse Portfolio expenses to the extent that the ratio of expenses to average net assetsexceeds, on an annual basis, the net expenses defined in Note 3. These contractual limits may be discontinued at any time after April 30, 2005. |
The accompanying notes are an integral part of these financial statements.
40|86 Series Trust | |
Financial Highlights | December 31, 2004 |
| For a share outstanding through the each year ended December 31, | |
| | | GOVERNMENT SECURITIES PORTFOLIO |
| | | | 2004 | | | 2003 | | | 2002 | | | 2001 | | | 2000 | |
| Net asset value per share, beginning of period | | $ | 11.70 | | $ | 12.04 | | $ | 11.70 | | $ | 11.54 | | $ | 10.96 | |
| Income from investment operations: | | | | | | | | | | | | | | | | |
| Net investment income (loss) | | | 0.40 | | | 0.42 | | | 0.47 | | | 0.54 | | | 0.66 | |
Net realized gains (losses) and change in unrealized appreciation or depreciation on investments | | | (0.11 | ) | | (0.25 | ) | | 0.60 | | | 0.16 | | | 0.58 | |
| Total income (loss) from investment | | | 0.29 | | | 0.17 | | | 1.07 | | | 0.70 | | | 1.24 | |
| Distributions: | | | | | | | | | | | | | | | | |
| Dividends from net investment income | | | (0.40 | ) | | (0.42 | ) | | (0.47 | ) | | (0.54 | ) | | (0.66 | ) |
| Distributions of net realized gains | | | — | | | (0.09 | ) | | (0.26 | ) | | — | | | — | |
| Total distributions | | | (0.40 | ) | | (0.51 | ) | | (0.73 | ) | | (0.54 | ) | | (0.66 | ) |
| Net asset value per share, end of period | | $ | 11.59 | | $ | 11.70 | | $ | 12.04 | | $ | 11.70 | | $ | 11.54 | |
| Total return (a)(b) | | | 2.48 | % | | 1.36 | % | | 9.33 | % | | 6.13 | % | | 11.71 | % |
| | | | | | | | | | | | | | | | | |
| Ratios/supplemental data: | | | | | | | | | | | | | | | | |
| Net assets (dollars in thousands), end of period | | $ | 14,565 | | $ | 22,791 | | $ | 41,676 | | $ | 31,267 | | $ | 18,833 | |
| Ratio of expenses to average net assets (b): | | | | | | | | | | | | | | | | |
| Before expense reimbursement and recoveries | | | 0.94 | % | | 1.04 | % | | 0.99 | % | | 0.91 | % | | 0.66 | % |
| After expense reimbursement and recoveries | | | 0.95 | % | | 0.95 | % | | 0.95 | % | | 0.91 | % | | 0.66 | % |
| Ratio of net investment income (loss) to average net assets (b) | | | 3.29 | % | | 3.32 | % | | 3.78 | % | | 4.60 | % | | 5.89 | % |
| Portfolio turnover rate | | | 250.46 | % | | 175.15 | % | | 174.37 | % | | 199.41 | % | | 69.31 | % |
__________
| (a) | Total return represents performance of the Portfolio only and does not include mortality and expense deductions in separate accounts. |
| (b) | The Adviser and Administrator have contractually agreed to reimburse Portfolio expenses to the extent that the ratio of expenses to average net assets exceeds, on an annual basis, the net expenses defined in Note 3. These contractual limits may be discontinued at any time after April 30, 2005. |
The accompanying notes are an integral part of these financial statements.
40|86 Series Trust | |
Financial Highlights | December 31, 2004 |
| For a share outstanding through the each year ended December 31, | |
| | | MONEY MARKET PORTFOLIO |
| | | | 2004 | | | 2003 | | | 2002 | | | 2001 | | | 2000 | |
| Net asset value per share, beginning of period | | $ | 1.00 | | $ | 1.00 | | $ | 1.00 | | $ | 1.00 | | $ | 1.00 | |
| Income from investment operations: | | | | | | | | | | | | | | | | |
| Net investment income (loss) | | | 0.01 | | | 0.01 | | | 0.01 | | | 0.04 | | | 0.06 | |
| Net realized gains (losses) and change in unrealized appreciation or depreciation on investments | | | 0.00 | (c) | | — | | | (0.00 | )(c) | | 0.00 | (c) | | — | |
| Total income (loss) from investment | | | 0.01 | | | 0.01 | | | 0.01 | | | 0.04 | | | 0.06 | |
| Distributions: | | | | | | | | | | | | | | | | |
| Dividends from net investment income | | | (0.01 | ) | | (0.01 | ) | | (0.01 | ) | | (0.04 | ) | | (0.06 | ) |
| Distributions of net realized gains | | | — | | | — | | | — | | | — | | | | |
| Total distributions | | | (0.01 | ) | | (0.01 | ) | | (0.01 | ) | | (0.04 | ) | | (0.06 | ) |
| Net asset value per share, end of period | | $ | 1.00 | | $ | 1.00 | | $ | 1.00 | | $ | 1.00 | | $ | 1.00 | |
| Total return (a)(b) | | | 0.93 | % | | 0.63 | % | | 1.24 | % | | 3.97 | % | | 6.08 | % |
| | | | | | | | | | | | | | | | | |
| Ratios/supplemental data: | | | | | | | | | | | | | | | | |
| Net assets (dollars in thousands), end of period | | $ | 33,755 | | $ | 41,965 | | $ | 95,767 | | $ | 129,530 | | $ | 96,616 | |
| Ratio of expenses to average net assets (b): | | | | | | | | | | | | | | | | |
| Before expense reimbursement and recoveries | | | 0.71 | % | | 0.76 | % | | 0.73 | % | | 0.72 | % | | 0.66 | % |
| After expense reimbursement and recoveries | | | 0.45 | % | | 0.45 | % | | 0.45 | % | | 0.43 | % | | 0.41 | % |
Ratio of net investment income (loss) to average
net assets (b) | | | 1.16 | % | | 0.64 | % | | 1.23 | % | | 3.74 | % | | 5.98 | % |
__________
| (a) | Total return represents performance of the Portfolio only and does not include mortality and expense deductions in separate accounts. |
| (b) | The Adviser and Administrator have contractually agreed to reimburse Portfolio expenses to the extent that the ratio of expenses to average net assets exceeds, on an annual basis, the net expenses defined in Note 3. These contractual limits may be discontinued at any time after April 30, 2005. |
| (c) | Amount calculated is less than $0.005 per share. |
The accompanying notes are an integral part of these financial statements.
40|86 Series Trust | |
Report of Independent Registered Public Accounting Firm | December 31, 2004 |
To the Board of Trustees and Shareholders of 40|86 Series Trust:
In our opinion, the accompanying statements of assets and liabilities, including the schedules of investments, and the related statements of operations and of changes in net assets and the financial highlights present fairly, in all material respects, the financial position of Focus 20 Portfolio, Equity Portfolio, Balanced Portfolio, High Yield Portfolio, Fixed Income Portfolio, Government Securities Portfolio and Money Market Portfolio (seven portfolios constituting 40|86 Series Trust, hereafter referred to as the "Funds") at December 31, 2004, the results of each of their operations for the year then ended, the changes in each of their net assets for each of the two years in the period then ended and the financial highlights for each of the five years in the period then ended, in conformity with accounting principles generally accepted in the United States of America. These financial statements and financial highlights (hereafter referred to as "financial statements") are the responsibility of the Funds’ management; our responsibility is to express an opinion on these financial statements based on our audits. We conducted our audits of these financial statements in accordance with the standards of the Public Company Accounting Oversight Board (United States). Those standards require that we plan and perform the audits to obtain reasonable assurance about whether the financial statements are free of material misstatement. An audit includes examining, on a test basis, evidence supporting the amounts and disclosures in the financial statements, assessing the accounting principles used and significant estimates made by management, and evaluating the overall financial statement presentation. We believe that our audits, which included confirmation of securities at December 31, 2004 by correspondence with the custodian and brokers, provide a reasonable basis for our opinion.
As described in Note 7, on February 7, 2005, the Board of Trustees voted to approve a Plan of Liquidation of the Focus 20 Portfolio.
Indianapolis, Indiana
February 28, 2005
40|86 Series Trust | |
Board of Trustees and Officers (unaudited) | December 31, 2004 |
Name, Address and Age | Position Held With Trust | Principal Occupation(s) During Past 5 Years |
| | | |
David N. Walthall (59) 11825 N. Pennsylvania St. Carmel, IN 46032 | Chairman of the Board Since March 2004 and Trustee Since December 1998 | Principal, Walthall Asset Management. Former President, Chief Executive Officer and Director of Lyrick Corporation. Formerly, President and CEO, Heritage Media Corporation. Formerly, Director, Eagle National Bank. Chairman of the Board and Trustee of one other mutual fund managed by the Adviser. |
| | | |
Gregory J. Hahn* (44) 11825 N. Pennsylvania St. Carmel, IN 46032 | President Since September 2003 and Trustee Since January 2001 | Chartered Financial Analyst. Chief Investment Officer and Senior Vice President, Adviser. Portfolio Manager of the fixed income portion of Balanced and Fixed Income Funds. President, Trustee and portfolio manager of one other mutual fund managed by the Adviser. |
| | | |
Harold W. Hartley (81) 11825 N. Pennsylvania St. Carmel, IN 46032 | Trustee Since June 1993 | Chartered Financial Analyst. Director, Ennis Business Forms, Inc. Retired, Executive Vice President, Tenneco Financial Services, Inc. Trustee of one other mutual fund managed by the Adviser. |
| | | |
Dr. R. Jan LeCroy (73) 11825 N. Pennsylvania St. Carmel, IN 46032 | Trustee Since June 1993 | Director, Southwest Securities Group, Inc. Retired, President, Dallas Citizens Council. Trustee of one other mutual fund managed by the Adviser. |
| | | |
Diana H. Hamilton (48) 11815 N. Pennsylvania St. Carmel, IN 46032 | Trustee Since December 2004 | Independent Consultant in Municipal Finance Advisory; Formerly, State of Indiana Director of Public Finance. Trustee of one other mutual fund managed by the Adviser. |
| | | |
R. Matthew Neff (49) 11815 N. Pennsylvania St. Carmel, IN 46032 | Trustee Since December 2004 | Chairman and Co-Chief Executive Officer of Senex Financial Corp., a financial services company engaged in the healthcare finance field. Trustee of one other mutual fund managed by the Adviser. |
| | | |
Sarah L. Bertrand (36) 11815 N. Pennsylvania St. Carmel, IN 46032 | Chief Compliance Officer and Secretary Since December 2004 | Chief Compliance Officer, Adviser. Chief Compliance Officer and Secretary of one other mutual fund managed by the Adviser. |
| | | |
Audrey L. Kurzawa (37) 11815 N. Pennsylvania St. Carmel, IN 46032 | Treasurer Since October 2002 | Certified Public Accountant. Controller, Adviser. Treasurer of one other mutual fund managed by the Adviser. |
| | | |
William T. Devanney (48) 11815 N. Pennsylvania St. Carmel, IN 46032 | Vice President Since June 1993 | Senior Vice President, Corporate Taxes of Conseco Services, LLC and various affiliates. Vice President of one other mutual fund managed by the Adviser. |
__________
| * | The Trustee so indicated is an "interested person," as defined in the 1940 Act, of the Trust due to the positions indicated with the Adviser and its affiliates. Each Trustee serves until the expiration of the term of his designated class and until his successor is elected and qualified, or until his death or resignation, or removal as provided in the Fund’s by-laws or charter or statute. All Trustees oversee the 8 portfolios that make up the total fund complex including 40|86 Strategic Income Fund (1) and 40|86 Series Trust (7). |
INVESTMENT ADVISER | LEGAL COUNSEL |
40|86 Advisors, Inc. Carmel, IN | Kirkpatrick & Lockhart LLP Washington, D.C. |
| | |
CUSTODIAN The Bank of New York New York, NY | INVESTMENT SUB-ADVISERS Chicago Equity Partners, LLC Chicago, IL Oak Associates, ltd. Akron, OH |
| | |
INDEPENDENT REGISTERED PUBLIC ACCOUNTING FIRM PricewaterhouseCoopers LLP Indianapolis, IN |
PROXY VOTING POLICIES AND PROCEDURES
A description of the policies and procedures that the Portfolios use to determine how to vote proxies relating to portfolio securities is available without charge, upon request, by calling (866) 299-4086. Furthermore, you can obtain the description on the SEC’s website at http://www.sec.gov.
PROXY VOTING RECORDS FOR THE 12-MONTH PERIOD ENDED JUNE 30, 2004
Information regarding how the Portfolios voted proxies relating to portfolio securities during the most recent 12-month period ended June 30 is available without charge, upon request, by calling (866) 299-4086. Furthermore, you can obtain the Portfolio’s proxy voting records on the SEC’s website at http://www.sec.gov.
AVAILABILITY OF QUARTERLY PORTFOLIO SCHEDULE
The Portfolios file complete schedule of portfolio holdings with the SEC for the first and third quarters of each fiscal year on Form N-Q. The filing for the most recent quarter is available without charge, upon request, by calling (866) 299-4086. Furthermore, you can obtain the Portfolio’s quarterly portfolio schedule on the SEC’s website at http://www.sec.gov. The Portfolio’s Forms N-Q may also be reviewed and copied at the SEC’s Public Reference Room in Washington, DC, and information on the operation of the Public Reference Room may be obtained by calling (800) SEC-0330.
40|86 Series Trust is a registered investment company managed by
40|86 Advisors, Inc., a leading fixed-income investment advisor.
40|86 Series Trust
11815 North Pennsylvania Street
Carmel, Indiana 46032
Principal Underwriter:
Conseco Equity Sales, Inc.
11815 North Pennsylvania Street
Carmel, Indiana 46032