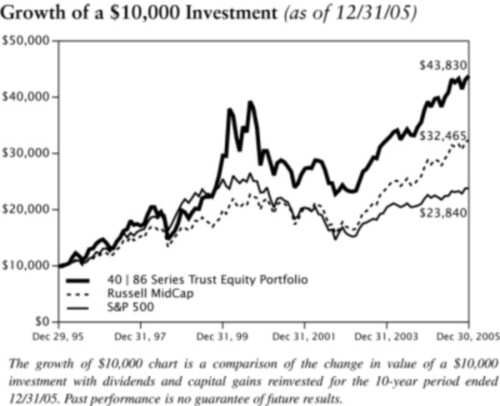
For the equity portion of the Portfolio, most of the out-performance came during the first three months of the year. We saw each of the three broad factors in our model (Value, Quality and Earnings Expectations) add value. Low volatility and moderate economic and profit growth laid the foundation for a rational market. In such an environment, investors tend to focus on long-term fundamentals, which bodes well for our disciplined philosophy and process.
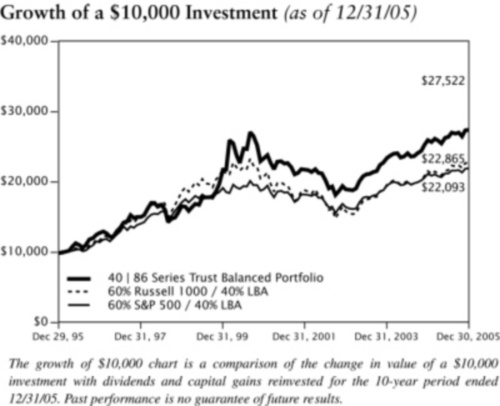
For the fixed income portion of the Portfolio, the primary factors for the variance were the barbell structure and short duration structure. Since the prices of fixed income instruments move inversely to yields, the performance of the Portfolio was aided by our overweight position in longer-term maturities. The long end of the yield curve rallied, with the 30-year US Treasury bond yields lower by 28 basis points (bps). The intermediate yield curve rose with the 5-year and 10-year Treasury bond yields up by 69 bps and 15 bps, respectively. Also, the front end of the yield curve rose with the 3-month and the 6-month Treasury Bill yields up by 190 bps and 177 bps, respectively. These movements resulted in a dramatic flattening of the yield curve. Our performance was also enhanced by the Portfolio’s above-average cash position combined with our investment in LIBOR-based floating-rate notes.
Stock selection in Consumer Discretionary, Utility and Technology sectors contributed the most for the equity portion of the Portfolio. The largest individual contributors, were overweight positions in electricity generator and distributor TXU, health insurance provider Humana and oil refiner and gasoline retailer Valero Energy.
For the fixed income portion of the Portfolio, selling positions in the auto sector prior to downgrades enhanced the Portfolio’s performance. In addition, positions in diversified energy company First Energy, natural gas and electric utility provider Pacific Gas & Electric, telecom firms Rogers Wireless and Sprint Capital and communications satellite company Intelsat Bermuda added to the Portfolio’s return.
Stock selection in the Industrial and Material sectors detracted the most. The largest individual detractors were underweight positions in integrated energy company ConocoPhillips and overweight positions in diversified conglomerate Tyco International and logistics and transportation company Ryder Systems.
For the fixed income portion of the Portfolio, although we sold our auto position prior to the downgrades, we bought General Motors Acceptance Corp (GMAC), the financial subsidiary of General Motors (GM), in the fourth quarter. Our move was based on GM’s announced plan to sell a stake in GMAC. We believe this sale will raise GMAC’s ratings to investment grade since it is very likely to be bought by a highly rated financial institution. With the auto sector still volatile, our position in GMAC was the worst performing holding for the year. In addition, positions in paper and wood products producer Boise Cascade and tobacco merchant Universal Corp detracted from the Portfolio’s return.
For the fixed income portion of the Portfolio, we expect higher short-term interest rates and a flattening, possibly inverting, yield curve, as the Fed continues to raise short-term rates, decreasing the use of financial leverage. We expect the Fed to stop tightening by the end of the first half of 2006. Earnings deceleration and negative event risk is a concern for the corporate sector. We plan to move to higher quality corporate bonds and increase exposure to Mortgage-backed Securities as volatility subsides. We will structure duration bias to neutral in anticipation of the end of Fed rate increases. We will also eliminate the barbell structure and lengthen portfolio duration as the Fed stops tightening.
The accompanying notes are an integral part of these financial statements.
40|86 Series Trust | Annual Report |
Schedule of Investments | December 31, 2005 |
| Balanced Portfolio | |
SHARES OR PRINCIPAL AMOUNT | | | VALUE |
| | | | | | |
Commercial Services & Supplies (0.6%) | |
| | 3,000 | | Equifax, Inc. (d) | $ | 114,060 |
| | 1,700 | | Robert Half International, Inc. (d) | | 64,413 |
| | 1,500 | | West Corp. (a)(d) | | 63,225 |
| | | | | | 241,698 |
Communications Equipment (1.9%) | |
| | 22,570 | | Cisco Systems, Inc. (a) | | 386,398 |
| | 3,300 | | Harris Corp. (d) | | 141,933 |
| | 12,000 | | Motorola, Inc. | | 271,080 |
| | 4,000 | | Tellabs, Inc. (a) | | 43,600 |
| | | | | | 843,011 |
Computers & Peripherals (2.9%) | |
| | 4,900 | | Apple Computer, Inc. (a) | | 352,261 |
| | 14,388 | | Hewlett Packard Co. | | 411,928 |
| | 4,400 | | International Business Machines Corp. | | 361,680 |
| | 6,200 | | Western Digital Corp. (a) (d) | | 115,382 |
| | | | | | 1,241,251 |
Construction Materials (0.4%) | | |
| | 3,800 | | Florida Rock Industries, Inc. | | 186,428 |
Diversified Financial Services (4.7%) | |
| | 10,400 | | CIT Group, Inc. | | 538,512 |
| | 6,332 | | Citigroup, Inc. | | 307,292 |
| | 13,340 | | J.P. Morgan Chase & Co. | | 529,465 |
| | 7,300 | | Moody's Corp. | | 448,366 |
| | 4,500 | | Principal Financial Group, Inc. (d) | | 213,435 |
| | | | | | 2,037,070 |
Diversified Telecommunication Services (1.9%) | |
| | 22,600 | | BellSouth Corp. (d) | | 612,460 |
| | 9,872 | | Sprint Corp. (d) | | 230,610 |
| | | | | | 843,070 |
Electric Utilities (1.2%) | |
| | 14,200 | | Pacific Gas & Electric Corp. (d) | | 527,104 |
Electrical Equipment (0.5%) | |
| | 3,600 | | Rockwell Automation, Inc. (d) | | 212,976 |
| | | | | | |
Electronic Equipment & Instruments (0.4%) | |
| | 1,900 | | Arrow Electronics, Inc. (a) | | 60,857 |
| | 5,500 | | Ingram Micro, Inc. (a) | | 109,615 |
| | | | | | 170,472 |
Energy Equipment & Services (0.7%) | |
| | 7,200 | | Patterson-UTI Energy, Inc. | | 237,240 |
| | 1,500 | | Unit Corp. (a) | | 82,545 |
| | | | | | 319,785 |
The accompanying notes are an integral part of these financial statements.
40|86 Series Trust | Annual Report |
Schedule of Investments | December 31, 2005 |
| Balanced Portfolio | |
SHARES OR PRINCIPAL AMOUNT | | | | VALUE |
| | | | | | |
Food & Staples Retailing (0.6%) | |
| | 4,200 | | CVS Corp. | $ | 110,964 |
| | 4,800 | | SUPERVALU, Inc. | | 155,904 |
| | | | | | 266,868 |
Food Products (0.8%) | |
| | 9,600 | | Archer-Daniels-Midland Co. (d) | | 236,736 |
| | 3,100 | | Pilgrim's Pride Corp. (d) | | 102,796 |
| | | | | | 339,532 |
Gas Utilities (0.6%) | |
| | 3,200 | | Questar Corp. | | 242,240 |
| | | | | | |
Health Care Equipment & Supplies (1.2%) | |
| | 1,400 | | Bausch & Lomb, Inc. | | 95,060 |
| | 3,400 | | Becton, Dickinson & Co. | | 204,272 |
| | 3,600 | | C.R. Bard, Inc. | | 237,312 |
| | | | | | 536,644 |
Health Care Providers & Services (2.5%) | |
| | 4,000 | | AmerisourceBergen Corp. (d) | | 165,600 |
| | 2,400 | | Cigna Corp. | | 268,080 |
| | 4,800 | | Humana, Inc. (a)(d) | | 260,784 |
| | 2,200 | | Lincare Holdings, Inc. (a) | | 92,202 |
| | 1 | | Medco Health Solutions, Inc. (a) | | 56 |
| | 3,900 | | Wellpoint, Inc. (a) | | 311,181 |
| | | | | | 1,097,903 |
Hotels Restaurants & Leisure (0.9%) | |
| | 6,200 | | Darden Restaurants, Inc. | | 241,056 |
| | 4,400 | | McDonald's Corp. | | 148,368 |
| | | | | | 389,424 |
Household Durables (0.4%) | |
| | 4,800 | | Toll Brothers, Inc. (a)(d) | 166,272 |
Household Products (1.7%) | |
| | 3,400 | | Colgate Palmolive Co. | | 186,490 |
| | 9,165 | | Procter & Gamble Co. | 530,470 |
| | | | | | 716,960 |
Independent Power Producers & Energy Traders (1.1%) | |
| | 9,200 | | TXU Corp. | | 461,748 |
Industrial Conglomerates (1.1%) | |
| | 6,500 | | Textron, Inc. | | 500,370 |
The accompanying notes are an integral part of these financial statements.
40|86 Series Trust | Annual Report |
Schedule of Investments | December 31, 2005 |
| Balanced Portfolio | |
SHARES OR PRINCIPAL AMOUNT | | | | VALUE |
| | | | | | |
Insurance (3.0%) | | |
| | 1,200 | | The Allstate Corp. | $ | 64,884 |
| | 6,000 | | Genworth Financial, Inc. | | 207,480 |
| | 4,800 | | Metlife, Inc. | | 235,200 |
| | 3,700 | | Prudential Financial, Inc. | | 270,803 |
| | 2,100 | | Safeco Corp. | | 118,650 |
| | 8,000 | | The St. Paul Travelers Companies, Inc. (d) | | 357,360 |
| | 3,000 | | UnumProvident Corp. | 68,250 |
| | | | | | 1,322,627 |
Internet Software & Services (0.6%) | | |
| | 650 | | Google, Inc. (a) | | 269,659 |
IT Services (0.5%) | | |
| | 1,500 | | CheckFree Corp. (a)(d) | | 68,850 |
| | 3,300 | | Computer Sciences Corp. (a) | | 167,112 |
| | | | | | 235,962 |
Machinery | (0.9%) | | | | |
| | 1,100 | | Cummins, Inc. (d) | | 98,703 |
| | 2,550 | | Joy Global, Inc. | | 102,000 |
| | 2,800 | | Paccar, Inc. | | 193,844 |
| | | | | | 394,547 |
Media (2.8%) | | |
| | 2,300 | | Harte Hanks, Inc. | | 60,697 |
| | 4,050 | | The McGraw-Hill Companies, Inc. (d) | | 209,102 |
| | 28,330 | | Time Warner, Inc. | | 494,075 |
| | 3,800 | | Viacom, Inc. - Class B | | 123,880 |
| | 13,900 | | The Walt Disney Co. | | 333,183 |
| | | | | | 1,220,937 |
Metals & Mining (0.5%) | |
| | 3,300 | | Nucor Corp. (d) | | 220,176 |
Multiline Retail (1.7%) | |
| | 2,700 | | Dillard's Inc. (d) | | 67,014 |
| | 4,300 | | Federated Department Stores (d) | | 285,219 |
| | 5,500 | | J.C. Penney Co., Inc. Holding Co. (d) | | 305,800 |
| | 2,700 | | Nordstrom, Inc. | | 100,980 |
| | | | | | 759,013 |
Oil, Gas & Consumable Fuels (5.2%) | |
| | 6,100 | | ConocoPhillips | | 354,898 |
| | 3,200 | | Devon Energy Corp. | | 200,128 |
| | 12,940 | | Exxon Mobil Corp. | | 726,840 |
| | 4,900 | | Marathon Oil Corp. (d) | | 298,753 |
| | 2,600 | | Occidental Petroleum Corp. | | 207,688 |
| | 8,400 | | Valero Energy Corp. | | 433,440 |
| | | | | | 2,221,747 |
Paper & Forest Products (0.7%) | |
| | 11,000 | | Louisiana-Pacific Corp. (d) | | 302,170 |
The accompanying notes are an integral part of these financial statements.
40|86 Series Trust | Annual Report |
Schedule of Investments | December 31, 2005 |
| Balanced Portfolio | |
SHARES OR PRINCIPAL AMOUNT | | | | VALUE |
| | | | | | |
Pharmaceuticals (4.5%) | |
| | 13,880 | | Johnson & Johnson | $ | 834,188 |
| | 8,200 | | King Pharmaceuticals, Inc. (a) | | 138,744 |
| | 11,500 | | Merck & Co., Inc. (d) | | 365,815 |
| | 15,840 | | Pfizer, Inc. | | 369,389 |
| | 2,600 | | Watson Pharmaceuticals, Inc. (a)(d) | | 84,526 |
| | 3,700 | | Wyeth | | 170,459 |
| | | | | | 1,963,121 |
Real Estate (1.3%) | |
| | 1,800 | | AvalonBay Communities, Inc. (d) | | 160,650 |
| | 3,200 | | CBL & Associates Properties, Inc. (d) | | 126,432 |
| | 4,300 | | Kimco Realty Corp. (d) | | 137,944 |
| | 2,400 | | Regency Centers Corp. (d) | | 141,480 |
| | | | | | 566,506 |
Road & Rail (0.8%) | |
| | 3,600 | | CSX Corp. | | 182,772 |
| | 3,800 | | Yellow Roadway Corp. (a)(d) | | 169,518 |
| | | | | | 352,290 |
Semiconductor & Semiconductor Equipment (2.3%) | |
| | 28,980 | | Intel Corp. | | 723,341 |
| | 8,500 | | MEMC Electronic Materials, Inc. (a) | | 188,445 |
| | 3,700 | | National Semiconductor Corp. (d) | | 96,126 |
| | | | | | 1,007,912 |
Software | (3.0%) | | | | |
| | 9,400 | | Adobe Systems, Inc. (d) | | 347,424 |
| | 1,400 | | Fair Isaac Corp | | 61,838 |
| | 22,040 | | Microsoft Corp | | 576,346 |
| | 26,500 | | Oracle Corp. (a) | | 323,565 |
| | | | | | 1,309,173 |
Specialty Retail (1.7%) | |
| | 1,500 | | Abercrombie & Fitch Co. - Class A (d) | | 97,770 |
| | 11,990 | | Home Depot, Inc. | | 485,355 |
| | 2,200 | | Lowe's Companies, Inc. | | 146,652 |
| | | | | | 729,777 |
Textiles, Apparel & Luxury Goods (0.3%) | |
| | 3,600 | | Coach, Inc. (a) | | 120,024 |
Thrifts & Mortgage Finance (0.9%) | |
| | 1,600 | | IndyMac Bancorp, Inc. (d) | | 62,432 |
| | 1,800 | | Radian Group, Inc. (d) | | 105,462 |
| | 5,045 | | Washington Mutual, Inc. (d) | | 219,457 |
| | | | | | 387,351 |
Tobacco (1.3%) | | |
| | 5,810 | | Altria Group, Inc. (d) | | 434,123 |
| | 1,300 | | Reynolds American, Inc. (d) | | 123,929 |
| | | | | | 558,052 |
The accompanying notes are an integral part of these financial statements.
40|86 Series Trust | Annual Report |
Schedule of Investments | December 31, 2005 |
| Balanced Portfolio | |
SHARES OR PRINCIPAL AMOUNT | | | | VALUE |
| | | | | | |
Trading Companies & Distributors (0.4%) | |
| | 2,500 | | W.W. Grainger, Inc. (d) | $ | 177,750 |
Wireless Telecommunication Services (0.2%) | |
| | 2,000 | | NII Holdings, Inc. (a)(d) | | 87,360 |
| | | | Total common stocks (cost $27,756,730 | | 31,948,466 |
PREFERRED STOCKS (0.5%) | |
Media (0.4%) | | |
| | 145 | | Centaur Funding Corp., 9.080%, 04/21/2020, Cost — $171,062; Acquired — 07/22/2003 (b)(f) | | 187,865 |
Textiles, Apparel & Luxury Goods (0.1%) | |
| | 1,695 | | Tommy Hilfiger USA, 9.000%, 12/01/2031 | | 42,816 |
| | | | Total preferred stocks (cost $214,259) | | 230,681 |
CORPORATE BONDS (15.1%) | |
Aerospace & Defense (0.3%) | |
| | $150,000 | | Boeing Capital Corp., 4.750%, 08/25/2008 | | 149,690 |
Beverages | (0.2%) | | | | |
| | | | | | |
| | 70,000 | | Miller Brewing Co., 5.500%, 08/15/2013, Cost — $71,959; Acquired — 07/13/2005 (b) | | 71,462 |
Capital Markets (0.1%) | | |
| | 45,011 | | PLC Trust, 2.709%, 03/31/2006, Cost — $45,011; Acquired — 12/12/2003 (b) | | 44,848 |
Chemical | (0.8%) | | | | |
| | 50,000 | | Lubrizol Corp., 5.500%, 10/01/2014 (d) | | 50,219 |
| | 80,000 | | Lyondell Chemical Co., 9.625%, 05/01/2007 | | 83,900 |
| | 190,000 | | Terra Capital, Inc., 12.875%, 10/15/2008 | | 222,300 |
| | | | | | 356,419 |
Commercial Banks (0.2%) | |
| | | | | | |
| | 35,000 | | Oversea-Chinese Banking Corp. Ltd., 7.750%, 09/06/2011, — Cost $39,133; Acquired — 11/08/2005 (b)(f) | | 39,391 |
| | 40,000 | | Union Planters Bank NA, 6.500%, 03/15/2008 | | 41,277 |
| | | | | | 80,668 |
Commercial Services & Supplies (0.7%) | |
| | 125,000 | | Cendant Corp., 7.375%, 01/15/2013 | | 139,847 |
| | 80,000 | | Corrections Corporation of America, 6.250%, 03/15/2013 | | 79,600 |
| | 105,000 | | International Lease Finance Corp., 4.000%, 01/17/2006 | | 104,978 |
| | | | | | 324,425 |
Construction & Engineering (0.2%) | |
| | 55,000 | | Blount, Inc., 8.875%, 08/01/2012 (d) | | 58,300 |
| | 50,000 | | William Lyon Homes, Inc., 7.625%, 12/15/2012 | | 44,375 |
| | | | | | 102,675 |
Containers & Packaging (0.7%) | |
| | 275,000 | | Owens-Brockway Glass Container, 8.875%, 02/15/2009 | | 288,406 |
The accompanying notes are an integral part of these financial statements.
40|86 Series Trust | Annual Report |
Schedule of Investments | December 31, 2005 |
| Balanced Portfolio | |
SHARES OR PRINCIPAL AMOUNT | | | | VALUE |
| | | | | | |
Diversified Financial Services (1.0%) | | |
| $ | 80,000 | | American General Finance Corp., 4.875%, 07/15/2012 | $ | 78,260 |
| | 35,000 | | General Motors Acceptance Corp., 7.750%, 01/19/2010 | | 32,713 |
| | 200,000 | | Household Finance Corp., 4.125%, 11/16/2009 | | 193,268 |
| | 100,000 | | Hutchison Whampoa CI Ltd., 7.450%, 08/01/2017, Cost — $113,980; Acquired — 12/19/2005 (b)(f) | | 113,708 |
| | | | | | 417,949 |
Diversified Telecommunication Services (0.6%) | | |
| | 65,000 | | Intelsat Bermuda Ltd., 8.625%, 01/15/2015, Cost — $65,000; Acquired — 01/25/2005 (b)(f) | | 65,975 |
| | 25,000 | | Sprint Capital Corp., 8.375%, 03/15/2012 | | 29,010 |
| | 65,000 | | Sprint Capital Corp., 8.750%, 03/15/2032 (d) | | 86,521 |
| | 84,000 | | TELUS Corp., 8.000%, 06/01/2011 (f) | | 94,274 |
| | | | | | 275,780 |
Electric Utilities (0.5%) | | |
| | 195,000 | | Pacific Gas & Electric Co., 6.050%, 03/01/2034 | | 202,510 |
Electronic Equipment & Instruments (0.2%) | | |
| | 35,000 | | Jabil Circuit, Inc., 5.875%, 07/15/2010 | | 35,582 |
| | 70,000 | | Nortel Networks Ltd., 6.125%, 02/15/2006 (d)(f) | | 70,350 |
| | | | | | 105,932 |
Food Products (0.1%) | | |
| | 35,000 | | Tyson Foods, Inc., 8.250%, 10/01/2011 | | 39,563 |
Health Care Equipment & Supplies (0.9%) | | |
| | 105,000 | | Guidant Corp., 6.150%, 02/15/2006 | | 105,172 |
| | 270,000 | | Hillenbrand Industries, Inc., 4.500%, 06/15/2009 | | 264,775 |
| | | | | | 369,947 |
Health Care Providers & Services (0.3%) | | |
| | 55,000 | | Davita, Inc., 6.625%, 03/15/2013 (d) | | 56,238 |
| | 35,000 | | Laboratory Corporation of America Holdings, 5.625%, 12/15/2015 | | 35,531 |
| | 35,000 | | Quest Diagnostics, Inc., 5.450%, 11/01/2015, Cost — $34,889; Acquired — 10/25/2005 (b) | | 35,328 |
| | | | | | 127,097 |
Hotels Restaurants & Leisure (1.0%) | | |
| | 75,000 | | Carnival Corp., 6.150%, 04/15/2008 (f) | | 76,846 |
| | 150,000 | | Starwood Hotels & Resorts Worldwide, Inc., 7.875%, 05/01/2012 | | 166,125 |
| | 155,000 | | Hyatt Equities LLC, 6.875%, 06/15/2007, Cost — $154,877; Acquired — 06/12/2002 (b) | | 158,196 |
| | 40,000 | | Wynn Las Vegas LLC, 6.625%, 12/01/2014 (d) | | 39,100 |
| | | | | | 440,267 |
Household Durables (0.9%) | | |
| | 175,000 | | KB Home, 5.750%, 02/01/2014 | | 165,877 |
| | 240,000 | | NVR, Inc., 5.000%, 06/15/2010 | | 232,700 |
| | | | | | 398,577 |
Insurance (0.9%) | | |
| | 140,000 | | Marsh & McLennan Companies, Inc., 4.270%, 07/13/2007 (c) | | 139,609 |
| | 225,000 | | RenaissanceRe Holdings Ltd., 7.000%, 07/15/2008 (f) | | 233,707 |
| | 35,000 | | The St. Paul Travelers Companies, Inc., 5.500%, 12/01/2015 | | 35,319 |
| | | | | | 408,635 |
The accompanying notes are an integral part of these financial statements.
40|86 Series Trust | Annual Report |
Schedule of Investments | December 31, 2005 |
| Balanced Portfolio | |
SHARES OR PRINCIPAL AMOUNT | | | | VALUE |
| | | | | | |
Machinery (0.1%) | | |
| | $55,000 | | Case Corp., 7.250%, 01/15/2016 | $ | 51,563 |
Media (1.2%) | | |
| | 40,000 | | British Sky Broadcasting PLC, 8.200%, 07/15/2009 (f) | | 43,752 |
| | 155,000 | | Charter Communications, Inc., 8.000%, 04/30/2012, Cost — $155,161; Acquired — 04/21/2004 (b) | | 155,000 |
| | 61,000 | | DirecTV Holdings LLC, 8.375%, 03/15/2013 | | 65,880 |
| | 100,000 | | EchoStar DBS Corporation, 6.625%, 10/01/2014 | | 96,375 |
| | 125,000 | | News America, Inc., 6.200%, 12/15/2034 (d) | | 124,577 |
| | 35,000 | | Tribune Company, 4.875%, 08/15/2010 | | 34,166 |
| | | | | | 519,750 |
Metals & Mining (0.1%) | | |
| | 65,000 | | Corporacion Nacional Del Cobre, 5.625%, 09/21/2035, Cost — $63,812; Acquired — 09/16/2005 (b)(f) | | 64,985 |
Multiline Retail (0.2%) | | |
| | 75,000 | | JC Penney Co., Inc., 8.000%, 03/01/2010 | | 82,519 |
Oil, Gas & Consumable Fuels (0.9%) | | |
| | 100,000 | | Chesapeake Energy Corp., 6.250%, 01/15/2018 | | 98,500 |
| | 70,000 | | Enterprise Products Operating LP, 5.600%, 10/15/2014 | | 70,065 |
| | 70,775 | | Ras Laffan Liquefied Natural Gas Co., Ltd., 3.437%, 09/15/2009, Cost — $69,876; Acquired — 07/02/2004 (b)(f) | | 68,372 |
| | 110,000 | | Southern Natural Gas Co., 8.875%, 03/15/2010 | | 118,109 |
| | | | | | 355,046 |
Paper & Forest Products (0.1%) | | |
| | 50,000 | | Boise Cascade LLC, 7.125%, 10/15/2014 | | 46,875 |
Real Estate (1.5%) | | |
| | 80,000 | | Health Care REIT, Inc., 7.500%, 08/15/2007 | | 82,559 |
| | 215,000 | | Hospitality Properties Trust, 6.750%, 02/15/2013 | | 229,384 |
| | 55,000 | | iStar Financial, Inc., 8.750%, 08/15/2008 | | 59,495 |
| | 40,000 | | iStar Financial, Inc., 5.150%, 03/01/2012 | | 38,788 |
| | 35,000 | | New Plan Excel Realty Trust, Inc., 5.125%, 09/15/2012 | | 34,443 |
| | 200,000 | | Senior Housing Properties Trust, 8.625%, 01/15/2012 | | 220,000 |
| | | | | | 664,669 |
Wireless Telecommunication Services (1.4%) | | |
| | 65,000 | | America Movil SA de CV, 6.375%, 03/01/2035 (f) | | 64,435 |
| | 155,000 | | Cingular Wireless Services, Inc., 8.750%, 03/01/2031 | | 205,958 |
| | 270,000 | | Nextel Communications, Inc., 6.875%, 10/31/2013 | | 281,903 |
| | 60,000 | | Rogers Wireless, Inc., 7.500%, 03/15/2015 | | 65,100 |
| | | | | | 617,396 |
| | | | Total corporate bonds (cost $6,500,990) | | 6,607,653 |
FOREIGN GOVERNMENT NOTES/BONDS (0.4%) | | |
| | 155,000 | | Export-Import Bank Of Korea, 4.500%, 08/12/2009 (f) | | 152,382 |
| | 40,000 | | Ministry Finance Russia, 3.000%, 05/14/2011 (f) | | 35,626 |
| | | | Total foreign government notes/bonds (cost $189,163) | | 188,008 |
The accompanying notes are an integral part of these financial statements.
40|86 Series Trust | Annual Report |
Schedule of Investments | December 31, 2005 |
| Balanced Portfolio | |
SHARES OR PRINCIPAL AMOUNT | | | | VALUE |
| | | | | | |
MORTGAGE BACKED SECURITIES (0.5%) | | |
| $ | 59,550 | | First Union National Bank Commercial Mortgage, Series 1999 — C4, 7.184%, 12/15/2031 | $ | 60,593 |
| | 139,050 | | Residential Funding Mortgage Securities I, Series 2005 — S7, 5.500%, 11/25/2035 | | 137,966 |
| | | | Total mortgage backed securities (cost $197,344) | | 198,559 |
| | | | | | |
MUNICIPAL BONDS (4.5%) | | |
| | 30,000 | | Baltimore Maryland General Obligation Unlimited, 7.250%, 10/15/2010 | | 31,797 |
| | 165,000 | | California County TOB Securitization Agency, 7.500%, 06/01/2019 | | 167,498 |
| | 154,791 | | Louisiana Tobacco Settlement Financing Corp., 6.360%, 05/15/2025 | | 156,008 |
| | 165,000 | | Mansfield Texas General Obligation Limited, 5.410%, 02/15/2019 | | 165,955 |
| | 65,000 | | Minneapolis Minnesota Refunding Bonds, 6.300%, 12/01/2035 | | 69,285 |
| | 235,000 | | Ohio State Revenue Bond, 5.540%, 10/01/2025 | | 238,511 |
| | 380,000 | | Providence Health System, 4.540%, 10/01/2008 | | 376,029 |
| | 150,000 | | Rhode Island Tobacco Settlement Financing Corp., 5.920%, 06/01/2012 | | 149,096 |
| | 270,000 | | San Jose California Financing Authority, 4.310%, 03/01/2029 (c) | | 270,000 |
| | 134,818 | | South Dakota Educational Enhancement Funding Corp., 6.720%, 06/01/2025 | | 134,473 |
| | 95,000 | | South El Monte California Tax Allocation Note, 4.950%, 08/01/2014 | | 100,855 |
| | 115,000 | | Susquehanna Area Regional Airport, 2.400%, 01/01/2006 | | 115,000 |
| | | | Total municipal bonds (cost $1,958,650) | | 1,974,507 |
U.S. TREASURY OBLIGATIONS (2.5%) | | |
| | 50,000 | | U.S. Treasury Note, 3.875%, 05/15/2010 (d) | | 49,068 |
| | 215,000 | | U.S. Treasury Note, 4.500%, 11/15/2010 (d) | | 216,226 |
| | 36,511 | | U.S. Treasury Note, 1.625%, 01/15/2015 | | 35,186 |
| | 780,000 | | U.S. Treasury Note, 4.250%, 08/15/2015 (d) | | 770,159 |
| | | | Total U.S. treasury obligations (cost $1,075,377) | | 1,070,639 |
INVESTMENTS PURCHASED WITH CASH PROCEEDS FROM SECURITIES LENDING (26.2%) | |
| | 250,000 | | AIG Sunamerica Global Finance XXXI Note, 4.380%, 02/23/2006 | | 249,987 |
| | 3,733,000 | | Bank of New York Institutional Cash Reserve Fund, 4.363% | | 3,733,000 |
| | 500,000 | | Berkshire Hathaway Finance, 4.400%, 02/16/2006 | | 499,980 |
| | 500,000 | | Beta Finance, Inc., 4.350%, 01/03/2006 | | 500,020 |
| | 500,000 | | Capital Auto Receivables Asset Trust, 4.429%, 01/17/2006 | | 500,223 |
| | 500,000 | | Credit Suisse First Boston, 4.340%, 02/21/2006 | | 499,922 |
| | 341,376 | | First Franklin Mortgage, 4.479%, 01/25/2006 (e) | | 341,405 |
| | 300,000 | | General Electric Capital Corp., 4.114%, 01/03/2006 | | 300,318 |
| | 200,000 | | General Electric Capital Corp., 4.420%, 02/21/2006 | | 200,130 |
| | 337,482 | | Granite Master Issuer PLC, 4.410%, 01/20/2006 (e) | | 337,482 |
| | 400,000 | | K2 USA LLC, 4.200%, 01/25/2006 | | 400,020 |
| | 250,000 | | Links Finance LLC, 4.353%, 01/03/2006 | | 250,045 |
| | 288,560 | | Morgan Stanley ABS Capital, 4.469%, 01/25/2006 (e) | | 288,445 |
| | 400,000 | | Permanent Financing PLC, 4.570%, 03/10/2006 (e) | | 400,494 |
| | 500,000 | | Royal Bank of Scotland PLC, 4.231%, 01/23/2006 | | 499,925 |
| | 400,000 | | Sigma Finance, Inc., 4.369%, 01/17/2006 | | 400,000 |
| | 107,225 | | Structured Asset Investment Loan Trust, 4.469%, 01/25/2006 (e) | | 107,344 |
The accompanying notes are an integral part of these financial statements.
40|86 Series Trust | Annual Report |
Schedule of Investments | December 31, 2005 |
| Balanced Portfolio | |
SHARES OR PRINCIPAL AMOUNT | | | | VALUE | |
| | | | | | | |
INVESTMENTS PURCHASED WITH CASH PROCEEDS FROM SECURITIES LENDING (continued) | | | |
| $ | 500,000 | | Suntrust Bank, 4.282%, 02/13/2006 | $ | 499,933 | |
| | 500,000 | | Superior Wholesale Inventory Financing Trust, 4.469%, 01/17/2006 | | 498,594 | |
| | 500,000 | | Textron Financial Floorplan Master Note, 4.482%, 01/13/2006 | | 483,590 | |
| | 400,000 | | World Savings Bank FSB, 4.550%, 03/20/2006 | | 400,232 | |
| | | | Total investments purchased with cash proceeds from securities lending (cost $11,391,089) | | 11,391,089 | |
SHORT TERM INVESTMENTS (2.8%) | | | |
| | 1,164,000 | | Columbia Treasury Reserve Capital Fund. 3.300% | | 1,164,000 | |
| | | | Total short term investments (cost $1,164,000) | | 1,164,000 | |
| | | | Total investments (Cost $50,447,602) (125.9%) | | 54,773,602 | |
| | | | Liabilities in excess of other assets (25.9%) | | (11,262,400 | ) |
| | | | Total Net Assets (100.0%) | $ | 43,511,202 | |
__________
| (a) | Non-income producing security. |
| (b) | Restricted under Rule 144A of the Securities Act of 1933. |
| (c) | Variable Coupon Rate - The rate reported is the rate in effect as of December 31, 2005. |
| (d) | All or a portion of the security is out on loan. |
| (e) | STEP - Bonds where the coupon increases or steps up at a predetermined rate. |
| (f) | Foreign Security or a U.S. Security of a foreign company. |
The accompanying notes are an integral part of these financial statements.
40|86 Series Trust | Annual Report |
Portfolio Managers’ Review (unaudited) | December 31, 2005 |
High Yield Portfolio
How did the Fund perform relative to its Benchmark?
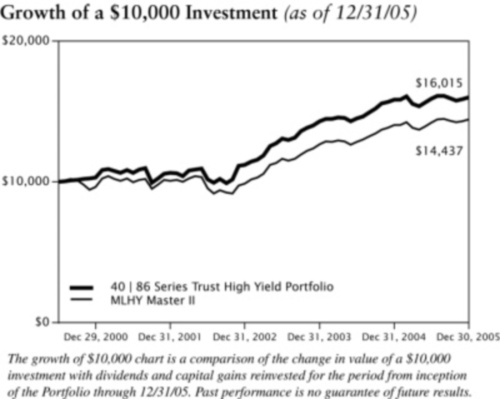
The 40|86 Series Trust High Yield Portfolio returned 1.15% for the year ended December 31, 2005. The Portfolio’s benchmark, the Merrill Lynch High Yield Master II Index, returned 2.72% for the same period.
What factors contributed to the variance between the Portfolio and its benchmark?
During the past six months, the Portfolio experienced a number of significant cash flows both in and out. These cash flows hindered our ability to manage the Portfolio to reach optimal performance. Subsequent to year-end, we have taken steps to prevent similar occurrences. The Portfolio was negatively impacted due to an overweight position in the paper and forest product sector. This sector suffered due to a Leveraged Buyout (LBO) transaction as well as continued weak demand trends and rising input costs. The Portfolio also was impacted negatively due to security selections in the capital goods sector. This resulted in an underperformance versus the benchmark. While the capital goods sector out-performed, we underperformed as a result of specific selections. Fundamental and broad concerns of a slowing economy impacted these securities. Finally, we were underweight the energy sector, which had favorable returns.
Which holdings most enhanced the Portfolio’s performance?
The Portfolio’s return was positively impacted by railroad TFM SA (Kansas City Southern de Mexico), utility operator Texas Genco and Canadian wireless phone operator Rogers Wireless. TFM SA was the best performing holding for the period, generating a 14.52% return. This return is a result of favorable price increases as the demand for railroad transportation increased. Texas Genco contributed with a positive return of 11.11% as strong fundamentals persisted in the utilities. In addition, the acquisition by NRG led to our bonds being tendered at above-market prices. Rogers Wireless demonstrated a strong operating performance from its now dominant wireless subsidiary and returned 10.77%.
Which holdings most negatively impacted the Portfolio’s performance?
The Portfolio’s main detractors for 2005 were auto parts company Affinia Group, polymer-based membrane manufacturer Polypore and paperboard packaging provider Graphic Packaging. Affinia Group, which was spun off from Dana Corporation in 2004, detracted from performance with a 10.82% decline. Affinia continues to struggle in its ability to pass on increasing raw material prices. We sold our Affinia Group position in August 2005. Graphic Packaging declined 9.44% amidst concerns about the ability to pass
Average Annual Total Return(1) (as of 12/31/05) | | | |
| | | 1 YEAR | | 5 YEARS | | SINCE INCEPTION | |
| High Yield Portfolio | | | 1.15% | | | 9.19% | | | 8.85% | |
| MLHY Master II | | | 2.72% | | | 8.39% | | | 6.80% | |
__________
(1) | The inception date of this portfolio was June 13, 2000. Past performance does not guarantee future results. Your investment return and principal will fluctuate, and your shares may be worth more or less than their original cost. Total return is provided in accordance with SEC guidelines for comparative purposes and reflects certain contractual expense reimbursements through April 30, 2006. If the expense reimbursements were not in place, the Portfolio's return would have been lower. The total returns shown do not include separate account expenses or the deduction of taxes that a contract holder would pay on portfolio distributions or the redemption of portfolio shares. The Merrill Lynch High Yield ("MLHY") Master II Index is an unmanaged market capitalization weighted index of all domestic and Yankee high yield bonds. Investors cannot actually invest in an index. |
40|86 Series Trust | Annual Report |
Portfolio Managers’ Review (unaudited) | December 31, 2005 |
through rising raw materials, energy, transportation and labor costs. Polypore’s 7.77% decline was due to increased competition in Asia and the loss of a major contract. We sold our Polypore position late in September 2005.
What is your outlook for the next year?
We expect the Federal Reserve will continue to raise short-term interest rates during the first half of 2006. We believe this policy will result in low inflation with slow and steady economic growth. We expect the high yield market to experience more volatility until the Fed ceases increasing rates. During the second half of 2006, we expect credit spreads will widen as default rates begin to increase from very low levels as economic growth slows. We do not anticipate new inflows into fixed income or the high yield market during 2006.
The high yield market continues to trade at historically low spreads while the domestic default rate remains well below the historical average. We expect this environment to persist for a good part of 2006. However, we do expect that the positive credit cycle could begin to turn late 2006. We anticipate the domestic default rate will begin to trend higher as increased risks enter the high yield market. The most prominent risks we envision are LBOs, increased dividends to shareholders, shareholder purchases and deteriorating quality of high yield issuance. All of these risks negatively impact debt securities. There is a trend developing in new issuance. LBO type transactions have been on the rise, whereas new issuance for refinancings has been on the decline. This is worrisome because LBO transactions are difficult to protect against, and refinancings improve balance sheets. However, while these risks exist, many high yield companies have taken advantage of the strong markets in recent years to strengthen their balance sheets. Stronger balance sheets will provide these companies with more flexibility when the economy and markets become less forgiving.
For 2006 we are implementing a more defensive stance in order to preserve principal and achieve consistent current income for the Portfolio. Currently, the core of the Portfolio remains in the middle tier (rated "B" by Standard and Poor’s) of the high yield market. We believe that this stance is acceptable; however, we plan to slowly move up in quality as opportunities present themselves. We expect once the Fed chooses to stop increasing short-term interest rates, higher quality names could outperform. In addition to credit quality, we will also look to sector allocations in order to achieve a more defensive outlook. We will concentrate on reducing allocations of highly cyclical sectors to less cyclical, more defensive areas in the high yield market. We continue to select securities based on recommendations from our credit research team. We are concentrating on those companies that are positioned well within their respective industries, have manageable debt maturities and have strong management teams. These companies generally have enterprise values able to withstand more volatile financial markets. These companies include independent natural gas producer Chesapeake Energy and medical equipment and service provider Universal Hospital Corporation.
| Amy Gibson, CFA | Richard Matas |
| Vice President | Senior Trader |
| 40|86 Advisors, Inc. | 40|86 Advisors, Inc. |
40|86 Series Trust | Annual Report |
Schedule of Investments | December 31, 2005 |
| High Yield Portfolio | |
SHARES OR PRINCIPAL AMOUNT | | | | VALUE |
| | | | | | |
COMMON STOCKS (0.2%) | | |
Chemicals | (0.2%) | | | | |
| | 842 | | Huntsman Corp. (a) | $ | 14,499 |
| | | | Total common stocks (cost $5,972) | | 14,499 |
PREFERRED STOCKS (0.3%) | | |
Textiles, Apparel & Luxury Goods (0.3%) | | |
| | 1,171 | | Tommy Hilfiger USA, 9.000%, 12/01/2031 | | 29,580 |
| | | | Total preferred stocks (cost $29,862) | | 29,580 |
CORPORATE BONDS (76.7%) | | |
Aerospace & Defense (1.3%) | | |
| $ | 70,000 | | DRS Technologies, Inc., 6.875%, 11/01/2013 | | 67,287 |
| | 45,000 | | Hexcel Corp, 6.750%, 02/01/2015 | | 43,650 |
| | | | | | 110,937 |
Auto Components (1.7%) | | |
| | 45,000 | | Tenneco Automotive, Inc., 8.625%, 11/15/2014 | | 42,750 |
| | 45,000 | | TRW Automotive Acquisition, 9.375%, 02/15/2013 | | 48,938 |
| | 60,000 | | United Components, Inc., 9.375%, 06/15/2013 | | 60,000 |
| | | | | | 151,688 |
Building Products (0.6%) | | |
| | 55,000 | | FastenTech, Inc., 11.500%, 05/01/2011 | | 54,175 |
Chemicals (2.1%) | | |
| | 80,000 | | Huntsman International LLC, 7.375%, 01/01/2015, Cost — $80,000; Acquired — 12/03/2004 (b) | | 77,600 |
| | 45,000 | | Nalco Co., 8.875%, 11/15/2013 | | 47,363 |
| | 53,000 | | Rockwood Specialties Group, Inc., 10.625%, 05/15/2011 | | 58,366 |
| | | | | | 183,329 |
Commercial Services & Supplies (2.6%) | | |
| | 100,000 | | Adesa, Inc., 7.625%, 06/15/2012 | | 100,000 |
| | 50,000 | | Allied Waste North America, Inc., 7.250%, 03/15/2015 | | 50,750 |
| | 80,000 | | Corrections Corporation of America, 6.250%, 03/15/2013 | | 79,600 |
| | | | | | 230,350 |
Communications Equipment (0.5%) | |
| | 45,000 | | Superior Essex Communications, 9.000%, 04/15/2012 | | 44,550 |
Construction & Engineering (1.8%) | | |
| | 60,000 | | Blount, Inc., 8.875%, 08/01/2012 | | 63,600 |
| | 100,000 | | William Lyon Homes, Inc., 7.625%, 12/15/2012 | | 88,750 |
| | | | | | 152,350 |
Construction Materials (1.4%) | | |
| | 120,000 | | US Concrete, Inc., 8.375%, 04/01/2014 | | 120,300 |
Containers & Packaging (3.1%) | | |
| | 125,000 | | Graham Packaging Co., 8.500%, 10/15/2012 | | 123,750 |
| | 100,000 | | Owens-Brockway Glass Container, 8.250%, 05/15/2013 | | 103,750 |
| | 45,000 | | Park-Ohio Industries, 8.375%, 11/15/2014 | | 39,600 |
| | | | | | 267,100 |
The accompanying notes are an integral part of these financial statements.
40|86 Series Trust | Annual Report |
Schedule of Investments | December 31, 2005 |
| High Yield Portfolio | |
SHARES OR PRINCIPAL AMOUNT | | | | VALUE |
| | | | | | |
Diversified Financial Services (0.5%) | | |
| $ | 50,000 | | General Motors Acceptance Corp., 7.750%, 01/19/2010 | $ | 46,734 |
Diversified Telecommunication Services (5.7%) | | |
| | 100,000 | | Cincinnati Bell, Inc., 8.375%, 01/15/2014 | | 98,875 |
| | 105,000 | | Innova S de RL, 9.375%, 09/19/2013 (d) | | 117,075 |
| | 45,000 | | Intelsat Bermuda Ltd., 8.695%, 01/15/2012, Cost — $45,000; Acquired — 01/25/2005 (b)(c)(d) | | 45,956 |
| | 25,000 | | Intelsat Bermuda Ltd., 8.625%, 01/15/2015, Cost — $25,000; Acquired — 01/25/2005 (b)(d) | | 25,375 |
| | 100,000 | | L-3 Communications Corp., 6.375%, 10/15/2015, Cost — $99,103; Acquired — 07/27/2005 (b) | | 100,250 |
| | 110,000 | | Qwest Communications International, Inc., 7.250%, 02/15/2011 | | 112,750 |
| | | | | | 500,281 |
Electric Utilities (2.1%) | | |
| | 100,000 | | Texas Genco LLC, 6.875%, 12/15/2014, Cost — $100,000; Acquired — 12/08/2004 (b) | | 108,750 |
| | 70,961 | | Midwest Generation LLC, 8.560%, 01/02/2016 | | 77,214 |
| | | | | | 185,964 |
Electronic Equipment & Instruments (2.1%) | | |
| | 75,000 | | Celestica, Inc., 7.875%, 07/01/2011 | | 75,938 |
| | 105,000 | | Flextronics International Ltd., 6.250%, 11/15/2014 | | 104,081 |
| | | | | | 180,019 |
Food Products (1.7%) | | |
| | 100,000 | | Del Monte Corp., 6.750%, 02/15/2015 | | 98,000 |
| | 50,000 | | Dole Food Co, Inc., 7.250%, 06/15/2010 | | 48,750 |
| | | | | | 146,750 |
Health Care Equipment & Supplies (1.3%) | | |
| | 105,000 | | Universal Hospital Services, Inc., 10.125%, 11/01/2011 | | 109,200 |
Health Care Providers & Services (3.7%) | | |
| | 125,000 | | Alderwoods Group, Inc., 7.750%, 09/15/2012 | | 130,000 |
| | 110,000 | | Davita, Inc., 7.250%, 03/15/2015 | | 111,925 |
| | 85,000 | | Healthsouth Corp., 10.750%, 10/01/2008 | | 85,425 |
| | | | | | 327,350 |
Hotels Restaurants & Leisure (7.8%) | | |
| | 30,000 | | Host Marriott LP, 7.125%, 11/01/2013 | | 31,350 |
| | 90,000 | | Host Marriott LP, 6.375%, 03/15/2015 | | 90,225 |
| | 95,000 | | Las Vegas Sands Corp., 6.375%, 02/15/2015 | | 91,912 |
| | 100,000 | | MGM Mirage, 6.625%, 07/15/2015 | | 100,250 |
| | 80,000 | | Pinnacle Entertainment, Inc., 8.250%, 03/15/2012 | | 83,100 |
| | 85,000 | | Starwood Hotels & Resorts Worldwide, Inc., 7.875%, 05/01/2012 | | 94,138 |
| | 95,000 | | Vail Resorts, Inc., 6.750%, 02/15/2014 | | 95,475 |
| | 100,000 | | Wynn Las Vegas LLC, 6.625%, 12/01/2014 | | 97,750 |
| | | | | | 684,200 |
Household Durables (1.1%) | | |
| | 100,000 | | Beazer Homes USA, Inc., 6.875%, 07/15/2015 | | 96,375 |
Household Products (1.1%) | | |
| | 95,000 | | Church & Dwight, Inc., 6.000%, 12/15/2012 | | 94,050 |
The accompanying notes are an integral part of these financial statements.
40|86 Series Trust | Annual Report |
Schedule of Investments | December 31, 2005 |
| High Yield Portfolio | |
SHARES OR PRINCIPAL AMOUNT | | | | VALUE |
| | | | | | |
Leisure Equipment & Products (2.0%) | | |
| $ | 60,000 | | K2 USA, Inc., 7.375%, 07/01/2014 | $ | 60,000 |
| | 125,000 | | Riddell Bell Holdings, Inc., 8.375%, 10/01/2012 | | 116,562 |
| | | | | | 176,562 |
Machinery (2.7%) | | |
| | 130,000 | | Case Corp., 7.250%, 01/15/2016 | | 121,875 |
| | 60,000 | | Navistar International, 7.500%, 06/15/2011 | | 57,450 |
| | 60,000 | | Terex Corp., 7.375%, 01/15/2014 | | 59,700 |
| | | | | | 239,025 |
Media (7.6%) | | |
| | 105,000 | | Charter Communications, 8.375%, 04/30/2014, Cost — $106,575; Acquired — 11/05/2004 (b) | | 105,000 |
| | 105,000 | | EchoStar DBS Corporation, 6.625%, 10/01/2014 | | 101,194 |
| | 100,000 | | Lin Television Corp., 6.500%, 05/15/2013 | | 96,375 |
| | 67,000 | | PanAmSat Corp., 9.000%, 08/15/2014 | | 70,517 |
| | 90,000 | | R.H. Donnelley Corp., 6.875%, 01/15/2013 | | 83,362 |
| | 85,000 | | Sinclair Broadcast Group, Inc., 8.000%, 03/15/2012 | | 87,975 |
| | 45,000 | | Sun Media Corp., 7.625%, 02/15/2013 (d) | | 46,350 |
| | 75,000 | | Warner Music Group, 7.375%, 04/15/2014 | | 74,813 |
| | | | | | 665,586 |
Metals & Mining (0.9%) | | |
| | 85,000 | | Novelis, Inc., 7.250%, 02/15/2015, Cost — $85,162; Acquired — 01/28/2005 and 06/02/2005 (b)(d) | | 79,688 |
Oil, Gas & Consumable Fuels (5.5%) | | |
| | 110,000 | | Chesapeake Energy Corp., 6.250%, 01/15/2018 | | 108,350 |
| | 40,000 | | Dynegy Holdings, Inc., 10.125%, 07/15/2013, Cost — $39,731; Acquired — 08/01/2003 (b) | | 45,400 |
| | 115,000 | | El Paso Production Holding Co., 7.750%, 06/01/2013 | | 119,887 |
| | 110,000 | | Houston Exploration Co., 7.000%, 06/15/2013 | | 106,150 |
| | 100,000 | | Pacific Energy Partners LP, 7.125%, 06/15/2014 | | 103,500 |
| | | | | | 483,287 |
Paper & Forest Products (3.2%) | | |
| | 75,000 | | Cenveo Corp., 9.625%, 03/15/2012 | | 81,375 |
| | 75,000 | | Georgia-Pacific Corp., 7.375%, 12/01/2025 | | 67,875 |
| | 55,000 | | Graphic Packaging International Corp., 9.500%, 08/15/2013 | | 52,800 |
| | 90,000 | | Neenah Paper, Inc., 7.375%, 11/15/2014 | | 81,675 |
| | | | | | 283,725 |
Personal Products (2.3%) | | |
| | 65,000 | | Del Laboratories, Inc., 8.000%, 02/01/2012 | | 51,675 |
| | 100,000 | | Elizabeth Arden, Inc., 7.750%, 01/15/2014 | | 101,500 |
| | 50,000 | | NBTY, Inc., 7.125%, 10/01/2015, Cost — $49,565; Acquired — 09/16/2005 (b) | | 47,875 |
| | | | | | 201,050 |
Pharmaceuticals (0.6%) | | |
| | 50,000 | | Mylan Labs, Inc., 6.375%, 08/15/2015, Cost — $50,000; Acquired — 07/14/2005 (b) | | 50,313 |
Real Estate (1.1%) | | |
| | 85,000 | | Senior Housing Properties Trust, 8.625%, 01/15/2012 | | 93,500 |
The accompanying notes are an integral part of these financial statements.
40|86 Series Trust | Annual Report |
Schedule of Investments | December 31, 2005 |
| High Yield Portfolio | |
SHARES OR PRINCIPAL AMOUNT | | | | VALUE |
| | | | | | |
Road & Rail (1.8%) | | |
| | $50,000 | | Hertz Corp., 8.875%, 01/01/2014, Cost — $50,000; Acquired — 12/15/2005 (b) | $ | 51,187 |
| | 100,000 | | TFM SA de CV, 9.375%, 05/01/2012, Cost — $101,181; Acquired — 04/13/2005 and 05/18/2005 (b)(d) | | 110,000 |
| | | | | | 161,187 |
Semiconductors & Semiconductor Equipment (0.6%) | | |
| | 50,000 | | Freescale Semiconductor, Inc., 7.125%, 07/15/2014 | | 53,500 |
Textiles, Apparel & Luxury Goods (2.5%) | | |
| | 100,000 | | Brown Shoe, Inc., 8.750%, 05/01/2012 | | 105,000 |
| | 115,000 | | Russell Corp., 9.250%, 05/01/2010 | | 117,156 |
| | | | | | 222,156 |
Tobacco (0.4%) | | |
| | 40,000 | | Alliance One International, Inc., 11.000%, 05/15/2012, Cost — $40,000; Acquired — 05/10/2005 (b) | | 35,400 |
Wireless Telecommunication Services (3.3%) | | |
| | 69,300 | | AirGate PCS, Inc., 9.375%, 09/01/2009, Cost — $61,591; Acquired — 02/13/2004 (b) | | 72,765 |
| | 32,000 | | Alamosa Delaware, Inc., 11.000%, 07/31/2010 | | 36,240 |
| | 25,000 | | New Skies Satellites NV, 9.125%, 11/01/2012 (d) | | 26,844 |
| | 40,000 | | Rogers Wireless, Inc., 9.625%, 05/01/2011 (d) | | 46,200 |
| | 50,000 | | Rogers Wireless, Inc., 7.500%, 03/15/2015 (d) | | 54,250 |
| | 50,000 | | Rural Cellular Corp., 8.250%, 03/15/2012 | | 53,000 |
| | | | | | 289,299 |
| | | | Total corporate bonds (cost $6,789,520) | | 6,719,980 |
MUNICIPAL BONDS (0.7%) | | |
| | 60,000 | | Academica Charter Schools, 8.100%, 08/15/2024, Cost — $60,000; Acquired — 08/18/2004 (b) | | 62,373 |
| | | | Total municipal bonds (cost $60,000) | | 62,373 |
SHORT TERM INVESTMENTS (8.5%) | | |
| | 371,000 | | Columbia Treasury Reserve Capital Fund. 3.300% | | 371,000 |
| | 371,000 | | AIM Short Term Investor Share Treasury #2 Fund, 4.130% | | 371,000 |
| | | | Total short term investments (cost $742,000) | | 742,000 |
| | | | Total investments (cost $7,627,354) (86.4%) | | 7,568,432 |
| | | | Other assets in excess of liabilities (13.6%) | | 1,190,685 |
| | | | Total Net Assets (100.0%) | $ | 8,759,117 |
__________
| (a) | Non-income producing security. |
| (b) | Restricted under Rule 144A of the Securities Act of 1933. |
| (c) | Variable Coupon Rate - The rate reported is the rate in effect at December 31, 2005. |
| (d) | Foreign Security or U.S. Security of a foreign company. |
The accompanying notes are an integral part of these financial statements.
40|86 Series Trust | Annual Report |
Portfolio Managers’ Review (unaudited) | December 31, 2005 |
Fixed Income Portfolio
How did the Portfolio perform relative to its benchmark?
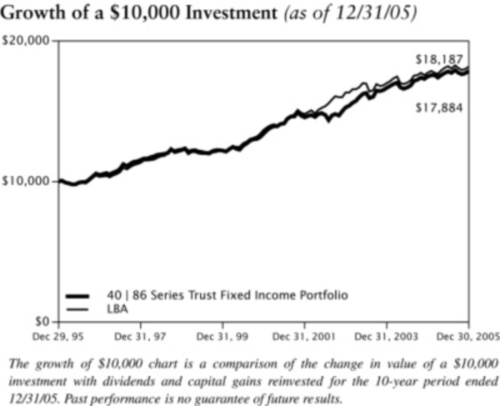
The 40|86 Series Trust Fixed Income Portfolio returned 2.26% for the year ended December 31, 2005. The Portfolio’s benchmark, the Lehman Brothers Aggregate Index, returned 2.43% for the same period.
What factors contributed to the variance between the Portfolio and its benchmark?
The primary factors for the variance were the barbell structure and short duration structure. Since the prices of fixed income instruments move inversely to yields, the performance of the Portfolio was aided by our overweight position in longer-term maturities. The long end of the yield curve rallied, with the 30-year US Treasury bond yields lower by 28 basis points (bps). The intermediate yield curve rose, with the 5-year and 10-year Treasury bond yields up by 69 bps and 15 bps, respectively. Also, the front end of the yield curve rose, with the 3-month and the 6-month Treasury Bills yields up by 190 bps and 177 bps, respectively. These movements resulted in a dramatic flattening of the yield curve. Our performance was also enhanced by the Portfolio’s above-average cash position combined with our investment in LIBOR-based floating-rate notes.
Our overweight positions in Commercial Mortgage-backed Securities, Asset-backed Securities, Collateralized Mortgage Obligation Securities, Agencies and Yankee bonds and our underweight position in pass-through Mortgage-backed Securities helped performance. However our overweight position in Corporate bonds hurt performance. Additionally, the 12.5% allocation to high yield securities also helped the performance of the Portfolio since high yield securities outperformed similar duration Treasury bonds for the year. The Portfolio’s benchmark is comprised completely of investment grade securities.
Which holdings most enhanced the Portfolio’s performance?
Selling positions in the auto sector prior to downgrades enhanced the Portfolio’s performance. In addition, positions in diversified energy company First Energy, natural gas and electric utility provider Pacific Gas & Electric, telecom firms Rogers Wireless and Sprint Capital and communications satellite company Intelsat Bermuda added to the Portfolio’s return.
Which holdings most negatively impacted the Portfolio’s performance?
Although we sold our auto position prior to the downgrades, we bought General Motors Acceptance Corp (GMAC), the financial subsidiary of General Motors (GM), in the fourth quarter. Our move was based on GM’s announced plan to sell a stake in GMAC. We believe this sale will raise GMAC’s ratings to investment grade
Average Annual Total Return(1) (as of 12/31/05)
| | | | 1 YEAR | | | 5 YEARS | | | 10 YEARS | |
| Fixed Income Portfolio | | | 2.26% | | | 5.93% | | | 5.99% | |
| LBA | | | 2.43% | | | 5.87% | | | 6.16% | |
__________
(1) | Past performance does not guarantee future results. Your investment return and principal will fluctuate, and your shares may be worth more or less than their original cost. Total return is provided in accordance with SEC guidelines for comparative purposes and reflects certain contractual expense reimbursements through April 30, 2006. If the expense reimbursements were not in place, the portfolio's return would have been lower. The total returns shown do not include separate account expenses or the deduction of taxes that a contract holder would pay on portfolio distributions or the redemption of portfolio shares. The Lehman Brothers Aggregate Index ("LBA") is an unmanaged broad-based market index that includes mortgage-backed securities. Investors cannot actually invest in an index. |
40|86 Series Trust | Annual Report |
Portfolio Managers’ Review (unaudited) | December 31, 2005 |
since it is very likely to be bought by a highly rated financial institution. With the auto sector still volatile, our positions in auto and truck parts manufacturer Lear Corp and GMAC were the worst performing holdings for the year. In addition, positions in paper and wood products producer Boise Cascade and tobacco merchant Universal Corp detracted from the Portfolio’s return.
What is your outlook for the next year?
We expect higher short-term interest rates and a flattening, possibly inverting, yield curve as the Fed continues to raise short-term rates, decreasing the use of financial leverage. We expect the Fed to stop tightening by the end of the first half of 2006. Earnings deceleration and negative event risk is a concern for the corporate sector. We plan to move to higher quality corporate bonds and increase exposure to Mortgage-backed Securities as volatility subsides. We will structure duration bias to neutral in anticipation of the end of Fed rate increases. We will also eliminate the barbell structure and lengthen portfolio duration as the Fed stops tightening.
| Michael J. Dunlop | John Saf, CFA, CPA |
| Senior Vice President | Vice President |
| 40|86 Advisors, Inc. | 40|86 Advisors, Inc. |
40|86 Series Trust | Annual Report |
Schedule of Investments | December 31, 2005 |
| Fixed Income Portfolio | |
SHARES OR PRINCIPAL AMOUNT | | | | VALUE |
| | | | | | |
PREFERRED STOCKS (0.9%) | | |
Media (0.7%) | | |
| | 130 | | Centaur Funding Corp., Cost — $153,366; Acquired — 07/22/2003 (b) | $ | 168,431 |
Textiles, Apparel & Luxury Goods (0.2%) | | |
| | 1,486 | | Tommy Hilfiger USA, 9.000%, 12/01/2031 | | 37,537 |
| | | | Total preferred stocks (cost $191,237) | | 205,968 |
ASSET BACKED SECURITIES (0.7%) | | |
| | $166,103 | | Centex Home Equity, Series #2001-A A6, 6.250%, 04/25/2031 | | 165,640 |
| | 248 | | Equity One ABS, Inc., Series #2002-1 AF2, 5.523%, 08/25/2032 | | 247 |
| | | | Total asset backed securities (cost $167,953) | | 165,887 |
CORPORATE BONDS (53.7%) | | |
Aerospace & Defense (0.4%) | | |
| | 95,000 | | Boeing Capital Corp., 4.750%, 08/25/2008 | | 94,804 |
Auto Components (0.4%) | | |
| | 100,000 | | Lear Corp., 8.110%, 05/15/2009 | | 93,137 |
Beverages (0.6%) | | |
| | 135,000 | | Miller Brewing Co., 5.500%, 08/15/2013, Cost — $138,778 Acquired — 07/13/2005 (b) | | 137,819 |
Capital Markets (0.3%) | | |
| | 65,000 | | Lehman Brothers Holdings, Inc., 3.600%, 03/13/2009 (d) | | 62,595 |
Chemicals (1.2%) | | |
| | 100,000 | | Lubrizol Corp., 5.500%, 10/01/2014 | | 100,438 |
| | 75,000 | | Lyondell Chemical Co., 9.625%, 05/01/2007 | | 78,656 |
| | 80,000 | | Terra Capital, Inc., 12.875%, 10/15/2008 | | 93,600 |
| | | | | | 272,694 |
Commercial Banks (1.8%) | | |
| | 145,000 | | Huntington National Bank, 3.125%, 05/15/2008 | | 139,368 |
| | 70,000 | | Oversea-Chinese Banking Corp. Ltd., 7.750%, 09/06/2011, Cost — $78,267; Acquired — 11/08/2005 (b) | | 78,781 |
| | 185,000 | | Union Planters Bank NA, 6.500%, 03/15/2008 | | 190,908 |
| | | | | | 409,057 |
Commercial Services & Supplies (2.0%) | | |
| | 75,000 | | Cendant Corp., 7.375%, 01/15/2013 | | 83,908 |
| | 170,000 | | Corrections Corporation of America, 6.250%, 03/15/2013 | | 169,150 |
| | 205,000 | | International Lease Finance Corp., 4.000%, 01/17/2006 | | 204,958 |
| | | | | | 458,016 |
Computers & Peripherals (0.3%) | | |
| | 70,000 | | NCR Corp., 7.125%, 06/15/2009 | | 73,279 |
Construction & Engineering (0.9%) | | |
| | 115,000 | | Blount, Inc., 8.875%, 08/01/2012 (d) | | 121,900 |
| | 105,000 | | William Lyon Homes, Inc., 7.625%, 12/15/2012 | | 93,187 |
| | | | | | 215,087 |
The accompanying notes are an integral part of these financial statements.
40|86 Series Trust | Annual Report |
Schedule of Investments | December 31, 2005 |
| Fixed Income Portfolio | |
SHARES OR PRINCIPAL AMOUNT | | | | VALUE |
| | | | | | |
Containers & Packaging (0.5%) | | |
| | $100,000 | | Owens-Brockway Glass Container, 8.875%, 02/15/2009 | $ | 104,875 |
Diversified Financial Services (2.3%) | | |
| | 150,000 | | American General Finance Corp., 4.875%, 07/15/2012 | | 146,737 |
| | 50,000 | | Bunge Ltd Finance Corp., 4.375%, 12/15/2008 | | 49,171 |
| | 165,000 | | General Motors Acceptance Corp., 7.750%, 01/19/2010 | | 154,221 |
| | 185,000 | | HSBC Finance Corp., 4.125%, 11/16/2009 | | 178,772 |
| | | | | | 528,901 |
Diversified Telecommunication Services (4.1%) | | |
| | 135,000 | | Intelsat Bermuda Ltd., 8.625%, 01/15/2015, Cost — $135,000; Acquired — 01/25/2005 (b)(d)(a) | | 137,025 |
| | 50,000 | | Sprint Capital Corp., 8.375%, 03/15/2012 | | 58,020 |
| | 130,000 | | Sprint Capital Corp., 8.750%, 03/15/2032 (d) | | 173,043 |
| | 75,000 | | Tele-Communications, Inc., 9.800%, 02/01/2012 | | 90,586 |
| | 445,000 | | TELUS Corp., 8.000%, 06/01/2011 (a) | | 499,425 |
| | | | | | 958,099 |
Electric Utilities (5.5%) | | |
| | 135,000 | | Cilcorp, Inc., 8.700%, 10/15/2009 | | 150,111 |
| | 185,000 | | FirstEnergy Corp., 7.375%, 11/15/2031 | | 218,981 |
| | 155,000 | | Nisource Finance Corp., 7.875%, 11/15/2010 | | 171,910 |
| | 130,000 | | Pacific Gas & Electric Co., 6.050%, 03/01/2034 | | 135,006 |
| | 330,000 | | PSI Energy, Inc., 6.650%, 06/15/2006 | | 332,726 |
| | 265,000 | | Southwestern Public Service Co., 5.125%, 11/01/2006 | | 265,276 |
| | | | | | 1,274,010 |
Electrical Equipment (0.7%) | | |
| | 150,000 | | Cooper Industries, Inc., 5.500%, 11/01/2009 | | 152,857 |
Electronic Equipment & Instruments (0.6%) | | |
| | 80,000 | | Jabil Circuit, Inc., 5.875%, 07/15/2010 | | 81,330 |
| | 50,000 | | Nortel Networks Ltd., 6.125%, 02/15/2006 (d)(a) | | 50,250 |
| | | | | | 131,580 |
Food Products (0.9%) | | |
| | 125,000 | | Corn Products International, Inc., 8.450%, 08/15/2009 | | 137,873 |
| | 70,000 | | Tyson Foods, Inc., 8.250%, 10/01/2011 | | 79,126 |
| | | | | | 216,999 |
Health Care Equipment & Supplies (0.4%) | | |
| | 95,000 | | Guidant Corp., 6.150%, 02/15/2006 | | 95,156 |
Health Care Providers & Services (2.7%) | | |
| | 100,000 | | Davita, Inc., 6.625%, 03/15/2013 (d) | | 102,250 |
| | 70,000 | | Laboratory Corporation of America Holdings, 5.625%, 12/15/2015 | | 71,062 |
| | 185,000 | | Medco Health Solutions, Inc., 7.250%, 08/15/2013 | | 203,526 |
| | 70,000 | | Quest Diagnostics, Inc., 5.450%, 11/01/2015, Cost — $69,779; Acquired — 10/25/2005 (b)(d) | | 70,657 |
| | 165,000 | | Service Corp International, 7.700%, 04/15/2009 | | 174,075 |
| | | | | | 621,570 |
The accompanying notes are an integral part of these financial statements.
40|86 Series Trust | Annual Report |
Schedule of Investments | December 31, 2005 |
| Fixed Income Portfolio | |
SHARES OR PRINCIPAL AMOUNT | | | | VALUE |
| | | | | | |
Hotels Restaurants & Leisure (1.8%) | | |
| | $80,000 | | Carnival Corp., 6.150%, 04/15/2008 (a) | $ | 81,969 |
| | 135,000 | | Hyatt Equities LLC, 6.875%, 06/15/2007, Cost — $134,895; Acquired — 06/12/2002 (b) | | 137,784 |
| | 100,000 | | Starwood Hotels & Resorts Worldwide, Inc., 7.875%, 05/01/2012 | | 110,750 |
| | 80,000 | | Wynn Las Vegas LLC, 6.625%, 12/01/2014 (d) | | 78,200 |
| | | | | | 408,703 |
Household Durables (1.9%) | | |
| | 110,000 | | KB Home, 5.750%, 02/01/2014 (d) | | 104,266 |
| | 155,000 | | NVR, Inc., 5.000%, 06/15/2010. | | 150,285 |
| | 175,000 | | Ryland Group, Inc., 5.375%, 06/01/2008 | | 175,002 |
| | | | | | 429,553 |
Insurance (6.4%) | | |
| | 30,000 | | Citizens Property Insurance Corp., 6.850%, 08/25/2007, Cost — $30,401; Acquired — 06/22/2001 (b) | | 30,791 |
| | 275,000 | | Marsh & McLennan Co., Inc., 4.270%, 07/13/2007 (c) | | 274,233 |
| | 220,000 | | Monumental Global Funding II, 4.625%, 03/15/2010, Cost — $219,992; Acquired — 03/09/2005 (b) | | 218,840 |
| | 505,000 | | Protective Life US Funding Trust, 5.875%, 08/15/2006, Cost — $505,202; Acquired — 08/06/2001 and 08/28/2001 (b) | | 507,899 |
| | 325,000 | | RenaissanceRe Holdings Ltd., 7.000%, 07/15/2008 (a) | | 337,577 |
| | 70,000 | | St. Paul Travelers, Inc., 5.500%, 12/01/2015 (d) | | 70,637 |
| | 35,000 | | Transamerica Corp., 6.750%, 11/15/2006 | | 35,543 |
| | | | | | 1,475,520 |
Machinery (0.8%) | | |
| | 105,000 | | Case Corp., 7.250%, 01/15/2016 | | 98,437 |
| | 80,000 | | Kennametal, Inc., 7.200%, 06/15/2012 | | 86,958 |
| | | | | | 185,395 |
Media (4.8%) | | |
| | 75,000 | | British Sky Broadcasting PLC, 8.200%, 07/15/2009 (d) (a) | | 82,034 |
| | 100,000 | | Charter Communications Op. LLC, 8.000%, 04/30/2012, Cost — $100,104; Acquired — 04/21/2004 (b) | | 100,000 |
| | 90,000 | | Clear Channel Communications, Inc., 6.625%, 06/15/2008 | | 92,258 |
| | 185,000 | | Clear Channel Communications, Inc., 8.000%, 11/01/2008 | | 196,807 |
| | 175,000 | | Comcast Corp., 7.050%, 03/15/2033 (d) | | 189,522 |
| | 60,000 | | DirecTV Holdings LLC, 8.375%, 03/15/2013 | | 64,800 |
| | 100,000 | | EchoStar DBS Corporation, 6.625%, 10/01/2014 | | 96,375 |
| | 110,000 | | News America Holdings, 7.700%, 10/30/2025 | | 126,550 |
| | 95,000 | | News America, Inc., 6.200%, 12/15/2034 (d) | | 94,679 |
| | 70,000 | | Tribune Company, 4.875%, 08/15/2010 | | 68,333 |
| | | | | | 1,111,358 |
Metals & Mining (0.5%) | | |
| | 125,000 | | Corporacion Nacional Del Cobre, 5.625%, 09/21/2035, Cost — $122,717; Acquired — 09/16/2005 (b)(a) | | 124,970 |
Motor Vehicles And Passenger Car Bodies (0.6%) | | |
| | 135,000 | | Enterprise Products Operating LP, 5.600%, 10/15/2014 | | 135,126 |
Multi-Utilities (0.6%) | | |
| | 145,000 | | Consolidated Edison, Inc., 3.625%, 08/01/2008 | | 140,606 |
The accompanying notes are an integral part of these financial statements.
40|86 Series Trust | Annual Report |
Schedule of Investments | December 31, 2005 |
| Fixed Income Portfolio | |
SHARES OR PRINCIPAL AMOUNT | | | | VALUE |
| | | | | | |
Oil, Gas & Consumable Fuels (2.2%) | | |
| | $200,000 | | Chesapeake Energy Corp., 6.250%, 01/15/2018 | $ | 197,000 |
| | 108,025 | | Ras Laffan Liquefied Natural Gas Co. Ltd., 3.437%, 09/15/2009, Cost — $108,025; Acquired — 03/02/2004 (b)(a) | | 104,358 |
| | 100,000 | | Southern Natural Gas Co., 8.875%, 03/15/2010 | | 107,371 |
| | 115,000 | | TGT Pipeline LLC, 5.200%, 06/01/2018 | | 111,169 |
| | | | | | 519,898 |
Paper & Forest Products (0.4%) | | |
| | 100,000 | | Boise Cascade LLC, 7.125%, 10/15/2014 | | 93,750 |
Pharmaceuticals (0.3%) | | |
| | 60,000 | | Wyeth, 5.500%, 03/15/2013 | | 60,916 |
Real Estate (4.1%) | | |
| | 85,000 | | Developers Diversified Realty Corp., 3.875%, 01/30/2009 | | 81,704 |
| | 160,000 | | Equity One, Inc., 3.875%, 04/15/2009 | | 152,058 |
| | 62,000 | | Health Care REIT, Inc., 7.500%, 08/15/2007 | | 63,983 |
| | 175,000 | | Hospitality Properties Trust, 6.750%, 02/15/2013 | | 186,707 |
| | 65,000 | | iStar Financial, Inc., 8.750%, 08/15/2008. | | 70,313 |
| | 70,000 | | iStar Financial, Inc., 5.150%, 03/01/2012 | | 67,880 |
| | 70,000 | | New Plan Excel Realty Trust, Inc., 5.125%, 09/15/2012 | | 68,886 |
| | 150,000 | | Senior Housing Properties Trust, 8.625%, 01/15/2012 | | 165,000 |
| | 90,000 | | United Dominion Realty Trust, Inc., 6.500%, 06/15/2009 | | 93,884 |
| | | | | | 950,415 |
Special Purpose Entity (0.1%) | | |
| | 32,893 | | PLC Trust, 2.709%, 03/31/2006, Cost — $32,893; Acquired — 12/12/2003 (b) | | 32,774 |
Textiles, Apparel & Luxury Goods (0.2%) | | |
| | 50,000 | | Brown Shoe, Inc., 8.750%, 05/01/2012 | | 52,500 |
Tobacco (0.7%) | | |
| | 185,000 | | Universal Corp., 5.200%, 10/15/2013 (d) | | 169,837 |
Wholesale Trade Non-Durable Goods (0.7%) | | |
| | 135,000 | | Hutchison Whampoa CI Ltd., 7.450%, 08/01/2017, Cost — $153,870; Acquired — 12/19/2005 (b)(a) | | 153,506 |
Wireless Telecommunication Services (2.0%) | | |
| | 125,000 | | America Movil SA de CV, 6.375%, 03/01/2035 | | 123,912 |
| | 115,000 | | Cingular Wireless, 8.750%, 03/01/2031 (d) | | 152,808 |
| | 125,000 | | Nextel Communications, Inc., 6.875%, 10/31/2013 | | 130,511 |
| | 50,000 | | Rogers Wireless, Inc., 7.500%, 03/15/2015 (d)(a) | | 54,250 |
| | | | | | 461,481 |
| | | | Total corporate bonds (cost $12,252,190) | | 12,406,843 |
FOREIGN GOVERNMENT NOTES/BONDS (1.2%) | | |
| | 215,000 | | Export-Import Bank Of Korea, 4.500%, 08/12/2009 (a) | | 211,368 |
| | 70,000 | | Ministry Finance Russia, 3.000%, 05/14/2011 (a) | | 62,345 |
| | | | Total foreign government notes/bonds (cost $275,095) | | 273,713 |
The accompanying notes are an integral part of these financial statements.
40|86 Series Trust | Annual Report |
Schedule of Investments | December 31, 2005 |
| Fixed Income Portfolio | |
SHARES OR PRINCIPAL AMOUNT | | | | VALUE |
| | | | | | |
MORTGAGE BACKED SECURITIES (14.6%) | | |
| | $100,381 | | Bank of America Mortgage Securities, Series #2004-7 6A1, 4.500%, 08/25/2019 | $ | 96,451 |
| | 196,406 | | Bank of America Mortgage Securities, Series #2004-7 5A10, 5.250%, 08/25/2034 | | 193,256 |
| | 55,673 | | Bear Stearns Commercial Mortgage Securities, Series #1999-C1 A1, 5.910%, 02/14/2031 | | 56,108 |
| | 250,000 | | Bear Stearns Commercial Mortgage Securities, Series #2002-TOP6 A2, 6.460%, 10/15/2036 | | 265,729 |
| | 87,321 | | CS First Boston Mortgage Securities Corp., Series #2001-CKN5 A3, 5.107%, 09/15/2034 | | 87,422 |
| | 212,031 | | Deutsche Mortgage and Asset Receiving Corp., Series #1998-C1 A2, 6.538%, 06/15/2031 | | 217,330 |
| | 10,166 | | DLJ Commercial Mortgage Corp., Series #1999-CG3 A1A, 7.120%, 10/10/2032 | | 10,267 |
| | 86,713 | | Federal Home Loan Mortgage Corp., Series #2614CH, 3.500%, 12/15/2010 | | 86,038 |
| | 41,277 | | Federal Home Loan Mortgage Corp., Series #2638NA, 3.000%, 02/15/2015 | | 41,126 |
| | 135,000 | | Federal Home Loan Mortgage Corp., Series #2614TD, 3.500%, 05/15/2016 | | 128,886 |
| | 165,000 | | Federal Home Loan Mortgage Corp., Series #2517VH, 6.000%, 03/15/2019 | | 167,978 |
| | 18,448 | | Federal Home Loan Mortgage Corp., Gold Pool #G00479, 9.000%, 04/01/2025 | | 20,233 |
| | 30,344 | | Federal Home Loan Mortgage Corp., Gold Pool #G00943, 6.000%, 07/01/2028 | | 30,756 |
| | 2,657 | | Federal Home Loan Mortgage Corp., Gold Pool #C00712, 6.500%, 02/01/2029 | | 2,735 |
| | 28,772 | | Federal Home Loan Mortgage Corp., Gold Pool #C50964, 6.500%, 05/01/2031 | | 29,554 |
| | 15,725 | | Federal Home Loan Mortgage Corp., Gold Pool #C60697, 6.000%, 11/01/2031 | | 15,926 |
| | 52,297 | | Federal Home Loan Mortgage Corp., Series #2407BJ, 6.500%, 01/15/2032 | | 54,340 |
| | 165,000 | | Federal National Mortgage Assn., Series #200357, 4.500%, 12/25/2012 | | 163,873 |
| | 79,046 | | Federal National Mortgage Assn., Pool #545449, 6.500%, 02/01/2017 | | 81,342 |
| | 220,000 | | Federal National Mortgage Assn., Series #200336, 4.500%, 07/25/2022 | | 218,516 |
| | 2,587 | | Federal National Mortgage Assn., Pool #349410, 7.000%, 08/01/2026 | | 2,707 |
| | 3,660 | | Federal National Mortgage Assn., Pool #062289, 3.900%, 03/01/2028 | | 3,662 |
| | 150,000 | | Federal National Mortgage Assn., Series #200180, 6.000%, 07/25/2029 | | 152,758 |
| | 10,558 | | GMAC Commercial Mortgage Securities, Inc., Series #1999-C1 A1, 5.830%, 05/15/2033 | | 10,553 |
| | 5,697 | | GMAC Commercial Mortgage Securities, Inc., Series #1999-C2 A1, 6.570%, 09/15/2033 | | 5,724 |
| | 436 | | Government National Mortgage Assn., Pool #051699, 15.000%, 07/15/2011 | | 499 |
| | 1,317 | | Government National Mortgage Assn., Pool #354859, 9.000%, 07/15/2024 | | 1,444 |
| | 460,000 | | JP Morgan Chase Commercial Mortgage Securities Corp., Series #2001-CIB3 A2, 6.044%, 11/15/2035 | | 470,651 |
| | 273,133 | | Residential Funding Mortgage Securities I, Series 2005-S7, 5.500%, 11/25/2035 | | 271,005 |
| | 465,000 | | Salomon Brothers Mortgage Securities VII, Series #2001-C2, 6.168%, 02/13/2010 | | 475,448 |
| | | | Total mortgage backed securities (cost $3,455,306) | | 3,362,317 |
MUNICIPAL BONDS (15.2%) | | |
| | 110,000 | | Academica Charter Schools, 8.100%, 08/15/2024, Cost — $110,000; Acquired — 08/18/2004 (b) | | 114,350 |
| | 55,000 | | Baltimore Maryland General Obligation Unlimited, 7.250%, 10/15/2010 | | 58,295 |
| | 60,000 | | Bay Area Government Assn. California Revenue Tax Allocation Note, 4.290%, 09/01/2009 | | 59,139 |
| | 150,000 | | Brooklyn Park Minnesota Economic Development Authority, 3.330%, 09/01/2006 | | 148,407 |
| | 140,000 | | California County TOB Securitization Agency, 7.500%, 06/01/2019 | | 142,120 |
| | 115,000 | | Decatur Hospital Authority, 7.750%, 09/01/2009 | | 121,934 |
| | 70,000 | | Harrisburg PA Rescue & Recovery Revenue Notes, 3.090%, 11/01/2022 | | 69,215 |
| | 60,000 | | Heart of Texas Education Finance Corp., 5.000%, 02/15/2013 | | 58,182 |
| | 90,000 | | Indiana Development Finance Authority, 5.500%, 01/01/2033 | | 94,675 |
| | 35,000 | | Los Banos California Redevelopment Agency, 7.500%, 09/01/2029 | | 35,345 |
| | 166,257 | | Louisiana Tobacco Settlement Financing Corp., 6.360%, 05/15/2025 | | 167,564 |
| | 320,000 | | Mansfield Texas General Obligation Limited, 5.410%, 02/15/2019 | | 321,853 |
| | 125,000 | | Minneapolis Minnesota Development Revenue, 6.300%, 12/01/2035 | | 133,240 |
| | 100,000 | | New Jersey Economic Development Authority, 3.250%, 09/15/2006 | | 98,989 |
The accompanying notes are an integral part of these financial statements.
40|86 Series Trust | Annual Report |
Schedule of Investments | December 31, 2005 |
| Fixed Income Portfolio | |
SHARES OR PRINCIPAL AMOUNT | | | | VALUE | |
| | | | | | | |
MUNICIPAL BONDS (continued) | | | |
| | $ 505,000 | | North Carolina Eastern Municipal Power Agency, 7.050%, 01/01/2007 | $ | 512,141 | |
| | 455,000 | | Ohio State Revenue Bond, 5.540%, 10/01/2025 | | 461,798 | |
| | 155,000 | | Rhode Island Tobacco Settlement Financing Corp., 5.920%, 06/01/2012 | | 154,065 | |
| | 240,000 | | San Jose California Financing Authority Leave Revenue, 4.460%, 03/01/2029 | | 240,000 | |
| | 113,073 | | South Dakota Educational Enhancement Funding Corp., 6.720%, 06/01/2025 | | 112,784 | |
| | 180,000 | | South El Monte California Improvement District Tax Allocation, 4.700%, 08/01/2011 | | 187,879 | |
| | 220,000 | | Susquehanna Area Regional Airport, 2.400%, 01/01/2006 | | 220,000 | |
| | | | Total municipal bonds (cost $3,450,241) | | 3,511,975 | |
U.S. GOVERNMENT AGENCY ISSUES (2.1%) | | | |
| | 275,000 | | Federal National Mortgage Assn., 2.750%, 08/11/2006 | | 271,963 | |
| | 215,000 | | Federal National Mortgage Assn., 3.000%, 12/15/2006 | | 211,562 | |
| | | | Total U.S. government agency issues (cost $490,000) | | 483,525 | |
U.S. TREASURY OBLIGATIONS (6.6%) | | | |
| | 145,000 | | U.S. Treasury Note, 4.500%, 11/15/2010 (d) | | 145,827 | |
| | 204,820 | | U.S. Treasury Note, 2.000%, 01/15/2014 (d) | | 203,724 | |
| | 78,237 | | U.S. Treasury Note, 1.625%, 01/15/2015 (d) | | 75,398 | |
| | 40,000 | | U.S. Treasury Note, 4.500%, 11/15/2015 (d) | | 40,341 | |
| | 935,000 | | U.S. Treasury Note, 5.375%, 02/15/2031 (d) | | 1,050,560 | |
| | | | Total U.S. treasury obligations (cost $1,506,889) | | 1,515,850 | |
INVESTMENTS PURCHASED WITH CASH PROCEEDS FROM SECURITIES LENDING (15.7%) | | | |
| | 3,001,000 | | Bank of New York Institutional Cash Reserve Fund, 4.363% | | 3,001,000 | |
| | 67,496 | | Granite Master Issuer PLC, 4.410%, 01/20/2006 | | 67,496 | |
Pooled Investments - | | | |
| | 569,597 | | Bank of New York, collateralized by various United States Government and Agency Issues,
1.500% to 14.000%, 12/31/2005 to 06/20/2035 | | 569,597 | |
| | | | Total investments purchased with cash proceeds from securities lending (cost $3,638,093) | | 3,638,093 | |
SHORT TERM INVESTMENTS (2.2%) | | | |
| | 505,000 | | Columbia Treasury Reserve Capital Fund, 3.300% | | 505,000 | |
| | | | Total short term investments (cost $505,000) | | 505,000 | |
| | | | Total investments (cost $25,932,004) (112.9%) | | 26,069,171 | |
| | | | Liabilities in excess of other assets (12.9%) | | (2,977,689 | ) |
| | | | Total Net Assets (100.0%) | $ | 23,091,482 | |
__________
| (a) | Foreign Security or a U.S. Security of a foreign company. |
| (b) | Restricted under Rule 144A of Securities Act of 1933. |
| (c) | Variable Coupon Rate - The rate reported is the rate in effect as of December 31, 2005. |
| (d) | All or a portion of the security is out on loan. |
The accompanying notes are an integral part of these financial statements.
40|86 Series Trust | Annual Report |
Portfolio Managers’ Review (unaudited) | December 31, 2005 |
Government Securities Portfolio
How did the Portfolio perform relative to its benchmark?
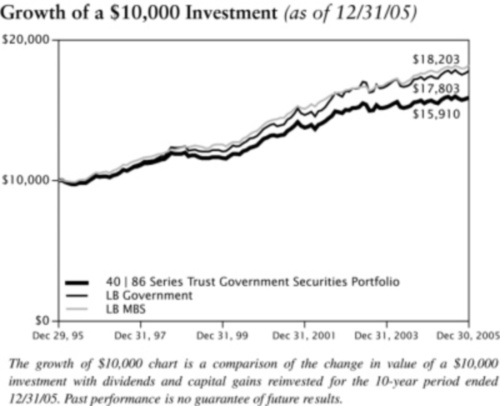
The 40|86 Series Trust Government Securities Portfolio returned 1.73% for the year ended December 31, 2005. The Portfolio’s benchmarks, the Lehman Brothers Government Index and the Lehman Brothers Mortgage-Backed Securities Index, returned 2.65% and 2.61%, respectively, for the same period.
What factors contributed to the variance between the Portfolio and its benchmark?
The Portfolio trailed the Lehman Brothers Government Index due to its lower allocation to long-term US Treasury bonds. Longer-term interest rates have fallen despite the Federal Reserve’s increases to short-term rates. The Portfolio trailed the Lehman Brothers Mortgage-backed Securities Index because of greater exposure to higher coupon Mortgage-backed Securities, which lagged lower coupons in price appreciation. The Portfolio’s allocation to Commercial Mortgage-backed Securities and Asset-backed Securities mitigated its underperformance.
Which holdings most enhanced the Portfolio’s performance?
The Portfolio’s performance was enhanced by an Asset-backed Security issued by Atlantic City Electric Transition Funding LLC, 30-year US Treasury bonds and a Commercial Mortgage-backed Security with a 5% coupon rate.
Which holdings most negatively impacted the Portfolio’s performance?
Mortgage-backed Securities with higher coupon rates detracted from performance. Specifically, those holdings with coupon rates above 5.5% hurt the Portfolio’s performance. As interest rates fell, these positions lagged with respect to price appreciation.
What is your outlook for the next year?
The Federal Reserve has indicated it will continue raising short-term interest rates. Toward the second half of the year, we anticipate investors becoming concerned over non-US Treasury bonds, which are trading at historically low risk premiums, as measured by the spread between corporate yields and US Treasury yields. As such, investors may reallocate funds from non-US Treasury bonds to US Treasury bonds. This move would result in greater yield spreads and underperformance of the non-US Treasury sectors.
| Michael J. Dunlop | Willie Brown, CFA |
| Senior Vice President | Structured Securities Analyst |
| 40|86 Advisors, Inc. | 40|86 Advisors, Inc. |
Average Annual Total Return(1) (as of 12/31/05)
| | | 1 YEAR | | 5 YEARS | | 10 YEARS | |
| Government Securities Portfolio | | | 1.73% | | | 4.16% | | | 4.75% | |
| LB Government | | | 2.65% | | | 5.39% | | | 5.94% | |
| LB MBS | | | 2.61% | | | 5.44% | | | 6.17% | |
__________
(1) | Past performance does not guarantee future results. Your investment return and principal will fluctuate, and your shares may be worth more or less thantheir original cost. Total return is provided in accordance with SEC guidelines for comparative purposes and reflects certain contractual expense reimbursements through April 30, 2006. If the expense reimbursements were not in place, the portfolio's return would have been lower. The total returns shown do not include separate account expenses or the deduction of taxes that a contract holder would pay on portfolio distributions or the redemption of portfolio shares. The Lehman Brothers Government Index (“LB Government”) is an unmanaged index considered to be representative of bonds issued by the U.S. government or its agencies. The Lehman Brothers Mortgage-Backed Securities Index ("LB MBS") is an unmanaged index composed of all fixed securities mortgage pools by GNMA, FNMA and the FHLCM, including GHMA Graduated Payment Mortgages. Investors cannot actually invest in an index. |
40|86 Series Trust | Annual Report |
Schedule of Investments | December 31, 2005 |
| Government Securities Portfolio | |
SHARES OR PRINCIPAL AMOUNT | | | | VALUE |
| | | | | | |
ASSET BACKED SECURITIES (5.0%) | | |
| | $75,000 | | Atlantic City Electric Transition Funding LLC, Series #2002-1 A4, 5.550%, 10/20/2023 | $ | 78,083 |
| | 882 | | Centex Home Equity, Series #2001-A A4, 6.470%, 07/25/2029 | | 880 |
| | 5,000 | | Citibank Credit Card Issuance Trust, Series #2003-C4 C4, 5.000%, 06/10/2015 | | 4,908 |
| | 91,839 | | Countrywide Asset-Backed Certificates, Series #2002-S1 A5, 6.460%, 11/25/2016 (b) | | 91,614 |
| | 70,000 | | MBNA Credit Card Master Note Trust, Series #2002-C1 C1, 6.800%, 07/15/2014 | | 75,489 |
| | 191,740 | | The Money Store Home Equity Trust, Series #1998-B AF9, 6.335%, 08/15/2039 | | 192,681 |
| | 162,035 | | Residential Asset Securities Corp., Series #2000-KS3 AI6, 7.810%, 07/25/2031 | | 162,655 |
| | | | Total asset-backed securities (cost $615,669) | | 606,310 |
CORPORATE BONDS (0.8%) | | |
Insurance (0.8%) | | |
| | 95,000 | | MGIC Investment Corp., 6.000%, 03/15/2007 | | 95,977 |
| | | | Total corporate bonds (cost $94,999) | | 95,977 |
MORTGAGE BACKED SECURITIES (34.9%) | | |
| | 13,918 | | Bear Stearns Commercial Mortgage Securities, Series #1999-C A1, 5.910%, 02/14/2031 | | 14,027 |
| | 330,000 | | Citicorp Mortgage Securities, Inc., Series #2005-4, 5.500%, 07/25/2035 | | 322,060 |
| | 27,956 | | DLJ Commercial Mortgage Corp., Series #1999-CG3, 7.120%, 10/10/2032 | | 28,235 |
| | 3,883 | | Federal Home Loan Mortgage Corp. Gold, Pool #E00441, 7.500%, 07/01/2011 | | 4,071 |
| | 3,338 | | Federal Home Loan Mortgage Corp. Gold, Pool #D66012, 7.000%, 11/01/2025 | | 3,487 |
| | 26,047 | | Federal Home Loan Mortgage Corp. Gold, Pool #C28063, 6.500%, 07/01/2029 | | 26,802 |
| | 13,583 | | Federal Home Loan Mortgage Corp. Gold, Pool #C29168, 6.500%, 07/01/2029 | | 13,976 |
| | 20,130 | | Federal Home Loan Mortgage Corp. Gold, Pool #C01131, 6.500%, 01/01/2031 | | 20,690 |
| | 20,491 | | Federal Home Loan Mortgage Corp. Gold, Pool #C01148, 6.500%, 02/01/2031 | | 21,061 |
| | 63,943 | | Federal Home Loan Mortgage Corp. Gold, Pool #C01184, 6.500%, 06/01/2031 | | 65,681 |
| | 63,622 | | Federal Home Loan Mortgage Corp. Gold, Pool #C01186, 6.000%, 06/01/2031 | | 64,435 |
| | 475,430 | | Federal Home Loan Mortgage Corp., Pool #2407 BJ, 6.500%, 01/15/2032 | | 493,997 |
| | 240,375 | | Federal Home Loan Mortgage Corp. Gold, Pool #G01805, 4.500%, 04/01/2035 | | 226,228 |
| | 488,370 | | Federal Home Loan Mortgage Corp., Pool #G0-8062, 5.000%, 06/01/2035 | | 472,956 |
| | 243,411 | | Federal Home Loan Mortgage Corp., Pool #A3-5760, 5.000%, 07/01/2035 | | 235,729 |
| | 26,496 | | Federal National Mortgage Assn., Pool #320582, 6.500%, 01/01/2011 | | 27,251 |
| | 62,997 | | Federal National Mortgage Assn., Pool #336290, 6.500%, 04/01/2011 | | 64,795 |
| | 170,463 | | Federal National Mortgage Assn., Pool #253845, 6.000%, 06/01/2016 | | 174,304 |
| | 99,372 | | Federal National Mortgage Assn., Pool #545449, 6.500%, 02/01/2017 | | 102,258 |
| | 177,781 | | Federal National Mortgage Assn., Pool #645649, 6.000%, 06/01/2017 | | 181,786 |
| | 4,024 | | Federal National Mortgage Assn., Pool #303780, 7.000%, 03/01/2026 | | 4,212 |
| | 406,343 | | Federal National Mortgage Assn., Pool #2004-91 AH, 4.500%, 05/25/2029 | | 397,551 |
| | 100,000 | | Federal National Mortgage Assn., Pool #2001-80 PE, 6.000%, 07/25/2029 | | 101,839 |
| | 26,622 | | Federal National Mortgage Assn., Pool #535837, 6.000%, 04/01/2031 | | 26,945 |
| | 6,266 | | Federal National Mortgage Assn., Pool #609583, 6.000%, 11/01/2031 | | 6,342 |
| | 26,973 | | Federal National Mortgage Assn., Pool #254091, 6.000%, 12/01/2031 | | 27,299 |
| | 266,812 | | Federal National Mortgage Assn., Pool #816362, 4.887%, 01/01/2035 | | 266,142 |
| | 298,298 | | Federal National Mortgage Assn., Pool #826443, 4.975%, 07/01/2035 | | 292,789 |
| | 288,227 | | Federal National Mortgage Assn., Pool #837926, 4.846%, 08/01/2035 | | 285,632 |
| | 24,588 | | Federal National Mortgage Assn. Grantor Trust, Series #1999-T2 A1, 7.500%, 01/19/2029 | | 25,789 |
| | 75,000 | | First Union National Bank Commercial Mortgage, Series #1999-C4 A2, 7.390%, 12/15/2031 | | 80,676 |
| | 6,104 | | GMAC Commercial Mortgage Securities, Inc., Series #1999-C2 A1, 6.570%, 09/15/2033 | | 6,132 |
| | 3,584 | | Government National Mortgage Assn., Pool #119896, 13.000%, 11/15/2014 | | 4,034 |
The accompanying notes are an integral part of these financial statements.
40|86 Series Trust | Annual Report |
Schedule of Investments | December 31, 2005 |
| Government Securities Portfolio | |
SHARES OR PRINCIPAL AMOUNT | | | | VALUE | |
| | | | | | | |
MORTGAGE BACKED SECURITIES (continued) | | | |
| | $ 15,117 | | Government National Mortgage Assn., Pool #408675, 7.500%, 01/15/2026 | $ | 15,942 | |
| | 150,000 | | GS Mortgage Securities Corporation II, Series 2004-GG2, 5.396%, 08/10/2038 | | 152,255 | |
| | | | Total mortgage backed securities (cost $4,305,679) | | 4,257,408 | |
MUNICIPAL BONDS (1.7%) | | | |
| | 100,000 | | Alaska Industrial Development & Export Authority, 6.625%, 05/01/2006 | | 100,326 | |
| | 105,000 | | Tobacco Settlement Financing Corp., 5.920%, 06/01/2012 | | 104,367 | |
| | | | Total municipal bonds (cost $204,653) | | 204,693 | |
U.S. GOVERNMENT AGENCY ISSUES (13.0%) | | | |
| | 500,000 | | Federal Home Loan Bank, 3.875%, 08/22/2008 | | 489,871 | |
| | 700,000 | | Federal Home Loan Bank, 4.500%, 09/16/2013 | | 687,542 | |
| | 400,000 | | Federal Home Loan Mortgage Corp., 6.250%, 03/05/2012 | | 406,189 | |
| | | | Total U.S. government agency issues (cost $1,582,874) | | 1,583,602 | |
U.S. TREASURY OBLIGATIONS (41.3%) | | | |
| | 700,000 | | U.S. Treasury Note, 2.375%, 08/31/2006 (a) | | 690,922 | |
| | 1,000,000 | | U.S. Treasury Note, 3.875%, 05/15/2009 (a) | | 984,610 | |
| | 750,000 | | U.S. Treasury Note, 3.875%, 09/15/2010 (a) | | 734,620 | |
| | 650,000 | | U.S. Treasury Note, 4.000%, 02/15/2014 | | 632,583 | |
| | 300,000 | | U.S. Treasury Note, 4.125%, 08/15/2008 (a) | | 298,441 | |
| | 30,000 | | U.S. Treasury Note, 4.250%, 08/15/2015 (a) | | 29,622 | |
| | 500,000 | | U.S. Treasury Note, 5.500%, 02/15/2008 (a) | | 511,348 | |
| | 250,000 | | U.S. Treasury Note, 5.375%, 02/15/2031 (a) | | 280,898 | |
| | 587,000 | | U.S. Treasury Note, 11.250%, 02/15/2015 (a) | | 883,986 | |
| | | | Total U.S. treasury obligations (cost $5,095,637) | | 5,047,030 | |
INVESTMENTS PURCHASED WITH CASH PROCEEDS FROM SECURITIES LENDING (24.4%) | | | |
| | 2,828,000 | | Bank of New York Institutional Cash Reserve Fund, 4.363% | | 2,828,000 | |
Pooled Investments — | | | |
| | 158,622 | | Bank of New York, collateralized by various United States Government and Agency Issues,
2.000% to 9.250%, 05/15/2006 to 08/15/2044 | | 158,622 | |
| | | | Total investments purchased with cash proceeds from securities lending (cost $2,986,622) | | 2,986,622 | |
SHORT TERM INVESTMENTS (1.3%) | | | |
| | 165,000 | | JP Morgan Prime Money Market Fund, 4.120% | | 165,000 | |
| | | | Total short term investments (cost $165,000) | | 165,000 | |
| | | | Total investments (cost $15,051,133) (122.4%) | | 14,946,642 | |
| | | | Liabilities in excess of other assets (22.4%) | | (2,738,026 | ) |
| | | | Total Net Assets (100.0%) | $ | 12,208,616 | |
__________
| (a) | All or a portion of the security is out on loan. |
| (b) | STEP - Bonds where coupon increases or steps up at a predetermined rate. |
The accompanying notes are an integral part of these financial statements.
40|86 Series Trust | Annual Report |
Portfolio Manager’s Review (unaudited) | December 31, 2005 |
Money Market Portfolio
The 40|86 Series Trust Money Market Portfolio returned 2.89% for the year ended December 31, 2005. The Federal Reserve continued to hike short-term interest rates at a measured pace throughout the year, raising the Fed Funds rate from 2.25% to 4.25%. The rise in short-term interest rates and stability in longer-term rates produced a dramatic flattening of the yield curve for the year.
Money market yields, as measured by LIBOR, rose throughout the year. Although the entire yield curve rose, the 1-month rate rose more than the 1-year rate, resulting in a curve flattening of 28 basis points (bps) for the year.
As rates rose, we maintained the weighted-average maturity of the Portfolio close to one month. Approximately 75% of the Portfolio was invested in securities with maturities of less than 20 days. We invested significantly in Variable Rate Demand Notes (VRDNs), which have floating rate coupons that reset weekly. In a rising interest rate environment, coupons of VRDNs reset to higher rates weekly as rates increase. In addition, VRDNs are highly liquid and offer higher yields than 1-week Tier-1 Non-Asset-backed securities. Because we believed the Fed was close to the end of its tightening cycle, toward year-end, we began investing in corporate paper near the long end of the money market curve.
We expect higher short-term interest rates and a flattening, possibly inverting yield curve, as the Fed continues to raise short-term rates, decreasing the use of financial leverage. We believe the Fed will stop tightening by the end of the first half of 2006. Trading in commercial paper should remain heavily skewed to short maturities, although investors might slowly start extending to longer maturities as fed tightening comes to a close. We will maintain the short weighted-average maturity of the Portfolio until the Fed stops raising rates, and then lengthen when compensated to invest in the intermediate and long end of the money market curve. We expect VRDNs to continue to outperform fixed coupon short-term bonds in the current economic scenario.
Michael J. Dunlop
Senior Vice President
40|86 Advisors, Inc.
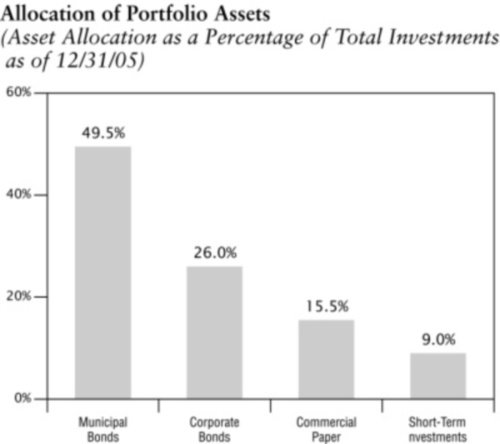
40|86 Series Trust | Annual Report |
Schedule of Investments | December 31, 2005 |
| Money Market Portfolio | |
SHARES OR PRINCIPAL AMOUNT | | | | VALUE |
| | | | | | |
CORPORATE BONDS (25.0%) | | |
Beverages (2.5%) | | |
| | $1,000,000 | | Coca-Cola Enterprises, Inc., 5.375%, 08/15/2006 | $ | 1,003,604 |
Capital Markets (5.0%) | | |
| | 990,000 | | Corporate Finance Managers, Inc., 4.370%, 01/06/2006 (b) | | 990,000 |
| | 525,000 | | Cunat Capital Corp., 4.580%, 01/29/2006 (a)(b) | | 525,000 |
| | 500,000 | | Westgate Investment Fund, 4.370%, 01/06/2006 (a)(b) | | 500,000 |
| | | | | | 2,015,000 |
Commercial Services & Supplies (1.2%) | | |
| | 500,000 | | International Lease Finance Corp., 4.000%, 01/17/2006 | | 500,027 |
Diversified Financial Services (3.7%) | | |
| | 500,000 | | Countrywide Home Loan, 4.500%, 02/17/2006 (a) | | 500,005 |
| | 1,000,000 | | National Rural Utilities, 3.000%, 02/15/2006 | | 998,333 |
| | | | | | 1,498,338 |
Diversified Telecommunication Services (2.5%) | | |
| | 1,000,000 | | France Telecom, 7.200%, 03/01/2006 (d) | | 1,004,249 |
Insurance (3.9%) | | |
| | 560,000 | | ASIF Global Financing XX, 2.650%, 01/17/2006, Cost - $559,699; Acquired - 05/04/2005 (c) | | 559,699 |
| | 1,000,000 | | Hartford Life Global Fund, 4.349%, 08/15/2006 (a)(b) | | 1,000,000 |
| | | | | | 1,559,699 |
Pharmaceuticals (2.5%) | | |
| | 1,000,000 | | Merck & Co, Inc., 5.250%, 07/01/2006 | | 1,002,506 |
Real Estate (1.2%) | | |
| | 490,000 | | Kuehn Enterprises LLC, 4.320%, 01/06/2006 (a)(b) | | 490,000 |
Thrifts & Mortgage Finance (2.5%) | | |
| | 1,000,000 | | Amsouth Bank N.A., 4.224%, 01/20/2006 (a) | | 999,910 |
| | | | Total corporate bonds (amortized cost $10,073,333) | | 10,073,333 |
MUNICIPAL BONDS (47.5%) | | |
| | 100,000 | | ABAG Financial Authorities for Nonprofit Corps, 4.450%, 01/06/2006 (a)(b) (CS: Federal National Mortgage Assn.) | | 100,000 |
| | 1,000,000 | | Arlington County Virginia Industrial Development Authority, 4.300%, 01/06/2006 (a)(b) (LOC: Bank of America) | | 1,000,000 |
| | 1,085,000 | | Birmingham Alabama Waterworks and Sewer Board, 2.170%, 01/01/2006 (b) (CS: FGIC) | | 1,084,942 |
| | 1,300,000 | | California Housing Finance Agency, 4.300%, 01/06/2006 (a)(b) | | 1,300,000 |
| | 100,000 | | Colorado Housing & Finance Authority, 4.300%, 01/06/2006 (a)(b) (CS: Federal National Mortgage Assn.) | | 100,000 |
| | 965,000 | | Colorado Housing & Finance Authority, 4.300%, 01/06/2006 (a)(b) (SPA: Dexia Credit Local) | | 965,000 |
| | 1,000,000 | | Florida Housing & Finance Authority, 4.300%, 01/06/2006 (a)(b) | | 1,000,000 |
| | 1,000,000 | | Fulton County Georgia Development Authority, 4.350%, 01/06/2006 (a)(b) (LOC: Regions Bank) | | 1,000,000 |
| | 700,000 | | Louisiana Public Facilities Authority, 4.180%, 01/06/2006 (a)(b) | | 700,000 |
| | 580,000 | | Michigan State Housing Development Authority, 4.300%, 01/06/2006 (a)(b) (SPA: Dexia Credit Local) | | 580,000 |
| | 500,000 | | Michigan State Housing Development Authority, 4.300%, 01/06/2006 (a)(b) (SPA: DEPFA Bank PLC) | | 500,000 |
The accompanying notes are an integral part of these financial statements.
40|86 Series Trust | Annual Report |
Schedule of Investments | December 31, 2005 |
| Money Market Portfolio | |
SHARES OR PRINCIPAL AMOUNT | | | | VALUE |
| | | | | | |
MUNICIPAL BONDS (continued) | | |
| | $1,000,000 | | New Orleans Louisiana Pension, 4.550%, 01/06/2006 (a)(b) | $ | 1,000,000 |
| | 1,000,000 | | North Texas Education Authority, 4.300%, 01/06/2006 (a)(b) (CS: Ambac Financial Group) | | 1,000,000 |
| | 1,210,000 | | Philadelphia Authority For Industrial Development, 4.300%, 01/06/2006 (a)(b) | | 1,210,000 |
| | 700,000 | | Portland Maine Pension, 4.300%, 01/06/2006 (a)(b) (SPA: Bayerische Landesbank) | | 700,000 |
| | 600,000 | | Sacramento County California Pension, 4.300%, 01/06/2006 (a)(b) (LOC: Bayerische Landesbank) | | 600,000 |
| | 805,000 | | St. Francis Healthcare Foundation Hawaii, 4.890%, 01/06/2006 (a)(b) (LOC: First Hawaiian Bank) | | 805,000 |
| | 1,000,000 | | St. Johns County Industrial Development Authority, 4.370%, 01/06/2006 (a)(b) (LOC: Allied Irish Bank PLC) | | 1,000,000 |
| | 450,000 | | San Jose California Financing Authority, 4.460%, 01/06/2006 (a)(b) | | 450,000 |
| | 1,000,000 | | Susquehanna Area Regional Airport, 2.400%, 01/01/2006 (CS: Ambac Financial Group) | | 999,953 |
| | 785,000 | | University of Minnesota, 4.300%, 01/06/2006 (a)(b) | | 785,000 |
| | 800,000 | | Utah Housing Finance Agency, 4.300%, 01/06/2006 (a)(b) (SPA: Bayerische Landesbank) | | 800,000 |
| | 500,000 | | Westminster Colorado Economic Development Authority, 4.420%, 01/06/2006 (a)(b) (LOC: HSH Nordbank) | | 500,000 |
| | 1,000,000 | | Wheaton College Illinois, 4.300%, 01/06/2006 (a)(b) (SPA: J.P. Morgan & Chase Bank) | | 1,000,000 |
| | | | Total municipal bonds (amortized cost $19,179,895) | | 19,179,895 |
COMMERCIAL PAPER (14.9%) | | |
Commercial Banks (5.0%) | | |
| | 2,000,000 | | Rabobank USA, 4.040%, 01/03/2006 | | 1,999,326 |
Diversified Financial Services (4.9%) | | |
| | 2,000,000 | | UBS Financial Services, Inc., 4.290%, 01/03/2006 | | 1,999,302 |
Insurance (5.0%) | | |
| | 2,000,000 | | The Allstate Corp., 4.170%, 01/03/2006, Cost — $1,999,305; Acquired — 12/30/2005 (c) | | 1,999,305 |
| | | | Total commercial paper (amortized cost $5,997,933) | | 5,997,933 |
SHORT TERM INVESTMENTS (8.6%) | | |
| | 1,713,000 | | AIM Liquid Asset Portfolio, 4.130% | | 1,713,000 |
| | 1,750,000 | | Columbia Treasury Reserve Capital, 3.300% | | 1,750,000 |
| | | | Total short term investments (cost $3,463,000) | | 3,463,000 |
| | | | Total investments (cost $38,714,161) (96.0%) | | 38,714,161 |
| | | | Other assets in excess of liabilities (4.0%) | | 1,625,929 |
| | | | Total Net Assets (100.0%) | $ | 40,340,090 |
__________
| (a) | Variable Coupon Rate - The rate reported is the rate in effect as of December 31, 2005. |
| (b) | Maturity date represents first available put date. |
| (c) | Restricted under Rule 144A of the Securities Act of 1933. |
| (d) | Foreign Security or a U.S. Security of a foreign company. |
CS - Credit Support.
LOC - Letter of Credit.
SPA - Standby Purchase Agreement.
The accompanying notes are an integral part of these financial statements.
40|86 Series Trust | Annual Report |
Financial Highlights
For a share outstanding through the year or period ended December 31,
| | | EQUITY PORTFOLIO |
| | | 2005 | | 2004 | | 2003 | | 2002 | | 2001 | |
| | | | | | | | | | | | |
| Net asset value per share, beginning of period | | $ | 24.53 | | $ | 20.42 | | $ | 14.92 | | $ | 17.30 | | $ | 19.43 | |
| Income from investment operations: | | | | | | | | | | | | | | | | |
| Net investment income | | | 0.13 | | | 0.08 | | | 0.06 | | | 0.06 | | | 0.07 | |
Net realized gain (loss) and change in unrealized appreciation (depreciation) on investments | | | 2.69 | | | 4.20 | | | 5.49 | | | (2.38 | ) | | (2.07 | ) |
| Total income (loss) from investment operations | | | 2.82 | | | 4.28 | | | 5.55 | | | (2.32 | ) | | (2.00 | ) |
| Distributions: | | | | | | | | | | | | | | | | |
| Dividends from net investment income | | | (0.13 | ) | | (0.08 | ) | | (0.05 | ) | | (0.06 | ) | | (0.07 | ) |
| Distributions of net realized gain | | | (2.53 | ) | | (0.09 | ) | | — | | | — | | | (0.06 | ) |
| Total distributions | | | (2.66 | ) | | (0.17 | ) | | (0.05 | ) | | (0.06 | ) | | (0.13 | ) |
| Net asset value per share, end of period | | $ | 24.69 | | $ | 24.53 | | $ | 20.42 | | $ | 14.92 | | $ | 17.30 | |
| Total return (a)(b) | | | 11.43 | % | | 20.94 | % | | 37.17 | % | | (13.42 | %) | | (10.30 | %) |
| | | | | | | | | | | | | | | | | |
| Ratios/supplemental data: | | | | | | | | | | | | | | | | |
| Net assets (dollars in thousands), end of period | | $ | 171,779 | | $ | 168,901 | | $ | 165,798 | | $ | 148,881 | | $ | 233,983 | |
| Ratio of expenses to average net assets (b): | | | | | | | | | | | | | | | | |
| Before expense reimbursement | | | 1.20 | % | | 1.13 | % | | 1.14 | % | | 1.15 | % | | 1.02 | % |
| After expense reimbursement | | | 1.10 | % | | 1.10 | % | | 1.10 | % | | 1.10 | % | | 1.02 | % |
| Ratio of net investment income to average net assets (b) | | | 0.48 | % | | 0.38 | % | | 0.28 | % | | 0.32 | % | | 0.38 | % |
| Portfolio turnover rate | | | 90 | % | | 89 | % | | 107 | % | | 102 | % | | 133 | % |
__________
| (a) | Total return represents performance of the Portfolio only and does not include mortality and expense deductions in separate accounts. |
| (b) | The Adviser and Administrator have contractually agreed to reimburse Portfolio expenses to the extent that the ratio of expenses to average net assets exceeds, on an annual basis, the net expenses defined in Note 3. These contractual limits may be discontinued at any time after April 30, 2006. |
The accompanying notes are an integral part of these financial statements.
40|86 Series Trust | Annual Report |
Financial Highlights
For a share outstanding through the year or period ended December 31,
| | BALANCED PORTFOLIO |
| | | 2005 | | 2004 | | 2003 | | 2002 | | 2001 | |
| | | | | | | | | | | | |
| Net asset value per share, beginning of period | | $ | 13.42 | | $ | 12.35 | | $ | 10.25 | | $ | 12.16 | | $ | 13.45 | |
| Income from investment operations: | | | | | | | | | | | | | | | | |
| Net investment income | | | 0.23 | | | 0.26 | | | 0.27 | | | 0.36 | | | 0.40 | |
Net realized gain (loss) and change in unrealized appreciation (depreciation) on investments | | | 0.52 | | | 1.07 | | | 2.09 | | | (1.91 | ) | | (1.29 | ) |
| Total income (loss) from investment operations | | | 0.75 | | | 1.33 | | | 2.36 | | | (1.55 | ) | | (0.89 | ) |
| Distributions: | | | | | | | | | | | | | | | | |
| Dividends from net investment income | | | (0.23 | ) | | (0.26 | ) | | (0.26 | ) | | (0.36 | ) | | (0.40 | ) |
| Distributions of net realized gain | | | — | | | — | | | — | | | — | | | (0.00 | )(c) |
| Total distributions | | | (0.23 | ) | | (0.26 | ) | | (0.26 | ) | | (0.36 | ) | | (0.40 | ) |
| Net asset value per share, end of period | | $ | 13.94 | | $ | 13.42 | | $ | 12.35 | | $ | 10.25 | | $ | 12.16 | |
| Total return (a)(b) | | | 5.63 | % | | 10.84 | % | | 23.29 | % | | (12.87 | %) | | (6.60 | %) |
| | | | | | | | | | | | | | | | | |
| Ratios/supplemental data: | | | | | | | | | | | | | | | | |
| Net assets (dollars in thousands), end of period | | $ | 43,511 | | $ | 47,056 | | $ | 48,282 | | $ | 44,455 | | $ | 71,635 | |
| Ratio of expenses to average net assets (b): | | | | | | | | | | | | | | | | |
| Before expense reimbursement | | | 1.22 | % | | 1.14 | % | | 1.15 | % | | 1.18 | % | | 1.04 | % |
| After expense reimbursement | | | 1.10 | % | | 1.10 | % | | 1.10 | % | | 1.10 | % | | 1.04 | % |
| Ratio of net investment income to average net assets (b) | | | 1.66 | % | | 2.03 | % | | 2.27 | % | | 3.11 | % | | 3.16 | % |
| Portfolio turnover rate | | | 91 | % | | 97 | % | | 100 | % | | 180 | % | | 239 | % |
__________
| (a) | Total return represents performance of the Portfolio only and does not include mortality and expense deductions in separate accounts. |
| (b) | The Adviser and Administrator have contractually agreed to reimburse Portfolio expenses to the extent that the ratio of expenses to average net assets exceeds, on an annual basis, the net expenses defined in Note 3. These contractual limits may be discontinued at any time after April 30, 2006. |
| (c) | Amount calculated is less than $0.005 per share. |
The accompanying notes are an integral part of these financial statements.
40|86 Series Trust | Annual Report |
Financial Highlights
For a share outstanding through the year or period ended December 31,
| | | HIGH YIELD PORTFOLIO |
| | | 2005 | | 2004 | | 2003 | | 2002 | | 2001 | |
| | | | | | | | | | | | |
| Net asset value per share, beginning of period | | $ | 10.40 | | $ | 10.53 | | $ | 8.86 | | $ | 9.28 | | $ | 10.07 | |
| Income from investment operations: | | | | | | | | | | | | | | | | |
| Net investment income | | | 0.62 | | | 0.71 | | | 0.67 | | | 0.86 | | | 1.10 | |
Net realized gain (loss) and change in unrealized appreciation (depreciation) on investments | | | (0.50 | ) | | 0.37 | | | 1.68 | | | (0.42 | ) | | (0.78 | ) |
| Total income from investment operations | | | 0.12 | | | 1.08 | | | 2.35 | | | 0.44 | | | 0.32 | |
| Distributions: | | | | | | | | | | | | | | | | |
| Dividends from net investment income | | | (0.62 | ) | | (0.70 | ) | | (0.68 | ) | | (0.86 | ) | | (1.11 | ) |
| Distributions of net realized gain | | | (0.52 | ) | | (0.51 | ) | | — | | | — | | | — | |
| Total distributions | | | (1.14 | ) | | (1.21 | ) | | (0.68 | ) | | (0.86 | ) | | (1.11 | ) |
| Net asset value per share, end of period | | $ | 9.38 | | $ | 10.40 | | $ | 10.53 | | $ | 8.86 | | $ | 9.28 | |
| Total return (a)(b) | | | 1.15 | % | | 10.69 | % | | 27.38 | % | | 5.47 | % | | 3.17 | % |
| | | | | | | | | | | | | | | | | |
| Ratios/supplemental data: | | | | | | | | | | | | | | | | |
| Net assets (dollars in thousands), end of period | | $ | 8,759 | | $ | 8,876 | | $ | 10,941 | | $ | 9,202 | | $ | 7,091 | |
| Ratio of expenses to average net assets (b): | | | | | | | | | | | | | | | | |
| Before expense reimbursement | | | 1.36 | % | | 1.24 | % | | 1.25 | % | | 1.47 | % | | 1.11 | % |
| After expense reimbursement | | | 1.15 | % | | 1.15 | % | | 1.15 | % | | 1.15 | % | | 1.11 | % |
| Ratio of net investment income to average net assets (b) | | | 6.01 | % | | 6.53 | % | | 6.53 | % | | 8.95 | % | | 11.12 | % |
| Portfolio turnover rate | | | 125 | % | | 177 | % | | 126 | % | | 258 | % | | 232 | % |
__________
| (a) | Total return represents performance of the Portfolio only and does not include mortality and expense deductions in separate accounts. |
| (b) | The Adviser and Administrator have contractually agreed to reimburse Portfolio expenses to the extent that the ratio of expenses to average net assets exceeds, on an annual basis, the net expenses defined in Note 3. These contractual limits may be discontinued at any time after April 30, 2006. |
The accompanying notes are an integral part of these financial statements.
40|86 Series Trust | Annual Report |
Financial Highlights
For a share outstanding during through the year or period ended December 31,
| | | FIXED INCOME PORTFOLIO |
| | | 2005 | | 2004 | | 2003 | | 2002 | | 2001 | |
| | | | | | | | | | | | |
| Net asset value per share, beginning of period | | $ | 10.10 | | $ | 10.08 | | $ | 9.66 | | $ | 9.88 | | $ | 9.63 | |
| Income from investment operations: | | | | | | | | | | | | | | | | |
| Net investment income | | | 0.44 | | | 0.44 | | | 0.46 | | | 0.58 | | | 0.59 | |
Net realized gain (loss) and change in unrealized appreciation or depreciation on investments | | | (0.22 | ) | | 0.02 | | | 0.42 | | | (0.13 | ) | | 0.25 | |
| Total income from investment operations | | | 0.22 | | | 0.46 | | | 0.88 | | | 0.45 | | | 0.84 | |
| Distributions: | | | | | | | | | | | | | | | | |
| Dividends from net investment income | | | (0.44 | ) | | (0.44 | ) | | (0.46 | ) | | (0.58 | ) | | (0.59 | ) |
| Distributions of net realized gain | | | — | | | — | | | — | | | (0.09 | ) | | — | |
| Total distributions | | | (0.44 | ) | | (0.44 | ) | | (0.46 | ) | | (0.67 | ) | | (0.59 | ) |
| Net asset value per share, end of period | | $ | 9.88 | | $ | 10.10 | | $ | 10.08 | | $ | 9.66 | | $ | 9.88 | |
| Total return (a)(b) | | | 2.26 | % | | 4.74 | % | | 9.33 | % | | 4.68 | % | | 8.84 | % |
| | | | | | | | | | | | | | | | | |
| Ratios/supplemental data: | | | | | | | | | | | | | | | | |
| Net assets (dollars in thousands), end of period | | $ | 23,091 | | $ | 27,448 | | $ | 35,068 | | $ | 41,957 | | $ | 60,649 | |
| Ratio of expenses to average net assets (b) | | | | | | | | | | | | | | | | |
| Before expense reimbursement | | | 1.06 | % | | 0.98 | % | | 1.00 | % | | 1.02 | % | | 0.91 | % |
| After expense reimbursement | | | 0.95 | % | | 0.95 | % | | 0.95 | % | | 0.95 | % | | 0.91 | % |
| Ratio of net investment income to average net assets (b) | | | 4.33 | % | | 4.40 | % | | 4.61 | % | | 5.86 | % | | 5.96 | % |
| Portfolio turnover rate | | | 197 | % | | 226 | % | | 307 | % | | 371 | % | | 515 | % |
__________
| (a) | Total return represents performance of the Portfolio only and does not include mortality and expense deductions in separate accounts. |
| (b) | The Adviser and Administrator have contractually agreed to reimburse Portfolio expenses to the extent that the ratio of expenses to average net assets exceeds, on an annual basis, the net expenses defined in Note 3. These contractual limits may be discontinued at any time after April 30, 2006. |
The accompanying notes are an integral part of these financial statements.
40|86 Series Trust | Annual Report |
Financial Highlights
For a share outstanding during through the year or period ended December 31,
| | GOVERNMENT SECURITIES PORTFOLIO |
| | 2005 | | 2004 | | 2003 | | 2002 | | 2001 | |
| | | | | | | | | | | | |
| Net asset value per share, beginning of period | | $ | 11.59 | | $ | 11.70 | | $ | 12.04 | | $ | 11.70 | | $ | 11.54 | |
| Income from investment operations: | | | | | | | | | | | | | | | | |
| Net investment income | | | 0.39 | | | 0.40 | | | 0.42 | | | 0.47 | | | 0.54 | |
Net realized gain (loss) and change in unrealized appreciation or depreciation on investments | | | (0.19 | ) | | (0.11 | ) | | (0.25 | ) | | 0.60 | | | 0.16 | |
| Total income from investment operations | | | 0.20 | | | 0.29 | | | 0.17 | | | 1.07 | | | 0.70 | |
| Distributions: | | | | | | | | | | | | | | | | |
| Dividends from net investment income | | | (0.43 | ) | | (0.40 | ) | | (0.42 | ) | | (0.47 | ) | | (0.54 | ) |
| Distributions of net realized gain | | | — | | | — | | | (0.09 | ) | | (0.26 | ) | | — | |
| Total distributions | | | (0.43 | ) | | (0.40 | ) | | (0.51 | ) | | (0.73 | ) | | (0.54 | ) |
| Net asset value per share, end of period | | $ | 11.36 | | $ | 11.59 | | $ | 11.70 | | $ | 12.04 | | $ | 11.70 | |
| Total return (a)(b) | | | 1.73 | % | | 2.48 | % | | 1.36 | % | | 9.33 | % | | 6.13 | % |
| | | | | | | | | | | | | | | | | |
| Ratios/supplemental data: | | | | | | | | | | | | | | | | |
| Net assets (dollars in thousands), end of period | | $ | 12,209 | | $ | 14,565 | | $ | 22,791 | | $ | 41,676 | | $ | 31,267 | |
| Ratio of expenses to average net assets (b): | | | | | | | | | | | | | | | | |
| Before expense reimbursement | | | 1.06 | % | | 0.94 | % | | 1.04 | % | | 0.99 | % | | 0.91 | % |
| After expense reimbursement | | | 0.95 | % | | 0.95 | % | | 0.95 | % | | 0.95 | % | | 0.91 | % |
| Ratio of net investment income to average net assets (b) | | | 3.40 | % | | 3.29 | % | | 3.32 | % | | 3.78 | % | | 4.60 | % |
| Portfolio turnover rate | | | 189 | % | | 250 | % | | 175 | % | | 174 | % | | 199 | % |
__________
| (a) | Total return represents performance of the Portfolio only and does not include mortality and expense deductions in separate accounts. |
| (b) | The Adviser and Administrator have contractually agreed to reimburse Portfolio expenses to the extent that the ratio of expenses to average net assets exceeds, on an annual basis, the net expenses defined in Note 3. These contractual limits may be discontinued at any time after April 30, 2006. |
The accompanying notes are an integral part of these financial statements.
40|86 Series Trust | Annual Report |
Financial Highlights
For a share outstanding during through the year or period ended December 31,
| | MONEY MARKET PORTFOLIO |
| | 2005 | | 2004 | | 2003 | | 2002 | | 2001 | |
| | | | | | | | | | | | |
| Net asset value per share, beginning of period | | $ | 1.00 | | $ | 1.00 | | $ | 1.00 | | $ | 1.00 | | $ | 1.00 | |
| Income from investment operations: | | | | | | | | | | | | | | | | |
| Net investment income | | | 0.03 | | | 0.01 | | | 0.01 | | | 0.01 | | | 0.04 | |
Net realized gain (loss) and change in unrealized appreciation (depreciation) on investments | | | 0.00 | | | 0.00 | (c) | | — | | | (0.00 | )(c) | | 0.00 | (c) |
| Total income from investment operations | | | 0.03 | | | 0.01 | | | 0.01 | | | 0.01 | | | 0.04 | |
| Distributions: | | | | | | | | | | | | | | | | |
| Dividends from net investment income | | | (0.03 | ) | | (0.01 | ) | | (0.01 | ) | | (0.01 | ) | | (0.04 | ) |
| Distributions of net realized gain | | | — | | | — | | | — | | | (0.00 | )(c) | | — | |
| Total distributions | | | (0.03 | ) | | (0.01 | ) | | (0.01 | ) | | (0.01 | ) | | (0.04 | ) |
| Net asset value per share, end of period | | $ | 1.00 | | $ | 1.00 | | $ | 1.00 | | $ | 1.00 | | $ | 1.00 | |
| Total return (a)(b) | | | 2.89 | % | | 0.93 | % | | 0.63 | % | | 1.24 | % | | 3.97 | % |
| | | | | | | | | | | | | | | | | |
| Ratios/supplemental data: | | | | | | | | | | | | | | | | |
| Net assets (dollars in thousands), end of period | | $ | 40,340 | | $ | 33,755 | | $ | 41,965 | | $ | 95,767 | | $ | 129,530 | |
| Ratio of expenses to average net assets (b): | | | | | | | | | | | | | | | | |
| Before expense reimbursement | | | 0.83 | % | | 0.71 | % | | 0.76 | % | | 0.73 | % | | 0.72 | % |
| After expense reimbursement | | | 0.45 | % | | 0.45 | % | | 0.45 | % | | 0.45 | % | | 0.43 | % |
| Ratio of net investment income to average net assets (b) | | | 2.90 | % | | 1.16 | % | | 0.64 | % | | 1.23 | % | | 3.74 | % |
__________
| (a) | Total return represents performance of the Portfolio only and does not include mortality and expense deductions in separate accounts. |
| (b) | The Adviser and Administrator have contractually agreed to reimburse Portfolio expenses to the extent that the ratio of expenses to average net assets exceeds, on an annual basis, the net expenses defined in Note 3. These contractual limits may be discontinued at any time after April 30, 2006. |
| (c) | Amount calculated is less than $0.005 per share. |
The accompanying notes are an integral part of these financial statements.
40|86 Series Trust | Annual Report |
Notes to Financial Statements | December 31, 2005 |
1. GENERAL
40|86 Series Trust (the “Trust”) is an open-end management investment company registered with the Securities and Exchange Commission under the Investment Company Act of 1940, as amended (the “Act”), and was organized as a Massachusetts Trust effective November 15, 1982. The Trust is a “series” type of mutual fund which issues separate series of shares, each of which currently represents a separate portfolio of investments. The Trust consists of six series (“Portfolios”) each with its own investment objective and investment policies. The Portfolios are the Equity, Balanced, High Yield, Fixed Income, Government Securities and Money Market. Effective May 31, 2005, the Focus 20 Portfolio was terminated. The Trust offers shares to affiliated and unaffiliated life insurance company separate accounts (registered as unit investment trusts under the Act) to fund the benefits under variable annuity and variable life contracts. However, Jefferson National Life variable annuity products own a majority of the shares offered by each Portfolio.
2. SUMMARY OF SIGNIFICANT ACCOUNTING POLICIES
SECURITY VALUATION, TRANSACTIONS AND RELATED INVESTMENT INCOME
The investments in each Portfolio are valued at the close of regular trading on the New York Stock Exchange on each business day. Investment transactions are accounted for on trade date (the date the order to buy or sell is executed). Dividend income is recorded on the ex-dividend date and interest income is accrued daily. The cost of investments sold is determined on the specific identification basis. The following summarizes the investments, which carry certain restrictions as to resale from the Trust to certain qualified buyers:
Portfolio | | Cost | | Value | | % of Net Assets |
| Balanced Portfolio | | $ | 984,760 | | $ | 1,005,130 | | | 2.31 | % |
| High Yield Portfolio | | | 992,908 | | | 1,017,932 | | | 11.62 | % |
| Fixed Income Portfolio | | | 2,093,289 | | | 2,117,985 | | | 9.17 | % |
| Money Market Portfolio | | | 2,559,004 | | | 2,559,004 | | | 6.34 | % |
These securities are eligible for resale to qualified institutional buyers in transactions exempt from registration under Rule 144A of the Securities Act of 1933. In addition, 40|86 Advisors, Inc. (the “Adviser”), a wholly-owned subsidiary of Conseco, Inc. (“Conseco”), which serves as investment adviser to the Portfolios, has determined that the securities are liquid securities through a procedure approved by the Board of Trustees of the Trust (the “Trustees”).
The Trustees determined that the Money Market Portfolio will value investments at amortized cost, which is conditioned on the Trust’s compliance with certain conditions contained in Rule 2a-7 of the Act. The Adviser continuously reviews this method of valuation and recommends changes to the Trustees, if necessary, to ensure that the Money Market Portfolio investments are valued at fair value (as determined by the Trustees in good faith).
In all Portfolios of the Trust, except for the Money Market Portfolio, securities that are traded on stock exchanges, excluding the NASDAQ national market system, are valued at the last sale price as of the close of business on the day the securities are being valued, or lacking any sales, at the mean between the closing bid and asked prices. Securities that are principally traded on the NAS-DAQ national market system are generally valued at the NASDAQ Official Closing Price (“NOCP”). Securities traded in the over-the-counter market are valued at the mean between the bid and asked prices obtained from a pricing service or brokers. Prices for fixed income securities may be obtained from an independent pricing source that uses information provided by market makers or estimates of market value obtained from yield data relating to investments or securities with similar characteristics. Portfolio securities that are traded both in the over-the-counter market and on a stock exchange are valued according to the broadest and most representative market, and it is expected that for debt securities this ordinarily will be the over-the-counter market. Debt securities with maturities of sixty (60) days or less are valued at amortized cost that approximates value.
Under the direction of the Trustees, the Adviser may use a practice known as fair value pricing under certain circumstances. This may include, but is not limited to, securities and assets for which market quotations are not readily available, situations where events occur after an exchange closes that are likely to affect the value of the security or the Adviser deems that the market price is not reflective of a security’s appropriate value. The Adviser may consider many factors when determining fair values, including but not limited to, the type of security, the financial statements of the issuer, the cost at date of purchase, the size of holdings and information as to any transactions or offers with respect to the security, existence of merger proposals or tender offers with respect to the security. These general and specific factors listed do not provide all the criteria, which may be considered when using the fair value method. When using the fair value method, the Adviser will take into consideration all indications of value available to them in determining the “fair value” assigned to a particular security.
If an investment owned by a Portfolio experiences a default and has accrued interest from purchase or has recorded accrued interest during the period it is owned, the Portfolio’s policy is to cease interest accruals from the time the investments are traded as “flat” in the market. The Portfolio evaluates the collectibility of purchased accrued interest and previously recorded interest on an investment-by-investment basis.
FEDERAL INCOME TAXES
Each Portfolio is treated as a separate taxable entity for federal income tax purposes and intends to qualify as a regulated investment company under Subchapter M of the Internal Revenue Code. The Trust intends to distribute substantially all taxable income and net realized gains to shareholders annually, and otherwise comply with the requirements for regulated investment companies. Therefore, no provision has been made for federal income taxes.
Net investment income and net realized gains (losses) may differ for financial statement and tax purposes because of temporary or permanent book/tax differences. To the extent these differences are permanent, reclassifications are made to the appropriate equity accounts in the period the difference arises.
On the Statement of Assets and Liabilities, the following reclassifications were made:
40|86 Series Trust | Annual Report |
Notes to Financial Statements | December 31, 2005 |
Portfolio | | Accumulated Net Realized Gain (Loss) | | Undistributed Investment Income | | Paid-in Capital | |
| Equity | | $ | 5,140 | | $ | (5,140 | ) | $ | — | |
| Balanced | | | 3,330 | | | (1,370 | ) | | (1,960 | ) |
| High Yield | | | 15,366 | | | (252 | ) | | (15,114 | ) |
| Fixed Income | | | (20,278 | ) | | 20,278 | | | — | |
| Government Securities | | | (38,056 | ) | | 38,056 | | | — | |
DIVIDENDS TO SHAREHOLDERS
Dividends are declared and paid from net investment income on a daily basis in the Money Market Portfolio, on a monthly basis in the Government Securities, Fixed Income and High Yield Portfolios, on a quarterly basis in the Balanced Portfolio and on an annual basis in the Equity Portfolio. Distributions of net short-term capital gains and losses are declared and reinvested, at least annually, as a component of net realized gains (losses).
Dividends to shareholders from net investment income are determined in accordance with income tax regulations which may differ from accounting principles generally accepted in the United States of America. Permanent book and tax differences relating to dividends to shareholders may result in reclassifications to paid-in capital and may effect per-share allocation between net investment income and realized and unrealized gains (losses). Any taxable income or gain of the Trust remaining at fiscal year end will be declared and distributed in the following year to the shareholders of the Portfolio or Portfolios to which such gains are attributable.
SECURITIES LENDING
The Portfolios have entered into a Securities Lending Agreement (the “Agreement”) with the Bank of New York. Under terms of the Agreement, the Portfolios may lend portfolio securities to qualified institutional borrowers in order to earn additional income. The Agreement requires that loans are collateralized at all times in an amount equal to at least 102% of the market value of any loaned securities, plus accrued interest. Cash collateral is invested in short-term securities or variable rate bonds and Certificates of Deposit that are included in the respective Portfolio’s Schedule of Investments.
At December 31, 2005, the Equity, Balanced, Fixed Income and Government Securities Portfolios had securities with a market value of $48,508,525, $11,042,736, $3,211,943 and $2,807,937, respectively, on loan (included within Investments in securities in the Statements of Assets and Liabilities) and had received $49,954,624, $11,391,089, $3,638,093 and $2,986,622, respectively, in collateral. Amounts earned as interest on investments of cash collateral, net of rebates and other securities lending expenses, are included in Securities Lending income in the Statements of Operations. For the year ended December 31, 2005, the securities lending income totaled $59,034, $18,489, $10,926 and $6,055, net of $25,300, $7,924, $4,683 and $2,595 paid to the agent, respectively.
The primary risk associated with securities lending is if the borrower defaults on its obligation to return the securities loaned because of insolvency or other reasons. The Portfolios could experience delays and costs in recovering securities loaned or in gaining access to the collateral.
USE OF ESTIMATES
The preparation of financial statements in conformity with accounting principles generally accepted in the United States of America requires management to make estimates and assumptions that affect the reported amount of assets and liabilities, and disclosure of contingent assets and liabilities as of the date of the financial statements and the reported amounts of increases and decreases in net assets from operations during the reporting period. Actual results may differ from these estimates.
3. TRANSACTIONS WITH AFFILIATES
INVESTMENT ADVISORY AGREEMENT
The Adviser provides investment advice and, in general, supervises the Trust’s management and investment program, furnishes office space, prepares Portfolio reports for the Trust, monitors Portfolio compliance by the Trust in its investment activities and pays compensation of officers and Trustees of the Trust who are affiliated persons of the Adviser. The Trust pays all other expenses incurred in the operation of the Trust, including fees and expenses of unaffiliated Trustees of the Trust.
Under the Investment Advisory Agreement, the Adviser receives an investment advisory fee based on the daily net asset value at an annual rate of 0.70 percent for the High Yield Portfolio, 0.65 percent for the Equity and Balanced Portfolios, and 0.50 percent for the Fixed Income, Government Securities, and Money Market Portfolios. The Adviser has voluntarily reduced its advisory fee to 0.25 percent of the average daily net assets of the Money Market Portfolio. The total fees incurred for such services were $1,807,111 for the year ended December 31, 2005.
The Adviser has entered into Subadvisory Agreements for the management of the investments in the Equity Portfolio and the equity portion of the Balanced Portfolio. The Adviser is solely responsible for the payment of all fees to the Subadviser. The Subadviser for the Equity Portfolio and the equity portion of the Balanced Portfolio is Chicago Equity Partners, LLC. The Adviser has contractually agreed to waive its investment advisory fee and/or reimburse the Portfolios through April 30, 2006 to the extent that the ratio of expenses to net assets on an annual basis exceed the following:
Portfolio | |
| Equity | 1.10% |
| Balanced | 1.10% |
| High Yield | 1.15% |
| Fixed Income | 0.95% |
| Government Securities | 0.95% |
| Money Market | 0.45% |
The Adviser may discontinue these contractual limits at any time after April 30, 2006. After this date the Adviser may elect to continue, modify or terminate the limitation on Portfolio operating expenses. Further, under the terms of this agreement, any Portfolio expenses waived or reimbursed may be recouped by the Adviser from the Portfolio to the extent actual operating expenses for a period are less than the expense limitation caps. The Adviser may only be entitled to recoup such amounts for a period of three years from the fiscal
40|86 Series Trust | Annual Report |
Notes to Financial Statements | December 31, 2005 |
year that they were waived or reimbursed. Reimbursed/absorbed expenses subject to potential recovery by year of expiration are as follows:
| | Year of Expiration |
| | | December 31, |
| | 2006 | | 2007 | | 2008 | |
| Equity | | $ | 64,540 | | $ | 42,025 | | $ | 163,295 | |
| Balanced | | | 21,956 | | | 18,765 | | | 51,616 | |
| High Yield | | | 8,570 | | | 8,536 | | | 17,536 | |
| Fixed Income | | | 20,431 | | | 8,208 | | | 28,208 | |
| Government Securities | | | 31,927 | | | — | | | 13,948 | |
| Money Market | | | 237,653 | | | 103,777 | | | 129,638 | |
ADMINISTRATIVE AGREEMENT
Conseco Services, LLC (the “Administrator”), a wholly-owned subsidiary of Conseco, supervises the preparation and filing of regulatory documents required for compliance by the Portfolios with applicable laws and regulations, supervises the maintenance of books and records of the Portfolios and provides other general and administrative services. Effective May 1, 2001, the Administrator receives an annual fee, for providing these services, equal to 0.15 percent for the first $200 million of average daily net assets of the Trust; 0.10 percent of the next $300 million of average daily net assets of the Trust; and 0.08 percent of the average daily net assets in excess of $500 million of the Trust. The total fees under this Agreement for the year ended December 31, 2005 were $390,256. The Administrator has contractually agreed to waive its administration fee and/or reimburse the Portfolios through April 30, 2006 to the extent that the ratio of expenses to net assets on an annual basis exceeds the expense limitations as stated for the Investment Advisory Agreement. The Administrator may discontinue these contractual limits at any time after April 30, 2006.
DISTRIBUTION AGREEMENT
Conseco Equity Sales, Inc. (the “Distributor”), a wholly-owned subsidiary of Conseco, serves as the principal underwriter for each Portfolio pursuant to a Principal Underwriting Agreement, approved by the Trustees. The Distributor is a registered broker-dealer and a member of the National Association of Securities Dealers, Inc. (“NASD”). Shares of each Portfolio will be continuously offered to life insurance company separate accounts to fund the benefits under variable annuity and variable life contracts. The Distributor bears all the expenses of providing services pursuant to the Principal Underwriting Agreement including the payment of the expenses relating to the distribution of prospectuses for sales purposes, as well as, any advertising or sales literature.
The Trust adopted a Distribution and Service Plan pursuant to Rule 12b-1 (the “Plan”), dated May 1, 2001, for the Equity, Balanced, High Yield, Fixed Income and Government Securities Portfolios in accordance with the requirements of Rule 12b-1 under the 1940 Act and the requirements of the applicable rules of the NASD regarding asset based sales charges. Pursuant to the Plan, a Portfolio may compensate the Distributor for its expenditures in financing any activity primarily intended to result in the sale of shares of the Portfolio and for account maintenance provided to shareholders. The Plan authorizes payments to the Distributor at 0.25 percent annually of each Portfolio’s average daily net assets. The Plan provides for periodic payments by the Distributor to financial intermediaries for providing shareholder services to accounts that hold shares and for promotional and other sales related costs. The total fees incurred by the Trust for such services for the year ended December 31, 2005, were $649,246.
4. INVESTMENT TRANSACTIONS
The aggregate cost of purchases and the aggregate proceeds from sales of investments (excluding short-term securities) for the year ended December 31, 2005 are shown below:
| | | EQUITY PORTFOLIO | | BALANCED PORTFOLIO | | HIGH YIELD PORTFOLIO | | FIXED INCOME PORTFOLIO | | GOVERNMENT SECURITIES PORTFOLIO | |
| | | | | | | | | | | | |
| Purchases: | | | | | | | | | | | |
| U.S. Government | | $ | — | | $ | 7,787,777 | | $ | — | | $ | 15,555,980 | | $ | 6,841,340 | |
| Other | | | 149,997,380 | | | 31,347,935 | | | 9,643,425 | | | 30,766,501 | | | 16,635,169 | |
| Sales: | | | | | | | | | | | | | | | | |
| U.S. Government | | $ | — | | $ | 8,214,523 | | $ | — | | $ | 14,979,676 | | $ | 8,012,942 | |
| Other | | | 165,198,878 | | | 35,720,793 | | | 11,112,840 | | | 34,943,423 | | | 17,260,069 | |
5. FEDERAL INCOME TAXES
The following information for the Portfolios is presented on an income tax basis as of December 31, 2005:
| | | | | | | | | | | | | | |
| | | | | | | | | | | | | | |
| | $ | 194,100,202 | | $ | 50,592,102 | | $ | 7,630,276 | | $ | 25,962,652 | | $ | 15,051,785 | | $ | 38,714,161 | |
Gross unrealized appreciation | | $ | 29,988,385 | | $ | 4,740,169 | | $ | 114,460 | | $ | 368,736 | | $ | 51,840 | | $ | — | |
Gross unrealized depreciation | | | (2,542,571 | ) | | (668,364 | ) | | (176,304 | ) | | (284,156 | ) | | (156,983 | ) | | — | |
Net unrealized appreciation(depreciation) on investments | | $ | 27,445,814 | | $ | 4,071,805 | | $ | (61,844 | ) | $ | 84,580 | | $ | (105,143 | ) | $ | — | |
__________
| (a) | Represents cost for federal income tax purposes and differs from the cost for financial reporting purposes by the amount of losses recognized for the financial reporting purposes in excess of federal income tax purposes. |
40|86 Series Trust | Annual Report |
Notes to Financial Statements | December 31, 2005 |
As of December 31, 2005, the components of accumulated earnings (deficit) on a tax basis were:
| | EQUITY PORTFOLIO | | BALANCED PORTFOLIO | | HIGH YIELD PORTFOLIO | | FIXED INCOME PORTFOLIO | | GOVERNMENT SECURITIES PORTFOLIO | | MONEY MARKET PORTFOLIO | |
| | | | | | | | | | | | | |
| Distributable ordinary income | $ | — | | $ | — | | $ | 2,128 | | $ | 5,527 | | $ | 2,019 | | $ | 9,296 | |
| Distributable long-term gains | | 20,243,570 | | | — | | | — | | | — | | | — | | | — | |
| Accumulated earnings | | 20,243,570 | | | — | | | 2,128 | | | 5,527 | | | 2,019 | | | 9,296 | |
| Accumulated capital and post-October losses | | (20,873,345 | ) | | (10,035,101 | ) | | (427,624 | ) | | (510,209 | ) | | (232,940 | ) | | (9,296 | ) |
| Unrealized appreciation (depreciation) | | 27,445,814 | | | 4,071,805 | | | (61,844 | ) | | 84,580 | | | (105,143 | ) | | — | |
| Total accumulated earnings (deficit) | $ | 26,816,039 | | $ | (5,963,296 | ) | $ | (487,340 | ) | $ | (420,102 | ) | $ | (336,064 | ) | $ | — | |
The tax character of dividends paid during the years ended December 31, 2005 and December 31, 2004 were as follows:(1)
| | | EQUITY PORTFOLIO | | BALANCED PORTFOLIO | | HIGH YIELD PORTFOLIO | | FIXED INCOME PORTFOLIO | | GOVERNMENT SECURITIES PORTFOLIO | | MONEY MARKET PORTFOLIO | |
| | | | | | | | | | | | | | |
| Ordinary Income dividends | | | | | | | | | | | | | | | | | | | |
| December 31, 2005 | | $ | 749,443 | | $ | 744,826 | | $ | 633,160 | | $ | 1,104,249 | | $ | 482,446 | | $ | 998,425 | |
| December 31, 2004 | | | 546,828 | | | 919,319 | | | 888,049 | | | 1,327,299 | | | 630,280 | | | 362,228 | |
| Long-term capital gain distributions | | | | | | | | | | | | | | | | | | | |
| December 31, 2005 | | $ | 15,985,995 | | $ | — | | $ | 323,316 | | $ | — | | $ | — | | $ | — | |
| December 31, 2004 | | | 590,150 | | | — | | | 140,663 | | | — | | | — | | | — | |
As of December 31, 2005, the following Portfolios have capital loss carryforwards available to offset capital gains in the future, if any:
| | AMOUNT | | EXPIRES | |
| Balanced Portfolio | $2,672,638 | | 2010 | |
| Balanced Portfolio | 1,556,918 | | 2011 | |
| Fixed Income Portfolio | 420,142 | | 2010 | |
| Government Securities Portfolio | 200,502 | | 2012 | |
| Government Securities Portfolio | 21,830 | | 2013 | |
| Money Market Portfolio | 4,462 | | 2010 | |
| Money Market Portfolio | 80 | | 2011 | |
| Money Market Portfolio | 4,754 | | 2012 | |
As of the tax year end December 31, 2005, the following Portfolios had additional net capital loss carryforwards, subject to certain limitations on availability, to offset future net capital gains, if any. To the extent that these carryovers are used to offset future capital gains, it is probable that the gains so offset will not be distributed to shareholders:
| | AMOUNT | | EXPIRES | |
| Equity Portfolio | $14,851,019 | | 2009 | |
| Equity Portfolio | 6,022,326 | | 2010 | |
| Balanced Portfolio | 5,805,545 | | 2010 | |
| High Yield Portfolio | 400,775 | | 2010 | |
| High Yield Portfolio | 23,814 | | 2011 | |
Net realized gains or losses may differ from Federal income tax purposes primarily as a result of wash sales and post-October losses which may not be recognized for tax purposes until the first of the following fiscal year. Such amounts may be used to offset future capital gains.
The following summarizes the amount of post-October losses deferred, on a tax basis, for the year ended December 31, 2005.
| | | AMOUNT | |
| High Yield Portfolio | | $ | 3,035 | |
| Government Securities Portfolio | | | 10,608 | |
| Fixed Income Portfolio | | | 88,527 | |
(1) | (The total distributions paid differs from the Statement of Changes in Net Assets because, for tax purposes, dividends are recognized when actually paid). |
40|86 Series Trust | Annual Report |
Notes to Financial Statements | December 31, 2005 |
Under the Trust’s organizational documents, its officers and trustees are indemnified against certain liabilities arising out of the performance of their duties to the Trust. In addition, in the normal course of business, the Trust enters into contacts with its vendors and others that may provide for general indemnifications. The Trust’s maximum exposure under these arrangements is unknown as this would involve future claims be made against the Trust. However, based on experience, the Trust expects the risk of loss to be remote.
The accompanying notes are an integral part of these financial statements.
40|86 Series Trust | Annual Report |
Report of Independent Registered Public Accounting Firm | |
To the Board of Trustees and Shareholders of 40|86 Series Trust:
In our opinion, the accompanying statements of assets and liabilities, including the schedules of investments, and the related statements of operations and of changes in net assets and the financial highlights present fairly, in all material respects, the financial position of Equity Portfolio, Balanced Portfolio, High Yield Portfolio, Fixed Income Portfolio, Government Securities Portfolio and Money Market Portfolio (collectively referred to as the “Trust”) at December 31, 2005, the results of each of their operations for the year then ended, the changes in each of their net assets for each of the two years in the period then ended and the financial highlights for each of the periods presented, in conformity with accounting principles generally accepted in the United States of America. These financial statements and financial highlights (hereafter referred to as “financial statements”) are the responsibility of the Trust’s management; our responsibility is to express an opinion on these financial statements based on our audits. We conducted our audits of these financial statements in accordance with the standards of the Public Company Accounting Oversight Board (United States). Those standards require that we plan and perform the audit to obtain reasonable assurance about whether the financial statements are free of material misstatement. An audit includes examining, on a test basis, evidence supporting the amounts and disclosures in the financial statements, assessing the accounting principles used and significant estimates made by management, and evaluating the overall financial statement presentation. We believe that our audits, which included confirmation of securities at December 31, 2005, by correspondence with the custodian and brokers, provide a reasonable basis for our opinion.

Indianapolis, Indiana
February 21, 2006
40|86 Series Trust | Annual Report |
Expense Example (unaudited) | |
| December 31, 2005 | |
As a shareholder of the 40|86 Series Trust (the “Trust”), you incur ongoing costs, including management fees, distribution fees and other Trust expenses. This Example is intended to help you understand your ongoing costs (in dollars) of investing in the Trust and to compare these costs with the ongoing costs of investing in other mutual funds. The Example is based on an investment of $1,000 invested at the beginning of the period and held for the entire period (07/01/05 - 12/31/05).
Actual Expenses
The first line of the table below provides information about actual account values and actual expenses. The example below includes, but is not limited to, management fees, administration, distribution, custody and transfer agent fees. However, the example below does not include portfolio trading commissions and related expenses and other extraordinary expenses as determined under generally accepted accounting principles. You may use the information in this line, together with the amount you invested, to estimate the expenses that you paid over the period. Simply divide your account value by $1,000 (for example, an $8,600 account value divided by $1,000 = 8.6), then multiply the result by the number in the first line under the heading entitled “Expenses Paid During Period” to estimate the expenses you paid on your account during this period.
Hypothetical Example for Comparison Purposes
The second line of the table below provides information about hypothetical account values and hypothetical expenses based on the Trust’s actual expense ratio and an assumed rate of return of 5% per year before expenses, which is not the Trust’s actual return. The hypothetical account values and expenses may not be used to estimate the actual ending account balance or expenses you paid for the period. You may use this information to compare the ongoing costs of investing in the Trust and other funds. To do so, compare this 5% hypothetical example with the 5% hypothetical examples that appear in the shareholder reports of the other funds. Please note that the expenses shown in the table are meant to highlight your ongoing costs only and do not reflect any transactional costs, such as sales charges (loads), redemption fees, or exchange fees. Therefore, the second line of the table is useful in comparing ongoing costs only, and will not help you determine the relative total costs of owning different funds. In addition, if these transactional costs were included, your costs would have been higher.
Equity Portfolio | Beginning Account Value 07/01/05 | Ending Account Value 12/31/05 | Expenses Paid During Period 07/01/05 - 12/31/05 (1) |
| Actual | $1,000.00 | $1,069.90 | $5.74 |
Hypothetical (5% return before expenses) | 1,000.00 | 1,019.45 | 5.60 |
(1) | Expenses are equal to the Fund’s annualized expense ratio of 1.10% multiplied by the average account value over the period multiplied by 184/365 (to reflect the one-half year period). |
Beginning Balanced Portfolio | Beginning Account Value 07/01/05 | Ending Account Value 12/31/05 | Expenses Paid During Period 07/01/05 - 12/31/05 (1) |
| Actual | $1,000.00 | $1,036.80 | $5.65 |
Hypothetical (5% return before expenses) | 1,000.00 | 1,019.45 | 5.60 |
(2) | Expenses are equal to the Fund’s annualized expense ratio of 1.10% multiplied by the average account value over the period multiplied by 184/365 (to reflect the one-half year period). |
High Yield Portfolio | Beginning Account Value 07/01/05 | Ending Account Value 12/31/05 | Expenses Paid During Period 07/01/05 - 12/31/05 (3) |
| Actual | $1,000.00 | $1,006.60 | $5.82 |
Hypothetical (5% return before expenses) | 1,000.00 | 1,019.20 | 5.85 |
(3) | Expenses are equal to the Fund’s annualized expense ratio of 1.15% multiplied by the average account value over the period multiplied by 184/365 (to reflect the one-half year period). |
40|86 Series Trust | Annual Report |
Expense Example (unaudited) | |
| December 31, 2005 | |
Fixed Income Portfolio | Beginning Account Value 07/01/05 | Ending Account Value 12/31/05 | Expenses Paid During Period 07/01/05 - 12/31/05 (4) |
| Actual | $1,000.00 | $1,002.60 | $4.80 |
Hypothetical (5% return before expenses) | 1,000.00 | 1,020.21 | 4.84 |
(4) | Expenses are equal to the Fund’s annualized expense ratio of 0.95% multiplied by the average account value over the period multiplied by 184/365 (to reflect the one-half year period). |
Government Securities Portfolio | Beginning Account Value 07/01/05 | Ending Account Value 12/31/05 | Expenses Paid During Period 07/01/05 - 12/31/05 (5) |
| Actual | $1,000.00 | $995.40 | $4.78 |
Hypothetical (5% return before expenses) | 1,000.00 | 1,020.21 | 4.84 |
(5) | Expenses are equal to the Fund’s annualized expense ratio of 0.95% multiplied by the average account value over the period multiplied by 184/365 (to reflect the one-half year period). |
Money Market Portfolio | Beginning Account Value 07/01/05 | Ending Account Value 12/31/05 | Expenses Paid During Period 07/01/05 - 12/31/05(6) |
| Actual | $1,000.00 | $1,017.00 | $2.29 |
Hypothetical (5% return before expenses) | 1,000.00 | 1,022.73 | 2.29 |
(6) | Expenses are equal to the Fund’s annualized expense ratio of 0.45% multiplied by the average account value over the period multiplied by 184/365 (to reflect the one-half year period). |
December 14, 2005 Special Meeting of Shareholders (unaudited)
PROPOSAL #1: ELECT TWO TRUSTEES TO THE BOARD OF TRUSTEES
Audrey L. Kurzawa | | Shares Voted | | Percent of Shares Outstanding | | Percent of Shares Voted | |
| Affirmative | | | 52,617,038.793 | | 99.532% | | | 99.889 | % |
| Withhold | | | 58,466.517 | | | 0.111% | | | 0.111 | % |
| Total | | | 52,675,505.310 | | | 99.643% | | | 100.000 | % |
| | | | | | | | | | | |
Vincent J. Otto |
| Affirmative | | | 52,617,038.793 | | | 99.532% | | | 99.889 | % |
| Withhold | | | 58,466.517 | | | 0.111% | | | 0.111 | % |
| Total | | | 52,675,505.310 | | | 99.643% | | | 100.000 | % |
The accompanying notes are an integral part of these financial statements.
40|86 Series Trust | Annual Report |
Board of Trustees and Officers (unaudited) | |
Name (Age) Address | Position Held With Trust | Principal Occupation(s) During Past 5 Years |
Audrey L. Kurzawa* (38) 11815 N. Pennsylvania St. Carmel, IN 46032 | President and Trustee Since June 2005 and Formerly Treasurer Since October 2002 | Certified Public Accountant. Controller, Adviser. President and Trustee of one other mutual fund managed by the Adviser. |
| | | |
Diana H. Hamilton (48) 11815 N. Pennsylvania St. Carmel, IN 46032 | Trustee Since December 2004 | President, Sycamore Advisors, LLC, a municipal finance advisory firm; Formerly, State of Indiana Director of Public Finance. Trustee of one other mutual fund managed by the Adviser. |
| | | |
R. Matthew Neff (49) 11815 N. Pennsylvania St. Carmel, IN 46032 | Trustee Since December 2004 | Chairman and Co-Chief Executive Officer of Senex Financial Corp., a financial services company engaged in the healthcare finance field. Trustee of one other mutual fund managed by the Adviser. |
| | | |
Vincent J. Otto (46) 11815 N. Pennsylvania St. Carmel, IN 46032 | Trustee Since December 2005 | Executive Vice President and Chief Financial Officer, Waterfield Mortgage Company and Union Federal Bank. Director, Federal Home Loan Bank of Indianapolis. |
| | | |
William T. Devanney (49) 11815 N. Pennsylvania St. Carmel, IN 46032 | Vice President Since July 1998 | Senior Vice President, Corporate Taxes of Conseco Services, LLC and various affiliates. Vice President of one other mutual fund managed by the Adviser. |
| | | |
Daniel Murphy (49) 11815 N. Pennsylvania St. Carmel, IN 46032 | Treasurer Since June 2005 | Senior Vice President and Treasurer, Conseco, Inc. Treasurer of one other mutual fund managed by the Adviser. |
| | | |
Jeffrey M. Stautz (47) 11815 N. Pennsylvania St. Carmel, IN 46032 | Chief Legal Officer and Secretary Since May 2005 | Vice President, General Counsel, Secretary and Chief Compliance Officer, Adviser. Chief Legal Officer and Secretary of one other mutual fund managed by the Adviser. |
| | | |
Sarah L. Bertrand (37) 11815 N. Pennsylvania St. Carmel, IN 46032 | Chief Compliance Officer and Assistant Secretary Since December 2004 | Assistant Vice President, Legal and Compliance, Adviser. Chief Compliance Officer and Assistant Secretary of one other mutual fund managed by the Adviser. |
__________
| * | The Trustee so indicated is an “interested person,” as defined in the 1940 Act, of the Trust due to the positions indicated with the Adviser and its affiliates. |
| | |
| | Each Trustee serves until the expiration of the term of his designated class and until his successor is elected and qualified, or until his death or resignation, or removal as provided in the Fund’s by-laws or charter or statute. |
| | |
| | All Trustees oversee the seven portfolios that make up the total fund complex including 40|86 Strategic Income Fund (1) and 40|86 Series Trust (6). |
40|86 Series Trust | Annual Report |
INVESTMENT ADVISER | | LEGAL COUNSEL |
| 40|86 Advisors, Inc. | | Kirkpatrick & Lockhart |
| Carmel, IN | | Nicholson Graham LLP |
| | | Washington, D.C. |
CUSTODIAN | | |
| The Bank of New York | | INVESTMENT SUB-ADVISERS |
| New York, NY | | Chicago Equity Partners, LLC |
| | | Chicago, IL |
INDEPENDENT REGISTERED | | |
PUBLIC ACCOUNTING FIRM | | |
| PricewaterhouseCoopers LLP | | |
| Indianapolis, IN | | |
PROXY VOTING POLICIES AND PROCEDURES
A description of the policies and procedures that the Portfolios use to determine how to vote proxies relating to portfolio securities is available without charge, upon request, by calling (866) 299-4086. Furthermore, you can obtain the description on the SEC’s website at http://www.sec.gov.
PROXY VOTING RECORDS FOR THE 12-MONTH PERIOD ENDED JUNE 30, 2005
Information regarding how the Portfolios voted proxies relating to portfolio securities during the most recent 12-month period ended June 30 is available without charge, upon request, by calling (866) 299-4086. Furthermore, you can obtain the Portfolio’s proxy voting records on the SEC’s website at http://www.sec.gov.
AVAILABILITY OF QUARTERLY PORTFOLIO SCHEDULE
The Portfolios file complete schedule of portfolio holdings with the SEC for the first and third quarters of each fiscal year on Form N-Q. The filing for the most recent quarter is available without charge, upon request, by calling (866) 299-4086. Furthermore, you can obtain the Portfolio’s quarterly portfolio schedule on the SEC’s website at http://www.sec.gov. The Portfolio’s Forms N-Q may also be reviewed and copied at the SEC’s Public Reference Room in Washington, DC, and information on the operation of the Public Reference Room may be obtained by calling (800) SEC-0330.
40|86 Series Trust is a registered investment company managed by
40|86 Advisors, Inc., a leading fixed-income investment advisor.
40|86 Series Trust
11815 North Pennsylvania Street
Carmel, Indiana 46032
Principal Underwriter:
Conseco Equity Sales, Inc.
11815 North Pennsylvania Street
Carmel, Indiana 46032
Item 2. Code of Ethics.
| (a) | The registrant, as of the end of the period covered by this report, has adopted a code of ethics that applies to the registrant’s principal executive officer, principal financial officer, principal accounting officer or controller, or persons performing similar functions, regardless of whether these individuals are employed by the registrant or a third party. |
| | (c) | There have been no amendments, during the period covered by this report, to a provision of the code of ethics that applies to the registrant’s principal executive officer, principal financial officer, principal accounting officer or controller, or persons performing similar functions, regardless of whether these individuals are employed by the registrant or a third party, and that relates to any element of the code of ethics description. |
| | (d) | The registrant has not granted any waivers, including an implicit waiver, from a provision of the code of ethics that applies to the registrant’s principal executive officer, principal financial officer, principal accounting officer or controller, or persons performing similar functions, regardless of whether these individuals are employed by the registrant or a third party, that relates to one or more of the items set forth in paragraph (b) of this item’s instructions. |
A copy of the registrant’s Code of Ethics is filed herewith.
Item 3. Audit Committee Financial Expert.
The registrant’s board of trustees determined that Harold W. Hartley was qualified to serve as an audit committee financial expert serving on its audit committee during 2005. The board of trustees determined that Mr. Hartley was “independent,” as that term is defined by Item 3 of Form N-CSR. The registrant’s board of trustees has also determined that Vincent J. Otto is qualified to serve as an audit committee financial expert serving on its audit committee and that he is “independent” as that term is defined by Item 3 of Form N-CSR.
Item 4. Principal Accountant Fees and Services.
Audit Fees
| (a) | The aggregate fees billed for each of the last two fiscal years for professional services rendered by the principal accountant for the audit of the registrant's annual financial statements or services that are normally provided by the accountant in connection with statutory and regulatory filings or engagements for those fiscal years are $113,400 for the year ended December 31, 2004 and $107,000 for the year ended December 31, 2005. |
Audit-Related Fees
| (b) | There were no fees billed in either of the last two fiscal years for assurance and related services by the principal accountant that are reasonably related to the performance of the audit of the registrant's financial statements and are not reported under paragraph (a) of this Item. |
Tax Fees
| (c) | The aggregate fees billed in each of the last two fiscal years for professional services rendered by the principal accountant for tax compliance, tax advice, and tax planning are $22,400 for the year ended December 31, 2004 and $20,310 for the year ended December 31, 2005. |
Tax return review and Excise Review
All Other Fees
| | (d) | There were no fees billed in either of the last two fiscal years for products and services provided by the principal accountant, other than the services reported in paragraphs (a) through (c) of this Item. |
| (e)(1) | Disclose the audit committee's pre-approval policies and procedures described in paragraph (c)(7) of Rule 2-01 of Regulation S-X. |
| | | Before the accountant is engaged by the registrant to render audit or non-audit services, the engagement is approved by the registrant’s audit committee. The Chairman of the audit committee is authorized to pre-approve engagement of the accountant to perform other non-audit services for the registrant and to report such pre-approvals to the audit committee at their next meeting. |
| (e)(2) | The percentage of services described in each of paragraphs (b) through (d) of this Item that were approved by the audit committee pursuant to paragraph (c)(7)(i)(C) of Rule 2-01 of Regulation S-X are as follows: |
(b) N/A
(c) 100%
(d) N/A
| | (f) | The percentage of hours expended on the principal accountant's engagement to audit the registrant's financial statements for the most recent fiscal year that were attributed to work performed by persons other than the principal accountant's full-time, permanent employees was less than fifty percent. |
| (g) | The aggregate non-audit fees billed by the registrant's accountant for services rendered to the registrant, and rendered to the registrant's investment adviser (not including any sub-adviser whose role is primarily portfolio management and is subcontracted with or overseen by another investment adviser), and any entity controlling, controlled by, or under common control with the adviser that provides ongoing services to the registrant for each of the last two fiscal years of the registrant was $30,233 for the year ended December 31, 2004 and $25,615 for the year ended December 31, 2005. |
| (h) | The registrant's audit committee of the board of directors has considered whether the provision of non-audit services that were rendered to the registrant's investment adviser (not including any sub-adviser whose role is primarily portfolio management and is subcontracted with or overseen by another investment adviser), and any entity controlling, controlled by, or under common control with the investment adviser that provides ongoing services to the registrant that were not pre-approved pursuant to paragraph (c)(7)(ii) of Rule 2-01 of Regulation S-X is compatible with maintaining the principal accountant's independence. |
Item 5. Audit Committee of Listed registrants.
The registrant has a separately designated audit committee consisting of all the independent directors of the registrant. The members of the audit committee are: Diana H. Hamilton, R. Matthew Neff and Vincent J. Otto
Item 6. Schedule of Investments
Schedule of Investments in securities of unaffiliated issuers as of the close of the reporting period is included as part of the report to shareholders filed under Item 1 of this form.
Item 7. Disclosure of Proxy Voting Policies and Procedures for Closed-End Management Investment Companies.
Not applicable to open-end investment companies.
Item 8. Portfolio Managers of Closed-End Management Investment Companies.
Not applicable to open-end investment companies.
Item 9. Purchases of Equity Securities by Closed-End Management Investment Company and Affiliated Purchasers.
Not applicable to open-end investment companies.
Item 10. Submission of Matters to a Vote of Security Holders.
There have been no material changes to the procedures by which the shareholders may recommend nominees to the registrant’s board of directors, where those changes were implemented after the registrant last provided disclosure in response to the requirements of Item 7(d)(2)(ii)(G) of Schedule 14A (17 CFR 240.14a-101), or this Item.
Item 11. Controls and Procedures.
| (a) | The registrant’s principal executive and principal financial officers, or persons performing similar functions, have concluded that the registrant’s disclosure controls and procedures (as defined in Rule 30a-3(c) under the Investment Company Act of 1940, as amended (the “1940 Act”) (17 CFR 270.30a-3(c))) are effective, as of a date within 90 days of the filing date of the report that includes the disclosure required by this paragraph, based on their evaluation of these controls and procedures required by Rule 30a-3(b) under the 1940 Act (17 CFR 270.30a-3(b)) and Rules 13a-15(b) or 15d-15(b) under the Securities Exchange Act of 1934, as amended (17 CFR 240.13a-15(b) or 240.15d-15(b)). |
| (b) | There were no changes in the registrant’s internal control over financial reporting (as defined in Rule 30a-3(d) under the 1940 Act (17 CFR 270.30a-3(d)) that occurred during the registrant’s second fiscal quarter of the period covered by this report that has materially affected, or is reasonably likely to materially affect, the registrant’s internal control over financial reporting. |
Item 12. Exhibits.
| | (a)(1) | Any code of ethics or amendment thereto. Attached hereto. |
| | (a)(2) | Certifications pursuant to Section 302 of the Sarbanes-Oxley Act of 2002. Filed herewith. |
| (a)(3) | Any written solicitation to purchase securities under Rule 23c-1 under the Act sent or given during the period covered by the report by or on behalf of the registrant to 10 or more persons. Not applicable to open-end investment companies. |
| | (b) | Certifications pursuant to Rule 30a-2(b) under the 1940 Act and Section 906 of the Sarbanes-Oxley Act of 2002. Filed herewith. |
SIGNATURES
Pursuant to the requirements of the Securities Exchange Act of 1934 and the Investment Company Act of 1940, the registrant has duly caused this report to be signed on its behalf by the undersigned, thereunto duly authorized.
(Registrant) 40|86 Series Trust
By (Signature and Title)* /s/ Audrey L. Kurzawa
Audrey L. Kurzawa, President
(principal executive officer)
Date 3/6/06
Pursuant to the requirements of the Securities Exchange Act of 1934 and the Investment Company Act of 1940, this report has been signed below by the following persons on behalf of the registrant and in the capacities and on the dates indicated.
By (Signature and Title) /s/ Audrey L. Kurzawa
Audrey L. Kurzawa, President
(principal executive officer)
Date 3/6/06
By (Signature and Title) /s/ Daniel J. Murphy
Daniel J. Murphy, Treasurer
(principal financial officer)
Date 3/6/06