ITEM 7. MANAGEMENT'S DISCUSSION AND ANALYSIS OR PLAN OF OPERATION
The following discussion of our financial condition and results of operations should be read in conjunction with our audited consolidated financial statements and the notes to those financial statements appearing elsewhere in this Form 10-K. This discussion contains forward-looking statements that involve significant risks and uncertainties. As a result of many factors, such as those set forth under “Forward Looking Statements” and “Item 1A. Risk Factors” and elsewhere in this Form 10-K, our actual results may differ materially from those anticipated in these forward-looking statements.
Overview
We believe we are one of the world’s largest producer, based on manufacturing capacity, and a leading innovator of bimetallic wire products, principally copper-clad aluminum (CCA) and copper-clad steel (CCS) products. Our products are primarily used within the telecommunications, electrical utility, and transportation industries, and are sold as conductor components within the broadband wire and cable market, and finished products in the electrical utility and transportation markets. Our products significantly reduce the amount of copper required to manufacture a conductor, and since copper is expensive; we significantly reduce conductor cost through the addition of an aluminum or steel core. CCA and CCS conductors are generally used in substitution of solid copper conductors where either cost savings or specific electrical and/or physical attributes are either required or desired. In the fiscal year of 2008, our products were sold to over 300 customers in 38 countries. We market our products under the trademarked names of “Copperweld®” and “Fushi™,” and sell either directly to cable manufacturers or through distributors or sales agents to end-users.
Although we are engaged in one line of business, as a result of the differing markets primarily served by each of our manufacturing facilities and significant differences in the operating results among each of our facilities as a result of the acquisition of Copperweld we now analyze our worldwide operations based on two geographic reportable segments: 1) “PRC” which consists of our facility located in Dalian, Liaoning, the People’s Republic of China (PRC) and 2) “US” which consists of our Fayetteville, Tennessee, (USA), and Telford, England, (UK) facilities. We have combined our U.S. and U.K. operations as one segment since the UK is a subsidiary of the US operating company and is under the direction of our U.S. segment manager. Further, the nature of our products, services and production processes at our U.S. and U.K. facilities, along with the customer base, methods to distribute products and services are nearly identical.
We believe we have a strong market position in all markets in which we compete due to product, geographic, customer diversity and our ability to deliver superior products while operating as a low cost provider. As a result, we are now the leading producer of bimetallic wire products in the world and are the market leaders in North America, Europe, North Africa the Middle East, and the People’s Republic of China. We strive to continue expansion within current and evolving markets, and to create shareholder value by:
| | · | Investing in organic and inorganic growth in both infrastructure-based and fast-growing markets; |
| | · | Focusing on expansion within and into new, higher-margin products, applications and markets through investment into new machinery and research and development; |
| | · | Continuously improving business processes throughout the Company by focusing on key performance indicators and operational excellence; |
| | · | Hiring and developing strategic talent thus improving the effectiveness of our performance management processes; and |
| | · | Protecting and enhancing shareholder value of the Fushi Copperweld brand. |
To accomplish these goals, we are focused on continuously improving operational efficiency in areas we view to be vital: quality, delivery, cost, and innovation. We also take an opportunistic approach to achieving our goals, and thus, we seek acquisitions of businesses which facilitate overall growth and cash flows of the Company.
Typically using 70% less copper than conventional copper wire, but offering materially the same utility and functionality, our bimetallic wire is used in applications such as distribution products for telecommunication networks, cables for the wireless industry, automotive and consumer products, video and data applications, electrical power cables, wire components for electronic devices, as well as other industrial conductors. In many applications, the value of bimetallic wire is based on advantages other than the economies of bimetallic versus solid copper. Weight considerations strongly favor CCA because the end user can expect approximately 2.6 times the length with the same weight as solid copper. Wire is sold by weight but used by length. The additional length increases the value of CCA. Weight is a major concern in some applications where the end product is portable, such as cell phones, music players, etc. and in automotive applications. We believe that the use of much lighter bimetallic products will continue to offer opportunities for these applications. Other advantages include RF resistance factor. RF signals travel over the surface of the wire. With bimetallic wire, the RF resistance characteristics of the copper cladding offers identical high frequency characteristics as solid copper, but with much less weight and lower end-product stiffness.
CCS combines the functionality of copper with the strength of steel to provide a higher value, stronger alternative to solid copper for use in coaxial drop cables for cable television, electrical utility applications including ground cables and tracer wire, automotive wiring harnesses, catenary cable for electrified railroads and other applications requiring specific levels of conductivity and higher levels of tensile strength. Copperweld CCS is synonymous with copper-clad steel and is registered as Copperweld®.
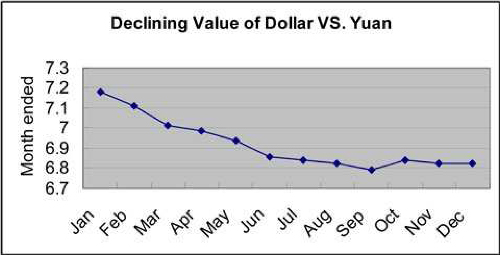
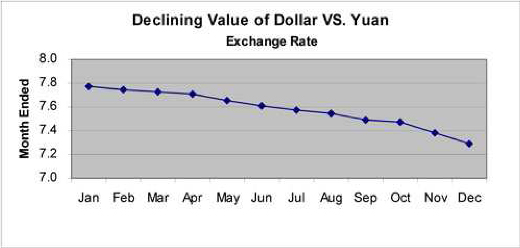
Our products are effectively “engineered composite conductors”. We do not produce commodity products and are not subject to the same pricing effects of pure commodity metals. Our customers purchase and use our products for their physical and/or conductive qualities, which have their respective application advantages, with cost savings being an added incentive. While the pricing volatility of our raw materials, especially copper, is a primary cause of cost variations in our products, changes in raw material costs do not materially affect our earnings per share. Although an increase in the price of raw materials may serve to reduce our gross margins as a percentage of net sales, likewise, a decline in raw material prices will increase our gross margin as a percentage of net sales. We generally pass the cost of price changes in our raw materials to our customers rather than the percentage changes. We establish prices for our products based on market factors and our cost to produce our products. Typically, we set a base price for our products for our customers with an understanding that as prices of raw materials change, primarily for copper but also for aluminum and steel, we will pass the change through to our customers. Therefore, when prices of raw material increase, our prices to our customers increase and the amount of our total net sales increases while the dollar amount of our gross margin remains relatively stable. As a result, the impact on earnings per share from volatile raw material prices is minimal, although there are timing delays of varying lengths depending upon volatility of metals prices, the type of product, competitive conditions and particular customer arrangements.
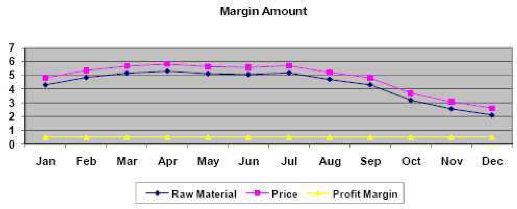
The above chart demonstrates how changes in the 2008 Comex monthly average copper and aluminum prices can hypothetically affect our margins. The combined cost of copper and aluminum changed from approximately $4.25 at month one to a high of $5.33 in month four and then trended generally down during the remainder of the year to a low of $2.11 in month twelve. In this example, we have a gross margin per pound of $0.50 for illustrative purposes. Passing the changing costs through to our customers’ prices allows us to maintain a level amount of dollar gross margin. Considering gross margin as a percentage of net sales can be misleading when raw materials costs are increasing even though the dollar amount of gross margin remains the same. Although the gross margin would have fluctuated between from 8.6% and 19.2% in our example, the dollar amount of gross margin and resulting net income flowing to earnings per share remained the same.
Factors driving and affecting operations results include raw material prices, product and price competition, economic conditions in various geographic regions, foreign currency exchange rates, interest rates, changes in technology, fluctuations in customer demand, variations in the mix of products, production capacity and utilization, working capital sufficiency, availability of credit and general market liquidity, patent and intellectual property issues, litigation results and legal and regulatory developments, and our ability to accurately forecast sales demand and calibrate manufacturing to such demand, manage volatile raw material costs, develop, manufacture and successfully market new and enhanced products and product lines, control operating costs, and attract, motivate and retain key personnel to manage our operational, financial and management information systems.
Current Business Environment and 2009 Outlook
With respect to the overall business trends in 2009 and forward, management recognizes that the current condition of the global economy may present us with significant challenges to our financial condition and results of operations. Statistics showed that the global economy decelerated quickly and severely in the second half of 2008. China, a market that has generated most of our revenue and growth, saw its GDP growth in the fourth quarter of 2008 drop to 6.8%, the slowest the country has experienced in seven years. The figure was more than 10% in the first half of 2008, and 13% rate for 2007. Global economic turmoil, uncertainties in capital markets, currency fluctuations and commodity cost volatility have substantially reduced the visibility for our industry and our business.
However, we think the following macro-level trends will positively impact our business and offer us opportunity to capture new business despite global economic conditions and preserve profitability:
| | · | Continued growth in demand for CCA-based telecommunication products; |
| | · | Government stimulus packages focused on infrastructure: high-speed railways, T&D and power grid build out; |
| | · | Continued strength of grounding wire market; |
| | · | Worldwide underlying long-term growth trends in electric utility and infrastructure markets; |
| | · | Continuing demand for cost effective, energy saving alternatives. |
In addition to these macro-level trends, the Company is presented with tremendous opportunities brought by the increasing capital expenditures of major telecommunications operators in China subsequent to the restructuring and the recent issuance of 3G licenses. In order to capture the growth opportunities, we will focus on driving profitability by streamlining our organizational structure and business procedures, increasing operational efficiency and optimizing operating processes, while managing production costs and operating expenses.
In addition, we are seeking to continue to develop the high potential utility and electrical appliance markets, to enhance productivity and to expand our sales of higher margin products. Meanwhile, we are also working to strengthen sales management and customer relations. We will seek to consolidate our relationships with our best customers, stop or suspend selling to customers that pose significant credit risk, and develop new customers cautiously. In addition, as part of our ongoing efforts to reduce total operating costs, we continuously improve our ability to efficiently utilize existing and new manufacturing capacity to manage expansion and growth. Investment in new capacity will pay dividends. Effectively utilized manufacturing assets, economy of scale generated, will help offset high raw material prices and dilute overhead over time. Despite worsening economic conditions, we expect to operate our facilities at relatively high combined utilization rates.
We actively seek to identify and promptly respond to key economic and industry trends in order to capitalize on expanding niche markets for our products, and possibly entering into new markets both down and up stream, in order to achieve better returns. We have the resources, technology, working capital and capacity to meet growing market demands. Over the long-term, we believe that we are well positioned to benefit from the growth opportunities in China and throughout the world.
Financial Performance Highlights:
Results of Operations
The following table shows, for the periods indicated, information derived from our consolidated statements of income in thousands of dollars and as a percentage of net sales (net sales and expenses for the Fayetteville and Telford (Copperweld) are included for the 2007 fiscal year beginning October 29, 2007 through December 31, 2007). Percentages may not add due to rounding.
| | | Year Ended December 31, | |
| | | 2008 | | | 2007 | | | 2006 | |
| | | Amount | | | % | | | Amount | | | % | | | Amount | | | % | |
| Net Sales | | $ | 221,435 | | | | 100 | % | | $ | 128,222 | | | | 100 | % | | $ | 67,596 | | | | 100 | % |
| Cost of Sales | | | 164,182 | | | | 74 | % | | | 85,774 | | | | 67 | % | | | 42,782 | | | | 63 | % |
| Gross Profit | | | 57,253 | | | | 26 | % | | | 42,448 | | | | 33 | % | | | 24,814 | | | | 37 | % |
| Selling, general and administrative expenses | | | 20,163 | | | | 9 | % | | | 11,803 | | | | 9 | % | | | 4,428 | | | | 7 | % |
| Operating income | | | 37,090 | | | | 17 | % | | | 30,645 | | | | 24 | % | | | 20,386 | | | | 30 | % |
| Income before taxes | | | 28,970 | | | | 13 | % | | | 26,654 | | | | 21 | % | | | 18,208 | | | | 27 | % |
| Net income | | $ | 28,475 | | | | 13 | % | | $ | 29,506 | | | | 23 | % | | $ | 17,810 | | | | 26 | % |
Year ended December 31, 2008 compared to year ended December 31, 2007
Net Sales
The following tables set forth net sales in millions by each of our reporting segments and metric tons (MT) sold on a combined basis:
| | | Net Sales | | | | | | | |
| | | Year ended December 31 | | | | | | | |
| | | 2008 | | | 2007 | | | | | | | |
| | | | | | % of Net | | | | | | % of Net | | | Dollar | | | | |
| | | Amount | | | Sales | | | Amount | | | Sales | | | Change | | | % Change | |
| PRC | | $ | 159.5 | | | | 72.0 | % | | $ | 118.1 | | | | 92.1 | % | | $ | 41.4 | | | | 35.1 | % |
| US | | $ | 62.0 | | | | 28.0 | % | | $ | 10.1 | | | | 7.9 | % | | $ | 51.9 | | | | 513.9 | % |
| Total Net sales | | $ | 221.5 | | | | 100.0 | % | | $ | 128.2 | | | | 100.0 | % | | $ | 93.3 | | | | 72.8 | % |
| | | Metric Tons Sold | | | | | | | |
| | | Year ended December 31 | | | | | | | |
| | | 2008 | | | 2007 | | | | | | | |
| | | | | | % of MT | | | | | | % of MT | | | Tonnage | | | | |
| | | MT | | | Sold | | | MT | | | Sold | | | Change | | | % Change | |
| PRC | | | 26,261 | | | | 70.4 | % | | | 19,416 | | | | 91.1 | % | | | 6,845 | | | | 35.3 | % |
| US | | | 11,030 | | | | 29.6 | % | | | 1,906 | | | | 8.9 | % | | | 9,124 | | | | 478.7 | % |
| Total MT sold | | | 37,291 | | | | 100.0 | % | | | 21,322 | | | | 100.0 | % | | | 15,969 | | | | 74.9 | % |
Net sales were $221.4 million in 2008, compared to $128.2 million in 2007. The 73% increase in sales in the fiscal year ended December, 2008 was primarily attributable to the full year inclusion of the Copperweld acquisition and an increase in sales from our Dalian facility. Substantially all organic growth was due to increases in sales volumes.
The PRC segment experienced an increase of 35.1% in net sales for the fiscal year ended December 31, 2008 relative to the comparable 2007 period. The majority of the increase in PRC net sales is primarily due to a 35.3% increase in metric tons sold.
Prior to the acquisition of Copperweld in October of 2007 we did not engage in operations within our US segment. We began to realize contributions from our operations within the US segment beginning October 29, 2007. As a result, our US segment experienced a significant increase in net sales of 513.9% for the fiscal year ended December 31, 2008. This was primarily due to the full-year inclusion of Copperweld into our operations
Net Sales by Industry
The following table breaks down sales by categories for both Dalian and Fayetteville for the year ended December 31, 2008 and 2007. Telford’s production is reflected in Fayetteville’s production.
| | | FY2008 | | | FY 2007* | |
| | | Dalian | | | Fayetteville | | | Dalian | | | Fayetteville | |
| | | sales (tons) | | | % of total sales | | | sales (tons) | | | % of total sales | | | sales (tons) | | | % of total sales | | | sales (tons) | | | % of total sales | |
| | | | | | | | | | | | | | | | | | | | | | | | | |
| Telecom | | | 13,918 | | | | 53 | % | | | 4,631 | | | | 42.0 | % | | | 12,928 | | | | 66.6 | % | | | 7,564 | | | | 56.9 | % |
| Utility | | | 11,674 | | | | 44 | % | | | 4,304 | | | | 39 | % | | | 6,139 | | | | 31.6 | % | | | 2,560 | | | | 19.3 | % |
| Automotive | | | - | | | | - | | | | 532 | | | | 4.8 | % | | | - | | | | - | | | | 2,593 | | | | 19.5 | % |
| Other | | | 669 | | | | 3 | % | | | 1,563 | | | | 14.2 | % | | | 349 | | | | 1.8 | % | | | 579 | | | | 4.4 | % |
| Total | | | 26,261 | | | | 100.0 | % | | | 11,030 | | | | 100.0 | % | | | 19,416 | | | | 100.0 | % | | | 13,296 | | | | 100.0 | % |
*Fiscal year 2007 volumes are shown on a pro forma basis assuming that sales from Fayetteville and Telford were included for the full fiscal year for illustrative purposes.
The following table summarizes installed capacities and outputs by product type for both Dalian and Fayetteville for the year ended December 31, 2008. Telford’s production is reflected in Fayetteville’s numbers.
| | | Dalian | | | Fayetteville | |
| | | Installed Capacity | | | Output | | | Installed Capacity | | | Output | |
| Product line | | (Metric Tons) | | | (Metric Tons) | | | (Metric Tons) | | | (Metric Tons) | |
| CCA | | | 34,000 | | | | 25,358 | | | | 12,400 | | | | 2,771 | |
| CCS | | | 800 | | | | 25 | | | | 16,300 | | | | 7,896 | |
Capacity in Transit: CCA 6,000 M Tons and CCS 8,200 M Tons
At December 31, 2008, we had combined production capacity for CCA of 46,400 metric tons and CCS capacity of 17,100 metric tons. We had an additional 6,000 metric tons of CCA capacity and 4,100 metric tons of CCS capacity in transit to Dalian. We expect to have the additional CCA capacity installed in Dalian by the end of second quarter 2009 and the CCS capacity installed in the third quarter 2009. We also expect to install a further 4,100 metric tons of CCs at our Fayetteville facility over the course of 2009. During 2008, the average price of CCA produced in Dalian and sold primarily in the PRC was $6,188 per ton while the average price of CCA produced and sold from Fayetteville was $6,654 per ton, and CCS produced in Fayetteville sold for an average of $5,086. Both Dalian and Fayetteville sell a variety of CCA products and the price for each variety may vary based on the amount of manufacturing required and the ratio of copper to aluminum. Dalian did not sell a significant amount of CCS during 2008. The average selling price of CCS sold by Fayetteville varies by product type primarily based on the amount of copper (conductivity) in the product and the amount of manufacturing required. Sales referred to as Fayetteville include the sales from Telford also.
Customers
We significantly expanded and diversified our customer base in 2008 both through our acquisition of Copperweld and through organic growth. Our five largest customers accounted for 18.2% of total sales in 2008, down from 24.6% in 2007 and 29% in 2006. (Copperweld’s sales for the full year of 2007 are included for comparison purposes.) Furthermore, our ten largest customers in 2008 accounted for only 29.6% of net sales, down from 37.8% in 2007 on a pro forma basis including full year sales for Fayetteville facility. We believe this increased diversification significantly limits our market risk and gives us a stronger base on which to expand. We further believe our overall customer composition and the concentration of our top customers will change as we expand our business and seek to shift our product sales portfolio to higher margin products. We are continuing to expand and consolidate the direction of our combined sales and marketing group in order to focus our resources towards diversification of our customer base, product mix and geographic presence to mitigate customer concentration risk. Our objective is to focus on expanding our existing business relationships by offering a wider range of products and building new sales relationships throughout the world with our expanded sales organization.
The following table sets forth our ten largest customers in fiscal 2008:
| Originating Office | | 2008 Sales in USD | | | Percentage of Total Sales | |
| Dalian | | | 10,077,574 | | | | 4.55 | % |
| Fayetteville | | | 8,682,315 | | | | 3.92 | % |
| Fayetteville | | | 8,545,835 | | | | 3.86 | % |
| Dalian | | | 6,713,586 | | | | 3.03 | % |
| Dalian | | | 6,270,735 | | | | 2.83 | % |
| Dalian | | | 6,133,967 | | | | 2.77 | % |
| Dalian | | | 5,275,169 | | | | 2.38 | % |
| Fayetteville | | | 4,858,052 | | | | 2.19 | % |
| Dalian | | | 4,784,115 | | | | 2.16 | % |
| Dalian | | | 4,294,241 | | | | 1.94 | % |
| Total | | | 65,635,589 | | | | 29.63 | % |
Our manufacturing activities are determined and scheduled upon both firm orders and projected sales information gathered by our sales personnel from direct contact with our customers. Customers typically submit purchase orders seven to thirty days prior to the requested delivery date. However, depending on the product and the available equipment run schedules, the lead time can be as short as three days. The sales price is determined at the time of purchase based on a formula or a unit price for each product. In either case, the purchase price is a function of the market price of our raw materials at the time of purchase, subject to adjustment at the time of delivery. For some customers, we adjust our prices based on the average cost of raw materials for the previous month.
Geographically, a substantial portion of our customers served by our Dalian sales force is based in the PRC. Some of our customers are US based corporations that have established subsidiaries operating inside the PRC. Several of these corporations were former customers of our Fayetteville facility but now place orders through their subsidiaries located in the PRC. We categorize these orders as domestic orders. On the other hand, most of our customers served by our Fayetteville and Telford based sales group are located in the Americas, Europe, Africa, Asia, excluding the PRC and the Middle East. We are transferring all of our Asian customers to our PRC based sales group in order to provide more efficient customer service. As a result, we anticipate that most of our net sales will continue to be derived from sales to our Asian customers. Combined, we expect our sales growth to continue worldwide because of our working capital base, our combined sales force, our production capacity and our commitment to innovative research and development of our existing products and for developing new products.
Cost of Goods Sold
Cost of goods sold increased to $164.2 million in 2008, from $85.8 million in 2007. As measured by percentage of net sales, our cost of goods sold was 74.1% in 2008 compared with 66.9% in 2007. Cost of goods sold principally consists of the cost of raw materials, labor, utilities, manufacturing costs, manufacturing related depreciation, machinery maintenance costs, purchasing and receiving costs, inspection costs, shipping and handling costs, and other fixed costs associated with the manufacturing process. The increase in Cost of Goods Sold as a percentage of net sales was principally due to the acquisition of Copperweld in October 2007, which has labor and overhead costs that historically have been greater than our legacy operations in Dalian.
Raw material costs accounted for 84.8% of total costs in 2008. Copper composed 55.6% of our raw material costs, aluminum 38.7% and steel 5.7%. Other variable costs included manufacturing labor, maintenance, shipping and handling, and utility expenses. Depreciation and overhead costs as a percentage of COGS were 7.4% in 2008. The manufacturing related depreciation for 2008 was $4,843,153.
Suppliers
In Dalian we have historically relied on two key suppliers for the procurement of copper strip and aluminum. These two suppliers combined to account for approximately 37% of our total raw material purchases for the fiscal years to 2008. Our strategically located facilities worldwide provide us with the opportunity to pursue global sourcing and we plan to increase the number of raw material suppliers further spreading our supply risk over a larger number of suppliers. We will continue our strategy of expanding our sources of supply to overcome supply and price issues that can develop with only one or two suppliers, particularly for copper.
42
The following table sets forth our ten largest raw material suppliers for fiscal 2008:
Ten Largest Raw Material Suppliers 2008 | | Purchases in USD | | | % of Raw Material Purchases | |
| Copper—Dalian | | | 34,758,156 | | | | 25.2 | % |
| Aluminum—Dalian | | | 16,172,714 | | | | 11.8 | % |
| Aluminum—Dalian | | | 14,987,557 | | | | 10.9 | % |
| Copper—Dalian | | | 14,087,237 | | | | 10.3 | % |
| Aluminum—Dalian | | | 9,092,174 | | | | 6.6 | % |
| Copper—Fayetteville | | | 7,177,355 | | | | 5.2 | % |
| Aluminum—Fayetteville | | | 5,251,721 | | | | 3.8 | % |
| Copper—Fayetteville | | | 5,191,525 | | | | 3.8 | % |
| Steel—Fayetteville | | | 4,204,542 | | | | 3.1 | % |
Steel-Fayetteville | | | 3,802,794 | | | | 2.8 | % |
| Total—Top Ten | | | 114,725,775 | | | | 83.5 | % |
Gross margin
Gross profit was $57.3 million in 2008, increased 34.9% from approximately $42.4 million in 2007. As a percentage of net sales, gross profit decreased from 33.1% to 25.9%. This was primarily due to the lower margins contributed by the Fayetteville and Telford facilities acquired in October 2007, as well as a slight decline in gross margins in Dalian.
Selling, General and Administrative Expenses
Selling expenses, which principally includes sales related staff salary and benefits, travel expenses, and sales commissions, were $4.6 million in 2008, compared to $1.8 in 2007, a 161.4% increase. This increase is primarily due to the inclusion of a full year of Fayetteville and Telford salaries, as well as a ramp up in sales efforts to penetrate new markets and industries. As a percentage of net sales, selling expenses increased by 0.7% in 2008 compared to 2007. General and administrative expenses, as a percentage of net sales, decreased to 7% of net sales in 2008, compared to 7.8% in 2007. The decrease is primarily due to benefits realized from integrating our global sales team following the acquisition of Copperweld in October 2007 and economies of scale resulting from increased revenues. On a dollar for dollar basis, general and administrative expenses increased to $15.6 million in 2008 compared to $10.0 million in 2007. As with selling expenses, the increase in gross amount of general and administrative expenses primarily is attributed to a full year of expenses associated with the acquisition of Copperweld in October 2007.
Operating Income
The following table sets forth operating income by segment, in millions of dollars:
| | | Year ended December 31 | | | | | | | |
| | | 2008 | | | 2007 | | | | | | | |
| | | | | | % of | | | | | | % of | | | | | | | |
| | | | | | operating | | | | | | operating | | | Dollar | | | | |
| | | Amount | | | income | | | Amount | | | income | | | Change | | | % Change | |
| PRC | | $ | 43.1 | | | | 116 | % | | $ | 34.7 | | | | 113 | % | | $ | 8.4 | | | | 24.2 | % |
| US | | $ | (0.6 | ) | | | -2 | % | | $ | (0.6 | ) | | | -2 | % | | $ | - | | | | 0.0 | % |
| Corporate | | $ | (5.4 | ) | | | -15 | % | | $ | (3.5 | ) | | | -11 | % | | $ | (1.9 | ) | | | 54.3 | % |
| Total operating income | | $ | 37.1 | | | | 100 | % | | $ | 30.6 | | | | 100 | % | | $ | 6.5 | | | | 21.2 | % |
* Percentages may not equal 100% due to rounding
Operating income for the fiscal year ended December 31, 2008, increased approximately $6.5 million, or 21.2%, compared to the same period in 2007, which was primarily due to higher net sales from our PRC segment and partially offset by lower gross margins associated with the full-year consolidation of Copperweld and macroeconomic conditions which had significant effect on fourth quarter operations in our US segment.
The increase in operating income for the PRC segment of $8.4 million , or 24.2%, compared to the same period in 2007, is largely the result of increased volume due to continued strong demand for the segment’s telecommunication and utility products as a result of a strong economy and growing infrastructure demand.
Operating income in the US segment remained flat year over year despite an increase of 513.9% in total net sales from the full-year consolidation of Copperweld in fiscal 2008. Our US segment obtained profitability through the first three quarters of fiscal year 2008; however, as the global economy eroded in the fourth quarter of 2008 our gross margins were impacted in a negative manner due to significant declines in copper prices and decreased net sales associated with macroeconomic conditions which affected all products and markets within the segment.
Interest Expense
Interest expense increased to $8.8 million in 2008 from $7.5 million in 2007, while as a percentage of net sales, interest expense decreased to 4% in 2008 from 5.9% in 2007. This increase is primarily the result of interest on the $40 million High Yield notes and amortized loan commission, interest accrual and amortization of costs relating to the Kuhns Brothers litigation, as well as inclusion of the Dalian working capital line and increases in Dalian’s short term bank loans.
Taxation
U.S. income tax
Fushi Copperweld, Inc. (formerly Fushi International, Inc.) is a company incorporated in the State of Nevada, Fushi Holdings is a company incorporated in the State of Delaware, Copperweld Bimetallics, LLC is chartered in the State of Delaware and Copperweld UK, LLC is registered in the United Kingdom. Prior to the acquisition of Copperweld, we conducted substantially all our operations through our PRC operating subsidiaries. With the acquisition of Copperweld, we have a manufacturing facility and administrative offices located in Fayetteville, Tennessee, USA and in Telford, England, UK.
We are subject to United States taxation; however, we do not anticipate incurring significant United States income tax liability during fiscal year 2009 due to the following factors:
- We anticipate that Copperweld has sufficient tax loss carry forwards to offset any taxable income earned during the coming years.
- Earnings generated from our non-U.S. operating companies are generally eligible for a deferral from United States taxation until such earnings are repatriated to the United States, and
- We believe that we will not generate any significant amount of income inclusions under the income imputation rules applicable to a United States company that owns "controlled foreign corporations" for United States federal income tax purposes.
Therefore, no provision for U.S. federal income taxes or tax benefits on the undistributed earnings and/or losses of our company has been made.
A valuation allowance is required against deferred tax assets if, based on the weight of available evidence, it is more-likely-than-not that some or all of the deferred tax assets will not be realized. Management believes that the realization of the benefits can be used by their US operating subsidiary in future periods because expectations are that Copperweld U.S. will have taxable income in future periods. US companies must generate a total of $22,953,021 of taxable net income by years 2025 to 2028 in order to recover the deferred tax asset balance. Profits of Fayetteville in each of the first three quarters of 2008 were $1,036,996, $244,546 and $102,198 respectively. Through cost savings initiatives implemented beginning in the fourth quarter of 2008; the Company has lowered total labor overhead by approximately $100,000 per month. The Company is also in the process of refining and improving their manufacturing processes that may further realize cost savings of approximately $300,000 per month. With these cost saving measures in place, the Company believes that it is possible to realize profit at current sales levels at the Fayetteville facility and that Fayetteville will be well positioned to experience increased profitability when the global economic crisis subsides and sales begin to rebound to historical levels. The Company projects the Fayetteville facility to start generating positive annual pre-tax income in fiscal year 2010. Based on its review and taking into consideration the foregoing, the Company believes that, as of December 31, 2008, it was not necessary to provide a valuation allowance for deferred tax assets.
PRC enterprise income tax
In the fiscal year ended December 31, 2008, our business operations were principally conducted by our subsidiaries incorporated in the PRC. PRC enterprise income tax is calculated based on taxable income determined under PRC accounting principles. In accordance with “Income Tax Law of China for Enterprises with Foreign Investment and Foreign Enterprises,” or the Income Tax Law, “Foreign Invested Enterprises”, or FIEs, established in the PRC are generally subject to an “Enterprise Income Tax”, or EIT, rate of 33%. PRC domestic companies are governed by the Enterprise Income Tax Laws of the PRC and are also generally subject to an EIT rate of 33%. However, the Income Tax Laws provide certain favorable tax treatment to a company that qualifies as a "New or High-technology Enterprise" or a “Foreign Invested Enterprise” located in the old town of an inshore open city. Additionally, the governments at the provincial, municipal and local levels can provide many tax incentives and abatements based on a number of programs at each level.
The Dalian Municipal Government issued a notice in 2000 providing for a series of tax preferential treatments to companies that qualify as "New or High-tech Enterprise” or companies that are registered and operate in a specified development zone in Dalian City.
Dalian Fushi, a 100% variable interest, non-operating subsidiary, was incorporated in the PRC and is subject to PRC income tax which is computed according to the relevant laws and regulations in the PRC. Dalian Fushi's bimetallic composite conductor wire product was approved by Dalian Cit as a "high-tech" project. As a result, Dalian Fushi is a business entity that is qualified as a "new or high-technology enterprise," and is entitled to a two-year full exemption from the PRC enterprise income tax starting from its first year of operation, which expired on December 31, 2003, followed by a 50% reduction and other favorable tax treatment for the succeeding three years, which expired on December 31, 2006. The provision for income taxes for the twelve months ended December 31, 2008 was zero as we didn’t have any operation under Dalian Fushi from the beginning of 2007.
Fushi International (Dalian) (“FID”), a wholly owned subsidiary of Fushi Holdings, Inc., was incorporated in the PRC as an FIE and is subject to PRC income tax which is computed according to the relevant laws and regulations in the PRC. FID has located its factories in a special economic region in Dalian and is granted certain preferential treatments including a corporate income tax rate of 24%. In September 2005, FID was approved as a wholly foreign owned enterprise. This economic region allows FID a two-year income tax exemption for the years ended December 31, 2006 and 2007, and a 50% income tax reduction for the following three years ended December 31, 2008, 2009, and 2010.
Effective January 1, 2008, the new EIT Law in PRC imposes a unified income tax rate of 25.0% on all domestic-invested enterprises and FIEs, such as our PRC operating subsidiaries, unless they qualify under certain limited exceptions. But the EIT Law permits companies to continue to enjoy their existing preferential tax treatments until such treatments expire in accordance with their current terms. Any increase in our effective tax rate as a result of the above may adversely affect our operating results
Net Income
Pre-tax income increased 17.5% to $31.3 million from $26.6 million, excluding litigation accrual expense. Net income decreased to approximately $28.5 million, or 13% of net sales for the year ended December 31, 2008, from approximately $29.5 million, or 23% of net sales for the year ended December 31, 2007, representing a decrease of $1.03 million or 3.5%. The bottom line decrease is primarily due to a 7.2% decline in gross margin, slight increase in other expense and increase in the provision for income tax. As more fully described in the section “Taxation” above, we became liable for PRC income taxes on our Dalian operations during 2008.
Basic and diluted earnings per share (EPS) for the fiscal year ended December 31, 2008 were $1.04 and $1.00, compared to $1.33 and $1.19 for the prior year. The weighted average number of shares outstanding to calculate basic EPS was 27.3 million and 22.2 million for 2008 and 2007, respectively. The weighted average number of shares outstanding to calculate diluted EPS was 28.3 million and 25.2 million for 2008 and 2007, respectively.
Foreign Currency Translation Gains
In the year ended December 31, 2008, the RMB steadily rose against the US dollar for the first and second quarter’s months and then partially stabilized for the third and fourth quarters. As a result of the appreciation of the RMB, we recognized a foreign currency translation gain of $12.5 million. Given the uncertainty of exchange rate fluctuations, we cannot estimate the effect of these fluctuations on our future business, product pricing, and results of operations or financial condition. See “Risk Factors- Risks Related to Doing Business in the PRC. - The fluctuation of the Renminbi may materially and adversely affect your investment.”
Prior to acquiring Copperweld in October 2007, materially all of our revenues and a majority of our expenses were denominated in RMB Yuan. For our operations in the PRC, the income statement accounts and balance sheet amounts with the exception of equity at December 31, 2008 were translated at 1 RMB Yuan to 0.14657 USD, or 1 USD to 6.8225 RMB Yuan. The equity accounts were stated at their historical rate.
Year ended December 31, 2007 compared to year ended December 31, 2006
Net Sales
The following tables set forth net sales in millions by each of our reporting segments and metric tons (MT) sold on a combined basis:
| | | Net Sales | | | | | | | |
| | | Year ended December 31 | | | | | | | |
| | | 2007 | | | 2006 | | | | | | | |
| | | | | | % of Net | | | | | | % of Net | | | Dollar | | | | |
| | | Amount | | | Sales | | | Amount | | | Sales | | | Change | | | % Change | |
| PRC | | $ | 118.0 | | | | 92.0 | % | | $ | 67.6 | | | | 100.0 | % | | $ | 50.4 | | | | 74.6 | % |
| US | | $ | 10.2 | | | | 8.0 | % | | | n/a | | | | n/a | | | | n/a | | | | n/a | |
| Total Net sales | | $ | 128.2 | | | | 100.0 | % | | $ | 67.6 | * | | | 100.0 | % | | $ | 60.6 | | | | 89.6 | % |
| | | Metric Tons Sold | | | | | | | |
| | | Year ended December 31 | | | | | | | |
| | | 2007 | | | 2006 | | | | | | | |
| | | | | | % of MT | | | | | | % of MT | | | Tonnage | | | | |
| | | MT | | | Sold | | | MT | | | Sold | | | Change | | | % Change | |
| PRC | | | 19,416 | | | | 91.1 | % | | | 11,701 | | | | 100.0 | % | | | 7,715 | | | | 65.9 | % |
| US | | | 1,906 | | | | 8.9 | % | | | n/a | | | | n/a | | | | n/a | | | | n/a | |
| Total MT sold | | | 21,322 | | | | 100.0 | % | | | 11,701 | * | | | 100.0 | % | | | 9,621 | | | | 82.2 | % |
* We did not have any operations outside of China during the fiscal year 2006.
Net sales were $128.2 million in 2007 including sales from Fayetteville and Telford facilities for the period October 29 through the end of the period, compared to $67.6 million in 2006. Of the 89.6% sales growth in the fiscal year ended December 31, 2007, 74.8% was due to organic growth and 14.8% was attributable to sales from Fayetteville and Telford for November and December of 2007.
The PRC segment experienced an increase of 74.6% in net sales for the fiscal year ended December 31, 2007 relative to the comparable 2006 period. The majority of the increase in PRC net sales is due to a 65.9% increase in metric tons sold and a 7.4% increase in the average selling price as a result of higher metal prices relative to 2007 levels. The increase in average selling price in 2007 was primarily due to the increase in raw material prices, particularly copper prices, and the increased sales volume primarily reflects expanded production capacity as a result of our capital investment.
We did not have any operations outside of China during the fiscal year 2006. We began to realize contributions from our operations within the US segment beginning October 29, 2007 upon the completion of the acquisition of the Fayetteville and Telford facilities. As a result there is no comparable segment data to report for 2006.
Customers
We significantly expanded and diversified our customer base in 2007 both through our acquisition of Copperweld and through organic growth. Our five largest customers accounted for 24.6% of total sales in 2007, down from 29% in 2006 and 41% in 2005. Our largest customer accounted for 10.8% of sales in 2007. In fact, our ten largest customers in 2007 accounted for only 37.75% of net sales, on a pro forma basis including full year sales for Fayetteville facility. We believe this increased diversification significantly limits our market risk and gives us a stronger base on which to expand. We further believe our overall customer composition and the concentration of our top customers will change as we expand our business and seek to shift our product sales portfolio to higher margin products. However, the loss of, or significant reduction in orders from any of our largest customers may have a material adverse impact on our financial condition and operating results. We are continuing to expand and consolidate the direction of our combined sales and marketing group in order to focus our resources towards diversification of our customer base, product mix and geographic presence to mitigate customer concentration risk. Our objective is to focus on expanding our existing business relationships by offering a wider range of products and building new sales relationships throughout the world with our expanded sales organization.
The following table (which considers Fayetteville’s sales for the full year of 2007) sets forth our ten largest customers in fiscal 2007:
| Originating Office | | 2007 Sales in USD | | | Percentage of Total Sales | |
| Fayetteville | | | 21,215,885 | | | | 10.80 | % |
| Dalian | | | 8,027,451 | | | | 4.09 | % |
| Dalian | | | 6,798,765 | | | | 3.46 | % |
| Fayetteville | | | 6,638,111 | | | | 3.38 | % |
| Dalian | | | 5,636,408 | | | | 2.87 | % |
| Dalian | | | 5,518,656 | | | | 2.81 | % |
| Dalian | | | 5,476,410 | | | | 2.79 | % |
| Dalian | | | 5,222,391 | | | | 2.66 | % |
| Dalian | | | 4,977,456 | | | | 2.53 | % |
| Dalian | | | 4,624,811 | | | | 2.35 | % |
| Total | | | 74,136,344 | | | | 37.74 | % |
Cost of Goods Sold
Cost of goods sold increased to $85.8 million in 2007, from $42.8 million in 2006. As measured by percentage of net sales, our cost of goods sold was 66.9% in 2007 compared with 63.3% in 2006. Cost of goods sold principally consists of the cost of raw materials, labor, utilities, manufacturing costs, manufacturing related depreciation, machinery maintenance costs, purchasing and receiving costs, inspection costs, shipping and handling costs, and other fixed costs associated with the manufacturing process. The increase in Cost of Goods Sold as a percentage of net sales was principally due to the cost of adding capacity in Dalian and labor and overhead costs in Fayetteville that historically have been greater than in Dalian.
Suppliers
We also significantly diversified our sources of supply. In Dalian we have historically relied on two key suppliers for the procurement of copper strip and aluminum. These two suppliers combined to account for approximately 41% of our total raw material purchases during the fiscal years prior to 2007. During 2007, four suppliers provided 43.0% of our raw material for us. With the addition of Fayetteville and Telford, we will increase the number of raw material suppliers further spreading our supply risk over a larger number of suppliers. We will continue our strategy of expanding our sources of supply to overcome supply and price issues that can develop with only one or two suppliers, particularly for copper.
The following table sets forth our ten largest raw material suppliers for fiscal 2007:
Ten Largest Raw Material Suppliers 2007 | | Purchases in USD | | | % of Raw Material Purchases | |
| Copper—Dalian | | | 26,122,785 | | | | 12.5 | % |
| Aluminum—Dalian | | | 13,462,792 | | | | 11.0 | % |
| Aluminum—Dalian | | | 13,220,800 | | | | 10.8 | % |
| Copper—Dalian | | | 10,895,561 | | | | 8.9 | % |
| Aluminum—Dalian | | | 10,334,099 | | | | 8.4 | % |
| Copper—Fayetteville | | | 9,222,531 | | | | 7.5 | % |
| Aluminum—Fayetteville | | | 7,693,142 | | | | 6.3 | % |
| Copper—Fayetteville | | | 5,894,133 | | | | 4.8 | % |
| Copper—Fayetteville | | | 4,758,723 | | | | 3.9 | % |
| Steel—Fayetteville | | | 4,274,291 | | | | 3.5 | % |
| Total—Top Ten | | | 105,878,857 | | | | 77.6 | % |
The information in the preceding chart includes Fayetteville’s purchases for the full year of 2007.
Gross margin
Gross profit was $42.4 million in 2007, increased 71.1% from approximately $24.8 million in 2006. As a percentage of net sales, gross profit decreased from 36.7% to 33.1%. This was primarily driven by higher raw material costs that affected the selling price but not the dollar amount of margin. As we discussed in the overview, we pass increases in raw material costs to our customers rather than the percentage changes in our raw material costs. Therefore, when raw material increases are passed through to our customers, the sales price will increase and the net margin as a percentage of net sales will decline. However, the dollar amount of gross margin remains stable.
Selling, General and Administrative Expenses
Selling expenses, which principally include sales related staff salary and benefits, travel expenses, and sales commissions, were $1.8 million in 2007, compared to $613,119 in 2006, a 187.5% increase. As a percentage of net sales, selling expenses increased by 0.47% in 2007 compared to 2006. General and administrative expenses, as a percentage of net sales, increased to 7.8% of net sales in 2007, compared to 5.6% in 2006. The increase was primarily due to increased depreciation associated with expanded asset base amounting to $2.2 million, $1.9 million share based compensation, $1.6 million professional fee and costs associated with expanding our staff in Dalian to accommodate the increasing demand for our products and the inclusion of Copperweld operating expenses for the period October 29, 2007 through December 31, 2007.
Operating Income
The following table sets forth operating income by segment, in millions of dollars:
| | | Year ended December 31 | | | | | | | |
| | | 2007 | | | 2006 | | | | | | | |
| | | | | | % of | | | | | | % of | | | | | | | |
| | | | | | operating | | | | | | operating | | | Dollar | | | | |
| | | Amount | | | income | | | Amount | | | income | | | Change | | | % Change | |
| PRC | | $ | 34.7 | | | | 113 | % | | $ | 21.4 | | | | 105 | % | | $ | 13.3 | | | | 62.1 | % |
| US | | $ | (0.6 | ) | | | -2 | % | | | n/a | | | | n/a | | | | n/a | | | | n/a | |
| Corporate | | $ | (3.5 | ) | | | -11 | % | | $ | (1.0 | ) | | | -5 | % | | $ | (2.5 | ) | | | 250.0 | % |
| Total operating income | | $ | 30.6 | | | | 100 | % | | $ | 20.4 | * | | | 100 | % | | $ | 10.2 | | | | 50.0 | % |
* We did not have any operations outside of China during the fiscal year 2006.
Operating income for the fiscal year ended December 31, 2007, increased approximately $10.2 million, or 50.0%, compared to the same period in 2006, which was primarily due to higher net sales and partially offset by lower gross margins associated with the full-year consolidation of Copperweld.
Operating income in the PRC segment increased approximately $13.3 million, or 62.1%, compared to the same period in 2007, primarily due to an increase in total net sales and by $17 million in gross margins.
We did not have any operations outside of China during the fiscal year 2006. We began to realize contributions from our operations within the US segment beginning October 29, 2007 upon the completion of the acquisition of the Fayetteville and Telford facilities. As a result there is no comparable segment data to report for 2006.
Interest Expense
Interest expense increased to $7.5 million in 2007 from $1.07 million in 2006, while as a percentage of net sales, interest expense increased to 5.9% in 2007 from 1.6% in 2006. We issued $40 million in HY notes and $20 million in convertible notes that were purchased by Citadel Equity Fund Ltd. on January 24, 2007. Interest expense related to those notes during 2007 was approximately $5.2 million.
Taxation
Income tax
Fushi Copperweld, Inc. (formerly Fushi International, Inc.) is a company incorporated in the State of Nevada, Fushi Holdings is a company incorporated in the State of Delaware, Copperweld Bimetallics, LLC is chartered in the State of Delaware and Copperweld UK, LLC is registered in the United Kingdom. Prior to the acquisition of Copperweld, we conducted substantially all our operations through our PRC operating subsidiaries. With the acquisition of Copperweld, we have a manufacturing facility and administrative offices located in Fayetteville, Tennessee, USA and in Telford, England, UK.
PRC enterprise income tax
In the fiscal year ended December 31, 2007, our business operations were principally conducted by our subsidiaries incorporated in the PRC. PRC enterprise income tax is calculated based on taxable income determined under PRC accounting principles. In accordance with “Income Tax Law of China for Enterprises with Foreign Investment and Foreign Enterprises,” or the Income Tax Law, “Foreign Invested Enterprises”, or FIEs, established in the PRC are generally subject to an “Enterprise Income Tax”, or EIT, rate of 33%. PRC domestic companies are governed by the Enterprise Income Tax Laws of the PRC and are also generally subject to an EIT rate of 33%. However, the Income Tax Laws provide certain favorable tax treatment to a company that qualifies as a "New or High-technology Enterprise" or a “Foreign Invested Enterprise” located in the old town of an inshore open city. Additionally, the governments at the provincial, municipal and local levels can provide many tax incentives and abatements based on a number of programs at each level.
The Dalian Municipal Government issued a notice in 2000 providing for a series of tax preferential treatments to companies that qualify as "New or High-tech Enterprise” or companies that are registered and operate in a specified development zone in Dalian City.
Dalian Fushi, a 100% variable interest, non-operating subsidiary, was incorporated in the PRC and is subject to PRC income tax which is computed according to the relevant laws and regulations in the PRC. Dalian Fushi's bimetallic composite conductor wire product was approved by Dalian Cit as a "high-tech" project. As a result, Dalian Fushi is a business entity that is qualified as a "new or high-technology enterprise," and is entitled to a two-year full exemption from the PRC enterprise income tax starting from its first year of operation, which expired on December 31, 2003, followed by a 50% reduction and other favorable tax treatment for the succeeding three years, which expires on December 31, 2006. The provision for income taxes for the twelve months ended December 31 was zero as we didn’t have any operation under Dalian Fushi from the beginning of 2007.
Fushi International (Dalian) (“FID”), a wholly owned subsidiary of Fushi Holdings, Inc., was incorporated in the PRC as an FIE and is subject to PRC income tax which is computed according to the relevant laws and regulations in the PRC. FID has located its factories in a special economic region in Dalian and is granted certain preferential treatments including a corporate income tax rate of 24%. In September 2005, FID was approved as a wholly foreign owned enterprise. This economic region allows FID a two-year income tax exemption for the years ended December 31, 2006 and 2007, and a 50% income tax reduction for the following three years ended December 31, 2008, 2009, and 2010.
Effective January 1, 2008, the new EIT Law in PRC imposes a unified income tax rate of 25.0% on all domestic-invested enterprises and FIEs, such as our PRC operating subsidiaries, unless they qualify under certain limited exceptions. But the EIT Law permits companies to continue to enjoy their existing preferential tax treatments until such treatments expire in accordance with their current terms. Any increase in our effective tax rate as a result of the above may adversely affect our operating results
Net Income
Net income increased to approximately $29.5 million, or 23.0% of net sales for the year ended December 31, 2007, from approximately $17.8 million, or 26.4% of net sales for the year ended December 31, 2006, representing an increase of $11.7 million or 65.7% with a net margin of 26%. The bottom line increase is primarily due to substantial revenue increases while the decrease as a percentage of the net sales was primarily due to lower gross margin and higher SG&A.
Basic and diluted earnings per share (EPS) for the fiscal year ended December 31, 2007 were $1.33 and $1.19, compared to $0.89 and $0.84 for the prior year. The weighted average number of shares outstanding to calculate basic EPS was 22.2 million and 19.9 million for 2007 and 2006, respectively. The weighted average number of shares outstanding to calculate diluted EPS was 25.2 million and 21.3 million for 2007 and 2006, respectively.
Foreign Currency Translation Gains
In the year ended December 31, 2007, the RMB steadily rose against the US dollar. As a result of the appreciation of the RMB, we recognized a foreign currency translation gain of $9.9 million. Given the uncertainty of exchange rate fluctuations, we cannot estimate the effect of these fluctuations on our future business, product pricing, and results of operations or financial condition. See “Risk Factors- Risks Related to Doing Business in the PRC. - The fluctuation of the Renminbi may materially and adversely affect your investment.”
Prior to acquiring Copperweld, materially all of our revenues and a majority of our expenses in 2007 were denominated in RMB Yuan. For our operations in the PRC, the income statement accounts and balance sheet amounts with the exception of equity at December 31, 2007 were translated at 1 RMB Yuan to 0.1371 USD, or 1 USD to 7.2941 RMB Yuan. The equity accounts were stated at their historical rate.
LIQUIDITY AND CAPITAL RESOURCES
We have historically financed our operations and capital expenditures principally through private placements of debt and equity offerings, bank loans, and cash provided by operations. Significant factors affecting our cash liquidity include (1) cash provided by operating activities, (2) cash used for capital expenditures, and (3) our available credit facilities and other borrowing arrangements.
The transfer of operating funds from Dalian to our non-PRC subsidiaries and parent company during 2008 and 2007 was $6.1 million and $2.0 million, respectively.
As is customary in the industry, we provide payment terms to most of our customers that exceed terms that we receive from our suppliers. Therefore, the Company’s liquidity needs have generally consisted of working capital necessary to finance receivables and raw material inventory. Capital expenditures have historically been necessary to expand the production capacity of the Company’s manufacturing operations.
In summary, our cash flows were:
| | | December 31, 2008 | | | December 31, 2007 | |
| Net cash (used in) provided by operating activities | | $ | (368,212 | ) | | $ | 26,152,846 | |
| Net cash (used in) investing activities | | | (17,089,985 | ) | | | (51,182,872 | ) |
| Net cash (used in) provided by financing activities | | | (1,666,360 | ) | | | 80,257,602 | |
| Effect of exchange rate on cash and cash equivalents | | | 4,821,569 | | | | 4,193,631 | |
| Cash and cash equivalents at beginning | | | 79,914,758 | | | | 20,493,551 | |
| Cash and cash equivalents at ending | | $ | 65,611,770 | | | $ | 79,914,758 | |
For the fiscal year ended December 31, 2008, net cash used by operating activities was $368,212. This was primarily attributable to our net income of $28.5 million, $33.4 million increase in working capital from $7.9 million in 2007 to $41.3 million in 2008, adjusted by an add-back of non-cash expenses mainly consisting of depreciation and amortization of $9.7 million and share-based compensation expense of $1.9 million. The change in working capital for the year ended December 31, 2008 was primarily related to i) a $24.8 million increase in accounts receivable; ii) a $17.4 million increase in advance to raw material suppliers, partially offset by $5.1 million decrease in inventory; iii) a $5.0 million increase in deferred tax assets and a $1.8 million decrease in taxes payable; iv) a $1.1 million decrease in other payables and accrued liabilities, partially offset by a $4.1 million increase in accounts payables. Increase in accounts receivables was primarily driven by revenue growth, and extended credit term to certain customers as well as longer collection cycle as a result of challenging economic condition. We maintain an allowance for doubtful accounts for estimated losses resulting from the inability of our customers to make required payments. Allowance for doubtful accounts is based on our assessment of the collectability of specific customer accounts, the aging of accounts receivable, our history of bad debts, and the general condition of the industry. We have not experienced any significant amount of bad debt since the inception of our operation and have established appropriate procedures to facilitate collection. Increase in advance to raw material suppliers was due to significant purchase commitments of copper supplies incurred towards the end of the third quarter and the purchase commitments were subsequently renegotiated and amended with the suppliers to reflect prevailing market price for future delivery. The repairs and maintenance expense recognized in 2007 and 2008 are $227,248 and $819,283, respectively. The increase in repairs and maintenance expense for the fiscal year ended December 31, 2008 was primarily due to the additional cost on PP&E that were acquired through the acquisition of Copperweld in October 2007.
For the fiscal year ended December 31, 2008, net cash used in investing activities was $17.1 million, and was primarily attributable to i) a $1.7 million purchase of land use rights; ii) a $15.2 million capital expenditure on improvement of property and purchase of new equipment and machinery, and (iii) a $3.1 million advances for purchase of equipment
For the fiscal year ended December 31, 2008, net cash used in financing activities was $1.7million as a result of repayment of maturing, long term and short term working capital loan in the amount of $17.3 million and payment in the amount of $2.4 million on our existing credit line facilities, partially offset by proceeds from short term borrowing of $16.9 million. As of December 31, 2008, we had outstanding short-term working capital loans with banks in an aggregate amount of $17.6 million with terms ranging from three months to one year and maturity dates ranging from February to March, 2009. The weighted average annual interest rate on the loan was 8.96%
Our Fayetteville facility (Copperweld) maintains a revolving line of credit with Wells Fargo Bank. Availability on the credit line is the lower of $12.8 million or the collateral balances. The outstanding balance was $4,712,075 at December 31, 2008. The Company deposits the cash collections from its customers against the outstanding account balance of the line of credit on a daily basis. The line of credit matures in 2010. If we are unable to renew or replace our Fayetteville revolving line of credit, our Fayetteville results of operations would be adversely affected. See “Risk Factors – Risks Related to Our Business – Our Fayetteville, Tennessee operation is dependent upon a line of credit to fund working capital needs and, if we are unable to renew or replace the line of credit, our Fayetteville results of operations would be adversely affected.” Our Telford facility (Copperweld UK) maintains a revolving line of credit with a limit of approximately $1,096,000 (or ₤750,000) but had no balance outstanding at December 31, 2008. Both lines of credit expire in 2010.
As of December 31, 2008, we had cash and cash equivalents of $65.6 million, down $14.3 million from $79.9 million at December 31, 2007.
On January 24, 2007, we and Citadel Equity Fund Ltd. ("Citadel") entered a Notes Purchase Agreement (the “Notes Purchase Agreement”) pursuant to indicative financing term sheets dated December 19, 2006. Pursuant to the terms of the Notes Purchase Agreement, the Company offered and sold and Citadel purchased (a) $40,000,000 of the Company’s Guaranteed Senior Secured Floating Rate Notes due 2012 (the “HY Notes”) and (b) $20,000,000 of the Company’s 3.0% Senior Secured Convertible Notes due 2012 (the “Convertible Notes” and collectively with the HY Notes, the "Notes"). The details of the indentures are available in previous filing. The indenture for the Convertible Notes, among other provisions, allows the holder to convert the debt to common stock at a conversion rate of $7.00 for each share. On January 8, 2008, Citadel converted $15.0 million in debt to 2,142,857 shares of our common stock.
The HY Notes and Convertible Notes contain customary affirmative and negative covenants and other provisions, including restrictions on the incurrence of additional debt, creation of liens, making restricted payments, paying dividends, maintenance of a maximum leverage ratio, maintenance of a minimum fixed charge coverage ratio, and minimum net worth. We were in compliance with all of these requirements as of December 31, 2008.
Under the terms of the Indentures governing the Notes, we are required to make payments of interest on the Notes on the same day such payments are due and payable. We have experienced payment delays in January 2009 due to recent tightening of SAFE restrictions on the conversion of RMB to USD. We have since paid the interest amounts in full and have no current issues with respect to payment.
If there is a default, or we do not maintain certain financial covenants or we do not maintain borrowing availability in excess of certain pre-determined levels, we may be unable to incur additional indebtedness, make restricted payments or redeem or repurchase our capital stock. To the extent the Noteholders demand accelerated payment of maturity in entire or partial principal of the Notes as a result of declared default, our liquidity will be adversely affected. Without sufficient liquidity to fund our debt obligations, we may be forced to curtail our operations, including reducing or depleting our working capital, reducing or delaying capital expenditures, and limiting out ability to obtain additional financing for future working capital, capital expenditures, acquisitions and other business opportunities we want to pursue. Especially given the current adverse economic condition and the extreme volatility, disruption and dislocation the capital and credit markets have been experiencing in recent months, there can be no assurance that our ability to utilize our current credit facilities or our ability to access credit and capital markets and finance our operations will not be impaired. (See risk factors related to business referencing foreign exchange control and Fayetteville, and risks related to notes.)
In addition, if we are unable to stay enforcement of the judgment in the Kuhns litigation pending our appeal, we will be forced to pay the approximately $7 million judgment immediately. Any payment of the judgment would have a material adverse effect on our liquidity. The Company allocate the contingent liability of $7,197,794 to the following: (a) $710,544 was expensed immediately in second quarter of 2008; (b) $3,000,000 was recorded as deferred commissions on long term notes and is being amortized over the remainder of the long term note’s life, $1,650,000 was amortized for the year ended December 31, 2008, $1,350,000 was outstanding as deferred commissions on long term notes as of December 31, 2008; (c) $3,487,250 was allocated to Additional Paid in Capital. See “Item 3. Legal Proceedings.”
Days sales outstanding (DSO) was 82 days and 67 days at December 31, 2008 and 2007 respectively, while days payable outstanding was16 days and 13 days at December 31, 2008 and 2007 respectively.
Standard Customer and Supplier Payment Terms (days) as below:
| | | Year ended December 31, 2008 |
| Customer Payment Term | | Payment in advance to 90 days |
| Supplier Payment Term | | Payment in advance to 30 days |
The increase in DSO was because we extended credit terms for our P.R.C. segment in late 2008 to certain credible customers that have long-standing business relationships with us in order to capture increased market share. We believe that our ability to extend credit terms puts pressure on our smaller competitors whose limited capital resources have become further strained due to the global economic crisis and who are unable to make such adjustments for customers. Prior to this adjustment in customer credit policies, the standard number of days we gave our customers to pay was 90 days. We write off receivables specifically based on the facts we obtain about the customers’ ability to pay. The Company has established appropriate procedures to facilitate collection.
Aging Analysis of accounts receivable:
| | | 31-Dec-08 | |
| 1-30 days | | | 7,967,993 | |
| 31-60 days | | | 14,981,574 | |
| 61-90 days | | | 17,033,521 | |
| 91-180 days | | | 9,394,900 | |
| 181-365 days | | | 723,089 | |
| Bad debt | | | -318,529 | |
| Total | | | 49,782,548 | |
Inventory turnover days increased slightly from 13 days at December 31, 2007 to 16 days at December 31, 2008. The Company’s principal raw materials consist of aluminum and steel rods and copper strips. Changes in the price of copper, which has an established history of volatility, directly affect the prices of the Company’s products and influence the demand for products. The Company’s decision to make advanced purchases of raw materials is mainly based upon (1) the current and projected future market price of raw materials, (2) the demand and supply situation in the raw materials market, and (3) the forecasted demand of products.
Advance to supplier’s turnover days has increased from 10 days at December 31, 2007, to 45 days at December 31, 2008. The primary reason for the increased investments in inventory and advances is due to increased demand forecasts of our products within the P.R.C. market as a result of increased government spending related to infrastructure projects. Furthermore, due to globally depressed commodity prices, the Company believed there was an opportunity to secure lower purchase prices through increased investments in deposit (advance) to suppliers which in turn lowered the average purchase price of raw materials and minimized the loss resulting from the significant decline in spot prices in the fourth quarter of 2008.
We believe that our current cash flow and capital resources will be sufficient to meet our anticipated cash needs, including our cash needs for working capital, capital expenditures, and our other short-term operating strategies for the next 12 months. We may, however, require additional cash resources due to changing business conditions or other future developments, including any investments or acquisitions we may decide to pursue. Customer demand, competitive market forces, commodities pricing, customer acceptance of our product mix and economic conditions worldwide could affect our ability to continue to fund our future needs from business operations. The Company’s contractual obligations and commercial commitments as of December 31, 2008 are summarized below:
| Contractual obligations | | Total | | | Payment due by less than 1 year | | | 2–3 years | | | 4-5 years | | | More than 5 years | |
| Estimated variable rate interest payment related to High Yield notes(semi-annual) | | | 7,428,471 | | | | 3,277,267 | | | | 3,714,236 | | | | 436,968 | | | | - | |
| Estimated fixed rate interest payment related to Convertible notes(semi-annual) | | | 525,000 | | | | 150,000 | | | | 300,000 | | | | 75,000 | | | | - | |
| Long-Term Debt Obligations-High Yield note principal | | | 40,000,000 | | | | 5,000,000 | | | | 25,000,000 | | | | 10,000,000 | | | | - | |
| Long-Term Debt Obligations-Convertible note principal | | | 5,000,000 | | | | - | | | | - | | | | 5,000,000 | | | | - | |
| Long-Term Debt Obligations-Estimated interest upon | | | | | | | | | | | | | | | | | | | | |
| redemption of Convertible Notes at Mature | | | 5,305,158 | | | | - | | | | - | | | | 5,305,158 | | | | - | |
| Long-Term Debt Obligations-SWAP settlement | | | 6,177,304 | | | | 964,617 | | | | 3,784,729 | | | | 1,427,958 | | | | - | |
| Total | | | 64,435,933 | | | | 9,391,884 | | | | 32,798,965 | | | | 22,245,084 | | | | - | |
| (1) | This table assumes we will repay our outstanding High Yield Notes strictly to the mandatory redemption schedule defined in the High Yield note indentures. Calculations are based on 6 month LIBOR rate as of July 22, 2008 of 3.14% as reported by the British Bankers’ Associations (BBA). |
| (2) | This table assumes that our outstanding Convertible Notes will not be converted and will need to be redeemed by their maturity date of January 24, 2012. |
The fair market value of our derivative hedge is mainly determined based upon the changes in forward market six month USD LIBOR rates and changes in forward market exchange rate between USD and Chinese RMB, and the LIBOR yield curve. A decline in forward market LIBOR rates and accelerated depreciation in Chinese RMB against USD as well as a change from an upward to a flat or an inverted LIBOR yield curve can generate material losses on our derivative hedge.
The fair market values of our warrant and conversion option derivatives are determined by the market price of our stock, strike price, volatility, risk free interest rate, expected life and dividend yield. An increase in our stock price can generate material losses on our warrant and conversion option derivatives.
Management's discussion and analysis of its financial condition and results of operations are based upon the Company's consolidated financial statements, which have been prepared in accordance with United States generally accepted accounting principles. The Company's financial statements reflect the selection and application of accounting policies which require management to make significant estimates and judgments. See note 1 to the Company's consolidated financial statements, "Summary of Significant Accounting Policies and Organization". Management bases its estimates on historical experience and on various other assumptions that are believed to be reasonable under the circumstances. Actual results may differ from these estimates under different assumptions or conditions. The Company believes that the following reflect the more critical accounting policies that currently affect the Company's financial condition and results of operations:
Revenue recognition
Revenue is recognized when product is shipped and title passes to the customer and collectability is reasonably assured. Sales revenue represents the invoiced value of goods, net of a VAT. All of the Company's products that are sold in the PRC are subject to a Chinese value-added tax at a rate of 17% of the gross sales price. All of the Company’s products that are manufactured and sold in the UK are subject to a UK value-added tax at a rate of 15% of the gross sales price. This VAT may be offset by VAT paid by the Company on raw materials and other materials included in the cost of producing its finished products.
Although most of our products are covered by our warranty programs, the terms and conditions of which vary depending on the customers and the product sold. Because we have not experienced any significant warranty claims in the past, we have not established any reserve fund for warranty claims or defective products.
Segment reporting
The Company uses a “management approach” model for segment reporting. The management approach model is based on the way a company’s management organizes segments within the company for making operating decisions and assessing performance. For the years ended December 31, 2008 and 2007, the Company has two reportable segments: China and US. The China segment, through the Dalian manufacturing facility, is engaged in developing, designing, manufacturing, marketing and distributing copper-cladded bi-metallic engineered conductor products, principally copper-clad aluminum (CCA) and primarily services the Asia-Pacific region, and specifically the PRC market. The US segment, consisting of two manufacturing facilities, one in Fayetteville, Tennessee, USD and a second in Telford, England, are engaged in developing, designing, manufacturing, marketing and distributing copper-cladded bimetallic engineered conductor products, principally CCA and copper-clad steel (CCS) and primarily service the North and South America, European, Middle Eastern and North African markets.
Property, Plant and Equipment
Building, plant and equipment are recorded at cost less accumulated depreciation and amortization. Depreciation and amortization are recorded utilizing the straight-line method over the estimated original useful lives of the assets. Amortization of leasehold improvements is calculated on a straight-line basis over the life of the asset or the term of the lease, whichever is shorter. Major renewals and betterments are capitalized and depreciated; maintenance and repairs that do not extend the life of the respective assets are charged to expense as incurred. Upon disposal of assets, the cost and related accumulated depreciation are removed from the accounts and any gain or loss is included in income. Depreciation related to property and equipment used in production is reported in cost of sales.
Long-term assets of the Company are reviewed annually as to whether their carrying value has become impaired.
If a cost does not extend an asset’s useful life, increase its productivity, improve its operating efficiency, or add additional production capacity, the cost is regarded as repairs and maintenance and recognized as an expense as incurred, if it does, the cost is regarded as major renewals and betterments and capitalized.
The repairs and maintenance expense recognized in 2006, 2007 and 2008 are $59,330, $227,248 and $819,283, respectively. The increase in repairs and maintenance expense for the fiscal year ended December 31, 2008 was primarily due to the additional cost on PP&E that were acquired through the acquisition of Copperweld in October 2007.
For the years ended December 31, 2006, 2007 and 2008, there were no amounts expended for major renewals and betterments that were capitalized.
Bad debts
The Company's business operations are conducted in the PRC and in the US. The Company extends unsecured credit to customers with good credit history. Management reviews its accounts receivable on a regular basis to determine if the bad debt allowance is adequate at each year-end. Because we only extend trade credits too many of our customers, who tend to be well-established and large sized businesses, and we have not experienced any write-offs in our PRC operations and no material write-off of accounts receivable in our US operations. At December 31, 2008 we had an allowance of bad debts in the amount of $318,529.
We record a valuation allowance to reduce our deferred tax assets to the amount that we believe to be more likely than not to be realized. In the event we were to determine that we would be able to realize our deferred tax assets in the future in excess of their recorded amount, an adjustment to our deferred tax assets would increase income in the period such determination was made. Likewise, should we determine that we would not be able to realize all or part of our net deferred tax assets in the future, an adjustment to our deferred tax assets would be charged to income in the period such determination was made.
Fushi International, Inc., Fushi Holdings, Copperweld Bimetallics Holdings, LLC and Copperweld bimetallics, LLC were incorporated in the United States and have incurred net operating losses for income tax purposes for 2008, 2007 and 2006. Management believes that the realization of the benefits can be used by our US operating subsidiary in future periods because expectations are that Copperweld will have taxable income in future periods.
Stock-based compensation.
In preparing the consolidated financial statements for 2008, we adopted SFAS No. 123 (revised 2004), or SFAS No. 123(R), issued by the FASB in December 2004, to measure our issued share options based on the grant-date fair value of the options and recognized as compensation expense over the requisite service period, with a corresponding addition to equity. We adopt the Black-Scholes Model to value the fair value of the share options and the following major assumptions are adopted: average risk-free rate of return of 1.84% to 4.57%, expected option life of 2 years, volatility rate of 50% and no dividend yield.
Off-Balance Sheet Arrangements
We have not engaged in any off-balance sheet transactions since its inception.
FUSHI COPPERWELD, INC. AND SUBSIDIARIES
CONSOLIDATED BALANCE SHEETS
AS OF DECEMBER 31, 2008 AND 2007
| | | 2008 | | | 2007 | |
| ASSETS | | | | | | |
| | | | | | | |
| CURRENT ASSETS: | | | | | | |
| Cash | | $ | 65,611,770 | | | $ | 79,914,758 | |
| Marketable securities | | | - | | | | 2,977,699 | |
| Restricted cash | | | 1,000,000 | | | | 1,000,000 | |
| Accounts receivable, trade, net of allowance of bad debt $318,529 and $135,418 as of December 31, 2008 and 2007 | | | 49,782,548 | | | | 23,611,186 | |
| Inventories | | | 6,977,852 | | | | 12,308,295 | |
| Notes receivables | | | 171,300 | | | | 816,905 | |
| Other receivables and prepaid expenses | | | 869,973 | | | | 997,979 | |
| Advances to suppliers | | | 20,261,585 | | | | 2,341,839 | |
| Cross currency hedge receivable | | | - | | | | 706,170 | |
| Deposit in derivative hedge | | | 1,000,000 | | | | - | |
| Prepaid taxes | | | 670,805 | | | | - | |
| Total current assets | | | 146,345,833 | | | | 124,674,831 | |
| | | | | | | | | |
| PLANT AND EQUIPMENT, net | | | 119,761,027 | | | | 87,228,600 | |
| | | | | | | | | |
| OTHER ASSETS: | | | | | | | | |
| Notes receivable, noncurrent | | | 799,106 | | | | - | |
| Advances to suppliers, noncurrent | | | 4,022,879 | | | | 18,204,775 | |
| Prepaid land use right | | | - | | | | 4,559,760 | |
| Intangible asset, net of accumulated amortization | | | 12,406,920 | | | | 5,832,721 | |
| Deferred loan expense, net | | | 3,317,725 | | | | 3,115,930 | |
| Deferred tax assets, noncurrent | | | 7,804,027 | | | | 2,852,000 | |
| Total other assets | | | 28,350,657 | | | | 34,565,186 | |
| | | | | | | | | |
| Total assets | | $ | 294,457,517 | | | $ | 246,468,617 | |
| | | | | | | | | |
| LIABILITIES AND SHAREHOLDERS' EQUITY | | | | | | | | |
| | | | | | | | | |
| CURRENT LIABILITIES: | | | | | | | | |
| Accounts payable, trade | | $ | 7,204,156 | | | $ | 3,028,823 | |
| Line of credit | | | 4,712,075 | | | | 7,168,524 | |
| Short term bank loans | | | 17,588,400 | | | | 5,703,360 | |
| Current portion of long term debts | | | 5,000,000 | | | | 10,968,000 | |
| Other payables and accrued liabilities | | | 4,751,460 | | | | 5,791,597 | |
| Customer deposits | | | 542,540 | | | | - | |
| Taxes payable | | | - | | | | 1,005,259 | |
| Cross currency hedge payable | | | 104,324 | | | | - | |
| Total current liabilities | | | 39,902,955 | | | | 33,665,563 | |
| | | | | | | | | |
| LONG TERM LIABILITIES: | | | | | | | | |
| Notes payable | | | 40,000,000 | | | | 60,000,000 | |
| Fair value of derivative instrument | | | 4,377,076 | | | | 8,515,396 | |
| | | | | | | | | |
| Total liabilities | | | 84,280,031 | | | | 102,180,959 | |
| | | | | | | | | |
| COMMITMENTS AND CONTINGENCIES | | | 7,197,794 | | | | - | |
| | | | | | | | | |
| SHAREHOLDERS' EQUITY: | | | | | | | | |
| Preferred stock,$0.001 par value, 5,000,000 shares authorized, none issued or outstanding as of December 31, 2008 and 2007 | | | - | | | | - | |
| Common stock, $0.006 par value, 100,000,000 shares authorized, 2008: 27,499,034 issued and 27,399,034 outstanding, 2007: 25,311,304 issued and 25,211,304 outstanding | | | 164,395 | | | | 151,268 | |
| Common stock held in escrow, 100,000 shares | | | 600 | | | | 600 | |
| Additional paid in capital | | | 91,172,890 | | | | 77,665,064 | |
| Statutory reserves | | | 12,316,147 | | | | 8,321,726 | |
| Retained earnings | | | 78,613,158 | | | | 54,133,070 | |
| Accumulated other comprehensive income | | | 20,712,502 | | | | 4,015,930 | |
| Total shareholders' equity | | | 202,979,692 | | | | 144,287,658 | |
| | | | | | | | | |
| Total liabilities and shareholders' equity | | $ | 294,457,517 | | | $ | 246,468,617 | |
See report of independent registered public accounting firm.
The accompany notes are an integral part of this statement.
FUSHI COPPERWELD, INC. AND SUBSIDIARIES
CONSOLIDATED STATEMENTS OF INCOME AND
OTHER COMPREHENSIVE INCOME
FOR YEARS ENDED DECEMBER 31, 2008, 2007 AND 2006
| | | 2008 | | | 2007 | | | 2006 | |
| | | | | | | | | | |
| REVENUES | | $ | 221,434,702 | | | $ | 128,222,083 | | | $ | 67,595,774 | |
| | | | | | | | | | | | | |
| COST OF GOODS SOLD | | | 164,181,739 | | | | 85,773,819 | | | | 42,781,669 | |
| | | | | | | | | | | | | |
| GROSS PROFIT | | | 57,252,963 | | | | 42,448,264 | | | | 24,814,105 | |
| | | | | | | | | | | | | |
| OPERATING EXPENSE: | | | | | | | | | | | | |
| Selling expenses | | | 4,607,459 | | | | 1,762,461 | | | | 613,119 | |
| General and administrative expenses | | | 15,555,267 | | | | 10,040,827 | | | | 3,815,380 | |
| Total operating expense | | | 20,162,726 | | | | 11,803,288 | | | | 4,428,499 | |
| | | | | | | | | | | | | |
| INCOME FROM OPERATIONS | | | 37,090,237 | | | | 30,644,976 | | | | 20,385,606 | |
| | | | | | | | | | | | | |
| OTHER INCOME (EXPENSE): | | | | | | | | | | | | |
| Interest income | | | 662,290 | | | | 1,822,048 | | | | 73,949 | |
| Interest expense | | | (8,833,866 | ) | | | (7,544,635 | ) | | | (1,072,769 | ) |
| Gain on derivative instrument | | | 163,062 | | | | 1,508,693 | | | | - | |
| Other (expense) income | | | (112,303 | ) | | | 222,545 | | | | 300,185 | |
| Registration rights penalty | | | - | | | | - | | | | (1,478,520 | ) |
| Total other expense, net | | | (8,120,817 | ) | | | (3,991,349 | ) | | | (2,177,155 | ) |
| | | | | | | | | | | | | |
| INCOME BEFORE INCOME TAXES | | | 28,969,420 | | | | 26,653,627 | | | | 18,208,451 | |
| | | | | | | | | | | | | |
| PROVISION (BENEFIT) FOR INCOME TAXES | | | 494,911 | | | | (2,852,000 | ) | | | 398,425 | |
| | | | | | | | | | | | | |
| NET INCOME | | | 28,474,509 | | | | 29,505,627 | | | | 17,810,026 | |
| | | | | | | | | | | | | |
| OTHER COMPREHENSIVE INCOME: | | | | | | | | | | | | |
| Unrealized loss (gain) on marketable securities | | | 22,301 | | | | (22,301 | ) | | | - | |
| Foreign currency translation adjustment | | | 12,535,951 | | | | 9,853,904 | | | | 1,923,828 | |
| Change in fair value of derivative instrument | | | 4,138,320 | | | | (8,515,396 | ) | | | - | |
| | | | | | | | | | | | | |
| COMPREHENSIVE INCOME | | $ | 45,171,081 | | | $ | 30,821,834 | | | $ | 19,733,854 | |
| | | | | | | | | | | | | |
| Earnings per share: | | | | | | | | | | | | |
| Basic | | $ | 1.04 | | | $ | 1.33 | | | $ | 0.89 | |
| Diluted | | $ | 1.00 | | | $ | 1.19 | | | $ | 0.84 | |
| | | | | | | | | | | | | |
| Weighted average number of shares: | | | | | | | | | | | | |
| Basic | | | 27,298,891 | | | | 22,178,517 | | | | 19,933,193 | |
| Diluted | | | 28,271,863 | | | | 25,243,788 | | | | 21,276,263 | |
See report of independent registered public accounting firm.
The accompany notes are an integral part of this statement.
FUSHI COPPERWELD, INC AND SUBSIDIARIES
CONSOLIDATED STATEMENTS OF SHAREHOLDERS' EQUITY
FOR THE YEARS ENDED DECEMBER 2008, 2007 AND 2006
| | | Series A | | | Series B | | | | | | | | | | | | | | | | | | | | | | | | | | | | |
| | | convertible | | | convertible | | | Common stock | | | | | | | | | | | | | | | | |
| | | preferred stock | | | preferred stock | | | Shares outstanding | | | Shares In escrow | | | Additional | | | Retained earnings | | | Accumulated | | | | |
| | | Number | | | Par | | | Number | | | Par | | | Number | | | Par | | | Number | | | Par | | | paid in | | | Statutory | | | Unrestricted | | | comprehensive | | | | |
| | | of shares | | | value | | | of shares | | | value | | | of shares | | | value | | | of shares | | | value | | | capital | | | reserves | | | earnings | | | income (loss) | | | Totals | |
| BALANCE, December 31, 2005 | | | 784,575 | | | $ | 785 | | | | 216,000 | | | $ | 216 | | | | 78,459 | | | $ | 471 | | | | - | | | $ | - | | | $ | 29,307,285 | | | $ | 2,428,310 | | | $ | 12,710,833 | | | $ | 775,895 | | | $ | 45,223,795 | |
| | | | | | | | | | | | | | | | | | | | | | | | | | | | | | | | | | | | | | | | | | | | | | | | | | | | | |
| Conversion of preferred stock | | | (784,575 | ) | | | (785 | ) | | | (216,000 | ) | | | (216 | ) | | | 19,818,718 | | | | 118,912 | | | | | | | | | | | | (195,411 | ) | | | | | | | | | | | | | | | (77,500 | ) |
| Exercise of stock warrants | | | | | | | | | | | | | | | | | | | 148,985 | | | | 894 | | | | | | | | | | | | 253,081 | | | | | | | | | | | | | | | | 253,975 | |
| Net income | | | | | | | | | | | | | | | | | | | | | | | | | | | | | | | | | | | | | | | | | | | 17,810,026 | | | | | | | | 17,810,026 | |
| Adjustment to statutory reserve | | | | | | | | | | | | | | | | | | | | | | | | | | | | | | | | | | | | | | | 2,024,157 | | | | (2,024,157 | ) | | | | | | | - | |
| Foreign currency translation gain | | | | | | | | | | | | | | | | | | | | | | | | | | | | | | | | | | | | | | | | | | | | | | | 1,923,828 | | | | 1,923,828 | |
| | | | | | | | | | | | | | | | | | | | | | | | | | | | | | | | | | | | | | | | | | | | | | | | | | | | | |
| BALANCE, December 31, 2006 | | | - | | | | - | | | | - | | | | - | | | | 20,046,162 | | | | 120,277 | | | | - | | | | - | | | | 29,364,955 | | | | 4,452,467 | | | | 28,496,702 | | | | 2,699,723 | | | | 65,134,124 | |
| | | | | | | | | | | | | | | | | | | | | | | | | | | | | | | | | | | | | | | | | | | | | | | | | | | | | |
| Shares issued for liquidated penalty | | | | | | | | | | | | | | | | | | | 255,000 | | | | 1,530 | | | | | | | | | | | | 1,464,720 | | | | | | | | | | | | | | | | 1,466,250 | |
| Exercise of warrants for cash @ $3.67 | | | | | | | | | | | | | | | | | | | 2,056,015 | | | | 12,336 | | | | | | | | | | | | 7,533,239 | | | | | | | | | | | | | | | | 7,545,575 | |
| Exercise of warrants for cash @ $3.11 | | | | | | | | | | | | | | | | | | | 47,877 | | | | 287 | | | | | | | | | | | | 148,609 | | | | | | | | | | | | | | | | 148,896 | |
| Stock compensation expense | | | | | | | | | | | | | | | | | | | | | | | | | | | | | | | | | | | 1,938,073 | | | | | | | | | | | | | | | | 1,938,073 | |
| Shares placed in escrow | | | | | | | | | | | | | | | | | | | | | | | | | | | 100,000 | | | | 600 | | | | (600 | ) | | | | | | | | | | | | | | | - | |
| Shares issued for cash @ $14.00 | | | | | | | | | | | | | | | | | | | 2,786,000 | | | | 16,716 | | | | | | | | | | | | 37,216,190 | | | | | | | | | | | | | | | | 37,232,906 | |
| Adjustment to shares outstanding | | | | | | | | | | | | | | | | | | | 20,250 | | | | 122 | | | | | | | | | | | | (122 | ) | | | | | | | | | | | | | | | - | |
| Net income | | | | | | | | | | | | | | | | | | | | | | | | | | | | | | | | | | | | | | | | | | | 29,505,627 | | | | | | | | 29,505,627 | |
| Adjustment to statutory reserve | | | | | | | | | | | | | | | | | | | | | | | | | | | | | | | | | | | | | | | 3,869,259 | | | | (3,869,259 | ) | | | | | | | - | |
| Net change related to cash flow hedge | | | | | | | | | | | | | | | | | | | | | | | | | | | | | | | | | | | | | | | | | | | | | | | (8,515,396 | ) | | | (8,515,396 | ) |
| Unrealized loss on marketable securities | | | | | | | | | | | | | | | | | | | | | | | | | | | | | | | | | | | | | | | | | | | | | | | (22,301 | ) | | | (22,301 | ) |
| Foreign currency translation gain | | | | | | | | | | | | | | | | | | | | | | | | | | | | | | | | | | | | | | | | | | | | | | | 9,853,904 | | | | 9,853,904 | |
| | | | | | | | | | | | | | | | | | | | | | | | | | | | | | | | | | | | | | | | | | | | | | | | | | | | | |
| BALANCE, December 31, 2007 | | | - | | | | - | | | | - | | | | - | | | | 25,211,304 | | | | 151,268 | | | | 100,000 | | | | 600 | | | | 77,665,064 | | | | 8,321,726 | | | | 54,133,070 | | | | 4,015,930 | | | | 144,287,658 | |
| | | | | | | | | | | | | | | | | | | | | | | | | | | | | | | | | | | | | | | | | | | | | | | | | | | | | |
| Note payble converted to common stock @ $7.00 | | | | | | | | | | | | | | | | | | | 2,142,857 | | | | 12,857 | | | | | | | | | | | | 14,987,143 | | | | | | | | | | | | | | | | 15,000,000 | |
| Exercise of warrants for cash @ $3.11 | | | | | | | | | | | | | | | | | | | 44,873 | | | | 270 | | | | | | | | | | | | 139,124 | | | | | | | | | | | | | | | | 139,394 | |
| Stock compensation expense | | | | | | | | | | | | | | | | | | | | | | | | | | | | | | | | | | | 1,868,809 | | | | | | | | | | | | | | | | 1,868,809 | |
| Net income | | | | | | | | | | | | | | | | | | | | | | | | | | | | | | | | | | | | | | | | | | | 28,474,509 | | | | | | | | 28,474,509 | |
| Adjustment to statutory reserve | | | | | | | | | | | | | | | | | | | | | | | | | | | | | | | | | | | | | | | 3,994,421 | | | | (3,994,421 | ) | | | | | | | - | |
| Net change related to cash flow hedge | | | | | | | | | | | | | | | | | | | | | | | | | | | | | | | | | | | | | | | | | | | | | | | 4,138,320 | | | | 4,138,320 | |
| Foreign currency translation gain | | | | | | | | | | | | | | | | | | | | | | | | | | | | | | | | | | | | | | | | | | | | | | | 12,535,951 | | | | 12,535,951 | |
| Recognition of loss on marketable securities | | | | | | | | | | | | | | | | | | | | | | | | | | | | | | | | | | | | | | | | | | | | | | | 22,301 | | | | 22,301 | |
| Allocation of APIC due to Kuhn's litigation | | | | | | | | | | | | | | | | | | | | | | | | | | | | | | | | | | | (3,487,250 | ) | | | | | | | | | | | | | | | (3,487,250 | ) |
| | | | | | | | | | | | | | | | | | | | | | | | | | | | | | | | | | | | | | | | | | | | | | | | | | | | | |
| BALANCE, December 31, 2008 | | | - | | | $ | - | | | | - | | | $ | - | | | | 27,399,034 | | | $ | 164,395 | | | | 100,000 | | | $ | 600 | | | $ | 91,172,890 | | | $ | 12,316,147 | | | $ | 78,613,158 | | | $ | 20,712,502 | | | $ | 202,979,692 | |
See report of independent registered public accounting firm.
The accompany notes are an integral part of this statement.
FUSHI COPPERWELD, INC. AND SUBSIDIARIES
CONSOLIDATED STATEMENTS OF CASH FLOWS
FOR THE YEARS ENDED DECEMBER 31, 2008, 2007 AND 2006
| | | 2008 | | | 2007 | | | 2006 | |
| CASH FLOWS FROM OPERATING ACTIVITIES: | | | | | | | | | |
| Net income | | $ | 28,474,509 | | | $ | 29,505,627 | | | $ | 17,810,026 | |
| Adjustments to reconcile net income to cash provided by operating activities: | | | | | | | | | | | | |
| Bad debt expenses | | | 178,467 | | | | - | | | | - | |
| Reserve for inventory | | | 96,893 | | | | - | | | | - | |
| Depreciation | | | 6,457,629 | | | | 3,117,837 | | | | 2,208,924 | |
| Loss in disposal of PP&E | | | 28,887 | | | | - | | | | - | |
| Amortization of intangibles | | | 417,681 | | | | 234,672 | | | | 223,800 | |
| Amortization of loan commission | | | 2,798,205 | | | | 721,455 | | | | - | |
| Interest penalty | | | 710,544 | | | | - | | | | - | |
| Amortization of stock option compensation | | | 1,868,809 | | | | 1,938,073 | | | | - | |
| Gain on derivative instrument | | | (163,062 | ) | | | (1,508,693 | ) | | | - | |
| Investment loss on marketable securities | | | 16,158 | | | | - | | | | - | |
| Change in operating assets and liabilities: | | | | | | | | | | | | |
| Accounts receivable | | | (24,794,459 | ) | | | (9,151,252 | ) | | | (616,477 | ) |
| Inventories | | | 5,113,772 | | | | 4,344,568 | | | | 478,455 | |
| Other receivables and prepayments | | | (810,192 | ) | | | 200,721 | | | | 726 | |
| Notes receivables | | | (114,896 | ) | | | (784,551 | ) | | | - | |
| Advance to suppliers | | | (17,408,968 | ) | | | 1,015,842 | | | | - | |
| Deferred tax assets | | | (4,952,027 | ) | | | (2,852,000 | ) | | | - | |
| Accounts payable | | | 4,076,919 | | | | (2,564,797 | ) | | | (1,747,265 | ) |
| Other payables and accrued liabilities | | | (1,083,919 | ) | | | 2,667,158 | | | | (360,312 | ) |
| Customer deposits | | | 509,481 | | | | (545,440 | ) | | | 404,906 | |
| Taxes payable | | | (1,788,643 | ) | | | (186,374 | ) | | | (5,092,090 | ) |
| Net cash (used in) provided by operating activities | | $ | (368,212 | ) | | $ | 26,152,846 | | | $ | 13,310,693 | |
| | | | | | | | | | | | | |
| CASH FLOWS FROM INVESTING ACTIVITIES: | | | | | | | | | | | | |
| Marketable securities | | | 2,983,842 | | | | (2,977,699 | ) | | | - | |
| Payment for swap liability | | | - | | | | (127,380 | ) | | | - | |
| Proceeds from derivative instrument | | | 973,556 | | | | 802,523 | | | | - | |
| Purchase of land use right | | | (1,698,433 | ) | | | | | | | - | |
| Advance for purchase of land use right | | | - | | | | (4,379,166 | ) | | | - | |
| Purchase of property and equipment | | | (15,226,592 | ) | | | (31,115,408 | ) | | | (8,493,919 | ) |
| Advances for purchase of equipment | | | (3,148,802 | ) | | | (12,583,219 | ) | | | (4,465,823 | ) |
| Net cash used in investing activities | | | (16,116,429 | ) | | | (50,380,349 | ) | | | (12,959,742 | ) |
| | | | | | | | | | | | | |
| CASH FLOWS FROM FINANCING ACTIVITIES: | | | | | | | | | | | | |
| Loan from shareholder | | | - | | | | - | | | | 4,450,000 | |
| Repayments to shareholders | | | - | | | | (3,985,698 | ) | | | - | |
| Restricted cash in escrow | | | - | | | | (1,000,000 | ) | | | - | |
| Repayment to shareholder | | | - | | | | - | | | | (532,379 | ) |
| Due to related companies | | | - | | | | - | | | | 3,367,897 | |
| Net borrowings on revolver line | | | (2,419,008 | ) | | | 1,025,814 | | | | - | |
| Proceeds from bank loans | | | 16,908,000 | | | | 11,718,630 | | | | 24,365,120 | |
| Payments on bank loans | | | (17,268,032 | ) | | | (29,628,641 | ) | | | (19,714,490 | ) |
| Net proceeds from stock issuance in private placement | | | - | | | | 37,232,906 | | | | - | |
| Net proceeds from long term notes | | | - | | | | 56,400,000 | | | | - | |
| Proceeds from exercise of stock warrants | | | 139,124 | | | | 7,692,068 | | | | 248,729 | |
| Fees paid for recapitalization | | | - | | | | - | | | | (77,500 | ) |
| Net cash (used in) provided by financing activities | | | (2,639,916 | ) | | | 79,455,079 | | | | 12,107,377 | |
| | | | | | | | | | | | | |
| EFFECT OF EXCHANGE RATE ON CASH | | | 4,821,569 | | | | 4,193,631 | | | | 1,868,337 | |
| | | | | | | | | | | | | |
| CHANGE IN CASH | | | (14,302,988 | ) | | | 59,421,207 | | | | 14,326,665 | |
| | | | | | | | | | | | | |
| CASH, beginning | | | 79,914,758 | | | | 20,493,551 | | | | 6,166,886 | |
| | | | | | | | | | | | | |
| CASH, ending | | $ | 65,611,770 | | | $ | 79,914,758 | | | $ | 20,493,551 | |
| | | | | | | | | | | | | |
| SUPPLEMENTAL DISCLOSURE OF CASH FLOW INFORMATION: | | | | | | | | | | | | |
| Cash paid for interest expense | | $ | 6,327,084 | | | $ | 4,249,882 | | | $ | 1,352,377 | |
| Cash paid for income taxes | | $ | 4,509,274 | | | $ | - | | | $ | 2,288,242 | |
See report of independent registered public accounting firm.
The accompany notes are an integral part of this statement.
FUSHI COPPERWELD, INC. AND SUBSIDIARIES
NOTES TO CONSOLIDATED FINANCIAL STATEMENTS
DECEMBER 31, 2008
Note 1 - Organization
Fushi Copperweld, Inc (“Fushi”), the holding company of Fushi Holdings, Inc., (“Fushi Holdings”) incorporated in the state of Delaware, which is a holding company for Dalian Fushi International Bimetallic Cable Co., Ltd (“Fushi International”), organized under the laws of the People Republic of China (“PRC”). In a series of restructuring transactions which began in 2005 and were completed in 2006 (the “restructuring”), Fushi acquired Fushi Holdings. As a result of the restructuring transactions, Fushi International acquired substantially all of the manufacturing assets and business and controls the remaining assets and financial affairs of Dalian Fushi Bimetallic Manufacturing Co., Ltd (“Dalian Fushi”). Dalian Fushi is a limited liability company organized under the laws of the PRC, which is engaged in the manufacturing and sale of bimetallic wire products.
Fushi acquired Copperweld Bimetallics Holdings, LLC, a North Carolina limited liability company and the holder of the partnership interest in Copperweld Bimetallics, LLC, (“Copperweld”) a limited liability company registered in the state of Delaware and the parent of Copperweld Bimetallics UK, Ltd., a private company registered in the United Kingdom and Copperweld International Holdings, LLC a North Carolina limited liability company. Copperweld is a bimetallic sales and manufacturing operation headquartered in Fayetteville, Tennessee. Copperweld Bimetallics UK, Ltd. (“Copperweld UK”) is a manufacturing, distribution and customer service facility located in Telford, England. Copperweld International Holdings, LLC was a non-operating company that held partnership interests in a company located in Tongling, PRC at December 31, 2007. Those interests were liquidated in an agreement entered into by Copperweld and its subsidiaries, affiliates and International Manufacturing Equipment Sales, Inc. on January 16, 2008. Additionally, Fushi acquired International Manufacturing Equipment Sales, LLC, a shell company that was, at the time of purchase, a non-affiliated but commonly owned Limited Liability Company.
Three of the companies acquired on October 29, 2007 were dissolved in 2008:
1. Copperweld Holdings, LLC a North Carolina limited liability company. This company had no liabilities and it’s only asset was the ownership of Copperweld Bimetallics, LLC, which the ownership rights were transferred to Fushi Copperweld, Inc. on October 29, 2007.
2. Copperweld Bimetallics International Holdings, LLC a Delaware limited liability company was established to hold the partnership interest in the Tongling joint venture which has been dissolved. This company was a shell company with no assets or liabilities at the time the joint venture was dissolved.
3. International Manufacturing Equipment Suppliers, LLC a North Carolina limited liability company. This company was not an affiliate of the Copperweld companies. This company was formed by the prior owner of Copperweld Bimetallics to facilitate the transfer of equipment to the Tongling joint venture. As noted above, the Tongling joint venture has been dissolved. This company had no assets or liabilities at the time of the dissolution.
FUSHI COPPERWELD, INC. AND SUBSIDIARIES
NOTES TO CONSOLIDATED FINANCIAL STATEMENTS
DECEMBER 31, 2008
Fushi, Fushi Holdings, Fushi International, Dalian Fushi, Copperweld and Copperweld UK are hereinafter referred to as “the Company”.
Note 2 - Summary of Significant Accounting Policies
Principles of consolidation
The accompanying consolidated financial statements include the financial statements of Fushi and it’s wholly owned subsidiaries, Fushi Holdings, Fushi International (Dalian), Copperweld, Copperweld UK and its 100% variable interest entity Dalian Fushi. All significant inter-company transactions and balances have been eliminated in consolidation.
In accordance with FASB Interpretation No. 46R, Consolidation of Variable Interest Entities ("FIN 46R"), variable interest entities (VIEs) are generally entities that lack sufficient equity to finance their activities without additional financial support from other parties or whose equity holders lack adequate decision making ability. All VIEs with which the Company is involved must be evaluated to determine the primary beneficiary of the risks and rewards of the VIE. The primary beneficiary is required to consolidate the VIE for financial reporting purposes.
Fushi International owns 0% of Dalian Fushi; however, pursuant to the Entrusted Management Agreement, Voting Proxy Agreement and the Share Pledge Agreement (collectively, “Restructuring Agreements”) reached by Fushi International, Dalian Fushi and its registered shareholders in 2005, Fushi International has full control over Dalian Fushi’s remaining operations and financial affairs as a result. Fushi International is the primary beneficiary of Dalian Fushi, thus Dalian Fushi is a 100% VIE of Fushi International, which means 100% Voting Rights and 100% Financial Obligation to Fushi International. Thus Dalian Fushi is considered a Variable Interest Entity (“VIE”) and is consolidated within the financial statements.
Use of estimates
The preparation of financial statements in conformity with generally accepted accounting principles requires management to make estimates and assumptions that affect the reported amounts of assets and liabilities and disclosure of contingent assets and liabilities at the date of the financial statements and the reported amounts of revenues and expenses during the reporting period. For example, the Company estimates the fair value of its derivative instrument. Actual results could differ from those estimates.
Revenue recognition
The Company's revenue recognition policies are in accordance with Staff Accounting Bulletin (“SAB”) 104. Sales revenue is recognized at the date of shipment to customers when a formal arrangement exists, the price is fixed or determinable, the delivery is completed, no other significant obligations of the Company exist and collectability is reasonably assured. Payments received before all of the relevant criteria for revenue recognition are recorded as customer deposits.
FUSHI COPPERWELD, INC. AND SUBSIDIARIES
NOTES TO CONSOLIDATED FINANCIAL STATEMENTS
DECEMBER 31, 2008
Shipping and handling costs
Shipping and handling costs related to costs of goods sold are included in selling costs which totaled $1,979,689, $1,006,769 and $349,257 for the years ended December 31, 2008, 2007 and 2006, respectively.
Foreign currency translation and other comprehensive income
The reporting currency of the Company is the US dollar. The functional currency of Fushi Copperweld and its USA subsidiary is the US dollar. The functional currency of Fushi International (Dalian), Dalian Fushi and Beijing Office is Renminbi (RMB). The functional currency of Copperweld UK is the British Pound.
For the subsidiaries whose functional currencies are other than the US dollar, all assets and liabilities accounts were translated at the exchange rate on the balance sheet date; stockholder's equity is translated at the historical rates and items in the statement of operations items and cash flow statements are translated at the average rate in each applicable period. Translation adjustments resulting from this process are included in accumulated other comprehensive income in the statement of shareholders’ equity. The resulting translation gains and losses that arise from exchange rate fluctuations on transactions denominated in a currency other than the functional currency are included in the results of operations as incurred.
Accumulated other comprehensive income amounted to $20,712,502, $4,015,930 and $2,699,723 as of December 31, 2008, 2007 and 2006 respectively. The balance sheet amounts with the exception of equity at December 31, 2008 were translated at 6.823 RMB and £0.684 to $1.00. The balance sheet amounts with the exception of equity at December 31, 2007 were translated at 7.29 RMB and £0.501 to $1.00 USD. The average translation rates applied to income and cash flow statement amounts for year ended December 31, 2008 were 6.948 RMB and £0.539 to $1.00 respectively. The average translation rates applied to income and cash flow statement amounts for the year ended December 31, 2007 were 7.59 RMB and £0.49 to $1.00. The average translation rates applied to income statement accounts for the year ended December 31, 2006 was 7.96 RMB.
In accordance with FAS 95, "Statement of Cash Flows," cash flows from the Company's operations is calculated based upon the local currencies. As a result, amounts related to assets and liabilities reported on the statement of cash flows will not necessarily agree with changes in the corresponding balances on the balance sheet.
Cash and concentration of risk
The Company considers all highly liquid investments with original maturities of three months or less at the time of purchase to be cash equivalents, for cash flow statement purposes. Cash includes cash on hand and demand deposits in accounts maintained with state owned banks within the PRC and with banks in the United Kingdom (“UK”) and the USA.
FUSHI COPPERWELD, INC. AND SUBSIDIARIES
NOTES TO CONSOLIDATED FINANCIAL STATEMENTS
DECEMBER 31, 2008
Certain financial instruments, which subject the Company to concentration of credit risk, consist of cash. The Company maintains balances at financial institutions which, from time to time, may exceed deposit insurance limits for the banks located in the United States and UK. Balances at financial institutions or state owned banks within the PRC are not covered by insurance. As of December 31, 2008, the Company had deposits in excess of federally insured limits totaling $65,895,459. The Company has not experienced any losses in such accounts and believes it is not exposed to any significant risks on its cash in bank accounts.
Part of the Company's operations are carried out in the PRC and UK. Accordingly, the Company's business, financial condition and results of operations may be influenced by the political, economic and legal environments in the two countries, and by the general state of the two countries' economy. The Company's operations in the two countries are subject to specific considerations and significant risks not typically associated with companies in the North America. These include risks associated with, among others, the political, economic and legal environments and foreign currency exchange. The Company's results may be adversely affected by changes in governmental policies with respect to laws and regulations, anti-inflationary measures, currency conversion and remittance abroad, and rates and methods of taxation, among other things.
Additional product sales information
The Company has expanded its geographic sales area from the Chinese domestic market to the international market. The following chart shows that the PRC market remains the largest single market for the Company while approximately 29% sales were spread across international markets during the year of 2008, 8% during the year of 2007, and 0% during the year of 2006, respectively.
| | | 2008 | | | 2007 | | | 2006 | |
| China | | $ | 156,342,939 | | | $ | 117,737,442 | | | $ | 67,595,774 | |
| USA | | | 45,754,350 | | | | 9,327,218 | | | | - | |
| Europe | | | 8,375,872 | | | | 1,157,423 | | | | - | |
| Other countries | | | 10,961,541 | | | | - | | | | - | |
| Total sales | | $ | 221,434,702 | | | $ | 128,222,083 | | | $ | 67,595,774 | |
Major customers and suppliers
Ten major customers accounted for 30% and 37.75% of the sales for the years ended December 31, 2008 and 2007, respectively. (Copperweld’s sales for the full year of 2007 are included for comparison purpose.) Six customers accounted for 34% of the Company’s total sales for the year ended December 31, 2006. Total receivable balance due from the top ten customers at December 31, 2008 and 2007 amounted to $11,838,214 and $15,029,038, respectively.
Five major suppliers provided approximately 65% of the Company’s raw materials for the years ended December 31, 2008 and eight major suppliers provided approximately 79% for the year ended December 31, 2007. (Copperweld’s purchases for the full year of 2007 are included for comparison purpose). Four suppliers provided approximately 85% of the Company’s raw materials for the year ended December 31, 2006. At December 31, 2008, our advances to the major five suppliers were $20,111,644, all of which was current. At December 31, 2007, our advances to the major eight suppliers were $1.6 million, all of which was current.
FUSHI COPPERWELD, INC. AND SUBSIDIARIES
NOTES TO CONSOLIDATED FINANCIAL STATEMENTS
DECEMBER 31, 2008
Our principal raw materials consist of aluminum and steel rods and copper strips. Changes in the price of copper, which has an established history of volatility, directly affect the prices of our products and influence the demand for our products. Our decision to make advanced purchases of raw materials is mainly based upon (1) the current market price of raw materials and projected future market price of raw materials and (2) the demand and supply situation in the raw materials market, and (3) forecasted demand of our products. By securing these raw materials in advance, we believe we are able to manage and control our cost of production.
The primary reason for the increased investments in inventory and advances is due to increased demand forecasts of our products within the P.R.C. market as a result of increased government spending related to infrastructure projects. Furthermore, due to globally depressed commodity prices management believed there was an opportunity to lock-in lower purchase prices through increasing the deposit (advance) to suppliers which in turn lowered the average purchase price of raw materials and minimized the loss resulting from the significant decline in spot prices in the fourth quarter of 2008. Furthermore, we extended longer credit terms to selected qualified customers to capture an increased market share and further put pressure on smaller competitors whose limited capital resources have become further strained due to the global economic crisis.
Normal Customer and Supplier Payment Terms (days) as of December 31, 2008 as below:
| | 2008 |
| Customer Payment Term | Payment in advance to 90 days |
| | |
| Supplier Payment Term | Payment in advance to 30 days |
Accounts receivables and allowance for doubtful accounts
Management regularly reviews aging of receivables and changes in payment trends by its customers, and records a reserve when they believe collection of amounts due are at risk. Accounts considered uncollectible are written off. As of December 31, 2008 and 2007, management concluded its allowance for bad debts was sufficient.
Aging Analysis of accounts receivable:
| | | December 31, 2008 | |
| 1-30 days | | | 7,967,992 | |
| 31-60 days | | | 14,981,574 | |
| 61-90 days | | | 17,033,521 | |
| 91-180 days | | | 9,394,901 | |
| 181-365 days | | | 723,089 | |
| Bad debt | | | -318,529 | |
| Total | | | 49,782,548 | |
FUSHI COPPERWELD, INC. AND SUBSIDIARIES
NOTES TO CONSOLIDATED FINANCIAL STATEMENTS
DECEMBER 31, 2008
Inventories
Inventories are stated at the lower of cost or market using a weighted average method. Inventories consist of raw materials, work in process, finished goods and packing materials. Raw materials consist of copper, aluminum and steel used in production. The cost of finished goods included direct costs of raw materials as well as direct labor used in production. Indirect production costs such as utilities and indirect labor related to production such as assembling, shipping and handling for raw material costs are also included in the cost of inventory.
The Company reviews its inventory regularly for possible obsolete goods and net realizable and establishes reserves or written off when necessary.
Derivative Instrument
The Company uses a cross currency hedge, a derivative financial instrument, to hedge the risk of rising interest rates on its variable interest rate debt. This type of derivative financial instrument is known as a cash flow hedge. The Company accounts for this interest rate swap in accordance with FAS No. 133, “Accounting for Derivatives Instruments and Hedging Activity,” which requires the derivative to be carried on the balance sheet at fair value and to meet certain documentary and analytical requirements to qualify for hedge accounting treatment. The above derivative qualifies for hedge accounting under FAS 133 and, accordingly, changes in the fair value effective portion is reported in accumulated other comprehensive income, net of related income tax effects. Amounts included in accumulated other comprehensive income are reclassified into earnings when the hedged transaction affects earnings.
At the inception of the transaction, the Company documented the relationship between hedging instruments and hedged items, as well as its risk management objective and the strategy for undertaking various hedge transactions. This process includes linking all derivatives designated to specific firm commitments of forecast transactions. The Company also documents its assessment, both at inception and on an ongoing basis, of whether the derivative financial instruments that are used in hedging transactions are highly effective in offsetting changes in fair values or cash flows of hedged items. Any portion deemed ineffective is recorded in earnings with the effective portion reflected in accumulated other comprehensive. Changes in the fair values of derivative financial instruments accounted for as cash flow hedges, to the extent they qualify for hedge accounting, are recorded in accumulated other comprehensive income.
FUSHI COPPERWELD, INC. AND SUBSIDIARIES
NOTES TO CONSOLIDATED FINANCIAL STATEMENTS
DECEMBER 31, 2008
Financial instruments
The Company analyzes all financial instruments with features of both liabilities and equity under FAS 150, “Accounting for Certain Financial Instruments with Characteristics of Both Liabilities and Equity,” FAS 133 and EITF 00-19, “Accounting for Derivative Financial Instruments Indexed to, and Potentially Settled in, a Company’s Own Stock.” The convertible note issued in 2007 did not require bifurcation or result in liability accounting. Additionally, the Company analyzes registration rights agreements associated with any equity instruments issued to determine if penalties triggered for late filing should be accrued under FSP EITF 00-19-2, “Accounting for Registration Payment Arrangements.”
On January 1, 2008, the Company adopted FAS 157, “Fair Value Measurements,” which defines fair value, establishes a three-level valuation hierarchy for disclosures of fair value measurement and enhances disclosures requirements for fair value measures. The carrying amounts reported in the balance sheets for current assets and current liabilities qualify as financial instruments are a reasonable estimate of fair value because of the short period of time between the origination of such instruments and their expected realization and their current market rate of interest. The three levels are defined as follow:
| | · | Level 1 inputs to the valuation methodology are quoted prices (unadjusted) for identical assets or liabilities in active markets. |
| | · | Level 2 inputs to the valuation methodology include quoted prices for similar assets and liabilities in active markets, and inputs that are observable for the assets or liability, either directly or indirectly, for substantially the full term of the financial instruments. |
| | · | Level 3 inputs to the valuation methodology are unobservable and significant to the fair value. |
Other than the derivative instrument, the Company did not identify any assets and liabilities that are required to be presented on the balance sheet at fair value in accordance with FAS 157.
During 2007, the Company issued 3% secured convertible debentures in a face amount of $20,000,000 which are due in 2012 from issuance of common stock. The notes qualify as conventional convertible debt and thus the embedded conversion feature was not separated from the host instrument. Also during 2007, the Company borrowed $40,000,000 in the form of a debenture note with floating rate.
As of December 31, 2008, the outstanding principal amounted to $45,000,000. The Company used Level 3 inputs for its valuation methodology for the notes payable, and their fair values are determined using cash flows discounted at relevant market interest rates in effect at the period close since there is no observable market price.
As of December 31, 2008, the Company had a $4.4 million derivative instrument. Management obtains the fair value of the derivative instrument from a financial institution using Level 3 inputs since there is no observable market price.
| | | Carrying Value December 31, 2008 | | | Fair Value Measurements December 31, 2008 Using Fair Value Hierarchy | |
| | | | | | Level 1 | | | Level 2 | | | Level 3 | |
| Notes payable | | $ | 45,000,000 | | | | | | | | | | | $ | 40,883,269 | |
| Derivative Instrument | | $ | 4,377,076 | | | | | | | | | | | $ | 4,377,076 | |
FUSHI COPPERWELD, INC. AND SUBSIDIARIES
NOTES TO CONSOLIDATED FINANCIAL STATEMENTS
DECEMBER 31, 2008
Stock-Based Compensation
The Company records and reports stock-based compensation under FAS 123R, “Share-Based Payments”. This Statement requires a public entity to measure the cost of services received in exchange for an award of equity instruments based on the grant-date fair value of the award. That cost is recognized over the period during which services are received. Stock compensation for stock granted to non-employees is determined in accordance with FAS 123R and the EITF 96-18, "Accounting for Equity Instruments that are issued to Other than Employees for Acquiring, or in Conjunction with Selling Goods or Services", as the fair value of the consideration received or the fair value of equity instruments issued, whichever is more reliably measured.
Plant and equipment, net
Plant and equipment are stated at cost. Expenditures for maintenance and repairs are charged to earnings as incurred; additions, renewals and betterments are capitalized. If a cost does not extend an asset’s useful life, increase its productivity, improve its operating efficiency, or add additional production capacity, the cost is regarded as repairs and maintenance and recognized as an expense as incurred; if it does, the cost is regarded as major renewals and betterments and capitalized. When the asset property and equipment is retired or otherwise disposed of, the related cost and accumulated depreciation are removed from the respective accounts, and any gain or loss is included in operations. Depreciation of property and equipment is provided using the straight-line method for substantially all assets with estimated lives as follows:
| | Estimated Useful Life |
| Buildings | 20-39.5 years |
| Machinery and equipment | 7-15 years |
| Other equipment | 3-5 years |
| Transportation equipment | 3-5 years |
Construction in progress represents the costs incurred in connection with the construction of buildings or new additions to the Company’s plant facilities. Costs classified to construction in progress include all cost of obtaining the asset and bringing it to the location and condition necessary for its intended use. No depreciation is provided for construction in progress until such time as the assets are completed and are placed into service. Interest incurred during construction is capitalized into construction in progress. All other interest is expensed as incurred. Total interest capitalized for the years ended December 31, 2008 and 2007 amounted to $160,166 and $285,689, respectively.
For the years ended December 31, 2008, 2007 and 2006, there were no amounts expended for major renewals and betterments that were capitalized.
Repairs and maintenance expense for the years ended December 31, 2008, 2007 and 2006 amounted to $819,283, $227,248 and $59,330, respectively.
FUSHI COPPERWELD, INC. AND SUBSIDIARIES
NOTES TO CONSOLIDATED FINANCIAL STATEMENTS
DECEMBER 31, 2008
Long-lived assets
The Company evaluates the carrying value of long-lived assets each reporting period. When estimated cash flows generated by those assets are less than the carrying amounts of the asset, the Company recognizes an impairment loss. Based on its review, the Company believes that, as of December 31, 2008 and 2007, there were no impairments of its long-lived assets.
Intangible assets
Land use rights – land in the People’s Republic of China is government owned. However, the government grants “land use rights”. The Company amortizes land use rights on a straight line basis over the 50 year life.
Patents – Patents are stated at cost, less accumulated amortization. The Company amortizes patents on a straight line basis over 7-15 years.
The Company evaluates intangible assets for impairment, at least annually and more often whenever events or changes in circumstances indicate that the carrying value may not be recoverable from its estimated future cash flows. Recoverability of intangible assets, other long-lived assets, and goodwill is measured by comparing their net book value to the related projected undiscounted cash flows from these assets, considering a number of factors including past operating results, budgets, economic projections, market trends and product development cycles. If the net book value of the asset exceeds the related undiscounted cash flows, the asset is considered impaired, and a second test is performed to measure the amount of impairment loss. Based on its review, the Company believes that, as of December 31, 2008, there was no impairment of intangible assets.
Research and development
Research and development expenses include salaries, consultant fees, supplies and materials, as well as costs related to other overhead such as facilities, utilities and other departmental expenses. The costs we incur with respect to internally developed technology and engineering services are included in research and development expenses as incurred as they do not directly relate to any particular licensee, license agreement or licenses fee.
Research and development costs are recorded in general and administrative expenses. Research and development costs were $403,488, $154,127 and $195,058 for the years ended December 31, 2008, 2007 and 2006, respectively.
Earnings per share
The Company reports earnings per share in accordance with the provisions of FAS 128, "Earnings Per Share." FAS 128 requires presentation of basic and diluted earnings per share in conjunction with the disclosure of the methodology used in computing such earnings per share. Basic earnings per share excludes dilution and is computed by dividing income available to common stockholders by the weighted average common shares outstanding during the period. Diluted earnings per share takes into account the potential dilution that could occur if securities or other contracts to issue common stock were exercised and converted into common stock using the treasury method.
FUSHI COPPERWELD, INC. AND SUBSIDIARIES
NOTES TO CONSOLIDATED FINANCIAL STATEMENTS
DECEMBER 31, 2008
Income taxes
The Company records and reports income taxes pursuant to FAS 109, “Accounting for Income Taxes”. Provision for income taxes consist of taxes currently due plus deferred taxes. FAS 109 requires the recognition of deferred income tax liabilities and assets for the estimated future tax effects attributable to temporary differences and operating loss and tax credit carryforwards. Deferred tax liability or asset attributable to temporary differences is accounted for using the balance sheet liability method in respect of temporary differences between income tax basis and financial reporting basis of assets and liabilities. Deferred tax expense or benefit is the change during the year in deferred tax liabilities and assets. Deferred taxes are determined separately for each tax-paying component (an individual entity or group of entities that is consolidated for tax purposes) in each tax jurisdiction. Deferred tax liability or asset is calculated at the tax rates that are expected to apply to the period when the asset is realized or the liability is settled. Deferred tax is charged or credited in the income statement, except when it is related to items credited or charged directly to equity, in which case the deferred tax is also dealt with in equity. Deferred tax assets and liabilities are offset when they relate to income taxes levied by the same taxation authority and the Company intends to settle its current tax assets and liabilities on a net basis. Deferred tax assets is reduced by a valuation allowance if, based on the weight of available evidence, it is more likely than not (a likelihood of more than 50 percent) that some portion or all of the deferred tax assets will not be realized.
Under the new PRC Enterprise Income Tax Law (“PRC EIT Law”), which came into effect on January 1, 2008, and the implementation rules issued by the State Council, PRC income tax at the rate of 10% is applicable to dividends payable by PRC enterprises to “non-resident enterprises” (enterprises that do not have an establishment or place of business in the PRC, or that have such establishment or place of business but the relevant income is not effectively connected with the establishment or place of business) to the extent such dividends are derives from sources within the PRC subject to the application of any relevant income tax treaty that the PRC has entered into. As we are considered “non-resident enterprises) under the new PRC EIT Law, dividends that we receive from our PRC subsidiaries, if any, are subject to PRC taxation at such 10% rate (or lower treaty rate).
The Company adopted FIN 48, “Accounting for Uncertainty in Income Taxes”, on January 1, 2007. Under FIN 48, the evaluation of a tax position is a two-step process. The first step is to determine whether it is more-likely-than-not that a tax position will be sustained upon examination, including the resolution of any related appeals or litigation based on the technical merits of that position. The second step is to measure a tax position that meets the more-likely-than-not threshold to determine the amount of benefit to be recognized in the financial statements. A tax position is measured at the largest amount of benefit that is greater than 50 percent likely of being realized upon ultimate settlement. Tax positions that previously failed to meet the more-likely-than-not recognition threshold should be recognized in the first subsequent period in which the threshold is met. Previously recognized tax positions that no longer meet the more-likely-than-not criteria should be de-recognized in the first subsequent financial reporting period in which the threshold is no longer met. FIN 48 also provides guidance on de-recognition, classification, interest and penalties, accounting in interim periods, disclosures, and transition. The adoption had no affect on the Company’s financial statements.
FUSHI COPPERWELD, INC. AND SUBSIDIARIES
NOTES TO CONSOLIDATED FINANCIAL STATEMENTS
DECEMBER 31, 2008
Value Added Tax
Sales revenue represents the invoiced value of goods, net of a value-added tax (“VAT”). All of the Company’s products that are produced and sold in the PRC are subject to a Chinese value-added tax at a rate of 17% of the gross sales price. All of the Company’s products that are manufactured and sold in the UK are subject to a UK value-added tax at a rate of 15% of the gross sales price. This VAT may be offset by VAT paid by the Company on raw materials and other materials included in the cost of producing their finished product. The Company recorded VAT Payable and VAT receivable net of payments in the financial statements. The VAT tax return is filed offsetting the payables against the receivables.
Segment Reporting
The Company uses a “management approach” model for segment reporting. The management approach model is based on the way a company’s management organizes segments within the company for making operating decisions and assessing performance. The Company has determined that it has two reportable segments, China and U.S. (See Note 21).
Recently issued accounting pronouncements
In February 2007, the FASB issued FAS 159, The Fair Value Option for Financial Assets and Financial Liabilities—including an amendment of FASB Statement No. 115. FAS 159 permits companies to choose to measure many financial instruments and certain other items at fair value that are not currently required to be measured at fair value. The objective of FAS 159 is to provide opportunities to mitigate volatility in reported earnings caused by measuring related assets and liabilities differently without having to apply hedge accounting provisions. FAS 159 also establishes presentation and disclosure requirements designed to facilitate comparisons between companies that choose different measurement attributes for similar types of assets and liabilities. The Company adopted FAS 159 on January 1, 2008. The Company chose not to elect the option to measure the fair value of eligible financial assets and liabilities.
In December 2007, the FASB issued FAS 160, “Noncontrolling Interests in Consolidated Financial Statements - an amendment of Accounting Research Bulletin No. 51”, which establishes accounting and reporting standards for ownership interests in subsidiaries held by parties other than the parent, the amount of consolidated net income attributable to the parent and to the noncontrolling interest, changes in a parent’s ownership interest and the valuation of retained non-controlling equity investments when a subsidiary is deconsolidated. The Statement also establishes reporting requirements that provide sufficient disclosures that clearly identify and distinguish between the interests of the parent and the interests of the non-controlling owners. FAS 160 is effective for fiscal years beginning after December 15, 2008. The Company has not determined the effect that the application of FAS 160 will have on its consolidated financial statements.
FUSHI COPPERWELD, INC. AND SUBSIDIARIES
NOTES TO CONSOLIDATED FINANCIAL STATEMENTS
DECEMBER 31, 2008
In December 2007, FAS 141(R), “Business Combinations”, was issued. FAS 141R replaces FAS 141. SFAS 141R retains the fundamental requirements in FAS 141 that the acquisition method of accounting, which FAS 141 called the purchase method, be used for all business combinations and for an acquirer to be identified for each business combination. FAS 141R requires an acquirer to recognize the assets acquired, the liabilities assumed, and any noncontrolling interest in the acquiree at the acquisition date, measured at their fair values as of that date, with limited exceptions. This replaces FAS 141’s cost-allocation process, which required the cost of an acquisition to be allocated to the individual assets acquired and liabilities assumed based on their estimated fair values. FAS 141R also requires the acquirer in a business combination achieved in stages, sometimes referred to as a step acquisition, to recognize the identifiable assets and liabilities, as well as the noncontrolling interest in the acquiree, at the full amounts of their fair values, or other amounts determined in accordance with FAS 141R. FAS 141R applies prospectively to business combinations for which the acquisition date is on or after the beginning of the first annual reporting period beginning on or after December 15, 2008. An entity may not apply it before that date. The Company is currently evaluating the impact that adopting FAS 141R will have on its financial statements.
In May 2008, the FASB issued FAS 162, “The Hierarchy of Generally Accepted Accounting Principles.” This Statement identifies the sources of accounting principles and the framework for selecting the principles to be used in the preparation of financial statements of nongovernmental entities that are presented in conformity with generally accepted accounting principles (GAAP) in the United States (the GAAP hierarchy). This Statement has no impact on the Company’s financial statements.
In June 2008, the FASB issued EITF 07-5 “Determining whether an Instrument (or Embedded Feature) is indexed to an Entity’s Own Stock”. This Issue is effective for financial statements issued for fiscal years beginning after December 15, 2008, and interim periods within those fiscal years. Early application is not permitted. Paragraph 11(a) of FAS 133 specifies that a contract that would otherwise meet the definition of a derivative but is both (a) indexed to the Company’s own stock and (b) classified in stockholders’ equity in the statement of financial position would not be considered a derivative financial instrument. EITF 07-5 provides a new two-step model to be applied in determining whether a financial instrument or an embedded feature is indexed to an issuer’s own stock and thus able to qualify for the FAS 133 paragraph 11(a) scope exception. The Company believes adopting this statement will have a material impact on the financial statements because among other things, any option or warrant previously issued and all new issuances denominated in US dollars will be required to be carried as a liability and marked to market each reporting period.
FUSHI COPPERWELD, INC. AND SUBSIDIARIES
NOTES TO CONSOLIDATED FINANCIAL STATEMENTS
DECEMBER 31, 2008
In June 2008, FASB issued EITF 08-4, “Transition Guidance for Conforming Changes to Issue No. 98-5.” The objective of EITF 08-4 is to provide transition guidance for conforming changes made to EITF 98-5, “Accounting for Convertible Securities with Beneficial Conversion Features or Contingently Adjustable Conversion Ratios”, that result from EITF 00-27 “Application of Issue No. 98-5 to Certain Convertible Instruments”, and SFAS 150, “Accounting for Certain Financial Instruments with Characteristics of both Liabilities and Equity”. This Issue is effective for financial statements issued for fiscal years ending after December 15, 2008. Early application is permitted. Management is currently evaluating the impact of adoption of EITF 08-4 on the accounting for the convertible notes and related warrants transactions, no impact on the Company’s financial statements
On October 10, 2008, the FASB issued FSP 157-3, “Determining the Fair Value of a Financial Asset When the Market for That Asset Is Not Active,” which clarifies the application of FAS 157 in a market that is not active and provides an example to illustrate key considerations in determining the fair value of a financial asset when the market for that financial asset is not active. FSP 157-3 became effective on October 10, 2008, and its adoption did not have a material impact on our financial position or results for the year ended December 31, 2008.
In December 2008, the FASB issued FSP FAS 140-4 and FIN 46(R)-8, “Disclosures by Public Entities (Enterprises) about Transfers of Financial Assets and Interests in Variable Interest Entities” (“FSP FAS 140-4 and FIN 46(R)-8”). FSP FAS 140-4 and FIN 46(R)-8 amends FAS 140 and FIN 46(R) to require additional disclosures regarding transfers of financial assets and interest in variable interest entities. FSP FAS 140-4 and FIN 46(R)-8 is effective for interim or annual reporting periods ending after December 15, 2008. The Company is evaluating the impact of adopting the standard.
In January 2009, the FASB issued FSP EITF 99-20-1, “Amendments to the Impairment Guidance of EITF Issue No. 99-20, and EITF Issue No. 99-20, Recognition of Interest Income and Impairment on Purchased and Retained Beneficial Interests in Securitized Financial Assets” (“FSP EITF 99-20-1”). FSP EITF 99-20-1 changes the impairment model included within EITF 99-20 to be more consistent with the impairment model of FAS 115. FSP EITF 99-20-1 achieves this by amending the impairment model in EITF 99-20 to remove its exclusive reliance on “market participant” estimates of future cash flows used in determining fair value. Changing the cash flows used to analyze other-than-temporary impairment from the “market participant” view to a holder’s estimate of whether there has been a “probable” adverse change in estimated cash flows allows companies to apply reasonable judgment in assessing whether an other-than-temporary impairment has occurred. The adoption of FSP EITF 99-20-1 did not have a material impact on our consolidated financial statements because all of our investments in debt securities are classified as trading securities.
Reclassification
Certain reclassifications have been made to the 2007 consolidated financial statements to conform to the 2008 consolidated financial statement presentation. These reclassifications had no effect on net income or cash flows as previously reported.
FUSHI COPPERWELD, INC. AND SUBSIDIARIES
NOTES TO CONSOLIDATED FINANCIAL STATEMENTS
DECEMBER 31, 2008
Note 3 - Accounts receivable
Accounts receivable consisted of the following:
| | | 2008 | | | 2007 | |
| Trade accounts receivable | | $ | 50,101,077 | | | $ | 23,746,604 | |
| Allowance for bad debts | | | (318,529 | ) | | | (135,418 | ) |
| Trade accounts receivable, net | | $ | 49,782,548 | | | $ | 23,611,186 | |
The following table consists of allowance for doubtful accounts.
| Allowance for doubtful accounts at January 1, 2006 | | $ | - | |
| Additional reserves | | | - | |
| Accounts receivable write off | | | - | |
| Allowance for doubtful accounts at December 31, 2006 | | | - | |
| Additional reserves | | | - | |
| Accounts receivable write off | | | - | |
| Carried over from reorganization | | | 135,418 | |
| Allowance for doubtful accounts at December 31, 2007 | | | 135,418 | |
| Additional reserves | | | 178,467 | |
| Accounts receivable write off | | | (1,093 | ) |
| Effect of foreign currency translation | | | 5,737 | |
| Allowance for doubtful accounts at December 31, 2008 | | $ | 318,529 | |
Note 4 - Inventories
Inventories consisted of the following:
| | | 2008 | | | 2007 | |
| Raw materials | | $ | 3,929,585 | | | $ | 5,991,315 | |
| Work in process | | | 1,337,703 | | | | 2,260,015 | |
| Finished goods | | | 1,832,511 | | | | 4,120,559 | |
| Scrap | | | 38,540 | | | | - | |
| Totals | | | 7,138,339 | | | | 12,371,889 | |
| Less allowance for obsolete inventory | | | (160,487 | ) | | | (63,594 | ) |
| Totals | | $ | 6,977,852 | | | $ | 12,308,295 | |
The following table consists of allowance for obsolete inventory.
| Allowance for obsolete inventory at January 1, 2006 | | $ | - | |
| Additional reserves | | | - | |
| Reserves write off | | | - | |
| Allowance for obsolete inventory at December 31, 2006 | | | - | |
| Additional reserves | | | 63,594 | |
| Reserves write off | | | - | |
| Allowance for obsolete inventory at December 31, 2007 | | | 63,594 | |
| Additional reserves | | | 82,183 | |
| Reserves write off | | | - | |
| Effect of foreign currency translation | | | 14,710 | |
| Allowance for obsolete inventory at December 31, 2008 | | $ | 160,487 | |
FUSHI COPPERWELD, INC. AND SUBSIDIARIES
NOTES TO CONSOLIDATED FINANCIAL STATEMENTS
DECEMBER 31, 2008
For the years ended December 31, 2008, 2007 and 2006, total inventory write off due to the net realization of raw material cost amounted to $205,852, $0 and $0.
Note 5 - Plant and equipment
Plant and equipment consisted of the following:
| | | 2008 | | | 2007 | |
| Land | | $ | 100,726 | | | $ | 100,726 | |
| Buildings and improvements | | | 43,418,544 | | | | 32,846,156 | |
| Transportation equipment | | | 4,138,892 | | | | 3,193,995 | |
| Machinery and equipment | | | 55,147,707 | | | | 24,111,971 | |
| Office furniture | | | 1,166,477 | | | | 833,474 | |
| Construction in progress | | | 33,163,330 | | | | 36,880,809 | |
| Totals | | | 137,135,676 | | | | 97,967,131 | |
| Less accumulated depreciation | | | (17,374,649 | ) | | | (10,738,531 | ) |
| | | | | | | | | |
| Totals | | $ | 119,761,027 | | | $ | 87,228,600 | |
Construction in progress as of December 31, 2008 consisted of the following:
| | | | | | | | | Expected |
| No. | | Project description | | December 31, 2008 | | Commencement date | | Completion date |
| 1 | | Manufacturing machinery and equipment for CCA/CCS | | $ | 14,507,534 | | Dec-07 | | Dec-09 |
| 2 | | Corporation administration office building | | | 12,964,718 | | May-03 | | Dec-10 |
| 3 | | Manufacturing machinery and equipment for CCA (Multiple) | | | 3,298,681 | | Oct-07 thru Jan-08 | | Mar-09 thru Dec-09 |
| 4 | | Manufacturing machinery and equipment for CCS (Multiple) | | | 1,775,300 | | Mar-07 thru Sep-08 | | Mar-09 thru Dec-09 |
| 5 | | Manufacture building | | | 617,097 | | Jan-08 | | Dec-09 |
| | | Total | | $ | 33,163,330 | | | | |
Project No. 1 “Manufacturing Machinery and Equipment for CCA/CCS” is related to CCA and CCS production lines and ancillary equipment and is located in Dalian, China. The estimated costs to complete Project No.1 as of December 31, 2008 are $2.34 million.
Project No. 2 “Corporate Administration Office Building” represents Tower B of our corporate office building located at our Dalian facility. Tower B is still currently under construction and is expected to be completed by December 2010. The estimated costs to complete Project No. 2 (Tower B) as of December 31, 2008 are $3.09 million.
FUSHI COPPERWELD, INC. AND SUBSIDIARIES
NOTES TO CONSOLIDATED FINANCIAL STATEMENTS
DECEMBER 31, 2008
The change in plant and equipment is as follows:
| | | Plant and equipment | |
| Balance as of December 31, 2007 | | | 97,967,131 | |
| Acquired through cash payment | | | 15,226,592 | |
| Acquired from advanced payments | | | 18,219,023 | |
| Fixed assets transferred from CIP | | | 37,279,488 | |
| CIP transferred to fixed assets | | | (37,279,488 | ) |
| Disposal | | | (111,926 | ) |
| FX rate effect | | | 5,834,856 | |
| Balance as of December 31, 2008 | | | 137,135,676 | |
Depreciation expense for the years ended December 31, 2008, 2007 and 2006 amounted to $6,457,629, $3,117,837 and $2,208,924, respectively.
Note 6 – Advances to suppliers
Advances on purchases are monies deposited or advanced to outside vendors for future inventory and equipment purchases. Most of Company’s vendors require a certain amount of money to be deposited with them as a guarantee that the Company will receive their purchase on a timely basis.
Advances to suppliers consisted of the following:
| | | 2008 | | | 2007 | |
| Advances for inventories – current | | $ | 20,261,585 | | | $ | 2,341,839 | |
| Advances for equipment – non current | | | 4,022,879 | | | | 18,204,775 | |
| Total advances to suppliers | | $ | 24,284,464 | | | $ | 20,546,614 | |
The Company’s principal raw materials consist of aluminum and steel rods and copper strips. Changes in the prices of copper, which has an established history of volatility, directly affect the prices of our products and influence the demand for the products. Our decision to make advanced purchases of raw materials mainly based upon (1) the current market price of raw materials and projected future market price of raw materials and (2) the demand and supply situation in the raw materials market, and (3) forecasted demand of our products.
Note 7 – Intangible assets
Intangible assets consist of land use rights and patents. In June 2008, the Company obtained additional land use rights that had were prepaid in previous periods and reclassified it to intangible assets-land use rights where it began to be amortized. Intangible assets consisted of the following:
| | | 2008 | | | 2007 | |
| Patents | | $ | 1,755,025 | | | $ | 1,652,938 | |
| Land use rights | | | 12,478,090 | | | | 5,492,089 | |
| Total: | | | 14,233,115 | | | | 7,145,027 | |
| Less: accumulated amortization | | | (1,826,195 | ) | | | (1,312,306 | ) |
| Intangible assets, net | | $ | 12,406,920 | | | $ | 5,832,721 | |
FUSHI COPPERWELD, INC. AND SUBSIDIARIES
NOTES TO CONSOLIDATED FINANCIAL STATEMENTS
DECEMBER 31, 2008
Amortization expense for the years ended December 31, 2008, 2007 and 2006 amounted to $417,681, $234,672 and $223,800.
Estimated annual amortization expense is as the following, for the year ended:
| | | December 31, | |
| 2009 | | $ | 469,994 | |
| 2010 | | | 469,994 | |
| 2011 | | | 469,994 | |
| 2012 | | | 451,380 | |
| 2013 | | | 327,444 | |
Note 8 - Prepaid taxes, Taxes Payable and Deferred Tax Asset
Prepaid taxes and taxes payable consisted of the following:
| | | 2008 | | | 2007 | |
| Income Tax | | $ | 997,581 | | | $ | - | |
| VAT Benefit or Payable | | | (1,779,973 | ) | | | 856,482 | |
| Others | | | 111,587 | | | | 148,777 | |
| Total (prepaid taxes) tax payable | | $ | (670,805 | ) | | $ | 1,005,259 | |
Income Tax
Under the former Income Tax Laws of PRC, the Company is generally subject to an income tax at an effective rate of 33% (30% state income taxes plus 3% local income taxes) on income reported in the statutory financial statements after appropriate tax adjustments. For an enterprise that qualifies as a new or high-technology enterprise or a Foreign Invested Enterprise (“FIE”) located in the old town of an inshore open city, it is subject to an income tax rate of 24%. In addition, if the enterprise is located in a specially designated region that allows foreign enterprises the enterprise is entitled to a two-year income tax exemption and a 50% income tax reduction for the following three years.
Beginning January 1, 2008, the new Chinese Enterprise Income Tax (“EIT”) law replaced the former income tax laws for Domestic Enterprises (“DEs”) and FIEs. The new standard EIT rate of 25% replaced the 33% rate previously applicable to both DEs and FIEs. The two years tax exemption, three years 50% tax reduction tax holiday for production-oriented FIEs was eliminated. However, the new EIT Law permits companies to continue to enjoy their former preferential tax treatments until such treatments expire in accordance with their current terms.
FUSHI COPPERWELD, INC. AND SUBSIDIARIES
NOTES TO CONSOLIDATED FINANCIAL STATEMENTS
DECEMBER 31, 2008
The Company’s wholly owned subsidiary, Fushi International (Dalian), is a foreign limited liability company and is located in the old town of an inshore open city. Under the former Income Tax Laws of PRC, the Company qualified to use 24% income tax rate and has a full income tax exemption for the years ended December 2006 and 2007 and a 50% income tax reduction for the years ending December 31, 2008, 2009 and 2010. Under the new EIT law effected in 2008, the company continues to enjoy the former preferential tax rate until it expires in December 2010. So, the applicable corporate income tax rate in 2008 is 12%. The provision for income tax for the years ended December 31, 2008 and 2007 was $5,446,938 and $0, respectively.
Dalian Fushi was incorporated in the PRC and is subject to PRC income tax. Dalian Fushi located its factory in a special economic region in Dalian, PRC and qualified as a "new or high-technology enterprise" that is allowed a two year income tax exemption beginning in 2002, the first year after it became profitable, and a 50% income tax reduction for the following three years, 2004 through 2006. Dalian Fushi had a loss from operations in year 2008, so no provision for income taxes was made during this period.
The Company is subject to the United States federal income tax at a tax rate of 34%. No provision for income taxes in the U.S. has been made as the Company had no U.S. taxable income for the years ended December 31, 2008, 2007, 2006.
Fushi, Fushi Holdings, Copperweld Bimetallics Holdings, LLC and Copperweld Bimetallics, LLC were incorporated in the United States and have incurred net operating losses for income tax purposes since inception. The net operating loss carry forwards for United States income taxes may be available to reduce future years’ taxable income. These carry forwards will expire, if not utilized, through 2025 and 2028.
Copperweld UK is organized as a United Kingdom private company and subject to 20% to 28% statutory taxes on its taxable income. The provision for income tax for the years ended December 31, 2008, 2007 and 2006 was $0, $0 and $0, respectively.
The Provision for income taxes consisted of the following:
| | | 2008 | | | 2007 | | | 2006 | |
| Provision for China income taxes | | $ | 5,446,938 | | | $ | - | | | $ | 362,205 | |
| Provision for China local taxes | | | - | | | | - | | | | 36,220 | |
| Benefit for US income taxes | | | (4,952,027 | ) | | | (2,852,000 | ) | | | - | |
| Provision for income taxes | | $ | 494,911 | | | $ | (2,852,000 | ) | | $ | 398,425 | |
The following table reconciles the U.S. statutory rates to the Company’s effective tax rate for the years ended December 31, 2008, 2007 and 2006:
| | | 2008 | | | 2007 | | | 2006 | |
| U.S. Statutory rates on foreign income | | | 34.0 | % | | | 34.0 | % | | | 34.0 | % |
| NOL and foreign income not recognized in U.S. | | | (34.0 | ) | | | (34.0 | ) | | | (34.0 | ) |
| China income taxes | | | 25.0 | | | | 33.0 | | | | 33.0 | |
| China income tax exemption | | | (13.0 | ) | | | (33.0 | ) | | | (31.0 | ) |
| Total provision for income taxes | | | 12.0 | % | | | - | % | | | 2.0 | % |
FUSHI COPPERWELD, INC. AND SUBSIDIARIES
NOTES TO CONSOLIDATED FINANCIAL STATEMENTS
DECEMBER 31, 2008
The estimated tax savings from the tax exemptions for the year ended December 31, 2008, amounted to $5,900,849. The net effect on earnings per share had the income tax been applied would decrease basic earnings per share from $1.04 to $0.82 and diluted earning per share from $1.00 to $0.79.
The estimated tax savings from the tax exemptions for the year ended December 31, 2007, amounted to $12,815,700. The net effect on earnings per share had the income tax been applied would decrease basic earnings per share from $1.33 to $0.75 and diluted earning per share from $1.19 to $0.66.
The estimated tax savings for the year ended December 31, 2006 amounted to $6,281,290. The net effect on earnings per share had the income tax been applied would decrease basic earnings per share from $0.89 to $0.58 and diluted earning per share from $0.84 to $0.54.
The Company has cumulative undistributed earnings from foreign subsidiaries of approximately $97.9 million and $55.8 million as of December 31, 2008 and 2007, respectively, included in the consolidated retained earnings and will continue to be indefinitely reinvested in international operations. Accordingly, no provision has been made for U.S. deferred taxes related to future repatriation of these earnings, nor is it practicable to estimate the amount of income taxes that would have to be provided if we concluded that such earnings will be remitted in the future.
Deferred Tax Asset
The Company recognizes deferred income tax liabilities and assets for the estimated future tax effects attributable to temporary differences, operating loss carryforwards and tax credit carryforwards. Deferred tax liability or asset attributable to temporary differences is accounted for using the balance sheet liability method in respect of temporary differences between income tax basis and financial reporting basis of assets and liabilities.
Fushi was incorporated in the United States and have incurred net operating losses for income tax purposes since inception. The net operating loss carry forwards for United States income taxes may be available to reduce future years’ taxable income. These carry forwards will expire, if not utilized, through 2025 and 2028. Management believes that the realization of the benefits can be used by our US operating subsidiary in future periods because expectations are that Copperweld will have taxable income in future periods. Based on its review, the Company believes that, as of December 31, 2008, there was no valuation allowance for deferred tax assets.
The deferred tax asset consisted of the following:
| | | | |
| Deferred tax asset at December 31,2006 | | $ | - | |
| Additions to deferred tax asset | | | 2,852,000 | |
| Deferred tax asset at December 31,2007 | | | 2,852,000 | |
| Additions to deferred tax asset | | | 4,952,027 | |
| Deferred tax asset at December 31,2008 | | $ | 7,804,027 | |
FUSHI COPPERWELD, INC. AND SUBSIDIARIES
NOTES TO CONSOLIDATED FINANCIAL STATEMENTS
DECEMBER 31, 2008
A valuation allowance is required against deferred tax assets if, based on the weight of available evidence, it is more-likely-than-not that some or all of the deferred tax assets will not be realized. Management believes that the realization of the benefits can be used by their US operating subsidiary in future periods because expectations are that Copperweld U.S. will have taxable income in future periods. US companies must generate a total of $22,953,021 of taxable net income by years 2025 to 2028 in order to recover the deferred tax asset balance. Profits of Fayetteville in each of the first three quarters of 2008 were $1,036,996, $244,546 and $102,198 respectively. Through cost savings initiatives implemented beginning in the fourth quarter of 2008; the Company has lowered total labor overhead by approximately $100,000 per month. The Company is also in the process of refining and improving their manufacturing processes that may further realize cost savings of approximately $300,000 per month. With these cost saving measures in place, the Company believes that it is possible to realize profit at current sales levels at the Fayetteville facility and that Fayetteville will be well positioned to experience increased profitability when the global economic crisis subsides and sales begin to rebound to historical levels. The Company projects the Fayetteville facility to start generating positive annual pre-tax income in fiscal year 2010. Based on its review and taking into consideration the foregoing, the Company believes that, as of December 31, 2008, it was not necessary to provide a valuation allowance for deferred tax assets. A valuation allowance will not cause us to violate any debt covenants.
Value Added Tax
VAT on sales and VAT on purchases in Dalian China amounted to $27,272,714 and $19,151,207 for the year ended December 31, 2008, $20,030,111 and $12,303,624 for the year ended December 31, 2007, and $60,346,802 and $7,161,857 for the year ended December 31, 2006, respectively.
VAT on sales and VAT on purchases in Copperweld UK amounted to $210,487 and $447,746 for the year ended December 31, 2008 and $96,167 and $89,099 for the period from October 29, 2007 to December 31, 2007, respectively.
Sales and purchases are recorded net of VAT collected and paid as the Company acts as an agent for the government. VAT taxes are not impacted by the income tax holiday.
Note 9 - Short term bank loans and revolving credit lines
Short term bank loans represent amounts due to various banks and are due on demand or normally within one year. These loans generally can be renewed with the banks. Short term bank loans consisted of the following:
FUSHI COPPERWELD, INC. AND SUBSIDIARIES
NOTES TO CONSOLIDATED FINANCIAL STATEMENTS
DECEMBER 31, 2008
Name of lender | | 2008 | | | 2007 | |
Bank of China, Xinghaiwan Branch, due March 28, 2008, annual interest at 7.227% secured by the Company’s land use right and building. | | $ | - | | | $ | 2,687,160 | |
| | | | | | | | | |
Bank of China, Xinghaiwan Branch, due February 15, 2008, and was renewed to May 15, 2008 annual interest at 7.029%, secured by the Company’s land use right and building. | | | - | | | | 3,016,200 | |
| | | | | | | | | |
Guangdong Development bank, Dalian Stadium branch, due February 25, 2009, annual interest at 8.96%,secured by the Company’s land use right and building. | | | 8,794,200 | | | | - | |
| | | | | | | | | |
| Guangdong Development bank, Dalian Stadium branch, due March 9, 2009, annual interest at 8.96%, secured by the Company’s land use right and building | | | 2,931,400 | | | | - | |
| | | | | | | | | |
| Guangdong Development bank, Dalian Stadium branch, due March 19, 2009, annual interest at 8.96%, secured by the Company’s land use right and building | | | 1,465,700 | | | | - | |
| | | | | | | | | |
| Guangdong Development bank, Dalian Stadium branch, due March 26, 2009, annual interest at 8.96%, secured by the Company’s land use right and building | | | 4,397,100 | | | | - | |
| | | | | | | | | |
| Total Short Term Bank Loan | | | 17,588,400 | | | | 5,703,360 | |
| | | | | | | | | |
| Wells Fargo Bank revolving credit line, annual interest at 0.5% plus chase bank rate, the line of credit expires in 2010, secured by all present and future account receivables, equipment, inventory and other goods, documents of title, general intangibles, investment property, and real estate of Copperweld. | | | 4,712,075 | | | | 7,168,524 | |
| | | | | | | | | |
| Total | | $ | 22,300,475 | | | $ | 12,871,884 | |
The Company paid off its two short term loans with total outstanding balances of $5,703,360, in the first quarter of 2008 and obtained four new short term loans with total balances of $17,588,400 at December 31, 2008 at annual interest rate of 8.96% which are due in February and March 2009.
Copperweld maintains a revolving line of credit with Wells Fargo Bank. Availability of the credit line is the lower of $12.8 million or the collateral balances. The outstanding balance was $4,712,075 at December 31, 2008. The Company deposits the cash collections from its customers against the outstanding account balance of the line of credit on a daily basis. The annual interest rate is equal to the applicable margin of 0.25% plus the Chase Bank reference rate. Copperweld also has to pay a monthly administration management fee and a monthly unused line fee of 0.2% (annual rate) on the unused balance of its revolving credit line.
The asset-based revolving line of credit with Wells Fargo contains various covenants that may limit Copperweld’s discretion in operating its business. In addition, Copperweld is required to comply with certain financial covenants that are reported on a quarterly basis, including maintenance of a fixed charge coverage ratio of at least 1.0 to 1.0. Copperweld was in compliance with all covenants for the year ended December 31, 2008.
FUSHI COPPERWELD, INC. AND SUBSIDIARIES
NOTES TO CONSOLIDATED FINANCIAL STATEMENTS
DECEMBER 31, 2008
Copperweld UK maintains a revolving line of credit with a limit of approximately $1,096,000 (or ₤750,000) but had no balance outstanding at December 31, 2008. Both lines of credit expire in 2010.
Current portion of long term debt as of December 31, 2007, which represents the loan that was originated May 2003 and due on April 10, 2008 at an annual rate of 5.58%, secured by the Company’s land use right and building, were all paid off on April 29, 2008. $5,000,000 guaranteed senior secured floating rate notes will mature on July 24, 2009 and is reclassified to current portion of notes payable in the accompanying consolidated balance sheet as of December 31, 2008.
| Name of Lender | | 2008 | | | 2007 | |
| ICBC, Dalian JinZhou Branch | | | | | | |
| Due April 10, 2008, annual interest at 5.58%, | | | | | | |
| secured by the Company’s land use right and building | | $ | - | | | $ | 5,484,000 | |
| | | | | | | | | |
| ICBC, Dalian JinZhou Branch | | | | | | | | |
| Due April 10, 2008, annual interest at 5.58%, | | | | | | | | |
| secured by the Company’s land use right and building | | | - | | | | 5,484,000 | |
| | | | | | | | | |
| Guaranteed senior secured floating rate notes (“HY Notes”) maturing on January 24, 2012 | | | 5,000,000 | | | | - | |
| Total current portion of long term debts | | $ | 5,000,000 | | | $ | 10,968,000 | |
Total interest expense on the revolving credit line, short term and long term loans for the years ended December 31, 2008, 2007 and 2006 amounted to $2,014,149, $1,424,824 and $1,352,377, of which $160,166, $285,689 and $282,641, respectively was capitalized for construction projects.
Note 10 – Notes payable
Notes payable consisted of the following:
| | | December 31, 2008 | | | December 31, 2007 | |
| Senior secured convertible notes (“Convertible Notes”), bearing interest at 3% per annum, maturing on January 24, 2012, convertible to common stock at an initial conversion price of $7.00 per share | | $ | 5,000,000 | | | $ | 20,000,000 | |
| Guaranteed senior secured floating rate notes (“HY Notes”) maturing between July 24, 2009 to January 24, 2012 | | | 35,000,000 | | | | 40,000,000 | |
| | | | | | | | | |
| Total notes payable | | $ | 40,000,000 | | | $ | 60,000,000 | |
FUSHI COPPERWELD, INC. AND SUBSIDIARIES
NOTES TO CONSOLIDATED FINANCIAL STATEMENTS
DECEMBER 31, 2008
Current portion of long term debts
$5,000,000 HY notes will mature on July 24, 2009 and is reclassified to current portion of notes payable on the Balance Sheet as of December 31, 2008.
On January 24, 2007, the Company and Citadel Equity Fund Ltd. ("Citadel") entered a Notes Purchase Agreement. In this transaction, Citadel purchased:
(i) $40 million principal amount (less 3% Notes Discount and 4% commission for proceeds of $37,200,000) of guaranteed senior secured floating rate notes (“HY Notes”) due between July 2009 to January 2012 and
(ii) $20 million principal amount (less 4% commission for proceeds of $19,200,000) of the Company’s 3% senior secured convertible notes (“Convertible Notes”) due 2012, which are convertible into shares of the Company's common stock at an initial conversion price of $7.00 per share.
The HY notes bear interest at LIBOR (approximately 1.75% at December 31, 2008) + 7% and changes to LIBOR + 5.6% permanently upon successful completion of Qualifying IPO within eighteen months from January 24, 2007. See below for discussion of swap agreement changing variable interest to 8.3% fixed. The Convertible Notes bear interest at a fixed rate of 3.00%, payable semi-annually in arrears, and mature in 2012. The HY Notes and the Convertible Notes are guaranteed, jointly and severally, on a senior secured basis, by all of the Company’s wholly-owned existing and future domestic subsidiaries. Subsequently on November 15, 2007, the Company filed Form S-3 with the Securities and Exchange Commission (SEC) with a proposed prospectus to register up to 5,743,143 shares including 2,857,143 shares underlying the 3% Senior Convertible Notes. On November 21, 2007, the registration statement was declared effective by SEC. Upon the S-3 registration statement being declared effective, Management concluded that the Company had met all the requirements for a Qualifying IPO and therefore notified the HY Notes holders of the 140 basis points step-down and subsequently paid interest per the stepped down rate in January 2008.
Management determined that the conversion option in Convertible Notes does not qualify as an embedded derivative under FAS 133 nor does it qualify for fair value treatment under EITF 00-19 or beneficial conversion treatment under EITF 98-5 and 00-27.
FUSHI COPPERWELD, INC. AND SUBSIDIARIES
NOTES TO CONSOLIDATED FINANCIAL STATEMENTS
DECEMBER 31, 2008
In connection with the transaction, Citadel was also granted certain rights over the Company and its subsidiaries. On January 25, 2007, Fushi, Fushi Holdings, Fushi International (Dalian), Dalian Fushi, the “Group Companies”, Li Fu, our Chairman and Chief Executive Officer, Mathus Yue Yang, our then President, Chris Wenbing Wang, our current President and Chief Financial Officer and Citadel entered into an Investor Rights Agreement. Subsequently on June 4, 2008, the Group Companies, Li Fu, Chris Wenbing Wang and Citadel entered in an Amended and Restated Investor Rights Agreement. Pursuant to the Investor Rights Agreement and the Amended and Restated Investor Rights Agreement, Citadel was granted, among other things and subject to certain conditions, the right to designate up to certain number of the Company's board of directors, a right of first refusal with respect to any debt or equity financing sought by the Company and the right to approve the Company's annual business plan and budget. In addition, Messrs. Fu, Yang and Wang agreed to a non-competition covenant relating to their employment and ability to engage in a business that is competitive with the Company's business for five years.
The HY Notes and the Convertible Notes were issued pursuant to indentures, each dated January 25, 2007 (the “HY Indenture” and “CB Indenture”, respectively, and together, the "Indentures") among the Company, Fushi Holdings, as guarantor, and the Bank of New York, as trustee for the Notes. The indenture, notes purchase agreement and investor rights agreement related to the HY Notes and Convertible Notes contain various covenants that may limit the Company’s discretion in operating its business. In particular, the Company is limited in its ability to merge, consolidate or transfer substantially all of its assets, issue stock of its subsidiaries, incur additional debt and create liens on assets to secure debt. In addition, the Company is required to comply with certain financial covenants, including maintenance of a fixed charge coverage ratio of at least 2.0 and maintenance of a leverage ratio not exceeding 5.5. Management believes the Company was in compliance with all of these covenants as of December 31, 2008. In addition, upon occurrence of events defined as “Asset Sale”, “Change of Control” or “Designated Event (means any Fundamental Change or Termination of Trading)” under the Indentures, holders of the HY Notes and Convertible Notes may require the Company to make an offer to repurchase the principal amounts.
The Company also agrees that on the dates indicated in the following table, the Company will repay the corresponding principal amount (or such lesser principal amount as shall then be outstanding) in respect of the aggregate principal amounts.
| Date | | Principal Amount | |
| July 24, 2009 | | $ | 5,000,000 | |
| January 24, 2010 | | $ | 5,000,000 | |
| July 24, 2010 | | $ | 5,000,000 | |
| January 24, 2011 | | $ | 5,000,000 | |
| July 24, 2011 | | $ | 10,000,000 | |
The entire remaining principal amount of the Notes shall become due and payable on January 24, 2012.
Unless previously redeemed, converted, purchased or cancelled, the Company must repay the Convertible Notes on January 24, 2012. The Convertible Notes may not be prepaid at any time prior to maturity. At maturity, the Company must repay all of the outstanding Convertible Notes plus a premium of 15.00% per annum on the principal amount calculated on a semi-annual basis, plus accrued and unpaid interest on late payment, if any, to reflect a additional 5% per annum interest in excess of the rate of interest then in effect.
FUSHI COPPERWELD, INC. AND SUBSIDIARIES
NOTES TO CONSOLIDATED FINANCIAL STATEMENTS
DECEMBER 31, 2008
The Convertible Notes are convertible at the option of the holder into the Company’s common stock at an initial conversion price of $7 per share (approximating 14,286 shares per $100,000 principal amount of the Convertible Notes), subject to downward adjustment of conversion price on March 1 and September 1 of each year, beginning with March 1, 2008, to equal the simple arithmetic average of VWAP for the fifteen trading days preceding such March 1 or September1, with a floor of $4.5. In addition, adjustment of conversion price will be made if and at each time, upon completion of the quarter review (for each Fiscal Quarter ended March 31, June 30 and September 30) or annual audit (for each Fiscal Quarter ended December 31) of the Company’s financial statements an event defined as Financial and Operational Trigger under the CB indenture shall have occurred in the immediately preceding Fiscal Quarter, then within five (5) Business Days following issuance of the review or audit report, as the case may be, for such Fiscal Quarter. The Financial and Operational Trigger means, for the Company and its Subsidiaries on a consolidated basis, that net income for a Fiscal Quarter shall be less than the US dollar amount indicated in the table below opposite such Fiscal Quarter:
| Fiscal Quarter Ending | | Net Income | |
| June 30, 2007 | | $ | 5.0 million | |
| September 30, 2007 | | $ | 5.0 million | |
| December 31, 2007 | | $ | 5.0 million | |
| March 31, 2008 | | $ | 6.0 million | |
| June 30, 2008 | | $ | 6.0 million | |
| September 30, 2008 | | $ | 6.0 million | |
| December 31, 2008 | | $ | 6.0 million | |
| March 31, 2009 | | $ | 7.2 million | |
| June 30, 2009 | | $ | 7.2 million | |
| September 30, 2009 | | $ | 7.2 million | |
| December 31, 2009 | | $ | 7.2 million | |
Upon review of our financial statements, we determined that a Financial and Operational Trigger as defined under the CB indenture occurred in the quarter ended December 31, 2008. To the extend an conversion occurs, the Company shall be required to deliver approximately 140,000 additional shares of the Company’s common stock to the holder of the Convertible Notes by increasing the conversion rate with respect to such notes. Further, the Company cannot provide assurance that Financial and Operational Trigger may not occur again in future fiscal quarters especially under challenging macro-economic conditions and difficult operating environments like the current one.
On January 8, 2008, Citadel Equity Fund Ltd. exercised its rights under the CB indenture and received 2,142,857 in exchange for $15.0 million in debt with an exchange factor of $7.00 in debt for each share of stock.
FUSHI COPPERWELD, INC. AND SUBSIDIARIES
NOTES TO CONSOLIDATED FINANCIAL STATEMENTS
DECEMBER 31, 2008
As of December 31, 2007, the Company had $20 million Convertible Notes and $40 million HY notes, a total of $60 million long term notes payable outstanding. On January 8, 2008, Citadel converted $15.0 million of the Convertible Notes into 2,142,857 shares of common stock. As of December 31, 2008, the Company had $5 million Convertible Notes and $40 million HY notes, for a total of $45,000,000 long term notes outstanding, of which, $5 million HY Notes will be due on July 24, 2009 and become current liability as of December 31, 2008. Deferred commissions on long term notes amounted to $3,188,344 (of which $1,350,000 was due to Kuhn's verdict as explained in Note 19) as of December 31, 2008 and $2,946,740 as of December 31, 2007. Amortized commission for the years ended December 31, 2008 and 2007 amounted to $2,758,396 (of which $1,650,000 was due to Kuhn's verdict as explained in Note 19) and $ 653,260, respectively. Interest on long term notes for the years ended December 31, 2008, 2007 and 2006 amounted to $3,414,804, $5,180,067 and $0, respectively. Both amortized commission and interest on long term notes are recorded as interest expense.
If the $5 million Convertible Notes outstanding are not converted at maturity, January 24, 2012, the Company will have to repay the principal of $5 million and an additional redemption cost of $5,305,158.
Note 11 – Derivative instrument
The Company's operations are exposed to a variety of global market risks, including the effect of changing interest rates. This exposure is managed, in part, with the use of financial derivatives. The Company uses financial derivatives only to hedge exposures in the ordinary course of business and does not invest in derivative instruments for speculative purposes.
On April 10, 2007, effective January 24, 2007, the Company entered a cross currency swap transaction (the Swap) with Merrill Lynch Capital Services, Inc. (“MLCS”) on the $40 million HY notes which converts the LIBOR + 7% per annum USD variable interest rate to an 8.3% per annum RMB fixed interest rate. The agreement was deemed effective January 24, 2007. The Swap requires semi-annual payment in arrears on July 24 and January 24 and matures on the earlier of (1) cash settlement defined as early termination; or (2) January 24, 2012, at which point the Swap requires an exchange of RMB and USD based principals. Under the terms of the cross currency swap, the Company receives variable interest rate payments in USD and makes fixed interest rate payments in RMB with settlement netted in USD, thereby creating the equivalent of fixed-rate debt. MLCS requires the Company to deposit $1,000,000 with them to secure the agreement. The deposit may be increased to $3,000,000 if the exchange rate for RMB to USD falls below 6.5 and to $5,000,000 if the exchange rate falls below 5.5. This swap is designated and qualified as a cash flow hedge. In July, 2008, the Company placed the $1,000,000 deposit with MLCS to secure the agreement.
Since its effective date, the fair value of this Swap agreement changed to a payable of $4,377,076 on December 31, 2008, and a payable of $8,515,396 on December 31, 2007, respectively. For the year ended December 31, 2008, changes in fair value of the Swap resulted in an decrease in the liability and a gain to other comprehensive income of $4,138,320, respectively; For the year ended December 31, 2007, changes in fair value of the Swap resulted in an increase in the liability and a loss to other comprehensive income of $8,515,396, respectively, net of taxes.
FUSHI COPPERWELD, INC. AND SUBSIDIARIES
NOTES TO CONSOLIDATED FINANCIAL STATEMENTS
DECEMBER 31, 2008
The Company had cross currency hedge payable amounting to $104,324 as of December 31, 2008 and $706,170 cross currency hedge receivable as of December 31, 2007. The total gain from derivative transactions for the year 2008, 2007 and 2006 was $163,062, $1,508,693 and $0, respectively. For the year ended December 31, 2008, there were no amounts recorded in the consolidated statement of income in relation to this interest rate swap related to ineffectiveness of the swap transaction.
Note 12 – Supplemental disclosure of cash flow information
Total interest paid for the years ended December 31, 2008, 2007 and 2006 amounted to $6,327,084, $4,249,882 and $1,352,377, respectively.
Total income tax paid for the years ended December 31, 2008, 2007 and 2006 amounted to $4,509,274, $0 and $0, respectively.
Convertible notes totaling $15,000,000 were converted into 2,142,857 shares of common stock at $7.00 per share, on January 8, 2008.
Pursuant to the verdict from the United States District Court, the Company must pay Kuhns Brothers, Inc. (also explained in Note 19) $7,197,794. For the year ended December 31, 2008, the Company allocated $3,487,250 to Additional Paid in Capital.
Note 13 - Earnings per share
The following is information of net income per share:
| | | 2008 | | | 2007 | | | 2006 | |
| Net income for basic earnings per share | | $ | 28,474,509 | | | $ | 29,505,627 | | | $ | 17,810,026 | |
| Add: Interest expense for convertible note | | | 102,149 | | | | 4,151,233 | | | | - | |
| | | | | | | | | | | | | |
| Deduct: Loan issuance cost | | | (179,894 | ) | | | (3,600,000 | ) | | | - | |
| Net income for diluted earnings per share | | $ | 28,396,764 | | | $ | 30,056,860 | | | $ | 17,810,026 | |
| | | | | | | | | | | | | |
| Weighted average shares used in basic computation | | | 27,298,891 | | | | 22,178,517 | | | | 19,933,193 | |
| Diluted effect of warrants, option and convertible note | | | 972,972 | | | | 3,065,271 | | | | 1,343,070 | |
| Weighted average shares used in diluted computation | | | 28,271,863 | | | | 25,243,788 | | | | 21,276,263 | |
| | | | | | | | | | | | | |
| Earnings per share | | | | �� | | | | | | | | |
| Basic | | $ | 1.04 | | | $ | 1.33 | | | $ | 0.89 | |
| Diluted | | $ | 1.00 | | | $ | 1.19 | | | $ | 0.84 | |
FUSHI COPPERWELD, INC. AND SUBSIDIARIES
NOTES TO CONSOLIDATED FINANCIAL STATEMENTS
DECEMBER 31, 2008
Shares excluded from the calculation of diluted earnings per share:
Date issued/ granted | | Nature | | Excise price | | | Shares excluded for year diluted EPS calculation | | Reason for exclusion |
| 10/23/2007 | | Common stock held in escrow | | | | | | 100,000 | | Common stock issued in Company's name |
| 11/31/2007 | | Warrants | | 16.80 | | | | 100,000 | | Anti-dilutive |
| 10/29/2007 | | Options | | 16.44-20.94 | | | | 230,000 | | Anti-dilutive |
| 11/13/2007 | | Options | | 16.36 | | | | 10,000 | | Anti-dilutive |
| 4/10/2008 | | Options | | 15.04 | | | | 17,000 | | Anti-dilutive |
| 5/21/2008 | | Options | | 20.04 | | | | 50,000 | | Anti-dilutive |
| 6/25/2008 | | Options | | 23.25 | | | | 84,000 | | Anti-dilutive |
Note 14 - Stockholders' Equity
(A) Series A and Series B Convertible Preferred Stock
The Series A and Series B convertible preferred stock (“Series A and B Stock”) were automatically converted into common stock upon the effectiveness of the reverse split on January 30, 2006 under the certificates of designation for Series A and B stock. Specifically, 784,575 shares of Series A preferred stock and 216,000 shares of Series B preferred stock were converted into 19,818,718 shares of common stock. In connection with the $12 million financing closed in December 2005, we granted 2,125,000 warrants exercisable at $3.67 to the investors, 424,929 warrants exercisable at $3.11 to Kuhns Brothers, Inc. and its certain affiliates and 80,000 warrants exercisable at $0.01 to Glenn Little, then President of Parallel Technology.
| Outstanding Warrants | | | Exercisable Warrants | |
Exercise Price | | | | Number | | | Average Remaining Life (years) | | | Average Exercise Price | | | | Number | | | | Average Remaining Life (years) | |
| | | | | | | | | | | | | | | | | |
| $ | 3.11 | | | | 332,124 | | | | 3.00 | | | $ | 3.11 | | | | 332,124 | | | | 3.00 | |
| $ | 16.80 | | | | 100,000 | | | | 2.92 | | | $ | 16.80 | | | | 100,000 | | | | 2.92 | |
FUSHI COPPERWELD, INC. AND SUBSIDIARIES
NOTES TO CONSOLIDATED FINANCIAL STATEMENTS
DECEMBER 31, 2008
The following is a summary of the warrant activities:
| | | Number of Warrants Outstanding | | | Number of Warrants Exercisable | | | Weighted -Average Exercise Price | | | Average Remaining Contractual Life | |
| Balance, January 1, 2006 | | | - | | | | - | | | | - | | | | - | |
| Granted | | | 2,629,929 | | | | 2,629,929 | | | $ | 3.47 | | | 5.11 years | |
| Forfeited | | | - | | | | - | | | | | | | | | |
| Exercised | | | (148,985 | ) | | | (148,985 | ) | | $ | 1.70 | | | | | |
| Balance, December 31, 2006 | | | 2,480,944 | | | | 2,480,944 | | | $ | 3.57 | | | 4.92 years | |
| Granted | | | 100,000 | | | | 100,000 | | | $ | 16.80 | | | | | |
| Forfeited | | | - | | | | - | | | | | | | | | |
| Exercised | | | (2,103,892 | ) | | | (2,103,892 | ) | | $ | 3.67 | | | | | |
| Balance, at December 31, 2007 | | | 477,052 | | | | 477,052 | | | $ | 6.35 | | | 3.92 years | |
| Rounding adjustments | | | (55 | ) | | | (55 | ) | | | | | | | | |
| Granted | | | - | | | | - | | | | | | | | | |
| Forfeited | | | - | | | | - | | | | | | | | | |
| Exercised | | | (44,873 | ) | | | (44,873 | ) | | $ | 3.11 | | | | | |
| Balance, at December 31, 2008 | | | 432,124 | | | | 432,124 | | | $ | 6.28 | | | 2.92 years | |
Note 15 – Stock based compensation
On May 21 and June 7, 2007, the Company issued 500,000 and 150,000 options to four executives and three independent directors, respectively, both for a service period of two years starting from the grant date. The vesting period is two years for both grants. These options were not awarded pursuant to the 2007 Stock Incentive Plan.
On September 27, 2007, the Company granted to Mr. Chris Wenbing Wang, the president and CFO, a non-qualified stock option to purchase 125,000 shares of its Common Stock vesting immediately at an exercise price of $13.70 and terminating in five (5) years from the grant date.
On October 29, 2007, in connection with Mr. John Christopher Finley’s employment as Chief Operating Officer and Mr. James A. Todd’s employment as Financial Controller, the Board of Directors approved a non-qualified stock option grant to Mr. Finley and Mr. Todd in the amounts of 190,000 shares and 135,000 shares of common stock of the Company, respectively, for a service period of two years, vesting over a two (2) year period with 12.5% of the options vesting each quarter for eight (8) quarters. The grants to Mr. Finley and Mr. Todd were pursuant to the Fushi International, Inc. 2007 Stock Incentive Plan.
On May 29, 2008, we executed a Separation Agreement accepting the resignation of Mr. John Christopher Finley as our chief operating officer. Under the terms of the Separation Agreement, Mr. Finley’s options will continue to vest for six months following the execution of the agreement for the value of $290,242 was expensed on May 29, 2008. Further, Mr. Finley will have 15 months from the date of execution to exercise his vested options. As a result, total of 95,000 unvested options were forfeited.
On June 25, 2008, the Company issued 84,000 options to Copperweld employees. The vesting period is half year and exercise term of three years and exercisable at $23.25.
The fair values of stock options granted to the executives and the independent directors were estimated at the date of grant using the Black-Scholes option-pricing model with the following assumptions:
FUSHI COPPERWELD, INC. AND SUBSIDIARIES
NOTES TO CONSOLIDATED FINANCIAL STATEMENTS
DECEMBER 31, 2008
| | Expected | | Expected | | | Dividend | | | Risk Free | | | Grant Date | |
| | Life | | Volatility | | | Yield | | | Interest Rate | | | Fair Value | |
| Executives | 2.0 yrs | | | 50 | % | | | 0 | % | | | 1.84% - 4.57 | % | | $ | 3.08 - $5.33 | |
| Independent Directors | 2.0 yrs | | | 50 | % | | | 0 | % | | | 2.41% - 4.57 | % | | $ | 3.64 - $5.84 | |
| Employees | 0.5 yrs | | | 50 | % | | | 0 | % | | | 2.82 | % | | $ | 4.11 | |
| - | Volatility: One year historical volatility of our stock is 58%. Adjustment is made based on volatility of industry peers average which is 31%, to arrive at 50% as expected volatility. |
| - | Dividend Yield: The expected dividend yield is zero. The Company has not paid a dividend and does not anticipate paying dividends in the foreseeable future. |
| - | Risk Free Rate: Risk-free interest rate of 1.84% to 4.57% was used. The risk-free interest rate was based on U.S. Treasury yields that corresponded to the expected term of the option calculated on the granted date. |
| - | Expected Life: Because the Company has no historical share option exercise experience to estimate future exercise patterns, the expected life was determined using the simplified method as these awards meet the definition of "plain-vanilla" options under the rules prescribed by Staff Accounting Bulletin No. 107. |
Stock compensation expense is recognized based on awards expected to vest. There were no estimated forfeitures as the Company has a short history of issuing options. FAS 123R requires forfeitures to be estimated at the time of grant and revised in subsequent periods, if necessary, if actual forfeitures differ from those estimates.
As of December 31, 2008, the 790,333 executive options, 200,000 director options and 77,000 employee options issued had fair values of approximately $3,319,023, $838,731 and $345,151 respectively. The Company recognized $1,868,809, 1,938,073 and $0 of compensation expenses in general and administrative expenses for the years ended December 31, 2008, 2007 and 2006, respectively.
As of December 31, 2008, the total compensation cost related to stock options not yet recognized was $460,074 and will be recognized over the weighted average life of 2 years.
The following is a summary of the stock option activity:
| | | Number of Options Outstanding | | | Weighted -Average Exercise Price | | | Aggregate Intrinsic Value | |
| Balance, January 1, 2006 | | | - | | | | - | | | | - | |
| Granted | | | - | | | | - | | | | - | |
| Forfeited | | | - | | | | - | | | | - | |
| Exercised | | | - | | | | - | | | | - | |
| Balance, December 31, 2006 | | | - | | | | - | | | | - | |
| Granted | | | 1,110,000 | | | $ | 14.3 | | | | - | |
| Forfeited | | | - | | | | - | | | | - | |
| Exercised | | | - | | | | - | | | | - | |
| Balance, December 31, 2007 | | | 1,110,000 | | | $ | 14.3 | | | $ | 12,075,850 | |
| Granted | | | 151,000 | | | $ | 21.3 | | | | - | |
| Forfeited | | | (193,667 | ) | | $ | 16.3 | | | | - | |
| Exercised | | | - | | | | - | | | | - | |
| Balance, December 31, 2008 | | | 1,067,333 | | | $ | 14.9 | | | $ | - | |
FUSHI COPPERWELD, INC. AND SUBSIDIARIES
NOTES TO CONSOLIDATED FINANCIAL STATEMENTS
DECEMBER 31, 2008
Following is a summary of the status of options outstanding at December 31, 2008:
| Outstanding Option | | Exercisable Options | |
| Exercise Price | | Number | | Average Remaining Contractual Life | | Average Exercise Price | | | Number | | | Weighted Average Exercise Price | |
| $12.30 | | | 408,333 | | 0.39 years | | $ | 12.30 | | | | 358,333 | | | $ | 12.30 | |
| $11.75 | | | 150,000 | | 0.43 years | | $ | 11.75 | | | | 121,866 | | | $ | 11.75 | |
| $13.70 | | | 125,000 | | 0.74 years | | $ | 13.70 | | | | 125,000 | | | $ | 13.70 | |
| $16.44 - $20.94 | | | 230,000 | | 0.83 years | | $ | 18.69 | | | | 166,128 | | | $ | 16.40 | |
| $16.36 | | | 10,000 | | 0.87 years | | $ | 16.36 | | | | 10,000 | | | $ | 16.36 | |
| $23.25 | | | 77,000 | | 0.00 years | | $ | 23.25 | | | | 77,000 | | | $ | 23.25 | |
| $15.04 | | | 17,000 | | 0.28 years | | $ | 15.04 | | | | 12,283 | | | $ | 15.04 | |
| $20.04 | | | 50,000 | | 1.39 years | | $ | 20.04 | | | | 23,934 | | | $ | 20.04 | |
| Total | | | 1,067,333 | | | | | | | | | 894,544 | | | | | |
Note 16 - Statutory reserves
The laws and regulations of the People’s Republic of China require that before a Sino-foreign cooperative joint venture enterprise distributes profits to its partners, it must first satisfy all tax liabilities, provide for losses in previous years, and make allocations in proportions determined at the discretion of the board of directors, after the statutory reserve.
Surplus reserve fund
The Company is required to transfer 10% of its net income, as determined in accordance with the PRC accounting rules and regulations, to a statutory surplus reserve fund until such reserve balance reaches 50% of the Company’s registered capital, the Company has total registered capital approximately $80,931,711 (RMB 624.3 million). As of December 31, 2008 and 2007, the Company had statutory reserve amounted to $12,316,147 and $8,321,726, respectively. The Company is required to contribute an additional $28,149,708 from future earnings.
The transfer to this reserve must be made before distribution of any dividend to shareholders. The company will transfer at year end 10% of the year’s net income determined in accordance with PRC accounting rules and regulations.
FUSHI COPPERWELD, INC. AND SUBSIDIARIES
NOTES TO CONSOLIDATED FINANCIAL STATEMENTS
DECEMBER 31, 2008
The surplus reserve fund is non-distributable other than during liquidation and can be used to fund previous years’ losses, if any, and may be utilized for business expansion or converted into share capital by issuing new shares to existing shareholders in proportion to their shareholding or by increasing the par value of the shares currently held by them, provided that the remaining reserve balance after such issue is not less than 50% of the registered capital.
Note 17 – Employee pension
The Company’s employee pension for China employees generally includes two parts: the first to be paid by the Company is 20% of the employee’s actual salary in the prior year. The other part, paid by the employee, is 8% of the actual salary. The Company made $140,499 and $43,381 in contributions of employment benefits for China employees in the years ended December 31, 2008 and 2007, respectively.
US employees are provided a 401(k) plan. US employees are eligible for the defined contribution plan after three-months of full-time employment. Employee deferrals and company matching are 100% vested immediately upon eligibility. The company made $142,374 in contributions of employment benefits for US employees in the year ended December 31, 2008 and made $25,004 contributions in the period between October 29, 2007 and December 31, 2007. Copperweld UK operates a defined contribution pension scheme for employees. All UK employees are eligible to join the pension on satisfactory completion of their trial period, which is typically three months. UK employees can contribute as much as they like subject to current UK laws, but the company will match only the first 2.5% of gross pay in the current year.The assets of the scheme are held separately from those of the company. The annual contributions payable are charged to expense. The company made $29,149 in contributions of employment benefits for UK employees in the year ended December 31, 2008 and made no material contributions in the period between October 29, 2007 and December 31, 2007.
Copperweld UK operates a defined contribution pension scheme for employees. The assets of the scheme are held separately from those of the company. The annual contributions payable are charged to expense. The company made $29,149 in contributions of employment benefits for UK employees in the year ended December 31, 2008 and made no material contributions in the period between October 29, 2007 and December 31, 2007.
Note 18 – Business combinations
On July 18, 2007, the Company, Copperweld Bimetallics, Inc. and David S. Jones entered into a non-binding Memorandum of Understanding. Pursuant to the Memorandum of Understanding and certain agreements signed, Fushi extended $3,000,000 secured bridge funding to Copperweld Bimetallics, Inc.
FUSHI COPPERWELD, INC. AND SUBSIDIARIES
NOTES TO CONSOLIDATED FINANCIAL STATEMENTS
DECEMBER 31, 2008
On September 25, 2007, the Company entered into a LLC Membership Interest Purchase Agreement (the “Purchase Agreement”) with David S. Jones (the “Seller”), pursuant to which the Company agreed to purchase all of the issued and outstanding membership interests of Copperweld Holdings, LLC (“Copperweld”), the sole member of Copperweld Bimetallics, LLC, and all of the issued and outstanding membership interests of International Manufacturing Equipment Suppliers, LLC. The transaction is valued at $22.5 Million, including the assumption of debt and is subject to adjustment based upon Copperweld’s net working capital at closing.
10% of the purchase price ($2.25 million) has been deposited in escrow at closing to secure the indemnification obligations of the Seller. The Purchase Agreement also contains customary representations, warranties and covenants.
The Company subsequently completed the transaction on October 29, 2007 and the investment in Copperweld balance was eliminated on consolidation basis as of December 31, 2007. The results of operations of the acquired companies are included in the consolidated statement of income from October 29, 2007 to the end of the year.
Assets acquired and debts assumed of the transaction are listed as below:
| | | Fair Value | | | Acquired or Assumed by the Company | |
| Current assets | | $ | 16,241,211 | | | $ | 16,241,211 | |
| Property, plant and equipment, net | | | 31,274,166 | | | | 12,600,484 | |
| Other assets | | | 726,987 | | | | 726,987 | |
| Total assets | | | 48,242,364 | | | | 29,568,682 | |
| Total liabilities | | | 12,597,320 | | | | 12,597,320 | |
| Net assets | | $ | 35,645,044 | | | $ | 16,971,362 | |
We determined the fair value of the acquired assets of Copperweld based on an independent appraisal provided by Houlihan Lokey Howard & Zukin (Europe) Limited. The fair value of Copperweld’s net assets pursuant to the independent appraisals was $35,645,044, exceeding total consideration by $18,673,682. Pursuant to SFAS 141, Business Combination, the excess of total fair value acquired over the acquisition cost should be allocated as pro rata deduction of the amount of Copperweld’s fixed assets and intangible assets that would have been assigned to those assets. As a result, we arrived at the above list of amount of assets acquired and debt assumed.
Note 19 - Commitments and contingencies
As discussed in Note 11, the Company entered into a swap agreement that required a $1,000,000 deposit to secure the transaction. If the exchange rate for RMB to US Dollars drops below certain levels, the Company will be required to deposit up to $5,000,000. In July 2008, the Company deposited the $1,000,000 with MLCS to secure the agreement.
On December 11, 2007, the Company received service of an action filed by Kuhns Brothers, Inc., Kuhns Brothers Securities Corp., and Kuhns Brothers & Co., Inc. against the Company in the United States District Court, District of Connecticut on November 27, 2006. On August 5, 2008, the Company received verdict from the United States District Court that Kuhns is entitled to recover a total of $7,197,794. The court ruling was recorded as a contingent liability of $7,197,794 and was allocated to the following: (a) $710,544 was expensed immediately in second quarter of 2008; (b) $3,000,000 was recorded as deferred commissions on long term notes (also explained in Note 10) and is being amortized over the remainder of the long term note’s life, $1,650,000 was amortized for the year ended December 31, 2008, $1,350,000 was outstanding as deferred commissions on long term notes as of December 31, 2008; (c) $3,487,250 was allocated to Additional Paid in Capital. The Company is in the process of appealing the case.
FUSHI COPPERWELD, INC. AND SUBSIDIARIES
NOTES TO CONSOLIDATED FINANCIAL STATEMENTS
DECEMBER 31, 2008
Note 20 - Subsequent events
On January 5, 2009, the Company paid off its short term bank loan for the amount of $17,588,400.
In January 2009, the Company was 15 days late making interest payments on both the HY Notes and the Convertible Notes. The delay in payment was due to a delay in conversion from RMB to USD caused by the tightened controls under PRC State Administration for Foreign Exchange, or SAFE. Payment of the interest due has been made in full and the Company is now current in its payment obligations.
On February 23, 2009, the Company sold 400,000 shares of its common stock and 300,000 warrants in a private placement for an average price of $4.80 per share for $1,920,000. The warrants consisted of 100,000 Series A warrants at an exercise price of $5.25 per share, 100,000 Series B warrants at an exercise price of $5.50 per share, and 100,000 Series C warrants at an exercise price of $6.00 per share.
Note 21 - Segment Information
Pursuant to the “Disclosures about Segments of an Enterprise and Related Information” from GAAP, which establishes standards for reporting information about operating segments. Operating segments are defined as components of an enterprise about which separate financial information is available that is evaluated regularly by the chief operating decision maker in deciding how to allocate resources and assess performance. The Company’s chief operating decision makers have been identified as the Chief Executive Officer and Chief Financial Officer. The accounting policies of the reportable segments are the same as those described in the summary of significant accounting policies.
As of December 31, 2008, the Company has two reportable segments: China and US. We analyze our worldwide operations based on two geographic reportable segments: 1) “P.R.C.” which consists of our facility Located in Dalian, Liaoning, the People’s Republic of China (PRC) and 2) ”US” which consists of our Fayetteville, Tennessee, (USA), and Telford, England, (UK) facilities. The China segment, through the Dalian manufacturing facility, is engaged in developing, designing, manufacturing, marketing and distributing copper cladded bi-metallic engineered conductor products, principally copper-clad aluminum (CCA) and primarily services the Asia-Pacific region, and specifically the PRC market.
FUSHI COPPERWELD, INC. AND SUBSIDIARIES
NOTES TO CONSOLIDATED FINANCIAL STATEMENTS
DECEMBER 31, 2008
The US segment, consisting of two manufacturing facilities, one in Fayetteville, Tennessee, USA and a second in Telford, England, are engaged in developing, designing, manufacturing, marketing and distributing copper-cladded bimetallic engineered conductor products, principally CCA and copper-clad steel (CCS) and primarily services the North and South American, European, Middle Eastern and North African markets. Due to the size of the UK operations, the Company combined it with the US operation as one segment.
The below table illustrates the composition of the UK operations:
| | | For the year ended December 31, 2008 | | | For the year ended December 31, 2007 | |
| Revenue | | $ | 4,344,312 | | | $ | 1,124,245 | |
| Net loss | | | -166,989 | | | | 31,218 | |
| | | | | | | | | |
| | | December 31, 2008 | | | December 31, 2007 | |
| Assets | | $ | 2,452,972 | | | $ | 3,947,923 | |
The Company evaluates segment performance and allocates resources based on segment gross profit and segment operating income. Segment operating income represents income from continuing operations before interest income, interest expense, other income (expense), other financial costs and income tax.
Corporate operating expenses are primarily stock-based compensation, professional fees and outside service expenses.
FUSHI COPPERWELD, INC. AND SUBSIDIARIES
NOTES TO CONSOLIDATED FINANCIAL STATEMENTS
DECEMBER 31, 2008
Analysis of reportable segments (management information):
For the years ended December 31, 2008 | | | | | | | | | | | | | | | |
| | | China | | | US | | | Corporate | | | Eliminations | | | Total | |
| | | | | | | | | | | | | | | | | | | | | |
| Revenues | | $ | 160,298,125 | | | $ | 61,955,461 | | | $ | | | | $ | (818,884 | ) | | $ | 221,434,702 | |
| | | | | | | | | | | | | | | | | | | | | |
| Gross Profit | | | 51,497,280 | | | | 5,755,683 | | | | | | | | | | | | 57,252,963 | |
| Selling, general and administrative expenses | | | 8,394,768 | | | | 6,339,552 | | | | 5,428,406 | | | | | | | | 20,162,726 | |
| | | | | | | | | | | | | | | | | | | | | |
| Operating income (loss) | | | 43,102,512 | | | | (583,869 | ) | | | (5,428,406 | ) | | | | | | | 37,090,237 | |
| | | | | | | | | | | | | | | | | | | | | |
| Capital expenditures | | | 15,455,624 | | | | 4,618,203 | | | | | | | | | | | | 20,073,827 | |
| Depreciation expense (Included in cost of goods sold and Operating expense) | | $ | 5,011,699 | | | $ | 1,445,930 | | | $ | | | | $ | | | | $ | 6,457,629 | |
| | | | | | | | | | | | | | | | | | | | | |
| As of December 31, 2008 | | | | | | | | | | | | | | | | | | | | |
| Property, plant and equipment, net | | $ | 103,473,792 | | | $ | 16,287,235 | | | $ | | | | $ | | | | $ | 119,761,027 | |
| | | | | | | | | | | | | | | | | | | | | |
| Total assets | | $ | 252,774,005 | | | $ | 28,660,727 | | | $ | 13,022,785 | | | $ | | | | $ | 294,457,517 | |
| | | | | | | | | | | | | | | | | | | | | |
For the years ended December 31, 2007 | | | | | | | | | | | | | | | | | | | | |
| | | China | | | US | | | Corporate | | | Eliminations | | | Total | |
| | | | | | | | | | | | | | | | | | | | | |
| Revenues | | $ | 118,153,345 | | | $ | 10,068,738 | | | $ | | | | $ | | | | $ | 128,222,083 | |
| | | | | | | | | | | | | | | | | | | | | |
| Gross Profit | | | 41,872,179 | | | | 576,085 | | | | | | | | | | | | 42,448,264 | |
| Selling, general and administrative expenses | | | 7,204,928 | | | | 1,138,538 | | | | 3,459,822 | | | | | | | | 11,803,288 | |
| | | | | | | | | | | | | | | | | | | | | |
| Operating income (loss) | | | 34,667,251 | | | | (562,453 | ) | | | (3,459,822 | ) | | | | | | | 30,644,976 | |
| | | | | | | | | | | | | | | | | | | | | |
| Capital expenditures | | | 41,370,269 | | | | 6,707,524 | | | | | | | | | | | | 48,077,793 | |
| Depreciation expense (Included in cost of goods sold and Operating expense) | | $ | 2,830,328 | | | $ | 287,509 | | | $ | | | | $ | | | | $ | 3,117,837 | |
| | | | | | | | | | | | | | | | | | | | | |
| As of December 31, 2007 | | | | | | | | | | | | | | | | | | | | |
| Property, plant and equipment, net | | $ | 73,005,160 | | | $ | 14,223,440 | | | $ | | | | $ | | | | $ | 87,228,600 | |
| | | | | | | | | | | | | | | | | | | | | |
| Total assets | | $ | 202,766,295 | | | $ | 32,623,380 | | | $ | 11,078,942 | | | $ | | | | $ | 246,468,617 | |
FUSHI COPPERWELD, INC.