UNITED STATES
SECURITIES AND EXCHANGE COMMISSION
Washington, D.C. 20549
FORM N-CSR
CERTIFIED SHAREHOLDER REPORT OF REGISTERED MANAGEMENT
INVESTMENT COMPANIES
Investment Company Act file number 811-03651
Touchstone Strategic Trust-March Funds
(Exact name of registrant as specified in charter)
303 Broadway, Suite 1100
Cincinnati, Ohio 45202-4203
(Address of principal executive offices) (Zip code)
E. Blake Moore, Jr.
303 Broadway, Suite 1100
Cincinnati, Ohio 45202-4203
(Name and address of agent for service)
Registrant's telephone number, including area code: 800-638-8194
Date of fiscal year end: March 31
Date of reporting period: March 31, 2021
Form N-CSR is to be used by management investment companies to file reports with the Commission not later than 10 days after the transmission to stockholders of any report that is required to be transmitted to stockholders under Rule 30e-1 under the Investment Company Act of 1940 (17 CFR 270.30e-1). The Commission may use the information provided on Form N-CSR in its regulatory, disclosure review, inspection, and policymaking roles.
A registrant is required to disclose the information specified by Form N-CSR, and the Commission will make this information public. A registrant is not required to respond to the collection of information contained in Form N-CSR unless the Form displays a currently valid Office of Management and Budget ("OMB") control number. Please direct comments concerning the accuracy of the information collection burden estimate and any suggestions for reducing the burden to Secretary, Securities and Exchange Commission, 450 Fifth Street, NW, Washington, DC 20549-0609. The OMB has reviewed this collection of information under the clearance requirements of 44 U.S.C. § 3507.
Item 1. Reports to Stockholders.
| (a) | The Report to Shareholders is attached herewith. |
| Touchstone Strategic Trust |
| Touchstone Flexible Income Fund |
| Touchstone Focused Fund |
| Touchstone Global ESG Equity Fund |
| Touchstone Growth Opportunities Fund |
| Touchstone Mid Cap Growth Fund |
| Touchstone Sands Capital Emerging Markets Growth Fund |


President
Touchstone Strategic Trust

| Average Annual Total Returns** | |||
| Touchstone Flexible Income Fund | 1 Year | 5 Years | 10 Years |
| Class A | 13.35% | 3.26% | 3.93% |
| Class C | 13.89% | 3.73% | 3.93% |
| Class Y | 16.07% | 4.77% | 4.82% |
| Institutional Class* | 16.19% | 4.86% | 4.89% |
| Bloomberg Barclays U.S. Aggregate Bond Index | 0.71% | 3.10% | 3.44% |
| * | The chart above represents performance of Class A shares only, which will vary from the performance of Class C shares, Class Y shares and Institutional Class shares based on the differences in sales loads and fees paid by shareholders in the different classes. The inception date of Institutional Class shares was September 10, 2012. Institutional Class shares performance information was calculated using the historical performance of Class Y shares for the periods prior to September 10, 2012. The returns have been restated for sales loads and fees applicable to Institutional Class shares. |
| ** | The average annual total returns shown above are adjusted for maximum sales loads and fees, if applicable. Effective June 30, 2020, the maximum offering price per share of Class A shares is equal to the net asset value (“NAV”) per share plus a sales load equal to 3.36% of the NAV (or 3.25% of the offering price). Prior to June 30, 2020, the maximum offering price per share of Class A shares was equal to the NAV per share plus a sales load equal to 2.04% of the NAV (or 2.00% of the offering price). Class C shares are subject to a contingent deferred sales charge (“CDSC”) of 1.00%. The CDSC will be assessed on an amount equal to the lesser of (1) the NAV at the time of purchase of the shares being redeemed or (2) the NAV of such shares being redeemed, if redeemed within a one-year period from the date of purchase. Class Y shares and Institutional Class shares are not subject to sales charges. |

| Average Annual Total Returns** | |||
| Touchstone Focused Fund | 1 Year | 5 Years | 10 Years |
| Class A | 60.90% | 13.67% | 12.85% |
| Class C* | 67.10% | 14.17% | 12.96% |
| Class Y | 69.89% | 15.37% | 13.83% |
| Institutional Class | 70.00% | 15.45% | 13.95% |
| Russell 3000® Index | 62.53% | 16.64% | 13.79% |
| S&P 500® Index | 56.35% | 16.29% | 13.91% |
| * | The chart above represents performance of Class A shares only, which will vary from the performance of Class C shares, Class Y shares and Institutional Class shares based on the differences in sales loads and fees paid by shareholders in the different classes. The inception date of Class C shares was April 12, 2012. Class C shares performance information was calculated using the historical performance of Class Y shares for the periods prior to April 12, 2012. The returns have been restated for sales loads and fees applicable to Class C shares. |
| ** | The average annual total returns shown above are adjusted for maximum sales loads and fees, if applicable. The maximum offering price per share of Class A shares is equal to the net asset value (“NAV”) per share plus a sales load equal to 5.26% of the NAV (or 5.00% of the offering price). Class C shares are subject to a contingent deferred sales charge (“CDSC”) of 1.00%. The CDSC will be assessed on an amount equal to the lesser of (1) the NAV at the time of purchase of the shares being redeemed or (2) the NAV of such shares being redeemed, if redeemed within a one-year period from the date of purchase. Class Y shares and Institutional Class shares are not subject to sales charges. |

| Average Annual Total Returns** | |||
| Touchstone Global ESG Equity Fund | 1 Year | 5 Years | 10 Years |
| Class A | 48.04% | 10.75% | 9.60% |
| Class C | 53.55% | 11.16% | 9.57% |
| Class Y | 56.22% | 12.36% | 10.53% |
| Institutional Class* | 56.21% | 12.40% | 10.55% |
| MSCI All Country World Index | 54.60% | 13.21% | 9.14% |
| * | The chart above represents performance of Class A shares only, which will vary from the performance of Class C shares, Class Y shares and Institutional Class shares based on the differences in sales loads and fees paid by shareholders in the different classes. The inception date of Institutional Class shares was May 4, 2015. Institutional Class shares performance information was calculated using the historical performance of Class A shares for periods prior to May 4, 2015. The returns have been restated for sales loads and fees applicable to Institutional Class shares. |
| ** | The average annual total returns shown above are adjusted for maximum sales loads and fees, if applicable. The maximum offering price per share of Class A shares is equal to the net asset value (“NAV”) per share plus a sales load equal to 5.26% of the NAV (or 5.00% of the offering price). Class C shares are subject to a contingent deferred sales charge (“CDSC”) of 1.00%. The CDSC will be assessed on an amount equal to the lesser of (1) the NAV at the time of purchase of the shares being redeemed or (2) the NAV of such shares being redeemed, if redeemed within a one-year period from the date of purchase. Class Y shares and Institutional Class shares are not subject to sales charges. |
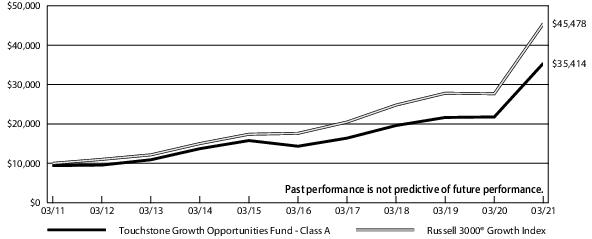
| Average Annual Total Returns** | |||
| Touchstone Growth Opportunities Fund | 1 Year | 5 Years | 10 Years |
| Class A | 54.43% | 18.40% | 13.48% |
| Class C | 60.29% | 18.90% | 13.48% |
| Class Y | 62.93% | 20.11% | 14.44% |
| Institutional Class | 63.13% | 20.23% | 14.56% |
| Russell 3000® Growth Index | 64.31% | 20.87% | 16.35% |
| * | The chart above represents performance of Class A shares only, which will vary from the performance of Class C shares, Class Y shares and Institutional Class shares based on the differences in sales loads and fees paid by shareholders in the different classes. |
| ** | The average annual total returns shown above are adjusted for maximum sales loads and fees, if applicable. The maximum offering price per share of Class A shares is equal to the net asset value (“NAV”) per share plus a sales load equal to 5.26% of the NAV (or 5.00% of the offering price). Class C shares are subject to a contingent deferred sales charge (“CDSC”) of 1.00%. The CDSC will be assessed on an amount equal to the lesser of (1) the NAV at the time of purchase of the shares being redeemed or (2) the NAV of such shares being redeemed, if redeemed within a one-year period from the date of purchase. Class Y shares and Institutional Class shares are not subject to sales charges. |

| Average Annual Total Returns** | |||
| Touchstone Mid Cap Growth Fund | 1 Year | 5 Years | 10 Years |
| Class A | 53.88% | 16.41% | 12.18% |
| Class C | 59.65% | 16.88% | 12.18% |
| Class Y | 62.40% | 18.09% | 13.15% |
| Class R6* | 62.58% | 18.17% | 13.24% |
| Institutional Class* | 62.50% | 18.16% | 13.24% |
| Russell Midcap® Growth Index | 68.61% | 18.39% | 14.11% |
| * | The chart above represents performance of Class A shares only, which will vary from the performance of Class C shares, Class Y shares, Class R6 shares and Institutional Class shares based on the differences in sales loads and fees paid by shareholders in the different classes. The inception date of Class R6 shares and Institutional Class shares was February 10, 2020 and April 1, 2011, respectively. Institutional Class shares performance information was calculated using the historical performance of Class A shares for periods prior to April 1, 2011. Class R6 shares performance information was calculated using the historical performance of Institutional Class shares for periods prior to February 10, 2020. The returns have been restated for fees applicable to Class R6 and Institutional Class shares. |
| ** | The average annual total returns shown above are adjusted for maximum sales loads and fees, if applicable. The maximum offering price per share of Class A shares is equal to the net asset value (“NAV”) per share plus a sales load equal to 5.26% of the NAV (or 5.00% of the offering price). Class C shares are subject to a contingent deferred sales charge (“CDSC”) of 1.00%. The CDSC will be assessed on an amount equal to the lesser of (1) the NAV at the time of purchase of the shares being redeemed or (2) the NAV of such shares being redeemed, if redeemed within a one-year period from the date of purchase. Class Y shares, Class R6 shares, and Institutional Class shares are not subject to sales charges. |

| Average Annual Total Returns** | |||
| Touchstone Sands Capital Emerging Markets Growth Fund | 1 Year | 5 Years | Since Inception* |
| Class A* | 77.68% | 16.49% | 10.62% |
| Class C* | 84.70% | 16.81% | 10.62% |
| Class Y* | 87.71% | 17.98% | 11.74% |
| Institutional Class* | 87.79% | 18.09% | 11.83% |
| MSCI Emerging Markets Index | 58.39% | 12.07% | 6.44% |
| * | The chart above represents performance of Class A shares only, which will vary from the performance of Class C shares, Class Y shares and Institutional Class shares based on the differences in sales loads and fees paid by shareholders in the different classes. The inception date of Class A shares, Class C shares, Class Y shares and Institutional Class shares was November 16, 2018, November 16, 2018, May 9, 2014 and May 9, 2014, respectively. Class A shares and Class C shares performance information was calculated using the historical performance of Class Y shares for periods prior to November 16, 2018. The returns have been restated for sales loads and fees applicable to Class A and Class C shares. The returns of the index listed above are based on the inception date of the Fund. |
| ** | The average annual total returns shown above are adjusted for maximum sales loads and fees, if applicable. The maximum offering price per share of Class A shares is equal to the net asset value (“NAV”) per share plus a sales load equal to 5.26% of the NAV (or 5.00% of the offering price). Class C shares are subject to a contingent deferred sales charge (“CDSC”) of 1.00%. The CDSC will be assessed on an amount equal to the lesser of (1) the NAV at the time of purchase of the shares being redeemed or (2) the NAV of such shares being redeemed, if redeemed within a one-year period from the date of purchase. Class Y shares and Institutional Class shares are not subject to sales charges. |
| Credit Quality*(% of Fixed Income Securities) | |
| AAA/Aaa | 47.0% |
| AA/Aa | 0.1 |
| A/A | 5.2 |
| BBB/Baa | 8.3 |
| BB/Ba | 13.5 |
| B/B | 7.6 |
| Not Rated | 18.3 |
| 100.0% | |
| Credit Quality*(% of Preferred Stocks) | |
| AA/Aa | 1.8 |
| BBB/Baa | 54.8 |
| BB/Ba | 27.8 |
| CCC | 0.8 |
| Not Rated | 14.8 |
| 100.0% | |
| Sector Allocation**(% of Net Assets) | |
| Fixed Income Securities | 59.1% |
| Preferred Stocks | |
| Financials | 10.7 |
| Utilities | 2.4 |
| Energy | 1.8 |
| Communication Services | 0.2 |
| Investment Funds | 9.1 |
| Short-Term Investment Funds | 13.1 |
| Other Assets/Liabilities (Net) | 3.6 |
| Total | 100.0% |
| Sector Allocation**(% of Net Assets) | |
| Information Technology | 21.8% |
| Consumer Discretionary | 17.2 |
| Communication Services | 15.5 |
| Financials | 12.7 |
| Industrials | 10.6 |
| Health Care | 10.5 |
| Real Estate | 3.9 |
| Consumer Staples | 3.3 |
| Materials | 1.5 |
| Energy | 1.1 |
| Short-Term Investment Fund | 2.0 |
| Other Assets/Liabilities (Net) | (0.1) |
| Total | 100.0% |
| Geographic Allocation(% of Net Assets) | |
| Common Stocks | |
| United States | 54.3% |
| Germany | 8.1 |
| France | 6.2 |
| Japan | 6.1 |
| Sweden | 4.4 |
| South Korea | 2.8 |
| Italy | 2.7 |
| Canada | 2.3 |
| China | 2.1 |
| Switzerland | 1.8 |
| United Kingdom | 1.7 |
| India | 1.7 |
| Singapore | 1.6 |
| Netherlands | 1.2 |
| Thailand | 0.8 |
| Denmark | 0.6 |
| Exchange-Traded Funds | 1.0 |
| Short-Term Investment Fund | 0.7 |
| Other Assets/Liabilities (Net) | (0.1) |
| Total | 100.0% |
| Sector Allocation*(% of Net Assets) | |
| Information Technology | 41.4% |
| Health Care | 13.5 |
| Consumer Discretionary | 12.6 |
| Industrials | 11.6 |
| Communication Services | 11.4 |
| Financials | 4.3 |
| Materials | 1.7 |
| Consumer Staples | 1.6 |
| Real Estate | 1.6 |
| Short-Term Investment Fund | 0.4 |
| Other Assets/Liabilities (Net) | (0.1) |
| Total | 100.0% |
| Sector Allocation*(% of Net Assets) | |
| Information Technology | 31.3% |
| Health Care | 22.7 |
| Industrials | 16.8 |
| Consumer Discretionary | 13.0 |
| Financials | 5.5 |
| Communication Services | 4.7 |
| Materials | 2.0 |
| Real Estate | 1.7 |
| Short-Term Investment Fund | 2.5 |
| Other Assets/Liabilities (Net) | (0.2) |
| Total | 100.0% |
| Geographic Allocation(% of Net Assets) | |
| Common Stocks | |
| China | 32.0% |
| India | 21.3 |
| Taiwan | 15.6 |
| Argentina | 8.5 |
| Brazil | 6.4 |
| Russia | 4.0 |
| Hong Kong | 3.5 |
| Indonesia | 1.5 |
| Kazakhstan | 1.5 |
| Thailand | 1.3 |
| Poland | 1.1 |
| Vietnam | 0.5 |
| Short-Term Investment Fund | 3.0 |
| Other Assets/Liabilities (Net) | (0.2) |
| Total | 100.0% |
| Principal Amount | Market Value | |||
| Corporate Bonds — 27.5% | ||||
| Financials — 12.4% | ||||
| $ 3,378,000 | Bank of New York Mellon Corp. (The), Ser G, 4.700%(A) | $ 3,659,894 | ||
| 16,003,000 | Charles Schwab Corp. (The), Ser G, 5.375%(A) | 17,739,325 | ||
| 7,814,000 | Citigroup, Inc., Ser Q, (3M LIBOR +4.095%), 4.289%(A)(B) | 7,774,930 | ||
| 1,179,000 | Citigroup, Inc., Ser R, (3M LIBOR +4.478%), 4.672%(A)(B) | 1,181,638 | ||
| 4,775,000 | Citigroup, Inc., Ser V, 4.700%(A) | 4,808,425 | ||
| 6,134,000 | Citigroup, Inc., Ser W, 4.000%(A) | 6,193,807 | ||
| 12,391,000 | Citizens Financial Group, Inc., Ser F, 5.650%(A) | 13,661,077 | ||
| 5,506,000 | Fifth Third Bancorp, Ser L, 4.500%(A) | 5,847,372 | ||
| 4,423,000 | Huntington Bancshares, Inc., Ser F, 5.625%(A) | 4,916,165 | ||
| 13,386,000 | Regions Financial Corp., Ser D, 5.750%(A) | 14,741,332 | ||
| 11,043,000 | Truist Financial Corp., Ser Q, 5.100%(A) | 12,023,066 | ||
| 5,172,000 | Wells Fargo & Co., 3.900%(A) | 5,223,203 | ||
| 97,770,234 | ||||
| Energy — 5.6% | ||||
| 24,808,000 | BP Capital Markets PLC (United Kingdom), 4.875%(A) | 26,575,570 | ||
| 4,302,000 | Energy Transfer Operating LP, (3M LIBOR +3.018%), 3.223%, 11/1/66(B) | 2,989,890 | ||
| 3,121,000 | Energy Transfer Operating LP, Ser G, 7.125%(A) | 3,040,790 | ||
| 11,421,000 | MPLX LP, Ser B, 6.875%(A) | 11,421,000 | ||
| 44,027,250 | ||||
| Utilities — 5.0% | ||||
| 14,830,000 | Edison International, 5.375%(A) | 15,089,525 | ||
| 23,090,000 | Sempra Energy, 4.875%(A) | 24,706,300 | ||
| 39,795,825 | ||||
| Consumer Discretionary — 4.5% | ||||
| 24,491,000 | Macy's, Inc., 144a, 8.375%, 6/15/25 | 27,116,680 | ||
| 8,434,000 | Marriott Ownership Resorts, Inc., 144a, 6.125%, 9/15/25 | 8,957,988 | ||
| 36,074,668 | ||||
| Total Corporate Bonds | $217,667,977 | |||
| Agency Collateralized Mortgage Obligations — 22.2% | ||||
| 27,757,128 | FHLMC Multifamily Structured Pass Through Certificates, Ser K104, Class X1, 1.127%, 1/25/30(B)(C)(D) | 2,355,656 | ||
| 47,450,320 | FHLMC Multifamily Structured Pass Through Certificates, Ser K109, Class X1, 1.583%, 4/25/30(B)(C)(D) | 5,781,788 | ||
| 34,563,933 | FHLMC Multifamily Structured Pass Through Certificates, Ser K110, Class X1, 1.698%, 4/25/30(B)(C)(D) | 4,453,086 | ||
| 7,005,157 | FHLMC Multifamily Structured Pass Through Certificates, Ser K110, Class X3, 3.404%, 6/25/48(B)(C)(D) | 1,791,474 | ||
| 28,800,000 | FHLMC Multifamily Structured Pass Through Certificates, Ser K110, Class XAM, 1.868%, 4/25/30(B)(C)(D) | 4,346,640 | ||
| 34,781,918 | FHLMC Multifamily Structured Pass Through Certificates, Ser K111, Class X1, 1.572%, 5/25/30(B)(C)(D) | 4,268,079 | ||
| 15,310,315 | FHLMC Multifamily Structured Pass Through Certificates, Ser K111, Class X3, 3.176%, 4/25/48(B)(C)(D) | 3,715,778 | ||
| 35,663,000 | FHLMC Multifamily Structured Pass Through Certificates, Ser K111, Class XAM, 1.796%, 5/25/30(B)(C)(D) | 5,179,748 | ||
| 66,962,427 | FHLMC Multifamily Structured Pass Through Certificates, Ser K112, Class X1, 1.433%, 5/25/30(B)(C)(D) | 7,574,107 | ||
| Principal Amount | Market Value | |||
| Agency Collateralized Mortgage Obligations — 22.2% (Continued) | ||||
| $ 15,300,000 | FHLMC Multifamily Structured Pass Through Certificates, Ser K112, Class X3, 3.001%, 7/25/48(B)(C)(D) | $ 3,488,652 | ||
| 10,630,000 | FHLMC Multifamily Structured Pass Through Certificates, Ser K112, Class XAM, 1.662%, 5/25/30(B)(C)(D) | 1,448,597 | ||
| 55,698,211 | FHLMC Multifamily Structured Pass Through Certificates, Ser K113, Class X1, 1.387%, 6/25/30(B)(C)(D) | 6,090,143 | ||
| 10,743,000 | FHLMC Multifamily Structured Pass Through Certificates, Ser K113, Class XAM, 1.590%, 6/25/30(B)(C)(D) | 1,410,517 | ||
| 19,500,000 | FHLMC Multifamily Structured Pass Through Certificates, Ser K114, Class X3, 2.736%, 8/25/48(B)(C)(D) | 4,024,782 | ||
| 21,702,896 | FHLMC Multifamily Structured Pass Through Certificates, Ser K115, Class X3, 2.958%, 9/25/48(B)(C)(D) | 4,893,356 | ||
| 26,000,000 | FHLMC Multifamily Structured Pass Through Certificates, Ser K116, Class X3, 3.021%, 9/25/47(B)(C)(D) | 6,045,668 | ||
| 39,700,000 | FHLMC Multifamily Structured Pass Through Certificates, Ser K117, Class XAM, 1.435%, 9/25/30(B)(C)(D) | 4,780,499 | ||
| 24,034,533 | FHLMC Multifamily Structured Pass Through Certificates, Ser K118, Class X3, 2.693%, 10/25/48(B)(C)(D) | 5,036,033 | ||
| 11,576,808 | FHLMC Multifamily Structured Pass Through Certificates, Ser K120, Class X3, 2.740%, 11/25/48(B)(C)(D) | 2,483,563 | ||
| 16,073,000 | FHLMC Multifamily Structured Pass Through Certificates, Ser K121, Class X3, 2.772%, 11/25/48(B)(C)(D) | 3,544,498 | ||
| 9,700,000 | FHLMC Multifamily Structured Pass Through Certificates, Ser K122, Class X3, 2.631%, 1/25/49(B)(C)(D) | 2,010,003 | ||
| 7,569,056 | FHLMC Multifamily Structured Pass Through Certificates, Ser K123, Class X3, 2.628%, 2/25/49(B)(C)(D) | 1,550,903 | ||
| 9,255,000 | FHLMC Multifamily Structured Pass Through Certificates, Ser K124, Class X3, 2.620%, 2/25/49(B)(C)(D) | 1,924,077 | ||
| 16,150,000 | FHLMC Multifamily Structured Pass Through Certificates, Ser K125, Class X3, 2.654%, 2/25/49(B)(C)(D) | 3,433,505 | ||
| 38,058,448 | FHLMC Multifamily Structured Pass Through Certificates, Ser K127, Class X3, 2.746%, 3/25/49(B)(C)(D) | 7,983,981 | ||
| 35,471,574 | FHLMC Multifamily Structured Pass Through Certificates, Ser K-1515, Class X1, 1.513%, 2/25/35(B)(C)(D) | 5,542,671 | ||
| 5,835,659 | FHLMC Multifamily Structured Pass Through Certificates, Ser K-1515, Class X3, 3.680%, 3/25/38(B)(C)(D) | 2,180,570 | ||
| 47,427,434 | FHLMC Multifamily Structured Pass Through Certificates, Ser K-1516, Class X1, 1.512%, 5/25/35(B)(C)(D) | 7,827,049 | ||
| 18,435,033 | FHLMC Multifamily Structured Pass Through Certificates, Ser K-1516, Class X3, 3.456%, 10/25/38(B)(C)(D) | 6,657,864 | ||
| 34,982,808 | FHLMC Multifamily Structured Pass Through Certificates, Ser K-1517, Class X1, 1.334%, 7/25/35(B)(C)(D) | 5,077,506 | ||
| Principal Amount | Market Value | |||
| Agency Collateralized Mortgage Obligations — 22.2% (Continued) | ||||
| $ 52,485,811 | FHLMC Multifamily Structured Pass Through Certificates, Ser K-1517, Class X3, 3.284%, 8/25/38(B)(C)(D) | $ 17,742,403 | ||
| 11,201,391 | FHLMC Multifamily Structured Pass Through Certificates, Ser K-1519, Class X3, 2.800%, 12/25/38(B)(C)(D) | 3,266,461 | ||
| 15,100,238 | FHLMC Multifamily Structured Pass Through Certificates, Ser K739, Class X3, 2.849%, 11/25/48(B)(C)(D) | 2,383,462 | ||
| 16,196,664 | FHLMC Multifamily Structured Pass Through Certificates, Ser K741, Class X3, 2.533%, 3/25/49(B)(C)(D) | 2,299,907 | ||
| 53,425,761 | FRESB 2020-SB81Mortgage Trust, Ser 2020-SB81, Class X1, 1.078%, 10/25/40(B)(C)(D) | 4,228,751 | ||
| 33,416,794 | FRESB Mortgage Trust, Ser 2020-SB79, Class X1, 1.236%, 7/25/40(B)(C)(D) | 2,305,562 | ||
| 45,647,220 | FRESB Mortgage Trust, Ser 2021-SB82, Class X1, 1.136%, 10/25/40(B)(C)(D) | 3,226,254 | ||
| 57,448,866 | FRESB Mortgage Trust, Ser 2021-SB83, Class X1, 0.875%, 1/25/41(B)(C)(D) | 4,202,810 | ||
| 34,250,000 | FRESB Mortgage Trust, Ser 2021-SB84, Class X1, 0.672%, 1/25/41(B)(C)(D) | 1,722,641 | ||
| 5,466,995 | GNMA, Ser 2012-147, Class IO, 0.579%, 4/16/54(B)(C)(D) | 112,871 | ||
| 21,097,093 | GNMA, Ser 2016-110, Class IO, 0.951%, 5/16/58(B)(C)(D) | 1,178,650 | ||
| 27,187,971 | GNMA, Ser 2016-158, Class IO, 0.795%, 6/16/58(B)(C)(D) | 1,338,048 | ||
| 32,860,215 | GNMA, Ser 2016-52, Class IO, 0.820%, 3/16/58(B)(C)(D) | 1,538,282 | ||
| 30,628,520 | GNMA, Ser 2017-76, Class IO, 0.892%, 12/16/56(B)(C)(D) | 1,719,427 | ||
| 23,154,623 | GNMA, Ser 2017-94, Class IO, 0.566%, 2/16/59(B)(C)(D) | 1,028,012 | ||
| Total Agency Collateralized Mortgage Obligations | $175,194,334 | |||
| Shares | ||||
| Preferred Stocks — 15.1% | ||||
| Financials — 10.7% | ||||
| 597,440 | AGNC Investment Corp., Ser F, 6.125%(A) | 14,135,430 | ||
| 493,052 | Annaly Capital Management, Inc., Ser I, 6.750%(A) | 12,508,729 | ||
| 446,648 | Ares Management Corp., Ser A, 7.000%(A) | 11,411,856 | ||
| 217,122 | Bank of America Corp., Ser EE, 6.000%(A) | 5,428,050 | ||
| 128,065 | Bank of America Corp., Ser GG, 6.000%(A) | 3,483,368 | ||
| 307,420 | GMAC Capital Trust I, Ser 2, (3M LIBOR +5.785%), 5.983%, 2/15/40(B) | 7,833,062 | ||
| 113,837 | Hartford Financial Services Group, Inc. (The), 7.875%, 4/15/42 | 3,055,385 | ||
| 17,276 | JPMorgan Chase & Co., Ser BB, 6.150%(A) | 440,884 | ||
| 124,252 | JPMorgan Chase & Co., Ser JJ, 4.550%(A) | 3,183,336 | ||
| 254,594 | National Rural Utilities Cooperative Finance Corp., Ser US, 5.500%, 5/15/64 | 6,728,920 | ||
| 84,703 | PartnerRe Ltd. (Bermuda), Ser H, 7.250%(A) | 2,140,445 | ||
| 144,582 | Reinsurance Group of America, Inc., 6.200%, 9/15/42 | 3,884,918 | ||
| 136,380 | Stifel Financial Corp., 5.200%, 10/15/47 | 3,549,971 | ||
| 190,829 | Virtus AllianzGI Convertible & Income Fund, Ser A, 5.625%(A) | 5,037,886 | ||
| 70,650 | Wells Fargo & Co., Ser Z, 4.750%(A) | 1,803,695 | ||
| 84,625,935 | ||||
| Shares | MarketValue | |||
| Utilities — 2.4% | ||||
| 349,698 | Brookfield Renewable Partners LP (Canada), Ser 17, 5.250%(A) | $ 9,116,627 | ||
| 241,181 | Duke Energy Corp., Ser A, 5.750%(A) | 6,668,655 | ||
| 126,633 | Entergy Louisiana LLC, 4.875%, 9/1/66 | 3,222,810 | ||
| 670 | Entergy New Orleans LLC, 5.000%, 12/1/52 | 17,089 | ||
| 19,025,181 | ||||
| Energy — 1.8% | ||||
| 22,839 | Enbridge, Inc. (Canada), Ser 1, 5.949%(A) | 454,953 | ||
| 90,996 | Enbridge, Inc. (Canada), Ser 5, 5.375%(A) | 1,742,573 | ||
| 46,849 | Enbridge, Inc. (Canada), Ser J, 4.887%(A) | 871,391 | ||
| 32,865 | Enbridge, Inc. (Canada), Ser L, 4.959%(A) | 628,708 | ||
| 426,035 | Energy Transfer Operating LP, Ser E, 7.600%(A) | 10,186,497 | ||
| 13,884,122 | ||||
| Communication Services — 0.2% | ||||
| 69,235 | AT&T, Inc. , 5.350%, 11/1/66 | 1,812,572 | ||
| Total Preferred Stocks | $119,347,810 | |||
| Investment Funds — 9.1% | ||||
| 631,461 | BlackRock Corporate High Yield Fund, Inc.± | 7,413,352 | ||
| 73,745 | BlackRock Credit Allocation Income Trust± | 1,082,577 | ||
| 85,719 | BlackRock Debt Strategies Fund, Inc.±† | 942,909 | ||
| 94,038 | BlackRock Ltd. Duration Income Trust±† | 1,575,136 | ||
| 62,062 | BlackRock Municipal Income Trust±† | 930,930 | ||
| 444,552 | BlackRock MuniVest Fund, Inc.± | 4,134,334 | ||
| 37,952 | BlackRock MuniYield Quality Fund III, Inc.±† | 541,196 | ||
| 19,728 | Cohen & Steers Ltd. Duration Preferred & Income Fund, Inc.±† | 515,295 | ||
| 117,689 | Eaton Vance Municipal Bond Fund± | 1,565,264 | ||
| 99,219 | First Trust High Income Long/Short Fund± | 1,500,191 | ||
| 26,692 | First Trust Intermediate Duration Preferred & Income Fund±† | 639,273 | ||
| 482,714 | Invesco Municipal Opportunity Trust±† | 6,362,171 | ||
| 117,978 | Invesco Municipal Trust±† | 1,557,310 | ||
| 1,501,838 | Invesco Senior Income Trust±† | 6,307,720 | ||
| 392,823 | Invesco Trust for Investment Grade Municipals±† | 5,295,254 | ||
| 149,681 | John Hancock Premium Dividend Fund±† | 2,234,737 | ||
| 308,005 | Nuveen AMT-Free Quality Municipal Income Fund±† | 4,564,634 | ||
| 1,538,241 | Nuveen Credit Strategies Income Fund±† | 9,998,566 | ||
| 104,375 | Nuveen Preferred & Income Opportunities Fund±† | 990,519 | ||
| 115,860 | Nuveen Preferred & Income Securities Fund±† | 1,126,159 | ||
| 247,936 | Nuveen Quality Municipal Income Fund±† | 3,753,751 | ||
| 248,476 | Wells Fargo Income Opportunities Fund± | 2,097,137 | ||
| 924,038 | Western Asset High Income Opportunity Fund, Inc.± | 4,694,113 | ||
| 117,465 | Western Asset High Yield Defined Opportunity Fund, Inc.± | 1,812,485 | ||
| Total Investment Funds | $71,635,013 | |||
| Principal Amount | ||||
| Non-Agency Collateralized Mortgage Obligations — 4.0% | ||||
| $ 70,045 | Bear Stearns Asset Backed Securities Trust, Ser 2003-AC7, Class A2, 5.750%, 1/25/34(B)(D) | 71,229 | ||
| 5,581 | Merrill Lynch Mortgage Investors Trust, Ser 2003-A1, Class 2A, (12M LIBOR +1.625%), 1.905%, 12/25/32(B) | 5,553 | ||
| 156,735 | Morgan Stanley Mortgage Loan Trust, Ser 2004-7AR, Class 2A6, 2.568%, 9/25/34(B)(D) | 159,850 | ||
| 4,710,289 | New Residential Mortgage Loan Trust, Ser 2020-RPL2, Class A1, 144a, 3.578%, 8/25/25(B)(D) | 4,799,379 | ||
| 12,187,254 | Pretium Mortgage Credit Partners I LLC, Ser 2020-RPL1, Class A1, 144a, 3.819%, 5/27/60(B)(D) | 12,266,673 | ||
| Principal Amount | MarketValue | |||
| Non-Agency Collateralized Mortgage Obligations — 4.0% (Continued) | ||||
| $ 2,763,818 | PRPM LLC, Ser 2020-2, Class A1, 144a, 3.671%, 8/25/25(B)(D) | $ 2,794,327 | ||
| 9,771 | RALI Series Trust, Ser 2004-QS6, Class A1, 5.000%, 5/25/19 | 9,206 | ||
| 12,375,356 | Redwood Funding Trust, Ser 2020-1, Class A, 144a, 4.750%, 7/27/59(B)(D) | 11,444,414 | ||
| Total Non-Agency Collateralized Mortgage Obligations | $31,550,631 | |||
| Commercial Mortgage-Backed Securities — 2.9% | ||||
| 29,948,809 | BANK, Ser 2020-BN26, Class XA, 1.237%, 3/15/63(B)(C)(D) | 2,599,670 | ||
| 3,020,640 | Harvest Commercial Capital Loan Trust, Ser 2019-1, Class A, 144a, 3.290%, 9/25/46(B)(D) | 3,038,228 | ||
| 6,788,275 | VCC Trust, Ser 2020-MC1, Class A, 144a, 4.500%, 6/25/45(B)(D) | 6,806,217 | ||
| 4,901,747 | Velocity Commercial Capital Loan Trust, Ser 2019-2, Class A, 144a, 3.130%, 7/25/49(B)(D) | 4,968,344 | ||
| 5,401,996 | Velocity Commercial Capital Loan Trust, Ser 2020-1, Class AFX, 144a, 2.610%, 2/25/50(B)(D) | 5,463,438 | ||
| Total Commercial Mortgage-Backed Securities | $22,875,897 | |||
| Asset-Backed Securities — 2.5% | ||||
| 352,857 | Arivo Acceptance Auto Loan Receivables Trust, Ser 2019-1, Class A, 144a, 2.990%, 7/15/24 | 357,210 | ||
| 96,152 | Conseco Finance Corp., Ser 1998-4, Class A7, 6.870%, 4/1/30(B)(D) | 97,759 | ||
| 21,657 | JFIN CLO Ltd. (Cayman Islands), Ser 2014-1A, Class AR, 144a, (3M LIBOR +0.950%), 1.174%, 4/21/25(B) | 21,660 | ||
| 369,180 | Mid-State Capital Corp. Trust, Ser 2005-1, Class M2, 7.079%, 1/15/40 | 410,642 | ||
| 4,290,338 | New Residential Mortgage Loan Trust, Ser 2020-NPL2, Class A1, 144a, 3.228%, 8/25/60(B)(D) | 4,324,734 | ||
| 3,000,000 | Palmer Square Loan Funding Ltd. (Cayman Islands), Ser 2021-1A, Class D, 144a, (3M LIBOR +6.000%), 6.155%, 4/20/29(B) | 3,015,084 | ||
| 5,697,289 | PRPM LLC, Ser 2020-1A, Class A1, 144a, 2.981%, 2/25/25(B)(D) | 5,709,962 | ||
| 5,592,581 | VCAT LLC, Ser 2020-NPL1, Class A1, 144a, 3.671%, 8/25/50(B)(D) | 5,648,173 | ||
| Total Asset-Backed Securities | $19,585,224 | |||
| Shares | ||||
| Short-Term Investment Funds — 13.1% | ||||
| 100,298,029 | Dreyfus Government Cash Management, Institutional Shares, 0.03%∞Ω | 100,298,029 | ||
| 3,187,193 | Invesco Government & Agency Portfolio, Institutional Class, 0.03%∞Ω** | 3,187,193 | ||
| Total Short-Term Investment Funds | $103,485,222 | |||
| Total Investment Securities—96.4% (Cost $742,334,174) | $761,342,108 | |||
| Other Assets in Excess of Liabilities — 3.6% | 28,310,044 | |||
| Net Assets — 100.0% | $789,652,152 | |||
| (A) | Perpetual Bond - A bond or preferred stock with no definite maturity date. |
| (B) | Variable rate security - Rate reflected is the rate in effect as of March 31, 2021. |
| (C) | Interest only security - This type of security represents the right to receive the monthly interest payments on an underlying pool of mortgages. Payments of principal on the pool reduce the value of the “interest only” holding. |
| (D) | Certain variable rate securities are not based on a published reference rate and spread but are determined by the issuer or agent and are based on current market conditions. These securities do not indicate a reference rate and spread in their description. |
| ± | Closed-end Fund. |
| ** | Represents collateral for securities loaned. |
| † | All or a portion of the security is on loan. The total market value of the securities on loan as of March 31, 2021 was $3,120,515. |
| ∞ | Open-End Fund. |
| Ω | Represents the 7-Day SEC yield as of March 31, 2021. |
| Portfolio Abbreviations: |
| CLO – Collateralized Loan Obligation |
| FHLMC – Federal Home Loan Mortgage Corporation |
| FRESB – Freddie Mac Multifamily Securitization Small Balance Loan |
| GNMA – Government National Mortgage Association |
| IO – Interest Only |
| LIBOR – London Interbank Offered Rate |
| LLC – Limited Liability Company |
| LP – Limited Partnership |
| PLC – Public Limited Company |
| 144a - This is a restricted security that was sold in a transaction qualifying for the exemption under Rule 144a of the Securities Act of 1933. This security may be sold in transactions exempt from registration, normally to qualified institutional buyers. At March 31, 2021, these securities were valued at $106,732,511 or 13.5% of net assets. These securities were deemed liquid pursuant to procedures approved by the Board of Trustees. |
| Valuation Inputs at Reporting Date: | ||||
| Description | Level 1 | Level 2 | Level 3 | Total |
| Corporate Bonds | $— | $217,667,977 | $— | $217,667,977 |
| Agency Collateralized Mortgage Obligations | — | 175,194,334 | — | 175,194,334 |
| Preferred Stocks | 117,605,237 | 1,742,573 | — | 119,347,810 |
| Investment Funds | 71,635,013 | — | — | 71,635,013 |
| Non-Agency Collateralized Mortgage Obligations | — | 31,550,631 | — | 31,550,631 |
| Commercial Mortgage-Backed Securities | — | 22,875,897 | — | 22,875,897 |
| Asset-Backed Securities | — | 19,585,224 | — | 19,585,224 |
| Short-Term Investment Funds | 103,485,222 | — | — | 103,485,222 |
| Total | $292,725,472 | $468,616,636 | $— | $761,342,108 |
| Shares | Market Value | |||
| Common Stocks — 98.1% | ||||
| Information Technology — 21.8% | ||||
| 433,946 | Apple, Inc. | $ 53,006,504 | ||
| 277,874 | Avnet, Inc. | 11,534,550 | ||
| 115,125 | International Business Machines Corp. | 15,341,557 | ||
| 300,854 | Microsoft Corp. | 70,932,348 | ||
| 316,235 | Oracle Corp. | 22,190,210 | ||
| 121,057 | salesforce.com, Inc.* | 25,648,347 | ||
| 183,412 | SS&C Technologies Holdings, Inc. | 12,814,996 | ||
| 114,131 | Texas Instruments, Inc. | 21,569,618 | ||
| 68,143 | Workday, Inc. - Class A* | 16,928,765 | ||
| 249,966,895 | ||||
| Consumer Discretionary — 17.2% | ||||
| 68,036 | Alibaba Group Holding Ltd. (China) ADR* | 15,425,802 | ||
| 15,216 | Amazon.com, Inc.* | 47,079,521 | ||
| 179,061 | Choice Hotels International, Inc. | 19,211,455 | ||
| 117,183 | Cracker Barrel Old Country Store, Inc. | 20,258,597 | ||
| 141,827 | Floor & Decor Holdings, Inc. - Class A* | 13,541,642 | ||
| 317,577 | frontdoor, Inc.* | 17,069,764 | ||
| 149,926 | Hilton Worldwide Holdings, Inc. | 18,129,052 | ||
| 198,186 | JD.com, Inc. (China) ADR* | 16,713,025 | ||
| 115,893 | Starbucks Corp. | 12,663,628 | ||
| 442,349 | Trip.com Group Ltd. (China) ADR* | 17,530,291 | ||
| 197,622,777 | ||||
| Communication Services — 15.5% | ||||
| 30,247 | Alphabet, Inc. - Class C* | 62,569,852 | ||
| 471,905 | Comcast Corp. - Class A | 25,534,779 | ||
| 205,333 | Facebook, Inc. - Class A* | 60,476,728 | ||
| 289,405 | Fox Corp. - Class A | 10,450,415 | ||
| 36,942 | Netflix, Inc.* | 19,271,164 | ||
| 178,302,938 | ||||
| Financials — 12.7% | ||||
| 861,071 | Bank of America Corp. | 33,314,837 | ||
| 152,113 | Berkshire Hathaway, Inc. - Class B* | 38,860,308 | ||
| 120,012 | Goldman Sachs Group, Inc. (The) | 39,243,924 | ||
| 81,656 | LPL Financial Holdings, Inc. | 11,608,217 | ||
| 100,642 | Signature Bank | 22,755,156 | ||
| 145,782,442 | ||||
| Industrials — 10.6% | ||||
| 77,798 | Allegiant Travel Co. | 18,987,380 | ||
| 50,188 | Deere & Co. | 18,777,338 | ||
| 307,793 | Hexcel Corp. | 17,236,408 | ||
| 119,016 | Hubbell, Inc. | 22,242,900 | ||
| 55,696 | Parker-Hannifin Corp. | 17,568,189 | ||
| 344,391 | Raytheon Technologies Corp. | 26,611,093 | ||
| 121,423,308 | ||||
| Health Care — 10.5% | ||||
| 114,291 | AmerisourceBergen Corp. | 13,494,339 | ||
| 297,102 | Bristol-Myers Squibb Co. | 18,756,049 | ||
| Shares | Market Value | |||
| Health Care — (Continued) | ||||
| 147,455 | HCA Healthcare, Inc. | $ 27,771,675 | ||
| 191,981 | Johnson & Johnson | 31,552,077 | ||
| 76,711 | UnitedHealth Group, Inc. | 28,541,862 | ||
| 120,116,002 | ||||
| Real Estate — 3.9% | ||||
| 314,841 | Americold Realty Trust REIT | 12,111,933 | ||
| 181,925 | Jones Lang LaSalle, Inc.* | 32,571,852 | ||
| 44,683,785 | ||||
| Consumer Staples — 3.3% | ||||
| 216,813 | Monster Beverage Corp.* | 19,749,496 | ||
| 200,357 | Philip Morris International, Inc. | 17,779,680 | ||
| 37,529,176 | ||||
| Materials — 1.5% | ||||
| 227,014 | DuPont de Nemours, Inc. | 17,543,642 | ||
| Energy — 1.1% | ||||
| 225,353 | Exxon Mobil Corp. | 12,581,458 | ||
| Total Common Stocks | $1,125,552,423 | |||
| Short-Term Investment Fund — 2.0% | ||||
| 23,166,103 | Dreyfus Government Cash Management, Institutional Shares, 0.03%∞Ω | 23,166,103 | ||
| Total Investment Securities—100.1% (Cost $618,022,877) | $1,148,718,526 | |||
| Liabilities in Excess of Other Assets — (0.1%) | (1,022,562) | |||
| Net Assets — 100.0% | $1,147,695,964 | |||
| * | Non-income producing security. |
| ∞ | Open-End Fund. |
| Ω | Represents the 7-Day SEC yield as of March 31, 2021. |
| Portfolio Abbreviations: |
| ADR – American Depositary Receipt |
| REIT – Real Estate Investment Trust |
| Valuation Inputs at Reporting Date: | ||||
| Description | Level 1 | Level 2 | Level 3 | Total |
| Common Stocks | $1,125,552,423 | $— | $— | $1,125,552,423 |
| Short-Term Investment Fund | 23,166,103 | — | — | 23,166,103 |
| Total | $1,148,718,526 | $— | $— | $1,148,718,526 |
| Shares | Market Value | |||
| Common Stocks — 98.4% | ||||
| United States — 54.3% | ||||
| Communication Services — 3.1% | ||||
| 74,571 | Facebook, Inc. - Class A* | $ 21,963,397 | ||
| Consumer Discretionary — 3.8% | ||||
| 3,270 | Amazon.com, Inc.* | 10,117,641 | ||
| 145,660 | Kohl's Corp. | 8,682,793 | ||
| 62,558 | Ralph Lauren Corp. | 7,704,643 | ||
| Financials — 13.7% | ||||
| 185,027 | Aflac, Inc. | 9,469,682 | ||
| 237,871 | Arch Capital Group Ltd.* | 9,127,110 | ||
| 219,571 | Discover Financial Services | 20,857,049 | ||
| 651,224 | First Horizon Corp. | 11,012,198 | ||
| 114,324 | Globe Life, Inc. | 11,047,128 | ||
| 40,022 | Progressive Corp. (The) | 3,826,504 | ||
| 140,176 | Reinsurance Group of America, Inc. | 17,669,185 | ||
| 55,732 | Willis Towers Watson PLC | 12,755,940 | ||
| Health Care — 9.7% | ||||
| 56,313 | Adaptive Biotechnologies Corp.* | 2,267,161 | ||
| 33,775 | Alnylam Pharmaceuticals, Inc.* | 4,768,692 | ||
| 70,870 | Becton Dickinson & Co. | 17,232,040 | ||
| 63,154 | BioMarin Pharmaceutical, Inc.* | 4,768,759 | ||
| 73,248 | Bridgebio Pharma, Inc.* | 4,512,077 | ||
| 85,414 | Cerner Corp. | 6,139,558 | ||
| 46,442 | Eli Lilly & Co. | 8,676,294 | ||
| 62,282 | Ionis Pharmaceuticals, Inc.* | 2,800,199 | ||
| 72,858 | Medtronic PLC | 8,606,716 | ||
| 51,799 | Neurocrine Biosciences, Inc.* | 5,037,453 | ||
| 6,607 | Regeneron Pharmaceuticals, Inc.* | 3,126,036 | ||
| Industrials — 5.2% | ||||
| 227,112 | Carrier Global Corp. | 9,588,668 | ||
| 50,857 | Deere & Co. | 19,027,638 | ||
| 23,135 | United Rentals, Inc.* | 7,618,587 | ||
| Information Technology — 16.4% | ||||
| 95,320 | Apple, Inc. | 11,643,338 | ||
| 103,489 | Applied Materials, Inc. | 13,826,130 | ||
| 80,269 | Fidelity National Information Services, Inc. | 11,286,624 | ||
| 44,284 | First Solar, Inc.* | 3,865,993 | ||
| 42,355 | Keysight Technologies, Inc.* | 6,073,707 | ||
| 149,994 | Micron Technology, Inc.* | 13,230,971 | ||
| 134,103 | Microsoft Corp. | 31,617,464 | ||
| 68,878 | New Relic, Inc.* | 4,234,620 | ||
| 75,570 | TE Connectivity Ltd. | 9,756,843 | ||
| 45,510 | Visa, Inc. - Class A | 9,635,832 | ||
| Materials — 1.2% | ||||
| 24,886 | Martin Marietta Materials, Inc. | 8,357,217 | ||
| Real Estate — 1.2% | ||||
| 405,956 | Medical Properties Trust, Inc. REIT | 8,638,744 | ||
| Total United States | 380,570,631 | |||
| Germany — 8.1% | ||||
| Consumer Discretionary — 1.4% | ||||
| 74,982 | Continental AG* | 9,925,707 | ||
| Industrials — 2.6% | ||||
| 326,356 | Deutsche Post AG | 17,904,174 | ||
| Materials — 2.2% | ||||
| 172,120 | HeidelbergCement AG | 15,638,472 | ||
| Real Estate — 1.9% | ||||
| 199,270 | Vonovia SE | 13,022,150 | ||
| Total Germany | 56,490,503 | |||
| Shares | Market Value | |||
| France — 6.2% | ||||
| Industrials — 5.4% | ||||
| 266,972 | Cie de Saint-Gobain* | $ 15,765,110 | ||
| 147,348 | Schneider Electric SE | 22,446,283 | ||
| Materials — 0.8% | ||||
| 34,094 | Air Liquide SA | 5,566,730 | ||
| Total France | 43,778,123 | |||
| Japan — 6.1% | ||||
| Communication Services — 0.9% | ||||
| 10,900 | Nintendo Co. Ltd. | 6,143,627 | ||
| Consumer Discretionary — 4.1% | ||||
| 71,000 | Denso Corp. | 4,733,152 | ||
| 674,600 | Panasonic Corp. | 8,735,704 | ||
| 149,100 | Sony Group Corp. | 15,779,771 | ||
| Information Technology — 1.1% | ||||
| 161,700 | Hitachi Ltd. | 7,329,599 | ||
| 4,700 | Kyocera Corp. | 299,061 | ||
| Total Japan | 43,020,914 | |||
| Sweden — 4.4% | ||||
| Communication Services — 1.4% | ||||
| 706,593 | Tele2 AB - Class B | 9,531,906 | ||
| Financials — 3.0% | ||||
| 1,110,557 | Svenska Handelsbanken AB - Class A | 12,073,089 | ||
| 509,294 | Swedbank AB - Class A | 8,979,810 | ||
| Total Sweden | 30,584,805 | |||
| South Korea — 2.8% | ||||
| Communication Services — 1.7% | ||||
| 459,575 | KT Corp. ADR* | 5,717,113 | ||
| 256,798 | KT Corp. | 6,421,675 | ||
| Financials — 1.1% | ||||
| 157,365 | KB Financial Group, Inc. | 7,756,138 | ||
| Total South Korea | 19,894,926 | |||
| Italy — 2.7% | ||||
| Utilities — 2.7% | ||||
| 1,936,362 | Enel SpA | 19,261,683 | ||
| Canada — 2.3% | ||||
| Financials — 1.0% | ||||
| 58,337 | Intact Financial Corp. | 7,148,801 | ||
| Materials — 1.3% | ||||
| 149,536 | Agnico Eagle Mines Ltd. | 8,644,676 | ||
| Total Canada | 15,793,477 | |||
| China — 2.1% | ||||
| Consumer Discretionary — 2.1% | ||||
| 64,077 | Alibaba Group Holding Ltd. ADR* | 14,528,178 | ||
| Switzerland — 1.8% | ||||
| Health Care — 1.8% | ||||
| 37,880 | Roche Holding AG | 12,270,976 | ||
| United Kingdom — 1.7% | ||||
| Financials — 1.7% | ||||
| 19,840,517 | Lloyds Banking Group PLC* | 11,638,936 | ||
| India — 1.7% | ||||
| Financials — 1.7% | ||||
| 721,569 | ICICI Bank Ltd. ADR* | 11,566,751 | ||
| Shares | Market Value | |||
| Common Stocks — 98.4% (Continued) | ||||
| Singapore — 1.6% | ||||
| Financials — 0.8% | ||||
| 599,200 | Oversea-Chinese Banking Corp. Ltd. | $ 5,242,405 | ||
| Real Estate — 0.8% | ||||
| 3,654,500 | CapitaLand Integrated Commercial Trust REIT | 5,913,341 | ||
| Total Singapore | 11,155,746 | |||
| Netherlands — 1.2% | ||||
| Health Care — 1.2% | ||||
| 147,080 | Koninklijke Philips NV* | 8,387,294 | ||
| Thailand — 0.8% | ||||
| Industrials — 0.8% | ||||
| 2,481,300 | Airports of Thailand PCL | 5,496,383 | ||
| Denmark — 0.6% | ||||
| Industrials — 0.6% | ||||
| 21,754 | Vestas Wind Systems A/S | 4,487,564 | ||
| Total Common Stocks | $688,926,890 | |||
| Exchange-Traded Funds — 1.0% | ||||
| 8,944 | iShares Core S&P 500 ETF | 3,558,102 | ||
| 48,159 | iShares Core MSCI EAFE ETF | 3,469,856 | ||
| Total Exchange-Traded Funds | $7,027,958 | |||
| Short-Term Investment Fund — 0.7% | ||||
| 4,832,912 | Dreyfus Government Cash Management, Institutional Shares, 0.03%∞,Ω | 4,832,912 | ||
| Total Investment Securities — 100.1% (Cost $499,174,866) | $700,787,760 | |||
| Liabilities in Excess of Other Assets — (0.1)% | (353,664) | |||
| Net Assets — 100.0% | $700,434,096 | |||
| * | Non-income producing security. |
| ∞ | Open-End Fund. |
| Ω | Represents the 7-Day SEC yield as of March 31, 2021. |
| Portfolio Abbreviations: |
| ADR – American Depositary Receipt |
| ETF – Exchange-Traded Fund |
| PCL – Public Company Limited |
| PLC – Public Limited Company |
| REIT – Real Estate Investment Trust |
| S&P – Standards & Poor's |
| Valuation inputs at Reporting Date: | ||||
| Description | Level 1 | Level 2 | Level 3 | Total |
| Common Stocks | ||||
| United States | $380,570,631 | $— | $— | $380,570,631 |
| Germany | — | 56,490,503 | — | 56,490,503 |
| France | — | 43,778,123 | — | 43,778,123 |
| Japan | — | 43,020,914 | — | 43,020,914 |
| Sweden | — | 30,584,805 | — | 30,584,805 |
| South Korea | 5,717,113 | 14,177,813 | — | 19,894,926 |
| Italy | — | 19,261,683 | — | 19,261,683 |
| Canada | 15,793,477 | — | — | 15,793,477 |
| China | 14,528,178 | — | — | 14,528,178 |
| Switzerland | — | 12,270,976 | — | 12,270,976 |
| United Kingdom | — | 11,638,936 | — | 11,638,936 |
| India | 11,566,751 | — | — | 11,566,751 |
| Singapore | — | 11,155,746 | — | 11,155,746 |
| Netherlands | — | 8,387,294 | — | 8,387,294 |
| Thailand | — | 5,496,383 | — | 5,496,383 |
| Denmark | — | 4,487,564 | — | 4,487,564 |
| Exchange-Traded Funds | 7,027,958 | — | — | 7,027,958 |
| Short-Term Investment Fund | 4,832,912 | — | — | 4,832,912 |
| Total | $440,037,020 | $260,750,740 | $— | $700,787,760 |
| Shares | Market Value | |||
| Common Stocks — 99.7% | ||||
| Information Technology — 41.4% | ||||
| 94,678 | Apple, Inc. | $ 11,564,918 | ||
| 24,190 | Applied Materials, Inc. | 3,231,784 | ||
| 5,980 | Broadcom, Inc. | 2,772,687 | ||
| 50,180 | Cisco Systems, Inc. | 2,594,808 | ||
| 22,399 | Fidelity National Information Services, Inc. | 3,149,523 | ||
| 13,877 | Global Payments, Inc. | 2,797,326 | ||
| 28,000 | Lumentum Holdings, Inc.* | 2,557,800 | ||
| 37,159 | Microsoft Corp. | 8,760,977 | ||
| 6,600 | NVIDIA Corp. | 3,523,938 | ||
| 15,920 | PayPal Holdings, Inc.* | 3,866,013 | ||
| 17,568 | salesforce.com, Inc.* | 3,722,132 | ||
| 7,831 | ServiceNow, Inc.* | 3,916,361 | ||
| 6,380 | Twilio, Inc. - Class A* | 2,174,049 | ||
| 22,862 | Visa, Inc. - Class A | 4,840,571 | ||
| 13,020 | Workday, Inc. - Class A* | 3,234,559 | ||
| 29,818 | Zendesk, Inc.* | 3,954,463 | ||
| 66,661,909 | ||||
| Health Care — 13.5% | ||||
| 40,460 | AbbVie, Inc. | 4,378,581 | ||
| 18,165 | Ascendis Pharma A/S (Denmark) ADR* | 2,341,105 | ||
| 3,915 | Bio-Rad Laboratories, Inc. - Class A* | 2,236,131 | ||
| 68,950 | Boston Scientific Corp.* | 2,664,918 | ||
| 5,410 | DexCom, Inc.* | 1,944,300 | ||
| 7,610 | Humana, Inc. | 3,190,492 | ||
| 13,670 | ICON PLC (Ireland)* | 2,684,378 | ||
| 4,972 | Thermo Fisher Scientific, Inc. | 2,269,121 | ||
| 21,709,026 | ||||
| Consumer Discretionary — 12.6% | ||||
| 3,742 | Amazon.com, Inc.* | 11,578,047 | ||
| 26,780 | Darden Restaurants, Inc. | 3,802,760 | ||
| 60,720 | MGM Resorts International | 2,306,753 | ||
| 59,281 | National Vision Holdings, Inc.* | 2,598,286 | ||
| 20,285,846 | ||||
| Industrials — 11.6% | ||||
| 23,260 | Advanced Drainage Systems, Inc. | 2,404,851 | ||
| 20,711 | AMETEK, Inc. | 2,645,416 | ||
| 32,759 | ITT, Inc. | 2,978,121 | ||
| 7,430 | Rockwell Automation, Inc. | 1,972,219 | ||
| 38,729 | Sensata Technologies Holding PLC* | 2,244,346 | ||
| 4,813 | TransDigm Group, Inc.* | 2,829,659 | ||
| 16,577 | Union Pacific Corp. | 3,653,737 | ||
| 18,728,349 | ||||
| Communication Services — 11.4% | ||||
| 4,541 | Alphabet, Inc. - Class A* | 9,365,903 | ||
| 25,419 | Facebook, Inc. - Class A* | 7,486,658 | ||
| 139,270 | Zynga, Inc. - Class A* | 1,421,947 | ||
| 18,274,508 | ||||
| Shares | Market Value | |||
| Financials — 4.3% | ||||
| 18,207 | American Financial Group, Inc. | $ 2,077,419 | ||
| 32,370 | Morgan Stanley | 2,513,854 | ||
| 58,880 | Synchrony Financial | 2,394,061 | ||
| 6,985,334 | ||||
| Materials — 1.7% | ||||
| 17,810 | Celanese Corp. | 2,668,116 | ||
| Consumer Staples — 1.6% | ||||
| 7,430 | Costco Wholesale Corp. | 2,618,926 | ||
| Real Estate — 1.6% | ||||
| 59,940 | Spirit Realty Capital, Inc. REIT | 2,547,450 | ||
| Total Common Stocks | $160,479,464 | |||
| Short-Term Investment Fund — 0.4% | ||||
| 679,922 | Dreyfus Government Cash Management, Institutional Shares, 0.03%∞Ω | 679,922 | ||
| Total Investment Securities—100.1% (Cost $91,592,033) | $161,159,386 | |||
| Liabilities in Excess of Other Assets — (0.1%) | (226,512) | |||
| Net Assets — 100.0% | $160,932,874 | |||
| * | Non-income producing security. |
| ∞ | Open-End Fund. |
| Ω | Represents the 7-Day SEC yield as of March 31, 2021. |
| Portfolio Abbreviations: |
| ADR – American Depositary Receipt |
| PLC – Public Limited Company |
| REIT – Real Estate Investment Trust |
| Valuation Inputs at Reporting Date: | ||||
| Description | Level 1 | Level 2 | Level 3 | Total |
| Common Stocks | $160,479,464 | $— | $— | $160,479,464 |
| Short-Term Investment Fund | 679,922 | — | — | 679,922 |
| Total | $161,159,386 | $— | $— | $161,159,386 |
| Shares | Market Value | |||
| Common Stocks — 97.7% | ||||
| Information Technology — 31.3% | ||||
| 290,889 | Cognizant Technology Solutions Corp. - Class A | $ 22,724,249 | ||
| 106,151 | FleetCor Technologies, Inc.* | 28,515,343 | ||
| 190,672 | Fortinet, Inc.* | 35,163,730 | ||
| 165,827 | Global Payments, Inc. | 33,427,407 | ||
| 48,020 | HubSpot, Inc.* | 21,811,164 | ||
| 390,551 | Lightspeed POS, Inc. (Canada)* | 24,530,508 | ||
| 194,856 | Microchip Technology, Inc. | 30,245,548 | ||
| 46,342 | MongoDB, Inc.* | 12,393,241 | ||
| 587,223 | NCR Corp.* | 22,285,113 | ||
| 111,810 | Nice Ltd. (Israel) ADR* | 24,371,226 | ||
| 678,365 | Nutanix, Inc. - Class A* | 18,017,374 | ||
| 67,282 | Palo Alto Networks, Inc.* | 21,668,841 | ||
| 57,227 | RingCentral, Inc. - Class A* | 17,046,779 | ||
| 154,095 | Splunk, Inc.* | 20,876,791 | ||
| 78,860 | Twilio, Inc. - Class A* | 26,872,333 | ||
| 186,060 | Xilinx, Inc. | 23,052,834 | ||
| 337,229 | Zendesk, Inc.* | 44,723,310 | ||
| 427,725,791 | ||||
| Health Care — 22.7% | ||||
| 210,070 | Ascendis Pharma A/S (Denmark) ADR* | 27,073,822 | ||
| 290,187 | BioMarin Pharmaceutical, Inc.* | 21,912,020 | ||
| 72,300 | Cooper Cos., Inc. (The) | 27,769,707 | ||
| 86,121 | DexCom, Inc.* | 30,951,026 | ||
| 150,047 | ICON PLC (Ireland)* | 29,464,729 | ||
| 79,776 | IDEXX Laboratories, Inc.* | 39,035,195 | ||
| 91,004 | Insulet Corp.* | 23,744,764 | ||
| 80,959 | Masimo Corp.* | 18,593,044 | ||
| 29,834 | Mettler-Toledo International, Inc.* | 34,478,856 | ||
| 163,870 | Rocket Pharmaceuticals, Inc.* | 7,270,912 | ||
| 202,112 | Seagen, Inc.* | 28,065,272 | ||
| 120,319 | STERIS PLC | 22,918,363 | ||
| 311,277,710 | ||||
| Industrials — 16.8% | ||||
| 183,133 | AMETEK, Inc. | 23,391,578 | ||
| 456,568 | AZEK Co., Inc. (The)* | 19,198,684 | ||
| 27,913 | CoStar Group, Inc.* | 22,941,415 | ||
| 101,896 | IDEX Corp. | 21,328,871 | ||
| 105,106 | Rockwell Automation, Inc. | 27,899,337 | ||
| 45,780 | Teledyne Technologies, Inc.* | 18,936,897 | ||
| 171,546 | Trane Technologies PLC | 28,401,156 | ||
| 49,695 | TransDigm Group, Inc.* | 29,216,684 | ||
| 185,367 | TransUnion | 16,683,030 | ||
| 204,065 | Waste Connections, Inc. | 22,034,939 | ||
| 230,032,591 | ||||
| Consumer Discretionary — 13.0% | ||||
| 26,042 | Chipotle Mexican Grill, Inc.* | 37,000,995 | ||
| 67,281 | Etsy, Inc.* | 13,568,559 | ||
| 114,600 | Expedia Group, Inc. | 19,724,952 | ||
| 249,851 | Ross Stores, Inc. | 29,959,633 | ||
| 678,922 | Tapestry, Inc. | 27,978,376 | ||
| Shares | Market Value | |||
| Consumer Discretionary — (Continued) | ||||
| 81,686 | Ulta Beauty, Inc.* | $ 25,254,861 | ||
| 139,722 | Williams-Sonoma, Inc. | 25,038,182 | ||
| 178,525,558 | ||||
| Financials — 5.5% | ||||
| 202,119 | Arthur J Gallagher & Co. | 25,218,387 | ||
| 61,138 | MSCI, Inc. | 25,633,941 | ||
| 589,732 | Synchrony Financial | 23,978,503 | ||
| 74,830,831 | ||||
| Communication Services — 4.7% | ||||
| 656,140 | Fox Corp. - Class A | 23,693,215 | ||
| 266,738 | Live Nation Entertainment, Inc.* | 22,579,372 | ||
| 54,859 | Roku, Inc.* | 17,871,417 | ||
| 64,144,004 | ||||
| Materials — 2.0% | ||||
| 183,131 | Celanese Corp. | 27,434,855 | ||
| Real Estate — 1.7% | ||||
| 84,442 | Essex Property Trust, Inc. REIT | 22,954,713 | ||
| Total Common Stocks | $1,336,926,053 | |||
| Short-Term Investment Fund — 2.5% | ||||
| 34,619,315 | Dreyfus Government Cash Management, Institutional Shares, 0.03%∞Ω | 34,619,315 | ||
| Total Investment Securities—100.2% (Cost $942,471,319) | $1,371,545,368 | |||
| Liabilities in Excess of Other Assets — (0.2%) | (2,890,137) | |||
| Net Assets — 100.0% | $1,368,655,231 | |||
| * | Non-income producing security. |
| ∞ | Open-End Fund. |
| Ω | Represents the 7-Day SEC yield as of March 31, 2021. |
| Portfolio Abbreviations: |
| ADR – American Depositary Receipt |
| PLC – Public Limited Company |
| REIT – Real Estate Investment Trust |
| Valuation Inputs at Reporting Date: | ||||
| Description | Level 1 | Level 2 | Level 3 | Total |
| Common Stocks | $1,336,926,053 | $— | $— | $1,336,926,053 |
| Short-Term Investment Fund | 34,619,315 | — | — | 34,619,315 |
| Total | $1,371,545,368 | $— | $— | $1,371,545,368 |
| Shares | Market Value | |||
| Common Stocks — 97.2% | ||||
| China — 32.0% | ||||
| Communication Services — 9.3% | ||||
| 4,218,900 | Tencent Holdings Ltd. | $ 336,700,095 | ||
| 3,383,520 | Tencent Music Entertainment Group ADR* | 69,328,325 | ||
| Consumer Discretionary — 16.7% | ||||
| 1,267,231 | Alibaba Group Holding Ltd. ADR* | 287,319,285 | ||
| 8,406,500 | ANTA Sports Products Ltd. | 137,882,373 | ||
| 2,136,119 | JD Health International, Inc., 144a* | 31,073,869 | ||
| 6,388,879 | New Oriental Education & Technology Group, Inc. ADR* | 89,444,306 | ||
| 880,658 | Prosus NV | 97,998,523 | ||
| 2,136,223 | Trip.com Group Ltd. ADR* | 84,658,517 | ||
| Consumer Staples — 1.5% | ||||
| 2,644,203 | Foshan Haitian Flavouring & Food Co. Ltd. - Class A | 64,718,659 | ||
| Health Care — 4.5% | ||||
| 3,461,650 | Hangzhou Tigermed Consulting Co. Ltd., 144a* | 68,937,375 | ||
| 10,089,500 | Wuxi Biologics Cayman, Inc., 144a* | 127,236,226 | ||
| Total China | 1,395,297,553 | |||
| India — 21.3% | ||||
| Consumer Discretionary — 4.4% | ||||
| 2,930,503 | Jubilant Foodworks Ltd. | 117,056,295 | ||
| 3,445,870 | Titan Co. Ltd. | 73,675,100 | ||
| Consumer Staples — 2.5% | ||||
| 2,201,931 | Britannia Industries Ltd. | 109,485,328 | ||
| Financials — 9.5% | ||||
| 2,082,702 | Bajaj Finance Ltd. | 147,447,794 | ||
| 10,874,356 | Bandhan Bank Ltd., 144a* | 50,867,595 | ||
| 6,528,602 | HDFC Bank Ltd.* | 133,638,805 | ||
| 13,293,510 | ICICI Prudential Life Insurance Co. Ltd., 144a* | 81,167,256 | ||
| Health Care — 3.6% | ||||
| 3,978,454 | Apollo Hospitals Enterprise Ltd. | 158,309,331 | ||
| Materials — 1.3% | ||||
| 1,594,022 | Asian Paints Ltd. | 55,460,660 | ||
| Total India | 927,108,164 | |||
| Taiwan — 15.6% | ||||
| Communication Services — 8.9% | ||||
| 1,732,927 | Sea Ltd. ADR* | 386,841,294 | ||
| Information Technology — 6.7% | ||||
| 2,469,028 | Taiwan Semiconductor Manufacturing Co. Ltd. ADR | 292,036,632 | ||
| Total Taiwan | 678,877,926 | |||
| Argentina — 8.5% | ||||
| Consumer Discretionary — 6.8% | ||||
| 200,637 | MercadoLibre, Inc.* | 295,365,753 | ||
| Information Technology — 1.7% | ||||
| 371,661 | Globant SA* | 77,160,540 | ||
| Total Argentina | 372,526,293 | |||
| Brazil — 6.4% | ||||
| Consumer Staples — 0.9% | ||||
| 8,656,000 | Raia Drogasil SA | 38,692,219 | ||
| Financials — 2.3% | ||||
| 2,636,586 | XP, Inc. - Class A* | 99,320,194 | ||
| Industrials — 1.2% | ||||
| 4,736,015 | Localiza Rent a Car SA | 50,434,250 | ||
| Shares | Market Value | |||
| Brazil — (Continued) | ||||
| Information Technology — 2.0% | ||||
| 1,908,430 | Pagseguro Digital Ltd. - Class A* | $ 88,360,309 | ||
| Total Brazil | 276,806,972 | |||
| Russia — 4.0% | ||||
| Communication Services — 4.0% | ||||
| 2,737,121 | Yandex NV - Class A* | 175,339,971 | ||
| Hong Kong — 3.5% | ||||
| Financials — 2.7% | ||||
| 9,627,200 | AIA Group Ltd. | 117,805,838 | ||
| Health Care — 0.8% | ||||
| 1,269,253 | Hutchison China MediTech Ltd. ADR* | 35,856,397 | ||
| Total Hong Kong | 153,662,235 | |||
| Indonesia — 1.5% | ||||
| Financials — 1.5% | ||||
| 31,380,900 | Bank Central Asia Tbk PT | 67,205,262 | ||
| Kazakhstan — 1.5% | ||||
| Financials — 1.5% | ||||
| 906,774 | Kaspi.KZ JSC GDR | 64,380,954 | ||
| Thailand — 1.3% | ||||
| Consumer Staples — 1.3% | ||||
| 25,797,000 | CP ALL PCL* | 56,959,776 | ||
| Poland — 1.1% | ||||
| Communication Services — 0.5% | ||||
| 391,116 | CD Projekt SA* | 18,922,091 | ||
| Consumer Discretionary — 0.6% | ||||
| 1,934,491 | Allegro.eu SA, 144a* | 27,202,020 | ||
| Total Poland | 46,124,111 | |||
| Vietnam — 0.5% | ||||
| Real Estate — 0.5% | ||||
| 16,005,244 | Vincom Retail JSC* | 22,769,463 | ||
| Total Common Stocks | $4,237,058,680 | |||
| Short-Term Investment Fund — 3.0% | ||||
| 129,337,643 | Dreyfus Government Cash Management, Institutional Shares, 0.03%∞,Ω | 129,337,643 | ||
| Total Investment Securities — 100.2% (Cost $3,144,417,202) | $4,366,396,323 | |||
| Liabilities in Excess of Other Assets — (0.2)% | (8,544,446) | |||
| Net Assets — 100.0% | $4,357,851,877 | |||
| * | Non-income producing security. |
| ∞ | Open-End Fund. |
| Ω | Represents the 7-Day SEC yield as of March 31, 2021. |
| Portfolio Abbreviations: |
| ADR – American Depositary Receipt |
| GDR – Global Depositary Receipt |
| JSC – Joint Stock Company |
| PCL – Public Company Limited |
| 144a - This is a restricted security that was sold in a transaction qualifying for the exemption under Rule 144a of the Securities Act of 1933. This security may be sold in transactions exempt from registration, normally to qualified institutional buyers. At March 31, 2021, these securities were valued at $386,484,341 or 8.9% of net assets. These securities were deemed liquid pursuant to procedures approved by the Board of Trustees. |
| Valuation inputs at Reporting Date: | ||||
| Description | Level 1 | Level 2 | Level 3 | Total |
| Common Stocks | ||||
| China | $530,750,433 | $864,547,120 | $— | $1,395,297,553 |
| India | — | 927,108,164 | — | 927,108,164 |
| Taiwan | 678,877,926 | — | — | 678,877,926 |
| Argentina | 372,526,293 | — | — | 372,526,293 |
| Brazil | 276,806,972 | — | — | 276,806,972 |
| Russia | 175,339,971 | — | — | 175,339,971 |
| Hong Kong | 35,856,397 | 117,805,838 | — | 153,662,235 |
| Indonesia | — | 67,205,262 | — | 67,205,262 |
| Kazakhstan | 64,380,954 | — | — | 64,380,954 |
| Thailand | 56,959,776 | — | — | 56,959,776 |
| Poland | 27,202,020 | 18,922,091 | — | 46,124,111 |
| Vietnam | — | 22,769,463 | — | 22,769,463 |
| Short-Term Investment Fund | 129,337,643 | — | — | 129,337,643 |
| Total | $2,348,038,385 | $2,018,357,938 | $— | $4,366,396,323 |
| Touchstone Flexible Income Fund | Touchstone Focused Fund | Touchstone Global ESG Equity Fund | Touchstone Growth Opportunities Fund | Touchstone Mid Cap Growth Fund | Touchstone Sands Capital Emerging Markets Growth Fund | |
| Assets | ||||||
| Investments, at cost | $742,334,174 | $618,022,877 | $499,174,866 | $91,592,033 | $942,471,319 | $3,144,417,202 |
| Investments, at market value * | $761,342,108 | $1,148,718,526 | $700,787,760 | $161,159,386 | $1,371,545,368 | $4,366,396,323 |
| Cash | 26,508,606 | — | — | — | — | — |
| Cash deposits held at prime broker | 4,608 | — | — | — | — | — |
| Foreign currency † | — | — | 476,072 | — | — | 12,481,497 |
| Dividends and interest receivable | 4,985,643 | 567,006 | 1,052,840 | 56,437 | 333,398 | 2,827,972 |
| Receivable for capital shares sold | 1,825,877 | 518,582 | 270,405 | 29,629 | 1,960,309 | 51,979,111 |
| Receivable for investments sold | 293,045 | — | 4,266,259 | — | 27,274,060 | 19,312,006 |
| Receivable for securities lending income | 11,519 | 132 | 125 | — | — | — |
| Tax reclaim receivable | — | — | 440,916 | — | 3,914 | 54,032 |
| Other assets | 29,254 | 22,382 | 21,501 | 15,518 | 18,472 | 96,614 |
| Total Assets | 795,000,660 | 1,149,826,628 | 707,315,878 | 161,260,970 | 1,401,135,521 | 4,453,147,555 |
| Liabilities | ||||||
| Bank overdrafts | — | — | 1,056,235 | — | — | 1,191,388 |
| Payable for return of collateral for securities on loan | 3,187,193 | — | — | — | — | — |
| Deferred foreign capital gains tax | — | — | — | — | — | 25,569,857 |
| Payable for capital shares redeemed | 882,569 | 721,063 | 459,800 | 63,318 | 30,259,524 | 10,186,181 |
| Payable for investments purchased | 276,264 | — | 4,422,950 | — | — | 52,920,262 |
| Payable to Investment Advisor | 348,683 | 602,646 | 387,493 | 95,961 | 844,209 | 3,743,228 |
| Payable to other affiliates | 149,573 | 168,989 | 136,917 | 30,379 | 256,866 | 490,401 |
| Payable to Trustees | 14,770 | 14,770 | 14,770 | 14,770 | 14,770 | 14,770 |
| Payable for professional services | 44,185 | 42,663 | 39,718 | 26,222 | 51,385 | 142,971 |
| Payable for reports to shareholders | 22,256 | 21,466 | 18,756 | 10,297 | 62,141 | 43,874 |
| Payable for transfer agent services | 408,799 | 542,251 | 335,626 | 79,319 | 857,549 | 919,677 |
| Other accrued expenses and liabilities | 14,216 | 16,816 | 9,517 | 7,830 | 133,846 | 73,069 |
| Total Liabilities | 5,348,508 | 2,130,664 | 6,881,782 | 328,096 | 32,480,290 | 95,295,678 |
| Net Assets | $789,652,152 | $1,147,695,964 | $700,434,096 | $160,932,874 | $1,368,655,231 | $4,357,851,877 |
| Net assets consist of: | ||||||
| Paid-in capital | $774,491,783 | $579,871,406 | $464,609,552 | $74,882,504 | $832,918,811 | $3,200,770,604 |
| Distributable earnings (deficit) | 15,160,369 | 567,824,558 | 235,824,544 | 86,050,370 | 535,736,420 | 1,157,081,273 |
| Net Assets | $789,652,152 | $1,147,695,964 | $700,434,096 | $160,932,874 | $1,368,655,231 | $4,357,851,877 |
| *Includes market value of securities on loan of: | $3,120,515 | $— | $— | $— | $— | $— |
| †Cost of foreign currency: | $— | $— | $475,115 | $— | $— | $12,480,362 |
| Touchstone Flexible Income Fund | Touchstone Focused Fund | Touchstone Global ESG Equity Fund | Touchstone Growth Opportunities Fund | Touchstone Mid Cap Growth Fund | Touchstone Sands Capital Emerging Markets Growth Fund | |
| Pricing of Class A Shares | ||||||
| Net assets applicable to Class A shares | $121,317,217 | $48,418,508 | $496,574,099 | $56,877,100 | $322,432,232 | $20,369,314 |
| Shares of beneficial interest outstanding (unlimited number of shares authorized, no par value) | 10,915,058 | 828,690 | 18,984,157 | 1,384,747 | 8,550,880 | 958,664 |
| Net asset value price per share* | $11.11 | $58.43 | $26.16 | $41.07 | $37.71 | $21.25 |
| Maximum sales charge - Class A shares | 3.25% | 5.00% | 5.00% | 5.00% | 5.00% | 5.00% |
| Maximum offering price per share (100%/(100%-maximum sales charge) of net asset value adjusted to the nearest cent) - Class A shares | $11.48 | $61.51 | $27.54 | $43.23 | $39.69 | $22.37 |
| Pricing of Class C Shares | ||||||
| Net assets applicable to Class C shares | $44,388,744 | $25,241,105 | $7,782,165 | $1,853,113 | $18,938,815 | $9,637,043 |
| Shares of beneficial interest outstanding (unlimited number of shares authorized, no par value) | 4,057,049 | 467,651 | 360,376 | 62,093 | 911,098 | 460,918 |
| Net asset value and offering price per share** | $10.94 | $53.97 | $21.59 | $29.84 | $20.79 | $20.91 |
| Pricing of Class Y Shares | ||||||
| Net assets applicable to Class Y shares | $587,810,124 | $1,058,713,098 | $182,806,380 | $30,741,759 | $641,217,800 | $1,460,472,892 |
| Shares of beneficial interest outstanding (unlimited number of shares authorized, no par value) | 52,718,992 | 17,914,581 | 6,730,072 | 713,561 | 16,161,376 | 68,389,334 |
| Net asset value, offering price and redemption price per share | $11.15 | $59.10 | $27.16 | $43.08 | $39.68 | $21.36 |
| Pricing of Institutional Class Shares | ||||||
| Net assets applicable to Institutional Class shares | $36,136,067 | $15,323,253 | $13,271,452 | $71,460,902 | $381,463,297 | $2,867,372,628 |
| Shares of beneficial interest outstanding (unlimited number of shares authorized, no par value) | 3,243,235 | 258,055 | 487,867 | 1,627,889 | 9,498,879 | 133,574,286 |
| Net asset value, offering price and redemption price per share | $11.14 | $59.38 | $27.20 | $43.90 | $40.16 | $21.47 |
| Pricing of Class R6 Shares | ||||||
| Net assets applicable to Class R6 shares | $— | $— | $— | $— | $4,603,087 | $— |
| Shares of beneficial interest outstanding (unlimited number of shares authorized, no par value) | — | — | — | — | 114,548 | — |
| Net asset value, offering price and redemption price per share | $— | $— | $— | $— | $40.18 | $— |
| * | There is no sales load on subscriptions of $1 million or more for all funds except for Flexible Income Fund. There is no sales load on subscriptions of $500,000 or more for Flexible Income Fund. Redemptions that were part of a $500,000 or $1 million or more subscription, as applicable, may be subject to a contingent deferred sales load if redeemed within a one-year period from the date of purchase. |
| ** | Redemption price per share varies by length of time shares are held due to the terms of the contingent deferred sales charge. |
| Touchstone Flexible Income Fund | Touchstone Focused Fund | Touchstone Global ESG Equity Fund | Touchstone Growth Opportunities Fund | Touchstone Mid Cap Growth Fund | Touchstone Sands Capital Emerging Markets Growth Fund | |
| Investment Income | ||||||
| Dividends* | $10,630,236 | $11,239,856 | $10,899,061 | $1,140,135 | $6,559,463 | $10,294,222 |
| Interest | 24,079,000 | — | — | — | — | 246 |
| Income from securities loaned | 306,281 | 112,695 | 75,617 | — | 3,861 | 7,815 |
| Total Investment Income | 35,015,517 | 11,352,551 | 10,974,678 | 1,140,135 | 6,563,324 | 10,302,283 |
| Expenses | ||||||
| Investment advisory fees | 4,125,675 | 6,116,896 | 4,066,691 | 1,231,724 | 9,524,765 | 26,924,253 |
| Administration fees | 1,027,327 | 1,372,103 | 885,977 | 233,139 | 1,930,478 | 3,786,754 |
| Compliance fees and expenses | 2,780 | 2,780 | 2,780 | 2,780 | 2,780 | 2,780 |
| Custody fees | 65,306 | 20,248 | 55,280 | 19,146 | 28,981 | 588,205 |
| Professional fees | 58,823 | 51,228 | 48,721 | 28,824 | 78,378 | 161,277 |
| Transfer Agent fees, Class A | 88,853 | 31,924 | 291,478 | 44,482 | 310,468 | 7,380 |
| Transfer Agent fees, Class C | 30,342 | 15,190 | 6,295 | 2,637 | 20,003 | 3,144 |
| Transfer Agent fees, Class Y | 415,554 | 651,505 | 108,549 | 31,977 | 607,842 | 679,805 |
| Transfer Agent fees, Institutional Class | 9,530 | 3,909 | 8,180 | 29,250 | 169,232 | 439,459 |
| Registration Fees, Class A | 16,185 | 15,685 | 20,441 | 14,173 | 22,396 | 18,456 |
| Registration Fees, Class C | 14,281 | 12,873 | 11,785 | 10,735 | 15,475 | 15,203 |
| Registration Fees, Class Y | 38,064 | 22,838 | 19,079 | 14,245 | 39,613 | 57,317 |
| Registration Fees, Institutional Class | 11,854 | 10,973 | 10,586 | 21,299 | 24,208 | 33,285 |
| Registration Fees, Class R6 | — | — | — | — | 6,076 | — |
| Interest expense on securities sold short | 13,960 | — | — | — | — | — |
| Reports to Shareholders, Class A | 11,973 | 6,240 | 21,484 | 6,530 | 17,002 | 7,243 |
| Reports to Shareholders, Class C | 8,798 | 5,582 | 5,206 | 4,515 | 6,659 | 6,971 |
| Reports to Shareholders, Class Y | 35,836 | 35,568 | 19,211 | 5,751 | 83,881 | 65,061 |
| Reports to Shareholders, Institutional Class | 6,879 | 4,746 | 4,667 | 6,470 | 41,470 | 33,173 |
| Reports to Shareholders, Class R6 | — | — | — | — | 3,930 | — |
| Distribution expenses, Class A | 285,242 | 93,224 | 922,490 | 127,737 | 782,148 | 23,819 |
| Distribution and shareholder servicing expenses, Class C | 482,670 | 242,918 | 77,886 | 24,094 | 211,296 | 38,840 |
| Trustee fees | 20,297 | 20,297 | 20,297 | 20,297 | 20,297 | 20,297 |
| Other expenses | 75,101 | 409,441 | 164,438 | 41,649 | 296,305 | 96,394 |
| Total Expenses | 6,845,330 | 9,146,168 | 6,771,521 | 1,921,454 | 14,243,683 | 33,009,116 |
| Fees waived and/or reimbursed by the Advisor and/or Affiliates(A) | (364,729) | (16,065) | (71,031) | (223,763) | (38,995) | (34,654) |
| Fees recouped by the Advisor(A) | — | — | — | — | — | 205,508 |
| Net Expenses | 6,480,601 | 9,130,103 | 6,700,490 | 1,697,691 | 14,204,688 | 33,179,970 |
| Net Investment Income (Loss) | 28,534,916 | 2,222,448 | 4,274,188 | (557,556) | (7,641,364) | (22,877,687) |
| Realized and Unrealized Gains (Losses) on Investments | ||||||
| Net realized gains (losses) on investments(B) | (9,177,396) | 113,770,654 | 66,473,953 | 33,445,786 | 272,551,221 | 35,112,713 |
| Net realized losses on securities sold short | (161,630) | — | — | — | — | — |
| Net realized gains on written options | 5,930,667 | — | — | — | — | — |
| Net realized losses on foreign currency transactions | — | — | (81,739) | — | — | (812,266) |
| Net change in unrealized appreciation (depreciation) on investments† | 76,082,971 | 380,150,794 | 197,943,633 | 49,085,637 | 354,354,600 | 1,243,558,043 |
| Net change in unrealized appreciation (depreciation) on foreign currency transactions | — | — | 60,295 | — | — | (26,127) |
| Net Realized and Unrealized Gains (Losses) on Investments | 72,674,612 | 493,921,448 | 264,396,142 | 82,531,423 | 626,905,821 | 1,277,832,363 |
| Change in Net Assets Resulting from Operations | $101,209,528 | $496,143,896 | $268,670,330 | $81,973,867 | $619,264,457 | $1,254,954,676 |
| *Net of foreign tax withholding of: | $38,134 | $— | $931,330 | $961 | $55,281 | $1,190,023 |
| †Includes increase in deferred foreign capital gains tax of: | $— | $— | $— | $— | $— | $(25,569,857) |
| (A) | See Note 4 in Notes to Financial Statements. |
| (B) | For the year ended March 31, 2021, the Focused Fund and the Mid Cap Growth Fund had a redemption-in-kind of securities in the amount of $83,852,328 and $95,367,046, respectively. Net realized gains (losses) on investments includes the realized gain on the transaction of $45,698,438 and $38,393,973, respectively, which will not be recognized by the Fund for tax purposes. |
| Touchstone Flexible Income Fund | Touchstone Focused Fund | Touchstone Global ESG Equity Fund | ||||
| For the Year Ended March 31, 2021 | For the Year Ended March 31, 2020 | For the Year Ended March 31, 2021 | For the Year Ended March 31, 2020 | For the Year Ended March 31, 2021 | For the Year Ended March 31, 2020 | |
| From Operations | ||||||
| Net investment income (loss) | $28,534,916 | $23,108,862 | $2,222,448 | $5,283,320 | $4,274,188 | $6,545,251 |
| Net realized gains (losses) on investments, securities sold short, written options and foreign currency transactions | (3,408,359) | 20,295,405 | 113,770,654 | 60,441,510 | 66,392,214 | (16,714,842) |
| Net change in unrealized appreciation (depreciation) on investments and foreign currency transactions | 76,082,971 | (68,835,404) | 380,150,794 | (132,563,075) | 198,003,928 | (67,784,463) |
| Change in Net Assets from Operations | 101,209,528 | (25,431,137) | 496,143,896 | (66,838,245) | 268,670,330 | (77,954,054) |
| Distributions to Shareholders: | ||||||
| Distributed earnings, Class A | (5,278,794) | (3,713,589) | (2,153,855) | (2,238,206) | (1,587,449) | (10,328,942) |
| Distributed earnings, Class C | (1,865,099) | (1,561,503) | (1,430,957) | (1,800,403) | — | (254,893) |
| Distributed earnings, Class Y | (26,122,141) | (17,755,930) | (53,264,171) | (55,429,651) | (940,684) | (5,179,635) |
| Distributed earnings, Institutional Class | (1,479,966) | (1,621,646) | (817,067) | (1,430,465) | (65,145) | (1,003,582) |
| Distributed earnings, Class R6 | — | — | — | — | — | — |
| Total Distributions | (34,746,000) | (24,652,668) | (57,666,050) | (60,898,725) | (2,593,278) | (16,767,052) |
| Change in Net Assets from Share Transactions(A) | 82,253,829 | (5,366,375) | (36,832,260) | (124,573,848) | (78,741,029) | (104,176,982) |
| Total Increase (Decrease) in Net Assets | 148,717,357 | (55,450,180) | 401,645,586 | (252,310,818) | 187,336,023 | (198,898,088) |
| Net Assets | ||||||
| Beginning of period | 640,934,795 | 696,384,975 | 746,050,378 | 998,361,196 | 513,098,073 | 711,996,161 |
| End of period | $789,652,152 | $640,934,795 | $1,147,695,964 | $746,050,378 | $700,434,096 | $513,098,073 |
| (A) | For details on share transactions by class, see Statements of Changes in Net Assets - Capital Stock Activity on pages 40-42. |
| Touchstone Growth Opportunities Fund | Touchstone Mid Cap Growth Fund | Touchstone Sands Capital Emerging Markets Growth Fund | |||
| For the Year Ended March 31, 2021 | For the Year Ended March 31, 2020 | For the Year Ended March 31, 2021 | For the Year Ended March 31, 2020 | For the Year Ended March 31, 2021 | For the Year Ended March 31, 2020 |
| $(557,556) | $125,712 | $(7,641,364) | $(750,687) | $(22,877,687) | $7,850,785 |
| 33,445,786 | 18,958,191 | 272,551,221 | 79,103,794 | 34,300,447 | (34,852,669) |
| 49,085,637 | (24,993,169) | 354,354,600 | (175,573,455) | 1,243,531,916 | (183,848,648) |
| 81,973,867 | (5,909,266) | 619,264,457 | (97,220,348) | 1,254,954,676 | (210,850,532) |
| (5,299,262) | (6,821,669) | (21,913,745) | (19,989,487) | — | (9,873) |
| (276,553) | (613,758) | (2,351,555) | (3,056,878) | — | (2,577) |
| (2,983,605) | (3,354,635) | (39,864,933) | (34,842,290) | — | (2,799,865) |
| (6,264,896) | (9,684,009) | (28,507,143) | (29,719,195) | — | (6,684,482) |
| — | — | (111,845) | — | — | — |
| (14,824,316) | (20,474,071) | (92,749,221) | (87,607,850) | — | (9,496,797) |
| (69,060,834) | 27,850,599 | (195,258,516) | 124,630,719 | 1,791,364,885 | 687,708,219 |
| (1,911,283) | 1,467,262 | 331,256,720 | (60,197,479) | 3,046,319,561 | 467,360,890 |
| 162,844,157 | 161,376,895 | 1,037,398,511 | 1,097,595,990 | 1,311,532,316 | 844,171,426 |
| $160,932,874 | $162,844,157 | $1,368,655,231 | $1,037,398,511 | $4,357,851,877 | $1,311,532,316 |
| Touchstone Flexible Income Fund | Touchstone Focused Fund | |||||||
| For the Year Ended March 31, 2021 | For the Year Ended March 31, 2020 | For the Year Ended March 31, 2021 | For the Year Ended March 31, 2020 | |||||
| Shares | Dollars | Shares | Dollars | Shares | Dollars | Shares | Dollars | |
| Class A | ||||||||
| Proceeds from Shares issued | 2,840,796 | $31,345,303 | 1,969,290 | $21,351,485 | 251,563 | $12,943,588 | 123,655 | $5,494,801 |
| Reinvestment of distributions | 403,612 | 4,461,293 | 292,070 | 3,150,421 | 35,107 | 1,821,706 | 44,106 | 1,944,038 |
| Cost of Shares redeemed | (2,228,003) | (24,536,572) | (2,639,515) | (28,391,878) | (223,201) | (10,767,368) | (700,697) | (30,599,001) |
| Change from Class A Share Transactions | 1,016,405 | 11,270,024 | (378,155) | (3,889,972) | 63,469 | 3,997,926 | (532,936) | (23,160,162) |
| Class C | ||||||||
| Proceeds from Shares issued | 735,883 | 7,973,288 | 1,208,385 | 12,893,719 | 11,317 | 524,313 | 41,324 | 1,692,900 |
| Reinvestment of distributions | 146,221 | 1,591,133 | 119,434 | 1,270,064 | 28,001 | 1,345,159 | 39,440 | 1,622,944 |
| Cost of Shares redeemed | (1,954,282) | (21,048,203) | (2,514,887) | (26,729,797) | (216,361) | (9,639,449) | (277,487) | (11,261,327) |
| Change from Class C Share Transactions | (1,072,178) | (11,483,782) | (1,187,068) | (12,566,014) | (177,043) | (7,769,977) | (196,723) | (7,945,483) |
| Class Y | ||||||||
| Proceeds from Shares issued | 19,864,583 | 220,062,508 | 20,459,737 | 222,117,191 | 396,405 | 19,966,667 | 600,464 | 26,350,973 |
| Reinvestment of distributions | 2,171,185 | 24,083,355 | 1,516,299 | 16,400,965 | 975,935 | 51,346,021 | 1,186,386 | 53,056,756 |
| Cost of Shares redeemed | (15,443,838) | (169,306,158) | (18,501,937) | (195,714,021) | (1,950,332) | (95,698,599) | (3,696,500) | (160,703,579) |
| Change from Class Y Share Transactions | 6,591,930 | 74,839,705 | 3,474,099 | 42,804,135 | (577,992) | (24,385,911) | (1,909,650) | (81,295,850) |
| Institutional Class | ||||||||
| Proceeds from Shares issued | 1,396,030 | 15,517,816 | 1,723,705 | 18,730,017 | 1,838,766 | 89,867,250 | 161,940 | 7,140,567 |
| Reinvestment of distributions | 93,094 | 1,031,402 | 129,615 | 1,405,196 | 14,676 | 776,182 | 31,825 | 1,430,530 |
| Cost of Shares redeemed | (806,241) | (8,921,336) | (4,778,658) | (51,849,737) | (2,008,192) | (99,317,730) | (459,600) | (20,743,450) |
| Change from Institutional Class Share Transactions | 682,883 | 7,627,882 | (2,925,338) | (31,714,524) | (154,750) | (8,674,298) | (265,835) | (12,172,353) |
| Change from Share Transactions | 7,219,040 | $82,253,829 | (1,016,462) | $(5,366,375) | (846,316) | $(36,832,260) | (2,905,144) | $(124,573,848) |
| Touchstone Global ESG Equity Fund | Touchstone Growth Opportunities Fund | ||||||
| For the Year Ended March 31, 2021 | For the Year Ended March 31, 2020 | For the Year Ended March 31, 2021 | For the Year Ended March 31, 2020 | ||||
| Shares | Dollars | Shares | Dollars | Shares | Dollars | Shares | Dollars |
| 396,735 | $8,721,587 | 493,946 | $10,169,304 | 87,918 | $3,266,253 | 61,496 | $2,058,524 |
| 60,977 | 1,507,353 | 454,776 | 9,783,738 | 130,107 | 5,057,274 | 201,139 | 6,464,623 |
| (2,085,406) | (46,097,121) | (2,689,637) | (54,785,146) | (162,699) | (6,232,248) | (229,675) | (7,684,999) |
| (1,627,694) | (35,868,181) | (1,740,915) | (34,832,104) | 55,326 | 2,091,279 | 32,960 | 838,148 |
| 26,993 | 529,386 | 39,062 | 670,788 | 2,453 | 68,989 | 15,450 | 391,648 |
| — | — | 12,459 | 220,907 | 9,531 | 269,741 | 20,275 | 495,111 |
| (246,181) | (4,330,629) | (368,405) | (6,248,381) | (78,433) | (2,196,413) | (54,735) | (1,451,229) |
| (219,188) | (3,801,243) | (316,884) | (5,356,686) | (66,449) | (1,857,683) | (19,010) | (564,470) |
| 1,187,900 | 26,934,242 | 2,590,628 | 54,554,611 | 225,691 | 7,953,280 | 445,257 | 15,830,929 |
| 34,565 | 886,951 | 215,559 | 4,821,697 | 71,950 | 2,931,242 | 98,237 | 3,286,034 |
| (2,286,476) | (50,260,030) | (5,034,185) | (106,875,253) | (498,231) | (18,257,698) | (922,991) | (32,183,620) |
| (1,064,011) | (22,438,837) | (2,227,998) | (47,498,945) | (200,590) | (7,373,176) | (379,497) | (13,066,657) |
| 219,555 | 5,270,130 | 369,505 | 7,892,739 | 290,108 | 10,798,698 | 1,759,821 | 61,464,438 |
| 1,577 | 40,541 | 42,505 | 951,605 | 150,998 | 6,264,896 | 284,991 | 9,684,009 |
| (975,584) | (21,943,439) | (1,315,432) | (25,333,591) | (2,070,981) | (78,984,848) | (873,870) | (30,504,869) |
| (754,452) | (16,632,768) | (903,422) | (16,489,247) | (1,629,875) | (61,921,254) | 1,170,942 | 40,643,578 |
| (3,665,345) | $(78,741,029) | (5,189,219) | $(104,176,982) | (1,841,588) | $(69,060,834) | 805,395 | $27,850,599 |
| Touchstone Mid Cap Growth Fund | Touchstone Sands Capital Emerging Markets Growth Fund | |||||||
| For the Year Ended March 31, 2021 | For the Year Ended March 31, 2020(A) | For the Year Ended March 31, 2021 | For the Year Ended March 31, 2020 | |||||
| Shares | Dollars | Shares | Dollars | Shares | Dollars | Shares | Dollars | |
| Class A | ||||||||
| Proceeds from Shares issued | 1,067,011 | $34,084,944 | 2,138,686 | $65,838,474 | 1,005,659 | $20,130,781 | 301,881 | $4,037,079 |
| Reinvestment of distributions | 541,386 | 19,879,699 | 586,059 | 18,135,023 | — | — | 633 | 9,119 |
| Cost of Shares redeemed | (2,471,731) | (85,865,487) | (2,281,110) | (69,290,691) | (302,118) | (5,795,374) | (150,007) | (1,979,207) |
| Change from Class A Share Transactions | (863,334) | (31,900,844) | 443,635 | 14,682,806 | 703,541 | 14,335,407 | 152,507 | 2,066,991 |
| Class C | ||||||||
| Proceeds from Shares issued | 76,143 | 1,468,504 | 232,703 | 4,339,937 | 392,695 | 8,087,311 | 101,370 | 1,406,635 |
| Reinvestment of distributions | 111,664 | 2,265,668 | 155,736 | 2,823,487 | — | — | 153 | 2,194 |
| Cost of Shares redeemed | (713,332) | (13,647,825) | (768,088) | (14,216,136) | (32,579) | (574,799) | (5,214) | (65,430) |
| Change from Class C Share Transactions | (525,525) | (9,913,653) | (379,649) | (7,052,712) | 360,116 | 7,512,512 | 96,309 | 1,343,399 |
| Class Y | ||||||||
| Proceeds from Shares issued | 3,838,529 | 135,254,385 | 6,073,933 | 187,749,638 | 49,959,576 | 1,004,168,771 | 21,621,094 | 290,726,041 |
| Reinvestment of distributions | 967,681 | 37,362,145 | 998,794 | 32,392,481 | — | — | 167,769 | 2,422,593 |
| Cost of Shares redeemed | (4,940,786) | (175,997,171) | (5,609,694) | (179,197,024) | (18,838,544) | (356,921,406) | (8,698,323) | (113,245,684) |
| Change from Class Y Share Transactions | (134,576) | (3,380,641) | 1,463,033 | 40,945,095 | 31,121,032 | 647,247,365 | 13,090,540 | 179,902,950 |
| Institutional Class | ||||||||
| Proceeds from Shares issued | 7,022,230 | 257,938,408 | 6,573,558 | 212,452,733 | 76,112,190 | 1,483,255,179 | 47,823,401 | 639,645,558 |
| Reinvestment of distributions | 513,798 | 20,068,967 | 769,260 | 25,222,235 | — | — | 340,034 | 4,930,489 |
| Cost of Shares redeemed | (11,629,901) | (432,407,355) | (5,111,765) | (161,621,938) | (19,830,368) | (360,985,578) | (10,574,079) | (140,181,168) |
| Change from Institutional Class Share Transactions | (4,093,873) | (154,399,980) | 2,231,053 | 76,053,030 | 56,281,822 | 1,122,269,601 | 37,589,356 | 504,394,879 |
| Class R6 | ||||||||
| Proceeds from Shares issued | 120,268 | 4,562,600 | 70 | 2,500 | — | — | — | — |
| Reinvestment of distributions | 2,862 | 111,845 | — | — | — | — | — | — |
| Cost of Shares redeemed | (8,652) | (337,843) | — | — | — | — | — | — |
| Change from Class R6 Share Transactions | 114,478 | 4,336,602 | 70 | 2,500 | — | — | — | — |
| Change from Share Transactions | (5,502,830) | $(195,258,516) | 3,758,142 | $124,630,719 | 88,466,511 | $1,791,364,885 | 50,928,712 | $687,708,219 |
| (A) | Represents the period from commencement of operations (February 10, 2020) through March 31, 2020 for Class R6. |
| Touchstone Flexible Income Fund—Class A | |||||
| Selected Data for a Share Outstanding Throughout Each Period | |||||
| Year Ended March 31, | |||||
| 2021 | 2020 | 2019 | 2018 | 2017 | |
| Net asset value at beginning of period | $10.05 | $10.75 | $10.81 | $10.71 | $10.58 |
| Income (loss) from investment operations: | |||||
| Net investment income | 0.41 | 0.34 | 0.39 | 0.26 | 0.30 |
| Net realized and unrealized gains (losses) on investments | 1.16 | (0.68) | (0.01) | 0.11 | 0.11 |
| Total from investment operations: | 1.57 | (0.34) | 0.38 | 0.37 | 0.41 |
| Distributions from: | |||||
| Net investment income | (0.41) | (0.36) | (0.38) | (0.27) | (0.28) |
| Realized capital gains | (0.10) | — | (0.06) | — | — |
| Total distributions | (0.51) | (0.36) | (0.44) | (0.27) | (0.28) |
| Net asset value at end of period | $11.11 | $10.05 | $10.75 | $10.81 | $10.71 |
| Total return(A) | 15.72% | (3.33%) | 3.59% | 3.46% | 3.93% |
| Ratios and supplemental data: | |||||
| Net assets at end of period (000's) | $121,317 | $99,460 | $110,460 | $136,609 | $49,544 |
| Ratio to average net assets: | |||||
| Net expenses (including dividend and interest expense on securities sold short) | 1.04% | 1.05%(B) | 1.04% | 1.06%(B) | 1.10%(B) |
| Gross expenses (including dividend and interest expense on securities sold short) | 1.09% | 1.14%(C) | 1.11% | 1.14%(C) | 1.30%(C) |
| Net investment income | 3.79% | 3.12% | 3.50% | 2.60% | 2.74% |
| Portfolio turnover rate | 103% | 136% | 171% | 100%(D) | 127% |
| Touchstone Flexible Income Fund—Class C | |||||
| Selected Data for a Share Outstanding Throughout Each Period | |||||
| Year Ended March 31, | |||||
| 2021 | 2020 | 2019 | 2018 | 2017 | |
| Net asset value at beginning of period | $9.90 | $10.60 | $10.67 | $10.57 | $10.44 |
| Income (loss) from investment operations: | |||||
| Net investment income | 0.32 | 0.24 | 0.30 | 0.20 | 0.20 |
| Net realized and unrealized gains (losses) on investments | 1.15 | (0.66) | (0.01) | 0.09 | 0.13 |
| Total from investment operations: | 1.47 | (0.42) | 0.29 | 0.29 | 0.33 |
| Distributions from: | |||||
| Net investment income | (0.33) | (0.28) | (0.30) | (0.19) | (0.20) |
| Realized capital gains | (0.10) | — | (0.06) | — | — |
| Total distributions | (0.43) | (0.28) | (0.36) | (0.19) | (0.20) |
| Net asset value at end of period | $10.94 | $9.90 | $10.60 | $10.67 | $10.57 |
| Total return(A) | 14.89% | (4.09%) | 2.77% | 2.73% | 3.22% |
| Ratios and supplemental data: | |||||
| Net assets at end of period (000's) | $44,389 | $50,767 | $66,926 | $100,800 | $55,043 |
| Ratio to average net assets: | |||||
| Net expenses (including dividend and interest expense on securities sold short) | 1.79% | 1.80%(B) | 1.79% | 1.81%(B) | 1.85%(B) |
| Gross expenses (including dividend and interest expense on securities sold short) | 1.85% | 1.91%(C) | 1.86% | 1.89%(C) | 2.00%(C) |
| Net investment income | 3.04% | 2.37% | 2.75% | 1.85% | 1.99% |
| Portfolio turnover rate | 103% | 136% | 171% | 100%(D) | 127% |
| (A) | Total returns shown exclude the effect of applicable sales loads and fees. If these charges were included, the returns would be lower. |
| (B) | The ratio of net expenses to average net assets excluding dividend and interest expense on securities sold short for Class A was 1.04%, 1.06% and 1.09% and for Class C was 1.79%, 1.81% and 1.84% for the years ended March 31, 2020, 2018 and 2017, respectively. |
| (C) | The ratio of gross expenses to average net assets excluding dividend and interest expense on securities sold short for Class A was 1.13%, 1.14% and 1.29% and for Class C was 1.90%, 1.89% and 1.99% for the years ended March 31, 2020, 2018 and 2017, respectively. |
| (D) | Portfolio turnover excludes the purchases and sales of securities of the Sentinel Multi-Asset Income Fund acquired on October 27, 2017. If these transactions were included, portfolio turnover would have been higher. |
| Touchstone Flexible Income Fund—Class Y | |||||
| Selected Data for a Share Outstanding Throughout Each Period | |||||
| Year Ended March 31, | |||||
| 2021 | 2020 | 2019 | 2018 | 2017 | |
| Net asset value at beginning of period | $10.08 | $10.78 | $10.85 | $10.75 | $10.61 |
| Income (loss) from investment operations: | |||||
| Net investment income | 0.44 | 0.37 | 0.42 | 0.31 | 0.32 |
| Net realized and unrealized gains (losses) on investments | 1.17 | (0.68) | (0.02) | 0.09 | 0.13 |
| Total from investment operations: | 1.61 | (0.31) | 0.40 | 0.40 | 0.45 |
| Distributions from: | |||||
| Net investment income | (0.44) | (0.39) | (0.41) | (0.30) | (0.31) |
| Realized capital gains | (0.10) | — | (0.06) | — | — |
| Total distributions | (0.54) | (0.39) | (0.47) | (0.30) | (0.31) |
| Net asset value at end of period | $11.15 | $10.08 | $10.78 | $10.85 | $10.75 |
| Total return | 16.07% | (3.07%) | 3.75% | 3.71% | 4.28% |
| Ratios and supplemental data: | |||||
| Net assets at end of period (000's) | $587,810 | $464,910 | $459,861 | $628,693 | $464,002 |
| Ratio to average net assets: | |||||
| Net expenses (including dividend and interest expense on securities sold short) | 0.79% | 0.80%(A) | 0.79% | 0.82%(A) | 0.85%(A) |
| Gross expenses (including dividend and interest expense on securities sold short) | 0.83% | 0.87%(B) | 0.84% | 0.90%(B) | 1.00%(B) |
| Net investment income | 4.04% | 3.37% | 3.75% | 2.84% | 2.99% |
| Portfolio turnover rate | 103% | 136% | 171% | 100%(C) | 127% |
| Touchstone Flexible Income Fund—Institutional Class | |||||
| Selected Data for a Share Outstanding Throughout Each Period | |||||
| Year Ended March 31, | |||||
| 2021 | 2020 | 2019 | 2018 | 2017 | |
| Net asset value at beginning of period | $10.08 | $10.78 | $10.84 | $10.74 | $10.60 |
| Income (loss) from investment operations: | |||||
| Net investment income | 0.45 | 0.40 | 0.44 | 0.33 | 0.33 |
| Net realized and unrealized gains (losses) on investments | 1.16 | (0.70) | (0.02) | 0.08 | 0.13 |
| Total from investment operations: | 1.61 | (0.30) | 0.42 | 0.41 | 0.46 |
| Distributions from: | |||||
| Net investment income | (0.45) | (0.40) | (0.42) | (0.31) | (0.32) |
| Realized capital gains | (0.10) | — | (0.06) | — | — |
| Total distributions | (0.55) | (0.40) | (0.48) | (0.31) | (0.32) |
| Net asset value at end of period | $11.14 | $10.08 | $10.78 | $10.84 | $10.74 |
| Total return | 16.19% | (3.02%) | 3.95% | 3.81% | 4.28% |
| Ratios and supplemental data: | |||||
| Net assets at end of period (000's) | $36,136 | $25,798 | $59,138 | $86,578 | $104,631 |
| Ratio to average net assets: | |||||
| Net expenses (including dividend and interest expense on securities sold short) | 0.69% | 0.70%(A) | 0.69% | 0.72%(A) | 0.75%(A) |
| Gross expenses (including dividend and interest expense on securities sold short) | 0.84% | 0.88%(B) | 0.82% | 0.86%(B) | 0.92%(B) |
| Net investment income | 4.14% | 3.47% | 3.85% | 2.94% | 3.09% |
| Portfolio turnover rate | 103% | 136% | 171% | 100%(C) | 127% |
| (A) | The ratio of net expenses to average net assets excluding dividend and interest expense on securities sold short for Class Y was 0.79%, 0.82% and 0.84% and for Institutional Class was 0.69%, 0.72% and 0.74% for the years ended March 31, 2020, 2018 and 2017, respectively. |
| (B) | The ratio of gross expenses to average net assets excluding dividend and interest expense on securities sold short for Class Y was 0.86%, 0.90% and 0.99% and for Institutional Class was 0.87%, 0.86% and 0.91% for the years ended March 31, 2020, 2018 and 2017, respectively. |
| (C) | Portfolio turnover excludes the purchases and sales of securities of the Sentinel Multi-Asset Income Fund acquired on October 27, 2017. If these transactions were included, portfolio turnover would have been higher. |
| Touchstone Focused Fund—Class A | |||||
| Selected Data for a Share Outstanding Throughout Each Period | |||||
| Year Ended March 31, | |||||
| 2021 | 2020 | 2019 | 2018 | 2017 | |
| Net asset value at beginning of period | $36.45 | $42.68 | $42.93 | $41.47 | $36.68 |
| Income (loss) from investment operations: | |||||
| Net investment income (loss)(A) | (0.02) | 0.14 | 0.14 | 0.17 | 0.15 |
| Net realized and unrealized gains (losses) on investments | 24.92 | (3.56) | 1.39 | 4.02 | 5.12 |
| Total from investment operations: | 24.90 | (3.42) | 1.53 | 4.19 | 5.27 |
| Distributions from: | |||||
| Net investment income | — | (0.10) | (0.01) | — | (0.14) |
| Realized capital gains | (2.92) | (2.71) | (1.77) | (2.73) | (0.34) |
| Total distributions | (2.92) | (2.81) | (1.78) | (2.73) | (0.48) |
| Net asset value at end of period | $58.43 | $36.45 | $42.68 | $42.93 | $41.47 |
| Total return(B) | 69.38% | (9.14%) | 3.82% | 10.13% | 14.45% |
| Ratios and supplemental data: | |||||
| Net assets at end of period (000's) | $48,419 | $27,889 | $55,399 | $167,354 | $425,366 |
| Ratio to average net assets: | |||||
| Net expenses (including liquidity provider expenses) | 1.22%(C) | 1.20%(D) | 1.20% | 1.20% | 1.20% |
| Gross expenses (including liquidity provider expenses) | 1.22%(E) | 1.19% | 1.32% | 1.29% | 1.28% |
| Net investment income (loss) | (0.05%) | 0.31% | 0.32% | 0.40% | 0.39% |
| Portfolio turnover rate | 18%(F) | 13% | 12% | 8%(F) | 20% |
| Touchstone Focused Fund—Class C | |||||
| Selected Data for a Share Outstanding Throughout Each Period | |||||
| Year Ended March 31, | |||||
| 2021 | 2020 | 2019 | 2018 | 2017 | |
| Net asset value at beginning of period | $34.06 | $40.26 | $40.89 | $39.90 | $35.54 |
| Income (loss) from investment operations: | |||||
| Net investment loss(A) | (0.36) | (0.18) | (0.18) | (0.14) | (0.13) |
| Net realized and unrealized gains (losses) on investments | 23.19 | (3.31) | 1.32 | 3.86 | 4.94 |
| Total from investment operations: | 22.83 | (3.49) | 1.14 | 3.72 | 4.81 |
| Distributions from: | |||||
| Net investment income | — | — | — | — | (0.11) |
| Realized capital gains | (2.92) | (2.71) | (1.77) | (2.73) | (0.34) |
| Total distributions | (2.92) | (2.71) | (1.77) | (2.73) | (0.45) |
| Net asset value at end of period | $53.97 | $34.06 | $40.26 | $40.89 | $39.90 |
| Total return(B) | 68.10% | (9.80%) | 3.03% | 9.34% | 13.56% |
| Ratios and supplemental data: | |||||
| Net assets at end of period (000's) | $25,241 | $21,961 | $33,875 | $41,635 | $53,776 |
| Ratio to average net assets: | |||||
| Net expenses (including liquidity provider expenses) | 1.96%(C) | 1.95% | 1.95% | 1.94% | 1.95% |
| Gross expenses (including liquidity provider expenses) | 1.96%(E) | 1.98% | 1.95% | 1.94% | 1.97% |
| Net investment loss | (0.79%) | (0.44%) | (0.43%) | (0.34%) | (0.36%) |
| Portfolio turnover rate | 18%(F) | 13% | 12% | 8%(F) | 20% |
| (A) | The net investment income (loss) per share was based on average shares outstanding for the period. |
| (B) | Total returns shown exclude the effect of applicable sales loads and fees. If these charges were included, the returns would be lower. |
| (C) | The ratio of net expenses to average net assets excluding liquidity provider expenses for Class A was 1.20% and for Class C was 1.94% for the year ended March 31, 2021. |
| (D) | Net expenses include amounts recouped by the Advisor. |
| (E) | The ratio of gross expenses to average net assets excluding liquidity provider expenses for Class A was 1.20% and for Class C was 1.94% for the year ended March 31, 2021. |
| (F) | Portfolio turnover excludes securities delivered from processing a redemption-in-kind. |
| Touchstone Focused Fund—Class Y | |||||
| Selected Data for a Share Outstanding Throughout Each Period | |||||
| Year Ended March 31, | |||||
| 2021 | 2020 | 2019 | 2018 | 2017 | |
| Net asset value at beginning of period | $36.82 | $43.12 | $43.50 | $42.21 | $37.29 |
| Income (loss) from investment operations: | |||||
| Net investment income(A) | 0.13 | 0.26 | 0.27 | 0.31 | 0.27 |
| Net realized and unrealized gains (losses) on investments | 25.21 | (3.58) | 1.39 | 4.08 | 5.22 |
| Total from investment operations: | 25.34 | (3.32) | 1.66 | 4.39 | 5.49 |
| Distributions from: | |||||
| Net investment income | (0.14) | (0.27) | (0.27) | (0.37) | (0.23) |
| Realized capital gains | (2.92) | (2.71) | (1.77) | (2.73) | (0.34) |
| Total distributions | (3.06) | (2.98) | (2.04) | (3.10) | (0.57) |
| Net asset value at end of period | $59.10 | $36.82 | $43.12 | $43.50 | $42.21 |
| Total return | 69.89% | (8.86%) | 4.13% | 10.43% | 14.77% |
| Ratios and supplemental data: | |||||
| Net assets at end of period (000's) | $1,058,713 | $680,934 | $879,704 | $972,273 | $974,660 |
| Ratio to average net assets: | |||||
| Net expenses (including liquidity provider expenses) | 0.91%(B) | 0.91% | 0.91% | 0.91% | 0.92% |
| Gross expenses (including liquidity provider expenses) | 0.91%(C) | 0.91% | 0.91% | 0.91% | 0.92% |
| Net investment income | 0.27% | 0.60% | 0.61% | 0.69% | 0.68% |
| Portfolio turnover rate | 18%(D) | 13% | 12% | 8%(D) | 20% |
| Touchstone Focused Fund—Institutional Class | |||||
| Selected Data for a Share Outstanding Throughout Each Period | |||||
| Year Ended March 31, | |||||
| 2021 | 2020 | 2019 | 2018 | 2017 | |
| Net asset value at beginning of period | $36.98 | $43.30 | $43.68 | $42.38 | $37.45 |
| Income (loss) from investment operations: | |||||
| Net investment income(A) | 0.16 | 0.30 | 0.30 | 0.34 | 0.30 |
| Net realized and unrealized gains (losses) on investments | 25.33 | (3.60) | 1.39 | 4.11 | 5.24 |
| Total from investment operations: | 25.49 | (3.30) | 1.69 | 4.45 | 5.54 |
| Distributions from: | |||||
| Net investment income | (0.17) | (0.31) | (0.30) | (0.42) | (0.27) |
| Realized capital gains | (2.92) | (2.71) | (1.77) | (2.73) | (0.34) |
| Total distributions | (3.09) | (3.02) | (2.07) | (3.15) | (0.61) |
| Net asset value at end of period | $59.38 | $36.98 | $43.30 | $43.68 | $42.38 |
| Total return | 70.00% | (8.79%) | 4.20% | 10.54% | 14.84% |
| Ratios and supplemental data: | |||||
| Net assets at end of period (000's) | $15,323 | $15,267 | $29,382 | $22,556 | $41,389 |
| Ratio to average net assets: | |||||
| Net expenses (including liquidity provider expenses) | 0.85%(B) | 0.83% | 0.83% | 0.83% | 0.83% |
| Gross expenses (including liquidity provider expenses) | 0.94%(C) | 0.92% | 0.92% | 0.92% | 0.88% |
| Net investment income | 0.32% | 0.68% | 0.69% | 0.77% | 0.76% |
| Portfolio turnover rate | 18%(D) | 13% | 12% | 8%(D) | 20% |
| (A) | The net investment income per share was based on average shares outstanding for the period. |
| (B) | The ratio of net expenses to average net assets excluding liquidity provider expenses for Class Y was 0.89% and for Institutional Class was 0.83% for the year ended March 31, 2021. |
| (C) | The ratio of gross expenses to average net assets excluding liquidity provider expenses for Class Y was 0.89% and for Institutional Class was 0.92% for the year ended March 31, 2021. |
| (D) | Portfolio turnover excludes securities delivered from processing a redemption-in-kind. |
| Touchstone Global ESG Equity Fund—Class A | |||||
| Selected Data for a Share Outstanding Throughout Each Period | |||||
| Year Ended March 31, | |||||
| 2021 | 2020 | 2019 | 2018 | 2017 | |
| Net asset value at beginning of period | $16.84 | $19.94 | $22.01 | $21.52 | $18.98 |
| Income (loss) from investment operations: | |||||
| Net investment income | 0.14(A) | 0.17(A) | 0.15 | 0.03 | 0.18 |
| Net realized and unrealized gains (losses) on investments | 9.26 | (2.78) | (0.29) | 3.37 | 2.47 |
| Total from investment operations: | 9.40 | (2.61) | (0.14) | 3.40 | 2.65 |
| Distributions from: | |||||
| Net investment income | (0.08) | (0.15) | (0.17) | (0.17) | (0.11) |
| Realized capital gains | — | (0.34) | (1.76) | (2.74) | — |
| Total distributions | (0.08) | (0.49) | (1.93) | (2.91) | (0.11) |
| Net asset value at end of period | $26.16 | $16.84 | $19.94 | $22.01 | $21.52 |
| Total return(B) | 55.86% | 13.61% | (0.37%) | 15.57% | 14.01% |
| Ratios and supplemental data: | |||||
| Net assets at end of period (000's) | $496,574 | $347,021 | $445,608 | $485,413 | $113,062 |
| Ratio to average net assets: | |||||
| Net expenses | 1.12% | 1.17% | 1.17% | 1.19% | 1.24% |
| Gross expenses | 1.12% | 1.18% | 1.17% | 1.22% | 1.36% |
| Net investment income | 0.63% | 0.84% | 0.70% | 0.58% | 0.83% |
| Portfolio turnover rate | 62% | 60% | 40% | 72%(C) | 53% |
| Touchstone Global ESG Equity Fund—Class C | |||||
| Selected Data for a Share Outstanding Throughout Each Period | |||||
| Year Ended March 31, | |||||
| 2021 | 2020 | 2019 | 2018 | 2017 | |
| Net asset value at beginning of period | $13.97 | $16.65 | $18.68 | $18.62 | $16.47 |
| Income (loss) from investment operations: | |||||
| Net investment income (loss) | (0.04)(A) | —(A)(D) | (0.06) | (0.05) | 0.01 |
| Net realized and unrealized gains (losses) on investments | 7.66 | (2.31) | (0.21) | 2.85 | 2.15 |
| Total from investment operations: | 7.62 | (2.31) | (0.27) | 2.80 | 2.16 |
| Distributions from: | |||||
| Net investment income | — | (0.03) | — | — | (0.01) |
| Realized capital gains | — | (0.34) | (1.76) | (2.74) | — |
| Total distributions | — | (0.37) | (1.76) | (2.74) | (0.01) |
| Net asset value at end of period | $21.59 | $13.97 | $16.65 | $18.68 | $18.62 |
| Total return(B) | 54.55% | (14.34%) | (1.18%) | 14.75% | 13.12% |
| Ratios and supplemental data: | |||||
| Net assets at end of period (000's) | $7,782 | $8,099 | $14,926 | $37,513 | $48,055 |
| Ratio to average net assets: | |||||
| Net expenses | 1.99% | 1.99% | 1.99% | 1.99% | 1.99% |
| Gross expenses | 2.14% | 2.14% | 2.03% | 2.05% | 2.12% |
| Net investment income (loss) | (0.24%) | 0.02% | (0.12%) | (0.23%) | 0.08% |
| Portfolio turnover rate | 62% | 60% | 40% | 72%(C) | 53% |
| (A) | The net investment income (loss) per share was based on average shares outstanding for the period. |
| (B) | Total returns shown exclude the effect of applicable sales loads and fees. If these charges were included, the returns would be lower. |
| (C) | Portfolio turnover excludes the purchases and sales of securities of the Sentinel Sustainable Core Opportunities Fund acquired on October 27, 2017. If these transactions were included, portfolio turnover would have been higher. |
| (D) | Less than $0.005 per share. |
| Touchstone Global ESG Equity Fund—Class Y | |||||
| Selected Data for a Share Outstanding Throughout Each Period | |||||
| Year Ended March 31, | |||||
| 2021 | 2020 | 2019 | 2018 | 2017 | |
| Net asset value at beginning of period | $17.48 | $20.66 | $22.75 | $22.11 | $19.49 |
| Income (loss) from investment operations: | |||||
| Net investment income | 0.20(A) | 0.24(A) | 0.21 | 0.16 | 0.20 |
| Net realized and unrealized gains (losses) on investments | 9.62 | (2.88) | (0.31) | 3.41 | 2.58 |
| Total from investment operations: | 9.82 | (2.64) | (0.10) | 3.57 | 2.78 |
| Distributions from: | |||||
| Net investment income | (0.14) | (0.20) | (0.23) | (0.19) | (0.16) |
| Realized capital gains | — | (0.34) | (1.76) | (2.74) | — |
| Total distributions | (0.14) | (0.54) | (1.99) | (2.93) | (0.16) |
| Net asset value at end of period | $27.16 | $17.48 | $20.66 | $22.75 | $22.11 |
| Total return | 56.22% | (13.37%) | (0.09%) | 15.90% | 14.30% |
| Ratios and supplemental data: | |||||
| Net assets at end of period (000's) | $182,806 | $136,239 | $207,080 | $189,837 | $112,790 |
| Ratio to average net assets: | |||||
| Net expenses | 0.90% | 0.90% | 0.90% | 0.94% | 0.99% |
| Gross expenses | 0.93% | 0.94% | 0.93% | 0.99% | 1.09% |
| Net investment income | 0.85% | 1.11% | 0.97% | 0.82% | 1.08% |
| Portfolio turnover rate | 62% | 60% | 40% | 72%(B) | 53% |
| Touchstone Global ESG Equity Fund—Institutional Class | |||||
| Selected Data for a Share Outstanding Throughout Each Period | |||||
| Year Ended March 31, | |||||
| 2021 | 2020 | 2019 | 2018 | 2017 | |
| Net asset value at beginning of period | $17.50 | $20.68 | $22.77 | $22.13 | $19.50 |
| Income (loss) from investment operations: | |||||
| Net investment income | 0.19(A) | 0.24(A) | 0.22 | 0.20 | 0.19 |
| Net realized and unrealized gains (losses) on investments | 9.64 | (2.88) | (0.32) | 3.38 | 2.61 |
| Total from investment operations: | 9.83 | (2.64) | (0.10) | 3.58 | 2.80 |
| Distributions from: | |||||
| Net investment income | (0.13) | (0.20) | (0.23) | (0.20) | (0.17) |
| Realized capital gains | — | (0.34) | (1.76) | (2.74) | — |
| Total distributions | (0.13) | (0.54) | (1.99) | (2.94) | (0.17) |
| Net asset value at end of period | $27.20 | $17.50 | $20.68 | $22.77 | $22.13 |
| Total return | 56.21% | (13.35%) | (0.10%) | 15.95% | 14.41% |
| Ratios and supplemental data: | |||||
| Net assets at end of period (000's) | $13,271 | $21,739 | $44,382 | $42,196 | $29,679 |
| Ratio to average net assets: | |||||
| Net expenses | 0.89% | 0.89% | 0.89% | 0.89% | 0.89% |
| Gross expenses | 0.97% | 0.95% | 0.93% | 1.01% | 1.11% |
| Net investment income | 0.86% | 1.12% | 0.98% | 0.87% | 1.18% |
| Portfolio turnover rate | 62% | 60% | 40% | 72%(B) | 53% |
| (A) | The net investment income per share was based on average shares outstanding for the period. |
| (B) | Portfolio turnover excludes the purchases and sales of securities of the Sentinel Sustainable Core Opportunities Fund acquired on October 27, 2017. If these transactions were included, portfolio turnover would have been higher. |
| Touchstone Growth Opportunities Fund—Class A | |||||
| Selected Data for a Share Outstanding Throughout Each Period | |||||
| Year Ended March 31, | |||||
| 2021 | 2020 | 2019 | 2018 | 2017 | |
| Net asset value at beginning of period | $27.94 | $32.71 | $32.79 | $30.20 | $27.35 |
| Income (loss) from investment operations: | |||||
| Net investment loss | (0.20) | (0.04) | (0.05) | (0.11) | (—)(A) |
| Net realized and unrealized gains on investments | 17.44 | 0.99 | 3.10 | 5.89 | 3.86 |
| Total from investment operations: | 17.24 | 0.95 | 3.05 | 5.78 | 3.86 |
| Distributions from: | |||||
| Realized capital gains | (4.11) | (5.72) | (3.13) | (3.19) | (1.01) |
| Net asset value at end of period | $41.07 | $27.94 | $32.71 | $32.79 | $30.20 |
| Total return(B) | 62.56% | 0.63% | 10.40% | 19.51% | 14.38% |
| Ratios and supplemental data: | |||||
| Net assets at end of period (000's) | $56,877 | $37,150 | $42,404 | $39,901 | $38,752 |
| Ratio to average net assets: | |||||
| Net expenses (including liquidity provider expenses) | 1.24% | 1.25%(C) | 1.24% | 1.24% | 0.99% |
| Gross expenses (including liquidity provider expenses) | 1.34% | 1.41%(D) | 1.37% | 1.38% | 1.09% |
| Net investment income (loss) | (0.55%) | (0.12%) | (0.17%) | (0.32%) | 1.08% |
| Portfolio turnover rate | 65% | 101%(E) | 94%(E) | 86% | 53% |
| Touchstone Growth Opportunities Fund—Class C | |||||
| Selected Data for a Share Outstanding Throughout Each Period | |||||
| Year Ended March 31, | |||||
| 2021 | 2020 | 2019 | 2018 | 2017 | |
| Net asset value at beginning of period | $21.19 | $26.18 | $27.08 | $25.60 | $23.51 |
| Income (loss) from investment operations: | |||||
| Net investment loss | (0.77) | (0.23) | (0.49) | (0.29) | (0.23) |
| Net realized and unrealized gains on investments | 13.53 | 0.96 | 2.72 | 4.96 | 3.33 |
| Total from investment operations: | 12.76 | 0.73 | 2.23 | 4.67 | 3.10 |
| Distributions from: | |||||
| Realized capital gains | (4.11) | (5.72) | (3.13) | (3.19) | (1.01) |
| Net asset value at end of period | $29.84 | $21.19 | $26.18 | $27.08 | $25.60 |
| Total return(B) | 61.29% | (0.09%) | 9.54% | 18.65% | 13.49% |
| Ratios and supplemental data: | |||||
| Net assets at end of period (000's) | $1,853 | $2,724 | $3,863 | $8,680 | $8,574 |
| Ratio to average net assets: | |||||
| Net expenses (including liquidity provider expenses) | 1.99% | 2.00%(C) | 1.99% | 1.99% | 1.99% |
| Gross expenses (including liquidity provider expenses) | 2.70% | 2.61%(D) | 2.32% | 2.29% | 2.26% |
| Net investment loss | (1.30%) | (0.87%) | (0.92%) | (1.07%) | (0.76%) |
| Portfolio turnover rate | 65% | 101%(E) | 94%(E) | 86% | 90% |
| (A) | Less than $0.005 per share. |
| (B) | Total returns shown exclude the effect of applicable sales loads and fees. If these charges were included, the returns would be lower. |
| (C) | The ratio of net expenses to average net assets excluding liquidity provider expenses for Class A was 1.24% and for Class C was 1.99% for the year ended March 31, 2020. |
| (D) | The ratio of gross expenses to average net assets excluding liquidity provider expenses for Class A was 1.40% and for Class C was 2.60% for the year ended March 31, 2020. |
| (E) | Portfolio turnover excludes securities delivered from processing redemptions-in-kind. |
| Touchstone Growth Opportunities Fund—Class Y | |||||
| Selected Data for a Share Outstanding Throughout Each Period | |||||
| Year Ended March 31, | |||||
| 2021 | 2020 | 2019 | 2018 | 2017 | |
| Net asset value at beginning of period | $29.11 | $33.78 | $33.69 | $30.87 | $27.90 |
| Income (loss) from investment operations: | |||||
| Net investment income (loss) | (0.12) | 0.04 | 0.03 | (0.02) | 0.10 |
| Net realized and unrealized gains on investments | 18.20 | 1.01 | 3.19 | 6.03 | 3.91 |
| Total from investment operations: | 18.08 | 1.05 | 3.22 | 6.01 | 4.01 |
| Distributions from: | |||||
| Net investment income | — | — | —(A) | — | (0.03) |
| Realized capital gains | (4.11) | (5.72) | (3.13) | (3.19) | (1.01) |
| Total distributions | (4.11) | (5.72) | (3.13) | (3.19) | (1.04) |
| Net asset value at end of period | $43.08 | $29.11 | $33.78 | $33.69 | $30.87 |
| Total return | 62.93% | 0.92% | 10.67% | 19.80% | 14.64% |
| Ratios and supplemental data: | |||||
| Net assets at end of period (000's) | $30,742 | $26,610 | $43,703 | $47,554 | $47,222 |
| Ratio to average net assets: | |||||
| Net expenses (including liquidity provider expenses) | 0.99% | 1.00%(B) | 0.99% | 0.99% | 0.99% |
| Gross expenses (including liquidity provider expenses) | 1.13% | 1.14%(C) | 1.08% | 1.07% | 1.07% |
| Net investment income (loss) | (0.30%) | 0.13% | 0.08% | (0.07%) | 0.24% |
| Portfolio turnover rate | 65% | 101%(D) | 94%(D) | 86% | 90% |
| Touchstone Growth Opportunities Fund—Institutional Class | |||||
| Selected Data for a Share Outstanding Throughout Each Period | |||||
| Year Ended March 31, | |||||
| 2021 | 2020 | 2019 | 2018 | 2017 | |
| Net asset value at beginning of period | $29.58 | $34.22 | $34.08 | $31.16 | $28.15 |
| Income (loss) from investment operations: | |||||
| Net investment income (loss) | (0.06) | 0.06 | 0.09 | 0.01 | 0.12 |
| Net realized and unrealized gains on investments | 18.49 | 1.02 | 3.21 | 6.10 | 3.96 |
| Total from investment operations: | 18.43 | 1.08 | 3.30 | 6.11 | 4.08 |
| Distributions from: | |||||
| Net investment income | — | — | (0.03) | — | (0.06) |
| Realized capital gains | (4.11) | (5.72) | (3.13) | (3.19) | (1.01) |
| Total distributions | (4.11) | (5.72) | (3.16) | (3.19) | (1.07) |
| Net asset value at end of period | $43.90 | $29.58 | $34.22 | $34.08 | $31.16 |
| Total return | 63.13% | 1.00% | 10.79% | 19.94% | 14.77% |
| Ratios and supplemental data: | |||||
| Net assets at end of period (000's) | $71,461 | $96,361 | $71,406 | $185,831 | $150,038 |
| Ratio to average net assets: | |||||
| Net expenses (including liquidity provider expenses) | 0.89% | 0.90%(B) | 0.89% | 0.89% | 0.89% |
| Gross expenses (including liquidity provider expenses) | 1.03% | 1.05%(C) | 1.01% | 1.01% | 1.00% |
| Net investment income (loss) | (0.20%) | 0.23% | 0.18% | 0.03% | 0.34% |
| Portfolio turnover rate | 65% | 101%(D) | 94%(D) | 86% | 90% |
| (A) | Less than $0.005 per share. |
| (B) | The ratio of net expenses to average net assets excluding liquidity provider expenses for Class Y was 0.99% and for Institutional Class was 0.89% for the year ended March 31, 2020. |
| (C) | The ratio of gross expenses to average net assets excluding liquidity provider expenses for Class Y was 1.13% and for Institutional Class was 1.04% for the year ended March 31, 2020. |
| (D) | Portfolio turnover excludes securities delivered from processing redemptions-in-kind. |
| Touchstone Mid Cap Growth Fund—Class A | |||||
| Selected Data for a Share Outstanding Throughout Each Period | |||||
| Year Ended March 31, | |||||
| 2021 | 2020 | 2019 | 2018 | 2017 | |
| Net asset value at beginning of period | $24.89 | $29.26 | $28.05 | $25.91 | $23.28 |
| Income (loss) from investment operations: | |||||
| Net investment loss | (0.28) | (0.07) | (0.09) | (0.08)(A) | (0.06) |
| Net realized and unrealized gains (losses) on investments | 15.64 | (2.06) | 3.36 | 4.95 | 3.31 |
| Total from investment operations: | 15.36 | (2.13) | 3.27 | 4.87 | 3.25 |
| Distributions from: | |||||
| Net investment income | — | (0.01) | — | — | — |
| Realized capital gains | (2.54) | (2.23) | (2.06) | (2.73) | (0.62) |
| Total distributions | (2.54) | (2.24) | (2.06) | (2.73) | (0.62) |
| Net asset value at end of period | $37.71 | $24.89 | $29.26 | $28.05 | $25.91 |
| Total return(B) | 61.98% | (8.78%) | 12.77% | 19.28% | 14.13% |
| Ratios and supplemental data: | |||||
| Net assets at end of period (000's) | $322,432 | $234,307 | $262,492 | $218,727 | $225,381 |
| Ratio to average net assets: | |||||
| Net expenses (including liquidity provider expenses) | 1.23%(C) | 1.25% | 1.27% | 1.29% | 1.30% |
| Gross expenses (including liquidity provider expenses) | 1.23%(D) | 1.25% | 1.27% | 1.29% | 1.30% |
| Net investment loss | (0.75%) | (0.24%) | (0.35%) | (0.29%) | (0.26%) |
| Portfolio turnover rate | 65%(E) | 82% | 71% | 76% | 95% |
| Touchstone Mid Cap Growth Fund—Class C | |||||
| Selected Data for a Share Outstanding Throughout Each Period | |||||
| Year Ended March 31, | |||||
| 2021 | 2020 | 2019 | 2018 | 2017 | |
| Net asset value at beginning of period | $14.56 | $18.08 | $18.27 | $17.84 | $16.33 |
| Income (loss) from investment operations: | |||||
| Net investment loss | (0.78) | (0.32) | (0.49) | (0.20)(A) | (0.22) |
| Net realized and unrealized gains (losses) on investments | 9.55 | (0.97) | 2.36 | 3.36 | 2.35 |
| Total from investment operations: | 8.77 | (1.29) | 1.87 | 3.16 | 2.13 |
| Distributions from: | |||||
| Realized capital gains | (2.54) | (2.23) | (2.06) | (2.73) | (0.62) |
| Net asset value at end of period | $20.79 | $14.56 | $18.08 | $18.27 | $17.84 |
| Total return(B) | 60.65% | (9.55%) | 11.91% | 18.38% | 13.28% |
| Ratios and supplemental data: | |||||
| Net assets at end of period (000's) | $18,939 | $20,918 | $32,831 | $90,502 | $113,153 |
| Ratio to average net assets: | |||||
| Net expenses (including liquidity provider expenses) | 2.07%(C) | 2.07% | 2.04% | 2.04% | 2.06% |
| Gross expenses (including liquidity provider expenses) | 2.07%(D) | 2.07% | 2.04% | 2.04% | 2.06% |
| Net investment loss | (1.59%) | (1.06%) | (1.12%) | (1.04%) | (1.02%) |
| Portfolio turnover rate | 65%(E) | 82% | 71% | 76% | 95% |
| (A) | The net investment loss per share was based on average shares outstanding for the period. |
| (B) | Total returns shown exclude the effect of applicable sales loads and fees. If these charges were included, the returns would be lower. |
| (C) | The ratio of net expenses to average net assets excluding liquidity provider expenses for Class A was 1.22% and for Class C was 2.06% for the year ended March 31, 2021. |
| (D) | The ratio of gross expenses to average net assets excluding liquidity provider expenses for Class A was 1.22% and for Class C was 2.06% for the year ended March 31, 2021. |
| (E) | Portfolio turnover excludes securities delivered from processing redemptions-in-kind. |
| Touchstone Mid Cap Growth Fund—Class Y | |||||
| Selected Data for a Share Outstanding Throughout Each Period | |||||
| Year Ended March 31, | |||||
| 2021 | 2020 | 2019 | 2018 | 2017 | |
| Net asset value at beginning of period | $26.04 | $30.50 | $29.07 | $26.70 | $23.92 |
| Income (loss) from investment operations: | |||||
| Net investment loss | (0.18) | (—)(A) | (0.03) | (0.01)(B) | (—)(A) |
| Net realized and unrealized gains (losses) on investments | 16.36 | (2.17) | 3.52 | 5.11 | 3.40 |
| Total from investment operations: | 16.18 | (2.17) | 3.49 | 5.10 | 3.40 |
| Distributions from: | |||||
| Net investment income | — | (0.06) | — | — | — |
| Realized capital gains | (2.54) | (2.23) | (2.06) | (2.73) | (0.62) |
| Total distributions | (2.54) | (2.29) | (2.06) | (2.73) | (0.62) |
| Net asset value at end of period | $39.68 | $26.04 | $30.50 | $29.07 | $26.70 |
| Total return | 62.40% | (8.58%) | 13.05% | 19.62% | 14.38% |
| Ratios and supplemental data: | |||||
| Net assets at end of period (000's) | $641,218 | $424,403 | $452,407 | $375,617 | $311,865 |
| Ratio to average net assets: | |||||
| Net expenses (including liquidity provider expenses) | 0.99%(C) | 1.01% | 1.02% | 1.02% | 1.06% |
| Gross expenses (including liquidity provider expenses) | 0.99%(D) | 1.01% | 1.02% | 1.02% | 1.06% |
| Net investment loss | (0.52%) | (—%)(A) | (0.10%) | (0.02%) | (0.02%) |
| Portfolio turnover rate | 65%(E) | 82% | 71% | 76% | 95% |
| Touchstone Mid Cap Growth Fund—Institutional Class | |||||
| Selected Data for a Share Outstanding Throughout Each Period | |||||
| Year Ended March 31, | |||||
| 2021 | 2020 | 2019 | 2018 | 2017 | |
| Net asset value at beginning of period | $26.32 | $30.79 | $29.32 | $26.90 | $24.07 |
| Income (loss) from investment operations: | |||||
| Net investment income (loss) | (0.20) | 0.01 | (0.01) | (—)(A)(B) | 0.10 |
| Net realized and unrealized gains (losses) on investments | 16.58 | (2.18) | 3.54 | 5.15 | 3.35 |
| Total from investment operations: | 16.38 | (2.17) | 3.53 | 5.15 | 3.45 |
| Distributions from: | |||||
| Net investment income | — | (0.07) | — | — | — |
| Realized capital gains | (2.54) | (2.23) | (2.06) | (2.73) | (0.62) |
| Total distributions | (2.54) | (2.30) | (2.06) | (2.73) | (0.62) |
| Net asset value at end of period | $40.16 | $26.32 | $30.79 | $29.32 | $26.90 |
| Total return | 62.50% | (8.49%) | 13.10% | 19.62% | 14.50% |
| Ratios and supplemental data: | |||||
| Net assets at end of period (000's) | $381,463 | $357,769 | $349,865 | $95,176 | $44,236 |
| Ratio to average net assets: | |||||
| Net expenses (including liquidity provider expenses) | 0.91%(C) | 0.94% | 0.97%(F) | 0.99% | 0.99% |
| Gross expenses (including liquidity provider expenses) | 0.92%(D) | 0.94% | 0.97% | 0.99% | 1.00% |
| Net investment income (loss) | (0.44%) | 0.06% | (0.06%) | 0.01% | 0.05% |
| Portfolio turnover rate | 65%(E) | 82% | 71% | 76% | 95% |
| (A) | Less than $0.005 per share or 0.005% |
| (B) | The net investment income per share was based on average shares outstanding for the period. |
| (C) | The ratio of net expenses to average net assets excluding liquidity provider expenses for Class Y was 0.98% and for Institutional Class was 0.90% for the year ended March 31, 2021. |
| (D) | The ratio of gross expenses to average net assets excluding liquidity provider expenses for Class Y was 0.98% and for Institutional Class was 0.91% for the year ended March 31, 2021. |
| (E) | Portfolio turnover excludes securities delivered from processing redemptions-in-kind. |
| (F) | Net expenses include amounts recouped by the Advisor. |
| Touchstone Mid Cap Growth Fund—Class R6 | ||
| Selected Data for a Share Outstanding Throughout Each Period | ||
| Year Ended March 31, 2021 | Period Ended March 31, 2020(A) | |
| Net asset value at beginning of period | $26.32 | $35.72(B) |
| Income (loss) from investment operations: | ||
| Net investment loss | (0.11) | (—)(C) |
| Net realized and unrealized gains (losses) on investments | 16.51 | (9.40) |
| Total from investment operations: | 16.40 | (9.40) |
| Distributions from: | ||
| Realized capital gains | (2.54) | — |
| Net asset value at end of period | $40.18 | $26.32 |
| Total return | 62.58% | (26.32%)(D) |
| Ratios and supplemental data: | ||
| Net assets at end of period (000's) | $4,603 | $2 |
| Ratio to average net assets: | ||
| Net expenses (including liquidity provider expenses) | 0.85%(E) | 0.89%(F) |
| Gross expenses (including liquidity provider expenses) | 1.47%(G) | 1,279.20%(F) |
| Net investment loss | (0.37%) | (0.02%)(F) |
| Portfolio turnover rate | 65%(H) | 82%(D) |
| (A) | Represents the period from commencement of operations (February 10, 2020) through March 31, 2020. |
| (B) | Net asset value at the beginning of period is based on the net asset value of Institutional Class shares on February 10, 2020. |
| (C) | Less than $0.0005 per share. |
| (D) | Not annualized. |
| (E) | The ratio of net expenses to average net assets excluding liquidity provider expenses for Class R6 was 0.84% for the year ended March 31, 2021. |
| (F) | Annualized. |
| (G) | The ratio of gross expenses to average net assets excluding liquidity provider expenses for Class R6 was 1.46% for the year ended March 31, 2021. |
| (H) | Portfolio turnover excludes securities delivered from processing redemptions-in-kind. |
| Touchstone Sands Capital Emerging Markets Growth Fund—Class A | |||
| Selected Data for a Share Outstanding Throughout Each Period | |||
| Year Ended March 31, | Period Ended March 31, 2019(A) | ||
| 2021 | 2020 | ||
| Net asset value at beginning of period | $11.36 | $13.15 | $11.21(B) |
| Income (loss) from investment operations: | |||
| Net investment income (loss) | (0.13) | 0.05(C) | (0.01) |
| Net realized and unrealized gains (losses) on investments | 10.02 | (1.77) | 1.95 |
| Total from investment operations: | 9.89 | (1.72) | 1.94 |
| Distributions from: | |||
| Net investment income | — | (0.07) | — |
| Net asset value at end of period | $21.25 | $11.36 | $13.15 |
| Total return(D) | 87.06% | (13.19%) | 17.31%(E) |
| Ratios and supplemental data: | |||
| Net assets at end of period (000's) | $20,369 | $2,897 | $1,349 |
| Ratio to average net assets: | |||
| Net expenses | 1.60% | 1.60% | 1.60%(F) |
| Gross expenses | 1.77% | 2.62% | 4.89%(F) |
| Net investment income (loss) | (1.22%) | 0.35% | (0.94%)(F) |
| Portfolio turnover rate | 27% | 20% | 31% |
| Touchstone Sands Capital Emerging Markets Growth Fund—Class C | |||
| Selected Data for a Share Outstanding Throughout Each Period | |||
| Year Ended March 31, | Period Ended March 31, 2019(A) | ||
| 2021 | 2020 | ||
| Net asset value at beginning of period | $11.26 | $13.11 | $11.21(B) |
| Income (loss) from investment operations: | |||
| Net investment loss | (0.14) | (0.05)(C) | (0.04) |
| Net realized and unrealized gains (losses) on investments | 9.79 | (1.75) | 1.94 |
| Total from investment operations: | 9.65 | (1.80) | 1.90 |
| Distributions from: | |||
| Net investment income | — | (0.05) | — |
| Net asset value at end of period | $20.91 | $11.26 | $13.11 |
| Total return(D) | 85.70% | (13.81%) | 16.95%(E) |
| Ratios and supplemental data: | |||
| Net assets at end of period (000's) | $9,637 | $1,135 | $59 |
| Ratio to average net assets: | |||
| Net expenses | 2.35% | 2.35% | 2.35%(F) |
| Gross expenses | 2.82% | 5.24% | 57.88%(F) |
| Net investment loss | (1.97%) | (0.40%) | (1.69%)(F) |
| Portfolio turnover rate | 27% | 20% | 31% |
| (A) | Represents the period from commencement of operations (November 16, 2018) through March 31, 2019. |
| (B) | Net asset value at the beginning of period is based on the net asset value of Class Y shares on November 16, 2018. |
| (C) | The net investment income (loss) per share was based on average shares outstanding for the period. |
| (D) | Total returns shown exclude the effect of applicable sales loads and fees. If these charges were included, the returns would be lower. |
| (E) | Not annualized. |
| (F) | Annualized. |
| Touchstone Sands Capital Emerging Markets Growth Fund—Class Y | |||||
| Selected Data for a Share Outstanding Throughout Each Period | |||||
| Year Ended March 31, | |||||
| 2021 | 2020 | 2019 | 2018 | 2017 | |
| Net asset value at beginning of period | $11.38 | $13.16 | $13.56 | $10.70 | $9.40 |
| Income (loss) from investment operations: | |||||
| Net investment income (loss) | (0.11) | 0.08(A) | (0.03) | (0.06) | (0.03) |
| Net realized and unrealized gains (losses) on investments | 10.09 | (1.77) | (0.37) | 2.92 | 1.33 |
| Total from investment operations: | 9.98 | (1.69) | (0.40) | 2.86 | 1.30 |
| Distributions from: | |||||
| Net investment income | — | (0.09) | — | — | — |
| Net asset value at end of period | $21.36 | $11.38 | $13.16 | $13.56 | $10.70 |
| Total return | 87.71% | (12.96%) | (3.02%) | 26.82% | 13.83% |
| Ratios and supplemental data: | |||||
| Net assets at end of period (000's) | $1,460,473 | $423,992 | $318,093 | $207,209 | $103,467 |
| Ratio to average net assets: | |||||
| Net expenses | 1.26% | 1.33%(B) | 1.35%(B) | 1.47% | 1.49% |
| Gross expenses | 1.26% | 1.31% | 1.35% | 1.49% | 1.55% |
| Net investment income (loss) | (0.88%) | 0.62% | (0.45%) | (0.73%) | (0.49%) |
| Portfolio turnover rate | 27% | 20% | 31% | 27% | 49% |
| Touchstone Sands Capital Emerging Markets Growth Fund—Institutional Class | |||||
| Selected Data for a Share Outstanding Throughout Each Period | |||||
| Year Ended March 31, | |||||
| 2021 | 2020 | 2019 | 2018 | 2017 | |
| Net asset value at beginning of period | $11.43 | $13.21 | $13.61 | $10.73 | $9.41 |
| Income (loss) from investment operations: | |||||
| Net investment income (loss) | (0.11) | 0.09(A) | (0.03) | (0.06) | (0.03) |
| Net realized and unrealized gains (losses) on investments | 10.15 | (1.77) | (0.37) | 2.94 | 1.35 |
| Total from investment operations: | 10.04 | (1.68) | (0.40) | 2.88 | 1.32 |
| Distributions from: | |||||
| Net investment income | — | (0.10) | — | — | — |
| Net asset value at end of period | $21.47 | $11.43 | $13.21 | $13.61 | $10.73 |
| Total return | 87.79% | (12.87%) | (2.94%) | 26.84% | 14.03% |
| Ratios and supplemental data: | |||||
| Net assets at end of period (000's) | $2,867,373 | $883,508 | $524,670 | $374,452 | $182,402 |
| Ratio to average net assets: | |||||
| Net expenses | 1.21%(B) | 1.25%(B) | 1.25% | 1.37% | 1.39% |
| Gross expenses | 1.20% | 1.24% | 1.27% | 1.41% | 1.46% |
| Net investment income (loss) | (0.83%) | 0.70% | (0.35%) | (0.63%) | (0.39%) |
| Portfolio turnover rate | 27% | 20% | 31% | 27% | 49% |
| (A) | The net investment income (loss) per share was based on average shares outstanding for the period. |
| (B) | Net expenses include amounts recouped by the Advisor. |
| Touchstone Flexible Income Fund ("Flexible Income Fund”) |
| Touchstone Focused Fund ("Focused Fund”) |
| Touchstone Global ESG Equity Fund ("Global ESG Equity Fund”) |
| Touchstone Growth Opportunities Fund ("Growth Opportunities Fund”) |
| Touchstone Mid Cap Growth Fund ("Mid Cap Growth Fund”) |
| Touchstone Sands Capital Emerging Markets Growth Fund ("Sands Capital Emerging Markets Growth Fund”) |
| Class A | Class C | Class Y | Institutional Class | Class R6 | |
| Flexible Income Fund | X | X | X | X | |
| Focused Fund | X | X | X | X | |
| Global ESG Equity Fund | X | X | X | X | |
| Growth Opportunities Fund | X | X | X | X | |
| Mid Cap Growth Fund | X | X | X | X | X |
| Sands Capital Emerging Markets Growth Fund | X | X | X | X |
| (1) | market value of investment securities, assets and liabilities at the current rate of exchange on the valuation date; and |
| (2) | purchases and sales of investment securities, income, and expenses at the relevant rates of exchange prevailing on the respective dates of such transactions. |
| Fund | Derivatives not accounted for as hedging instruments under ASC 815 | Realized Gains (Losses) on Derivatives | Change in Unrealized Appreciation (Depreciation) on Derivatives |
| Flexible Income Fund | Purchased Options - Equity Contracts* | $(20,624,541) | $573,496 |
| Written Options - Equity Contracts** | 5,930,667 | — |
| * | Statements of Operations Location: Net realized gains (losses) on investments and net change in unrealized appreciation (depreciation) on investments, respectively. |
| ** | Statements of Operations Location: Net realized gains on written options. |
| Flexible Income Fund | |
| Equity Contracts: | |
| Purchased Options - Cost | $1,633,936 |
| Written Options - Premiums received | $119,518 |
| Fund | Security Type | Market Value of Securities Loaned* | Market Value of Collateral Received** | Net Amount*** |
| Flexible Income Fund | Common Stocks | $3,120,515 | $3,187,193 | $66,678 |
| * | The remaining contractual maturity is overnight for all securities. |
| ** | Gross amount of recognized liabilities for securities lending included in the Statements of Assets and Liabilities. |
| *** | Net amount represents the net amount payable due to (receive from) the borrower in the event of default. |
| Flexible Income Fund | Focused Fund* | Global ESG Equity Fund | Growth Opportunities Fund | Mid Cap Growth Fund* | Sands Capital Emerging Markets Growth Fund | |
| Purchases of investment securities | $511,612,650 | $168,236,128 | $380,865,557 | $104,621,098 | $862,523,771 | $2,379,279,999 |
| Proceeds from sales and maturities | $601,162,143 | $199,174,202 | $452,060,987 | $186,377,313 | $1,082,508,232 | $694,829,727 |
| * | Focused Fund and Mid Cap Growth Fund had redemptions-in-kind out of the Fund of $88,549,838 and $98,927,080, respectively. The redemptions were comprised of securities of $83,852,328 and $95,367,046, which are excluded from the proceeds from sales and maturities and cash in the amount of $4,697,510 and $3,560,034, for the Focused Fund and Mid Cap Growth Fund, respectively. |
| Flexible Income Fund | 0.60% on the first $500 million 0.50% on such assets in excess of $500 million |
| Focused Fund | 0.70% on the first $100 million 0.65% on the next $400 million 0.60% on such assets in excess of $500 million |
| Global ESG Equity Fund | 0.65% on the first $1 billion 0.60% on such assets in excess of $1 billion |
| Growth Opportunities Fund | 0.75% on the first $500 million 0.70% on the next $500 million 0.65% on such assets in excess of $1 billion |
| Mid Cap Growth Fund | 0.75% on the first $500 million 0.70% on the next $500 million 0.65% on the next $200 million 0.60% on such assets in excess of $1.2 billion |
| Sands Capital Emerging Markets Growth Fund | 1.00% |
| Bramshill Investments, LLC | Sands Capital Management, LLC |
| Flexible Income Fund | Sands Capital Emerging Markets Growth Fund |
| Fort Washington Investment Advisors, Inc.* | Westfield Capital Management Company, L.P. |
| Focused Fund | Growth Opportunities Fund |
| Rockefeller & Co., LLC | Mid Cap Growth Fund |
| Global ESG Equity Fund |
| * | Affiliate of the Advisor and wholly-owned subsidiary of Western & Southern. |
| Class A | Class C | Class Y | Institutional Class | Class R6 | Termination Date | |
| Flexible Income Fund | 1.04% | 1.79% | 0.79% | 0.69% | — | July 29, 2021 |
| Focused Fund | 1.20% | 1.95% | 0.95% | 0.83% | — | July 29, 2021 |
| Global ESG Equity Fund | 1.17% | 1.99% | 0.90% | 0.89% | — | July 29, 2021 |
| Growth Opportunities Fund | 1.24% | 1.99% | 0.99% | 0.89% | — | July 29, 2021 |
| Mid Cap Growth Fund* | 1.39% | 2.14% | 1.14% | 0.86% | 0.77% | January 29, 2022 |
| Sands Capital Emerging Markets Growth Fund | 1.60% | 2.35% | 1.35% | 1.25% | — | July 29, 2021 |
| * | Prior to January 1, 2021, the Expense Limitation Agreement for the Mid Cap Growth Fund Institutional Class and Class R6 was 0.99% and 0.89%, respectively. |
| Fund | Investment Advisory Fees Waived | Administration Fees Waived | Other Operating Expenses Reimbursed/ Waived | Total |
| Flexible Income Fund | $— | $124,726 | $240,003 | $364,729 |
| Focused Fund | — | — | 16,065 | 16,065 |
| Global ESG Equity Fund | — | — | 71,031 | 71,031 |
| Growth Opportunities Fund | — | 73,136 | 150,627 | 223,763 |
| Mid Cap Growth Fund | — | 281 | 38,714 | 38,995 |
| Sands Capital Emerging Markets Growth Fund | — | — | 34,654 | 34,654 |
| Fund | Expires on or before March 31, 2022 | Expires on or before March 31, 2023 | Expires on or before March 31, 2024 | Total |
| Flexible Income Fund | $474,385 | $557,404 | $298,950 | $1,330,739 |
| Focused Fund | 22,968 | 22,297 | 15,681 | 60,946 |
| Global ESG Equity Fund | 73,180 | 107,012 | 59,632 | 239,824 |
| Growth Opportunities Fund | 273,078 | 198,248 | 167,127 | 638,453 |
| Mid Cap Growth Fund | — | 3,760 | 38,995 | 42,755 |
| Sands Capital Emerging Markets Growth Fund | 10,153 | 25,128 | 3,514 | 38,795 |
| Fund | Amount |
| Flexible Income Fund | $ 4,578 |
| Focused Fund | 8,378 |
| Global ESG Equity Fund | 9,564 |
| Growth Opportunities Fund | 4,727 |
| Mid Cap Growth Fund | 31,327 |
| Sands Capital Emerging Markets Growth Fund | 8,181 |
| Fund | Class C |
| Flexible Income Fund | $ 889 |
| Growth Opportunities Fund | 69 |
| Mid Cap Growth Fund | 81 |
| Fund | Shares ReFlow Subscribed to | Redemptions-in-kind |
| Focused Fund | 1,787,992 | $ 83,852,328 |
| Mid Cap Growth Fund | 2,603,073 | 95,367,046 |
| Fund | Daily Average Amount Loaned | Weighted Average Interest Rate | Interest Income* |
| Sands Capital Emerging Markets Growth Fund | $ 12,510,443 | 0.70% | $ 246 |
| * | Included in Interest in the Statements of Operations. |
| Fund | Daily Average Amount Borrowed | Weighted Average Interest Rate | Interest Expense* |
| Global ESG Equity Fund | $ 2,178,050 | 0.71% | $ 43 |
| Growth Opportunities Fund | $ 17,565,388 | 0.70% | $ 336 |
| Mid Cap Growth Fund | $ 3,937,694 | 0.68% | $ 74 |
| * | Included in Other expenses in the Statements of Operations. |
| Flexible Income Fund | Focused Fund | Global ESG Equity Fund | ||||
| Year Ended March 31, 2021 | Year Ended March 31, 2020 | Year Ended March 31, 2021 | Year Ended March 31, 2020 | Year Ended March 31, 2021 | Year Ended March 31, 2020 | |
| From ordinary income | $34,746,000 | $24,652,668 | $2,666,017 | $5,500,849 | $2,593,278 | $5,563,150 |
| From long-term capital gains | — | — | 55,000,033 | 55,397,876 | — | 11,203,902 |
| Total distributions | $34,746,000 | $24,652,668 | $57,666,050 | $60,898,725 | $2,593,278 | $16,767,052 |
| Growth Opportunities Fund | Mid Cap Growth Fund | Sands Capital Emerging Markets Growth Fund | ||||
| Year Ended March 31, 2021 | Year Ended March 31, 2020 | Year Ended March 31, 2021 | Year Ended March 31, 2020 | Year Ended March 31, 2021 | Year Ended March 31, 2020 | |
| From ordinary income | $4,515,690 | $8,130,533 | $— | $20,234,815 | $— | $9,496,797 |
| From long-term capital gains | 10,308,626 | 12,343,538 | 92,749,221 | 67,373,035 | — | — |
| Total distributions | $14,824,316 | $20,474,071 | $92,749,221 | $87,607,850 | $— | $9,496,797 |
| Flexible Income Fund | Focused Fund | Global ESG Equity Fund | |
| Tax cost of portfolio investments | $742,516,776 | $618,346,958 | $504,237,667 |
| Gross unrealized appreciation on investments | 27,137,096 | 538,153,106 | 219,483,844 |
| Gross unrealized depreciation on investments | (8,311,764) | (7,781,538) | (22,933,751) |
| Net unrealized appreciation (depreciation) on investments | 18,825,332 | 530,371,568 | 196,550,093 |
| Gross unrealized appreciation on foreign currency transactions | — | — | 5,759 |
| Gross unrealized depreciation on foreign currency transactions | — | — | (11,843) |
| Net unrealized appreciation (depreciation) on foreign currency transactions | — | — | (6,084) |
| Capital loss carryforwards | (4,468,859) | — | — |
| Undistributed ordinary income | 803,896 | 4,199,079 | 7,961,194 |
| Undistributed capital gains | — | 33,253,911 | 31,319,341 |
| Accumulated earnings (deficit) | $15,160,369 | $567,824,558 | $235,824,544 |
| Growth Opportunities Fund | Mid Cap Growth Fund | Sands Capital Emerging Markets Growth Fund | |
| Tax cost of portfolio investments | $92,231,897 | $946,265,618 | $3,156,686,646 |
| Gross unrealized appreciation on investments | 70,098,104 | 441,371,400 | 1,282,627,392 |
| Gross unrealized depreciation on investments | (1,170,615) | (16,091,650) | (72,917,715) |
| Net unrealized appreciation (depreciation) on investments | 68,927,489 | 425,279,750 | 1,209,709,677 |
| Gross unrealized depreciation on foreign currency transactions and deferred foreign capital gains tax | — | — | (25,626,170) |
| Net unrealized appreciation (depreciation) on foreign currency transactions and deferred foreign capital gains tax | — | — | (25,626,170) |
| Capital loss carryforwards | — | — | (17,045,819) |
| Late year ordinary losses deferrals | — | — | (9,956,415) |
| Undistributed ordinary income | 6,364,461 | 55,250,316 | — |
| Undistributed capital gains | 10,758,420 | 55,206,354 | — |
| Accumulated earnings (deficit) | $86,050,370 | $535,736,420 | $1,157,081,273 |
| Fund | No Expiration Short Term | No Expiration Long Term | Total |
| Flexible Income Fund | $ — | $ 4,468,859 | $ 4,468,859 |
| Sands Capital Emerging Markets Growth Fund | — | 17,045,819 | 17,045,819 |
| Fund | Utilized |
| Sands Capital Emerging Markets Growth Fund | $ 32,753,998 |
| Fund | Realized Capital Losses | Ordinary Losses | Total |
| Sands Capital Emerging Markets Growth Fund | $ — | $ 9,956,415 | $ 9,956,415 |
| Fund | Paid-In Capital | Distributable Earnings |
| Focused Fund | $ 45,698,428 | $ (45,698,428) |
| Mid Cap Growth Fund | 58,806,367 | (58,806,367) |
| Sands Capital Emerging Markets Growth Fund | (14,830,200) | 14,830,200 |

| Flexible Income Fund | 24.36 % |
| Focused Fund | 100.00 % |
| Global ESG Equity Fund | 100.00 % |
| Growth Opportunities Fund | 9.71 % |
| Mid Cap Growth Fund | 8.44 % |
| Flexible Income Fund | 20.98 % |
| Focused Fund | 100.00 % |
| Global ESG Equity Fund | 37.16 % |
| Growth Opportunities Fund | 9.55 % |
| Mid Cap Growth Fund | 7.03 % |
| Focused Fund | $ 66,095,534 |
| Global ESG Equity Fund | $ 31,319,341 |
| Growth Opportunities Fund | $ 21,067,046 |
| Mid Cap Growth Fund | $ 142,585,014 |
| Net Expense Ratio Annualized March 31, 2021 | Beginning Account Value October 1, 2020 | Ending Account Value March 31, 2021 | Expenses Paid During the Six Months Ended March 31, 2021* | ||
| Flexible Income Fund | |||||
| Class A | Actual | 1.04% | $1,000.00 | $1,040.90 | $5.29 |
| Class A | Hypothetical | 1.04% | $1,000.00 | $1,019.75 | $5.24 |
| Class C | Actual | 1.79% | $1,000.00 | $1,036.70 | $9.09 |
| Class C | Hypothetical | 1.79% | $1,000.00 | $1,016.01 | $9.00 |
| Class Y | Actual | 0.79% | $1,000.00 | $1,042.10 | $4.02 |
| Class Y | Hypothetical | 0.79% | $1,000.00 | $1,020.99 | $3.98 |
| Institutional Class | Actual | 0.69% | $1,000.00 | $1,042.10 | $3.51 |
| Institutional Class | Hypothetical | 0.69% | $1,000.00 | $1,021.49 | $3.48 |
| Focused Fund | |||||
| Class A | Actual | 1.22% | $1,000.00 | $1,260.90 | $6.88** |
| Class A | Hypothetical | 1.22% | $1,000.00 | $1,018.85 | $6.14** |
| Class C | Actual | 1.96% | $1,000.00 | $1,256.10 | $11.02** |
| Class C | Hypothetical | 1.96% | $1,000.00 | $1,015.16 | $9.85** |
| Class Y | Actual | 0.90% | $1,000.00 | $1,263.00 | $5.08** |
| Class Y | Hypothetical | 0.90% | $1,000.00 | $1,020.44 | $4.53** |
| Institutional Class | Actual | 0.85% | $1,000.00 | $1,263.10 | $4.80** |
| Institutional Class | Hypothetical | 0.85% | $1,000.00 | $1,020.69 | $4.28** |
| Global ESG Equity Fund | |||||
| Class A | Actual | 1.09% | $1,000.00 | $1,217.40 | $6.03 |
| Class A | Hypothetical | 1.09% | $1,000.00 | $1,019.50 | $5.49 |
| Class C | Actual | 1.99% | $1,000.00 | $1,211.60 | $10.97 |
| Class C | Hypothetical | 1.99% | $1,000.00 | $1,015.01 | $10.00 |
| Class Y | Actual | 0.90% | $1,000.00 | $1,218.00 | $4.98 |
| Class Y | Hypothetical | 0.90% | $1,000.00 | $1,020.44 | $4.53 |
| Institutional Class | Actual | 0.89% | $1,000.00 | $1,218.20 | $4.92 |
| Institutional Class | Hypothetical | 0.89% | $1,000.00 | $1,020.49 | $4.48 |
| Growth Opportunities Fund | |||||
| Class A | Actual | 1.24% | $1,000.00 | $1,146.00 | $6.63 |
| Class A | Hypothetical | 1.24% | $1,000.00 | $1,018.75 | $6.24 |
| Class C | Actual | 1.99% | $1,000.00 | $1,142.00 | $10.63 |
| Class C | Hypothetical | 1.99% | $1,000.00 | $1,015.01 | $10.00 |
| Class Y | Actual | 0.99% | $1,000.00 | $1,147.60 | $5.30 |
| Class Y | Hypothetical | 0.99% | $1,000.00 | $1,020.00 | $4.99 |
| Institutional Class | Actual | 0.89% | $1,000.00 | $1,148.30 | $4.77 |
| Institutional Class | Hypothetical | 0.89% | $1,000.00 | $1,020.49 | $4.48 |
| Mid Cap Growth Fund | |||||
| Class A | Actual | 1.23% | $1,000.00 | $1,184.10 | $6.70*** |
| Class A | Hypothetical | 1.23% | $1,000.00 | $1,018.80 | $6.19*** |
| Class C | Actual | 2.02% | $1,000.00 | $1,179.60 | $10.98*** |
| Net Expense Ratio Annualized March 31, 2021 | Beginning Account Value October 1, 2020 | Ending Account Value March 31, 2021 | Expenses Paid During the Six Months Ended March 31, 2021* | ||
| Class C | Hypothetical | 2.02% | $1,000.00 | $1,014.86 | $10.15*** |
| Class Y | Actual | 1.00% | $1,000.00 | $1,185.60 | $5.45*** |
| Class Y | Hypothetical | 1.00% | $1,000.00 | $1,019.95 | $5.04*** |
| Institutional Class | Actual | 0.90% | $1,000.00 | $1,186.10 | $4.91*** |
| Institutional Class | Hypothetical | 0.90% | $1,000.00 | $1,020.44 | $4.53*** |
| Class R6 | Actual | 0.84% | $1,000.00 | $1,186.00 | $4.58*** |
| Class R6 | Hypothetical | 0.84% | $1,000.00 | $1,020.74 | $4.23*** |
| Sands Capital Emerging Markets Growth Fund | |||||
| Class A | Actual | 1.60% | $1,000.00 | $1,178.60 | $8.69 |
| Class A | Hypothetical | 1.60% | $1,000.00 | $1,016.95 | $8.05 |
| Class C | Actual | 2.35% | $1,000.00 | $1,174.10 | $12.74 |
| Class C | Hypothetical | 2.35% | $1,000.00 | $1,013.21 | $11.80 |
| Class Y | Actual | 1.26% | $1,000.00 | $1,180.20 | $6.85 |
| Class Y | Hypothetical | 1.26% | $1,000.00 | $1,018.65 | $6.34 |
| Institutional Class | Actual | 1.20% | $1,000.00 | $1,180.40 | $6.52 |
| Institutional Class | Hypothetical | 1.20% | $1,000.00 | $1,018.95 | $6.04 |
| * | Expenses are equal to the Fund’s annualized expense ratio, multiplied by the average account value over the period, multiplied by 182/365 (to reflect one-half year period). |
| ** | Excluding liquidity provider expenses, your actual cost of investment in Class A, Class C, Class Y and Institutional Class would be $6.76, $10.91, $4.96 and $4.68, respectively, and your hypothetical cost of investment in Class A, Class C, Class Y and Institutional Class would be $6.04, $9.75, $4.43 and $4.18, respectively. |
| *** | Excluding liquidity provider expenses, your actual cost of investment in Class A, Class C, Class Y, Institutional Class and Class R6 would be $6.59, $10.87, $5.34, $4.80 and $4.47, respectively, and your hypothetical cost of investment in Class A, Class C, Class Y, Institutional Class and Class R6 would be $6.09, $10.05, $4.94, $4.43 and $4.13, respectively. |
| Interested Trustee1: | |||||
| Name Address Year of Birth | Position Held with Trust | Term of Office And Length of Time Served | Principal Occupation(s) During Past 5 Years | Number of Funds Overseen in the Touchstone Fund Complex2 | Other Directorships Held During Past 5 Years3 |
| Jill T. McGruder Touchstone Advisors, Inc. 303 Broadway Suite 1100 Cincinnati, Ohio 45202 Year of Birth: 1955 | Trustee | Until retirement at age 75 or until she resigns or is removed Trustee since 1999 | President of Touchstone Funds from 1999 to 2020; President, Director and CEO of IFS Financial Services, Inc. (a holding company) since 1999; and Senior Vice President and Chief Marketing Officer of Western & Southern Financial Group, Inc. (a financial services company) since 2016. | 38 | Director, Integrity Life Insurance Co. and National Integrity Life Insurance Co. since 2005; Director, Touchstone Securities (the Distributor) since 1999; Director, Touchstone Advisors (the Advisor) since 1999; Director, W&S Brokerage Services, Inc. since 1999; Director, W&S Financial Group Distributors, Inc. since 1999; Director, Insurance Profillment Solutions LLC since 2014; Director, Columbus Life Insurance Co. since 2016; Director, The Lafayette Life Insurance Co. since 2016; Director, Gerber Life Insurance Company since 2019; Director, Western & Southern Agency, Inc. since 2018; and Director, LL Global, Inc. (not-for-profit trade organization with operating divisions LIMRA and LOMA) since 2016. |
| Independent Trustees: | |||||
| Karen Carnahan c/o Touchstone Advisors, Inc. 303 Broadway Suite 1100 Cincinnati, Ohio 45202 Year of Birth: 1954 | Trustee | Until retirement at age 75 or until she resigns or is removed Trustee since 2019 | Retired; formerly Chief Operating Officer of Shred-it (a business services company) from 2014 to 2015; formerly President & Chief Operating Officer of the document management division of Cintas Corporation (a business services company) from 2008 to 2014. | 38 | Director, Cintas Corporation since 2019; Director, Boys & Girls Club of West Chester/Liberty since 2016; and Board of Advisors, Best Upon Request since 2020. |
| William C. Gale c/o Touchstone Advisors, Inc. 303 Broadway Suite 1100 Cincinnati, Ohio 45202 Year of Birth: 1952 | Trustee | Until retirement at age 75 or until he resigns or is removed Trustee since 2013 | Retired; formerly Senior Vice President and Chief Financial Officer of Cintas Corporation (a business services company) from 1995 to 2015. | 38 | None. |
| Susan J. Hickenlooper, CFA c/o Touchstone Advisors, Inc. 303 Broadway Suite 1100 Cincinnati, Ohio 45202 Year of Birth: 1946 | Trustee | Until retirement at age 75 or until she resigns or is removed Trustee since 2009 | Retired from investment management. | 38 | Trustee, Episcopal Diocese of Southern Ohio from 2014 to 2018. |
| Kevin A. Robie c/o Touchstone Advisors, Inc. 303 Broadway Suite 1100 Cincinnati, Ohio 45202 Year of Birth: 1956 | Trustee | Until retirement at age 75 or until he resigns or is removed Trustee since 2013 | Retired; formerly Vice President of Portfolio Management at Soin LLC (private multinational holding company and family office) from 2004 to 2020. | 38 | Director, SaverSystems, Inc. since 2015; Director, Buckeye EcoCare, Inc. from 2013 to 2018; Director, Turner Property Services Group, Inc. since 2017; Trustee, Dayton Region New Market Fund, LLC (private fund) since 2010; and Trustee, Entrepreneurs Center, Inc. (business incubator) since 2006. |
| William H. Zimmer III c/o Touchstone Advisors, Inc. 303 Broadway Suite 1100 Cincinnati, Ohio 45202 Year of Birth: 1953 | Trustee | Until retirement at age 75 or until he resigns or is removed Trustee since 2019 | Independent Treasury Consultant since 2014. | 38 | Director, Deaconess Associations, Inc. (healthcare) since 2001; Trustee, Huntington Funds (mutual funds) from 2006 to 2015; and Director, National Association of Corporate Treasurers from 2011 to 2015. |
| Principal Officers: | |||
| Name Address Year of Birth | Position(s) Held with Trust1 | Term of Office And Length of Time Served | Principal Occupation(s) During Past 5 Years |
| E. Blake Moore, Jr. Touchstone Advisors, Inc. 303 Broadway Suite 1100 Cincinnati, Ohio 45202 Year of Birth: 1958 | President | Until resignation, removal or disqualification President since January 2021 | Chief Executive Officer of Touchstone Advisors, Inc. and Touchstone Securities Inc. (since 2020); President, Foresters Investment Management Company, Inc. (2018 to 2020); President, North American Asset Management at Foresters Financial (2018 to 2020); Managing Director, Head of Americas at UBS Asset Management (2015 to 2017); and Executive Vice President, Head of Distribution at Mackenzie Investments (2011 to 2014). |
| Timothy D. Paulin Touchstone Advisors, Inc. 303 Broadway Suite 1100 Cincinnati, Ohio 45202 Year of Birth: 1963 | Vice President | Until resignation, removal or disqualification Vice President since 2010 | Senior Vice President of Investment Research and Product Management of Touchstone Advisors, Inc. |
| Timothy S. Stearns Touchstone Advisors, Inc. 303 Broadway Suite 1100 Cincinnati, Ohio 45202 Year of Birth: 1963 | Chief Compliance Officer | Until resignation, removal or disqualification Chief Compliance Officer since 2013 | Chief Compliance Officer of Touchstone Advisors, Inc. |
| Terrie A. Wiedenheft Touchstone Advisors, Inc. 303 Broadway Suite 1100 Cincinnati, Ohio 45202 Year of Birth: 1962 | Controller and Treasurer | Until resignation, removal or disqualification Controller and Treasurer since 2006 | Senior Vice President, Chief Financial Officer and Chief Operations Officer, of IFS Financial Services, Inc. (a holding company) and Senior Vice President and Chief Administration Officer within the Office of the Chief Marketing Officer of Western & Southern Financial Group (2021 to Present). |
| Meredyth A. Whitford-Schultz Western & Southern Financial Group 400 Broadway Cincinnati, Ohio 45202 Year of Birth: 1981 | Secretary | Until resignation, removal or disqualification Secretary since 2018 | Senior Counsel - Securities/Mutual Funds of Western & Southern Financial Group (2015 to present); Associate at Morgan Lewis & Bockius LLP (law firm) (2014 to 2015); Associate at Bingham McCutchen LLP (law firm) (2008 to 2014). |


303 Broadway
Cincinnati, Ohio 45202-4203
800.638.8194
www.touchstoneinvestments.com
303 Broadway
Cincinnati, Ohio 45202-4203
4400 Computer Drive
Westborough, Massachusetts 01581
(b) Not applicable.
Item 2. Code of Ethics.
| (a) | The registrant, as of the end of the period covered by this report, has adopted a code of ethics that applies to the registrant’s principal executive officer, principal financial officer, principal accounting officer or controller, or persons performing similar functions, regardless of whether these individuals are employed by the registrant or a third party. |
| (c) | There have been no amendments, during the period covered by this report, to a provision of the code of ethics that applies to the registrant’s principal executive officer, principal financial officer, principal accounting officer or controller, or persons performing similar functions, regardless of whether these individuals are employed by the registrant or a third party, and that relates to any element of the code of ethics description. |
| (d) | The registrant has not granted any waivers, including an implicit waiver, from a provision of the code of ethics that applies to the registrant’s principal executive officer, principal financial officer, principal accounting officer or controller, or persons performing similar functions, regardless of whether these individuals are employed by the registrant or a third party, that relates to one or more of the items set forth in paragraph (b) of this item’s instructions. |
| (e) | Not applicable. |
| (f) | A copy of the code of ethics is attached hereto as Exhibit 13(a)(1). |
Item 3. Audit Committee Financial Expert.
The registrant’s Board of Trustees has determined that the registrant has at least one audit committee financial expert serving on its audit committee. Ms. Karen Carnahan is the registrant’s audit committee financial expert and is an independent trustee within the meaning of the Investment Company Act of 1940, as amended (the “1940 Act”).
Item 4. Principal Accountant Fees and Services.
Audit Fees
| (a) | Audit fees for Touchstone Strategic Trust (March Funds) totaled $117,600 and $116,800 for the fiscal years ended March 31, 2021 and March 31, 2020, respectively, including fees associated with the annual audits and filings of Form N-1A and Form N-CEN. | |
Audit-Related Fees
| (b) | The aggregate fees billed in each of the last two fiscal years for assurance and related services by the principal accountant that are reasonably related to the performance of the audit of the registrant's financial statements and are not reported under paragraph (a) of this Item are $5,500 and $4,000 for the fiscal years ended March 31, 2021 and March 31, 2020 respectively. The fees for 2021 relate to additional fees for valuation procedures and 2020 fees relate to the review of Form N-1A filings. |
Tax Fees
| (c) | The aggregate fees billed in each of the last two fiscal years for professional services rendered by the principal accountant for tax compliance, tax advice, and tax planning were $39,555 and $62,045 for the fiscal years ended March 31, 2021 and March 31, 2020, respectively. The fees relate to the preparation of federal income and excise tax returns, review of capital gains distribution calculations and tax agent services. |
All Other Fees
| (d) | The aggregate fees billed in each of the last two fiscal years for products and services provided by the principal accountant, other than the services reported in paragraphs (a) through (c) of this Item are $18,354 and $20,756 for the fiscal years ended March 31, 2021 and March 31, 2020, respectively. The fees relate to the PFIC analyzer and Global Withholding Tax Reporter subscriptions. |
| (e)(1) | Disclose the audit committee's pre-approval policies and procedures described in paragraph (c)(7) of Rule 2-01 of Regulation S-X. |
The Audit Committee’s pre-approval policies describe the types of audit, audit-related, tax and other services that have the general pre-approval of the Audit Committee. The pre-approval policies provide that annual audit service fees, tax services not specifically granted pre-approval, services exceeding pre-approved cost levels and other services that have not received general pre-approval will be subject to specific pre-approval by the Audit Committee. The pre-approval policies further provide that the Committee may grant general pre-approval to other audit services (statutory audits and services associated with SEC registration statements, periodic reports and other documents filed with the SEC or other documents issued in connection with securities offerings), audit-related services (accounting consultations related to accounting, financial reporting or disclosure matters not classified as “audit services,” assistance with understanding and implementing new accounting and financial reporting guidance from rulemaking authorities, agreed-upon or expanded audit procedures related to accounting and/or billing records required to respond to or comply with financial, accounting or regulatory reporting matters and assistance with internal control reporting requirements under Form N-CSR), tax services that have historically been provided by the auditor that the Committee believes would not impair the independence of the auditor and are consistent with the SEC’s rules on auditor independence and permissible non-audit services classified as “all other services” that are routine and recurring services.
| (e)(2) | All of the services described in paragraphs (b) through (d) of Item 4 were approved by the Audit Committee. |
| (f) | The percentage of hours expended on the principal accountant's engagement to audit the registrant's financial statements for the most recent fiscal year that were attributed to work performed by persons other than the principal accountant's full-time, permanent employees was less than fifty percent. |
| (g) | The aggregate non-audit fees for Touchstone Strategic Trust (March Funds) and certain entities*, totaled approximately $719,238 and $655,460 for the fiscal years ended March 31, 2021 and March 31, 2020, respectively. |
* These include the advisors (excluding non-affiliated sub-advisors) and any entity controlling, controlled by or under common control with the advisors that provides ongoing services to the registrant (Funds).
| (h) | The registrant's audit committee of the board of trustees has considered whether the provision of non-audit services that were rendered to the registrant's investment adviser (not including any sub-adviser whose role is primarily portfolio management and is subcontracted with or overseen by another investment adviser), and any entity controlling, controlled by, or under common control with the investment adviser that provides ongoing services to the registrant that were not pre-approved pursuant to paragraph (c)(7)(ii) of Rule 2-01 of Regulation S-X is compatible with maintaining the principal accountant's independence. |
Item 5. Audit Committee of Listed Registrants.
Not applicable.
Item 6. Investments.
| (a) | Schedule of Investments in securities of unaffiliated issuers as of the close of the reporting period is included as part of the report to shareholders filed under Item 1(a) of this form. |
| (b) | Not applicable. |
Item 7. Disclosure of Proxy Voting Policies and Procedures for Closed-End Management Investment Companies.
Not applicable.
Item 8. Portfolio Managers of Closed-End Management Investment Companies.
Not applicable.
Item 9. Purchases of Equity Securities by Closed-End Management Investment Company and Affiliated Purchasers.
Not applicable.
Item 10. Submission of Matters to a Vote of Security Holders.
There have been no material changes to the procedures by which the shareholders may recommend nominees to the registrant’s board of trustees, where those changes were implemented after the registrant last provided disclosure in response to the requirements of Item 407(c)(2)(iv) of Regulation S-K (17 CFR 229.407) (as required by Item 22(b)(15) of Schedule 14A (17 CFR 240.14a-101)), or this Item.
Item 11. Controls and Procedures.
| (a) | The registrant’s principal executive and principal financial officers, or persons performing similar functions, have concluded that the registrant’s disclosure controls and procedures (as defined in Rule 30a-3(c) under the Investment Company Act of 1940, as amended (the “1940 Act”) (17 CFR 270.30a-3(c))) are effective, as of a date within 90 days of the filing date of the report that includes the disclosure required by this paragraph, based on their evaluation of these controls and procedures required by Rule 30a-3(b) under the 1940 Act (17 CFR 270.30a-3(b)) and Rules 13a-15(b) or 15d-15(b) under the Securities Exchange Act of 1934, as amended (17 CFR 240.13a-15(b) or 240.15d-15(b)). |
| (b) | There were no changes in the registrant’s internal control over financial reporting (as defined in Rule 30a-3(d) under the 1940 Act (17 CFR 270.30a-3(d))) that occurred during the period covered by this report that has materially affected, or is reasonably likely to materially affect, the registrant’s internal control over financial reporting. |
Item 12. Disclosure of Securities Lending Activities for Closed-End Management Investment Companies.
Not applicable.
Item 13. Exhibits.
| (a)(1) | Code of ethics, and any amendment thereto, that is the subject of disclosure required by Item 2 is attached hereto. |
| (a)(2) | Certifications pursuant to Rule 30a-2(a) under the 1940 Act and Section 302 of the Sarbanes-Oxley Act of 2002 are attached hereto. |
| (a)(3) | Not applicable. |
| (a)(4) | Not applicable. |
| (b) | Certifications pursuant to Rule 30a-2(b) under the 1940 Act and Section 906 of the Sarbanes-Oxley Act of 2002 are attached hereto. | |
SIGNATURES
Pursuant to the requirements of the Securities Exchange Act of 1934 and the Investment Company Act of 1940, the registrant has duly caused this report to be signed on its behalf by the undersigned, thereunto duly authorized.
| (Registrant) | Touchstone Strategic Trust |
| By (Signature and Title)* | /s/ E. Blake Moore, Jr. | |
| E. Blake Moore, Jr., President | ||
| (principal executive officer) | ||
| Date | June 1, 2021 |
Pursuant to the requirements of the Securities Exchange Act of 1934 and the Investment Company Act of 1940, this report has been signed below by the following persons on behalf of the registrant and in the capacities and on the dates indicated.
| By (Signature and Title)* | /s/ E. Blake Moore, Jr. | |
| E. Blake Moore, Jr., President | ||
| (principal executive officer) | ||
| Date | June 1, 2021 |
| By (Signature and Title)* | /s/ Terrie A. Wiedenheft | |
| Terrie A. Wiedenheft, Controller and Treasurer | ||
| (principal financial officer) | ||
| Date | June 1, 2021 |
* Print the name and title of each signing officer under his or her signature.