UNITED STATES
SECURITIES AND EXCHANGE COMMISSION
Washington, D.C. 20549
FORM N-CSR
CERTIFIED SHAREHOLDER REPORT OF REGISTERED MANAGEMENT INVESTMENT COMPANIES
Investment Company Act file number 811-03651
Touchstone Strategic Trust – June Funds
(Exact name of registrant as specified in charter)
303 Broadway, Suite 1100
Cincinnati, Ohio 45202-4203
(Address of principal executive offices) (Zip code)
E. Blake Moore, Jr.
303 Broadway, Suite 1100
Cincinnati, Ohio 45202-4203
(Name and address of agent for service)
Registrant's telephone number, including area code: 800-638-8194
Date of fiscal year end: June 30
Date of reporting period: June 30, 2021
Form N-CSR is to be used by management investment companies to file reports with the Commission not later than 10 days after the transmission to stockholders of any report that is required to be transmitted to stockholders under Rule 30e-1 under the Investment Company Act of 1940 (17 CFR 270.30e-1). The Commission may use the information provided on Form N-CSR in its regulatory, disclosure review, inspection, and policymaking roles.
A registrant is required to disclose the information specified by Form N-CSR, and the Commission will make this information public. A registrant is not required to respond to the collection of information contained in Form N-CSR unless the Form displays a currently valid Office of Management and Budget ("OMB") control number. Please direct comments concerning the accuracy of the information collection burden estimate and any suggestions for reducing the burden to Secretary, Securities and Exchange Commission, 450 Fifth Street, NW, Washington, DC 20549-0609. The OMB has reviewed this collection of information under the clearance requirements of 44 U.S.C. § 3507.
Item 1. Reports to Stockholders.
| (a) | The Report to Shareholders is attached herewith. |
| Touchstone Strategic Trust |
| Touchstone Balanced Fund |
| Touchstone International Equity Fund |
| Touchstone International Growth Fund (formerly Touchstone International Small Cap Fund) |
| Touchstone Large Cap Focused Fund |
| Touchstone Large Cap Fund |
| Touchstone Large Company Growth Fund |
| Touchstone Ohio Tax-Free Bond Fund |
| Touchstone Small Company Fund |
| Touchstone Value Fund |


President
Touchstone Strategic Trust

| Average Annual Total Returns** | |||
| Touchstone Balanced Fund | 1 Year | 5 Years | 10 Years |
| Class A | 20.57% | 12.12% | 9.77% |
| Class C | 24.93% | 12.41% | 9.66% |
| Class Y | 27.12% | 13.50% | 10.55% |
| Bloomberg Barclays US Aggregate Bond Index | -0.33% | 3.03% | 3.39% |
| S&P 500® Index | 40.79% | 17.65% | 14.84% |
| 60% S&P 500® Index and 40% Bloomberg Barclays U.S. Aggregate Bond Index | 23.02% | 11.89% | 10.39% |
| * | The chart above represents performance of Class A shares only, which will vary from the performance of Class C shares and Class Y shares based on the differences in sales loads and fees paid by shareholders in the different classes. |
| ** | The average annual total returns shown above are adjusted for maximum sales loads and fees, if applicable. The maximum offering price per share of Class A shares is equal to the net asset value (“NAV”) per share plus a sales load equal to 5.26% of the NAV (or 5.00% of the offering price). Class C shares are subject to a contingent deferred sales charge (“CDSC”) of 1.00%. The CDSC will be assessed on an amount equal to the lesser of (1) the NAV at the time of purchase of the shares being redeemed or (2) the NAV of such shares being redeemed, if redeemed within a one-year period from the date of purchase. Class Y shares are not subject to sales charges. |

| Average Annual Total Returns** | |||
| Touchstone International Equity Fund | 1 Year | 5 Years | 10 Years |
| Class A | 29.38% | 7.79% | 5.41% |
| Class C | 34.14% | 7.79% | 4.86% |
| Class Y | 36.71% | 9.24% | 6.37% |
| Institutional Class* | 36.83% | 9.32% | 6.39% |
| MSCI EAFE Index | 32.35% | 10.28% | 5.89% |
| * | The chart above represents performance of Class A shares only, which will vary from the performance of Class C shares, Class Y shares and Institutional Class shares based on the differences in sales loads and fees paid by shareholders in the different classes. The inception date of Institutional Class shares was October 30, 2017. Institutional Class shares performance information was calculated using the historical performance of Class A shares for the period prior to October 30, 2017. The returns have been restated for sales loads and fees applicable to Institutional Class shares. |
| ** | The average annual total returns shown above are adjusted for maximum sales loads and fees, if applicable. The maximum offering price per share of Class A shares is equal to the net asset value (“NAV”) per share plus a sales load equal to 5.26% of the NAV (or 5.00% of the offering price). Class C shares are subject to a contingent deferred sales charge (“CDSC”) of 1.00%. The CDSC will be assessed on an amount equal to the lesser of (1) the NAV at the time of purchase of the shares being redeemed or (2) the NAV of such shares being redeemed, if redeemed within a one-year period from the date of purchase. Class Y shares and Institutional Class shares are not subject to sales charges. |
| Average Annual Total Returns** | |||
| Touchstone International Growth Fund | 1 Year | 5 Years | Since Inception* |
| Class A | 24.92% | 13.73% | 11.55% |
| Class C | 29.55% | 14.22% | 11.43% |
| Class Y | 31.88% | 15.33% | 12.51% |
| Institutional Class | 32.00% | 15.47% | 12.59% |
| MSCI All Country World Ex USA Index | 35.72% | 11.08% | 6.76% |
| * | The chart above represents performance of Class A shares only, which will vary from the performance of Class C shares, Class Y shares and Institutional Class shares based on the differences in sales loads and fees paid by shareholders in the different classes. The inception date of Class A shares, Class C shares, Class Y shares and Institutional Class shares was August 15, 2016, August 15, 2016, August 15, 2016 and March 28, 2012, respectively. Class A shares, Class C shares and Class Y shares performance information was calculated using the historical performance of Institutional Class shares for periods prior to August 15, 2016. The returns have been restated for sales loads and fees applicable to Class A, Class C and Class Y shares. The returns of the index listed above are based on the inception date of the Fund. |
| ** | The average annual total returns shown above are adjusted for maximum sales loads and fees, if applicable. The maximum offering price per share of Class A shares is equal to the net asset value (“NAV”) per share plus a sales load equal to 5.26% of the NAV (or 5.00% of the offering price). Class C shares are subject to a contingent deferred sales charge (“CDSC”) of 1.00%. The CDSC will be assessed on an amount equal to the lesser of (1) the NAV at the time of purchase of the shares being redeemed or (2) the NAV of such shares being redeemed, if redeemed within a one-year period from the date of purchase. Class Y shares and Institutional Class shares are not subject to sales charges. |

| Average Annual Total Returns** | |||
| Touchstone Large Cap Focused Fund | 1 Year | 5 Years | 10 Years |
| Class A | 39.33% | 18.23% | 14.20% |
| Class C | 44.49% | 18.49% | 14.05% |
| Class Y | 47.07% | 19.76% | 15.11% |
| Institutional Class* | 47.14% | 19.84% | 15.03% |
| S&P 500® Index | 40.79% | 17.65% | 14.84% |
| * | The chart above represents performance of Class A shares only, which will vary from the performance of Class C shares, Class Y shares and Institutional Class shares based on the differences in sales loads and fees paid by shareholders in the different classes. The inception date of Institutional Class shares was December 23, 2014. Institutional Class shares performance was calculated using the historical performance of Class A shares for the period prior to December 23, 2014. The returns have been restated for sales loads and fees applicable to Institutional Class shares. |
| ** | The average annual total returns shown above are adjusted for maximum sales loads and fees, if applicable. The maximum offering price per share of Class A shares is equal to the net asset value (“NAV”) per share plus a sales load equal to 5.26% of the NAV (or 5.00% of the offering price). Class C shares are subject to a contingent deferred sales charge (“CDSC”) of 1.00%. The CDSC will be assessed on an amount equal to the lesser of (1) the NAV at the time of purchase of the shares being redeemed or (2) the NAV of such shares being redeemed, if redeemed within a one-year period from the date of purchase. Class Y shares and Institutional Class shares are not subject to sales charges. |
| Average Annual Total Returns** | |||
| Touchstone Large Cap Fund | 1 Year | 5 Years | Since Inception* |
| Class A | 31.12% | 11.97% | 9.29% |
| Class C | 36.06% | 12.46% | 9.42% |
| Class Y | 38.39% | 13.59% | 10.49% |
| Institutional Class | 38.59% | 13.72% | 10.61% |
| Russell 1000® Index | 43.07% | 17.99% | 14.14% |
| * | The chart above represents performance of Class A shares only, which will vary from the performance of Class C shares, Class Y shares and Institutional Class shares based on the differences in sales loads and fees paid by shareholders in the different classes. The inception date of the Fund was July 9, 2014. The returns of the index listed above are based on the inception date of the Fund. |
| ** | The average annual total returns shown above are adjusted for maximum sales loads and fees, if applicable. The maximum offering price per share of Class A shares is equal to the net asset value (“NAV”) per share plus a sales load equal to 5.26% of the NAV (or 5.00% of the offering price). Class C shares are subject to a contingent deferred sales charge (“CDSC”) of 1.00%. The CDSC will be assessed on an amount equal to the lesser of (1) the NAV at the time of purchase of the shares being redeemed or (2) the NAV of such shares being redeemed, if redeemed within a one-year period from the date of purchase. Class Y shares and Institutional Class shares are not subject to sales charges. |

| Average Annual Total Returns** | |||
| Touchstone Large Company Growth Fund | 1 Year | 5 Years | 10 Years |
| Class A* | 30.46% | 20.99% | 15.83% |
| Class C* | 35.28% | 21.52% | 15.65% |
| Class Y* | 37.64% | 22.73% | 16.80% |
| Institutional Class | 37.80% | 22.86% | 16.87% |
| Russell 1000® Growth Index | 42.50% | 23.66% | 17.87% |
| S&P 500® Index | 40.79% | 17.65% | 14.84% |
| * | The chart above represents performance of Class A shares only, which will vary from the performance of Class C shares, Class Y shares and Institutional Class shares based on the differences in sales loads and fees paid by shareholders in the different classes. The inception date of Class A shares, Class C shares and Class Y shares was August 15, 2016. Class A shares, Class C shares and Class Y shares performance information was calculated using the historical performance of Institutional Class shares for periods prior to August 15, 2016. The returns have been restated for sales loads and fees applicable to Class A, Class C and Class Y shares. |
| ** | The average annual total returns shown above are adjusted for maximum sales loads and fees, if applicable. The maximum offering price per share of Class A shares is equal to the net asset value (“NAV”) per share plus a sales load equal to 5.26% of the NAV (or 5.00% of the offering price). Class C shares are subject to a contingent deferred sales charge (“CDSC”) of 1.00%. The CDSC will be assessed on an amount equal to the lesser of (1) the NAV at the time of purchase of the shares being redeemed or (2) the NAV of such shares being redeemed, if redeemed within a one-year period from the date of purchase. Class Y shares and Institutional Class shares are not subject to sales charges. |
| Average Annual Total Returns** | |||
| Touchstone Ohio Tax-Free Bond Fund | 1 Year | 5 Years | 10 Years |
| Class A | -0.47% | 1.55% | 3.15% |
| Class C | 1.13% | 1.78% | 3.04% |
| Class Y* | 3.07% | 2.80% | 3.79% |
| Institutional Class* | 3.20% | 2.84% | 3.80% |
| Bloomberg Barclays Municipal Bond Index | 4.17% | 3.25% | 4.28% |
| * | The chart above represents performance of Class A shares only, which will vary from the performance of Class C shares, Class Y shares and Institutional Class shares based on the difference in sales loads and fees paid by shareholders in the different classes. The inception date of Class Y shares and Institutional Class shares was August 30, 2016. Class Y shares and Institutional Class shares performance information was calculated using the historical performance of Class A shares for the periods prior to August 30, 2016. The returns have been restated for sales loads and fees applicable to Class Y shares and Institutional Class shares. |
| ** | The average annual total returns shown above are adjusted for maximum sales loads and fees, if applicable. The maximum offering price per share of Class A shares is equal to the net asset value (“NAV”) per share plus a sales load equal to 3.36% of the NAV (or 3.25% of the offering price). Class C shares are subject to a contingent deferred sales charge (“CDSC”) of 1.00%. The CDSC will be assessed on an amount equal to the lesser of (1) the NAV at the time of purchase of the shares being redeemed or (2) the NAV of such shares being redeemed, if redeemed within a one-year period from the date of purchase. Class Y shares and Institutional Class shares are not subject to sales charges. |
| Average Annual Total Returns** | |||
| Touchstone Small Company Fund | 1 Year | 5 Years | 10 Years |
| Class A | 56.36% | 14.62% | 11.40% |
| Class C | 61.65% | 14.89% | 11.33% |
| Class Y | 64.61% | 16.11% | 12.33% |
| Class R6* | 65.08% | 16.28% | 12.29% |
| Institutional Class* | 64.75% | 16.09% | 12.29% |
| Russell 2000® Index | 62.03% | 16.47% | 12.34% |
| * | The chart above represents performance of Class A shares only, which will vary from the performance of Class C shares, Class Y shares, Institutional Class shares and Class R6 shares based on the differences in sales loads and fees paid by shareholders in the different classes. The inception date of Institutional Class shares and Class R6 shares was October 30, 2017 and December 23, 2014, respectively. Institutional Class shares and Class R6 shares performance was calculated using the historical performance of Class A shares for the periods prior to October 30, 2017 and December 23, 2014, respectively. The returns have been restated for sales loads and fees applicable to Institutional Class and Class R6 shares. |
| ** | The average annual total returns shown above are adjusted for maximum sales loads and fees, if applicable. The maximum offering price per share of Class A shares is equal to the net asset value (“NAV”) per share plus a sales load equal to 5.26% of the NAV (or 5.00% of the offering price). Class C shares are subject to a contingent deferred sales charge (“CDSC”) of 1.00%. The CDSC will be assessed on an amount equal to the lesser of (1) the NAV at the time of purchase of the shares being redeemed or (2) the NAV of such shares being redeemed, if redeemed within a one-year period from the date of purchase. Class Y shares, Institutional Class shares and Class R6 shares are not subject to sales charges. |
| Average Annual Total Returns** | |||
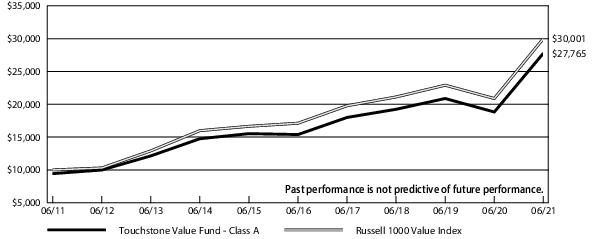
| Touchstone Value Fund | 1 Year | 5 Years | 10 Years |
| Class A | 40.09% | 11.20% | 10.75% |
| Class C* | 45.40% | 11.70% | 10.86% |
| Class Y | 47.93% | 12.83% | 11.72% |
| Institutional Class | 48.12% | 12.99% | 11.86% |
| Russell 1000® Value Index | 43.68% | 11.87% | 11.61% |
| * | The chart above represents performance of Class A shares only, which will vary from the performance of Class C shares, Class Y shares and Institutional Class shares based on the differences in sales loads and fees paid by shareholders in the different classes. The inception date of Class C shares was April 12, 2012. Class C shares performance was calculated using the historical performance of Class Y shares for the periods prior to April 12, 2012. The returns have been restated for sales loads and fees applicable to Class C shares. |
| ** | The average annual total returns shown above are adjusted for maximum sales loads and fees, if applicable. The maximum offering price per share of Class A shares is equal to the net asset value (“NAV”) per share plus a sales load equal to 5.26% of the NAV (or 5.00% of the offering price). Class C shares are subject to a contingent deferred sales charge (“CDSC”) of 1.00%. The CDSC will be assessed on an amount equal to the lesser of (1) the NAV at the time of purchase of the shares being redeemed or (2) the NAV of such shares being redeemed, if redeemed within a one-year period from the date of purchase. Class Y shares and Institutional Class shares are not subject to sales charges. |
| Credit Quality*(% of Fixed Income Securities) | |
| AAA/Aaa | 53.9% |
| AA/Aa | 7.4 |
| A/A | 10.3 |
| BBB/Baa | 26.4 |
| BB/Ba | 0.7 |
| Not Rated | 1.3 |
| Total | 100.0% |
| Sector Allocation**(% of Net Assets) | |
| Common Stocks | |
| Information Technology | 16.8% |
| Communication Services | 10.4 |
| Health Care | 8.1 |
| Consumer Discretionary | 7.6 |
| Financials | 7.5 |
| Industrials | 6.2 |
| Consumer Staples | 2.7 |
| Real Estate | 1.3 |
| Energy | 1.0 |
| Materials | 0.9 |
| Fixed Income Securities | 33.7 |
| Exchange-Traded Fund | 1.7 |
| Short-Term Investment Funds | 2.0 |
| Other Assets/Liabilities (Net) | 0.1 |
| Total | 100.0% |
| Geographic Allocation(% of Net Assets) | |
| Common Stocks | |
| Switzerland | 14.3% |
| United Kingdom | 13.7 |
| France | 10.7 |
| Germany | 10.3 |
| Japan | 8.9 |
| Mexico | 4.7 |
| China | 4.7 |
| India | 4.6 |
| Canada | 4.1 |
| South Korea | 3.5 |
| Hong Kong | 3.0 |
| Greece | 2.8 |
| Spain | 2.3 |
| Brazil | 2.3 |
| United States | 2.1 |
| Norway | 1.6 |
| Tanzania | 1.5 |
| Short-Term Investment Fund | 4.7 |
| Other Assets/Liabilities (Net) | 0.2 |
| Total | 100.0% |
| Geographic Allocation(% of Net Assets) | |
| Common Stocks | |
| China | 30.7% |
| France | 11.0 |
| United Kingdom | 9.6 |
| United States | 6.0 |
| Switzerland | 5.9 |
| India | 5.5 |
| Canada | 5.3 |
| Italy | 3.7 |
| Israel | 3.6 |
| Japan | 3.6 |
| Germany | 3.5 |
| Sweden | 3.1 |
| Spain | 2.0 |
| Singapore | 2.0 |
| Hong Kong | 1.8 |
| Denmark | 1.0 |
| Thailand | 1.0 |
| Short-Term Investment Funds | 2.4 |
| Other Assets/Liabilities (Net) | (1.7) |
| Total | 100.0% |
| Sector Allocation*(% of Net Assets) | |
| Information Technology | 25.2% |
| Communication Services | 19.1 |
| Consumer Discretionary | 12.1 |
| Financials | 11.9 |
| Health Care | 10.7 |
| Industrials | 8.0 |
| Consumer Staples | 3.5 |
| Real Estate | 2.3 |
| Energy | 2.0 |
| Materials | 1.4 |
| Exchange-Traded Fund | 0.6 |
| Short-Term Investment Fund | 3.0 |
| Other Assets/Liabilities (Net) | 0.2 |
| Total | 100.0% |
| Sector Allocation*(% of Net Assets) | |
| Information Technology | 18.1% |
| Financials | 17.2 |
| Consumer Discretionary | 13.0 |
| Communication Services | 11.8 |
| Consumer Staples | 10.2 |
| Industrials | 9.8 |
| Materials | 8.7 |
| Health Care | 6.1 |
| Real Estate | 3.7 |
| Short-Term Investment Fund | 1.2 |
| Other Assets/Liabilities (Net) | 0.2 |
| Total | 100.0% |
| Sector Allocation*(% of Net Assets) | |
| Information Technology | 47.9% |
| Communication Services | 22.5 |
| Consumer Discretionary | 14.7 |
| Health Care | 7.5 |
| Financials | 2.0 |
| Consumer Staples | 1.9 |
| Industrials | 1.6 |
| Short-Term Investment Funds | 3.0 |
| Other Assets/Liabilities (Net) | (1.1) |
| Total | 100.0% |
| Credit Quality*(% of Fixed Income Securities) | |
| AAA/Aaa | 8.7% |
| AA/Aa | 66.3 |
| A/A | 18.2 |
| BBB/Baa | 5.5 |
| Cash Equivalents | 1.3 |
| Total | 100.0% |
| Portfolio Allocation(% of Net Assets) | |
| Fixed Rate Revenue Bonds | 58.6% |
| Pre-refunded/Escrowed to Maturity | 20.0 |
| General Obligation Bonds | 18.9 |
| Variable Rate Demand Notes | 2.0 |
| Other Assets/Liabilities (Net) | 0.5 |
| Total | 100.0% |
| Sector Allocation**(% of Net Assets) | |
| Information Technology | 21.3% |
| Health Care | 19.4 |
| Industrials | 17.3 |
| Consumer Discretionary | 16.7 |
| Financials | 10.3 |
| Real Estate | 6.0 |
| Communication Services | 3.7 |
| Consumer Staples | 1.1 |
| Materials | 1.1 |
| Short-Term Investment Funds | 3.3 |
| Other Assets/Liabilities (Net) | (0.2) |
| Total | 100.0% |
| Sector Allocation**(% of Net Assets) | |
| Financials | 20.1% |
| Industrials | 17.1 |
| Consumer Discretionary | 14.8 |
| Health Care | 12.0 |
| Energy | 8.1 |
| Information Technology | 7.4 |
| Communication Services | 5.6 |
| Materials | 5.5 |
| Consumer Staples | 2.4 |
| Real Estate | 2.2 |
| Utilities | 1.5 |
| Short-Term Investment Fund | 2.8 |
| Other Assets/Liabilities (Net) | 0.5 |
| Total | 100.0% |
| Shares | Market Value | |||
| Common Stocks — 62.5% | ||||
| Information Technology — 16.8% | ||||
| 11,242 | Accenture PLC - Class A | $ 3,314,029 | ||
| 171,966 | Apple, Inc. | 23,552,463 | ||
| 30,494 | International Business Machines Corp. | 4,470,116 | ||
| 89,192 | Microsoft Corp. | 24,162,113 | ||
| 82,126 | Oracle Corp. | 6,392,688 | ||
| 35,222 | salesforce.com, Inc.* | 8,603,678 | ||
| 54,741 | SS&C Technologies Holdings, Inc. | 3,944,636 | ||
| 60,000 | Texas Instruments, Inc. | 11,538,000 | ||
| 31,190 | Visa, Inc. - Class A | 7,292,846 | ||
| 20,389 | Workday, Inc. - Class A* | 4,867,670 | ||
| 98,138,239 | ||||
| Communication Services — 10.4% | ||||
| 8,205 | Alphabet, Inc. - Class C* | 20,564,356 | ||
| 28,740 | AT&T, Inc. | 827,137 | ||
| 120,000 | Comcast Corp. - Class A | 6,842,400 | ||
| 58,621 | Facebook, Inc. - Class A* | 20,383,108 | ||
| 66,476 | Fox Corp. - Class A | 2,468,254 | ||
| 10,412 | Netflix, Inc.* | 5,499,722 | ||
| 22,743 | Walt Disney Co. (The)* | 3,997,537 | ||
| 60,582,514 | ||||
| Health Care — 8.1% | ||||
| 5,751 | Alcon, Inc. (Switzerland) | 404,065 | ||
| 35,863 | AmerisourceBergen Corp. | 4,105,955 | ||
| 13,000 | Becton Dickinson & Co. | 3,161,470 | ||
| 101,090 | Bristol-Myers Squibb Co. | 6,754,834 | ||
| 10,000 | CVS Health Corp. | 834,400 | ||
| 43,170 | HCA Healthcare, Inc. | 8,924,966 | ||
| 55,966 | Johnson & Johnson | 9,219,839 | ||
| 31,591 | Merck & Co., Inc. | 2,456,832 | ||
| 3,159 | Organon & Co.* | 95,591 | ||
| 10,047 | Stryker Corp. | 2,609,507 | ||
| 22,363 | UnitedHealth Group, Inc. | 8,955,040 | ||
| 47,522,499 | ||||
| Consumer Discretionary — 7.6% | ||||
| 24,090 | Alibaba Group Holding Ltd. (China) ADR* | 5,463,130 | ||
| 5,324 | Amazon.com, Inc.* | 18,315,412 | ||
| 58,893 | Hilton Worldwide Holdings, Inc.* | 7,103,674 | ||
| 59,307 | JD.com, Inc. (China) ADR* | 4,733,292 | ||
| 34,936 | Starbucks Corp. | 3,906,194 | ||
| 146,188 | Trip.com Group Ltd. (China) ADR* | 5,183,826 | ||
| 44,705,528 | ||||
| Financials — 7.5% | ||||
| 20,384 | American Express Co. | 3,368,048 | ||
| 46,875 | Berkshire Hathaway, Inc. - Class B* | 13,027,500 | ||
| 10,160 | CME Group, Inc. | 2,160,829 | ||
| 34,762 | Goldman Sachs Group, Inc. (The) | 13,193,222 | ||
| 39,000 | JPMorgan Chase & Co. | 6,066,060 | ||
| 25,618 | Signature Bank | 6,293,062 | ||
| 44,108,721 | ||||
| Industrials — 6.2% | ||||
| 10,646 | Boeing Co. (The)* | 2,550,356 | ||
| 16,080 | Deere & Co. | 5,671,577 | ||
| 8,072 | FedEx Corp. | 2,408,120 | ||
| 26,682 | Honeywell International, Inc. | 5,852,696 | ||
| 35,488 | Hubbell, Inc. | 6,630,578 | ||
| 14,919 | Parker-Hannifin Corp. | 4,581,774 | ||
| 103,849 | Raytheon Technologies Corp. | 8,859,358 | ||
| 36,554,459 | ||||
| Shares | Market Value | |||
| Consumer Staples — 2.7% | ||||
| 67,133 | Monster Beverage Corp.* | $ 6,132,600 | ||
| 8,485 | PepsiCo, Inc. | 1,257,223 | ||
| 64,848 | Philip Morris International, Inc. | 6,427,085 | ||
| 12,856 | Procter & Gamble Co. (The) | 1,734,660 | ||
| 15,551,568 | ||||
| Real Estate — 1.3% | ||||
| 40,029 | Jones Lang LaSalle, Inc.* | 7,824,068 | ||
| Energy — 1.0% | ||||
| 20,000 | Chevron Corp. | 2,094,800 | ||
| 38,000 | Exxon Mobil Corp. | 2,397,040 | ||
| 37,700 | Schlumberger NV | 1,206,777 | ||
| 5,698,617 | ||||
| Materials — 0.9% | ||||
| 67,991 | DuPont de Nemours, Inc. | 5,263,183 | ||
| Total Common Stocks | $365,949,396 | |||
| Principal Amount | ||||
| U.S. Treasury Obligations — 14.6% | ||||
| $14,500,000 | U.S. Treasury Bond, 1.875%, 2/15/41 | 14,210,000 | ||
| 1,910,000 | U.S. Treasury Bond, 1.875%, 2/15/51 | 1,824,647 | ||
| 11,945,000 | U.S. Treasury Note, 0.125%, 4/30/23 | 11,922,137 | ||
| 3,565,000 | U.S. Treasury Note, 0.250%, 10/31/25 | 3,486,876 | ||
| 8,630,000 | U.S. Treasury Note, 0.375%, 3/31/22 | 8,648,204 | ||
| 13,140,000 | U.S. Treasury Note, 0.750%, 3/31/26 | 13,087,132 | ||
| 4,200,000 | U.S. Treasury Note, 0.750%, 5/31/26 | 4,178,016 | ||
| 8,770,000 | U.S. Treasury Note, 1.125%, 2/28/22 | 8,831,664 | ||
| 8,790,000 | U.S. Treasury Note, 1.500%, 9/30/21 | 8,821,572 | ||
| 1,225,000 | U.S. Treasury Note, 1.500%, 10/31/24 | 1,264,190 | ||
| 2,820,000 | U.S. Treasury Note, 1.500%, 11/30/24 | 2,910,108 | ||
| 5,967,000 | U.S. Treasury Note, 1.625%, 5/15/31 | 6,065,828 | ||
| Total U.S. Treasury Obligations | $85,250,374 | |||
| Corporate Bonds — 11.9% | ||||
| Financials — 3.2% | ||||
| 636,000 | Allstate Corp. (The), 1.450%, 12/15/30 | 606,676 | ||
| 1,334,421 | American Financial Group, Inc., 5.250%, 4/2/30 | 1,636,819 | ||
| 552,000 | Ares Capital Corp., 3.250%, 7/15/25 | 580,945 | ||
| 322,000 | Bank of America Corp., 2.687%, 4/22/32 | 331,657 | ||
| 507,000 | Bank of America Corp., 3.705%, 4/24/28 | 560,915 | ||
| 764,000 | Bank of America Corp., MTN, 4.000%, 1/22/25 | 838,645 | ||
| 557,000 | Bank of Montreal (Canada), 3.803%, 12/15/32 | 614,658 | ||
| 350,000 | Berkshire Hathaway Finance Corp., 4.250%, 1/15/49 | 435,103 | ||
| 888,000 | Charles Schwab Corp. (The), 1.150%, 5/13/26 | 888,658 | ||
| 547,000 | Citigroup, Inc., 0.981%, 5/1/25 | 548,519 | ||
| 471,000 | Citigroup, Inc., 3.200%, 10/21/26 | 510,446 | ||
| 281,000 | Citigroup, Inc., 4.750%, 5/18/46 | 357,711 | ||
| 576,000 | Cooperatieve Rabobank UA (Netherlands), 144a, 1.106%, 2/24/27 | 568,160 | ||
| 742,000 | Corestates Capital III, 144a, (3M LIBOR +0.570%), 0.726%, 2/15/27(A) | 721,345 | ||
| 536,000 | Goldman Sachs Group, Inc. (The), 2.615%, 4/22/32 | 548,199 | ||
| 454,000 | Goldman Sachs Group, Inc. (The), 3.691%, 6/5/28 | 501,523 | ||
| 478,000 | HSBC Holdings PLC (United Kingdom), 3.900%, 5/25/26 | 531,828 | ||
| 791,000 | Huntington Bancshares, Inc., 2.550%, 2/4/30 | 824,052 | ||
| 590,000 | JPMorgan Chase & Co., 2.956%, 5/13/31 | 620,433 | ||
| 607,000 | JPMorgan Chase & Co., 3.509%, 1/23/29 | 668,792 | ||
| 594,000 | Lloyds Banking Group PLC (United Kingdom), 3.574%, 11/7/28 | 650,059 | ||
| 672,000 | Morgan Stanley, 3.950%, 4/23/27 | 751,341 | ||
| Principal Amount | MarketValue | |||
| Corporate Bonds — 11.9% (Continued) | ||||
| Financials — (Continued) | ||||
| $ 429,000 | Northwestern Mutual Life Insurance Co. (The), 144a, 3.850%, 9/30/47 | $ 490,647 | ||
| 732,000 | NTC Capital I, Ser A, (3M LIBOR +0.520%), 0.704%, 1/15/27(A) | 713,896 | ||
| 370,000 | PNC Bank NA, 2.700%, 11/1/22 | 380,956 | ||
| 704,000 | PNC Capital Trust, (3M LIBOR +0.570%), 0.705%, 6/1/28(A) | 675,938 | ||
| 620,000 | Toronto-Dominion Bank (The) (Canada), MTN, 1.150%, 6/12/25 | 624,694 | ||
| 980,000 | Truist Bank, Ser A, (3M LIBOR +0.670%), 0.830%, 5/15/27(A) | 957,278 | ||
| 380,000 | Truist Financial Corp., MTN, 2.850%, 10/26/24 | 406,352 | ||
| 63,000 | Wells Fargo & Co., MTN, 4.100%, 6/3/26 | 70,784 | ||
| 18,617,029 | ||||
| Industrials — 1.3% | ||||
| 507,000 | Amcor Flexibles North America, Inc., 2.630%, 6/19/30 | 518,854 | ||
| 151,000 | Boeing Co. (The), 5.040%, 5/1/27 | 174,312 | ||
| 202,000 | Boeing Co. (The), 5.805%, 5/1/50 | 272,208 | ||
| 597,000 | Burlington Northern Santa Fe LLC, 5.750%, 5/1/40 | 848,976 | ||
| 744,000 | CNH Industrial Capital LLC, 1.450%, 7/15/26 | 739,483 | ||
| 113,000 | Eagle Materials, Inc., 4.500%, 8/1/26 | 115,882 | ||
| 400,000 | FedEx Corp., 5.100%, 1/15/44 | 513,273 | ||
| 302,000 | General Electric Co., 4.125%, 10/9/42 | 348,615 | ||
| 578,000 | John Deere Capital Corp., MTN, 2.450%, 1/9/30 | 609,281 | ||
| 500,000 | Norfolk Southern Corp., 4.837%, 10/1/41 | 638,870 | ||
| 533,000 | Roper Technologies, Inc., 2.950%, 9/15/29 | 568,669 | ||
| 1,065,000 | Waste Management, Inc., 2.500%, 11/15/50 | 997,924 | ||
| 555,000 | Weir Group PLC (The) (United Kingdom), 144a, 2.200%, 5/13/26 | 557,510 | ||
| 474,000 | Xylem, Inc., 1.950%, 1/30/28 | 478,681 | ||
| 7,382,538 | ||||
| Health Care — 1.0% | ||||
| 371,000 | AbbVie, Inc., 3.800%, 3/15/25 | 405,944 | ||
| 521,000 | AbbVie, Inc., 4.450%, 5/14/46 | 631,766 | ||
| 322,000 | AbbVie, Inc., 5.000%, 12/15/21 | 325,061 | ||
| 457,000 | Alcon Finance Corp. (Switzerland), 144a, 3.800%, 9/23/49 | 508,235 | ||
| 503,000 | Becton Dickinson and Co., 4.685%, 12/15/44 | 626,589 | ||
| 428,000 | Bristol-Myers Squibb Co., 5.000%, 8/15/45 | 585,390 | ||
| 494,000 | CommonSpirit Health, 4.187%, 10/1/49 | 568,240 | ||
| 462,000 | CVS Health Corp., 5.125%, 7/20/45 | 601,529 | ||
| 570,000 | DH Europe Finance II Sarl, 3.250%, 11/15/39 | 610,898 | ||
| 457,000 | Mylan, Inc., 4.550%, 4/15/28 | 525,230 | ||
| 586,000 | UnitedHealth Group, Inc., 3.500%, 8/15/39 | 655,869 | ||
| 6,044,751 | ||||
| Energy — 1.0% | ||||
| 505,000 | Aker BP ASA (Norway), 144a, 3.000%, 1/15/25 | 530,229 | ||
| 449,000 | Boardwalk Pipelines LP, 4.450%, 7/15/27 | 508,659 | ||
| 386,000 | Canadian Natural Resources Ltd. (Canada), 6.250%, 3/15/38 | 516,371 | ||
| 400,000 | Cenovus Energy, Inc. (Canada), 5.250%, 6/15/37 | 479,244 | ||
| 730,000 | Cheniere Corpus Christi Holdings LLC, 7.000%, 6/30/24 | 836,290 | ||
| 541,000 | Diamondback Energy, Inc., 3.125%, 3/24/31 | 561,290 | ||
| 159,000 | Enable Midstream Partners LP, 4.150%, 9/15/29 | 174,253 | ||
| 347,000 | Energy Transfer LP, 4.950%, 6/15/28 | 401,230 | ||
| 510,000 | NGPL PipeCo LLC, 144a, 7.768%, 12/15/37 | 727,515 | ||
| 381,000 | Ovintiv Exploration, Inc., 5.375%, 1/1/26 | 429,525 | ||
| 569,000 | Phillips 66 Partners LP, 3.150%, 12/15/29 | 598,212 | ||
| 214,000 | Phillips 66 Partners LP, 3.750%, 3/1/28 | 234,328 | ||
| 5,997,146 | ||||
| Principal Amount | MarketValue | |||
| Information Technology — 0.9% | ||||
| $ 954,000 | Apple, Inc., 2.750%, 1/13/25 | $ 1,020,193 | ||
| 390,000 | Apple, Inc., 4.650%, 2/23/46 | 519,178 | ||
| 569,000 | Fiserv, Inc., 3.500%, 7/1/29 | 626,673 | ||
| 577,000 | Hewlett Packard Enterprise Co., 4.650%, 10/1/24 | 641,547 | ||
| 716,000 | Microchip Technology, Inc., 144a, 0.983%, 9/1/24 | 712,588 | ||
| 300,000 | Microsoft Corp., 3.500%, 2/12/35 | 348,334 | ||
| 614,000 | NXP BV / NXP Funding LLC (China), 144a, 5.350%, 3/1/26 | 716,677 | ||
| 372,000 | Oracle Corp., 2.650%, 7/15/26 | 392,700 | ||
| 424,000 | Visa, Inc., 4.150%, 12/14/35 | 522,034 | ||
| 5,499,924 | ||||
| Utilities — 0.9% | ||||
| 365,000 | American Water Capital Corp., 6.593%, 10/15/37 | 539,232 | ||
| 560,000 | Cleveland Electric Illuminating Co. (The), 144a, 4.550%, 11/15/30 | 647,755 | ||
| 338,000 | Duke Energy Progress LLC, 4.150%, 12/1/44 | 408,217 | ||
| 339,000 | Edison International, 4.125%, 3/15/28 | 360,926 | ||
| 554,000 | Electricite de France SA (France), 144a, 4.875%, 9/21/38 | 681,233 | ||
| 105,000 | Metropolitan Edison Co., 144a, 4.300%, 1/15/29 | 117,659 | ||
| 612,000 | Pacific Gas and Electric Co., 3.500%, 8/1/50 | 545,887 | ||
| 497,000 | PacifiCorp., 5.750%, 4/1/37 | 681,848 | ||
| 396,000 | Virginia Electric & Power Co., 3.300%, 12/1/49 | 426,949 | ||
| 1,018,000 | WEC Energy Group, Inc., (3M LIBOR +2.112%), 2.268%, 5/15/67(A) | 934,738 | ||
| 5,344,444 | ||||
| Consumer Staples — 0.9% | ||||
| 679,000 | 7-Eleven, Inc., 144a, 0.950%, 2/10/26 | 667,075 | ||
| 734,000 | Anheuser-Busch Cos. LLC / Anheuser-Busch InBev Worldwide, Inc. (Belgium), 4.900%, 2/1/46 | 926,326 | ||
| 346,000 | Ashtead Capital, Inc. (United Kingdom), 144a, 4.375%, 8/15/27 | 362,435 | ||
| 403,000 | BAT International Finance PLC (United Kingdom), 1.668%, 3/25/26 | 402,950 | ||
| 679,000 | Imperial Brands Finance PLC (United Kingdom), 144a, 4.250%, 7/21/25 | 748,273 | ||
| 202,000 | Kroger Co. (The), 5.000%, 4/15/42 | 255,010 | ||
| 572,000 | Mars, Inc., 144a, 3.875%, 4/1/39 | 673,775 | ||
| 502,000 | Reynolds American, Inc. (United Kingdom), 4.450%, 6/12/25 | 556,287 | ||
| 326,000 | Starbucks Corp., 3.350%, 3/12/50 | 341,282 | ||
| 199,000 | Sysco Corp., 5.950%, 4/1/30 | 255,469 | ||
| 5,188,882 | ||||
| Communication Services — 0.9% | ||||
| 228,000 | Alphabet, Inc., 1.900%, 8/15/40 | 208,142 | ||
| 291,000 | AT&T, Inc., 4.500%, 5/15/35 | 342,059 | ||
| 399,000 | Charter Communications Operating LLC / Charter Communications Operating Capital, 6.484%, 10/23/45 | 549,828 | ||
| 466,000 | Comcast Corp., 4.000%, 3/1/48 | 545,513 | ||
| 382,000 | Cox Communications, Inc., 144a, 3.350%, 9/15/26 | 414,990 | ||
| 211,000 | Deutsche Telekom International Finance BV (Germany), 8.750%, 6/15/30 | 316,407 | ||
| 584,000 | Netflix, Inc., 144a, 4.875%, 6/15/30 | 694,551 | ||
| 635,000 | T-Mobile USA, Inc., 3.875%, 4/15/30 | 709,003 | ||
| 632,000 | Verizon Communications, Inc., 2.987%, 10/30/56 | 594,657 | ||
| 138,000 | Verizon Communications, Inc., 4.672%, 3/15/55 | 177,444 | ||
| 400,000 | ViacomCBS, Inc., 4.950%, 5/19/50† | 507,355 | ||
| 5,059,949 | ||||
| Real Estate — 0.9% | ||||
| 334,000 | American Homes 4 Rent LP REIT, 4.250%, 2/15/28 | 373,999 | ||
| Principal Amount | MarketValue | |||
| Corporate Bonds — 11.9% (Continued) | ||||
| Real Estate — (Continued) | ||||
| $ 576,000 | Crown Castle International Corp. REIT, 3.650%, 9/1/27 | $ 634,668 | ||
| 460,000 | Equinix, Inc. REIT, 2.900%, 11/18/26 | 492,286 | ||
| 566,000 | Healthcare Realty Trust, Inc. REIT, 2.400%, 3/15/30 | 569,516 | ||
| 638,000 | Host Hotels & Resorts LP REIT, 4.500%, 2/1/26 | 701,123 | ||
| 412,000 | Mid-America Apartments LP REIT, 3.750%, 6/15/24 | 445,356 | ||
| 452,000 | Sabra Health Care LP REIT, 5.125%, 8/15/26 | 508,599 | ||
| 198,000 | STORE Capital Corp. REIT, 4.500%, 3/15/28 | 223,852 | ||
| 371,000 | STORE Capital Corp. REIT, 4.625%, 3/15/29 | 422,337 | ||
| 517,000 | VEREIT Operating Partnership LP, 4.600%, 2/6/24 | 563,359 | ||
| 4,935,095 | ||||
| Consumer Discretionary — 0.6% | ||||
| 89,175 | Air Canada 2015-1 Class A Pass Through Trust (Canada), 144a, 3.600%, 3/15/27 | 90,696 | ||
| 314,000 | Ford Motor Credit Co. LLC, 3.664%, 9/8/24 | 329,116 | ||
| 214,000 | General Motors Financial Co., Inc., 3.950%, 4/13/24 | 230,464 | ||
| 370,000 | General Motors Financial Co., Inc., 5.650%, 1/17/29 | 450,516 | ||
| 407,000 | Home Depot, Inc. (The), 5.950%, 4/1/41 | 594,282 | ||
| 598,000 | Hyundai Capital America, 144a, 2.650%, 2/10/25 | 625,697 | ||
| 593,000 | Lowe's Cos, Inc., 4.500%, 4/15/30 | 702,167 | ||
| 563,000 | Walmart, Inc., 2.850%, 7/8/24 | 600,876 | ||
| 3,623,814 | ||||
| Materials — 0.3% | ||||
| 337,000 | Braskem America Finance Co. (Brazil), 144a, 7.125%, 7/22/41 | 419,063 | ||
| 569,000 | Sherwin-Williams Co. (The), 4.500%, 6/1/47 | 712,217 | ||
| 471,000 | Vulcan Materials Co., 4.500%, 4/1/25 | 524,333 | ||
| 1,655,613 | ||||
| Total Corporate Bonds | $69,349,185 | |||
| U.S. Government Mortgage-Backed Obligations — 2.4% | ||||
| 2,045 | FHLMC, Pool #G08062, 5.000%, 6/1/35 | 2,348 | ||
| 218,502 | FHLMC, Pool #G08637, 4.000%, 4/1/45 | 238,022 | ||
| 1,111,011 | FHLMC, Pool #Q02664, 4.500%, 8/1/41 | 1,227,750 | ||
| 1,873,037 | FHLMC, Pool #Q29056, 4.000%, 10/1/44 | 2,049,918 | ||
| 954,824 | FHLMC, Pool #Q29260, 4.000%, 10/1/44 | 1,044,928 | ||
| 446 | FNMA, Pool #690305, 5.500%, 3/1/33 | 498 | ||
| 404,529 | FNMA, Pool #725423, 5.500%, 5/1/34 | 467,355 | ||
| 362,001 | FNMA, Pool #725610, 5.500%, 7/1/34 | 419,429 | ||
| 57,874 | FNMA, Pool #748895, 6.000%, 12/1/33 | 61,833 | ||
| 159,120 | FNMA, Pool #AD9193, 5.000%, 9/1/40 | 180,684 | ||
| 404,152 | FNMA, Pool #AH8925, 4.500%, 3/1/41 | 446,236 | ||
| 230,605 | FNMA, Pool #AL5718, 3.500%, 9/1/44 | 250,345 | ||
| 399,959 | FNMA, Pool #AR9195, 3.000%, 3/1/43 | 426,372 | ||
| 807,768 | FNMA, Pool #BC1809, 3.500%, 5/1/46 | 863,234 | ||
| 777,130 | FNMA, Pool #FM4996, 2.000%, 12/1/50 | 787,472 | ||
| 982,052 | FNMA, Pool #FM5166, 3.000%, 12/1/50 | 1,026,153 | ||
| 917,884 | FNMA, Pool #FM5279, 3.500%, 11/1/50 | 965,994 | ||
| 709,332 | FNMA, Pool #FM5468, 2.500%, 1/1/36 | 746,368 | ||
| 747,508 | FNMA, Pool #FM5682, 2.500%, 1/1/51 | 775,395 | ||
| 1,047,246 | FNMA, Pool #MA4166, 3.000%, 10/1/40 | 1,093,846 | ||
| 633,583 | GNMA, Pool #5175, 4.500%, 9/20/41 | 700,711 | ||
| Total U.S. Government Mortgage-Backed Obligations | $13,774,891 | |||
| Asset-Backed Securities — 2.2% | ||||
| 1,000,000 | AB BSL CLO 2 Ltd. (Cayman Islands), Ser 2021-2A, Class B1, 144a, (3M LIBOR +1.650%), 4/15/34(A) | 999,440 | ||
| 375,585 | Adams Outdoor Advertising LP, Ser 2018-1, Class A, 144a, 4.810%, 11/15/48 | 402,622 | ||
| 450,000 | Apidos CLO XVIII (Cayman Islands), Ser 2018-18A, Class A1, 144a, (3M LIBOR +1.140%), 1.324%, 10/22/30(A) | 450,007 | ||
| Principal Amount | MarketValue | |||
| Asset-Backed Securities — 2.2% (Continued) | ||||
| $ 575,000 | Benefit Street Partners CLO XIX Ltd. (Cayman Islands), Ser 2019-19A, Class B, 144a, (3M LIBOR +2.000%), 2.184%, 1/15/33(A) | $ 575,542 | ||
| 357,892 | CF Hippolyta LLC, Ser 2020-1, Class A1, 144a, 1.690%, 7/15/60 | 363,796 | ||
| 465,000 | CIFC Funding Ltd. (Cayman Islands), Ser 2016-1A, Class A1R, 144a, (3M LIBOR +1.350%), 1.536%, 10/21/31(A) | 465,854 | ||
| 855,313 | Driven Brands Funding LLC, Ser 2019-1A, Class A2, 144a, 4.641%, 4/20/49 | 920,975 | ||
| 519,909 | Elara HGV Timeshare Issuer LLC, Ser 2019-A, Class B, 144a, 2.910%, 1/25/34 | 531,442 | ||
| 86,294 | GLS Auto Receivables Issuer Trust, Ser 2019-3A, Class A, 144a, 2.580%, 7/17/23 | 86,610 | ||
| 694,750 | Jack In The Box Funding LLC, Ser 2019-1A, Class A2I, 144a, 3.982%, 8/25/49 | 710,785 | ||
| 378,000 | Jersey Mike's Funding, Ser 2019-1A, Class A2, 144a, 4.433%, 2/15/50 | 404,925 | ||
| 850,000 | Madison Park Funding XVIII Ltd. (Cayman Islands), Ser 2015-18A, Class BR, 144a, (3M LIBOR +1.600%), 1.786%, 10/21/30(A) | 850,042 | ||
| 465,000 | Madison Park Funding XXXV Ltd. (Cayman Islands), Ser 2019-35A, Class A2AR, 144a, (3M LIBOR +1.200%), 1.388%, 4/20/32(A) | 465,187 | ||
| 573,777 | Mill City Mortgage Loan Trust, Ser 2018-3, Class M3, 144a, 3.250%, 8/25/58(A)(B) | 597,213 | ||
| 850,000 | Neighborly Issuer LLC, Ser 2021-1A, Class A2, 144a, 3.584%, 4/30/51 | 874,386 | ||
| 525,000 | New Mountain CLO 1 Ltd. (Cayman Islands), Ser CLO-1A, Class A1, 144a, (3M LIBOR +1.550%), 1.734%, 10/15/32(A) | 525,584 | ||
| 575,000 | OHA Loan Funding Ltd. (Cayman Islands), Ser 2015-1A, Class B1R2, 144a, (3M LIBOR +1.900%), 2.056%, 11/15/32(A) | 575,303 | ||
| 1,000,000 | Palmer Square Loan Funding Ltd. (Cayman Islands), Ser 2021-2A, Class A2, 144a, (3M LIBOR +1.250%), 1.396%, 5/20/29(A) | 1,000,172 | ||
| 915,000 | STWD Ltd. (Cayman Islands), Ser 2019-FL1, Class A, 144a, (1M LIBOR +1.080%), 1.204%, 7/15/38(A) | 914,999 | ||
| 446,806 | TAL Advantage VII LLC, Ser 2020-1A, Class A, 144a, 2.050%, 9/20/45 | 450,424 | ||
| 493,505 | Towd Point Mortgage Trust, Ser 2019-1, Class A1, 144a, 3.722%, 3/25/58(A)(B) | 519,745 | ||
| 465,000 | Voya CLO Ltd. (Cayman Islands), Ser 2019-2A, Class A, 144a, (3M LIBOR +1.270%), 1.458%, 7/20/32(A) | 465,017 | ||
| Total Asset-Backed Securities | $13,150,070 | |||
| Shares | ||||
| Exchange-Traded Fund — 1.7% | ||||
| 89,101 | iShares JP Morgan USD Emerging Markets Bond ETF | 10,020,298 | ||
| Principal Amount | ||||
| Non-Agency Collateralized Mortgage Obligations — 1.2% | ||||
| $ 226,248 | Agate Bay Mortgage Trust, Ser 2013-1, Class B3, 144a, 3.605%, 7/25/43(A)(B) | 229,637 | ||
| 541,330 | Agate Bay Mortgage Trust, Ser 2015-4, Class B2, 144a, 3.545%, 6/25/45(A)(B) | 551,996 | ||
| 561,982 | Agate Bay Mortgage Trust, Ser 2015-7, Class B1, 144a, 3.709%, 10/25/45(A)(B) | 575,632 | ||
| 382,100 | CSMC Trust, Ser 2013-IVR3, Class B2, 144a, 3.386%, 5/25/43(A)(B) | 387,744 | ||
| Principal Amount | MarketValue | |||
| Non-Agency Collateralized Mortgage Obligations — 1.2% (Continued) | ||||
| $ 490,110 | CSMC Trust, Ser 2015-1, Class B3, 144a, 3.958%, 1/25/45(A)(B) | $ 500,561 | ||
| 573,120 | CSMC Trust, Ser 2015-WIN1, Class B3, 144a, 3.824%, 12/25/44(A)(B) | 581,803 | ||
| 497,450 | CSMC Trust, Ser 2018-RPL9, Class A, 144a, 3.850%, 9/25/57(A)(B) | 519,747 | ||
| 625,000 | GS Mortgage-Backed Securities Trust, Ser 2021-PJ6, Class A2, 144a, 2.500%, 11/25/51(A)(B) | 632,069 | ||
| 719,560 | JP Morgan Mortgage Trust, Ser 2017-1, Class B2, 144a, 3.498%, 1/25/47(A)(B) | 730,795 | ||
| 241,483 | Sequoia Mortgage Trust, Ser 2015-2, Class A19, 144a, 3.500%, 5/25/45(A)(B) | 244,486 | ||
| 915,829 | Sequoia Mortgage Trust, Ser 2018-CH3, Class B1B, 144a, 4.823%, 8/25/48(A)(B) | 960,884 | ||
| 830,924 | Sequoia Mortgage Trust, Ser 2018-CH3, Class B2B, 144a, 4.823%, 8/25/48(A)(B) | 868,388 | ||
| Total Non-Agency Collateralized Mortgage Obligations | $6,783,742 | |||
| Commercial Mortgage-Backed Securities — 1.0% | ||||
| 825,000 | BANK, Ser 2018-BN14, Class A3, 3.966%, 9/15/60 | 929,708 | ||
| 915,000 | BHMS, Ser 2018-ATLS, Class A, 144a, (1M LIBOR +1.250%), 1.323%, 7/15/35(A) | 915,559 | ||
| 900,000 | BPR Trust, Ser 2021-KEN, Class B, 144a, (1M LIBOR +1.950%), 2.023%, 2/15/29(A) | 900,464 | ||
| 700,000 | GS Mortgage Securities Trust, Ser 2017-FARM, Class B, 144a, 3.659%, 1/10/43(A)(B) | 758,531 | ||
| 500,000 | JPMorgan Chase Commercial Mortgage Securities Trust, Ser 2018-MINN, Class A, 144a, (1M LIBOR +1.020%), 2.020%, 11/15/35(A) | 501,474 | ||
| 825,000 | SG Commercial Mortgage Securities Trust, Ser 2019-787E, Class A, 144a, 4.163%, 2/15/41 | 948,341 | ||
| 980,167 | WFRBS Commercial Mortgage Trust, Ser 2014-C19, Class A3, 3.660%, 3/15/47 | 978,556 | ||
| Total Commercial Mortgage-Backed Securities | $5,932,633 | |||
| Sovereign Government Obligations — 0.2% | ||||
| 339,000 | Colombia Government International Bond, 5.000%, 6/15/45 | 360,327 | ||
| 331,000 | Mexico Government International Bond, 3.771%, 5/24/61 | 307,956 | ||
| 847,000 | Peruvian Government International Bond, 2.780%, 12/1/60 | 754,685 | ||
| Total Sovereign Government Obligations | $1,422,968 | |||
| Agency Collateralized Mortgage Obligations — 0.2% | ||||
| 687,362 | FHLMC REMIC, Ser 3859, Class JB, 5.000%, 5/15/41 | 780,612 | ||
| 341,783 | GNMA, Ser 2010-169, Class AW, 4.500%, 12/20/40 | 378,548 | ||
| 5,070,535 | GNMA, Ser 2012-147, Class IO, 0.567%, 4/16/54(A)(B)(C) | 97,698 | ||
| Total Agency Collateralized Mortgage Obligations | $1,256,858 | |||
| Shares | MarketValue | |||
| Short-Term Investment Funds — 2.0% | ||||
| 11,598,781 | Dreyfus Government Cash Management, Institutional Shares, 0.03%∞Ω | $ 11,598,781 | ||
| 494,000 | Invesco Government & Agency Portfolio, Institutional Class, 0.03%∞Ω** | 494,000 | ||
| Total Short-Term Investment Funds | $12,092,781 | |||
| Total Investment Securities—99.9% (Cost $380,463,552) | $584,983,196 | |||
| Other Assets in Excess of Liabilities — 0.1% | 357,576 | |||
| Net Assets — 100.0% | $585,340,772 | |||
| (A) | Variable rate security - Rate reflected is the rate in effect as of June 30, 2021. |
| (B) | Certain variable rate securities are not based on a published reference rate and spread but are determined by the issuer or agent and are based on current market conditions. These securities do not indicate a reference rate and spread in their description. |
| (C) | Interest only security - This type of security represents the right to receive the monthly interest payments on an underlying pool of mortgages. Payments of principal on the pool reduce the value of the “interest only” holding. |
| * | Non-income producing security. |
| ** | Represents collateral for securities loaned. |
| † | All or a portion of the security is on loan. The total market value of the securities on loan as of June 30, 2021 was $481,987. |
| ∞ | Open-End Fund. |
| Ω | Represents the 7-Day SEC yield as of June 30, 2021. |
| Portfolio Abbreviations: |
| ADR – American Depositary Receipt |
| CLO – Collateralized Loan Obligation |
| ETF – Exchange-Traded Fund |
| FHLMC – Federal Home Loan Mortgage Corporation |
| FNMA – Federal National Mortgage Association |
| GNMA – Government National Mortgage Association |
| IO – Interest Only |
| LIBOR – London Interbank Offered Rate |
| LLC – Limited Liability Company |
| LP – Limited Partnership |
| MTN – Medium Term Note |
| PLC – Public Limited Company |
| REIT – Real Estate Investment Trust |
| REMIC – Real Estate Mortgage Investment Conduit |
| 144a - This is a restricted security that was sold in a transaction qualifying for the exemption under Rule 144a of the Securities Act of 1933. This security may be sold in transactions exempt from registration, normally to qualified institutional buyers. At June 30, 2021, these securities were valued at $35,634,289 or 6.1% of net assets. These securities were deemed liquid pursuant to procedures approved by the Board of Trustees. |
| Valuation Inputs at Reporting Date: | ||||
| Description | Level 1 | Level 2 | Level 3 | Total |
| Assets: | ||||
| Common Stocks | $365,949,396 | $— | $— | $365,949,396 |
| U.S. Treasury Obligations | — | 85,250,374 | — | 85,250,374 |
| Corporate Bonds | — | 69,349,185 | — | 69,349,185 |
| U.S. Government Mortgage-Backed Obligations | — | 13,774,891 | — | 13,774,891 |
| Asset-Backed Securities | — | 13,150,070 | — | 13,150,070 |
| Exchange-Traded Fund | 10,020,298 | — | — | 10,020,298 |
| Non-Agency Collateralized Mortgage Obligations | — | 6,783,742 | — | 6,783,742 |
| Commercial Mortgage-Backed Securities | — | 5,932,633 | — | 5,932,633 |
| Sovereign Government Obligations | — | 1,422,968 | — | 1,422,968 |
| Agency Collateralized Mortgage Obligations | — | 1,256,858 | — | 1,256,858 |
| Short-Term Investment Funds | 12,092,781 | — | — | 12,092,781 |
| Other Financial Instruments* | ||||
| Futures | ||||
| Interest rate contracts | 3,906 | — | — | 3,906 |
| Total Assets | $388,066,381 | $196,920,721 | $— | $584,987,102 |
| Liabilities: | ||||
| Other Financial Instruments* | ||||
| Futures | ||||
| Interest rate contracts | $(4,219) | $— | $— | $(4,219) |
| Total | $388,062,162 | $196,920,721 | $— | $584,982,883 |
| * | Other Financial Instruments are derivative instruments not reflected in total investments. Amounts shown represent unrealized appreciation (depreciation) on futures contracts and is included in Payable for variation margin on futures contracts on the Statement of Assets and Liabilities. |
| Description | Expiration Date | Number of Contracts | Notional Value | Unrealized Appreciation/ (Depreciation) |
| Short Futures: | ||||
| Ultra Long U.S. Treasury Bond Futures | 9/21/2021 | 15 | $2,886,051 | $(4,219) |
| Long Futures: | ||||
| 5-Year U.S. Treasury Note Futures | 9/21/2021 | 100 | 12,339,330 | 3,906 |
| $(313) |
| Shares | Market Value | |||
| Common Stocks — 95.1% | ||||
| Switzerland — 14.3% | ||||
| Consumer Staples — 2.8% | ||||
| 27,300 | Nestle SA | $ 3,402,865 | ||
| Health Care — 6.2% | ||||
| 42,000 | Novartis AG | 3,831,517 | ||
| 10,000 | Roche Holding AG | 3,768,381 | ||
| Industrials — 2.8% | ||||
| 50,200 | Adecco Group AG | 3,415,698 | ||
| Materials — 2.5% | ||||
| 51,900 | LafargeHolcim Ltd. | 3,119,611 | ||
| Total Switzerland | 17,538,072 | |||
| United Kingdom — 13.7% | ||||
| Consumer Discretionary — 1.7% | ||||
| 100,100 | Compass Group PLC* | 2,108,898 | ||
| Consumer Staples — 2.1% | ||||
| 28,700 | Reckitt Benckiser Group PLC | 2,535,651 | ||
| Health Care — 2.5% | ||||
| 930,000 | ConvaTec Group PLC, 144a | 3,095,245 | ||
| Industrials — 2.1% | ||||
| 75,800 | Bunzl PLC | 2,507,558 | ||
| Information Technology — 2.0% | ||||
| 54,300 | Spectris PLC | 2,435,465 | ||
| Real Estate — 3.3% | ||||
| 1,750,000 | Foxtons Group PLC* | 1,371,333 | ||
| 170,000 | Savills PLC | 2,704,351 | ||
| Total United Kingdom | 16,758,501 | |||
| France — 10.7% | ||||
| Communication Services — 2.7% | ||||
| 117,100 | JCDecaux SA* | 3,246,344 | ||
| Consumer Discretionary — 5.2% | ||||
| 77,300 | Accor SA* | 2,891,300 | ||
| 22,000 | Cie Generale des Etablissements Michelin SCA | 3,511,098 | ||
| Energy — 2.8% | ||||
| 75,800 | TOTAL SE | 3,433,876 | ||
| Total France | 13,082,618 | |||
| Germany — 10.3% | ||||
| Health Care — 4.5% | ||||
| 104,900 | Fresenius SE & Co. KGaA | 5,474,721 | ||
| Industrials — 3.6% | ||||
| 19,000 | Brenntag SE | 1,768,376 | ||
| 52,300 | Norma Group SE | 2,677,796 | ||
| Information Technology — 2.2% | ||||
| 18,800 | SAP SE | 2,640,643 | ||
| Total Germany | 12,561,536 | |||
| Japan — 8.9% | ||||
| Communication Services — 2.1% | ||||
| 99,600 | Nippon Telegraph & Telephone Corp. | 2,604,061 | ||
| Consumer Discretionary — 3.0% | ||||
| 210,000 | USS Co. Ltd. | 3,670,886 | ||
| Consumer Staples — 1.6% | ||||
| 83,000 | Calbee, Inc. | 1,915,589 | ||
| Industrials — 2.2% | ||||
| 11,300 | FANUC Corp. | 2,709,716 | ||
| Total Japan | 10,900,252 | |||
| Shares | Market Value | |||
| Mexico — 4.7% | ||||
| Consumer Staples — 4.7% | ||||
| 340,000 | Gruma SAB de CV - Class B | $ 3,821,632 | ||
| 1,100,000 | Kimberly-Clark de Mexico SAB de CV | 1,953,998 | ||
| Total Mexico | 5,775,630 | |||
| China — 4.7% | ||||
| Communication Services — 2.1% | ||||
| 33,300 | Tencent Holdings Ltd. | 2,507,241 | ||
| Consumer Discretionary — 2.6% | ||||
| 14,000 | Alibaba Group Holding Ltd. ADR* | 3,174,920 | ||
| Total China | 5,682,161 | |||
| India — 4.6% | ||||
| Communication Services — 1.3% | ||||
| 520,000 | Indus Towers Ltd. | 1,672,130 | ||
| Consumer Discretionary — 0.6% | ||||
| 1,980,000 | PC Jeweller Ltd.* | 716,631 | ||
| Financials — 2.7% | ||||
| 650,600 | Indian Energy Exchange Ltd., 144a | 3,289,377 | ||
| Total India | 5,678,138 | |||
| Canada — 4.1% | ||||
| Materials — 4.1% | ||||
| 130,000 | Barrick Gold Corp. | 2,688,932 | ||
| 240,000 | Pretium Resources, Inc.* | 2,294,400 | ||
| Total Canada | 4,983,332 | |||
| South Korea — 3.5% | ||||
| Information Technology — 3.5% | ||||
| 59,900 | Samsung Electronics Co. Ltd. | 4,288,011 | ||
| Hong Kong — 3.0% | ||||
| Consumer Discretionary — 3.0% | ||||
| 457,000 | Galaxy Entertainment Group Ltd.* | 3,654,214 | ||
| Greece — 2.8% | ||||
| Consumer Discretionary — 2.8% | ||||
| 222,700 | OPAP SA | 3,358,809 | ||
| Spain — 2.3% | ||||
| Industrials — 2.3% | ||||
| 36,600 | Befesa SA, 144a | 2,812,220 | ||
| Brazil — 2.3% | ||||
| Industrials — 2.3% | ||||
| 1,225,000 | Boa Vista Servicos SA | 2,753,528 | ||
| United States — 2.1% | ||||
| Health Care — 2.1% | ||||
| 21,000 | Medtronic PLC | 2,606,730 | ||
| Norway — 1.6% | ||||
| Energy — 1.6% | ||||
| 156,300 | TGS NOPEC Geophysical Co. ASA | 1,993,073 | ||
| Tanzania — 1.5% | ||||
| Communication Services — 1.5% | ||||
| 830,000 | Helios Towers PLC* | 1,871,467 | ||
| Total Common Stocks | $116,298,292 | |||
| Shares | Market Value | |||
| Short-Term Investment Fund — 4.7% | ||||
| 5,751,601 | Dreyfus Government Cash Management, Institutional Shares, 0.03%∞Ω | $ 5,751,601 | ||
| Total Investment Securities — 99.8% (Cost $98,865,066) | $122,049,893 | |||
| Other Assets in Excess of Liabilities — 0.2% | 304,584 | |||
| Net Assets — 100.0% | $122,354,477 | |||
| * | Non-income producing security. |
| ∞ | Open-End Fund. |
| Ω | Represents the 7-Day SEC yield as of June 30, 2021. |
| Portfolio Abbreviations: |
| ADR – American Depositary Receipt |
| PLC – Public Limited Company |
| 144a - This is a restricted security that was sold in a transaction qualifying for the exemption under Rule 144a of the Securities Act of 1933. This security may be sold in transactions exempt from registration, normally to qualified institutional buyers. At June 30, 2021, these securities were valued at $9,196,842 or 7.5% of net assets. These securities were deemed liquid pursuant to procedures approved by the Board of Trustees. |
| Valuation inputs at Reporting Date: | ||||
| Description | Level 1 | Level 2 | Level 3 | Total |
| Common Stocks | ||||
| Switzerland | $— | $17,538,072 | $— | $17,538,072 |
| United Kingdom | 5,799,596 | 10,958,905 | — | 16,758,501 |
| France | 3,246,344 | 9,836,274 | — | 13,082,618 |
| Germany | 2,677,796 | 9,883,740 | — | 12,561,536 |
| Japan | — | 10,900,252 | — | 10,900,252 |
| Mexico | 5,775,630 | — | — | 5,775,630 |
| China | 3,174,920 | 2,507,241 | — | 5,682,161 |
| India | — | 5,678,138 | — | 5,678,138 |
| Canada | 4,983,332 | — | — | 4,983,332 |
| South Korea | — | 4,288,011 | — | 4,288,011 |
| Hong Kong | — | 3,654,214 | — | 3,654,214 |
| Greece | — | 3,358,809 | — | 3,358,809 |
| Spain | 2,812,220 | — | — | 2,812,220 |
| Brazil | 2,753,528 | — | — | 2,753,528 |
| United States | 2,606,730 | — | — | 2,606,730 |
| Norway | — | 1,993,073 | — | 1,993,073 |
| Tanzania | 1,871,467 | — | — | 1,871,467 |
| Short-Term Investment Fund | 5,751,601 | — | — | 5,751,601 |
| Total | $41,453,164 | $80,596,729 | $— | $122,049,893 |
| Shares | Market Value | |||
| Common Stocks — 99.3% | ||||
| China — 30.7% | ||||
| Communication Services — 7.2% | ||||
| 89,225 | Tencent Holdings Ltd. | $ 6,717,974 | ||
| 7,200 | Tencent Holdings Ltd. ADR | 542,160 | ||
| Consumer Discretionary — 20.7% | ||||
| 32,945 | Alibaba Group Holding Ltd. ADR* | 7,471,266 | ||
| 128,000 | ANTA Sports Products Ltd. | 3,004,253 | ||
| 67,785 | JD.com, Inc. ADR* | 5,409,921 | ||
| 329,890 | New Oriental Education & Technology Group, Inc. ADR* | 2,701,799 | ||
| 963,600 | Tongcheng-Elong Holdings Ltd.* | 2,411,555 | ||
| Financials — 2.8% | ||||
| 99,160 | Lufax Holding Ltd. ADR*† | 1,120,508 | ||
| 174,500 | Ping An Insurance Group Co. of China Ltd. | 1,705,807 | ||
| Total China | 31,085,243 | |||
| France — 11.0% | ||||
| Consumer Discretionary — 1.5% | ||||
| 1,796 | Kering SA | 1,573,687 | ||
| Industrials — 2.7% | ||||
| 19,905 | Safran SA | 2,762,474 | ||
| Information Technology — 6.8% | ||||
| 25,985 | Capgemini SE | 4,997,268 | ||
| 19,880 | Worldline SA, 144a* | 1,862,847 | ||
| Total France | 11,196,276 | |||
| United Kingdom — 9.6% | ||||
| Consumer Discretionary — 2.1% | ||||
| 87,120 | Entain PLC* | 2,105,136 | ||
| Health Care — 3.0% | ||||
| 25,720 | AstraZeneca PLC | 3,090,109 | ||
| Information Technology — 2.5% | ||||
| 22,595 | Endava PLC ADR* | 2,561,821 | ||
| Materials — 2.0% | ||||
| 6,860 | Linde PLC | 1,983,226 | ||
| Total United Kingdom | 9,740,292 | |||
| United States — 6.0% | ||||
| Communication Services — 4.2% | ||||
| 870 | Alphabet, Inc. - Class A* | 2,124,358 | ||
| 6,075 | Facebook, Inc. - Class A* | 2,112,338 | ||
| Information Technology — 1.8% | ||||
| 7,005 | Microsoft Corp. | 1,897,654 | ||
| Total United States | 6,134,350 | |||
| Switzerland — 5.9% | ||||
| Consumer Staples — 1.7% | ||||
| 48,200 | Coca-Cola HBC AG | 1,744,678 | ||
| Health Care — 4.2% | ||||
| 26,726 | Alcon, Inc. | 1,874,496 | ||
| 6,180 | Sonova Holding AG | 2,327,727 | ||
| Total Switzerland | 5,946,901 | |||
| India — 5.5% | ||||
| Financials — 4.0% | ||||
| 35,490 | HDFC Bank Ltd. ADR* | 2,595,029 | ||
| 85,410 | ICICI Bank Ltd. ADR* | 1,460,511 | ||
| Information Technology — 1.5% | ||||
| 27,580 | Larsen & Toubro Infotech Ltd., 144a | 1,510,648 | ||
| Total India | 5,566,188 | |||
| Shares | Market Value | |||
| Canada — 5.3% | ||||
| Consumer Discretionary — 3.0% | ||||
| 65,560 | Dollarama, Inc. | $ 3,000,867 | ||
| Industrials — 2.3% | ||||
| 30,500 | Canadian Pacific Railway Ltd.† | 2,345,755 | ||
| Total Canada | 5,346,622 | |||
| Italy — 3.7% | ||||
| Information Technology — 3.7% | ||||
| 170,015 | Nexi SpA, 144a* | 3,736,124 | ||
| Israel — 3.6% | ||||
| Information Technology — 3.6% | ||||
| 14,700 | Nice Ltd. ADR* | 3,637,662 | ||
| Japan — 3.6% | ||||
| Communication Services — 2.0% | ||||
| 68,100 | Kakaku.com, Inc. | 2,048,728 | ||
| Industrials — 1.6% | ||||
| 32,200 | Recruit Holdings Co. Ltd. | 1,579,049 | ||
| Total Japan | 3,627,777 | |||
| Germany — 3.5% | ||||
| Communication Services — 2.0% | ||||
| 26,004 | Stroeer SE & Co. KGaA | 2,083,153 | ||
| Consumer Discretionary — 1.5% | ||||
| 4,013 | adidas AG | 1,497,482 | ||
| Total Germany | 3,580,635 | |||
| Sweden — 3.1% | ||||
| Consumer Discretionary — 3.1% | ||||
| 20,040 | Evolution AB, 144a | 3,169,969 | ||
| Spain — 2.0% | ||||
| Health Care — 2.0% | ||||
| 74,789 | Grifols SA | 2,028,044 | ||
| Singapore — 2.0% | ||||
| Financials — 2.0% | ||||
| 89,900 | DBS Group Holdings Ltd. | 2,000,033 | ||
| Hong Kong — 1.8% | ||||
| Consumer Discretionary — 1.8% | ||||
| 230,000 | Galaxy Entertainment Group Ltd.* | 1,839,101 | ||
| Denmark — 1.0% | ||||
| Information Technology — 1.0% | ||||
| 9,183 | Netcompany Group A/S, 144a | 1,044,103 | ||
| Thailand — 1.0% | ||||
| Consumer Staples — 1.0% | ||||
| 2,002,000 | Thai Beverage PCL | 1,006,789 | ||
| Total Common Stocks | $100,686,109 | |||
| Shares | Market Value | |||
| Short-Term Investment Funds — 2.4% | ||||
| 725,862 | Dreyfus Government Cash Management, Institutional Shares, 0.03%∞Ω | $ 725,862 | ||
| 1,710,580 | Invesco Government & Agency Portfolio, Institutional Class, 0.03%∞Ω** | 1,710,580 | ||
| Total Short-Term Investment Funds | $2,436,442 | |||
| Total Investment Securities — 101.7% (Cost $82,412,162) | $103,122,551 | |||
| Liabilities in Excess of Other Assets — (1.7)% | (1,748,767) | |||
| Net Assets — 100.0% | $101,373,784 | |||
| * | Non-income producing security. |
| ** | Represents collateral for securities loaned. |
| † | All or a portion of the security is on loan. The total market value of the securities on loan as of June 30, 2021 was $1,646,900. |
| ∞ | Open-End Fund. |
| Ω | Represents the 7-Day SEC yield as of June 30, 2021. |
| Portfolio Abbreviations: |
| ADR – American Depositary Receipt |
| PCL – Public Company Limited |
| PLC – Public Limited Company |
| 144a - This is a restricted security that was sold in a transaction qualifying for the exemption under Rule 144a of the Securities Act of 1933. This security may be sold in transactions exempt from registration, normally to qualified institutional buyers. At June 30, 2021, these securities were valued at $11,323,691 or 11.2% of net assets. These securities were deemed liquid pursuant to procedures approved by the Board of Trustees. |
| Valuation inputs at Reporting Date: | ||||
| Description | Level 1 | Level 2 | Level 3 | Total |
| Common Stocks | ||||
| China | $17,245,654 | $13,839,589 | $— | $31,085,243 |
| France | — | 11,196,276 | — | 11,196,276 |
| United Kingdom | 4,545,047 | 5,195,245 | — | 9,740,292 |
| United States | 6,134,350 | — | — | 6,134,350 |
| Switzerland | — | 5,946,901 | — | 5,946,901 |
| India | 5,566,188 | — | — | 5,566,188 |
| Canada | 5,346,622 | — | — | 5,346,622 |
| Italy | — | 3,736,124 | — | 3,736,124 |
| Israel | 3,637,662 | — | — | 3,637,662 |
| Japan | — | 3,627,777 | — | 3,627,777 |
| Germany | — | 3,580,635 | — | 3,580,635 |
| Sweden | — | 3,169,969 | — | 3,169,969 |
| Spain | — | 2,028,044 | — | 2,028,044 |
| Singapore | — | 2,000,033 | — | 2,000,033 |
| Hong Kong | — | 1,839,101 | — | 1,839,101 |
| Denmark | — | 1,044,103 | — | 1,044,103 |
| Thailand | — | 1,006,789 | — | 1,006,789 |
| Short-Term Investment Funds | 2,436,442 | — | — | 2,436,442 |
| Total | $44,911,965 | $58,210,586 | $— | $103,122,551 |
| Shares | Market Value | |||
| Common Stocks — 96.2% | ||||
| Information Technology — 25.2% | ||||
| 987,979 | Apple, Inc. | $ 135,313,604 | ||
| 211,430 | International Business Machines Corp. | 30,993,524 | ||
| 641,666 | Microsoft Corp. | 173,827,319 | ||
| 636,081 | Oracle Corp. | 49,512,545 | ||
| 274,848 | salesforce.com, Inc.* | 67,137,121 | ||
| 350,262 | SS&C Technologies Holdings, Inc. | 25,239,880 | ||
| 213,715 | Texas Instruments, Inc. | 41,097,394 | ||
| 168,956 | Visa, Inc. - Class A | 39,505,292 | ||
| 137,935 | Workday, Inc. - Class A* | 32,930,602 | ||
| 595,557,281 | ||||
| Communication Services — 19.1% | ||||
| 63,799 | Alphabet, Inc. - Class C* | 159,900,710 | ||
| 716,294 | AT&T, Inc. | 20,614,941 | ||
| 910,052 | Comcast Corp. - Class A | 51,891,165 | ||
| 395,670 | Facebook, Inc. - Class A* | 137,578,416 | ||
| 543,444 | Fox Corp. - Class A | 20,178,076 | ||
| 71,172 | Netflix, Inc.* | 37,593,762 | ||
| 141,929 | Walt Disney Co. (The)* | 24,946,860 | ||
| 452,703,930 | ||||
| Consumer Discretionary — 12.1% | ||||
| 153,057 | Alibaba Group Holding Ltd. (China) ADR* | 34,710,267 | ||
| 34,482 | Amazon.com, Inc.* | 118,623,597 | ||
| 376,340 | Hilton Worldwide Holdings, Inc.* | 45,394,131 | ||
| 378,324 | JD.com, Inc. (China) ADR* | 30,194,038 | ||
| 220,525 | Starbucks Corp. | 24,656,900 | ||
| 928,792 | Trip.com Group Ltd. (China) ADR* | 32,934,964 | ||
| 286,513,897 | ||||
| Financials — 11.9% | ||||
| 1,369,882 | Bank of America Corp. | 56,480,235 | ||
| 323,366 | Berkshire Hathaway, Inc. - Class B* | 89,869,879 | ||
| 224,497 | Goldman Sachs Group, Inc. (The) | 85,203,346 | ||
| 204,357 | Signature Bank | 50,200,297 | ||
| 281,753,757 | ||||
| Health Care — 10.7% | ||||
| 233,271 | AmerisourceBergen Corp. | 26,707,197 | ||
| 642,534 | Bristol-Myers Squibb Co. | 42,934,122 | ||
| 284,637 | HCA Healthcare, Inc. | 58,845,853 | ||
| 368,593 | Johnson & Johnson | 60,722,011 | ||
| 62,363 | Merck & Co., Inc. | 4,849,971 | ||
| 6,236 | Organon & Co.* | 188,701 | ||
| 144,468 | UnitedHealth Group, Inc. | 57,850,766 | ||
| 252,098,621 | ||||
| Industrials — 8.0% | ||||
| 106,136 | Deere & Co. | 37,435,229 | ||
| 69,404 | FedEx Corp. | 20,705,295 | ||
| 223,892 | Hubbell, Inc. | 41,831,981 | ||
| 104,544 | Parker-Hannifin Corp. | 32,106,508 | ||
| 682,545 | Raytheon Technologies Corp. | 58,227,914 | ||
| 190,306,927 | ||||
| Shares | Market Value | |||
| Consumer Staples — 3.5% | ||||
| 445,710 | Monster Beverage Corp.* | $ 40,715,608 | ||
| 414,709 | Philip Morris International, Inc. | 41,101,809 | ||
| 81,817,417 | ||||
| Real Estate — 2.3% | ||||
| 277,122 | Jones Lang LaSalle, Inc.* | 54,166,266 | ||
| Energy — 2.0% | ||||
| 455,000 | Exxon Mobil Corp. | 28,701,400 | ||
| 563,299 | Schlumberger NV | 18,031,201 | ||
| 46,732,601 | ||||
| Materials — 1.4% | ||||
| 429,260 | DuPont de Nemours, Inc. | 33,229,017 | ||
| Total Common Stocks | $2,274,879,714 | |||
| Exchange-Traded Fund — 0.6% | ||||
| 35,666 | SPDR S&P 500 ETF Trust | 15,267,188 | ||
| Short-Term Investment Fund — 3.0% | ||||
| 70,701,619 | Dreyfus Government Cash Management, Institutional Shares, 0.03%∞Ω | 70,701,619 | ||
| Total Investment Securities—99.8% (Cost $1,167,164,147) | $2,360,848,521 | |||
| Other Assets in Excess of Liabilities — 0.2% | 4,251,273 | |||
| Net Assets — 100.0% | $2,365,099,794 | |||
| * | Non-income producing security. |
| ∞ | Open-End Fund. |
| Ω | Represents the 7-Day SEC yield as of June 30, 2021. |
| Portfolio Abbreviations: |
| ADR – American Depositary Receipt |
| ETF – Exchange-Traded Fund |
| S&P – Standards & Poor's |
| SPDR – Standard & Poor's Depositary Receipt |
| Valuation Inputs at Reporting Date: | ||||
| Description | Level 1 | Level 2 | Level 3 | Total |
| Common Stocks | $2,274,879,714 | $— | $— | $2,274,879,714 |
| Exchange-Traded Fund | 15,267,188 | — | — | 15,267,188 |
| Short-Term Investment Fund | 70,701,619 | — | — | 70,701,619 |
| Total | $2,360,848,521 | $— | $— | $2,360,848,521 |
| Shares | Market Value | |||
| Common Stocks — 98.6% | ||||
| Information Technology — 18.1% | ||||
| 150,125 | Apple, Inc. | $ 20,561,120 | ||
| 168,051 | Cisco Systems, Inc. | 8,906,703 | ||
| 67,232 | Citrix Systems, Inc. | 7,884,297 | ||
| 77,120 | Texas Instruments, Inc. | 14,830,176 | ||
| 63,517 | Visa, Inc. - Class A | 14,851,545 | ||
| 67,033,841 | ||||
| Financials — 17.2% | ||||
| 89,343 | Berkshire Hathaway, Inc. - Class B* | 24,830,207 | ||
| 12,790 | BlackRock, Inc. | 11,190,866 | ||
| 245,669 | Charles Schwab Corp. (The) | 17,887,160 | ||
| 97,229 | Progressive Corp. (The) | 9,548,860 | ||
| 63,457,093 | ||||
| Consumer Discretionary — 13.0% | ||||
| 110,750 | CarMax, Inc.* | 14,303,362 | ||
| 42,802 | Home Depot, Inc. (The) | 13,649,130 | ||
| 36,683 | Lowe's Cos., Inc. | 7,115,401 | ||
| 22,817 | O'Reilly Automotive, Inc.* | 12,919,214 | ||
| 47,987,107 | ||||
| Communication Services — 11.8% | ||||
| 8,675 | Alphabet, Inc. - Class C* | 21,742,326 | ||
| 36,683 | Facebook, Inc. - Class A* | 12,755,046 | ||
| 161,864 | Verizon Communications, Inc. | 9,069,240 | ||
| 43,566,612 | ||||
| Consumer Staples — 10.2% | ||||
| 323,299 | Altria Group, Inc. | 15,414,896 | ||
| 119,410 | Church & Dwight Co., Inc. | 10,176,120 | ||
| 96,940 | Nestle SA (Switzerland) ADR | 12,092,296 | ||
| 37,683,312 | ||||
| Industrials — 9.8% | ||||
| 50,840 | FedEx Corp. | 15,167,097 | ||
| 50,826 | Norfolk Southern Corp. | 13,489,729 | ||
| 30,039 | Old Dominion Freight Line, Inc. | 7,623,898 | ||
| 36,280,724 | ||||
| Materials — 8.7% | ||||
| 37,055 | Air Products & Chemicals, Inc. | 10,659,982 | ||
| 37,236 | Martin Marietta Materials, Inc. | 13,099,997 | ||
| 25,827 | NewMarket Corp. | 8,315,778 | ||
| 32,075,757 | ||||
| Shares | Market Value | |||
| Health Care — 6.1% | ||||
| 86,153 | Bristol-Myers Squibb Co. | $ 5,756,743 | ||
| 59,263 | Johnson & Johnson | 9,762,987 | ||
| 182,083 | Pfizer, Inc. | 7,130,370 | ||
| 22,650,100 | ||||
| Real Estate — 3.7% | ||||
| 392,476 | STORE Capital Corp. REIT | 13,544,347 | ||
| Total Common Stocks | $364,278,893 | |||
| Short-Term Investment Fund — 1.2% | ||||
| 4,328,294 | Dreyfus Government Cash Management, Institutional Shares, 0.03%∞Ω | 4,328,294 | ||
| Total Investment Securities—99.8% (Cost $226,592,519) | $368,607,187 | |||
| Other Assets in Excess of Liabilities — 0.2% | 662,181 | |||
| Net Assets — 100.0% | $369,269,368 | |||
| * | Non-income producing security. |
| ∞ | Open-End Fund. |
| Ω | Represents the 7-Day SEC yield as of June 30, 2021. |
| Portfolio Abbreviations: |
| ADR – American Depositary Receipt |
| REIT – Real Estate Investment Trust |
| Valuation Inputs at Reporting Date: | ||||
| Description | Level 1 | Level 2 | Level 3 | Total |
| Common Stocks | $364,278,893 | $— | $— | $364,278,893 |
| Short-Term Investment Fund | 4,328,294 | — | — | 4,328,294 |
| Total | $368,607,187 | $— | $— | $368,607,187 |
| Shares | Market Value | |||
| Common Stocks — 98.1% | ||||
| Information Technology — 47.9% | ||||
| 32,735 | Adobe, Inc.* | $ 19,170,925 | ||
| 27,605 | Automatic Data Processing, Inc. | 5,482,905 | ||
| 9,225 | EPAM Systems, Inc.* | 4,713,606 | ||
| 26,950 | Fortinet, Inc.* | 6,419,221 | ||
| 28,625 | Global Payments, Inc. | 5,368,333 | ||
| 23,900 | Intuit, Inc. | 11,715,063 | ||
| 17,625 | Mastercard, Inc. - Class A | 6,434,711 | ||
| 99,325 | Microsoft Corp. | 26,907,142 | ||
| 10,800 | NVIDIA Corp. | 8,641,080 | ||
| 65,168 | PayPal Holdings, Inc.* | 18,995,169 | ||
| 50,964 | Visa, Inc. - Class A | 11,916,402 | ||
| 125,764,557 | ||||
| Communication Services — 22.5% | ||||
| 10,667 | Alphabet, Inc. - Class A* | 26,046,574 | ||
| 46,825 | Facebook, Inc. - Class A* | 16,281,521 | ||
| 791,275 | Sirius XM Holdings, Inc.† | 5,174,939 | ||
| 155,425 | Tencent Holdings Ltd. (China) ADR | 11,703,502 | ||
| 59,206,536 | ||||
| Consumer Discretionary — 14.7% | ||||
| 55,125 | Alibaba Group Holding Ltd. (China) ADR* | 12,501,247 | ||
| 6,135 | Amazon.com, Inc.* | 21,105,382 | ||
| 62,350 | JD.com, Inc. (China) ADR* | 4,976,154 | ||
| 38,582,783 | ||||
| Health Care — 7.5% | ||||
| 112,475 | Boston Scientific Corp.* | 4,809,431 | ||
| 45,550 | Neurocrine Biosciences, Inc.* | 4,432,926 | ||
| 13,075 | UnitedHealth Group, Inc. | 5,235,753 | ||
| 27,500 | Zoetis, Inc. | 5,124,900 | ||
| 19,603,010 | ||||
| Financials — 2.0% | ||||
| 21,575 | Aon PLC - Class A | 5,151,247 | ||
| Consumer Staples — 1.9% | ||||
| 55,925 | Monster Beverage Corp.* | 5,108,749 | ||
| Industrials — 1.6% | ||||
| 20,150 | United Parcel Service, Inc. - Class B | 4,190,595 | ||
| Total Common Stocks | $257,607,477 | |||
| Shares | Market Value | |||
| Short-Term Investment Funds — 3.0% | ||||
| 2,754,103 | Dreyfus Government Cash Management, Institutional Shares, 0.03%∞Ω | $ 2,754,103 | ||
| 5,190,596 | Invesco Government & Agency Portfolio, Institutional Class, 0.03%∞Ω** | 5,190,596 | ||
| Total Short-Term Investment Funds | $7,944,699 | |||
| Total Investment Securities—101.1% (Cost $123,192,592) | $265,552,176 | |||
| Liabilities in Excess of Other Assets — (1.1%) | (2,820,668) | |||
| Net Assets — 100.0% | $262,731,508 | |||
| * | Non-income producing security. |
| ** | Represents collateral for securities loaned. |
| † | All or a portion of the security is on loan. The total market value of the securities on loan as of June 30, 2021 was $5,039,672. |
| ∞ | Open-End Fund. |
| Ω | Represents the 7-Day SEC yield as of June 30, 2021. |
| Portfolio Abbreviations: |
| ADR – American Depositary Receipt |
| PLC – Public Limited Company |
| Valuation Inputs at Reporting Date: | ||||
| Description | Level 1 | Level 2 | Level 3 | Total |
| Common Stocks | $257,607,477 | $— | $— | $257,607,477 |
| Short-Term Investment Funds | 7,944,699 | — | — | 7,944,699 |
| Total | $265,552,176 | $— | $— | $265,552,176 |
| Principal Amount | Market Value | |||
| Fixed Rate Revenue Bonds – 58.6% | ||||
| $ 315,000 | Akron, OH, Income Tax Rev., 4.000%, 12/01/41 | $ 356,298 | ||
| 1,000,000 | Allen County, OH, Hospital Fac. Rev. Ser I, 4.000%, 12/01/40 | 1,197,790 | ||
| 1,000,000 | Butler County, OH Ser X, 5.000%, 05/15/30 | 1,317,616 | ||
| 1,085,000 | Cincinnati, OH Ser B, 5.000%, 11/01/35 | 1,281,952 | ||
| 200,000 | Clermont County Port Auth. Ser W, 5.000%, 12/01/35 | 234,146 | ||
| 500,000 | Cleveland, OH, Airport System Rev. Ser B, 5.000%, 01/01/37 | 626,880 | ||
| 750,000 | Cleveland, OH, Income Tax Rev. Ser B, 5.000%, 10/01/29 | 884,233 | ||
| 340,000 | Confluence Community Auth., 4.000%, 05/01/39 | 389,918 | ||
| 1,000,000 | Cuyahoga County, OH COP, 5.000%, 12/01/32 | 1,104,255 | ||
| 250,000 | Cuyahoga Metropolitan Housing Authority, Rev., 144a, 2.000%, 12/01/31 | 253,307 | ||
| 200,000 | Dayton, OH, Water System Rev., 4.000%, 12/01/30 | 232,578 | ||
| 550,000 | Franklin County, OH, 4.000%, 11/01/36 | 630,888 | ||
| 970,000 | Franklin County, OH, Sales Tax Rev., 4.000%, 06/01/33 | 1,151,295 | ||
| 1,000,000 | Green, OH, 4.000%, 12/01/30 | 1,051,292 | ||
| 500,000 | Hamilton County, OH, 5.000%, 02/01/30 | 548,447 | ||
| 1,080,000 | Hamilton County, OH, 5.000%, 05/15/33 | 1,204,646 | ||
| 625,000 | Hamilton County, OH, 5.000%, 05/15/34 | 697,133 | ||
| 500,000 | Hamilton County, OH, 5.000%, 08/15/40 | 640,820 | ||
| 245,000 | Hamilton County, OH, 5.000%, 09/15/40 | 309,935 | ||
| 1,000,000 | Hamilton County, OH EDR, 5.000%, 06/01/33 | 1,157,080 | ||
| 570,000 | Miami University, 5.000%, 09/01/35 | 687,240 | ||
| 500,000 | New Albany Community Auth. Ser C, 5.000%, 10/01/24 | 529,236 | ||
| 100,000 | Ohio Higher Educational Fac. Commission, 4.000%, 02/01/41 | 117,666 | ||
| 500,000 | Ohio Higher Educational Fac. Commission, 5.000%, 03/01/34 | 594,346 | ||
| 500,000 | Ohio Higher Educational Fac. Commission, 5.000%, 04/01/36 | 560,192 | ||
| 250,000 | Ohio Higher Educational Fac. Commission, 5.000%, 11/01/39 | 313,000 | ||
| 290,000 | Ohio Higher Educational Fac. Commission Ser A, 4.000%, 12/01/35 | 337,410 | ||
| 265,000 | Ohio Higher Educational Fac. Commission Ser C, 5.000%, 05/01/33 | 302,546 | ||
| 200,000 | Ohio Higher Educational Fac. Commission Ser F, 4.000%, 11/01/40 | 239,694 | ||
| 630,000 | Ohio Higher Educational Fac. Commission Ser F, 5.000%, 05/01/32 | 819,981 | ||
| 500,000 | Ohio State University (The) Ser A, 4.000%, 12/01/32 | 550,986 | ||
| 525,000 | Ohio State University (The) Ser A, 4.000%, 12/01/33 | 577,797 | ||
| 150,000 | Ohio Univ. Ser A, 5.000%, 12/01/32 | 182,861 | ||
| 500,000 | Polaris Career Center COP, 5.000%, 11/01/35 | 587,255 | ||
| 390,000 | Port of Greater Cincinnati Development Auth., 4.000%, 12/01/32 | 462,475 | ||
| 300,000 | Port of Greater Cincinnati Development Auth. Ser A, 4.000%, 04/01/33 | 357,999 | ||
| 1,000,000 | State of Ohio, 4.000%, 01/01/40 | 1,180,603 | ||
| 400,000 | State of Ohio, 4.000%, 11/15/40 | 458,497 | ||
| 1,000,000 | State of Ohio Ser A, 5.000%, 12/01/36 | 1,262,983 | ||
| 1,060,000 | State of Ohio EDR, 4.750%, 12/01/32 | 1,063,769 | ||
| 375,000 | Univ. of Akron (The) Ser A, 5.000%, 01/01/28 | 414,712 | ||
| 1,000,000 | Univ. of Cincinnati Ser A, 5.000%, 06/01/37 | 1,250,851 | ||
| 160,000 | Warren County, OH Ser A, 4.000%, 07/01/39 | 184,724 | ||
| 1,000,000 | Wright State Univ. Ser A, 5.000%, 05/01/31 | 1,003,356 | ||
| Total Fixed Rate Revenue Bonds | $29,310,688 | |||
| Pre-refunded/Escrowed to Maturity — 20.0% | ||||
| 345,000 | Bowling Green CSD UTGO, 5.000%, 12/01/34(A) | 406,567 | ||
| 750,000 | Brecksville-Broadview Heights CSD UTGO Pre-refunded @ 100, 5.000%, 12/01/38(A) | 836,646 | ||
| Principal Amount | Market Value | |||
| Pre-refunded/Escrowed to Maturity—20.0% (Continued) | ||||
| $2,000,000 | Cincinnati, OH EDR Ser U, 5.000%, 11/01/33(A) | $ 2,032,378 | ||
| 475,000 | Cincinnati, OH, Water System Rev. Pre-refunded @ 100, 5.000%, 12/01/35(A) | 569,578 | ||
| 265,000 | Cleveland Department of Public Utilities Division of Water Ser Y, 4.000%, 01/01/34(A) | 289,723 | ||
| 500,000 | Cuyahoga County, OH, 5.000%, 12/01/34(A) | 579,942 | ||
| 1,000,000 | Hamilton County, OH Pre-refunded @ 100, 5.250%, 06/01/32(A) | 1,046,274 | ||
| 1,000,000 | Kent State Univ. Pre-refunded @ 100, 4.500%, 05/01/32(A) | 1,036,348 | ||
| 250,000 | Lakewood CSD UTGO Pre-refunded @ 100, 5.000%, 11/01/33(A) | 266,145 | ||
| 750,000 | Middleburg Heights, OH, 5.125%, 08/01/31 | 753,034 | ||
| 620,000 | Montgomery County, OH Pre-refunded @ 100, 5.250%, 05/01/29(A) | 687,481 | ||
| 335,000 | Montgomery County, OH Pre-refunded @ 100, 5.250%, 05/01/29(A) | 373,275 | ||
| 1,000,000 | Toledo CSD UTGO, 5.000%, 12/01/32(A) | 1,115,528 | ||
| Total Pre-refunded/Escrowed to Maturity | $9,992,919 | |||
| General Obligation Bonds – 18.9% | ||||
| 400,000 | Athens CSD UTGO Ser A, 4.000%, 12/01/40 | 470,247 | ||
| 500,000 | Cuyahoga County, OH LTGO Ser A, 3.000%, 12/01/35 | 552,834 | ||
| 500,000 | Dublin, OH LTGO Ser A, 5.000%, 12/01/35 | 634,327 | ||
| 500,000 | Greene County Vocational School District UTGO, 4.000%, 12/01/37 | 587,117 | ||
| 1,000,000 | Hamilton County, OH LTGO Ser A, 5.000%, 12/01/37 | 1,236,880 | ||
| 500,000 | Lakewood, OH LTGO, 5.000%, 12/01/36 | 606,093 | ||
| 300,000 | Lexington LSD UTGO Ser A, 4.000%, 10/01/39 | 356,892 | ||
| 830,000 | Licking Heights LSD UTGO, 6.400%, 12/01/28 | 1,028,500 | ||
| 435,000 | Miami Trace LSD UTGO, 5.000%, 12/01/35 | 515,470 | ||
| 700,000 | Miami Valley Career Technology Center UTGO, 4.000%, 12/01/34 | 825,789 | ||
| 200,000 | Milford Exempt Village School District UTGO, 5.000%, 12/01/35 | 232,927 | ||
| 250,000 | Parma, OH LTGO, 3.000%, 12/01/32 | 276,590 | ||
| 500,000 | Three Rivers LSD UTGO, 5.000%, 12/01/34 | 573,737 | ||
| 1,000,000 | Toledo, OH, LTGO, 4.000%, 12/01/35 | 1,180,081 | ||
| 300,000 | Upper Arlington, OH LTGO, 4.000%, 12/01/32 | 343,282 | ||
| Total General Obligation Bonds | $9,420,766 | |||
| Variable Rate Demand Notes(B)(C)(D) — 2.0% | ||||
| 1,000,000 | Allen County, OH, Hospital Fac. Rev. Ser C, 0.020%, 06/01/34 | 1,000,000 | ||
| Total Investment Securities—99.5% (Cost $45,868,509) | $49,724,373 | |||
| Other Assets in Excess of Liabilities — 0.5% | $255,364 | |||
| Net Assets — 100.0% | $49,979,737 | |||
| (A) | Bonds denoted as pre-refunded are anticipated to be redeemed prior to their scheduled maturity. The dates indicated are the stipulated pre-refunded dates. |
| (B) | Demand Feature - Maturities shown are the final maturities, not the date on which principal could be recovered through the demand feature. |
| (C) | Floating and variable rate demand notes (“put bonds”) earn interest at a coupon rate which fluctuates at specified intervals, usually daily, monthly or semi-annually. The interest rates shown are the coupon rates in effect at June 30, 2021. Put bonds may be redeemed at the discretion of the holder on specified dates prior to maturity. Mandatory put bonds are automatically redeemed at a specified put date unless action is taken by the holder to prevent redemption. |
| (D) | Certain variable rate securities are not based on a published reference rate and spread but are determined by the issuer or agent and are based on current market conditions. These securities do not indicate a reference rate and spread in their description. |
| 144a - This is a restricted security that was sold in a transaction qualifying for the exemption under Rule 144a of the Securities Act of 1933. This security may be sold in transactions exempt from registration, normally to qualified institutional buyers. At June 30, 2021, these securities were valued at $253,307 or 0.5% of net assets. These securities were deemed liquid pursuant to procedures approved by the Board of Trustees. |
| Portfolio Abbreviations: |
| COP–Certificates of Participation |
| CSD–City School District |
| EDR–Economic Development Revenue |
| LSD–Local School District |
| LTGO–Limited Tax General Obligation |
| UTGO–Unlimited Tax General Obligation |
| Valuation Inputs at Reporting Date: | ||||
| Description | Level 1 | Level 2 | Level 3 | Total |
| Municipal Bonds | $— | $49,724,373 | $— | $49,724,373 |
| Shares | Market Value | |||
| Common Stocks — 96.9% | ||||
| Information Technology — 21.3% | ||||
| 457,770 | 8x8, Inc.* | $ 12,707,695 | ||
| 83,153 | Aspen Technology, Inc.* | 11,436,864 | ||
| 640,490 | Box, Inc. - Class A* | 16,364,520 | ||
| 463,250 | Cognyte Software Ltd. (Israel)* | 11,349,625 | ||
| 150,396 | CommVault Systems, Inc.* | 11,756,455 | ||
| 150,449 | Envestnet, Inc.* | 11,413,061 | ||
| 112,129 | ExlService Holdings, Inc.* | 11,914,828 | ||
| 123,782 | J2 Global, Inc.* | 17,026,214 | ||
| 129,959 | MAXIMUS, Inc. | 11,432,493 | ||
| 245,372 | Methode Electronics, Inc. | 12,074,756 | ||
| 295,502 | Onto Innovation, Inc.* | 21,583,466 | ||
| 113,584 | Qualys, Inc.* | 11,436,773 | ||
| 114,474 | SPS Commerce, Inc.* | 11,430,229 | ||
| 593,375 | Tower Semiconductor Ltd. (Israel)* | 17,463,026 | ||
| 258,086 | Verint Systems, Inc.* | 11,631,936 | ||
| 151,573 | WNS Holdings Ltd. (India) ADR* | 12,106,136 | ||
| 213,128,077 | ||||
| Health Care — 19.4% | ||||
| 107,100 | Addus HomeCare Corp.* | 9,343,404 | ||
| 618,091 | Allscripts Healthcare Solutions, Inc.* | 11,440,864 | ||
| 288,302 | Anika Therapeutics, Inc.* | 12,480,594 | ||
| 23,865 | Bio-Techne Corp. | 10,745,455 | ||
| 24,402 | Chemed Corp. | 11,578,749 | ||
| 146,466 | Encompass Health Corp. | 11,428,742 | ||
| 140,866 | Ensign Group, Inc. (The) | 12,208,856 | ||
| 167,454 | Globus Medical, Inc. - Class A* | 12,982,709 | ||
| 172,033 | Integra LifeSciences Holdings Corp.* | 11,739,532 | ||
| 62,032 | ModivCare, Inc.* | 10,549,782 | ||
| 169,319 | NuVasive, Inc.* | 11,476,442 | ||
| 85,054 | Omnicell, Inc.* | 12,881,428 | ||
| 632,106 | Premier, Inc. - Class A | 21,990,968 | ||
| 159,456 | Progyny, Inc.* | 9,407,904 | ||
| 205,212 | Tactile Systems Technology, Inc.* | 10,671,024 | ||
| 333,704 | Vocera Communications, Inc.* | 13,298,104 | ||
| 194,224,557 | ||||
| Industrials — 17.3% | ||||
| 105,411 | ASGN, Inc.* | 10,217,488 | ||
| 131,517 | Clean Harbors, Inc. * | 12,249,493 | ||
| 129,544 | Crane Co. | 11,965,979 | ||
| 92,524 | Curtiss-Wright Corp. | 10,988,150 | ||
| 106,606 | Forward Air Corp. | 9,567,889 | ||
| 770,158 | Great Lakes Dredge & Dock Corp.* | 11,252,008 | ||
| 128,741 | ITT, Inc. | 11,791,388 | ||
| 378,009 | JELD-WEN Holding, Inc.* | 9,926,516 | ||
| 73,679 | John Bean Technologies Corp. | 10,508,099 | ||
| 274,513 | KBR, Inc. | 10,472,671 | ||
| 170,975 | Mercury Systems, Inc.* | 11,332,223 | ||
| 108,836 | Quanta Services, Inc. | 9,857,277 | ||
| 52,500 | RBC Bearings, Inc.* | 10,469,550 | ||
| 234,885 | Rexnord Corp. | 11,753,646 | ||
| 239,090 | SkyWest, Inc.* | 10,297,606 | ||
| 85,262 | Woodward, Inc. | 10,476,995 | ||
| 173,126,978 | ||||
| Consumer Discretionary — 16.7% | ||||
| 313,781 | American Eagle Outfitters, Inc. | 11,776,201 | ||
| 376,908 | Aritzia, Inc. (Canada)* | 11,274,402 | ||
| 279,500 | Canada Goose Holdings, Inc. (Canada)* | 12,225,330 | ||
| 266,837 | Foot Locker, Inc. | 16,445,164 | ||
| 64,898 | Fox Factory Holding Corp.* | 10,102,023 | ||
| 208,338 | frontdoor, Inc.* | 10,379,399 | ||
| Shares | Market Value | |||
| Consumer Discretionary — (Continued) | ||||
| 121,504 | Grand Canyon Education, Inc.* | $ 10,931,715 | ||
| 145,468 | Malibu Boats, Inc. - Class A* | 10,667,168 | ||
| 107,133 | Oxford Industries, Inc. | 10,589,026 | ||
| 209,123 | Skyline Champion Corp.* | 11,146,256 | ||
| 285,966 | Steven Madden Ltd. | 12,513,872 | ||
| 102,407 | Texas Roadhouse, Inc. | 9,851,553 | ||
| 56,693 | TopBuild Corp.* | 11,212,742 | ||
| 353,395 | Zumiez, Inc.* | 17,312,821 | ||
| 166,427,672 | ||||
| Financials — 10.3% | ||||
| 76,084 | Evercore, Inc. - Class A | 10,710,345 | ||
| 884,972 | FNB Corp. | 10,911,705 | ||
| 484,128 | Old National Bancorp | 8,525,494 | ||
| 250,579 | Pacific Premier Bancorp, Inc. | 10,596,986 | ||
| 90,000 | PJT Partners, Inc. - Class A | 6,424,200 | ||
| 209,912 | PROG Holdings, Inc. | 10,103,064 | ||
| 832,300 | Umpqua Holdings Corp. | 15,355,935 | ||
| 365,835 | Webster Financial Corp. | 19,513,639 | ||
| 118,199 | Western Alliance Bancorp | 10,974,777 | ||
| 103,116,145 | ||||
| Real Estate — 6.0% | ||||
| 173,578 | Agree Realty Corp. REIT | 12,235,513 | ||
| 862,679 | Corporate Office Properties Trust REIT | 24,146,385 | ||
| 389,489 | Healthcare Realty Trust, Inc. REIT | 11,762,568 | ||
| 301,695 | STAG Industrial, Inc. REIT | 11,292,444 | ||
| 59,436,910 | ||||
| Communication Services — 3.7% | ||||
| 491,546 | Cargurus, Inc.* | 12,893,252 | ||
| 154,964 | Cogent Communications Holdings, Inc. | 11,915,182 | ||
| 647,332 | QuinStreet, Inc.* | 12,027,428 | ||
| 36,835,862 | ||||
| Consumer Staples — 1.1% | ||||
| 549,521 | Mission Produce, Inc.*† | 11,380,580 | ||
| Materials — 1.1% | ||||
| 74,191 | Eagle Materials, Inc. | 10,543,283 | ||
| Total Common Stocks | $968,220,064 | |||
| Short-Term Investment Funds — 3.3% | ||||
| 32,838,058 | Dreyfus Government Cash Management, Institutional Shares, 0.03%∞Ω | 32,838,058 | ||
| 407,660 | Invesco Government & Agency Portfolio, Institutional Class, 0.03%∞Ω** | 407,660 | ||
| Total Short-Term Investment Funds | $33,245,718 | |||
| Total Investment Securities—100.2% (Cost $685,195,632) | $1,001,465,782 | |||
| Liabilities in Excess of Other Assets — (0.2%) | (1,864,866) | |||
| Net Assets — 100.0% | $999,600,916 | |||
| * | Non-income producing security. |
| ** | Represents collateral for securities loaned. |
| † | All or a portion of the security is on loan. The total market value of the securities on loan as of June 30, 2021 was $397,301. |
| ∞ | Open-End Fund. |
| Ω | Represents the 7-Day SEC yield as of June 30, 2021. |
| Portfolio Abbreviations: |
| ADR – American Depositary Receipt |
| REIT – Real Estate Investment Trust |
| Valuation Inputs at Reporting Date: | ||||
| Description | Level 1 | Level 2 | Level 3 | Total |
| Common Stocks | $968,220,064 | $— | $— | $968,220,064 |
| Short-Term Investment Funds | 33,245,718 | — | — | 33,245,718 |
| Total | $1,001,465,782 | $— | $— | $1,001,465,782 |
| Shares | Market Value | |||
| Common Stocks — 96.7% | ||||
| Financials — 20.1% | ||||
| 40,510 | American Express Co. | $ 6,693,467 | ||
| 248,735 | American International Group, Inc. | 11,839,786 | ||
| 28,221 | Chubb Ltd. | 4,485,446 | ||
| 81,897 | Citigroup, Inc. | 5,794,213 | ||
| 36,791 | Goldman Sachs Group, Inc. (The) | 13,963,288 | ||
| 46,011 | JPMorgan Chase & Co. | 7,156,551 | ||
| 53,278 | Northern Trust Corp. | 6,160,002 | ||
| 224,378 | US Bancorp | 12,782,815 | ||
| 277,266 | Wells Fargo & Co. | 12,557,377 | ||
| 17,680 | Willis Towers Watson PLC | 4,066,754 | ||
| 85,499,699 | ||||
| Industrials — 17.1% | ||||
| 160,659 | AECOM* | 10,172,928 | ||
| 34,756 | Deere & Co. | 12,258,789 | ||
| 44,046 | General Dynamics Corp. | 8,292,100 | ||
| 20,568 | Jacobs Engineering Group, Inc. | 2,744,182 | ||
| 69,182 | JB Hunt Transport Services, Inc. | 11,273,207 | ||
| 60,293 | Quanta Services, Inc. | 5,460,737 | ||
| 135,619 | Raytheon Technologies Corp. | 11,569,657 | ||
| 52,364 | Stanley Black & Decker, Inc. | 10,734,096 | ||
| 72,505,696 | ||||
| Consumer Discretionary — 14.8% | ||||
| 68,487 | Advance Auto Parts, Inc. | 14,049,423 | ||
| 221,071 | Aramark | 8,234,895 | ||
| 48,216 | Dollar General Corp. | 10,433,460 | ||
| 122,659 | Las Vegas Sands Corp.* | 6,462,903 | ||
| 49,187 | Lennar Corp. - Class A | 4,886,728 | ||
| 48,768 | Lowe's Cos., Inc. | 9,459,529 | ||
| 79,534 | Ralph Lauren Corp. | 9,369,901 | ||
| 62,896,839 | ||||
| Health Care — 12.0% | ||||
| 33,428 | Anthem, Inc. | 12,762,810 | ||
| 129,129 | CVS Health Corp. | 10,774,524 | ||
| 46,522 | Medtronic PLC | 5,774,776 | ||
| 143,593 | Merck & Co., Inc. | 11,167,228 | ||
| 26,189 | UnitedHealth Group, Inc. | 10,487,123 | ||
| 50,966,461 | ||||
| Energy — 8.1% | ||||
| 142,152 | Hess Corp. | 12,412,713 | ||
| 144,282 | Phillips 66 | 12,382,281 | ||
| 34,081 | Pioneer Natural Resources | 5,538,844 | ||
| 53,594 | Valero Energy Corp. | 4,184,619 | ||
| 34,518,457 | ||||
| Information Technology — 7.4% | ||||
| 22,369 | Broadcom, Inc. | 10,666,434 | ||
| 125,985 | Cognizant Technology Solutions Corp. - Class A | 8,725,721 | ||
| 45,989 | Oracle Corp. | 3,579,784 | ||
| 38,710 | QUALCOMM, Inc. | 5,532,820 | ||
| 14,736 | Texas Instruments, Inc. | 2,833,733 | ||
| 31,338,492 | ||||
| Shares | Market Value | |||
| Communication Services — 5.6% | ||||
| 314,741 | Altice USA, Inc. - Class A* | $ 10,745,258 | ||
| 176,720 | Comcast Corp. - Class A | 10,076,574 | ||
| 20,856 | T-Mobile US, Inc.* | 3,020,575 | ||
| 23,842,407 | ||||
| Materials — 5.5% | ||||
| 217,689 | Corteva, Inc. | 9,654,507 | ||
| 93,280 | International Flavors & Fragrances, Inc. | 13,936,032 | ||
| 23,590,539 | ||||
| Consumer Staples — 2.4% | ||||
| 171,350 | Coca-Cola Europacific Partners PLC (United Kingdom) | 10,164,482 | ||
| Real Estate — 2.2% | ||||
| 251,583 | MGM Growth Properties LLC - Class A REIT | 9,212,969 | ||
| Utilities — 1.5% | ||||
| 143,834 | Exelon Corp. | 6,373,285 | ||
| Total Common Stocks | $410,909,326 | |||
| Short-Term Investment Fund — 2.8% | ||||
| 11,831,034 | Dreyfus Government Cash Management, Institutional Shares, 0.03%∞Ω | 11,831,033 | ||
| Total Investment Securities—99.5% (Cost $305,049,483) | $422,740,359 | |||
| Other Assets in Excess of Liabilities — 0.5% | 1,916,352 | |||
| Net Assets — 100.0% | $424,656,711 | |||
| * | Non-income producing security. |
| ∞ | Open-End Fund. |
| Ω | Represents the 7-Day SEC yield as of June 30, 2021. |
| Portfolio Abbreviations: |
| PLC – Public Limited Company |
| REIT – Real Estate Investment Trust |
| Valuation Inputs at Reporting Date: | ||||
| Description | Level 1 | Level 2 | Level 3 | Total |
| Common Stocks | $410,909,326 | $— | $— | $410,909,326 |
| Short-Term Investment Fund | 11,831,033 | — | — | 11,831,033 |
| Total | $422,740,359 | $— | $— | $422,740,359 |
| Touchstone Balanced Fund | Touchstone International Equity Fund | Touchstone International Growth Fund | Touchstone Large Cap Focused Fund | Touchstone Large Cap Fund | Touchstone Large Company Growth Fund | |
| Assets | ||||||
| Investments, at cost | $380,463,552 | $98,865,066 | $82,412,162 | $1,167,164,147 | $226,592,519 | $123,192,592 |
| Investments, at market value * | $584,983,196 | $122,049,893 | $103,122,551 | $2,360,848,521 | $368,607,187 | $265,552,176 |
| Cash | 94,621 | 3 | — | — | — | — |
| Foreign currency † | 1,069 | 1,011 | — | — | — | — |
| Dividends and interest receivable | 1,050,697 | 184,490 | 11,198 | 805,246 | 562,599 | 28,295 |
| Receivable for capital shares sold | 725,077 | 39,369 | 1,517 | 7,256,649 | 942,401 | 49,808 |
| Receivable for investments sold | — | — | 1,497,719 | — | — | 2,628,325 |
| Receivable for securities lending income | 132 | 553 | 893 | 478 | — | 1,467 |
| Tax reclaim receivable | 124 | 496,255 | 173,733 | 7,150 | — | — |
| Other assets | 4,075 | 6,571 | — | 4,751 | 4,514 | 2,072 |
| Total Assets | 586,858,991 | 122,778,145 | 104,807,611 | 2,368,922,795 | 370,116,701 | 268,262,143 |
| Liabilities | ||||||
| Bank overdrafts | — | — | 349 | — | — | — |
| Dividends payable | — | — | — | — | — | — |
| Payable for return of collateral for securities on loan | 494,000 | — | 1,710,580 | — | — | 5,190,596 |
| Payable for capital shares redeemed | 333,179 | 173,739 | 20,009 | 1,505,678 | 474,316 | 71,386 |
| Payable for investments purchased | — | — | 1,527,711 | — | — | — |
| Payable to Investment Advisor | 236,207 | 68,878 | 67,537 | 974,817 | 157,853 | 104,442 |
| Payable to other affiliates | 171,021 | 34,742 | 11,973 | 550,126 | 46,230 | 29,794 |
| Payable to Trustees | 10,284 | 10,284 | 10,284 | 10,284 | 10,284 | 10,284 |
| Payable for professional services | 37,888 | 52,160 | 54,550 | 59,821 | 28,118 | 26,905 |
| Payable for reports to shareholders | 8,865 | 6,706 | 6,017 | 18,799 | 8,512 | 5,044 |
| Payable for transfer agent services | 184,595 | 61,941 | 20,493 | 580,027 | 92,391 | 55,008 |
| Payable for variation margin on futures contracts | 623 | — | — | — | — | — |
| Other accrued expenses and liabilities | 41,557 | 15,218 | 4,324 | 123,449 | 29,629 | 37,176 |
| Total Liabilities | 1,518,219 | 423,668 | 3,433,827 | 3,823,001 | 847,333 | 5,530,635 |
| Net Assets | $585,340,772 | $122,354,477 | $101,373,784 | $2,365,099,794 | $369,269,368 | $262,731,508 |
| Net assets consist of: | ||||||
| Paid-in capital | 374,089,003 | 92,831,286 | 84,798,574 | 1,097,300,155 | 219,891,638 | 98,616,813 |
| Distributable earnings (deficit) | 211,251,769 | 29,523,191 | 16,575,210 | 1,267,799,639 | 149,377,730 | 164,114,695 |
| Net Assets | $585,340,772 | $122,354,477 | $101,373,784 | $2,365,099,794 | $369,269,368 | $262,731,508 |
| *Includes market value of securities on loan of: | $481,987 | $— | $1,646,900 | $— | $— | $5,039,672 |
| †Cost of foreign currency: | $1,017 | $1,019 | $— | $— | $— | $— |
| Touchstone Ohio Tax-Free Bond Fund | Touchstone Small Company Fund | Touchstone Value Fund |
| $45,868,509 | $685,195,632 | $305,049,483 |
| $49,724,373 | $1,001,465,782 | $422,740,359 |
| 42,765 | — | — |
| — | — | — |
| 313,533 | 460,018 | 632,798 |
| 304,491 | 488,327 | 1,834,909 |
| — | 1,618,693 | — |
| — | 105 | — |
| — | — | — |
| 106 | 1,957 | 18,978 |
| 50,385,268 | 1,004,034,882 | 425,227,044 |
| — | — | — |
| 12,406 | — | — |
| — | 407,660 | — |
| 33,227 | 2,710,518 | 107,679 |
| 276,590 | — | 88,070 |
| 17,490 | 532,300 | 154,419 |
| 8,334 | 263,890 | 50,525 |
| 10,284 | 10,284 | 10,284 |
| 26,269 | 38,910 | 29,615 |
| 4,024 | 24,680 | 9,448 |
| 9,968 | 380,099 | 98,781 |
| — | — | — |
| 6,939 | 65,625 | 21,512 |
| 405,531 | 4,433,966 | 570,333 |
| $49,979,737 | $999,600,916 | $424,656,711 |
| 46,106,388 | 565,211,494 | 288,715,291 |
| 3,873,349 | 434,389,422 | 135,941,420 |
| $49,979,737 | $999,600,916 | $424,656,711 |
| $— | $397,301 | $— |
| $— | $— | $— |
| Touchstone Balanced Fund | Touchstone International Equity Fund | Touchstone International Growth Fund | Touchstone Large Cap Focused Fund | Touchstone Large Cap Fund | Touchstone Large Company Growth Fund | |
| Pricing of Class A Shares | ||||||
| Net assets applicable to Class A shares | $322,008,692 | $88,021,840 | $2,216,405 | $1,541,127,235 | $4,278,028 | $3,616,947 |
| Shares of beneficial interest outstanding (unlimited number of shares authorized, no par value) | 12,620,254 | 4,661,307 | 144,377 | 26,264,628 | 239,475 | 63,169 |
| Net asset value price per share* | $25.52 | $18.88 | $15.35 | $58.68 | $17.86 | $57.26 |
| Maximum sales charge - Class A shares | 5.00% | 5.00% | 5.00% | 5.00% | 5.00% | 5.00% |
| Maximum offering price per share (100%/(100%-maximum sales charge) of net asset value adjusted to the nearest cent) - Class A shares | $26.86 | $19.87 | $16.16 | $61.77 | $18.80 | $60.27 |
| Pricing of Class C Shares | ||||||
| Net assets applicable to Class C shares | $65,455,073 | $2,114,859 | $1,315,989 | $41,644,751 | $4,327,801 | $472,621 |
| Shares of beneficial interest outstanding (unlimited number of shares authorized, no par value) | 2,558,042 | 120,522 | 88,848 | 775,033 | 246,920 | 8,639 |
| Net asset value and offering price per share** | $25.59 | $17.55 | $14.81 | $53.73 | $17.53 | $54.71 |
| Pricing of Class Y Shares | ||||||
| Net assets applicable to Class Y shares | $197,877,007 | $27,902,542 | $74,507,373 | $575,053,473 | $270,305,200 | $28,952,217 |
| Shares of beneficial interest outstanding (unlimited number of shares authorized, no par value) | 7,826,819 | 1,495,733 | 4,724,804 | 9,817,230 | 15,114,597 | 498,281 |
| Net asset value, offering price and redemption price per share | $25.28 | $18.65 | $15.77 | $58.58 | $17.88 | $58.10 |
| Pricing of Institutional Class Shares | ||||||
| Net assets applicable to Institutional Class shares | $— | $4,315,236 | $23,334,017 | $207,274,335 | $90,358,339 | $229,689,723 |
| Shares of beneficial interest outstanding (unlimited number of shares authorized, no par value) | — | 231,687 | 1,468,589 | 3,531,979 | 5,045,590 | 3,929,036 |
| Net asset value, offering price and redemption price per share | $— | $18.63 | $15.89 | $58.69 | $17.91 | $58.46 |
| Pricing of Class R6 Shares | ||||||
| Net assets applicable to Class R6 shares | $— | $— | $— | $— | $— | $— |
| Shares of beneficial interest outstanding (unlimited number of shares authorized, no par value) | — | — | — | — | — | — |
| Net asset value, offering price and redemption price per share | $— | $— | $— | $— | $— | $— |
| * | There is no sales load on subscriptions of $1 million or more for all funds except for Ohio Tax-Free Bond Fund. There is no sales load on subscriptions of $500,000 or more for Ohio Tax-Free Bond Fund. Redemptions that were part of a $500,000 or $1 million or more subscription, as applicable, may be subject to a contingent deferred sales load if redeemed within a one-year period from the date of purchase. |
| ** | Redemption price per share varies by length of time shares are held due to the terms of the contingent deferred sales charge. |
| Touchstone Ohio Tax-Free Bond Fund | Touchstone Small Company Fund | Touchstone Value Fund |
| $30,869,895 | $608,513,267 | $33,051,776 |
| 2,596,339 | 91,245,332 | 2,895,870 |
| $11.89 | $6.67 | $11.41 |
| 3.25% | 5.00% | 5.00% |
| $12.29 | $7.02 | $12.01 |
| $1,179,687 | $26,123,046 | $1,943,136 |
| 99,035 | 8,079,009 | 170,784 |
| $11.91 | $3.23 | $11.38 |
| $3,448,713 | $282,428,373 | $100,542,008 |
| 289,730 | 37,896,064 | 8,770,824 |
| $11.90 | $7.45 | $11.46 |
| $14,481,442 | $18,770,308 | $289,119,791 |
| 1,216,970 | 2,521,205 | 25,300,507 |
| $11.90 | $7.44 | $11.43 |
| $— | $63,765,922 | $— |
| — | 9,234,386 | — |
| $— | $6.91 | $— |
| Touchstone Balanced Fund | Touchstone International Equity Fund | Touchstone International Growth Fund | Touchstone Large Cap Focused Fund | Touchstone Large Cap Fund | Touchstone Large Company Growth Fund | |
| Investment Income | ||||||
| Dividends* | $4,069,513 | $2,340,933 | $537,865 | $22,982,247 | $5,829,942 | $871,792 |
| Interest | 4,132,099 | — | — | — | — | — |
| Income from securities loaned | 3,398 | 9,215 | 2,472 | 50,924 | — | 7,976 |
| Total Investment Income | 8,205,010 | 2,350,148 | 540,337 | 23,033,171 | 5,829,942 | 879,768 |
| Expenses | ||||||
| Investment advisory fees | 2,514,118 | 858,156 | 705,551 | 11,499,650 | 1,952,831 | 1,517,931 |
| Administration fees | 683,053 | 170,659 | 122,040 | 2,758,537 | 452,251 | 351,855 |
| Compliance fees and expenses | 2,951 | 2,951 | 2,951 | 2,951 | 2,951 | 2,951 |
| Custody fees | 55,569 | 24,881 | 17,320 | 25,920 | 11,763 | 9,197 |
| Professional fees | 43,594 | 44,918 | 55,158 | 81,095 | 31,758 | 29,828 |
| Transfer Agent fees, Class A | 185,589 | 87,166 | 3,062 | 610,107 | 3,141 | 2,495 |
| Transfer Agent fees, Class C | 32,903 | 2,836 | 1,640 | 27,918 | 1,779 | 674 |
| Transfer Agent fees, Class Y | 117,024 | 31,883 | 66,298 | 457,263 | 171,550 | 29,753 |
| Transfer Agent fees, Institutional Class | — | 107 | 9,390 | 64,558 | 6,338 | 75,911 |
| Transfer Agent fees, Class R6 | — | — | — | — | — | — |
| Registration Fees, Class A | 25,535 | 18,550 | 12,999 | 32,172 | 12,334 | 11,052 |
| Registration Fees, Class C | 16,230 | 13,180 | 10,757 | 14,143 | 7,020 | 7,069 |
| Registration Fees, Class Y | 32,167 | 14,946 | 11,107 | 23,021 | 23,982 | 13,217 |
| Registration Fees, Institutional Class | — | 5,811 | 9,757 | 17,004 | 11,176 | 28,700 |
| Registration Fees, Class R6 | — | — | — | — | — | — |
| Reports to Shareholders, Class A | 11,038 | 6,074 | 2,388 | 16,908 | 2,018 | 1,968 |
| Reports to Shareholders, Class C | 5,365 | 2,057 | 2,246 | 3,848 | 2,017 | 1,891 |
| Reports to Shareholders, Class Y | 11,416 | 3,231 | 7,274 | 13,901 | 12,550 | 3,016 |
| Reports to Shareholders, Institutional Class | — | 1,925 | 2,476 | 7,073 | 1,887 | 3,323 |
| Reports to Shareholders, Class R6 | — | — | — | — | — | — |
| Distribution expenses, Class A | 727,157 | 211,429 | 4,887 | 3,371,351 | 9,178 | 7,125 |
| Distribution and shareholder servicing expenses, Class C | 530,268 | 19,834 | 11,125 | 360,476 | 45,809 | 6,060 |
| Trustee fees | 20,108 | 20,108 | 20,108 | 20,108 | 20,108 | 20,108 |
| Other expenses | 136,544 | 86,845 | 57,308 | 568,591 | 140,267 | 81,939 |
| Total Expenses | 5,150,629 | 1,627,547 | 1,135,842 | 19,976,595 | 2,922,708 | 2,206,063 |
| Fees waived and/or reimbursed by the Advisor and/or Affiliates(A) | (70,152) | (88,739) | (271,383) | (1,325,081) | (358,756) | (370,348) |
| Net Expenses | 5,080,477 | 1,538,808 | 864,459 | 18,651,514 | 2,563,952 | 1,835,715 |
| Net Investment Income (Loss) | 3,124,533 | 811,340 | (324,122) | 4,381,657 | 3,265,990 | (955,947) |
| Realized and Unrealized Gains (Losses) on Investments | ||||||
| Net realized gains on investments(B) | 31,689,377 | 13,305,768 | 21,952,480 | 223,307,044 | 14,682,457 | 46,369,318 |
| Net realized gains on futures contracts | 449,558 | — | — | — | — | — |
| Net realized gains (losses) on foreign currency transactions | (38) | (100,599) | (108,458) | — | — | (171) |
| Net change in unrealized appreciation (depreciation) on investments(C) | 78,373,430 | 23,628,125 | (2,307,362) | 516,360,601 | 85,403,699 | 34,594,589 |
| Net change in unrealized appreciation (depreciation) on futures contracts | (19,243) | — | — | — | — | — |
| Net change in unrealized appreciation (depreciation) on foreign currency transactions | 50 | 8,044 | 4,353 | — | — | — |
| Net Realized and Unrealized Gains (Losses) on Investments | 110,493,134 | 36,841,338 | 19,541,013 | 739,667,645 | 100,086,156 | 80,963,736 |
| Change in Net Assets Resulting from Operations | $113,617,667 | $37,652,678 | $19,216,891 | $744,049,302 | $103,352,146 | $80,007,789 |
| *Net of foreign tax withholding of: | $2,145 | $299,745 | $64,769 | $3,311 | $43,648 | $— |
| (A) | See Note 4 in Notes to Financial Statements. |
| (B) | For the year ended June 30, 2021, Large Cap Focused Fund, Large Cap Fund, Large Company Growth Fund and Small Company Fund had redemptions-in-kind of securities in the amount of $97,535,259, $17,157,359, $19,982,960 and $67,765,469. Net realized gains (losses) on investments includes the realized gain on the transactions of $71,023,166, $6,990,793 $16,577,389 and $26,985,392, which will not be recognized by the Fund for tax purposes. |
| (C) | Change in unrealized appreciation (depreciation) does not include net appreciation of $13,999,828 for the Touchstone International Growth Fund in connection with the Fund's reorganization. See Note 9 in the Notes to Financial Statements. |
| Touchstone Ohio Tax-Free Bond Fund | Touchstone Small Company Fund | Touchstone Value Fund |
| $— | $6,389,597 | $6,861,781 |
| 1,597,694 | — | — |
| — | 2,013 | 26,308 |
| 1,597,694 | 6,391,610 | 6,888,089 |
| 249,521 | 5,738,784 | 2,077,411 |
| 69,508 | 1,180,064 | 443,012 |
| 2,951 | 2,951 | 2,951 |
| 3,967 | 24,717 | 8,641 |
| 26,858 | 49,119 | 33,595 |
| 15,548 | 374,366 | 26,028 |
| 488 | 24,766 | 961 |
| 2,483 | 236,531 | 75,320 |
| 669 | 6,782 | 76,784 |
| — | 19 | — |
| 12,906 | 26,114 | 13,574 |
| 3,475 | 13,215 | 8,040 |
| 8,197 | 23,024 | 20,920 |
| 3,654 | 8,624 | 24,127 |
| — | 12,123 | — |
| 2,719 | 23,549 | 5,834 |
| 2,006 | 4,511 | 2,730 |
| 2,052 | 16,261 | 7,077 |
| 1,994 | 2,772 | 7,729 |
| — | 3,224 | — |
| 80,690 | 1,305,340 | 72,142 |
| 12,684 | 234,889 | 18,638 |
| 20,108 | 20,108 | 20,108 |
| 25,764 | 383,582 | 60,882 |
| 548,242 | 9,715,435 | 3,006,504 |
| (162,223) | (281,047) | (571,844) |
| 386,019 | 9,434,388 | 2,434,660 |
| 1,211,675 | (3,042,778) | 4,453,429 |
| 61,169 | 201,581,495 | 21,404,241 |
| — | — | — |
| — | 15,071 | (598) |
| 179,252 | 208,112,135 | 95,152,352 |
| — | — | — |
| — | — | — |
| 240,421 | 409,708,701 | 116,555,995 |
| $1,452,096 | $406,665,923 | $121,009,424 |
| $— | $— | $— |
| Touchstone Balanced Fund | Touchstone International Equity Fund | Touchstone International Growth Fund | ||||
| For the Year Ended June 30, 2021 | For the Year Ended June 30, 2020 | For the Year Ended June 30, 2021 | For the Year Ended June 30, 2020 | For the Year Ended June 30, 2021 | For the Year Ended June 30, 2020 | |
| From Operations | ||||||
| Net investment income (loss) | $3,124,533 | $4,316,777 | $811,340 | $873,880 | $(324,122) | $21,270 |
| Net realized gains (losses) on investments, futures contracts and foreign currency transactions | 32,138,897 | 41,965,054 | 13,205,169 | (1,148,996) | 21,844,022 | (788,646) |
| Net change in unrealized appreciation (depreciation) on investments, futures contracts and foreign currency transactions | 78,354,237 | (11,983,129) | 23,636,169 | (8,844,334) | (2,303,009) | 1,743,725 |
| Change in Net Assets from Operations | 113,617,667 | 34,298,702 | 37,652,678 | (9,119,450) | 19,216,891 | 976,349 |
| Distributions to Shareholders: | ||||||
| Distributed earnings, Class A | (20,171,816) | (29,089,903) | (394,252) | (4,839,678) | — | — |
| Distributed earnings, Class C | (3,376,561) | (4,497,775) | (503) | (132,585) | — | — |
| Distributed earnings, Class Y | (10,441,301) | (8,553,810) | (151,009) | (2,047,719) | — | — |
| Distributed earnings, Institutional Class | — | — | (102,145) | (585,637) | (29,001) | (2,978) |
| Total Distributions | (33,989,678) | (42,141,488) | (647,909) | (7,605,619) | (29,001) | (2,978) |
| Change in Net Assets from Share Transactions(A) | 116,319,904 | 58,180,563 | (32,507,841) | (20,781,556) | 50,853,513 | (4,362,971) |
| Total Increase (Decrease) in Net Assets | 195,947,893 | 50,337,777 | 4,496,928 | (37,506,625) | 70,041,403 | (3,389,600) |
| Net Assets | ||||||
| Beginning of period | 389,392,879 | 339,055,102 | 117,857,549 | 155,364,174 | 31,332,381 | 34,721,981 |
| End of period | $585,340,772 | $389,392,879 | $122,354,477 | $117,857,549 | $101,373,784 | $31,332,381 |
| (A) | For details on share transactions by class, see Statements of Changes in Net Assets - Capital Stock Activity on page 60 to 64. |
| Touchstone Large Cap Focused Fund | Touchstone Large Cap Fund | Touchstone Large Company Growth Fund | Touchstone Ohio Tax-Free Bond Fund | ||||
| For the Year Ended June 30, 2021 | For the Year Ended June 30, 2020 | For the Year Ended June 30, 2021 | For the Year Ended June 30, 2020 | For the Year Ended June 30, 2021 | For the Year Ended June 30, 2020 | For the Year Ended June 30, 2021 | For the Year Ended June 30, 2020 |
| $4,381,657 | $12,034,606 | $3,265,990 | $3,674,499 | $(955,947) | $(555,010) | $1,211,675 | $1,268,514 |
| 223,307,044 | 346,567,982 | 14,682,457 | 144,355 | 46,369,147 | 28,792,111 | 61,169 | (25,576) |
| 516,360,601 | (208,421,193) | 85,403,699 | (5,779,963) | 34,594,589 | 11,444,230 | 179,252 | 861,083 |
| 744,049,302 | 150,181,395 | 103,352,146 | (1,961,109) | 80,007,789 | 39,681,331 | 1,452,096 | 2,104,021 |
| (72,232,394) | (131,578,336) | (27,980) | (218,888) | (322,644) | (108,767) | (759,648) | (833,284) |
| (2,013,341) | (4,739,957) | — | (440,616) | (75,536) | (31,405) | (20,387) | (44,602) |
| (23,353,681) | (46,568,506) | (2,756,697) | (14,927,652) | (3,492,139) | (1,238,482) | (72,530) | (75,132) |
| (8,585,123) | (12,116,401) | (904,834) | (5,380,266) | (26,267,865) | (14,021,254) | (359,126) | (343,542) |
| (106,184,539) | (195,003,200) | (3,689,511) | (20,967,422) | (30,158,184) | (15,399,908) | (1,211,691) | (1,296,560) |
| 89,413,334 | (49,295,124) | (5,958,798) | 14,194,362 | (13,485,397) | (23,706,216) | 229,658 | 1,487,589 |
| 727,278,097 | (94,116,929) | 93,703,837 | (8,734,169) | 36,364,208 | 575,207 | 470,063 | 2,295,050 |
| 1,637,821,697 | 1,731,938,626 | 275,565,531 | 284,299,700 | 226,367,300 | 225,792,093 | 49,509,674 | 47,214,624 |
| $2,365,099,794 | $1,637,821,697 | $369,269,368 | $275,565,531 | $262,731,508 | $226,367,300 | $49,979,737 | $49,509,674 |
| Touchstone Small Company Fund | Touchstone Value Fund | |||
| For the Year Ended June 30, 2021 | For the Year Ended June 30, 2020 | For the Year Ended June 30, 2021 | For the Year Ended June 30, 2020 | |
| From Operations | ||||
| Net investment income (loss) | $(3,042,778) | $(1,998,820) | $4,453,429 | $5,228,529 |
| Net realized gains (losses) on investments and foreign currency transactions | 201,596,566 | (11,873,437) | 21,403,643 | 4,605,555 |
| Net change in unrealized appreciation (depreciation) on investments | 208,112,135 | (82,101,153) | 95,152,352 | (33,559,870) |
| Change in Net Assets from Operations | 406,665,923 | (95,973,410) | 121,009,424 | (23,725,786) |
| Distributions to Shareholders: | ||||
| Distributed earnings, Class A | (526,115) | (31,748,103) | (776,520) | (2,056,786) |
| Distributed earnings, Class C | (48,748) | (3,292,320) | (34,628) | (185,828) |
| Distributed earnings, Class Y | (196,776) | (14,318,842) | (2,368,580) | (5,870,992) |
| Distributed earnings, Institutional Class | (13,108) | (472,170) | (6,305,785) | (14,575,885) |
| Distributed earnings, Class R6 | (57,850) | (6,772,410) | — | — |
| Total Distributions | (842,597) | (56,603,845) | (9,485,513) | (22,689,491) |
| Change in Net Assets from Share Transactions(A) | (113,421,577) | (235,099,173) | 57,417,338 | (35,622,508) |
| Total Increase (Decrease) in Net Assets | 292,401,749 | (387,676,428) | 168,941,249 | (82,037,785) |
| Net Assets | ||||
| Beginning of period | 707,199,167 | 1,094,875,595 | 255,715,462 | 337,753,247 |
| End of period | $999,600,916 | $707,199,167 | $424,656,711 | $255,715,462 |
| (A) | For details on share transactions by class, see Statements of Changes in Net Assets - Capital Stock Activity on page 60 to 64. |
| Touchstone Balanced Fund | Touchstone International Equity Fund | |||||||
| For the Year Ended June 30, 2021 | For the Year Ended June 30, 2020 | For the Year Ended June 30, 2021 | For the Year Ended June 30, 2020 | |||||
| Shares | Dollars | Shares | Dollars | Shares | Dollars | Shares | Dollars | |
| Class A | ||||||||
| Proceeds from Shares issued | 1,466,609 | $34,722,660 | 1,071,065 | $23,146,193 | 207,265 | $3,466,458 | 295,634 | $4,268,954 |
| Proceeds from Shares issued in connection with reorganization(A) | — | — | — | — | — | — | — | — |
| Net shares increase due to stock split(A) | — | — | — | — | — | — | — | — |
| Reinvestment of distributions | 833,000 | 19,264,341 | 1,325,400 | 27,861,603 | 21,556 | 369,692 | 293,411 | 4,629,085 |
| Cost of Shares redeemed | (1,260,991) | (30,118,012) | (1,817,914) | (39,245,858) | (1,149,415) | (18,959,641) | (1,836,149) | (27,342,281) |
| Change from Class A Share Transactions | 1,038,618 | 23,868,989 | 578,551 | 11,761,938 | (920,594) | (15,123,491) | (1,247,104) | (18,444,242) |
| Class C | ||||||||
| Proceeds from Shares issued | 1,079,296 | 25,816,477 | 888,630 | 19,494,979 | 11,590 | 194,768 | 11,691 | 164,188 |
| Proceeds from Shares issued in connection with reorganization(A) | — | — | — | — | — | — | — | — |
| Net shares increase due to stock split(A) | — | — | — | — | — | — | — | — |
| Reinvestment of distributions | 141,948 | 3,289,385 | 179,350 | 3,786,820 | 30 | 491 | 8,823 | 128,355 |
| Cost of Shares redeemed | (696,913) | (16,339,915) | (576,807) | (12,235,340) | (50,705) | (745,214) | (119,310) | (1,595,439) |
| Change from Class C Share Transactions | 524,331 | 12,765,947 | 491,173 | 11,046,459 | (39,085) | (549,955) | (98,796) | (1,302,896) |
| Class Y | ||||||||
| Proceeds from Shares issued | 4,074,596 | 95,993,587 | 1,883,944 | 39,791,844 | 349,073 | 6,178,013 | 339,363 | 4,856,858 |
| Proceeds from Shares issued in connection with reorganization(A) | — | — | — | — | — | — | — | — |
| Net shares increase due to stock split(A) | — | — | — | — | — | — | — | — |
| Reinvestment of distributions | 454,002 | 10,425,611 | 407,750 | 8,502,103 | 8,826 | 149,244 | 129,700 | 2,019,569 |
| Cost of Shares redeemed | (1,131,521) | (26,734,230) | (616,752) | (12,921,781) | (597,691) | (9,525,838) | (1,461,821) | (21,458,191) |
| Change from Class Y Share Transactions | 3,397,077 | 79,684,968 | 1,674,942 | 35,372,166 | (239,792) | (3,198,581) | (992,758) | (14,581,764) |
| Institutional Class | ||||||||
| Proceeds from Shares issued | — | — | — | — | 326,028 | 5,389,374 | 972,020 | 14,827,692 |
| Proceeds from Shares issued in connection with reorganization(A) | — | — | — | — | — | — | — | — |
| Net shares increase due to stock split(A) | — | — | — | — | — | — | — | — |
| Reinvestment of distributions | — | — | — | — | 6,055 | 102,145 | 37,466 | 585,849 |
| Cost of Shares redeemed | — | — | — | — | (1,136,788) | (19,127,333) | (141,192) | (1,866,195) |
| Change from Institutional Class Share Transactions | — | — | — | — | (804,705) | (13,635,814) | 868,294 | 13,547,346 |
| Change from Share Transactions | 4,960,026 | $116,319,904 | 2,744,666 | $58,180,563 | (2,004,176) | $(32,507,841) | (1,470,364) | $(20,781,556) |
| (A) | See Note 9 in Notes to Financial Statements. |
| Touchstone International Growth Fund | Touchstone Large Cap Focused Fund | ||||||
| For the Year Ended June 30, 2021 | For the Year Ended June 30, 2020 | For the Year Ended June 30, 2021 | For the Year Ended June 30, 2020 | ||||
| Shares | Dollars | Shares | Dollars | Shares | Dollars | Shares | Dollars |
| 17,989 | $289,648 | 12,111 | $260,627 | 1,524,656 | $76,745,640 | 1,093,228 | $45,630,547 |
| 97,100 | 1,290,678 | — | — | — | — | — | — |
| 32,844 | — | — | — | — | — | — | — |
| — | — | — | — | 1,343,599 | 65,769,214 | 2,871,516 | 120,183,045 |
| (38,276) | (564,950) | (13,111) | (266,084) | (3,086,035) | (155,866,155) | (4,469,691) | (185,302,273) |
| 109,657 | 1,015,376 | (1,000) | (5,457) | (217,780) | (13,351,301) | (504,947) | (19,488,681) |
| 29,320 | 430,015 | 11,876 | 249,101 | 166,455 | 8,057,729 | 82,067 | 3,184,364 |
| 48,931 | 631,074 | — | — | — | — | — | — |
| 16,544 | — | — | — | — | — | — | — |
| — | — | — | — | 44,113 | 1,981,119 | 117,565 | 4,539,194 |
| (24,564) | (372,108) | (2,187) | (46,547) | (391,914) | (17,295,180) | (422,583) | (16,633,766) |
| 70,231 | 688,981 | 9,689 | 202,554 | (181,346) | (7,256,332) | (222,951) | (8,910,208) |
| 77,402 | 1,153,585 | 83,502 | 1,764,656 | 3,821,151 | 200,689,582 | 1,636,808 | 67,768,500 |
| 5,338,452 | 72,719,437 | — | — | — | — | — | — |
| 33,230 | — | — | — | — | — | — | — |
| — | — | — | — | 437,489 | 21,384,607 | 993,280 | 41,493,721 |
| (762,790) | (11,389,617) | (154,441) | (3,112,215) | (2,789,494) | (139,140,516) | (3,836,605) | (158,226,210) |
| 4,686,294 | 62,483,405 | (70,939) | (1,347,559) | 1,469,146 | 82,933,673 | (1,206,517) | (48,963,989) |
| 134,196 | 2,022,011 | 49,235 | 1,015,777 | 3,340,243 | 166,343,316 | 6,111,185 | 255,066,019 |
| 282,595 | 3,877,901 | — | — | — | — | — | — |
| 1,095,088 | — | — | — | — | — | — | — |
| 1,123 | 28,917 | 130 | 2,978 | 173,680 | 8,505,633 | 288,925 | 12,103,812 |
| (1,338,444) | (19,263,078) | (219,872) | (4,231,264) | (3,011,062) | (147,761,655) | (5,690,923) | (239,102,077) |
| 174,558 | (13,334,249) | (170,507) | (3,212,509) | 502,861 | 27,087,294 | 709,187 | 28,067,754 |
| 5,040,740 | $50,853,513 | (232,757) | $(4,362,971) | 1,572,881 | $89,413,334 | (1,225,228) | $(49,295,124) |
| Touchstone Large Cap Fund | Touchstone Large Company Growth Fund | |||||||
| For the Year Ended June 30, 2021 | For the Year Ended June 30, 2020 | For the Year Ended June 30, 2021 | For the Year Ended June 30, 2020 | |||||
| Shares | Dollars | Shares | Dollars | Shares | Dollars | Shares | Dollars | |
| Class A | ||||||||
| Proceeds from Shares issued | 104,007 | $1,512,734 | 61,831 | $840,848 | 30,562 | $1,579,939 | 27,584 | $1,175,940 |
| Reinvestment of distributions | 1,558 | 24,185 | 13,629 | 193,756 | 6,746 | 322,644 | 2,596 | 108,767 |
| Cost of Shares redeemed | (95,257) | (1,367,690) | (134,518) | (1,853,321) | (18,633) | (968,868) | (19,213) | (848,637) |
| Change from Class A Share Transactions | 10,308 | 169,229 | (59,058) | (818,717) | 18,675 | 933,715 | 10,967 | 436,070 |
| Class C | ||||||||
| Proceeds from Shares issued | 1,416 | 20,032 | 23,690 | 316,151 | 1,658 | 82,710 | 3,214 | 136,311 |
| Reinvestment of distributions | — | — | 30,317 | 420,803 | 1,612 | 73,982 | 768 | 31,234 |
| Cost of Shares redeemed | (174,814) | (2,535,160) | (165,774) | (2,198,939) | (7,524) | (386,344) | (615) | (27,011) |
| Change from Class C Share Transactions | (173,398) | (2,515,128) | (111,767) | (1,461,985) | (4,254) | (229,652) | 3,367 | 140,534 |
| Class Y | ||||||||
| Proceeds from Shares issued | 1,169,625 | 18,630,577 | 1,724,859 | 21,568,055 | 150,337 | 7,767,761 | 225,624 | 10,088,751 |
| Reinvestment of distributions | 173,509 | 2,691,115 | 1,020,838 | 14,562,437 | 72,037 | 3,491,645 | 29,287 | 1,238,247 |
| Cost of Shares redeemed | (2,051,020) | (32,393,077) | (2,034,074) | (27,404,668) | (225,751) | (11,468,545) | (210,527) | (9,205,265) |
| Change from Class Y Share Transactions | (707,886) | (11,071,385) | 711,623 | 8,725,824 | (3,377) | (209,139) | 44,384 | 2,121,733 |
| Institutional Class | ||||||||
| Proceeds from Shares issued | 2,119,773 | 34,538,882 | 1,656,126 | 23,370,143 | 998,459 | 53,254,493 | 621,303 | 27,092,012 |
| Reinvestment of distributions | 56,203 | 872,839 | 321,896 | 4,601,323 | 503,639 | 24,547,358 | 310,297 | 13,168,983 |
| Cost of Shares redeemed | (1,743,984) | (27,953,235) | (1,546,062) | (20,222,226) | (1,715,936) | (91,782,172) | (1,547,054) | (66,665,548) |
| Change from Institutional Class Share Transactions | 431,992 | 7,458,486 | 431,960 | 7,749,240 | (213,838) | (13,980,321) | (615,454) | (26,404,553) |
| Class R6 | ||||||||
| Proceeds from Shares issued | — | — | — | — | — | — | — | — |
| Reinvestment of distributions | — | — | — | — | — | — | — | — |
| Cost of Shares redeemed | — | — | — | — | — | — | — | — |
| Change from Class R6 Share Transactions | — | — | — | — | — | — | — | — |
| Change from Share Transactions | (438,984) | $(5,958,798) | 972,758 | $14,194,362 | (202,794) | $(13,485,397) | (556,736) | $(23,706,216) |
| Touchstone Ohio Tax-Free Bond Fund | Touchstone Small Company Fund | ||||||
| For the Year Ended June 30, 2021 | For the Year Ended June 30, 2020 | For the Year Ended June 30, 2021 | For the Year Ended June 30, 2020 | ||||
| Shares | Dollars | Shares | Dollars | Shares | Dollars | Shares | Dollars |
| 117,818 | $1,400,793 | 106,958 | $1,258,988 | 3,075,590 | $17,218,868 | 5,229,849 | $22,478,782 |
| 50,202 | 596,606 | 54,876 | 644,729 | 93,455 | 505,592 | 6,439,957 | 30,074,578 |
| (281,021) | (3,336,930) | (334,608) | (3,920,411) | (15,524,699) | (80,974,108) | (30,257,387) | (132,023,765) |
| (113,001) | (1,339,531) | (172,774) | (2,016,694) | (12,355,654) | (63,249,648) | (18,587,581) | (79,470,405) |
| 6,947 | 82,902 | 2,012 | 23,216 | 628,972 | 1,798,689 | 1,006,615 | 2,036,014 |
| 1,669 | 19,873 | 3,086 | 36,303 | 18,373 | 48,323 | 1,402,573 | 3,211,891 |
| (82,503) | (982,412) | (68,781) | (806,395) | (3,241,901) | (8,058,123) | (7,363,570) | (16,728,640) |
| (73,887) | (879,637) | (63,683) | (746,876) | (2,594,556) | (6,211,111) | (4,954,382) | (11,480,735) |
| 134,759 | 1,602,926 | 53,795 | 632,460 | 8,997,577 | 57,602,814 | 9,218,953 | 44,364,273 |
| 4,722 | 56,160 | 3,770 | 44,349 | 32,470 | 195,796 | 2,704,570 | 14,036,717 |
| (70,525) | (839,958) | (97,210) | (1,137,457) | (12,972,512) | (71,392,653) | (31,239,620) | (151,096,957) |
| 68,956 | 819,128 | (39,645) | (460,648) | (3,942,465) | (13,594,043) | (19,316,097) | (92,695,967) |
| 146,972 | 1,743,284 | 537,246 | 6,309,218 | 551,770 | 3,508,683 | 2,365,997 | 11,430,932 |
| 29,346 | 349,022 | 27,077 | 318,450 | 2,177 | 13,108 | 91,153 | 472,170 |
| (38,939) | (462,608) | (164,375) | (1,915,861) | (528,096) | (3,157,833) | (378,369) | (1,974,306) |
| 137,379 | 1,629,698 | 399,948 | 4,711,807 | 25,851 | 363,958 | 2,078,781 | 9,928,796 |
| — | — | — | — | 21,970,125 | 114,262,491 | 4,043,763 | 18,024,523 |
| — | — | — | — | 10,144 | 56,706 | 862,270 | 4,147,518 |
| — | — | — | — | (28,152,157) | (145,049,930) | (17,268,992) | (83,552,903) |
| — | — | — | — | (6,171,888) | (30,730,733) | (12,362,959) | (61,380,862) |
| 19,447 | $229,658 | 123,846 | $1,487,589 | (25,038,712) | $(113,421,577) | (53,142,238) | $(235,099,173) |
| Touchstone Value Fund | ||||
| For the Year Ended June 30, 2021 | For the Year Ended June 30, 2020 | |||
| Shares | Dollars | Shares | Dollars | |
| Class A | ||||
| Proceeds from Shares issued | 294,009 | $2,988,202 | 208,759 | $1,790,085 |
| Reinvestment of distributions | 74,853 | 722,633 | 210,421 | 1,942,246 |
| Cost of Shares redeemed | (563,236) | (5,436,299) | (833,351) | (7,537,550) |
| Change from Class A Share Transactions | (194,374) | (1,725,464) | (414,171) | (3,805,219) |
| Class C | ||||
| Proceeds from Shares issued | 43,137 | 463,857 | 68,628 | 635,575 |
| Reinvestment of distributions | 3,629 | 34,591 | 17,964 | 167,755 |
| Cost of Shares redeemed | (150,389) | (1,401,306) | (150,811) | (1,236,808) |
| Change from Class C Share Transactions | (103,623) | (902,858) | (64,219) | (433,478) |
| Class Y | ||||
| Proceeds from Shares issued | 2,240,371 | 23,194,008 | 2,623,997 | 22,752,238 |
| Reinvestment of distributions | 238,204 | 2,317,284 | 623,279 | 5,737,361 |
| Cost of Shares redeemed | (3,105,283) | (28,962,292) | (3,688,022) | (32,340,885) |
| Change from Class Y Share Transactions | (626,708) | (3,451,000) | (440,746) | (3,851,286) |
| Institutional Class | ||||
| Proceeds from Shares issued | 12,763,089 | 135,117,333 | 5,719,683 | 50,154,102 |
| Reinvestment of distributions | 587,454 | 5,736,439 | 1,545,141 | 14,277,687 |
| Cost of Shares redeemed | (7,394,847) | (77,357,112) | (10,077,773) | (91,964,314) |
| Change from Institutional Class Share Transactions | 5,955,696 | 63,496,660 | (2,812,949) | (27,532,525) |
| Change from Share Transactions | 5,030,991 | $57,417,338 | (3,732,085) | $(35,622,508) |
| Touchstone Balanced Fund—Class A | ||||||
| Selected Data for a Share Outstanding Throughout Each Period | ||||||
| Year Ended June 30, | Seven Months Ended June 30, 2018(A) | Year Ended November 30, | ||||
| 2021 | 2020 | 2019 | 2017 | 2016 | ||
| Net asset value at beginning of period | $21.61 | $22.18 | $21.54 | $22.40 | $19.68 | $19.87 |
| Income (loss) from investment operations: | ||||||
| Net investment income | 0.16(B) | 0.27 | 0.32 | 0.16 | 0.21 | 0.23(B) |
| Net realized and unrealized gains on investments | 5.47 | 1.85 | 1.73 | 0.22 | 2.89 | 0.66 |
| Total from investment operations: | 5.63 | 2.12 | 2.05 | 0.38 | 3.10 | 0.89 |
| Distributions from: | ||||||
| Net investment income | (0.15) | (0.28) | (0.34) | (0.18) | (0.25) | (0.44) |
| Realized capital gains | (1.57) | (2.41) | (1.07) | (1.06) | (0.13) | (0.64) |
| Total distributions | (1.72) | (2.69) | (1.41) | (1.24) | (0.38) | (1.08) |
| Net asset value at end of period | $25.52 | $21.61 | $22.18 | $21.54 | $22.40 | $19.68 |
| Total return(C) | 26.92% | 10.09% | 10.13% | 1.72%(D) | 15.95% | 4.75% |
| Ratios and supplemental data: | ||||||
| Net assets at end of period (000's) | $322,009 | $250,298 | $244,037 | $239,056 | $258,279 | $264,910 |
| Ratio to average net assets: | ||||||
| Net expenses | 1.01% | 1.01% | 1.01% | 1.01%(E) | 1.03% | 1.01% |
| Gross expenses | 1.03% | 1.07% | 1.09% | 1.07%(E) | 1.04% | 1.01% |
| Net investment income | 0.66% | 1.25% | 1.49% | 1.24%(E) | 0.99% | 1.20% |
| Portfolio turnover rate | 60% | 135% | 81% | 119%(D) | 46% | 45% |
| Touchstone Balanced Fund—Class C | ||||||
| Selected Data for a Share Outstanding Throughout Each Period | ||||||
| Year Ended June 30, | Seven Months Ended June 30, 2018(A) | Year Ended November 30, | ||||
| 2021 | 2020 | 2019 | 2017 | 2016 | ||
| Net asset value at beginning of period | $21.72 | $22.29 | $21.63 | $22.46 | $19.73 | $19.93 |
| Income (loss) from investment operations: | ||||||
| Net investment income (loss) | (0.03)(B) | 0.11 | 0.15 | 0.06 | 0.04 | 0.08(B) |
| Net realized and unrealized gains on investments | 5.49 | 1.86 | 1.75 | 0.22 | 2.91 | 0.66 |
| Total from investment operations: | 5.46 | 1.97 | 1.90 | 0.28 | 2.95 | 0.74 |
| Distributions from: | ||||||
| Net investment income | (0.02) | (0.13) | (0.17) | (0.05) | (0.09) | (0.30) |
| Realized capital gains | (1.57) | (2.41) | (1.07) | (1.06) | (0.13) | (0.64) |
| Total distributions | (1.59) | (2.54) | (1.24) | (1.11) | (0.22) | (0.94) |
| Net asset value at end of period | $25.59 | $21.72 | $22.29 | $21.63 | $22.46 | $19.73 |
| Total return(C) | 25.93% | 9.23% | 9.33% | 1.25%(D) | 15.09% | 3.91% |
| Ratios and supplemental data: | ||||||
| Net assets at end of period (000's) | $65,455 | $44,174 | $34,380 | $39,769 | $42,800 | $43,066 |
| Ratio to average net assets: | ||||||
| Net expenses | 1.78% | 1.78% | 1.78% | 1.78%(E) | 1.79% | 1.78% |
| Gross expenses | 1.81% | 1.88% | 1.89% | 1.86%(E) | 1.81% | 1.78% |
| Net investment income (loss) | (0.11%) | 0.48% | 0.72% | 0.47%(E) | 0.23% | 0.43% |
| Portfolio turnover rate | 60% | 135% | 81% | 119%(D) | 46% | 45% |
| (A) | The Fund changed its fiscal year end from November 30 to June 30. |
| (B) | The net investment income per share was based on average shares outstanding for the period. |
| (C) | Total returns shown exclude the effect of applicable sales loads and fees. If these charges were included, the returns would be lower. |
| (D) | Not annualized. |
| (E) | Annualized. |
| Touchstone Balanced Fund—Class Y | ||||||
| Selected Data for a Share Outstanding Throughout Each Period | ||||||
| Year Ended June 30, | Seven Months Ended June 30, 2018(A) | Year Ended November 30, | ||||
| 2021 | 2020 | 2019 | 2017(B) | 2016 | ||
| Net asset value at beginning of period | $21.43 | $22.01 | $21.39 | $22.26 | $19.57 | $19.78 |
| Income (loss) from investment operations: | ||||||
| Net investment income | 0.20(C) | 0.32 | 0.35 | 0.19 | 0.28 | 0.27(C) |
| Net realized and unrealized gains on investments | 5.41 | 1.84 | 1.72 | 0.22 | 2.84 | 0.65 |
| Total from investment operations: | 5.61 | 2.16 | 2.07 | 0.41 | 3.12 | 0.92 |
| Distributions from: | ||||||
| Net investment income | (0.19) | (0.33) | (0.38) | (0.22) | (0.30) | (0.49) |
| Realized capital gains | (1.57) | (2.41) | (1.07) | (1.06) | (0.13) | (0.64) |
| Total distributions | (1.76) | (2.74) | (1.45) | (1.28) | (0.43) | (1.13) |
| Net asset value at end of period | $25.28 | $21.43 | $22.01 | $21.39 | $22.26 | $19.57 |
| Total return | 27.12% | 10.35% | 10.33% | 1.86%(D) | 16.20% | 4.94% |
| Ratios and supplemental data: | ||||||
| Net assets at end of period (000's) | $197,877 | $94,921 | $60,638 | $30,612 | $31,215 | $14,477 |
| Ratio to average net assets: | ||||||
| Net expenses | 0.81% | 0.81% | 0.81% | 0.81%(E) | 0.78% | 0.81% |
| Gross expenses | 0.81% | 0.87% | 0.88% | 0.90%(E) | 0.80% | 0.81% |
| Net investment income | 0.86% | 1.45% | 1.69% | 1.44%(E) | 1.25% | 1.41% |
| Portfolio turnover rate | 60% | 135% | 81% | 119%(D) | 46% | 45% |
| (A) | The Fund changed its fiscal year end from November 30 to June 30. |
| (B) | Effective October 28, 2017, Class I shares of the Sentinel Balanced Fund (the “Predecessor Fund”) were reorganized into Class Y shares of the Fund. |
| (C) | The net investment income per share was based on average shares outstanding for the period. |
| (D) | Not annualized. |
| (E) | Annualized. |
| Touchstone International Equity Fund—Class A | ||||||
| Selected Data for a Share Outstanding Throughout Each Period | ||||||
| Year Ended June 30, | Seven Months Ended June 30, 2018(A) | Year Ended November 30, | ||||
| 2021 | 2020 | 2019 | 2017 | 2016 | ||
| Net asset value at beginning of period | $13.93 | $15.65 | $18.15 | $19.64 | $15.52 | $16.92 |
| Income (loss) from investment operations: | ||||||
| Net investment income | 0.09(B) | 0.08(B) | 0.20(B) | 0.36(C) | 0.17 | 0.18(B) |
| Net realized and unrealized gains (losses) on investments | 4.94 | (0.98) | (0.57) | (0.94) | 4.05 | (0.97) |
| Total from investment operations: | 5.03 | (0.90) | (0.37) | (0.58) | 4.22 | (0.79) |
| Distributions from: | ||||||
| Net investment income | (0.08) | (0.19) | (0.26) | (0.21) | (0.10) | (0.12) |
| Realized capital gains | — | (0.63) | (1.87) | (0.70) | — | (0.49) |
| Total distributions | (0.08) | (0.82) | (2.13) | (0.91) | (0.10) | (0.61) |
| Net asset value at end of period | $18.88 | $13.93 | $15.65 | $18.15 | $19.64 | $15.52 |
| Total return(D) | 36.16% | (6.28%) | (0.78%) | (3.23%)(E) | 27.39% | (4.81%) |
| Ratios and supplemental data: | ||||||
| Net assets at end of period (000's) | $88,022 | $77,744 | $106,870 | $118,391 | $129,139 | $114,616 |
| Ratio to average net assets: | ||||||
| Net expenses | 1.36% | 1.29% | 1.30% | 1.23%(F) | 1.37% | 1.36% |
| Gross expenses | 1.37% | 1.40% | 1.37% | 1.30%(F) | 1.39% | 1.36% |
| Net investment income | 0.56% | 0.57% | 1.26% | 3.22%(C)(F) | 0.92% | 1.11% |
| Portfolio turnover rate | 31% | 45% | 43% | 26%(E) | 37% | 36% |
| Touchstone International Equity Fund—Class C | ||||||
| Selected Data for a Share Outstanding Throughout Each Period | ||||||
| Year Ended June 30, | Seven Months Ended June 30, 2018(A) | Year Ended November 30, | ||||
| 2021 | 2020 | 2019 | 2017 | 2016 | ||
| Net asset value at beginning of period | $12.99 | $14.64 | $17.12 | $18.46 | $14.66 | $16.06 |
| Income (loss) from investment operations: | ||||||
| Net investment income (loss) | (0.04)(B) | (0.09)(B) | 0.03(B) | 0.26(C) | (0.06) | (0.01)(B) |
| Net realized and unrealized gains (losses) on investments | 4.60 | (0.93) | (0.54) | (0.90) | 3.86 | (0.90) |
| Total from investment operations: | 4.56 | (1.02) | (0.51) | (0.64) | 3.80 | (0.91) |
| Distributions from: | ||||||
| Net investment income | —(G) | — | (0.10) | — | — | — |
| Realized capital gains | — | (0.63) | (1.87) | (0.70) | — | (0.49) |
| Total distributions | —(G) | (0.63) | (1.97) | (0.70) | — | (0.49) |
| Net asset value at end of period | $17.55 | $12.99 | $14.64 | $17.12 | $18.46 | $14.66 |
| Total return(D) | 35.14% | (7.41%) | (1.87%) | (3.72%)(E) | 25.92% | (5.82%) |
| Ratios and supplemental data: | ||||||
| Net assets at end of period (000's) | $2,115 | $2,073 | $3,783 | $6,737 | $6,924 | $5,876 |
| Ratio to average net assets: | ||||||
| Net expenses | 2.15% | 2.49% | 2.34% | 2.18%(F) | 2.45% | 2.49% |
| Gross expenses | 2.90% | 2.74% | 2.42% | 2.25%(F) | 2.49% | 2.49% |
| Net investment income (loss) | (0.24%) | (0.63%) | 0.21% | 2.27%(C)(F) | (0.16%) | (0.04%) |
| Portfolio turnover rate | 31% | 45% | 43% | 26%(E) | 37% | 36% |
| (A) | The Fund changed its fiscal year end from November 30 to June 30. |
| (B) | The net investment income (loss) per share was based on average shares outstanding for the period. |
| (C) | Reflects the impact of a special dividend that resulted in a one-time increase to net investment income. If the special dividend had not occurred, the ratio of net investment income to average net assets would have been lower by 1.54% for Class A and Class C shares and the net investment income per share would have been lower by $0.17 and $0.16 for Class A and Class C shares, respectively. |
| (D) | Total returns shown exclude the effect of applicable sales loads and fees. If these charges were included, the returns would be lower. |
| (E) | Not annualized. |
| (F) | Annualized. |
| (G) | Less than $0.005 per share. |
| Touchstone International Equity Fund—Class Y | ||||||
| Selected Data for a Share Outstanding Throughout Each Period | ||||||
| Year Ended June 30, | Seven Months Ended June 30, 2018(A) | Year Ended November 30, | ||||
| 2021 | 2020 | 2019 | 2017(B) | 2016 | ||
| Net asset value at beginning of period | $13.73 | $15.44 | $17.93 | $19.45 | $15.40 | $16.79 |
| Income (loss) from investment operations: | ||||||
| Net investment income | 0.15(C) | 0.13(C) | 0.25(C) | 0.40(D) | 0.25 | 0.23(C) |
| Net realized and unrealized gains (losses) on investments | 4.88 | (0.97) | (0.57) | (0.93) | 3.98 | (0.95) |
| Total from investment operations: | 5.03 | (0.84) | (0.32) | (0.53) | 4.23 | (0.72) |
| Distributions from: | ||||||
| Net investment income | (0.11) | (0.24) | (0.30) | (0.29) | (0.18) | (0.18) |
| Realized capital gains | — | (0.63) | (1.87) | (0.70) | — | (0.49) |
| Total distributions | (0.11) | (0.87) | (2.17) | (0.99) | (0.18) | (0.67) |
| Net asset value at end of period | $18.65 | $13.73 | $15.44 | $17.93 | $19.45 | $15.40 |
| Total return | 36.71% | (6.03%) | (0.47%) | (3.05%)(E) | 27.78% | (4.41%) |
| Ratios and supplemental data: | ||||||
| Net assets at end of period (000's) | $27,903 | $23,835 | $42,120 | $57,438 | $63,320 | $40,528 |
| Ratio to average net assets: | ||||||
| Net expenses | 0.99% | 0.99% | 0.99% | 0.99%(F) | 1.01% | 0.99% |
| Gross expenses | 1.19% | 1.15% | 1.12% | 1.09%(F) | 1.03% | 0.99% |
| Net investment income | 0.93% | 0.87% | 1.57% | 3.47%(D)(F) | 1.28% | 1.45% |
| Portfolio turnover rate | 31% | 45% | 43% | 26%(E) | 37% | 36% |
| Touchstone International Equity Fund—Institutional Class | |||||
| Selected Data for a Share Outstanding Throughout Each Period | |||||
| Year Ended June 30, | Seven Months Ended June 30, 2018(A) | Period Ended November 30, 2017(G) | |||
| 2021 | 2020 | 2019 | |||
| Net asset value at beginning of period | $13.71 | $15.42 | $17.92 | $19.46 | $18.91 |
| Income (loss) from investment operations: | |||||
| Net investment income | 0.16(C) | 0.14(C) | 0.26(C) | 0.56(D) | 0.02 |
| Net realized and unrealized gains (losses) on investments | 4.88 | (0.95) | (0.57) | (1.09) | 0.53 |
| Total from investment operations: | 5.04 | (0.81) | (0.31) | (0.53) | 0.55 |
| Distributions from: | |||||
| Net investment income | (0.12) | (0.27) | (0.32) | (0.31) | — |
| Realized capital gains | — | (0.63) | (1.87) | (0.70) | — |
| Total distributions | (0.12) | (0.90) | (2.19) | (1.01) | — |
| Net asset value at end of period | $18.63 | $13.71 | $15.42 | $17.92 | $19.46 |
| Total return | 36.83% | (5.89%) | (0.39%) | (3.02%)(E) | 2.91%(E) |
| Ratios and supplemental data: | |||||
| Net assets at end of period (000's) | $4,315 | $14,205 | $2,592 | $2,260 | $3 |
| Ratio to average net assets: | |||||
| Net expenses | 0.89% | 0.89% | 0.89% | 0.89%(F) | 0.89%(F) |
| Gross expenses | 1.06% | 1.12% | 1.38% | 1.63%(F) | 1,921.18%(F) |
| Net investment income | 1.03% | 0.97% | 1.67% | 3.57%(D)(F) | 1.40%(F) |
| Portfolio turnover rate | 31% | 45% | 43% | 26%(E) | 37% |
| (A) | The Fund changed its fiscal year end from November 30 to June 30. |
| (B) | Effective October 28, 2017, Class I shares of the Sentinel Balanced Fund (the “Predecessor Fund”) were reorganized into Class Y shares of the Fund. |
| (C) | The net investment income (loss) per share was based on average shares outstanding for the period. |
| (D) | Reflects the impact of a special dividend that resulted in a one-time increase to net investment income. If the special dividend had not occurred, the ratio of net investment income to average net assets would have been lower by 1.54% for Class Y and Institutional Class shares and the net investment income per share would have been lower by $0.17 and $0.16 for Class Y and Institutional Class shares, respectively. |
| (E) | Not annualized. |
| (F) | Annualized. |
| (G) | Represents the period from commencement of operations (October 30, 2017) through November 30, 2017. |
| Touchstone International Growth Fund—Class A | |||||
| Selected Data for a Share Outstanding Throughout Each Period | |||||
| Year Ended June 30, | Period Ended June 30, 2017(A)(B) | ||||
| 2021(A) | 2020(A) | 2019(A) | 2018(A) | ||
| Net asset value at beginning of period | $11.68 | $11.11 | $13.11 | $11.61 | $9.78(C) |
| Income (loss) from investment operations: | |||||
| Net investment loss | (0.10)(D) | (0.03)(D) | (0.04)(D) | (0.01) | (0.01) |
| Net realized and unrealized gains (losses) on investments | 3.77 | 0.60 | (0.47) | 1.75 | 1.84 |
| Total from investment operations: | 3.67 | 0.57 | (0.51) | 1.74 | 1.83 |
| Distributions from: | |||||
| Realized capital gains | — | — | (1.49) | (0.24) | — |
| Net asset value at end of period | $15.35 | $11.68 | $11.11 | $13.11 | $11.61 |
| Total return(E) | 31.51% | 5.07% | (1.78%) | 15.00% | 18.73%(F) |
| Ratios and supplemental data: | |||||
| Net assets at end of period (000's) | $2,216 | $777 | $760 | $918 | $140 |
| Ratio to average net assets: | |||||
| Net expenses | 1.24% | 1.24% | 1.24% | 1.36% | 1.41%(G) |
| Gross expenses | 2.31% | 4.17% | 4.36% | 3.75% | 42.93%(G) |
| Net investment loss | (0.63%) | (0.26%) | (0.31%) | (0.05%) | (0.35%)(G) |
| Portfolio turnover rate | 116%(H) | 74% | 103% | 109% | 72%(I) |
| Touchstone International Growth Fund—Class C | |||||
| Selected Data for a Share Outstanding Throughout Each Period | |||||
| Year Ended June 30, | Period Ended June 30, 2017(A)(B) | ||||
| 2021(A) | 2020(A) | 2019(A) | 2018(A) | ||
| Net asset value at beginning of period | $11.34 | $10.88 | $12.97 | $11.57 | $9.81(C) |
| Income (loss) from investment operations: | |||||
| Net investment loss | (0.20)(D) | (0.11)(D) | (0.12)(D) | (0.05) | (0.10) |
| Net realized and unrealized gains (losses) on investments | 3.67 | 0.57 | (0.48) | 1.69 | 1.86 |
| Total from investment operations: | 3.47 | 0.46 | (0.60) | 1.64 | 1.76 |
| Distributions from: | |||||
| Realized capital gains | — | — | (1.49) | (0.24) | — |
| Net asset value at end of period | $14.81 | $11.34 | $10.88 | $12.97 | $11.57 |
| Total return(E) | 30.55% | 4.28% | (2.52%) | 14.14% | 17.93%(F) |
| Ratios and supplemental data: | |||||
| Net assets at end of period (000's) | $1,316 | $403 | $185 | $436 | $3 |
| Ratio to average net assets: | |||||
| Net expenses | 1.99% | 1.99% | 1.99% | 2.10% | 2.16%(G) |
| Gross expenses | 3.43% | 5.96% | 6.35% | 5.06% | 237.46%(G) |
| Net investment loss | (1.38%) | (1.01%) | (1.06%) | (0.79%) | (1.11%)(G) |
| Portfolio turnover rate | 116%(H) | 74% | 103% | 109% | 72%(I) |
| (A) | During the Year Ended June 30, 2021, the Fund effected the following stock split effective the close of business September 11, 2020: 1.9160 for 1 for Class A shares and 1.9095 for 1 for Class C shares. All historical per share information has been retroactively adjusted to reflect this stock split. |
| (B) | Represents the period from commencement of operations (August 15, 2016) through June 30, 2017. |
| (C) | Net asset value at the beginning of period is based on the net asset value of Institutional Class shares on August 15, 2016. |
| (D) | The net investment income (loss) per share was based on average shares outstanding for the period. |
| (E) | Total returns shown exclude the effect of applicable sales loads and fees. If these charges were included, the returns would be lower. |
| (F) | Not annualized. |
| (G) | Annualized. |
| (H) | Portfolio turnover excludes the purchases and sales of securities of the International Small Cap Fund acquired on September 11, 2020 (See Note 9 in the Notes to Financial Statements). If these transactions were included, portfolio turnover would have been higher. |
| (I) | Portfolio turnover excludes the purchases and sales of the DSM Global Growth & Income Fund merger on August 15, 2016. If these transactions were included, portfolio turnover would have been higher. |
| Touchstone International Growth Fund—Class Y | |||||
| Selected Data for a Share Outstanding Throughout Each Period | |||||
| Year Ended June 30, | Period Ended June 30, 2017(A)(B) | ||||
| 2021(A) | 2020(A) | 2019(A) | 2018(A) | ||
| Net asset value at beginning of period | $11.95 | $11.35 | $13.37 | $11.81 | $9.95(C) |
| Income (loss) from investment operations: | |||||
| Net investment income (loss) | (0.06)(D) | (—)(D)(E) | (0.01)(D) | 0.01 | (—)(E) |
| Net realized and unrealized gains (losses) on investments | 3.88 | 0.60 | (0.49) | 1.79 | 1.86 |
| Total from investment operations: | 3.82 | 0.60 | (0.50) | 1.80 | 1.86 |
| Distributions from: | |||||
| Net investment income | — | — | (0.01) | — | — |
| Realized capital gains | — | — | (1.51) | (0.24) | — |
| Total distributions | — | — | (1.52) | (0.24) | — |
| Net asset value at end of period | $15.77 | $11.95 | $11.35 | $13.37 | $11.81 |
| Total return | 31.88% | 5.28% | (1.53%) | 15.32% | 18.73%(F) |
| Ratios and supplemental data: | |||||
| Net assets at end of period (000's) | $74,507 | $867 | $2,341 | $4,553 | $161 |
| Ratio to average net assets: | |||||
| Net expenses | 0.99% | 0.99% | 0.99% | 1.03% | 1.16%(G) |
| Gross expenses | 1.25% | 2.50% | 1.89% | 1.81% | 51.68%(G) |
| Net investment income (loss) | (0.38%) | (0.01%) | (0.06%) | 0.28% | (0.10%)(G) |
| Portfolio turnover rate | 116%(H) | 74% | 103% | 109% | 72%(I) |
| Touchstone International Growth Fund—Institutional Class | |||||
| Selected Data for a Share Outstanding Throughout Each Period | |||||
| Year Ended June 30, | |||||
| 2021(A) | 2020(A) | 2019(A) | 2018(A) | 2017(A) | |
| Net asset value at beginning of period | $12.05 | $11.43 | $13.46 | $11.88 | $9.37 |
| Income (loss) from investment operations: | |||||
| Net investment income (loss) | (0.05)(D) | 0.01(D) | 0.01(D) | 0.04 | (0.01) |
| Net realized and unrealized gains (losses) on investments | 3.91 | 0.61 | (0.50) | 1.78 | 2.75 |
| Total from investment operations: | 3.86 | 0.62 | (0.49) | 1.82 | 2.74 |
| Distributions from: | |||||
| Net investment income | (0.02) | (—)(E) | (0.02) | — | — |
| Realized capital gains | — | — | (1.52) | (0.24) | (0.23) |
| Total distributions | (0.02) | — | (1.54) | (0.24) | (0.23) |
| Net asset value at end of period | $15.89 | $12.05 | $11.43 | $13.46 | $11.88 |
| Total return | 32.00% | 5.46% | (1.46%) | 15.42% | 29.63% |
| Ratios and supplemental data: | |||||
| Net assets at end of period (000's) | $23,334 | $29,285 | $31,435 | $28,159 | $23,956 |
| Ratio to average net assets: | |||||
| Net expenses | 0.89% | 0.89% | 0.89% | 1.02% | 1.06% |
| Gross expenses | 1.20% | 1.35% | 1.30% | 1.31% | 1.82% |
| Net investment income (loss) | (0.28%) | 0.09% | 0.04% | 0.28% | (0.14%) |
| Portfolio turnover rate | 116%(H) | 74% | 103% | 109% | 72%(I) |
| (A) | During the Year Ended June 30, 2021, the Fund effected the following stock split effective the close of business September 11, 2020: 1.8839 for 1 for Class Y shares and 1.8777 for 1 for Institutional Class shares. All historical per share information has been retroactively adjusted to reflect this stock split. |
| (B) | Represents the period from commencement of operations (August 15, 2016) through June 30, 2017. |
| (C) | Net asset value at the beginning of period is based on the net asset value of Institutional Class shares on August 15, 2016. |
| (D) | The net investment income (loss) per share was based on average shares outstanding for the period. |
| (E) | Less than $0.005 per share. |
| (F) | Not annualized. |
| (G) | Annualized. |
| (H) | Portfolio turnover excludes the purchases and sales of securities of the International Small Cap Fund acquired on September 11, 2020 (See Note 9 in the Notes to Financial Statements). If these transactions were included, portfolio turnover would have been higher. |
| (I) | Portfolio turnover excludes the purchases and sales of the DSM Global Growth & Income Fund merger on August 15, 2016. If these transactions were included, portfolio turnover would have been higher. |
| Touchstone Large Cap Focused Fund—Class A | ||||||
| Selected Data for a Share Outstanding Throughout Each Period | ||||||
| Year Ended June 30, | Seven Months Ended June 30, 2018(A) | Year Ended November 30, | ||||
| 2021 | 2020 | 2019 | 2017 | 2016 | ||
| Net asset value at beginning of period | $42.30 | $43.37 | $43.80 | $48.75 | $42.28 | $43.08 |
| Income (loss) from investment operations: | ||||||
| Net investment income | 0.08(B) | 0.27 | 0.38(B) | 0.23 | 0.45 | 0.53(B) |
| Net realized and unrealized gains on investments | 19.10 | 3.78 | 3.72 | 1.85 | 8.99 | 2.43 |
| Total from investment operations: | 19.18 | 4.05 | 4.10 | 2.08 | 9.44 | 2.96 |
| Distributions from: | ||||||
| Net investment income | (0.09) | (0.27) | (0.27) | (0.07) | (0.51) | (1.08) |
| Realized capital gains | (2.71) | (4.85) | (4.26) | (6.96) | (2.46) | (2.68) |
| Total distributions | (2.80) | (5.12) | (4.53) | (7.03) | (2.97) | (3.76) |
| Net asset value at end of period | $58.68 | $42.30 | $43.37 | $43.80 | $48.75 | $42.28 |
| Total return(C) | 46.68% | 9.54% | 10.51% | 4.74%(D) | 23.67% | 7.53% |
| Ratios and supplemental data: | ||||||
| Net assets at end of period (000's) | $1,541,127 | $1,120,305 | $1,170,490 | $1,218,721 | $1,321,506 | $1,350,861 |
| Ratio to average net assets: | ||||||
| Net expenses (including liquidity provider expenses)(E) | 1.01% | 1.01% | 0.97% | 0.97%(F) | 1.02% | 1.00% |
| Gross expenses (including liquidity provider expenses)(G) | 1.05% | 1.10% | 1.09% | 1.09%(F) | 1.02% | 1.00% |
| Net investment income | 0.15% | 0.66% | 0.88% | 0.88%(F) | 0.98% | 1.32% |
| Portfolio turnover rate | 16%(H) | 29%(H) | 15%(H) | 9%(D)(H) | 12%(H) | 8% |
| (A) | The Fund changed its fiscal year end from November 30 to June 30. |
| (B) | The net investment income per share was based on average shares outstanding for the period. |
| (C) | Total returns shown exclude the effect of applicable sales loads and fees. If these charges were included, the returns would be lower. |
| (D) | Not annualized. |
| (E) | The ratio of net expenses to average net assets excluding liquidity provider expenses was 1.00% 0.98%, 0.96%, 0.95% and 1.02% for the years ended June 30, 2021, 2020 and 2019, the seven months ended June 30, 2018 and the year ended November 30, 2017, respectively. |
| (F) | Annualized. |
| (G) | The ratio of gross expenses to average net assets excluding liquidity provider expenses was 1.04%, 1.07%, 1.08%, 1.07% and 1.02% for the years ended June 30, 2021, 2020 and 2019, the seven months ended June 30, 2018 and the year ended November 30, 2017, respectively. |
| (H) | Portfolio turnover excludes securities delivered from processing redemptions-in-kind. |
| Touchstone Large Cap Focused Fund—Class C | ||||||
| Selected Data for a Share Outstanding Throughout Each Period | ||||||
| Year Ended June 30, | Seven Months Ended June 30, 2018(A) | Year Ended November 30, | ||||
| 2021 | 2020 | 2019 | 2017 | 2016 | ||
| Net asset value at beginning of period | $39.16 | $40.56 | $41.29 | $46.48 | $40.44 | $41.36 |
| Income (loss) from investment operations: | ||||||
| Net investment income (loss) | (0.30)(B) | (0.19) | 0.03(B) | 0.03 | —(C) | 0.21(B) |
| Net realized and unrealized gains on investments | 17.58 | 3.64 | 3.50 | 1.74 | 8.67 | 2.33 |
| Total from investment operations: | 17.28 | 3.45 | 3.53 | 1.77 | 8.67 | 2.54 |
| Distributions from: | ||||||
| Net investment income | — | — | — | — | (0.17) | (0.78) |
| Realized capital gains | (2.71) | (4.85) | (4.26) | (6.96) | (2.46) | (2.68) |
| Total distributions | (2.71) | (4.85) | (4.26) | (6.96) | (2.63) | (3.46) |
| Net asset value at end of period | $53.73 | $39.16 | $40.56 | $41.29 | $46.48 | $40.44 |
| Total return(D) | 45.49% | 8.69% | 9.61% | 4.24%(E) | 22.69% | 6.71% |
| Ratios and supplemental data: | ||||||
| Net assets at end of period (000's) | $41,645 | $37,450 | $47,838 | $67,599 | $74,122 | $83,246 |
| Ratio to average net assets: | ||||||
| Net expenses (including liquidity provider expenses)(F) | 1.80% | 1.82% | 1.79% | 1.78%(G) | 1.82% | 1.79% |
| Gross expenses (including liquidity provider expenses)(H) | 1.88% | 1.94% | 1.90% | 1.89%(G) | 1.82% | 1.79% |
| Net investment income (loss) | (0.64%) | (0.15%) | 0.07% | 0.07%(G) | 0.18% | 0.54% |
| Portfolio turnover rate | 16%(I) | 29%(I) | 15%(I) | 9%(E)(I) | 12%(I) | 8% |
| (A) | The Fund changed its fiscal year end from November 30 to June 30. |
| (B) | The net investment income (loss) per share was based on average shares outstanding for the period. |
| (C) | Less than $0.005 per share. |
| (D) | Total returns shown exclude the effect of applicable sales loads and fees. If these charges were included, the returns would be lower. |
| (E) | Not annualized. |
| (F) | The ratio of net expenses to average net assets excluding liquidity provider expenses was 1.79%, 1.79%, 1.78%, 1.76% and 1.82% for the years ended June 30, 2021, 2020 and 2019, the seven months ended June 30, 2018 and the year ended November 30, 2017, respectively. |
| (G) | Annualized. |
| (H) | The ratio of gross expenses to average net assets excluding liquidity provider expenses was 1.87%, 1.91%, 1.89%, 1.87% and 1.82% for the years ended June 30, 2021, 2020 and 2019, the seven months ended June 30, 2018 and the year ended November 30, 2017, respectively. |
| (I) | Portfolio turnover excludes securities delivered from processing redemptions-in-kind. |
| Touchstone Large Cap Focused Fund—Class Y | ||||||
| Selected Data for a Share Outstanding Throughout Each Period | ||||||
| Year Ended June 30, | Seven Months Ended June 30, 2018(A) | Year Ended November 30, | ||||
| 2021 | 2020 | 2019 | 2017(B) | 2016 | ||
| Net asset value at beginning of period | $42.18 | $43.24 | $43.68 | $48.72 | $42.26 | $43.06 |
| Income (loss) from investment operations: | ||||||
| Net investment income | 0.22(C) | 0.40 | 0.48(C) | 0.29 | 0.56 | 0.64(C) |
| Net realized and unrealized gains on investments | 19.05 | 3.76 | 3.71 | 1.84 | 8.99 | 2.43 |
| Total from investment operations: | 19.27 | 4.16 | 4.19 | 2.13 | 9.55 | 3.07 |
| Distributions from: | ||||||
| Net investment income | (0.16) | (0.37) | (0.37) | (0.21) | (0.63) | (1.19) |
| Realized capital gains | (2.71) | (4.85) | (4.26) | (6.96) | (2.46) | (2.68) |
| Total distributions | (2.87) | (5.22) | (4.63) | (7.17) | (3.09) | (3.87) |
| Net asset value at end of period | $58.58 | $42.18 | $43.24 | $43.68 | $48.72 | $42.26 |
| Total return | 47.07% | 9.84% | 10.81% | 4.85%(D) | 24.03% | 7.84% |
| Ratios and supplemental data: | ||||||
| Net assets at end of period (000's) | $575,053 | $352,103 | $413,137 | $394,077 | $438,732 | $552,611 |
| Ratio to average net assets: | ||||||
| Net expenses (including liquidity provider expenses)(E) | 0.73% | 0.75% | 0.73% | 0.74%(F) | 0.74% | 0.72% |
| Gross expenses (including liquidity provider expenses)(G) | 0.86% | 0.91% | 0.89% | 0.90%(F) | 0.75% | 0.72% |
| Net investment income | 0.43% | 0.92% | 1.13% | 1.11%(F) | 1.26% | 1.60% |
| Portfolio turnover rate | 16%(H) | 29%(H) | 15%(H) | 9%(D)(H) | 12%(H) | 8% |
| (A) | The Fund changed its fiscal year end from November 30 to June 30. |
| (B) | Effective October 28, 2017, Class I shares of the Sentinel International Equity Fund (the “Predecessor Fund”) were reorganized into Class Y shares of the Fund. |
| (C) | The net investment income per share was based on average shares outstanding for the period. |
| (D) | Not annualized. |
| (E) | The ratio of net expenses to average net assets excluding liquidity provider expenses was 0.72%, 0.72%, 0.72%, 0.72% and 0.74% for the years ended June 30, 2021, 2020 and 2019, the seven months ended June 30, 2018 and the year ended November 30, 2017, respectively. |
| (F) | Annualized. |
| (G) | The ratio of gross expenses to average net assets excluding liquidity provider expenses was 0.85%, 0.88%, 0.88%, 0.88% and 0.75% for the years ended June 30, 2021, 2020 and 2019, the seven months ended June 30, 2018 and the year ended November 30, 2017, respectively. |
| (H) | Portfolio turnover excludes securities delivered from processing redemptions-in-kind. |
| Touchstone Large Cap Focused Fund—Institutional Class | ||||||
| Selected Data for a Share Outstanding Throughout Each Period | ||||||
| Year Ended June 30, | Seven Months Ended June 30, 2018(A) | Year Ended November 30, | ||||
| 2021 | 2020 | 2019 | 2017(B) | 2016 | ||
| Net asset value at beginning of period | $42.24 | $43.31 | $43.75 | $48.81 | $42.32 | $43.11 |
| Income (loss) from investment operations: | ||||||
| Net investment income | 0.23(C) | 0.35 | 0.51(C) | 0.34 | 0.61 | 0.70(C) |
| Net realized and unrealized gains on investments | 19.10 | 3.83 | 3.71 | 1.80 | 9.01 | 2.41 |
| Total from investment operations: | 19.33 | 4.18 | 4.22 | 2.14 | 9.62 | 3.11 |
| Distributions from: | ||||||
| Net investment income | (0.17) | (0.40) | (0.40) | (0.24) | (0.67) | (1.22) |
| Realized capital gains | (2.71) | (4.85) | (4.26) | (6.96) | (2.46) | (2.68) |
| Total distributions | (2.88) | (5.25) | (4.66) | (7.20) | (3.13) | (3.90) |
| Net asset value at end of period | $58.69 | $42.24 | $43.31 | $43.75 | $48.81 | $42.32 |
| Total return | 47.14% | 9.87% | 10.87% | 4.93%(D) | 24.14% | 7.92% |
| Ratios and supplemental data: | ||||||
| Net assets at end of period (000's) | $207,274 | $127,963 | $100,473 | $46,683 | $44,738 | $29,927 |
| Ratio to average net assets: | ||||||
| Net expenses (including liquidity provider expenses)(E) | 0.70% | 0.71% | 0.66% | 0.67%(F) | 0.68% | 0.65% |
| Gross expenses (including liquidity provider expenses)(G) | 0.81% | 0.88% | 0.85% | 0.88%(F) | 0.70% | 0.72% |
| Net investment income | 0.46% | 0.96% | 1.20% | 1.18%(F) | 1.32% | 1.72% |
| Portfolio turnover rate | 16%(H) | 29%(H) | 15%(H) | 9%(D)(H) | 12%(H) | 8% |
| (A) | The Fund changed its fiscal year end from November 30 to June 30. |
| (B) | Effective October 30, 2017, Class R6 shares of the Predecessor Fund were reorganized into Institutional Class shares of the Fund. |
| (C) | The net investment income per share was based on average shares outstanding for the period. |
| (D) | Not annualized. |
| (E) | The ratio of net expenses to average net assets excluding liquidity provider expenses was 0.69%, 0.68%, 0.65%, 0.65% and 0.68% for the years ended June 30, 2021, 2020 and 2019, the seven months ended June 30, 2018 and the year ended November 30, 2017, respectively. |
| (F) | Annualized. |
| (G) | The ratio of gross expenses to average net assets excluding liquidity provider expenses was 0.80%, 0.85%, 0.84%, 0.86% and 0.70% for the years ended June 30, 2021, 2020 and 2019, the seven months ended June 30, 2018 and the year ended November 30, 2017, respectively. |
| (H) | Portfolio turnover excludes securities delivered from processing redemptions-in-kind. |
| Touchstone Large Cap Fund—Class A | |||||
| Selected Data for a Share Outstanding Throughout Each Period | |||||
| Year Ended June 30, | |||||
| 2021 | 2020 | 2019 | 2018 | 2017 | |
| Net asset value at beginning of period | $13.04 | $14.11 | $13.27 | $11.96 | $10.49 |
| Income (loss) from investment operations: | |||||
| Net investment income | 0.11 | 0.15 | 0.09(A) | 0.09 | 0.06 |
| Net realized and unrealized gains (losses) on investments | 4.83 | (0.24) | 0.83 | 1.27 | 1.49 |
| Total from investment operations: | 4.94 | (0.09) | 0.92 | 1.36 | 1.55 |
| Distributions from: | |||||
| Net investment income | (0.12) | (0.11) | (0.08) | (0.05) | (0.08) |
| Realized capital gains | — | (0.87) | — | — | — |
| Total distributions | (0.12) | (0.98) | (0.08) | (0.05) | (0.08) |
| Net asset value at end of period | $17.86 | $13.04 | $14.11 | $13.27 | $11.96 |
| Total return(B) | 38.06% | (1.18%) | 7.04% | 11.35% | 14.82% |
| Ratios and supplemental data: | |||||
| Net assets at end of period (000's) | $4,278 | $2,989 | $4,067 | $2,975 | $5,368 |
| Ratio to average net assets: | |||||
| Net expenses (including liquidity provider expenses)(C) | 1.04% | 1.03% | 1.11% | 1.12% | 1.12% |
| Gross expenses (including liquidity provider expenses)(D) | 1.53% | 1.91% | 1.67% | 1.50% | 1.57% |
| Net investment income | 0.75% | 1.03% | 0.63% | 0.48% | 0.56% |
| Portfolio turnover rate | 15%(E) | 20% | 19%(E) | 10% | 23% |
| Touchstone Large Cap Fund—Class C | |||||
| Selected Data for a Share Outstanding Throughout Each Period | |||||
| Year Ended June 30, | |||||
| 2021 | 2020 | 2019 | 2018 | 2017 | |
| Net asset value at beginning of period | $12.79 | $13.85 | $13.04 | $11.80 | $10.37 |
| Income (loss) from investment operations: | |||||
| Net investment income (loss) | (0.10) | 0.01 | (0.02)(A) | (0.04) | (0.02) |
| Net realized and unrealized gains (losses) on investments | 4.84 | (0.20) | 0.83 | 1.28 | 1.47 |
| Total from investment operations: | 4.74 | (0.19) | 0.81 | 1.24 | 1.45 |
| Distributions from: | |||||
| Net investment income | — | — | — | — | (0.02) |
| Realized capital gains | — | (0.87) | — | — | — |
| Total distributions | — | (0.87) | — | — | (0.02) |
| Net asset value at end of period | $17.53 | $12.79 | $13.85 | $13.04 | $11.80 |
| Total return(B) | 37.06% | (1.89%) | 6.21% | 10.51% | 13.98% |
| Ratios and supplemental data: | |||||
| Net assets at end of period (000's) | $4,328 | $5,376 | $7,372 | $7,849 | $8,102 |
| Ratio to average net assets: | |||||
| Net expenses (including liquidity provider expenses)(C) | 1.79% | 1.78% | 1.86% | 1.87% | 1.87% |
| Gross expenses (including liquidity provider expenses)(D) | 2.03% | 2.09% | 2.13% | 2.12% | 2.12% |
| Net investment income (loss) | (—)(F) | 0.27% | (0.12%) | (0.27%) | (0.19%) |
| Portfolio turnover rate | 15%(E) | 20% | 19%(E) | 10% | 23% |
| (A) | The net investment income per share was based on average shares outstanding for the period. |
| (B) | Total returns shown exclude the effect of applicable sales loads and fees. If these charges were included, the returns would be lower. |
| (C) | The ratio of net expenses to average net assets excluding liquidity provider expenses for Class A and Class C was 1.03% and 1.78%, respectively, for the year ended June 30, 2021. |
| (D) | The ratio of gross expenses to average net assets excluding liquidity provider expenses for Class A and Class C was 1.52% and 2.02%, respectively, for the year ended June 30, 2021. |
| (E) | Portfolio turnover excludes securities delivered from processing redemptions-in-kind. |
| (F) | Less than 0.005%. |
| Touchstone Large Cap Fund—Class Y | |||||
| Selected Data for a Share Outstanding Throughout Each Period | |||||
| Year Ended June 30, | |||||
| 2021 | 2020 | 2019 | 2018 | 2017 | |
| Net asset value at beginning of period | $13.07 | $14.14 | $13.31 | $12.00 | $10.52 |
| Income (loss) from investment operations: | |||||
| Net investment income | 0.16 | 0.17 | 0.12(A) | 0.10 | 0.09 |
| Net realized and unrealized gains (losses) on investments | 4.83 | (0.22) | 0.84 | 1.30 | 1.49 |
| Total from investment operations: | 4.99 | (0.05) | 0.96 | 1.40 | 1.58 |
| Distributions from: | |||||
| Net investment income | (0.18) | (0.15) | (0.13) | (0.09) | (0.10) |
| Realized capital gains | — | (0.87) | — | — | — |
| Total distributions | (0.18) | (1.02) | (0.13) | (0.09) | (0.10) |
| Net asset value at end of period | $17.88 | $13.07 | $14.14 | $13.31 | $12.00 |
| Total return | 38.39% | (0.93%) | 7.31% | 11.62% | 15.13% |
| Ratios and supplemental data: | |||||
| Net assets at end of period (000's) | $270,305 | $206,798 | $213,650 | $231,984 | $222,080 |
| Ratio to average net assets: | |||||
| Net expenses (including liquidity provider expenses)(B) | 0.79% | 0.78% | 0.86% | 0.87% | 0.87% |
| Gross expenses (including liquidity provider expenses)(C) | 0.88% | 0.90% | 0.99% | 0.99% | 1.01% |
| Net investment income | 1.00% | 1.28% | 0.88% | 0.73% | 0.81% |
| Portfolio turnover rate | 15%(D) | 20% | 19%(D) | 10% | 23% |
| Touchstone Large Cap Fund—Institutional Class | |||||
| Selected Data for a Share Outstanding Throughout Each Period | |||||
| Year Ended June 30, | |||||
| 2021 | 2020 | 2019 | 2018 | 2017 | |
| Net asset value at beginning of period | $13.09 | $14.16 | $13.33 | $12.02 | $10.53 |
| Income (loss) from investment operations: | |||||
| Net investment income | 0.16 | 0.15 | 0.14(A) | 0.10 | 0.11 |
| Net realized and unrealized gains (losses) on investments | 4.86 | (0.19) | 0.83 | 1.31 | 1.49 |
| Total from investment operations: | 5.02 | (0.04) | 0.97 | 1.41 | 1.60 |
| Distributions from: | |||||
| Net investment income | (0.20) | (0.16) | (0.14) | (0.10) | (0.11) |
| Realized capital gains | — | (0.87) | — | — | — |
| Total distributions | (0.20) | (1.03) | (0.14) | (0.10) | (0.11) |
| Net asset value at end of period | $17.91 | $13.09 | $14.16 | $13.33 | $12.02 |
| Total return | 38.59% | (0.83%) | 7.43% | 11.70% | 15.31% |
| Ratios and supplemental data: | |||||
| Net assets at end of period (000's) | $90,358 | $60,402 | $59,211 | $124,759 | $97,888 |
| Ratio to average net assets: | |||||
| Net expenses (including liquidity provider expenses)(B) | 0.69% | 0.68% | 0.77% | 0.77% | 0.77% |
| Gross expenses (including liquidity provider expenses)(C) | 0.82% | 0.84% | 0.92% | 0.91% | 0.91% |
| Net investment income | 1.10% | 1.38% | 0.98% | 0.83% | 0.91% |
| Portfolio turnover rate | 15%(D) | 20% | 19%(D) | 10% | 23% |
| (A) | The net investment income per share was based on average shares outstanding for the period. |
| (B) | The ratio of net expenses to average net assets excluding liquidity provider expenses for Class Y and Institutional Class was 0.78% and 0.68%, respectively, for the year ended June 30, 2021. |
| (C) | The ratio of gross expenses to average net assets excluding liquidity provider expenses for Class Y and Institutional Class was 0.87% and 0.81%, respectively, for the year ended June 30, 2021. |
| (D) | Portfolio turnover excludes securities delivered from processing redemptions-in-kind. |
| Touchstone Large Company Growth Fund—Class A | |||||
| Selected Data for a Share Outstanding Throughout Each Period | |||||
| Year Ended June 30, | Period Ended June 30, 2017(A) | ||||
| 2021 | 2020 | 2019 | 2018 | ||
| Net asset value at beginning of period | $47.46 | $42.50 | $41.33 | $35.52 | $31.38(B) |
| Income (loss) from investment operations: | |||||
| Net investment loss | (0.15) | (0.08) | (0.56) | (0.24) | (0.19)(C) |
| Net realized and unrealized gains on investments | 16.56 | 8.19 | 4.42 | 7.19 | 5.41 |
| Total from investment operations: | 16.41 | 8.11 | 3.86 | 6.95 | 5.22 |
| Distributions from: | |||||
| Realized capital gains | (6.61) | (3.15) | (2.69) | (1.14) | (1.08) |
| Net asset value at end of period | $57.26 | $47.46 | $42.50 | $41.33 | $35.52 |
| Total return(D) | 37.33% | 20.07% | 10.39% | 19.75% | 17.31%(E) |
| Ratios and supplemental data: | |||||
| Net assets at end of period (000's) | $3,617 | $2,112 | $1,425 | $3,417 | $140 |
| Ratio to average net assets: | |||||
| Net expenses (including liquidity provider expenses)(F) | 1.06% | 1.07% | 1.23% | 1.23% | 1.23%(G) |
| Gross expenses (including liquidity provider expenses)(H) | 1.59% | 2.28% | 2.01% | 1.67% | 11.14%(G) |
| Net investment income (loss) | (0.71%) | 0.60% | (0.59%) | (0.63%) | (0.68%)(G) |
| Portfolio turnover rate | 36%(I) | 30% | 41% | 44% | 55% |
| Touchstone Large Company Growth Fund—Class C | |||||
| Selected Data for a Share Outstanding Throughout Each Period | |||||
| Year Ended June 30, | Period Ended June 30, 2017(A) | ||||
| 2021 | 2020 | 2019 | 2018 | ||
| Net asset value at beginning of period | $45.93 | $41.52 | $40.74 | $35.29 | $31.38(B) |
| Income (loss) from investment operations: | |||||
| Net investment loss | (1.42) | (0.31) | (0.40) | (0.30) | (0.38)(C) |
| Net realized and unrealized gains on investments | 16.81 | 7.87 | 3.87 | 6.89 | 5.37 |
| Total from investment operations: | 15.39 | 7.56 | 3.47 | 6.59 | 4.99 |
| Distributions from: | |||||
| Realized capital gains | (6.61) | (3.15) | (2.69) | (1.14) | (1.08) |
| Net asset value at end of period | $54.71 | $45.93 | $41.52 | $40.74 | $35.29 |
| Total return(D) | 36.28% | 19.19% | 9.55% | 18.88% | 16.52%(E) |
| Ratios and supplemental data: | |||||
| Net assets at end of period (000's) | $473 | $592 | $396 | $236 | $31 |
| Ratio to average net assets: | |||||
| Net expenses (including liquidity provider expenses)(F) | 1.81% | 1.82% | 1.98% | 1.98% | 1.98%(G) |
| Gross expenses (including liquidity provider expenses)(H) | 3.39% | 4.64% | 4.38% | 8.12% | 257.02%(G) |
| Net investment loss | (1.46%) | (1.35%) | (1.34%) | (1.38%) | (1.43%)(G) |
| Portfolio turnover rate | 36%(I) | 30% | 41% | 44% | 55% |
| (A) | Represents the period from commencement of operations (August 15, 2016) through June 30, 2017. |
| (B) | Net asset value at the beginning of period is based on the net asset value of Institutional Class shares on August 15, 2016. |
| (C) | The net investment income (loss) per share was based on average shares outstanding for the period. |
| (D) | Total returns shown exclude the effect of applicable sales loads and fees. If these charges were included, the returns would be lower. |
| (E) | Not annualized. |
| (F) | The ratio of net expenses to average net assets excluding liquidity provider expenses for Class A was 1.04% and for Class C was 1.79% for the year ended June 30, 2021. |
| (G) | Annualized. |
| (H) | The ratio of gross expenses to average net assets excluding liquidity provider expenses for Class A was 1.57% and for Class C was 3.37% for the year ended June 30, 2021. |
| (I) | Portfolio turnover excludes securities delivered from processing a redemption-in-kind. |
| Touchstone Large Company Growth Fund—Class Y | |||||
| Selected Data for a Share Outstanding Throughout Each Period | |||||
| Year Ended June 30, | Period Ended June 30, 2017(A) | ||||
| 2021 | 2020 | 2019 | 2018 | ||
| Net asset value at beginning of period | $47.97 | $42.82 | $41.53 | $35.60 | $31.38(B) |
| Income (loss) from investment operations: | |||||
| Net investment loss | (0.26) | (0.12) | (0.12) | (0.13) | (0.12)(C) |
| Net realized and unrealized gains on investments | 17.00 | 8.42 | 4.10 | 7.20 | 5.42 |
| Total from investment operations: | 16.74 | 8.30 | 3.98 | 7.07 | 5.30 |
| Distributions from: | |||||
| Realized capital gains | (6.61) | (3.15) | (2.69) | (1.14) | (1.08) |
| Net asset value at end of period | $58.10 | $47.97 | $42.82 | $41.53 | $35.60 |
| Total return | 37.64% | 20.38% | 10.66% | 20.02% | 17.57%(D) |
| Ratios and supplemental data: | |||||
| Net assets at end of period (000's) | $28,952 | $24,062 | $19,580 | $15,961 | $9,938 |
| Ratio to average net assets: | |||||
| Net expenses (including liquidity provider expenses)(E) | 0.81% | 0.82% | 0.98% | 0.98% | 0.98%(F) |
| Gross expenses (including liquidity provider expenses)(G) | 0.96% | 1.04% | 1.16% | 1.12% | 1.12%(F) |
| Net investment loss | (0.46%) | (0.35%) | (0.34%) | (0.38%) | (0.42%)(F) |
| Portfolio turnover rate | 36%(H) | 30% | 41% | 44% | 55% |
| Touchstone Large Company Growth Fund—Institutional Class | |||||
| Selected Data for a Share Outstanding Throughout Each Period | |||||
| Year Ended June 30, | |||||
| 2021 | 2020 | 2019 | 2018 | 2017 | |
| Net asset value at beginning of period | $48.18 | $42.95 | $41.61 | $35.63 | $29.15 |
| Income (loss) from investment operations: | |||||
| Net investment loss | (0.21) | (0.12) | (0.10) | (0.11) | (0.12)(C) |
| Net realized and unrealized gains on investments | 17.10 | 8.50 | 4.13 | 7.23 | 7.68 |
| Total from investment operations: | 16.89 | 8.38 | 4.03 | 7.12 | 7.56 |
| Distributions from: | |||||
| Realized capital gains | (6.61) | (3.15) | (2.69) | (1.14) | (1.08) |
| Net asset value at end of period | $58.46 | $48.18 | $42.95 | $41.61 | $35.63 |
| Total return | 37.80% | 20.51% | 10.74% | 20.17% | 26.67% |
| Ratios and supplemental data: | |||||
| Net assets at end of period (000's) | $229,690 | $199,601 | $204,391 | $224,379 | $189,444 |
| Ratio to average net assets: | |||||
| Net expenses (including liquidity provider expenses)(E) | 0.71% | 0.73% | 0.88% | 0.88% | 0.89% |
| Gross expenses (including liquidity provider expenses)(G) | 0.85% | 0.86% | 0.99% | 0.98% | 1.02% |
| Net investment loss | (0.36%) | (0.25%) | (0.24%) | (0.28%) | (0.39%) |
| Portfolio turnover rate | 36%(H) | 30% | 41% | 44% | 55% |
| (A) | Represents the period from commencement of operations (August 15, 2016) through June 30, 2017. |
| (B) | Net asset value at the beginning of period is based on the net asset value of Institutional Class shares on August 15, 2016. |
| (C) | The net investment income (loss) per share was based on average shares outstanding for the period. |
| (D) | Not annualized. |
| (E) | The ratio of net expenses to average net assets excluding liquidity provider expenses for Class Y was 0.79% and for Institutional Class was 0.69% for the year ended June 30, 2021. |
| (F) | Annualized. |
| (G) | The ratio of gross expenses to average net assets excluding liquidity provider expenses for Class Y was 0.94% and for Institutional Class was 0.83% for the year ended June 30, 2021. |
| (H) | Portfolio turnover excludes securities delivered from processing a redemption-in-kind. |
| Touchstone Ohio Tax-Free Bond Fund—Class A | |||||
| Selected Data for a Share Outstanding Throughout Each Period | |||||
| Year Ended June 30, | |||||
| 2021 | 2020 | 2019 | 2018 | 2017 | |
| Net asset value at beginning of period | $11.83 | $11.63 | $11.33 | $11.55 | $12.04 |
| Income (loss) from investment operations: | |||||
| Net investment income | 0.28 | 0.30 | 0.32 | 0.33 | 0.35 |
| Net realized and unrealized gains (losses) on investments | 0.06 | 0.21 | 0.30 | (0.22) | (0.47) |
| Total from investment operations: | 0.34 | 0.51 | 0.62 | 0.11 | (0.12) |
| Distributions from: | |||||
| Net investment income | (0.28) | (0.30) | (0.32) | (0.33) | (0.35) |
| Realized capital gains | — | (0.01) | — | — | (0.02) |
| Total distributions | (0.28) | (0.31) | (0.32) | (0.33) | (0.37) |
| Net asset value at end of period | $11.89 | $11.83 | $11.63 | $11.33 | $11.55 |
| Total return(A) | 2.90% | 4.38% | 5.60% | 0.99% | (1.03%) |
| Ratios and supplemental data: | |||||
| Net assets at end of period (000's) | $30,870 | $32,060 | $33,515 | $35,728 | $42,818 |
| Ratio to average net assets: | |||||
| Net expenses | 0.85% | 0.85% | 0.85% | 0.85% | 0.85% |
| Gross expenses | 1.15% | 1.18% | 1.15% | 1.13% | 1.13% |
| Net investment income | 2.35% | 2.53% | 2.85% | 2.91% | 2.98% |
| Portfolio turnover rate | 21% | 33% | 53% | 47% | 34% |
| Touchstone Ohio Tax-Free Bond Fund—Class C | |||||
| Selected Data for a Share Outstanding Throughout Each Period | |||||
| Year Ended June 30, | |||||
| 2021 | 2020 | 2019 | 2018 | 2017 | |
| Net asset value at beginning of period | $11.85 | $11.65 | $11.33 | $11.57 | $12.06 |
| Income (loss) from investment operations: | |||||
| Net investment income | 0.18 | 0.21 | 0.23 | 0.25 | 0.26 |
| Net realized and unrealized gains (losses) on investments | 0.07 | 0.21 | 0.33 | (0.24) | (0.47) |
| Total from investment operations: | 0.25 | 0.42 | 0.56 | 0.01 | (0.21) |
| Distributions from: | |||||
| Net investment income | (0.19) | (0.21) | (0.24) | (0.25) | (0.26) |
| Realized capital gains | — | (0.01) | — | — | (0.02) |
| Total distributions | (0.19) | (0.22) | (0.24) | (0.25) | (0.28) |
| Net asset value at end of period | $11.91 | $11.85 | $11.65 | $11.33 | $11.57 |
| Total return(A) | 2.13% | 3.61% | 4.97% | 0.06% | (1.77%) |
| Ratios and supplemental data: | |||||
| Net assets at end of period (000's) | $1,180 | $2,050 | $2,756 | $5,363 | $6,515 |
| Ratio to average net assets: | |||||
| Net expenses | 1.60% | 1.60% | 1.60% | 1.60% | 1.60% |
| Gross expenses | 2.27% | 2.32% | 2.08% | 2.01% | 2.03% |
| Net investment income | 1.60% | 1.78% | 2.10% | 2.16% | 2.23% |
| Portfolio turnover rate | 21% | 33% | 53% | 47% | 34% |
| (A) | Total returns shown exclude the effect of applicable sales loads and fees. If these charges were included, the returns would be lower. |
| Touchstone Ohio Tax-Free Bond Fund—Class Y | |||||
| Selected Data for a Share Outstanding Throughout Each Period | |||||
| Year Ended June 30, | Period Ended June 30, 2017(A) | ||||
| 2021 | 2020 | 2019 | 2018 | ||
| Net asset value at beginning of period | $11.85 | $11.64 | $11.33 | $11.56 | $12.00(B) |
| Income (loss) from investment operations: | |||||
| Net investment income | 0.31 | 0.33 | 0.35 | 0.29 | 0.38 |
| Net realized and unrealized gains (losses) on investments | 0.05 | 0.22 | 0.31 | (0.16) | (0.49) |
| Total from investment operations: | 0.36 | 0.55 | 0.66 | 0.13 | (0.11) |
| Distributions from: | |||||
| Net investment income | (0.31) | (0.33) | (0.35) | (0.36) | (0.31) |
| Realized capital gains | — | (0.01) | — | — | (0.02) |
| Total distributions | (0.31) | (0.34) | (0.35) | (0.36) | (0.33) |
| Net asset value at end of period | $11.90 | $11.85 | $11.64 | $11.33 | $11.56 |
| Total return | 3.07% | 4.73% | 5.96% | 1.15% | (0.90%)(C) |
| Ratios and supplemental data: | |||||
| Net assets at end of period (000's) | $3,449 | $2,616 | $3,031 | $4,596 | $2 |
| Ratio to average net assets: | |||||
| Net expenses | 0.60% | 0.60% | 0.60% | 0.60% | 0.60%(D) |
| Gross expenses | 1.25% | 1.31% | 1.05% | 1.16% | 298.27%(D) |
| Net investment income | 2.60% | 2.78% | 3.10% | 3.16% | 4.00%(D) |
| Portfolio turnover rate | 21% | 33% | 53% | 47% | 34% |
| Touchstone Ohio Tax-Free Bond Fund—Institutional Class | |||||
| Selected Data for a Share Outstanding Throughout Each Period | |||||
| Year Ended June 30, | Period Ended June 30, 2017(A) | ||||
| 2021 | 2020 | 2019 | 2018 | ||
| Net asset value at beginning of period | $11.84 | $11.64 | $11.33 | $11.56 | $12.00(B) |
| Income (loss) from investment operations: | |||||
| Net investment income | 0.32 | 0.33 | 0.36 | 0.30 | 0.39 |
| Net realized and unrealized gains (losses) on investments | 0.06 | 0.21 | 0.31 | (0.16) | (0.50) |
| Total from investment operations: | 0.38 | 0.54 | 0.67 | 0.14 | (0.11) |
| Distributions from: | |||||
| Net investment income | (0.32) | (0.33) | (0.36) | (0.37) | (0.31) |
| Realized capital gains | — | (0.01) | — | — | (0.02) |
| Total distributions | (0.32) | (0.34) | (0.36) | (0.37) | (0.33) |
| Net asset value at end of period | $11.90 | $11.84 | $11.64 | $11.33 | $11.56 |
| Total return | 3.20% | 4.69% | 6.05% | 1.18% | (0.90%)(C) |
| Ratios and supplemental data: | |||||
| Net assets at end of period (000's) | $14,481 | $12,785 | $7,913 | $560 | $2 |
| Ratio to average net assets: | |||||
| Net expenses | 0.55% | 0.55% | 0.55% | 0.55% | 0.55%(D) |
| Gross expenses | 0.85% | 0.91% | 0.96% | 2.54% | 298.26%(D) |
| Net investment income | 2.65% | 2.83% | 3.15% | 3.21% | 4.04%(D) |
| Portfolio turnover rate | 21% | 33% | 53% | 47% | 34% |
| (A) | Represents the period from commencement of operations (August 31, 2016) through June 30, 2017. |
| (B) | Net asset value at the beginning of period is based on the net asset value of Class A shares on August 31, 2016. |
| (C) | Not annualized. |
| (D) | Annualized. |
| Touchstone Small Company Fund—Class A | ||||||
| Selected Data for a Share Outstanding Throughout Each Period | ||||||
| Year Ended June 30, | Seven Months Ended June 30, 2018(A) | Year Ended November 30, | ||||
| 2021 | 2020 | 2019 | 2017 | 2016 | ||
| Net asset value at beginning of period | $4.06 | $4.83 | $5.53 | $5.64 | $5.19 | $5.58 |
| Income (loss) from investment operations: | ||||||
| Net investment loss | (0.03) | (0.02) | (0.01) | (0.01) | (0.02) | (0.02)(B) |
| Net realized and unrealized gains (losses) on investments | 2.65 | (0.47) | (0.07) | 0.37 | 0.89 | 0.57 |
| Total from investment operations: | 2.62 | (0.49) | (0.08) | 0.36 | 0.87 | 0.55 |
| Distributions from: | ||||||
| Realized capital gains | (0.01) | (0.28) | (0.62) | (0.47) | (0.42) | (0.94) |
| Net asset value at end of period | $6.67 | $4.06 | $4.83 | $5.53 | $5.64 | $5.19 |
| Total return(C) | 64.45% | (10.82%) | (0.73%) | 6.89%(D) | 17.95% | 12.52% |
| Ratios and supplemental data: | ||||||
| Net assets at end of period (000's) | $608,513 | $420,822 | $589,664 | $661,866 | $677,055 | $685,807 |
| Ratio to average net assets: | ||||||
| Net expenses (including liquidity provider expenses)(E) | 1.20% | 1.15% | 1.12% | 1.10%(F) | 1.18% | 1.22% |
| Gross expenses (including liquidity provider expenses)(G) | 1.20% | 1.24% | 1.20% | 1.18%(F) | 1.18% | 1.22% |
| Net investment loss | (0.45%) | (0.32%) | (0.26%) | (0.26%)(F) | (0.49%) | (0.38%) |
| Portfolio turnover rate | 80%(H) | 81% | 94%(H)(I) | 30%(D) | 82% | 61% |
| (A) | The Fund changed its fiscal year end from November 30 to June 30. |
| (B) | The net investment income (loss) per share was based on average shares outstanding for the period. |
| (C) | Total returns shown exclude the effect of applicable sales loads and fees. If these charges were included, the returns would be lower. |
| (D) | Not annualized. |
| (E) | The ratio of net expenses to average net assets excluding liquidity provider expenses for Class A was 1.18% for the year ended June 30, 2021. |
| (F) | Annualized. |
| (G) | The ratio of gross expenses to average net assets excluding liquidity provider expenses for Class A was 1.18% for the year ended June 30, 2021. |
| (H) | Portfolio turnover excludes securities delivered from processing redemptions-in-kind. |
| (I) | Portfolio turnover excludes the purchases and sales of securities by the Touchstone Small Cap Growth Fund acquired on September 21, 2018. If these transactions were included, portfolio turnover would have been higher. |
| Touchstone Small Company Fund—Class C | ||||||
| Selected Data for a Share Outstanding Throughout Each Period | ||||||
| Year Ended June 30, | Seven Months Ended June 30, 2018(A) | Year Ended November 30, | ||||
| 2021 | 2020 | 2019 | 2017 | 2016 | ||
| Net asset value at beginning of period | $1.99 | $2.52 | $3.23 | $3.50 | $3.39 | $4.01 |
| Income (loss) from investment operations: | ||||||
| Net investment loss | (0.04) | (0.05) | (0.05) | (0.02) | (0.10) | (0.03)(B) |
| Net realized and unrealized gains (losses) on investments | 1.29 | (0.20) | (0.04) | 0.22 | 0.63 | 0.35 |
| Total from investment operations: | 1.25 | (0.25) | (0.09) | 0.20 | 0.53 | 0.32 |
| Distributions from: | ||||||
| Realized capital gains | (0.01) | (0.28) | (0.62) | (0.47) | (0.42) | (0.94) |
| Net asset value at end of period | $3.23 | $1.99 | $2.52 | $3.23 | $3.50 | $3.39 |
| Total return(C) | 62.65% | (11.22%) | (1.65%) | 6.51%(D) | 17.36% | 11.48% |
| Ratios and supplemental data: | ||||||
| Net assets at end of period (000's) | $26,123 | $21,204 | $39,390 | $97,136 | $104,051 | $110,842 |
| Ratio to average net assets: | ||||||
| Net expenses (including liquidity provider expenses)(E) | 1.97% | 1.95% | 1.88% | 1.85%(F) | 1.92% | 1.95% |
| Gross expenses (including liquidity provider expenses)(G) | 2.05% | 2.07% | 1.96% | 1.93%(F) | 1.92% | 1.95% |
| Net investment loss | (1.22%) | (1.12%) | (1.01%) | (1.02%)(F) | (1.23%) | (1.10%) |
| Portfolio turnover rate | 80%(H) | 81% | 94%(H)(I) | 30%(D) | 82% | 61% |
| (A) | The Fund changed its fiscal year end from November 30 to June 30. |
| (B) | The net investment income (loss) per share was based on average shares outstanding for the period. |
| (C) | Total returns shown exclude the effect of applicable sales loads and fees. If these charges were included, the returns would be lower. |
| (D) | Not annualized. |
| (E) | The ratio of net expenses to average net assets excluding liquidity provider expenses for Class C was 1.95% for the year ended June 30, 2021. |
| (F) | Annualized. |
| (G) | The ratio of gross expenses to average net assets excluding liquidity provider expenses for Class C was 2.03% for the year ended June 30, 2021. |
| (H) | Portfolio turnover excludes securities delivered from processing redemptions-in-kind. |
| (I) | Portfolio turnover excludes the purchases and sales of securities by the Touchstone Small Cap Growth Fund acquired on September 21, 2018. If these transactions were included, portfolio turnover would have been higher. |
| Touchstone Small Company Fund—Class Y | ||||||
| Selected Data for a Share Outstanding Throughout Each Period | ||||||
| Year Ended June 30, | Seven Months Ended June 30, 2018(A) | Year Ended November 30, | ||||
| 2021 | 2020 | 2019 | 2017(B) | 2016 | ||
| Net asset value at beginning of period | $4.53 | $5.33 | $6.04 | $6.10 | $5.56 | $5.89 |
| Income (loss) from investment operations: | ||||||
| Net investment income (loss) | (0.01) | (—)(C) | (—)(C) | (—)(C) | (0.06) | —(C)(D) |
| Net realized and unrealized gains (losses) on investments | 2.94 | (0.52) | (0.09) | 0.41 | 1.02 | 0.61 |
| Total from investment operations: | 2.93 | (0.52) | (0.09) | 0.41 | 0.96 | 0.61 |
| Distributions from: | ||||||
| Net investment income | —(C) | — | (—)(C) | — | — | — |
| Realized capital gains | (0.01) | (0.28) | (0.62) | (0.47) | (0.42) | (0.94) |
| Total distributions | (0.01) | (0.28) | (0.62) | (0.47) | (0.42) | (0.94) |
| Net asset value at end of period | $7.45 | $4.53 | $5.33 | $6.04 | $6.10 | $5.56 |
| Total return | 64.61% | (10.35%) | (0.79%) | 7.21%(E) | 18.41% | 12.95% |
| Ratios and supplemental data: | ||||||
| Net assets at end of period (000's) | $282,428 | $189,336 | $326,021 | $383,050 | $388,404 | $257,483 |
| Ratio to average net assets: | ||||||
| Net expenses (including liquidity provider expenses)(F) | 0.91% | 0.89% | 0.87% | 0.84%(G) | 0.85% | 0.89% |
| Gross expenses (including liquidity provider expenses)(H) | 0.99% | 0.98% | 0.95% | 0.92%(G) | 0.85% | 0.89% |
| Net investment income (loss) | (0.16%) | (0.06%) | 0.00%(C) | (0.01%)(G) | (0.16%) | (0.04%) |
| Portfolio turnover rate | 80%(I) | 81% | 94%(J) | 30%(E) | 82% | 61% |
| (A) | The Fund changed its fiscal year end from November 30 to June 30. |
| (B) | Effective October 28, 2017, Class I shares of the Sentinel Small Company Fund (the “Predecessor Fund”) were reorganized into Class Y shares of the Fund. |
| (C) | Less than $0.005 per share or 0.005%. |
| (D) | The net investment income (loss) per share was based on average shares outstanding for the period. |
| (E) | Not annualized. |
| (F) | The ratio of net expenses to average net assets excluding liquidity provider expenses for Class Y was 0.89% for the year ended June 30, 2021. |
| (G) | Annualized. |
| (H) | The ratio of gross expenses to average net assets excluding liquidity provider expenses for Class Y was 0.97% for the year ended June 30, 2021. |
| (I) | Portfolio turnover excludes securities delivered from processing redemptions-in-kind. |
| (J) | Portfolio turnover excludes the purchases and sales of securities by the Touchstone Small Cap Growth Fund acquired on September 21, 2018. If these transactions were included, portfolio turnover would have been higher. |
| Touchstone Small Company Fund—Institutional Class | |||||
| Selected Data for a Share Outstanding Throughout Each Period | |||||
| Year Ended June 30, | Seven Months Ended June 30, 2018(A) | Period Ended November 30, 2017(B) | |||
| 2021 | 2020 | 2019 | |||
| Net asset value at beginning of period | $4.52 | $5.32 | $6.04 | $6.10 | $5.80 |
| Income (loss) from investment operations: | |||||
| Net investment income (loss) | (—)(C) | —(C) | —(C) | —(C) | (—)(C) |
| Net realized and unrealized gains (losses) on investments | 2.93 | (0.52) | (0.10) | 0.41 | 0.30 |
| Total from investment operations: | 2.93 | (0.52) | (0.10) | 0.41 | 0.30 |
| Distributions from: | |||||
| Net investment income | —(C) | — | (—)(C) | — | — |
| Realized capital gains | (0.01) | (0.28) | (0.62) | (0.47) | — |
| Total distributions | (0.01) | (0.28) | (0.62) | (0.47) | — |
| Net asset value at end of period | $7.44 | $4.52 | $5.32 | $6.04 | $6.10 |
| Total return | 64.75% | (10.37%) | (0.91%) | 7.21%(D) | 5.17%(D) |
| Ratios and supplemental data: | |||||
| Net assets at end of period (000's) | $18,770 | $11,269 | $2,216 | $8 | $3 |
| Ratio to average net assets: | |||||
| Net expenses (including liquidity provider expenses)(E) | 0.81% | 0.79% | 0.79% | 0.79%(F) | 0.79%(F) |
| Gross expenses (including liquidity provider expenses)(G) | 0.99% | 1.13% | 2.52% | 275.86%(F) | 2,069.15%(F) |
| Net investment income (loss) | (0.06%) | 0.05% | 0.08% | 0.05%(F) | (0.70%)(F) |
| Portfolio turnover rate | 80%(H) | 81% | 94%(H)(I) | 30%(D) | 82% |
| (A) | The Fund changed its fiscal year end from November 30 to June 30. |
| (B) | Represents the period from commencement of operations (October 30, 2017) through November 30, 2017. |
| (C) | Less than $0.005 per share. |
| (D) | Not annualized. |
| (E) | The ratio of net expenses to average net assets excluding liquidity provider expenses for Instituitional Class was 0.79% for the year ended June 30, 2021. |
| (F) | Annualized. |
| (G) | The ratio of gross expenses to average net assets excluding liquidity provider expenses for Institutional Class was 0.97% for the year ended June 30, 2021. |
| (H) | Portfolio turnover excludes securities delivered from processing redemptions-in-kind. |
| (I) | Portfolio turnover excludes the purchases and sales of securities by the Touchstone Small Cap Growth Fund acquired on September 21, 2018. If these transactions were included, portfolio turnover would have been higher. |
| Touchstone Small Company Fund—Class R6 | ||||||
| Selected Data for a Share Outstanding Throughout Each Period | ||||||
| Year Ended June 30, | Seven Months Ended June 30, 2018(A) | Year Ended November 30, | ||||
| 2021 | 2020 | 2019 | 2017 | 2016 | ||
| Net asset value at beginning of period | $4.19 | $4.95 | $5.65 | $5.73 | $5.24 | $5.60 |
| Income (loss) from investment operations: | ||||||
| Net investment income (loss) | (—)(B) | 0.01 | 0.01 | —(B) | (0.03) | 0.01(C) |
| Net realized and unrealized gains (losses) on investments | 2.73 | (0.49) | (0.08) | 0.39 | 0.94 | 0.57 |
| Total from investment operations: | 2.73 | (0.48) | (0.07) | 0.39 | 0.91 | 0.58 |
| Distributions from: | ||||||
| Net investment income | (—)(B) | — | (0.01) | — | — | — |
| Realized capital gains | (0.01) | (0.28) | (0.62) | (0.47) | (0.42) | (0.94) |
| Total distributions | (0.01) | (0.28) | (0.63) | (0.47) | (0.42) | (0.94) |
| Net asset value at end of period | $6.91 | $4.19 | $4.95 | $5.65 | $5.73 | $5.24 |
| Total return | 65.08% | (10.35%) | (0.59%) | 7.33%(D) | 18.58% | 13.07% |
| Ratios and supplemental data: | ||||||
| Net assets at end of period (000's) | $63,766 | $64,567 | $137,585 | $76,246 | $67,052 | $13,000 |
| Ratio to average net assets: | ||||||
| Net expenses (including liquidity provider expenses)(E) | 0.81% | 0.76% | 0.73% | 0.73%(F) | 0.75% | 0.73% |
| Gross expenses (including liquidity provider expenses)(G) | 0.89% | 0.88% | 0.84% | 0.84%(F) | 0.77% | 0.99% |
| Net investment income (loss) | (0.06%) | 0.07% | 0.14% | 0.10%(F) | (0.07%) | 0.16% |
| Portfolio turnover rate | 80%(H) | 81% | 94%(H)(I) | 30%(D) | 82% | 61% |
| (A) | The Fund changed its fiscal year end from November 30 to June 30. |
| (B) | Less than $0.005 per share. |
| (C) | The net investment income (loss) per share was based on average shares outstanding for the period. |
| (D) | Not annualized. |
| (E) | The ratio of net expenses to average net assets excluding liquidity provider expenses for Class R6 was 0.79% for the year ended June 30, 2021. |
| (F) | Annualized. |
| (G) | The ratio of gross expenses to average net assets excluding liquidity provider expenses for Class R6 was 0.87% for the year ended June 30, 2021. |
| (H) | Portfolio turnover excludes securities delivered from processing redemptions-in-kind. |
| (I) | Portfolio turnover excludes the purchases and sales of securities by the Touchstone Small Cap Growth Fund acquired on September 21, 2018. If these transactions were included, portfolio turnover would have been higher. |
| Touchstone Value Fund—Class A | |||||
| Selected Data for a Share Outstanding Throughout Each Period | |||||
| Year Ended June 30, | |||||
| 2021 | 2020 | 2019 | 2018 | 2017 | |
| Net asset value at beginning of period | $7.95 | $9.41 | $9.92 | $10.13 | $8.84 |
| Income (loss) from investment operations: | |||||
| Net investment income | 0.10 | 0.13 | 0.16 | 0.14 | 0.19 |
| Net realized and unrealized gains (losses) on investments | 3.62 | (0.98) | 0.57 | 0.55 | 1.30 |
| Total from investment operations: | 3.72 | (0.85) | 0.73 | 0.69 | 1.49 |
| Distributions from: | |||||
| Net investment income | (0.10) | (0.12) | (0.16) | (0.14) | (0.18) |
| Realized capital gains | (0.16) | (0.49) | (1.08) | (0.76) | (0.02) |
| Total distributions | (0.26) | (0.61) | (1.24) | (0.90) | (0.20) |
| Net asset value at end of period | $11.41 | $7.95 | $9.41 | $9.92 | $10.13 |
| Total return(A) | 47.49% | (9.83%) | 8.53% | 6.92% | 16.92% |
| Ratios and supplemental data: | |||||
| Net assets at end of period (000's) | $33,052 | $24,567 | $32,964 | $36,968 | $43,607 |
| Ratio to average net assets: | |||||
| Net expenses | 1.08% | 1.08% | 1.08% | 1.08% | 1.08% |
| Gross expenses | 1.24% | 1.26% | 1.26% | 1.26% | 1.24% |
| Net investment income | 1.08% | 1.37% | 1.67% | 1.42% | 1.86% |
| Portfolio turnover rate | 37% | 57% | 37%(B) | 24% | 29% |
| Touchstone Value Fund—Class C | |||||
| Selected Data for a Share Outstanding Throughout Each Period | |||||
| Year Ended June 30, | |||||
| 2021 | 2020 | 2019 | 2018 | 2017 | |
| Net asset value at beginning of period | $7.93 | $9.38 | $9.89 | $10.10 | $8.81 |
| Income (loss) from investment operations: | |||||
| Net investment income | 0.03 | 0.06 | 0.09 | 0.08 | 0.12 |
| Net realized and unrealized gains (losses) on investments | 3.61 | (0.97) | 0.56 | 0.54 | 1.29 |
| Total from investment operations: | 3.64 | (0.91) | 0.65 | 0.62 | 1.41 |
| Distributions from: | |||||
| Net investment income | (0.03) | (0.05) | (0.08) | (0.07) | (0.10) |
| Realized capital gains | (0.16) | (0.49) | (1.08) | (0.76) | (0.02) |
| Total distributions | (0.19) | (0.54) | (1.16) | (0.83) | (0.12) |
| Net asset value at end of period | $11.38 | $7.93 | $9.38 | $9.89 | $10.10 |
| Total return(A) | 46.40% | (10.49%) | 7.72% | 6.12% | 16.06% |
| Ratios and supplemental data: | |||||
| Net assets at end of period (000's) | $1,943 | $2,175 | $3,175 | $3,654 | $4,503 |
| Ratio to average net assets: | |||||
| Net expenses | 1.83% | 1.83% | 1.83% | 1.83% | 1.83% |
| Gross expenses | 2.46% | 2.43% | 2.35% | 2.21% | 2.12% |
| Net investment income | 0.33% | 0.62% | 0.92% | 0.68% | 1.11% |
| Portfolio turnover rate | 37% | 57% | 37%(B) | 24% | 29% |
| (A) | Total returns shown exclude the effect of applicable sales loads and fees. If these charges were included, the returns would be lower. |
| (B) | Portfolio turnover excludes securities delivered from processing redemptions-in-kind. |
| Touchstone Value Fund—Class Y | |||||
| Selected Data for a Share Outstanding Throughout Each Period | |||||
| Year Ended June 30, | |||||
| 2021 | 2020 | 2019 | 2018 | 2017 | |
| Net asset value at beginning of period | $7.98 | $9.45 | $9.96 | $10.17 | $8.87 |
| Income (loss) from investment operations: | |||||
| Net investment income | 0.13 | 0.15 | 0.19 | 0.17 | 0.20 |
| Net realized and unrealized gains (losses) on investments | 3.64 | (0.98) | 0.57 | 0.55 | 1.32 |
| Total from investment operations: | 3.77 | (0.83) | 0.76 | 0.72 | 1.52 |
| Distributions from: | |||||
| Net investment income | (0.13) | (0.15) | (0.19) | (0.17) | (0.20) |
| Realized capital gains | (0.16) | (0.49) | (1.08) | (0.76) | (0.02) |
| Total distributions | (0.29) | (0.64) | (1.27) | (0.93) | (0.22) |
| Net asset value at end of period | $11.46 | $7.98 | $9.45 | $9.96 | $10.17 |
| Total return | 47.93% | (9.64%) | 8.82% | 7.19% | 17.28% |
| Ratios and supplemental data: | |||||
| Net assets at end of period (000's) | $100,542 | $75,028 | $92,928 | $81,988 | $83,974 |
| Ratio to average net assets: | |||||
| Net expenses | 0.83% | 0.80% | 0.79% | 0.81% | 0.83% |
| Gross expenses | 0.95% | 0.96% | 0.94% | 0.95% | 0.97% |
| Net investment income | 1.33% | 1.64% | 1.96% | 1.70% | 2.11% |
| Portfolio turnover rate | 37% | 57% | 37%(A) | 24% | 29% |
| Touchstone Value Fund—Institutional Class | |||||
| Selected Data for a Share Outstanding Throughout Each Period | |||||
| Year Ended June 30, | |||||
| 2021 | 2020 | 2019 | 2018 | 2017 | |
| Net asset value at beginning of period | $7.96 | $9.42 | $9.93 | $10.14 | $8.85 |
| Income (loss) from investment operations: | |||||
| Net investment income | 0.14 | 0.16 | 0.20 | 0.19 | 0.22 |
| Net realized and unrealized gains (losses) on investments | 3.63 | (0.97) | 0.57 | 0.55 | 1.31 |
| Total from investment operations: | 3.77 | (0.81) | 0.77 | 0.74 | 1.53 |
| Distributions from: | |||||
| Net investment income | (0.14) | (0.16) | (0.20) | (0.19) | (0.22) |
| Realized capital gains | (0.16) | (0.49) | (1.08) | (0.76) | (0.02) |
| Total distributions | (0.30) | (0.65) | (1.28) | (0.95) | (0.24) |
| Net asset value at end of period | $11.43 | $7.96 | $9.42 | $9.93 | $10.14 |
| Total return | 48.12% | (9.43%) | 8.96% | 7.34% | 17.38% |
| Ratios and supplemental data: | |||||
| Net assets at end of period (000's) | $289,120 | $153,945 | $208,686 | $262,467 | $249,035 |
| Ratio to average net assets: | |||||
| Net expenses | 0.68% | 0.68% | 0.68% | 0.68% | 0.68% |
| Gross expenses | 0.88% | 0.90% | 0.89% | 0.87% | 0.86% |
| Net investment income | 1.48% | 1.77% | 2.07% | 1.82% | 2.26% |
| Portfolio turnover rate | 37% | 57% | 37%(A) | 24% | 29% |
| (A) | Portfolio turnover excludes securities delivered from processing redemptions-in-kind. |
| Touchstone Balanced Fund ("Balanced Fund”) |
| Touchstone International Equity Fund ("International Equity Fund”) |
| Touchstone International Growth Fund (formerly Touchstone International Small Cap Fund) ("International Growth Fund”) |
| Touchstone Large Cap Focused Fund ("Large Cap Focused Fund”) |
| Touchstone Large Cap Fund ("Large Cap Fund”) |
| Touchstone Large Company Growth Fund ("Large Company Growth Fund”) |
| Touchstone Ohio Tax-Free Bond Fund ("Ohio Tax-Free Bond Fund”) |
| Touchstone Small Company Fund ("Small Company Fund”) |
| Touchstone Value Fund ("Value Fund”) |
| Class A | Class C | Class Y | Institutional Class | Class R6 | |
| Balanced Fund | X | X | X | ||
| International Equity Fund | X | X | X | X | |
| International Growth Fund | X | X | X | X | |
| Large Cap Focused Fund | X | X | X | X | |
| Large Cap Fund | X | X | X | X | |
| Large Company Growth Fund | X | X | X | X | |
| Ohio Tax-Free Bond Fund | X | X | X | X | |
| Small Company Fund | X | X | X | X | X |
| Value Fund | X | X | X | X |
| (1) | market value of investment securities, assets and liabilities at the current rate of exchange on the valuation date; and |
| (2) | purchases and sales of investment securities, income, and expenses at the relevant rates of exchange prevailing on the respective dates of such transactions. |
| Fund | Derivatives not accounted for as hedging instruments under ASC 815 | Asset Derivatives | Liability Derivatives |
| Balanced Fund | Futures Contracts - Interest Rate Contracts* | $3,906 | $4,219 |
| * | Statements of Assets and Liabilities Location: Receivable and Payable for variation margin on futures contracts. Only current day’s variation margin is reported within the payable/receivable on the Statement of Assets and Liabilities. Includes cumulative appreciation/(depreciation) on futures contracts as reported on the Portfolio of Investments and within the components of net assets section of the Statement of Assets and Liabilities. |
| Fund | Derivatives not accounted for as hedging instruments under ASC 815 | Realized Gains (Losses) on Derivatives | Change in Unrealized Appreciation (Depreciation) on Derivatives |
| Balanced Fund | Futures - Interest Rate Contracts* | $449,558 | $(19,243) |
| * | Statements of Operations Location: Net realized gains on futures contracts and Net change in unrealized appreciation (depreciation) on futures contracts, respectively. |
| Balanced Fund | |
| Interest Rate Contracts: | |
| Futures Contracts - Notional Value | $10,434,155 |
| Fund | Security Type | Market Value of Securities Loaned* | Market Value of Collateral Received** | Net Amount*** |
| Balanced Fund | Corporate Bonds | $481,987 | $494,000 | $12,013 |
| International Growth Fund | Common Stocks | 1,646,900 | 1,710,580 | 63,680 |
| Large Company Growth Fund | Common Stocks | 5,039,672 | 5,190,596 | 150,924 |
| Small Company Fund | Common Stocks | 397,301 | 407,660 | 10,359 |
| * | The remaining contractual maturity is overnight for all securities. |
| ** | Gross amount of recognized liabilities for securities lending included in the Statements of Assets and Liabilities. |
| *** | Net amount represents the net amount payable due to (receive from) the borrower in the event of default. |
| Balanced Fund | International Equity Fund | International Growth Fund* | Large Cap Focused Fund** | |
| Purchases of investment securities | $125,686,269 | $35,578,132 | $97,831,055 | $321,273,911 |
| Proceeds from sales and maturities | $103,917,522 | $62,820,473 | $124,424,733 | $312,482,754 |
| Large Cap Fund** | Large Company Growth Fund** | Ohio Tax-Free Bond Fund | Small Company Fund** | Value Fund | |
| Purchases of investment securities | $61,815,705 | $90,436,889 | $10,450,466 | $653,693,180 | $158,240,885 |
| Proceeds from sales and maturities | $47,193,835 | $115,016,181 | $10,219,932 | $703,866,200 | $113,759,836 |
| * | The costs of purchases and proceeds from sales of the International Growth Fund (formerly known as International Small Cap Fund) excludes the purchases and sales of securities of the International Small Cap Fund acquired on September 11, 2020 (see Note 9). If these transactions were included, purchases and sales would have been higher. |
| ** | Large Cap Focused Fund, Large Cap Fund, Large Company Growth Fund and Small Company Fund had redemptions-in-kind out of the Fund of $118,461,472, $20,366,868, $22,313,069 and $88,942,215, respectively. The redemptions were comprised of securities in the amount of $97,535,259, $17,157,359, $19,982,960 and $67,765,469, which is excluded from the proceeds from sales and maturities, and cash in the amount of $20,926,213, $3,209,509, $2,330,109, $21,176,746, for the Large Cap Focused Fund, Large Cap Fund, Large Company Growth Fund and Small Company Fund, respectively. |
| Balanced Fund | 0.55% on the first $200 million 0.50% on the next $200 million 0.45% on the next $600 million 0.40% on the next $1 billion 0.35% on such assets over $2 billion |
| International Equity Fund | 0.70% on the first $500 million 0.65% on the next $300 million 0.60% on the next $200 million 0.50% on the next $1 billion 0.40% on such assets over $2 billion |
| International Growth Fund | 0.80% on the first $1 billion 0.75% on the next $500 million 0.70% on the next $500 million 0.65% on such assets over $2 billion |
| Large Cap Focused Fund | 0.70% on the first $500 million 0.65% on the next $300 million 0.60% on the next $200 million 0.50% on the next $1 billion 0.40% on such assets over $2 billion |
| Large Cap Fund | 0.60% on the first $500 million 0.54% on the next $500 million 0.50% on such assets over $1 billion |
| Large Company Growth Fund | 0.60% |
| Ohio Tax-Free Bond Fund | 0.50% on the first $100 million 0.45% on the next $100 million 0.40% on the next $100 million 0.375% on such assets over $300 million |
| Small Company Fund | 0.70% on the first $500 million 0.65% on the next $300 million 0.60% on the next $200 million 0.50% on the next $1 billion 0.40% on such assets over $2 billion |
| Value Fund | 0.65% |
| Barrow, Hanley, Mewhinney & Strauss, LLC | London Company of Virginia d/b/a The London Company |
| Value Fund | Large Cap Fund |
| DSM Capital Partners LLC | Fort Washington Investment Advisors, Inc.* |
| International Growth Fund | Balanced Fund |
| Large Company Growth Fund | International Equity Fund |
| Large Cap Focused Fund | |
| Ohio Tax-Free Bond Fund | |
| Small Company Fund |
| Class A | Class C | Class Y | Institutional Class | Class R6 | |
| Balanced Fund | 1.01% | 1.78% | 0.81% | — | — |
| International Equity Fund* | 1.36% | 1.99% | 0.99% | 0.89% | — |
| International Growth Fund | 1.24% | 1.99% | 0.99% | 0.89% | — |
| Large Cap Focused Fund | 1.00% | 1.79% | 0.72% | 0.69% | — |
| Large Cap Fund | 1.03% | 1.78% | 0.78% | 0.68% | — |
| Large Company Growth Fund | 1.04% | 1.79% | 0.79% | 0.69% | — |
| Ohio Tax-Free Bond Fund | 0.85% | 1.60% | 0.60% | 0.55% | — |
| Small Company Fund | 1.22% | 1.95% | 0.89% | 0.79% | 0.79% |
| Value Fund | 1.08% | 1.83% | 0.83% | 0.68% | — |
| * | Prior to October 30, 2020, the expense limitation for Class C shares was 2.49%. |
| Fund | Investment Advisory Fees Waived | Administration Fees Waived | Other Operating Expenses Reimbursed/ Waived | Total |
| Balanced Fund | $— | $— | $70,152 | $70,152 |
| International Equity Fund | — | 10,857 | 77,882 | 88,739 |
| International Growth Fund | — | 107,688 | 163,695 | 271,383 |
| Large Cap Focused Fund | — | 174,993 | 1,150,088 | 1,325,081 |
| Large Cap Fund | — | 102,241 | 256,515 | 358,756 |
| Large Company Growth Fund | — | 195,042 | 175,306 | 370,348 |
| Ohio Tax-Free Bond Fund | — | 22,786 | 139,437 | 162,223 |
| Small Company Fund | — | 46,577 | 234,470 | 281,047 |
| Value Fund | — | 285,372 | 286,472 | 571,844 |
| Fund | Expires on or before June 30, 2022 | Expires on or before June 30, 2023 | Expires on or before June 30, 2024 | Total |
| Balanced Fund | $36,339 | $44,186 | $1,461 | $81,986 |
| International Equity Fund | 158,366 | 174,004 | 67,613 | 399,983 |
| International Growth Fund | 185,823 | 193,290 | 255,371 | 634,484 |
| Large Cap Focused Fund | 2,201,447 | 1,851,991 | 757,813 | 4,811,251 |
| Large Cap Fund | 440,511 | 393,233 | 338,365 | 1,172,109 |
| Large Company Growth Fund | 259,049 | 326,338 | 357,163 | 942,550 |
| Ohio Tax-Free Bond Fund | 143,581 | 157,632 | 73,030 | 374,243 |
| Small Company Fund | 1,008,474 | 818,548 | 262,375 | 2,089,397 |
| Value Fund | 645,575 | 606,669 | 515,267 | 1,767,511 |
| Fund | Amount |
| Balanced Fund | $ 36,386 |
| International Equity Fund | 3,551 |
| International Growth Fund | 861 |
| Large Cap Focused Fund | 22,901 |
| Large Cap Fund | 479 |
| Large Company Growth Fund | 613 |
| Ohio Tax-Free Bond Fund | 832 |
| Small Company Fund | 12,063 |
| Value Fund | 4,670 |
| Fund | Class A | Class C |
| Balanced Fund | $ — | $ 293 |
| International Equity Fund | — | 29 |
| Large Cap Focused Fund | 50 | 549 |
| Ohio Tax-Free Bond Fund | — | 3 |
| Small Company Fund | 45 | 176 |
| Value Fund | — | 298 |
| Fund | Shares ReFlow Subscribed to | Redemptions-in-kind |
| Large Cap Focused Fund | 2,390,616 | $ 97,535,259 |
| Large Cap Fund | 1,377,946 | 17,157,359 |
| Large Company Growth Fund | 412,875 | 19,982,960 |
| Small Company Fund | 16,881,138 | 67,765,469 |
| Fund | Daily Average Amount Borrowed | Weighted Average Interest Rate | Interest Expense* |
| International Equity Fund | $ 83,595 | 0.68% | $ 572 |
| International Growth Fund | $ 4,934 | 0.69% | $ 34 |
| Large Company Growth Fund | $ 191,744 | 0.68% | $ 1,319 |
| * | Included in Other expenses in the Statements of Operations. |
| Balanced Fund | International Equity Fund | International Growth Fund | ||||
| Year Ended June 30, 2021 | Year Ended June 30, 2020 | Year Ended June 30, 2021 | Year Ended June 30, 2020 | Year Ended June 30, 2021 | Year Ended June 30, 2020 | |
| From ordinary income | $7,630,981 | $6,480,488 | $647,909 | $1,923,637 | $— | $2,978 |
| From long-term capital gains | 26,358,697 | 35,661,000 | — | 5,681,982 | — | — |
| Total distributions | $33,989,678 | $42,141,488 | $647,909 | $7,605,619 | $— | $2,978 |
| Large Cap Focused Fund | Large Cap Fund | Large Company Growth Fund | ||||
| Year Ended June 30, 2021 | Year Ended June 30, 2020 | Year Ended June 30, 2021 | Year Ended June 30, 2020 | Year Ended June 30, 2021 | Year Ended June 30, 2020 | |
| From ordinary income | $12,163,638 | $12,128,375 | $3,689,511 | $3,199,658 | $1,164,162 | $— |
| From long-term capital gains | 94,020,901 | 182,874,825 | — | 17,767,764 | 28,994,022 | 15,399,908 |
| Total distributions | $106,184,539 | $195,003,200 | $3,689,511 | $20,967,422 | $30,158,184 | $15,399,908 |
| Ohio Tax-Free Bond Fund | Small Company Fund | Value Fund | ||||
| Year Ended June 30, 2021 | Year Ended June 30, 2020 | Year Ended June 30, 2021 | Year Ended June 30, 2020 | Year Ended June 30, 2021 | Year Ended June 30, 2020 | |
| From ordinary income | $— | $148 | $842,597 | $— | $4,536,512 | $5,160,391 |
| From tax-exempt income | 1,211,675 | 1,274,837 | — | — | — | — |
| From long-term capital gains | 5,224 | 28,458 | — | 56,603,845 | 4,949,001 | 17,529,100 |
| Total distributions | $1,216,899 | $1,303,443 | $842,597 | $56,603,845 | $9,485,513 | $22,689,491 |
| Balanced Fund | International Equity Fund | International Growth Fund | Large Cap Focused Fund | Large Cap Fund | |
| Tax cost of portfolio investments | $380,718,668 | $99,579,696 | $82,696,255 | $1,167,944,723 | $226,933,898 |
| Gross unrealized appreciation on investments | 204,950,034 | 35,031,720 | 23,199,260 | 1,193,040,189 | 144,676,727 |
| Gross unrealized depreciation on investments | (685,506) | (12,561,523) | (2,772,964) | (136,391) | (3,003,438) |
| Net unrealized appreciation (depreciation) on investments | 204,264,528 | 22,470,197 | 20,426,296 | 1,192,903,798 | 141,673,289 |
| Gross unrealized appreciation on foreign currency transactions | 51 | 17,760 | 4,613 | — | — |
| Gross unrealized depreciation on foreign currency transactions | (2) | (2,249) | (39) | — | — |
| Net unrealized appreciation (depreciation) on foreign currency transactions | 49 | 15,511 | 4,574 | — | — |
| Capital loss carryforwards | — | — | (3,748,566) | — | — |
| Late year ordinary losses deferrals | — | — | (107,094) | — | — |
| Undistributed ordinary income | 216,763 | 2,669,976 | — | 6,657,445 | 2,630,507 |
| Undistributed capital gains | 6,900,702 | 4,367,507 | — | 68,238,396 | 5,073,934 |
| Other temporary differences | (130,273) | — | — | — | — |
| Accumulated earnings (deficit) | $211,251,769 | $29,523,191 | $16,575,210 | $1,267,799,639 | $149,377,730 |
| Large Company Growth Fund | Ohio Tax-Free Bond Fund | Small Company Fund | Value Fund | |
| Tax cost of portfolio investments | $123,703,047 | $45,868,509 | $697,076,068 | $306,666,443 |
| Gross unrealized appreciation on investments | 141,849,129 | 3,855,864 | 318,483,779 | 117,756,011 |
| Gross unrealized depreciation on investments | — | — | (14,094,065) | (1,682,095) |
| Net unrealized appreciation (depreciation) on investments | 141,849,129 | 3,855,864 | 304,389,714 | 116,073,916 |
| Undistributed ordinary income | 2,681,389 | — | 48,143,409 | 4,480,577 |
| Undistributed capital gains | 19,584,177 | 29,891 | 81,856,299 | 15,386,927 |
| Other temporary differences | — | (12,406) | — | — |
| Accumulated earnings (deficit) | $164,114,695 | $3,873,349 | $434,389,422 | $135,941,420 |
| Fund | No Expiration Short Term | No Expiration Long Term | Total |
| International Growth Fund | $ 3,748,566 | $ — | $ 3,748,566 |
| Fund | Utilized |
| International Growth Fund | $ 20,488,614 |
| Fund | Realized Capital Losses | Ordinary Losses | Total |
| International Growth Fund | $ — | $ 107,094 | $ 107,094 |
| Fund | Paid-In Capital | Distributable Earnings |
| International Growth Fund | $ 19,926,556 | $ (19,926,556) |
| Large Cap Focused Fund | 71,023,166 | (71,023,166) |
| Large Cap Fund | 6,657,470 | (6,657,470) |
| Large Company Growth Fund | 16,575,108 | (16,575,108) |
| Small Company Fund | 31,550,393 | (31,550,393) |
| Before Reorganization | After Reorganization | ||
| Touchstone International Growth Opportunities Fund | Touchstone International Small Cap Fund | Touchstone International Growth Fund | |
| Class A | |||
| Shares | 68,698(A) | 97,100 | 165,798 |
| Net Assets | $913,153 | $1,290,678 | $2,203,831 |
| Net Assets Value | $13.29(A) | $13.29 | $13.29 |
| Class C | |||
| Shares | 34,733(B) | 48,931 | 83,664 |
| Net Assets | $447,961 | $631,074 | $1,079,035 |
| Net Asset Value | $12.90(B) | $12.90 | $12.90 |
| Class Y | |||
| Shares | 70,826(C) | 5,338,452 | 5,409,278 |
| Net Assets | $964,777 | $72,719,437 | $73,684,214 |
| Net Asset Value | $13.62(C) | $13.62 | $13.62 |
| Institutional Class | |||
| Shares | 2,342,813(D) | 282,595 | 2,625,408 |
| Net Assets | $32,149,279 | $3,877,901 | $36,027,180 |
| Net Asset Value | $13.72(D) | $13.72 | $13.72 |
| Fund Total | |||
| Shares Outstanding | 2,517,070 | 5,767,078 | 8,284,148 |
| Net Assets | $34,475,170 | $78,519,090 | $112,994,260 |
| Unrealized Appreciation (Depreciation) | $12,701,727 | $13,999,828 | $26,701,555 |
| (A) | Reflects a 1.9160:1 stock split which occurred on the date of the reorganization, September 11, 2020. |
| (B) | Reflects a 1.9095:1 stock split which occurred on the date of the reorganization, September 11, 2020. |
| (C) | Reflects a 1.8839:1 stock split which occurred on the date of the reorganization, September 11, 2020. |
| (D) | Reflects a 1.8777:1 stock split which occurred on the date of the reorganization, September 11, 2020. |
| Net investment loss | $(369,945) |
| Net realized and unrealized gain (loss) on investments | $26,464,225 |
| Net increase in net assets resulting from operations | $26,094,280 |
| Individual funds constituting Touchstone Strategic Trust | Statement of operations | Statements of changes in net assets | Financial highlights |
| Touchstone Balanced Fund Touchstone International Equity Fund Touchstone Large Cap Focused Fund Touchstone Small Company Fund | For the year ended June 30, 2021 | For each of the two years in the period ended June 30, 2021 | For each of the three years in the period ended June 30, 2021, the seven months ended June 30, 2018 and the year ended November 30, 2017 |
| Touchstone International Growth Fund Touchstone Large Cap Fund Touchstone Large Company Growth Fund Touchstone Ohio Tax-Free Bond Fund Touchstone Value Fund | For the year ended June 30, 2021 | For each of the two years in the period ended June 30, 2021 | For each of the five years in the period ended June 30, 2021 |

| Balanced Fund | 90.54 % |
| International Equity Fund | 68.66 % |
| Large Cap Focused Fund | 100.00 % |
| Large Cap Fund | 100.00 % |
| Large Company Growth Fund | 21.93 % |
| Small Company Fund | 9.22 % |
| Value Fund | 72.03 % |
| Balanced Fund | 88.42 % |
| International Equity Fund | 11.00 % |
| Large Cap Focused Fund | 100.00 % |
| Large Cap Fund | 100.00 % |
| Large Company Growth Fund | 18.58 % |
| Small Company Fund | 9.30 % |
| Value Fund | 67.65 % |
| Balanced Fund | $ 30,056,972 |
| International Equity Fund | $ 4,367,507 |
| Large Cap Focused Fund | $ 140,768,522 |
| Large Cap Fund | $ 5,073,934 |
| Large Company Growth Fund | $ 28,994,022 |
| Ohio Tax-Free Bond Fund | $ 35,115 |
| Small Company Fund | $ 87,311,584 |
| Value Fund | $ 17,164,195 |
| Net Expense Ratio Annualized June 30, 2021 | Beginning Account Value January 1, 2021 | Ending Account Value June 30, 2021 | Expenses Paid During the Six Months Ended June 30, 2021* | ||
| Balanced Fund | |||||
| Class A | Actual | 1.01% | $1,000.00 | $1,090.90 | $5.24 |
| Class A | Hypothetical | 1.01% | $1,000.00 | $1,019.79 | $5.06 |
| Class C | Actual | 1.78% | $1,000.00 | $1,086.60 | $9.21 |
| Class C | Hypothetical | 1.78% | $1,000.00 | $1,015.97 | $8.90 |
| Class Y | Actual | 0.81% | $1,000.00 | $1,091.50 | $4.20 |
| Class Y | Hypothetical | 0.81% | $1,000.00 | $1,020.78 | $4.06 |
| International Equity Fund | |||||
| Class A | Actual | 1.36% | $1,000.00 | $1,099.00 | $7.08 |
| Class A | Hypothetical | 1.36% | $1,000.00 | $1,018.05 | $6.81 |
| Class C | Actual | 1.99% | $1,000.00 | $1,096.20 | $10.34 |
| Class C | Hypothetical | 1.99% | $1,000.00 | $1,014.93 | $9.94 |
| Class Y | Actual | 0.99% | $1,000.00 | $1,101.00 | $5.16 |
| Class Y | Hypothetical | 0.99% | $1,000.00 | $1,019.89 | $4.96 |
| Institutional Class | Actual | 0.89% | $1,000.00 | $1,102.40 | $4.64 |
| Institutional Class | Hypothetical | 0.89% | $1,000.00 | $1,020.38 | $4.46 |
| Net Expense Ratio Annualized June 30, 2021 | Beginning Account Value January 1, 2021 | Ending Account Value June 30, 2021 | Expenses Paid During the Six Months Ended June 30, 2021* | ||
| International Growth Fund | |||||
| Class A | Actual | 1.24% | $1,000.00 | $1,042.80 | $6.28 |
| Class A | Hypothetical | 1.24% | $1,000.00 | $1,018.65 | $6.21 |
| Class C | Actual | 1.99% | $1,000.00 | $1,038.60 | $10.06 |
| Class C | Hypothetical | 1.99% | $1,000.00 | $1,014.93 | $9.94 |
| Class Y | Actual | 0.99% | $1,000.00 | $1,044.40 | $5.02 |
| Class Y | Hypothetical | 0.99% | $1,000.00 | $1,019.89 | $4.96 |
| Institutional Class | Actual | 0.89% | $1,000.00 | $1,044.70 | $4.51 |
| Institutional Class | Hypothetical | 0.89% | $1,000.00 | $1,020.38 | $4.46 |
| Large Cap Focused Fund | |||||
| Class A | Actual | 1.00% | $1,000.00 | $1,171.50 | $5.38 |
| Class A | Hypothetical | 1.00% | $1,000.00 | $1,019.84 | $5.01 |
| Class C | Actual | 1.79% | $1,000.00 | $1,166.80 | $9.62 |
| Class C | Hypothetical | 1.79% | $1,000.00 | $1,015.92 | $8.95 |
| Class Y | Actual | 0.72% | $1,000.00 | $1,173.00 | $3.88 |
| Class Y | Hypothetical | 0.72% | $1,000.00 | $1,021.22 | $3.61 |
| Institutional Class | Actual | 0.69% | $1,000.00 | $1,173.30 | $3.72 |
| Institutional Class | Hypothetical | 0.69% | $1,000.00 | $1,021.37 | $3.46 |
| Large Cap Fund | |||||
| Class A | Actual | 1.05% | $1,000.00 | $1,143.40 | $5.58** |
| Class A | Hypothetical | 1.05% | $1,000.00 | $1,019.59 | $5.26** |
| Class C | Actual | 1.80% | $1,000.00 | $1,139.80 | $9.55** |
| Class C | Hypothetical | 1.80% | $1,000.00 | $1,015.87 | $9.00** |
| Class Y | Actual | 0.80% | $1,000.00 | $1,144.70 | $4.25** |
| Class Y | Hypothetical | 0.80% | $1,000.00 | $1,020.83 | $4.01** |
| Institutional Class | Actual | 0.70% | $1,000.00 | $1,145.90 | $3.72** |
| Institutional Class | Hypothetical | 0.70% | $1,000.00 | $1,021.32 | $3.51** |
| Large Company Growth Fund | |||||
| Class A | Actual | 1.07% | $1,000.00 | $1,162.20 | $5.74*** |
| Class A | Hypothetical | 1.07% | $1,000.00 | $1,019.49 | $5.36*** |
| Class C | Actual | 1.82% | $1,000.00 | $1,157.70 | $9.74*** |
| Class C | Hypothetical | 1.82% | $1,000.00 | $1,015.77 | $9.10*** |
| Class Y | Actual | 0.82% | $1,000.00 | $1,163.40 | $4.40*** |
| Class Y | Hypothetical | 0.82% | $1,000.00 | $1,020.73 | $4.11*** |
| Institutional Class | Actual | 0.72% | $1,000.00 | $1,164.10 | $3.86*** |
| Institutional Class | Hypothetical | 0.72% | $1,000.00 | $1,021.22 | $3.61*** |
| Ohio Tax-Free Bond Fund | |||||
| Class A | Actual | 0.85% | $1,000.00 | $1,007.30 | $4.23 |
| Class A | Hypothetical | 0.85% | $1,000.00 | $1,020.58 | $4.26 |
| Class C | Actual | 1.60% | $1,000.00 | $1,003.60 | $7.95 |
| Class C | Hypothetical | 1.60% | $1,000.00 | $1,016.86 | $8.00 |
| Class Y | Actual | 0.60% | $1,000.00 | $1,008.50 | $2.99 |
| Class Y | Hypothetical | 0.60% | $1,000.00 | $1,021.82 | $3.01 |
| Institutional Class | Actual | 0.55% | $1,000.00 | $1,008.80 | $2.74 |
| Institutional Class | Hypothetical | 0.55% | $1,000.00 | $1,022.07 | $2.76 |
| Small Company Fund | |||||
| Class A | Actual | 1.16% | $1,000.00 | $1,180.50 | $6.27**** |
| Class A | Hypothetical | 1.16% | $1,000.00 | $1,019.04 | $5.81**** |
| Class C | Actual | 1.96% | $1,000.00 | $1,174.50 | $10.57**** |
| Class C | Hypothetical | 1.96% | $1,000.00 | $1,015.08 | $9.79**** |
| Class Y | Actual | 0.90% | $1,000.00 | $1,182.50 | $4.87**** |
| Class Y | Hypothetical | 0.90% | $1,000.00 | $1,020.33 | $4.51**** |
| Institutional Class | Actual | 0.80% | $1,000.00 | $1,182.80 | $4.33**** |
| Institutional Class | Hypothetical | 0.80% | $1,000.00 | $1,020.83 | $4.01**** |
| Class R6 | Actual | 0.80% | $1,000.00 | $1,183.20 | $4.33**** |
| Class R6 | Hypothetical | 0.80% | $1,000.00 | $1,020.83 | $4.01**** |
| Value Fund | |||||
| Class A | Actual | 1.08% | $1,000.00 | $1,180.80 | $5.84 |
| Class A | Hypothetical | 1.08% | $1,000.00 | $1,019.44 | $5.41 |
| Net Expense Ratio Annualized June 30, 2021 | Beginning Account Value January 1, 2021 | Ending Account Value June 30, 2021 | Expenses Paid During the Six Months Ended June 30, 2021* | ||
| Class C | Actual | 1.83% | $1,000.00 | $1,176.40 | $9.88 |
| Class C | Hypothetical | 1.83% | $1,000.00 | $1,015.72 | $9.15 |
| Class Y | Actual | 0.83% | $1,000.00 | $1,181.30 | $4.49 |
| Class Y | Hypothetical | 0.83% | $1,000.00 | $1,020.68 | $4.16 |
| Institutional Class | Actual | 0.68% | $1,000.00 | $1,183.80 | $3.68 |
| Institutional Class | Hypothetical | 0.68% | $1,000.00 | $1,021.42 | $3.41 |
| * | Expenses are equal to the Fund’s annualized expense ratio, multiplied by the average account value over the period, multiplied by 181/365 (to reflect one-half year period). |
| ** | Excluding liquidity provider expenses, your actual cost of investment in Class A, Class C, Class Y and Institutional Class would be $5.58, $9.55, $4.25 and $3.72, respectively, and your hypothetical cost of investment in Class A, Class C, Class Y and Institutional Class would be $5.26, $9.00, $4.01, and $3.51, respectively. |
| *** | Excluding liquidity provider expenses, your actual cost of investment in Class A, Class C, Class Y and Institutional Class would be $5.58, $9.58, $4.24 and $3.70, respectively, and your hypothetical cost of investment in Class A, Class C, Class Y and Institutional Class would be $5.21, $8.95, $3.96 and $3.46, respectively. |
| **** | Excluding liquidity provider expenses, your actual cost of investment in Class A, Class C, Class Y, Institutional Class and Class R6 would be $6.22, $10.51, $4.82, $4.28, and $4.28, respectively, and your hypothetical cost of investment in Class A, Class C, Class Y, Institutional Class and Class R6 would be $5.76, $9.74, $4.46, $3.96, and $3.96, respectively. |
| Interested Trustee1: | |||||
| Name Address Year of Birth | Position Held with Trust | Term of Office And Length of Time Served | Principal Occupation(s) During Past 5 Years | Number of Funds Overseen in the Touchstone Fund Complex2 | Other Directorships Held During Past 5 Years3 |
| Jill T. McGruder Touchstone Advisors, Inc. 303 Broadway Suite 1100 Cincinnati, Ohio 45202 Year of Birth: 1955 | Trustee | Until retirement at age 75 or until she resigns or is removed Trustee since 1999 | President of Touchstone Funds from 1999 to 2020; President, Director and CEO of IFS Financial Services, Inc. (a holding company) since 1999; and Senior Vice President and Chief Marketing Officer of Western & Southern Financial Group, Inc. (a financial services company) since 2016. | 34 | Director, Integrity Life Insurance Co. and National Integrity Life Insurance Co. since 2005; Director, Touchstone Securities (the Distributor) since 1999; Director, Touchstone Advisors (the Advisor) since 1999; Director, W&S Brokerage Services, Inc. since 1999; Director, W&S Financial Group Distributors, Inc. since 1999; Director, Insurance Profillment Solutions LLC since 2014; Director, Columbus Life Insurance Co. since 2016; Director, The Lafayette Life Insurance Co. since 2016; Director, Gerber Life Insurance Company since 2019; Director, Western & Southern Agency, Inc. since 2018; and Director, LL Global, Inc. (not-for-profit trade organization with operating divisions LIMRA and LOMA) since 2016. |
| Independent Trustees: | |||||
| Karen Carnahan c/o Touchstone Advisors, Inc. 303 Broadway Suite 1100 Cincinnati, Ohio 45202 Year of Birth: 1954 | Trustee | Until retirement at age 75 or until she resigns or is removed Trustee since 2019 | Retired; formerly Chief Operating Officer of Shred-it (a business services company) from 2014 to 2015; formerly President & Chief Operating Officer of the document management division of Cintas Corporation (a business services company) from 2008 to 2014. | 34 | Director, Cintas Corporation since 2019; Director, Boys & Girls Club of West Chester/Liberty since 2016; and Board of Advisors, Best Upon Request since 2020. |
| William C. Gale c/o Touchstone Advisors, Inc. 303 Broadway Suite 1100 Cincinnati, Ohio 45202 Year of Birth: 1952 | Trustee | Until retirement at age 75 or until he resigns or is removed Trustee since 2013 | Retired; formerly Senior Vice President and Chief Financial Officer of Cintas Corporation (a business services company) from 1995 to 2015. | 34 | None. |
| Susan J. Hickenlooper, CFA c/o Touchstone Advisors, Inc. 303 Broadway Suite 1100 Cincinnati, Ohio 45202 Year of Birth: 1946 | Trustee | Until retirement at age 75 or until she resigns or is removed Trustee since 2009 | Retired from investment management. | 34 | Trustee, Episcopal Diocese of Southern Ohio from 2014 to 2018. |
| Kevin A. Robie c/o Touchstone Advisors, Inc. 303 Broadway Suite 1100 Cincinnati, Ohio 45202 Year of Birth: 1956 | Trustee | Until retirement at age 75 or until he resigns or is removed Trustee since 2013 | Retired; formerly Vice President of Portfolio Management at Soin LLC (private multinational holding company and family office) from 2004 to 2020. | 34 | Director, SaverSystems, Inc. since 2015; Director, Buckeye EcoCare, Inc. from 2013 to 2018; Director, Turner Property Services Group, Inc. since 2017; Trustee, Dayton Region New Market Fund, LLC (private fund) since 2010; and Trustee, Entrepreneurs Center, Inc. (business incubator) since 2006. |
| William H. Zimmer III c/o Touchstone Advisors, Inc. 303 Broadway Suite 1100 Cincinnati, Ohio 45202 Year of Birth: 1953 | Trustee | Until retirement at age 75 or until he resigns or is removed Trustee since 2019 | Independent Treasury Consultant since 2014. | 34 | Director, Deaconess Associations, Inc. (healthcare) since 2001; Trustee, Huntington Funds (mutual funds) from 2006 to 2015; and Director, National Association of Corporate Treasurers from 2011 to 2015. |
| Principal Officers: | |||
| Name Address Year of Birth | Position(s) Held with Trust1 | Term of Office And Length of Time Served | Principal Occupation(s) During Past 5 Years |
| E. Blake Moore, Jr. Touchstone Advisors, Inc. 303 Broadway Suite 1100 Cincinnati, Ohio 45202 Year of Birth: 1958 | President | Until resignation, removal or disqualification President since January 2021 | Chief Executive Officer of Touchstone Advisors, Inc. and Touchstone Securities Inc. (since 2020); President, Foresters Investment Management Company, Inc. (2018 to 2020); President, North American Asset Management at Foresters Financial (2018 to 2020); Managing Director, Head of Americas at UBS Asset Management (2015 to 2017); and Executive Vice President, Head of Distribution at Mackenzie Investments (2011 to 2014). |
| Timothy D. Paulin Touchstone Advisors, Inc. 303 Broadway Suite 1100 Cincinnati, Ohio 45202 Year of Birth: 1963 | Vice President | Until resignation, removal or disqualification Vice President since 2010 | Senior Vice President of Investment Research and Product Management of Touchstone Advisors, Inc. |
| Timothy S. Stearns Touchstone Advisors, Inc. 303 Broadway Suite 1100 Cincinnati, Ohio 45202 Year of Birth: 1963 | Chief Compliance Officer | Until resignation, removal or disqualification Chief Compliance Officer since 2013 | Chief Compliance Officer of Touchstone Advisors, Inc., Touchstone Securities, Inc. and W&S Brokerage Services, Inc. |
| Terrie A. Wiedenheft Touchstone Advisors, Inc. 303 Broadway Suite 1100 Cincinnati, Ohio 45202 Year of Birth: 1962 | Controller and Treasurer | Until resignation, removal or disqualification Controller and Treasurer since 2006 | Senior Vice President, Chief Financial Officer and Chief Operations Officer, of IFS Financial Services, Inc. (a holding company) and Senior Vice President and Chief Administration Officer within the Office of the Chief Marketing Officer of Western & Southern Financial Group (2021 to Present). |
| Meredyth A. Whitford Western & Southern Financial Group 400 Broadway Cincinnati, Ohio 45202 Year of Birth: 1981 | Secretary | Until resignation, removal or disqualification Secretary since 2018 | Senior Counsel - Securities/Mutual Funds of Western & Southern Financial Group (2015 to present); Associate at Morgan Lewis & Bockius LLP (law firm) (2014 to 2015); Associate at Bingham McCutchen LLP (law firm) (2008 to 2014). |

303 Broadway
Cincinnati, Ohio 45202-4203
800.638.8194
www.touchstoneinvestments.com
303 Broadway
Cincinnati, Ohio 45202-4203
4400 Computer Drive
Westborough, Massachusetts 01581
| (b) | Not applicable |
Item 2. Code of Ethics.
| (a) | The registrant, as of the end of the period covered by this report, has adopted a code of ethics that applies to the registrant’s principal executive officer, principal financial officer, principal accounting officer or controller, or persons performing similar functions, regardless of whether these individuals are employed by the registrant or a third party. |
| (c) | There have been no amendments, during the period covered by this report, to a provision of the code of ethics that applies to the registrant’s principal executive officer, principal financial officer, principal accounting officer or controller, or persons performing similar functions, regardless of whether these individuals are employed by the registrant or a third party, and that relates to any element of the code of ethics description. |
| (d) | The registrant has not granted any waivers, including an implicit waiver, from a provision of the code of ethics that applies to the registrant’s principal executive officer, principal financial officer, principal accounting officer or controller, or persons performing similar functions, regardless of whether these individuals are employed by the registrant or a third party, that relates to one or more of the items set forth in paragraph (b) of this item’s instructions. |
| (e) | Not applicable. |
| (f) | A copy of the code of ethics is attached hereto as Exhibit 13(a)(1). |
Item 3. Audit Committee Financial Expert.
The registrant’s Board of Trustees has determined that the registrant has at least one audit committee financial expert serving on its audit committee. Ms. Karen Carnahan is the registrant’s audit committee financial expert and is an independent trustee within the meaning of the Investment Company Act of 1940, as amended (the “1940 Act”).
Item 4. Principal Accountant Fees and Services.
Audit Fees
| (a) | Audit fees for Touchstone Strategic Trust (June Funds) totaled $171,300 and $203,400 for the fiscal years ended June 30, 2021 and June 30, 2020, respectively. The fees relate to the annual audit or for services normally provided by Ernst & Young LLP in connection with statutory and regulatory filings or engagements. |
Audit-Related Fees
| (b) | The aggregate fees billed in each of the last two fiscal years for assurance and related services by the principal accountant that are reasonably related to the performance of the audit of the registrant's financial statements and are not reported under paragraph (a) of this Item are $10,000 and $8,000 for the fiscal years ended June 30, 2021 and June 30, 2020, respectively. The fees for the June 30, 2021 fiscal year relate to the review of Form N-14 and N-1a filings. The fees for the June 30, 2020 fiscal year relate to the review of Form N-14 filings. |
Tax Fees
| (c) | The aggregate fees billed in each of the last two fiscal years for professional services rendered by the principal accountant for tax compliance, tax advice, and tax planning were $49,570 and $69,985 for the fiscal years ended June 30, 2021 and June 30, 2020, respectively. The fees relate to the preparation of federal income and excise tax returns, review of capital gains distribution calculations and tax agent services. |
All Other Fees
| (d) | The aggregate fees billed in each of the last two fiscal years for products and services provided by the principal accountant, other than the services reported in paragraphs (a) through (c) of this Item are $26,999 and $40,675 for the fiscal years ended June 30, 2021 and June 30, 2020, respectively. The fees relate to the PFIC Analyzer and Global Withholding Tax Reporter subscriptions. |
| (e)(1) | Disclose the audit committee's pre-approval policies and procedures described in paragraph (c)(7) of Rule 2-01 of Regulation S-X. |
The Audit Committee’s pre-approval policies describe the types of audit, audit-related, tax and other services that have the general pre-approval of the Audit Committee. The pre-approval policies provide that annual audit service fees, tax services not specifically granted pre-approval, services exceeding pre-approved cost levels and other services that have not received general pre-approval will be subject to specific pre-approval by the Audit Committee. The pre-approval policies further provide that the Committee may grant general pre-approval to other audit services (statutory audits and services associated with SEC registration statements, periodic reports and other documents filed with the SEC or other documents issued in connection with securities offerings), audit-related services (accounting consultations related to accounting, financial reporting or disclosure matters not classified as “audit services,” assistance with understanding and implementing new accounting and financial reporting guidance from rulemaking authorities, agreed-upon or expanded audit procedures related to accounting and/or billing records required to respond to or comply with financial, accounting or regulatory reporting matters and assistance with internal control reporting requirements under Form N-CSR), tax services that have historically been provided by the auditor that the Committee believes would not impair the independence of the auditor and are consistent with the SEC’s rules on auditor independence and permissible non-audit services classified as “all other services” that are routine and recurring services.
| (e)(2) | All services described in paragraphs (b) through (d) of Item 4 were approved by the Audit Committee. |
| (f) | The percentage of hours expended on the principal accountant's engagement to audit the registrant's financial statements for the most recent fiscal year that were attributed to work performed by persons other than the principal accountant's full-time, permanent employees was less than fifty percent. |
| (g) | The aggregate non-audit fees for Touchstone Strategic Trust (June Funds) and certain entities*, totaled approximately $499,534 and $890,010 for the fiscal years ended June 30, 2021 and June 30, 2020, respectively. |
* These include the advisors (excluding sub-advisors) and any entity controlling, controlled by or under common control with the advisors that provides ongoing services to the registrant (Funds).
| (h) | The registrant's audit committee of the board of trustees has considered whether the provision of non-audit services that were rendered to the registrant's investment adviser (not including any sub-adviser whose role is primarily portfolio management and is subcontracted with or overseen by another investment adviser), and any entity controlling, controlled by, or under common control with the investment adviser that provides ongoing services to the registrant that were not pre-approved pursuant to paragraph (c)(7)(ii) of Rule 2-01 of Regulation S-X is compatible with maintaining the principal accountant's independence. |
Item 5. Audit Committee of Listed Registrants.
Not applicable.
Item 6. Investments.
| (a) | Schedule of Investments in securities of unaffiliated issuers as of the close of the reporting period is included as part of the report to shareholders filed under Item 1(a) of this form. |
| (b) | Not applicable. |
Item 7. Disclosure of Proxy Voting Policies and Procedures for Closed-End Management Investment Companies.
Not applicable.
Item 8. Portfolio Managers of Closed-End Management Investment Companies.
Not applicable.
Item 9. Purchases of Equity Securities by Closed-End Management Investment Company and Affiliated Purchasers.
Not applicable.
Item 10. Submission of Matters to a Vote of Security Holders.
There have been no material changes to the procedures by which the shareholders may recommend nominees to the registrant’s board of trustees, where those changes were implemented after the registrant last provided disclosure in response to the requirements of Item 407(c)(2)(iv) of Regulation S-K (17 CFR 229.407) (as required by Item 22(b)(15) of Schedule 14A (17 CFR 240.14a-101)), or this Item.
Item 11. Controls and Procedures.
| (a) | The registrant’s principal executive and principal financial officers, or persons performing similar functions, have concluded that the registrant’s disclosure controls and procedures (as defined in Rule 30a-3(c) under the Investment Company Act of 1940, as amended (the “1940 Act”) (17 CFR 270.30a-3(c))) are effective, as of a date within 90 days of the filing date of the report that includes the disclosure required by this paragraph, based on their evaluation of these controls and procedures required by Rule 30a-3(b) under the 1940 Act (17 CFR 270.30a-3(b)) and Rules 13a-15(b) or 15d-15(b) under the Securities Exchange Act of 1934, as amended (17 CFR 240.13a-15(b) or 240.15d-15(b)). |
| (b) | There were no changes in the registrant’s internal control over financial reporting (as defined in Rule 30a-3(d) under the 1940 Act (17 CFR 270.30a-3(d))) that occurred during the period covered by this report that has materially affected, or is reasonably likely to materially affect, the registrant’s internal control over financial reporting. |
Item 12. Disclosure of Securities Lending Activities for Closed-End Management Investment Companies.
Not applicable.
Item 13. Exhibits.
| (a)(1) | Code of ethics, and any amendment thereto, that is the subject of disclosure required by Item 2 is attached hereto. |
| (a)(2) | Certifications pursuant to Rule 30a-2(a) under the 1940 Act and Section 302 of the Sarbanes-Oxley Act of 2002 are attached hereto. |
| (a)(3) | Not applicable. |
| (a)(4) | Not applicable. |
| (b) | Certifications pursuant to Rule 30a-2(b) under the 1940 Act and Section 906 of the Sarbanes- Oxley Act of 2002 are attached hereto. |
SIGNATURES
Pursuant to the requirements of the Securities Exchange Act of 1934 and the Investment Company Act of 1940, the registrant has duly caused this report to be signed on its behalf by the undersigned, thereunto duly authorized.
| (Registrant) | Touchstone Strategic Trust |
| By (Signature and Title)* | /s/ E. Blake Moore, Jr. | |
| E. Blake Moore, Jr., President | ||
| (principal executive officer) |
| Date | August 30, 2021 |
Pursuant to the requirements of the Securities Exchange Act of 1934 and the Investment Company Act of 1940, this report has been signed below by the following persons on behalf of the registrant and in the capacities and on the dates indicated.
| By (Signature and Title)* | /s/ E. Blake Moore, Jr. | |
| E. Blake Moore, Jr., President | ||
| (principal executive officer) |
| Date | August 30, 2021 |
| By (Signature and Title)* | /s/ Terrie A. Wiedenheft | |
| Terrie A. Wiedenheft, Controller and Treasurer | ||
| (principal financial officer) |
| Date | August 30, 2021 |
* Print the name and title of each signing officer under his or her signature.