UNITED STATES
SECURITIES AND EXCHANGE COMMISSION
Washington, D.C. 20549
FORM N-CSR
CERTIFIED SHAREHOLDER REPORT OF REGISTERED MANAGEMENT
INVESTMENT COMPANIES
| Investment Company Act file number | 811-03651 |
| Touchstone Strategic Trust – December Funds |
| (Exact name of registrant as specified in charter) |
| 303 Broadway, Suite 1100 |
| Cincinnati, Ohio 45202-4203 |
| (Address of principal executive offices) (Zip code) |
| Jill T. McGruder |
| 303 Broadway, Suite 1100 |
| Cincinnati, Ohio 45202-4203 |
| (Name and address of agent for service) |
Registrant's telephone number, including area code: 800-638-8194
Date of fiscal year end: December 31
Date of reporting period: December 31, 2014
Form N-CSR is to be used by management investment companies to file reports with the Commission not later than 10 days after the transmission to stockholders of any report that is required to be transmitted to stockholders under Rule 30e-1 under the Investment Company Act of 1940 (17 CFR 270.30e-1). The Commission may use the information provided on Form N-CSR in its regulatory, disclosure review, inspection, and policymaking roles.
A registrant is required to disclose the information specified by Form N-CSR, and the Commission will make this information public. A registrant is not required to respond to the collection of information contained in Form N-CSR unless the Form displays a currently valid Office of Management and Budget ("OMB") control number. Please direct comments concerning the accuracy of the information collection burden estimate and any suggestions for reducing the burden to Secretary, Securities and Exchange Commission, 100 F Street, NE, Washington, DC 20549. The OMB has reviewed this collection of information under the clearance requirements of 44 U.S.C. § 3507.
Item 1. Reports to Stockholders.
The Report to Shareholders is attached herewith.
December 31, 2014
Annual Report
Touchstone Strategic Trust
Touchstone Dynamic Equity Fund
Touchstone Balanced Allocation Fund
Touchstone Conservative Allocation Fund
Touchstone Growth Allocation Fund
Touchstone Moderate Growth Allocation Fund

Table of Contents
This report identifies the Funds' investments on December 31, 2014. These holdings are subject to change. Not all investments in each Fund performed the same, nor is there any guarantee that these investments will perform as well in the future. Market forecasts provided in this report may not occur.
Letter from the President
Dear Shareholder:
We are pleased to provide you with the Touchstone Strategic Trust Annual Report. Inside you will find key financial information, as well as manager commentaries for the Funds, for the 12 months ended December 31, 2014.
After struggling through an unusually harsh winter, the U.S. economy generated strong growth during 2014. This economic growth and an improving labor market supported the U.S. Federal Reserve Board’s actions to discontinue its Quantitative Easing program. Globally, economic weakness and lower-than-expected inflation pushed central banks outside the U.S. to further loosen monetary policy in an effort to stimulate their economies. This divergence in economic growth, monetary policy, and expected interest rate paths led to a significant appreciation of the dollar.
Equity markets posted solid gains in 2014. Looking across the market capitalization spectrum, smaller- and mid-capitalization company stocks experienced greater volatility and lower returns than their large-capitalization counterparts. Outside the U.S., developed and emerging market equities suffered losses as a result of the strong appreciation in the U.S. dollar.
The bond market also performed well in 2014. As yields on intermediate- and long-term U.S. Treasuries declined, investment grade corporate bonds benefited from the tailwind of falling interest rates. While high yield securities also generated positive returns, the gains were limited after a lengthy period of strong performance. Non-U.S. fixed income securities faced the same currency headwinds as non-U.S. equities and recorded moderate losses during the year.
After more than five years of robust performance from U.S. stocks and bonds, we continue to believe that diversification is essential to balancing risk and return. We recommend that you work with your financial professional to employ a sound asset allocation strategy to help keep your financial strategy on course. We also believe that it is important to maintain a long-term approach to gain the full potential benefits of investing.
Touchstone is committed to helping investors achieve their financial goals by providing access to a distinctive selection of institutional asset managers who are known and respected for proficiency in their specific areas of expertise.
We greatly appreciate your continued support. Thank you for including Touchstone as part of your investment plan.
Sincerely,

Jill T. McGruder
President
Touchstone Strategic Trust
Management's Discussion of Fund Performance (Unaudited)
Touchstone Dynamic Equity Fund
Sub-Advised by Analytic Investors, LLC
Investment Philosophy
The Fund seeks long-term capital appreciation from hedged equity investments with less risk than a fully invested, unhedged equity portfolio. A proprietary system that ranks stocks according to a mathematical model is utilized in an attempt to create a diversified and hedged portfolio, which invests in a combination of stocks and options including covered calls. A security’s intrinsic value is determined by evaluating variables such as relative valuation, price momentum, company fundamentals, liquidity and risk. Portfolio optimization is utilized to select securities that are expected to maximize return, minimize volatility and diversify assets.
Fund Performance
The Touchstone Dynamic Equity Fund (Class A Shares) underperformed its benchmark, the S&P 500 Index, for the 12-month period ended December 31, 2014. The Fund’s total return was 3.64 percent (calculated excluding the maximum sales charge) while the total return of the benchmark was 13.69 percent.
Market Environment
U.S. equities posted strong gains in 2014 as represented by the S&P 500 Index. The U.S. Federal Reserve Board (Fed) remained a key focus during the year, as Janet Yellen replaced Ben Bernanke as Federal Reserve Chair. The Federal Open Market Committee (FOMC) stayed the course regarding its quantitative easing (QE) program, but removed the explicit unemployment-rate target with regard to when the Fed may begin to raise interest rates. In general, economic news was positive during the year. The U.S. unemployment rate declined in October for the third consecutive month, the overall U.S. economy grew faster during the third quarter than at any point since 2003 and real gross domestic product (GDP)–the value of the production of goods and services in the U.S. adjusted for price changes–increased at an annual rate above forecasts. In addition, reports on construction, manufacturing and the services sector were also positive during the fourth quarter. As a result of this encouraging economic momentum, a statement from the Fed in late December set the stage for the central bank to turn away from its longstanding near-zero interest-rate policy and potentially begin to make gradual interest rate hikes in 2015.
However, global growth in 2014 was not as strong as it was in the U.S. The Chinese economy slowed during the second quarter as the country’s industrial production and retail sales posted weak results. In addition, China’s real estate market also fell in the second quarter, which weighed heavily on commodity prices and negatively impacted the country’s GDP. The European Central Bank (ECB) signaled that it was ready to provide further stimulus to revive the eurozone economy and avoid deflation, and the central banks of Japan and China acted to spur their economies as well.
Portfolio Review
The Fund is a hedged equity fund, comprised of equities and options. During the year, the equity component of the Fund posted positive returns. However, the strong-performing equity market once again proved to be a challenging environment for selling call options, and the options component of the Fund negatively impacted performance. Options sold on the S&P 500 Index were the primary sources of negative returns during the 12-month period.
The equity portion of the Fund is structured to be sector-, style- and beta1- neutral relative to the S&P 500 Index. It attempts to deliver outperformance from stock selection. During the year, stock selection contributed to performance, especially within the Health Care and Utilities sectors, although this was slightly offset by negative stock selection within the Financials sector.
The Fund’s equity investment process uses a multi-characteristic approach when valuing securities. During the year, the Fund was properly positioned to certain quality, growth and valuation characteristics, while its position to certain technical characteristics negatively impacted results. Specifically, stocks with solid asset utilization were rewarded, and the Fund’s overweight position to these stocks benefited performance. The Fund’s emphasis toward companies with strong sales and cash flow relative to their share prices also helped performance, as
Management's Discussion of Fund Performance (Unaudited) (Continued)
these traits were in favor during the year. In addition, investors favored certain growth characteristics and, as a result, the Fund’s overweight position to growth in profitability was additive to performance. Finally, the Fund’s overweight to companies with strong price momentum negatively impacted returns as investors deemphasized this technical characteristic.
Among the individual stocks that contributed to the Fund’s relative performance during the year included long positions in Gilead Sciences Inc., Eli Lilly and Co. and Myriad Genetics Inc. (all from the Health Care sector), FedEx Corp. (Industrials sector) and a short position in Peabody Energy Corp. (Energy sector). Gilead Sciences, a research-based biopharmaceutical company, moved higher after the company doubled its sales forecast on better-than-expected revenue from its blockbuster hepatitis C drug SOVALDI®. FedEx–a transportation, e-commerce and business services provider–rallied after news that the company’s fourth-quarter earnings-per-share would come in ahead of estimates. The Fund’s overweight position in FedEx further helped performance. Eli Lilly, a producer of human pharmaceuticals and animal health products, rallied after a study of its lung cancer treatment drug increased survival rates in patients. Myriad Genetics, a molecular diagnostic company, moved higher after the company raised its 2014 forecasts and announced its acquisition of Crescendo Bioscience Inc., a company known as a global leader in auto-immune diagnostics. A short position in Peabody Energy Corp., a private coal company, helped performance as the company moved lower after reporting profits that missed analyst estimates because of falling coal prices.
Among the stocks that detracted from Fund performance were long positions in Oracle Corp. and International Business Machines Corp. (IBM) (both from the Information Technology sector), Aaron’s Inc. and Comcast Corp. (both from the Consumer Discretionary sector) and a short position in Concur Technologies Inc. (Information Technology sector). Oracle is a provider of enterprise software and computer hardware products and services. Oracle’s shares fell after the company’s Chief Executive Officer Larry Ellison announced he was stepping down. IBM, a diversified information technology company, abandoned its earnings forecast for 2015, which sent shares to a three-year low. Furthermore, the company’s software sales were weaker than expected and its services business experienced lower productivity, which also impacted the stock. Aaron’s is a specialty retailer of consumer electronics, furniture and household appliances. The company reported lower revenue and announced it was closing 44 underperforming stores, which negatively impacted the stock. Comcast, a provider of entertainment and cable communications products, moved lower after the company agreed to buy Time Warner Cable Inc. for $45 billion. Concur Technologies, a provider of travel and expense management solutions, moved higher after it was announced that SAP SE would purchase the company for $7.4 billion.
Outlook
The Fund’s approach is based on the fundamental belief that there is persistency in the types of characteristics investors prefer. We continue to emphasize stocks with certain attractive valuation characteristics, such as stocks with above-average cash flow-to-price ratios and sales-to-price ratios. We also intend to focus on companies with strong quality metrics, such as stocks with above-average asset utilization and return on equity. Furthermore, we anticipate continuing to underweight companies with above-average sales-per-share volatility and companies with above-average volatility in analyst earnings estimates.
| 1 | Beta is a measure of the volatility of a portfolio relative to its benchmark. |
Management's Discussion of Fund Performance (Unaudited) (Continued)
Comparison of the Change in Value of a $10,000 Investment in the Touchstone Dynamic
Equity Fund - Class A*, the S&P 500 Index and the Citigroup 3-Month T-Bill Index
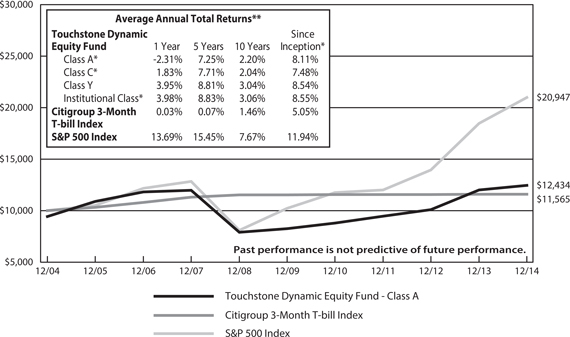
| * | The chart above represents performance of Class A shares only, which will vary from the performance of Class C shares, Class Y shares and Institutional Class shares based on the differences in loads and fees paid by shareholders in the different classes. The inception date of Class A shares, Class C shares, Class Y shares and Institutional Class shares was March 31, 2005, March 31, 2005, July 1, 1978 and December 9, 2005, respectively. Class A shares, Class C shares and Institutional Class shares performance information was calculated using the historical performance of Class Y shares for periods prior to March 31, 2005, March 31, 2005 and December 9, 2005, respectively. The returns have been restated for sales charges and for fees applicable to Class A, Class C, and Institutional Class shares. The returns of the indexes listed above are based on the inception date of the Fund. |
| ** | The average annual total returns shown above are adjusted for maximum applicable sales charges, if applicable. The maximum offering price per share of Class A shares is equal to the net asset value (“NAV”) per share plus a sales load equal to 6.10% of the NAV (or 5.75% of the offering price). Class C shares are subject to a contingent deferred sales charge (“CDSC”) of 1.00%. The CDSC will be assessed on an amount equal to the lesser of (1) the NAV at the time of purchase of the shares being redeemed or (2) the NAV of such shares being redeemed if redeemed within a one-year period from the date of purchase. Class Y shares and Institutional Class shares are not subject to sales charges. |
The performance of the above Fund does not reflect the deduction of taxes that a shareholder would pay on Fund distributions or the redemption of Fund shares.
Notes to Chart
S&P 500 Index is a group of 500 widely held stocks and is commonly regarded to be representative of the large capitalization stock universe.
Citigroup 3-Month T-Bill Index tracks the performance of U.S. Treasury Bills with a remaining maturity of three months.
Management's Discussion of Fund Performance (Unaudited)
Touchstone Balanced Allocation Fund
Sub-Advised by Ibbotson Associates, Inc.
Investment Philosophy
The Fund seeks to provide investors with capital appreciation and current income. The Fund is a fund of funds and therefore the value of an investment in the Fund is based on the performance of the underlying funds in which it invests and the allocation of its assets among those funds. This fund of funds primarily invests in a diversified portfolio of underlying equity and fixed income funds. The underlying funds, in turn, invest in a variety of U.S. and foreign equity and fixed income securities and may hold cash, cash equivalents and money market funds. An optimal model allocation among underlying funds is sought by using an analysis that looks at forecasted returns, standard deviations in historical returns, and the correlation of the performance of different market sectors. The underlying funds are selected and weighted based on historical returns-based style analysis, holdings-based style analysis, manager interviews, relative and absolute performance, including correlations with other underlying funds as well as corresponding benchmarks, and historical volatility (the variability of returns from one period to the next). Under normal circumstances, the Fund expects to allocate its assets among equity and fixed income funds as follows: Equity Fund Allocation: 50–70%, Fixed Income Fund Allocation: 30–50%.
Fund Performance
The Touchstone Balanced Allocation Fund (Class A Shares) underperformed its benchmarks for the 12-month period ended December 31, 2014. The Fund’s total return was 4.46 percent (calculated excluding the maximum sales charge) while the total return of the Barclays U.S. Aggregate Bond Index was 5.97 percent and the total return of the S&P Composite 1500 was 13.08 percent for the same period.
Market Environment
U.S. stocks enjoyed a profitable year, and the S&P 500 Index posted a double-digit gain for 2014. The Russell 2000® Index, which is representative of small-cap equities, also ended in positive territory though returns were not as elevated as the S&P 500. Though the domestic economy was weak during the first quarter, it strengthened after both gross domestic product (GDP) growth and employment gains buoyed investors’ spirits later in the year. GDP growth during the third quarter was reported to be among the fastest in more than a decade, and the unemployment rate was down notably in November 2014 compared to November 2013. Additionally, oil prices fell significantly from the highs posted in June due to increased U.S. production and OPEC’s failure to cut its output, which left consumers with more money to spend in other areas.
However, the economic outlook did not improve in most countries outside the U.S. In October, the International Monetary Fund lowered its 2015 growth target for the euro zone and Japan. In response to the continued economic sluggishness, central bankers in Europe and Japan looked to further ease monetary policy, even as the U.S. Federal Reserve Board (Fed) officially ended its bond-buying program. This divergence in monetary policy caused the U.S. dollar to appreciate strongly relative to both the euro and the yen in the second half of 2014, which turned modest foreign market gains into losses in U.S. dollar terms. In fact, the MSCI EAFE Index, which is representative of the developed foreign stock market, lost ground at year’s end. Emerging markets also suffered as a result of the strong U.S. dollar, albeit to a lesser degree, and the MSCI Emerging Markets Index also ended the year in negative territory.
The sharp fall in oil prices headlined a tough year for commodities overall, with natural gas, agriculture and metals also experiencing declines. The oil-heavy S&P GSCI® lost considerable ground in 2014, while the more diversified Bloomberg Commodity Index also declined but not as significantly. Real estate was one of the few successful diversifiers in 2014, as that asset class benefited from low bond yields.
In our opinion, the bond market may have provided the biggest surprise in 2014. For instance, at the end of 2013, as 10-year Treasury yields were on the rise and the Fed’s bond-buying program was winding down, the consensus pointed to higher yields in 2014. However, those forecasts were off-target as weak global growth, low inflation and loose global monetary conditions combined to push rates back down. As such, longer-term bonds appreciated steadily throughout the year as yields fell.
Portfolio Review
The Fund’s asset allocation positioning detracted from performance during the year as both strategic and dynamic exposures negatively impacted the Fund. Strategically, non-U.S. equity, emerging markets equity, non-U.S.
Management's Discussion of Fund Performance (Unaudited) (Continued)
bonds and short-term bonds were the largest detractors from performance. Real estate investment trusts (REITs) and large-cap growth equities contributed the most to the Fund’s annual performance.
During the period, the Fund held multiple dynamic asset allocation positions. Overall, the Fund’s defensive positioning had a slight negative impact on performance. A heightened short-term bond exposure and slight overweight to non-U.S. equities detracted from performance. Conversely, an underweight position in high yield bonds contributed to performance.
Performance was mixed among individual funds within the portfolio versus their respective benchmarks. Touchstone Sands Capital Institutional Growth Fund, Touchstone Small Cap Core Fund and Touchstone Arbitrage Fund were the largest detractors from relative performance, while Touchstone Total Return Bond Fund, Touchstone Flexible Income Fund and Touchstone Premium Yield Equity Fund were the main contributors to performance.
Outlook
During 2014, we maintained a defensive position in the Fund. This overall position continues to reflect our ongoing concern with the current lofty levels of most asset valuations that, in our view, still fail to reflect the growing risks and uncertainties in which investors are presented. While seemingly remote, we believe the risk of rising interest rates is not reflected in asset prices or appreciated by investors.
We saw volatility rise within many equity markets in response to this more uncertain environment, and bonds were also not immune to this volatility. Bond yields rose because of concerns over the pace of future interest rate increases; yet only seem to retrace those losses because of growth and inflation concerns. Investor sentiment also saw meaningful swings on this renewed volatility, which resulted in large outflows from asset classes that typically see strong support—the U.S. high yield bond asset class is an example.
In our opinion, such shifts have been welcome, as they presented opportunities to adjust some of our views across the Fund’s strategy. However, we remain cautious as to the level of key normalized valuation metrics, which we believe do not reflect the downside risk to earnings. The bond market presents a similar story, as yields across most markets have remained low relative to historic levels.
These stretched valuations are a direct result of the unprecedented action of global central banks over the last few years that has forced interest rates lower and pushed investors out the risk curve. We believe this activity has resulted in investors losing focus on fundamentals and increasing their risk profile. However, we believe this environment is set to change as central banks begin to take divergent paths rather than the same concerted front as in the past. In this environment, the difference in fundamentals across countries and sectors should attract greater focus resulting in differentiation across asset classes.
Given this outlook, the Fund’s strategy maintains its divergent views of global stock markets. The U.S. market is among the more expensive regions given the ongoing elevated levels of margins and prices being supported by cyclically adjusted multiples. Additionally, based on the fact that investors still hold large overweight positions in U.S. stocks, we believe this could exacerbate any market declines. As an alternative, we continue to look to international stocks for growth asset exposure because, in our view, these stocks offer a more reasonable reward for risk. This relative attractiveness has improved during the market’s recent volatility, and, as a result, we added to the Fund’s Europe, Australasia and Far East (EAFE) exposure. We have also maintained an overweight position to emerging markets, as these markets appear more attractively priced and better able to weather challenges that may arise.
In our opinion, U.S. REITs offer an unattractive return for risk, as their prices remain near all-time highs and there is a significant risk of permanent capital loss. We believe investors’ search for yield has supported the rise in recent years as U.S. REITs yields have attracted strong investor flows. Though non-U.S. REITs appear more attractive, valuations have become less so, as they too have benefitted from the same dynamic that has pushed U.S. valuations to their current levels.
With regard to bonds, the profile for most income assets is generally unappealing; however, relative to the low expected returns from growth assets, we believe income assets should offer benefits in more difficult markets.
On balance, the Fund’s strategy positioning remains defensive and more focused on preserving capital. As such, the Fund ended the quarter with greater international equity exposure and more short-term bond exposure than usual. Going forward, we will continue to monitor valuations and sentiment, and will adjust the portfolio should the opportunity present itself.
Management's Discussion of Fund Performance (Unaudited) (Continued)
Comparison of the Change in Value of a $10,000 Investment in the
Touchstone Balanced Allocation Fund - Class A*, the S&P Composite 1500 Index and
the Barclays U.S. Aggregate Bond Index
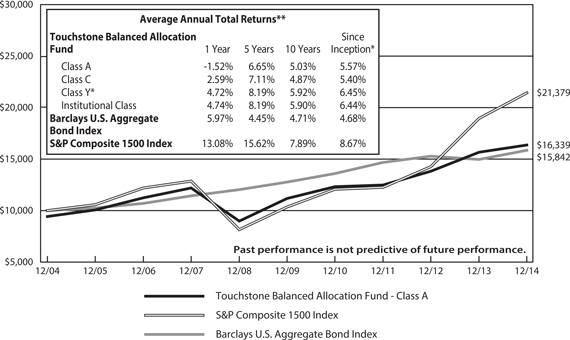
| * | The chart above represents performance of Class A shares only, which will vary from the performance of Class C shares, Class Y shares and Institutional Class shares based on the differences in loads and fees paid by shareholders in the different classes. The inception date of Class A shares, Class C shares, Class Y shares and Institutional Class shares was September 30, 2004, September 30, 2004, December 9, 2005 and September 30, 2004, respectively. Class Y shares performance information is calculated using the historical performance of Institutional Class shares for periods prior to December 9, 2005. The returns have been restated for sales charges and for fees applicable to Class Y shares. The returns of the indexes listed above are based on the inception date of the Fund. |
| ** | The average annual total returns shown above are adjusted for maximum applicable sales charges, if applicable. The maximum offering price per share of Class A shares is equal to the net asset value (“NAV”) per share plus a sales load equal to 6.10% of the NAV (or 5.75% of the offering price). Class C shares are subject to a contingent deferred sales charge (“CDSC”) of 1.00%. The CDSC will be assessed on an amount equal to the lesser of (1) the NAV at the time of purchase of the shares being redeemed or (2) the NAV of such shares being redeemed if redeemed within a one-year period from the date of purchase. Class Y shares and Institutional Class shares are not subject to sales charges. |
The performance of the above Fund does not reflect the deduction of taxes that a shareholder would pay on Fund distributions or the redemption of Fund shares.
Notes to Chart
S&P Composite 1500 Index is an unmanaged, broad market index representing the large-cap, mid-cap, and small-cap segments of the U.S. equity market.
Barclays U.S. Aggregate Bond Index is an unmanaged index comprised of U.S. investment grade, fixed rate bond market securities, including government, government agency, corporate and mortgage-backed securities between one and ten years.
Management's Discussion of Fund Performance (Unaudited)
Touchstone Conservative Allocation Fund
Sub-Advised by Ibbotson Associates, Inc.
Investment Philosophy
The Fund seeks to provide investors with current income and preservation of capital. The Fund is a fund of funds and therefore the value of an investment in the Fund is based on the performance of the underlying funds in which it invests and the allocation of its assets among those funds. This fund of funds primarily invests in a diversified portfolio of underlying equity and fixed income funds. The underlying funds, in turn, invest in a variety of U.S. and foreign equity and fixed income securities and may hold cash, cash equivalents and money market funds. An optimal model allocation among underlying funds is sought, by using an analysis that looks at forecasted returns, standard deviations in historical returns, and the correlation of the performance of different market sectors. The underlying funds are selected and weighted based on historical returns-based style analysis, holdings-based style analysis, manager interviews, relative and absolute performance, including correlations with other underlying funds as well as corresponding benchmarks, and historical volatility (the variability of returns from one period to the next). Under normal circumstances, the Fund expects to allocate its assets among equity and fixed income funds as follows: Equity Fund Allocation: 20–40%, Fixed Income Fund Allocation: 60–80%.
Fund Performance
The Touchstone Conservative Allocation Fund (Class A Shares) underperformed its benchmarks for the 12-month period ended December 31, 2014. The Fund’s total return was 3.51 percent (calculated excluding the maximum sales charge) while the total return of the Barclays U.S. Aggregate Bond Index was 5.97 percent and the total return of the S&P Composite 1500 was 13.08 percent for the same period.
Market Environment
U.S. stocks enjoyed a profitable year, and the S&P 500 Index posted a double-digit gain for 2014. The Russell 2000® Index, which is representative of small-cap equities, also ended in positive territory though returns were not as elevated as the S&P 500. Though the domestic economy was weak during the first quarter, it strengthened after both gross domestic product (GDP) growth and employment gains buoyed investors’ spirits later in the year. GDP growth during the third quarter was reported to be among the fastest in more than a decade, and the unemployment rate was down notably in November 2014 compared to November 2013. Additionally, oil prices fell significantly from the highs posted in June due to increased U.S. production and OPEC’s failure to cut its output, which left consumers with more money to spend in other areas.
However, the economic outlook did not improve in most countries outside the U.S. In October, the International Monetary Fund lowered its 2015 growth target for the euro zone and Japan. In response to the continued economic sluggishness, central bankers in Europe and Japan looked to further ease monetary policy, even as the U.S. Federal Reserve Board (Fed) officially ended its bond-buying program. This divergence in monetary policy caused the U.S. dollar to appreciate strongly relative to both the euro and the yen in the second half of 2014, which turned modest foreign market gains into losses in U.S. dollar terms. In fact, the MSCI EAFE Index, which is representative of the developed foreign stock market, lost ground at year’s end. Emerging markets also suffered as a result of the strong U.S. dollar, albeit to a lesser degree, and the MSCI Emerging Markets Index also ended the year in negative territory.
The sharp fall in oil prices headlined a tough year for commodities overall, with natural gas, agriculture and metals also experiencing declines. The oil-heavy S&P GSCI® lost considerable ground in 2014, while the more diversified Bloomberg Commodity Index also declined but not as significantly. Real estate was one of the few successful diversifiers in 2014, as that asset class benefited from low bond yields.
In our opinion, the bond market may have provided the biggest surprise in 2014. For instance, at the end of 2013, as 10-year Treasury yields were on the rise and the Fed’s bond-buying program was winding down, the consensus pointed to higher yields in 2014. However, those forecasts were off-target as weak global growth, low inflation and loose global monetary conditions combined to push rates back down. As such, longer-term bonds appreciated steadily throughout the year as yields fell.
Portfolio Review
Asset allocation positioning detracted from Fund performance during the year, as both strategic and dynamic exposures negatively impacted the Fund. Strategically, non-U.S. equity, emerging markets equity, non-U.S.
Management's Discussion of Fund Performance (Unaudited) (Continued)
bonds and short-term bonds were the largest detractors from performance. Real estate investment trusts (REITs) and large-cap growth equities were the main contributors to annual performance.
During the period, the Fund held multiple dynamic asset allocation positions. Overall, the Fund’s defensive positioning had a slight negative impact on performance. A heightened short-term bond exposure and slight overweight to non-U.S. equities detracted from performance. Conversely, an underweight position in high yield bonds contributed to performance.
Performance was mixed among individual funds within the portfolio versus their respective benchmarks.Touchstone Sands Capital Institutional Growth Fund, Touchstone Small Cap Core Fund and Touchstone Arbitrage Fund were the largest detractors from the Fund’s relative performance, while Touchstone Total Return Bond Fund, Touchstone Flexible Income Fund and Touchstone Premium Yield Equity Fund were the main contributors.
Outlook
During 2014, we maintained a defensive position in the Fund. This overall position continues to reflect our ongoing concern with the current lofty levels of most asset valuations that, in our view, still fail to reflect the growing risks and uncertainties in which investors are presented. While seemingly remote, we believe the risk of rising interest rates is not reflected in asset prices or appreciated by investors.
We saw volatility rise within many equity markets in response to this more uncertain environment, and bonds were also not immune to this volatility. Bond yields rose because of concerns over the pace of future interest rate increases; yet only seem to retrace those losses because of growth and inflation concerns. Investor sentiment also saw meaningful swings on this renewed volatility, which resulted in large outflows from asset classes that typically see strong support—the U.S. high yield bond asset class is an example.
In our opinion, such shifts have been welcome, as they presented opportunities to adjust some of our views across the Fund’s strategy. However, we remain cautious as to the level of key normalized valuation metrics, which we believe do not reflect the downside risk to earnings. The bond market presents a similar story, as yields across most markets have remained low relative to historic levels.
These stretched valuations are a direct result of the unprecedented action of global central banks over the last few years that has forced interest rates lower and pushed investors out the risk curve. We believe this activity has resulted in investors losing focus on fundamentals and increasing their risk profile. However, we believe this environment is set to change as central banks begin to take divergent paths rather than the same concerted front as in the past. In this environment, the difference in fundamentals across countries and sectors should attract greater focus resulting in differentiation across asset classes.
Given this outlook, the Fund’s strategy maintains its divergent views of global stock markets. The U.S. market is among the more expensive regions given the ongoing elevated levels of margins and prices being supported by cyclically adjusted multiples. Additionally, based on the fact that investors still hold large overweight positions in U.S. stocks, we believe this could exacerbate any market declines. As an alternative, we continue to look to international stocks for growth asset exposure because, in our view, these stocks offer a more reasonable reward for risk. This relative attractiveness has improved during the market’s recent volatility, and, as a result, we added to the Fund’s Europe, Australasia and Far East (EAFE) exposure. We have also maintained an overweight position to emerging markets, as these markets appear more attractively priced and better able to weather challenges that may arise.
In our opinion, U.S. REITs offer an unattractive return for risk, as their prices remain near all-time highs and there is a significant risk of permanent capital loss. We believe investors’ search for yield has supported the rise in recent years as U.S. REITs yields have attracted strong investor flows. Though non-U.S. REITs appear more attractive, valuations have become less so, as they too have benefitted from the same dynamic that has pushed U.S. valuations to their current levels.
With regard to bonds, the profile for most income assets is generally unappealing; however, relative to the low expected returns from growth assets, we believe income assets should offer benefits in more difficult markets.
On balance, the Fund’s strategy positioning remains defensive and more focused on preserving capital. As such, the Fund ended the quarter with greater international equity exposure and more short-term bond exposure than usual. Going forward, we will continue to monitor valuations and sentiment, and will adjust the portfolio should the opportunity present itself.
Management's Discussion of Fund Performance (Unaudited) (Continued)
Comparison of the Change in Value of a $10,000 Investment in the
Touchstone Conservative Allocation Fund - Class A*, the S&P Composite 1500 Index and
the Barclays U.S. Aggregate Bond Index
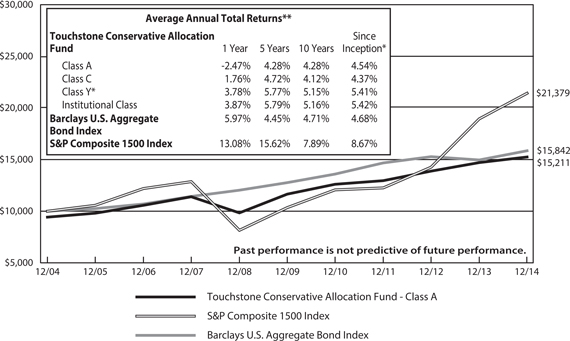
| * | The chart above represents performance of Class A shares only, which will vary from the performance of Class C shares, Class Y shares and Institutional Class shares based on the differences in loads and fees paid by shareholders in the different classes. The inception date of Class A shares, Class C shares, Class Y shares and Institutional Class shares was September 30, 2004, September 30, 2004, December 9, 2005 and September 30, 2004, respectively. Class Y shares performance information is calculated using the historical performance of Institutional Class shares for periods prior to December 9, 2005. The returns have been restated for sales charges and for fees applicable to Class Y shares. The returns of the indexes listed above are based on the inception date of the Fund. |
| ** | The average annual total returns shown above are adjusted for maximum applicable sales charges, if applicable. The maximum offering price per share of Class A shares is equal to the net asset value (“NAV”) per share plus a sales load equal to 6.10% of the NAV (or 5.75% of the offering price). Class C shares are subject to a contingent deferred sales charge (“CDSC”) of 1.00%. The CDSC will be assessed on an amount equal to the lesser of (1) the NAV at the time of purchase of the shares being redeemed or (2) the NAV of such shares being redeemed if redeemed within a one-year period from the date of purchase. Class Y shares and Institutional Class shares are not subject to sales charges. |
The performance of the above Fund does not reflect the deduction of taxes that a shareholder would pay on Fund distributions or the redemption of Fund shares.
Notes to Chart
S&P Composite 1500 Index is an unmanaged, broad market index representing the large-cap, mid-cap, and small-cap segments of the U.S. equity market.
Barclays U.S. Aggregate Bond Index is an unmanaged index comprised of U.S. investment grade, fixed rate bond market securities, including government, government agency, corporate and mortgage-backed securities between one and ten years.
Management's Discussion of Fund Performance (Unaudited)
Touchstone Growth Allocation Fund
Sub-Advised by Ibbotson Associates, Inc.
Investment Philosophy
The Fund seeks to provide investors with capital appreciation. The Fund is a fund of funds and therefore the value of an investment in the Fund is based on the performance of the underlying funds in which it invests and the allocation of its assets among those funds. This fund of funds primarily invests in a diversified portfolio of underlying equity and fixed income funds. The underlying funds, in turn, invest in a variety of U.S. and foreign equity and fixed income securities and may hold cash, cash equivalents and money market funds. An optimal model allocation among underlying funds is sought, by using an analysis that looks at forecasted returns, standard deviations in historical returns, and the correlation of the performance of different market sectors. The underlying funds are selected and weighted based on historical returns-based style analysis, holdings-based style analysis, manager interviews, relative and absolute performance, including correlations with other underlying funds as well as corresponding benchmarks, and historical volatility (the variability of returns from one period to the next). Under normal circumstances, the Fund expects to allocate its assets among equity and fixed income funds as follows: Equity Fund Allocation: 90–100%, Fixed Income Fund Allocation: 0–10%.
Fund Performance
The Touchstone Growth Allocation Fund (Class A Shares) underperformed its benchmark, the S&P Composite 1500 Index, for the 12-month period ended December 31, 2014. The Fund’s total return was 4.54 percent (calculated excluding the maximum sales charge) while the total return of the benchmark was 13.08 percent for the same period.
Market Environment
U.S. stocks enjoyed a profitable year, and the S&P 500 Index posted a double-digit gain for 2014. The Russell 2000® Index, which is representative of small-cap equities, also ended in positive territory though returns were not as elevated as the S&P 500. Though the domestic economy was weak during the first quarter, it strengthened after both gross domestic product (GDP) growth and employment gains buoyed investors’ spirits later in the year. GDP growth during the third quarter was reported to be among the fastest in more than a decade, and the unemployment rate was down notably in November 2014 compared to November 2013. Additionally, oil prices fell significantly from the highs posted in June due to increased U.S. production and OPEC’s failure to cut its output, which left consumers with more money to spend in other areas.
However, the economic outlook did not improve in most countries outside the U.S. In October, the International Monetary Fund lowered its 2015 growth target for the euro zone and Japan. In response to the continued economic sluggishness, central bankers in Europe and Japan looked to further ease monetary policy, even as the U.S. Federal Reserve Board (Fed) officially ended its bond-buying program. This divergence in monetary policy caused the U.S. dollar to appreciate strongly relative to both the euro and the yen in the second half of 2014, which turned modest foreign market gains into losses in U.S. dollar terms. In fact, the MSCI EAFE Index, which is representative of the developed foreign stock market, lost ground at year’s end. Emerging markets also suffered as a result of the strong U.S. dollar, albeit to a lesser degree, and the MSCI Emerging Markets Index also ended the year in negative territory.
The sharp fall in oil prices headlined a tough year for commodities overall, with natural gas, agriculture and metals also experiencing declines. The oil-heavy S&P GSCI® lost considerable ground in 2014, while the more diversified Bloomberg Commodity Index also declined but not as significantly. Real estate was one of the few successful diversifiers in 2014, as that asset class benefited from low bond yields.
In our opinion, the bond market may have provided the biggest surprise in 2014. For instance, at the end of 2013, as 10-year Treasury yields were on the rise and the Fed’s bond-buying program was winding down, the consensus pointed to higher yields in 2014. However, those forecasts were off-target as weak global growth, low inflation and loose global monetary conditions combined to push rates back down. As such, longer-term bonds appreciated steadily throughout the year as yields fell.
Management's Discussion of Fund Performance (Unaudited) (Continued)
Portfolio Review
Asset allocation positioning detracted from Fund performance during the year, as both strategic and dynamic exposures negatively impacted the Fund. Strategically, non-U.S. equity, emerging markets equity and alternatives were the largest detractors from performance. Real estate investment trusts (REITs) and large-cap growth equities were the main contributors to annual performance.
During the period, the Fund held multiple dynamic asset allocation positions. Overall, the Fund’s defensive positioning had a slight negative impact on performance. A heightened short-term bond exposure and slight overweight to non-U.S. equities detracted from performance.
Performance was mixed among individual funds within the portfolio versus their respective benchmarks. Touchstone Sands Capital Institutional Growth Fund, Touchstone Small Cap Core Fund and Touchstone Focused Fund were the largest detractors from relative performance, while Touchstone International Value Fund, Touchstone International Small Cap Fund and Touchstone Premium Yield Equity Fund were the main contributors.
Outlook
During 2014, we maintained a defensive position in the Fund. This overall position continues to reflect our ongoing concern with the current lofty levels of most asset valuations that, in our view, still fail to reflect the growing risks and uncertainties in which investors are presented. While seemingly remote, we believe the risk of rising interest rates is not reflected in asset prices or appreciated by investors.
We saw volatility rise within many equity markets in response to this more uncertain environment, and bonds were also not immune to this volatility. Bond yields rose because of concerns over the pace of future interest rate increases; yet only seem to retrace those losses because of growth and inflation concerns. Investor sentiment also saw meaningful swings on this renewed volatility, which resulted in large outflows from asset classes that typically see strong support–the U.S. high yield bond asset class is an example.
In our opinion, such shifts have been welcome, as they presented opportunities to adjust some of our views across the Fund’s strategy. However, we remain cautious as to the level of key normalized valuation metrics, which we believe do not reflect the downside risk to earnings. The bond market presents a similar story, as yields across most markets have remained low relative to historic levels.
These stretched valuations are a direct result of the unprecedented action of global central banks over the last few years that has forced interest rates lower and pushed investors out the risk curve. We believe this activity has resulted in investors losing focus on fundamentals and increasing their risk profile. However, we believe this environment is set to change as central banks begin to take divergent paths rather than the same concerted front as in the past. In this environment, the difference in fundamentals across countries and sectors should attract greater focus resulting in differentiation across asset classes.
Given this outlook, the Fund’s strategy maintains its divergent views of global stock markets. The U.S. market is among the more expensive regions given the ongoing elevated levels of margins and prices being supported by cyclically adjusted multiples. Additionally, based on the fact that investors still hold large overweight positions in U.S. stocks, we believe this could exacerbate any market declines. As an alternative, we continue to look to international stocks for growth asset exposure because, in our view, these stocks offer a more reasonable reward for risk. This relative attractiveness has improved during the market’s recent volatility, and, as a result, we added to the Fund’s Europe, Australasia and Far East (EAFE) exposure. We have also maintained an overweight position to emerging markets, as these markets appear more attractively priced and better able to weather challenges that may arise.
In our opinion, U.S. REITs offer an unattractive return for risk, as their prices remain near all-time highs and there is a significant risk of permanent capital loss. We believe investors’ search for yield has supported the rise in recent years as U.S. REITs yields have attracted strong investor flows. Though non-U.S. REITs appear more attractive, valuations have become less so, as they too have benefitted from the same dynamic that has pushed U.S. valuations to their current levels.
With regard to bonds, the profile for most income assets is generally unappealing; however, relative to the low expected returns from growth assets, we believe income assets should offer benefits in more difficult markets.
Management's Discussion of Fund Performance (Unaudited) (Continued)
On balance, the Fund’s strategy positioning remains defensive and more focused on preserving capital. As such, the Fund ended the quarter with greater international equity exposure and more short-term bond exposure than usual. Going forward, we will continue to monitor valuations and sentiment, and will adjust the portfolio should the opportunity present itself.
Comparison of the Change in Value of a $10,000 Investment in the
Touchstone Growth Allocation Fund - Class A* and the S&P Composite 1500 Index
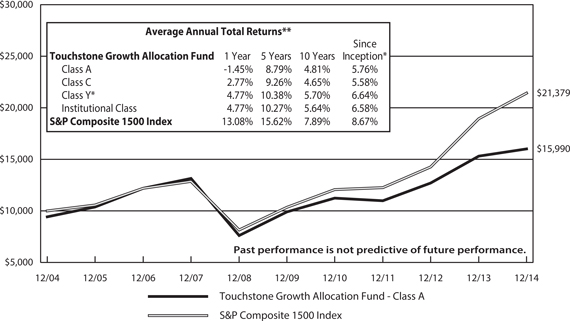
| * | The chart above represents performance of Class A shares only, which will vary from the performance of Class C shares, Class Y shares and Institutional Class shares based on the differences in loads and fees paid by shareholders in the different classes. The inception date of Class A shares, Class C shares, Class Y shares and Institutional Class shares was September 30, 2004, September 30, 2004, December 9, 2005 and September 30, 2004, respectively. Class Y shares performance information is calculated using the historical performance of Institutional Class shares for periods prior to December 9, 2005. The returns have been restated for sales charges and for fees applicable to Class Y shares. The returns of the index listed above are based on the inception date of the Fund. |
| ** | The average annual total returns shown above are adjusted for maximum applicable sales charges, if applicable. The maximum offering price per share of Class A shares is equal to the net asset value (“NAV”) per share plus a sales load equal to 6.10% of the NAV (or 5.75% of the offering price). Class C shares are subject to a contingent deferred sales charge (“CDSC”) of 1.00%. The CDSC will be assessed on an amount equal to the lesser of (1) the NAV at the time of purchase of the shares being redeemed or (2) the NAV of such shares being redeemed if redeemed within a one-year period from the date of purchase. Class Y shares and Institutional Class shares are not subject to sales charges. |
The performance of the above Fund does not reflect the deduction of taxes that a shareholder would pay on Fund distributions or the redemption of Fund shares.
Note to Chart
S&P Composite 1500 Index is an unmanaged, broad market index representing the large-cap, mid-cap, and small-cap segments of the U.S. equity market.
Management's Discussion of Fund Performance (Unaudited)
Touchstone Moderate Growth Allocation Fund
Sub-Advised by Ibbotson Associates, Inc.
Investment Philosophy
The Fund seeks to provide investors with capital appreciation and current income. The Fund is a fund of funds and therefore the value of an investment in the Fund is based on the performance of the underlying funds in which it invests and the allocation of its assets among those funds. This fund of funds primarily invests in a diversified portfolio of underlying equity and fixed income funds. The underlying funds, in turn, invest in a variety of U.S. and foreign equity and fixed income securities and may hold cash, cash equivalents and money market funds. An optimal model allocation among underlying funds is sought, by using an analysis that looks at forecasted returns, standard deviations in historical returns, and the correlation of the performance of different market sectors. The underlying funds are selected and weighted based on historical returns-based style analysis, holdings-based style analysis, manager interviews, relative and absolute performance, including correlations with other underlying funds as well as corresponding benchmarks, and historical volatility (the variability of returns from one period to the next). Under normal circumstances, the Fund expects to allocate its assets among equity and fixed income funds as follows: Equity Fund Allocation: 70–90%, Fixed Income Fund Allocation: 10–30%.
Fund Performance
The Touchstone Moderate Growth Allocation Fund (Class A Shares) underperformed its benchmarks for the 12-month period ended December 31, 2014. The Fund’s total return was 5.06 percent (calculated excluding the maximum sales charge) while the total return of the Barclays U.S. Aggregate Bond Index was 5.97 percent and the total return of the S&P Composite 1500 was 13.08 percent for the same period.
Market Environment
U.S. stocks enjoyed a profitable year, and the S&P 500 Index posted a double-digit gain for 2014. The Russell 2000® Index, which is representative of small-cap equities, also ended in positive territory though returns were not as elevated as the S&P 500. Though the domestic economy was weak during the first quarter, it strengthened after both gross domestic product (GDP) growth and employment gains buoyed investors’ spirits later in the year. GDP growth during the third quarter was reported to be among the fastest in more than a decade, and the unemployment rate was down notably in November 2014 compared to November 2013. Additionally, oil prices fell significantly from the highs posted in June due to increased U.S. production and OPEC’s failure to cut its output, which left consumers with more money to spend in other areas.
However, the economic outlook did not improve in most countries outside the U.S. In October, the International Monetary Fund lowered its 2015 growth target for the euro zone and Japan. In response to the continued economic sluggishness, central bankers in Europe and Japan looked to further ease monetary policy, even as the U.S. Federal Reserve Board (Fed) officially ended its bond-buying program. This divergence in monetary policy caused the U.S. dollar to appreciate strongly relative to both the euro and the yen in the second half of 2014, which turned modest foreign market gains into losses in U.S. dollar terms. In fact, the MSCI EAFE Index, which is representative of the developed foreign stock market, lost ground at year’s end. Emerging markets also suffered as a result of the strong U.S. dollar, albeit to a lesser degree, and the MSCI Emerging Markets Index also ended the year in negative territory.
The sharp fall in oil prices headlined a tough year for commodities overall, with natural gas, agriculture and metals also experiencing declines. The oil-heavy S&P GSCI® lost considerable ground in 2014, while the more diversified Bloomberg Commodity Index also declined but not as significantly. Real estate was one of the few successful diversifiers in 2014, as that asset class benefited from low bond yields.
In our opinion, the bond market may have provided the biggest surprise in 2014. For instance, at the end of 2013, as 10-year Treasury yields were on the rise and the Fed’s bond-buying program was winding down, the consensus pointed to higher yields in 2014. However, those forecasts were off-target as weak global growth, low inflation and loose global monetary conditions combined to push rates back down. As such, longer-term bonds appreciated steadily throughout the year as yields fell.
Portfolio Review
Asset allocation positioning detracted from Fund performance during the year, as both strategic and dynamic exposures negatively impacted the Fund. Strategically, non-U.S. equity, emerging markets equity, non-U.S.
Management's Discussion of Fund Performance (Unaudited) (Continued)
bonds and short-term bonds were the largest detractors from performance. Conversely, Real Estate Investment Trusts (REITs) and large-cap growth equities were the main contributors to annual performance.
During the period, the Fund held multiple dynamic asset allocation positions. Overall, the Fund’s defensive positioning had a slight negative impact on performance. A heightened short-term bond exposure and slight overweight to non-U.S. equities detracted from Fund performance, while an underweight position in high yield bonds contributed to performance.
Performance was mixed among individual funds within the portfolio versus their respective benchmarks. Touchstone Sands Capital Institutional Growth Fund, Touchstone Small Cap Core Fund and Touchstone Focused Fund were the largest detractors from relative performance, while Touchstone Total Return Bond Fund, Touchstone International Value Fund and Touchstone Premium Yield Equity Fund were the main contributors.
Outlook
During 2014, we maintained a defensive position in the Fund. This overall position continues to reflect our ongoing concern with the current lofty levels of most asset valuations that, in our view, still fail to reflect the growing risks and uncertainties in which investors are presented. While seemingly remote, we believe the risk of rising interest rates is not reflected in asset prices or appreciated by investors.
We saw volatility rise within many equity markets in response to this more uncertain environment, and bonds were also not immune to this volatility. Bond yields rose because of concerns over the pace of future interest rate increases; yet only seem to retrace those losses because of growth and inflation concerns. Investor sentiment also saw meaningful swings on this renewed volatility, which resulted in large outflows from asset classes that typically see strong support—the U.S. high yield bond asset class is an example.
In our opinion, such shifts have been welcome, as they presented opportunities to adjust some of our views across the Fund’s strategy. However, we remain cautious as to the level of key normalized valuation metrics, which we believe do not reflect the downside risk to earnings. The bond market presents a similar story, as yields across most markets have remained low relative to historic levels.
These stretched valuations are a direct result of the unprecedented action of global central banks over the last few years that has forced interest rates lower and pushed investors out the risk curve. We believe this activity has resulted in investors losing focus on fundamentals and increasing their risk profile. However, we believe this environment is set to change as central banks begin to take divergent paths rather than the same concerted front as in the past. In this environment, the difference in fundamentals across countries and sectors should attract greater focus resulting in differentiation across asset classes.
Given this outlook, the Fund’s strategy maintains its divergent views of global stock markets. The U.S. market is among the more expensive regions given the ongoing elevated levels of margins and prices being supported by cyclically adjusted multiples. Additionally, based on the fact that investors still hold large overweight positions in U.S. stocks, we believe this could exacerbate any market declines. As an alternative, we continue to look to international stocks for growth asset exposure because, in our view, these stocks offer a more reasonable reward for risk. This relative attractiveness has improved during the market’s recent volatility, and, as a result, we added to the Fund’s Europe, Australasia and Far East (EAFE) exposure. We have also maintained an overweight position to emerging markets, as these markets appear more attractively priced and better able to weather challenges that may arise.
In our opinion, U.S. REITs offer an unattractive return for risk, as their prices remain near all-time highs and there is a significant risk of permanent capital loss. We believe investors’ search for yield has supported the rise in recent years as U.S. REITs yields have attracted strong investor flows. Though non-U.S. REITs appear more attractive, valuations have become less so, as they too have benefitted from the same dynamic that has pushed U.S. valuations to their current levels.
With regard to bonds, the profile for most income assets is generally unappealing; however, relative to the low expected returns from growth assets, we believe income assets should offer benefits in more difficult markets.
On balance, the Fund’s strategy positioning remains defensive and more focused on preserving capital. As such, the Fund ended the quarter with greater international equity exposure and more short-term bond exposure than usual. Going forward, we will continue to monitor valuations and sentiment, and will adjust the portfolio should the opportunity present itself.
Management's Discussion of Fund Performance (Unaudited) (Continued)
Comparison of the Change in Value of a $10,000 Investment in the
Touchstone Moderate Growth Allocation Fund-Class A*, the S&P Composite 1500 Index and
the Barclays U.S. Aggregate Bond Index

| * | The chart above represents performance of Class A shares only, which will vary from the performance of Class C shares, Class Y shares and Institutional Class shares based on the differences in loads and fees paid by shareholders in the different classes. The inception date of Class A shares, Class C shares, Class Y shares and Institutional Class shares was September 30, 2004, September 30, 2004, December 9, 2005 and September 30, 2004, respectively. Class Y shares performance information is calculated using the historical performance of Institutional Class shares for periods prior to December 9, 2005. The returns have been restated for sales charges and for fees applicable to Class Y shares. The returns of the indexes listed above are based on the inception date of the Fund. |
| ** | The average annual total returns shown above are adjusted for maximum applicable sales charges, if applicable. The maximum offering price per share of Class A shares is equal to the net asset value (“NAV”) per share plus a sales load equal to 6.10% of the NAV (or 5.75% of the offering price). Class C shares are subject to a contingent deferred sales charge (“CDSC”) of 1.00%. The CDSC will be assessed on an amount equal to the lesser of (1) the NAV at the time of purchase of the shares being redeemed or (2) the NAV of such shares being redeemed if redeemed within a one-year period from the date of purchase. Class Y shares and Institutional Class shares are not subject to sales charges. |
The performance of the above Fund does not reflect the deduction of taxes that a shareholder would pay on Fund distributions or the redemption of Fund shares.
Notes to Chart
S&P Composite 1500 Index is an unmanaged, broad market index representing the large-cap, mid-cap, and small-cap segments of the U.S. equity market.
Barclays U.S. Aggregate Bond Index is an unmanaged index comprised of U.S. investment grade, fixed rate bond market securities, including government, government agency, corporate and mortgage-backed securities between one and ten years.
Tabular Presentation of Portfolios of Investments (Unaudited)
December 31, 2014
The tables below provide each Fund’s sector allocation. We hope it will be useful to shareholders as it summarizes key information about each Fund’s investments.
| Touchstone Dynamic Equity Fund | | | |
| Sector Allocation* | | (% of Net Assets) | |
| Long Positions | | | | |
| Information Technology | | | 24.5 | % |
| Financials | | | 20.4 | |
| Health Care | | | 13.9 | |
| Consumer Discretionary | | | 13.6 | |
| Industrials | | | 12.3 | |
| Consumer Staples | | | 11.9 | |
| Energy | | | 10.6 | |
| Materials | | | 3.7 | |
| Telecommunication Services | | | 3.3 | |
| Utilities | | | 2.2 | |
| Investment Fund | | | 1.5 | |
| Other Assets/Liabilities (Net) | | | 3.5 | |
| | | | 121.4 | % |
| | | | | |
| Short Positions and Written Options | | | | |
| Information Technology | | | (4.5 | )% |
| Financials | | | (4.1 | ) |
| Energy | | | (3.9 | ) |
| Call and Put Options | | | (2.3 | ) |
| Industrials | | | (2.0 | ) |
| Consumer Discretionary | | | (1.7 | ) |
| Health Care | | | (1.4 | ) |
| Materials | | | (0.7 | ) |
| Utilities | | | (0.4 | ) |
| Consumer Staples | | | (0.2 | ) |
| Telecommunication Services | | | (0.2 | ) |
| | | | (21.4 | ) |
| Total | | | 100.0 | % |
| Touchstone Balanced Allocation Fund | | | |
| Sector Allocation* | | (% of Net Assets) | |
| Government/Corporate | | | 24.5 | % |
| International Equity | | | 12.1 | |
| Value | | | 10.1 | |
| Growth | | | 10.1 | |
| Equity Income | | | 7.0 | |
| Balanced | | | 5.1 | |
| International Debt | | | 4.9 | |
| Emerging Market-Equity | | | 4.9 | |
| Various Assets | | | 3.6 | |
| Blue Chip | | | 3.5 | |
| Growth Mid-Cap | | | 3.1 | |
| Taxable-Money Market | | | 3.0 | |
| Sector Fund Real-Estate | | | 2.5 | |
| Value Small-Cap | | | 2.0 | |
| Corporate/Preferred-High Yield | | | 1.8 | |
| Value Mid Cap | | | 1.0 | |
| Growth Small-Cap | | | 1.0 | |
| Other Assets/Liabilities (Net) | | | (0.2 | ) |
| Total | | | 100.0 | % |
* Sector classifications are based upon the Global Industry Classification Standard (GICS®).
Tabular Presentation of Portfolios of Investments (Unaudited) (Continued)
| Touchstone Conservative Allocation Fund | | | |
| Sector Allocation* | | (% of Net Assets) | |
| Government/Corporate | | | 45.3 | % |
| International Debt | | | 8.0 | |
| Balanced | | | 7.0 | |
| Growth | | | 6.0 | |
| International Equity | | | 5.7 | |
| Taxable-Money Market | | | 5.0 | |
| Various Assets | | | 5.0 | |
| Value | | | 4.9 | |
| Equity Income | | | 4.5 | |
| Blue Chip | | | 3.0 | |
| Corporate/Preferred-High Yield | | | 1.8 | |
| Value Small-Cap | | | 1.0 | |
| Sector Fund Real-Estate | | | 1.0 | |
| Emerging Market-Equity | | | 1.0 | |
| Value Mid-Cap | | | 1.0 | |
| Other Assets/Liabilities (Net) | | | (0.2 | ) |
| Total | | | 100.0 | % |
| Touchstone Growth Allocation Fund | | | |
| Sector Allocation* | | (% of Net Assets) | |
| International Equity | | | 19.3 | % |
| Value | | | 17.7 | |
| Growth | | | 13.7 | |
| Emerging Market-Equity | | | 12.8 | |
| Equity Income | | | 7.1 | |
| Value Small-Cap | | | 6.7 | |
| Blue Chip | | | 5.1 | |
| Sector Fund Real-Estate | | | 4.6 | |
| Government/Corporate | | | 4.0 | |
| Growth Small-Cap | | | 3.9 | |
| Growth Mid-Cap | | | 3.3 | |
| Value Mid-Cap | | | 2.1 | |
| Other Assets/Liabilities (Net) | | | (0.3 | ) |
| Total | | | 100.0 | % |
| Touchstone Moderate Growth Allocation Fund | | | |
| Sector Allocation* | | (% of Net Assets) | |
| Government/Corporate | | | 14.9 | % |
| International Equity | | | 14.4 | |
| Value | | | 14.2 | |
| Growth | | | 12.3 | |
| Emerging Market-Equity | | | 7.9 | |
| Equity Income | | | 7.1 | |
| Value Small-Cap | | | 5.1 | |
| Blue Chip | | | 4.1 | |
| Balanced | | | 4.0 | |
| Growth Mid-Cap | | | 3.6 | |
| Sector Fund Real-Estate | | | 3.1 | |
| Value Mid-Cap | | | 2.1 | |
| Growth Small-Cap | | | 2.0 | |
| Various Assets | | | 2.0 | |
| International Debt | | | 1.9 | |
| Corporate/Preferred-High Yield | | | 1.5 | |
| Other Assets/Liabilities (Net) | | | (0.2 | ) |
| Total | | | 100.0 | % |
* Sector classifications are based upon the Global Industry Classification Standard (GICS®).
Portfolio of Investments
Touchstone Dynamic Equity Fund – December 31, 2014
| | | | | | Market | |
| | | Shares | | | Value | |
| | | | | | | |
| Common Stocks † — 116.4% | | | | | | | | |
| | | | | | | | | |
| Information Technology — 24.5% | | | | | | | | |
| Accenture PLC (Ireland) - Class A | | | 18,275 | | | $ | 1,632,141 | |
| Apple, Inc. | | | 10,299 | | | | 1,136,804 | |
| ARRIS Group, Inc.* | | | 6,291 | | | | 189,925 | |
| Automatic Data Processing, Inc. | | | 633 | | | | 52,773 | |
| Booz Allen Hamilton Holding Corp. | | | 11,116 | | | | 294,907 | |
| Cadence Design Systems, Inc.* | | | 3,434 | | | | 65,143 | |
| Cisco Systems, Inc. | | | 56,484 | | | | 1,571,102 | |
| Computer Sciences Corp. | | | 13,638 | | | | 859,876 | |
| DST Systems, Inc. | | | 16,682 | | | | 1,570,610 | |
| Electronic Arts, Inc.* | | | 23,211 | | | | 1,091,265 | |
| Hewlett-Packard Co. | | | 61,072 | | | | 2,450,819 | |
| Ingram Micro, Inc. - Class A* | | | 13,409 | | | | 370,625 | |
| Intel Corp. | | | 17,832 | | | | 647,123 | |
| International Business Machines Corp. | | | 11,095 | | | | 1,780,082 | |
| Intuit, Inc. | | | 4,279 | | | | 394,481 | |
| Lexmark International, Inc. - Class A | | | 517 | | | | 21,337 | |
| Micron Technology, Inc.* | | | 33,236 | | | | 1,163,592 | |
| Microsoft Corp. | | | 19,524 | | | | 906,890 | |
| QUALCOMM, Inc. | | | 25,381 | | | | 1,886,570 | |
| Red Hat, Inc.* | | | 3,509 | | | | 242,612 | |
| Visa, Inc. - Class A | | | 2,142 | | | | 561,632 | |
| Xerox Corp. | | | 7,702 | | | | 106,750 | |
| | | | | | | | 18,997,059 | |
| | | | | | | | | |
| Financials — 20.4% | | | | | | | | |
| Allstate Corp. (The) | | | 233 | | | | 16,368 | |
| Ally Financial, Inc.* | | | 38,334 | | | | 905,449 | |
| American International Group, Inc. | | | 44,475 | | | | 2,491,045 | |
| Berkshire Hathaway, Inc. - Class B* | | | 1,965 | | | | 295,045 | |
| Capital One Financial Corp. | | | 6,176 | | | | 509,829 | |
| CBRE Group, Inc. - Class A* | | | 35,127 | | | | 1,203,100 | |
| Chimera Investment Corp. REIT | | | 175,213 | | | | 557,177 | |
| Host Hotels & Resorts, Inc. REIT | | | 52,549 | | | | 1,249,090 | |
| Jones Lang LaSalle, Inc. | | | 10,361 | | | | 1,553,425 | |
| JPMorgan Chase & Co. | | | 51,072 | | | | 3,196,086 | |
| Liberty Broadband Corp. - Class C* | | | 3,707 | | | | 184,683 | |
| Navient Corp. | | | 2,621 | | | | 56,640 | |
| Old Republic International Corp. | | | 18,327 | | | | 268,124 | |
| Progressive Corp. (The) | | | 12,635 | | | | 341,019 | |
| Regions Financial Corp. | | | 29,570 | | | | 312,259 | |
| Simon Property Group, Inc. REIT | | | 7,762 | | | | 1,413,538 | |
| Voya Financial, Inc. | | | 27,571 | | | | 1,168,459 | |
| Wells Fargo & Co. | | | 1,981 | | | | 108,598 | |
| | | | | | | | 15,829,934 | |
| | | | | | | | | |
| Health Care — 13.9% | | | | | | | | |
| Allergan, Inc. | | | 6,653 | | | | 1,414,361 | |
| AmerisourceBergen Corp. | | | 2,312 | | | | 208,450 | |
| Cardinal Health, Inc. | | | 4,422 | | | | 356,988 | |
| CareFusion Corp.* | | | 212 | | | | 12,580 | |
| Catamaran Corp. (Canada)* | | | 26,582 | | | | 1,375,618 | |
| Covidien PLC (Ireland) | | | 1,619 | | | | 165,591 | |
| Eli Lilly & Co. | | | 35,143 | | | | 2,424,516 | |
| Gilead Sciences, Inc.* | | | 14,272 | | | | 1,345,279 | |
| Halyard Health, Inc.* | | | 581 | | | | 26,418 | |
| Johnson & Johnson | | | 13,685 | | | | 1,431,040 | |
| McKesson Corp. | | | 3,174 | | | | 658,859 | |
| Merck & Co., Inc. | | | 24,594 | | | | 1,396,693 | |
| | | | | | | | 10,816,393 | |
| | | | | | | | | |
| Consumer Discretionary — 13.6% | | | | | | | | |
| Big Lots, Inc. | | | 3,506 | | | | 140,310 | |
| Comcast Corp. - Class A | | | 10,682 | | | | 619,663 | |
| Delphi Automotive PLC (United | | | | | | | | |
| Kingdom) | | | 15,708 | | | | 1,142,286 | |
| DIRECTV* | | | 2,073 | | | | 179,729 | |
| Dollar General Corp.* | | | 897 | | | | 63,418 | |
| Expedia, Inc. | | | 8,662 | | | | 739,388 | |
| Ford Motor Co. | | | 11,562 | | | | 179,211 | |
| Garmin Ltd. (Switzerland) | | | 5,523 | | | | 291,780 | |
| Genuine Parts Co. | | | 7,977 | | | | 850,109 | |
| Home Depot, Inc. (The) | | | 6,977 | | | | 732,376 | |
| Macy's, Inc. | | | 19,154 | | | | 1,259,376 | |
| Marriott International, Inc. - Class A | | | 6,912 | | | | 539,343 | |
| Murphy USA, Inc.* | | | 11,010 | | | | 758,149 | |
| Newell Rubbermaid, Inc. | | | 6,816 | | | | 259,621 | |
| News Corp. - Class A* | | | 1,192 | | | | 18,702 | |
| NIKE, Inc. - Class B | | | 3,073 | | | | 295,469 | |
| PetSmart, Inc. | | | 7,117 | | | | 578,577 | |
| Target Corp. | | | 2,168 | | | | 164,573 | |
| Time Warner Cable, Inc. | | | 1,016 | | | | 154,493 | |
| Twenty-First Century Fox, Inc., Class A | | | 2,730 | | | | 104,846 | |
| Walt Disney Co. (The) | | | 15,822 | | | | 1,490,274 | |
| | | | | | | | 10,561,693 | |
| | | | | | | | | |
| Industrials — 12.3% | | | | | | | | |
| Acuity Brands, Inc. | | | 603 | | | | 84,462 | |
| Delta Air Lines, Inc. | | | 20,435 | | | | 1,005,198 | |
| General Electric Co. | | | 88,133 | | | | 2,227,121 | |
| Lockheed Martin Corp. | | | 12,879 | | | | 2,480,109 | |
| ManpowerGroup, Inc. | | | 12,792 | | | | 872,031 | |
| Masco Corp. | | | 11,818 | | | | 297,814 | |
| Robert Half International, Inc. | | | 5,887 | | | | 343,683 | |
| Southwest Airlines Co. | | | 32,523 | | | | 1,376,373 | |
| Toro Co. (The) | | | 12,027 | | | | 767,443 | |
| United Continental Holdings, Inc.* | | | 1,752 | | | | 117,191 | |
| | | | | | | | 9,571,425 | |
| | | | | | | | | |
| Consumer Staples — 11.9% | | | | | | | | |
| Archer-Daniels-Midland Co. | | | 10,336 | | | | 537,472 | |
| Constellation Brands, Inc. - Class A* | | | 6,110 | | | | 599,819 | |
| CVS Health Corp. | | | 16,848 | | | | 1,622,631 | |
| Kroger Co. (The) | | | 21,198 | | | | 1,361,124 | |
| Lorillard, Inc. | | | 987 | | | | 62,122 | |
| Monster Beverage Corp.* | | | 6,691 | | | | 724,970 | |
| PepsiCo, Inc. | | | 8,872 | | | | 838,936 | |
| Pilgrim's Pride Corp.* | | | 32,948 | | | | 1,080,365 | |
| Reynolds American, Inc. | | | 724 | | | | 46,531 | |
| Tyson Foods, Inc. - Class A | | | 16,271 | | | | 652,304 | |
| Wal-Mart Stores, Inc. | | | 20,359 | | | | 1,748,431 | |
| | | | | | | | 9,274,705 | |
Touchstone Dynamic Equity Fund (Continued)
| | | | | | Market | |
| | | Shares | | | Value | |
| | | | | | | |
| Common Stocks † — 116.4% (Continued) | | | | | | | | |
| | | | | | | | | |
| Energy — 10.6% | | | | | | | | |
| Baker Hughes, Inc. | | | 1,119 | | | $ | 62,742 | |
| California Resources Corp.* | | | 92,194 | | | | 507,989 | |
| ConocoPhillips | | | 9,665 | | | | 667,465 | |
| Marathon Petroleum Corp. | | | 18,859 | | | | 1,702,213 | |
| Nabors Industries Ltd. (Bermuda) | | | 49,480 | | | | 642,250 | |
| Phillips 66 | | | 25,203 | | | | 1,807,055 | |
| Tesoro Corp. | | | 3,966 | | | | 294,872 | |
| Valero Energy Corp. | | | 28,727 | | | | 1,421,986 | |
| World Fuel Services Corp. | | | 12,521 | | | | 587,611 | |
| WPX Energy, Inc.* | | | 44,512 | | | | 517,675 | |
| | | | | | | | 8,211,858 | |
| | | | | | | | | |
| Materials — 3.7% | | | | | | | | |
| Dow Chemical Co. (The) | | | 21,600 | | | | 985,176 | |
| LyondellBasell Industries N.V. - Class A | | | | | | | | |
| (Netherlands) | | | 19,615 | | | | 1,557,235 | |
| Sigma-Aldrich Corp. | | | 237 | | | | 32,533 | |
| United States Steel Corp. | | | 10,376 | | | | 277,454 | |
| | | | | | | | 2,852,398 | |
| | | | | | | | | |
| Telecommunication Services — 3.3% | | | | | | | | |
| AT&T, Inc. | | | 21,261 | | | | 714,157 | |
| Verizon Communications, Inc. | | | 39,316 | | | | 1,839,202 | |
| | | | | | | | 2,553,359 | |
| | | | | | | | | |
| Utilities — 2.2% | | | | | | | | |
| American Electric Power Co., Inc. | | | 6,331 | | | | 384,418 | |
| Consolidated Edison, Inc. | | | 5,351 | | | | 353,220 | |
| Edison International | | | 15,406 | | | | 1,008,785 | |
| | | | | | | | 1,746,423 | |
| Total Common Stocks | | | | | | $ | 90,415,247 | |
| | | | | | | | | |
| | | | Number | | | | | |
| | | | of | | | | | |
| | | | Rights | | | | | |
| | | | | | | | | |
| Rights — 0.0% | | | | | | | | |
| | | | | | | | | |
| Financials — 0.0% | | | | | | | | |
| Liberty Broadband Corp. | | | | | | | | |
| Expiration 01/09/15 | | | | | | | | |
| Price $40.36* | | | 741 | | | | 7,043 | |
| | | | | | | | | |
| | | | Shares | | | | | |
| | | | | | | | | |
| Investment Fund — 1.5% | | | | | | | | |
| Touchstone Institutional Money Market | | | | | | | | |
| Fund, 0.01%^∞Ω | | | 1,212,923 | | | | 1,212,923 | |
| | | | | | | | | |
| Total Long Positions | | | | | | | | |
| (Cost $86,959,224) | | | | | | $ | 91,635,213 | |
| | | | | | Market | |
| | | Shares | | | Value | |
| | | | | | | | | |
| Securities Sold Short — (19.1%) | | | | | | | | |
| | | | | | | | | |
| Common Stocks — (19.1%) | | | | | | | | |
| | | | | | | | | |
| Information Technology — (4.5%) | | | | | | | | |
| Altera Corp. | | | (17,414 | ) | | $ | (643,274 | ) |
| CoStar Group, Inc.* | | | (1,932 | ) | | | (354,773 | ) |
| FireEye, Inc.* | | | (9,949 | ) | | | (314,189 | ) |
| FLIR Systems, Inc. | | | (1,411 | ) | | | (45,589 | ) |
| HomeAway, Inc.* | | | (3,828 | ) | | | (113,998 | ) |
| JDS Uniphase Corp.* | | | (65,656 | ) | | | (900,800 | ) |
| Pandora Media, Inc.* | | | (18,160 | ) | | | (323,793 | ) |
| SunEdison, Inc.* | | | (19,419 | ) | | | (378,865 | ) |
| Twitter, Inc.* | | | (8,821 | ) | | | (316,409 | ) |
| Zynga, Inc., Class A* | | | (48,867 | ) | | | (129,986 | ) |
| | | | | | | | (3,521,676 | ) |
| | | | | | | | | |
| Financials — (4.1%) | | | | | | | | |
| American Capital Agency Corp., REIT | | | (24,631 | ) | | | (537,695 | ) |
| American Realty Capital Properties, Inc., | | | | | | | | |
| REIT | | | (77,801 | ) | | | (704,099 | ) |
| BioMed Realty Trust, Inc., REIT | | | (25,663 | ) | | | (552,781 | ) |
| Corporate Office Properties Trust, REIT | | | (1,193 | ) | | | (33,845 | ) |
| First Niagara Financial Group, Inc. | | | (36,293 | ) | | | (305,949 | ) |
| FNFV Group* | | | (1,813 | ) | | | (28,537 | ) |
| Gaming and Leisure Properties, Inc., | | | | | | | | |
| REIT | | | (3,103 | ) | | | (91,042 | ) |
| Howard Hughes Corp. (The)* | | | (3,278 | ) | | | (427,517 | ) |
| Kilroy Realty Corp., REIT | | | (258 | ) | | | (17,820 | ) |
| Popular, Inc. (Puerto Rico)* | | | (3,440 | ) | | | (117,132 | ) |
| Vornado Realty Trust, REIT | | | (3,385 | ) | | | (398,448 | ) |
| | | | | | | | (3,214,865 | ) |
| | | | | | | | | |
| Energy — (3.9%) | | | | | | | | |
| Cobalt International Energy, Inc.* | | | (66,419 | ) | | | (590,465 | ) |
| CONSOL Energy, Inc. | | | (18,169 | ) | | | (614,294 | ) |
| Dril-Quip, Inc.* | | | (868 | ) | | | (66,602 | ) |
| Golar LNG Ltd. (Bermuda) | | | (5,547 | ) | | | (202,299 | ) |
| Gulfport Energy Corp.* | | | (11,146 | ) | | | (465,234 | ) |
| Memorial Resource Development | | | | | | | | |
| Corp.* | | | (10,434 | ) | | | (188,125 | ) |
| Peabody Energy Corp. | | | (64,818 | ) | | | (501,691 | ) |
| Rice Energy, Inc.* | | | (18,007 | ) | | | (377,607 | ) |
| Tidewater, Inc. | | | (1,880 | ) | | | (60,931 | ) |
| | | | | | | | (3,067,248 | ) |
| | | | | | | | | |
| Industrials — (2.0%) | | | | | | | | |
| American Airlines Group, Inc. | | | (13,404 | ) | | | (718,857 | ) |
| Copa Holdings SA, Class A (Panama) | | | (2,524 | ) | | | (261,587 | ) |
| Joy Global, Inc. | | | (768 | ) | | | (35,727 | ) |
| Navistar International Corp.* | | | (15,162 | ) | | | (507,624 | ) |
| | | | | | | | (1,523,795 | ) |
| | | | | | | | | |
| Consumer Discretionary — (1.7%) | | | | | | | | |
| DreamWorks Animation SKG, Inc. - Class | | | | | | | | |
| A* | | | (42,691 | ) | | | (953,290 | ) |
| JC Penney Co., Inc.* | | | (52,000 | ) | | | (336,960 | ) |
| | | | | | | | (1,290,250 | ) |
Touchstone Dynamic Equity Fund (Continued)
| | | | | | Market | |
| | | Shares | | | Value | |
| | | | | | | | | |
| Common Stocks — (19.1%) (Continued) | | | | | | | | |
| | | | | | | | | |
| Health Care — (1.4%) | | | | | | | | |
| Allscripts Healthcare Solutions, Inc.* | | | (8,527 | ) | | $ | (108,890 | ) |
| Endo International PLC (Ireland)* | | | (4,973 | ) | | | (358,653 | ) |
| MEDNAX, Inc.* | | | (8,911 | ) | | | (589,106 | ) |
| | | | | | | | (1,056,649 | ) |
| | | | | | | | | |
| Materials — (0.7%) | | | | | | | | |
| Allegheny Technologies, Inc. | | | (7,162 | ) | | | (249,023 | ) |
| Cytec Industries, Inc. | | | (7,233 | ) | | | (333,948 | ) |
| | | | | | | | (582,971 | ) |
| | | | | | | | | |
| Utilities — (0.4%) | | | | | | | | |
| ITC Holdings Corp. | | | (7,257 | ) | | | (293,401 | ) |
| | | | | | | | | |
| Consumer Staples — (0.2%) | | | | | | | | |
| Sprouts Farmers Market, Inc.* | | | (4,383 | ) | | | (148,934 | ) |
| | | | | | | | | |
| Telecommunication Services — (0.2%) | | | | | | | | |
| SBA Communications Corp. - Class A* | | | (327 | ) | | | (36,219 | ) |
| Sprint Corp.* | | | (25,076 | ) | | | (104,065 | ) |
| | | | | | | | (140,284 | ) |
| Total Common Stocks | | | | | | $ | (14,840,073 | ) |
| Total Securities Sold Short | | | | | | | | |
| (Proceeds $16,020,342) | | | | | | $ | (14,840,073 | ) |
| | | | | | | | | |
| | | | Number | | | | | |
| | | | of | | | | | |
| | | | Contracts | | | | | |
| | | | | | | | | |
| Written Options Contracts — (2.3%) | | | | | | | | |
| | | | | | | | | |
| Call Options — (2.3%) | | | | | | | | |
| S&P 100 Index | | | | | | | | |
| January 2015 | | | | | | | | |
| Strike Price $940 | | | (20 | ) | | | (1,400 | ) |
| S&P 500 Index | | | | | | | | |
| January 2015 | | | | | | | | |
| Strike Price $2,020 | | | (290 | ) | | | (1,754,500 | ) |
| S&P 500 Index | | | | | | | | |
| January 2015 | | | | | | | | |
| Strike Price $2,135 | | | (70 | ) | | | (8,400 | ) |
| Total Call Options | | | | | | | (1,764,300 | ) |
| | | Number | | | | |
| | | of | | | Market | |
| | | Contracts | | | Value | |
| | | | | | | | | |
| Put Options — 0.0% | | | | | | | | |
| S&P 500 Index | | | | | | | | |
| January 2015 | | | | | | | | |
| Strike Price $2,065 | | | (15 | ) | | $ | (41,550 | ) |
| | | | | | | | | |
| Total Written Options Contracts | | | | | | | | |
| (Proceeds $1,683,899) | | | | | | $ | (1,805,850 | ) |
| | | | | | | | | |
| Total —96.5% | | | | | | $ | 74,989,290 | |
| | | | | | | | | |
| Other Assets in Excess of Liabilities — 3.5% | | | | | | | 2,688,515 | |
| | | | | | | | | |
| Net Assets — 100.0% | | | | | | $ | 77,677,805 | |
| * | Non-income producing security. |
| ^ | Affiliated Fund. See Note 4 in Notes to Financial Statements. |
| † | All or a portion of these securities are held as collateral for securities sold short and written options. The total value of the securities held as collateral as of December 31, 2014 was $90,422,290. |
| Ω | Represents the 7-day SEC yield as of December 31, 2014. |
Portfolio Abbreviations:
PLC - Public Limited Company
REIT - Real Estate Investment Trust
Touchstone Dynamic Equity Fund (Continued)
Other Information:
The inputs or methodology used for valuing securities may not be an indication of the risk associated with investing in those securities. For more information on valuation inputs, and their aggregation into the levels used in the table below, please refer to the security valuation section in the accompanying Notes to Financial Statements.
Valuation inputs at Reporting Date:
| Description | | Level 1 | | | Level 2 | | | Level 3 | | | Total | |
| Assets: | | | | | | | | | | | | | | | | |
| Long Positions | | | | | | | | | | | | | | | | |
| Common Stocks | | $ | 90,415,247 | | | $ | — | | | $ | — | | | $ | 90,415,247 | |
| Rights | | | 7,043 | | | | — | | | | — | | | | 7,043 | |
| Investment Fund | | | 1,212,923 | | | | — | | | | — | | | | 1,212,923 | |
| | | | | | | | | | | | | | | $ | 91,635,213 | |
| Liabilities: | | | | | | | | | | | | | | | | |
| Securities Sold Short | | | | | | | | | | | | | | | | |
| Common Stocks | | $ | (14,840,073 | ) | | $ | — | | | $ | — | | | $ | (14,840,073 | ) |
| Other Financial Instruments | | | | | | | | | | | | | | | | |
| Liabilities: | | | | | | | | | | | | | | | | |
| Written Options | | | | | | | | | | | | | | | | |
| Equity Contracts | | | (1,805,850 | ) | | | — | | | | — | | | | (1,805,850 | ) |
| | | | | | | | | | | | | | | $ | (16,645,923 | ) |
Transactions in written options for the year ended December 31, 2014:
| | | Number of | | | | |
| | | | Contracts | | | | Proceeds | |
| Beginning of Period, December 31, 2013 | | | 390 | | | $ | 1,498,844 | |
| Call Options Written | | | 9,569 | | | | 17,120,818 | |
| Put Options Written | | | 361 | | | | 918,079 | |
| Call Options Closed | | | (5,974 | ) | | | (14,475,721 | ) |
| Put Options Closed | | | (211 | ) | | | (538,763 | ) |
| Call Options Expired | | | (3,590 | ) | | | (2,472,908 | ) |
| Put Options Expired | | | (150 | ) | | | (366,450 | ) |
| December 31, 2014 | | | 395 | | | $ | 1,683,899 | |
See accompanying Notes to Financial Statements.
Portfolio of Investments
Touchstone Balanced Allocation Fund – December 31, 2014
| | | | | | Market | |
| | | Shares | | | Value | |
| | | | | | | | | |
| Affiliated Mutual Funds^∞ — 100.2% | | | | | | | | |
| | | | | | | | | |
| Government/Corporate — 24.5% | | | | | | | | |
| Touchstone Active Bond Fund | | | 267,919 | | | $ | 2,794,397 | |
| Touchstone Total Return Bond Fund | | | 1,058,411 | | | | 10,933,388 | |
| Touchstone Ultra Short Duration Fixed | | | | | | | | |
| Income Fund | | | 943,446 | | | | 8,840,090 | |
| | | | | | | | 22,567,875 | |
| | | | | | | | | |
| International Equity — 12.1% | | | | | | | | |
| Touchstone International Small Cap | | | | | | | | |
| Fund | | | 185,969 | | | | 2,796,981 | |
| Touchstone International Value Fund | | | 1,002,893 | | | | 8,354,097 | |
| | | | | | | | 11,151,078 | |
| | | | | | | | | |
| Value — 10.1% | | | | | | | | |
| Touchstone Focused Fund | | | 75,774 | | | | 2,799,075 | |
| Touchstone Value Fund | | | 671,682 | | | | 6,515,318 | |
| | | | | | | | 9,314,393 | |
| | | | | | | | | |
| Growth — 10.1% | | | | | | | | |
| Touchstone Growth Opportunities Fund | | | 57,140 | | | | 1,867,915 | |
| Touchstone Sands Capital Institutional | | | | | | | | |
| Growth Fund | | | 334,252 | | | | 7,437,111 | |
| | | | | | | | 9,305,026 | |
| | | | | | | | | |
| Equity Income — 7.0% | | | | | | | | |
| Touchstone Premium Yield Equity Fund, | | | | | | | | |
| Class Y | | | 683,042 | | | | 6,475,236 | |
| | | | | | | | | |
| Balanced — 5.1% | | | | | | | | |
| Touchstone Flexible Income Fund | | | 440,615 | | | | 4,657,300 | |
| | | | | | | | | |
| International Debt — 4.9% | | | | | | | | |
| Touchstone International Fixed Income | | | | | | | | |
| Fund | | | 482,351 | | | | 4,519,631 | |
| | | | | | | | | |
| Emerging Market-Equity — 4.9% | | | | | | | | |
| Touchstone Emerging Markets Equity | | | | | | | | |
| Fund | | | 164,554 | | | | 1,801,866 | |
| Touchstone Sands Capital Emerging | | | | | | | | |
| Markets Growth Fund* | | | 264,679 | | | | 2,707,666 | |
| | | | | | | | 4,509,532 | |
| | | | | | | | | |
| Various Assets — 3.6% | | | | | | | | |
| Touchstone Arbitrage Fund | | | 328,208 | | | | 3,272,237 | |
| | | | | | | | | |
| Blue Chip — 3.5% | | | | | | | | |
| Touchstone Dynamic Equity Fund | | | 236,426 | | | | 3,269,766 | |
| | | | | | | | | |
| Growth Mid-Cap — 3.1% | | | | | | | | |
| Touchstone Mid Cap Fund | | | 111,568 | | | | 2,809,273 | |
| | | | | | | | | |
| Taxable-Money Market — 3.0% | | | | | | | | |
| Touchstone Institutional Money Market | | | | | | | | |
| Fund, 0.01%Ω | | | 2,787,078 | | | | 2,787,078 | |
| | | | | | | | | |
| Sector Fund Real-Estate — 2.5% | | | | | | | | |
| Touchstone Global Real Estate Fund | | | 211,665 | | | | 2,336,787 | |
| | | | | | | | | |
| Value Small-Cap — 2.0% | | | | | | | | |
| Touchstone Small Cap Core Fund | | | 49,000 | | | | 938,848 | |
| Touchstone Small Cap Value Fund | | | 39,051 | | | | 941,902 | |
| | | | | | | | 1,880,750 | |
| | | | | | | | | |
| Corporate/Preferred-High Yield — 1.8% | | | | | | | | |
| Touchstone High Yield Fund | | | 185,457 | | | | 1,622,750 | |
| | | | | | | | | |
| Value Mid-Cap — 1.0% | | | | | | | | |
| Touchstone Mid Cap Value Fund | | | 55,338 | | | | 937,420 | |
| | | | | | | | | |
| Growth Small-Cap — 1.0% | | | | | | | | |
| Touchstone Small Cap Growth Fund | | | 160,051 | | | | 936,298 | |
| Total Affiliated Mutual Funds | | | | | | $ | 92,352,430 | |
| | | | | | | | | |
| Total Investment Securities —100.2% | | | | | | | | |
| (Cost $84,805,694) | | | | | | $ | 92,352,430 | |
| | | | | | | | | |
| Liabilities in Excess of Other Assets — (0.2%) | | | | | | | (199,542 | ) |
| | | | | | | | | |
| Net Assets — 100.0% | | | | | | $ | 92,152,888 | |
| * | Non-income producing security. |
| ^ | All affiliated fund investments are in Institutional Class shares, unless otherwise indicated. The financial statements of the underlying funds can be found on the SEC website. See Note 4 in Notes to Financial Statements. |
| Ω | Represents the 7-day SEC yield as of December 31, 2014. |
Other Information:
The inputs or methodology used for valuing securities may not be an indication of the risk associated with investing in those securities. For more information on valuation inputs, and their aggregation into the levels used in the table below, please refer to the security valuation section in the accompanying Notes to Financial Statements.
Valuation inputs at Reporting Date:
| Description | | Level 1 | | | Level 2 | | | Level 3 | | | Total | |
| Affiliated Mutual Funds | | $ | 92,352,430 | | | $ | — | | | $ | — | | | $ | 92,352,430 | |
See accompanying Notes to Financial Statements.
Portfolio of Investments
Touchstone Conservative Allocation Fund – December 31, 2014
| | | | | | Market | |
| | | Shares | | | Value | |
| | | | | | | |
| Affiliated Mutual Funds^∞ — 100.2% | | | | | | | | |
| | | | | | | | | |
| Government/Corporate — 45.3% | | | | | | | | |
| Touchstone Active Bond Fund | | | 211,002 | | | $ | 2,200,756 | |
| Touchstone Total Return Bond Fund | | | 852,298 | | | | 8,804,238 | |
| Touchstone Ultra Short Duration Fixed | | | | | | | | |
| Income Fund | | | 940,840 | | | | 8,815,669 | |
| | | | | | | | 19,820,663 | |
| | | | | | | | | |
| International Debt — 8.0% | | | | | | | | |
| Touchstone International Fixed Income | | | | | | | | |
| Fund | | | 374,288 | | | | 3,507,078 | |
| | | | | | | | | |
| Balanced — 7.0% | | | | | | | | |
| Touchstone Flexible Income Fund | | | 290,934 | | | | 3,075,177 | |
| | | | | | | | | |
| Growth — 6.0% | | | | | | | | |
| Touchstone Growth Opportunities Fund | | | 13,204 | | | | 431,647 | |
| Touchstone Sands Capital Institutional | | | | | | | | |
| Growth Fund | | | 97,542 | | | | 2,170,317 | |
| | | | | | | | 2,601,964 | |
| | | | | | | | | |
| International Equity — 5.7% | | | | | | | | |
| Touchstone International Small Cap | | | | | | | | |
| Fund | | | 29,033 | | | | 436,652 | |
| Touchstone International Value Fund | | | 248,300 | | | | 2,068,340 | |
| | | | | | | | 2,504,992 | |
| | | | | | | | | |
| Taxable-Money Market — 5.0% | | | | | | | | |
| Touchstone Institutional Money Market | | | | | | | | |
| Fund, 0.01%Ω | | | 2,198,922 | | | | 2,198,922 | |
| | | | | | | | | |
| Various Assets — 5.0% | | | | | | | | |
| Touchstone Arbitrage Fund | | | 220,520 | | | | 2,198,580 | |
| | | | | | | | | |
| Value — 4.9% | | | | | | | | |
| Touchstone Value Fund | | | 222,808 | | | | 2,161,233 | |
| | | | | | | | | |
| Equity Income — 4.5% | | | | | | | | |
| Touchstone Premium Yield Equity Fund, | | | | | | | | |
| Class Y | | | 206,551 | | | | 1,958,099 | |
| | | | | | | | | |
| Blue Chip — 3.0% | | | | | | | | |
| Touchstone Dynamic Equity Fund | | | 94,629 | | | | 1,308,714 | |
| | | | | | | | | |
| Corporate/Preferred-High Yield — 1.8% | | | | | | | | |
| Touchstone High Yield Fund | | | 87,941 | | | | 769,485 | |
| | | | | | | | | |
| Value Small-Cap — 1.0% | | | | | | | | |
| Touchstone Small Cap Core Fund | | | 22,774 | | | | 436,349 | |
| | | | | | | | | |
| Sector Fund Real-Estate — 1.0% | | | | | | |
| Touchstone Global Real Estate Fund | | | 39,503 | | | | 436,115 | |
| | | | | | | | | |
| Emerging Market-Equity — 1.0% | | | | | | | | |
| Touchstone Emerging Markets Equity | | | | | | | | |
| Fund | | | 39,728 | | | | 435,023 | |
| | | | | | | | | |
| Value Mid-Cap — 1.0% | | | | | | | | |
| Touchstone Mid Cap Value Fund | | | 25,417 | | | | 430,561 | |
| Total Affiliated Mutual Funds | | | | | | $ | 43,842,955 | |
| | | | | | | | | |
| Total Investment Securities —100.2% | | | | | | | | |
| (Cost $42,476,049) | | | | | | $ | 43,842,955 | |
| | | | | | | | | |
| Liabilities in Excess of Other Assets — (0.2%) | | | | | | | (74,574 | ) |
| | | | | | | | | |
| Net Assets — 100.0% | | | | | | $ | 43,768,381 | |
| ^ | All affiliated fund investments are in Institutional Class shares, unless otherwise indicated. The financial statements of the underlying funds can be found on the SEC website. See Note 4 in Notes to Financial Statements. |
| Ω | Represents the 7-day SEC yield as of December 31, 2014. |
Other Information:
The inputs or methodology used for valuing securities may not be an indication of the risk associated with investing in those securities. For more information on valuation inputs, and their aggregation into the levels used in the table below, please refer to the security valuation section in the accompanying Notes to Financial Statements.
Valuation inputs at Reporting Date:
| Description | | Level 1 | | | Level 2 | | | Level 3 | | | Total | |
| Affiliated Mutual Funds | | $ | 43,842,955 | | | $ | — | | | $ | — | | | $ | 43,842,955 | |
See accompanying Notes to Financial Statements.
Portfolio of Investments
Touchstone Growth Allocation Fund – December 31, 2014
| | | | | | Market | |
| | | Shares | | | Value | |
| | | | | | | |
| Affiliated Mutual Funds^∞ — 100.3% | | | | | | | | |
| | | | | | | | | |
| International Equity — 19.3% | | | | | | | | |
| Touchstone International Small Cap | | | | | | | | |
| Fund | | | 269,537 | | | $ | 4,053,829 | |
| Touchstone International Value Fund | | | 839,390 | | | | 6,992,121 | |
| | | | | | | | 11,045,950 | |
| | | | | | | | | |
| Value — 17.7% | | | | | | | | |
| Touchstone Focused Fund | | | 125,651 | | | | 4,641,560 | |
| Touchstone Value Fund | | | 564,437 | | | | 5,475,041 | |
| | | | | | | | 10,116,601 | |
| | | | | | | | | |
| Growth — 13.7% | | | | | | | | |
| Touchstone Growth Opportunities Fund | | | 72,647 | | | | 2,374,841 | |
| Touchstone Sands Capital Institutional | | | | | | | | |
| Growth Fund | | | 245,167 | | | | 5,454,969 | |
| | | | | | | | 7,829,810 | |
| | | | | | | | | |
| Emerging Market-Equity — 12.8% | | | | | | | | |
| Touchstone Emerging Markets Equity | | | | | | | | |
| Fund | | | 308,908 | | | | 3,382,543 | |
| Touchstone Sands Capital Emerging | | | | | | | | |
| Markets Growth Fund* | | | 383,537 | | | | 3,923,580 | |
| | | | | | | | 7,306,123 | |
| | | | | | | | | |
| Equity Income — 7.1% | | | | | | | | |
| Touchstone Premium Yield Equity Fund, | | | | | | | | |
| Class Y | | | 427,136 | | | | 4,049,247 | |
| | | | | | | | | |
| Value Small-Cap — 6.7% | | | | | | | | |
| Touchstone Small Cap Core Fund | | | 122,115 | | | | 2,339,726 | |
| Touchstone Small Cap Value Fund | | | 61,626 | | | | 1,486,427 | |
| | | | | | | | 3,826,153 | |
| | | | | | | | | |
| Blue Chip — 5.1% | | | | | | | | |
| Touchstone Dynamic Equity Fund | | | 210,028 | | | | 2,904,683 | |
| | | | | | | | | |
| Sector Fund Real-Estate — 4.6% | | | | | | | | |
| Touchstone Global Real Estate Fund | | | 236,455 | | | | 2,610,467 | |
| | | | | | | | | |
| Government/Corporate — 4.0% | | | | | | | | |
| Touchstone Ultra Short Duration Fixed | | | | | | | | |
| Income Fund | | | 246,357 | | | | 2,308,365 | |
| | | | | | | | | |
| Growth Small-Cap — 3.9% | | | | | | | | |
| Touchstone Small Cap Growth Fund | | | 376,473 | | | | 2,202,369 | |
| | | | | | | | | |
| Growth Mid-Cap — 3.3% | | | | | | |
| Touchstone Mid Cap Fund | | | 74,986 | | | | 1,888,145 | |
| | | | | | | | | |
| Value Mid-Cap — 2.1% | | | | | | | | |
| Touchstone Mid Cap Value Fund | | | 69,977 | | | | 1,185,403 | |
| Total Affiliated Mutual Funds | | | | | | $ | 57,273,316 | |
| | | | | | | | | |
| Total Investment Securities —100.3% | | | | | | | | |
| (Cost $49,049,736) | | | | | | $ | 57,273,316 | |
| | | | | | | | | |
| Liabilities in Excess of Other Assets — (0.3%) | | | | | | | (170,165 | ) |
| | | | | | | | | |
| Net Assets — 100.0% | | | | | | $ | 57,103,151 | |
| * | Non-income producing security. |
| ^ | All affiliated fund investments are in Institutional Class shares, unless otherwise indicated. The financial statements of the underlying funds can be found on the SEC website. See Note 4 in Notes to Financial Statements. |
Other Information:
The inputs or methodology used for valuing securities may not be an indication of the risk associated with investing in those securities. For more information on valuation inputs, and their aggregation into the levels used in the table below, please refer to the security valuation section in the accompanying Notes to Financial Statements.
Valuation inputs at Reporting Date:
| Description | | Level 1 | | | Level 2 | | | Level 3 | | | Total | |
| Affiliated Mutual Funds | | $ | 57,273,316 | | | $ | — | | | $ | — | | | $ | 57,273,316 | |
See accompanying Notes to Financial Statements.
Portfolio of Investments
Touchstone Moderate Growth Allocation Fund – December 31, 2014
| | | | | | Market | |
| | | Shares | | | Value | |
| | | | | | | |
| Affiliated Mutual Funds^∞ — 100.2% | | | | | | | | |
| | | | | | | | | |
| Government/Corporate — 14.9% | | | | | | | | |
| Touchstone Total Return Bond Fund | | | 1,173,331 | | | $ | 12,120,512 | |
| Touchstone Ultra Short Duration Fixed | | | | | | | | |
| Income Fund | | | 573,631 | | | | 5,374,922 | |
| | | | | | | | 17,495,434 | |
| | | | | | | | | |
| International Equity — 14.4% | | | | | | | | |
| Touchstone International Small Cap | | | | | | | | |
| Fund | | | 316,601 | | | | 4,761,677 | |
| Touchstone International Value Fund | | | 1,457,785 | | | | 12,143,351 | |
| | | | | | | | 16,905,028 | |
| | | | | | | | | |
| Value — 14.2% | | | | | | | | |
| Touchstone Focused Fund | | | 193,917 | | | | 7,163,299 | |
| Touchstone Value Fund | | | 985,162 | | | | 9,556,070 | |
| | | | | | | | 16,719,369 | |
| | | | | | | | | |
| Growth — 12.3% | | | | | | | | |
| Touchstone Growth Opportunities Fund | | | 111,883 | | | | 3,657,445 | |
| Touchstone Sands Capital Institutional | | | | | | | | |
| Growth Fund | | | 483,752 | | | | 10,763,493 | |
| | | | | | | | 14,420,938 | |
| | | | | | | | | |
| Emerging Market-Equity — 7.9% | | | | | | | | |
| Touchstone Emerging Markets Equity | | | | | | | | |
| Fund | | | 421,441 | | | | 4,614,775 | |
| Touchstone Sands Capital Emerging | | | | | | | | |
| Markets Growth Fund* | | | 450,406 | | | | 4,607,657 | |
| | | | | | | | 9,222,432 | |
| | | | | | | | | |
| Equity Income — 7.1% | | | | | | | | |
| Touchstone Premium Yield Equity Fund, | | | | | | | | |
| Class Y | | | 876,008 | | | | 8,304,553 | |
| | | | | | | | | |
| Value Small-Cap — 5.1% | | | | | | | | |
| Touchstone Small Cap Core Fund | | | 187,395 | | | | 3,590,483 | |
| Touchstone Small Cap Value Fund | | | 100,794 | | | | 2,431,153 | |
| | | | | | | | 6,021,636 | |
| | | | | | | | | |
| Blue Chip — 4.1% | | | | | | | | |
| Touchstone Dynamic Equity Fund | | | 345,997 | | | | 4,785,134 | |
| | | | | | | | | |
| Balanced — 4.0% | | | | | | | | |
| Touchstone Flexible Income Fund | | | 448,721 | | | | 4,742,985 | |
| | | | | | | | | |
| Growth Mid-Cap — 3.6% | | | | | | | | |
| Touchstone Mid Cap Fund | | | 169,176 | | | | 4,259,853 | |
| | | | | | | | | |
| Sector Fund Real-Estate — 3.1% | | | | | | | | |
| Touchstone Global Real Estate Fund | | | 325,184 | | | | 3,590,037 | |
| | | | | | | | | |
| Value Mid-Cap — 2.1% | | | | | | | | |
| Touchstone Mid Cap Value Fund | | | 142,450 | | | | 2,413,096 | |
| | | | | | | | | |
| Growth Small-Cap — 2.0% | | | | | | | | |
| Touchstone Small Cap Growth Fund | | | 411,184 | | | | 2,405,428 | |
| | | | | | | | | |
| Various Assets — 2.0% | | | | | | | | |
| Touchstone Arbitrage Fund | | | 239,269 | | | | 2,385,508 | |
| | | | | | | | | |
| International Debt — 1.9% | | | | | | | | |
| Touchstone International Fixed Income | | | | | | | | |
| Fund | | | 243,393 | | | | 2,280,596 | |
| | | | | | | | | |
| Corporate/Preferred-High Yield — 1.5% | | | | | | | | |
| Touchstone High Yield Fund | | | 200,555 | | | | 1,754,860 | |
| Total Affiliated Mutual Funds | | | | | | $ | 117,706,887 | |
| | | | | | | | | |
| Total Investment Securities —100.2% | | | | | | | | |
| (Cost $103,807,112) | | | | | | $ | 117,706,887 | |
| | | | | | | | | |
| Liabilities in Excess of Other Assets — (0.2%) | | | | | | | (242,818 | ) |
| | | | | | | | | |
| Net Assets — 100.0% | | | | | | $ | 117,464,069 | |
| * | Non-income producing security. |
| ^ | All affiliated fund investments are in Institutional Class shares, unless otherwise indicated. The financial statements of the underlying funds can be found on the SEC website. See Note 4 in Notes to Financial Statements. |
Other Information:
The inputs or methodology used for valuing securities may not be an indication of the risk associated with investing in those securities. For more information on valuation inputs, and their aggregation into the levels used in the table below, please refer to the security valuation section in the accompanying Notes to Financial Statements.
Valuation inputs at Reporting Date:
| Description | | Level 1 | | | Level 2 | | | Level 3 | | | Total | |
| Affiliated Mutual Funds | | $ | 117,706,887 | | | $ | — | | | $ | — | | | $ | 117,706,887 | |
See accompanying Notes to Financial Statements.
This page intentionally left blank.
Statements of Assets and Liabilities
December 31, 2014
| | | Touchstone | | | Touchstone | | | Touchstone | |
| | | Dynamic | | | Balanced | | | Conservative | |
| | | Equity | | | Allocation | | | Allocation | |
| | | Fund | | | Fund | | | Fund | |
| Assets | | | | | | | | | | | | |
| Investments, at cost | | $ | 86,959,224 | | | $ | 84,805,694 | | | $ | 42,476,049 | |
| Affiliated securities, at market value | | $ | 1,212,923 | | | $ | 92,352,430 | | | $ | 43,842,955 | |
| Non-affiliated securities, at market value | | | 90,422,290 | | | | — | | | | — | |
| Investments, at market value | | $ | 91,635,213 | | | $ | 92,352,430 | | | $ | 43,842,955 | |
| Cash deposits held at prime broker | | | 2,658,106 | | | | — | | | | — | |
| Dividends and interest receivable | | | 139,384 | | | | — | | | | — | |
| Receivable for capital shares sold | | | 250,455 | | | | 60,282 | | | | 22,905 | |
| Receivable for investments sold | | | — | | | | 86,005 | | | | 86,241 | |
| Tax reclaim receivable | | | 207 | | | | — | | | | — | |
| Other assets | | | 17,385 | | | | 27,375 | | | | 26,900 | |
| Total Assets | | | 94,700,750 | | | | 92,526,092 | | | | 43,979,001 | |
| | | | | | | | | | | | | |
| Liabilities | | | | | | | | | | | | |
| Written options, at market value (A) | | | 1,805,850 | | | | — | | | | — | |
| Securities sold short (B) | | | 14,840,073 | | | | — | | | | — | |
| Dividends for securities sold short payable | | | 16,346 | | | | — | | | | — | |
| Bank overdrafts | | | — | | | | 72,078 | | | | 67,904 | |
| Dividends payable | | | — | | | | 211 | | | | — | |
| Payable for capital shares redeemed | | | 206,199 | | | | 191,087 | | | | 77,297 | |
| Payable to Investment Advisor | | | 65,657 | | | | 9,534 | | | | 2,375 | |
| Payable to other affiliates | | | 25,144 | | | | 28,602 | | | | 12,905 | |
| Payable to Trustees | | | 6,061 | | | | 6,061 | | | | 6,061 | |
| Payable for professional services | | | 18,861 | | | | 19,716 | | | | 18,560 | |
| Payable to Transfer Agent | | | 20,454 | | | | 33,663 | | | | 15,397 | |
| Other accrued expenses and liabilities | | | 18,300 | | | | 12,252 | | | | 10,121 | |
| Total Liabilities | | | 17,022,945 | | | | 373,204 | | | | 210,620 | |
| | | | | | | | | | | | | |
| Net Assets | | $ | 77,677,805 | | | $ | 92,152,888 | | | $ | 43,768,381 | |
| | | | | | | | | | | | | |
| Net assets consist of: | | | | | | | | | | | | |
| Paid-in capital | | $ | 207,062,163 | | | $ | 105,294,718 | | | $ | 43,117,121 | |
| Accumulated net investment income | | | 100,823 | | | | 9,681 | | | | 4,322 | |
| Accumulated net realized losses on investments, written options, short positions and capital gain distributions received | | | (135,219,488 | ) | | | (20,698,247 | ) | | | (719,968 | ) |
| Net unrealized appreciation on investments, written options and short positions | | | 5,734,307 | | | | 7,546,736 | | | | 1,366,906 | |
| Net Assets | | $ | 77,677,805 | | | $ | 92,152,888 | | | $ | 43,768,381 | |
| (A) Proceeds received for written options: | | $ | 1,683,899 | | | $ | — | | | $ | — | |
| (B) Proceeds received for securities sold short: | | $ | 16,020,342 | | | $ | — | | | $ | — | |
See accompanying Notes to Financial Statements.
Statements of Assets and Liabilities (Continued)
| | | | Touchstone | |
| Touchstone | | | Moderate | |
| Growth | | | Growth | |
| Allocation | | | Allocation | |
| Fund | | | Fund | |
| | | | | | | |
| $ | 49,049,736 | | | $ | 103,807,112 | |
| $ | 57,273,316 | | | $ | 117,706,887 | |
| | — | | | | — | |
| $ | 57,273,316 | | | $ | 117,706,887 | |
| | — | | | | — | |
| | — | | | | — | |
| | 10,391 | | | | 52,495 | |
| | 55,179 | | | | 96,794 | |
| | — | | | | — | |
| | 26,681 | | | | 27,718 | |
| | 57,365,567 | | | | 117,883,894 | |
| | | | | | | |
| | | | | | | |
| | — | | | | — | |
| | — | | | | — | |
| | — | | | | — | |
| | 43,949 | | | | 153,542 | |
| | — | | | | 1,725 | |
| | 134,029 | | | | 118,116 | |
| | 3,457 | | | | 15,969 | |
| | 17,502 | | | | 42,977 | |
| | 6,061 | | | | 6,061 | |
| | 19,073 | | | | 20,380 | |
| | 26,863 | | | | 46,808 | |
| | 11,482 | | | | 14,247 | |
| | 262,416 | | | | 419,825 | |
| | | | | | | |
| $ | 57,103,151 | | | $ | 117,464,069 | |
| | | | | | | |
| | | | | | | |
| $ | 56,144,858 | | | $ | 112,531,128 | |
| | 9,902 | | | | — | |
| | | | | | | |
| | (7,275,189 | ) | | | (8,966,834 | ) |
| | 8,223,580 | | | | 13,899,775 | |
| $ | 57,103,151 | | | $ | 117,464,069 | |
| $ | — | | | $ | — | |
| $ | — | | | $ | — | |
Statements of Assets and Liabilities (Continued)
| | | Touchstone | | | Touchstone | | | Touchstone | |
| | | Dynamic | | | Balanced | | | Conservative | |
| | | Equity | | | Allocation | | | Allocation | |
| | | Fund | | | Fund | | | Fund | |
| | | | | | | | | | | | | |
| Pricing of Class A Shares | | | | | | | | | | | | |
| Net assets applicable to Class A shares | | $ | 11,546,276 | | | $ | 35,689,373 | | | $ | 17,407,928 | |
| Shares of beneficial interest outstanding | | | | | | | | | | | | |
| (unlimited number of shares authorized, no par value) | | | 849,763 | | | | 2,819,874 | | | | 1,570,546 | |
| Net asset value price per share* | | $ | 13.59 | | | $ | 12.66 | | | $ | 11.08 | |
| Maximum offering price per share | | $ | 14.42 | | | $ | 13.43 | | | $ | 11.76 | |
| | | | | | | | | | | | | |
| Pricing of Class C Shares | | | | | | | | | | | | |
| Net assets applicable to Class C shares | | $ | 10,486,035 | | | $ | 32,960,909 | | | $ | 14,356,790 | |
| Shares of beneficial interest outstanding | | | | | | | | | | | | |
| (unlimited number of shares authorized, no par value) | | | 825,658 | | | | 2,600,888 | | | | 1,301,692 | |
| Net asset value, offering price per share** | | $ | 12.70 | | | $ | 12.67 | | | $ | 11.03 | |
| | | | | | | | | | | | | |
| Pricing of Class Y Shares | | | | | | | | | | | | |
| Net assets applicable to Class Y shares | | $ | 43,348,549 | | | $ | 23,465,741 | | | $ | 11,931,033 | |
| Shares of beneficial interest outstanding | | | | | | | | | | | | |
| (unlimited number of shares authorized, no par value) | | | 3,141,783 | | | | 1,851,169 | | | | 1,076,359 | |
| Net asset value, offering price and redemption price per share | | $ | 13.80 | | | $ | 12.68 | | | $ | 11.08 | |
| | | | | | | | | | | | | |
| Pricing of Institutional Class Shares | | | | | | | | | | | | |
| Net assets applicable to Institutional Class Shares | | $ | 12,296,945 | | | $ | 36,865 | | | $ | 72,630 | |
| Shares of beneficial interest outstanding | | | | | | | | | | | | |
| (unlimited number of shares authorized, no par value) | | | 889,024 | | | | 2,922 | | | | 6,545 | |
| Net asset value, offering price and redemption price per share | | $ | 13.83 | | | $ | 12.62 | | | $ | 11.10 | |
* There is no sales load on subscriptions of $1 million or more. Redemptions that were part of a $1 million or more subscription may be subject to a contingent deferred sales load if redeemed within a one-year period from the date of purchase.
** Redemption price per share varies by length of time shares are held.
See accompanying Notes to Financial Statements.
Statements of Assets and Liabilities (Continued)
| | | | Touchstone | |
| Touchstone | | | Moderate | |
| Growth | | | Growth | |
| Allocation | | | Allocation | |
| Fund | | | Fund | |
| | | | | |
| | | | | |
| $ | 25,384,189 | | | $ | 56,893,333 | |
| | | | | | | |
| | 1,786,301 | | | | 4,415,365 | |
| $ | 14.21 | | | $ | 12.89 | |
| $ | 15.08 | | | $ | 13.68 | |
| | | | | | | |
| | | | | | | |
| $ | 21,901,498 | | | $ | 43,844,114 | |
| | | | | | | |
| | 1,597,467 | | | | 3,460,792 | |
| $ | 13.71 | | | $ | 12.67 | |
| | | | | | | |
| | | | | | | |
| $ | 9,797,379 | | | $ | 16,719,286 | |
| | | | | | | |
| | 682,551 | | | | 1,287,599 | |
| $ | 14.35 | | | $ | 12.98 | |
| | | | | | | |
| | | | | | | |
| $ | 20,085 | | | $ | 7,336 | |
| | | | | | | |
| | 1,541 | | | | 566 | |
| $ | 13.03 | | | $ | 12.96 | |
Statements of Operations
For the Year Ended December 31, 2014
| | | Touchstone | | | Touchstone | | | Touchstone | |
| | | Dynamic | | | Balanced | | | Conservative | |
| | | Equity | | | Allocation | | | Allocation | |
| | | Fund | | | Fund | | | Fund | |
| Investment Income | | | | | | | | | | | | |
| Dividends from affiliated funds | | $ | 531 | | | $ | 2,233,828 | | | $ | 1,269,349 | |
| Dividends from non-affiliated securities(A) | | | 1,560,923 | | | | — | | | | — | |
| Total Investment Income | | | 1,561,454 | | | | 2,233,828 | | | | 1,269,349 | |
| Expenses | | | | | | | | | | | | |
| Investment advisory fees | | | 639,010 | | | | 215,835 | | | | 112,670 | |
| Administration fees | | | 120,397 | | | | 172,882 | | | | 90,260 | |
| Compliance fees and expenses | | | 1,703 | | | | 1,702 | | | | 1,703 | |
| Custody fees | | | 23,724 | | | | 4,709 | | | | 4,035 | |
| Professional fees | | | 20,286 | | | | 22,155 | | | | 19,857 | |
| Transfer Agent fees, Class A | | | 22,976 | | | | 44,148 | | | | 19,957 | |
| Transfer Agent fees, Class C | | | 15,101 | | | | 28,745 | | | | 11,218 | |
| Transfer Agent fees, Class Y | | | 23,401 | | | | 29,420 | | | | 17,557 | |
| Transfer Agent fees, Institutional Class | | | 98 | | | | 40 | | | | 61 | |
| Registration Fees, Class A | | | 13,751 | | | | 13,514 | | | | 17,410 | |
| Registration Fees, Class C | | | 13,686 | | | | 13,389 | | | | 13,274 | |
| Registration Fees, Class Y | | | 14,378 | | | | 13,431 | | | | 14,272 | |
| Registration Fees, Institutional Class | | | 13,696 | | | | 13,278 | | | | 13,331 | |
| Dividend expense on securities sold short | | | 250,936 | | | | — | | | | — | |
| Interest expense on securities sold short | | | 140,567 | | | | — | | | | — | |
| Reports to Shareholders, Class A | | | 6,203 | | | | 8,140 | | | | 5,347 | |
| Reports to Shareholders, Class C | | | 5,470 | | | | 6,688 | | | | 4,494 | |
| Reports to Shareholders, Class Y | | | 6,649 | | | | 4,149 | | | | 3,837 | |
| Reports to Shareholders, Institutional Class | | | 3,881 | | | | 3,712 | | | | 3,455 | |
| Distribution expenses, Class A | | | 35,857 | | | | 106,609 | | | | 56,941 | |
| Distribution and shareholder servicing expenses, Class C | | | 104,232 | | | | 349,438 | | | | 150,802 | |
| Trustee fees | | | 12,052 | | | | 11,913 | | | | 12,047 | |
| Other expenses | | | 19,960 | | | | 32,839 | | | | 16,803 | |
| Total Expenses | | | 1,508,014 | | | | 1,096,736 | | | | 589,331 | |
| Fees waived and/or reimbursed by the Advisor and/or Affiliates(B) | | | (30,986 | ) | | | (411,472 | ) | | | (262,674 | ) |
| Fees recouped by Advisor(B) | | | 9,792 | | | | — | | | | — | |
| Net Expenses | | | 1,486,820 | | | | 685,264 | | | | 326,657 | |
| Net Investment Income | | | 74,634 | | | | 1,548,564 | | | | 942,692 | |
| Realized and Unrealized Gains (Losses) on Investments | | | | | | | | | | | | |
| Net realized gains on investments from non-affiliated securities | | | 6,922,240 | | | | — | | | | — | |
| Net realized gains on investments from affiliated securities | | | — | | | | 4,739,960 | | | | 2,076,414 | |
| Net realized gains on written options | | | 646,956 | | | | — | | | | — | |
| Net realized losses on securities sold short | | | (3,107,286 | ) | | | — | | | | — | |
| Capital gain distributions received from affiliated funds | | | — | | | | 1,623,978 | | | | 545,357 | |
| Net change in unrealized appreciation (depreciation) on investments | | | (4,797,934 | ) | | | (3,103,328 | ) | | | (1,421,276 | ) |
| Net change in unrealized appreciation (depreciation) on written options | | | 449,480 | | | | — | | | | — | |
| Net change in unrealized appreciation (depreciation) on securities sold short | | | 2,430,189 | | | | — | | | | — | |
| Net Realized and Unrealized Gains on Investments | | $ | 2,543,645 | | | $ | 3,260,610 | | | $ | 1,200,495 | |
| Change in Net Assets Resulting from Operations | | $ | 2,618,279 | | | $ | 4,809,174 | | | $ | 2,143,187 | |
| (A) Net of foreign tax withholding of: | | $ | 311 | | | $ | — | | | $ | — | |
| (B)See Note 4 in Notes to Financial Statements. | | | | | | | | | | | | |
See accompanying Notes to Financial Statements.
Statements of Operations (Continued)
| | | | Touchstone | |
| Touchstone | | | Moderate | |
| Growth | | | Growth | |
| Allocation | | | Allocation | |
| Fund | | | Fund | |
| | | | | |
| $ | 991,878 | | | $ | 2,549,597 | |
| | — | | | | — | |
| | 991,878 | | | | 2,549,597 | |
| | | | | | | |
| | 161,481 | | | | 334,403 | |
| | 103,472 | | | | 214,281 | |
| | 1,703 | | | | 1,702 | |
| | 2,342 | | | | 4,748 | |
| | 20,699 | | | | 23,286 | |
| | 39,125 | | | | 76,960 | |
| | 26,889 | | | | 44,662 | |
| | 10,846 | | | | 14,332 | |
| | 83 | | | | 32 | |
| | 13,274 | | | | 13,846 | |
| | 13,274 | | | | 13,636 | |
| | 13,595 | | | | 13,817 | |
| | 13,164 | | | | 13,278 | |
| | — | | | | — | |
| | — | | | | — | |
| | 7,734 | | | | 11,946 | |
| | 6,284 | | | | 8,703 | |
| | 3,939 | | | | 4,332 | |
| | 3,704 | | | | 3,969 | |
| | 70,380 | | | | 158,359 | |
| | 232,317 | | | | 467,340 | |
| | 12,034 | | | | 11,836 | |
| | 31,457 | | | | 51,746 | |
| | 787,796 | | | | 1,487,214 | |
| | (347,658 | ) | | | (577,631 | ) |
| | — | | | | — | |
| | 440,138 | | | | 909,583 | |
| | 551,740 | | | | 1,640,014 | |
| | | | | | | |
| | — | | | | — | |
| | 2,615,740 | | | | 6,255,400 | |
| | — | | | | — | |
| | — | | | | — | |
| | 1,375,346 | | | | 2,570,501 | |
| | (1,665,705 | ) | | | (3,931,077 | ) |
| | — | | | | — | |
| | — | | | | — | |
| $ | 2,325,381 | | | $ | 4,894,824 | |
| $ | 2,877,121 | | | $ | 6,534,838 | |
| $ | — | | | $ | — | |
Statements of Changes in Net Assets
| | | Touchstone | | | Touchstone | |
| | | Dynamic Equity | | | Balanced Allocation | |
| | | Fund | | | Fund | |
| | | For the | | | For the | | | For the | | | For the | |
| | | Year | | | Year | | | Year | | | Year | |
| | | Ended | | | Ended | | | Ended | | | Ended | |
| | | December 31, | | | December 31, | | | December 31, | | | December 31, | |
| | | 2014 | | | 2013 | | | 2014 | | | 2013 | |
| From Operations | | | | | | | | | | | | | | | | |
| Net investment income | | $ | 74,634 | | | $ | 222,072 | | | $ | 1,548,564 | | | $ | 1,623,082 | |
| Net realized gain (loss) on investments, written options, securities sold short and capital gain distribution received | | | 4,461,910 | | | | 11,148,928 | | | | 6,363,938 | | | | 7,573,700 | |
| Net change in unrealized appreciation (depreciation) on investments, written options and securities sold short | | | (1,918,265 | ) | | | (136,692 | ) | | | (3,103,328 | ) | | | 6,379,801 | |
| Change in Net Assets from Operations | | | 2,618,279 | | | | 11,234,308 | | | | 4,809,174 | | | | 15,576,583 | |
| | | | | | | | | | | | | | | | | |
| Distributions to Shareholders from: | | | | | | | | | | | | | | | | |
| Net investment income, Class A | | | (32,934 | ) | | | — | | | | (803,034 | ) | | | (888,587 | ) |
| Net investment income, Class C | | | — | | | | — | | | | (356,687 | ) | | | (425,415 | ) |
| Net investment income, Class Y | | | (305,772 | ) | | | (8,135 | ) | | | (630,483 | ) | | | (803,034 | ) |
| Net investment income, Institutional Class | | | (82,486 | ) | | | (7,882 | ) | | | (843 | ) | | | (734 | ) |
| Net realized gains, Class A | | | — | | | | — | | | | — | | | | — | |
| Net realized gains, Class C | | | — | | | | — | | | | — | | | | — | |
| Net realized gains, Class Y | | | — | | | | — | | | | — | | | | — | |
| Net realized gains, Institutional Class | | | — | | | | — | | | | — | | | | — | |
| Total Distributions | | | (421,192 | ) | | | (16,017 | ) | | | (1,791,047 | ) | | | (2,117,770 | ) |
| | | | | | | | | | | | | | | | | |
| Net Increase (Decrease) from Share Transactions(A) | | | 10,331,100 | | | | (13,127,797 | ) | | | (27,945,544 | ) | | | (30,845,583 | ) |
| | | | | | | | | | | | | | | | | |
| Total Increase (Decrease) in Net Assets | | | 12,528,187 | | | | (1,909,506 | ) | | | (24,927,417 | ) | | | (17,386,770 | ) |
| | | | | | | | | | | | | | | | | |
| Net Assets | | | | | | | | | | | | | | | | |
| Beginning of period | | | 65,149,618 | | | | 67,059,124 | | | | 117,080,305 | | | | 134,467,075 | |
| End of period | | $ | 77,677,805 | | | $ | 65,149,618 | | | $ | 92,152,888 | | | $ | 117,080,305 | |
| Accumulated Net Investment Income | | $ | 100,823 | | | $ | 423,004 | | | $ | 9,681 | | | $ | 12,326 | |
(A) For details on share transactions by class, see Statements of Changes in Net Assets - Capital Stock Activity on pages 38 to 41.
See accompanying Notes to Financial Statements.
Statements of Changes in Net Assets (Continued)
| Touchstone | | | Touchstone | | | Touchstone | |
| Conservative Allocation | | | Growth Allocation | | | Moderate Growth Allocation | |
| Fund | | | Fund | | | Fund | |
| For the | | | For the | | | For the | | | For the | | | For the | | | For the | |
| Year | | | Year | | | Year | | | Year | | | Year | | | Year | |
| Ended | | | Ended | | | Ended | | | Ended | | | Ended | | | Ended | |
| December 31, | | | December 31, | | | December 31, | | | December 31, | | | December 31, | | | December 31, | |
| 2014 | | | 2013 | | | 2014 | | | 2013 | | | 2014 | | | 2013 | |
| | | | | | | | | | | | | | | | | | | | | | | |
| $ | 942,692 | | | $ | 1,185,767 | | | $ | 551,740 | | | $ | 552,922 | | | $ | 1,640,014 | | | $ | 1,686,407 | |
| | | | | | | | | | | | | | | | | | | | | | | |
| | 2,621,771 | | | | 1,961,058 | | | | 3,991,086 | | | | 7,624,883 | | | | 8,825,901 | | | | 12,118,343 | |
| | | | | | | | | | | | | | | | | | | | | | | |
| | (1,421,276 | ) | | | 1,089,766 | | | | (1,665,705 | ) | | | 6,276,724 | | | | (3,931,077 | ) | | | 10,548,517 | |
| | 2,143,187 | | | | 4,236,591 | | | | 2,877,121 | | | | 14,454,529 | | | | 6,534,838 | | | | 24,353,267 | |
| | | | | | | | | | | | | | | | | | | | | | | |
| | | | | | | | | | | | | | | | | | | | | | | |
| | (436,936 | ) | | | (493,274 | ) | | | (435,547 | ) | | | (552,769 | ) | | | (1,129,427 | ) | | | (1,327,579 | ) |
| | (198,766 | ) | | | (193,431 | ) | | | (163,777 | ) | | | (284,682 | ) | | | (520,631 | ) | | | (669,021 | ) |
| | (386,452 | ) | | | (577,063 | ) | | | (213,069 | ) | | | (389,522 | ) | | | (430,228 | ) | | | (716,754 | ) |
| | (1,766 | ) | | | (7,428 | ) | | | (423 | ) | | | (451 | ) | | | (226 | ) | | | (216 | ) |
| | — | | | | — | | | | — | | | | (203,688 | ) | | | (2,142,958 | ) | | | — | |
| | — | | | | — | | | | — | | | | (171,688 | ) | | | (1,681,327 | ) | | | — | |
| | — | | | | — | | | | — | | | | (122,883 | ) | | | (627,104 | ) | | | — | |
| | — | | | | — | | | | — | | | | (147 | ) | | | (397 | ) | | | — | |
| | (1,023,920 | ) | | | (1,271,196 | ) | | | (812,816 | ) | | | (1,725,830 | ) | | | (6,532,298 | ) | | | (2,713,570 | ) |
| | | | | | | | | | | | | | | | | | | | | | | |
| | (20,794,838 | ) | | | (24,984,211 | ) | | | (15,041,461 | ) | | | (26,047,307 | ) | | | (30,831,305 | ) | | | (37,159,833 | ) |
| | | | | | | | | | | | | | | | | | | | | | | |
| | (19,675,571 | ) | | | (22,018,816 | ) | | | (12,977,156 | ) | | | (13,318,608 | ) | | | (30,828,765 | ) | | | (15,520,136 | ) |
| | | | | | | | | | | | | | | | | | | | | | | |
| | | | | | | | | | | | | | | | | | | | | | | |
| | 63,443,952 | | | | 85,462,768 | | | | 70,080,307 | | | | 83,398,915 | | | | 148,292,834 | | | | 163,812,970 | |
| $ | 43,768,381 | | | $ | 63,443,952 | | | $ | 57,103,151 | | | $ | 70,080,307 | | | $ | 117,464,069 | | | $ | 148,292,834 | |
| $ | 4,322 | | | $ | 4,479 | | | $ | 9,902 | | | $ | 10,678 | | | $ | — | | | $ | 11,411 | |
Statements of Changes in Net Assets - Capital Stock Activity
| | | Touchstone Dynamic Equity Fund | |
| | | For the Year | | | For the Year | |
| | | Ended | | | Ended | |
| | | December 31, 2014 | | | December 31, 2013 | |
| | | Shares | | | Dollars | | | Shares | | | Dollars | |
| Class A | | | | | | | | | | | | | | | | |
| Proceeds from Shares sold | | | 432,702 | | | $ | 5,737,437 | | | | 374,104 | | | $ | 4,480,414 | |
| Reinvestment of distributions | | | 1,740 | | | | 23,827 | | | | — | | | | — | |
| Cost of Shares redeemed | | | (748,511 | ) | | | (10,219,139 | ) | | | (671,945 | ) | | | (8,052,047 | ) |
| Change from Class A Share Transactions | | | (314,069 | ) | | | (4,457,875 | ) | | | (297,841 | ) | | | (3,571,633 | ) |
| Class C | | | | | | | | | | | | | | | | |
| Proceeds from Shares sold | | | 169,934 | | | | 2,228,628 | | | | 52,021 | | | | 605,939 | |
| Reinvestment of distributions | | | — | | | | — | | | | — | | | | — | |
| Cost of Shares redeemed | | | (175,478 | ) | | | (2,201,554 | ) | | | (217,239 | ) | | | (2,471,586 | ) |
| Change from Class C Share Transactions | | | (5,544 | ) | | | 27,074 | | | | (165,218 | ) | | | (1,865,647 | ) |
| Class Y | | | | | | | | | | | | | | | | |
| Proceeds from Shares sold | | | 2,525,684 | | | | 34,801,483 | | | | 1,090,242 | | | | 13,522,101 | |
| Reinvestment of distributions | | | 19,153 | | | | 266,224 | | | | 549 | | | | 7,337 | |
| Cost of Shares redeemed | | | (1,203,234 | ) | | | (16,569,784 | ) | | | (1,109,120 | ) | | | (13,620,139 | ) |
| Change from Class Y Share Transactions | | | 1,341,603 | | | | 18,497,923 | | | | (18,329 | ) | | | (90,701 | ) |
| Institutional Class | | | | | | | | | | | | | | | | |
| Proceeds from Shares sold | | | 61,199 | | | | 845,127 | | | | 33,833 | | | | 417,533 | |
| Reinvestment of distributions | | | 5,921 | | | | 82,486 | | | | 589 | | | | 7,882 | |
| Cost of Shares redeemed | | | (337,036 | ) | | | (4,663,635 | ) | | | (663,484 | ) | | | (8,025,231 | ) |
| Change from Institutional Class Share Transactions | | | (269,916 | ) | | | (3,736,022 | ) | | | (629,062 | ) | | | (7,599,816 | ) |
| | | | | | | | | | | | | | | | | |
| Change from Share Transactions | | | 752,074 | | | $ | 10,331,100 | | | | (1,110,450 | ) | | $ | (13,127,797 | ) |
See accompanying Notes to Financial Statements.
Statements of Changes in Net Assets - Capital Stock Activity (Continued)
| Touchstone Balanced Allocation Fund | | | Touchstone Conservative Allocation Fund | |
| For the Year | | | For the Year | | | For the Year | | | For the Year | |
| Ended | | | Ended | | | Ended | | | Ended | |
| December 31, 2014 | | | December 31, 2013 | | | December 31, 2014 | | | December 31, 2013 | |
| Shares | | | Dollars | | | Shares | | | Dollars | | | Shares | | | Dollars | | | Shares | | | Dollars | |
| | | | | | | | | | | | | | | | | | | | | | | | | | | | | | | |
| | 257,634 | | | $ | 3,260,976 | | | | 280,981 | | | $ | 3,311,134 | | | | 353,159 | | | $ | 3,944,565 | | | | 462,199 | | | $ | 4,982,787 | |
| | 56,932 | | | | 723,096 | | | | 67,601 | | | | 815,079 | | | | 32,321 | | | | 359,956 | | | | 37,844 | | | | 407,407 | |
| | (1,236,173 | ) | | | (15,716,395 | ) | | | (1,019,792 | ) | | | (12,047,014 | ) | | | (1,088,913 | ) | | | (12,181,332 | ) | | | (1,364,874 | ) | | | (14,641,844 | ) |
| | (921,607 | ) | | | (11,732,323 | ) | | | (671,210 | ) | | | (7,920,801 | ) | | | (703,433 | ) | | | (7,876,811 | ) | | | (864,831 | ) | | | (9,251,650 | ) |
| | | | | | | | | | | | | | | | | | | | | | | | | | | | | | | |
| | 90,111 | | | | 1,135,083 | | | | 135,642 | | | | 1,604,319 | | | | 81,479 | | | | 901,715 | | | | 98,690 | | | | 1,052,995 | |
| | 19,130 | | | | 243,067 | | | | 23,260 | | | | 283,302 | | | | 13,589 | | | | 150,441 | | | | 12,887 | | | | 138,300 | |
| | (476,671 | ) | | | (6,025,159 | ) | | | (628,273 | ) | | | (7,414,630 | ) | | | (197,495 | ) | | | (2,189,544 | ) | | | (426,779 | ) | | | (4,586,185 | ) |
| | (367,430 | ) | | | (4,647,009 | ) | | | (469,371 | ) | | | (5,527,009 | ) | | | (102,427 | ) | | | (1,137,388 | ) | | | (315,202 | ) | | | (3,394,890 | ) |
| | | | | | | | | | | | | | | | | | | | | | | | | | | | | | | |
| | 297,507 | | | | 3,770,622 | | | | 514,994 | | | | 6,094,088 | | | | 272,994 | | | | 3,039,700 | | | | 697,450 | | | | 7,531,888 | |
| | 47,139 | | | | 599,745 | | | | 63,081 | | | | 758,122 | | | | 30,740 | | | | 342,442 | | | | 49,467 | | | | 532,491 | |
| | (1,244,262 | ) | | | (15,937,422 | ) | | | (2,051,080 | ) | | | (24,250,717 | ) | | | (1,351,912 | ) | | | (15,152,082 | ) | | | (1,794,484 | ) | | | (19,263,173 | ) |
| | (899,616 | ) | | | (11,567,055 | ) | | | (1,473,005 | ) | | | (17,398,507 | ) | | | (1,048,178 | ) | | | (11,769,940 | ) | | | (1,047,567 | ) | | | (11,198,794 | ) |
| | | | | | | | | | | | | | | | | | | | | | | | | | | | | | | |
| | — | | | | — | | | | — | | | | — | | | | — | | | | — | | | | 1,241 | | | | 13,469 | |
| | 67 | | | | 843 | | | | 61 | | | | 734 | | | | 158 | | | | 1,766 | | | | 593 | | | | 6,326 | |
| | — | | | | — | | | | — | | | | — | | | | (1,105 | ) | | | (12,465 | ) | | | (108,251 | ) | | | (1,158,672 | ) |
| | 67 | | | | 843 | | | | 61 | | | | 734 | | | | (947 | ) | | | (10,699 | ) | | | (106,417 | ) | | | (1,138,877 | ) |
| | | | | | | | | | | | | | | | | | | | | | | | | | | | | | | |
| | (2,188,586 | ) | | $ | (27,945,544 | ) | | | (2,613,525 | ) | | $ | (30,845,583 | ) | | | (1,854,985 | ) | | $ | (20,794,838 | ) | | | (2,334,017 | ) | | $ | (24,984,211 | ) |
Statements of Changes in Net Assets - Capital Stock Activity (Continued)
| | | Touchstone Growth Allocation Fund | |
| | | For the Year | | | For the Year | |
| | | Ended | | | Ended | |
| | | December 31, 2014 | | | December 31, 2013 | |
| | | Shares | | | Dollars | | | Shares | | | Dollars | |
| Class A | | | | | | | | | | | | | | | | |
| Proceeds from Shares sold | | | 141,791 | | | $ | 2,011,820 | | | | 144,721 | | | $ | 1,858,211 | |
| Reinvestment of distributions | | | 28,063 | | | | 400,572 | | | | 50,827 | | | | 695,151 | |
| Cost of Shares redeemed | | | (501,432 | ) | | | (7,153,770 | ) | | | (753,611 | ) | | | (9,731,501 | ) |
| Change from Class A Share Transactions | | | (331,578 | ) | | | (4,741,378 | ) | | | (558,063 | ) | | | (7,178,139 | ) |
| Class C | | | | | | | | | | | | | | | | |
| Proceeds from Shares sold | | | 51,106 | | | | 693,463 | | | | 156,664 | | | | 1,958,269 | |
| Reinvestment of distributions | | | 9,047 | | | | 124,648 | | | | 24,735 | | | | 326,028 | |
| Cost of Shares redeemed | | | (270,144 | ) | | | (3,691,190 | ) | | | (498,883 | ) | | | (6,235,592 | ) |
| Change from Class C Share Transactions | | | (209,991 | ) | | | (2,873,079 | ) | | | (317,484 | ) | | | (3,951,295 | ) |
| Class Y | | | | | | | | | | | | | | | | |
| Proceeds from Shares sold | | | 111,776 | | | | 1,600,404 | | | | 349,010 | | | | 4,506,727 | |
| Reinvestment of distributions | | | 13,957 | | | | 200,955 | | | | 36,184 | | | | 496,016 | |
| Cost of Shares redeemed | | | (640,664 | ) | | | (9,228,099 | ) | | | (1,538,044 | ) | | | (19,907,914 | ) |
| Change from Class Y Share Transactions | | | (514,931 | ) | | | (7,426,740 | ) | | | (1,152,850 | ) | | | (14,905,171 | ) |
| Institutional Class | | | | | | | | | | | | | | | | |
| Proceeds from Shares sold | | | — | | | | — | | | | 329 | | | | 3,691 | |
| Reinvestment of distributions | | | 32 | | | | 423 | | | | 48 | | | | 598 | |
| Cost of Shares redeemed | | | (54 | ) | | | (687 | ) | | | (1,497 | ) | | | (16,991 | ) |
| Change from Institutional Class Share Transactions | | | (22 | ) | | | (264 | ) | | | (1,120 | ) | | | (12,702 | ) |
| | | | | | | | | | | | | | | | | |
| Change from Share Transactions | | | (1,056,522 | ) | | $ | (15,041,461 | ) | | | (2,029,517 | ) | | $ | (26,047,307 | ) |
See accompanying Notes to Financial Statements.
Statements of Changes in Net Assets - Capital Stock Activity (Continued)
| Touchstone Moderate Growth Allocation Fund | |
| For the Year | | | For the Year | |
| Ended | | | Ended | |
| December 31, 2014 | | | December 31, 2013 | |
| Shares | | | Dollars | | | Shares | | | Dollars | |
| | | | | | | | | | | |
| | 246,109 | | | $ | 3,288,823 | | | | 281,126 | | | $ | 3,458,840 | |
| | 228,734 | | | | 2,976,504 | | | | 94,159 | | | | 1,194,334 | |
| | (1,307,090 | ) | | | (17,389,743 | ) | | | (1,434,032 | ) | | | (17,450,279 | ) |
| | (832,247 | ) | | | (11,124,416 | ) | | | (1,058,747 | ) | | | (12,797,105 | ) |
| | | | | | | | | | | | | | | |
| | 153,626 | | | | 1,998,397 | | | | 141,827 | | | | 1,718,675 | |
| | 119,689 | | | | 1,524,234 | | | | 34,847 | | | | 440,284 | |
| | (691,371 | ) | | | (9,028,165 | ) | | | (697,559 | ) | | | (8,395,893 | ) |
| | (418,056 | ) | | | (5,505,534 | ) | | | (520,885 | ) | | | (6,236,934 | ) |
| | | | | | | | | | | | | | | |
| | 275,245 | | | | 3,688,089 | | | | 488,950 | | | | 6,004,836 | |
| | 73,383 | | | | 964,220 | | | | 52,336 | | | | 664,249 | |
| | (1,391,373 | ) | | | (18,850,918 | ) | | | (2,041,647 | ) | | | (24,795,095 | ) |
| | (1,042,745 | ) | | | (14,198,609 | ) | | | (1,500,361 | ) | | | (18,126,010 | ) |
| | | | | | | | | | | | | | | |
| | — | | | | — | | | | — | | | | — | |
| | 48 | | | | 623 | | | | 17 | | | | 216 | |
| | (261 | ) | | | (3,369 | ) | | | — | | | | — | |
| | (213 | ) | | | (2,746 | ) | | | 17 | | | | 216 | |
| | | | | | | | | | | | | | | |
| | (2,293,261 | ) | | $ | (30,831,305 | ) | | | (3,079,976 | ) | | $ | (37,159,833 | ) |
Statement of Cash Flows
For the Year Ended December 31, 2014
| | | Touchstone | |
| | | Dynamic | |
| | | Equity | |
| | | Fund | |
| Cash Flows Used in Operating Activities | | | | |
| | | | | |
| Change in net assets resulting from operations | | $ | 2,618,279 | |
| | | | | |
| Adjustments to reconcile net increase (decrease) in net assets resulting from operations to net cash used in operating activities: | | | | |
| Purchases of investments | | | (201,942,216 | ) |
| Proceeds from disposition of investments | | | 198,186,859 | |
| Net cost of purchased options | | | (6,133,219 | ) |
| Premiums on call and put options written | | | 18,038,897 | |
| Costs to cover written options | | | (17,206,886 | ) |
| Proceeds from securities sold short | | | 48,470,505 | |
| Covers of securities sold short | | | (47,580,320 | ) |
| Net sales of short term securities | | | 466,765 | |
| Increase in deposits with Prime Broker | | | (1,938,139 | ) |
| Increase in dividends and interest receivable | | | (60,065 | ) |
| Increase in tax reclaim receivable | | | (207 | ) |
| Increase in other assets | | | (3,660 | ) |
| Proceeds from litigation settlements | | | 5,154 | |
| Decrease in dividends for securities sold short payable | | | (199,005 | ) |
| Decrease in payable to Trustees | | | (889 | ) |
| Increase in payable to Investment Advisor | | | 16,534 | |
| Increase in payable to other affiliates | | | 1,317 | |
| Increase in other accrued expenses and liabilities | | | 3,106 | |
| Net realized (gains) on investments | | | (6,922,240 | ) |
| Net realized (gains) on written options | | | (646,956 | ) |
| Net realized losses from securities sold short | | | 3,107,286 | |
| Net change in unrealized (appreciation) depreciation on investments | | | 4,797,934 | |
| Net change in unrealized (appreciation) depreciation on written options | | | (449,480 | ) |
| Net change in unrealized (appreciation) depreciation on securities sold short | | | (2,430,189 | ) |
| Net cash used in operating activities | | | (9,800,835 | ) |
| | | | | |
| Cash Flows Provided by Financing Activities | | | | |
| Decrease in bank overdrafts | | | (3,572 | ) |
| Proceeds from shares sold | | | 43,442,826 | |
| Cash distributions paid | | | (48,655 | ) |
| Payment of shares redeemed | | | (33,589,764 | ) |
| Net cash provided by financing activities | | | 9,800,835 | |
| Net change in cash | | | — | |
| | | | | |
| Net change in cash | | | | |
| Cash - beginning of the period | | | — | |
| Cash - end of period | | $ | — | |
| | | | | |
| Supplemental disclosure of cash flow information: | | | | |
| Reinvestment of dividends and distributions | | $ | 372,537 | |
See accompanying Notes to Financial Statements.
Financial Highlights
Touchstone Dynamic Equity Fund—Class A
Selected Data for a Share Outstanding Throughout Each Period
| | | | | | | | | Five Months | | | | | | | | | | |
| | | | | | | | | Ended | | | | | | | | | | |
| | | Year Ended December 31, | | | December 31, | | | Year Ended July 31, | |
| | | 2014 | | | 2013 | | | 2012(A) | | | 2012 | | | 2011 | | | 2010 | |
| Net asset value at beginning of period | | $ | 13.15 | | | $ | 11.05 | | | $ | 11.20 | | | $ | 10.26 | | | $ | 9.02 | | | $ | 8.68 | |
| Income (loss) from investment operations: | | | | | | | | | | | | | | | | | | | | | | | | |
| Net investment income (loss) | | | — | (B)(C) | | | 0.04 | | | | 0.04 | (C) | | | (0.07 | )(C) | | | 0.06 | (C) | | | 0.05 | (C) |
| Net realized and unrealized gains (losses) on investments | | | 0.48 | | | | 2.06 | | | | (0.19 | ) | | | 1.09 | | | | 1.18 | | | | 0.29 | |
| Total from investment operations | | | 0.48 | | | | 2.10 | | | | (0.15 | ) | | | 1.02 | | | | 1.24 | | | | 0.34 | |
| Distributions from: | | | | | | | | | | | | | | | | | | | | | | | | |
| Net investment income | | | (0.04 | ) | | | — | | | | — | | | | (0.08 | ) | | | — | | | | — | |
| Net asset value at end of period | | $ | 13.59 | | | $ | 13.15 | | | $ | 11.05 | | | $ | 11.20 | | | $ | 10.26 | | | $ | 9.02 | |
| Total return(D) | | | 3.64 | % | | | 19.01 | % | | | (1.34 | )%(E) | | | 10.00 | % | | | 13.75 | % | | | 3.92 | % |
| Ratios and supplemental data: | | | | | | | | | | | | | | | | | | | | | | | | |
| Net assets at end of period (000's) | | $ | 11,546 | | | $ | 15,300 | | | $ | 16,156 | | | $ | 17,919 | | | $ | 23,505 | | | $ | 38,274 | |
| Ratio to average net assets: | | | | | | | | | | | | | | | | | | | | | | | | |
| Net expenses (including dividend expense on securities sold short)(F) | | | 2.07 | % | | | 2.21 | % | | | 2.46 | %(G) | | | 2.80 | % | | | 1.82 | % | | | 1.78 | % |
| Gross expenses (including dividend expense on securities sold short)(H) | | | 2.18 | % | | | 2.41 | % | | | 2.65 | %(G) | | | 3.08 | % | | | 2.16 | % | | | 2.27 | % |
| Net investment income (loss) | | | 0.01 | % | | | 0.30 | % | | | 0.88 | %(G) | | | (0.63 | )% | | | 0.66 | % | | | 0.52 | % |
| Portfolio turnover rate | | | 236 | % | | | 382 | % | | | 105 | %(E) | | | 234 | % | | | 231 | % | | | 168 | % |
| (A) | The Fund changed its fiscal year end from July 31 to December 31. |
| (B) | Less than $0.005 per share. |
| (C) | The net investment income (loss) per share is based on average shares outstanding for the period. |
| (D) | Total returns shown exclude the effect of applicable sales loads. If these charges were included, the returns would be lower. |
| (F) | The ratio of net expenses to average net assets excluding dividend expense on securities sold short is 1.55%, 1.55%, 1.55%, 1.55%, 1.66% and 1.65% for the years ended December 31, 2014 and 2013, period ended December 31, 2012 and years ended July 31, 2012, 2011 and 2010, respectively. |
| (H) | The ratio of gross expenses to average net assets excluding dividend expense on securities sold short is 1.66%, 1.75%, 1.74%, 1.82%, 2.00% and 2.14% for the years ended December 31, 2014 and 2013, period ended December 31, 2012 and years ended July 31, 2012, 2011 and 2010, respectively. |
See accompanying Notes to Financial Statements.
Financial Highlights (Continued)
Touchstone Dynamic Equity Fund—Class C
Selected Data for a Share Outstanding Throughout Each Period
| | | | | | | | | Five Months | | | | | | | | | | |
| | | | | | | | | Ended | | | | | | | | | | |
| | | Year Ended December 31, | | | December 31, | | | Year Ended July 31, | |
| | | 2014 | | | 2013 | | | 2012(A) | | | 2012 | | | 2011 | | | 2010 | |
| Net asset value at beginning of period | | $ | 12.35 | | | $ | 10.46 | | | $ | 10.63 | | | $ | 9.79 | | | $ | 8.67 | | | $ | 8.40 | |
| Income (loss) from investment operations: | | | | | | | | | | | | | | | | | | | | | | | | |
| Net investment income (loss) | | | (0.09 | )(B) | | | (0.08 | ) | | | 0.01 | (B) | | | (0.14 | )(B) | | | (0.01 | )(B) | | | (0.02 | )(B) |
| Net realized and unrealized gains (losses) on investments | | | 0.44 | | | | 1.97 | | | | (0.18 | ) | | | 1.03 | | | | 1.13 | | | | 0.29 | |
| Total from investment operations | | | 0.35 | | | | 1.89 | | | | (0.17 | ) | | | 0.89 | | | | 1.12 | | | | 0.27 | |
| Distributions from: | | | | | | | | | | | | | | | | | | | | | | | | |
| Net investment income | | | — | | | | — | | | | — | | | | (0.05 | ) | | | — | | | | — | |
| Net asset value at end of period | | $ | 12.70 | | | $ | 12.35 | | | $ | 10.46 | | | $ | 10.63 | | | $ | 9.79 | | | $ | 8.67 | |
| Total return(C) | | | 2.83 | % | | | 18.07 | % | | | (1.60 | )%(D) | | | 9.09 | % | | | 12.92 | % | | | 3.21 | % |
| Ratios and supplemental data: | | | | | | | | | | | | | | | | | | | | | | | | |
| Net assets at end of period (000's) | | $ | 10,486 | | | $ | 10,261 | | | $ | 10,420 | | | $ | 11,684 | | | $ | 14,243 | | | $ | 20,558 | |
| Ratio to average net assets: | | | | | | | | | | | | | | | | | | | | | | | | |
| Net expenses (including dividend expense on securities sold short)(E) | | | 2.82 | % | | | 2.96 | % | | | 3.21 | %(F) | | | 3.55 | % | | | 2.57 | % | | | 2.53 | % |
| Gross expenses (including dividend expense on securities sold short)(G) | | | 2.96 | % | | | 3.20 | % | | | 3.48 | %(F) | | | 3.75 | % | | | 2.78 | % | | | 2.91 | % |
| Net investment income (loss) | | | (0.74 | )% | | | (0.45 | )% | | | 0.13 | %(F) | | | (1.38 | )% | | | (0.10 | )% | | | (0.23 | )% |
| Portfolio turnover rate | | | 236 | % | | | 382 | % | | | 105 | %(D) | | | 234 | % | | | 231 | % | | | 168 | % |
| (A) | The Fund changed its fiscal year end from July 31 to December 31. |
| (B) | The net investment income (loss) per share is based on average shares outstanding for the period. |
| (C) | Total returns shown exclude the effect of applicable sales loads. If these charges were included, the returns would be lower. |
| (E) | The ratio of net expenses to average net assets excluding dividend expense on securities sold short is 2.30%, 2.30%, 2.30%, 2.30%, 2.41% and 2.40% for the years ended December 31, 2014 and 2013, period ended December 31, 2012 and years ended July 31, 2012, 2011 and 2010, respectively. |
| (G) | The ratio of gross expenses to average net assets excluding dividend expense on securities sold short is 2.44%, 2.54%, 2.57%, 2.50%, 2.62% and 2.78% for the years ended December 31, 2014 and 2013, period ended December 31, 2012 and years ended July 31, 2012, 2011 and 2010, respectively. |
See accompanying Notes to Financial Statements.
Financial Highlights (Continued)
| Touchstone Dynamic Equity Fund—Class Y |
| Selected Data for a Share Outstanding Throughout Each Period |
| | | | | | | | | Five Months | | | | | | | | | | |
| | | | | | | | | Ended | | | | | | | | | | |
| | | Year Ended December 31, | | | December 31, | | | Year Ended July 31, 2013 | |
| | | 2014 | | | 2013 | | | 2012(A) | | | 2012 | | | 2011 | | | 2010 | |
| Net asset value at beginning of period | | $ | 13.37 | | | $ | 11.22 | | | $ | 11.35 | | | $ | 10.40 | | | $ | 9.11 | | | $ | 8.75 | |
| Income (loss) from investment operations: | | | | | | | | | | | | | | | | | | | | | | | | |
| Net investment income (loss) | | | 0.04 | (B) | | | 0.07 | | | | 0.05 | (B) | | | (0.04 | )(B) | | | 0.08 | (B) | | | 0.07 | (B) |
| Net realized and unrealized gains (losses) on investments | | | 0.49 | | | | 2.08 | | | | (0.18 | ) | | | 1.09 | | | | 1.21 | | | | 0.29 | |
| Total from investment operations | | | 0.53 | | | | 2.15 | | | | (0.13 | ) | | | 1.05 | | | | 1.29 | | | | 0.36 | |
| Distributions from: | | | | | | | | | | | | | | | | | | | | | | | | |
| Net investment income | | | (0.10 | ) | | | — | (C) | | | — | | | | (0.10 | ) | | | — | | | | — | |
| Net asset value at end of period | | $ | 13.80 | | | $ | 13.37 | | | $ | 11.22 | | | $ | 11.35 | | | $ | 10.40 | | | $ | 9.11 | |
| Total return | | | 3.95 | % | | | 19.20 | % | | | (1.15 | )%(D) | | | 10.14 | % | | | 14.16 | % | | | 4.11 | % |
| Ratios and supplemental data: | | | | | | | | | | | | | | | | | | | | | | | | |
| Net assets at end of period (000's) | | $ | 43,349 | | | $ | 24,066 | | | $ | 20,397 | | | $ | 24,054 | | | $ | 30,511 | | | $ | 22,347 | |
| Ratio to average net assets: | | | | | | | | | | | | | | | | | | | | | | | | |
| Net expenses (including dividend expense on securities sold short)(E) | | | 1.78 | % | | | 1.96 | % | | | 2.21 | %(F) | | | 2.56 | % | | | 1.59 | % | | | 1.52 | % |
| Gross expenses (including dividend expense on securities sold short)(G) | | | 1.76 | % | | | 1.95 | % | | | 2.31 | %(F) | | | 2.60 | % | | | 1.68 | % | | | 1.68 | % |
| Net investment income (loss) | | | 0.30 | % | | | 0.55 | % | | | 1.13 | %(F) | | | (0.38 | )% | | | 0.77 | % | | | 0.81 | % |
| Portfolio turnover rate | | | 236 | % | | | 382 | % | | | 105 | %(D) | | | 234 | % | | | 231 | % | | | 168 | % |
| (A) | The Fund changed its fiscal year end from July 31 to December 31. |
| (B) | The net investment income (loss) per share is based on average shares outstanding for the period. |
| (C) | Less than $0.005 per share. |
| (E) | The ratio of net expenses to average net assets excluding dividend expense on securities sold short is 1.26%, 1.30%, 1.30%, 1.30%, 1.42% and 1.40% for the years ended December 31, 2014 and 2013, period ended December 31, 2012 and years ended July 31, 2012, 2011 and 2010, respectively. |
| (G) | The ratio of gross expenses to average net assets excluding dividend expense on securities sold short is 1.24%, 1.29%, 1.40%, 1.35%, 1.51% and 1.56% for the years ended December 31, 2014 and 2013, period ended December 31, 2012 and years ended July 31, 2012, 2011 and 2010, respectively. |
See accompanying Notes to Financial Statements.
Financial Highlights (Continued)
| Touchstone Dynamic Equity Fund—Institutional Class |
| Selected Data for a Share Outstanding Throughout Each Period |
| | | | | | | | | Five Months | | | | | | | | | | |
| | | | | | | | | Ended | | | | | | | | | | |
| | | Year Ended December 31, | | | December 31, | | | Year Ended July 31, | |
| | | 2014 | | | 2013 | | | 2012(A) | | | 2012 | | | 2011 | | | 2010 | |
| Net asset value at beginning of period | | $ | 13.39 | | | $ | 11.23 | | | $ | 11.36 | | | $ | 10.40 | | | $ | 9.12 | | | $ | 8.76 | |
| Income (loss) from investment operations: | | | | | | | | | | | | | | | | | | | | | | | | |
| Net investment income (loss) | | | 0.04 | (B) | | | 0.12 | | | | 0.06 | (B) | | | (0.04 | )(B) | | | 0.09 | (B) | | | 0.11 | (B) |
| Net realized and unrealized gains (losses) on investments | | | 0.49 | | | | 2.05 | | | | (0.19 | ) | | | 1.10 | | | | 1.19 | | | | 0.25 | |
| Total from investment operations | | | 0.53 | | | | 2.17 | | | | (0.13 | ) | | | 1.06 | | | | 1.28 | | | | 0.36 | |
| Distributions from: | | | | | | | | | | | | | | | | | | | | | | | | |
| Net investment income | | | (0.09 | ) | | | (0.01 | ) | | | — | | | | (0.10 | ) | | | — | | | | — | |
| Net asset value at end of period | | $ | 13.83 | | | $ | 13.39 | | | $ | 11.23 | | | $ | 11.36 | | | $ | 10.40 | | | $ | 9.12 | |
| Total return | | | 3.98 | % | | | 19.29 | % | | | (1.15 | )%(C) | | | 10.27 | % | | | 14.04 | % | | | 4.11 | % |
| Ratios and supplemental data: | | | | | | | | | | | | | | | | | | | | | | | | |
| Net assets at end of period (000's) | | $ | 12,297 | | | $ | 15,523 | | | $ | 20,085 | | | $ | 6,168 | | | $ | 2 | | | $ | 2 | |
| Ratio to average net assets: | | | | | | | | | | | | | | | | | | | | | | | | |
| Net expenses (including dividend expense on securities sold short)(D) | | | 1.77 | % | | | 1.91 | % | | | 2.16 | %(E) | | | 2.50 | % | | | 1.52 | % | | | 1.41 | % |
| Gross expenses (including dividend expense on securities sold short)(F) | | | 1.76 | % | | | 1.95 | % | | | 2.18 | %(E) | | | 2.95 | % | | | 816.82 | % | | | 2.84 | % |
| Net investment income (loss) | | | 0.31 | % | | | 0.60 | % | | | 1.18 | %(E) | | | (0.33 | )% | | | 0.92 | % | | | 1.31 | % |
| Portfolio turnover rate | | | 236 | % | | | 382 | % | | | 105 | %(C) | | | 234 | % | | | 231 | % | | | 168 | % |
| (A) | The Fund changed its fiscal year end from July 31 to December 31. |
| (B) | The net investment income (loss) per share is based on average shares outstanding for the period. |
| (D) | The ratio of net expenses to average net assets excluding dividend expense on securities sold short is 1.25%, 1.25%, 1.25%, 1.25%, 1.35% and 1.36% for the years ended December 31, 2014 and 2013, period ended December 31, 2012 and years ended July 31, 2012, 2011 and 2010, respectively. |
| (F) | The ratio of gross expenses to average net assets excluding dividend expense on securities sold short is 1.24%, 1.29%, 1.27%, 1.70%, 816.65% and 2.79% for the years ended December 31, 2014 and 2013, period ended December 31, 2012 and years ended July 31, 2012, 2011 and 2010, respectively. |
See accompanying Notes to Financial Statements.
Financial Highlights (Continued)
| Touchstone Balanced Allocation Fund—Class A |
| Selected Data for a Share Outstanding Throughout Each Period |
| | | | | | | | | Five Months | | | | | | | | | | |
| | | | | | | | | Ended | | | | | | | | | | |
| | | Year Ended December 31, | | | December 31, | | | Year Ended July 31, | |
| | | 2014 | | | 2013 | | | 2012(A) | | | 2012 | | | 2011 | | | 2010 | |
| Net asset value at beginning of period | | $ | 12.37 | | | $ | 11.13 | | | $ | 11.18 | | | $ | 11.03 | | | $ | 9.99 | | | $ | 9.28 | |
| Income from investment operations: | | | | | | | | | | | | | | | | | | | | | | | | |
| Net investment income | | | 0.22 | | | | 0.17 | | | | 0.13 | (B) | | | 0.17 | (B) | | | 0.18 | (B) | | | 0.22 | (B) |
| Net realized and unrealized gains on investments | | | 0.33 | | | | 1.30 | | | | 0.35 | | | | 0.14 | | | | 1.13 | | | | 0.80 | |
| Total from investment operations | | | 0.55 | | | | 1.47 | | | | 0.48 | | | | 0.31 | | | | 1.31 | | | | 1.02 | |
| Distributions from: | | | | | | | | | | | | | | | | | | | | | | | | |
| Net investment income | | | (0.26 | ) | | | (0.23 | ) | | | (0.24 | ) | | | (0.16 | ) | | | (0.27 | ) | | | (0.31 | ) |
| Realized capital gains | | | — | | | | — | | | | (0.29 | ) | | | — | | | | — | | | | — | |
| Total distributions | | | (0.26 | ) | | | (0.23 | ) | | | (0.53 | ) | | | (0.16 | ) | | | (0.27 | ) | | | (0.31 | ) |
| Net asset value at end of period | | $ | 12.66 | | | $ | 12.37 | | | $ | 11.13 | | | $ | 11.18 | | | $ | 11.03 | | | $ | 9.99 | |
| Total return(C) | | | 4.46 | % | | | 13.28 | % | | | 4.37 | %(D) | | | 2.89 | % | | | 13.21 | % | | | 10.99 | % |
| Ratios and supplemental data: | | | | | | | | | | | | | | | | | | | | | | | | |
| Net assets at end of period (000's) | | $ | 35,689 | | | $ | 46,285 | | | $ | 49,118 | | | $ | 9,839 | | | $ | 12,650 | | | $ | 21,312 | |
| Ratio to average net assets: | | | | | | | | | | | | | | | | | | | | | | | | |
| Net expenses(E) | | | 0.46 | % | | | 0.35 | % | | | 0.41 | %(F) | | | 0.64 | % | | | 0.64 | % | | | 0.64 | % |
| Gross expenses(E) | | | 0.83 | % | | | 0.86 | % | | | 0.83 | %(F) | | | 0.97 | % | | | 0.94 | % | | | 0.93 | % |
| Net investment income(E) | | | 1.61 | % | | | 1.42 | % | | | 2.75 | %(F) | | | 1.58 | % | | | 1.71 | % | | | 2.26 | % |
| Portfolio turnover rate | | | 11 | % | | | 32 | % | | | 74 | %(D)(G) | | | 76 | % | | | 6 | % | | | 33 | % |
| Touchstone Balanced Allocation Fund—Class C |
| Selected Data for a Share Outstanding Throughout Each Period |
| | | | | | | | | Five Months | | | | | | | | | | |
| | | | | | | | | Ended | | | | | | | | | | |
| | | Year Ended December 31, | | | December 31, | | | Year Ended July 31, | |
| | | 2014 | | | 2013 | | | 2012(A) | | | 2012 | | | 2011 | | | 2010 | |
| Net asset value at beginning of period | | $ | 12.36 | | | $ | 11.12 | | | $ | 11.14 | | | $ | 11.01 | | | $ | 9.97 | | | $ | 9.26 | |
| Income from investment operations: | | | | | | | | | | | | | | | | | | | | | | | | |
| Net investment income | | | 0.11 | | | | 0.08 | | | | 0.09 | (B) | | | 0.09 | (B) | | | 0.10 | (B) | | | 0.15 | (B) |
| Net realized and unrealized gains on investments | | | 0.33 | | | | 1.30 | | | | 0.35 | | | | 0.14 | | | | 1.13 | | | | 0.79 | |
| Total from investment operations | | | 0.44 | | | | 1.38 | | | | 0.44 | | | | 0.23 | | | | 1.23 | | | | 0.94 | |
| Distributions from: | | | | | | | | | | | | | | | | | | | | | | | | |
| Net investment income | | | (0.13 | ) | | | (0.14 | ) | | | (0.17 | ) | | | (0.10 | ) | | | (0.19 | ) | | | (0.23 | ) |
| Realized capital gains | | | — | | | | — | | | | (0.29 | ) | | | — | | | | — | | | | — | |
| Total distributions | | | (0.13 | ) | | | (0.14 | ) | | | (0.46 | ) | | | (0.10 | ) | | | (0.19 | ) | | | (0.23 | ) |
| Net asset value at end of period | | $ | 12.67 | | | $ | 12.36 | | | $ | 11.12 | | | $ | 11.14 | | | $ | 11.01 | | | $ | 9.97 | |
| Total return(C) | | | 3.59 | % | | | 12.45 | % | | | 4.03 | %(D) | | | 2.13 | % | | | 12.41 | % | | | 10.19 | % |
| Ratios and supplemental data: | | | | | | | | | | | | | | | | | | | | | | | | |
| Net assets at end of period (000's) | | $ | 32,961 | | | $ | 36,681 | | | $ | 38,226 | | | $ | 38,388 | | | $ | 50,108 | | | $ | 59,480 | |
| Ratio to average net assets: | | | | | | | | | | | | | | | | | | | | | | | | |
| Net expenses(E) | | | 1.21 | % | | | 1.10 | % | | | 1.16 | %(F) | | | 1.39 | % | | | 1.39 | % | | | 1.39 | % |
| Gross expenses(E) | | | 1.57 | % | | | 1.58 | % | | | 1.60 | %(F) | | | 1.59 | % | | | 1.59 | % | | | 1.62 | % |
| Net investment income(E) | | | 0.86 | % | | | 0.67 | % | | | 2.00 | %(F) | | | 0.84 | % | | | 0.98 | % | | | 1.51 | % |
| Portfolio turnover rate | | | 11 | % | | | 32 | % | | | 74 | %(D)(G) | | | 76 | % | | | 6 | % | | | 33 | % |
| (A) | The Fund changed its fiscal year end from July 31 to December 31. |
| (B) | The net investment income per share is based on average shares outstanding for the period. |
| (C) | Total returns shown exclude the effect of applicable sales loads. If these charges were included, the returns would be lower. |
| (E) | Ratio does not include income and expenses of the underlying funds. |
| (G) | Portfolio turnover excludes the purchases and sales of the Fifth Third LifeModel Moderate Fund acquired on September 10, 2012. If these transactions were included, portfolio turnover would have been higher. |
See accompanying Notes to Financial Statements.
Financial Highlights (Continued)
| Touchstone Balanced Allocation Fund—Class Y |
| Selected Data for a Share Outstanding Throughout Each Period |
| | | | | | | | | Five Months | | | | | | | | | | |
| | | | | | | | | Ended | | | | | | | | | | |
| | | Year Ended December 31, | | | December 31, | | | Year Ended July 31, | |
| | | 2014 | | | 2013 | | | 2012(A) | | | 2012 | | | 2011 | | | 2010 | |
| Net asset value at beginning of period | | $ | 12.39 | | | $ | 11.15 | | | $ | 11.21 | | | $ | 11.05 | | | $ | 10.01 | | | $ | 9.30 | |
| Income from investment operations: | | | | | | | | | | | | | | | | | | | | | | | | |
| Net investment income | | | 0.27 | | | | 0.22 | | | | 0.14 | (B) | | | 0.20 | (B) | | | 0.23 | (B) | | | 0.24 | (B) |
| Net realized and unrealized gains on investments | | | 0.31 | | | | 1.28 | | | | 0.35 | | | | 0.14 | | | | 1.11 | | | | 0.80 | |
| Total from investment operations | | | 0.58 | | | | 1.50 | | | | 0.49 | | | | 0.34 | | | | 1.34 | | | | 1.04 | |
| Distributions from: | | | | | | | | | | | | | | | | | | | | | | | | |
| Net investment income | | | (0.29 | ) | | | (0.26 | ) | | | (0.26 | ) | | | (0.18 | ) | | | (0.30 | ) | | | (0.33 | ) |
| Realized capital gains | | | — | | | | — | | | | (0.29 | ) | | | — | | | | — | | | | — | |
| Total distributions | | | (0.29 | ) | | | (0.26 | ) | | | (0.55 | ) | | | (0.18 | ) | | | (0.30 | ) | | | (0.33 | ) |
| Net asset value at end of period | | $ | 12.68 | | | $ | 12.39 | | | $ | 11.15 | | | $ | 11.21 | | | $ | 11.05 | | | $ | 10.01 | |
| Total return | | | 4.72 | % | | | 13.54 | % | | | 4.45 | %(C) | | | 3.18 | % | | | 13.49 | % | | | 11.25 | % |
| Ratios and supplemental data: | | | | | | | | | | | | | | | | | | | | | | | | |
| Net assets at end of period (000's) | | $ | 23,466 | | | $ | 34,079 | | | $ | 47,092 | | | $ | 1,287 | | | $ | 1,866 | | | $ | 929 | |
| Ratio to average net assets: | | | | | | | | | | | | | | | | | | | | | | | | |
| Net expenses(D) | | | 0.21 | % | | | 0.10 | % | | | 0.16 | %(E) | | | 0.39 | % | | | 0.39 | % | | | 0.39 | % |
| Gross expenses(D) | | | 0.58 | % | | | 0.59 | % | | | 0.52 | %(E) | | | 1.40 | % | | | 1.41 | % | | | 2.28 | % |
| Net investment income(D) | | | 1.86 | % | | | 1.67 | % | | | 3.00 | %(E) | | | 1.84 | % | | | 2.11 | % | | | 2.46 | % |
| Portfolio turnover rate | | | 11 | % | | | 32 | % | | | 74 | %(C)(F) | | | 76 | % | | | 6 | % | | | 33 | % |
| Touchstone Balanced Allocation Fund—Institutional Class |
| Selected Data for a Share Outstanding Throughout Each Period |
| | | | | | | | | Five Months | | | | | | | | | | |
| | | | | | | | | Ended | | | | | | | | | | |
| | | Year Ended December 31, | | | December 31, | | | Year Ended July 31, | |
| | | 2014 | | | 2013 | | | 2012(A) | | | 2012 | | | 2011 | | | 2010 | |
| Net asset value at beginning of period | | $ | 12.33 | | | $ | 11.10 | | | $ | 11.16 | | | $ | 11.00 | | | $ | 9.97 | | | $ | 9.26 | |
| Income from investment operations: | | | | | | | | | | | | | | | | | | | | | | | | |
| Net investment income | | | 0.24 | | | | 0.20 | | | | 0.14 | (B) | | | 0.20 | (B) | | | 0.21 | (B) | | | 0.35 | (B) |
| Net realized and unrealized gains on investments | | | 0.34 | | | | 1.29 | | | | 0.35 | | | | 0.14 | | | | 1.12 | | | | 0.69 | |
| Total from investment operations | | | 0.58 | | | | 1.49 | | | | 0.49 | | | | 0.34 | | | | 1.33 | | | | 1.04 | |
| Distributions from: | | | | | | | | | | | | | | | | | | | | | | | | |
| Net investment income | | | (0.29 | ) | | | (0.26 | ) | | | (0.26 | ) | | | (0.18 | ) | | | (0.30 | ) | | | (0.33 | ) |
| Realized capital gains | | | — | | | | — | | | | (0.29 | ) | | | — | | | | — | | | | — | |
| Total distributions | | | (0.29 | ) | | | (0.26 | ) | | | (0.55 | ) | | | (0.18 | ) | | | (0.30 | ) | | | (0.33 | ) |
| Net asset value at end of period | | $ | 12.62 | | | $ | 12.33 | | | $ | 11.10 | | | $ | 11.16 | | | $ | 11.00 | | | $ | 9.97 | |
| Total return | | | 4.74 | % | | | 13.51 | % | | | 4.47 | %(C) | | | 3.19 | % | | | 13.44 | % | | | 11.29 | % |
| Ratios and supplemental data: | | | | | | | | | | | | | | | | | | | | | | | | |
| Net assets at end of period (000's) | | $ | 37 | | | $ | 35 | | | $ | 31 | | | $ | 30 | | | $ | 31 | | | $ | 27 | |
| Ratio to average net assets: | | | | | | | | | | | | | | | | | | | | | | | | |
| Net expenses(D) | | | 0.21 | % | | | 0.11 | % | | | 0.16 | %(E) | | | 0.39 | % | | | 0.39 | % | | | 0.39 | % |
| Gross expenses(D) | | | 47.31 | % | | | 63.11 | % | | | 56.07 | %(E) | | | 28.86 | % | | | 46.94 | % | | | 2.29 | % |
| Net investment income(D) | | | 1.86 | % | | | 1.66 | % | | | 3.00 | %(E) | | | 1.85 | % | | | 1.97 | % | | | 3.55 | % |
| Portfolio turnover rate | | | 11 | % | | | 32 | % | | | 74 | %(C)(F) | | | 76 | % | | | 6 | % | | | 33 | % |
| (A) | The Fund changed its fiscal year end from July 31 to December 31. |
| (B) | The net investment income per share is based on average shares outstanding for the period. |
| (D) | Ratio does not include income and expenses of the underlying funds. |
| (F) | Portfolio turnover excludes the purchases and sales of the Fifth Third LifeModel Moderate Fund acquired on September 10, 2012. If these transactions were included, portfolio turnover would have been higher. |
See accompanying Notes to Financial Statements.
| Financial Highlights (Continued) |
| |
| Touchstone Conservative Allocation Fund—Class A |
| Selected Data for a Share Outstanding Throughout Each Period |
| | | | | | | | | Five Months | | | | | | | | | | |
| | | | | | | | | Ended | | | | | | | | | | |
| | | Year Ended December 31, | | | December 31, | | | Year Ended July 31, | |
| | | 2014 | | | 2013 | | | 2012(A) | | | 2012 | | | 2011 | | | 2010 | |
| Net asset value at beginning of period | | $ | 10.93 | | | $ | 10.50 | | | $ | 10.98 | | | $ | 10.87 | | | $ | 10.38 | | | $ | 9.84 | |
| Income from investment operations: | | | | | | | | | | | | | | | | | | | | | | | | |
| Net investment income | | | 0.21 | | | | 0.19 | (B) | | | 0.10 | (B) | | | 0.21 | (B) | | | 0.26 | (B) | | | 0.34 | (B) |
| Net realized and unrealized gains on investments | | | 0.17 | | | | 0.45 | | | | 0.17 | | | | 0.13 | | | | 0.64 | | | | 0.66 | |
| Total from investment operations | | | 0.38 | | | | 0.64 | | | | 0.27 | | | | 0.34 | | | | 0.90 | | | | 1.00 | |
| Distributions from: | | | | | | | | | | | | | | | | | | | | | | | | |
| Net investment income | | | (0.23 | ) | | | (0.21 | ) | | | (0.28 | ) | | | (0.23 | ) | | | (0.41 | ) | | | (0.46 | ) |
| Realized capital gains | | | — | | | | — | | | | (0.47 | ) | | | — | | | | — | | | | — | |
| Total distributions | | | (0.23 | ) | | | (0.21 | ) | | | (0.75 | ) | | | (0.23 | ) | | | (0.41 | ) | | | (0.46 | ) |
| Net asset value at end of period | | $ | 11.08 | | | $ | 10.93 | | | $ | 10.50 | | | $ | 10.98 | | | $ | 10.87 | | | $ | 10.38 | |
| Total return(C) | | | 3.51 | % | | | 6.14 | % | | | 2.47 | %(D) | | | 3.23 | % | | | 8.81 | % | | | 10.27 | % |
| Ratios and supplemental data: | | | | | | | | | | | | | | | | | | | | | | | | |
| Net assets at end of period (000's) | | $ | 17,408 | | | $ | 24,857 | | | $ | 32,965 | | | $ | 8,466 | | | $ | 11,138 | | | $ | 12,141 | |
| Ratio to average net assets: | | | | | | | | | | | | | | | | | | | | | | | | |
| Net expenses(E) | | | 0.46 | % | | | 0.35 | % | | | 0.40 | %(F) | | | 0.61 | % | | | 0.61 | % | | | 0.61 | % |
| Gross expenses(E) | | | 0.89 | % | | | 0.89 | % | | | 0.85 | %(F) | | | 1.02 | % | | | 0.91 | % | | | 0.94 | % |
| Net investment income(E) | | | 1.79 | % | | | 1.74 | % | | | 2.28 | %(F) | | | 1.95 | % | | | 2.43 | % | | | 3.36 | % |
| Portfolio turnover rate | | | 11 | % | | | 30 | % | | | 79 | %(D)(G) | | | 89 | % | | | 13 | % | | | 33 | % |
| Touchstone Conservative Allocation Fund—Class C |
| Selected Data for a Share Outstanding Throughout Each Period |
| | | | | | | | | Five Months | | | | | | | | | | |
| | | | | | | | | Ended | | | | | | | | | | |
| | | Year Ended December 31, | | | December 31, | | | Year Ended July 31, | |
| | | 2014 | | | 2013 | | | 2012(A) | | | 2012 | | | 2011 | | | 2010 | |
| Net asset value at beginning of period | | $ | 10.88 | | | $ | 10.45 | | | $ | 10.92 | | | $ | 10.81 | | | $ | 10.33 | | | $ | 9.80 | |
| Income from investment operations: | | | | | | | | | | | | | | | | | | | | | | | | |
| Net investment income | | | 0.12 | | | | 0.11 | (B) | | | 0.07 | (B) | | | 0.13 | (B) | | | 0.18 | (B) | | | 0.27 | (B) |
| Net realized and unrealized gains on investments | | | 0.18 | | | | 0.45 | | | | 0.17 | | | | 0.13 | | | | 0.63 | | | | 0.64 | |
| Total from investment operations | | | 0.30 | | | | 0.56 | | | | 0.24 | | | | 0.26 | | | | 0.81 | | | | 0.91 | |
| Distributions from: | | | | | | | | | | | | | | | | | | | | | | | | |
| Net investment income | | | (0.15 | ) | | | (0.13 | ) | | | (0.24 | ) | | | (0.15 | ) | | | (0.33 | ) | | | (0.38 | ) |
| Realized capital gains | | | — | | | | — | | | | (0.47 | ) | | | — | | | | — | | | | — | |
| Total distributions | | | (0.15 | ) | | | (0.13 | ) | | | (0.71 | ) | | | (0.15 | ) | | | (0.33 | ) | | | (0.38 | ) |
| Net asset value at end of period | | $ | 11.03 | | | $ | 10.88 | | | $ | 10.45 | | | $ | 10.92 | | | $ | 10.81 | | | $ | 10.33 | |
| Total return(C) | | | 2.76 | % | | | 5.36 | % | | | 2.18 | %(D) | | | 2.50 | % | | | 7.93 | % | | | 9.37 | % |
| Ratios and supplemental data: | | | | | | | | | | | | | | | | | | | | | | | | |
| Net assets at end of period (000's) | | $ | 14,357 | | | $ | 15,275 | | | $ | 17,972 | | | $ | 17,104 | | | $ | 20,000 | | | $ | 23,985 | |
| Ratio to average net assets: | | | | | | | | | | | | | | | | | | | | | | | | |
| Net expenses(E) | | | 1.21 | % | | | 1.10 | % | | | 1.15 | %(F) | | | 1.36 | % | | | 1.36 | % | | | 1.36 | % |
| Gross expenses(E) | | | 1.65 | % | | | 1.64 | % | | | 1.67 | %(F) | | | 1.70 | % | | | 1.61 | % | | | 1.65 | % |
| Net investment income(E) | | | 1.04 | % | | | 0.99 | % | | | 1.53 | %(F) | | | 1.20 | % | | | 1.72 | % | | | 2.61 | % |
| Portfolio turnover rate | | | 11 | % | | | 30 | % | | | 79 | %(D)(G) | | | 89 | % | | | 13 | % | | | 33 | % |
| (A) | The Fund changed its fiscal year end from July 31 to December 31. |
| (B) | The net investment income per share is based on average shares outstanding for the period. |
| (C) | Total returns shown exclude the effect of applicable sales loads. If these charges were included, the returns would be lower. |
| (E) | Ratio does not include income and expenses of the underlying funds. |
| (G) | Portfolio turnover excludes the purchases and sales of the Fifth Third LifeModel Conservative Fund and Fifth Third LifeModel Moderately Conservative Fund acquired on September 10, 2012. If these transactions were included, portfolio turnover would have been higher. |
See accompanying Notes to Financial Statements.
Financial Highlights (Continued)
| Touchstone Conservative Allocation Fund—Class Y |
| Selected Data for a Share Outstanding Throughout Each Period |
| | | | | | | | | Five Months | | | | | | | | | | |
| | | | | | | | | Ended | | | | | | | | | | |
| | | Year Ended December 31, | | | December 31, | | | Year Ended July 31, | |
| | | 2014 | | | 2013 | | | 2012(A) | | | 2012 | | | 2011 | | | 2010 | |
| Net asset value at beginning of period | | $ | 10.93 | | | $ | 10.51 | | | $ | 10.99 | | | $ | 10.87 | | | $ | 10.39 | | | $ | 9.85 | |
| Income from investment operations: | | | | | | | | | | | | | | | | | | | | | | | | |
| Net investment income | | | 0.25 | | | | 0.21 | (B) | | | 0.12 | (B) | | | 0.24 | (B) | | | 0.29 | (B) | | | 0.35 | (B) |
| Net realized and unrealized gains on investments | | | 0.16 | | | | 0.45 | | | | 0.16 | | | | 0.14 | | | | 0.62 | | | | 0.67 | |
| Total from investment operations | | | 0.41 | | | | 0.66 | | | | 0.28 | | | | 0.38 | | | | 0.91 | | | | 1.02 | |
| Distributions from: | | | | | | | | | | | | | | | | | | | | | | | | |
| Net investment income | | | (0.26 | ) | | | (0.24 | ) | | | (0.29 | ) | | | (0.26 | ) | | | (0.43 | ) | | | (0.48 | ) |
| Realized capital gains | | | — | | | | — | | | | (0.47 | ) | | | — | | | | — | | | | — | |
| Total distributions | | | (0.26 | ) | | | (0.24 | ) | | | (0.76 | ) | | | (0.26 | ) | | | (0.43 | ) | | | (0.48 | ) |
| Net asset value at end of period | | $ | 11.08 | | | $ | 10.93 | | | $ | 10.51 | | | $ | 10.99 | | | $ | 10.87 | | | $ | 10.39 | |
| Total return | | | 3.78 | % | | | 6.31 | % | | | 2.60 | %(C) | | | 3.60 | % | | | 8.97 | % | | | 10.54 | % |
| Ratios and supplemental data: | | | | | | | | | | | | | | | | | | | | | | | | |
| Net assets at end of period (000's) | | $ | 11,931 | | | $ | 23,230 | | | $ | 33,329 | | | $ | 2,156 | | | $ | 1,370 | | | $ | 1,129 | |
| Ratio to average net assets: | | | | | | | | | | | | | | | | | | | | | | | | |
| Net expenses(D) | | | 0.21 | % | | | 0.10 | % | | | 0.15 | %(E) | | | 0.36 | % | | | 0.36 | % | | | 0.34 | % |
| Gross expenses(D) | | | 0.65 | % | | | 0.62 | % | | | 0.57 | %(E) | | | 1.38 | % | | | 1.65 | % | | | 1.65 | % |
| Net investment income(D) | | | 2.04 | % | | | 1.99 | % | | | 2.53 | %(E) | | | 2.20 | % | | | 2.72 | % | | | 3.40 | % |
| Portfolio turnover rate | | | 11 | % | | | 30 | % | | | 79 | %(C)(F) | | | 89 | % | | | 13 | % | | | 33 | % |
| Touchstone Conservative Allocation Fund—Institutional Class |
| Selected Data for a Share Outstanding Throughout Each Period |
| | | | | | | | | Five Months | | | | | | | | | | |
| | | | | | | | | Ended | | | | | | | | | | |
| | | Year Ended December 31, | | | December 31, | | | Year Ended July 31, | |
| | | 2014 | | | 2013 | | | 2012(A) | | | 2012 | | | 2011 | | | 2010 | |
| Net asset value at beginning of period | | $ | 10.95 | | | $ | 10.51 | | | $ | 10.99 | | | $ | 10.89 | | | $ | 10.40 | | | $ | 9.86 | |
| Income from investment operations: | | | | | | | | | | | | | | | | | | | | | | | | |
| Net investment income | | | 0.28 | | | | 0.21 | (B) | | | 0.12 | (B) | | | 0.24 | (B) | | | 0.29 | (B) | | | 0.37 | (B) |
| Net realized and unrealized gains on investments | | | 0.13 | | | | 0.47 | | | | 0.16 | | | | 0.12 | | | | 0.63 | | | | 0.65 | |
| Total from investment operations | | | 0.41 | | | | 0.68 | | | | 0.28 | | | | 0.36 | | | | 0.92 | | | | 1.02 | |
| Distributions from: | | | | | | | | | | | | | | | | | | | | | | | | |
| Net investment income | | | (0.26 | ) | | | (0.24 | ) | | | (0.29 | ) | | | (0.26 | ) | | | (0.43 | ) | | | (0.48 | ) |
| Realized capital gains | | | — | | | | — | | | | (0.47 | ) | | | — | | | | — | | | | — | |
| Total distributions | | | (0.26 | ) | | | (0.24 | ) | | | (0.76 | ) | | | (0.26 | ) | | | (0.43 | ) | | | (0.48 | ) |
| Net asset value at end of period | | $ | 11.10 | | | $ | 10.95 | | | $ | 10.51 | | | $ | 10.99 | | | $ | 10.89 | | | $ | 10.40 | |
| Total return | | | 3.87 | % | | | 6.40 | % | | | 2.50 | %(C) | | | 3.52 | % | | | 9.06 | % | | | 10.52 | % |
| Ratios and supplemental data: | | | | | | | | | | | | | | | | | | | | | | | | |
| Net assets at end of period (000's) | | $ | 73 | | | $ | 82 | | | $ | 1,198 | | | $ | 1,342 | | | $ | 6,459 | | | $ | 6,158 | |
| Ratio to average net assets: | | | | | | | | | | | | | | | | | | | | | | | | |
| Net expenses(D) | | | 0.21 | % | | | 0.09 | % | | | 0.15 | %(E) | | | 0.36 | % | | | 0.36 | % | | | 0.36 | % |
| Gross expenses(D) | | | 22.08 | % | | | 4.85 | % | | | 1.93 | %(E) | | | 0.66 | % | | | 0.63 | % | | | 0.56 | % |
| Net investment income(D) | | | 2.04 | % | | | 2.00 | % | | | 2.53 | %(E) | | | 2.20 | % | | | 2.70 | % | | | 3.62 | % |
| Portfolio turnover rate | | | 11 | % | | | 30 | % | | | 79 | %(C)(F) | | | 89 | % | | | 13 | % | | | 33 | % |
| (A) | The Fund changed its fiscal year end from July 31 to December 31. |
| (B) | The net investment income per share is based on average shares outstanding for the period. |
| (D) | Ratio does not include income and expenses of the underlying funds. |
| (F) | Portfolio turnover excludes the purchases and sales of the Fifth Third LifeModel Conservative Fund and Fifth Third LifeModel Moderately Conservative Fund acquired on September 10, 2012. If these transactions were included, portfolio turnover would have been higher. |
See accompanying Notes to Financial Statements.
Financial Highlights (Continued)
| Touchstone Growth Allocation Fund—Class A |
| Selected Data for a Share Outstanding Throughout Each Period |
| | | | | | | | | Five Months | | | | | | | | | | |
| | | | | | | | | Ended | | | | | | | | | | |
| | | Year Ended December 31, | | | December 31, | | | Year Ended July 31, | |
| | | 2014 | | | 2013 | | | 2012(A) | | | 2012 | | | 2011 | | | 2010 | |
| Net asset value at beginning of period | | $ | 13.82 | | | $ | 11.75 | | | $ | 11.28 | | | $ | 11.40 | | | $ | 9.58 | | | $ | 8.66 | |
| Income (loss) from investment operations: | | | | | | | | | | | | | | | | | | | | | | | | |
| Net investment income | | | 0.16 | | | | 0.12 | | | | 0.14 | (B) | | | 0.13 | (B) | | | 0.08 | (B) | | | 0.12 | (B) |
| Net realized and unrealized gains (losses) on investments | | | 0.47 | | | | 2.31 | | | | 0.67 | | | | (0.14 | ) | | | 1.80 | | | | 0.99 | |
| Total from investment operations | | | 0.63 | | | | 2.43 | | | | 0.81 | | | | (0.01 | ) | | | 1.88 | | | | 1.11 | |
| Distributions from: | | | | | | | | | | | | | | | | | | | | | | | | |
| Net investment income | | | (0.24 | ) | | | (0.26 | ) | | | (0.34 | ) | | | (0.11 | ) | | | (0.06 | ) | | | (0.19 | ) |
| Realized capital gains | | | — | | | | (0.10 | ) | | | — | | | | — | | | | — | | | | — | |
| Total distributions | | | (0.24 | ) | | | (0.36 | ) | | | (0.34 | ) | | | (0.11 | ) | | | (0.06 | ) | | | (0.19 | ) |
| Net asset value at end of period | | $ | 14.21 | | | $ | 13.82 | | | $ | 11.75 | | | $ | 11.28 | | | $ | 11.40 | | | $ | 9.58 | |
| Total return(C) | | | 4.54 | % | | | 20.69 | % | | | 7.29 | %(D) | | | (0.04 | )% | | | 19.65 | % | | | 12.78 | % |
| Ratios and supplemental data: | | | | | | | | | | | | | | | | | | | | | | | | |
| Net assets at end of period (000's) | | $ | 25,384 | | | $ | 29,279 | | | $ | 31,432 | | | $ | 10,320 | | | $ | 13,619 | | | $ | 16,721 | |
| Ratio to average net assets: | | | | | | | | | | | | | | | | | | | | | | | | |
| Net expenses(E) | | | 0.46 | % | | | 0.35 | % | | | 0.39 | %(F) | | | 0.57 | % | | | 0.57 | % | | | 0.57 | % |
| Gross expenses(E) | | | 0.98 | % | | | 1.01 | % | | | 1.04 | %(F) | | | 1.21 | % | | | 1.13 | % | | | 1.18 | % |
| Net investment income(E) | | | 1.07 | % | | | 0.87 | % | | | 2.95 | %(F) | | | 1.17 | % | | | 0.77 | % | | | 1.26 | % |
| Portfolio turnover rate | | | 14 | % | | | 50 | % | | | 65 | %(D)(G) | | | 77 | % | | | 8 | % | | | 41 | % |
| Touchstone Growth Allocation Fund—Class C |
| Selected Data for a Share Outstanding Throughout Each Period |
| | | | | | | | | Five Months | | | | | | | | | | |
| | | | | | | | | Ended | | | | | | | | | | |
| | | Year Ended December 31, | | | December 31, | | | Year Ended July 31, | |
| | | 2014 | | | 2013 | | | 2012(A) | | | 2012 | | | 2011 | | | 2010 | |
| Net asset value at beginning of period | | $ | 13.32 | | | $ | 11.32 | | | $ | 10.80 | | | $ | 10.90 | | | $ | 9.18 | | | $ | 8.30 | |
| Income (loss) from investment operations: | | | | | | | | | | | | | | | | | | | | | | | | |
| Net investment income | | | 0.04 | | | | 0.02 | | | | 0.10 | (B) | | | 0.04 | (B) | | | — | (B)(H) | | | 0.04 | (B) |
| Net realized and unrealized gains (losses) on investments | | | 0.45 | | | | 2.24 | | | | 0.63 | | | | (0.12 | ) | | | 1.72 | | | | 0.96 | |
| Total from investment operations | | | 0.49 | | | | 2.26 | | | | 0.73 | | | | (0.08 | ) | | | 1.72 | | | | 1.00 | |
| Distributions from: | | | | | | | | | | | | | | | | | | | | | | | | |
| Net investment income | | | (0.10 | ) | | | (0.16 | ) | | | (0.21 | ) | | | (0.02 | ) | | | — | | | | (0.12 | ) |
| Realized capital gains | | | — | | | | (0.10 | ) | | | — | | | | — | | | | — | | | | — | |
| Total distributions | | | (0.10 | ) | | | (0.26 | ) | | | (0.21 | ) | | | (0.02 | ) | | | — | | | | (0.12 | ) |
| Net asset value at end of period | | $ | 13.71 | | | $ | 13.32 | | | $ | 11.32 | | | $ | 10.80 | | | $ | 10.90 | | | $ | 9.18 | |
| Total return(C) | | | 3.77 | % | | | 19.88 | % | | | 6.82 | %(D) | | | (0.75 | )% | | | 18.74 | % | | | 12.03 | % |
| Ratios and supplemental data: | | | | | | | | | | | | | | | | | | | | | | | | |
| Net assets at end of period (000's) | | $ | 21,901 | | | $ | 24,066 | | | $ | 24,065 | | | $ | 23,968 | | | $ | 33,477 | | | $ | 36,655 | |
| Ratio to average net assets: | | | | | | | | | | | | | | | | | | | | | | | | |
| Net expenses(E) | | | 1.21 | % | | | 1.10 | % | | | 1.14 | %(F) | | | 1.32 | % | | | 1.32 | % | | | 1.32 | % |
| Gross expenses(E) | | | 1.72 | % | | | 1.73 | % | | | 1.81 | %(F) | | | 1.87 | % | | | 1.75 | % | | | 1.84 | % |
| Net investment income(E) | | | 0.32 | % | | | 0.12 | % | | | 2.20 | %(F) | | | 0.42 | % | | | 0.02 | % | | | 0.47 | % |
| Portfolio turnover rate | | | 14 | % | | | 50 | % | | | 65 | %(D)(G) | | | 77 | % | | | 8 | % | | | 41 | % |
| (A) | The Fund changed its fiscal year end from July 31 to December 31. |
| (B) | The net investment income per share is based on average shares outstanding for the period. |
| (C) | Total returns shown exclude the effect of applicable sales loads. If these charges were included, the returns would be lower. |
| (E) | Ratio does not include income and expenses of the underlying funds. |
| (G) | Portfolio turnover excludes the purchases and sales of the Fifth Third LifeModel Aggressive Fund acquired on September 10, 2012. If these transactions were included, portfolio turnover would have been higher. |
| (H) | Less than $0.005 per share. |
See accompanying Notes to Financial Statements.
Financial Highlights (Continued)
| Touchstone Growth Allocation Fund—Class Y |
| Selected Data for a Share Outstanding Throughout Each Period |
| | | | | | | | | Five Months | | | | | | | | | | |
| | | | | | | | | Ended | | | | | | | | | | |
| | | Year Ended December 31, | | | December 31, | | | Year Ended July 31, | |
| | | 2014 | | | 2013 | | | 2012(A) | | | 2012 | | | 2011 | | | 2010 | |
| Net asset value at beginning of period | | $ | 13.96 | | | $ | 11.86 | | | $ | 11.43 | | | $ | 11.57 | | | $ | 9.72 | | | $ | 8.77 | |
| Income (loss) from investment operations: | | | | | | | | | | | | | | | | | | | | | | | | |
| Net investment income | | | 0.26 | | | | 0.18 | | | | 0.16 | (B) | | | 0.15 | (B) | | | 0.12 | (B) | | | 0.05 | (B) |
| Net realized and unrealized gains (losses) on investments | | | 0.41 | | | | 2.31 | | | | 0.67 | | | | (0.14 | ) | | | 1.81 | | | | 1.11 | |
| Total from investment operations | | | 0.67 | | | | 2.49 | | | | 0.83 | | | | 0.01 | | | | 1.93 | | | | 1.16 | |
| Distributions from: | | | | | | | | | | | | | | | | | | | | | | | | |
| Net investment income | | | (0.28 | ) | | | (0.29 | ) | | | (0.40 | ) | | | (0.15 | ) | | | (0.08 | ) | | | (0.21 | ) |
| Realized capital gains | | | — | | | | (0.10 | ) | | | — | | | | — | | | | — | | | | — | |
| Total distributions | | | (0.28 | ) | | | (0.39 | ) | | | (0.40 | ) | | | (0.15 | ) | | | (0.08 | ) | | | (0.21 | ) |
| Net asset value at end of period | | $ | 14.35 | | | $ | 13.96 | | | $ | 11.86 | | | $ | 11.43 | | | $ | 11.57 | | | $ | 9.72 | |
| Total return | | | 4.77 | % | | | 21.06 | % | | | 7.35 | %(C) | | | 0.22 | % | | | 19.94 | % | | | 13.22 | % |
| Ratios and supplemental data: | | | | | | | | | | | | | | | | | | | | | | | | |
| Net assets at end of period (000's) | | $ | 9,797 | | | $ | 16,716 | | | $ | 27,873 | | | $ | 881 | | | $ | 3,561 | | | $ | 2,322 | |
| Ratio to average net assets: | | | | | | | | | | | | | | | | | | | | | | | | |
| Net expenses(D) | | | 0.21 | % | | | 0.10 | % | | | 0.14 | %(E) | | | 0.32 | % | | | 0.32 | % | | | 0.32 | % |
| Gross expenses(D) | | | 0.73 | % | | | 0.68 | % | | | 0.65 | %(E) | | | 1.62 | % | | | 1.13 | % | | | 1.33 | % |
| Net investment income(D) | | | 1.32 | % | | | 1.12 | % | | | 3.20 | %(E) | | | 1.42 | % | | | 1.11 | % | | | 0.56 | % |
| Portfolio turnover rate | | | 14 | % | | | 50 | % | | | 65 | %(C)(F) | | | 77 | % | | | 8 | % | | | 41 | % |
| Touchstone Growth Allocation Fund—Institutional Class |
| Selected Data for a Share Outstanding Throughout Each Period |
| | | | | | | | | Five Months | | | | | | | | | | |
| | | | | | | | | Ended | | | | | | | | | | |
| | | Year Ended December 31, | | | December 31, | | | Year Ended July 31, | |
| | | 2014 | | | 2013 | | | 2012(A) | | | 2012 | | | 2011 | | | 2010 | |
| Net asset value at beginning of period | | $ | 12.70 | | | $ | 10.82 | | | $ | 10.58 | | | $ | 11.56 | | | $ | 9.71 | | | $ | 8.77 | |
| Income (loss) from investment operations: | | | | | | | | | | | | | | | | | | | | | | | | |
| Net investment income | | | 0.17 | | | | 0.15 | | | | 0.14 | (B) | | | 0.15 | (B) | | | 0.11 | (B) | | | 0.32 | (B) |
| Net realized and unrealized gains (losses) on investments | | | 0.44 | | | | 2.12 | | | | 0.61 | | | | (0.25 | ) | | | 1.83 | | | | 0.83 | |
| Total from investment operations | | | 0.61 | | | | 2.27 | | | | 0.75 | | | | (0.10 | ) | | | 1.94 | | | | 1.15 | |
| Distributions from: | | | | | | | | | | | | | | | | | | | | | | | | |
| Net investment income | | | (0.28 | ) | | | (0.29 | ) | | | (0.51 | ) | | | (0.88 | ) | | | (0.09 | ) | | | (0.21 | ) |
| Realized capital gains | | | — | | | | (0.10 | ) | | | — | | | | — | | | | — | | | | — | |
| Total distributions | | | (0.28 | ) | | | (0.39 | ) | | | (0.51 | ) | | | (0.88 | ) | | | (0.09 | ) | | | (0.21 | ) |
| Net asset value at end of period | | $ | 13.03 | | | $ | 12.70 | | | $ | 10.82 | | | $ | 10.58 | | | $ | 11.56 | | | $ | 9.71 | |
| Total return | | | 4.77 | % | | | 21.06 | % | | | 7.30 | %(C) | | | (0.26 | )% | | | 20.01 | % | | | 13.10 | % |
| Ratios and supplemental data: | | | | | | | | | | | | | | | | | | | | | | | | |
| Net assets at end of period (000's) | | $ | 20 | | | $ | 20 | | | $ | 29 | | | $ | 13 | | | $ | 788 | | | $ | 674 | |
| Ratio to average net assets: | | | | | | | | | | | | | | | | | | | | | | | | |
| Net expenses(D) | | | 0.22 | % | | | 0.10 | % | | | 0.14 | %(E) | | | 0.32 | % | | | 0.32 | % | | | 0.32 | % |
| Gross expenses(D) | | | 83.94 | % | | | 98.07 | % | | | 94.73 | %(E) | | | 7.68 | % | | | 2.29 | % | | | 0.67 | % |
| Net investment income(D) | | | 1.32 | % | | | 1.12 | % | | | 3.20 | %(E) | | | 1.42 | % | | | 0.96 | % | | | 3.37 | % |
| Portfolio turnover rate | | | 14 | % | | | 50 | % | | | 65 | %(C)(F) | | | 77 | % | | | 8 | % | | | 41 | % |
| (A) | The Fund changed its fiscal year end from July 31 to December 31. |
| (B) | The net investment income per share is based on average shares outstanding for the period. |
| (D) | Ratio does not include income and expenses of the underlying funds. |
| (F) | Portfolio turnover excludes the purchases and sales of the Fifth Third LifeModel Aggressive Fund acquired on September 10, 2012. If these transactions were included, portfolio turnover would have been higher. |
See accompanying Notes to Financial Statements.
Financial Highlights (Continued)
| Touchstone Moderate Growth Allocation Fund—Class A |
| Selected Data for a Share Outstanding Throughout Each Period |
| | | | | | | | | Five Months | | | | | | | | | | |
| | | | | | | | | Ended | | | | | | | | | | |
| | | Year Ended December 31, | | | December 31, | | | Year Ended July 31, | |
| | | 2014 | | | 2013 | | | 2012(A) | | | 2012 | | | 2011 | | | 2010 | |
| Net asset value at beginning of period | | $ | 12.99 | | | $ | 11.30 | | | $ | 11.13 | | | $ | 11.11 | | | $ | 9.66 | | | $ | 8.87 | |
| Income from investment operations: | | | | | | | | | | | | | | | | | | | | | | | | |
| Net investment income | | | 0.20 | | | | 0.17 | | | | 0.14 | (B) | | | 0.15 | (B) | | | 0.12 | (B) | | | 0.15 | (B) |
| Net realized and unrealized gains on investments | | | 0.46 | | | | 1.77 | | | | 0.51 | | | | 0.02 | (C) | | | 1.47 | | | | 0.87 | (D) |
| Total from investment operations | | | 0.66 | | | | 1.94 | | | | 0.65 | | | | 0.17 | | | | 1.59 | | | | 1.02 | |
| Distributions from: | | | | | | | | | | | | | | | | | | | | | | | | |
| Net investment income | | | (0.25 | ) | | | (0.25 | ) | | | (0.30 | ) | | | (0.15 | ) | | | (0.14 | ) | | | (0.23 | ) |
| Realized capital gains | | | (0.51 | ) | | | — | | | | (0.18 | ) | | | — | | | | — | | | | — | |
| Total distributions | | | (0.76 | ) | | | (0.25 | ) | | | (0.48 | ) | | | (0.15 | ) | | | (0.14 | ) | | | (0.23 | ) |
| Net asset value at end of period | | $ | 12.89 | | | $ | 12.99 | | | $ | 11.30 | | | $ | 11.13 | | | $ | 11.11 | | | $ | 9.66 | |
| Total return(E) | | | 5.06 | % | | | 17.23 | % | | | 5.96 | %(F) | | | 1.65 | % | | | 16.56 | % | | | 11.52 | %(D) |
| Ratios and supplemental data: | | | | | | | | | | | | | | | | | | | | | | | | |
| Net assets at end of period (000's) | | $ | 56,893 | | | $ | 68,184 | | | $ | 71,235 | | | $ | 15,181 | | | $ | 18,848 | | | $ | 22,740 | |
| Ratio to average net assets: | | | | | | | | | | | | | | | | | | | | | | | | |
| Net expenses(G) | | | 0.46 | % | | | 0.35 | % | | | 0.39 | %(H) | | | 0.57 | % | | | 0.57 | % | | | 0.57 | % |
| Gross expenses(G) | | | 0.89 | % | | | 0.93 | % | | | 0.90 | %(H) | | | 1.03 | % | | | 1.01 | % | | | 1.08 | % |
| Net investment income(G) | | | 1.44 | % | | | 1.27 | % | | | 2.90 | %(H) | | | 1.38 | % | | | 1.17 | % | | | 1.53 | % |
| Portfolio turnover rate | | | 11 | % | | | 38 | % | | | 73 | %(F)(I) | | | 77 | % | | | 9 | % | | | 38 | % |
| Touchstone Moderate Growth Allocation Fund—Class C |
| Selected Data for a Share Outstanding Throughout Each Period |
| | | | | | | | | Five Months | | | | | | | | | | |
| | | | | | | | | Ended | | | | | | | | | | |
| | | Year Ended December 31, | | | December 31, | | | Year Ended July 31, | |
| | | 2014 | | | 2013 | | | 2012(A) | | | 2012 | | | 2011 | | | 2010 | |
| Net asset value at beginning of period | | $ | 12.79 | | | $ | 11.13 | | | $ | 10.89 | | | $ | 10.86 | | | $ | 9.44 | | | $ | 8.67 | |
| Income from investment operations: | | | | | | | | | | | | | | | | | | | | | | | | |
| Net investment income | | | 0.09 | | | | 0.06 | | | | 0.10 | (B) | | | 0.07 | (B) | | | 0.05 | (B) | | | 0.07 | (B) |
| Net realized and unrealized gains on investments | | | 0.45 | | | | 1.77 | | | | 0.50 | | | | 0.02 | (C) | | | 1.43 | | | | 0.86 | (D) |
| Total from investment operations | | | 0.54 | | | | 1.83 | | | | 0.60 | | | | 0.09 | | | | 1.48 | | | | 0.93 | |
| Distributions from: | | | | | | | | | | | | | | | | | | | | | | | | |
| Net investment income | | | (0.15 | ) | | | (0.17 | ) | | | (0.18 | ) | | | (0.06 | ) | | | (0.06 | ) | | | (0.16 | ) |
| Realized capital gains | | | (0.51 | ) | | | — | | | | (0.18 | ) | | | — | | | | — | | | | — | |
| Total distributions | | | (0.66 | ) | | | (0.17 | ) | | | (0.36 | ) | | | (0.06 | ) | | | (0.06 | ) | | | (0.16 | ) |
| Net asset value at end of period | | $ | 12.67 | | | $ | 12.79 | | | $ | 11.13 | | | $ | 10.89 | | | $ | 10.86 | | | $ | 9.44 | |
| Total return(E) | | | 4.20 | % | | | 16.49 | % | | | 5.52 | %(F) | | | 0.89 | % | | | 15.70 | % | | | 10.71 | %(D) |
| Ratios and supplemental data: | | | | | | | | | | | | | | | | | | | | | | | | |
| Net assets at end of period (000's) | | $ | 43,844 | | | $ | 49,601 | | | $ | 48,985 | | | $ | 47,508 | | | $ | 61,074 | | | $ | 70,934 | |
| Ratio to average net assets: | | | | | | | | | | | | | | | | | | | | | | | | |
| Net expenses(G) | | | 1.21 | % | | | 1.11 | % | | | 1.14 | %(H) | | | 1.32 | % | | | 1.32 | % | | | 1.32 | % |
| Gross expenses(G) | | | 1.62 | % | | | 1.65 | % | | | 1.68 | %(H) | | | 1.74 | % | | | 1.69 | % | | | 1.74 | % |
| Net investment income(G) | | | 0.69 | % | | | 0.52 | % | | | 2.15 | %(H) | | | 0.63 | % | | | 0.46 | % | | | 0.78 | % |
| Portfolio turnover rate | | | 11 | % | | | 38 | % | | | 73 | %(F)(I) | | | 77 | % | | | 9 | % | | | 38 | % |
| (A) | The Fund changed its fiscal year end from July 31 to December 31. |
| (B) | The net investment income per share is based on average shares outstanding for the period. |
| (C) | The amounts shown for a share outstanding throughout the period does not accord with the change in net realized and unrealized gains (losses) on investments for the period due to the timing of purchases and sales of fund shares in relation to fluctuating market values during the period. |
| (D) | Impact of payment from affiliate was less than $0.01 per share and 0.01%, respectively. |
| (E) | Total returns shown exclude the effect of applicable sales loads. If these charges were included, the returns would be lower. |
| (G) | Ratio does not include income and expenses of the underlying funds. |
| (I) | Portfolio turnover excludes the purchases and sales of the Fifth Third LifeModel Moderately Aggressive Fund acquired on September 10, 2012. If these transactions were included, portfolio turnover would have been higher. |
See accompanying Notes to Financial Statements.
Financial Highlights (Continued)
| Touchstone Moderate Growth Allocation Fund—Class Y |
| Selected Data for a Share Outstanding Throughout Each Period |
| | | | | | | | | Five Months | | | | | | | | | | |
| | | | | | | | | Ended | | | | | | | | | | |
| | | Year Ended December 31, | | | December 31, | | | Year Ended July 31, | |
| | | 2014 | | | 2013 | | | 2012(A) | | | 2012 | | | 2011 | | | 2010 | |
| Net asset value at beginning of period | | $ | 13.09 | | | $ | 11.38 | | | $ | 11.24 | | | $ | 11.23 | | | $ | 9.75 | | | $ | 8.95 | |
| Income from investment operations: | | | | | | | | | | | | | | | | | | | | | | | | |
| Net investment income | | | 0.28 | | | | 0.21 | | | | 0.15 | (B) | | | 0.18 | (B) | | | 0.18 | (B) | | | 0.17 | (B) |
| Net realized and unrealized gains on investments | | | 0.40 | | | | 1.78 | | | | 0.52 | | | | 0.01 | (C) | | | 1.46 | | | | 0.88 | (D) |
| Total from investment operations | | | 0.68 | | | | 1.99 | | | | 0.67 | | | | 0.19 | | | | 1.64 | | | | 1.05 | |
| Distributions from: | | | | | | | | | | | | | | | | | | | | | | | | |
| Net investment income | | | (0.28 | ) | | | (0.28 | ) | | | (0.35 | ) | | | (0.18 | ) | | | (0.16 | ) | | | (0.25 | ) |
| Realized capital gains | | | (0.51 | ) | | | — | | | | (0.18 | ) | | | — | | | | — | | | | — | |
| Total distributions | | | (0.79 | ) | | | (0.28 | ) | | | (0.53 | ) | | | (0.18 | ) | | | (0.16 | ) | | | (0.25 | ) |
| Net asset value at end of period | | $ | 12.98 | | | $ | 13.09 | | | $ | 11.38 | | | $ | 11.24 | | | $ | 11.23 | | | $ | 9.75 | |
| Total return | | | 5.21 | % | | | 17.57 | % | | | 6.04 | %(E) | | | 1.84 | % | | | 16.93 | % | | | 11.77 | %(D) |
| Ratios and supplemental data: | | | | | | | | | | | | | | | | | | | | | | | | |
| Net assets at end of period (000's) | | $ | 16,719 | | | $ | 30,498 | | | $ | 43,585 | | | $ | 763 | | | $ | 1,289 | | | $ | 635 | |
| Ratio to average net assets: | | | | | | | | | | | | | | | | | | | | | | | | |
| Net expenses(F) | | | 0.21 | % | | | 0.10 | % | | | 0.14 | %(G) | | | 0.32 | % | | | 0.32 | % | | | 0.32 | % |
| Gross expenses(F) | | | 0.62 | % | | | 0.60 | % | | | 0.54 | %(G) | | | 1.89 | % | | | 1.65 | % | | | 2.59 | % |
| Net investment income(F) | | | 1.69 | % | | | 1.53 | % | | | 3.15 | %(G) | | | 1.63 | % | | | 1.63 | % | | | 1.72 | % |
| Portfolio turnover rate | | | 11 | % | | | 38 | % | | | 73 | %(E)(H) | | | 77 | % | | | 9 | % | | | 38 | % |
| Touchstone Moderate Growth Allocation Fund—Institutional Class |
| Selected Data for a Share Outstanding Throughout Each Period |
| | | | | | | | | Five Months | | | | | | | | | | |
| | | | | | | | | Ended | | | | | | | | | | |
| | | Year Ended December 31, | | | December 31, | | | Year Ended July 31, | |
| | | 2014 | | | 2013 | | | 2012(A) | | | 2012 | | | 2011 | | | 2010 | |
| Net asset value at beginning of period | | $ | 13.03 | | | $ | 11.33 | | | $ | 11.18 | | | $ | 11.16 | | | $ | 9.75 | | | $ | 8.95 | |
| Income from investment operations: | | | | | | | | | | | | | | | | | | | | | | | | |
| Net investment income | | | 0.21 | | | | 0.19 | | | | 0.15 | (B) | | | 0.18 | (B) | | | 0.15 | (B) | | | 0.28 | (B) |
| Net realized and unrealized gains on investments | | | 0.51 | | | | 1.79 | | | | 0.52 | | | | 0.02 | (C) | | | 1.48 | | | | 0.78 | (D) |
| Total from investment operations | | | 0.72 | | | | 1.98 | | | | 0.67 | | | | 0.20 | | | | 1.63 | | | | 1.06 | |
| Distributions from: | | | | | | | | | | | | | | | | | | | | | | | | |
| Net investment income | | | (0.28 | ) | | | (0.28 | ) | | | (0.34 | ) | | | (0.18 | ) | | | (0.22 | ) | | | (0.26 | ) |
| Realized capital gains | | | (0.51 | ) | | | — | | | | (0.18 | ) | | | — | | | | — | | | | — | |
| Total distributions | | | (0.79 | ) | | | (0.28 | ) | | | (0.52 | ) | | | (0.18 | ) | | | (0.22 | ) | | | (0.26 | ) |
| Net asset value at end of period | | $ | 12.96 | | | $ | 13.03 | | | $ | 11.33 | | | $ | 11.18 | | | $ | 11.16 | | | $ | 9.75 | |
| Total return | | | 5.31 | % | | | 17.57 | % | | | 6.11 | %(E) | | | 1.92 | % | | | 16.88 | % | | | 11.79 | %(D) |
| Ratios and supplemental data: | | | | | | | | | | | | | | | | | | | | | | | | |
| Net assets at end of period (000's) | | $ | 7 | | | $ | 10 | | | $ | 9 | | | $ | 8 | | | $ | 8 | | | $ | 7 | |
| Ratio to average net assets: | | | | | | | | | | | | | | | | | | | | | | | | |
| Net expenses(F) | | | 0.21 | % | | | 0.11 | % | | | 0.14 | %(G) | | | 0.32 | % | | | 0.32 | % | | | 0.32 | % |
| Gross expenses(F) | | | 165.34 | % | | | 228.55 | % | | | 230.25 | %(G) | | | 111.34 | % | | | 183.59 | % | | | 0.99 | % |
| Net investment income(F) | | | 1.69 | % | | | 1.52 | % | | | 3.15 | %(G) | | | 1.63 | % | | | 1.43 | % | | | 2.99 | % |
| Portfolio turnover rate | | | 11 | % | | | 38 | % | | | 73 | %(E)(H) | | | 77 | % | | | 9 | % | | | 38 | % |
| (A) | The Fund changed its fiscal year end from July 31 to December 31. |
| (B) | The net investment income per share is based on average shares outstanding for the period. |
| (C) | The amounts shown for a share outstanding throughout the period does not accord with the change in net realized and unrealized gains (losses) on investments for the period due to the timing of purchases and sales of fund shares in relation to fluctuating market values during the period. |
| (D) | Impact of payment from affiliate was less than $0.01 per share and 0.01%, respectively. |
| (F) | Ratio does not include income and expenses of the underlying funds. |
| (H) | Portfolio turnover excludes the purchases and sales of the Fifth Third LifeModel Moderately Aggressive Fund acquired on September 10, 2012. If these transactions were included, portfolio turnover would have been higher. |
See accompanying Notes to Financial Statements.
Notes to Financial Statements
December 31, 2014
1. Organization
The Touchstone Strategic Trust (the “Trust”) is registered under the Investment Company Act of 1940, as amended (the “1940 Act”), as an open-end management investment company. The Trust was established as a Massachusetts business trust pursuant to a Declaration of Trust dated November 18, 1982. The Trust consists of eighteen funds, including the following five funds (individually, a “Fund”, and collectively, the “Funds”):
Touchstone Dynamic Equity Fund (“Dynamic Equity Fund”)
Touchstone Balanced Allocation Fund (“Balanced Allocation Fund”)
Touchstone Conservative Allocation Fund (“Conservative Allocation Fund”)
Touchstone Growth Allocation Fund (“Growth Allocation Fund”)
Touchstone Moderate Growth Allocation Fund (“Moderate Growth Allocation Fund”)
Each Fund is diversified. Additionally, the Balanced Allocation Fund, Conservative Allocation Fund, Growth Allocation Fund and Moderate Growth Allocation Fund (collectively, the “Allocation Funds”) are “Funds of Funds”, sub-advised by Ibbotson Associates, Inc., which seek to achieve their investment goals by primarily investing in a diversified portfolio of affiliated underlying equity and fixed income funds. These underlying funds, in turn, invest in a variety of U.S. and foreign equity and fixed income securities. Under normal circumstances, the Allocation Funds expect to invest their assets among equity and fixed income funds in the following ranges:
| Equity Fund | | Fixed Income | |
| | Allocation | | Fund Allocation | |
| Balanced Allocation Fund | 50-70% | | 30-50% | |
| Conservative Allocation Fund | 20-40% | | 60-80% | |
| Growth Allocation Fund | 90-100% | | 0-10% | |
| Moderate Growth Allocation Fund | 70-90% | | 10-30% | |
The investment goal of each of the underlying funds that the Allocation Funds invest in is as follows:
| Fund | | Investment Goal |
| Touchstone Active Bond Fund | | Seeks to provide as high a level of current income as is consistent with the preservation of capital. Capital appreciation is a secondary goal. |
| Touchstone Arbitrage Fund | | Seeks to achieve positive absolute returns over the long-term regardless of market conditions. |
| Touchstone Dynamic Equity Fund | | Seeks to obtain long-term capital appreciation from hedged equity investments with less risk than a fully invested, unhedged equity portfolio. |
| Touchstone Emerging Markets Equity Fund | | Seeks capital appreciation. |
| Touchstone Focused Fund | | Seeks to provide investors with capital appreciation. |
| Touchstone Global Real Estate Fund | | Seeks capital appreciation. |
| Touchstone High Yield Fund | | Seeks to achieve a high level of income as its main goal. Capital appreciation is a secondary consideration. |
| Touchstone Institutional Money Market Fund | | Seeks high current income, consistent with liquidity and stability of principal. The Fund is a money market fund, which seeks to maintain a constant share price of $1.00 per share. |
| Touchstone International Fixed Income Fund | | Seeks total return. |
| Touchstone International Small Cap Fund | | Seeks to provide investors with capital appreciation. |
| Touchstone Large Cap Growth Fund | | Seeks long-term growth of capital. |
| Touchstone Merger Arbitrage Fund | | Seeks to achieve positive absolute returns regardless of market conditions over the long-term. |
Notes to Financial Statements (Continued)
| Fund | | Investment Goal |
| Touchstone Mid Cap Growth Fund | | Seeks to increase the value of Fund shares as a primary goal and to earn income as a secondary goal. |
| Touchstone Mid Cap Value Fund | | Seeks capital appreciation. |
| Touchstone Sands Capital Emerging Markets Growth Fund | | Seeks long-term capital appreciation. |
| Touchstone Sands Capital Institutional Growth Fund | | Seeks long-term capital appreciation. |
| Touchstone Small Cap Core Fund | | Seeks capital appreciation. |
| Touchstone Small Cap Value Fund | | Seeks long-term capital growth. |
| Touchstone Total Return Bond Fund | | Seeks current income. Capital appreciation is a secondary goal. |
| Touchstone Value Fund | | Seeks to provide investors with long-term capital growth. |
The Declaration of Trust permits the Trust to issue an unlimited number of shares of beneficial interest of each Fund. The Funds are registered to offer the following classes of shares: Class A shares, Class C shares, Class Y shares, and Institutional Class shares. The assets of each Fund are segregated, and a shareholder’s interest is limited to the Fund in which shares are held. The Funds’ prospectus provides a description of each Fund’s investment goals, policies, and strategies along with information on the classes of shares currently being offered.
2. Significant Accounting Policies
The following is a summary of the Funds’ significant accounting policies:
Security valuation and fair value measurements — Generally accepted accounting principles in the United States (“U.S. GAAP”) defines fair value as the price the Funds would receive to sell an asset or pay to transfer a liability in an orderly transaction between market participants at the measurement date. All investments in securities are recorded at their estimated fair value.The Funds define the term “market value”, as used throughout this report, as the estimated fair value. The Funds use various methods to measure fair value of their portfolio securities on a recurring basis. U.S. GAAP fair value measurement standards require disclosure of a hierarchy that prioritizes inputs to valuation methods. These inputs are summarized in the three broad levels listed below:
| • | Level 1 | – | quoted prices in active markets for identical securities |
| | | | |
| • | Level 2 | – | other significant observable inputs (including quoted prices for similar securities, interest rates, prepayment speeds, credit risk, etc.) |
| • | Level 3 | – | significant unobservable inputs (including a Fund’s own assumptions in determining the fair value of investments) |
The inputs or methodology used for valuing securities are not necessarily an indication of the risk associated with investing in those securities. For example, money market instruments are valued using amortized cost, in accordance with rules under the 1940 Act. Generally, amortized cost approximates the current fair value of a security, but since the value is not obtained from a quoted price in an active market, such securities are reflected as Level 2.
The aggregate value by input level, as of December 31, 2014, for the Funds’ investments, as well as a reconciliation of assets for which significant unobservable inputs (Level 3) were used in determining value, if applicable, is
Notes to Financial Statements (Continued)
included in the Funds’ Portfolio of Investments, which also includes a breakdown of the Funds’ investments by sector allocation. The Funds did not hold any Level 3 categorized securities during the year ended December 31, 2014.
Changes in valuation techniques may result in transfers into or out of an investment’s assigned level within the hierarchy. All transfers in and out of the levels are recognized at the value at the end of the period. During the year ended December 31, 2014, there were no transfers between Levels 1, 2 and 3 for all Funds.
The Funds’ portfolio securities are valued as of the close of the regular session of trading on the New York Stock Exchange (“NYSE”) (currently 4:00 p.m., Eastern time). Portfolio securities traded on stock exchanges are valued at the last reported sale price, official close price, or last bid price if no sales are reported. Portfolio securities quoted by NASDAQ are valued at the NASDAQ Official Closing Price (“NOCP”) or from the primary exchange on which the security trades. To the extent these securities are actively traded, they are categorized in Level 1 of the fair value hierarchy. Shares of options are valued at the mean between the last bid and ask prices at the close of the options market in which the options trade. An option for which there is no mean price is valued at the last bid (long position) or ask (short position) price and categorized in Level 1. Shares of open-end mutual funds in which the Funds invest are valued at their respective net asset values (“NAV”) as reported by the underlying funds and are categorized in Level 1. Money market instruments and other debt securities with a remaining maturity of less than 60 days are valued at amortized cost, provided such amount approximates market value and are categorized in Level 2. While this method provides consistency in valuation (and may only be used if it approximates market value), it may result in periods during which value, as determined by amortized cost, is higher or lower than the price that would be received if the Fund sold the investment.
Securities mainly traded on a non-U.S. exchange or denominated in foreign currency are generally valued according to the preceding closing values on that exchange, translated to U.S. dollars using currency exchange rates as of the close of regular trading on the NYSE, and generally categorized in Level 1. However, if an event that may change the value of a security occurs after the time that the closing value on the non-U.S. exchange was determined, but before the close of regular trading on the NYSE, the security may be priced based on fair value and generally categorized in Level 2. This may cause the value of the security, if held on the books of the Fund to be different from the closing value on the non-U.S. exchange and may affect the calculation of that Fund’s NAV. The Fund may use fair value pricing under the following circumstances, among others:
| • | If the value of a security has been materially affected by events occurring before the Fund’s pricing time but after the close of the primary markets on which the security is traded. |
| • | If the exchange on which a portfolio security is principally traded closes early or if trading in a particular portfolio security was halted during the day and did not resume prior to the Fund’s NAV calculation. |
| • | If a security is so thinly traded that reliable market quotations are unavailable due to infrequent trading. |
| • | If the validity of market quotations is not reliable. |
Securities held by the Funds that do not have readily available market quotations, significant observable inputs, or securities for which the available market quotations are not reliable, are priced at their estimated fair value using procedures approved by the Funds’ Board of Trustees and are generally categorized in Level 3.
Allocation Funds — The Allocation Funds invest in securities of affiliated mutual funds (the “Underlying Funds”). The value of an investment in the Allocation Funds is based on the performance of the Underlying Funds in which they invest and the allocation of their assets among those funds. Because the Allocation Funds invest in mutual funds, shareholders of the Allocation Funds indirectly bear a proportionate share of the expenses charged by the Underlying Funds in which they invest as well as their share of the Allocation Funds’ fees and expenses. The principal risks of an investment in the Allocation Funds include the principal risks of investing
Notes to Financial Statements (Continued)
in the Underlying Funds. Investments in the Underlying Funds are valued at the NAV per share of each class of the Underlying Funds and are categorized as Level 1.
Investment companies — Certain Funds may invest in securities of other investment companies, including exchange-traded funds (“ETFs”), open-end funds and closed-end funds. Open-end funds are investment companies that issue new shares continuously and redeem shares daily. Closed-end funds are investment companies that typically issue a fixed number of shares that trade on a securities exchange or over-the-counter. An ETF is an investment company that typically seeks to track the performance of an index by holding in its portfolio shares of all the companies, or a representative sample of the companies, that are components of a particular index. ETFs are traded on a securities exchange based on their market value. The risks of investment in other investment companies typically reflect the risks of the types of securities in which investment companies invest. Investments in ETFs and closed-end funds are subject to the additional risk that their shares may trade at a premium or discount to their NAV. When a Fund invests in another investment company, shareholders of the Fund indirectly bear their proportionate share of the other investment company’s fees and expenses, including operating, registration, trustee, licensing, and marketing, as well as their share of the Fund’s fees and expenses.
Cash and cash equivalents — The Funds consider liquid assets deposited with a bank, money market funds, and certain short term debt instruments with maturities of 3 months or less to be cash equivalents and are included in the investments on the financial statements.These investments represent amounts held with financial institutions that are readily accessible to pay Fund expenses or investments. Cash and cash equivalents are valued at cost plus accrued interest, which approximates market value. The value of cash equivalents denominated in foreign currencies is determined by converting to U.S. dollars on the date of the Statement of Assets and Liabilities.
Securities sold short — The Dynamic Equity Fund periodically engages in selling securities short, which obligates the Fund to replace a security borrowed by purchasing the same security at the current market value. The Fund would incur a loss if the price of the security increases between the date of the short sale and the date on which the Fund replaces the borrowed security. The Fund would realize a gain if the price of the security declines between those dates. As of December 31, 2014, the Dynamic Equity Fund held securities sold short with a fair value of $14,840,073 and had securities with a fair value of $90,422,290 held as collateral and cash collateral of $2,658,106 for both securities sold short and options written.
Options — The Funds may write or purchase financial option contracts primarily to hedge against changes in the value of equity securities (or securities that the Funds intend to purchase), against fluctuations in fair value caused by changes in prevailing market interest rates or foreign currency exchange rates and against changes in overall equity market volatility. In addition, the Funds may utilize options in an attempt to generate gains from option premiums or to reduce overall portfolio risk. The Funds’ option strategy primarily focuses on the use of writing call options on equity indexes. When the Funds write or purchase an option, an amount equal to the premium received or paid by the Funds is recorded as a liability or an asset and is subsequently adjusted to the current market value of the option written or purchased. Premiums received or paid from writing or purchasing options which expire unexercised are treated by the Funds on the expiration date as realized gains or losses. The difference between the premium and the amount paid or received on effecting a closing purchase or sale transaction, including brokerage commissions, is also treated as a realized gain or loss. If an option is exercised, the premium paid or received is added to the cost of the purchase or proceeds from the sale in determining whether the Funds have realized a gain or loss on investment transactions. The Funds, as writers of an option, may have no control over whether the underlying securities may be sold (call) or purchased (put) and as a result bear the market risk of an unfavorable change in the price of the security underlying the written option. The Funds, as purchasers of an option, bear the risk that the counterparties to the option may not have the ability to meet the terms of the option contracts. There is minimal counterparty credit risk involved in entering into option contracts since they are exchange-traded instruments and the exchange’s clearinghouse, as counterparty
Notes to Financial Statements (Continued)
to all exchange-traded options, guarantees the options against default. Options are valued at the last quoted sales price. If there is no such reported sale on the valuation date, long option positions are valued at the most recent bid price, and short option positions are valued at the most recent ask price. As of December 31, 2014, the Dynamic Equity Fund held written options with a fair value of $1,805,850 and had securities with a fair value of $90,422,290 held as collateral and cash collateral of $2,658,106 for both securities sold short and written options.
Derivative instruments and hedging activities — In order to better define its contractual rights and to secure rights that will help a Fund mitigate its counterparty risk, the Funds may enter into an International Swaps and Derivatives Association, Inc. Master Agreement (“ISDA Master Agreement” or “MNA”) or similar agreement with certain counterparties. An ISDA Master Agreement is a bilateral agreement between a Fund and a counterparty that governs over-the-counter (“OTC”) derivatives and foreign exchange contracts, and typically contains, among other things, collateral posting terms and master netting provisions in the event of a default or termination. Under an ISDA Master Agreement, a party may, under certain circumstances, offset with the counterparty certain derivative financial instrument’s payables or receivables with collateral held or posted and create one single net payment. The provisions of the ISDA Master Agreement typically permit a single net payment in the event of default (close-out netting). These default events include bankruptcy or insolvency of the counterparty. Note, however, that bankruptcy or insolvency laws of a particular jurisdiction may impose restrictions on or prohibitions against the right of offset.
When entering into a derivative transaction, a Fund may be required to post and maintain collateral or margin (including both initial and maintenance margin). Collateral and margin requirements differ by type of derivative. Margin requirements are established by the broker or clearing house for exchange-traded and centrally-cleared derivatives (financial futures contracts, options, and centrally-cleared swaps). Brokers can ask for margining in excess of the clearing house’s minimum in certain circumstances. Collateral terms are contract specific for OTC derivatives (foreign currency exchange contracts, options, and swaps). For derivatives traded under an ISDA Master Agreement, the collateral requirements are typically calculated by netting the marked-to-market amount for each transaction under such agreement and comparing that amount to the value of any collateral currently pledged by the Fund and the counterparty. For financial reporting purposes, cash collateral that has been pledged to cover obligations of the Fund and cash collateral received from the counterparty, if any, is reported separately on the Statements of Assets and Liabilities as cash pledged as collateral and cash received as collateral, respectively. Non-cash collateral pledged by the Fund, if any, is noted in the Portfolio of Investments. To the extent amounts due to the Fund from its counterparties are not fully collateralized, contractually or otherwise, the Fund bears the risk of loss from counterparty non-performance. A Fund attempts to mitigate counterparty risk by only entering into agreements with counterparties that it believes have the financial resources to honor their obligations and by monitoring the financial stability of those counterparties.
Certain ISDA Master Agreements allow counterparties to OTC derivatives transactions to terminate derivative contracts prior to maturity in the event the Fund’s net assets decline by a stated percentage or the Fund fails to meet the terms of its ISDA Master Agreement, which would cause the Fund to accelerate payment of any net liability owed to the counterparty.
For financial reporting purposes, the Funds do not offset derivative assets and derivative liabilities that are subject to netting arrangements in the Statements of Assets and Liabilities.
Notes to Financial Statements (Continued)
As of December 31, 2014, the Dynamic Equity Fund’s assets and liabilities that were subject to a MNA on a gross basis were as follows:
| | | Assets | | | Liabilities | |
| Derivative Financial Instruments: | | | | | | | | |
| Written Options | | $ | — | | | $ | 1,805,850 | |
| Total gross amount of assets and liabilities subject to MNA | | $ | — | | | $ | 1,805,850 | |
The following table presents the Dynamic Equity Fund’s assets and liabilities net of amounts available for offset under a MNA and net of the related collateral pledged by the Fund as of December 31, 2014:
| | | | | | Gross Amounts | | | | | | | | | | |
| | | | | | Available for Offset | | | | | | | | | | |
| | | Gross Amount of | | | in Statement of | | | Non-cash | | | | | | | |
| | | Recognized | | | Assets and | | | Collateral | | | Cash Collateral | | | | |
| | | Liabilities(A) | | | Liabilities | | | Pledged(B) | | | Pledged(B) | | | Net Amount(C) | |
| Written Options | | $ | 1,805,850 | | | $ | — | | | $ | (1,517,483 | ) | | $ | (288,367 | ) | | $ | — | |
| Total | | $ | 1,805,850 | | | $ | — | | | $ | (1,517,483 | ) | | $ | (288,367 | ) | | $ | — | |
| (A) | Gross and net amounts are equal. |
| (B) | Pershing LLC is the counterparty |
.
| (C) | Net amount represents the net amount payable due to the counterparty in the event of default. |
The following table sets forth the fair value of the Funds’ derivative financial instruments by primary risk exposure as of December 31, 2014:
| | | Fair Value of Derivative Investments | | | | | | |
| | | As of December 31, 2014 | | | | | | |
| | | Derivatives not accounted for as hedging | | Asset | | | Liability | |
| Fund | | instruments under ASC 815 | | Derivatives | | | Derivatives* | |
| Dynamic Equity Fund | | Options - Equity Contracts | | $ | — | | | $ | 1,805,850 | |
* Statements of Assets and Liabilities Location: Written options, at market value.
The following table sets forth the operations of the Funds’ derivative financial instruments by primary risk exposure as of December 31, 2014.
| The Effect of Derivative Investments on the Statement of Operations |
| for the Year Ended December 31, 2014 |
| | | | | | | | Change in | |
| | | | | Realized | | | Unrealized | |
| | | Derivatives not accounted for as hedging | | Gain(Loss) | | | Appreciation | |
| Fund | | instruments under ASC 815 | | on Derivatives | | | on Derivatives | |
| Dynamic Equity Fund | | Purchased Options - Equity Contacts* | | $ | (6,133,219 | ) | | $ | — | |
| | | Written Options - Equity Contacts** | | | 646,956 | | | | 449,480 | |
* Statements of Operations Location: Net realized gains on investments from non-affiliated securities.
** Statements of Operations Location: Net realized gains on written options and net change in unrealized appreciation (depreciation) on written options, respectively.
Notes to Financial Statements (Continued)
For the year ended December 31, 2014, the average quarterly balances of outstanding derivative financial instruments were as follows:
| | | Dynamic | |
| | | Equity | |
| Fund | | Fund | |
| Equity contracts: | | | | |
| Purchased Options - Cost* | | $ | — | |
| Written Options – Proceeds | | | 1,504,113 | |
* The balance at each quarter end was zero.
Share valuation — The NAV per share of each class of shares of each Fund is calculated daily by dividing the total value of a Fund’s assets attributable to that class, less liabilities attributable to that class, by the number of outstanding shares of that class.
The maximum offering price per share of Class A shares of the Funds is equal to the NAV per share plus a sales load equal to 6.10% of the NAV (or 5.75% of the offering price). There is no sales load on purchases of $1 million or more of Class A shares. The maximum offering price per share of Classes C, Y, and Institutional Class shares of the Funds is equal to the NAV per share.
The redemption price per share of each class of shares of the Funds is generally equal to the NAV per share. However, Class A redemptions that were part of a no-load $1 million subscription may be subject to a contingent deferred sales charge (“CDSC”) of up to 1.00% if redeemed within a one-year period from the date of purchase. Additionally, purchases of Class C shares of the Funds are subject to a CDSC of 1.00%. The CDSC will be assessed on an amount equal to the lesser of (1) the NAV at the time of purchase of the shares being redeemed or (2) the NAV of such shares being redeemed if redeemed within a one-year period from the date of purchase.
Investment income — Dividend income from securities is recognized on the ex-dividend date, net of foreign withholding taxes, if any, which are reduced by any amounts reclaimable by the Funds, where applicable. Interest income from securities is recorded on the basis of interest accrued, premium amortized and discount accreted.
Distributions to shareholders — Each Fund intends to distribute to its shareholders substantially all of its income and capital gains. The Dynamic Equity Fund declares and distributes net investment income, if any, annually as a dividend to shareholders. The Allocation Funds each declare and distribute net investment income, if any, quarterly as a dividend to shareholders. Each Fund makes distributions of capital gains, if any, at least annually, net of applicable capital loss carryforwards. Income distributions and capital gain distributions are determined in accordance with income tax regulations. Recognition of the Funds’ net investment income that invests in Underlying Funds is affected by the timing of dividend declarations by those Underlying Funds.
Allocations — Investment income earned, realized capital gains and losses, and unrealized appreciation and depreciation for a Fund are allocated daily to each class of shares based upon its proportionate share of total net assets of the Fund. Class-specific expenses are charged directly to the class incurring the expense. Common expenses, which are not attributable to a specific class, are allocated daily to each class of shares based upon their proportionate share of total net assets of the Fund. Expenses not directly billed to a Fund are allocated proportionally among all Funds in the Trust, and, if applicable, Touchstone Investment Trust, Touchstone Institutional Funds Trust, Touchstone Variable Series Trust, Touchstone Funds Group Trust, and Touchstone Tax-Free Trust (collectively with the Trust, “Touchstone Fund Complex”), daily in relation to net assets of each Fund or another reasonable measure.
Notes to Financial Statements (Continued)
Security transactions — Security transactions are reflected for financial reporting purposes as of the trade date. Realized gains and losses on sales of portfolio securities are calculated using the identified cost basis.
Estimates — The preparation of financial statements in conformity with U.S. GAAP requires management to make estimates and assumptions that affect the reported amounts of assets and liabilities and disclosure of contingent assets and liabilities at the date of the financial statements and the reported amounts of income and expenses during the reporting period. Actual results could differ from those estimates.
3. Investment Transactions
Investment transactions (excluding short-term investments and U.S. Government securities) were as follows for the year ended December 31, 2014:
| | | Dynamic | | | Balanced | | | Conservative | |
| | | Equity | | | Allocation | | | Allocation | �� |
| | | Fund | | | Fund | | | Fund | |
| Purchases of investment securities | | $ | 201,942,216 | | | $ | 11,625,004 | | | $ | 6,259,072 | |
| Proceeds from sales and maturities | | $ | 198,186,859 | | | $ | 39,079,648 | | | $ | 27,237,938 | |
| | | | | | Moderate | |
| | | Growth | | | Growth | |
| | | Allocation | | | Allocation | |
| | | Fund | | | Fund | |
| Purchases of investment securities | | $ | 9,393,724 | | | $ | 14,986,236 | |
| Proceeds from sales and maturities | | $ | 24,323,364 | | | $ | 49,104,114 | |
There were no purchases or proceeds from sales and maturities of U.S. Government securities by the Funds for the year ended December 31, 2014.
4. Transactions with Affiliates and Other Related Parties
Certain officers of the Trust are also officers of Touchstone Advisors, Inc. (the “Advisor”), Touchstone Securities, Inc. (the “Underwriter”), or BNY Mellon Investment Servicing (US) Inc. (“BNY Mellon”), the Sub-Administrator and Transfer Agent to the Funds. Such officers receive no compensation from the Trust. The Advisor and the Underwriter are each wholly-owned, indirect subsidiaries of Western & Southern Financial Group, Inc.
On behalf of the Funds, the Advisor pays each Independent Trustee a quarterly retainer plus additional retainers to the Lead Independent Trustee and the chairs of each standing committee. Interested Trustees do not receive compensation from the Funds. Each Independent Trustee also receives compensation for each board meeting and committee meeting attended. Each standing committee chair receives additional compensation for each committee meeting that he or she oversees. The Advisor is reimbursed by the Funds for the Independent Trustees’ compensation and out-of-pocket expenses relating to their services. The Funds accrued Trustee-related expenses of $59,882 for the year ended December 31, 2014.
Notes to Financial Statements (Continued)
MANAGEMENT & EXPENSE LIMITATION AGREEMENTS
The Advisor provides general investment supervisory services for the Funds, under terms of an advisory agreement (the “Advisory Agreement”). Under the Advisory Agreement, each Fund pays the Advisor a fee, which is computed and accrued daily and paid monthly, at an annual rate based on average daily net assets of each Fund as shown in the table below.
| Dynamic Equity Fund | 0.85% on the first $300 million of assets |
| | 0.80% on the next $200 million of assets |
| | 0.75% on the next $250 million of assets |
| | 0.70% on the next $250 million of assets |
| | 0.65% on the next $500 million of assets |
| | 0.60% on the next $500 million of assets |
| | 0.55% on such assets in excess of $2 billion |
| Balanced Allocation Fund | 0.20% on the first $1 billion of assets |
| Conservative Allocation Fund | 0.175% on the next $1 billion of assets |
| | 0.15% on the next $1 billion of assets |
| | 0.125% on such assets in excess of $3 billion |
| Growth Allocation Fund | 0.25% on the first $1 billion of assets |
| Moderate Growth Allocation Fund | 0.225% on the next $1 billion of assets |
| | 0.20% on the next $1 billion of assets |
| | 0.175% on such assets in excess of $3 billion |
The Advisor has entered into investment sub-advisory agreements with the following parties (each, a “Sub-Advisor”):
| Analytic Investors, LLC | Ibbotson Associates, Inc. |
| Dynamic Equity Fund | Balanced Allocation Fund |
| | Conservative Allocation Fund |
| | Growth Allocation Fund |
| | Moderate Growth Allocation Fund |
The Advisor, not the Funds, pays sub-advisory fees to each Sub-Advisor.
The Advisor entered into an amended expense limitation agreement (the “Expense Limitation Agreement”) to contractually limit operating expenses of the Funds, excluding: dividend and interest expenses on short sales; interest; taxes; brokerage commissions; other expenditures which are capitalized in accordance with GAAP; the cost of “Acquired Fund Fees and Expenses”, if any; and other extraordinary expenses not incurred in the ordinary course of business. The maximum operating expense limit in any year with respect to the Funds is based on a percentage of the average daily net assets of the Funds. The Advisor has agreed to separately waive class-level expenses, advisory fees and administration fees, and to reimburse expenses in order to maintain the following expense limitations for the Funds:
| | | | | | | | | | | | Institutional | | | Termination |
| Fund | | Class A | | | Class C | | | Class Y | | | Class | | | Date |
| Dynamic Equity Fund | | | 1.55 | % | | | 2.30 | % | | | 1.30 | % | | | 1.25 | % | | April 30, 2015 |
| Balanced Allocation Fund | | | 0.49 | % | | | 1.24 | % | | | 0.24 | % | | | 0.24 | % | | April 30, 2015 |
| Conservative Allocation Fund | | | 0.49 | % | | | 1.24 | % | | | 0.24 | % | | | 0.24 | % | | April 30, 2015 |
| Growth Allocation Fund | | | 0.49 | % | | | 1.24 | % | | | 0.24 | % | | | 0.24 | % | | April 30, 2015 |
| Moderate Growth Allocation Fund | | | 0.49 | % | | | 1.24 | % | | | 0.24 | % | | | 0.24 | % | | April 30, 2015 |
Notes to Financial Statements (Continued)
Prior to April 30, 2014, the expense limitations for the Allocation Funds were as follows:
| Fund | | Class A | | | Class C | | | Class Y | | | Institutional
Class | |
| Balanced Allocation Fund | | | 0.41 | % | | | 1.16 | % | | | 0.16 | % | | | 0.16 | % |
| Conservative Allocation Fund | | | 0.41 | % | | | 1.16 | % | | | 0.16 | % | | | 0.16 | % |
| Growth Allocation Fund | | | 0.41 | % | | | 1.16 | % | | | 0.16 | % | | | 0.16 | % |
| Moderate Growth Allocation Fund | | | 0.41 | % | | | 1.16 | % | | | 0.16 | % | | | 0.16 | % |
During the year ended December 31, 2014, the Advisor or its affiliates waived investment advisory fees and administration fees or reimbursed expenses, including 12b-1 fees, of the Funds as follows:
| | | Investment | | | | | | Other | | | | |
| | | Advisory | | | | | | Operating | | | | |
| | | Fees | | | Administration | | | Expenses | | | | |
| | | Waived | | | Fees Waived | | | Reimbursed | | | Total | |
| Dynamic Equity Fund | | $ | — | | | $ | — | | | $ | 30,986 | | | $ | 30,986 | |
| Balanced Allocation Fund | | | 60,526 | | | | 172,882 | | | | 178,064 | | | | 411,472 | |
| Conservative Allocation Fund | | | 49,175 | | | | 90,260 | | | | 123,239 | | | | 262,674 | |
| Growth Allocation Fund | | | 92,811 | | | | 103,472 | | | | 151,375 | | | | 347,658 | |
| Moderate Growth Allocation Fund | | | 143,724 | | | | 214,281 | | | | 219,626 | | | | 577,631 | |
Under the terms of the Expense Limitation Agreement, the Advisor is entitled to recover, subject to approval by the Funds’ Board, such amounts waived or reimbursed for a period of up to three years from the year in which the Advisor reduced its compensation or assumed expenses for the Funds. No recoupment will occur unless a Fund’s operating expenses are below the expense limitation amount in effect at the time of the waiver or reimbursement.
As of December 31, 2014, the Advisor may seek recoupment of previously waived fees and reimbursed expenses as follows:
| | | Expiration | | | Expiration | | | Expiration | | | Expiration | | | | |
| | | July 31, | | | December 31, | | | December 31, | | | December 31, | | | | |
| Fund | | 2015 | | | 2015 | | | 2016 | | | 2017 | | | Total | |
| Dynamic Equity Fund | | $ | — | | | $ | — | | | $ | 6,701 | | | $ | — | | | $ | 6,701 | |
| Balanced Allocation Fund | | | 18,241 | | | | 172,469 | | | | 513,519 | | | | 297,198 | | | | 1,001,427 | |
| Conservative Allocation Fund | | | 24,108 | | | | 115,995 | | | | 320,973 | | | | 191,617 | | | | 652,693 | |
| Growth Allocation Fund | | | 32,481 | | | | 138,241 | | | | 396,930 | | | | 241,453 | | | | 809,105 | |
| Moderate Growth Allocation Fund | | | 31,679 | | | | 231,358 | | | | 666,379 | | | | 407,648 | | | | 1,337,064 | |
For the year ended December 31, 2014, the Advisor recouped $9,792 of previously waived fees or reimbursed expenses from the Dynamic Equity Fund.
ADMINISTRATION AGREEMENT
The Advisor entered into an Administration Agreement with the Trust, whereby the Advisor is responsible for: supplying executive and regulatory compliance services; supervising the preparation of tax returns; coordinating the preparation of reports to shareholders and reports to, and filings with, the Securities and Exchange Commission (“SEC”) and state securities authorities, as well as materials for meetings of the Board; calculating the daily NAV per share; and maintaining the financial books and records of each Fund.
Notes to Financial Statements (Continued)
For its services through December 31, 2014, the Advisor’s annual administrative fee was:
0.20% on the first $6 billion of the aggregate average daily net assets;
0.16% of the next $4 billion of aggregate average daily net assets; and
0.12% of the aggregate average daily net assets over $10 billion.
The fee was computed and allocated among the funds of the Touchstone Fund Complex (excluding Touchstone Institutional Money Market Fund, Touchstone Institutional Funds Trust, and Touchstone Variable Series Trust) on the basis of relative daily net assets.
Beginning January 1, 2015, the Advisor’s annual administrative fee is:
0.145% on the first $20 billion of the aggregate average daily net assets;
0.11% on the next $10 billion of aggregate average daily net assets;
0.09% on the next $10 billion of aggregate average daily net assets; and
0.07% on the aggregate average daily net assets over $40 billion.
The fee is computed and allocated among the Touchstone Fund Complex (excluding Touchstone Institutional Funds Trust) on the basis of relative daily net assets.
The Advisor has engaged BNY Mellon as the Sub-Administrator to the Trust. BNY Mellon provides administrative and accounting services to the Trust and is compensated directly by the Advisor, not the Trust.
TRANSFER AGENT AGREEMENT
Under the terms of the Transfer Agent Agreement between the Trust and BNY Mellon, BNY Mellon maintains the records of each shareholder’s account, answers shareholders’ inquiries concerning their accounts, processes purchases and redemptions of each Fund’s shares, acts as dividend and distribution disbursing agent, and performs other shareholder service functions. For these services, BNY Mellon receives a monthly fee per shareholder account from each Fund. In addition, each Fund pays out-of-pocket expenses incurred by BNY Mellon, including, but not limited to, postage and supplies.
The Funds may reimburse the Advisor for fees paid to intermediaries such as banks, broker-dealers, financial advisors or other financial institutions for sub-transfer agency, sub-administration and other services provided to investors whose shares of record are held in omnibus, other group accounts, retirement plans or accounts traded through registered securities clearing agents. These fees may vary based on, for example, the nature of services provided, but generally range up to 0.15% of the assets of the class serviced or maintained by the intermediary or up to $22 per sub-account maintained by the intermediary. Prior to December 1, 2014, the Funds reimbursed the Advisor up to $17 per sub-account maintained by the intermediary.
PLANS OF DISTRIBUTION AND SHAREHOLDER SERVICING FEE ARRANGEMENTS
The Trust has adopted distribution plans pursuant to Rule 12b-1 under the 1940 Act for each class of shares it offers that is subject to 12b-1 distribution fees. The plans allow each Fund to pay distribution and other fees for the sale and distribution of its shares and for services provided to shareholders. The fees charged to the Funds are limited to the actual expenses incurred. Under the Class A plan, each Fund offering Class A shares pays an annual fee of up to 0.25% of average daily net assets that are attributable to Class A shares. Under the Class C plan, each Fund offering Class C shares pays an annual fee of up to 1.00% of average daily net assets that are attributable to Class C shares (of which up to 0.75% is a distribution fee and up to 0.25% is a shareholder servicing fee).
Notes to Financial Statements (Continued)
UNDERWRITING AGREEMENT
The Underwriter is the Funds’ principal underwriter and, as such, acts as exclusive agent for distribution of the Funds’ shares. Under the terms of the Underwriting Agreement between the Trust and the Underwriter, the Underwriter earned the following from underwriting and broker commissions on the sale of Class A shares of the Funds listed below during the year ended December 31, 2014:
| Fund | | Amount | |
| Dynamic Equity Fund | | $ | 5,490 | |
| Balanced Allocation Fund | | | 15,870 | |
| Conservative Allocation Fund | | | 12,465 | |
| Growth Allocation Fund | | | 9,369 | |
| Moderate Growth Allocation Fund | | | 11,541 | |
In addition, the Underwriter collected CDSC on the redemption of Class C shares of the Funds listed below during the year ended December 31, 2014:
| Fund | | Amount | |
| Balanced Allocation Fund | | $ | 155 | |
| Conservative Allocation Fund | | | 155 | |
| Growth Allocation Fund | | | 217 | |
| Moderate Growth Allocation Fund | | | 788 | |
AFFILIATED INVESTMENTS
Each Fund may invest in the Touchstone Institutional Money Market Fund, subject to compliance with several conditions set forth in an exemptive order received by the Trust from the SEC. To the extent that the Funds are invested in the Touchstone Institutional Money Market Fund, the Advisor and Administrator will be paid additional fees from the Touchstone Institutional Money Market Fund that will not be waived or reimbursed.
A summary of the Dynamic Equity Fund’s investment, as applicable, in the Touchstone Institutional Money Market Fund for the year ended December 31, 2014, is as follows:
| | | Share Activity | | | | | | | |
| | | | | | | | | | | | | | | | | | Market | |
| | | Balance | | | | | | | | | Balance | | | | | | Value | |
| Fund | | 12/31/13 | | | Purchases | | | Sales | | | 12/31/14 | | | Dividends | | | 12/31/14 | |
| Dynamic Equity Fund | | | 1,679,688 | | | | 46,249,546 | | | | (46,716,311 | ) | | | 1,212,923 | | | $ | 531 | | | $ | 1,212,923 | |
A summary of each Allocation Fund’s transactions in affiliated Underlying Funds during the year ended December 31, 2014 is as follows:
| Balanced Allocation Fund |
| | | Purchases at | | | Proceeds | | | Market Value | | | Dividend | | | Net Realized | |
| Underlying Fund* | | cost | | | from sale | | | 12/31/14 | | | Income | | | Gain/Loss | |
| Touchstone Active Bond Fund | | $ | 115,034 | | | $ | 881,286 | | | $ | 2,794,397 | | | $ | 104,450 | | | $ | 6,438 | |
| Touchstone Total Return Bond Fund | | | 685,147 | | | | 3,620,558 | | | | 10,933,388 | | | | 400,887 | | | | 49,962 | |
| Touchstone Ultra Short | | | | | | | | | | | | | | | | | | | | |
| Duration Fixed Income Fund | | | 319,218 | | | | 3,411,818 | | | | 8,840,090 | | | | 177,637 | | | | (37,180 | ) |
| Touchstone International Small Cap Fund | | | 93,863 | | | | 899,802 | | | | 2,796,981 | | | | 22,936 | | | | 229,618 | |
| Touchstone International Value Fund | | | 533,932 | | | | 3,775,185 | | | | 8,354,097 | | | | 285,652 | | | | 593,270 | |
| Touchstone Focused Fund | | | 30,700 | | | | 2,284,537 | | | | 2,799,075 | | | | 14,597 | | | | 605,711 | |
Notes to Financial Statements (Continued)
| Balanced Allocation Fund | | | | | | | | | | | | |
| | | Purchases at | | | Proceeds | | | Market Value | | | Dividend | | | Net Realized | |
| Underlying Fund* | | cost | | | from sale | | | 12/31/14 | | | Income | | | Gain/Loss | |
| Touchstone Value Fund | | $ | 299,587 | | | $ | 3,969,845 | | | $ | 6,515,318 | | | $ | 179,535 | | | $ | 1,681,845 | |
| Touchstone Growth Opportunities Fund | | | 226,449 | | | | 782,895 | | | | 1,867,915 | | | | 1,420 | | | | 364,144 | |
| Touchstone Sands Capital Institutional Growth Fund | | | 1,017,427 | | | | 3,253,245 | | | | 7,437,111 | | | | — | | | | 1,153,001 | |
| Touchstone Premium Yield Equity Fund, Class Y | | | 673,173 | | | | 2,806,404 | | | | 6,475,236 | | | | 355,354 | | | | 629,582 | |
| Touchstone Flexible Income Fund | | | 262,173 | | | | 1,625,663 | | | | 4,657,300 | | | | 259,992 | | | | 21,929 | |
| Touchstone International Fixed Income Fund | | | 331,095 | | | | 1,291,755 | | | | 4,519,631 | | | | 85,783 | | | | 171,943 | |
| Touchstone Emerging Markets Equity Fund | | | 268,401 | | | | 3,278,801 | | | | 1,801,866 | | | | 19,770 | | | | (45,751 | ) |
| Touchstone Sands Capital Emerging Markets Growth Fund | | | 3,378,637 | | | | 558,684 | | | | 2,707,666 | | | | — | | | | 11,198 | |
| Touchstone Arbitrage Fund | | | 558,559 | | | | 783,884 | | | | 3,272,237 | | | | — | | | | 2,989 | |
| Touchstone Dynamic Equity Fund | | | 45,294 | | | | 1,668,526 | | | | 3,269,766 | | | | 21,935 | | | | 309,584 | |
Touchstone Mid Cap Fund
Touchstone Institutional | | | 1,054,040 | | | | 865,437 | | | | 2,809,273 | | | | 7,657 | | | | 283,559 | |
| Money Market Fund | | | 38,466 | | | | 763,952 | | | | 2,787,078 | | | | 339 | | | | — | |
| Touchstone Global Real Estate Fund | | | 192,707 | | | | 1,024,388 | | | | 2,336,787 | | | | 173,125 | | | | (18,721 | ) |
| Touchstone Small Cap Core Fund | | | 78,101 | | | | 244,440 | | | | 938,848 | | | | 577 | | | | 128,395 | |
| Touchstone Small Cap Value Fund^ | | | 75,823 | | | | 261,819 | | | | 941,902 | | | | 17,727 | | | | 39,424 | |
| Touchstone High Yield Fund | | | 123,621 | | | | 481,986 | | | | 1,622,750 | | | | 97,886 | | | | 43,055 | |
| Touchstone Mid Cap Value | | | 1,117,228 | | | | 166,302 | | | | 937,420 | | | | 1,857 | | | | 37,103 | |
| Touchstone Small Cap Growth Fund | | | 50,702 | | | | 334,914 | | | | 936,298 | | | | — | | | | 53,188 | |
| Touchstone Small Company Value Fund^ | | | 55,627 | | | | 43,522 | | | | — | | | | 4,712 | | | | 49,652 | |
| Total: | | $ | 11,625,004 | | | $ | 39,079,648 | | | $ | 92,352,430 | | | $ | 2,233,828 | | | $ | 6,363,938 | |
| Conservative Allocation Fund |
| | | Purchases at | | | Proceeds | | | Market Value | | | Dividend | | | Net Realized | |
| Underlying Fund* | | cost | | | from sale | | | 12/31/14 | | | Income | | | Gain/Loss | |
| Touchstone Active Bond Fund | | $ | 137,470 | | | $ | 1,195,054 | | | $ | 2,200,756 | | | $ | 90,601 | | | $ | 39,979 | |
| Touchstone Total Return Bond Fund | | | 627,170 | | | | 5,042,021 | | | | 8,804,238 | | | | 359,487 | | | | 60,334 | |
| Touchstone Ultra Short Duration Fixed Income Fund | | | 548,503 | | | | 4,984,892 | | | | 8,815,669 | | | | 189,661 | | | | (46,280 | ) |
| Touchstone International Fixed Income | | | 530,741 | | | | 1,897,964 | | | | 3,507,078 | | | | 66,502 | | | | 160,449 | |
| Touchstone Flexible Income Fund | | | 257,381 | | | | 1,804,120 | | | | 3,075,177 | | | | 187,810 | | | | 16,770 | |
| Touchstone Growth Opportunities Fund | | | 122,253 | | | | 350,063 | | | | 431,647 | | | | 328 | | | | 112,920 | |
| Touchstone Sands Capital Institutional Growth Fund | | | 796,932 | | | | 1,893,087 | | | | 2,170,317 | | | | — | | | | 449,560 | |
Notes to Financial Statements (Continued)
| Conservative Allocation Fund |
| | | Purchases at | | | Proceeds | | | Market Value | | | Dividend | | | Net Realized | |
| Underlying Fund* | | cost | | | from sale | | | 12/31/14 | | | Income | | | Gain/Loss | |
| Touchstone International Small Cap Fund | | $ | 93,360 | | | $ | 306,436 | | | $ | 436,652 | | | $ | 3,575 | | | $ | 63,817 | |
| Touchstone International Value Fund | | | 784,048 | | | | 1,197,438 | | | | 2,068,340 | | | | 70,666 | | | | 266,796 | |
| Touchstone Institutional Money Market Fund | | | 83,421 | | | | 1,092,445 | | | | 2,198,922 | | | | 290 | | | | — | |
| Touchstone Arbitrage Fund | | | 99,383 | | | | 1,078,956 | | | | 2,198,580 | | | | — | | | | (3,741 | ) |
| Touchstone Value Fund | | | 380,195 | | | | 1,662,547 | | | | 2,161,233 | | | | 59,571 | | | | 821,598 | |
| Touchstone Premium Yield Equity Fund, Class Y | | | 603,542 | | | | 2,337,858 | | | | 1,958,099 | | | | 139,925 | | | | 380,809 | |
| Touchstone Dynamic Equity Fund | | | 159,393 | | | | 840,208 | | | | 1,308,714 | | | | 8,808 | | | | 150,199 | |
| Touchstone High Yield Fund | | | 84,985 | | | | 408,493 | | | | 769,485 | | | | 50,833 | | | | 28,639 | |
| Touchstone Small Cap Core Fund | | | 104,901 | | | | 272,998 | | | | 436,349 | | | | 268 | | | | 91,404 | |
| Touchstone Global Real Estate | | | 83,898 | | | | 337,738 | | | | 436,115 | | | | 35,345 | | | | 6,506 | |
| Touchstone Emerging Markets Equity Fund | | | 108,089 | | | | 319,867 | | | | 435,023 | | | | 4,777 | | | | 5,135 | |
| Touchstone Mid Cap Value Fund | | | 653,407 | | | | 215,753 | | | | 430,561 | | | | 902 | | | | 16,877 | |
| Total: | | $ | 6,259,072 | | | $ | 27,237,938 | | | $ | 43,842,955 | | | $ | 1,269,349 | | | $ | 2,621,771 | |
| Growth Allocation Fund |
| | | Purchases at | | | Proceeds | | | Market Value | | | Dividend | | | Net Realized | |
| Underlying Fund* | | cost | | | from sale | | | 12/31/14 | | | Income | | | Gain/Loss | |
| Touchstone International Small Cap Fund | | $ | 87,208 | | | $ | 1,056,280 | | | $ | 4,053,829 | | | $ | 33,218 | | | $ | 244,382 | |
| Touchstone International Value Fund | | | 423,649 | | | | 2,401,668 | | | | 6,992,121 | | | | 239,259 | | | | 381,801 | |
| Touchstone Focused Fund | | | 32,063 | | | | 1,462,347 | | | | 4,641,560 | | | | 24,185 | | | | 415,108 | |
Touchstone Value Fund
Touchstone Growth | | | 247,149 | | | | 1,659,373 | | | | 5,475,041 | | | | 129,775 | | | | 588,138 | |
| Opportunities Fund | | | 269,463 | | | | 1,557,327 | | | | 2,374,841 | | | | 1,808 | | | | 541,470 | |
| Touchstone Sands Capital Institutional Growth Fund | | | 609,826 | | | | 1,669,176 | | | | 5,454,969 | | | | — | | | | 665,747 | |
| Touchstone Emerging Markets Equity Fund | | | 426,122 | | | | 4,856,780 | | | | 3,382,543 | | | | 37,118 | | | | (76,305 | ) |
| Touchstone Sands Capital Emerging Markets Growth Fund | | | 4,656,692 | | | | 560,125 | | | | 3,923,580 | | | | — | | | | 6,223 | |
| Touchstone Premium Yield Equity Fund, Class Y | | | 407,613 | | | | 1,510,109 | | | | 4,049,247 | | | | 211,644 | | | | 350,988 | |
| Touchstone Small Cap Core Fund | | | 200,766 | | | | 514,058 | | | | 2,339,726 | | | | 1,438 | | | | 292,815 | |
| Touchstone Small Cap Value Fund^ | | | 102,060 | | | | 295,362 | | | | 1,486,427 | | | | 27,001 | | | | 84,352 | |
| Touchstone Dynamic Equity Fund | | | 656,616 | | | | 698,494 | | | | 2,904,683 | | | | 19,470 | | | | 128,766 | |
| Touchstone Global Real Estate Fund | | | 204,487 | | | | 988,552 | | | | 2,610,467 | | | | 188,493 | | | | (36,952 | ) |
| Touchstone Ultra Short Duration Fixed Income Fund | | | 172,676 | | | | 2,070,186 | | | | 2,308,365 | | | | 60,110 | | | | (24,160 | ) |
Notes to Financial Statements (Continued)
| Growth Allocation Fund |
| | | Purchases at | | | Proceeds | | | Market Value | | | Dividend | | | Net Realized | |
| Underlying Fund* | | cost | | | from sale | | | 12/31/14 | | | Income | | | Gain/Loss | |
| Touchstone Small Cap Growth Fund | | $ | 77,991 | | | $ | 806,357 | | | $ | 2,202,369 | | | $ | — | | | $ | 123,958 | |
| Touchstone Mid Cap Fund | | | 667,978 | | | | 357,966 | | | | 1,888,145 | | | | 5,123 | | | | 118,578 | |
| Touchstone Mid Cap Value Fund | | | 49,847 | | | | 366,791 | | | | 1,185,403 | | | | 6,192 | | | | 117,345 | |
| Touchstone Arbitrage Fund | | | 13,239 | | | | 1,413,969 | | | | — | | | | — | | | | (6,689 | ) |
| Touchstone Small Company Value Fund^ | | | 88,279 | | | | 78,444 | | | | — | | | | 7,044 | | | | 75,521 | |
| Total: | | $ | 9,393,724 | | | $ | 24,323,364 | | | $ | 57,273,316 | | | $ | 991,878 | | | $ | 3,991,086 | |
| Moderate Growth Allocation Fund | | | | | | | | | | | | |
| | | Purchases at | | | Proceeds | | | Market Value | | | Dividend | | | Net Realized | |
| Underlying Fund* | | cost | | | from sale | | | 12/31/14 | | | Income | | | Gain/Loss | |
| Touchstone Total Return Bond Fund | | $ | 599,392 | | | $ | 4,021,604 | | | $ | 12,120,512 | | | $ | 437,761 | | | $ | 23,575 | |
| Touchstone Ultra Short Duration Fixed Income Fund | | | 143,849 | | | | 2,463,086 | | | | 5,374,922 | | | | 112,626 | | | | (27,599 | ) |
| Touchstone International Small Cap Fund | | | 77,544 | | | | 1,410,082 | | | | 4,761,677 | | | | 39,027 | | | | 342,117 | |
| Touchstone International Value Fund | | | 825,545 | | | | 4,807,928 | | | | 12,143,351 | | | | 416,208 | | | | 971,362 | |
| Touchstone Focused Fund | | | 50,059 | | | | 2,492,654 | | | | 7,163,299 | | | | 37,360 | | | | 764,327 | |
| Touchstone Value Fund | | | 409,706 | | | | 3,747,025 | | | | 9,556,070 | | | | 234,151 | | | | 1,820,516 | |
| Touchstone Growth Opportunities Fund | | | 414,606 | | | | 2,992,940 | | | | 3,657,445 | | | | 2,789 | | | | 1,034,150 | |
| Touchstone Sands Capital Institutional Growth Fund | | | 1,010,037 | | | | 3,968,562 | | | | 10,763,493 | | | | — | | | | 1,492,980 | |
| Touchstone Emerging Markets Equity Fund | | | 256,214 | | | | 7,494,293 | | | | 4,614,775 | | | | 50,682 | | | | (120,184 | ) |
| Touchstone Sands Capital Emerging Markets Growth Fund | | | 5,508,601 | | | | 700,154 | | | | 4,607,657 | | | | — | | | | 10,931 | |
| Touchstone Premium Yield Equity Fund, Class Y | | | 848,820 | | | | 3,399,457 | | | | 8,304,553 | | | | 443,668 | | | | 730,477 | |
| Touchstone Small Cap Core Fund | | | 315,813 | | | | 925,273 | | | | 3,590,483 | | | | 2,207 | | | | 481,302 | |
| Touchstone Small Cap Value Fund^ | | | 185,206 | | | | 599,679 | | | | 2,431,153 | | | | 44,202 | | | | 145,197 | |
| Touchstone Dynamic Equity Fund | | | 53,637 | | | | 1,456,157 | | | | 4,785,134 | | | | 32,093 | | | | 269,557 | |
| Touchstone Flexible Income Fund | | | 285,999 | | | | 1,612,531 | | | | 4,742,985 | | | | 258,010 | | | | (4,751 | ) |
| Touchstone Mid Cap Fund | | | 1,727,837 | | | | 787,051 | | | | 4,259,853 | | | | 11,579 | | | | 244,867 | |
| Touchstone Global Real Estate Fund | | | 262,347 | | | | 1,409,239 | | | | 3,590,037 | | | | 259,263 | | | | (55,874 | ) |
| Touchstone Mid Cap Value Fund | | | 1,429,743 | | | | 581,040 | | | | 2,413,096 | | | | 8,724 | | | | 216,094 | |
| Touchstone Small Cap Growth Fund | | | 87,530 | | | | 2,337,717 | | | | 2,405,428 | | | | — | | | | 228,775 | |
| Touchstone Arbitrage Fund | | | 31,124 | | | | 582,996 | | | | 2,385,508 | | | | — | | | | 1,520 | |
| Touchstone International | | | | | | | | | | | | | | | | | | | | |
| Fixed Income Fund | | | 185,416 | | | | 657,597 | | | | 2,280,596 | | | | 43,360 | | | | 87,387 | |
| Touchstone High Yield Fund | | | 143,079 | | | | 536,821 | | | | 1,754,860 | | | | 104,014 | | | | 43,432 | |
Notes to Financial Statements (Continued)
| Moderate Growth Allocation Fund | | | | | | | | | | | | |
| | | Purchases at | | | Proceeds | | | Market Value | | | Dividend | | | Net Realized | |
| Underlying Fund* | | cost | | | from sale | | | 12/31/14 | | | Income | | | Gain/Loss | |
| Touchstone Small Company Value Fund^ | | $ | 134,132 | | | $ | 120,228 | | | $ | — | | | $ | 11,873 | | | $ | 125,743 | |
| Total: | | $ | 14,986,236 | | | $ | 49,104,114 | | | $ | 117,706,887 | | | $ | 2,549,597 | | | $ | 8,825,901 | |
| * | All affiliated fund investments are in Institutional Class shares, unless otherwise indicated. |
| ^ | The Touchstone Small Company Value Fund merged into the Touchstone Small Cap Value Fund on March 21, 2014. |
5. Federal Tax Information
Federal income tax — It is each Fund’s policy to continue to comply with the special provisions of the Internal Revenue Code applicable to regulated investment companies. As provided therein, in any fiscal year in which a Fund so qualifies and distributes at least 90% of its investment company taxable income, the Fund (but not the shareholders) will be relieved of federal income tax on the income distributed. It is each Fund’s policy to distribute all of its taxable income and accordingly, no provision for income taxes has been made.
In order to avoid imposition of the excise tax applicable to regulated investment companies, it is also each Fund’s intention to declare and pay as dividends in each calendar year at least 98% of its investment company taxable income (earned during the calendar year) and 98.2% of its net realized capital gains (earned during the twelve months ending October 31) plus undistributed amounts from prior years.
The tax character of distributions paid for the years ended December 31, 2014 and December 31, 2013 are as follows:
| | | Dynamic | | Balanced |
| | | Equity Fund | | Allocation Fund |
| | | Year Ended | | Year Ended | | Year Ended | | Year Ended |
| | | December 31, | | December 31, | | December 31, | | December 31, |
| | | 2014 | | 2013 | | 2014 | | 2013 |
| From ordinary income | | $ | 421,192 | | | $ | 16,017 | | | $ | 1,791,047 | | | $ | 2,117,770 | |
| From long-term capital gains | | | — | | | | — | | | | — | | | | — | |
| Total distributions | | $ | 421,192 | | | $ | 16,017 | | | $ | 1,791,047 | | | $ | 2,117,770 | |
| | | Conservative | | Growth |
| | | Allocation Fund | | Allocation Fund |
| | | Year Ended | | Year Ended | | Year Ended | | Year Ended |
| | | December 31, | | December 31, | | December 31, | | December 31, |
| | | 2014 | | 2013 | | 2014 | | 2013 |
| From ordinary income | | $ | 1,023,920 | | | $ | 1,271,196 | | | $ | 812,816 | | | $ | 1,227,505 | |
| From long-term capital gains | | | — | | | | — | | | | — | | | | 498,325 | |
| Total distributions | | $ | 1,023,920 | | | $ | 1,271,196 | | | $ | 812,816 | | | $ | 1,725,830 | |
| | | Moderate Growth |
| | | Allocation Fund |
| | | Year Ended | | Year Ended |
| | | December 31, | | December 31, |
| | | 2014 | | 2013 |
| From ordinary income | | $ | 2,190,334 | | | $ | 2,713,570 | |
| From long-term capital gains | | | 4,341,964 | | | | — | |
| Total distributions | | $ | 6,532,298 | | | $ | 2,713,570 | |
Notes to Financial Statements (Continued)
The following information is computed on a tax basis for each item as of December 31, 2014:
| | | Dynamic | | Balanced | | Conservative |
| | | Equity Fund | | Allocation Fund | | Allocation Fund |
| Tax cost of portfolio investments | | $ | 87,054,946 | | | $ | 85,167,700 | | | $ | 42,807,712 | |
| Gross unrealized appreciation | | | 6,821,710 | | | | 8,728,420 | | | | 2,015,235 | |
| Gross unrealized depreciation | | | (2,241,443 | ) | | | (1,543,690 | ) | | | (979,992 | ) |
| Net unrealized appreciation (depreciation) | | | 4,580,267 | | | | 7,184,730 | | | | 1,035,243 | |
| Net unrealized appreciation (depreciation) on written options and short sales | | | 1,163,763 | | | | — | | | | — | |
| Accumulated capital and other losses | | | (135,229,211 | ) | | | (20,336,241 | ) | | | (388,305 | ) |
| Undistributed ordinary income | | | 100,823 | | | | 9,681 | | | | 4,322 | |
| Other temporary differences | | | — | | | | — | | | | — | |
| Accumulated earnings (deficit) | | $ | (129,384,358 | ) | | $ | (13,141,830 | ) | | $ | 651,260 | |
| | | | | Moderate |
| | | Growth | | Growth |
| | | Allocation Fund | | Allocation Fund |
| Tax cost of portfolio investments | | $ | 49,173,519 | | | $ | 105,024,269 | |
| Gross unrealized appreciation | | | 8,750,441 | | | | 15,004,164 | |
| Gross unrealized depreciation | | | (650,644 | ) | | | (2,321,546 | ) |
| Net unrealized appreciation (depreciation) | | | 8,099,797 | | | | 12,682,618 | |
| Accumulated capital and other losses | | | (7,151,406 | ) | | | (7,789,144 | ) |
| Undistributed ordinary income | | | 9,902 | | | | — | |
| Other temporary differences | | | — | | | | 39,467 | |
| Accumulated earnings (deficit) | | $ | 958,293 | | | $ | 4,932,941 | |
The difference between the tax cost of portfolio investments and the financial statement cost is primarily due to wash sale loss deferrals.
As of December 31, 2014, the Funds had the following capital loss carryforwards for federal income tax purposes:
| | | | | | | | | No | | No | | |
| | | Short Term Expiring On* | | Expiration | | Expiration | | |
| | | 2015 | | 2016 | | 2017 | | 2018 | | Short Term* | | Long Term* | | Total |
| Dynamic Equity Fund | | $ | 26,060,248 | | | $ | 31,726,954 | | | $ | 77,442,009 | | | $ | — | | | $ | — | | | $ | — | | | $ | 135,229,211 | |
| Balanced Allocation Fund | | | — | | | | 1,701,738 | | | | 13,833,137 | ** | | | 4,801,366 | ** | | | — | | | | — | | | | 20,336,241 | |
| Conservative Allocation Fund | | | — | | | | — | | | | 364,984 | ** | | | 23,321 | | | | — | | | | — | | | | 388,305 | |
| Growth Allocation Fund | | | — | | | | — | | | | 2,820,842 | | | | 4,330,564 | ** | | | — | | | | — | | | | 7,151,406 | |
| Moderate Growth | | | | | | | | | | | | | | | | | | | | | | | | | | | | |
| Allocation Fund | | | — | | | | — | | | | — | | | | 7,789,144 | ** | | | — | | | | — | | | | 7,789,144 | |
* The Regulated Investment Company Modernization Act of 2010 (the “Act”) was enacted on December 22, 2010. The Act made changes to several tax rules impacting the Funds. The provisions of the Act first became effective for the Funds’ fiscal year ended December 31, 2012 and are applicable to all subsequent fiscal years. Although the Act provides several benefits, including the unlimited carryover of future capital losses, there may be a greater likelihood that all or a portion of each Fund’s pre-enactment capital loss carryovers may expire without being utilized due to the fact that post-enactment capital losses must be utilized before pre-enactment capital loss carryovers may be utilized. Under the Act, new capital losses may now be carried forward indefinitely, and retain the character of the original loss as compared with pre-enactment law, where capital losses could be carried forward for up to eight years, and carried forward as short-term capital losses, irrespective of the character of the original loss.
**May be subject to limitation.
Notes to Financial Statements (Continued)
The capital loss carryforwards may be utilized in future years to offset net realized capital gains, if any, prior to distributing such gains to shareholders.
The following Funds had capital loss carryforwards that were deemed unusable due to limitations:
| Fund | | Amount |
| Balanced Allocation Fund | | $ | 10,540,836 | |
| Growth Allocation Fund | | | 29,327,131 | |
| Moderate Allocation Fund | | | 24,394,573 | |
During the year ended December 31, 2014, the following Funds utilized capital loss carryforwards:
| Fund | | Amount |
| Dynamic Equity Fund | | $ | 4,846,535 | |
| Balanced Allocation Fund | | | 5,928,712 | |
| Conservative Allocation Fund | | | 2,155,149 | |
| Growth Allocation Fund | | | 2,920,514 | |
| Moderate Growth Allocation Fund | | | 3,596,718 | |
Under current laws, certain capital losses realized after October 31 and ordinary losses realized after December 31 may be deferred (and certain ordinary losses after October and/or December 31 may be deferred) and treated as occurring on the first day of the following fiscal year. For the year ended December 31, 2014, the Funds did not elect to defer any losses.
The Funds have analyzed their tax positions taken on federal income tax returns for all open tax years (tax years ended December 31, 2012 through 2014 and July 31, 2011 through 2012) and have concluded that no provision for income tax is required in their financial statements.
Certain reclassifications, the result of permanent differences between financial statement and income tax reporting requirements, have been made to the components of capital. These reclassifications have no impact on the net assets or NAV per share of the Funds. The following reclassifications, which are primarily attributed to the reclassification of distributions received, redesignation of dividends paid, fund level over distribution, capital loss carryforwards written off due to limitations and capital dividends on short sales have been made to the following Funds for the year ended December 31, 2014:
| | | | | Accumulated | | Accumulated |
| | | Paid-In | | Net Investment | | Net Realized |
| Fund | | Capital | | Income (Loss) | | Gains (Losses) |
| Dynamic Equity Fund | | $ | — | | | $ | 24,377 | | | $ | (24,377 | ) |
| Balanced Allocation Fund | | | (10,540,836 | ) | | | 239,838 | | | | 10,300,998 | |
| Conservative Allocation Fund | | | — | | | | 81,071 | | | | (81,071 | ) |
| Growth Allocation Fund | | | (29,327,131 | ) | | | 260,300 | | | | 29,066,831 | |
| Moderate Growth Allocation Fund | | | (24,494,562 | ) | | | 429,087 | | | | 24,065,475 | |
6. Commitments and Contingencies
The Funds indemnify theTrust’s officers andTrustees for certain liabilities that might arise from their performance of their duties to the Funds. Additionally, in the normal course of business, the Funds enter into contracts that contain a variety of representations and warranties and which provide general indemnifications. The Funds’ maximum exposure under these arrangements is unknown, as this would involve future claims that may be made against the Funds.
Notes to Financial Statements (Continued)
7. Risk Associated with Concentration
Certain Funds invest a high percentage of their assets in specific sectors of the market in order to achieve a potentially greater investment return. As a result, these Funds may be more susceptible to economic, political, and regulatory developments in a particular sector of the market, positive or negative, and may experience increased volatility on the Funds’ NAVs and magnified effect on the total return.
8. Risks Associated with Credit
An issuer may be unable to make timely payments of either principal or interest. This may cause the issuer’s securities to decline in value. Credit risk is particularly relevant to those Funds that invest a significant amount of their assets in junk bonds or lower-rated securities.
9. Risks Associated with Interest Rate Changes
As interest rates rise, the value of fixed-income securities a Fund owns will likely decrease. The price of debt securities is generally linked to the prevailing market interest rates. In general, when interest rates rise, the price of debt securities falls, and when interest rates fall, the price of debt securities rises. The price volatility of a debt security also depends on its maturity. Longer-term securities are generally more volatile, so the longer the average maturity or duration of these securities, the greater their price risk. Duration is a measure of the expected life, taking into account any prepayment or call features of the security, that is used to determine the price sensitivity of the security for a given change in interest rates. Specifically, duration is the change in the value of a fixed-income security that will result from a 1% change in interest rates, and generally is stated in years. For example, as a general rule a 1% rise in interest rates means a 1% fall in value for every year of duration. Maturity, on the other hand, is the date on which a fixed-income security becomes due for payment of principal. There may be less governmental intervention in the securities markets in the near future. The negative impact on fixed income securities if interest rates increase as a result could negatively impact a Fund’s NAV.
10. Risks Associated with Leverage
By investing the proceeds received from selling securities short, the Dynamic Equity Fund is employing leverage, which creates special risks.The use of leverage may increase the Fund’s exposure to long or short equity positions and may cause the Fund’s NAV to be more volatile than if the Fund had not used leverage. This could result in increased volatility of returns.
11. Subsequent Events
Subsequent events occurring after the date of this report have been evaluated for potential impact to this report through the date the financial statements were issued.There were no subsequent events that necessitated recognition or disclosure in the Funds’ financial statements.
Report of Independent Registered Public Accounting Firm
The Board of Trustees and Shareholders of Touchstone Dynamic Equity Fund,Touchstone Balanced Allocation Fund, Touchstone Conservative Allocation Fund, Touchstone Growth Allocation Fund, and Touchstone Moderate Growth Allocation Fund
We have audited the accompanying statements of assets and liabilities, including the portfolios of investments, of Touchstone Dynamic Equity Fund,Touchstone Balanced Allocation Fund,Touchstone Conservative Allocation Fund, Touchstone Growth Allocation Fund, and Touchstone Moderate Growth Allocation Fund (the “Funds”) (five of the funds constituting the Touchstone Strategic Trust) as of December 31, 2014, and the related statements of operations and the statement of cash flows of Touchstone Dynamic Equity Fund for the year then ended, the statements of changes in net assets for each of the two years in the period then ended, and the financial highlights for each of the two years in the period then ended and the five-month period ended December 31, 2012. These financial statements and financial highlights are the responsibility of the Funds’ management. Our responsibility is to express an opinion on these financial statements and financial highlights based on our audits. The financial highlights for each of the periods presented through July 31, 2012 were audited by other auditors whose report dated September 21, 2012 expressed an unqualified opinion on those financial highlights.
We conducted our audits in accordance with the standards of the Public Company Accounting Oversight Board (United States). Those standards require that we plan and perform the audit to obtain reasonable assurance about whether the financial statements and financial highlights are free of material misstatement. We were not engaged to perform an audit of the Funds’ internal control over financial reporting. Our audits included consideration of internal control over financial reporting as a basis for designing audit procedures that are appropriate in the circumstances, but not for the purpose of expressing an opinion on the effectiveness of the Funds’ internal control over financial reporting. Accordingly, we express no such opinion. An audit also includes examining, on a test basis, evidence supporting the amounts and disclosures in the financial statements and financial highlights, assessing the accounting principles used and significant estimates made by management, and evaluating the overall financial statement presentation. Our procedures included confirmation of securities owned as of December 31, 2014, by correspondence with the custodian, transfer agent, and brokers or by other appropriate auditing procedures where replies from brokers were not received. We believe that our audits provide a reasonable basis for our opinion.
In our opinion, the financial statements and financial highlights referred to above present fairly, in all material respects, the financial position of Touchstone Dynamic Equity Fund, Touchstone Balanced Allocation Fund, Touchstone Conservative Allocation Fund, Touchstone Growth Allocation Fund, and Touchstone Moderate Growth Allocation Fund (five of the funds constituting the Touchstone Strategic Trust) at December 31, 2014, the results of their operations and its cash flows for Touchstone Dynamic Equity Fund for the year then ended, the statements of changes in net assets for each of the two years in the period then ended, and the financial highlights for each of the two years in the period then ended and the five-month period ended December 31, 2012, in conformity with U.S. generally accepted accounting principles.

Cincinnati, Ohio
February 20, 2015
Other Items (Unaudited)
Qualified Dividend Income
Under the Jobs and Growth Tax Relief Reconciliation Act of 2003 (the “Act”), the following percentages of ordinary dividends paid during the fiscal year ended December 31, 2014 are designated as “qualified dividend income,” as defined in the Act, and are subject to reduced tax rates. The Funds intend to pass through the maximum allowable percentage for Form 1099Div.
| Dynamic Equity Fund | | | 100.00 | % |
| Balanced Allocation Fund | | | 56.54 | % |
| Conservative Allocation Fund | | | 33.87 | % |
| Growth Allocation Fund | | | 94.50 | % |
| Moderate Growth Allocation Fund | | | 66.03 | % |
Dividend Received Deduction
For corporate shareholders, the following ordinary distributions paid during the current fiscal year ended December 31, 2014 qualify for the corporate dividends received deduction.The Funds intend to pass through the maximum allowable percentage for Form 1099Div.
| Dynamic Equity Fund | | | 100.00 | % |
| Balanced Allocation Fund | | | 29.31 | % |
| Conservative Allocation Fund | | | 18.08 | % |
| Growth Allocation Fund | | | 49.08 | % |
| Moderate Growth Allocation Fund | | | 34.94 | % |
For the year ended December 31, 2014, the Moderate Growth Allocation Fund designated $4,341,964 as long-term capital gains.
Foreign Tax Income & Foreign Tax Credit
Balanced Allocation Fund, Conservative Allocation Fund, Growth Allocation Fund and Moderate Growth Allocation Fund intend to pass through a foreign tax credit to their respective shareholders. For the fiscal year ended December 31, 2014, the total amount of foreign source income is $455,168 or $0.06 per share, $153,387 or $0.04 per share, $361,725 or $0.09 per share and $610,616 or $0.07 per share, respectively. The total amount of foreign taxes to be paid is $23,377 or $0.003 per share, $5,770 or $0.001 per share, $24,478 or $0.006 per share and $37,497 or $0.004 per share, respectively. Shareholders’ allocable share of the foreign tax credit will be reported on Form 1099Div.
Proxy Voting Guidelines
The Sub-Advisors are responsible for exercising the voting rights associated with the securities purchased and held by the Funds. A description of the policies and procedures that the Sub-Advisors use in fulfilling this responsibility is available as an appendix to the most recent Statement of Additional Information, which can be obtained without charge by calling toll free 1.800.543.0407 or by visiting the Touchstone website at www.touchstoneinvestments.com or on the Securities and Exchange Commission’s (the “Commission”) website www.sec.gov. Information regarding how those proxies were voted during the most recent twelve-month period ended June 30 is also available without charge by calling toll free 1.800.543.0407 or on the Commission’s website at www.sec.gov.
Quarterly Portfolio Disclosure
The Trust files a complete listing of portfolio holdings for each Fund as of the end of the first and third quarters of each fiscal year on Form N-Q. The complete listing (i) is available on the Commission’s website; (ii) may be reviewed and copied at the Commission’s Public Reference Room in Washington, DC; (iii) will be made available to shareholders upon request by calling 1.800.543.0407; or (iv) can be obtained on the Touchstone
Other Items (Unaudited) (Continued)
website at www.touchstoneinvestments.com. Information on the operation of the Public Reference Room may be obtained by calling 1.800.SEC.0330.
Schedule of Shareholder Expenses
As a shareholder of the Funds, you incur two types of costs: (1) transaction costs, including reinvested dividends or other distributions; and (2) ongoing costs, including investment advisory fees; distribution (12b-1) fees; and other Fund expenses. This example is intended to help you understand your ongoing costs (in dollars) of investing in the Funds and to compare these costs with the ongoing costs of investing in other mutual funds.
The example is based on an investment of $1,000 invested at the beginning of the period and held for the entire period, (July 1, 2014 through December 31, 2014).
Actual Expenses
The first line for each share class of a Fund in the table below provides information about actual account values and actual expenses. You may use the information in this line, together with the amount you invested, to estimate the expenses that you paid over the period. Simply divide your account value by $1,000 (for example, an $8,600 account value divided by $1,000 = 8.6), then multiply the result by the number in the first line under the heading entitled “Expenses Paid During the Six Months Ended December 31, 2014” to estimate the expenses you paid on your account during this period.
Hypothetical Example for Comparison Purposes
The second line for each share class of a Fund in the table below provides information about hypothetical account values and hypothetical expenses based on the Funds’ actual expense ratio and an assumed rate of return of 5% per year before expenses, which is not the Funds’ actual return. The hypothetical account values and expenses may not be used to estimate the actual ending account balance or expenses you paid for the period. You may use this information to compare the ongoing costs of investing in the Funds and other funds. To do so, compare this 5% hypothetical example with the 5% hypothetical examples that appear in the shareholder reports of the other funds.
Please note that the expenses shown in the table below are meant to highlight your ongoing costs only and do not reflect any transactional costs, such as sales charges (loads), redemption fees, or exchange fees. Therefore, the second line for each share class of a Fund in the table below is useful in comparing ongoing costs only, and will not help you determine the relative total costs of owning different funds. In addition, if these transactional costs were included, your costs would have been higher.
| | | | | | | | | | | Expenses |
| | | | | Net Expense | | Beginning | | Ending | | Paid During |
| | | | | Ratio | | Account | | Account | | the Six Months |
| | | | | Annualized | | Value | | Value | | Ended |
| | | | | December 31, | | July 1, | | December 31, | | December 31, |
| | | | | 2014 | | 2014 | | 2014 | | 2014* |
| Touchstone Dynamic Equity Fund | | | | | | | | | | | | | | | | |
| Class A | | Actual | | | 2.02 | % | | $ | 1,000.00 | | | $ | 1,002.80 | | | $ | 10.20 | ** |
| Class A | | Hypothetical | | | 2.02 | % | | $ | 1,000.00 | | | $ | 1,015.02 | | | $ | 10.26 | ** |
| | | | | | | | | | | | | | | | | | | |
| Class C | | Actual | | | 2.77 | % | | $ | 1,000.00 | | | $ | 999.20 | | | $ | 13.96 | ** |
| Class C | | Hypothetical | | | 2.77 | % | | $ | 1,000.00 | | | $ | 1,011.24 | | | $ | 14.04 | ** |
| | | | | | | | | | | | | | | | | | | |
| Class Y | | Actual | | | 1.70 | % | | $ | 1,000.00 | | | $ | 1,004.90 | | | $ | 8.59 | ** |
| Class Y | | Hypothetical | | | 1.70 | % | | $ | 1,000.00 | | | $ | 1,016.64 | | | $ | 8.64 | ** |
| | | | | | | | | | | | | | | | | | | |
| Institutional Class | | Actual | | | 1.72 | % | | $ | 1,000.00 | | | $ | 1,004.50 | | | $ | 8.69 | ** |
| Institutional Class | | Hypothetical | | | 1.72 | % | | $ | 1,000.00 | | | $ | 1,016.53 | | | $ | 8.74 | ** |
Other Items (Unaudited) (Continued)
| | | | | | | | | | | Expenses |
| | | | | Net Expense | | Beginning | | Ending | | Paid During |
| | | | | Ratio | | Account | | Account | | the Six Months |
| | | | | Annualized | | Value | | Value | | Ended |
| | | | | December 31, | | July 1, | | December 31, | | December 31, |
| | | | | 2014 | | 2014 | | 2014 | | 2014* |
| Touchstone Balanced Allocation Fund*** | | | | | | | | | | | | | | | | |
| Class A | | Actual | | | 0.49 | % | | $ | 1,000.00 | | | $ | 994.60 | | | $ | 2.46 | |
| Class A | | Hypothetical | | | 0.49 | % | | $ | 1,000.00 | | | $ | 1,022.74 | | | $ | 2.50 | |
| | | | | | | | | | | | | | | | | | | |
| Class C | | Actual | | | 1.24 | % | | $ | 1,000.00 | | | $ | 990.10 | | | $ | 6.22 | |
| Class C | | Hypothetical | | | 1.24 | % | | $ | 1,000.00 | | | $ | 1,018.95 | | | $ | 6.31 | |
| | | | | | | | | | | | | | | | | | | |
| Class Y | | Actual | | | 0.24 | % | | $ | 1,000.00 | | | $ | 995.90 | | | $ | 1.21 | |
| Class Y | | Hypothetical | | | 0.24 | % | | $ | 1,000.00 | | | $ | 1,024.00 | | | $ | 1.22 | |
| | | | | | | | | | | | | | | | | | | |
| Institutional Class | | Actual | | | 0.24 | % | | $ | 1,000.00 | | | $ | 995.90 | | | $ | 1.21 | |
| Institutional Class | | Hypothetical | | | 0.24 | % | | $ | 1,000.00 | | | $ | 1,024.00 | | | $ | 1.22 | |
| | | | | | | | | | | | | | | | | | | |
| Touchstone Conservative Allocation Fund*** | | | | | | | | | | |
| Class A | | Actual | | | 0.49 | % | | $ | 1,000.00 | | | $ | 996.30 | | | $ | 2.47 | |
| Class A | | Hypothetical | | | 0.49 | % | | $ | 1,000.00 | | | $ | 1,022.74 | | | $ | 2.50 | |
| | | | | | | | | | | | | | | | | | | |
| Class C | | Actual | | | 1.24 | % | | $ | 1,000.00 | | | $ | 992.60 | | | $ | 6.23 | |
| Class C | | Hypothetical | | | 1.24 | % | | $ | 1,000.00 | | | $ | 1,018.95 | | | $ | 6.31 | |
| | | | | | | | | | | | | | | | | | | |
| Class Y | | Actual | | | 0.24 | % | | $ | 1,000.00 | | | $ | 997.60 | | | $ | 1.21 | |
| Class Y | | Hypothetical | | | 0.24 | % | | $ | 1,000.00 | | | $ | 1,024.00 | | | $ | 1.22 | |
| | | | | | | | | | | | | | | | | | | |
| Institutional Class | | Actual | | | 0.24 | % | | $ | 1,000.00 | | | $ | 998.50 | | | $ | 1.21 | |
| Institutional Class | | Hypothetical | | | 0.24 | % | | $ | 1,000.00 | | | $ | 1,024.00 | | | $ | 1.22 | |
| | | | | | | | | | | | | | | | | | | |
| Touchstone Growth Allocation Fund*** | | | | | | | | | | | |
| Class A | | Actual | | | 0.49 | % | | $ | 1,000.00 | | | $ | 988.50 | | | $ | 2.46 | |
| Class A | | Hypothetical | | | 0.49 | % | | $ | 1,000.00 | | | $ | 1,022.74 | | | $ | 2.50 | |
| | | | | | | | | | | | | | | | | | | |
| Class C | | Actual | | | 1.24 | % | | $ | 1,000.00 | | | $ | 984.60 | | | $ | 6.20 | |
| Class C | | Hypothetical | | | 1.24 | % | | $ | 1,000.00 | | | $ | 1,018.95 | | | $ | 6.31 | |
| | | | | | | | | | | | | | | | | | | |
| Class Y | | Actual | | | 0.24 | % | | $ | 1,000.00 | | | $ | 990.00 | | | $ | 1.20 | |
| Class Y | | Hypothetical | | | 0.24 | % | | $ | 1,000.00 | | | $ | 1,024.00 | | | $ | 1.22 | |
| | | | | | | | | | | | | | | | | | | |
| Institutional Class | | Actual | | | 0.24 | % | | $ | 1,000.00 | | | $ | 989.70 | | | $ | 1.20 | |
| Institutional Class | | Hypothetical | | | 0.24 | % | | $ | 1,000.00 | | | $ | 1,024.00 | | | $ | 1.22 | |
Other Items (Unaudited) (Continued)
| | | | | | | | | | | Expenses |
| | | | | Net Expense | | Beginning | | Ending | | Paid During |
| | | | | Ratio | | Account | | Account | | the Six Months |
| | | | | Annualized | | Value | | Value | | Ended |
| | | | | December 31, | | July 1, | | December 31, | | December 31, |
| | | | | 2014 | | 2014 | | 2014 | | 2014* |
| Touchstone Moderate Growth Allocation Fund*** | | | | | | | | | | | | | |
| Class A | | Actual | | | 0.49 | % | | $ | 1,000.00 | | | $ | 995.20 | | | $ | 2.46 | |
| Class A | | Hypothetical | | | 0.49 | % | | $ | 1,000.00 | | | $ | 1,022.74 | | | $ | 2.50 | |
| | | | | | | | | | | | | | | | | | | |
| Class C | | Actual | | | 1.24 | % | | $ | 1,000.00 | | | $ | 991.40 | | | $ | 6.22 | |
| Class C | | Hypothetical | | | 1.24 | % | | $ | 1,000.00 | | | $ | 1,018.95 | | | $ | 6.31 | |
| | | | | | | | | | | | | | | | | | | |
| Class Y | | Actual | | | 0.24 | % | | $ | 1,000.00 | | | $ | 995.70 | | | $ | 1.21 | |
| Class Y | | Hypothetical | | | 0.24 | % | | $ | 1,000.00 | | | $ | 1,024.00 | | | $ | 1.22 | |
| | | | | | | | | | | | | | | | | | | |
| Institutional Class | | Actual | | | 0.24 | % | | $ | 1,000.00 | | | $ | 996.50 | | | $ | 1.21 | |
| Institutional Class | | Hypothetical | | | 0.24 | % | | $ | 1,000.00 | | | $ | 1,024.00 | | | $ | 1.22 | |
| * | Expenses are equal to the Fund's annualized expense ratio, multiplied by the average account value over the period, multiplied by 184/365 (to reflect one-half year period). |
| ** | Excluding interest and dividend expenses on securities sold short, your actual cost of investment in Class A, Class C, Class Y and Institutional Class would be $7.82, $11.59, $6.22 and $6.32, respectively, and your hypothetical cost of investment in Class A, Class C, Class Y and Institutional Class would be $7.88, $11.67, $6.26, and $6.36, respectively. |
| *** | The annualized expense ratios for the Allocation Funds do not include fees and expenses of the Underlying Funds in which the Allocation Funds invest. |
Advisory and Sub-Advisory Agreement Approval Disclosure
At a meeting held on November 20, 2014, the Board of Trustees (the “Board” or “Trustees”) of the Touchstone Strategic Trust (the “Trust”), and by a separate vote, the Independent Trustees of the Trust, approved the continuance of the Investment Advisory Agreement between the Trust and the Advisor with respect to each Fund of the Trust, and the continuance of the Sub-Advisory Agreement between the Advisor and each Fund’s respective Sub-Advisor.
In determining whether to approve the continuation of the Investment Advisory Agreement and the Sub-Advisory Agreement, the Advisor furnished information necessary for a majority of the Independent Trustees to make the determination that the continuance of the Investment Advisory Agreement and the Sub-Advisory Agreement was in the best interests of the respective Funds and their shareholders. The information provided to the Board included: (1) industry data comparing advisory fees and expense ratios of comparable investment companies; (2) comparative performance information; (3) the Advisor’s and its affiliates’ revenues and costs of providing services to the Funds; and (4) information about the Advisor’s and Sub-Advisor’s personnel. Prior to voting, the Independent Trustees reviewed the proposed continuance of the Investment Advisory Agreement and the Sub-Advisory Agreement with management and experienced independent legal counsel and received materials from such counsel discussing the legal standards for their consideration of the proposed continuation of the Investment Advisory Agreement and the Sub-Advisory Agreement. The Independent Trustees also reviewed the proposed continuation of the Investment Advisory Agreement and the Sub-Advisory Agreement within dependent legal counsel in private sessions at which no representatives of management were present.
In approving the Funds’ Investment Advisory Agreement, the Board considered various factors, among them: (1) the nature, extent and quality of services provided to the Funds, including the personnel providing such services; (2) the Advisor’s compensation and profitability; (3) a comparison of fees and performance with other advisers; (4) economies of scale; and (5) the terms of the Investment Advisory Agreement. The Board’s analysis of these factors is set forth below. The Independent Trustees were advised by independent legal counsel throughout the process.
Other Items (Unaudited) (Continued)
Nature, Extent and Quality of Advisor Services. The Board considered the level and depth of knowledge of the Advisor, including the professional experience and qualifications of senior personnel. In evaluating the quality of services provided by the Advisor, the Board took into account its familiarity with the Advisor’s senior management through Board meetings, discussions and reports during the preceding year. The Board also took into account the Advisor’s compliance policies and procedures. The quality of administrative and other services, including the Advisor’s role in coordinating the activities of the Funds’ other service providers, was also considered. The Board also considered the Advisor’s relationship with its affiliates and the resources available to them, as well as any potential conflicts of interest.
The Board discussed the Advisor’s effectiveness in monitoring the performance of each Sub-Advisor, and the Advisor’s timeliness in responding to performance issues. The Board considered the Advisor’s process for monitoring each of the Sub-Advisors, which includes an examination of both qualitative and quantitative elements of the Sub-Advisor’s organization, personnel, procedures, investment discipline, infrastructure and performance. The Board considered that the Advisor conducts regular on-site compliance visits with each Sub-Advisor, during which the Advisor examines a wide variety of factors, such as the financial condition of the Sub-Advisor, the quality of the Sub-Advisor’s systems, the effectiveness of the Sub-Advisor’s disaster recovery programs, trade allocation and execution procedures, compliance with the Sub-Advisor’s policies and procedures, results of regulatory examinations and any other factors that might affect the quality of services that the Sub-Advisor provides to the applicable Funds. The Board noted that the Advisor’s compliance monitoring processes also include quarterly reviews of compliance reports, and that any issues arising from such reports and the Advisor’s compliance visits to the Sub-Advisors are reported to the Board.
The Trustees concluded that they were satisfied with the nature, extent and quality of services provided to each Fund by the Advisor under the Investment Advisory Agreement.
Advisor’s Compensation and Profitability. The Board took into consideration the financial condition and profitability of the Advisor and its affiliates and the direct and indirect benefits derived by the Advisor and its affiliates from the Advisor’s relationship with the Funds. The information considered by the Board included operating profit margin information for the Advisor’s business as a whole. The Board noted that the Advisor had waived a portion of advisory fees and administrative fees and/or reimbursed expenses in order to limit the Funds’ net operating expenses. The Board also noted that the Advisor pays the Sub-Advisors’ sub-advisory fees out of the advisory fees the Advisor receives from the Funds. The Board reviewed the profitability of the Advisor’s relationship with the Funds both before and after tax expenses, and also considered whether the Advisor has the financial wherewithal to continue to provide services to the Funds, noting the ongoing commitment of the Advisor’s parent company with respect to providing support and resources as needed. The Board considered that the Funds’ distributor, an affiliate of the Advisor, receives Rule 12b-1 distribution fees from the Funds and receives a portion of the sales charges on sales or redemptions of certain classes of shares. The Board also noted that the Advisor derives benefits to its reputation and other benefits from its association with the Funds.
The Board recognized that the Advisor should be entitled to earn a reasonable level of profits in exchange for the level of services it provides to each Fund and the entrepreneurial risk that it assumes as Advisor. Based upon their review, the Trustees concluded that the Advisor’s and its affiliates’ level of profitability, if any, from their relationship with each Fund was reasonable and not excessive.
Expenses and Performance. The Board compared the respective advisory fees and total expense ratios for each of the Funds with various comparative data, including the median and average advisory fees and total expense ratios of each Fund’s respective peer group. The Board also considered, among other data, the Funds’ respective performance results during the six-month, twelve-month and thirty-six-month periods ended June 30, 2014, and noted that the Board reviews on a quarterly basis detailed information about each Fund’s performance
Other Items (Unaudited) (Continued)
results, portfolio composition and investment strategies. The Board also took into account current market conditions and their effect on the Funds’ performance.
The Board also considered the effect of each Fund’s growth and size on its performance and expenses. The Board noted that the Advisor had waived portions of the fees and/or reimbursed expenses of the Funds in order to reduce the Funds’ respective operating expenses to targeted levels. The Board noted that the sub-advisory fees under the Sub-Advisory Agreement with respect to each Fund were paid by the Advisor out of the advisory fees it receives from the Fund and considered the impact of such sub-advisory fees on the profitability of the Advisor. In reviewing the respective expense ratios and performance of each of the Funds, the Board also took into account the nature, extent and quality of the services provided to the Funds by the Advisor and its affiliates.
The Board considered, among other data, the specific factors and related conclusions set forth below with respect to each Fund:
Touchstone Dynamic Equity Fund. The Fund’s advisory fee and total expense ratio (net of applicable expense waivers and reimbursements) were below the median of its peer group. The Board noted that the Advisor was currently waiving a portion of the Fund’s fees. The Fund’s performance for the six- and thirty-six-month periods ended June 30, 2014 was in the 2nd quintile of its peer group. The Fund’s performance for the twelve-month period ended June 30, 2014 was in the 3rd quintile of its peer group. Based upon their review, the Trustees concluded that the Fund’s performance was satisfactory relative to the performance of funds with similar investment objectives and relevant indices, and that the advisory fee was reasonable in light of the services received by the Fund from the Advisor and the other factors considered.
Touchstone Conservative Allocation Fund. The Fund’s advisory fee and total expense ratio (net of applicable expense waivers and reimbursements) were above the median and below the median, respectively, of its peer group. The Board noted that the Advisor was currently waiving a portion of the Fund’s fees. The Fund’s performance for the six- and thirty-six-month-periods ended June 30, 2014 was in the 4th quintile of its peer group. The Fund’s performance for the twelve-month period ended June 30, 2014 was in the 5th quintile of its peer group. The Board noted management’s discussion of fund performance and management’s continued close monitoring of the fund. Based upon their review, the Trustees concluded that the Fund’s overall performance was satisfactory relative to the performance of funds with similar investment objectives and relevant indices, and that the advisory fee was reasonable in light of the services received by the Fund from the Advisor and the other factors considered.
Touchstone Balanced Allocation Fund. The Fund’s advisory fee and total expense ratio (net of applicable expense waivers and reimbursements) were above the median of its peer group. The Board noted that the Advisor was currently waiving a portion of the Fund’s fees. The Fund’s performance for the six-month period ended June 30, 2014 was in the 3rd quintile of its peer group. The Fund’s performance for the twelve-month period ended June 30, 2014 was in the 5th quintile of its peer group and the Fund’s performance was in the 4th quintile of its peer group for the same thirty-six-month period. The Board noted management’s explanation for the Fund’s underperformance and management’s continued close monitoring of fund performance. Based upon their review, the Trustees concluded that the Fund’s overall performance was satisfactory relative to the performance of funds with similar investment objectives and relevant indices, and that the advisory fee was reasonable in light of the services received by the Fund from the Advisor and the other factors considered.
Touchstone Moderate Growth Allocation Fund. The Fund’s advisory fee and total expense ratio (net of applicable expense waivers and reimbursements) were above the median and below the median, respectively, of its peer group. The Board noted that the Advisor was currently waiving a portion of the Fund’s fees. The Fund’s performance for the six-month period ended June 30, 2014 was in the 3rd quintile of its peer group. The Fund’s performance for the twelve-month period ended June 30, 2014 was in the 5th quintile of its peer group. The Fund’s performance
Other Items (Unaudited) (Continued)
for the thirty-six-month period ended June 30, 2014 was in the 4th quintile of its peer group. The Board considered management’s discussion of fund performance and management’s continued close monitoring of fund performance. Based upon their review, the Trustees concluded that the Fund’s overall performance was satisfactory relative to the performance of funds with similar investment objectives and relevant indices, and that the advisory fee was reasonable in light of the services received by the Fund from the Advisor and the other factors considered.
Touchstone Growth Allocation Fund. The Fund’s advisory fee and total expense ratio (net of applicable expense waivers and reimbursements) were below the median and above the median, respectively, of its peer group. The Board noted that the Advisor was currently waiving a portion of the Fund’s fees. The Board took into account management’s discussion of the Fund’s expenses, including the impact that the relatively small size of the Fund has upon expenses. The Fund’s performance for the six-month period ended June 30, 2014 was in the 4th quintile of its peer group. The Fund’s performance for the twelve- and thirty-six-month periods ended June 30, 2014 was in the 5th quintile of its peer group. The Board considered management’s discussion of fund performance and management’s continued close monitoring of fund performance. Based upon their review, the Trustees concluded that the Fund’s overall performance was satisfactory relative to the performance of funds with similar investment objectives and relevant indices, and that the advisory fee was reasonable in light of the services received by the Fund from the Advisor and the other factors considered.
Economies of Scale. The Board considered the effect of each Fund’s current size and potential growth on its performance and expenses. The Board considered the effective advisory fees under the Investment Advisory Agreement as a percentage of assets at different asset levels and possible economies of scale that might be realized if the assets of each Fund increase. The Board noted that the advisory fee schedules for the Funds contain breakpoints that would reduce the respective advisory fee rate on assets above specified levels as the respective Fund’s assets increased. The Board also noted that if a Fund’s assets increase over time, the Fund also might realize other economies of scale if assets increase proportionally more than certain other expenses. The Board also considered the fact that, under the Investment Advisory Agreement, the advisory fee payable to the Advisor by a Fund was reduced by the total sub-advisory fee paid by the Advisor to the Fund’s Sub-Advisor.
Conclusion. In considering the renewal of the Funds’ Investment Advisory Agreement, the Board, including the Independent Trustees, did not identify any single factor as controlling, and each Trustee may have attributed different weights to the various factors. The Trustees evaluated all information available to them on a Fund-by-Fund basis, and their determinations were made separately with respect to each Fund. The Board reached the following conclusions regarding the Funds’ Investment Advisory Agreement with the Advisor, among others: (a) the Advisor demonstrated that it possesses the capability and resources to perform the duties required of it under the Investment Advisory Agreement; (b) the Advisor maintains an appropriate compliance program; (c) the overall performance of each Fund is satisfactory relative to the performance of funds with similar investment objectives and relevant indices; and (d) each Fund’s advisory fee is reasonable in light of the services received by the Fund from the Advisor and the other factors considered. Based on their conclusions, the Trustees determined with respect to each Fund that continuation of the Investment Advisory Agreement was in the best interests of the Fund and its shareholders.
In approving the applicable Funds’ Sub-Advisory Agreement, the Board considered various factors with respect to each Fund and the Sub-Advisory Agreement, among them: (1) the nature, extent and quality of services provided to the Fund, including the personnel providing such services; (2) the Sub-Advisor’s compensation; (3) a comparison of the sub-advisory fee and performance with other advisers; and (4) the terms of the Sub-Advisory Agreement. The Board’s analysis of these factors is set forth below. The Independent Trustees were advised by independent legal counsel throughout the process.
Other Items (Unaudited) (Continued)
Nature, Extent and Quality of Services Provided; Investment Personnel. The Board considered information provided by the Advisor regarding the services provided by the Sub-Advisor, including information presented periodically throughout the previous year. The Board noted that, on a periodic basis, the Board meets with portfolio managers of the Sub-Advisor to discuss their performance and investment processes and strategies. The Board considered the Sub-Advisor’s level of knowledge and investment style. The Board reviewed the experience and credentials of the investment personnel who are responsible for managing the investment of portfolio securities with respect to the Funds. The Board also noted the Sub-Advisor’s brokerage practices.
Sub-Advisor’s Compensation, Profitability and Economies of Scale. The Board also took into consideration the financial condition of the Sub-Advisor and any indirect benefits derived by the Sub-Advisor and its affiliates from the Sub-Advisor’s relationship with the Funds. In considering the profitability to the Sub-Advisor of its relationship with the Funds, the Board noted the undertaking of the Advisor to maintain expense limitations for the Funds and also noted that the sub-advisory fees under the Sub-Advisory Agreement were paid by the Advisor out of the advisory fees that it receives under the Investment Advisory Agreement and are negotiated at arm’s-length. As a consequence, the profitability to the Sub-Advisor of its relationship with a Fund was not a substantial factor in the Board’s deliberations. For similar reasons, the Board did not consider the potential economies of scale in the Sub-Advisor’s management of the Funds to be a substantial factor in its consideration, although the Board noted that the sub-advisory fee schedule for each Fund contained breakpoints that would reduce the sub-advisory fee rate on assets above specified levels if the Fund’s assets increased.
Sub-Advisory Fees and Fund Performance. The Board considered that each Fund pays an advisory fee to the Advisor and that the Advisor pays a sub-advisory fee to the Sub-Advisor out of the advisory fees it receives from the respective Funds. The Board considered the amount retained by the Advisor and the sub-advisory fees paid to the Sub-Advisor with respect to the various services provided by the Advisor and the Sub-Advisor. The Board also noted that the Advisor negotiated the sub-advisory fee with the Sub-Advisor at arm’s-length. The Board reviewed the sub-advisory fee for each Fund in relation to various comparative data, including the median and average sub-advisory fees of each Fund’s peer group, and considered the following information.
Touchstone Dynamic Equity Fund. The Fund’s sub-advisory fee was below the median of its peer group. Based upon their review, the Trustees concluded that the sub-advisory fee was reasonable in light of the services received by the Fund from the Sub-Advisor and the other factors considered.
Touchstone Conservative Allocation Fund. The Fund’s sub-advisory fee was at the median of its peer group. Based upon their review, the Trustees concluded that the sub-advisory fee was reasonable in light of the services received by the Fund from the Sub-Advisor and the other factors considered.
Touchstone Balanced Allocation Fund. The Fund’s sub-advisory fee was below the median of its peer group. Based upon their review, the Trustees concluded that the sub-advisory fee was reasonable in light of the services received by the Fund from the Sub-Advisor and the other factors considered.
Touchstone Moderate Growth Allocation Fund. The Fund’s sub-advisory fee was below the median of its peer group. Based upon their review, the Trustees concluded that the sub-advisory fee was reasonable in light of the services received by the Fund from the Sub-Advisor and the other factors considered.
Touchstone Growth Allocation Fund. The Fund’s sub-advisory fee was below the median of its peer group. Based upon their review, the Trustees concluded that the sub-advisory fee was reasonable in light of the services received by the Fund from the Sub-Advisor and the other factors considered.
As noted above, the Board considered each Fund’s performance during the six-month, twelve-month and thirty-six-month periods ended June 30, 2014 as compared to each Fund’s peer group and noted that the Board reviews on a quarterly basis detailed information about each Fund’s performance results, portfolio composition and investment strategies.The Board also noted the Advisor’s expertise and resources in monitoring the performance,
Other Items (Unaudited) (Continued)
investment style and risk-adjusted performance of the Sub-Advisor. The Board also was mindful of the Advisor’s ongoing monitoring of the Sub-Advisor’s performance and the measures undertaken by the Advisor to address any underperformance.
Conclusion. In considering the renewal of the Sub-Advisory Agreement with respect to each applicable Fund, the Board, including the Independent Trustees, did not identify any single factor as controlling, and each Trustee may have attributed different weights to the various factors. The Board reached the following conclusions regarding the Sub-Advisory Agreement with respect to each Fund, among others: (a) the Sub-Advisor is qualified to manage each Fund’s assets in accordance with the Fund’s investment goals and policies; (b) the Sub-Advisor maintains an appropriate compliance program; (c) the overall performance of each Fund is satisfactory relative to the performance of funds with similar investment objectives and relevant indices; (d) each Fund’s sub-advisory fee is reasonable in light of the services received by the Fund from the Sub-Advisor and the other factors considered; and (e) the Sub-Advisor’s investment strategies are appropriate for pursuing the investment goals of each Fund. Based on its conclusions, the Board determined that approval of the Sub-Advisory Agreement with respect to each applicable Fund was in the best interests of the Fund and its shareholders.
Management of the Trust (Unaudited)
Listed below is required information regarding the Trustees and principal officers of the Trust. The Trust’s Statement of Additional Information includes additional information about the Trustees and is available, without charge, upon request by calling 1.800.543.0407 or by visiting the Touchstone website at www.touchstoneinvestments.com.
| Interested Trustees1 : | | | | | | |
| | | | | | | | | Number | | |
| | | | | | | | | of Funds | | |
| | | | | | | | | Overseen | | |
| | | | | Term of | | | | in the | | |
| Name | | Position(s) | | Office And | | | | Touchstone | | Other |
| Address | | Held with | | Length of | | Principal Occupation(s) | | Fund | | Directorships |
| Age | | Trust | | Time Served | | During Past 5 Years | | Complex2 | | Held During the Past 5 Years3 |
Jill T. McGruder
Touchstone Advisors, Inc
303 Broadway
Suite 1100
Cincinnati, OH
Year of Birth: 1955 | | Trustee and President | | Until retirement at age 75 or until she resigns or is removed Trustee since 1999 | | President and CEO of IFS Financial Services, Inc. (a holding company). | | 49 | | Director of LaRosa’s, Inc. (a restaurant chain) from 1999 to 2011; IFS Financial Services, Inc. (a holding company) from 1999 to the present; Integrity and National Integrity Life Insurance Co. from 2005 to the present; Touchstone Securities (the Trust’s distributor) from 1999 to the present; Touchstone Advisors (the Trust’s investment advisor and administrator) from 1999 to the present; W&S Brokerage Services (a brokerage company) from 1999 to the present; W&S Financial Group Distributors (a distribution company) from 1999 to the present; Every Child Succeeds (a social services company) from 2007 to the present; Taft Museum of Art from 2007 to the present; and YMCA of Greater Cincinnati from 2012 to the present. |
| Independent Trustees: |
Phillip R. Cox
c/o Touchstone Advisors, Inc.
303 Broadway
Suite 1100
Cincinnati, OH 45202
Year of Birth: 1947 | | Trustee | | Until retirement at age 75 or until he resigns or is removed Trustee since 1999 | | President and Chief Executive Officer of Cox Financial Corp. (a financial services company) from 1971 to the present. | | 49 | | Director of Cincinnati Bell (a communications company) from 1994 to the present; Bethesda Inc. (a hospital) from 2005 to the present; Timken Co. (a manufacturing company) from 2004 to the 2014; TimkenSteel from 2014 to the present; Diebold, Inc. (a technology solutions company) from 2004 to the present; and Ohio Business Alliance for Higher Education and the Economy from 2005 to the present. |
William C. Gale
c/o Touchstone Advisors, Inc.
303 Broadway Suite 1100
Cincinnati, OH 45202
Year of Birth: 1952 | | Trustee | | Until retirement at age 75 or until he resigns or is removed Trustee since 2013 | | Senior Vice President and Chief Financial Officer (from 2003 to January 2015) of Cintas Corporation (a business services company). | | 49 | | None. |
Susan J. Hickenlooper
c/o Touchstone Advisors, Inc.
303 Broadway
Suite 1100
Cincinnati, OH 45202
Year of Birth: 1946 | | Trustee | | Until retirement at age 75 or until she resigns or is removed Trustee since 2009 | | Financial Analyst for Impact 100 (charitable organization) from November 2012 to 2013. | | 49 | | Trustee of Diocese of Southern Ohio from 2014 to present; and Trustee of Episcopal Retirement Homes Foundation from 1998 to 2011 (a charitable organization). |
Management of the Trust (Unaudited) (Continued)
| Independent Trustees (Continued): |
| | | | | | | | | Number | | |
| | | | | | | | | of Funds | | |
| | | | | | | | | Overseen | | |
| | | | | Term of | | | | in the | | |
| Name | | Position(s) | | Office And | | | | Touchstone | | Other |
| Address | | Held with | | Length of | | Principal Occupation(s) | | Fund | | Directorships |
| Age | | Trust | | Time Served | | During Past 5 Years | | Complex2 | | Held During the Past 5 Years3 |
Kevin A. Robie
c/o Touchstone Advisors, Inc.
303 Broadway
Suite 1100
Cincinnati, OH 45202
Year of Birth: 1956 | | Trustee | | Until retirement at age 75 or until he resigns or is removed Trustee since 2013 | | Vice President of Portfolio Management at Soin International LLC (a multinational holding company) from 2004 to the present. | | 49 | | Director of Buckeye EcoCare, Inc. (a lawn care company) from 2013 to the present; Trustee of Dayton Region New Market Fund, LLC (a private fund) from 2010 to present; Trustee of the Entrepreneurs Center, Inc. (a small business incubator) from 2006 to the present; and Director of Interventional Imaging, Inc. (a medical device company) from 2004 to 2011. |
Edward J. VonderBrink
c/o Touchstone Advisors, Inc.
303 Broadway
Suite 1100
Cincinnati, OH 45202
Year of Birth: 1944 | | Trustee | | Until retirement at age 75 or until he resigns or is removed Trustee since 2013 | | Consultant, VonderBrink Consulting LLC from 2000 to the present. | | 49 | | Director of Streamline Health Solutions, Inc. (healthcare IT) from 2006 to the present; Mercy Health from 2013 to the present; Mercy Health Foundation (healthcare nonprofit) from 2008 to the present; and Al Neyer Inc. (a construction company) from 2013 to the present. |
| 1 | Ms. McGruder, as a director of the Advisor and the Distributor and an officer of affiliates of the Advisor and the Distributor, is an “interested person” of the Trust within the meaning of Section 2(a)(19) of the 1940 Act. |
| 2 | As of December 31, 2014, the Touchstone Fund Complex consists of 18 series of the Trust, 1 series of Touchstone Institutional Funds Trust, 4 series of Touchstone Investment Trust, 13 series of Touchstone Funds Group Trust, 3 series of Touchstone Tax-Free Trust, and 10 variable annuity series of Touchstone Variable Series Trust. |
| 3 | Each Trustee is also a Trustee of Touchstone Institutional Funds Trust, Touchstone Investment Trust, Touchstone Funds Group Trust, Touchstone Tax-Free Trust, and Touchstone Variable Series Trust. |
Management of the Trust (Unaudited) (Continued)
The following is a list of the Officers of the Trusts, the length of time served and principal occupations for the past five years.
| Principal Officers: |
| | | | | Term of | | |
| Name | | Position(s) | | Office And | | |
| Address | | Held with | | Length of | | Principal Occupation(s) |
| Age | | Trust1 | | Time Served | | During the Past 5 Years |
Jill T. McGruder
Touchstone Advisors, Inc
303 Broadway
Suite 1100
Cincinnati, OH 45202
Year of Birth: 1955 | | President | | Until resignation, removal or disqualification President since 2006 | | See biography above. |
Steven M. Graziano
Touchstone Advisors, Inc
303 Broadway
Suite 1100
Cincinnati, OH 45202
Year of Birth: 1954 | | Vice President | | Until resignation, removal or disqualification Vice President since 2009 | | President of Touchstone Advisors, Inc. |
Timothy D. Paulin
Touchstone Advisors, Inc
303 Broadway
Suite 1100
Cincinnati, OH 45202
Year of Birth: 1963 | | Vice President | | Until resignation, removal or disqualification Vice President since 2010 | | Vice President of Investment Research and Product Management of Touchstone Advisors, Inc.; Director of Product Design of Klein Decisions, Inc. 2003 – 2010. |
Timothy S. Stearns
Touchstone Advisors, Inc
303 Broadway
Suite 1100
Cincinnati, OH 45202
Year of Birth: 1963 | | Chief Compliance Officer | | Until resignation, removal or disqualification Chief Compliance Officer since 2013 | | Chief Compliance Officer of Touchstone Advisors, Inc.; Chief Compliance Officer of Envestnet Asset Management, Inc. (2009 to 2013). |
Terrie A. Wiedenheft
Touchstone Advisors, Inc
303 Broadway
Suite 1100
Cincinnati, OH 45202
Year of Birth: 1962 | | Controller and Treasurer | | Until resignation, removal or disqualification Controller and Treasurer since 2006 | | Senior Vice President, Chief Financial Officer and Chief Operations Officer of IFS Financial Services, Inc. (a holding company). |
Elizabeth R. Freeman
BNY Mellon
201 Washington St, 34th Fl.
Boston, MA 02108
Year of Birth: 1962 | | Secretary | | Until resignation, removal or disqualification Secretary since 2011 | | Managing Director and Senior Counsel of BNY Mellon Investment Servicing (US) Inc. |
| 1 | Each officer also holds the same office with the Trust, Touchstone Institutional Funds Trust, Touchstone Investment Trust, Touchstone Funds Group Trust, Touchstone Tax-Free Trust, and Touchstone Variable Series Trust. |
PRIVACY PROTECTION POLICY
We Respect Your Privacy
Thank you for your decision to invest with us. Touchstone and its affiliates have always placed a high value on the trust and confidence our clients place in us. We believe that confidence must be earned and validated through time. In today’s world, when technology allows the sharing of information at light speeds, trust must be reinforced by our sincere pledge to take the steps necessary to ensure that the information you share with us is treated with respect and confidentiality.
Our Pledge to Our Clients
| • | We collect only the information we need to service your account and administer our business. |
| • | We are committed to keeping your information confidential and we place strict limits and controls on the use and sharing of your information. |
| • | We make every effort to ensure the accuracy of your information. |
We Collect the Following Nonpublic Personal Information About You:
| • | Information we receive from you on or in applications or other forms, correspondence, or conversations, including, but not limited to, your name, address, phone number, social security number, assets, income and date of birth; and |
| • | Information about your transactions with us, our affiliates, or others, including, but not limited to, your account number and balance, payment history, parties to transactions, cost basis information, and other financial information. |
Categories of Information We Disclose and Parties to Whom We Disclose
We do not disclose any nonpublic personal information about our current or former clients to nonaffiliated third parties, except as required or permitted by law.
We Place Strict Limits and Controls on the Use and Sharing of Your Information
| • | We restrict access to nonpublic personal information about you to authorized employees who need the information to administer your business. |
| • | We maintain physical, electronic and procedural safeguards that comply with federal standards to protect this information. |
| • | We do not disclose any nonpublic personal information about our current or former clients to anyone, except as required or permitted by law or as described in this document. |
| • | We will not sell your personal information to anyone. |
We May Provide Information to Service Your Account
Sometimes it is necessary to provide information about you to various companies such as transfer agents, custodians, broker-dealers and marketing service firms to facilitate the servicing of your account. These organizations have a legitimate business need to see some of your personal information in order for us to provide service to you. We may disclose to these various companies the information that we collect as described above. We require that these companies, including our own subsidiaries and affiliates, strictly maintain the confidentiality of this information and abide by all applicable laws. Companies within our corporate family that may receive this information are financial service providers and insurance companies. We do not permit these associated companies to sell the information for their own purposes, and we never sell our customer information.
This policy is applicable to the following affiliated companies: Touchstone Funds Group Trust, Touchstone Investment Trust, Touchstone Strategic Trust, Touchstone Tax-Free Trust, Touchstone Variable Series Trust, Touchstone Institutional Funds Trust, Touchstone Securities, Inc.* and W&S Brokerage Services, Inc.
* Touchstone Securities, Inc. serves as the underwriter to the Touchstone Funds.
A Member of Western & Southern Financial Group®
The Privacy Protection Policy is not part of the Annual Report.


Touchstone Investments
Distributor
Touchstone Securities, Inc.*
303 Broadway
Cincinnati, Ohio 45202-4203 800.638.8194
www.touchstoneinvestments.com
Investment Advisor
Touchstone Advisors, Inc.*
303 Broadway
Cincinnati, Ohio 45202-4203
Transfer Agent
BNY Mellon Investment Servicing (US) Inc.
4400 Computer Drive
Westborough, MA 01581
Shareholder Service
800.543.0407
* A Member of Western & Southern Financial Group
TSF-54CC-TST-AR-1412
Item 2. Code of Ethics.
| (a) | The registrant, as of the end of the period covered by this report, has adopted a code of ethics that applies to the registrant’s principal executive officer, principal financial officer, principal accounting officer or controller, or persons performing similar functions, regardless of whether these individuals are employed by the registrant or a third party. |
| (c) | There have been no amendments, during the period covered by this report, to a provision of the code of ethics that applies to the registrant’s principal executive officer, principal financial officer, principal accounting officer or controller, or persons performing similar functions, regardless of whether these individuals are employed by the registrant or a third party, and that relates to any element of the code of ethics description. |
| (d) | The registrant has not granted any waivers, including an implicit waiver, from a provision of the code of ethics that applies to the registrant’s principal executive officer, principal financial officer, principal accounting officer or controller, or persons performing similar functions, regardless of whether these individuals are employed by the registrant or a third party, that relates to one or more of the items set forth in paragraph (b) of this item’s instructions. |
Item 3. Audit Committee Financial Expert.
The registrant’s Board of Trustees has determined that the registrant has at least one audit committee financial expert serving on its audit committee. Mr. William Gale is the registrant’s audit committee financial expert and is an independent trustee within the meaning of the Investment Company Act of 1940, as amended (the “1940 Act”).
Item 4. Principal Accountant Fees and Services.
Audit Fees
| (a) | Audit fees for Touchstone Strategic Trust (December Funds) totaled $65,000 and $65,000 in fiscal 2014 and 2013, respectively, including fees associated with the annual audit and filing of Form N-1A and Form NSAR. |
Audit-Related Fees
| (b) | Audit related fees totaled $0 for 2014 and $0 for 2013, respectively. |
Tax Fees
| (c) | The fees for tax compliance services totaled $15,400 for 2014 and $27,000 for 2013. The fees relate to the preparation of federal income and excise tax returns and review of capital gains distribution calculations. |
All Other Fees
| (d) | The aggregate fees billed in each of the last two fiscal years for products and services provided by the principal accountant, other than the services reported in paragraphs (a) through (c) of this Item are $433 for 2014 and $7,007 for 2013, respectively. The fees are related to the PFIC Analyzer and Global Withholding Tax Reporter subscriptions. |
| (e)(1) | Disclose the audit committee's pre-approval policies and procedures described in paragraph (c)(7) of Rule 2-01 of Regulation S-X. |
The Audit Committee’s pre-approval policies describe the types of audit, audit-related, tax and other services that have the general pre-approval of the Audit Committee. The pre-approval policies provide that annual audit service fees, tax services not specifically granted pre-approval, services exceeding pre-approved cost levels and other services that have not received general pre-approval will be subject to specific pre-approval by the Audit Committee. The pre-approval policies further provide that the Committee may grant general pre-approval to other audit services (statutory audits and services associated with SEC registration statements, periodic reports and other documents filed with the SEC or other documents issued in connection with securities offerings), audit-related services (accounting consultations related to accounting, financial reporting or disclosure matters not classified as “audit services,” assistance with understanding and implementing new accounting and financial reporting guidance from rulemaking authorities, agreed-upon or expanded audit procedures related to accounting and/or billing records required to respond to or comply with financial, accounting or regulatory reporting matters and assistance with internal control reporting requirements under Form N-SAR and Form N-CSR), tax services that have historically been provided by the auditor that the Committee believes would not impair the independence of the auditor and are consistent with the SEC’s rules on auditor independence and permissible non-audit services classified as “all other services” that are routine and recurring services.
| (e)(2) | All of the services described in paragraphs (b) through (d) of Item 4 were approved by the Audit Committee. |
| (f) | The percentage of hours expended on the principal accountant's engagement to audit the registrant's financial statements for the most recent fiscal year that were attributed to work performed by persons other than the principal accountant's full-time, permanent employees was less than fifty percent. |
| (g) | The aggregate non-audit fees for Touchstone Strategic Trust (December Funds) and certain entities*, totaled approximately $15,833 and $34,007 in 2014 for 2013, respectively. |
* These include the advisors (excluding sub-advisors) and any entity controlling, controlled by or under common control with the advisors that provides ongoing services to the registrant (Funds).
| (h) | The registrant's audit committee of the board of trustees has considered whether the provision of non-audit services that were rendered to the registrant's investment adviser (not including any sub-adviser whose role is primarily portfolio management and is subcontracted with or overseen by another investment adviser), and any entity controlling, controlled by, or under common control with the investment adviser that provides ongoing services to the registrant that were not pre-approved pursuant to paragraph (c)(7)(ii) of Rule 2-01 of Regulation S-X is compatible with maintaining the principal accountant's independence. |
| Item 5. | Audit Committee of Listed Registrants. |
Not applicable.
| (a) | Schedule of Investments in securities of unaffiliated issuers as of the close of the reporting period is included as part of the report to shareholders filed under Item 1 of this form. |
| Item 7. | Disclosure of Proxy Voting Policies and Procedures for Closed-End Management Investment Companies. |
Not applicable.
| Item 8. | Portfolio Managers of Closed-End Management Investment Companies. |
Not applicable.
| Item 9. | Purchases of Equity Securities by Closed-End Management Investment Company and Affiliated Purchasers. |
Not applicable.
| Item 10. | Submission of Matters to a Vote of Security Holders. |
There have been no material changes to the procedures by which the shareholders may recommend nominees to the registrant’s board of trustees, where those changes were implemented after the registrant last provided disclosure in response to the requirements of Item 407(c)(2)(iv) of Regulation S-K (17 CFR 229.407) (as required by Item 22(b)(15) of Schedule 14A (17 CFR 240.14a-101)), or this Item.
| Item 11. | Controls and Procedures. |
| (a) | The registrant’s principal executive and principal financial officers, or persons performing similar functions, have concluded that the registrant’s disclosure controls and procedures (as defined in Rule 30a-3(c) under the Investment Company Act of 1940, as amended (the “1940 Act”) (17 CFR 270.30a-3(c))) are effective, as of a date within 90 days of the filing date of the report that includes the disclosure required by this paragraph, based on their evaluation of these controls and procedures required by Rule 30a-3(b) under the 1940 Act (17 CFR 270.30a-3(b)) and Rules 13a-15(b) or 15d-15(b) under the Securities Exchange Act of 1934, as amended (17 CFR 240.13a-15(b) or 240.15d-15(b)). |
| (b) | There were no changes in the registrant’s internal control over financial reporting (as defined in Rule 30a-3(d) under the 1940 Act (17 CFR 270.30a-3(d))) that occurred during the registrant’s second fiscal quarter of the period covered by this report that has materially affected, or is reasonably likely to materially affect, the registrant’s internal control over financial reporting. |
| (a)(1) | Code of ethics, or any amendment thereto, that is the subject of disclosure required by Item 2 is attached hereto. |
| (a)(2) | Certifications pursuant to Rule 30a-2(a) under the 1940 Act and Section 302 of the Sarbanes-Oxley Act of 2002 are attached hereto. |
| (b) | Certifications pursuant to Rule 30a-2(b) under the 1940 Act and Section 906 of the Sarbanes- Oxley Act of 2002 are attached hereto. |
| (12.other) | Not applicable. |
SIGNATURES
Pursuant to the requirements of the Securities Exchange Act of 1934 and the Investment Company Act of 1940, the registrant has duly caused this report to be signed on its behalf by the undersigned, thereunto duly authorized.
| (Registrant) | Touchstone Strategic Trust | |
| By (Signature and Title)* | /s/ Jill T. McGruder | |
| | Jill T. McGruder, President | |
| | (principal executive officer) | |
Pursuant to the requirements of the Securities Exchange Act of 1934 and the Investment Company Act of 1940, this report has been signed below by the following persons on behalf of the registrant and in the capacities and on the dates indicated.
| By (Signature and Title)* | /s/ Jill T. McGruder | |
| | Jill T. McGruder, President | |
| | (principal executive officer) | |
| By (Signature and Title)* | /s/ Terrie A. Wiedenheft | |
| | Terrie A. Wiedenheft, Controller and Treasurer | |
| | (principal financial officer) | |
* Print the name and title of each signing officer under his or her signature.