UNITED STATES
SECURITIES AND EXCHANGE COMMISSION
Washington, D.C. 20549
FORM N-CSR
CERTIFIED SHAREHOLDER REPORT OF REGISTERED MANAGEMENT INVESTMENT COMPANIES
Investment Company Act file number 811-03651
Touchstone Strategic Trust – December Funds
(Exact name of registrant as specified in charter)
303 Broadway, Suite 1100
Cincinnati, Ohio 45202-4203
(Address of principal executive offices) (Zip code)
Jill T. McGruder
303 Broadway, Suite 1100
Cincinnati, Ohio 45202-4203
(Name and address of agent for service)
Registrant's telephone number, including area code: 800-638-8194
Date of fiscal year end: December 31
Date of reporting period: December 31, 2013
Form N-CSR is to be used by management investment companies to file reports with the Commission not later than 10 days after the transmission to stockholders of any report that is required to be transmitted to stockholders under Rule 30e-1 under the Investment Company Act of 1940 (17 CFR 270.30e-1). The Commission may use the information provided on Form N-CSR in its regulatory, disclosure review, inspection, and policymaking roles.
A registrant is required to disclose the information specified by Form N-CSR, and the Commission will make this information public. A registrant is not required to respond to the collection of information contained in Form N-CSR unless the Form displays a currently valid Office of Management and Budget ("OMB") control number. Please direct comments concerning the accuracy of the information collection burden estimate and any suggestions for reducing the burden to Secretary, Securities and Exchange Commission, 100 F Street, NE, Washington, DC 20549. The OMB has reviewed this collection of information under the clearance requirements of 44 U.S.C. § 3507.
Item 1. Reports to Stockholders.
The Report to Shareholders is attached herewith.
December 31, 2013
Annual Report
Touchstone Strategic Trust
Touchstone Dynamic Equity Fund
Touchstone Balanced Allocation Fund
Touchstone Conservative Allocation Fund
Touchstone Growth Allocation Fund
Touchstone Moderate Growth Allocation Fund

Table of Contents
| | Page | |
| Letter from the President | 3 | |
| Management's Discussion of Fund Performance (Unaudited) | 4 - 18 | |
| Tabular Presentation of Portfolios of Investments | 19 - 20 | |
| Portfolios of Investments: | | |
| Touchstone Dynamic Equity Fund | 21 | |
| Touchstone Balanced Allocation Fund | 24 | |
| Touchstone Conservative Allocation Fund | 25 | |
| Touchstone Growth Allocation Fund | 26 | |
| Touchstone Moderate Growth Allocation Fund | 27 | |
| Statements of Assets and Liabilities | 28 - 31 | |
| Statements of Operations | 32 - 33 | |
| Statements of Changes in Net Assets | 34 - 37 | |
| Statements of Changes in Net Assets - Capital Stock Activity | 38 - 42 | |
| Statement of Cash Flows | 43 | |
| Financial Highlights | 44 - 63 | |
| Notes to Financial Statements | 64 - 87 | |
| Report of Independent Registered Public Accounting Firm | 88 | |
| Other Items (Unaudited) | 89 - 97 | |
| Management of the Trust (Unaudited) | 98 - 100 | |
| Privacy Protection Policy | 103 | |
This report identifies the Funds' investments on December 31, 2013. These holdings are subject to change. Not all investments in each Fund performed the same, nor is there any guarantee that these investments will perform as well in the future. Market forecasts provided in this report may not occur.
Letter from the President
Dear Shareholder:
We are pleased to provide you with the Touchstone Strategic Trust Annual Report. Inside you will find key financial information, as well as manager commentaries for the Funds, for the 12 months ended December 31, 2013.
During the year the U.S. economy was able to weather many problems and grow at a moderate rate despite uncertainty over federal government budget policies and U.S. Federal Reserve (Fed) monetary policies. The unemployment rate fell to the lowest it had been in five years and the monthly pace of job creation accelerated in the final months of 2013. Domestic home prices increased throughout the year, the number of homes for sale fell substantially and homes under construction increased. Domestic energy supplies increased, while energy consumption fell, which should translate to continued low energy costs and help boost U.S. manufacturing.
Equity investors saw solid gains as nearly all major U.S. stock market indices returned more than 30% in 2013; however, bond market performance was a vastly different story. Overall, U.S. equities outperformed developed international stocks and fixed income during the period. Within equities, U.S. growth stocks bested value stocks, while small-capitalization stocks outperformed mid- and large-capitalization stocks. International stocks markedly outperformed emerging market stocks.
U.S. Treasury securities and investment-grade corporate bonds posted small losses for the period. High yield bonds outperformed the rest of the bond market by a large margin due to their low degree of interest-rate sensitivity. Non-U.S. bonds underperformed the broad U.S. fixed income market, as foreign currencies slightly weakened relative to the U.S. dollar.
After four plus years of robust equity markets, we believe that diversification is essential to balancing risk and return. We recommend that you work with your financial professional to employ a sound asset allocation strategy that invests in a combination of stock, bond, alternative and money market mutual funds to help keep your financial strategy on course. It is critical to maintain a long-term approach to gain the full potential benefits of investing.
Touchstone is committed to helping investors achieve their financial goals by providing access to a distinctive selection of institutional asset managers who are known and respected for proficiency in their specific areas of expertise. We hope that you will find the enclosed commentaries helpful.
We greatly appreciate your continued support. Thank you for including Touchstone as part of your investment plan.
Sincerely,

Jill T. McGruder
President
Touchstone Strategic Trust
Management's Discussion of Fund Performance (Unaudited)
Touchstone Dynamic Equity Fund
Sub-Advised by Analytic Investors, LLC
Investment Philosophy
The Fund seeks long-term capital appreciation from hedged equity investments with less risk than a fully invested, unhedged equity portfolio. A proprietary system that ranks stocks according to a mathematical model is utilized in an attempt to create a diversified and hedged portfolio, which invests in a combination of stocks and options including covered calls. A security’s intrinsic value is determined by evaluating variables such as relative valuation, price momentum, company fundamentals, liquidity and risk. Portfolio optimization is utilized to select securities that are expected to maximize return, minimize volatility and diversify assets.
Fund Performance
The Touchstone Dynamic Equity Fund (Class A Shares) underperformed its benchmark, the S&P 500 Index, for the 12-month period ended December 31, 2013. The Fund’s total return was 19.01 percent (calculated excluding the maximum sales charge) while the total return of the benchmark was 32.39 percent.
Market Environment
The S&P 500 Index finished the period on a strong note. In fact, it seemed like nothing could slow down the bull market in 2013 as a whole, as equities posted positive gains in each quarter of the year.
The U.S. Federal Reserve Board (Fed) was the center of investors’ attention during the course of the year. At the beginning of the period, stocks moved higher as the Fed remained accommodative in its monetary policy and the U.S. economy continued to recover at a slow but steady pace. Mid-period, the Fed initiated talks of fiscal tightening because of improvement in the U.S. economy and, as a result, its next move was under scrutiny throughout the remainder of that timeframe. Although the data that was released showed steady economic progress, there were still headwinds to growth. In particular, consumers remained under pressure, employment data improved but was still far from peak levels, and higher mortgage rates were expected to impact housing prices. At the Fed’s September 2013 meeting, the central bank chose to remain committed to its program of purchasing mortgage-backed securities (MBS). This caught market participants by surprise as the Fed had spent the last several months hinting that a taper of its monthly bond purchases was imminent. Near period-end, the U.S. government came close to breaching the debt ceiling again, and it also endured a 16-day partial government shutdown that started and ended during the month of October. By the end of the period, the Fed announced that it intended to reduce the size of its bond purchases by $10 billion a month, but interestingly the market’s reaction was quite subdued.
Portfolio Review
The Fund is a hedged equity fund, comprised of equities and options. During the 12-month period, the equity component of the Fund posted positive returns and outperformed the S&P 500 Index. The call options component posted negative total returns, yet outperformed the passive option component of the Chicago Board Options Exchange (CBOE) S&P BuyWrite Index (BXM Index). The strong performing equity market once again proved to be a challenging environment for selling call options, and as a result options negatively impacted the Fund’s performance; options sold primarily on the S&P 500 Index and S&P 100 Index negatively impacted returns during the fiscal year.
The equity portion of the Fund is structured to be sector-, style- and beta1-neutral relative to the S&P 500 Index, and the Fund attempts to deliver outperformance from stock selection. During the period, stock selection within the Consumer Staples, Financials, and Industrials sectors contributed to performance, while stock selection within the Information Technology and Energy sectors negatively impacted performance.
The Fund’s investment process uses a multi-characteristic approach when valuing securities. During the period, the Fund was properly positioned to characteristics that helped equities in the Fund’s portfolio to outperform the S&P 500. Specifically, investors rewarded stocks that exhibited strong sales relative to the company’s price per share and above-average predicted earnings to price, which were characteristics emphasized in the Fund’s investment process. In addition, investors looked for certain quality characteristics and, as a result, the Fund’s overweight position to asset utilization helped performance during the year. On the other hand, while the
Management's Discussion of Fund Performance (Unaudited) (Continued)
Fund’s positioning to certain valuation and quality metrics benefited performance during the year, deemphasizing volatility characteristics negatively impacted performance. For example, the Fund avoided stocks with above-average cash flow and sales volatility, which hurt results as these stocks outperformed during the year. In addition, the Fund underweighted stocks with above-average trading volume, which negatively impacted results.
Among the individual stocks that contributed to the Fund’s relative performance during the period included long positions in Brinker International Inc. (Consumer Services sector), Pitney Bowes Inc. (Information Technology sector), and The Goodyear Tire & Rubber Co. (Consumer Services sector), and a short position in Walter Energy Inc. (Energy sector). Shares of Brinker International, a casual dining restaurant company, moved higher after the company reported strong quarterly earnings. Pitney Bowes, a global provider of services and solutions for physical and digital communication channels, saw its shares rally after the company agreed to sell its management services unit to Apollo Global Asset Management LLC for $400 million in cash. Shares of Goodyear Tire & Rubber, the largest U.S. tire maker, increased significantly after the company doubled its net income from a year prior and announced second-quarter earnings that exceeded analyst expectations. Shares of Walter Energy, a producer and exporter of metallurgical coal for the steel industry, moved lower after investor Audley Capital Advisors LLP announced plans to name five new candidates for its board of directors, stating the firm lacked leadership and had not done enough to cut costs. This was viewed as disruptive by many investors and the shares moved lower. Later in the year, shares of Walter Energy dropped further after the firm cancelled a plan to refinance $1.55 billion of loans as yields moved higher.
Among the stocks that detracted from Fund performance were short positions in Endo Health Solutions Inc. and Salix Pharmaceuticals Inc. (both from the Health Care sector), and long positions in Newmont Mining Corp. (Materials sector) and International Business Machines Corp. (Information Technology sector). Endo Health Solutions, a specialty health care company focused on branded and generic pharmaceuticals, soared the most in 13 years after the company announced its plan to buy Canadian drug company Paladin Labs Inc. with the goal of expanding in that country and emerging markets. Salix Pharmaceuticals, a specialty pharmaceutical company that offers innovative gastroenterology treatments, rallied after it was announced unexpectedly that an FDA panel would review its drug RELISTOR. Analysts noted it should make the hurdle for FDA approval more manageable, which benefited the stock. Shares of Newmont Mining, a global gold producer, dropped the most since 2008 as metal prices moved lower. Shares of International Business Machines, a multinational technology and consulting company, dropped after company sales fell for the sixth straight quarter and its hardware business posted a loss.
Outlook
Our process is based on the fundamental belief that there is persistency in the types of characteristics investors prefer. If this holds going forward, we believe the Fund can benefit from being properly positioned toward stocks with characteristics favored by investors.
Looking ahead, we will continue to emphasize stocks with certain attractive valuation characteristics, such as stocks with above-average earnings-to-price ratios and sales-to-price ratios. We also intend to focus on companies with strong quality metrics, such as stocks with above-average asset utilization and return on assets. Furthermore, we anticipate continuing to underweight companies with above-average sales-per-share volatility and underweight companies where analysts report above-average volatility in earnings estimates.
| 1 | Beta is a measure of the volatility of a fund relative to its benchmark. |
Management's Discussion of Fund Performance (Unaudited) (Continued)
Comparison of the Change in Value of a $10,000 Investment in the Touchstone Dynamic
Equity Fund - Class A*, the S&P 500 Index and the Citigroup 3-Month T-Bill Index
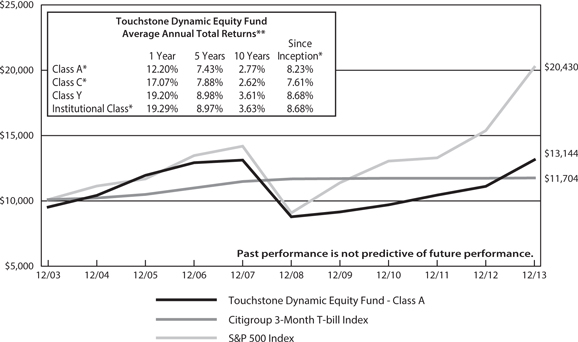
| * | The chart above represents performance of Class A shares only, which will vary from the performance of Class C shares, Class Y shares and Institutional Class shares based on the differences in loads and fees paid by shareholders in the different classes. Class Y shares commenced operations on July 1, 1978, Class A shares and Class C shares commenced operations on March 31, 2005 and Institutional Class shares commenced operations on December 9, 2005. The Class A and Class C shares performance information is calculated using the historical performance of Class Y shares for periods prior to March 31, 2005 and Institutional Class shares performance information is calculated using the historical performance of Class Y shares for periods prior to December 9, 2005. The returns have been restated for sales charges and for fees applicable to Class A, Class C, and Institutional Class shares. |
| ** | The average annual total returns shown above are adjusted for maximum applicable sales charges. |
The performance of the above Fund does not reflect the deduction of taxes that a shareholder would pay on Fund distributions or the redemption of Fund shares.
Notes to Chart
S&P 500 Index is a group of 500 widely held stocks and is commonly regarded to be representative of the large capitalization stock universe.
Citigroup 3-Month T-Bill Index tracks the performance of U.S. Treasury Bills with a remaining maturity of three months.
Management's Discussion of Fund Performance (Unaudited)
Touchstone Balanced Allocation Fund
Sub-Advised by Ibbotson Associates, Inc.
Investment Philosophy
The Fund seeks to provide investors with capital appreciation and current income. The Fund is a fund of funds and therefore the value of an investment in the Fund is based on the performance of the underlying funds in which it invests and the allocation of its assets among those funds. This fund of funds primarily invests in a diversified portfolio of underlying equity and fixed income funds. The underlying funds, in turn, invest in a variety of U.S. and foreign equity and fixed income securities and may hold cash, cash equivalents and money market funds. An optimal model allocation among underlying funds is sought, by using an analysis that looks at forecasted returns, standard deviations in historical returns, and the correlation of the performance of different market sectors. The underlying funds are selected and weighted based on historical returns-based style analysis, holdings-based style analysis, manager interviews, relative and absolute performance, including correlations with other underlying funds as well as corresponding benchmarks, and historical volatility (the variability of returns from one period to the next). Under normal circumstances, the Fund expects to allocate its assets among equity and fixed income funds as follows: Equity Fund Allocation: 50-70%, Fixed Income Fund Allocation: 30-50%.
Fund Performance
The Touchstone Balanced Allocation Fund (Class A Shares) underperformed its benchmark, the 40% Barclays U.S. Aggregate Bond Index / 60% S&P Composite 1500 Index, for the 12-month period ended December 31, 2013. The Fund’s total return was 13.28 percent (calculated excluding the maximum sales charge) while the total return of the benchmark was 17.78 percent.
Market Environment
Overall, the 12-month period resulted in an exceptional year for stock investors. From the rapid rise in interest rates mid-period as the U.S. Federal Reserve Board (Fed) prepared to exit its quantitative easing programs, to the government shutdown in the near period-end, it seemed nothing could stop the bull market. In fact, the S&P 500 Index and the Dow Jones Industrial Average set performance records during the calendar year. The biggest story during the period was the Fed’s quantitative easing program. Mid-period, Fed Chairman Ben Bernanke began discussing the possibility of tapering the purchases of securities in the face of improving economic data, and the market was fixated for months on the timing of the central bank’s exit from its signature bond-buying program. The discussion led to a sharp and sudden increase in U.S. Treasury rates. By the time Fed officials announced at period-end that they were going to reduce the size of their bond purchases by $10 billion a month, the market reaction was quite muted as investors had already priced in the taper. Nevertheless, interest rates continued to rise as the period came to a close.
U.S. equity markets posted record-breaking positive returns during the period, while fixed income asset classes were mixed. Within the U.S. equity market, small-cap stocks outperformed both large-cap stocks and mid-cap stocks. Foreign developed equity markets continued their trend from 2012 and finished 2013 with positive returns, while emerging markets posted a negative return and was the worst performing equity asset class in the portfolio.
Within the bond market, results were mixed. In the U.S., high yield bonds outperformed the rest of the bond market by a large margin due to their low degree of interest-rate sensitivity. Non-U.S. bonds underperformed the broad U.S. fixed income market, as foreign currencies slightly weakened relative to the U.S. dollar.
Portfolio Review
Asset allocation positioning detracted from Fund performance during the year, as neither strategic nor dynamic exposures benefited the Fund. Strategically, non-U.S. equities, emerging markets equities, global real estate investment trusts (REITs) and non-U.S. small cap equities were the largest detractors from performance. High yield bonds and short-term bonds were the main contributors to annual performance.
During the period, the Fund held multiple dynamic asset allocation positions. Overall, the Fund’s defensive positioning had a slight negative impact on performance. The heightened short-term bond exposure and an
Management's Discussion of Fund Performance (Unaudited) (Continued)
underweight position in domestic stocks also detracted from performance. Touchstone Sands Capital Institutional Growth Fund, Touchstone Dynamic Equity Fund and Touchstone International Small Cap Fund were the largest contributors to relative performance, while Touchstone Premium Yield Equity Fund, Touchstone International Value Fund and Touchstone Emerging Markets Equity Fund were the main detractors from relative performance. Near mid-period, the Touchstone Focused Equity Fund merged into the Touchstone Focused Fund, and the Touchstone Short Duration Fixed Income Fund merged into the Touchstone Ultra Short Fixed Income Fund. Near period-end, Touchstone Arbitrage Fund replaced Touchstone Merger Arbitrage Fund in the portfolio.
Outlook
Most share markets pushed higher during period-end, although the magnitude of the move was considerably less than that of prior months. Despite this, key share market sentiment indicators increasingly point to optimism. Investor positioning also supports this view and expectations appear biased toward further strength in stock markets. This is, however, against a backdrop of challenged fundamentals. For example, margins for most regions and sectors remain stretched, and current forward estimates suggest that these margins will continue to climb going forward. In our opinion, this is in an environment where earnings growth remains benign and, as a consequence, the recent move upward in markets has come from significant multiple expansions as opposed to earnings growth.
Looking ahead, we believe the current exuberant investor activity may continue in the short term as fundamental valuation drivers are seemingly ignored and central banks are viewed as the buyer of last resort for most risky assets. This sentiment cannot continue indefinitely and as data point to improved conditions, we expect the U.S. central bank and its global peers may taper their support for the markets. Though it is highly uncertain when and if this might occur, if it does occur the fundamental quality of an asset may return to focus. This would highlight to investors how expensive many assets have become on an absolute and relative basis, particularly given the significant challenges the current global investment environment presents.
As a consequence of investors’ recent focus, most asset valuations remain at overvalued levels. Among these assets, U.S. stocks still appear to be overvalued and, as such, we retained the Fund’s underweight position despite many investors retaining large overweight positions relative to other regions. From our perspective, valuations for international stocks continue to be more reasonable but, relative to recent history, they do not appear as attractive following their recent strong run. Emerging market equities have become more attractive in a relative sense, and it is largely attributable to sustained outflows from this asset class. We believe these changes are likely due to the slowing growth across these countries and recent capital outflows as a whole.
On balance, the Fund’s strategic positioning remains defensive and more focused on preserving capital. As such, the Fund ended the quarter with greater international equity exposure and more short-term bonds than usual. Going forward, we will continue to monitor valuations and sentiment, and will adjust the Fund’s portfolio should the opportunity present itself.
Management's Discussion of Fund Performance (Unaudited) (Continued)
Comparison of the Change in Value of a $10,000 Investment in the
Touchstone Balanced Allocation Fund - Class A*, the S&P Composite 1500 Index
and the Barclays U.S. Aggregate Bond Index
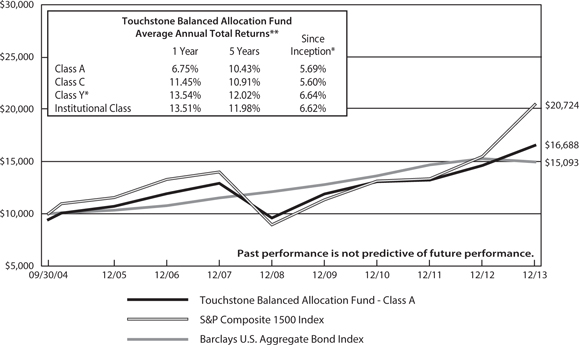
| * | The chart above represents performance of Class A shares only, which will vary from the performance of Class C shares, Class Y shares and Institutional Class shares based on the differences in loads and fees paid by shareholders in the different classes. Class A shares, Class C shares and Institutional Class shares commenced operations on September 30, 2004 and Class Y shares commenced operations on December 9, 2005. Class Y shares performance information is calculated using the historical performance of Institutional Class shares for periods prior to December 9, 2005. The returns have been restated for sales charges and for fees applicable to Class Y shares. |
| ** | The average annual total returns shown above are adjusted for maximum applicable sales charges. |
The performance of the above Fund does not reflect the deduction of taxes that a shareholder would pay on Fund distributions or the redemption of Fund shares.
Notes to Chart
S&P Composite 1500 Index is an unmanaged, broad market index representing the large-cap, mid-cap, and small-cap segments of the U.S. equity market.
Barclays U.S. Aggregate Bond Index is an unmanaged index comprised of U.S. investment grade, fixed rate bond market securities, including government, government agency, corporate and mortgage-backed securities between one and ten years.
Management's Discussion of Fund Performance (Unaudited)
Touchstone Conservative Allocation Fund
Sub-Advised by Ibbotson Associates, Inc.
Investment Philosophy
The Fund seeks to provide investors with current income and preservation of capital. The Fund is a fund of funds and therefore the value of an investment in the Fund is based on the performance of the underlying funds in which it invests and the allocation of its assets among those funds. This fund of funds primarily invests in a diversified portfolio of underlying equity and fixed income funds. The underlying funds, in turn, invest in a variety of U.S. and foreign equity and fixed income securities and may hold cash, cash equivalents and money market funds. An optimal model allocation among underlying funds is sought, by using an analysis that looks at forecasted returns, standard deviations in historical returns, and the correlation of the performance of different market sectors. The underlying funds are selected and weighted based on historical returns-based style analysis, holdings-based style analysis, manager interviews, relative and absolute performance, including correlations with other underlying funds as well as corresponding benchmarks, and historical volatility (the variability of returns from one period to the next). Under normal circumstances, the Fund expects to allocate its assets among equity and fixed income funds as follows: Equity Fund Allocation: 20–40%, Fixed Income Fund Allocation: 60–80%.
Fund Performance
The Touchstone Conservative Allocation Fund (Class A Shares) underperformed its benchmark, the 70% Barclays U.S. Aggregate Bond Index / 30% S&P Composite 1500 Index, for the 12-month period ended December 31, 2013. The Fund’s total return was 6.14 percent (calculated excluding the maximum sales charge) while the total return of the benchmark was 7.49 percent.
Market Environment
Overall, the 12-month period resulted in an exceptional year for stock investors. From the rapid rise in interest rates mid-period as the U.S. Federal Reserve Board (Fed) prepared to exit its quantitative easing programs, to the government shutdown in the near period-end, it seemed nothing could stop the bull market. In fact, the S&P 500 Index and the Dow Jones Industrial Average set performance records during the calendar year. The biggest story in 2013 was the Fed’s quantitative easing program. Mid-period, Fed Chairman Ben Bernanke began discussing the possibility of tapering the purchases of securities in the face of improving economic data, and the market was fixated for months on the timing of the central bank’s exit from its signature bond-buying program. The discussion led to a sharp and sudden increase in U.S. Treasury rates. By the time Fed officials announced at period-end that they were going to reduce the size of their bond purchases by $10 billion a month, the market reaction was quite muted as investors had already priced in the taper. Nevertheless, interest rates continued to rise as the period came to a close.
U.S. equity markets posted record-breaking positive returns during the period, while fixed income asset classes were mixed. Within the U.S. equity market, small-cap stocks outperformed both large-cap stocks and mid-cap stocks. Foreign developed equity markets continued their trend from 2012 and finished 2013 with positive returns, while emerging markets posted a negative return and was the worst performing equity asset class in the portfolio.
Within the bond market, results were mixed. In the U.S., high yield bonds outperformed the rest of the bond market by a large margin due to their low degree of interest-rate sensitivity. Non-U.S. bonds underperformed the broad U.S. fixed income market, as foreign currencies slightly weakened relative to the U.S. dollar.
Portfolio Review
Asset allocation positioning detracted from Fund performance during the year, as neither strategic nor dynamic exposures benefited the Fund. Strategically, non-U.S. equities, emerging markets equities, global real estate investment trusts (REITs) and non-U.S. bonds were the largest detractors from performance. High yield bonds and short-term bonds were the main contributors to annual performance.
During the period, the Fund held multiple dynamic asset allocation positions. Overall, the Fund’s defensive positioning had a slight negative impact on performance. The heightened short-term bond exposure and an
Management's Discussion of Fund Performance (Unaudited) (Continued)
underweight position in domestic stocks also detracted from performance. Touchstone Sands Capital Institutional Growth Fund, Touchstone Dynamic Equity Fund and Touchstone International Fixed Income Fund were the largest contributors to relative performance, while Touchstone Premium Yield Equity Fund, Touchstone International Value Fund and Touchstone Emerging Markets Equity Fund were the main detractors from relative performance. Near mid-period, the Touchstone Short Duration Fixed Income Fund merged into the Touchstone Ultra Short Fixed Income Fund. Near period-end Touchstone Arbitrage Fund replaced Touchstone Merger Arbitrage Fund in the portfolio.
Outlook and Conclusion
Most share markets pushed higher during period-end, although the magnitude of the move was considerably less than that of prior months. Despite this, key share market sentiment indicators increasingly point to optimism. Investor positioning also supports this view and expectations appear biased toward further strength in stock markets. This is, however, against a backdrop of challenged fundamentals. For example, margins for most regions and sectors remain stretched, and current forward estimates suggest that these margins will continue to climb going forward. In our opinion, this is in an environment where earnings growth remains benign and, as a consequence, the recent move upward in markets has come from significant multiple expansions as opposed to earnings growth.
Looking ahead, we believe the current exuberant investor activity may continue in the short term as fundamental valuation drivers are seemingly ignored and central banks are viewed as the buyer of last resort for most risky assets. This sentiment cannot continue indefinitely and as data point to improved conditions, we expect the U.S. central bank and its global peers may taper their support for the markets. Though it is highly uncertain when and if this might occur, if it does occur the fundamental quality of an asset may return to focus. This would highlight to investors how expensive many assets have become on an absolute and relative basis, particularly given the significant challenges the current global investment environment presents.
As a consequence of investors’ recent focus, most asset valuations remain at overvalued levels. Among these assets, U.S. stocks still appear to be overvalued and, as such, we retained the Fund’s underweight position despite many investors retaining large overweight positions relative to other regions. From our perspective, valuations for international stocks continue to be more reasonable but, relative to recent history, they do not appear as attractive following their recent strong run. Emerging market equities have become more attractive in a relative sense, and it is largely attributable to sustained outflows from this asset class. We believe these changes are likely due to the slowing growth across these countries and recent capital outflows as a whole.
On balance, the Fund’s strategic positioning remains defensive and more focused on preserving capital. As such, the Fund ended the quarter with greater international equity exposure and more short-term bonds than usual. Going forward, we will continue to monitor valuations and sentiment, and will adjust the Fund’s portfolio should the opportunity present itself.
Management's Discussion of Fund Performance (Unaudited) (Continued)
Comparison of the Change in Value of a $10,000 Investment in the
Touchstone Conservative Allocation Fund Class - A*, the S&P Composite 1500 Index and
the Barclays U.S. Aggregate Bond Index
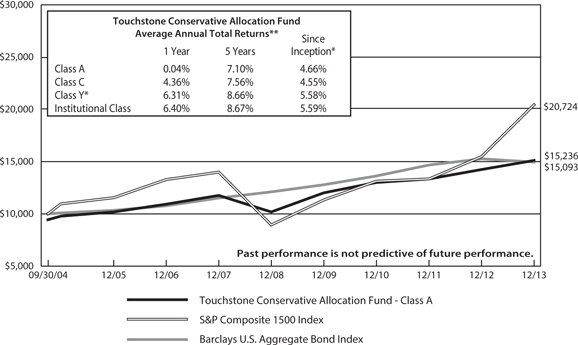
| * | The chart above represents performance of Class A shares only, which will vary from the performance of Class C shares, Class Y shares and Institutional Class shares based on the differences in loads and fees paid by shareholders in the different classes. Class A shares, Class C shares and Institutional Class shares commenced operations on September 30, 2004 and Class Y shares commenced operations on December 9, 2005. Class Y shares performance information is calculated using the historical performance of Institutional Class shares for periods prior to December 9, 2005. The returns have been restated for sales charges and for fees applicable to Class Y shares. |
| ** | The average annual total returns shown above are adjusted for maximum applicable sales charges. |
The performance of the above Fund does not reflect the deduction of taxes that a shareholder would pay on Fund distributions or the redemption of Fund shares.
Notes to Chart
S&P Composite 1500 Index is an unmanaged, broad market index representing the large-cap, mid-cap, and small-cap segments of the U.S. equity market.
Barclays U.S. Aggregate Bond Index is an unmanaged index comprised of U.S. investment grade, fixed rate bond market securities, including government, government agency, corporate and mortgage-backed securities between one and ten years.
Management's Discussion of Fund Performance (Unaudited)
Touchstone Growth Allocation Fund
Sub-Advised by Ibbotson Associates, Inc.
Investment Philosophy
The Fund seeks to provide investors with capital appreciation. The Fund is a fund of funds and therefore the value of an investment in the Fund is based on the performance of the underlying funds in which it invests and the allocation of its assets among those funds. This fund of funds primarily invests in a diversified portfolio of underlying equity and fixed income funds. The underlying funds, in turn, invest in a variety of U.S. and foreign equity and fixed income securities and may hold cash, cash equivalents and money market funds. An optimal model allocation among underlying funds is sought, by using an analysis that looks at forecasted returns, standard deviations in historical returns, and the correlation of the performance of different market sectors. The underlying funds are selected and weighted based on historical returns-based style analysis, holdings-based style analysis, manager interviews, relative and absolute performance, including correlations with other underlying funds as well as corresponding benchmarks, and historical volatility (the variability of returns from one period to the next). Under normal circumstances, the Fund expects to allocate its assets among equity and fixed income funds as follows: Equity Fund Allocation: 90-100%, Fixed Income Fund Allocation: 0-10%.
Fund Performance
The Touchstone Growth Allocation Fund (Class A Shares) underperformed its benchmark, the S&P Composite 1500 Index, for the 12-month period ended December 31, 2013. The Fund’s total return was 20.69 percent (calculated excluding the maximum sales charge) while the total return of the benchmark was 32.80 percent.
Market Environment
Overall, the 12-month period resulted in an exceptional year for stock investors. From the rapid rise in interest rates mid-period as the U.S. Federal Reserve Board (Fed) prepared to exit its quantitative easing programs, to the government shutdown in the near period-end, it seemed nothing could stop the bull market. In fact, the S&P 500 Index and the Dow Jones Industrial Average set performance records during the calendar year. The biggest story in 2013 was the Fed’s quantitative easing program. Mid-period, Fed Chairman Ben Bernanke began discussing the possibility of tapering the purchases of securities in the face of improving economic data, and the market was fixated for months on the timing of the central bank’s exit from its signature bond-buying program. The discussion led to a sharp and sudden increase in U.S. Treasury rates. By the time Fed officials announced at period-end that they were going to reduce the size of their bond purchases by $10 billion a month, the market reaction was quite muted as investors had already priced in the taper. Nevertheless, interest rates continued to rise as the period came to a close.
U.S. equity markets posted record-breaking positive returns during the period, while fixed income asset classes were mixed. Within the U.S. equity market, small-cap stocks outperformed both large-cap stocks and mid-cap stocks. Foreign developed equity markets continued their trend from 2012 and finished 2013 with positive returns, while emerging markets posted a negative return and was the worst performing equity asset class in the portfolio.
Within the bond market, results were mixed. In the U.S., high yield bonds outperformed the rest of the bond market by a large margin due to their low degree of interest-rate sensitivity. Non-U.S. bonds underperformed the broad U.S. fixed income market, as foreign currencies slightly weakened relative to the U.S. dollar.
Portfolio Review
Asset allocation positioning detracted from Fund performance during the year, as neither strategic nor dynamic exposures benefited the Fund. Strategically, non-U.S. equities, emerging markets equities, global real estate investment trusts (REITs) and non-U.S. small cap equities were the largest detractors from performance. High yield bonds were the main contributors to annual performance.
During the period, the Fund held multiple dynamic asset allocation positions. Overall, the Fund’s defensive positioning had a slight negative impact on performance. The heightened short-term bond exposure and an underweight position in domestic stocks also detracted from performance. Touchstone Sands Capital Institutional Growth Fund, Touchstone Dynamic Equity Fund and Touchstone International Small Cap Fund were the
Management's Discussion of Fund Performance (Unaudited) (Continued)
largest contributors to relative performance, while Touchstone Premium Yield Equity Fund, Touchstone International Value Fund and Touchstone Emerging Markets Equity Fund were the main detractors from relative performance. Near mid-period, the Touchstone Focused Equity Fund merged into the Touchstone Focused Fund, and the Touchstone Short Duration Fixed Income Fund merged into the Touchstone Ultra Short Fixed Income Fund. Near period-end, Touchstone Arbitrage Fund replaced Touchstone Merger Arbitrage Fund in the portfolio.
Outlook
Most equity market indexes continued to push higher as the period came to a close, although the magnitude of the move has been considerably less than that of prior months. Despite this, key share market sentiment indicators increasingly point to optimism. Investor positioning also supports this view and expectations appear biased toward further strength in stock markets. This is, however, against a backdrop of challenged fundamentals. For example, margins for most regions and sectors remain stretched, and current forward estimates suggest that these margins will continue to climb going forward. In our opinion, this is in an environment where earnings growth remains benign and, as a consequence, the recent move upward in markets has come from significant multiple expansions as opposed to earnings growth.
Looking ahead, we believe the current exuberant investor activity may continue in the short term as fundamental valuation drivers are seemingly ignored and central banks are viewed as the buyer of last resort for most risky assets. This sentiment cannot continue indefinitely and as data point to improved conditions, we expect the U.S. central bank and its global peers may taper their support for the markets. Though it is highly uncertain when and if this might occur, if it does occur the fundamental quality of an asset may return to focus. This would highlight to investors how expensive many assets have become on an absolute and relative basis, particularly given the significant challenges the current global investment environment presents.
As a consequence of investors’ recent focus, most asset valuations remain at overvalued levels. Among these assets, U.S. stocks still appear to be overvalued and, as such, we retained the Fund’s underweight position despite many investors retaining large overweight positions relative to other regions. From our perspective, valuations for international stocks continue to be more reasonable but, relative to recent history, they do not appear as attractive following their recent strong run. Emerging market equities have become more attractive in a relative sense, and it is largely attributable to sustained outflows from this asset class. We believe these changes are likely due to the slowing growth across these countries and recent capital outflows as a whole.
On balance, the Fund’s strategic positioning remains defensive and more focused on preserving capital. As such, the Fund ended the quarter with greater international equity exposure and more short-term bonds than usual. Going forward, we will continue to monitor valuations and sentiment, and will adjust the Fund’s portfolio should the opportunity present itself.
Management's Discussion of Fund Performance (Unaudited) (Continued)
Comparison of the Change in Value of a $10,000 Investment in the
Touchstone Growth Allocation Fund Class - A* and the S&P Composite 1500 Index
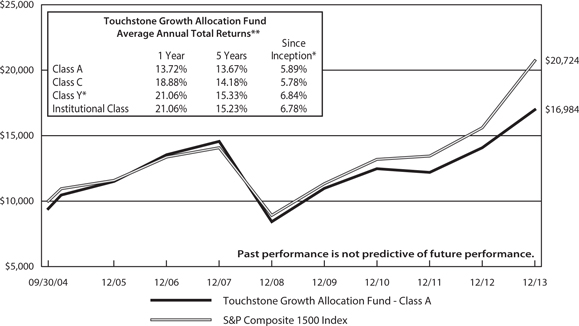
| * | The chart above represents performance of Class A shares only, which will vary from the performance of Class C shares, Class Y shares and Institutional Class shares based on the differences in loads and fees paid by shareholders in the different classes. Class A shares, Class C shares and Institutional Class shares commenced operations on September 30, 2004 and Class Y shares commenced operations on December 9, 2005. Class Y shares performance information is calculated using the historical performance of Institutional Class shares for periods prior to December 9, 2005. The returns have been restated for sales charges and for fees applicable to Class Y shares. |
| ** | The average annual total returns shown above are adjusted for maximum applicable sales charges. |
The performance of the above Fund does not reflect the deduction of taxes that a shareholder would pay on Fund distributions or the redemption of Fund shares.
Note to Chart
S&P Composite 1500 Index is an unmanaged, broad market index representing the large-cap, mid-cap, and small-cap segments of the U.S. equity market.
Management's Discussion of Fund Performance (Unaudited)
Touchstone Moderate Growth Allocation Fund
Sub-Advised by Ibbotson Associates, Inc.
Investment Philosophy
The Fund seeks to provide investors with capital appreciation and current income. The Fund is a fund of funds and therefore the value of an investment in the Fund is based on the performance of the underlying funds in which it invests and the allocation of its assets among those funds. This fund of funds primarily invests in a diversified portfolio of underlying equity and fixed income funds. The underlying funds, in turn, invest in a variety of U.S. and foreign equity and fixed income securities and may hold cash, cash equivalents and money market funds. An optimal model allocation among underlying funds is sought, by using an analysis that looks at forecasted returns, standard deviations in historical returns, and the correlation of the performance of different market sectors. The underlying funds are selected and weighted based on historical returns-based style analysis, holdings-based style analysis, manager interviews, relative and absolute performance, including correlations with other underlying funds as well as corresponding benchmarks, and historical volatility (the variability of returns from one period to the next). Under normal circumstances, the Fund expects to allocate its assets among equity and fixed income funds as follows: Equity Fund Allocation: 70–90%, Fixed Income Fund Allocation: 10–30%.
Fund Performance
The Touchstone Moderate Growth Allocation Fund (Class A Shares) underperformed its benchmark, the 20% Barclays U.S. Aggregate Bond Index / 80% S&P Composite 1500 Index, for the 12-month period ended December 31, 2013. The Fund’s total return was 17.23 percent (calculated excluding the maximum sales charge) while the total return of the benchmark was 25.10 percent.
Market Environment
Overall, the 12-month period resulted in an exceptional year for stock investors. From the rapid rise in interest rates mid-period as the U.S. Federal Reserve Board (Fed) prepared to exit its quantitative easing programs, to the government shutdown in the near period-end, it seemed nothing could stop the bull market. In fact, the S&P 500 Index and the Dow Jones Industrial Average set performance records during the calendar year. The biggest story in 2013 was the Fed’s quantitative easing program. Mid-period, Fed Chairman Ben Bernanke began discussing the possibility of tapering the purchases of securities in the face of improving economic data, and the market was fixated for months on the timing of the central bank’s exit from its signature bond-buying program. The discussion led to a sharp and sudden increase in U.S. Treasury rates. By the time Fed officials announced at period-end that they were going to reduce the size of their bond purchases by $10 billion a month, the market reaction was quite muted as investors had already priced in the taper. Nevertheless, interest rates continued to rise as the period came to a close.
U.S. equity markets posted record-breaking positive returns during the period, while fixed income asset classes were mixed. Within the U.S. equity market, small-cap stocks outperformed both large-cap stocks and mid-cap stocks. Foreign developed equity markets continued their trend from 2012 and finished 2013 with positive returns, while emerging markets posted a negative return and was the worst performing equity asset class in the portfolio.
Within the bond market, results were mixed. In the U.S., high yield bonds outperformed the rest of the bond market by a large margin due to their low degree of interest-rate sensitivity. Non-U.S. bonds underperformed the broad U.S. fixed income market, as foreign currencies slightly weakened relative to the U.S. dollar.
Portfolio Review
Asset allocation positioning detracted from Fund performance during the year, as neither strategic nor dynamic exposures benefited the Fund. Strategically, non-U.S. equities, emerging markets equities, global real estate investment trusts (REITs) and non-U.S. small cap equities were the largest detractors from performance. High yield bonds were the main contributors to performance in 2013.
During the period, the Fund held multiple dynamic asset allocation positions. Overall, the Fund’s defensive positioning had a slight negative impact on performance. The heightened short-term bond exposure and an
Management's Discussion of Fund Performance (Unaudited) (Continued)
underweight position in domestic stocks also detracted from performance. Touchstone Sands Capital Institutional Growth Fund, Touchstone Dynamic Equity Fund and Touchstone Focused Fund were the largest contributors to relative performance, while Touchstone Premium Yield Equity Fund, Touchstone International Value Fund and Touchstone Emerging Markets Equity Fund were the main detractors from relative performance. Near mid-period, the Touchstone Focused Equity Fund merged into the Touchstone Focused Fund, and the Touchstone Short Duration Fixed Income Fund merged into the Touchstone Ultra Short Fixed Income Fund. Near period-end, Touchstone Arbitrage Fund replaced Touchstone Merger Arbitrage Fund in the portfolio.
Outlook
Most equity market indexes continued to push higher as the period came to a close, although the magnitude of the move has been considerably less than that of prior months. Despite this, key share market sentiment indicators increasingly point to excessive optimism, in many cases moving to levels not seen since April 2011. Investor positioning also supports this view and expectations appear strongly biased to further strength in stock markets. This is against a backdrop of what we see as challenged fundamentals. For example, margins for most regions and sectors remain stretched and current forward estimates imply that they will continue to climb to new record levels. This is in an environment where earnings growth remains benign and as a consequence the recent move up in markets has come from significant multiple expansions as opposed to earnings growth.
The current exuberant investor activity may yet still continue in the short term as fundamental valuation drivers are seemingly ignored and investors look to the central banks as the buyer of last resort for most risky assets. This focus cannot continue forever and as data point to improved conditions, the U.S. central bank and its global peers will likely look to wind back their support for the markets. Just when this might occur remains highly uncertain to us, but if it does, the true fundamental quality of an asset may need to return to focus. We expect this will highlight to investors just how expensive many assets have become on an absolute and relative basis particularly given the significant challenges the global investment environment presents.
As a consequence of many investors’ current focus, most asset valuations remain at overvalued levels. Amongst these assets, U.S. stocks still appear to be overvalued and we therefore retain our underweight position despite many investors retaining large overweight relative to other regions. From our perspective, valuations for international stocks continue to appear more reasonable, but relative to recent history don’t look as attractive following their recent strong run. Emerging market equities have become more attractive in a relative sense with this largely attributable to sustained outflows from this asset class. These changes are likely due to the slowing growth across these countries and recent capital outflows as a whole.
On balance, the Fund’s strategic positioning remains defensive and more focused on preserving capital, as we find ourselves with greater international equity exposure and holding more short-term bonds than usual. Going forward, we will continue to monitor valuations and sentiment, and will adjust the Fund’s portfolio should the opportunity present itself.
Management's Discussion of Fund Performance (Unaudited) (Continued)
Comparison of the Change in Value of a $10,000 Investment in the
Touchstone Moderate Growth Allocation Fund Class-A*, the S&P Composite 1500 Index and
the Barclays U.S. Aggregate Bond Index
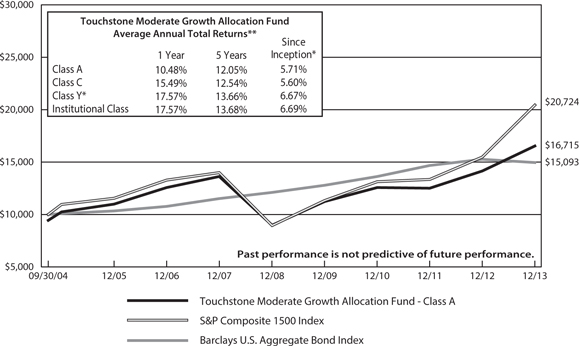
| * | The chart above represents performance of Class A shares only, which will vary from the performance of Class C shares, Class Y shares and Institutional Class shares based on the differences in loads and fees paid by shareholders in the different classes. Class A shares, Class C shares and Institutional Class shares commenced operations on September 30, 2004 and Class Y shares commenced operations on December 9, 2005. Class Y shares performance information is calculated using the historical performance of Institutional Class shares for periods prior to December 9, 2005. The returns have been restated for sales charges and for fees applicable to Class Y shares. |
| ** | The average annual total returns shown above are adjusted for maximum applicable sales charges. |
The performance of the above Fund does not reflect the deduction of taxes that a shareholder would pay on Fund distributions or the redemption of Fund shares.
Notes to Chart
S&P Composite 1500 Index is an unmanaged, broad market index representing the large-cap, mid-cap, and small-cap segments of the U.S. equity market.
Barclays U.S. Aggregate Bond Index is an unmanaged index comprised of U.S. investment grade, fixed rate bond market securities, including government, government agency, corporate and mortgage-backed securities between one and ten years.
Tabular Presentation of Portfolios of Investments
December 31, 2013
The tables below provide each Fund’s sector allocation. We hope it will be useful to shareholders as it summarizes key information about each Fund’s investments.
| Touchstone Dynamic Equity Fund |
| Sector Allocation* | | (% of Net Assets) | |
| Long Positions | | | | |
| Information Technology | | | 20.7 | % |
| Energy | | | 18.1 | |
| Financials | | | 15.8 | |
| Health Care | | | 15.5 | |
| Consumer Discretionary | | | 13.3 | |
| Industrials | | | 12.5 | |
| Consumer Staples | | | 11.7 | |
| Materials | | | 7.1 | |
| Telecommunication Services | | | 3.8 | |
| Utilities | | | 1.9 | |
| Investment Fund | | | 2.6 | |
| Other Assets/Liabilities (Net) | | | 0.6 | |
| | | | 123.6 | % |
| Short Positions and Written Options |
| Energy | | | (7.6 | ) |
| Health Care | | | (3.4 | ) |
| Call and Put Options | | | (3.2 | ) |
| Information Technology | | | (2.6 | ) |
| Materials | | | (2.0 | ) |
| Industrials | | | (1.9 | ) |
| Telecommunication Services | | | (1.6 | ) |
| Financials | | | (1.1 | ) |
| Consumer Discretionary | | | (0.2 | ) |
| | | | (23.6 | ) |
| Total | | | 100.0 | % |
| Touchstone Balanced Allocation Fund |
| Sector Allocation | | (% of Net Assets) | |
| Government/Corporate | | | 24.7 | % |
| International Equity | | | 13.3 | |
| Value | | | 12.2 | |
| Growth | | | 10.2 | |
| Equity Income | | | 7.1 | |
| Balanced | | | 5.0 | |
| International Debt | | | 5.0 | |
| Blue Chip | | | 4.1 | |
| Emerging Market-Equity | | | 4.0 | |
| Various Assets | | | 3.0 | |
| Taxable-Money Market | | | 3.0 | |
| Sector Fund Real-Estate | | | 2.5 | |
| Value Small-Cap | | | 2.0 | |
| Growth Mid-Cap | | | 2.0 | |
| Corporate/Preferred-High Yield | | | 1.8 | |
| Growth Small-Cap | | | 1.0 | |
| Other Assets/Liabilities (Net) | | | (0.9 | ) |
| Total | | | 100.0 | % |
* Sector classifications are based upon the Global Industry Classification Standard (GICS®).
Tabular Presentation of Portfolios of Investments (Continued)
| Touchstone Conservative Allocation Fund |
| Sector Allocation | | (% of Net Assets) | |
| Government/Corporate | | | 46.2 | % |
| International Debt | | | 8.1 | |
| Balanced | | | 7.1 | |
| Growth | | | 6.1 | |
| Equity Income | | | 5.6 | |
| Value | | | 5.1 | |
| International Equity | | | 5.1 | |
| Taxable-Money Market | | | 5.0 | |
| Various Assets | | | 5.0 | |
| Blue Chip | | | 3.0 | |
| Corporate/Preferred-High Yield | | | 1.8 | |
| Value Small-Cap | | | 1.0 | |
| Sector Fund Real-Estate | | | 1.0 | |
| Emerging Market-Equity | | | 1.0 | |
| Other Assets/Liabilities (Net) | | | (1.1 | ) |
| Total | | | 100.0 | % |
| Touchstone Moderate Growth Allocation Fund |
| Sector Allocation | | (% of Net Assets) | |
| Government/Corporate | | | 15.4 | % |
| International Equity | | | 15.3 | |
| Value | | | 14.3 | |
| Growth | | | 13.3 | |
| Emerging Market-Equity | | | 7.7 | |
| Equity Income | | | 7.1 | |
| Value Small-Cap | | | 5.1 | |
| Blue Chip | | | 4.0 | |
| Balanced | | | 4.0 | |
| Growth Small-Cap | | | 3.1 | |
| Sector Fund Real-Estate | | | 3.0 | |
| Growth Mid-Cap | | | 2.0 | |
| Various Assets | | | 2.0 | |
| International Debt | | | 2.0 | |
| Corporate/Preferred-High Yield | | | 1.5 | |
| Value Mid-Cap | | | 1.0 | |
| Other Assets/Liabilities (Net) | | | (0.8 | ) |
| Total | | | 100.0 | % |
| Touchstone Growth Allocation Fund |
| Sector Allocation | | (% of Net Assets) | |
| International Equity | | | 20.4 | % |
| Value | | | 17.4 | |
| Growth | | | 14.4 | |
| Emerging Market-Equity | | | 10.8 | |
| Equity Income | | | 7.2 | |
| Value Small-Cap | | | 6.7 | |
| Government/Corporate | | | 6.0 | |
| Sector Fund Real-Estate | | | 4.5 | |
| Growth Small-Cap | | | 4.1 | |
| Blue Chip | | | 4.1 | |
| Growth Mid-Cap | | | 2.1 | |
| Value Mid-Cap | | | 2.0 | |
| Various Assets | | | 2.0 | |
| Other Assets/Liabilities (Net) | | | (1.7 | ) |
| Total | | | 100.0 | % |
Portfolio of Investments
Touchstone Dynamic Equity Fund – December 31, 2013
| | | | | | Market | |
| | | Shares | | | Value | |
| | | | | | | |
| Common Stocks†— 120.4% | | | | | | | | |
| | | | | | | | | |
| Information Technology — 20.7% | | | | | | | | |
| Accenture PLC (Ireland) - Class A | | | 22,192 | | | $ | 1,824,626 | |
| Activision Blizzard, Inc. | | | 10,722 | | | | 191,173 | |
| Apple, Inc. | | | 1,214 | | | | 681,188 | |
| Booz Allen Hamilton Holding Corp. | | | 5,707 | | | | 109,289 | |
| Cisco Systems, Inc. | | | 77,228 | | | | 1,733,769 | |
| Computer Sciences Corp. | | | 19,539 | | | | 1,091,839 | |
| Hewlett-Packard Co. | | | 27,511 | | | | 769,758 | |
| Ingram Micro, Inc. - Class A* | | | 30,732 | | | | 720,973 | |
| International Business Machines Corp. | | | 14,601 | | | | 2,738,710 | |
| Jabil Circuit, Inc. | | | 7,744 | | | | 135,055 | |
| LSI Corp. | | | 37,521 | | | | 413,481 | |
| Micron Technology, Inc.* | | | 33,733 | | | | 734,030 | |
| Microsoft Corp. | | | 8,722 | | | | 326,464 | |
| Oracle Corp. | | | 9,998 | | | | 382,523 | |
| Science Applications International Corp. | | | 5,726 | | | | 189,359 | |
| Seagate Technology PLC (Ireland) | | | 10,441 | | | | 586,367 | |
| Symantec Corp. | | | 33,395 | | | | 787,454 | |
| Western Union Co. (The) | | | 4,023 | | | | 69,397 | |
| | | | | | | | 13,485,455 | |
| | | | | | | | | |
| Energy — 18.1% | | | | | | | | |
| Anadarko Petroleum Corp. | | | 572 | | | | 45,371 | |
| Chevron Corp. | | | 22,558 | | | | 2,817,720 | |
| ConocoPhillips | | | 31,275 | | | | 2,209,579 | |
| EOG Resources, Inc. | | | 4,455 | | | | 747,727 | |
| Exxon Mobil Corp. | | | 7,723 | | | | 781,568 | |
| Murphy Oil Corp. | | | 10,191 | | | | 661,192 | |
| Occidental Petroleum Corp. | | | 4,540 | | | | 431,754 | |
| Phillips 66 | | | 21,450 | | | | 1,654,438 | |
| Schlumberger Ltd. (Cook Islands) | | | 11,112 | | | | 1,001,302 | |
| Valero Energy Corp. | | | 22,765 | | | | 1,147,356 | |
| World Fuel Services Corp. | | | 6,442 | | | | 278,037 | |
| | | | | | | | 11,776,044 | |
| | | | | | | | | |
| Financials — 15.8% | | | | | | | | |
| American International Group, Inc. | | | 4,927 | | | | 251,523 | |
| Bank of America Corp. | | | 65,185 | | | | 1,014,931 | |
| CBOE Holdings, Inc. | | | 394 | | | | 20,472 | |
| CBRE Group, Inc. - Class A* | | | 52,881 | | | | 1,390,770 | |
| Eaton Vance Corp. | | | 1,034 | | | | 44,245 | |
| Jones Lang LaSalle, Inc. | | | 5,663 | | | | 579,835 | |
| JPMorgan Chase & Co. | | | 33,947 | | | | 1,985,221 | |
| Popular, Inc. (Puerto Rico)* | | | 8,339 | | | | 239,579 | |
| Public Storage REIT | | | 1,625 | | | | 244,595 | |
| T Rowe Price Group, Inc. | | | 16,759 | | | | 1,403,901 | |
| Torchmark Corp. | | | 11,910 | | | | 930,766 | |
| US Bancorp | | | 54,452 | | | | 2,199,861 | |
| | | | | | | | 10,305,699 | |
| | | | | | | | | |
| Health Care — 15.5% | | | | | | | | |
| AbbVie, Inc. | | | 35,715 | | | | 1,886,109 | |
| Agilent Technologies, Inc. | | | 25,042 | | | | 1,432,152 | |
| AmerisourceBergen Corp. | | | 20,856 | | | | 1,466,385 | |
| Amgen, Inc. | | | 4,050 | | | | 462,348 | |
| Biogen Idec, Inc.* | | | 1,369 | | | | 382,978 | |
| Celgene Corp.* | | | 3,882 | | | | 655,903 | |
| Covance, Inc.* | | | 1,979 | | | | 174,271 | |
| Eli Lilly & Co. | | | 27,330 | | | | 1,393,830 | |
| Gilead Sciences, Inc.* | | | 6,569 | | | | 493,660 | |
| Johnson & Johnson | | | 1,466 | | | | 134,271 | |
| Life Technologies Corp.* | | | 323 | | | | 24,483 | |
| McKesson Corp. | | | 5,155 | | | | 832,017 | |
| Mylan, Inc.* | | | 10,944 | | | | 474,970 | |
| Myriad Genetics, Inc.* | | | 7,014 | | | | 147,154 | |
| Pfizer, Inc. | | | 4,104 | | | | 125,706 | |
| | | | | | | | 10,086,237 | |
| | | | | | | | | |
| Consumer Discretionary — 13.3% | | | | | | | | |
| Big Lots, Inc.* | | | 7,520 | | | | 242,821 | |
| Brinker International, Inc. | | | 18,143 | | | | 840,747 | |
| Dollar Tree, Inc.* | | | 11,302 | | | | 637,659 | |
| Ford Motor Co. | | | 37,718 | | | | 581,989 | |
| GameStop Corp. - Class A | | | 13,582 | | | | 669,049 | |
| Gannett Co., Inc. | | | 905 | | | | 26,770 | |
| Genuine Parts Co. | | | 11,206 | | | | 932,227 | |
| Lear Corp. | | | 21,979 | | | | 1,779,640 | |
| Lowe's Cos., Inc. | | | 4,464 | | | | 221,191 | |
| Macy's, Inc. | | | 7,257 | | | | 387,524 | |
| Omnicom Group, Inc. | | | 3,152 | | | | 234,414 | |
| Staples, Inc. | | | 31,656 | | | | 503,014 | |
| Starz - Class A* | | | 39,757 | | | | 1,162,495 | |
| Taylor Morrison Home Corp. - Class A* | | | 2,929 | | | | 65,756 | |
| TRW Automotive Holdings Corp.* | | | 5,558 | | | | 413,460 | |
| | | | | | | | 8,698,756 | |
| | | | | | | | | |
| Industrials — 12.5% | | | | | | | | |
| 3M Co. | | | 16,586 | | | | 2,326,186 | |
| Con-way, Inc. | | | 257 | | | | 10,206 | |
| Emerson Electric Co. | | | 19,628 | | | | 1,377,493 | |
| Jacobs Engineering Group, Inc.* | | | 4,689 | | | | 295,360 | |
| Manpowergroup, Inc. | | | 2,303 | | | | 197,736 | |
| Northrop Grumman Corp. | | | 11,881 | | | | 1,361,681 | |
| Robert Half International, Inc. | | | 34,892 | | | | 1,465,115 | |
| Southwest Airlines Co. | | | 8,505 | | | | 160,234 | |
| United Parcel Service, Inc. - Class B | | | 243 | | | | 25,534 | |
| WW Grainger, Inc. | | | 3,524 | | | | 900,100 | |
| | | | | | | | 8,119,645 | |
| | | | | | | | | |
| Consumer Staples — 11.7% | | | | | | | | |
| Altria Group, Inc. | | | 30,411 | | | | 1,167,478 | |
| Archer-Daniels-Midland Co. | | | 33,117 | | | | 1,437,278 | |
| CVS Caremark Corp. | | | 19,289 | | | | 1,380,514 | |
| Herbalife Ltd. (Cayman Islands) | | | 3,958 | | | | 311,495 | |
| Kroger Co. (The) | | | 28,203 | | | | 1,114,865 | |
| Nu Skin Enterprises, Inc. - Class A | | | 2,044 | | | | 282,522 | |
| Tyson Foods, Inc. - Class A | | | 22,846 | | | | 764,427 | |
| Wal-Mart Stores, Inc. | | | 14,470 | | | | 1,138,644 | |
| | | | | | | | 7,597,223 | |
| | | | | | | | | |
| Materials — 7.1% | | | | | | | | |
| Dow Chemical Co. (The) | | | 5,921 | | | | 262,892 | |
| EI du Pont de Nemours & Co. | | | 10,663 | | | | 692,775 | |
| Freeport-McMoRan Copper & Gold, Inc. | | | 26,615 | | | | 1,004,450 | |
Touchstone Dynamic Equity Fund (Continued)
| | | | | | Market | |
| | | Shares | | | Value | |
| | | | | | | |
| Common Stocks† — 120.4% (Continued) | | | | | | | | |
| | | | | | | | | |
| Materials — (Continued) | | | | | | | | |
| Lyondellbasell Industries N.V. - Class A | | | 24,811 | | | $ | 1,991,827 | |
| Monsanto Co. | | | 2,195 | | | | 255,827 | |
| Nucor Corp. | | | 8,480 | | | | 452,662 | |
| | | | | | | | 4,660,433 | |
| | | | | | | | | |
| Telecommunication Services — 3.8% | | | | | | | | |
| AT&T, Inc. | | | 4,385 | | | | 154,177 | |
| Verizon Communications, Inc. | | | 47,115 | | | | 2,315,231 | |
| | | | | | | | 2,469,408 | |
| | | | | | | | | |
| Utilities — 1.9% | | | | | | | | |
| DTE Energy Co. | | | 1,140 | | | | 75,685 | |
| Edison International | | | 21,621 | | | | 1,001,052 | |
| Public Service Enterprise Group, Inc. | | | 4,336 | | | | 138,925 | |
| | | | | | | | 1,215,662 | |
| Total Common Stocks | | | | | | $ | 78,414,562 | |
| | | | | | | | | |
| Investment Fund — 2.6% | | | | | | | | |
| Touchstone Institutional Money Market | | | | | | | | |
Fund, 0.01%^Ω | | | 1,679,688 | | | | 1,679,688 | |
| | | | | | | | | |
| Total Long Positions | | | | | | | | |
| (Cost $70,620,327) | | | | | | $ | 80,094,250 | |
| | | | | | | | | |
| Securities Sold Short— (20.4%) | | | | | | | | |
| | | | | | | | | |
| Common Stocks— (20.4%) | | | | | | | | |
| | | | | | | | | |
| Energy — (7.6%) | | | | | | | | |
| Cheniere Energy, Inc.* | | | (23,820 | ) | | | (1,027,119 | ) |
| Cobalt International Energy, Inc.* | | | (17,840 | ) | | | (293,468 | ) |
| Gulfport Energy Corp.* | | | (3,314 | ) | | | (209,279 | ) |
| McDermott International, Inc.* | | | (82,326 | ) | | | (754,106 | ) |
| Newfield Exploration Co.* | | | (33,193 | ) | | | (817,544 | ) |
| Peabody Energy Corp. | | | (39,494 | ) | | | (771,318 | ) |
| Range Resources Corp. | | | (7,178 | ) | | | (605,177 | ) |
| Teekay Corp. | | | (9,978 | ) | | | (479,044 | ) |
| Williams Cos., Inc. (The) | | | (228 | ) | | | (8,794 | ) |
| | | | | | | | (4,965,849 | ) |
| | | | | | | | | |
| Health Care — (3.4%) | | | | | | | | |
| Ariad Pharmaceuticals, Inc.* | | | (68,637 | ) | | | (468,104 | ) |
| Endo Health Solutions, Inc.* | | | (15,143 | ) | | | (1,021,547 | ) |
| Hologic, Inc.* | | | (20,882 | ) | | | (466,713 | ) |
| Theravance, Inc.* | | | (5,614 | ) | | | (200,139 | ) |
| Vertex Pharmaceuticals, Inc.* | | | (740 | ) | | | (54,982 | ) |
| | | | | | | | (2,211,485 | ) |
| | | | | | | | | |
| Information Technology — (2.6%) | | | | | | | | |
| 3D Systems Corp.* | | | (3,883 | ) | | | (360,847 | ) |
| Riverbed Technology, Inc.* | | | (5,040 | ) | | | (91,123 | ) |
| Rovi Corp.* | | | (26,858 | ) | | | (528,834 | ) |
| Silicon Laboratories, Inc.* | | | (2,601 | ) | | | (112,649 | ) |
| VeriFone Systems, Inc.* | | | (22,158 | ) | | | (594,278 | ) |
| | | | | | | | (1,687,731 | ) |
| | | | | | | | | |
| Materials — (2.0%) | | | | | | | | |
| Kronos Worldwide, Inc. | | | (13,989 | ) | | | (266,491 | ) |
| Newmont Mining Corp. | | | (8,097 | ) | | | (186,474 | ) |
| Rockwood Holdings, Inc. | | | (9,508 | ) | | | (683,815 | ) |
| WR Grace & Co.* | | | (1,668 | ) | | | (164,915 | ) |
| | | | | | | | (1,301,695 | ) |
| | | | | | | | | |
| Industrials — (1.9%) | | | | | | | | |
| Covanta Holding Corp. | | | (29,600 | ) | | | (525,400 | ) |
| SolarCity Corp.* | | | (1,239 | ) | | | (70,399 | ) |
| TransDigm Group, Inc. | | | (3,933 | ) | | | (633,292 | ) |
| | | | | | | | (1,229,091 | ) |
| | | | | | | | | |
| Telecommunication Services — (1.6%) | | | | | | | | |
| Crown Castle International Corp.* | | | (6,547 | ) | | | (480,746 | ) |
| SBA Communications Corp. - Class A* | | | (6,163 | ) | | | (553,684 | ) |
| | | | | | | | (1,034,430 | ) |
| | | | | | | | | |
| Financials — (1.1%) | | | | | | | | |
| Corporate Office Properties Trust, REIT | | | (21,554 | ) | | | (510,614 | ) |
| Kilroy Realty Corp., REIT | | | (4,666 | ) | | | (234,140 | ) |
| | | | | | | | (744,754 | ) |
| | | | | | | | | |
| Consumer Discretionary — (0.2%) | | | | | | | | |
| Tempur Sealy International, Inc.* | | | (227 | ) | | | (12,249 | ) |
| Toll Brothers, Inc.* | | | (2,311 | ) | | | (85,507 | ) |
| | | | | | | | (97,756 | ) |
| Total Common Stocks | | | | | | $ | (13,272,791 | ) |
| | | | | | | | | |
| Total Securities Sold Short | | | | | | | | |
| (Proceeds $(12,022,871)) | | | | | | $ | (13,272,791 | ) |
| | | Number | | | | |
| | | of | | | | |
| | | Contracts | | | | |
| | | | | | | |
| Written Options Contracts— (3.2%) | | | | | | | | |
| | | | | | | | | |
| Call Options— (3.2%) | | | | | | | | |
| NASDAQ-100 Index | | | | | | | | |
| January 2014 | | | | | | | | |
| Strike Price $3,650 | | | (10 | ) | | | (13,090 | ) |
| Russell-2000 Index | | | | | | | | |
| January 2014 | | | | | | | | |
| Strike Price $1,195 | | | (80 | ) | | | (26,560 | ) |
| S&P 500 Index | | | | | | | | |
| January 2014 | | | | | | | | |
| Strike Price $1,755 | | | (210 | ) | | | (1,978,200 | ) |
| S&P 500 Index | | | | | | | | |
| January 2014 | | | | | | | | |
| Strike Price $1,880 | | | (75 | ) | | | (40,125 | ) |
| Total Call Options | | | | | | | (2,057,975 | ) |
Touchstone Dynamic Equity Fund (Continued)
| | | Number | | | | |
| | | of | | | Market | |
| | | Contracts | | | Value | |
| | | | | | | |
| Put Options— 0.0% | | | | | | | | |
| S&P 500 Index | | | | | | | | |
| January 2014 | | | | | | | | |
| Strike Price $1,815 | | | (15 | ) | | $ | (12,300 | ) |
| | | | | | | | | |
| Total Written Options Contracts | | | | | | | | |
| (Proceeds $(1,498,844)) | | | | | | $ | (2,070,275 | ) |
| | | | | | | | | |
| Total Investment Securities —99.4% | | | | | | | | |
| (Cost $57,098,612) | | | | | | $ | 64,751,184 | |
| | | | | | | | | |
| Other Assets in Excess of Liabilities — 0.6% | | | | | | | 398,434 | |
| | | | | | | | | |
| Net Assets — 100.0% | | | | | | $ | 65,149,618 | |
| * | Non-income producing security. |
| ^ | Affiliated Fund. See Note 4 in Notes to Financial Statements. |
| † | All or a portion of these securities are held as collateral for securities sold short and written options. The total value of the securities held as collateral as of December 31, 2013 was $78,414,562. |
| Ω | Represents the 7-day SEC yield as of December 31, 2013. |
Portfolio Abbreviations:
PLC - Public Limited Company
REIT - Real Estate Investment Trust
Other Information:
The inputs or methodology used for valuing securities may not be an indication of the risk associated with investing in those securities. For more information on valuation inputs, and their aggregation into the levels used in the table below, please refer to the security valuation section in the accompanying Notes to Financial Statements.
Valuation inputs at Reporting Date:
| Description | | Level 1 | | | Level 2 | | | Level 3 | | | Total | |
| | | | | | | | | | | | | |
| Assets: | | | | | | | | | | | | | | | | |
| Long Positions | | | | | | | | | | | | | | | | |
| Common Stocks | | $ | 78,414,562 | | | $ | — | | | $ | — | | | $ | 78,414,562 | |
| Investment Fund | | | 1,679,688 | | | | — | | | | — | | | | 1,679,688 | |
| | | | | | | | | | | | | | | $ | 80,094,250 | |
| | | | | | | | | | | | | | | | | |
| Liabilities: | | | | | | | | | | | | | | | | |
| Securities Sold Short | | | | | | | | | | | | | | | | |
| Common Stocks | | $ | (13,272,791 | ) | | $ | — | | | $ | — | | | $ | (13,272,791 | ) |
| Other Financial Instruments | | | | | | | | | | | | | | | | |
| Liabilities: | | | | | | | | | | | | | | | | |
| Written Options | | | | | | | | | | | | | | | | |
| Equity Contracts | | | (2,070,275 | ) | | | — | | | | — | | | | (2,070,275 | ) |
| | | | | | | | | | | | | | | $ | (15,343,066 | ) |
Transactions in written options for the year ended December 31, 2013
| | | Number of | | | | |
| | | Contracts | | | Premium | |
| Beginning of Period, December 31, 2012 | | | 930 | | | $ | 1,799,847 | |
| Call Options Written | | | 24,405 | | | | 21,006,045 | |
| Put Options Written | | | 256 | | | | 617,588 | |
| Call Options Closed | | | (12,653 | ) | | | (16,930,107 | ) |
| Put Options Closed | | | (100 | ) | | | (213,521 | ) |
| Call Options Expired | | | (2,152 | ) | | | (196,170 | ) |
| Put Options Expired | | | (171 | ) | | | (452,355 | ) |
| Call Options Exercised | | | (10,125 | ) | | | (4,132,483 | ) |
| | | | | | | | | |
| December 31, 2013 | | | 390 | | | $ | 1,498,844 | |
See accompanying Notes to Financial Statements.
Portfolio of Investments
Touchstone Balanced Allocation Fund – December 31, 2013
| | | | | | Market | |
| | | Shares | | | Value | |
| | | | | | | |
| Affiliated Mutual Funds^— 100.9% | | | | | | | | |
| | | | | | | | | |
| Government/Corporate—24.7% | | | | | | | | |
| Touchstone Core Bond Fund | | | 340,825 | | | $ | 3,510,495 | |
| Touchstone Total Return Bond Fund | | | 1,343,909 | | | | 13,412,213 | |
| Touchstone Ultra Short Duration Fixed | | | | | | | | |
| Income Fund | | | 1,271,858 | | | | 12,006,339 | |
| | | | | | | | 28,929,047 | |
| | | | | | | | | |
| International Equity — 13.3% | | | | | | | | |
| Touchstone International Small Cap | | | | | | | | |
| Fund | | | 237,553 | | | | 3,591,800 | |
| Touchstone International Value Fund | | | 1,348,621 | | | | 11,948,786 | |
| | | | | | | | 15,540,586 | |
| | | | | | | | | |
| Value — 12.2% | | | | | | | | |
| Touchstone Focused Fund | | | 137,533 | | | | 4,777,892 | |
| Touchstone Value Fund | | | 1,054,616 | | | | 9,544,273 | |
| | | | | | | | 14,322,165 | |
| | | | | | | | | |
| Growth — 10.2% | | | | | | | | |
| Touchstone Growth Opportunities Fund | | | 72,795 | | | | 2,386,946 | |
| Touchstone Sands Capital Institutional | | | | | | | | |
| Growth Fund | | | 427,048 | | | | 9,540,253 | |
| | | | | | | | 11,927,199 | |
| | | | | | | | | |
| Equity Income — 7.1% | | | | | | | | |
| Touchstone Premium Yield Equity Fund, | | | | | | | | |
| Class Y | | | 895,741 | | | | 8,357,262 | |
| | | | | | | | | |
| Balanced — 5.0% | | | | | | | | |
| Touchstone Flexible Income Fund | | | 568,780 | | | | 5,881,187 | |
| | | | | | | | | |
| International Debt — 5.0% | | | | | | | | |
| Touchstone International Fixed Income | | | | | | | | |
| Fund | | | 570,541 | | | | 5,836,635 | |
| | | | | | | | | |
| Blue Chip — 4.1% | | | | | | | | |
| Touchstone Dynamic Equity Fund | | | 353,443 | | | | 4,732,601 | |
| | | | | | | | | |
| Emerging Market-Equity — 4.0% | | | | | | | | |
| Touchstone Emerging Markets Equity | | | | | | | | |
| Fund | | | 416,065 | | | | 4,634,970 | |
| | | | | | | | | |
| Various Assets — 3.0% | | | | | | | | |
| Touchstone Arbitrage Fund* | | | 350,985 | | | | 3,523,887 | |
| | | | | | | | | |
| Taxable-Money Market — 3.0% | | | | | | | | |
| Touchstone Institutional Money Market | | | | | | | | |
| Fund, 0.01%Ω | | | 3,512,562 | | | | 3,512,563 | |
| | | | | | | | | |
| Sector Fund Real-Estate — 2.5% | | | | | | | | |
| Touchstone Global Real Estate Fund | | | 286,389 | | | | 2,964,123 | |
| | | | | | | | | |
| Value Small-Cap — 2.0% | | | | | | | | |
| Touchstone Small Cap Core Fund | | | 56,460 | | | | 1,190,734 | |
| Touchstone Small Company Value Fund | | | 64,185 | | | | 1,193,843 | |
| | | | | | | | 2,384,577 | |
| | | | | | | | | |
| Growth Mid-Cap — 2.0% | | | | | | | | |
| Touchstone Mid Cap Fund | | | 103,242 | | | | 2,378,710 | |
| | | | | | | | | |
| Corporate/Preferred-High Yield — 1.8% | | | | | | | | |
| Touchstone High Yield Fund | | | 223,760 | | | | 2,056,354 | |
| | | | | | | | | |
| Growth Small-Cap — 1.0% | | | | | | | | |
| Touchstone Small Cap Growth Fund | | | 207,796 | | | | 1,192,747 | |
| Total Affiliated Mutual Funds | | | | | | $ | 118,174,613 | |
| | | | | | | | | |
| Total Investment Securities —100.9% | | | | | | | | |
| (Cost $107,524,549) | | | | | | $ | 118,174,613 | |
| | | | | | | | | |
| Liabilities in Excess of Other Assets — (0.9%) | | | | | | | (1,094,308 | ) |
| | | | | | | | | |
| Net Assets — 100.0% | | | | | | $ | 117,080,305 | |
| * | Non-income producing security. |
| ^ | All affiliated fund investments are in Institutional Class shares, unless otherwise indicated. The financial statements of the underlying funds can be found on the SEC website. See Note 4 in Notes to Financial Statements. |
| Ω | Represents the 7-day SEC yield as of December 31, 2013. |
Other Information:
The inputs or methodology used for valuing securities may not be an indication of the risk associated with investing in those securities. For more information on valuation inputs, and their aggregation into the levels used in the table below, please refer to the security valuation section in the accompanying Notes to Financial Statements.
Valuation inputs at Reporting Date:
| Description | | Level 1 | | | Level 2 | | | Level 3 | | | Total | |
| | | | | | | | | | | | | |
| Affiliated Mutual Funds | | $ | 118,174,613 | | | $ | — | | | $ | — | | | $ | 118,174,613 | |
See accompanying Notes to Financial Statements.
Portfolio of Investments
Touchstone Conservative Allocation Fund – December 31, 2013
| | | | | | Market | |
| | | Shares | | | Value | |
| | | | | | | |
| Affiliated Mutual Funds^— 101.1% | | | | | | | | |
| | | | | | | | | |
| Government/Corporate—46.2% | | | | | | | | |
| Touchstone Core Bond Fund | | | 311,489 | | | $ | 3,208,340 | |
| Touchstone Total Return Bond Fund | | | 1,281,373 | | | | 12,788,101 | |
| Touchstone Ultra Short Duration Fixed | | | | | | | | |
| Income Fund | | | 1,411,789 | | | | 13,327,285 | |
| | | | | | | | 29,323,726 | |
| | | | | | | | | |
| International Debt — 8.1% | | | | | | | | |
| Touchstone International Fixed Income | | | | | | | | |
| Fund | | | 500,625 | | | | 5,121,392 | |
| | | | | | | | | |
| Balanced — 7.1% | | | | | | | | |
| Touchstone Flexible Income Fund | | | 435,908 | | | | 4,507,289 | |
| | | | | | | | | |
| Growth — 6.1% | | | | | | | | |
| Touchstone Growth Opportunities Fund | | | 19,674 | | | | 645,119 | |
| Touchstone Sands Capital Institutional | | | | | | | | |
| Growth Fund | | | 143,823 | | | | 3,213,001 | |
| | | | | | | | 3,858,120 | |
| | | | | | | | | |
| Equity Income — 5.6% | | | | | | | | |
| Touchstone Premium Yield Equity Fund, | | | | | | | | |
| Class Y | | | 378,543 | | | | 3,531,811 | |
| | | | | | | | | |
| Value — 5.1% | | | | | | | | |
| Touchstone Value Fund | | | 356,009 | | | | 3,221,880 | |
| | | | | | | | | |
| International Equity — 5.1% | | | | | | | | |
| Touchstone International Small Cap | | | | | | | | |
| Fund | | | 42,618 | | | | 644,383 | |
| Touchstone International Value Fund | | | 290,466 | | | | 2,573,532 | |
| | | | | | | | 3,217,915 | |
| | | | | | | | | |
| Taxable-Money Market — 5.0% | | | | | | | | |
| Touchstone Institutional Money Market | | | | | | | | |
| Fund, 0.01%Ω | | | 3,207,946 | | | | 3,207,946 | |
| | | | | | | | | |
| Various Assets — 5.0% | | | | | | | | |
| Touchstone Arbitrage Fund* | | | 319,300 | | | | 3,205,776 | |
| | | | | | | | | |
| Blue Chip — 3.0% | | | | | | | | |
| Touchstone Dynamic Equity Fund | | | 143,463 | | | | 1,920,969 | |
| | | | | | | | | |
| Corporate/Preferred-High Yield — 1.8% | | | | | | | | |
| Touchstone High Yield Fund | | | 122,510 | | | | 1,125,864 | |
| | | | | | | | | |
| Value Small-Cap — 1.0% | | | | | | | | |
| Touchstone Small Cap Core Fund | | | 30,530 | | | | 643,880 | |
| | | | | | | | | |
| Sector Fund Real-Estate — 1.0% | | | | | | | | |
| Touchstone Global Real Estate Fund | | | 62,152 | | | | 643,277 | |
| | | | | | | | | |
| Emerging Market-Equity — 1.0% | | | | | | | | |
| Touchstone Emerging Markets Equity | | | | | | | | |
| Fund | | | 57,217 | | | | 637,392 | |
| Total Affiliated Mutual Funds | | | | | | $ | 64,167,237 | |
| | | | | | | | | |
| Total Investment Securities —101.1% | | | | | | | | |
| (Cost $61,379,055) | | | | | | $ | 64,167,237 | |
| | | | | | | | | |
| Liabilities in Excess of Other Assets — (1.1%) | | | | | | | (723,285 | ) |
| | | | | | | | | |
| Net Assets — 100.0% | | | | | | $ | 63,443,952 | |
| * | Non-income producing security. |
| ^ | All affiliated fund investments are in Institutional Class shares, unless otherwise indicated. The financial statements of the underlying funds can be found on the SEC website. See Note 4 in Notes to Financial Statements. |
| Ω | Represents the 7-day SEC yield as of December 31, 2013. |
Other Information:
The inputs or methodology used for valuing securities may not be an indication of the risk associated with investing in those securities. For more information on valuation inputs, and their aggregation into the levels used in the table below, please refer to the security valuation section in the accompanying Notes to Financial Statements.
Valuation inputs at Reporting Date:
| Description | | Level 1 | | | Level 2 | | | Level 3 | | | Total | |
| | | | | | | | | | | | | |
| Affiliated Mutual Funds | | $ | 64,167,237 | | | $ | — | | | $ | — | | | $ | 64,167,237 | |
See accompanying Notes to Financial Statements.
Portfolio of Investments
Touchstone Growth Allocation Fund – December 31, 2013
| | | | | | Market | |
| | | Shares | | | Value | |
| | | | | | | |
| Affiliated Mutual Funds^— 101.7% | | | | | | | | |
| | | | | | | | | |
| International Equity — 20.4% | | | | | | | | |
| Touchstone International Small Cap | | | | | | | | |
| Fund | | | 332,026 | | | $ | 5,020,239 | |
| Touchstone International Value Fund | | | 1,050,134 | | | | 9,304,186 | |
| | | | | | | | 14,324,425 | |
| | | | | | | | | |
| Value — 17.4% | | | | | | | | |
| Touchstone Focused Fund | | | 165,306 | | | | 5,742,714 | |
| Touchstone Value Fund | | | 714,249 | | | | 6,463,953 | |
| | | | | | | | 12,206,667 | |
| | | | | | | | | |
| Growth — 14.4% | | | | | | | | |
| Touchstone Growth Opportunities Fund | | | 109,598 | | | | 3,593,709 | |
| Touchstone Sands Capital Institutional | | | | | | | | |
| Growth Fund | | | 289,817 | | | | 6,474,521 | |
| | | | | | | | 10,068,230 | |
| | | | | | | | | |
| Emerging Market-Equity — 10.8% | | | | | | | | |
| Touchstone Emerging Markets Equity | | | | | | | | |
| Fund | | | 679,018 | | | | 7,564,257 | |
| | | | | | | | | |
| Equity Income — 7.2% | | | | | | | | |
| Touchstone Premium Yield Equity Fund, | | | | | | | | |
| Class Y | | | 537,964 | | | | 5,019,202 | |
| | | | | | | | | |
| Value Small-Cap — 6.7% | | | | | | | | |
| Touchstone Small Cap Core Fund | | | 135,916 | | | | 2,866,475 | |
| Touchstone Small Company Value Fund | | | 96,248 | | | | 1,790,217 | |
| | | | | | | | 4,656,692 | |
| | | | | | | | | |
| Government/Corporate—6.0% | | | | | | | | |
| Touchstone Ultra Short Duration Fixed | | | | | | | | |
| Income Fund | | | 448,025 | | | | 4,229,360 | |
| | | | | | | | | |
| Sector Fund Real-Estate — 4.5% | | | | | | | | |
| Touchstone Global Real Estate Fund | | | 307,629 | | | | 3,183,962 | |
| | | | | | | | | |
| Growth Small-Cap — 4.1% | | | | | | | | |
| Touchstone Small Cap Growth Fund | | | 499,638 | | | | 2,867,920 | |
| | | | | | | | | |
| Blue Chip — 4.1% | | | | | | | | |
| Touchstone Dynamic Equity Fund | | | 213,490 | | | | 2,858,636 | |
| | | | | | | | | |
| Growth Mid-Cap — 2.1% | | | | | | | | |
| Touchstone Mid Cap Fund | | | 62,223 | | | | 1,433,610 | |
| | | | | | | | | |
| Value Mid-Cap — 2.0% | | | | | | | | |
| Touchstone Mid Cap Value Fund | | | 88,715 | | | | 1,431,853 | |
| | | | | | | | | |
| Various Assets — 2.0% | | | | | | | | |
| Touchstone Arbitrage Fund* | | | 140,887 | | | | 1,414,503 | |
| Total Affiliated Mutual Funds | | | | | | $ | 71,259,317 | |
| | | | | | | | | |
| Total Investment Securities —101.7% | | | | | | | | |
| (Cost $61,370,032) | | | | | | $ | 71,259,317 | |
| | | | | | | | | |
| Liabilities in Excess of Other Assets — (1.7%) | | | | | | | (1,179,010 | ) |
| | | | | | | | | |
| Net Assets — 100.0% | | | | | | $ | 70,080,307 | |
| * | Non-income producing security. |
| ^ | All affiliated fund investments are in Institutional Class shares, unless otherwise indicated. The financial statements of the underlying funds can be found on the SEC website. See Note 4 in Notes to Financial Statements. |
Other Information:
The inputs or methodology used for valuing securities may not be an indication of the risk associated with investing in those securities. For more information on valuation inputs, and their aggregation into the levels used in the table below, please refer to the security valuation section in the accompanying Notes to Financial Statements.
Valuation inputs at Reporting Date:
| Description | | Level 1 | | | Level 2 | | | Level 3 | | | Total | |
| | | | | | | | | | | | | |
| Affiliated Mutual Funds | | $ | 71,259,317 | | | $ | — | | | $ | — | | | $ | 71,259,317 | |
See accompanying Notes to Financial Statements.
Portfolio of Investments
Touchstone Moderate Growth Allocation Fund – December 31, 2013
| | | | | | Market | |
| | | Shares | | | Value | |
| | | | | | | |
| Affiliated Mutual Funds^— 100.8% | | | | | | | | |
| | | | | | | | | |
| Government/Corporate—15.4% | | | | | | | | |
| Touchstone Total Return Bond Fund | | | 1,506,687 | | | $ | 15,036,734 | |
| Touchstone Ultra Short Duration Fixed | | | | | | | | |
| Income Fund | | | 819,943 | | | | 7,740,258 | |
| | | | | | | | 22,776,992 | |
| | | | | | | | | |
| International Equity — 15.3% | | | | | | | | |
| Touchstone International Small Cap | | | | | | | | |
| Fund | | | 401,785 | | | | 6,074,990 | |
| Touchstone International Value Fund | | | 1,880,904 | | | | 16,664,810 | |
| | | | | | | | 22,739,800 | |
| | | | | | | | | |
| Value — 14.3% | | | | | | | | |
| Touchstone Focused Fund | | | 261,705 | | | | 9,091,631 | |
| Touchstone Value Fund | | | 1,336,833 | | | | 12,098,338 | |
| | | | | | | | 21,189,969 | |
| | | | | | | | | |
| Growth — 13.3% | | | | | | | | |
| Touchstone Growth Opportunities Fund | | | 184,736 | | | | 6,057,497 | |
| Touchstone Sands Capital Institutional | | | | | | | | |
| Growth Fund | | | 609,062 | | | | 13,606,453 | |
| | | | | | | | 19,663,950 | |
| | | | | | | | | |
| Emerging Market-Equity — 7.7% | | | | | | | | |
| Touchstone Emerging Markets Equity | | | | | | | | |
| Fund | | | 1,027,678 | | | | 11,448,330 | |
| | | | | | | | | |
| Equity Income — 7.1% | | | | | | | | |
| Touchstone Premium Yield Equity Fund, | | | | | | | | |
| Class Y | | | 1,133,618 | | | | 10,576,658 | |
| | | | | | | | | |
| Value Small-Cap — 5.1% | | | | | | | | |
| Touchstone Small Cap Core Fund | | | 214,826 | | | | 4,530,686 | |
| Touchstone Small Company Value Fund | | | 163,056 | | | | 3,032,836 | |
| | | | | | | | 7,563,522 | |
| | | | | | | | | |
| Blue Chip — 4.0% | | | | | | | | |
| Touchstone Dynamic Equity Fund | | | 447,527 | | | | 5,992,392 | |
| | | | | | | | | |
| Balanced — 4.0% | | | | | | | | |
| Touchstone Flexible Income Fund | | | 573,635 | | | | 5,931,388 | |
| | | | | | | | | |
| Growth Small-Cap — 3.1% | | | | | | | | |
| Touchstone Small Cap Growth Fund | | | 791,475 | | | | 4,543,067 | |
| | | | | | | | | |
| Sector Fund Real-Estate — 3.0% | | | | | | | | |
| Touchstone Global Real Estate Fund | | | 428,892 | | | | 4,439,033 | |
| | | | | | | | | |
| Growth Mid-Cap — 2.0% | | | | | | | | |
| Touchstone Mid Cap Fund | | | 130,924 | | | | 3,016,500 | |
| | | | | | | | | |
| Various Assets — 2.0% | | | | | | | | |
| Touchstone Arbitrage Fund* | | | 294,731 | | | | 2,959,096 | |
| | | | | | | | | |
| International Debt — 2.0% | | | | | | | | |
| Touchstone International Fixed Income | | | | | | | | |
| Fund | | | 286,336 | | | | 2,929,217 | |
| | | | | | | | | |
| Corporate/Preferred-High Yield — 1.5% | | | | | | | | |
| Touchstone High Yield Fund | | | 242,628 | | | | 2,229,751 | |
| | | | | | | | | |
| Value Mid-Cap — 1.0% | | | | | | | | |
| Touchstone Mid Cap Value Fund | | | 93,568 | | | | 1,510,187 | |
| Total Affiliated Mutual Funds | | | | | | $ | 149,509,852 | |
| | | | | | | | | |
| Total Investment Securities —100.8% | | | | | | | | |
| (Cost $131,679,000) | | | | | | $ | 149,509,852 | |
| | | | | | | | | |
| Liabilities in Excess of Other Assets — (0.8%) | | | | | | | (1,217,018 | ) |
| | | | | | | | | |
| Net Assets — 100.0% | | | | | | $ | 148,292,834 | |
| * | Non-income producing security. |
| ^ | All affiliated fund investments are in Institutional Class shares, unless otherwise indicated. The financial statements of the underlying funds can be found on the SEC website. See Note 4 in Notes to Financial Statements. |
Other Information:
The inputs or methodology used for valuing securities may not be an indication of the risk associated with investing in those securities. For more information on valuation inputs, and their aggregation into the levels used in the table below, please refer to the security valuation section in the accompanying Notes to Financial Statements.
Valuation inputs at Reporting Date:
| Description | | Level 1 | | | Level 2 | | | Level 3 | | | Total | |
| | | | | | | | | | | | | |
| Affiliated Mutual Funds | | $ | 149,509,852 | | | $ | — | | | $ | — | | | $ | 149,509,852 | |
See accompanying Notes to Financial Statements.
Statements of Assets and Liabilities
December 31, 2013
| | | Touchstone | | | Touchstone | | | Touchstone | |
| | | Dynamic | | | Balanced | | | Conservative | |
| | | Equity | | | Allocation | | | Allocation | |
| | | Fund | | | Fund | | | Fund | |
| Assets | | | | | | | | | | | | |
| Investments, at cost | | $ | 70,620,327 | | | $ | 107,524,549 | | | $ | 61,379,055 | |
| Affiliated securities, at market value | | $ | 1,679,688 | | | $ | 118,174,613 | | | $ | 64,167,237 | |
| Non-affiliated securities, at market value | | | 78,414,562 | | | | — | | | | — | |
| Investments, at market value | | $ | 80,094,250 | | | $ | 118,174,613 | | | $ | 64,167,237 | |
| Cash deposits held at prime broker | | | 719,967 | | | | — | | | | — | |
| Dividends and interest receivable | | | 79,319 | | | | — | | | | — | |
| Receivable for capital shares sold | | | 80,606 | | | | 48,001 | | | | 99,814 | |
| Receivable for investments sold | | | — | | | | 334,280 | | | | 205,086 | |
| Receivable from Investment Advisor | | | — | | | | — | | | | — | |
| Other assets | | | 13,725 | | | | 24,400 | | | | 28,597 | |
| Total Assets | | | 80,987,867 | | | | 118,581,294 | | | | 64,500,734 | |
| | | | | | | | | | | | | |
| Liabilities | | | | | | | | | | | | |
| Written options, at market value (A) | | | 2,070,275 | | | | — | | | | — | |
| Securities sold short (B) | | | 13,272,791 | | | | — | | | | — | |
| Dividends for securities sold short payable | | | 215,351 | | | | — | | | | — | |
| Bank overdrafts | | | 3,572 | | | | 335,091 | | | | 205,942 | |
| Payable for capital shares redeemed | | | 141,851 | | | | 1,054,482 | | | | 783,820 | |
| Payable to Investment Advisor | | | 49,123 | | | | 3,495 | | | | 749 | |
| Payable to other affiliates | | | 23,827 | | | | 39,419 | | | | 17,229 | |
| Payable to Trustees | | | 6,950 | | | | 7,088 | | | | 6,954 | |
| Payable for professional services | | | 18,220 | | | | 18,666 | | | | 17,510 | |
| Other accrued expenses and liabilities | | | 36,289 | | | | 42,748 | | | | 24,578 | |
| Total Liabilities | | | 15,838,249 | | | | 1,500,989 | | | | 1,056,782 | |
| | | | | | | | | | | | | |
| Net Assets | | $ | 65,149,618 | | | $ | 117,080,305 | | | $ | 63,443,952 | |
| | | | | | | | | | | | | |
| Net assets consist of: | | | | | | | | | | | | |
| Paid-in capital | | $ | 196,731,063 | | | $ | 143,781,098 | | | $ | 63,911,959 | |
| Accumulated net investment income | | | 423,004 | | | | 12,326 | | | | 4,479 | |
| Accumulated net realized losses on investments, written options, short positions and capital gain distributions received | | | (139,657,021 | ) | | | (37,363,183 | ) | | | (3,260,668 | ) |
| Net unrealized appreciation on investments, written options, foreign currency transactions and short positions | | | 7,652,572 | | | | 10,650,064 | | | | 2,788,182 | |
| Net Assets | | $ | 65,149,618 | | | $ | 117,080,305 | | | $ | 63,443,952 | |
| (A) Proceeds received for written options: | | $ | 1,498,844 | | | $ | — | | | $ | — | |
| (B) Proceeds received for securities sold short: | | $ | 12,022,871 | | | $ | — | | | $ | — | |
See accompanying Notes to Financial Statements.
Statements of Assets and Liabilities (Continued)
| | | | Touchstone | |
| Touchstone | | | Moderate | |
| Growth | | | Growth | |
| Allocation | | | Allocation | |
| Fund | | | Fund | |
| | | | | |
| $ | 61,370,032 | | | $ | 131,679,000 | |
| $ | 71,259,317 | | | $ | 149,509,852 | |
| | — | | | | — | |
| $ | 71,259,317 | | | $ | 149,509,852 | |
| | — | | | | — | |
| | — | | | | — | |
| | 106,836 | | | | 67,994 | |
| | 608,741 | | | | 514,445 | |
| | 778 | | | | — | |
| | 24,431 | | | | 24,895 | |
| | 72,000,103 | | | | 150,117,186 | |
| | | | | | | |
| | | | | | | |
| | — | | | | — | |
| | — | | | | — | |
| | — | | | | — | |
| | 609,493 | | | | 515,269 | |
| | 1,218,396 | | | | 1,165,145 | |
| | — | | | | 4,466 | |
| | 31,646 | | | | 55,553 | |
| | 6,967 | | | | 7,166 | |
| | 17,603 | | | | 19,330 | |
| | 35,691 | | | | 57,423 | |
| | 1,919,796 | | | | 1,824,352 | |
| | | | | | | |
| $ | 70,080,307 | | | $ | 148,292,834 | |
| | | | | | | |
| | | | | | | |
| $ | 100,513,450 | | | $ | 167,856,995 | |
| | 10,678 | | | | 11,411 | |
| | | | | | | |
| | (40,333,106 | ) | | | (37,406,424 | ) |
| | | | | | | |
| | 9,889,285 | | | | 17,830,852 | |
| $ | 70,080,307 | | | $ | 148,292,834 | |
| $ | — | | | $ | — | |
| $ | — | | | $ | — | |
Statements of Assets and Liabilities (Continued)
| | | Touchstone | | | Touchstone | | | Touchstone | |
| | | Dynamic | | | Balanced | | | Conservative | |
| | | Equity | | | Allocation | | | Allocation | |
| | | Fund | | | Fund | | | Fund | |
| | | | | | | | | | |
| Pricing of Class A Shares | | | | | | | | | | | | |
| Net assets applicable to Class A shares | | $ | 15,299,673 | | | $ | 46,285,006 | | | $ | 24,857,085 | |
| Shares of beneficial interest outstanding | | | | | | | | | | | | |
| (unlimited number of shares authorized, no par value) | | | 1,163,832 | | | | 3,741,481 | | | | 2,273,979 | |
| Net asset value price per share* | | $ | 13.15 | | | $ | 12.37 | | | $ | 10.93 | |
| Maximum offering price per share | | $ | 13.95 | | | $ | 13.12 | | | $ | 11.60 | |
| | | | | | | | | | | | | |
| Pricing of Class C Shares | | | | | | | | | | | | |
| Net assets applicable to Class C shares | | $ | 10,261,468 | | | $ | 36,680,616 | | | $ | 15,275,253 | |
| Shares of beneficial interest outstanding | | | | | | | | | | | | |
| (unlimited number of shares authorized, no par value) | | | 831,202 | | | | 2,968,318 | | | | 1,404,119 | |
| Net asset value, offering price per share** | | $ | 12.35 | | | $ | 12.36 | | | $ | 10.88 | |
| | | | | | | | | | | | | |
| Pricing of Class Y Shares | | | | | | | | | | | | |
| Net assets applicable to Class Y shares | | $ | 24,065,590 | | | $ | 34,079,468 | | | $ | 23,229,614 | |
| Shares of beneficial interest outstanding | | | | | | | | | | | | |
| (unlimited number of shares authorized, no par value) | | | 1,800,180 | | | | 2,750,785 | | | | 2,124,537 | |
| Net asset value, offering price and redemption price per share | | $ | 13.37 | | | $ | 12.39 | | | $ | 10.93 | |
| | | | | | | | | | | | | |
| Pricing of Institutional Class Shares | | | | | | | | | | | | |
| Net assets applicable to Institutional Class Shares | | $ | 15,522,887 | | | $ | 35,215 | | | $ | 82,000 | |
| Shares of beneficial interest outstanding | | | | | | | | | | | | |
| (unlimited number of shares authorized, no par value) | | | 1,158,940 | | | | 2,855 | | | | 7,492 | |
| Net asset value, offering price and redemption price per share | | $ | 13.39 | | | $ | 12.33 | | | $ | 10.95 | |
* There is no sales load on subscriptions of $1 million or more. Redemptions that were part of a $1 million or more subscription may be subject to a contingent deferred sales load if redeemed within a one-year period from the date of purchase.
** Redemption price per share varies by length of time shares are held.
See accompanying Notes to Financial Statements.
Statements of Assets and Liabilities (Continued)
| | | | Touchstone | |
| Touchstone | | | Moderate | |
| Growth | | | Growth | |
| Allocation | | | Allocation | |
| Fund | | | Fund | |
| | | | | |
| | | | | |
| $ | 29,278,509 | | | $ | 68,183,896 | |
| | | | | | | |
| | 2,117,879 | | | | 5,247,612 | |
| $ | 13.82 | | | $ | 12.99 | |
| $ | 14.66 | | | $ | 13.78 | |
| | | | | | | |
| | | | | | | |
| $ | 24,066,369 | | | $ | 49,600,809 | |
| | | | | | | |
| | 1,807,458 | | | | 3,878,848 | |
| $ | 13.32 | | | $ | 12.79 | |
| | | | | | | |
| | | | | | | |
| $ | 16,715,585 | | | $ | 30,497,979 | |
| | | | | | | |
| | 1,197,482 | | | | 2,330,344 | |
| $ | 13.96 | | | $ | 13.09 | |
| | | | | | | |
| | | | | | | |
| $ | 19,844 | | | $ | 10,150 | |
| | | | | | | |
| | 1,563 | | | | 779 | |
| $ | 12.70 | | | $ | 13.03 | |
Statements of Operations
For the Year Ended December 31, 2013
| | | Touchstone | | | Touchstone | | | Touchstone | |
| | | Dynamic | | | Balanced | | | Conservative | |
| | | Equity | | | Allocation | | | Allocation | |
| | | Fund | | | Fund | | | Fund | |
| Investment Income | | | | | | | | | |
| Dividends from affiliated funds | | $ | 685 | | | $ | 2,249,210 | | | $ | 1,498,274 | |
| Dividends from non-affiliated securities(A) | | | 1,622,934 | | | | — | | | | — | |
| Total Investment Income | | | 1,623,619 | | | | 2,249,210 | | | | 1,498,274 | |
| Expenses | | | | | | | | | | | | |
| Investment advisory fees | | | 550,645 | | | | 253,931 | | | | 143,445 | |
| Administration fees | | | 108,269 | | | | 212,405 | | | | 120,040 | |
| Compliance fees and expenses | | | 1,277 | | | | 1,277 | | | | 1,277 | |
| Custody fees | | | 26,650 | | | | 8,510 | | | | 7,355 | |
| Professional fees | | | 22,742 | | | | 23,794 | | | | 21,473 | |
| Transfer Agent fees, Class A | | | 31,875 | | | | 54,322 | | | | 23,671 | |
| Transfer Agent fees, Class C | | | 17,090 | | | | 30,216 | | | | 12,157 | |
| Transfer Agent fees, Class Y | | | 7,597 | | | | 43,475 | | | | 25,759 | |
| Transfer Agent fees, Institutional Class | | | 129 | | | | 45 | | | | 81 | |
| Registration Fees, Class A | | | 16,678 | | | | 15,401 | | | | 17,090 | |
| Registration Fees, Class C | | | 18,724 | | | | 15,438 | | | | 15,581 | |
| Registration Fees, Class Y | | | 17,435 | | | | 15,974 | | | | 14,462 | |
| Registration Fees, Institutional Class | | | 17,396 | | | | 17,921 | | | | 17,527 | |
| Dividend expense on securities sold short | | | 426,064 | | | | — | | | | — | |
| Reports to Shareholders, Class A | | | 3,686 | | | | 12,794 | | | | 7,816 | |
| Reports to Shareholders, Class C | | | 1,632 | | | | 6,767 | | | | 3,518 | |
| Reports to Shareholders, Class Y | | | 1,708 | | | | 4,334 | | | | 3,437 | |
| Reports to Shareholders, Institutional Class | | | 2,531 | | | | 2,775 | | | | 2,262 | |
| Distribution expenses, Class A | | | 39,351 | | | | 119,896 | | | | 66,274 | |
| Distribution and shareholder servicing expenses, Class C | | | 102,352 | | | | 375,637 | | | | 172,586 | |
| Trustee fees | | | 14,802 | | | | 14,890 | | | | 14,735 | |
| Other expenses | | | 34,858 | | | | 44,595 | | | | 22,266 | |
| Total Expenses | | | 1,463,491 | | | | 1,274,397 | | | | 712,812 | |
| Fees waived and/or reimbursed by the Advisor and/or Affiliates(B) | | | (63,325 | ) | | | (648,269 | ) | | | (400,305 | ) |
| Fees recouped by Advisor(B) | | | 1,381 | | | | — | | | | — | |
| Net Expenses | | | 1,401,547 | | | | 626,128 | | | | 312,507 | |
| Net Investment Income | | | 222,072 | | | | 1,623,082 | | | | 1,185,767 | |
| Realized and Unrealized Gains (Losses) on Investments | | | | | | | | | | | | |
| Net realized gains on investments from non-affiliated securities | | | 19,390,504 | | | | — | | | | — | |
| Net realized gains on investments from affiliated securities | | | — | | | | 5,962,690 | | | | 1,509,596 | |
| Net realized losses on written options | | | (4,350,800 | ) | | | — | | | | — | |
| Net realized losses on securities sold short | | | (3,890,776 | ) | | | — | | | | — | |
| Capital Gain Distributions Received from Affiliated Funds | | | — | | | | 1,611,010 | | | | 451,462 | |
| Net change in unrealized appreciation (depreciation) on investments | | | 1,502,323 | | | | 6,379,801 | | | | 1,089,766 | |
| Net change in unrealized appreciation (depreciation) on written options | | | (596,298 | ) | | | — | | | | — | |
| Net change in unrealized appreciation (depreciation) on securities sold short | | | (1,042,717 | ) | | | — | | | | — | |
| Net Realized and Unrealized Gains on Investments | | $ | 11,012,236 | | | $ | 13,953,501 | | | $ | 3,050,824 | |
| Change in Net Assets Resulting from Operations | | $ | 11,234,308 | | | $ | 15,576,583 | | | $ | 4,236,591 | |
| (A) Net of foreign tax withholding of: | | $ | 1,897 | | | $ | — | | | $ | — | |
| (B) See Note 4 in Notes to Financial Statements. | | | | | | | | | | | | |
See accompanying Notes to Financial Statements.
Statements of Operations (Continued)
| | | | Touchstone | |
| Touchstone | | | Moderate | |
| Growth | | | Growth | |
| Allocation | | | Allocation | |
| Fund | | | Fund | |
| | | | | |
| $ | 953,351 | | | $ | 2,514,367 | |
| | — | | | | — | |
| | 953,351 | | | | 2,514,367 | |
| | | | | | | |
| | 194,751 | | | | 386,185 | |
| | 130,363 | | | | 258,352 | |
| | 1,277 | | | | 1,277 | |
| | 8,584 | | | | 10,122 | |
| | 21,625 | | | | 27,542 | |
| | 46,020 | | | | 88,043 | |
| | 29,802 | | | | 48,733 | |
| | 17,192 | | | | 17,151 | |
| | 135 | | | | 38 | |
| | 15,554 | | | | 16,109 | |
| | 15,574 | | | | 16,378 | |
| | 15,692 | | | | 15,950 | |
| | 17,518 | | | | 17,587 | |
| | — | | | | — | |
| | 10,248 | | | | 23,204 | |
| | 4,371 | | | | 9,327 | |
| | 3,305 | | | | 4,768 | |
| | 2,229 | | | | 3,761 | |
| | 76,341 | | | | 173,171 | |
| | 244,071 | | | | 494,447 | |
| | 14,831 | | | | 14,970 | |
| | 38,726 | | | | 67,949 | |
| | 908,209 | | | | 1,695,064 | |
| | (507,780 | ) | | | (867,104 | ) |
| | — | | | | — | |
| | 400,429 | | | | 827,960 | |
| | 552,922 | | | | 1,686,407 | |
| | | | | | | |
| | — | | | | — | |
| | 5,843,929 | | | | 9,133,243 | |
| | — | | | | — | |
| | — | | | | — | |
| | 1,780,954 | | | | 2,985,100 | |
| | 6,276,724 | | | | 10,548,517 | |
| | — | | | | — | |
| | | | | | | |
| | — | | | | — | |
| $ | 13,901,607 | | | $ | 22,666,860 | |
| $ | 14,454,529 | | | $ | 24,353,267 | |
| $ | — | | | $ | — | |
Statements of Changes in Net Assets
| | | Touchstone Dynamic Equity Fund | |
| | | For the | | | For the | | | | |
| | | Year | | | Five Months | | | For the | |
| | | Ended | | | Ended | | | Year | |
| | | December 31, | | | December 31, | | | Ended | |
| | | 2013 | | | 2012(A) | | | July 31, 2012 | |
| From Operations | | | | | | | | | | | | |
| Net investment income (loss) | | $ | 222,072 | | | $ | 259,349 | | | $ | (409,958 | ) |
| Net realized gains (losses) on investments, written options, securities sold short and capital gain distributions received | | | 11,148,928 | | | | (307,770 | ) | | | 3,827,422 | |
| Net change in unrealized appreciation (depreciation) on investments, written options and securities sold short | | | (136,692 | ) | | | (1,019,180 | ) | | | 2,431,040 | |
| Change in Net Assets from Operations | | | 11,234,308 | | | | (1,067,601 | ) | | | 5,848,504 | |
| | | | | | | | | | | | | |
| Distributions to Shareholders from: | | | | | | | | | | | | |
| Net investment income, Class A | | | — | | | | — | | | | (151,828 | ) |
| Net investment income, Class C | | | — | | | | — | | | | (59,199 | ) |
| Net investment income, Class Y | | | (8,135 | ) | | | — | | | | — | |
| Net investment income, Class Z | | | — | | | | — | | | | (303,846 | ) |
| Net investment income, Institutional Class | | | (7,882 | ) | | | — | | | | (17 | ) |
| Net realized gains, Class A | | | — | | | | — | | | | — | |
| Net realized gains, Class C | | | — | | | | — | | | | — | |
| Net realized gains, Class Y | | | — | | | | — | | | | — | |
| Net realized gains, Institutional Class | | | — | | | | — | | | | — | |
| Total Distributions | | | (16,017 | ) | | | — | | | | (514,890 | ) |
| | | | | | | | | | | | | |
| Net Increase (Decrease) from Share Transactions(B) | | | (13,127,797 | ) | | | 8,301,265 | | | | (13,768,800 | ) |
| | | | | | | | | | | | | |
| Total Increase (Decrease) in Net Assets | | | (1,909,506 | ) | | | 7,233,664 | | | | (8,435,186 | ) |
| | | | | | | | | | | | | |
| Net Assets | | | | | | | | | | | | |
| Beginning of period | | | 67,059,124 | | | | 59,825,460 | | | | 68,260,646 | |
| End of period | | $ | 65,149,618 | | | $ | 67,059,124 | | | $ | 59,825,460 | |
| Accumulated Net Investment Income (Loss) | | $ | 423,004 | | | $ | 15,903 | | | $ | (386,369 | ) |
| (A) | The Fund changed its fiscal year from July 31 to December 31. See Note 11 in the Notes to Financial Statements. |
| (B) | For details on share transaction by class, see statements of changes in net assets - capital stock activity on pages 38 to 40. |
See accompanying Notes to Financial Statements.
Statements of Changes in Net Assets (Continued)
| Touchstone Balanced Allocation Fund | | | Touchstone Conservative Allocation Fund | |
| For the | | | For the | | | | | | For the | | | For the | | | | |
| Year | | | Five Months | | | For the | | | Year | | | Five Months | | | For the | |
| Ended | | | Ended | | | Year | | | Ended | | | Ended | | | Year | |
| December 31, | | | December 31, | | | Ended | | | December 31, | | | December 31, | | | Ended | |
| 2013 | | | 2012(A) | | | July 31, 2012 | | | 2013 | | | 2012(A) | | | July 31, 2012 | |
| | | | | | | | | | | | | | | | | |
| $ | 1,623,082 | | | $ | 1,417,962 | | | $ | 567,559 | | | $ | 1,185,767 | | | $ | 693,271 | | | $ | 535,072 | |
| | | | | | | | | | | | | | | | | | | | | | | |
| | 7,573,700 | | | | 5,632,070 | | | | 5,462,607 | | | | 1,961,058 | | | | 3,844,351 | | | | 3,112,528 | |
| | | | | | | | | | | | | | | | | | | | | | | |
| | 6,379,801 | | | | (3,322,821 | ) | | | (5,042,105 | ) | | | 1,089,766 | | | | (3,335,699 | ) | | | (2,902,390 | ) |
| | 15,576,583 | | | | 3,727,211 | | | | 988,061 | | | | 4,236,591 | | | | 1,201,923 | | | | 745,210 | |
| | | | | | | | | | | | | | | | | | | | | | | |
| | | | | | | | | | | | | | | | | | | | | | | |
| | (888,587 | ) | | | (751,006 | ) | | | (164,728 | ) | | | (493,274 | ) | | | (479,405 | ) | | | (135,704 | ) |
| | (425,415 | ) | | | (585,993 | ) | | | (414,996 | ) | | | (193,431 | ) | | | (376,396 | ) | | | (266,757 | ) |
| | (803,034 | ) | | | (998,571 | ) | | | — | | | | (577,063 | ) | | | (456,004 | ) | | | (7,041 | ) |
| | — | | | | — | | | | (27,150 | ) | | | — | | | | — | | | | (43,132 | ) |
| | (734 | ) | | | (707 | ) | | | (477 | ) | | | (7,428 | ) | | | (34,395 | ) | | | (136,455 | ) |
| | — | | | | (1,250,595 | ) | | | — | | | | — | | | | (1,422,514 | ) | | | — | |
| | — | | | | (989,596 | ) | | | — | | | | — | | | | (773,349 | ) | | | — | |
| | — | | | | (1,701,479 | ) | | | — | | | | — | | | | (1,620,816 | ) | | | — | |
| | — | | | | (783 | ) | | | — | | | | — | | | | (52,524 | ) | | | — | |
| | (2,117,770 | ) | | | (6,278,730 | ) | | | (607,351 | ) | | | (1,271,196 | ) | | | (5,215,403 | ) | | | (589,089 | ) |
| | | | | | | | | | | | | | | | | | | | | | | |
| | (30,845,583 | ) | | | 87,474,773 | | | | (15,492,104 | ) | | | (24,984,211 | ) | | | 60,408,531 | | | | (10,055,229 | ) |
| | | | | | | | | | | | | | | | | | | | | | | |
| | (17,386,770 | ) | | | 84,923,254 | | | | (15,111,394 | ) | | | (22,018,816 | ) | | | 56,395,051 | | | | (9,899,108 | ) |
| | | | | | | | | | | | | | | | | | | | | | | |
| | | | | | | | | | | | | | | | | | | | | | | |
| | 134,467,075 | | | | 49,543,821 | | | | 64,655,215 | | | | 85,462,768 | | | | 29,067,717 | | | | 38,966,825 | |
| $ | 117,080,305 | | | $ | 134,467,075 | | | $ | 49,543,821 | | | $ | 63,443,952 | | | $ | 85,462,768 | | | $ | 29,067,717 | |
| $ | 12,326 | | | $ | — | | | $ | 271,112 | | | $ | 4,479 | | | $ | — | | | $ | 359,301 | |
Statements of Changes in Net Assets (Continued)
| | | Touchstone Growth Allocation Fund | |
| | | For the | | | For the Five | | | | |
| | | Year | | | Months | | | For the | |
| | | Ended | | | Ended | | | Year | |
| | | December 31, | | | December 31, | | | Ended | |
| | | 2013 | | | 2012(A) | | | July 31, 2012 | |
| From Operations | | | | | | | | | | | | |
| Net investment income | | $ | 552,922 | | | $ | 850,224 | | | $ | 269,656 | |
| Net realized gains on investments and capital gain distributions received | | | 7,624,883 | | | | 4,772,422 | | | | 2,532,790 | |
| Net change in unrealized appreciation (depreciation) on investments | | | 6,276,724 | | | | (1,824,714 | ) | | | (3,917,579 | ) |
| Change in Net Assets from Operations | | | 14,454,529 | | | | 3,797,932 | | | | (1,115,133 | ) |
| | | | | | | | | | | | | |
| Distributions to Shareholders from: | | | | | | | | | | | | |
| Net investment income, Class A | | | (552,769 | ) | | | (646,035 | ) | | | (114,772 | ) |
| Net investment income, Class C | | | (284,682 | ) | | | (450,497 | ) | | | (44,632 | ) |
| Net investment income, Class Y | | | (389,522 | ) | | | (503,325 | ) | | | — | |
| Net investment income, Class Z | | | — | | | | — | | | | (20,102 | ) |
| Net investment income, Institutional Class | | | (451 | ) | | | (901 | ) | | | (983 | ) |
| Net realized gains, Class A | | | (203,688 | ) | | | — | | | | — | |
| Net realized gains, Class C | | | (171,688 | ) | | | — | | | | — | |
| Net realized gains, Class Y | | | (122,883 | ) | | | — | | | | — | |
| Net realized gains, Institutional Class | | | (147 | ) | | | — | | | | — | |
| Total Distributions | | | (1,725,830 | ) | | | (1,600,758 | ) | | | (180,489 | ) |
| | | | | | | | | | | | | |
| Net Increase (Decrease) from Share Transactions(B) | | | (26,047,307 | ) | | | 46,019,976 | | | | (14,968,001 | ) |
| | | | | | | | | | | | | |
| Total Increase (Decrease) in Net Assets | | | (13,318,608 | ) | | | 48,217,150 | | | | (16,263,623 | ) |
| | | | | | | | | | | | | |
| Net Assets | | | | | | | | | | | | |
| Beginning of period | | | 83,398,915 | | | | 35,181,765 | | | | 51,445,388 | |
| End of period | | $ | 70,080,307 | | | $ | 83,398,915 | | | $ | 35,181,765 | |
| Accumulated Net Investment Income | | $ | 10,678 | | | $ | — | | | $ | 269,645 | |
| (A) | The Fund changed its fiscal year from July 31 to December 31. See Note 11 in the Notes to Financial Statements. |
| (B) | For details on share transaction by class, see statements of changes in net assets - capital stock activity on pages 41 to 42. |
See accompanying Notes to Financial Statements.
Statements of Changes in Net Assets (Continued)
| Touchstone Moderate Growth Allocation Fund | |
| For the | | | For the Five | | | | |
| Year | | | Months | | | For the | |
| Ended | | | Ended | | | Year | |
| December 31, | | | December 31, | | | Ended | |
| 2013 | | | 2012(A) | | | July 31, 2012 | |
| | | | | | | | |
| $ | 1,686,407 | | | $ | 1,697,720 | | | $ | 569,460 | |
| | 12,118,343 | | | | 13,038,497 | | | | 4,106,912 | |
| | 10,548,517 | | | | (8,653,626 | ) | | | (4,637,598 | ) |
| | 24,353,267 | | | | 6,082,591 | | | | 38,774 | |
| | | | | | | | | | | |
| | | | | | | | | | | |
| | (1,327,579 | ) | | | (1,238,170 | ) | | | (237,914 | ) |
| | (669,021 | ) | | | (772,314 | ) | | | (314,758 | ) |
| | (716,754 | ) | | | (880,957 | ) | | | — | |
| | — | | | | — | | | | (20,136 | ) |
| | (216 | ) | | | (254 | ) | | | (127 | ) |
| | — | | | | (1,119,959 | ) | | | — | |
| | — | | | | (769,189 | ) | | | — | |
| | — | | | | (855,859 | ) | | | — | |
| | — | | | | (131 | ) | | | — | |
| | (2,713,570 | ) | | | (5,636,833 | ) | | | (572,935 | ) |
| | | | | | | | | | | |
| | (37,159,833 | ) | | | 99,907,478 | | | | (17,225,588 | ) |
| | | | | | | | | | | |
| | (15,520,136 | ) | | | 100,353,236 | | | | (17,759,749 | ) |
| | | | | | | | | | | |
| | | | | | | | | | | |
| | 163,812,970 | | | | 63,459,734 | | | | 81,219,483 | |
| $ | 148,292,834 | | | $ | 163,812,970 | | | $ | 63,459,734 | |
| $ | 11,411 | | | $ | — | | | $ | 392,606 | |
Statements of Changes in Net Assets - Capital Stock Activity
| | | Touchstone Dynamic Equity Fund | |
| | | For the Year | | | For the Five Months | | | For the Year | |
| | | Ended | | | Ended | | | Ended | |
| | | December 31, 2013 | | | December 31, 2012(A) | | | July 31, 2012 | |
| | | Shares | | | Dollars | | | Shares | | | Dollars | | | Shares | | | Dollars | |
| Class A | | | | | | | | | | | | | | | | | | | | | | | | |
| Proceeds from Shares sold | | | 374,104 | | | $ | 4,480,414 | | | | 113,667 | | | $ | 1,270,554 | | | | 97,187 | | | $ | 1,023,913 | |
| Cost of Shares redeemed in connection with merger(B) | | | — | | | | — | | | | — | | | | — | | | | — | | | | — | |
| Reinvestment of distributions | | | — | | | | — | | | | — | | | | — | | | | 12,141 | | | | 127,964 | |
| Redemption fees | | | — | | | | — | | | | — | | | | — | | | | — | | | | 22 | |
| Cost of Shares redeemed | | | (671,945 | ) | | | (8,052,047 | ) | | | (252,268 | ) | | | (2,812,907 | ) | | | (799,021 | ) | | | (8,368,813 | ) |
| Change in Net Assets from Class A Share Transactions | | | (297,841 | ) | | | (3,571,633 | ) | | | (138,601 | ) | | | (1,542,353 | ) | | | (689,693 | ) | | | (7,216,914 | ) |
| Class C | | | | | | | | | | | | | | | | | | | | | | | | |
| Proceeds from Shares sold | | | 52,021 | | | | 605,939 | | | | 11,073 | | | | 118,005 | | | | 38,462 | | | | 411,299 | |
| Cost of Shares redeemed in connection with merger(B) | | | — | | | | — | | | | — | | | | — | | | | — | | | | — | |
| Reinvestment of distributions | | | — | | | | — | | | | — | | | | — | | | | 2,418 | | | | 24,273 | |
| Redemption fees | | | — | | | | — | | | | — | | | | — | | | | — | | | | 14 | |
| Cost of Shares redeemed | | | (217,239 | ) | | | (2,471,586 | ) | | | (113,949 | ) | | | (1,211,134 | ) | | | (396,981 | ) | | | (3,980,527 | ) |
| Change in Net Assets from Class C Share Transactions | | | (165,218 | ) | | | (1,865,647 | ) | | | (102,876 | ) | | | (1,093,129 | ) | | | (356,101 | ) | | | (3,544,941 | ) |
| Class Y | | | | | | | | | | | | | | | | | | | | | | | | |
| Proceeds from Shares sold | | | 1,090,242 | | | | 13,522,101 | | | | 17,727 | | | | 201,695 | | | | 115,845 | | | | 1,254,036 | |
| Proceeds from Shares issued in connection with merger(B) | | | — | | | | — | | | | — | | | | — | | | | 2,239,679 | | | | 21,354,181 | |
| Reinvestment of distributions | | | 549 | | | | 7,337 | | | | — | | | | — | | | | — | | | | — | |
| Cost of Shares redeemed | | | (1,109,120 | ) | | | (13,620,139 | ) | | | (318,203 | ) | | | (3,604,761 | ) | | | (236,539 | ) | | | (2,604,497 | ) |
| Change in Net Assets from Class Y Share Transactions | | | (18,329 | ) | | | (90,701 | ) | | | (300,476 | ) | | | (3,403,066 | ) | | | 2,118,985 | | | | 20,003,720 | |
| Class Z | | | | | | | | | | | | | | | | | | | | | | | | |
| Proceeds from Shares sold | | | — | | | | — | | | | — | | | | — | | | | 685,868 | | | | 7,058,978 | |
| Reinvestment of distributions | | | — | | | | — | | | | — | | | | — | | | | 26,540 | | | | 283,182 | |
| Redemption fees | | | — | | | | — | | | | — | | | | — | | | | — | | | | 30 | |
| Cost of Shares redeemed | | | — | | | | — | | | | — | | | | — | | | | (1,407,539 | ) | | | (14,954,589 | ) |
| Cost of Shares redeemed in connection with merger(B) | | | — | | | | — | | | | — | | | | — | | | | (2,239,679 | ) | | | (21,354,181 | ) |
| Change in Net Assets from Class Z Share Transactions | | | — | | | | — | | | | — | | | | — | | | | (2,934,810 | ) | | | (28,966,580 | ) |
| Institutional Class | | | | | | | | | | | | | | | | | | | | | | | | |
| Proceeds from Shares sold | | | 33,833 | | | | 417,533 | | | | 1,329,419 | | | | 15,304,513 | | | | 623,310 | | | | 6,847,071 | |
| Reinvestment of distributions | | | 589 | | | | 7,882 | | | | — | | | | — | | | | 1 | | | | 17 | |
| Redemption fees | | | — | | | | — | | | | — | | | | — | | | | — | | | | 8 | |
| Cost of Shares redeemed | | | (663,484 | ) | | | (8,025,231 | ) | | | (84,149 | ) | | | (964,700 | ) | | | (80,747 | ) | | | (891,181 | ) |
| Change in Net Assets from Institutional Class Share Transactions | | | (629,062 | ) | | | (7,599,816 | ) | | | 1,245,270 | | | | 14,339,813 | | | | 542,564 | | | | 5,955,915 | |
| Net Increase (Decrease) from Share Transactions | | | (1,110,450 | ) | | $ | (13,127,797 | ) | | | 703,317 | | | $ | 8,301,265 | | | | (1,319,055 | ) | | $ | (13,768,800 | ) |
| (A) | The Fund changed its fiscal year from July 31 to December 31. See Note 11 in the Notes to Financial Statements. |
| (B) | See Note 11 in the Notes to Financial Statements. |
See accompanying Notes to Financial Statements.
Statements of Changes in Net Assets - Capital Stock Activity (Continued)
| Touchstone Balanced Allocation Fund | |
| For the Year | | | For the Five Months | | | For the Year | |
| Ended | | | Ended | | | Ended | |
| December 31, 2013 | | | December 31, 2012(A) | | | July 31, 2012 | |
| Shares | | | Dollars | | | Shares | | | Dollars | | | Shares | | | Dollars | |
| | | | | | | | | | | | | | | | | |
| | 280,981 | | | $ | 3,311,134 | | | | 133,156 | | | $ | 1,512,715 | | | | 51,372 | | | $ | 555,561 | |
| | | | | | | | | | | | | | | | | | | | | | | |
| | — | | | | — | | | | 3,650,589 | | | | 41,600,137 | | | | — | | | | — | |
| | 67,601 | | | | 815,079 | | | | 160,880 | | | | 1,794,307 | | | | 11,764 | | | | 124,335 | |
| | — | | | | — | | | | — | | | | — | | | | — | | | | — | |
| | (1,019,792 | ) | | | (12,047,014 | ) | | | (411,962 | ) | | | (4,677,019 | ) | | | (329,730 | ) | | | (3,549,105 | ) |
| | | | | | | | | | | | | | | | | | | | | | | |
| | (671,210 | ) | | | (7,920,801 | ) | | | 3,532,663 | | | | 40,230,140 | | | | (266,594 | ) | | | (2,869,209 | ) |
| | | | | | | | | | | | | | | | | | | | | | | |
| | 135,642 | | | | 1,604,319 | | | | 93,366 | | | | 1,049,120 | | | | 111,052 | | | | 1,192,025 | |
| | | | | | | | | | | | | | | | | | | | | | | |
| | — | | | | — | | | | 191,231 | | | | 2,174,823 | | | | — | | | | — | |
| | 23,260 | | | | 283,302 | | | | 91,476 | | | | 1,018,509 | | | | 24,035 | | | | 254,301 | |
| | — | | | | — | | | | — | | | | — | | | | — | | | | 9 | |
| | (628,273 | ) | | | (7,414,630 | ) | | | (385,238 | ) | | | (4,344,101 | ) | | | (1,239,184 | ) | | | (13,462,919 | ) |
| | | | | | | | | | | | | | | | | | | | | | | |
| | (469,371 | ) | | | (5,527,009 | ) | | | (9,165 | ) | | | (101,649 | ) | | | (1,104,097 | ) | | | (12,016,584 | ) |
| | | | | | | | | | | | | | | | | | | | | | | |
| | 514,994 | | | | 6,094,088 | | | | 301,709 | | | | 3,426,829 | | | | 4,552 | | | | 49,425 | |
| | | | | | | | | | | | | | | | | | | | | | | |
| | — | | | | — | | | | 6,276,974 | | | | 71,649,327 | | �� | | 114,668 | | | | 1,301,456 | |
| | 63,081 | | | | 758,122 | | | | 234,665 | | | | 2,620,777 | | | | — | | | | — | |
| | (2,051,080 | ) | | | (24,250,717 | ) | | | (2,704,435 | ) | | | (30,352,141 | ) | | | (4,343 | ) | | | (47,913 | ) |
| | | | | | | | | | | | | | | | | | | | | | | |
| | (1,473,005 | ) | | | (17,398,507 | ) | | | 4,108,913 | | | | 47,344,792 | | | | 114,877 | | | | 1,302,968 | |
| | | | | | | | | | | | | | | | | | | | | | | |
| | — | | | | — | | | | — | | | | — | | | | 8,853 | | | | 96,418 | |
| | — | | | | — | | | | — | | | | — | | | | 1,293 | | | | 13,562 | |
| | — | | | | — | | | | — | | | | — | | | | — | | | | — | |
| | — | | | | — | | | | — | | | | — | | | | (64,331 | ) | | | (716,348 | ) |
| | | | | | | | | | | | | | | | | | | | | | | |
| | — | | | | — | | | | — | | | | — | | | | (114,668 | ) | | | (1,301,456 | ) |
| | | | | | | | | | | | | | | | | | | | | | | |
| | — | | | | — | | | | — | | | | — | | | | (168,853 | ) | | | (1,907,824 | ) |
| | | | | | | | | | | | | | | | | | | | | | | |
| | — | | | | — | | | | — | | | | — | | | | 35 | | | | 372 | |
| | 61 | | | | 734 | | | | 134 | | | | 1,490 | | | | 19 | | | | 205 | |
| | — | | | | — | | | | — | | | | — | | | | — | | | | — | |
| | — | | | | — | | | | — | | | | — | | | | (197 | ) | | | (2,032 | ) |
| | | | | | | | | | | | | | | | | | | | | | | |
| | | | | | | | | | | | | | | | | | | | | | | |
| | 61 | | | | 734 | | | | 134 | | | | 1,490 | | | | (143 | ) | | | (1,455 | ) |
| | | | | | | | | | | | | | | | | | | | | | | |
| | (2,613,525 | ) | | $ | (30,845,583 | ) | | | 7,632,545 | | | $ | 87,474,773 | | | | (1,424,810 | ) | | $ | (15,492,104 | ) |
Statements of Changes in Net Assets - Capital Stock Activity (Continued)
| | | Touchstone Conservative Allocation Fund | |
| | | For the Year | | | For the Five Months | | | For the Year | |
| | | Ended | | | Ended | | | Ended | |
| | | December 31, 2013 | | | December 31, 2012(A) | | | July 31, 2012 | |
| | | Shares | | | Dollars | | | Shares | | | Dollars | | | Shares | | | Dollars | |
| Class A | | | | | | | | | | | | | | | | | | | | | | | | |
| Proceeds from Shares sold | | | 462,199 | | | $ | 4,982,787 | | | | 182,352 | | | $ | 1,984,226 | | | | 435,959 | | | $ | 4,679,336 | |
| Proceeds from Shares issued in connection with merger(B) | | | — | | | | — | | | | 2,370,245 | | | | 26,062,498 | | | | — | | | | — | |
| Reinvestment of distributions | | | 37,844 | | | | 407,407 | | | | 140,042 | | | | 1,482,044 | | | | 8,431 | | | | 89,062 | |
| Redemption fees | | | — | | | | — | | | | — | | | | — | | | | — | | | | — | |
| Cost of Shares redeemed | | | (1,364,874 | ) | | | (14,641,844 | ) | | | (324,849 | ) | | | (3,545,483 | ) | | | (698,325 | ) | | | (7,410,892 | ) |
| Change in Net Assets from Class A Share Transactions | | | (864,831 | ) | | | (9,251,650 | ) | | | 2,367,790 | | | | 25,983,285 | | | | (253,935 | ) | | | (2,642,494 | ) |
| Class C | | | | | | | | | | | | | | | | | | | | | | | | |
| Proceeds from Shares sold | | | 98,690 | | | | 1,052,995 | | | | 87,113 | | | | 933,883 | | | | 120,414 | | | | 1,289,950 | |
| Proceeds from Shares issued in connection with merger(B) | | | — | | | | — | | | | 161,697 | | | | 1,770,015 | | | | — | | | | — | |
| Reinvestment of distributions | | | 12,887 | | | | 138,300 | | | | 75,779 | | | | 801,084 | | | | 15,629 | | | | 163,870 | |
| Cost of Shares redeemed | | | (426,779 | ) | | | (4,586,185 | ) | | | (170,909 | ) | | | (1,856,950 | ) | | | (419,692 | ) | | | (4,493,992 | ) |
| Change in Net Assets from Class C Share Transactions | | | (315,202 | ) | | | (3,394,890 | ) | | | 153,680 | | | | 1,648,032 | | | | (283,649 | ) | | | (3,040,172 | ) |
| Class Y | | | | | | | | | | | | | | | | | | | | | | | | |
| Proceeds from Shares sold | | | 697,450 | | | | 7,531,888 | | | | 170,254 | | | | 1,861,753 | | | | 6,373 | | | | 68,638 | |
| Proceeds from Shares issued in connection with merger(B) | | | — | | | | — | | | | 3,465,392 | | | | 38,120,235 | | | | 197,512 | | | | 2,081,642 | |
| Reinvestment of distributions | | | 49,467 | | | | 532,491 | | | | 191,804 | | | | 2,030,304 | | | | 527 | | | | 5,686 | |
| Cost of Shares redeemed | | | (1,794,484 | ) | | | (19,263,173 | ) | | | (851,598 | ) | | | (9,144,512 | ) | | | (8,160 | ) | | | (88,920 | ) |
| Change in Net Assets from Class Y Share Transactions | | | (1,047,567 | ) | | | (11,198,794 | ) | | | 2,975,852 | | | | 32,867,780 | | | | 196,252 | | | | 2,067,046 | |
| Class Z | | | | | | | | | | | | | | | | | | | | | | | | |
| Proceeds from Shares sold | | | — | | | | — | | | | — | | | | — | | | | 169,193 | | | | 1,789,083 | |
| Reinvestment of distributions | | | — | | | | — | | | | — | | | | — | | | | 3,396 | | | | 35,873 | |
| Cost of Shares redeemed | | | — | | | | — | | | | — | | | | — | | | | (101,097 | ) | | | (1,080,371 | ) |
| Cost of Shares redeemed in connection with merger(B) | | | — | | | | — | | | | — | | | | — | | | | (197,512 | ) | | | (2,081,642 | ) |
| Change in Net Assets from Class Z Share Transactions | | | — | | | | — | | | | — | | | | — | | | | (126,020 | ) | | | (1,337,057 | ) |
| Institutional Class | | | | | | | | | | | | | | | | | | | | | | | | |
| Proceeds from Shares sold | | | 1,241 | | | | 13,469 | | | | — | | | | — | | | | 12,061 | | | | 130,383 | |
| Reinvestment of distributions | | | 593 | | | | 6,326 | | | | 8,105 | | | | 86,416 | | | | 12,914 | | | | 136,455 | |
| Cost of Shares redeemed | | | (108,251 | ) | | | (1,158,672 | ) | | | (16,235 | ) | | | (176,982 | ) | | | (496,227 | ) | | | (5,369,390 | ) |
| Change in Net Assets from Institutional Class Share Transactions | | | (106,417 | ) | | | (1,138,877 | ) | | | (8,130 | ) | | | (90,566 | ) | | | (471,252 | ) | | | (5,102,552 | ) |
| Net Increase (Decrease) from Share Transactions | | | (2,334,017 | ) | | $ | (24,984,211 | ) | | | 5,489,192 | | | $ | 60,408,531 | | | | (938,604 | ) | | $ | (10,055,229 | ) |
| (A) | The Fund changed its fiscal year from July 31 to December 31. See Note 11 in the Notes to Financial Statements. |
| (B) | See Note 11 in the Notes to Financial Statements. |
See accompanying Notes to Financial Statements.
Statements of Changes in Net Assets - Capital Stock Activity (Continued)
| Touchstone Growth Allocation Fund | |
| For the Year | | | For the Five Months | | | For the Year | |
| Ended | | | Ended | | | Ended | |
| December 31, 2013 | | | December 31, 2012(A) | | | July 31, 2012 | |
| Shares | | | Dollars | | | Shares | | | Dollars | | | Shares | | | Dollars | |
| | | | | | | | | | | | | | | | | |
| | 144,721 | | | $ | 1,858,211 | | | | 83,538 | | | $ | 975,036 | | | | 55,210 | | | $ | 587,614 | |
| | | | | | | | | | | | | | | | | | | | | | | |
| | — | | | | — | | | | 1,982,555 | | | | 23,010,705 | | | | — | | | | — | |
| | 50,827 | | | | 695,151 | | | | 50,396 | | | | 581,838 | | | | 9,788 | | | | 101,796 | |
| | — | | | | — | | | | — | | | | — | | | | — | | | | 2 | |
| | (753,611 | ) | | | (9,731,501 | ) | | | (355,247 | ) | | | (4,130,048 | ) | | | (344,708 | ) | | | (3,716,622 | ) |
| | | | | | | | | | | | | | | | | | | | | | | |
| | (558,063 | ) | | | (7,178,139 | ) | | | 1,761,242 | | | | 20,437,531 | | | | (279,710 | ) | | | (3,027,210 | ) |
| | | | | | | | | | | | | | | | | | | | | | | |
| | 156,664 | | | | 1,958,269 | | | | 25,816 | | | | 286,872 | | | | 66,499 | | | | 633,936 | |
| | | | | | | | | | | | | | | | | | | | | | | |
| | — | | | | — | | | | 86,836 | | | | 971,379 | | | | — | | | | — | |
| | 24,735 | | | | 326,028 | | | | 29,133 | | | | 323,605 | | | | 3,080 | | | | 30,774 | |
| | (498,883 | ) | | | (6,235,592 | ) | | | (236,712 | ) | | | (2,642,774 | ) | | | (920,431 | ) | | | (9,388,471 | ) |
| | | | | | | | | | | | | | | | | | | | | | | |
| | (317,484 | ) | | | (3,951,295 | ) | | | (94,927 | ) | | | (1,060,918 | ) | | | (850,852 | ) | | | (8,723,761 | ) |
| | | | | | | | | | | | | | | | | | | | | | | |
| | 349,010 | | | | 4,506,727 | | | | 92,145 | | | | 1,085,271 | | | | 9,691 | | | | 107,236 | |
| | | | | | | | | | | | | | | | | | | | | | | |
| | — | | | | — | | | | 2,547,823 | | | | 29,855,473 | | | | 68,967 | | | | 732,300 | |
| | 36,184 | | | | 496,016 | | | | 40,877 | | | | 478,642 | | | | — | | | | — | |
| | (1,538,044 | ) | | | (19,907,914 | ) | | | (407,565 | ) | | | (4,791,580 | ) | | | (1,606 | ) | | | (17,612 | ) |
| | | | | | | | | | | | | | | | | | | | | | | |
| | (1,152,850 | ) | | | (14,905,171 | ) | | | 2,273,280 | | | | 26,627,806 | | | | 77,052 | | | | 821,924 | |
| | | | | | | | | | | | | | | | | | | | | | | |
| | — | | | | — | | | | — | | | | — | | | | 7,102 | | | | 75,977 | |
| | — | | | | — | | | | — | | | | — | | | | 1,071 | | | | 11,260 | |
| | — | | | | — | | | | — | | | | — | | | | (246,979 | ) | | | (2,681,751 | ) |
| | | | | | | | | | | | | | | | | | | | | | | |
| | — | | | | — | | | | — | | | | — | | | | (68,967 | ) | | | (732,300 | ) |
| | | | | | | | | | | | | | | | | | | | | | | |
| | — | | | | — | | | | — | | | | — | | | | (307,773 | ) | | | (3,326,814 | ) |
| | | | | | | | | | | | | | | | | | | | | | | |
| | 329 | | | | 3,691 | | | | 1,400 | | | | 15,008 | | | | 623 | | | | 6,895 | |
| | 48 | | | | 598 | | | | 85 | | | | 901 | | | | 100 | | | | 983 | |
| | (1,497 | ) | | | (16,991 | ) | | | (32 | ) | | | (352 | ) | | | (67,704 | ) | | | (720,018 | ) |
| | | | | | | | | | | | | | | | | | | | | | | |
| | | | | | | | | | | | | | | | | | | | | | | |
| | (1,120 | ) | | | (12,702 | ) | | | 1,453 | | | | 15,557 | | | | (66,981 | ) | | | (712,140 | ) |
| | | | | | | | | | | | | | | | | | | | | | | |
| | (2,029,517 | ) | | $ | (26,047,307 | ) | | | 3,941,048 | | | $ | 46,019,976 | | | | (1,428,264 | ) | | $ | (14,968,001 | ) |
Statements of Changes in Net Assets - Capital Stock Activity (Continued)
| | | Touchstone Moderate Growth Allocation Fund | |
| | | For the Year | | | For the Five Months | | | For the Year | |
| | | Ended | | | Ended | | | Ended | |
| | | December 31, 2013 | | | December 31, 2012(A) | | | July 31, 2012 | |
| | | Shares | | | Dollars | | | Shares | | | Dollars | | | Shares | | | Dollars | |
| Class A | | | | | | | | | | | | | | | | | | | | | | | | |
| Proceeds from Shares sold | | | 281,126 | | | $ | 3,458,840 | | | | 129,646 | | | $ | 1,475,971 | | | | 97,822 | | | $ | 1,064,952 | |
| Proceeds from Shares issued in connection with merger(B) | | | — | | | | — | | | | 5,396,673 | | | | 61,461,849 | | | | — | | | | — | |
| Reinvestment of distributions | | | 94,159 | | | | 1,194,334 | | | | 187,033 | | | | 2,104,863 | | | | 19,053 | | | | 196,629 | |
| Redemption fees | | | — | | | | — | | | | — | | | | — | | | | — | | | | 2 | |
| Cost of Shares redeemed | | | (1,434,032 | ) | | | (17,450,279 | ) | | | (771,111 | ) | | | (8,774,777 | ) | | | (448,546 | ) | | | (4,814,500 | ) |
| Change in Net Assets from Class A Share Transactions | | | (1,058,747 | ) | | | (12,797,105 | ) | | | 4,942,241 | | | | 56,267,906 | | | | (331,671 | ) | | | (3,552,917 | ) |
| Class C | | | | | | | | | | | | | | | | | | | | | | | | |
| Proceeds from Shares sold | | | 141,827 | | | | 1,718,675 | | | | 106,912 | | | | 1,194,059 | | | | 133,586 | | | | 1,407,737 | |
| Proceeds from Shares issued in connection with merger(B) | | | — | | | | — | | | | 221,281 | | | | 2,482,569 | | | | — | | | | — | |
| Reinvestment of distributions | | | 34,847 | | | | 440,284 | | | | 88,949 | | | | 985,199 | | | | 18,947 | | | | 192,127 | |
| Redemption fees | | | — | | | | — | | | | — | | | | — | | | | — | | | | 1 | |
| Cost of Shares redeemed | | | (697,559 | ) | | | (8,395,893 | ) | | | (381,823 | ) | | | (4,268,695 | ) | | | (1,411,866 | ) | | | (14,742,597 | ) |
| Change in Net Assets from Class C Share Transactions | | | (520,885 | ) | | | (6,236,934 | ) | | | 35,319 | | | | 393,132 | | | | (1,259,333 | ) | | | (13,142,732 | ) |
| Class Y | | | | | | | | | | | | | | | | | | | | | | | | |
| Proceeds from Shares sold | | | 488,950 | | | | 6,004,836 | | | | 214,196 | | | | 2,459,768 | | | | 14,400 | | | | 155,956 | |
| Proceeds from Shares issued in connection with merger(B) | | | — | | | | — | | | | 4,909,444 | | | | 56,310,746 | | | | 59,133 | | | | 690,081 | |
| Reinvestment of distributions | | | 52,336 | | | | 664,249 | | | | 146,774 | | | | 1,665,234 | | | | — | | | | — | |
| Cost of Shares redeemed | | | (2,041,647 | ) | | | (24,795,095 | ) | | | (1,507,596 | ) | | | (17,189,693 | ) | | | (5,646 | ) | | | (61,748 | ) |
| Change in Net Assets from Class Y Share Transactions | | | (1,500,361 | ) | | | (18,126,010 | ) | | | 3,762,818 | | | | 43,246,055 | | | | 67,887 | | | | 784,289 | |
| Class Z | | | | | | | | | | | | | | | | | | | | | | | | |
| Proceeds from Shares sold | | | — | | | | — | | | | — | | | | — | | | | 5,102 | | | | 56,108 | |
| Reinvestment of distributions | | | — | | | | — | | | | — | | | | — | | | | 1,101 | | | | 11,461 | |
| Cost of Shares redeemed | | | — | | | | — | | | | — | | | | — | | | | (61,849 | ) | | | (691,938 | ) |
| Cost of Shares redeemed in connection with merger(B) | | | — | | | | — | | | | — | | | | — | | | | (59,133 | ) | | | (690,081 | ) |
| Change in Net Assets from Class Z Share Transactions | | | — | | | | — | | | | — | | | | — | | | | (114,779 | ) | | | (1,314,450 | ) |
| Institutional Class | | | | | | | | | | | | | | | | | | | | | | | | |
| Proceeds from Shares sold | | | — | | | | — | | | | — | | | | — | | | | 9 | | | | 100 | |
| Reinvestment of distributions | | | 17 | | | | 216 | | | | 34 | | | | 385 | | | | 12 | | | | 127 | |
| Cost of Shares redeemed | | | — | | | | — | | | | — | | | | — | | | | — | | | | (5 | ) |
| Change in Net Assets from Institutional Class Share Transactions | | | 17 | | | | 216 | | | | 34 | | | | 385 | | | | 21 | | | | 222 | |
| Net Increase (Decrease) from Share Transactions | | | (3,079,976 | ) | | $ | (37,159,833 | ) | | | 8,740,412 | | | $ | 99,907,478 | | | | (1,637,875 | ) | | $ | (17,225,588 | ) |
| (A) | The Fund changed its fiscal year from July 31 to December 31. See Note 11 in the Notes to Financial Statements. |
| (A) | See Note 11 in the Notes to Financial Statements. |
See accompanying Notes to Financial Statements.
Statement of Cash Flows
For the Year December 31, 2013
| | | Touchstone | |
| | | Dynamic | |
| | | Equity | |
| | | Fund | |
| Cash Flows Provided by Operating Activities | | | | |
| | | | | |
| Change in net assets resulting from operations | | $ | 11,234,308 | |
| | | | | |
| Adjustments to reconcile net increase (decrease) in net assets resulting from operations to net cash provided by operating activities: | | | | |
| Purchases of investments | | | (293,557,300 | ) |
| Proceeds from disposition of investments | | | 314,659,555 | |
| Net proceeds from purchased options | | | 234,031 | |
| Premiums on call and put options written | | | 21,623,631 | |
| Costs to cover written options | | | (26,275,434 | ) |
| Proceeds from securities sold short | | | 77,297,695 | |
| Covers of securities sold short | | | (82,210,118 | ) |
| Net sales of short term securities | | | 1,305,861 | |
| Cash received from litigation claim | | | 9,000 | |
| Increase in deposits with Prime Broker | | | (560,814 | ) |
| Increase in dividends and interest receivable | | | (6,653 | ) |
| Increase in dividends for securities sold short payable | | | 211,235 | |
| Increase in payable to Trustees | | | 6,054 | |
| Increase in payable to Investment Advisor | | | 11,272 | |
| Increase in payable to other affiliates | | | 583 | |
| Decrease in other accrued expenses and liabilities | | | (12,135 | ) |
| Decrease in other assets | | | 19,583 | |
| Net realized (gain) from investments | | | (19,390,504 | ) |
| Net realized (gain) loss from written options | | | 4,350,800 | |
| Net realized loss from securities sold short | | | 3,890,776 | |
| Net change in unrealized (appreciation) depreciation on investments | | | (1,502,323 | ) |
| Net change in unrealized (appreciation) depreciation on written options | | | 596,298 | |
| Net change in unrealized (appreciation) depreciation on securities sold short | | | 1,042,717 | |
| Net cash provided by operating activities | | | 12,978,118 | |
| | | | | |
| Cash Flows from Financing Activities | | | | |
| Increase in bank overdrafts | | | 3,572 | |
| Proceeds from shares sold | | | 19,090,751 | |
| Cash distributions paid | | | (798 | ) |
| Payment of shares redeemed | | | (32,071,643 | ) |
| Net cash used in financing activities | | | (12,978,118 | ) |
| Net change in cash | | | — | |
| | | | | |
| Cash - beginning of the period | | | — | |
| Cash - end of period | | $ | — | |
| | | | | |
| Supplemental disclosure of cash flow information: | | | | |
| Reinvestment of dividends and distributions | | $ | 15,219 | |
See accompanying Notes to Financial Statements.
Financial Highlights
| Touchstone Dynamic Equity Fund—Class A |
| Selected Data for a Share Outstanding Throughout Each Period |
| | | | | | Five | | | | | | | | | | | | | |
| | | Year | | | Months | | | | | | | | | | | | | |
| | | Ended | | | Ended | | | | | | | | | | | | | |
| | | December 31, | | | December 31, | | | Year Ended July 31, | |
| | | 2013 | | | 2012(A) | | | 2012 | | | 2011 | | | 2010 | | | 2009 | |
| Net asset value at beginning of period | | $ | 11.05 | | | $ | 11.20 | | | $ | 10.26 | | | $ | 9.02 | | | $ | 8.68 | | | $ | 11.88 | |
| Income (loss) from investment operations: | | | | | | | | | | | | | | | | | | | | | | | | |
| Net investment income (loss) | | | 0.04 | | | | 0.04 | (B) | | | (0.07 | )(B) | | | 0.06 | (B) | | | 0.05 | (B) | | | 0.02 | (B) |
| Net realized and unrealized gains (losses) on investments | | | 2.06 | | | | (0.19 | ) | | | 1.09 | | | | 1.18 | | | | 0.29 | | | | (3.22 | ) |
| Total from investment operations | | | 2.10 | | | | (0.15 | ) | | | 1.02 | | | | 1.24 | | | | 0.34 | | | | (3.20 | ) |
| Distributions from: | | | | | | | | | | | | | | | | | | | | | | | | |
| Net investment income | | | — | | | | — | | | | (0.08 | ) | | | — | | | | — | | | | — | |
| Realized capital gains | | | — | | | | — | | | | — | | | | — | | | | — | | | | — | |
| Total distributions | | | — | | | | — | | | | (0.08 | ) | | | — | | | | — | | | | — | |
| Net asset value at end of period | | $ | 13.15 | | | $ | 11.05 | | | $ | 11.20 | | | $ | 10.26 | | | $ | 9.02 | | | $ | 8.68 | |
| Total return(C) | | | 19.01 | % | | | (1.34 | %)(D) | | | 10.00 | % | | | 13.75 | % | | | 3.92 | % | | | (26.94 | %) |
| Ratios and supplemental data: | | | | | | | | | | | | | | | | | | | | | | | | |
| Net assets at end of period (000's) | | $ | 15,300 | | | $ | 16,156 | | | $ | 17,919 | | | $ | 23,505 | | | $ | 38,274 | | | $ | 83,169 | |
| Ratio to average net assets: | | | | | | | | | | | | | | | | | | | | | | | | |
| Net expenses (including dividend expense on securities sold short)(E) | | | 2.21 | % | | | 2.46 | %(F) | | | 2.80 | % | | | 1.82 | % | | | 1.78 | % | | | 2.07 | % |
| Gross expenses (including dividend expense on securities sold short)(G) | | | 2.41 | % | | | 2.65 | %(F) | | | 3.08 | % | | | 2.16 | % | | | 2.27 | % | | | 2.41 | % |
| Net investment income (loss) | | | 0.30 | % | | | 0.88 | %(F) | | | (0.63 | %) | | | 0.66 | % | | | 0.52 | % | | | 0.24 | % |
| Portfolio turnover rate | | | 382 | % | | | 105 | %(D) | | | 234 | % | | | 231 | % | | | 168 | % | | | 195 | % |
| (A) | The Fund changed its fiscal year end from July 31 to December 31. See Note 11 in Notes to Financial Statements. |
| (B) | The net investment income per share is based on average shares outstanding for the period. |
| (C) | Total returns shown exclude the effect of applicable sales loads. If these charges were included, the returns would be lower. |
| (E) | The ratio of net expenses to average net assets excluding dividend expense on securities sold short is 1.55%, 1.55%, 1.55%, 1.66%, 1.65% and 1.71% for the year ended December 31, 2013, period ended December 31, 2012 and years ended July 31, 2012, 2011, 2010 and 2009, respectively. |
| (G) | The ratio of gross expenses to average net assets excluding dividend expense on securities sold short is 1.75%, 1.74%, 1.82%, 2.00%, 2.14% and 2.05% for the year ended December 31, 2013, the period ended December 31, 2012 and years ended July 31, 2012, 2011, 2010 and 2009, respectively. |
See accompanying Notes to Financial Statements.
Financial Highlights (Continued)
| Touchstone Dynamic Equity Fund—Class C |
| Selected Data for a Share Outstanding Throughout Each Period |
| | | | | | Five | | | | | | | | | | | | | |
| | | Year | | | Months | | | | | | | | | | | | | |
| | | Ended | | | Ended | | | | | | | | | | | | | |
| | | December 31, | | | December 31, | | | Year Ended July 31, | |
| | | 2013 | | | 2012(A) | | | 2012 | | | 2011 | | | 2010 | | | 2009 | |
| Net asset value at beginning of period | | $ | 10.46 | | | $ | 10.63 | | | $ | 9.79 | | | $ | 8.67 | | | $ | 8.40 | | | $ | 11.59 | |
| Income (loss) from investment operations: | | | | | | | | | | | | | | | | | | | | | | | | |
| Net investment income (loss) | | | (0.08 | ) | | | 0.01 | (B) | | | (0.14 | )(B) | | | (0.01 | )(B) | | | (0.02 | )(B) | | | (0.05 | )(B) |
| Net realized and unrealized gains (losses) on investments | | | 1.97 | | | | (0.18 | ) | | | 1.03 | | | | 1.13 | | | | 0.29 | | | | (3.14 | ) |
| Total from investment operations | | | 1.89 | | | | (0.17 | ) | | | 0.89 | | | | 1.12 | | | | 0.27 | | | | (3.19 | ) |
| Distributions from: | | | | | | | | | | | | | | | | | | | | | | | | |
| Net investment income | | | — | | | | — | | | | (0.05 | ) | | | — | | | | — | | | | — | |
| Realized capital gains | | | — | | | | — | | | | — | | | | — | | | | — | | | | — | |
| Total distributions | | | — | | | | — | | | | (0.05 | ) | | | — | | | | — | | | | — | |
| Net asset value at end of period | | $ | 12.35 | | | $ | 10.46 | | | $ | 10.63 | | | $ | 9.79 | | | $ | 8.67 | | | $ | 8.40 | |
| Total return(C) | | | 18.07 | % | | | (1.60 | %)(D) | | | 9.09 | % | | | 12.92 | % | | | 3.21 | % | | | (27.52 | %) |
| Ratios and supplemental data: | | | | | | | | | | | | | | | | | | | | | | | | |
| Net assets at end of period (000's) | | $ | 10,261 | | | $ | 10,420 | | | $ | 11,684 | | | $ | 14,243 | | | $ | 20,558 | | | $ | 51,879 | |
| Ratio to average net assets: | | | | | | | | | | | | | | | | | | | | | | | | |
| Net expenses (including dividend expense on securities sold short)(E) | | | 2.96 | % | | | 3.21 | %(F) | | | 3.55 | % | | | 2.57 | % | | | 2.53 | % | | | 2.82 | % |
| Gross expenses (including dividend expense on securities sold short)(G) | | | 3.20 | % | | | 3.48 | %(F) | | | 3.75 | % | | | 2.78 | % | | | 2.91 | % | | | 2.97 | % |
| Net investment income (loss) | | | (0.45 | %) | | | 0.13 | %(F) | | | (1.38 | %) | | | (0.10 | %) | | | (0.23 | %) | | | (0.52 | %) |
| Portfolio turnover rate | | | 382 | % | | | 105 | %(D) | | | 234 | % | | | 231 | % | | | 168 | % | | | 195 | % |
| (A) | The Fund changed its fiscal year end from July 31 to December 31. See Note 11 in Notes to Financial Statements. |
| (B) | The net investment income per share is based on average shares outstanding for the period. |
| (C) | Total returns shown exclude the effect of applicable sales loads. If these charges were included, the returns would be lower. |
| (E) | The ratio of net expenses to average net assets excluding dividend expense on securities sold short is 2.30%, 2.30%, 2.30%, 2.41%, 2.40% and 2.46% for the year ended December 31, 2013, period ended December 31, 2012 and years ended July 31, 2012, 2011, 2010 and 2009, respectively. |
| (G) | The ratio of gross expenses to average net assets excluding dividend expense on securities sold short is 2.54%, 2.57%, 2.50%, 2.62%, 2.78% and 2.61% for the year ended December 31, 2013, period ended December 31, 2012 and years ended July 31, 2012, 2011, 2010 and 2009, respectively. |
See accompanying Notes to Financial Statements.
Financial Highlights (Continued)
| Touchstone Dynamic Equity Fund—Class Y |
| Selected Data for a Share Outstanding Throughout Each Period |
| | | | | | Five | | | | | | | | | | | | | |
| | | Year | | | Months | | | | | | | | | | | | | |
| | | Ended | | | Ended | | | | | | | | | | | | | |
| | | December 31, | | | December 31, | | | Year Ended July 31, 2013 | |
| | | 2013 | | | 2012(A) | | | 2012 | | | 2011 | | | 2010 | | | 2009 | |
| Net asset value at beginning of period | | $ | 11.22 | | | $ | 11.35 | | | $ | 10.40 | | | $ | 9.11 | | | $ | 8.75 | | | $ | 11.94 | |
| Income (loss) from investment operations: | | | | | | | | | | | | | | | | | | | | | | | | |
| Net investment income (loss) | | | 0.07 | | | | 0.05 | (B) | | | (0.04 | )(B) | | | 0.08 | (B) | | | 0.07 | (B) | | | 0.04 | (B) |
| Net realized and unrealized gains (losses) on investments | | | 2.08 | | | | (0.18 | ) | | | 1.09 | | | | 1.21 | | | | 0.29 | | | | (3.23 | ) |
| Total from investment operations | | | 2.15 | | | | (0.13 | ) | | | 1.05 | | | | 1.29 | | | | 0.36 | | | | (3.19 | ) |
| Distributions from: | | | | | | | | | | | | | | | | | | | | | | | | |
| Net investment income | | | — | (C) | | | — | | | | (0.10 | ) | | | — | | | | — | | | | — | |
| Realized capital gains | | | — | | | | — | | | | — | | | | — | | | | — | | | | — | |
| Total distributions | | | — | | | | — | | | | (0.10 | ) | | | — | | | | — | | | | — | |
| Net asset value at end of period | | $ | 13.37 | | | $ | 11.22 | | | $ | 11.35 | | | $ | 10.40 | | | $ | 9.11 | | | $ | 8.75 | |
| Total return | | | 19.20 | % | | | (1.15 | %)(D) | | | 10.14 | % | | | 14.16 | % | | | 4.11 | % | | | (26.72 | %) |
| Ratios and supplemental data: | | | | | | | | | | | | | | | | | | | | | | | | |
| Net assets at end of period (000's) | | $ | 24,066 | | | $ | 20,397 | | | $ | 24,054 | | | $ | 30,511 | | | $ | 22,347 | | | $ | 29,734 | |
| Ratio to average net assets: | | | | | | | | | | | | | | | | | | | | | | | | |
| Net expenses (including dividend expense on securities sold short)(E) | | | 1.96 | % | | | 2.21 | %(F) | | | 2.56 | % | | | 1.59 | % | | | 1.52 | % | | | 1.81 | % |
| Gross expenses (including dividend expense on securities sold short)(G) | | | 1.95 | % | | | 2.31 | %(F) | | | 2.60 | % | | | 1.68 | % | | | 1.68 | % | | | 1.97 | % |
| Net investment income (loss) | | | 0.55 | % | | | 1.13 | %(F) | | | (0.38 | %) | | | 0.77 | % | | | 0.81 | % | | | 0.45 | % |
| Portfolio turnover rate | | | 382 | % | | | 105 | %(D) | | | 234 | % | | | 231 | % | | | 168 | % | | | 195 | % |
| (A) | The Fund changed its fiscal year end from July 31 to December 31. See Note 11 in Notes to Financial Statements. |
| (B) | The net investment income per share is based on average shares outstanding for the period. |
| (C) | Amount rounds to less than $0.0005 per share. |
| (E) | The ratio of net expenses to average net assets excluding dividend expense on securities sold short is 1.30%, 1.30%, 1.30%, 1.42%, 1.40% and 1.46% for the year ended December 31, 2013, period ended December 31, 2012 and years ended July 31, 2012, 2011, 2010 and 2009, respectively. |
| (G) | The ratio of gross expenses to average net assets excluding dividend expense on securities sold short is 1.29%, 1.40%, 1.35%, 1.51%, 1.56% and 1.62% for the year ended December 31, 2013, period ended December 31, 2012 and years ended July 31, 2012, 2011, 2010 and 2009, respectively. |
See accompanying Notes to Financial Statements.
Financial Highlights (Continued)
Touchstone Dynamic Equity Fund—Institutional Class
| Selected Data for a Share Outstanding Throughout Each Period |
| | | | | | Five | | | | | | | | | | | | | |
| | | Year | | | Months | | | | | | | | | | | | | |
| | | Ended | | | Ended | | | | | | | | | | | | | |
| | | December 31, | | | December 31, | | | Year Ended July 31, | |
| | | 2013 | | | 2012(A) | | | 2012 | | | 2011 | | | 2010 | | | 2009 | |
| Net asset value at beginning of period | | $ | 11.23 | | | $ | 11.36 | | | $ | 10.40 | | | $ | 9.12 | | | $ | 8.76 | | | $ | 11.96 | |
| Income (loss) from investment operations: | | | | | | | | | | | | | | | | | | | | | | | | |
| Net investment income (loss) | | | 0.12 | | | | 0.06 | (B) | | | (0.04 | )(B) | | | 0.09 | (B) | | | 0.11 | (B) | | | 0.05 | (B) |
| Net realized and unrealized gains (losses) on investments | | | 2.05 | | | | (0.19 | ) | | | 1.10 | | | | 1.19 | | | | 0.25 | | | | (3.25 | ) |
| Total from investment operations | | | 2.17 | | | | (0.13 | ) | | | 1.06 | | | | 1.28 | | | | 0.36 | | | | (3.20 | ) |
| Distributions from: | | | | | | | | | | | | | | | | | | | | | | | | |
| Net investment income | | | (0.01 | ) | | | — | | | | (0.10 | ) | | | — | | | | — | | | | — | |
| Realized capital gains | | | — | | | | — | | | | — | | | | — | | | | — | | | | — | |
| Total distributions | | | (0.01 | ) | | | — | | | | (0.10 | ) | | | — | | | | — | | | | — | |
| Net asset value at end of period | | $ | 13.39 | | | $ | 11.23 | | | $ | 11.36 | | | $ | 10.40 | | | $ | 9.12 | | | $ | 8.76 | |
| Total return | | | 19.29 | % | | | (1.15 | %)(C) | | | 10.27 | % | | | 14.04 | % | | | 4.11 | % | | | (26.76 | %) |
| Ratios and supplemental data: | | | | | | | | | | | | | | | | | | | | | | | | |
| Net assets at end of period (000's) | | $ | 15,523 | | | $ | 20,085 | | | $ | 6,168 | | | $ | 2 | | | $ | 2 | | | $ | 12,547 | |
| Ratio to average net assets: | | | | | | | | | | | | | | | | | | | | | | | | |
| Net expenses (including dividend expense on securities sold short)(D) | | | 1.91 | % | | | 2.16 | %(E) | | | 2.50 | % | | | 1.52 | % | | | 1.41 | % | | | 1.77 | % |
| Gross expenses (including dividend expense on securities sold short)(F) | | | 1.95 | % | | | 2.18 | %(E) | | | 2.95 | % | | | 816.82 | % | | | 2.84 | % | | | 1.87 | % |
| Net investment income (loss) | | | 0.60 | % | | | 1.18 | %(E) | | | (0.33 | %) | | | 0.92 | % | | | 1.31 | % | | | 0.55 | % |
| Portfolio turnover rate | | | 382 | % | | | 105 | %(C) | | | 234 | % | | | 231 | % | | | 168 | % | | | 195 | % |
| (A) | The Fund changed its fiscal year end from July 31 to December 31. See Note 11 in Notes to Financial Statements. |
| (B) | The net investment income per share is based on average shares outstanding for the period. |
| (D) | The ratio of net expenses to average net assets excluding dividend expense on securities sold short is 1.25%, 1.25%, 1.25%, 1.35%, 1.36% and 1.41% for the year ended December 31, 2013, period ended December 31, 2012 and years ended July 31, 2012, 2011, 2010 and 2009, respectively. |
| (F) | The ratio of gross expenses to average net assets excluding dividend expense on securities sold short is 1.29%, 1.27%, 1.70%, 816.65%, 2.79% and 1.51% for the year ended December 31, 2013, period ended December 31, 2012 and years ended July 31, 2012, 2011, 2010 and 2009, respectively. |
See accompanying Notes to Financial Statements.
Financial Highlights (Continued)
Touchstone Balanced Allocation Fund—Class A
| Selected Data for a Share Outstanding Throughout Each Period |
| | | | | | Five | | | | | | | | | | | | | |
| | | Year | | | Months | | | | | | | | | | | | | |
| | | Ended | | | Ended | | | | | | | | | | | | | |
| | | December 31, | | | December 31, | | | Year Ended July 31, | |
| | | 2013 | | | 2012(A) | | | 2012 | | | 2011 | | | 2010 | | | 2009 | |
| Net asset value at beginning of period | | $ | 11.13 | | | $ | 11.18 | | | $ | 11.03 | | | $ | 9.99 | | | $ | 9.28 | | | $ | 11.27 | |
| Income (loss) from investment operations: | | | | | | | | | | | | | | | | | | | | | | | | |
| Net investment income | | | 0.17 | | | | 0.13 | (B) | | | 0.17 | (B) | | | 0.18 | (B) | | | 0.22 | (B) | | | 0.29 | (B) |
| Net realized and unrealized gains (losses) on investments | | | 1.30 | | | | 0.35 | | | | 0.14 | | | | 1.13 | | | | 0.80 | | | | (1.46 | ) |
| Total from investment operations | | | 1.47 | | | | 0.48 | | | | 0.31 | | | | 1.31 | | | | 1.02 | | | | (1.17 | ) |
| Distributions from: | | | | | | | | | | | | | | | | | | | | | | | | |
| Net investment income | | | (0.23 | ) | | | (0.24 | ) | | | (0.16 | ) | | | (0.27 | ) | | | (0.31 | ) | | | (0.36 | ) |
| Realized capital gains | | | — | | | | (0.29 | ) | | | — | | | | — | | | | — | | | | (0.46 | ) |
| Total distributions | | | (0.23 | ) | | | (0.53 | ) | | | (0.16 | ) | | | (0.27 | ) | | | (0.31 | ) | | | (0.82 | ) |
| Net asset value at end of period | | $ | 12.37 | | | $ | 11.13 | | | $ | 11.18 | | | $ | 11.03 | | | $ | 9.99 | | | $ | 9.28 | |
| Total return(C) | | | 13.28 | % | | | 4.37 | %(D) | | | 2.89 | % | | | 13.21 | % | | | 10.99 | % | | | (9.30 | %) |
| Ratios and supplemental data: | | | | | | | | | | | | | | | | | | | | | | | | |
| Net assets at end of period (000's) | | $ | 46,285 | | | $ | 49,118 | | | $ | 9,839 | | | $ | 12,650 | | | $ | 21,312 | | | $ | 25,356 | |
| Ratio to average net assets: | | | | | | | | | | | | | | | | | | | | | | | | |
| Net expenses(E) | | | 0.35 | % | | | 0.41 | %(F) | | | 0.64 | % | | | 0.64 | % | | | 0.64 | % | | | 0.65 | % |
| Gross expenses(E) | | | 0.86 | % | | | 0.83 | %(F) | | | 0.97 | % | | | 0.94 | % | | | 0.93 | % | | | 0.79 | % |
| Net investment income(E) | | | 1.42 | % | | | 2.75 | %(F) | | | 1.58 | % | | | 1.71 | % | | | 2.26 | % | | | 3.30 | % |
| Portfolio turnover rate | | | 32 | % | | | 74 | %(D)(G) | | | 76 | % | | | 6 | % | | | 33 | % | | | 30 | % |
| (A) | The Fund changed its fiscal year end from July 31 to December 31. See Note 11 in Notes to Financial Statements. |
| (B) | The net investment income per share is based on average shares outstanding for the period. |
| (C) | Total returns shown exclude the effect of applicable sales loads. If these charges were included, the returns would be lower. |
| (E) | Ratio does not include income and expenses of the underlying funds. |
| (G) | Portfolio turnover excludes the purchases and sales of the Acquired Funds (see Note 11). If these transactions were included, portfolio turnover would have been higher. |
See accompanying Notes to Financial Statements.
Financial Highlights (Continued)
Touchstone Balanced Allocation Fund—Class C
| Selected Data for a Share Outstanding Throughout Each Period |
| | | | | | Five | | | | | | | | | | | | | |
| | | Year | | | Months | | | | | | | | | | | | | |
| | | Ended | | | Ended | | | | | | | | | | | | | |
| | | December 31, | | | December 31, | | | Year Ended July 31, | |
| | | 2013 | | | 2012(A) | | | 2012 | | | 2011 | | | 2010 | | | 2009 | |
| Net asset value at beginning of period | | $ | 11.12 | | | $ | 11.14 | | | $ | 11.01 | | | $ | 9.97 | | | $ | 9.26 | | | $ | 11.17 | |
| Income (loss) from investment operations: | | | | | | | | | | | | | | | | | | | | | | | | |
| Net investment income | | | 0.08 | | | | 0.09 | (B) | | | 0.09 | (B) | | | 0.10 | (B) | | | 0.15 | (B) | | | 0.22 | (B) |
| Net realized and unrealized gains (losses) on investments | | | 1.30 | | | | 0.35 | | | | 0.14 | | | | 1.13 | | | | 0.79 | | | | (1.44 | ) |
| Total from investment operations | | | 1.38 | | | | 0.44 | | | | 0.23 | | | | 1.23 | | | | 0.94 | | | | (1.22 | ) |
| Distributions from: | | | | | | | | | | | | | | | | | | | | | | | | |
| Net investment income | | | (0.14 | ) | | | (0.17 | ) | | | (0.10 | ) | | | (0.19 | ) | | | (0.23 | ) | | | (0.23 | ) |
| Realized capital gains | | | — | | | | (0.29 | ) | | | — | | | | — | | | | — | | | | (0.46 | ) |
| Total distributions | | | (0.14 | ) | | | (0.46 | ) | | | (0.10 | ) | | | (0.19 | ) | | | (0.23 | ) | | | (0.69 | ) |
| Net asset value at end of period | | $ | 12.36 | | | $ | 11.12 | | | $ | 11.14 | | | $ | 11.01 | | | $ | 9.97 | | | $ | 9.26 | |
| Total return(C) | | | 12.45 | % | | | 4.03 | %(D) | | | 2.13 | % | | | 12.41 | % | | | 10.19 | % | | | (10.00 | %) |
| Ratios and supplemental data: | | | | | | | | | | | | | | | | | | | | | | | | |
| Net assets at end of period (000's) | | $ | 36,681 | | | $ | 38,226 | | | $ | 38,388 | | | $ | 50,108 | | | $ | 59,480 | | | $ | 77,330 | |
| Ratio to average net assets: | | | | | | | | | | | | | | | | | | | | | | | | |
| Net expenses(E) | | | 1.10 | % | | | 1.16 | %(F) | | | 1.39 | % | | | 1.39 | % | | | 1.39 | % | | | 1.40 | % |
| Gross expenses(E) | | | 1.58 | % | | | 1.60 | %(F) | | | 1.59 | % | | | 1.59 | % | | | 1.62 | % | | | 1.51 | % |
| Net investment income(E) | | | 0.67 | % | | | 2.00 | %(F) | | | 0.84 | % | | | 0.98 | % | | | 1.51 | % | | | 2.46 | % |
| Portfolio turnover rate | | | 32 | % | | | 74 | %(D)(G) | | | 76 | % | | | 6 | % | | | 33 | % | | | 30 | % |
| (A) | The Fund changed its fiscal year end from July 31 to December 31. See Note 11 in Notes to Financial Statements. |
| (B) | The net investment income per share is based on average shares outstanding for the period. |
| (C) | Total returns shown exclude the effect of applicable sales loads. If these charges were included, the returns would be lower. |
| (E) | Ratio does not include income and expenses of the underlying funds. |
| (G) | Portfolio turnover excludes the purchases and sales of the Acquired Funds (see Note 11). If these transactions were included, portfolio turnover would have been higher. |
See accompanying Notes to Financial Statements.
Financial Highlights (Continued)
Touchstone Balanced Allocation Fund—Class Y
| Selected Data for a Share Outstanding Throughout Each Period |
| | | | | | Five | | | | | | | | | | | | | |
| | | Year | | | Months | | | | | | | | | | | | | |
| | | Ended | | | Ended | | | | | | | | | | | | | |
| | | December 31, | | | December 31, | | | Year Ended July 31, | |
| | | 2013 | | | 2012(A) | | | 2012 | | | 2011 | | | 2010 | | | 2009 | |
| Net asset value at beginning of period | | $ | 11.15 | | | $ | 11.21 | | | $ | 11.05 | | | $ | 10.01 | | | $ | 9.30 | | | $ | 11.31 | |
| Income (loss) from investment operations: | | | | | | | | | | | | | | | | | | | | | | | | |
| Net investment income | | | 0.22 | | | | 0.14 | (B) | | | 0.20 | (B) | | | 0.23 | (B) | | | 0.24 | (B) | | | 0.31 | (B) |
| Net realized and unrealized gains (losses) on investments | | | 1.28 | | | | 0.35 | | | | 0.14 | | | | 1.11 | | | | 0.80 | | | | (1.46 | ) |
| Total from investment operations | | | 1.50 | | | | 0.49 | | | | 0.34 | | | | 1.34 | | | | 1.04 | | | | (1.15 | ) |
| Distributions from: | | | | | | | | | | | | | | | | | | | | | | | | |
| Net investment income | | | (0.26 | ) | | | (0.26 | ) | | | (0.18 | ) | | | (0.30 | ) | | | (0.33 | ) | | | (0.40 | ) |
| Realized capital gains | | | — | | | | (0.29 | ) | | | — | | | | — | | | | — | | | | (0.46 | ) |
| Total distributions | | | (0.26 | ) | | | (0.55 | ) | | | (0.18 | ) | | | (0.30 | ) | | | (0.33 | ) | | | (0.86 | ) |
| Net asset value at end of period | | $ | 12.39 | | | $ | 11.15 | | | $ | 11.21 | | | $ | 11.05 | | | $ | 10.01 | | | $ | 9.30 | |
| Total return | | | 13.54 | % | | | 4.45 | %(C) | | | 3.18 | % | | | 13.49 | % | | | 11.25 | % | | | (9.00 | %) |
| Ratios and supplemental data: | | | | | | | | | | | | | | | | | | | | | | | | |
| Net assets at end of period (000's) | | $ | 34,079 | | | $ | 47,092 | | | $ | 1,287 | | | $ | 1,866 | | | $ | 929 | | | $ | 672 | |
| Ratio to average net assets: | | | | | | | | | | | | | | | | | | | | | | | | |
| Net expenses(D) | | | 0.10 | % | | | 0.16 | %(E) | | | 0.39 | % | | | 0.39 | % | | | 0.39 | % | | | 0.40 | % |
| Gross expenses(D) | | | 0.59 | % | | | 0.52 | %(E) | | | 1.40 | % | | | 1.41 | % | | | 2.28 | % | | | 1.41 | % |
| Net investment income(D) | | | 1.67 | % | | | 3.00 | %(E) | | | 1.84 | % | | | 2.11 | % | | | 2.46 | % | | | 3.53 | % |
| Portfolio turnover rate | | | 32 | % | | | 74 | %(C)(F) | | | 76 | % | | | 6 | % | | | 33 | % | | | 30 | % |
| (A) | The Fund changed its fiscal year end from July 31 to December 31. See Note 11 in Notes to Financial Statements. |
| (B) | The net investment income per share is based on average shares outstanding for the period. |
| (D) | Ratio does not include income and expenses of the underlying funds. |
| (F) | Portfolio turnover excludes the purchases and sales of the Acquired Funds (see Note 11). If these transactions were included, portfolio turnover would have been higher. |
See accompanying Notes to Financial Statements.
Financial Highlights (Continued)
Touchstone Balanced Allocation Fund—Institutional Class
| Selected Data for a Share Outstanding Throughout Each Period |
| | | | | | Five | | | | | | | | | | | | | |
| | | Year | | | Months | | | | | | | | | | | | | |
| | | Ended | | | Ended | | | | | | | | | | | | | |
| | | December 31, | | | December 31, | | | Year Ended July 31, | |
| | | 2013 | | | 2012(A) | | | 2012 | | | 2011 | | | 2010 | | | 2009 | |
| Net asset value at beginning of period | | $ | 11.10 | | | $ | 11.16 | | | $ | 11.00 | | | $ | 9.97 | | | $ | 9.26 | | | $ | 11.28 | |
| Income (loss) from investment operations: | | | | | | | | | | | | | | | | | | | | | | | | |
| Net investment income | | | 0.20 | | | | 0.14 | (B) | | | 0.20 | (B) | | | 0.21 | (B) | | | 0.35 | (B) | | | 0.30 | (B) |
| Net realized and unrealized gains (losses) on investments | | | 1.29 | | | | 0.35 | | | | 0.14 | | | | 1.12 | | | | 0.69 | | | | (1.46 | ) |
| Total from investment operations | | | 1.49 | | | | 0.49 | | | | 0.34 | | | | 1.33 | | | | 1.04 | | | | (1.16 | ) |
| Distributions from: | | | | | | | | | | | | | | | | | | | | | | | | |
| Net investment income | | | (0.26 | ) | | | (0.26 | ) | | | (0.18 | ) | | | (0.30 | ) | | | (0.33 | ) | | | (0.40 | ) |
| Realized capital gains | | | — | | | | (0.29 | ) | | | — | | | | — | | | | — | | | | (0.46 | ) |
| Total distributions | | | (0.26 | ) | | | (0.55 | ) | | | (0.18 | ) | | | (0.30 | ) | | | (0.33 | ) | | | (0.86 | ) |
| Net asset value at end of period | | $ | 12.33 | | | $ | 11.10 | | | $ | 11.16 | | | $ | 11.00 | | | $ | 9.97 | | | $ | 9.26 | |
| Total return | | | 13.51 | % | | | 4.47 | %(C) | | | 3.19 | % | | | 13.44 | % | | | 11.29 | % | | | (9.13 | %) |
| Ratios and supplemental data: | | | | | | | | | | | | | | | | | | | | | | | | |
| Net assets at end of period (000's) | | $ | 35 | | | $ | 31 | | | $ | 30 | | | $ | 31 | | | $ | 27 | | | $ | 2,011 | |
| Ratio to average net assets: | | | | | | | | | | | | | | | | | | | | | | | | |
| Net expenses(D) | | | 0.11 | % | | | 0.16 | %(E) | | | 0.39 | % | | | 0.39 | % | | | 0.39 | % | | | 0.40 | % |
| Gross expenses(D) | | | 63.11 | % | | | 56.07 | %(E) | | | 28.86 | % | | | 46.94 | % | | | 2.29 | % | | | 0.58 | % |
| Net investment income(D) | | | 1.66 | % | | | 3.00 | %(E) | | | 1.85 | % | | | 1.97 | % | | | 3.55 | % | | | 3.35 | % |
| Portfolio turnover rate | | | 32 | % | | | 74 | %(C)(F) | | | 76 | % | | | 6 | % | | | 33 | % | | | 30 | % |
| (A) | The Fund changed its fiscal year end from July 31 to December 31. See Note 11 in Notes to Financial Statements. |
| (B) | The net investment income per share is based on average shares outstanding for the period. |
| (D) | Ratio does not include income and expenses of the underlying funds. |
| (F) | Portfolio turnover excludes the purchases and sales of the Acquired Funds (see Note 11). If these transactions were included, portfolio turnover would have been higher. |
See accompanying Notes to Financial Statements.
Financial Highlights (Continued)
Touchstone Conservative Allocation Fund—Class A
| Selected Data for a Share Outstanding Throughout Each Period |
| | | | | | Five | | | | | | | | | | | | | |
| | | Year | | | Months | | | | | | | | | | | | | |
| | | Ended | | | Ended | | | | | | | | | | | | | |
| | | December 31, | | | December 31, | | | Year Ended July 31, | |
| | | 2013 | | | 2012(A) | | | 2012 | | | 2011 | | | 2010 | | | 2009 | |
| Net asset value at beginning of period | | $ | 10.50 | | | $ | 10.98 | | | $ | 10.87 | | | $ | 10.38 | | | $ | 9.84 | | | $ | 10.76 | |
| Income (loss) from investment operations: | | | | | | | | | | | | | | | | | | | | | | | | |
| Net investment income(B) | | | 0.19 | | | | 0.10 | | | | 0.21 | | | | 0.26 | | | | 0.34 | | | | 0.48 | |
| Net realized and unrealized gains (losses) on investments | | | 0.45 | | | | 0.17 | | | | 0.13 | | | | 0.64 | | | | 0.66 | | | | (0.61 | ) |
| Total from investment operations | | | 0.64 | | | | 0.27 | | | | 0.34 | | | | 0.90 | | | | 1.00 | | | | (0.13 | ) |
| Distributions from: | | | | | | | | | | | | | | | | | | | | | | | | |
| Net investment income | | | (0.21 | ) | | | (0.28 | ) | | | (0.23 | ) | | | (0.41 | ) | | | (0.46 | ) | | | (0.57 | ) |
| Realized capital gains | | | — | | | | (0.47 | ) | | | — | | | | — | | | | — | | | | (0.22 | ) |
| Total distributions | | | (0.21 | ) | | | (0.75 | ) | | | (0.23 | ) | | | (0.41 | ) | | | (0.46 | ) | | | (0.79 | ) |
| Net asset value at end of period | | $ | 10.93 | | | $ | 10.50 | | | $ | 10.98 | | | $ | 10.87 | | | $ | 10.38 | | | $ | 9.84 | |
| Total return(C) | | | 6.14 | % | | | 2.47 | %(D) | | | 3.23 | % | | | 8.81 | % | | | 10.27 | % | | | (0.49 | %) |
| Ratios and supplemental data: | | | | | | | | | | | | | | | | | | | | | | | | |
| Net assets at end of period (000's) | | $ | 24,857 | | | $ | 32,965 | | | $ | 8,466 | | | $ | 11,138 | | | $ | 12,141 | | | $ | 13,632 | |
| Ratio to average net assets: | | | | | | | | | | | | | | | | | | | | | | | | |
| Net expenses(E) | | | 0.35 | % | | | 0.40 | %(F) | | | 0.61 | % | | | 0.61 | % | | | 0.61 | % | | | 0.65 | % |
| Gross expenses(E) | | | 0.89 | % | | | 0.85 | %(F) | | | 1.02 | % | | | 0.91 | % | | | 0.94 | % | | | 0.86 | % |
| Net investment income(E) | | | 1.74 | % | | | 2.28 | %(F) | | | 1.95 | % | | | 2.43 | % | | | 3.36 | % | | | 5.09 | % |
| Portfolio turnover rate | | | 30 | % | | | 79 | %(D)(G) | | | 89 | % | | | 13 | % | | | 33 | % | | | 40 | % |
| (A) | The Fund changed its fiscal year end from July 31 to December 31. See Note 11 in Notes to Financial Statements. |
| (B) | The net investment income per share is based on average shares outstanding for the period. |
| (C) | Total returns shown exclude the effect of applicable sales loads. If these charges were included, the returns would be lower. |
| (E) | Ratio does not include income and expenses of the underlying funds. |
| (G) | Portfolio turnover excludes the purchases and sales of the Acquired Funds (see Note 11). If these transactions were included, portfolio turnover would have been higher. |
See accompanying Notes to Financial Statements.
Financial Highlights (Continued)
Touchstone Conservative Allocation Fund—Class C
| Selected Data for a Share Outstanding Throughout Each Period |
| | | | | | Five | | | | | | | | | | | | | |
| | | Year | | | Months | | | | | | | | | | | | | |
| | | Ended | | | Ended | | | | | | | | | | | | | |
| | | December 31, | | | December 31, | | | Year Ended July 31, | |
| | | 2013 | | | 2012(A) | | | 2012 | | | 2011 | | | 2010 | | | 2009 | |
| Net asset value at beginning of period | | $ | 10.45 | | | $ | 10.92 | | | $ | 10.81 | | | $ | 10.33 | | | $ | 9.80 | | | $ | 10.66 | |
| Income (loss) from investment operations: | | | | | | | | | | | | | | | | | | | | | | | | |
| Net investment income(B) | | | 0.11 | | | | 0.07 | | | | 0.13 | | | | 0.18 | | | | 0.27 | | | | 0.39 | |
| Net realized and unrealized gains (losses) on investments | | | 0.45 | | | | 0.17 | | | | 0.13 | | | | 0.63 | | | | 0.64 | | | | (0.58 | ) |
| Total from investment operations | | | 0.56 | | | | 0.24 | | | | 0.26 | | | | 0.81 | | | | 0.91 | | | | (0.19 | ) |
| Distributions from: | | | | | | | | | | | | | | | | | | | | | | | | |
| Net investment income | | | (0.13 | ) | | | (0.24 | ) | | | (0.15 | ) | | | (0.33 | ) | | | (0.38 | ) | | | (0.45 | ) |
| Realized capital gains | | | — | | | | (0.47 | ) | | | — | | | | — | | | | — | | | | (0.22 | ) |
| Total distributions | | | (0.13 | ) | | | (0.71 | ) | | | (0.15 | ) | | | (0.33 | ) | | | (0.38 | ) | | | (0.67 | ) |
| Net asset value at end of period | | $ | 10.88 | | | $ | 10.45 | | | $ | 10.92 | | | $ | 10.81 | | | $ | 10.33 | | | $ | 9.80 | |
| Total return(C) | | | 5.36 | % | | | 2.18 | %(D) | | | 2.50 | % | | | 7.93 | % | | | 9.37 | % | | | (1.20 | %) |
| Ratios and supplemental data: | | | | | | | | | | | | | | | | | | | | | | | | |
| Net assets at end of period (000's) | | $ | 15,275 | | | $ | 17,972 | | | $ | 17,104 | | | $ | 20,000 | | | $ | 23,985 | | | $ | 31,465 | |
| Ratio to average net assets: | | | | | | | | | | | | | | | | | | | | | | | | |
| Net expenses(E) | | | 1.10 | % | | | 1.15 | %(F) | | | 1.36 | % | | | 1.36 | % | | | 1.36 | % | | | 1.41 | % |
| Gross expenses(E) | | | 1.64 | % | | | 1.67 | %(F) | | | 1.70 | % | | | 1.61 | % | | | 1.65 | % | | | 1.54 | % |
| Net investment income(E) | | | 0.99 | % | | | 1.53 | %(F) | | | 1.20 | % | | | 1.72 | % | | | 2.61 | % | | | 4.23 | % |
| Portfolio turnover rate | | | 30 | % | | | 79 | %(D)(G) | | | 89 | % | | | 13 | % | | | 33 | % | | | 40 | % |
| (A) | The Fund changed its fiscal year end from July 31 to December 31. See Note 11 in Notes to Financial Statements. |
| (B) | The net investment income per share is based on average shares outstanding for the period. |
| (C) | Total returns shown exclude the effect of applicable sales loads. If these charges were included, the returns would be lower. |
| (E) | Ratio does not include income and expenses of the underlying funds. |
| (G) | Portfolio turnover excludes the purchases and sales of the Acquired Funds (see Note 11). If these transactions were included, portfolio turnover would have been higher. |
See accompanying Notes to Financial Statements.
Financial Highlights (Continued)
Touchstone Conservative Allocation Fund—Class Y
| Selected Data for a Share Outstanding Throughout Each Period |
| | | | | | Five | | | | | | | | | | | | | |
| | | Year | | | Months | | | | | | | | | | | | | |
| | | Ended | | | Ended | | | | | | | | | | | | | |
| | | December 31, | | | December 31, | | | Year Ended July 31, | |
| | | 2013 | | | 2012(A) | | | 2012 | | | 2011 | | | 2010 | | | 2009 | |
| Net asset value at beginning of period | | $ | 10.51 | | | $ | 10.99 | | | $ | 10.87 | | | $ | 10.39 | | | $ | 9.85 | | | $ | 10.78 | |
| Income (loss) from investment operations: | | | | | | | | | | | | | | | | | | | | | | | | |
| Net investment income(B) | | | 0.21 | | | | 0.12 | | | | 0.24 | | | | 0.29 | | | | 0.35 | | | | 0.44 | |
| Net realized and unrealized gains (losses) on investments | | | 0.45 | | | | 0.16 | | | | 0.14 | | | | 0.62 | | | | 0.67 | | | | (0.54 | ) |
| Total from investment operations | | | 0.66 | | | | 0.28 | | | | 0.38 | | | | 0.91 | | | | 1.02 | | | | (0.10 | ) |
| Distributions from: | | | | | | | | | | | | | | | | | | | | | | | | |
| Net investment income | | | (0.24 | ) | | | (0.29 | ) | | | (0.26 | ) | | | (0.43 | ) | | | (0.48 | ) | | | (0.61 | ) |
| Realized capital gains | | | — | | | | (0.47 | ) | | | — | | | | — | | | | — | | | | (0.22 | ) |
| Total distributions | | | (0.24 | ) | | | (0.76 | ) | | | (0.26 | ) | | | (0.43 | ) | | | (0.48 | ) | | | (0.83 | ) |
| Net asset value at end of period | | $ | 10.93 | | | $ | 10.51 | | | $ | 10.99 | | | $ | 10.87 | | | $ | 10.39 | | | $ | 9.85 | |
| Total return | | | 6.31 | % | | | 2.60 | %(C) | | | 3.60 | % | | | 8.97 | % | | | 10.54 | % | | | (0.17 | %) |
| Ratios and supplemental data: | | | | | | | | | | | | | | | | | | | | | | | | |
| Net assets at end of period (000's) | | $ | 23,230 | | | $ | 33,329 | | | $ | 2,156 | | | $ | 1,370 | | | $ | 1,129 | | | $ | 234 | |
| Ratio to average net assets: | | | | | | | | | | | | | | | | | | | | | | | | |
| Net expenses(D) | | | 0.10 | % | | | 0.15 | %(E) | | | 0.36 | % | | | 0.36 | % | | | 0.34 | % | | | 0.40 | % |
| Gross expenses(D) | | | 0.62 | % | | | 0.57 | %(E) | | | 1.38 | % | | | 1.65 | % | | | 1.65 | % | | | 7.77 | % |
| Net investment income(D) | | | 1.99 | % | | | 2.53 | %(E) | | | 2.20 | % | | | 2.72 | % | | | 3.40 | % | | | 4.56 | % |
| Portfolio turnover rate | | | 30 | % | | | 79 | %(C)(F) | | | 89 | % | | | 13 | % | | | 33 | % | | | 40 | % |
| (A) | The Fund changed its fiscal year end from July 31 to December 31. See Note 11 in Notes to Financial Statements. |
| (B) | The net investment income per share is based on average shares outstanding for the period. |
| (D) | Ratio does not include income and expenses of the underlying funds. |
| (F) | Portfolio turnover excludes the purchases and sales of the Acquired Funds (see Note 11). If these transactions were included, portfolio turnover would have been higher. |
See accompanying Notes to Financial Statements.
Financial Highlights (Continued)
Touchstone Conservative Allocation Fund—Institutional Class
| Selected Data for a Share Outstanding Throughout Each Period |
| | | | | | Five | | | | | | | | | | | | | |
| | | Year | | | Months | | | | | | | | | | | | | |
| | | Ended | | | Ended | | | | | | | | | | | | | |
| | | December 31, | | | December 31, | | | Year Ended July 31, | |
| | | 2013 | | | 2012(A) | | | 2012 | | | 2011 | | | 2010 | | | 2009 | |
| Net asset value at beginning of period | | $ | 10.51 | | | $ | 10.99 | | | $ | 10.89 | | | $ | 10.40 | | | $ | 9.86 | | | $ | 10.79 | |
| Income (loss) from investment operations: | | | | | | | | | | | | | | | | | | | | | | | | |
| Net investment income(B) | | | 0.21 | | | | 0.12 | | | | 0.24 | | | | 0.29 | | | | 0.37 | | | | 0.47 | |
| Net realized and unrealized gains (losses) on investments | | | 0.47 | | | | 0.16 | | | | 0.12 | | | | 0.63 | | | | 0.65 | | | | (0.58 | ) |
| Total from investment operations | | | 0.68 | | | | 0.28 | | | | 0.36 | | | | 0.92 | | | | 1.02 | | | | (0.11 | ) |
| Distributions from: | | | | | | | | | | | | | | | | | | | | | | | | |
| Net investment income | | | (0.24 | ) | | | (0.29 | ) | | | (0.26 | ) | | | (0.43 | ) | | | (0.48 | ) | | | (0.60 | ) |
| Realized capital gains | | | — | | | | (0.47 | ) | | | — | | | | — | | | | — | | | | (0.22 | ) |
| Total distributions | | | (0.24 | ) | | | (0.76 | ) | | | (0.26 | ) | | | (0.43 | ) | | | (0.48 | ) | | | (0.82 | ) |
| Net asset value at end of period | | $ | 10.95 | | | $ | 10.51 | | | $ | 10.99 | | | $ | 10.89 | | | $ | 10.40 | | | $ | 9.86 | |
| Total return | | | 6.40 | % | | | 2.50 | %(C) | | | 3.52 | % | | | 9.06 | % | | | 10.52 | % | | | (0.19 | %) |
| Ratios and supplemental data: | | | | | | | | | | | | | | | | | | | | | | | | |
| Net assets at end of period (000's) | | $ | 82 | | | $ | 1,198 | | | $ | 1,342 | | | $ | 6,459 | | | $ | 6,158 | | | $ | 6,017 | |
| Ratio to average net assets: | | | | | | | | | | | | | | | | | | | | | | | | |
| Net expenses(D) | | | 0.09 | % | | | 0.15 | %(E) | | | 0.36 | % | | | 0.36 | % | | | 0.36 | % | | | 0.40 | % |
| Gross expenses(D) | | | 4.85 | % | | | 1.93 | %(E) | | | 0.66 | % | | | 0.63 | % | | | 0.56 | % | | | 1.43 | % |
| Net investment income(D) | | | 2.00 | % | | | 2.53 | %(E) | | | 2.20 | % | | | 2.70 | % | | | 3.62 | % | | | 4.85 | % |
| Portfolio turnover rate | | | 30 | % | | | 79 | %(C)(F) | | | 89 | % | | | 13 | % | | | 33 | % | | | 40 | % |
| (A) | The Fund changed its fiscal year end from July 31 to December 31. See Note 11 in Notes to Financial Statements. |
| (B) | The net investment income per share is based on average shares outstanding for the period. |
| (D) | Ratio does not include income and expenses of the underlying funds. |
| (F) | Portfolio turnover excludes the purchases and sales of the Acquired Funds (see Note 11). If these transactions were included, portfolio turnover would have been higher. |
See accompanying Notes to Financial Statements.
Financial Highlights (Continued)
Touchstone Growth Allocation Fund—Class A
| Selected Data for a Share Outstanding Throughout Each Period |
| | | | | | Five | | | | | | | | | | | | | |
| | | Year | | | Months | | | | | | | | | | | | | |
| | | Ended | | | Ended | | | | | | | | | | | | | |
| | | December 31, | | | December 31, | | | Year Ended July 31, | |
| | | 2013 | | | 2012(A) | | | 2012 | | | 2011 | | | 2010 | | | 2009 | |
| Net asset value at beginning of period | | $ | 11.75 | | | $ | 11.28 | | | $ | 11.40 | | | $ | 9.58 | | | $ | 8.66 | | | $ | 12.33 | |
| Income (loss) from investment operations: | | | | | | | | | | | | | | | | | | | | | | | | |
| Net investment income | | | 0.12 | | | | 0.14 | (B) | | | 0.13 | (B) | | | 0.08 | (B) | | | 0.12 | (B) | | | 0.10 | (B) |
| Net realized and unrealized gains (losses) on investments | | | 2.31 | | | | 0.67 | | | | (0.14 | ) | | | 1.80 | | | | 0.99 | | | | (3.12 | ) |
| Total from investment operations | | | 2.43 | | | | 0.81 | | | | (0.01 | ) | | | 1.88 | | | | 1.11 | | | | (3.02 | ) |
| Distributions from: | | | | | | | | | | | | | | | | | | | | | | | | |
| Net investment income | | | (0.26 | ) | | | (0.34 | ) | | | (0.11 | ) | | | (0.06 | ) | | | (0.19 | ) | | | — | |
| Realized capital gains | | | (0.10 | ) | | | — | | | | — | | | | — | | | | — | | | | (0.65 | ) |
| Total distributions | | | (0.36 | ) | | | (0.34 | ) | | | (0.11 | ) | | | (0.06 | ) | | | (0.19 | ) | | | (0.65 | ) |
| Net asset value at end of period | | $ | 13.82 | | | $ | 11.75 | | | $ | 11.28 | | | $ | 11.40 | | | $ | 9.58 | | | $ | 8.66 | |
| Total return(C) | | | 20.69 | % | | | 7.29 | %(D) | | | (0.04 | %) | | | 19.65 | % | | | 12.78 | % | | | (23.55 | %) |
| Ratios and supplemental data: | | | | | | | | | | | | | | | | | | | | | | | | |
| Net assets at end of period (000's) | | $ | 29,279 | | | $ | 31,432 | | | $ | 10,320 | | | $ | 13,619 | | | $ | 16,721 | | | $ | 20,556 | |
| Ratio to average net assets: | | | | | | | | | | | | | | | | | | | | | | | | |
| Net expenses(E) | | | 0.35 | % | | | 0.39 | %(F) | | | 0.57 | % | | | 0.57 | % | | | 0.57 | % | | | 0.56 | % |
| Gross expenses(E) | | | 1.01 | % | | | 1.04 | %(F) | | | 1.21 | % | | | 1.13 | % | | | 1.18 | % | | | 1.03 | % |
| Net investment income(E) | | | 0.87 | % | | | 2.95 | %(F) | | | 1.17 | % | | | 0.77 | % | | | 1.26 | % | | | 1.14 | % |
| Portfolio turnover rate | | | 50 | % | | | 65 | %(D)(G) | | | 77 | % | | | 8 | % | | | 41 | % | | | 27 | % |
| (A) | The Fund changed its fiscal year end from July 31 to December 31. See Note 11 in Notes to Financial Statements. |
| (B) | The net investment income per share is based on average shares outstanding for the period. |
| (C) | Total returns shown exclude the effect of applicable sales loads. If these charges were included, the returns would be lower. |
| (E) | Ratio does not include income and expenses of the underlying funds. |
| (G) | Portfolio turnover excludes the purchases and sales of the Acquired Funds (see Note 11). If these transactions were included, portfolio turnover would have been higher. |
See accompanying Notes to Financial Statements.
Financial Highlights (Continued)
Touchstone Growth Allocation Fund—Class C
| Selected Data for a Share Outstanding Throughout Each Period |
| | | | | | Five | | | | | | | | | | | | | |
| | | Year | | | Months | | | | | | | | | | | | | |
| | | Ended | | | Ended | | | | | | | | | | | | | |
| | | December 31, | | | December 31, | | | Year Ended July 31, | |
| | | 2013 | | | 2012(A) | | | 2012 | | | 2011 | | | 2010 | | | 2009 | |
| Net asset value at beginning of period | | $ | 11.32 | | | $ | 10.80 | | | $ | 10.90 | | | $ | 9.18 | | | $ | 8.30 | | | $ | 11.95 | |
| Income (loss) from investment operations: | | | | | | | | | | | | | | | | | | | | | | | | |
| Net investment income | | | 0.02 | | | | 0.10 | (B) | | | 0.04 | (B) | | | — | (B)(C) | | | 0.04 | (B) | | | 0.03 | (B) |
| Net realized and unrealized gains (losses) on investments | | | 2.24 | | | | 0.63 | | | | (0.12 | ) | | | 1.72 | | | | 0.96 | | | | (3.03 | ) |
| Total from investment operations | | | 2.26 | | | | 0.73 | | | | (0.08 | ) | | | 1.72 | | | | 1.00 | | | | (3.00 | ) |
| Distributions from: | | | | | | | | | | | | | | | | | | | | | | | | |
| Net investment income | | | (0.16 | ) | | | (0.21 | ) | | | (0.02 | ) | | | — | | | | (0.12 | ) | | | — | |
| Realized capital gains | | | (0.10 | ) | | | — | | | | — | | | | — | | | | — | | | | (0.65 | ) |
| Total distributions | | | (0.26 | ) | | | (0.21 | ) | | | (0.02 | ) | | | — | | | | (0.12 | ) | | | (0.65 | ) |
| Net asset value at end of period | | $ | 13.32 | | | $ | 11.32 | | | $ | 10.80 | | | $ | 10.90 | | | $ | 9.18 | | | $ | 8.30 | |
| Total return(D) | | | 19.88 | % | | | 6.82 | %(E) | | | (0.75 | %) | | | 18.74 | % | | | 12.03 | % | | | (24.16 | %) |
| Ratios and supplemental data: | | | | | | | | | | | | | | | | | | | | | | | | |
| Net assets at end of period (000's) | | $ | 24,066 | | | $ | 24,065 | | | $ | 23,968 | | | $ | 33,477 | | | $ | 36,655 | | | $ | 48,126 | |
| Ratio to average net assets: | | | | | | | | | | | | | | | | | | | | | | | | |
| Net expenses(F) | | | 1.10 | % | | | 1.14 | %(G) | | | 1.32 | % | | | 1.32 | % | | | 1.32 | % | | | 1.31 | % |
| Gross expenses(F) | | | 1.73 | % | | | 1.81 | %(G) | | | 1.87 | % | | | 1.75 | % | | | 1.84 | % | | | 1.75 | % |
| Net investment income(F) | | | 0.12 | % | | | 2.20 | %(G) | | | 0.42 | % | | | 0.02 | % | | | 0.47 | % | | | 0.42 | % |
| Portfolio turnover rate | | | 50 | % | | | 65 | %(E)(H) | | | 77 | % | | | 8 | % | | | 41 | % | | | 27 | % |
| (A) | The Fund changed its fiscal year end from July 31 to December 31. See Note 11 in Notes to Financial Statements. |
| (B) | The net investment income per share is based on average shares outstanding for the period. |
| (C) | Less than $0.005 per share. |
| (D) | Total returns shown exclude the effect of applicable sales loads. If these charges were included, the returns would be lower. |
| (F) | Ratio does not include income and expenses of the underlying funds. |
| (H) | Portfolio turnover excludes the purchases and sales of the Acquired Funds (see Note 11). If these transactions were included, portfolio turnover would have been higher. |
See accompanying Notes to Financial Statements.
Financial Highlights (Continued)
Touchstone Growth Allocation Fund—Class Y
| Selected Data for a Share Outstanding Throughout Each Period |
| | | | | | Five | | | | | | | | | | | | | |
| | | Year | | | Months | | | | | | | | | | | | | |
| | | Ended | | | Ended | | | | | | | | | | | | | |
| | | December 31, | | | December 31, | | | Year Ended July 31, | |
| | | 2013 | | | 2012(A) | | | 2012 | | | 2011 | | | 2010 | | | 2009 | |
| Net asset value at beginning of period | | $ | 11.86 | | | $ | 11.43 | | | $ | 11.57 | | | $ | 9.72 | | | $ | 8.77 | | | $ | 12.45 | |
| Income (loss) from investment operations: | | | | | | | | | | | | | | | | | | | | | | | | |
| Net investment income | | | 0.18 | | | | 0.16 | (B) | | | 0.15 | (B) | | | 0.12 | (B) | | | 0.05 | (B) | | | 0.12 | (B) |
| Net realized and unrealized gains (losses) on investments | | | 2.31 | | | | 0.67 | | | | (0.14 | ) | | | 1.81 | | | | 1.11 | | | | (3.15 | ) |
| Total from investment operations | | | 2.49 | | | | 0.83 | | | | 0.01 | | | | 1.93 | | | | 1.16 | | | | (3.03 | ) |
| Distributions from: | | | | | | | | | | | | | | | | | | | | | | | | |
| Net investment income | | | (0.29 | ) | | | (0.40 | ) | | | (0.15 | ) | | | (0.08 | ) | | | (0.21 | ) | | | — | |
| Realized capital gains | | | (0.10 | ) | | | — | | | | — | | | | — | | | | — | | | | (0.65 | ) |
| Total distributions | | | (0.39 | ) | | | (0.40 | ) | | | (0.15 | ) | | | (0.08 | ) | | | (0.21 | ) | | | (0.65 | ) |
| Net asset value at end of period | | $ | 13.96 | | | $ | 11.86 | | | $ | 11.43 | | | $ | 11.57 | | | $ | 9.72 | | | $ | 8.77 | |
| Total return | | | 21.06 | % | | | 7.35 | %(C) | | | 0.22 | % | | | 19.94 | % | | | 13.22 | % | | | (23.40 | %) |
| Ratios and supplemental data: | | | | | | | | | | | | | | | | | | | | | | | | |
| Net assets at end of period (000's) | | $ | 16,716 | | | $ | 27,873 | | | $ | 881 | | | $ | 3,561 | | | $ | 2,322 | | | $ | 667 | |
| Ratio to average net assets: | | | | | | | | | | | | | | | | | | | | | | | | |
| Net expenses(D) | | | 0.10 | % | | | 0.14 | %(E) | | | 0.32 | % | | | 0.32 | % | | | 0.32 | % | | | 0.32 | % |
| Gross expenses(D) | | | 0.68 | % | | | 0.65 | %(E) | | | 1.62 | % | | | 1.13 | % | | | 1.33 | % | | | 3.50 | % |
| Net investment income(D) | | | 1.12 | % | | | 3.20 | %(E) | | | 1.42 | % | | | 1.11 | % | | | 0.56 | % | | | 1.46 | % |
| Portfolio turnover rate | | | 50 | % | | | 65 | %(C)(F) | | | 77 | % | | | 8 | % | | | 41 | % | | | 27 | % |
| (A) | The Fund changed its fiscal year end from July 31 to December 31. See Note 11 in Notes to Financial Statements. |
| (B) | The net investment income per share is based on average shares outstanding for the period. |
| (D) | Ratio does not include income and expenses of the underlying funds. |
| (F) | Portfolio turnover excludes the purchases and sales of the Acquired Funds (see Note 11). If these transactions were included, portfolio turnover would have been higher. |
See accompanying Notes to Financial Statements.
Financial Highlights (Continued)
Touchstone Growth Allocation Fund—Institutional Class
| Selected Data for a Share Outstanding Throughout Each Period |
| | | | | | Five | | | | | | | | | | | | | |
| | | Year | | | Months | | | | | | | | | | | | | |
| | | Ended | | | Ended | | | | | | | | | | | | | |
| | | December 31, | | | December 31, | | | Year Ended July 31, | |
| | | 2013 | | | 2012(A) | | | 2012 | | | 2011 | | | 2010 | | | 2009 | |
| Net asset value at beginning of period | | $ | 10.82 | | | $ | 10.58 | | | $ | 11.56 | | | $ | 9.71 | | | $ | 8.77 | | | $ | 12.44 | |
| Income (loss) from investment operations: | | | | | | | | | | | | | | | | | | | | | | | | |
| Net investment income | | | 0.15 | | | | 0.14 | (B) | | | 0.15 | (B) | | | 0.11 | (B) | | | 0.32 | (B) | | | 0.12 | (B) |
| Net realized and unrealized gains (losses) on investments | | | 2.12 | | | | 0.61 | | | | (0.25 | ) | | | 1.83 | | | | 0.83 | | | | (3.14 | ) |
| Total from investment operations | | | 2.27 | | | | 0.75 | | | | (0.10 | ) | | | 1.94 | | | | 1.15 | | | | (3.02 | ) |
| Distributions from: | | | | | | | | | | | | | | | | | | | | | | | | |
| Net investment income | | | (0.29 | ) | | | (0.51 | ) | | | (0.88 | ) | | | (0.09 | ) | | | (0.21 | ) | | | — | |
| Realized capital gains | | | (0.10 | ) | | | — | | | | — | | | | — | | | | — | | | | (0.65 | ) |
| Total distributions | | | (0.39 | ) | | | (0.51 | ) | | | (0.88 | ) | | | (0.09 | ) | | | (0.21 | ) | | | (0.65 | ) |
| Net asset value at end of period | | $ | 12.70 | | | $ | 10.82 | | | $ | 10.58 | | | $ | 11.56 | | | $ | 9.71 | | | $ | 8.77 | |
| Total return | | | 21.06 | % | | | 7.30 | %(C) | | | (0.26 | %) | | | 20.01 | % | | | 13.10 | % | | | (23.34 | %) |
| Ratios and supplemental data: | | | | | | | | | | | | | | | | | | | | | | | | |
| Net assets at end of period (000's) | | $ | 20 | | | $ | 29 | | | $ | 13 | | | $ | 788 | | | $ | 674 | | | $ | 17,845 | |
| Ratio to average net assets: | | | | | | | | | | | | | | | | | | | | | | | | |
| Net expenses(D) | | | 0.10 | % | | | 0.14 | %(E) | | | 0.32 | % | | | 0.32 | % | | | 0.32 | % | | | 0.31 | % |
| Gross expenses(D) | | | 98.07 | % | | | 94.73 | %(E) | | | 7.68 | % | | | 2.29 | % | | | 0.67 | % | | | 0.50 | % |
| Net investment income(D) | | | 1.12 | % | | | 3.20 | %(E) | | | 1.42 | % | | | 0.96 | % | | | 3.37 | % | | | 1.39 | % |
| Portfolio turnover rate | | | 50 | % | | | 65 | %(C)(F) | | | 77 | % | | | 8 | % | | | 41 | % | | | 27 | % |
| (A) | The Fund changed its fiscal year end from July 31 to December 31. See Note 11 in Notes to Financial Statements. |
| (B) | The net investment income per share is based on average shares outstanding for the period. |
| (D) | Ratio does not include income and expenses of the underlying funds. |
| (F) | Portfolio turnover excludes the purchases and sales of the Acquired Funds (see Note 11). If these transactions were included, portfolio turnover would have been higher. |
See accompanying Notes to Financial Statements.
Financial Highlights (Continued)
Touchstone Moderate Growth Allocation Fund—Class A
| Selected Data for a Share Outstanding Throughout Each Period |
| | | | | | Five | | | | | | | | | | | | | |
| | | Year | | | Months | | | | | | | | | | | | | |
| | | Ended | | | Ended | | | | | | | | | | | | | |
| | | December 31, | | | December 31, | | | Year Ended July 31, | |
| | | 2013 | | | 2012(A) | | | 2012 | | | 2011 | | | 2010 | | | 2009 | |
| Net asset value at beginning of period | | $ | 11.30 | | | $ | 11.13 | | | $ | 11.11 | | | $ | 9.66 | | | $ | 8.87 | | | $ | 11.91 | |
| Income (loss) from investment operations: | | | | | | | | | | | | | | | | | | | | | | | | |
| Net investment income | | | 0.17 | | | | 0.14 | (B) | | | 0.15 | (B) | | | 0.12 | (B) | | | 0.15 | (B) | | | 0.17 | (B) |
| Net realized and unrealized gains (losses) on investments | | | 1.77 | | | | 0.51 | | | | 0.02 | (C) | | | 1.47 | | | | 0.87 | (D) | | | (2.37 | ) |
| Total from investment operations | | | 1.94 | | | | 0.65 | | | | 0.17 | | | | 1.59 | | | | 1.02 | | | | (2.20 | ) |
| Distributions from: | | | | | | | | | | | | | | | | | | | | | | | | |
| Net investment income | | | (0.25 | ) | | | (0.30 | ) | | | (0.15 | ) | | | (0.14 | ) | | | (0.23 | ) | | | (0.16 | ) |
| Realized capital gains | | | — | | | | (0.18 | ) | | | — | | | | — | | | | — | | | | (0.68 | ) |
| Total distributions | | | (0.25 | ) | | | (0.48 | ) | | | (0.15 | ) | | | (0.14 | ) | | | (0.23 | ) | | | (0.84 | ) |
| Net asset value at end of period | | $ | 12.99 | | | $ | 11.30 | | | $ | 11.13 | | | $ | 11.11 | | | $ | 9.66 | | | $ | 8.87 | |
| Total return(E) | | | 17.23 | % | | | 5.96 | %(F) | | | 1.65 | % | | | 16.56 | % | | | 11.52 | %(D) | | | (17.27 | %) |
| Ratios and supplemental data: | | | | | | | | | | | | | | | | | | | | | | | | |
| Net assets at end of period (000's) | | $ | 68,184 | | | $ | 71,235 | | | $ | 15,181 | | | $ | 18,848 | | | $ | 22,740 | | | $ | 25,782 | |
| Ratio to average net assets: | | | | | | | | | | | | | | | | | | | | | | | | |
| Net expenses(G) | | | 0.35 | % | | | 0.39 | %(H) | | | 0.57 | % | | | 0.57 | % | | | 0.57 | % | | | 0.57 | % |
| Gross expenses(G) | | | 0.93 | % | | | 0.90 | %(H) | | | 1.03 | % | | | 1.01 | % | | | 1.08 | % | | | 0.99 | % |
| Net investment income(G) | | | 1.27 | % | | | 2.90 | %(H) | | | 1.38 | % | | | 1.17 | % | | | 1.53 | % | | | 2.00 | % |
| Portfolio turnover rate | | | 38 | % | | | 73 | %(F)(I) | | | 77 | % | | | 9 | % | | | 38 | % | | | 32 | % |
| (A) | The Fund changed its fiscal year end from July 31 to December 31. See Note 11 in Notes to Financial Statements. |
| (B) | The net investment income per share is based on average shares outstanding for the period. |
| (C) | The amounts shown for a share outstanding throughout the period does not accord with the change in net realized and unrealized gains (losses) on investments for the period due to the timing of purchases and sales of fund shares in relation to fluctuating market values during the period. |
| (D) | Impact of payment from affiliate was less than $0.01 per share and 0.01%, respectively. |
| (E) | Total returns shown exclude the effect of applicable sales loads. If these charges were included, the returns would be lower. |
| (G) | Ratio does not include income and expenses of the underlying funds. |
| (I) | Portfolio turnover excludes the purchases and sales of the Acquired Funds (see Note 11). If these transactions were included, portfolio turnover would have been higher. |
See accompanying Notes to Financial Statements.
Financial Highlights (Continued)
Touchstone Moderate Growth Allocation Fund—Class C
| Selected Data for a Share Outstanding Throughout Each Period |
| | | | | | Five | | | | | | | | | | | | | |
| | | Year | | | Months | | | | | | | | | | | | | |
| | | Ended | | | Ended | | | | | | | | | | | | | |
| | | December 31, | | | December 31, | | | Year Ended July 31, | |
| | | 2013 | | | 2012(A) | | | 2012 | | | 2011 | | | 2010 | | | 2009 | |
| Net asset value at beginning of period | | $ | 11.13 | | | $ | 10.89 | | | $ | 10.86 | | | $ | 9.44 | | | $ | 8.67 | | | $ | 11.63 | |
| Income (loss) from investment operations: | | | | | | | | | | | | | | | | | | | | | | | | |
| Net investment income | | | 0.06 | | | | 0.10 | (B) | | | 0.07 | (B) | | | 0.05 | (B) | | | 0.07 | (B) | | | 0.11 | (B) |
| Net realized and unrealized gains (losses) on investments | | | 1.77 | | | | 0.50 | | | | 0.02 | (C) | | | 1.43 | | | | 0.86 | (D) | | | (2.31 | ) |
| Total from investment operations | | | 1.83 | | | | 0.60 | | | | 0.09 | | | | 1.48 | | | | 0.93 | | | | (2.20 | ) |
| Distributions from: | | | | | | | | | | | | | | | | | | | | | | | | |
| Net investment income | | | (0.17 | ) | | | (0.18 | ) | | | (0.06 | ) | | | (0.06 | ) | | | (0.16 | ) | | | (0.08 | ) |
| Realized capital gains | | | — | | | | (0.18 | ) | | | — | | | | — | | | | — | | | | (0.68 | ) |
| Total distributions | | | (0.17 | ) | | | (0.36 | ) | | | (0.06 | ) | | | (0.06 | ) | | | (0.16 | ) | | | (0.76 | ) |
| Net asset value at end of period | | $ | 12.79 | | | $ | 11.13 | | | $ | 10.89 | | | $ | 10.86 | | | $ | 9.44 | | | $ | 8.67 | |
| Total return(E) | | | 16.49 | % | | | 5.52 | %(F) | | | 0.89 | % | | | 15.70 | % | | | 10.71 | %(D) | | | (17.90 | %) |
| Ratios and supplemental data: | | | | | | | | | | | | | | | | | | | | | | | | |
| Net assets at end of period (000's) | | $ | 49,601 | | | $ | 48,985 | | | $ | 47,508 | | | $ | 61,074 | | | $ | 70,934 | | | $ | 92,373 | |
| Ratio to average net assets: | | | | | | | | | | | | | | | | | | | | | | | | |
| Net expenses(G) | | | 1.11 | % | | | 1.14 | %(H) | | | 1.32 | % | | | 1.32 | % | | | 1.32 | % | | | 1.32 | % |
| Gross expenses(G) | | | 1.65 | % | | | 1.68 | %(H) | | | 1.74 | % | | | 1.69 | % | | | 1.74 | % | | | 1.69 | % |
| Net investment income(G) | | | 0.52 | % | | | 2.15 | %(H) | | | 0.63 | % | | | 0.46 | % | | | 0.78 | % | | | 1.33 | % |
| Portfolio turnover rate | | | 38 | % | | | 73 | %(F)(I) | | | 77 | % | | | 9 | % | | | 38 | % | | | 32 | % |
| (A) | The Fund changed its fiscal year end from July 31 to December 31. See Note 11 in Notes to Financial Statements. |
| (B) | The net investment income per share is based on average shares outstanding for the period. |
| (C) | The amounts shown for a share outstanding throughout the period does not accord with the change in net realized and unrealized gains (losses) on investments for the period due to the timing of purchases and sales of fund shares in relation to fluctuating market values during the period. |
| (D) | Impact of payment from affiliate was less than $0.01 per share and 0.01%, respectively. |
| (E) | Total returns shown exclude the effect of applicable sales loads. If these charges were included, the returns would be lower. |
| (G) | Ratio does not include income and expenses of the underlying funds. |
| (I) | Portfolio turnover excludes the purchases and sales of the Acquired Funds (see Note 11). If these transactions were included, portfolio turnover would have been higher. |
See accompanying Notes to Financial Statements.
Financial Highlights (Continued)
| Touchstone Moderate Growth Allocation Fund—Class Y |
| Selected Data for a Share Outstanding Throughout Each Period |
| | | | | | Five | | | | | | | | | | | | | |
| | | Year | | | Months | | | | | | | | | | | | | |
| | | Ended | | | Ended | | | | | | | | | | | | | |
| | | December 31, | | | December 31, | | | Year Ended July 31, | |
| | | 2013 | | | 2012(A) | | | 2012 | | | 2011 | | | 2010 | | | 2009 | |
| Net asset value at beginning of period | | $ | 11.38 | | | $ | 11.24 | | | $ | 11.23 | | | $ | 9.75 | | | $ | 8.95 | | | $ | 12.02 | |
| Income (loss) from investment operations: | | | | | | | | | | | | | | | | | | | | | | | | |
| Net investment income | | | 0.21 | | | | 0.15 | (B) | | | 0.18 | (B) | | | 0.18 | (B) | | | 0.17 | (B) | | | 0.20 | (B) |
| Net realized and unrealized gains (losses) on investments | | | 1.78 | | | | 0.52 | | | | 0.01 | (C) | | | 1.46 | | | | 0.88 | (D) | | | (2.40 | ) |
| Total from investment operations | | | 1.99 | | | | 0.67 | | | | 0.19 | | | | 1.64 | | | | 1.05 | | | | (2.20 | ) |
| Distributions from: | | | | | | | | | | | | | | | | | | | | | | | | |
| Net investment income | | | (0.28 | ) | | | (0.35 | ) | | | (0.18 | ) | | | (0.16 | ) | | | (0.25 | ) | | | (0.19 | ) |
| Realized capital gains | | | — | | | | (0.18 | ) | | | — | | | | — | | | | — | | | | (0.68 | ) |
| Total distributions | | | (0.28 | ) | | | (0.53 | ) | | | (0.18 | ) | | | (0.16 | ) | | | (0.25 | ) | | | (0.87 | ) |
| Net asset value at end of period | | $ | 13.09 | | | $ | 11.38 | | | $ | 11.24 | | | $ | 11.23 | | | $ | 9.75 | | | $ | 8.95 | |
| Total return | | | 17.57 | % | | | 6.04 | %(E) | | | 1.84 | % | | | 16.93 | % | | | 11.77 | %(D) | | | (17.07 | %) |
| Ratios and supplemental data: | | | | | | | | | | | | | | | | | | | | | | | | |
| Net assets at end of period (000's) | | $ | 30,498 | | | $ | 43,585 | | | $ | 763 | | | $ | 1,289 | | | $ | 635 | | | $ | 508 | |
| Ratio to average net assets: | | | | | | | | | | | | | | | | | | | | | | | | |
| Net expenses(F) | | | 0.10 | % | | | 0.14 | %(G) | | | 0.32 | % | | | 0.32 | % | | | 0.32 | % | | | 0.32 | % |
| Gross expenses(F) | | | 0.60 | % | | | 0.54 | %(G) | | | 1.89 | % | | | 1.65 | % | | | 2.59 | % | | | 2.64 | % |
| Net investment income(F) | | | 1.53 | % | | | 3.15 | %(G) | | | 1.63 | % | | | 1.63 | % | | | 1.72 | % | | | 2.34 | % |
| Portfolio turnover rate | | | 38 | % | | | 73 | %(E)(H) | | | 77 | % | | | 9 | % | | | 38 | % | | | 32 | % |
| (A) | The Fund changed its fiscal year end from July 31 to December 31. See Note 11 in Notes to Financial Statements. |
| (B) | The net investment income per share is based on average shares outstanding for the period. |
| (C) | The amounts shown for a share outstanding throughout the period does not accord with the change in net realized and unrealized gains (losses) on investments for the period due to the timing of purchases and sales of fund shares in relation to fluctuating market values during the period. |
| (D) | Impact of payment from affiliate was less than $0.01 per share and 0.01%, respectively. |
| (F) | Ratio does not include income and expenses of the underlying funds. |
| (H) | Portfolio turnover excludes the purchases and sales of the Acquired Funds (see Note 11). If these transactions were included, portfolio turnover would have been higher. |
See accompanying Notes to Financial Statements.
Financial Highlights (Continued)
| Touchstone Moderate Growth Allocation Fund—Institutional Class |
| Selected Data for a Share Outstanding Throughout Each Period |
| | | | | | Five | | | | | | | | | | | | | |
| | | Year | | | Months | | | | | | | | | | | | | |
| | | Ended | | | Ended | | | | | | | | | | | | | |
| | | December 31, | | | December 31, | | | Year Ended July 31, | |
| | | 2013 | | | 2012(A) | | | 2012 | | | 2011 | | | 2010 | | | 2009 | |
| Net asset value at beginning of period | | $ | 11.33 | | | $ | 11.18 | | | $ | 11.16 | | | $ | 9.75 | | | $ | 8.95 | | | $ | 12.01 | |
| Income (loss) from investment operations: | | | | | | | | | | | | | | | | | | | | | | | | |
| Net investment income | | | 0.19 | | | | 0.15 | (B) | | | 0.18 | (B) | | | 0.15 | (B) | | | 0.28 | (B) | | | 0.19 | (B) |
| Net realized and unrealized gains (losses) on investments | | | 1.79 | | | | 0.52 | | | | 0.02 | (C) | | | 1.48 | | | | 0.78 | (D) | | | (2.38 | ) |
| Total from investment operations | | | 1.98 | | | | 0.67 | | | | 0.20 | | | | 1.63 | | | | 1.06 | | | | (2.19 | ) |
| Distributions from: | | | | | | | | | | | | | | | | | | | | | | | | |
| Net investment income | | | (0.28 | ) | | | (0.34 | ) | | | (0.18 | ) | | | (0.22 | ) | | | (0.26 | ) | | | (0.19 | ) |
| Realized capital gains | | | — | | | | (0.18 | ) | | | — | | | | — | | | | — | | | | (0.68 | ) |
| Total distributions | | | (0.28 | ) | | | (0.52 | ) | | | (0.18 | ) | | | (0.22 | ) | | | (0.26 | ) | | | (0.87 | ) |
| Net asset value at end of period | | $ | 13.03 | | | $ | 11.33 | | | $ | 11.18 | | | $ | 11.16 | | | $ | 9.75 | | | $ | 8.95 | |
| Total return | | | 17.57 | % | | | 6.11 | %(E) | | | 1.92 | % | | | 16.88 | % | | | 11.79 | %(D) | | | (16.99 | %) |
| Ratios and supplemental data: | | | | | | | | | | | | | | | | | | | | | | | | |
| Net assets at end of period (000's) | | $ | 10 | | | $ | 9 | | | $ | 8 | | | $ | 8 | | | $ | 7 | | | $ | 7,948 | |
| Ratio to average net assets: | | | | | | | | | | | | | | | | | | | | | | | | |
| Net expenses(F) | | | 0.11 | % | | | 0.14 | %(G) | | | 0.32 | % | | | 0.32 | % | | | 0.32 | % | | | 0.32 | % |
| Gross expenses(F) | | | 228.55 | % | | | 230.25 | %(G) | | | 111.34 | % | | | 183.59 | % | | | 0.99 | % | | | 0.61 | % |
| Net investment income(F) | | | 1.52 | % | | | 3.15 | %(G) | | | 1.63 | % | | | 1.43 | % | | | 2.99 | % | | | 2.21 | % |
| Portfolio turnover rate | | | 38 | % | | | 73 | %(E)(H) | | | 77 | % | | | 9 | % | | | 38 | % | | | 32 | % |
| (A) | The Fund changed its fiscal year end from July 31 to December 31. See Note 11 in Notes to Financial Statements. |
| (B) | The net investment income per share is based on average shares outstanding for the period. |
| (C) | The amounts shown for a share outstanding throughout the period does not accord with the change in net realized and unrealized gains (losses) on investments for the period due to the timing of purchases and sales of fund shares in relation to fluctuating market values during the period. |
| (D) | Impact of payment from affiliate was less than $0.01 per share and 0.01%, respectively. |
| (F) | Ratio does not include income and expenses of the underlying funds. |
| (H) | Portfolio turnover excludes the purchases and sales of the Acquired Funds (see Note 11). If these transactions were included, portfolio turnover would have been higher. |
See accompanying Notes to Financial Statements.
Notes to Financial Statements
December 31, 2013
1. Organization
The Touchstone Strategic Trust (the “Trust”) is registered under the Investment Company Act of 1940, as amended (the “1940 Act”), as an open-end management investment company. The Trust was established as a Massachusetts business trust pursuant to a Declaration of Trust dated November 18, 1982. The Trust consists of eighteen funds, including the following five funds (individually, a “Fund”, and collectively, the “Funds”):
Touchstone Dynamic Equity Fund (“Dynamic Equity Fund”)
Touchstone Balanced Allocation Fund (“Balanced Allocation Fund”)
Touchstone Conservative Allocation Fund (“Conservative Allocation Fund”)
Touchstone Growth Allocation Fund (“Growth Allocation Fund”)
Touchstone Moderate Growth Allocation Fund (“Moderate Growth Allocation Fund”)
Each Fund is an open-end, diversified, management investment company. Additionally, the Balanced Allocation Fund, Conservative Allocation Fund, Growth Allocation Fund and Moderate Growth Allocation Fund (collectively, the “Allocation Funds”) are “Funds of Funds”, sub-advised by Ibbotson Associates, Inc., which seek to achieve their investment goals by primarily investing in a diversified portfolio of affiliated underlying equity and fixed income funds. These underlying funds, in turn, invest in a variety of U.S. and foreign equity and fixed income securities. Under normal circumstances, the Allocation Funds expect to invest their assets among equity and fixed income funds in the following ranges:
| | Equity | Fixed Income |
| | Allocation Fund | Allocation Fund |
| Balanced Allocation Fund | 50-70% | 30-50% |
| Conservative Allocation Fund | 20-40% | 60-80% |
| Growth Allocation Fund | 90-100% | 0-10% |
| Moderate Growth Allocation Fund | 70-90% | 10-30% |
The investment goal of each of the underlying funds that the Allocation Funds invest in is as follows:
| Fund | | Investment Goal |
| Touchstone Arbitrage Fund | | The Fund seeks to achieve positive absolute returns regardless of market conditions. |
| | | |
| Touchstone Core Bond Fund | | Seeks to provide as high level of current income as is consistent with the preservation of capital. Capital appreciation is a secondary objective. |
| Touchstone Dynamic Equity Fund | | Seeks to obtain long-term capital appreciation from hedged equity investments with less risk than a fully invested, unhedged equity portfolio. |
| Touchstone Emerging Markets Equity Fund | | Seeks capital appreciation by primarily investing in equity securities of companies in emerging markets. |
| Touchstone Flexible Income Fund | | Seeks a high level of income consistent with reasonable risk by investing primarily in income producing securities. Capital appreciation is a secondary goal. |
| Touchstone Focused Fund | | Seeks capital appreciation by primarily investing in equity securities. |
| Touchstone Global Real Estate Fund | | Seeks capital appreciation by primarily investing in common stocks and other equity securities of U.S. and foreign real estate companies without regard to market capitalization. |
| Touchstone Growth Opportunities Fund | | Seeks long-term growth of capital by investing primarily in stocks of U.S. companies of any size. |
| Touchstone High Yield Fund | | Seeks to achieve a high level of income by primarily investing in non-investment grade debt securities. Capital appreciation is a secondary consideration. |
| Touchstone Institutional Money Market Fund | | Seeks high current income, consistent with liquidity and stability of principal. It invests in U.S. government securities and high quality money market instruments rated in one of the top two short-term rating categories or determined to be of comparable quality. |
| Touchstone International Fixed Income Fund | | Seeks total return by investing primarily in fixed income securities of issuers located outside the United States. |
Notes to Financial Statements (Continued)
| Fund | | Investment Goal |
| Touchstone International Small Cap Fund | | Seeks capital appreciation by primarily investing in equity securities of non-U.S. small capitalization companies, including companies located in countries with emerging markets. |
| Touchstone International Value Fund | | Seeks long-term capital growth by primarily investing in equity securities of non-U.S. companies. |
| Touchstone Merger Arbitrage Fund | | Seeks to achieve positive absolute returns regardless of market conditions over the long-term. It primarily invests in equity securities of U.S. and foreign issuers. |
| Touchstone Mid Cap Fund | | Seeks long-term capital growth by investing primarily in common stocks of mid-cap U.S. listed companies. |
| Touchstone Mid Cap Growth Fund | | Seeks to increase the value of its shares as a primary goal and to earn income as a secondary goal by primarily investing in common stocks of mid capitalization U.S. companies. |
| Touchstone Mid Cap Value Fund | | Seeks capital appreciation by primarily investing in common stocks of medium capital- ization companies. |
| Touchstone Premium Yield Equity Fund | | Seeks long-term growth of capital and high current income by investing primarily in equity securities of any size. |
| Touchstone Sands Capital Institutional Growth Fund | | Seeks long-term capital appreciation by primarily investing in common stocks of U.S. companies believed to have above-average potential for earnings or revenue growth. |
| Touchstone Small Cap Core Fund | | Seeks capital appreciation by primarily investing in common stocks of small capitalization U.S. companies. |
| Touchstone Small Cap Growth Fund | | Seeks long-term capital growth by investing primarily in stocks of small-cap companies. |
| Touchstone Small Company Value Fund | | Seeks long-term capital growth by investing primarily in stocks of small-cap companies. |
| Touchstone Total Return Bond Fund | | Seeks to provide current income, by primarily investing in fixed-income securities. Capital appreciation is a secondary goal. |
| Touchstone Ultra Short Duration Fixed Income Fund | | Seeks maximum total return consistent with the preservation of capital by investing primarily in fixed income securities. |
| Touchstone Value Fund | | Seeks long-term capital growth by primarily investing in equity securities of large- and mid-capitalization companies believed to be undervalued. |
The Declaration of Trust permits the Trust to issue an unlimited number of shares of beneficial interest of each Fund. The Funds are registered to offer the following classes of shares: Class A shares, Class C shares, Class Y shares, and Institutional Class shares. The assets of each Fund are segregated, and a shareholder’s interest is limited to the Fund in which shares are held. The Funds’ prospectus provides a description of each Fund’s investment goals, policies, and strategies along with information on the classes of shares currently being offered.
2. Significant Accounting Policies
The following is a summary of the Funds’ significant accounting policies:
Security valuation and fair value measurements — All investments in securities are recorded at their estimated fair value. The Funds define the term “market value”, as used throughout this report, as the estimated fair value. The Funds use various methods to measure fair value of their portfolio securities on a recurring basis. Generally accepted accounting principles in the United States (“U.S. GAAP”) establish a hierarchy that prioritizes inputs to valuation methods. These inputs are summarized in the three broad levels listed below:
| • | Level 1 – | quoted prices in active markets for identical securities |
| | | |
| • | Level 2 – | other significant observable inputs (including quoted prices for similar securities, interest rates, prepayment speeds, credit risk, etc.) |
Notes to Financial Statements (Continued)
| • | Level 3 – | significant unobservable inputs (including a Fund’s own assumptions in determining the fair value of investments) |
The inputs or methodology used for valuing securities are not necessarily an indication of the risk associated with investing in those securities. For example, money market instruments are valued using amortized cost, in accordance with rules under the 1940 Act. Generally, amortized cost approximates the current fair value of a security, but since the value is not obtained from a quoted price in an active market, such securities are reflected as Level 2.
The aggregate value by input level, as of December 31, 2013, for each Fund’s investments, as well as a reconciliation of assets for which significant unobservable inputs (Level 3) were used in determining value, if applicable, is included in each Fund’s Portfolio of Investments or Tabular Presentation, which also includes a breakdown of the Fund’s investments by sector allocation. The Funds did not hold any Level 3 categorized securities during the year ended December 31, 2013.
All transfers in and out of the levels are recognized at the value at the end of the period. During the year ended December 31, 2013, there were no transfers between Levels 1, 2 and 3 for all Funds.
The Funds’ portfolio securities are valued as of the close of the regular session of trading on the New York Stock Exchange (“NYSE”) (currently 4:00 p.m., Eastern time). Portfolio securities traded on stock exchanges are valued at the last sale price, and to the extent these securities are actively traded, they are categorized in Level 1 of the fair value hierarchy. Portfolio securities quoted by NASDAQ are valued at the NASDAQ Official Closing Price (“NOCP”). Securities not traded on a particular day, or for which the last sale price is not readily available, are valued at their last broker-quoted bid prices as obtained from one or more of the major market makers for such securities by an independent pricing service and are categorized in Level 2. Debt securities for which market quotations are readily available are valued at their most recent bid prices as obtained from one or more of the major market makers for such securities by an independent pricing service and are categorized in Level 2. Money market instruments and other debt securities with a remaining maturity of less than 60 days are valued at amortized cost, which approximates market value and are categorized in Level 2. While this method provides consistency in valuation (and may only be used if it approximates market value), it may result in periods during which value, as determined by amortized cost, is higher or lower than the price that would be received if the Fund sold the investment. Securities for which market quotations or the NOCP are not readily available are fair valued as determined by or under the direction of the Board ofTrustees and are categorized in Level 3. Shares of open-end mutual funds in which the Funds invest are valued at their respective net asset values (“NAV”) as reported by the underlying funds and are categorized in Level 1. The prices for foreign securities are reported in local currency and translated into U.S. dollars using currency exchange rates.
Level 2 Valuation — Securities mainly traded on a non-U.S. exchange are generally valued according to the preceding closing values on that exchange. However, if an event that may change the value of a security occurs after the time that the closing value on the non-U.S. exchange was determined, but before the close of regular trading on the NYSE, the security may be priced based on fair value. This may cause the value of the security on the books of the Funds to be significantly different from the closing value on the non-U.S. exchange and may affect the calculation of the NAV of the Funds. Any debt securities held by the Funds for which market quotations are not readily available are generally priced at their most recent bid prices as obtained from one or more of the major market makers for such securities.
Level 3 Valuation — Securities held by the Funds that do not have readily available market quotations, or securities for which the available market quotations are not reliable, are priced at their fair value using procedures approved by the Funds’ Board of Trustees.
The Funds may use fair value pricing under the following circumstances, among others:
Notes to Financial Statements (Continued)
• If the value of a security has been materially affected by events occurring before the Funds’ pricing time but after the close of the primary markets on which the security is traded.
• If the exchange on which a portfolio security is principally traded closes early or if trading in a particular portfolio security was halted during the day and did not resume prior to the Funds’ NAV calculation.
| • | If a security is so thinly traded that reliable market quotations are unavailable due to infrequent trading. |
| • | If the validity of market quotations is not reliable. |
Allocation Funds — The Allocation Funds invest in securities of affiliated mutual funds (the “Underlying Funds”). The value of an investment in the Allocation Funds is based on the performance of the Underlying Funds in which they invest and the allocation of their assets among those funds. Because the Allocation Funds invest in mutual funds, shareholders of the Allocation Funds indirectly bear a proportionate share of the expenses charged by the Underlying Funds in which they invest as well as their share of the Allocation Funds’ fees and expenses. The principal risks of an investment in the Allocation Funds include the principal risks of investing in the Underlying Funds. Investments in the Underlying Funds are valued at the NAV per share of each class of the Underlying Funds and are categorized as Level 1.
Investment companies — Certain Funds invest in securities of other investment companies, including exchange traded funds (“ETFs”), open-end funds, and closed-end funds. Open-end funds are investment companies that issue new shares continuously and redeem shares daily. Closed-end funds are investment companies that typically issue a fixed number of shares that trade on a securities exchange or over-the-counter. An ETF is an investment company that typically seeks to track the performance of an index by holding in its portfolio shares of all the companies, or a representative sample of the companies, that are components of a particular index. ETFs are traded on a securities exchange based on their market value. The risks of investment in other investment companies typically reflect the risks of the types of securities in which investment companies invest. Investments in ETFs and closed-end funds are subject to the additional risk that their shares may trade at a premium or discount to their NAV. When a Fund invests in another investment company, shareholders of the Fund indirectly bear their proportionate share of the other investment company’s fees and expenses, including operating, registration, trustee, licensing and marketing, as well as their share of the Funds’ fees and expenses.
Cash and cash equivalents — The Funds consider liquid assets deposited with a bank, money market funds, and certain short term debt instruments with maturities of 3 months or less to be cash equivalents and are included in the investments on the financial statements. These investments represent amounts held with financial institutions that are readily accessible to pay Fund expenses or investments. Cash and cash equivalents are valued at cost plus accrued interest, which approximates market value. The value of cash equivalents denominated in foreign currencies is determined by converting to U.S. dollars on the date of the Statement of Assets and Liabilities.
Securities sold short — The Dynamic Equity Fund periodically engages in selling securities short, which obligates the Fund to replace a security borrowed by purchasing the same security at the current market value. The Fund would incur a loss if the price of the security increases between the date of the short sale and the date on which the Fund replaces the borrowed security. The Fund would realize a gain if the price of the security declines between those dates. As of December 31, 2013, the Dynamic Equity Fund held securities sold short with a fair value of $13,272,791 and had securities with a fair value of $78,414,562 held as collateral and cash collateral of $719,967 for both securities sold short and options written.
Options — The Funds may write or purchase financial option contracts primarily to hedge against changes in the value of equity securities (or securities that the Funds intend to purchase), against fluctuations in fair value caused by changes in prevailing market interest rates or foreign currency exchange rates and against changes in overall equity market volatility. In addition, the Funds may utilize options in an attempt to generate gains from option premiums or to reduce overall portfolio risk. The Funds’ option strategy primarily focuses on
Notes to Financial Statements (Continued)
the use of writing call options on equity indexes. When the Funds write or purchase an option, an amount equal to the premium received or paid by the Funds is recorded as a liability or an asset and is subsequently adjusted to the current market value of the option written or purchased. Premiums received or paid from writing or purchasing options which expire unexercised are treated by the Funds on the expiration date as realized gains or losses. The difference between the premium and the amount paid or received on effecting a closing purchase or sale transaction, including brokerage commissions, is also treated as a realized gain or loss. If an option is exercised, the premium paid or received is added to the cost of the purchase or proceeds from the sale in determining whether the Funds have realized a gain or loss on investment transactions. The Funds, as writers of an option, may have no control over whether the underlying securities may be sold (call) or purchased (put) and as a result bear the market risk of an unfavorable change in the price of the security underlying the written option. The Funds, as purchasers of an option, bear the risk that the counterparties to the option may not have the ability to meet the terms of the option contracts. There is minimal counterparty credit risk involved in entering into option contracts since they are exchange-traded instruments and the exchange’s clearinghouse, as counterparty to all exchange-traded options, guarantees the options against default. Options are valued at the last quoted sales price. If there is no such reported sale on the valuation date, long option positions are valued at the most recent bid price, and short option positions are valued at the most recent ask price. As of December 31, 2013, the Dynamic Equity Fund held written options with a fair value of $2,070,275 and had securities with a fair value of $78,414,562 held as collateral and cash collateral of $719,967 for both securities sold short and options written.
Derivative instruments and hedging activities — In order to better define its contractual rights and to secure rights that will help the Funds mitigate their counterparty risk, the Funds may enter into an International Swaps and Derivatives Association, Inc. Master Agreement (“ISDA Master Agreement” or “MNA”) or similar agreement with certain counterparties. An ISDA Master Agreement is a bilateral agreement between a Fund and a counterparty that governs over-the-counter (“OTC”) derivatives and foreign exchange contracts, and typically contains, among other things, collateral posting terms and master netting provisions in the event of a default or termination. Under an ISDA Master Agreement, a party may, under certain circumstances, offset with the counterparty certain derivative financial instrument’s payables or receivables with collateral held or posted and create one single net payment. The provisions of the ISDA Master Agreement typically permit a single net payment in the event of default (close-out netting). These default events include bankruptcy or insolvency of the counterparty. Note, however, that bankruptcy or insolvency laws of a particular jurisdiction may impose restrictions on or prohibitions against the right of offset.
When entering into a derivative transaction, a Fund may be required to post and maintain collateral or margin (including both initial and maintenance margin). Collateral and margin requirements differ by type of derivative. Margin requirements are established by the broker or clearing house for exchange traded and centrally cleared derivatives (financial futures contracts, options, and centrally cleared swaps). Brokers can ask for margining in excess of the clearing house’s minimum in certain circumstances. Collateral terms are contract specific for OTC derivatives (foreign currency exchange contracts, options, and swaps). For derivatives traded under an ISDA Master Agreement, the collateral requirements are typically calculated by netting the marked-to-market amount for each transaction under such agreement and comparing that amount to the value of any collateral currently pledged by the Fund and the counterparty. For financial reporting purposes, cash collateral that has been pledged to cover obligations of the Fund and cash collateral received from the counterparty, if any, is reported separately on the Statements of Assets and Liabilities as cash pledged as collateral and cash received as collateral, respectively. Non-cash collateral pledged by the Fund, if any, is noted in the Portfolio of Investments. To the extent amounts due to the Fund from its counterparties are not fully collateralized, contractually or otherwise, the Fund bears the risk of loss from counterparty non-performance. A Fund attempts to mitigate counterparty risk by only entering into agreements with counterparties that it believes have the financial resources to honor their obligations and by monitoring the financial stability of those counterparties.
Notes to Financial Statements (Continued)
Certain ISDA Master Agreements allow counterparties to OTC derivatives transactions to terminate derivative contracts prior to maturity in the event the Fund’s net assets decline by a stated percentage or the Fund fails to meet the terms of their ISDA Master Agreement, which would cause the Fund to accelerate payment of any net liability owed to the counterparty.
For financial reporting purposes, the Funds do not offset derivative assets and derivative liabilities that are subject to netting arrangements in the Statements of Assets and Liabilities.
As of December 31, 2013, the Dynamic Equity Fund’s derivative assets and liabilities (by type) on a gross basis were as follows:
| | | Assets | | | Liabilities | |
| Derivative Financial Instruments: | | | | | | | | |
| Written Options | | $ | — | | | $ | 2,070,275 | |
| Total gross amount of assets and liabilities subject to MNA | | $ | — | | | $ | 2,070,275 | |
The following table presents the Dynamic Equity Fund’s derivative liabilities net of amounts available for offset under a MNA and net of the related collateral pledged by the Fund as of December 31, 2013:
| | | | | | Gross Amounts | | | | | | | | | | |
| | | | | | Offset in | | | | | | | | | | |
| | | Gross Amount of | | | Statement of | | | Non-cash | | | | | | Net Amount of | |
| | | Recognized | | | Assets and | | | Collateral | | | Cash Collateral | | | Derivative | |
| | | Liabilities(A) | | | Liabilities | | | Pledged(B) | | | Pledged(B) | | | Liabilities(C) | |
| Written Options | | $ | 2,070,275 | | | $ | — | | | $ | (1,973,128 | ) | | $ | (97,147 | ) | | $ | — | |
| Total | | $ | 2,070,275 | | | $ | — | | | $ | (1,973,128 | ) | | $ | (97,147 | ) | | $ | — | |
| (A) | Gross and net amounts are equal. |
| (B) | Pershing is the counterparty. |
| (C) | Net amount represents the net amount payable due to the counterparty in the event of default. |
The following table sets forth the fair value of the Funds’ derivative financial instruments by primary risk exposure as of December 31, 2013:
| | | Fair Value of Derivative Investments | | | | | | |
| | | As of December 31, 2013 | | | | | | |
| | | Derivatives not accounted for as hedging | | Asset | | | Liability | |
| Fund | | instruments under ASC 815 | | Derivatives* | | | Derivatives* | |
| Dynamic Equity Fund | | Options - Equity Contracts | | $ | — | | | $ | 2,070,275 | |
* Statements of Assets and Liabilities Location: Written options, at market value.
Notes to Financial Statements (Continued)
The following table sets forth the operations of the Funds’ derivative financial instruments by primary risk exposure as of December 31, 2013.
The Effect of Derivative Investments on the Statement of Operations
for the Year Ended December 31, 2013
| | | | | | | | Change in | |
| | | | | | | | Unrealized | |
| | | Derivatives not accounted for as hedging | | Realized Loss | | | Appreciation | |
| Fund | | instruments under ASC 815 | | on Derivatives | | | on Derivatives | |
| Dynamic Equity Fund | | Purchased Options - Equity Contacts* | | $ | 234,031 | | | $ | — | |
| | | Written Options - Equity Contacts** | | | (4,350,800 | ) | | | (596,298 | ) |
* Statements of Operations Location: Net realized gain (loss) on investments from non-affiliated securities.
** Statements of Operations Location: Net realized gain (loss) on written options and net change in unrealized appreciation (depreciation) on written options, respectively.
For the year ended December 31, 2013, the average quarterly balances of outstanding derivative financial instruments were as follows:
| | | Dynamic | |
| | | Equity | |
| | | Fund | |
| Equity contracts: | | | | |
| Written Options - Average number of contracts | | | 1,284 | |
Share valuation — The NAV per share of each class of shares of each Fund is calculated daily by dividing the total value of a Fund’s assets attributable to that class, less liabilities attributable to that class, by the number of outstanding shares of that class.
The maximum offering price per share of Class A shares of the Funds is equal to the NAV per share plus a sales load equal to 6.10% of the NAV (or 5.75% of the offering price). There is no sales load on purchases of $1 million or more of Class A shares. The maximum offering price per share of Class C, Class Y, and Institutional Class shares of the Funds is equal to the NAV per share.
The redemption price per share of each class of shares of the Funds is generally equal to the NAV per share. However, Class A redemptions that were part of a no-load $1 million subscription may be subject to a contingent deferred sales charge (“CDSC”) of up to 1.00% if redeemed within a one-year period from the date of purchase. Additionally, purchases of Class C shares of the Funds are subject to a CDSC of 1.00% of the original purchase price if redeemed within a one-year period from the date of purchase.
Investment income — Dividend income from securities is recognized on the ex-dividend date, net of foreign withholding taxes, if any, which are reduced by any amounts reclaimable by the Funds, where applicable. Interest income from securities is recorded on the basis of interest accrued, premium amortized and discount accreted.
Distributions to shareholders — Each Fund intends to distribute to its shareholders substantially all of its income and capital gains. The Dynamic Equity Fund declares and distributes net investment income, if any, annually as a dividend to shareholders. The Balanced Allocation Fund, Conservative Allocation Fund, Growth Allocation Fund, and Moderate Growth Allocation Fund each declare and distribute net investment income, if any, quarterly as a dividend to shareholders. Each Fund makes distributions of capital gains, if any, at least annually, net of applicable capital loss carry forwards. Income distributions and capital gain distributions are determined in accordance with income tax regulations. Recognition of the Funds’ net investment income that invests in underlying funds is affected by the timing of dividend declarations by underlying funds.
Allocations — Investment income earned, realized capital gains and losses, and unrealized appreciation and depreciation for a Fund are allocated daily to each class of shares based upon its proportionate share of total
Notes to Financial Statements (Continued)
net assets of the Fund. Class-specific expenses are charged directly to the class incurring the expense. Common expenses, which are not attributable to a specific class, are allocated daily to each class of shares based upon their proportionate share of total net assets of the Fund. Expenses not directly billed to a Fund are allocated proportionally among all Funds in the Trust, and if applicable, in Touchstone Investment Trust, Touchstone Institutional Funds Trust, Touchstone Variable Series Trust, Touchstone Funds Group Trust, and Touchstone Tax-Free Trust (collectively with the Trust, “Touchstone Fund Complex”), daily in relation to net assets of each Fund or another reasonable measure.
Security transactions — Security transactions are reflected for financial reporting purposes as of the trade date. Realized gains and losses on sales of portfolio securities are calculated using the identified cost basis.
Estimates — The preparation of financial statements in conformity with U.S. GAAP requires management to make estimates and assumptions that affect the reported amounts of assets and liabilities and disclosure of contingent assets and liabilities at the date of the financial statements and the reported amounts of income and expenses during the reporting period. Actual results could differ from those estimates.
Redemption Fees — Prior to April 16, 2012, the Funds imposed a 2% redemption/exchange fee on total redemption proceeds (after applicable deferred sales charges) of any shareholder redeeming shares (including redemptions by exchange) of the Funds within 10 calendar days of their purchase. The Funds charged the redemption/exchange fee to discourage market timing by those shareholders initiating redemptions or exchanges to take advantage of short-term market movements. The redemption fee was imposed to the extent that the number of Fund shares redeemed exceeded the number of the Fund shares that had been held for more than 10 calendar days. In determining how long shares of the Fund had been held, shares held by the shareholder for the longest period of time were sold first. The Funds retained the redemption/exchange fee for the benefit of the remaining shareholders by crediting Paid-in Capital. The redemption fees can be found on the Statements of Changes in Net Assets - Capital Stock Activity. Effective April 16, 2012, the redemption fee plan was terminated.
3. Investment Transactions
Investment transactions (excluding short-term investments and U.S. Government securities) were as follows for the year ended December 31, 2013:
| | | Dynamic | | | Balanced | | | Conservative | |
| | | Equity | | | Allocation | | | Allocation | |
| | | Fund | | | Fund | | | Fund | |
| Purchases of investment securities | | $ | 293,557,300 | | | $ | 40,470,089 | | | $ | 21,886,789 | |
| Proceeds from sales and maturities | | $ | 314,659,555 | | | $ | 89,688,355 | | | $ | 48,559,654 | |
| | | | | | Moderate | |
| | | Growth | | | Growth | |
| | | Allocation | | | Allocation | |
| | | Fund | | | Fund | |
| Purchases of investment securities | | $ | 38,916,350 | | | $ | 58,499,193 | |
| Proceeds from sales and maturities | | $ | 64,461,616 | | | $ | 105,557,444 | |
There were no purchases or proceeds from sales and maturities of U.S. Government securities by the Funds for the year ended December 31, 2013.
4. Transactions with Affiliates and Other Related Parties
Certain officers of the Trust are also officers of Touchstone Advisors, Inc. (the “Advisor”), Touchstone Securities, Inc. (the “Underwriter”) or BNY Mellon Investment Servicing (US) Inc. (“BNY Mellon”), the Sub-Administrator
Notes to Financial Statements (Continued)
and Transfer Agent to the Funds. Such officers receive no compensation from the Trust. The Advisor and the Underwriter are each wholly-owned, indirect subsidiaries of Western & Southern Financial Group, Inc.
MANAGEMENT & EXPENSE LIMITATION AGREEMENTS
The Advisor provides general investment supervisory services for the Funds, under terms of an advisory agreement (the “Advisory Agreement”). Under the Advisory Agreement, each Fund pays the Advisor a fee, which is computed and accrued daily and paid monthly, at an annual rate based on average daily net assets of each Fund as shown in the table below.
| Dynamic Equity Fund | 0.85% on the first $300 million of assets |
| | 0.80% on the next $200 million of assets |
| | 0.75% on the next $250 million of assets |
| | 0.70% on the next $250 million of assets |
| | 0.65% on the next $500 million of assets |
| | 0.60% on the next $500 million of assets |
| | 0.55% on such assets in excess of $2 billion |
| Balanced Allocation Fund | 0.20% on the first $1 billion of assets |
| Conservative Allocation Fund | 0.175% on the next $1 billion of assets |
| | 0.150% on the next $1 billion of assets |
| | 0.125% of such assets in excess of $3 billion |
| Growth Allocation Fund | 0.25% on the first $1 billion of assets |
| Moderate Growth Allocation Fund | 0.225% on the next $1 billion of assets |
| | 0.20% on the next $1 billion of assets |
| | 0.175% of such assets in excess of $3 billion |
The Advisor has entered into investment sub-advisory agreements with the following parties (each, a “Sub-Advisor”):
| Analytic Investors, LLC | Ibbotson Associates, Inc |
| Dynamic Equity Fund | Balanced Allocation Fund |
| | Conservative Allocation Fund |
| | Growth Allocation Fund |
| | Moderate Growth Allocation Fund |
The Advisor, not the Funds, pays sub-advisory fees to each Sub-Advisor.
The Advisor entered into an expense limitation agreement (the “Expense Limitation Agreement”), to contractually limit operating expenses of the Funds excluding: dividend expenses on short sales; interest; taxes; brokerage commissions; other expenditures which are capitalized in accordance with GAAP; the cost of “Acquired Fund Fees and Expenses”, if any; and other extraordinary expenses not incurred in the ordinary course of business. The maximum operating expense limit in any year with respect to the Funds is based on a percentage of the average daily net assets of the Funds. The Advisor has agreed to separately waive class-level expenses, advisory
Notes to Financial Statements (Continued)
fees and administration fees and to reimburse expenses in order to maintain the following expense limitations for the Funds:
| | | | | | | | | | | | Institutional | | | Termination |
| Fund | | Class A | | | Class C | | | Class Y | | | Class | | | Date |
| Dynamic Equity Fund | | | 1.55 | % | | | 2.30 | % | | | 1.30 | % | | | 1.25 | % | | April 29, 2014 |
| Balanced Allocation Fund | | | 0.41 | % | | | 1.16 | % | | | 0.16 | % | | | 0.16 | % | | April 29, 2014 |
| Conservative Allocation Fund | | | 0.41 | % | | | 1.16 | % | | | 0.16 | % | | | 0.16 | % | | April 29, 2014 |
| Growth Allocation Fund | | | 0.41 | % | | | 1.16 | % | | | 0.16 | % | | | 0.16 | % | | April 29, 2014 |
| Moderate Growth Allocation Fund | | | 0.41 | % | | | 1.16 | % | | | 0.16 | % | | | 0.16 | % | | April 29, 2014 |
Prior to September 10, 2013, the expense limitation for the Allocation Funds were as follows:
| | | | | | | | | | | | Institutional | |
| Fund | | Class A | | | Class C | | | Class Y | | | Class | |
| Balanced Allocation Fund | | | 0.33 | % | | | 1.08 | % | | | 0.08 | % | | | 0.08 | % |
| Conservative Allocation Fund | | | 0.33 | % | | | 1.08 | % | | | 0.08 | % | | | 0.08 | % |
| Growth Allocation Fund | | | 0.33 | % | | | 1.08 | % | | | 0.08 | % | | | 0.08 | % |
| Moderate Growth Allocation Fund | | | 0.33 | % | | | 1.08 | % | | | 0.08 | % | | | 0.08 | % |
During the year ended December 31, 2013, the Advisor or its affiliates waived investment advisory fees and administration fees or reimbursed expenses, including 12b-1 fees, of the Funds as follows:
| | | | | | | | | Other | |
| | | Investment | | | | | | Operating | |
| | | Advisory | | | Administration | | | Expenses | |
| | | Fees Waived | | | Fees Waived | | | Reimbursed | |
| Dynamic Equity Fund | | $ | — | | | $ | — | | | $ | 63,325 | |
| Balanced Allocation Fund | | | 216,747 | | | | 212,405 | | | | 219,117 | |
| Conservative Allocation Fund | | | 137,764 | | | | 120,040 | | | | 142,501 | |
| Growth Allocation Fund | | | 214,143 | | | | 130,363 | | | | 163,274 | |
| Moderate Growth Allocation Fund | | | 349,192 | | | | 258,352 | | | | 259,560 | |
Under the terms of the Expense Limitation Agreement the Advisor is entitled to recover, subject to approval by the Funds’ Board of Trustees, such amounts waived or reimbursed for a period of up to three years from the year in which the Advisor reduced its compensation or assumed expenses for the Funds. No recoupment will occur unless a Fund’s operating expenses are below the expense limitation amount.
As of December 31, 2013, the Advisor may seek recoupment of previously waived fees and reimbursed expenses as follows:
| | | Expiration | | | Expiration | | | Expiration | |
| | | July 31, | | | December | | | December | |
| Fund | | 2015 | | | 31, 2015 | | | 31, 2016 | |
| Dynamic Equity Fund | | $ | — | | | $ | 9,588 | | | $ | 6,904 | |
| Balanced Allocation Fund | | | 18,241 | | | | 172,469 | | | | 513,519 | |
| Conservative Allocation Fund | | | 24,108 | | | | 115,995 | | | | 320,973 | |
| Growth Allocation Fund | | | 32,481 | | | | 138,241 | | | | 396,930 | |
| Moderate Growth Allocation Fund | | | 31,679 | | | | 231,358 | | | | 666,379 | |
For the year ended December 31, 2013, the Advisor recouped previously waived fees/reimbursed expenses from the Dynamic Equity Fund of $1,381.
ADMINISTRATION AGREEMENT
The Advisor entered into an Administration Agreement with the Trust, whereby the Advisor is responsible for: supplying executive and regulatory compliance services; supervising the preparation of tax returns; coordinating
Notes to Financial Statements (Continued)
the preparation of reports to shareholders and reports to, and filings with, the Securities and Exchange Commission (“SEC”) and state securities authorities, as well as materials for meetings of the Board of Trustees; calculating the daily NAV per share; and maintaining the financial books and records of each Fund. For its services, the Advisor receives an annual fee of 0.20% on the first $6 billion of the aggregate average daily net assets of the Touchstone Fund Complex (excluding Touchstone Institutional Money Market Fund, Touchstone Institutional Funds Trust, and Touchstone Variable Series Trust); 0.16% of the next $4 billion of aggregate average daily net assets; and 0.12% of the aggregate average daily net assets over $10 billion. The fee is allocated among the funds of the Touchstone Fund Complex (excluding Touchstone Institutional Money Market Fund, Touchstone Institutional Funds Trust, and Touchstone Variable Series Trust) on the basis of relative daily net assets.
The Advisor has engaged BNY Mellon as the Sub-Administrator to the Trust. BNY Mellon provides administrative and accounting services to the Trust and is compensated directly by the Advisor, not the Trust.
TRANSFER AGENT AGREEMENT
Under the terms of the Transfer Agent Agreement between the Trust and BNY Mellon, BNY Mellon maintains the records of each shareholder’s account, answers shareholders’ inquiries concerning their accounts, processes purchases and redemptions of each Fund’s shares, acts as dividend and distribution disbursing agent, and performs other shareholder service functions. For these services, BNY Mellon receives a monthly fee per shareholder account from each Fund. In addition, each Fund pays out-of-pocket expenses incurred by BNY Mellon, including, but not limited to, postage and supplies.
PLANS OF DISTRIBUTION AND SHAREHOLDER SERVICING FEE ARRANGEMENTS
The Trust has adopted distribution plans pursuant to Rule 12b-1 under the 1940 Act for each class of shares it offers that are subject to 12b-1 distribution fees. The plans allow each Fund to pay distribution and other fees for the sale and distribution of its shares and for services provided to shareholders. Under the Class A plan, each Fund offering Class A shares pays an annual fee of up to 0.25% of average daily net assets that are attributable to Class A shares. Under the Class C plan, each Fund offering Class C shares pays an annual fee of up to 1.00% of average daily net assets that are attributable to Class C shares (of which up to 0.75% is a distribution fee and up to 0.25% is a shareholder servicing fee).
UNDERWRITING AGREEMENT
The Underwriter is the Funds’ principal underwriter and, as such, acts as exclusive agent for distribution of the Funds’ shares. Under the terms of the Underwriting Agreement between the Trust and the Underwriter, the Underwriter earned the following from underwriting and broker commissions on the sale of Class A shares of the Funds listed below during the year ended December 31, 2013:
| Fund | | Amount | |
| Dynamic Equity Fund | | $ | 3,692 | |
| Balanced Allocation Fund | | | 12,562 | |
| Conservative Allocation Fund | | | 3,404 | |
| Growth Allocation Fund | | | 5,806 | |
| Moderate Growth Allocation Fund | | | 13,324 | |
Notes to Financial Statements (Continued)
In addition, the Underwriter collected CDSC on the redemption of Class C shares of the Funds listed below during the year ended December 31, 2013:
| Fund | | Amount | |
| Dynamic Equity Fund | | $ | 320 | |
| Balanced Allocation Fund | | | 239 | |
| Conservative Allocation Fund | | | 839 | |
| Growth Allocation Fund | | | 650 | |
| Moderate Growth Allocation Fund | | | 966 | |
AFFILIATED INVESTMENTS
Each Fund may invest in the Touchstone Institutional Money Market Fund, subject to compliance with several conditions set forth in an exemptive order received by the Trust from the SEC. To the extent that the Funds are invested in the Touchstone Institutional Money Market Fund, the Advisor and Administrator will be paid additional fees from the Touchstone Institutional Money Market Fund that will not be waived or reimbursed.
A summary of the Dynamic Equity Fund’s investment, as applicable, in the Touchstone Institutional Money Market Fund for the year ended December 31, 2013, is as follows:
| | | Share Activity | | | | | | | |
| | | | | | | | | | | | | | | Market | |
| | | Balance | | | | | | Balance | | | | | | Value | |
| Fund | | 12/31/12 | | | Purchases | | | Sales | | | 12/31/13 | | | Dividends | | | 12/31/13 | |
| Dynamic Equity Fund | | | 2,985,549 | | | | 31,521,225 | | | | (32,827,086 | ) | | | 1,679,688 | | | $ | 685 | | | $ | 1,679,688 | |
A summary of each Allocation Fund’s transactions in affiliated underlying funds during the year ended December 31, 2013 is as follows:
Balanced Allocation Fund
| | | Purchases at | | | Proceeds | | | Market Value | | | Dividend | | | Net Realized | |
| Underlying Fund | | cost | | | from sale | | | 12/31/13 | | | Income | | | Gain/Loss | |
| Touchstone Core Bond Fund | | $ | 293,845 | | | $ | 2,784,525 | | | $ | 3,510,495 | | | $ | 154,826 | | | $ | (30,231 | ) |
| Touchstone Total Return Bond Fund | | | 2,516,587 | | | | 4,595,258 | | | | 13,412,213 | | | | 428,416 | | | | (59,478 | ) |
| Touchstone Ultra Short Duration FixedIncome Fund^ | | | 14,506,528 | | | | 17,344,792 | | | | 12,006,339 | | | | 235,034 | | | | (25,868 | ) |
| Touchstone International Small Cap Fund | | | 114,132 | | | | 2,145,618 | | | | 3,591,800 | | | | 54,747 | | | | 208,752 | |
| Touchstone International Value Fund | | | 5,667,093 | | | | 6,791,601 | | | | 11,948,786 | | | | 154,899 | | | | 166,700 | |
| Touchstone Focused Fund | | | 7,465,707 | | | | 7,228,391 | | | | 4,777,892 | | | | 19,953 | | | | 209,878 | |
| Touchstone Value Fund | | | 440,892 | | | | 7,715,934 | | | | 9,544,273 | | | | 194,695 | | | | 1,062,857 | |
| Touchstone Growth Opportunities Fund | | | 2,712,052 | | | | 798,243 | | | | 2,386,946 | | | | 2,208 | | | | 173,144 | |
| Touchstone Sands Capital Institutional Growth Fund | | | 3,147,415 | | | | 5,318,438 | | | | 9,540,253 | | | | 421 | | | | 1,069,135 | |
| Touchstone Premium Yield Equity Fund, Class Y | | | 9,366,500 | | | | 1,639,577 | | | | 8,357,262 | | | | 185,274 | | | | 5,704 | |
| Touchstone Flexible Income Fund | | | 1,100,821 | | | | 1,933,204 | | | | 5,881,187 | | | | 310,953 | | | | (40,169 | ) |
| Touchstone International Fixed Income Fund | | | 390,342 | | | | 2,084,814 | | | | 5,836,635 | | | | 48,782 | | | | 19,795 | |
| Touchstone Dynamic Equity Fund | | | 18,586 | | | | 2,355,712 | | | | 4,732,601 | | | | 2,397 | | | | 96,056 | |
Notes to Financial Statements (Continued)
Balanced Allocation Fund
| | | Purchases at | | | Proceeds | | | Market Value | | | Dividend | | | Net Realized | |
| Underlying Fund | | cost | | | from sale | | | 12/31/13 | | | Income | | | Gain/Loss | |
| Touchstone Emerging Markets Equity Fund | | $ | 855,264 | | | $ | 1,786,183 | | | $ | 4,634,970 | | | $ | 61,289 | | | $ | 47,755 | |
| Touchstone Arbitrage Fund | | | 3,526,148 | | | | 19,844 | | | | 3,523,887 | | | | — | | | | 29 | |
| Touchstone Institutional Money Market Fund | | | 157,398 | | | | 1,269,716 | | | | 3,512,563 | | | | 1,446 | | | | — | |
| Touchstone Global Real Estate Fund | | | 838,455 | | | | 2,131,772 | | | | 2,964,123 | | | | 170,006 | | | | 455,015 | |
| Touchstone Small Cap Core Fund | | | 63,631 | | | | 2,576,927 | | | | 1,190,734 | | | | 21,107 | | | | 319,935 | |
| Touchstone Small Company Value Fund | | | 1,482,911 | | | | 357,702 | | | | 1,193,843 | | | | 19,714 | | | | 174,227 | |
| Touchstone Mid Cap Fund | | | 22,211 | | | | 1,546,800 | | | | 2,378,710 | | | | 5,951 | | | | 184,687 | |
| Touchstone High Yield Fund | | | 865,976 | | | | 2,647,673 | | | | 2,056,354 | | | | 171,139 | | | | (26,699 | ) |
| Touchstone Small Cap Growth Fund | | | 2,862,029 | | | | 1,752,853 | | | | 1,192,747 | | | | — | | | | 160,151 | |
| Touchstone Global Equity Fund+ | | | 4,481 | | | | 3,300,698 | | | | — | | | | — | | | | 243,051 | |
| Touchstone International Equity Fund+ | | | 3,977 | | | | 6,623,697 | | | | — | | | | — | | | | 1,298,022 | |
| Touchstone Large Cap Growth Fund | | | — | | | | 3,289,584 | | | | — | | | | — | | | | 916,661 | |
| Touchstone Large Cap Relative Value Fund+ | | | 3,462 | | | | 5,849,641 | | | | — | | | | — | | | | 213,433 | |
| Touchstone Merger Arbitrage Fund | | | 91,246 | | | | 4,908,000 | | | | — | | | | — | | | | 176,018 | |
| Touchstone Mid Cap Growth Fund | | | 2,588 | | | | 3,463,460 | | | | — | | | | — | | | | 183,933 | |
| Touchstone Mid Cap Value Fund | | | 2,335 | | | | 3,480,220 | | | | — | | | | 5,953 | | | | 371,207 | |
| Total: | | $ | 58,522,612 | | | $ | 107,740,877 | | | $ | 118,174,613 | | | $ | 2,249,210 | | | $ | 7,573,700 | |
Conservative Allocation Fund
| | | Purchases at | | | Proceeds | | | Market Value | | | Dividend | | | Net Realized | |
| Underlying Fund | | cost | | | from sale | | | 12/31/13 | | | Income | | | Gain/Loss | |
| Touchstone Core Bond Fund | | $ | 443,936 | | | $ | 2,360,958 | | | $ | 3,208,340 | | | $ | 142,030 | | | $ | 49,222 | |
| Touchstone Total Return Bond Fund | | | 2,046,915 | | | | 5,271,077 | | | | 12,788,101 | | | | 433,117 | | | | (80,139 | ) |
| Touchstone Ultra Short Duration Fixed Income Fund^ | | | 17,132,142 | | | | 21,244,608 | | | | 13,327,285 | | | | 268,998 | | | | (45,615 | ) |
| Touchstone International Fixed Income | | | 787,497 | | | | 2,520,881 | | | | 5,121,392 | | | | 42,883 | | | | (6,286 | ) |
| Touchstone Flexible Income Fund | | | 1,761,039 | | | | 1,898,613 | | | | 4,507,289 | | | | 239,451 | | | | (44,200 | ) |
| Touchstone Growth Opportunities Fund | | | 859,496 | | | | 346,011 | | | | 645,119 | | | | 597 | | | | 49,190 | |
| Touchstone Sands Capital Institutional Growth Fund | | | 1,443,926 | | | | 3,507,755 | | | | 3,213,001 | | | | 142 | | | | 373,561 | |
| Touchstone Premium Yield Equity Fund, Class Y | | | 4,574,374 | | | | 1,345,876 | | | | 3,531,811 | | | | 83,586 | | | | 34,431 | |
| Touchstone Value Fund | | | 534,634 | | | | 3,641,501 | | | | 3,221,880 | | | | 68,258 | | | | 660,896 | |
| Touchstone International Small Cap Fund | | | 84,792 | | | | 501,024 | | | | 644,383 | | | | 9,904 | | | | 46,965 | |
Notes to Financial Statements (Continued)
Conservative Allocation Fund
| | | Purchases at | | | Proceeds | | | Market Value | | | Dividend | | | Net Realized | |
| Underlying Fund | | cost | | | from sale | | | 12/31/13 | | | Income | | | Gain/Loss | |
| Touchstone International Value Fund | | $ | 1,296,789 | | | $ | 2,797,058 | | | $ | 2,573,532 | | | $ | 33,501 | | | $ | 79,738 | |
| Touchstone Institutional Money Market Fund | | | 307,312 | | | | 1,498,515 | | | | 3,207,946 | | | | 1,393 | | | | — | |
| Touchstone Arbitrage Fund | | | 3,371,149 | | | | 181,655 | | | | 3,205,776 | | | | — | | | | 317 | |
| Touchstone Dynamic Equity Fund | | | 254,583 | | | | 2,317,393 | | | | 1,920,969 | | | | 985 | | | | 85,547 | |
| Touchstone High Yield Fund | | | 244,634 | | | | 1,748,712 | | | | 1,125,864 | | | | 102,764 | | | | 5,552 | |
| Touchstone Small Cap Core Fund | | | 167,609 | | | | 1,619,291 | | | | 643,880 | | | | 11,535 | | | | 170,579 | |
| Touchstone Global Real Estate Fund | | | 383,082 | | | | 1,417,822 | | | | 643,277 | | | | 50,684 | | | | 118,418 | |
| Touchstone Emerging Markets Equity Fund | | | 191,597 | | | | 343,447 | | | | 637,392 | | | | 8,446 | | | | 2,911 | |
| Touchstone Global Equity Fund+ | | | 8,500 | | | | 946,567 | | | | — | | | | — | | | | 73,625 | |
| Touchstone Large Cap Relative Value Fund+ | | | 25,309 | | | | 2,404,254 | | | | — | | | | — | | | | 94,292 | |
| Touchstone Merger Arbitrage Fund | | | 994,709 | | | | 4,669,592 | | | | — | | | | — | | | | 152,589 | |
| Touchstone Mid Cap Fund | | | 14,181 | | | | 1,018,460 | | | | — | | | | — | | | | 139,465 | |
| Total: | | $ | 36,928,205 | | | $ | 63,601,070 | | | $ | 64,167,237 | | | $ | 1,498,274 | | | $ | 1,961,058 | |
| | | Purchases at | | | Proceeds | | | Market Value | | | Dividend | | | Net Realized | |
| Underlying Fund | | cost | | | from sale | | | 12/31/13 | | | Income | | | Gain/Loss | |
| Touchstone International Small Cap Fund | | $ | 1,791,487 | | | $ | 2,168,353 | | | $ | 5,020,239 | | | $ | 77,138 | | | $ | 48,094 | |
| Touchstone International Value Fund | | | 6,309,208 | | | | 6,506,894 | | | | 9,304,186 | | | | 121,366 | | | | 211,226 | |
| Touchstone Focused Fund | | | 8,645,879 | | | | 8,967,896 | | | | 5,742,714 | | | | 25,543 | | | | 243,549 | |
| Touchstone Value Fund | | | 925,348 | | | | 3,880,287 | | | | 6,463,953 | | | | 128,533 | | | | 620,868 | |
| Touchstone Growth Opportunities Fund | | | 4,811,729 | | | | 1,860,291 | | | | 3,593,709 | | | | 3,337 | | | | 245,855 | |
| Touchstone Sands Capital Institutional Growth Fund | | | 2,007,137 | | | | 4,079,004 | | | | 6,474,521 | | | | 286 | | | | 793,347 | |
| Touchstone Emerging Markets Equity Fund | | | 2,400,903 | | | | 2,392,302 | | | | 7,564,257 | | | | 100,260 | | | | 39,450 | |
| Touchstone Premium Yield Equity Fund, Class Y | | | 5,695,462 | | | | 1,052,889 | | | | 5,019,202 | | | | 112,777 | | | | 1,890 | |
| Touchstone Small Cap Core Fund | | | 154,732 | | | | 1,552,391 | | | | 2,866,475 | | | | 51,106 | | | | 227,103 | |
| Touchstone Small Company Value Fund | | | 598,893 | | | | 779,437 | | | | 1,790,217 | | | | 30,068 | | | | 282,835 | |
| Touchstone Ultra Short Duration Fixed Income Fund ^ | | | 6,420,766 | | | | 6,262,756 | | | | 4,229,360 | | | | 83,909 | | | | (12,069 | ) |
| Touchstone Global Real Estate Fund | | | 838,024 | | | | 2,312,766 | | | | 3,183,962 | | | | 193,424 | | | | 475,697 | |
| Touchstone Small Cap Growth Fund | | | 6,036,645 | | | | 3,349,727 | | | | 2,867,920 | | | | — | | | | 357,541 | |
| Touchstone Dynamic Equity Fund | | | 87,204 | | | | 1,146,463 | | | | 2,858,636 | | | | 1,456 | | | | 71,297 | |
| Touchstone Mid Cap Fund | | | 41,839 | | | | 1,823,175 | | | | 1,433,610 | | | | 3,587 | | | | 297,574 | |
Notes to Financial Statements (Continued)
Growth Allocation Fund
| | | Purchases at | | | Proceeds | | | Market Value | | | Dividend | | | Net Realized | |
| Underlying Fund | | cost | | | from sale | | | 12/31/13 | | | Income | | | Gain/Loss | |
| Touchstone Mid Cap Value Fund | | $ | 142,681 | | | $ | 2,722,488 | | | $ | 1,431,853 | | | $ | 20,561 | | | $ | 451,866 | |
| Touchstone Arbitrage Fund | | | 1,429,359 | | | | 21,965 | | | | 1,414,503 | | | | — | | | | 26 | |
| Touchstone Emerging Growth Fund + | | | — | | | | 2,841,554 | | | | — | | | | — | | | | 437,022 | |
| Touchstone Global Equity Fund + | | | — | | | | 4,535,697 | | | | — | | | | — | | | | 306,397 | |
| Touchstone International Equity Fund + | | | — | | | | 5,469,091 | | | | — | | | | — | | | | 1,241,977 | |
| Touchstone Large Cap Growth Fund | | | — | | | | 2,732,356 | | | | — | | | | — | | | | 818,427 | |
| Touchstone Large Cap Relative Value Fund + | | | — | | | | 3,680,357 | | | | — | | | | — | | | | 176,932 | |
| Touchstone Merger Arbitrage Fund | | | 66,813 | | | | 1,811,417 | | | | — | | | | — | | | | 75,145 | |
| Touchstone Mid Cap Growth Fund | | | 1,710,042 | | | | 3,709,861 | | | | — | | | | — | | | | 212,834 | |
| Total: | | $ | 50,114,151 | | | $ | 75,659,417 | | | $ | 71,259,317 | | | $ | 953,351 | | | $ | 7,624,883 | |
Moderate Growth Allocation Fund
| | | Purchases at | | | Proceeds | | | Market Value | | | Dividend | | | Net Realized | |
| Underlying Fund | | cost | | | from sale | | | 12/31/13 | | | Income | | | Gain/Loss | |
| Touchstone Total Return Bond Fund | | $ | 1,556,296 | | | $ | 3,724,446 | | | $ | 15,036,734 | | | $ | 484,221 | | | $ | (17,229 | ) |
| Touchstone Ultra Short Duration Fixed Income Fund ^ | | | 10,612,125 | | | | 10,282,612 | | | | 7,740,258 | | | | 144,005 | | | | (11,944 | ) |
| Touchstone International Small Cap Fund | | | 1,648,284 | | | | 2,315,199 | | | | 6,074,990 | | | | 92,499 | | | | 93,518 | |
| Touchstone International Value Fund | | | 10,067,315 | | | | 8,981,791 | | | | 16,664,810 | | | | 215,761 | | | | 327,984 | |
| Touchstone Focused Fund | | | 10,082,427 | | | | 12,848,255 | | | | 9,091,631 | | | | 36,585 | | | | 417,983 | |
| Touchstone Value Fund | | | 282,262 | | | | 7,635,437 | | | | 12,098,338 | | | | 244,512 | | | | 1,544,424 | |
| Touchstone Growth Opportunities Fund | | | 7,994,048 | | | | 3,016,705 | | | | 6,057,497 | | | | 5,613 | | | | 395,543 | |
| Touchstone Sands Capital Institutional Growth Fund | | | 2,568,845 | | | | 6,604,935 | | | | 13,606,453 | | | | 601 | | | | 1,396,586 | |
| Touchstone Emerging Markets Equity Fund | | | 2,905,162 | | | | 2,545,691 | | | | 11,448,330 | | | | 151,390 | | | | 95,504 | |
| Touchstone Premium Yield Equity Fund, Class Y | | | 11,231,401 | | | | 1,435,332 | | | | 10,576,658 | | | | 227,380 | | | | 12,266 | |
| Touchstone Small Cap Core Fund | | | 177,627 | | | | 2,268,206 | | | | 4,530,686 | | | | 80,367 | | | | 284,080 | |
| Touchstone Small Company Value Fund | | | 2,131,580 | | | | 1,223,160 | | | | 3,032,836 | | | | 50,943 | | | | 453,881 | |
| Touchstone Dynamic Equity Fund | | | 65,035 | | | | 2,205,662 | | | | 5,992,392 | | | | 3,037 | | | | 100,208 | |
| Touchstone Flexible Income Fund | | | 1,210,769 | | | | 1,192,695 | | | | 5,931,388 | | | | 302,583 | | | | (22,021 | ) |
| Touchstone Small Cap Growth Fund | | | 8,368,962 | | | | 4,100,904 | | | | 4,543,067 | | | | — | | | | 542,359 | |
| Touchstone Global Real Estate Fund | | | 973,717 | | | | 3,085,022 | | | | 4,439,033 | | | | 258,886 | | | | 690,693 | |
| Touchstone Mid Cap Fund | | | 24,001 | | | | 3,659,356 | | | | 3,016,500 | | | | 7,555 | | | | 536,199 | |
| Touchstone Arbitrage Fund | | | 2,944,393 | | | | — | | | | 2,959,096 | | | | — | | | | — | |
Notes to Financial Statements (Continued)
Moderate Growth Allocation Fund
| | | Purchases at | | | Proceeds | | | Market Value | | | Dividend | | | Net Realized | |
| Underlying Fund | | cost | | | from sale | | | 12/31/13 | | | Income | | | Gain/Loss | |
| Touchstone International Fixed Income Fund | | $ | 195,817 | | | $ | 695,157 | | | $ | 2,929,217 | | | $ | 24,489 | | | $ | 18,063 | |
| Touchstone High Yield Fund | | | 218,326 | | | | 1,519,642 | | | | 2,229,751 | | | | 157,671 | | | | (10,201 | ) |
| Touchstone Mid Cap Value Fund | | | 150,758 | | | | 4,851,205 | | | | 1,510,187 | | | | 26,269 | | | | 681,895 | |
| Touchstone Emerging Growth Fund + | | | — | | | | 1,977,571 | | | | — | | | | — | | | | 258,849 | |
| Touchstone Global Equity Fund + | | | — | | | | 7,564,889 | | | | — | | | | — | | | | 437,064 | |
| Touchstone International Equity Fund + | | | — | | | | 9,544,929 | | | | — | | | | — | | | | 1,775,402 | |
| Touchstone Large Cap Growth Fund | | | — | | | | 3,758,535 | | | | — | | | | — | | | | 1,373,503 | |
| Touchstone Large Cap Relative Value Fund+ | | | — | | | | 7,716,921 | | | | — | | | | — | | | | 315,137 | |
| Touchstone Merger Arbitrage Fund | | | 105,084 | | | | 3,781,491 | | | | — | | | | — | | | | 146,235 | |
| Touchstone Mid Cap Growth Fund | | | 5,990 | | | | 4,042,727 | | | | — | | | | — | | | | 282,362 | |
| Total: | | $ | 75,520,224 | | | $ | 122,578,475 | | | $ | 149,509,852 | | | $ | 2,514,367 | | | $ | 12,118,343 | |
| ^ | Includes activity of the Touchstone Short Duration Fixed Income Fund prior to merging into the Touchstone Ultra Short Duration Fixed Income Fund on May 17, 2013. |
| + | The Fund ceased operations on March 27, 2013. |
5. Federal Tax Information
Federal income tax — It is each Fund’s policy to continue to comply with the special provisions of the Internal Revenue Code applicable to regulated investment companies. As provided therein, in any fiscal year in which a Fund so qualifies and distributes at least 90% of its investment company taxable income, the Fund (but not the shareholders) will be relieved of federal income tax on the income distributed. It is each Fund’s policy to distribute all of its taxable income and accordingly, no provision for income taxes has been made.
In order to avoid imposition of the excise tax applicable to regulated investment companies, it is also each Fund’s intention to declare and pay as dividends in each calendar year at least 98% of its investment company taxable income (earned during the calendar year) and 98.2% of its net realized capital gains (earned during the twelve months ending October 31) plus undistributed amounts from prior years.
Notes to Financial Statements (Continued)
The tax character of distributions paid for the year ended December 31, 2013, five months ended December 31, 2012, and fiscal year ended July 31, 2012 was as follows:
| | | | | | Dynamic | | | | | | | | | Balanced | | | | |
| | | | | | Equity Fund | | | | | | | | | Allocation Fund | | | | |
| | | | | | Five Months | | | | | | | | | Five Months | | | | |
| | | Year Ended | | | Ended | | | Year Ended | | | Year Ended | | | Ended | | | Year Ended | |
| | | December 31, | | | December 31, | | | July 31, | | | December 31, | | | December 31, | | | July 31, | |
| | | 2013 | | | 2012 | | | 2012 | | | 2013 | | | 2012 | | | 2012 | |
| From ordinary income | | $ | 16,017 | | | $ | — | | | $ | 514,890 | | | $ | 2,117,770 | | | $ | 6,140,882 | | | $ | 607,351 | |
| From long-term capital gains | | | — | | | | — | | | | — | | | | — | | | | 137,848 | | | | — | |
| Total distributions | | $ | 16,017 | | | $ | — | | | $ | 514,890 | | | $ | 2,117,770 | | | $ | 6,278,730 | | | $ | 607,351 | |
| | | | | | Conservative | | | | | | | | | Growth | | | | |
| | | | | | Allocation Fund | | | | | | | | | Allocation Fund | | | | |
| | | | | | Five Months | | | | | | | | | Five Months | | | | |
| | | Year Ended | | | Ended | | | Year Ended | | | Year Ended | | | Ended | | | Year Ended | |
| | | December 31, | | | December 31, | | | July 31, | | | December 31, | | | December 31, | | | July 31, | |
| | | 2013 | | | 2012 | | | 2012 | | | 2013 | | | 2012 | | | 2012 | |
| From ordinary income | | $ | 1,271,196 | | | $ | 5,215,403 | | | $ | 589,089 | | | $ | 1,227,505 | | | $ | 1,600,296 | | | $ | 180,489 | |
| From long-term capital gains | | | — | | | | — | | | | — | | | | 498,325 | | | | 462 | | | | — | |
| Total distributions | | $ | 1,271,196 | | | $ | 5,215,403 | | | $ | 589,089 | | | $ | 1,725,830 | | | $ | 1,600,758 | | | $ | 180,489 | |
| | | | | | Moderate Growth | | | | |
| | | | | | Allocation Fund | | | | |
| | | | | | Five Months | | | | |
| | | Year Ended | | | Ended | | | Year Ended | |
| | | December 31, | | | December 31, | | | July 31, | |
| | | 2013 | | | 2012 | | | 2012 | |
| From ordinary income | | $ | 2,713,570 | | | $ | 3,961,419 | | | $ | 572,935 | |
| From long-term capital gains | | | — | | | | 1,675,414 | | | | — | |
| Total distributions | | $ | 2,713,570 | | | $ | 5,636,833 | | | $ | 572,935 | |
The following information is computed on a tax basis for each item as of December 31, 2013:
| | | Dynamic | | | Balanced | | | Conservative | |
| | | Equity Fund | | | Allocation Fund | | | Allocation Fund | |
| Tax cost of portfolio investments | | $ | 70,754,886 | | | $ | 108,081,943 | | | $ | 62,096,269 | |
| Gross unrealized appreciation | | | 9,801,260 | | | | 12,098,216 | | | | 3,567,839 | |
| Gross unrealized depreciation | | | (461,896 | ) | | | (2,005,546 | ) | | | (1,496,871 | ) |
| Net unrealized appreciation (depreciation) | | | 9,339,364 | | | | 10,092,670 | | | | 2,070,968 | |
| Net unrealized appreciation (depreciation) on written options and short sales | | | (1,264,205 | ) | | | — | | | | — | |
| Accumulated capital and other losses | | | (140,077,305 | ) | | | (36,805,789 | ) | | | (2,543,454 | ) |
| Undistributed ordinary income | | | 423,004 | | | | 12,326 | | | | 4,479 | |
| Other temporary differences | | | (2,303 | ) | | | — | | | | — | |
| Accumulated earnings (deficit) | | $ | (131,581,445 | ) | | $ | (26,700,793 | ) | | $ | (468,007 | ) |
Notes to Financial Statements (Continued)
| | | | | | Moderate | |
| | | Growth | | | Growth | |
| | | Allocation Fund | | | Allocation Fund | |
| Tax cost of portfolio investments | | $ | 62,304,087 | | | $ | 133,344,456 | |
| Gross unrealized appreciation | | | 10,810,384 | | | | 19,946,602 | |
| Gross unrealized depreciation | | | (1,855,154 | ) | | | (3,781,206 | ) |
| Net unrealized appreciation (depreciation) | | | 8,955,230 | | | | 16,165,396 | |
| Accumulated capital and other losses | | | (39,399,051 | ) | | | (35,780,435 | ) |
| Undistributed ordinary income | | | 10,678 | | | | 11,411 | |
| Other temporary differences | | | — | | | | 39,467 | |
| Accumulated earnings (deficit) | | $ | (30,433,143 | ) | | $ | (19,564,161 | ) |
The difference between the tax cost of portfolio investments and the financial statement cost is primarily due to wash sale loss deferrals.
As of December 31, 2013, the Funds had the following capital loss carryforwards for federal income tax purposes:
| | | | | | | | | | | | | | | No | | | No | | | | |
| | | Short Term Expiring On | | | Expiration | | | Expiration | | | | |
| | | 2015 | | | 2016 | | | 2017 | | | 2018 | | | Short Term* | | | Long Term* | | | Total | |
| Dynamic Equity Fund | | $ | 30,908,342 | | | $ | 31,726,954 | | | $ | 77,442,009 | | | $ | — | | | $ | — | | | $ | — | | | $ | 140,077,305 | |
| Balanced Allocation Fund | | | — | | | | 7,630,450 | | | | 24,373,973 | ** | | | 4,801,366 | ** | | | — | | | | — | | | | 36,805,789 | |
| Conservative Allocation Fund | | | — | | | | — | | | | 2,520,133 | ** | | | 23,321 | | | | — | | | | — | | | | 2,543,454 | |
| Growth Allocation Fund | | | — | | | | 2,474,920 | ** | | | 26,260,412 | ** | | | 10,663,719 | ** | | | — | | | | — | | | | 39,399,051 | |
| Moderate Growth Allocation Fund | | | — | | | | — | | | | 26,652,778 | ** | | | 9,127,657 | ** | | | — | | | | — | | | | 35,780,435 | |
* The Regulated Investment Company Modernization Act of 2010 (the “Act”) was enacted on December 22, 2010. The Act makes changes to several tax rules impacting the Funds. The provisions of the Act were effective for the Funds’ fiscal year ended December 31, 2012. Although the Act provides several benefits, including the unlimited carryover of future capital losses, there may be a greater likelihood that all or a portion of each Fund’s pre-enactment capital loss carryovers may expire without being utilized due to the fact that post-enactment capital losses must be utilized before pre-enactment capital loss carryovers may be utilized. Under the Act, new capital losses may now be carried forward indefinitely, and retain the character of the original loss as compared with pre-enactment law, where capital losses could be carried forward for up to eight years, and carried forward as short-term capital losses, irrespective of the character of the original loss.
**May be subject to limitation.
The capital loss carryforwards may be utilized in future years to offset net realized capital gains, if any, prior to distributing such gains to shareholders.
During the year ended December 31, 2013, the following Funds utilized capital loss carryforwards:
| Fund | | Amount | |
| Dynamic Equity Fund | | $ | 8,744,432 | |
| Balanced Allocation Fund | | | 5,681,369 | |
| Conservative Allocation Fund | | | 1,090,919 | |
| Growth Allocation Fund | | | 5,082,875 | |
| Moderate Growth Allocation Fund | | | 9,091,825 | |
Notes to Financial Statements (Continued)
Under current laws, certain capital losses realized after October 31 and ordinary losses realized after December 31 may be deferred (and certain ordinary losses after October and/or December 31 may be deferred) and treated as occurring on the first day of the following fiscal year. For the year ended December 31, 2013, the Funds did not elect to defer any losses.
The Funds have analyzed their tax positions taken on federal income tax returns for all open tax years (tax years ended December 31, 2012 through 2013 and July 31, 2010 through 2012) and have concluded that no provision for income tax is required in their financial statements.
Certain reclassifications, the result of permanent differences between financial statement and income tax reporting requirements, have been made to the components of capital. These reclassifications have no impact on the net assets or NAV per share of the Funds and are designed to present the Funds’ capital accounts on a tax basis. The following reclassifications, which are primarily attributed to the reclassification of distributions received and reclassifications on short sales have been made to the following Funds for the year ended December 31, 2013:
| | | | | | Accumulated | | | Accumulated | |
| | | Paid-In | | | Net Investment | | | Net Realized | |
| Fund | | Capital | | | Income(Loss) | | | Gains(Losses) | |
| Dynamic Equity Fund | | $ | — | | | $ | 201,046 | | | $ | (201,046 | ) |
| Balanced Allocation Fund | | | — | | | | 507,014 | | | | (507,014 | ) |
| Conservative Allocation Fund | | | — | | | | 89,908 | | | | (89,908 | ) |
| Growth Allocation Fund | | | — | | | | 685,180 | | | | (685,180 | ) |
| Moderate Growth Allocation Fund | | | — | | | | 1,038,574 | | | | (1,038,574 | ) |
6. Commitments and Contingencies
The Funds indemnify the Trust’s officers and Trustees for certain liabilities that might arise from their performance of their duties to the Funds. Additionally, in the normal course of business, the Funds enter into contracts that contain a variety of representations and warranties and which provide general indemnifications. The Funds’ maximum exposure under these arrangements is unknown, as this would involve future claims that may be made against the Funds. However, based on experience, the Funds expect the risk of loss to be remote.
7. Risk Associated with Concentration
Certain Funds invest a high percentage of their assets in specific sectors of the market in order to achieve a potentially greater investment return. As a result, the Funds may be more susceptible to economic, political, and regulatory developments in a particular sector of the market, positive or negative, and may experience increased volatility on the Fund’s NAV and magnified effect on the total return.
8. Risks Associated with Credit
An issuer may be unable to make timely payments of either principal or interest. This may cause the issuer’s securities to decline in value. Credit risk is particularly relevant to those portfolios that invest a significant amount of their assets in junk bonds or lower-rated securities.
9. Risks Associated with Interest Rate
As interest rates rise, the value of fixed-income securities the Funds owns will be likely to decrease. Longer-term securities are generally more volatile, so the longer the average maturity or duration of these securities the greater their price risk. Duration is a measure of the expected life, taking into account any prepayment or call features of the security, of a fixed-income security that is used to determine the price sensitivity of the security for a given change in interest rates. Specifically, duration is the change in the value of a fixed-income security that
Notes to Financial Statements (Continued)
will result from a 1% change in interest rates, and generally is stated in years. Maturity, on the other hand, is the date on which a fixed-income security becomes due for payment of principal.
10. Risks Associated with Leverage
By investing the proceeds received from selling securities short, the Dynamic Equity Fund is employing leverage, which creates special risks. The use of leverage may increase the Fund’s exposure to long or short equity positions and may cause the Fund’s NAV to be more volatile than if the Fund had not used leverage. This could result in increased volatility of returns.
11. Fund Mergers
On February 10, 2012, the Shareholders of the Old Mutual Funds I (the “Reorganizing Funds”) approved an Agreement and Plan of Reorganization (the “Plan”) providing for the transfer of all assets and liabilities of each Reorganizing Fund to the corresponding Touchstone Fund as noted below. The tax-free mergers took place on April 13, 2012. The fiscal year end of the Reorganizing Funds was July 31. After the fiscal year end July 31, 2012, the Funds’ year end changed to December 31.
| | | | | Net | | | Shares | |
| Reorganizing Funds* | | Touchstone Funds | | Assets | | | Outstanding | |
| Old Mutual Analytic Fund | | Dynamic Equity Fund | | $ | 56,128,406 | | | | 5,182,646 | |
| Old Mutual Asset Allocation Balanced Portfolio | | Balanced Allocation Fund | | | 54,581,260 | | | | 4,909,161 | |
| Old Mutual Asset Allocation Conservative Portfolio | | Conservative Allocation Fund | | | 35,536,596 | | | | 3,274,555 | |
| Old Mutual Asset Allocation Growth Portfolio | | Growth Allocation Fund | | | 38,970,804 | | | | 3,527,780 | |
| Old Mutual Asset Allocation Moderate Growth Portfolio | | Moderate Growth Allocation Fund | | | 68,462,430 | | | | 6,232,923 | |
| * | Reorganizing Fund had Class Z Shares outstanding immediately prior to the reorganization, which were exchanged for Class Y Shares of the corresponding Touchstone Fund. |
At the meeting held on March 13, 2012, the Board of Trustees of the Trust approved an Agreement and Plan of Reorganization (the “Plan”) providing for the transfer of all the assets and liabilities of the Fifth Third LifeModel Moderate Fund, Fifth Third LifeModel Conservative Fund, Fifth Third LifeModel Moderately Conservative Fund, Fifth Third LifeModel Aggressive Fund, and Fifth Third LifeModel Moderately Aggressive Fund (the “Acquired Funds”) to the corresponding Touchstone Funds shown below. The merger took place on September 10, 2012.
| Acquired Funds | Touchstone Funds |
| Fifth Third LifeModel Moderate Fund | Balanced Allocation Fund |
| Fifth Third LifeModel Conservative Fund | Conservative Allocation Fund |
| Fifth Third LifeModel Moderately Conservative Fund | Conservative Allocation Fund |
| Fifth Third LifeModel Aggressive Fund | Growth Allocation Fund |
| Fifth Third LifeModel Moderately Aggressive Fund | Moderate Growth Allocation Fund |
Notes to Financial Statements (Continued)
The following is a summary of shares outstanding, net assets, net assets value per share and unrealized appreciation (depreciation) immediately before and after the September 10, 2012 reorganization for the Allocation Funds.
| | | | | | | | | After | |
| | | Before Reorganization | | | Reorganization | |
| | | Fifth Third | | | | | | | |
| | | LifeModel | | | Touchstone | | | Touchstone | |
| | | Moderate | | | Balanced | | | Balanced | |
| | | Fund | | | Allocation Fund | | | Allocation Fund | |
| Class A* | | | | | | | | | | | | |
| Shares | | | 3,650,589 | (A) | | | 856,628 | | | | 4,507,217 | |
| Net Assets | | $ | 41,600,137 | | | $ | 9,761,746 | | | $ | 51,361,883 | |
| Net Asset Value | | $ | 11.40 | (A) | | $ | 11.40 | | | $ | 11.40 | |
| | | | | | | | | | | | | |
| Class C | | | | | | | | | | | | |
| Shares | | | 191,231 | (B) | | | 3,356,100 | | | | 3,547,331 | |
| Net Assets | | $ | 2,174,823 | | | $ | 38,167,906 | | | $ | 40,342,729 | |
| Net Asset Value | | $ | 11.37 | (B) | | $ | 11.37 | | | $ | 11.37 | |
| Class Y** | | | | | | | | | | | | |
| Shares | | | 6,276,974 | (C) | | | 132,241 | | | | 6,409,215 | |
| Net Assets | | $ | 71,649,327 | | | $ | 1,509,480 | | | $ | 73,158,807 | |
| Net Asset Value | | $ | 11.41 | (C) | | $ | 11.41 | | | $ | 11.41 | |
| Institutional Class | | | | | | | | | | | | |
| Shares | | | — | | | | 2,683 | | | | 2,683 | |
| Net Assets | | $ | — | | | $ | 30,489 | | | $ | 30,489 | |
| Net Asset Value | | $ | — | | | $ | 11.36 | | | $ | 11.36 | |
| Fund Total | | | | | | | | | | | | |
| Shares Outstanding | | | 10,277,468 | | | | 4,347,652 | | | | 14,466,446 | |
| Net Assets | | $ | 115,424,287 | | | $ | 49,469,621 | | | $ | 164,893,908 | |
| Unrealized Appreciation (Depreciation) | | $ | 5,211,794 | | | $ | 3,570,090 | | | $ | 8,781,884 | |
(A) Reflects a 0.9853:1 stock split on Class A Shares and a 0.9807:1 stock split on Class B Shares which occurred on the date of reorganization, September 10, 2012.
(B) Reflects a 0.9820:1 stock split which occurred on the date of reorganization, September 10, 2012.
(C) Reflects a 0.9845:1 stock split which occurred on the date of reorganization, September 10, 2012.
* The Acquired Fund had Class B Shares outstanding immediately prior to the reorganization, which were exchanged for Class A Shares of the corresponding Touchstone Fund.
** The Acquired Fund had Institutional Class Shares outstanding immediately prior to the reorganization, which were exchanged for Class Y Shares of the corresponding Touchstone Fund.
| | | | | | | | | | | | After | |
| | | Before Reorganization | | | Reorganization | |
| | | | | | Fifth Third | | | | | | | |
| | | Fifth Third | | | LifeModel | | | Touchstone | | | Touchstone | |
| | | LifeModel | | | Moderately | | | Conservative | | | Conservative | |
| | | Conservative | | | Conservative | | | Allocation | | | Allocation | |
| | | Fund | | | Fund | | | Fund | | | Fund | |
| Class A* | | | | | | | | | | | | | | | | |
| Shares | | | 912,961 | (A) | | | 1,457,284 | (B) | | | 778,704 | | | | 3,148,949 | |
| Net Assets | | $ | 10,038,678 | | | $ | 16,023,820 | | | $ | 8,562,424 | | | $ | 34,624,922 | |
| Net Asset Value | | $ | 11.00 | (A) | | $ | 11.00 | (B) | | $ | 11.00 | | | $ | 11.00 | |
| Class C | | | | | | | | | | | | | | | | |
| Shares | | | 72,314 | (C) | | | 89,383 | (D) | | | 1,541,709 | | | | 1,703,406 | |
| Net Assets | | $ | 791,586 | | | $ | 978,429 | | | $ | 16,876,314 | | | $ | 18,646,329 | |
| Net Asset Value | | $ | 10.95 | (C) | | $ | 10.95 | (D) | | $ | 10.95 | | | $ | 10.95 | |
Notes to Financial Statements (Continued)
| | | | | | | | | | | | After | |
| | | Before Reorganization | | | Reorganization | |
| | | | | | Fifth Third | | | | | | | |
| | | Fifth Third | | | LifeModel | | | Touchstone | | | Touchstone | |
| | | LifeModel | | | Moderately | | | Conservative | | | Conservative | |
| | | Conservative | | | Conservative | | | Allocation | | | Allocation | |
| | | Fund | | | Fund | | | Fund | | | Fund | |
| Class Y** | | | | | | | | | | | | | | | | |
| Shares | | | 1,658,986 | (E) | | | 1,806,406 | (F) | | | 198,245 | | | | 3,663,637 | |
| Net Assets | | $ | 18,249,300 | | | $ | 19,870,935 | | | $ | 2,180,756 | | | $ | 40,300,991 | |
| Net Asset Value | | $ | 11.00 | (E) | | $ | 11.00 | (F) | | $ | 11.00 | | | $ | 11.00 | |
| Institutional Class | | | | | | | | | | | | | | | | |
| Shares | | | — | | | | — | | | | 119,726 | | | | 119,726 | |
| Net Assets | | $ | — | | | $ | — | | | $ | 1,318,057 | | | $ | 1,318,057 | |
| Net Asset Value | | $ | — | | | $ | — | | | $ | 11.01 | | | $ | 11.01 | |
| Fund Total | | | | | | | | | | | | | | | | |
| Shares Outstanding | | | 2,869,464 | | | | 3,603,186 | | | | 2,638,384 | | | | 8,635,718 | |
| Net Assets | | $ | 29,079,564 | | | $ | 36,873,184 | | | $ | 28,937,551 | | | $ | 94,890,299 | |
(A) Reflects a 0.9206:1 stock split on Class A Shares and a 0.9190:1 stock split on Class B Shares which occurred on the date of reorganization, September 10, 2012.
(B) Reflects a 0.9301:1 stock split on Class A Shares and a 0.9270:1 stock split on Class B Shares which occurred on the date of reorganization, September 10, 2012.
(C) Reflects a 0.9235:1 stock split which occurred on the date of reorganization, September 10, 2012.
(D) Reflects a 0.9309:1 stock split which occurred on the date of reorganization, September 10, 2012.
(E) Reflects a 0.92200:1 stock split which occurred on the date of reorganization, September 10, 2012.
(F) Reflects a 0.9311:1 stock split which occurred on the date of reorganization, September 10, 2012.
* The Acquired Fund had Class B Shares outstanding immediately prior to the reorganization, which were exchanged for Class A Shares of the corresponding Touchstone Fund.
** The Acquired Fund had Institutional Class Shares outstanding immediately prior to the reorganization, which were exchanged for Class Y Shares of the corresponding Touchstone Fund.
| | | | | | After | |
| | | Before Reorganization | | | Reorganization | |
| | | Fifth Third | | | Touchstone | | | Touchstone | |
| | | LifeModel | | | Growth | | | Growth | |
| | | Aggressive | | | Allocation | | | Allocation | |
| | | Fund | | | Fund | | | Fund | |
| Class A* | | | | | | | | | | | | |
| Shares | | | 1,982,555 | (A) | | | 905,293 | | | | 2,887,848 | |
| Net Assets | | $ | 23,010,705 | | | $ | 10,507,403 | | | $ | 33,518,108 | |
| Net Asset Value | | $ | 11.61 | (A) | | $ | 11.61 | | | $ | 11.61 | |
| Class C | | | | | | | | | | | | |
| Shares | | | 86,836 | (B) | | | 2,187,151 | | | | 2,273,987 | |
| Net Assets | | $ | 971,379 | | | $ | 24,466,210 | | | $ | 25,437,589 | |
| Net Asset Value | | $ | 11.19 | (B) | | $ | 11.19 | | | $ | 11.19 | |
| Class Y** | | | | | | | | | | | | |
| Shares | | | 2,547,823 | (C) | | | 73,550 | | | | 2,621,373 | |
| Net Assets | | $ | 29,855,473 | | | $ | 861,864 | | | $ | 30,717,337 | |
| Net Asset Value | | $ | 11.72 | (C) | | $ | 11.72 | | | $ | 11.72 | |
| Institutional Class | | | | | | | | | | | | |
| Shares | | | — | | | | 1,267 | | | | 1,267 | |
| Net Assets | | $ | — | | | $ | 13,568 | | | $ | 13,568 | |
| Net Asset Value | | $ | — | | | $ | 10.71 | | | $ | 10.71 | |
Notes to Financial Statements (Continued)
| | | | | | | | | After | |
| | | Before Reorganization | | | Reorganization | |
| | | Fifth Third | | | Touchstone | | | Touchstone | |
| | | LifeModel | | | Growth | | | Growth | |
| | | Aggressive | | | Allocation | | | Allocation | |
| | | Fund | | | Fund | | | Fund | |
| Fund Total | | | | | | | | | | | | |
| Shares Outstanding | | | 4,576,737 | | | | 3,167,261 | | | | 7,784,475 | |
| Net Assets | | $ | 53,837,557 | | | $ | 35,849,045 | | | $ | 89,686,602 | |
| Unrealized Appreciation (Depreciation) | | $ | 3,817,238 | | | $ | 3,056,427 | | | $ | 6,873,665 | |
(A) Reflects a 1.0117:1 reverse stock split on Class A Shares and a 0.9675:1 stock split on Class B Shares which occurred on the date of reorganization, September 10, 2012.
(B) Reflects a 1.0019:1 reverse stock split which occurred on the date of reorganization, September 10, 2012.
(C) Reflects a 1.010:1 reverse stock split which occurred on the date of reorganization, September 10, 2012.
* The Acquired Fund had Class B Shares outstanding immediately prior to the reorganization, which were exchanged for Class A Shares of the corresponding Touchstone Fund.
** The Acquired Fund had Institutional Class Shares outstanding immediately prior to the reorganization, which were exchanged for Class Y Shares of the corresponding Touchstone Fund.
| | | | | | | | | After | |
| | | Before Reorganization | | | Reorganization | |
| | | Fifth Third | | | Touchstone | | | Touchstone | |
| | | LifeModel | | | Moderate | | | Moderate | |
| | | Moderately | | | Growth | | | Growth | |
| | | Aggressive | | | Allocation | | | Allocation | |
| | | Fund | | | Fund | | | Fund | |
| Class A* | | | | | | | | | | | | |
| Shares | | | 5,396,673 | (A) | | | 1,340,687 | | | | 6,737,360 | |
| Net Assets | | $ | 61,461,849 | | | $ | 15,268,777 | | | $ | 76,730,626 | |
| Net Asset Value | | $ | 11.39 | (A) | | $ | 11.39 | | | $ | 11.39 | |
| Class C | | | | | | | | | | | | |
| Shares | | | 221,281 | (B) | | | 4,305,668 | | | | 4,526,949 | |
| Net Assets | | $ | 2,482,569 | | | $ | 48,305,735 | | | $ | 50,788,304 | |
| Net Asset Value | | $ | 11.22 | (B) | | $ | 11.22 | | | $ | 11.22 | |
| Class Y** | | | | | | | | | | | | |
| Shares | | | 4,909,444 | (C) | | | 78,182 | | | | 4,987,626 | |
| Net Assets | | $ | 56,310,746 | | | $ | 896,739 | | | $ | 57,207,485 | |
| Net Asset Value | | $ | 11.47 | (C) | | $ | 11.47 | | | $ | 11.47 | |
| Institutional Class | | | | | | | | | | | | |
| Shares | | | — | | | | 738 | | | | 738 | |
| Net Assets | | $ | — | | | $ | 8,431 | | | $ | 8,431 | |
| Net Asset Value | | $ | — | | | $ | 11.42 | | | $ | 11.42 | |
| Fund Total | | | | | | | | | | | | |
| Shares Outstanding | | | 10,118,280 | | | | 5,725,275 | | | | 16,252,673 | |
| Net Assets | | $ | 120,255,164 | | | $ | 64,479,682 | | | $ | 184,734,846 | |
| Unrealized Appreciation (Depreciation) | | $ | 13,091,873 | | | $ | 5,016,633 | | | $ | 18,108,506 | |
(A) Reflects a 1.0437:1 reverse stock split on Class A Shares and a 1.0329:1 reverse stock split on Class B Shares which occurred on the date of reorganization, September 10, 2012.
(B) Reflects a 1.0475:1 reverse stock split which occurred on the date of reorganization, September 10, 2012.
(C) Reflects a 1.0378:1 reverse stock split which occurred on the date of reorganization, September 10, 2012.
* The Acquired Fund had Class B Shares outstanding immediately prior to the reorganization, which were exchanged for Class A Shares of the corresponding Touchstone Fund.
** The Acquired Fund had Institutional Class Shares outstanding immediately prior to the reorganization, which were exchanged for Class Y Shares of the corresponding Touchstone Fund.
Notes to Financial Statements (Continued)
Assuming these September 10, 2012 reorganizations had been completed on August 1, 2012, the Balanced Allocation Fund, Conservative Allocation Fund, Growth Allocation Fund and Moderate Growth Allocation Fund results of operations for the five months ended December 31, 2012, would have been as follows:
| | | | | | | | | | | | Touchstone | |
| | | Touchstone | | | Touchstone | | | Touchstone | | | Moderate | |
| | | Balanced | | | Conservative | | | Growth | | | Growth | |
| | | Allocation | | | Allocation | | | Allocation | | | Allocation | |
| (Unaudited) | | Fund | | | Fund | | | Fund | | | Fund | |
| Net investment income | | $ | 2,451,480 | | | $ | 1,210,897 | | | $ | 1,323,552 | | | $ | 2,716,948 | |
| Net realized and unrealized gain (loss) on investments | | | 11,632,977 | | | | 5,230,795 | | | | 10,153,370 | | | | 22,183,410 | |
| Net increase (decrease) in asset from operations | | | 14,084,457 | | | | 6,441,692 | | | | 11,476,922 | | | | 24,900,358 | |
Because the combined investment portfolios have been managed as single portfolios since the reorganizations were completed, it is not practical to separate the amounts of revenue and earnings to the Acquiring Funds that have been included in their statements of operations since the reorganizations.
12. Subsequent Events
Subsequent events occurring after the date of this report have been evaluated for potential impact to this report through the date the financial statements were issued. There were no subsequent events that necessitated recognition or disclosure on the Funds’ financial statements.
Report of Independent Registered Public Accounting Firm
To the Board of Trustees and Shareholders of Touchstone Dynamic Equity Fund, Touchstone Balanced Allocation Fund, Touchstone Conservative Allocation Fund, Touchstone Growth Allocation Fund, and Touchstone Moderate Growth Allocation Fund
We have audited the accompanying statements of assets and liabilities, including the portfolios of investments, of Touchstone Dynamic Equity Fund, Touchstone Balanced Allocation Fund, Touchstone Conservative Allocation Fund, Touchstone Growth Allocation Fund, and Touchstone Moderate Growth Allocation Fund (the “Funds”) (five of the funds constituting the Touchstone Strategic Trust), as of December 31, 2013, and the related statements of operations and statement of cash flows for Touchstone Dynamic Equity Fund for the year then ended, and the statements of changes in net assets and the financial highlights for each of the two years or periods in the period then ended. These financial statements and financial highlights are the responsibility of the Funds’ management. Our responsibility is to express an opinion on these financial statements and financial highlights based on our audits. The statements of changes in net assets for the year ended July 31, 2012 and the financial highlights for the year then ended and prior indicated therein of the Funds were audited by other auditors whose report dated September 21, 2012, expressed an unqualified opinion on those financial statements and financial highlights.
We conducted our audits in accordance with the standards of the Public Company Accounting Oversight Board (United States). Those standards require that we plan and perform the audits to obtain reasonable assurance about whether the financial statements are free of material misstatement. We were not engaged to perform an audit of the Funds’ internal control over financial reporting. Our audits included consideration of internal control over financial reporting as a basis for designing audit procedures that are appropriate in the circumstances, but not for the purpose of expressing an opinion on the effectiveness of the Funds’ internal control over financial reporting. Accordingly, we express no such opinion. An audit also includes examining, on a test basis, evidence supporting the amounts and disclosures in the financial statements, assessing the accounting principles used and significant estimates made by management, and evaluating the overall financial statement presentation. Our procedures included confirmation of securities owned as of December 31, 2013, by correspondence with the custodian, transfer agent, and brokers or by other appropriate auditing procedures where replies from brokers were not received. We believe that our audits provide a reasonable basis for our opinion.
In our opinion, the financial statements and financial highlights referred to above present fairly, in all material respects, the financial position of Touchstone Dynamic Equity Fund, Touchstone Balanced Allocation Fund, Touchstone Conservative Allocation Fund, Touchstone Growth Allocation Fund, and Touchstone Moderate Growth Allocation Fund (five of the funds constituting the Touchstone Strategic Trust) at December 31, 2013, the results of their operations and cash flows for Touchstone Dynamic Equity Fund for the year then ended, and the changes in their net assets and the financial highlights for each of the two years or periods in the period then ended, in conformity with U.S. generally accepted accounting principles.

Cincinnati, Ohio
February 21, 2014
Other Items (Unaudited)
Qualified Dividend Income
Under the Jobs and Growth Tax Relief Reconciliation Act of 2003 (the “Act”), the following percentages of ordinary dividends paid during the fiscal year ended December 31, 2013 are designated as “qualified dividend income,” as defined in the Act, and are subject to reduced tax rates. The Funds intend to pass through the maximum allowable percentage for 1099s.
| Dynamic Equity Fund | | | 100.00 | % |
| Balanced Allocation Fund | | | 40.83 | % |
| Conservative Allocation Fund | | | 22.58 | % |
| Growth Allocation Fund | | | 64.95 | % |
| Moderate Growth Allocation Fund | | | 48.95 | % |
Dividend Received Deduction
For corporate shareholders, the following ordinary distributions paid during the current fiscal year ended December 31, 2013 qualify for the corporate dividends received deduction. The Funds intend to pass through the maximum allowable percentage for 1099s.
| Dynamic Equity Fund | | | 100.00 | % |
| Balanced Allocation Fund | | | 24.82 | % |
| Conservative Allocation Fund | | | 16.05 | % |
| Growth Allocation Fund | | | 33.61 | % |
| Moderate Growth Allocation Fund | | | 28.65 | % |
Foreign Tax Income & Foreign Tax Credit
Balanced Allocation Fund, Conservative Allocation Fund, Growth Allocation Fund and Moderate Growth Allocation Fund intend to pass through a foreign tax credit to their respective shareholders. For the fiscal year ended December 31, 2013, the total amount of foreign source income is $320,728 or $0.03, $66,142 or $0.01 per share, $359,351 or $0.07 per share and $535,198 or $0.05 per share, respectively. The total amount of foreign taxes to be paid is $26,854 or $0.003 per share, $4,980 or $0.001 per share, $31,801 or $0.006 per share and $48,648 or $0.004 per share, respectively. Shareholders’ allocable share of the foreign tax credit will be reported on Form 1099 Div.
Proxy Voting Guidelines
The Sub-Advisors are responsible for exercising the voting rights associated with the securities purchased and held by the Funds. A description of the policies and procedures that the Sub-Advisors use in fulfilling this responsibility is available as an appendix to the most recent Statement of Additional Information, which can be obtained without charge by calling toll free 1.800.543.0407 or by visiting the Touchstone website at www.touchstoneinvestments.com or on the Securities and Exchange Commission’s (the “Commission”) website www.sec.gov. Information regarding how those proxies were voted during the most recent twelve-month period ended June 30 is also available without charge by calling toll free 1.800.543.0407 or on the Commission’s website at www.sec.gov.
Quarterly Portfolio Disclosure
The Trust files a complete listing of portfolio holdings for each Fund as of the end of the first and third quarters of each fiscal year on Form N-Q. The complete listing (i) is available on the Commission’s website; (ii) may be reviewed and copied at the Commission’s Public Reference Room in Washington, DC; (iii) will be made available to shareholders upon request by calling 1.800.543.0407; or (iv) can be obtained on the Touchstone website at www.touchstoneinvestments.com. Information on the operation of the Public Reference Room may be obtained by calling 1.800.SEC.0330.
Other Items (Unaudited) (Continued)
Schedule of Shareholder Expenses
As a shareholder of the Funds, you incur two types of costs: (1) transaction costs, including reinvested dividends or other distributions; and (2) ongoing costs, including investment advisory fees; distribution (12b-1) fees; and other Fund expenses. This example is intended to help you understand your ongoing costs (in dollars) of investing in the Funds and to compare these costs with the ongoing costs of investing in other mutual funds.
The example is based on an investment of $1,000 invested at the beginning of the period and held for the entire period, (July 1, 2013 through December 31, 2013).
Actual Expenses
The first line for each share class of a Fund in the table below provides information about actual account values and actual expenses. You may use the information in this line, together with the amount you invested, to estimate the expenses that you paid over the period. Simply divide your account value by $1,000 (for example, an $8,600 account value divided by $1,000 = 8.6), then multiply the result by the number in the first line under the heading entitled “Expenses Paid During the Six Months Ended December 31, 2013” to estimate the expenses you paid on your account during this period.
Hypothetical Example for Comparison Purposes
The second line for each share class of a Fund in the table below provides information about hypothetical account values and hypothetical expenses based on the Funds’ actual expense ratio and an assumed rate of return of 5% per year before expenses, which is not the Funds’ actual return. The hypothetical account values and expenses may not be used to estimate the actual ending account balance or expenses you paid for the period. You may use this information to compare the ongoing costs of investing in the Funds and other funds. To do so, compare this 5% hypothetical example with the 5% hypothetical examples that appear in the shareholder reports of the other funds.
Please note that the expenses shown in the table below are meant to highlight your ongoing costs only and do not reflect any transactional costs, such as sales charges (loads), redemption fees, or exchange fees. Therefore, the second line for each share class of a Fund in the table below is useful in comparing ongoing costs only, and will not help you determine the relative total costs of owning different funds. In addition, if these transactional costs were included, your costs would have been higher.
| | | | | | | | | | | | | | Expenses | |
| | | | | Net Expense | | | Beginning | | | Ending | | | Paid During | |
| | | | | Ratio | | | Account | | | Account | | | the Six Months | |
| | | | | Annualized | | | Value | | | Value | | | Ended | |
| | | | | December 31, | | | July 1, | | | December 31, | | | December 31, | |
| | | | | 2013 | | | 2013 | | | 2013 | | | 2013* | |
| Touchstone Dynamic Equity Fund | | | | | | | | | | | | | | | | |
| Class A | | Actual | | | 2.53 | % | | $ | 1,000.00 | | | $ | 1,077.90 | | | $ | 13.25 | ** |
| Class A | | Hypothetical | | | 2.53 | % | | $ | 1,000.00 | | | $ | 1,012.45 | | | $ | 12.83 | |
| | | | | | | | | | | | | | | | | | | |
| Class C | | Actual | | | 3.28 | % | | $ | 1,000.00 | | | $ | 1,073.90 | | | $ | 17.15 | ** |
| Class C | | Hypothetical | | | 3.28 | % | | $ | 1,000.00 | | | $ | 1,008.67 | | | $ | 16.61 | |
| | | | | | | | | | | | | | | | | | | |
| Class Y | | Actual | | | 2.28 | % | | $ | 1,000.00 | | | $ | 1,079.50 | | | $ | 11.95 | ** |
| Class Y | | Hypothetical | | | 2.28 | % | | $ | 1,000.00 | | | $ | 1,013.71 | | | $ | 11.57 | |
| | | | | | | | | | | | | | | | | | | |
| Institutional Class | | Actual | | | 2.23 | % | | $ | 1,000.00 | | | $ | 1,079.50 | | | $ | 11.69 | ** |
| Institutional Class | | Hypothetical | | | 2.23 | % | | $ | 1,000.00 | | | $ | 1,013.96 | | | $ | 11.32 | |
Other Items (Unaudited) (Continued)
| | | | | | | | | | | | | | Expenses | |
| | | | | Net Expense | | | Beginning | | | Ending | | | Paid During | |
| | | | | Ratio | | | Account | | | Account | | | the Six Months | |
| | | | | Annualized | | | Value | | | Value | | | Ended | |
| | | | | December 31, | | | July 1, | | | December 31, | | | December 31, | |
| | | | | 2013 | | | 2013 | | | 2013 | | | 2013* | |
| Touchstone Balanced Allocation Fund*** | | | | | | | | | | | | | | | | |
| Class A | | Actual | | | 0.38 | % | | $ | 1,000.00 | | | $ | 1,087.40 | | | $ | 2.00 | |
| Class A | | Hypothetical | | | 0.38 | % | | $ | 1,000.00 | | | $ | 1,023.29 | | | $ | 1.94 | |
| | | | | | | | | | | | | | | | | | | |
| Class C | | Actual | | | 1.13 | % | | $ | 1,000.00 | | | $ | 1,083.40 | | | $ | 5.93 | |
| Class C | | Hypothetical | | | 1.13 | % | | $ | 1,000.00 | | | $ | 1,019.51 | | | $ | 5.75 | |
| | | | | | | | | | | | | | | | | �� | | |
| Class Y | | Actual | | | 0.13 | % | | $ | 1,000.00 | | | $ | 1,088.60 | | | $ | 0.68 | |
| Class Y | | Hypothetical | | | 0.13 | % | | $ | 1,000.00 | | | $ | 1,024.55 | | | $ | 0.66 | |
| | | | | | | | | | | | | | | | | | | |
| Institutional Class | | Actual | | | 0.13 | % | | $ | 1,000.00 | | | $ | 1,088.10 | | | $ | 0.68 | |
| Institutional Class | | Hypothetical | | | 0.13 | % | | $ | 1,000.00 | | | $ | 1,024.55 | | | $ | 0.66 | |
| | | | | | | | | | | | | | | | | | | |
| Touchstone Conservative Allocation Fund*** | | | | | | | | | | | | | | | | |
| Class A | | Actual | | | 0.38 | % | | $ | 1,000.00 | | | $ | 1,043.90 | | | $ | 1.96 | |
| Class A | | Hypothetical | | | 0.38 | % | | $ | 1,000.00 | | | $ | 1,023.29 | | | $ | 1.94 | |
| | | | | | | | | | | | | | | | | | | |
| Class C | | Actual | | | 1.13 | % | | $ | 1,000.00 | | | $ | 1,041.00 | | | $ | 5.81 | |
| Class C | | Hypothetical | | | 1.13 | % | | $ | 1,000.00 | | | $ | 1,019.51 | | | $ | 5.75 | |
| | | | | | | | | | | | | | | | | | | |
| Class Y | | Actual | | | 0.13 | % | | $ | 1,000.00 | | | $ | 1,045.20 | | | $ | 0.67 | |
| Class Y | | Hypothetical | | | 0.13 | % | | $ | 1,000.00 | | | $ | 1,024.55 | | | $ | 0.66 | |
| | | | | | | | | | | | | | | | | | | |
| Institutional Class | | Actual | | | 0.13 | % | | $ | 1,000.00 | | | $ | 1,046.10 | | | $ | 0.67 | |
| Institutional Class | | Hypothetical | | | 0.13 | % | | $ | 1,000.00 | | | $ | 1,024.55 | | | $ | 0.66 | |
| | | | | | | | | | | | | | | | | | | |
| Touchstone Growth Allocation Fund*** | | | | | | | | | | | | | | | | |
| Class A | | Actual | | | 0.38 | % | | $ | 1,000.00 | | | $ | 1,132.60 | | | $ | 2.04 | |
| Class A | | Hypothetical | | | 0.38 | % | | $ | 1,000.00 | | | $ | 1,023.29 | | | $ | 1.94 | |
| | | | | | | | | | | | | | | | | | | |
| Class C | | Actual | | | 1.13 | % | | $ | 1,000.00 | | | $ | 1,129.00 | | | $ | 6.06 | |
| Class C | | Hypothetical | | | 1.13 | % | | $ | 1,000.00 | | | $ | 1,019.51 | | | $ | 5.75 | |
| | | | | | | | | | | | | | | | | | | |
| Class Y | | Actual | | | 0.13 | % | | $ | 1,000.00 | | | $ | 1,134.30 | | | $ | 0.70 | |
| Class Y | | Hypothetical | | | 0.13 | % | | $ | 1,000.00 | | | $ | 1,024.55 | | | $ | 0.66 | |
| | | | | | | | | | | | | | | | | | | |
| Institutional Class | | Actual | | | 0.14 | % | | $ | 1,000.00 | | | $ | 1,135.30 | | | $ | 0.75 | |
| Institutional Class | | Hypothetical | | | 0.14 | % | | $ | 1,000.00 | | | $ | 1,024.50 | | | $ | 0.71 | |
Other Items (Unaudited) (Continued)
| | | | | | | | | | | | | | Expenses | |
| | | | | Net Expense | | | Beginning | | | Ending | | | Paid During | |
| | | | | Ratio | | | Account | | | Account | | | the Six Months | |
| | | | | Annualized | | | Value | | | Value | | | Ended | |
| | | | | December 31, | | | July 1, | | | December 31, | | | December 31, | |
| | | | | 2013 | | | 2013 | | | 2013 | | | 2013* | |
| Touchstone Moderate Growth Allocation Fund*** | | | | | | | | | | | | | | | | |
| Class A | | Actual | | | 0.38 | % | | $ | 1,000.00 | | | $ | 1,111.60 | | | $ | 2.02 | |
| Class A | | Hypothetical | | | 0.38 | % | | $ | 1,000.00 | | | $ | 1,023.29 | | | $ | 1.94 | |
| | | | | | | | | | | | | | | | | | | |
| Class C | | Actual | | | 1.13 | % | | $ | 1,000.00 | | | $ | 1,107.50 | | | $ | 6.00 | |
| Class C | | Hypothetical | | | 1.13 | % | | $ | 1,000.00 | | | $ | 1,019.51 | | | $ | 5.75 | |
| | | | | | | | | | | | | | | | | | | |
| Class Y | | Actual | | | 0.13 | % | | $ | 1,000.00 | | | $ | 1,113.00 | | | $ | 0.69 | |
| Class Y | | Hypothetical | | | 0.13 | % | | $ | 1,000.00 | | | $ | 1,024.55 | | | $ | 0.66 | |
| | | | | | | | | | | | | | | | | | | |
| Institutional Class | | Actual | | | 0.14 | % | | $ | 1,000.00 | | | $ | 1,112.70 | | | $ | 0.75 | |
| Institutional Class | | Hypothetical | | | 0.14 | % | | $ | 1,000.00 | | | $ | 1,024.50 | | | $ | 0.71 | |
| * | Expenses are equal to the Fund's annualized expense ratio, multiplied by the average account value over the period, multiplied by 184/365 (to reflect one-half year period). |
| ** | Excluding interest and dividend expenses on securities sold short, your actual cost of investment in Class A, Class C, Class Y and Institutional Class would be $8.12, $12.02, $6.81 and $6.55, respectively. |
| *** | The annualized expense ratios for the Allocation Funds do not include fees and expenses of the Underlying Funds in which the Allocation Funds invest. |
Advisory and Sub-Advisory Agreement Approval Disclosure
At a meeting held on November 21, 2013, the Board of Trustees (the “Board” or “Trustees”) of the Touchstone Strategic Trust (the “Trust”), and by a separate vote, the Independent Trustees of the Trust, approved the continuance of the Investment Advisory Agreement between the Trust and the Advisor with respect to each Fund of the Trust, and the continuance of the Sub-Advisory Agreement between the Advisor and each Fund’s respective Sub-Advisor, with the exception of the Sub-Advisory Agreement relating to Touchstone Dynamic Equity Fund, which was not up for renewal because it had been approved in November 2012 for an initial two-year period.
In determining whether to approve the continuation of the Investment Advisory Agreement and the Sub-Advisory Agreement, the Advisor furnished information necessary for a majority of the Independent Trustees to make the determination that the continuance of the Investment Advisory Agreement and the Sub-Advisory Agreement was in the best interests of the respective Funds and their shareholders. The information provided to the Board included: (1) industry data comparing advisory fees and expense ratios of comparable investment companies; (2) comparative performance information; (3) the Advisor’s and its affiliates’ revenues and costs of providing services to the Funds; and (4) information about the Advisor’s and Sub-Advisor’s personnel. Prior to voting, the Independent Trustees reviewed the proposed continuance of the Investment Advisory Agreement and the Sub-Advisory Agreement with management and experienced independent legal counsel and received materials from such counsel discussing the legal standards for their consideration of the proposed continuation of the Investment Advisory Agreement and the Sub-Advisory Agreement. The Independent Trustees also reviewed the proposed continuation of the Investment Advisory Agreement and the Sub-Advisory Agreement with independent legal counsel in private sessions at which no representatives of management were present.
In approving the Funds’ Investment Advisory Agreement, the Board considered various factors, among them: (1) the nature, extent and quality of services provided to the Funds, including the personnel providing such services; (2) the Advisor’s compensation and profitability; (3) a comparison of fees and performance with other
Other Items (Unaudited) (Continued)
advisers; (4) economies of scale; and (5) the terms of the Investment Advisory Agreement. The Board’s analysis of these factors is set forth below. The Independent Trustees were advised by independent legal counsel throughout the process.
Nature, Extent and Quality of Advisor Services. The Board considered the level and depth of knowledge of the Advisor, including the professional experience and qualifications of senior personnel. In evaluating the quality of services provided by the Advisor, the Board took into account its familiarity with the Advisor’s senior management through Board meetings, discussions and reports during the preceding year. The Board also took into account the Advisor’s compliance policies and procedures. The quality of administrative and other services, including the Advisor’s role in coordinating the activities of the Funds’ other service providers, was also considered. The Board also considered the Advisor’s relationship with its affiliates and the resources available to them, as well as any potential conflicts of interest.
The Board discussed the Advisor’s effectiveness in monitoring the performance of each Sub- Advisor, and the Advisor’s timeliness in responding to performance issues. The Board considered the Advisor’s process for monitoring each of the Sub-Advisors, which includes an examination of both qualitative and quantitative elements of the Sub-Advisor’s organization, personnel, procedures, investment discipline, infrastructure and performance. The Board considered that the Advisor conducts regular on-site compliance visits with each Sub-Advisor, during which the Advisor examines a wide variety of factors, such as the financial condition of the Sub-Advisor, the quality of the Sub-Advisor’s systems, the effectiveness of the Sub- Advisor’s disaster recovery programs, trade allocation and execution procedures, compliance with the Sub-Advisor’s policies and procedures, results of regulatory examinations and any other factors that might affect the quality of services that the Sub-Advisor provides to the applicable Funds. The Board noted that the Advisor’s compliance monitoring processes also include quarterly reviews of compliance reports, and that any issues arising from such reports and the Advisor’s compliance visits to the Sub-Advisors are reported to the Board.
The Trustees concluded that they were satisfied with the nature, extent and quality of services provided to each Fund by the Advisor under the Investment Advisory Agreement.
Advisor’s Compensation and Profitability. The Board took into consideration the financial condition and profitability of the Advisor and its affiliates and the direct and indirect benefits derived by the Advisor and its affiliates from the Advisor’s relationship with the Funds. The information considered by the Board included operating profit margin information for the Advisor’s business as a whole. The Board noted that the Advisor had waived a portion of advisory fees and administrative fees and/or reimbursed expenses in order to limit the Funds’ net operating expenses. The Board also noted that the Advisor pays the Sub-Advisors’ sub-advisory fees out of the advisory fees the Advisor receives from the Funds. The Board reviewed the profitability of the Advisor’s relationship with the Funds both before and after tax expenses, and also considered whether the Advisor has the financial wherewithal to continue to provide services to the Funds, noting the ongoing commitment of the Advisor’s parent company with respect to providing support and resources as needed. The Board considered that the Funds’ distributor, an affiliate of the Advisor, receives Rule 12b-1 distribution fees from the Funds and receives a portion of the sales charges on sales or redemptions of certain classes of shares. The Board also noted that the Advisor derives benefits to its reputation and other benefits from its association with the Funds.
The Board recognized that the Advisor should be entitled to earn a reasonable level of profits in exchange for the level of services it provides to each Fund and the entrepreneurial risk that it assumes as Advisor. Based upon their review, the Trustees concluded that the Advisor’s and its affiliates’ level of profitability, if any, from their relationship with each Fund was reasonable and not excessive.
Expenses and Performance. The Board compared the respective advisory fees and total expense ratios for each of the Funds with various comparative data, including the median and average advisory fees and total expense ratios of each Fund’s respective peer group. The Board also considered, among other data, the Funds’ respective
Other Items (Unaudited) (Continued)
performance results during the six-month, twelve-month and thirty-six-month periods ended June 30, 2013 and noted that the Board reviews on a quarterly basis detailed information about each Fund’s performance results, portfolio composition and investment strategies. The Board also took into account current market conditions and their effect on the Funds’ performance.
The Board also considered the effect of each Fund’s growth and size on its performance and expenses. The Board noted that the Advisor had waived portions of the fees and/or reimbursed expenses of the Funds in order to reduce the Funds’ respective operating expenses to targeted levels. The Board noted that the sub-advisory fees under the Sub-Advisory Agreement with respect to each Fund were paid by the Advisor out of the advisory fees it receives from the Fund and considered the impact of such sub-advisory fees on the profitability of the Advisor. In reviewing the respective expense ratios and performance of each of the Funds, the Board also took into account the nature, extent and quality of the services provided to the Funds by the Advisor and its affiliates.
The Board considered, among other data, the specific factors and related conclusions set forth below with respect to each Fund:
Touchstone Dynamic Equity Fund. The Fund’s advisory fee and total expense ratio (net of applicable expense waivers and reimbursements) were below the median of its peer group. The Board noted that the Advisor was currently waiving a portion of the Fund’s fees. The Fund’s performance for the six- and twelve-month periods ended June 30, 2013 was in the 2nd quintile of its peer group. The Fund’s performance for the thirty-six month period ended June 30, 2013 was in the 1st quintile of its peer group. Based upon their review, the Trustees concluded that the Fund’s performance was satisfactory relative to the performance of funds with similar investment objectives and relevant indices, and that the advisory fee was reasonable in light of the services received by the Fund from the Advisor and the other factors considered.
Touchstone Conservative Allocation Fund. The Fund’s advisory fee and total expense ratio (net of applicable expense waivers and reimbursements) were above the median and below the median, respectively, of its peer group. The Board noted that the Advisor was currently waiving a portion of the Fund’s fees. The Fund’s performance for the six-month period ended June 30, 2013 was in the 3rd quintile of its peer group. The Fund’s performance for the twelve- and thirty- six-month periods ended June 30, 2013 was in the 4th quintile of its peer group. The Board noted management’s explanation for the Fund’s underperformance. Based upon their review, the Trustees concluded that the Fund’s overall performance was satisfactory relative to the performance of funds with similar investment objectives and relevant indices, and that the advisory fee was reasonable in light of the services received by the Fund from the Advisor and the other factors considered.
Touchstone Balanced Allocation Fund. The Fund’s advisory fee and total expense ratio (net of applicable expense waivers and reimbursements) were above the median and below the median, respectively, of its peer group. The Board noted that the Advisor was currently waiving a portion of the Fund’s fees. The Fund’s performance for the six-, twelve- and thirty-six-month periods ended June 30, 2013 was in the 4th quintile of its peer group. The Board noted management’s explanation for the Fund’s underperformance. Based upon their review, the Trustees concluded that the Fund’s overall performance was satisfactory relative to the performance of funds with similar investment objectives and relevant indices, and that the advisory fee was reasonable in light of the services received by the Fund from the Advisor and the other factors considered.
Touchstone Moderate Growth Allocation Fund. The Fund’s advisory fee and total expense ratio (net of applicable expense waivers and reimbursements) were above the median and below the median, respectively, of its peer group. The Board noted that the Advisor was currently waiving a portion of the Fund’s fees. The Fund’s performance for the six- and twelve-month periods ended June 30, 2013 was in the 4th quintile of its peer group. The Fund’s performance for the thirty-six-month period ended June 30, 2013 was in the 3rd quintile of its peer group. The Board noted management’s explanation for the Fund’s underperformance. Based upon their review,
Other Items (Unaudited) (Continued)
the Trustees concluded that the Fund’s overall performance was satisfactory relative to the performance of funds with similar investment objectives and relevant indices, and that the advisory fee was reasonable in light of the services received by the Fund from the Advisor and the other factors considered.
Touchstone Growth Allocation Fund. The Fund’s advisory fee and total expense ratio (net of applicable expense waivers and reimbursements) were below the median and above the median, respectively, of its peer group. The Board noted that the Advisor was currently waiving a portion of the Fund’s fees. The Board took into account management’s discussion of the Fund’s expenses, including the impact that the relatively small size of the Fund has upon expenses. The Fund’s performance for the six-, twelve- and thirty-six-month periods ended June 30, 2013 was in the 5th quintile of its peer group. The Board noted management’s explanation for the Fund’s underperformance. Based upon their review, the Trustees concluded that the Fund’s overall performance was satisfactory relative to the performance of funds with similar investment objectives and relevant indices, and that the advisory fee was reasonable in light of the services received by the Fund from the Advisor and the other factors considered. The Fund’s advisory fee and total expense ratio (net of applicable expense waivers and reimbursements) were below the median and above the median, respectively, of its peer group. The Board noted that the Advisor was currently waiving a portion of the Fund’s fees. The Board took into account management’s discussion of the Fund’s expenses, including the impact that the relatively small size of the Fund has upon expenses. The Fund’s performance for the six-, twelve- and thirty-six-month periods ended June 30, 2013 was in the 5th quintile of its peer group. The Board noted management’s explanation for the Fund’s underperformance. Based upon their review, the Trustees concluded that the Fund’s overall performance was satisfactory relative to the performance of funds with similar investment objectives and relevant indices, and that the advisory fee was reasonable in light of the services received by the Fund from the Advisor and the other factors considered.
Economies of Scale. The Board considered the effect of each Fund’s current size and potential growth on its performance and expenses. The Board considered the effective advisory fees under the Investment Advisory Agreement as a percentage of assets at different asset levels and possible economies of scale that might be realized if the assets of each Fund increase. The Board noted that the advisory fee schedules for the Funds contain breakpoints that would reduce the respective advisory fee rate on assets above specified levels as the respective Fund’s assets increased. The Board also noted that if a Fund’s assets increase over time, the Fund also might realize other economies of scale if assets increase proportionally more than certain other expenses. The Board also considered the fact that, under the Investment Advisory Agreement, the advisory fee payable to the Advisor by a Fund was reduced by the total sub-advisory fee paid by the Advisor to the Fund’s Sub-Advisor.
Conclusion. In considering the renewal of the Funds’ Investment Advisory Agreement, the Board, including the Independent Trustees, did not identify any single factor as controlling, and each Trustee may have attributed different weights to the various factors. The Trustees evaluated all information available to them on a Fund-by-Fund basis, and their determinations were made separately with respect to each Fund. The Board reached the following conclusions regarding the Funds’ Investment Advisory Agreement with the Advisor, among others: (a) the Advisor demonstrated that it possesses the capability and resources to perform the duties required of it under the Investment Advisory Agreement; (b) the Advisor maintains an appropriate compliance program; (c) the overall performance of each Fund is satisfactory relative to the performance of funds with similar investment objectives and relevant indices; and (d) each Fund’s advisory fee is reasonable in light of the services received by the Fund from the Advisor and the other factors considered. Based on their conclusions, the Trustees determined with respect to each Fund that continuation of the Investment Advisory Agreement was in the best interests of the Fund and its shareholders.
In approving the applicable Funds’ Sub-Advisory Agreement, the Board considered various factors with respect to each Fund and the Sub-Advisory Agreement, among them: (1) the nature, extent and quality of services provided to the Fund, including the personnel providing such services; (2) the Sub-Advisor’s compensation; (3) a comparison of the sub-advisory fee and performance with other advisers; and (4) the terms of the Sub-Advisory
Other Items (Unaudited) (Continued)
Agreement. The Board’s analysis of these factors is set forth below. The Independent Trustees were advised by independent legal counsel throughout the process.
Nature, Extent and Quality of Services Provided; Investment Personnel. The Board considered information provided by the Advisor regarding the services provided by the Sub-Advisor, including information presented periodically throughout the previous year. The Board noted that, on a periodic basis, the Board meets with portfolio managers of the Sub-Advisor to discuss their performance and investment processes and strategies. The Board considered the Sub-Advisor’s level of knowledge and investment style. The Board reviewed the experience and credentials of the investment personnel who are responsible for managing the investment of portfolio securities with respect to the Funds. The Board also noted the Sub-Advisor’s brokerage practices.
Sub-Advisor’s Compensation, Profitability and Economies of Scale. The Board also took into consideration the financial condition of the Sub-Advisor and any indirect benefits derived by the Sub-Advisor and its affiliates from the Sub-Advisor’s relationship with the Funds. In considering the profitability to the Sub-Advisor of its relationship with the Funds, the Board noted the undertaking of the Advisor to maintain expense limitations for the Funds and also noted that the sub-advisory fees under the Sub-Advisory Agreement were paid by the Advisor out of the advisory fees that it receives under the Investment Advisory Agreement and are negotiated at rm’s-length. As a consequence, the profitability to the Sub-Advisor of its relationship with a Fund was not a substantial factor in the Board’s deliberations. For similar reasons, the Board did not consider the potential economies of scale in the Sub-Advisor’s management of the Funds to be a substantial factor in its consideration, although the Board noted that the sub-advisory fee schedule for each Fund contained breakpoints that would reduce the sub-advisory fee rate on assets above specified levels if the Fund’s assets increased.
Sub-Advisory Fees and Fund Performance. The Board considered that each Fund pays an advisory fee to the Advisor and that the Advisor pays a sub-advisory fee to the Sub-Advisor out of the advisory fees it receives from the respective Funds. The Board considered the amount retained by the Advisor and the sub-advisory fees paid to the Sub-Advisor with respect to the various services provided by the Advisor and the Sub-Advisor. The Board also noted that the Advisor negotiated the sub-advisory fee with the Sub-Advisor at arm’s-length. The Board reviewed the sub-advisory fee for each Fund in relation to various comparative data, including the median and average sub-advisory fees of each Fund’s peer group, and considered the following information:
Touchstone Conservative Allocation Fund. The Fund’s sub-advisory fee was below the median of its peer group. Based upon their review, the Trustees concluded that the sub-advisory fee was reasonable in light of the services received by the Fund from the Sub-Advisor and the other factors considered.
Touchstone Balanced Allocation Fund. The Fund’s sub-advisory fee was below the median of its peer group. Based upon their review, the Trustees concluded that the sub-advisory fee was reasonable in light of the services received by the Fund from the Sub-Advisor and the other factors considered.
Touchstone Moderate Growth Allocation Fund. The Fund’s sub-advisory fee was below the median of its peer group. Based upon their review, the Trustees concluded that the sub-advisory fee was reasonable in light of the services received by the Fund from the Sub-Advisor and the other factors considered.
Touchstone Growth Allocation Fund. The Fund’s sub-advisory fee was below the median of its peer group. Based upon their review, the Trustees concluded that the sub-advisory fee was reasonable in light of the services received by the Fund from the Sub-Advisor and the other factors considered.
As noted above, the Board considered each Fund’s performance during the six-month, twelve- month and thirty-six-month periods ended June 30, 2013 as compared to each Fund’s peer group and noted that the Board reviews on a quarterly basis detailed information about each Fund’s performance results, portfolio composition and investment strategies. The Board also noted the Advisor’s expertise and resources in monitoring the performance, investment style and risk- adjusted performance of the Sub-Advisor. The Board also was mindful of the Advisor’s
Other Items (Unaudited) (Continued)
ongoing monitoring of the Sub-Advisor’s performance and the measures undertaken by the Advisor to address any underperformance.
Conclusion. In considering the renewal of the Sub-Advisory Agreement with respect to each applicable Fund, the Board, including the Independent Trustees, did not identify any single factor as controlling, and each Trustee may have attributed different weights to the various factors. The Board reached the following conclusions regarding the Sub-Advisory Agreement with respect to each Fund, among others: (a) the Sub-Advisor is qualified to manage each Fund’s assets in accordance with the Fund’s investment goals and policies; (b) the Sub-Advisor maintains an appropriate compliance program; (c) the overall performance of each Fund is satisfactory relative to the performance of funds with similar investment objectives and relevant indices; (d) each Fund’s sub-advisory fee is reasonable in light of the services received by the Fund from the Sub-Advisor and the other factors considered; and (e) the Sub-Advisor’s investment strategies are appropriate for pursuing the investment goals of each Fund. Based on its conclusions, the Board determined that approval of the Sub-Advisory Agreement with respect to each applicable Fund was in the best interests of the Fund and its shareholders.
Management of the Trust (Unaudited)
Listed below is required information regarding the Trustees and principal officers of the Trust. The Trust’s Statement of Additional Information includes additional information about the Trustees and is available, without charge, upon request by calling 1.800.543.0407 or by visiting the Touchstone website at www.touchstoneinvestments.com.
Interested Trustees1:
| | | | | | | | | Number | | |
| | | | | | | | | of Funds | | |
| | | | | | | | | Overseen | | |
| | | | | Term of | | | | in the | | |
| Name | | Position(s) | | Office2 And | | | | Touchstone | | Other |
| Address | | Held with | | Length of | | Principal Occupation(s) | | Fund | | Directorships |
| Age | | Trust | | Time Served | | During Past 5 Years | | Complex3 | | Held During the Past 5 Years4 |
Jill T. McGruder Touchstone Advisors, Inc 303 Broadway Suite 1100 Cincinnati, OH 45202 Year of Birth: 1955 | | Trustee and President | | Until retirement at age 75 or until she resigns or is removed Trustee since 1999 | | President and CEO of IFS Financial Services, Inc. (a holding company) from 1999 to the present. | | 49 | | Director of LaRosa’s, Inc. (a restaurant chain) from 1999 to the present, IFS Financial Services, Inc. (a holding company) from 1999 to the present, Integrity and National Integrity Life Insurance Co. from 2005 to the present, Touchstone Securities (the Trust’s distributor) from 1999 to the present, Touchstone Advisors (the Trust’s investment advisor and administrator) from 1999 to the present, W&S Brokerage Services ( a brokerage company) from 1999 to the present and W&S Financial Group Distributors (a distribution company) from 1999 to the present. |
| | | | | | | | | | | |
| Independent Trustees: |
Phillip R. Cox c/o Touchstone Advisors, Inc. 303 Broadway Suite 1100 Cincinnati, OH 45202 Year of Birth: 1947 | | Trustee | | Until retirement at age 75 or until he resigns or is removed Trustee since 1999 | | President and Chief Executive Officer of Cox Financial Corp. (a financial services company) from 1971 to the present. | | 49 | | Director of Cincinnati Bell (a communications company) from 1994 to the present, Bethesda Inc. (a hospital) from 2005 to the present, Timken Co. (a manufacturing company) from 2004 to the present and Diebold, Inc. (a technology solutions company) from 2004 to the present. |
| | | | | | | | | | | |
William C. Gale c/o Touchstone Advisors, Inc. 303 Broadway Suite 1100 Cincinnati, OH 45202 Year of Birth: 1952 | | Trustee | | Until retirement at age 75 or until he resigns or is removed Trustee since 2013 | | Senior Vice President (from 2003 to the present) and Chief Financial Officer (from 1995 to the present) of Cintas Corporation (a business services company). | | 49 | | None. |
| | | | | | | | | | | |
Susan J. Hickenlooper, CFA c/o Touchstone Advisors, Inc. 303 Broadway Suite 1100 Cincinnati, OH 45202 Year of Birth: 1946 | | Trustee | | Until retirement at age 75 or until she resigns or is removed Trustee since 2009 | | Financial Analyst for Impact 100 (Charitable Organization) from 2012 to present. | | 49 | | Trustee of Gateway Trust (a mutual fund) from 2006-2009, Cincinnati Parks Foundation (a charitable organization) from 2000 to present and Trustee of Episcopal Retirement Homes Foundation from 1998-2011. |
Management of the Trust (Unaudited) (Continued)
Independent Trustees (Continued):
| | | | | | | | | Number | | |
| | | | | | | | | of Funds | | |
| | | | | | | | | Overseen | | |
| | | | | Term of | | | | in the | | |
| Name | | Position(s) | | Office2 And | | | | Touchstone | | Other |
| Address | | Held with | | Length of | | Principal Occupation(s) | | Fund | | Directorships |
| Age | | Trust | | Time Served | | During Past 5 Years | | Complex3 | | Held During the Past 5 Years4 |
Kevin A. Robie5 c/o Touchstone Advisors, Inc. 303 Broadway Suite 1100 Cincinnati, OH 45202 Year of Birth: 1956 | | Trustee | | Until retirement at age 75 or until he resigns or is removed Trustee since 2013 | | Vice President of Portfolio Management at Soin International LLC (a multinational holding company) from 2004 to the present. | | 49 | | Director of Buckeye EcoCare, Inc. (a lawn care company) from 2013 to the present, Trustee of Dayton Region New Market Fund, LLC (a private fund) from 2010 to present, Trustee of the Entrepreneurs Center, Inc. (a small business incubator) from 2006 to the present and Director of Interventional Imaging, Inc. (a medical device company) from 2004 to 2011. |
| | | | | | | | | | | |
Edward J. VonderBrink5 c/o Touchstone Advisors, Inc. 303 Broadway Suite 1100 Cincinnati, OH 45202 Year of Birth: 1944 | | Trustee | | Until retirement at age 75 or until he resigns or is removed Trustee since 2013 | | Consultant, VonderBrink Consulting LLC from 2000 to the present. | | 49 | | Director of Streamline Health Solutions, Inc. (healthcare IT) from 2006 to the present and Mercy Health Foundation from 2007 to the present. |
| 1 | Ms. McGruder, as a director of the Advisor and the Trust's Distributor, and an officer of affiliates of the Advisor and the Trust's Distributor, is an “interested person” of the Trust within the meaning of Section 2(a)(19) of the 1940 Act. |
| 2 | Each Trustee is elected to serve until the age of 75 or until he or she sooner resigns or is removed. |
| 3 | As of December 31, 2013, the Touchstone Fund Complex consisted of 18 Series of the Trust, 3 series of Touchstone Tax-Free Trust ,13 series of Touchstone Funds Group Trust, 4 series of Touchstone Investment Trust, 1 series of Touchstone Institutional Funds Trust and 10 variable annuity series of Touchstone Variable Series Trust. |
| 4 | Each Trustee is also a Trustee of Touchstone Variable Series Trust, Touchstone Institutional Funds Trust, Touchstone Investment Trust, Touchstone Strategic Trust, and Touchstone Tax-Free Trust. |
| 5 | Mr. Robie and Mr. VonderBrink were elected to the Board of Trustees at a shareholder meeting held on August 2, 2013. |
Management of the Trust (Unaudited) (Continued)
The following is a list of the Officers of the Trusts, the length of time served and principal occupations for the past five years.
| Principal Officers: | | | | | | |
| | | | | Term of | | |
| Name | | Position(s) | | Office And | | |
| Address | | Held with | | Length of | | Principal Occupation(s) |
| Age | | Trust3 | | Time Served | | During the Past 5 Years |
Jill T. McGruder1 Year of Birth: 1955 | | President and Trustee | | Until resignation, removal or disqualification President since 2006 | | See biography above. |
| | | | | | | |
Steven M. Graziano1 Year of Birth: 1954 | | Vice President | | Until resignation, removal or disqualification Vice President since 2009 | | President of Touchstone Advisors, Inc. |
| | | | | | | |
Timothy D. Paulin1 Year of Birth: 1963 | | Vice President | | Until resignation, removal or disqualification Vice President since 2010 | | Senior Vice President of Investment Research and Product Management of Touchstone Advisors, Inc.; Director of Product Design of Klein Decisions, Inc. 2003-2010. |
| | | | | | | |
Timothy S. Stearns1 Year of Birth: 1963 | | Chief Compliance Officer | | Until resignation, removal or disqualification Chief Compliance Officer since September 2013 | | Senior Vice President and Chief Compliance and Ethics Officer of Envestnet Asset Management, Inc. (2009 to 2013) and Chief Compliance Officer, Americas of Franklin Templeton Investments (1997 to 2009). |
| | | | | | | |
Terrie A. Wiedenheft1 Year of Birth: 1962 | | Controller and Treasurer | | Until resignation, removal or disqualification Controller and Treasurer since 2006 | | Senior Vice President, Chief Financial Officer and Chief Operations Officer of IFS Financial Services, Inc. (a holding company). |
| | | | | | | |
Elizabeth R. Freeman2 Year of Birth: 1962 | | Secretary | | Until resignation, removal or disqualification Secretary since 2011 | | Managing Director and Senior Counsel at BNY Mellon Investment Servicing (US) Inc. |
| 1 | The address of Touchstone Advisors, Inc. is 303 Broadway, Suite 1100, Cincinnati, OH 45202. |
| 2 | The address of BNY Mellon Investment Servicing (US) Inc. is 201 Washington Street, Boston, MA 02108. |
| 3 | Each officer also holds the same office with Touchstone Funds Variable Series Trust, Touchstone Institutional Funds Trust, Touchstone Investment Trust, Touchstone Strategic Trust, and Touchstone Tax-Free Trust. |
This page intentionally left blank.
This page intentionally left blank.
PRIVACY PROTECTION POLICY
We Respect Your Privacy
Thank you for your decision to invest with us. Touchstone and its affiliates have always placed a high value on the trust and confidence our clients place in us. We believe that confidence must be earned and validated through time. In today’s world, when technology allows the sharing of information at light speeds, trust must be reinforced by our sincere pledge to take the steps necessary to ensure that the information you share with us is treated with respect and confidentiality.
Our Pledge to Our Clients
| • | We collect only the information we need to service your account and administer our business. |
| • | We are committed to keeping your information confidential and we place strict limits and controls on the use and sharing of your information. |
| • | We make every effort to ensure the accuracy of your information. |
We Collect the Following Nonpublic Personal Information About You:
| • | Information we receive from you on or in applications or other forms, correspondence, or conversations, including, but not limited to, your name, address, phone number, social security number, assets, income and date of birth; and |
| • | Information about your transactions with us, our affiliates, or others, including, but not limited to, your account number and balance, payment history, parties to transactions, cost basis information, and other financial information. |
Categories of Information We Disclose and Parties to Whom We Disclose
We do not disclose any nonpublic personal information about our current or former clients to nonaffiliated third parties, except as required or permitted by law.
We Place Strict Limits and Controls on the Use and Sharing of Your Information
| • | We restrict access to nonpublic personal information about you to authorized employees who need the information to administer your business. |
| • | We maintain physical, electronic and procedural safeguards that comply with federal standards to protect this information. |
| • | We do not disclose any nonpublic personal information about our current or former clients to anyone, except as required or permitted by law or as described in this document. |
| • | We will not sell your personal information to anyone. |
We May Provide Information to Service Your Account
Sometimes it is necessary to provide information about you to various companies such as transfer agents, custodians, broker-dealers and marketing service firms to facilitate the servicing of your account. These organizations have a legitimate business need to see some of your personal information in order for us to provide service to you. We may disclose to these various companies the information that we collect as described above. We require that these companies, including our own subsidiaries and affiliates, strictly maintain the confidentiality of this information and abide by all applicable laws. Companies within our corporate family that may receive this information are financial service providers and insurance companies. We do not permit these associated companies to sell the information for their own purposes, and we never sell our customer information.
This policy is applicable to the following affiliated companies: Touchstone Funds Group Trust, Touchstone Investment Trust, Touchstone Strategic Trust, Touchstone Tax-Free Trust, Touchstone Variable Series Trust, Touchstone Institutional Funds Trust, Touchstone Securities, Inc.* and W&S Brokerage Services, Inc.
* Touchstone Securities, Inc. serves as the underwriter to the Touchstone Funds.
A Member of Western & Southern Financial Group®
The Privacy Protection Policy is not part of the Annual Report.


Touchstone Investments
Distributor
Touchstone Securities, Inc.*
303 Broadway
Cincinnati, Ohio 45202-4203 800.638.8194
www.touchstoneinvestments.com
Investment Advisor
Touchstone Advisors, Inc.*
303 Broadway
Cincinnati, Ohio 45202-4203
Transfer Agent
BNY Mellon Investment Servicing (US) Inc.
4400 Computer Drive
Westborough, MA 01581
Shareholder Service
800.543.0407
* A Member of Western & Southern Financial Group
TSF-54CC-TST-AR-1312
Item 2. Code of Ethics.
| (a) | The registrant, as of the end of the period covered by this report, has adopted a code of ethics that applies to the registrant’s principal executive officer, principal financial officer, principal accounting officer or controller, or persons performing similar functions, regardless of whether these individuals are employed by the registrant or a third party. |
| (c) | There have been no amendments, during the period covered by this report, to a provision of the code of ethics that applies to the registrant’s principal executive officer, principal financial officer, principal accounting officer or controller, or persons performing similar functions, regardless of whether these individuals are employed by the registrant or a third party, and that relates to any element of the code of ethics description. |
| (d) | The registrant has not granted any waivers, including an implicit waiver, from a provision of the code of ethics that applies to the registrant’s principal executive officer, principal financial officer, principal accounting officer or controller, or persons performing similar functions, regardless of whether these individuals are employed by the registrant or a third party, that relates to one or more of the items set forth in paragraph (b) of this item’s instructions. |
Item 3. Audit Committee Financial Expert.
The registrant’s Board of Trustees has determined that the registrant has at least one audit committee financial expert serving on its audit committee. Mr. William Gale is the registrant’s audit committee financial expert and is an independent trustee within the meaning of the Investment Company Act of 1940, as amended (the “1940 Act”).
Item 4. Principal Accountant Fees and Services.
Audit Fees
| (a) | The aggregate fees billed for each of the last two fiscal years for professional services rendered by the principal accountant for the audit of the registrant's annual financial statements or services that are normally provided by the accountant in connection with statutory and regulatory filings or engagements for those fiscal years are $65,000 for 2013 and $85,680 for 2012. |
Audit-Related Fees
| (b) | Audit related fees totaled $0 for 2013 and $0 for 2012, respectively. |
Tax Fees
| (c) | The aggregate fees billed in each of the last two fiscal years for professional services rendered by the principal accountant for tax compliance, tax advice, and tax planning are $27,000 for 2013 and $25,000 for 2012. Fees relate to the preparation of federal income and excise tax returns and review of capital gains distribution calculations. |
All Other Fees
| (d) | The aggregate fees billed in each of the last two fiscal years for products and services provided by the principal accountant, other than the services reported in paragraphs (a) through (c) of this Item are $7,007 for 2013 and $0 for 2012, respectively. The fees related to the PFIC Analyzer and Global Withholding Tax Reporter subscriptions. |
| (e)(1) | Disclose the audit committee's pre-approval policies and procedures described in paragraph (c)(7) of Rule 2-01 of Regulation S-X. |
The Audit Committee’s pre-approval policies describe the types of audit, audit-related, tax and other services that have the general pre-approval of the Audit Committee. The pre-approval policies provide that annual audit service fees, tax services not specifically granted pre-approval, services exceeding pre-approved cost levels and other services that have not received general pre-approval will be subject to specific pre-approval by the Audit Committee. The pre-approval policies further provide that the Committee may grant general pre-approval to other audit services (statutory audits and services associated with SEC registration statements, periodic reports and other documents filed with the SEC or other documents issued in connection with securities offerings), audit-related services (accounting consultations related to accounting, financial reporting or disclosure matters not classified as “audit services,” assistance with understanding and implementing new accounting and financial reporting guidance from rulemaking authorities, agreed-upon or expanded audit procedures related to accounting and/or billing records required to respond to or comply with financial, accounting or regulatory reporting matters and assistance with internal control reporting requirements under Form N-SAR and Form N-CSR), tax services that have historically been provided by the auditor that the Committee believes would not impair the independence of the auditor and are consistent with the SEC’s rules on auditor independence and permissible non-audit services classified as “all other services” that are routine and recurring services.
| (e)(2) | All of the services described in paragraphs (b) through (d) of Item 4 were approved by the Audit Committee. |
| (f) | The percentage of hours expended on the principal accountant's engagement to audit the registrant's financial statements for the most recent fiscal year that were attributed to work performed by persons other than the principal accountant's full-time, permanent employees was less than fifty percent. |
| (g) | The aggregate non-audit fees for Touchstone Strategic Trust (December Funds) and certain entities*, for each of the last two fiscal years of the registrant was $34,007 for 2013 and $25,000 for 2012. |
* These include the advisors (excluding sub-advisors) and any entity controlling, controlled by or under common control with the advisors that provides ongoing services to the registrant (Funds)
| (h) | The registrant's audit committee of the board of trustees has considered whether the provision of non-audit services that were rendered to the registrant's investment adviser (not including any sub-adviser whose role is primarily portfolio management and is subcontracted with or overseen by another investment adviser), and any entity controlling, controlled by, or under common control with the investment adviser that provides ongoing services to the registrant that were not pre-approved pursuant to paragraph (c)(7)(ii) of Rule 2-01 of Regulation S-X is compatible with maintaining the principal accountant's independence. |
Item 5. Audit Committee of Listed Registrants.
Not applicable.
Item 6. Investments.
| (a) | Schedule of Investments in securities of unaffiliated issuers as of the close of the reporting period is included as part of the report to shareholders filed under Item 1 of this form. |
Item 7. Disclosure of Proxy Voting Policies and Procedures for Closed-End Management Investment Companies.
Not applicable.
Item 8. Portfolio Managers of Closed-End Management Investment Companies.
Not applicable.
Item 9. Purchases of Equity Securities by Closed-End Management Investment Company and Affiliated Purchasers.
Not applicable.
Item 10. Submission of Matters to a Vote of Security Holders.
There have been no material changes to the procedures by which the shareholders may recommend nominees to the registrant’s board of trustees, where those changes were implemented after the registrant last provided disclosure in response to the requirements of Item 407(c)(2)(iv) of Regulation S-K (17 CFR 229.407) (as required by Item 22(b)(15) of Schedule 14A (17 CFR 240.14a-101)), or this Item.
Item 11. Controls and Procedures.
| (a) | The registrant’s principal executive and principal financial officers, or persons performing similar functions, have concluded that the registrant’s disclosure controls and procedures (as defined in Rule 30a-3(c) under the Investment Company Act of 1940, as amended (the “1940 Act”) (17 CFR 270.30a-3(c))) are effective, as of a date within 90 days of the filing date of the report that includes the disclosure required by this paragraph, based on their evaluation of these controls and procedures required by Rule 30a-3(b) under the 1940 Act (17 CFR 270.30a-3(b)) and Rules 13a-15(b) or 15d-15(b) under the Securities Exchange Act of 1934, as amended (17 CFR 240.13a-15(b) or 240.15d-15(b)). |
| (b) | There were no changes in the registrant’s internal control over financial reporting (as defined in Rule 30a-3(d) under the 1940 Act (17 CFR 270.30a-3(d)) that occurred during the registrant’s second fiscal quarter of the period covered by this report that has materially affected, or is reasonably likely to materially affect, the registrant’s internal control over financial reporting. |
Item 12. Exhibits.
| (a)(1) | Code of ethics, or any amendment thereto, that is the subject of disclosure required by Item 2 is attached hereto. |
| (a)(2) | Certifications pursuant to Rule 30a-2(a) under the 1940 Act and Section 302 of the Sarbanes-Oxley Act of 2002 are attached hereto. |
| (b) | Certifications pursuant to Rule 30a-2(b) under the 1940 Act and Section 906 of the Sarbanes- Oxley Act of 2002 are attached hereto. |
(12.other) Not applicable.
SIGNATURES
Pursuant to the requirements of the Securities Exchange Act of 1934 and the Investment Company Act of 1940, the registrant has duly caused this report to be signed on its behalf by the undersigned, thereunto duly authorized.
(Registrant) Touchstone Strategic Trust
By (Signature and Title)* /s/ Jill T. McGruder
Jill T. McGruder, President
(principal executive officer)
Date 02/28/14
Pursuant to the requirements of the Securities Exchange Act of 1934 and the Investment Company Act of 1940, this report has been signed below by the following persons on behalf of the registrant and in the capacities and on the dates indicated.
By (Signature and Title)* /s/ Jill T. McGruder
Jill T. McGruder, President
(principal executive officer)
Date 02/28/14
By (Signature and Title)* /s/ Terrie A. Wiedenheft
Terrie A. Wiedenheft, Controller and Treasurer
(principal financial officer)
Date 02/28/14
* Print the name and title of each signing officer under his or her signature.