UNITED STATES
SECURITIES AND EXCHANGE COMMISSION
Washington, D.C. 20549
FORM N-CSR
CERTIFIED SHAREHOLDER REPORT OF REGISTERED MANAGEMENT INVESTMENT COMPANIES
Investment Company Act file number 811-03651
Touchstone Strategic Trust – June Funds
(Exact name of registrant as specified in charter)
303 Broadway, Suite 1100
Cincinnati, Ohio 45202-4203
(Address of principal executive offices) (Zip code)
Jill T. McGruder
303 Broadway, Suite 1100
Cincinnati, Ohio 45202-4203
(Name and address of agent for service)
Registrant's telephone number, including area code: 800-638-8194
Date of fiscal year end: June 30
Date of reporting period: June 30, 2013
Form N-CSR is to be used by management investment companies to file reports with the Commission not later than 10 days after the transmission to stockholders of any report that is required to be transmitted to stockholders under Rule 30e-1 under the Investment Company Act of 1940 (17 CFR 270.30e-1). The Commission may use the information provided on Form N-CSR in its regulatory, disclosure review, inspection, and policymaking roles.
A registrant is required to disclose the information specified by Form N-CSR, and the Commission will make this information public. A registrant is not required to respond to the collection of information contained in Form N-CSR unless the Form displays a currently valid Office of Management and Budget ("OMB") control number. Please direct comments concerning the accuracy of the information collection burden estimate and any suggestions for reducing the burden to Secretary, Securities and Exchange Commission, 100 F Street, NE, Washington, DC 20549. The OMB has reviewed this collection of information under the clearance requirements of 44 U.S.C. § 3507.
Item 1. Reports to Stockholders.
The Report to Shareholders is attached herewith.
June 30, 2013
Annual Report
Touchstone Strategic Trust
Touchstone Capital Growth Fund
Touchstone International Small Cap Fund
Touchstone Mid Cap Value Opportunities Fund
Touchstone Small Cap Value Opportunities Fund
Touchstone Value Fund

Table of Contents
| | Page |
| Letter from the President | 3 |
| Management's Discussion of Fund Performance (Unaudited) | 4 - 19 |
| Tabular Presentation of Portfolios of Investments (Unaudited) | 20 - 21 |
| Portfolio of Investments: | |
| Touchstone Capital Growth Fund | 22 |
| Touchstone International Small Cap Fund | 24 |
| Touchstone Mid Cap Value Opportunities Fund | 26 |
| Touchstone Small Cap Value Opportunities Fund | 28 |
| Touchstone Value Fund | 30 |
| Statements of Assets and Liabilities | 32 - 35 |
| Statements of Operations | 36 - 37 |
| Statements of Changes in Net Assets | 38 - 41 |
| Statements of Changes in Net Assets - Capital Stock Activity | 42 - 46 |
| Financial Highlights | 47 - 58 |
| Notes to Financial Statements | 59 - 72 |
| Report of Independent Registered Public Accounting Firm | 73 |
| Other Items (Unaudited) | 74 - 79 |
| Management of the Trust (Unaudited) | 80 - 82 |
| Privacy Protection Policy | 83 |
Letter from the President
Dear Fellow Shareholder,
We are pleased to provide you with the Touchstone Strategic Trust Annual Report. Inside you will find key financial information, as well as manager commentaries for the Funds, for the 12 months ended June 30, 2013.
Uneven economic conditions and volatility reigned throughout most of the fiscal year. Despite a U.S. Presidential election that left many apprehensive about the potential direction of spending and taxation, and a Congressional “fiscal cliff” that brought the return of the payroll tax, the U.S. economy, although uneven, continued to grow at a moderate pace. Stock market gains and rising home prices helped to bolster consumer confidence, which sparked consumer spending. Employment was also a bright spot as new jobs were added to the economy and the unemployment rate declined. Federal Reserve (the Fed) policy remained accommodative throughout the period as the Fed kept short-term rates in the 0.00% - 0.25% range where they have been since 2008. Domestic equities rallied for most of the period until the Fed indicated it might start scaling back its massive bond-buying program, negatively affecting both equity and bond markets. The resulting pullback in equities shook the confidence of many investors; however, stocks proved much more resilient than many expected.
For the fiscal year, U.S. equity markets posted positive, double-digit returns and outperformed both developed and emerging markets. Value stocks’ performance exceeded their growth counterparts and mid-cap stock returns surpassed those of small- and large-cap stocks, although all capitalizations performed well and also posted double-digit returns.
We believe it remains more important than ever to focus on the long-term composition of your investment portfolio as diversification is essential to balancing risk and return. We recommend that you continue to work with your financial professional on a sound asset allocation strategy to help keep your financial goals on course.
We greatly appreciate your continued support. Thank you for including Touchstone as part of your investment plan.
Sincerely,

Jill T. McGruder
President
Touchstone Strategic Trust
Management's Discussion of Fund Performance (Unaudited)
Touchstone Capital Growth Fund
Sub-Advised by Ashfield Capital Partners, LLC
Investment Philosophy
The Fund seeks long-term capital growth by primarily investing in equity securities of large capitalization companies believed to possess above-average growth potential by utilizing an integrated systematic investment process that combines bottom-up fundamental analysis with a top-down, thematic overlay to construct the Fund’s portfolio.
Fund Performance
The Touchstone Capital Growth Fund (Class A Shares) underperformed its benchmark, the Russell 1000® Growth Index, for the 12-month period ended June 30, 2013. The Fund’s total return was 15.30 percent (calculated excluding the maximum sales charge) while the total return of the benchmark was 17.07 percent for the same period.
Market Environment
The one-year period ended June 30, 2013, brought strong returns for the overall equity markets. At the same time, the fixed income markets—which saw an unprecedented 30-year slide in interest rates—finally experienced a bottoming out and an increase in interest rates. Commodities continued the trend of moderation that had begun in mid-2011 and investors’ view of gold being a safe haven finally saw a topping process unfold, leading to a significant retracement during the one-year period. As liquidity continued to flow forth from central banks, equities reacted positively. Mid- and small-capstocks’ performance exceeded that of their large-cap counterparts and value stocks outperformed growth stocks. Throughout the period, defensive stocks outperformed cyclical stocks. From a factor perspective, performance favored stocks with lower beta1, lower price-to-earnings (P/E), lower market caps, and either a zero-to-low yield or very high yield within the Russell 1000® Growth Index.
Portfolio Review
The major overriding factor that detracted from the Fund’s performance during the period was the lack of demand for cyclically oriented stocks and sectors. Over the past several summers, the markets have experienced a sell-off of cyclically inclined sectors, as the economic data weakened and investor sentiment was driven lower by the self-fulfilling “sell in May” experience. (Often declared as “sell in May and go away,” this adage encourages investors to sell their stock holdings in May to avoid a seasonal decline in equity markets.) During 2013, this phenomenon occurred earlier for the cyclically inclined sectors, thus detracting from Fund performance. And, with the Consumer Discretionary, Energy, Industrials and Information Technology sectors comprising more than two-thirds of the portfolio weight, we believe this trend was very difficult to avoid. Interestingly, in 2013 the economic data did not turn lower as it had in the previous years, possibly allowing for a better rebound once the market normalizes.
The Fund’s worst performing sector during the period was the Information Technology sector, where higher-growth-leaning names underperformed. Higher-growth-leaning is a term that refers to those companies in the technology space that are not considered “mature tech.” (“Mature tech” would be considered companies like Microsoft Corp., Intel Corp. and Hewlett-Packard Co.) Growth technology names are companies experiencing high revenue growth while also reinvesting in their businesses at high levels. The Fund tended to own more of the latter, which were not rewarded during the period.
Among the top contributors to Fund performance were Google Inc. (Information Technology sector), Celgene Corp. (Health Care sector), and Pioneer Natural Resources Co. (Energy sector). Google, a global technology company, continued to lead online and in mobile search businesses from an innovation standpoint, which sent
Management's Discussion of Fund Performance (Unaudited) (Continued)
the company’s shares higher. Company earnings estimates also continued to climb as Google made forays into new businesses and better monetized its existing businesses. Celgene, a global biopharmaceutical company, announced several milestones for their portfolio of drugs, including the approval of REVLIMID in China. The company also achieved FDA approval for its cancer drug POMALYST in February. Overall, Celgene continued to meet or exceed expectations during the period. Pioneer Natural Resources, an independent oil and gas exploration and production company, continued to perform well within its portfolio of drilling properties and issued strong production guidance. The company also entered into an agreement with Sinochem Group, one of China’s largest suppliers of chemical products and sold a 40 percent stake of its interest in its Texas oil-shale acreage, which pushed Pioneer Natural Resources’ stock higher.
Among the largest detractors from Fund performance for the period were Apple Inc., NetEase Inc. and VMware Inc. (all from the Information Technology sector). Shares of Apple, a designer and manufacturer of computers and mobile devices, issued guidance below analysts’ lofty expectations, which hurt the stock. Apple also faced scrutiny over tax-avoidance tactics and experienced slipping margins as higher priced phone sales slowed and competitive pressures weighed on shares. NetEase, an Internet-technology company, missed its third quarter of 2012 earnings and revenue expectations, in addition to experiencing margin erosion. As such, the Fund’s position in the company was sold in November of 2012. Shares of VMware, a provider of virtualization infrastructure solutions, were negatively impacted when the company’s chief executive officer departed in July of 2012. There were also market fears over high penetration of server virtualization software, which led to lower growth projections. As a result, the position was sold in March 2013.
Outlook
We believe that with reasonably low earnings expectations in the U.S. and the prospect for earnings surprises improving, the equity market may advance further in the second half of 2013, despite the likelihood that bond yields will continue to rise over the next 18 months. Going forward, with increased confidence in the U.S. economy and an improvement in Europe’s economy, based on current and leading indicators, we remain committed to holding quality, economically sensitive issues in the Information Technology, Industrials and Consumer Discretionary sectors. And, while our focus remains balanced between established large-cap growth companies and emerging large-cap growth companies, we continue to believe that in a growth-challenged world, companies that can deliver higher-than-average top- and bottom-line growth could be rewarded with higher valuations. As the inter-market forces of defensive versus cyclical securities stabilize over time, we believe the Fund is positioned to benefit from the rebound in cyclical names.
1Beta is a measure of the volatility of a portfolio relative to its benchmark.
Management's Discussion of Fund Performance (Unaudited) (Continued)
Comparison of the Change in Value of a $10,000 Investment in the Touchstone Capital Growth Fund - Class A* and the Russell 1000® Growth Index
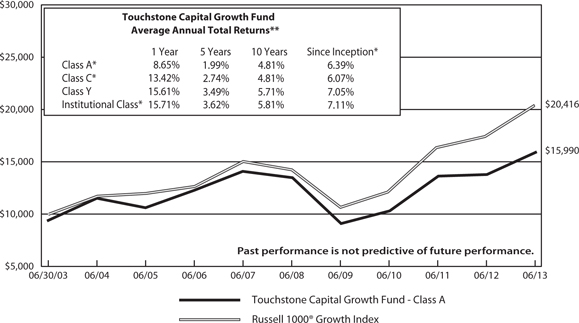
| * | The chart above represents performance for Class A shares only, which will vary from the performance of Class C shares, Class Y shares and Institutional Class shares based on the differences in loads and fees paid by shareholders in the different classes. Class A, Class C, Class Y and Institutional Class shares commenced operations on September 30, 2003, April 12, 2012, November 29, 1996 and December 20, 2006, respectively. Class A shares, Class C shares and Institutional shares performance was calculated using the historical performance of Class Y shares for the periods prior to September 30, 2003, April 12, 2012 and December 20, 2006, respectively. The returns have been restated for sales charges and for fees applicable to Class A, Class C and Institutional Class shares. |
| ** | The average annual total returns shown above are adjusted for maximum applicable sales charges. |
The performance of the above Fund does not reflect the deduction of taxes that a shareholder would pay on Fund distributions or the redemption of Fund shares. The past performance is not predictive of future results.
Note to Chart
The Russell 1000® Growth Index measures the performance of those Russell 1000 companies with higher price-to-book ratios and higher forecasted growth values.
The Frank Russell Company (FRC) is the source and owner of the data contained or reflected in this material and all trademarks and copyrights related thereto. The material may contain confidential information and unauthorized use, disclosure, copying, dissemination or redistribution is strictly prohibited. This is a Touchstone Investments presentation of the data, and FRC is not responsible for the formatting or configuration of this material or for any inaccuracy in the presentation thereof.
Management's Discussion of Fund Performance (Unaudited)
Touchstone International Small Cap Fund
Sub-Advised by Copper Rock Capital Partners LLC
Investment Philosophy
The Touchstone International Small Cap Fund seeks capital appreciation by primarily investing in equity securities of non-U.S. small-cap companies diversified across sectors and industries. The Fund’s investment process seeks to add value through bottom-up stock selection and in-depth fundamental research and searches for companies believed to have strong management, superior earnings growth prospects and attractive relative valuations.
Fund Performance
The Touchstone International Small Cap Fund (Class A Shares) outperformed its benchmark the S&P Developed Ex-U.S. Small Cap Index for the 12-month period ended June 30, 2013. The Fund’s total return was 24.99 percent (calculated excluding the maximum sales charge) while the total return of the benchmark was 18.54 percent.
Market Environment
Investors were generally risk averse in response to the political and economic uncertainties throughout the world. Yet, following economic turmoil early in the period, investors grew more confident due to definitive statements from central banks to stabilize the global financial system. At the onset of 2013, this led to record-breaking rallies in the U.S. and significant positive returns in the international markets. By period end, the tone for the equity markets emphasized the economic recovery, albeit a slow global economic recovery.
The most pronounced impact to the markets during the period was Japan’s policy directives to stimulate its economy and resume consumer confidence by indirect spending to weaken the yen. As a result, Japan’s stock market reacted positively in early 2013, as the Nikkei 225 Index rallied and Japanese stocks outperformed amongst developed-economy stock markets. However, investors later weathered wide swings and extreme volatility in the Japanese market—much of which was attributed to the combination of investors’ uncertainty over whether these policy moves and parliamentary decisions would be lasting, and the natural correction following the dramatic market rally. Regardless, with generally improving consumer and business sentiment, niche businesses in Japan and Europe also benefited, along with niche market leaders in the emerging markets, due to their developing middle classes. In general, the period was representative of a typical market where stock selection mattered and earnings were rewarded, as the economy moved forward and investors saw signs of a global economic recovery.
Portfolio Review
For the period, there was contribution to the Fund’s relative return from stock selection within the Consumer Discretionary, Financials, Materials, Consumer Staples, Energy, and Information Technology sectors. Also as a result of the Fund’s bottom-up stock selection, there was positive contribution to relative return across all regions, along with modest underperformance from stock selection within Japan.
Among the stocks that contributed to Fund performance during the period were Compagnie Plastic Omnium SA (Consumer Discretionary sector), ams AG (Information Technology sector), Avex Group Holdings Inc., (Consumer Discretionary sector), and Ashtead Group PLC (Industrials sector). Compagnie Plastic Omnium, a France-based global auto-parts company, maintained its leading market share in niche products and its unique long-term growth trajectory, as the company benefited from the rising number of vehicle purchases in the emerging markets. The company also posted consistently strong results, which were driven primarily by the increasing penetration of plastic fuel tanks for automobiles. Ams AG, the Austria-based semiconductor manufacturer formerly known as austriamicrosystems AG, had been a long-term holding in the Fund over the period. However,
Management's Discussion of Fund Performance (Unaudited) (Continued)
we sensed pressure in global demand for semiconductors while the market simultaneously became increasingly sensitive to the fact that the supply chain for Apple Inc.2 was beginning to build inventory at an uncomfortable rate. In light of this change in the landscape, coupled with the fact the stock approached our fair-value target, we exited the position in favor of other opportunities. Avex Group Holdings, a Japan-based producer and distributor of entertainment media, benefited from strong momentum during the year. The company’s platform extension into broader goods and distribution significantly boosted earnings contribution per artist or group. Additionally, a long string of popular album releases and high demand for online music offerings led to expanded royalty revenues and expanded returns on invested capital. Ashtead Group is a U.K.-based construction-equipment rental company with assets primarily in the U.S. under the Sunbelt brand name. The company’s prudent capital-expenditures program has resulted in high incremental margins through significantly increased utilization rates and rental yields. Furthermore, we believe Ashtead Group’s young fleet is among the best service proposition for small and medium-sized contractors, and is an efficient branch network operation. We also believe the company is primed to further capitalize on the secular shift as U.S. construction companies move from owned to rented fleets of machinery, as well as the nascent U.S. construction market recovery.
The Fund maintained an underweight position relative to the Index in the Industrials sector during the period, which detracted from relative returns. This, coupled with some modest underperformance in a handful of individual positions, contributed to the sector’s overall underperformance. Among the individual stocks that detracted from performance were Ausdrill Ltd. (Industrials sector), NRW Holdings Ltd. (Industrials sector), Weathernews Inc. (Industrials sector), and ITOCHUTechno-Solutions Corp. (Technology sector). Both Ausdrill, an Australia-based mining service provider, and NRW Holdings, an Australia-based mine services and civil contracting company, were impacted by falling bulk commodity prices against the background of a slowing economy in China. Also, fears of systemic risk in the Chinese banking system halted many areas of new exploration and construction, and left mine service providers with significant overcapacities. As a result, Ausdrill and NRW Holdings were sold during the period, as there was a change in visibility for each stock. Weathernews is a Japan-based provider of weather forecasting and routing services for shipping and railway companies as well as for consumer online applications. Shares of Weathernews declined during the period as network-carrier pricing of the company’s mobile phone application came in significantly lower than expected. This altered expectations of the company’s sustainable profits and capital returns, and, as such, we exited the position in favor of higher and more visible upside opportunities. ITOCHUTechno-Solutions is a Japan-based designer and constructer of computer network systems and software in Japan. The stock’s fundamental results had been sound and the stock outperformed until the fourth quarter of 2012 when the sharp rotation occurred in favor of Japanese stocks that benefited from a sharply weaker yen. This rotation fell on the back of the aggressive stimulus monetary policies from the country’s newly elected government. As a result, ITOCHU Techno-Solutions stock underperformed and its model score deteriorated as its earnings momentum declined. In turn, we exited the position.
Outlook
We remain positive on our outlook for global markets, as steady, improving U.S. economic growth is acknowledged by both U.S.-based investors and non-U.S. based investors. Additionally, we believe valuations remain generally reasonable outside of the U.S. and earnings growth is accelerating within small corporations that can finance their own growth and offer innovative products and services despite the moderate global economy.
Going forward, we anticipate the economic recovery should produce an environment of commitment from investors. We believe the markets are indeed differentiating between successful and unsuccessful business models, thus offering stock pickers opportunities to add alpha1 in the foreseeable future.
1Alpha is the portion of a portfolio's total return that is unique to that portfolio and is independent of movements in its benchmark.
2Apple Inc. was not a fund holding on June 30, 2013.
Management's Discussion of Fund Performance (Unaudited) (Continued)
Comparison of the Change in Value of a $10,000 Investment in the Touchstone International Small Cap Fund - Class A* and the S&P Developed Ex-U.S. Small Cap Index

| * | The chart above represents performance for Class A shares only, which will vary from the performance of Class C shares, Class Y shares and Institutional Class shares based on the differences in loads and fees paid by shareholders in the different classes. Class A, Class C, Class Y and Institutional Class shares commenced operations on July 31, 2003, April 12, 2012, December 31, 1996 and December 20, 2006, respectively. Class A shares, Class C shares and Institutional shares performance was calculated using the historical performance of Class Y shares for the periods prior to July 31, 2003, April 12, 2012 and December 20, 2006, respectively. The returns have been restated for sales charges and for fees applicable to Class A, Class C and Institutional Class shares. |
| ** | The average annual total returns shown above are adjusted for maximum applicable sales charges. |
The performance of the above Fund does not reflect the deduction of taxes that a shareholder would pay on Fund distributions or the redemption of Fund shares. The past performance is not predictive of future results.
Note to Chart
The S&P Developed Ex-U.S. Small Cap Index is an unmanaged index of small-cap stocks from developed countries, excluding the United States.
Management's Discussion of Fund Performance (Unaudited)
Touchstone Mid Cap Value Opportunities Fund
Sub-Advised by Thompson Siegel & Walmsley LLC
Investment Philosophy
The Fund seeks long-term capital growth by primarily investing in equity securities of mid-cap companies that are believed to present value that is not reflected by prevailing market prices or that have experienced fundamental changes and are intrinsically undervalued by the investment community. Using a combination of quantitative and qualitative methods, a company’s attractiveness is assessed in an effort to understand why the market may be mispricing the stocks, what factors are changing that can return the stock to fair value and whether those changes are sustainable over a medium term investment horizon based on both absolute and sector-relative valuation of cash flows, the relative earnings prospects of the company and the stock’s recent price action.
Fund Performance
The Touchstone Mid Cap Value Opportunities Fund (Class A Shares) outperformed its benchmark, the Russell Midcap® Value Index, for the 12-month period ended June 30, 2013. The Fund’s total return was 31.36 percent (calculated excluding the maximum sales charge) while the total return of the benchmark was 27.65 percent for the same period.
Market Environment
During the one-year period, the European Central Bank managed to eliminate the worst fears from the minds of investors around mid-year 2012, and equities rallied into year-end and through most of the first half of 2013. Investors’ risk appetite was not the driver of returns however, unlike in previous rallies since the beginning of the financial crisis. Though the market favored value, performance was mixed between defensive and cyclical sectors, and the market dynamic was ultimately stock specific.
Portfolio Review
The Fund outperformed its benchmark for the one-year period based predominantly on stock selection, though sector allocation was also positive during the period. The Consumer Discretionary and Health Care sectors were the leading sectors that contributed to the Fund’s positive returns. The Fund was overweight in both of these top-performing sectors and value was also added through stock selection. A wide variety of consumer stocks added to performance, especially retailers and media companies. Investors moved through industries as they searched for pockets of inexpensive stocks—first running up valuations for service companies and health maintenance organizations (HMOs), and only later rotating into pharmaceuticals. Holdings within the Industrials sector detracted from performance primarily because the Fund was underweight this top-performing sector.
Among the individual stocks that contributed to Fund performance during the period were GameStop Corp. (Consumer Discretionary sector), T-Mobile US Inc. (Telecommunication Services sector), H&R Block Inc. (Consumer Discretionary sector), Symantec Corp. (Information Technology sector), and Western Digital Corp. (Information Technology sector). Shares of GameStop, a multichannel video game retailer, rallied sharply with anticipation of an upswing in the gaming console cycle. Upcoming console launches by Sony Corp. and Microsoft Corp. helped drive positive sentiment around this video gaming retailer. T-Mobile US, a wireless carrier, rallied for a number of reasons, including the completion of its merger with Metro PCS, its first official iPhone launch, and continued build out of the higher-speed LTE network. H&R Block, a tax-preparation services company, experienced a number of positive events during the period, including a strong outlook for tax filings industry-wide, increased gain in market share, and analyst upgrades. Symantec, a network security provider, announced that the company’s chairman of the board would take over as chief executive officer, which the market viewed as a potential catalyst for unlocking value. Western Digital, a hard disk drive maker, significantly beat earnings
Management's Discussion of Fund Performance (Unaudited) (Continued)
expectations. Additionally, the company expects positive results going forward due to cost savings from its acquisition of Hitachi, and its upcoming rollout of Windows 8.
Among the individual stocks that detracted from performance were Energy XXI (Bermuda) Ltd. (Energy sector), DeVry, Inc. (Consumer Discretionary sector), Annaly Capital Management, Inc. (Financials sector), CF Industries Holdings Inc. (Materials sector), and Windstream Corp. (Telecommunication Services sector). Energy XXI (Bermuda), an oil exploration and production company, experienced weather-related delays that resulted in reduced production output during the first quarter of 2013. Commodity price declines during the second quarter of 2013 further weighed on the stock. DeVry, a for-profit education provider, was hindered by an industry-wide phenomenon of higher costs to attract new students, including increased advertising and scholarships. The Fund eliminated the position in late 2012. Shares of Annaly Capital Management, a U.S. mortgage Real Estate Investment Trust (REIT), declined over the period, despite announcing a new chief executive officer and an acquisition intended to diversify its portfolio of mortgage-backed securities. The company also suffered during the period as rising concerns over interest rates weighed on dividend-yielding stocks, especially REITs. The company, which had offered a double-digit dividend yield, was particularly affected by concerns over interest rates. CF Industries Holdings, a fertilizer producer, reported record profits and surpassed analyst expectations during the second quarter of 2013; however, a lack of outlook comments for the second half of 2013 caused the stock to sell-off. Windstream, a voice and data services provider, came under pressure after a competitor announced a significant dividend cut, which sent shares lower.
Outlook
Looking ahead, we believe growth in the U.S. economy is stable but slow, with much of the strength coming from the recovering auto and housing markets. Corporate balance sheets are sound, even cash-heavy; but, with profit margins near historic levels, we expect earnings will be under pressure over the next few years. Growth must come mainly from rising revenues, which should remain elusive until the U.S. manages a return to trend Gross Domestic Product (GDP) growth. The government is playing a major role in how the economic cycle plays out. In our opinion, the U.S. Federal Reserve Board (the Fed) must manage an artful exit from its position supporting this fragile recovery as it becomes self-sustaining. The timing and circumstances of the next fiscal policy debate could complicate or simplify that maneuver.
Even after the market’s correction in the second quarter of 2013, the strong equity rally of the last year has left few, if any, broad swathes of undervalued stocks in the market. Increasingly, investors have to be selective to find those companies where opportunity and risk are not adequately reflected by price. The Fund’s disciplined investment process favors this type of market environment.
Management's Discussion of Fund Performance (Unaudited) (Continued)
Comparison of the Change in Value of a $10,000 Investment in the Touchstone Mid Cap Value Opportunities Fund - Class A* and the Russell Midcap® Value Index
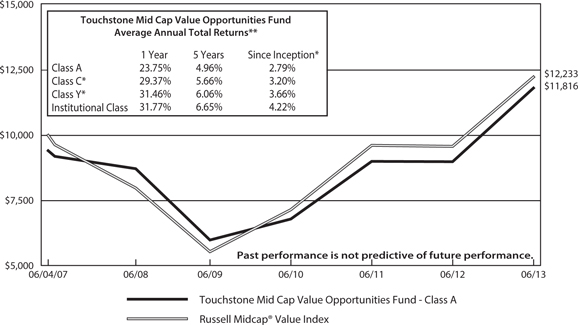
| * | The chart above represents performance for Class A shares only, which will vary from the performance of Class C shares, Class Y shares and Institutional Class shares based on the differences in loads and fees paid by shareholders in the different classes. Class A, Class C, Class Y and Institutional Class shares commenced operations on June 4, 2007, April 12, 2012, December 9, 2008 and June 4, 2007, respectively. Class C shares and Class Y shares performance was calculated using the historical performance of Class A shares for the periods prior to April 12, 2012 and December 9, 2008, respectively. The returns have been restated for sales charges and for fees applicable to Class C and Class Y shares. |
| ** | The average annual total returns shown above are adjusted for maximum applicable sales charges. |
The performance of the above Fund does not reflect the deduction of taxes that a shareholder would pay on Fund distributions or the redemption of Fund shares. The past performance is not predictive of future results.
Note to Chart
The Russell Midcap® Value Index measures the performance of those Russell Midcap companies with lower price-to-book ratios and lower forecasted growth values.
The Frank Russell Company (FRC) is the source and owner of the data contained or reflected in this material and all trademarks and copyrights related thereto. The material may contain confidential information and unauthorized use, disclosure, copying, dissemination or redistribution is strictly prohibited. This is a Touchstone Investments presentation of the data, and FRC is not responsible for the formatting or configuration of this material or for any inaccuracy in the presentation thereof.
Management's Discussion of Fund Performance (Unaudited)
Touchstone Small Cap Value Opportunities Fund
Sub-Advised by Thompson, Siegel & Walmsley LLC
Investment Philosophy
The Fund seeks long-term capital growth by primarily investing in equity securities of small-cap companies that are believed to present value that is not reflected by prevailing market prices or that have experienced fundamental changes and are intrinsically undervalued by the investment community. Using a combination of quantitative and qualitative methods, a company’s attractiveness is assessed in an effort to understand why the market may be mispricing the stocks, what factors are changing that can return the stock to fair value and whether those changes are sustainable over a medium term investment horizon based on both absolute and sector-relative valuation of cash flows, the relative earnings prospects of the company and the stock’s recent price action.
Fund Performance
The Touchstone Small Cap Value Opportunities Fund (Class A Shares) slightly underperformed its benchmark, the Russell 2000® Value Index, for the 12-month period ended June 30, 2013. The Fund’s total return was 24.31% (calculated excluding the maximum sales charge) while the total return of the benchmark was 24.76 % for the same period.
Market Environment
During the one-year period, the European Central Bank managed to eliminate the worst fears from the minds of investors around mid-year 2012, and equities rallied into year-end and through most of the first half of 2013. Investors’ risk appetite was not the driver of returns, however, unlike in previous rallies since the beginning of the financial crisis. Though the market favored value, performance was mixed between defensive and cyclical sectors, and the market dynamic was ultimately stock-specific.
Portfolio Review
As the market shifted away from macroeconomic and political themes, and instead focused on stock-specific drivers, the Fund posted a strong absolute return yet slightly underperformed its benchmark during the period.
The leading economic sectors, in terms of contribution to the Fund’s relative returns, were the Consumer Discretionary and Health Care sectors. Within the Consumer Discretionary sector, positions from multiple industry groups posted strong gains, many of which were the result of turnaround stories. Within the Health Care sector, the Fund’s services positions benefited from anticipated reimbursement rate increases.
Stock selection within the Financials sector was a top detractor during the period. Industry-wide regulatory changes (such as reduced fees paid to ATM providers by third-party networks) and increased competition weighed on the Fund’s selection of electronic payment processors and consumer finance companies. However, despite recent performance, we believe significant opportunities remain for these companies to benefit from growth among under-banked consumers, especially in areas such as prepaid debit cards and payday loans. The Fund also owned a number of stocks that benefited from Mergers & Acquisitions (M&A) activity during the period. The stocks were from multiple sectors that included Consumer Discretionary, Financials, Health Care, and Information Technology.
Among the individual stocks that contributed to Fund performance were Krispy Kreme Doughnuts, Inc. (Consumer Discretionary sector), Santarus, Inc. (Health Care sector), and Cooper Tire & Rubber Co., Multimedia Games Holdings Co. Inc. and Shutterfly, Inc. (all three from the Consumer Discretionary sector). Doughnut maker Krispy Kreme was a prime example of a turnaround story that was discussed earlier. During the period, the company appointed a new management team, closed underperforming stores, and implemented a strategy to grow its
Management's Discussion of Fund Performance (Unaudited) (Continued)
store base through franchise opportunities. The market took notice and the stock more than doubled during the last twelve months. After experiencing a sizable gain, the stock was sold during the period upon reaching a justified valuation. Santarus Inc., a specialty biopharmaceutical company, was a standout holding during the period. Santarus received official FDA approval of one of its major pipeline drugs, Uceris, and raised its full-year guidance estimates, which sent shares higher. Cooper Tire & Rubber, a global tire manufacturer, was an attractive stock during the period, as we believed the company would benefit from a favorable spread between raw materials costs and tire prices because it was the only tire company using a last-in-first-out accounting system. However, in June 2013, the company was acquired by a competitor at an attractive premium, which sent shares higher, and the stock was sold after benefiting from the increase in share price. Multimedia Games Holdings, a gaming machine company, received approval to sell gaming devices in Nevada, New Jersey, and Pennsylvania, which drove demand for the company. Internet-based photo-customizing company Shutterfly continued to take market share. The company, which allows users to turn digital photos into products such as calendars and greeting cards, forecasted higher-than-expected 2013 sales based on new mobile applications and recent acquisitions.
Among the individual stocks that detracted from performance during the period were ACCO Brands Corp. and Acacia Research Corp. (both in the Industrials sector), Energy XXI (Bermuda) Ltd. (Energy sector), magicJack VocalTec Ltd. (Telecommunication Services sector), and Noranda Aluminum Holding Corp. (Materials sector). Shares of ACCO Brands, an office-products manufacturer, declined after reporting lackluster forward guidance due to the uncertainty regarding the global unemployment picture, especially in Europe. Acacia Research, a patent- and licensing-services company, secured licensing deals with major technology companies during the quarter; however, investors were hoping for but did not see increased revenue from one of its largest clients Apple Inc., which sent shares lower. Shares of Energy XXI (Bermuda), an oil exploration and production company, experienced weather-related delays that resulted in reduced production output for the company. The company’s stock fell further in sympathy with the sell-off in crude oil and other commodities during the second quarter of 2013. Shares of magicJack VocalTec, an Internet phone-service provider, suffered as a result of a delayed rollout of the company’s new WiFi-enabled product. Noranda Aluminum, an integrated producer of aluminum products and rolled aluminum coils, suffered from weak aluminum prices industry-wide, which weighed on the company’s stock.
Outlook
Auto sales, unemployment, and commercial and residential construction all exhibited stable, positive trends, and consumer confidence improved during the one-year period. Going forward, as the U.S. economy continues to strengthen, we expect smaller companies, which tend to be more cyclical, will likely benefit from a pickup in both consumer and corporate spending. It is also at this point in the equity market cycle - with higher multiples and growth more stable and abundant - that investors seem to go searching for bargains, which tends to favor less expensive stocks. We continue to believe the Fund will be at an advantage in this environment due to its significant cash- flow-valuation discount and attractive growth characteristics relative to its benchmark. The market continues to display encouraging signs that investors are differentiating between stocks based on fundamentals rather than macro developments, which we believe is a favorable environment for the Fund’s stock-picking abilities.
Management's Discussion of Fund Performance (Unaudited) (Continued)
Comparison of the Change in Value of a $10,000 Investment in the Touchstone Small Cap Value Opportunities Fund - Class A* and the Russell 2000® Value Index
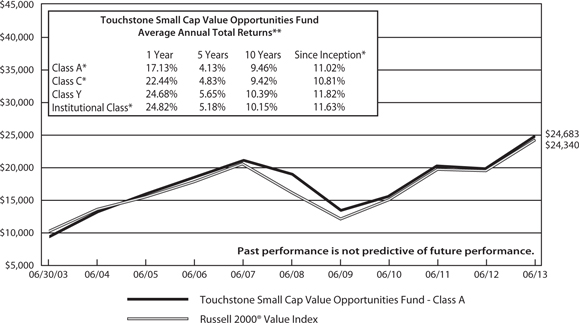
| * | The chart above represents performance for Class A shares only, which will vary from the performance of Class C shares, Class Y shares and Institutional Class shares based on the differences in loads and fees paid by shareholders in the different classes. Class A, Class C, Class Y and Institutional Class shares commenced operations on July 31, 2003 April 12, 2012, July 25, 2003 and December 9, 2008, respectively. Performance information presented prior to July 25, 2003 for Class Y shares includes performance of a predecessor fund whose inception date was July 31, 2000. Class A shares, Class C shares and Institutional Class shares performance was calculated using the historical performance of Class Y shares for periods prior to July 31, 2003, April 12, 2012 and December 9, 2008, respectively. The returns have been restated for sales charges and for fees applicable to Class A, Class C and Institutional Class shares. |
| ** | The average annual total returns shown above are adjusted for maximum applicable sales charges. |
The performance of the above Fund does not reflect the deduction of taxes that a shareholder would pay on Fund distributions or the redemption of Fund shares. The past performance is not predictive of future results.
Note to Chart
The Russell 2000® Value Index measures the performance of those Russell 2000 companies with lower price-to-book ratios and lower forecasted growth values.
The Frank Russell Company (FRC) is the source and owner of the data contained or reflected in this material and all trademarks and copyrights related thereto. The material may contain confidential information and unauthorized use, disclosure, copying, dissemination or redistribution is strictly prohibited. This is a Touchstone Investments presentation of the data, and FRC is not responsible for the formatting or configuration of this material or for any inaccuracy in the presentation thereof.
Management's Discussion of Fund Performance (Unaudited)
Touchstone Value Fund
Sub-Advised by Barrow, Hanley, Mewhinney & Strauss, LLC
Investment Philosophy
The Touchstone Value Fund seeks long-term growth by primarily investing in equity securities of large-and mid-cap companies believed to be undervalued. The Fund uses traditional methods of stock selection - research and analysis - to identify companies that have price-to-earnings and price-to-book ratios below the market, above-average dividend yields, and are out of favor due to internal or external challenges judged to be short-term in nature. Stock selection is driven by fundamental analysis on individual companies rather than by broad market themes.
Fund Performance
The Touchstone Value Fund (Class A Shares) underperformed its benchmark, the Russell 1000® Value Index, for the 12-month period ended June 30, 2013. The Fund’s total return was 21.56% (calculated excluding the maximum sales charge) while the total return of the benchmark was 25.32% for the same period.
Market Environment
Domestic equities rallied during the fiscal year period, until the U.S. Federal Reserve Board (the Fed) indicated it might start scaling back its massive bond-buying program. The announcement sparked a difficult period for the bond market and a pullback in most equity markets. The rapidity and magnitude of the rise in interest rates shocked investors in both bond and equity markets, challenging investors’ perceptions of safety and risk. Extrapolating further interest rate increases had some bond investors pouring out of retail bond funds after years of massive inflows, in spite of an economy that was still weak and measured inflation readings that were still low. The pain in the bond market has dwarfed that in the equity markets, but the pullback in equities has been enough to shake the confidence of many investors, particularly those who were seeking safety in stocks perceived to be bond proxies with high-dividend yields.
Despite the recent pullback in U.S. equities, stocks have proven much more resilient than many expected. While there was a more severe pullback in some of the highest-yielding sectors, such as Telecommunication Services and Utilities, it was unusual for the broader equity market to hold up as well as it did. During the period, domestic equities outperformed international equities and value outperformed growth. Within the S&P 500 Index, the Financials sector was the best performing sector while Utilities, typically one of the highest-yielding sectors, was the worst performing sector.
Portfolio Review
Within the Russell 1000® Value Index, there were some notable performance trends related to market capitalization and valuation. The largest companies, as defined by market capitalization, lagged the performance of companies further down the market-cap spectrum. Additionally, stocks with higher price-to-earnings (P/E) outperformed during the period. The Fund’s focus on companies trading at a significant P/E discount to the market was at odds with that performance attribute of the Russell 1000® Value Index over the period. The dividend premium and valuation discount the Fund seeks are often masked in a rapidly rising market. However, we believe a market in such rapid ascension inevitably moderates and the Fund’s relative performance advantage tends to be gained in more modestly rising or down markets.
Stock selection contributed to Fund performance during the period, and the Fund’s Energy and Heath Care sector stocks meaningfully outperformed those in the Index. However, the relative returns from those sectors were not enough to offset the negative impact from the Fund’s Consumer Staples stocks - especially tobacco companies - and holdings in the Information Technology sector.
Management's Discussion of Fund Performance (Unaudited) (Continued)
Energy sector stocks were mixed during the one-year period, as oil price volatility continued to impact share prices. However, the largest positive contributor to Fund performance was Phillips 66 Co., a producer of natural gas liquids and petrochemicals. The company’s earnings were ahead of expectations, as its refining operations were able to access price-advantaged crudes in the U.S. and Canada and its chemical operations benefited from growing demand in the U.S. The company’s share price also benefited from an increase in its dividend during the period.
The Health Care sector proved to be fertile ground for finding companies that are trading at discounted valuations, have high free-cash-flow yields and have significant potential for capital return. The portfolio’s overweight to the sector added to the Fund’s relative performance during the period. Among the companies that supported Fund performance most were Baxter International Inc. and Medtronic Inc. Diversified health care company Baxter International has a profitable product line that has improved over time as the industry consolidates and vertically integrates. In addition, Baxter International’s relatively stable medical supply and pharmaceutical businesses performed well and the company’s pipeline of new products has improved rapidly. Though Baxter International did suffer from a disappointing delay to one of its new pipeline drugs, the delay was not material to earnings in the near term. Medtronic, a medical device manufacturer, has a broad array of new products in the pipeline, a new CEO with a strong track record and advantages over its competitors in product-bundling deals, which we believe should prove important as hospital systems consolidate and reduce costs. Though there were concerns about the company’s weaker ICD (Implantable Cardioverter Defibrillator) and spine markets, which weighed on the stock, the concerns started to ease during the period. The other portion of Medtronic’s business, however, performed well and we believe the outlook remains positive.
Within the Financials sector, stocks performed well during the period, particularly as the sell-off in the bond market drove interest rates higher. Fund performance was led by consumer credit companies American Express Co. and SLM Corp., and banks, JPMorgan Chase & Co. and Citigroup Inc. Many Financials sector stocks benefited from higher interest rates through higher net interest margins (the spread they charge between the cost of funds and the rate at which they loan the funds; net interest margins have been under pressure in the prolonged low-interest-rate environment). While these financial companies benefit the most from a rise in short-term rates, the market is also anticipating a steepening in the yield curve, which could further boost margins. The outlook for higher dividends and buybacks in the Financials space also continued to be robust. We believe incremental capital will continue to be built through retained earnings, much of which can be returned to shareholders.
The Fund’s underperformance in the Consumer Staples sector was driven almost entirely by tobacco holdings. The largest detractor in this sector was Imperial Tobacco Group PLC, whose underperformance suffered chiefly from a geography problem, given that more than 60 percent of its earnings come from Europe and the United Kingdom and many of the consumers in these regions have endured severe economic pressure. The beleaguered consumer is switching in droves either to illicit cigarettes or trading down to low-priced value cigarettes, and some are turning to RYO (roll your own) and MYO (make your own) cigarettes. The existence of illicit cigarettes has cut into Imperial Tobacco Group’s organic growth, and its price-to-earnings ratio has contracted as a result. Partial offsets to the adverse impact of illicit trade is the company’s strong positioning in fine-cut tobacco used in RYO cigarettes, its good growth in a handful of emerging markets and its strong cigar business.
Outlook
We believe interest rates and decisions made by the Fed will remain central issues for equity investors going forward and predicting the magnitude of further rate increases, or the Fed’s action or inaction is highly speculative. We can say that, for some time, we have kept our focus on higher interest rates when analyzing companies and we continue to believe that the stocks in the Fund’s portfolio should generate and return capital to shareholders in a variety of interest rate scenarios.
Management's Discussion of Fund Performance (Unaudited) (Continued)
We believe the effect of further interest rate increases on equities may be more muted than expected if accompanied by better economic growth (improving earnings), or if the economy proves less sensitive than in past cycles because rates (negative real rates) have been so low for so long. We believe it is also important to remember that the change in Fed language - which intended to taper purchases - does not include a signal to begin selling the massive portfolio of bonds on the Fed’s balance sheet, and should mean that Fed-driven interest rate hikes will not happen for some time. If rates do increase, we believe that equity markets can still post gains despite growing competition from higher bond rates. As always, we believe active stock selection remains key. While stocks don’t appear overvalued, we believe a significant amount of upside has likely been captured for now.
Management's Discussion of Fund Performance (Unaudited) (Continued)
Comparison of the Change in Value of a $10,000 Investment in the Touchstone Value Fund - Class A* and the Russell 1000® Value Index
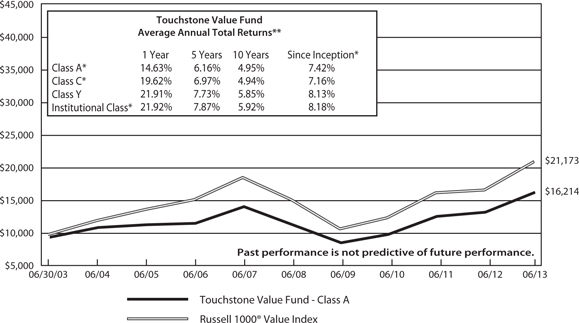
| * | The chart above represents performance for Class A shares only, which will vary from the performance of Class C shares, Class Y shares and Institutional Class shares based on the differences in loads and fees paid by shareholders in the different classes. Class A, Class C, Class Y and Institutional Class shares commenced operations on July 31, 2003, April 12, 2012, September 10, 1998 and December 20, 2006, respectively. Class A shares, Class C shares and Institutional Class shares performance was calculated using the historical performance of Class Y shares for the periods prior to July 31, 2003, April 12, 2012 and December 20, 2006, respectively. The returns have been restated for sales charges and for fees applicable to Class A, Class C and Institutional Class shares. |
| ** | The average annual total returns shown above are adjusted for maximum applicable sales charges. |
The performance of the above Fund does not reflect the deduction of taxes that a shareholder would pay on Fund distributions or the redemption of Fund shares. The past performance is not predictive of future results.
Note to Chart
The Russell 1000® Value Index measures those Russell 1000 companies with lower price-to-book ratios and lower expected growth values.
The Frank Russell Company (FRC) is the source and owner of the data contained or reflected in this material and all trademarks and copyrights related thereto. The material may contain confidential information and unauthorized use, disclosure, copying, dissemination or redistribution is strictly prohibited. This is a Touchstone Investments presentation of the data, and FRC is not responsible for the formatting or configuration of this material or for any inaccuracy in the presentation thereof.
Tabular Presentation of Portfolios of Investments (Unaudited)
June 30, 2013
The tables below provide each Fund’s sector allocation. We hope it will be useful to shareholders as it summarizes key information about each Fund’s investments.
| Touchstone Capital Growth Fund |
| Sector Allocation* | | (% of Net Assets) | |
| Information Technology | | | 27.8 | % |
| Consumer Discretionary | | | 19.9 | |
| Industrials | | | 14.1 | |
| Health Care | | | 12.5 | |
| Energy | | | 8.6 | |
| Consumer Staples | | | 8.1 | |
| Financials | | | 6.2 | |
| Materials | | | 2.0 | |
| Investment Funds | | | 1.6 | |
| Other Assets/Liabilities (Net) | | | (0.8 | ) |
| Total | | | 100.0 | % |
| Touchstone International Small Cap Fund |
| Sector Allocation* | | (% of Net Assets) | |
| Consumer Discretionary | | | 20.6 | % |
| Financials | | | 18.9 | |
| Industrials | | | 17.0 | |
| Materials | | | 9.3 | |
| Consumer Staples | | | 8.8 | |
| Information Technology | | | 8.7 | |
| Health Care | | | 6.0 | |
| Energy | | | 3.7 | |
| Utilities | | | 3.3 | |
| Telecommunication Services | | | 1.9 | |
| Exchange Traded Funds | | | 2.0 | |
| Investment Funds | | | 5.5 | |
| Other Assets/Liabilities (Net) | | | (5.7 | ) |
| Total | | | 100.0 | % |
| Touchstone Mid Cap Value Opportunities Fund |
| Sector Allocation* | | (% of Net Assets) | |
| Financials | | | 18.8 | % |
| Information Technology | | | 17.7 | |
| Utilities | | | 13.3 | |
| Health Care | | | 11.8 | |
| Consumer Discretionary | | | 11.3 | |
| Industrials | | | 6.8 | |
| Energy | | | 5.2 | |
| Materials | | | 3.6 | |
| Telecommunications Services | | | 3.6 | |
| Consumer Staples | | | 2.0 | |
| Investment Funds | | | 15.4 | |
| Other Assets/Liabilities (Net) | | | (9.5 | ) |
| Total | | | 100.0 | % |
| Touchstone Small Cap Value Opportunities Fund |
| Sector Allocation* | | (% of Net Assets) | |
| Financials | | | 26.3 | % |
| Industrials | | | 18.4 | |
| Consumer Discretionary | | | 13.0 | |
| Information Technology | | | 11.9 | |
| Health Care | | | 8.8 | |
| Materials | | | 5.1 | |
| Energy | | | 4.2 | |
| Utilities | | | 3.8 | |
| Consumer Staples | | | 3.5 | |
| Telecommunication Services | | | 1.4 | |
| Exchange Traded Fund | | | 1.3 | |
| Investment Funds | | | 11.7 | |
| Other Assets/Liabilities (Net) | | | (9.4 | ) |
| Total | | | 100.0 | % |
* Sector classifications are based upon the Global Industry Classification Standard (GICS®).
Tabular Presentation of Portfolios of Investments (Unaudited) (Continued)
| Touchstone Value Fund |
| Sector Allocation* | | (% of Net Assets) | |
| Financials | | | 25.0 | % |
| Health Care | | | 20.7 | |
| Industrials | | | 12.9 | |
| Energy | | | 11.9 | |
| Consumer Staples | | | 7.4 | |
| Information Technology | | | 6.7 | |
| Consumer Discretionary | | | 5.5 | |
| Telecommunication Services | | | 4.6 | |
| Utilities | | | 1.1 | |
| Materials | | | 1.1 | |
| Investment Funds | | | 2.7 | |
| Other Assets/Liabilities (Net) | | | 0.4 | |
| Total | | | 100.0 | % |
* Sector classifications are based upon the Global Industry Classification Standard (GICS®).
Portfolio of Investments
Touchstone Capital Growth Fund – June 30, 2013
| | | | | | Market | |
| | | Shares | | | Value | |
| | | | | | | |
| Common Stocks— 99.2% | | | | | | | | |
| | | | | | | | | |
| Information Technology — 27.8% | | | | | | | | |
| Accenture PLC (Ireland) - Class A† | | | 33,680 | | | $ | 2,423,613 | |
| Analog Devices, Inc. | | | 59,480 | | | | 2,680,169 | |
| Apple, Inc. | | | 20,380 | | | | 8,072,110 | |
| ARM Holdings PLC (United Kingdom), ADR | | | 58,325 | | | | 2,110,198 | |
| ASML Holding NV | | | 23,323 | | | | 1,844,849 | |
| Broadcom Corp. - Class A | | | 71,185 | | | | 2,403,206 | |
| eBay, Inc.* | | | 68,400 | | | | 3,537,648 | |
| EMC Corp. | | | 140,396 | | | | 3,316,154 | |
| Equinix, Inc.* | | | 20,920 | | | | 3,864,342 | |
| Google, Inc. - Class A* | | | 8,154 | | | | 7,178,537 | |
| International Business Machines Corp. | | | 13,068 | | | | 2,497,425 | |
| Qualcomm, Inc. | | | 77,890 | | | | 4,757,521 | |
| Trimble Navigation Ltd.* | | | 126,430 | | | | 3,288,444 | |
| | | | | | | | 47,974,216 | |
| | | | | | | | | |
| Consumer Discretionary — 19.9% | | | | | | | | |
| Amazon.com, Inc.* | | | 8,375 | | | | 2,325,654 | |
| Autoliv, Inc.† | | | 22,665 | | | | 1,754,044 | |
| BorgWarner, Inc.* | | | 43,695 | | | | 3,764,324 | |
| Dollar General Corp.* | | | 48,025 | | | | 2,421,901 | |
| Lululemon Athletica, Inc. (Canada)* | | | 23,255 | | | | 1,523,668 | |
| Michael Kors Holdings Ltd. (Hong Kong)* | | | 62,870 | | | | 3,899,197 | |
| priceline.com, Inc.* | | | 3,435 | | | | 2,841,192 | |
| Ralph Lauren Corp. | | | 13,670 | | | | 2,375,026 | |
| Starbucks Corp. | | | 30,245 | | | | 1,980,745 | |
| Starwood Hotels & Resorts Worldwide, Inc. | | | 26,695 | | | | 1,686,857 | |
| Urban Outfitters, Inc.* | | | 79,820 | | | | 3,210,360 | |
| VF Corp. | | | 10,420 | | | | 2,011,685 | |
| Walt Disney Co. (The) | | | 34,410 | | | | 2,172,992 | |
| Williams-Sonoma, Inc. | | | 40,705 | | | | 2,275,002 | |
| | | | | | | | 34,242,647 | |
| | | | | | | | | |
| Industrials — 14.1% | | | | | | | | |
| Danaher Corp. | | | 48,875 | | | | 3,093,788 | |
| Deere & Co. | | | 36,540 | | | | 2,968,875 | |
| Flowserve Corp. | | | 47,595 | | | | 2,570,606 | |
| Fluor Corp. | | | 39,100 | | | | 2,319,021 | |
| Precision Castparts Corp. | | | 9,895 | | | | 2,236,369 | |
| Rockwell Automation, Inc. | | | 39,735 | | | | 3,303,568 | |
| Union Pacific Corp. | | | 26,155 | | | | 4,035,193 | |
| United Technologies Corp. | | | 40,485 | | | | 3,762,676 | |
| | | | | | | | 24,290,096 | |
| | | | | | | | | |
| Health Care — 12.5% | | | | | | | | |
| Allergan, Inc. | | | 16,669 | | | | 1,404,197 | |
| Celgene Corp.* | | | 29,721 | | | | 3,474,682 | |
| Cerner Corp.* | | | 23,834 | | | | 2,290,209 | |
| Express Scripts Holding Co.* | | | 38,371 | | | | 2,367,107 | |
| Henry Schein, Inc.* | | | 46,781 | | | | 4,479,281 | |
| Thermo Fisher Scientific, Inc. | | | 36,500 | | | | 3,088,995 | |
| Valeant Pharmaceuticals International, Inc. (Canada)* | | | 26,520 | | | | 2,282,842 | |
| Varian Medical Systems, Inc.* | | | 32,696 | | | | 2,205,345 | |
| | | | | | | | 21,592,658 | |
| | | | | | | | | |
| Energy — 8.6% | | | | | | | | |
| Anadarko Petroleum Corp. | | | 30,300 | | | | 2,603,679 | |
| Cameron International Corp.* | | | 54,785 | | | | 3,350,651 | |
| Chevron Corp. | | | 18,340 | | | | 2,170,356 | |
| Pioneer Natural Resources Co. | | | 23,458 | | | | 3,395,546 | |
| Schlumberger Ltd. | | | 45,626 | | | | 3,269,559 | |
| | | | | | | | 14,789,791 | |
| | | | | | | | | |
| Consumer Staples — 8.1% | | | | | | | | |
| Anheuser-Busch InBev N.V. (Belgium), ADR | | | 37,990 | | | | 3,428,977 | |
| Diageo PLC (United Kingdom), ADR | | | 29,275 | | | | 3,365,161 | |
| Estee Lauder Cos., Inc. (The) - Class A | | | 33,655 | | | | 2,213,489 | |
| Hain Celestial Group, Inc. (The)* | | | 30,720 | | | | 1,995,878 | |
| Walgreen Co. | | | 67,760 | | | | 2,994,992 | |
| | | | | | | | 13,998,497 | |
| | | | | | | | | |
| Financials — 6.2% | | | | | | | | |
| Ameriprise Financial, Inc. | | | 36,042 | | | | 2,915,077 | |
| BlackRock, Inc. | | | 9,565 | | | | 2,456,770 | |
| Goldman Sachs Group, Inc. (The) | | | 17,070 | | | | 2,581,838 | |
| Ocwen Financial Corp.* | | | 65,850 | | | | 2,714,337 | |
| | | | | | | | 10,668,022 | |
| | | | | | | | | |
| Materials — 2.0% | | | | | | | | |
| Monsanto Co. | | | 35,210 | | | | 3,478,748 | |
| Total Common Stocks | | | | | | $ | 171,034,675 | |
| | | | | | | | | |
| Investment Funds— 1.6% | | | | | | | | |
| Invesco Government & Agency Portfolio, Institutional Class** | | | 1,219,083 | | | | 1,219,083 | |
| Touchstone Institutional Money Market Fund^ | | | 1,639,168 | | | | 1,639,168 | |
| Total Investment Funds | | | | | | $ | 2,858,251 | |
| | | | | | | | | |
| Total Investment Securities —100.8% | | | | | | | | |
| (Cost $119,682,020) | | | | | | $ | 173,892,926 | |
| | | | | | | | | |
| Liabilities in Excess of Other Assets — (0.8%) | | | | | | | (1,407,275 | ) |
| | | | | | | | | |
| Net Assets — 100.0% | | | | | | $ | 172,485,651 | |
| * | Non-income producing security. |
| ** | Represents collateral for securities loaned. |
| ^ | Affiliated Fund. See Note 4 in Notes to Financial Statements. |
| † | All or a portion of the security is on loan. The total market value of the securities on loan as of June 30, 2013 was $1,157,702. |
Touchstone Capital Growth Fund (Continued)
Portfolio Abbreviations:
ADR - American Depositary Receipt
PLC - Public Limited Company
Other Information:
The inputs or methodology used for valuing securities may not be an indication of the risk associated with investing in those securities. For more information on valuation inputs, and their aggregation into the levels used in the table below, please refer to the security valuation section in the accompanying Notes to Financial Statements.
Valuation inputs at Reporting Date:
| Description | | Level 1 | | | Level 2 | | | Level 3 | | | Total | |
| Common Stocks | | $ | 171,034,675 | | | $ | — | | | $ | — | | | $ | 171,034,675 | |
| Investment Funds | | | 2,858,251 | | | | — | | | | — | | | | 2,858,251 | |
| | | | | | | | | | | | | | | $ | 173,892,926 | |
See accompanying Notes to Financial Statements.
Portfolio of Investments
Touchstone International Small Cap Fund – June 30, 2013
| | | | | | Market | |
| | | Shares | | | Value | |
| | | | | | | |
| Common Stocks— 98.2% | | | | | | | | |
| | | | | | | | | |
| United Kingdom — 20.6% | | | | | | | | |
| Ashtead Group PLC | | | 163,138 | | | $ | 1,601,655 | |
| Babcock International Group PLC | | | 47,859 | | | | 802,891 | |
| Berendsen PLC | | | 63,596 | | | | 720,132 | |
| Blinkx PLC* | | | 476,100 | | | | 791,110 | |
| Cineworld Group PLC | | | 192,000 | | | | 990,692 | |
| Dialight PLC | | | 39,764 | | | | 679,184 | |
| Elementis PLC | | | 235,539 | | | | 785,990 | |
| esure Group PLC* | | | 202,435 | | | | 1,000,352 | |
| Hargreaves Lansdown PLC | | | 100,648 | | | | 1,359,364 | |
| Majestic Wine PLC | | | 111,861 | | | | 808,146 | |
| Micro Focus International PLC | | | 133,580 | | | | 1,442,505 | |
| Moneysupermarket.com Group PLC | | | 398,665 | | | | 1,161,773 | |
| Paragon Group of Cos. PLC | | | 229,037 | | | | 1,067,362 | |
| Rightmove PLC | | | 33,100 | | | | 1,049,164 | |
| Rotork PLC | | | 19,366 | | | | 786,446 | |
| Savills PLC | | | 197,124 | | | | 1,711,958 | |
| Spectris PLC | | | 31,400 | | | | 912,180 | |
| TalkTalk Telecom Group PLC | | | 216,700 | | | | 739,604 | |
| Taylor Wimpey PLC | | | 714,000 | | | | 1,039,811 | |
| TUI Travel PLC | | | 286,000 | | | | 1,552,495 | |
| WS Atkins PLC | | | 63,800 | | | | 978,135 | |
| | | | | | | | 21,980,949 | |
| | | | | | | | | |
| Japan — 18.2% | | | | | | | | |
| Avex Group Holdings, Inc. | | | 46,500 | | | | 1,465,139 | |
| Chiyoda Co. Ltd. | | | 31,600 | | | | 808,957 | |
| COMSYS Holdings Corp. | | | 69,000 | | | | 881,458 | |
| Credit Saison Co. Ltd. | | | 38,900 | | | | 976,226 | |
| Daiichikosho Co. Ltd. | | | 24,300 | | | | 665,690 | |
| FP Corp. | | | 13,700 | | | | 948,972 | |
| Fuji Media Holdings, Inc. | | | 600 | | | | 1,208,711 | |
| HIS Co. Ltd. | | | 25,800 | | | | 1,099,062 | |
| Hoshizaki Electric Co. Ltd. | | | 48,000 | | | | 1,539,020 | |
| Japan Petroleum Exploration Co. | | | 27,400 | | | | 1,111,968 | |
| Jin Co. Ltd.† | | | 22,500 | | | | 1,077,586 | |
| Pola Orbis Holdings, Inc. | | | 29,600 | | | | 1,001,291 | |
| Sawai Pharmaceutical Co. Ltd. | | | 7,800 | | | | 931,942 | |
| Seria Co. Ltd.† | | | 32,158 | | | | 969,150 | |
| Ship Healthcare Holdings, Inc. | | | 28,700 | | | | 1,056,211 | |
| Sumitomo Rubber Industries Ltd. | | | 59,200 | | | | 968,163 | |
| Suzuken Co. Ltd. | | | 23,900 | | | | 804,860 | |
| Tokyo Ohka Kogyo Co. Ltd. | | | 40,100 | | | | 921,839 | |
| Toshiba Machine Co. Ltd. | | | 210,400 | | | | 1,028,877 | |
| | | | | | | | 19,465,122 | |
| | | | | | | | | |
| Canada — 6.7% | | | | | | | | |
| Dollarama, Inc. | | | 12,034 | | | | 842,277 | |
| Element Financial Corp.* | | | 122,979 | | | | 1,399,694 | |
| Horizon North Logistics, Inc. | | | 191,666 | | | | 1,157,249 | |
| Intertape Polymer Group, Inc. | | | 85,900 | | | | 1,061,805 | |
| Onex Corp. | | | 26,579 | | | | 1,206,000 | |
| Westjet Airlines Ltd. | | | 67,500 | | | | 1,476,181 | |
| | | | | | | | 7,143,206 | |
| | | | | | | | | |
| Ireland — 6.3% | | | | | | | | |
| C&C Group PLC | | | 220,000 | | | | 1,186,109 | |
| Glanbia PLC | | | 71,209 | | | | 959,327 | |
| Greencore Group PLC | | | 605,000 | | | | 1,233,041 | |
| Kingspan Group PLC | | | 83,500 | | | | 1,111,870 | |
| Paddy Power PLC | | | 14,365 | | | | 1,239,684 | |
| Smurfit Kappa Group PLC | | | 62,205 | | | | 1,038,828 | |
| | | | | | | | 6,768,859 | |
| | | | | | | | | |
| Australia — 5.1% | | | | | | | | |
| DuluxGroup Ltd. | | | 298,703 | | | | 1,150,087 | |
| FlexiGroup Ltd. | | | 284,617 | | | | 1,134,896 | |
| Iluka Resources Ltd. | | | 98,000 | | | | 895,366 | |
| REA Group Ltd. | | | 35,000 | | | | 881,218 | |
| Spark Infrastructure Group | | | 868,576 | | | | 1,378,212 | |
| | | | | | | | 5,439,779 | |
| | | | | | | | | |
| Denmark — 5.1% | | | | | | | | |
| GN Store Nord A/S | | | 79,672 | | | | 1,505,816 | |
| Matas A/S* | | | 45,126 | | | | 937,155 | |
| Royal UNIBREW A/S | | | 12,689 | | | | 1,116,081 | |
| Topdanmark A/S* | | | 73,280 | | | | 1,867,137 | |
| | | | | | | | 5,426,189 | |
| | | | | | | | | |
| Germany — 4.6% | | | | | | | | |
| Aurelius AG | | | 44,421 | | | | 1,067,362 | |
| Draegerwerk AG & Co. KGaA (Preference)† | | | 8,700 | | | | 1,192,448 | |
| Freenet AG | | | 58,775 | | | | 1,283,738 | |
| NORMA Group AG | | | 37,700 | | | | 1,366,163 | |
| | | | | | | | 4,909,711 | |
| | | | | | | | | |
| France — 4.2% | | | | | | | | |
| Plastic Omnium SA | | | 34,000 | | | | 1,843,699 | |
| Teleperformance | | | 22,500 | | | | 1,083,032 | |
| UBISOFT Entertainment* | | | 116,620 | | | | 1,527,084 | |
| | | | | | | | 4,453,815 | |
| | | | | | | | | |
| Cayman Islands — 3.3% | | | | | | | | |
| NagaCorp Ltd. | | | 1,296,000 | | | | 1,010,927 | |
| Prince Frog International Holdings Ltd.† | | | 1,816,000 | | | | 1,254,989 | |
| Towngas China Co. Ltd. | | | 1,258,000 | | | | 1,252,153 | |
| | | | | | | | 3,518,069 | |
| | | | | | | | | |
| Norway — 2.7% | | | | | | | | |
| Borregaard ASA | | | 182,709 | | | | 797,088 | |
| Det Norske Oljeselskap ASA* | | | 55,861 | | | | 766,044 | |
| TGS Nopec Geophysical Co. ASA | | | 46,000 | | | | 1,336,604 | |
| | | | | | | | 2,899,736 | |
| | | | | | | | | |
| Belgium — 2.6% | | | | | | | | |
| Barco NV | | | 23,882 | | | | 1,932,607 | |
| EVS Broadcast Equipment SA | | | 11,798 | | | | 819,131 | |
| | | | | | | | 2,751,738 | |
| | | | | | | | | |
| Austria — 2.6% | | | | | | | | |
| Oesterreichische Post AG | | | 43,400 | | | | 1,694,739 | |
| RHI AG | | | 30,000 | | | | 1,044,568 | |
| | | | | | | | 2,739,307 | |
Touchstone International Small Cap Fund (Continued)
| | | | | | Market | |
| | | Shares | | | Value | |
| | | | | | | |
| Common Stocks — 98.2% (Continued) | | | | | | | | |
| | | | | | | | | |
| Singapore — 2.3% | | | | | | | | |
| Asian Pay Television Trust* | | | 1,250,000 | | | $ | 838,264 | |
| China Minzhong Food Corp. Ltd.*† | | | 930,000 | | | | 766,746 | |
| SATS Ltd. | | | 334,000 | | | | 866,951 | |
| | | | | | | | 2,471,961 | |
| | | | | | | | | |
| Thailand — 2.1% | | | | | | | | |
| Sansiri PCL | | | 6,845,082 | | | | 688,591 | |
| Thai Tap Water Supply PCL | | | 2,691,902 | | | | 876,615 | |
| Tisco Financial Group PCL | | | 502,493 | | | | 664,266 | |
| | | | | | | | 2,229,472 | |
| | | | | | | | | |
| Italy — 2.1% | | | | | | | | |
| Banca Generali SpA | | | 57,592 | | | | 1,241,408 | |
| Recordati SpA | | | 85,531 | | | | 949,095 | |
| | | | | | | | 2,190,503 | |
| | | | | | | | | |
| Switzerland — 2.0% | | | | | | | | |
| Aryzta AG | | | 19,540 | | | | 1,098,485 | |
| Bucher Industries AG | | | 4,500 | | | | 1,078,132 | |
| | | | | | | | 2,176,617 | |
| | | | | | | | | |
| Finland — 2.0% | | | | | | | | |
| Huhtamaki OYJ | | | 68,105 | | | | 1,265,013 | |
| Pohjola Bank PLC, Class A† | | | 58,628 | | | | 861,571 | |
| | | | | | | | 2,126,584 | |
| | | | | | | | | |
| Bermuda — 1.7% | | | | | | | | |
| Catlin Group Ltd. | | | 128,902 | | | | 978,705 | |
| Lancashire Holdings Ltd. | | | 73,284 | | | | 882,779 | |
| | | | | | | | 1,861,484 | |
| | | | | | | | | |
| Luxembourg — 1.3% | | | | | | | | |
| Samsonite International SA | | | 591,000 | | | | 1,423,389 | |
| | | | | | | | | |
| Sweden — 1.2% | | | | | | | | |
| Fastighets AB Balder, Class B* | | | 174,811 | | | | 1,264,272 | |
| | | | | | | | | |
| Turkey — 0.8% | | | | | | | | |
| Dogus Otomotiv Servis ve Ticaret AS | | | 173,977 | | | | 882,198 | |
| | | | | | | | | |
| Cyprus — 0.7% | | | | | | | | |
| Prosafe SE | | | 87,100 | | | | 764,985 | |
| Total Common Stocks | | | | | | $ | 104,887,945 | |
| | | | | | | | | |
| Exchange Traded Fund — 2.0% | | | | | | | | |
| iShares MSCI EAFE Small Cap Index Fund† | | | 50,209 | | | | 2,105,765 | |
| | | | | | | | | |
| Investment Funds— 5.5% | | | | | | | | |
| Invesco Government & Agency Portfolio, Institutional Class** | | | 5,205,070 | | | | 5,205,070 | |
| Touchstone Institutional Money Market Fund^ | | | 699,197 | | | | 699,197 | |
| Total Investment Funds | | | | | | $ | 5,904,267 | |
| | | | | | | | | |
| Total Investment Securities —105.7% | | | | | | | | |
| (Cost $96,127,704) | | | | | | $ | 112,897,977 | |
| | | | | | | | | |
| Liabilities in Excess of Other Assets — (5.7%) | | | | | | | (6,039,080 | ) |
| | | | | | | | | |
| Net Assets — 100.0% | | | | | | $ | 106,858,897 | |
| * | Non-income producing security. |
| ** | Represents collateral for securities loaned. |
| ^ | Affiliated Fund. See Note 4 in Notes to Financial Statements. |
| † | All or a portion of the security is on loan. The total market value of the securities on loan as of June 30, 2013 was $5,054,576. |
Portfolio Abbreviations:
PCL - Public Company Limited
PLC - Public Limited Company
Other Information:
The inputs or methodology used for valuing securities may not be an indication of the risk associated with investing in those securities. For more information on valuation inputs, and their aggregation into the levels used in the table below, please refer to the security valuation section in the accompanying Notes to Financial Statements.
Valuation inputs at Reporting Date:
| | | Level 1 | | | Level 2 | | | Level 3 | | | Total | |
| Common Stocks | | $ | 104,887,945 | | | $ | — | | | $ | — | | | $ | 104,887,945 | |
| Exchange Traded Fund | | | 2,105,765 | | | | — | | | | — | | | | 2,105,765 | |
| Investment Funds | | | 5,904,267 | | | | — | | | | — | | | | 5,904,267 | |
| | | | | | | | | | | | | | | $ | 112,897,977 | |
At June 30, 2013, equity securities valued at $49,843,113 were transferred from Level 2 to Level 1. Transfers from Level 2 to Level 1 are due to significant movement of a designated U.S. market index, triggering a systematic valuation model provided by an independent third party to fair value the international equity securities at the end of the prior reporting period.
See accompanying Notes to Financial Statements.
Portfolio of Investments
Touchstone Mid Cap Value Opportunities Fund – June 30, 2013
| | | | | | Market | |
| | | Shares | | | Value | |
| | | | | | | |
| Common Stocks— 94.1% | | | | | | | | |
| | | | | | | | | |
| Financials — 18.8% | | | | | | | | |
| Allstate Corp. (The) | | | 54,700 | | | $ | 2,632,164 | |
| Annaly Capital Management, Inc. REIT | | | 303,000 | | | | 3,808,710 | |
| Assured Guaranty Ltd. (Bermuda) | | | 55,100 | | | | 1,215,506 | |
| Everest Re Group Ltd. (Bermuda) | | | 18,200 | | | | 2,334,332 | |
| Fairfax Financial Holdings Ltd. (Canada) | | | 6,200 | | | | 2,418,620 | |
| First Republic Bank | | | 61,000 | | | | 2,347,280 | |
| HCC Insurance Holdings, Inc. | | | 48,100 | | | | 2,073,591 | |
| Loews Corp. | | | 51,300 | | | | 2,277,720 | |
| Progressive Corp. (The) | | | 81,000 | | | | 2,059,020 | |
| Willis Group Holdings PLC (Ireland) | | | 27,420 | | | | 1,118,188 | |
| | | | | | | | 22,285,131 | |
| | | | | | | | | |
| Information Technology — 17.7% | | | | | | | | |
| Amdocs Ltd. (Guernsey) | | | 64,300 | | | | 2,384,887 | |
| CA, Inc. | | | 67,200 | | | | 1,923,936 | |
| Dolby Laboratories, Inc. - Class A† | | | 61,900 | | | | 2,070,555 | |
| EchoStar Corp.* | | | 26,400 | | | | 1,032,504 | |
| Global Payments, Inc.† | | | 48,800 | | | | 2,260,416 | |
| KLA-Tencor Corp. | | | 35,700 | | | | 1,989,561 | |
| Lam Research Corp.* | | | 40,600 | | | | 1,800,204 | |
| Micron Technology, Inc.* | | | 42,300 | | | | 606,159 | |
| Teradyne, Inc.*† | | | 95,300 | | | | 1,674,421 | |
| Total System Services, Inc. | | | 100,300 | | | | 2,455,344 | |
| Western Digital Corp. | | | 14,500 | | | | 900,305 | |
| Western Union Co. (The) | | | 103,900 | | | | 1,777,729 | |
| | | | | | | | 20,876,021 | |
| | | | | | | | | |
| Utilities — 13.3% | | | | | | | | |
| Alliant Energy Corp. | | | 54,200 | | | | 2,732,764 | |
| American Water Works Co., Inc. | | | 64,300 | | | | 2,651,089 | |
| CMS Energy Corp. | | | 98,800 | | | | 2,684,396 | |
| Westar Energy, Inc. | | | 81,700 | | | | 2,611,132 | |
| Wisconsin Energy Corp. | | | 65,900 | | | | 2,701,241 | |
| Xcel Energy, Inc. | | | 82,300 | | | | 2,332,382 | |
| | | | | | | | 15,713,004 | |
| | | | | | | | | |
| Health Care — 11.8% | | | | | | | | |
| AmerisourceBergen Corp. | | | 26,800 | | | | 1,496,244 | |
| Cardinal Health, Inc. | | | 36,800 | | | | 1,736,960 | |
| CIGNA Corp. | | | 8,000 | | | | 579,920 | |
| Endo Health Solutions, Inc.* | | | 37,956 | | | | 1,396,401 | |
| Humana, Inc. | | | 20,600 | | | | 1,738,228 | |
| MEDNAX, Inc.* | | | 15,600 | | | | 1,428,648 | |
| Questcor Pharmaceuticals, Inc.† | | | 24,000 | | | | 1,091,040 | |
| Salix Pharmaceuticals Ltd.* | | | 13,200 | | | | 873,180 | |
| United Therapeutics Corp.* | | | 34,400 | | | | 2,264,208 | |
| Zimmer Holdings, Inc. | | | 17,700 | | | | 1,326,438 | |
| | | | | | | | 13,931,267 | |
| | | | | | | | | |
| Consumer Discretionary — 11.3% | | | | | | | | |
| Abercrombie & Fitch Co. - Class A | | | 39,500 | | | | 1,787,375 | |
| Best Buy Co., Inc. | | | 41,200 | | | | 1,125,996 | |
| Cablevision Systems Corp. - Class A | | | 117,800 | | | | 1,981,396 | |
| H&R Block, Inc. | | | 61,734 | | | | 1,713,118 | |
| Interpublic Group of Cos, Inc. (The) | | | 39,500 | | | | 574,725 | |
| Lear Corp. | | | 32,900 | | | | 1,989,134 | |
| Liberty Media Corp. - Class A* | | | 9,200 | | | | 1,166,192 | |
| Staples, Inc. | | | 110,200 | | | | 1,747,772 | |
| TRW Automotive Holdings Corp.* | | | 19,900 | | | | 1,322,156 | |
| | | | | | | | 13,407,864 | |
| | | | | | | | | |
| Industrials — 6.8% | | | | | | | | |
| Huntington Ingalls Industries, Inc. | | | 10,300 | | | | 581,744 | |
| KAR Auction Services, Inc. | | | 63,100 | | | | 1,443,097 | |
| Northrop Grumman Corp. | | | 6,900 | | | | 571,320 | |
| Pitney Bowes, Inc.† | | | 104,100 | | | | 1,528,188 | |
| Rexam PLC ADR | | | 18,000 | | | | 657,180 | |
| Towers Watson & Co. - Class A | | | 14,400 | | | | 1,179,936 | |
| Trinity Industries, Inc. | | | 8,200 | | | | 315,208 | |
| URS Corp. | | | 36,700 | | | | 1,732,974 | |
| | | | | | | | 8,009,647 | |
| | | | | | | | | |
| Energy — 5.2% | | | | | | | | |
| Energy XXI Bermuda Ltd. (Bermuda) | | | 64,700 | | | | 1,435,046 | |
| HollyFrontier Corp. | | | 40,900 | | | | 1,749,702 | |
| Williams Cos., Inc. (The) | | | 54,600 | | | | 1,772,862 | |
| World Fuel Services Corp. | | | 30,300 | | | | 1,211,394 | |
| | | | | | | | 6,169,004 | |
| | | | | | | | | |
| Materials — 3.6% | | | | | | | | |
| Bemis Co., Inc. | | | 43,900 | | | | 1,718,246 | |
| CF Industries Holdings, Inc. | | | 8,000 | | | | 1,372,000 | |
| Sealed Air Corp. | | | 49,000 | | | | 1,173,550 | |
| | | | | | | | 4,263,796 | |
| | | | | | | | | |
| Telecommunication Services — 3.6% | | | | | | | | |
| T-Mobile US, Inc. | | | 63,750 | | | | 1,581,638 | |
| Windstream Corp.† | | | 343,000 | | | | 2,644,530 | |
| | | | | | | | 4,226,168 | |
| | | | | | | | | |
| Consumer Staples — 2.0% | | | | | | | | |
| Dr Pepper Snapple Group, Inc. | | | 50,500 | | | | 2,319,465 | |
| Total Common Stocks | | | | | | $ | 111,201,367 | |
| | | | | | | | | |
| Investment Funds— 15.4% | | | | | | | | |
| Invesco Government & Agency Portfolio, Institutional Class** | | | 11,244,700 | | | | 11,244,700 | |
| Touchstone Institutional Money Market Fund^ | | | 7,005,605 | | | | 7,005,605 | |
| Total Investment Funds | | | | | | $ | 18,250,305 | |
| | | | | | | | | |
| Total Investment Securities —109.5% | | | | | | | | |
| (Cost $112,186,391) | | | | | | $ | 129,451,672 | |
| | | | | | | | | |
| Liabilities in Excess of Other Assets — (9.5%) | | | | | | | (11,195,610 | ) |
| | | | | | | | | |
| Net Assets — 100.0% | | | | | | $ | 118,256,062 | |
| * | Non-income producing security. |
| ** | Represents collateral for securities loaned. |
Touchstone Mid Cap Value Opportunities Fund (Continued)
| ^ | Affiliated Fund. See Note 4 in Notes to Financial Statements. |
| † | All or a portion of the security is on loan. The total market value of the securities on loan as of June 30, 2013 was $10,361,731. |
Portfolio Abbreviations:
ADR - American Depositary Receipt
PLC - Public Limited Company
REIT - Real Estate Investment Trust
Other Information:
The inputs or methodology used for valuing securities may not be an indication of the risk associated with investing in those securities. For more information on valuation inputs, and their aggregation into the levels used in the table below, please refer to the security valuation section in the accompanying Notes to Financial Statements.
Valuation inputs at Reporting Date:
| Description | | Level 1 | | | Level 2 | | | Level 3 | | | Total | |
| Common Stocks | | $ | 111,201,367 | | | $ | — | | | $ | — | | | $ | 111,201,367 | |
| Investment Funds | | | 18,250,305 | | | | — | | | | — | | | | 18,250,305 | |
| | | | | | | | | | | | | | | $ | 129,451,672 | |
See accompanying Notes to Financial Statements.
Portfolio of Investments
Touchstone Small Cap Value Opportunities Fund – June 30, 2013
| | | | | | Market | |
| | | Shares | | | Value | |
| | | | | | | |
| Common Stocks— 96.4% | | | | | | | | |
| | | | | | | | | |
| Financials — 26.3% | | | | | | | | |
| Altisource Portfolio Solutions SA (Luxembourg)* | | | 19,700 | | | $ | 1,853,376 | |
| American Equity Investment Life Holding Co. | | | 119,400 | | | | 1,874,580 | |
| Aspen Insurance Holdings Ltd. | | | 27,200 | | | | 1,008,848 | |
| Bofi Holding, Inc.* | | | 17,500 | | | | 801,850 | |
| Capstead Mortgage Corp. REIT | | | 87,400 | | | | 1,057,540 | |
| Cash America International, Inc. | | | 23,750 | | | | 1,079,675 | |
| Columbia Banking System, Inc. | | | 60,100 | | | | 1,430,981 | |
| DFC Global Corp.* | | | 69,800 | | | | 963,938 | |
| Endurance Specialty Holdings Ltd. | | | 26,600 | | | | 1,368,570 | |
| First Cash Financial Services, Inc.* | | | 26,200 | | | | 1,289,302 | |
| First Commonwealth Financial Corp. | | | 160,100 | | | | 1,179,937 | |
| Horace Mann Educators Corp. | | | 47,000 | | | | 1,145,860 | |
| Iberiabank Corp. | | | 31,600 | | | | 1,694,076 | |
| Lexington Realty Trust REIT† | | | 136,200 | | | | 1,590,816 | |
| Maiden Holdings Ltd. | | | 72,500 | | | | 813,450 | |
| Stewart Information Services Corp. | | | 29,600 | | | | 775,224 | |
| Stifel Financial Corp.* | | | 45,300 | | | | 1,615,851 | |
| SVB Financial Group* | | | 21,400 | | | | 1,783,048 | |
| Texas Capital Bancshares, Inc.* | | | 36,000 | | | | 1,596,960 | |
| Tower Group International Ltd. (Bermuda) | | | 67,790 | | | | 1,390,374 | |
| Wintrust Financial Corp. | | | 41,200 | | | | 1,577,136 | |
| | | | | | | | 27,891,392 | |
| | | | | | | | | |
| Industrials — 18.4% | | | | | | | | |
| ABM Industries, Inc. | | | 69,150 | | | | 1,694,866 | |
| Acacia Research Corp. | | | 41,100 | | | | 918,585 | |
| ACCO Brands Corp.* | | | 154,100 | | | | 980,076 | |
| Atlas Air Worldwide Holdings, Inc.* | | | 17,300 | | | | 757,048 | |
| Brink's Co. (The) | | | 41,100 | | | | 1,048,461 | |
| Con-way, Inc. | | | 32,500 | | | | 1,266,200 | |
| DigitalGlobe, Inc.* | | | 37,900 | | | | 1,175,279 | |
| DXP Enterprises, Inc.* | | | 24,200 | | | | 1,611,720 | |
| Encore Capital Group, Inc.*† | | | 53,200 | | | | 1,761,452 | |
| Generac Holdings, Inc. | | | 36,500 | | | | 1,350,865 | |
| H&E Equipment Services, Inc. | | | 50,200 | | | | 1,057,714 | |
| Hawaiian Holdings, Inc.*† | | | 123,200 | | | | 752,752 | |
| Hexcel Corp.* | | | 47,500 | | | | 1,617,375 | |
| ICF International, Inc.* | | | 17,900 | | | | 564,029 | |
| Mueller Water Products, Inc. Class A | | | 76,700 | | | | 529,997 | |
| Sykes Enterprises, Inc.* | | | 67,200 | | | | 1,059,072 | |
| Tutor Perini Corp.* | | | 75,700 | | | | 1,369,413 | |
| | | | | | | | 19,514,904 | |
| | | | | | | | | |
| Consumer Discretionary — 13.0% | | | | | | | | |
| Barnes & Noble, Inc.*† | | | 37,200 | | | | 593,712 | |
| Children's Place Retail Stores, Inc. (The)* | | | 14,700 | | | | 805,560 | |
| Coinstar, Inc.*† | | | 27,400 | | | | 1,607,558 | |
| Deckers Outdoor Corp.*† | | | 25,200 | | | | 1,272,852 | |
| Gentherm, Inc.* | | | 74,000 | | | | 1,374,180 | |
| LifeLock, Inc.*† | | | 80,100 | | | | 937,971 | |
| Men's Wearhouse, Inc. (The) | | | 35,200 | | | | 1,332,320 | |
| Multimedia Games Holding Co., Inc.* | | | 52,200 | | | | 1,360,854 | |
| Rent-A-Center, Inc. TX† | | | 35,900 | | | | 1,348,045 | |
| SHFL Entertainment, Inc.* | | | 63,100 | | | | 1,117,501 | |
| Shutterfly, Inc.* | | | 21,800 | | | | 1,216,222 | |
| TravelCenters of America LLC* | | | 74,100 | | | | 810,654 | |
| | | | | | | | 13,777,429 | |
| | | | | | | | | |
| Information Technology — 11.9% | | | | | | | | |
| AVG Technologies N.V. (Netherlands)† | | | 77,300 | | | | 1,503,485 | |
| Cardtronics, Inc.* | | | 52,300 | | | | 1,443,480 | |
| Dealertrack Technologies, Inc.* | | | 43,000 | | | | 1,523,490 | |
| Emulex Corp.* | | | 120,300 | | | | 784,356 | |
| GT Advanced Technologies, Inc.*† | | | 100,300 | | | | 416,245 | |
| Kulicke & Soffa Industries, Inc.* | | | 96,950 | | | | 1,072,267 | |
| Methode Electronics, Inc. | | | 52,800 | | | | 898,128 | |
| MoneyGram International, Inc.* | | | 20,400 | | | | 462,060 | |
| Netscout Systems, Inc.* | | | 67,200 | | | | 1,568,448 | |
| Silicon Image, Inc.* | | | 222,000 | | | | 1,298,700 | |
| SS&C Technologies Holdings, Inc.* | | | 49,000 | | | | 1,612,100 | |
| | | | | | | | 12,582,759 | |
| | | | | | | | | |
| Health Care — 8.8% | | | | | | | | |
| Acadia Healthcare Co., Inc.* | | | 47,750 | | | | 1,579,092 | |
| Acorda Therapeutics, Inc.* | | | 23,400 | | | | 771,966 | |
| Air Methods Corp. | | | 58,700 | | | | 1,988,756 | |
| Furiex Pharmaceuticals, Inc.* | | | 30,200 | | | | 1,028,914 | |
| Questcor Pharmaceuticals, Inc.† | | | 18,600 | | | | 845,556 | |
| Santarus, Inc.* | | | 74,300 | | | | 1,564,015 | |
| Team Health Holdings, Inc.* | | | 38,400 | | | | 1,577,088 | |
| Universal American Corp. NY | | | 800 | | | | 7,112 | |
| | | | | | | | 9,362,499 | |
| | | | | | | | | |
| Materials — 5.1% | | | | | | | | |
| American Vanguard Corp. | | | 46,700 | | | | 1,094,181 | |
| FutureFuel Corp. | | | 90,550 | | | | 1,283,094 | |
| Headwaters, Inc.* | | | 106,200 | | | | 938,808 | |
| Noranda Aluminum Holding Corp. | | | 142,800 | | | | 461,244 | |
| PH Glatfelter Co. | | | 66,250 | | | | 1,662,875 | |
| | | | | | | | 5,440,202 | |
| | | | | | | | | |
| Energy — 4.2% | | | | | | | | |
| Energy XXI Bermuda Ltd. (Bermuda) | | | 62,900 | | | | 1,395,122 | |
| Helix Energy Solutions Group, Inc.* | | | 54,500 | | | | 1,255,680 | |
| Newpark Resources, Inc.* | | | 104,200 | | | | 1,145,158 | |
| Western Refining, Inc. | | | 24,400 | | | | 684,908 | |
| | | | | | | | 4,480,868 | |
| | | | | | | | | |
| Utilities — 3.8% | | | | | | | | |
| NorthWestern Corp. | | | 51,100 | | | | 2,038,890 | |
| PNM Resources, Inc. | | | 45,500 | | | | 1,009,645 | |
| UNS Energy Corp. | | | 20,900 | | | | 934,857 | |
| | | | | | | | 3,983,392 | |
| | | | | | | | | |
| Consumer Staples — 3.5% | | | | | | | | |
| Andersons, Inc. (The) | | | 14,800 | | | | 787,212 | |
| Harris Teeter Supermarkets, Inc. | | | 28,683 | | | | 1,344,085 | |
| Medifast, Inc.* | | | 61,700 | | | | 1,589,392 | |
| | | | | | | | 3,720,689 | |
Touchstone Small Cap Value Opportunities Fund (Continued)
| | | | | | Market | |
| | | Shares | | | Value | |
| | | | | | | |
| Common Stocks — 96.4% (Continued) | | | | | | | | |
| | | | | | | | | |
| Telecommunication Services — 1.4% | | | | | | | | |
| Leap Wireless International, Inc.*† | | | 133,000 | | | $ | 895,090 | |
| Magicjack Vocaltec Ltd.*† | | | 39,200 | | | | 556,248 | |
| | | | | | | | 1,451,338 | |
| Total Common Stocks | | | | | | $ | 102,205,472 | |
| | | | | | | | | |
| Exchange Traded Fund — 1.3% | | | | | | | | |
| iShares Russell 2000 Value Index Fund† | | | 16,000 | | | | 1,374,400 | |
| | | | | | | | | |
| Investment Funds— 11.7% | | | | | | | | |
| Invesco Government & Agency Portfolio, Institutional Class** | | | 10,035,029 | | | | 10,035,029 | |
| Touchstone Institutional Money Market Fund^ | | | 2,374,756 | | | | 2,374,756 | |
| Total Investment Funds | | | | | | $ | 12,409,785 | |
| | | | | | | | | |
| Total Investment Securities —109.4% | | | | | | | | |
| (Cost $100,278,918) | | | | | | $ | 115,989,657 | |
| | | | | | | | | |
| Liabilities in Excess of Other Assets — (9.4%) | | | | | | | (9,965,018 | ) |
| | | | | | | | | |
| Net Assets — 100.0% | | | | | | $ | 106,024,639 | |
| * | Non-income producing security. |
| ** | Represents collateral for securities loaned. |
| ^ | Affiliated Fund. See Note 4 in Notes to Financial Statements. |
| † | All or a portion of the security is on loan. The total market value of the securities on loan as of June 30, 2013 was $9,828,831. |
Portfolio Abbreviations:
REIT - Real Estate Investment Trust
Other Information:
The inputs or methodology used for valuing securities may not be an indication of the risk associated with investing in those securities. For more information on valuation inputs, and their aggregation into the levels used in the table below, please refer to the security valuation section in the accompanying Notes to Financial Statements.
Valuation inputs at Reporting Date:
| Description | | Level 1 | | | Level 2 | | | Level 3 | | | Total | |
| Common Stocks | | $ | 102,205,472 | | | $ | — | | | $ | — | | | $ | 102,205,472 | |
| Exchanged Traded Fund | | | 1,374,400 | | | | — | | | | — | | | | 1,374,400 | |
| Investment Funds | | | 12,409,785 | | | | — | | | | — | | | | 12,409,785 | |
| | | | | | | | | | | | | | | $ | 115,989,657 | |
See accompanying Notes to Financial Statements.
Portfolio of Investments
Touchstone Value Fund – June 30, 2013
| | | | | | Market | |
| | | Shares | | | Value | |
| | | | | | | |
| Common Stocks— 96.9% | | | | | | | | |
| | | | | | | | | |
| Financials — 25.0% | | | | | | | | |
| American Express Co. | | | 147,462 | | | $ | 11,024,259 | |
| Bank of America Corp. | | | 509,743 | | | | 6,555,296 | |
| Capital One Financial Corp. | | | 167,479 | | | | 10,519,357 | |
| Citigroup, Inc. | | | 168,962 | | | | 8,105,107 | |
| JPMorgan Chase & Co. | | | 202,744 | | | | 10,702,856 | |
| PNC Financial Services Group, Inc. | | | 132,221 | | | | 9,641,555 | |
| SLM Corp. | | | 344,636 | | | | 7,878,379 | |
| State Street Corp. | | | 113,489 | | | | 7,400,618 | |
| Wells Fargo & Co. | | | 266,269 | | | | 10,988,922 | |
| XL Group PLC (Ireland) | | | 99,953 | | | | 3,030,576 | |
| | | | | | | | 85,846,925 | |
| | | | | | | | | |
| Health Care — 20.7% | | | | | | | | |
| Baxter International, Inc. | | | 16,500 | | | | 1,142,955 | |
| Cardinal Health, Inc. | | | 73,400 | | | | 3,464,480 | |
| Johnson & Johnson | | | 115,670 | | | | 9,931,426 | |
| Medtronic, Inc. | | | 222,552 | | | | 11,454,751 | |
| Merck & Co., Inc. | | | 189,943 | | | | 8,822,852 | |
| Pfizer, Inc. | | | 401,749 | | | | 11,252,989 | |
| Sanofi ADR | | | 103,003 | | | | 5,305,685 | |
| Teva Pharmaceutical Industries Ltd. ADR | | | 119,136 | | | | 4,670,131 | |
| UnitedHealth Group, Inc. | | | 112,110 | | | | 7,340,963 | |
| WellPoint, Inc. | | | 92,453 | | | | 7,566,354 | |
| | | | | | | | 70,952,586 | |
| | | | | | | | | |
| Industrials — 12.9% | | | | | | | | |
| Emerson Electric Co. | | | 121,904 | | | | 6,648,644 | |
| General Dynamics Corp. | | | 41,300 | | | | 3,235,029 | |
| General Electric Co. | | | 84,643 | | | | 1,962,871 | |
| Honeywell International, Inc. | | | 114,030 | | | | 9,047,140 | |
| Illinois Tool Works, Inc. | | | 134,888 | | | | 9,330,203 | |
| Raytheon Co. | | | 133,850 | | | | 8,850,162 | |
| Stanley Black & Decker, Inc. | | | 66,964 | | | | 5,176,317 | |
| | | | | | | | 44,250,366 | |
| | | | | | | | | |
| Energy — 11.9% | | | | | | | | |
| BP PLC ADR | | | 230,687 | | | | 9,628,875 | |
| ConocoPhillips | | | 143,105 | | | | 8,657,852 | |
| Marathon Oil Corp. | | | 215,482 | | | | 7,451,368 | |
| Occidental Petroleum Corp. | | | 123,038 | | | | 10,978,681 | |
| Phillips 66 | | | 71,190 | | | | 4,193,803 | |
| | | | | | | | 40,910,579 | |
| | | | | | | | | |
| Consumer Staples — 7.4% | | | | | | | | |
| Altria Group, Inc. | | | 168,964 | | | | 5,912,050 | |
| Imperial Tobacco Group PLC ADR† | | | 49,928 | | | | 3,479,482 | |
| Philip Morris International, Inc. | | | 123,315 | | | | 10,681,545 | |
| Walgreen Co. | | | 119,885 | | | | 5,298,917 | |
| | | | | | | | 25,371,994 | |
| | | | | | | | | |
| Information Technology — 6.7% | | | | | | | | |
| Intel Corp. | | | 139,985 | | | | 3,390,437 | |
| International Business Machines Corp. | | | 17,358 | | | | 3,317,287 | |
| Microsoft Corp. | | | 295,543 | | | | 10,205,100 | |
| Texas Instruments, Inc. | | | 173,344 | | | | 6,044,505 | |
| | | | | | | | 22,957,329 | |
| | | | | | | | | |
| Consumer Discretionary — 5.5% | | | | | | | | |
| Carnival Corp. | | | 232,941 | | | | 7,987,547 | |
| Delphi Automotive PLC (Jersey) | | | 94,900 | | | | 4,810,481 | |
| Target Corp. | | | 86,497 | | | | 5,956,183 | |
| | | | | | | | 18,754,211 | |
| | | | | | | | | |
| Telecommunication Services — 4.6% | | | | | | | | |
| AT&T, Inc. | | | 245,646 | | | | 8,695,868 | |
| Verizon Communications, Inc. | | | 138,756 | | | | 6,984,977 | |
| | | | | | | | 15,680,845 | |
| | | | | | | | | |
| Utilities — 1.1% | | | | | | | | |
| Entergy Corp. | | | 56,251 | | | | 3,919,570 | |
| | | | | | | | | |
| Materials — 1.1% | | | | | | | | |
| EI du Pont de Nemours & Co. | | | 69,533 | | | | 3,650,482 | |
| Total Common Stocks | | | | | | $ | 332,294,887 | |
| | | | | | | | | |
| Investment Funds— 2.7% | | | | | | | | |
| Invesco Government & Agency Portfolio, Institutional Class** | | | 408,975 | | | | 408,975 | |
| Touchstone Institutional Money Market Fund^ | | | 8,753,580 | | | | 8,753,580 | |
| Total Investment Funds | | | | | | $ | 9,162,555 | |
| | | | | | | | | |
| Total Investment Securities —99.6% | | | | | | | | |
| (Cost $278,467,153) | | | | | | $ | 341,457,442 | |
| | | | | | | | | |
| Other Assets in Excess of Liabilities — 0.4% | | | | | | | 1,388,113 | |
| | | | | | | | | |
| Net Assets — 100.0% | | | | | | $ | 342,845,555 | |
| ** | Represents collateral for securities loaned. |
| ^ | Affiliated Fund. See Note 4 in Notes to Financial Statements. |
| † | All or a portion of the security is on loan. The total market value of the securities on loan as of June 30, 2013 was $397,233. |
Portfolio Abbreviations:
ADR - American Depositary Receipt
PLC - Public Limited Company
Touchstone Value Fund (Continued)
Other Information:
The inputs or methodology used for valuing securities may not be an indication of the risk associated with investing in those securities. For more information on valuation inputs, and their aggregation into the levels used in the table below, please refer to the security valuation section in the accompanying Notes to Financial Statements.
Valuation inputs at Reporting Date:
| Description | | Level 1 | | | Level 2 | | | Level 3 | | | Total | |
| Common Stocks | | $ | 332,294,887 | | | $ | — | | | $ | — | | | $ | 332,294,887 | |
| Investment Funds | | | 9,162,555 | | | | — | | | | — | | | | 9,162,555 | |
| | | | | | | | | | | | | | | $ | 341,457,442 | |
See accompanying Notes to Financial Statements.
Statements of Assets and Liabilities
June 30, 2013
| | | Touchstone | | | Touchstone | |
| | | Capital | | | International | |
| | | Growth | | | Small Cap | |
| | | Fund | | | Fund | |
| Assets | | | | | | | | |
| Investments, at cost | | $ | 119,682,020 | | | $ | 96,127,704 | |
| Affiliated securities, at market value | | $ | 1,639,168 | | | $ | 699,197 | |
| Non-affiliated securities, at market value | | | 172,253,758 | | | | 112,198,780 | |
| Investments, at market value (A) | | $ | 173,892,926 | | | $ | 112,897,977 | |
| Foreign currency (B) | | | — | | | | 195,285 | |
| Dividends and interest receivable | | | 90,365 | | | | 198,425 | |
| Receivable for capital shares sold | | | 101,856 | | | | 36,979 | |
| Receivable for investments sold | | | — | | | | — | |
| Receivable for securities lending income | | | 194 | | | | 18,856 | |
| Receivable from other affiliates | | | — | | | | — | |
| Tax reclaim receivable | | | — | | | | 91,397 | |
| Other assets | | | 25,039 | | | | 28,542 | |
| Total Assets | | | 174,110,380 | | | | 113,467,461 | |
| | | | | | | | | |
| Liabilities | | | | | | | | |
| Bank overdrafts | | | 487 | | | | 3,930 | |
| Payable for return of collateral for securities on loan | | | 1,219,083 | | | | 5,205,070 | |
| Payable for capital shares redeemed | | | 58,612 | | | | 42,928 | |
| Payable for investments purchased | | | — | | | | 1,113,912 | |
| Payable to Investment Advisor | | | 138,719 | | | | 75,737 | |
| Payable to other affiliates | | | 5,575 | | | | 403 | |
| Payable to Trustees | | | 3,727 | | | | 3,716 | |
| Payable to Transfer Agent | | | 148,583 | | | | 76,996 | |
| Payable for reports to shareholders | | | 19,460 | | | | 19,360 | |
| Payable for professional services | | | 19,551 | | | | 36,923 | |
| Other accrued expenses and liabilities | | | 10,932 | | | | 29,589 | |
| Total Liabilities | | | 1,624,729 | | | | 6,608,564 | |
| | | | | | | | | |
| Net Assets | | $ | 172,485,651 | | | $ | 106,858,897 | |
| | | | | | | | | |
| Net assets consist of: | | | | | | | | |
| Paid-in capital | | $ | 143,124,018 | | | $ | 115,526,752 | |
| Accumulated net investment income | | | 67,522 | | | | 801,177 | |
| Accumulated net realized gains (losses) on investments, warrants and foreign currency transactions | | | (24,916,795 | ) | | | (26,232,693 | ) |
| Net unrealized appreciation on investments, warrants and foreign currency transactions | | | 54,210,906 | | | | 16,763,661 | |
| | | | | | | | | |
| Net Assets | | $ | 172,485,651 | | | $ | 106,858,897 | |
| (A) Includes market value of securities on loan of: | | $ | 1,157,702 | | | $ | 5,054,576 | |
| (B) Cost of foreign currency: | | $ | — | | | $ | 196,873 | |
See accompanying Notes to Financial Statements.
Statements of Assets and Liabilities (Continued)
| Touchstone | | | Touchstone | | | | |
| Mid Cap | | | Small Cap | | | | |
| Value | | | Value | | | Touchstone | |
| Opportunities | | | Opportunities | | | Value | |
| Fund | | | Fund | | | Fund | |
| | | | | | | | | | | |
| $ | 112,186,391 | | | $ | 100,278,918 | | | $ | 278,467,153 | |
| $ | 7,005,605 | | | $ | 2,374,756 | | | $ | 8,753,580 | |
| | 122,446,067 | | | | 113,614,901 | | | | 332,703,862 | |
| $ | 129,451,672 | | | $ | 115,989,657 | | | $ | 341,457,442 | |
| | — | | | | — | | | | — | |
| | 389,793 | | | | 98,424 | | | | 480,723 | |
| | 431,793 | | | | 50,947 | | | | 1,090,456 | |
| | 940,040 | | | | 38,082 | | | | 846,287 | |
| | 4,403 | | | | 28,581 | | | | 122 | |
| | — | | | | — | | | | 4,917 | |
| | — | | | | — | | | | — | |
| | 31,067 | | | | 33,882 | | | | 32,109 | |
| | 131,248,768 | | | | 116,239,573 | | | | 343,912,056 | |
| | | | | | | | | | | |
| | | | | | | | | | | |
| | 735 | | | | 822 | | | | 945 | |
| | 11,244,700 | | | | 10,035,029 | | | | 408,975 | |
| | 16,424 | | | | 22,569 | | | | 304,837 | |
| | 1,571,781 | | | | — | | | | 47,076 | |
| | 80,986 | | | | 88,737 | | | | 162,324 | |
| | 403 | | | | 1,178 | | | | — | |
| | 3,717 | | | | 3,715 | | | | 3,750 | |
| | 34,909 | | | | 23,496 | | | | 79,379 | |
| | 12,463 | | | | 11,368 | | | | 18,663 | |
| | 18,373 | | | | 19,421 | | | | 20,299 | |
| | 8,215 | | | | 8,599 | | | | 20,253 | |
| | 12,992,706 | | | | 10,214,934 | | | | 1,066,501 | |
| | | | | | | | | | | |
| $ | 118,256,062 | | | $ | 106,024,639 | | | $ | 342,845,555 | |
| | | | | | | | | | | |
| | | | | | | | | | | |
| $ | 95,783,672 | | | $ | 78,149,948 | | | $ | 317,282,492 | |
| | — | | | | 301,750 | | | | — | |
| | 5,207,109 | | | | 11,862,202 | | | | (37,427,226 | ) |
| | 17,265,281 | | | | 15,710,739 | | | | 62,990,289 | |
| | | | | | | | | | | |
| $ | 118,256,062 | | | $ | 106,024,639 | | | $ | 342,845,555 | |
| $ | 10,361,731 | | | $ | 9,828,831 | | | $ | 397,233 | |
| $ | — | | | $ | — | | | $ | — | |
Statements of Assets and Liabilities (Continued)
| | | Touchstone | | | Touchstone | |
| | | Capital | | | International | |
| | | Growth | | | Small Cap | |
| | | Fund | | | Fund | |
| | | | | | | |
| Pricing of Class A Shares | | | | | | | | |
| Net assets applicable to Class A shares | | $ | 1,103,588 | | | $ | 488,931 | |
| Shares of beneficial interest outstanding | | | | | | | | |
| (unlimited number of shares authorized, no par value) | | | 50,481 | | | | 38,880 | |
| Net asset value price per share* | | $ | 21.86 | | | $ | 12.58 | |
| Maximum offering price per share | | $ | 23.19 | | | $ | 13.35 | |
| | | | | | | | | |
| Pricing of Class C Shares | | | | | | | | |
| Net assets applicable to Class C shares | | $ | 47,008 | | | $ | 6,774 | |
| Shares of beneficial interest outstanding | | | | | | | | |
| (unlimited number of shares authorized, no par value) | | | 2,170 | | | | 540 | |
| Net asset value, offering price per share** | | $ | 21.66 | | | $ | 12.54 | |
| | | | | | | | | |
| Pricing of Class Y Shares | | | | | | | | |
| Net assets applicable to Class Y shares | | $ | 171,277,328 | | | $ | 90,124,942 | |
| Shares of beneficial interest outstanding | | | | | | | | |
| (unlimited number of shares authorized, no par value) | | | 7,694,521 | | | | 7,017,884 | |
| Net asset value, offering price and redemption price per share | | $ | 22.26 | | | $ | 12.84 | |
| | | | | | | | | |
| Pricing of Institutional Class Shares | | | | | | | | |
| Net assets applicable to Institutional Class shares | | $ | 57,727 | | | $ | 16,238,250 | |
| Shares of beneficial interest outstanding | | | | | | | | |
| (unlimited number of shares authorized, no par value) | | | 2,577 | | | | 1,258,459 | |
| Net asset value, offering price and redemption price per share | | $ | 22.40 | | | $ | 12.90 | |
* There is no sales load on subscriptions of $1 million or more. Redemptions that were part of a $1 million or more subscription may be subject to a contingent deferred sales load if redeemed within a one year period from the date of purchase.
** Redemption price per share varies by length of time shares are held.
See accompanying Notes to Financial Statements.
Statements of Assets and Liabilities (Continued)
| Touchstone | | | Touchstone | | | | |
| Mid Cap Value | | | Small Cap Value | | | Touchstone | |
| Opportunities | | | Opportunities | | | Value | |
| Fund | | | Fund | | | Fund | |
| | | | | | | | |
| | | | | | | | | | | |
| $ | 4,292,361 | | | $ | 1,309,449 | | | $ | 53,432,524 | |
| | | | | | | | | | | |
| | 466,193 | | | | 69,849 | | | | 6,658,886 | |
| $ | 9.21 | | | $ | 18.75 | | | $ | 8.02 | |
| $ | 9.77 | | | $ | 19.89 | | | $ | 8.51 | |
| | | | | | | | | | | |
| | | | | | | | | | | |
| $ | 167,650 | | | $ | 35,752 | | | $ | 3,025,145 | |
| | | | | | | | | | | |
| | 18,331 | | | | 1,913 | | | | 377,121 | |
| $ | 9.15 | | | $ | 18.69 | | | $ | 8.02 | |
| | | | | | | | | | | |
| | | | | | | | | | | |
| $ | 81,868,568 | | | $ | 96,583,632 | | | $ | 99,397,868 | |
| | | | | | | | | | | |
| | 8,846,186 | | | | 4,965,753 | | | | 12,350,642 | |
| $ | 9.25 | | | $ | 19.45 | | | $ | 8.05 | |
| | | | | | | | | | | |
| | | | | | | | | | | |
| $ | 31,927,483 | | | $ | 8,095,806 | | | $ | 186,990,018 | |
| | | | | | | | | | | |
| | 3,451,732 | | | | 412,643 | | | | 23,281,113 | |
| $ | 9.25 | | | $ | 19.62 | | | $ | 8.03 | |
Statements of Operations
For the Year Ended June 30, 2013
| | | Touchstone | | | Touchstone | |
| | | Capital | | | International | |
| | | Growth | | | Small Cap | |
| | | Fund | | | Fund | |
| Investment Income | | | | | | | | |
| Dividends from affiliated securities | | $ | 2,088 | | | $ | 1,778 | |
| Dividends from non-affiliated securities(A) | | | 1,892,794 | | | | 2,928,051 | |
| Income from securities loaned | | | 5,099 | | | | 75,615 | |
| Total Investment Income | | | 1,899,981 | | | | 3,005,444 | |
| Expenses | | | | | | | | |
| Investment advisory fees | | | 1,206,944 | | | | 966,202 | |
| Administration fees | | | 301,614 | | | | 177,511 | |
| Compliance fees and expenses | | | 1,455 | | | | 1,455 | |
| Custody fees | | | 7,334 | | | | 60,077 | |
| Professional fees | | | 30,238 | | | | 48,042 | |
| Transfer Agent fees, Class A | | | 1,187 | | | | 1,045 | |
| Transfer Agent fees, Class C | | | 88 | | | | 38 | |
| Transfer Agent fees, Class Y | | | 254,827 | | | | 142,344 | |
| Transfer Agent fees, Institutional Class | | | 357 | | | | 359 | |
| Registration Fees, Class A | | | 8,181 | | | | 12,682 | |
| Registration Fees, Class C | | | 175 | | | | 189 | |
| Registration Fees, Class Y | | | 16,177 | | | | 12,980 | |
| Registration Fees, Institutional Class | | | 10,930 | | | | 12,335 | |
| Reports to Shareholders, Class A | | | 10,137 | | | | 8,987 | |
| Reports to Shareholders, Class C | | | 2,959 | | | | 3,100 | |
| Reports to Shareholders, Class Y | | | 27,627 | | | | 1,929 | |
| Reports to Shareholders, Institutional Class | | | 6,065 | | | | 6,361 | |
| Distribution expenses, Class A | | | 2,204 | | | | 920 | |
| Distribution expenses, Class C | | | 152 | | | | 36 | |
| Trustee fees | | | 10,506 | | | | 10,498 | |
| Other expenses | | | 112,829 | | | | 110,294 | |
| Total Expenses | | | 2,011,986 | | | | 1,577,384 | |
| Fees waived and/or reimbursed by the Advisor and/or Affiliates(B) | | | (285,561 | ) | | | (346,964 | ) |
| Fees recouped by the Advisor | | | — | | | | 8,809 | |
| Net Expenses | | | 1,726,425 | | | | 1,239,229 | |
| Net Investment Income | | | 173,556 | | | | 1,766,215 | |
| Realized and Unrealized Gain (Loss) on Investments | | | | | | | | |
| Net realized gain on investments | | | 18,725,481 | | | | 3,022,615 | |
| Net realized gain on warrants | | | — | | | | 6,346 | |
| Net realized loss on foreign currency | | | — | | | | (68,461 | ) |
| Net change in unrealized appreciation on investments(C) | | | 5,878,081 | | | | 17,012,878 | |
| Net change in unrealized depreciation on foreign currency transactions | | | — | | | | (388 | ) |
| Net Realized and Unrealized Gain on Investments | | | 24,603,562 | | | | 19,972,990 | |
| Change in Net Assets Resulting from Operations | | $ | 24,777,118 | | | $ | 21,739,205 | |
| (A)Net of foreign tax withholding of: | | $ | 13,537 | | | $ | 173,432 | |
(B)See Note 4 in Notes to Financial Statements
(C)Change in unrealized appreciation/(depreciation) does not include net unrealized depreciation of $(20,792,699) for the Value Fund in connection with the Fund's merger. See Note 8 in the Notes to Financial Statements.
See accompanying Notes to Financial Statements.
Statements of Operations (Continued)
| Touchstone | | | Touchstone | | | | |
| Mid Cap Value | | | Small Cap Value | | | Touchstone | |
| Opportunities | | | Opportunities | | | Value | |
| Fund | | | Fund | | | Fund | |
| | | | | | | | | | | |
| $ | 4,260 | | | $ | 2,607 | | | $ | 4,358 | |
| | 2,701,844 | | | | 1,496,343 | | | | 8,385,218 | |
| | 91,542 | | | | 480,820 | | | | 6,708 | |
| | 2,797,646 | | | | 1,979,770 | | | | 8,396,284 | |
| | | | | | | | | | | |
| | 874,667 | | | | 925,865 | | | | 2,125,843 | |
| | 179,943 | | | | 170,379 | | | | 492,421 | |
| | 1,455 | | | | 1,455 | | | | 1,455 | |
| | 5,374 | | | | 5,583 | | | | 12,705 | |
| | 27,985 | | | | 22,984 | | | | 30,374 | |
| | 2,259 | | | | 4,724 | | | | 79,475 | |
| | 55 | | | | 71 | | | | 4,507 | |
| | 69,047 | | | | 60,892 | | | | 75,017 | |
| | 316 | | | | 1,005 | | | | 1,277 | |
| | 12,484 | | | | 11,211 | | | | 12,879 | |
| | 190 | | | | 206 | | | | 249 | |
| | 13,346 | | | | 13,432 | | | | 14,678 | |
| | 15,262 | | | | 10,645 | | | | 13,970 | |
| | 7,560 | | | | 7,366 | | | | 16,333 | |
| | 3,012 | | | | 3,150 | | | | 2,778 | |
| | 10,078 | | | | 6,618 | | | | 19,991 | |
| | 8,368 | | | | 6,950 | | | | 18,861 | |
| | 4,633 | | | | 5,774 | | | | 90,954 | |
| | 187 | | | | 149 | | | | 22,507 | |
| | 10,492 | | | | 10,495 | | | | 10,538 | |
| | 37,767 | | | | 31,405 | | | | 65,071 | |
| | 1,284,480 | | | | 1,300,359 | | | | 3,111,883 | |
| | (276,685 | ) | | | (138,113 | ) | | | (975,786 | ) |
| | 8,078 | | | | — | | | | — | |
| | 1,015,873 | | | | 1,162,246 | | | | 2,136,097 | |
| | 1,781,773 | | | | 817,524 | | | | 6,260,187 | |
| | | | | | | | | | | |
| | 19,380,415 | | | | 20,108,352 | | | | 33,676,826 | |
| | — | | | | — | | | | — | |
| | — | | | | — | | | | — | |
| | 6,794,557 | | | | 742,439 | | | | 16,063,683 | |
| | — | | | | — | | | | — | |
| | 26,174,972 | | | | 20,850,791 | | | | 49,740,509 | |
| $ | 27,956,745 | | | $ | 21,668,315 | | | $ | 56,000,696 | |
| $ | — | | | $ | 229 | | | $ | 40,995 | |
Statements of Changes in Net Assets
| | | Touchstone Capital | |
| | | | | | Growth Fund | | | | |
| | | | | | For the | | | | |
| | | For the | | | Three Months | | | For the | |
| | | Year Ended | | | Ended | | | Year Ended | |
| | | June 30, 2013 | | | June 30, 2012 | | | March 31, 2012 | |
| From Operations | | | | | | | | | | | | |
| Net investment income | | $ | 173,556 | | | $ | 112,772 | | | $ | 247,154 | |
| Net realized gain (loss) on investments, warrants and foreign currency transactions | | | 18,725,481 | | | | 6,540,076 | | | | 11,638,448 | |
| Net change in unrealized appreciation (depreciation) on investments and foreign currency transactions | | | 5,878,081 | | | | (20,410,114 | ) | | | 3,017,037 | |
| Change in Net Assets from Operations | | | 24,777,118 | | | | (13,757,266 | ) | | | 14,902,639 | |
| Distributions to Shareholders from: | | | | | | | | | | | | |
| Net investment income, Class A | | | — | | | | — | | | | — | |
| Net investment income, Class C | | | — | (A) | | | (1 | ) | | | — | |
| Net investment income, Class Y | | | (218,564 | ) | | | (31,764 | ) | | | — | |
| Net investment income, Class Z | | | — | | | | — | | | | (186,919 | ) |
| Net investment income, Institutional Class | | | (68 | ) | | | (84 | ) | | | (28,443 | ) |
| Net realized gains, Class A | | | — | | | | — | | | | — | |
| Net realized gains, Class C | | | — | | | | — | | | | — | |
| Net realized gains, Class Y | | | — | | | | — | | | | — | |
| Net realized gains, Class Z | | | — | | | | — | | | | — | |
| Net realized gains, Institutional Class | | | — | | | | — | | | | — | |
| Total Distributions | | | (218,632 | ) | | | (31,849 | ) | | | (215,362 | ) |
| Net Increase (Decrease) from Share Transactions(B) | | | (17,375,158 | ) | | | (19,077,394 | ) | | | (25,723,783 | ) |
| Total Increase (Decrease) in Net Assets | | | 7,183,328 | | | | (32,866,509 | ) | | | (11,036,506 | ) |
| Net Assets | | | | | | | | | | | | |
| Beginning of period | | | 165,302,323 | | | | 198,168,832 | | | | 209,205,338 | |
| End of period | | $ | 172,485,651 | | | $ | 165,302,323 | | | $ | 198,168,832 | |
| Accumulated Net Investment Income | | $ | 67,522 | | | $ | 112,598 | | | $ | 31,675 | |
(A)Amount rounds to less than $0.50
(B)For details on share transactions by class, see Statements of Changes in Net Assets - Capital Stock Activity on pages 42-44.
See accompanying Notes to Financial Statements.
Statements of Changes in Net Assets (Continued)
| Touchstone International | | | Touchstone Mid Cap | |
| | | | Small Cap Fund | | | | | | Value Opportunities Fund | |
| | | | For the | | | | | | | | | For the | | | | |
| For the | | | Three Months | | | For the | | | For the | | | Three Months | | | For the | |
| Year Ended | | | Ended | | | Year Ended | | | Year Ended | | | Ended | | | Year Ended | |
| June 30, 2013 | | | June 30, 2012 | | | March 31, 2012 | | | June 30, 2013 | | | June 30, 2012 | | | March 31, 2012 | |
| | | | | | | | | | | | | | | | | | | | | | | |
| $ | 1,766,215 | | | $ | 795,817 | | | $ | 635,227 | | | $ | 1,781,773 | | | $ | 258,018 | | | $ | 1,780,201 | |
| | 2,960,500 | | | | (2,705,536 | ) | | | 16,798,403 | | | | 19,380,415 | | | | 12,269,428 | | | | 30,556,486 | |
| | 17,012,490 | | | | (4,812,758 | ) | | | (25,628,709 | ) | | | 6,794,557 | | | | (15,845,639 | ) | | | (31,885,780 | ) |
| | 21,739,205 | | | | (6,722,477 | ) | | | (8,195,079 | ) | | | 27,956,745 | | | | (3,318,193 | ) | | | 450,907 | |
| | | | | | | | | | | | | | | | | | | | | | | |
| | (5,381 | ) | | | (1,870 | ) | | | (2,138 | ) | | | (14,855 | ) | | | (7,739 | ) | | | (5,292 | ) |
| | (22 | ) | | | (24 | ) | | | — | | | | (17 | ) | | | (16 | ) | | | — | |
| | (1,271,067 | ) | | | (761,702 | ) | | | — | | | | (845,877 | ) | | | (390,339 | ) | | | — | |
| | — | | | | — | | | | (1,710,699 | ) | | | — | | | | — | | | | (733,074 | ) |
| | (249,360 | ) | | | (38,728 | ) | | | (129,464 | ) | | | (390,985 | ) | | | (229,480 | ) | | | (1,432,706 | ) |
| | — | | | | — | | | | — | | | | (252,628 | ) | | | (48,352 | ) | | | (85,531 | ) |
| | — | | | | — | | | | — | | | | (435 | ) | | | (85 | ) | | | — | |
| | — | | | | — | | | | — | | | | (10,540,601 | ) | | | (2,162,086 | ) | | | — | |
| | — | | | | — | | | | — | | | | — | | | | — | | | | (4,048,591 | ) |
| | — | | | | — | | | | — | | | | (5,173,566 | ) | | | (1,208,407 | ) | | | (7,091,468 | ) |
| | (1,525,830 | ) | | | (802,324 | ) | | | (1,842,301 | ) | | | (17,218,964 | ) | | | (4,046,504 | ) | | | (13,396,662 | ) |
| | 1,821,419 | | | | (4,110,935 | ) | | | (13,562,188 | ) | | | 6,937,651 | | | | (64,948,800 | ) | | | (100,560,408 | ) |
| | 22,034,794 | | | | (11,635,736 | ) | | | (23,599,568 | ) | | | 17,675,432 | | | | (72,313,497 | ) | | | (113,506,163 | ) |
| | | | | | | | | | | | | | | | | | | | | | | |
| | 84,824,103 | | | | 96,459,839 | | | | 120,059,407 | | | | 100,580,630 | | | | 172,894,127 | | | | 286,400,290 | |
| $ | 106,858,897 | | | $ | 84,824,103 | | | $ | 96,459,839 | | | $ | 118,256,062 | | | $ | 100,580,630 | | | $ | 172,894,127 | |
| $ | 801,177 | | | $ | 618,914 | | | $ | 654,028 | | | $ | — | | | $ | 257,446 | | | $ | 627,003 | |
Statements of Changes in Net Assets (Continued)
| | | Touchstone Small Cap
Value Opportunities Fund | |
| | | | | | For the | | | | |
| | | For the | | | Three Months | | | For the | |
| | | Year Ended | | | Ended | | | Year Ended | |
| | | June 30, 2013 | | | June 30, 2012 | | | March 31, 2012 | |
| From Operations | | | | | | | | | | | | |
| Net investment income (loss) | | $ | 817,524 | | | $ | 29,097 | | | $ | (78,001 | ) |
| Net realized gain on investments | | | 20,108,352 | | | | 5,243,556 | | | | 4,981,033 | |
| Net change in unrealized appreciation (depreciation) on investments | | | 742,439 | | | | (8,565,429 | ) | | | (4,671,365 | ) |
| Change in Net Assets from Operations | | | 21,668,315 | | | | (3,292,776 | ) | | | 231,667 | |
| Distributions to Shareholders from: | | | | | | | | | | | | |
| Net investment income, Class A | | | (21,532 | ) | | | — | | | | — | |
| Net investment income, Class C | | | — | | | | — | | | | — | |
| Net investment income, Class Y | | | (534,115 | ) | | | — | | | | — | |
| Net investment income, Class Z(A) | | | — | | | | — | | | | — | |
| Net investment income, Institutional Class | | | (38,047 | ) | | | — | | | | — | |
| Net realized gains, Class A | | | (411,110 | ) | | | (61,018 | ) | | | (128,052 | ) |
| Net realized gains, Class C | | | (276 | ) | | | (75 | ) | | | — | |
| Net realized gains, Class Y | | | (8,672,644 | ) | | | (2,424,199 | ) | | | — | |
| Net realized gains, Class Z(A) | | | — | | | | — | | | | (4,410,675 | ) |
| Net realized gains, Institutional Class | | | (738,390 | ) | | | (206,182 | ) | | | (957,098 | ) |
| Total Distributions | | | (10,416,114 | ) | | | (2,691,474 | ) | | | (5,495,825 | ) |
| Net Increase (Decrease) from Share Transactions(B) | | | 2,863,294 | | | | (11,407,982 | ) | | | (6,890,909 | ) |
| | | | | | | | | | | | | |
| Total Increase (Decrease) in Net Assets | | | 14,115,495 | | | | (17,392,232 | ) | | | (12,155,067 | ) |
| Net Assets | | | | | | | | | | | | |
| Beginning of period | | | 91,909,144 | | | | 109,301,376 | | | | 121,456,443 | |
| End of period | | $ | 106,024,639 | | | $ | 91,909,144 | | | $ | 109,301,376 | |
| Accumulated Net Investment Income | | $ | 301,750 | | | $ | 29,097 | | | $ | — | |
(A)See Note 8 in the Notes to Financial Statements.
(B)For details on share transactions by class, see Statements of Changes in Net Assets - Capital Stock Activity on pages 45-46.
See accompanying Notes to Financial Statements.
Statements of Changes in Net Assets (Continued)
| | | | Touchstone | | | | |
| | | | Value Fund | | | | |
| | | | For the | | | | |
| For the | | | Three Months | | | For the | |
| Year Ended | | | Ended | | | Year Ended | |
| June 30, 2013 | | | June 30, 2012 | | | March 31, 2012 | |
| | | | | | | | | | | |
| $ | 6,260,187 | | | $ | 566,642 | | | $ | 2,393,351 | |
| | 33,676,826 | | | | 3,049,444 | | | | 3,679,428 | |
| | 16,063,683 | | | | (5,520,709 | ) | | | 5,418,074 | |
| | 56,000,696 | | | | (1,904,623 | ) | | | 11,490,853 | |
| | | | | | | | | | | |
| | (741,258 | ) | | | (13,015 | ) | | | (35,067 | ) |
| | (25,816 | ) | | | (20 | ) | | | — | |
| | (1,911,954 | ) | | | (495,472 | ) | | | — | |
| | — | | | | — | | | | (1,506,155 | ) |
| | (3,581,840 | ) | | | (719,710 | ) | | | (746,586 | ) |
| | (1,261,426 | ) | | | — | | | | — | |
| | (80,161 | ) | | | — | | | | — | |
| | (3,086,060 | ) | | | — | | | | — | |
| | — | | | | — | | | | — | |
| | (5,131,975 | ) | | | — | | | | — | |
| | (15,820,490 | ) | | | (1,228,217 | ) | | | (2,287,808 | ) |
| | 180,083,499 | | | | 2,836,068 | | | | (17,414,538 | ) |
| | | | | | | | | | | |
| | 220,263,705 | | | | (296,772 | ) | | | (8,211,493 | ) |
| | | | | | | | | | | |
| | 122,581,850 | | | | 122,878,622 | | | | 131,090,115 | |
| $ | 342,845,555 | | | $ | 122,581,850 | | | $ | 122,878,622 | |
| $ | — | | | $ | 24,961 | | | $ | 686,536 | |
Statements of Changes in Net Assets - Capital Stock Activity
| | | | | | | | | Touchstone Capital | | | | | | | |
| | | | | | | | | Growth Fund | | | | | | | |
| | | For the Year | | | For the Three Months | | | For the | |
| | | Ended | | | Ended | | | Year Ended | |
| | | June 30, 2013 | | | June 30, 2012 | | | March 31, 2012 | |
| | | Shares | | | Dollars | | | Shares | | | Dollars | | | Shares | | | Dollars | |
| Class A | | | | | | | | | | | | | | | | | | | | | | | | |
| Proceeds from Shares sold | | | 54,764 | | | $ | 1,158,223 | | | | 1,530 | | | $ | 29,519 | | | | 3,459 | | | $ | 66,930 | |
| Reinvestment of distributions | | | — | | | | — | | | | — | | | | — | | | | — | | | | — | |
| Redemption fees | | | — | | | | — | | | | — | | | | — | | | | — | | | | — | |
| Capital contribution | | | — | | | | — | | | | — | | | | — | | | | — | | | | — | |
| Cost of Shares redeemed | | | (33,765 | ) | | | (711,164 | ) | | | (6,429 | ) | | | (120,348 | ) | | | (27,739 | ) | | | (501,671 | ) |
| Change in Net Assets from Class A Share Transactions | | | 20,999 | | | | 447,059 | | | | (4,899 | ) | | | (90,829 | ) | | | (24,280 | ) | | | (434,741 | ) |
| Class C(A) | | | | | | | | | | | | | | | | | | | | | | | | |
| Proceeds from Shares sold | | | 2,045 | | | | 44,317 | | | | 125 | | | | 2,500 | | | | — | | | | — | |
| Reinvestment of distributions | | | — | | | | — | | | | — | | | | — | | | | — | | | | — | |
| Cost of Shares redeemed | | | — | | | | — | | | | — | | | | — | | | | — | | | | — | |
| Change in Net Assets from Class C Share Transactions | | | 2,045 | | | | 44,317 | | | | 125 | | | | 2,500 | | | | — | | | | — | |
| Class Y | | | | | | | | | | | | | | | | | | | | | | | | |
| Proceeds from Shares sold | | | 282,019 | | | | 6,131,148 | | | | 35,435 | | | | 708,926 | | | | — | | | | — | |
| Proceeds from Shares issued in connection with merger(B) | | | — | | | | — | | | | 8,733,626 | | | | 176,870,346 | | | | — | | | | — | |
| Reinvestment of distributions | | | 10,235 | | | | 209,920 | | | | 1,636 | | | | 30,619 | | | | — | | | | — | |
| Cost of Shares redeemed | | | (1,131,710 | ) | | | (24,100,893 | ) | | | (236,720 | ) | | | (4,678,976 | ) | | | — | | | | — | |
| Change in Net Assets from Class Y Share Transactions | | | (839,456 | ) | | | (17,759,825 | ) | | | 8,533,977 | | | | 172,930,915 | | | | — | | | | — | |
| Class Z | | | | | | | | | | | | | | | | | | | | | | | | |
| Proceeds from Shares sold | | | — | | | | — | | | | 10,516 | | | | 217,602 | | | | 250,864 | | | | 4,663,886 | |
| Reinvestment of distributions | | | — | | | | — | | | | — | | | | — | | | | 10,082 | | | | 180,476 | |
| Redemption fees | | | — | | | | — | | | | — | | | | — | | | | — | | | | 60 | |
| Capital contribution | | | — | | | | — | | | | — | | | | — | | | | — | | | | — | |
| Cost of Shares redeemed | | | — | | | | — | | | | (52,391 | ) | | | (1,084,808 | ) | | | (1,292,604 | ) | | | (24,178,763 | ) |
| Cost of Shares redeemed in connection with merger(B) | | | — | | | | — | | | | (8,733,626 | ) | | | (176,870,346 | ) | | | — | | | | — | |
| Change in Net Assets from Class Z Share Transactions | | | — | | | | — | | | | (8,775,501 | ) | | | (177,737,552 | ) | | | (1,031,658 | ) | | | (19,334,341 | ) |
| Institutional Class | | | | | | | | | | | | | | | | | | | | | | | | |
| Proceeds from Shares sold | | | 934 | | | | 18,816 | | | | 7,466 | | | | 153,843 | | | | 173,498 | | | | 3,067,390 | |
| Reinvestment of distributions | | | 3 | | | | 68 | | | | 4 | | | | 84 | | | | 1,581 | | | | 28,442 | |
| Capital contribution | | | — | | | | — | | | | — | | | | — | | | | — | | | | — | |
| Cost of Shares redeemed | | | (6,191 | ) | | | (125,593 | ) | | | (698,268 | ) | | | (14,336,355 | ) | | | (480,349 | ) | | | (9,050,533 | ) |
| Change in Net Assets from Institutional Class Share Transactions | | | (5,254 | ) | | | (106,709 | ) | | | (690,798 | ) | | | (14,182,428 | ) | | | (305,270 | ) | | | (5,954,701 | ) |
| Net Increase (Decrease) from Share Transactions | | $ | (821,666 | ) | | $ | (17,375,158 | ) | | | (937,096 | ) | | $ | (19,077,394 | ) | | | (1,361,208 | ) | | $ | (25,723,783 | ) |
(A)The Fund began issuing Class C shares on April 12, 2012.
(B)See Note 8 in the Notes to Financial Statements.
(C)During the year ended March 31, 2012, the Touchstone International Small Cap Fund received a one time distribution of settlement funds from Bank of America Fair Fund, and Zurich Financial Services Ltd, respectively.
See accompanying Notes to Financial Statements.
Statements of Changes in Net Assets - Capital Stock Activity (Continued)
| | | | Touchstone International | | | | |
| | | | Small Cap Fund | | | | |
| For the Year | | | For the Three Months | | | For the | |
| Ended | | | Ended | | | Year Ended | |
| June 30, 2013 | | | June 30, 2012 | | | March 31, 2012 | |
| Shares | | | Dollars | | | Shares | | | Dollars | | | Shares | | | Dollars | |
| | | | | | | | | | | | | | | | | | | | | | | |
| | 26,602 | | | $ | 315,859 | | | | 6,837 | | | $ | 74,411 | | | | 8,346 | | | $ | 94,756 | |
| | 357 | | | | 4,133 | | | | 171 | | | | 1,686 | | | | 189 | | | | 1,850 | |
| | — | | | | — | | | | — | | | | — | | | | — | | | | 49 | |
| | — | | | | — | | | | — | | | | — | | | | — | | | | 2,779 | (C) |
| | (7,570 | ) | | | (91,704 | ) | | | (381 | ) | | | (3,852 | ) | | | (13,135 | ) | | | (149,178 | ) |
| | 19,389 | | | | 228,288 | | | | 6,627 | | | | 72,245 | | | | (4,600 | ) | | | (49,744 | ) |
| | | | | | | | | | | | | | | | | | | | | | | |
| | 582 | | | | 7,074 | | | | 229 | | | | 2,500 | | | | — | | | | — | |
| | 2 | | | | 22 | | | | 2 | | | | 24 | | | | — | | | | — | |
| | (275 | ) | | | (3,147 | ) | | | — | | | | — | | | | — | | | | — | |
| | 309 | | | | 3,949 | | | | 231 | | | | 2,524 | | | | — | | | | — | |
| | | | | | | | | | | | | | | | | | | | | | | |
| | 116,715 | | | | 1,459,632 | | | | 34,312 | | | | 375,239 | | | | — | | | | — | |
| | — | | | | — | | | | 7,920,316 | | | | 108,468,743 | | | | — | | | | — | |
| | 103,876 | | | | 1,225,021 | | | | 73,475 | | | | 736,947 | | | | — | | | | — | |
| | (967,013 | ) | | | (11,575,060 | ) | | | (263,797 | ) | | | (2,859,596 | ) | | | — | | | | — | |
| | (746,422 | ) | | | (8,890,407 | ) | | | 7,764,306 | | | | 106,721,333 | | | | — | | | | — | |
| | | | | | | | | | | | | | | | | | | | | | | |
| | — | | | | — | | | | 4,918 | | | | 55,160 | | | | 297,008 | | | | 3,274,383 | |
| | — | | | | — | | | | — | | | | — | | | | 166,235 | | | | 1,659,021 | |
| | — | | | | — | | | | — | | | | — | | | | — | | | | 143 | |
| | — | | | | — | | | | — | | | | — | | | | — | | | | 1,690,684 | (C) |
| | — | | | | — | | | | (36,040 | ) | | | (400,660 | ) | | | (2,288,637 | ) | | | (25,808,164 | ) |
| | — | | | | — | | | | (7,920,316 | ) | | | (108,468,743 | ) | | | — | | | | — | |
| | — | | | | — | | | | (7,951,438 | ) | | | (108,814,243 | ) | | | (1,825,394 | ) | | | (19,183,933 | ) |
| | | | | | | | | | | | | | | | | | | | | | | |
| | 1,333,832 | | | | 15,915,712 | | | | 17,760 | | | | 199,592 | | | | 469,209 | | | | 5,699,848 | |
| | 20,975 | | | | 248,348 | | | | 3,788 | | | | 38,182 | | | | 12,933 | | | | 129,464 | |
| | — | | | | — | | | | — | | | | — | | | | — | | | | 109,786 | (C) |
| | (466,601 | ) | | | (5,684,471 | ) | | | (204,182 | ) | | | (2,330,568 | ) | | | (25,444 | ) | | | (267,609 | ) |
| | 888,206 | | | | 10,479,589 | | | | (182,634 | ) | | | (2,092,794 | ) | | | 456,698 | | | | 5,671,489 | |
| | 161,482 | | | $ | 1,821,419 | | | | (362,908 | ) | | $ | (4,110,935 | ) | | | (1,373,296 | ) | | $ | (13,562,188 | ) |
Statements of Changes in Net Assets - Capital Stock Activity (Continued)
| | | Touchstone Mid Cap | |
| | | Value Opportunities Fund | |
| | | For the Year | | | For the Three Months | | | For the | |
| | | Ended | | | Ended | | | Year Ended | |
| | | June 30, 2013 | | | June 30, 2012 | | | March 31, 2012 | |
| | | Shares | | | Dollars | | | Shares | | | Dollars | | | Shares | | | Dollars | |
| Class A | | | | | | | | | | | | | | | | | | | | | | | | |
| Proceeds from Shares sold | | | 378,106 | | | $ | 3,377,789 | | | | 996 | | | $ | 8,613 | | | | 34,843 | | | $ | 320,329 | |
| Reinvestment of distributions | | | 27,708 | | | | 209,648 | | | | 5,030 | | | | 41,752 | | | | 8,236 | | | | 66,381 | |
| Redemption fees | | | — | | | | — | | | | — | | | | — | | | | — | | | | 37 | |
| Cost of Shares redeemed | | | (106,496 | ) | | | (895,744 | ) | | | (7,099 | ) | | | (60,859 | ) | | | (324,638 | ) | | | (2,983,666 | ) |
| Change in Net Assets from Class A Share Transactions | | | 299,318 | | | | 2,691,693 | | | | (1,073 | ) | | | (10,494 | ) | | | (281,559 | ) | | | (2,596,919 | ) |
| Class C(A) | | | | | | | | | | | | | | | | | | | | | | | | |
| Proceeds from Shares sold | | | 18,556 | | | | 166,338 | | | | 286 | | | | 2,500 | | | | — | | | | — | |
| Reinvestment of distributions | | | 60 | | | | 452 | | | | 12 | | | | 101 | | | | — | | | | — | |
| Cost of Shares redeemed | | | (583 | ) | | | (5,296 | ) | | | — | | | | — | | | | — | | | | — | |
| Change in Net Assets from Class C Share Transactions | | | 18,033 | | | | 161,494 | | | | 298 | | | | 2,601 | | | | — | | | | — | |
| Class Y | | | | | | | | | | | | | | | | | | | | | | | | |
| Proceeds from Shares sold | | | 1,098,206 | | | | 9,707,354 | | | | 47,328 | | | | 408,654 | | | | — | | | | — | |
| Proceeds from Shares issued in connection with merger(B) | | | — | | | | — | | | | 7,523,299 | | | | 82,084,306 | | | | — | | | | — | |
| Reinvestment of distributions | | | 1,463,395 | | | | 11,127,631 | | | | 300,246 | | | | 2,501,049 | | | | — | | | | — | |
| Cost of Shares redeemed | | | (1,291,652 | ) | | | (11,143,689 | ) | | | (294,636 | ) | | | (2,568,229 | ) | | | — | | | | — | |
| Change in Net Assets from Class Y Share Transactions | | | 1,269,949 | | | | 9,691,296 | | | | 7,576,237 | | | | 82,425,780 | | | | — | | | | — | |
| Class Z | | | | | | | | | | | | | | | | | | | | | | | | |
| Proceeds from Shares sold | | | — | | | | — | | | | 4,778 | | | | 43,126 | | | | 261,278 | | | | 2,339,714 | |
| Reinvestment of distributions | | | — | | | | — | | | | — | | | | — | | | | 579,040 | | | | 4,678,646 | |
| Redemption fees | | | — | | | | — | | | | — | | | | — | | | | — | | | | 178 | |
| Cost of Shares redeemed | | | — | | | | — | | | | (45,504 | ) | | | (407,047 | ) | | | (1,359,346 | ) | | | (12,097,655 | ) |
| Cost of Shares redeemed in connection with merger(B) | | | — | | | | — | | | | (7,523,299 | ) | | | (82,084,306 | ) | | | — | | | | — | |
| Change in Net Assets from Class Z Share Transactions | | | — | | | | — | | | | (7,564,025 | ) | | | (82,448,227 | ) | | | (519,028 | ) | | | (5,079,117 | ) |
| Institutional Class | | | | | | | | | | | | | | | | | | | | | | | | |
| Proceeds from Shares sold | | | 1,037,811 | | | | 8,742,179 | | | | 65,074 | | | | 567,568 | | | | 1,685,177 | | | | 15,296,264 | |
| Reinvestment of distributions | | | 141,150 | | | | 1,073,105 | | | | 26,841 | | | | 223,314 | | | | 233,931 | | | | 1,887,820 | |
| Redemption fees | | | — | | | | — | | | | — | | | | — | | | | — | | | | 805 | |
| Cost of Shares redeemed | | | (1,825,101 | ) | | | (15,422,116 | ) | | | (7,398,449 | ) | | | (65,709,342 | ) | | | (12,153,913 | ) | | | (110,069,261 | ) |
| Change in Net Assets from Institutional Class Share Transactions | | | (646,140 | ) | | | (5,606,832 | ) | | | (7,306,534 | ) | | | (64,918,460 | ) | | | (10,234,805 | ) | | | (92,884,372 | ) |
| Net Increase (Decrease) from Share Transactions | | | 941,160 | | | $ | 6,937,651 | | | | (7,295,097 | ) | | $ | (64,948,800 | ) | | | (11,035,392 | ) | | $ | (100,560,408 | ) |
(A)The Fund began issuing Class C shares on April 12, 2012.
(B)See Note 8 in the Notes to Financial Statements.
See accompanying Notes to Financial Statements.
Statements of Changes in Net Assets - Capital Stock Activity (Continued)
| Touchstone Small Cap | |
| Value Opportunities Fund | |
| For the Year | | | For the Three Months | | | For the | |
| Ended | | | Ended | | | Year Ended | |
| June 30, 2013 | | | June 30, 2012 | | | March 31, 2012 | |
| Shares | | | Dollars | | | Shares | | | Dollars | | | Shares | | | Dollars | |
| | | | | | | | | | | | | | | | | | | | | | | |
| | 142,142 | | | $ | 2,469,527 | | | | 267 | | | $ | 4,630 | | | | 8,333 | | | $ | 148,894 | |
| | 26,279 | | | | 413,524 | | | | 3,355 | | | | 55,414 | | | | 7,338 | | | | 116,008 | |
| | — | | | | — | | | | — | | | | — | | | | — | | | | 40 | |
| | (217,734 | ) | | | (3,726,829 | ) | | | (8,917 | ) | | | (153,524 | ) | | | (52,141 | ) | | | (903,971 | ) |
| | (49,313 | ) | | | (843,778 | ) | | | (5,295 | ) | | | (93,480 | ) | | | (36,470 | ) | | | (639,029 | ) |
| | | | | | | | | | | | | | | | | | | | | | | |
| | 1,749 | | | | 30,000 | | | | 142 | | | | 2,500 | | | | — | | | | — | |
| | 17 | | | | 276 | | | | 5 | | | | 75 | | | | — | | | | — | |
| | — | | | | — | | | | — | | | | — | | | | — | | | | — | |
| | 1,766 | | | | 30,276 | | | | 147 | | | | 2,575 | | | | — | | | | — | |
| | | | | | | | | | | | | | | | | | | | | | | |
| | 443,625 | | | | 7,998,195 | | | | 99,840 | | | | 1,789,027 | | | | — | | | | — | |
| | — | | | | — | | | | 4,703,562 | | | | 71,625,574 | | | | — | | | | — | |
| | 555,066 | | | | 9,051,359 | | | | 140,421 | | | | 2,392,767 | | | | — | | | | — | |
| | (766,392 | ) | | | (13,741,561 | ) | | | (210,369 | ) | | | (3,739,581 | ) | | | — | | | | — | |
| | 232,299 | | | | 3,307,993 | | | | 4,733,454 | | | | 72,067,787 | | | | — | | | | — | |
| | | | | | | | | | | | | | | | | | | | | | | |
| | — | | | | — | | | | 28,256 | | | | 520,312 | | | | 877,947 | | | | 15,758,310 | |
| | — | | | | — | | | | — | | | | — | | | | 263,593 | | | | 4,286,016 | |
| | — | | | | — | | | | — | | | | — | | | | — | | | | 5,729 | |
| | — | | | | — | | | | (50,553 | ) | | | (941,857 | ) | | | (1,442,108 | ) | | | (26,119,117 | ) |
| | — | | | | — | | | | (4,703,562 | ) | | | (71,625,574 | ) | | | — | | | | — | |
| | — | | | | — | | | | (4,725,859 | ) | | | (72,047,119 | ) | | | (300,568 | ) | | | (6,069,062 | ) |
| | | | | | | | | | | | | | | | | | | | | | | |
| | 157,469 | | | | 2,911,887 | | | | 63,682 | | | | 1,120,571 | | | | 55,531 | | | | 1,007,117 | |
| | 37,917 | | | | 623,558 | | | | 9,660 | | | | 165,858 | | | | 53,990 | | | | 883,809 | |
| | — | | | | — | | | | — | | | | — | | | | — | | | | 37 | |
| | (180,985 | ) | | | (3,166,642 | ) | | | (691,859 | ) | | | (12,624,174 | ) | | | (116,381 | ) | | | (2,073,781 | ) |
| | 14,401 | | | | 368,803 | | | | (618,517 | ) | | | (11,337,745 | ) | | | (6,860 | ) | | | (182,818 | ) |
| | 199,153 | | | $ | 2,863,294 | | | | (616,070 | ) | | $ | (11,407,982 | ) | | | (343,898 | ) | | $ | (6,890,909 | ) |
Statements of Changes in Net Assets - Capital Stock Activity (Continued)
| | | Touchstone | |
| | | Value Fund | |
| | | For the | | | For the Three Months | | | For the | |
| | | Year Ended | | | Ended | | | Year Ended | |
| | | June 30, 2013 | | | June 30, 2012 | | | March 31, 2012 | |
| | | Shares | | | Dollars | | | Shares | | | Dollars | | | Shares | | | Dollars | |
| Class A | | | | | | | | | | | | | | | | | | | | | | | | |
| Proceeds from Shares sold | | | 2,686,402 | | | $ | 19,925,893 | | | | 17,290 | | | $ | 116,995 | | | | 93,237 | | | $ | 618,049 | |
| Proceeds from Shares issued in connection with merger(B) | | | 4,934,586 | | | | 35,709,582 | | | | — | | | | — | | | | — | | | | — | |
| Reinvestment of distributions | | | 223,431 | | | | 1,614,615 | | | | 1,686 | | | | 11,468 | | | | 5,515 | | | | 34,944 | |
| Redemption fees | | | — | | | | — | | | | — | | | | — | | | | — | | | | — | |
| Cost of Shares redeemed | | | (1,413,277 | ) | | | (10,625,867 | ) | | | (16,190 | ) | | | (109,738 | ) | | | (222,483 | ) | | | (1,508,451 | ) |
| Change in Net Assets from Class A Share Transactions | | | 6,431,142 | | | | 46,624,223 | | | | 2,786 | | | | 18,725 | | | | (123,731 | ) | | | (855,458 | ) |
| Class C(A) | | | | | | | | | | | | | | | | | | | | | | | | |
| Proceeds from Shares issued | | | 57,700 | | | | 426,590 | | | | 362 | | | | 2,500 | | | | — | | | | — | |
| Proceeds from Shares issued in connection with merger(B) | | | 380,586 | | | | 2,753,770 | | | | — | | | | — | | | | — | | | | — | |
| Reinvestment of distributions | | | 8,642 | | | | 61,616 | | | | 3 | | | | 20 | | | | — | | | | — | |
| Cost of Shares redeemed | | | (70,172 | ) | | | (522,176 | ) | | | — | | | | — | | | | — | | | | — | |
| Change in Net Assets from Class C Share Transactions | | | 376,756 | | | | 2,719,800 | | | | 365 | | | | 2,520 | | | | — | | | | — | |
| Class Y | | | | | | | | | | | | | | | | | | | | | | | | |
| Proceeds from Shares sold | | | 2,825,877 | | | | 21,698,663 | | | | 72,824 | | | | 503,826 | | | | — | | | | — | |
| Proceeds from Shares issued in connection with merger(B) | | | 25,947,803 | | | | 188,290,146 | | | | 12,199,491 | | | | 61,217,913 | | | | — | | | | — | |
| Reinvestment of distributions | | | 597,448 | | | | 4,288,083 | | | | 71,221 | | | | 485,728 | | | | — | | | | — | |
| Cost of Shares redeemed | | | (24,403,044 | ) | | | (178,396,079 | ) | | | (4,960,978 | ) | | | (34,377,298 | ) | | | — | | | | — | |
| Change in Net Assets from Class Y Share Transactions | | | 4,968,084 | | | | 35,880,813 | | | | 7,382,558 | | | | 27,830,169 | | | | — | | | | — | |
| Class Z | | | | | | | | | | | | | | | | | | | | | | | | |
| Proceeds from Shares sold | | | — | | | | — | | | | 147,280 | | | | 1,057,827 | | | | 3,259,081 | | | | 20,953,779 | |
| Reinvestment of distributions | | | — | | | | — | | | | — | | | | — | | | | 191,652 | | | | 1,217,319 | |
| Redemption fees | | | — | | | | — | | | | — | | | | — | | | | — | | | | 82 | |
| Cost of Shares redeemed | | | — | | | | — | | | | (170,728 | ) | | | (1,202,700 | ) | | | (4,181,411 | ) | | | (28,151,691 | ) |
| Cost of Shares redeemed in connection with merger(B) | | | — | | | | — | | | | (12,199,491 | ) | | | (61,217,913 | ) | | | — | | | | — | |
| Change in Net Assets from Class Z Share Transactions | | | — | | | | — | | | | (12,222,939 | ) | | | (61,362,786 | ) | | | (730,678 | ) | | | (5,980,511 | ) |
| Institutional Class | | | | | | | | | | | | | | | | | | | | | | | | |
| Proceeds from Shares sold | | | 26,603,580 | | | | 194,446,619 | | | | 6,249,356 | | | | 43,073,243 | | | | 565,867 | | | | 3,618,510 | |
| Reinvestment of distributions | | | 970,333 | | | | 7,016,860 | | | | 58,289 | | | | 396,950 | | | | 117,670 | | | | 746,586 | |
| Cost of Shares redeemed | | | (14,289,720 | ) | | | (106,604,816 | ) | | | (1,025,855 | ) | | | (7,122,753 | ) | | | (2,271,367 | ) | | | (14,943,665 | ) |
| Change in Net Assets from Institutional Class Share Transactions | | | 13,284,193 | | | | 94,858,663 | | | | 5,281,790 | | | | 36,347,440 | | | | (1,587,830 | ) | | | (10,578,569 | ) |
| Net Increase (Decrease) from Share Transactions | | | 25,060,175 | | | $ | 180,083,499 | | | | 444,560 | | | $ | 2,836,068 | | | | (2,442,239 | ) | | $ | (17,414,538 | ) |
| (A) | The Fund began issuing Class C shares on April 12, 2012. |
| (B) | See Note 8 in the Notes to Financial Statements. |
See accompanying Notes to Financial Statements.
Financial Highlights
Touchstone Capital Growth Fund—Class A
Selected Data for a Share Outstanding Throughout Each Period
| | | Year | | | Three Months | | | | | | | | | | | | | |
| | | Ended | | | Ended | | | | | | | | | | | | | |
| | | June 30, | | | June 30, | | | Year Ended March 31, | |
| | | 2013 | | | 2012 | | | 2012 | | | 2011 | | | 2010 | | | 2009 | |
| Net asset value at beginning of period | | $ | 18.96 | | | $ | 20.49 | | | $ | 18.95 | | | $ | 15.98 | | | $ | 11.01 | | | $ | 18.69 | |
| Income (loss) from investment operations: | | | | | | | | | | | | | | | | | | | | | | | | |
| Net investment income (loss)(A) | | | (0.03 | ) | | | — | (B) | | | (0.03 | ) | | | (0.01 | ) | | | — | | | | (0.01 | ) |
| Net realized and unrealized gains (losses) on investments | | | 2.93 | | | | (1.53 | ) | | | 1.57 | | | | 2.98 | | | | 4.98 | | | | (7.67 | ) |
| Total from investment operations | | | 2.90 | | | | (1.53 | ) | | | 1.54 | | | | 2.97 | | | | 4.98 | | | | (7.68 | ) |
| Distributions from: | | | | | | | | | | | | | | | | | | | | | | | | |
| Net investment income | | | — | | | | — | | | | — | | | | — | | | | (0.01 | ) | | | — | |
| Net asset value at end of period | | $ | 21.86 | | | $ | 18.96 | | | $ | 20.49 | | | $ | 18.95 | | | $ | 15.98 | | | $ | 11.01 | |
| Total return(C) | | | 15.30 | % | | | (7.47 | )%(D) | | | 8.13 | % | | | 18.59 | % | | | 45.22 | % | | | (41.09 | )% |
| Ratios and supplemental data: | | | | | | | | | | | | | | | | | | | | | | | | |
| Net assets at end of period (000's) | | $ | 1,104 | | | $ | 559 | | | $ | 705 | | | $ | 1,111 | | | $ | 1,066 | | | $ | 1,700 | |
| Ratio to average net assets: | | | | | | | | | | | | | | | | | | | | | | | | |
| Net expenses | | | 1.25 | % | | | 1.23 | %(E) | | | 1.14 | % | | | 1.23 | % | �� | | 1.36 | % | | | 1.50 | % |
| Gross expenses | | | 3.43 | % | | | 7.09 | %(E) | | | 2.93 | %(F) | | | 2.70 | %(F) | | | 0.36 | %(F) | | | 2.44 | %(F) |
| Net investment income (loss) | | | (0.15 | )% | | | 0.01 | %(E) | | | (0.15 | )% | | | (0.07 | )% | | | 0.01 | % | | | (0.06 | )% |
| Portfolio turnover rate | | | 38 | % | | | 6 | %(D) | | | 27 | % | | | 33 | % | | | 99 | % | | | 161 | % |
Touchstone Capital Growth Fund—Class C
Selected Data for a Share Outstanding Throughout Each Period
| | | Year | | | Period | |
| | | Ended | | | Ended | |
| | | June 30, | | | June 30, | |
| | | 2013 | | | 2012(G) | |
| Net asset value at beginning of period | | $ | 18.93 | | | $ | 20.06 | |
| Income (loss) from investment operations: | | | | | | | | |
| Net investment loss(A) | | | (0.19 | ) | | | (0.03 | ) |
| Net realized and unrealized gains (losses) on investments | | | 2.92 | | | | (1.09 | ) |
| Total from investment operations | | | 2.73 | | | | (1.12 | ) |
| Distributions from: | | | | | | | | |
| Net investment income | | | — | (B) | | | (0.01 | ) |
| Net asset value at end of period | | $ | 21.66 | | | $ | 18.93 | |
| Total return(C) | | | 14.42 | % | | | (5.59 | )%(D) |
| Ratios and supplemental data: | | | | | | | | |
| Net assets at end of period (000's) | | $ | 47 | | | $ | 2 | |
| Ratio to average net assets: | | | | | | | | |
| Net expenses | | | 2.00 | % | | | 2.00 | %(E) |
| Gross expenses | | | 23.11 | % | | | 962.52 | %(E) |
| Net investment loss | | | (0.90 | )% | | | (0.76 | )%(E) |
| Portfolio turnover rate | | | 38 | % | | | 6 | %(D) |
| (A) | The net investment income per share is based on average shares outstanding for the period. |
| (B) | Less than $0.005 per share. |
| (C) | Total returns shown exclude the effect of applicable sales loads. If these charges were included, the returns would be lower. |
| (F) | Legal, printing and/or compliance audit expenses relating to civil litigation and certain regulatory actions in connection with market timing allegations were incurred, and the Former Adviser paid these expenses on behalf of the Funds. Had the Former Adviser not paid these expenses, the expenses for the Funds would have been higher than what is reflected in the financial highlights for the years ended March 31, 2012, 2011, 2010 and 2009. |
| (G) | The Fund began issuing Class C shares on April 12, 2012. |
See accompanying Notes to Financial Statements.
Financial Highlights (Continued)
Touchstone Capital Growth Fund—Class Y
Selected Data for a Share Outstanding Throughout Each Period
| | | Year | | | Three Months | | | | | | | | | | | | | |
| | | Ended | | | Ended | | | | | | | | | | | | | |
| | | June 30, | | | June 30, | | | Year Ended March 31, | |
| | | 2013 | | | 2012 | | | 2012 | | | 2011 | | | 2010 | | | 2009 | |
| Net asset value at beginning of period | | $ | 19.29 | | | $ | 20.83 | | | $ | 19.24 | | | $ | 16.21 | | | $ | 11.18 | | | $ | 18.91 | |
| Income (loss) from investment operations: | | | | | | | | | | | | | | | | | | | | | | | | |
| Net investment income(A) | | | 0.02 | | | | 0.01 | | | | 0.02 | | | | 0.03 | | | | 0.04 | | | | 0.02 | |
| Net realized and unrealized gains (losses) on investments | | | 2.98 | | | | (1.55 | ) | | | 1.59 | | | | 3.04 | | | | 5.05 | | | | (7.75 | ) |
| Total from investment operations | | | 3.00 | | | | (1.54 | ) | | | 1.61 | | | | 3.07 | | | | 5.09 | | | | (7.73 | ) |
| Distributions from: | | | | | | | | | | | | | | | | | | | | | | | | |
| Net investment income | | | (0.03 | ) | | | — | (B) | | | (0.02 | ) | | | (0.04 | ) | | | (0.05 | ) | | | — | |
| Return of capital | | | — | | | | — | | | | — | | | | — | | | | (0.01 | ) | | | — | |
| Total distributions | | | (0.03 | ) | | | — | | | | (0.02 | ) | | | (0.04 | ) | | | (0.06 | ) | | | — | |
| Net asset value at end of period | | $ | 22.26 | | | $ | 19.29 | | | $ | 20.83 | | | $ | 19.24 | | | $ | 16.21 | | | $ | 11.18 | |
| Total return | | | 15.61 | % | | | (7.42 | )%(C) | | | 8.39 | % | | | 18.93 | % | | | 45.52 | % | | | (40.88 | )% |
| Ratios and supplemental data: | | | | | | | | | | | | | | | | | | | | | | | | |
| Net assets at end of period (000's) | | $ | 171,277 | | | $ | 164,589 | | | $ | 182,828 | | | $ | 188,671 | | | $ | 178,941 | | | $ | 136,809 | |
| Ratio to average net assets: | | | | | | | | | | | | | | | | | | | | | | | | |
| Net expenses | | | 1.00 | % | | | 0.98 | %(D) | | | 0.89 | % | | | 0.98 | % | | | 1.08 | % | | | 1.25 | % |
| Gross expenses | | | 1.14 | % | | | 1.27 | %(D) | | | 1.30 | %(E) | | | 1.32 | %(E) | | | 1.44 | %(E) | | | 1.61 | %(E) |
| Net investment income | | | 0.10 | % | | | 0.26 | %(D) | | | 0.13 | % | | | 0.18 | % | | | 0.27 | % | | | 0.14 | % |
| Portfolio turnover rate | | | 38 | % | | | 6 | %(C) | | | 27 | % | | | 33 | % | | | 99 | % | | | 161 | % |
| Touchstone Capital Growth Fund—Institutional Class |
| Selected Data for a Share Outstanding Throughout Each Period |
| | | Year | | | Three Months | | | | | | | | | | | | | |
| | | Ended | | | Ended | | | | | | | | | | | | | |
| | | June 30, | | | June 30, | | | Year Ended March 31, | |
| | | 2013 | | | 2012 | | | 2012 | | | 2011 | | | 2010 | | | 2009 | |
| Net asset value at beginning of period | | $ | 19.38 | | | $ | 20.95 | | | $ | 19.35 | | | $ | 16.31 | | | $ | 11.25 | | | $ | 18.96 | |
| Income (loss) from investment operations: | | | | | | | | | | | | | | | | | | | | | | | | |
| Net investment income(A) | | | 0.04 | | | | 0.02 | | | | 0.04 | | | | 0.05 | | | | 0.06 | | | | 0.19 | |
| Net realized and unrealized gains (losses) on investments | | | 3.00 | | | | (1.58 | ) | | | 1.60 | | | | 3.04 | | | | 5.07 | | | | (7.90 | ) |
| Total from investment operations | | | 3.04 | | | | (1.56 | ) | | | 1.64 | | | | 3.09 | | | | 5.13 | | | | (7.71 | ) |
| Distributions from: | | | | | | | | | | | | | | | | | | | | | | | | |
| Net investment income | | | (0.02 | ) | | | (0.01 | ) | | | (0.04 | ) | | | (0.05 | ) | | | (0.05 | ) | | | — | |
| Return of capital | | | — | | | | — | | | | — | | | | — | | | | (0.02 | ) | | | — | |
| Total distributions | | | (0.02 | ) | | | (0.01 | ) | | | (0.04 | ) | | | (0.05 | ) | | | (0.07 | ) | | | — | |
| Net asset value at end of period | | $ | 22.40 | | | $ | 19.38 | | | $ | 20.95 | | | $ | 19.35 | | | $ | 16.31 | | | $ | 11.25 | |
| Total return | | | 15.71 | % | | | (7.44 | )%(C) | | | 8.51 | % | | | 18.99 | % | | | 45.69 | % | | | (40.66 | )% |
| Ratios and supplemental data: | | | | | | | | | | | | | | | | | | | | | | | | |
| Net assets at end of period (000's) | | $ | 58 | | | $ | 152 | | | $ | 14,636 | | | $ | 19,423 | | | $ | 26,977 | | | $ | 1,610 | |
| Ratio to average net assets: | | | | | | | | | | | | | | | | | | | | | | | | |
| Net expenses | | | 0.90 | % | | | 0.88 | %(D) | | | 0.79 | % | | | 0.88 | % | | | 0.90 | % | | | 0.95 | % |
| Gross expenses | | | 24.29 | % | | | 1.83 | %(D) | | | 0.90 | %(E) | | | 0.85 | %(E) | | | 0.79 | %(E) | | | 8.98 | %(E) |
| Net investment income | | | 0.20 | % | | | 0.36 | %(D) | | | 0.20 | % | | | 0.28 | % | | | 0.41 | % | | | 1.74 | % |
| Portfolio turnover rate | | | 38 | % | | | 6 | %(C) | | | 27 | % | | | 33 | % | | | 99 | % | | | 161 | % |
| (A) | The net investment income per share is based on average shares outstanding for the period. |
| (B) | Less than $0.005 per share. |
| (E) | Legal, printing and/or compliance audit expenses relating to civil litigation and certain regulatory actions in connection with market timing allegations were incurred, and the Former Adviser paid these expenses on behalf of the Funds. Had the Former Adviser not paid these expenses, the expenses for the Funds would have been higher than what is reflected in the financial highlights for the years ended March 31, 2012, 2011, 2010 and 2009. |
See accompanying Notes to Financial Statements.
Financial Highlights (Continued)
Touchstone International Small Cap Fund—Class A
Selected Data for a Share Outstanding Throughout Each Period
| | | Year | | | Three Months | | | | | | | | | | | | | |
| | | Ended | | | Ended | | | | | | | | | | | | | |
| | | June 30, | | | June 30, | | | Year Ended March 31, | |
| | | 2013 | | | 2012 | | | 2012 | | | 2011 | | | 2010 | | | 2009 | |
| Net asset value at beginning of period | | $ | 10.21 | | | $ | 11.12 | | | $ | 11.88 | | | $ | 9.25 | | | $ | 6.25 | | | $ | 9.61 | |
| Income (loss) from investment operations: | | | | | | | | | | | | | | | | | | | | | | | | |
| Net investment income (loss) | | | 0.11 | | | | 0.09 | (A) | | | 0.03 | (A) | | | (0.10 | )(A) | | | (0.08 | )(A) | | | (0.03 | )(A) |
| Net realized and unrealized gains (losses) on investments | | | 2.43 | | | | (0.90 | ) | | | (0.84 | ) | | | 2.73 | | | | 3.09 | (B) | | | (3.33 | )(B) |
| Total from investment operations | | | 2.54 | | | | (0.81 | ) | | | (0.81 | ) | | | 2.63 | | | | 3.01 | | | | (3.36 | ) |
| Distributions from: | | | | | | | | | | | | | | | | | | | | | | | | |
| Net investment income | | | (0.17 | ) | | | (0.10 | ) | | | (0.15 | ) | | | — | | | | (0.01 | ) | | | — | |
| Capital contribution | | | — | | | | — | | | | 0.20 | (C) | | | — | | | | — | | | | — | |
| Net asset value at end of period | | $ | 12.58 | | | $ | 10.21 | | | $ | 11.12 | | | $ | 11.88 | | | $ | 9.25 | | | $ | 6.25 | |
| Total return(D) | | | 24.99 | % | | | (7.28 | )%(E) | | | (4.96 | )%(C) | | | 28.43 | % | | | 48.12 | %(B) | | | (34.96 | )%(B) |
| Ratios and supplemental data: | | | | | | | | | | | | | | | | | | | | | | | | |
| Net assets at end of period (000's) | | $ | 489 | | | $ | 199 | | | $ | 143 | | | $ | 207 | | | $ | 918 | | | $ | 720 | |
| Ratio to average net assets: | | | | | | | | | | | | | | | | | | | | | | | | |
| Net expenses | | | 1.55 | % | | | 1.55 | %(F) | | | 1.55 | % | | | 1.55 | % | | | 1.55 | % | | | 1.36 | % |
| Gross expenses | | | 7.77 | % | | | 19.37 | %(F) | | | 10.50 | %(G) | | | 3.23 | %(G) | | | 0.44 | %(G) | | | 4.20 | %(G) |
| Net investment income (loss) | | | 1.41 | % | | | 3.36 | %(F) | | | 0.26 | % | | | (1.02 | )% | | | (0.97 | )% | | | (0.32 | )% |
| Portfolio turnover rate | | | 79 | % | | | 21 | %(E) | | | 207 | % | | | 152 | % | | | 172 | % | | | 290 | % |
| (A) | The net investment income per share is based on average shares outstanding for the period. |
| (B) | Impact of payment from affiliate was less than $0.01 per share and 0.01%, respectively. |
| (C) | Impact of one time distribution of settlement funds from the Bank of America Fair Fund. If the distribution had not occurred the total return would have been lower. |
| (D) | Total returns shown exclude the effect of applicable sales loads. If these charges were included, the returns would be lower. |
| (G) | Legal, printing and/or compliance audit expenses relating to civil litigation and certain regulatory actions in connection with market timing allegations were incurred, and the Former Adviser paid these expenses on behalf of the Funds. Had the Former Adviser not paid these expenses, the expenses for the Funds would have been higher than what is reflected in the financial highlights for the years ended March 31, 2012, 2011, 2010 and 2009. |
See accompanying Notes to Financial Statements.
Financial Highlights (Continued)
Touchstone International Small Cap Fund—Class C
Selected Data for a Share Outstanding Throughout Each Period
| | | Year | | | Period | |
| | | Ended | | | Ended | |
| | | June 30, | | | June 30, | |
| | | 2013 | | | 2012(A) | |
| Net asset value at beginning of period | | $ | 10.19 | | | $ | 10.94 | |
| Income (loss) from investment operations: | | | | | | | | |
| Net investment income | | | 0.14 | | | | 0.05 | (B) |
| Net realized and unrealized gains (losses) on investments | | | 2.31 | | | | (0.69 | ) |
| Total from investment operations | | | 2.45 | | | | (0.64 | ) |
| Distributions from: | | | | | | | | |
| Net investment income | | | (0.10 | ) | | | (0.11 | ) |
| Net asset value at end of period | | $ | 12.54 | | | $ | 10.19 | |
| Total return(C) | | | 24.08 | % | | | (5.84 | )%(D) |
| Ratios and supplemental data: | | | | | | | | |
| Net assets at end of period (000's) | | $ | 7 | | | $ | 2 | |
| Ratio to average net assets: | | | | | | | | |
| Net expenses | | | 2.30 | % | | | 2.30 | %(E) |
| Gross expenses | | | 94.29 | % | | | 968.58 | %(E) |
| Net investment income | | | 0.66 | % | | | 2.12 | %(E) |
| Portfolio turnover rate | | | 79 | % | | | 21 | %(D) |
| (A) | The Fund began issuing Class C shares on April 12, 2012. |
| (B) | The net investment income per share is based on average shares outstanding for the period. |
| (C) | Total returns shown exclude the effect of applicable sales loads. If these charges were included, the returns would be lower. |
See accompanying Notes to Financial Statements.
Financial Highlights (Continued)
Touchstone International Small Cap Fund—Class Y
Selected Data for a Share Outstanding Throughout Each Period
| | | Year | | | Three Months | | | | | | | | | | | | | |
| | | Ended | | | Ended | | | | | | | | | | | | | |
| | | June 30, | | | June 30, | | | Year Ended March 31, | |
| | | 2013 | | | 2012 | | | 2012 | | | 2011 | | | 2010 | | | 2009 | |
| Net asset value at beginning of period | | $ | 10.40 | | | $ | 11.32 | | | $ | 12.14 | | | $ | 9.44 | | | $ | 6.37 | | | $ | 9.78 | |
| Income (loss) from investment operations: | | | | | | | | | | | | | | | | | | | | | | | | |
| Net investment income (loss) | | | 0.21 | | | | 0.10 | (A) | | | 0.07 | (A) | | | (0.08 | )(A) | | | (0.05 | )(A) | | | — | (A) |
| Net realized and unrealized gains (losses) on investments | | | 2.40 | | | | (0.92 | ) | | | (0.88 | ) | | | 2.80 | | | | 3.14 | (B) | | | (3.41 | )(B) |
| Total from investment operations | | | 2.61 | | | | (0.82 | ) | | | (0.81 | ) | | | 2.72 | | | | 3.09 | | | | (3.41 | ) |
| Distributions from: | | | | | | | | | | | | | | | | | | | | | | | | |
| Net investment income | | | (0.17 | ) | | | (0.10 | ) | | | (0.21 | ) | | | (0.02 | ) | | | (0.02 | ) | | | — | |
| Capital contribution | | | — | | | | — | | | | 0.20 | (C) | | | — | | | | — | | | | — | |
| Net asset value at end of period | | $ | 12.84 | | | $ | 10.40 | | | $ | 11.32 | | | $ | 12.14 | | | $ | 9.44 | | | $ | 6.37 | |
| Total return | | | 25.38 | % | | | (7.22 | )%(D) | | | (4.81 | )%(C) | | | 28.82 | % | | | 48.56 | %(B) | | | (34.87 | )%(B) |
| Ratios and supplemental data: | | | | | | | | | | | | | | | | | | | | | | | | |
| Net assets at end of period (000's) | | $ | 90,125 | | | $ | 80,754 | | | $ | 90,029 | | | $ | 118,679 | | | $ | 107,478 | | | $ | 79,518 | |
| Ratio to average net assets: | | | | | | | | | | | | | | | | | | | | | | | | |
| Net expenses | | | 1.24 | % | | | 1.30 | %(E) | | | 1.30 | % | | | 1.30 | % | | | 1.30 | % | | | 1.10 | % |
| Gross expenses | | | 1.53 | % | | | 1.74 | %(E) | | | 1.69 | %(F) | | | 1.59 | %(F) | | | 1.74 | %(F) | | | 1.75 | %(F) |
| Net investment income (loss) | | | 1.71 | % | | | 3.61 | %(E) | | | 0.60 | % | | | (0.80 | )% | | | (0.65 | )% | | | (0.01 | )% |
| Portfolio turnover rate | | | 79 | % | | | 21 | %(D) | | | 207 | % | | | 152 | % | | | 172 | % | | | 290 | % |
| (A) | The net investment income per share is based on average shares outstanding for the period. |
| (B) | Impact of payment from affiliate was less than $0.01 per share and 0.01%, respectively. |
| (C) | Impact of one time distribution of settlement funds from the Bank of America Fair Fund. If the distribution had not occurred the total return would have been lower. |
| (F) | Legal, printing and/or compliance audit expenses relating to civil litigation and certain regulatory actions in connection with market timing allegations were incurred, and the Former Adviser paid these expenses on behalf of the Funds. Had the Former Adviser not paid these expenses, the expenses for the Funds would have been higher than what is reflected in the financial highlights for the years ended March 31, 2012, 2011, 2010 and 2009. |
See accompanying Notes to Financial Statements.
Financial Highlights (Continued)
Touchstone International Small Cap Fund—Institutional Class
Selected Data for a Share Outstanding Throughout Each Period
| | | Year | | | Three Months | | | | | | | | | | | | | |
| | | Ended | | | Ended | | | | | | | | | | | | | |
| | | June 30, | | | June 30, | | | Year Ended March 31, | |
| | | 2013 | | | 2012 | | | 2012 | | | 2011 | | | 2010 | | | 2009 | |
| Net asset value at beginning of period | | $ | 10.45 | | | $ | 11.37 | | | $ | 12.20 | | | $ | 9.49 | | | $ | 6.39 | | | $ | 9.80 | |
| Income (loss) from investment operations: | | | | | | | | | | | | | | | | | | | | | | | | |
| Net investment income (loss) | | | 0.23 | | | | 0.10 | (A) | | | 0.13 | (A) | | | (0.06 | )(A) | | | (0.03 | )(A) | | | (0.02 | )(A) |
| Net realized and unrealized gains (losses) on investments | | | 2.42 | | | | (0.91 | ) | | | (0.93 | ) | | | 2.81 | | | | 3.16 | (B) | | | (3.39 | )(B) |
| Total from investment operations | | | 2.65 | | | | (0.81 | ) | | | (0.80 | ) | | | 2.75 | | | | 3.13 | | | | (3.41 | ) |
| Distributions from: | | | | | | | | | | | | | | | | | | | | | | | | |
| Net investment income | | | (0.20 | ) | | | (0.11 | ) | | | (0.24 | ) | | | (0.04 | ) | | | (0.03 | ) | | | — | |
| Capital contribution | | | — | | | | — | | | | 0.21 | (C) | | | — | | | | — | | | | — | |
| Net asset value at end of period | | $ | 12.90 | | | $ | 10.45 | | | $ | 11.37 | | | $ | 12.20 | | | $ | 9.49 | | | $ | 6.39 | |
| Total return | | | 25.59 | % | | | (7.13 | )%(D) | | | (4.55 | )%(C) | | | 29.00 | % | | | 49.05 | %(B) | | | (34.80 | )%(B) |
| Ratios and supplemental data: | | | | | | | | | | | | | | | | | | | | | | | | |
| Net assets at end of period (000's) | | $ | 16,238 | | | $ | 3,869 | | | $ | 6,288 | | | $ | 1,173 | | | $ | 3,168 | | | $ | 11,923 | |
| Ratio to average net assets: | | | | | | | | | | | | | | | | | | | | | | | | |
| Net expenses | | | 1.05 | % | | | 1.05 | %(E) | | | 1.05 | % | | | 1.05 | % | | | 1.05 | % | | | 1.06 | % |
| Gross expenses | | | 1.50 | % | | | 2.05 | %(E) | | | 1.46 | %(F) | | | 2.22 | %(F) | | | 1.14 | %(F) | | | 18.23 | %(F) |
| Net investment income (loss) | | | 1.90 | % | | | 3.86 | %(E) | | | 1.15 | % | | | (0.61 | )% | | | (0.35 | )% | | | (0.32 | )% |
| Portfolio turnover rate | | | 79 | % | | | 21 | %(D) | | | 207 | % | | | 152 | % | | | 172 | % | | | 290 | % |
| (A) | The net investment income per share is based on average shares outstanding for the period. |
| (B) | Impact of payment from affiliate was less than $0.01 per share and 0.01%, respectively. |
| (C) | Impact of one time distribution of settlement funds from the Bank of America Fair Fund. If the distribution had not occurred the total return would have been lower. |
| (F) | Legal, printing and/or compliance audit expenses relating to civil litigation and certain regulatory actions in connection with market timing allegations were incurred, and the Former Adviser paid these expenses on behalf of the Funds. Had the Former Adviser not paid these expenses, the expenses for the Funds would have been higher than what is reflected in the financial highlights for the years ended March 31, 2012, 2011, 2010 and 2009. |
See accompanying Notes to Financial Statements.
Financial Highlights (Continued)
Touchstone Mid Cap Value Opportunities Fund—Class A
Selected Data for a Share Outstanding Throughout Each Period
| | | | | | Three | | | | | | | | | | | | | |
| | | Year | | | Months | | | | | | | | | | | | | |
| | | Ended | | | Ended | | | | | | | | | | | | | |
| | | June 30, | | | June 30, | | | Year Ended March 31, | |
| | | 2013 | | | 2012 | | | 2012 | | | 2011 | | | 2010 | | | 2009 | |
| Net asset value at beginning of period | | $ | 8.46 | | | $ | 9.01 | | | $ | 9.42 | | | $ | 7.86 | | | $ | 5.61 | | | $ | 8.69 | |
| Income (loss) from investment operations: | | | | | | | | | | | | | | | | | | | | | | | | |
| Net investment income(A) | | | 0.12 | | | | 0.01 | | | | 0.03 | | | | 0.04 | | | | 0.03 | | | | 0.02 | |
| Net realized and unrealized gains (losses) on investments | | | 2.17 | | | | (0.21 | )(B) | | | 0.14 | | | | 1.54 | | | | 2.24 | | | | (3.07 | ) |
| Total from investment operations | | | 2.29 | | | | (0.20 | ) | | | 0.17 | | | | 1.58 | | | | 2.27 | | | | (3.05 | ) |
| Distributions from: | | | | | | | | | | | | | | | | | | | | | | | | |
| Net investment income | | | (0.08 | ) | | | (0.05 | ) | | | (0.03 | ) | | | (0.02 | ) | | | (0.02 | ) | | | (0.03 | ) |
| Realized capital gains | | | (1.46 | ) | | | (0.30 | ) | | | (0.55 | ) | | | — | | | | — | | | | — | |
| Total distributions | | | (1.54 | ) | | | (0.35 | ) | | | (0.58 | ) | | | (0.02 | ) | | | (0.02 | ) | | | (0.03 | ) |
| Net asset value at end of period | | $ | 9.21 | | | $ | 8.46 | | | $ | 9.01 | | | $ | 9.42 | | | $ | 7.86 | | | $ | 5.61 | |
| Total return(C) | | | 31.36 | % | | | (2.21 | )%(D) | | | 2.54 | % | | | 20.14 | % | | | 40.41 | % | | | (35.07 | )% |
| Ratios and supplemental data: | | | | | | | | | | | | | | | | | | | | | | | | |
| Net assets at end of period (000's) | | $ | 4,292 | | | $ | 1,412 | | | $ | 1,512 | | | $ | 4,234 | | | $ | 5,408 | | | $ | 5,304 | |
| Ratio to average net assets: | | | | | | | | | | | | | | | | | | | | | | | | |
| Net expenses | | | 1.29 | % | | | 1.31 | %(E) | | | 1.40 | % | | | 1.40 | % | | | 1.40 | % | | | 1.40 | % |
| Gross expenses | | | 2.56 | % | | | 3.93 | %(E) | | | 2.34 | %(F) | | | 2.10 | %(F) | | | 1.94 | %(F) | | | 2.53 | %(F) |
| Net investment income | | | 1.43 | % | | | 0.55 | %(E) | | | 0.32 | % | | | 0.53 | % | | | 0.36 | % | | | 0.29 | % |
| Portfolio turnover rate | | | 102 | % | | | 20 | %(D) | | | 101 | % | | | 89 | % | | | 125 | % | | | 163 | % |
Touchstone Mid Cap Value Opportunities Fund—Class C
Selected Data for a Share Outstanding Throughout Each Period
| | | Year | | | Period | |
| | | Ended | | | Ended | |
| | | June 30, | | | June 30, | |
| | | 2013 | | | 2012(G) | |
| Net asset value at beginning of period | | $ | 8.44 | | | $ | 8.76 | |
| Income (loss) from investment operations: | | | | | | | | |
| Net investment income (loss)(A) | | | 0.06 | | | | (— | )(H) |
| Net realized and unrealized gains on investments | | | 2.16 | | | | 0.04 | (B) |
| Total from investment operations | | | 2.22 | | | | 0.04 | |
| Distributions from: | | | | | | | | |
| Net investment income | | | (0.05 | ) | | | (0.06 | ) |
| Realized capital gains | | | (1.46 | ) | | | (0.30 | ) |
| Total distributions | | | (1.51 | ) | | | (0.36 | ) |
| Net asset value at end of period | | $ | 9.15 | | | $ | 8.44 | |
| Total return(C) | | | 30.37 | % | | | 0.46 | %(D) |
| Ratios and supplemental data: | | | | | | | | |
| Net assets at end of period (000's) | | $ | 168 | | | $ | 3 | |
| Ratio to average net assets: | | | | | | | | |
| Net expenses | | | 2.04 | % | | | 2.04 | %(E) |
| Gross expenses | | | 19.56 | % | | | 931.83 | %(E) |
| Net investment income (loss) | | | 0.68 | % | | | (0.21 | )%(E) |
| Portfolio turnover rate | | | 102 | % | | | 20 | %(D) |
| (A) | The net investment income per share is based on average shares outstanding for the period. |
| (B) | For the period ended June 30, 2012, the Fund received a corporate action payment that resulted in a one-time increase to realized gains. If the corporate action event had not occurred, the net realized and unrealized gains (losses) per share would have been lower by approximately $0.05 per share. |
| (C) | Total returns shown exclude the effect of applicable sales loads. If these charges were included, the returns would be lower. |
| (F) | Legal, printing and/or compliance audit expenses relating to civil litigation and certain regulatory actions in connection with market timing allegations were incurred, and the Former Adviser paid these expenses on behalf of the Funds. Had the Former Adviser not paid these expenses, the expenses for the Funds would have been higher than what is reflected in the financial highlights for the years ended March 31, 2012, 2011, 2010 and 2009. |
| (G) | The Fund began issuing Class C shares on April 12, 2012. |
| (H) | Less than $0.005 per share. |
See accompanying Notes to Financial Statements.
Financial Highlights (Continued)
Touchstone Mid Cap Value Opportunities Fund—Class Y
Selected Data for a Share Outstanding Throughout Each Period
| | | Year | | | Three Months | | | | | | | | | | | | | |
| | | Ended | | | Ended | | | | | | | | | | | | | |
| | | June 30, | | | June 30, | | | Year Ended March 31, | |
| | | 2013 | | | 2012 | | | 2012 | | | 2011 | | | 2010 | | | 2009(A) | |
| Net asset value at beginning of period | | $ | 8.50 | | | $ | 9.04 | | | $ | 9.50 | | | $ | 7.92 | | | $ | 5.65 | | | $ | 6.02 | |
| Income (loss) from investment operations: | | | | | | | | | | | | | | | | | | | | | | | | |
| Net investment income(B) | | | 0.15 | | | | 0.02 | | | | 0.07 | | | | 0.07 | | | | 0.05 | | | | 0.07 | |
| Net realized and unrealized gains (losses) on investments | | | 2.16 | | | | (0.21 | )(C) | | | 0.12 | | | | 1.56 | | | | 2.26 | | | | (0.41 | ) |
| Total from investment operations | | | 2.31 | | | | (0.19 | ) | | | 0.19 | | | | 1.63 | | | | 2.31 | | | | (0.34 | ) |
| Distributions from: | | | | | | | | | | | | | | | | | | | | | | | | |
| Net investment income | | | (0.10 | ) | | | (0.05 | ) | | | (0.10 | ) | | | (0.05 | ) | | | (0.04 | ) | | | (0.03 | ) |
| Realized capital gains | | | (1.46 | ) | | | (0.30 | ) | | | (0.55 | ) | | | — | | | | — | | | | — | |
| Total distributions | | | (1.56 | ) | | | (0.35 | ) | | | (0.65 | ) | | | (0.05 | ) | | | (0.04 | ) | | | (0.03 | ) |
| Net asset value at end of period | | $ | 9.25 | | | $ | 8.50 | | | $ | 9.04 | | | $ | 9.50 | | | $ | 7.92 | | | $ | 5.65 | |
| Total return | | | 31.46 | % | | | (2.02 | )%(D) | | | 2.77 | % | | | 20.59 | % | | | 40.90 | % | | | (5.60 | )% |
| Ratios and supplemental data: | | | | | | | | | | | | | | | | | | | | | | | | |
| Net assets at end of period (000's) | | $ | 81,869 | | | $ | 64,371 | | | $ | 68,366 | | | $ | 76,756 | | | $ | 76,965 | | | $ | 60,618 | |
| Ratio to average net assets: | | | | | | | | | | | | | | | | | | | | | | | | |
| Net expenses | | | 1.02 | % | | | 1.05 | %(E) | | | 1.12 | % | | | 1.12 | % | | | 1.12 | % | | | 1.12 | % |
| Gross expenses | | | 1.24 | % | | | 1.38 | %(E) | | | 1.36 | %(F) | | | 1.37 | %(F) | | | 1.38 | %(F) | | | 3.20 | %(F) |
| Net investment income | | | 1.70 | % | | | 0.81 | %(E) | | | 0.83 | % | | | 0.80 | % | | | 0.64 | % | | | 1.29 | % |
| Portfolio turnover rate | | | 102 | % | | | 20 | %(D) | | | 101 | % | | | 89 | % | | | 125 | % | | | 163 | % |
| Touchstone Mid Cap Value Opportunities Fund—Institutional Class |
| Selected Data for a Share Outstanding Throughout Each Period |
| | | Year | | | Three Months | | | | | | | | | | | | | |
| | | Ended | | | Ended | | | | | | | | | | | | | |
| | | June 30, | | | June 30, | | | Year Ended March 31, | |
| | | 2013 | | | 2012 | | | 2012 | | | 2011 | | | 2010 | | | 2009 | |
| Net asset value at beginning of period | | $ | 8.49 | | | $ | 9.03 | | | $ | 9.49 | | | $ | 7.92 | | | $ | 5.65 | | | $ | 8.72 | |
| Income (loss) from investment operations: | | | | | | | | | | | | | | | | | | | | | | | | |
| Net investment income(B) | | | 0.16 | | | | 0.02 | | | | 0.08 | | | | 0.08 | | | | 0.06 | | | | 0.05 | |
| Net realized and unrealized gains (losses) on investments | | | 2.17 | | | | (0.20 | )(C) | | | 0.12 | | | | 1.55 | | | | 2.25 | | | | (3.08 | ) |
| Total from investment operations | | | 2.33 | | | | (0.18 | ) | | | 0.20 | | | | 1.63 | | | | 2.31 | | | | (3.03 | ) |
| Distributions from: | | | | | | | | | | | | | | | | | | | | | | | | |
| Net investment income | | | (0.11 | ) | | | (0.06 | ) | | | (0.11 | ) | | | (0.06 | ) | | | (0.04 | ) | | | (0.04 | ) |
| Realized capital gains | | | (1.46 | ) | | | (0.30 | ) | | | (0.55 | ) | | | — | | | | — | | | | — | |
| Total distributions | | | (1.57 | ) | | | (0.36 | ) | | | (0.66 | ) | | | (0.06 | ) | | | (0.04 | ) | | | (0.04 | ) |
| Net asset value at end of period | | $ | 9.25 | | | $ | 8.49 | | | $ | 9.03 | | | $ | 9.49 | | | $ | 7.92 | | | $ | 5.65 | |
| Total return | | | 31.77 | % | | | (1.99 | )%(D) | | | 2.91 | % | | | 20.61 | % | | | 41.01 | % | | | (34.81 | )% |
| Ratios and supplemental data: | | | | | | | | | | | | | | | | | | | | | | | | |
| Net assets at end of period (000's) | | $ | 31,927 | | | $ | 34,795 | | | $ | 103,016 | | | $ | 205,410 | | | $ | 171,807 | | | $ | 57,430 | |
| Ratio to average net assets: | | | | | | | | | | | | | | | | | | | | | | | | |
| Net expenses | | | 0.89 | % | | | 0.91 | %(E) | | | 1.00 | % | | | 1.00 | % | | | 1.00 | % | | | 1.00 | % |
| Gross expenses | | | 1.18 | % | | | 1.22 | %(E) | | | 1.08 | %(F) | | | 1.06 | %(F) | | | 1.06 | %(F) | | | 1.18 | %(F) |
| Net investment income | | | 1.83 | % | | | 0.96 | %(E) | | | 0.85 | % | | | 0.91 | % | | | 0.82 | % | | | 0.58 | % |
| Portfolio turnover rate | | | 102 | % | | | 20 | %(D) | | | 101 | % | | | 89 | % | | | 125 | % | | | 163 | % |
| (A) | Class commenced operations on December 9, 2008. |
| (B) | The net investment income per share is based on average shares outstanding for the period. |
| (C) | For the period ended June 30, 2012, the Fund received a corporate action payment that resulted in a one-time increase to realized gains. If the corporate action event had not occurred, the net realized and unrealized gains (losses) per share would have been lower by approximately $0.05 per share. |
| (F) | Legal, printing and/or compliance audit expenses relating to civil litigation and certain regulatory actions in connection with market timing allegations were incurred, and the Former Adviser paid these expenses on behalf of the Funds. Had the Former Adviser not paid these expenses, the expenses for the Funds would have been higher than what is reflected in the financial highlights for the years ended March 31, 2012, 2011, 2010 and 2009. |
See accompanying Notes to Financial Statements.
Financial Highlights (Continued)
Touchstone Small Cap Value Opportunities Fund—Class A
Selected Data for a Share Outstanding Throughout Each Period
| | | Year | | | Three Months | | | | | | | | | | | | | |
| | | Ended | | | Ended | | | | | | | | | | | | | |
| | | June 30, | | | June 30, | | | Year Ended March 31, | |
| | | 2013 | | | 2012 | | | 2012 | | | 2011 | | | 2010 | | | 2009 | |
| Net asset value at beginning of period | | $ | 16.97 | | | $ | 18.08 | | | $ | 19.06 | | | $ | 16.43 | | | $ | 11.05 | | | $ | 19.43 | |
| Income (loss) from investment operations: | | | | | | | | | | | | | | | | | | | | | | | | |
| Net investment income (loss) | | | 0.09 | (A) | | | (0.01 | ) | | | (0.06 | )(A) | | | (0.08 | )(A) | | | (0.01 | )(A) | | | (— | )(A)(B) |
| Net realized and unrealized gains (losses) on investments | | | 3.66 | | | | (0.57 | ) | | | 0.04 | | | | 2.71 | | | | 5.39 | | | | (6.66 | )(C) |
| Total from investment operations | | | 3.75 | | | | (0.58 | ) | | | (0.02 | ) | | | 2.63 | | | | 5.38 | | | | (6.66 | ) |
| Distributions from: | | | | | | | | | | | | | | | | | | | | | | | | |
| Net investment income | | | (0.09 | ) | | | — | | | | — | | | | — | | | | — | | | | (0.02 | ) |
| Realized capital gains | | | (1.88 | ) | | | (0.53 | ) | | | (0.96 | ) | | | — | | | | — | | | | (1.70 | ) |
| Total distributions | | | (1.97 | ) | | | (0.53 | ) | | | (0.96 | ) | | | — | | | | — | | | | (1.72 | ) |
| Net asset value at end of period | | $ | 18.75 | | | $ | 16.97 | | | $ | 18.08 | | | $ | 19.06 | | | $ | 16.43 | | | $ | 11.05 | |
| Total return(D) | | | 24.31 | % | | | (3.09 | )%(E) | | | 0.60 | % | | | 16.01 | % | | | 48.71 | % | | | (34.71 | )%(C) |
| Ratios and supplemental data: | | | | | | | | | | | | | | | | | | | | | | | | |
| Net assets at end of period (000's) | | $ | 1,309 | | | $ | 2,023 | | | $ | 2,251 | | | $ | 3,068 | | | $ | 4,815 | | | $ | 2,160 | |
| Ratio to average net assets: | | | | | | | | | | | | | | | | | | | | | | | | |
| Net expenses | | | 1.50 | % | | | 1.50 | %(F) | | | 1.50 | % | | | 1.50 | % | | | 1.50 | % | | | 1.53 | % |
| Gross expenses | | | 2.46 | % | | | 3.31 | %(F) | | | 2.27 | %(G) | | | 2.10 | %(G) | | | 1.47 | %(G) | | | 3.25 | %(G) |
| Net investment income (loss) | | | 0.53 | % | | | (0.16 | )%(F) | | | (0.34 | )% | | | (0.46 | )% | | | (0.08 | )% | | | (0.01 | )% |
| Portfolio turnover rate | | | 95 | % | | | 18 | %(E) | | | 49 | % | | | 55 | % | | | 83 | % | | | 140 | % |
Touchstone Small Cap Value Opportunities Fund—Class C
Selected Data for a Share Outstanding Throughout Each Period
| | | Year | | | Period | |
| | | Ended | | | Ended | |
| | | June 30, | | | June 30, | |
| | | 2013 | | | 2012(H) | |
| Net asset value at beginning of period | | $ | 16.95 | | | $ | 17.58 | |
| Income (loss) from investment operations: | | | | | | | | |
| Net investment loss | | | (0.04 | )(A) | | | (0.03 | ) |
| Net realized and unrealized gains (losses) on investments | | | 3.66 | | | | (0.07 | ) |
| Total from investment operations | | | 3.62 | | | | (0.10 | ) |
| Distributions from: | | | | | | | | |
| Realized capital gains | | | (1.88 | ) | | | (0.53 | ) |
| Net asset value at end of period | | $ | 18.69 | | | $ | 16.95 | |
| Total return(D) | | | 23.44 | % | | | (0.51 | )%(E) |
| Ratios and supplemental data: | | | | | | | | |
| Net assets at end of period (000's) | | $ | 36 | | | $ | 2 | |
| Ratio to average net assets: | | | | | | | | |
| Net expenses | | | 2.25 | % | | | 2.25 | %(F) |
| Gross expenses | | | 25.27 | % | | | 942.58 | %(F) |
| Net investment loss | | | (0.22 | )% | | | (0.95 | )%(F) |
| Portfolio turnover rate | | | 95 | % | | | 18 | %(E) |
| (A) | The net investment income per share is based on average shares outstanding for the period. |
| (B) | Less than $0.005 per share. |
| (C) | Impact of payment from affiliate was less than $0.01 per share and 0.01%, respectively. |
| (D) | Total returns shown exclude the effect of applicable sales loads. If these charges were included, the returns would be lower. |
| (G) | Legal, printing and/or compliance audit expenses relating to civil litigation and certain regulatory actions in connection with market timing allegations were incurred, and the Former Adviser paid these expenses on behalf of the Funds. Had the Former Adviser not paid these expenses, the expenses for the Funds would have been higher than what is reflected in the financial highlights for the years ended March 31, 2012, 2011, 2010 and 2009. |
| (H) | The Fund began issuing Class C shares on April 12, 2012. |
See accompanying Notes to Financial Statements.
Financial Highlights (Continued)
Touchstone Small Cap Value Opportunities Fund— Class Y
Selected Data for a Share Outstanding Throughout Each Period
| | | Year | | | Three Months | | | | | | | | | | | | | |
| | | Ended | | | Ended | | | | | | | | | | | | | |
| | | June 30, | | | June 30, | | | Year Ended March 31, | |
| | | 2013 | | | 2012 | | | 2012 | | | 2011 | | | 2010 | | | 2009 | |
| Net asset value at beginning of period | | $ | 17.51 | | | $ | 18.62 | | | $ | 19.55 | | | $ | 16.80 | | | $ | 11.29 | | | $ | 19.76 | |
| Income (loss) from investment operations: | | | | | | | | | | | | | | | | | | | | | | | | |
| Net investment income (loss) | | | 0.15 | (A) | | | 0.01 | | | | (0.02 | )(A) | | | (0.04 | )(A) | | | 0.03 | (A) | | | 0.02 | (A) |
| Net realized and unrealized gains (losses) on investments | | | 3.77 | | | | (0.59 | ) | | | 0.05 | | | | 2.79 | | | | 5.51 | | | | (6.77 | )(B) |
| Total from investment operations | | | 3.92 | | | | (0.58 | ) | | | 0.03 | | | | 2.75 | | | | 5.54 | | | | (6.75 | ) |
| Distributions from: | | | | | | | | | | | | | | | | | | | | | | | | |
| Net investment income | | | (0.10 | ) | | | — | | | | — | | | | — | | | | (0.03 | ) | | | (0.02 | ) |
| Realized capital gains | | | (1.88 | ) | | | (0.53 | ) | | | (0.96 | ) | | | — | | | | — | | | | (1.70 | ) |
| Total distributions | | | (1.98 | ) | | | (0.53 | ) | | | (0.96 | ) | | | — | | | | (0.03 | ) | | | (1.72 | ) |
| Net asset value at end of period | | $ | 19.45 | | | $ | 17.51 | | | $ | 18.62 | | | $ | 19.55 | | | $ | 16.80 | | | $ | 11.29 | |
| Total return | | | 24.68 | % | | | (3.05 | )%(C) | | | 0.85 | % | | | 16.37 | % | | | 49.10 | % | | | (34.57 | )%(B) |
| Ratios and supplemental data: | | | | | | | | | | | | | | | | | | | | | | | | |
| Net assets at end of period (000's) | | $ | 96,584 | | | $ | 82,861 | | | $ | 87,984 | | | $ | 98,269 | | | $ | 86,737 | | | $ | 55,976 | |
| Ratio to average net assets: | | | | | | | | | | | | | | | | | | | | | | | | |
| Net expenses | | | 1.19 | % | | | 1.22 | %(D) | | | 1.25 | % | | | 1.25 | % | | | 1.25 | % | | | 1.23 | % |
| Gross expenses | | | 1.29 | % | | | 1.40 | %(D) | | | 1.27 | %(E) | | | 1.26 | %(E) | | | 1.30 | %(E) | | | 1.37 | %(E) |
| Net investment income (loss) | | | 0.84 | % | | | 0.12 | %(D) | | | (0.09 | )% | | | (0.23 | )% | | | 0.18 | % | | | 0.15 | % |
| Portfolio turnover rate | | | 95 | % | | | 18 | %(C) | | | 49 | % | | | 55 | % | | | 83 | % | | | 140 | % |
| Touchstone Small Cap Value Opportunities Fund—Institutional Class |
| Selected Data for a Share Outstanding Throughout Each Period |
| | | Year | | | Three Months | | | | | | | | | | | | | |
| | | Ended | | | Ended | | | | | | | | | | | | | |
| | | June 30, | | | June 30, | | | Year Ended March 31, | |
| | | 2013 | | | 2012 | | | 2012 | | | 2011 | | | 2010 | | | 2009(F) | |
| Net asset value at beginning of period | | $ | 17.63 | | | $ | 18.75 | | | $ | 19.65 | | | $ | 16.87 | | | $ | 11.32 | | | $ | 14.28 | |
| Income (loss) from investment operations: | | | | | | | | | | | | | | | | | | | | | | | | |
| Net investment income (loss) | | | 0.17 | (A) | | | 0.01 | | | | 0.01 | (A) | | | (0.01 | )(A) | | | 0.05 | (A) | | | 0.02 | (A) |
| Net realized and unrealized gains (losses) on investments | | | 3.82 | | | | (0.60 | ) | | | 0.05 | | | | 2.79 | | | | 5.54 | | | | (1.26 | )(B) |
| Total from investment operations | | | 3.99 | | | | (0.59 | ) | | | 0.06 | | | | 2.78 | | | | 5.59 | | | | (1.24 | ) |
| Distributions from: | | | | | | | | | | | | | | | | | | | | | | | | |
| Net investment income | | | (0.12 | ) | | | — | | | | — | | | | — | | | | (0.04 | ) | | | (0.02 | ) |
| Realized capital gains | | | (1.88 | ) | | | (0.53 | ) | | | (0.96 | ) | | | — | | | | — | | | | (1.70 | ) |
| Total distributions | | | (2.00 | ) | | | (0.53 | ) | | | (0.96 | ) | | | — | | | | (0.04 | ) | | | (1.72 | ) |
| Net asset value at end of period | | $ | 19.62 | | | $ | 17.63 | | | $ | 18.75 | | | $ | 19.65 | | | $ | 16.87 | | | $ | 11.32 | |
| Total return | | | 24.82 | % | | | (3.04 | )%(C) | | | 1.00 | % | | | 16.48 | % | | | 49.46 | % | | | (9.52 | )%(B) |
| Ratios and supplemental data: | | | | | | | | | | | | | | | | | | | | | | | | |
| Net assets at end of period (000's) | | $ | 8,096 | | | $ | 7,023 | | | $ | 19,066 | | | $ | 20,119 | | | $ | 26,915 | | | $ | — | |
| Ratio to average net assets: | | | | | | | | | | | | | | | | | | | | | | | | |
| Net expenses | | | 1.10 | % | | | 1.10 | %(D) | | | 1.10 | % | | | 1.10 | % | | | 1.10 | % | | | 1.09 | % |
| Gross expenses | | | 1.46 | % | | | 1.60 | %(D) | | | 1.18 | %(E) | | | 1.18 | %(E) | | | 1.16 | %(E) | | | 24,873.11 | %(E) |
| Net investment income (loss) | | | 0.93 | % | | | 0.24 | %(D) | | | 0.06 | % | | | (0.08 | )% | | | 0.34 | % | | | 0.15 | % |
| Portfolio turnover rate | | | 95 | % | | | 18 | %(C) | | | 49 | % | | | 55 | % | | | 83 | % | | | 140 | % |
| (A) | The net investment income per share is based on average shares outstanding for the period. |
| (B) | Impact of payment from affiliate was less than $0.01 per share and 0.01%, respectively. |
| (E) | Legal, printing and/or compliance audit expenses relating to civil litigation and certain regulatory actions in connection with market timing allegations were incurred, and the Former Adviser paid these expenses on behalf of the Funds. Had the Former Adviser not paid these expenses, the expenses for the Funds would have been higher than what is reflected in the financial highlights for the years ended March 31, 2012, 2011, 2010 and 2009. |
| (F) | Class commenced operations on December 9, 2008. |
See accompanying Notes to Financial Statements.
Financial Highlights (Continued)
Touchstone Value Fund—Class A
Selected Data for a Share Outstanding Throughout Each Period
| | | Year | | | Three Months | | | | | | | | | | | | | |
| | | Ended | | | Ended | | | | | | | | | | | | | |
| | | June 30, | | | June 30, | | | Year Ended March 31, | |
| | | 2013 | | | 2012 | | | 2012 | | | 2011 | | | 2010 | | | 2009 | |
| Net asset value at beginning of period | | $ | 6.95 | | | $ | 7.14 | | | $ | 6.67 | | | $ | 6.17 | | | $ | 4.00 | | | $ | 6.64 | |
| Income (loss) from investment operations: | | | | | | | | | | | | | | | | | | | | | | | | |
| Net investment income(A) | | | 0.15 | | | | 0.03 | | | | 0.12 | | | | 0.08 | | | | 0.09 | | | | 0.14 | |
| Net realized and unrealized gains (losses) on investments | | | 1.30 | | | | (0.16 | ) | | | 0.45 | | | | 0.50 | | | | 2.17 | | | | (2.66 | ) |
| Total from investment operations | | | 1.45 | | | | (0.13 | ) | | | 0.57 | | | | 0.58 | | | | 2.26 | | | | (2.52 | ) |
| Distributions from: | | | | | | | | | | | | | | | | | | | | | | | | |
| Net investment income | | | (0.15 | ) | | | (0.06 | ) | | | (0.10 | ) | | | (0.08 | ) | | | (0.09 | ) | | | (0.12 | ) |
| Realized capital gains | | | (0.23 | ) | | | — | | | | — | | | | — | | | | — | | | | — | |
| Total distributions | | | (0.38 | ) | | | (0.06 | ) | | | (0.10 | ) | | | (0.08 | ) | | | (0.09 | ) | | | (0.12 | ) |
| Net asset value at end of period | | $ | 8.02 | | | $ | 6.95 | | | $ | 7.14 | | | $ | 6.67 | | | $ | 6.17 | | | $ | 4.00 | |
| Total return(B) | | | 21.56 | % | | | (1.83 | )%(C) | | | 8.77 | % | | | 9.59 | % | | | 57.05 | % | | | (38.39 | )% |
| Ratios and supplemental data: | | | | | | | | | | | | | | | | | | | | | | | | |
| Net assets at end of period (000's) | | $ | 53,433 | | | $ | 1,583 | | | $ | 1,606 | | | $ | 2,325 | | | $ | 2,514 | | | $ | 2,530 | |
| Ratio to average net assets: | | | | | | | | | | | | | | | | | | | | | | | | |
| Net expenses | | | 1.00 | % | | | 1.20 | %(D) | | | 1.20 | % | | | 1.20 | % | | | 1.26 | % | | | 1.35 | % |
| Gross expenses | | | 1.51 | % | | | 3.49 | %(D) | | | 1.96 | %(E) | | | 2.04 | %(E) | | | 1.76 | %(E) | | | 2.23 | %(E) |
| Net investment income | | | 1.96 | % | | | 1.68 | %(D) | | | 1.84 | % | | | 1.31 | % | | | 1.72 | % | | | 2.76 | % |
| Portfolio turnover rate | | | 110 | %(F) | | | 13 | %(C) | | | 15 | % | | | 13 | % | | | 25 | % | | | 17 | % |
Touchstone Value Fund—Class C
Selected Data for a Share Outstanding Throughout Each Period
| | | Year | | | Period | |
| | | Ended | | | Ended | |
| | | June 30, | | | June 30, | |
| | | 2013 | | | 2012(G) | |
| Net asset value at beginning of period | | $ | 6.95 | | | $ | 6.90 | |
| Income from investment operations: | | | | | | | | |
| Net investment income(A) | | | 0.09 | | | | 0.01 | |
| Net realized and unrealized gains on investments | | | 1.30 | | | | 0.10 | |
| Total from investment operations | | | 1.39 | | | | 0.11 | |
| Distributions from: | | | | | | | | |
| Net investment income | | | (0.09 | ) | | | (0.06 | ) |
| Realized capital gains | | | (0.23 | ) | | | — | |
| Total distributions | | | (0.32 | ) | | | (0.06 | ) |
| Net asset value at end of period | | $ | 8.02 | | | $ | 6.95 | |
| Total return(B) | | | 20.62 | % | | | 1.56 | %(C) |
| Ratios and supplemental data: | | | | | | | | |
| Net assets at end of period (000's) | | $ | 3,025 | | | $ | 3 | |
| Ratio to average net assets: | | | | | | | | |
| Net expenses | | | 1.75 | % | | | 1.95 | %(D) |
| Gross expenses | | | 2.30 | % | | | 929.36 | %(D) |
| Net investment income | | | 1.21 | % | | | 0.93 | %(D) |
| Portfolio turnover rate | | | 110 | %(F) | | | 13 | %(C) |
| (A) | The net investment income per share is based on average shares outstanding for the period. |
| (B) | Total returns shown exclude the effect of applicable sales loads. If these charges were included, the returns would be lower. |
| (E) | Legal, printing and/or compliance audit expenses relating to civil litigation and certain regulatory actions in connection with market timing allegations were incurred, and the Former Adviser paid these expenses on behalf of the Funds. Had the Former Adviser not paid these expenses, the expenses for the Funds would have been higher than what is reflected in the financial highlights for the years ended March 31, 2012, 2011, 2010 and 2009. |
| (F) | Portfolio turnover excludes the purchases and sales of the Acquired Fund (see Note 8). If these transactions were included, portfolio turnover would have been higher. |
| (G) | The Fund began issuing Class C shares on April 12, 2012. |
See accompanying Notes to Financial Statements.
Financial Highlights (Continued)
Touchstone Value Fund—Class Y
Selected Data for a Share Outstanding Throughout Each Period
| | | Year | | | Three Months | | | | | | | | | | | | | |
| | | Ended | | | Ended | | | | | | | | | | | | | |
| | | June 30, | | | June 30, | | | Year Ended March 31, | |
| | | 2013 | | | 2012 | | | 2012 | | | 2011 | | | 2010 | | | 2009 | |
| Net asset value at beginning of period | | $ | 6.97 | | | $ | 7.16 | | | $ | 6.69 | | | $ | 6.19 | | | $ | 4.01 | | | $ | 6.65 | |
| Income (loss) from investment operations: | | | | | | | | | | | | | | | | | | | | | | | | |
| Net investment income(A) | | | 0.16 | | | | 0.03 | | | | 0.12 | | | | 0.09 | | | | 0.10 | | | | 0.16 | |
| Net realized and unrealized gains (losses) on investments | | | 1.32 | | | | (0.15 | ) | | | 0.47 | | | | 0.51 | | | | 2.19 | | | | (2.68 | ) |
| Total from investment operations | | | 1.48 | | | | (0.12 | ) | | | 0.59 | | | | 0.60 | | | | 2.29 | | | | (2.52 | ) |
| Distributions from: | | | | | | | | | | | | | | | | | | | | | | | | |
| Net investment income | | | (0.17 | ) | | | (0.07 | ) | | | (0.12 | ) | | | (0.10 | ) | | | (0.11 | ) | | | (0.12 | ) |
| Realized capital gains | | | (0.23 | ) | | | — | | | | — | | | | — | | | | — | | | | — | |
| Total distributions | | | (0.40 | ) | | | (0.07 | ) | | | (0.12 | ) | | | (0.10 | ) | | | (0.11 | ) | | | (0.12 | ) |
| Net asset value at end of period | | $ | 8.05 | | | $ | 6.97 | | | $ | 7.16 | | | $ | 6.69 | | | $ | 6.19 | | | $ | 4.01 | |
| Total return | | | 21.91 | % | | | (1.69 | )%(B) | | | 9.01 | % | | | 9.86 | % | | | 57.65 | % | | | (38.29 | )% |
| Ratios and supplemental data: | | | | | | | | | | | | | | | | | | | | | | | | |
| Net assets at end of period (000's) | | $ | 99,398 | | | $ | 51,447 | | | $ | 87,546 | | | $ | 86,659 | | | $ | 88,766 | | | $ | 67,325 | |
| Ratio to average net assets: | | | | | | | | | | | | | | | | | | | | | | | | |
| Net expenses | | | 0.77 | % | | | 0.95 | %(C) | | | 0.95 | % | | | 0.95 | % | | | 1.00 | % | | | 1.10 | % |
| Gross expenses | | | 1.09 | % | | | 1.23 | %(C) | | | 1.03 | %(D) | | | 1.04 | %(D) | | | 1.07 | %(D) | | | 1.22 | %(D) |
| Net investment income | | | 2.19 | % | | | 1.93 | %(C) | | | 1.90 | % | | | 1.58 | % | | | 1.87 | % | | | 3.03 | % |
| Portfolio turnover rate | | | 110 | %(E) | | | 13 | %(B) | | | 15 | % | | | 13 | % | | | 25 | % | | | 17 | % |
| Touchstone Value Fund—Institutional Class |
| Selected Data for a Share Outstanding Throughout Each Period |
| | | Year | | | Three Months | | | | | | | | | | | | | |
| | | Ended | | | Ended | | | | | | | | | | | | | |
| | | June 30, | | | June 30, | | | Year Ended March 31, | |
| | | 2013 | | | 2012 | | | 2012 | | | 2011 | | | 2010 | | | 2009 | |
| Net asset value at beginning of period | | $ | 6.96 | | | $ | 7.15 | | | $ | 6.68 | | | $ | 6.18 | | | $ | 4.01 | | | $ | 6.63 | |
| Income (loss) from investment operations: | | | | | | | | | | | | | | | | | | | | | | | | |
| Net investment income(A) | | | 0.17 | | | | 0.03 | | | | 0.13 | | | | 0.10 | | | | 0.11 | | | | 0.17 | |
| Net realized and unrealized gains (losses) on investments | | | 1.31 | | | | (0.16 | ) | | | 0.46 | | | | 0.51 | | | | 2.18 | | | | (2.66 | ) |
| Total from investment operations | | | 1.48 | | | | (0.13 | ) | | | 0.59 | | | | 0.61 | | | | 2.29 | | | | (2.49 | ) |
| Distributions from: | | | | | | | | | | | | | | | | | | | | | | | | |
| Net investment income | | | (0.18 | ) | | | (0.06 | ) | | | (0.12 | ) | | | (0.11 | ) | | | (0.12 | ) | | | (0.13 | ) |
| Realized capital gains | | | (0.23 | ) | | | — | | | | — | | | | — | | | | — | | | | — | |
| Total distributions | | | (0.41 | ) | | | (0.06 | ) | | | (0.12 | ) | | | (0.11 | ) | | | (0.12 | ) | | | (0.13 | ) |
| Net asset value at end of period | | $ | 8.03 | | | $ | 6.96 | | | $ | 7.15 | | | $ | 6.68 | | | $ | 6.18 | | | $ | 4.01 | |
| Total return | | | 21.92 | % | | | (1.62 | )%(B) | | | 9.13 | % | | | 9.99 | % | | | 57.64 | % | | | (38.06 | )% |
| Ratios and supplemental data: | | | | | | | | | | | | | | | | | | | | | | | | |
| Net assets at end of period (000's) | | $ | 186,990 | | | $ | 69,549 | | | $ | 33,727 | | | $ | 42,106 | | | $ | 51,274 | | | $ | 44,011 | |
| Ratio to average net assets: | | | | | | | | | | | | | | | | | | | | | | | | |
| Net expenses | | | 0.67 | % | | | 0.85 | %(C) | | | 0.85 | % | | | 0.85 | % | | | 0.87 | % | | | 0.90 | % |
| Gross expenses | | | 0.99 | % | | | 1.09 | %(C) | | | 0.88 | %(D) | | | 0.89 | %(D) | | | 0.90 | %(D) | | | 1.02 | %(D) |
| Net investment income | | | 2.29 | % | | | 2.04 | %(C) | | | 2.00 | % | | | 1.67 | % | | | 2.01 | % | | | 3.24 | % |
| Portfolio turnover rate | | | 110 | %(E) | | | 13 | %(B) | | | 15 | % | | | 13 | % | | | 25 | % | | | 17 | % |
| (A) | The net investment income per share is based on average shares outstanding for the period. |
| (D) | Legal, printing and/or compliance audit expenses relating to civil litigation and certain regulatory actions in connection with market timing allegations were incurred, and the Former Adviser paid these expenses on behalf of the Funds. Had the Former Adviser not paid these expenses, the expenses for the Funds would have been higher than what is reflected in the financial highlights for the years ended March 31, 2012, 2011, 2010 and 2009. |
| (E) | Portfolio turnover excludes the purchases and sales of the Acquired Fund (see Note 8). If these transactions were included, portfolio turnover would have been higher. |
See accompanying Notes to Financial Statements.
Notes to Financial Statements
June 30, 2013
1. Organization
The Touchstone Strategic Trust (the “Trust”) is registered under the Investment Company Act of 1940, as amended, (the “1940 Act”), as an open-end management investment company. The Trust was established as a Massachusetts business trust pursuant to a Declaration of Trust dated November 18, 1982. The Trust consists of nineteen funds including the following five funds (individually, a “Fund”, and collectively, the “Funds”):
Touchstone Capital Growth Fund (“Capital Growth Fund”)
Touchstone International Small Cap Fund (“International Small Cap Fund”)
Touchstone Mid Cap Value Opportunities Fund (“Mid Cap Value Opportunities Fund”)
Touchstone Small Cap Value Opportunities Fund (“Small Cap Value Opportunities Fund”)
Touchstone Value Fund (“Value Fund”)
Each Fund is an open-end, diversified management investment company, with the exception of the Capital Growth Fund and Value Fund, each of which is an open-end, non-diversified management investment company.
The Declaration of Trust permits the Trust to issue an unlimited number of shares of beneficial interest of each Fund. The Funds are registered to offer the following classes of shares: Class A shares, Class C shares, Class Y shares, and Institutional Class shares. The assets of each Fund are segregated, and a shareholder’s interest is limited to the Fund in which shares are held. The Funds’ prospectus provides a description of each Fund’s investment goals, policies, and strategies along with information on the classes of shares currently being offered.
2. Significant Accounting Policies
The following is a summary of the Funds’ significant accounting policies:
Security valuation and fair value measurements — All investments in securities are recorded at their estimated fair value. The Funds define the term “market value”, as used throughout this report, as the estimated fair value. The Funds use various methods to measure fair value of their portfolio securities on a recurring basis. Generally accepted accounting principles in the United States (“U.S. GAAP”) establish a hierarchy that prioritizes inputs to valuation methods. These inputs are summarized in the three broad levels listed below:
| • | Level 1 – quoted prices in active markets for identical securities |
| • | Level 2 – other significant observable inputs (including quoted prices for similar securities, interest rates, prepayment speeds, credit risk, etc.) |
| • | Level 3 – significant unobservable inputs (including a Fund’s own assumptions in determining the fair value of investments) |
The inputs or methodology used for valuing securities are not necessarily an indication of the risk associated with investing in those securities. For example, money market instruments are valued using amortized cost, in accordance with rules under the 1940 Act. Generally, amortized cost approximates the current fair value of a security, but since the value is not obtained from a quoted price in an active market, such securities are reflected as Level 2.
The aggregate value by input level, as of June 30, 2013, for each Fund’s investments, as well as a reconciliation of assets for which significant unobservable inputs (Level 3) were used in determining value, if applicable, is included in each Fund’s Portfolio of Investments or Tabular Presentation, which also includes a breakdown of the Fund’s investments by geographic or sector allocation. There were no Level 3 securities for the Funds during the year ended June 30, 2013.
Notes to Financial Statements (Continued)
All transfers in and out of the levels are recognized at the value at the end of the period. During the year ended June 30, 2013, there were no transfers between Levels 1, 2 and 3 for all Funds except as shown in the Portfolio of Investments for the International Small Cap Fund.
The Funds’ portfolio securities are valued as of the close of the regular session of trading on the New York Stock Exchange (“NYSE”) (currently 4:00 p.m., Eastern time). Portfolio securities traded on stock exchanges are valued at the last sale price, and to the extent these securities are actively traded, they are categorized in Level 1 of the fair value hierarchy. Portfolio securities quoted by NASDAQ are valued at the NASDAQ Official Closing Price (“NOCP”). Securities not traded on a particular day, or for which the last sale price is not readily available, are valued at their last broker-quoted bid prices as obtained from one or more of the major market makers for such securities by an independent pricing service and are categorized in Level 2. Money market instruments and other debt securities with a remaining maturity of less than 60 days are valued at amortized cost, which approximates market value and are categorized in Level 2. While this method provides consistency in valuation (and may only be used if it approximates market value), it may result in periods during which value, as determined by amortized cost, is higher or lower than the price that would be received if the Fund sold the investment. Securities for which market quotations or the NOCP are not readily available are fair valued as determined by or under the direction of the Board of Trustees and are categorized in Level 3. Shares of open-end mutual funds in which the Funds invest are valued at their respective net asset values (“NAV”) as reported by the underlying funds and are categorized in Level 1. The prices for foreign securities are reported in local currency and translated into U.S. dollars using currency exchange rates.
Level 2 Valuation— Securities mainly traded on a non-U.S. exchange are generally valued according to the preceding closing values on that exchange. However, if an event that may change the value of a security occurs after the time that the closing value on the non-U.S. exchange was determined, but before the close of regular trading on the NYSE, the security may be priced based on fair value. This may cause the value of the security on the books of the Fund to be significantly different from the closing value on the non-U.S. exchange and may affect the calculation of the NAV of the Funds. Any debt securities held by the Funds for which market quotations are not readily available are generally priced at their most recent bid prices as obtained from one or more of the major market makers for such securities.
Level 3 Valuation— Securities held by the Funds that do not have readily available market quotations, or securities for which the available market quotations are not reliable, are priced at their fair values using procedures approved by the Fund’s Board of Trustees. The Funds may use fair value pricing under the following circumstances, among others:
| • | If the value of a security has been materially affected by events occurring before the Funds’ pricing time but after the close of the primary markets on which the security is traded. |
| • | If the exchange on which a portfolio security is principally traded closes early or if trading in a particular portfolio security was halted during the day and did not resume prior to the Funds’ NAV calculation. |
| • | If a security is so thinly traded that reliable market quotations are unavailable due to infrequent trading. |
| • | If the validity of market quotations is not reliable. |
Certain Funds invest in securities of other investment companies, including exchange traded funds (“ETFs”), open-end funds, and closed-end funds. Open-end funds are investment companies that issue new shares continuously and redeem shares daily. Closed-end funds are investment companies that typically issue a fixed number of shares that trade on a securities exchange or over-the-counter. An ETF is an investment company that typically seeks to track the performance of an index by holding in its portfolio shares of all the companies, or a representative sample of the companies, that are components of a particular index. ETFs are traded on a securities exchange based on their market value. The risks of investment in other investment companies typically reflect the risks
Notes to Financial Statements (Continued)
of the types of securities in which investment companies invest. Investments in ETFs and closed-end funds are subject to the additional risk that shares of the fund may trade at a premium or discount to their NAV. When a Fund invests in another investment company, shareholders of the Fund indirectly bear their proportionate share of the other investment company’s fees and expenses, including operating, registration, trustee, licensing and marketing, as well as their share of the Funds’ fees and expenses.
New accounting pronouncements — In December 2011, the Financial Accounting Standards Board (“FASB”) issued Accounting Standards Update (“ASU”) No. 2011-11, “Disclosures about Offsetting Assets and Liabilities”. ASU No. 2011-11 requires disclosures to make financial statements that are prepared under U.S. GAAP more comparable to those prepared under the International Financial Reporting Standards (“IFRS”). The new disclosure requirements mandate that entities disclose both gross and net information about instruments and transactions eligible for offset in the Statement of Assets and Liabilities as well as instruments and transactions subject to an agreement similar to a master netting arrangement. In addition, ASU No. 2011-11 requires disclosure of collateral received and posted in connection with master netting agreements or similar arrangements. In January 2013, the FASB issued ASU No. 2013-01, “Clarifying the Scope of Disclosures about Offsetting Assets and Liabilities.” This update limits the scope of the ASU No. 2011-11 to derivatives, repurchase agreements, reverse repurchase agreements, securities borrowing, and securities lending transactions that are either offset in the Statement of Assets and Liabilities or are subject to an enforceable master netting arrangement or similar agreement. New disclosures are required for annual reporting periods beginning on or after January 1, 2013, and interim periods within those annual periods. Management is currently evaluating the impact these updates may have on the Funds’ financial statements and disclosures.
Foreign currency translation — The books and records of the Funds are maintained in U.S. dollars and translated into U.S. dollars on the following basis:
| (1) | market value of investment securities, assets and liabilities at the current rate of exchange on the valuation date; and |
| (2) | purchases and sales of investment securities, income and expenses at the relevant rates of exchange prevailing on the respective dates of such transactions. |
The Funds do not isolate that portion of gains and losses on investments in equity securities that is due to changes in the foreign exchange rates from that which is due to changes in market prices of equity securities.
Derivative instruments and hedging activities — The International Small Cap Fund held derivative instruments during the year ended June 30, 2013. At June 30, 2013, the International Small Cap Fund did not hold any derivative instruments.
| The Effect of Derivative Investments on the Statement of Operations |
| for the Year Ended June 30, 2013 |
| | | | | | | Change in | |
| | | | | | | Unrealized | |
| | | | | | | Appreciation | |
| | | | | | | (Depreciation) | |
| | | Derivatives not accounted for as hedging | | Realized Gain | | on | |
| Fund | | instruments under ASC 815 | | on Derivatives* | | Derivatives** | |
| International Small Cap Fund | | Warrants - Equity Contracts | | $ | 6,346 | | $ | (2,824 | ) |
| * | Statements of Operations Location: Net realized gain on warrants. |
| ** | Statements of Operations Location: Net change in unrealized appreciation on investments. |
For the year ended June 30, 2013, the average quarterly balance of outstanding derivative financial instruments were as follows:
Notes to Financial Statements (Continued)
| | | International | |
| | | Small Cap | |
| | | Fund | |
| Equity Contracts: | | | | |
| Warrants -Average units | | | 33,940 | |
Portfolio securities loaned — Each Fund may lend its portfolio securities. Lending portfolio securities exposes a Fund to the risk that the borrower may fail to return the loaned securities or may not be able to provide additional collateral or that the Funds may experience delays in recovery of the loaned securities or loss of rights in the collateral if the borrower fails financially. To minimize these risks, the borrower must agree to maintain cash collateral with the Funds’ custodian in an amount at least equal to the market value of the loaned securities. The loaned securities are secured by collateral valued at least equal, at all times, to the market value of the securities loaned plus accrued interest, if any. When the collateral falls below specified amounts, the lending agent will use its best effort to obtain additional collateral on the next business day to meet required amounts under the security lending agreement. The cash collateral is reinvested by the Funds’ custodian into an approved investment vehicle.
As of June 30, 2013, the following Funds loaned securities and received collateral as follows:
| | | Market | | | Market | |
| | | Value of | | | Value of | |
| | | Securities | | | Collateral | |
| Fund | | Loaned | | | Received | |
| Capital Growth Fund | | $ | 1,157,702 | | | $ | 1,219,083 | |
| International Small Cap Fund | | | 5,054,576 | | | | 5,205,070 | |
| Mid Cap Value Opportunities Fund | | | 10,361,731 | | | | 11,244,700 | |
| Small Cap Value Opportunities Fund | | | 9,828,831 | | | | 10,035,029 | |
| Value Fund | | | 397,233 | | | | 408,975 | |
All collateral received as cash is received, held and administered by the Funds’ custodian for the benefit of the Funds in the applicable custody account or other account established for the purpose of holding collateral.
Funds participating in securities lending receive compensation in the form of fees, or retain a portion of interest or dividends on the investment of any cash received as collateral. The Funds also continue to receive interest or dividends on the securities loaned.
Unrealized gain or loss on the market value of the securities loaned that may occur during the term of the loan is recognized by the Funds. The Funds have the right under the lending agreement to recover the securities from the borrower on demand.
Share valuation — The NAV per share of each class of shares of each Fund is calculated daily by dividing the total value of a Fund’s assets attributable to that class, less liabilities attributable to that class, by the number of outstanding shares of that class.
The maximum offering price per share of Class A shares of the Funds is equal to the net asset value per share plus a sales load equal to 6.10% of the net asset value (or 5.75% of the offering price). There is no sales load on purchases of $1 million or more of Class A shares. The maximum offering price per share of Class C, Class Y, and Institutional Class shares of the Funds is equal to the net asset value per share.
The redemption price per share of each class of shares of the Funds is generally equal to the net asset value per share. However, Class A redemptions that were part of a no load $1 million subscription may be subject to a contingent deferred sales charge (“CDSC”) of up to 1% if redeemed within a one-year period from the date of purchase. Purchases of Class C shares of the Funds are subject to a CDSC of 1.00% of the original purchase price if redeemed within a one-year period from the date of purchase.
Notes to Financial Statements (Continued)
Investment income — Dividend income from securities is recognized on the ex-dividend date, net of foreign withholding taxes, if any, which are reduced by any amounts reclaimable by the Funds, where applicable.
Distributions to shareholders — Each Fund intends to distribute to its shareholders substantially all of its income and capital gains. Each Fund, except the Value Fund, declares and distributes net investment income, if any, annually, as a dividend to shareholders. The Value Fund declares and distributes net investment income, if any, semi-annually, as a dividend to shareholders. Each Fund makes distributions of capital gains, if any, at least annually, net of applicable capital loss carryforwards. Income distributions and capital gain distributions are determined in accordance with income tax regulations.
Allocations — Investment income earned, realized capital gains and losses, and unrealized appreciation and depreciation for the Funds are allocated daily to each class of shares based upon its proportionate share of total net assets of a Fund. Class-specific expenses are charged directly to the class incurring the expense. Common expenses, which are not attributable to a specific class, are allocated daily to each class of shares based upon their proportionate share of total net assets of the Fund. Expenses not directly billed to a Fund are allocated proportionally among all Funds in the Trust, and/or in Touchstone Investment Trust, Touchstone Institutional Funds Trust, Touchstone Variable Series Trust, Touchstone Funds Group Trust and Touchstone Tax-Free Trust (“Touchstone Fund Complex”), daily in relation to net assets of each Fund or another reasonable measure.
Security transactions — Security transactions are reflected for financial reporting purposes as of the trade date. Realized gains and losses on sales of portfolio securities are calculated using the identified cost basis.
Estimates — The preparation of financial statements in conformity with U.S. GAAP requires management to make estimates and assumptions that affect the reported amounts of assets and liabilities and disclosure of contingent assets and liabilities at the date of the financial statements and the reported amounts of income and expenses during the reporting period. Actual results could differ from those estimates.
Redemption fees — Prior to April 16, 2012, each Fund imposed a 2% redemption/exchange fee on total redemption proceeds (after applicable deferred sales charges) of any shareholder redeeming shares (including redemption by exchange) of the Funds within 10 calendar days of their purchase. The Funds charged the redemption/exchange fee to discourage market timing by those shareholders initiating redemptions or exchanges to take advantage of short-term market movements. The redemption/exchange fee was imposed to the extent that the number of Fund shares redeemed exceeded the number of Fund shares that were held for more than 10 calendar days. In determining how long shares of the Fund have been held, shares held by the shareholder for the longest period of time were sold first. The Funds retained the redemption/exchange fee for the benefit of the remaining shareholders by crediting Paid-in Capital. The redemption fees can be found on the Statements of Changes in Net Assets - Capital Stock Activity. Effective April 16, 2012, the redemption fee plan was terminated.
3. Investment Transactions
Investment transactions (excluding short-term investments and U.S. Government securities) were as follows for the year ended June 30, 2013:
| | | | | | International | | | Mid Cap Value | |
| | | Capital Growth | | | Small Cap | | | Opportunities | |
| | | Fund | | | Fund | | | Fund | |
| Purchases of investment securities | | $ | 64,956,125 | | | $ | 82,889,815 | | | $ | 100,954,972 | |
| Proceeds from sales and maturities | | $ | 82,409,017 | | | $ | 78,674,569 | | | $ | 112,954,260 | |
Notes to Financial Statements (Continued)
| | | Small Cap | | | | |
| | | Value | | | | |
| | | Opportunities | | | Value | |
| | | Fund | | | Fund | |
| Purchases of investment securities | | $ | 90,363,977 | | | $ | 297,238,855 | |
| Proceeds from sales and maturities | | $ | 97,129,511 | | | $ | 361,739,657 | |
There were no purchases or proceeds from sales and maturities of U.S. government securities by the Funds for the year ended June 30, 2013.
4. Transactions with Affiliates and Other Related Parties
Certain officers of the Trust are also officers of Touchstone Advisors, Inc. (the “Advisor”),Touchstone Securities, Inc. (the “Underwriter”) or BNY Mellon Investment Servicing (U.S.) Inc. (“BNY Mellon”), the Sub-Administrator and Transfer Agent to the Funds. Such officers receive no compensation from the Trust. The Advisor and the Underwriter are each wholly-owned, indirect subsidiaries of The Western & Southern Financial Group, Inc.
MANAGEMENT & EXPENSE LIMITATIONS AGREEMENTS
The Advisor provides general investment supervisory services for the Funds, under terms of an advisory agreement (the “Advisory Agreement”). Under the Advisory Agreement, each Fund pays the Advisor a fee, which is computed and accrued daily and paid monthly, at an annual rate based on average daily net assets of each Fund as shown in the table below.
| Touchstone Capital Growth Fund | 0.70% on the first $300 million |
| | 0.685% on the next $200 million |
| | 0.675% on the next $500 million |
| | 0.625% on the next $500 million |
| | 0.575% on the next $500 million |
| | 0.525% of such assets over $2 billion |
| Touchstone International Small Cap Fund | 0.95% on the first $300 million |
| | 0.90% on the next $200 million |
| | 0.85% on the next $250 million |
| | 0.80% on the next $250 million |
| | 0.75% on the next $500 million |
| | 0.70% on the next $500 million |
| | 0.65% of such assets over $2 billion |
| Touchstone Mid Cap Value Opportunities Fund | 0.85% on the first $300 million |
| | 0.80% on the next $200 million |
| | 0.75% of such assets over $500 million |
| Touchstone Small Cap Value Opportunities Fund | 0.95% on the first $300 million |
| | 0.90% on the next $200 million |
| | 0.85% of such assets over $500 million |
| Touchstone Value Fund | 0.75% on the first $300 million |
| | 0.73% on the next $200 million |
| | 0.72% on the next $250 million |
| | 0.70% on the next $250 million |
| | 0.68% on the next $500 million |
| | 0.67% on the next $500 million |
| | 0.66% of such assets over $2 billion |
The Advisor has entered into investment sub-advisory agreements with the following parties (each, a “Sub-Advisor”):
Notes to Financial Statements (Continued)
| Ashfield Capital Partners, LLC | | Copper Rock Capital Partners LLC |
| Capital Growth Fund | | International Small Cap Fund |
| | | |
| Barrow, Hanley, Mewhinney & Strauss, LLC | | Thompson Siegel & Walmsley LLC |
| Value Fund | | Mid Cap Value Opportunities Fund |
| | | Small Cap Value Opportunities Fund |
The Advisor, not the Funds, pays the sub-advisory fees to each Sub-Advisor.
The Advisor entered into an expense limitation agreement (the “Expense Limitation Agreement”) to contractually limit operating expenses of the Funds, excluding: dividend expenses on short sales; interest; taxes; brokerage commissions; other expenditures which are capitalized in accordance with GAAP; the cost of “Acquired Fund Fees and Expenses”, if any; and other extraordinary expenses not incurred in the ordinary course of business. The maximum operating expense limit in any year with respect to the Funds is based on a percentage of the average daily net assets of the Funds. The Advisor has agreed to separately waive class-level expenses, advisory and administration fees, and to reimburse expenses in order to maintain the following expense limitations for the Funds:
| | | | | | | | | | | | Institutional | | | | Termination | |
| | | Class A | | | Class C | | | Class Y | | | Class | | | | Date | |
| Capital Growth Fund | | | 1.25 | % | | | 2.00 | % | | | 1.00 | % | | | 0.90 | % | | | April 16, 2014 | |
| International Small Cap Fund | | | 1.55 | % | | | 2.30 | % | | | 1.30 | % | | | 1.05 | % | | | April 16, 2014 | |
| Mid Cap Value Opportunities Fund | | | 1.29 | % | | | 2.04 | % | | | 1.04 | % | | | 0.89 | % | | | April 16, 2014 | |
| Small Cap Value Opportunities Fund | | | 1.50 | % | | | 2.25 | % | | | 1.25 | % | | | 1.10 | % | | | April 16, 2014 | |
| Value Fund* | | | 1.00 | % | | | 1.75 | % | | | 0.75 | % | | | 0.65 | % | | | September 10, 2013 | |
| Value Fund* | | | 1.08 | % | | | 1.83 | % | | | 0.83 | % | | | 0.68 | % | | | April 16, 2014 | |
* Prior to September 10, 2012 the expense limitation for Class A, Class C, Class Y and Institutional Class Shares were 1.20%, 1.95%, 0.95% and 0.85%, respectively.
Where multiple caps are in effect, the lower of the two amounts will apply.
During the year ended June 30, 2013, the Advisor or affiliates waived investment advisory fees and administration fees or reimbursed expenses, including 12b-1 fees, of the Funds as follows:
| | | | | | | | | Other | |
| | | Investment | | | | | | Operating | |
| | | Advisory | | | Administration | | | Expenses | |
| | | Fees Waived | | | Fees Waived | | | Reimbursed | |
| Capital Growth Fund | | $ | — | | | $ | 119,395 | | | $ | 166,166 | |
| International Small Cap Fund | | | 125,274 | | | | 177,511 | | | | 44,179 | |
| Mid Cap Value Opportunities Fund | | | 54,268 | | | | 179,943 | | | | 42,474 | |
| Small Cap Value Opportunities Fund | | | — | | | | 96,262 | | | | 41,851 | |
| Value Fund | | | 352,783 | | | | 492,421 | | | | 130,582 | |
Effective April 16, 2012, under the terms of the Expense Limitation Agreement, the Advisor is entitled to recover, subject to approval by the Funds’ Board of Trustees, such amounts waived or reimbursed for a period of up to three years from the year in which the Advisor reduced its compensation or assumed expenses for the Funds. No recoupment will occur unless a Fund’s operating expenses are below the expense limitation amount.
Notes to Financial Statements (Continued)
As of June 30, 2013, the Advisor may seek recoupment of previously waived and reimbursed fees as follows:
| | | Expiration | | | Expiration | |
| | | June 30, | | | June 30, | |
| | | 2015 | | | 2016 | |
| Capital Growth Fund | | $ | 118,022 | | | $ | 283,205 | |
| International Small Cap Fund | | | 99,781 | | | | 346,008 | |
| Mid Cap Value Opportunities Fund | | | 90,213 | | | | 271,865 | |
| Small Cap Value Opportunities Fund | | | 59,559 | | | | 132,190 | |
| Value Fund | | | 81,083 | | | | 897,689 | |
For the year ended June 30, 2013, the Advisor recouped fees from the International Small Cap Fund and Mid Cap Value Opportunities Fund of $8,809 and $8,078, respectively.
ADMINISTRATION AGREEMENT
The Advisor entered into an Administration Agreement with the Trust, whereby the Advisor is responsible for: supplying executive and regulatory compliance services; supervising the preparation of tax returns; coordinating the preparation of reports to shareholders and reports to, and filings with, the Securities and Exchange Commission and state securities authorities, as well as materials for meetings of the Board of Trustees; calculating the daily net asset value per share; and maintaining the financial books and records of each Fund. For its services, the Advisor receives an annual fee of 0.20% on the first $6 billion of the aggregate average daily net assets of the Touchstone Fund Complex (excluding Touchstone Institutional Money Market Fund, Touchstone Institutional Funds Trust, and Touchstone Variable Series Trust); 0.16% of the next $4 billion of aggregate average daily net assets; and 0.12% of the aggregate average daily net assets of all such assets in excess of $10 billion. The fee is allocated among the Touchstone Fund Complex (excluding Touchstone Institutional Money Market Fund, Touchstone Institutional Funds Trust, and Touchstone Variable Series Trust) on the basis of relative daily net assets.
The Advisor has engaged BNY Mellon as the Sub-Administrator to the Trust. BNY Mellon provides administrator and accounting services to the Trust and is compensated directly by the Advisor, not the Trust.
TRANSFER AGENT AGREEMENT
Under the terms of the Transfer Agent Agreement between the Trust and BNY Mellon, BNY Mellon maintains the records of each shareholder’s account, answers shareholders’ inquiries concerning their accounts, processes purchases and redemptions of each Fund’s shares, acts as dividend and distribution disbursing agent and performs other shareholder service functions. For these services, BNY Mellon receives a monthly fee per shareholder account from each Fund. In addition, each Fund pays out-of-pocket expenses incurred by BNY Mellon, including, but not limited to, postage and supplies.
PLANS OF DISTRIBUTION AND SHAREHOLDER SERVICING FEE ARRANGEMENTS
The Trust has adopted distribution plans pursuant to Rule 12b-1 under the 1940 Act for each class of shares it offers that are subject to 12b-1 distribution fees. The plans allow each Fund to pay distribution and other fees for the sale and distribution of its shares and for services provided to shareholders. Under the Class A plan, each Fund offering Class A shares pays an annual fee of up to 0.25% of average daily net assets that are attributable to Class A shares. Under the Class C plan, each Fund offering Class C shares pays an annual fee of up to 1.00% of average daily net assets that are attributable to Class C shares (of which up to 0.75% is a distribution fee and up to 0.25% is a shareholder servicing fee).
Notes to Financial Statements (Continued)
UNDERWRITING AGREEMENT
The Underwriter is the Funds’ principal underwriter and, as such, acts as exclusive agent for distribution of the Funds’ shares. Under the terms of the Underwriting Agreement between the Trust and the Underwriter, the Underwriter earned the following from underwriting and broker commissions on the sale of Class A shares of the Funds listed below during the year ended June 30, 2013:
| | | Amount | |
| Capital Growth | | $ | 9,636 | |
| International Small Cap Fund | | | 6,183 | |
| Mid Cap Value Opportunities Fund | | | 15,190 | |
| Small Cap Value Opportunities Fund | | | 2,444 | |
| Value Fund | | | 20,988 | |
The Underwriter did not collect any CDSC on the redemption of the Class C shares of the Fund during the year ended June 30, 2013.
AFFILIATED INVESTMENTS
Each Fund may invest in the Touchstone Institutional Money Market Fund, subject to compliance with several conditions set forth in an exemptive order received by the Trust from the SEC. To the extent that the Funds are invested in the Touchstone Institutional Money Market Fund, the Advisor and Administrator will be paid additional fees from the Touchstone Institutional Money Market Fund that will not be waived or reimbursed.
A summary of each Fund’s investment, as applicable, in the Touchstone Institutional Money Market Fund for the year ended June 30, 2013, is as follows:
| | | Share Activity | | | | | | | |
| | | | | | | | | | | | | | | | | | Market | |
| | | Balance | | | | | | | | | Balance | | | | | | Value | |
| | | 06/30/12 | | | Purchases | | | Sales | | | 06/30/13 | | | Dividends | | | 06/30/13 | |
| Capital Growth Fund | | | 1,389,986 | | | | 34,248,675 | | | | (33,999,493 | ) | | | 1,639,168 | | | $ | 2,088 | | | $ | 1,639,168 | |
| International Small Cap Fund | | | 1,743,433 | | | | 45,903,788 | | | | (46,948,024 | ) | | | 699,197 | | | | 1,778 | | | | 699,197 | |
| Mid Cap Value Opportunities Fund | | | 3,046,587 | | | | 40,513,828 | | | | (36,554,810 | ) | | | 7,005,605 | | | | 4,260 | | | | 7,005,605 | |
| Small Cap Value Opportunities Fund | | | 2,600,391 | | | | 38,141,853 | | | | (38,367,488 | ) | | | 2,374,756 | | | | 2,607 | | | | 2,374,756 | |
| Value Fund | | | 9,429,223 | | | | 146,461,252 | | | | (147,136,895 | ) | | | 8,753,580 | | | | 4,358 | | | | 8,753,580 | |
5. Federal Tax Information
Federal income tax — It is each Fund’s policy to continue to comply with the special provisions of the Internal Revenue Code applicable to regulated investment companies. As provided therein, in any fiscal year in which a Fund so qualifies and distributes at least 90% of its investment company taxable income, the Fund (but not the shareholders) will be relieved of federal income tax on the income distributed. It is the Fund’s policy to distribute all of its taxable income and accordingly, no provision for income taxes has been made.
In order to avoid imposition of the excise tax applicable to regulated investment companies, it is also each Fund’s intention to declare and pay as dividends in each calendar year at least 98% of its investment company taxable income (earned during the calendar year) and 98.2% of its net realized capital gains (earned during the twelve months ending October 31) plus undistributed amounts from prior years.
Notes to Financial Statements (Continued)
The tax character of distributions paid for the years ended June 30, 2013, June 30, 2012 and March 31, 2012 was as follows:
| | | | | | International | |
| | | Capital Growth | | | Small Cap | |
| | | Fund | | | Fund | |
| | | Year Ended | | | Period Ended | | | Year Ended | | | Year Ended | | | Period Ended | | | Year Ended | |
| | | June 30, | | | June 30, | | | March 31, | | | June 30, | | | June 30, | | | March 31, | |
| | | 2013 | | | 2012 | | | 2012 | | | 2013 | | | 2012 | | | 2012 | |
| From ordinary income | | $ | 218,632 | | | $ | 31,849 | | | $ | 215,362 | | | $ | 1,525,830 | | | $ | 802,324 | | | $ | 1,842,301 | |
| Total Distributions | | $ | 218,632 | | | $ | 31,849 | | | $ | 215,362 | | | $ | 1,525,830 | | | $ | 802,324 | | | $ | 1,842,301 | |
| | | Mid Cap Value | | | Small Cap Value | |
| | | Opportunities | | | Opportunities | |
| | | Fund | | | Fund | |
| | | Year Ended | | | Period Ended | | | Year Ended | | | Year Ended | | | Period Ended | | | Year Ended | |
| | | June 30, | | | June 30, | | | March 31, | | | June 30, | | | June 30, | | | March 31, | |
| | | 2013 | | | 2012 | | | 2012 | | | 2013 | | | 2012 | | | 2012 | |
| From ordinary income | | $ | 8,052,985 | | | $ | 627,574 | | | $ | 2,171,072 | | | $ | 1,230,862 | | | $ | — | | | $ | — | |
| From long-term capital gains | | $ | 9,165,979 | | | $ | 3,418,930 | | | $ | 11,225,590 | | | $ | 9,185,252 | | | $ | 2,691,474 | | | $ | 5,495,825 | |
| Total Distributions | | $ | 17,218,964 | | | $ | 4,046,504 | | | $ | 13,396,662 | | | $ | 10,416,114 | | | $ | 2,691,474 | | | $ | 5,495,825 | |
| | | | | | Value | | | | |
| | | | | | Fund | | | | |
| | | Year Ended | | | Period Ended | | | Year Ended | |
| | | June 30, | | | June 30, | | | March 31, | |
| | | 2013 | | | 2012 | | | 2012 | |
| From ordinary income | | $ | 9,968,846 | | | $ | 1,228,217 | | | $ | 2,287,808 | |
| From long-term capital gains | | | 5,851,644 | | | | — | | | | — | |
| Total Distributions | | $ | 15,820,490 | | | $ | 1,228,217 | | | $ | 2,287,808 | |
The following information is computed on a tax basis for each item as of June 30, 2013:
| | | | | | International | | | Mid Cap Value | |
| | | Capital | | | Small Cap | | | Opportunities | |
| | | Growth Fund | | | Fund | | | Fund | |
| Tax cost of portfolio investments | | $ | 120,067,429 | | | $ | 96,698,381 | | | $ | 113,824,625 | |
| Gross unrealized appreciation | | | 54,949,721 | | | | 18,909,364 | | | | 18,688,220 | |
| Gross unrealized depreciation | | | (1,124,224 | ) | | | (2,709,768 | ) | | | (3,061,173 | ) |
| Net portfolio unrealized appreciation (depreciation) | | | 53,825,497 | | | | 16,199,596 | | | | 15,627,047 | |
| Net other unrealized appreciation (depreciation) | | | — | | | | (6,612 | ) | | | — | |
| Total net unrealized appreciation (depreciation) | | | 53,825,497 | | | | 16,192,984 | | | | 15,627,047 | |
| Accumulated capital and other losses | | | (24,221,746 | ) | | | (26,090,771 | ) | | | (3,299,947 | ) |
| Post-October and qualified late-year losses | | | (309,640 | ) | | | — | | | | — | |
| Undistributed Ordinary Income | | | 67,522 | | | | 1,229,932 | | | | — | |
| Undistributed capital gains | | | — | | | | — | | | | 10,145,290 | |
| Accumulated earnings (deficit) | | $ | 29,361,633 | | | $ | (8,667,855 | ) | | $ | 22,472,390 | |
| | | Small Cap Value | | | | |
| | | Opportunities | | | Value | |
| | | Fund | | | Fund | |
| Tax cost of portfolio investments | | $ | 100,433,155 | | | $ | 280,563,947 | |
| Gross unrealized appreciation | | | 19,185,061 | | | | 63,763,179 | |
| Gross unrealized depreciation | | | (3,628,559 | ) | | | (2,869,684 | ) |
| Net unrealized appreciation (depreciation) | | | 15,556,502 | | | | 60,893,495 | |
Notes to Financial Statements (Continued)
| | | Small Cap Value | | | | |
| | | Opportunities | | | Value | |
| | | Fund | | | Fund | |
| Accumulated capital and other losses | | | (1,829,031 | ) | | | (35,330,432 | ) |
| Undistributed ordinary income | | | 6,545,981 | | | | — | |
| Undistributed capital gains | | | 7,601,239 | | | | — | |
| Accumulated earnings (deficit) | | $ | 27,874,691 | | | $ | 25,563,063 | |
The difference between the tax cost of portfolio investments and the financial statement cost is primarily due to wash sale loss deferrals and passive foreign investment company (“PFIC”) adjustments.
As of June 30, 2013, the Funds had the following capital loss carryforwards for federal income tax purposes:
| | | | | | | | | | | | | | | No | | | No | | | | |
| | | Short Term Expiring On | | | Expiration | | | Expiration | | | | |
| | | 2015 | | | 2016 | | | 2017 | | | 2018 | | | Short Term* | | | Long Term* | | | Total | |
| Capital Growth Fund** | | $ | 5,765,572 | | | $ | 3,960,100 | | | $ | 14,496,074 | | | $ | — | | | $ | — | | | $ | — | | | $ | 24,221,746 | |
| International Small Cap Fund** | | | 10,436,336 | | | | 4,523,327 | | | | 4,884,304 | | | | — | | | | 6,246,804 | | | | — | | | | 26,090,771 | |
| Mid Cap Value Opportunities Fund** | | | — | | | | — | | | | 3,299,947 | | | | — | | | | — | | | | — | | | | 3,299,947 | |
| Small Cap Value Opportunities Fund** | | | 1,829,031 | | | | — | | | | — | | | | — | | | | — | | | | — | | | | 1,829,031 | |
| Value Fund**,^ | | | — | | | | — | | | | 31,829,885 | | | | 3,500,547 | | | | — | | | | — | | | | 35,330,432 | |
*The Regulated Investment Company Modernization Act of 2010 (the “Act”) was enacted on December 22, 2010. The Act makes changes to several tax rules impacting the Funds. The provisions of the Act became effective for the Funds’ since the fiscal year ending June 30, 2012. Although the Act provides several benefits, including the unlimited carryover of future capital losses, there may be a greater likelihood that all or a portion of each Fund’s pre-enactment capital loss carryovers may expire without being utilized due to the fact that post-enactment capital losses must be utilized before pre-enactment capital loss carryovers may be utilized. Under the Act, new capital losses may now be carried forward indefinitely, and retain the character of the original loss as compared with pre-enactment law, where capital losses could be carried forward for up to eight years, and carried forward as short-term capital losses, irrespective of the character of the original loss.
**Utilization may be limited by current income tax regulations.
^ Value Fund’s ability to utilize the capital loss carryforwards is limited, under Internal Revenue Services regulations. $ 25,021,131 was written off due to limitations.
The capital loss carryforwards may be utilized in future years to offset net realized capital gains, if any, prior to distributing such gains to shareholders.
During the year ended June 30, 2013, the following Funds utilized capital loss carryforwards:
| Fund | | Amount | |
| Capital Growth Fund | | $ | 18,756,575 | |
| International Small Cap Fund | | | 3,062,054 | |
| Mid Cap Value Opportunities Fund | | | 3,298,343 | |
| Small Cap Value Opportunities Fund | | | 1,287,961 | |
| Value Fund | | | 27,503,345 | |
Under current laws, certain capital losses realized after October 31 and ordinary losses realized after December 31 may be deferred (and certain ordinary losses after October and/or December 31 may be deferred) and treated as occurring on the first day of the following fiscal year. For the year ended June 30, 2013, the Funds elected to defer the following losses:
| | | Realized | | | Realized | | | | |
| | | Short-Term | | | Long-Term | | | | |
| | | Capital | | | Capital | | | Ordinary | |
| Fund | | Losses | | | Losses | | | Losses | |
| Capital Growth Fund | | $ | 309,640 | | | $ | — | | | $ | — | |
Notes to Financial Statements (Continued)
The Funds have analyzed their tax positions taken on federal income tax returns for all open tax years (tax years ended March 31, 2010 through June 30, 2013) and have concluded that no provision for income tax is required in their financial statements.
Certain reclassifications, the result of permanent differences between financial statement and income tax reporting requirements, have been made to the components of capital. These reclassifications have no impact on the net assets or NAV per share of the Funds and are designed to present the Funds’ capital accounts on a tax basis. The following reclassifications, which are primarily attributed to the tax treatment of foreign currency gains/losses, investments in PFICs, redesignation of distributions paid, distributions paid in excess of earnings, expiration of capital loss carryforwards and attributes related to acquired funds that for tax purposes have been made to the following Funds for the year ended June 30, 2013:
| | | | | | Accumulated | | | Accumulated | |
| | | Paid-In | | | Net Investment | | | Net Realized | |
| | | Capital | | | Income(Loss) | | | Gains(Losses) | |
| International Small Cap Fund | | $ | — | | | $ | (58,122 | ) | | $ | 58,122 | |
| Mid Cap Value Opportunities Fund | | | — | | | | (787,485 | ) | | | 787,485 | |
| Small Cap Value Opportunities Fund | | | — | | | | 48,823 | | | | (48,823 | ) |
| Value Fund | | | 44,624,552 | | | | (24,280 | ) | | | (44,600,272 | ) |
6. Commitments and Contingencies
The Funds indemnify the Trust’s officers and Trustees for certain liabilities that might arise from their performance of their duties to the Funds. Additionally, in the normal course of business, the Funds enter into contracts that contain a variety of representations and warranties and which provide general indemnifications. The Funds’ maximum exposure under these arrangements is unknown, as this would involve future claims that may be made against the Funds. However, based on experience, the Funds expect the risk of loss to be remote.
7. Risks Associated with Foreign Investments
Some of the Funds may invest in the securities of foreign issuers. Investing in securities issued by companies whose principal business activities are outside the U.S. may involve significant risks not present in domestic investments. For example, there is generally less publicly available information about foreign companies, particularly those not subject to the disclosure and reporting requirements of the U.S. securities laws. Foreign issuers are generally not bound by uniform accounting, auditing, and financial reporting requirements and standards of practice comparable to those applicable to domestic issuers. Investments in foreign securities also involve the risk of possible adverse changes in investment or exchange control regulations, expropriation or confiscatory taxation, limitations on the removal of funds or other assets of the Fund, political or financial instability or diplomatic and other developments which could affect such investments. Foreign stock markets, while growing in volume and sophistication, are generally not as developed as those in the U.S., and securities of some foreign issuers (particularly those located in developing countries) may be less liquid and more volatile than securities of comparable U.S. companies. In general, there is less overall governmental supervision and regulation of foreign securities markets, broker-dealers, and issuers than in the U.S.
8. Fund Mergers
On February 10, 2012, the shareholders of the Old Mutual Funds II (the “Reorganizing Funds”), with the exception of the Old Mutual Large Cap Growth Fund, approved an Agreement and Plan of Reorganization (the “Plan”) providing for the transfer of all assets and liabilities of each Reorganizing Fund to the corresponding Touchstone Fund as noted below. The Old Mutual Large Cap Growth Fund shareholders approved the Plan on March 9, 2012. The mergers took place on April 13, 2012. The fiscal year end of the Reorganizing Funds was March 31. After the merger, the Funds year end changed to June 30.
Notes to Financial Statements (Continued)
| | | | | Net | | | Shares | |
| Reorganizing Funds* | | Touchstone Funds | | Assets | | | Outstanding | |
| Old Mutual Large Cap Growth Fund | | Capital Growth Fund | | $ | 193,000,739 | | | | 9,458,968 | |
| Old Mutual Copper Rock International Small Cap Fund | | International Small Cap Fund | | | 94,539,664 | | | | 8,488,001 | |
| Old Mutual TS&W Mid Cap Value Fund | | Mid Cap Value Opportunities Fund | | | 163,004,026 | | | | 18,535,707 | |
| Old Mutual TS&W Small Cap Value Fund | | Small Cap Value Opportunities Fund | | | 105,855,279 | | | | 5,843,115 | |
| Old Mutual Barrow Hanley Value Fund | | Value Fund | | | 118,385,619 | | | | 17,118,623 | |
| * | Fund had Class Z shares outstanding immediately prior to the reorganization, which were exchanged for Class Y Shares of the corresponding Touchstone Fund. |
At a meeting held on March 13, 2012, the Board of Trustees of the Trust approved an Agreement and Plans of Reorganization (the “Plans”) providing for the transfer of all assets and liabilities of the Fifth Third Disciplined Large Cap Value Fund and the Fifth Third All Cap Value Fund (each, an “Acquired Fund”), each a series of the Fifth Third Funds (“Fifth Third”), to the Touchstone Value Fund, (the “Acquiring Fund”). The mergers took place on September 10, 2012.
The following is a summary of shares outstanding, net assets, net asset value per share, and unrealized appreciation immediately before and after the reorganization:
| | | | | | | | | | | | After | |
| | | Before Reorganization | | | Reorganization | |
| | | Fifth Third | | | | | | | | | | |
| | | Disciplined | | | Fifth Third | | | Touchstone | | | Touchstone | |
| | | Large Cap | | | All Cap | | | Value | | | Value | |
| | | Value Fund | | | Value Fund | | | Fund | | | Fund | |
| Class A * | | | | | | | | | | | | | | | | |
| Shares | | | 1,419,797 | (A) | | | 3,514,789 | (B) | | | 245,017 | | | | 5,179,603 | |
| Net Assets | | $ | 10,274,502 | | | $ | 25,435,080 | | | $ | 1,773,081 | | | $ | 37,482,663 | |
| Net Asset Value | | $ | 7.24 | (A) | | $ | 7.24 | (B) | | $ | 7.24 | | | $ | 7.24 | |
| Class C | | | | | | | | | | | | | | | | |
| Shares | | | 39,232 | (C) | | | 341,354 | (D) | | | 366 | | | | 380,953 | |
| Net Assets | | $ | 283,871 | | | $ | 2,469,899 | | | $ | 2,651 | | | $ | 2,756,421 | |
| Net Asset Value | | $ | 7.24 | (C) | | $ | 7.24 | (D) | | $ | 7.24 | | | $ | 7.24 | |
| Class Y | | | | | | | | | | | | | | | | |
| Shares | | | 20,691,815 | (E) | | | 5,255,988 | (F) | | | 6,754,404 | | | | 32,702,207 | |
| Net Assets | | $ | 150,150,006 | | | $ | 38,140,140 | | | $ | 49,013,423 | | | $ | 237,303,569 | |
| Net Asset Value | | $ | 7.26 | (E) | | $ | 7.26 | (F) | | $ | 7.26 | | | $ | 7.26 | |
| Institutional Class | | | | | | | | | | | | | | | | |
| Shares | | | — | | | | — | | | | 10,340,227 | | | | 10,340,227 | |
| Net Assets | | $ | — | | | $ | — | | | $ | 74,892,668 | | | $ | 74,892,668 | |
| Net Asset Value | | $ | — | | | $ | — | | | $ | 7.24 | | | $ | 7.24 | |
| Fund Total | | | | | | | | | | | | | | | | |
| Shares Outstanding | | | 13,906,702 | | | | 3,991,534 | | | | 17,340,014 | | | | 48,602,989 | |
| Net Assets | | $ | 160,708,379 | | | $ | 66,045,119 | | | $ | 125,681,823 | | | $ | 352,435,321 | |
| Unrealized Depreciation | | $ | (13,753,975 | ) | | $ | (7,038,724 | ) | | $ | (28,894,804 | ) | | $ | (49,687,503 | ) |
(A)Reflects a 1.5919:1 reverse stock split on Class A Shares and a 1.6123:1 reverse stock split on Class B Shares which occurred on the date of reorganization, September 10, 2012.
(B)Reflects a 2.2762:1 reverse stock split on Class A Shares and a 2.1413:1 reverse stock split on Class B Shares which occurred on the date of reorganization, September 10, 2012.
(C)Reflects a 1.5725:1 reverse stock split which occurred on the date of reorganization, September 10, 2012.
(D)Reflects a 2.1338:1 reverse stock split which occurred on the date of reorganization, September 10, 2012.
(E)Reflects a 1.5929:1 reverse stock split which occurred on the date of reorganization, September 10, 2012.
(F)Reflects a 2.3023:1 reverse stock split which occurred on the date of reorganization, September 10, 2012.
*The Acquired Funds had Class B shares outstanding immediately prior to the reorganization, which were exchanged for Class A shares of the Acquiring Fund.
Notes to Financial Statements (Continued)
Assuming the reorganization had been completed on July 1, 2012, the results of operations for the Value Fund for the year ended June 30, 2013 would have been as follows:
| | | Touchstone | |
| | | Value | |
| | | Fund | |
| Net investment income | | $ | 7,031,003 | |
| Net realized and unrealized gain on investments | | $ | 87,588,530 | |
| Net increase in asset from operations | | $ | 94,619,533 | |
9. Litigation
In January 2012, the Old Mutual Mid-Cap Fund (which reorganized into the TS&W Mid-Cap Value Fund in March 2009 and reorganized into the Touchstone Mid Cap Value Opportunities Fund in April 2012) was served with a summons and complaint in an action brought by Edward S. Weisfelner, as Trustee of the LB Creditor Trust, in the case captioned Weisfelner v. Fund 1, et al. (U.S. Bankruptcy Court, Southern District of New York, Adv. Pro No. 10-4609) (the “Action”). The Action alleges that, under state law, all payments made to shareholders in the December 2007 leveraged buyout of Lyondell Chemical Company were made, by means of intentional and constructive fraudulent transfer and seeks to recover all those payments. The amount sought to be disgorged is what the Fund received in payments in connection with the leveraged buyout, $3,784,800. The Fund (along with thousands of other defendants) has filed a joinder to the currently pending motion to dismiss and awaits the court’s ruling on that motion. The path the litigation will follow (including whether it will proceed at all) depends on the outcome of that ruling; it is uncertain when that ruling will come down, however. At this nascent stage of the litigation, it is not possible to assess likely outcome. The Fund is currently assessing the case and has not yet determined the potential effect, if any, on its net asset value.
10. Subsequent Events
Subsequent events occurring after the date of this report have been evaluated for potential impact to this report through the date the financial statements were issued. There were no subsequent events that necessitated recognition or disclosure on the Funds’ financial statements.
Report of Independent Registered Public Accounting Firm
To the Board of Trustees and Shareholders of Touchstone Capital Growth Fund, Touchstone International Small Cap Fund, Touchstone Mid Cap Value Opportunities Fund, Touchstone Small Cap Value Opportunities Fund, and Touchstone Value Fund
We have audited the accompanying statements of assets and liabilities, including the portfolios of investments, of Touchstone Capital Growth Fund, Touchstone International Small Cap Fund, Touchstone Mid Cap Value Opportunities Fund, Touchstone Small Cap Value Opportunities Fund, and Touchstone Value Fund (the “Funds”) (five of the funds constituting the Touchstone Strategic Trust), as of June 30, 2013, and the related statements of operations, the statements of changes in net assets, and the financial highlights for the year then ended. These financial statements and financial highlights are the responsibility of the Funds’ management. Our responsibility is to express an opinion on these financial statements and financial highlights based on our audits. The statements of changes in net assets and the financial highlights for each of the periods indicated therein through June 30, 2012 were audited by other auditors whose report dated August 20, 2012, expressed an unqualified opinion on those financial statements and financial highlights.
We conducted our audits in accordance with the standards of the Public Company Accounting Oversight Board (United States). Those standards require that we plan and perform the audits to obtain reasonable assurance about whether the financial statements are free of material misstatement. We were not engaged to perform an audit of the Funds’ internal control over financial reporting. Our audits included consideration of internal control over financial reporting as a basis for designing audit procedures that are appropriate in the circumstances, but not for the purpose of expressing an opinion on the effectiveness of the Funds’ internal control over financial reporting. Accordingly, we express no such opinion. An audit also includes examining, on a test basis, evidence supporting the amounts and disclosures in the financial statements, assessing the accounting principles used and significant estimates made by management, and evaluating the overall financial statement presentation. Our procedures included confirmation of securities owned as of June 30, 2013, by correspondence with the custodian, transfer agent, and brokers or by other appropriate auditing procedures where replies from brokers were not received. We believe that our audits provide a reasonable basis for our opinion.
In our opinion, the financial statements and financial highlights referred to above present fairly, in all material respects, the financial position of Touchstone Capital Growth Fund, Touchstone International Small Cap Fund, Touchstone Mid Cap Value Opportunities Fund, Touchstone Small Cap Value Opportunities Fund, and Touchstone Value Fund (five of the funds constituting the Touchstone Strategic Trust) at June 30, 2013, the results of their operations, the changes in their net assets, and the financial highlights for the year then ended, in conformity with accounting principles generally accepted in the United States.

Cincinnati, Ohio
August 23, 2013
Other Items (Unaudited)
Qualified Dividend Income
Under the Jobs and Growth Tax Relief Reconciliation Act of 2003 (the “Act”), the following percentages of ordinary dividends paid during the fiscal year ended June 30, 2013 are designated as “qualified dividend income,” as defined in the Act, and are subject to reduced tax rates in 2011. The Funds intend to pass through the maximum allowable percentage for 1099s.
| Touchstone Capital Growth Fund | | | 100.00 | % |
| Touchstone International Small Cap Fund | | | 99.96 | % |
| Touchstone Mid Cap Value Opportunities Fund | | | 28.81 | % |
| Touchstone Small Cap Value Opportunities Fund | | | 78.79 | % |
| Touchstone Value Fund | | | 100.00 | % |
Dividend Received Deduction
For corporate shareholders, the following ordinary distributions paid during the current fiscal year ended June 30, 2013 qualify for the corporate dividends received deduction. The Funds intend to pass through the maximum allowable percentage for 1099s.
| Touchstone Capital Growth Fund | | | 100.00 | % |
| Touchstone International Small Cap Fund | | | 2.14 | % |
| Touchstone Mid Cap Value Opportunities Fund | | | 27.14 | % |
| Touchstone Small Cap Value Opportunities Fund | | | 84.37 | % |
| Touchstone Value Fund | | | 100.00 | % |
For the period ended June 30, 2013, the Mid Cap Value Opportunities Fund, Small Cap Value Opportunities Fund and Value Fund designates $10,355,166, $12,530,804 and $5,851,644, respectively, as long-term capital gains.
Foreign Tax Income & Foreign Tax Credit
International Small Cap Fund intends to pass through a foreign tax credit to the shareholders. For the fiscal year ended June 30, 2013, the total amount of foreign source income is $1,947,916 (or $0.23 per share). The total amount of foreign taxes to be paid is $118,318 (or $0.01 per share). Your allocable share of the foreign tax credit will be reported on Form 1099 Div.
Proxy Voting Guidelines
The Sub-Advisors are responsible for exercising the voting rights associated with the securities purchased and held by the Funds. A description of the policies and procedures that the Sub-Advisors use in fulfilling this responsibility is available as an appendix to the most recent Statement of Additional Information, which can be obtained without charge by calling toll free 1.800.543.0407 or by visiting the Touchstone website at www.touchstoneinvestments.com or on the Securities and Exchange Commission’s (the “Commission”) website www.sec.gov. Information regarding how those proxies were voted during the most recent twelve-month period ended June 30 is also available without charge by calling toll free 1.800.543.0407 or on the Commission’s website at www.sec.gov.
Quarterly Portfolio Disclosure
The Trust files a complete listing of portfolio holdings for each Fund as of the end of the first and third quarters of each fiscal year on Form N-Q. The complete listing (i) is available on the Commission’s website; (ii) may be reviewed and copied at the Commission’s Public Reference Room in Washington, DC; (iii) will be made available to shareholders upon request by calling 1.800.543.0407; or (iv) can be obtained on the Touchstone website at www.touchstoneinvestments.com. Information on the operation of the Public Reference Room may be obtained by calling 1.800.SEC.0330.
Other Items (Unaudited) (Continued)
Schedule of Shareholder Expenses
As a shareholder of the Funds, you incur two types of costs: (1) transaction costs, including reinvested dividends or other distributions; and (2) ongoing costs, including investment advisory fees; distribution (12b-1) fees; and other Fund expenses. This example is intended to help you understand your ongoing costs (in dollars) of investing in the Funds and to compare these costs with the ongoing costs of investing in other mutual funds.
The example is based on an investment of $1,000 invested at the beginning of the period and held for the entire period (January 1, 2013 through June 30, 2013).
Actual Expenses
The first line for each share class of a Fund in the table below provides information about actual account values and actual expenses. You may use the information in this line, together with the amount you invested, to estimate the expenses that you paid over the period. Simply divide your account value by $1,000 (for example, an $8,600 account value divided by $1,000 = 8.6), then multiply the result by the number in the first line under the heading entitled “Expenses Paid During the six months ended June 30, 2013” to estimate the expenses you paid on your account during this period.
Hypothetical Example for Comparison Purposes
The second line for each share class of a Fund in the table below provides information about hypothetical account values and hypothetical expenses based on the Funds’ actual expense ratio and an assumed rate of return of 5% per year before expenses, which is not the Funds’ actual return. The hypothetical account values and expenses may not be used to estimate the actual ending account balance or expenses you paid for the period. You may use this information to compare the ongoing costs of investing in the Funds and other funds. To do so, compare this 5% hypothetical example with the 5% hypothetical examples that appear in the shareholder reports of the other funds.
Please note that the expenses shown in the table are meant to highlight your ongoing costs only and do not reflect any transactional costs, such as sales charges (loads), redemption fees, or exchange fees. Therefore, the second line of the table below is useful in comparing ongoing costs only, and will not help you determine the relative total costs of owning different funds. In addition, if these transactional costs were included, your costs would have been higher.
Other Items (Unaudited) (Continued)
Schedule of Shareholder Expenses
| | | | | | | | | | | | | | | Expenses | |
| | | | | | Net Expense | | | Beginning | | | Ending | | | Paid During | |
| | | | | | Ratio | | | Account | | | Account | | | the Six Months | |
| | | | | | Annualized | | | Value | | | Value | | | Ended | |
| | | | | | June 30, | | | January 1, | | | June 30, | | | June 30, | |
| | | | | | 2013 | | | 2013 | | | 2013 | | | 2013* | |
| Touchstone Capital Growth Fund | |
| Class A | | Actual | | | | 1.25 | % | | $ | 1,000.00 | | | $ | 1,073.20 | | | $ | 6.43 | |
| Class A | | Hypothetical | | | | 1.25 | % | | $ | 1,000.00 | | | $ | 1,018.60 | | | $ | 6.26 | |
| | | | | | | | | | | | | | | | | | | | |
| Class C | | Actual | | | | 2.00 | % | | $ | 1,000.00 | | | $ | 1,069.10 | | | $ | 10.26 | |
| Class C | | Hypothetical | | | | 2.00 | % | | $ | 1,000.00 | | | $ | 1,014.88 | | | $ | 9.99 | |
| | | | | | | | | | | | | | | | | | | | |
| Class Y | | Actual | | | | 1.00 | % | | $ | 1,000.00 | | | $ | 1,074.90 | | | $ | 5.14 | |
| Class Y | | Hypothetical | | | | 1.00 | % | | $ | 1,000.00 | | | $ | 1,019.84 | | | $ | 5.01 | |
| | | | | | | | | | | | | | | | | | | | |
| Institutional Class | | Actual | | | | 0.90 | % | | $ | 1,000.00 | | | $ | 1,075.40 | | | $ | 4.63 | |
| Institutional Class | | Hypothetical | | | | 0.90 | % | | $ | 1,000.00 | | | $ | 1,020.33 | | | $ | 4.51 | |
| | | | | | | | | | | | | | | | | | | | |
| Touchstone International Small Cap Fund | |
| Class A | | Actual | | | | 1.55 | % | | $ | 1,000.00 | | | $ | 1,079.80 | | | $ | 7.99 | |
| Class A | | Hypothetical | | | | 1.55 | % | | $ | 1,000.00 | | | $ | 1,017.11 | | | $ | 7.75 | |
| | | | | | | | | | | | | | | | | | | | |
| Class C | | Actual | | | | 2.30 | % | | $ | 1,000.00 | | | $ | 1,076.40 | | | $ | 11.84 | |
| Class C | | Hypothetical | | | | 2.30 | % | | $ | 1,000.00 | | | $ | 1,013.39 | | | $ | 11.48 | |
| | | | | | | | | | | | | | | | | | | | |
| Class Y | | Actual | | | | 1.19 | % | | $ | 1,000.00 | | | $ | 1,082.60 | | | $ | 6.14 | |
| Class Y | | Hypothetical | | | | 1.19 | % | | $ | 1,000.00 | | | $ | 1,018.89 | | | $ | 5.96 | |
| | | | | | | | | | | | | | | | | | | | |
| Institutional Class | | Actual | | | | 1.05 | % | | $ | 1,000.00 | | | $ | 1,083.10 | | | $ | 5.42 | |
| Institutional Class | | Hypothetical | | | | 1.05 | % | | $ | 1,000.00 | | | $ | 1,019.59 | | | $ | 5.26 | |
| | | | | | | | | | | | | | | | | | | | |
| Touchstone Mid Cap Value Opportunities Fund | |
| Class A | | Actual | | | | 1.29 | % | | $ | 1,000.00 | | | $ | 1,221.50 | | | $ | 7.11 | |
| Class A | | Hypothetical | | | | 1.29 | % | | $ | 1,000.00 | | | $ | 1,018.40 | | | $ | 6.46 | |
| | | | | | | | | | | | | | | | | | | | |
| Class C | | Actual | | | | 2.30 | % | | $ | 1,000.00 | | | $ | 1,216.80 | | | $ | 12.64 | |
| Class C | | Hypothetical | | | | 2.30 | % | | $ | 1,000.00 | | | $ | 1,013.39 | | | $ | 11.48 | |
| | | | | | | | | | | | | | | | | | | | |
| Class Y | | Actual | | | | 1.01 | % | | $ | 1,000.00 | | | $ | 1,221.90 | | | $ | 5.56 | |
| Class Y | | Hypothetical | | | | 1.01 | % | | $ | 1,000.00 | | | $ | 1,019.79 | | | $ | 5.06 | |
| | | | | | | | | | | | | | | | | | | | |
| Institutional Class | | Actual | | | | 0.89 | % | | $ | 1,000.00 | | | $ | 1,223.50 | | | $ | 4.91 | |
| Institutional Class | | Hypothetical | | | | 0.89 | % | | $ | 1,000.00 | | | $ | 1,020.38 | | | $ | 4.46 | |
Other Items (Unaudited) (Continued)
Schedule of Shareholder Expenses (Continued)
| | | | | | | | | | | | | | | Expenses | |
| | | | | | Net Expense | | | Beginning | | | Ending | | | Paid During | |
| | | | | | Ratio | | | Account | | | Account | | | the Six Months | |
| | | | | | Annualized | | | Value | | | Value | | | Ended | |
| | | | | | June 30, | | | January 1, | | | June 30, | | | June 30, | |
| | | | | | 2013 | | | 2013 | | | 2013 | | | 2013* | |
| Touchstone Small Cap Value Opportunities Fund | |
| Class A | | | Actual | | | | 1.50 | % | | $ | 1,000.00 | | | $ | 1,164.60 | | | $ | 8.05 | |
| Class A | | | Hypothetical | | | | 1.50 | % | | $ | 1,000.00 | | | $ | 1,017.36 | | | $ | 7.50 | |
| | | | | | | | | | | | | | | | | | | | | |
| Class C | | | Actual | | | | 2.25 | % | | $ | 1,000.00 | | | $ | 1,160.30 | | | $ | 12.05 | |
| Class C | | | Hypothetical | | | | 2.25 | % | | $ | 1,000.00 | | | $ | 1,013.64 | | | $ | 11.23 | |
| | | | | | | | | | | | | | | | | | | | | |
| Class Y | | | Actual | | | | 1.19 | % | | $ | 1,000.00 | | | $ | 1,166.10 | | | $ | 6.39 | |
| Class Y | | | Hypothetical | | | | 1.19 | % | | $ | 1,000.00 | | | $ | 1,018.89 | | | $ | 5.96 | |
| | | | | | | | | | | | | | | | | | | | | |
| Institutional Class | | | Actual | | | | 1.10 | % | | $ | 1,000.00 | | | $ | 1,167.20 | | | $ | 5.91 | |
| Institutional Class | | | Hypothetical | | | | 1.10 | % | | $ | 1,000.00 | | | $ | 1,019.34 | | | $ | 5.51 | |
| | | | | | | | | | | | | | | | | | | | | |
| Touchstone Value Fund | |
| Class A | | | Actual | | | | 0.97 | % | | $ | 1,000.00 | | | $ | 1,152.60 | | | $ | 5.18 | |
| Class A | | | Hypothetical | | | | 0.97 | % | | $ | 1,000.00 | | | $ | 1,019.98 | | | $ | 4.86 | |
| | | | | | | | | | | | | | | | | | | | | |
| Class C | | | Actual | | | | 1.72 | % | | $ | 1,000.00 | | | $ | 1,148.30 | | | $ | 9.16 | |
| Class C | | | Hypothetical | | | | 1.72 | % | | $ | 1,000.00 | | | $ | 1,016.27 | | | $ | 8.60 | |
| | | | | | | | | | | | | | | | | | | | | |
| Class Y | | | Actual | | | | 0.72 | % | | $ | 1,000.00 | | | $ | 1,154.80 | | | $ | 3.85 | |
| Class Y | | | Hypothetical | | | | 0.72 | % | | $ | 1,000.00 | | | $ | 1,021.22 | | | $ | 3.61 | |
| | | | | | | | | | | | | | | | | | | | | |
| Institutional Class | | | Actual | | | | 0.62 | % | | $ | 1,000.00 | | | $ | 1,154.20 | | | $ | 3.31 | |
| Institutional Class | | | Hypothetical | | | | 0.62 | % | | $ | 1,000.00 | | | $ | 1,021.72 | | | $ | 3.11 | |
| * | Expenses are equal to the Fund's annualized expense ratio, multiplied by the average account value over the period, multiplied by [181/365] (to reflect the one-half year period). |
Annual renewal of Investment Advisory and Sub-Advisory Agreements
At a meeting held on November 15, 2012, the Board of Trustees (the “Board”) of the Touchstone Strategic Trust (the “Trust”), and by a separate vote, the Independent Trustees of the Trust, considered and approved a new sub-advisory agreement (the “New Sub-Advisory Agreement”) between Touchstone Advisors, Inc. (“Touchstone”) and Ashfield Capital Partners, LLC (“Ashfield”) with respect to Touchstone Capital Growth Fund (the “Fund”), a series of the Trust, to be effective on January 1, 2013. At the meeting, Touchstone informed the Board that the current sub-advisory agreement, dated April 16, 2012, as amended, between Touchstone and Ashfield (the “Prior Sub-Advisory Agreement”) was expected to be automatically terminated on or about December 31, 2012 due to an expected change in control at Ashfield. Ashfield was expected to undergo a restructuring in which its employees would purchase the shares owned by Old Mutual (US) Holdings, Inc., which was the majority owner of Ashfield. Touchstone recommended the Fund continue to use Ashfield as its sub-advisor. Touchstone reported the change in control would not affect Ashfield’s management of the Fund. Ashfield’s management team and key investment personnel would continue to manage the Fund and Ashfield would operate the Fund under the same terms and conditions as previously agreed to by the Board.
Touchstone and Ashfield provided the Board with various written materials in advance of the meeting to assist with the Board’s consideration of Ashfield as sub-advisor to the Fund. Touchstone provided written and oral information stating the basis for its recommendation to continue engaging Ashfield. The information also
Other Items (Unaudited) (Continued)
included details regarding Ashfield’s: (a) investment philosophy and investment process; (b) investment management services proposed to be provided to the Fund; (c) investment management personnel; (d) operating history, infrastructure, and financial condition; (e) proposed sub-advisory fee that would be paid to Ashfield by Touchstone; and (f) reputation, expertise, and resources as an investment advisor. The Board then discussed the written materials that it received before the meeting and all other information that it received at the meeting.
In approving the New Sub-Advisory Agreement, the Board considered various factors, among them: (1) the nature, extent, and quality of services to be provided to the Fund, including the personnel who would be providing such services; (2) the Sub-Advisor’s proposed compensation; (3) the Sub-Advisor’s past performance; and (4) the terms of the New Sub-Advisory Agreement. The Board’s analysis of these factors is set forth below. The Independent Trustees were advised by independent legal counsel throughout the process.
Nature, Extent and Quality of Services Provided; Investment Personnel. The Board considered information provided by Touchstone regarding the services to be provided by Ashfield. The Board considered Ashfield’s level of knowledge and investment style. The Board reviewed the experience and credentials of the investment personnel who would continue to be responsible for managing the investment of portfolio securities with respect to the Fund. The Board also noted that it is familiar with Ashfield, as the sub-advisor already served as investment manager to the Fund. The Board also recognized that there would be no personnel change relating to the management of the Fund. The Board also took into account certain information and materials it received and considered in connection with its initial approval of the Prior Sub-Advisory Agreement between Touchstone and Ashfield with respect to the Fund at a meeting held in February 2012.
Ashfield’s Compensation. The Board took into consideration the financial condition of Ashfield and any direct and indirect benefits to be derived by Ashfield and its affiliates from Ashfield’s relationship with the Fund. In considering the anticipated level of profitability to Ashfield and its affiliates, the Board noted the proposed contractual undertaking of Touchstone to maintain expense limitations for the Fund. The Board also noted that the sub-advisory fee under the New Sub-Advisory Agreement would be paid by Touchstone out of the advisory fee that Touchstone receives from the Fund, and that the sub-advisory fee is negotiated at arm’s length. Finally, the Board noted that the proposed sub-advisory fee schedule contains breakpoints that would reduce the sub-advisory fee rate on Fund assets above specified levels.
The Board also considered certain comparative fee information concerning the current sub-advisory fee paid to Ashfield for managing the Fund. The proposed sub-advisory fee was identical to the fee previously approved by the Board and shareholders of the Fund. The Board considered the amount of the advisory fee to be retained by Touchstone and the amount to be paid to Ashfield with respect to the various services to be provided by each. Finally, the Board noted that from April 16, 2012 through the fiscal year end June 30, 2012, Ashfield received from Touchstone sub-advisory fees totaling $124,129. Based upon their review, the Trustees concluded that the Fund’s proposed sub-advisory fee under the New Sub-Advisory Agreement was reasonable in light of Ashfield’s services to the Fund.
Fund Performance. The Board also considered Ashfield’s investment performance and the Fund’s performance under Ashfield’s management. The Trustees reviewed Ashfield’s investment performance across various sectors, highlighting its strong performance in the large-cap growth universe. The Board was mindful of Touchstone’s focus on the performance of sub-advisors, including Ashfield, and Touchstone’s ways of addressing underperformance.
Conclusion. The Board reached the following conclusions regarding the New Sub-Advisory Agreement: (a) Ashfield is qualified to continue managing the Fund’s assets in accordance with the Fund’s investment goal and policies; (b) Ashfield maintains an appropriate compliance program; (c) the Fund’s proposed sub-advisory fee is reasonable in relation to the fees of similar funds and the services to be provided by Ashfield; and (d) Ashfield’s proposed investment strategies are appropriate for pursuing the investment goal of the Fund. In considering the approval
Other Items (Unaudited) (Continued)
of the New Sub-Advisory Agreement, the Board, including the Independent Trustees, did not identify any single factor as controlling, and each Trustee attributed different weights to the various factors. Based on its conclusions, the Board determined that approval of the New Sub-Advisory Agreement was in the best interests of the Fund and its shareholders.
Management of the Trust (Unaudited)
Listed below is required information regarding the Trustees and principal officers of the Trust. The Trust’s Statement of Additional Information includes additional information about theTrustees and is available, without charge, upon request by calling 1.800.543.0407 or by visiting the Touchstone website at www.touchstoneinvestments.com.
Interested Trustees1:
| | | | | | | | | Number | | |
| | | | | | | | | of Funds | | |
| | | | | | | | | Overseen | | |
| | | | | Term of | | | | in the | | |
| Name | | Position(s) | | Office2 And | | | | Touchstone | | Other |
| Address | | Held with | | Length of | | Principal Occupation(s) | | Fund | | Directorships |
| Age | | Trust | | Time Served | | During Past 5 Years | | Complex3 | | Held During the Past 5 Years4 |
Jill T. McGruder Touchstone Advisors, Inc 303 Broadway Suite 1100 Cincinnati, OH 45202 Year of Birth: 1955 | | Trustee and President | | Until retirement at age 75 or until she resigns or is removed Trustee since 1999 | | President and CEO of IFS Financial Services, Inc. (a holding company) from 1999 to the present. | | 50 | | Director of LaRosa’s, Inc. (a restaurant chain) from 1999 to the present, IFS Financial Services, Inc. (a holding company) from 1999 to the present, Integrity and National Integrity Life Insurance Co. from 2005 to the present, Touchstone Securities (the Trust’s distributor) from 1999 to the present, Touchstone Advisors (the Trust’s investment advisor and administrator) from 1999 to the present, W&S Brokerage Services ( a brokerage company) from 1999 to the present and W&S Financial Group Distributors (a distribution company) from 1999 to the present. |
| Independent Trustees |
Phillip R. Cox c/o Touchstone Advisors, Inc. 303 Broadway Suite 1100 Cincinnati, OH 45202 Year of Birth: 1947 | | Trustee | | Until retirement at age 75 or until he resigns or is removed Trustee since 1999 | | President and Chief Executive Officer of Cox Financial Corp. (a financial services company) from 1971 to the present. | | 50 | | Director of Cincinnati Bell (a communications company) from 1994 to the present, Bethesda Inc. (a hospital) from 2005 to the present, Timken Co. (a manufacturing company) from 2004 to the present, Diebold, Inc. (a technology solutions company) from 2004 to the present, and Duke Energy (energy holding company) from 1994 until 2008. |
William C. Gale c/o Touchstone Advisors, Inc. 303 Broadway Suite 1100 Cincinnati, OH 45202 Year of Birth: 1952 | | Trustee | | Until retirement at age 75 or until he resigns or is removed Trustee since 2013 | | Senior Vice President (from 2003 to the present) and Chief Financial Officer (from 1995 to the present) of Cintas Corporation (a business services company). | | 50 | | None. |
Susan J. Hickenlooper, CFA c/o Touchstone Advisors, Inc. 303 Broadway Suite 1100 Cincinnati, OH 45202 Year of Birth: 1946 | | Trustee | | Until retirement at age 75 or until she resigns or is removed Trustee since 2009 | | Financial Analyst for Impact 100 (Charitable Organization) from 2012 to present. | | 50 | | Trustee of Gateway Trust (a mutual fund) from 2006-2009, Cincinnati Parks Foundation (a charitable organization) from 2000 to present and Trustee of Episcopal Retirement Homes Foundation from 1998-2011. |
Management of the Trust (Unaudited) (Continued)
Independent Current Trustees/Independent Nominees (Continued):
| | | | | | | | | Number | | |
| | | | | | | | | of Funds | | |
| | | | | | | | | Overseen | | |
| | | | | Term of | | | | in the | | |
| Name | | Position(s) | | Office2 And | | | | Touchstone | | Other |
| Address | | Held with | | Length of | | Principal Occupation(s) | | Fund | | Directorships |
| Age | | Trust | | Time Served | | During Past 5 Years | | Complex3 | | Held During the Past 5 Years4 |
H. Jerome Lerner c/o Touchstone Advisors, Inc. 303 Broadway Suite 1100 Cincinnati, OH 45202 Year of Birth: 1938 | | Trustee | | Until retirement at age 75 or until he resigns or is removed Trustee since 1989 | | None. | | 50 | | Director of BASCO Shower Enclosures (a design and manufacturing company) from 2000 to the present and Hebrew Union College - Jewish Institute of Religion from 1990 to the present. |
Kevin A. Robie5 c/o Touchstone Advisors, Inc. 303 Broadway Suite 1100 Cincinnati, OH 45202 Year of Birth: 1956 | | Trustee | | Until retirement he resigns or is removed Trustee since 2013 | | Vice President of Portfolio at age 75 or until Management at Soin International LLC (a multinational holding company) from 2004 to the present. | | 50 | | Director of Buckeye EcoCare, Inc. (a lawn care company) from 2013 to the present, Trustee of Dayton Region New Market Fund, LLC (a private fund) from 2010 to present, Trustee of the Entrepreneurs Center, Inc. (a small business incubator) from 2006 to the present and Director of Interventional Imaging, Inc. (a medical device company) from 2004 to 2011. |
Donald C. Siekmann c/o Touchstone Advisors, Inc. 303 Broadway Cincinnati, OH Year of Birth: 1938 | | Trustee | | Until retirement at age 75 or until he resigns or is removed Trustee since 2005 | | Executive for Duro Bag Manufacturing Co. (a bag manufacturer) from 2002 to 2008. | | 50 | | Trustee of Riverfront Mutual Funds (until 2008). |
Edward J. VonderBrink5 c/o Touchstone Advisors, Inc. 303 Broadway Suite 1100 Cincinnati, OH 45202 Year of Birth: 1944 | | Trustee | | Until retirement at age 75 or until he resigns or is removed Trustee since 2013 | | Consultant, VonderBrink Consulting LLC from 2000 to the present. | | 50 | | Director of Streamline Health Solutions, Inc. (healthcare IT) from 2006 to the present, BASCO shower Enclosures (a design and manufacturing company) from 2010 to the present, Mercy Health Foundation from 2008 to the present and Pelican Sound Golf and River Club from 2012 to the present. |
| 1 | Ms. McGruder, as a director of the Advisor and the Trust's Distributor, and an officer of affiliates of the Advisor and the Trust's Distributor, is an “interested person” of the Trust within the meaning of Section 2(a)(19) of the 1940 Act. |
| 2 | Each Trustee is elected to serve until the age of 75 or until he or she sooner resigns or is removed. |
| 3 | As of June 30, 2013, The Touchstone Fund Complex consisted of 12 series of Touchstone Funds Group Trust, 4 series of Touchstone Investment Trust, 1 series of Touchstone Institutional Funds Trust, 19 series of the Touchstone Strategic Trust, 3 series of Touchstone Tax-Free Trust, and 11 variable annuity series of Touchstone Variable Series Trust. |
| 4 | Each Trustee is also a Trustee of Touchstone Funds Group Trust, Touchstone Tax-Free Trust, Touchstone Investment Trust, Touchstone Institutional Funds Trust, and Touchstone Variable Series Trust. |
| 5 | Mr. Robie and Mr. VonderBrink were elected to the Board of Trustees at a shareholder meeting held on August 2, 2013. |
The following is a list of the Officers of the Trusts, the length of time served, and principal occupations for the past five years.
Management of the Trust (Unaudited) (Continued)
Principal Officers:
| | | | | Term of | | |
| Name | | Position(s) | | Office And | | |
| Address | | Held with | | Length of | | Principal Occupation(s) |
| Age | | Trust4 | | Time Served | | During the Past 5 Years |
Jill T. McGruder1 Year of Birth: 1955 | | President and Trustee | | Until resignation, removal or disqualification President since 2006 | | See biography above. |
Steven M. Graziano1 Year of Birth: 1954 | | Vice President | | Until resignation, removal or disqualification Vice President since 2009 | | President of Touchstone Advisors, Inc.; Executive Vice President of Pioneer Investment Management, Head of Retail Distribution and Strategic Marketing 2007-2008. |
Timothy D. Paulin1
Year of Birth: 1963 | | Vice
President | | Until resignation, removal or disqualification Vice President since 2010 | | Senior Vice President of Investment Research and Product Management of Touchstone Advisors, Inc.; Director of Product Design of Klein Decisions, Inc. 2003-2010. |
Michael R. Moser1,2 Year of Birth: 1968 | | Chief Compliance Officer | | Until resignation, removal or disqualification Chief Compliance Officer since 2012 | | Vice President and Chief Compliance Officer of the Western & Southern Financial Group and Chief Compliance Officer of Touchstone Advisors. |
Terrie A. Wiedenheft1 Year of Birth: 1962 | | Controller and Treasurer | | Until resignation, removal or disqualification Controller and Treasurer since 2006 | | Senior Vice President, Chief Financial Officer and Chief Operations Officer of IFS Financial Services, Inc. (a holding company). |
Elizabeth R. Freeman3 Year of Birth: 1962 | | Secretary | | Until resignation, removal or disqualification Secretary since 2011 | | Managing Director and Senior Counsel at BNY Mellon Investment Servicing (US) Inc. |
| 1 | The address of Touchstone Advisors, Inc. is 303 Broadway, Suite 1100, Cincinnati, OH 45202. |
| 2 | Timothy S. Stearns replaced Mr. Moser as the Chief Compliance Officer of the Trust on August 22, 2013. |
| 3 | The address of BNY Mellon Investment Servicing (US) Inc. is 201 Washington Street, Boston, MA 02108. |
| 4 | Each officer also holds the same office with Touchstone Funds Group Trust, Touchstone Institutional Funds Trust, Touchstone Investment Trust, Touchstone Strategic Trust, and Touchstone Variable Series Trust. |
PRIVACY PROTECTION POLICY
We Respect Your Privacy
Thank you for your decision to invest with us. Touchstone and its affiliates have always placed a high value on the trust and confidence our clients place in us. We believe that confidence must be earned and validated through time. In today’s world, when technology allows the sharing of information at light speeds, trust must be reinforced by our sincere pledge to take the steps necessary to ensure that the information you share with us is treated with respect and confidentiality.
Our Pledge to Our Clients
| • | We collect only the information we need to service your account and administer our business. |
| • | We are committed to keeping your information confidential and we place strict limits and controls on the use and sharing of your information. |
| • | We make every effort to ensure the accuracy of your information. |
We Collect the Following Nonpublic Personal Information About You:
| • | Information we receive from you on or in applications or other forms, correspondence, or conversations, including, but not limited to, your name, address, phone number, social security number, assets, income and date of birth; and |
| • | Information about your transactions with us, our affiliates, or others, including, but not limited to, your account number and balance, payment history, parties to transactions, cost basis information, and other financial information. |
Categories of Information We Disclose and Parties to Whom We Disclose
We do not disclose any nonpublic personal information about our current or former clients to nonaffiliated third parties, except as required or permitted by law.
We Place Strict Limits and Controls on the Use and Sharing of Your Information
| • | We restrict access to nonpublic personal information about you to authorized employees who need the information to administer your business. |
| • | We maintain physical, electronic and procedural safeguards that comply with federal standards to protect this information. |
| • | We do not disclose any nonpublic personal information about our current or former clients to anyone, except as required or permitted by law or as described in this document. |
| • | We will not sell your personal information to anyone. |
We May Provide Information to Service Your Account
Sometimes it is necessary to provide information about you to various companies such as transfer agents, custodians, broker-dealers and marketing service firms to facilitate the servicing of your account. These organizations have a legitimate business need to see some of your personal information in order for us to provide service to you. We may disclose to these various companies the information that we collect as described above. We require that these companies, including our own subsidiaries and affiliates, strictly maintain the confidentiality of this information and abide by all applicable laws. Companies within our corporate family that may receive this information are financial service providers and insurance companies. We do not permit these associated companies to sell the information for their own purposes, and we never sell our customer information.
This policy is applicable to the following affiliated companies: Touchstone Funds Group Trust, Touchstone Investment Trust, Touchstone Strategic Trust, Touchstone Tax-Free Trust, Touchstone Variable Series Trust, Touchstone Institutional Funds Trust, Touchstone Securities, Inc.,* and W&S Brokerage Services, Inc.
* Touchstone Securities, Inc. serves as the underwriter to the Touchstone Funds.
A Member of Western & Southern Financial Group®
The Privacy Protection Policy is not part of the Annual Report.


Touchstone Investments
Distributor
Touchstone Securities, Inc.*
303 Broadway
Cincinnati, Ohio 45202-4203 800.638.8194
www.touchstoneinvestments.com
Investment Advisor
Touchstone Advisors, Inc.*
303 Broadway
Cincinnati, Ohio 45202-4203
Transfer Agent
BNY Mellon Investment Servicing (US) Inc.
4400 Computer Drive
Westborough, MA 01581
Shareholder Service
800.543.0407
* A Member of Western & Southern Financial Group
TSF-54BB-TST-AR-1306
Item 2. Code of Ethics.
| (a) | The registrant, as of the end of the period covered by this report, has adopted a code of ethics that applies to the registrant’s principal executive officer, principal financial officer, principal accounting officer or controller, or persons performing similar functions, regardless of whether these individuals are employed by the registrant or a third party. |
| (c) | There have been no amendments, during the period covered by this report, to a provision of the code of ethics that applies to the registrant’s principal executive officer, principal financial officer, principal accounting officer or controller, or persons performing similar functions, regardless of whether these individuals are employed by the registrant or a third party, and that relates to any element of the code of ethics description. |
| (d) | The registrant has not granted any waivers, including an implicit waiver, from a provision of the code of ethics that applies to the registrant’s principal executive officer, principal financial officer, principal accounting officer or controller, or persons performing similar functions, regardless of whether these individuals are employed by the registrant or a third party, that relates to one or more of the items set forth in paragraph (b) of this item’s instructions. |
Item 3. Audit Committee Financial Expert.
The registrant’s Board of Trustees has determined that the registrant has at least one audit committee financial expert serving on its audit committee. Mr. Donald Siekmann is the registrant’s audit committee financial expert and is an independent trustee within the meaning of the Investment Company Act of 1940, as amended (the “1940 Act”).
Item 4. Principal Accountant Fees and Services.
Audit Fees
| (a) | The Audit fees totaled $69,200 and $133,600 in fiscal 2013 and the period ended June 30, 2012, respectively, including fees associated with the annual audits and filings of Form N-1A and Form N-SAR. The funds were acquired by the Touchstone Strategic Trust on April 16, 2012. |
Audit-Related Fees
| (b) | There were no audit related fees for the fiscal year ended June 30, 2013 and the period ended June 30, 2012. The funds were acquired by the Touchstone Strategic Trust on April 16, 2012. |
Tax Fees
| (c) | The aggregate fees billed in each of the last two fiscal years for professional services rendered by the principal accountant for tax compliance, tax advice, and tax planning were $24,200 for the fiscal year ended June 30, 2013 and $23,200 for the period ended June 30, 2012. |
Fees for fiscal year ended June 30, 2013 and the period ended June 30, 2012 relate to the preparation of federal income and excise tax returns and review of capital gains distribution calculations.
All Other Fees
| (d) | There were no other fees for all other services for products and services provided by the principal accountant for the fiscal year ended June 30, 2013 and for the period of April 1, 2012 through fiscal year ended June 30, 2012. The funds were acquired by the Touchstone Strategic Trust on April 16, 2012. |
| (e)(1) | Disclose the audit committee's pre-approval policies and procedures described in paragraph (c)(7) of Rule 2-01 of Regulation S-X. |
The Audit Committee’s pre-approval policies describe the types of audit, audit-related, tax and other services that have the general pre-approval of the Audit Committee. The pre-approval policies provide that annual audit service fees, tax services not specifically granted pre-approval, services exceeding pre-approved cost levels and other services that have not received general pre-approval will be subject to specific pre-approval by the Audit Committee. The pre-approval policies further provide that the Committee may grant general pre-approval to other audit services (statutory audits and services associated with SEC registration statements, periodic reports and other documents filed with the SEC or other documents issued in connection with securities offerings), audit-related services (accounting consultations related to accounting, financial reporting or disclosure matters not classified as “audit services,” assistance with understanding and implementing new accounting and financial reporting guidance from rulemaking authorities, agreed-upon or expanded audit procedures related to accounting and/or billing records required to respond to or comply with financial, accounting or regulatory reporting matters and assistance with internal control reporting requirements under Form N-SAR and Form N-CSR), tax services that have historically been provided by the auditor that the Committee believes would not impair the independence of the auditor and are consistent with the SEC’s rules on auditor independence and permissible non-audit services classified as “all other services” that are routine and recurring services.
| (e)(2) | All of the services described in paragraphs (b) through (d) of Item 4 were approved by the Audit Committee. |
| (f) | The percentage of hours expended on the principal accountant's engagement to audit the registrant's financial statements for the most recent fiscal year that were attributed to work performed by persons other than the principal accountant's full-time, permanent employees was less than fifty percent. |
| (g) | The aggregate non-audit fees billed by the registrant's accountant for services rendered to the registrant, and rendered to the registrant's investment adviser (not including any sub-adviser whose role is primarily portfolio management and is subcontracted with or overseen by another investment adviser), and any entity controlling, controlled by, or under common control with the adviser that provides ongoing services to the registrant for the fiscal year ended June 30, 2013 was $24,200 and $23,200 for the period ended June 30, 2012. The funds were acquired by the Touchstone Strategic Trust on April 16, 2012. |
| (h) | The registrant's audit committee of the board of trustees has considered whether the provision of non-audit services that were rendered to the registrant's investment adviser (not including any sub-adviser whose role is primarily portfolio management and is subcontracted with or overseen by another investment adviser), and any entity controlling, controlled by, or under common control with the investment adviser that provides ongoing services to the registrant that were not pre-approved pursuant to paragraph (c)(7)(ii) of Rule 2-01 of Regulation S-X is compatible with maintaining the principal accountant's independence. |
Item 5. Audit Committee of Listed registrants.
Not applicable.
Item 6. Investments.
| (a) | Schedule of Investments in securities of unaffiliated issuers as of the close of the reporting period is included as part of the report to shareholders filed under Item 1 of this form. |
Item 7. Disclosure of Proxy Voting Policies and Procedures for Closed-End Management Investment Companies.
Not applicable.
Item 8. Portfolio Managers of Closed-End Management Investment Companies.
Not applicable.
Item 9. Purchases of Equity Securities by Closed-End Management Investment Company and Affiliated Purchasers.
Not applicable.
Item 10. Submission of Matters to a Vote of Security Holders.
There have been no material changes to the procedures by which the shareholders may recommend nominees to the registrant’s board of trustees, where those changes were implemented after the registrant last provided disclosure in response to the requirements of Item 407(c)(2)(iv) of Regulation S-K (17 CFR 229.407) (as required by Item 22(b)(15) of Schedule 14A (17 CFR 240.14a-101)), or this Item.
Item 11. Controls and Procedures.
| (a) | The registrant’s principal executive and principal financial officers, or persons performing similar functions, have concluded that the registrant’s disclosure controls and procedures (as defined in Rule 30a-3(c) under the Investment Company Act of 1940, as amended (the “1940 Act”) (17 CFR 270.30a-3(c))) are effective, as of a date within 90 days of the filing date of the report that includes the disclosure required by this paragraph, based on their evaluation of these controls and procedures required by Rule 30a-3(b) under the 1940 Act (17 CFR 270.30a-3(b)) and Rules 13a-15(b) or 15d-15(b) under the Securities Exchange Act of 1934, as amended (17 CFR 240.13a-15(b) or 240.15d-15(b)). |
| (b) | There were no changes in the registrant’s internal control over financial reporting (as defined in Rule 30a-3(d) under the 1940 Act (17 CFR 270.30a-3(d)) that occurred during the registrant’s second fiscal quarter of the period covered by this report that has materially affected, or is reasonably likely to materially affect, the registrant’s internal control over financial reporting. |
Item 12. Exhibits.
| (a)(1) | Code of ethics, or any amendment thereto, that is the subject of disclosure required by Item 2 is attached hereto. |
| (a)(2) | Certifications pursuant to Rule 30a-2(a) under the 1940 Act and Section 302 of the Sarbanes-Oxley Act of 2002 are attached hereto. |
| (b) | Certifications pursuant to Rule 30a-2(b) under the 1940 Act and Section 906 of the Sarbanes-Oxley Act of 2002 are attached hereto. |
| (12.other) | Not applicable. |
SIGNATURES
Pursuant to the requirements of the Securities Exchange Act of 1934 and the Investment Company Act of 1940, the registrant has duly caused this report to be signed on its behalf by the undersigned, thereunto duly authorized.
| (Registrant) | Touchstone Strategic Trust | |
| By (Signature and Title)* | /s/ Jill T. McGruder | |
| | Jill T. McGruder, President | |
| | (principal executive officer) | |
Pursuant to the requirements of the Securities Exchange Act of 1934 and the Investment Company Act of 1940, this report has been signed below by the following persons on behalf of the registrant and in the capacities and on the dates indicated.
| By (Signature and Title)* | /s/ Jill T. McGruder | |
| | Jill T. McGruder, President | |
| | (principal executive officer) | |
| By (Signature and Title)* | /s/ Terrie A. Wiedenheft | |
| | Terrie A. Wiedenheft, Controller and Treasurer | |
| | (principal financial officer) | |
* Print the name and title of each signing officer under his or her signature.