UNITED STATES
SECURITIES AND EXCHANGE COMMISSION
Washington, D.C. 20549
FORMN-CSR
CERTIFIED SHAREHOLDER REPORT OF REGISTERED MANAGEMENT
INVESTMENT COMPANIES
| | |
Investment Company Act file number: | | 811-03623 |
| |
Exact name of registrant as specified in charter: | | The Prudential Series Fund |
| |
Address of principal executive offices: | | 655 Broad Street, 17th Floor |
| | Newark, New Jersey 07102 |
| |
Name and address of agent for service: | | Andrew R. French |
| | 655 Broad Street, 17th Floor |
| | Newark, New Jersey 07102 |
| |
Registrant’s telephone number, including area code: | | 800-225-1852 |
| |
Date of fiscal year end: | | 12/31/2019 |
| |
Date of reporting period: | | 12/31/2019 |
Item 1 – Reports to Stockholders

The Prudential Series Fund
| | |
| ANNUAL REPORT | | December 31, 2019 |

Based on the variable contract you own or the portfolios you invested in, you may receive additional reports for other portfolios. Please refer to your variable annuity or variable life insurance contract prospectus to determine which portfolios are available to you.
The views expressed in this report and information about each portfolio’s holdings are for the period covered by this report and are subject to change thereafter.
Please note that this report may include prospectus supplements that are separate from and not a part of this report. Please refer to your variable annuity or variable life insurance contract prospectus to determine which supplements are applicable to you.
Conservative Balanced Portfolio
Diversified Bond Portfolio
Equity Portfolio
Flexible Managed Portfolio
Global Portfolio
Government Income Portfolio
Government Money Market Portfolio
High Yield Bond Portfolio
Jennison Portfolio
Natural Resources Portfolio
Small Capitalization Stock Portfolio
Stock Index Portfolio
Value Portfolio

Join the e-movement.SM
Enroll in e-delivery today!
By enrolling in e-Delivery, you’ll gain secure, online access to important documents with the flexibility to choose which documents you receive in the mail… and which ones you don’t!
Individual Annuity Contract Owners
Get started by visiting www.prudential.com/login and follow the instructions on the screen, or scan the code below.

Individual Life Insurance Contract Owners
To receive your reports online, go to www.prudential.com/edelivery, or scan the code below.

Group Variable Universal Life Contract Owners
To receive your reports online, go to www.prudential.com/gulgvul, or scan the code.

| | |
| |
 | | Save paper and reduce clutter. Receive Prospectuses and Reports electronically by enrolling today! |
| | | | |
The Prudential Series Fund Table of Contents | | Annual Report | | December 31, 2019 |
| | ∎ | | LETTER TO CONTRACT OWNERS |
| | ∎ | | REPORT OF THE INVESTMENT MANAGERS AND PRESENTATION OF PORTFOLIO HOLDINGS |
| | | | |
| Section A | | Schedule of Investments and Financial Statements |
| | |
| | Glossary | | A1 |
| | Conservative Balanced Portfolio | | A2 |
| | Diversified Bond Portfolio | | A38 |
| | Equity Portfolio | | A71 |
| | Flexible Managed Portfolio | | A76 |
| | Global Portfolio | | A110 |
| | Government Income Portfolio | | A119 |
| | Government Money Market Portfolio | | A128 |
| | High Yield Bond Portfolio | | A132 |
| | Jennison Portfolio | | A149 |
| | Natural Resources Portfolio | | A153 |
| | Small Capitalization Stock Portfolio | | A158 |
| | Stock Index Portfolio | | A171 |
| | Value Portfolio | | A183 |
| |
| Section B | | Notes to Financial Statements |
| Section C | | Financial Highlights |
| Section D | | Report of Independent Registered Public Accounting Firm |
| Section E | | Information about Trustees and Officers |
This report may include financial information pertaining to certain portfolios that are not available through the variable life insurance policy or variable annuity contract that you have chosen. Please refer to your variable life insurance or variable annuity prospectus to determine which portfolios are available to you.
| | | | |
The Prudential Series Fund Letter to Contract Owners | | Annual Report | | December 31, 2019 |
At Prudential, our primary objective is to help investors achieve and maintain long-term financial success. This Prudential Series Fund annual report outlines our efforts to achieve this goal. We hope you find it informative and useful.
Prudential has been building on a heritage of success for more than 135 years. We believe the array of our products provides a highly attractive value proposition to clients like you who are focused on financial security.
Your financial professional is the best resource to help you make the most informed investment decisions. Together, you can build a diversified investment portfolio that aligns with your long-term financial goals. Please keep in mind that diversification and asset allocation strategies do not assure a profit or protect against loss in declining markets.
Thank you for selecting Prudential as one of your financial partners. We value your trust and appreciate the opportunity to help you achieve financial security.
Sincerely,

Timothy S. Cronin
President,
The Prudential Series Fund | January 31, 2020 |
| | | | |
| Market Overview — unaudited | | Annual Report | | December 31, 2019 |
Equity Market Overview
US and international stock markets posted stellar returns in 2019 as many central banks, including the Federal Reserve (the Fed), cut interest rates or used other stimuli to spur growth. Although the markets fluctuated sharply at times in reaction to on-again-off-again trade tensions between the US and China, concerns about tariffs subsided later in the year.
In the US, the broad-based S&P 500® Index and Russell 3000® Index returned 31.46% and 31.02%, respectively, for the year. Internationally, the MSCI ACWI Ex-US Index, a broad measure of stock performance in developed and emerging markets outside the US, returned 21.51%. (All returns cited are in US dollars and include dividends.)
Global economic growth slowed, central banks cut rates
During 2019, the pace of global growth slowed and concerns about the economic outlook rose due in part to uncertainties regarding US-China tariffs and other geopolitical factors, which created a drag on manufacturing and export activity. Many central banks responded by loosening monetary policy — in some cases reversing their positions. For example, the Fed, which hiked rates four times in 2018, cut its federal funds rate target three times in 2019 and moved from tapering its balance sheet to expanding it through asset purchases. The European Central Bank, which had been rolling back its bond-buying program in 2018, restarted it to stimulate the eurozone economy.
Although US real gross domestic product (GDP) growth rose 2.1% (annualized) in the third quarter, down from 3.1% in the first quarter, the US economy expanded at a moderate pace. (Fourth-quarter GDP data had not been released when this overview was published.) Corporate earnings, consumer spending, and the labor market were strong, while inflation remained low.
Stock markets rallied, retreated, and rebounded to record highs
Early in the first quarter, stocks rallied as US-China trade negotiations appeared to be progressing, the Fed signaled that it planned to pause from hiking rates unless warranted, the US government’s partial shutdown ended, and corporate earnings rose sharply despite slower growth. The S&P 500 jumped nearly 8.0% in January alone.
Stocks sold off in May as trade-war worries resurfaced. However, equity markets rallied in June in anticipation of possible rate cuts and on hopes for a trade deal. During the first half of 2019, the Fed maintained its interest rate target.
Trade concerns re-emerged in the third quarter amid signs of slowing growth and renewed trade frictions. With inflation below its target, the Fed cut rates in July for the first time since the financial crisis in 2008 as a pre-emptive measure to help sustain the US economy’s expansion and withstand the risk of a global economic slowdown and further drop in business investment.
In August, concerns about tariffs, the growth of China’s industrial output, and the global economy intensified, driving investors toward less-risky investments like US Treasuries. The yield on the 10-year US Treasury note, which moves opposite to its price, briefly dropped below the rate on two-year Treasuries. Although many analysts didn’t interpret this particular “yield curve inversion” as indicative of a looming recession, as they often have in the past, stock prices — particularly in emerging markets — dropped sharply.
Although the Fed cut rates again in September and October to a range of 1.50%-1.75%, Chairman Jerome Powell conveyed that the central bank did not plan to cut rates further unless incoming information required its members to materially reassess their outlook for the economy. As expected, the Fed did not adjust rates through the remainder of the year.
During the fourth quarter, US stock indexes surged to new highs and emerging market stocks rallied amid reports the US and China were moving toward a “phase one” partial trade deal. (The agreement was signed in January 2020 after the reporting period ended.) Eurozone stock markets rose in reaction to improved economic results from Germany. United Kingdom investors were encouraged by the outcome of December elections that many hope will lead to a smoother potential exit of the UK from the European Union.
All S&P 500 sectors rose
The best-performing sectors in the S&P 500 were information technology (+50.3%), communication services (+32.7%), and financials (+32.1%). Next in line were industrials (+29.4%), real estate (+29.0%), consumer discretionary (+27.9%), consumer staples (+27.6%), utilities (+26.4%), materials (+24.6%), health care (+20.8%), and energy (+11.8%).
| | | | |
| Market Overview — unaudited(continued) | | Annual Report | | December 31, 2019 |
Growth outperformed value, large-cap stocks topped small caps
For the year, the Russell 3000® Growth Index returned 35.85%, outperforming the Russell 3000® Value Index, which rose 26.26%. Large-cap stocks, as measured by the Russell 1000® Index, rose 31.43%. The Russell Midcap® Index returned 30.54%, and the small-cap Russell 2000® Index lagged yet still returned 25.52%.
International stocks collectively rose but underperformed US equities
Stocks trading in emerging markets, as measured by the MSCI Emerging Markets Index, returned 18.4% for the year. Notable top-performing country components in the index included Russia (+50.9%), supported by a jump in oil prices, Taiwan (+36.4%), Brazil (+26.3%), and China (23.5%). Taiwan’s and China’s markets advanced in the fourth quarter as trade frictions diminished, although weak economic data from China dampened investor sentiment during the year. Notable countries that underperformed the index but still contributed positively to performance included South Korea (+12.5%), Mexico (+11.4%), and India (+7.6%). Malaysia (-2.0%) detracted from the index’s performance.
Equities in developed markets outside the US and Canada, as measured by the MSCI EAFE Index, rose 22.01%. For the year, the MSCI Europe Index rose 23.77%, the MSCI UK Index returned 21.05%, and the MSCI Japan Index rose 19.61%.
Fixed Income Market Overview
In 2019, for the first time in more than a decade, the Federal Reserve (the Fed) cut interest rates to help sustain the US economy’s expansion in the face of slowing global economic growth and US-China trade-war risks. The central bank was merely one of dozens that reduced rates throughout the year, igniting rallies in numerous global bond markets. During 2019, emerging markets debt, US high yield bonds, and corporate investment-grade bonds delivered robust returns, yet US government bonds and many other fixed income categories also posted solid results.
In the US, the economy grew at a healthy but slow pace. Although real gross domestic product (GDP) growth dropped from 3.1% (annualized) in the first quarter to 2.1% in the third, the economy continued to expand. (Fourth-quarter GDP data had not been released when this overview was published.) The national unemployment rate dropped to a 50-year low of 3.5% in September, corporate earnings were generally strong, and inflation remained low. Elsewhere, the European economy grew weakly. Notably, China’s growth rate dropped significantly from 6.6% in 2018 to 6.1% in 2019.
Bond markets fluctuated but closed higher
During the first quarter of 2019, global growth expectations softened. The Fed, which increased rates four times in 2018, signaled it would pause from hiking rates further based on its outlook at the time, sending bond markets higher. US high yield and emerging market bond prices rose sharply, supported by a tailwind of receding tariff worries and favorable corporate earnings.
In May, worries about the US-China trade war surfaced again. US Treasuries rallied while riskier assets such as high yield bonds dropped in price. The following month, however, the Fed hinted at the possibility of interest rate cuts ahead, trade fears cooled, and the high yield bond market rebounded. The Fed did not adjust rates during the first half of the year.
In July, the global economy showed signs of a slowdown and tariff fears returned. Later that month, for the first time since the financial crisis in 2008, the Fed cut rates as a pre-emptive measure to help sustain the expansion of the US economy and provide a cushion against the risk of a global economic slowdown. During August, the yield on 10-year US Treasuries dropped below yields on two-year Treasuries. Historically, when yields on longer-term Treasuries fall below yields on shorter-term issues, recessions have often followed. While many analysts questioned the “yield curve inversion” as a recessionary indicator in this instance, investors concerned about the economy gravitated to “safe-haven” securities like longer-term US Treasuries and other high-quality credits.
The investment-grade Bloomberg Barclays US Aggregate Bond Index returned 2.59% in August. US high yield bonds finished virtually flat, whereas emerging market sovereign debt markets dropped sharply due in part to a stronger US dollar versus most currencies.
In September, the Fed cut rates again and the European Central Bank restarted its bond-buying program to help stimulate the eurozone economy after rolling it back the previous year. After the Fed dropped its rate target to a range of 1.50% to 1.75% in October, Chairman Jerome Powell conveyed that the central bank had no plans for further cuts unless incoming data compelled its members to materially reassess their outlook for the economy. As expected, the Fed maintained its rate target through the remainder of the year.
During the fourth quarter, stronger-than-expected economic data and reports that the US and China were moving toward a “phase one” partial trade deal led to a “risk-on” rally. (The agreement was signed in January 2020 after the reporting period ended.) Over the final month of the year, high yield bonds and emerging markets bonds posted solid gains, while investment-grade US bonds dropped slightly.
| | | | |
| Market Overview — unaudited(continued) | | Annual Report | | December 31, 2019 |
Emerging market debt and high yield bonds surged by double digits
For the year, the Bloomberg Barclays Global Aggregate Bond Index (unhedged), which measures global investment-grade debt performance, returned 6.84%. (All returns cited are in US dollars.) Bonds trading in the US, based on the Bloomberg Barclays US Aggregate Bond Index, rose 8.72%. The US index’s leading component sectors included investment-grade corporate bonds (+14.5%), which benefited from the interest rate cuts and solid fundamentals, along with Treasury inflation-protected securities (+8.4%), commercial mortgage-backed securities (+8.3%), and US Treasury securities (+6.9%). Treasuries with longer maturities rallied in the second and third quarters when trade tensions escalated, which triggered a “flight to quality.” The 10-year US Treasury note’s yield, which moves opposite to its price, opened 2019 at approximately 2.65% and closed the year at 1.92% as trade tensions eased.
The Bloomberg Barclays Municipal Bond Index returned 7.54% for the year. US high yield bonds (debt rated below investment grade), as measured by the ICE BofAML US Cash High Yield Index, returned 14.40%. Accommodative monetary policies, strong corporate earnings, and investors’ quest for enhanced yield supported demand for high yield opportunities. Emerging market debt, based on the J.P. Morgan EMBI Global Diversified Index surged 15.04%. Despite a strong US dollar (relative to most currencies), sovereign debt yields in general drifted lower as inflation was contained in many countries, providing their central banks with latitude to reduce interest rates, which bolstered bond prices.
| | |
The Prudential Series Fund, Conservative Balanced Portfolio | | December 31, 2019 |
Report of the Investment Manager - As of December 31, 2019 (Unaudited)
| | | | | | | | | | | | |
| Average Annual Total Returns | | 1 Year | | | 5 Years | | | 10 Years | |
Portfolio | | | 18.49 | % | | | 6.94 | % | | | 8.67 | % |
Blended Index | | | 19.14 | | | | 7.29 | | | | 8.44 | |
S&P 500 Index | | | 31.46 | | | | 11.69 | | | | 13.55 | |
Past performance does not guarantee future returns. The investment return and principal value of an investment will fluctuate, so that shares, when redeemed, may be worth more or less than their original cost. Current performance may be lower or higher than the past performance.
Portfolio performance is net of fund expenses, but not contract charges, which, if included, would significantly lower the performance quoted. Performance figures may reflect fee waivers and/or expense reimbursements. In the absence of such fee waivers and/or expense reimbursements, performance would be lower.
$10,000 INVESTED OVER 10 YEARS
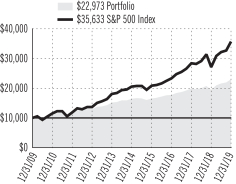
For the year ended December 31, 2019, the Conservative Balanced Portfolio returned 18.49%. The Portfolio underperformed both its Blended Index and the S&P 500 Index.
The Portfolio’s investment objective is total investment return consistent with a conservatively managed diversified portfolio.
What were the market conditions during the reporting period?
Global growth in 2019 (the reporting period) was the weakest in a decade, weighed down by an escalation of the US-China trade war, which hit manufacturing and export sectors hard. Consumer sectors, propped up by strong labor markets and decent wage growth, remained pillars of strength, preventing a more ominous tumble. The US economy slowed from 2018 as the positive impact of the 2017 fiscal tax stimulus faded and four rate hikes by the Federal Reserve (the Fed) in 2018 resulted in tighter financial conditions by the end of that year. Global growth in 2019 also suffered collateral damage from the US-China trade conflict as manufacturing and other sectors in multiple countries were negatively impacted during the period.
With global growth weak and inflation running below target levels across major economies, nearly 50 central banks delivered over 100 interest rate cuts in 2019, the largest cumulative easing since the 2008 financial crisis. In 2019, financial markets posted solid gains across most equity and fixed income asset classes. A key driver of stellar equity market performance was a shift from rate tightening to rate easing by the Fed, which cut interest rates three times in 2019. This helped lead to strong expansion of stock valuation, while earnings were flat to down. Stocks also benefited from a reduction in trade tensions and other geopolitical risks at the end of 2019, as the US and China agreed on a so-called “phase-one” trade deal.
What strategies or holdings affected the Portfolio’s performance?
Asset allocation decisions had a negative impact on the Portfolio’s performance during the reporting period, driven by conservative positioning at the start of the year. At the close of 2018, with investors fearing the prospect of recession, equity markets experienced a sharp spike in volatility. In response, the Portfolio moved to a safer allocation by overweighting bonds and underweighting equities. However, a sharp reversal of risk sentiment in January and February of 2019 led the Portfolio to lag its benchmark index.
Otherwise, the effects from asset allocation were minimal. The remainder of the year saw the Portfolio shift to an average overweight in both equities and bonds, while keeping cash below benchmark weight. A small off-benchmark diversifying exposure to international equities was a drag, as they trailed US equity performance during the year. This was offset by an underweight position in cash, which was outpaced by both equities and fixed income investments. In addition, an off-benchmark position in Treasury inflation-protected securities — closed out in late spring — was a benefit and outpaced the broader fixed income benchmark during its time in the Portfolio.
At the close of 2019, the Portfolio was positioned with an overweight exposure to equities, equally split between domestic and international markets, as well as underweight exposures to fixed income and cash.
For a complete list of holdings, please refer to the Schedule of Investments section of this report. Holdings reflect only long-term investments. Credit Quality/Country Allocation/Holdings/Line of Business are subject to change.
1
| | |
The Prudential Series Fund, Conservative Balanced Portfolio | | December 31, 2019 |
Report of the Investment Manager - As of December 31, 2019 (Unaudited) (Continued)
Presentation of Portfolio Holdings — unaudited
| | | | | | |
| Conservative Balanced Portfolio (As of 12/31/2019) | |
Ten Largest Holdings | | Line of Business | | | (% of Net Assets | ) |
| Apple, Inc. | | Technology Hardware, Storage & Peripherals | | | 2.3% | |
| Microsoft Corp. | | Software | | | 2.3% | |
| Amazon.com, Inc. | | Internet & Direct Marketing Retail | | | 1.4% | |
| Federal National Mortgage Assoc., 3.500%, TBA | | U.S. Government Agency Obligations | | | 1.2% | |
| Facebook, Inc. (Class A Stock) | | Interactive Media & Services | | | 0.9% | |
| Federal National Mortgage Assoc., 4.000%, TBA | | U.S. Government Agency Obligations | | | 0.9% | |
| Berkshire Hathaway, Inc. (Class B Stock) | | Diversified Financial Services | | | 0.8% | |
| JPMorgan Chase & Co. | | Banks | | | 0.8% | |
| Alphabet, Inc. (Class C Stock) | | Interactive Media & Services | | | 0.8% | |
| Federal National Mortgage Assoc., 3.500%, 08/01/49 | | U.S. Government Agency Obligations | | | 0.8% | |
For a complete list of holdings, please refer to the Schedule of Investments section of this report. Holdings reflect only long-term investments. Credit Quality/Country Allocation/Holdings/Line of Business are subject to change.
2
| | |
| The Prudential Series Fund, Diversified Bond Portfolio | | December 31, 2019 |
Report of the Investment Manager - As of December 31, 2019 (Unaudited)
| | | | | | | | | | | | |
| Average Annual Total Returns | | 1 Year | | | 5 Years | | | 10 Years | |
Portfolio | | | 10.90 | % | | | 4.53 | % | | | 5.73 | % |
Bloomberg Barclays U.S. Aggregate Bond Index | | | 8.72 | | | | 3.05 | | | | 3.75 | |
Past performance does not guarantee future returns. The investment return and principal value of an investment will fluctuate, so that shares, when redeemed, may be worth more or less than their original cost. Current performance may be lower or higher than the past performance.
Portfolio performance is net of fund expenses, but not contract charges, which, if included, would significantly lower the performance quoted. Performance figures may reflect fee waivers and/or expense reimbursements. In the absence of such fee waivers and/or expense reimbursements, performance would be lower.
$10,000 INVESTED OVER 10 YEARS
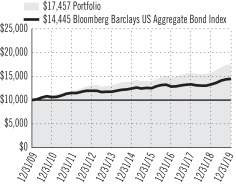
For the year ended December 31, 2019, the Diversified Bond Portfolio returned 10.90%. The Portfolio outperformed the Bloomberg Barclays U.S. Aggregate Bond Index.
The Portfolio’s investment objective is a high level of income over a longer term while providing reasonable safety of capital.
What were the market conditions during the reporting period?
As 2019 concluded, we reached a juncture of several milestones: the end of a decade, two decades into the 21st century, and 40 years into what has undoubtedly been one of the best bond bull markets in history. It’s a logical point to reflect on where we are, where we may be headed, and what might be the most appropriate fixed income investment approach going forward.
In 2019, the 40-year bull market proved that it could still put up some big numbers, with all fixed income sectors posting positive total returns for the year as the Federal Reserve cut interest rates three times, spreads tightened, and Treasury yields declined. (Spreads are yield differentials between securities of comparable maturity.) Some of the top-performing sectors included US long investment-grade corporates (23.9%), emerging markets hard currency debt (15.0%), US investment-grade corporates (14.5%), and US high yield bonds (14.4%). PGIM Fixed Income does not think 2019 was the fixed income market’s grand finale. For some time, long-term developed market interest rates have been low and range bound, while credit spreads (yield differentials between corporate bonds and US Treasuries) have been tighter than average. And yet, the effect of rolling down spread and yield curves, combined with some spread compression and a slight decline in yields, has resulted in sizable returns in three out of the last four years. (Rolling down is a strategy of investing where spreads and yields can change most over a period of time.) Granted, based on current yield and spread levels, the market may be out of room for similar returns — at least for now.
PGIM Fixed Income’s conclusion is straightforward: stay invested in the markets. While this conclusion may sound quaint — or even maniacal, considering the level of yields and spreads — it also has held true over the past several years. The bond market has put up respectable returns despite fears that interest rates have already approached rock-bottom levels and that the business cycle has surely neared its end. The culmination of these factors has proven, in PGIM Fixed Income’s view, that the resulting novel investment environment can provide fertile ground to add value through active management.
What strategies or holdings affected the Portfolio’s performance?
During the reporting period, sector allocation added to performance as the Portfolio’s overweights to high yield, collateralized loan obligations, commercial mortgage-backed securities (CMBS), and emerging markets all added value. An underweight to mortgage-backed securities hurt performance. Individual issue selection was also positive, with positioning in sovereigns, investment-grade corporates, non-agency mortgages, high yield, and CMBS the largest contributors. Security selection in Treasuries limited results. Within its holdings of corporate bonds, the Portfolio benefited from positions in the foreign non-corporate, health care & pharmaceutical and banking sectors, while positions in the chemicals and midstream energy sectors detracted from performance. The combined impact of the Portfolio’s duration and yield curve strategies added to performance for the period. Duration is a measure of a bond’s price sensitivity to interest rate changes over time.
During the period, the Portfolio used interest rate swaps to help manage duration and yield curve exposure. The use of interest rate swaps had a negative impact on performance during the period. In addition, the Portfolio used futures and options to manage interest rate risk, a more efficient
For a complete list of holdings, please refer to the Schedule of Investments section of this report. Holdings reflect only long-term investments. Credit Quality/Country Allocation/Holdings/Line of Business are subject to change.
3
| | |
The Prudential Series Fund, Diversified Bond Portfolio | | December 31, 2019 |
Report of the Investment Manager - As of December 31, 2019 (Unaudited) (Continued)
way of managing interest rate risk than through the purchase and sale of cash bonds. The use of futures and options detracted from the Portfolio’s performance during the period. The Portfolio also used credit derivatives in the form of CDX (an index of credit default swaps) to hedge credit risk or to increase or decrease credit risk. The use of CDX contributed to performance for the period.
Presentation of Portfolio Holdings — unaudited
| | | | | | |
| Diversified Bond Portfolio (As of 12/31/2019) | |
| Credit Quality | | | | | (% of Net Assets | ) |
| AAA | | | | | 38.7% | |
| AA | | | | | 3.5% | |
| A | | | | | 12.7% | |
| BBB | | | | | 22.8% | |
| BB | | | | | 7.3% | |
| B | | | | | 4.5% | |
| CCC | | | | | 0.9% | |
| CC | | | | | 0.1% | |
| C | | | | | 0.2% | |
| NR | | | | | 7.3% | |
| Cash & Equivalents | | | | | 2.0% | |
| Total | | | | | 100.0% | |
Credit ratings reflect the middle rating assigned by a nationally recognized statistical rating organization (NRSRO) such as Moody’s Investor Service, Inc. (Moody’s), S&P Global Ratings (S&P), or Fitch, Inc. (Fitch). Credit ratings reflect the common nomenclature used by both S&P and Fitch. Where applicable, ratings are converted to the comparable S&P/Fitch rating tier nomenclature. These rating agencies are independent, and are widely used. The Not Rated (NR) category consists of securities that have not been rated by a NRSRO. Ratings category may include derivative instruments that could have a negative value. Credit ratings are subject to change.
For a complete list of holdings, please refer to the Schedule of Investments section of this report. Holdings reflect only long-term investments. Credit Quality/Country Allocation/Holdings/Line of Business are subject to change.
4
| | |
| The Prudential Series Fund, Equity Portfolio | | December 31, 2019 |
Report of the Investment Manager - As of December 31, 2019 (Unaudited)
| | | | | | | | | | | | |
| Average Annual Total Returns | | 1 Year | | | 5 Years | | | 10 Years | |
Portfolio: Class I | | | 28.89 | % | | | 10.38 | % | | | 11.21 | % |
Portfolio: Class II | | | 28.36 | | | | 9.94 | | | | 10.77 | |
Russell 1000® Index | | | 31.43 | | | | 11.48 | | | | 13.54 | |
S&P 500 Index | | | 31.46 | | | | 11.69 | | | | 13.55 | |
Past performance does not guarantee future returns. The investment return and principal value of an investment will fluctuate, so that shares, when redeemed, may be worth more or less than their original cost. Current performance may be lower or higher than the past performance.
Portfolio performance is net of fund expenses, but not contract charges, which, if included, would significantly lower the performance quoted. Performance figures may reflect fee waivers and/or expense reimbursements. In the absence of such fee waivers and/or expense reimbursements, performance would be lower.
The Russell 1000® Index is a trademark/service mark of the Frank Russell Company. Russell® is a trademark of the Frank Russell Company.
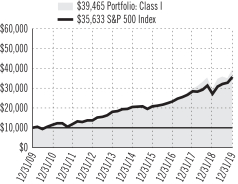
$10,000 INVESTED OVER 10 YEARS1
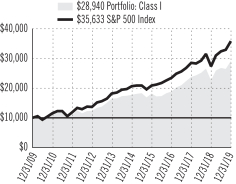
For the year ended December 31, 2019, Equity Portfolio Class I shares returned 28.89% and Class II shares returned 28.36%. The Portfolio’s Class I & II shares underperformed the Russell 1000 Index, and the S&P 500 Index.
The Portfolio’s investment objective is long-term growth of capital.
What were the market conditions during the reporting period?
US equities markets were highly volatile in 2019, unsettled by US-China trade discord; softening economic growth in the US, Europe, and China; and geopolitical uncertainty. Companies across market sectors cited trade tensions as the source of heightened caution in planning and investing. The US political landscape was likewise unsettled, as investigations of interference in the 2016 presidential election unfolded, impeachment hearings against President Donald Trump proceeded, and the 2020 election cycle ramped up. US economic activity showed signs of tempering, with job growth and business activity moderating. Modest wage gains and positive consumption indicated a still-healthy consumer. Markets responded favorably as the Federal Reserve pivoted on monetary policy, lowering the federal funds rate three times in the period to a range of 1.50%-1.75% by the end of the year.
The S&P 500® Index gained 31.46% in 2019, as all 11 sectors within the Index posted positive total returns. Information technology notched the strongest result among all sectors with just over 30% of the Index’s total return. Financials and communication services also helped to drive the Index’s gain. Energy, materials, and real estate posted positive results but lagged the Index. Top-performing individual Index components included Apple Inc., Microsoft Corp., Facebook Inc., Amazon.com Inc., and JPMorgan Chase & Co. Meanwhile, the Index’s weakest performers were Pfizer Inc., Occidental Petroleum Corp., PG&E Corp., Walgreens Co., and The Kraft Heinz Co.
What strategies or holdings affected the Portfolio’s performance?
The Portfolio posted a solid double-digit gain but slightly trailed the Index over the period. Information technology holdings such as Apple, Microsoft, and MasterCard Inc. contributed to relative performance. Apple’s fundamental strength reflects the global proliferation of the company’s iOS platform across the personal device landscape (smartphone, tablet, etc.). With its huge installed base, Apple saw rapid growth in service business subscriptions during the period and is poised to benefit from a potentially robust product cycle that incorporates fifth-generation (5G) wireless standards. Performance was also helped by overweighting data processing & outsourced services stocks, including MasterCard. The company delivered solid revenues and its earnings exceeded consensus estimates. At the same time, MasterCard saw solid growth in gross dollar volume (the total value of cardholder transactions and transactions processed) as the firm continued to benefit from the long-term shift from cash to electronic credit and debit transactions. Meanwhile, underexposure to technology hardware storage & peripherals and systems software was a negative and partially offset the Portfolio’s gains within the sector.
Stock selection within consumer staples and materials also contributed to relative performance. Despite downward earnings-per-share revisions on average across the financials sector, a less dovish Federal Reserve and fee growth contributed to the overall gain for financial stocks. Investors’ expectations for moderate, but positive gross domestic product growth, along with a stable yield curve, helped to shift market sentiment that benefited shares of JPMorgan Chase and Bank of America Corp.
| 1 | The graph is based on the performance of Class I shares. Performance of Class II shares will be lower due to differences in the fee structure. Class II shares have associated 12b-1 and administrative fees at an annual rate of 0.25% and 0.15%, respectively, of the average daily net assets of the Class II shares. |
For a complete list of holdings, refer to the Schedule of Investments section of this report.
5
| | |
The Prudential Series Fund, Equity Portfolio | | December 31, 2019 |
Report of the Investment Manager - As of December 31, 2019 (Unaudited) (Continued)
Conversely, Twilio Inc. shares hurt performance. Twilio’s cloud communications platform enables software developers to build, scale, and operate communications functions such as phone calls, text messages, video, and email within its mobile applications. Billing errors resulted in the issuance of one-time credits to a handful of customers.
An underweight allocation to the health care sector also hurt, specifically within pharmaceuticals. Shares of global pharmaceuticals company Pfizer fell sharply in July after the firm announced a deal to merge Pfizer’s Upjohn unit (off-patent branded drugs business) with competitor Mylan to form a new entity. The potential transaction was ill-received by the market.
Shares of apparel accessories & luxury goods maker Tapestry Inc. declined about 22% in August 2019 after poor execution and performance from its Kate Spade brand and an operating loss at its Stuart Weitzman brand.
Presentation of Portfolio Holdings — unaudited
| | | | | | |
| Equity Portfolio (As of 12/31/2019) | |
| Ten Largest Holdings | | Line of Business | | | (% of Net Assets | ) |
| Apple, Inc. | | Technology Hardware, Storage & Peripherals | | | 4.3% | |
| Microsoft Corp. | | Software | | | 3.4% | |
| Amazon.com, Inc. | | Internet & Direct Marketing Retail | | | 3.0% | |
| Walt Disney Co. (The) | | Entertainment | | | 2.8% | |
| AstraZeneca PLC (United Kingdom), ADR | | Pharmaceuticals | | | 2.8% | |
| Alphabet, Inc. (Class A Stock) | | Interactive Media & Services | | | 2.6% | |
| JPMorgan Chase & Co. | | Banks | | | 2.5% | |
| Mastercard, Inc. (Class A Stock) | | IT Services | | | 2.2% | |
| Bank of America Corp. | | Banks | | | 2.1% | |
| salesforce.com, Inc. | | Software | | | 2.0% | |
For a complete list of holdings, please refer to the Schedule of Investments section of this report. Holdings reflect only long-term investments. Credit Quality/Country Allocation/Holdings/Line of Business are subject to change.
6
| | |
| The Prudential Series Fund, Flexible Managed Portfolio | | December 31, 2019 |
Report of the Investment Manager - As of December 31, 2019 (Unaudited)
| | | | | | | | | | | | |
| Average Annual Total Returns | | 1 Year | | | 5 Years | | | 10 Years | |
Portfolio | | | 19.87 | % | | | 7.68 | % | | | 9.85 | % |
Blended Index | | | 21.79 | | | | 8.26 | | | | 9.59 | |
S&P 500 Index | | | 31.46 | | | | 11.69 | | | | 13.55 | |
Past performance does not guarantee future returns. The investment return and principal value of an investment will fluctuate, so that shares, when redeemed, may be worth more or less than their original cost. Current performance may be lower or higher than the past performance.
Portfolio performance is net of fund expenses, but not contract charges, which, if included, would significantly lower the performance quoted. Performance figures may reflect fee waivers and/or expense reimbursements. In the absence of such fee waivers and/or expense reimbursements, performance would be lower.
$10,000 INVESTED OVER 10 YEARS
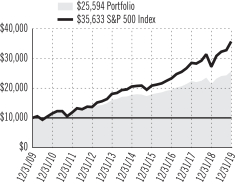
For the year ended December 31, 2019, the Flexible Managed Portfolio returned 19.87%. The Portfolio underperformed both its Blended Index and the S&P 500 Index.
The Portfolio’s investment objective is total investment return consistent with an aggressively managed diversified portfolio.
What were the market conditions during the reporting period?
Global growth in 2019 (the reporting period) was the weakest in a decade, weighed down by an escalation of the US-China trade war, which hit manufacturing and export sectors hard. Consumer sectors, propped up by strong labor markets and decent wage growth, remained pillars of strength, preventing a more ominous tumble. The US economy slowed from 2018 as the positive impact of the 2017 fiscal tax stimulus faded and four rate hikes by the Federal Reserve (the Fed) in 2018 resulted in tighter financial conditions by the end of that year. Global growth in 2019 also suffered collateral damage from the US-China trade conflict as manufacturing and other sectors in multiple countries were negatively impacted during the period.
With global growth weak and inflation running below target levels across major economies, nearly 50 central banks delivered over 100 interest rate cuts in 2019, the largest cumulative easing since the 2008 financial crisis. In 2019, financial markets posted solid gains across most equity and fixed income asset classes. A key driver of stellar equity market performance was a shift from rate tightening to rate easing by the Fed, which cut interest rates three times in 2019. This helped lead to strong expansion of stock valuation, while earnings were flat to down. Stocks also benefited from a reduction in trade tensions and other geopolitical risks at the end of 2019, as the US and China agreed on a so-called “phase-one” trade deal.
What strategies or holdings affected the Portfolio’s performance?
Subadvisors detracted from the Portfolio’s returns, accounting for the majority of its underperformance during the period. Specifically, the core US equity subadvisor had a difficult year as a bias toward value stocks failed to keep pace with strong performance among growth equities during the period. The fixed income subadvisor ended the year with a positive contribution.
Asset allocation decisions had a negative impact on performance in 2019, driven by conservative positioning at the start of the year. At the close of 2018, with investors fearing the prospect of recession, equity markets experienced a sharp spike in volatility. In response, the Portfolio moved to a safer allocation by overweighting bonds and underweighting equities. However, a sharp reversal of risk sentiment in January and February of 2019 led the Portfolio to lag its benchmark index.
Otherwise, the effects from asset allocation were minimal. The remainder of the year saw the Portfolio shift to an average overweight in both equities and bonds, while keeping cash below benchmark weight. A small off-benchmark diversifying exposure to international equities was a drag, as they trailed US equity performance during the year. This was offset by an underweight in cash, which was outpaced by both equities and fixed income investments.
At the close of 2019, the Portfolio was positioned with an overweight exposure to equities, equally split between domestic and international markets, as well as underweight exposures to fixed income and cash.
For a complete list of holdings, please refer to the Schedule of Investments section of this report. Holdings reflect only long-term investments. Credit Quality/Country Allocation/Holdings/Line of Business are subject to change.
7
| | |
The Prudential Series Fund, Flexible Managed Portfolio | | December 31, 2019 |
Report of the Investment Manager - As of December 31, 2019 (Unaudited) (Continued)
Presentation of Portfolio Holdings — unaudited
| | | | | | |
| Flexible Managed Portfolio (As of 12/31/2019) | |
Ten Largest Holdings | | Line of Business | | | (% of Net Assets | ) |
| Apple, Inc. | | Technology Hardware, Storage & Peripherals | | | 3.4% | |
| Microsoft Corp. | | Software | | | 3.2% | |
| Facebook, Inc. (Class A Stock) | | Interactive Media & Services | | | 1.5% | |
| Bank of America Corp. | | Banks | | | 1.2% | |
| Amazon.com, Inc. | | Internet & Direct Marketing Retail | | | 1.1% | |
| Alphabet, Inc. (Class A Stock) | | Interactive Media & Services | | | 1.0% | |
| Procter & Gamble Co. (The) | | Household Products | | | 1.0% | |
| Intel Corp. | | Semiconductors & Semiconductor Equipment | | | 1.0% | |
| Federal National Mortgage Assoc., 3.500%, TBA | | U.S. Government Agency Obligations | | | 1.0% | |
| Alphabet, Inc. (Class C Stock) | | Interactive Media & Services | | | 0.9% | |
For a complete list of holdings, please refer to the Schedule of Investments section of this report. Holdings reflect only long-term investments. Credit Quality/Country Allocation/Holdings/Line of Business are subject to change.
8
| | |
| The Prudential Series Fund, Global Portfolio | | December 31, 2019 |
Report of the Investment Manager - As of December 31, 2019 (Unaudited)
| | | | | | | | | | | | |
| Average Annual Total Returns | | 1 Year | | | 5 Years | | | 10 Years | |
Portfolio | | | 30.39 | % | | | 10.04 | % | | | 10.08 | % |
MSCI World Index (GD) | | | 28.40 | | | | 9.36 | | | | 10.08 | |
Past performance does not guarantee future returns. The investment return and principal value of an investment will fluctuate, so that shares, when redeemed, may be worth more or less than their original cost. Current performance may be lower or higher than the past performance.
Portfolio performance is net of fund expenses, but not contract charges, which, if included, would significantly lower the performance quoted. Performance figures may reflect fee waivers and/or expense reimbursements. In the absence of such fee waivers and/or expense reimbursements, performance would be lower.
$10,000 INVESTED OVER 10 YEARS
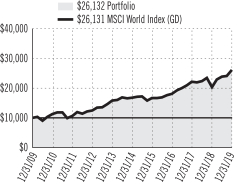
For the year ended December 31, 2019, the Global Portfolio returned 30.39%. The Portfolio outperformed the MSCI World Index (GD).
The Portfolio’s investment objective is long-term growth of capital.
What were the market conditions during the reporting period?
Global economic growth in 2019 was the weakest in a decade, weighed down by an escalation of the US-China trade war. However, it was a great year for financial markets, with solid gains across most asset classes, driven by valuations for equities and lower yields for fixed income. The subadvisor expects a moderate improvement in global economic growth in 2020 rather than a strong rebound, fueled by monetary stimulus, potential fiscal stimulus, and reduced geopolitical uncertainty.
What strategies or holdings affected the Portfolio’s performance?
In aggregate, the Portfolio’s subadvisors posted positive relative performance for the reporting period, with three of the four outperforming their respective style-specific benchmarks. The Brown Large-Cap Growth and William Blair sleeves significantly outperformed the Russell 1000 Growth Index and the MSCI EAFE Index, respectively. At the end of the period, both subadvisors’ sleeves had higher growth exposure relative to their benchmarks, adding to returns as the growth style continued its strong run of performance during the year.
The Brown sleeve’s outperformance was mainly driven by strong stock selection within the health care sector, while the William Blair sleeve added value with an overweight to the technology sector.
Presentation of Portfolio Holdings — unaudited
| | | | | | | | |
| Global Portfolio (As of 12/31/2019) | |
Ten Largest Holdings | | Line of Business | | Country | | | (% of Net Assets | ) |
| Microsoft Corp. | | Software | | United States | | | 2.1% | |
| Thermo Fisher Scientific, Inc. | | Life Sciences Tools & Services | | United States | | | 1.4% | |
| Zoetis, Inc. | | Pharmaceuticals | | United States | | | 1.4% | |
| Amazon.com, Inc. | | Internet & Direct Marketing Retail | | United States | | | 1.3% | |
| Visa, Inc. (Class A Stock) | | IT Services | | United States | | | 1.3% | |
| Alibaba Group Holding Ltd. | | Internet & Direct Marketing Retail | | China | | | 1.2% | |
| SBA Communications Corp. | | Equity Real Estate Investment Trusts (REITs) | | United States | | | 1.2% | |
| JPMorgan Chase & Co. | | Banks | | United States | | | 1.2% | |
| Wells Fargo & Co. | | Banks | | United States | | | 1.2% | |
| Sherwin-Williams Co. (The) | | Chemicals | | United States | | | 1.1% | |
For a complete list of holdings, please refer to the Schedule of Investments section of this report. Holdings reflect only long-term investments. Credit Quality/Country Allocation/Holdings/Line of Business are subject to change.
9
| | |
| The Prudential Series Fund, Government Income Portfolio | | December 31, 2019 |
Report of the Investment Manager - As of December 31, 2019 (Unaudited)
| | | | | | | | | | | | |
| Average Annual Total Returns | | 1 Year | | | 5 Years | | | 10 Years | |
Portfolio | | | 6.61 | % | | | 2.58 | % | | | 3.43 | % |
Bloomberg Barclays Government Bond Index | | | 6.83 | | | | 2.36 | | | | 3.03 | |
Past performance does not guarantee future returns. The investment return and principal value of an investment will fluctuate, so that shares, when redeemed, may be worth more or less than their original cost. Current performance may be lower or higher than the past performance.
Portfolio performance is net of fund expenses, but not contract charges, which, if included, would significantly lower the performance quoted. Performance figures may reflect fee waivers and/or expense reimbursements. In the absence of such fee waivers and/or expense reimbursements, performance would be lower.
$10,000 INVESTED OVER 10 YEARS
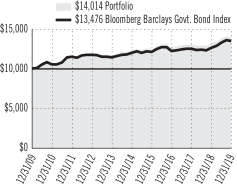
For the year ended December 31, 2019, the Government Income Portfolio returned 6.61%. The Portfolio underperformed the Bloomberg Barclays Government Bond Index.
The Portfolio’s investment objective is a high level of income over the long-term consistent with the preservation of capital.
What were the market conditions during the reporting period?
As 2019 concluded, we reached a juncture of several milestones: the end of a decade, two decades into the 21st century, and 40 years into what has undoubtedly been one of the best bond bull markets in history. It’s a logical point to reflect on where we are, where we may be headed, and what might be the most appropriate fixed income investment approach going forward.
In 2019, the 40-year bull market proved that it could still put up some big numbers, with all fixed income sectors posting positive total returns for the year as the Federal Reserve (the Fed) cut interest rates three times, spreads tightened, and Treasury yields declined. (Spreads are yield differentials between securities of comparable maturity.) Some of the top-performing sectors included US long investment-grade corporates (23.9%), emerging markets hard currency debt (15.0%), US investment-grade corporates (14.5%), and US high yield bonds (14.4%). PGIM Fixed Income does not think 2019 was the fixed income market’s grand finale. For some time, long-term developed market interest rates have been low and range bound, while credit spreads (yield differentials between corporate bonds and US Treasuries) have been tighter than average. And yet, the effect of rolling down spread and yield curves, combined with some spread compression and a slight decline in yields, has resulted in sizable returns in three out of the last four years. (Rolling down is a strategy of investing where spreads and yields can change most over a period of time.) Granted, based on current yield and spread levels, the market may be out of room for similar returns — at least for now.
The Fed is one of several developed market central banks that will likely remain on hold through much, if not all, of 2020. Yet the Fed’s ongoing initiatives in 2020 — including its significant Treasury bill purchases and series of repurchase agreement operations — have shaped some of PGIM Fixed Income’s opportunistic positions in the new year.
In terms of nominal US interest rates, PGIM Fixed Income anticipates that the 10-year Treasury yield could trade in a range of 1.50% to 2.25% in the first quarter of 2020, with the potential for some slight bear steepening. (Bear steepening is a change in the yield curve wherein longer-term yields rise faster than short-term yields.) However, an increase in the 10-year yield above 2.00% would be difficult to sustain given the prevalence of low-yielding developed market rates globally, in PGIM Fixed Income’s view.
What strategies or holdings affected the Portfolio’s performance?
During the reporting period, sector allocation was a strong driver of the Portfolio’s outperformance, highlighted by overweights to commercial mortgage-backed securities (CMBS), collateralized loan obligations (CLOs), and agencies. Security selection was negative for the period, with positioning in Treasuries, CMBS, swaps, and mortgage-backed securities limiting results. Security selection in CLOs added to performance. The Portfolio’s positioning for a flatter US yield curve was negative, while its tactical duration positioning was a strong contributor. Duration is a measure of a bond’s price sensitivity to interest rate changes over time.
For a complete list of holdings, please refer to the Schedule of Investments section of this report. Holdings reflect only long-term investments. Credit Quality/Country Allocation/Holdings/Line of Business are subject to change.
10
| | |
The Prudential Series Fund, Government Income Portfolio | | December 31, 2019 |
Report of the Investment Manager - As of December 31, 2019 (Unaudited) (Continued)
During the period, the Portfolio used interest rate swaps to help manage duration and yield curve exposure. The use of interest rate swaps had a negative impact on performance during the period. The Portfolio used futures and options to manage interest rate risk, which is a more efficient way of managing interest rate risk than through the purchase and sale of cash bonds. The use of futures and options collectively hurt the Portfolio’s performance during the period.
Presentation of Portfolio Holdings — unaudited
| | | | | | |
| Government Income Portfolio (As of 12/31/2019) | |
| Credit Quality | | | | | (% of Net Assets | ) |
| AAA | | | | | 97.0% | |
| AA | | | | | 2.4% | |
| NR | | | | | -1.1% | |
| Cash & Equivalents | | | | | 1.7% | |
| Total | | | | | 100.0% | |
Credit ratings reflect the middle rating assigned by a nationally recognized statistical rating organization (NRSRO) such as Moody’s Investor Service, Inc. (Moody’s), S&P Global Ratings (S&P), or Fitch, Inc. (Fitch). Credit ratings reflect the common nomenclature used by both S&P and Fitch. Where applicable, ratings are converted to the comparable S&P/ Fitch rating tier nomenclature. These rating agencies are independent, and are widely used. The Not Rated (NR) category consists of securities that have not been rated by a NRSRO. Ratings category may include derivative instruments that could have a negative value. Credit ratings are subject to change.
For a complete list of holdings, please refer to the Schedule of Investments section of this report. Holdings reflect only long-term investments. Credit Quality/Country Allocation/Holdings/Line of Business are subject to change.
11
| | |
| The Prudential Series Fund, Government Money Market Portfolio | | December 31, 2019 |
Report of the Investment Manager - As of December 31, 2019 (Unaudited)
| | | | | | | | | | | | | | | | |
Average Annual Total
Returns | | 7-Day*
Current
Net Yield | | | 1 Year | | | 5 Years | | | 10 Years | |
Portfolio | | | 1.32 | | | | 1.92 | % | | | 0.82 | % | | | 0.42 | % |
Lipper US Government Money Market Index | | | N/A | | | | 1.71 | | | | 0.73 | | | | 0.37 | |
Past performance does not guarantee future returns. The investment return and principal value of an investment will fluctuate, so that shares, when redeemed, may be worth more or less than their original cost. Current performance may be lower or higher than the past performance.
The yield quotation more closely reflects the current earnings of the Portfolio than the total return quotation. Portfolio performance is net of fund expenses, but not contract charges, which, if included, would significantly lower the performance quoted. Performance figures may reflect fee waivers and/or expense reimbursements. In the absence of such fee waivers and/or expense reimbursements, performance would be lower.
7-DAY CURRENT NET YIELD*
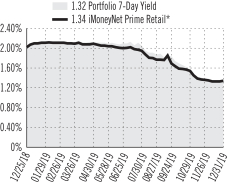
For the year ended December 31, 2019, the Government Money Market Portfolio returned 1.92%. The Portfolio outperformed the Lipper US Government Money Market Index.
The Portfolio’s investment objective is to seek maximum current income consistent with the stability of capital and maintenance of liquidity.
What were the market conditions during the reporting period?
As 2019 concluded, we reached a juncture of several milestones: the end of a decade, two decades into the 21st century, and 40 years into what has undoubtedly been one of the best bond bull markets in history. It’s a logical point to reflect on where we are, where we may be headed, and what might be the most appropriate fixed income investment approach going forward.
In 2019, the 40-year bull market proved that it could still put up some big numbers, with all fixed income sectors posting positive total returns for the year as the Federal Reserve cut interest rates three times, spreads tightened, and Treasury yields declined. (Spreads are yield differentials between securities of comparable maturity.) Some of the top-performing sectors included US long investment-grade corporates (23.9%), emerging markets hard currency debt (15.0%), US investment-grade corporates (14.5%), and US high yield bonds (14.4%). PGIM Fixed Income does not think 2019 was the fixed income market’s grand finale. For some time, long-term developed market interest rates have been low and range bound, while credit spreads (yield differentials between corporate bonds and US Treasuries) have been tighter than average. And yet, the effect of rolling down spread and yield curves, combined with some spread compression and a slight decline in yields, has resulted in sizable returns in three out of the last four years. (Rolling down is a strategy of investing where spreads and yields can change most over a period of time.) Granted, based on current yield and spread levels, the market may be out of room for similar returns — at least for now.
The Fed is one of several developed market central banks that will likely remain on hold through much, if not all, of 2020. Yet the Fed’s ongoing initiatives in 2020 — including its significant Treasury bill purchases and series of repurchase agreement operations — have shaped some of PGIM Fixed Income’s opportunistic positions in the new year.
Taxable government money market funds continued to see large flows in 2019 ($256 billion net flow). This was primarily driven by a flat yield curve in the US as more money moved to the front, or short-term, end of the curve in an effort to reduce duration risk and credit risk without giving up much yield. (Duration is a measure of a bond’s price sensitivity to interest rate changes over time.) For instance, as of December 31, 2019, the average taxable government money market fund yielded 1.64%, which compared favorably to the Bloomberg Barclays US Aggregate Bond Index, which yielded 2.31% and had 5.87 years of duration on that date. The three-month LIBOR (London Interbank Offered Rate) ended 2019 at 1.91%. (Source: Morningstar, as of December 31, 2019.)
What strategies or holdings affected the Portfolio’s performance?
For the first half of 2019, the Fed remained stable and, with the markets pricing in multiple rate cuts, the Portfolio’s weighted average maturity (WAM) lengthened, getting longer than the peer group average. At the same time, the Portfolio’s weighted average life (WAL) extended through purchases of
* Source: iMoneyNet, Inc. based on 97 funds in the iMoneyNet Prime Retail universe. Weekly 7-day current net yields of the Government Money Market Portfolio and the iMoneyNet Prime Retail universe as of 12/31/2019.
An investment in the Government Money Market Portfolio is not insured or guaranteed by the Federal Deposit Insurance Corporation or any other government agency. Although the Portfolio seeks to preserve the value of your investment at $10.00 per share, it is possible to lose money by investing in the Portfolio.
For a complete list of holdings, please refer to the Schedule of Investments section of this report.
12
| | |
The Prudential Series Fund, Government Money Market Portfolio | | December 31, 2019 |
Report of the Investment Manager - As of December 31, 2019 (Unaudited) (Continued)
floating rate securities versus peers in anticipation of expected lower future interest rates. As the anticipated Fed rate cuts were implemented three times in the second half of 2019, the Portfolio’s WAM remained stable into the July rate cut and lengthened slightly ahead of the October cut. The Portfolio’s WAL shortened after the October cut but remained longer versus its peers as it became clear the Fed was reaching the end of its easing cycle.
Throughout 2019, the Portfolio took advantage of wider floating rate spreads and increased its position in LIBOR floaters. Floaters are bonds whose coupon rates reset based on each security’s terms over their life.
Additionally, to take advantage of changing relative value across security types, the Portfolio shifted its positioning in agency discount notes, repurchase agreements, and US Treasuries throughout the period.
Presentation of Portfolio Holdings — unaudited
| | | | | | | | |
| Government Money Market Portfolio (As of 12/31/2019) | |
| Ten Largest Holdings | | Interest Rate | | Maturity Date | | | (% of Net Assets | ) |
| Bank of America Securities, Inc. | | 1.570% | | 01/02/2020 | | | 4.7% | |
| Federal Home Loan Bank | | 1.599% | | 01/30/2020 | | | 3.8% | |
| Federal Home Loan Bank | | 1.594% | | 03/06/2020 | | | 3.2% | |
| U.S. Treasury Bills | | 1.545% | | 01/07/2020 | | | 3.2% | |
| U.S. Treasury Bills | | 1.562% | | 02/13/2020 | | | 2.3% | |
| Federal Home Loan Mortgage Corp. | | 1.560% | | 07/10/2020 | | | 2.2% | |
| Federal Home Loan Bank | | 1.569% | | 01/15/2020 | | | 2.2% | |
| Federal Farm Credit Bank | | 1.730% | | 01/16/2020 | | | 2.0% | |
| Federal Home Loan Bank | | 1.560% | | 05/22/2020 | | | 2.0% | |
| Federal Home Loan Bank | | 1.589% | | 02/03/2020 | | | 2.0% | |
Holdings reflect only short-term investments.
For a complete list of holdings, please refer to the Schedule of Investments section of this report. Credit Quality/Country Allocation/Holdings/Line of Business are subject to change.
13
| | |
The Prudential Series Fund, High Yield Bond Portfolio | | December 31, 2019 |
Report of the Investment Manager - As of December 31, 2019 (Unaudited)
| | | | | | | | | | | | |
| Average Annual Total Returns | | 1 Year | | | 5 Years | | | 10 Years | |
Portfolio | | | 16.33 | % | | | 7.02 | % | | | 7.81 | % |
Bloomberg Barclays US High Yield 1% Issuer Capped Index | | | 14.27 | | | | 6.10 | | | | 7.50 | |
Past performance does not guarantee future returns. The investment return and principal value of an investment will fluctuate, so that shares, when redeemed, may be worth more or less than their original cost. Current performance may be lower or higher than the past performance.
Portfolio performance is net of fund expenses, but not contract charges, which, if included, would significantly lower the performance quoted. Performance figures may reflect fee waivers and/or expense reimbursements. In the absence of such fee waivers and/or expense reimbursements, performance would be lower.
$10,000 INVESTED OVER 10 YEARS
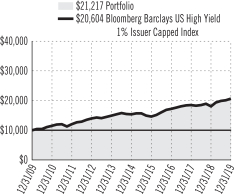
For the year ended December 31, 2019, the High Yield Bond Portfolio returned 16.33%. The Portfolio outperformed the Bloomberg Barclays US High Yield 1% Issuer Capped Index.
The Portfolio’s objective is high total return.
What were market conditions during the reporting period?
The high yield market came roaring out of the gates to start 2019, as dovish language from the Federal Reserve (the Fed) and optimism surrounding US-China trade discussions fueled risky assets. Throughout the second quarter, fear of a global economic slowdown worsened, inducing volatility in the market. However, dovish commentary from the Fed in early June sparked a rebound in risky assets, leaving bond prices essentially flat for the quarter. Sentiment shifted somewhat during the third quarter amid a backdrop of weakening global economic data and the aggressive central bank actions across the globe to combat it. The high yield market posted solid returns in the fourth quarter, the bulk of which came in December, as an apparent “phase one” US-China trade deal, a resounding Conservative Party election victory in the United Kingdom that put Brexit back on track, and a Federal Open Market Committee meeting that left interest rates on hold all helped to alleviate uncertainties overhanging the market.
For the year, the Bloomberg Barclays 1% Issuer Constrained Index returned 14.27%. By quality, BB-rated credits fared the best, posting a total return of 15.5%, while B-rated bonds and CCC-rated bonds returned 14.7% and 9.4%, respectively. By industry, financials, retail, and cable were the outperformers, while energy, airlines, and paper lagged the broader market. Moody’s 12-month US speculative grade default rate ended November at 4.0%, up from 2.8% at the end of 2018.
What strategies or holdings affected the Portfolio’s performance?
During the reporting period, the Portfolio’s relative outperformance was driven largely by broad-based issue selection, principally within the electric utilities, metals & mining, and healthcare & pharmaceutical sectors. Issue selection within the homebuilders and media & entertainment sectors also boosted returns.
A few of the overall largest single-name contributors included overweights to Genon (electric utilities) and Wind Tre Spa (telecom) and underweights to EP Energy (upstream energy) and Frontier (telecom). This was partially offset by issue selection within the midstream energy and automotive sectors, which detracted from performance. Overweights to Alta Mesa (upstream energy) and Digicel (telecom) were the largest single-name detractors from performance.
Having more risk on in the Portfolio relative to the benchmark was also a large contributor to returns as spreads rallied during the period. Overall industry selection was mixed during the period. Overweights to home builders and electric utilities added to performance. This was mostly offset by an underweight to banking, which detracted from returns.
During the period, the Portfolio used US Treasury futures to manage the Portfolio’s interest rate risk, a more efficient way of managing interest rate risk than through the purchase and sale of cash bonds. The use of futures and foreign exchange derivatives had no material impact on the Portfolio’s performance during the period. The Portfolio used credit derivatives to manage its overall risk profile. The impact was modestly negative.
For a complete list of holdings, please refer to the Schedule of Investments section of this report. Holdings reflect only long-term investments. Credit Quality/Country Allocation/Holdings/Line of Business are subject to change.
14
| | |
The Prudential Series Fund, High Yield Bond Portfolio | | December 31, 2019 |
Report of the Investment Manager - As of December 31, 2019 (Unaudited) (Continued)
Presentation of Portfolio Holdings — unaudited
| | | | | | |
| High Yield Bond (As of 12/31/2019) | |
| Credit Quality | | | | | (% of Net Assets | ) |
| AAA | | | | | 11.1% | |
| BBB | | | | | 2.0% | |
| BB | | | | | 24.3% | |
| B | | | | | 38.6% | |
| CCC | | | | | 19.8% | |
| CC | | | | | 0.7% | |
| C | | | | | 0.7% | |
| NR | | | | | 0.7% | |
| Cash & Equivalents | | | | | 2.1% | |
| Total | | | | | 100.0% | |
Credit ratings reflect the middle rating assigned by a nationally recognized statistical rating organization (NRSRO) such as Moody’s Investor Service, Inc. (Moody’s), S&P Global Ratings (S&P), or Fitch, Inc. (Fitch). Credit ratings reflect the common nomenclature used by both S&P and Fitch. Where applicable, ratings are converted to the comparable S&P/Fitch rating tier nomenclature. These rating agencies are independent, and are widely used. The Not Rated (NR) category consists of securities that have not been rated by a NRSRO. Ratings category may include derivative instruments that could have a negative value. Credit ratings are subject to change.
For a complete list of holdings, please refer to the Schedule of Investments section of this report. Holdings reflect only long-term investments. Credit Quality/Country Allocation/Holdings/Line of Business are subject to change.
15
| | |
| The Prudential Series Fund, Jennison Portfolio | | December 31, 2019 |
Report of the Investment Manager - As of December 31, 2019 (Unaudited)
| | | | | | | | | | | | |
| Average Annual Total Returns | | 1 Year | | | 5 Years | | | 10 Years | |
Portfolio: Class I | | | 33.34 | % | | | 14.85 | % | | | 14.72 | % |
Portfolio: Class II | | | 32.82 | | | | 14.39 | | | | 14.26 | |
Russell 1000® Growth Index | | | 36.39 | | | | 14.63 | | | | 15.22 | |
S&P 500 Index | | | 31.46 | | | | 11.69 | | | | 13.55 | |
Past performance does not guarantee future returns. The investment return and principal value of an investment will fluctuate, so that shares, when redeemed, may be worth more or less than their original cost. Current performance may be lower or higher than the past performance.
Portfolio performance is net of fund expenses, but not contract charges, which, if included, would significantly lower the performance quoted. Performance figures may reflect fee waivers and/or expense reimbursements. In the absence of such fee waivers and/or expense reimbursements, performance would be lower.
The Russell 1000® Growth Index is a trademark/service of the Frank Russell Company. Russell® is a trademark of the Frank Russell Company.
$10,000 INVESTED OVER 10 YEARS1
For the year ended December 31, 2019, the Jennison Portfolio Class I shares returned 33.34% and Class II shares returned 32.82%. The Portfolio’s Class I & II shares underperformed the Russell 1000 Growth Index and outperformed the S&P 500 Index.
The Portfolio’s investment objective is long-term growth of capital.
What were the market conditions during the reporting period?
US equities markets were highly volatile in 2019, unsettled by US-China trade discord; softening economic growth in the US, Europe, and China; and geopolitical uncertainty. Companies across market sectors cited trade tensions as the source of heightened caution in planning and investing. The US political landscape was likewise unsettled, as investigations of interference in the 2016 presidential election unfolded, impeachment hearings against President Trump proceeded, and the 2020 election cycle ramped up. US economic activity showed signs of tempering, with job growth and business activity moderating. Modest wage gains and positive consumption indicated a still-healthy consumer. Markets responded favorably as the US Federal Reserve pivoted on monetary policy, lowering the federal funds rate three times in the period to 1.50%-1.75% at the end of the year.
The Russell 1000® Growth benchmark advanced strongly in 2019. Every sector in the Index rose, but only information technology outperformed the overall index. Communication services and financial services performed essentially in line with the benchmark, while energy and health care lagged the most.
What strategies or holdings affected the Portfolio’s performance?
Consumer discretionary positions were strong positive contributors to the Portfolio’s absolute and relative performance. Alibaba Group Holding Ltd., one of the world’s largest e-commerce companies, benefited from significant revenue synergies of its various segments, laying the groundwork for strong, durable top-line growth. For yoga-inspired athletic apparel retailer Lululemon Athletica Inc., new products, integrated marketing, and online sales momentum combined with a high-end customer base and athleisure fashion trends to drive strong customer traffic, sales conversion, and comparable store sales. Athletic footwear and apparel giant Nike Inc. generated impressive earnings, revenue, and gross margins on the strength of its execution and the Nike brand. The company’s growth opportunities include e-commerce and innovation in apparel and manufacturing technology.
Stock selection was also beneficial in consumer staples, where Estée Lauder Companies Inc. has enhanced its strong brand portfolio in the fast-growing luxury beauty care market with complementary acquisitions and subsequent brand development. Costco Wholesale Corp. was helped by a consistent stream of membership fee income that allowed for low prices and broad product selection, which led to high inventory turnover.
In financials, S&P Global Inc.benefited from secular trends such as debt market development abroad, disintermediation of securities markets, and passive investing. S&P’s financial services and business information units have solid fundamentals, significant barriers to entry, substantial recurring revenue, and attractive long-term growth opportunities.
The Portfolio’s information technology holdings rose significantly but lagged the sector return within the benchmark, as gains from Apple Inc., Microsoft Corp., MasterCard Inc., Visa Inc., Adobe Inc., and Nvidia Corp. were partially offset by declines in Twilio Inc., SAP SE, and Taiwan
| 1 | The graph is based on the performance of Class I shares. Performance of Class II shares will be lower due to differences in the fee structure. Class II shares have associated12b-1 and administrative fees at an annual rate of 0.25% and 0.15%, respectively, of the average daily net assets of the Class II shares. |
For a complete list of holdings, refer to the Schedule of Investments section of this report.
16
| | |
The Prudential Series Fund, Jennison Portfolio | | December 31, 2019 |
Report of the Investment Manager - As of December 31, 2019 (Unaudited) (Continued)
Semiconductor Manufacturing Company, Ltd. Apple’s fundamental strength reflects the proliferation of the iOS platform across the global mobile phone, tablet, and personal device landscape. With its huge installed base, Apple is benefiting from rapid growth in service business subscriptions — a key source of recurring revenue. In 2020, a potentially robust product cycle for Apple incorporates fifth-generation (5G) wireless standards. Payments companies continue to benefit from the long-term shift from cash to electronic credit and debit transactions. In particular, MasterCard and Visa maintain strong market positions with high barriers to entry, pricing power, and solid operating leverage potential. Microsoft and Adobe continue to offer mission-critical cloud-based applications and services that are creating fundamental changes in the way businesses operate. Nvidia is focused on key high-growth markets where it can leverage its graphics semiconductor expertise to offer high-value-added solutions.
Twilio’s cloud communications platform enables software developers to build, scale, and operate communications functions such as phone calls, text messages, video, and e-mail within their mobile applications. Billing errors resulted in the issuance of one-time credits to a handful of customers during the period. SAP, the world’s largest vendor of enterprise resource planning software, faced challenges during the period as it stepped up its cloud-based offerings. Taiwan Semiconductor shares, like those of many semiconductor companies, declined during the period on worries that US-China trade discord could depress chip demand. The Portfolio sold its position in Taiwan Semiconductor in May 2019 and also sold its position in SAP in September 2019.
In industrials, ride-sharing company Uber Technologies Inc. reported bigger-than-expected losses, raising concerns that the company’s path to profitability could be longer than anticipated.
Presentation of Portfolio Holdings — unaudited
| | | | | | |
| Jennison Portfolio (As of 12/31/2019) | |
| Ten Largest Holdings | | Line of Business | | | (% of Net Assets | ) |
| Amazon.com, Inc. | | Internet & Direct Marketing Retail | | | 5.5% | |
| Microsoft Corp. | | Software | | | 5.2% | |
| Apple, Inc. | | Technology Hardware, Storage & Peripherals | | | 5.1% | |
| Mastercard, Inc. (Class A Stock) | | IT Services | | | 4.0% | |
| salesforce.com, Inc. | | Software | | | 3.8% | |
| Alibaba Group Holding Ltd. (China), ADR | | Internet & Direct Marketing Retail | | | 3.6% | |
| Visa, Inc. (Class A Stock) | | IT Services | | | 3.3% | |
| Adobe, Inc. | | Software | | | 3.2% | |
| Alphabet, Inc. (Class A Stock) | | Interactive Media & Services | | | 3.0% | |
| Alphabet, Inc. (Class C Stock) | | Interactive Media & Services | | | 3.0% | |
For a Complete list of holdings, please refer to the Schedule of Investments section of this report. Holdings reflect only long-term investments. Credit Quality/Country Allocation/Holdings/Line of Business are subject to change.
17
| | |
| The Prudential Series Fund, Natural Resources Portfolio | | December 31, 2019 |
Report of the Investment Manager - As of December 31, 2019 (Unaudited)
| | | | | | | | | | | | |
| Average Annual Total Returns | | 1 Year | | | 5 Years | | | 10 Years | |
Portfolio: Class I | | | 10.69 | % | | | -4.11 | % | | | -3.14 | % |
Portfolio: Class II | | | 10.25 | | | | -4.49 | | | | -3.53 | |
Blended Index | | | 16.14 | | | | 2.26 | | | | 2.52 | |
MSCI World Index (GD) | | | 28.40 | | | | 9.36 | | | | 10.08 | |
Past performance does not guarantee future returns. The investment return and principal value of an investment will fluctuate, so that shares, when redeemed, may be worth more or less than their original cost. Current performance may be lower or higher than the past performance.
Portfolio performance is net of fund expenses, but not contract charges, which, if included, would significantly lower the performance quoted. Performance figures may reflect fee waivers and/or expense reimbursements. In the absence of such fee waivers and/or expense reimbursements, performance would be lower.
$10,000 INVESTED OVER 10 YEARS1
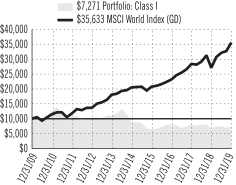
For the year ended December 31, 2019, the Natural Resources Portfolio Class I returned 10.69% and Class II returned 10.25%. The Portfolio’s Class I & II shares underperformed both the Blended Index and the MSCI World Index.
The Portfolio’s investment objective is long-term growth of capital.
What were the market conditions during the reporting period?
It was a challenging year for natural resource-related portfolios in general compared to broader markets. This was largely due to industrial/manufacturing economic indicators remaining mired in negative territory, as well as factor investing, which continued to strongly favor momentum and growth over cyclicality, commodity exposure, and value.
During 2019, most commodity prices remained range-bound at levels modestly below their long-term historical averages, as the prospect of lower supply growth through improved operator capital discipline was offset by uncertainty as to the near- to intermediate-term rate-of-demand growth.
What strategies or holdings affected the Portfolio’s performance?
For the year, the Portfolio of Class I shares gained 10.69% but underperformed its benchmark index, the MSCI World Energy/Materials Index (60%/40%, respectively), as well as broader markets. The underperformance was largely a result of adverse energy and materials stock selection.
International trade relations and free flow of goods, in particular between the United States and China, are essentially important to the manufacturing, industrial, and cyclical parts of the economy that are so critical to investor perception of future demand growth for commodities. During the year, there were several frustrating and unpredictable changes in direction in US-China trade policy where the subadvisors were caught wrong-footed with positioning that cost them performance, with the impact evenly spaced across capital goods, mining, utilities, gold, and energy.
The subadvisors recently read an analysis that indicated energy stocks dropped to a 93-year valuation low versus the broader market. While the subadvisors acknowledged the risks of holding energy stocks during 2019, they viewed valuations in the sector attractive at the start of the year and did not anticipate a reduction in value of this colossal magnitude. The energy sector detracted most from the Portfolio’s relative performance in 2019. The bottom-five stock detractors were Continental Resources Inc., Occidental Petroleum Corp., Marathon Oil Corp., Marathon Petroleum Corp., and Anadarko Petroleum Corp. (The Portfolio did not hold shares of Anadarko Petroleum; the company was acquired by Occidental Petroleum at a high premium.) As of the end of the period, the Portfolio continued to hold Continental Resources, Occidental Petroleum, and the refiner Marathon Petroleum as the subadvisors view these shares as having an attractive upside potential. The Portfolio sold its Marathon Oil shares during the period.
Stock selection in the chemicals sector was a bright spot for the Portfolio. Perceived “safe-haven stocks” such as Air Products and Chemicals Inc., FMC Corp., and Ecolab Inc. outperformed. The Portfolio also benefited from making some well-timed purchases and avoiding more cyclical chemical stocks.
The Portfolio’s overweight in industrials was also a positive contributor to performance, led by stocks held in the rails sector, notably Union Pacific Corp. and Kansas City Southern. The subadvisors view these stocks as secular winners and the Portfolio continued to hold them as of the end of the period.
| 1 | The graph is based on the performance of Class I shares. Performance of Class II shares will be lower due to differences in the fee structure. Class II shares have associated12b-1 and administrative fees at an annual rate of 0.25% and 0.15%, respectively, of the average daily net assets of the Class II shares. |
For a complete list of holdings, refer to the Schedule of Investments section of this report.
18
| | |
| The Prudential Series Fund, Natural Resources Portfolio | | December 31, 2019 |
Report of the Investment Manager - As of December 31, 2019 (Unaudited) (Continued)
At times, the Portfolio utilizes a buy-write strategy with call options written against long equity positions. At any given time, call options may be written against some of the long exposure depending on the premium income, market volatility, and outlook on the underlying positions. In 2019, the Portfolio did not utilize derivatives.
Presentation of Portfolio Holdings — unaudited
| | | | | | | | |
| Natural Resources Portfolio (As of 12/31/2019) | | | | | | |
| Ten Largest Holdings | | Line of Business | | Country | | | (% of Net Assets | ) |
| Exxon Mobil Corp. | | Integrated Oil & Gas | | United States | | | 6.2% | |
| Chevron Corp. | | Integrated Oil & Gas | | United States | | | 4.9% | |
| BHP Group Ltd. | | Diversified Metals & Mining | | Australia | | | 3.7% | |
| TOTAL SA | | Integrated Oil & Gas | | France | | | 3.1% | |
| Linde PLC | | Industrial Gases | | United Kingdom | | | 3.1% | |
| ConocoPhillips | | Oil & Gas Exploration & Production | | United States | | | 2.8% | |
| Schlumberger Ltd. | | Oil & Gas Equipment & Services | | United States | | | 2.8% | |
| Rio Tinto PLC | | Diversified Metals & Mining | | Australia | | | 2.7% | |
| Air Products & Chemicals, Inc. | | Industrial Gases | | United States | | | 2.2% | |
| BP PLC | | Integrated Oil & Gas | | United Kingdom | | | 2.2% | |
For a complete list of holdings, please refer to the Schedule of Investments section of this report. Holdings reflect only long-term investments. Credit Quality/Country Allocation/Holdings/Line of Business are subject to change.
19
| | |
The Prudential Series Fund, Small Capitalization Stock Portfolio | | December 31, 2019 |
Report of the Investment Manager - As of December 31, 2019 (Unaudited)
| | | | | | | | | | | | |
| Average Annual Total Returns | | 1 Year | | | 5 Years | | | 10 Years | |
Portfolio | | | 22.42 | % | | | 9.31 | % | | | 13.04 | % |
S&P SmallCap 600 Index | | | 22.78 | | | | 9.56 | | | | 13.35 | |
Past performance does not guarantee future returns. The investment return and principal value of an investment will fluctuate, so that shares, when redeemed, may be worth more or less than their original cost. Current performance may be lower or higher than the past performance.
Portfolio performance is net of fund expenses, but not contract charges, which, if included, would significantly lower the performance quoted. Performance figures may reflect fee waivers and/or expense reimbursements. In the absence of such fee waivers and/or expense reimbursements, performance would be lower.
$10,000 INVESTED OVER 10 YEARS
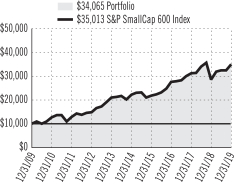
For the year ended December 31, 2019, the Small Capitalization Stock Portfolio returned 22.42%. The Portfolio underperformed the S&P SmallCap 600 Index.
The Portfolio’s investment objective is long-term growth of capital.
What were the market conditions during the reporting period?
US equities performed robustly in 2019 (the reporting period), despite headwinds from slowing global growth and trade policy conflicts, specifically between the US and China. Helping offset some of these risks was the Federal Reserve’s (the Fed) monetary policy, which became increasingly accommodative to growth as the Fed began cutting interest rates in July. In December, the US and China agreed to sign “phase one” of a trade agreement, which catapulted US equity prices even higher. Investors favored growth stocks in the beginning of the period, while stocks priced more reasonably relative to their earnings trailed the market averages. Later in the period, investors’ focus shifted to stocks of profitable companies and away from speculative growth stocks of companies with little to no earnings.
What strategies or holdings affected the Portfolio’s performance?
Potential tracking error differences (the difference between the return of the Portfolio and that of the benchmark), brokerage costs, and other Portfolio costs and expenses may cause the Portfolio’s return to be lower than that of the benchmark, the S&P Small Cap 600 Index (the Index). The Portfolio slightly underperformed the Index.
In terms of positions, biopharmaceutical firms Medicines Co. and Arrowhead Pharmaceuticals Inc. were the largest contributors to Portfolio performance, while oil exploration & production firm Whiting Petroleum Corp. and Merit Medical Systems, Inc., a maker of medical devices, were the largest detractors. Medicines shares were eliminated from the Portfolio after the company was acquired during the period. Arrowhead was also eliminated when the stock migrated to the S&P 400 Index.
Most of the Portfolio’s buy or sell trades were performed market-on-close, or as close as possible to the end of the trading day in order to more closely track the Index. The Portfolio also seeks to add income through securities lending. This income tends to be greater for small caps, which are often more difficult to borrow because they are not typically as widely traded as their mid- and large-cap counterparts.
The Portfolio had modest exposure to derivative instruments to help enhance liquidity, but the position did not have a material impact on performance this period.
For a complete list of holdings, please refer to the Schedule of Investments section of this report. Holdings reflect only long-term investments. Credit Quality/Country Allocation/Holdings/Line of Business are subject to change.
20
| | |
The Prudential Series Fund, Small Capitalization Stock Portfolio | | December 31, 2019 |
Report of the Investment Manager - As of December 31, 2019 (Unaudited) (Continued)
Presentation of Portfolio Holdings — unaudited
| | | | | | |
| Small Capitalization Stock Portfolio (As of 12/31/2019) | | | | |
| Ten Largest Holdings | | Line of Business | | | (% of Net Assets | ) |
| Medicines Co. (The) | | Biotechnology | | | 0.8% | |
| Darling Ingredients, Inc. | | Food Products | | | 0.6% | |
| iShares Core S&PSmall-Cap ETF | | Exchange-Traded Funds | | | 0.6% | |
| LHC Group, Inc. | | Health Care Providers & Services | | | 0.5% | |
| Glacier Bancorp, Inc. | | Banks | | | 0.5% | |
| Community Bank System, Inc. | | Banks | | | 0.5% | |
| John Bean Technologies Corp. | | Machinery | | | 0.5% | |
| Exponent, Inc. | | Professional Services | | | 0.4% | |
| TopBuild Corp. | | Household Durables | | | 0.4% | |
| Strategic Education, Inc. | | Diversified Consumer Services | | | 0.4% | |
For a complete list of holdings, please refer to the Schedule of Investments section of this report. Holdings reflect only long-term investments. Credit Quality/Country Allocation/Holdings/Line of Business are subject to change.
21
| | |
| The Prudential Series Fund, Stock Index Portfolio | | December 31, 2019 |
Report of the Investment Manager - As of December 31, 2019 (Unaudited)
| | | | | | | | | | | | |
| Average Annual Total Returns | | 1 Year | | | 5 Years | | | 10 Years | |
Portfolio | | | 31.07 | % | | | 11.44 | % | | | 13.25 | % |
S&P 500 Index | | | 31.46 | | | | 11.69 | | | | 13.55 | |
Past performance does not guarantee future returns. The investment return and principal value of an investment will fluctuate, so that shares, when redeemed, may be worth more or less than their original cost. Current performance may be lower or higher than the past performance.
Portfolio performance is net of fund expenses, but not contract charges, which, if included, would significantly lower the performance quoted. Performance figures may reflect fee waivers and/or expense reimbursements. In the absence of such fee waivers and/or expense reimbursements, performance would be lower.
$10,000 INVESTED OVER 10 YEARS
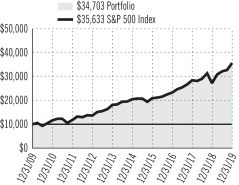
For the year ended December 31, 2019, the Stock Index Portfolio returned 31.07%. The Portfolio underperformed the S&P 500 Index.
The Portfolio’s investment objective is to achieve investment results that generally correspond to the performance of publicly traded common stocks.
What were the market conditions during the reporting period?
US equities performed robustly in 2019 (the reporting period), despite headwinds from slowing global growth and trade policy conflicts, specifically between the US and China. Helping offset some of these risks was the Federal Reserve’s (the Fed’s) monetary policy, which became increasingly accommodative to growth as the Fed began cutting interest rates in July. In December, the US and China agreed to sign “phase one” of a trade agreement, which catapulted US equity prices even higher. Investors favored growth stocks in the beginning of the period, while stocks priced more reasonably relative to their earnings trailed the market averages. Later in the period, investors’ focus shifted to stocks of profitable companies and away from speculative growth stocks of companies with little to no earnings.
What strategies or holdings affected the Portfolio’s performance?
Potential tracking error differences (the difference between the return of the Portfolio and the return of the benchmark), brokerage costs, and other costs and expenses caused the Portfolio’s return to be slightly lower than that of the S&P 500 Index (the Index).
Information technology remained the largest sector in the Portfolio and the Index and also was the top sector contributor to performance.
Apple Inc. and Microsoft Corp. were largest individual stock contributors to Portfolio performance, while Occidental Petroleum Corp. and Pfizer Inc. were the largest detractors.
The Portfolio had a small exposure to derivative instruments to help enhance liquidity, but the position did not have a material impact on performance.
Presentation of Portfolio Holdings — unaudited
| | | | | | |
| Stock Index Portfolio (As of 12/31/2019) | |
Ten Largest Holdings | | Line of Business | | | (% of Net Assets | ) |
| Apple, Inc. | | Technology Hardware, Storage & Peripherals | | | 4.5% | |
| Microsoft Corp. | | Software | | | 4.4% | |
| Amazon.com, Inc. | | Internet & Direct Marketing Retail | | | 2.8% | |
| Facebook, Inc. (Class A Stock) | | Interactive Media & Services | | | 1.8% | |
| Berkshire Hathaway, Inc. (Class B Stock) | | Diversified Financial Services | | | 1.6% | |
| JPMorgan Chase & Co. | | Banks | | | 1.6% | |
| Alphabet, Inc. (Class C Stock) | | Interactive Media & Services | | | 1.5% | |
| Alphabet, Inc. (Class A Stock) | | Interactive Media & Services | | | 1.4% | |
| Johnson & Johnson | | Pharmaceuticals | | | 1.4% | |
| Visa, Inc. (Class A Stock) | | IT Services | | | 1.2% | |
For a complete list of holdings, please refer to the Schedule of Investments section of this report. Holdings reflect only long-term investments. Credit Quality/Country Allocation/Holdings/Line of Business are subject to change.
22
| | |
| The Prudential Series Fund, Value Portfolio | | December 31, 2019 |
Report of the Investment Manager - As of December 31, 2019 (Unaudited)
| | | | | | | | | | | | |
| Average Annual Total Returns | | 1 Year | | | 5 Years | | | 10 Years | |
Portfolio: Class I | | | 26.06 | % | | | 6.33 | % | | | 9.39 | % |
Portfolio: Class II | | | 25.58 | | | | 5.91 | | | | 8.96 | |
Russell 1000® Value Index | | | 26.54 | | | | 8.29 | | | | 11.80 | |
S&P 500 Index | | | 31.46 | | | | 11.69 | | | | 13.55 | |
Past performance does not guarantee future returns. The investment return and principal value of an investment will fluctuate, so that shares, when redeemed, may be worth more or less than their original cost. Current performance may be lower or higher than the past performance.
Portfolio performance is net of fund expenses, but not contract charges, which, if included, would significantly lower the performance quoted. Performance figures may reflect fee waivers and/or expense reimbursements. In the absence of such fee waivers and/or expense reimbursements, performance would be lower.
The Russell 1000® Value Index is a trademark/service mark of the Frank Russell Company. Russell® is a trademark of the Frank Russell Company.
$10,000 INVESTED OVER 10 YEARS1
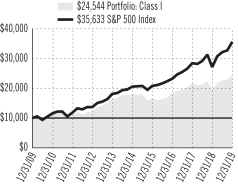
For the year ended December 31, 2019, the Value Portfolio Class I shares returned 26.06% and Class II shares returned 25.58%. The Portfolio’s Class I & II shares underperformed the Russell 1000 Value Index and S&P 500 Index.
The Portfolio’s investment objective is capital appreciation.
What were the market conditions during the reporting period?
US equities markets were highly volatile in 2019, unsettled by US-China trade discord; softening economic growth in the US, Europe, and China; and geopolitical uncertainty. Companies across market sectors cited trade tensions as the source of heightened caution in planning and investing. The US political landscape was likewise unsettled, as investigations of interference in the 2016 presidential election unfolded, impeachment hearings against President Donald Trump proceeded, and the 2020 election cycle ramped up. US economic activity showed signs of tempering, with job growth and business activity moderating.
The Russell 1000® Value Index (the Index) returned 26.54% in 2019, with each of the 11 market sectors except for energy producing a double-digit gain. Financials and information technology notched the strongest results, while materials, energy, and real estate were among the relative laggards.
What strategies or holdings affected the Portfolio’s performance?
The Portfolio’s position in diversified banks was the dominant driver of absolute performance over the period, while regional banks contributed to a lesser degree. Apparel accessories & luxury goods and general merchandise stores hampered absolute gains.
Stock selection among oil & gas exploration & production names helped to drive the Portfolio’s gain relative to the Index. West Texas Intermediate (WTI) oil prices rose over 30% in 2019, which benefited producers. Overweight allocations to diversified banks, consumer finance, and aerospace & defense stocks also contributed. Conversely, overweight positions within pharmaceuticals and apparel retail were among the main detractors of relative performance over the year.
The Portfolio’s most notable individual contributors to overall performance included diversified banks JPMorgan Chase & Co. and Bank of America Corp., as investors’ expectations for moderate but positive gross domestic product (GDP) growth, along with a stable yield curve, helped to shift market sentiment and lift financial stocks during the period. JPMorgan’s third-quarter revenue rose 8% year-over-year, beating consensus expectations. Meanwhile, Bank of America reported solid third-quarter earnings, with core numbers ahead of consensus driven largely by strong investment banking revenue, improved expenses, and better credit attributable to recoveries in non-core loan sales. Shares of specialized real estate investment trust (REIT) American Tower Corp. benefited from bouts of market volatility that caused investors to pile into “risk-off” stocks such as utilities and REITs during the period.
Top detractors from the Portfolio’s performance during the period included global biopharmaceutical company Pfizer Inc. The stock fell sharply in July after the firm announced a deal to merge Pfizer’s Upjohn unit (off-patent branded drugs business) with competitor Mylan to form a new entity. The potential transaction was ill-received by the market. This, combined with headwinds facing the broader health care sector in the period, hurt Pfizer shares.
| 1 | The graph is based on the performance of Class I shares. Performance of Class II shares will be lower due to differences in the fee structure. Class II shares have associated12b-1 and administrative fees at an annual rate of 0.25% and 0.15%, respectively, of the average daily net assets of the Class II shares. |
For a complete list of holdings, refer to the Schedule of Investments section of this report.
23
| | |
| The Prudential Series Fund, Value Portfolio | | December 31, 2019 |
Report of the Investment Manager - As of December 31, 2019 (Unaudited) (Continued)
Dollar Tree Stores Inc. underperformed after missing its quarterly earnings and revising its guidance. The discount retailer’s cost pressures were expected to continue into 2020, causing a stock price decline at the end of 2019. Shares of apparel accessories & luxury goods maker Tapestry Inc. declined about 22% in August 2019 after poor execution and performance from its Kate Spade brand and an operating loss at its Stuart Weitzman brand. The Portfolio no longer held a position in Tapestry at the end of the period.
Presentation of Portfolio Holdings — unaudited
| | | | | | |
| Value Portfolio (As of 12/31/2019) | |
Ten Largest Holdings | | Line of Business | | | (% of Net Assets | ) |
| JPMorgan Chase & Co. | | Banks | | | 4.8% | |
| Bank of America Corp. | | Banks | | | 3.1% | |
| Chevron Corp. | | Oil, Gas & Consumable Fuels | | | 2.9% | |
| Walmart, Inc. | | Food & Staples Retailing | | | 2.5% | |
| Citigroup, Inc. | | Banks | | | 2.5% | |
| American Electric Power Co., Inc. | | Electric Utilities | | | 2.5% | |
| Chubb Ltd. | | Insurance | | | 2.2% | |
| Comcast Corp. (Class A Stock) | | Media | | | 2.2% | |
| Walt Disney Co. (The) | | Entertainment | | | 2.2% | |
| Linde PLC (United Kingdom) | | Chemicals | | | 2.2% | |
For a complete list of holdings, please refer to the Schedule of Investments section of this report. Holdings reflect only long-term investments. Credit Quality/Country Allocation/Holdings/Line of Business are subject to change.
24
| | |
The Prudential Series Fund Benchmark Glossary — unaudited | | December 31, 2019 |
The indexes are unmanaged and include reinvestment of any income or distributions. They do not reflect any fees, expenses or sales charges. Investors cannot invest directly in a market index.
For Russell Indexes: Russell Investment Group is the source and owner of the trademarks, service marks and copyrights related to the Russell Indexes. Russell® is a trademark of Russell Investment Group.
Bloomberg Barclays Government Bond Index is a weighted unmanaged index comprised of securities issued or backed by the US Government, its agencies, and instrumentalities with a remaining maturity of one to 30 years.
Bloomberg Barclays US Aggregate Bond Index is an unmanaged index comprised of more than 5,000 government and corporate bonds.
Bloomberg Barclays US High Yield 1% Issuer Capped Index is an unmanaged index that covers the universe of US dollar denominated,non-convertible, fixed-rate,non-investment-grade debt. Issuers are capped at 1% of the Index. Index holdings must have at least one year to final maturity, at least $150 million par amount outstanding, and be publicly issued with a rating of Ba1 or lower.
Lipper US Government Money Market Index invests principally in financial instruments issued or guaranteed by the US government, its agencies, or its instrumentalities, with dollar-weighted average maturities of less than 90 days.
Lipper Variable Insurance Products (VIP) Funds Average is calculated by Lipper Analytical Services, Inc., and reflects the investment return of certain portfolios underlying variable life and annuity products. Returns for the Lipper Average reflect the deduction of operating expenses.
MSCI World Index (GD) - The Morgan Stanley Capital International World Index is an unmanaged capitalization weighted index which includes the equity markets of Australia, Austria, Belgium, Canada, Denmark, Finland, France, Germany, Hong Kong, Ireland, Italy, Japan, Malaysia, Netherlands, New Zealand, Norway, Singapore, Spain, Sweden, Switzerland, United Kingdom, and United States. The GD version does not reflect the impact of withholding taxes on reinvested dividends.
PSF Conservative Balanced Portfolio Blended Index consists of the S&P 500 Index (50%), the Bloomberg Barclays US Aggregate Bond Index (40%), an unmanaged index comprised of more than 5,000 government and corporate bonds, and the FTSE3-MonthT-Bill Index (10%), an unmanaged market value-weighted index of investment grade fixed rate public obligations of the US Treasury with maturities of three months, excluding zero coupon strips.
PSF Flexible Managed Portfolio Blended Index consists of the S&P 500 Index (60%), the Bloomberg Barclays U.S. Aggregate Bond Index (35%), an unmanaged index comprised of more than 5,000 government and corporate bonds, and the FTSE3-MonthT-Bill Index (5%), an unmanaged market value-weighted index of investment grade fixed rate public obligations of the U.S. Treasury with maturities of three months, excluding zero coupon strips.
PSF Natural Resources Portfolio Blended Index consists of MSCI (Morgan Stanley Capital International) World Energy Index (ND) (60%), is an unmanaged capitalization-weighted index that is designed to capture the large andmid-cap segments across twenty-three Developed Markets countries. All securities in the index are classified in the Energy sector. MSCI (Morgan Stanley Capital International) World Materials Energy Index (ND) (40%), is an unmanaged capitalization-weighted index that is designed to capture the large andmid-cap segments across twenty-three Developed Markets countries. All securities in the index are classified in the Materials sector.
Russell 1000® Index is an unmanaged marketcap-weighted index that measures the performance of the 1,000 largest companies in the Russell 3000 Index, which represents approximately 92% of the total market.
Russell 1000 Growth Index is an unmanaged marketcap-weighted index that measures the performance of those Russell 1000 companies with higherprice-to-book ratios and higher forecasted growth values.
Russell 1000 Value Index is an unmanaged marketcap-weighted index that measures the performance of those Russell 1000 companies with lowerprice-to-book ratios and lower forecasted growth values.
S&P 500 Index is an unmanaged, market value-weighted index of over 500 stocks generally representative of the broad stock market.
S&P SmallCap 600 Index is an unmanaged index representing the aggregate market value of the common equity of 600 small-company stocks.
| | |
The Prudential Series Fund Fees and Expenses — unaudited | | December 31, 2019 |
As a contract owner investing in Portfolios of the Fund through a variable annuity or variable life contract, you incur ongoing costs, including management fees, and other Portfolio expenses. This example is intended to help you understand your ongoing costs (in dollars) of investing in the Fund and to compare these costs with the ongoing costs of investing in other investment options. This example does not reflect fees and charges under your variable annuity or variable life contract. If contract charges were included, the costs shown below would be higher. Please consult the prospectus for your contract for more information about contract fees and charges.
The example is based on an investment of $1,000 invested at the beginning of the period and held for the entire period July 1, 2019 through December 31, 2019.
Actual Expenses
The first line of the table below provides information about actual account values and actual expenses. You may use this information, together with the amount you invested, to estimate the Portfolio expenses that you paid over the period. Simply divide your account value by $1,000 (for example, an $8,600 account value divided by $1,000 = 8.6), then multiply the result by the number in the first line under the heading entitled “Expenses Paid During the Six-Month Period” to estimate the Portfolio expenses you paid on your account during this period. As noted above, the table does not reflect variable contract fees and charges.
Hypothetical Example for Comparison Purposes
The second line of the table below provides information about hypothetical account values and hypothetical expenses based on the Portfolio’s actual expense ratio and an assumed rate of return of 5% per year before expenses, which is not the Portfolio’s actual return. The hypothetical account values and expenses may not be used to estimate the actual ending account balance or expenses you paid for the period. You may use this information to compare the ongoing costs of investing in the Portfolio and other investment options. To do so, compare this 5% hypothetical example with the 5% hypothetical examples that appear in the shareholder reports of the other investment options.
Please note that the expenses shown in the table are meant to highlight your ongoing Portfolio costs only and do not reflect any contract fees and charges, such as sales charges (loads), insurance charges or administrative charges. Therefore the second line of the table is useful to compare ongoing investment option costs only, and will not help you determine the relative total costs of owning different contracts. In addition, if these contract fees and charges were included, your costs would have been higher.
| | | | | | | | | | | | | | | | | | |
| The Prudential Series Fund Portfolios | | Beginning
Account Value
July 1, 2019 | | | Ending
Account Value
December 31, 2019 | | | Annualized Expense
Ratio based on the
Six-Month period | | | Expenses Paid
During the
Six-Month period* | |
| | | | | |
| Conservative Balanced (Class I) | | Actual | | $ | 1,000.00 | | | $ | 1,064.40 | | | | 0.59 | % | | $ | 3.07 | |
| | Hypothetical | | $ | 1,000.00 | | | $ | 1,022.23 | | | | 0.59 | % | | $ | 3.01 | |
| | | | | |
| Diversified Bond (Class I) | | Actual | | $ | 1,000.00 | | | $ | 1,029.70 | | | | 0.44 | % | | $ | 2.25 | |
| | Hypothetical | | $ | 1,000.00 | | | $ | 1,022.99 | | | | 0.44 | % | | $ | 2.24 | |
| | | | | |
| Equity (Class I) | | Actual | | $ | 1,000.00 | | | $ | 1,088.40 | | | | 0.47 | % | | $ | 2.47 | |
| | Hypothetical | | $ | 1,000.00 | | | $ | 1,022.84 | | | | 0.47 | % | | $ | 2.40 | |
| | | | | |
| Equity (Class II) | | Actual | | $ | 1,000.00 | | | $ | 1,086.10 | | | | 0.87 | % | | $ | 4.57 | |
| | Hypothetical | | $ | 1,000.00 | | | $ | 1,020.82 | | | | 0.87 | % | | $ | 4.43 | |
| | | | | |
| Flexible Managed (Class I) | | Actual | | $ | 1,000.00 | | | $ | 1,068.50 | | | | 0.63 | % | | $ | 3.28 | |
| | Hypothetical | | $ | 1,000.00 | | | $ | 1,022.03 | | | | 0.63 | % | | $ | 3.21 | |
| | | | | |
| Global (Class I) | | Actual | | $ | 1,000.00 | | | $ | 1,097.60 | | | | 0.76 | % | | $ | 4.02 | |
| | Hypothetical | | $ | 1,000.00 | | | $ | 1,021.37 | | | | 0.76 | % | | $ | 3.87 | |
| | | | | |
| Government Income (Class I) | | Actual | | $ | 1,000.00 | | | $ | 1,015.80 | | | | 0.53 | % | | $ | 2.69 | |
| | Hypothetical | | $ | 1,000.00 | | | $ | 1,022.53 | | | | 0.53 | % | | $ | 2.70 | |
| | | | | |
| Government Money Market (Class I) | | Actual | | $ | 1,000.00 | | | $ | 1,008.70 | | | | 0.35 | % | | $ | 1.77 | |
| | Hypothetical | | $ | 1,000.00 | | | $ | 1,023.44 | | | | 0.35 | % | | $ | 1.79 | |
| | | | | |
| High Yield Bond (Class I) | | Actual | | $ | 1,000.00 | | | $ | 1,049.10 | | | | 0.57 | % | | $ | 2.94 | |
| | Hypothetical | | $ | 1,000.00 | | | $ | 1,022.33 | | | | 0.57 | % | | $ | 2.91 | |
| | | | | |
| Jennison (Class I) | | Actual | | $ | 1,000.00 | | | $ | 1,100.10 | | | | 0.62 | % | | $ | 3.28 | |
| | Hypothetical | | $ | 1,000.00 | | | $ | 1,022.08 | | | | 0.62 | % | | $ | 3.16 | |
| | |
The Prudential Series Fund Fees and Expenses — unaudited(continued) | | December 31, 2019 |
| | | | | | | | | | | | | | | | | | |
| The Prudential Series Fund Portfolios | | Beginning
Account Value
July 1, 2019 | | | Ending
Account Value
December 31, 2019 | | | Annualized Expense
Ratio based on the
Six-Month period | | | Expenses Paid
During the
Six-Month period* | |
| | | | | |
| Jennison (Class II) | | Actual | | $ | 1,000.00 | | | $ | 1,097.90 | | | | 1.02 | % | | $ | 5.39 | |
| | Hypothetical | | $ | 1,000.00 | | | $ | 1,020.06 | | | | 1.02 | % | | $ | 5.19 | |
| | | | | |
| Natural Resources (Class I) | | Actual | | $ | 1,000.00 | | | $ | 975.20 | | | | 0.55 | % | | $ | 2.74 | |
| | Hypothetical | | $ | 1,000.00 | | | $ | 1,022.43 | | | | 0.55 | % | | $ | 2.80 | |
| | | | | |
| Natural Resources (Class II) | | Actual | | $ | 1,000.00 | | | $ | 973.00 | | | | 0.95 | % | | $ | 4.72 | |
| | Hypothetical | | $ | 1,000.00 | | | $ | 1,020.42 | | | | 0.95 | % | | $ | 4.84 | |
| | | | | |
| Small Capitalization Stock (Class I) | | Actual | | $ | 1,000.00 | | | $ | 1,078.40 | | | | 0.39 | % | | $ | 2.04 | |
| | Hypothetical | | $ | 1,000.00 | | | $ | 1,023.24 | | | | 0.39 | % | | $ | 1.99 | |
| | | | | |
| Stock Index (Class I) | | Actual | | $ | 1,000.00 | | | $ | 1,107.90 | | | | 0.31 | % | | $ | 1.65 | |
| | Hypothetical | | $ | 1,000.00 | | | $ | 1,023.64 | | | | 0.31 | % | | $ | 1.58 | |
| | | | | |
| Value (Class I) | | Actual | | $ | 1,000.00 | | | $ | 1,082.70 | | | | 0.43 | % | | $ | 2.26 | |
| | Hypothetical | | $ | 1,000.00 | | | $ | 1,023.04 | | | | 0.43 | % | | $ | 2.19 | |
| | | | | |
| Value (Class II) | | Actual | | $ | 1,000.00 | | | $ | 1,080.60 | | | | 0.83 | % | | $ | 4.35 | |
| | Hypothetical | | $ | 1,000.00 | | | $ | 1,021.02 | | | | 0.83 | % | | $ | 4.23 | |
* Portfolio expenses (net of fee waivers or subsidies, if any) for each share class are equal to the annualized expense ratio for each share class (provided in the table), multiplied by the average account value over the period, multiplied by the 184 days in the six-month period ended December 31, 2019, and divided by the 365 days in the Portfolio’s fiscal year ended December 31, 2019 (to reflect the six-month period). Expenses presented in the table include the expenses of any underlying portfolios in which the Portfolio may invest.
The following abbreviations are used in the Portfolios’ descriptions:
| | |
| AUD | | Australian Dollar |
| BRL | | Brazilian Real |
| CAD | | Canadian Dollar |
| CNH | | Chinese Renminbi |
| EUR | | Euro |
| GBP | | British Pound |
| JPY | | Japanese Yen |
| USD | | US Dollar |
| | |
| 144A | | Security was purchased pursuant to Rule 144A under the Securities Act of 1933 and, pursuant to the requirements of Rule 144A, may not be resold except to qualified institutional buyers. |
| A | | Annual payment frequency for swaps |
| ABS | | Asset-Backed Security |
| Aces | | Alternative Credit Enhancements Securities |
| ADR | | American Depositary Receipt |
| BABs | | Build America Bonds |
| BROIS | | Brazil Overnight Index Swap |
| CDX | | Credit Derivative Index |
| CLO | | Collateralized Loan Obligation |
| CMBS | | Collateralized Mortgage-Backed Security |
| CMBX | | Commercial Mortgage-Backed Index |
| CMS | | Constant Maturity Swap |
| CVA | | Certificate Van Aandelen (Bearer) |
| CVR | | Contingent Value Rights |
| CVT | | Convertible Security |
| EAFE | | Europe, Australasia, Far East |
| EMTN | | Euro Medium Term Note |
| EONIA | | Euro Overnight Index Average |
| ETF | | Exchange-Traded Fund |
| EURIBOR | | Euro Interbank Offered Rate |
| FHLMC | | Federal Home Loan Mortgage Corporation |
| GDR | | Global Depositary Receipt |
| GMTN | | Global Medium Term Note |
| IO | | Interest Only (Principal amount represents notional) |
| L2 | | Level 2 |
| L3 | | Level 3 |
| LIBOR | | London Interbank Offered Rate |
| M | | Monthly payment frequency for swaps |
| MSCI | | Morgan Stanley Capital International |
| MTN | | Medium Term Note |
| MUNIPSA | | Municipal Swap Weekly Yield Index |
| OTC | | Over-the-counter |
| PIK | | Payment-in-Kind |
| PJSC | | Public Joint-Stock Company |
| PO | | Principal Only |
| PRFC | | Preference Shares |
| Q | | Quarterly payment frequency for swaps |
| REITs | | Real Estate Investment Trust |
| REMICS | | Real Estate Mortgage Investment Conduit Security |
| RSP | | Savings Shares |
| S | | Semiannual payment frequency for swaps |
| S&P | | Standard & Poor’s |
| SONIA | | Sterling Overnight Index Average |
| SPDR | | Standard & Poor’s Depositary Receipts |
| STACR | | Structured Agency Credit Risk |
| Strips | | Separate Trading of Registered Interest and Principal of Securities |
| SWX | | SIX Swiss Exchange |
| T | | Swap payment upon termination |
| TBA | | To Be Announced |
| USAID | | United States Agency for International Development |
| USOIS | | United States Overnight Index Swap |
SEE NOTES TO FINANCIAL STATEMENTS.
A1
| | | | | | |
| | |
| | CONSERVATIVE BALANCED PORTFOLIO | | |
| | | | | | |
| |
| SCHEDULE OF INVESTMENTS | | as of December 31, 2019 |
| | | | | | | | |
| LONG-TERM INVESTMENTS — 93.0% | |
| COMMON STOCKS — 51.8% | | Shares | | | Value | |
Aerospace & Defense — 1.2% | |
Arconic, Inc. | | | 17,280 | | | $ | 531,706 | |
BAE Systems PLC (United Kingdom) | | | 11,160 | | | | 83,520 | |
Boeing Co. (The) | | | 25,850 | | | | 8,420,896 | |
Dassault Aviation SA (France) | | | 9 | | | | 11,838 | |
General Dynamics Corp. | | | 11,500 | | | | 2,028,025 | |
Huntington Ingalls Industries, Inc. | | | 2,200 | | | | 551,936 | |
L3Harris Technologies, Inc. | | | 10,970 | | | | 2,170,634 | |
Lockheed Martin Corp. | | | 12,040 | | | | 4,688,135 | |
Northrop Grumman Corp. | | | 7,762 | | | | 2,669,895 | |
Raytheon Co. | | | 13,600 | | | | 2,988,464 | |
Safran SA (France) | | | 1,144 | | | | 176,858 | |
Textron, Inc. | | | 10,400 | | | | 463,840 | |
TransDigm Group, Inc. | | | 2,400 | | | | 1,344,000 | |
United Technologies Corp. | | | 39,102 | | | | 5,855,915 | |
| | | | | | | | |
| | | | | | | 31,985,662 | |
| | | | | | | | |
Air Freight & Logistics — 0.3% | |
C.H. Robinson Worldwide, Inc.(a) | | | 6,600 | | | | 516,120 | |
Deutsche Post AG (Germany) | | | 3,406 | | | | 130,443 | |
Expeditors International of Washington, Inc. | | | 8,600 | | | | 670,972 | |
FedEx Corp. | | | 11,780 | | | | 1,781,254 | |
SG Holdings Co. Ltd. (Japan) | | | 500 | | | | 11,246 | |
United Parcel Service, Inc.
(Class B Stock) | | | 33,600 | | | | 3,933,216 | |
| | | | | | | | |
| | | | | | | 7,043,251 | |
| | | | | | | | |
Airlines — 0.2% | | | | | | | | |
Alaska Air Group, Inc.(a) | | | 5,700 | | | | 386,175 | |
American Airlines Group, Inc.(a) | | | 18,800 | | | | 539,184 | |
Delta Air Lines, Inc. | | | 27,300 | | | | 1,596,504 | |
Qantas Airways Ltd. (Australia) | | | 2,613 | | | | 13,091 | |
Southwest Airlines Co. | | | 23,400 | | | | 1,263,132 | |
United Airlines Holdings, Inc.* | | | 11,000 | | | | 968,990 | |
| | | | | | | | |
| | | | | | | 4,767,076 | |
| | | | | | | | |
Auto Components — 0.1% | |
Aptiv PLC | | | 12,700 | | | | 1,206,119 | |
BorgWarner, Inc. | | | 9,600 | | | | 416,448 | |
| | | | | | | | |
| | | | | | | 1,622,567 | |
| | | | | | | | |
Automobiles — 0.2% | |
Bayerische Motoren Werke AG (Germany) | | | 348 | | | | 28,613 | |
Ferrari NV (Italy) | | | 424 | | | | 70,258 | |
Fiat Chrysler Automobiles NV
(United Kingdom) | | | 23,908 | | | | 350,835 | |
Ford Motor Co. | | | 185,585 | | | | 1,725,940 | |
General Motors Co. | | | 60,500 | | | | 2,214,300 | |
Harley-Davidson, Inc.(a) | | | 6,600 | | | | 245,454 | |
Peugeot SA (France) | | | 14,533 | | | | 349,624 | |
Subaru Corp. (Japan) | | | 3,500 | | | | 86,537 | |
Toyota Motor Corp. (Japan) | | | 7,900 | | | | 556,869 | |
Volkswagen AG (Germany) | | | 111 | | | | 21,651 | |
| | | | | | | | |
| | | | | | | 5,650,081 | |
| | | | | | | | |
| | | | | | | | |
COMMON STOCKS
(continued) | | Shares | | | Value | |
Banks — 3.0% | |
Banco Bilbao Vizcaya Argentaria SA (Spain) | | | 22,798 | | | $ | 127,680 | |
Bank of America Corp. | | | 397,041 | | | | 13,983,784 | |
Barclays PLC (United Kingdom) | | | 127,957 | | | | 305,437 | |
BNP Paribas SA (France) | | | 9,101 | | | | 541,042 | |
BOC Hong Kong Holdings Ltd. (China) | | | 13,000 | | | | 45,181 | |
CaixaBank SA (Spain) | | | 12,267 | | | | 38,587 | |
Citigroup, Inc. | | | 109,035 | | | | 8,710,806 | |
Citizens Financial Group, Inc. | | | 20,400 | | | | 828,444 | |
Comerica, Inc. | | | 7,300 | | | | 523,775 | |
Commonwealth Bank of Australia (Australia) | | | 236 | | | | 13,225 | |
Credit Agricole SA (France) | | | 25,506 | | | | 370,478 | |
DBS Group Holdings Ltd. (Singapore) | | | 2,800 | | | | 53,927 | |
DNB ASA (Norway) | | | 20,920 | | | | 391,061 | |
Fifth Third Bancorp | | | 33,621 | | | | 1,033,510 | |
First Republic Bank | | | 8,200 | | | | 963,090 | |
Fukuoka Financial Group, Inc. (Japan) | | | 1,400 | | | | 26,733 | |
HSBC Holdings PLC
(United Kingdom) | | | 21,375 | | | | 167,889 | |
Huntington Bancshares, Inc.(a) | | | 47,236 | | | | 712,319 | |
Intesa Sanpaolo SpA (Italy) | | | 51,408 | | | | 135,352 | |
Israel Discount Bank Ltd. (Israel)
(Class A Stock) | | | 3,947 | | | | 18,343 | |
Japan Post Bank Co. Ltd. (Japan) | | | 1,400 | | | | 13,450 | |
JPMorgan Chase & Co. | | | 153,645 | | | | 21,418,113 | |
KBC Group NV (Belgium) | | | 845 | | | | 63,655 | |
KeyCorp. | | | 45,700 | | | | 924,968 | |
M&T Bank Corp. | | | 6,400 | | | | 1,086,400 | |
Mediobanca Banca di Credito Finanziario SpA (Italy) | | | 2,220 | | | | 24,474 | |
Mitsubishi UFJ Financial Group, Inc. (Japan) | | | 99,400 | | | | 537,660 | |
Oversea-Chinese Banking Corp. Ltd. (Singapore) | | | 11,000 | | | | 90,009 | |
People’s United Financial, Inc. | | | 18,300 | | | | 309,270 | |
PNC Financial Services Group, Inc. (The) | | | 21,433 | | | | 3,421,350 | |
Raiffeisen Bank International AG (Austria) | | | 229 | | | | 5,761 | |
Regions Financial Corp. | | | 45,503 | | | | 780,831 | |
Resona Holdings, Inc. (Japan) | | | 7,300 | | | | 31,827 | |
Shinsei Bank Ltd. (Japan) | | | 700 | | | | 10,688 | |
Skandinaviska Enskilda Banken AB (Sweden) (Class A Stock) | | | 40,055 | | | | 376,830 | |
Societe Generale SA (France) | | | 12,084 | | | | 421,145 | |
Sumitomo Mitsui Financial Group, Inc. (Japan) | | | 8,700 | | | | 320,517 | |
Sumitomo Mitsui Trust Holdings, Inc. (Japan) | | | 1,200 | | | | 47,437 | |
SVB Financial Group* | | | 2,700 | | | | 677,808 | |
Truist Financial Corp. | | | 64,501 | | | | 3,632,696 | |
U.S. Bancorp | | | 69,085 | | | | 4,096,050 | |
United Overseas Bank Ltd. (Singapore) | | | 19,500 | | | | 384,116 | |
Wells Fargo & Co. | | | 190,364 | | | | 10,241,583 | |
Zions Bancorp NA(a) | | | 8,250 | | | | 428,340 | |
| | | | | | | | |
| | | | | | | 78,335,641 | |
| | | | | | | | |
Beverages — 0.9% | | | | | | | | |
Asahi Group Holdings Ltd. (Japan) | | | 7,600 | | | | 347,406 | |
SEE NOTES TO FINANCIAL STATEMENTS.
A2
| | | | | | |
| | |
| | CONSERVATIVE BALANCED PORTFOLIO (continued) | | |
| | | | | | |
| |
| SCHEDULE OF INVESTMENTS | | as of December 31, 2019 |
| | | | | | | | |
COMMON STOCKS
(continued) | | Shares | | | Value | |
Beverages (continued) | |
Brown-Forman Corp. (Class B Stock)(a) | | | 8,475 | | | $ | 572,910 | |
Carlsberg A/S (Denmark) (Class B Stock) | | | 372 | | | | 55,496 | |
Coca-Cola Amatil Ltd. (Australia) | | | 1,677 | | | | 13,018 | |
Coca-Cola Co. (The) | | | 185,401 | | | | 10,261,945 | |
Coca-Cola European Partners PLC
(United Kingdom) | | | 800 | | | | 40,704 | |
Constellation Brands, Inc. (Class A Stock) | | | 8,200 | | | | 1,555,950 | |
Diageo PLC (United Kingdom) | | | 9,650 | | | | 410,003 | |
Kirin Holdings Co. Ltd. (Japan) | | | 2,900 | | | | 63,293 | |
Molson Coors Brewing Co. (Class B Stock)(a) | | | 8,800 | | | | 474,320 | |
Monster Beverage Corp.* | | | 18,300 | | | | 1,162,965 | |
PepsiCo, Inc. | | | 67,407 | | | | 9,212,515 | |
Pernod Ricard SA (France) | | | 730 | | | | 130,748 | |
Treasury Wine Estates Ltd. (Australia) | | | 2,439 | | | | 27,822 | |
| | | | | | | | |
| | | | | | | 24,329,095 | |
| | | | | | | | |
Biotechnology — 1.0% | |
AbbVie, Inc. | | | 71,300 | | | | 6,312,902 | |
Alexion Pharmaceuticals, Inc.* | | | 10,800 | | | | 1,168,020 | |
Amgen, Inc. | | | 29,237 | | | | 7,048,164 | |
Biogen, Inc.* | | | 9,060 | | | | 2,688,374 | |
CSL Ltd. (Australia) | | | 1,569 | | | | 303,818 | |
Gilead Sciences, Inc. | | | 61,300 | | | | 3,983,274 | |
Incyte Corp.* | | | 8,700 | | | | 759,684 | |
Regeneron Pharmaceuticals, Inc.* | | | 3,940 | | | | 1,479,391 | |
Vertex Pharmaceuticals, Inc.* | | | 12,600 | | | | 2,758,770 | |
| | | | | | | | |
| | | | | | | 26,502,397 | |
| | | | | | | | |
Building Products — 0.2% | |
A.O. Smith Corp. | | | 6,800 | | | | 323,952 | |
Allegion PLC | | | 4,633 | | | | 576,994 | |
Assa Abloy AB (Sweden) (Class B Stock) | | | 3,510 | | | | 82,036 | |
Daikin Industries Ltd. (Japan) | | | 800 | | | | 112,802 | |
Fortune Brands Home & Security, Inc. | | | 6,600 | | | | 431,244 | |
Geberit AG (Switzerland) | | | 156 | | | | 87,515 | |
Johnson Controls International PLC | | | 37,722 | | | | 1,535,663 | |
Kingspan Group PLC (Ireland) | | | 527 | | | | 32,216 | |
Masco Corp. | | | 13,200 | | | | 633,468 | |
| | | | | | | | |
| | | | | | | 3,815,890 | |
| | | | | | | | |
Capital Markets — 1.4% | |
3i Group PLC (United Kingdom) | | | 24,970 | | | | 364,004 | |
Ameriprise Financial, Inc. | | | 6,320 | | | | 1,052,786 | |
Amundi SA (France), 144A | | | 208 | | | | 16,350 | |
ASX Ltd. (Australia) | | | 6,077 | | | | 334,530 | |
Bank of New York Mellon Corp. (The) | | | 40,758 | | | | 2,051,350 | |
BlackRock, Inc. | | | 5,800 | | | | 2,915,660 | |
Cboe Global Markets, Inc. | | | 5,600 | | | | 672,000 | |
Charles Schwab Corp. (The) | | | 55,550 | | | | 2,641,958 | |
CME Group, Inc. | | | 17,500 | | | | 3,512,600 | |
E*TRADE Financial Corp. | | | 11,120 | | | | 504,514 | |
Franklin Resources, Inc. | | | 11,900 | | | | 309,162 | |
Goldman Sachs Group, Inc. (The) | | | 15,600 | | | | 3,586,908 | |
| | | | | | | | |
COMMON STOCKS
(continued) | | Shares | | | Value | |
Capital Markets (continued) | |
Intercontinental Exchange, Inc. | | | 27,055 | | | $ | 2,503,940 | |
Invesco Ltd. | | | 16,000 | | | | 287,680 | |
London Stock Exchange Group PLC (United Kingdom) | | | 1,125 | | | | 115,834 | |
Macquarie Group Ltd. (Australia) | | | 227 | | | | 21,967 | |
Magellan Financial Group Ltd. (Australia) | | | 9,225 | | | | 368,819 | |
MarketAxess Holdings, Inc. | | | 1,920 | | | | 727,891 | |
Moody’s Corp. | | | 8,050 | | | | 1,911,150 | |
Morgan Stanley | | | 60,380 | | | | 3,086,626 | |
MSCI, Inc. | | | 4,200 | | | | 1,084,356 | |
Nasdaq, Inc. | | | 5,600 | | | | 599,760 | |
Nomura Holdings, Inc. (Japan) | | | 75,100 | | | | 385,439 | |
Northern Trust Corp. | | | 10,600 | | | | 1,126,144 | |
Raymond James Financial, Inc. | | | 5,900 | | | | 527,814 | |
S&P Global, Inc. | | | 11,900 | | | | 3,249,295 | |
Singapore Exchange Ltd. (Singapore) | | | 25,300 | | | | 167,066 | |
State Street Corp. | | | 17,800 | | | | 1,407,980 | |
T. Rowe Price Group, Inc. | | | 11,600 | | | | 1,413,344 | |
| | | | | | | | |
| | | | | | | 36,946,927 | |
| | | | | | | | |
Chemicals — 1.0% | |
Air Products & Chemicals, Inc. | | | 10,800 | | | | 2,537,892 | |
Albemarle Corp.(a) | | | 5,100 | | | | 372,504 | |
Arkema SA (France) | | | 1,101 | | | | 116,997 | |
BASF SE (Germany) | | | 3,190 | | | | 241,959 | |
Celanese Corp. | | | 6,300 | | | | 775,656 | |
CF Industries Holdings, Inc. | | | 10,700 | | | | 510,818 | |
Corteva, Inc. | | | 34,947 | | | | 1,033,033 | |
Dow, Inc. | | | 35,747 | | | | 1,956,433 | |
DuPont de Nemours, Inc. | | | 35,947 | | | | 2,307,798 | |
Eastman Chemical Co. | | | 6,400 | | | | 507,264 | |
Ecolab, Inc. | | | 12,300 | | | | 2,373,777 | |
FMC Corp. | | | 6,200 | | | | 618,884 | |
Givaudan SA (Switzerland) | | | 32 | | | | 100,235 | |
International Flavors & Fragrances, Inc.(a) | | | 5,000 | | | | 645,100 | |
Israel Chemicals Ltd. (Israel) | | | 67,017 | | | | 315,575 | |
Linde PLC (United Kingdom) | | | 26,100 | | | | 5,556,690 | |
LyondellBasell Industries NV (Class A Stock) | | | 12,700 | | | | 1,199,896 | |
Mosaic Co. (The) | | | 15,600 | | | | 337,584 | |
Nippon Paint Holdings Co. Ltd. (Japan) | | | 500 | | | | 25,758 | |
Nitto Denko Corp. (Japan) | | | 600 | | | | 33,731 | |
Orica Ltd. (Australia) | | | 15,652 | | | | 241,229 | |
PPG Industries, Inc. | | | 11,600 | | | | 1,548,484 | |
Sherwin-Williams Co. (The) | | | 4,050 | | | | 2,363,337 | |
Shin-Etsu Chemical Co. Ltd. (Japan) | | | 400 | | | | 44,031 | |
Showa Denko KK (Japan) | | | 200 | | | | 5,268 | |
Sika AG (Switzerland) | | | 448 | | | | 84,203 | |
| | | | | | | | |
| | | | | | | 25,854,136 | |
| | | | | | | | |
Commercial Services & Supplies — 0.2% | |
Cintas Corp. | | | 4,100 | | | | 1,103,228 | |
Copart, Inc.* | | | 9,800 | | | | 891,212 | |
Dai Nippon Printing Co. Ltd. (Japan) | | | 900 | | | | 24,314 | |
Republic Services, Inc. | | | 10,365 | | | | 929,015 | |
Rollins, Inc. | | | 6,600 | | | | 218,856 | |
Secom Co. Ltd. (Japan) | | | 800 | | | | 71,593 | |
SEE NOTES TO FINANCIAL STATEMENTS.
A3
| | | | | | |
| | |
| | CONSERVATIVE BALANCED PORTFOLIO (continued) | | |
| | | | | | |
| |
| SCHEDULE OF INVESTMENTS | | as of December 31, 2019 |
| | | | | | | | |
COMMON STOCKS
(continued) | | Shares | | | Value | |
Commercial Services & Supplies (continued) | |
Sohgo Security Services Co. Ltd. (Japan) | | | 300 | | | $ | 16,269 | |
Toppan Printing Co. Ltd. (Japan) | | | 12,100 | | | | 249,975 | |
Waste Management, Inc. | | | 19,042 | | | | 2,170,026 | |
| | | | | | | | |
| | | | | | | 5,674,488 | |
| | | | | | | | |
Communications Equipment — 0.5% | |
Arista Networks, Inc.* | | | 2,600 | | | | 528,840 | |
Cisco Systems, Inc. | | | 204,600 | | | | 9,812,616 | |
F5 Networks, Inc.* | | | 2,900 | | | | 404,985 | |
Juniper Networks, Inc. | | | 16,500 | | | | 406,395 | |
Motorola Solutions, Inc. | | | 8,089 | | | | 1,303,462 | |
Telefonaktiebolaget LM Ericsson (Sweden) (Class B Stock) | | | 10,357 | | | | 90,182 | |
| | | | | | | | |
| | | | | | | 12,546,480 | |
| | | | | | | | |
Construction & Engineering — 0.1% | |
ACS Actividades de Construccion y Servicios SA (Spain) | | | 5,655 | | | | 226,672 | |
Eiffage SA (France) | | | 271 | | | | 31,017 | |
Jacobs Engineering Group, Inc. | | | 6,300 | | | | 565,929 | |
Obayashi Corp. (Japan) | | | 31,100 | | | | 345,883 | |
Quanta Services, Inc. | | | 6,100 | | | | 248,331 | |
Shimizu Corp. (Japan) | | | 33,600 | | | | 342,106 | |
Skanska AB (Sweden) (Class B Stock) | | | 1,152 | | | | 26,014 | |
Taisei Corp. (Japan) | | | 700 | | | | 29,078 | |
| | | | | | | | |
| | | | | | | 1,815,030 | |
| | | | | | | | |
Construction Materials — 0.1% | | | | | | | | |
CRH PLC (Ireland) | | | 2,786 | | | | 111,678 | |
HeidelbergCement AG (Germany) | | | 4,727 | | | | 346,790 | |
LafargeHolcim Ltd. (Switzerland)* | | | 1,680 | | | | 93,278 | |
Martin Marietta Materials, Inc. | | | 3,100 | | | | 866,884 | |
Vulcan Materials Co. | | | 6,600 | | | | 950,334 | |
| | | | | | | | |
| | | | | | | 2,368,964 | |
| | | | | | | | |
Consumer Finance — 0.3% | | | | | | | | |
American Express Co. | | | 32,800 | | | | 4,083,272 | |
Capital One Financial Corp. | | | 22,961 | | | | 2,362,916 | |
Credit Saison Co. Ltd. (Japan) | | | 5,200 | | | | 90,206 | |
Discover Financial Services | | | 15,440 | | | | 1,309,621 | |
Synchrony Financial | | | 28,372 | | | | 1,021,676 | |
| | | | | | | | |
| | | | | | | 8,867,691 | |
| | | | | | | | |
Containers & Packaging — 0.2% | | | | | | | | |
Amcor PLC(a) | | | 75,650 | | | | 820,046 | |
Avery Dennison Corp. | | | 4,300 | | | | 562,526 | |
Ball Corp. | | | 15,700 | | | | 1,015,319 | |
International Paper Co. | | | 18,173 | | | | 836,867 | |
Packaging Corp. of America | | | 4,800 | | | | 537,552 | |
Sealed Air Corp. | | | 6,700 | | | | 266,861 | |
Westrock Co. | | | 12,344 | | | | 529,681 | |
| | | | | | | | |
| | | | | | | 4,568,852 | |
| | | | | | | | |
Distributors — 0.1% | | | | | | | | |
Genuine Parts Co. | | | 7,200 | | | | 764,856 | |
LKQ Corp.* | | | 14,200 | | | | 506,940 | |
| | | | | | | | |
| | | | | | | 1,271,796 | |
| | | | | | | | |
| | | | | | | | |
COMMON STOCKS
(continued) | | Shares | | | Value | |
Diversified Consumer Services — 0.0% | |
H&R Block, Inc. | | | 8,600 | | | $ | 201,928 | |
| | | | | | | | |
Diversified Financial Services — 0.8% | |
Berkshire Hathaway, Inc. (Class B Stock)* | | | 94,620 | | | | 21,431,430 | |
Kinnevik AB (Sweden) (Class B Stock) | | | 880 | | | | 21,533 | |
M&G PLC (United Kingdom)* | | | 41,167 | | | | 129,858 | |
Mitsubishi UFJ Lease & Finance Co. Ltd. (Japan) | | | 1,400 | | | | 9,009 | |
| | | | | | | | |
| | | | | | | 21,591,830 | |
| | | | | | | | |
Diversified Telecommunication Services — 1.1% | | | | | |
AT&T, Inc. | | | 354,036 | | | | 13,835,727 | |
CenturyLink, Inc.(a) | | | 46,279 | | | | 611,346 | |
Deutsche Telekom AG (Germany) | | | 24,933 | | | | 407,301 | |
Elisa OYJ (Finland) | | | 504 | | | | 27,808 | |
Nippon Telegraph & Telephone Corp. (Japan) | | | 16,400 | | | | 416,361 | |
Telecom Italia SpA (Italy)* | | | 431,254 | | | | 269,672 | |
Telecom Italia SpA (Italy), RSP | | | 22,010 | | | | 13,510 | |
Telefonica Deutschland Holding AG (Germany) | | | 27,390 | | | | 79,663 | |
Telenor ASA (Norway) | | | 2,514 | | | | 45,035 | |
Verizon Communications, Inc. | | | 199,276 | | | | 12,235,546 | |
| | | | | | | | |
| | | | | | | 27,941,969 | |
| | | | | | | | |
Electric Utilities — 1.1% | |
Alliant Energy Corp. | | | 11,200 | | | | 612,864 | |
American Electric Power Co., Inc. | | | 24,160 | | | | 2,283,362 | |
Chubu Electric Power Co., Inc. (Japan) | | | 22,900 | | | | 323,688 | |
Duke Energy Corp.(a) | | | 35,061 | | | | 3,197,914 | |
Edison International | | | 17,600 | | | | 1,327,216 | |
Enel SpA (Italy) | | | 69,195 | | | | 549,539 | |
Entergy Corp. | | | 9,500 | | | | 1,138,100 | |
Evergy, Inc. | | | 11,500 | | | | 748,535 | |
Eversource Energy | | | 15,900 | | | | 1,352,613 | |
Exelon Corp. | | | 46,313 | | | | 2,111,410 | |
FirstEnergy Corp. | | | 25,806 | | | | 1,254,172 | |
Iberdrola SA (Spain) | | | 47,831 | | | | 493,906 | |
Kansai Electric Power Co., Inc. (The) (Japan) | | | 10,100 | | | | 117,171 | |
NextEra Energy, Inc. | | | 23,600 | | | | 5,714,976 | |
Pinnacle West Capital Corp. | | | 5,300 | | | | 476,629 | |
PPL Corp. | | | 34,000 | | | | 1,219,920 | |
Southern Co. (The) | | | 50,400 | | | | 3,210,480 | |
SSE PLC (United Kingdom) | | | 3,699 | | | | 70,597 | |
Xcel Energy, Inc. | | | 25,510 | | | | 1,619,630 | |
| | | | | | | | |
| | | | | | | 27,822,722 | |
| | | | | | | | |
Electrical Equipment — 0.3% | | | | | | | | |
AMETEK, Inc. | | | 10,900 | | | | 1,087,166 | |
Eaton Corp. PLC | | | 20,137 | | | | 1,907,377 | |
Emerson Electric Co. | | | 29,300 | | | | 2,234,418 | |
Legrand SA (France) | | | 4,550 | | | | 371,198 | |
Rockwell Automation, Inc. | | | 5,800 | | | | 1,175,486 | |
Schneider Electric SE (France) | | | 840 | | | | 86,312 | |
| | | | | | | | |
| | | | | | | 6,861,957 | |
| | | | | | | | |
SEE NOTES TO FINANCIAL STATEMENTS.
A4
| | | | | | |
| | |
| | CONSERVATIVE BALANCED PORTFOLIO (continued) | | |
| | | | | | |
| |
| SCHEDULE OF INVESTMENTS | | as of December 31, 2019 |
| | | | | | | | |
COMMON STOCKS
(continued) | | Shares | | | Value | |
Electronic Equipment, Instruments & Components — 0.3% | |
Amphenol Corp. (Class A Stock) | | | 14,600 | | | $ | 1,580,158 | |
CDW Corp. | | | 7,100 | | | | 1,014,164 | |
Corning, Inc. | | | 36,700 | | | | 1,068,337 | |
FLIR Systems, Inc. | | | 6,100 | | | | 317,627 | |
Halma PLC (United Kingdom) | | | 1,267 | | | | 35,715 | |
Hitachi High-Technologies Corp. (Japan) | | | 1,800 | | | | 127,056 | |
Ingenico Group SA (France) | | | 3,064 | | | | 332,787 | |
IPG Photonics Corp.* | | | 1,700 | | | | 246,364 | |
Keysight Technologies, Inc.* | | | 8,900 | | | | 913,407 | |
TDK Corp. (Japan) | | | 500 | | | | 56,335 | |
TE Connectivity Ltd. | | | 16,000 | | | | 1,533,440 | |
Zebra Technologies Corp. (Class A Stock)* | | | 2,300 | | | | 587,512 | |
| | | | | | | | |
| | | | | | | 7,812,902 | |
| | | | | | | | |
Energy Equipment & Services — 0.2% | | | | | | | | |
Baker Hughes Co. | | | 28,798 | | | | 738,093 | |
Halliburton Co. | | | 41,700 | | | | 1,020,399 | |
Helmerich & Payne, Inc. | | | 5,400 | | | | 245,322 | |
National Oilwell Varco, Inc. | | | 18,400 | | | | 460,920 | |
Schlumberger Ltd. | | | 66,424 | | | | 2,670,245 | |
TechnipFMC PLC (United Kingdom) | | | 18,400 | | | | 394,496 | |
| | | | | | | | |
| | | | | | | 5,529,475 | |
| | | | | | | | |
Entertainment — 1.0% | | | | | | | | |
Activision Blizzard, Inc. | | | 36,400 | | | | 2,162,888 | |
Electronic Arts, Inc.* | | | 14,100 | | | | 1,515,891 | |
Live Nation Entertainment, Inc.* | | | 5,600 | | | | 400,232 | |
Netflix, Inc.* | | | 21,170 | | | | 6,849,977 | |
Nintendo Co. Ltd. (Japan) | | | 400 | | | | 161,234 | |
Square Enix Holdings Co. Ltd. (Japan) | | | 400 | | | | 19,912 | |
Take-Two Interactive Software, Inc.* | | | 5,800 | | | | 710,094 | |
Toho Co. Ltd. (Japan) | | | 400 | | | | 16,648 | |
Vivendi SA (France) | | | 6,458 | | | | 186,968 | |
Walt Disney Co. (The) | | | 86,782 | | | | 12,551,281 | |
| | | | | | | | |
| | | | | | | 24,575,125 | |
| | | | | | | | |
Equity Real Estate Investment Trusts (REITs) — 1.4% | |
Alexandria Real Estate Equities, Inc. | | | 5,600 | | | | 904,848 | |
American Tower Corp. | | | 21,400 | | | | 4,918,148 | |
Apartment Investment & Management Co.
(Class A Stock) | | | 6,936 | | | | 358,244 | |
AvalonBay Communities, Inc. | | | 6,875 | | | | 1,441,687 | |
Boston Properties, Inc. | | | 7,100 | | | | 978,806 | |
CapitaLand Commercial Trust (Singapore) | | | 9,200 | | | | 13,629 | |
Crown Castle International Corp. | | | 20,000 | | | | 2,843,000 | |
Digital Realty Trust, Inc.(a) | | | 9,900 | | | | 1,185,426 | |
Duke Realty Corp. | | | 16,500 | | | | 572,055 | |
Equinix, Inc. | | | 4,154 | | | | 2,424,690 | |
Equity Residential | | | 17,100 | | | | 1,383,732 | |
Essex Property Trust, Inc. | | | 3,150 | | | | 947,709 | |
Extra Space Storage, Inc. | | | 6,400 | | | | 675,968 | |
Federal Realty Investment Trust | | | 3,300 | | | | 424,809 | |
Goodman Group (Australia) | | | 5,492 | | | | 51,675 | |
Healthpeak Properties, Inc. | | | 23,400 | | | | 806,598 | |
Host Hotels & Resorts, Inc. | | | 34,082 | | | | 632,221 | |
| | | | | | | | |
COMMON STOCKS
(continued) | | Shares | | | Value | |
Equity Real Estate Investment Trusts (REITs) (continued) | |
Iron Mountain, Inc.(a) | | | 13,102 | | | $ | 417,561 | |
Japan Real Estate Investment Corp. (Japan) | | | 5 | | | | 33,174 | |
Japan Retail Fund Investment Corp. (Japan) | | | 9 | | | | 19,323 | |
Kimco Realty Corp. | | | 18,700 | | | | 387,277 | |
Klepierre SA (France) | | | 2,866 | | | | 108,881 | |
Land Securities Group PLC (United Kingdom) | | | 2,508 | | | | 32,964 | |
Mapletree Commercial Trust (Singapore) | | | 119,500 | | | | 212,447 | |
Mid-America Apartment Communities, Inc. | | | 5,800 | | | | 764,788 | |
Nippon Building Fund, Inc. (Japan) | | | 5 | | | | 36,611 | |
Orix JREIT, Inc. (Japan) | | | 10 | | | | 21,702 | |
Prologis, Inc. | | | 30,277 | | | | 2,698,892 | |
Public Storage | | | 7,300 | | | | 1,554,608 | |
Realty Income Corp. | | | 15,700 | | | | 1,155,991 | |
Regency Centers Corp. | | | 7,900 | | | | 498,411 | |
SBA Communications Corp. | | | 5,700 | | | | 1,373,643 | |
Simon Property Group, Inc.(a) | | | 15,093 | | | | 2,248,253 | |
SL Green Realty Corp. | | | 4,300 | | | | 395,084 | |
Stockland (Australia) | | | 8,093 | | | | 26,233 | |
UDR, Inc. | | | 14,300 | | | | 667,810 | |
Ventas, Inc. | | | 17,918 | | | | 1,034,585 | |
Vornado Realty Trust | | | 7,725 | | | | 513,712 | |
Welltower, Inc. | | | 19,900 | | | | 1,627,422 | |
Weyerhaeuser Co. | | | 35,818 | | | | 1,081,704 | |
| | | | | | | | |
| | | | | | | 37,474,321 | |
| | | | | | | | |
Food & Staples Retailing — 0.8% | | | | | | | | |
Coles Group Ltd. (Australia) | | | 3,854 | | | | 40,156 | |
Colruyt SA (Belgium) | | | 200 | | | | 10,434 | |
Costco Wholesale Corp. | | | 21,300 | | | | 6,260,496 | |
J Sainsbury PLC (United Kingdom) | | | 81,203 | | | | 247,484 | |
Koninklijke Ahold Delhaize NV (Netherlands) | | | 13,192 | | | | 329,749 | |
Kroger Co. (The) | | | 37,992 | | | | 1,101,388 | |
Sysco Corp. | | | 24,600 | | | | 2,104,284 | |
Tesco PLC (United Kingdom) | | | 33,417 | | | | 113,078 | |
Walgreens Boots Alliance, Inc. | | | 36,100 | | | | 2,128,456 | |
Walmart, Inc. | | | 68,600 | | | | 8,152,424 | |
Wm Morrison Supermarkets PLC (United Kingdom) | | | 3,633 | | | | 9,615 | |
Woolworths Group Ltd. (Australia) | | | 13,339 | | | | 338,729 | |
| | | | | | | | |
| | | | | | | 20,836,293 | |
| | | | | | | | |
Food Products — 0.6% | | | | | | | | |
Archer-Daniels-Midland Co. | | | 27,026 | | | | 1,252,655 | |
Associated British Foods PLC (United Kingdom) | | | 1,178 | | | | 40,699 | |
Campbell Soup Co. | | | 7,900 | | | | 390,418 | |
Conagra Brands, Inc.(a) | | | 23,000 | | | | 787,520 | |
General Mills, Inc. | | | 29,300 | | | | 1,569,308 | |
Hershey Co. (The) | | | 7,200 | | | | 1,058,256 | |
Hormel Foods Corp.(a) | | | 13,300 | | | | 599,963 | |
J.M. Smucker Co. (The)(a) | | | 5,600 | | | | 583,128 | |
Kellogg Co. | | | 11,800 | | | | 816,088 | |
Kraft Heinz Co. (The) | | | 29,717 | | | | 954,807 | |
SEE NOTES TO FINANCIAL STATEMENTS.
A5
| | | | | | |
| | |
| | CONSERVATIVE BALANCED PORTFOLIO (continued) | | |
| | | | | | |
| |
| SCHEDULE OF INVESTMENTS | | as of December 31, 2019 |
| | | | | | | | |
COMMON STOCKS
(continued) | | Shares | | | Value | |
Food Products (continued) | | | | | | | | |
Lamb Weston Holdings, Inc. | | | 7,400 | | | $ | 636,622 | |
McCormick & Co., Inc.(a) | | | 6,100 | | | | 1,035,353 | |
Mondelez International, Inc. (Class A Stock) | | | 69,453 | | | | 3,825,471 | |
Nestle SA (Switzerland) | | | 9,977 | | | | 1,080,044 | |
Orkla ASA (Norway) | | | 2,598 | | | | 26,332 | |
Tate & Lyle PLC (United Kingdom) | | | 7,241 | | | | 73,039 | |
Tyson Foods, Inc. (Class A Stock) | | | 14,400 | | | | 1,310,976 | |
WH Group Ltd. (Hong Kong), 144A | | | 328,000 | | | | 339,706 | |
Wilmar International Ltd. (Singapore) | | | 3,900 | | | | 11,956 | |
| | | | | | | | |
| | | | | | | 16,392,341 | |
| | | | | | | | |
Gas Utilities — 0.0% | | | | | | | | |
Atmos Energy Corp. | | | 5,900 | | | | 659,974 | |
Enagas SA (Spain) | | | 782 | | | | 19,951 | |
Naturgy Energy Group SA (Spain) | | | 1,056 | | | | 26,623 | |
Snam SpA (Italy) | | | 6,780 | | | | 35,675 | |
Tokyo Gas Co. Ltd. (Japan) | | | 1,400 | | | | 33,997 | |
| | | | | | | | |
| | | | | | | 776,220 | |
| | | | | | | | |
Health Care Equipment & Supplies — 1.8% | |
Abbott Laboratories | | | 85,200 | | | | 7,400,472 | |
ABIOMED, Inc.* | | | 2,360 | | | | 402,592 | |
Align Technology, Inc.* | | | 3,600 | | | | 1,004,544 | |
Baxter International, Inc. | | | 24,800 | | | | 2,073,776 | |
Becton, Dickinson & Co. | | | 13,210 | | | | 3,592,724 | |
Boston Scientific Corp.* | | | 66,667 | | | | 3,014,682 | |
Cooper Cos., Inc. (The) | | | 2,440 | | | | 783,948 | |
Danaher Corp. | | | 30,800 | | | | 4,727,184 | |
DENTSPLY SIRONA, Inc. | | | 10,800 | | | | 611,172 | |
Edwards Lifesciences Corp.* | | | 10,000 | | | | 2,332,900 | |
Fisher & Paykel Healthcare Corp. Ltd. (New Zealand) | | | 2,001 | | | | 29,859 | |
Hologic, Inc.* | | | 12,500 | | | | 652,625 | |
Hoya Corp. (Japan) | | | 1,200 | | | | 114,758 | |
IDEXX Laboratories, Inc.* | | | 4,200 | | | | 1,096,746 | |
Intuitive Surgical, Inc.* | | | 5,560 | | | | 3,286,794 | |
Koninklijke Philips NV (Netherlands) | | | 662 | | | | 32,374 | |
Medtronic PLC. | | | 64,690 | | | | 7,339,080 | |
Olympus Corp. (Japan) | | | 3,500 | | | | 54,707 | |
ResMed, Inc. | | | 7,100 | | | | 1,100,287 | |
Siemens Healthineers AG (Germany), 144A | | | 2,091 | | | | 100,577 | |
Smith & Nephew PLC (United Kingdom) | | | 2,251 | | | | 54,823 | |
STERIS PLC | | | 3,850 | | | | 586,817 | |
Stryker Corp. | | | 15,500 | | | | 3,254,070 | |
Teleflex, Inc. | | | 2,400 | | | | 903,456 | |
Varian Medical Systems, Inc.* | | | 4,600 | | | | 653,246 | |
Zimmer Biomet Holdings, Inc. | | | 10,100 | | | | 1,511,768 | |
| | | | | | | | |
| | | | | | | 46,715,981 | |
| | | | | | | | |
Health Care Providers & Services — 1.5% | |
Alfresa Holdings Corp. (Japan) | | | 2,800 | | | | 56,815 | |
AmerisourceBergen Corp. | | | 7,500 | | | | 637,650 | |
Anthem, Inc. | | | 12,500 | | | | 3,775,375 | |
Cardinal Health, Inc. | | | 14,150 | | | | 715,707 | |
Centene Corp.*(a) | | | 19,700 | | | | 1,238,539 | |
| | | | | | | | |
COMMON STOCKS
(continued) | | Shares | | | Value | |
Health Care Providers & Services (continued) | |
Cigna Corp. | | | 18,200 | | | $ | 3,721,718 | |
CVS Health Corp. | | | 62,683 | | | | 4,656,720 | |
DaVita, Inc.* | | | 4,700 | | | | 352,641 | |
Fresenius Medical Care AG & Co. KGaA (Germany) | | | 740 | | | | 54,946 | |
HCA Healthcare, Inc. | | | 13,100 | | | | 1,936,311 | |
Henry Schein, Inc.*(a) | | | 6,800 | | | | 453,696 | |
Humana, Inc. | | | 6,650 | | | | 2,437,358 | |
Laboratory Corp. of America Holdings* | | | 5,000 | | | | 845,850 | |
McKesson Corp. | | | 9,030 | | | | 1,249,030 | |
Medipal Holdings Corp. (Japan) | | | 13,800 | | | | 304,166 | |
Quest Diagnostics, Inc. | | | 6,800 | | | | 726,172 | |
Sonic Healthcare Ltd. (Australia) | | | 850 | | | | 17,153 | |
Suzuken Co. Ltd. (Japan) | | | 6,900 | | | | 281,027 | |
UnitedHealth Group, Inc. | | | 45,760 | | | | 13,452,525 | |
Universal Health Services, Inc. (Class B Stock) | | | 3,900 | | | | 559,494 | |
WellCare Health Plans, Inc.* | | | 2,500 | | | | 825,525 | |
| | | | | | | | |
| | | | | | | 38,298,418 | |
| | | | | | | | |
Health Care Technology — 0.0% | | | | | | | | |
Cerner Corp. | | | 15,600 | | | | 1,144,884 | |
| | | | | | | | |
Hotels, Restaurants & Leisure — 1.0% | |
Aristocrat Leisure Ltd. (Australia) | | | 3,305 | | | | 78,303 | |
Carnival Corp.(a) | | | 19,300 | | | | 981,019 | |
Chipotle Mexican Grill, Inc.* | | | 1,270 | | | | 1,063,130 | |
Compass Group PLC (United Kingdom) | | | 5,529 | | | | 138,730 | |
Darden Restaurants, Inc.(a) | | | 5,950 | | | | 648,609 | |
Flutter Entertainment PLC (Ireland) | | | 266 | | | | 32,390 | |
Galaxy Entertainment Group Ltd. (Macau) | | | 7,000 | | | | 51,624 | |
Hilton Worldwide Holdings, Inc. | | | 13,800 | | | | 1,530,558 | |
Las Vegas Sands Corp. | | | 15,600 | | | | 1,077,024 | |
Marriott International, Inc. (Class A Stock) | | | 13,328 | | | | 2,018,259 | |
McDonald’s Corp. | | | 36,600 | | | | 7,232,526 | |
MGM Resorts International | | | 23,800 | | | | 791,826 | |
Norwegian Cruise Line Holdings Ltd.* | | | 9,900 | | | | 578,259 | |
Oriental Land Co. Ltd. (Japan) | | | 700 | | | | 95,521 | |
Royal Caribbean Cruises Ltd. | | | 8,400 | | | | 1,121,484 | |
Sodexo SA (France) | | | 296 | | | | 35,070 | |
Starbucks Corp. | | | 57,700 | | | | 5,072,984 | |
Tabcorp Holdings Ltd. (Australia) | | | 6,996 | | | | 22,230 | |
TUI AG (Germany) | | | 1,519 | | | | 19,237 | |
Wynn Resorts Ltd. | | | 4,700 | | | | 652,689 | |
Yum! Brands, Inc. | | | 14,900 | | | | 1,500,877 | |
| | | | | | | | |
| | | | | | | 24,742,349 | |
| | | | | | | | |
Household Durables — 0.2% | | | | | | | | |
Barratt Developments PLC (United Kingdom) | | | 3,530 | | | | 35,067 | |
Berkeley Group Holdings PLC (United Kingdom) | | | 4,903 | | | | 315,499 | |
Casio Computer Co. Ltd. (Japan) | | | 700 | | | | 14,017 | |
D.R. Horton, Inc. | | | 16,300 | | | | 859,825 | |
Garmin Ltd. | | | 6,500 | | | | 634,140 | |
Leggett & Platt, Inc.(a) | | | 5,400 | | | | 274,482 | |
SEE NOTES TO FINANCIAL STATEMENTS.
A6
| | | | | | |
| | |
| | CONSERVATIVE BALANCED PORTFOLIO (continued) | | |
| | | | | | |
| |
| SCHEDULE OF INVESTMENTS | | as of December 31, 2019 |
| | | | | | | | |
COMMON STOCKS
(continued) | | Shares | | | Value | |
Household Durables (continued) | | | | | | | | |
Lennar Corp. (Class A Stock) | | | 13,600 | | | $ | 758,744 | |
Mohawk Industries, Inc.* | | | 2,940 | | | | 400,957 | |
Newell Brands, Inc. | | | 15,914 | | | | 305,867 | |
NVR, Inc.* | | | 160 | | | | 609,345 | |
PulteGroup, Inc. | | | 11,922 | | | | 462,574 | |
Sekisui House Ltd. (Japan) | | | 2,200 | | | | 47,093 | |
Sony Corp. (Japan) | | | 9,200 | | | | 625,332 | |
Taylor Wimpey PLC (United Kingdom) | | | 10,680 | | | | 27,518 | |
Whirlpool Corp. | | | 3,026 | | | | 446,426 | |
| | | | | | | | |
| | | | | | | 5,816,886 | |
| | | | | | | | |
Household Products — 0.9% | | | | | | | | |
Church & Dwight Co., Inc. | | | 11,800 | | | | 830,012 | |
Clorox Co. (The) | | | 6,100 | | | | 936,594 | |
Colgate-Palmolive Co. | | | 41,300 | | | | 2,843,092 | |
Essity AB (Sweden) (Class B Stock) | | | 6,866 | | | | 220,723 | |
Henkel AG & Co. KGaA (Germany) | | | 363 | | | | 34,323 | |
Kimberly-Clark Corp. | | | 16,500 | | | | 2,269,575 | |
Procter & Gamble Co. (The) | | | 120,825 | | | | 15,091,042 | |
| | | | | | | | |
| | | | | | | 22,225,361 | |
| | | | | | | | |
Independent Power & Renewable Electricity Producers — 0.0% | |
AES Corp. | | | 30,700 | | | | 610,930 | |
NRG Energy, Inc. | | | 12,000 | | | | 477,000 | |
| | | | | | | | |
| | | | | | | 1,087,930 | |
| | | | | | | | |
Industrial Conglomerates — 0.7% | | | | | | | | |
3M Co. | | | 27,800 | | | | 4,904,476 | |
CK Hutchison Holdings Ltd. (United Kingdom) | | | 9,500 | | | | 90,661 | |
General Electric Co. | | | 423,530 | | | | 4,726,595 | |
Honeywell International, Inc. | | | 34,712 | | | | 6,144,024 | |
Roper Technologies, Inc. | | | 5,000 | | | | 1,771,150 | |
Siemens AG (Germany) | | | 2,653 | | | | 347,647 | |
| | | | | | | | |
| | | | | | | 17,984,553 | |
| | | | | | | | |
Insurance — 1.2% | | | | | | | | |
Aegon NV (Netherlands) | | | 43,318 | | | | 197,975 | |
Aflac, Inc. | | | 35,800 | | | | 1,893,820 | |
Ageas (Belgium) | | | 624 | | | | 36,915 | |
AIA Group Ltd. (Hong Kong) | | | 11,800 | | | | 124,023 | |
Allianz SE (Germany) | | | 1,467 | | | | 359,542 | |
Allstate Corp. (The) | | | 16,100 | | | | 1,810,445 | |
American International Group, Inc. | | | 41,939 | | | | 2,152,729 | |
Aon PLC | | | 11,600 | | | | 2,416,164 | |
Arthur J Gallagher & Co. | | | 9,000 | | | | 857,070 | |
Assicurazioni Generali SpA (Italy) | | | 3,704 | | | | 76,468 | |
Assurant, Inc. | | | 3,000 | | | | 393,240 | |
Aviva PLC (United Kingdom) | | | 13,476 | | | | 75,173 | |
Chubb Ltd. | | | 21,986 | | | | 3,422,341 | |
Cincinnati Financial Corp. | | | 7,237 | | | | 760,970 | |
CNP Assurances (France) | | | 588 | | | | 11,703 | |
Dai-ichi Life Holdings, Inc. (Japan) | | | 3,800 | | | | 62,761 | |
Everest Re Group Ltd. | | | 2,140 | | | | 592,438 | |
Globe Life, Inc. | | | 5,025 | | | | 528,881 | |
Hannover Rueck SE (Germany) | | | 210 | | | | 40,636 | |
Hartford Financial Services Group, Inc. (The) | | | 17,700 | | | | 1,075,629 | |
| | | | | | | | |
COMMON STOCKS
(continued) | | Shares | | | Value | |
Insurance (continued) | | | | | | | | |
Japan Post Holdings Co. Ltd. (Japan) | | | 5,500 | | | $ | 51,677 | |
Japan Post Insurance Co. Ltd. (Japan) | | | 800 | | | | 13,571 | |
Legal & General Group PLC (United Kingdom) | | | 102,675 | | | | 415,324 | |
Lincoln National Corp. | | | 10,018 | | | | 591,162 | |
Loews Corp. | | | 12,675 | | | | 665,311 | |
Marsh & McLennan Cos., Inc.(a) | | | 24,800 | | | | 2,762,968 | |
MetLife, Inc. | | | 37,850 | | | | 1,929,214 | |
MS&AD Insurance Group Holdings, Inc. (Japan) | | | 1,700 | | | | 56,101 | |
Muenchener Rueckversicherungs-Gesellschaft AG in Muenchen (Germany) | | | 706 | | | | 208,265 | |
NN Group NV (Netherlands) | | | 8,654 | | | | 328,549 | |
Principal Financial Group, Inc.(a) | | | 12,200 | | | | 671,000 | |
Progressive Corp. (The) | | | 28,600 | | | | 2,070,354 | |
QBE Insurance Group Ltd. (Australia) | | | 4,550 | | | | 41,105 | |
Swiss Life Holding AG (Switzerland) | | | 119 | | | | 59,764 | |
Travelers Cos., Inc. (The) | | | 12,535 | | | | 1,716,668 | |
Unum Group | | | 9,910 | | | | 288,976 | |
W.R. Berkley Corp. | | | 6,000 | | | | 414,600 | |
Willis Towers Watson PLC | | | 6,340 | | | | 1,280,300 | |
Zurich Insurance Group AG (Switzerland) | | | 1,283 | | | | 526,299 | |
| | | | | | | | |
| | | | | | | 30,980,131 | |
| | | | | | | | |
Interactive Media & Services — 2.5% | | | | | | | | |
Alphabet, Inc. (Class A Stock)* | | | 14,530 | | | | 19,461,337 | |
Alphabet, Inc. (Class C Stock)* | | | 14,723 | | | | 19,684,945 | |
Facebook, Inc. (Class A Stock)* | | | 116,630 | | | | 23,938,307 | |
Kakaku.com, Inc. (Japan) | | | 500 | | | | 12,713 | |
Twitter, Inc.* | | | 36,800 | | | | 1,179,440 | |
Z Holdings Corp. (Japan) | | | 3,600 | | | | 15,194 | |
| | | | | | | | |
| | | | | | | 64,291,936 | |
| | | | | | | | |
Internet & Direct Marketing Retail — 1.7% | | | | | |
Amazon.com, Inc.* | | | 20,150 | | | | 37,233,976 | |
Booking Holdings, Inc.*(a) | | | 2,070 | | | | 4,251,221 | |
eBay, Inc. | | | 37,800 | | | | 1,364,958 | |
Expedia Group, Inc. | | | 6,850 | | | | 740,759 | |
Rakuten, Inc. (Japan) | | | 2,900 | | | | 24,736 | |
| | | | | | | | |
| | | | | | | 43,615,650 | |
| | | | | | | | |
IT Services — 2.7% | | | | | | | | |
Accenture PLC (Class A Stock) | | | 30,700 | | | | 6,464,499 | |
Adyen NV (Netherlands), 144A* | | | 34 | | | | 27,896 | |
Akamai Technologies, Inc.* | | | 8,000 | | | | 691,040 | |
Alliance Data Systems Corp. | | | 2,240 | | | | 251,328 | |
Amadeus IT Group SA (Spain) | | | 1,476 | | | | 120,659 | |
Atos SE (France) | | | 335 | | | | 27,996 | |
Automatic Data Processing, Inc. | | | 20,900 | | | | 3,563,450 | |
Broadridge Financial Solutions, Inc. | | | 5,600 | | | | 691,824 | |
Capgemini SE (France) | | | 251 | | | | 30,668 | |
Cognizant Technology Solutions Corp. (Class A Stock) | | | 27,000 | | | | 1,674,540 | |
DXC Technology Co. | | | 11,328 | | | | 425,819 | |
Fidelity National Information Services, Inc. | | | 29,600 | | | | 4,117,064 | |
SEE NOTES TO FINANCIAL STATEMENTS.
A7
| | | | | | |
| | |
| | CONSERVATIVE BALANCED PORTFOLIO (continued) | | |
| | | | | | |
| |
| SCHEDULE OF INVESTMENTS | | as of December 31, 2019 |
| | | | | | | | |
COMMON STOCKS
(continued) | | Shares | | | Value | |
IT Services (continued) | | | | | | | | |
Fiserv, Inc.* | | | 27,500 | | | $ | 3,179,825 | |
FleetCor Technologies, Inc.*(a) | | | 4,200 | | | | 1,208,424 | |
Fujitsu Ltd. (Japan) | | | 2,100 | | | | 197,487 | |
Gartner, Inc.* | | | 4,400 | | | | 678,040 | |
Global Payments, Inc. | | | 14,477 | | | | 2,642,921 | |
International Business Machines Corp. | | | 42,700 | | | | 5,723,508 | |
Jack Henry & Associates, Inc. | | | 3,800 | | | | 553,546 | |
Leidos Holdings, Inc. | | | 6,400 | | | | 626,496 | |
Mastercard, Inc. (Class A Stock) | | | 43,100 | | | | 12,869,229 | |
NEC Corp. (Japan) | | | 400 | | | | 16,539 | |
Nomura Research Institute Ltd. (Japan) | | | 15,200 | | | | 325,413 | |
NTT Data Corp. (Japan) | | | 2,100 | | | | 28,154 | |
Obic Co. Ltd. (Japan) | | | 900 | | | | 121,303 | |
Otsuka Corp. (Japan) | | | 400 | | | | 16,006 | |
Paychex, Inc. | | | 15,600 | | | | 1,326,936 | |
PayPal Holdings, Inc.* | | | 56,700 | | | | 6,133,239 | |
VeriSign, Inc.* | | | 5,200 | | | | 1,001,936 | |
Visa, Inc. (Class A Stock)(a) | | | 83,300 | | | | 15,652,070 | |
Western Union Co. (The) | | | 20,210 | | | | 541,224 | |
Wirecard AG (Germany)(a) | | | 477 | | | | 57,988 | |
| | | | | | | | |
| | | | | | | 70,987,067 | |
| | | | | | | | |
Leisure Products — 0.0% | | | | | | | | |
Bandai Namco Holdings, Inc. (Japan) | | | 2,200 | | | | 133,571 | |
Hasbro, Inc. | | | 5,700 | | | | 601,977 | |
Shimano, Inc. (Japan) | | | 200 | | | | 32,548 | |
| | | | | | | | |
| | | | | | | 768,096 | |
| | | | | | | | |
Life Sciences Tools & Services — 0.5% | | | | | | | | |
Agilent Technologies, Inc. | | | 15,114 | | | | 1,289,375 | |
Illumina, Inc.* | | | 7,200 | | | | 2,388,528 | |
IQVIA Holdings, Inc.* | | | 8,800 | | | | 1,359,688 | |
Mettler-Toledo International, Inc.* | | | 1,200 | | | | 951,936 | |
PerkinElmer, Inc. | | | 5,300 | | | | 514,630 | |
QIAGEN NV* | | | 786 | | | | 26,882 | |
Sartorius Stedim Biotech (France) | | | 96 | | | | 15,928 | |
Thermo Fisher Scientific, Inc. | | | 19,380 | | | | 6,295,981 | |
Waters Corp.*(a) | | | 3,200 | | | | 747,680 | |
| | | | | | | | |
| | | | | | | 13,590,628 | |
| | | | | | | | |
Machinery — 0.9% | | | | | | | | |
Alfa Laval AB (Sweden) | | | 1,071 | | | | 26,972 | |
Alstom SA (France) | | | 7,169 | | | | 340,588 | |
Amada Holdings Co. Ltd. (Japan) | | | 10,300 | | | | 117,086 | |
Atlas Copco AB (Sweden) (Class A Stock) | | | 10,643 | | | | 424,394 | |
Atlas Copco AB (Sweden) (Class B Stock) | | | 1,378 | | | | 47,835 | |
Caterpillar, Inc. | | | 27,100 | | | | 4,002,128 | |
Cummins, Inc. | | | 7,300 | | | | 1,306,408 | |
Deere & Co. | | | 15,380 | | | | 2,664,739 | |
Dover Corp. | | | 7,000 | | | | 806,820 | |
Epiroc AB (Sweden) (Class B Stock) | | | 1,360 | | | | 16,103 | |
Flowserve Corp. | | | 6,100 | | | | 303,597 | |
Fortive Corp. | | | 13,650 | | | | 1,042,723 | |
IDEX Corp. | | | 3,910 | | | | 672,520 | |
Illinois Tool Works, Inc. | | | 14,400 | | | | 2,586,672 | |
Ingersoll-Rand PLC | | | 11,900 | | | | 1,581,748 | |
| | | | | | | | |
COMMON STOCKS
(continued) | | Shares | | | Value | |
Machinery (continued) | | | | | | | | |
Kone OYJ (Finland) (Class B Stock) | | | 4,008 | | | $ | 261,853 | |
Metso OYJ (Finland) | | | 8,041 | | | | 317,255 | |
Mitsubishi Heavy Industries Ltd. (Japan) | | | 1,100 | | | | 42,714 | |
PACCAR, Inc. | | | 16,843 | | | | 1,332,281 | |
Parker-Hannifin Corp. | | | 6,365 | | | | 1,310,044 | |
Pentair PLC | | | 7,677 | | | | 352,144 | |
Sandvik AB (Sweden) | | | 1,673 | | | | 32,583 | |
Schindler Holding AG (Switzerland) | | | 71 | | | | 17,397 | |
SKF AB (Sweden) (Class B Stock) | | | 581 | | | | 11,738 | |
Snap-on, Inc.(a) | | | 2,800 | | | | 474,320 | |
Stanley Black & Decker, Inc. | | | 7,297 | | | | 1,209,405 | |
Volvo AB (Sweden) (Class B Stock) | | | 5,107 | | | | 85,460 | |
Westinghouse Air Brake Technologies Corp. | | | 8,851 | | | | 688,608 | |
Xylem, Inc. | | | 8,500 | | | | 669,715 | |
Yangzijiang Shipbuilding Holdings Ltd. (China) | | | 13,600 | | | | 11,372 | |
| | | | | | | | |
| | | | | | | 22,757,222 | |
| | | | | | | | |
Marine — 0.0% | | | | | | | | |
AP Moller - Maersk A/S (Denmark) (Class A Stock) | | | 12 | | | | 16,253 | |
Mitsui OSK Lines Ltd. (Japan) | | | 400 | | | | 11,000 | |
| | | | | | | | |
| | | | | | | 27,253 | |
| | | | | | | | |
Media — 0.7% | | | | | | | | |
Altice Europe NV (Netherlands)* | | | 2,422 | | | | 15,649 | |
Charter Communications, Inc. (Class A Stock)*(a) | | | 7,940 | | | | 3,851,535 | |
Comcast Corp. (Class A Stock) | | | 218,580 | | | | 9,829,543 | |
Discovery, Inc. (Class A Stock)*(a) | | | 6,000 | | | | 196,440 | |
Discovery, Inc. (Class C Stock)* | | | 16,600 | | | | 506,134 | |
DISH Network Corp. (Class A Stock)* | | | 12,017 | | | | 426,243 | |
Fox Corp. (Class A Stock) | | | 16,100 | | | | 596,827 | |
Fox Corp. (Class B Stock) | | | 6,633 | | | | 241,441 | |
Interpublic Group of Cos., Inc. (The) | | | 16,431 | | | | 379,556 | |
News Corp. (Class A Stock) | | | 16,175 | | | | 228,715 | |
News Corp. (Class B Stock) | | | 4,800 | | | | 69,648 | |
Omnicom Group, Inc.(a) | | | 10,300 | | | | 834,506 | |
ViacomCBS, Inc. (Class B Stock) | | | 25,730 | | | | 1,079,888 | |
| | | | | | | | |
| | | | | | | 18,256,125 | |
| | | | | | | | |
Metals & Mining — 0.2% | | | | | | | | |
Alumina Ltd. (Australia) | | | 8,448 | | | | 13,640 | |
Anglo American PLC (South Africa) | | | 14,734 | | | | 426,857 | |
Antofagasta PLC (Chile) | | | 1,368 | | | | 16,718 | |
ArcelorMittal SA (Luxembourg) | | | 2,242 | | | | 39,605 | |
BHP Group Ltd. (Australia) | | | 10,236 | | | | 279,987 | |
BHP Group PLC (Australia) | | | 13,263 | | | | 312,461 | |
BlueScope Steel Ltd. (Australia) | | | 821 | | | | 8,693 | |
Boliden AB (Sweden) | | | 945 | | | | 25,108 | |
Fortescue Metals Group Ltd. (Australia) | | | 13,449 | | | | 101,186 | |
Freeport-McMoRan, Inc. | | | 69,788 | | | | 915,618 | |
Newcrest Mining Ltd. (Australia) | | | 2,607 | | | | 55,163 | |
Newmont Goldcorp Corp. | | | 38,800 | | | | 1,685,860 | |
Nucor Corp. | | | 14,000 | | | | 787,920 | |
Rio Tinto Ltd. (Australia) | | | 1,286 | | | | 90,810 | |
SEE NOTES TO FINANCIAL STATEMENTS.
A8
| | | | | | |
| | |
| | CONSERVATIVE BALANCED PORTFOLIO (continued) | | |
| | | | | | |
| |
| SCHEDULE OF INVESTMENTS | | as of December 31, 2019 |
| | | | | | | | |
COMMON STOCKS
(continued) | | Shares | | | Value | |
Metals & Mining (continued) | | | | | | | | |
Rio Tinto PLC (Australia) | | | 9,382 | | | $ | 561,519 | |
Sumitomo Metal Mining Co. Ltd. (Japan) | | | 800 | | | | 25,864 | |
| | | | | | | | |
| | | | | | | 5,347,009 | |
| | | | | | | | |
Multiline Retail — 0.3% | | | | | | | | |
Dollar General Corp. | | | 12,400 | | | | 1,934,152 | |
Dollar Tree, Inc.* | | | 11,665 | | | | 1,097,093 | |
Kohl’s Corp.(a) | | | 7,300 | | | | 371,935 | |
Macy’s, Inc.(a) | | | 14,674 | | | | 249,458 | |
Next PLC (United Kingdom) | | | 469 | | | | 43,574 | |
Nordstrom, Inc.(a) | | | 4,800 | | | | 196,464 | |
Target Corp. | | | 24,800 | | | | 3,179,608 | |
Wesfarmers Ltd. (Australia) | | | 3,835 | | | | 111,373 | |
| | | | | | | | |
| | | | | | | 7,183,657 | |
| | | | | | | | |
Multi-Utilities — 0.5% | | | | | | | | |
AGL Energy Ltd. (Australia) | | | 10,885 | | | | 156,675 | |
Ameren Corp. | | | 12,200 | | | | 936,960 | |
CenterPoint Energy, Inc. | | | 24,000 | | | | 654,480 | |
CMS Energy Corp. | | | 13,900 | | | | 873,476 | |
Consolidated Edison, Inc. | | | 15,800 | | | | 1,429,426 | |
Dominion Energy, Inc.(a) | | | 39,915 | | | | 3,305,760 | |
DTE Energy Co. | | | 9,100 | | | | 1,181,817 | |
Engie SA (France) | | | 6,642 | | | | 107,374 | |
National Grid PLC (United Kingdom) | | | 6,981 | | | | 87,562 | |
NiSource, Inc. | | | 17,300 | | | | 481,632 | |
Public Service Enterprise Group, Inc. | | | 24,500 | | | | 1,446,725 | |
RWE AG (Germany) | | | 2,006 | | | | 61,804 | |
Sempra Energy | | | 13,419 | | | | 2,032,710 | |
WEC Energy Group, Inc. | | | 15,513 | | | | 1,430,764 | |
| | | | | | | | |
| | | | | | | 14,187,165 | |
| | | | | | | | |
Oil, Gas & Consumable Fuels — 2.0% | | | | | | | | |
Apache Corp. | | | 17,614 | | | | 450,742 | |
BP PLC (United Kingdom) | | | 13,813 | | | | 86,623 | |
Cabot Oil & Gas Corp. | | | 19,400 | | | | 337,754 | |
Chevron Corp. | | | 91,522 | | | | 11,029,316 | |
Cimarex Energy Co. | | | 4,600 | | | | 241,454 | |
Concho Resources, Inc. | | | 9,900 | | | | 866,943 | |
ConocoPhillips | | | 53,477 | | | | 3,477,609 | |
Devon Energy Corp. | | | 17,800 | | | | 462,266 | |
Diamondback Energy, Inc.(a) | | | 7,200 | | | | 668,592 | |
EOG Resources, Inc. | | | 27,800 | | | | 2,328,528 | |
Exxon Mobil Corp. | | | 203,899 | | | | 14,228,072 | |
Hess Corp. | | | 12,700 | | | | 848,487 | |
HollyFrontier Corp. | | | 7,300 | | | | 370,183 | |
Kinder Morgan, Inc. | | | 92,898 | | | | 1,966,651 | |
Lundin Petroleum AB (Sweden) | | | 544 | | | | 18,488 | |
Marathon Oil Corp. | | | 37,182 | | | | 504,932 | |
Marathon Petroleum Corp. | | | 31,419 | | | | 1,892,995 | |
Neste OYJ (Finland) | | | 1,161 | | | | 40,423 | |
Noble Energy, Inc. | | | 21,900 | | | | 543,996 | |
Occidental Petroleum Corp. | | | 42,804 | | | | 1,763,953 | |
OMV AG (Austria) | | | 4,918 | | | | 276,358 | |
ONEOK, Inc.(a) | | | 19,900 | | | | 1,505,833 | |
Origin Energy Ltd. (Australia) | | | 60,060 | | | | 356,796 | |
Phillips 66 | | | 21,838 | | | | 2,432,972 | |
| | | | | | | | |
COMMON STOCKS
(continued) | | Shares | | | Value | |
Oil, Gas & Consumable Fuels (continued) | | | | | |
Pioneer Natural Resources Co. | | | 8,150 | | | $ | 1,233,665 | |
Repsol SA (Spain) | | | 4,902 | | | | 76,860 | |
Royal Dutch Shell PLC (Netherlands) (Class A Stock) | | | 14,702 | | | | 436,586 | |
Royal Dutch Shell PLC (Netherlands) (Class B Stock) | | | 17,453 | | | | 519,484 | |
Santos Ltd. (Australia) | | | 60,705 | | | | 349,531 | |
TOTAL SA (France) | | | 8,086 | | | | 447,737 | |
Valero Energy Corp. | | | 19,900 | | | | 1,863,635 | |
Williams Cos., Inc. (The) | | | 58,400 | | | | 1,385,248 | |
| | | | | | | | |
| | | | | | | 53,012,712 | |
| | | | | | | | |
Paper & Forest Products — 0.0% | | | | | | | | |
Oji Holdings Corp. (Japan) | | | 1,400 | | | | 7,580 | |
| | | | | | | | |
Personal Products — 0.1% | | | | | | | | |
Coty, Inc. (Class A Stock) | | | 11,100 | | | | 124,875 | |
Estee Lauder Cos., Inc. (The) (Class A Stock) | | | 10,700 | | | | 2,209,978 | |
Unilever NV (United Kingdom) | | | 10,141 | | | | 583,978 | |
Unilever PLC (United Kingdom) | | | 3,891 | | | | 225,115 | |
| | | | | | | | |
| | | | | | | 3,143,946 | |
| | | | | | | | |
Pharmaceuticals — 2.5% | | | | | | | | |
Allergan PLC | | | 15,775 | | | | 3,015,707 | |
Astellas Pharma, Inc. (Japan) | | | 24,600 | | | | 420,351 | |
AstraZeneca PLC (United Kingdom) | | | 575 | | | | 58,022 | |
Bayer AG (Germany) | | | 1,980 | | | | 161,636 | |
Bristol-Myers Squibb Co. | | | 112,870 | | | | 7,245,125 | |
Chugai Pharmaceutical Co. Ltd. (Japan) | | | 800 | | | | 73,909 | |
Eli Lilly & Co. | | | 41,000 | | | | 5,388,630 | |
GlaxoSmithKline PLC (United Kingdom) | | | 30,955 | | | | 730,165 | |
Johnson & Johnson | | | 127,178 | | | | 18,551,455 | |
Kyowa Kirin Co. Ltd. (Japan) | | | 900 | | | | 21,170 | |
Merck & Co., Inc. | | | 123,433 | | | | 11,226,231 | |
Merck KGaA (Germany) | | | 432 | | | | 51,190 | |
Mylan NV* | | | 23,300 | | | | 468,330 | |
Novartis AG (Switzerland) | | | 10,988 | | | | 1,042,272 | |
Novo Nordisk A/S (Denmark) (Class B Stock) | | | 10,147 | | | | 589,178 | |
Ono Pharmaceutical Co. Ltd. (Japan) | | | 1,400 | | | | 32,038 | |
Orion OYJ (Finland) (Class B Stock) | | | 369 | | | | 17,066 | |
Otsuka Holdings Co. Ltd. (Japan) | | | 1,400 | | | | 62,511 | |
Perrigo Co. PLC(a) | | | 6,200 | | | | 320,292 | |
Pfizer, Inc. | | | 266,470 | | | | 10,440,295 | |
Recordati SpA (Italy) | | | 354 | | | | 14,935 | |
Roche Holding AG (Switzerland) | | | 3,457 | | | | 1,121,799 | |
Sanofi (France) | | | 603 | | | | 60,686 | |
Shionogi & Co. Ltd. (Japan) | | | 2,700 | | | | 167,054 | |
Sumitomo Dainippon Pharma Co. Ltd. (Japan) | | | 5,600 | | | | 108,898 | |
Zoetis, Inc. | | | 23,000 | | | | 3,044,050 | |
| | | | | | | | |
| | | | | | | 64,432,995 | |
| | | | | | | | |
Professional Services — 0.2% | | | | | | | | |
Equifax, Inc. | | | 5,900 | | | | 826,708 | |
IHS Markit Ltd.*(a) | | | 18,700 | | | | 1,409,045 | |
SEE NOTES TO FINANCIAL STATEMENTS.
A9
| | | | | | |
| | |
| | CONSERVATIVE BALANCED PORTFOLIO (continued) | | |
| | | | | | |
| |
| SCHEDULE OF INVESTMENTS | | as of December 31, 2019 |
| | | | | | | | |
COMMON STOCKS
(continued) | | Shares | | | Value | |
Professional Services (continued) | | | | | | | | |
Nielsen Holdings PLC | | | 17,000 | | | $ | 345,100 | |
Recruit Holdings Co. Ltd. (Japan) | | | 4,700 | | | | 175,759 | |
Robert Half International, Inc. | | | 5,700 | | | | 359,955 | |
Verisk Analytics, Inc. | | | 7,800 | | | | 1,164,852 | |
Wolters Kluwer NV (Netherlands) | | | 2,115 | | | | 154,398 | |
| | | | | | | | |
| | | | | | | 4,435,817 | |
| | | | | | | | |
Real Estate Management & Development — 0.1% | | | | | |
CBRE Group, Inc. (Class A Stock)* | | | 15,700 | | | | 962,253 | |
CK Asset Holdings Ltd. (Hong Kong) | | | 9,000 | | | | 64,877 | |
Daito Trust Construction Co. Ltd. (Japan) | | | 200 | | | | 24,661 | |
Daiwa House Industry Co. Ltd. (Japan) | | | 1,900 | | | | 58,745 | |
Henderson Land Development Co. Ltd. (Hong Kong) | | | 66,200 | | | | 325,089 | |
Hongkong Land Holdings Ltd. (Hong Kong) | | | 4,000 | | | | 23,030 | |
Mitsubishi Estate Co. Ltd. (Japan) | | | 4,100 | | | | 78,323 | |
Nomura Real Estate Holdings, Inc. (Japan) | | | 500 | | | | 11,976 | |
Sino Land Co. Ltd. (Hong Kong) | | | 10,000 | | | | 14,557 | |
Sumitomo Realty & Development Co. Ltd. (Japan) | | | 1,200 | | | | 41,947 | |
Swire Pacific Ltd. (Hong Kong) (Class A Stock) | | | 34,500 | | | | 321,189 | |
Wharf Real Estate Investment Co. Ltd. (Hong Kong) | | | 4,000 | | | | 24,441 | |
Wheelock & Co. Ltd. (Hong Kong) | | | 27,000 | | | | 180,520 | |
| | | | | | | | |
| | | | | | | 2,131,608 | |
| | | | | | | | |
Road & Rail — 0.5% | | | | | | | | |
Aurizon Holdings Ltd. (Australia) | | | 6,888 | | | | 25,340 | |
CSX Corp. | | | 38,500 | | | | 2,785,860 | |
Hankyu Hanshin Holdings, Inc. (Japan) | | | 6,800 | | | | 290,630 | |
J.B. Hunt Transport Services, Inc.(a) | | | 4,100 | | | | 478,798 | |
Kansas City Southern(a) | | | 4,800 | | | | 735,168 | |
Keikyu Corp. (Japan) | | | 800 | | | | 15,431 | |
Keisei Electric Railway Co. Ltd. (Japan) | | | 500 | | | | 19,364 | |
Kyushu Railway Co. (Japan) | | | 600 | | | | 20,065 | |
Nippon Express Co. Ltd. (Japan) | | | 300 | | | | 17,596 | |
Norfolk Southern Corp. | | | 12,900 | | | | 2,504,277 | |
Old Dominion Freight Line, Inc. | | | 2,550 | | | | 483,939 | |
Seibu Holdings, Inc. (Japan) | | | 2,500 | | | | 41,079 | |
Tobu Railway Co. Ltd. (Japan) | | | 700 | | | | 25,307 | |
Union Pacific Corp. | | | 34,000 | | | | 6,146,860 | |
West Japan Railway Co. (Japan) | | | 3,900 | | | | 337,255 | |
| | | | | | | | |
| | | | | | | 13,926,969 | |
| | | | | | | | |
Semiconductors & Semiconductor Equipment — 2.2% | |
Advanced Micro Devices, Inc.*(a) | | | 52,200 | | | | 2,393,892 | |
Advantest Corp. (Japan) | | | 6,800 | | | | 381,252 | |
Analog Devices, Inc. | | | 18,058 | | | | 2,146,013 | |
Applied Materials, Inc. | | | 44,200 | | | | 2,697,968 | |
ASML Holding NV (Netherlands) | | | 80 | | | | 23,794 | |
Broadcom, Inc. | | | 19,280 | | | | 6,092,866 | |
Intel Corp. | | | 214,500 | | | | 12,837,825 | |
KLA Corp. | | | 7,750 | | | | 1,380,817 | |
Lam Research Corp. | | | 7,070 | | | | 2,067,268 | |
| | | | | | | | |
COMMON STOCKS
(continued) | | Shares | | | Value | |
Semiconductors & Semiconductor Equipment (continued) | |
Maxim Integrated Products, Inc. | | | 13,400 | | | $ | 824,234 | |
Microchip Technology, Inc.(a) | | | 11,800 | | | | 1,235,696 | |
Micron Technology, Inc.* | | | 52,700 | | | | 2,834,206 | |
NVIDIA Corp. | | | 29,350 | | | | 6,906,055 | |
Qorvo, Inc.* | | | 6,007 | | | | 698,194 | |
QUALCOMM, Inc. | | | 56,500 | | | | 4,984,995 | |
Skyworks Solutions, Inc. | | | 8,400 | | | | 1,015,392 | |
STMicroelectronics NV (Switzerland) | | | 2,333 | | | | 62,920 | |
Texas Instruments, Inc. | | | 45,000 | | | | 5,773,050 | |
Tokyo Electron Ltd. (Japan) | | | 1,800 | | | | 392,139 | |
Xilinx, Inc. | | | 12,200 | | | | 1,192,794 | |
| | | | | | | | |
| | | | | | | 55,941,370 | |
| | | | | | | | |
Software — 3.5% | | | | | | | | |
Adobe, Inc.* | | | 23,500 | | | | 7,750,535 | |
ANSYS, Inc.* | | | 4,100 | | | | 1,055,381 | |
Autodesk, Inc.* | | | 10,800 | | | | 1,981,368 | |
Cadence Design Systems, Inc.* | | | 13,600 | | | | 943,296 | |
Check Point Software Technologies Ltd. (Israel)* | | | 400 | | | | 44,384 | |
Citrix Systems, Inc. | | | 6,000 | | | | 665,400 | |
CyberArk Software Ltd.* | | | 2,900 | | | | 338,082 | |
Fortinet, Inc.* | | | 7,200 | | | | 768,672 | |
Intuit, Inc. | | | 12,600 | | | | 3,300,318 | |
Micro Focus International PLC (United Kingdom) | | | 528 | | | | 7,437 | |
Microsoft Corp. | | | 369,250 | | | | 58,230,725 | |
NortonLifeLock, Inc. | | | 25,578 | | | | 652,750 | |
Oracle Corp. | | | 106,100 | | | | 5,621,178 | |
salesforce.com, Inc.* | | | 42,450 | | | | 6,904,068 | |
SAP SE (Germany) | | | 2,132 | | | | 289,273 | |
ServiceNow, Inc.* | | | 8,800 | | | | 2,484,416 | |
Synopsys, Inc.* | | | 7,400 | | | | 1,030,080 | |
| | | | | | | | |
| | | | | | | 92,067,363 | |
| | | | | | | | |
Specialty Retail — 1.2% | | | | | | | | |
ABC-Mart, Inc. (Japan) | | | 100 | | | | 6,820 | |
Advance Auto Parts, Inc. | | | 3,500 | | | | 560,560 | |
AutoZone, Inc.* | | | 1,200 | | | | 1,429,572 | |
Best Buy Co., Inc. | | | 11,425 | | | | 1,003,115 | |
CarMax, Inc.* | | | 8,200 | | | | 718,894 | |
Gap, Inc. (The) | | | 9,500 | | | | 167,960 | |
Hennes & Mauritz AB (Sweden) (Class B Stock) | | | 17,600 | | | | 358,192 | |
Hikari Tsushin, Inc. (Japan) | | | 700 | | | | 175,652 | |
Home Depot, Inc. (The) | | | 52,850 | | | | 11,541,383 | |
Industria de Diseno Textil SA (Spain) | | | 3,514 | | | | 124,020 | |
JD Sports Fashion PLC (United Kingdom) | | | 22,795 | | | | 254,425 | |
L Brands, Inc. | | | 10,906 | | | | 197,617 | |
Lowe’s Cos., Inc. | | | 37,200 | | | | 4,455,072 | |
Nitori Holdings Co. Ltd. (Japan) | | | 300 | | | | 47,386 | |
O’Reilly Automotive, Inc.* | | | 3,700 | | | | 1,621,562 | |
Ross Stores, Inc. | | | 17,600 | | | | 2,048,992 | |
Tiffany & Co. | | | 5,220 | | | | 697,653 | |
TJX Cos., Inc. (The) | | | 58,300 | | | | 3,559,798 | |
Tractor Supply Co. | | | 6,000 | | | | 560,640 | |
SEE NOTES TO FINANCIAL STATEMENTS.
A10
| | | | | | |
| | |
| | CONSERVATIVE BALANCED PORTFOLIO (continued) | | |
| | | | | | |
| |
| SCHEDULE OF INVESTMENTS | | as of December 31, 2019 |
| | | | | | | | |
COMMON STOCKS
(continued) | | Shares | | | Value | |
Specialty Retail (continued) | |
Ulta Beauty, Inc.* | | | 2,900 | | | $ | 734,106 | |
| | | | | | | | |
| | | | | | | 30,263,419 | |
| | | | | | | | |
Technology Hardware, Storage & Peripherals — 2.5% | |
Apple, Inc. | | | 203,060 | | | | 59,628,569 | |
Brother Industries Ltd. (Japan) | | | 700 | | | | 14,410 | |
FUJIFILM Holdings Corp. (Japan) | | | 7,600 | | | | 363,480 | |
Hewlett Packard Enterprise Co. | | | 60,648 | | | | 961,877 | |
HP, Inc. | | | 69,148 | | | | 1,420,992 | |
NetApp, Inc. | | | 11,100 | | | | 690,975 | |
Seagate Technology PLC | | | 11,100 | | | | 660,450 | |
Western Digital Corp. | | | 13,803 | | | | 876,077 | |
Xerox Holdings Corp. | | | 8,190 | | | | 301,965 | |
| | | | | | | | |
| | | | | | | 64,918,795 | |
| | | | | | | | |
Textiles, Apparel & Luxury Goods — 0.4% | |
adidas AG (Germany) | | | 623 | | | | 203,483 | |
Burberry Group PLC (United Kingdom) | | | 1,409 | | | | 41,503 | |
Capri Holdings Ltd.* | | | 6,000 | | | | 228,900 | |
EssilorLuxottica SA (France) | | | 948 | | | | 144,841 | |
Hanesbrands, Inc.(a) | | | 15,400 | | | | 228,690 | |
Hermes International (France) | | | 532 | | | | 398,673 | |
LVMH Moet Hennessy Louis Vuitton SE (France) | | | 955 | | | | 444,679 | |
NIKE, Inc. (Class B Stock) | | | 60,300 | | | | 6,108,993 | |
Puma SE (Germany) | | | 283 | | | | 21,683 | |
PVH Corp. | | | 3,700 | | | | 389,055 | |
Ralph Lauren Corp. | | | 2,500 | | | | 293,050 | |
Swatch Group AG (The) (Switzerland), (SWX) | | | 77 | | | | 4,073 | |
Tapestry, Inc. | | | 13,400 | | | | 361,398 | |
Under Armour, Inc. (Class A Stock)*(a) | | | 7,500 | | | | 162,000 | |
Under Armour, Inc. (Class C Stock)* | | | 7,374 | | | | 141,433 | |
VF Corp. | | | 15,900 | | | | 1,584,594 | |
| | | | | | | | |
| | | | | | | 10,757,048 | |
| | | | | | | | |
Tobacco — 0.5% | |
Altria Group, Inc. | | | 90,000 | | | | 4,491,900 | |
British American Tobacco PLC (United Kingdom) | | | 11,683 | | | | 500,687 | |
Imperial Brands PLC (United Kingdom) | | | 4,429 | | | | 110,314 | |
Japan Tobacco, Inc. (Japan) | | | 4,200 | | | | 93,606 | |
Philip Morris International, Inc. | | | 75,000 | | | | 6,381,750 | |
Swedish Match AB (Sweden) | | | 567 | | | | 29,234 | |
| | | | | | | | |
| | | | | | | 11,607,491 | |
| | | | | | | | |
Trading Companies & Distributors — 0.1% | |
AerCap Holdings NV (Ireland)* | | | 5,500 | | | | 338,085 | |
Brenntag AG (Germany) | | | 513 | | | | 28,083 | |
Fastenal Co.(a) | | | 27,400 | | | | 1,012,430 | |
Ferguson PLC | | | 4,211 | | | | 382,674 | |
ITOCHU Corp. (Japan) | | | 4,700 | | | | 109,134 | |
Marubeni Corp. (Japan) | | | 5,400 | | | | 39,881 | |
Toyota Tsusho Corp. (Japan) | | | 9,600 | | | | 338,093 | |
United Rentals, Inc.* | | | 3,700 | | | | 617,049 | |
W.W. Grainger, Inc. | | | 2,240 | | | | 758,285 | |
| | | | | | | | |
| | | | | | | 3,623,714 | |
| | | | | | | | |
| | | | | | | | |
COMMON STOCKS
(continued) | | Shares | | | Value | |
Transportation Infrastructure — 0.0% | |
Aena SME SA (Spain), 144A | | | 225 | | | $ | 43,126 | |
Fraport AG Frankfurt Airport Services Worldwide (Germany) | | | 3,787 | | | | 323,645 | |
Kamigumi Co. Ltd. (Japan) | | | 5,700 | | | | 125,221 | |
| | | | | | | | |
| | | | | | | 491,992 | |
| | | | | | | | |
Water Utilities — 0.0% | | | | | | | | |
American Water Works Co., Inc. | | | 8,600 | | | | 1,056,510 | |
| | | | | | | | |
Wireless Telecommunication Services — 0.1% | |
KDDI Corp. (Japan) | | | 16,400 | | | | 489,486 | |
NTT DOCOMO, Inc. (Japan) | | | 9,200 | | | | 256,249 | |
Softbank Corp. (Japan) | | | 5,900 | | | | 79,031 | |
T-Mobile US, Inc.* | | | 15,300 | | | | 1,199,826 | |
Vodafone Group PLC (United Kingdom) | | | 92,550 | | | | 180,457 | |
| | | | | | | | |
| | | | | | | 2,205,049 | |
| | | | | | | | |
TOTAL COMMON STOCKS
(cost $401,898,791) | | | | | | | 1,345,815,786 | |
| | | | | | | | |
|
| EXCHANGE-TRADED FUNDS — 0.3% | |
iShares Core S&P 500 ETF | | | 25,050 | | | | 8,097,162 | |
iShares MSCI EAFE ETF | | | 3,759 | | | | 261,025 | |
| | | | | | | | |
TOTAL EXCHANGE-TRADED FUNDS
(cost $6,766,441) | | | | 8,358,187 | |
| | | | | | | | |
|
| PREFERRED STOCKS — 0.1% | |
Automobiles — 0.0% | | | | | | | | |
Bayerische Motoren Werke AG (Germany) (PRFC) | | | 75 | | | | 4,640 | |
Porsche Automobil Holding SE (Germany) (PRFC) | | | 532 | | | | 39,876 | |
Volkswagen AG (Germany) (PRFC) | | | 1,246 | | | | 247,333 | |
| | | | | | | | |
| | | | | | | 291,849 | |
| | | | | | | | |
Banks — 0.0% | | | | | | | | |
Citigroup Capital XIII, 8.306%, (Capital Security, fixed to floating preferred) | | | 20,000 | | | | 556,000 | |
| | | | | | | | |
Capital Markets — 0.1% | |
State Street Corp., 5.350%, (Capital Security, fixed to floating preferred)(rr) | | | 30,000 | | | | 836,100 | |
| | | | | | | | |
Health Care Equipment & Supplies — 0.0% | |
Sartorius AG (Germany) (PRFC) | | | 123 | | | | 26,474 | |
| | | | | | | | |
Household Products — 0.0% | |
Henkel AG & Co. KGaA (Germany) (PRFC) | | | 621 | | | | 64,483 | |
| | | | | | | | |
TOTAL PREFERRED STOCKS
(cost $1,626,837) | | | | | | | 1,774,906 | |
| | | | | | | | |
| | |
| | | Units | | | | |
| | |
| RIGHTS* — 0.0% | | | | | | | | |
Oil, Gas & Consumable Fuels | |
Repsol SA (Spain), expiring 01/10/20
(cost $2,315) | | | 4,902 | | | | 2,326 | |
| | | | | | | | |
SEE NOTES TO FINANCIAL STATEMENTS.
A11
| | | | | | |
| | |
| | CONSERVATIVE BALANCED PORTFOLIO (continued) | | |
| | | | | | |
| |
| SCHEDULE OF INVESTMENTS | | as of December 31, 2019 |
| | | | | | | | | | | | | | | | |
Interest
Rate | | Maturity
Date | | | | | | Principal
Amount
(000)# | | | Value | |
|
| ASSET-BACKED SECURITIES — 7.8% | |
Automobiles — 2.3% | | | | | | | | | | | | | |
AmeriCredit Automobile Receivables Trust, | |
Series2018-01, Class C | |
3.500% | | | 01/18/24 | | | | | | | | 1,200 | | | $ | 1,230,288 | |
Series2019-01, Class B | | | | | | | | | | | | | |
3.130% | | | 02/18/25 | | | | | | | | 600 | | | | 611,117 | |
Series2019-01, Class C | | | | | | | | | | | | | |
3.360% | | | 02/18/25 | | | | | | | | 700 | | | | 718,147 | |
Series2019-02, Class C | | | | | | | | | | | | | |
2.740% | | | 04/18/25 | | | | | | | | 1,400 | | | | 1,412,743 | |
Series2019-03, Class C | | | | | | | | | | | | | |
2.320% | | | 07/18/25 | | | | | | | | 2,300 | | | | 2,291,914 | |
Avis Budget Rental Car Funding AESOP LLC, | | | | | |
Series2015-01A, Class A, 144A | | | | | | | | | | | | | |
2.500% | | | 07/20/21 | | | | | | | | 1,100 | | | | 1,101,414 | |
Series2018-01A, Class A, 144A | | | | | | | | | | | | | |
3.700% | | | 09/20/24 | | | | | | | | 1,300 | | | | 1,351,791 | |
Series2018-02A, Class A, 144A | | | | | | | | | | | | | |
4.000% | | | 03/20/25 | | | | | | | | 1,100 | | | | 1,160,519 | |
Series2019-02A, Class A, 144A | | | | | | | | | | | | | |
3.350% | | | 09/22/25 | | | | | | | | 2,000 | | | | 2,062,490 | |
Series2019-03A, Class A, 144A | | | | | | | | | | | | | |
2.360% | | | 03/20/26 | | | | | | | | 2,700 | | | | 2,670,328 | |
Drive Auto Receivables Trust, | | | | | | | | | | | | | |
Series2019-03, Class B | | | | | | | | | | | | | |
2.650% | | | 02/15/24 | | | | | | | | 900 | | | | 902,451 | |
Ford Auto Securitization Trust (Canada), | | | | | | | | | |
Series2019-BA, Class A2, 144A | | | | | | | | | | | | | |
2.321% | | | 10/15/23 | | | | | | | CAD | 1,700 | | | | 1,309,729 | |
Ford Credit Auto Owner Trust, | | | | | | | | | | | | | |
Series2017-02, Class A, 144A | | | | | | | | | | | | | |
2.360% | | | 03/15/29 | | | | | | | | 4,200 | | | | 4,222,472 | |
Series2018-01, Class A, 144A | | | | | | | | | | | | | |
3.190% | | | 07/15/31 | | | | | | | | 2,700 | | | | 2,788,617 | |
Series2018-02, Class A, 144A | | | | | | | | | | | | | |
3.470% | | | 01/15/30 | | | | | | | | 2,200 | | | | 2,293,496 | |
Series2019-01, Class A, 144A | | | | | | | | | | | | | |
3.520% | | | 07/15/30 | | | | | | | | 3,900 | | | | 4,091,338 | |
Ford Credit Floorplan Master Owner Trust, | | | | | | | | | |
Series2017-03, Class A | | | | | | | | | | | | | |
2.480% | | | 09/15/24 | | | | | | | | 1,400 | | | | 1,412,106 | |
Series2018-02, Class A | | | | | | | | | | | | | |
3.170% | | | 03/15/25 | | | | | | | | 9,700 | | | | 9,992,795 | |
Series2019-02, Class A | | | | | | | | | | | | | |
3.060% | | | 04/15/26 | | | | | | | | 1,000 | | | | 1,032,271 | |
GM Financial Consumer Automobile Receivables Trust, | | | | | |
Series2018-04, Class C | | | | | | | | | | | | | |
3.620% | | | 06/17/24 | | | | | | | | 300 | | | | 309,193 | |
OneMain Direct Auto Receivables Trust, | | | | | | | | | |
Series2017-02A, Class B, 144A | | | | | | | | | | | | | |
2.550% | | | 11/14/23 | | | | | | | | 2,300 | | | | 2,300,872 | |
Series2017-02A, Class C, 144A | | | | | | | | | | | | | |
2.820% | | | 07/15/24 | | | | | | | | 600 | | | | 601,023 | |
Series2018-01A, Class A, 144A | | | | | | | | | | | | | |
3.430% | | | 12/16/24 | | | | | | | | 3,800 | | | | 3,861,087 | |
Series2019-01A, Class A, 144A | | | | | | | | | | | | | |
3.630% | | | 09/14/27 | | | | | | | | 3,600 | | | | 3,707,582 | |
| | | | | | | | | | | | | | | | |
Interest
Rate | | Maturity
Date | | | | | | Principal
Amount
(000)# | | | Value | |
|
| ASSET-BACKED SECURITIES (continued) | |
Automobiles (continued) | | | | | | | | | | | | | |
Santander Drive Auto Receivables Trust, | | | | | | | | | | | | | |
Series2019-03, Class C | | | | | |
2.490% | | | 10/15/25 | | | | | | | | 1,300 | | | $ | 1,304,115 | |
Toyota Auto Loan Extended Note Trust, | | | | | | | | | | | | | |
Series2019-01A, Class A, 144A | | | | | |
2.560% | | | 11/25/31 | | | | | | | | 3,900 | | | | 3,958,038 | |
| | | | | | | | | | | | | | | | |
| | | | | | | | | | | | | | | 58,697,936 | |
| | | | | | | | | | | | | | | | |
Collateralized Loan Obligations — 3.2% | | | | | |
Anchorage Capital CLO Ltd. (Cayman Islands), | | | | | |
Series2019-11A, Class A, 144A, 3 Month LIBOR + 1.390% (Cap N/A, Floor 1.390%) | |
3.534%(c) | | | 07/22/32 | | | | | | | | 2,500 | | | | 2,498,257 | |
ArrowMark Colorado Holdings (Cayman Islands), | | | | | |
Series2017-06A, Class A1, 144A, 3 Month LIBOR + 1.280% (Cap N/A, Floor 0.000%) | |
3.281%(c) | | | 07/15/29 | | | | | | | | 500 | | | | 497,169 | |
Battalion CLO Ltd. (Cayman Islands), | | | | | | | | | | | | | |
Series2015-08A, Class A1R, 144A, 3 Month LIBOR + 1.340% (Cap N/A, Floor 0.000%) | |
3.343%(c) | | | 07/18/30 | | | | | | | | 1,000 | | | | 998,284 | |
Benefit Street Partners CLO Ltd. (Cayman Islands), | | | | | |
Series2013-IIA, Class A1R, 144A, 3 Month LIBOR + 1.250% (Cap N/A, Floor 0.000%) | |
3.251%(c) | | | 07/15/29 | | | | | | | | 1,000 | | | | 999,883 | |
Brookside Mill CLO Ltd. (Cayman Islands), | | | | | |
Series2013-01A, Class AR, 144A, 3 Month LIBOR + 0.820% (Cap N/A, Floor 0.000%) | |
2.822%(c) | | | 01/17/28 | | | | | | | | 1,000 | | | | 996,197 | |
Canyon Capital CLO Ltd. (Cayman Islands), | | | | | |
Series2015-01A, Class AS, 144A, 3 Month LIBOR + 1.250% (Cap N/A, Floor 0.000%) | |
3.251%(c) | | | 04/15/29 | | | | | | | | 2,500 | | | | 2,492,700 | |
CIFC Funding Ltd. (Cayman Islands), | | | | | | | | | | | | | |
Series2014-05A, Class A1R2, 144A, 3 Month LIBOR + 1.200% (Cap N/A, Floor 1.200%) | |
3.202%(c) | | | 10/17/31 | | | | | | | | 7,000 | | | | 6,989,200 | |
Galaxy CLO Ltd. (Cayman Islands), | | | | | | | | | | | | | |
Series2018-29A, Class A, 144A, 3 Month LIBOR + 0.790% (Cap N/A, Floor 0.000%) | |
2.700%(c) | | | 11/15/26 | | | | | | | | 908 | | | | 906,457 | |
Greenwood Park CLO Ltd. (Cayman Islands), | | | | | |
Series2018-01A, Class A2, 144A, 3 Month LIBOR + 1.010% (Cap N/A, Floor 0.000%) | |
3.011%(c) | | | 04/15/31 | | | | | | | | 1,000 | | | | 994,117 | |
Highbridge Loan Management Ltd. (Cayman Islands), | | | | | |
Series2015-06A, Class A1R, 144A, 3 Month LIBOR + 1.000% (Cap N/A, Floor 0.000%) | |
2.891%(c) | | | 02/05/31 | | | | | | | | 250 | | | | 248,363 | |
HPS Loan Management Ltd. (Cayman Islands), | | | | | |
Series15A-19, Class A1, 144A, 3 Month LIBOR + 1.320% (Cap N/A, Floor 1.320%) | |
3.486%(c) | | | 07/22/32 | | | | | | | | 2,500 | | | | 2,502,745 | |
ICG US CLO Ltd. (Cayman Islands), | | | | | | | | | | | | | |
Series2015-01A, Class A1R, 144A, 3 Month LIBOR + 1.140% (Cap N/A, Floor 1.140%) | |
3.106%(c) | | | 10/19/28 | | | | | | | | 7,000 | | | | 6,975,059 | |
SEE NOTES TO FINANCIAL STATEMENTS.
A12
| | | | | | |
| | |
| | CONSERVATIVE BALANCED PORTFOLIO (continued) | | |
| | | | | | |
| |
| SCHEDULE OF INVESTMENTS | | as of December 31, 2019 |
| | | | | | | | | | | | | | | | |
Interest
Rate | | Maturity
Date | | | | | | Principal
Amount
(000)# | | | Value | |
|
| ASSET-BACKED SECURITIES (continued) | |
Collateralized Loan Obligations (continued) | |
Series2017-02A, Class A1, 144A, 3 Month LIBOR + 1.280% (Cap N/A, Floor 0.000%) | |
3.214%(c) | | | 10/23/29 | | | | | | | | 1,250 | | | $ | 1,250,133 | |
Jackson Mill CLO Ltd. (Cayman Islands), | | | | | | | | | | | | | |
Series2015-01A, Class AR, 144A, 3 Month LIBOR + 0.830% (Cap N/A, Floor 0.830%) | |
2.831%(c) | | | 04/15/27 | | | | | | | | 1,240 | | | | 1,234,203 | |
Jamestown CLO Ltd. (Cayman Islands), | | | | | | | | | | | | | |
Series2019-01A, Class A1, 144A, 3 Month LIBOR + 1.470% (Cap N/A, Floor 1.470%) | |
3.436%(c) | | | 04/20/32 | | | | | | | | 4,750 | | | | 4,734,187 | |
Jefferson Mill CLO Ltd. (Cayman Islands), | | | | | |
Series2015-01A, Class AR, 144A, 3 Month LIBOR + 1.175% (Cap N/A, Floor 0.000%) | |
3.141%(c) | | | 10/20/31 | | | | | | | | 4,250 | | | | 4,191,100 | |
MidOcean Credit CLO (Cayman Islands), | | | | | | | | | | | | | |
Series2014-03A, Class A1R, 144A, 3 Month LIBOR + 1.120% (Cap N/A, Floor 1.120%) | |
3.086%(c) | | | 04/21/31 | | | | | | | | 3,500 | | | | 3,446,960 | |
Mountain View CLO Ltd. (Cayman Islands), | | | | | |
Series2015-09A, Class A1R, 144A, 3 Month LIBOR + 1.120% (Cap N/A, Floor 0.000%) | |
3.121%(c) | | | 07/15/31 | | | | | | | | 2,500 | | | | 2,458,218 | |
Ocean Trails CLO Ltd. (Cayman Islands), | | | | | | | | | | | | | |
Series2019-07A, Class A1, 144A, 3 Month LIBOR + 1.400% (Cap N/A, Floor 1.400%) | |
3.402%(c) | | | 04/17/30 | | | | | | | | 1,750 | | | | 1,746,547 | |
OCP CLO Ltd. (Cayman Islands), | | | | | | | | | | | | | |
Series2019-17A, Class A1, 144A, 3 Month LIBOR + 1.330% (Cap N/A, Floor 1.330%) | |
3.627%(c) | | | 07/20/32 | | | | | | | | 7,000 | | | | 7,007,265 | |
OZLM Ltd. (Cayman Islands), | | | | | | | | | | | | | |
Series2014-06A, Class A1S, 144A, 3 Month LIBOR + 1.080% (Cap N/A, Floor 0.000%) | |
3.082%(c) | | | 04/17/31 | | | | | | | | 3,000 | | | | 2,958,663 | |
Series2015-11A, Class A1R, 144A, 3 Month LIBOR + 1.250% (Cap N/A, Floor 0.000%) | |
3.186%(c) | | | 10/30/30 | | | | | | | | 750 | | | | 748,247 | |
Series2019-24A, Class A1A, 144A, 3 Month LIBOR + 1.390% (Cap N/A, Floor 0.000%) | |
3.546%(c) | | | 07/20/32 | | | | | | | | 2,500 | | | | 2,499,641 | |
Park Avenue Institutional Advisers CLO Ltd. (Cayman Islands), | |
Series2017-01A, Class A1, 144A, 3 Month LIBOR + 1.220% (Cap N/A, Floor 0.000%) | |
3.129%(c) | | | 11/14/29 | | | | | | | | 500 | | | | 500,165 | |
Telos CLO Ltd. (Cayman Islands), | | | | | | | | | | | | | |
Series2013-03A, Class AR, 144A, 3 Month LIBOR + 1.300% (Cap N/A, Floor 1.300%) | |
3.302%(c) | | | 07/17/26 | | | | | | | | 2,407 | | | | 2,403,838 | |
TIAA CLO Ltd. (Cayman Islands), | | | | | | | | | | | | | |
Series2016-01A, Class AR, 144A, 3 Month LIBOR + 1.200% (Cap N/A, Floor 0.000%) | |
3.166%(c) | | | 07/20/31 | | | | | | | | 1,750 | | | | 1,747,570 | |
TICP CLO Ltd. (Cayman Islands), | | | | | | | | | | | | | |
Series2017-07A, Class AS, 144A, 3 Month LIBOR + 1.230% (Cap N/A, Floor 1.230%) | |
3.231%(c) | | | 07/15/29 | | | | | | | | 1,000 | | | | 1,001,671 | |
| | | | | | | | | | | | | | | | |
Interest
Rate | | Maturity
Date | | | | | | Principal
Amount
(000)# | | | Value | |
|
| ASSET-BACKED SECURITIES (continued) | |
Collateralized Loan Obligations (continued) | |
Trimaran Cavu Ltd. (Cayman Islands), | | | | | | | | | | | | | |
Series2019-01A, Class A1, 144A, 3 Month LIBOR + 1.460% (Cap N/A, Floor 1.460%) | |
3.426%(c) | | | 07/20/32 | | | | | | | | 7,500 | | | $ | 7,479,305 | |
Trinitas CLO Ltd. (Cayman Islands), | | | | | | | | | | | | | |
Series2017-07A, Class A, 144A, 3 Month LIBOR + 1.210% (Cap N/A, Floor 0.000%) | |
3.150%(c) | | | 01/25/31 | | | | | | | | 1,750 | | | | 1,738,899 | |
Venture CLO Ltd. (Cayman Islands), | | | | | | | | | | | | | |
Series2015-21A, Class AR, 144A, 3 Month LIBOR + 0.880% (Cap N/A, Floor 0.000%) | |
2.881%(c) | | | 07/15/27 | | | | | | | | 960 | | | | 957,744 | |
Wellfleet CLO Ltd. (Cayman Islands), | | | | | | | | | | | | | |
Series2017-03A, Class A1, 144A, 3 Month LIBOR + 1.150% (Cap N/A, Floor 1.150%) | |
3.152%(c) | | | 01/17/31 | | | | | | | | 2,000 | | | | 1,992,609 | |
Series2018-02A, Class A1, 144A, 3 Month LIBOR + 1.200% (Cap N/A, Floor 1.200%) | |
3.166%(c) | | | 10/20/31 | | | | | | | | 3,750 | | | | 3,734,751 | |
York CLO Ltd. (Cayman Islands), | | | | | | | | | | | | | |
Series2019-01A, Class A1, 144A, 3 Month LIBOR + 1.350% (Cap N/A, Floor 0.000%) | |
3.516%(c) | | | 07/22/32 | | | | | | | | 2,000 | | | | 2,003,504 | |
Zais CLO Ltd. (Cayman Islands), | | | | | | | | | | | | | |
Series2017-01A, Class A1, 144A, 3 Month LIBOR + 1.370% (Cap N/A, Floor 0.000%) | |
3.371%(c) | | | 07/15/29 | | | | | | | | 1,250 | | | | 1,236,074 | |
| | | | | | | | | | | | | | | | |
| | | | | | | | | | | | | | | 84,169,725 | |
| | | | | | | | | | | | | | | | |
Consumer Loans — 0.1% | | | | | | | | | | | | | |
OneMain Financial Issuance Trust, | | | | | | | | | | | | | |
Series2017-01A, Class A2, 144A, 1 Month LIBOR + 0.800% (Cap N/A, Floor 0.000%) | |
2.540%(c) | | | 09/14/32 | | | | | | | | 2,110 | | | | 2,110,816 | |
Oportun Funding LLC, | | | | | | | | | | | | | |
Series2018-C, Class A, 144A | |
4.100% | | | 10/08/24 | | | | | | | | 1,100 | | | | 1,122,551 | |
Series2018-D, Class A, 144A | |
4.150% | | | 12/09/24 | | | | | | | | 800 | | | | 817,088 | |
| | | | | | | | | | | | | | | | |
| | | | | | | | | | | | | | | 4,050,455 | |
| | | | | | | | | | | | | | | | |
Credit Cards — 0.2% | | | | | | | | | | | | | |
Citibank Credit Card Issuance Trust, | | | | | | | | | | | | | |
Series2018-A07, Class A7 | |
3.960% | | | 10/13/30 | | | | | | | | 4,000 | | | | 4,430,586 | |
| | | | | | | | | | | | | | | | |
Equipment — 0.3% | | | | | | | | | | | | | |
MMAF Equipment Finance LLC, | | | | | | | | | | | | | |
Series2017-B, Class A5, 144A | |
2.720% | | | 06/15/40 | | | | | | | | 2,100 | | | | 2,135,846 | |
Series2018-A, Class A4, 144A | | | | | | | | | | | | | |
3.390% | | | 01/10/25 | | | | | | | | 1,200 | | | | 1,233,434 | |
Series2018-A, Class A5, 144A | |
3.610% | | | 03/10/42 | | | | | | | | 500 | | | | 517,092 | |
Series2019-A, Class A5, 144A | |
3.080% | | | 11/12/41 | | | | | | | | 1,600 | | | | 1,646,765 | |
SEE NOTES TO FINANCIAL STATEMENTS.
A13
| | | | | | |
| | |
| | CONSERVATIVE BALANCED PORTFOLIO (continued) | | |
| | | | | | |
| |
| SCHEDULE OF INVESTMENTS | | as of December 31, 2019 |
| | | | | | | | | | | | | | | | |
Interest
Rate | | Maturity
Date | | | | | | Principal
Amount
(000)# | | | Value | |
| |
| ASSET-BACKED SECURITIES (continued) | | | | | |
Equipment (continued) | | | | | | | | | | | | | |
Series2019-B, Class A5, 144A | | | | | | | | | |
2.290% | | | 11/12/41 | | | | | | | | 1,600 | | | $ | 1,587,984 | |
| | | | | | | | | | | | | | | | |
| | | | | | | | | | | | | | | 7,121,121 | |
| | | | | | | | | | | | | | | | |
Home Equity Loans — 0.1% | | | | | |
CDC Mortgage Capital Trust, | | | | | | | | | |
Series 2002-HE03, Class M1, 1 Month LIBOR + 1.650% (Cap N/A, Floor 1.100%) | |
3.442%(c) | | | 03/25/33 | | | | | | | | 83 | | | | 83,039 | |
Morgan Stanley Dean Witter Capital I, Inc. Trust, | | | | | |
Series 2002-HE01, Class M1, 1 Month LIBOR + 0.900% (Cap N/A, Floor 0.600%) | |
2.692%(c) | | | 07/25/32 | | | | | | | | 39 | | | | 39,027 | |
Series 2002-NC04, Class M1, 1 Month LIBOR + 1.275% (Cap N/A, Floor 0.850%) | |
3.067%(c) | | | 09/25/32 | | | | | | | | 1,516 | | | | 1,516,588 | |
| | | | | | | | | | | | | | | | |
| | | | | | | | | | | | | | | 1,638,654 | |
| | | | | | | | | | | | | | | | |
Other — 0.2% | | | | | | | | | | | | | | | | |
Sierra Timeshare Receivables Funding LLC, | | | | | |
Series2018-02A, Class A, 144A | | | | | | | | | |
3.500% | | | 06/20/35 | | | | | | | | 1,007 | | | | 1,023,275 | |
Series2019-02A, Class A, 144A | | | | | | | | | |
2.590% | | | 05/20/36 | | | | | | | | 1,677 | | | | 1,683,036 | |
TH MSR Issuer Trust, | | | | | | | | | | | | | |
Series 2019-FT01, Class A, 144A, 1 Month LIBOR + 2.800% (Cap N/A, Floor 2.800%) | |
4.592%(c) | | | 06/25/24 | | | | | | | | 2,240 | | | | 2,228,845 | |
| | | | | | | | | | | | | | | | |
| | | | | | | | | | | | | | | 4,935,156 | |
| | | | | | | | | | | | | | | | |
Residential Mortgage-Backed Securities — 0.5% | | | | | |
Credit Suisse Mortgage Trust, | | | | | | | | | |
Series 2018-RPL08, Class A1, 144A | | | | | |
4.125%(cc) | | | 07/25/58 | | | | | | | | 1,159 | | | | 1,165,950 | |
CWABS, Inc., Asset-Backed Certificates, | | | | | |
Series2004-01, Class M1, 1 Month LIBOR + 0.750% (Cap N/A, Floor 0.500%) | |
2.542%(c) | | | 03/25/34 | | | | | | | | 630 | | | | 626,903 | |
Legacy Mortgage Asset Trust, | | | | | |
Series 2019-GS02, Class A1, 144A | | | | | |
3.750% | | | 01/25/59 | | | | | | | | 177 | | | | 178,570 | |
Series 2019-GS03, Class A1, 144A | | | | | |
3.750% | | | 04/25/59 | | | | | | | | 184 | | | | 185,541 | |
Series 2019-GS04, Class A1, 144A | | | | | |
3.438% | | | 05/25/59 | | | | | | | | 1,036 | | | | 1,040,682 | |
Series 2019-SL01, Class A, 144A | | | | | |
4.000% | | | 12/28/54 | | | | | | | | 151 | | | | 151,745 | |
Long Beach Mortgage Loan Trust, | | | | | |
Series2004-02, Class M1, 1 Month LIBOR + 0.795% (Cap N/A, Floor 0.530%) | |
2.587%(c) | | | 06/25/34 | | | | | | | | 163 | | | | 160,936 | |
Mill City Mortgage Loan Trust, | | | | | |
Series2017-03, Class A1, 144A | | | | | |
2.750%(cc) | | | 01/25/61 | | | | | | | | 1,259 | | | | 1,264,017 | |
TFS (Spain), | | | | | |
Series2018-03, Class A1, 1 Month EURIBOR + 2.900% | |
2.900%(c) | | | 03/16/23 | | | | | | | EUR | 1,925 | | | | 2,154,867 | |
| | | | | | | | | | | | | | | | |
Interest
Rate | | Maturity
Date | | | | | | Principal
Amount
(000)# | | | Value | |
|
| ASSET-BACKED SECURITIES (continued) | |
Residential Mortgage-Backed Securities (continued) | |
Towd Point Mortgage Trust, | |
Series 2017-04, Class A1, 144A | |
2.750%(cc) | | | 06/25/57 | | | | | | | | 807 | | | $ | 811,102 | |
Series2017-05, Class A1, 144A, 1 Month LIBOR + 0.600% (Cap N/A, Floor 0.000%) | |
2.392%(c) | | | 02/25/57 | | | | | | | | 2,082 | | | | 2,076,541 | |
Series2017-06, Class A1, 144A | |
2.750%(cc) | | | 10/25/57 | | | | | | | | 2,005 | | | | 2,016,013 | |
Series2018-02, Class A1, 144A | |
3.250%(cc) | | | 03/25/58 | | | | | | | | 189 | | | | 192,700 | |
Series2018-03, Class A1, 144A | |
3.750%(cc) | | | 05/25/58 | | | | | | | | 86 | | | | 89,234 | |
Series2018-05, Class A1, 144A | |
3.250%(cc) | | | 07/25/58 | | | | | | | | 673 | | | | 686,690 | |
| | | | | | | | | | | | | | | | |
| | | | | | | | | | | | | | | 12,801,491 | |
| | | | | | | | | | | | | | | | |
Student Loans — 0.9% | | | | | | | | | | | | | |
Commonbond Student Loan Trust, | |
Series2017-BGS, Class A1, 144A | |
2.680% | | | 09/25/42 | | | | | | | | 1,625 | | | | 1,624,639 | |
Series2018-AGS, Class A1, 144A | |
3.210% | | | 02/25/44 | | | | | | | | 1,168 | | | | 1,192,362 | |
Series2018-CGS, Class A1, 144A | |
3.870% | | | 02/25/46 | | | | | | | | 440 | | | | 449,822 | |
Series2018-CGS, Class A2, 144A, 1 Month LIBOR + 0.800% (Cap N/A, Floor 0.800%) | |
2.592%(c) | | | 02/25/46 | | | | | | | | 505 | | | | 497,600 | |
Laurel Road Prime Student Loan Trust, | |
Series2017-C, Class A2B, 144A | |
2.810% | | | 11/25/42 | | | | | | | | 1,201 | | | | 1,209,729 | |
Series2018-B, Class A2FX, 144A | |
3.540% | | | 05/26/43 | | | | | | | | 2,099 | | | | 2,146,017 | |
Series2019-A, Class A2FX, 144A | |
2.730% | | | 10/25/48 | | | | | | | | 1,000 | | | | 1,002,123 | |
Navient Private Education Refi Loan Trust, | | | | | |
Series2018-A, Class A2, 144A | |
3.190% | | | 02/18/42 | | | | | | | | 3,300 | | | | 3,355,580 | |
Series2018-CA, Class A2, 144A | |
3.520% | | | 06/16/42 | | | | | | | | 1,200 | | | | 1,231,276 | |
Series2019-CA, Class A2, 144A | |
3.130% | | | 02/15/68 | | | | | | | | 1,400 | | | | 1,417,377 | |
Series2019-EA, Class A2A, 144A | |
2.640% | | | 05/15/68 | | | | | | | | 1,500 | | | | 1,492,554 | |
SoFi Professional Loan Program LLC, | |
Series2019-A, Class A2FX, 144A | |
3.690% | | | 06/15/48 | | | | | | | | 2,600 | | | | 2,698,782 | |
Series2019-B, Class A2FX, 144A | |
3.090% | | | 08/17/48 | | | | | | | | 1,400 | | | | 1,421,551 | |
Series2019-C, Class A2FX, 144A | |
2.370% | | | 11/16/48 | | | | | | | | 1,700 | | | | 1,666,503 | |
SoFi Professional Loan Program Trust, | |
Series2018-B, Class A1FX, 144A | |
2.640% | | | 08/25/47 | | | | | | | | 706 | | | | 706,618 | |
SEE NOTES TO FINANCIAL STATEMENTS.
A14
| | | | | | |
| | |
| | CONSERVATIVE BALANCED PORTFOLIO (continued) | | |
| | | | | | |
| |
| SCHEDULE OF INVESTMENTS | | as of December 31, 2019 |
| | | | | | | | | | | | | | | | |
Interest
Rate | | Maturity
Date | | | | | | Principal
Amount
(000)# | | | Value | |
|
| ASSET-BACKED SECURITIES (continued) | |
Student Loans (continued) | | | | | | | | | | | | | |
Series2018-B, Class A2FX, 144A | |
3.340% | | | 08/25/47 | | | | | | | | 2,200 | | | $ | 2,252,723 | |
| | | | | | | | | | | | | | | | |
| | | | | | | | | | | | | | | 24,365,256 | |
| | | | | | | | | | | | | | | | |
TOTAL ASSET-BACKED SECURITIES
(cost $200,271,947) | | | | 202,210,380 | |
| | | | | | | | | | | | | | | | |
|
COMMERCIAL MORTGAGE-BACKED
SECURITIES — 8.0% | |
Assurant Commercial Mortgage Trust, | |
Series2016-01A, Class AS, 144A | |
3.172% | | | 05/15/49 | | | | | | | | 3,100 | | | | 3,153,744 | |
BBCMS Mortgage Trust, | |
Series2018-C02, Class A4 | |
4.047% | | | 12/15/51 | | | | | | | | 3,850 | | | | 4,257,005 | |
Benchmark Mortgage Trust, | |
Series2018-B03, Class A4 | |
3.761% | | | 04/10/51 | | | | | | | | 3,600 | | | | 3,900,570 | |
CFCRE Commercial Mortgage Trust, | |
Series2016-C04, Class A3 | |
3.014% | | | 05/10/58 | | | | | | | | 2,500 | | | | 2,568,802 | |
Citigroup Commercial Mortgage Trust, | |
Series 2014-GC21, Class A4 | |
3.575% | | | 05/10/47 | | | | | | | | 1,006 | | | | 1,052,323 | |
Series2016-C01, Class A3 | |
2.944% | | | 05/10/49 | | | | | | | | 2,700 | | | | 2,771,202 | |
Series2017-P07, Class A3 | |
3.442% | | | 04/14/50 | | | | | | | | 4,000 | | | | 4,223,535 | |
Commercial Mortgage Trust, | |
Series 2014-CR15, Class A2 | |
2.928% | | | 02/10/47 | | | | | | | | 590 | | | | 590,862 | |
Series 2014-CR18, Class A4 | |
3.550% | | | 07/15/47 | | | | | | | | 2,087 | | | | 2,176,140 | |
Series 2014-LC17, Class A4 | |
3.648% | | | 10/10/47 | | | | | | | | 5,000 | | | | 5,272,779 | |
CSAIL Commercial Mortgage Trust, | |
Series2015-C04, Class A3 | |
3.544% | | | 11/15/48 | | | | | | | | 2,500 | | | | 2,639,652 | |
Series2017-C08, Class A3 | |
3.127% | | | 06/15/50 | | | | | | | | 3,800 | | | | 3,932,263 | |
FannieMae-Aces, | |
Series2015-M08, Class AB2 | |
2.829%(cc) | | | 01/25/25 | | | | | | | | 1,618 | | | | 1,658,456 | |
Series2015-M17, Class A2 | |
2.934%(cc) | | | 11/25/25 | | | | | | | | 3,000 | | | | 3,105,323 | |
Series2016-M07, Class AB2 | |
2.385% | | | 09/25/26 | | | | | | | | 1,800 | | | | 1,797,768 | |
Series2017-M01, Class A2 | |
2.417%(cc) | | | 10/25/26 | | | | | | | | 1,600 | | | | 1,618,737 | |
Series2017-M04, Class A2 | |
2.586%(cc) | | | 12/25/26 | | | | | | | | 8,600 | | | | 8,810,938 | |
Series2017-M08, Class A2 | |
3.061%(cc) | | | 05/25/27 | | | | | | | | 5,900 | | | | 6,153,151 | |
Series2018-M04, Class A2 | |
3.045%(cc) | | | 03/25/28 | | | | | | | | 3,075 | | | | 3,223,259 | |
FHLMC Multifamily Structured Pass-Through Certificates, | |
Series K020, Class X1, IO | |
1.373%(cc) | | | 05/25/22 | | | | | | | | 18,467 | | | | 466,030 | |
| | | | | | | | | | | | | | | | |
Interest
Rate | | Maturity
Date | | | | | | Principal
Amount
(000)# | | | Value | |
|
| COMMERCIAL MORTGAGE-BACKED SECURITIES (continued) | |
Series K021, Class X1, IO | |
1.425%(cc) | | | 06/25/22 | | | | | | | | 5,204 | | | $ | 142,746 | |
Series K055, Class X1, IO | |
1.364%(cc) | | | 03/25/26 | | | | | | | | 4,579 | | | | 322,907 | |
Series K064, Class AM | |
3.327%(cc) | | | 03/25/27 | | | | | | | | 4,200 | | | | 4,448,258 | |
Series K068, Class AM | |
3.315% | | | 08/25/27 | | | | | | | | 4,100 | | | | 4,331,041 | |
Series K069, Class A2 | |
3.187%(cc) | | | 09/25/27 | | | | | | | | 3,500 | | | | 3,692,567 | |
Series K069, Class AM | |
3.248%(cc) | | | 09/25/27 | | | | | | | | 750 | | | | 790,016 | |
Series K070, Class A2 | |
3.303%(cc) | | | 11/25/27 | | | | | | | | 5,200 | | | | 5,522,669 | |
Series K070, Class AM | |
3.364% | | | 12/25/27 | | | | | | | | 1,100 | | | | 1,166,016 | |
Series K072, Class A2 | |
3.444% | | | 12/25/27 | | | | | | | | 1,400 | | | | 1,500,711 | |
Series K075, Class AM | |
3.650%(cc) | | | 02/25/28 | | | | | | | | 2,550 | | | | 2,752,424 | |
Series K076, Class A2 | |
3.900% | | | 04/25/28 | | | | | | | | 6,200 | | | | 6,841,856 | |
Series K076, Class AM | |
3.900% | | | 04/25/28 | | | | | | | | 1,825 | | | | 2,003,398 | |
Series K077, Class A2 | |
3.850%(cc) | | | 05/25/28 | | | | | | | | 3,470 | | | | 3,814,092 | |
Series K077, Class AM | |
3.850%(cc) | | | 05/25/28 | | | | | | | | 690 | | | | 755,218 | |
Series K080, Class AM | |
3.986%(cc) | | | 07/25/28 | | | | | | | | 5,150 | | | | 5,689,959 | |
Series K081, Class AM | |
3.900%(cc) | | | 08/25/28 | | | | | | | | 2,600 | | | | 2,857,362 | |
Series K086, Class AM | |
3.919%(cc) | | | 12/25/28 | | | | | | | | 800 | | | | 880,920 | |
Series K157, Class A2 | |
3.990%(cc) | | | 05/25/33 | | | | | | | | 3,100 | | | | 3,496,697 | |
Series W5FX, Class AFX | |
3.214%(cc) | | | 04/25/28 | | | | | | | | 1,630 | | | | 1,727,598 | |
GS Mortgage Securities Trust, | |
Series 2015-GC28, Class A4 | |
3.136% | | | 02/10/48 | | | | | | | | 3,000 | | | | 3,099,606 | |
Series 2015-GC34, Class A3 | |
3.244% | | | 10/10/48 | | | | | | | | 4,800 | | | | 4,985,375 | |
Series 2016-GS03, Class A3 | |
2.592% | | | 10/10/49 | | | | | | | | 4,200 | | | | 4,230,200 | |
Series 2016-GS04, Class A3 | |
3.178% | | | 11/10/49 | | | | | | | | 4,000 | | | | 4,158,288 | |
JPMBB Commercial Mortgage Securities Trust, | | | | | |
Series2014-C25, Class A4A1 | |
3.408% | | | 11/15/47 | | | | | | | | 1,100 | | | | 1,147,207 | |
Series2015-C27, Class A3A1 | |
2.920% | | | 02/15/48 | | | | | | | | 5,000 | | | | 5,111,796 | |
JPMCC Commercial Mortgage Securities Trust, | | | | | |
Series 2017-JP06, Class A3 | |
3.109% | | | 07/15/50 | | | | | | | | 5,581 | | | | 5,739,203 | |
SEE NOTES TO FINANCIAL STATEMENTS.
A15
| | | | | | |
| | |
| | CONSERVATIVE BALANCED PORTFOLIO (continued) | | |
| | | | | | |
| |
| SCHEDULE OF INVESTMENTS | | as of December 31, 2019 |
| | | | | | | | | | | | | | | | |
Interest
Rate | | Maturity
Date | | | | | | Principal
Amount
(000)# | | | Value | |
|
| COMMERCIAL MORTGAGE-BACKED SECURITIES (continued) | |
JPMDB Commercial Mortgage Securities Trust, | |
Series2016-C02, Class A3A | | | | | |
2.881% | | | 06/15/49 | | | | | | | | 2,500 | | | $ | 2,549,739 | |
JPMorgan Chase Commercial Mortgage Securities Trust, | |
Series 2013-LC11, Class A4 | | | | | |
2.694% | | | 04/15/46 | | | | | | | | 498 | | | | 505,387 | |
Morgan Stanley Bank of America Merrill Lynch Trust, | |
Series2013-C08, Class A3 | | | | | |
2.863% | | | 12/15/48 | | | | | | | | 1,081 | | | | 1,097,538 | |
Morgan Stanley Capital I Trust, | |
Series 2015-UBS08, Class A3 | | | | | |
3.540% | | | 12/15/48 | | | | | | | | 5,000 | | | | 5,263,754 | |
Series 2016-UB11, Class A3 | | | | | |
2.531% | | | 08/15/49 | | | | | | | | 6,300 | | | | 6,298,317 | |
Series2019-H06, Class A3 | | | | | |
3.158% | | | 06/15/52 | | | | | | | | 5,000 | | | | 5,184,985 | |
Series2019-H07, Class A2 | | | | | |
2.492% | | | 07/15/52 | | | | | | | | 9,400 | | | | 9,425,854 | |
UBS Commercial Mortgage Trust, | |
Series2017-C02, Class ASB | | | | | |
3.264% | | | 08/15/50 | | | | | | | | 2,500 | | | | 2,596,172 | |
Series2017-C05, Class A4 | | | | | |
3.212% | | | 11/15/50 | | | | | | | | 5,000 | | | | 5,213,729 | |
Series2018-C09, Class A3 | | | | | |
3.854% | | | 03/15/51 | | | | | | | | 1,800 | | | | 1,960,728 | |
Series2018-C14, Class A3 | | | | | |
4.180% | | | 12/15/51 | | | | | | | | 2,900 | | | | 3,240,358 | |
UBS-Barclays Commercial Mortgage Trust, | | | | | |
Series2012-C04, Class A4 | | | | | |
2.792% | | | 12/10/45 | | | | | | | | 1,400 | | | | 1,416,205 | |
Series2013-C05, Class A3 | | | | | |
2.920% | | | 03/10/46 | | | | | | | | 1,631 | | | | 1,652,712 | |
Series2013-C06, Class A3 | | | | | |
2.971% | | | 04/10/46 | | | | | | | | 1,498 | | | | 1,528,321 | |
Wells Fargo Commercial Mortgage Trust, | |
Series 2016-NXS06, Class A3 | | | | | |
2.642% | | | 11/15/49 | | | | | | | | 4,500 | | | | 4,536,954 | |
Series2017-C38, Class A4 | | | | | |
3.190% | | | 07/15/50 | | | | | | | | 3,300 | | | | 3,435,597 | |
Series2019-C49, Class A3 | | | | | |
3.749% | | | 03/15/52 | | | | | | | | 7,300 | | | | 7,767,614 | |
| | | | | | | | | | | | | | | | |
TOTAL COMMERCIAL MORTGAGE-BACKED SECURITIES
(cost $200,483,591) | | | | 208,254,633 | |
| | | | | | | | | | | | | | | | |
|
| CORPORATE BONDS — 10.9% | |
Aerospace & Defense — 0.2% | |
Boeing Co. (The), | |
Sr. Unsec’d. Notes | | | | | |
3.750% | | | 02/01/50 | (a) | | | | | | | 1,470 | | | | 1,558,745 | |
Embraer Netherlands Finance BV (Brazil), | | | | | |
Gtd. Notes | | | | | |
5.050% | | | 06/15/25 | | | | | | | | 616 | | | | 675,800 | |
Embraer Overseas Ltd. (Brazil), | |
Gtd. Notes, 144A | | | | | |
5.696% | | | 09/16/23 | | | | | | | | 765 | | | | 840,843 | |
| | | | | | | | | | | | | | | | |
Interest
Rate | | Maturity
Date | | | | | | Principal
Amount
(000)# | | | Value | |
|
| CORPORATE BONDS (continued) | |
Aerospace & Defense (continued) | |
United Technologies Corp., | |
Sr. Unsec’d. Notes | | | | | |
4.125% | | | 11/16/28 | | | | | | | | 910 | | | $ | 1,023,849 | |
| | | | | | | | | | | | | | | | |
| | | | | | | | | | | | | | | 4,099,237 | |
| | | | | | | | | | | | | | | | |
Agriculture — 0.1% | |
BAT Capital Corp. (United Kingdom), | |
Gtd. Notes | | | | | |
3.222% | | | 08/15/24 | | | | | | | | 2,685 | | | | 2,744,452 | |
| | | | | | | | | | | | | | | | |
Airlines — 0.2% | |
American Airlines2015-1 Class A Pass-Through Trust, | |
Pass-Through Certificates | |
3.375% | | | 11/01/28 | | | | | | | | 2,049 | | | | 2,119,802 | |
Continental Airlines2001-1Class A-1 Pass-Through Trust, | |
Pass-Through Certificates | | | | | |
6.703% | | | 12/15/22 | | | | | | | | 13 | | | | 13,971 | |
Continental Airlines2010-1 Class A Pass-Through Trust, | |
Pass-Through Certificates | | | | | |
4.750% | | | 07/12/22 | | | | | | | | 312 | | | | 317,869 | |
Continental Airlines2012-2 Class A Pass-Through Trust, | |
Pass-Through Certificates | | | | | |
4.000% | | | 04/29/26 | | | | | | | | 283 | | | | 298,327 | |
Delta Air Lines2007-1 Class A Pass-Through Trust, | | | | | |
Pass-Through Certificates | | | | | |
6.821% | | | 02/10/24 | | | | | | | | 206 | | | | 224,349 | |
Delta Air Lines, Inc., | | | | | | | | | | | | | |
Sr. Unsec’d. Notes | | | | | |
2.875% | | | 03/13/20 | | | | | | | | 1,300 | | | | 1,301,027 | |
| | | | | | | | | | | | | | | | |
| | | | | | | | | | | | | | | 4,275,345 | |
| | | | | | | | | | | | | | | | |
Auto Manufacturers — 0.5% | |
BMW US Capital LLC (Germany), | |
Gtd. Notes, 144A, 3 Month LIBOR + 0.410% | | | | | |
2.411%(c) | | | 04/12/21 | | | | | | | | 355 | | | | 355,501 | |
Daimler Finance North America LLC (Germany), | | | | | |
Gtd. Notes, 144A | | | | | |
3.350% | | | 05/04/21 | | | | | | | | 1,455 | | | | 1,478,275 | |
Ford Motor Co., | |
Sr. Unsec’d. Notes | | | | | |
5.291% | | | 12/08/46 | | | | | | | | 665 | | | | 631,631 | |
Ford Motor Credit Co. LLC, | |
Sr. Unsec’d. Notes | | | | | |
3.336% | | | 03/18/21 | | | | | | | | 515 | | | | 518,593 | |
3.350% | | | 11/01/22 | | | | | | | | 2,845 | | | | 2,875,444 | |
General Motors Co., | |
Sr. Unsec’d. Notes | | | | | |
6.250% | | | 10/02/43 | | | | | | | | 740 | | | | 824,957 | |
6.600% | | | 04/01/36 | | | | | | | | 585 | | | | 688,824 | |
General Motors Financial Co., Inc., | |
Gtd. Notes, 3 Month LIBOR + 0.850% | | | | | |
2.862%(c) | | | 04/09/21 | | | | | | | | 820 | | | | 820,713 | |
Gtd. Notes | | | | | |
3.550% | | | 04/09/21 | | | | | | | | 620 | | | | 630,244 | |
3.950% | | | 04/13/24 | | | | | | | | 1,700 | | | | 1,777,971 | |
SEE NOTES TO FINANCIAL STATEMENTS.
A16
| | | | | | |
| | |
| | CONSERVATIVE BALANCED PORTFOLIO (continued) | | |
| | | | | | |
| |
| SCHEDULE OF INVESTMENTS | | as of December 31, 2019 |
| | | | | | | | | | | | | | | | |
Interest
Rate | | Maturity
Date | | | | | | Principal
Amount
(000)# | | | Value | |
|
| CORPORATE BONDS (continued) | |
Auto Manufacturers (continued) | |
Harley-Davidson Financial Services, Inc., | |
Gtd. Notes, 144A, MTN | | | | | | | | | | | | | |
2.850% | | | 01/15/21 | | | | | | | | 2,300 | | | $ | 2,310,959 | |
| | | | | | | | | | | | | | | | |
| | | | | | | | | | | | | | | 12,913,112 | |
| | | | | | | | | | | | | | | | |
Banks — 2.7% | |
Banco Santander SA (Spain), | |
Sr. Unsec’d. Notes, 3 Month LIBOR + 1.120% | |
3.121%(c) | | | 04/12/23 | | | | | | | | 400 | | | | 402,833 | |
Sr. Unsec’d. Notes | |
3.848% | | | 04/12/23 | | | | | | | | 800 | | | | 834,572 | |
Bank of America Corp., | |
Jr. Sub. Notes, Series DD | | | | | |
6.300%(ff) | | | — | (rr) | | | | | | | 275 | | | | 318,705 | |
Jr. Sub. Notes, Series JJ | | | | | |
5.125%(ff) | | | — | (rr) | | | | | | | 1,145 | | | | 1,207,953 | |
Sr. Unsec’d. Notes, GMTN | | | | | |
3.300% | | | 01/11/23 | | | | | | | | 1,520 | | | | 1,573,293 | |
Sr. Unsec’d. Notes, MTN | | | | | |
3.194%(ff) | | | 07/23/30 | | | | | | | | 1,050 | | | | 1,086,200 | |
3.824%(ff) | | | 01/20/28 | | | | | | | | 615 | | | | 660,369 | |
4.000% | | | 04/01/24 | (a) | | | | | | | 745 | | | | 796,649 | |
Sub. Notes, MTN | | | | | |
4.000% | | | 01/22/25 | | | | | | | | 1,700 | | | | 1,813,086 | |
4.450% | | | 03/03/26 | | | | | | | | 4,790 | | | | 5,254,976 | |
Bank of America NA, | |
Sub. Notes | | | | | |
6.000% | | | 10/15/36 | | | | | | | | 805 | | | | 1,106,765 | |
Barclays PLC (United Kingdom), | |
Sr. Unsec’d. Notes | | | | | | | | | | | | | |
3.650% | | | 03/16/25 | (a) | | | | | | | 610 | | | | 637,633 | |
3.684% | | | 01/10/23 | | | | | | | | 320 | | | | 328,002 | |
4.375% | | | 01/12/26 | | | | | | | | 323 | | | | 349,965 | |
Sr. Unsec’d. Notes, MTN | | | | | |
4.972%(ff) | | | 05/16/29 | | | | | | | | 705 | | | | 794,863 | |
Citigroup, Inc., | |
Jr. Sub. Notes, Series Q | | | | | |
5.950%(ff) | | | — | (rr) | | | | | | | 1,590 | | | | 1,621,526 | |
Jr. Sub. Notes, Series R | | | | | |
6.125%(ff) | | | — | (rr) | | | | | | | 945 | | | | 973,492 | |
Jr. Sub. Notes, Series T | | | | | |
6.250%(ff) | | | — | (rr) | | | | | | | 640 | | | | 727,704 | |
Sr. Unsec’d. Notes | | | | | |
3.200% | | | 10/21/26 | | | | | | | | 670 | | | | 694,677 | |
3.700% | | | 01/12/26 | | | | | | | | 1,610 | | | | 1,714,947 | |
3.887%(ff) | | | 01/10/28 | (a) | | | | | | | 560 | | | | 602,809 | |
8.125% | | | 07/15/39 | | | | | | | | 365 | | | | 606,384 | |
Sub. Notes | | | | | |
4.450% | | | 09/29/27 | | | | | | | | 1,485 | | | | 1,635,110 | |
4.750% | | | 05/18/46 | | | | | | | | 440 | | | | 526,178 | |
Credit Suisse Group AG (Switzerland), | |
Sr. Unsec’d. Notes, 144A | | | | | |
4.282% | | | 01/09/28 | | | | | | | | 980 | | | | 1,065,771 | |
Deutsche Bank AG (Germany), | |
Sr. Unsec’d. Notes, GMTN | | | | | |
3.375% | | | 05/12/21 | | | | | | | | 1,240 | | | | 1,252,679 | |
| | | | | | | | | | | | | | | | |
Interest
Rate | | Maturity
Date | | | | | | Principal
Amount
(000)# | | | Value | |
|
| CORPORATE BONDS (continued) | |
Banks (continued) | |
Sr. Unsec’d. Notes, Series D | | | | | |
5.000% | | | 02/14/22 | | | | | | | | 1,350 | | | $ | 1,409,182 | |
Discover Bank, | |
Sr. Unsec’d. Notes | | | | | |
4.250% | | | 03/13/26 | | | | | | | | 595 | | | | 642,596 | |
Sub. Notes | | | | | |
7.000% | | | 04/15/20 | | | | | | | | 485 | | | | 491,430 | |
Goldman Sachs Group, Inc. (The), | |
Jr. Sub. Notes, Series M | | | | | |
5.375%(ff) | | | — | (rr) | | | | | | | 1,800 | | | | 1,818,891 | |
Jr. Sub. Notes, Series O | | | | | |
5.300%(ff) | | | — | (rr) | | | | | | | 560 | | | | 604,963 | |
Sr. Unsec’d. Notes | | | | | |
3.750% | | | 02/25/26 | | | | | | | | 1,165 | | | | 1,237,044 | |
3.814%(ff) | | | 04/23/29 | (a) | | | | | | | 440 | | | | 470,996 | |
3.850% | | | 01/26/27 | | | | | | | | 2,625 | | | | 2,792,121 | |
5.750% | | | 01/24/22 | | | | | | | | 3,265 | | | | 3,501,644 | |
Sub. Notes | | | | | |
6.750% | | | 10/01/37 | | | | | | | | 225 | | | | 311,282 | |
HSBC Holdings PLC (United Kingdom), | |
Sr. Unsec’d. Notes, 3 Month LIBOR + 0.600% | |
2.504%(c) | | | 05/18/21 | | | | | | | | 1,530 | | | | 1,531,497 | |
Sr. Unsec’d. Notes, 3 Month LIBOR + 2.240% | |
4.125%(c) | | | 03/08/21 | | | | | | | | 920 | | | | 940,561 | |
Sr. Unsec’d. Notes | | | | | |
4.875% | | | 01/14/22 | | | | | | | | 1,230 | | | | 1,298,199 | |
ING Groep NV (Netherlands), | |
Sr. Unsec’d. Notes | | | | | |
3.550% | | | 04/09/24 | | | | | | | | 400 | | | | 418,408 | |
JPMorgan Chase & Co., | |
Jr. Sub. Notes, Series FF | | | | | |
5.000%(ff) | | | — | (rr) | | | | | | | 540 | | | | 564,241 | |
Jr. Sub. Notes, Series I, 3 Month LIBOR + 3.470% | |
5.406%(c) | | | — | (rr) | | | | | | | 979 | | | | 988,014 | |
Jr. Sub. Notes, Series X | | | | | |
6.100%(ff) | | | — | (rr) | | | | | | | 1,175 | | | | 1,284,677 | |
Sr. Unsec’d. Notes | | | | | |
3.782%(ff) | | | 02/01/28 | | | | | | | | 270 | | | | 290,405 | |
3.964%(ff) | | | 11/15/48 | | | | | | | | 2,240 | | | | 2,528,673 | |
4.005%(ff) | | | 04/23/29 | | | | | | | | 1,360 | | | | 1,491,264 | |
Sub. Notes | | | | | |
3.875% | | | 09/10/24 | | | | | | | | 3,525 | | | | 3,771,240 | |
Morgan Stanley, | |
Jr. Sub. Notes, Series H, 3 Month LIBOR + 3.610% | |
5.611%(c) | | | — | (rr) | | | | | | | 640 | | | | 644,455 | |
Sr. Unsec’d. Notes | | | | | |
4.375% | | | 01/22/47 | (a) | | | | | | | 930 | | | | 1,111,477 | |
Sr. Unsec’d. Notes, GMTN | | | | | |
3.750% | | | 02/25/23 | | | | | | | | 610 | | | | 638,431 | |
3.772%(ff) | | | 01/24/29 | (a) | | | | | | | 1,295 | | | | 1,392,357 | |
3.875% | | | 01/27/26 | | | | | | | | 550 | | | | 590,983 | |
4.431%(ff) | | | 01/23/30 | | | | | | | | 455 | | | | 514,106 | |
Sr. Unsec’d. Notes, MTN | | | | | |
3.591%(ff) | | | 07/22/28 | | | | | | | | 1,030 | | | | 1,092,971 | |
Sub. Notes, GMTN | | | | | |
4.350% | | | 09/08/26 | | | | | | | | 3,050 | | | | 3,332,323 | |
SEE NOTES TO FINANCIAL STATEMENTS.
A17
| | | | | | |
| | |
| | CONSERVATIVE BALANCED PORTFOLIO (continued) | | |
| | | | | | |
| |
| SCHEDULE OF INVESTMENTS | | as of December 31, 2019 |
| | | | | | | | | | | | | | | | |
Interest
Rate | | Maturity
Date | | | | | | Principal
Amount
(000)# | | | Value | |
|
| CORPORATE BONDS (continued) | |
Banks (continued) | |
Royal Bank of Scotland Group PLC (United Kingdom), | |
Sr. Unsec’d. Notes | | | | | | | | | | | | | |
4.445%(ff) | | | 05/08/30 | | | | | | | | 1,570 | | | $ | 1,733,572 | |
State Bank of India (India), | | | | | | | | | | | | | |
Sr. Unsec’d. Notes, 144A | | | | | | | | | | | | | |
4.375% | | | 01/24/24 | | | | | | | | 1,255 | | | | 1,321,685 | |
| | | | | | | | | | | | | | | | |
| | | | | | | | | | | | | | | 69,346,829 | |
| | | | | | | | | | | | | | | | |
Beverages — 0.1% | | | | | | | | | | | | | |
Anheuser-Busch Cos. LLC/Anheuser-Busch InBev Worldwide, Inc. (Belgium), | |
Gtd. Notes | | | | | | | | | | | | | | | | |
4.700% | | | 02/01/36 | | | | | | | | 1,220 | | | | 1,407,482 | |
| | | | | | | | | | | | | | | | |
Building Materials — 0.0% | | | | | | | | | | | | | |
Standard Industries, Inc., | | | | | | | | | | | | | |
Sr. Unsec’d. Notes, 144A | | | | | | | | | | | | | |
4.750% | | | 01/15/28 | (a) | | | | | | | 300 | | | | 307,636 | |
| | | | | | | | | | | | | | | | |
Chemicals — 0.4% | | | | | | | | | | | | | |
Braskem Netherlands Finance BV (Brazil), | | | | | |
Gtd. Notes, 144A | | | | | | | | | | | | | |
5.875% | | | 01/31/50 | (a) | | | | | | | 335 | | | | 333,469 | |
Celanese US Holdings LLC, | | | | | | | | | | | | | |
Gtd. Notes | | | | | | | | | | | | | | | | |
5.875% | | | 06/15/21 | | | | | | | | 1,160 | | | | 1,217,826 | |
CF Industries, Inc., | | | | | | | | | | | | | |
Gtd. Notes | | | | | | | | | | | | | | | | |
5.375% | | | 03/15/44 | | | | | | | | 445 | | | | 485,183 | |
CNAC HK Finbridge Co. Ltd. (China), | | | | | | | | | | | | | |
Gtd. Notes | | | | | | | | | | | | | | | | |
3.500% | | | 07/19/22 | | | | | | | | 2,675 | | | | 2,721,876 | |
Dow Chemical Co. (The), | | | | | | | | | | | | | |
Sr. Unsec’d. Notes | | | | | | | | | | | | | |
4.800% | | | 05/15/49 | (a) | | | | | | | 345 | | | | 398,028 | |
5.250% | | | 11/15/41 | | | | | | | | 5 | | | | 5,845 | |
9.400% | | | 05/15/39 | | | | | | | | 30 | | | | 49,036 | |
LYB International Finance BV, | | | | | | | | | | | | | |
Gtd. Notes | | | | | | | | | | | | | | | | |
4.875% | | | 03/15/44 | (a) | | | | | | | 620 | | | | 704,029 | |
Mosaic Co. (The), | | | | | | | | | | | | | |
Sr. Unsec’d. Notes | | | | | | | | | | | | | |
5.450% | | | 11/15/33 | | | | | | | | 265 | | | | 301,417 | |
5.625% | | | 11/15/43 | | | | | | | | 295 | | | | 348,539 | |
NOVA Chemicals Corp. (Canada), | | | | | | | | | | | | | |
Sr. Unsec’d. Notes, 144A | | | | | | | | | | | | | |
4.875% | | | 06/01/24 | | | | | | | | 875 | | | | 902,134 | |
SASOL Financing USA LLC (South Africa), | | | | | |
Gtd. Notes | | | | | | | | | | | | | | | | |
5.875% | | | 03/27/24 | | | | | | | | 600 | | | | 651,191 | |
6.500% | | | 09/27/28 | | | | | | | | 405 | | | | 450,343 | |
Union Carbide Corp., | | | | | | | | | | | | | |
Sr. Unsec’d. Notes | | | | | | | | | | | | | |
7.500% | | | 06/01/25 | | | | | | | | 500 | | | | 610,111 | |
| | | | | | | | | | | | | | | | |
| | | | | | | | | | | | | | | 9,179,027 | |
| | | | | | | | | | | | | | | | |
| | | | | | | | | | | | | | | | |
Interest
Rate | | Maturity
Date | | | | | | Principal
Amount
(000)# | | | Value | |
|
| CORPORATE BONDS (continued) | |
Commercial Services — 0.1% | |
ERAC USA Finance LLC, | |
Gtd. Notes, 144A | |
4.200% | | | 11/01/46 | | | | | | | | 875 | | | $ | 937,530 | |
7.000% | | | 10/15/37 | | | | | | | | 390 | | | | 548,763 | |
United Rentals North America, Inc., | | | | | | | | | | | | | |
Gtd. Notes | | | | | | | | | | | | | |
4.875% | | | 01/15/28 | | | | | | | | 735 | | | | 765,556 | |
5.250% | | | 01/15/30 | | | | | | | | 265 | | | | 285,337 | |
5.875% | | | 09/15/26 | | | | | | | | 225 | | | | 241,633 | |
| | | | | | | | | | | | | | | | |
| | | | | | | | | | | | | | | 2,778,819 | |
| | | | | | | | | | | | | | | | |
Computers — 0.1% | | | | | | | | | | | | | |
Apple, Inc., | |
Sr. Unsec’d. Notes | |
3.200% | | | 05/13/25 | | | | | | | | 2,400 | | | | 2,535,361 | |
| | | | | | | | | | | | | | | | |
Diversified Financial Services — 0.2% | |
CDP Financial, Inc. (Canada), | |
Gtd. Notes, 144A | | | | | | | | | | | | | |
3.150% | | | 07/24/24 | | | | | | | | 445 | | | | 468,776 | |
Discover Financial Services, | |
Sr. Unsec’d. Notes | |
3.850% | | | 11/21/22 | | | | | | | | 900 | | | | 939,948 | |
Jefferies Group LLC, | |
Sr. Unsec’d. Notes | |
6.500% | | | 01/20/43 | | | | | | | | 465 | | | | 555,212 | |
Lehman Brothers Holdings, Inc., | |
Sr. Unsec’d. Notes, MTN | |
5.250% | | | 02/06/12 | (d) | | | | | | | 1,850 | | | | 23,125 | |
6.875% | | | 05/02/18 | (d) | | | | | | | 700 | | | | 9,100 | |
Private Export Funding Corp., | |
Gov’t. Gtd. Notes, Series GG | |
2.450% | | | 07/15/24 | | | | | | | | 285 | | | | 290,430 | |
U.S. Gov’t. Gtd. Notes, Series NN | |
3.250% | | | 06/15/25 | | | | | | | | 255 | | | | 270,110 | |
Synchrony Financial, | |
Sr. Unsec’d. Notes | |
2.700% | | | 02/03/20 | | | | | | | | 2,175 | | | | 2,175,268 | |
| | | | | | | | | | | | | | | | |
| | | | | | | | | | | | | | | 4,731,969 | |
| | | | | | | | | | | | | | | | |
Electric — 1.3% | | | | | | | | | | | | | | | | |
Avista Corp., | |
First Mortgage | |
4.350% | | | 06/01/48 | | | | | | | | 845 | | | | 970,094 | |
Baltimore Gas & Electric Co., | |
Sr. Unsec’d. Notes | |
6.350% | | | 10/01/36 | | | | | | | | 530 | | | | 731,263 | |
Berkshire Hathaway Energy Co., | |
Sr. Unsec’d. Notes | |
5.950% | | | 05/15/37 | | | | | | | | 335 | | | | 451,205 | |
CenterPoint Energy Houston Electric LLC, | |
General Ref. Mortgage, Series K2 | |
6.950% | | | 03/15/33 | | | | | | | | 300 | | | | 422,500 | |
Consolidated Edison Co. of New York, Inc., | |
Sr. Unsec’d. Notes, Series09-C | |
5.500% | | | 12/01/39 | | | | | | | | 145 | | | | 187,224 | |
SEE NOTES TO FINANCIAL STATEMENTS.
A18
| | | | | | |
| | |
| | CONSERVATIVE BALANCED PORTFOLIO (continued) | | |
| | | | | | |
| |
| SCHEDULE OF INVESTMENTS | | as of December 31, 2019 |
| | | | | | | | | | | | | | | | |
Interest
Rate | | Maturity
Date | | | | | | Principal
Amount
(000)# | | | Value | |
|
| CORPORATE BONDS (continued) | |
Electric (continued) | |
Dominion Energy, Inc., | |
Jr. Sub. Notes | |
4.104% | | | 04/01/21 | | | | | | | | 2,470 | | | $ | 2,527,165 | |
DTE Electric Co., | |
General Ref. Mortgage, Series A | |
4.050% | | | 05/15/48 | | | | | | | | 1,075 | | | | 1,243,701 | |
Duke Energy Carolinas LLC, | |
First Mortgage | |
6.050% | | | 04/15/38 | | | | | | | | 530 | | | | 726,232 | |
El Paso Electric Co., | |
Sr. Unsec’d. Notes | |
6.000% | | | 05/15/35 | | | | | | | | 845 | | | | 1,034,962 | |
Enel Finance International NV (Italy), | |
Gtd. Notes, 144A | |
2.650% | | | 09/10/24 | | | | | | | | 1,960 | | | | 1,967,281 | |
Exelon Corp., | |
Jr. Sub. Notes | |
3.497% | | | 06/01/22 | | | | | | | | 2,397 | | | | 2,459,391 | |
Exelon Generation Co. LLC, | |
Sr. Unsec’d. Notes | |
6.250% | | | 10/01/39 | | | | | | | | 1,375 | | | | 1,652,170 | |
FirstEnergy Transmission LLC, | |
Sr. Unsec’d. Notes, 144A | |
5.450% | | | 07/15/44 | | | | | | | | 265 | | | | 331,598 | |
Florida Power & Light Co., | |
First Mortgage | |
5.950% | | | 10/01/33 | | | | | | | | 380 | | | | 507,630 | |
Iberdrola International BV (Spain), | |
Gtd. Notes | |
6.750% | | | 09/15/33 | | | | | | | | 140 | | | | 181,267 | |
Indiana Michigan Power Co., | |
Sr. Unsec’d. Notes | | | | | | | | | | | | | |
3.850% | | | 05/15/28 | | | | | | | | 2,105 | | | | 2,287,663 | |
Israel Electric Corp. Ltd. (Israel), | |
Sr. Sec’d. Notes, 144A | |
9.375% | | | 01/28/20 | | | | | | | | 1,000 | | | | 1,004,704 | |
Sr. Sec’d. Notes, 144A, GMTN | |
4.250% | | | 08/14/28 | | | | | | | | 575 | | | | 625,303 | |
Monongahela Power Co., | |
First Mortgage, 144A | |
4.100% | | | 04/15/24 | | | | | | | | 1,560 | | | | 1,668,050 | |
Northern States Power Co., | |
First Mortgage | |
3.600% | | | 09/15/47 | | | | | | | | 1,035 | | | | 1,105,338 | |
Ohio Power Co., | |
Sr. Unsec’d. Notes | |
4.000% | | | 06/01/49 | | | | | | | | 465 | | | | 524,043 | |
PPL Capital Funding, Inc., | |
Gtd. Notes | |
4.000% | | | 09/15/47 | | | | | | | | 980 | | | | 999,433 | |
5.000% | | | 03/15/44 | | | | | | | | 495 | | | | 570,830 | |
PSEG Power LLC, | |
Gtd. Notes | |
3.000% | | | 06/15/21 | | | | | | | | 1,260 | | | | 1,274,342 | |
Public Service Electric & Gas Co., | |
First Mortgage, MTN | |
3.000% | | | 05/15/27 | | | | | | | | 675 | | | | 698,569 | |
| | | | | | | | | | | | | | | | |
Interest
Rate | | Maturity
Date | | | | | | Principal
Amount
(000)# | | | Value | |
|
| CORPORATE BONDS (continued) | |
Electric (continued) | |
3.700% | | | 05/01/28 | | | | | | | | 850 | | | $ | 924,727 | |
Sr. Sec’d. Notes, MTN | |
5.800% | | | 05/01/37 | | | | | | | | 515 | | | | 682,714 | |
San Diego Gas & Electric Co., | |
First Mortgage | | | | | | | | | | | | | |
4.150% | | | 05/15/48 | | | | | | | | 1,010 | | | | 1,109,284 | |
Southern California Edison Co., | | | | | | | | | | | | | |
First Ref. Mortgage | |
4.000% | | | 04/01/47 | | | | | | | | 350 | | | | 367,323 | |
First Ref. Mortgage, Series C | |
3.600% | | | 02/01/45 | | | | | | | | 690 | | | | 675,223 | |
Vistra Operations Co. LLC, | | | | | | | | | | | | | |
Gtd. Notes, 144A | |
5.000% | | | 07/31/27 | | | | | | | | 495 | | | | 518,054 | |
Sr. Sec’d. Notes, 144A | |
3.550% | | | 07/15/24 | | | | | | | | 1,475 | | | | 1,499,744 | |
Xcel Energy, Inc., | | | | | | | | | | | | | |
Sr. Unsec’d. Notes | |
4.800% | | | 09/15/41 | | | | | | | | 480 | | | | 542,720 | |
| | | | | | | | | | | | | | | | |
| | | | | | | | | | | | | | | 32,471,747 | |
| | | | | | | | | | | | | | | | |
Electronics — 0.0% | | | | | | | | | | | | | |
FLIR Systems, Inc., | |
Sr. Unsec’d. Notes | |
3.125% | | | 06/15/21 | | | | | | | | 650 | | | | 654,495 | |
| | | | | | | | | | | | | | | | |
Engineering & Construction — 0.1% | | | | | | | | | | | | | |
AECOM, | |
Gtd. Notes | |
5.125% | | | 03/15/27 | | | | | | | | 1,000 | | | | 1,074,974 | |
Mexico City Airport Trust (Mexico), | |
Sr. Sec’d. Notes, 144A | |
5.500% | | | 07/31/47 | | | | | | | | 1,350 | | | | 1,394,432 | |
| | | | | | | | | | | | | | | | |
| | | | | | | | | | | | | | | 2,469,406 | |
| | | | | | | | | | | | | | | | |
Foods — 0.3% | | | | | | | | | | | | | | | | |
Conagra Brands, Inc., | |
Sr. Unsec’d. Notes | |
3.800% | | | 10/22/21 | | | | | | | | 2,470 | | | | 2,547,247 | |
Kraft Heinz Foods Co., | |
Gtd. Notes | |
4.375% | | | 06/01/46 | | | | | | | | 360 | | | | 353,987 | |
Gtd. Notes, 144A | |
3.750% | | | 04/01/30 | | | | | | | | 1,140 | | | | 1,174,828 | |
4.875% | | | 10/01/49 | | | | | | | | 1,585 | | | | 1,665,716 | |
Mars, Inc., | |
Gtd. Notes, 144A | |
3.950% | | | 04/01/49 | | | | | | | | 1,120 | | | | 1,263,738 | |
| | | | | | | | | | | | | | | | |
| | | | | | | | | | | | | | | 7,005,516 | |
| | | | | | | | | | | | | | | | |
Forest Products & Paper — 0.1% | | | | | | | | | | | | | |
International Paper Co., | |
Sr. Unsec’d. Notes | |
6.000% | | | 11/15/41 | | | | | | | | 1,270 | | | | 1,581,165 | |
| | | | | | | | | | | | | | | | |
Gas — 0.2% | | | | | | | | | | | | | | | | |
Dominion Energy Gas Holdings LLC, | |
Sr. Unsec’d. Notes | |
4.600% | | | 12/15/44 | | | | | | | | 45 | | | | 50,036 | |
SEE NOTES TO FINANCIAL STATEMENTS.
A19
| | | | | | |
| | |
| | CONSERVATIVE BALANCED PORTFOLIO (continued) | | |
| | | | | | |
| |
| SCHEDULE OF INVESTMENTS | | as of December 31, 2019 |
| | | | | | | | | | | | | | | | |
Interest
Rate | | Maturity
Date | | | | | | Principal
Amount
(000)# | | | Value | |
|
| CORPORATE BONDS (continued) | |
Gas (continued) | |
NiSource, Inc., | |
Sr. Unsec’d. Notes | |
3.490% | | | 05/15/27 | | | | | | | | 2,355 | | | $ | 2,473,960 | |
Piedmont Natural Gas Co., Inc., | |
Sr. Unsec’d. Notes | |
3.500% | | | 06/01/29 | | | | | | | | 2,090 | | | | 2,233,540 | |
| | | | | | | | | | | | | | | | |
| | | | | | | | | | | | | | | 4,757,536 | |
| | | | | | | | | | | | | | | | |
Healthcare-Products — 0.1% | |
Abbott Laboratories, | |
Sr. Unsec’d. Notes | |
4.900% | | | 11/30/46 | | | | | | | | 720 | | | | 942,001 | |
DH Europe Finance II Sarl, | |
Gtd. Notes | |
1.350% | | | 09/18/39 | | | | | | | EUR | 1,125 | | | | 1,194,184 | |
Medtronic Global Holdings SCA, | |
Gtd. Notes | |
1.625% | | | 03/07/31 | | | | | | | EUR | 200 | | | | 246,129 | |
2.250% | | | 03/07/39 | | | | | | | EUR | 300 | | | | 382,625 | |
| | | | | | | | | | | | | | | | |
| | | | | | | | | | | | | | | 2,764,939 | |
| | | | | | | | | | | | | | | | |
Healthcare-Services — 0.2% | | | | | | | | | | | | | |
Aetna, Inc., | |
Sr. Unsec’d. Notes | |
6.625% | | | 06/15/36 | | | | | | | | 480 | | | | 650,791 | |
Anthem, Inc., | |
Sr. Unsec’d. Notes | |
4.625% | | | 05/15/42 | | | | | | | | 330 | | | | 369,777 | |
Fresenius Medical Care U.S. Finance II, Inc. (Germany), | |
Gtd. Notes, 144A | |
4.125% | | | 10/15/20 | | | | | | | | 435 | | | | 439,074 | |
HCA, Inc., | |
Gtd. Notes | |
5.875% | | | 02/01/29 | | | | | | | | 700 | | | | 809,125 | |
Sr. Sec’d. Notes | |
5.125% | | | 06/15/39 | | | | | | | | 665 | | | | 733,816 | |
Kaiser Foundation Hospitals, | |
Gtd. Notes | |
4.150% | | | 05/01/47 | | | | | | | | 670 | | | | 763,729 | |
Laboratory Corp. of America Holdings, | |
Sr. Unsec’d. Notes | |
3.200% | | | 02/01/22 | | | | | | | | 160 | | | | 163,230 | |
MEDNAX, Inc., | |
Gtd. Notes, 144A | |
5.250% | | | 12/01/23 | | | | | | | | 725 | | | | 743,431 | |
New York and Presbyterian Hospital (The), | |
Unsec’d. Notes | |
4.024% | | | 08/01/45 | | | | | | | | 340 | | | | 376,624 | |
| | | | | | | | | | | | | | | | |
| | | | | | | | | | | | | | | 5,049,597 | |
| | | | | | | | | | | | | | | | |
Home Builders — 0.0% | |
Taylor Morrison Communities, Inc., | |
Gtd. Notes, 144A | |
5.875% | | | 06/15/27 | (a) | | | | | | | 405 | | | | 445,034 | |
| | | | | | | | | | | | | | | | |
Interest
Rate | | Maturity
Date | | | | | | Principal
Amount
(000)# | | | Value | |
|
| CORPORATE BONDS (continued) | |
Home Builders (continued) | |
Taylor Morrison Communities, Inc./Taylor Morrison Holdings II, Inc., | |
Gtd. Notes, 144A | |
5.625% | | | 03/01/24 | | | | | | | | 600 | | | $ | 648,762 | |
| | | | | | | | | | | | | | | | |
| | | | | | | | | | | | | | | 1,093,796 | |
| | | | | | | | | | | | | | | | |
Housewares — 0.1% | |
Newell Brands, Inc., | |
Sr. Unsec’d. Notes | |
4.200% | | | 04/01/26 | (a) | | | | | | | 2,010 | | | | 2,094,732 | |
| | | | | | | | | | | | | | | | |
Insurance — 0.2% | |
AXIS Specialty Finance LLC, | |
Gtd. Notes | |
5.875% | | | 06/01/20 | | | | | | | | 990 | | | | 1,004,756 | |
Liberty Mutual Group, Inc., | |
Gtd. Notes, 144A | |
3.951% | | | 10/15/50 | | | | | | | | 1,125 | | | | 1,177,985 | |
Lincoln National Corp., | |
Sr. Unsec’d. Notes | |
6.300% | | | 10/09/37 | | | | | | | | 701 | | | | 911,272 | |
Markel Corp., | |
Sr. Unsec’d. Notes | |
5.000% | | | 03/30/43 | | | | | | | | 165 | | | | 181,189 | |
New York Life Insurance Co., | |
Sub. Notes, 144A | |
6.750% | | | 11/15/39 | | | | | | | | 650 | | | | 951,185 | |
Principal Financial Group, Inc., | |
Gtd. Notes | |
4.625% | | | 09/15/42 | | | | | | | | 105 | | | | 122,311 | |
Teachers Insurance & Annuity Association of America, | |
Sub. Notes, 144A | |
4.270% | | | 05/15/47 | | | | | | | | 1,430 | | | | 1,624,459 | |
6.850% | | | 12/16/39 | | | | | | | | 122 | | | | 178,369 | |
Unum Group, | |
Sr. Unsec’d. Notes | |
5.625% | | | 09/15/20 | | | | | | | | 315 | | | | 323,111 | |
| | | | | | | | | | | | | | | | |
| | | | | | | | | | | | | | | 6,474,637 | |
| | | | | | | | | | | | | | | | |
Lodging — 0.0% | |
Marriott International, Inc., | |
Sr. Unsec’d. Notes | |
3.250% | | | 09/15/22 | | | | | | | | 805 | | | | 825,701 | |
| | | | | | | | | | | | | | | | |
Machinery-Diversified — 0.0% | |
Xylem, Inc., | |
Sr. Unsec’d. Notes | |
4.875% | | | 10/01/21 | | | | | | | | 1,060 | | | | 1,110,847 | |
| | | | | | | | | | | | | | | | |
Media — 0.5% | |
AMC Networks, Inc., | |
Gtd. Notes | |
5.000% | | | 04/01/24 | | | | | | | | 825 | | | | 842,633 | |
Charter Communications Operating LLC/Charter Communications Operating Capital, | |
Sr. Sec’d. Notes | |
4.800% | | | 03/01/50 | | | | | | | | 870 | | | | 918,113 | |
6.384% | | | 10/23/35 | | | | | | | | 1,695 | | | | 2,139,450 | |
6.484% | | | 10/23/45 | | | | | | | | 1,000 | | | | 1,248,289 | |
SEE NOTES TO FINANCIAL STATEMENTS.
A20
| | | | | | |
| | |
| | CONSERVATIVE BALANCED PORTFOLIO (continued) | | |
| | | | | | |
| |
| SCHEDULE OF INVESTMENTS | | as of December 31, 2019 |
| | | | | | | | | | | | | | | | |
Interest
Rate | | Maturity
Date | | | | | | Principal
Amount
(000)# | | | Value | |
|
| CORPORATE BONDS (continued) | |
Media (continued) | |
Comcast Cable Holdings LLC, | |
Gtd. Notes | |
9.875% | | | 06/15/22 | | | | | | | | 1,440 | | | $ | 1,671,365 | |
Comcast Corp., | |
Gtd. Notes | |
4.150% | | | 10/15/28 | | | | | | | | 1,455 | | | | 1,636,841 | |
Discovery Communications LLC, | |
Gtd. Notes | |
5.000% | | | 09/20/37 | | | | | | | | 677 | | | | 765,452 | |
Time Warner Cable LLC, | |
Sr. Sec’d. Notes | |
5.500% | | | 09/01/41 | | | | | | | | 270 | | | | 301,275 | |
ViacomCBS, Inc., | |
Sr. Unsec’d. Notes | |
5.250% | | | 04/01/44 | | | | | | | | 1,340 | | | | 1,555,862 | |
Videotron Ltd. (Canada), | |
Gtd. Notes | |
5.000% | | | 07/15/22 | | | | | | | | 850 | | | | 897,903 | |
Walt Disney Co. (The), | |
Gtd. Notes | |
7.625% | | | 11/30/28 | | | | | | | | 1,265 | | | | 1,735,450 | |
| | | | | | | | | | | | | | | | |
| | | | | | | | | | | | | | | 13,712,633 | |
| | | | | | | | | | | | | | | | |
Mining — 0.0% | | | | | | | | | | | | | | | | |
BHP Billiton Finance USA Ltd. (Australia), | |
Gtd. Notes, 144A | |
6.250%(ff) | | | 10/19/75 | | | | | | | | 315 | | | | 324,064 | |
| | | | | | | | | | | | | | | | |
Miscellaneous Manufacturing — 0.2% | |
Actuant Corp., | |
Gtd. Notes | |
5.625% | | | 06/15/22 | | | | | | | | 1,040 | | | | 1,047,966 | |
Amsted Industries, Inc., | |
Gtd. Notes, 144A | |
5.625% | | | 07/01/27 | | | | | | | | 800 | | | | 848,495 | |
Pentair Finance Sarl, | |
Gtd. Notes | |
4.500% | | | 07/01/29 | | | | | | | | 2,415 | | | | 2,551,256 | |
| | | | | | | | | | | | | | | | |
| | | | | | | | | | | | | | | 4,447,717 | |
| | | | | | | | | | | | | | | | |
Multi-National — 0.1% | |
Corp. Andina de Fomento (Supranational Bank), | |
Sr. Unsec’d. Notes | |
2.125% | | | 09/27/21 | | | | | | | | 480 | | | | 478,776 | |
2.750% | | | 01/06/23 | | | | | | | | 385 | | | | 388,722 | |
North American Development Bank (Supranational Bank), | |
Sr. Unsec’d. Notes | |
2.400% | | | 10/26/22 | | | | | | | | 855 | | | | 861,323 | |
4.375% | | | 02/11/20 | | | | | | | | 800 | | | | 802,424 | |
| | | | | | | | | | | | | | | | |
| | | | | | | | | | | | | | | 2,531,245 | |
| | | | | | | | | | | | | | | | |
Oil & Gas — 0.9% | |
Antero Resources Corp., | |
Gtd. Notes | |
5.000% | | | 03/01/25 | | | | | | | | 950 | | | | 715,808 | |
Cenovus Energy, Inc. (Canada), | |
Sr. Unsec’d. Notes | |
5.400% | | | 06/15/47 | | | | | | | | 850 | | | | 987,980 | |
| | | | | | | | | | | | | | | | |
Interest
Rate | | Maturity
Date | | | | | | Principal
Amount
(000)# | | | Value | |
|
| CORPORATE BONDS (continued) | |
Oil & Gas (continued) | |
CNOOC Finance Ltd. (China), | |
Gtd. Notes | |
2.875% | | | 09/30/29 | (a) | | | | | | | 1,350 | | | $ | 1,348,263 | |
Concho Resources, Inc., | |
Gtd. Notes | |
4.875% | | | 10/01/47 | | | | | | | | 150 | | | | 173,478 | |
Continental Resources, Inc., | |
Gtd. Notes | |
4.500% | | | 04/15/23 | | | | | | | | 2,141 | | | | 2,243,575 | |
Devon Energy Corp., | |
Sr. Unsec’d. Notes | |
5.600% | | | 07/15/41 | | | | | | | | 225 | | | | 273,922 | |
Encana Corp. (Canada), | |
Gtd. Notes | |
6.500% | | | 02/01/38 | | | | | | | | 240 | | | | 281,686 | |
Gazprom PJSC Via Gaz Capital SA (Russia), | |
Sr. Unsec’d. Notes, 144A | |
4.950% | | | 07/19/22 | | | | | | | | 255 | | | | 269,897 | |
6.510% | | | 03/07/22 | | | | | | | | 440 | | | | 477,984 | |
Helmerich & Payne, Inc., | |
Sr. Unsec’d. Notes | |
4.650% | | | 03/15/25 | | | | | | | | 1,555 | | | | 1,696,382 | |
KazMunayGas National Co. JSC (Kazakhstan), | |
Sr. Unsec’d. Notes, 144A | |
4.750% | | | 04/24/25 | | | | | | | | 400 | | | | 437,966 | |
Newfield Exploration Co., | |
Gtd. Notes | |
5.750% | | | 01/30/22 | | | | | | | | 80 | | | | 84,991 | |
Noble Energy, Inc., | |
Sr. Unsec’d. Notes | |
5.050% | | | 11/15/44 | | | | | | | | 595 | | | | 660,868 | |
Occidental Petroleum Corp., | |
Sr. Unsec’d. Notes | |
4.264%(s) | | | 10/10/36 | | | | | | | | 1,000 | | | | 502,502 | |
4.850% | | | 03/15/21 | | | | | | | | 287 | | | | 295,537 | |
6.450% | | | 09/15/36 | | | | | | | | 1,040 | | | | 1,273,895 | |
Petrobras Global Finance BV (Brazil), | |
Gtd. Notes | |
5.750% | | | 02/01/29 | | | | | | | | 610 | | | | 686,569 | |
Gtd. Notes, 144A | | | | | | | | | | | | | | | | |
5.093% | | | 01/15/30 | (a) | | | | | | | 577 | | | | 618,815 | |
Petroleos Mexicanos (Mexico), | |
Gtd. Notes | |
5.500% | | | 01/21/21 | | | | | | | | 1,295 | | | | 1,330,515 | |
6.350% | | | 02/12/48 | | | | | | | | 458 | | | | 442,025 | |
Gtd. Notes, 144A | |
6.490% | | | 01/23/27 | | | | | | | | 346 | | | | 368,991 | |
7.690% | | | 01/23/50 | | | | | | | | 1,682 | | | | 1,836,396 | |
Gtd. Notes, MTN | |
6.750% | | | 09/21/47 | (a) | | | | | | | 1,805 | | | | 1,815,703 | |
6.875% | | | 08/04/26 | | | | | | | | 1,000 | | | | 1,099,691 | |
Sinopec Group Overseas Development 2015 Ltd. (China), | |
Gtd. Notes, 144A | |
2.500% | | | 04/28/20 | | | | | | | | 1,000 | | | | 1,000,827 | |
Sinopec Group Overseas Development 2018 Ltd. (China), | |
Gtd. Notes, 144A | |
3.680% | | | 08/08/49 | | | | | | | | 990 | | | | 1,012,409 | |
SEE NOTES TO FINANCIAL STATEMENTS.
A21
| | | | | | |
| | |
| | CONSERVATIVE BALANCED PORTFOLIO (continued) | | |
| | | | | | |
| |
| SCHEDULE OF INVESTMENTS | | as of December 31, 2019 |
| | | | | | | | | | | | | | | | |
Interest
Rate | | Maturity
Date | | | | | | Principal
Amount
(000)# | | | Value | |
|
| CORPORATE BONDS (continued) | |
Oil & Gas (continued) | |
Valero Energy Corp., | |
Sr. Unsec’d. Notes | |
4.000% | | | 04/01/29 | | | | | | | | 580 | | | $ | 625,191 | |
| | | | | | | | | | | | | | | | |
| | | | | | | | | | | | | | | 22,561,866 | |
| | | | | | | | | | | | | | | | |
Oil & Gas Services — 0.0% | |
Schlumberger Holdings Corp., | |
Sr. Unsec’d. Notes, 144A | |
4.000% | | | 12/21/25 | | | | | | | | 139 | | | | 149,776 | |
| | | | | | | | | | | | | | | | |
Packaging & Containers — 0.0% | |
Ball Corp., | |
Gtd. Notes | |
4.375% | | | 12/15/20 | | | | | | | | 465 | | | | 474,799 | |
WestRock RKT LLC, | |
Gtd. Notes | |
4.900% | | | 03/01/22 | | | | | | | | 675 | | | | 711,149 | |
| | | | | | | | | | | | | | | | |
| | | | | | | | | | | | | | | 1,185,948 | |
| | | | | | | | | | | | | | | | |
Pharmaceuticals — 0.6% | |
AbbVie, Inc., | |
Sr. Unsec’d. Notes | |
3.600% | | | 05/14/25 | | | | | | | | 950 | | | | 1,002,964 | |
4.500% | | | 05/14/35 | | | | | | | | 1,595 | | | | 1,791,195 | |
4.700% | | | 05/14/45 | | | | | | | | 855 | | | | 954,515 | |
Sr. Unsec’d. Notes, 144A | |
4.250% | | | 11/21/49 | | | | | | | | 1,480 | | | | 1,566,080 | |
Allergan Funding SCS, | |
Gtd. Notes | |
4.550% | | | 03/15/35 | | | | | | | | 1,770 | | | | 1,909,447 | |
Bayer US Finance II LLC (Germany), | |
Gtd. Notes, 144A, 3 Month LIBOR + 0.630% | |
2.577%(c) | | | 06/25/21 | | | | | | | | 805 | | | | 807,522 | |
Gtd. Notes, 144A | |
3.500% | | | 06/25/21 | | | | | | | | 350 | | | | 356,401 | |
Becton, Dickinson & Co., | |
Sr. Unsec’d. Notes | |
3.734% | | | 12/15/24 | | | | | | | | 372 | | | | 394,338 | |
Bristol-Myers Squibb Co., | |
Sr. Unsec’d. Notes, 144A | |
4.125% | | | 06/15/39 | | | | | | | | 280 | | | | 322,196 | |
4.250% | | | 10/26/49 | | | | | | | | 1,285 | | | | 1,523,181 | |
5.000% | | | 08/15/45 | | | | | | | | 745 | | | | 953,231 | |
Cigna Corp., | |
Gtd. Notes | |
4.375% | | | 10/15/28 | | | | | | | | 1,870 | | | | 2,074,660 | |
CVS Health Corp., | |
Sr. Unsec’d. Notes | |
4.780% | | | 03/25/38 | | | | | | | | 210 | | | | 238,318 | |
5.125% | | | 07/20/45 | | | | | | | | 991 | | | | 1,171,185 | |
5.300% | | | 12/05/43 | | | | | | | | 185 | | | | 221,559 | |
| | | | | | | | | | | | | | | | |
| | | | | | | | | | | | | | | 15,286,792 | |
| | | | | | | | | | | | | | | | |
Pipelines — 0.4% | |
DCP Midstream Operating LP, | |
Gtd. Notes, 144A | |
5.350% | | | 03/15/20 | | | | | | | | 473 | | | | 475,514 | |
| | | | | | | | | | | | | | | | |
Interest
Rate | | Maturity
Date | | | | | | Principal
Amount
(000)# | | | Value | |
|
| CORPORATE BONDS (continued) | |
Pipelines (continued) | |
Energy Transfer Operating LP, | |
Gtd. Notes | |
4.650% | | | 06/01/21 | | | | | | | | 610 | | | $ | 626,649 | |
4.950% | | | 06/15/28 | | | | | | | | 795 | | | | 871,415 | |
6.125% | | | 12/15/45 | | | | | | | | 120 | | | | 138,841 | |
Enterprise Products Operating LLC, | |
Gtd. Notes | |
3.750% | | | 02/15/25 | | | | | | | | 1,055 | | | | 1,125,718 | |
MPLX LP, | |
Sr. Unsec’d. Notes | |
4.000% | | | 02/15/25 | | | | | | | | 1,140 | | | | 1,191,611 | |
4.700% | | | 04/15/48 | | | | | | | | 750 | | | | 761,566 | |
4.875% | | | 06/01/25 | | | | | | | | 2,275 | | | | 2,483,961 | |
5.200% | | | 03/01/47 | | | | | | | | 25 | | | | 26,956 | |
ONEOK Partners LP, | |
Gtd. Notes | |
6.650% | | | 10/01/36 | | | | | | | | 130 | | | | 165,778 | |
ONEOK, Inc., | |
Gtd. Notes | |
4.950% | | | 07/13/47 | | | | | | | | 640 | | | | 699,881 | |
Western Midstream Operating LP, | |
Sr. Unsec’d. Notes | |
4.000% | | | 07/01/22 | | | | | | | | 1,315 | | | | 1,351,083 | |
5.300% | | | 03/01/48 | | | | | | | | 80 | | | | 69,406 | |
Williams Cos., Inc. (The), | |
Sr. Unsec’d. Notes | |
4.850% | | | 03/01/48 | (a) | | | | | | | 230 | | | | 251,872 | |
4.900% | | | 01/15/45 | | | | | | | | 1,100 | | | | 1,185,125 | |
| | | | | | | | | | | | | | | | |
| | | | | | | | | | | | | | | 11,425,376 | |
| | | | | | | | | | | | | | | | |
Real Estate Investment Trusts (REITs) — 0.0% | |
GLP Capital LP/GLP Financing II, Inc., | |
Gtd. Notes | |
5.375% | | | 04/15/26 | | | | | | | | 725 | | | | 802,231 | |
| | | | | | | | | | | | | | | | |
Retail — 0.3% | |
AutoZone, Inc., | |
Sr. Unsec’d. Notes | |
3.750% | | | 04/18/29 | | | | | | | | 1,820 | | | | 1,950,027 | |
Dollar Tree, Inc., | |
Sr. Unsec’d. Notes, 3 Month LIBOR + 0.700% | |
2.702%(c) | | | 04/17/20 | | | | | | | | 795 | | | | 794,974 | |
Sr. Unsec’d. Notes | |
4.000% | | | 05/15/25 | | | | | | | | 3,395 | | | | 3,627,449 | |
L Brands, Inc., | |
Gtd. Notes | |
5.625% | | | 10/15/23 | (a) | | | | | | | 1,000 | | | | 1,076,945 | |
Macy’s Retail Holdings, Inc., | |
Gtd. Notes | |
3.875% | | | 01/15/22 | | | | | | | | 168 | | | | 171,457 | |
Sally Holdings LLC/Sally Capital, Inc., | |
Gtd. Notes | |
5.625% | | | 12/01/25 | (a) | | | | | | | 1,020 | | | | 1,067,440 | |
| | | | | | | | | | | | | | | | |
| | | | | | | | | | | | | | | 8,688,292 | |
| | | | | | | | | | | | | | | | |
SEE NOTES TO FINANCIAL STATEMENTS.
A22
| | | | | | |
| | |
| | CONSERVATIVE BALANCED PORTFOLIO (continued) | | |
| | | | | | |
| |
| SCHEDULE OF INVESTMENTS | | as of December 31, 2019 |
| | | | | | | | | | | | | | | | |
Interest
Rate | | Maturity
Date | | | | | | Principal
Amount
(000)# | | | Value | |
|
| CORPORATE BONDS (continued) | |
Savings & Loans — 0.0% | |
People’s United Financial, Inc., | |
Sr. Unsec’d. Notes | |
3.650% | | | 12/06/22 | | | | | | | | 1,195 | | | $ | 1,242,000 | |
| | | | | | | | | | | | | | | | |
Semiconductors — 0.1% | |
Broadcom, Inc., | |
Gtd. Notes, 144A | |
3.125% | | | 04/15/21 | | | | | | | | 830 | | | | 839,953 | |
3.125% | | | 10/15/22 | | | | | | | | 640 | | | | 652,471 | |
| | | | | | | | | | | | | | | | |
| | | | | | | | | | | | | | | 1,492,424 | |
| | | | | | | | | | | | | | | | |
Software — 0.0% | |
Microsoft Corp., | |
Sr. Unsec’d. Notes | |
4.000% | | | 02/12/55 | | | | | | | | 360 | | | | 425,189 | |
| | | | | | | | | | | | | | | | |
Telecommunications — 0.5% | |
AT&T, Inc., | |
Sr. Unsec’d. Notes | |
3.400% | | | 05/15/25 | | | | | | | | 1,665 | | | | 1,744,801 | |
3.600% | | | 07/15/25 | | | | | | | | 250 | | | | 264,425 | |
3.800% | | | 02/15/27 | | | | | | | | 1,200 | | | | 1,283,851 | |
4.300% | | | 02/15/30 | | | | | | | | 490 | | | | 544,360 | |
4.500% | | | 05/15/35 | | | | | | | | 225 | | | | 250,592 | |
4.550% | | | 03/09/49 | | | | | | | | 4 | | | | 4,434 | |
4.850% | | | 03/01/39 | | | | | | | | 3,615 | | | | 4,170,305 | |
5.350% | | | 09/01/40 | | | | | | | | 113 | | | | 136,020 | |
British Telecommunications PLC (United Kingdom), | |
Sr. Unsec’d. Notes | |
9.625% | | | 12/15/30 | | | | | | | | 350 | | | | 539,094 | |
Level 3 Financing, Inc., | |
Sr. Sec’d. Notes, 144A | |
3.400% | | | 03/01/27 | | | | | | | | 250 | | | | 252,009 | |
Sprint Communications, Inc., | |
Gtd. Notes, 144A | |
7.000% | | | 03/01/20 | | | | | | | | 400 | | | | 402,855 | |
Sprint Spectrum Co. LLC/Sprint Spectrum Co. II LLC/Sprint Spectrum Co. III LLC, | |
Sr. Sec’d. Notes, 144A | |
3.360% | | | 03/20/23 | | | | | | | | 613 | | | | 618,606 | |
Verizon Communications, Inc., | |
Sr. Unsec’d. Notes | |
4.016% | | | 12/03/29 | (a) | | | | | | | 1,365 | | | | 1,525,107 | |
4.125% | | | 08/15/46 | (a) | | | | | | | 520 | | | | 585,240 | |
4.500% | | | 08/10/33 | | | | | | | | 865 | | | | 1,010,490 | |
4.862% | | | 08/21/46 | | | | | | | | 615 | | | | 762,401 | |
| | | | | | | | | | | | | | | | |
| | | | | | | | | | | | | | | 14,094,590 | |
| | | | | | | | | | | | | | | | |
Transportation — 0.1% | |
Burlington Northern Santa Fe LLC, | |
Sr. Unsec’d. Notes | |
6.700% | | | 08/01/28 | | | | | | | | 735 | | | | 950,246 | |
CSX Corp., | |
Sr. Unsec’d. Notes | |
6.150% | | | 05/01/37 | | | | | | | | 690 | | | | 915,632 | |
| | | | | | | | | | | | | | | | |
Interest
Rate | | Maturity
Date | | | | | | Principal
Amount
(000)# | | | Value | |
|
| CORPORATE BONDS (continued) | |
Transportation (continued) | |
Norfolk Southern Corp., | |
Sr. Unsec’d. Notes | |
5.590% | | | 05/17/25 | | | | | | | | 120 | | | $ | 138,450 | |
| | | | | | | | | | | | | | | | |
| | | | | | | | | | | | | | | 2,004,328 | |
| | | | | | | | | | | | | | | | |
TOTAL CORPORATE BONDS
(cost $266,506,432) | | | | | | | | | | | | 283,047,854 | |
| | | | | | | | | | | | | | | | |
|
| MUNICIPAL BONDS — 0.6% | |
Alabama — 0.0% | |
Alabama Economic Settlement Authority, | |
Revenue Bonds, BABs | |
4.263% | | | 09/15/32 | | | | | | | | 180 | | | | 199,375 | |
| | | | | | | | | | | | | | | | |
California — 0.2% | |
Bay Area Toll Authority, | |
Revenue Bonds, BABs | |
2.574% | | | 04/01/31 | | | | | | | | 415 | | | | 412,303 | |
6.263% | | | 04/01/49 | | | | | | | | 1,305 | | | | 1,987,110 | |
State of California, | |
General Obligation, BABs | |
7.300% | | | 10/01/39 | | | | | | | | 1,250 | | | | 1,909,575 | |
7.500% | | | 04/01/34 | | | | | | | | 350 | | | | 528,234 | |
7.550% | | | 04/01/39 | | | | | | | | 245 | | | | 392,007 | |
7.625% | | | 03/01/40 | | | | | | | | 205 | | | | 326,791 | |
| | | | | | | | | | | | | | | | |
| | | | | | | | | | | | | | | 5,556,020 | |
| | | | | | | | | | | | | | | | |
Colorado — 0.0% | |
Regional Transportation District, | |
Revenue Bonds, Series2010-B, BABs | |
5.844% | | | 11/01/50 | | | | | | | | 565 | | | | 820,657 | |
| | | | | | | | | | | | | | | | |
Illinois — 0.2% | |
Chicago O’Hare International Airport, | |
Revenue Bonds, BABs | |
6.395% | | | 01/01/40 | | | | | | | | 970 | | | | 1,391,843 | |
State of Illinois, | |
General Obligation, Series D | |
5.000% | | | 11/01/22 | | | | | | | | 2,305 | | | | 2,486,519 | |
General Obligation, Series D, BABs | |
5.100% | | | 06/01/33 | (a) | | | | | | | 200 | | | | 215,420 | |
| | | | | | | | | | | | | | | | |
| | | | | | | | | | | | | | | 4,093,782 | |
| | | | | | | | | | | | | | | | |
New Jersey — 0.1% | |
New Jersey Turnpike Authority, | |
Revenue Bonds, Series F, BABs | |
7.414% | | | 01/01/40 | | | | | | | | 1,000 | | | | 1,569,120 | |
| | | | | | | | | | | | | | | | |
New York — 0.1% | |
New York City Transitional Finance Authority Future Tax Secured Revenue, | |
Revenue Bonds, BABs | |
5.767% | | | 08/01/36 | | | | | | | | 1,100 | | | | 1,354,364 | |
| | | | | | | | | | | | | | | | |
Ohio — 0.0% | |
Ohio State University (The), | |
Revenue Bonds, Series C, BABs | |
4.910% | | | 06/01/40 | | | | | | | | 415 | | | | 524,755 | |
SEE NOTES TO FINANCIAL STATEMENTS.
A23
| | | | | | |
| | |
| | CONSERVATIVE BALANCED PORTFOLIO (continued) | | |
| | | | | | |
| |
| SCHEDULE OF INVESTMENTS | | as of December 31, 2019 |
| | | | | | | | | | | | | | | | |
Interest
Rate | | Maturity
Date | | | | | | Principal
Amount
(000)# | | | Value | |
|
| MUNICIPAL BONDS (continued) | |
Ohio (continued) | | | | | | | | | | | | | | | | |
Ohio Water Development Authority Water Pollution Control Loan Fund, | |
Revenue Bonds, BABs | |
4.879% | | | 12/01/34 | | | | | | | | 275 | | | $ | 316,110 | |
| | | | | | | | | | | | | | | | |
| | | | | | | | | | | | | | | 840,865 | |
| | | | | | | | | | | | | | | | |
Oregon — 0.0% | | | | | | | | | | | | | | | | |
State of Oregon Department of Transportation, | |
Revenue Bonds, Series A, BABs | |
5.834% | | | 11/15/34 | | | | | | | | 425 | | | | 566,049 | |
| | | | | | | | | | | | | | | | |
Pennsylvania — 0.0% | | | | | | | | | | | | | |
Pennsylvania Turnpike Commission, | |
Revenue Bonds, Series B, BABs | |
5.511% | | | 12/01/45 | | | | | | | | 505 | | | | 671,423 | |
| | | | | | | | | | | | | | | | |
Virginia — 0.0% | | | | | | | | | | | | | |
University of Virginia, | |
Revenue Bonds, Taxable, Series C | |
4.179% | | | 09/01/2117 | | | | | | | | 355 | | | | 414,618 | |
| | | | | | | | | | | | | | | | |
TOTAL MUNICIPAL BONDS
(cost $12,325,441) | | | | | | | | | | | | 16,086,273 | |
| | | | | | | | | | | | | | | | |
|
RESIDENTIAL MORTGAGE-BACKED
SECURITIES — 1.4% | |
Alternative Loan Trust, | |
Series 2004-18CB, Class 3A1 | |
5.250% | | | 09/25/20 | | | | | | | | 22 | | | | 22,402 | |
Banc of America Funding Trust, | |
Series2015-R04, Class 4A1, 144A | |
3.500%(cc) | | | 01/27/30 | | | | | | | | 272 | | | | 271,418 | |
Banc of America Mortgage Trust, | |
Series2005-A, Class 2A1 | |
4.459%(cc) | | | 02/25/35 | | | | | | | | 103 | | | | 103,277 | |
Bellemeade Re Ltd. (Bermuda), | |
Series2017-01, Class M1, 144A, 1 Month LIBOR + 1.700% (Cap N/A, Floor 0.000%) | |
3.492%(c) | | | 10/25/27 | | | | | | | | 149 | | | | 149,418 | |
Series2018-01A, Class M1B, 144A, 1 Month LIBOR + 1.600% (Cap N/A, Floor 0.000%) | |
3.392%(c) | | | 04/25/28 | | | | | | | | 179 | | | | 179,265 | |
Series2018-02A, Class M1A, 144A, 1 Month LIBOR + 0.950% (Cap N/A, Floor 0.000%) | |
2.742%(c) | | | 08/25/28 | | | | | | | | 52 | | | | 52,425 | |
Series2018-02A, Class M1B, 144A, 1 Month LIBOR + 1.350% (Cap N/A, Floor 0.000%) | |
3.142%(c) | | | 08/25/28 | | | | | | | | 300 | | | | 300,756 | |
Series2018-02A, Class M1C, 144A, 1 Month LIBOR + 1.600% (Cap N/A, Floor 0.000%) | |
3.392%(c) | | | 08/25/28 | | | | | | | | 300 | | | | 301,041 | |
Series2019-02A, Class M1A, 144A, 1 Month LIBOR + 1.000% (Cap N/A, Floor 1.000%) | |
2.792%(c) | | | 04/25/29 | | | | | | | | 149 | | | | 148,531 | |
BVRT Financing Trust, | |
Series2019-01, Class F, 144A | |
3.865% | | | 09/15/21 | ^ | | | | | | | 4,795 | | | | 4,795,171 | |
Central Park Funding Trust, | | | | | | | | | | | | | |
Series2018-01, Class A, 144A, 1 Month LIBOR + 1.500% (Cap N/A, Floor 1.500%) | |
3.209%(c) | | | 11/01/23 | | | | | | | | 3,500 | | | | 3,499,998 | |
| | | | | | | | | | | | | | | | |
Interest
Rate | | Maturity
Date | | | | | | Principal
Amount
(000)# | | | Value | |
|
| RESIDENTIAL MORTGAGE-BACKED SECURITIES (continued) | |
Chase Mortgage Finance Trust, | |
Series2007-A01, Class 1A5 | |
4.574%(cc) | | | 02/25/37 | | | | | | | | 199 | | | $ | 201,471 | |
CIM Trust, | |
Series2017-02, Class A1, 144A, 1 Month LIBOR + 2.000% (Cap N/A, Floor 2.000%) | |
3.709%(c) | | | 12/25/57 | | | | | | | | 1,760 | | | | 1,773,943 | |
Series2017-03, Class A1, 144A, 1 Month LIBOR + 2.000% (Cap N/A, Floor 0.000%) | |
3.709%(c) | | | 01/25/57 | | | | | | | | 2,060 | | | | 2,100,393 | |
Series2017-06, Class A1, 144A | |
3.015%(cc) | | | 06/25/57 | | | | | | | | 2,017 | | | | 2,017,478 | |
Series2017-08, Class A1, 144A | |
3.000%(cc) | | | 12/25/65 | | | | | | | | 1,884 | | | | 1,882,863 | |
Credit Suisse Mortgage Trust, | |
Series 2018-RPL09, Class A, 144A | |
3.850%(cc) | | | 09/25/57 | | | | | | | | 1,666 | | | | 1,735,076 | |
Eagle Re Ltd. (Bermuda), | |
Series2019-01, Class M1A, 144A, 1 Month LIBOR + 1.250% (Cap N/A, Floor 0.000%) | |
3.042%(c) | | | 04/25/29 | | | | | | | | 75 | | | | 74,888 | |
Fannie Mae Connecticut Avenue Securities, | |
Series2016-C04, Class 1M1, 1 Month LIBOR + 1.450% (Cap N/A, Floor 0.000%) | |
3.242%(c) | | | 01/25/29 | | | | | | | | 3 | | | | 3,083 | |
Freddie Mac Structured Agency Credit Risk Debt Notes, | |
Series 2016-DNA04, Class M2, 1 Month LIBOR + 1.300% (Cap N/A, Floor 1.300%) | |
3.092%(c) | | | 03/25/29 | | | | | | | | 406 | | | | 406,716 | |
Series 2016-HQA02, Class M2, 1 Month LIBOR + 2.250% (Cap N/A, Floor 0.000%) | |
4.042%(c) | | | 11/25/28 | | | | | | | | 217 | | | | 217,569 | |
Series 2017-DNA01, Class M1, 1 Month LIBOR + 1.200% (Cap N/A, Floor 1.200%) | |
2.992%(c) | | | 07/25/29 | | | | | | | | 874 | | | | 875,680 | |
Series 2017-DNA03, Class M1, 1 Month LIBOR + 0.750% (Cap N/A, Floor 0.000%) | |
2.542%(c) | | | 03/25/30 | | | | | | | | 1,999 | | | | 1,999,869 | |
Series 2019-HRP01, Class M1, 144A, 1 Month LIBOR + 0.750% (Cap N/A, Floor 0.000%) | |
2.542%(c) | | | 02/25/49 | | | | | | | | 533 | | | | 532,608 | |
Gosforth Funding PLC (United Kingdom), | |
Series2018-01A, Class A1, 144A, 3 Month LIBOR + 0.450% (Cap N/A, Floor 0.000%) | |
2.360%(c) | | | 08/25/60 | | | | | | | | 1,058 | | | | 1,056,269 | |
Holmes Master Issuer PLC (United Kingdom), | |
Series2018-01A, Class A2, 144A, 3 Month LIBOR + 0.360% (Cap N/A, Floor 0.000%) | |
2.361%(c) | | | 10/15/54 | | | | | | | | 1,051 | | | | 1,051,250 | |
Home Re Ltd. (Bermuda), | |
Series2019-01, Class M1, 144A, 1 Month LIBOR + 1.650% (Cap N/A, Floor 0.000%) | |
3.442%(c) | | | 05/25/29 | | | | | | | | 328 | | | | 328,094 | |
JPMorgan Mortgage Trust, | |
Series2007-A01, Class 4A1 | |
4.657%(cc) | | | 07/25/35 | | | | | | | | 93 | | | | 93,853 | |
SEE NOTES TO FINANCIAL STATEMENTS.
A24
| | | | | | |
| | |
| | CONSERVATIVE BALANCED PORTFOLIO (continued) | | |
| | | | | | |
| |
| SCHEDULE OF INVESTMENTS | | as of December 31, 2019 |
| | | | | | | | | | | | | | | | |
Interest
Rate | | Maturity
Date | | | | | | Principal
Amount
(000)# | | | Value | |
|
| RESIDENTIAL MORTGAGE-BACKED SECURITIES (continued) | |
Lanark Master Issuer PLC (United Kingdom), | |
Series2018-01A, Class 1A, 144A, 3 Month LIBOR + 0.420% (Cap N/A, Floor 0.000%) | |
2.319%(c) | | | 12/22/69 | | | | | | | | 868 | | | $ | 867,125 | |
LSTAR Securities Investment Trust, | |
Series2019-02, Class A1, 144A, 1 Month LIBOR + 1.500% (Cap N/A, Floor 0.000%) | |
3.281%(c) | | | 04/01/24 | | | | | | | | 128 | | | | 127,836 | |
MetLife Securitization Trust, | |
Series2018-01A, Class A, 144A | |
3.750%(cc) | | | 03/25/57 | | | | | | | | 575 | | | | 596,782 | |
Mill City Mortgage Loan Trust, | |
Series2019-01, Class A1, 144A | |
3.250%(cc) | | | 10/25/69 | | | | | | | | 719 | | | | 732,317 | |
New Residential Mortgage Loan Trust, | |
Series2018-01A, Class A1A, 144A | |
4.000%(cc) | | | 12/25/57 | | | | | | | | 1,187 | | | | 1,229,512 | |
Series2018-04A, Class A1S, 144A, 1 Month LIBOR + 0.750% (Cap N/A, Floor 0.750%) | |
2.542%(c) | | | 01/25/48 | | | | | | | | 450 | | | | 448,599 | |
Oaktown Re Ltd. (Bermuda), | |
Series2018-01A, Class M1, 144A, 1 Month LIBOR + 1.550% (Cap N/A, Floor 0.000%) | |
3.342%(c) | | | 07/25/28 | | | | | | | | 295 | | | | 295,312 | |
Series2019-01A, Class M1A, 144A, 1 Month LIBOR + 1.400% (Cap N/A, Floor 1.400%) | |
3.192%(c) | | | 07/25/29 | | | | | | | | 490 | | | | 490,649 | |
Park Avenue Funding Trust, | |
Series2019-01, Class PT, 144A, 1 Month LIBOR + 1.500% (Cap N/A, Floor 1.500%) | |
3.292%(c) | | | 11/27/20 | | | | | | | | 520 | | | | 519,696 | |
Series2019-03, Class PT, 144A, 1 Month LIBOR + 2.750% (Cap N/A, Floor 1.500%) | |
4.542%(c) | | | 01/27/21 | | | | | | | | 705 | | | | 704,314 | |
Seasoned Credit Risk Transfer Trust, | |
Series2019-02, Class MA | |
3.500% | | | 08/25/58 | | | | | | | | 1,483 | | | | 1,539,589 | |
STACR Trust, | |
Series 2018-DNA03, Class M1, 144A, 1 Month LIBOR + 0.750% (Cap N/A, Floor 0.000%) | |
2.542%(c) | | | 09/25/48 | | | | | | | | 540 | | | | 540,420 | |
Station Place Securitization Trust, | |
Series 2019-WL01, Class A, 144A, 1 Month LIBOR + 0.650% (Cap N/A, Floor 0.650%) | |
2.442%(c) | | | 08/25/52 | | | | | | | | 1,375 | | | | 1,375,206 | |
Structured Adjustable Rate Mortgage Loan Trust, | |
Series2004-01, Class 4A3 | |
4.389%(cc) | | | 02/25/34 | | | | | | | | 151 | | | | 150,639 | |
Washington Mutual Mortgage Pass-Through Certificates, | |
Series2005-01, Class 3A | |
5.000% | | | 03/25/20 | | | | | | | | 20 | | | | 19,644 | |
| | | | | | | | | | | | | | | | |
TOTAL RESIDENTIAL MORTGAGE-BACKED SECURITIES
(cost $35,592,551) | | | | 35,812,445 | |
| | | | | | | | | | | | | | | | |
| | | | | | | | | | | | | | | | |
Interest
Rate | | Maturity
Date | | | | | | Principal
Amount
(000)# | | | Value | |
|
| SOVEREIGN BONDS — 1.1% | |
Abu Dhabi Government International Bond (United Arab Emirates), | |
Sr. Unsec’d. Notes, 144A | |
3.125% | | | 10/11/27 | | | | | | | | 2,420 | | | $ | 2,535,129 | |
Colombia Government International Bond (Colombia), | |
Sr. Unsec’d. Notes | |
4.000% | | | 02/26/24 | | | | | | | | 220 | | | | 231,770 | |
4.375% | | | 07/12/21 | (a) | | | | | | | 400 | | | | 412,856 | |
5.000% | | | 06/15/45 | (a) | | | | | | | 430 | | | | 499,573 | |
7.375% | | | 09/18/37 | (a) | | | | | | | 450 | | | | 639,013 | |
Export-Import Bank of India (India), | |
Sr. Unsec’d. Notes, 144A | |
3.875% | | | 02/01/28 | | | | | | | | 745 | | | | 777,371 | |
Export-Import Bank of Korea (South Korea), | |
Sr. Unsec’d. Notes | |
5.125% | | | 06/29/20 | | | | | | | | 265 | | | | 269,048 | |
Finnvera OYJ (Finland), | |
Gov’t. Gtd. Notes, 144A, MTN | |
2.375% | | | 06/04/25 | | | | | | | | 400 | | | | 408,437 | |
Hungary Government International Bond (Hungary), | |
Sr. Unsec’d. Notes | |
6.375% | | | 03/29/21 | | | | | | | | 1,760 | | | | 1,857,580 | |
Indonesia Government International Bond (Indonesia), | |
Sr. Unsec’d. Notes | |
3.375% | | | 07/30/25 | | | | | | | EUR | 1,200 | | | | 1,530,603 | |
4.450% | | | 02/11/24 | | | | | | | | 355 | | | | 382,569 | |
Sr. Unsec’d. Notes, 144A, MTN | |
5.875% | | | 01/15/24 | | | | | | | | 750 | | | | 848,483 | |
Sr. Unsec’d. Notes, EMTN | |
2.150% | | | 07/18/24 | | | | | | | EUR | 1,510 | | | | 1,805,979 | |
4.750% | | | 01/08/26 | | | | | | | | 350 | | | | 389,129 | |
Japan Bank for International Cooperation (Japan), | |
Gov’t. Gtd. Notes | |
3.375% | | | 10/31/23 | | | | | | | | 200 | | | | 210,390 | |
Japan Finance Organization for Municipalities (Japan), | |
Sr. Unsec’d. Notes, 144A, MTN | |
2.125% | | | 10/25/23 | | | | | | | | 1,000 | | | | 1,002,876 | |
2.625% | | | 04/20/22 | | | | | | | | 1,400 | | | | 1,420,144 | |
3.000% | | | 03/12/24 | | | | | | | | 200 | | | | 207,229 | |
Panama Government International Bond (Panama), | |
Sr. Unsec’d. Notes | |
4.000% | | | 09/22/24 | | | | | | | | 395 | | | | 422,594 | |
4.500% | | | 04/16/50 | | | | | | | | 340 | | | | 402,113 | |
Province of Manitoba (Canada), | |
Sr. Unsec’d. Notes, Series GX | |
2.600% | | | 04/16/24 | (a) | | | | | | | 225 | | | | 231,343 | |
Province of Ontario (Canada), | |
Sr. Unsec’d. Notes | |
3.400% | | | 10/17/23 | | | | | | | | 240 | | | | 253,656 | |
Qatar Government International Bond (Qatar), | |
Sr. Unsec’d. Notes, 144A | |
3.875% | | | 04/23/23 | | | | | | | | 800 | | | | 844,557 | |
4.817% | | | 03/14/49 | | | | | | | | 200 | | | | 246,892 | |
5.103% | | | 04/23/48 | | | | | | | | 665 | | | | 853,595 | |
Romanian Government International Bond (Romania), | |
Sr. Unsec’d. Notes, EMTN | |
4.125% | | | 03/11/39 | | | | | | | EUR | 960 | | | | 1,249,125 | |
SEE NOTES TO FINANCIAL STATEMENTS.
A25
| | | | | | |
| | |
| | CONSERVATIVE BALANCED PORTFOLIO (continued) | | |
| | | | | | |
| |
| SCHEDULE OF INVESTMENTS | | as of December 31, 2019 |
| | | | | | | | | | | | | | | | |
Interest
Rate | | Maturity
Date | | | | | | Principal
Amount
(000)# | | | Value | |
|
| SOVEREIGN BONDS (continued) | |
Saudi Government International Bond (Saudi Arabia), | |
Sr. Unsec’d. Notes, 144A | | | | | | | | | | | | | |
2.000% | | | 07/09/39 | | | | | | | EUR | 182 | | | $ | 214,867 | |
Sr. Unsec’d. Notes, 144A, MTN | | | | | | | | | | | | | |
2.375% | | | 10/26/21 | | | | | | | | 980 | | | | 983,736 | |
2.875% | | | 03/04/23 | | | | | | | | 1,285 | | | | 1,307,913 | |
4.000% | | | 04/17/25 | | | | | | | | 750 | | | | 809,189 | |
Tokyo Metropolitan Government (Japan), | |
Sr. Unsec’d. Notes, 144A | | | | | | | | | | | | | |
2.500% | | | 06/08/22 | | | | | | | | 1,200 | | | | 1,213,700 | |
3.250% | | | 06/01/23 | | | | | | | | 600 | | | | 623,990 | |
Turkey Government International Bond (Turkey), | |
Sr. Unsec’d. Notes | | | | | | | | | | | | | |
7.000% | | | 06/05/20 | | | | | | | | 1,260 | | | | 1,284,197 | |
Uruguay Government International Bond (Uruguay), | |
Sr. Unsec’d. Notes | | | | | | | | | | | | | |
4.975% | | | 04/20/55 | (a) | | | | | | | 405 | | | | 477,155 | |
5.100% | | | 06/18/50 | (a) | | | | | | | 490 | | | | 588,054 | |
| | | | | | | | | | | | | | | | |
TOTAL SOVEREIGN BONDS
(cost $26,121,394) | | | | | | | | | | | | 27,434,855 | |
| | | | | | | | | | | | | | | | |
|
| U.S. GOVERNMENT AGENCY OBLIGATIONS — 10.2% | |
Federal Home Loan Bank | |
5.500% | | | 07/15/36 | (k) | | | | | | | 850 | | | | 1,193,569 | |
Federal Home Loan Mortgage Corp. | |
2.000% | | | 01/01/32 | | | | | | | | 865 | | | | 857,906 | |
2.500% | | | 03/01/30 | | | | | | | | 494 | | | | 501,043 | |
3.000% | | | 10/01/28 | | | | | | | | 366 | | | | 376,815 | |
3.000% | | | 06/01/29 | | | | | | | | 702 | | | | 723,260 | |
3.000% | | | 01/01/37 | | | | | | | | 228 | | | | 234,428 | |
3.000% | | | 06/01/42 | | | | | | | | 365 | | | | 376,622 | |
3.000% | | | 10/01/42 | | | | | | | | 859 | | | | 885,854 | |
3.000% | | | 01/01/43 | | | | | | | | 774 | | | | 797,893 | |
3.000% | | | 07/01/43 | | | | | | | | 2,031 | | | | 2,091,026 | |
3.500% | | | 06/01/42 | | | | | | | | 358 | | | | 376,681 | |
3.500% | | | 01/01/47 | | | | | | | | 788 | | | | 822,622 | |
3.500% | | | 02/01/47 | | | | | | | | 1,067 | | | | 1,113,233 | |
4.000% | | | 06/01/26 | | | | | | | | 447 | | | | 467,736 | |
4.000% | | | 09/01/26 | | | | | | | | 154 | | | | 161,301 | |
4.000% | | | 03/01/38 | | | | | | | | 426 | | | | 447,183 | |
4.000% | | | 10/01/39 | | | | | | | | 622 | | | | 666,908 | |
4.000% | | | 09/01/40 | | | | | | | | 1,007 | | | | 1,080,329 | |
4.000% | | | 12/01/40 | | | | | | | | 393 | | | | 421,684 | |
4.000% | | | 10/01/41 | | | | | | | | 423 | | | | 453,482 | |
4.000% | | | 01/01/42 | | | | | | | | 140 | | | | 150,159 | |
4.500% | | | 07/01/20 | | | | | | | | 6 | | | | 6,069 | |
4.500% | | | 02/01/39 | | | | | | | | 82 | | | | 89,310 | |
4.500% | | | 09/01/39 | | | | | | | | 141 | | | | 153,355 | |
4.500% | | | 10/01/39 | | | | | | | | 1,275 | | | | 1,390,313 | |
4.500% | | | 12/01/39 | | | | | | | | 123 | | | | 134,309 | |
4.500% | | | 07/01/41 | | | | | | | | 255 | | | | 276,781 | |
4.500% | | | 07/01/41 | | | | | | | | 1,747 | | | | 1,898,965 | |
4.500% | | | 08/01/41 | | | | | | | | 126 | | | | 137,604 | |
4.500% | | | 08/01/41 | | | | | | | | 188 | | | | 204,877 | |
4.500% | | | 08/01/41 | | | | | | | | 487 | | | | 529,432 | |
4.500% | | | 10/01/41 | | | | | | | | 148 | | | | 161,073 | |
4.500% | | | 12/01/47 | | | | | | | | 383 | | | | 407,598 | |
4.500% | | | 08/01/48 | | | | | | | | 1,062 | | | | 1,123,303 | |
| | | | | | | | | | | | | | | | |
Interest
Rate | | Maturity
Date | | | | | | Principal
Amount
(000)# | | | Value | |
|
| U.S. GOVERNMENT AGENCY OBLIGATIONS (continued) | |
5.000% | | | 05/01/34 | | | | | | | | 20 | | | $ | 21,673 | |
5.000% | | | 05/01/34 | | | | | | | | 263 | | | | 290,931 | |
5.000% | | | 10/01/35 | | | | | | | | 7 | | | | 7,503 | |
5.000% | | | 07/01/37 | | | | | | | | 433 | | | | 478,709 | |
5.000% | | | 05/01/39 | | | | | | | | 60 | | | | 65,722 | |
5.500% | | | 12/01/33 | | | | | | | | 44 | | | | 49,216 | |
5.500% | | | 01/01/34 | | | | | | | | 42 | | | | 46,680 | |
5.500% | | | 06/01/34 | | | | | | | | 77 | | | | 86,709 | |
5.500% | | | 07/01/34 | | | | | | | | 187 | | | | 210,066 | |
5.500% | | | 05/01/37 | | | | | | | | 49 | | | | 54,381 | |
5.500% | | | 02/01/38 | | | | | | | | 396 | | | | 443,417 | |
5.500% | | | 05/01/38 | | | | | | | | 43 | | | | 47,953 | |
5.500% | | | 07/01/38 | | | | | | | | 106 | | | | 118,779 | |
6.000% | | | 03/01/32 | | | | | | | | 143 | | | | 161,109 | |
6.000% | | | 12/01/33 | | | | | | | | 51 | | | | 54,658 | |
6.000% | | | 11/01/36 | | | | | | | | 50 | | | | 57,267 | |
6.000% | | | 01/01/37 | | | | | | | | 41 | | | | 46,356 | |
6.000% | | | 05/01/37 | | | | | | | | 23 | | | | 26,791 | |
6.000% | | | 02/01/38 | | | | | | | | 4 | | | | 4,461 | |
6.000% | | | 08/01/39 | | | | | | | | 58 | | | | 67,171 | |
6.750% | | | 09/15/29 | | | | | | | | 605 | | | | 847,550 | |
6.750% | | | 03/15/31 | (k) | | | | | | | 550 | | | | 795,858 | |
7.000% | | | 05/01/31 | | | | | | | | 10 | | | | 11,648 | |
7.000% | | | 06/01/31 | | | | | | | | 13 | | | | 14,314 | |
7.000% | | | 08/01/31 | | | | | | | | 109 | | | | 123,277 | |
7.000% | | | 10/01/31 | | | | | | | | 6 | | | | 7,052 | |
Federal National Mortgage Assoc. | |
2.000% | | | 08/01/31 | | | | | | | | 791 | | | | 784,035 | |
2.500% | | | TBA | | | | | | | | 4,500 | | | | 4,540,185 | |
2.500% | | | 01/01/28 | | | | | | | | 714 | | | | 722,106 | |
2.500% | | | 10/01/43 | | | | | | | | 663 | | | | 664,278 | |
2.500% | | | 12/01/46 | | | | | | | | 1,392 | | | | 1,387,091 | |
2.500% | | | 09/01/49 | | | | | | | | 3,539 | | | | 3,499,894 | |
2.500% | | | 11/01/49 | | | | | | | | 3,499 | | | | 3,460,184 | |
2.500% | | | 12/01/49 | | | | | | | | 598 | | | | 591,875 | |
3.000% | | | 02/01/27 | | | | | | | | 1,447 | | | | 1,485,948 | |
3.000% | | | 08/01/30 | | | | | | | | 971 | | | | 1,000,106 | |
3.000% | | | 11/01/36 | | | | | | | | 2,053 | | | | 2,108,339 | |
3.000% | | | 12/01/42 | | | | | | | | 1,510 | | | | 1,555,178 | |
3.000% | | | 03/01/43 | | | | | | | | 326 | | | | 335,145 | |
3.000% | | | 11/01/46 | | | | | | | | 1,260 | | | | 1,289,102 | |
3.000% | | | 01/01/47 | | | | | | | | 1,763 | | | | 1,804,426 | |
3.000% | | | 02/01/47 | | | | | | | | 1,756 | | | | 1,797,116 | |
3.000% | | | 03/01/47 | | | | | | | | 880 | | | | 900,212 | |
3.500% | | | TBA | | | | | | | | 29,000 | | | | 29,830,850 | |
3.500% | | | 07/01/31 | | | | | | | | 967 | | | | 1,012,201 | |
3.500% | | | 02/01/33 | | | | | | | | 2,744 | | | | 2,853,807 | |
3.500% | | | 06/01/39 | | | | | | | | 518 | | | | 545,258 | |
3.500% | | | 01/01/42 | | | | | | | | 4,365 | | | | 4,599,994 | |
3.500% | | | 05/01/42 | | | | | | | | 2,196 | | | | 2,311,362 | |
3.500% | | | 07/01/42 | | | | | | | | 821 | | | | 864,476 | |
3.500% | | | 08/01/42 | | | | | | | | 330 | | | | 346,973 | |
3.500% | | | 08/01/42 | | | | | | | | 1,044 | | | | 1,099,190 | |
3.500% | | | 09/01/42 | | | | | | | | 493 | | | | 519,487 | |
3.500% | | | 09/01/42 | | | | | | | | 1,728 | | | | 1,819,406 | |
3.500% | | | 11/01/42 | | | | | | | | 298 | | | | 314,235 | |
3.500% | | | 03/01/43 | | | | | | | | 2,358 | | | | 2,488,315 | |
3.500% | | | 04/01/43 | | | | | | | | 561 | | | | 590,815 | |
SEE NOTES TO FINANCIAL STATEMENTS.
A26
| | | | | | |
| | |
| | CONSERVATIVE BALANCED PORTFOLIO (continued) | | |
| | | | | | |
| |
| SCHEDULE OF INVESTMENTS | | as of December 31, 2019 |
| | | | | | | | | | | | | | | | |
Interest
Rate | | Maturity
Date | | | | | | Principal
Amount
(000)# | | | Value | |
|
| U.S. GOVERNMENT AGENCY OBLIGATIONS (continued) | |
3.500% | | | 04/01/43 | | | | | | | | 816 | | | $ | 858,667 | |
3.500% | | | 01/01/46 | | | | | | | | 1,812 | | | | 1,894,130 | |
3.500% | | | 07/01/46 | | | | | | | | 2,228 | | | | 2,323,036 | |
3.500% | | | 11/01/46 | | | | | | | | 1,890 | | | | 1,970,854 | |
3.500% | | | 09/01/47 | | | | | | | | 1,225 | | | | 1,272,111 | |
3.500% | | | 05/01/48 | | | | | | | | 2,358 | | | | 2,430,159 | |
3.500% | | | 07/01/48 | | | | | | | | 1,461 | | | | 1,506,310 | |
3.500% | | | 08/01/49 | | | | | | | | 19,039 | | | | 19,588,536 | |
4.000% | | | TBA | | | | | | | | 22,500 | | | | 23,402,700 | |
4.000% | | | 10/01/41 | | | | | | | | 2,640 | | | | 2,825,548 | |
4.000% | | | 09/01/44 | | | | | | | | 2,445 | | | | 2,601,087 | |
4.000% | | | 10/01/46 | | | | | | | | 546 | | | | 576,422 | |
4.000% | | | 02/01/47 | | | | | | | | 769 | | | | 811,002 | |
4.000% | | | 09/01/47 | | | | | | | | 1,924 | | | | 2,023,559 | |
4.000% | | | 11/01/47 | | | | | | | | 770 | | | | 823,703 | |
4.000% | | | 11/01/47 | | | | | | | | 3,437 | | | | 3,613,712 | |
4.500% | | | 07/01/33 | | | | | | | | 50 | | | | 53,156 | |
4.500% | | | 08/01/33 | | | | | | | | 43 | | | | 45,548 | |
4.500% | | | 09/01/33 | | | | | | | | 102 | | | | 109,056 | |
4.500% | | | 10/01/33 | | | | | | | | 10 | | | | 10,436 | |
4.500% | | | 10/01/33 | | | | | | | | 33 | | | | 35,596 | |
4.500% | | | 10/01/33 | | | | | | | | 120 | | | | 128,165 | |
4.500% | | | 01/01/35 | | | | | | | | 2 | | | | 1,614 | |
4.500% | | | 07/01/39 | | | | | | | | 853 | | | | 929,850 | |
4.500% | | | 08/01/39 | | | | | | | | 1,297 | | | | 1,413,754 | |
4.500% | | | 03/01/41 | | | | | | | | 446 | | | | 484,544 | |
4.500% | | | 11/01/47 | | | | | | | | 3,634 | | | | 3,868,899 | |
4.500% | | | 01/01/49 | | | | | | | | 1,060 | | | | 1,120,015 | |
5.000% | | | 03/01/34 | | | | | | | | 226 | | | | 248,672 | |
5.000% | | | 06/01/35 | | | | | | | | 84 | | | | 92,838 | |
5.000% | | | 07/01/35 | | | | | | | | 112 | | | | 124,272 | |
5.000% | | | 09/01/35 | | | | | | | | 73 | | | | 80,533 | |
5.000% | | | 11/01/35 | | | | | | | | 86 | | | | 95,197 | |
5.000% | | | 02/01/36 | | | | | | | | 105 | | | | 116,096 | |
5.000% | | | 05/01/36 | | | | | | | | 52 | | | | 57,931 | |
5.500% | | | 09/01/33 | | | | | | | | 205 | | | | 229,898 | |
5.500% | | | 10/01/33 | | | | | | | | 71 | | | | 80,048 | |
5.500% | | | 12/01/33 | | | | | | | | 51 | | | | 57,125 | |
5.500% | | | 01/01/34 | | | | | | | | 1 | | | | 1,309 | |
5.500% | | | 12/01/34 | | | | | | | | 165 | | | | 184,895 | |
5.500% | | | 10/01/35 | | | | | | | | 592 | | | | 662,932 | |
5.500% | | | 03/01/36 | | | | | | | | 131 | | | | 146,937 | |
5.500% | | | 05/01/36 | | | | | | | | 117 | | | | 131,419 | |
5.500% | | | 04/01/37 | | | | | | | | 92 | | | | 102,661 | |
6.000% | | | 05/01/21 | | | | | | | | 13 | | | | 13,068 | |
6.000% | | | 08/01/22 | | | | | | | | 24 | | | | 24,895 | |
6.000% | | | 04/01/33 | | | | | | | | 17 | | | | 18,194 | |
6.000% | | | 06/01/33 | | | | | | | | 6 | | | | 6,520 | |
6.000% | | | 10/01/33 | | | | | | | | 303 | | | | 345,301 | |
6.000% | | | 11/01/33 | | | | | | | | 5 | | | | 6,177 | |
6.000% | | | 11/01/33 | | | | | | | | 15 | | | | 16,727 | |
6.000% | | | 11/01/33 | | | | | | | | 47 | | | | 50,196 | |
6.000% | | | 01/01/34 | | | | | | | | 282 | | | | 323,032 | |
6.000% | | | 02/01/34 | | | | | | | | 64 | | | | 72,451 | |
6.000% | | | 03/01/34 | | | | | | | | 30 | | | | 31,250 | |
6.000% | | | 03/01/34 | | | | | | | | 44 | | | | 48,779 | |
6.000% | | | 07/01/34 | | | | | | | | 173 | | | | 196,966 | |
6.000% | | | 08/01/34 | | | | | | | | 1 | | | | 662 | |
| | | | | | | | | | | | | | | | |
Interest
Rate | | Maturity
Date | | | | | | Principal
Amount
(000)# | | | Value | |
|
| U.S. GOVERNMENT AGENCY OBLIGATIONS (continued) | |
6.000% | | | 10/01/34 | | | | | | | | 3 | | | $ | 3,537 | |
6.000% | | | 11/01/34 | | | | | | | | 3 | | | | 2,736 | |
6.000% | | | 11/01/34 | | | | | | | | 33 | | | | 36,324 | |
6.000% | | | 01/01/35 | | | | | | | | 63 | | | | 71,472 | |
6.000% | | | 01/01/35 | | | | | | | | 155 | | | | 171,585 | |
6.000% | | | 02/01/35 | | | | | | | | 4 | | | | 3,716 | |
6.000% | | | 02/01/35 | | | | | | | | 76 | | | | 81,283 | |
6.000% | | | 02/01/35 | | | | | | | | 230 | | | | 262,920 | |
6.000% | | | 03/01/35 | | | | | | | | 2 | | | | 2,417 | |
6.000% | | | 04/01/35 | | | | | | | | 1 | | | | 941 | |
6.000% | | | 07/01/36 | | | | | | | | 40 | | | | 45,480 | |
6.000% | | | 02/01/37 | | | | | | | | 69 | | | | 78,999 | |
6.000% | | | 05/01/37 | | | | | | | | 26 | | | | 30,281 | |
6.000% | | | 06/01/37 | | | | | | | | 1 | | | | 735 | |
6.000% | | | 08/01/37 | | | | | | | | — | (r) | | | 107 | |
6.000% | | | 08/01/37 | | | | | | | | 16 | | | | 17,903 | |
6.000% | | | 09/01/37 | | | | | | | | — | (r) | | | 371 | |
6.000% | | | 10/01/37 | | | | | | | | 35 | | | | 40,543 | |
6.000% | | | 05/01/38 | | | | | | | | 63 | | | | 72,097 | |
6.000% | | | 06/01/38 | | | | | | | | 2 | | | | 2,695 | |
6.250% | | | 05/15/29 | (k) | | | | | | | 610 | | | | 823,836 | |
6.500% | | | 07/01/32 | | | | | | | | 42 | | | | 48,388 | |
6.500% | | | 09/01/32 | | | | | | | | 2 | | | | 1,612 | |
6.500% | | | 09/01/32 | | | | | | | | 53 | | | | 59,645 | |
6.500% | | | 09/01/32 | | | | | | | | 61 | | | | 70,555 | |
6.500% | | | 09/01/32 | | | | | | | | 86 | | | | 99,658 | |
6.500% | | | 04/01/33 | | | | | | | | 94 | | | | 107,871 | |
6.500% | | | 11/01/33 | | | | | | | | 21 | | | | 22,812 | |
6.500% | | | 01/01/34 | | | | | | | | 43 | | | | 48,175 | |
6.500% | | | 09/01/34 | | | | | | | | 60 | | | | 69,236 | |
6.500% | | | 10/01/34 | | | | | | | | 66 | | | | 72,554 | |
6.500% | | | 09/01/36 | | | | | | | | 54 | | | | 63,060 | |
6.500% | | | 10/01/36 | | | | | | | | 23 | | | | 26,961 | |
6.500% | | | 11/01/36 | | | | | | | | 21 | | | | 22,935 | |
6.500% | | | 01/01/37 | | | | | | | | 39 | | | | 42,402 | |
6.500% | | | 01/01/37 | | | | | | | | 106 | | | | 117,944 | |
6.625% | | | 11/15/30 | (k) | | | | | | | 800 | | | | 1,139,244 | |
7.000% | | | 02/01/32 | | | | | | | | 30 | | | | 34,941 | |
7.000% | | | 05/01/32 | | | | | | | | 14 | | | | 16,471 | |
7.000% | | | 06/01/32 | | | | | | | | 19 | | | | 22,033 | |
7.000% | | | 07/01/32 | | | | | | | | 55 | | | | 64,513 | |
7.125% | | | 01/15/30 | (k) | | | | | | | 3,195 | | | | 4,620,420 | |
Government National Mortgage Assoc. | |
2.500% | | | 03/20/43 | | | | | | | | 277 | | | | 280,681 | |
2.500% | | | 12/20/46 | | | | | | | | 679 | | | | 685,284 | |
3.000% | | | 12/20/44 | | | | | | | | 297 | | | | 306,868 | |
3.000% | | | 03/15/45 | | | | | | | | 921 | | | | 951,152 | |
3.000% | | | 11/20/45 | | | | | | | | 850 | | | | 878,801 | |
3.000% | | | 03/20/46 | | | | | | | | 1,948 | | | | 2,009,921 | |
3.000% | | | 07/20/46 | | | | | | | | 3,613 | | | | 3,727,456 | |
3.000% | | | 08/20/46 | | | | | | | | 1,347 | | | | 1,389,279 | |
3.000% | | | 11/20/46 | | | | | | | | 686 | | | | 707,984 | |
3.000% | | | 12/20/46 | | | | | | | | 1,231 | | | | 1,269,652 | |
3.000% | | | 01/20/47 | | | | | | | | 350 | | | | 361,203 | |
3.000% | | | 04/20/47 | | | | | | | | 1,460 | | | | 1,505,486 | |
3.500% | | | TBA | | | | | | | | 14,500 | | | | 14,945,150 | |
3.500% | | | 12/20/42 | | | | | | | | 1,252 | | | | 1,318,537 | |
3.500% | | | 05/20/43 | | | | | | | | 385 | | | | 404,210 | |
SEE NOTES TO FINANCIAL STATEMENTS.
A27
| | | | | | |
| | |
| | CONSERVATIVE BALANCED PORTFOLIO (continued) | | |
| | | | | | |
| |
| SCHEDULE OF INVESTMENTS | | as of December 31, 2019 |
| | | | | | | | | | | | | | | | |
Interest
Rate | | Maturity
Date | | | | | | Principal
Amount
(000)# | | | Value | |
|
| U.S. GOVERNMENT AGENCY OBLIGATIONS (continued) | |
3.500% | | | 04/20/45 | | | | | | | | 1,599 | | | $ | 1,669,576 | |
3.500% | | | 07/20/46 | | | | | | | | 6,110 | | | | 6,371,266 | |
3.500% | | | 07/20/48 | | | | | | | | 5,699 | | | | 5,909,569 | |
3.500% | | | 11/20/48 | | | | | | | | 1,935 | | | | 2,006,207 | |
4.000% | | | 06/15/40 | | | | | | | | 79 | | | | 83,605 | |
4.000% | | | 05/20/41 | | | | | | | | 66 | | | | 70,801 | |
4.000% | | | 12/20/42 | | | | | | | | 643 | | | | 683,999 | |
4.000% | | | 08/20/44 | | | | | | | | 293 | | | | 309,560 | |
4.000% | | | 11/20/45 | | | | | | | | 658 | | | | 693,173 | |
4.000% | | | 12/20/45 | | | | | | | | 1,749 | | | | 1,843,434 | |
4.000% | | | 09/20/47 | | | | | | | | 6,802 | | | | 7,119,372 | |
4.000% | | | 02/20/49 | | | | | | | | 3,680 | | | | 3,831,322 | |
4.500% | | | 04/15/40 | | | | | | | | 548 | | | | 590,498 | |
4.500% | | | 01/20/41 | | | | | | | | 481 | | | | 517,227 | |
4.500% | | | 02/20/41 | | | | | | | | 794 | | | | 852,937 | |
4.500% | | | 03/20/41 | | | | | | | | 401 | | | | 431,470 | |
4.500% | | | 06/20/44 | | | | | | | | 586 | | | | 632,762 | |
4.500% | | | 09/20/46 | | | | | | | | 522 | | | | 563,893 | |
4.500% | | | 11/20/46 | | | | | | | | 785 | | | | 847,157 | |
4.500% | | | 03/20/47 | | | | | | | | 518 | | | | 549,038 | |
4.500% | | | 05/20/48 | | | | | | | | 1,277 | | | | 1,340,311 | |
4.500% | | | 08/20/48 | | | | | | | | 2,174 | | | | 2,282,127 | |
5.000% | | | 10/20/37 | | | | | | | | 89 | | | | 96,008 | |
5.000% | | | 04/20/45 | | | | | | | | 612 | | | | 669,051 | |
5.500% | | | 08/15/33 | | | | | | | | 242 | | | | 269,637 | |
5.500% | | | 08/15/33 | | | | | | | | 270 | | | | 297,394 | |
5.500% | | | 09/15/33 | | | | | | | | 78 | | | | 82,777 | |
5.500% | | | 12/15/33 | | | | | | | | 22 | | | | 24,348 | |
5.500% | | | 03/15/34 | | | | | | | | 154 | | | | 171,231 | |
5.500% | | | 12/15/34 | | | | | | | | 300 | | | | 335,782 | |
5.500% | | | 07/15/35 | | | | | | | | 63 | | | | 70,350 | |
5.500% | | | 04/15/36 | | | | | | | | 100 | | | | 109,292 | |
6.000% | �� | | 11/15/23 | | | | | | | | — | (r) | | | 271 | |
6.000% | | | 05/15/32 | | | | | | | | — | (r) | | | 74 | |
6.000% | | | 04/15/33 | | | | | | | | 7 | | | | 7,854 | |
6.000% | | | 12/15/33 | | | | | | | | 99 | | | | 111,136 | |
6.000% | | | 01/15/34 | | | | | | | | 21 | | | | 22,195 | |
6.000% | | | 01/15/34 | | | | | | | | 33 | | | | 37,513 | |
6.000% | | | 01/15/34 | | | | | | | | 64 | | | | 72,584 | |
6.000% | | | 06/20/34 | | | | | | | | 107 | | | | 121,768 | |
6.000% | | | 07/15/34 | | | | | | | | 79 | | | | 89,680 | |
6.500% | | | 10/15/23 | | | | | | | | 1 | | | | 825 | |
6.500% | | | 12/15/23 | | | | | | | | 3 | | | | 3,141 | |
6.500% | | | 01/15/24 | | | | | | | | — | (r) | | | 399 | |
6.500% | | | 01/15/24 | | | | | | | | 1 | | | | 915 | |
6.500% | | | 01/15/24 | | | | | | | | 3 | | | | 2,995 | |
6.500% | | | 01/15/24 | | | | | | | | 10 | | | | 9,675 | |
6.500% | | | 01/15/24 | | | | | | | | 10 | | | | 10,416 | |
6.500% | | | 01/15/24 | | | | | | | | 14 | | | | 14,264 | |
6.500% | | | 01/15/24 | | | | | | | | 27 | | | | 28,196 | |
6.500% | | | 01/15/24 | | | | | | | | 46 | | | | 48,006 | |
6.500% | | | 02/15/24 | | | | | | | | 2 | | | | 2,084 | |
6.500% | | | 02/15/24 | | | | | | | | 4 | | | | 3,883 | |
6.500% | | | 02/15/24 | | | | | | | | 5 | | | | 4,589 | |
6.500% | | | 02/15/24 | | | | | | | | 5 | | | | 5,488 | |
6.500% | | | 02/15/24 | | | | | | | | 6 | | | | 6,280 | |
6.500% | | | 02/15/24 | | | | | | | | 10 | | | | 10,431 | |
6.500% | | | 03/15/24 | | | | | | | | 1 | | | | 1,039 | |
| | | | | | | | | | | | | | | | |
Interest
Rate | | Maturity
Date | | | | | | Principal
Amount
(000)# | | | Value | |
|
| U.S. GOVERNMENT AGENCY OBLIGATIONS (continued) | |
6.500% | | | 03/15/24 | | | | | | | | 1 | | | $ | 1,151 | |
6.500% | | | 03/15/24 | | | | | | | | 3 | | | | 3,234 | |
6.500% | | | 04/15/24 | | | | | | | | — | (r) | | | 312 | |
6.500% | | | 04/15/24 | | | | | | | | 1 | | | | 1,238 | |
6.500% | | | 04/15/24 | | | | | | | | 2 | | | | 1,693 | |
6.500% | | | 04/15/24 | | | | | | | | 2 | | | | 1,704 | |
6.500% | | | 04/15/24 | | | | | | | | 6 | | | | 6,082 | |
6.500% | | | 04/15/24 | | | | | | | | 10 | | | | 10,554 | |
6.500% | | | 05/15/24 | | | | | | | | 3 | | | | 3,480 | |
6.500% | | | 05/15/24 | | | | | | | | 4 | | | | 3,929 | |
6.500% | | | 05/15/24 | | | | | | | | 15 | | | | 16,216 | |
6.500% | | | 10/15/24 | | | | | | | | 15 | | | | 15,394 | |
6.500% | | | 11/15/28 | | | | | | | | 5 | | | | 5,097 | |
6.500% | | | 08/15/31 | | | | | | | | 5 | | | | 5,902 | |
6.500% | | | 12/15/31 | | | | | | | | 10 | | | | 11,400 | |
6.500% | | | 02/15/32 | | | | | | | | 35 | | | | 40,246 | |
6.500% | | | 06/15/32 | | | | | | | | 22 | | | | 24,576 | |
6.500% | | | 07/15/32 | | | | | | | | 38 | | | | 42,823 | |
6.500% | | | 08/15/32 | | | | | | | | 5 | | | | 5,143 | |
6.500% | | | 08/15/32 | | | | | | | | 6 | | | | 6,823 | |
6.500% | | | 08/15/32 | | | | | | | | 7 | | | | 7,867 | |
6.500% | | | 08/15/32 | | | | | | | | 26 | | | | 28,772 | |
6.500% | | | 08/15/32 | | | | | | | | 180 | | | | 206,597 | |
6.500% | | | 08/15/34 | | | | | | | | 25 | | | | 28,632 | |
6.500% | | | 06/15/35 | | | | | | | | 37 | | | | 42,230 | |
6.500% | | | 09/15/36 | | | | | | | | 49 | | | | 56,385 | |
8.000% | | | 01/15/24 | | | | | | | | 6 | | | | 6,485 | |
8.000% | | | 07/15/24 | | | | | | | | — | (r) | | | 388 | |
Tennessee Valley Authority, Sr. Unsec’d. Notes | |
7.125% | | | 05/01/30 | | | | | | | | 510 | | | | 736,626 | |
| | | | | | | | | | | | | | | | |
TOTAL U.S. GOVERNMENT AGENCY OBLIGATIONS
(cost $260,586,293) | | | | 264,787,639 | |
| | | | | | | | | | | | | | | | |
|
| U.S. TREASURY OBLIGATIONS — 0.8% | |
U.S. Treasury Strips Coupon | |
2.000%(s) | | | 08/15/39 | (k) | | | | | | | 3,825 | | | | 2,378,821 | |
2.067%(s) | | | 02/15/39 | | | | | | | | 1,465 | | | | 924,152 | |
2.208%(s) | | | 05/15/39 | | | | | | | | 2,345 | | | | 1,470,755 | |
2.334%(s) | | | 11/15/42 | | | | | | | | 40 | | | | 22,620 | |
2.334%(s) | | | 02/15/44 | | | | | | | | 730 | | | | 399,703 | |
2.364%(s) | | | 08/15/44 | | | | | | | | 7,280 | | | | 3,935,750 | |
2.373%(s) | | | 11/15/44 | | | | | | | | 1,720 | | | | 924,567 | |
2.376%(s) | | | 11/15/41 | | | | | | | | 150 | | | | 87,439 | |
2.377%(s) | | | 05/15/42 | | | | | | | | 180 | | | | 103,416 | |
2.394%(s) | | | 11/15/43 | | | | | | | | 19,000 | | | | 10,480,430 | |
| | | | | | | | | | | | | | | | |
TOTAL U.S. TREASURY OBLIGATIONS
(cost $21,676,584) | | | | 20,727,653 | |
| | | | | | | | | | | | | | | | |
TOTAL LONG-TERM INVESTMENTS
(cost $1,433,858,617) | | | | 2,414,312,937 | |
| | | | | | | | | | | | | | | | |
| | | | |
| | | | | | | | | Shares | | | | |
|
| SHORT-TERM INVESTMENTS — 12.8% | |
AFFILIATED MUTUAL FUNDS — 12.7% | |
PGIM Core Ultra Short Bond Fund(w) | | | | | | | | 255,146,173 | | | | 255,146,173 | |
SEE NOTES TO FINANCIAL STATEMENTS.
A28
| | | | | | |
| | |
| | CONSERVATIVE BALANCED PORTFOLIO (continued) | | |
| | | | | | |
| |
| SCHEDULE OF INVESTMENTS | | as of December 31, 2019 |
| | | | | | | | | | | | |
| | | | Shares | | | Value | |
|
| AFFILIATED MUTUAL FUNDS (continued) | |
PGIM Institutional Money Market Fund (cost $75,211,616; includes $75,085,329 of cash collateral for securities on loan)(b)(w) | | | | 75,210,263 | | | $ | 75,225,305 | |
| | | | | | | | | | | | |
TOTAL AFFILIATED MUTUAL FUNDS
(cost $330,357,789) | | | | 330,371,478 | |
| | | | | | | | | | | | |
| | | |
Interest
Rate | | Maturity
Date | | | Principal
Amount
(000)# | | | | |
|
| U.S. TREASURY OBLIGATION — 0.1% | |
U.S. Treasury Bills 1.528%(n) | | | 03/19/20 | (k) | | | 1,895 | | | | 1,888,998 | |
| | | | | | | | | | | | |
(cost $1,888,749) | |
OPTIONS PURCHASED*~ — 0.0%
(cost $13,847) | | | | 371,227 | |
| | | | | | | | | | | | |
TOTAL SHORT-TERM INVESTMENTS
(cost $332,260,385) | | | | 332,631,703 | |
| | | | | | | | | | | | |
TOTAL INVESTMENTS — 105.8%
(cost $1,766,119,002) | | | | 2,746,944,640 | |
Liabilities in excess of other assets(z) — (5.8)% | | | | (149,955,486 | ) |
| | | | | | | | | | | | |
NET ASSETS — 100.0% | | | $ | 2,596,989,154 | |
| | | | | | | | | | | | |
See the Glossary for a list of the abbreviation(s) used in the annual report.
| * | Non-income producing security. |
| # | Principal or notional amount is shown in U.S. dollars unless otherwise stated. |
| ~ | See tables subsequent to the Schedule of Investments for options detail. |
| ^ | Indicates a Level 3 instrument. The aggregate value of Level 3 instruments is $4,795,171 and 0.2% of net assets. |
| (a) | All or a portion of security is on loan. The aggregate market value of such securities, including those sold and pending settlement, is $73,605,089; cash collateral of $75,085,329 (included in liabilities) was received with which the Portfolio purchased highly liquid short-term investments. |
| (b) | Represents security purchased with cash collateral received for securities on loan and includes dividend reinvestment. |
| (c) | Variable rate instrument. The interest rate shown reflects the rate in effect at December 31, 2019. |
| (cc) | Variable rate instrument. The rate shown is based on the latest available information as of December 31, 2019. Certain variable rate securities are not based on a published reference rate and spread but are determined by the issuer or agent and are based on current market conditions. These securities do not indicate a reference rate and spread in their description. |
| (d) | Represents issuer in default on interest payments and/or principal repayment.Non-income producing security. Such securities may be post-maturity. |
| (ff) | Variable rate security. Security may be issued at a fixed coupon rate, which converts to a variable rate at a specified date. Rate shown is the rate in effect as of period end. |
| (k) | Represents security, or a portion thereof, segregated as collateral for centrally cleared/exchange-traded derivatives. |
| (n) | Rate shown reflects yield to maturity at purchased date. |
| (rr) | Perpetual security with no stated maturity date. |
| (s) | Represents zero coupon bond or principal only security. Rate represents yield to maturity at purchase date. |
| (w) | PGIM Investments LLC, the manager of the Portfolio, also serves as manager of the PGIM Core Ultra Short Bond Fund and PGIM Institutional Money Market Fund. |
| (z) | Includes net unrealized appreciation/(depreciation) and/or market value of the below holdings which are excluded from the Schedule of Investments: |
Options Purchased:
OTC Traded
| | | | | | | | | | | | | | | | | | | | | | | | |
Description | | Call/
Put | | Counterparty | | Expiration
Date | | | Strike | | | Contracts | | | Notional
Amount
(000)# | | | Value | |
2-Year 10 CMS Curve CAP | | Call | | Barclays Bank PLC | | | 07/12/21 | | | | 0.11% | | | | — | | | | 2,424 | | | $ | 25,250 | |
2-Year 10 CMS Curve CAP | | Call | | Barclays Bank PLC | | | 07/13/21 | | | | 0.11% | | | | — | | | | 2,357 | | | | 24,529 | |
2-Year 10 CMS Curve CAP | | Call | | Bank of America, N.A. | | | 08/16/21 | | | | 0.15% | | | | — | | | | 5,892 | | | | 56,233 | |
2-Year 10 CMS Curve CAP | | Call | | Bank of America, N.A. | | | 08/20/21 | | | | 0.15% | | | | — | | | | 11,696 | | | | 117,348 | |
2-Year 10 CMS Curve CAP | | Call | | Bank of America, N.A. | | | 09/13/21 | | | | 0.14% | | | | — | | | | 11,860 | | | | 124,779 | |
2-Year 10 CMS Curve CAP | | Call | | Barclays Bank PLC | | | 11/09/21 | | | | 0.21% | | | | — | | | | 2,357 | | | | 23,088 | |
| | | | | | | | | | | | | | | | | | | | | | | | |
| Total Options Purchased(cost $ 13,847) | | | | | | | | | | | | | | | | | | $ | 371,227 | |
| | | | | | | | | | | | | | | | | | | | | | | | |
Futures contracts outstanding at December 31, 2019:
| | | | | | | | | | | | | | | | |
Number of
Contracts | | Type | | | Expiration
Date | | | Current
Notional
Amount | | | Value /
Unrealized
Appreciation
(Depreciation) | |
| Long Positions: | | | | | | | | | | | | | | | | |
| 930 | | | 5 Year U.S. Treasury Notes | | | | Mar. 2020 | | | $ | 110,306,723 | | | $ | (377,046 | ) |
| 212 | | | 10 Year U.S. Ultra Treasury Notes | | | | Mar. 2020 | | | | 29,829,064 | | | | (352,395 | ) |
SEE NOTES TO FINANCIAL STATEMENTS.
A29
| | | | | | |
| | |
| | CONSERVATIVE BALANCED PORTFOLIO (continued) | | |
| | | | | | |
| |
| SCHEDULE OF INVESTMENTS | | as of December 31, 2019 |
| | | | | | | | | | | | | | | | |
Futures contracts outstanding at December 31, 2019 (continued): | |
Number of
Contracts | | Type | | | Expiration
Date | | | Current
Notional
Amount | | | Value /
Unrealized
Appreciation
(Depreciation) | |
Long Positions (continued): | |
| 67 | | | 20 Year U.S. Treasury Bonds | | | | Mar. 2020 | | | $ | 10,445,719 | | | $ | (41,079 | ) |
| 211 | | | 30 Year U.S. Ultra Treasury Bonds | | | | Mar. 2020 | | | | 38,329,469 | | | | (1,011,294 | ) |
| 13 | | | Mini MSCI EAFE Index | | | | Mar. 2020 | | | | 1,323,725 | | | | (2,361 | ) |
| 149 | | | S&P 500E-Mini Index | | | | Mar. 2020 | | | | 24,071,695 | | | | 346,077 | |
| 17 | | | S&P 500 Index | | | | Mar. 2020 | | | | 13,732,175 | | | | 139,761 | |
| | | | | | | | | | | | | | | | |
| | | | | | | | | | | | | | | (1,298,337 | ) |
| | | | | | | | | | | | | | | | |
| Short Positions: | | | | | | | | | | | | | | | | |
| 214 | | | 90 Day Euro Dollar | | | | Dec. 2020 | | | | 52,633,300 | | | | 134,747 | |
| 265 | | | 2 Year U.S. Treasury Notes | | | | Mar. 2020 | | | | 57,107,500 | | | | 19,649 | |
| 26 | | | 10 Year Euro-Bund | | | | Mar. 2020 | | | | 4,972,204 | | | | 65,608 | |
| 167 | | | 10 Year U.S. Treasury Notes | | | | Mar. 2020 | | | | 21,446,454 | | | | 170,181 | |
| | | | | | | | | | | | | | | | |
| | | | | | | | | | | | | | | 390,185 | |
| | | | | | | | | | | | | | | | |
| | | | | | | | | | | | | | $ | (908,152 | ) |
| | | | | | | | | | | | | | | | |
Forward foreign currency exchange contracts outstanding at December 31, 2019:
| | | | | | | | | | | | | | | | | | | | | | | | | | | | |
Sale Contracts | | Counterparty | | | Notional
Amount
(000) | | | Value at
Settlement
Date | | | Current
Value | | | Unrealized
Appreciation | | | Unrealized
Depreciation | |
OTC Forward Foreign Currency Exchange Contracts: | |
Canadian Dollar, | | | | | | | | | | | | | | | | | | | | | | | | | | | | |
Expiring 01/22/20 | | | Citibank, N.A. | | | | CAD | | | | 1,700 | | | $ | 1,302,191 | | | $ | 1,309,308 | | | $ | — | | | $ | (7,117 | ) |
Euro, | | | | | | | | | | | | | | | | | | | | | | | | | | | | |
Expiring 01/09/20 | | | Citibank, N.A. | | | | EUR | | | | 8,396 | | | | 9,307,988 | | | | 9,422,791 | | | | — | | | | (114,803 | ) |
| | | | | | | | | | | | | | | | | | | | | | | | | | | | |
| | | | | | | | | | | | | | $ | 10,610,179 | | | $ | 10,732,099 | | | $ | — | | | $ | (121,920 | ) |
| | | | | | | | | | | | | | | | | | | | | | | | | | | | |
Credit default swap agreement outstanding at December 31, 2019:
| | | | | | | | | | | | | | | | | | |
Reference Entity/Obligation | | Termination
Date | | Fixed
Rate | | Notional
Amount
(000)#(3) | | Value at
Trade Date | | | Value at
December 31,
2019 | | | Unrealized
Appreciation
(Depreciation) | |
Centrally Cleared Credit Default Swap Agreement on credit indices—Buy Protection(1): | | | | | | | | | |
CDX.NA.IG.33.V1 | | 12/20/29 | | 1.000%(Q) | | 15,600 | | $ | 64,115 | | | $ | (140,771 | ) | | $ | (204,886 | ) |
| | | | | | | | | | | | | | | | | | |
The Portfolio entered into credit default swaps (“CDS”) to provide a measure of protection against defaults or to take an active long or short position with respect to the likelihood of a particular issuer’s default or the reference entity’s credit soundness. CDS contracts generally trade based on a spread which represents the cost a protection buyer has to pay the protection seller. The protection buyer is said to be short the credit as the value of the contract rises the more the credit deteriorates. The value of the CDS contract increases for the protection buyer if the spread increases.
| (1) | If the Portfolio is a buyer of protection, it pays the fixed rate. When a credit event occurs, as defined under the terms of that particular swap agreement, the Portfolio will either (i) receive from the seller of protection an amount equal to the notional amount of the swap and make delivery of the referenced obligation or underlying securities comprising the referenced index or (ii) receive a net settlement amount in the form of cash or securities equal to the notional amount of the swap less the recovery value of the referenced obligation or underlying securities comprising the referenced index. |
| (2) | If the Portfolio is a seller of protection, it receives the fixed rate. When a credit event occurs, as defined under the terms of that particular swap agreement, the Portfolio will either (i) pay to the buyer of protection an amount equal to the notional amount of the swap and take delivery of the referenced obligation or underlying securities comprising the referenced index or (ii) pay a net settlement amount in the form of cash or securities equal to the notional amount of the swap less the recovery value of the referenced obligation or underlying securities comprising the referenced index. |
| (3) | Notional amount represents the maximum potential amount the Portfolio could be required to pay as a seller of credit protection or receive as a buyer of credit protection if a credit event occurs as defined under the terms of that particular swap agreement. |
SEE NOTES TO FINANCIAL STATEMENTS.
A30
| | | | | | |
| | |
| | CONSERVATIVE BALANCED PORTFOLIO (continued) | | |
| | | | | | |
| |
| SCHEDULE OF INVESTMENTS | | as of December 31, 2019 |
| (4) | Implied credit spreads, represented in absolute terms, utilized in determining the fair value of credit default swap agreements where the Portfolio is the seller of protection as of the reporting date serve as an indicator of the current status of the payment/ performance risk and represent the likelihood of risk of default for the credit derivative. The implied credit spread of a particular referenced entity reflects the cost of buying/selling protection and may includeup-front payments required to be made to enter into the agreement. Wider credit spreads represent a deterioration of the referenced entity’s credit soundness and a greater likelihood of risk of default or other credit event occurring as defined under the terms of the agreement. |
Interest rate swap agreements outstanding at December 31, 2019:
| | | | | | | | | | | | | | | | | | | | | | | | |
Notional
Amount
(000)# | | | Termination
Date | | | Fixed
Rate | | | Floating
Rate | | Value at
Trade Date | | | Value at
December 31,
2019 | | | Unrealized
Appreciation
(Depreciation) | |
| | Centrally Cleared Interest Rate Swap Agreements: | | | | | | | | | | | | |
| EUR | 2,835 | | | | 05/11/24 | | | | 0.050%(A) | | | 1 Day EONIA(1)(A) | | $ | (31,287 | ) | | $ | (62,722 | ) | | $ | (31,435 | ) |
| EUR | 790 | | | | 05/11/39 | | | | 1.100%(A) | | | 1 Day EONIA(1)(A) | | | (7,175 | ) | | | (123,801 | ) | | | (116,626 | ) |
| | 7,968 | | | | 03/31/21 | | | | 2.173%(A) | | | 1 Day USOIS(2)(A) | | | (2,753 | ) | | | 75,181 | | | | 77,934 | |
| | 109,263 | | | | 06/15/21 | | | | 1.830%(S) | | | 3 Month LIBOR(2)(Q) | | | — | | | | 173,656 | | | | 173,656 | |
| | 40,535 | | | | 09/15/21 | | | | 1.381%(S) | | | 3 Month LIBOR(2)(Q) | | | (80,388 | ) | | | (208,085 | ) | | | (127,697 | ) |
| | 19,355 | | | | 09/15/21 | | | | 1.480%(S) | | | 3 Month LIBOR(2)(Q) | | | 18,401 | | | | (67,696 | ) | | | (86,097 | ) |
| | 13,105 | | | | 09/15/21 | | | | 1.604%(S) | | | 3 Month LIBOR(2)(Q) | | | 61,324 | | | | (18,643 | ) | | | (79,967 | ) |
| | 570 | | | | 05/31/22 | | | | 2.353%(A) | | | 1 Day USOIS(1)(A) | | | — | | | | (13,075 | ) | | | (13,075 | ) |
| | 2,340 | | | | 02/29/24 | | | | 1.520%(S) | | | 3 Month LIBOR(2)(Q) | | | — | | | | (16,944 | ) | | | (16,944 | ) |
| | 22,000 | | | | 03/29/24 | | | | 1.949%(A) | | | 1 Day USOIS(1)(A) | | | — | | | | (407,484 | ) | | | (407,484 | ) |
| | 14,815 | | | | 08/15/24 | | | | 2.170%(S) | | | 3 Month LIBOR(1)(Q) | | | 32,653 | | | | (380,921 | ) | | | (413,574 | ) |
| | 11,300 | | | | 11/15/24 | | | | 2.334%(S) | | | 3 Month LIBOR(1)(Q) | | | 35,176 | | | | (325,846 | ) | | | (361,022 | ) |
| | 7,455 | | | | 02/12/25 | | | | 2.408%(A) | | | 1 Day USOIS(1)(A) | | | — | | | | (351,742 | ) | | | (351,742 | ) |
| | 1,180 | | | | 02/28/25 | | | | 2.454%(A) | | | 1 Day USOIS(1)(A) | | | — | | | | (59,318 | ) | | | (59,318 | ) |
| | 4,758 | | | | 05/31/25 | | | | 2.998%(S) | | | 3 Month LIBOR(1)(Q) | | | (3,259 | ) | | | (313,789 | ) | | | (310,530 | ) |
| | 2,620 | | | | 07/31/25 | | | | 2.802%(A) | | | 1 Day USOIS(1)(A) | | | — | | | | (192,484 | ) | | | (192,484 | ) |
| | 3,685 | | | | 07/31/25 | | | | 3.105%(S) | | | 3 Month LIBOR(1)(Q) | | | 2,907 | | | | (302,624 | ) | | | (305,531 | ) |
| | 11,431 | | | | 07/31/25 | | | | 3.109%(S) | | | 3 Month LIBOR(1)(Q) | | | 657 | | | | (941,657 | ) | | | (942,314 | ) |
| | 27,645 | | | | 01/08/26 | | | | 2.210%(S) | | | 3 Month LIBOR(1)(Q) | | | 216,719 | | | | (868,918 | ) | | | (1,085,637 | ) |
| | 615 | | | | 01/31/26 | | | | 2.236%(S) | | | 3 Month LIBOR(1)(Q) | | | — | | | | (20,539 | ) | | | (20,539 | ) |
| | 4,251 | | | | 01/31/26 | | | | 2.269%(A) | | | 1 Day USOIS(1)(A) | | | (15,685 | ) | | | (191,718 | ) | | | (176,033 | ) |
| | 125 | | | | 04/30/26 | | | | 1.876%(S) | | | 3 Month LIBOR(1)(Q) | | | (492 | ) | | | (768 | ) | | | (276 | ) |
| | 5,668 | | | | 02/15/27 | | | | 1.824%(A) | | | 1 Day USOIS(1)(A) | | | 62,809 | | | | (84,593 | ) | | | (147,402 | ) |
| | 1,185 | | | | 02/15/27 | | | | 1.899%(A) | | | 1 Day USOIS(1)(A) | | | 1,503 | | | | (24,541 | ) | | | (26,044 | ) |
| | 925 | | | | 02/15/27 | | | | 1.965%(A) | | | 1 Day USOIS(1)(A) | | | — | | | | (23,846 | ) | | | (23,846 | ) |
| | 3,150 | | | | 02/15/27 | | | | 2.067%(A) | | | 1 Day USOIS(1)(A) | | | (1,997 | ) | | | (106,081 | ) | | | (104,084 | ) |
| | 525 | | | | 05/15/27 | | | | 2.295%(S) | | | 3 Month LIBOR(1)(Q) | | | — | | | | (18,035 | ) | | | (18,035 | ) |
| | 13,836 | | | | 08/15/28 | | | | 2.579%(A) | | | 1 Day USOIS(1)(A) | | | (209,164 | ) | | | (1,126,130 | ) | | | (916,966 | ) |
| | 4,601 | | | | 08/15/28 | | | | 2.835%(S) | | | 3 Month LIBOR(1)(Q) | | | (18,250 | ) | | | (401,837 | ) | | | (383,587 | ) |
| | 283 | | | | 08/15/29 | | | | 1.611%(A) | | | 1 Day USOIS(1)(A) | | | — | | | | 875 | | | | 875 | |
| | 145 | | | | 11/15/43 | | | | 2.659%(S) | | | 3 Month LIBOR(1)(Q) | | | — | | | | (16,315 | ) | | | (16,315 | ) |
| | 2,120 | | | | 08/09/49 | | | | 1.508%(A) | | | 1 Day USOIS(1)(A) | | | — | | | | 168,354 | | | | 168,354 | |
| | | | | | | | | | | | | | | | | | | | | | | | |
| | | | | | | | | | | | | | $ | 61,699 | | | $ | (6,252,086 | ) | | $ | (6,313,785 | ) |
| | | | | | | | | | | | | | | | | | | | | | | | |
| (1) | The Portfolio pays the fixed rate and receives the floating rate. |
| (2) | The Portfolio pays the floating rate and receives the fixed rate. |
Total return swap agreements outstanding at December 31, 2019:
| | | | | | | | | | | | | | | | | | | | | | | | | | | | |
Reference Entity | | Financing
Rate | | | Counterparty | | | Termination
Date | | | Long (Short)
Notional
Amount
(000)#(1) | | | Fair
Value | | | Upfront
Premiums
Paid
(Received) | | | Unrealized
Appreciation
(Depreciation)(2) | |
OTC Total Return Swap Agreement: | | | | | | | | | | | | | | | | | | | | | | | | | |
Barclays US Agency CMBS Index(M) | | | 1 Month LIBOR(M) | | | | Barclays Bank PLC | | | | 10/01/20 | | | | 11,000 | | | $ | (42,931 | ) | | $ | — | | | $ | (42,931 | ) |
| | | | | | | | | | | | | | | | | | | | | | | | | | | | |
SEE NOTES TO FINANCIAL STATEMENTS.
A31
| | | | | | |
| | |
| | CONSERVATIVE BALANCED PORTFOLIO (continued) | | |
| | | | | | |
| |
| SCHEDULE OF INVESTMENTS | | as of December 31, 2019 |
Total return swap agreements outstanding at December 31, 2019 (continued):
| (1) | On a long total return swap, the Portfolio receives payments for any positive return on the reference entity (makes payments for any negative return) and pays the financing rate. On a short total return swap, the Portfolio makes payments for any positive return on the reference entity (receives payments for any negative return) and receives the financing rate. |
| (2) | Upfront/recurring fees or commissions, as applicable, are included in the net unrealized appreciation (depreciation). |
Balances Reported in the Statement of Assets and Liabilities for OTC Swap Agreements:
| | | | | | | | | | | | | | | | |
| | | Premiums Paid | | | Premiums Received | | | Unrealized
Appreciation | | | Unrealized
Depreciation | |
OTC Swap Agreements | | $ | — | | | $ | — | | | $ | — | | | $ | (42,931 | ) |
| | | | | | | | | | | | | | | | |
Summary of Collateral for Centrally Cleared/Exchange-traded Derivatives:
Cash and securities segregated as collateral, including pending settlement for closed positions, to cover requirements for centrally cleared/exchange-traded derivatives are listed by broker as follows:
| | | | | | | | |
Broker | | Cash and/or Foreign Currency | | | Securities Market Value | |
Citigroup Global Markets, Inc. | | $ | — | | | $ | 6,449,297 | |
Goldman Sachs & Co. LLC | | | — | | | | 1,888,998 | |
| | | | | | | | |
Total | | $ | — | | | $ | 8,338,295 | |
| | | | | | | | |
Fair Value Measurements:
Various inputs are used in determining the value of the Portfolio’s investments. These inputs are summarized in the three broad levels listed below.
| Level 1— | unadjusted quoted prices generally in active markets for identical securities. |
| Level 2— | quoted prices for similar securities, interest rates and yield curves, prepayment speeds, foreign currency exchange rates and other observable inputs. |
| Level 3— | unobservable inputs for securities valued in accordance with Board approved fair valuation procedures. |
The following is a summary of the inputs used as of December 31, 2019 in valuing such portfolio securities:
| | | | | | | | | | | | |
| | | Level 1 | | | Level 2 | | | Level 3 | |
Investments in Securities | | | | | | | | | | | | |
Assets | | | | | | | | | | | | |
Common Stocks | | $ | 1,296,003,933 | | | $ | 49,811,853 | | | $ | — | |
Exchange-Traded Funds | | | 8,358,187 | | | | — | | | | — | |
Preferred Stocks | | | 1,392,100 | | | | 382,806 | | | | — | |
Rights | | | 2,326 | | | | — | | | | — | |
Asset-Backed Securities | | | | | | | | | | | | |
Automobiles | | | — | | | | 58,697,936 | | | | — | |
Collateralized Loan Obligations | | | — | | | | 84,169,725 | | | | — | |
Consumer Loans | | | — | | | | 4,050,455 | | | | — | |
Credit Cards | | | — | | | | 4,430,586 | | | | — | |
Equipment | | | — | | | | 7,121,121 | | | | — | |
Home Equity Loans | | | — | | | | 1,638,654 | | | | — | |
Other | | | — | | | | 4,935,156 | | | | — | |
Residential Mortgage-Backed Securities | | | — | | | | 12,801,491 | | | | — | |
Student Loans | | | — | | | | 24,365,256 | | | | — | |
Commercial Mortgage-Backed Securities | | | — | | | | 208,254,633 | | | | — | |
Corporate Bonds | | | — | | | | 283,047,854 | | | | — | |
Municipal Bonds | | | — | | | | 16,086,273 | | | | — | |
Residential Mortgage-Backed Securities | | | — | | | | 31,017,274 | | | | 4,795,171 | |
Sovereign Bonds | | | — | | | | 27,434,855 | | | | — | |
U.S. Government Agency Obligations | | | — | | | | 264,787,639 | | | | — | |
U.S. Treasury Obligations | | | — | | | | 22,616,651 | | | | — | |
Affiliated Mutual Funds | | | 330,371,478 | | | | — | | | | — | |
Options Purchased | | | — | | | | 371,227 | | | | — | |
| | | | | | | | | | | | |
Total | | $ | 1,636,128,024 | | | $ | 1,106,021,445 | | | $ | 4,795,171 | |
| | | | | | | | | | | | |
SEE NOTES TO FINANCIAL STATEMENTS.
A32
| | | | | | |
| | |
| | CONSERVATIVE BALANCED PORTFOLIO (continued) | | |
| | | | | | |
| |
| SCHEDULE OF INVESTMENTS | | as of December 31, 2019 |
| | | | | | | | | | | | |
| | | Level 1 | | | Level 2 | | | Level 3 | |
Other Financial Instruments* | | | | | | | | | | | | |
Assets | | | | | | | | | | | | |
Futures Contracts | | $ | 876,023 | | | $ | — | | | $ | — | |
Centrally Cleared Interest Rate Swap Agreements | | | — | | | | 420,819 | | | | — | |
| | | | | | | | | | | | |
Total | | $ | 876,023 | | | $ | 420,819 | | | $ | — | |
| | | | | | | | | | | | |
| | | |
Liabilities | | | | | | | | | | | | |
Futures Contracts | | $ | (1,784,175 | ) | | $ | — | | | $ | — | |
OTC Forward Foreign Currency Exchange Contracts | | | — | | | | (121,920 | ) | | | — | |
Centrally Cleared Credit Default Swap Agreement | | | — | | | | (204,886 | ) | | | — | |
Centrally Cleared Interest Rate Swap Agreements | | | — | | | | (6,734,604 | ) | | | — | |
OTC Total Return Swap Agreement | | | — | | | | (42,931 | ) | | | — | |
| | | | | | | | | | | | |
Total | | $ | (1,784,175 | ) | | $ | (7,104,341 | ) | | $ | — | |
| | | | | | | | | | | | |
| * | Other financial instruments are derivative instruments not reflected in the Schedule of Investments, such as futures, forwards and centrally cleared swap contracts, which are recorded at the unrealized appreciation (depreciation) on the instrument, and OTC swap contracts which are recorded at fair value. |
Industry Classification:
The industry classification of investments and liabilities in excess of other assets shown as a percentage of net assets as of December 31, 2019 were as follows (unaudited):
| | | | |
Affiliated Mutual Funds (2.9% represents investments
purchased with collateral from securities on loan) | | | 12.7 | % |
U.S. Government Agency Obligations | | | 10.2 | |
Commercial Mortgage-Backed Securities | | | 8.0 | |
Banks | | | 5.7 | |
Software | | | 3.5 | |
Collateralized Loan Obligations | | | 3.2 | |
Pharmaceuticals | | | 3.1 | |
IT Services | | | 2.7 | |
Technology Hardware, Storage & Peripherals | | | 2.5 | |
Automobiles | | | 2.5 | |
Interactive Media & Services | | | 2.5 | |
Semiconductors & Semiconductor Equipment | | | 2.2 | |
Oil, Gas & Consumable Fuels | | | 2.0 | |
Residential Mortgage-Backed Securities | | | 1.9 | |
Health Care Equipment & Supplies | | | 1.8 | |
Internet & Direct Marketing Retail | | | 1.7 | |
Health Care Providers & Services | | | 1.5 | |
Capital Markets | | | 1.5 | |
Equity Real Estate Investment Trusts (REITs) | | | 1.4 | |
Insurance | | | 1.4 | |
Aerospace & Defense | | | 1.4 | |
Chemicals | | | 1.4 | |
Electric | | | 1.3 | |
Media | | | 1.2 | |
Specialty Retail | | | 1.2 | |
Diversified Telecommunication Services | | | 1.1 | |
Electric Utilities | | | 1.1 | |
Sovereign Bonds | | | 1.1 | |
Biotechnology | | | 1.0 | |
Diversified Financial Services | | | 1.0 | |
Beverages | | | 1.0 | |
Hotels, Restaurants & Leisure | | | 1.0 | |
Entertainment | | | 1.0 | |
Student Loans | | | 0.9 | |
Machinery | | | 0.9 | |
| | | | |
U.S. Treasury Obligations | | | 0.9 | % |
Oil & Gas | | | 0.9 | |
Household Products | | | 0.9 | |
Food & Staples Retailing | | | 0.8 | |
Industrial Conglomerates | | | 0.7 | |
Food Products | | | 0.6 | |
Municipal Bonds | | | 0.6 | |
Multi-Utilities | | | 0.5 | |
Telecommunications | | | 0.5 | |
Road & Rail | | | 0.5 | |
Life Sciences Tools & Services | | | 0.5 | |
Auto Manufacturers | | | 0.5 | |
Communications Equipment | | | 0.5 | |
Tobacco | | | 0.5 | |
Pipelines | | | 0.4 | |
Textiles, Apparel & Luxury Goods | | | 0.4 | |
Airlines | | | 0.4 | |
Consumer Finance | | | 0.3 | |
Retail | | | 0.3 | |
Exchange-Traded Funds | | | 0.3 | |
Electronic Equipment, Instruments & Components | | | 0.3 | |
Multiline Retail | | | 0.3 | |
Equipment | | | 0.3 | |
Air Freight & Logistics | | | 0.3 | |
Foods | | | 0.3 | |
Electrical Equipment | | | 0.3 | |
Household Durables | | | 0.2 | |
Commercial Services & Supplies | | | 0.2 | |
Energy Equipment & Services | | | 0.2 | |
Metals & Mining | | | 0.2 | |
Healthcare-Services | | | 0.2 | |
Other | | | 0.2 | |
Gas | | | 0.2 | |
Containers & Packaging | | | 0.2 | |
Miscellaneous Manufacturing | | | 0.2 | |
Professional Services | | | 0.2 | |
SEE NOTES TO FINANCIAL STATEMENTS.
A33
| | | | | | |
| | |
| | CONSERVATIVE BALANCED PORTFOLIO (continued) | | |
| | | | | | |
| |
| SCHEDULE OF INVESTMENTS | | as of December 31, 2019 |
| | | | |
Industry Classification (continued): | | | |
Credit Cards | | | 0.2 | % |
Building Products | | | 0.2 | |
Consumer Loans | | | 0.1 | |
Trading Companies & Distributors | | | 0.1 | |
Personal Products | | | 0.1 | |
Commercial Services | | | 0.1 | |
Healthcare-Products | | | 0.1 | |
Agriculture | | | 0.1 | |
Computers | | | 0.1 | |
Multi-National | | | 0.1 | |
Engineering & Construction | | | 0.1 | |
Construction Materials | | | 0.1 | |
Wireless Telecommunication Services | | | 0.1 | |
Real Estate Management & Development | | | 0.1 | |
Housewares | | | 0.1 | |
Transportation | | | 0.1 | |
Construction & Engineering | | | 0.1 | |
Home Equity Loans | | | 0.1 | |
Auto Components | | | 0.1 | |
Forest Products & Paper | | | 0.1 | |
Semiconductors | | | 0.1 | |
Distributors | | | 0.1 | |
Savings & Loans | | | 0.0 | * |
Packaging & Containers | | | 0.0 | * |
Health Care Technology | | | 0.0 | * |
| | | | |
| | | | |
Machinery-Diversified | | | 0.0 | *% |
Home Builders | | | 0.0 | * |
Independent Power & Renewable Electricity Producers | | | 0.0 | * |
Water Utilities | | | 0.0 | * |
Lodging | | | 0.0 | * |
Real Estate Investment Trusts (REITs) | | | 0.0 | * |
Gas Utilities | | | 0.0 | * |
Leisure Products | | | 0.0 | * |
Electronics | | | 0.0 | * |
Transportation Infrastructure | | | 0.0 | * |
Options Purchased | | | 0.0 | * |
Mining | | | 0.0 | * |
Building Materials | | | 0.0 | * |
Diversified Consumer Services | | | 0.0 | * |
Oil & Gas Services | | | 0.0 | * |
Marine | | | 0.0 | * |
Paper & Forest Products | | | 0.0 | * |
| | | | |
| | | 105.8 | |
Liabilities in excess of other assets | | | (5.8 | ) |
| | | | |
| | | 100.0 | % |
| | | | |
Effects of Derivative Instruments on the Financial Statements and Primary Underlying Risk Exposure:
The Portfolio invested in derivative instruments during the reporting period. The primary types of risk associated with these derivative instruments are credit contracts risk, equity contracts risk, foreign exchange contracts risk and interest rate contracts risk. See the Notes to Financial Statements for additional detail regarding these derivative instruments and their risks. The effect of such derivative instruments on the Portfolio’s financial position and financial performance as reflected in the Statement of Assets and Liabilities and Statement of Operations is presented in the summary below.
Fair values of derivative instruments as of December 31, 2019 as presented in the Statement of Assets and Liabilities:
| | | | | | | | | | | | |
| | | Asset Derivatives | | | Liability Derivatives | |
Derivatives not accounted for as hedging
instruments, carried at fair value | | Statement of
Assets and
Liabilities Location | | Fair Value | | | Statement of
Assets and
Liabilities Location | | Fair Value | |
Credit contracts | | — | | $ | — | | | Due from/to broker-variation margin swaps | | $ | 204,886 | * |
Equity contracts | | Due from/to broker-variation margin futures | | | 485,838 | * | | Due from/to broker-variation margin futures | | | 2,361 | * |
Equity contracts | | Unaffiliated investments | | | 2,326 | | | — | | | — | |
Foreign exchange contracts | | — | | | — | | | Unrealized depreciation on OTC forward foreign currency exchange contracts | | | 121,920 | |
Interest rate contracts | | Due from/to broker-variation margin futures | | | 390,185 | * | | Due from/to broker-variation margin futures | | | 1,781,814 | * |
Interest rate contracts | | Due from/to broker-variation margin swaps | | | 420,819 | * | | Due from/to broker-variation margin swaps | | | 6,734,604 | * |
Interest rate contracts | | Unaffiliated investments | | | 371,227 | | | — | | | — | |
Interest rate contracts | | — | | | — | | | Unrealized depreciation on OTC swap agreements | | | 42,931 | |
| | | | | | | | | | | | |
| | | | $ | 1,670,395 | | | | | $ | 8,888,516 | |
| | | | | | | | | | | | |
| * | Includes cumulative appreciation (depreciation) as reported in the schedule of open futures and centrally cleared swap contracts. Only unsettled variation margin receivable (payable) is reported within the Statement of Assets and Liabilities. |
SEE NOTES TO FINANCIAL STATEMENTS.
A34
| | | | | | |
| | |
| | CONSERVATIVE BALANCED PORTFOLIO (continued) | | |
| | | | | | |
| |
| SCHEDULE OF INVESTMENTS | | as of December 31, 2019 |
The effects of derivative instruments on the Statement of Operations for the year ended December 31, 2019 are as follows:
| | | | | | | | | | | | | | | | | | | | | | | | |
Amount of Realized Gain (Loss) on Derivatives Recognized in Income | |
Derivatives not accounted for as hedging
instruments, carried at fair value | | Options
Purchased(1) | | | Options
Written | | | Futures | | | Forward
Currency
Contracts | | | Forward
Rate
Agreements | | | Swaps | |
Credit contracts | | $ | — | | | $ | — | | | $ | — | | | $ | — | | | $ | — | | | $ | (1,225,608 | ) |
Equity contracts | | | — | | | | — | | | | 7,544,576 | | | | — | | | | — | | | | — | |
Foreign exchange contracts | | | — | | | | — | | | | — | | | | 391,585 | | | | — | | | | — | |
Interest rate contracts | | | (529,830 | ) | | | 239,608 | | | | 20,652,166 | | | | — | | | | (719,772 | ) | | | 1,368,961 | |
| | | | | | | | | | | | | | | | | | | | | | | | |
Total | | $ | (529,830 | ) | | $ | 239,608 | | | $ | 28,196,742 | | | $ | 391,585 | | | $ | (719,772 | ) | | $ | 143,353 | |
| | | | | | | | | | | | | | | | | | | | | | | | |
| (1) | Included in net realized gain (loss) on investment transactions in the Statement of Operations. |
| | | | | | | | | | | | | | | | | | | | | | | | |
Change in Unrealized Appreciation (Depreciation) on Derivatives Recognized in Income | |
Derivatives not accounted for as hedging
instruments, carried at fair value | | Rights(2) | | | Options
Purchased(2) | | | Futures | | | Forward
Currency
Exchange
Contracts | | | Forward
Rate
Agreements | | | Swaps | |
Credit contracts. | | $ | — | | | $ | — | | | $ | — | | | $ | — | | | $ | — | | | $ | (988,096 | ) |
Equity contracts | | | 113 | | | | — | | | | 1,317,439 | | | | — | | | | — | | | | — | |
Foreign exchange contracts | | | — | | | | — | | | | — | | | | (58,016 | ) | | | — | | | | — | |
Interest rate contracts | | | — | | | | 18,887 | | | | (5,955,595 | ) | | | — | | | | 45,927 | | | | (7,259,454 | ) |
| | | | | | | | | | | | | | | | | | | | | | | | |
Total | | $ | 113 | | | $ | 18,887 | | | $ | (4,638,156 | ) | | $ | (58,016 | ) | | $ | 45,927 | | | $ | (8,247,550 | ) |
| | | | | | | | | | | | | | | | | | | | | | | | |
| (2) | Included in net change in unrealized appreciation (depreciation) on investments in the Statement of Operations. |
For the year ended December 31, 2019, the Portfolio’s average volume of derivative activities is as follows:
| | | | | | | | |
Options Purchased(1) | | Options
Written(2) | | Futures Contracts— Long Positions(2) | | Futures Contracts— Short Positions(2) | | Forward Foreign
Currency Exchange
Contracts—
Purchased(3) |
| $128,732 | | $1,001,300 | | $332,274,510 | | $116,483,746 | | $3,348,851 |
| | | | | | |
Forward Foreign Currency Exchange Contracts—Sold(3) | | Forward Rate Agreements(2) | | Interest Rate Swap Agreements(2) | | Credit Default Swap Agreements— Buy Protection(2) |
| $11,469,012 | | $117,640,000 | | $238,899,083 | | $24,960,000 |
| | |
Total Return Swap Agreements(2) | | Inflation Swap Agreements(2) |
| $4,400,000 | | $1,416,000 |
| (2) | Notional Amount in USD. |
| (3) | Value at Settlement Date. |
Financial Instruments/Transactions—Summary of Offsetting and Netting Arrangements:
The Portfolio invested in OTC derivatives and entered into financial instruments/transactions during the reporting period that are either offset in accordance with current requirements or are subject to enforceable master netting arrangements or similar agreements that permit offsetting. The information about offsetting and related netting arrangements for OTC derivatives and financial instruments/transactions where the legal right toset-off exists is presented in the summary below.
SEE NOTES TO FINANCIAL STATEMENTS.
A35
| | | | | | |
| | |
| | CONSERVATIVE BALANCED PORTFOLIO (continued) | | |
| | | | | | |
| |
| SCHEDULE OF INVESTMENTS | | as of December 31, 2019 |
Offsetting of financial instrument/transaction assets and liabilities:
| | | | | | | | | | | | |
Description | | Gross Market
Value of
Recognized
Assets/(Liabilities) | | | Collateral
Pledged/(Received)(2) | | | Net
Amount | |
Securities on Loan | | $ | 73,605,089 | | | $ | (73,605,089 | ) | | $ | — | |
| | | | | | | | | | | | |
Offsetting of OTC derivative assets and liabilities:
| | | | | | | | | | | | | | | | | | | | |
Counterparty | | Gross Amounts of
Recognized
Assets(1) | | | Gross Amounts of
Recognized
Liabilities(1) | | | Net Amounts of
Recognized
Assets/(Liabilities) | | | Collateral
Pledged/(Received)(2) | | | Net Amount | |
Bank of America, N.A. | | $ | 298,360 | | | $ | — | | | $ | 298,360 | | | $ | (260,000 | ) | | $ | 38,360 | |
Barclays Bank PLC | | | 72,867 | | | | (42,931 | ) | | | 29,936 | | | | — | | | | 29,936 | |
Citibank, N.A. | | | — | | | | (121,920 | ) | | | (121,920 | ) | | | — | | | | (121,920 | ) |
| | | | | | | | | | | | | | | | | | | | |
| | $ | 371,227 | | | $ | (164,851 | ) | | $ | 206,376 | | | $ | (260,000 | ) | | $ | (53,624 | ) |
| | | | | | | | | | | | | | | | | | | | |
| (1) | Includes unrealized appreciation/(depreciation) on swaps and forwards, premiums paid/(received) on swap agreements and market value of purchased and written options, as represented on the Statement of Assets and Liabilities. |
| (2) | Collateral amount disclosed by the Portfolio is limited to the market value of financial instruments/transactions and the Portfolio’s OTC derivative exposure by counterparty. |
SEE NOTES TO FINANCIAL STATEMENTS.
A36
| | | | | | |
| | |
| | CONSERVATIVE BALANCED PORTFOLIO (continued) | | |
STATEMENT OF ASSETS AND LIABILITIES
as of December 31, 2019
| | | | |
| ASSETS | | | | |
Investments at value, including securities on loan of $73,605,089: | | | | |
Unaffiliated investments (cost $1,435,761,213) | | $ | 2,416,573,162 | |
Affiliated investments (cost $330,357,789) | | | 330,371,478 | |
Foreign currency, at value (cost $1,207,414) | | | 1,221,920 | |
Cash | | | 255,471 | |
Receivable for investments sold | | | 38,739,827 | |
Dividends and interest receivable | | | 7,132,342 | |
Tax reclaim receivable | | | 375,483 | |
Due from broker-variation margin swaps | | | 272,641 | |
Due from broker-variation margin futures | | | 96,677 | |
Receivable for Portfolio shares sold | | | 1,363 | |
Receivable from affiliate | | | 550 | |
Prepaid expenses | | | 23,404 | |
| | | | |
Total Assets | | | 2,795,064,318 | |
| | | | |
| LIABILITIES | | | | |
Payable for investments purchased | | | 119,967,198 | |
Payable to broker for collateral for securities on loan | | | 75,085,329 | |
Management fee payable | | | 1,205,092 | |
Payable for Portfolio shares repurchased | | | 710,353 | |
Accrued expenses and other liabilities | | | 456,851 | |
Due to broker-variation margin futures | | | 316,501 | |
Payable to affiliate | | | 168,009 | |
Unrealized depreciation on OTC forward foreign currency exchange contracts | | | 121,920 | |
Unrealized depreciation on OTC swap agreements | | | 42,931 | |
Affiliated transfer agent fee payable | | | 980 | |
| | | | |
Total Liabilities | | | 198,075,164 | |
| | | | |
| NET ASSETS | | $ | 2,596,989,154 | |
| | | | |
Net assets were comprised of: | | | | |
Partners’ Equity | | $ | 2,596,989,154 | |
| | | | |
Net asset value and redemption price per share, $2,596,989,154 / 82,701,191 outstanding shares of beneficial interest | | $ | 31.40 | |
| | | | |
STATEMENT OF OPERATIONS
Year Ended December 31, 2019
| | | | |
NET INVESTMENT INCOME (LOSS) INCOME | | | | |
Interest income | | $ | 32,467,377 | |
Unaffiliated dividend income (net of $80,454 foreign withholding tax, of which $11,450 is reimbursable by an affiliate) | | | 24,762,473 | |
Affiliated dividend income | | | 8,012,940 | |
Income from securities lending, net (including affiliated income of $127,815) | | | 145,726 | |
| | | | |
Total income | | | 65,388,516 | |
| | | | |
| EXPENSES | | | | |
Management fee | | | 13,783,977 | |
Shareholders’ reports | | | 389,692 | |
Custodian and accounting fees | | | 338,817 | |
Audit fee | | | 50,033 | |
Trustees’ fees | | | 38,360 | |
Legal fees and expenses | | | 20,376 | |
Transfer agent’s fees and expenses (including affiliated expense of $5,882) | | | 10,684 | |
Miscellaneous | | | 64,009 | |
| | | | |
Total expenses | | | 14,695,948 | |
| | | | |
| NET INVESTMENT INCOME (LOSS) | | | 50,692,568 | |
| | | | |
| REALIZED AND UNREALIZED GAIN (LOSS) ON INVESTMENT AND FOREIGN CURRENCY TRANSACTIONS | | | | |
Net realized gain (loss) on: | | | | |
Investment transactions (including affiliated of $(26,087)) | | | 64,741,778 | |
Futures transactions | | | 28,196,742 | |
Forward rate agreement transactions | | | (719,772 | ) |
Forward currency contract transactions | | | 391,585 | |
Options written transactions | | | 239,608 | |
Swap agreements transactions | | | 143,353 | |
Foreign currency transactions | | | (48,443 | ) |
| | | | |
| | | 92,944,851 | |
| | | | |
Net change in unrealized appreciation (depreciation) on: | | | | |
Investments (including affiliated of $173,621) | | | 292,464,934 | |
Futures | | | (4,638,156 | ) |
Forward rate agreements | | | 45,927 | |
Forward currency contracts | | | (58,016 | ) |
Swap agreements | | | (8,247,550 | ) |
Foreign currencies | | | 15,577 | |
| | | | |
| | | 279,582,716 | |
| | | | |
| NET GAIN (LOSS) ON INVESTMENT AND FOREIGN CURRENCY TRANSACTIONS | | | 372,527,567 | |
| | | | |
| NET INCREASE (DECREASE) IN NET ASSETS RESULTING FROM OPERATIONS | | $ | 423,220,135 | |
| | | | |
STATEMENTS OF CHANGES IN NET ASSETS
| | | | | | | | |
| | | Year Ended
December 31, 2019 | | | Year Ended
December 31, 2018 | |
| INCREASE (DECREASE) IN NET ASSETS | | | | | | | | |
| OPERATIONS | | | | | | | | |
Net investment income (loss) | | $ | 50,692,568 | | | $ | 49,177,630 | |
Net realized gain (loss) on investment and foreign currency transactions | | | 92,944,851 | | | | 69,751,675 | |
Net change in unrealized appreciation (depreciation) on investments and foreign currencies | | | 279,582,716 | | | | (177,772,406 | ) |
| | | | | | | | |
NET INCREASE (DECREASE) IN NET ASSETS RESULTING FROM OPERATIONS | | | 423,220,135 | | | | (58,843,101 | ) |
| | | | | | | | |
| PORTFOLIO SHARE TRANSACTIONS | | | | | | | | |
Portfolio shares sold [246,721 and 303,199 shares, respectively] | | | 7,257,351 | | | | 8,272,676 | |
Portfolio shares repurchased [6,977,375 and 6,356,332 shares, respectively] | | | (203,275,054 | ) | | | (174,377,090 | ) |
| | | | | | | | |
NET INCREASE (DECREASE) IN NET ASSETS FROM PORTFOLIO SHARE TRANSACTIONS | | | (196,017,703 | ) | | | (166,104,414 | ) |
| | | | | | | | |
| CAPITAL CONTRIBUTIONS | | | 13,184 | | | | 55,261 | |
| | | | | | | | |
| TOTAL INCREASE (DECREASE) | | | 227,215,616 | | | | (224,892,254 | ) |
| NET ASSETS: | | | | | | | | |
Beginning of year | | | 2,369,773,538 | | | | 2,594,665,792 | |
| | | | | | | | |
End of year | | $ | 2,596,989,154 | | | $ | 2,369,773,538 | |
| | | | | | | | |
SEE NOTES TO FINANCIAL STATEMENTS.
A37
| | | | | | |
| | |
| | DIVERSIFIED BOND PORTFOLIO | | |
| | | | | | |
| |
| SCHEDULE OF INVESTMENTS | | as of December 31, 2019 |
| | | | | | | | | | | | | | | | |
Interest
Rate | | Maturity
Date | | | | | | Principal
Amount
(000)# | | | Value | |
|
| LONG-TERM INVESTMENTS — 99.0% | |
|
| ASSET-BACKED SECURITIES — 26.5% | |
Automobiles — 0.9% | |
Ford Credit Floorplan Master Owner Trust, | |
Series2018-04, Class A | |
4.060% | | | 11/15/30 | | | | | | | | 3,300 | | | $ | 3,590,484 | |
Hertz Vehicle Financing LP, | |
Series2015-01A, Class A, 144A | |
2.730% | | | 03/25/21 | | | | | | | | 400 | | | | 400,438 | |
Series2019-02A, Class A, 144A | |
3.420% | | | 05/25/25 | | | | | | | | 200 | | | | 205,854 | |
Series2019-03A, Class A, 144A | |
2.670% | | | 12/26/25 | | | | | | | | 2,200 | | | | 2,191,851 | |
OneMain Direct Auto Receivables Trust, | |
Series2019-01A, Class A, 144A | |
3.630% | | | 09/14/27 | | | | | | | | 3,500 | | | | 3,604,593 | |
Series2019-01A, Class B, 144A | |
3.950% | | | 11/14/28 | | | | | | | | 800 | | | | 822,206 | |
| | | | | | | | | | | | | | | | |
| | | | | | | | | | | | | | | 10,815,426 | |
| | | | | | | | | | | | | | | | |
Collateralized Loan Obligations — 18.9% | |
Anchorage Capital CLO Ltd. (Cayman Islands), | |
Series2019-11A, Class A, 144A, 3 Month LIBOR + 1.390% (Cap N/A, Floor 1.390%) | |
3.534%(c) | | | 07/22/32 | | | | | | | | 4,000 | | | | 3,997,212 | |
Anchorage Credit Opportunities CLO Ltd. (Cayman Islands), | |
Series2019-01A, Class A1, 144A | |
—%(p) | | | 01/20/32 | | | | | | | | 3,000 | | | | 2,999,991 | |
ArrowMark Colorado Holdings (Cayman Islands), | |
Series2017-06A, Class A1, 144A, 3 Month LIBOR + 1.280% (Cap N/A, Floor 0.000%) | |
3.281%(c) | | | 07/15/29 | | | | | | | | 250 | | | | 248,585 | |
Atlas Senior Loan Fund Ltd. (Cayman Islands), | |
Series2014-01A, Class AR2, 144A, 3 Month LIBOR + 1.260% (Cap N/A, Floor 0.000%) | |
3.261%(c) | | | 07/16/29 | | | | | | | | 500 | | | | 498,760 | |
Atrium (Cayman Islands), | |
Series 12A, Class AR, 144A, 3 Month LIBOR + 0.830% (Cap N/A, Floor 0.000%) | |
2.783%(c) | | | 04/22/27 | | | | | | | | 8,250 | | | | 8,239,542 | |
Ballyrock CLO Ltd. (Cayman Islands), | |
Series2016-01A, Class AR, 144A, 3 Month LIBOR + 1.350% (Cap N/A, Floor 1.350%) | |
3.351%(c) | | | 10/15/28 | | | | | | | | 2,500 | | | | 2,501,997 | |
Battalion CLO Ltd., | |
Series2018-12A, Class A1, 144A, 3 Month LIBOR + 1.070% (Cap N/A, Floor 1.070%) | |
2.974%(c) | | | 05/17/31 | | | | | | | | 3,000 | | | | 2,968,033 | |
Benefit Street Partners CLO Ltd. (Cayman Islands), | |
Series2017-12A, Class A1, 144A, 3 Month LIBOR + 1.250% (Cap N/A, Floor 0.000%) | |
3.251%(c) | | | 10/15/30 | | | | | | | | 4,500 | | | | 4,492,238 | |
Series2019-18A, Class A, 144A, 3 Month LIBOR + 1.340% (Cap N/A, Floor 1.340%) | |
3.249%(c) | | | 10/15/32 | | | | | | | | 2,500 | | | | 2,500,083 | |
Brookside Mill CLO Ltd. (Cayman Islands), | |
Series2013-01A, Class BR, 144A, 3 Month LIBOR + 1.350% (Cap N/A, Floor 0.000%) | |
3.352%(c) | | | 01/17/28 | | | | | | | | 2,500 | | | | 2,453,125 | |
| | | | | | | | | | | | | | | | |
Interest
Rate | | Maturity
Date | | | | | | Principal
Amount
(000)# | | | Value | |
|
| ASSET-BACKED SECURITIES (continued) | |
Collateralized Loan Obligations (continued) | |
Carlyle US CLO Ltd. (Cayman Islands), | |
Series2017-04A, Class A1, 144A, 3 Month LIBOR + 1.180% (Cap N/A, Floor 0.000%) | |
3.181%(c) | | | 01/15/30 | | | | | | | | 4,000 | | | $ | 3,994,073 | |
Catamaran CLO Ltd. (Cayman Islands), | |
Series2014-01A, Class A1AR, 144A, 3 Month LIBOR + 1.260% (Cap N/A, Floor 0.000%) | |
3.213%(c) | | | 04/22/30 | | | | | | | | 7,750 | | | | 7,737,942 | |
CIFC Funding Ltd. (Cayman Islands), | |
Series 2013-03RA, Class A1, 144A, 3 Month LIBOR + 0.980% (Cap N/A, Floor 0.980%) | |
2.916%(c) | | | 04/24/31 | | | | | | | | 1,500 | | | | 1,486,048 | |
Series2015-01A, Class ARR, 144A, 3 Month LIBOR + 1.110% (Cap N/A, Floor 1.110%) | |
3.063%(c) | | | 01/22/31 | | | | | | | | 3,750 | | | | 3,738,043 | |
Series2015-03A, Class AR, 144A, 3 Month LIBOR + 0.870% (CAP N/A, Floor 0.000%) | |
2.836%(c) | | | 04/19/29 | | | | | | | | 5,000 | | | | 4,950,609 | |
Elevation CLO Ltd. (Cayman Islands), | |
Series2014-02A, Class A1R, 144A, 3 Month LIBOR + 1.230% (Cap N/A, Floor 0.000%) | |
3.231%(c) | | | 10/15/29 | | | | | | | | 7,500 | | | | 7,507,225 | |
Series2017-07A, Class A, 144A, 3 Month LIBOR + 1.220% (Cap N/A, Floor 0.000%) | |
3.221%(c) | | | 07/15/30 | | | | | | | | 5,250 | | | | 5,235,989 | |
Greenwood Park CLO Ltd. (Cayman Islands), | |
Series2018-01A, Class A2, 144A, 3 Month LIBOR + 1.010% (Cap N/A, Floor 0.000%) | |
3.011%(c) | | | 04/15/31 | | | | | | | | 6,000 | | | | 5,964,704 | |
Greywolf CLO Ltd. (Cayman Islands), | |
Series2018-01A, Class A1, 144A, 3 Month LIBOR + 1.030% (Cap N/A, Floor 0.000%) | |
2.966%(c) | | | 04/26/31 | | | | | | | | 3,500 | | | | 3,469,341 | |
Highbridge Loan Management Ltd. (Cayman Islands), | |
Series2015-06A, Class A1R, 144A, 3 Month LIBOR + 1.000% (Cap N/A, Floor 0.000%) | |
2.891%(c) | | | 02/05/31 | | | | | | | | 4,000 | | | | 3,973,815 | |
HPS Loan Management Ltd. (Cayman Islands), | |
Series15A-19, Class A1, 144A, 3 Month LIBOR + 1.320% (Cap N/A, Floor 1.320%) | |
3.486%(c) | | | 07/22/32 | | | | | | | | 4,000 | | | | 4,004,392 | |
ICG US CLO Ltd. (Cayman Islands), | |
Series2014-03A, Class A1RR, 144A, 3 Month LIBOR + 1.030% (Cap N/A, Floor 0.000%) | |
2.970%(c) | | | 04/25/31 | | | | | | | | 2,500 | | | | 2,468,651 | |
Series2017-02A, Class A1, 144A, 3 Month LIBOR + 1.280% (Cap N/A, Floor 0.000%) | |
3.214%(c) | | | 10/23/29 | | | | | | | | 1,250 | | | | 1,250,133 | |
Madison Park Funding Ltd. (Cayman Islands), | |
Series2016-21A, Class A1AR, 144A, 3 Month LIBOR + 1.350% (Cap N/A, Floor 1.350%) | |
3.290%(c) | | | 10/15/32 | | | | | | | | 3,500 | | | | 3,500,570 | |
Mariner CLO Ltd. (Cayman Islands), | |
Series2018-05A, Class A, 144A, 3 Month LIBOR + 1.110% (Cap N/A, Floor 1.110%) | |
3.050%(c) | | | 04/25/31 | | | | | | | | 5,750 | | | | 5,729,287 | |
SEE NOTES TO FINANCIAL STATEMENTS.
A38
| | | | | | |
| | |
| | DIVERSIFIED BOND PORTFOLIO (continued) | | |
| | | | | | |
| |
| SCHEDULE OF INVESTMENTS | | as of December 31, 2019 |
| | | | | | | | | | | | | | | | |
Interest
Rate | | Maturity
Date | | | | | | Principal
Amount
(000)# | | | Value | |
|
| ASSET-BACKED SECURITIES (continued) | |
Collateralized Loan Obligations (continued) | |
MidOcean Credit CLO (Cayman Islands), | |
Series2014-03A, Class A1R, 144A, 3 Month LIBOR + 1.120% (Cap N/A, Floor 1.120%) | |
3.086%(c) | | | 04/21/31 | | | | | | | | 9,750 | | | $ | 9,602,245 | |
Series2018-08A, Class A1, 144A, 3 Month LIBOR + 1.150% (Cap N/A, Floor 0.000%) | |
3.049%(c) | | | 02/20/31 | | | | | | | | 4,000 | | | | 3,967,982 | |
Mountain View CLO LLC (Cayman Islands), | |
Series2017-02A, Class A, 144A, 3 Month LIBOR + 1.210% (Cap N/A, Floor 0.000%) | |
3.211%(c) | | | 01/16/31 | | | | | | | | 4,000 | | | | 3,956,155 | |
Mountain View CLO Ltd. (Cayman Islands), | |
Series2013-01A, Class AR, 144A, 3 Month LIBOR + 1.250% (Cap N/A, Floor 0.000%) | |
3.251%(c) | | | 10/12/30 | | | | | | | | 8,000 | | | | 7,917,467 | |
Series2015-09A, Class A1R, 144A, 3 Month LIBOR + 1.120% (Cap N/A, Floor 0.000%) | |
3.121%(c) | | | 07/15/31 | | | | | | | | 6,000 | | | | 5,899,723 | |
Neuberger Berman CLO Ltd. (Cayman Islands), | |
Series 2017-16SA, Class A, 144A, 3 Month LIBOR + 0.850% (Cap N/A, Floor 0.000%) | |
2.851%(c) | | | 01/15/28 | | | | | | | | 3,000 | | | | 2,999,984 | |
OCP CLO Ltd. (Cayman Islands), | |
Series2017-13A, Class A1A, 144A, 3 Month LIBOR + 1.260% (Cap N/A, Floor 0.000%) | |
3.261%(c) | | | 07/15/30 | | | | | | | | 750 | | | | 750,018 | |
OZLM Ltd. (Cayman Islands), | |
Series2014-09A, Class A1AR, 144A, 3 Month LIBOR + 1.280% (CAP N/A, Floor 1.280%) | |
3.246%(c) | | | 10/20/31 | | | | | | | | 2,750 | | | | 2,732,275 | |
Series2015-11A, Class A1R, 144A, 3 Month LIBOR + 1.250% (Cap N/A, Floor 0.000%) | |
3.186%(c) | | | 10/30/30 | | | | | | | | 1,250 | | | | 1,247,079 | |
Series2019-24A, Class A1A, 144A, 3 Month LIBOR + 1.390% (Cap N/A, Floor 0.000%) | |
3.546%(c) | | | 07/20/32 | | | | | | | | 4,000 | | | | 3,999,426 | |
Palmer Square CLO Ltd. (Cayman Islands), | |
Series2014-01A, Class A1R2, 144A, 3 Month LIBOR + 1.130% (Cap N/A, Floor 1.130%) | |
3.132%(c) | | | 01/17/31 | | | | | | | | 4,000 | | | | 3,992,241 | |
Series2015-02A, Class A1AR, 144A, 3 Month LIBOR + 1.270% (Cap N/A, Floor 0.000%) | |
3.236%(c) | | | 07/20/30 | | | | | | | | 1,000 | | | | 1,001,429 | |
Park Avenue Institutional Advisers CLO Ltd. (Cayman Islands), | |
Series2017-01A, Class A1, 144A, 3 Month LIBOR + 1.220% (Cap N/A, Floor 0.000%) | |
3.129%(c) | | | 11/14/29 | | | | | | | | 3,500 | | | | 3,501,157 | |
RomarkWM-R Ltd. (Cayman Islands), | |
Series2018-01A, Class A1, 144A, 3 Month LIBOR + 1.030% (Cap N/A, Floor 0.000%) | |
2.996%(c) | | | 04/20/31 | | | | | | | | 4,000 | | | | 3,953,027 | |
Shackleton CLO Ltd. (Cayman Islands), | |
Series 2014-05RA, Class A, 144A, 3 Month LIBOR + 1.100% (Cap N/A, Floor 0.000%) | |
2.994%(c) | | | 05/07/31 | | | | | | | | 4,955 | | | | 4,900,269 | |
| | | | | | | | | | | | | | | | |
Interest
Rate | | Maturity
Date | | | | | | Principal
Amount
(000)# | | | Value | |
|
| ASSET-BACKED SECURITIES (continued) | |
Collateralized Loan Obligations (continued) | |
Sound Point CLO Ltd. (Cayman Islands), | |
Series2013-01A, Class A1R, 144A, 3 Month LIBOR + 1.070% (Cap N/A, Floor 1.070%) | |
3.006%(c) | | | 01/26/31 | | | | | | | | 3,500 | | | $ | 3,443,114 | |
Series2017-03A, Class A1A, 144A, 3 Month LIBOR + 1.220% (Cap N/A, Floor 0.000%) | |
3.186%(c) | | | 10/20/30 | | | | | | | | 5,750 | | | | 5,716,520 | |
Telos CLO Ltd. (Cayman Islands), | |
Series2013-04A, Class AR, 144A, 3 Month LIBOR + 1.240% (CAP N/A, Floor 0.000%) | |
3.242%(c) | | | 01/17/30 | | | | | | | | 3,500 | | | | 3,477,673 | |
TICP CLO Ltd. (Cayman Islands), | |
Series2015-01A, Class BR, 144A, 3 Month LIBOR + 1.300% (Cap N/A, Floor 0.000%) | |
3.266%(c) | | | 07/20/27 | | | | | | | | 6,000 | | | | 5,878,512 | |
Series2017-09A, Class A, 144A, 3 Month LIBOR + 1.140% (Cap N/A, Floor 0.000%) | |
3.106%(c) | | | 01/20/31 | | | | | | | | 3,000 | | | | 2,994,859 | |
Trinitas CLO Ltd. (Cayman Islands), | |
Series2015-03A, Class BR, 144A, 3 Month LIBOR + 1.400% (Cap N/A, Floor 0.000%) | |
3.401%(c) | | | 07/15/27 | | | | | | | | 5,000 | | | | 4,948,961 | |
Series2017-07A, Class A, 144A, 3 Month LIBOR + 1.210% (Cap N/A, Floor 0.000%) | |
3.150%(c) | | | 01/25/31 | | | | | | | | 4,000 | | | | 3,974,626 | |
Series2017-07A, Class B, 144A, 3 Month LIBOR + 1.600% (Cap N/A, Floor 0.000%) | |
3.540%(c) | | | 01/25/31 | | | | | | | | 1,500 | | | | 1,466,067 | |
Venture CLO Ltd. (Cayman Islands), | |
Series2015-21A, Class AR, 144A, 3 Month LIBOR + 0.880% (Cap N/A, Floor 0.000%) | |
2.881%(c) | | | 07/15/27 | | | | | | | | 4,797 | | | | 4,788,720 | |
Voya CLO Ltd. (Cayman Islands), | |
Series2013-01A, Class A1AR, 144A, 3 Month LIBOR + 1.210% (Cap N/A, Floor 0.000%) | |
3.211%(c) | | | 10/15/30 | | | | | | | | 7,500 | | | | 7,472,522 | |
Series2013-02A, Class A1R, 144A, 3 Month LIBOR + 0.970% (Cap N/A, Floor 0.970%) | |
2.910%(c) | | | 04/25/31 | | | | | | | | 3,000 | | | | 2,965,353 | |
Wellfleet CLO Ltd. (Cayman Islands), | |
Series2017-02A, Class A1, 144A, 3 Month LIBOR + 1.250% (Cap N/A, Floor 0.000%) | |
3.216%(c) | | | 10/20/29 | | | | | | | | 1,000 | | | | 999,906 | |
Series2017-03A, Class A1, 144A, 3 Month LIBOR + 1.150% (Cap N/A, Floor 1.150%) | |
3.152%(c) | | | 01/17/31 | | | | | | | | 6,500 | | | | 6,475,981 | |
Series2018-02A, Class A1, 144A, 3 Month LIBOR + 1.200% (Cap N/A, Floor 1.200%) | |
3.166%(c) | | | 10/20/31 | | | | | | | | 2,750 | | | | 2,738,817 | |
York CLO Ltd. (Cayman Islands), | |
Series2015-01A, Class AR, 144A, 3 Month LIBOR + 1.150% (Cap N/A, Floor 0.000%) | |
3.103%(c) | | | 01/22/31 | | | | | | | | 2,000 | | | | 1,995,584 | |
Zais CLO Ltd. (Cayman Islands), | |
Series2017-01A, Class A1, 144A, 3 Month LIBOR + 1.370% (Cap N/A, Floor 0.000%) | |
3.371%(c) | | | 07/15/29 | | | | | | | | 1,000 | | | | 988,859 | |
SEE NOTES TO FINANCIAL STATEMENTS.
A39
| | | | | | |
| | |
| | DIVERSIFIED BOND PORTFOLIO (continued) | | |
| | | | | | |
| |
| SCHEDULE OF INVESTMENTS | | as of December 31, 2019 |
| | | | | | | | | | | | | | | | |
Interest
Rate | | Maturity
Date | | | | | | Principal
Amount
(000)# | | | Value | |
|
| ASSET-BACKED SECURITIES (continued) | |
Collateralized Loan Obligations (continued) | |
Series2018-01A, Class A, 144A, 3 Month LIBOR + 0.950% (Cap N/A, Floor 0.000%) | |
2.951%(c) | | | 04/15/29 | | | | | | | | 8,500 | | | $ | 8,455,411 | |
| | | | | | | | | | | | | | | | |
| | | | | | | | | | | | | | | 225,112,350 | |
| | | | | | | | | | | | | | | | |
Consumer Loans — 1.7% | |
Lendmark Funding Trust, | |
Series2018-02A, Class A, 144A | |
4.230% | | | 04/20/27 | | | | | | | | 1,400 | | | | 1,438,713 | |
Series2019-01A, Class A, 144A | |
3.000% | | | 12/20/27 | | | | | | | | 2,100 | | | | 2,099,162 | |
Series2019-02A, Class A, 144A | |
2.780% | | | 04/20/28 | | | | | | | | 1,000 | | | | 995,729 | |
Mariner Finance Issuance Trust, | |
Series2019-AA, Class A, 144A | |
2.960% | | | 07/20/32 | | | | | | | | 700 | | | | 697,603 | |
OneMain Financial Issuance Trust, | |
Series2016-01A, Class A, 144A | |
3.660% | | | 02/20/29 | | | | | | | | 380 | | | | 380,558 | |
Series2017-01A, Class B, 144A | |
2.790% | | | 09/14/32 | | | | | | | | 500 | | | | 499,475 | |
Series2017-01A, Class C, 144A | |
3.350% | | | 09/14/32 | | | | | | | | 500 | | | | 501,092 | |
Series2018-01A, Class A, 144A | |
3.300% | | | 03/14/29 | | | | | | | | 930 | | | | 943,577 | |
Oportun Funding LLC, | |
Series2017-A, Class A, 144A | |
3.230% | | | 06/08/23 | | | | | | | | 1,250 | | | | 1,253,276 | |
Series2017-B, Class A, 144A | |
3.220% | | | 10/10/23 | | | | | | | | 3,000 | | | | 3,009,474 | |
Series2018-A, Class A, 144A | |
3.610% | | | 03/08/24 | | | | | | | | 1,140 | | | | 1,151,046 | |
Series2018-B, Class A, 144A | |
3.910% | | | 07/08/24 | | | | | | | | 1,200 | | | | 1,218,927 | |
Series2018-B, Class C, 144A | |
5.430% | | | 07/08/24 | | | | | | | | 500 | | | | 511,168 | |
Series2018-C, Class A, 144A | |
4.100% | | | 10/08/24 | | | | | | | | 1,400 | | | | 1,428,702 | |
Series2018-D, Class A, 144A | |
4.150% | | | 12/09/24 | | | | | | | | 1,000 | | | | 1,021,360 | |
Series2019-A, Class A, 144A | |
3.080% | | | 08/08/25 | | | | | | | | 1,400 | | | | 1,399,809 | |
PNMAC GMSR Issuer Trust, | |
Series 2018-GT01, Class A, 144A, 1 Month LIBOR + 2.850% (Cap N/A, Floor 2.850%) | |
4.642%(c) | | | 02/25/23 | | | | | | | | 740 | | | | 744,366 | |
Series 2018-GT02, Class A, 144A, 1 Month LIBOR + 2.650% (Cap N/A, Floor 0.000%) | |
4.442%(c) | | | 08/25/25 | | | | | | | | 1,200 | | | | 1,204,073 | |
| | | | | | | | | | | | | | | | |
| | | | | | | | | | | | | | | 20,498,110 | |
| | | | | | | | | | | | | | | | |
Credit Cards — 0.2% | |
Citibank Credit Card Issuance Trust, | |
Series2018-A07, Class A7 | |
3.960% | | | 10/13/30 | | | | | | | | 2,500 | | | | 2,769,116 | |
| | | | | | | | | | | | | | | | |
| | | | | | | | | | | | | | | | |
Interest
Rate | | Maturity
Date | | | | | | Principal
Amount
(000)# | | | Value | |
|
| ASSET-BACKED SECURITIES (continued) | |
Home Equity Loans — 0.4% | | | | | |
Ameriquest Mortgage Securities, Inc., Asset-Backed Pass-Through Certificates, | |
Series 2003-AR01, Class M3, 1 Month LIBOR + 4.500% (Cap N/A, Floor 3.000%) | |
3.885%(c) | | | 01/25/33 | | | | | | | | 1,330 | | | $ | 1,330,851 | |
Asset-Backed Securities Corp. Home Equity Loan Trust, | |
Series 2003-HE03, Class M1, 1 Month LIBOR + 1.245% (Cap N/A, Floor 0.830%) | |
2.985%(c) | | | 06/15/33 | | | | | | | | 684 | | | | 684,465 | |
Centex Home Equity Loan Trust, | |
Series2004-B, Class AF6 | |
4.686% | | | 03/25/34 | | | | | | | | 174 | | | | 174,058 | |
Floating Rate Mortgage Pass-Through Certificates, | |
Series2001-02, Class M3, 1 Month LIBOR + 2.925% (Cap N/A, Floor 1.950%) | |
4.717%(c) | | | 10/25/31 | | | | | | | | 226 | | | | 238,518 | |
Merrill Lynch Mortgage Investors Trust, | |
Series 2004-HE02, Class M1, 1 Month LIBOR + 1.200% (Cap N/A, Floor 0.800%) | |
2.992%(c) | | | 08/25/35 | | | | | | | | 183 | | | | 182,941 | |
Morgan Stanley ABS Capital I, Inc. Trust, | |
Series 2003-HE03, Class M1, 1 Month LIBOR + 1.020% (Cap N/A, Floor 0.680%) | |
2.812%(c) | | | 10/25/33 | | | | | | | | 322 | | | | 320,514 | |
Residential Asset Securities Trust, | |
Series 2004-KS01, Class AI5 | |
5.721%(cc) | | | 02/25/34 | | | | | | | | 444 | | | | 444,182 | |
Securitized Asset-Backed Receivables LLC Trust, | |
Series 2004-NC01, Class M1, 1 Month LIBOR + 0.780% (Cap N/A, Floor 0.520%) | |
2.572%(c) | | | 02/25/34 | | | | | | | | 1,531 | | | | 1,504,450 | |
| | | | | | | | | | | | | | | | |
| | | | | | | | | | | | | | | 4,879,979 | |
| | | | | | | | | | | | | | | | |
Other — 0.0% | |
PNMAC FMSR Issuer Trust, | |
Series 2018-FT01, Class A, 144A, 1 Month LIBOR + 2.350% (Cap N/A, Floor 0.000%) | |
4.142%(c) | | | 04/25/23 | | | | | | | | 120 | | | | 120,127 | |
TH MSR Issuer Trust, | |
Series 2019-FT01, Class A, 144A, 1 Month LIBOR + 2.800% (Cap N/A, Floor 2.800%) | |
4.592%(c) | | | 06/25/24 | | | | | | | | 140 | | | | 139,303 | |
| | | | | | | | | | | | | | | | |
| | | | | | | | | | | | | | | 259,430 | |
| | | | | | | | | | | | | | | | |
Residential Mortgage-Backed Securities — 1.8% | |
Ameriquest Mortgage Securities, Inc., Asset-Backed Pass-Through Certificates, | |
Series2004-R08, Class M1, 1 Month LIBOR + 0.960% (Cap N/A, Floor 0.640%) | |
2.752%(c) | | | 09/25/34 | | | | | | | | 46 | | | | 46,194 | |
Argent Securities, Inc. Asset-Backed Pass-Through Certificates, | |
Series 2004-W010, Class A2, 1 Month LIBOR + 0.780% (Cap N/A, Floor 0.390%) | |
2.572%(c) | | | 10/25/34 | | | | | | | | 969 | | | | 954,856 | |
Credit Suisse Mortgage Trust, | |
Series 2018-RPL08, Class A1, 144A | |
4.125%(cc) | | | 07/25/58 | | | | | | | | 1,317 | | | | 1,325,325 | |
SEE NOTES TO FINANCIAL STATEMENTS.
A40
| | | | | | |
| | |
| | DIVERSIFIED BOND PORTFOLIO (continued) | | |
| | | | | | |
| |
| SCHEDULE OF INVESTMENTS | | as of December 31, 2019 |
| | | | | | | | | | | | |
Interest
Rate | | Maturity
Date | | | Principal
Amount
(000)# | | | Value | |
|
| ASSET-BACKED SECURITIES (continued) | |
Residential Mortgage-Backed Securities (continued) | |
Legacy Mortgage Asset Trust, | |
Series 2017-RPL01, Class A, 144A, 1 Month LIBOR + 1.750% (Cap N/A, Floor 1.750%) | |
3.555%(c) | | | 01/28/70 | | | | 543 | | | $ | 548,837 | |
Series 2019-GS01, Class A1, 144A | |
4.000% | | | 01/25/59 | | | | 942 | | | | 950,573 | |
Series 2019-GS02, Class A1, 144A | |
3.750% | | | 01/25/59 | | | | 973 | | | | 982,137 | |
Series 2019-GS03, Class A1, 144A | |
3.750% | | | 04/25/59 | | | | 460 | | | | 463,852 | |
Series 2019-GS04, Class A1, 144A | |
3.438% | | | 05/25/59 | | | | 1,507 | | | | 1,513,719 | |
Series 2019-SL01, Class A, 144A | |
4.000%(cc) | | | 12/28/54 | | | | 603 | | | | 606,979 | |
Merrill Lynch Mortgage Investors Trust, | |
Series 2004-OPT01, Class A1A, 1 Month LIBOR + 0.520% (Cap N/A, Floor 0.260%) | |
2.312%(c) | | | 06/25/35 | | | | 579 | | | | 574,271 | |
Structured Asset Investment Loan Trust, | |
Series2004-07, Class A8, 1 Month LIBOR + 1.200% (Cap N/A, Floor 0.600%) | |
2.992%(c) | | | 08/25/34 | | | | 1,400 | | | | 1,386,944 | |
TFS (Spain), | |
Series2018-03, Class A1, 1 Month EURIBOR + 2.900% | |
2.900%(c) | | | 03/16/23 | | | EUR | 3,958 | | | | 4,430,568 | |
Towd Point Mortgage Trust, | |
Series2017-04, Class A1, 144A | |
2.750%(cc) | | | 06/25/57 | | | | 2,004 | | | | 2,014,880 | |
Series2017-06, Class A1, 144A | |
2.750%(cc) | | | 10/25/57 | | | | 2,265 | | | | 2,277,741 | |
Series2018-02, Class A1, 144A | |
3.250%(cc) | | | 03/25/58 | | | | 356 | | | | 362,275 | |
Series2018-03, Class A1, 144A | |
3.750%(cc) | | | 05/25/58 | | | | 165 | | | | 170,355 | |
Series2018-05, Class A1, 144A | |
3.250%(cc) | | | 07/25/58 | | | | 505 | | | | 515,017 | |
Series2018-06, Class A1A, 144A | |
3.750%(cc) | | | 03/25/58 | | | | 1,803 | | | | 1,854,580 | |
| | | | | | | | | | | | |
| | | | | | | | | | | 20,979,103 | |
| | | | | | | | | | | | |
Student Loans — 2.6% | |
Earnest Student Loan Program LLC, | |
Series2016-D, Class A1, 144A, 1 Month LIBOR + 1.400% (Cap N/A, Floor 1.400%) | |
3.192%(c) | | | 01/25/41 | | | | 107 | | | | 108,219 | |
Laurel Road Prime Student Loan Trust, | |
Series2018-A, Class A, 144A | |
—%(p) | | | 02/25/43 | | | | 2,980 | | | | 3,129,889 | |
Series2018-C, Class A, 144A | |
—%(p) | | | 08/25/43 | | | | 2,882 | | | | 2,933,764 | |
Series2018-D, Class A, 144A | |
—%(p) | | | 11/25/43 | | | | 2,916 | | | | 2,994,081 | |
Series2019-A, Class R, 144A | |
—%(p) | | | 10/25/48 | | | | 5,500 | | | | 401,088 | |
SoFi Alternative Trust, | |
Series2019-B, Class PT, 144A | |
—%(p) | | | 12/15/45 | | | | 6,471 | | | | 6,608,288 | |
| | | | | | | | | | | | |
Interest
Rate | | Maturity
Date | | | Principal
Amount
(000)# | | | Value | |
|
| ASSET-BACKED SECURITIES (continued) | |
Student Loans (continued) | |
Series2019-D, Class 1PT, 144A | |
2.460%(cc) | | | 01/16/46 | | | | 5,847 | | | $ | 5,990,921 | |
Series2019-F, Class PT1, 144A | |
1.870%(cc) | | | 02/15/45 | | | | 5,000 | | | | 5,023,000 | |
SoFi RR Funding Trust, | |
Series2019-01, Class A, 144A, 1 Month LIBOR + 1.250% (Cap N/A, Floor 1.250%) | |
2.953%(c) | | | 11/29/24 | | | | 3,495 | | | | 3,492,455 | |
| | | | | | | | | | | | |
| | | | | | | | | | | 30,681,705 | |
| | | | | | | | | | | | |
TOTAL ASSET-BACKED SECURITIES
(cost $315,362,005) | | | | 315,995,219 | |
| | | | | | | | | | | | |
|
| BANK LOANS — 0.6% | |
Computers — 0.1% | |
McAfee LLC, | |
Second Lien Initial Loan, 3 Month LIBOR + 8.500% | |
10.305%(c) | | | 09/29/25 | | | | 438 | | | | 439,414 | |
Term B USD Loan, 1 Month LIBOR + 3.750% | |
5.555%(c) | | | 09/30/24 | | | | 522 | | | | 524,198 | |
| | | | | | | | | | | | |
| | | | | | | | | | | 963,612 | |
| | | | | | | | | | | | |
Foods — 0.2% | |
Sigma Bidco BV (Netherlands), | |
FacilityB-4 Loan, 1 Month GBP LIBOR + 4.000% | |
4.704%(c) | | | 07/02/25 | | | GBP | 1,550 | | | | 2,031,498 | |
| | | | | | | | | | | | |
Healthcare-Products — 0.0% | |
Avantor, Inc. (United Kingdom), | |
InitialB-2 Euro Term Loan, 1 Month EURIBOR + 3.250% | |
3.250%(c) | | | 11/21/24 | | | EUR | 157 | | | | 178,438 | |
| | | | | | | | | | | | |
Oil & Gas — 0.1% | |
Chesapeake Energy Corp., | |
Class A Loan, 3 Month LIBOR + 8.000% | |
9.928%(c) | | | 05/23/24 | | | | 1,525 | | | | 1,566,938 | |
| | | | | | | | | | | | |
Pharmaceuticals — 0.1% | |
Nidda Healthcare Holding AG (Germany), | |
Facility C GBP, 3 Month GBP LIBOR + 4.500% | |
5.298%(c) | | | 08/21/24 | | | GBP | 1,000 | | | | 1,329,015 | |
| | | | | | | | | | | | |
Retail — 0.1% | |
EG America LLC (United Kingdom), | |
Second Lien Facility (USD), 3 Month LIBOR + 8.000% | |
9.961%(c) | | | 04/20/26^ | | | | 665 | | | | 631,329 | |
EG Finco Ltd. (United Kingdom), | |
Second Lien Term Loan, 3 Month EURIBOR + 7.750% | |
8.750%(c) | | | 04/20/26^ | | | EUR | 374 | | | | 419,805 | |
| | | | | | | | | | | | |
| | | | | | | | | | | 1,051,134 | |
| | | | | | | | | | | | |
TOTAL BANK LOANS
(cost $7,225,539) | | | | 7,120,635 | |
| | | | | | | | | | | | |
|
| COMMERCIAL MORTGAGE-BACKED SECURITIES — 14.7% | |
Banc of America Commercial Mortgage Trust, | |
Series 2016-UB10, Class A3 | |
2.903% | | | 07/15/49 | | | | 2,300 | | | | 2,348,343 | |
SEE NOTES TO FINANCIAL STATEMENTS.
A41
| | | | | | |
| | |
| | DIVERSIFIED BOND PORTFOLIO (continued) | | |
| | | | | | |
| |
| SCHEDULE OF INVESTMENTS | | as of December 31, 2019 |
| | | | | | | | | | | | | | | | |
Interest
Rate | | Maturity
Date | | | | | | Principal
Amount
(000)# | | | Value | |
|
| COMMERCIAL MORTGAGE-BACKED SECURITIES (continued) | |
BANK, | |
Series 2017-BNK05, Class A4 | |
3.131% | | | 06/15/60 | | | | | | | | 4,400 | | | $ | 4,573,204 | |
Series 2017-BNK06, Class A4 | |
3.254% | | | 07/15/60 | | | | | | | | 3,300 | | | | 3,456,019 | |
Series 2017-BNK08, Class A3 | |
3.229% | | | 11/15/50 | | | | | | | | 1,950 | | | | 2,038,960 | |
Series 2019-BN18, Class A3 | |
3.325% | | | 05/15/62 | | | | | | | | 1,500 | | | | 1,580,288 | |
BBCMS Mortgage Trust, | |
Series2016-ETC, Class A, 144A | |
2.937% | | | 08/14/36 | | | | | | | | 1,170 | | | | 1,177,016 | |
Series2016-ETC, Class B, 144A | |
3.189% | | | 08/14/36 | | | | | | | | 510 | | | | 505,963 | |
Series2016-ETC, Class C, 144A | |
3.391% | | | 08/14/36 | | | | | | | | 430 | | | | 424,503 | |
Series2016-ETC, Class D, 144A | |
3.609%(cc) | | | 08/14/36 | | | | | | | | 1,560 | | | | 1,539,012 | |
Benchmark Mortgage Trust, | |
Series2019-B09, Class A4 | |
3.751% | | | 03/15/52 | | | | | | | | 3,400 | | | | 3,692,411 | |
BX Commercial Mortgage Trust, | |
Series2019-XL, Class G, 144A, 1 Month LIBOR + 2.300% (Cap N/A, Floor 2.300%) | |
4.040%(c) | | | 10/15/36 | | | | | | | | 1,600 | | | | 1,602,314 | |
Cantor Commercial Real Estate Lending, | |
Series 2019-CF01, Class A5 | |
3.786% | | | 05/15/52 | | | | | | | | 4,000 | | | | 4,349,387 | |
Series 2019-CF02, Class A3 | |
2.647% | | | 11/15/52 | | | | | | | | 7,700 | | | | 7,701,910 | |
CD Mortgage Trust, | |
Series 2017-CD05, Class A3 | |
3.171% | | | 08/15/50 | | | | | | | | 3,500 | | | | 3,637,404 | |
Citigroup Commercial Mortgage Trust, | |
Series 2016-GC37, Class A4 | |
3.314% | | | 04/10/49 | | | | | | | | 1,600 | | | | 1,674,053 | |
CityLine Commercial Mortgage Trust, | |
Series 2016-CLNE, Class B, 144A | |
2.778%(cc) | | | 11/10/31 | | | | | | | | 2,400 | | | | 2,405,365 | |
Series 2016-CLNE, Class C, 144A | |
2.778%(cc) | | | 11/10/31 | | | | | | | | 900 | | | | 894,233 | |
Commercial Mortgage Trust, | |
Series 2014-UBS04, Class A4 | |
3.420% | | | 08/10/47 | | | | | | | | 3,200 | | | | 3,333,872 | |
Series 2014-UBS05, Class A4 | |
3.838% | | | 09/10/47 | | | | | | | | 3,600 | | | | 3,828,511 | |
Series 2015-DC01, Class A4 | |
3.078% | | | 02/10/48 | | | | | | | | 5,000 | | | | 5,149,958 | |
Series 2015-LC21, Class A4 | |
3.708% | | | 07/10/48 | | | | | | | | 820 | | | | 870,676 | |
Series 2015-PC01, Class A5 | |
3.902% | | | 07/10/50 | | | | | | | | 1,570 | | | | 1,674,266 | |
Series 2016-COR01, Class A3 | |
2.826% | | | 10/10/49 | | | | | | | | 2,500 | | | | 2,542,868 | |
Series 2016-DC02, Class A5 | |
3.765% | | | 02/10/49 | | | | | | | | 240 | | | | 256,164 | |
| | | | | | | | | | | | | | | | |
Interest
Rate | | Maturity
Date | | | | | | Principal
Amount
(000)# | | | Value | |
|
| COMMERCIAL MORTGAGE-BACKED SECURITIES (continued) | |
Series 2017-COR02, Class A2 | |
3.239% | | | 09/10/50 | | | | | | | | 4,500 | | | $ | 4,691,043 | |
Credit Suisse Mortgage Capital Certificates, | |
Series 2019-ICE04, Class E, 144A, 1 Month LIBOR + 2.150% (Cap N/A, Floor 2.150%) | |
3.890%(c) | | | 05/15/36 | | | | | | | | 2,600 | | | | 2,603,335 | |
CSAIL Commercial Mortgage Trust, | |
Series2019-C16, Class A2 | |
3.067% | | | 06/15/52 | | | | | | | | 1,200 | | | | 1,234,617 | |
DBJPM Mortgage Trust, | |
Series2017-C06, Class A4 | |
3.071% | | | 06/10/50 | | | | | | | | 2,800 | | | | 2,890,841 | |
DBWF Mortgage Trust, | |
Series2016-85T, Class D, 144A | |
3.808%(cc) | | | 12/10/36 | | | | | | | | 1,400 | | | | 1,441,187 | |
Eleven Madison Mortgage Trust, | |
Series 2015-11MD, Class C, 144A | |
3.555%(cc) | | | 09/10/35 | | | | | | | | 3,000 | | | | 3,108,700 | |
FHLMC Multifamily Structured Pass-Through Certificates, | |
Series K008, Class X1, IO | |
1.479%(cc) | | | 06/25/20 | | | | | | | | 7,110 | | | | 9,411 | |
Series K020, Class X1, IO | |
1.373%(cc) | | | 05/25/22 | | | | | | | | 25,338 | | | | 639,436 | |
Series K021, Class X1, IO | |
1.425%(cc) | | | 06/25/22 | | | | | | | | 14,729 | | | | 404,042 | |
Series K025, Class X1, IO | |
0.820%(cc) | | | 10/25/22 | | | | | | | | 10,002 | | | | 183,990 | |
Series K027, Class X1, IO | |
0.760%(cc) | | | 01/25/23 | | | | | | | | 126,591 | | | | 2,317,253 | |
Series K044, Class X1, IO | |
0.740%(cc) | | | 01/25/25 | | | | | | | | 81,509 | | | | 2,386,629 | |
Series K053, Class X1, IO | |
0.888%(cc) | | | 12/25/25 | | | | | | | | 88,318 | | | | 3,907,754 | |
Series K055, Class X1, IO | |
1.364%(cc) | | | 03/25/26 | | | | | | | | 13,738 | | | | 968,722 | |
GS Mortgage Securities Trust, | |
Series 2015-GC30, Class A3 | |
3.119% | | | 05/10/50 | | | | | | | | 3,025 | | | | 3,123,140 | |
Series 2017-GS06, Class A2 | |
3.164% | | | 05/10/50 | | | | | | | | 3,400 | | | | 3,534,173 | |
Series 2019-GC38, Class A3 | |
3.703% | | | 02/10/52 | | | | | | | | 5,800 | | | | 6,278,998 | |
IMT Trust, | |
Series 2017-APTS, Class AFX, 144A | |
3.478% | | | 06/15/34 | | | | | | | | 310 | | | | 321,553 | |
JPMBB Commercial Mortgage Securities Trust, | |
Series2014-C21, Class A4 | |
3.493% | | | 08/15/47 | | | | | | | | 3,103 | | | | 3,230,919 | |
JPMDB Commercial Mortgage Securities Trust, | |
Series2016-C02, Class A3A | |
2.881% | | | 06/15/49 | | | | | | | | 1,070 | | | | 1,091,288 | |
Series2017-C05, Class A4 | |
3.414% | | | 03/15/50 | | | | | | | | 1,975 | | | | 2,075,212 | |
Series2017-C07, Class A4 | |
3.147% | | | 10/15/50 | | | | | | | | 3,600 | | | | 3,731,654 | |
SEE NOTES TO FINANCIAL STATEMENTS.
A42
| | | | | | |
| | |
| | DIVERSIFIED BOND PORTFOLIO (continued) | | |
| | | | | | |
| |
| SCHEDULE OF INVESTMENTS | | as of December 31, 2019 |
| | | | | | | | | | | | | | | | |
Interest
Rate | | Maturity
Date | | | | | | Principal
Amount
(000)# | | | Value | |
|
| COMMERCIAL MORTGAGE-BACKED SECURITIES (continued) | |
JPMorgan Chase Commercial Mortgage Securities Corp., | |
Series2018-AON, Class E, 144A | |
4.613%(cc) | | | 07/05/31 | | | | | | | | 5,875 | | | $ | 6,065,838 | |
JPMorgan Chase Commercial Mortgage Securities Trust, | |
Series 2016-JP02, Class A3 | |
2.559% | | | 08/15/49 | | | | | | | | 2,900 | | | | 2,908,378 | |
Morgan Stanley Bank of America Merrill Lynch Trust, | |
Series2012-C05, Class XA, IO, 144A | |
1.440%(cc) | | | 08/15/45 | | | | | | | | 36,375 | | | | 1,033,186 | |
Series2013-C08, Class A3 | |
2.863% | | | 12/15/48 | | | | | | | | 1,531 | | | | 1,554,845 | |
Series2013-C10, Class A3 | |
3.966%(cc) | | | 07/15/46 | | | | | | | | 4,545 | | | | 4,785,694 | |
Series2016-C30, Class A5 | |
2.860% | | | 09/15/49 | | | | | | | | 2,000 | | | | 2,034,552 | |
Morgan Stanley Capital I Trust, | |
Series2017-H01, Class A4 | |
3.259% | | | 06/15/50 | | | | | | | | 2,750 | | | | 2,866,145 | |
Series 2017-HR02, Class A3 | |
3.330% | | | 12/15/50 | | | | | | | | 5,500 | | | | 5,781,978 | |
Series2019-L03, Class A3 | |
2.874% | | | 10/15/29 | | | | | | | | 1,200 | | | | 1,213,465 | |
Series 2019-MEAD, Class E, 144A | |
3.177% | | | 11/10/36 | | | | | | | | 575 | | | | 549,027 | |
Shops at Crystals Trust, | |
Series 2016-CSTL, Class A, 144A | |
3.126% | | | 07/05/36 | | | | | | | | 140 | | | | 141,685 | |
UBS Commercial Mortgage Trust, | |
Series2017-C02, Class A3 | |
3.225% | | | 08/15/50 | | | | | | | | 4,400 | | | | 4,574,395 | |
Series2017-C07, Class A3 | |
3.418% | | | 12/15/50 | | | | | | | | 5,600 | | | | 5,917,058 | |
Series2018-C10, Class A3 | |
4.048% | | | 05/15/51 | | | | | | | | 2,200 | | | | 2,430,270 | |
Series2019-C17, Class A3 | |
2.669% | | | 10/15/52 | | | | | | | | 2,000 | | | | 1,991,632 | |
Series2019-C17, Class ASB | |
2.866% | | | 10/15/52 | | | | | | | | 600 | | | | 612,146 | |
UBS-Barclays Commercial Mortgage Trust, | |
Series2013-C05, Class A3 | |
2.920% | | | 03/10/46 | | | | | | | | 2,345 | | | | 2,375,774 | |
Wells Fargo Commercial Mortgage Trust, | |
Series 2014-LC16, Class A4 | |
3.548% | | | 08/15/50 | | | | | | | | 4,300 | | | | 4,455,623 | |
Series 2016-C032, Class A3 | |
3.294% | | | 01/15/59 | | | | | | | | 2,250 | | | | 2,348,028 | |
Series2016-C34, Class A3 | |
2.834% | | | 06/15/49 | | | | | | | | 2,500 | | | | 2,546,087 | |
Series2016-C35, Class A3 | |
2.674% | | | 07/15/48 | | | | | | | | 4,600 | | | | 4,640,089 | |
Series2017-C40, Class A3 | |
3.317% | | | 10/15/50 | | | | | | | | 1,370 | | | | 1,435,645 | |
Series2019-C54, Class A3 | |
2.892% | | | 12/15/52 | | | | | | | | 1,200 | | | | 1,216,556 | |
| | | | | | | | | | | | | | | | |
TOTAL COMMERCIAL MORTGAGE-BACKED SECURITIES
(cost $171,240,916) | | | | 174,908,693 | |
| | | | | | | | | | | | | | | | |
| | | | | | | | | | | | | | | | |
Interest
Rate | | Maturity
Date | | | | | | Principal
Amount
(000)# | | | Value | |
|
| CORPORATE BONDS — 36.6% | |
Aerospace & Defense — 0.7% | |
Boeing Co. (The), | |
Sr. Unsec’d. Notes | |
3.750% | | | 02/01/50 | (a) | | | | | | | 1,670 | | | $ | 1,770,818 | |
Bombardier, Inc. (Canada), | |
Sr. Unsec’d. Notes, 144A | |
7.500% | | | 12/01/24 | | | | | | | | 1,600 | | | | 1,684,056 | |
7.500% | | | 03/15/25 | | | | | | | | 1,250 | | | | 1,289,920 | |
7.875% | | | 04/15/27 | | | | | | | | 1,825 | | | | 1,880,342 | |
United Technologies Corp., | |
Sr. Unsec’d. Notes | |
4.125% | | | 11/16/28 | | | | | | | | 1,115 | | | | 1,254,497 | |
| | | | | | | | | | | | | | | | |
| | | | | | | | | | | | | | | 7,879,633 | |
| | | | | | | | | | | | | | | | |
Agriculture — 0.2% | |
BAT Capital Corp. (United Kingdom), | |
Gtd. Notes | |
3.222% | | | 08/15/24 | | | | | | | | 2,810 | | | | 2,872,220 | |
| | | | | | | | | | | | | | | | |
Airlines — 0.5% | |
American Airlines2016-1 Class AA Pass-Through Trust, Pass-Through Certificates | |
3.575% | | | 07/15/29 | | | | | | | | 1,573 | | | | 1,641,972 | |
Continental Airlines2001-1Class A-1 Pass-Through Trust, Pass-Through Certificates | |
6.703% | | | 12/15/22 | | | | | | | | — | (r) | | | 264 | |
Continental Airlines2007-1 Class A Pass-Through Trust, Pass-Through Certificates | |
5.983% | | | 10/19/23 | | | | | | | | 1,197 | | | | 1,260,077 | |
Continental Airlines2010-1 Class A Pass-Through Trust, Pass-Through Certificates | |
4.750% | | | 07/12/22 | | | | | | | | 237 | | | | 242,186 | |
Delta Air Lines2007-1 Class A Pass-Through Trust, Pass-Through Certificates | |
6.821% | | | 02/10/24 | | | | | | | | 765 | | | | 832,334 | |
Delta Air Lines, Inc., | |
Sr. Unsec’d. Notes | |
2.875% | | | 03/13/20 | | | | | | | | 1,180 | | | | 1,180,932 | |
United Airlines2007-1 Class A Pass-Through Trust, Pass-Through Certificates | |
6.636% | | | 01/02/24 | (a) | | | | | | | 547 | | | | 578,046 | |
| | | | | | | | | | | | | | | | |
| | | | | | | | | | | | | | | 5,735,811 | |
| | | | | | | | | | | | | | | | |
Auto Manufacturers — 1.0% | |
BMW US Capital LLC (Germany), | |
Gtd. Notes, 144A, 3 Month LIBOR + 0.410% | |
2.411%(c) | | | 04/12/21 | | | | | | | | 425 | | | | 425,600 | |
Gtd. Notes, 144A | |
3.100% | | | 04/12/21 | | | | | | | | 570 | | | | 578,482 | |
Daimler Finance North America LLC (Germany), | |
Gtd. Notes, 144A | |
3.100% | | | 05/04/20 | | | | | | | | 1,030 | | | | 1,033,014 | |
3.350% | | | 05/04/21 | | | | | | | | 1,715 | | | | 1,742,434 | |
Ford Motor Co., | |
Sr. Unsec’d. Notes | |
5.291% | | | 12/08/46 | | | | | | | | 290 | | | | 275,448 | |
Ford Motor Credit Co. LLC, | |
Sr. Unsec’d. Notes | |
3.350% | | | 11/01/22 | | | | | | | | 3,800 | | | | 3,840,664 | |
SEE NOTES TO FINANCIAL STATEMENTS.
A43
| | | | | | |
| | |
| | DIVERSIFIED BOND PORTFOLIO (continued) | | |
| | | | | | |
| |
| SCHEDULE OF INVESTMENTS | | as of December 31, 2019 |
| | | | | | | | | | | | |
Interest
Rate | | Maturity
Date | | | Principal
Amount
(000)# | | | Value | |
|
| CORPORATE BONDS (continued) | |
Auto Manufacturers (continued) | |
General Motors Co., | |
Sr. Unsec’d. Notes | |
4.875% | | | 10/02/23 | (a) | | | 1,350 | | | $ | 1,453,056 | |
6.250% | | | 10/02/43 | | | | 1,455 | | | | 1,622,043 | |
6.600% | | | 04/01/36 | | | | 210 | | | | 247,270 | |
General Motors Financial Co., Inc., | |
Gtd. Notes, 3 Month LIBOR + 0.850% | |
2.862%(c) | | | 04/09/21 | | | | 610 | | | | 610,531 | |
Gtd. Notes | |
3.550% | | | 04/09/21 | | | | 460 | | | | 467,600 | |
| | | | | | | | | | | | |
| | | | | | | | | | | 12,296,142 | |
| | | | | | | | | | | | |
Auto Parts & Equipment — 0.5% | |
Adient Global Holdings Ltd., | |
Gtd. Notes, 144A | |
3.500% | | | 08/15/24 | | | EUR | 701 | | | | 743,064 | |
Adient US LLC, | |
Sr. Sec’d. Notes, 144A | |
7.000% | | | 05/15/26 | (a) | | | 250 | | | | 272,446 | |
American Axle & Manufacturing, Inc., | |
Gtd. Notes | |
6.500% | | | 04/01/27 | (a) | | | 1,225 | | | | 1,271,723 | |
6.625% | | | 10/15/22 | (a) | | | 275 | | | | 279,243 | |
Cooper-Standard Automotive, Inc., | |
Gtd. Notes, 144A | |
5.625% | | | 11/15/26 | (a) | | | 1,150 | | | | 1,090,675 | |
Dana Financing Luxembourg Sarl, | |
Gtd. Notes, 144A | |
5.750% | | | 04/15/25 | | | | 875 | | | | 917,005 | |
LKQ Italia Bondco SpA, | |
Gtd. Notes, 144A | |
3.875% | | | 04/01/24 | | | EUR | 1,275 | | | | 1,607,388 | |
| | | | | | | | | | | | |
| | | | | | | | | | | 6,181,544 | |
| | | | | | | | | | | | |
Banks — 9.9% | |
Banco Santander SA (Spain), | |
Sr. Unsec’d. Notes, 3 Month LIBOR + 1.120% | |
3.121%(c) | | | 04/12/23 | | | | 400 | | | | 402,833 | |
Sr. Unsec’d. Notes | |
3.848% | | | 04/12/23 | | | | 600 | | | | 625,929 | |
Bank of America Corp., | |
Jr. Sub. Notes, Series JJ | |
5.125%(ff) | | | — | (rr) | | | 1,655 | | | | 1,745,994 | |
Sr. Unsec’d. Notes, GMTN | |
3.300% | | | 01/11/23 | | | | 5,870 | | | | 6,075,809 | |
3.593%(ff) | | | 07/21/28 | | | | 740 | | | | 784,987 | |
Sr. Unsec’d. Notes, MTN | |
3.499%(ff) | | | 05/17/22 | | | | 385 | | | | 392,644 | |
3.824%(ff) | | | 01/20/28 | | | | 1,715 | | | | 1,841,518 | |
3.974%(ff) | | | 02/07/30 | | | | 1,840 | | | | 2,018,099 | |
4.078%(ff) | | | 04/23/40 | | | | 2,340 | | | | 2,655,993 | |
4.125% | | | 01/22/24 | | | | 3,750 | | | | 4,031,352 | |
4.271%(ff) | | | 07/23/29 | | | | 910 | | | | 1,010,775 | |
Sub. Notes, MTN | |
4.000% | | | 01/22/25 | | | | 1,117 | | | | 1,191,304 | |
4.450% | | | 03/03/26 | | | | 1,735 | | | | 1,903,420 | |
| | | | | | | | | | | | |
Interest
Rate | | Maturity
Date | | | Principal
Amount
(000)# | | | Value | |
|
| CORPORATE BONDS (continued) | |
Banks (continued) | |
Barclays PLC (United Kingdom), | |
Sr. Unsec’d. Notes | |
3.650% | | | 03/16/25 | (a) | | | 700 | | | $ | 731,710 | |
3.684% | | | 01/10/23 | | | | 480 | | | | 492,002 | |
Sr. Unsec’d. Notes, MTN | |
4.972%(ff) | | | 05/16/29 | | | | 475 | | | | 535,546 | |
Sub. Notes | |
5.088%(ff) | | | 06/20/30 | (a) | | | 565 | | | | 629,380 | |
BNP Paribas SA (France), | |
Sr. Unsec’d. Notes, 144A | |
4.400% | | | 08/14/28 | | | | 420 | | | | 466,242 | |
Sr. Unsec’d. Notes, 144A, MTN | |
3.800% | | | 01/10/24 | | | | 855 | | | | 898,175 | |
BPCE SA (France), | |
Sr. Unsec’d. Notes, 144A, MTN | |
3.500% | | | 10/23/27 | | | | 300 | | | | 312,070 | |
Sub. Notes, 144A, MTN | |
4.500% | | | 03/15/25 | | | | 1,120 | | | | 1,209,304 | |
4.875% | | | 04/01/26 | | | | 380 | | | | 417,550 | |
Citibank NA, | |
Sr. Unsec’d. Notes | |
3.050% | | | 05/01/20 | | | | 1,385 | | | | 1,389,097 | |
Citigroup, Inc., | |
Jr. Sub. Notes, Series Q | |
5.950%(ff) | | | — | (rr) | | | 1,355 | | | | 1,381,867 | |
Jr. Sub. Notes, Series R | |
6.125%(ff) | | | — | (rr) | | | 1,085 | | | | 1,117,713 | |
Sr. Unsec’d. Notes | |
3.200% | | | 10/21/26 | | | | 3,255 | | | | 3,374,883 | |
3.887%(ff) | | | 01/10/28 | (a) | | | 1,710 | | | | 1,840,721 | |
8.125% | | | 07/15/39 | | | | 1,060 | | | | 1,761,006 | |
Sub. Notes | |
4.450% | | | 09/29/27 | | | | 2,630 | | | | 2,895,852 | |
Credit Suisse AG (Switzerland), | |
Sr. Unsec’d. Notes, MTN | |
3.625% | | | 09/09/24 | | | | 1,050 | | | | 1,115,161 | |
Deutsche Bank AG (Germany), | |
Sr. Unsec’d. Notes, 3 Month LIBOR + 1.290% | |
3.192%(c) | | | 02/04/21 | | | | 1,025 | | | | 1,025,523 | |
Sr. Unsec’d. Notes | |
4.250% | | | 02/04/21 | | | | 950 | | | | 965,780 | |
Sr. Unsec’d. Notes, GMTN | |
3.375% | | | 05/12/21 | | | | 900 | | | | 909,203 | |
Sr. Unsec’d. Notes, MTN | |
3.700% | | | 05/30/24 | | | | 159 | | | | 161,955 | |
Sr. Unsec’d. Notes, Series D | |
5.000% | | | 02/14/22 | | | | 1,350 | | | | 1,409,182 | |
Discover Bank, | |
Sr. Unsec’d. Notes | |
3.450% | | | 07/27/26 | | | | 280 | | | | 290,545 | |
4.250% | | | 03/13/26 | | | | 1,150 | | | | 1,241,993 | |
Sub. Notes | |
7.000% | | | 04/15/20 | | | | 2,005 | | | | 2,031,582 | |
Goldman Sachs Group, Inc. (The), | |
Jr. Sub. Notes, Series M | |
5.375%(ff) | | | — | (rr) | | | 1,950 | | | | 1,970,465 | |
SEE NOTES TO FINANCIAL STATEMENTS.
A44
| | | | | | |
| | |
| | DIVERSIFIED BOND PORTFOLIO (continued) | | |
| | | | | | |
| |
| SCHEDULE OF INVESTMENTS | | as of December 31, 2019 |
| | | | | | | | | | | | | | | | |
Interest Rate | | Maturity
Date | | | | | | Principal
Amount
(000)# | | | Value | |
|
| CORPORATE BONDS (continued) | |
Banks (continued) | |
Goldman Sachs Group, Inc. (The), (continued) | |
Sr. Unsec’d. Notes | |
3.272%(ff) | | | 09/29/25 | | | | | | | | 4,063 | | | $ | 4,208,072 | |
3.750% | | | 02/25/26 | | | | | | | | 125 | | | | 132,730 | |
3.814%(ff) | | | 04/23/29 | (a) | | | | | | | 1,060 | | | | 1,134,673 | |
3.850% | | | 01/26/27 | | | | | | | | 1,765 | | | | 1,877,369 | |
5.750% | | | 01/24/22 | | | | | | | | 4,200 | | | | 4,504,412 | |
Sr. Unsec’d. Notes, Series D, MTN | |
6.000% | | | 06/15/20 | | | | | | | | 2,420 | | | | 2,463,646 | |
HSBC Holdings PLC (United Kingdom), | |
Sr. Unsec’d. Notes, 3 Month LIBOR + 0.600% | |
2.504%(c) | | | 05/18/21 | | | | | | | | 1,785 | | | | 1,786,746 | |
Sr. Unsec’d. Notes | |
4.583%(ff) | | | 06/19/29 | | | | | | | | 1,000 | | | | 1,115,336 | |
JPMorgan Chase & Co., | | | | | | | | | | | | | |
Jr. Sub. Notes, Series I, 3 Month LIBOR + 3.470% | |
5.406%(c) | | | — | (rr) | | | | | | | 2,998 | | | | 3,025,605 | |
Jr. Sub. Notes, Series X | |
6.100%(ff) | | | — | (rr) | | | | | | | 1,450 | | | | 1,585,346 | |
Sr. Unsec’d. Notes | |
2.950% | | | 10/01/26 | | | | | | | | 1,740 | | | | 1,793,407 | |
3.200% | | | 01/25/23 | | | | | | | | 470 | | | | 486,412 | |
3.200% | | | 06/15/26 | | | | | | | | 3,020 | | | | 3,152,890 | |
3.509%(ff) | | | 01/23/29 | | | | | | | | 1,435 | | | | 1,521,960 | |
3.782%(ff) | | | 02/01/28 | | | | | | | | 965 | | | | 1,037,927 | |
3.964%(ff) | | | 11/15/48 | | | | | | | | 985 | | | | 1,111,939 | |
4.005%(ff) | | | 04/23/29 | | | | | | | | 1,200 | | | | 1,315,821 | |
4.250% | | | 10/15/20 | | | | | | | | 600 | | | | 610,711 | |
Sub. Notes | |
4.250% | | | 10/01/27 | | | | | | | | 420 | | | | 464,737 | |
KeyCorp, | | | | | | | | | | | | | | | | |
Sr. Unsec’d. Notes, MTN | |
5.100% | | | 03/24/21 | | | | | | | | 1,155 | | | | 1,197,943 | |
Lloyds Bank PLC (United Kingdom), | |
Gtd. Notes, 144A, MTN | |
5.800% | | | 01/13/20 | | | | | | | | 2,650 | | | | 2,652,785 | |
Morgan Stanley, | | | | | | | | | | | | | | | | |
Jr. Sub. Notes, Series H, 3 Month LIBOR + 3.610% | |
5.611%(c) | | | — | (rr) | | | | | | | 975 | | | | 981,786 | |
Sr. Unsec’d. Notes | |
4.375% | | | 01/22/47 | (a) | | | | | | | 895 | | | | 1,069,647 | |
5.750% | | | 01/25/21 | | | | | | | | 1,920 | | | | 1,994,635 | |
Sr. Unsec’d. Notes, GMTN | |
3.125% | | | 01/23/23 | | | | | | | | 1,190 | | | | 1,222,804 | |
3.750% | | | 02/25/23 | | | | | | | | 395 | | | | 413,410 | |
3.772%(ff) | | | 01/24/29 | (a) | | | | | | | 1,875 | | | | 2,015,961 | |
4.431%(ff) | | | 01/23/30 | (a) | | | | | | | 1,340 | | | | 1,514,070 | |
5.500% | | | 07/28/21 | | | | | | | | 2,080 | | | | 2,190,487 | |
Sr. Unsec’d. Notes, MTN | |
3.125% | | | 07/27/26 | | | | | | | | 2,725 | | | | 2,814,804 | |
Sub. Notes, GMTN | |
4.350% | | | 09/08/26 | | | | | | | | 750 | | | | 819,424 | |
PNC Financial Services Group, Inc. (The), | | | | | |
Sub. Notes | |
3.900% | | | 04/29/24 | | | | | | | | 975 | | | | 1,039,515 | |
| | | | | | | | | | | | | | | | |
Interest Rate | | Maturity
Date | | | | | | Principal
Amount
(000)# | | | Value | |
|
| CORPORATE BONDS (continued) | |
Banks (continued) | |
Santander UK Group Holdings PLC (United Kingdom), | |
Sr. Unsec’d. Notes | |
2.875% | | | 10/16/20 | | | | | | | | 1,550 | | | $ | 1,561,294 | |
Sumitomo Mitsui Banking Corp. (Japan), | |
Bank Gtd. Notes, 3 Month LIBOR + 0.350% | |
2.352%(c) | | | 01/17/20 | | | | | | | | 1,820 | | | | 1,820,358 | |
Truist Financial Corp., | |
Jr. Sub. Notes, Series N | |
4.800%(ff) | | | — | (rr) | | | | | | | 1,440 | | | | 1,482,632 | |
UBS Group AG (Switzerland), | |
Sr. Unsec’d. Notes, 144A | |
2.859%(ff) | | | 08/15/23 | | | | | | | | 1,100 | | | | 1,116,230 | |
3.491% | | | 05/23/23 | | | | | | | | 2,970 | | | | 3,056,124 | |
| | | | | | | | | | | | | | | | |
| | | | | | | | | | | | | | | 117,548,812 | |
| | | | | | | | | | | | | | | | |
Beverages — 0.4% | |
Anheuser-Busch Cos. LLC/Anheuser-Busch InBev Worldwide, Inc. (Belgium), | |
Gtd. Notes | |
4.900% | | | 02/01/46 | | | | | | | | 1,880 | | | | 2,231,889 | |
Anheuser-Busch InBev Worldwide, Inc. (Belgium), | |
Gtd. Notes | |
5.550% | | | 01/23/49 | | | | | | | | 1,440 | | | | 1,867,067 | |
Keurig Dr. Pepper, Inc., | |
Gtd. Notes | |
3.551% | | | 05/25/21 | | | | | | | | 970 | | | | 990,864 | |
| | | | | | | | | | | | | | | | |
| | | | | | | | | | | | | | | 5,089,820 | |
| | | | | | | | | | | | | | | | |
Building Materials — 0.3% | |
Masonite International Corp., | |
Gtd. Notes, 144A | |
5.375% | | | 02/01/28 | | | | | | | | 750 | | | | 794,585 | |
Standard Industries, Inc., | |
Sr. Unsec’d. Notes, 144A | |
5.375% | | | 11/15/24 | | | | | | | | 2,550 | | | | 2,620,134 | |
U.S. Concrete, Inc., | |
Gtd. Notes | |
6.375% | | | 06/01/24 | (a) | | | | | | | 600 | | | | 626,518 | |
| | | | | | | | | | | | | | | | |
| | | | | | | | | | | | | | | 4,041,237 | |
| | | | | | | | | | | | | | | | |
Chemicals — 1.6% | |
Ashland LLC, | |
Gtd. Notes | |
6.875% | | | 05/15/43 | | | | | | | | 1,400 | | | | 1,605,222 | |
CF Industries, Inc., | |
Gtd. Notes | |
4.950% | | | 06/01/43 | (a) | | | | | | | 675 | | | | 706,396 | |
5.375% | | | 03/15/44 | | | | | | | | 700 | | | | 763,209 | |
Chemours Co. (The), | |
Gtd. Notes | |
7.000% | | | 05/15/25 | (a) | | | | | | | 1,000 | | | | 1,006,611 | |
DuPont de Nemours, Inc., | |
Sr. Unsec’d. Notes | |
3.766% | | | 11/15/20 | | | | | | | | 490 | | | | 497,382 | |
LyondellBasell Industries NV, | |
Sr. Unsec’d. Notes | |
6.000% | | | 11/15/21 | | | | | | | | 3,550 | | | | 3,766,650 | |
SEE NOTES TO FINANCIAL STATEMENTS.
A45
| | | | | | |
| | |
| | DIVERSIFIED BOND PORTFOLIO (continued) | | |
| | | | | | |
| |
| SCHEDULE OF INVESTMENTS | | as of December 31, 2019 |
| | | | | | | | | | | | | | | | |
Interest Rate | | Maturity
Date | | | | | | Principal
Amount
(000)# | | | Value | |
|
| CORPORATE BONDS (continued) | |
Chemicals (continued) | |
Mosaic Co. (The), | |
Sr. Unsec’d. Notes | |
5.450% | | | 11/15/33 | | | | | | | | 465 | | | $ | 528,902 | |
5.625% | | | 11/15/43 | | | | | | | | 155 | | | | 183,131 | |
NOVA Chemicals Corp. (Canada), | |
Sr. Unsec’d. Notes, 144A | |
4.875% | | | 06/01/24 | | | | | | | | 1,150 | | | | 1,185,662 | |
Nutrien Ltd. (Canada), | |
Sr. Unsec’d. Notes | |
4.900% | | | 06/01/43 | | | | | | | | 870 | | | | 976,699 | |
5.250% | | | 01/15/45 | | | | | | | | 420 | | | | 497,750 | |
6.125% | | | 01/15/41 | | | | | | | | 450 | | | | 556,503 | |
Sasol Financing International Ltd. (South Africa), | |
Gtd. Notes | |
4.500% | | | 11/14/22 | | | | | | | | 1,525 | | | | 1,575,133 | |
Sasol Financing USA LLC (South Africa), | |
Gtd. Notes | |
5.875% | | | 03/27/24 | | | | | | | | 375 | | | | 406,994 | |
Sherwin-Williams Co. (The), | |
Sr. Unsec’d. Notes | |
3.450% | | | 08/01/25 | | | | | | | | 445 | | | | 468,385 | |
TPC Group, Inc., | |
Sr. Sec’d. Notes, 144A | |
10.500% | | | 08/01/24 | | | | | | | | 450 | | | | 453,149 | |
Union Carbide Corp., | |
Sr. Unsec’d. Notes | |
7.875% | | | 04/01/23 | | | | | | | | 3,058 | | | | 3,511,383 | |
| | | | | | | | | | | | | | | | |
| | | | | | | | | | | | | | | 18,689,161 | |
| | | | | | | | | | | | | | | | |
Commercial Services — 0.7% | |
ERAC USA Finance LLC, | |
Gtd. Notes, 144A | |
6.700% | | | 06/01/34 | | | | | | | | 920 | | | | 1,241,271 | |
7.000% | | | 10/15/37 | | | | | | | | 770 | | | | 1,083,456 | |
Nielsen Finance LLC/Nielsen Finance Co., | |
Gtd. Notes, 144A | |
5.000% | | | 04/15/22 | | | | | | | | 1,225 | | | | 1,231,440 | |
Refinitiv US Holdings, Inc., | |
Gtd. Notes, 144A | |
8.250% | | | 11/15/26 | (a) | | | | | | | 950 | | | | 1,070,165 | |
United Rentals North America, Inc., | |
Gtd. Notes | |
4.625% | | | 10/15/25 | | | | | | | | 375 | | | | 386,322 | |
4.875% | | | 01/15/28 | | | | | | | | 1,325 | | | | 1,380,084 | |
5.250% | | | 01/15/30 | | | | | | | | 525 | | | | 565,291 | |
5.500% | | | 05/15/27 | | | | | | | | 975 | | | | 1,045,902 | |
| | | | | | | | | | | | | | | | |
| | | | | | | | | | | | | | | 8,003,931 | |
| | | | | | | | | | | | | | | | |
Computers — 0.1% | |
Everi Payments, Inc., | |
Gtd. Notes, 144A | |
7.500% | | | 12/15/25 | (a) | | | | | | | 900 | | | | 965,259 | |
| | | | | | | | | | | | | | | | |
Diversified Financial Services — 0.9% | |
American Express Co., | |
Sr. Unsec’d. Notes | |
3.375% | | | 05/17/21 | | | | | | | | 3,695 | | | | 3,764,801 | |
| | | | | | | | | | | | | | | | |
Interest Rate | | Maturity
Date | | | | | | Principal
Amount
(000)# | | | Value | |
|
| CORPORATE BONDS (continued) | |
Diversified Financial Services (continued) | |
Capital One Financial Corp., | |
Sr. Unsec’d. Notes | |
3.450% | | | 04/30/21 | | | | | | | | 5,235 | | | $ | 5,328,227 | |
Jefferies Group LLC, | |
Sr. Unsec’d. Notes | |
6.500% | | | 01/20/43 | | | | | | | | 650 | | | | 776,103 | |
Lehman Brothers Holdings, Inc., | |
Sr. Unsec’d. Notes, MTN | |
6.875% | | | 05/02/18 | (d) | | | | | | | 2,740 | | | | 35,620 | |
Nationstar Mortgage Holdings, Inc., | |
Gtd. Notes, 144A | |
8.125% | | | 07/15/23 | | | | | | | | 1,250 | | | | 1,326,160 | |
| | | | | | | | | | | | | | | | |
| | | | | | | | | | | | | | | 11,230,911 | |
| | | | | | | | | | | | | | | | |
Electric — 2.2% | |
Baltimore Gas & Electric Co., | |
Sr. Unsec’d. Notes | |
3.350% | | | 07/01/23 | | | | | | | | 550 | | | | 570,460 | |
Calpine Corp., | |
Sr. Unsec’d. Notes | |
5.750% | | | 01/15/25 | (a) | | | | | | | 3,100 | | | | 3,188,130 | |
Sr. Unsec’d. Notes, 144A | |
5.125% | | | 03/15/28 | | | | | | | | 1,000 | | | | 1,019,678 | |
Consolidated Edison Co. of New York, Inc., | |
Sr. Unsec’d. Notes, Series C | |
4.300% | | | 12/01/56 | | | | | | | | 235 | | | | 262,731 | |
Dominion Energy, Inc., | |
Jr. Sub. Notes | |
4.104% | | | 04/01/21 | | | | | | | | 2,710 | | | | 2,772,719 | |
El Paso Electric Co., | |
Sr. Unsec’d. Notes | |
6.000% | | | 05/15/35 | | | | | | | | 2,325 | | | | 2,847,678 | |
Eskom Holdings SOC Ltd. (South Africa), | |
Gov’t. Gtd. Notes, 144A, MTN | |
6.350% | | | 08/10/28 | | | | | | | | 550 | | | | 590,474 | |
Sr. Unsec’d. Notes | |
5.750% | | | 01/26/21 | | | | | | | | 520 | | | | 521,233 | |
Sr. Unsec’d. Notes, 144A | |
5.750% | | | 01/26/21 | | | | | | | | 1,300 | | | | 1,303,083 | |
7.125% | | | 02/11/25 | | | | | | | | 390 | | | | 400,030 | |
Exelon Generation Co. LLC, | |
Sr. Unsec’d. Notes | |
6.250% | | | 10/01/39 | | | | | | | | 1,900 | | | | 2,282,999 | |
FirstEnergy Transmission LLC, | |
Sr. Unsec’d. Notes, 144A | |
5.450% | | | 07/15/44 | | | | | | | | 400 | | | | 500,526 | |
Iberdrola International BV (Spain), | |
Gtd. Notes | |
6.750% | | | 09/15/33 | | | | | | | | 1,150 | | | | 1,488,978 | |
Israel Electric Corp. Ltd. (Israel), | |
Sr. Sec’d. Notes, 144A, GMTN | |
4.250% | | | 08/14/28 | | | | | | | | 680 | | | | 739,489 | |
Kentucky Utilities Co., | |
First Mortgage | |
4.375% | | | 10/01/45 | | | | | | | | 3,050 | | | | 3,512,813 | |
SEE NOTES TO FINANCIAL STATEMENTS.
A46
| | | | | | |
| | |
| | DIVERSIFIED BOND PORTFOLIO (continued) | | |
| | | | | | |
| |
| SCHEDULE OF INVESTMENTS | | as of December 31, 2019 |
| | | | | | | | | | | | | | | | |
Interest
Rate | | Maturity
Date | | | | | | Principal
Amount
(000)# | | | Value | |
|
| CORPORATE BONDS (continued) | |
Electric (continued) | |
Korea Hydro & Nuclear Power Co. Ltd. (South Korea), | |
Sr. Unsec’d. Notes, 144A | |
4.750% | | | 07/13/21 | | | | | | | | 250 | | | $ | 259,614 | |
NRG Energy, Inc., | |
Gtd. Notes, 144A | |
5.250% | | | 06/15/29 | | | | | | | | 375 | | | | 406,687 | |
South Carolina Electric & Gas Co., | |
First Mortgage | |
4.600% | | | 06/15/43 | (a) | | | | | | | 2,025 | | | | 2,403,700 | |
Vistra Operations Co. LLC, | |
Gtd. Notes, 144A | |
5.000% | | | 07/31/27 | | | | | | | | 450 | | | | 470,958 | |
5.625% | | | 02/15/27 | | | | | | | | 600 | | | | 633,371 | |
| | | | | | | | | | | | | | | | |
| | | | | | | | | | | | | | | 26,175,351 | |
| | | | | | | | | | | | | | | | |
Electronics — 0.1% | |
Sensata Technologies BV, | |
Gtd. Notes, 144A | |
5.000% | | | 10/01/25 | | | | | | | | 1,000 | | | | 1,087,443 | |
| | | | | | | | | | | | | | | | |
Engineering & Construction — 0.2% | |
GMR Hyderabad International Airport Ltd. (India), | |
Sr. Sec’d. Notes, 144A | |
4.250% | | | 10/27/27 | | | | | | | | 345 | | | | 326,019 | |
Mexico City Airport Trust (Mexico), | |
Sr. Sec’d. Notes, 144A | |
4.250% | | | 10/31/26 | | | | | | | | 605 | | | | 632,732 | |
5.500% | | | 07/31/47 | | | | | | | | 1,690 | | | | 1,745,623 | |
| | | | | | | | | | | | | | | | |
| | | | | | | | | | | | | | | 2,704,374 | |
| | | | | | | | | | | | | | | | |
Entertainment — 0.4% | |
AMC Entertainment Holdings, Inc., | |
Gtd. Notes | |
5.875% | | | 11/15/26 | (a) | | | | | | | 1,200 | | | | 1,082,531 | |
Caesars Resort Collection LLC/CRC Finco, Inc., | |
Gtd. Notes, 144A | |
5.250% | | | 10/15/25 | (a) | | | | | | | 750 | | | | 776,831 | |
CPUK Finance Ltd. (United Kingdom), | |
Sec’d. Notes, 144A | |
4.250% | | | 02/28/47 | | | | | | | GBP | 250 | | | | 337,414 | |
4.875% | | | 02/28/47 | | | | | | | GBP | 125 | | | | 171,074 | |
Golden Entertainment, Inc., | |
Sr. Unsec’d. Notes, 144A | |
7.625% | | | 04/15/26 | | | | | | | | 875 | | | | 932,496 | |
Penn National Gaming, Inc., | |
Sr. Unsec’d. Notes, 144A | |
5.625% | | | 01/15/27 | (a) | | | | | | | 800 | | | | 847,766 | |
Scientific Games International, Inc., | |
Gtd. Notes, 144A | |
7.000% | | | 05/15/28 | | | | | | | | 350 | | | | 375,571 | |
7.250% | | | 11/15/29 | (a) | | | | | | | 475 | | | | 515,889 | |
| | | | | | | | | | | | | | | | |
| | | | | | | | | | | | | | | 5,039,572 | |
| | | | | | | | | | | | | | | | |
Foods — 0.7% | |
Ingles Markets, Inc., | |
Sr. Unsec’d. Notes | |
5.750% | | | 06/15/23 | | | | | | | | 78 | | | | 79,534 | |
| | | | | | | | | | | | | | | | |
Interest
Rate | | Maturity
Date | | | | | | Principal
Amount
(000)# | | | Value | |
|
| CORPORATE BONDS (continued) | |
Foods (continued) | |
JBS USA LUX SA/JBS USA Finance, Inc., | |
Gtd. Notes, 144A | |
5.750% | | | 06/15/25 | | | | | | | | 1,800 | | | $ | 1,867,278 | |
Kraft Heinz Foods Co., | |
Gtd. Notes | |
5.000% | | | 07/15/35 | | | | | | | | 725 | | | | 805,220 | |
5.200% | | | 07/15/45 | | | | | | | | 450 | | | | 489,305 | |
Gtd. Notes, 144A | |
4.625% | | | 10/01/39 | | | | | | | | 645 | | | | 670,559 | |
4.875% | | | 10/01/49 | | | | | | | | 2,880 | | | | 3,026,665 | |
Mars, Inc., | |
Gtd. Notes, 144A | |
3.875% | | | 04/01/39 | | | | | | | | 440 | | | | 488,167 | |
4.200% | | | 04/01/59 | | | | | | | | 380 | | | | 430,293 | |
| | | | | | | | | | | | | | | | |
| | | | | | | | | | | | | | | 7,857,021 | |
| | | | | | | | | | | | | | | | |
Forest Products & Paper — 0.1% | |
International Paper Co., | |
Sr. Unsec’d. Notes | |
7.300% | | | 11/15/39 | | | | | | | | 1,000 | | | | 1,382,498 | |
| | | | | | | | | | | | | | | | |
Gas — 0.3% | |
Korea Gas Corp. (South Korea), | |
Sr. Unsec’d. Notes | |
4.250% | | | 11/02/20 | | | | | | | | 1,750 | | | | 1,780,619 | |
NiSource, Inc., | |
Sr. Unsec’d. Notes | |
4.800% | | | 02/15/44 | | | | | | | | 300 | | | | 346,883 | |
Southern Co. Gas Capital Corp., | |
Gtd. Notes | |
4.400% | | | 06/01/43 | | | | | | | | 1,050 | | | | 1,144,312 | |
| | | | | | | | | | | | | | | | |
| | | | | | | | | | | | | | | 3,271,814 | |
| | | | | | | | | | | | | | | | |
Healthcare-Products — 0.3% | |
DH Europe Finance II Sarl, | |
Gtd. Notes | |
1.350% | | | 09/18/39 | | | | | | | EUR | 1,275 | | | | 1,353,408 | |
Medtronic Global Holdings SCA, | |
Gtd. Notes | |
1.625% | | | 03/07/31 | | | | | | | EUR | 200 | | | | 246,129 | |
2.250% | | | 03/07/39 | | | | | | | EUR | 300 | | | | 382,625 | |
Stryker Corp., | |
Sr. Unsec’d. Notes | |
2.125% | | | 11/30/27 | | | | | | | EUR | 510 | | | | 640,751 | |
Thermo Fisher Scientific, Inc., | |
Sr. Unsec’d. Notes, EMTN | |
1.500% | | | 10/01/39 | | | | | | | EUR | 600 | | | | 636,203 | |
1.875% | | | 10/01/49 | | | | | | | EUR | 425 | | | | 442,129 | |
| | | | | | | | | | | | | | | | |
| | | | | | | | | | | | | | | 3,701,245 | |
| | | | | | | | | | | | | | | | |
Healthcare-Services — 1.0% | |
Aetna, Inc., | |
Sr. Unsec’d. Notes | |
6.750% | | | 12/15/37 | | | | | | | | 1,900 | | | | 2,558,620 | |
Anthem, Inc., | |
Sr. Unsec’d. Notes | |
4.650% | | | 01/15/43 | | | | | | | | 385 | | | | 434,651 | |
SEE NOTES TO FINANCIAL STATEMENTS.
A47
| | | | | | |
| | |
| | DIVERSIFIED BOND PORTFOLIO (continued) | | |
| | | | | | |
| |
| SCHEDULE OF INVESTMENTS | | as of December 31, 2019 |
| | | | | | | | | | | | | | | | |
Interest
Rate | | Maturity
Date | | | | | | Principal
Amount
(000)# | | | Value | |
|
| CORPORATE BONDS (continued) | |
Healthcare-Services (continued) | |
CHS/Community Health Systems, Inc., | |
Sec’d. Notes, 144A | |
8.125% | | | 06/30/24 | (a) | | | | | | | 625 | | | $ | 511,987 | |
Cigna Corp., | |
Gtd. Notes | |
4.375% | | | 12/15/20 | | | | | | | | 745 | | | | 757,174 | |
Encompass Health Corp., | |
Gtd. Notes | |
4.750% | | | 02/01/30 | (a) | | | | | | | 500 | | | | 519,759 | |
Fresenius Medical Care U.S. Finance II, Inc. (Germany), | |
Gtd. Notes, 144A | |
4.125% | | | 10/15/20 | | | | | | | | 330 | | | | 333,090 | |
HCA, Inc., | |
Gtd. Notes | |
5.375% | | | 02/01/25 | (a) | | | | | | | 2,325 | | | | 2,573,005 | |
5.875% | | | 02/01/29 | | | | | | | | 150 | | | | 173,384 | |
Laboratory Corp. of America Holdings, | |
Sr. Unsec’d. Notes | |
3.200% | | | 02/01/22 | | | | | | | | 240 | | | | 244,845 | |
3.250% | | | 09/01/24 | | | | | | | | 1,495 | | | | 1,551,529 | |
Tenet Healthcare Corp., | |
Sec’d. Notes, 144A | |
6.250% | | | 02/01/27 | (a) | | | | | | | 375 | | | | 404,679 | |
Sr. Sec’d. Notes, 144A | |
5.125% | | | 11/01/27 | | | | | | | | 600 | | | | 633,597 | |
Sr. Unsec’d. Notes | |
7.000% | | | 08/01/25 | (a) | | | | | | | 900 | | | | 950,764 | |
UnitedHealth Group, Inc., | |
Sr. Unsec’d. Notes | |
3.950% | | | 10/15/42 | | | | | | | | 220 | | | | 241,072 | |
| | | | | | | | | | | | | | | | |
| | | | | | | | | | | | | | | 11,888,156 | |
| | | | | | | | | | | | | | | | |
Home Builders — 0.4% | |
Brookfield Residential Properties, Inc./Brookfield Residential US Corp. (Canada), | |
Gtd. Notes, 144A | |
6.125% | | | 07/01/22 | (a) | | | | | | | 1,000 | | | | 1,015,861 | |
PulteGroup, Inc., | |
Gtd. Notes | |
5.000% | | | 01/15/27 | (a) | | | | | | | 975 | | | | 1,062,722 | |
Taylor Morrison Communities, Inc., | |
Gtd. Notes, 144A | |
5.875% | | | 06/15/27 | | | | | | | | 875 | | | | 961,493 | |
William Lyon Homes, Inc., | |
Gtd. Notes | |
5.875% | | | 01/31/25 | | | | | | | | 300 | | | | 308,133 | |
7.000% | | | 08/15/22 | | | | | | | | 236 | | | | 236,258 | |
Gtd. Notes, 144A | |
6.625% | | | 07/15/27 | | | | | | | | 1,050 | | | | 1,134,002 | |
| | | | | | | | | | | | | | | | |
| | | | | | | | | | | | | | | 4,718,469 | |
| | | | | | | | | | | | | | | | |
Housewares — 0.1% | |
Newell Brands, Inc., | |
Sr. Unsec’d. Notes | |
4.200% | | | 04/01/26 | | | | | | | | 670 | | | | 698,244 | |
| | | | | | | | | | | | | | | | |
| | | | | | | | | | | | | | | | |
Interest
Rate | | Maturity
Date | | | | | | Principal
Amount
(000)# | | | Value | |
|
| CORPORATE BONDS (continued) | |
Insurance — 1.0% | |
American International Group, Inc., | |
Sr. Unsec’d. Notes | |
3.750% | | | 07/10/25 | | | | | | | | 2,110 | | | $ | 2,258,846 | |
4.500% | | | 07/16/44 | | | | | | | | 1,075 | | | | 1,237,063 | |
Liberty Mutual Finance Europe DAC, | |
Gtd. Notes, 144A | |
1.750% | | | 03/27/24 | | | | | | | EUR | 800 | | | | 945,356 | |
Liberty Mutual Group, Inc., | |
Gtd. Notes, 144A | |
3.951% | | | 10/15/50 | | | | | | | | 1,030 | | | | 1,078,511 | |
Lincoln National Corp., | |
Sr. Unsec’d. Notes | |
7.000% | | | 06/15/40 | | | | | | | | 405 | | | | 578,440 | |
Markel Corp., | |
Sr. Unsec’d. Notes | |
4.150% | | | 09/17/50 | | | | | | | | 180 | | | | 185,391 | |
5.000% | | | 03/30/43 | | | | | | | | 350 | | | | 384,341 | |
Principal Financial Group, Inc., | |
Gtd. Notes | |
4.625% | | | 09/15/42 | | | | | | | | 150 | | | | 174,730 | |
Sompo International Holdings Ltd. (Bermuda), | |
Sr. Unsec’d. Notes | |
7.000% | | | 07/15/34 | | | | | | | | 1,350 | | | | 1,803,511 | |
Teachers Insurance & Annuity Association of America, | |
Sub. Notes, 144A | |
4.270% | | | 05/15/47 | | | | | | | | 2,310 | | | | 2,624,125 | |
6.850% | | | 12/16/39 | | | | | | | | 196 | | | | 286,560 | |
Unum Group, | |
Sr. Unsec’d. Notes | |
5.625% | | | 09/15/20 | | | | | | | | 500 | | | | 512,875 | |
| | | | | | | | | | | | | | | | |
| | | | | | | | | | | | | | | 12,069,749 | |
| | | | | | | | | | | | | | | | |
Internet — 0.1% | |
Netflix, Inc., | |
Sr. Unsec’d. Notes | |
3.625% | | | 05/15/27 | | | | | | | EUR | 1,050 | | | | 1,260,230 | |
| | | | | | | | | | | | | | | | |
Lodging — 0.2% | |
Marriott International, Inc., | |
Sr. Unsec’d. Notes | |
3.250% | | | 09/15/22 | | | | | | | | 1,325 | | | | 1,359,072 | |
MGM Resorts International, | |
Gtd. Notes | |
6.000% | | | 03/15/23 | | | | | | | | 625 | | | | 686,840 | |
Sands China Ltd. (Macau), | |
Sr. Unsec’d. Notes | |
5.125% | | | 08/08/25 | | | | | | | | 400 | | | | 440,663 | |
| | | | | | | | | | | | | | | | |
| | | | | | | | | | | | | | | 2,486,575 | |
| | | | | | | | | | | | | | | | |
Machinery-Diversified — 0.4% | |
CNH Industrial Capital LLC, | |
Gtd. Notes | |
4.875% | | | 04/01/21 | (a) | | | | | | | 1,050 | | | | 1,084,609 | |
Rockwell Automation, Inc., | |
Sr. Unsec’d. Notes | |
5.200% | | | 01/15/98 | | | | | | | | 1,100 | | | | 1,382,761 | |
SEE NOTES TO FINANCIAL STATEMENTS.
A48
| | | | | | |
| | |
| | DIVERSIFIED BOND PORTFOLIO (continued) | | |
| | | | | | |
| |
| SCHEDULE OF INVESTMENTS | | as of December 31, 2019 |
| | | | | | | | | | | | | | | | |
Interest
Rate | | Maturity
Date | | | | | | Principal
Amount
(000)# | | | Value | |
|
| CORPORATE BONDS (continued) | |
Machinery-Diversified (continued) | |
Xylem, Inc., | |
Sr. Unsec’d. Notes | |
4.875% | | | 10/01/21 | | | | | | | | 1,960 | | | $ | 2,054,019 | |
| | | | | | | | | | | | | | | | |
| | | | | | | | | | | | | | | 4,521,389 | |
| | | | | | | | | | | | | | | | |
Media — 2.1% | |
CCO Holdings LLC/CCO Holdings Capital Corp., | |
Sr. Unsec’d. Notes, 144A | |
5.375% | | | 06/01/29 | | | | | | | | 975 | | | | 1,045,838 | |
5.500% | | | 05/01/26 | | | | | | | | 3,300 | | | | 3,469,302 | |
5.875% | | | 05/01/27 | | | | | | | | 25 | | | | 26,546 | |
Charter Communications Operating LLC/Charter Communications | |
Operating Capital, | |
Sr. Sec’d. Notes | |
4.800% | | | 03/01/50 | | | | | | | | 875 | | | | 923,390 | |
6.384% | | | 10/23/35 | | | | | | | | 2,470 | | | | 3,117,665 | |
6.484% | | | 10/23/45 | | | | | | | | 855 | | | | 1,067,287 | |
6.834% | | | 10/23/55 | | | | | | | | 225 | | | | 289,325 | |
Clear Channel Worldwide Holdings, Inc., | |
Gtd. Notes, 144A | |
9.250% | | | 02/15/24 | (a) | | | | | | | 1,234 | | | | 1,368,413 | |
Comcast Corp., | |
Gtd. Notes | |
3.450% | | | 02/01/50 | | | | | | | | 955 | | | | 976,621 | |
4.150% | | | 10/15/28 | | | | | | | | 1,820 | | | | 2,047,458 | |
4.250% | | | 10/15/30 | | | | | | | | 620 | | | | 709,539 | |
Cox Communications, Inc., | |
Sr. Unsec’d. Notes, 144A | |
3.150% | | | 08/15/24 | | | | | | | | 2,800 | | | | 2,877,986 | |
Diamond Sports Group LLC/Diamond Sports Finance Co., | |
Gtd. Notes, 144A | |
6.625% | | | 08/15/27 | (a) | | | | | | | 270 | | | | 262,669 | |
Sr. Sec’d. Notes, 144A | |
5.375% | | | 08/15/26 | | | | | | | | 1,000 | | | | 1,013,212 | |
Discovery Communications LLC, | |
Gtd. Notes | |
5.000% | | | 09/20/37 | | | | | | | | 1,010 | | | | 1,141,959 | |
5.300% | | | 05/15/49 | | | | | | | | 265 | | | | 313,375 | |
NBCUniversal Media LLC, | |
Gtd. Notes | |
4.450% | | | 01/15/43 | | | | | | | | 15 | | | | 17,471 | |
TCI Communications, Inc., | |
Sr. Unsec’d. Notes | |
7.875% | | | 02/15/26 | | | | | | | | 750 | | | | 974,347 | |
Univision Communications, Inc., | |
Sr. Sec’d. Notes, 144A | |
5.125% | | | 02/15/25 | | | | | | | | 1,175 | | | | 1,161,101 | |
Walt Disney Co. (The), | |
Gtd. Notes | |
7.625% | | | 11/30/28 | | | | | | | | 1,415 | | | | 1,941,235 | |
| | | | | | | | | | | | | | | | |
| | | | | | | | | | | | | | | 24,744,739 | |
| | | | | | | | | | | | | | | | |
Mining — 0.2% | |
Barrick Gold Corp. (Canada), | |
Sr. Unsec’d. Notes | |
5.250% | | | 04/01/42 | | | | | | | | 680 | | | | 815,493 | |
| | | | | | | | | | | | | | | | |
Interest
Rate | | Maturity
Date | | | | | | Principal
Amount
(000)# | | | Value | |
|
| CORPORATE BONDS (continued) | |
Mining (continued) | |
Barrick North America Finance LLC (Canada), | |
Gtd. Notes | |
5.750% | | | 05/01/43 | | | | | | | | 410 | | | $ | 524,224 | |
Newmont Goldcorp Corp., | |
Gtd. Notes | |
3.625% | | | 06/09/21 | | | | | | | | 825 | | | | 839,364 | |
Southern Copper Corp. (Peru), | |
Sr. Unsec’d. Notes | |
6.750% | | | 04/16/40 | | | | | | | | 295 | | | | 394,053 | |
| | | | | | | | | | | | | | | | |
| | | | | | | | | | | | | | | 2,573,134 | |
| | | | | | | | | | | | | | | | |
Multi-National — 0.3% | |
Corp. Andina de Fomento (Supranational Bank), | |
Sr. Unsec’d. Notes | |
2.125% | | | 09/27/21 | | | | | | | | 1,240 | | | | 1,236,837 | |
4.375% | | | 06/15/22 | | | | | | | | 500 | | | | 523,223 | |
Inter-American Development Bank (Supranational Bank), | |
Unsec’d. Notes | |
6.950% | | | 08/01/26 | | | | | | | | 1,500 | | | | 1,919,783 | |
| | | | | | | | | | | | | | | | |
| | | | | | | | | | | | | | | 3,679,843 | |
| | | | | | | | | | | | | | | | |
Oil & Gas — 2.6% | |
Antero Resources Corp., | |
Gtd. Notes | |
5.625% | | | 06/01/23 | | | | | | | | 1,200 | | | | 967,479 | |
Ascent Resources Utica Holdings LLC/ARU Finance Corp., | |
Sr. Unsec’d. Notes, 144A | |
7.000% | | | 11/01/26 | | | | | | | | 350 | | | | 279,655 | |
10.000% | | | 04/01/22 | (a) | | | | | | | 575 | | | | 571,459 | |
Cenovus Energy, Inc. (Canada), | |
Sr. Unsec’d. Notes | |
5.400% | | | 06/15/47 | | | | | | | | 1,000 | | | | 1,162,329 | |
Citgo Holding, Inc., | |
Sr. Sec’d. Notes, 144A | |
9.250% | | | 08/01/24 | | | | | | | | 125 | | | | 134,263 | |
CNOOC Finance 2013 Ltd. (China), | |
Gtd. Notes | |
3.000% | | | 05/09/23 | | | | | | | | 750 | | | | 762,562 | |
CNX Resources Corp., | |
Gtd. Notes, 144A | |
7.250% | | | 03/14/27 | | | | | | | | 975 | | | | 853,459 | |
Concho Resources, Inc., | |
Gtd. Notes | |
4.875% | | | 10/01/47 | | | | | | | | 180 | | | | 208,173 | |
Devon Energy Corp., | |
Sr. Unsec’d. Notes | |
5.600% | | | 07/15/41 | | | | | | | | 850 | | | | 1,034,815 | |
Encana Corp. (Canada), | |
Gtd. Notes | |
6.500% | | | 02/01/38 | | | | | | | | 200 | | | | 234,738 | |
Gazprom PJSC Via Gaz Capital SA (Russia), | |
Sr. Unsec’d. Notes | |
4.950% | | | 07/19/22 | | | | | | | | 390 | | | | 412,783 | |
Sr. Unsec’d. Notes, 144A | |
6.510% | | | 03/07/22 | | | | | | | | 1,665 | | | | 1,808,736 | |
SEE NOTES TO FINANCIAL STATEMENTS.
A49
| | | | | | |
| | |
| | DIVERSIFIED BOND PORTFOLIO (continued) | | |
| | | | | | |
| |
| SCHEDULE OF INVESTMENTS | | as of December 31, 2019 |
| | | | | | | | | | | | |
Interest
Rate | | Maturity
Date | | | Principal
Amount
(000)# | | | Value | |
|
| CORPORATE BONDS (continued) | |
Oil & Gas (continued) | |
Helmerich & Payne, Inc., | |
Sr. Unsec’d. Notes | |
4.650% | | | 03/15/25 | | | | 1,500 | | | $ | 1,636,381 | |
KazMunayGas National Co. JSC (Kazakhstan), | |
Sr. Unsec’d. Notes, 144A | |
4.750% | | | 04/24/25 | | | | 1,160 | | | | 1,270,102 | |
4.750% | | | 04/19/27 | | | | 200 | | | | 219,668 | |
Lukoil International Finance BV (Russia), | |
Gtd. Notes, 144A | |
6.125% | | | 11/09/20 | | | | 600 | | | | 619,870 | |
MEG Energy Corp. (Canada), | |
Gtd. Notes, 144A | |
6.375% | | | 01/30/23 | | | | 575 | | | | 576,988 | |
7.000% | | | 03/31/24 | | | | 500 | | | | 504,670 | |
Occidental Petroleum Corp., | |
Sr. Unsec’d. Notes | |
4.264%(s) | | | 10/10/36 | | | | 2,000 | | | | 1,005,004 | |
6.450% | | | 09/15/36 | | | | 945 | | | | 1,157,530 | |
Petrobras Global Finance BV (Brazil), | |
Gtd. Notes | |
4.750% | | | 01/14/25 | | | EUR | 400 | | | | 517,050 | |
5.750% | | | 02/01/29 | | | | 725 | | | | 816,004 | |
6.625% | | | 01/16/34 | | | GBP | 680 | | | | 1,082,612 | |
6.900% | | | 03/19/49 | | | | 495 | | | | 581,248 | |
7.375% | | | 01/17/27 | | | | 405 | | | | 494,022 | |
Gtd. Notes, 144A | |
5.093% | | | 01/15/30 | (a) | | | 339 | | | | 363,567 | |
Petroleos Mexicanos (Mexico), | |
Gtd. Notes | |
4.750% | | | 02/26/29 | | | EUR | 1,200 | | | | 1,428,166 | |
6.350% | | | 02/12/48 | | | | 840 | | | | 810,700 | |
6.500% | | | 03/13/27 | | | | 1,225 | | | | 1,296,732 | |
6.500% | | | 01/23/29 | | | | 100 | | | | 105,090 | |
Gtd. Notes, 144A | |
6.490% | | | 01/23/27 | | | | 1,565 | | | | 1,668,991 | |
6.840% | | | 01/23/30 | | | | 100 | | | | 106,880 | |
7.690% | | | 01/23/50 | | | | 797 | | | | 870,159 | |
Gtd. Notes, EMTN | |
2.750% | | | 04/21/27 | | | EUR | 700 | | | | 752,314 | |
3.750% | | | 02/21/24 | | | EUR | 400 | | | | 478,673 | |
4.875% | | | 02/21/28 | | | EUR | 1,250 | | | | 1,504,123 | |
Gtd. Notes, MTN | |
6.750% | | | 09/21/47 | | | | 1,025 | | | | 1,031,078 | |
Sinopec Group Overseas Development 2015 Ltd. (China), | |
Gtd. Notes, 144A | |
2.500% | | | 04/28/20 | | | | 1,250 | | | | 1,251,034 | |
YPF SA (Argentina), | |
Sr. Unsec’d. Notes, 144A | |
8.500% | | | 03/23/21 | | | | 235 | | | | 232,755 | |
| | | | | | | | | | | | |
| | | | | | | | | | | 30,811,862 | |
| | | | | | | | | | | | |
Oil & Gas Services — 0.1% | |
Cameron International Corp., | |
Gtd. Notes | |
7.000% | | | 07/15/38 | | | | 450 | | | | 605,297 | |
| | | | | | | | | | | | |
| | | | | | | | | | | | |
Interest
Rate | | Maturity
Date | | | Principal
Amount
(000)# | | | Value | |
|
| CORPORATE BONDS (continued) | |
Pharmaceuticals — 2.7% | |
AbbVie, Inc., | |
Sr. Unsec’d. Notes | |
3.600% | | | 05/14/25 | | | | 1,020 | | | $ | 1,076,866 | |
4.500% | | | 05/14/35 | | | | 1,715 | | | | 1,925,956 | |
Sr. Unsec’d. Notes, 144A | |
4.050% | | | 11/21/39 | | | | 5,135 | | | | 5,381,635 | |
Allergan Funding SCS, | |
Gtd. Notes | |
4.550% | | | 03/15/35 | | | | 2,040 | | | | 2,200,719 | |
Allergan Sales LLC, | |
Gtd. Notes, 144A | |
4.875% | | | 02/15/21 | | | | 1,350 | | | | 1,380,962 | |
Bausch Health Americas, Inc., | |
Gtd. Notes, 144A | |
8.500% | | | 01/31/27 | | | | 320 | | | | 364,882 | |
Bausch Health Cos., Inc., | |
Gtd. Notes, 144A | |
6.125% | | | 04/15/25 | (a) | | | 325 | | | | 336,309 | |
7.250% | | | 05/30/29 | | | | 100 | | | | 114,163 | |
Sr. Sec’d. Notes, 144A | |
5.750% | | | 08/15/27 | | | | 130 | | | | 141,204 | |
Sr. Unsec’d. Notes, 144A | |
5.000% | | | 01/30/28 | | | | 300 | | | | 307,792 | |
5.250% | | | 01/30/30 | | | | 300 | | | | 310,756 | |
Bristol-Myers Squibb Co., | |
Sr. Unsec’d. Notes, 144A | |
2.250% | | | 08/15/21 | | | | 1,070 | | | | 1,076,589 | |
4.125% | | | 06/15/39 | | | | 420 | | | | 483,295 | |
4.250% | | | 10/26/49 | | | | 650 | | | | 770,481 | |
4.550% | | | 02/20/48 | | | | 1,145 | | | | 1,395,877 | |
5.000% | | | 08/15/45 | | | | 750 | | | | 959,629 | |
Cigna Corp., | |
Gtd. Notes | |
4.375% | | | 10/15/28 | | | | 1,320 | | | | 1,464,466 | |
Gtd. Notes, 144A | |
4.500% | | | 02/25/26 | | | | 3,690 | | | | 4,056,936 | |
CVS Health Corp., | |
Sr. Unsec’d. Notes | |
4.780% | | | 03/25/38 | | | | 270 | | | | 306,409 | |
5.050% | | | 03/25/48 | | | | 655 | | | | 775,253 | |
5.125% | | | 07/20/45 | | | | 565 | | | | 667,729 | |
Endo Dac/Endo Finance LLC/Endo Finco, Inc., | |
Gtd. Notes, 144A | |
6.000% | | | 07/15/23 | | | | 512 | | | | 371,985 | |
Mylan, Inc., | |
Gtd. Notes | |
5.200% | | | 04/15/48 | | | | 1,415 | | | | 1,576,323 | |
Shire Acquisitions Investments Ireland DAC, | |
Gtd. Notes | |
3.200% | | | 09/23/26 | | | | 3,745 | | | | 3,856,238 | |
Takeda Pharmaceutical Co. Ltd. (Japan), | |
Sr. Unsec’d. Notes | |
4.000% | | | 11/26/21 | | | | 600 | | | | 620,105 | |
| | | | | | | | | | | | |
| | | | | | | | | | | 31,922,559 | |
| | | | | | | | | | | | |
SEE NOTES TO FINANCIAL STATEMENTS.
A50
| | | | | | |
| | |
| | DIVERSIFIED BOND PORTFOLIO (continued) | | |
| | | | | | |
| |
| SCHEDULE OF INVESTMENTS | | as of December 31, 2019 |
| | | | | | | | | | | | | | | | |
Interest
Rate | | Maturity
Date | | | | | | Principal
Amount
(000)# | | | Value | |
|
| CORPORATE BONDS (continued) | |
Pipelines — 1.1% | |
Energy Transfer Operating LP, | |
Gtd. Notes | |
5.150% | | | 03/15/45 | | | | | | | | 55 | | | $ | 57,683 | |
5.300% | | | 04/15/47 | | | | | | | | 120 | | | | 127,977 | |
6.125% | | | 12/15/45 | | | | | | | | 90 | | | | 104,131 | |
6.250% | | | 04/15/49 | | | | | | | | 1,400 | | | | 1,691,822 | |
Enterprise Products Operating LLC, | |
Gtd. Notes | |
4.900% | | | 05/15/46 | | | | | | | | 2,110 | | | | 2,471,325 | |
Fermaca Enterprises S de RL de CV (Mexico), | |
Sr. Sec’d. Notes, 144A | |
6.375% | | | 03/30/38 | | | | | | | | 380 | | | | 414,007 | |
Magellan Midstream Partners LP, | |
Sr. Unsec’d. Notes | |
4.200% | | | 03/15/45 | | | | | | | | 1,000 | | | | 1,000,666 | |
MPLX LP, | |
Sr. Unsec’d. Notes | |
4.500% | | | 04/15/38 | | | | | | | | 970 | | | | 987,048 | |
5.200% | | | 03/01/47 | | | | | | | | 115 | | | | 123,997 | |
NGPL PipeCo LLC, | |
Sr. Unsec’d. Notes, 144A | |
4.375% | | | 08/15/22 | | | | | | | | 50 | | | | 51,894 | |
4.875% | | | 08/15/27 | (a) | | | | | | | 225 | | | | 239,591 | |
ONEOK Partners LP, | |
Gtd. Notes | |
6.850% | | | 10/15/37 | | | | | | | | 1,250 | | | | 1,597,471 | |
ONEOK, Inc., | |
Gtd. Notes | |
4.950% | | | 07/13/47 | | | | | | | | 450 | | | | 492,104 | |
Phillips 66 Partners LP, | |
Sr. Unsec’d. Notes | |
4.680% | | | 02/15/45 | | | | | | | | 1,900 | | | | 2,046,750 | |
Sunoco Logistics Partners Operations LP, | |
Gtd. Notes | |
5.400% | | | 10/01/47 | | | | | | | | 55 | | | | 59,598 | |
Western Midstream Operating LP, | |
Sr. Unsec’d. Notes | |
5.450% | | | 04/01/44 | | | | | | | | 575 | | | | 506,419 | |
Williams Cos., Inc. (The), | |
Sr. Unsec’d. Notes | |
4.900% | | | 01/15/45 | | | | | | | | 1,200 | | | | 1,292,864 | |
| | | | | | | | | | | | | | | | |
| | | | | | | | | | | | | | | 13,265,347 | |
| | | | | | | | | | | | | | | | |
Real Estate — 0.1% | |
Greystar Real Estate Partners LLC, | |
Sr. Sec’d. Notes, 144A | |
5.750% | | | 12/01/25 | | | | | | | | 1,200 | | | | 1,245,591 | |
| | | | | | | | | | | | | | | | |
Retail — 0.7% | |
Dollar Tree, Inc., | |
Sr. Unsec’d. Notes, 3 Month LIBOR + 0.700% | |
2.702%(c) | | | 04/17/20 | | | | | | | | 950 | | | | 949,969 | |
Sr. Unsec’d. Notes | |
4.200% | | | 05/15/28 | | | | | | | | 1,875 | | | | 2,011,945 | |
Ferrellgas Partners LP/Ferrellgas Partners Finance Corp., | |
Sr. Unsec’d. Notes | |
8.625% | | | 06/15/20 | | | | | | | | 850 | | | | 509,529 | |
8.625% | | | 06/15/20 | | | | | | | | 900 | | | | 550,662 | |
| | | | | | | | | | | | | | | | |
Interest
Rate | | Maturity
Date | | | | | | Principal
Amount
(000)# | | | Value | |
|
| CORPORATE BONDS (continued) | |
Retail (continued) | |
L Brands, Inc., | |
Gtd. Notes | |
5.625% | | | 10/15/23 | | | | | | | | 1,600 | | | $ | 1,723,113 | |
6.625% | | | 04/01/21 | (a) | | | | | | | 551 | | | | 580,065 | |
Michaels Stores, Inc., | |
Gtd. Notes, 144A | |
8.000% | | | 07/15/27 | (a) | | | | | | | 800 | | | | 768,453 | |
PetSmart, Inc., | |
Sr. Sec’d. Notes, 144A | |
5.875% | | | 06/01/25 | (a) | | | | | | | 439 | | | | 448,308 | |
Rite Aid Corp., | |
Gtd. Notes, 144A | |
6.125% | | | 04/01/23 | (a) | | | | | | | 375 | | | | 344,794 | |
| | | | | | | | | | | | | | | | |
| | | | | | | | | | | | | | | 7,886,838 | |
| | | | | | | | | | | | | | | | |
Savings & Loans — 0.1% | |
People’s United Financial, Inc., | |
Sr. Unsec’d. Notes | |
3.650% | | | 12/06/22 | | | | | | | | 1,675 | | | | 1,740,878 | |
| | | | | | | | | | | | | | | | |
Semiconductors — 0.5% | |
Broadcom, Inc., | |
Gtd. Notes, 144A | |
3.125% | | | 04/15/21 | | | | | | | | 1,930 | | | | 1,953,142 | |
3.125% | | | 10/15/22 | | | | | | | | 1,480 | | | | 1,508,840 | |
NXP BV/NXP Funding LLC (Netherlands), | |
Gtd. Notes, 144A | |
4.625% | | | 06/01/23 | | | | | | | | 2,675 | | | | 2,857,236 | |
| | | | | | | | | | | | | | | | |
| | | | | | | | | | | | | | | 6,319,218 | |
| | | | | | | | | | | | | | | | |
Software — 0.4% | |
Fidelity National Information Services, Inc., | |
Sr. Unsec’d. Notes | |
0.750% | | | 05/21/23 | | | | | | | EUR | 400 | | | | 457,943 | |
Fiserv, Inc., | |
Sr. Unsec’d. Notes | |
3.500% | | | 10/01/22 | | | | | | | | 1,162 | | | | 1,203,745 | |
Microsoft Corp., | |
Sr. Unsec’d. Notes | |
3.750% | | | 02/12/45 | | | | | | | | 1,540 | | | | 1,745,485 | |
4.000% | | | 02/12/55 | | | | | | | | 435 | | | | 513,770 | |
4.450% | | | 11/03/45 | | | | | | | | 275 | | | | 343,929 | |
| | | | | | | | | | | | | | | | |
| | | | | | | | | | | | | | | 4,264,872 | |
| | | | | | | | | | | | | | | | |
Telecommunications — 1.4% | |
AT&T, Inc., | |
Sr. Unsec’d. Notes | |
3.400% | | | 05/15/25 | | | | | | | | 1,010 | | | | 1,058,408 | |
3.600% | | | 07/15/25 | | | | | | | | 150 | | | | 158,655 | |
3.800% | | | 02/15/27 | | | | | | | | 1,065 | | | | 1,139,418 | |
4.300% | | | 02/15/30 | | | | | | | | 485 | | | | 538,805 | |
4.550% | | | 03/09/49 | | | | | | | | 774 | | | | 857,970 | |
4.850% | | | 03/01/39 | | | | | | | | 4,230 | | | | 4,879,776 | |
5.250% | | | 03/01/37 | | | | | | | | 680 | | | | 812,517 | |
5.350% | | | 09/01/40 | | | | | | | | 424 | | | | 510,375 | |
CenturyLink, Inc., | |
Sr. Unsec’d. Notes, Series P | |
7.600% | | | 09/15/39 | (a) | | | | | | | 850 | | | | 886,729 | |
SEE NOTES TO FINANCIAL STATEMENTS.
A51
| | | | | | |
| | |
| | DIVERSIFIED BOND PORTFOLIO (continued) | | |
| | | | | | |
| |
| SCHEDULE OF INVESTMENTS | | as of December 31, 2019 |
| | | | | | | | | | | | | | | | |
Interest
Rate | | Maturity
Date | | | | | | Principal
Amount
(000)# | | | Value | |
|
| CORPORATE BONDS (continued) | |
Telecommunications (continued) | |
Embarq Corp., | |
Sr. Unsec’d. Notes | |
7.995% | | | 06/01/36 | | | | | | | | 1,700 | | | $ | 1,799,651 | |
Iridium Communications, Inc., | |
Sr. Unsec’d. Notes, 144A | |
10.250% | | | 04/15/23 | | | | | | | | 1,000 | | | | 1,072,234 | |
Level 3 Financing, Inc., | |
Sr. Sec’d. Notes, 144A | |
3.400% | | | 03/01/27 | | | | | | | | 230 | | | | 231,848 | |
Sprint Corp., | |
Gtd. Notes | |
7.625% | | | 02/15/25 | | | | | | | | 500 | | | | 549,976 | |
Verizon Communications, Inc., | |
Sr. Unsec’d. Notes | |
4.016% | | | 12/03/29 | | | | | | | | 120 | | | | 134,075 | |
4.500% | | | 08/10/33 | | | | | | | | 990 | | | | 1,156,515 | |
4.522% | | | 09/15/48 | | | | | | | | 360 | | | | 430,199 | |
| | | | | | | | | | | | | | | | |
| | | | | | | | | | | | | | | 16,217,151 | |
| | | | | | | | | | | | | | | | |
Textiles — 0.0% | |
Mohawk Industries, Inc., | |
Sr. Unsec’d. Notes | |
3.850% | | | 02/01/23 | (a) | | | | | | | 294 | | | | 306,651 | |
| | | | | | | | | | | | | | | | |
Transportation — 0.0% | |
Lima Metro Line 2 Finance Ltd. (Peru), | |
Sr. Sec’d. Notes | |
5.875% | | | 07/05/34 | | | | | | | | 110 | | | | 127,234 | |
| | | | | | | | | | | | | | | | |
TOTAL CORPORATE BONDS
(cost $409,295,616) | | | | 435,107,825 | |
| | | | | | | | | | | | | | | | |
|
| MUNICIPAL BONDS — 2.0% | |
California — 0.6% | |
Bay Area Toll Authority, | |
Taxable, Revenue Bonds, BABs, Series S3 | |
6.907% | | | 10/01/50 | | | | | | | | 1,125 | | | | 1,819,440 | |
State of California, | |
General Obligation Unlimited, BABs | |
7.300% | | | 10/01/39 | | | | | | | | 1,550 | | | | 2,367,873 | |
General Obligation Unlimited, Taxable, BABs | |
7.625% | | | 03/01/40 | | | | | | | | 725 | | | | 1,155,722 | |
University of California, | |
Revenue Bonds, BABs | |
5.770% | | | 05/15/43 | | | | | | | | 1,400 | | | | 1,852,578 | |
| | | | | | | | | | | | | | | | |
| | | | | | | | | | | | | | | 7,195,613 | |
| | | | | | | | | | | | | | | | |
Colorado — 0.1% | |
Regional Transportation District Sales Tax Revenue, | |
Revenue Bonds, BABs, Series B | |
5.844% | | | 11/01/50 | | | | | | | | 770 | | | | 1,118,417 | |
| | | | | | | | | | | | | | | | |
Illinois — 0.4% | |
Chicago O’Hare International Airport, | |
Revenue Bonds, BABs, Series B | |
6.395% | | | 01/01/40 | | | | | | | | 1,380 | | | | 1,980,148 | |
State of Illinois, | |
General Obligation Unlimited, Series A | |
5.000% | | | 10/01/22 | | | | | | | | 20 | | | | 21,579 | |
| | | | | | | | | | | | | | | | |
Interest
Rate | | Maturity
Date | | | | | | Principal
Amount
(000)# | | | Value | |
|
| MUNICIPAL BONDS (continued) | |
Illinois (continued) | |
General Obligation Unlimited, Series D | |
5.000% | | | 11/01/22 | | | | | | | | 2,650 | | | $ | 2,858,688 | |
| | | | | | | | | | | | | | | | |
| | | | | | | | | | | | | | | 4,860,415 | |
| | | | | | | | | | | | | | | | |
New Jersey — 0.4% | |
New Jersey Turnpike Authority, | |
Taxable, Revenue Bonds, BABs, Series A | |
7.102% | | | 01/01/41 | | | | | | | | 1,175 | | | | 1,797,785 | |
Taxable, Revenue Bonds, BABs, Series F | |
7.414% | | | 01/01/40 | | | | | | | | 2,050 | | | | 3,216,696 | |
| | | | | | | | | | | | | | | | |
| | | | | | | | | | | | | | | 5,014,481 | |
| | | | | | | | | | | | | | | | |
Ohio — 0.1% | |
Ohio State University (The), | |
Taxable, Revenue Bonds, BABs, Series C | |
4.910% | | | 06/01/40 | | | | | | | | 695 | | | | 878,807 | |
| | | | | | | | | | | | | | | | |
Oregon — 0.1% | |
State of Oregon Department of Transportation, | |
Taxable, Revenue Bonds, BABs, Series A | |
5.834% | | | 11/15/34 | | | | | | | | 615 | | | | 819,106 | |
| | | | | | | | | | | | | | | | |
Pennsylvania — 0.1% | |
Pennsylvania Turnpike Commission, | |
Revenue Bonds, BABs, Series B | |
5.511% | | | 12/01/45 | | | | | | | | 800 | | | | 1,063,640 | |
| | | | | | | | | | | | | | | | |
Puerto Rico — 0.2% | |
Puerto Rico Sales Tax Financing Corp. Sales Tax Revenue, | |
Revenue Bonds, SeriesA-1 | |
5.000% | | | 07/01/58 | | | | | | | | 1,710 | | | | 1,813,643 | |
| | | | | | | | | | | | | | | | |
Texas — 0.0% | |
Texas Private Activity Bond Surface Transportation Corp., | |
Taxable, Revenue Bonds, Series B | |
3.922% | | | 12/31/49 | | | | | | | | 450 | | | | 453,146 | |
| | | | | | | | | | | | | | | | |
Virginia — 0.0% | |
University of Virginia, | |
Taxable, Revenue Bonds, Series C | |
4.179% | | | 09/01/2117 | | | | | | | | 425 | | | | 496,375 | |
| | | | | | | | | | | | | | | | |
TOTAL MUNICIPAL BONDS
(cost $17,702,009) | | | | 23,713,643 | |
| | | | | | | | | | | | | | | | |
|
RESIDENTIAL MORTGAGE-BACKED
SECURITIES — 5.1% | |
Alternative Loan Trust, | |
Series 2004-18CB, Class 3A1 | |
5.250% | | | 09/25/20 | | | | | | | | 28 | | | | 27,707 | |
Bellemeade Re Ltd. (Bermuda), | |
Series2017-01, Class M1, 144A, 1 Month LIBOR + 1.700% (Cap N/A, Floor 0.000%) | |
3.492%(c) | | | 10/25/27 | | | | | | | | 176 | | | | 176,179 | |
Series2018-01A, Class M1B, 144A, 1 Month LIBOR + 1.600% (Cap N/A, Floor 0.000%) | |
3.392%(c) | | | 04/25/28 | | | | | | | | 855 | | | | 856,320 | |
Series2018-02A, Class M1A, 144A, 1 Month LIBOR + 0.950% (Cap N/A, Floor 0.000%) | |
2.742%(c) | | | 08/25/28 | | | | | | | | 92 | | | | 91,743 | |
Series2018-02A, Class M1B, 144A, 1 Month LIBOR + 1.350% (Cap N/A, Floor 0.000%) | |
3.142%(c) | | | 08/25/28 | | | | | | | | 450 | | | | 451,134 | |
SEE NOTES TO FINANCIAL STATEMENTS.
A52
| | | | | | |
| | |
| | DIVERSIFIED BOND PORTFOLIO (continued) | | |
| | | | | | |
| |
| SCHEDULE OF INVESTMENTS | | as of December 31, 2019 |
| | | | | | | | | | | | | | | | |
Interest
Rate | | Maturity
Date | | | | | | Principal
Amount
(000)# | | | Value | |
|
| RESIDENTIAL MORTGAGE-BACKED SECURITIES (continued) | |
Series2018-02A, Class M1C, 144A, 1 Month LIBOR + 1.600% (Cap N/A, Floor 0.000%) | |
3.392%(c) | | | 08/25/28 | | | | | | | | 450 | | | $ | 451,562 | |
Series2018-03A, Class M1A, 144A, 1 Month LIBOR + 1.200% (Cap N/A, Floor 1.200%) | |
2.992%(c) | | | 10/25/28 | | | | | | | | 181 | | | | 181,483 | |
Series2018-03A, Class M1B, 144A, 1 Month LIBOR + 1.850% (Cap N/A, Floor 1.850%) | |
3.642%(c) | | | 10/25/28 | | | | | | | | 1,040 | | | | 1,041,971 | |
Series2019-02A, Class M1B, 144A, 1 Month LIBOR + 1.450% (Cap N/A, Floor 1.450%) | |
3.242%(c) | | | 04/25/29 | | | | | | | | 820 | | | | 820,467 | |
Series2019-04A, Class M1A, 144A, 1 Month LIBOR + 1.400% (Cap N/A, Floor 1.400%) | |
3.192%(c) | | | 10/25/29 | | | | | | | | 700 | | | | 700,218 | |
Series2019-04A, Class M1B, 144A, 1 Month LIBOR + 2.000% (Cap N/A, Floor 2.000%) | |
3.792%(c) | | | 10/25/29 | | | | | | | | 700 | | | | 699,631 | |
BVRT Financing Trust, | |
Series2019-01, Class F, 144A | | | | | | | | | | | | | |
3.865% | | | 09/15/21^ | | | | | | | | 9,291 | | | | 9,290,644 | |
Central Park Funding Trust, | |
Series2018-01, Class A, 144A, 1 Month LIBOR + 1.500% (Cap N/A, Floor 1.500%) | |
3.281%(c) | | | 11/01/23 | | | | | | | | 5,400 | | | | 5,399,997 | |
CIM Trust, | |
Series2017-02, Class A1, 144A, 1 Month LIBOR + 2.000% (Cap N/A, Floor 2.000%) | |
3.709%(c) | | | 12/25/57 | | | | | | | | 1,227 | | | | 1,237,341 | |
Series2017-03, Class A1, 144A, 1 Month LIBOR + 2.000% (Cap N/A, Floor 0.000%) | |
3.709%(c) | | | 01/25/57 | | | | | | | | 1,319 | | | | 1,344,696 | |
Series2017-06, Class A1, 144A | | | | | | | | | | | | | |
3.015%(cc) | | | 06/25/57 | | | | | | | | 1,163 | | | | 1,163,412 | |
Series2017-08, Class A1, 144A | | | | | | | | | | | | | |
3.000%(cc) | | | 12/25/65 | | | | | | | | 2,228 | | | | 2,226,908 | |
Citigroup Mortgage Loan Trust, | |
Series2011-12, Class 3A2, 144A | | | | | | | | | | | | | |
3.794%(cc) | | | 09/25/47 | | | | | | | | 500 | | | | 496,542 | |
Credit Suisse Mortgage Trust, | |
Series2019-06R, Class 1A1, 144A, 1 Month LIBOR + 1.400% (Cap N/A, Floor 1.400%) | |
3.094%(c) | | | 10/25/46 | | | | | | | | 1,329 | | | | 1,331,560 | |
Eagle Re Ltd. (Bermuda), | |
Series2018-01, Class M1, 144A, 1 Month LIBOR + 1.700% (Cap N/A, Floor 1.700%) | |
3.492%(c) | | | 11/25/28 | | | | | | | | 1,158 | | | | 1,159,112 | |
Series2019-01, Class M1A, 144A, 1 Month LIBOR + 1.250% (Cap N/A, Floor 0.000%) | |
3.042%(c) | | | 04/25/29 | | | | | | | | 225 | | | | 224,665 | |
Series2019-01, Class M1B, 144A, 1 Month LIBOR + 1.800% (Cap N/A, Floor 0.000%) | |
3.592%(c) | | | 04/25/29 | | | | | | | | 300 | | | | 300,421 | |
Fannie Mae Connecticut Avenue Securities, | |
Series2016-C04, Class 1M1, 1 Month LIBOR + 1.450% (Cap N/A, Floor 0.000%) | |
3.242%(c) | | | 01/25/29 | | | | | | | | 3 | | | | 3,382 | |
| | | | | | | | | | | | | | | | |
Interest
Rate | | Maturity
Date | | | | | | Principal
Amount
(000)# | | | Value | |
|
| RESIDENTIAL MORTGAGE-BACKED SECURITIES (continued) | |
Series2018-C06, Class 1M2, 1 Month LIBOR + 2.000% (Cap N/A, Floor 2.000%) | |
3.792%(c) | | | 03/25/31 | | | | | | | | 550 | | | $ | 551,427 | |
Fannie Mae REMICS, | |
Series2011-116, Class ZA | |
3.500% | | | 11/25/41 | | | | | | | | 2,129 | | | | 2,232,618 | |
Series2012-34, Class EB | |
4.000% | | | 04/25/42 | | | | | | | | 1,575 | | | | 1,730,971 | |
Freddie Mac REMICS, | |
Series 4289, Class WZ | |
3.000% | | | 01/15/44 | | | | | | | | 755 | | | | 760,608 | |
Series 4768, Class GA | |
3.500% | | | 09/15/45 | | | | | | | | 1,855 | | | | 1,908,715 | |
Freddie Mac Structured Agency Credit Risk Debt Notes, | |
Series 2014-DN04, Class M3, 1 Month LIBOR + 4.550% (Cap N/A, Floor 0.000%) | |
6.342%(c) | | | 10/25/24 | | | | | | | | 209 | | | | 224,174 | |
Series 2015-DNA01, Class M3, 1 Month LIBOR + 3.300% (Cap N/A, Floor 0.000%) | |
5.092%(c) | | | 10/25/27 | | | | | | | | 2,460 | | | | 2,622,041 | |
Series 2016-HQA02, Class M2, 1 Month LIBOR + 2.250% (Cap N/A, Floor 0.000%) | |
4.042%(c) | | | 11/25/28 | | | | | | | | 261 | | | | 262,132 | |
Series 2016-HQA03, Class M2, 1 Month LIBOR + 1.350% (Cap N/A, Floor 0.000%) | |
3.142%(c) | | | 03/25/29 | | | | | | | | 453 | | | | 454,437 | |
Series 2016-HQA04, Class M2, 1 Month LIBOR + 1.300% (Cap N/A, Floor 0.000%) | |
3.092%(c) | | | 04/25/29 | | | | | | | | 1,031 | | | | 1,033,622 | |
Series 2019-DNA01, Class M2, 144A, 1 Month LIBOR + 2.650% (Cap N/A, Floor 0.000%) | |
4.442%(c) | | | 01/25/49 | | | | | | | | 250 | | | | 254,315 | |
GCAT LLC, | |
Series2019-04, Class A1, 144A | |
3.228% | | | 11/26/49 | | | | | | | | 1,975 | | | | 1,974,482 | |
GSMSC Resecuritization Trust, | |
Series2015-03R, Class 1A1, 144A, 1 Month LIBOR + 0.140% (Cap N/A, Floor 0.140%) | |
1.932%(c) | | | 01/26/37 | | | | | | | | 485 | | | | 483,193 | |
Series2015-03R, Class 1A2, 144A, 1 Month LIBOR + 0.140% (Cap N/A, Floor 0.140%) | |
1.932%(c) | | | 01/26/37 | | | | | | | | 1,400 | | | | 1,371,992 | |
Home Re Ltd. (Bermuda), | | | | | | | | | | | | | |
Series2018-01, Class M1, 144A, 1 Month LIBOR + 1.600% (Cap N/A, Floor 0.000%) | |
3.392%(c) | | | 10/25/28 | | | | | | | | 334 | | | | 334,009 | |
Series2019-01, Class M1, 144A, 1 Month LIBOR + 1.650% (Cap N/A, Floor 0.000%) | |
3.442%(c) | | | 05/25/29 | | | | | | | | 507 | | | | 507,765 | |
Legacy Mortgage Asset Trust, | |
Series 2019-GS06, Class A1, 144A | |
3.000% | | | 06/25/59 | | | | | | | | 679 | | | | 677,474 | |
LSTAR Securities Investment Trust, | |
Series2019-02, Class A1, 144A, 1 Month LIBOR + 1.500% (Cap N/A, Floor 0.000%) | |
3.281%(c) | | | 04/01/24 | | | | | | | | 657 | | | | 655,158 | |
SEE NOTES TO FINANCIAL STATEMENTS.
A53
| | | | | | |
| | |
| | DIVERSIFIED BOND PORTFOLIO (continued) | | |
| | | | | | |
| |
| SCHEDULE OF INVESTMENTS | | as of December 31, 2019 |
| | | | | | | | | | | | |
Interest
Rate | | Maturity
Date | | | Principal
Amount
(000)# | | | Value | |
|
| RESIDENTIAL MORTGAGE-BACKED SECURITIES (continued) | |
MetLife Securitization Trust, | |
Series2018-01A, Class A, 144A | |
3.750%(cc) | | | 03/25/57 | | | | 985 | | | $ | 1,023,055 | |
New Residential Mortgage Loan Trust, | |
Series2018-01A, Class A1A, 144A | |
4.000%(cc) | | | 12/25/57 | | | | 1,145 | | | | 1,186,117 | |
Series2018-04A, Class A1S, 144A, 1 Month LIBOR + 0.750% (Cap N/A, Floor 0.750%) | |
2.542%(c) | | | 01/25/48 | | | | 1,157 | | | | 1,153,541 | |
Oaktown Re II Ltd. (Bermuda), | |
Series2018-01A, Class M1, 144A, 1 Month LIBOR + 1.550% (Cap N/A, Floor 0.000%) | |
3.342%(c) | | | 07/25/28 | | | | 295 | | | | 295,312 | |
Oaktown Re III Ltd. (Bermuda), | |
Series2019-01A, Class M1A, 144A, 1 Month LIBOR + 1.400% (Cap N/A, Floor 1.400%) | |
3.192%(c) | | | 07/25/29 | | | | 791 | | | | 791,925 | |
Park Avenue Funding Trust, | |
Series2019-01, Class PT, 144A, 1 Month LIBOR + 1.500% (Cap N/A, Floor 1.500%) | |
3.292%(c) | | | 11/27/20 | | | | 802 | | | | 801,713 | |
Series2019-03, Class PT, 144A, 1 Month LIBOR + 2.750% (Cap N/A, Floor 1.500%) | |
4.542%(c) | | | 01/27/21 | | | | 705 | | | | 704,315 | |
Series2019-04, Class PT, 144A, 1 Month LIBOR + 1.500% (Cap N/A, Floor 1.500%) | |
3.305%(c) | | | 05/27/21^ | | | | 2,390 | | | | 2,390,000 | |
Radnor Re Ltd. (Bermuda), | |
Series2018-01, Class M1, 144A, 1 Month LIBOR + 1.400% (Cap N/A, Floor 0.000%) | |
3.192%(c) | | | 03/25/28 | | | | 309 | | | | 309,186 | |
Series2018-01, Class M2, 144A, 1 Month LIBOR + 2.700% (Cap N/A, Floor 0.000%) | |
4.492%(c) | | | 03/25/28 | | | | 360 | | | | 361,175 | |
Series2019-01, Class M1A, 144A, 1 Month LIBOR + 1.250% (Cap N/A, Floor 1.250%) | |
3.042%(c) | | | 02/25/29 | | | | 540 | | | | 539,723 | |
Series2019-02, Class M1A, 144A, 1 Month LIBOR + 1.200% (Cap N/A, Floor 1.200%) | |
2.992%(c) | | | 06/25/29 | | | | 366 | | | | 365,567 | |
STACR Trust, | |
Series 2018-DNA03, Class M1, 144A, 1 Month LIBOR + 0.750% (Cap N/A, Floor 0.000%) | |
2.542%(c) | | | 09/25/48 | | | | 659 | | | | 659,313 | |
Series 2018-HRP02, Class M1, 144A, 1 Month LIBOR + 0.850% (Cap N/A, Floor 0.000%) | |
2.642%(c) | | | 02/25/47 | | | | 186 | | | | 186,152 | |
Structured Adjustable Rate Mortgage Loan Trust, | |
Series2004-01, Class 4A3 | |
4.389%(cc) | | | 02/25/34 | | | | 422 | | | | 421,787 | |
Series2004-18, Class 3A1 | |
3.849%(cc) | | | 12/25/34 | | | | 2,088 | | | | 2,088,300 | |
| | | | | | | | | | | | |
Interest
Rate | | Maturity
Date | | | Principal
Amount
(000)# | | | Value | |
|
| RESIDENTIAL MORTGAGE-BACKED SECURITIES (continued) | |
Washington Mutual Mortgage Pass-Through Certificates, | |
Series2005-01, Class 3A | |
5.000% | | | 03/25/20 | | | | 30 | | | $ | 30,136 | |
| | | | | | | | | | | | |
TOTAL RESIDENTIAL MORTGAGE-BACKED SECURITIES
(cost $60,581,866) | | | | 61,023,545 | |
| | | | | | | | | | | | |
|
| SOVEREIGN BONDS — 8.0% | |
Argentine Republic Government International Bond (Argentina), | |
Bonds | |
3.380%(cc) | | | 12/31/38 | | | EUR | 300 | | | | 152,577 | |
Sr. Unsec’d. Notes | |
4.625% | | | 01/11/23 | | | | 1,625 | | | | 808,723 | |
6.875% | | | 04/22/21 | | | | 1,775 | | | | 956,011 | |
7.820% | | | 12/31/33 | | | EUR | 958 | | | | 619,198 | |
7.820% | | | 12/31/33 | | | EUR | 634 | | | | 404,242 | |
8.280% | | | 12/31/33 | | | | 582 | | | | 359,017 | |
Brazil Minas SPE via State of Minas Gerais (Brazil), | |
Gov’t. Gtd. Notes | |
5.333% | | | 02/15/28 | | | | 1,444 | | | | 1,549,324 | |
Colombia Government International Bond (Colombia), | |
Sr. Unsec’d. Notes | |
4.000% | | | 02/26/24 | | | | 250 | | | | 263,375 | |
5.000% | | | 06/15/45 | (a) | | | 205 | | | | 238,169 | |
Dominican Republic International Bond (Dominican Republic), | |
Sr. Unsec’d. Notes | |
7.500% | | | 05/06/21 | | | | 1,500 | | | | 1,559,118 | |
Sr. Unsec’d. Notes, 144A | |
6.000% | | | 07/19/28 | | | | 575 | | | | 639,201 | |
7.500% | | | 05/06/21 | | | | 400 | | | | 415,765 | |
Ecuador Government International Bond (Ecuador), | |
Sr. Unsec’d. Notes, 144A | |
10.500% | | | 03/24/20 | | | | 200 | | | | 202,979 | |
Egypt Government International Bond (Egypt), | |
Sr. Unsec’d. Notes, 144A, MTN | |
4.750% | | | 04/11/25 | | | EUR | 875 | | | | 1,034,291 | |
4.750% | | | 04/16/26 | | | EUR | 1,410 | | | | 1,662,654 | |
6.375% | | | 04/11/31 | | | EUR | 1,015 | | | | 1,219,018 | |
Hellenic Republic Government Bond (Greece), | |
Bonds | |
3.000%(cc) | | | 02/24/23 | | | EUR | 1,200 | | | | 1,489,168 | |
3.000%(cc) | | | 02/24/26 | | | EUR | 380 | | | | 501,160 | |
3.000%(cc) | | | 02/24/29 | | | EUR | 1,000 | | | | 1,334,422 | |
3.000%(cc) | | | 02/24/31 | | | EUR | 620 | | | | 831,282 | |
3.000%(cc) | | | 02/24/32 | | | EUR | 1,280 | | | | 1,758,587 | |
3.000%(cc) | | | 02/24/34 | | | EUR | 640 | | | | 886,270 | |
3.000%(cc) | | | 02/24/39 | | | EUR | 1,000 | | | | 1,396,185 | |
3.750% | | | 01/30/28 | | | EUR | 3,095 | | | | 4,111,016 | |
3.900% | | | 01/30/33 | | | EUR | 1,990 | | | | 2,739,068 | |
4.200% | | | 01/30/42 | | | EUR | 295 | | | | 437,574 | |
Hellenic Republic Government International Bond (Greece), | |
Sr. Unsec’d. Notes | |
5.200% | | | 07/17/34 | | | EUR | 1,500 | | | | 2,290,937 | |
Hungary Government International Bond (Hungary), | |
Sr. Unsec’d. Notes | |
5.375% | | | 02/21/23 | | | | 436 | | | | 478,420 | |
5.375% | | | 03/25/24 | | | | 290 | | | | 326,887 | |
SEE NOTES TO FINANCIAL STATEMENTS.
A54
| | | | | | |
| | |
| | DIVERSIFIED BOND PORTFOLIO (continued) | | |
| | | | | | |
| |
| SCHEDULE OF INVESTMENTS | | as of December 31, 2019 |
| | | | | | | | | | | | | | | | |
Interest
Rate | | Maturity
Date | | | | | | Principal
Amount
(000)# | | | Value | |
|
| SOVEREIGN BONDS (continued) | |
5.750% | | | 11/22/23 | | | | | | | | 2,300 | | | $ | 2,593,428 | |
6.375% | | | 03/29/21 | | | | | | | | 2,776 | | | | 2,929,910 | |
Indonesia Government International Bond (Indonesia), | |
Sr. Unsec’d. Notes | |
1.450% | | | 09/18/26 | | | | | | | EUR | 375 | | | | 436,009 | |
3.375% | | | 07/30/25 | | | | | | | EUR | 3,125 | | | | 3,985,944 | |
Sr. Unsec’d. Notes, EMTN | |
2.875% | | | 07/08/21 | | | | | | | EUR | 1,225 | | | | 1,431,518 | |
3.750% | | | 06/14/28 | | | | | | | EUR | 1,250 | | | | 1,689,561 | |
Iraq International Bond (Iraq), | |
Sr. Unsec’d. Notes, 144A | |
5.800% | | | 01/15/28 | | | | | | | | 450 | | | | 440,720 | |
6.752% | | | 03/09/23 | | | | | | | | 400 | | | | 410,809 | |
Japan Bank for International Cooperation (Japan), | |
Gov’t. Gtd. Notes | |
2.500% | | | 05/23/24 | | | | | | | | 1,000 | | | | 1,019,008 | |
Japan Finance Organization for Municipalities (Japan), | |
Sr. Unsec’d. Notes, 144A | |
3.375% | | | 09/27/23 | | | | | | | | 600 | | | | 628,951 | |
Sr. Unsec’d. Notes, 144A, MTN | |
1.750% | | | 09/05/24 | | | | | | | | 600 | | | | 590,290 | |
2.000% | | | 09/08/20 | | | | | | | | 800 | | | | 800,443 | |
2.625% | | | 04/20/22 | | | | | | | | 1,000 | | | | 1,014,389 | |
3.000% | | | 03/12/24 | | | | | | | | 600 | | | | 621,687 | |
Lithuania Government International Bond (Lithuania), | |
Sr. Unsec’d. Notes | |
6.625% | | | 02/01/22 | | | | | | | | 1,000 | | | | 1,095,630 | |
Panama Government International Bond (Panama), | |
Sr. Unsec’d. Notes | |
3.750% | | | 03/16/25 | | | | | | | | 450 | | | | 477,987 | |
Portugal Government International Bond (Portugal), | |
Sr. Unsec’d. Notes, EMTN | |
5.125% | | | 10/15/24 | | | | | | | | 12,675 | | | | 14,233,742 | |
Portugal Obrigacoes do Tesouro OT (Portugal), | |
Sr. Unsec’d. Notes, 144A | |
3.875% | | | 02/15/30 | | | | | | | EUR | 3,070 | | | | 4,590,075 | |
Province of Ontario (Canada), | |
Sr. Unsec’d. Notes | |
3.400% | | | 10/17/23 | | | | | | | | 295 | | | | 311,786 | |
Provincia de Buenos Aires (Argentina), | |
Sr. Unsec’d. Notes, 144A | |
6.500% | | | 02/15/23 | | | | | | | | 120 | | | | 49,409 | |
9.950% | | | 06/09/21 | | | | | | | | 1,940 | | | | 894,181 | |
Qatar Government International Bond (Qatar), | |
Sr. Unsec’d. Notes, 144A | |
5.103% | | | 04/23/48 | | | | | | | | 780 | | | | 1,001,209 | |
Republic of Italy Government International Bond (Italy), | |
Sr. Unsec’d. Notes | |
2.375% | | | 10/17/24 | | | | | | | | 1,000 | | | | 979,500 | |
6.875% | | | 09/27/23 | | | | | | | | 260 | | | | 298,270 | |
Sr. Unsec’d. Notes, EMTN | |
6.000% | | | 08/04/28 | | | | | | | GBP | 2,060 | | | | 3,410,636 | |
Sr. Unsec’d. Notes, MTN | |
5.375% | | | 06/15/33 | | | | | | | | 4,730 | | | | 5,492,123 | |
Romanian Government International Bond (Romania), | |
Sr. Unsec’d. Notes, 144A, MTN | |
3.875% | | | 10/29/35 | | | | | | | EUR | 945 | | | | 1,232,393 | |
| | | | | | | | | | | | | | | | |
Interest
Rate | | Maturity
Date | | | | | | Principal
Amount
(000)# | | | Value | |
|
| SOVEREIGN BONDS (continued) | |
Sr. Unsec’d. Notes, EMTN | |
3.875% | | | 10/29/35 | | | | | | | EUR | 940 | | | $ | 1,225,873 | |
4.125% | | | 03/11/39 | | | | | | | EUR | 254 | | | | 330,498 | |
Saudi Government International Bond (Saudi Arabia), | |
Sr. Unsec’d. Notes, 144A | |
2.000% | | | 07/09/39 | | | | | | | EUR | 400 | | | | 472,236 | |
Sr. Unsec’d. Notes, 144A, MTN | |
4.000% | | | 04/17/25 | | | | | | | | 675 | | | | 728,270 | |
Senegal Government International Bond (Senegal), | |
Sr. Unsec’d. Notes, 144A | |
4.750% | | | 03/13/28 | | | | | | | EUR | 475 | | | | 561,272 | |
Serbia International Bond (Serbia), | |
Sr. Unsec’d. Notes | |
7.250% | | | 09/28/21 | | | | | | | | 2,000 | | | | 2,180,248 | |
Tokyo Metropolitan Government (Japan), | |
Sr. Unsec’d. Notes, 144A | |
2.500% | | | 06/08/22 | | | | | | | | 600 | | | | 606,850 | |
Turkey Government International Bond (Turkey), | |
Sr. Unsec’d. Notes | |
5.625% | | | 03/30/21 | | | | | | | | 500 | | | | 514,654 | |
7.000% | | | 06/05/20 | | | | | | | | 1,510 | | | | 1,538,998 | |
Ukraine Government International Bond (Ukraine), | |
Sr. Unsec’d. Notes | |
7.750% | | | 09/01/20 | | | | | | | | 145 | | | | 149,139 | |
7.750% | | | 09/01/21 | | | | | | | | 160 | | | | 169,425 | |
7.750% | | | 09/01/22 | | | | | | | | 1,120 | | | | 1,205,278 | |
8.994% | | | 02/01/24 | | | | | | | | 200 | | | | 225,288 | |
Sr. Unsec’d. Notes, 144A | |
7.750% | | | 09/01/20 | | | | | | | | 520 | | | | 534,842 | |
7.750% | | | 09/01/22 | | | | | | | | 930 | | | | 1,000,811 | |
8.994% | | | 02/01/24 | | | | | | | | 200 | | | | 225,288 | |
| | | | | | | | | | | | | | | | |
TOTAL SOVEREIGN BONDS
(cost $92,160,055) | | | | 94,993,216 | |
| | | | | | | | | | | | | | | | |
|
| U.S. GOVERNMENT AGENCY OBLIGATIONS — 1.8% | |
Federal Home Loan Mortgage Corp. | |
3.500% | | | 02/01/47 | | | | | | | | 1,828 | | | | 1,902,153 | |
5.500% | | | 10/01/33 | | | | | | | | 548 | | | | 614,465 | |
5.500% | | | 06/01/34 | | | | | | | | 7 | | | | 7,321 | |
6.000% | | | 11/01/33 | | | | | | | | 143 | | | | 161,179 | |
6.000% | | | 05/01/34 | | | | | | | | 55 | | | | 57,690 | |
6.000% | | | 06/01/34 | | | | | | | | 96 | | | | 103,799 | |
6.250% | | | 07/15/32 | (k) | | | | | | | 830 | | | | 1,192,478 | |
6.500% | | | 07/01/32 | | | | | | | | 21 | | | | 22,655 | |
6.500% | | | 07/01/32 | | | | | | | | 21 | | | | 23,272 | |
6.500% | | | 08/01/32 | | | | | | | | 37 | | | | 41,161 | |
6.500% | | | 08/01/32 | | | | | | | | 41 | | | | 47,105 | |
6.500% | | | 08/01/32 | | | | | | | | 42 | | | | 47,895 | |
6.500% | | | 09/01/32 | | | | | | | | 39 | | | | 44,608 | |
6.500% | | | 09/01/32 | | | | | | | | 104 | | | | 119,319 | |
6.750% | | | 09/15/29 | (k) | | | | | | | 525 | | | | 735,477 | |
6.750% | | | 03/15/31 | (k) | | | | | | | 600 | | | | 868,209 | |
Federal National Mortgage Assoc. | |
2.500% | | | TBA | | | | | | | | 1,000 | | | | 1,008,930 | |
4.500% | | | 08/01/40 | | | | | | | | 2,079 | | | | 2,258,631 | |
5.500% | | | 02/01/33 | | | | | | | | 15 | | | | 17,124 | |
5.500% | | | 02/01/33 | | | | | | | | 21 | | | | 23,344 | |
5.500% | | | 03/01/33 | | | | | | | | 22 | | | | 24,830 | |
SEE NOTES TO FINANCIAL STATEMENTS.
A55
| | | | | | |
| | |
| | DIVERSIFIED BOND PORTFOLIO (continued) | | |
| | | | | | |
| |
| SCHEDULE OF INVESTMENTS | | as of December 31, 2019 |
| | | | | | | | | | | | |
Interest
Rate | | Maturity
Date | | | Principal
Amount
(000)# | | | Value | |
|
| U.S. GOVERNMENT AGENCY OBLIGATIONS (continued) | |
5.500% | | | 03/01/33 | | | | 41 | | | $ | 45,742 | |
5.500% | | | 03/01/33 | | | | 50 | | | | 55,703 | |
5.500% | | | 04/01/33 | | | | 6 | | | | 6,529 | |
5.500% | | | 04/01/33 | | | | 27 | | | | 30,400 | |
5.500% | | | 04/01/33 | | | | 31 | | | | 35,208 | |
5.500% | | | 04/01/33 | | | | 36 | | | | 39,791 | |
5.500% | | | 07/01/33 | | | | 26 | | | | 29,550 | |
5.500% | | | 07/01/33 | | | | 34 | | | | 37,686 | |
5.500% | | | 08/01/33 | | | | 16 | | | | 17,705 | |
5.500% | | | 02/01/34 | | | | 29 | | | | 32,700 | |
5.500% | | | 04/01/34 | | | | 27 | | | | 30,161 | |
5.500% | | | 06/01/34 | | | | 38 | | | | 42,031 | |
6.000% | | | 10/01/33 | | | | 3 | | | | 3,852 | |
6.000% | | | 10/01/33 | | | | 206 | | | | 231,220 | |
6.000% | | | 03/01/34 | | | | 58 | | | | 65,039 | |
6.000% | | | 02/01/35 | | | | 189 | | | | 216,104 | |
6.000% | | | 11/01/36 | | | | 52 | | | | 59,324 | |
6.250% | | | 05/15/29 | (k) | | | 535 | | | | 722,545 | |
6.500% | | | 08/01/32 | | | | 127 | | | | 146,755 | |
6.500% | | | 09/01/32 | | | | 102 | | | | 117,592 | |
6.500% | | | 09/01/32 | | | | 172 | | | | 198,223 | |
6.500% | | | 10/01/32 | | | | 92 | | | | 106,644 | |
6.500% | | | 04/01/33 | | | | 158 | | | | 182,444 | |
6.500% | | | 11/01/33 | | | | 3 | | | | 3,431 | |
6.625% | | | 11/15/30 | (k) | | | 530 | | | | 754,749 | |
7.000% | | | 05/01/32 | | | | 58 | | | | 63,761 | |
7.000% | | | 06/01/32 | | | | 8 | | | | 8,866 | |
7.125% | | | 01/15/30 | (k) | | | 785 | | | | 1,135,220 | |
Government National Mortgage Assoc. | |
3.500% | | | TBA | | | | 3,000 | | | | 3,092,100 | |
3.500% | | | 01/20/48 | | | | 495 | | | | 513,881 | |
4.000% | | | 02/20/49 | | | | 1,457 | | | | 1,517,355 | |
5.500% | | | 01/15/33 | | | | 65 | | | | 71,484 | |
5.500% | | | 02/15/33 | | | | 44 | | | | 49,286 | |
5.500% | | | 05/15/33 | | | | 126 | | | | 137,424 | |
5.500% | | | 05/15/33 | | | | 182 | | | | 200,616 | |
5.500% | | | 06/15/33 | | | | 193 | | | | 218,598 | |
5.500% | | | 09/15/33 | | | | 89 | | | | 99,409 | |
5.500% | | | 07/15/35 | | | | 63 | | | | 70,350 | |
6.000% | | | 12/15/32 | | | | 121 | | | | 136,132 | |
6.000% | | | 11/15/33 | | | | 59 | | | | 66,301 | |
6.000% | | | 01/15/34 | | | | 11 | | | | 13,012 | |
6.000% | | | 06/20/34 | | | | 321 | | | | 365,303 | |
6.000% | | | 11/15/34 | | | | 477 | | | | 540,517 | |
6.500% | | | 09/15/32 | | | | 35 | | | | 36,236 | |
6.500% | | | 09/15/32 | | | | 173 | | | | 195,159 | |
6.500% | | | 09/15/32 | | | | 216 | | | | 245,321 | |
6.500% | | | 11/15/33 | | | | 139 | | | | 159,313 | |
| | | | | | | | | | | | |
TOTAL U.S. GOVERNMENT AGENCY OBLIGATIONS
(cost $20,893,605) | | | | 21,468,417 | |
| | | | | | | | | | | | |
|
| U.S. TREASURY OBLIGATIONS — 3.5% | |
U.S. Treasury Bonds | |
2.250% | | | 08/15/49 | | | | 3,700 | | | | 3,589,000 | |
2.500% | | | 05/15/46 | (k) | | | 965 | | | | 985,356 | |
3.000% | | | 05/15/45 | (h)(k) | | | 17,745 | | | | 19,824,492 | |
3.000% | | | 02/15/47 | (k) | | | 310 | | | | 348,314 | |
3.000% | | | 02/15/48 | (k) | | | 270 | | | | 303,539 | |
| | | | | | | | | | | | |
Interest Rate | | Maturity
Date | | | Principal
Amount
(000)# | | | Value | |
|
| U.S. TREASURY OBLIGATIONS (continued) | |
3.125% | | | 02/15/43 | | | | 3,495 | | | $ | 3,964,641 | |
U.S. Treasury Notes | |
1.500% | | | 10/31/21 | | | | 210 | | | | 209,680 | |
U.S. Treasury Strips Coupon | |
2.056%(s) | | | 11/15/38 | (k) | | | 1,690 | | | | 1,076,583 | |
2.058%(s) | | | 02/15/39 | | | | 1,725 | | | | 1,088,165 | |
2.148%(s) | | | 05/15/39 | (h)(k) | | | 5,755 | | | | 3,609,464 | |
2.394%(s) | | | 11/15/43 | | | | 3,019 | | | | 1,665,285 | |
2.783%(s) | | | 08/15/29 | (k) | | | 1,200 | | | | 984,328 | |
2.878%(s) | | | 05/15/31 | (k) | | | 940 | | | | 736,835 | |
3.042%(s) | | | 11/15/35 | (k) | | | 2,400 | | | | 1,664,531 | |
3.202%(s) | | | 08/15/40 | (k) | | | 2,400 | | | | 1,450,594 | |
| | | | | | | | | | | | |
TOTAL U.S. TREASURY OBLIGATIONS
(cost $42,294,608) | | | | 41,500,807 | |
| | | | | | | | | | | | |
| | | |
| | | | | | Shares | | | | |
|
| PREFERRED STOCKS — 0.2% | |
Banks — 0.1% | |
Citigroup Capital XIII, 8.306% | | | | 45,000 | | | | 1,251,000 | |
| | | | | | | | | | | | |
Capital Markets — 0.1% | |
State Street Corp., 5.350% | | | | 35,000 | | | | 975,450 | |
| | | | | | | | | | | | |
TOTAL PREFERRED STOCKS
(cost $2,000,000) | | | | 2,226,450 | |
| | | | | | | | | | | | |
TOTAL LONG-TERM INVESTMENTS
(cost $1,138,756,219) | | | | 1,178,058,450 | |
| | | | | | | | | | | | |
|
| SHORT-TERM INVESTMENTS — 3.1% | |
AFFILIATED MUTUAL FUNDS — 3.1% | |
PGIM Core Ultra Short Bond Fund(w) | | | | 2,890,447 | | | | 2,890,447 | |
PGIM Institutional Money Market Fund
(cost $33,310,758; includes $33,261,386 of cash collateral for securities on loan)(b)(w) | | | | 33,308,374 | | | | 33,315,035 | |
| | | | | | | | | | | | |
TOTAL AFFILIATED MUTUAL FUNDS
(cost $36,201,205) | | | | 36,205,482 | |
| | | | | | | | | | | | |
OPTIONS PURCHASED*~ — 0.0%
(cost $17,284) | | | | 432,750 | |
| | | | | | | | | | | | |
TOTAL SHORT-TERM INVESTMENTS
(cost $36,218,489) | | | | 36,638,232 | |
| | | | | | | | | | | | |
TOTAL INVESTMENTS, BEFORE OPTIONS WRITTEN — 102.1%
(cost $1,174,974,708) | | | | 1,214,696,682 | |
| | | | | | | | | | | | |
OPTIONS WRITTEN*~ — (0.0)%
(premiums received $46,457) | | | | (13,345 | ) |
| | | | | | | | | | | | |
TOTAL INVESTMENTS, NET OF OPTIONS WRITTEN — 102.1%
(cost $1,174,928,251) | | | | 1,214,683,337 | |
Liabilities in excess of other assets(z) — (2.1)% | | | | (24,578,609 | ) |
| | | | | | | | | | | | |
NET ASSETS — 100.0% | | | $ | 1,190,104,728 | |
| | | | | | | | | | | | |
SEE NOTES TO FINANCIAL STATEMENTS.
A56
| | | | | | |
| | |
| | DIVERSIFIED BOND PORTFOLIO (continued) | | |
| | | | | | |
| |
| SCHEDULE OF INVESTMENTS | | as of December 31, 2019 |
See the Glossary for a list of the abbreviation(s) used in the annual report.
| * | Non-income producing security. |
| # | Principal or notional amount is shown in U.S. dollars unless otherwise stated. |
| ~ | See tables subsequent to the Schedule of Investments for options detail. |
| ^ | Indicates a Level 3 instrument. The aggregate value of Level 3 instruments is $12,731,778 and 1.1% of net assets. |
| (a) | All or a portion of security is on loan. The aggregate market value of such securities, including those sold and pending settlement, is $32,550,435; cash collateral of $33,261,386 (included in liabilities) was received with which the Portfolio purchased highly liquid short-term investments. |
| (b) | Represents security purchased with cash collateral received for securities on loan and includes dividend reinvestment. |
| (c) | Variable rate instrument. The interest rate shown reflects the rate in effect at December 31, 2019. |
| (cc) | Variable rate instrument. The rate shown is based on the latest available information as of December 31, 2019. Certain variable rate securities are not based on a published reference rate and spread but are determined by the issuer or agent and are based on current market conditions. These securities do not indicate a reference rate and spread in their description. |
| (d) | Represents issuer in default on interest payments and/or principal repayment.Non-income producing security. Such securities may be post-maturity. |
| (ff) | Variable rate security. Security may be issued at a fixed coupon rate, which converts to a variable rate at a specified date. Rate shown is the rate in effect as of period end. |
| (h) | Represents security, or a portion thereof, segregated as collateral for OTC derivatives. |
| (k) | Represents security, or a portion thereof, segregated as collateral for centrally cleared/exchange-traded derivatives. |
| (p) | Interest rate not available as of December 31, 2019. |
| (r) | Principal or notional amount is less than $500 par. |
| (rr) | Perpetual security with no stated maturity date. |
| (s) | Represents zero coupon bond or principal only security. Rate represents yield to maturity at purchase date. |
| (w) | PGIM Investments LLC, the manager of the Portfolio, also serves as manager of the PGIM Core Ultra Short Bond Fund and PGIM Institutional Money Market Fund. |
| (z) | Includes net unrealized appreciation/(depreciation) and/or market value of the below holdings which are excluded from the Schedule of Investments: |
Options Purchased:
OTC Traded
| | | | | | | | | | | | | | | | | | | | | | | | | | | | |
Description | | Call/
Put | | | Counterparty | | | Expiration
Date | | | Strike | | | Contracts | | | Notional
Amount
(000)# | | | Value | |
2-Year 10 CMS Curve CAP | | | Call | | | | Barclays Bank PLC | | | | 07/12/21 | | | | 0.11% | | | | — | | | | 3,026 | | | $ | 31,521 | |
2-Year 10 CMS Curve CAP | | | Call | | | | Bank of America, N.A. | | | | 08/16/21 | | | | 0.15% | | | | — | | | | 7,356 | | | | 70,205 | |
2-Year 10 CMS Curve CAP | | | Call | | | | Bank of America, N.A. | | | | 08/20/21 | | | | 0.15% | | | | — | | | | 14,601 | | | | 146,495 | |
2-Year 10 CMS Curve CAP | | | Call | | | | Bank of America, N.A. | | | | 09/13/21 | | | | 0.14% | | | | — | | | | 14,800 | | | | 155,710 | |
2-Year 10 CMS Curve CAP | | | Call | | | | Barclays Bank PLC | | | | 11/09/21 | | | | 0.21% | | | | — | | | | 2,942 | | | | 28,819 | |
| | | | | | | | | | | | | | | | | | | | | | | | | | | | |
Total Options Purchased(cost $17,284) | | | | | | | | | | | | | | | | | | | | | | | | | | $ | 432,750 | |
| | | | | | | | | | | | | | | | | | | | | | | | | | | | |
Options Written:
OTC Swaptions
| | | | | | | | | | | | | | | | | | | | | | | | | | | | |
Description | | Call/
Put | | Counterparty | | Expiration
Date | | | Strike | | | Receive | | | Pay | | | Notional
Amount
(000)# | | | Value | |
CDX.NA.HY.32.V2, 06/20/24 | | Put | | Citibank, N.A. | | | 01/15/20 | | | $ | 95.00 | | | | 5.00%(Q) | | | | CDX.NA.HY.32.V2(Q) | | | | 7,300 | | | $ | — | |
CDX.NA.HY.33.V1, 12/20/24 | | Put | | BNP Paribas S.A. | | | 06/17/20 | | | $ | 95.00 | | | | 5.00%(Q) | | | | CDX.NA.HY.33.V1(Q) | | | | 5,000 | | | | (8,637 | ) |
CDX.NA.HY.33.V2, 12/20/24 | | Put | | BNP Paribas S.A. | | | 03/18/20 | | | $ | 100.00 | | | | 5.00%(Q) | | | | CDX.NA.HY.33.V2(Q) | | | | 5,000 | | | | (2,931 | ) |
CDX.NA.IG.33.V1, 12/20/29 | | Put | | Goldman Sachs International | | | 02/19/20 | | | | 2.25 | % | | | 1.00%(Q) | | | | CDX.NA.IG.33.V1(Q) | | | | 10,000 | | | | (1,346 | ) |
iTraxx.EUR.32.V1, 12/20/29 | | Put | | Goldman Sachs International | | | 01/15/20 | | | | 2.20 | % | | | 1.00%(Q) | | | | iTraxx.EUR.32.V1(Q) | | | | EUR 100,000 | | | | (431 | ) |
| | | | | | | | | | | | | | | | | | | | | | | | | | | | |
Total Options Written(premiums received $46,457) | | | | | | | | | | | | | | | | | | | | | | $ | (13,345 | ) |
| | | | | | | | | | | | | | | | | | | | | | | | | | | | |
SEE NOTES TO FINANCIAL STATEMENTS.
A57
| | | | | | |
| | |
| | DIVERSIFIED BOND PORTFOLIO (continued) | | |
| | | | | | |
| |
| SCHEDULE OF INVESTMENTS | | as of December 31, 2019 |
Futures contracts outstanding at December 31, 2019:
| | | | | | | | | | | | | | | | |
Number of
Contracts | | Type | | | Expiration
Date | | | Current
Notional
Amount | | | Value /
Unrealized
Appreciation
(Depreciation) | |
| Long Positions: | | | | | | | | | | | | | | | | |
| 4,409 | | | 5 Year U.S. Treasury Notes | | | | Mar. 2020 | | | $ | 522,948,757 | | | $ | (1,528,507 | ) |
| 1,530 | | | 10 Year U.S. Treasury Notes | | | | Mar. 2020 | | | | 196,485,476 | | | | (1,277,114 | ) |
| 197 | | | 10 Year U.S. Ultra Treasury Notes | | | | Mar. 2020 | | | | 27,718,517 | | | | (316,563 | ) |
| 573 | | | 30 Year U.S. Ultra Treasury Bonds | | | | Mar. 2020 | | | | 104,089,031 | | | | (2,624,282 | ) |
| | | | | | | | | | | | | | | | |
| | | | | | | | | | | | | | | (5,746,466 | ) |
| | | | | | | | | | | | | | | | |
| Short Positions: | | | | | | | | | | | | | | | | |
| 2,792 | | | 2 Year U.S. Treasury Notes | | | | Mar. 2020 | | | | 601,676,000 | | | | 306,943 | |
| 108 | | | 10 Year Euro-Bund | | | | Mar. 2020 | | | | 20,653,772 | | | | 274,654 | |
| 91 | | | 20 Year U.S. Treasury Bonds | | | | Mar. 2020 | | | | 14,187,469 | | | | 181,126 | |
| | | | | | | | | | | | | | | | |
| | | | | | | | | | | | | | | 762,723 | |
| | | | | | | | | | | | | | | | |
| | | | | | | | | | | | | | $ | (4,983,743 | ) |
| | | | | | | | | | | | | | | | |
Forward foreign currency exchange contracts outstanding at December 31, 2019:
| | | | | | | | | | | | | | | | | | | | | | | | | | | | |
Sale Contracts | | Counterparty | | | Notional
Amount
(000) | | | Value at
Settlement
Date | | | Current
Value | | | Unrealized
Appreciation | | | Unrealized
Depreciation | |
OTC Forward Foreign Currency Exchange Contracts: | |
Australian Dollar, | | | | | | | | | | | | | | | | | | | | | | | | | | | | |
Expiring 01/22/20 | | | HSBC Bank USA, N.A. | | | | AUD | | | | 559 | | | $ | 382,970 | | | $ | 392,750 | | | $ | — | | | $ | (9,780 | ) |
British Pound, | | | | | | | | | | | | | | | | | | | | | | | | | | | | |
Expiring 01/09/20 | | | Barclays Bank PLC | | | | GBP | | | | 7,090 | | | | 9,127,528 | | | | 9,393,672 | | | | — | | | | (266,144 | ) |
Euro, | | | | | | | | | | | | | | | | | | | | | | | | | | | | |
Expiring 01/09/20 | | | Citibank, N.A. | | | | EUR | | | | 54,094 | | | | 59,971,866 | | | | 60,711,550 | | | | — | | | | (739,684 | ) |
Expiring 01/09/20 | | | Citibank, N.A. | | | | EUR | | | | 855 | | | | 955,326 | | | | 959,591 | | | | — | | | | (4,265 | ) |
| | | | | | | | | | | | | | | | | | | | | | | | | | | | |
| | | | | | | | | | | | | | $ | 70,437,690 | | | $ | 71,457,563 | | | $ | — | | | $ | (1,019,873 | ) |
| | | | | | | | | | | | | | | | | | | | | | | | | | | | |
Credit default swap agreements outstanding at December 31, 2019:
| | | | | | | | | | | | | | | | | | | | | | | | | | |
Reference Entity/
Obligation | | Termination
Date | | Fixed
Rate | | Notional
Amount
(000)#(3) | | | Implied
Credit
Spread at
December 31,
2019(4) | | | Fair
Value | | | Upfront
Premiums
Paid
(Received) | | | Unrealized
Appreciation
(Depreciation) | | | Counterparty |
OTC Packaged Credit Default Swap Agreements on corporate and/or sovereign issues—Sell Protection(2)*: |
Emirate of Abu Dhabi (D01) | | 12/20/24 | | 1.000%(Q) | | | 400 | | | | 0.336% | | | $ | 12,868 | | | $ | (189 | ) | | $ | 13,057 | | | Morgan Stanley & Co. International PLC |
Government of Malaysia (D01) | | 12/20/24 | | 1.000%(Q) | | | 800 | | | | 0.352% | | | | 25,064 | | | | (378 | ) | | | 25,442 | | | Morgan Stanley & Co. International PLC |
Kingdom of Saudi Arabia (D01) | | 12/20/24 | | 1.000%(Q) | | | 400 | | | | 0.563% | | | | 8,470 | | | | (189 | ) | | | 8,659 | | | Morgan Stanley & Co. International PLC |
People’s Republic of China (D01) | | 12/20/24 | | 1.000%(Q) | | | 1,800 | | | | 0.320% | | | | 59,178 | | | | (850 | ) | | | 60,028 | | | Morgan Stanley & Co. International PLC |
Republic of Argentina (D01) | | 12/20/24 | | 1.000%(Q) | | | 1,000 | | | | 79.997% | | | | (577,894 | ) | | | (472 | ) | | | (577,422 | ) | | Morgan Stanley & Co. International PLC |
Republic of Brazil (D01) | | 12/20/24 | | 1.000%(Q) | | | 2,400 | | | | 0.991% | | | | 1,810 | | | | (1,267 | ) | | | 3,077 | | | Morgan Stanley & Co. International PLC |
Republic of Chile (D01) | | 12/20/24 | | 1.000%(Q) | | | 400 | | | | 0.422% | | | | 11,194 | | | | (189 | ) | | | 11,383 | | | Morgan Stanley & Co. International PLC |
Republic of Colombia (D01) | | 12/20/24 | | 1.000%(Q) | | | 1,000 | | | | 0.727% | | | | 13,311 | | | | (472 | ) | | | 13,783 | | | Morgan Stanley & Co. International PLC |
Republic of Indonesia (D01) | | 12/20/24 | | 1.000%(Q) | | | 1,600 | | | | 0.629% | | | | 28,724 | | | | (756 | ) | | | 29,480 | | | Morgan Stanley & Co. International PLC |
SEE NOTES TO FINANCIAL STATEMENTS.
A58
| | | | | | |
| | |
| | DIVERSIFIED BOND PORTFOLIO (continued) | | |
| | | | | | |
| |
| SCHEDULE OF INVESTMENTS | | as of December 31, 2019 |
Credit default swap agreements outstanding at December 31, 2019 (continued):
| | | | | | | | | | | | | | | | | | | | | | | | | | | | | | |
Reference Entity/
Obligation | | Termination
Date | | | Fixed
Rate | | | Notional
Amount
(000)#(3) | | | Implied
Credit
Spread at
December 31,
2019(4) | | | Fair
Value | | | Upfront
Premiums
Paid
(Received) | | | Unrealized
Appreciation
(Depreciation) | | | Counterparty |
OTC Packaged Credit Default Swap Agreements on corporate and/or sovereign issues—Sell Protection(2)* (continued): |
Republic of Lebanon (D01) | | | 12/20/24 | | | | 1.000%(Q) | | | | 400 | | | | 34.265 | % | | $ | (223,932 | ) | | $ | (189 | ) | | $ | (223,743 | ) | | Morgan Stanley & Co. International PLC |
Republic of Panama (D01) | | | 12/20/24 | | | | 1.000%(Q) | | | | 400 | | | | 0.423 | % | | | 11,185 | | | | (189 | ) | | | 11,374 | | | Morgan Stanley & Co. International PLC |
Republic of Peru (D01) | | | 12/20/24 | | | | 1.000%(Q) | | | | 400 | | | | 0.421 | % | | | 11,224 | | | | (189 | ) | | | 11,413 | | | Morgan Stanley & Co. International PLC |
Republic of Philippines (D01) | | | 12/20/24 | | | | 1.000%(Q) | | | | 400 | | | | 0.338 | % | | | 12,787 | | | | (189 | ) | | | 12,976 | | | Morgan Stanley & Co. International PLC |
Republic of South Africa (D01) | | | 12/20/24 | | | | 1.000%(Q) | | | | 1,800 | | | | 1.625 | % | | | (51,584 | ) | | | (850 | ) | | | (50,734 | ) | | Morgan Stanley & Co. International PLC |
Republic of Turkey (D01) | | | 12/20/24 | | | | 1.000%(Q) | | | | 2,400 | | | | 2.791 | % | | | (191,919 | ) | | | (1,267 | ) | | | (190,652 | ) | | Morgan Stanley & Co. International PLC |
Russian Federation (D01) | | | 12/20/24 | | | | 1.000%(Q) | | | | 1,600 | | | | 0.556 | % | | | 34,401 | | | | (756 | ) | | | 35,157 | | | Morgan Stanley & Co. International PLC |
State of Qatar (D01) | | | 12/20/24 | | | | 1.000%(Q) | | | | 400 | | | | 0.365 | % | | | 12,301 | | | | (189 | ) | | | 12,490 | | | Morgan Stanley & Co. International PLC |
United Mexican States (D01) | | | 12/20/24 | | | | 1.000%(Q) | | | | 2,400 | | | | 0.784 | % | | | 25,352 | | | | (1,267 | ) | | | 26,619 | | | Morgan Stanley & Co. International PLC |
Emirate of Abu Dhabi (D02) | | | 12/20/24 | | | | 1.000%(Q) | | | | 2,000 | | | | 0.336 | % | | | 64,339 | | | | (556 | ) | | | 64,895 | | | Morgan Stanley & Co. International PLC |
Government of Malaysia (D02) | | | 12/20/24 | | | | 1.000%(Q) | | | | 4,000 | | | | 0.352 | % | | | 125,322 | | | | (1,444 | ) | | | 126,766 | | | Morgan Stanley & Co. International PLC |
Kingdom of Saudi Arabia (D02) | | | 12/20/24 | | | | 1.000%(Q) | | | | 2,000 | | | | 0.563 | % | | | 42,352 | | | | (556 | ) | | | 42,908 | | | Morgan Stanley & Co. International PLC |
People’s Republic of China (D02) | | | 12/20/24 | | | | 1.000%(Q) | | | | 9,000 | | | | 0.320 | % | | | 295,892 | | | | (3,250 | ) | | | 299,142 | | | Morgan Stanley & Co. International PLC |
Republic of Argentina (D02) | | | 12/20/24 | | | | 1.000%(Q) | | | | 5,000 | | | | 79.997 | % | | | (2,889,472 | ) | | | (1,806 | ) | | | (2,887,666 | ) | | Morgan Stanley & Co. International PLC |
Republic of Brazil (D02) | | | 12/20/24 | | | | 1.000%(Q) | | | | 12,000 | | | | 0.991 | % | | | 9,052 | | | | (4,333 | ) | | | 13,385 | | | Morgan Stanley & Co. International PLC |
Republic of Chile (D02) | | | 12/20/24 | | | | 1.000%(Q) | | | | 2,000 | | | | 0.422 | % | | | 55,969 | | | | (556 | ) | | | 56,525 | | | Morgan Stanley & Co. International PLC |
Republic of Colombia (D02) | | | 12/20/24 | | | | 1.000%(Q) | | | | 5,000 | | | | 0.727 | % | | | 66,555 | | | | (1,806 | ) | | | 68,361 | | | Morgan Stanley & Co. International PLC |
Republic of Indonesia (D02) | | | 12/20/24 | | | | 1.000%(Q) | | | | 8,000 | | | | 0.629 | % | | | 143,622 | | | | (2,889 | ) | | | 146,511 | | | Morgan Stanley & Co. International PLC |
Republic of Lebanon (D02) | | | 12/20/24 | | | | 1.000%(Q) | | | | 2,000 | | | | 34.265 | % | | | (1,119,658 | ) | | | (556 | ) | | | (1,119,102 | ) | | Morgan Stanley & Co. International PLC |
Republic of Panama (D02) | | | 12/20/24 | | | | 1.000%(Q) | | | | 2,000 | | | | 0.423 | % | | | 55,924 | | | | (556 | ) | | | 56,480 | | | Morgan Stanley & Co. International PLC |
Republic of Peru (D02) | | | 12/20/24 | | | | 1.000%(Q) | | | | 2,000 | | | | 0.421 | % | | | 56,118 | | | | (556 | ) | | | 56,674 | | | Morgan Stanley & Co. International PLC |
Republic of Philippines (D02) | | | 12/20/24 | | | | 1.000%(Q) | | | | 2,000 | | | | 0.338 | % | | | 63,933 | | | | (556 | ) | | | 64,489 | | | Morgan Stanley & Co. International PLC |
Republic of South Africa (D02) | | | 12/20/24 | | | | 1.000%(Q) | | | | 9,000 | | | | 1.625 | % | | | (257,918 | ) | | | (3,250 | ) | | | (254,668 | ) | | Morgan Stanley & Co. International PLC |
Republic of Turkey (D02) | | | 12/20/24 | | | | 1.000%(Q) | | | | 12,000 | | | | 2.791 | % | | | (959,593 | ) | | | (4,333 | ) | | | (955,260 | ) | | Morgan Stanley & Co. International PLC |
Russian Federation (D02) | | | 12/20/24 | | | | 1.000%(Q) | | | | 8,000 | | | | 0.556 | % | | | 172,007 | | | | (2,889 | ) | | | 174,896 | | | Morgan Stanley & Co. International PLC |
State of Qatar (D02) | | | 12/20/24 | | | | 1.000%(Q) | | | | 2,000 | | | | 0.365 | % | | | 61,506 | | | | (556 | ) | | | 62,062 | | | Morgan Stanley & Co. International PLC |
SEE NOTES TO FINANCIAL STATEMENTS.
A59
| | | | | | |
| | |
| | DIVERSIFIED BOND PORTFOLIO (continued) | | |
| | | | | | |
| |
| SCHEDULE OF INVESTMENTS | | as of December 31, 2019 |
Credit default swap agreements outstanding at December 31, 2019 (continued):
| | | | | | | | | | | | | | | | | | | | | | | | | | | | | | |
Reference Entity/
Obligation | | Termination
Date | | | Fixed
Rate | | | Notional
Amount
(000)#(3) | | | Implied
Credit
Spread at
December 31,
2019(4) | | | Fair
Value | | | Upfront
Premiums
Paid
(Received) | | | Unrealized
Appreciation
(Depreciation) | | | Counterparty |
OTC Packaged Credit Default Swap Agreements on corporate and/or sovereign issues—Sell Protection(2)* (continued): |
United Mexican States (D02) | | | 12/20/24 | | | | 1.000%(Q) | | | | 12,000 | | | | 0.784 | % | | $ | 126,761 | | | $ | (4,333 | ) | | $ | 131,094 | | | Morgan Stanley & Co. International PLC |
| | | | | | | | | | | | | | | | | | | | | | | | | | | | | | |
| | | | | | | | | | | | | | | | | | $ | (4,664,749 | ) | | $ | (44,628 | ) | | $ | (4,620,121 | ) | | |
| | | | | | | | | | | | | | | | | | | | | | | | | | | | | | |
| | | | | | | | | | | | | | | | | | | | | | | | | | |
Reference Entity/
Obligation | | Termination
Date | | | Fixed
Rate | | | Notional
Amount
(000)#(3) | | | Fair
Value | | | Upfront
Premiums
Paid
(Received) | | | Unrealized
Appreciation
(Depreciation) | | | Counterparty |
OTC Packaged Credit Default Swap Agreements on credit indices—Buy Protection(1)*: |
CDX.EM.32.V1 (D01) | | | 12/20/24 | | | | 1.000%(Q) | | | | 20,000 | | | $ | 665,487 | | | $ | (18,556 | ) | | $ | 684,043 | | | Morgan Stanley & Co. International PLC |
CDX.EM.32.V1 (D02) | | | 12/20/24 | | | | 1.000%(Q) | | | | 100,000 | | | | 3,327,437 | | | | (112,222 | ) | | | 3,439,659 | | | Morgan Stanley & Co. International PLC |
| | | | | | | | | | | | | | | | | | | | | | | | | | |
| | | | | | | | | | | | | | $ | 3,992,924 | | | $ | (130,778 | ) | | $ | 4,123,702 | | | |
| | | | | | | | | | | | | | | | | | | | | | | | | | |
| * | The Portfolio entered into multiple credit default swap agreements in a packaged trade consisting of two parts. The Portfolio bought/sold protection on an Emerging Market CDX Index and bought/sold protection on the countries which comprise the index. Theup-front premium is attached to the index of the trade. Each swap is priced individually. If any of the component swaps are closed out early, the Index exposure will be reduced by an amount proportionate to the terminated swap(s). Individual packages in the tables above are denoted by the corresponding footnotes (D01 - D02). |
| | | | | | | | | | | | | | | | | | | | | | | | | | |
Reference Entity/
Obligation | | Termination
Date | | | Fixed
Rate | | | Notional
Amount
(000)#(3) | | | Fair
Value | | | Upfront
Premiums
Paid
(Received) | | | Unrealized
Appreciation
(Depreciation) | | | Counterparty |
OTC Credit Default Swap Agreements on corporate and/or sovereign issues—Buy Protection(1): | | | |
Assicurazioni Generali SpA | | | 12/20/20 | | | | 1.000%(Q) | | | | EUR 900 | | | $ | (7,797 | ) | | $ | (6,978 | ) | | $ | (819 | ) | | Citibank, N.A. |
Kingdom of Spain | | | 06/20/23 | | | | 1.000%(Q) | | | | 2,100 | | | | (56,925 | ) | | | (51,964 | ) | | | (4,961 | ) | | Bank of America, N.A. |
Republic of Argentina | | | 06/20/21 | | | | 5.000%(Q) | | | | 905 | | | | 482,532 | | | | 389,150 | | | | 93,382 | | | Morgan Stanley & Co. International PLC |
Republic of Argentina | | | 06/20/21 | | | | 5.000%(Q) | | | | 360 | | | | 191,946 | | | | 158,400 | | | | 33,546 | | | Barclays Bank PLC |
Republic of Argentina | | | 06/20/22 | | | | 5.000%(Q) | | | | 700 | | | | 380,576 | | | | 404,250 | | | | (23,674 | ) | | Citibank, N.A. |
United Mexican States | | | 06/20/23 | | | | 1.000%(Q) | | | | 665 | | | | (11,592 | ) | | | 4,137 | | | | (15,729 | ) | | Citibank, N.A. |
United Mexican States | | | 06/20/23 | | | | 1.000%(Q) | | | | 655 | | | | (11,418 | ) | | | 10,327 | | | | (21,745 | ) | | Citibank, N.A. |
United Mexican States | | | 06/20/23 | | | | 1.000%(Q) | | | | 220 | | | | (3,835 | ) | | | 3,884 | | | | (7,719 | ) | | Citibank, N.A. |
United Mexican States | | | 06/20/23 | | | | 1.000%(Q) | | | | 220 | | | | (3,835 | ) | | | 3,567 | | | | (7,402 | ) | | Citibank, N.A. |
United Mexican States | | | 06/20/23 | | | | 1.000%(Q) | | | | 215 | | | | (3,748 | ) | | | 1,258 | | | | (5,006 | ) | | Citibank, N.A. |
United Mexican States | | | 06/20/23 | | | | 1.000%(Q) | | | | 115 | | | | (2,005 | ) | | | 715 | | | | (2,720 | ) | | Citibank, N.A. |
United Mexican States | | | 12/20/24 | | | | 1.000%(Q) | | | | 160 | | | | (1,690 | ) | | | 1,173 | | | | (2,863 | ) | | Citibank, N.A. |
United Mexican States | | | 12/20/24 | | | | 1.000%(Q) | | | | 130 | | | | (1,373 | ) | | | 1,141 | | | | (2,514 | ) | | Citibank, N.A. |
| | | | | | | | | | | | | | | | | | | | | | | | | | |
| | | | | | | | | | | | | | $ | 950,836 | | | $ | 919,060 | | | $ | 31,776 | | | |
| | | | | | | | | | | | | | | | | | | | | | | | | | |
| | | | | | | | | | | | | | | | | | | | | | | | | | | | | | |
Reference Entity/
Obligation | | Termination
Date | | | Fixed
Rate | | | Notional
Amount
(000)#(3) | | | Implied
Credit
Spread at
December 31,
2019(4) | | | Fair
Value | | | Upfront
Premiums
Paid
(Received) | | | Unrealized
Appreciation
(Depreciation) | | | Counterparty |
OTC Credit Default Swap Agreements on corporate and/or sovereign issues—Sell Protection(2): | | | | | | | |
AT&T Inc. | | | 06/20/20 | | | | 1.000%(Q) | | | | 1,000 | | | | 0.118 | % | | $ | 4,515 | | | $ | 5,842 | | | $ | (1,327 | ) | | BNP Paribas S.A. |
Barclays Bank PLC | | | 06/20/20 | | | | 1.000%(Q) | | | | EUR 1,200 | | | | 0.143 | % | | | 5,966 | | | | 5,815 | | | | 151 | | | Citibank, N.A. |
SEE NOTES TO FINANCIAL STATEMENTS.
A60
| | | | | | |
| | |
| | DIVERSIFIED BOND PORTFOLIO (continued) | | |
| | | | | | |
| |
| SCHEDULE OF INVESTMENTS | | as of December 31, 2019 |
Credit default swap agreements outstanding at December 31, 2019 (continued):
| | | | | | | | | | | | | | | | | | | | | | | | | | | | | | |
Reference Entity/
Obligation | | Termination
Date | | | Fixed
Rate | | | Notional
Amount
(000)#(3) | | | Implied
Credit
Spread at
December 31,
2019(4) | | | Fair
Value | | | Upfront
Premiums
Paid
(Received) | | | Unrealized
Appreciation
(Depreciation) | | | Counterparty |
OTC Credit Default Swap Agreements on corporate and/or sovereign issues—Sell Protection(2) (continued): |
Bombardier Inc. | | | 03/20/20 | | | | 5.000%(Q) | | | | 100 | | | | 1.661% | | | $ | 903 | | | $ | 870 | | | $ | 33 | | | JPMorgan Chase Bank, N.A. |
Bombardier Inc. | | | 06/20/20 | | | | 5.000%(Q) | | | | 500 | | | | 1.767% | | | | 8,449 | | | | 8,087 | | | | 362 | | | JPMorgan Chase Bank, N.A. |
General Electric Co. | | | 03/20/20 | | | | 1.000%(Q) | | | | 1,090 | | | | 0.287% | | | | 2,080 | | | | 3,305 | | | | (1,225 | ) | | Morgan Stanley & Co. International PLC |
General Electric Co. | | | 06/20/20 | | | | 1.000%(Q) | | | | 2,340 | | | | 0.295% | | | | 8,597 | | | | 9,232 | | | | (635 | ) | | Bank of America, N.A. |
Hellenic Republic | | | 06/20/23 | | | | 1.000%(Q) | | | | 660 | | | | 0.798% | | | | 4,685 | | | | (64,559 | ) | | | 69,244 | | | Citibank, N.A. |
Hellenic Republic | | | 06/20/24 | | | | 1.000%(Q) | | | | 500 | | | | 1.024% | | | | (341 | ) | | | (108,125 | ) | | | 107,784 | | | Barclays Bank PLC |
Hellenic Republic | | | 12/20/25 | | | | 1.000%(Q) | | | | 1,280 | | | | 1.335% | | | | (23,136 | ) | | | (231,773 | ) | | | 208,637 | | | Bank of America, N.A. |
Kingdom of Saudi Arabia | | | 06/20/24 | | | | 1.000%(Q) | | | | 405 | | | | 0.497% | | | | 8,934 | | | | 1,918 | | | | 7,016 | | | Morgan Stanley & Co. International PLC |
Kingdom of Spain | | | 06/20/23 | | | | 1.000%(Q) | | | | 2,100 | | | | 0.307% | | | | 49,979 | | | | 31,812 | | | | 18,167 | | | Bank of America, N.A. |
Petroleo Brasileiro SA | | | 03/20/20 | | | | 1.000%(Q) | | | | 735 | | | | 0.218% | | | | 1,516 | | | | 2,065 | | | | (549 | ) | | Credit Suisse International |
Petroleos Mexicanos | | | 06/20/23 | | | | 1.000%(Q) | | | | 550 | | | | 1.682% | | | | (12,262 | ) | | | (30,406 | ) | | | 18,144 | | | Citibank, N.A. |
Petroleos Mexicanos | | | 06/20/23 | | | | 1.000%(Q) | | | | 545 | | | | 1.682% | | | | (12,151 | ) | | | (36,167 | ) | | | 24,016 | | | Citibank, N.A. |
Petroleos Mexicanos | | | 06/20/23 | | | | 1.000%(Q) | | | | 185 | | | | 1.682% | | | | (4,124 | ) | | | (12,581 | ) | | | 8,457 | | | Citibank, N.A. |
Petroleos Mexicanos | | | 06/20/23 | | | | 1.000%(Q) | | | | 185 | | | | 1.682% | | | | (4,124 | ) | | | (12,353 | ) | | | 8,229 | | | Citibank, N.A. |
Petroleos Mexicanos | | | 06/20/23 | | | | 1.000%(Q) | | | | 180 | | | | 1.682% | | | | (4,013 | ) | | | (9,998 | ) | | | 5,985 | | | Citibank, N.A. |
Petroleos Mexicanos | | | 06/20/23 | | | | 1.000%(Q) | | | | 90 | | | | 1.682% | | | | (2,007 | ) | | | (4,973 | ) | | | 2,966 | | | Citibank, N.A. |
Petroleos Mexicanos | | | 12/20/24 | | | | 1.000%(Q) | | | | 160 | | | | 2.295% | | | | (9,433 | ) | | | (15,715 | ) | | | 6,282 | | | Citibank, N.A. |
Petroleos Mexicanos | | | 12/20/24 | | | | 1.000%(Q) | | | | 130 | | | | 2.295% | | | | (7,664 | ) | | | (12,912 | ) | | | 5,248 | | | Citibank, N.A. |
Republic of Argentina | | | 06/20/24 | | | | 5.000%(Q) | | | | 905 | | | | 82.684% | | | | (494,619 | ) | | | (434,400 | ) | | | (60,219 | ) | | Morgan Stanley & Co. International PLC |
Republic of Argentina | | | 06/20/24 | | | | 5.000%(Q) | | | | 700 | | | | 82.684% | | | | (382,578 | ) | | | (413,000 | ) | | | 30,422 | | | Citibank, N.A. |
Republic of Argentina | | | 06/20/24 | | | | 5.000%(Q) | | | | 360 | | | | 82.684% | | | | (196,754 | ) | | | (176,400 | ) | | | (20,354 | ) | | Barclays Bank PLC |
Republic of Italy | | | 09/20/20 | | | | 1.000%(Q) | | | | 5,650 | | | | 0.365% | | | | 27,886 | | | | 26,214 | | | | 1,672 | | | JPMorgan Chase Bank, N.A. |
Republic of Italy | | | 12/20/20 | | | | 1.000%(Q) | | | EUR | 900 | | | | 0.359% | | | | 6,709 | | | | 6,649 | | | | 60 | | | Citibank, N.A. |
State of Illinois | | | 06/20/24 | | | | 1.000%(Q) | | | | 580 | | | | 1.465% | | | | (10,891 | ) | | | (7,441 | ) | | | (3,450 | ) | | Citibank, N.A. |
United Mexican States | | | 03/20/20 | | | | 1.000%(Q) | | | | 2,380 | | | | 0.144% | | | | 5,296 | | | | 6,591 | | | | (1,295 | ) | | Citibank, N.A. |
| | | | | | | | | | | | | | | | | | | | | | | | | | | | | | |
| | | | | | | | | | | | | | | | | | $ | (1,028,582 | ) | | $ | (1,462,403 | ) | | $ | 433,821 | | | |
| | | | | | | | | | | | | | | | | | | | | | | | | | | | | | |
| | | | | | | | | | | | | | | | | | | | | | | | |
Reference Entity/Obligation | | Termination
Date | | | Fixed
Rate | | | Notional
Amount
(000)#(3) | | | Value at
Trade Date | | | Value at
December 31,
2019 | | | Unrealized
Appreciation
(Depreciation) | |
Centrally Cleared Credit Default Swap Agreement on credit indices—Buy Protection(1): | |
CDX.NA.IG.33.V1 | | | 12/20/29 | | | | 1.000%(Q) | | | | 7,525 | | | $ | 30,927 | | | $ | (67,904 | ) | | $ | (98,831 | ) |
| | | | | | | | | | | | | | | | | | | | | | | | |
| | | | | | | | | | | | | | | | | | | | | | | | | | |
Reference Entity/Obligation | | Termination
Date | | | Fixed
Rate | | | Notional
Amount
(000)#(3) | | | Fair
Value | | | Upfront
Premiums
Paid
(Received) | | | Unrealized
Appreciation
(Depreciation) | | | Counterparty |
OTC Credit Default Swap Agreement on credit indices—Buy Protection(1): | | | | | | | | | | | |
CMBX.NA.10.AAA | | | 11/17/59 | | | | 0.500%(M) | | | | 6,000 | | | $ | (65,756 | ) | | $ | 68,926 | | | $ | (134,682 | ) | | Deutsche Bank AG |
| | | | | | | | | | | | | | | | | | | | | | | | | | |
SEE NOTES TO FINANCIAL STATEMENTS.
A61
| | | | | | |
| | |
| | DIVERSIFIED BOND PORTFOLIO (continued) | | |
| | | | | | |
| |
| SCHEDULE OF INVESTMENTS | | as of December 31, 2019 |
Credit default swap agreements outstanding at December 31, 2019 (continued):
| | | | | | | | | | | | | | | | | | | | | | | | | | | | | | |
Reference Entity/
Obligation | | Termination
Date | | | Fixed
Rate | | | Notional
Amount
(000)#(3) | | | Implied
Credit
Spread at
December 31,
2019(4) | | | Fair
Value | | | Upfront
Premiums
Paid
(Received) | | | Unrealized
Appreciation
(Depreciation) | | | Counterparty |
OTC Credit Default Swap Agreements on credit indices—Sell Protection(2): |
CDX.BEIJING 1Y 30% - 100% | | | 12/20/20 | | | | 0.000% | | | | 8,900 | | | | * | | | $ | (847 | ) | | $ | (5,340 | ) | | $ | 4,493 | | | Citibank, N.A. |
CMBX.NA.6.AA | | | 05/11/63 | | | | 1.500% | (M) | | | 650 | | | | * | | | | 14,463 | | | | (2,368 | ) | | | 16,831 | | | Deutsche Bank AG |
| | | | | | | | | | | | | | | | | | | | | | | | | | | | | | |
| | | | | | | | | | | | | | | | | | $ | 13,616 | | | $ | (7,708 | ) | | $ | 21,324 | | | |
| | | | | | | | | | | | | | | | | | | | | | | | | | | | | | |
The Portfolio entered into credit default swaps (“CDS”) to provide a measure of protection against defaults or to take an active long or short position with respect to the likelihood of a particular issuer’s default or the reference entity’s credit soundness. CDS contracts generally trade based on a spread which represents the cost a protection buyer has to pay the protection seller. The protection buyer is said to be short the credit as the value of the contract rises the more the credit deteriorates. The value of the CDS contract increases for the protection buyer if the spread increases.
| (1) | If the Portfolio is a buyer of protection, it pays the fixed rate. When a credit event occurs, as defined under the terms of that particular swap agreement, the Portfolio will either (i) receive from the seller of protection an amount equal to the notional amount of the swap and make delivery of the referenced obligation or underlying securities comprising the referenced index or (ii) receive a net settlement amount in the form of cash or securities equal to the notional amount of the swap less the recovery value of the referenced obligation or underlying securities comprising the referenced index. |
| (2) | If the Portfolio is a seller of protection, it receives the fixed rate. When a credit event occurs, as defined under the terms of that particular swap agreement, the Portfolio will either (i) pay to the buyer of protection an amount equal to the notional amount of the swap and take delivery of the referenced obligation or underlying securities comprising the referenced index or (ii) pay a net settlement amount in the form of cash or securities equal to the notional amount of the swap less the recovery value of the referenced obligation or underlying securities comprising the referenced index. |
| (3) | Notional amount represents the maximum potential amount the Portfolio could be required to pay as a seller of credit protection or receive as a buyer of credit protection if a credit event occurs as defined under the terms of that particular swap agreement. |
| (4) | Implied credit spreads, represented in absolute terms, utilized in determining the fair value of credit default swap agreements where the Portfolio is the seller of protection as of the reporting date serve as an indicator of the current status of the payment/ performance risk and represent the likelihood of risk of default for the credit derivative. The implied credit spread of a particular referenced entity reflects the cost of buying/selling protection and may includeup-front payments required to be made to enter into the agreement. Wider credit spreads represent a deterioration of the referenced entity’s credit soundness and a greater likelihood of risk of default or other credit event occurring as defined under the terms of the agreement. |
| * | When an implied credit spread is not available, reference the fair value of credit default swap agreements on credit indices and asset-backed securities. Where the Portfolio is the seller of protection, it serves as an indicator of the current status of the payment/performance risk and represents the likelihood of an expected liability (or profit) for the credit derivative should the notional amount of the swap agreement be closed/sold as of the reporting date. Increasing fair value in absolute terms, when compared to the notional amount of the swap, represents a deterioration of the referenced entity’s credit soundness and a greater likelihood of risk of default or other credit event occurring as defined under the terms of the agreement. |
Interest rate swap agreements outstanding at December 31, 2019:
| | | | | | | | | | | | | | | | | | | | | | | | |
Notional
Amount
(000)# | | | Termination
Date | | | Fixed
Rate | | | Floating
Rate | | Value at
Trade Date | | | Value at
December 31,
2019 | | | Unrealized
Appreciation
(Depreciation) | |
| | Centrally Cleared Interest Rate Swap Agreements: | |
| BRL | 12,664 | | | | 01/02/25 | | | | 5.903%(T) | | | 1 Day BROIS(2)(T) | | $ | — | | | $ | (55,457 | ) | | $ | (55,457 | ) |
| BRL | 6,276 | | | | 01/02/25 | | | | 6.640%(T) | | | 1 Day BROIS(2)(T) | | | — | | | | 34,017 | | | | 34,017 | |
| BRL | 7,043 | | | | 01/02/25 | | | | 6.670%(T) | | | 1 Day BROIS(2)(T) | | | — | | | | 41,343 | | | | 41,343 | |
| BRL | 18,662 | | | | 01/02/25 | | | | 6.670%(T) | | | 1 Day BROIS(2)(T) | | | — | | | | 108,336 | | | | 108,336 | |
| CNH | 16,230 | | | | 06/14/24 | | | | 2.900%(Q) | | | 7 Day China Fixing Repo Rates(2)(Q) | | | 58 | | | | (604 | ) | | | (662 | ) |
| CNH | 46,000 | | | | 06/28/24 | | | | 2.901%(Q) | | | 7 Day China Fixing Repo Rates(2)(Q) | | | — | | | | (3,042 | ) | | | (3,042 | ) |
| CNH | 16,400 | | | | 09/19/24 | | | | 2.940%(Q) | | | 7 Day China Fixing Repo Rates(2)(Q) | | | (15 | ) | | | 2,043 | | | | 2,058 | |
| CNH | 15,700 | | | | 10/10/24 | | | | 2.860%(Q) | | | 7 Day China Fixing Repo Rates(2)(Q) | | | (10 | ) | | | (5,689 | ) | | | (5,679 | ) |
| EUR | 7,065 | | | | 05/11/21 | | | | (0.300)%(A) | | | 1 Day EONIA(1)(A) | | | (6,014 | ) | | | (21,335 | ) | | | (15,321 | ) |
| EUR | 8,125 | | | | 05/11/22 | | | | (0.250)%(A) | | | 1 Day EONIA(1)(A) | | | (5,161 | ) | | | (47,760 | ) | | | (42,599 | ) |
| EUR | 4,650 | | | | 05/11/23 | | | | (0.100)%(A) | | | 1 Day EONIA(1)(A) | | | (26,137 | ) | | | (61,869 | ) | | | (35,732 | ) |
SEE NOTES TO FINANCIAL STATEMENTS.
A62
| | | | | | |
| | |
| | DIVERSIFIED BOND PORTFOLIO (continued) | | |
| | | | | | |
| |
| SCHEDULE OF INVESTMENTS | | as of December 31, 2019 |
| | | | | | | | | | | | | | | | | | | | | | | | |
Notional
Amount
(000)# | | | Termination
Date | | | Fixed
Rate | | | Floating
Rate | | Value at
Trade Date | | | Value at
December 31,
2019 | | | Unrealized
Appreciaton
(Depreciation) | |
| | Centrally Cleared Interest Rate Swap Agreements (continued): | | | | | |
| EUR | 3,980 | | | | 05/11/24 | | | | 0.050%(A) | | | 1 Day EONIA(1)(A) | | $ | (61,623 | ) | | $ | (88,053 | ) | | $ | (26,430 | ) |
| EUR | 2,110 | | | | 05/11/25 | | | | 0.100%(A) | | | 1 Day EONIA(1)(A) | | | (12,404 | ) | | | (54,956 | ) | | | (42,552 | ) |
| EUR | 3,815 | | | | 05/11/26 | | | | 0.250%(A) | | | 1 Day EONIA(1)(A) | | | (62,921 | ) | | | (144,467 | ) | | | (81,546 | ) |
| EUR | 1,880 | | | | 05/11/29 | | | | 0.600%(A) | | | 1 Day EONIA(1)(A) | | | (122,780 | ) | | | (138,895 | ) | | | (16,115 | ) |
| EUR | 2,420 | | | | 05/11/33 | | | | 0.750%(A) | | | 1 Day EONIA(1)(A) | | | (45,098 | ) | | | (215,784 | ) | | | (170,686 | ) |
| EUR | 1,240 | | | | 05/11/36 | | | | 0.950%(A) | | | 1 Day EONIA(1)(A) | | | (23,480 | ) | | | (151,311 | ) | | | (127,831 | ) |
| EUR | 230 | | | | 05/11/37 | | | | 0.950%(A) | | | 1 Day EONIA(1)(A) | | | (6,564 | ) | | | (28,146 | ) | | | (21,582 | ) |
| EUR | 2,165 | | | | 05/11/39 | | | | 1.100%(A) | | | 1 Day EONIA(1)(A) | | | (246,784 | ) | | | (339,277 | ) | | | (92,493 | ) |
| EUR | 195 | | | | 05/11/42 | | | | 1.100%(A) | | | 1 Day EONIA(1)(A) | | | (4,923 | ) | | | (32,586 | ) | | | (27,663 | ) |
| GBP | 977 | | | | 10/22/28 | | | | 0.680%(A) | | | 1 Day SONIA(1)(A) | | | — | | | | 8,024 | | | | 8,024 | |
| GBP | 230 | | | | 05/08/34 | | | | 1.200%(A) | | | 1 Day SONIA(1)(A) | | | (9,088 | ) | | | (15,703 | ) | | | (6,615 | ) |
| JPY | 2,215,030 | | | | 12/17/20 | | | | 0.015%(S) | | | 6 Month JPY LIBOR(1)(S) | | | — | | | | (1,643 | ) | | | (1,643 | ) |
| | 43,825 | | | | 03/12/20 | | | | 2.405%(A) | | | 1 Day USOIS(2)(A) | | | — | | | | 169,201 | | | | 169,201 | |
| | 65,680 | | | | 04/25/20 | | | | 2.328%(A) | | | 1 Day USOIS(2)(A) | | | (1,064 | ) | | | 277,281 | | | | 278,345 | |
| | 24,116 | | | | 03/31/21 | | | | 2.173%(A) | | | 1 Day USOIS(2)(A) | | | (8,487 | ) | | | 227,543 | | | | 236,030 | |
| | 74,985 | | | | 06/15/21 | | | | 1.830%(S) | | | 3 Month LIBOR(2)(Q) | | | — | | | | 119,177 | | | | 119,177 | |
| | 65,004 | | | | 09/15/21 | | | | 1.381%(S) | | | 3 Month LIBOR(2)(Q) | | | (104,376 | ) | | | (333,695 | ) | | | (229,319 | ) |
| | 78,515 | | | | 09/15/21 | | | | 1.480%(S) | | | 3 Month LIBOR(2)(Q) | | | 74,757 | | | | (274,614 | ) | | | (349,371 | ) |
| | 88,215 | | | | 09/15/21 | | | | 1.604%(S) | | | 3 Month LIBOR(2)(Q) | | | 248,337 | | | | (125,493 | ) | | | (373,830 | ) |
| | 5,260 | | | | 05/31/22 | | | | 2.353%(A) | | | 1 Day USOIS(1)(A) | | | — | | | | (120,658 | ) | | | (120,658 | ) |
| | 4,490 | | | | 09/27/22 | | | | 2.360%(A) | | | 1 Day USOIS(1)(A) | | | 53 | | | | (119,082 | ) | | | (119,135 | ) |
| | 6,920 | | | | 02/15/24 | | | | 2.115%(S) | | | 3 Month LIBOR(1)(Q) | | | 16,360 | | | | (150,633 | ) | | | (166,993 | ) |
| | 16,137 | | | | 02/15/24 | | | | 2.151%(S) | | | 3 Month LIBOR(1)(Q) | | | (17,628 | ) | | | (376,531 | ) | | | (358,903 | ) |
| | 19,590 | | | | 02/15/24 | | | | 2.183%(S) | | | 3 Month LIBOR(1)(Q) | | | (27,672 | ) | | | (484,925 | ) | | | (457,253 | ) |
| | 17,085 | | | | 02/29/24 | | | | 1.520%(S) | | | 3 Month LIBOR(2)(Q) | | | — | | | | (123,713 | ) | | | (123,713 | ) |
| | 3,650 | | | | 05/15/24 | | | | 1.808%(A) | | | 1 Day USOIS(1)(A) | | | — | | | | (46,426 | ) | | | (46,426 | ) |
| | 11,070 | | | | 08/15/24 | | | | 2.168%(S) | | | 3 Month LIBOR(1)(Q) | | | — | | | | (283,738 | ) | | | (283,738 | ) |
| | 88,455 | | | | 08/15/24 | | | | 2.170%(S) | | | 3 Month LIBOR(1)(Q) | | | 297,704 | | | | (2,274,342 | ) | | | (2,572,046 | ) |
| | 29,940 | | | | 08/15/24 | | | | 2.176%(S) | | | 3 Month LIBOR(1)(Q) | | | 102,544 | | | | (777,880 | ) | | | (880,424 | ) |
| | 34,400 | | | | 11/15/24 | | | | 2.334%(S) | | | 3 Month LIBOR(1)(Q) | | | 120,853 | | | | (991,955 | ) | | | (1,112,808 | ) |
| | 6,025 | | | | 02/28/25 | | | | 2.454%(A) | | | 1 Day USOIS(1)(A) | | | 5,665 | | | | (302,875 | ) | | | (308,540 | ) |
| | 2,040 | | | | 02/28/25 | | | | 3.019%(S) | | | 3 Month LIBOR(1)(Q) | | | — | | | | (146,718 | ) | | | (146,718 | ) |
| | 41,999 | | | | 05/31/25 | | | | 2.998%(S) | | | 3 Month LIBOR(1)(Q) | | | (29,049 | ) | | | (2,769,819 | ) | | | (2,740,770 | ) |
| | 2,620 | | | | 07/31/25 | | | | 2.802%(A) | | | 1 Day USOIS(1)(A) | | | — | | | | (192,484 | ) | | | (192,484 | ) |
| | 8,910 | | | | 07/31/25 | | | | 3.105%(S) | | | 3 Month LIBOR(1)(Q) | | | 7,030 | | | | (731,715 | ) | | | (738,745 | ) |
| | 26,843 | | | | 07/31/25 | | | | 3.109%(S) | | | 3 Month LIBOR(1)(Q) | | | 939 | | | | (2,211,259 | ) | | | (2,212,198 | ) |
| | 4,420 | | | | 01/31/26 | | | | 2.236%(S) | | | 3 Month LIBOR(1)(Q) | | | — | | | | (147,616 | ) | | | (147,616 | ) |
| | 26,791 | | | | 01/31/26 | | | | 2.269%(A) | | | 1 Day USOIS(1)(A) | | | (78,239 | ) | | | (1,208,261 | ) | | | (1,130,022 | ) |
| | 4,036 | | | | 01/31/26 | | | | 2.406%(S) | | | 3 Month LIBOR(1)(Q) | | | — | | | | (177,410 | ) | | | (177,410 | ) |
| | 6,705 | | | | 03/12/26 | | | | 2.290%(A) | | | 1 Day USOIS(1)(A) | | | 138 | | | | (312,104 | ) | | | (312,242 | ) |
| | 18,032 | | | | 04/30/26 | | | | 1.876%(S) | | | 3 Month LIBOR(1)(Q) | | | (73,020 | ) | | | (110,793 | ) | | | (37,773 | ) |
| | 15,934 | | | | 02/15/27 | | | | 1.824%(A) | | | 1 Day USOIS(1)(A) | | | 211,226 | | | | (237,809 | ) | | | (449,035 | ) |
| | 6,555 | | | | 02/15/27 | | | | 1.899%(A) | | | 1 Day USOIS(1)(A) | | | 7,830 | | | | (135,752 | ) | | | (143,582 | ) |
| | 2,515 | | | | 02/15/27 | | | | 1.965%(A) | | | 1 Day USOIS(1)(A) | | | — | | | | (64,836 | ) | | | (64,836 | ) |
| | 7,480 | | | | 02/15/27 | | | | 2.067%(A) | | | 1 Day USOIS(1)(A) | | | (5,086 | ) | | | (251,901 | ) | | | (246,815 | ) |
| | 5,020 | | | | 05/08/27 | | | | 2.309%(S) | | | 3 Month LIBOR(1)(Q) | | | — | | | | (177,763 | ) | | | (177,763 | ) |
| | 3,295 | | | | 05/15/27 | | | | 1.823%(A) | | | 1 Day USOIS(1)(A) | | | — | | | | (53,832 | ) | | | (53,832 | ) |
| | 2,095 | | | | 05/15/27 | | | | 2.295%(S) | | | 3 Month LIBOR(1)(Q) | | | — | | | | (71,967 | ) | | | (71,967 | ) |
| | 16,008 | | | | 08/15/28 | | | | 2.579%(A) | | | 1 Day USOIS(1)(A) | | | (241,841 | ) | | | (1,302,894 | ) | | | (1,061,053 | ) |
| | 9,330 | | | | 08/15/28 | | | | 2.835%(S) | | | 3 Month LIBOR(1)(Q) | | | (40,174 | ) | | | (814,855 | ) | | | (774,681 | ) |
| | 2,905 | | | | 02/15/42 | | | | 1.369%(A) | | | 1 Day USOIS(1)(A) | | | 203 | | | | 268,178 | | | | 267,975 | |
| | 580 | | | | 11/15/43 | | | | 2.659%(S) | | | 3 Month LIBOR(1)(Q) | | | — | | | | (65,261 | ) | | | (65,261 | ) |
| | 1,835 | | | | 09/27/46 | | | | 1.380%(A) | | | 1 Day USOIS(1)(A) | | | 183 | | | | 183,216 | | | | 183,033 | |
| | 1,100 | | | | 04/09/48 | | | | 2.545%(S) | | | 3 Month LIBOR(1)(Q) | | | — | | | | (111,528 | ) | | | (111,528 | ) |
| | 1,020 | | | | 05/08/48 | | | | 2.627%(S) | | | 3 Month LIBOR(1)(Q) | | | — | | | | (122,089 | ) | | | (122,089 | ) |
| | | | | | | | | | | | | | | | | | | | | | | | |
| | | | | | | | | | | | | | $ | (165,758 | ) | | $ | (18,173,444 | ) | | $ | (18,007,686 | ) |
| | | | | | | | | | | | | | | | | | | | | | | | |
SEE NOTES TO FINANCIAL STATEMENTS.
A63
| | | | | | |
| | |
| | DIVERSIFIED BOND PORTFOLIO (continued) | | |
| | | | | | |
| |
| SCHEDULE OF INVESTMENTS | | as of December 31, 2019 |
| | | | | | | | | | | | | | | | | | | | | | | | | | |
Notional
Amount
(000)# | | | Termination
Date | | | Fixed
Rate | | | Floating
Rate | | Fair
Value | | | Upfront
Premiums
Paid(Received) | | | Unrealized
Appreciation
(Depreciation) | | | Counterparty |
| | OTC Interest Rate Swap Agreement: |
| | 525 | | | | 03/05/49 | | | | 2.403%(Q) | | | 1 Week MUNIPSA(1)(Q) | | $ | (79,448 | ) | | $ | — | | | $ | (79,448 | ) | | JPMorgan Chase Bank, N.A. |
| | | | | | | | | | | | | | | | | | | | | | | | | | |
| (1) | The Portfolio pays the fixed rate and receives the floating rate. |
| (2) | The Portfolio pays the floating rate and receives the fixed rate. |
Total return swap agreements outstanding at December 31, 2019:
| | | | | | | | | | | | | | | | | | | | | | | | | | | | |
Reference Entity | | Financing
Rate | | | Counterparty | | | Termination
Date | | | Long (Short)
Notional
Amount
(000)#(1) | | | Fair
Value | | | Upfront
Premiums
Paid
(Received) | | | Unrealized
Appreciation
(Depreciation)(2) | |
OTC Total Return Swap Agreement: | | | | | | | | | | | | | | | | | | | | | | | | | |
IOS.FN30.450.10(M) | | | 1 Month LIBOR | (M) | | | Credit Suisse International | | | | 1/12/41 | | | | 1,346 | | | $ | (3,767 | ) | | $ | (4,111 | ) | | $ | 344 | |
| | | | | | | | | | | | | | | | | | | | | | | | | | | | |
| (1) | On a long total return swap, the Portfolio receives payments for any positive return on the reference entity (makes payments for any negative return) and pays the financing rate. On a short total return swap, the Portfolio makes payments for any positive return on the reference entity (receives payments for any negative return) and receives the financing rate. |
| (2) | Upfront/recurring fees or commissions, as applicable, are included in the net unrealized appreciation (depreciation). |
Balances Reported in the Statement of Assets and Liabilities for OTC Swap Agreements:
| | | | | | | | | | | | | | | | |
| | | Premiums Paid | | | Premiums Received | | | Unrealized Appreciation | | | Unrealized Depreciation | |
OTC Swap Agreements | | $ | 1,155,328 | | | $ | (1,816,970 | ) | | $ | 6,434,299 | | | $ | (6,657,583 | ) |
| | | | | | | | | | | | | | | | |
Summary of Collateral for Centrally Cleared/Exchange-traded Derivatives:
Cash and securities segregated as collateral, including pending settlement for closed positions, to cover requirements for centrally cleared/exchange-traded derivatives are listed by broker as follows:
| | | | | | | | |
Broker | | Cash and/or Foreign Currency | | | Securities Market Value | |
Citigroup Global Markets, Inc. | | $ | 146,000 | | | $ | 20,045,268 | |
| | | | | | | | |
Fair Value Measurements:
Various inputs are used in determining the value of the Portfolio’s investments. These inputs are summarized in the three broad levels listed below.
| Level 1— | unadjusted quoted prices generally in active markets for identical securities. |
| Level 2— | quoted prices for similar securities, interest rates and yield curves, prepayment speeds, foreign currency exchange rates and other observable inputs. |
| Level 3— | unobservable inputs for securities valued in accordance with Board approved fair valuation procedures. |
The following is a summary of the inputs used as of December 31, 2019 in valuing such portfolio securities:
| | | | | | | | | | | | |
| | | Level 1 | | | Level 2 | | | Level 3 | |
Investments in Securities | | | | | | | | | | | | |
Assets | | | | | | | | | | | | |
Asset-Backed Securities | | | | | | | | | | | | |
Automobiles | | $ | — | | | $ | 10,815,426 | | | $ | — | |
Collateralized Loan Obligations. | | | — | | | | 225,112,350 | | | | — | |
Consumer Loans | | | — | | | | 20,498,110 | | | | — | |
Credit Cards | | | — | | | | 2,769,116 | | | | — | |
Home Equity Loans | | | — | | | | 4,879,979 | | | | — | |
Other | | | — | | | | 259,430 | | | | — | |
Residential Mortgage-Backed Securities | | | — | | | | 20,979,103 | | | | — | |
SEE NOTES TO FINANCIAL STATEMENTS.
A64
| | | | | | |
| | |
| | DIVERSIFIED BOND PORTFOLIO (continued) | | |
| | | | | | |
| |
| SCHEDULE OF INVESTMENTS | | as of December 31, 2019 |
| | | | | | | | | | | | |
| | | Level 1 | | | Level 2 | | | Level 3 | |
Investments in Securities (continued) | | | | | | | | | | | | |
Assets (continued) | | | | | | | | | | | | |
Asset-Backed Securities (continued) | | | | | | | | | | | | |
Student Loans | | $ | — | | | $ | 30,681,705 | | | $ | — | |
Bank Loans | | | — | | | | 6,069,501 | | | | 1,051,134 | |
Commercial Mortgage-Backed Securities | | | — | | | | 174,908,693 | | | | — | |
Corporate Bonds | | | — | | | | 435,107,825 | | | | — | |
Municipal Bonds | | | — | | | | 23,713,643 | | | | — | |
Residential Mortgage-Backed Securities | | | — | | | | 49,342,901 | | | | 11,680,644 | |
Sovereign Bonds | | | — | | | | 94,993,216 | | | | — | |
U.S. Government Agency Obligations | | | — | | | | 21,468,417 | | | | — | |
U.S. Treasury Obligations | | | — | | | | 41,500,807 | | | | — | |
Preferred Stocks | | | 2,226,450 | | | | — | | | | — | |
Affiliated Mutual Funds | | | 36,205,482 | | | | — | | | | — | |
Options Purchased | | | — | | | | 432,750 | | | | — | |
| | | | | | | | | | | | |
Total | | $ | 38,431,932 | | | $ | 1,163,532,972 | | | $ | 12,731,778 | |
| | | | | | | | | | | | |
Liabilities | | | | | | | | | | | | |
Options Written | | $ | — | | | $ | (13,345 | ) | | $ | — | |
| | | | | | | | | | | | |
Other Financial Instruments* | | | | | | | | | | | | |
Assets | | | | | | | | | | | | |
Futures Contracts | | $ | 762,723 | | | $ | — | | | $ | — | |
OTC Packaged Credit Default Swap Agreements | | | — | | | | 5,600,145 | | | | — | |
OTC Credit Default Swap Agreements | | | — | | | | 1,205,032 | | | | — | |
Centrally Cleared Interest Rate Swap Agreements | | | — | | | | 1,447,539 | | | | — | |
| | | | | | | | | | | | |
Total | | $ | 762,723 | | | $ | 8,252,716 | | | $ | — | |
| | | | | | | | | | | | |
Liabilities | | | | | | | | | | | | |
Futures Contracts | | $ | (5,746,466 | ) | | $ | — | | | $ | — | |
OTC Forward Foreign Currency Exchange Contracts | | | — | | | | (1,019,873 | ) | | | — | |
OTC Packaged Credit Default Swap Agreements | | | — | | | | (6,271,970 | ) | | | — | |
Centrally Cleared Credit Default Swap Agreement | | | — | | | | (98,831 | ) | | | — | |
OTC Credit Default Swap Agreements | | | — | | | | (1,334,918 | ) | | | — | |
Centrally Cleared Interest Rate Swap Agreements | | | — | | | | (19,455,225 | ) | | | — | |
OTC Interest Rate Swap Agreement | | | — | | | | (79,448 | ) | | | — | |
OTC Total Return Swap Agreement | | | — | | | | (3,767 | ) | | | — | |
| | | | | | | | | | | | |
Total | | $ | (5,746,466 | ) | | $ | (28,264,032 | ) | | $ | — | |
| | | | | | | | | | | | |
| * | Other financial instruments are derivative instruments not reflected in the Schedule of Investments, such as futures, forwards and centrally cleared swap contracts, which are recorded at the unrealized appreciation (depreciation) on the instrument, and OTC swap contracts which are recorded at fair value. |
The following is a reconciliation of assets in which unobservable inputs (Level 3) were used in determining fair value:
| | | | | | | | | | | | | | | | | | | | |
| | | Asset-Backed
Securities—
Residential
Mortgage-Backed
Securities | | | Bank
Loans | | | Residential
Mortgage-Backed
Securities | | | Credit Default
Swap Agreements | | | Forward
Rate
Agreements | |
Balance as of 12/31/18 | | $ | 7,996,987 | | | $ | 1,004,500 | | | $ | 5,400,000 | | | $ | 8,505 | | | $ | (130,337 | ) |
Realized gain (loss) | | | 17,100 | | | | (16,488 | ) | | | — | | | | 7,652 | | | | 15,592 | |
Change in unrealized appreciation (depreciation) | | | (61,419 | ) | | | 1,870 | | | | — | | | | — | | | | — | |
Purchases/Exchanges/Issuances | | | — | | | | — | | | | 11,690,000 | | | | — | | | | — | |
Sales/Paydowns | | | (7,953,906 | ) | | | (616,783 | ) | | | (9,356 | ) | | | (16,157 | ) | | | 114,745 | |
Accrued discount/premium | | | 1,238 | | | | 896 | | | | — | | | | — | | | | — | |
Transfers into Level 3 | | | — | | | | 677,139 | | | | — | | | | — | | | | — | |
Transfers out of Level 3 | | | — | | | | — | | | | (5,400,000 | ) | | | — | | | | — | |
| | | | | | | | | | | | | | | | | | | | |
Balance as of 12/31/19 | | $ | — | | | $ | 1,051,134 | | | $ | 11,680,644 | | | $ | — | | | $ | — | |
| | | | | | | | | | | | | | | | | | | | |
SEE NOTES TO FINANCIAL STATEMENTS.
A65
| | | | | | |
| | |
| | DIVERSIFIED BOND PORTFOLIO (continued) | | |
| | | | | | |
| |
| SCHEDULE OF INVESTMENTS | | as of December 31, 2019 |
| | | | | | | | | | | | | | | | | | | | |
| | | Asset-Backed
Securities—
Residential
Mortgage-Backed
Securities | | | Bank
Loans | | | Residential
Mortgage-Backed
Securities | | | Credit Default
Swap Agreements | | | Forward
Rate
Agreements | |
Change in unrealized appreciation (depreciation) relating to securities still held at reporting period end | | $ | — | | | $ | 1,870 | | | $ | — | | | $ | — | | | $ | — | |
| | | | | | | | | | | | | | | | | | | | |
Level 3 securities as presented in the table above are being fair valued using pricing methodologies approved by Board, which contain unobservable inputs as follows:
| | | | | | | | |
Level 3 Securities | | Fair Value as of
December 31, 2019 | | | Valuation
Methodology | | Unobservable Inputs |
Bank Loans | | $ | 1,051,134 | | | Market Approach | | Single Broker Indicative Quote |
Residential Mortgage-Backed Securities | | | 9,290,644 | | | Market Approach | | Single Broker Indicative Quote |
Residential Mortgage-Backed Securities | | | 2,390,000 | | | Pricing at Cost | | Unadjusted Purchase Price |
| | | | | | | | |
| | $ | 12,731,778 | | | | | |
| | | | | | | | |
It is the Portfolios’ policy to recognize transfers in and transfers out at the fair value as of the beginning of period. Securities transferred levels as follows:
| | | | | | | | |
Investments in Securities | | Amount Transferred | | | Level Transfer | | Logic |
Bank Loans | | $ | 677,139 | | | L2 to L3 | | Multiple Broker Quotes to Single Broker Indicative Quote |
Residential Mortgage-Backed Securities | | $ | 5,400,000 | | | L3 to L2 | | Single Broker Indicative Quote to Evaluated Bid |
Industry Classification:
The industry classification of investments and liabilities in excess of other assets shown as a percentage of net assets as of December 31, 2019 were as follows (unaudited):
| | | | |
Collateralized Loan Obligations | | | 18.9 | % |
Commercial Mortgage-Backed Securities | | | 14.7 | |
Banks | | | 10.0 | |
Sovereign Bonds | | | 8.0 | |
Residential Mortgage-Backed Securities | | | 6.9 | |
U.S. Treasury Obligations | | | 3.5 | |
Affiliated Mutual Funds (2.8% represents investments purchased with collateral from securities on loan) | | | 3.1 | |
Pharmaceuticals | | | 2.8 | |
Oil & Gas | | | 2.7 | |
Student Loans | | | 2.6 | |
Electric | | | 2.2 | |
Media | | | 2.1 | |
Municipal Bonds | | | 2.0 | |
U.S. Government Agency Obligations | | | 1.8 | |
Consumer Loans | | | 1.7 | |
Chemicals | | | 1.6 | |
Telecommunications | | | 1.4 | |
Pipelines | | | 1.1 | |
Auto Manufacturers | | | 1.0 | |
Insurance | | | 1.0 | |
Healthcare-Services | | | 1.0 | |
Diversified Financial Services | | | 0.9 | |
Automobiles | | | 0.9 | |
Foods | | | 0.9 | |
Retail | | | 0.8 | |
| | | | |
Commercial Services | | | 0.7 | % |
Aerospace & Defense | | | 0.7 | |
Semiconductors | | | 0.5 | |
Auto Parts & Equipment | | | 0.5 | |
Airlines | | | 0.5 | |
Beverages | | | 0.4 | |
Entertainment | | | 0.4 | |
Home Equity Loans | | | 0.4 | |
Home Builders | | | 0.4 | |
Machinery-Diversified | | | 0.4 | |
Software | | | 0.4 | |
Building Materials | | | 0.3 | |
Healthcare-Products | | | 0.3 | |
Multi-National | | | 0.3 | |
Gas | | | 0.3 | |
Agriculture | | | 0.2 | |
Credit Cards | | | 0.2 | |
Engineering & Construction | | | 0.2 | |
Mining | | | 0.2 | |
Lodging | | | 0.2 | |
Computers | | | 0.2 | |
Savings & Loans | | | 0.1 | |
Forest Products & Paper | | | 0.1 | |
Internet | | | 0.1 | |
Real Estate | | | 0.1 | |
Electronics | | | 0.1 | |
SEE NOTES TO FINANCIAL STATEMENTS.
A66
| | | | | | |
| | |
| | DIVERSIFIED BOND PORTFOLIO (continued) | | |
| | | | | | |
| |
| SCHEDULE OF INVESTMENTS | | as of December 31, 2019 |
| | | | |
Industry Classification (continued): | | | |
Capital Markets | | | 0.1 | % |
Housewares | | | 0.1 | |
Oil & Gas Services | | | 0.1 | |
Options Purchased | | | 0.0 | * |
Textiles | | | 0.0 | * |
Other | | | 0.0 | * |
Transportation | | | 0.0 | * |
| | | | |
| | | 102.1 | |
Options Written | | | (0.0 | )* |
Liabilities in excess of other assets | | | (2.1 | ) |
| | | | |
| | | 100.0 | % |
| | | | |
Effects of Derivative Instruments on the Financial Statements and Primary Underlying Risk Exposure:
The Portfolio invested in derivative instruments during the reporting period. The primary types of risk associated with these derivative instruments are credit contracts risk, foreign exchange contracts risk and interest rate contracts risk. See the Notes to Financial Statements for additional detail regarding these derivative instruments and their risks. The effect of such derivative instruments on the Portfolio’s financial position and financial performance as reflected in the Statement of Assets and Liabilities and Statement of Operations is presented in the summary below.
Fair values of derivative instruments as of December 31, 2019 as presented in the Statement of Assets and Liabilities:
| | | | | | | | | | | | |
Derivatives not accounted for as hedging
instruments, carried at fair value | | Asset Derivatives | | | Liability Derivatives | |
| | Statement of Assets
and Liabilities Location | | Fair Value | | | Statement of Assets
and Liabilities Location | | Fair Value | |
Credit contracts | | — | | $ | — | | | Due from/to broker — variation margin swaps | | $ | 98,831 | * |
Credit contracts | | Premiums paid for OTC swap agreements | | | 1,155,328 | | | Premiums received for OTC swap agreements | | | 1,812,859 | |
Credit contracts | | — | | | — | | | Options written outstanding, at value | | | 13,345 | |
Credit contracts | | Unrealized appreciation on OTC swap agreements | | | 6,433,955 | | | Unrealized depreciation on OTC swap agreements | | | 6,578,135 | |
Foreign exchange contracts | | — | | | — | | | Unrealized depreciation on OTC forward foreign currency exchange contracts | | | 1,019,873 | |
Interest rate contracts | | Due from/to broker — variation margin futures | | | 762,723 | * | | Due from/to broker — variation margin futures | | | 5,746,466 | * |
Interest rate contracts | | Due from/to broker — variation margin swaps | | | 1,447,539 | * | | Due from/to broker — variation margin swaps | | | 19,455,225 | * |
Interest rate contracts | | — | | | — | | | Premiums received for OTC swap agreements | | | 4,111 | |
Interest rate contracts | | Unaffiliated investments | | | 432,750 | | | — | | | — | |
Interest rate contracts | | Unrealized appreciation on OTC swap agreements | | | 344 | | | Unrealized depreciation on OTC swap agreements | | | 79,448 | |
| | | | | | | | | | | | |
| | | | $ | 10,232,639 | | | | | $ | 34,808,293 | |
| | | | | | | | | | | | |
| * | Includes cumulative appreciation (depreciation) as reported in the schedule of open futures and centrally cleared swap contracts. Only unsettled variation margin receivable (payable) is reported within the Statement of Assets and Liabilities. |
SEE NOTES TO FINANCIAL STATEMENTS.
A67
| | | | | | |
| | |
| | DIVERSIFIED BOND PORTFOLIO (continued) | | |
| | | | | | |
| |
| SCHEDULE OF INVESTMENTS | | as of December 31, 2019 |
The effects of derivative instruments on the Statement of Operations for the year ended December 31, 2019 are as follows:
| | | | | | | | | | | | | | | | | | | | | | | | |
Amount of Realized Gain (Loss) on Derivatives Recognized in Income | |
Derivatives not accounted for as hedging
instruments, carried at fair value | | Options
Purchased(1) | | | Options
Written | | | Futures | | | Forward &
Cross
Currency
Exchange
Contracts | | | Forward
Rate
Agreements | | | Swaps | |
Credit contracts | | $ | (48,560 | ) | | $ | 579,823 | | | $ | — | | | $ | — | | | $ | — | | | $ | 369,163 | |
Foreign exchange contracts | | | — | | | | — | | | | — | | | | 2,996,701 | | | | — | | | | — | |
Interest rate contracts | | | (321,383 | ) | | | 199,488 | | | | 64,197,766 | | | | — | | | | (98,770 | ) | | | 2,916,094 | |
| | | | | | | | | | | | | | | | | | | | | | | | |
Total | | $ | (369,943 | ) | | $ | 779,311 | | | $ | 64,197,766 | | | $ | 2,996,701 | | | $ | (98,770 | ) | | $ | 3,285,257 | |
| | | | | | | | | | | | | | | | | | | | | | | | |
| (1) | Included in net realized gain (loss) on investment transactions in the Statement of Operations. |
| | | | | | | | | | | | | | | | | | | | | | | | |
Change in Unrealized Appreciation (Depreciation) on Derivatives Recognized in Income | |
Derivatives not accounted for as hedging
instruments, carried at fair value | | Options
Purchased(2) | | | Options
Written | | | Futures | | | Forward &
Cross
Currency
Exchange
Contracts | | | Forward
Rate
Agreements | | | Swaps | |
Credit contracts | | $ | 19,301 | | | $ | 194,739 | | | $ | — | | | $ | — | | | $ | — | | | $ | (299,410 | ) |
Foreign exchange contracts | | | — | | | | — | | | | — | | | | (505,597 | ) | | | — | | | | — | |
Interest rate contracts | | | (28,341 | ) | | | — | | | | (24,209,624 | ) | | | — | | | | 130,337 | | | | (22,896,241 | ) |
| | | | | | | | | | | | | | | | | | | | | | | | |
Total | | $ | (9,040 | ) | | $ | 194,739 | | | $ | (24,209,624 | ) | | $ | (505,597 | ) | | $ | 130,337 | | | $ | (23,195,651 | ) |
| | | | | | | | | | | | | | | | | | | | | | | | |
| (2) | Included in net change in unrealized appreciation (depreciation) on investments in the Statement of Operations. For the year ended December 31, 2019, the Portfolio’s average volume of derivative activities is as follows: |
| | | | | | | | |
Options
Purchased(1) | | Options
Written(2) | | Futures
Contracts—
Long
Positions(2) | | Futures
Contracts—
Short
Positions(2) | | Forward Foreign
Currency Exchange
Contracts—
Purchased(3) |
| $112,097 | | $127,397,792 | | $913,361,499 | | $413,887,554 | | $27,032,960 |
| | | | | | | | |
Forward Foreign
Currency Exchange
Contracts—Sold(3) | | Cross
Currency
Exchange
Contracts(4) | | Forward Rate
Agreements(2) | | Interest Rate
Swap
Agreements(2) | | Credit Default
Swap Agreements—
Buy Protection(2) |
| $91,626,118 | | $65,143 | | $101,338,400 | | $883,948,111 | | $78,470,506 |
| | | | | | | | |
Credit Default
Swap Agreements—
Sell Protection(2) | | | | Total Return
Swap
Agreements(2) | | | | Inflation Swap
Agreements(2) |
| $91,524,514 | | | | $2,364,600 | | | | $1,704,000 |
| (2) | Notional Amount in USD. |
| (3) | Value at Settlement Date. |
Financial Instruments/Transactions—Summary of Offsetting and Netting Arrangements:
The Portfolio invested in OTC derivatives and entered into financial instruments/transactions during the reporting period that are either offset in accordance with current requirements or are subject to enforceable master netting arrangements or similar agreements that permit offsetting. The information about offsetting and related netting arrangements for OTC derivatives and financial instruments/transactions where the legal right toset-off exists is presented in the summary below.
SEE NOTES TO FINANCIAL STATEMENTS.
A68
| | | | | | |
| | |
| | DIVERSIFIED BOND PORTFOLIO (continued) | | |
| | | | | | |
| |
| SCHEDULE OF INVESTMENTS | | as of December 31, 2019 |
Offsetting of financial instrument/transaction assets and liabilities:
| | | | | | | | | | | | |
Description | | Gross Market
Value of
Recognized
Assets/(Liabilities) | | | Collateral
Pledged/(Received)(2) | | | Net
Amount | |
Securities on Loan | | $ | 32,550,435 | | | $ | (32,550,435 | ) | | $ | — | |
| | | | | | | | | | | | |
Offsetting of OTC derivative assets and liabilities:
| | | | | | | | | | | | | | | | | | | | |
Counterparty | | Gross Amounts
of Recognized
Assets(1) | | | Gross Amounts
of Recognized
Liabilities(1) | | | Net Amounts
of Recognized
Assets/(Liabilities) | | | Collateral
Pledged/(Received)(2) | | | Net Amount | |
Bank of America, N.A. | | $ | 640,258 | | | $ | (289,333 | ) | | $ | 350,925 | | | $ | (350,925 | ) | | $ | — | |
Barclays Bank PLC | | | 360,070 | | | | (571,023 | ) | | | (210,953 | ) | | | — | | | | (210,953 | ) |
BNP Paribas S.A. | | | 5,842 | | | | (12,895 | ) | | | (7,053 | ) | | | — | | | | (7,053 | ) |
Citibank, N.A. | | | 633,204 | | | | (1,471,308 | ) | | | (838,104 | ) | | | 593,540 | | | | (244,564 | ) |
Credit Suisse International | | | 2,409 | | | | (4,660 | ) | | | (2,251 | ) | | | — | | | | (2,251 | ) |
Deutsche Bank AG | | | 85,757 | | | | (137,050 | ) | | | (51,293 | ) | | | — | | | | (51,293 | ) |
Goldman Sachs International | | | — | | | | (1,777 | ) | | | (1,777 | ) | | | 1,777 | | | | — | |
HSBC Bank USA, N.A | | | — | | | | (9,780 | ) | | | (9,780 | ) | | | — | | | | (9,780 | ) |
JPMorgan Chase Bank, N.A. | | | 37,238 | | | | (79,448 | ) | | | (42,210 | ) | | | 42,210 | | | | — | |
Morgan Stanley & Co. International PLC | | | 6,257,599 | | | | (6,930,497 | ) | | | (672,898 | ) | | | 672,898 | | | | — | |
| | | | | | | | | | | | | | | | | | | | |
| | $ | 8,022,377 | | | $ | (9,507,771 | ) | | $ | (1,485,394 | ) | | $ | 959,500 | | | $ | (525,894 | ) |
| | | | | | | | | | | | | | | | | | | | |
| (1) | Includes unrealized appreciation/(depreciation) on swaps and forwards, premiums paid/(received) on swap agreements and market value of purchased and written options, as represented on the Statement of Assets and Liabilities. |
| (2) | Collateral amount disclosed by the Portfolio is limited to the market value of financial instruments/transactions and the Portfolio’s OTC derivative exposure by counterparty. |
SEE NOTES TO FINANCIAL STATEMENTS.
A69
| | | | | | |
| | |
| | DIVERSIFIED BOND PORTFOLIO (continued) | | |
STATEMENT OF ASSETS AND LIABILITIES
as of December 31, 2019
| | | | |
| ASSETS | | | | |
Investments at value, including securities on loan of $32,550,435: | | | | |
Unaffiliated investments (cost $1,138,773,503) | | $ | 1,178,491,200 | |
Affiliated investments (cost $36,201,205) | | | 36,205,482 | |
Foreign currency, at value (cost $8,979,159) | | | 9,092,021 | |
Cash | | | 771,774 | |
Cash segregated for counterparty—OTC | | | 715,000 | |
Dividends and interest receivable | | | 9,905,978 | |
Receivable for investments sold | | | 6,723,264 | |
Unrealized appreciation on OTC swap agreements | | | 6,434,299 | |
Premiums paid for OTC swap agreements | | | 1,155,328 | |
Due from broker-variation margin swaps | | | 618,663 | |
Deposit with broker for centrally cleared/exchange-traded derivatives | | | 146,000 | |
Receivable for Portfolio shares sold | | | 29,743 | |
Tax reclaim receivable | | | 26,366 | |
Prepaid expenses and other assets | | | 228,515 | |
| | | | |
Total Assets | | | 1,250,543,633 | |
| | | | |
| LIABILITIES | | | | |
Payable to broker for collateral for securities on loan | | | 33,261,386 | |
Payable for investments purchased | | | 15,872,637 | |
Unrealized depreciation on OTC swap agreements | | | 6,657,583 | |
Premiums received for OTC swap agreements | | | 1,816,970 | |
Due to broker-variation margin futures | | | 1,071,246 | |
Unrealized depreciation on OTC forward foreign currency exchange contracts | | | 1,019,873 | |
Management fee payable | | | 405,069 | |
Accrued expenses and other liabilities | | | 205,736 | |
Payable for Portfolio shares repurchased | | | 114,080 | |
Options written outstanding, at value (proceeds received $46,457) | | | 13,345 | |
Affiliated transfer agent fee payable | | | 980 | |
| | | | |
Total Liabilities | | | 60,438,905 | |
| | | | |
| NET ASSETS | | $ | 1,190,104,728 | |
| | | | |
Net assets were comprised of: | | | | |
Partners’ Equity | | $ | 1,190,104,728 | |
| | | | |
Net asset value and redemption price per share, $1,190,104,728 / 81,790,890 outstanding shares of beneficial interest | | $ | 14.55 | |
| | | | |
STATEMENT OF OPERATIONS
Year Ended December 31, 2019
| | | | |
| NET INVESTMENT INCOME (LOSS) INCOME | | | | |
Interest income (net of $2,092 foreign withholding tax) | | $ | 44,856,435 | |
Affiliated dividend income | | | 1,264,379 | |
Unaffiliated dividend income (net of $1,040 foreign withholding tax) | | | 148,300 | |
Income from securities lending, net (including affiliated income of $38,088) | | | 38,392 | |
| | | | |
Total income | | | 46,307,506 | |
| | | | |
| EXPENSES | | | | |
Management fee | | | 4,662,390 | |
Custodian and accounting fees | | | 186,047 | |
Shareholders’ reports | | | 157,086 | |
Audit fee | | | 57,409 | |
Trustees’ fees | | | 23,390 | |
Legal fees and expenses | | | 15,948 | |
Transfer agent’s fees and expenses (including affiliated expense of $5,882) | | | 10,682 | |
Miscellaneous | | | 31,737 | |
| | | | |
Total expenses | | | 5,144,689 | |
| | | | |
| NET INVESTMENT INCOME (LOSS) | | | 41,162,817 | |
| | | | |
| REALIZED AND UNREALIZED GAIN (LOSS) ON INVESTMENT AND FOREIGN CURRENCY TRANSACTIONS | | | | |
Net realized gain (loss) on: | | | | |
Investment transactions (including affiliated of $(467,129)) | | | 6,623,428 | |
Futures transactions | | | 64,197,766 | |
Forward rate agreement transactions | | | (98,770 | ) |
Forward and cross currency contract transactions | | | 2,996,701 | |
Options written transactions | | | 779,311 | |
Swap agreements transactions | | | 3,285,257 | |
Foreign currency transactions | | | (70,773 | ) |
| | | | |
| | | 77,712,920 | |
| | | | |
Net change in unrealized appreciation (depreciation) on: | | | | |
Investments (including affiliated of $549,625) | | | 48,499,883 | |
Futures | | | (24,209,624 | ) |
Forward rate agreements | | | 130,337 | |
Forward and cross currency contracts | | | (505,597 | ) |
Options written | | | 194,739 | |
Swap agreements | | | (23,195,651 | ) |
Foreign currencies | | | 88,515 | |
| | | | |
| | | 1,002,602 | |
| | | | |
| NET GAIN (LOSS) ON INVESTMENT AND FOREIGN CURRENCY TRANSACTIONS | | | 78,715,522 | |
| | | | |
| NET INCREASE (DECREASE) IN NET ASSETS RESULTING FROM OPERATIONS | | $ | 119,878,339 | |
| | | | |
STATEMENTS OF CHANGES IN NET ASSETS
| | | | | | | | |
| | | Year Ended
December 31, 2019 | | | Year Ended
December 31, 2018 | |
| INCREASE (DECREASE) IN NET ASSETS | | | | | | | | |
| OPERATIONS | | | | | | | | |
Net investment income (loss) | | $ | 41,162,817 | | | $ | 38,991,560 | |
Net realized gain (loss) on investment and foreign currency transactions | | | 77,712,920 | | | | (15,612,916 | ) |
Net change in unrealized appreciation (depreciation) on investments and foreign currencies | | | 1,002,602 | | | | (26,218,514 | ) |
| | | | | | | | |
NET INCREASE (DECREASE) IN NET ASSETS RESULTING FROM OPERATIONS | | | 119,878,339 | | | | (2,839,870 | ) |
| | | | | | | | |
| PORTFOLIO SHARE TRANSACTIONS | | | | | | | | |
Portfolio shares sold [3,069,133 and 6,799,295 shares, respectively] | | | 43,101,026 | | | | 88,168,310 | |
Portfolio shares repurchased [6,864,355 and 8,370,109 shares, respectively] | | | (95,800,032 | ) | | | (108,237,839 | ) |
| | | | | | | | |
NET INCREASE (DECREASE) IN NET ASSETS FROM PORTFOLIO SHARE TRANSACTIONS | | | (52,699,006 | ) | | | (20,069,529 | ) |
| | | | | | | | |
| CAPITAL CONTRIBUTIONS | | | — | | | | 736,677 | |
| | | | | | | | |
| TOTAL INCREASE (DECREASE) | | | 67,179,333 | | | | (22,172,722 | ) |
| NET ASSETS: | | | | | | | | |
Beginning of year | | | 1,122,925,395 | | | | 1,145,098,117 | |
| | | | | | | | |
End of year | | $ | 1,190,104,728 | | | $ | 1,122,925,395 | |
| | | | | | | | |
SEE NOTES TO FINANCIAL STATEMENTS.
A70
| | | | | | |
| |
| SCHEDULE OF INVESTMENTS | | as of December 31, 2019 |
| | | | | | | | |
| LONG-TERM INVESTMENTS — 98.6% | |
| COMMON STOCKS | | Shares | | | Value | |
Aerospace & Defense — 4.6% | |
Airbus SE (France) | | | 552,978 | | | $ | 81,062,563 | |
Boeing Co. (The) | | | 106,842 | | | | 34,804,850 | |
Safran SA (France) | | | 350,207 | | | | 54,140,580 | |
United Technologies Corp. | | | 323,510 | | | | 48,448,857 | |
| | | | | | | | |
| | | | | | | 218,456,850 | |
| | | | | | | | |
Banks — 8.5% | |
Bank of America Corp. | | | 2,752,790 | | | | 96,953,264 | |
Citigroup, Inc. | | | 789,967 | | | | 63,110,464 | |
JPMorgan Chase & Co. | | | 857,702 | | | | 119,563,659 | |
PNC Financial Services Group, Inc.(The) | | | 401,566 | | | | 64,101,980 | |
Truist Financial Corp. | | | 985,378 | | | | 55,496,489 | |
| | | | | | | | |
| | | | | | | 399,225,856 | |
| | | | | | | | |
Beverages — 0.7% | |
PepsiCo, Inc. | | | 246,730 | | | | 33,720,589 | |
| | | | | | | | |
Building Products — 0.9% | |
Johnson Controls International PLC | | | 992,892 | | | | 40,420,633 | |
| | | | | | | | |
Capital Markets — 0.9% | |
Goldman Sachs Group, Inc. (The) | | | 181,127 | | | | 41,646,531 | |
| | | | | | | | |
Chemicals — 2.1% | |
FMC Corp. | | | 402,333 | | | | 40,160,880 | |
Linde PLC (United Kingdom) | | | 279,016 | | | | 59,402,507 | |
| | | | | | | | |
| | | | | | | 99,563,387 | |
| | | | | | | | |
Consumer Finance — 1.4% | |
Capital One Financial Corp. | | | 421,085 | | | | 43,333,857 | |
SLM Corp. | | | 2,482,612 | | | | 22,120,073 | |
| | | | | | | | |
| | | | | | | 65,453,930 | |
| | | | | | | | |
Diversified Telecommunication Services — 1.2% | |
Verizon Communications, Inc. | | | 914,796 | | | | 56,168,474 | |
| | | | | | | | |
Electric Utilities — 2.0% | |
American Electric Power Co., Inc. | | | 979,863 | | | | 92,606,852 | |
| | | | | | | | |
Electrical Equipment — 0.7% | |
Emerson Electric Co. | | | 467,730 | | | | 35,669,090 | |
| | | | | | | | |
Energy Equipment & Services — 0.6% | |
Schlumberger Ltd. | | | 687,320 | | | | 27,630,264 | |
| | | | | | | | |
Entertainment — 4.3% | |
Netflix, Inc.* | | | 210,583 | | | | 68,138,341 | |
Walt Disney Co. (The) | | | 926,649 | | | | 134,021,245 | |
| | | | | | | | |
| | | | | | | 202,159,586 | |
| | | | | | | | |
Equity Real Estate Investment Trusts (REITs) — 1.3% | |
American Tower Corp. | | | 132,041 | | | | 30,345,663 | |
Boston Properties, Inc. | | | 226,612 | | | | 31,240,730 | |
| | | | | | | | |
| | | | | | | 61,586,393 | |
| | | | | | | | |
Food & Staples Retailing — 2.6% | |
Costco Wholesale Corp. | | | 159,191 | | | | 46,789,419 | |
Walmart, Inc. | | | 628,681 | | | | 74,712,450 | |
| | | | | | | | |
| | | | | | | 121,501,869 | |
| | | | | | | | |
| | | | | | | | |
COMMON STOCKS
(continued) | | Shares | | | Value | |
Food Products — 1.8% | |
Conagra Brands, Inc.(a) | | | 971,093 | | | $ | 33,250,224 | |
Mondelez International, Inc. (Class A Stock) | | | 931,374 | | | | 51,300,080 | |
| | | | | | | | |
| | | | | | | 84,550,304 | |
| | | | | | | | |
Health Care Equipment & Supplies — 3.6% | |
DexCom, Inc.* | | | 137,676 | | | | 30,115,248 | |
Edwards Lifesciences Corp.* | | | 148,142 | | | | 34,560,047 | |
Intuitive Surgical, Inc.* | | | 71,597 | | | | 42,324,567 | |
Zimmer Biomet Holdings, Inc. | | | 423,759 | | | | 63,428,247 | |
| | | | | | | | |
| | | | | | | 170,428,109 | |
| | | | | | | | |
Health Care Providers & Services — 1.0% | |
Laboratory Corp. of America Holdings* | | | 281,453 | | | | 47,613,404 | |
| | | | | | | | |
Hotels, Restaurants & Leisure — 1.3% | |
Marriott International, Inc. (Class A Stock) | | | 179,972 | | | | 27,253,160 | |
McDonald’s Corp. | | | 169,174 | | | | 33,430,474 | |
| | | | | | | | |
| | | | | | | 60,683,634 | |
| | | | | | | | |
Insurance — 2.3% | |
Chubb Ltd. | | | 362,217 | | | | 56,382,698 | |
MetLife, Inc. | | | 995,673 | | | | 50,749,453 | |
| | | | | | | | |
| | | | | | | 107,132,151 | |
| | | | | | | | |
Interactive Media & Services — 6.0% | |
Alphabet, Inc. (Class A Stock)* | | | 89,684 | | | | 120,121,853 | |
Alphabet, Inc. (Class C Stock)* | | | 60,486 | | | | 80,870,992 | |
Facebook, Inc. (Class A Stock)* | | | 394,265 | | | | 80,922,891 | |
| | | | | | | | |
| | | | | | | 281,915,736 | |
| | | | | | | | |
Internet & Direct Marketing Retail — 4.9% | |
Alibaba Group Holding Ltd. (China), ADR* | | | 427,760 | | | | 90,727,896 | |
Amazon.com, Inc.* | | | 75,610 | | | | 139,715,182 | |
| | | | | | | | |
| | | | | | | 230,443,078 | |
| | | | | | | | |
IT Services — 8.0% | |
Adyen NV (Netherlands), 144A* | | | 74,401 | | | | 61,044,690 | |
FleetCor Technologies, Inc.* | | | 113,636 | | | | 32,695,350 | |
Mastercard, Inc. (Class A Stock) | | | 345,692 | | | | 103,220,174 | |
PayPal Holdings, Inc.* | | | 217,037 | | | | 23,476,892 | |
Shopify, Inc. (Canada)
(Class A Stock)*(a) | | | 122,598 | | | | 48,742,513 | |
Square, Inc. (Class A Stock)* | | | 175,452 | | | | 10,976,277 | |
Twilio, Inc. (Class A Stock)*(a) | | | 184,597 | | | | 18,142,193 | |
Visa, Inc. (Class A Stock)(a) | | | 417,793 | | | | 78,503,305 | |
| | | | | | | | |
| | | | | | | 376,801,394 | |
| | | | | | | | |
Life Sciences Tools & Services — 0.8% | |
Illumina, Inc.*(a) | | | 112,708 | | | | 37,389,752 | |
| | | | | | | | |
Media — 1.2% | |
Comcast Corp. (Class A Stock) | | | 1,250,817 | | | | 56,249,241 | |
| | | | | | | | |
Multiline Retail — 0.4% | |
Dollar Tree, Inc.* | | | 200,946 | | | | 18,898,971 | |
| | | | | | | | |
Multi-Utilities — 0.6% | |
Dominion Energy, Inc. | | | 353,845 | | | | 29,305,443 | |
| | | | | | | | |
SEE NOTES TO FINANCIAL STATEMENTS.
A71
| | | | | | |
| | |
| | EQUITY PORTFOLIO (continued) | | |
| | | | | | |
| |
| SCHEDULE OF INVESTMENTS | | as of December 31, 2019 |
| | | | | | | | |
COMMON STOCKS
(continued) | | Shares | | | Value | |
Oil, Gas & Consumable Fuels — 2.6% | | | | | | | | |
Chevron Corp. | | | 597,252 | | | $ | 71,974,839 | |
Noble Energy, Inc.(a) | | | 999,908 | | | | 24,837,715 | |
Royal Dutch Shell PLC (Netherlands) (Class A Stock), ADR | | | 475,678 | | | | 28,055,488 | |
| | | | | | | | |
| | | | | | | 124,868,042 | |
| | | | | | | | |
Pharmaceuticals — 5.0% | | | | | | | | |
AstraZeneca PLC (United Kingdom), ADR | | | 2,638,821 | | | | 131,571,615 | |
Eli Lilly & Co. | | | 504,076 | | | | 66,250,709 | |
Pfizer, Inc. | | | 949,271 | | | | 37,192,438 | |
| | | | | | | | |
| | | | | | | 235,014,762 | |
| | | | | | | | |
Road & Rail — 1.0% | | | | | | | | |
Union Pacific Corp. | | | 273,705 | | | | 49,483,127 | |
| | | | | | | | |
Semiconductors & Semiconductor Equipment — 5.5% | |
Broadcom, Inc. | | | 228,084 | | | | 72,079,106 | |
NVIDIA Corp. | | | 337,776 | | | | 79,478,693 | |
QUALCOMM, Inc. | | | 794,249 | | | | 70,076,589 | |
Texas Instruments, Inc. | | | 286,374 | | | | 36,738,920 | |
| | | | | | | | |
| | | | | | | 258,373,308 | |
| | | | | | | | |
Software — 9.2% | | | | | | | | |
Adobe, Inc.* | | | 235,837 | | | | 77,781,401 | |
Coupa Software, Inc.*(a) | | | 224,310 | | | | 32,805,338 | |
Microsoft Corp. | | | 1,027,852 | | | | 162,092,260 | |
salesforce.com, Inc.* | | | 586,030 | | | | 95,311,919 | |
SAP SE (Germany), ADR(a) | | | 295,105 | | | | 39,541,119 | |
Workday, Inc. (Class A Stock)* | | | 158,228 | | | | 26,020,595 | |
| | | | | | | | |
| | | | | | | 433,552,632 | |
| | | | | | | | |
Specialty Retail — 1.1% | | | | | | | | |
Advance Auto Parts, Inc. | | | 96,741 | | | | 15,494,039 | |
Lowe’s Cos., Inc. | | | 311,744 | | | | 37,334,461 | |
| | | | | | | | |
| | | | | | | 52,828,500 | |
| | | | | | | | |
Technology Hardware, Storage & Peripherals — 4.3% | |
Apple, Inc. | | | 693,392 | | | | 203,614,561 | |
| | | | | | | | |
Textiles, Apparel & Luxury Goods — 5.6% | | | | | |
adidas AG (Germany) | | | 134,374 | | | | 43,889,076 | |
| | | | | | | | |
| | | | | | | | |
COMMON STOCKS
(continued) | | Shares | | | Value | |
Textiles, Apparel & Luxury Goods (continued) | | | | | |
Kering SA (France) | | | 91,208 | | | $ | 59,924,103 | |
Lululemon Athletica, Inc.* | | | 308,712 | | | | 71,519,309 | |
NIKE, Inc. (Class B Stock) | | | 863,305 | | | | 87,461,430 | |
| | | | | | | | |
| | | | | | | 262,793,918 | |
| | | | | | | | |
Trading Companies & Distributors — 0.6% | | | | | |
United Rentals, Inc.* | | | 175,964 | | | | 29,345,516 | |
| | | | | | | | |
TOTAL LONG-TERM INVESTMENTS
(cost $2,881,151,270) | | | | 4,647,095,887 | |
| | | | | | | | |
| |
| SHORT-TERM INVESTMENTS — 5.8% | | | | | |
AFFILIATED MUTUAL FUNDS | | | | | | | | |
PGIM Core Ultra Short Bond Fund(w) | | | 54,364,910 | | | | 54,364,910 | |
PGIM Institutional Money Market Fund (cost $220,840,399; includes $220,523,024 of cash collateral for securities on loan)(b)(w) | | | 220,857,106 | | | | 220,901,277 | |
| | | | | | | | |
TOTAL SHORT-TERM INVESTMENTS
(cost $275,205,309) | | | | 275,266,187 | |
| | | | | |
TOTAL INVESTMENTS — 104.4%
(cost $3,156,356,579) | | | | 4,922,362,074 | |
Liabilities in excess of
other assets — (4.4)% | | | | (209,643,671 | ) |
| | | | | |
NET ASSETS — 100.0% | | | $ | 4,712,718,403 | |
| | | | | | | | |
See the Glossary for a list of the abbreviation(s) used in the annual report.
| * | Non-income producing security. |
| (a) | All or a portion of security is on loan. The aggregate market value of such securities, including those sold and pending settlement, is $216,892,986; cash collateral of $220,523,024 (included in liabilities) was received with which the Portfolio purchased highly liquid short-term investments. |
| (b) | Represents security purchased with cash collateral received for securities on loan and includes dividend reinvestment. |
| (w) | PGIM Investments LLC, the manager of the Portfolio, also serves as manager of the PGIM Core Ultra Short Bond Fund and PGIM Institutional Money Market Fund. |
Fair Value Measurements:
Various inputs are used in determining the value of the Portfolio’s investments. These inputs are summarized in the three broad levels listed below.
| Level 1— | unadjusted quoted prices generally in active markets for identical securities. |
| Level 2— | quoted prices for similar securities, interest rates and yield curves, prepayment speeds, foreign currency exchange rates and other observable inputs. |
| Level 3— | unobservable inputs for securities valued in accordance with Board approved fair valuation procedures. |
The following is a summary of the inputs used as of December 31, 2019 in valuing such portfolio securities:
| | | | | | | | | | | | |
| | | Level 1 | | | Level 2 | | | Level 3 | |
Investments in Securities | | | | | | | | | | | | |
Assets | | | | | | | | | | | | |
Common Stocks | | | | | | | | | | | | |
Aerospace & Defense | | $ | 83,253,707 | | | $ | 135,203,143 | | | $ | — | |
SEE NOTES TO FINANCIAL STATEMENTS.
A72
| | | | | | |
| | |
| | EQUITY PORTFOLIO (continued) | | |
| | | | | | |
| |
| SCHEDULE OF INVESTMENTS | | as of December 31, 2019 |
| | | | | | | | | | | | |
| | | Level 1 | | | Level 2 | | | Level 3 | |
Investments in Securities (continued) | | | | | | | | | | | | |
Assets (continued) | | | | | | | | | | | | |
Common Stocks (continued) | | | | | | | | | | | | |
Banks | | $ | 399,225,856 | | | $ | — | | | $ | — | |
Beverages | | | 33,720,589 | | | | — | | | | — | |
Building Products | | | 40,420,633 | | | | — | | | | — | |
Capital Markets | | | 41,646,531 | | | | — | | | | — | |
Chemicals | | | 99,563,387 | | | | — | | | | — | |
Consumer Finance | | | 65,453,930 | | | | — | | | | — | |
Diversified Telecommunication Services | | | 56,168,474 | | | | — | | | | — | |
Electric Utilities | | | 92,606,852 | | | | — | | | | — | |
Electrical Equipment | | | 35,669,090 | | | | — | | | | — | |
Energy Equipment & Services | | | 27,630,264 | | | | — | | | | — | |
Entertainment | | | 202,159,586 | | | | — | | | | — | |
Equity Real Estate Investment Trusts (REITs) | | | 61,586,393 | | | | — | | | | — | |
Food & Staples Retailing | | | 121,501,869 | | | | — | | | | — | |
Food Products | | | 84,550,304 | | | | — | | | | — | |
Health Care Equipment & Supplies | | | 170,428,109 | | | | — | | | | — | |
Health Care Providers & Services | | | 47,613,404 | | | | — | | | | — | |
Hotels, Restaurants & Leisure | | | 60,683,634 | | | | — | | | | — | |
Insurance | | | 107,132,151 | | | | — | | | | — | |
Interactive Media & Services | | | 281,915,736 | | | | — | | | | — | |
Internet & Direct Marketing Retail | | | 230,443,078 | | | | — | | | | — | |
IT Services | | | 315,756,704 | | | | 61,044,690 | | | | — | |
Life Sciences Tools & Services | | | 37,389,752 | | | | — | | | | — | |
Media | | | 56,249,241 | | | | — | | | | — | |
Multiline Retail | | | 18,898,971 | | | | — | | | | — | |
Multi-Utilities | | | 29,305,443 | | | | — | | | | — | |
Oil, Gas & Consumable Fuels | | | 124,868,042 | | | | — | | | | — | |
Pharmaceuticals | | | 235,014,762 | | | | — | | | | — | |
Road & Rail | | | 49,483,127 | | | | — | | | | — | |
Semiconductors & Semiconductor Equipment | | | 258,373,308 | | | | — | | | | — | |
Software | | | 433,552,632 | | | | — | | | | — | |
Specialty Retail | | | 52,828,500 | | | | — | | | | — | |
Technology Hardware, Storage & Peripherals | | | 203,614,561 | | | | — | | | | — | |
Textiles, Apparel & Luxury Goods | | | 158,980,739 | | | | 103,813,179 | | | | — | |
Trading Companies & Distributors | | | 29,345,516 | | | | — | | | | — | |
Affiliated Mutual Funds | | | 275,266,187 | | | | — | | | | — | |
| | | | | | | | | | | | |
Total | | $ | 4,622,301,062 | | | $ | 300,061,012 | | | $ | — | |
| | | | | | | | | | | | |
Industry Classification:
The industry classification of investments and liabilities in excess of other assets shown as a percentage of net assets as of December 31, 2019 were as follows (unaudited):
| | | | |
Software | | | 9.2 | % |
Banks | | | 8.5 | |
IT Services | | | 8.0 | |
Interactive Media & Services | | | 6.0 | |
Affiliated Mutual Funds (4.7% represents investments purchased with collateral from securities on loan) | | | 5.8 | |
Textiles, Apparel & Luxury Goods | | | 5.6 | |
Semiconductors & Semiconductor Equipment | | | 5.5 | |
Pharmaceuticals | | | 5.0 | |
Internet & Direct Marketing Retail | | | 4.9 | |
Aerospace & Defense | | | 4.6 | |
Technology Hardware, Storage & Peripherals | | | 4.3 | |
Entertainment | | | 4.3 | |
Health Care Equipment & Supplies | | | 3.6 | |
Oil, Gas & Consumable Fuels | | | 2.6 | |
| | | | |
Food & Staples Retailing | | | 2.6 | % |
Insurance | | | 2.3 | |
Chemicals | | | 2.1 | |
Electric Utilities | | | 2.0 | |
Food Products | | | 1.8 | |
Consumer Finance | | | 1.4 | |
Equity Real Estate Investment Trusts (REITs) | | | 1.3 | |
Hotels, Restaurants & Leisure | | | 1.3 | |
Media | | | 1.2 | |
Diversified Telecommunication Services | | | 1.2 | |
Specialty Retail | | | 1.1 | |
Road & Rail | | | 1.0 | |
Health Care Providers & Services | | | 1.0 | |
Capital Markets | | | 0.9 | |
Building Products | | | 0.9 | |
SEE NOTES TO FINANCIAL STATEMENTS.
A73
| | | | | | |
| | |
| | EQUITY PORTFOLIO (continued) | | |
| | | | | | |
| |
| SCHEDULE OF INVESTMENTS | | as of December 31, 2019 |
| | | | |
Industry Classification (continued): | | | |
Life Sciences Tools & Services | | | 0.8 | % |
Electrical Equipment | | | 0.7 | |
Beverages | | | 0.7 | |
Trading Companies & Distributors | | | 0.6 | |
Multi-Utilities | | | 0.6 | |
Energy Equipment & Services | | | 0.6 | |
| | | | |
Multiline Retail | | | 0.4 | % |
| | | | |
| | | 104.4 | |
Liabilities in excess of other assets | | | (4.4 | ) |
| | | | |
| | | 100.0 | % |
| | | | |
Financial Instruments/Transactions — Summary of Offsetting and Netting Arrangements:
The Portfolio entered into financial instruments/transactions during the reporting period that are either offset in accordance with current requirements or are subject to enforceable master netting arrangements or similar agreements that permit offsetting. The information about offsetting and related netting arrangements for financial instruments/transactions where the legal right toset-off exists is presented in the summary below.
Offsetting of financial instrument/transaction assets and liabilities:
| | | | | | | | | | | | |
Description | | Gross Market
Value of
Recognized
Assets/(Liabilities) | | | Collateral
Pledged/(Received)(1) | | | Net
Amount | |
Securities on Loan | | $ | 216,892,986 | | | $ | (216,892,986 | ) | | $ | — | |
| | | | | | | | | | | | |
| (1) | Collateral amount disclosed by the Portfolio is limited to the market value of financial instruments/transactions. |
SEE NOTES TO FINANCIAL STATEMENTS.
A74
| | | | | | |
| | |
| | EQUITY PORTFOLIO (continued) | | |
STATEMENT OF ASSETS AND LIABILITIES
as of December 31, 2019
| | | | |
| ASSETS | | | | |
Investments at value, including securities on loan of $216,892,986: | | | | |
Unaffiliated investments (cost $2,881,151,270) | | $ | 4,647,095,887 | |
Affiliated investments (cost $275,205,309) | | | 275,266,187 | |
Cash | | | 44 | |
Receivable for investments sold | | | 10,051,473 | |
Dividends receivable | | | 3,390,873 | |
Tax reclaim receivable | | | 1,139,912 | |
Prepaid expenses and other assets | | | 33,498 | |
| | | | |
Total Assets | | | 4,936,977,874 | |
| | | | |
| LIABILITIES | | | | |
Payable to broker for collateral for securities on loan | | | 220,523,024 | |
Management fee payable | | | 1,775,802 | |
Payable for Portfolio shares repurchased | | | 731,424 | |
Payable to affiliate | | | 677,642 | |
Accrued expenses and other liabilities | | | 549,924 | |
Affiliated transfer agent fee payable | | | 980 | |
Distribution fee payable | | | 365 | |
Administration fee payable | | | 310 | |
| | | | |
Total Liabilities | | | 224,259,471 | |
| | | | |
| NET ASSETS | | $ | 4,712,718,403 | |
| | | | |
Net assets were comprised of: | | | | |
Partners’ Equity | | $ | 4,712,718,403 | |
| | | | |
| Class I: | | | | |
Net asset value and redemption price per share, $4,710,969,988 / 74,563,997 outstanding shares of beneficial interest | | $ | 63.18 | |
| | | | |
| Class II: | | | | |
Net asset value and redemption price per share, $1,748,415 / 28,158 outstanding shares of beneficial interest | | $ | 62.09 | |
| | | | |
STATEMENT OF OPERATIONS
Year Ended December 31, 2019
| | | | |
| NET INVESTMENT INCOME (LOSS) | | | | |
| INCOME | | | | |
Unaffiliated dividend income (net of $805,187 foreign withholding tax, of which $13,151 is reimbursable by an affiliate) | | $ | 68,598,877 | |
Affiliated dividend income | | | 2,362,922 | |
Income from securities lending, net (including affiliated income of $660,547) | | | 970,515 | |
| | | | |
Total income | | | 71,932,314 | |
| | | | |
| EXPENSES | | | | |
Management fee | | | 19,837,842 | |
Distribution fee—Class II | | | 4,064 | |
Administration fee—Class II | | | 2,438 | |
Shareholders’ reports | | | 341,004 | |
Custodian and accounting fees | | | 313,752 | |
Trustees’ fees | | | 58,950 | |
Audit fee | | | 32,033 | |
Legal fees and expenses | | | 26,541 | |
Transfer agent’s fees and expenses (including affiliated expense of $5,882) | | | 10,682 | |
Miscellaneous | | | 82,549 | |
| | | | |
Total expenses | | | 20,709,855 | |
| | | | |
| NET INVESTMENT INCOME (LOSS) | | | 51,222,459 | |
| | | | |
| REALIZED AND UNREALIZED GAIN (LOSS) ON INVESTMENT AND FOREIGN CURRENCY TRANSACTIONS | | | | |
Net realized gain (loss) on: | | | | |
Investment transactions (including affiliated of $(2,168)) | | | 305,530,346 | |
Foreign currency transactions | | | (141,659 | ) |
| | | | |
| | | 305,388,687 | |
| | | | |
Net change in unrealized appreciation (depreciation) on: Investments (including affiliated of $58,738) | | | 742,648,725 | |
Foreign currencies | | | 61,812 | |
| | | | |
| | | 742,710,537 | |
| | | | |
| NET GAIN (LOSS) ON INVESTMENT AND FOREIGN CURRENCY TRANSACTIONS | | | 1,048,099,224 | |
| | | | |
| NET INCREASE (DECREASE) IN NET ASSETS RESULTING FROM OPERATIONS | | $ | 1,099,321,683 | |
| | | | |
STATEMENTS OF CHANGES IN NET ASSETS
| | | | | | | | |
| | | Year Ended
December 31, 2019 | | | Year Ended
December 31, 2018 | |
| INCREASE (DECREASE) IN NET ASSETS | | | | | | | | |
| OPERATIONS | | | | | | | | |
Net investment income (loss) | | $ | 51,222,459 | | | $ | 43,908,728 | |
Net realized gain (loss) on investment and foreign currency transactions | | | 305,388,687 | | | | 267,278,639 | |
Net change in unrealized appreciation (depreciation) on investments and foreign currencies | | | 742,710,537 | | | | (497,934,768 | ) |
| | | | | | | | |
NET INCREASE (DECREASE) IN NET ASSETS RESULTING FROM OPERATIONS | | | 1,099,321,683 | | | | (186,747,401 | ) |
| | | | | | | | |
| PORTFOLIO SHARE TRANSACTIONS | | | | | | | | |
Portfolio shares sold | | | 5,848,700 | | | | 16,251,411 | |
Portfolio shares repurchased | | | (313,517,496 | ) | | | (329,183,650 | ) |
| | | | | | | | |
NET INCREASE (DECREASE) IN NET ASSETS FROM PORTFOLIO SHARE TRANSACTIONS | | | (307,668,796 | ) | | | (312,932,239 | ) |
| | | | | | | | |
| CAPITAL CONTRIBUTIONS | | | 3 | | | | 3,505,159 | |
| | | | | | | | |
| TOTAL INCREASE (DECREASE) | | | 791,652,890 | | | | (496,174,481 | ) |
| NET ASSETS: | | | | | | | | |
Beginning of year | | | 3,921,065,513 | | | | 4,417,239,994 | |
| | | | | | | | |
End of year | | $ | 4,712,718,403 | | | $ | 3,921,065,513 | |
| | | | | | | | |
SEE NOTES TO FINANCIAL STATEMENTS.
A75
| | | | | | |
| | |
| | FLEXIBLE MANAGED PORTFOLIO | | |
| | | | | | |
| |
| SCHEDULE OF INVESTMENTS | | as of December 31, 2019 |
| | | | | | | | |
| LONG-TERM INVESTMENTS — 98.9% | |
| COMMON STOCKS — 63.6% | | Shares | | | Value | |
Aerospace & Defense — 2.0% | |
Arconic, Inc. | | | 647,900 | | | $ | 19,935,883 | |
BAE Systems PLC (United Kingdom) | | | 18,476 | | | | 138,272 | |
Dassault Aviation SA (France) | | | 14 | | | | 18,414 | |
General Dynamics Corp. | | | 95,600 | | | | 16,859,060 | |
Huntington Ingalls Industries, Inc. | | | 6,100 | | | | 1,530,368 | |
Lockheed Martin Corp. | | | 49,200 | | | | 19,157,496 | |
Meggitt PLC (United Kingdom) | | | 2,070 | | | | 18,036 | |
Northrop Grumman Corp. | | | 39,600 | | | | 13,621,212 | |
Safran SA (France) | | | 3,524 | | | | 544,796 | |
United Technologies Corp. | | | 95,700 | | | | 14,332,032 | |
| | | | | | | | |
| | | | | | | 86,155,569 | |
| | | | | | | | |
Air Freight & Logistics — 0.1% | |
Deutsche Post AG (Germany) | | | 5,637 | | | | 215,886 | |
Hub Group, Inc. (Class A Stock)* | | | 20,900 | | | | 1,071,961 | |
SG Holdings Co. Ltd. (Japan) | | | 800 | | | | 17,994 | |
United Parcel Service, Inc. (Class B Stock) | | | 40,200 | | | | 4,705,812 | |
| | | | | | | | |
| | | | | | | 6,011,653 | |
| | | | | | | | |
Airlines — 0.0% | |
Qantas Airways Ltd. (Australia) | | | 4,355 | | | | 21,818 | |
United Airlines Holdings, Inc.* | | | 14,700 | | | | 1,294,923 | |
| | | | | | | | |
| | | | | | | 1,316,741 | |
| | | | | | | | |
Automobiles — 0.7% | |
Bayerische Motoren Werke AG (Germany) | | | 500 | | | | 41,110 | |
Ferrari NV (Italy) | | | 703 | | | | 116,489 | |
Fiat Chrysler Automobiles NV (United Kingdom) | | | 39,665 | | | | 582,059 | |
Ford Motor Co. | | | 1,648,300 | | | | 15,329,190 | |
General Motors Co. | | | 298,200 | | | | 10,914,120 | |
Peugeot SA (France) | | | 24,097 | | | | 579,708 | |
Subaru Corp. (Japan) | | | 3,500 | | | | 86,537 | |
Toyota Motor Corp. (Japan) | | | 13,100 | | | | 923,416 | |
Volkswagen AG (Germany) | | | 184 | | | | 35,890 | |
| | | | | | | | |
| | | | | | | 28,608,519 | |
| | | | | | | | |
Banks — 3.3% | |
Banco Bilbao Vizcaya Argentaria SA (Spain) | | | 37,742 | | | | 211,373 | |
Bank of America Corp. | | | 1,412,050 | | | | 49,732,401 | |
Bank of Kyoto Ltd. (The) (Japan) | | | 300 | | | | 12,839 | |
Barclays PLC (United Kingdom) | | | 220,986 | | | | 527,500 | |
BNP Paribas SA (France) | | | 15,083 | | | | 896,665 | |
BOC Hong Kong Holdings Ltd. (China) | | | 21,000 | | | | 72,984 | |
CaixaBank SA (Spain) | | | 20,558 | | | | 64,667 | |
CIT Group, Inc. | | | 84,700 | | | | 3,864,861 | |
Citigroup, Inc. | | | 466,550 | | | | 37,272,679 | |
Commerzbank AG (Germany) | | | 5,620 | | | | 34,879 | |
Commonwealth Bank of Australia (Australia) | | | 692 | | | | 38,778 | |
Credit Agricole SA (France) | | | 42,298 | | | | 614,384 | |
DBS Group Holdings Ltd. (Singapore) | | | 10,200 | | | | 196,447 | |
DNB ASA (Norway) | | | 34,726 | | | | 649,139 | |
Fifth Third Bancorp | | | 64,600 | | | | 1,985,804 | |
| | | | | | | | |
COMMON STOCKS
(continued) | | Shares | | | Value | |
Banks (continued) | |
Fukuoka Financial Group, Inc. (Japan) | | | 1,200 | | | $ | 22,914 | |
HSBC Holdings PLC (United Kingdom) | | | 35,375 | | | | 277,852 | |
Intesa Sanpaolo SpA (Italy) | | | 85,164 | | | | 224,228 | |
Israel Discount Bank Ltd. (Israel) (Class A Stock) | | | 6,456 | | | | 30,004 | |
Japan Post Bank Co. Ltd. (Japan) | | | 2,400 | | | | 23,057 | |
JPMorgan Chase & Co. | | | 144,394 | | | | 20,128,524 | |
KBC Group NV (Belgium) | | | 1,401 | | | | 105,540 | |
KeyCorp. | | | 57,800 | | | | 1,169,872 | |
Mediobanca Banca di Credito Finanziario SpA (Italy) | | | 3,658 | | | | 40,326 | |
Mitsubishi UFJ Financial Group, Inc. (Japan) | | | 164,900 | | | | 891,952 | |
Oversea-Chinese Banking Corp. Ltd. (Singapore) | | | 18,300 | | | | 149,743 | |
Popular, Inc. (Puerto Rico) | | | 95,200 | | | | 5,593,000 | |
Raiffeisen Bank International AG (Austria) | | | 856 | | | | 21,535 | |
Resona Holdings, Inc. (Japan) | | | 24,800 | | | | 108,123 | |
Shinsei Bank Ltd. (Japan) | | | 1,100 | | | | 16,796 | |
Simmons First National Corp. (Class A Stock)(a) | | | 32,600 | | | | 873,354 | |
Skandinaviska Enskilda Banken AB (Sweden) (Class A Stock) | | | 66,587 | | | | 626,439 | |
Societe Generale SA (France) | | | 20,040 | | | | 698,423 | |
Sumitomo Mitsui Financial Group, Inc. (Japan) | | | 21,100 | | | | 777,346 | |
Sumitomo Mitsui Trust Holdings, Inc. (Japan) | | | 1,900 | | | | 75,109 | |
Synovus Financial Corp. | | | 89,800 | | | | 3,520,160 | |
United Overseas Bank Ltd. (Singapore) | | | 30,000 | | | | 590,947 | |
Wells Fargo & Co. | | | 157,400 | | | | 8,468,120 | |
Wintrust Financial Corp. | | | 24,600 | | | | 1,744,140 | |
| | | | | | | | |
| | | | | | | 142,352,904 | |
| | | | | | | | |
Beverages — 1.3% | |
Asahi Group Holdings Ltd. (Japan) | | | 12,600 | | | | 575,963 | |
Carlsberg A/S (Denmark) (Class B Stock) | | | 620 | | | | 92,494 | |
Coca-Cola Amatil Ltd. (Australia) | | | 2,568 | | | | 19,935 | |
Coca-Cola Co. (The) | | | 414,300 | | | | 22,931,505 | |
Coca-Cola European Partners PLC (United Kingdom) | | | 1,300 | | | | 66,144 | |
Diageo PLC (United Kingdom) | | | 16,505 | | | | 701,253 | |
Heineken Holding NV (Netherlands) | | | 329 | | | | 31,928 | |
Keurig Dr. Pepper, Inc.(a) | | | 460,900 | | | | 13,343,055 | |
Kirin Holdings Co. Ltd. (Japan) | | | 4,700 | | | | 102,578 | |
Monster Beverage Corp.* | | | 69,900 | | | | 4,442,145 | |
PepsiCo, Inc. | | | 88,220 | | | | 12,057,027 | |
Pernod Ricard SA (France) | | | 1,206 | | | | 216,003 | |
Treasury Wine Estates Ltd. (Australia) | | | 4,059 | | | | 46,301 | |
| | | | | | | | |
| | | | | | | 54,626,331 | |
| | | | | | | | |
Biotechnology — 1.7% | |
AbbVie, Inc. | | | 144,700 | | | | 12,811,738 | |
Alexion Pharmaceuticals, Inc.* | | | 43,300 | | | | 4,682,895 | |
Amgen, Inc. | | | 19,508 | | | | 4,702,793 | |
Biogen, Inc.* | | | 74,700 | | | | 22,165,731 | |
CSL Ltd. (Australia) | | | 2,600 | | | | 503,460 | |
SEE NOTES TO FINANCIAL STATEMENTS.
A76
| | | | | | |
| | |
| | FLEXIBLE MANAGED PORTFOLIO (continued) | | |
| | | | | | |
| |
| SCHEDULE OF INVESTMENTS | | as of December 31, 2019 |
| | | | | | | | |
COMMON STOCKS
(continued) | | Shares | | | Value | |
Biotechnology (continued) | | | | | | | | |
Gilead Sciences, Inc. | | | 300,950 | | | $ | 19,555,731 | |
Vertex Pharmaceuticals, Inc.* | | | 39,800 | | | | 8,714,210 | |
| | | | | | | | |
| | | | | | | 73,136,558 | |
| | | | | | | | |
Building Products — 0.5% | | | | | |
American Woodmark Corp.* | | | 24,900 | | | | 2,602,299 | |
Assa Abloy AB (Sweden) (Class B Stock) | | | 5,824 | | | | 136,119 | |
Daikin Industries Ltd. (Japan) | | | 1,400 | | | | 197,404 | |
Geberit AG (Switzerland) | | | 371 | | | | 208,129 | |
Johnson Controls International PLC | | | 314,600 | | | | 12,807,366 | |
Kingspan Group PLC (Ireland) | | | 870 | | | | 53,185 | |
Masco Corp. | | | 37,600 | | | | 1,804,424 | |
Universal Forest Products, Inc. | | | 96,800 | | | | 4,617,360 | |
| | | | | | | | |
| | | | | | | 22,426,286 | |
| | | | | | | | |
Capital Markets — 1.8% | | | | | | | | |
3i Group PLC (United Kingdom) | | | 41,324 | | | | 602,407 | |
Affiliated Managers Group, Inc. | | | 138,500 | | | | 11,736,490 | |
Ameriprise Financial, Inc. | | | 78,850 | | | | 13,134,833 | |
Amundi SA (France), 144A | | | 324 | | | | 25,468 | |
ASX Ltd. (Australia) | | | 10,081 | | | | 554,945 | |
Bank of New York Mellon Corp. (The) | | | 70,300 | | | | 3,538,199 | |
Goldman Sachs Group, Inc. (The) | | | 98,900 | | | | 22,740,077 | |
London Stock Exchange Group PLC (United Kingdom) | | | 1,864 | | | | 191,924 | |
Macquarie Group Ltd. (Australia) | | | 382 | | | | 36,966 | |
Magellan Financial Group Ltd. (Australia) | | | 15,307 | | | | 611,979 | |
Morgan Stanley | | | 436,050 | | | | 22,290,876 | |
Nomura Holdings, Inc. (Japan) | | | 124,500 | | | | 638,976 | |
Singapore Exchange Ltd. (Singapore) | | | 49,300 | | | | 325,547 | |
| | | | | | | | |
| | | | | | | 76,428,687 | |
| | | | | | | | |
Chemicals — 1.3% | | | | | | | | |
Air Water, Inc. (Japan) | | | 900 | | | | 13,138 | |
Arkema SA (France) | | | 2,452 | | | | 260,561 | |
BASF SE (Germany) | | | 5,283 | | | | 400,711 | |
CF Industries Holdings, Inc. | | | 148,600 | | | | 7,094,164 | |
Corteva, Inc. | | | 154,000 | | | | 4,552,240 | |
DuPont de Nemours, Inc. | | | 259,900 | | | | 16,685,580 | |
Givaudan SA (Switzerland) | | | 53 | | | | 166,014 | |
Huntsman Corp. | | | 245,800 | | | | 5,938,528 | |
Israel Chemicals Ltd. (Israel) | | | 111,328 | | | | 524,230 | |
Nippon Paint Holdings Co. Ltd. (Japan) | | | 900 | | | | 46,364 | |
Nitto Denko Corp. (Japan) | | | 900 | | | | 50,596 | |
Orica Ltd. (Australia) | | | 28,508 | | | | 439,366 | |
Sherwin-Williams Co. (The) | | | 30,900 | | | | 18,031,386 | |
Shin-Etsu Chemical Co. Ltd. (Japan) | | | 400 | | | | 44,031 | |
Showa Denko KK (Japan) | | | 800 | | | | 21,072 | |
Sika AG (Switzerland) | | | 744 | | | | 139,837 | |
Trinseo SA | | | 15,400 | | | | 573,034 | |
Westlake Chemical Corp. | | | 16,400 | | | | 1,150,460 | |
| | | | | | | | |
| | | | | | | 56,131,312 | |
| | | | | | | | |
Commercial Services & Supplies — 0.2% | | | | | |
Dai Nippon Printing Co. Ltd. (Japan) | | | 1,400 | | | | 37,822 | |
Deluxe Corp.(a) | | | 77,200 | | | | 3,853,824 | |
| | | | | | | | |
COMMON STOCKS
(continued) | | Shares | | | Value | |
Commercial Services & Supplies (continued) | |
Secom Co. Ltd. (Japan) | | | 1,600 | | | $ | 143,186 | |
Sohgo Security Services Co. Ltd. (Japan) | | | 400 | | | | 21,692 | |
Steelcase, Inc. (Class A Stock) | | | 164,800 | | | | 3,371,808 | |
Toppan Printing Co. Ltd. (Japan) | | | 16,000 | | | | 330,545 | |
UniFirst Corp. | | | 12,800 | | | | 2,585,344 | |
| | | | | | | | |
| | | | | | | 10,344,221 | |
| | | | | | | | |
Communications Equipment — 0.6% | | | | | | | | |
Cisco Systems, Inc. | | | 553,000 | | | | 26,521,880 | |
Telefonaktiebolaget LM Ericsson (Sweden) (Class B Stock) | | | 17,287 | | | | 150,525 | |
| | | | | | | | |
| | | | | | | 26,672,405 | |
| | | | | | | | |
Construction & Engineering — 0.3% | | | | | | | | |
ACS Actividades de Construccion y Servicios SA (Spain) | | | 9,566 | | | | 383,439 | |
Eiffage SA (France) | | | 446 | | | | 51,047 | |
EMCOR Group, Inc. | | | 106,200 | | | | 9,165,060 | |
Obayashi Corp. (Japan) | | | 51,500 | | | | 572,764 | |
Shimizu Corp. (Japan) | | | 55,700 | | | | 567,122 | |
Skanska AB (Sweden) (Class B Stock) | | | 1,910 | | | | 43,130 | |
Taisei Corp. (Japan) | | | 800 | | | | 33,232 | |
| | | | | | | | |
| | | | | | | 10,815,794 | |
| | | | | | | | |
Construction Materials — 0.6% | | | | | | | | |
CRH PLC (Ireland) | | | 4,617 | | | | 185,073 | |
HeidelbergCement AG (Germany) | | | 7,844 | | | | 575,465 | |
LafargeHolcim Ltd. (Switzerland)* | | | 2,782 | | | | 154,464 | |
Martin Marietta Materials, Inc. | | | 46,600 | | | | 13,031,224 | |
Vulcan Materials Co. | | | 71,300 | | | | 10,266,487 | |
| | | | | | | | |
| | | | | | | 24,212,713 | |
| | | | | | | | |
Consumer Finance — 0.6% | | | | | | | | |
Capital One Financial Corp. | | | 204,800 | | | | 21,075,968 | |
Credit Saison Co. Ltd. (Japan) | | | 900 | | | | 15,612 | |
Navient Corp. | | | 185,150 | | | | 2,532,852 | |
OneMain Holdings, Inc. | | | 74,100 | | | | 3,123,315 | |
| | | | | | | | |
| | | | | | | 26,747,747 | |
| | | | | | | | |
Containers & Packaging — 0.1% | | | | | | | | |
Greif, Inc. (Class A Stock) | | | 23,350 | | | | 1,032,070 | |
Sealed Air Corp. | | | 41,700 | | | | 1,660,911 | |
| | | | | | | | |
| | | | | | | 2,692,981 | |
| | | | | | | | |
Distributors — 0.2% | | | | | | | | |
LKQ Corp.* | | | 285,100 | | | | 10,178,070 | |
| | | | | | | | |
Diversified Consumer Services — 0.1% | | | | | |
frontdoor, Inc.* | | | 43,600 | | | | 2,067,512 | |
| | | | | | | | |
Diversified Financial Services — 0.6% | | | | | |
Berkshire Hathaway, Inc. (Class B Stock)* | | | 74,950 | | | | 16,976,175 | |
Jefferies Financial Group, Inc. | | | 377,400 | | | | 8,065,038 | |
Kinnevik AB (Sweden) (Class B Stock) | | | 1,458 | | | | 35,676 | |
M&G PLC (United Kingdom)* | | | 40,068 | | | | 126,391 | |
SEE NOTES TO FINANCIAL STATEMENTS.
A77
| | | | | | |
| | |
| | FLEXIBLE MANAGED PORTFOLIO (continued) | | |
| | | | | | |
| |
| SCHEDULE OF INVESTMENTS | | as of December 31, 2019 |
| | | | | | | | |
COMMON STOCKS
(continued) | | Shares | | | Value | |
Diversified Financial Services (continued) | | | | | | | | |
Mitsubishi UFJ Lease & Finance Co. Ltd. (Japan) | | | 2,400 | | | $ | 15,445 | |
| | | | | | | | |
| | | | | | | 25,218,725 | |
| | | | | | | | |
Diversified Telecommunication Services — 1.8% | |
AT&T, Inc. | | | 935,900 | | | | 36,574,972 | |
Deutsche Telekom AG (Germany) | | | 42,849 | | | | 699,974 | |
Elisa OYJ (Finland) | | | 780 | | | | 43,036 | |
Nippon Telegraph & Telephone Corp. (Japan) | | | 27,000 | | | | 685,472 | |
Telecom Italia SpA (Italy)* | | | 900,556 | | | | 563,137 | |
Telecom Italia SpA (Italy), RSP | | | 18,981 | | | | 11,651 | |
Telefonica Deutschland Holding AG (Germany) | | | 25,562 | | | | 74,346 | |
Telenor ASA (Norway) | | | 4,175 | | | | 74,790 | |
Verizon Communications, Inc. | | | 621,588 | | | | 38,165,503 | |
| | | | | | | | |
| | | | | | | 76,892,881 | |
| | | | | | | | |
Electric Utilities — 0.8% | |
Chubu Electric Power Co., Inc. (Japan) | | | 37,900 | | | | 535,712 | |
Enel SpA (Italy) | | | 108,204 | | | | 859,344 | |
Exelon Corp. | | | 409,600 | | | | 18,673,664 | |
FirstEnergy Corp. | | | 157,900 | | | | 7,673,940 | |
Iberdrola SA (Spain) | | | 85,357 | | | | 881,401 | |
Kansai Electric Power Co., Inc. (The) (Japan) | | | 12,500 | | | | 145,014 | |
Red Electrica Corp. SA (Spain) | | | 1,128 | | | | 22,715 | |
Southern Co. (The) | | | 120,600 | | | | 7,682,220 | |
SSE PLC (United Kingdom) | | | 6,120 | | | | 116,804 | |
| | | | | | | | |
| | | | | | | 36,590,814 | |
| | | | | | | | |
Electrical Equipment — 0.2% | |
Atkore International Group, Inc.* | | | 105,350 | | | | 4,262,461 | |
Hubbell, Inc. | | | 10,900 | | | | 1,611,238 | |
Legrand SA (France) | | | 7,566 | | | | 617,250 | |
Schneider Electric SE (France) | | | 1,403 | | | | 144,161 | |
| | | | | | | | |
| | | | | | | 6,635,110 | |
| | | | | | | | |
Electronic Equipment, Instruments & Components — 0.2% | |
Anixter International, Inc.* | | | 1,100 | | | | 101,310 | |
CDW Corp. | | | 29,100 | | | | 4,156,644 | |
Halma PLC (United Kingdom) | | | 2,055 | | | | 57,927 | |
Hitachi High-Technologies Corp. (Japan) | | | 3,800 | | | | 268,229 | |
Ingenico Group SA (France) | | | 5,081 | | | | 551,858 | |
Itron, Inc.* | | | 16,500 | | | | 1,385,175 | |
TDK Corp. (Japan) | | | 800 | | | | 90,136 | |
| | | | | | | | |
| | | | | | | 6,611,279 | |
| | | | | | | | |
Energy Equipment & Services — 0.1% | |
National Oilwell Varco, Inc. | | | 196,500 | | | | 4,922,325 | |
| | | | | | | | |
Entertainment — 0.4% | | | | | | | | |
Electronic Arts, Inc.* | | | 131,600 | | | | 14,148,316 | |
Nintendo Co. Ltd. (Japan) | | | 700 | | | | 282,160 | |
Square Enix Holdings Co. Ltd. (Japan) | | | 600 | | | | 29,867 | |
Take-Two Interactive Software, Inc.* | | | 26,400 | | | | 3,232,152 | |
Toho Co. Ltd. (Japan) | | | 700 | | | | 29,135 | |
Vivendi SA (France) | | | 11,139 | | | | 322,490 | |
| | | | | | | | |
COMMON STOCKS
(continued) | | Shares | | | Value | |
Entertainment (continued) | | | | | | | | |
Walt Disney Co. (The) | | | 5,800 | | | $ | 838,854 | |
| | | | | | | | |
| | | | | | | 18,882,974 | |
| | | | | | | | |
Equity Real Estate Investment Trusts (REITs) — 1.4% | |
American Tower Corp. | | | 75,100 | | | | 17,259,482 | |
Apartment Investment & Management Co. (Class A Stock) | | | 45,500 | | | | 2,350,075 | |
Apple Hospitality REIT, Inc. | | | 238,550 | | | | 3,876,438 | |
CapitaLand Commercial Trust (Singapore) | | | 15,200 | | | | 22,517 | |
CoreCivic, Inc. | | | 140,250 | | | | 2,437,545 | |
Crown Castle International Corp. | | | 109,400 | | | | 15,551,210 | |
DiamondRock Hospitality Co. | | | 107,250 | | | | 1,188,330 | |
EPR Properties | | | 29,800 | | | | 2,105,072 | |
Franklin Street Properties Corp. | | | 83,550 | | | | 715,188 | |
Gaming & Leisure Properties, Inc. | | | 54,200 | | | | 2,333,310 | |
GEO Group, Inc. (The) | | | 233,450 | | | | 3,877,604 | |
Goodman Group (Australia) | | | 9,201 | | | | 86,573 | |
Japan Real Estate Investment Corp. (Japan) | | | 8 | | | | 53,079 | |
Japan Retail Fund Investment Corp. (Japan) | | | 14 | | | | 30,058 | |
Klepierre SA (France) | | | 4,888 | | | | 185,697 | |
Land Securities Group PLC (United Kingdom) | | | 3,328 | | | | 43,741 | |
Mapletree Commercial Trust (Singapore) | | | 218,700 | | | | 388,805 | |
Nippon Building Fund, Inc. (Japan) | | | 8 | | | | 58,577 | |
Orix JREIT, Inc. (Japan) | | | 15 | | | | 32,554 | |
RLJ Lodging Trust | | | 84,200 | | | | 1,492,024 | |
Ryman Hospitality Properties, Inc. | | | 52,400 | | | | 4,540,984 | |
Stockland (Australia) | | | 13,491 | | | | 43,730 | |
UDR, Inc. | | | 19,900 | | | | 929,330 | |
| | | | | | | | |
| | | | | | | 59,601,923 | |
| | | | | | | | |
Food & Staples Retailing — 0.9% | |
Coles Group Ltd. (Australia) | | | 6,348 | | | | 66,141 | |
Colruyt SA (Belgium) | | | 325 | | | | 16,955 | |
Costco Wholesale Corp. | | | 71,900 | | | | 21,132,848 | |
J Sainsbury PLC (United Kingdom) | | | 132,579 | | | | 404,064 | |
Koninklijke Ahold Delhaize NV (Netherlands) | | | 24,159 | | | | 603,881 | |
Sysco Corp. | | | 16,800 | | | | 1,437,072 | |
Tesco PLC (United Kingdom) | | | 55,460 | | | | 187,669 | |
Walgreens Boots Alliance, Inc. | | | 256,900 | | | | 15,146,824 | |
Woolworths Group Ltd. (Australia) | | | 20,130 | | | | 511,179 | |
| | | | | | | | |
| | | | | | | 39,506,633 | |
| | | | | | | | |
Food Products — 1.2% | |
Archer-Daniels-Midland Co. | | | 320,250 | | | | 14,843,587 | |
Associated British Foods PLC (United Kingdom) | | | 1,976 | | | | 68,269 | |
Bunge Ltd. | | | 160,500 | | | | 9,236,775 | |
Nestle SA (Switzerland) | | | 16,020 | | | | 1,734,220 | |
Orkla ASA (Norway) | | | 4,251 | | | | 43,086 | |
Pilgrim’s Pride Corp.* | | | 247,300 | | | | 8,090,420 | |
Tate & Lyle PLC (United Kingdom) | | | 14,472 | | | | 145,976 | |
Tyson Foods, Inc. (Class A Stock) | | | 210,500 | | | | 19,163,920 | |
SEE NOTES TO FINANCIAL STATEMENTS.
A78
| | | | | | |
| | |
| | FLEXIBLE MANAGED PORTFOLIO (continued) | | |
| | | | | | |
| |
| SCHEDULE OF INVESTMENTS | | as of December 31, 2019 |
| | | | | | | | |
COMMON STOCKS
(continued) | | Shares | | | Value | |
Food Products (continued) | | | | | | | | |
WH Group Ltd. (Hong Kong), 144A | | | 544,000 | | | $ | 563,414 | |
Wilmar International Ltd. (Singapore) | | | 10,900 | | | | 33,416 | |
| | | | | | | | |
| | | | | | | 53,923,083 | |
| | | | | | | | |
Gas Utilities — 0.3% | | | | | | | | |
Enagas SA (Spain) | | | 1,273 | | | | 32,477 | |
Naturgy Energy Group SA (Spain) | | | 1,728 | | | | 43,565 | |
Snam SpA (Italy) | | | 11,949 | | | | 62,873 | |
Tokyo Gas Co. Ltd. (Japan) | | | 2,200 | | | | 53,425 | |
UGI Corp. | | | 302,500 | | | | 13,660,900 | |
| | | | | | | | |
| | | | | | | 13,853,240 | |
| | | | | | | | |
Health Care Equipment & Supplies — 2.6% | |
Baxter International, Inc. | | | 141,050 | | | | 11,794,601 | |
Becton, Dickinson & Co. | | | 78,500 | | | | 21,349,645 | |
Cooper Cos., Inc. (The) | | | 8,200 | | | | 2,634,578 | |
DENTSPLY SIRONA, Inc. | | | 249,600 | | | | 14,124,864 | |
Edwards Lifesciences Corp.* | | | 75,800 | | | | 17,683,382 | |
Fisher & Paykel Healthcare Corp. Ltd. (New Zealand) | | | 3,248 | | | | 48,467 | |
Hologic, Inc.* | | | 291,500 | | | | 15,219,215 | |
Hoya Corp. (Japan) | | | 2,200 | | | | 210,390 | |
Integer Holdings Corp.* | | | 40,100 | | | | 3,225,243 | |
Medtronic PLC. | | | 213,300 | | | | 24,198,885 | |
Olympus Corp. (Japan) | | | 5,800 | | | | 90,657 | |
Siemens Healthineers AG (Germany), 144A | | | 4,421 | | | | 212,649 | |
Smith & Nephew PLC (United Kingdom) | | | 2,541 | | | | 61,886 | |
Stryker Corp. | | | 10,800 | | | | 2,267,352 | |
| | | | | | | | |
| | | | | | | 113,121,814 | |
| | | | | | | | |
Health Care Providers & Services — 1.5% | |
Alfresa Holdings Corp. (Japan) | | | 4,800 | | | | 97,397 | |
AmerisourceBergen Corp. | | | 30,700 | | | | 2,610,114 | |
Anthem, Inc. | | | 11,200 | | | | 3,382,736 | |
Cigna Corp. | | | 81,400 | | | | 16,645,486 | |
CVS Health Corp. | | | 340,250 | | | | 25,277,172 | |
Fresenius Medical Care AG & Co. KGaA (Germany) | | | 1,224 | | | | 90,884 | |
HCA Healthcare, Inc. | | | 96,050 | | | | 14,197,151 | |
Medipal Holdings Corp. (Japan) | | | 23,400 | | | | 515,760 | |
Sonic Healthcare Ltd. (Australia) | | | 2,573 | | | | 51,924 | |
Suzuken Co. Ltd. (Japan) | | | 10,600 | | | | 431,722 | |
Universal Health Services, Inc. (Class B Stock) | | | 13,600 | | | | 1,951,056 | |
| | | | | | | | |
| | | | | | | 65,251,402 | |
| | | | | | | | |
Hotels, Restaurants & Leisure — 0.9% | | | | | | | | |
Aristocrat Leisure Ltd. (Australia) | | | 4,830 | | | | 114,434 | |
Compass Group PLC (United Kingdom) | | | 9,164 | | | | 229,936 | |
Flutter Entertainment PLC (Ireland) | | | 441 | | | | 53,700 | |
Galaxy Entertainment Group Ltd. (Macau) | | | 12,000 | | | | 88,498 | |
McDonald’s Corp. | | | 59,100 | | | | 11,678,751 | |
Melco Resorts & Entertainment Ltd. (Hong Kong), ADR | | | 500 | | | | 12,085 | |
| | | | | | | | |
COMMON STOCKS
(continued) | | Shares | | | Value | |
Hotels, Restaurants & Leisure (continued) | | | | | |
Oriental Land Co. Ltd. (Japan) | | | 1,100 | | | $ | 150,105 | |
Sodexo SA (France) | | | 490 | | | | 58,055 | |
Starbucks Corp. | | | 284,700 | | | | 25,030,824 | |
Tabcorp Holdings Ltd. (Australia) | | | 11,544 | | | | 36,681 | |
TUI AG (Germany) | | | 2,514 | | | | 31,838 | |
| | | | | | | | |
| | | | | | | 37,484,907 | |
| | | | | | | | |
Household Durables — 0.5% | | | | | | | | |
Barratt Developments PLC (United Kingdom) | | | 5,762 | | | | 57,240 | |
Berkeley Group Holdings PLC (United Kingdom) | | | 8,646 | | | | 556,355 | |
Casio Computer Co. Ltd. (Japan) | | | 1,100 | | | | 22,027 | |
Lennar Corp. (Class A Stock) | | | 67,100 | | | | 3,743,509 | |
M/I Homes, Inc.* | | | 89,400 | | | | 3,517,890 | |
Meritage Homes Corp.* | | | 35,400 | | | | 2,163,294 | |
Sekisui House Ltd. (Japan) | | | 3,600 | | | | 77,061 | |
Sony Corp. (Japan) | | | 14,700 | | | | 999,171 | |
Taylor Wimpey PLC (United Kingdom) | | | 17,712 | | | | 45,636 | |
Whirlpool Corp.(a) | | | 57,100 | | | | 8,423,963 | |
| | | | | | | | |
| | | | | | | 19,606,146 | |
| | | | | | | | |
Household Products — 1.0% | | | | | | | | |
Essity AB (Sweden) (Class B Stock) | | | 11,388 | | | | 366,093 | |
Henkel AG & Co. KGaA (Germany) | | | 601 | | | | 56,826 | |
Procter & Gamble Co. (The) | | | 340,805 | | | | 42,566,544 | |
Spectrum Brands Holdings, Inc. | | | 15,257 | | | | 980,873 | |
| | | | | | | | |
| | | | | | | 43,970,336 | |
| | | | | | | | |
Independent Power & Renewable Electricity Producers — 0.5% | |
NRG Energy, Inc. | | | 347,850 | | | | 13,827,038 | |
Vistra Energy Corp. | | | 314,400 | | | | 7,228,056 | |
| | | | | | | | |
| | | | | | | 21,055,094 | |
| | | | | | | | |
Industrial Conglomerates — 0.7% | | | | | | | | |
CK Hutchison Holdings Ltd. (United Kingdom) | | | 15,500 | | | | 147,920 | |
General Electric Co. | | | 2,365,900 | | | | 26,403,444 | |
Honeywell International, Inc. | | | 6,800 | | | | 1,203,600 | |
Siemens AG (Germany) | | | 4,399 | | | | 576,442 | |
| | | | | | | | |
| | | | | | | 28,331,406 | |
| | | | | | | | |
Insurance — 1.7% | | | | | | | | |
Aegon NV (Netherlands) | | | 35,457 | | | | 162,048 | |
Ageas (Belgium) | | | 1,011 | | | | 59,810 | |
AIA Group Ltd. (Hong Kong) | | | 18,000 | | | | 189,188 | |
Allianz SE (Germany) | | | 2,379 | | | | 583,061 | |
Allstate Corp. (The) | | | 153,400 | | | | 17,249,830 | |
American International Group, Inc. | | | 337,900 | | | | 17,344,407 | |
Assicurazioni Generali SpA (Italy) | | | 6,140 | | | | 126,758 | |
Aviva PLC (United Kingdom) | | | 22,361 | | | | 124,737 | |
CNP Assurances (France) | | | 980 | | | | 19,505 | |
Dai-ichi Life Holdings, Inc. (Japan) | | | 6,200 | | | | 102,400 | |
Hannover Rueck SE (Germany) | | | 348 | | | | 67,340 | |
Japan Post Holdings Co. Ltd. (Japan) | | | 9,100 | | | | 85,502 | |
Japan Post Insurance Co. Ltd. (Japan) | | | 1,300 | | | | 22,052 | |
Legal & General Group PLC (United Kingdom) | | | 176,381 | | | | 713,467 | |
SEE NOTES TO FINANCIAL STATEMENTS.
A79
| | | | | | |
| | |
| | FLEXIBLE MANAGED PORTFOLIO (continued) | | |
| | | | | | |
| |
| SCHEDULE OF INVESTMENTS | | as of December 31, 2019 |
| | | | | | | | |
COMMON STOCKS
(continued) | | Shares | | | Value | |
Insurance (continued) | | | | | | | | |
MetLife, Inc. | | | 402,300 | | | $ | 20,505,231 | |
MS&AD Insurance Group Holdings, Inc. (Japan) | | | 2,700 | | | | 89,102 | |
Muenchener Rueckversicherungs-Gesellschaft AG in Muenchen (Germany) | | | 1,321 | | | | 389,685 | |
NN Group NV (Netherlands) | | | 14,363 | | | | 545,291 | |
Poste Italiane SpA (Italy), 144A | | | 2,897 | | | | 32,847 | |
Progressive Corp. (The) | | | 141,800 | | | | 10,264,902 | |
QBE Insurance Group Ltd. (Australia) | | | 7,470 | | | | 67,484 | |
Swiss Life Holding AG (Switzerland) | | | 197 | | | | 98,937 | |
Unum Group | | | 58,400 | | | | 1,702,944 | |
Zurich Insurance Group AG (Switzerland) | | | 2,128 | | | | 872,926 | |
| | | | | | | | |
| | | | | | | 71,419,454 | |
| | | | | | | | |
Interactive Media & Services — 3.4% | | | | | | | | |
Alphabet, Inc. (Class A Stock)* | | | 32,650 | | | | 43,731,084 | |
Alphabet, Inc. (Class C Stock)* | | | 29,832 | | | | 39,885,981 | |
Facebook, Inc. (Class A Stock)* | | | 307,350 | | | | 63,083,587 | |
Kakaku.com, Inc. (Japan) | | | 800 | | | | 20,340 | |
TripAdvisor, Inc. | | | 66,000 | | | | 2,005,080 | |
| | | | | | | | |
| | | | | | | 148,726,072 | |
| | | | | | | | |
Internet & Direct Marketing Retail — 2.1% | |
Amazon.com, Inc.* | | | 26,600 | | | | 49,152,544 | |
Booking Holdings, Inc.* | | | 10,850 | | | | 22,282,970 | |
eBay, Inc. | | | 433,800 | | | | 15,664,518 | |
Qurate Retail, Inc., Series A* | | | 404,600 | | | | 3,410,778 | |
Rakuten, Inc. (Japan) | | | 4,900 | | | | 41,795 | |
Zalando SE (Germany), 144A* | | | 331 | | | | 16,786 | |
ZOZO, Inc. (Japan) | | | 1,100 | | | | 21,027 | |
| | | | | | | | |
| | | | | | | 90,590,418 | |
| | | | | | | | |
IT Services — 2.9% | | | | | | | | |
Accenture PLC (Class A Stock) | | | 128,650 | | | | 27,089,831 | |
Adyen NV (Netherlands), 144A* | | | 57 | | | | 46,768 | |
Alliance Data Systems Corp. | | | 10,200 | | | | 1,144,440 | |
Amadeus IT Group SA (Spain) | | | 2,457 | | | | 200,853 | |
Atos SE (France) | | | 558 | | | | 46,633 | |
Automatic Data Processing, Inc. | | | 56,200 | | | | 9,582,100 | |
Capgemini SE (France) | | | 415 | | | | 50,706 | |
Cognizant Technology Solutions Corp. (Class A Stock) | | | 243,800 | | | | 15,120,476 | |
Fujitsu Ltd. (Japan) | | | 2,900 | | | | 272,720 | |
International Business Machines Corp. | | | 149,000 | | | | 19,971,960 | |
Itochu Techno-Solutions Corp. (Japan) | | | 600 | | | | 16,918 | |
Leidos Holdings, Inc. | | | 118,600 | | | | 11,609,754 | |
NEC Corp. (Japan) | | | 700 | | | | 28,943 | |
Nomura Research Institute Ltd. (Japan) | | | 25,200 | | | | 539,500 | |
NTT Data Corp. (Japan) | | | 3,600 | | | | 48,263 | |
Obic Co. Ltd. (Japan) | | | 1,700 | | | | 229,127 | |
Otsuka Corp. (Japan) | | | 600 | | | | 24,009 | |
Perspecta, Inc. | | | 28,900 | | | | 764,116 | |
Visa, Inc. (Class A Stock)(a) | | | 211,200 | | | | 39,684,480 | |
Wirecard AG (Germany)(a) | | | 1,381 | | | | 167,885 | |
| | | | | | | | |
| | | | | | | 126,639,482 | |
| | | | | | | | |
| | | | | | | | |
COMMON STOCKS
(continued) | | Shares | | | Value | |
Leisure Products — 0.0% | | | | | | | | |
Bandai Namco Holdings, Inc. (Japan) | | | 3,900 | | | $ | 236,785 | |
Sega Sammy Holdings, Inc. (Japan) | | | 900 | | | | 13,020 | |
Shimano, Inc. (Japan) | | | 400 | | | | 65,096 | |
| | | | | | | | |
| | | | | | | 314,901 | |
| | | | | | | | |
Life Sciences Tools & Services — 0.5% | | | | | | | | |
IQVIA Holdings, Inc.* | | | 97,800 | | | | 15,111,078 | |
QIAGEN NV* | | | 1,287 | | | | 44,016 | |
Sartorius Stedim Biotech (France) | | | 159 | | | | 26,381 | |
Thermo Fisher Scientific, Inc. | | | 15,400 | | | | 5,002,998 | |
| | | | | | | | |
| | | | | | | 20,184,473 | |
| | | | | | | | |
Machinery — 0.6% | | | | | | | | |
Alfa Laval AB (Sweden) | | | 1,770 | | | | 44,576 | |
Allison Transmission Holdings, Inc. | | | 59,200 | | | | 2,860,544 | |
Alstom SA (France) | | | 7,686 | | | | 365,150 | |
Amada Holdings Co. Ltd. (Japan) | | | 36,200 | | | | 411,505 | |
Atlas Copco AB (Sweden) (Class A Stock) | | | 17,663 | | | | 704,320 | |
Atlas Copco AB (Sweden) (Class B Stock) | | | 2,266 | | | | 78,660 | |
Dover Corp. | | | 34,800 | | | | 4,011,048 | |
Epiroc AB (Sweden) (Class B Stock) | | | 2,251 | | | | 26,653 | |
Kone OYJ (Finland) (Class B Stock) | | | 1,969 | | | | 128,640 | |
Kurita Water Industries Ltd. (Japan) | | | 500 | | | | 14,828 | |
Metso OYJ (Finland) | | | 13,340 | | | | 526,325 | |
Mitsubishi Heavy Industries Ltd. (Japan) | | | 1,800 | | | | 69,895 | |
Oshkosh Corp. | | | 120,200 | | | | 11,376,930 | |
Sandvik AB (Sweden) | | | 2,823 | | | | 54,980 | |
Schindler Holding AG (Switzerland) | | | 115 | | | | 28,178 | |
Timken Co. (The) | | | 73,000 | | | | 4,110,630 | |
Volvo AB (Sweden) (Class B Stock) | | | 8,471 | | | | 141,752 | |
Yangzijiang Shipbuilding Holdings Ltd. (China) | | | 13,100 | | | | 10,954 | |
| | | | | | | | |
| | | | | | | 24,965,568 | |
| | | | | | | | |
Marine — 0.0% | | | | | | | | |
AP Moller - Maersk A/S (Denmark) (Class A Stock) | | | 21 | | | | 28,444 | |
Mitsui OSK Lines Ltd. (Japan) | | | 700 | | | | 19,250 | |
| | | | | | | | |
| | | | | | | 47,694 | |
| | | | | | | | |
Media — 0.8% | | | | | | | | |
Altice Europe NV (Netherlands)* | | | 4,032 | | | | 26,052 | |
Charter Communications, Inc. (Class A Stock)*(a) | | | 2,000 | | | | 970,160 | |
Comcast Corp. (Class A Stock) | | | 66,896 | | | | 3,008,313 | |
Discovery, Inc. (Class A Stock)*(a) | | | 54,600 | | | | 1,787,604 | |
Discovery, Inc. (Class C Stock)* | | | 356,100 | | | | 10,857,489 | |
DISH Network Corp. (Class A Stock)* | | | 117,700 | | | | 4,174,819 | |
Schibsted ASA (Norway) (Class B Stock) | | | 558 | | | | 15,988 | |
ViacomCBS, Inc. (Class B Stock) | | | 353,355 | | | | 14,830,309 | |
| | | | | | | | |
| | | | | | | 35,670,734 | |
| | | | | | | | |
Metals & Mining — 0.1% | | | | | | | | |
Alumina Ltd. (Australia) | | | 13,815 | | | | 22,306 | |
SEE NOTES TO FINANCIAL STATEMENTS.
A80
| | | | | | |
| | |
| | FLEXIBLE MANAGED PORTFOLIO (continued) | | |
| | | | | | |
| |
| SCHEDULE OF INVESTMENTS | | as of December 31, 2019 |
| | | | | | | | |
COMMON STOCKS
(continued) | | Shares | | | Value | |
Metals & Mining (continued) | | | | | | | | |
Anglo American PLC (South Africa) | | | 24,422 | | | $ | 707,527 | |
Antofagasta PLC (Chile) | | | 2,280 | | | | 27,863 | |
ArcelorMittal SA (Luxembourg) | | | 6,220 | | | | 109,877 | |
BHP Group Ltd. (Australia) | | | 16,960 | | | | 463,911 | |
BHP Group PLC (Australia) | | | 17,806 | | | | 419,488 | |
BlueScope Steel Ltd. (Australia) | | | 3,027 | | | | 32,050 | |
Boliden AB (Sweden) | | | 2,916 | | | | 77,475 | |
Fortescue Metals Group Ltd. (Australia) | | | 24,188 | | | | 181,983 | |
Newcrest Mining Ltd. (Australia) | | | 4,323 | | | | 91,472 | |
Rio Tinto Ltd. (Australia) | | | 2,129 | | | | 150,337 | |
Rio Tinto PLC (Australia) | | | 15,533 | | | | 929,661 | |
Sumitomo Metal Mining Co. Ltd. (Japan) | | | 1,300 | | | | 42,029 | |
| | | | | | | | |
| | | | | | | 3,255,979 | |
| | | | | | | | |
Mortgage Real Estate Investment Trusts (REITs) — 0.1% | |
Annaly Capital Management, Inc. | | | 283,200 | | | | 2,667,744 | |
Ladder Capital Corp. | | | 97,095 | | | | 1,751,594 | |
| | | | | | | | |
| | | | | | | 4,419,338 | |
| | | | | | | | |
Multiline Retail — 0.8% | |
Big Lots, Inc.(a) | | | 25,800 | | | | 740,976 | |
Dollar General Corp. | | | 5,100 | | | | 795,498 | |
Macy’s, Inc.(a) | | | 428,050 | | | | 7,276,850 | |
Next PLC (United Kingdom) | | | 776 | | | | 72,097 | |
Target Corp. | | | 206,200 | | | | 26,436,902 | |
Wesfarmers Ltd. (Australia) | | | 6,351 | | | | 184,440 | |
| | | | | | | | |
| | | | | | | 35,506,763 | |
| | | | | | | | |
Multi-Utilities — 0.3% | |
AGL Energy Ltd. (Australia) | | | 17,131 | | | | 246,579 | |
Dominion Energy, Inc. | | | 162,200 | | | | 13,433,404 | |
Engie SA (France) | | | 10,200 | | | | 164,892 | |
National Grid PLC (United Kingdom) | | | 14,464 | | | | 181,420 | |
RWE AG (Germany) | | | 2,451 | | | | 75,514 | |
| | | | | | | | |
| | | | | | | 14,101,809 | |
| | | | | | | | |
Oil, Gas & Consumable Fuels — 2.1% | |
BP PLC (United Kingdom) | | | 22,988 | | | | 144,160 | |
Chevron Corp. | | | 89,700 | | | | 10,809,747 | |
ConocoPhillips | | | 131,600 | | | | 8,557,948 | |
Exxon Mobil Corp. | | | 68,466 | | | | 4,777,558 | |
HollyFrontier Corp. | | | 97,800 | | | | 4,959,438 | |
Kinder Morgan, Inc. | | | 144,300 | | | | 3,054,831 | |
Lundin Petroleum AB (Sweden) | | | 491 | | | | 16,687 | |
Marathon Petroleum Corp. | | | 256,600 | | | | 15,460,150 | |
Neste OYJ (Finland) | | | 6,889 | | | | 239,857 | |
OMV AG (Austria) | | | 3,761 | | | | 211,343 | |
Origin Energy Ltd. (Australia) | | | 99,682 | | | | 592,177 | |
Phillips 66 | | | 169,100 | | | | 18,839,431 | |
Repsol SA (Spain) | | | 8,119 | | | | 127,300 | |
Royal Dutch Shell PLC (Netherlands) (Class A Stock) | | | 24,420 | | | | 725,168 | |
Royal Dutch Shell PLC (Netherlands) (Class B Stock) | | | 32,309 | | | | 961,669 | |
Santos Ltd. (Australia) | | | 100,593 | | | | 579,200 | |
TOTAL SA (France) | | | 13,435 | | | | 743,922 | |
Valero Energy Corp. | | | 183,700 | | | | 17,203,505 | |
| | | | | | | | |
COMMON STOCKS
(continued) | | Shares | | | Value | |
Oil, Gas & Consumable Fuels (continued) | | | | | |
World Fuel Services Corp. | | | 84,200 | | | $ | 3,655,964 | |
| | | | | | | | |
| | | | | | | 91,660,055 | |
| | | | | | | | |
Paper & Forest Products — 0.0% | |
Oji Holdings Corp. (Japan) | | | 4,700 | | | | 25,447 | |
| | | | | | | | |
Personal Products — 0.0% | | | | | | | | |
Unilever NV (United Kingdom) | | | 16,815 | | | | 968,306 | |
Unilever PLC (United Kingdom) | | | 6,391 | | | | 369,753 | |
| | | | | | | | |
| | | | | | | 1,338,059 | |
| | | | | | | | |
Pharmaceuticals — 3.1% | |
Astellas Pharma, Inc. (Japan) | | | 40,800 | | | | 697,167 | |
AstraZeneca PLC (United Kingdom) | | | 958 | | | | 96,669 | |
Bayer AG (Germany) | | | 3,138 | | | | 256,169 | |
Bristol-Myers Squibb Co. | | | 452,200 | | | | 29,026,718 | |
Chugai Pharmaceutical Co. Ltd. (Japan) | | | 3,300 | | | | 304,875 | |
Eli Lilly & Co. | | | 37,900 | | | | 4,981,197 | |
GlaxoSmithKline PLC (United Kingdom) | | | 51,345 | | | | 1,211,123 | |
H. Lundbeck A/S (Denmark) | | | 413 | | | | 15,772 | |
Hisamitsu Pharmaceutical Co., Inc. (Japan) | | | 300 | | | | 14,619 | |
Johnson & Johnson | | | 225,148 | | | | 32,842,339 | |
Kyowa Kirin Co. Ltd. (Japan) | | | 1,400 | | | | 32,931 | |
Merck & Co., Inc. | | | 430,000 | | | | 39,108,500 | |
Merck KGaA (Germany) | | | 742 | | | | 87,923 | |
Novartis AG (Switzerland) | | | 18,216 | | | | 1,727,887 | |
Novo Nordisk A/S (Denmark) (Class B Stock) | | | 16,825 | | | | 976,931 | |
Ono Pharmaceutical Co. Ltd. (Japan) | | | 2,200 | | | | 50,345 | |
Orion OYJ (Finland) (Class B Stock) | | | 608 | | | | 28,120 | |
Otsuka Holdings Co. Ltd. (Japan) | | | 2,200 | | | | 98,232 | |
Pfizer, Inc. | | | 25,400 | | | | 995,172 | |
Recordati SpA (Italy) | | | 588 | | | | 24,808 | |
Roche Holding AG (Switzerland) | | | 5,733 | | | | 1,860,363 | |
Sanofi (France) | | | 987 | | | | 99,332 | |
Shionogi & Co. Ltd. (Japan) | | | 4,600 | | | | 284,611 | |
Sumitomo Dainippon Pharma Co. Ltd. (Japan) | | | 900 | | | | 17,501 | |
Zoetis, Inc. | | | 151,500 | | | | 20,051,025 | |
| | | | | | | | |
| | | | | | | 134,890,329 | |
| | | | | | | | |
Professional Services — 0.1% | |
Korn Ferry | | | 59,700 | | | | 2,531,280 | |
Nielsen Holdings PLC | | | 60,800 | | | | 1,234,240 | |
Recruit Holdings Co. Ltd. (Japan) | | | 7,700 | | | | 287,946 | |
Wolters Kluwer NV (Netherlands) | | | 3,397 | | | | 247,986 | |
| | | | | | | | |
| | | | | | | 4,301,452 | |
| | | | | | | | |
Real Estate Management & Development — 0.1% | |
CBRE Group, Inc. (Class A Stock)* | | | 59,250 | | | | 3,631,432 | |
CK Asset Holdings Ltd. (Hong Kong) | | | 15,000 | | | | 108,129 | |
Daito Trust Construction Co. Ltd. (Japan) | | | 400 | | | | 49,321 | |
Daiwa House Industry Co. Ltd. (Japan) | | | 3,100 | | | | 95,847 | |
Henderson Land Development Co. Ltd. (Hong Kong) | | | 108,740 | | | | 533,991 | |
SEE NOTES TO FINANCIAL STATEMENTS.
A81
| | | | | | |
| | |
| | FLEXIBLE MANAGED PORTFOLIO (continued) | | |
| | | | | | |
| |
| SCHEDULE OF INVESTMENTS | | as of December 31, 2019 |
| | | | | | | | |
COMMON STOCKS
(continued) | | Shares | | | Value | |
Real Estate Management & Development (continued) | |
Hongkong Land Holdings Ltd. (Hong Kong) | | | 6,500 | | | $ | 37,424 | |
Jones Lang LaSalle, Inc. | | | 800 | | | | 139,272 | |
Mitsubishi Estate Co. Ltd. (Japan) | | | 6,800 | | | | 129,902 | |
Nomura Real Estate Holdings, Inc. (Japan) | | | 700 | | | | 16,767 | |
Sino Land Co. Ltd. (Hong Kong) | | | 16,000 | | | | 23,291 | |
Sumitomo Realty & Development Co. Ltd. (Japan) | | | 1,900 | | | | 66,417 | |
Swire Pacific Ltd. (Hong Kong) (Class A Stock) | | | 57,500 | | | | 535,314 | |
Swire Properties Ltd. (Hong Kong) | | | 3,000 | | | | 9,975 | |
Wharf Real Estate Investment Co. Ltd. (Hong Kong) | | | 6,000 | | | | 36,662 | |
Wheelock & Co. Ltd. (Hong Kong) | | | 51,000 | | | | 340,982 | |
| | | | | | | | |
| | | | | | | 5,754,726 | |
| | | | | | | | |
Road & Rail — 0.3% | | | | | | | | |
Aurizon Holdings Ltd. (Australia) | | | 11,244 | | | | 41,365 | |
CSX Corp. | | | 146,250 | | | | 10,582,650 | |
Hankyu Hanshin Holdings, Inc. (Japan) | | | 9,100 | | | | 388,932 | |
Kansas City Southern(a) | | | 11,700 | | | | 1,791,972 | |
Keikyu Corp. (Japan) | | | 1,300 | | | | 25,076 | |
Keisei Electric Railway Co. Ltd. (Japan) | | | 800 | | | | 30,983 | |
Kyushu Railway Co. (Japan) | | | 1,000 | | | | 33,441 | |
Nippon Express Co. Ltd. (Japan) | | | 500 | | | | 29,327 | |
Seibu Holdings, Inc. (Japan) | | | 1,200 | | | | 19,718 | |
Tobu Railway Co. Ltd. (Japan) | | | 1,100 | | | | 39,768 | |
West Japan Railway Co. (Japan) | | | 6,500 | | | | 562,091 | |
| | | | | | | | |
| | | | | | | 13,545,323 | |
| | | | | | | | |
Semiconductors & Semiconductor Equipment — 2.9% | |
Advantest Corp. (Japan) | | | 11,300 | | | | 633,551 | |
Applied Materials, Inc. | | | 326,000 | | | | 19,899,040 | |
ASML Holding NV (Netherlands) | | | 133 | | | | 39,558 | |
Broadcom, Inc. | | | 48,300 | | | | 15,263,766 | |
Intel Corp. | | | 710,150 | | | | 42,502,477 | |
Lam Research Corp. | | | 55,800 | | | | 16,315,920 | |
Micron Technology, Inc.* | | | 396,500 | | | | 21,323,770 | |
NVIDIA Corp. | | | 35,100 | | | | 8,259,030 | |
STMicroelectronics NV (Switzerland) | | | 3,855 | | | | 103,969 | |
Tokyo Electron Ltd. (Japan) | | | 2,800 | | | | 609,994 | |
| | | | | | | | |
| | | | | | | 124,951,075 | |
| | | | | | | | |
Software — 4.8% | | | | | | | | |
Adobe, Inc.* | | | 36,950 | | | | 12,186,480 | |
Cadence Design Systems, Inc.* | | | 12,800 | | | | 887,808 | |
Check Point Software Technologies Ltd. (Israel)*(a) | | | 700 | | | | 77,672 | |
CyberArk Software Ltd.* | | | 4,700 | | | | 547,926 | |
Intuit, Inc. | | | 78,000 | | | | 20,430,540 | |
Micro Focus International PLC (United Kingdom) | | | 1,762 | | | | 24,817 | |
Microsoft Corp. | | | 885,600 | | | | 139,659,120 | |
Oracle Corp. | | | 458,150 | | | | 24,272,787 | |
SAP SE (Germany) | | | 2,523 | | | | 342,324 | |
SS&C Technologies Holdings, Inc. | | | 40,700 | | | | 2,498,980 | |
| | | | | | | | |
COMMON STOCKS
(continued) | | Shares | | | Value | |
Software (continued) | | | | | | | | |
Synopsys, Inc.* | | | 56,300 | | | $ | 7,836,960 | |
| | | | | | | | |
| | | | | | | 208,765,414 | |
| | | | | | | | |
Specialty Retail — 1.0% | | | | | | | | |
ABC-Mart, Inc. (Japan) | | | 100 | | | | 6,820 | |
Asbury Automotive Group, Inc.* | | | 7,400 | | | | 827,246 | |
AutoNation, Inc.* | | | 159,900 | | | | 7,775,937 | |
Best Buy Co., Inc. | | | 47,300 | | | | 4,152,940 | |
Hennes & Mauritz AB (Sweden) (Class B Stock) | | | 28,030 | | | | 570,461 | |
Hikari Tsushin, Inc. (Japan) | | | 1,300 | | | | 326,212 | |
Home Depot, Inc. (The) | | | 4,600 | | | | 1,004,548 | |
Industria de Diseno Textil SA (Spain) | | | 6,337 | | | | 223,652 | |
JD Sports Fashion PLC (United Kingdom) | | | 36,064 | | | | 402,526 | |
L Brands, Inc. | | | 68,800 | | | | 1,246,656 | |
Lithia Motors, Inc. (Class A Stock) | | | 1,200 | | | | 176,400 | |
Lowe’s Cos., Inc. | | | 193,100 | | | | 23,125,656 | |
Michaels Cos., Inc. (The)*(a) | | | 157,500 | | | | 1,274,175 | |
Nitori Holdings Co. Ltd. (Japan) | | | 500 | | | | 78,977 | |
Shimamura Co. Ltd. (Japan) | | | 100 | | | | 7,608 | |
Sonic Automotive, Inc. (Class A Stock)(a) | | | 44,800 | | | | 1,388,800 | |
| | | | | | | | |
| | | | | | | 42,588,614 | |
| | | | | | | | |
Technology Hardware, Storage & Peripherals — 3.6% | |
Apple, Inc. | | | 495,000 | | | | 145,356,750 | |
Brother Industries Ltd. (Japan) | | | 1,200 | | | | 24,704 | |
FUJIFILM Holdings Corp. (Japan) | | | 12,500 | | | | 597,829 | |
HP, Inc. | | | 457,250 | | | | 9,396,487 | |
| | | | | | | | |
| | | | | | | 155,375,770 | |
| | | | | | | | |
Textiles, Apparel & Luxury Goods — 0.4% | |
adidas AG (Germany) | | | 1,033 | | | | 337,397 | |
Burberry Group PLC (United Kingdom) | | | 2,060 | | | | 60,678 | |
Capri Holdings Ltd.* | | | 357,500 | | | | 13,638,625 | |
EssilorLuxottica SA (France) | | | 1,570 | | | | 239,873 | |
Hermes International (France) | | | 881 | | | | 660,209 | |
LVMH Moet Hennessy Louis Vuitton SE (France) | | | 1,584 | | | | 737,562 | |
Puma SE (Germany) | | | 465 | | | | 35,627 | |
Swatch Group AG (The) (Switzerland) | | | 140 | | | | 7,406 | |
| | | | | | | | |
| | | | | | | 15,717,377 | |
| | | | | | | | |
Tobacco — 0.6% | | | | | | | | |
Altria Group, Inc. | | | 499,650 | | | | 24,937,531 | |
British American Tobacco PLC (United Kingdom) | | | 17,961 | | | | 769,737 | |
Imperial Brands PLC (United Kingdom) | | | 8,994 | | | | 224,015 | |
Japan Tobacco, Inc. (Japan) | | | 6,900 | | | | 153,782 | |
Philip Morris International, Inc. | | | 15,600 | | | | 1,327,404 | |
Swedish Match AB (Sweden) | | | 945 | | | | 48,724 | |
| | | | | | | | |
| | | | | | | 27,461,193 | |
| | | | | | | | |
Trading Companies & Distributors — 0.3% | | | | | |
AerCap Holdings NV (Ireland)* | | | 9,100 | | | | 559,377 | |
Ashtead Group PLC (United Kingdom) | | | 2,651 | | | | 84,901 | |
BMC Stock Holdings, Inc.* | | | 109,500 | | | | 3,141,555 | |
SEE NOTES TO FINANCIAL STATEMENTS.
A82
| | | | | | |
| | |
| | FLEXIBLE MANAGED PORTFOLIO (continued) | | |
| | | | | | |
| |
| SCHEDULE OF INVESTMENTS | | as of December 31, 2019 |
| | | | | | | | |
COMMON STOCKS (continued) | | Shares | | | Value | |
Trading Companies & Distributors (continued) | | | | | |
Brenntag AG (Germany) | | | 868 | | | $ | 47,517 | |
Ferguson PLC | | | 6,980 | | | | 634,307 | |
GMS, Inc.* | | | 89,800 | | | | 2,431,784 | |
ITOCHU Corp. (Japan) | | | 13,500 | | | | 313,470 | |
Marubeni Corp. (Japan) | | | 6,600 | | | | 48,743 | |
Toyota Tsusho Corp. (Japan) | | | 15,900 | | | | 559,967 | |
WESCO International, Inc.* | | | 109,100 | | | | 6,479,449 | |
| | | | | | | | |
| | | | | | | 14,301,070 | |
| | | | | | | | |
Transportation Infrastructure — 0.0% | | | | | |
Aena SME SA (Spain), 144A | | | 369 | | | | 70,726 | |
Aeroports de Paris (France) | | | 176 | | | | 34,780 | |
Fraport AG Frankfurt Airport Services | | | | | | | | |
Worldwide (Germany) | | | 6,280 | | | | 536,702 | |
Kamigumi Co. Ltd. (Japan) | | | 9,600 | | | | 210,900 | |
| | | | | | | | |
| | | | | | | 853,108 | |
| | | | | | | | |
Wireless Telecommunication Services — 0.0% | | | | | |
KDDI Corp. (Japan) | | | 27,200 | | | | 811,830 | |
NTT DOCOMO, Inc. (Japan) | | | 12,500 | | | | 348,164 | |
Softbank Corp. (Japan) | | | 9,800 | | | | 131,272 | |
Vodafone Group PLC (United Kingdom) | | | 153,185 | | | | 298,686 | |
| | | | | | | | |
| | | | | | | 1,589,952 | |
| | | | | | | | |
TOTAL COMMON STOCKS
(cost $2,065,173,018) | | | | | | | 2,751,347,744 | |
| | | | | | | | |
|
| EXCHANGE-TRADED FUND — 0.0% | |
iShares MSCI EAFE ETF
(cost $393,221) | | | 6,088 | | | | 422,751 | |
| | | | | | | | |
| |
| PREFERRED STOCKS — 0.0% | | | | | |
Automobiles — 0.0% | | | | | | | | |
Bayerische Motoren Werke AG (Germany) (PRFC) | | | 320 | | | | 19,798 | |
Porsche Automobil Holding SE (Germany) (PRFC) | | | 869 | | | | 65,135 | |
Volkswagen AG (Germany) (PRFC) | | | 2,106 | | | | 418,044 | |
| | | | | | | | |
| | | | | | | 502,977 | |
| | | | | | | | |
Banks — 0.0% | | | | | | | | |
Citigroup Capital XIII, 8.306% | | | 22,000 | | | | 611,600 | |
| | | | | | | | |
Chemicals — 0.0% | | | | | | | | |
Fuchs Petrolub SE (Germany) (PRFC) | | | 370 | | | | 18,414 | |
| | | | | | | | |
Health Care Equipment & Supplies — 0.0% | |
Sartorius AG (Germany) (PRFC) | | | 206 | | | | 44,339 | |
| | | | | | | | |
Household Products — 0.0% | | | | | | | | |
Henkel AG & Co. KGaA (Germany) (PRFC) | | | 1,029 | | | | 106,848 | |
| | | | | | | | |
TOTAL PREFERRED STOCKS
(cost $1,212,898) | | | | | | | 1,284,178 | |
| | | | | | | | |
| | | | | | | | |
RIGHTS* — 0.0% | | Units | | | Value | |
Oil, Gas & Consumable Fuels | | | | | | | | |
Repsol SA (Spain), expiring 01/10/20
(cost $3,834) | | | 8,119 | | | $ | 3,852 | |
| | | | | | | | |
| | | | | | | | | | | | |
| | | |
Interest
Rate | | Maturity
Date | | | Principal
Amount
(000)# | | | | |
| |
| ASSET-BACKED SECURITIES — 7.3% | | | | | |
Automobiles — 2.1% | | | | | | | | | |
AmeriCredit Automobile Receivables Trust, | |
Series2018-01, Class C | |
3.500% | | | 01/18/24 | | | | 1,600 | | | | 1,640,384 | |
Series2019-01, Class B | |
3.130% | | | 02/18/25 | | | | 1,000 | | | | 1,018,528 | |
Series2019-01, Class C | |
3.360% | | | 02/18/25 | | | | 1,000 | | | | 1,025,925 | |
Series2019-02, Class C | |
2.740% | | | 04/18/25 | | | | 2,000 | | | | 2,018,204 | |
Series2019-03, Class C | |
2.320% | | | 07/18/25 | | | | 3,400 | | | | 3,388,047 | |
Avis Budget Rental Car Funding AESOP LLC, | |
Series2015-01A, Class A, 144A | |
2.500% | | | 07/20/21 | | | | 2,100 | | | | 2,102,699 | |
Series2018-01A, Class A, 144A | |
3.700% | | | 09/20/24 | | | | 1,600 | | | | 1,663,743 | |
Series2018-02A, Class A, 144A | |
4.000% | | | 03/20/25 | | | | 1,600 | | | | 1,688,028 | |
Series2019-02A, Class A, 144A | |
3.350% | | | 09/22/25 | | | | 3,000 | | | | 3,093,736 | |
Series2019-03A, Class A, 144A | |
2.360% | | | 03/20/26 | | | | 4,000 | | | | 3,956,042 | |
Drive Auto Receivables Trust, | |
Series2019-03, Class B | |
2.650% | | | 02/15/24 | | | | 1,400 | | | | 1,403,813 | |
Ford Auto Securitization Trust (Canada), | |
Series2019-BA, Class A2, 144A | |
2.321% | | | 10/15/23 | | | CAD | 2,500 | | | | 1,926,071 | |
Ford Credit Auto Owner Trust, | |
Series2017-02, Class A, 144A | |
2.360% | | | 03/15/29 | | | | 2,500 | | | | 2,513,376 | |
Series2018-01, Class A, 144A | |
3.190% | | | 07/15/31 | | | | 3,800 | | | | 3,924,719 | |
Series2018-02, Class A, 144A | |
3.470% | | | 01/15/30 | | | | 3,000 | | | | 3,127,495 | |
Series2019-01, Class A, 144A | |
3.520% | | | 07/15/30 | | | | 5,900 | | | | 6,189,461 | |
Ford Credit Floorplan Master Owner Trust, | |
Series2017-03, Class A | |
2.480% | | | 09/15/24 | | | | 1,900 | | | | 1,916,430 | |
Series2018-02, Class A | |
3.170% | | | 03/15/25 | | | | 13,350 | | | | 13,752,970 | |
Series2019-02, Class A | |
3.060% | | | 04/15/26 | | | | 1,500 | | | | 1,548,407 | |
GM Financial Consumer Automobile Receivables Trust, | |
Series2018-04, Class C | |
3.620% | | | 06/17/24 | | | | 500 | | | | 515,321 | |
GMF Floorplan Owner Revolving Trust, | |
Series2019-02, Class A, 144A | |
2.900% | | | 04/15/26 | | | | 5,700 | | | | 5,849,298 | |
SEE NOTES TO FINANCIAL STATEMENTS.
A83
| | | | | | |
| | |
| | FLEXIBLE MANAGED PORTFOLIO (continued) | | |
| | | | | | |
| |
| SCHEDULE OF INVESTMENTS | | as of December 31, 2019 |
| | | | | | | | | | | | |
Interest
Rate | | Maturity
Date | | | Principal
Amount
(000)# | | | Value | |
|
| ASSET-BACKED SECURITIES (continued) | |
Automobiles (continued) | |
OneMain Direct Auto Receivables Trust, | |
Series2017-02A, Class B, 144A | |
2.550% | | | 11/14/23 | | | | 5,800 | | | $ | 5,802,198 | |
Series2017-02A, Class C, 144A | |
2.820% | | | 07/15/24 | | | | 1,400 | | | | 1,402,386 | |
Series2018-01A, Class A, 144A | |
3.430% | | | 12/16/24 | | | | 5,200 | | | | 5,283,593 | |
Series2019-01A, Class A, 144A | |
3.630% | | | 09/14/27 | | | | 5,500 | | | | 5,664,361 | |
Santander Drive Auto Receivables Trust, | |
Series2019-03, Class C | |
2.490% | | | 10/15/25 | | | | 1,900 | | | | 1,906,014 | |
Toyota Auto Loan Extended Note Trust, | |
Series2019-01A, Class A, 144A | |
2.560% | | | 11/25/31 | | | | 5,700 | | | | 5,784,825 | |
| | | | | | | | | | | | |
| | | | | | | | | | | 90,106,074 | |
| | | | | | | | | | | | |
Collateralized Loan Obligations — 3.0% | |
Anchorage Capital CLO Ltd. (Cayman Islands), | |
Series2019-11A, Class A, 144A, 3 Month LIBOR + 1.390% (Cap N/A, Floor 1.390%) | |
3.534%(c) | | | 07/22/32 | | | | 3,750 | | | | 3,747,386 | |
ArrowMark Colorado Holdings (Cayman Islands), | |
Series2017-06A, Class A1, 144A, 3 Month LIBOR + 1.280% (Cap N/A, Floor 0.000%) | |
3.281%(c) | | | 07/15/29 | | | | 500 | | | | 497,169 | |
Ballyrock CLO Ltd. (Cayman Islands), | |
Series2016-01A, Class AR, 144A, 3 Month LIBOR + 1.350% (Cap N/A, Floor 1.350%) | |
3.351%(c) | | | 10/15/28 | | | | 4,500 | | | | 4,503,594 | |
Battalion CLO Ltd. (Cayman Islands), | |
Series2015-08A, Class A1R, 144A, 3 Month LIBOR + 1.340% (Cap N/A, Floor 0.000%) | |
3.343%(c) | | | 07/18/30 | | | | 1,500 | | | | 1,497,425 | |
Benefit Street Partners CLO Ltd. (Cayman Islands), | |
Series2013-IIA, Class A1R, 144A, 3 Month LIBOR + 1.250% (Cap N/A, Floor 0.000%) | |
3.251%(c) | | | 07/15/29 | | | | 1,500 | | | | 1,499,824 | |
Brookside Mill CLO Ltd. (Cayman Islands), | |
Series2013-01A, Class AR, 144A, 3 Month LIBOR + 0.820% (Cap N/A, Floor 0.000%) | |
2.822%(c) | | | 01/17/28 | | | | 1,500 | | | | 1,494,295 | |
Canyon Capital CLO Ltd. (Cayman Islands), | |
Series2015-01A, Class AS, 144A, 3 Month LIBOR + 1.250% (Cap N/A, Floor 0.000%) | |
3.251%(c) | | | 04/15/29 | | | | 3,000 | | | | 2,991,239 | |
Catamaran CLO Ltd. (Cayman Islands), | |
Series2014-02A, Class A1R, 144A, 3 Month LIBOR + 1.400% (Cap N/A, Floor 0.000%) | |
3.403%(c) | | | 10/18/26 | | | | 284 | | | | 283,576 | |
CIFC Funding Ltd. (Cayman Islands), | |
Series2014-05A, Class A1R2, 144A, 3 Month LIBOR + 1.200% (Cap N/A, Floor 1.200%) | |
3.202%(c) | | | 10/17/31 | | | | 9,750 | | | | 9,734,957 | |
Greenwood Park CLO Ltd. (Cayman Islands), | |
Series2018-01A, Class A2, 144A, 3 Month LIBOR + 1.010% (Cap N/A, Floor 0.000%) | |
3.011%(c) | | | 04/15/31 | | | | 2,000 | | | | 1,988,235 | |
| | | | | | | | | | | | |
Interest
Rate | | Maturity
Date | | | Principal
Amount
(000)# | | | Value | |
|
| ASSET-BACKED SECURITIES (continued) | |
Collateralized Loan Obligations (continued) | |
Greywolf CLO Ltd. (Cayman Islands), | |
Series2018-01A, Class A1, 144A, 3 Month LIBOR + 1.030% (Cap N/A, Floor 0.000%) | |
2.966%(c) | | | 04/26/31 | | | | 4,000 | | | $ | 3,964,961 | |
Highbridge Loan Management Ltd. (Cayman Islands), | |
Series2015-06A, Class A1R, 144A, 3 Month LIBOR + 1.000% (Cap N/A, Floor 0.000%) | |
2.891%(c) | | | 02/05/31 | | | | 250 | | | | 248,364 | |
HPS Loan Management Ltd. (Cayman Islands), | |
Series15A-19, Class A1, 144A, 3 Month LIBOR + 1.320% (Cap N/A, Floor 1.320%) | |
3.486%(c) | | | 07/22/32 | | | | 3,750 | | | | 3,754,117 | |
ICG US CLO Ltd. (Cayman Islands), | |
Series2015-01A, Class A1R, 144A, 3 Month LIBOR + 1.140% (Cap N/A, Floor 1.140%) | |
3.106%(c) | | | 10/19/28 | | | | 10,000 | | | | 9,964,370 | |
Series2017-02A, Class A1, 144A, 3 Month LIBOR + 1.280% (Cap N/A, Floor 0.000%) | |
3.214%(c) | | | 10/23/29 | | | | 1,250 | | | | 1,250,133 | |
Jamestown CLO Ltd. (Cayman Islands), | |
Series2019-01A, Class A1, 144A, 3 Month LIBOR + 1.470% (Cap N/A, Floor 1.470%) | |
3.436%(c) | | | 04/20/32 | | | | 5,750 | | | | 5,730,858 | |
Jefferson Mill CLO Ltd. (Cayman Islands), | |
Series2015-01A, Class AR, 144A, 3 Month LIBOR + 1.175% (Cap N/A, Floor 0.000%) | |
3.141%(c) | | | 10/20/31 | | | | 6,750 | | | | 6,656,452 | |
MidOcean Credit CLO (Cayman Islands), | |
Series2014-03A, Class A1R, 144A, 3 Month LIBOR + 1.120% (Cap N/A, Floor 1.120%) | |
3.086%(c) | | | 04/21/31 | | | | 2,400 | | | | 2,363,629 | |
Ocean Trails CLO Ltd. (Cayman Islands), | |
Series2019-07A, Class A1, 144A, 3 Month LIBOR + 1.400% (Cap N/A, Floor 1.400%) | |
3.402%(c) | | | 04/17/30 | | | | 2,750 | | | | 2,744,574 | |
OCP CLO Ltd. (Cayman Islands), | |
Series2017-13A, Class A1A, 144A, 3 Month LIBOR + 1.260% (Cap N/A, Floor 0.000%) | |
3.261%(c) | | | 07/15/30 | | | | 1,250 | | | | 1,250,030 | |
Series2019-17A, Class A1, 144A, 3 Month LIBOR + 1.330% (Cap N/A, Floor 1.330%) | |
3.627%(c) | | | 07/20/32 | | | | 10,000 | | | | 10,010,378 | |
OZLM Ltd. (Cayman Islands), | |
Series2014-09A, Class A1AR, 144A, 3 Month LIBOR + 1.280% (CAP N/A, Floor 1.280%) | |
3.246%(c) | | | 10/20/31 | | | | 7,500 | | | | 7,451,658 | |
Series2015-11A, Class A1R, 144A, 3 Month LIBOR + 1.250% (Cap N/A, Floor 0.000%) | |
3.186%(c) | | | 10/30/30 | | | | 1,500 | | | | 1,496,494 | |
Series2019-24A, Class A1A, 144A, 3 Month LIBOR + 1.390% (Cap N/A, Floor 0.000%) | |
3.546%(c) | | | 07/20/32 | | | | 3,750 | | | | 3,749,462 | |
Palmer Square CLO Ltd. (Cayman Islands), | |
Series2014-01A, Class A1R2, 144A, 3 Month LIBOR + 1.130% (Cap N/A, Floor 1.130%) | |
3.132%(c) | | | 01/17/31 | | | | 1,500 | | | | 1,497,091 | |
SEE NOTES TO FINANCIAL STATEMENTS.
A84
| | | | | | |
| | |
| | FLEXIBLE MANAGED PORTFOLIO (continued) | | |
| | | | | | |
| |
| SCHEDULE OF INVESTMENTS | | as of December 31, 2019 |
| | | | | | | | | | | | |
Interest
Rate | | Maturity
Date | | | Principal
Amount
(000)# | | | Value | |
|
| ASSET-BACKED SECURITIES (continued) | |
Collateralized Loan Obligations (continued) | | | | | |
Series2018-02A, Class A1A, 144A, 3 Month LIBOR + 1.100% (Cap N/A, Floor 0.000%) | |
3.101%(c) | | | 07/16/31 | | | | 2,350 | | | $ | 2,343,017 | |
Park Avenue Institutional Advisers CLO Ltd. (Cayman Islands), | |
Series2018-01A, Class A1A, 144A, 3 Month LIBOR + 1.280% (Cap N/A, Floor 1.280%) | |
3.246%(c) | | | 10/20/31 | | | | 8,750 | | | | 8,735,180 | |
Romark CLO Ltd. (Cayman Islands), | |
Series2018-02A, Class A1, 144A, 3 Month LIBOR + 1.175% (Cap N/A, Floor 1.175%) | |
3.115%(c) | | | 07/25/31 | | | | 1,000 | | | | 993,556 | |
Telos CLO Ltd. (Cayman Islands), | |
Series2013-03A, Class AR, 144A, 3 Month LIBOR + 1.300% (Cap N/A, Floor 1.300%) | |
3.302%(c) | | | 07/17/26 | | | | 1,444 | | | | 1,442,303 | |
Series2013-04A, Class AR, 144A, 3 Month LIBOR + 1.240% (CAP N/A, Floor 0.000%) | |
3.242%(c) | | | 01/17/30 | | | | 2,500 | | | | 2,484,052 | |
TICP CLO Ltd. (Cayman Islands), | |
Series2017-07A, Class AS, 144A, 3 Month LIBOR + 1.230% (Cap N/A, Floor 1.230%) | |
3.231%(c) | | | 07/15/29 | | | | 1,250 | | | | 1,252,089 | |
Series2018-03R, Class A, 144A, 3 Month LIBOR + 0.840% (Cap N/A, Floor 0.840%) | |
2.806%(c) | | | 04/20/28 | | | | 4,000 | | | | 3,994,060 | |
Trimaran Cavu Ltd. (Cayman Islands), | |
Series2019-01A, Class A1, 144A, 3 Month LIBOR + 1.460% (Cap N/A, Floor 1.460%) | |
3.426%(c) | | | 07/20/32 | | | | 3,000 | | | | 2,991,722 | |
Trinitas CLO Ltd. (Cayman Islands), | |
Series2017-07A, Class A, 144A, 3 Month LIBOR + 1.210% (Cap N/A, Floor 0.000%) | |
3.150%(c) | | | 01/25/31 | | | | 2,500 | | | | 2,484,141 | |
Venture CLO Ltd. (Cayman Islands), | |
Series2015-21A, Class AR, 144A, 3 Month LIBOR + 0.880% (Cap N/A, Floor 0.000%) | |
2.881%(c) | | | 07/15/27 | | | | 959 | | | | 957,744 | |
Wellfleet CLO Ltd. (Cayman Islands), | |
Series2017-03A, Class A1, 144A, 3 Month LIBOR + 1.150% (Cap N/A, Floor 1.150%) | |
3.152%(c) | | | 01/17/31 | | | | 2,750 | | | | 2,739,838 | |
Series2018-01A, Class A, 144A, 3 Month LIBOR + 1.100% (Cap N/A, Floor 1.100%) | |
3.102%(c) | | | 07/17/31 | | | | 3,500 | | | | 3,465,058 | |
Series2018-02A, Class A1, 144A, 3 Month LIBOR + 1.200% (Cap N/A, Floor 1.200%) | |
3.166%(c) | | | 10/20/31 | | | | 5,750 | | | | 5,726,618 | |
Zais CLO Ltd. (Cayman Islands), | |
Series2017-01A, Class A1, 144A, 3 Month LIBOR + 1.370% (Cap N/A, Floor 0.000%) | |
3.371%(c) | | | 07/15/29 | | | | 1,750 | | | | 1,730,504 | |
| | | | | | | | | | | | |
| | | | | | | | | | | 131,710,153 | |
| | | | | | | | | | | | |
Consumer Loans — 0.1% | | | | | | | | | |
OneMain Financial Issuance Trust, | |
Series2017-01A, Class A2, 144A, 1 Month LIBOR + 0.800% (Cap N/A, Floor 0.000%) | |
2.540%(c) | | | 09/14/32 | | | | 3,002 | | | | 3,003,853 | |
| | | | | | | | | | | | |
Interest
Rate | | Maturity
Date | | | Principal
Amount
(000)# | | | Value | |
|
| ASSET-BACKED SECURITIES (continued) | |
Consumer Loans (continued) | | | | | |
Oportun Funding LLC, | |
Series2018-C, Class A, 144A | |
4.100% | | | 10/08/24 | | | | 1,600 | | | $ | 1,632,803 | |
Series2018-D, Class A, 144A | |
4.150% | | | 12/09/24 | | | | 1,100 | | | | 1,123,496 | |
| | | | | | | | | | | | |
| | | | | | | | | | | 5,760,152 | |
| | | | | | | | | | | | |
Credit Cards — 0.3% | | | | | | | | | |
Citibank Credit Card Issuance Trust, | |
Series2017-A05, Class A5, 1 Month LIBOR + 0.620% (Cap N/A, Floor 0.620%) | |
2.405%(c) | | | 04/22/26 | | | | 2,900 | | | | 2,920,606 | |
Series2018-A07, Class A7 | |
3.960% | | | 10/13/30 | | | | 5,800 | | | | 6,424,349 | |
Discover Card Execution Note Trust, | | | | | | | | | |
Series2017-A05, Class A5, 1 Month LIBOR + 0.600% (Cap N/A, Floor 0.000%) | |
2.340%(c) | | | 12/15/26 | | | | 2,600 | | | | 2,609,028 | |
| | | | | | | | | | | | |
| | | | | | | | | | | 11,953,983 | |
| | | | | | | | | | | | |
Equipment — 0.2% | | | | | | | | | |
MMAF Equipment Finance LLC, | | | | | | | | | |
Series2017-B, Class A5, 144A | |
2.720% | | | 06/15/40 | | | | 2,800 | | | | 2,847,795 | |
Series2018-A, Class A4, 144A | |
3.390% | | | 01/10/25 | | | | 1,600 | | | | 1,644,579 | |
Series2018-A, Class A5, 144A | |
3.610% | | | 03/10/42 | | | | 800 | | | | 827,347 | |
Series2019-A, Class A5, 144A | |
3.080% | | | 11/12/41 | | | | 2,500 | | | | 2,573,070 | |
Series2019-B, Class A5, 144A | |
2.290% | | | 11/12/41 | | | | 2,400 | | | | 2,381,976 | |
| | | | | | | | | | | | |
| | | | | | | | | | | 10,274,767 | |
| | | | | | | | | | | | |
Home Equity Loans — 0.1% | | | | | | | | | |
CDC Mortgage Capital Trust, | |
Series 2002-HE03, Class M1, 1 Month LIBOR + 1.650% (Cap N/A, Floor 1.100%) | |
3.442%(c) | | | 03/25/33 | | | | 66 | | | | 65,912 | |
Morgan Stanley ABS Capital I, Inc. Trust, | |
Series 2004-HE05, Class M1, 1 Month LIBOR + 0.945% (Cap N/A, Floor 0.630%) | |
2.737%(c) | | | 06/25/34 | | | | 418 | | | | 411,776 | |
Morgan Stanley Dean Witter Capital I, Inc. Trust, | |
Series 2002-HE01, Class M1, 1 Month LIBOR + 0.900% (Cap N/A, Floor 0.600%) | |
2.692%(c) | | | 07/25/32 | | | | 36 | | | | 35,946 | |
Series 2002-NC04, Class M1, 1 Month LIBOR + 1.275% (Cap N/A, Floor 0.850%) | |
3.067%(c) | | | 09/25/32 | | | | 1,954 | | | | 1,954,699 | |
| | | | | | | | | | | | |
| | | | | | | | | | | 2,468,333 | |
| | | | | | | | | | | | |
Other — 0.2% | | | | | | | | | | | | |
Sierra Timeshare Receivables Funding LLC, | |
Series2018-02A, Class A, 144A | | | | | |
3.500% | | | 06/20/35 | | | | 1,342 | | | | 1,364,367 | |
SEE NOTES TO FINANCIAL STATEMENTS.
A85
| | | | | | |
| | |
| | FLEXIBLE MANAGED PORTFOLIO (continued) | | |
| | | | | | |
| |
| SCHEDULE OF INVESTMENTS | | as of December 31, 2019 |
| | | | | | | | | | | | |
Interest
Rate | | Maturity
Date | | | Principal
Amount
(000)# | | | Value | |
|
| ASSET-BACKED SECURITIES (continued) | |
Other (continued) | | | | | | | | | |
Series2019-02A, Class A, 144A | |
2.590% | | | 05/20/36 | | | | 2,476 | | | $ | 2,484,481 | |
TH MSR Issuer Trust, | | | | | | | | | |
Series 2019-FT01, Class A, 144A, 1 Month LIBOR + 2.800% (Cap N/A, Floor 2.800%) | |
4.592%(c) | | | 06/25/24 | | | | 3,250 | | | | 3,233,815 | |
| | | | | | | | | | | | |
| | | | | | | | | | | 7,082,663 | |
| | | | | | | | | | | | |
Residential Mortgage-Backed Securities — 0.5% | |
Credit Suisse Mortgage Trust, | | | | | | | | | |
Series 2018-RPL08, Class A1, 144A | |
4.125%(cc) | | | 07/25/58 | | | | 1,217 | | | | 1,224,667 | |
Legacy Mortgage Asset Trust, | |
Series 2019-GS02, Class A1, 144A | |
3.750%(cc) | | | 01/25/59 | | | | 796 | | | | 803,567 | |
Series 2019-GS03, Class A1, 144A | |
3.750%(cc) | | | 04/25/59 | | | | 184 | | | | 185,541 | |
Series 2019-GS04, Class A1, 144A | |
3.438%(cc) | | | 05/25/59 | | | | 1,413 | | | | 1,419,112 | |
Series 2019-SL01, Class A, 144A | |
4.000%(cc) | | | 12/28/54 | | | | 527 | | | | 531,107 | |
Long Beach Mortgage Loan Trust, | | | | | | | | | |
Series2004-02, Class M1, 1 Month LIBOR + 0.795% (Cap N/A, Floor 0.530%) | |
2.587%(c) | | | 06/25/34 | | | | 164 | | | | 160,936 | |
Mill City Mortgage Loan Trust, | |
Series2017-03, Class A1, 144A | | | | | | | | | |
2.750%(cc) | | | 01/25/61 | | | | 1,749 | | | | 1,756,569 | |
TFS (Spain), | | | | | | | | | | | | |
Series2018-03, Class A1, 1 Month EURIBOR + 2.900% | |
2.900%(c) | | | 03/16/23 | | | | EUR 2,680 | | | | 3,000,703 | |
Towd Point Mortgage Trust, | | | | | | | | | |
Series2017-04, Class A1, 144A | | | | | | | | | |
2.750%(cc) | | | 06/25/57 | | | | 4,053 | | | | 4,074,820 | |
Series2017-05, Class A1, 144A, 1 Month LIBOR + 0.600% (Cap N/A, Floor 0.000%) | |
2.392%(c) | | | 02/25/57 | | | | 2,961 | | | | 2,953,302 | |
Series2017-06, Class A1, 144A | | | | | | | | | |
2.750%(cc) | | | 10/25/57 | | | | 2,771 | | | | 2,787,049 | |
Series2018-02, Class A1, 144A | | | | | | | | | |
3.250%(cc) | | | 03/25/58 | | | | 341 | | | | 346,859 | |
Series2018-03, Class A1, 144A | | | | | | | | | |
3.750%(cc) | | | 05/25/58 | | | | 157 | | | | 162,243 | |
Series2018-05, Class A1, 144A | | | | | | | | | |
3.250%(cc) | | | 07/25/58 | | | | 589 | | | | 600,854 | |
| | | | | | | | | | | | |
| | | | | | | | | | | 20,007,329 | |
| | | | | | | | | | | | |
Student Loans — 0.8% | | | | | | | | | |
Commonbond Student Loan Trust, | | | | | | | | | |
Series2017-BGS, Class A1, 144A | | | | | | | | | |
2.680% | | | 09/25/42 | | | | 2,221 | | | | 2,220,340 | |
Series2018-AGS, Class A1, 144A | | | | | | | | | |
3.210% | | | 02/25/44 | | | | 1,623 | | | | 1,656,059 | |
Series2018-CGS, Class A1, 144A | | | | | | | | | |
3.870% | | | 02/25/46 | | | | 659 | | | | 674,733 | |
Series2018-CGS, Class A2, 144A, 1 Month LIBOR + 0.800% (Cap N/A, Floor 0.800%) | |
2.592%(c) | | | 02/25/46 | | | | 695 | | | | 684,200 | |
| | | | | | | | | | | | |
Interest
Rate | | Maturity
Date | | | Principal
Amount
(000)# | | | Value | |
|
| ASSET-BACKED SECURITIES (continued) | |
Student Loans (continued) | | | | | |
Laurel Road Prime Student Loan Trust, | |
Series2017-C, Class A2B, 144A | |
2.810% | | | 11/25/42 | | | | 1,601 | | | $ | 1,612,972 | |
Series2018-B, Class A2FX, 144A | | | | | | | | | |
3.540% | | | 05/26/43 | | | | 2,863 | | | | 2,926,387 | |
Series2019-A, Class A2FX, 144A | | | | | | | | | |
2.730% | | | 10/25/48 | | | | 1,400 | | | | 1,402,973 | |
Navient Private Education Refi Loan Trust, | |
Series2018-A, Class A2, 144A | | | | | | | | | |
3.190% | | | 02/18/42 | | | | 4,600 | | | | 4,677,475 | |
Series2018-CA, Class A2, 144A | | | | | | | | | |
3.520% | | | 06/16/42 | | | | 1,700 | | | | 1,744,307 | |
Series2019-CA, Class A2, 144A | | | | | | | | | |
3.130% | | | 02/15/68 | | | | 2,100 | | | | 2,126,065 | |
Series2019-EA, Class A2A, 144A | | | | | | | | | |
2.640% | | | 05/15/68 | | | | 2,100 | | | | 2,089,575 | |
SoFi Professional Loan Program LLC, | |
Series2019-A, Class A2FX, 144A | | | | | | | | | |
3.690% | | | 06/15/48 | | | | 3,800 | | | | 3,944,373 | |
Series2019-B, Class A2FX, 144A | | | | | | | | | |
3.090% | | | 08/17/48 | | | | 2,100 | | | | 2,132,327 | |
Series2019-C, Class A2FX, 144A | | | | | | | | | |
2.370% | | | 11/16/48 | | | | 2,500 | | | | 2,450,740 | |
SoFi Professional Loan Program Trust, | |
Series2018-B, Class A1FX, 144A | | | | | | | | | |
2.640% | | | 08/25/47 | | | | 962 | | | | 963,570 | |
Series2018-B, Class A2FX, 144A | | | | | | | | | |
3.340% | | | 08/25/47 | | | | 3,100 | | | | 3,174,291 | |
| | | | | | | | | | | | |
| | | | | | | | | | | 34,480,387 | |
| | | | | | | | | | | | |
TOTAL ASSET-BACKED SECURITIES
(cost $310,934,298) | | | | | | | | 313,843,841 | |
| | | | | | | | | | | | |
|
COMMERCIAL MORTGAGE-BACKED
SECURITIES — 6.6% | |
Assurant Commercial Mortgage Trust, | |
Series2016-01A, Class AS, 144A | | | | | | | | | |
3.172% | | | 05/15/49 | | | | 4,000 | | | | 4,069,347 | |
BANK, | | | | | | | | | | | | |
Series 2017-BNK04, Class A3 | | | | | | | | | |
3.362% | | | 05/15/50 | | | | 6,500 | | | | 6,850,310 | |
BBCMS Mortgage Trust, | | | | | | | | | |
Series2018-C02, Class A4 | | | | | | | | | |
4.047% | | | 12/15/51 | | | | 5,400 | | | | 5,970,864 | |
Benchmark Mortgage Trust, | | | | | | | | | |
Series2018-B03, Class A4 | | | | | | | | | |
3.761% | | | 04/10/51 | | | | 5,000 | | | | 5,417,458 | |
Series2018-B08, Class A4 | | | | | | | | | |
3.963% | | | 01/15/52 | | | | 6,700 | | | | 7,373,353 | |
Citigroup Commercial Mortgage Trust, | | | | | | | | | |
Series 2014-GC21, Class A4 | | | | | | | | | |
3.575% | | | 05/10/47 | | | | 1,323 | | | | 1,384,635 | |
Series 2014-GC23, Class A3 | | | | | | | | | |
3.356% | | | 07/10/47 | | | | 2,351 | | | | 2,444,878 | |
Series2016-C01, Class A3 | | | | | | | | | |
2.944% | | | 05/10/49 | | | | 5,000 | | | | 5,131,855 | |
Series 2016-GC37, Class A3 | | | | | | | | | |
3.050% | | | 04/10/49 | | | | 6,500 | | | | 6,699,020 | |
SEE NOTES TO FINANCIAL STATEMENTS.
A86
| | | | | | |
| | |
| | FLEXIBLE MANAGED PORTFOLIO (continued) | | |
| | | | | | |
| |
| SCHEDULE OF INVESTMENTS | | as of December 31, 2019 |
| | | | | | | | | | | | |
Interest
Rate | | Maturity
Date | | | Principal
Amount
(000)# | | | Value | |
|
| COMMERCIAL MORTGAGE-BACKED SECURITIES (continued) | |
Series2017-P07, Class A3 | |
3.442% | | | 04/14/50 | | | | 5,500 | | | $ | 5,807,361 | |
Commercial Mortgage Trust, | | | | | | | | | |
Series 2014-CR15, Class A2 | |
2.928% | | | 02/10/47 | | | | 796 | | | | 797,663 | |
Series 2014-CR18, Class A4 | |
3.550% | | | 07/15/47 | | | | 2,783 | | | | 2,901,519 | |
Series 2014-CR20, Class A3 | |
3.326% | | | 11/10/47 | | | | 5,000 | | | | 5,213,833 | |
Series 2015-CR27, Class A3 | |
3.349% | | | 10/10/48 | | | | 6,100 | | | | 6,376,897 | |
CSAIL Commercial Mortgage Trust, | | | | | | | | | |
Series2015-C04, Class A3 | |
3.544% | | | 11/15/48 | | | | 3,000 | | | | 3,167,582 | |
Series2017-C08, Class A3 | |
3.127% | | | 06/15/50 | | | | 5,300 | | | | 5,484,471 | |
FannieMae-Aces, | | | | | | | | | |
Series2015-M17, Class A2 | |
2.934%(cc) | | | 11/25/25 | | | | 3,900 | | | | 4,036,921 | |
Series2016-M07, Class AB2 | |
2.385% | | | 09/25/26 | | | | 2,400 | | | | 2,397,024 | |
Series2017-M01, Class A2 | |
2.417%(cc) | | | 10/25/26 | | | | 2,200 | | | | 2,225,763 | |
Series2017-M04, Class A2 | |
2.586%(cc) | | | 12/25/26 | | | | 11,800 | | | | 12,089,426 | |
Series2017-M08, Class A2 | |
3.061%(cc) | | | 05/25/27 | | | | 8,250 | | | | 8,603,983 | |
Series2018-M04, Class A2 | |
3.045%(cc) | | | 03/25/28 | | | | 4,325 | | | | 4,533,527 | |
FHLMC Multifamily Structured Pass-Through Certificates, | |
Series K020, Class X1, IO | |
1.373%(cc) | | | 05/25/22 | | | | 22,332 | | | | 563,571 | |
Series K021, Class X1, IO | |
1.425%(cc) | | | 06/25/22 | | | | 6,438 | | | | 176,617 | |
Series K055, Class X1, IO | |
1.364%(cc) | | | 03/25/26 | | | | 13,736 | | | | 968,549 | |
Series K057, Class AM | |
2.624% | | | 08/25/26 | | | | 7,230 | | | | 7,345,329 | |
Series K064, Class AM | |
3.327%(cc) | | | 03/25/27 | | | | 5,900 | | | | 6,248,744 | |
Series K068, Class AM | |
3.315% | | | 08/25/27 | | | | 5,600 | | | | 5,915,569 | |
Series K069, Class A2 | |
3.187%(cc) | | | 09/25/27 | | | | 4,900 | | | | 5,169,594 | |
Series K069, Class AM | |
3.248%(cc) | | | 09/25/27 | | | | 1,050 | | | | 1,106,023 | |
Series K070, Class A2 | |
3.303%(cc) | | | 11/25/27 | | | | 7,250 | | | | 7,699,875 | |
Series K070, Class AM | |
3.364% | | | 12/25/27 | | | | 1,525 | | | | 1,616,522 | |
Series K072, Class A2 | |
3.444% | | | 12/25/27 | | | | 2,000 | | | | 2,143,873 | |
Series K075, Class AM | |
3.650%(cc) | | | 02/25/28 | | | | 3,575 | | | | 3,858,790 | |
Series K076, Class AM | |
3.900% | | | 04/25/28 | | | | 2,575 | | | | 2,826,712 | |
| | | | | | | | | | | | |
Interest
Rate | | Maturity
Date | | | Principal
Amount
(000)# | | | Value | |
|
| COMMERCIAL MORTGAGE-BACKED SECURITIES (continued) | |
Series K077, Class A2 | |
3.850%(cc) | | | 05/25/28 | | | | 4,800 | | | $ | 5,275,977 | |
Series K077, Class AM | |
3.850%(cc) | | | 05/25/28 | | | | 950 | | | | 1,039,792 | |
Series K080, Class AM | |
3.986%(cc) | | | 07/25/28 | | | | 7,050 | | | | 7,789,167 | |
Series K081, Class AM | |
3.900%(cc) | | | 08/25/28 | | | | 3,500 | | | | 3,846,449 | |
Series K086, Class AM | |
3.919%(cc) | | | 12/25/28 | | | | 1,300 | | | | 1,431,495 | |
Series K087, Class AM | |
3.832%(cc) | | | 12/25/28 | | | | 1,350 | | | | 1,478,409 | |
Series K157, Class A2 | |
3.990%(cc) | | | 05/25/33 | | | | 4,200 | | | | 4,737,460 | |
Series W5FX, Class AFX | |
3.214%(cc) | | | 04/25/28 | | | | 2,260 | | | | 2,395,320 | |
GS Mortgage Securities Trust, | | | | | | | | | |
Series 2015-GC28, Class A4 | |
3.136% | | | 02/10/48 | | | | 4,000 | | | | 4,132,809 | |
Series 2015-GC32, Class A3 | |
3.498% | | | 07/10/48 | | | | 5,800 | | | | 6,100,795 | |
Series 2016-GS03, Class A3 | |
2.592% | | | 10/10/49 | | | | 5,800 | | | | 5,841,705 | |
Series 2016-GS04, Class A3 | |
3.178% | | | 11/10/49 | | | | 5,500 | | | | 5,717,646 | |
JPMBB Commercial Mortgage Securities Trust, | | | | | |
Series2014-C25, Class A4A1 | |
3.408% | | | 11/15/47 | | | | 1,400 | | | | 1,460,082 | |
Series2015-C27, Class A3A1 | |
2.920% | | | 02/15/48 | | | | 6,000 | | | | 6,134,155 | |
JPMorgan Chase Commercial Mortgage Securities Trust, | |
Series 2013-LC11, Class A4 | |
2.694% | | | 04/15/46 | | | | 634 | | | | 643,219 | |
Morgan Stanley Bank of America Merrill Lynch Trust, | |
Series2013-C08, Class A3 | |
2.863% | | | 12/15/48 | | | | 1,351 | | | | 1,371,922 | |
Morgan Stanley Capital I Trust, | |
Series 2016-UB11, Class A3 | |
2.531% | | | 08/15/49 | | | | 10,400 | | | | 10,397,223 | |
Series2018-H04, Class A3 | |
4.043% | | | 12/15/51 | | | | 1,900 | | | | 2,093,847 | |
Series2019-H07, Class A2 | |
2.492% | | | 07/15/52 | | | | 13,500 | | | | 13,537,131 | |
UBS Commercial Mortgage Trust, | |
Series2017-C02, Class ASB | |
3.264% | | | 08/15/50 | | | | 3,500 | | | | 3,634,641 | |
Series2017-C05, Class A4 | |
3.212% | | | 11/15/50 | | | | 6,750 | | | | 7,038,534 | |
Series2018-C09, Class A3 | |
3.854% | | | 03/15/51 | | | | 2,500 | | | | 2,723,234 | |
Series2018-C14, Class A3 | |
4.180% | | | 12/15/51 | | | | 4,100 | | | | 4,581,196 | |
UBS-Barclays Commercial Mortgage Trust, | |
Series2012-C04, Class A4 | |
2.792% | | | 12/10/45 | | | | 1,700 | | | | 1,719,678 | |
Series2013-C05, Class A3 | |
2.920% | | | 03/10/46 | | | | 1,988 | | | | 2,014,243 | |
SEE NOTES TO FINANCIAL STATEMENTS.
A87
| | | | | | |
| | |
| | FLEXIBLE MANAGED PORTFOLIO (continued) | | |
| | | | | | |
| |
| SCHEDULE OF INVESTMENTS | | as of December 31, 2019 |
| | | | | | | | | | | | |
Interest
Rate | | Maturity
Date | | | Principal
Amount
(000)# | | | Value | |
|
| COMMERCIAL MORTGAGE-BACKED SECURITIES (continued) | |
Series2013-C06, Class A3 | |
2.971% | | | 04/10/46 | | | | 1,798 | | | $ | 1,833,986 | |
Wells Fargo Commercial Mortgage Trust, | |
Series 2016-NXS06, Class A3 | |
2.642% | | | 11/15/49 | | | | 8,000 | | | | 8,065,695 | |
Series2017-C38, Class A4 | |
3.190% | | | 07/15/50 | | | | 4,600 | | | | 4,789,015 | |
Series2018-C48, Class A4 | |
4.037% | | | 01/15/52 | | | | 7,000 | | | | 7,726,466 | |
| | | | | | | | | | | | |
TOTAL COMMERCIAL MORTGAGE-BACKED SECURITIES
(cost $273,124,038) | | | | 284,168,749 | |
| | | | | | | | | | | | |
|
| CORPORATE BONDS — 9.5% | |
Aerospace & Defense — 0.1% | |
Boeing Co. (The), | |
Sr. Unsec’d. Notes | |
3.750% | | | 02/01/50 | (a) | | | 2,130 | | | | 2,258,589 | |
Embraer Netherlands Finance BV (Brazil), | |
Gtd. Notes | |
5.050% | | | 06/15/25 | | | | 1,001 | | | | 1,098,174 | |
Embraer Overseas Ltd. (Brazil), | |
Gtd. Notes, 144A | |
5.696% | | | 09/16/23 | | | | 950 | | | | 1,044,184 | |
United Technologies Corp., | |
Sr. Unsec’d. Notes | |
4.125% | | | 11/16/28 | | | | 1,270 | | | | 1,428,889 | |
| | | | | | | | | | | | |
| | | | | | | | | | | 5,829,836 | |
| | | | | | | | | | | | |
Agriculture — 0.1% | |
BAT Capital Corp. (United Kingdom), | |
Gtd. Notes | |
3.222% | | | 08/15/24 | | | | 3,740 | | | | 3,822,812 | |
| | | | | | | | | | | | |
Airlines — 0.1% | |
American Airlines2015-1 Class A Pass-Through Trust, | |
Pass-Through Certificates | |
3.375% | | | 11/01/28 | | | | 2,535 | | | | 2,622,602 | |
Continental Airlines2010-1 Class A Pass-Through Trust, | |
Pass-Through Certificates | |
4.750% | | | 07/12/22 | | | | 362 | | | | 369,766 | |
Continental Airlines2012-2 Class A Pass-Through Trust, | |
Pass-Through Certificates | |
4.000% | | | 04/29/26 | | | | 493 | | | | 519,310 | |
Delta Air Lines2007-1 Class A Pass-Through Trust, | |
Pass-Through Certificates | |
6.821% | | | 02/10/24 | | | | 214 | | | | 233,323 | |
Delta Air Lines, Inc., | |
Sr. Unsec’d. Notes | |
2.875% | | | 03/13/20 | | | | 2,000 | | | | 2,001,580 | |
| | | | | | | | | | | | |
| | | | | | | | | | | 5,746,581 | |
| | | | | | | | | | | | |
Auto Manufacturers — 0.5% | |
BMW US Capital LLC (Germany), | |
Gtd. Notes, 144A, 3 Month LIBOR + 0.410% | |
2.411%(c) | | | 04/12/21 | | | | 495 | | | | 495,699 | |
| | | | | | | | | | | | |
Interest
Rate | | Maturity
Date | | | Principal
Amount
(000)# | | | Value | |
|
| CORPORATE BONDS (continued) | |
Auto Manufacturers (continued) | |
Daimler Finance North America LLC (Germany), | |
Gtd. Notes, 144A | |
3.350% | | | 05/04/21 | (a) | | | 2,010 | | | $ | 2,042,154 | |
Ford Motor Co., | |
Sr. Unsec’d. Notes | |
5.291% | | | 12/08/46 | | | | 1,220 | | | | 1,158,782 | |
Ford Motor Credit Co. LLC, | |
Sr. Unsec’d. Notes | |
3.336% | | | 03/18/21 | | | | 680 | | | | 684,744 | |
3.350% | | | 11/01/22 | | | | 4,205 | | | | 4,249,997 | |
General Motors Co., | |
Sr. Unsec’d. Notes | |
6.250% | | | 10/02/43 | | | | 980 | | | | 1,092,510 | |
6.600% | | | 04/01/36 | | | | 760 | | | | 894,882 | |
General Motors Financial Co., Inc., | |
Gtd. Notes, 3 Month LIBOR + 0.850% | |
2.862%(c) | | | 04/09/21 | | | | 1,060 | | | | 1,060,922 | |
Gtd. Notes | |
3.550% | | | 04/09/21 | | | | 805 | | | | 818,301 | |
3.950% | | | 04/13/24 | | | | 2,800 | | | | 2,928,422 | |
Harley-Davidson Financial Services, Inc., | |
Gtd. Notes, 144A, MTN | |
2.850% | | | 01/15/21 | (a) | | | 4,705 | | | | 4,727,419 | |
| | | | | | | | | | | | |
| | | | | | | | | | | 20,153,832 | |
| | | | | | | | | | | | |
Banks — 2.8% | |
Banco Santander SA (Spain), | |
Sr. Unsec’d. Notes, 3 Month LIBOR + 1.120% | |
3.121%(c) | | | 04/12/23 | | | | 800 | | | | 805,666 | |
Sr. Unsec’d. Notes | |
3.848% | | | 04/12/23 | | | | 1,000 | | | | 1,043,215 | |
Bank of America Corp., | |
Jr. Sub. Notes, Series DD | |
6.300%(ff) | | | — | (rr) | | | 445 | | | | 515,723 | |
Jr. Sub. Notes, Series JJ | |
5.125%(ff) | | | — | (rr) | | | 1,665 | | | | 1,756,543 | |
Sr. Unsec’d. Notes, MTN | |
3.824%(ff) | | | 01/20/28 | | | | 955 | | | | 1,025,452 | |
4.125% | | | 01/22/24 | | | | 4,830 | | | | 5,192,382 | |
4.271%(ff) | | | 07/23/29 | | | | 510 | | | | 566,478 | |
Sub. Notes, MTN | |
4.000% | | | 01/22/25 | | | | 2,000 | | | | 2,133,042 | |
4.450% | | | 03/03/26 | | | | 8,455 | | | | 9,275,746 | |
Bank of America NA, | |
Sub. Notes | |
6.000% | | | 10/15/36 | | | | 410 | | | | 563,694 | |
Barclays PLC (United Kingdom), | |
Sr. Unsec’d. Notes | |
3.650% | | | 03/16/25 | (a) | | | 850 | | | | 888,505 | |
3.684% | | | 01/10/23 | | | | 585 | | | | 599,628 | |
Sr. Unsec’d. Notes, MTN | |
4.972%(ff) | | | 05/16/29 | | | | 3,825 | | | | 4,312,553 | |
Citigroup, Inc., | |
Jr. Sub. Notes, Series Q | |
5.950%(ff) | | | — | (rr) | | | 2,205 | | | | 2,248,720 | |
Jr. Sub. Notes, Series R | |
6.125%(ff) | | | — | (rr) | | | 1,375 | | | | 1,416,456 | |
SEE NOTES TO FINANCIAL STATEMENTS.
A88
| | | | | | |
| | |
| | FLEXIBLE MANAGED PORTFOLIO (continued) | | |
| | | | | | |
| |
| SCHEDULE OF INVESTMENTS | | as of December 31, 2019 |
| | | | | | | | | | | | |
Interest
Rate | | Maturity
Date | | | Principal
Amount
(000)# | | | Value | |
|
| CORPORATE BONDS (continued) | |
Banks (continued) | |
Jr. Sub. Notes, Series T | |
6.250%(ff) | | | — | (rr) | | | 625 | | | $ | 710,648 | |
Sr. Unsec’d. Notes | |
3.200% | | | 10/21/26 | | | | 1,870 | | | | 1,938,873 | |
3.700% | | | 01/12/26 | | | | 6,180 | | | | 6,582,839 | |
Sub. Notes | |
4.450% | | | 09/29/27 | | | | 5,965 | | | | 6,567,969 | |
4.750% | | | 05/18/46 | | | | 820 | | | | 980,604 | |
Credit Suisse Group AG (Switzerland), | |
Sr. Unsec’d. Notes, 144A | |
4.282% | | | 01/09/28 | | | | 1,370 | | | | 1,489,904 | |
Deutsche Bank AG (Germany), | |
Sr. Unsec’d. Notes, GMTN | |
3.375% | | | 05/12/21 | | | | 1,640 | | | | 1,656,770 | |
Sr. Unsec’d. Notes, Series D | |
5.000% | | | 02/14/22 | | | | 2,400 | | | | 2,505,212 | |
Discover Bank, | |
Sr. Unsec’d. Notes | |
4.250% | | | 03/13/26 | | | | 970 | | | | 1,047,594 | |
Sub. Notes | |
7.000% | | | 04/15/20 | | | | 570 | | | | 577,557 | |
Goldman Sachs Group, Inc. (The), | |
Jr. Sub. Notes, Series M | |
5.375%(ff) | | | — | (rr) | | | 2,215 | | | | 2,238,246 | |
Jr. Sub. Notes, Series O | |
5.300%(ff) | | | — | (a)(rr) | | | 740 | | | | 799,415 | |
Sr. Unsec’d. Notes | |
3.500% | | | 01/23/25 | | | | 4,100 | | | | 4,300,504 | |
3.750% | | | 02/25/26 | | | | 1,010 | | | | 1,072,458 | |
3.814%(ff) | | | 04/23/29 | (a) | | | 540 | | | | 578,041 | |
3.850% | | | 01/26/27 | | | | 2,910 | | | | 3,095,266 | |
5.750% | | | 01/24/22 | | | | 5,420 | | | | 5,812,836 | |
Sub. Notes | |
6.750% | | | 10/01/37 | | | | 104 | | | | 143,882 | |
HSBC Holdings PLC (United Kingdom), | |
Sr. Unsec’d. Notes, 3 Month LIBOR + 0.600% | |
2.504%(c) | | | 05/18/21 | | | | 2,115 | | | | 2,117,069 | |
Sr. Unsec’d. Notes, 3 Month LIBOR + 2.240% | |
4.125%(c) | | | 03/08/21 | | | | 1,025 | | | | 1,047,907 | |
Sr. Unsec’d. Notes | |
4.875% | | | 01/14/22 | | | | 1,910 | | | | 2,015,903 | |
JPMorgan Chase & Co., | |
Jr. Sub. Notes, Series I, 3 Month LIBOR + 3.470% | |
5.406%(c) | | | — | (rr) | | | 978 | | | | 987,005 | |
Jr. Sub. Notes, Series X | |
6.100%(ff) | | | — | (rr) | | | 1,275 | | | | 1,394,012 | |
Sr. Unsec’d. Notes | |
3.782%(ff) | | | 02/01/28 | | | | 695 | | | | 747,523 | |
3.964%(ff) | | | 11/15/48 | | | | 3,250 | | | | 3,668,834 | |
4.005%(ff) | | | 04/23/29 | | | | 2,170 | | | | 2,379,444 | |
4.452%(ff) | | | 12/05/29 | | | | 3,350 | | | | 3,811,628 | |
Sub. Notes | |
3.875% | | | 09/10/24 | | | | 3,775 | | | | 4,038,703 | |
Lloyds Bank PLC (United Kingdom), | |
Gtd. Notes | |
3.300% | | | 05/07/21 | | | | 2,200 | | | | 2,239,556 | |
| | | | | | | | | | | | |
Interest
Rate | | Maturity
Date | | | Principal
Amount
(000)# | | | Value | |
|
| CORPORATE BONDS (continued) | |
Banks (continued) | |
Morgan Stanley, | |
Jr. Sub. Notes, Series H, 3 Month LIBOR + 3.610% | |
5.611%(c) | | | — | (rr) | | | 840 | | | $ | 845,846 | |
Sr. Unsec’d. Notes | |
4.375% | | | 01/22/47 | (a) | | | 1,045 | | | | 1,248,918 | |
Sr. Unsec’d. Notes, GMTN | |
3.750% | | | 02/25/23 | (a) | | | 950 | | | | 994,278 | |
3.772%(ff) | | | 01/24/29 | (a) | | | 8,775 | | | | 9,434,700 | |
3.875% | | | 01/27/26 | | | | 675 | | | | 725,297 | |
4.431%(ff) | | | 01/23/30 | | | | 515 | | | | 581,900 | |
Sr. Unsec’d. Notes, MTN | |
3.591%(ff) | | | 07/22/28 | | | | 1,255 | | | | 1,331,727 | |
Sub. Notes, GMTN | |
4.350% | | | 09/08/26 | | | | 3,825 | | | | 4,179,061 | |
State Bank of India (India), | |
Sr. Unsec’d. Notes, 144A | |
4.375% | | | 01/24/24 | | | | 1,925 | | | | 2,027,286 | |
| | | | | | | | | | | | |
| | | | | | | | | | | 120,259,018 | |
| | | | | | | | | | | | |
Beverages — 0.1% | |
Anheuser-Busch Cos. LLC/Anheuser-Busch InBev Worldwide, Inc. (Belgium), | |
Gtd. Notes | |
4.900% | | | 02/01/46 | | | | 620 | | | | 736,048 | |
Anheuser-Busch InBev Worldwide, Inc. (Belgium), | |
Gtd. Notes | |
5.550% | | | 01/23/49 | | | | 450 | | | | 583,459 | |
8.000% | | | 11/15/39 | | | | 1,285 | | | | 2,026,807 | |
8.200% | | | 01/15/39 | | | | 250 | | | | 391,805 | |
Constellation Brands, Inc., | |
Gtd. Notes | |
4.250% | | | 05/01/23 | | | | 1,400 | | | | 1,486,478 | |
| | | | | | | | | | | | |
| | | | | | | | | | | 5,224,597 | |
| | | | | | | | | | | | |
Building Materials — 0.0% | |
Standard Industries, Inc., | |
Sr. Unsec’d. Notes, 144A | |
4.750% | | | 01/15/28 | (a) | | | 700 | | | | 717,817 | |
| | | | | | | | | | | | |
Chemicals — 0.3% | |
Braskem Netherlands Finance BV (Brazil), | |
Gtd. Notes, 144A | |
5.875% | | | 01/31/50 | (a) | | | 485 | | | | 482,784 | |
Celanese US Holdings LLC, | |
Gtd. Notes | |
5.875% | | | 06/15/21 | | | | 1,500 | | | | 1,574,775 | |
CF Industries, Inc., | |
Gtd. Notes | |
5.375% | | | 03/15/44 | | | | 585 | | | | 637,825 | |
CNAC HK Finbridge Co. Ltd. (China), | |
Gtd. Notes | |
3.500% | | | 07/19/22 | | | | 3,680 | | | | 3,744,487 | |
Dow Chemical Co. (The), | |
Sr. Unsec’d. Notes | |
5.250% | | | 11/15/41 | | | | 45 | | | | 52,605 | |
9.400% | | | 05/15/39 | | | | 347 | | | | 567,178 | |
SEE NOTES TO FINANCIAL STATEMENTS.
A89
| | | | | | |
| | |
| | FLEXIBLE MANAGED PORTFOLIO (continued) | | |
| | | | | | |
| |
| SCHEDULE OF INVESTMENTS | | as of December 31, 2019 |
| | | | | | | | | | | | |
Interest
Rate | | Maturity
Date | | | Principal
Amount
(000)# | | | Value | |
|
| CORPORATE BONDS (continued) | |
Chemicals (continued) | |
Mosaic Co. (The), | |
Sr. Unsec’d. Notes | |
5.450% | | | 11/15/33 | | | | 345 | | | $ | 392,411 | |
5.625% | | | 11/15/43 | | | | 430 | | | | 508,039 | |
NOVA Chemicals Corp. (Canada), | |
Sr. Unsec’d. Notes, 144A | |
4.875% | | | 06/01/24 | | | | 1,300 | | | | 1,340,313 | |
Nutrien Ltd. (Canada), | |
Sr. Unsec’d. Notes | |
3.150% | | | 10/01/22 | | | | 780 | | | | 796,994 | |
Orbia Advance Corp. SAB de CV (Mexico), | |
Gtd. Notes, 144A | |
4.875% | | | 09/19/22 | (a) | | | 2,000 | | | | 2,112,632 | |
SASOL Financing USA LLC (South Africa), | |
Gtd. Notes | |
5.875% | | | 03/27/24 | | | | 700 | | | | 759,723 | |
6.500% | | | 09/27/28 | | | | 670 | | | | 745,012 | |
Union Carbide Corp., | |
Sr. Unsec’d. Notes | |
7.500% | | | 06/01/25 | | | | 460 | | | | 561,302 | |
| | | | | | | | | | | | |
| | | | | | | | | | | 14,276,080 | |
| | | | | | | | | | | | |
Commercial Services — 0.1% | |
ERAC USA Finance LLC, | |
Gtd. Notes, 144A | |
4.200% | | | 11/01/46 | | | | 975 | | | | 1,044,676 | |
6.700% | | | 06/01/34 | | | | 420 | | | | 566,667 | |
7.000% | | | 10/15/37 | | | | 380 | | | | 534,693 | |
Massachusetts Institute of Technology, | |
Unsec’d. Notes | |
3.885% | | | 07/01/2116 | | | | 1,500 | | | | 1,644,016 | |
United Rentals North America, Inc., | |
Gtd. Notes | |
4.875% | | | 01/15/28 | | | | 1,190 | | | | 1,239,471 | |
5.250% | | | 01/15/30 | | | | 385 | | | | 414,547 | |
5.875% | | | 09/15/26 | | | | 235 | | | | 252,372 | |
| | | | | | | | | | | | |
| | | | | | | | | | | 5,696,442 | |
| | | | | | | | | | | | |
Diversified Financial Services — 0.2% | |
CDP Financial, Inc. (Canada), | |
Gtd. Notes, 144A | |
3.150% | | | 07/24/24 | | | | 480 | | | | 505,646 | |
Discover Financial Services, | |
Sr. Unsec’d. Notes | |
3.850% | | | 11/21/22 | | | | 900 | | | | 939,948 | |
GE Capital International Funding Co. Unlimited Co., | |
Gtd. Notes | |
2.342% | | | 11/15/20 | | | | 766 | | | | 766,257 | |
Jefferies Group LLC, | |
Sr. Unsec’d. Notes | |
6.500% | | | 01/20/43 | | | | 560 | | | | 668,642 | |
Lehman Brothers Holdings, Inc., | |
Sr. Unsec’d. Notes, MTN | |
5.250% | | | 02/06/12 | (d) | | | 1,715 | | | | 21,437 | |
6.875% | | | 05/02/18 | (d) | | | 700 | | | | 9,100 | |
| | | | | | | | | | | | |
Interest
Rate | | Maturity
Date | | | Principal
Amount
(000)# | | | Value | |
|
| CORPORATE BONDS (continued) | |
Diversified Financial Services (continued) | |
Private Export Funding Corp., | |
Gov’t. Gtd. Notes, Series GG | |
2.450% | | | 07/15/24 | | | | 475 | | | $ | 484,051 | |
Gov’t. Gtd. Notes, Series NN | |
3.250% | | | 06/15/25 | | | | 330 | | | | 349,554 | |
Sr. Unsec’d. Notes, 144A | |
2.650% | | | 02/16/21 | | | | 1,915 | | | | 1,930,050 | |
Synchrony Financial, | |
Sr. Unsec’d. Notes | |
2.700% | | | 02/03/20 | | | | 2,700 | | | | 2,700,333 | |
| | | | | | | | | | | | |
| | | | | | | | | | | 8,375,018 | |
| | | | | | | | | | | | |
Electric — 1.0% | |
Avista Corp., | |
First Mortgage | |
4.350% | | | 06/01/48 | | | | 1,160 | | | | 1,331,726 | |
Baltimore Gas & Electric Co., | |
Sr. Unsec’d. Notes | |
6.350% | | | 10/01/36 | | | | 550 | | | | 758,858 | |
Berkshire Hathaway Energy Co., | |
Sr. Unsec’d. Notes | |
5.950% | | | 05/15/37 | | | | 305 | | | | 410,799 | |
CenterPoint Energy Houston Electric LLC, | |
General Ref. Mortgage, Series K2 | |
6.950% | | | 03/15/33 | | | | 590 | | | | 830,917 | |
Commonwealth Edison Co., | |
First Mortgage | |
3.750% | | | 08/15/47 | | | | 1,610 | | | | 1,728,021 | |
Consolidated Edison Co. of New York, Inc., | |
Sr. Unsec’d. Notes, Series09-C | |
5.500% | | | 12/01/39 | | | | 220 | | | | 284,064 | |
Dominion Energy, Inc., | |
Jr. Sub. Notes | |
4.104% | | | 04/01/21 | | | | 3,210 | | | | 3,284,291 | |
DTE Electric Co., | |
General Ref. Mortgage, Series A | |
4.050% | | | 05/15/48 | | | | 1,490 | | | | 1,723,828 | |
Duke Energy Carolinas LLC, | |
First Mortgage | |
6.050% | | | 04/15/38 | | | | 550 | | | | 753,637 | |
First Ref. Mortgage | |
4.000% | | | 09/30/42 | | | | 570 | | | | 632,442 | |
El Paso Electric Co., | |
Sr. Unsec’d. Notes | |
6.000% | | | 05/15/35 | | | | 670 | | | | 820,621 | |
Enel Finance International NV (Italy), | |
Gtd. Notes, 144A | |
2.650% | | | 09/10/24 | | | | 2,860 | | | | 2,870,625 | |
Exelon Corp., | |
Jr. Sub. Notes | |
3.497% | | | 06/01/22 | | | | 3,470 | | | | 3,560,320 | |
Exelon Generation Co. LLC, | |
Sr. Unsec’d. Notes | |
6.250% | | | 10/01/39 | | | | 1,425 | | | | 1,712,249 | |
FirstEnergy Transmission LLC, | |
Sr. Unsec’d. Notes, 144A | |
5.450% | | | 07/15/44 | | | | 355 | | | | 444,217 | |
SEE NOTES TO FINANCIAL STATEMENTS.
A90
| | | | | | |
| | |
| | FLEXIBLE MANAGED PORTFOLIO (continued) | | |
| | | | | | |
| |
| SCHEDULE OF INVESTMENTS | | as of December 31, 2019 |
| | | | | | | | | | | | |
Interest
Rate | | Maturity
Date | | | Principal
Amount
(000)# | | | Value | |
|
| CORPORATE BONDS (continued) | |
Electric (continued) | |
Florida Power & Light Co., | |
First Mortgage | |
5.950% | | | 10/01/33 | | | | 295 | | | $ | 394,081 | |
Iberdrola International BV (Spain), | |
Gtd. Notes | |
6.750% | | | 09/15/33 | | | | 145 | | | | 187,741 | |
Indiana Michigan Power Co., | |
Sr. Unsec’d. Notes | |
3.850% | | | 05/15/28 | (a) | | | 2,910 | | | | 3,162,517 | |
Israel Electric Corp. Ltd. (Israel), | |
Sr. Sec’d. Notes, 144A, GMTN | |
4.250% | | | 08/14/28 | | | | 470 | | | | 511,117 | |
Monongahela Power Co., | |
First Mortgage, 144A | |
4.100% | | | 04/15/24 | | | | 2,170 | | | | 2,320,301 | |
Northern States Power Co., | |
First Mortgage | |
3.600% | | | 09/15/47 | | | | 1,580 | | | | 1,687,377 | |
PPL Capital Funding, Inc., | |
Gtd. Notes | |
4.000% | | | 09/15/47 | | | | 1,360 | | | | 1,386,968 | |
5.000% | | | 03/15/44 | | | | 695 | | | | 801,468 | |
PSEG Power LLC, | |
Gtd. Notes | |
3.000% | | | 06/15/21 | | | | 1,760 | | | | 1,780,033 | |
Public Service Electric & Gas Co., | |
First Mortgage, MTN | |
3.000% | | | 05/15/27 | | | | 1,130 | | | | 1,169,456 | |
3.700% | | | 05/01/28 | | | | 1,280 | | | | 1,392,530 | |
Sr. Sec’d. Notes, MTN | |
5.800% | | | 05/01/37 | | | | 535 | | | | 709,227 | |
San Diego Gas & Electric Co., | |
First Mortgage | |
4.150% | | | 05/15/48 | | | | 1,400 | | | | 1,537,622 | |
Southern California Edison Co., | |
First Ref. Mortgage | |
4.000% | | | 04/01/47 | | | | 580 | | | | 608,706 | |
First Ref. Mortgage, Series C | |
3.600% | | | 02/01/45 | | | | 860 | | | | 841,582 | |
Vistra Operations Co. LLC, | |
Gtd. Notes, 144A | |
5.000% | | | 07/31/27 | | | | 725 | | | | 758,766 | |
Sr. Sec’d. Notes, 144A | |
3.550% | | | 07/15/24 | | | | 2,135 | | | | 2,170,816 | |
Xcel Energy, Inc., | |
Sr. Unsec’d. Notes | |
4.800% | | | 09/15/41 | | | | 480 | | | | 542,720 | |
| | | | | | | | | | | | |
| | | | | | | | | | | 43,109,643 | |
| | | | | | | | | | | | |
Electronics — 0.0% | |
FLIR Systems, Inc., | |
Sr. Unsec’d. Notes | |
3.125% | | | 06/15/21 | | | | 900 | | | | 906,224 | |
| | | | | | | | | | | | |
Engineering & Construction — 0.1% | |
AECOM, | |
Gtd. Notes | |
5.125% | | | 03/15/27 | | | | 1,050 | | | | 1,128,723 | |
| | | | | | | | | | | | | | | | |
Interest
Rate | | Maturity
Date | | | | | | Principal
Amount
(000)# | | | Value | |
|
| CORPORATE BONDS (continued) | |
Engineering & Construction (continued) | |
Mexico City Airport Trust (Mexico), | |
Sr. Sec’d. Notes, 144A | |
3.875% | | | 04/30/28 | | | | | | | | 700 | | | $ | 716,191 | |
5.500% | | | 07/31/47 | | | | | | | | 800 | | | | 826,330 | |
| | | | | | | | | | | | | | | | |
| | | | | | | | | | | | | | | 2,671,244 | |
| | | | | | | | | | | | | | | | |
Foods — 0.2% | |
Conagra Brands, Inc., | |
Sr. Unsec’d. Notes | |
3.800% | | | 10/22/21 | | | | | | | | 3,440 | | | | 3,547,583 | |
Kraft Heinz Foods Co., | |
Gtd. Notes | |
4.375% | | | 06/01/46 | | | | | | | | 475 | | | | 467,066 | |
5.000% | | | 07/15/35 | | | | | | | | 815 | | | | 905,179 | |
5.200% | | | 07/15/45 | | | | | | | | 355 | | | | 386,007 | |
Gtd. Notes, 144A | |
3.750% | | | 04/01/30 | | | | | | | | 1,440 | | | | 1,483,993 | |
4.875% | | | 10/01/49 | | | | | | | | 1,695 | | | | 1,781,318 | |
Mars, Inc., | |
Gtd. Notes, 144A | |
3.950% | | | 04/01/49 | | | | | | | | 1,720 | | | | 1,940,740 | |
| | | | | | | | | | | | | | | | |
| | | | | | | | | | | | | | | 10,511,886 | |
| | | | | | | | | | | | | | | | |
Forest Products & Paper — 0.1% | |
International Paper Co., | |
Sr. Unsec’d. Notes | |
6.000% | | | 11/15/41 | | | | | | | | 1,595 | | | | 1,985,794 | |
| | | | | | | | | | | | | | | | |
Gas — 0.1% | |
Dominion Energy Gas Holdings LLC, | |
Sr. Unsec’d. Notes | |
4.600% | | | 12/15/44 | | | | | | | | 65 | | | | 72,274 | |
NiSource, Inc., | |
Sr. Unsec’d. Notes | |
3.490% | | | 05/15/27 | | | | | | | | 3,285 | | | | 3,450,938 | |
| | | | | | | | | | | | | | | | |
| | | | | | | | | | | | | | | 3,523,212 | |
| | | | | | | | | | | | | | | | |
Healthcare-Products — 0.1% | |
DH Europe Finance II Sarl, | |
Gtd. Notes | |
1.350% | | | 09/18/39 | | | | | | | EUR | 1,635 | | | | 1,735,547 | |
Medtronic Global Holdings SCA, | |
Gtd. Notes | |
1.625% | | | 03/07/31 | | | | | | | EUR | 300 | | | | 369,193 | |
2.250% | | | 03/07/39 | | | | | | | EUR | 400 | | | | 510,167 | |
| | | | | | | | | | | | | | | | |
| | | | | | | | | | | | | | | 2,614,907 | |
| | | | | | | | | | | | | | | | |
Healthcare-Services — 0.2% | |
Aetna, Inc., | |
Sr. Unsec’d. Notes | |
6.625% | | | 06/15/36 | | | | | | | | 515 | | | | 698,244 | |
Anthem, Inc., | |
Sr. Unsec’d. Notes | |
4.625% | | | 05/15/42 | | | | | | | | 390 | | | | 437,009 | |
Fresenius Medical Care U.S. Finance II, Inc. (Germany), | |
Gtd. Notes, 144A | |
4.125% | | | 10/15/20 | | | | | | | | 640 | | | | 645,993 | |
SEE NOTES TO FINANCIAL STATEMENTS.
A91
| | | | | | |
| | |
| | FLEXIBLE MANAGED PORTFOLIO (continued) | | |
| | | | | | |
| |
| SCHEDULE OF INVESTMENTS | | as of December 31, 2019 |
| | | | | | | | | | | | |
Interest
Rate | | Maturity
Date | | | Principal
Amount
(000)# | | | Value | |
|
| CORPORATE BONDS (continued) | |
Healthcare-Services (continued) | |
HCA, Inc., | |
Gtd. Notes | |
5.375% | | | 02/01/25 | (a) | | | 1,155 | | | $ | 1,278,203 | |
5.875% | | | 02/01/29 | (a) | | | 675 | | | | 780,228 | |
Kaiser Foundation Hospitals, | |
Gtd. Notes | |
4.150% | | | 05/01/47 | | | | 940 | | | | 1,071,500 | |
Laboratory Corp. of America Holdings, | |
Sr. Unsec’d. Notes | |
3.200% | | | 02/01/22 | | | | 190 | | | | 193,836 | |
MEDNAX, Inc., | |
Gtd. Notes, 144A | |
5.250% | | | 12/01/23 | | | | 1,075 | | | | 1,102,328 | |
New York and Presbyterian Hospital (The), | |
Unsec’d. Notes | |
4.024% | | | 08/01/45 | | | | 445 | | | | 492,935 | |
Providence St. Joseph Health Obligated Group, | |
Unsec’d. Notes, Series 19A | |
2.532% | | | 10/01/29 | | | | 765 | | | | 751,009 | |
| | | | | | | | | | | | |
| | | | | | | | | | | 7,451,285 | |
| | | | | | | | | | | | |
Home Builders — 0.0% | |
Taylor Morrison Communities, Inc., | |
Gtd. Notes, 144A | |
5.875% | | | 06/15/27 | (a) | | | 525 | | | | 576,896 | |
Taylor Morrison Communities, Inc./Taylor Morrison Holdings II, Inc., | |
Gtd. Notes, 144A | |
5.625% | | | 03/01/24 | | | | 800 | | | | 865,016 | |
| | | | | | | | | | | | |
| | | | | | | | | | | 1,441,912 | |
| | | | | | | | | | | | |
Housewares — 0.0% | |
Newell Brands, Inc., | |
Sr. Unsec’d. Notes | |
4.200% | | | 04/01/26 | (a) | | | 1,695 | | | | 1,766,453 | |
| | | | | | | | | | | | |
Insurance — 0.2% | |
AXIS Specialty Finance LLC, | |
Gtd. Notes | |
5.875% | | | 06/01/20 | | | | 1,030 | | | | 1,045,352 | |
Liberty Mutual Group, Inc., | |
Gtd. Notes, 144A | |
3.951% | | | 10/15/50 | | | | 1,215 | | | | 1,272,224 | |
Lincoln National Corp., | |
Sr. Unsec’d. Notes | |
6.300% | | | 10/09/37 | | | | 772 | | | | 1,003,569 | |
Markel Corp., | |
Sr. Unsec’d. Notes | |
4.150% | | | 09/17/50 | | | | 410 | | | | 422,280 | |
5.000% | | | 03/30/43 | | | | 200 | | | | 219,624 | |
New York Life Insurance Co., | |
Sub. Notes, 144A | |
6.750% | | | 11/15/39 | | | | 660 | | | | 965,818 | |
Principal Financial Group, Inc., | |
Gtd. Notes | |
4.625% | | | 09/15/42 | | | | 130 | | | | 151,433 | |
Teachers Insurance & Annuity Association of America, | |
Sub. Notes, 144A | |
4.270% | | | 05/15/47 | | | | 1,450 | | | | 1,647,178 | |
| | | | | | | | | | | | |
Interest
Rate | | Maturity
Date | | | Principal
Amount
(000)# | | | Value | |
|
| CORPORATE BONDS (continued) | |
Insurance (continued) | |
6.850% | | | 12/16/39 | | | | 124 | | | $ | 181,293 | |
Unum Group, | |
Sr. Unsec’d. Notes | | | | | | | | | |
5.625% | | | 09/15/20 | | | | 350 | | | | 359,012 | |
| | | | | | | | | | | | |
| | | | | | | | | | | 7,267,783 | |
| | | | | | | | | | | | |
Lodging — 0.0% | |
Marriott International, Inc., | |
Sr. Unsec’d. Notes | | | | | | | | | |
3.250% | | | 09/15/22 | | | | 980 | | | | 1,005,201 | |
| | | | | | | | | | | | |
Machinery-Diversified — 0.0% | |
Xylem, Inc., | |
Sr. Unsec’d. Notes | | | | | | | | | |
4.875% | | | 10/01/21 | | | | 1,260 | | | | 1,320,441 | |
| | | | | | | | | | | | |
Media — 0.3% | |
AMC Networks, Inc., | |
Gtd. Notes | | | | | | | | | | | | |
5.000% | | | 04/01/24 | (a) | | | 1,120 | | | | 1,143,938 | |
Charter Communications Operating LLC/Charter Communications Operating Capital, | |
Sr. Sec’d. Notes | | | | | | | | | |
4.800% | | | 03/01/50 | | | | 1,260 | | | | 1,329,681 | |
5.375% | | | 04/01/38 | | | | 1,950 | | | | 2,224,915 | |
6.384% | | | 10/23/35 | | | | 875 | | | | 1,104,436 | |
6.484% | | | 10/23/45 | | | | 1,386 | | | | 1,730,129 | |
Comcast Corp., | |
Gtd. Notes | | | | | | | | | | | | |
6.400% | | | 05/15/38 | | | | 530 | | | | 743,734 | |
NBCUniversal Media LLC, | |
Gtd. Notes | | | | | | | | | | | | |
2.875% | | | 01/15/23 | | | | 330 | | | | 338,977 | |
Time Warner Cable LLC, | |
Sr. Sec’d. Notes | | | | | | | | | |
5.500% | | | 09/01/41 | | | | 360 | | | | 401,700 | |
ViacomCBS, Inc., | |
Sr. Unsec’d. Notes | | | | | | | | | |
5.250% | | | 04/01/44 | | | | 1,450 | | | | 1,683,582 | |
Videotron Ltd. (Canada), | |
Gtd. Notes | | | | | | | | | | | | |
5.000% | | | 07/15/22 | | | | 1,040 | | | | 1,098,611 | |
| | | | | | | | | | | | |
| | | | | | | | | | | 11,799,703 | |
| | | | | | | | | | | | |
Mining — 0.0% | |
BHP Billiton Finance USA Ltd. (Australia), | |
Gtd. Notes, 144A | | | | | | | | | |
6.250%(ff) | | | 10/19/75 | | | | 425 | | | | 437,229 | |
Southern Copper Corp. (Peru), | |
Sr. Unsec’d. Notes | | | | | | | | | |
6.750% | | | 04/16/40 | | | | 425 | | | | 567,703 | |
| | | | | | | | | | | | |
| | | | | | | | | | | 1,004,932 | |
| | | | | | | | | | | | |
Miscellaneous Manufacturing — 0.1% | |
Actuant Corp., | |
Gtd. Notes | | | | | | | | | | | | |
5.625% | | | 06/15/22 | | | | 1,205 | | | | 1,214,230 | |
SEE NOTES TO FINANCIAL STATEMENTS.
A92
| | | | | | |
| | |
| | FLEXIBLE MANAGED PORTFOLIO (continued) | | |
| | | | | | |
| |
| SCHEDULE OF INVESTMENTS | | as of December 31, 2019 |
| | | | | | | | | | | | |
Interest
Rate | | Maturity
Date | | | Principal
Amount
(000)# | | | Value | |
|
| CORPORATE BONDS (continued) | |
Miscellaneous Manufacturing (continued) | |
Amsted Industries, Inc., | |
Gtd. Notes, 144A | |
5.625% | | | 07/01/27 | | | | 1,200 | | | $ | 1,272,743 | |
| | | | | | | | | | | | |
| | | | | | | | | | | 2,486,973 | |
| | | | | | | | | | | | |
Multi-National — 0.1% | |
Corp. Andina de Fomento (Supranational Bank), | |
Sr. Unsec’d. Notes | |
2.125% | | | 09/27/21 | | | | 905 | | | | 902,692 | |
2.750% | | | 01/06/23 | | | | 315 | | | | 318,045 | |
North American Development Bank (Supranational Bank), | |
Sr. Unsec’d. Notes | |
2.400% | | | 10/26/22 | | | | 1,095 | | | | 1,103,099 | |
4.375% | | | 02/11/20 | | | | 1,000 | | | | 1,003,030 | |
| | | | | | | | | | | | |
| | | | | | | | | | | 3,326,866 | |
| | | | | | | | | | | | |
Oil & Gas — 0.6% | |
Antero Resources Corp., | |
Gtd. Notes | |
5.000% | | | 03/01/25 | | | | 1,400 | | | | 1,054,875 | |
Cenovus Energy, Inc. (Canada), | |
Sr. Unsec’d. Notes | |
5.400% | | | 06/15/47 | | | | 1,200 | | | | 1,394,795 | |
CNOOC Finance Ltd. (China), | |
Gtd. Notes | |
2.875% | | | 09/30/29 | (a) | | | 1,950 | | | | 1,947,492 | |
Concho Resources, Inc., | |
Gtd. Notes | |
4.875% | | | 10/01/47 | | | | 210 | | | | 242,869 | |
Devon Energy Corp., | |
Sr. Unsec’d. Notes | |
5.600% | | | 07/15/41 | | | | 300 | | | | 365,229 | |
Encana Corp. (Canada), | |
Gtd. Notes | |
6.500% | | | 08/15/34 | | | | 370 | | | | 435,940 | |
6.500% | | | 02/01/38 | | | | 275 | | | | 322,765 | |
Gazprom PJSC Via Gaz Capital SA (Russia), | |
Sr. Unsec’d. Notes, 144A | |
4.950% | | | 07/19/22 | | | | 350 | | | | 370,446 | |
6.510% | | | 03/07/22 | | | | 580 | | | | 630,070 | |
Helmerich & Payne, Inc., | |
Sr. Unsec’d. Notes | |
4.650% | | | 03/15/25 | | | | 1,995 | | | | 2,176,387 | |
KazMunayGas National Co. JSC (Kazakhstan), | |
Sr. Unsec’d. Notes, 144A | |
4.750% | | | 04/24/25 | | | | 550 | | | | 602,204 | |
Noble Energy, Inc., | |
Sr. Unsec’d. Notes | |
5.050% | | | 11/15/44 | | | | 835 | | | | 927,437 | |
Occidental Petroleum Corp., | |
Sr. Unsec’d. Notes | |
4.264%(s) | | | 10/10/36 | | | | 2,000 | | | | 1,005,004 | |
4.850% | | | 03/15/21 | | | | 575 | | | | 592,104 | |
6.450% | | | 09/15/36 | | | | 1,155 | | | | 1,414,759 | |
Petrobras Global Finance BV (Brazil), | |
Gtd. Notes | |
5.750% | | | 02/01/29 | | | | 840 | | | | 945,439 | |
| | | | | | | | | | | | |
Interest
Rate | | Maturity
Date | | | Principal
Amount
(000)# | | | Value | |
|
| CORPORATE BONDS (continued) | |
Oil & Gas (continued) | |
Gtd. Notes, 144A | |
5.093% | | | 01/15/30 | (a) | | | 797 | | | $ | 854,759 | |
Petroleos Mexicanos (Mexico), | |
Gtd. Notes | |
5.500% | | | 01/21/21 | | | | 2,110 | | | | 2,167,866 | |
6.350% | | | 02/12/48 | | | | 1,536 | | | | 1,482,423 | |
Gtd. Notes, 144A | |
6.490% | | | 01/23/27 | | | | 471 | | | | 502,297 | |
7.690% | | | 01/23/50 | | | | 2,146 | | | | 2,342,988 | |
Gtd. Notes, MTN | |
6.750% | | | 09/21/47 | (a) | | | 2,265 | | | | 2,278,430 | |
6.875% | | | 08/04/26 | | | | 1,000 | | | | 1,099,691 | |
Sinopec Group Overseas Development 2018 Ltd. (China), | |
Gtd. Notes, 144A | |
3.680% | | | 08/08/49 | | | | 1,445 | | | | 1,477,709 | |
| | | | | | | | | | | | |
| | | | | | | | | | | 26,633,978 | |
| | | | | | | | | | | | |
Oil & Gas Services — 0.0% | |
Schlumberger Holdings Corp., | |
Sr. Unsec’d. Notes, 144A | |
4.000% | | | 12/21/25 | | | | 183 | | | | 197,188 | |
| | | | | | | | | | | | |
Packaging & Containers — 0.0% | |
Ball Corp., | |
Gtd. Notes | |
4.375% | | | 12/15/20 | | | | 630 | | | | 643,276 | |
WestRock RKT LLC, | |
Gtd. Notes | |
4.900% | | | 03/01/22 | | | | 800 | | | | 842,843 | |
| | | | | | | | | | | | |
| | | | | | | | | | | 1,486,119 | |
| | | | | | | | | | | | |
Pharmaceuticals — 0.8% | |
AbbVie, Inc., | |
Sr. Unsec’d. Notes | |
3.600% | | | 05/14/25 | | | | 1,175 | | | | 1,240,508 | |
4.500% | | | 05/14/35 | | | | 1,910 | | | | 2,144,942 | |
4.700% | | | 05/14/45 | | | | 1,460 | | | | 1,629,932 | |
Sr. Unsec’d. Notes, 144A | |
4.250% | | | 11/21/49 | | | | 2,515 | | | | 2,661,277 | |
Allergan Funding SCS, | |
Gtd. Notes | |
4.550% | | | 03/15/35 | | | | 2,190 | | | | 2,362,536 | |
Bayer US Finance II LLC (Germany), | |
Gtd. Notes, 144A, 3 Month LIBOR + 0.630% | |
2.577%(c) | | | 06/25/21 | | | | 1,115 | | | | 1,118,493 | |
Gtd. Notes, 144A | |
3.500% | | | 06/25/21 | | | | 500 | | | | 509,144 | |
Becton, Dickinson & Co., | |
Sr. Unsec’d. Notes | |
3.734% | | | 12/15/24 | | | | 474 | | | | 502,463 | |
Bristol-Myers Squibb Co., | |
Sr. Unsec’d. Notes, 144A | |
4.125% | | | 06/15/39 | | | | 410 | | | | 471,788 | |
4.250% | | | 10/26/49 | | | | 1,115 | | | | 1,321,671 | |
4.550% | | | 02/20/48 | | | | 1,200 | | | | 1,462,928 | |
5.000% | | | 08/15/45 | | | | 645 | | | | 825,281 | |
SEE NOTES TO FINANCIAL STATEMENTS.
A93
| | | | | | |
| | |
| | FLEXIBLE MANAGED PORTFOLIO (continued) | | |
| | | | | | |
| |
| SCHEDULE OF INVESTMENTS | | as of December 31, 2019 |
| | | | | | | | | | | | |
Interest
Rate | | Maturity
Date | | | Principal
Amount
(000)# | | | Value | |
|
| CORPORATE BONDS (continued) | |
Pharmaceuticals (continued) | |
Cigna Corp., | |
Gtd. Notes | |
4.375% | | | 10/15/28 | | | | 9,285 | | | $ | 10,301,187 | |
CVS Health Corp., | |
Sr. Unsec’d. Notes | |
4.780% | | | 03/25/38 | | | | 310 | | | | 351,803 | |
5.050% | | | 03/25/48 | | | | 3,685 | | | | 4,361,537 | |
5.125% | | | 07/20/45 | | | | 610 | | | | 720,911 | |
5.300% | | | 12/05/43 | | | | 250 | | | | 299,403 | |
Mylan, Inc., | |
Gtd. Notes | |
5.200% | | | 04/15/48 | | | | 1,375 | | | | 1,531,762 | |
Wyeth LLC, | |
Gtd. Notes | |
6.450% | | | 02/01/24 | | | | 60 | | | | 70,286 | |
| | | | | | | | | | | | |
| | | | | | | | | | | 33,887,852 | |
| | | | | | | | | | | | |
Pipelines — 0.4% | |
DCP Midstream Operating LP, | |
Gtd. Notes, 144A | |
5.350% | | | 03/15/20 | | | | 717 | | | | 720,811 | |
Energy Transfer Operating LP, | |
Gtd. Notes | |
4.650% | | | 06/01/21 | | | | 675 | | | | 693,423 | |
4.950% | | | 06/15/28 | | | | 1,115 | | | | 1,222,173 | |
6.125% | | | 12/15/45 | | | | 180 | | | | 208,262 | |
Enterprise Products Operating LLC, | |
Gtd. Notes | |
3.750% | | | 02/15/25 | | | | 1,345 | | | | 1,435,156 | |
MPLX LP, | |
Sr. Unsec’d. Notes | |
4.000% | | | 02/15/25 | | | | 1,430 | | | | 1,494,740 | |
4.000% | | | 03/15/28 | (a) | | | 1,980 | | | | 2,052,541 | |
4.875% | | | 06/01/25 | | | | 3,250 | | | | 3,548,516 | |
5.200% | | | 03/01/47 | | | | 40 | | | | 43,130 | |
5.500% | | | 02/15/49 | (a) | | | 395 | | | | 446,842 | |
ONEOK Partners LP, | |
Gtd. Notes | |
6.650% | | | 10/01/36 | | | | 145 | | | | 184,906 | |
ONEOK, Inc., | |
Gtd. Notes | |
4.950% | | | 07/13/47 | | | | 935 | | | | 1,022,483 | |
Western Midstream Operating LP, | |
Sr. Unsec’d. Notes | |
5.300% | | | 03/01/48 | | | | 125 | | | | 108,446 | |
Williams Cos., Inc. (The), | |
Sr. Unsec’d. Notes | |
4.850% | | | 03/01/48 | (a) | | | 315 | | | | 344,955 | |
4.900% | | | 01/15/45 | | | | 1,000 | | | | 1,077,386 | |
5.100% | | | 09/15/45 | | | | 500 | | | | 554,445 | |
| | | | | | | | | | | | |
| | | | | | | | | | | 15,158,215 | |
| | | | | | | | | | | | |
Real Estate Investment Trusts (REITs) — 0.0% | |
GLP Capital LP/GLP Financing II, Inc., | |
Gtd. Notes | |
5.375% | | | 04/15/26 | | | | 1,050 | | | | 1,161,852 | |
| | | | | | | | | | | | |
| | | | | | | | | | | | |
Interest
Rate | | Maturity
Date | | | Principal
Amount
(000)# | | | Value | |
|
| CORPORATE BONDS (continued) | |
Retail — 0.2% | |
Dollar Tree, Inc., | |
Sr. Unsec’d. Notes, 3 Month LIBOR + 0.700% | |
2.702%(c) | | | 04/17/20 | | | | 1,100 | | | $ | 1,099,964 | |
Sr. Unsec’d. Notes | |
4.000% | | | 05/15/25 | (a) | | | 4,705 | | | | 5,027,142 | |
L Brands, Inc., | |
Gtd. Notes | |
5.625% | | | 10/15/23 | (a) | | | 1,450 | | | | 1,561,571 | |
Macy’s Retail Holdings, Inc., | |
Gtd. Notes | |
3.875% | | | 01/15/22 | | | | 201 | | | | 205,136 | |
Sally Holdings LLC/Sally Capital, Inc., | |
Gtd. Notes | |
5.625% | | | 12/01/25 | (a) | | | 1,375 | | | | 1,438,951 | |
| | | | | | | | | | | | |
| | | | | | | | | | | 9,332,764 | |
| | | | | | | | | | | | |
Savings & Loans — 0.0% | |
People’s United Financial, Inc., | |
Sr. Unsec’d. Notes | |
3.650% | | | 12/06/22 | | | | 1,455 | | | | 1,512,225 | |
| | | | | | | | | | | | |
Semiconductors — 0.1% | |
Broadcom, Inc., | |
Gtd. Notes, 144A | |
3.125% | | | 04/15/21 | | | | 1,310 | | | | 1,325,708 | |
3.125% | | | 10/15/22 | | | | 1,010 | | | | 1,029,681 | |
| | | | | | | | | | | | |
| | | | | | | | | | | 2,355,389 | |
| | | | | | | | | | | | |
Software — 0.0% | |
Microsoft Corp., | |
Sr. Unsec’d. Notes | |
3.750% | | | 02/12/45 | | | | 1,210 | | | | 1,371,452 | |
4.450% | | | 11/03/45 | | | | 215 | | | | 268,890 | |
| | | | | | | | | | | | |
| | | | | | | | | | | 1,640,342 | |
| | | | | | | | | | | | |
Telecommunications — 0.5% | |
AT&T, Inc., | |
Sr. Unsec’d. Notes | |
3.400% | | | 05/15/25 | | | | 1,840 | | | | 1,928,189 | |
3.600% | | | 07/15/25 | | | | 275 | | | | 290,868 | |
3.800% | | | 02/15/27 | | | | 1,065 | | | | 1,139,418 | |
4.300% | | | 02/15/30 | | | | 615 | | | | 683,227 | |
4.550% | | | 03/09/49 | | | | 139 | | | | 154,080 | |
4.850% | | | 03/01/39 | | | | 6,690 | | | | 7,717,659 | |
5.250% | | | 03/01/37 | | | | 65 | | | | 77,667 | |
5.350% | | | 09/01/40 | | | | 82 | | | | 98,705 | |
Level 3 Financing, Inc., | |
Sr. Sec’d. Notes, 144A | |
3.400% | | | 03/01/27 | | | | 300 | | | | 302,410 | |
Sprint Communications, Inc., | |
Gtd. Notes, 144A | |
7.000% | | | 03/01/20 | | | | 750 | | | | 755,353 | |
Sprint Spectrum Co. LLC/Sprint Spectrum Co. II LLC/Sprint Spectrum Co. III LLC, | |
Sr. Sec’d. Notes, 144A | |
3.360% | | | 03/20/23 | | | | 875 | | | | 883,723 | |
SEE NOTES TO FINANCIAL STATEMENTS.
A94
| | | | | | |
| | |
| | FLEXIBLE MANAGED PORTFOLIO (continued) | | |
| | | | | | |
| |
| SCHEDULE OF INVESTMENTS | | as of December 31, 2019 |
| | | | | | | | | | | | |
Interest
Rate | | Maturity
Date | | | Principal
Amount
(000)# | | | Value | |
|
| CORPORATE BONDS (continued) | |
Telecommunications (continued) | |
Verizon Communications, Inc., | |
Sr. Unsec’d. Notes | |
4.016% | | | 12/03/29 | (a) | | | 1,900 | | | $ | 2,122,859 | |
4.125% | | | 08/15/46 | (a) | | | 725 | | | | 815,960 | |
4.500% | | | 08/10/33 | | | | 1,205 | | | | 1,407,677 | |
4.862% | | | 08/21/46 | | | | 860 | | | | 1,066,122 | |
| | | | | | | | | | | | |
| | | | | | | | | | | 19,443,917 | |
| | | | | | | | | | | | |
Transportation — 0.1% | |
Burlington Northern Santa Fe LLC, | |
Sr. Unsec’d. Notes | |
6.700% | | | 08/01/28 | | | | 670 | | | | 866,210 | |
CSX Corp., | |
Sr. Unsec’d. Notes | |
6.150% | | | 05/01/37 | | | | 715 | | | | 948,808 | |
Norfolk Southern Corp., | |
Sr. Unsec’d. Notes | |
5.590% | | | 05/17/25 | | | | 100 | | | | 115,375 | |
| | | | | | | | | | | | |
| | | | | | | | | | | 1,930,393 | |
| | | | | | | | | | | | |
TOTAL CORPORATE BONDS
(cost $382,258,466) | | | | | | | | 409,036,726 | |
| | | | | | | | | | | | |
|
| MUNICIPAL BONDS — 0.4% | |
Alabama — 0.0% | |
Alabama Economic Settlement Authority, | |
Taxable, Revenue Bonds, Series B | |
4.263% | | | 09/15/32 | | | | 240 | | | | 265,834 | |
| | | | | | | | | | | | |
California — 0.2% | |
Bay Area Toll Authority, | |
Revenue Bonds, BABs, Series F2 | |
6.263% | | | 04/01/49 | | | | 1,325 | | | | 2,017,564 | |
Taxable, Revenue Bonds | |
2.574% | | | 04/01/31 | | | | 1,210 | | | | 1,202,135 | |
State of California, | |
General Obligation Unlimited, BABs | |
7.300% | | | 10/01/39 | | | | 1,270 | | | | 1,940,128 | |
General Obligation Unlimited, Taxable, BABs | |
7.500% | | | 04/01/34 | | | | 475 | | | | 716,889 | |
7.625% | | | 03/01/40 | | | | 215 | | | | 342,732 | |
7.550% | | | 04/01/39 | | | | 245 | | | | 392,007 | |
| | | | | | | | | | | | |
| | | | | | | | | | | 6,611,455 | |
| | | | | | | | | | | | |
Colorado — 0.0% | |
Regional Transportation District Sales Tax Revenue, | |
Revenue Bonds, BABs, Series B | |
5.844% | | | 11/01/50 | | | | 680 | | | | 987,693 | |
| | | | | | | | | | | | |
Illinois — 0.1% | |
Chicago O’Hare International Airport, | |
Revenue Bonds, BABs, Series B | |
6.395% | | | 01/01/40 | | | | 1,030 | | | | 1,477,937 | |
State of Illinois, | |
General Obligation Unlimited, Series D | |
5.000% | | | 11/01/22 | | | | 3,190 | | | | 3,441,212 | |
| | | | | | | | | | | | |
Interest
Rate | | Maturity
Date | | | Principal
Amount
(000)# | | | Value | |
|
| MUNICIPAL BONDS (continued) | |
Illinois (continued) | |
General Obligation Unlimited, Taxable | |
5.100% | | | 06/01/33 | (a) | | | 325 | | | $ | 350,058 | |
| | | | | | | | | | | | |
| | | | | | | | | | | 5,269,207 | |
| | | | | | | | | | | | |
New Jersey — 0.1% | |
New Jersey Turnpike Authority, | |
Taxable, Revenue Bonds, BABs, Series F | |
7.414% | | | 01/01/40 | | | | 1,070 | | | | 1,678,958 | |
| | | | | | | | | | | | |
New York — 0.0% | |
New York City Transitional Finance Authority Future Tax Secured Revenue, | |
Taxable, Revenue Bonds, BABs | |
5.767% | | | 08/01/36 | | | | 1,130 | | | | 1,391,301 | |
| | | | | | | | | | | | |
Ohio — 0.0% | |
Ohio State University (The), | |
Taxable, Revenue Bonds, BABs, Series C | |
4.910% | | | 06/01/40 | | | | 455 | | | | 575,334 | |
Ohio Water Development Authority Water Pollution Control Loan Fund, | |
Taxable, Revenue Bonds, BABs, Series B2 | |
4.879% | | | 12/01/34 | | | | 300 | | | | 344,847 | |
| | | | | | | | | | | | |
| | | | | | | | | | | 920,181 | |
| | | | | | | | | | | | |
Oregon — 0.0% | |
State of Oregon Department of Transportation, | |
Taxable, Revenue Bonds, BABs, Series A | |
5.834% | | | 11/15/34 | | | | 445 | | | | 592,687 | |
| | | | | | | | | | | | |
Pennsylvania — 0.0% | |
Pennsylvania Turnpike Commission, | |
Revenue Bonds, BABs, Series B | |
5.511% | | | 12/01/45 | | | | 550 | | | | 731,253 | |
| | | | | | | | | | | | |
Virginia — 0.0% | |
University of Virginia, | |
Taxable, Revenue Bonds, Series C | |
4.179% | | | 09/01/2117 | | | | 495 | | | | 578,130 | |
| | | | | | | | | | | | |
TOTAL MUNICIPAL BONDS
(cost $14,970,827) | | | | | | | | 19,026,699 | |
| | | | | | | | | | | | |
|
RESIDENTIAL MORTGAGE-BACKED
SECURITIES — 1.2% | |
Alternative Loan Trust, | |
Series 2004-18CB, Class 3A1 | |
5.250% | | | 09/25/20 | | | | 18 | | | | 17,685 | |
Banc of America Funding Trust, | |
Series2015-R04, Class 4A1, 144A | |
3.500%(cc) | | | 01/27/30 | | | | 333 | | | | 333,103 | |
Banc of America Mortgage Trust, | |
Series2005-A, Class 2A1 | |
4.459%(cc) | | | 02/25/35 | | | | 280 | | | | 279,536 | |
Bellemeade Re Ltd. (Bermuda), | |
Series2017-01, Class M1, 144A, 1 Month LIBOR + 1.700% (Cap N/A, Floor 0.000%) | |
3.492%(c) | | | 10/25/27 | | | | 207 | | | | 207,401 | |
Series2018-02A, Class M1A, 144A, 1 Month LIBOR + 0.950% (Cap N/A, Floor 0.000%) | |
2.742%(c) | | | 08/25/28 | | | | 79 | | | | 78,637 | |
Series2018-02A, Class M1B, 144A, 1 Month LIBOR + 1.350% (Cap N/A, Floor 0.000%) | |
3.142%(c) | | | 08/25/28 | | | | 300 | | | | 300,756 | |
SEE NOTES TO FINANCIAL STATEMENTS.
A95
| | | | | | |
| | |
| | FLEXIBLE MANAGED PORTFOLIO (continued) | | |
| | | | | | |
| |
| SCHEDULE OF INVESTMENTS | | as of December 31, 2019 |
| | | | | | | | | | | | |
Interest
Rate | | Maturity
Date | | | Principal
Amount
(000)# | | | Value | |
|
| RESIDENTIAL MORTGAGE-BACKED SECURITIES (continued) | |
Series2018-02A, Class M1C, 144A, 1 Month LIBOR + 1.600% (Cap N/A, Floor 0.000%) | |
3.392%(c) | | | 08/25/28 | | | | 300 | | | $ | 301,041 | |
Series2019-02A, Class M1A, 144A, 1 Month LIBOR + 1.000% (Cap N/A, Floor 1.000%) | |
2.792%(c) | | | 04/25/29 | | | | 631 | | | | 631,258 | |
Series2019-03A, Class M1A, 144A, 1 Month LIBOR + 1.100% (Cap N/A, Floor 1.100%) | |
2.892%(c) | | | 07/25/29 | | | | 1,441 | | | | 1,442,569 | |
Series2019-03A, Class M1B, 144A, 1 Month LIBOR + 1.600% (Cap N/A, Floor 1.600%) | |
3.392%(c) | | | 07/25/29 | | | | 1,200 | | | | 1,201,277 | |
BVRT Financing Trust, | |
Series2019-01, Class F, 144A | | | | | | | | | |
3.865%(cc) | | | 09/15/21 | ^ | | | 6,893 | | | | 6,893,058 | |
Central Park Funding Trust, | |
Series2018-01, Class A, 144A, 1 Month LIBOR + 1.500% (Cap N/A, Floor 1.500%) | |
3.281%(c) | | | 11/01/23 | | | | 4,700 | | | | 4,699,998 | |
Chase Mortgage Finance Trust, | |
Series2007-A01, Class 1A5 | | | | | | | | | |
4.574%(cc) | | | 02/25/37 | | | | 206 | | | | 208,666 | |
CIM Trust, | |
Series2017-02, Class A1, 144A, 1 Month LIBOR + 2.000% (Cap N/A, Floor 2.000%) | |
3.709%(c) | | | 12/25/57 | | | | 2,667 | | | | 2,689,322 | |
Series2017-03, Class A1, 144A, 1 Month LIBOR + 2.000% (Cap N/A, Floor 0.000%) | |
3.709%(c) | | | 01/25/57 | | | | 2,785 | | | | 2,839,420 | |
Series2017-06, Class A1, 144A | | | | | | | | | |
3.015%(cc) | | | 06/25/57 | | | | 2,872 | | | | 2,871,543 | |
Series2017-08, Class A1, 144A | | | | | | | | | |
3.000%(cc) | | | 12/25/65 | | | | 2,610 | | | | 2,608,485 | |
Credit Suisse Mortgage Trust, | |
Series 2018-RPL09, Class A, 144A | | | | | | | | | |
3.850%(cc) | | | 09/25/57 | | | | 2,249 | | | | 2,342,353 | |
Eagle Re Ltd. (Bermuda), | |
Series2019-01, Class M1A, 144A, 1 Month LIBOR + 1.250% (Cap N/A, Floor 0.000%) | |
3.042%(c) | | | 04/25/29 | | | | 150 | | | | 149,777 | |
Series2019-01, Class M1B, 144A, 1 Month LIBOR + 1.800% (Cap N/A, Floor 0.000%) | |
3.592%(c) | | | 04/25/29 | | | | 300 | | | | 300,421 | |
Fannie Mae Connecticut Avenue Securities, | |
Series2016-C04, Class 1M1, 1 Month LIBOR + 1.450% (Cap N/A, Floor 0.000%) | |
3.242%(c) | | | 01/25/29 | | | | 4 | | | | 4,028 | |
Freddie Mac Structured Agency Credit Risk Debt Notes, | |
Series 2016-DNA04, Class M2, 1 Month LIBOR + 1.300% (Cap N/A, Floor 1.300%) | |
3.092%(c) | | | 03/25/29 | | | | 555 | | | | 556,558 | |
Series 2016-HQA02, Class M2, 1 Month LIBOR + 2.250% (Cap N/A, Floor 0.000%) | |
4.042%(c) | | | 11/25/28 | | | | 290 | | | | 290,966 | |
Series 2016-HQA04, Class M2, 1 Month LIBOR + 1.300% (Cap N/A, Floor 0.000%) | |
3.092%(c) | | | 04/25/29 | | | | 1,215 | | | | 1,217,773 | |
| | | | | | | | | | | | |
Interest
Rate | | Maturity
Date | | | Principal
Amount
(000)# | | | Value | |
|
| RESIDENTIAL MORTGAGE-BACKED SECURITIES (continued) | |
Series 2017-DNA01, Class M1, 1 Month LIBOR + 1.200% (Cap N/A, Floor 1.200%) | |
2.992%(c) | | | 07/25/29 | | | | 1,186 | | | $ | 1,187,878 | |
Series 2017-DNA03, Class M1, 1 Month LIBOR + 0.750% (Cap N/A, Floor 0.000%) | |
2.542%(c) | | | 03/25/30 | | | | 2,466 | | | | 2,466,506 | |
Series 2019-HRP01, Class M1, 144A, 1 Month LIBOR + 0.750% (Cap N/A, Floor 0.000%) | |
2.542%(c) | | | 02/25/49 | | | | 710 | | | | 710,144 | |
Gosforth Funding PLC (United Kingdom), | |
Series2018-01A, Class A1, 144A, 3 Month LIBOR + 0.450% (Cap N/A, Floor 0.000%) | |
2.360%(c) | | | 08/25/60 | | | | 1,587 | | | | 1,584,404 | |
Holmes Master Issuer PLC (United Kingdom), | |
Series2018-01A, Class A2, 144A, 3 Month LIBOR + 0.360% (Cap N/A, Floor 0.000%) | |
2.361%(c) | | | 10/15/54 | | | | 1,446 | | | | 1,445,468 | |
Home Re Ltd. (Bermuda), | |
Series2019-01, Class M1, 144A, 1 Month LIBOR + 1.650% (Cap N/A, Floor 0.000%) | |
3.442%(c) | | | 05/25/29 | | | | 476 | | | | 476,518 | |
JPMorgan Mortgage Trust, | |
Series2007-A01, Class 4A1 | | | | | | | | | |
4.657%(cc) | | | 07/25/35 | | | | 100 | | | | 101,297 | |
Lanark Master Issuer PLC (United Kingdom), | |
Series2018-01A, Class 1A, 144A, 3 Month LIBOR + 0.420% (Cap N/A, Floor 0.000%) | |
2.319%(c) | | | 12/22/69 | | | | 1,240 | | | | 1,238,750 | |
LSTAR Securities Investment Trust, | |
Series2019-02, Class A1, 144A, 1 Month LIBOR + 1.500% (Cap N/A, Floor 0.000%) | |
3.281%(c) | | | 04/01/24 | | | | 539 | | | | 537,975 | |
MetLife Securitization Trust, | |
Series2018-01A, Class A, 144A | | | | | | | | | |
3.750%(cc) | | | 03/25/57 | | | | 821 | | | | 852,546 | |
Mill City Mortgage Loan Trust, | |
Series2019-01, Class A1, 144A | | | | | | | | | |
3.250%(cc) | | | 10/25/69 | | | | 1,079 | | | | 1,098,472 | |
New Residential Mortgage Loan Trust, | |
Series2018-01A, Class A1A, 144A | | | | | | | | | |
4.000%(cc) | | | 12/25/57 | | | | 1,641 | | | | 1,699,619 | |
Series2018-04A, Class A1S, 144A, 1 Month LIBOR + 0.750% (Cap N/A, Floor 0.750%) | |
2.542%(c) | | | 01/25/48 | | | | 707 | | | | 704,942 | |
Oaktown Re II Ltd. (Bermuda), | |
Series2018-01A, Class M1, 144A, 1 Month LIBOR + 1.550% (Cap N/A, Floor 0.000%) | |
3.342%(c) | | | 07/25/28 | | | | 390 | | | | 389,812 | |
Oaktown Re III Ltd. (Bermuda), | |
Series2019-01A, Class M1A, 144A, 1 Month LIBOR + 1.400% (Cap N/A, Floor 1.400%) | |
3.192%(c) | | | 07/25/29 | | | | 808 | | | | 809,141 | |
Park Avenue Funding Trust, | |
Series2019-01, Class PT, 144A, 1 Month LIBOR + 1.500% (Cap N/A, Floor 1.500%) | |
3.292%(c) | | | 11/27/20 | | | | 756 | | | | 755,827 | |
SEE NOTES TO FINANCIAL STATEMENTS.
A96
| | | | | | |
| | |
| | FLEXIBLE MANAGED PORTFOLIO (continued) | | |
| | | | | | |
| |
| SCHEDULE OF INVESTMENTS | | as of December 31, 2019 |
| | | | | | | | | | | | | | | | |
Interest
Rate | | Maturity
Date | | | | | | Principal
Amount
(000)# | | | Value | |
|
| RESIDENTIAL MORTGAGE-BACKED SECURITIES (continued) | |
Series2019-03, Class PT, 144A, 1 Month LIBOR + 2.750% (Cap N/A, Floor 1.500%) | |
4.542%(c) | | | 01/27/21 | | | | | | | | 705 | | | $ | 704,315 | |
Seasoned Credit Risk Transfer Trust, | |
Series2019-02, Class MA | |
3.500% | | | 08/25/58 | | | | | | | | 1,251 | | | | 1,299,028 | |
STACR Trust, | |
Series 2018-DNA03, Class M1, 144A, 1 Month LIBOR + 0.750% (Cap N/A, Floor 0.000%) | |
2.542%(c) | | | 09/25/48 | | | | | | | | 746 | | | | 745,780 | |
Station Place Securitization Trust, | |
Series 2019-WL01, Class A, 144A, 1 Month LIBOR + 0.650% (Cap N/A, Floor 0.650%) | |
2.442%(c) | | | 08/25/52 | | | | | | | | 2,300 | | | | 2,300,345 | |
Structured Adjustable Rate Mortgage Loan Trust, | |
Series2004-01, Class 4A3 | |
4.389%(cc) | | | 02/25/34 | | | | | | | | 120 | | | | 120,511 | |
Washington Mutual Mortgage Pass-Through Certificates, | |
Series2005-01, Class 3A | |
5.000% | | | 03/25/20 | | | | | | | | 10 | | | | 10,045 | |
| | | | | | | | | | | | | | | | |
TOTAL RESIDENTIAL MORTGAGE-BACKED SECURITIES
(cost $53,413,745) | | | | 53,704,954 | |
| | | | | | | | | | | | | | | | |
| |
| SOVEREIGN BONDS — 0.9% | | | | | |
Abu Dhabi Government International Bond (United Arab Emirates), | |
Sr. Unsec’d. Notes, 144A | |
3.125% | | | 10/11/27 | | | | | | | | 3,350 | | | | 3,509,372 | |
Colombia Government International Bond (Colombia), | |
Sr. Unsec’d. Notes | |
4.000% | | | 02/26/24 | | | | | | | | 175 | | | | 184,363 | |
4.375% | | | 07/12/21 | (a) | | | | | | | 500 | | | | 516,070 | |
5.000% | | | 06/15/45 | (a) | | | | | | | 620 | | | | 720,315 | |
7.375% | | | 09/18/37 | | | | | | | | 625 | | | | 887,518 | |
Export-Import Bank of India (India), | |
Sr. Unsec’d. Notes, 144A | |
3.875% | | | 02/01/28 | | | | | | | | 1,040 | | | | 1,085,189 | |
Export-Import Bank of Korea (South Korea), | |
Sr. Unsec’d. Notes | |
5.125% | | | 06/29/20 | | | | | | | | 400 | | | | 406,109 | |
Finnvera OYJ (Finland), | |
Gov’t. Gtd. Notes, 144A, MTN | |
2.375% | | | 06/04/25 | | | | | | | | 400 | | | | 408,437 | |
Hungary Government International Bond (Hungary), | |
Sr. Unsec’d. Notes | |
6.375% | | | 03/29/21 | | | | | | | | 2,280 | | | | 2,406,410 | |
Indonesia Government International Bond (Indonesia), | |
Sr. Unsec’d. Notes | |
3.375% | | | 07/30/25 | | | | | | | | EUR 1,500 | | | | 1,913,253 | |
4.450% | | | 02/11/24 | | | | | | | | 505 | | | | 544,218 | |
Sr. Unsec’d. Notes, 144A, MTN | |
5.875% | | | 01/15/24 | | | | | | | | 950 | | | | 1,074,745 | |
Sr. Unsec’d. Notes, EMTN | |
2.150% | | | 07/18/24 | | | | | | | | EUR 2,100 | | | | 2,511,626 | |
4.750% | | | 01/08/26 | | | | | | | | 540 | | | | 600,371 | |
| | | | | | | | | | | | | | | | |
Interest
Rate | | Maturity
Date | | | | | | Principal
Amount
(000)# | | | Value | |
|
| SOVEREIGN BONDS (continued) | |
Japan Finance Organization for Municipalities (Japan), | |
Sr. Unsec’d. Notes, 144A, MTN | |
2.125% | | | 04/13/21 | | | | | | | | 200 | | | $ | 200,431 | |
2.125% | | | 10/25/23 | | | | | | | | 1,400 | | | | 1,404,026 | |
2.625% | | | 04/20/22 | | | | | | | | 2,000 | | | | 2,028,777 | |
3.000% | | | 03/12/24 | | | | | | | | 400 | | | | 414,458 | |
Panama Government International Bond (Panama), | |
Sr. Unsec’d. Notes | |
4.000% | | | 09/22/24 | | | | | | | | 515 | | | | 550,977 | |
4.500% | | | 04/16/50 | | | | | | | | 475 | | | | 561,776 | |
Qatar Government International Bond (Qatar), | |
Sr. Unsec’d. Notes, 144A | |
3.875% | | | 04/23/23 | | | | | | | | 1,105 | | | | 1,166,545 | |
4.817% | | | 03/14/49 | | | | | | | | 500 | | | | 617,231 | |
5.103% | | | 04/23/48 | | | | | | | | 915 | | | | 1,174,495 | |
Romanian Government International Bond (Romania), | |
Sr. Unsec’d. Notes, EMTN | |
4.125% | | | 03/11/39 | | | | | | | | EUR 1,395 | | | | 1,815,135 | |
Saudi Government International Bond (Saudi Arabia), | |
Sr. Unsec’d. Notes, 144A | |
2.000% | | | 07/09/39 | | | | | | | | EUR 277 | | | | 327,023 | |
Sr. Unsec’d. Notes, 144A, MTN | |
2.375% | | | 10/26/21 | | | | | | | | 1,325 | | | | 1,330,051 | |
2.875% | | | 03/04/23 | | | | | | | | 1,785 | | | | 1,816,828 | |
4.000% | | | 04/17/25 | | | | | | | | 1,035 | | | | 1,116,681 | |
Tokyo Metropolitan Government (Japan), | |
Sr. Unsec’d. Notes, 144A | |
2.500% | | | 06/08/22 | | | | | | | | 1,800 | | | | 1,820,551 | |
3.250% | | | 06/01/23 | | | | | | | | 800 | | | | 831,987 | |
Turkey Government International Bond (Turkey), | |
Sr. Unsec’d. Notes | |
7.000% | | | 06/05/20 | | | | | | | | 1,710 | | | | 1,742,839 | |
Uruguay Government International Bond (Uruguay), | |
Sr. Unsec’d. Notes | |
4.975% | | | 04/20/55 | (a) | | | | | | | 1,025 | | | | 1,207,615 | |
5.100% | | | 06/18/50 | (a) | | | | | | | 680 | | | | 816,075 | |
| | | | | | | | | | | | | | | | |
TOTAL SOVEREIGN BONDS
(cost $35,875,285) | | | | | | | | | | | | 37,711,497 | |
| | | | | | | | | | | | | | | | |
|
| U.S. GOVERNMENT AGENCY OBLIGATIONS — 8.7% | |
Federal Home Loan Bank | |
5.500% | | | 07/15/36 | (k) | | | | | | | 1,080 | | | | 1,516,534 | |
Federal Home Loan Mortgage Corp. | |
2.000% | | | 01/01/32 | | | | | | | | 941 | | | | 934,272 | |
2.500% | | | 03/01/30 | | | | | | | | 494 | | | | 501,043 | |
2.500% | | | 10/01/32 | | | | | | | | 1,024 | | | | 1,037,372 | |
3.000% | | | 10/01/28 | | | | | | | | 366 | | | | 376,815 | |
3.000% | | | 06/01/29 | | | | | | | | 877 | | | | 904,075 | |
3.000% | | | 03/01/32 | | | | | | | | 1,057 | | | | 1,090,481 | |
3.000% | | | 01/01/37 | | | | | | | | 532 | | | | 546,999 | |
3.000% | | | 01/01/43 | | | | | | | | 1,032 | | | | 1,063,857 | |
3.000% | | | 07/01/43 | | | | | | | | 2,031 | | | | 2,091,026 | |
3.000% | | | 01/01/47 | | | | | | | | 6,219 | | | | 6,368,821 | |
3.500% | | | 03/01/42 | | | | | | | | 622 | | | | 655,107 | |
3.500% | | | 06/01/42 | | | | | | | | 358 | | | | 376,681 | |
3.500% | | | 01/01/47 | | | | | | | | 1,183 | | | | 1,234,290 | |
3.500% | | | 02/01/47 | | | | | | | | 1,394 | | | | 1,454,014 | |
4.000% | | | 06/01/26 | | | | | | | | 521 | | | | 545,692 | |
SEE NOTES TO FINANCIAL STATEMENTS.
A97
| | | | | | |
| | |
| | FLEXIBLE MANAGED PORTFOLIO (continued) | | |
| | | | | | |
| |
| SCHEDULE OF INVESTMENTS | | as of December 31, 2019 |
| | | | | | | | | | | | |
Interest
Rate | | Maturity
Date | | | Principal
Amount
(000)# | | | Value | |
|
| U.S. GOVERNMENT AGENCY OBLIGATIONS (continued) | |
4.000% | | | 09/01/26 | | | | 260 | | | $ | 271,794 | |
4.000% | | | 10/01/39 | | | | 829 | | | | 889,211 | |
4.000% | | | 12/01/40 | | | | 393 | | | | 421,684 | |
4.000% | | | 10/01/41 | | | | 424 | | | | 453,482 | |
4.000% | | | 01/01/42 | | | | 151 | | | | 161,909 | |
4.000% | | | 10/01/45 | | | | 611 | | | | 648,477 | |
4.000% | | | 07/01/48 | | | | 9,768 | | | | 10,180,190 | |
4.500% | | | 07/01/20 | | | | 6 | | | | 6,080 | |
4.500% | | | 09/01/39 | | | | 281 | | | | 306,709 | |
4.500% | | | 10/01/39 | | | | 1,623 | | | | 1,769,489 | |
4.500% | | | 12/01/39 | | | | 493 | | | | 537,237 | |
4.500% | | | 07/01/41 | | | | 267 | | | | 290,394 | |
4.500% | | | 07/01/41 | | | | 1,833 | | | | 1,992,357 | |
4.500% | | | 08/01/41 | | | | 132 | | | | 144,372 | |
4.500% | | | 08/01/41 | | | | 198 | | | | 214,953 | |
4.500% | | | 08/01/41 | | | | 511 | | | | 555,469 | |
4.500% | | | 10/01/41 | | | | 148 | | | | 161,073 | |
4.500% | | | 10/01/46 | | | | 314 | | | | 336,295 | |
4.500% | | | 12/01/47 | | | | 1,800 | | | | 1,917,482 | |
4.500% | | | 08/01/48 | | | | 990 | | | | 1,047,029 | |
5.000% | | | 05/01/34 | | | | 22 | | | | 24,668 | |
5.000% | | | 05/01/34 | | | | 210 | | | | 232,744 | |
5.000% | | | 08/01/35 | | | | 22 | | | | 23,799 | |
5.000% | | | 09/01/35 | | | | 33 | | | | 36,837 | |
5.000% | | | 10/01/36 | | | | 34 | | | | 38,057 | |
5.000% | | | 05/01/37 | | | | 22 | | | | 24,797 | |
5.000% | | | 07/01/37 | | | | 450 | | | | 497,666 | |
5.000% | | | 09/01/38 | | | | 53 | | | | 58,656 | |
5.000% | | | 09/01/38 | | | | 56 | | | | 61,749 | |
5.000% | | | 09/01/38 | | | | 64 | | | | 70,730 | |
5.000% | | | 02/01/39 | | | | 22 | | | | 24,369 | |
5.000% | | | 06/01/39 | | | | 60 | | | | 66,141 | |
5.500% | | | 02/01/34 | | | | 33 | | | | 37,198 | |
5.500% | | | 04/01/34 | | | | 308 | | | | 345,497 | |
5.500% | | | 06/01/34 | | | | 107 | | | | 120,423 | |
5.500% | | | 06/01/34 | | | | 160 | | | | 178,971 | |
5.500% | | | 05/01/37 | | | | 49 | | | | 54,381 | |
5.500% | | | 02/01/38 | | | | 396 | | | | 443,417 | |
5.500% | | | 05/01/38 | | | | 71 | | | | 79,921 | |
5.500% | | | 07/01/38 | | | | 350 | | | | 391,972 | |
6.000% | | | 03/01/32 | | | | 143 | | | | 161,109 | |
6.000% | | | 12/01/33 | | | | 51 | | | | 54,658 | |
6.000% | | | 07/01/36 | | | | 3 | | | | 3,830 | |
6.000% | | | 12/01/36 | | | | 8 | | | | 9,681 | |
6.000% | | | 05/01/37 | | | | 13 | | | | 14,565 | |
6.000% | | | 12/01/37 | | | | 29 | | | | 33,133 | |
6.000% | | | 01/01/38 | | | | 4 | | | | 3,989 | |
6.000% | | | 01/01/38 | | | | 14 | | | | 15,379 | |
6.000% | | | 01/01/38 | | | | 299 | | | | 340,513 | |
6.000% | | | 10/01/38 | | | | 73 | | | | 83,570 | |
6.000% | | | 08/01/39 | | | | 41 | | | | 46,786 | |
6.750% | | | 09/15/29 | | | | 935 | | | | 1,309,850 | |
6.750% | | | 03/15/31 | | | | 500 | | | | 723,507 | |
7.000% | | | 01/01/31 | | | | 21 | | | | 23,859 | |
7.000% | | | 06/01/31 | | | | 29 | | | | 32,377 | |
7.000% | | | 09/01/31 | | | | 3 | | | | 3,873 | |
7.000% | | | 10/01/31 | | | | 40 | | | | 46,232 | |
7.000% | | | 10/01/32 | | | | 30 | | | | 32,875 | |
| | | | | | | | | | | | |
Interest
Rate | | Maturity
Date | | | Principal
Amount
(000)# | | | Value | |
|
| U.S. GOVERNMENT AGENCY OBLIGATIONS (continued) | |
Federal National Mortgage Assoc. | |
2.000% | | | 08/01/31 | | | | 1,318 | | | $ | 1,306,724 | |
2.500% | | | TBA | | | | 7,000 | | | | 7,062,510 | |
2.500% | | | 01/01/28 | | | | 1,071 | | | | 1,083,158 | |
2.500% | | | 10/01/43 | | | | 995 | | | | 996,417 | |
2.500% | | | 12/01/46 | | | | 1,801 | | | | 1,795,059 | |
2.500% | | | 09/01/49 | | | | 4,127 | | | | 4,082,072 | |
2.500% | | | 11/01/49 | | | | 5,499 | | | | 5,438,830 | |
3.000% | | | 02/01/27 | | | | 1,601 | | | | 1,643,992 | |
3.000% | | | 08/01/30 | | | | 971 | | | | 1,000,106 | |
3.000% | | | 11/01/36 | | | | 2,737 | | | | 2,811,119 | |
3.000% | | | 12/01/42 | | | | 1,213 | | | | 1,249,914 | |
3.000% | | | 12/01/42 | | | | 1,812 | | | | 1,866,214 | |
3.000% | | | 03/01/43 | | | | 326 | | | | 335,145 | |
3.000% | | | 11/01/46 | | | | 350 | | | | 358,508 | |
3.000% | | | 01/01/47 | | | | 2,647 | | | | 2,708,547 | |
3.000% | | | 02/01/47 | | | | 1,756 | | | | 1,797,116 | |
3.000% | | | 03/01/47 | | | | 1,319 | | | | 1,350,318 | |
3.500% | | | TBA | | | | 41,000 | | | | 42,174,650 | |
3.500% | | | 07/01/31 | | | | 967 | | | | 1,012,201 | |
3.500% | | | 11/01/32 | | | | 453 | | | | 474,542 | |
3.500% | | | 02/01/33 | | | | 1,358 | | | | 1,412,312 | |
3.500% | | | 05/01/33 | | | | 2,493 | | | | 2,585,151 | |
3.500% | | | 06/01/39 | | | | 647 | | | | 681,573 | |
3.500% | | | 01/01/42 | | | | 6,419 | | | | 6,764,696 | |
3.500% | | | 05/01/42 | | | | 3,074 | | | | 3,235,648 | |
3.500% | | | 07/01/42 | | | | 821 | | | | 864,476 | |
3.500% | | | 08/01/42 | | | | 330 | | | | 346,973 | |
3.500% | | | 08/01/42 | | | | 1,044 | | | | 1,099,190 | |
3.500% | | | 09/01/42 | | | | 987 | | | | 1,038,973 | |
3.500% | | | 09/01/42 | | | | 1,655 | | | | 1,742,193 | |
3.500% | | | 11/01/42 | | | | 597 | | | | 628,471 | |
3.500% | | | 03/01/43 | | | | 3,002 | | | | 3,166,946 | |
3.500% | | | 04/01/43 | | | | 561 | | | | 590,816 | |
3.500% | | | 04/01/43 | | | | 1,359 | | | | 1,431,112 | |
3.500% | | | 07/01/43 | | | | 270 | | | | 284,326 | |
3.500% | | | 06/01/45 | | | | 6,766 | | | | 7,072,494 | |
3.500% | | | 07/01/46 | | | | 1,381 | | | | 1,439,628 | |
3.500% | | | 11/01/46 | | | | 1,890 | | | | 1,970,854 | |
3.500% | | | 09/01/47 | | | | 2,046 | | | | 2,125,049 | |
3.500% | | | 05/01/48 | | | | 2,358 | | | | 2,430,159 | |
3.500% | | | 06/01/48 | | | | 5,570 | | | | 5,833,650 | |
3.500% | | | 07/01/48 | | | | 2,112 | | | | 2,176,700 | |
3.500% | | | 08/01/49 | | | | 25,051 | | | | 25,774,183 | |
4.000% | | | TBA | | | | 30,500 | | | | 31,723,660 | |
4.000% | | | 12/01/36 | | | | 1,059 | | | | 1,127,179 | |
4.000% | | | 10/01/41 | | | | 3,300 | | | | 3,531,935 | |
4.000% | | | 07/01/44 | | | | 1,252 | | | | 1,334,456 | |
4.000% | | | 09/01/44 | | | | 2,795 | | | | 2,972,671 | |
4.000% | | | 10/01/46 | | | | 866 | | | | 913,864 | |
4.000% | | | 06/01/47 | | | | 1,593 | | | | 1,675,109 | |
4.000% | | | 09/01/47 | | | | 573 | | | | 601,994 | |
4.000% | | | 11/01/47 | | | | 1,077 | | | | 1,152,352 | |
4.000% | | | 11/01/47 | | | | 3,059 | | | | 3,216,601 | |
4.500% | | | 07/01/33 | | | | 50 | | | | 53,156 | |
4.500% | | | 08/01/33 | | | | 13 | | | | 13,881 | |
4.500% | | | 09/01/33 | | | | 44 | | | | 47,033 | |
4.500% | | | 10/01/33 | | | | 120 | | | | 128,165 | |
SEE NOTES TO FINANCIAL STATEMENTS.
A98
| | | | | | |
| | |
| | FLEXIBLE MANAGED PORTFOLIO (continued) | | |
| | | | | | |
| |
| SCHEDULE OF INVESTMENTS | | as of December 31, 2019 |
| | | | | | | | | | | | |
Interest
Rate | | Maturity
Date | | | Principal
Amount
(000)# | | | Value | |
|
| U.S. GOVERNMENT AGENCY OBLIGATIONS (continued) | |
4.500% | | | 03/01/34 | | | | 34 | | | $ | 35,958 | |
4.500% | | | 01/01/35 | | | | 2 | | | | 2,378 | |
4.500% | | | 07/01/39 | | | | 853 | | | | 929,850 | |
4.500% | | | 08/01/39 | | | | 649 | | | | 706,877 | |
4.500% | | | 09/01/39 | | | | 461 | | | | 502,464 | |
4.500% | | | 12/01/39 | | | | 5 | | | | 5,408 | |
4.500% | | | 03/01/41 | | | | 1,561 | | | | 1,695,903 | |
4.500% | | | 07/01/42 | | | | 135 | | | | 146,847 | |
4.500% | | | 01/01/49 | | | | 1,413 | | | | 1,493,353 | |
5.000% | | | 03/01/34 | | | | 226 | | | | 248,672 | |
5.000% | | | 04/01/35 | | | | 544 | | | | 602,461 | |
5.000% | | | 06/01/35 | | | | 133 | | | | 147,474 | |
5.000% | | | 07/01/35 | | | | 94 | | | | 103,906 | |
5.000% | | | 07/01/35 | | | | 135 | | | | 149,126 | |
5.000% | | | 09/01/35 | | | | 80 | | | | 88,586 | |
5.000% | | | 11/01/35 | | | | 95 | | | | 104,717 | |
5.000% | | | 02/01/36 | | | | 75 | | | | 83,305 | |
5.500% | | | 02/01/33 | | | | 111 | | | | 124,651 | |
5.500% | | | 08/01/33 | | | | 197 | | | | 220,952 | |
5.500% | | | 10/01/33 | | | | 48 | | | | 53,365 | |
5.500% | | | 12/01/33 | | | | 51 | | | | 57,126 | |
5.500% | | | 12/01/34 | | | | 132 | | | | 147,916 | |
5.500% | | | 10/01/35 | | | | 533 | | | | 596,639 | |
5.500% | | | 03/01/36 | | | | 50 | | | | 56,316 | |
5.500% | | | 04/01/36 | | | | 111 | | | | 124,018 | |
5.500% | | | 01/01/37 | | | | 65 | | | | 73,265 | |
5.500% | | | 04/01/37 | | | | 35 | | | | 39,062 | |
5.500% | | | 05/01/37 | | | | 217 | | | | 243,097 | |
5.500% | | | 08/01/37 | | | | 261 | | | | 292,990 | |
6.000% | | | 05/01/21 | | | | 21 | | | | 21,378 | |
6.000% | | | 10/01/33 | | | | 260 | | | | 295,972 | |
6.000% | | | 11/01/33 | | | | 24 | | | | 26,901 | |
6.000% | | | 11/01/33 | | | | 30 | | | | 32,436 | |
6.000% | | | 01/01/34 | | | | 247 | | | | 282,653 | |
6.000% | | | 02/01/34 | | | | 103 | | | | 116,122 | |
6.000% | | | 03/01/34 | | | | 2 | | | | 2,260 | |
6.000% | | | 03/01/34 | | | | 13 | | | | 13,268 | |
6.000% | | | 03/01/34 | | | | 29 | | | | 32,519 | |
6.000% | | | 11/01/34 | | | | 24 | | | | 24,834 | |
6.000% | | | 01/01/35 | | | | 57 | | | | 66,086 | |
6.000% | | | 01/01/35 | | | | 116 | | | | 128,689 | |
6.000% | | | 02/01/35 | | | | 3 | | | | 3,482 | |
6.000% | | | 02/01/35 | | | | 108 | | | | 115,717 | |
6.000% | | | 02/01/35 | | | | 199 | | | | 227,332 | |
6.000% | | | 04/01/35 | | | | 17 | | | | 19,423 | |
6.000% | | | 12/01/35 | | | | 89 | | | | 94,544 | |
6.000% | | | 05/01/36 | | | | 40 | | | | 45,159 | |
6.000% | | | 06/01/36 | | | | 15 | | | | 16,351 | |
6.000% | | | 02/01/37 | | | | 69 | | | | 79,000 | |
6.000% | | | 06/01/37 | | | | 32 | | | | 35,905 | |
6.000% | | | 05/01/38 | | | | 183 | | | | 209,241 | |
6.250% | | | 05/15/29 | | | | 950 | | | | 1,283,023 | |
6.500% | | | 09/01/32 | | | | 1 | | | | 1,074 | |
6.500% | | | 09/01/32 | | | | 13 | | | | 14,149 | |
6.500% | | | 09/01/32 | | | | 41 | | | | 47,037 | |
6.500% | | | 09/01/32 | | | | 43 | | | | 50,080 | |
6.500% | | | 10/01/32 | | | | 44 | | | | 50,774 | |
6.500% | | | 04/01/33 | | | | 62 | | | | 70,940 | |
| | | | | | | | | | | | |
Interest
Rate | | Maturity
Date | | | Principal
Amount
(000)# | | | Value | |
|
| U.S. GOVERNMENT AGENCY OBLIGATIONS (continued) | |
6.500% | | | 11/01/33 | | | | 22 | | | $ | 22,812 | |
6.500% | | | 01/01/34 | | | | 43 | | | | 48,175 | |
6.500% | | | 09/01/34 | | | | 50 | | | | 57,405 | |
6.500% | | | 10/01/34 | | | | 44 | | | | 48,369 | |
6.500% | | | 09/01/36 | | | | 119 | | | | 139,237 | |
6.500% | | | 10/01/36 | | | | 33 | | | | 38,690 | |
6.500% | | | 11/01/36 | | | | 38 | | | | 40,696 | |
6.500% | | | 01/01/37 | | | | 39 | | | | 42,402 | |
6.500% | | | 01/01/37 | | | | 106 | | | | 117,944 | |
6.500% | | | 09/01/37 | | | | 15 | | | | 17,967 | |
6.625% | | | 11/15/30 | (k) | | | 550 | | | | 783,230 | |
7.000% | | | 02/01/32 | | | | 30 | | | | 34,941 | |
7.000% | | | 05/01/32 | | | | 14 | | | | 16,471 | |
7.000% | | | 06/01/32 | | | | 14 | | | | 15,738 | |
7.000% | | | 07/01/32 | | | | 55 | | | | 64,513 | |
7.125% | | | 01/15/30 | (k) | | | 3,600 | | | | 5,206,107 | |
Government National Mortgage Assoc. | |
2.500% | | | 03/20/43 | | | | 743 | | | | 751,611 | |
2.500% | | | 12/20/46 | | | | 934 | | | | 942,265 | |
3.000% | | | 03/15/45 | | | | 1,152 | | | | 1,188,939 | |
3.000% | | | 11/20/45 | | | | 1,275 | | | | 1,317,928 | |
3.000% | | | 03/20/46 | | | | 8,442 | | | | 8,709,656 | |
3.000% | | | 07/20/46 | | | | 3,311 | | | | 3,416,018 | |
3.000% | | | 12/20/46 | | | | 1,231 | | | | 1,269,652 | |
3.000% | | | 02/20/47 | | | | 2,514 | | | | 2,593,128 | |
3.500% | | | TBA | | | | 21,000 | | | | 21,644,700 | |
3.500% | | | 12/20/42 | | | | 1,878 | | | | 1,977,805 | |
3.500% | | | 05/20/43 | | | | 385 | | | | 404,210 | |
3.500% | | | 03/20/45 | | | | 1,638 | | | | 1,709,934 | |
3.500% | | | 04/20/45 | | | | 2,285 | | | | 2,385,109 | |
3.500% | | | 07/20/46 | | | | 8,332 | | | | 8,688,090 | |
3.500% | | | 07/20/48 | | | | 6,139 | | | | 6,365,112 | |
3.500% | | | 11/20/48 | | | | 3,386 | | | | 3,510,970 | |
4.000% | | | 06/15/40 | | | | 161 | | | | 170,422 | |
4.000% | | | 05/20/41 | | | | 298 | | | | 317,552 | |
4.000% | | | 12/20/42 | | | | 643 | | | | 683,999 | |
4.000% | | | 08/20/44 | | | | 293 | | | | 309,561 | |
4.000% | | | 11/20/45 | | | | 1,645 | | | | 1,732,933 | |
4.000% | | | 12/20/45 | | | | 1,749 | | | | 1,843,434 | |
4.000% | | | 11/20/46 | | | | 410 | | | | 430,111 | |
4.000% | | | 09/20/47 | | | | 6,930 | | | | 7,253,700 | |
4.000% | | | 02/20/49 | | | | 5,891 | | | | 6,133,909 | |
4.500% | | | 04/15/40 | | | | 684 | | | | 738,122 | |
4.500% | | | 01/20/41 | | | | 1,309 | | | | 1,407,624 | |
4.500% | | | 02/20/41 | | | | 824 | | | | 885,309 | |
4.500% | | | 06/20/44 | | | | 880 | | | | 950,324 | |
4.500% | | | 09/20/46 | | | | 522 | | | | 563,893 | |
4.500% | | | 11/20/46 | | | | 1,046 | | | | 1,129,543 | |
4.500% | | | 03/20/47 | | | | 1,037 | | | | 1,098,076 | |
4.500% | | | 05/20/48 | | | | 1,588 | | | | 1,667,076 | |
4.500% | | | 06/20/48 | | | | 2,158 | | | | 2,265,158 | |
4.500% | | | 08/20/48 | | | | 6,596 | | | | 6,923,501 | |
5.000% | | | 10/20/37 | | | | 117 | | | | 126,501 | |
5.000% | | | 04/20/45 | | | | 808 | | | | 883,879 | |
5.500% | | | 11/15/32 | | | | 78 | | | | 86,357 | |
5.500% | | | 02/15/33 | | | | 56 | | | | 61,831 | |
5.500% | | | 08/15/33 | | | | 117 | | | | 130,099 | |
5.500% | | | 08/15/33 | | | | 160 | | | | 173,254 | |
SEE NOTES TO FINANCIAL STATEMENTS.
A99
| | | | | | |
| | |
| | FLEXIBLE MANAGED PORTFOLIO (continued) | | |
| | | | | | |
| |
| SCHEDULE OF INVESTMENTS | | as of December 31, 2019 |
| | | | | | | | | | | | |
Interest
Rate | | Maturity
Date | | | Principal
Amount
(000)# | | | Value | |
|
| U.S. GOVERNMENT AGENCY OBLIGATIONS (continued) | |
5.500% | | | 09/15/33 | | | | 43 | | | $ | 44,790 | |
5.500% | | | 09/15/33 | | | | 82 | | | | 91,892 | |
5.500% | | | 10/15/33 | | | | 67 | | | | 76,646 | |
5.500% | | | 12/15/33 | | | | 11 | | | | 12,174 | |
5.500% | | | 04/15/34 | | | | 329 | | | | 367,301 | |
5.500% | | | 07/15/35 | | | | 63 | | | | 70,350 | |
5.500% | | | 02/15/36 | | | | 115 | | | | 128,354 | |
6.000% | | | 02/15/33 | | | | 2 | | | | 2,009 | |
6.000% | | | 04/15/33 | | | | 18 | | | | 20,048 | |
6.000% | | | 09/15/33 | | | | 14 | | | | 16,238 | |
6.000% | | | 12/15/33 | | | | 35 | | | | 40,078 | |
6.000% | | | 12/15/33 | | | | 99 | | | | 111,136 | |
6.000% | | | 01/15/34 | | | | 20 | | | | 23,067 | |
6.000% | | | 01/15/34 | | | | 33 | | | | 37,513 | |
6.000% | | | 06/20/34 | | | | 71 | | | | 81,179 | |
6.000% | | | 07/15/34 | | | | 158 | | | | 179,360 | |
6.000% | | | 10/15/34 | | | | 162 | | | | 179,548 | |
6.500% | | | 10/15/23 | | | | 1 | | | | 825 | |
6.500% | | | 12/15/23 | | | | 3 | | | | 3,141 | |
6.500% | | | 01/15/24 | | | | 1 | | | | 1,193 | |
6.500% | | | 01/15/24 | | | | 2 | | | | 1,552 | |
6.500% | | | 01/15/24 | | | | 4 | | | | 3,909 | |
6.500% | | | 01/15/24 | | | | 10 | | | | 10,416 | |
6.500% | | | 01/15/24 | | | | 15 | | | | 15,693 | |
6.500% | | | 01/15/24 | | | | 46 | | | | 48,006 | |
6.500% | | | 02/15/24 | | | | — | (r) | | | 251 | |
6.500% | | | 02/15/24 | | | | — | (r) | | | 382 | |
6.500% | | | 02/15/24 | | | | 2 | | | | 1,976 | |
6.500% | | | 02/15/24 | | | | 2 | | | | 2,215 | |
6.500% | | | 02/15/24 | | | | 3 | | | | 3,491 | |
6.500% | | | 02/15/24 | | | | 6 | | | | 6,280 | |
6.500% | | | 02/15/24 | | | | 7 | | | | 7,381 | |
6.500% | | | 02/15/24 | | | | 10 | | | | 10,431 | |
6.500% | | | 02/15/24 | | | | 13 | | | | 13,305 | |
6.500% | | | 02/15/24 | | | | 26 | | | | 25,948 | |
6.500% | | | 04/15/24 | | | | 1 | | | | 1,491 | |
6.500% | | | 04/15/24 | | | | 2 | | | | 1,687 | |
6.500% | | | 04/15/24 | | | | 2 | | | | 1,693 | |
6.500% | | | 04/15/24 | | | | 2 | | | | 2,015 | |
6.500% | | | 04/15/24 | | | | 3 | | | | 3,439 | |
6.500% | | | 04/15/24 | | | | 4 | | | | 3,799 | |
6.500% | | | 04/15/24 | | | | 10 | | | | 10,554 | |
6.500% | | | 05/15/24 | | | | 9 | | | | 9,867 | |
6.500% | | | 05/15/24 | | | | 13 | | | | 12,994 | |
6.500% | | | 10/15/24 | | | | 15 | | | | 15,394 | |
6.500% | | | 12/15/30 | | | | 7 | | | | 7,262 | |
6.500% | | | 01/15/32 | | | | 19 | | | | 21,925 | |
6.500% | | | 02/15/32 | | | | 16 | | | | 18,413 | |
6.500% | | | 07/15/32 | | | | 40 | | | | 45,788 | |
6.500% | | | 08/15/32 | | | | 5 | | | | 5,462 | |
6.500% | | | 08/15/32 | | | | 8 | | | | 8,312 | |
6.500% | | | 08/15/32 | | | | 27 | | | | 30,554 | |
6.500% | | | 08/15/32 | | | | 192 | | | | 219,435 | |
6.500% | | | 06/15/35 | | | | 5 | | | | 5,515 | |
6.500% | | | 06/15/35 | | | | 36 | | | | 41,364 | |
6.500% | | | 07/15/35 | | | | 7 | | | | 7,099 | |
8.000% | | | 01/15/24 | | | | 6 | | | | 6,485 | |
| | | | | | | | | | | | |
Interest
Rate | | Maturity
Date | | | Principal
Amount
(000)# | | | Value | |
|
| U.S. GOVERNMENT AGENCY OBLIGATIONS (continued) | |
8.000% | | | 04/15/25 | | | | 4 | | | $ | 4,559 | |
| | | | | | | | | | | | |
TOTAL U.S. GOVERNMENT AGENCY OBLIGATIONS
(cost $372,476,343) | | | | 378,631,522 | |
| | | | | | | | | | | | |
|
| U.S. TREASURY OBLIGATIONS — 0.7% | |
U.S. Treasury Bonds | |
2.250% | | | 08/15/49 | | | | 375 | | | | 363,750 | |
U.S. Treasury Notes | |
3.125% | | | 11/15/28 | (k) | | | 670 | | | | 736,686 | |
U.S. Treasury Strips Coupon | |
1.986%(s) | | | 08/15/39 | | | | 16,790 | | | | 10,441,937 | |
2.056%(s) | | | 11/15/38 | | | | 2,095 | | | | 1,334,580 | |
2.058%(s) | | | 02/15/39 | | | | 2,125 | | | | 1,340,493 | |
2.147%(s) | | | 05/15/39 | | | | 6,990 | | | | 4,384,041 | |
2.241%(s) | | | 05/15/28 | (k) | | | 2,553 | | | | 2,162,471 | |
2.244%(s) | | | 02/15/41 | | | | 770 | | | | 458,932 | |
2.287%(s) | | | 11/15/40 | | | | 990 | | | | 593,923 | |
2.328%(s) | | | 11/15/43 | | | | 9,756 | | | | 5,381,425 | |
2.334%(s) | | | 11/15/42 | | | | 465 | | | | 262,961 | |
2.334%(s) | | | 02/15/44 | | | | 385 | | | | 210,803 | |
2.365%(s) | | | 08/15/44 | (k) | | | 3,850 | | | | 2,081,406 | |
2.373%(s) | | | 11/15/44 | | | | 910 | | | | 489,160 | |
2.376%(s) | | | 11/15/41 | | | | 1,055 | | | | 614,991 | |
2.377%(s) | | | 05/15/42 | | | | 1,630 | | | | 936,486 | |
| | | | | | | | | | | | |
TOTAL U.S. TREASURY OBLIGATIONS
(cost $33,527,524) | | | | 31,794,045 | |
| | | | | | | | | | | | |
TOTAL LONG-TERM INVESTMENTS
(cost $3,543,363,497) | | | | 4,280,976,558 | |
| | | | | | | | | | | | |
| | |
| | | | Shares | | | | |
|
| SHORT-TERM INVESTMENTS — 6.3% | |
AFFILIATED MUTUAL FUNDS — 6.3% | |
PGIM Core Ultra Short Bond Fund(w) | | | | 153,379,057 | | | | 153,379,057 | |
PGIM Institutional Money Market Fund
(cost $117,650,253; includes $117,441,159 of cash collateral for securities on loan)(b)(w) | | | | 117,651,235 | | | | 117,674,766 | |
| | | | | | | | | | | | |
TOTAL AFFILIATED MUTUAL FUNDS
(cost $271,029,310) | | | | 271,053,823 | |
| | | | | | | | | | | | |
| | | |
Interest
Rate | | Maturity
Date | | | Principal
Amount
(000)# | | | | |
|
| U.S. TREASURY OBLIGATION(k)(n) — 0.0% | |
U.S. Treasury Bills | |
1.528% | | | 03/19/20 | | | | 150 | | | | 149,525 | |
| | | | | | | | | | | | |
(cost $149,505) | | | | | | | | | |
SEE NOTES TO FINANCIAL STATEMENTS.
A100
| | | | | | |
| | |
| | FLEXIBLE MANAGED PORTFOLIO (continued) | | |
| | | | | | |
| |
| SCHEDULE OF INVESTMENTS | | as of December 31, 2019 |
| | | | | | | | | | | | | | | | |
| | | | | | | | | | | | Value | |
OPTIONS PURCHASED*~ — 0.0%
(cost $19,300) | | | | | | | | | | | | | | $ | 517,516 | |
| | | | | | | | | | | | | | | | |
TOTAL SHORT-TERM INVESTMENTS
(cost $271,198,115) | | | | | | | | | | | | | | | 271,720,864 | |
| | | | | | | | | | | | | | | | |
TOTAL INVESTMENTS — 105.2%
(cost $3,814,561,612) | | | | | | | | | | | | | | | 4,552,697,422 | |
Liabilities in excess of other assets(z) — (5.2)% | | | | (224,841,216 | ) |
| | | | | | | | | | | | | | | | |
NET ASSETS — 100.0% | | | | | | | | | | | | | | $ | 4,327,856,206 | |
| | | | | | | | | | | | | | | | |
See the Glossary for a list of the abbreviation(s) used in the annual report.
| * | Non-income producing security. |
| # | Principal or notional amount is shown in U.S. dollars unless otherwise stated. |
| ~ | See tables subsequent to the Schedule of Investments for options detail. |
| ^ | Indicates a Level 3 instrument. The aggregate value of Level 3 instruments is $6,893,058 and 0.2% of net assets. |
| (a) | All or a portion of security is on loan. The aggregate market value of such securities, including those sold and pending settlement, is $115,209,133; cash collateral of $117,441,159 (included in liabilities) was received with which the Portfolio purchased highly liquid short-term investments. |
| (b) | Represents security purchased with cash collateral received for securities on loan and includes dividend reinvestment. |
| (c) | Variable rate instrument. The interest rate shown reflects the rate in effect at December 31, 2019. |
| (cc) | Variable rate instrument. The rate shown is based on the latest available information as of December 31, 2019. Certain variable rate securities are not based on a published reference rate and spread but are determined by the issuer or agent and are based on current market conditions. These securities do not indicate a reference rate and spread in their description. |
| (d) | Represents issuer in default on interest payments and/or principal repayment.Non-income producing security. Such securities may be post-maturity. |
| (ff) | Variable rate security. Security may be issued at a fixed coupon rate, which converts to a variable rate at a specified date. Rate shown is the rate in effect as of period end. |
| (k) | Represents security, or a portion thereof, segregated as collateral for centrally cleared/exchange-traded derivatives. |
| (n) | Rate shown reflects yield to maturity at purchased date. |
| (r) | Principal or notional amount is less than $500 par. |
| (rr) | Perpetual security with no stated maturity date. |
| (s) | Represents zero coupon bond or principal only security. Rate represents yield to maturity at purchase date. |
| (w) | PGIM Investments LLC, the manager of the Portfolio, also serves as manager of the PGIM Core Ultra Short Bond Fund and PGIM Institutional Money Market Fund. |
| (z) | Includes net unrealized appreciation/(depreciation) and/or market value of the below holdings which are excluded from the Schedule of Investments: |
Options Purchased:
OTC Traded
| | | | | | | | | | | | | | | | | | | | | | | | |
Description | | Call/
Put | | Counterparty | | Expiration
Date | | | Strike | | | Contracts | | | Notional
Amount
(000)# | | | Value | |
2- Year 10 CMS Curve CAP | | Call | | Barclays Bank PLC | | | 07/12/21 | | | | 0.11% | | | | — | | | | 3,379 | | | $ | 35,198 | |
2- Year 10 CMS Curve CAP | | Call | | Barclays Bank PLC | | | 07/13/21 | | | | 0.11% | | | | — | | | | 3,285 | | | | 34,187 | |
2- Year 10 CMS Curve CAP | | Call | | Bank of America, N.A. | | | 08/16/21 | | | | 0.15% | | | | — | | | | 8,212 | | | | 78,374 | |
2- Year 10 CMS Curve CAP | | Call | | Bank of America, N.A. | | | 08/20/21 | | | | 0.15% | | | | — | | | | 16,302 | | | | 163,561 | |
2- Year 10 CMS Curve CAP | | Call | | Bank of America, N.A. | | | 09/13/21 | | | | 0.14% | | | | — | | | | 16,540 | | | | 174,017 | |
2- Year 10 CMS Curve CAP | | Call | | Barclays Bank PLC | | | 11/09/21 | | | | 0.21% | | | | — | | | | 3,285 | | | | 32,179 | |
| | | | | | | | | | | | | | | | | | | | | | | | |
| Total Options Purchased (cost $19,300) | | | | | | | | | | | | | | | | | | $ | 517,516 | |
| | | | | | | | | | | | | | | | | | | | | | | | |
Futures contracts outstanding at December 31, 2019:
| | | | | | | | | | | | | | | | |
Number of
Contracts | | Type | | | Expiration
Date | | | Current
Notional
Amount | | | Value /
Unrealized
Appreciation
(Depreciation) | |
| Long Positions: | | | | | | | | | | | | | | | | |
| 1,411 | | | 5 Year U.S. Treasury Notes | | | | Mar. 2020 | | | $ | 167,357,835 | | | $ | (575,532 | ) |
| 395 | | | 10 Year U.S. Ultra Treasury Notes | | | | Mar. 2020 | | | | 55,577,736 | | | | (662,906 | ) |
| 384 | | | 30 Year U.S. Ultra Treasury Bonds | | | | Mar. 2020 | | | | 69,756,000 | | | | (1,840,467 | ) |
| 16 | | | Mini MSCI EAFE Index | | | | Mar. 2020 | | | | 1,629,200 | | | | (3,068 | ) |
| | | | | | | | | | | | | | | | |
| | | | | | | | | | | | | | | (3,081,973 | ) |
| | | | | | | | | | | | | | | | |
| Short Positions: | | | | | | | | | | | | | | | | |
| 312 | | | 90 Day Euro Dollar | | | | Dec. 2020 | | | | 76,736,400 | | | | 196,457 | |
| 691 | | | 2 Year U.S. Treasury Notes | | | | Mar. 2020 | | | | 148,910,500 | | | | 63,997 | |
| 22 | | | 10 Year Euro-Bund | | | | Mar. 2020 | | | | 4,207,250 | | | | 55,471 | |
| 163 | | | 10 Year U.S. Treasury Notes | | | | Mar. 2020 | | | | 20,932,767 | | | | 164,195 | |
SEE NOTES TO FINANCIAL STATEMENTS.
A101
| | | | | | |
| | |
| | FLEXIBLE MANAGED PORTFOLIO (continued) | | |
| | | | | | |
| |
| SCHEDULE OF INVESTMENTS | | as of December 31, 2019 |
Futures contracts outstanding at December 31, 2019 (continued):
| | | | | | | | | | | | | | |
Number of
Contracts | | Type | | Expiration
Date | | | Current
Notional
Amount | | | Value /
Unrealized
Appreciation
(Depreciation) | |
Short Positions (continued): | | | | | | | | | | | | |
| 17 | | 20 Year U.S. Treasury Bonds | | | Mar. 2020 | | | $ | 2,650,406 | | | $ | 53,615 | |
| | | | | | | | | | | | | | |
| | | | | | | | | | | | | 533,735 | |
| | | | | | | | | | | | | | |
| | | | | | | | | | | | $ | (2,548,238 | ) |
| | | | | | | | | | | | | | |
Forward foreign currency exchange contracts outstanding at December 31, 2019:
| | | | | | | | | | | | | | | | | | | | | | | | |
Purchase Contracts | | Counterparty | | | Notional
Amount
(000) | | | Value at
Settlement
Date | | | Current
Value | | | Unrealized
Appreciation | | | Unrealized
Depreciation | |
OTC Forward Foreign Currency Exchange Contracts: | |
Euro, | | | | | | | | | | | | | | | | | | | | | | | | |
Expiring 01/09/20 | | | Morgan Stanley & Co. International PLC | | | | EUR 1,447 | | | $ | 1,607,347 | | | $ | 1,623,625 | | | $ | 16,278 | | | $ | — | |
| | | | | | | | | | | | | | | | | | | | | | | | |
| | | | | | |
Sale Contracts | | Counterparty | | | Notional
Amount
(000) | | | Value at
Settlement
Date | | | Current
Value | | | Unrealized
Appreciation | | | Unrealized
Depreciation | |
OTC Forward Foreign Currency Exchange Contracts: | |
Canadian Dollar, | |
Expiring 01/22/20 | | | HSBC Bank USA, N.A. | | | | CAD 2,500 | | | $ | 1,915,112 | | | $ | 1,925,452 | | | $ | — | | | $ | (10,340 | ) |
Euro, | | | | | | | | | | | | | | | | | | | | | | | | |
Expiring 01/09/20 | | | Citibank, N.A. | | | | EUR 11,436 | | | | 12,679,019 | | | | 12,835,400 | | | | — | | | | (156,381 | ) |
| | | | | | | | | | | | | | | | | | | | | | | | |
| | | | | | | | | | $ | 14,594,131 | | | $ | 14,760,852 | | | | — | | | | (166,721 | ) |
| | | | | | | | | | | | | | | | | | | | | | | | |
| | | | | | | | | | | | | | | | | | $ | 16,278 | | | $ | (166,721 | ) |
| | | | | | | | | | | | | | | | | | | | | | | | |
Credit default swap agreements outstanding at December 31, 2019:
| | | | | | | | | | | | | | | | | | | | | | | | |
Reference Entity/ Obligation | | Termination
Date | | | Fixed
Rate | | | Notional
Amount
(000)#(3) | | | Value at
Trade Date | | | Value at
December 31, 2019 | | | Unrealized
Appreciation
(Depreciation) | |
Centrally Cleared Credit Default Swap Agreement on credit indices—Buy Protection(1): | |
CDX.NA.IG.33.V1 | | | 12/20/29 | | | | 1.000 | %(Q) | | | 24,000 | | | $ | 98,638 | | | $ | (216,571 | ) | | $ | (315,209 | ) |
| | | | | | | | | | | | | | | | | | | | | | | | |
The Portfolio entered into credit default swaps (“CDS”) to provide a measure of protection against defaults or to take an active long or short position with respect to the likelihood of a particular issuer’s default or the reference entity’s credit soundness. CDS contracts generally trade based on a spread which represents the cost a protection buyer has to pay the protection seller. The protection buyer is said to be short the credit as the value of the contract rises the more the credit deteriorates. The value of the CDS contract increases for the protection buyer if the spread increases.
| (1) | If the Portfolio is a buyer of protection, it pays the fixed rate. When a credit event occurs, as defined under the terms of that particular swap agreement, the Portfolio will either (i) receive from the seller of protection an amount equal to the notional amount of the swap and make delivery of the referenced obligation or underlying securities comprising the referenced index or (ii) receive a net settlement amount in the form of cash or securities equal to the notional amount of the swap less the recovery value of the referenced obligation or underlying securities comprising the referenced index. |
| (2) | If the Portfolio is a seller of protection, it receives the fixed rate. When a credit event occurs, as defined under the terms of that particular swap agreement, the Portfolio will either (i) pay to the buyer of protection an amount equal to the notional amount of the swap and take delivery of the referenced obligation or underlying securities comprising the referenced index or (ii) pay a net settlement amount in the form of cash or securities equal to the notional amount of the swap less the recovery value of the referenced obligation or underlying securities comprising the referenced index. |
| (3) | Notional amount represents the maximum potential amount the Portfolio could be required to pay as a seller of credit protection or receive as a buyer of credit protection if a credit event occurs as defined under the terms of that particular swap agreement. |
SEE NOTES TO FINANCIAL STATEMENTS.
A102
| | | | | | |
| | |
| | FLEXIBLE MANAGED PORTFOLIO (continued) | | |
| | | | | | |
| |
| SCHEDULE OF INVESTMENTS | | as of December 31, 2019 |
| (4) | Implied credit spreads, represented in absolute terms, utilized in determining the fair value of credit default swap agreements where the Portfolio is the seller of protection as of the reporting date serve as an indicator of the current status of the payment/ performance risk and represent the likelihood of risk of default for the credit derivative. The implied credit spread of a particular referenced entity reflects the cost of buying/selling protection and may includeup-front payments required to be made to enter into the agreement. Wider credit spreads represent a deterioration of the referenced entity’s credit soundness and a greater likelihood of risk of default or other credit event occurring as defined under the terms of the agreement. |
Interest rate swap agreements outstanding at December 31, 2019:
| | | | | | | | | | | | | | | | | | | | | | | | |
Notional
Amount
(000)# | | | Termination
Date | | | Fixed
Rate | | | Floating
Rate | | Value at
Trade Date | | | Value at
December 31,
2019 | | | Unrealized
Appreciaton
(Depreciation) | |
| | Centrally Cleared Interest Rate Swap Agreements: | | | | | | | | | | | | |
| EUR | 3,905 | | | | 05/11/24 | | | | 0.050%(A) | | | 1 Day EONIA(1)(A) | | $ | (43,095 | ) | | $ | (86,394 | ) | | $ | (43,299 | ) |
| EUR | 1,190 | | | | 05/11/39 | | | | 1.100%(A) | | | 1 Day EONIA(1)(A) | | | (10,808 | ) | | | (186,485 | ) | | | (175,677 | ) |
| | 12,277 | | | | 03/31/21 | | | | 2.173%(A) | | | 1 Day USOIS(2)(A) | | | (4,128 | ) | | | 115,838 | | | | 119,966 | |
| | 223,025 | | | | 06/15/21 | | | | 1.830%(S) | | | 3 Month LIBOR(2)(Q) | | | — | | | | 354,463 | | | | 354,463 | |
| | 53,193 | | | | 09/15/21 | | | | 1.381%(S) | | | 3 Month LIBOR(2)(Q) | | | (103,151 | ) | | | (273,063 | ) | | | (169,912 | ) |
| | 20,385 | | | | 09/15/21 | | | | 1.480%(S) | | | 3 Month LIBOR(2)(Q) | | | 19,358 | | | | (71,298 | ) | | | (90,656 | ) |
| | 13,965 | | | | 09/15/21 | | | | 1.604%(S) | | | 3 Month LIBOR(2)(Q) | | | 65,348 | | | | (19,867 | ) | | | (85,215 | ) |
| | 685 | | | | 05/31/22 | | | | 2.353%(A) | | | 1 Day USOIS(1)(A) | | | — | | | | (15,713 | ) | | | (15,713 | ) |
| | 4,330 | | | | 02/29/24 | | | | 1.520%(S) | | | 3 Month LIBOR(2)(Q) | | | — | | | | (31,354 | ) | | | (31,354 | ) |
| | 33,700 | | | | 03/29/24 | | | | 1.949%(A) | | | 1 Day USOIS(1)(A) | | | — | | | | (624,191 | ) | | | (624,191 | ) |
| | 610 | | | | 05/15/24 | | | | 1.808%(A) | | | 1 Day USOIS(1)(A) | | | — | | | | (7,759 | ) | | | (7,759 | ) |
| | 20,135 | | | | 08/15/24 | | | | 2.170%(S) | | | 3 Month LIBOR(1)(Q) | | | 49,779 | | | | (517,708 | ) | | | (567,487 | ) |
| | 14,985 | | | | 11/15/24 | | | | 2.334%(S) | | | 3 Month LIBOR(1)(Q) | | | 46,829 | | | | (432,106 | ) | | | (478,935 | ) |
| | 10,320 | | | | 02/12/25 | | | | 2.408%(A) | | | 1 Day USOIS(1)(A) | | | — | | | | (486,919 | ) | | | (486,919 | ) |
| | 4,710 | | | | 02/28/25 | | | | 2.454%(A) | | | 1 Day USOIS(1)(A) | | | — | | | | (236,770 | ) | | | (236,770 | ) |
| | 6,432 | | | | 05/31/25 | | | | 2.998%(S) | | | 3 Month LIBOR(1)(Q) | | | (4,468 | ) | | | (424,188 | ) | | | (419,720 | ) |
| | 3,575 | | | | 07/31/25 | | | | 2.802%(A) | | | 1 Day USOIS(1)(A) | | | — | | | | (262,645 | ) | | | (262,645 | ) |
| | 4,870 | | | | 07/31/25 | | | | 3.105%(S) | | | 3 Month LIBOR(1)(Q) | | | 3,842 | | | | (399,939 | ) | | | (403,781 | ) |
| | 16,149 | | | | 07/31/25 | | | | 3.109%(S) | | | 3 Month LIBOR(1)(Q) | | | 1,001 | | | | (1,330,314 | ) | | | (1,331,315 | ) |
| | 36,240 | | | | 01/08/26 | | | | 2.210%(S) | | | 3 Month LIBOR(1)(Q) | | | 294,382 | | | | (1,139,070 | ) | | | (1,433,452 | ) |
| | 860 | | | | 01/31/26 | | | | 2.236%(S) | | | 3 Month LIBOR(1)(Q) | | | — | | | | (28,722 | ) | | | (28,722 | ) |
| | 5,960 | | | | 01/31/26 | | | | 2.269%(A) | | | 1 Day USOIS(1)(A) | | | (24,421 | ) | | | (268,793 | ) | | | (244,372 | ) |
| | 8,033 | | | | 02/15/27 | | | | 1.824%(A) | | | 1 Day USOIS(1)(A) | | | 90,939 | | | | (119,889 | ) | | | (210,828 | ) |
| | 1,575 | | | | 02/15/27 | | | | 1.899%(A) | | | 1 Day USOIS(1)(A) | | | 1,997 | | | | (32,618 | ) | | | (34,615 | ) |
| | 1,325 | | | | 02/15/27 | | | | 1.965%(A) | | | 1 Day USOIS(1)(A) | | | — | | | | (34,158 | ) | | | (34,158 | ) |
| | 4,595 | | | | 02/15/27 | | | | 2.067%(A) | | | 1 Day USOIS(1)(A) | | | (2,908 | ) | | | (154,744 | ) | | | (151,836 | ) |
| | 1,580 | | | | 05/15/27 | | | | 1.823%(A) | | | 1 Day USOIS(1)(A) | | | — | | | | (25,813 | ) | | | (25,813 | ) |
| | 655 | | | | 05/15/27 | | | | 2.295%(S) | | | 3 Month LIBOR(1)(Q) | | | — | | | | (22,500 | ) | | | (22,500 | ) |
| | 25,041 | | | | 08/15/28 | | | | 2.579%(A) | | | 1 Day USOIS(1)(A) | | | (365,234 | ) | | | (2,038,124 | ) | | | (1,672,890 | ) |
| | 11,635 | | | | 08/15/28 | | | | 2.835%(S) | | | 3 Month LIBOR(1)(Q) | | | (50,614 | ) | | | (1,016,166 | ) | | | (965,552 | ) |
| | 290 | | | | 11/15/43 | | | | 2.659%(S) | | | 3 Month LIBOR(1)(Q) | | | — | | | | (32,631 | ) | | | (32,631 | ) |
| | 3,085 | | | | 08/09/49 | | | | 1.508%(A) | | | 1 Day USOIS(1)(A) | | | — | | | | 244,987 | | | | 244,987 | |
| | | | | | | | | | | | | | | | | | | | | | | | |
| | | | | | | | | | | | | | $ | (35,352 | ) | | $ | (9,604,653 | ) | | $ | (9,569,301 | ) |
| | | | | | | | | | | | | | | | | | | | | | | | |
| (1) | The Portfolio pays the fixed rate and receives the floating rate. |
| (2) | The Portfolio pays the floating rate and receives the fixed rate. |
Total return swap agreements outstanding at December 31, 2019:
| | | | | | | | | | | | | | | | | | | | | | | | | | |
Reference Entity | | Financing
Rate | | Counterparty | | | Termination
Date | | | Long (Short)
Notional
Amount
(000)#(1) | | | Fair
Value | | | Upfront
Premiums
Paid
(Received) | | | Unrealized
Appreciation
(Depreciation)(2) | |
OTC Total Return Swap Agreement: | | | | | | | | | | | | | | | | | | | | | | | | |
Barclays US Agency CMBS Index(T) | | 1 Month LIBOR(M) | | | Barclays Bank PLC | | | | 10/01/20 | | | | 16,000 | | | $ | (62,445 | ) | | $ | — | | | $ | (62,445) | |
| | | | | | | | | | | | | | | | | | | | | | | | | | |
SEE NOTES TO FINANCIAL STATEMENTS.
A103
| | | | | | |
| | |
| | FLEXIBLE MANAGED PORTFOLIO (continued) | | |
| | | | | | |
| |
| SCHEDULE OF INVESTMENTS | | as of December 31, 2019 |
| (1) | On a long total return swap, the Portfolio receives payments for any positive return on the reference entity (makes payments for any negative return) and pays the financing rate. On a short total return swap, the Portfolio makes payments for any positive return on the reference entity (receives payments for any negative return) and receives the financing rate. |
| (2) | Upfront/recurring fees or commissions, as applicable, are included in the net unrealized appreciation (depreciation). |
Balances Reported in the Statement of Assets and Liabilities for OTC Swap Agreements:
| | | | | | | | | | | | | | | | |
| | | Premiums Paid | | | Premiums Received | | | Unrealized
Appreciation | | | Unrealized
Depreciation | |
OTC Swap Agreements | | $ | — | | | $ | — | | | $ | — | | | $ | (62,445 | ) |
| | | | | | | | | | | | | | | | |
Summary of Collateral for Centrally Cleared/Exchange-traded Derivatives:
Cash and securities segregated as collateral, including pending settlement for closed positions, to cover requirements for centrally cleared/exchange-traded derivatives are listed by broker as follows:
| | | | | | | | |
Broker | | Cash and/or Foreign Currency | | | Securities Market Value | |
Citigroup Global Markets, Inc. | | $ | — | | | $ | 9,841,260 | |
Goldman Sachs & Co. LLC | | | — | | | | 149,525 | |
| | | | | | | | |
Total | | $ | — | | | $ | 9,990,785 | |
| | | | | | | | |
Fair Value Measurements:
Various inputs are used in determining the value of the Portfolio’s investments. These inputs are summarized in the three broad levels listed below.
| Level 1— | unadjusted quoted prices generally in active markets for identical securities. |
| Level 2— | quoted prices for similar securities, interest rates and yield curves, prepayment speeds, foreign currency exchange rates and other observable inputs. |
| Level 3— | unobservable inputs for securities valued in accordance with Board approved fair valuation procedures. |
The following is a summary of the inputs used as of December 31, 2019 in valuing such portfolio securities:
| | | | | | | | | | | | |
| | | Level 1 | | | Level 2 | | | Level 3 | |
Investments in Securities | | | | | | | | | | | | |
Assets | | | | | | | | | | | | |
Common Stocks | | $ | 2,668,415,731 | | | $ | 82,932,013 | | | $ | — | |
Exchange-Traded Fund | | | 422,751 | | | | — | | | | — | |
Preferred Stocks | | | 611,600 | | | | 672,578 | | | | — | |
Rights | | | 3,852 | | | | — | | | | — | |
Asset-Backed Securities | | | | | | | | | | | | |
Automobiles | | | — | | | | 90,106,074 | | | | — | |
Collateralized Loan Obligations | | | — | | | | 131,710,153 | | | | — | |
Consumer Loans | | | — | | | | 5,760,152 | | | | — | |
Credit Cards | | | — | | | | 11,953,983 | | | | — | |
Equipment | | | — | | | | 10,274,767 | | | | — | |
Home Equity Loans | | | — | | | | 2,468,333 | | | | — | |
Other | | | — | | | | 7,082,663 | | | | — | |
Residential Mortgage-Backed Securities | | | — | | | | 20,007,329 | | | | — | |
Student Loans | | | — | | | | 34,480,387 | | | | — | |
Commercial Mortgage-Backed Securities | | | — | | | | 284,168,749 | | | | — | |
Corporate Bonds | | | — | | | | 409,036,726 | | | | — | |
Municipal Bonds | | | — | | | | 19,026,699 | | | | — | |
Residential Mortgage-Backed Securities | | | — | | | | 46,811,896 | | | | 6,893,058 | |
Sovereign Bonds | | | — | | | | 37,711,497 | | | | — | |
U.S. Government Agency Obligations | | | — | | | | 378,631,522 | | | | — | |
U.S. Treasury Obligations | | | — | | | | 31,943,570 | | | | — | |
Affiliated Mutual Funds | | | 271,053,823 | | | | — | | | | — | |
Options Purchased | | | — | | | | 517,516 | | | | — | |
| | | | | | | | | | | | |
Total | | $ | 2,940,507,757 | | | $ | 1,605,296,607 | | | $ | 6,893,058 | |
| | | | | | | | | | | | |
SEE NOTES TO FINANCIAL STATEMENTS.
A104
| | | | | | |
| | |
| | FLEXIBLE MANAGED PORTFOLIO (continued) | | |
| | | | | | |
| |
| SCHEDULE OF INVESTMENTS | | as of December 31, 2019 |
| | | | | | | | | | | | |
| | | Level 1 | | | Level 2 | | | Level 3 | |
Other Financial Instruments* | | | | | | | | | | | | |
Assets | | | | | | | | | | | | |
Futures Contracts | | $ | 533,735 | | | $ | — | | | $ | — | |
OTC Forward Foreign Currency Exchange Contract | | | — | | | | 16,278 | | | | — | |
Centrally Cleared Interest Rate Swap Agreements | | | — | | | | 719,416 | | | | — | |
| | | | | | | | | | | | |
Total. | | $ | 533,735 | | | $ | 735,694 | | | $ | — | |
| | | | | | | | | | | | |
| | | |
Liabilities | | | | | | | | | | | | |
Futures Contracts | | $ | (3,081,973 | ) | | $ | — | | | $ | — | |
OTC Forward Foreign Currency Exchange Contracts | | | — | | | | (166,721 | ) | | | — | |
Centrally Cleared Credit Default Swap Agreement | | | — | | | | (315,209 | ) | | | — | |
Centrally Cleared Interest Rate Swap Agreements | | | — | | | | (10,288,717 | ) | | | — | |
OTC Total Return Swap Agreement | | | — | | | | (62,445 | ) | | | — | |
| | | | | | | | | | | | |
Total | | $ | (3,081,973 | ) | | $ | (10,833,092 | ) | | $ | — | |
| | | | | | | | | | | | |
| * | Other financial instruments are derivative instruments not reflected in the Schedule of Investments, such as futures, forwards and centrally cleared swap contracts, which are recorded at the unrealized appreciation (depreciation) on the instrument, and OTC swap contracts which are recorded at fair value. |
Industry Classification:
The industry classification of investments and liabilities in excess of other assets shown as a percentage of net assets as of December 31, 2019 were as follows (unaudited):
| | | | |
U.S. Government Agency Obligations | | | 8.7 | % |
Commercial Mortgage-Backed Securities | | | 6.6 | |
Affiliated Mutual Funds (2.7% represents investments purchased with collateral from securities on loan) | | | 6.3 | |
Banks | | | 6.1 | |
Software | | | 4.8 | |
Pharmaceuticals | | | 3.9 | |
Technology Hardware, Storage & Peripherals | | | 3.6 | |
Interactive Media & Services | | | 3.4 | |
Collateralized Loan Obligations | | | 3.0 | |
IT Services | | | 2.9 | |
Semiconductors & Semiconductor Equipment | | | 2.9 | |
Automobiles | | | 2.8 | |
Health Care Equipment & Supplies | | | 2.6 | |
Aerospace & Defense | | | 2.1 | |
Oil, Gas & Consumable Fuels | | | 2.1 | |
Internet & Direct Marketing Retail | | | 2.1 | |
Insurance | | | 1.9 | |
Diversified Telecommunication Services | | | 1.8 | |
Capital Markets | | | 1.8 | |
Residential Mortgage-Backed Securities | | | 1.7 | |
Biotechnology | | | 1.7 | |
Chemicals | | | 1.6 | |
Health Care Providers & Services | | | 1.5 | |
Beverages | | | 1.4 | |
Equity Real Estate Investment Trusts (REITs) | | | 1.4 | |
Food Products | | | 1.2 | |
Media | | | 1.1 | |
Household Products | | | 1.0 | |
Electric | | | 1.0 | |
Specialty Retail | | | 1.0 | |
Food & Staples Retailing | | | 0.9 | |
Sovereign Bonds | | | 0.9 | |
Hotels, Restaurants & Leisure | | | 0.9 | |
Electric Utilities | | | 0.8 | |
| | | | |
Multiline Retail | | | 0.8 | % |
Student Loans | | | 0.8 | |
Diversified Financial Services | | | 0.8 | |
U.S. Treasury Obligations | | | 0.7 | |
Industrial Conglomerates | | | 0.7 | |
Tobacco | | | 0.6 | |
Consumer Finance | | | 0.6 | |
Communications Equipment | | | 0.6 | |
Oil & Gas | | | 0.6 | |
Machinery | | | 0.6 | |
Construction Materials | | | 0.6 | |
Building Products | | | 0.5 | |
Independent Power & Renewable Electricity Producers | | | 0.5 | |
Life Sciences Tools & Services | | | 0.5 | |
Auto Manufacturers | | | 0.5 | |
Household Durables | | | 0.5 | |
Telecommunications | | | 0.5 | |
Municipal Bonds | | | 0.4 | |
Entertainment | | | 0.4 | |
Textiles, Apparel & Luxury Goods | | | 0.4 | |
Pipelines | | | 0.4 | |
Trading Companies & Distributors | | | 0.3 | |
Multi-Utilities | | | 0.3 | |
Gas Utilities | | | 0.3 | |
Road & Rail | | | 0.3 | |
Credit Cards | | | 0.3 | |
Construction & Engineering | | | 0.3 | |
Foods | | | 0.2 | |
Commercial Services & Supplies | | | 0.2 | |
Equipment | | | 0.2 | |
Distributors | | | 0.2 | |
Retail | | | 0.2 | |
Healthcare-Services | | | 0.2 | |
Other | | | 0.2 | |
Electrical Equipment | | | 0.2 | |
SEE NOTES TO FINANCIAL STATEMENTS.
A105
| | | | | | |
| | |
| | FLEXIBLE MANAGED PORTFOLIO (continued) | | |
| | | | | | |
| |
| SCHEDULE OF INVESTMENTS | | as of December 31, 2019 |
| | | | |
Industry Classification (continued): | | | |
Electronic Equipment, Instruments & Components | | | 0.2 | % |
Airlines | | | 0.1 | |
Air Freight & Logistics | | | 0.1 | |
Consumer Loans | | | 0.1 | |
Real Estate Management & Development | | | 0.1 | |
Commercial Services | | | 0.1 | |
Energy Equipment & Services | | | 0.1 | |
Mortgage Real Estate Investment Trusts (REITs) | | | 0.1 | |
Professional Services | | | 0.1 | |
Agriculture | | | 0.1 | |
Gas | | | 0.1 | |
Multi-National | | | 0.1 | |
Metals & Mining | | | 0.1 | |
Containers & Packaging | | | 0.1 | |
Engineering & Construction | | | 0.1 | |
Healthcare-Products | | | 0.1 | |
Miscellaneous Manufacturing | | | 0.1 | |
Home Equity Loans | | | 0.1 | |
Semiconductors | | | 0.1 | |
Diversified Consumer Services | | | 0.1 | |
Forest Products & Paper | | | 0.1 | |
Transportation | | | 0.1 | |
Housewares | | | 0.0 | * |
Wireless Telecommunication Services | | | 0.0 | * |
| | | | |
Savings & Loans | | | 0.0 | *% |
Packaging & Containers | | | 0.0 | * |
Home Builders | | | 0.0 | * |
Personal Products | | | 0.0 | * |
Machinery-Diversified | | | 0.0 | * |
Real Estate Investment Trusts (REITs) | | | 0.0 | * |
Lodging | | | 0.0 | * |
Mining | | | 0.0 | * |
Electronics | | | 0.0 | * |
Transportation Infrastructure | | | 0.0 | * |
Building Materials | | | 0.0 | * |
Options Purchased | | | 0.0 | * |
Exchange-Traded Fund | | | 0.0 | * |
Leisure Products | | | 0.0 | * |
Oil & Gas Services | | | 0.0 | * |
Marine | | | 0.0 | * |
Paper & Forest Products | | | 0.0 | * |
| | | | |
| | | 105.2 | |
Liabilities in excess of other assets | | | (5.2 | ) |
| | | | |
| | | 100.0 | % |
| | | | |
Effects of Derivative Instruments on the Financial Statements and Primary Underlying Risk Exposure:
The Portfolio invested in derivative instruments during the reporting period. The primary types of risk associated with these derivative instruments are credit contracts risk, equity contracts risk, foreign exchange contracts risk and interest rate contracts risk. See the Notes to Financial Statements for additional detail regarding these derivative instruments and their risks. The effect of such derivative instruments on the Portfolio’s financial position and financial performance as reflected in the Statement of Assets and Liabilities and Statement of Operations is presented in the summary below.
Fair values of derivative instruments as of December 31, 2019 as presented in the Statement of Assets and Liabilities:
| | | | | | | | | | | | |
Derivatives not accounted for as hedging
instruments, carried at fair value | | Asset Derivatives | | | Liability Derivatives | |
| | Statement of
Assets and
Liabilities Location | | Fair Value | | | Statement of
Assets and
Liabilities Location | | Fair Value | |
Credit contracts | | — | | $ | — | | | Due from/to broker-variation margin swaps | | $ | 315,209 | * |
Equity contracts | | — | | | — | | | Due from/to broker-variation margin futures | | | 3,068 | * |
Equity contracts | | Unaffiliated investments | | | 3,852 | | | — | | | — | |
Foreign exchange contracts | | Unrealized appreciation on OTC forward foreign currency exchange contracts | | | 16,278 | | | Unrealized depreciation on OTC forward foreign currency exchange contracts | | | 166,721 | |
Interest rate contracts | | Due from/to broker-variation margin futures | | | 533,735 | * | | Due from/to broker-variation margin futures | | | 3,078,905 | * |
Interest rate contracts | | Due from/to broker-variation margin swaps | | | 719,416 | * | | Due from/to broker-variation margin swaps | | | 10,288,717 | * |
Interest rate contracts | | Unaffiliated investments | | | 517,516 | | | — | | | — | |
Interest rate contracts | | — | | | — | | | Unrealized depreciation on OTC swap agreements | | | 62,445 | |
| | | | | | | | | | | | |
| | | | $ | 1,790,797 | | | | | $ | 13,915,065 | |
| | | | | | | | | | | | |
| * | Includes cumulative appreciation (depreciation) as reported in the schedule of open futures and centrally cleared swap contracts. Only unsettled variation margin receivable (payable) is reported within the Statement of Assets and Liabilities. |
SEE NOTES TO FINANCIAL STATEMENTS.
A106
| | | | | | |
| | |
| | FLEXIBLE MANAGED PORTFOLIO (continued) | | |
| | | | | | |
| |
| SCHEDULE OF INVESTMENTS | | as of December 31, 2019 |
The effects of derivative instruments on the Statement of Operations for the year ended December 31, 2019 are as follows:
| | | | | | | | | | | | | | | | | | | | | | | | |
Amount of Realized Gain (Loss) on Derivatives Recognized in Income | |
Derivatives not accounted for as hedging
instruments, carried at fair value | | Options
Purchased(1) | | | Options
Written | | | Futures | | | Forward
Currency
Contracts | | | Forward
Rate
Agreements | | | Swaps | |
Credit contracts | | $ | — | | | $ | — | | | $ | — | | | $ | — | | | $ | — | | | $ | (944,029 | ) |
Equity contracts | | | — | | | | — | | | | 141,458 | | | | — | | | | — | | | | — | |
Foreign exchange contracts | | | — | | | | — | | | | — | | | | 536,428 | | | | — | | | | — | |
Interest rate contracts | | | (774,740 | ) | | | 350,323 | | | | 30,990,115 | | | | — | | | | (1,053,551 | ) | | | 787,285 | |
| | | | | | | | | | | | | | | | | | | | | | | | |
Total | | $ | (774,740 | ) | | $ | 350,323 | | | $ | 31,131,573 | | | $ | 536,428 | | | $ | (1,053,551 | ) | | $ | (156,744 | ) |
| | | | | | | | | | | | | | | | | | | | | | | | |
| (1) | Included in net realized gain (loss) on investment transactions in the Statement of Operations. |
| | | | | | | | | | | | | | | | | | | | | | | | |
Change in Unrealized Appreciation (Depreciation) on Derivatives Recognized in Income | |
Derivatives not accounted for as hedging
instruments, carried at fair value | | Rights(2) | | | Options
Purchased(2) | | | Futures | | | Forward
Currency
Exchange
Contracts | | | Forward
Rate
Agreements | | | Swaps | |
Credit contracts. | | $ | — | | | $ | — | | | $ | — | | | $ | — | | | $ | — | | | $ | (1,098,419 | ) |
Equity contracts | | | 201 | | | | — | | | | 13,334 | | | | — | | | | — | | | | — | |
Foreign exchange contracts | | | — | | | | — | | | | — | | | | (64,324 | ) | | | — | | | | — | |
Interest rate contracts | | | — | | | | 25,984 | | | | (9,329,679 | ) | | | — | | | | 74,123 | | | | (10,798,528 | ) |
| | | | | | | | | | | | | | | | | | | | | | | | |
Total | | $ | 201 | | | $ | 25,984 | | | $ | (9,316,345 | ) | | $ | (64,324 | ) | | $ | 74,123 | | | $ | (11,896,947 | ) |
| | | | | | | | | | | | | | | | | | | | | | | | |
| (2) | Included in net change in unrealized appreciation (depreciation) on investments in the Statement of Operations. |
For the year ended December 31, 2019, the Portfolio’s average volume of derivative activities is as follows:
| | | | | | | | |
Options
Purchased(1) | | Options
Written(2) | | Futures
Contracts—
Long
Positions(2) | | Futures
Contracts—
Short
Positions(2) | | Forward Foreign
Currency Exchange
Contracts—
Purchased(3) |
| $187,990 | | $1,469,800 | | $467,655,703 | | $212,591,361 | | $4,908,435 |
| | | | | | |
Forward Foreign
Currency Exchange
Contracts—Sold(3) | | Forward Rate
Agreements(2) | | Interest Rate
Swap
Agreements(2) | | Credit Default
Swap Agreements—
Buy Protection(2) |
| $15,706,389 | | $198,340,000 | | $372,165,031 | | $36,000,000 |
| | |
Total Return
Swap
Agreements(2) | | Inflation Swap
Agreements(2) |
| $6,400,000 | | $2,184,000 |
| (2) | Notional Amount in USD. |
| (3) | Value at Settlement Date. |
Financial Instruments/Transactions—Summary of Offsetting and Netting Arrangements:
The Portfolio invested in OTC derivatives and entered into financial instruments/transactions during the reporting period that are either offset in accordance with current requirements or are subject to enforceable master netting arrangements or similar agreements that permit offsetting. The information about offsetting and related netting arrangements for OTC derivatives and financial instruments/transactions where the legal right toset-off exists is presented in the summary below.
SEE NOTES TO FINANCIAL STATEMENTS.
A107
| | | | | | |
| | |
| | FLEXIBLE MANAGED PORTFOLIO (continued) | | |
| | | | | | |
| |
| SCHEDULE OF INVESTMENTS | | as of December 31, 2019 |
Offsetting of financial instrument/transaction assets and liabilities:
| | | | | | | | | | | | |
Description | | Gross Market
Value of
Recognized
Assets/(Liabilities) | | | Collateral
Pledged/(Received)(2) | | | Net
Amount | |
Securities on Loan | | $ | 115,209,133 | | | $ | (115,209,133 | ) | | $ | — | |
| | | | | | | | | | | | |
Offsetting of OTC derivative assets and liabilities:
| | | | | | | | | | | | | | | | | | | | |
Counterparty | | Gross Amounts of
Recognized
Assets(1) | | | Gross Amounts of
Recognized
Liabilities(1) | | | Net Amounts of
Recognized
Assets/(Liabilities) | | | Collateral
Pledged/(Received)(2) | | | Net Amount | |
Bank of America, N.A. | | $ | 415,952 | | | $ | — | | | $ | 415,952 | | | $ | (415,952 | ) | | $ | — | |
Barclays Bank PLC | | | 101,564 | | | | (62,445 | ) | | | 39,119 | | | | — | | | | 39,119 | |
Citibank, N.A. | | | — | | | | (156,381 | ) | | | (156,381 | ) | | | — | | | | (156,381 | ) |
HSBC Bank USA, N.A. | | | — | | | | (10,340 | ) | | | (10,340 | ) | | | — | | | | (10,340 | ) |
Morgan Stanley & Co. International PLC | | | 16,278 | | | | — | | | | 16,278 | | | | — | | | | 16,278 | |
| | | | | | | | | | | | | | | | | | | | |
| | $ | 533,794 | | | $ | (229,166 | ) | | $ | 304,628 | | | $ | (415,952 | ) | | $ | (111,324 | ) |
| | | | | | | | | | | | | | | | | | | | |
| (1) | Includes unrealized appreciation/(depreciation) on swaps and forwards, premiums paid/(received) on swap agreements and market value of purchased and written options, as represented on the Statement of Assets and Liabilities. |
| (2) | Collateral amount disclosed by the Portfolio is limited to the market value of financial instruments/transactions and the Portfolio’s OTC derivative exposure by counterparty. |
SEE NOTES TO FINANCIAL STATEMENTS.
A108
| | | | | | |
| | |
| | FLEXIBLE MANAGED PORTFOLIO (continued) | | |
STATEMENT OF ASSETS AND LIABILITIES
as of December 31, 2019
| | | | |
| ASSETS | | | | |
Investments at value, including securities on loan of $115,209,133: | | | | |
Unaffiliated investments (cost $3,543,532,302) | | $ | 4,281,643,599 | |
Affiliated investments (cost $271,029,310) | | | 271,053,823 | |
Cash | | | 373,402 | |
Foreign currency, at value (cost $184,595) | | | 186,478 | |
Receivable for investments sold | | | 60,180,083 | |
Dividends and interest receivable | | | 10,447,520 | |
Tax reclaim receivable | | | 452,623 | |
Due from broker-variation margin swaps | | | 414,111 | |
Unrealized appreciation on OTC forward foreign currency exchange contracts | | | 16,278 | |
Due from broker-variation margin futures | | | 8,117 | |
Receivable for Portfolio shares sold | | | 2,353 | |
Receivable from affiliate | | | 974 | |
Prepaid expenses and other assets | | | 36,789 | |
| | | | |
Total Assets | | | 4,624,816,150 | |
| | | | |
| LIABILITIES | | | | |
Payable for investments purchased | | | 174,923,022 | |
Payable to broker for collateral for securities on loan | | | 117,441,159 | |
Management fee payable | | | 2,188,160 | |
Payable for Portfolio shares repurchased | | | 807,078 | |
Accrued expenses and other liabilities | | | 596,860 | |
Due to broker-variation margin futures | | | 549,731 | |
Payable to affiliate | | | 223,788 | |
Unrealized depreciation on OTC forward foreign currency exchange contracts | | | 166,721 | |
Unrealized depreciation on OTC swap agreements | | | 62,445 | |
Affiliated transfer agent fee payable | | | 980 | |
| | | | |
Total Liabilities | | | 296,959,944 | |
| | | | |
| NET ASSETS | | $ | 4,327,856,206 | |
| | | | |
Net assets were comprised of: | | | | |
Partners’ Equity | | $ | 4,327,856,206 | |
| | | | |
Net asset value and redemption price per share, $4,327,856,206 / 126,104,682 outstanding shares of beneficial interest | | $ | 34.32 | |
| | | | |
STATEMENT OF OPERATIONS
Year Ended December 31, 2019
| | | | |
| NET INVESTMENT INCOME (LOSS) | | | | |
| INCOME | | | | |
Unaffiliated dividend income (net of $139,963 foreign withholding tax, of which $19,183 is reimbursable by an affiliate) | | $ | 53,319,859 | |
Interest income (net of $1,931 foreign withholding tax) | | | 45,815,883 | |
Affiliated dividend income | | | 5,900,161 | |
Income from securities lending, net (including affiliated income of $234,519) | | | 250,253 | |
| | | | |
Total income | | | 105,286,156 | |
| | | | |
| EXPENSES | | | | |
Management fee | | | 24,762,784 | |
Shareholders’ reports | | | 448,738 | |
Custodian and accounting fees | | | 440,497 | |
Trustees’ fees | | | 56,660 | |
Audit fee | | | 46,933 | |
Legal fees and expenses | | | 25,723 | |
Transfer agent’s fees and expenses (including affiliated expense of $5,882) | | | 10,684 | |
Miscellaneous | | | 88,245 | |
| | | | |
Total expenses | | | 25,880,264 | |
| | | | |
| NET INVESTMENT INCOME (LOSS) | | | 79,405,892 | |
| | | | |
| REALIZED AND UNREALIZED GAIN (LOSS) ON INVESTMENT AND FOREIGN CURRENCY TRANSACTIONS | | | | |
Net realized gain (loss) on: | | | | |
Investment transactions (including affiliated of $(3,394,833)) | | | 146,015,598 | |
Futures transactions | | | 31,131,573 | |
Forward rate agreement transactions | | | (1,053,551 | ) |
Forward currency contract transactions | | | 536,428 | |
Options written transactions | | | 350,323 | |
Swap agreements transactions | | | (156,744 | ) |
Foreign currency transactions | | | (63,587 | ) |
| | | | |
| | | 176,760,040 | |
| | | | |
Net change in unrealized appreciation (depreciation) on: | | | | |
Investments (including affiliated of $3,586,957) | | | 507,191,436 | |
Futures | | | (9,316,345 | ) |
Forward rate agreements | | | 74,123 | |
Forward currency contracts | | | (64,324 | ) |
Swap agreements | | | (11,896,947 | ) |
Foreign currencies | | | 4,125 | |
| | | | |
| | | 485,992,068 | |
| | | | |
| NET GAIN (LOSS) ON INVESTMENT AND FOREIGN CURRENCY TRANSACTIONS | | | 662,752,108 | |
| | | | |
| NET INCREASE (DECREASE) IN NET ASSETS RESULTING FROM OPERATIONS | | $ | 742,158,000 | |
| | | | |
STATEMENTS OF CHANGES IN NET ASSETS
| | | | | | | | |
| | | Year Ended
December 31, 2019 | | | Year Ended
December 31, 2018 | |
| INCREASE (DECREASE) IN NET ASSETS | | | | | | | | |
| OPERATIONS | | | | | | | | |
Net investment income (loss) | | $ | 79,405,892 | | | $ | 72,609,431 | |
Net realized gain (loss) on investment and foreign currency transactions | | | 176,760,040 | | | | 235,710,436 | |
Net change in unrealized appreciation (depreciation) on investments and foreign currencies | | | 485,992,068 | | | | (472,582,378 | ) |
| | | | | | | | |
NET INCREASE (DECREASE) IN NET ASSETS RESULTING FROM OPERATIONS | | | 742,158,000 | | | | (164,262,511 | ) |
| | | | | | | | |
| PORTFOLIO SHARE TRANSACTIONS | | | | | | | | |
Portfolio shares sold [177,562 and 233,974 shares, respectively] | | | 5,636,300 | | | | 7,057,478 | |
Portfolio shares repurchased [7,989,312 and 7,894,348 shares, respectively] | | | (253,479,611 | ) | | | (239,041,615 | ) |
| | | | | | | | |
NET INCREASE (DECREASE) IN NET ASSETS FROM PORTFOLIO SHARE TRANSACTIONS | | | (247,843,311 | ) | | | (231,984,137 | ) |
| | | | | | | | |
| CAPITAL CONTRIBUTIONS | | | 14,632 | | | | 72,588 | |
| | | | | | | | |
| TOTAL INCREASE (DECREASE) | | | 494,329,321 | | | | (396,174,060 | ) |
| NET ASSETS: | | | | | | | | |
Beginning of year | | | 3,833,526,885 | | | | 4,229,700,945 | |
| | | | | | | | |
End of year | | $ | 4,327,856,206 | | | $ | 3,833,526,885 | |
| | | | | | | | |
SEE NOTES TO FINANCIAL STATEMENTS.
A109
| | | | | | |
| |
| SCHEDULE OF INVESTMENTS | | as of December 31, 2019 |
| | | | | | | | |
| LONG-TERM INVESTMENTS — 96.8% | | | | |
| COMMON STOCKS — 96.4% | | Shares | | | Value | |
Australia — 1.9% | | | | | | | | |
AGL Energy Ltd. | | | 66,200 | | | $ | 952,863 | |
Aristocrat Leisure Ltd. | | | 105,928 | | | | 2,509,685 | |
Beach Energy Ltd. | | | 58,000 | | | | 103,174 | |
Coca-Cola Amatil Ltd. | | | 30,000 | | | | 232,882 | |
CSL Ltd. | | | 25,142 | | | | 4,868,454 | |
CSR Ltd. | | | 334,900 | | | | 1,067,719 | |
Fortescue Metals Group Ltd. | | | 201,900 | | | | 1,519,030 | |
Harvey Norman Holdings Ltd.(a) | | | 196,000 | | | | 560,484 | |
Inghams Group Ltd. | | | 268,900 | | | | 635,263 | |
Lendlease Group | | | 56,900 | | | | 701,877 | |
Macquarie Group Ltd. | | | 47,717 | | | | 4,617,544 | |
Metcash Ltd. | | | 412,500 | | | | 742,617 | |
Mineral Resources Ltd. | | | 57,700 | | | | 670,457 | |
Perenti Global Ltd. | | | 432,300 | | | | 493,027 | |
Qantas Airways Ltd. | | | 292,200 | | | | 1,463,860 | |
Rio Tinto Ltd. | | | 20,600 | | | | 1,454,651 | |
St. Barbara Ltd. | | | 343,600 | | | | 653,275 | |
Stockland | | | 200,300 | | | | 649,253 | |
Super Retail Group Ltd. | | | 12,400 | | | | 88,128 | |
| | | | | | | | |
| | | | | | | 23,984,243 | |
| | | | | | | | |
Austria — 0.3% | | | | | | | | |
OMV AG | | | 33,700 | | | | 1,893,711 | |
voestalpine AG | | | 28,800 | | | | 808,108 | |
Wienerberger AG | | | 26,400 | | | | 782,374 | |
| | | | | | | | |
| | | | | | | 3,484,193 | |
| | | | | | | | |
Belgium — 0.2% | | | | | | | | |
Bekaert SA | | | 22,500 | | | | 668,083 | |
UCB SA | | | 15,000 | | | | 1,193,028 | |
| | | | | | | | |
| | | | | | | 1,861,111 | |
| | | | | | | | |
Canada — 2.2% | | | | | | | | |
Brookfield Asset Management, Inc. (Class A Stock) | | | 92,906 | | | | 5,369,967 | |
Canadian National Railway Co. | | | 58,565 | | | | 5,297,933 | |
Dollarama, Inc. | | | 70,672 | | | | 2,428,933 | |
Magna International, Inc. | | | 47,527 | | | | 2,606,381 | |
TC Energy Corp. | | | 136,050 | | | | 7,252,825 | |
Toronto-Dominion Bank (The) | | | 78,745 | | | | 4,416,463 | |
| | | | | | | | |
| | | | | | | 27,372,502 | |
| | | | | | | | |
China — 2.6% | | | | | | | | |
Alibaba Group Holding Ltd., ADR* | | | 72,724 | | | | 15,424,760 | |
China Merchants Bank Co. Ltd. (Class H Stock) | | | 866,500 | | | | 4,464,024 | |
China Resources Cement Holdings Ltd. | | | 1,234,000 | | | | 1,574,422 | |
Kingboard Holdings Ltd. | | | 216,000 | | | | 687,583 | |
Lee & Man Paper Manufacturing Ltd. | | | 1,049,000 | | | | 796,460 | |
NetEase, Inc., ADR | | | 11,992 | | | | 3,677,227 | |
TAL Education Group, ADR* | | | 16,032 | | | | 772,742 | |
Tencent Holdings Ltd. | | | 106,100 | | | | 5,106,992 | |
| | | | | | | | |
| | | | | | | 32,504,210 | |
| | | | | | | | |
Denmark — 1.3% | | | | | | | | |
Coloplast A/S (Class B Stock) | | | 32,350 | | | | 4,010,012 | |
| | | | | | | | |
COMMON STOCKS
(continued) | | Shares | | | Value | |
Denmark (continued) | | | | | | | | |
Danske Bank A/S | | | 61,200 | | | $ | 990,530 | |
Dfds A/S | | | 11,300 | | | | 551,092 | |
DSV Panalpina A/S | | | 17,087 | | | | 1,968,953 | |
Novo Nordisk A/S (Class B Stock) | | | 76,544 | | | | 4,444,469 | |
Orsted A/S, 144A | | | 40,240 | | | | 4,165,951 | |
| | | | | | | | |
| | | | | | | 16,131,007 | |
| | | | | | | | |
Finland — 0.2% | | | | | | | | |
Neste OYJ | | | 28,250 | | | | 983,590 | |
Nordea Bank Abp | | | 83,600 | | | | 675,112 | |
UPM-Kymmene OYJ | | | 30,100 | | | | 1,043,403 | |
Valmet OYJ | | | 14,900 | | | | 357,131 | |
| | | | | | | | |
| | | | | | | 3,059,236 | |
| | | | | | | | |
France — 4.4% | | | | | | | | |
Airbus SE | | | 36,449 | | | | 5,343,159 | |
Arkema SA | | | 11,900 | | | | 1,264,548 | |
Atos SE | | | 11,390 | | | | 951,883 | |
AXA SA | | | 54,100 | | | | 1,524,370 | |
BNP Paribas SA | | | 23,200 | | | | 1,379,209 | |
Bouygues SA | | | 27,600 | | | | 1,174,566 | |
Capgemini SE | | | 31,908 | | | | 3,898,603 | |
Cie Generale des Etablissements Michelin SCA | | | 9,600 | | | | 1,175,582 | |
CNP Assurances | | | 42,800 | | | | 851,860 | |
Credit Agricole SA | | | 78,500 | | | | 1,140,223 | |
Engie SA | | | 82,000 | | | | 1,325,600 | |
LVMH Moet Hennessy Louis Vuitton SE | | | 13,226 | | | | 6,158,458 | |
Natixis SA | | | 146,400 | | | | 651,231 | |
Nexity SA | | | 13,100 | | | | 658,371 | |
Orange SA | | | 72,700 | | | | 1,069,643 | |
Peugeot SA | | | 30,500 | | | | 733,747 | |
Renault SA | | | 12,300 | | | | 582,179 | |
Safran SA | | | 34,514 | | | | 5,335,724 | |
Sanofi | | | 39,700 | | | | 3,995,421 | |
Societe BIC SA | | | 700 | | | | 48,672 | |
Societe Generale SA | | | 28,600 | | | | 996,751 | |
Sopra Steria Group | | | 7,100 | | | | 1,143,988 | |
TOTAL SA | | | 68,100 | | | | 3,770,828 | |
TOTAL SA, ADR | | | 184,592 | | | | 10,207,938 | |
Valeo SA | | | 8,300 | | | | 292,499 | |
| | | | | | | | |
| | | | | | | 55,675,053 | |
| | | | | | | | |
Germany — 2.3% | | | | | | | | |
Allianz SE | | | 10,200 | | | | 2,499,885 | |
Aurubis AG | | | 10,800 | | | | 666,438 | |
Bayerische Motoren Werke AG | | | 14,800 | | | | 1,216,864 | |
Covestro AG, 144A | | | 26,100 | | | | 1,221,224 | |
Daimler AG | | | 17,600 | | | | 976,631 | |
Deutsche Lufthansa AG | | | 54,200 | | | | 1,000,699 | |
Deutsche Post AG | | | 60,200 | | | | 2,305,546 | |
Evonik Industries AG | | | 36,500 | | | | 1,123,007 | |
Infineon Technologies AG | | | 163,677 | | | | 3,740,397 | |
METRO AG | | | 46,000 | | | | 736,304 | |
MuenchenerRueckversicherungs-Gesellschaft AG in Muenchen | | | 5,000 | | | | 1,474,964 | |
SEE NOTES TO FINANCIAL STATEMENTS.
A110
| | | | | | |
| | |
| | GLOBAL PORTFOLIO (continued) | | |
| | | | | | |
| |
| SCHEDULE OF INVESTMENTS | | as of December 31, 2019 |
| | | | | | | | |
COMMON STOCKS
(continued) | | Shares | | | Value | |
Germany (continued) | | | | | | | | |
Rational AG | | | 3,391 | | | $ | 2,728,442 | |
Rheinmetall AG | | | 9,200 | | | | 1,059,430 | |
SAP SE | | | 30,588 | | | | 4,150,221 | |
Siemens AG | | | 7,600 | | | | 995,899 | |
Siltronic AG | | | 8,900 | | | | 902,826 | |
Volkswagen AG | | | 10,600 | | | | 2,067,558 | |
| | | | | | | | |
| | | | | | | 28,866,335 | |
| | | | | | | | |
Hong Kong — 0.8% | | | | | | | | |
AIA Group Ltd. | | | 644,600 | | | | 6,775,047 | |
PAX Global Technology Ltd. | | | 933,000 | | | | 438,445 | |
Skyworth Group Ltd.* | | | 1,072,000 | | | | 310,865 | |
Tongda Group Holdings Ltd. | | | 3,246,000 | | | | 407,320 | |
WH Group Ltd., 144A | | | 1,291,500 | | | | 1,337,590 | |
Yue Yuen Industrial Holdings Ltd. | | | 296,500 | | | | 877,580 | |
| | | | | | | | |
| | | | | | | 10,146,847 | |
| | | | | | | | |
India — 0.5% | | | | | | | | |
HDFC Bank Ltd., ADR | | | 56,484 | | | | 3,579,391 | |
Reliance Industries Ltd., 144A, GDR | | | 49,148 | | | | 2,093,422 | |
| | | | | | | | |
| | | | | | | 5,672,813 | |
| | | | | | | | |
Ireland — 0.4% | | | | | | | | |
Kingspan Group PLC | | | 69,129 | | | | 4,225,999 | |
Smurfit Kappa Group PLC | | | 35,200 | | | | 1,352,345 | |
| | | | | | | | |
| | | | | | | 5,578,344 | |
| | | | | | | | |
Israel — 0.3% | | | | | | | | |
Bank Hapoalim BM | | | 85,600 | | | | 711,312 | |
Check Point Software Technologies Ltd.*(a) | | | 28,825 | | | | 3,198,422 | |
| | | | | | | | |
| | | | | | | 3,909,734 | |
| | | | | | | | |
Italy — 0.7% | | | | | | | | |
A2A SpA | | | 546,200 | | | | 1,025,215 | |
Enel SpA | | | 455,800 | | | | 3,619,914 | |
Ferrari NV | | | 7,448 | | | | 1,234,158 | |
Leonardo SpA | | | 97,000 | | | | 1,137,018 | |
Mediobanca Banca di Credito Finanziario SpA | | | 87,600 | | | | 965,713 | |
UnipolSai Assicurazioni SpA | | | 253,700 | | | | 736,282 | |
| | | | | | | | |
| | | | | | | 8,718,300 | |
| | | | | | | | |
Japan — 6.5% | | | | | | | | |
AGC, Inc. | | | 42,400 | | | | 1,514,418 | |
Aisan Industry Co. Ltd. | | | 68,400 | | | | 493,636 | |
Aisin Seiki Co. Ltd. | | | 14,000 | | | | 519,499 | |
Asahi Intecc Co. Ltd. | | | 41,500 | | | | 1,213,241 | |
Astellas Pharma, Inc. | | | 152,500 | | | | 2,605,832 | |
Brother Industries Ltd. | | | 34,700 | | | | 714,344 | |
Credit Saison Co. Ltd. | | | 42,600 | | | | 738,992 | |
Daikin Industries Ltd. | | | 26,300 | | | | 3,708,374 | |
Daiwa House Industry Co. Ltd. | | | 31,900 | | | | 986,293 | |
EDION Corp. | | | 3,100 | | | | 34,460 | |
Fujikura Ltd. | | | 88,500 | | | | 363,751 | |
Hazama Ando Corp. | | | 85,900 | | | | 745,973 | |
Hitachi Capital Corp. | | | 28,500 | | | | 748,332 | |
Hitachi Ltd. | | | 27,000 | | | | 1,137,440 | |
| | | | | | | | |
COMMON STOCKS
(continued) | | Shares | | | Value | |
Japan (continued) | | | | | | | | |
Honda Motor Co. Ltd. | | | 2,800 | | | $ | 79,257 | |
Hoya Corp. | | | 39,100 | | | | 3,739,199 | |
Isuzu Motors Ltd. | | | 78,200 | | | | 926,337 | |
ITOCHU Corp. | | | 82,800 | | | | 1,922,619 | |
Japan Airlines Co. Ltd. | | | 35,700 | | | | 1,109,872 | |
Japan Aviation Electronics Industry Ltd. | | | 46,000 | | | | 927,829 | |
JTEKT Corp. | | | 50,800 | | | | 599,332 | |
Kaneka Corp. | | | 14,800 | | | | 474,647 | |
KDDI Corp. | | | 106,900 | | | | 3,190,613 | |
Keihin Corp. | | | 50,600 | | | | 1,182,613 | |
Keiyo Bank Ltd. (The) | | | 76,500 | | | | 441,692 | |
Keyence Corp. | | | 17,200 | | | | 6,055,809 | |
Komatsu Ltd. | | | 30,800 | | | | 741,241 | |
Konica Minolta, Inc. | | | 113,700 | | | | 738,627 | |
Lintec Corp. | | | 30,000 | | | | 667,718 | |
Marubeni Corp. | | | 173,200 | | | | 1,279,131 | |
Matsumotokiyoshi Holdings Co. Ltd. | | | 23,800 | | | | 920,722 | |
Mazda Motor Corp. | | | 56,700 | | | | 482,990 | |
Mitsubishi Chemical Holdings Corp. | | | 82,800 | | | | 618,942 | |
Mitsubishi Gas Chemical Co., Inc. | | | 70,200 | | | | 1,069,569 | |
Mitsubishi UFJ Financial Group, Inc. | | | 274,000 | | | | 1,482,080 | |
Mitsubishi UFJ Lease & Finance Co. Ltd. | | | 165,800 | | | | 1,066,955 | |
Mitsui & Co. Ltd. | | | 75,000 | | | | 1,331,282 | |
Mitsui Chemicals, Inc. | | | 42,400 | | | | 1,034,897 | |
Mizuho Financial Group, Inc. | | | 736,200 | | | | 1,132,263 | |
Nikon Corp. | | | 45,200 | | | | 552,609 | |
Nippon Telegraph & Telephone Corp. | | | 138,600 | | | | 3,518,758 | |
Nishi-Nippon Financial Holdings, Inc. | | | 48,600 | | | | 379,466 | |
Nisshin Oillio Group Ltd. (The) | | | 21,400 | | | | 741,156 | |
Nitori Holdings Co. Ltd. | | | 13,100 | | | | 2,069,211 | |
Nomura Real Estate Holdings, Inc. | | | 27,200 | | | | 651,510 | |
NTT DOCOMO, Inc. | | | 24,800 | | | | 690,758 | |
Obayashi Corp. | | | 14,800 | | | | 164,600 | |
ORIX Corp. | | | 64,800 | | | | 1,075,452 | |
Resona Holdings, Inc. | | | 366,600 | | | | 1,598,303 | |
Sawai Pharmaceutical Co. Ltd. | | | 9,200 | | | | 583,468 | |
Shiseido Co. Ltd. | | | 50,600 | | | | 3,595,566 | |
SKY Perfect JSAT Holdings, Inc. | | | 151,000 | | | | 670,867 | |
SMC Corp. | | | 8,400 | | | | 3,832,783 | |
Sompo Holdings, Inc. | | | 33,400 | | | | 1,309,210 | |
Sumitomo Corp. | | | 109,000 | | | | 1,616,134 | |
Sumitomo Forestry Co. Ltd. | | | 50,100 | | | | 739,674 | |
Sumitomo Heavy Industries Ltd. | | | 32,300 | | | | 918,511 | |
Sumitomo Mitsui Financial Group, Inc. | | | 40,900 | | | | 1,506,799 | |
Teijin Ltd. | | | 67,300 | | | | 1,259,443 | |
Toagosei Co. Ltd. | | | 28,700 | | | | 330,726 | |
Toho Holdings Co. Ltd. | | | 12,400 | | | | 274,886 | |
Towa Pharmaceutical Co. Ltd. | | | 28,200 | | | | 732,859 | |
Toyo Tire Corp. | | | 27,900 | | | | 400,611 | |
Toyoda Gosei Co. Ltd. | | | 33,200 | | | | 829,978 | |
Toyota Motor Corp. | | | 15,730 | | | | 1,108,804 | |
Tsubakimoto Chain Co. | | | 17,000 | | | | 598,234 | |
Ube Industries Ltd. | | | 30,100 | | | | 652,653 | |
Ulvac, Inc. | | | 17,900 | | | | 706,918 | |
Yokohama Rubber Co. Ltd. (The) | | | 45,000 | | | | 874,614 | |
| | | | | | | | |
| | | | | | | 82,725,382 | |
| | | | | | | | |
SEE NOTES TO FINANCIAL STATEMENTS.
A111
| | | | | | |
| | |
| | GLOBAL PORTFOLIO (continued) | | |
| | | | | | |
| |
| SCHEDULE OF INVESTMENTS | | as of December 31, 2019 |
| | | | | | | | |
COMMON STOCKS
(continued) | | Shares | | | Value | |
Luxembourg — 0.1% | | | | | | | | |
Tenaris SA | | | 122,176 | | | $ | 1,379,907 | |
| | | | | | | | |
Macau — 0.2% | | | | | | | | |
Galaxy Entertainment Group Ltd. | | | 405,000 | | | | 2,986,812 | |
| | | | | | | | |
Netherlands — 2.2% | | | | | | | | |
ABN AMRO Bank NV, 144A, CVA | | | 45,300 | | | | 825,816 | |
Adyen NV, 144A* | | | 3,332 | | | | 2,733,847 | |
Aegon NV | | | 215,700 | | | | 985,807 | |
ING Groep NV | | | 79,200 | | | | 951,680 | |
Koninklijke Ahold Delhaize NV | | | 95,900 | | | | 2,397,126 | |
Koninklijke Philips NV | | | 87,131 | | | | 4,261,011 | |
NN Group NV | | | 27,800 | | | | 1,055,427 | |
NXP Semiconductors NV | | | 85,636 | | | | 10,898,037 | |
Royal Dutch Shell PLC (Class B Stock) | | | 69,700 | | | | 2,074,604 | |
Signify NV, 144A | | | 46,800 | | | | 1,463,822 | |
| | | | | | | | |
| | | | | | | 27,647,177 | |
| | | | | | | | |
New Zealand — 0.1% | | | | | | | | |
Air New Zealand Ltd. | | | 485,600 | | | | 959,763 | |
| | | | | | | | |
Norway — 0.3% | | | | | | | | |
DNB ASA | | | 68,200 | | | | 1,274,873 | |
Equinor ASA | | | 55,200 | | | | 1,102,187 | |
Leroy Seafood Group ASA | | | 170,000 | | | | 1,129,851 | |
| | | | | | | | |
| | | | | | | 3,506,911 | |
| | | | | | | | |
Portugal — 0.1% | | | | | | | | |
Altri SGPS SA | | | 102,400 | | | | 655,806 | |
| | | | | | | | |
Singapore — 0.1% | | | | | | | | |
DBS Group Holdings Ltd. | | | 62,300 | | | | 1,199,866 | |
Venture Corp. Ltd. | | | 3,000 | | | | 36,279 | |
| | | | | | | | |
| | | | | | | 1,236,145 | |
| | | | | | | | |
South Africa — 0.0% | | | | | | | | |
Investec PLC | | | 79,700 | | | | 469,419 | |
| | | | | | | | |
Spain — 1.0% | | | | | | | | |
ACS Actividades de Construccion y Servicios SA | | | 83,782 | | | | 3,358,279 | |
Amadeus IT Group SA | | | 51,805 | | | | 4,234,920 | |
Banco Santander SA | | | 199,500 | | | | 836,707 | |
Iberdrola SA | | | 55,600 | | | | 574,129 | |
Mapfre SA | | | 494,400 | | | | 1,310,043 | |
Repsol SA | | | 117,700 | | | | 1,845,454 | |
Telefonica SA | | | 142,000 | | | | 992,944 | |
| | | | | | | | |
| | | | | | | 13,152,476 | |
| | | | | | | | |
Sweden — 1.2% | | | | | | | | |
Atlas Copco AB (Class A Stock) | | | 121,496 | | | | 4,844,708 | |
Boliden AB | | | 35,400 | | | | 940,543 | |
Electrolux AB (Class B Stock) | | | 37,400 | | | | 917,506 | |
Hexagon AB (Class B Stock) | | | 69,586 | | | | 3,895,977 | |
Sandvik AB | | | 45,200 | | | | 880,297 | |
SKF AB (Class B Stock) | | | 70,400 | | | | 1,422,308 | |
Swedbank AB (Class A Stock) | | | 18,400 | | | | 273,725 | |
Volvo AB (Class B Stock) | | | 133,200 | | | | 2,228,943 | |
| | | | | | | | |
| | | | | | | 15,404,007 | |
| | | | | | | | |
Switzerland — 2.7% | | | | | | | | |
Adecco Group AG | | | 15,300 | | | | 967,026 | |
| | | | | | | | |
COMMON STOCKS
(continued) | | Shares | | | Value | |
Switzerland (continued) | | | | | | | | |
Baloise Holding AG | | | 6,000 | | | $ | 1,084,988 | |
Credit Suisse Group AG* | | | 136,900 | | | | 1,847,828 | |
Helvetia Holding AG | | | 4,600 | | | | 650,635 | |
Landis+Gyr Group AG* | | | 7,900 | | | | 820,766 | |
Lonza Group AG* | | | 14,274 | | | | 5,208,528 | |
Partners Group Holding AG(a) | | | 4,551 | | | | 4,179,716 | |
Roche Holding AG | | | 19,200 | | | | 6,230,415 | |
Sika AG | | | 18,243 | | | | 3,428,830 | |
Swiss Life Holding AG | | | 3,400 | | | | 1,707,533 | |
Swiss Re AG | | | 14,000 | | | | 1,572,047 | |
Temenos AG* | | | 22,763 | | | | 3,613,927 | |
UBS Group AG* | | | 100,600 | | | | 1,270,242 | |
Zurich Insurance Group AG | | | 4,700 | | | | 1,927,984 | |
| | | | | | | | |
| | | | | | | 34,510,465 | |
| | | | | | | | |
Taiwan — 0.6% | | | | | | | | |
Taiwan Semiconductor Manufacturing Co. Ltd. | | | 653,000 | | | | 7,249,518 | |
| | | | | | | | |
United Kingdom — 5.4% | | | | | | | | |
3i Group PLC | | | 117,200 | | | | 1,708,501 | |
Abcam PLC | | | 51,636 | | | | 925,419 | |
Ashtead Group PLC | | | 35,200 | | | | 1,127,312 | |
Aviva PLC | | | 164,200 | | | | 915,959 | |
Babcock International Group PLC | | | 113,300 | | | | 944,822 | |
BAE Systems PLC | | | 286,300 | | | | 2,142,633 | |
Barclays PLC | | | 373,500 | | | | 891,555 | |
Barratt Developments PLC | | | 61,900 | | | | 614,917 | |
Bellway PLC | | | 13,600 | | | | 686,306 | |
Bovis Homes Group PLC | | | 37,300 | | | | 672,536 | |
BP PLC | | | 361,100 | | | | 2,264,499 | |
British American Tobacco PLC | | | 49,500 | | | | 2,121,372 | |
BT Group PLC | | | 455,900 | | | | 1,162,460 | |
Centrica PLC | | | 457,200 | | | | 541,193 | |
CK Hutchison Holdings Ltd. | | | 160,300 | | | | 1,529,784 | |
Compass Group PLC | | | 148,216 | | | | 3,718,928 | |
Crest Nicholson Holdings PLC | | | 143,814 | | | | 823,099 | |
Debenhams PLC*^ | | | 228,400 | | | | 30 | |
Diageo PLC | | | 88,111 | | | | 3,743,601 | |
Dialog Semiconductor PLC* | | | 1,900 | | | | 96,542 | |
Experian PLC | | | 148,184 | | | | 5,010,686 | |
GlaxoSmithKline PLC | | | 145,300 | | | | 3,427,328 | |
Go-Ahead Group PLC (The) | | | 34,500 | | | | 1,014,196 | |
Imperial Brands PLC | | | 56,400 | | | | 1,404,763 | |
Inchcape PLC | | | 66,600 | | | | 623,851 | |
International Consolidated Airlines Group SA | | | 150,000 | | | | 1,242,857 | |
J Sainsbury PLC | | | 405,100 | | | | 1,234,633 | |
Keller Group PLC | | | 48,200 | | | | 479,072 | |
Kingfisher PLC | | | 357,200 | | | | 1,026,918 | |
Legal & General Group PLC | | | 302,800 | | | | 1,224,836 | |
Lloyds Banking Group PLC | | | 1,666,000 | | | | 1,383,051 | |
London Stock Exchange Group PLC | | | 44,406 | | | | 4,572,184 | |
Marks & Spencer Group PLC | | | 279,900 | | | | 797,306 | |
National Express Group PLC | | | 114,300 | | | | 711,963 | |
Paragon Banking Group PLC | | | 105,900 | | | | 759,186 | |
Premier Foods PLC* | | | 357,756 | | | | 179,647 | |
QinetiQ Group PLC | | | 137,800 | | | | 652,607 | |
Redrow PLC | | | 77,600 | | | | 767,540 | |
SEE NOTES TO FINANCIAL STATEMENTS.
A112
| | | | | | |
| | |
| | GLOBAL PORTFOLIO (continued) | | |
| | | | | | |
| |
| SCHEDULE OF INVESTMENTS | | as of December 31, 2019 |
| | | | | | | | |
COMMON STOCKS
(continued) | | Shares | | | Value | |
United Kingdom (continued) | | | | | | | | |
RELX PLC | | | 172,160 | | | $ | 4,347,941 | |
Royal Mail PLC | | | 120,900 | | | | 362,424 | |
Segro PLC, REIT | | | 329,095 | | | | 3,920,784 | |
St. James’s Place PLC | | | 126,590 | | | | 1,960,023 | |
Tate & Lyle PLC | | | 141,000 | | | | 1,422,242 | |
Taylor Wimpey PLC | | | 263,400 | | | | 678,667 | |
Tesco PLC | | | 518,400 | | | | 1,754,191 | |
Vesuvius PLC | | | 81,100 | | | | 536,740 | |
| | | | | | | | |
| | | | | | | 68,127,104 | |
| | | | | | | | |
United States — 57.8% | | | | | | | | |
AbbVie, Inc. | | | 45,609 | | | | 4,038,221 | |
Adobe, Inc.* | | | 23,572 | | | | 7,774,281 | |
Alphabet, Inc. (Class C Stock)* | | | 9,994 | | | | 13,362,178 | |
Amazon.com, Inc.* | | | 8,962 | | | | 16,560,342 | |
American International Group, Inc. | | | 172,391 | | | | 8,848,830 | |
Amphenol Corp. (Class A Stock) | | | 99,543 | | | | 10,773,539 | |
Applied Materials, Inc. | | | 95,503 | | | | 5,829,503 | |
Autodesk, Inc.* | | | 76,178 | | | | 13,975,616 | |
AXA Equitable Holdings, Inc. | | | 106,580 | | | | 2,641,052 | |
Becton, Dickinson & Co. | | | 13,210 | | | | 3,592,724 | |
Boeing Co. (The) | | | 16,953 | | | | 5,522,609 | |
Booking Holdings, Inc.* | | | 4,960 | | | | 10,186,501 | |
Brown-Forman Corp. (Class B Stock)(a) | | | 150,985 | | | | 10,206,586 | |
Bunge Ltd. | | | 57,369 | | | | 3,301,586 | |
BWX Technologies, Inc. | | | 103,542 | | | | 6,427,887 | |
Carnival Corp.(a) | | | 65,068 | | | | 3,307,406 | |
CenterPoint Energy, Inc. | | | 84,444 | | | | 2,302,788 | |
CF Industries Holdings, Inc. | | | 78,981 | | | | 3,770,553 | |
Charles Schwab Corp. (The) | | | 51,818 | | | | 2,464,464 | |
Chubb Ltd. | | | 54,701 | | | | 8,514,758 | |
Cintas Corp. | | | 42,798 | | | | 11,516,086 | |
Cisco Systems, Inc. | | | 116,885 | | | | 5,605,805 | |
Citigroup, Inc. | | | 28,812 | | | | 2,301,791 | |
Cognizant Technology Solutions Corp. (Class A Stock) | | | 28,495 | | | | 1,767,260 | |
Comcast Corp. (Class A Stock) | | | 108,802 | | | | 4,892,826 | |
Conagra Brands, Inc.(a) | | | 103,867 | | | | 3,556,406 | |
Costco Wholesale Corp. | | | 29,121 | | | | 8,559,244 | |
CVS Health Corp. | | | 93,749 | | | | 6,964,613 | |
Danaher Corp. | | | 67,046 | | | | 10,290,220 | |
DexCom, Inc.* | | | 58,429 | | | | 12,780,759 | |
Dow, Inc. | | | 38,188 | | | | 2,090,029 | |
DuPont de Nemours, Inc. | | | 55,346 | | | | 3,553,213 | |
Edison International | | | 61,661 | | | | 4,649,856 | |
Edwards Lifesciences Corp.* | | | 40,499 | | | | 9,448,012 | |
Electronic Arts, Inc.* | | | 111,968 | | | | 12,037,680 | |
EQT Corp. | | | 54,136 | | | | 590,082 | |
Equitrans Midstream Corp.(a) | | | 42,278 | | | | 564,834 | |
Estee Lauder Cos., Inc. (The) (Class A Stock) | | | 59,618 | | | | 12,313,502 | |
Evergy, Inc. | | | 31,863 | | | | 2,073,963 | |
Exxon Mobil Corp. | | | 89,479 | | | | 6,243,845 | |
Fifth Third Bancorp | | | 213,743 | | | | 6,570,460 | |
Fortive Corp. | | | 144,401 | | | | 11,030,792 | |
Fortune Brands Home & Security, Inc. | | | 42,247 | | | | 2,760,419 | |
Fox Corp. (Class B Stock) | | | 108,636 | | | | 3,954,350 | |
Franklin Resources, Inc. | | | 61,798 | | | | 1,605,512 | |
| | | | | | | | |
COMMON STOCKS
(continued) | | Shares | | | Value | |
United States (continued) | | | | | | | | |
General Electric Co. | | | 884,796 | | | $ | 9,874,323 | |
Genpact Ltd. | | | 254,383 | | | | 10,727,331 | |
Gilead Sciences, Inc. | | | 43,493 | | | | 2,826,175 | |
Hologic, Inc.* | | | 68,439 | | | | 3,573,200 | |
Illinois Tool Works, Inc. | | | 18,637 | | | | 3,347,764 | |
Illumina, Inc.* | | | 29,827 | | | | 9,894,809 | |
International Paper Co. | | | 103,482 | | | | 4,765,346 | |
Intuit, Inc. | | | 44,419 | | | | 11,634,669 | |
Intuitive Surgical, Inc.* | | | 22,541 | | | | 13,325,112 | |
Johnson & Johnson | | | 59,295 | | | | 8,649,362 | |
Johnson Controls International PLC | | | 65,994 | | | | 2,686,616 | |
JPMorgan Chase & Co. | | | 108,492 | | | | 15,123,785 | |
Kimberly-Clark Corp. | | | 39,718 | | | | 5,463,211 | |
Kohl’s Corp.(a) | | | 21,306 | | | | 1,085,541 | |
L3Harris Technologies, Inc. | | | 31,123 | | | | 6,158,308 | |
Las Vegas Sands Corp. | | | 38,035 | | | | 2,625,936 | |
Loews Corp. | | | 18,723 | | | | 982,770 | |
Lululemon Athletica, Inc.* | | | 5,118 | | | | 1,185,687 | |
Marsh & McLennan Cos., Inc. | | | 46,567 | | | | 5,188,029 | |
Mattel, Inc.*(a) | | | 55,303 | | | | 749,356 | |
Medtronic PLC | | | 80,502 | | | | 9,132,952 | |
Merck & Co., Inc. | | | 24,725 | | | | 2,248,739 | |
MetLife, Inc. | | | 91,388 | | | | 4,658,046 | |
Microsoft Corp. | | | 168,866 | | | | 26,630,168 | |
Morgan Stanley | | | 177,269 | | | | 9,061,991 | |
News Corp. (Class A Stock) | | | 183,200 | | | | 2,590,448 | |
NextEra Energy, Inc. | | | 21,513 | | | | 5,209,588 | |
Nielsen Holdings PLC | | | 111,147 | | | | 2,256,284 | |
Occidental Petroleum Corp. | | | 117,770 | | | | 4,853,302 | |
PayPal Holdings, Inc.* | | | 110,161 | | | | 11,916,115 | |
PepsiCo, Inc. | | | 18,592 | | | | 2,540,969 | |
Perrigo Co. PLC(a) | | | 53,862 | | | | 2,782,511 | |
Pfizer, Inc. | | | 153,549 | | | | 6,016,050 | |
Philip Morris International, Inc. | | | 66,576 | | | | 5,664,952 | |
Pioneer Natural Resources Co. | | | 22,205 | | | | 3,361,171 | |
QUALCOMM, Inc. | | | 91,894 | | | | 8,107,808 | |
Raytheon Co. | | | 18,378 | | | | 4,038,382 | |
Roper Technologies, Inc. | | | 38,157 | | | | 13,516,354 | |
salesforce.com, Inc.* | | | 62,792 | | | | 10,212,491 | |
SBA Communications Corp. | | | 63,080 | | | | 15,201,649 | |
Sempra Energy | | | 11,600 | | | | 1,757,168 | |
Sherwin-Williams Co. (The) | | | 24,382 | | | | 14,227,872 | |
Signature Bank | | | 17,235 | | | | 2,354,473 | |
SL Green Realty Corp. | | | 35,960 | | | | 3,304,005 | |
Southern Co. (The) | | | 149,611 | | | | 9,530,221 | |
Southwest Airlines Co. | | | 79,372 | | | | 4,284,501 | |
State Street Corp. | | | 50,568 | | | | 3,999,929 | |
Stericycle, Inc.*(a) | | | 31,439 | | | | 2,006,123 | |
TE Connectivity Ltd. | | | 29,199 | | | | 2,798,432 | |
Texas Instruments, Inc. | | | 35,503 | | | | 4,554,680 | |
Thermo Fisher Scientific, Inc. | | | 53,873 | | | | 17,501,722 | |
TJX Cos., Inc. (The) | | | 169,425 | | | | 10,345,090 | |
Tyson Foods, Inc. (Class A Stock) | | | 100,264 | | | | 9,128,035 | |
U.S. Bancorp | | | 77,956 | | | | 4,622,011 | |
United Parcel Service, Inc. (Class B Stock) | | | 59,858 | | | | 7,006,977 | |
Verizon Communications, Inc. | | | 125,092 | | | | 7,680,649 | |
Visa, Inc. (Class A Stock)(a) | | | 87,249 | | | | 16,394,087 | |
Walmart, Inc. | | | 40,619 | | | | 4,827,162 | |
SEE NOTES TO FINANCIAL STATEMENTS.
A113
| | | | | | |
| | |
| | GLOBAL PORTFOLIO (continued) | | |
| | | | | | |
| |
| SCHEDULE OF INVESTMENTS | | as of December 31, 2019 |
| | | | | | | | |
COMMON STOCKS
(continued) | | Shares | | | Value | |
United States (continued) | | | | | | | | |
Walt Disney Co. (The) | | | 21,151 | | | $ | 3,059,069 | |
Wells Fargo & Co. | | | 275,313 | | | | 14,811,839 | |
Weyerhaeuser Co. | | | 172,073 | | | | 5,196,605 | |
Zimmer Biomet Holdings, Inc. | | | 21,251 | | | | 3,180,850 | |
Zoetis, Inc. | | | 131,243 | | | | 17,370,011 | |
| | | | | | | | |
| | | | | | | 730,931,794 | |
| | | | | | | | |
TOTAL COMMON STOCKS
(cost $826,503,207) | | | | | | | 1,217,906,614 | |
| | | | | | | | |
| |
| PREFERRED STOCKS — 0.4% | | | | | |
United States | | | | | | | | |
Becton, Dickinson & Co., Series A, CVT, 6.125% | | | 13,865 | | | | 907,603 | |
Sempra Energy, Series A, CVT, 6.000% | | | 21,874 | | | | 2,625,318 | |
Sempra Energy, Series B, CVT, 6.750%(a) | | | 4,673 | | | | 556,414 | |
Southern Co. (The), CVT, 6.750% | | | 29,319 | | | | 1,580,294 | |
| | | | | | | | |
TOTAL PREFERRED STOCKS
(cost $4,858,026) | | | | | | | 5,669,629 | |
| | | | | | | | |
| | |
| | | Units | | | | |
| | |
| RIGHTS* — 0.0% | | | | | | | | |
Spain | | | | | | | | |
Repsol SA, expiring 01/10/20
(cost $55,581) | | | 117,700 | | | | 55,846 | |
| | | | | | | | |
TOTAL LONG-TERM INVESTMENTS
(cost $831,416,814) | | | | | | | 1,223,632,089 | |
| | | | | | | | |
| | | | | | | | |
| | | Shares | | | Value | |
| |
| SHORT-TERM INVESTMENTS — 6.5% | | | | | |
AFFILIATED MUTUAL FUNDS | | | | | | | | |
PGIM Core Ultra Short Bond Fund(w) | | | 35,350,796 | | | $ | 35,350,796 | |
PGIM Institutional Money Market Fund (cost $46,457,517; includes $46,389,754 of cash collateral for securities on loan)(b)(w) | | | 46,457,268 | | | | 46,466,559 | |
| | | | | | | | |
TOTAL SHORT-TERM INVESTMENTS
(cost $81,808,313) | | | | | | | 81,817,355 | |
| | | | | | | | |
TOTAL INVESTMENTS — 103.3%
(cost $913,225,127) | | | | | | | 1,305,449,444 | |
Liabilities in excess of other assets — (3.3)% | | | | (41,761,248 | ) |
| | | | | | | | |
NET ASSETS — 100.0% | | | | | | $ | 1,263,688,196 | |
| | | | | | | | |
See the Glossary for a list of the abbreviation(s) used in the annual report.
| * | Non-income producing security. |
| ^ | Indicates a Level 3 instrument. The aggregate value of Level 3 instruments is $30 and 0.0% of net assets. |
| (a) | All or a portion of security is on loan. The aggregate market value of such securities, including those sold and pending settlement, is $45,313,367; cash collateral of $46,389,754 (included in liabilities) was received with which the Portfolio purchased highly liquid short-term investments. |
| (b) | Represents security purchased with cash collateral received for securities on loan and includes dividend reinvestment. |
| (w) | PGIM Investments LLC, the manager of the Portfolio, also serves as manager of the PGIM Core Ultra Short Bond Fund and PGIM Institutional Money Market Fund. |
Fair Value Measurements:
Various inputs are used in determining the value of the Portfolio’s investments. These inputs are summarized in the three broad levels listed below.
| Level 1— | unadjusted quoted prices generally in active markets for identical securities. |
| Level 2— | quoted prices for similar securities, interest rates and yield curves, prepayment speeds, foreign currency exchange rates and other observable inputs. |
| Level 3— | unobservable inputs for securities valued in accordance with Board approved fair valuation procedures. |
The following is a summary of the inputs used as of December 31, 2019 in valuing such portfolio securities:
| | | | | | | | | | | | |
| | | Level 1 | | | Level 2 | | | Level 3 | |
Investments in Securities | | | | | | | | | | | | |
Assets | | | | | | | | | | | | |
Common Stocks | | | | | | | | | | | | |
Australia | | $ | — | | | $ | 23,984,243 | | | $ | — | |
Austria | | | — | | | | 3,484,193 | | | | — | |
Belgium | | | — | | | | 1,861,111 | | | | — | |
Canada | | | 27,372,502 | | | | — | | | | — | |
China | | | 19,874,729 | | | | 12,629,481 | | | | — | |
Denmark | | | — | | | | 16,131,007 | | | | — | |
Finland | | | — | | | | 3,059,236 | | | | — | |
France | | | 10,207,938 | | | | 45,467,115 | | | | — | |
Germany | | | — | | | | 28,866,335 | | | | — | |
Hong Kong | | | — | | | | 10,146,847 | | | | — | |
India | | | 3,579,391 | | | | 2,093,422 | | | | — | |
Ireland | | | — | | | | 5,578,344 | | | | — | |
SEE NOTES TO FINANCIAL STATEMENTS.
A114
| | | | | | |
| | |
| | GLOBAL PORTFOLIO (continued) | | |
| | | | | | |
| |
| SCHEDULE OF INVESTMENTS | | as of December 31, 2019 |
| | | | | | | | | | | | |
| | | Level 1 | | | Level 2 | | | Level 3 | |
Investments in Securities (continued) | | | | | | | | | | | | |
Assets (continued) | | | | | | | | | | | | |
Common Stocks (continued) | | | | | | | | | | | | |
Israel | | $ | 3,198,422 | | | $ | 711,312 | | | $ | — | |
Italy | | | — | | | | 8,718,300 | | | | — | |
Japan | | | — | | | | 82,725,382 | | | | — | |
Luxembourg | | | — | | | | 1,379,907 | | | | — | |
Macau | | | — | | | | 2,986,812 | | | | — | |
Netherlands | | | 10,898,037 | | | | 16,749,140 | | | | — | |
New Zealand | | | — | | | | 959,763 | | | | — | |
Norway | | | — | | | | 3,506,911 | | | | — | |
Portugal | | | — | | | | 655,806 | | | | — | |
Singapore | | | — | | | | 1,236,145 | | | | — | |
South Africa | | | — | | | | 469,419 | | | | — | |
Spain | | | — | | | | 13,152,476 | | | | — | |
Sweden | | | — | | | | 15,404,007 | | | | — | |
Switzerland | | | — | | | | 34,510,465 | | | | — | |
Taiwan | | | — | | | | 7,249,518 | | | | — | |
United Kingdom | | | — | | | | 68,127,074 | | | | 30 | |
United States | | | 730,931,794 | | | | — | | | | — | |
Preferred Stocks | | | | | | | | | | | | |
United States | | | 5,669,629 | | | | — | | | | — | |
Rights | | | | | | | | | | | | |
Spain | | | 55,846 | | | | — | | | | — | |
Affiliated Mutual Funds | | | 81,817,355 | | | | — | | | | — | |
| | | | | | | | | | | | |
Total | | $ | 893,605,643 | | | $ | 411,843,771 | | | $ | 30 | |
| | | | | | | | | | | | |
Industry Classification:
The industry classification of investments and liabilities in excess of other assets shown as a percentage of net assets as of December 31, 2019 were as follows (unaudited):
| | | | |
Affiliated Mutual Funds (3.7% represents investments purchased with collateral from securities on loan) | | | 6.5 | % |
Banks | | | 6.4 | |
Software | | | 6.3 | |
Health Care Equipment & Supplies | | | 6.2 | |
Pharmaceuticals | | | 4.9 | |
Insurance | | | 4.5 | |
IT Services | | | 4.1 | |
Oil, Gas & Consumable Fuels | | | 3.9 | |
Semiconductors & Semiconductor Equipment | | | 3.4 | |
Capital Markets | | | 3.3 | |
Internet & Direct Marketing Retail | | | 3.3 | |
Chemicals | | | 2.8 | |
Aerospace & Defense | | | 2.8 | |
Machinery | | | 2.6 | |
Life Sciences Tools & Services | | | 2.6 | |
Electric Utilities | | | 2.5 | |
Equity Real Estate Investment Trusts (REITs) | | | 2.2 | |
Electronic Equipment, Instruments & Components | | | 2.2 | |
Industrial Conglomerates | | | 2.2 | |
Food Products | | | 1.7 | |
Food & Staples Retailing | | | 1.7 | |
Interactive Media & Services | | | 1.5 | |
Entertainment | | | 1.4 | |
Beverages | | | 1.3 | |
Personal Products | | | 1.3 | |
Hotels, Restaurants & Leisure | | | 1.2 | |
| | | | |
Commercial Services & Supplies | | | 1.2 | % |
Diversified Telecommunication Services | | | 1.2 | |
Building Products | | | 1.1 | |
Specialty Retail | | | 1.1 | |
Biotechnology | | | 1.0 | |
Professional Services | | | 1.0 | |
Media | | | 1.0 | |
Air Freight & Logistics | | | 1.0 | |
Multi-Utilities | | | 0.8 | |
Airlines | | | 0.8 | |
Automobiles | | | 0.8 | |
Tobacco | | | 0.7 | |
Textiles, Apparel & Luxury Goods | | | 0.7 | |
Metals & Mining | | | 0.7 | |
Auto Components | | | 0.6 | |
Road & Rail | | | 0.6 | |
Trading Companies & Distributors | | | 0.5 | |
Health Care Providers & Services | | | 0.5 | |
Household Durables | | | 0.5 | |
Containers & Packaging | | | 0.5 | |
Construction & Engineering | | | 0.5 | |
Communications Equipment | | | 0.4 | |
Household Products | | | 0.4 | |
Multiline Retail | | | 0.4 | |
Diversified Financial Services | | | 0.4 | |
Wireless Telecommunication Services | | | 0.3 | |
Construction Materials | | | 0.3 | |
SEE NOTES TO FINANCIAL STATEMENTS.
A115
| | | | | | |
| | |
| | GLOBAL PORTFOLIO (continued) | | |
| | | | | | |
| |
| SCHEDULE OF INVESTMENTS | | as of December 31, 2019 |
| | | | |
Industry Classification (continued): | | | |
Real Estate Management & Development | | | 0.3 | % |
Paper & Forest Products | | | 0.3 | |
Consumer Finance | | | 0.2 | |
Technology Hardware, Storage & Peripherals | | | 0.2 | |
Electrical Equipment | | | 0.1 | |
Energy Equipment & Services | | | 0.1 | |
Diversified Consumer Services | | | 0.1 | |
Thrifts & Mortgage Finance | | | 0.1 | |
Leisure Products | | | 0.1 | |
| | | | |
Distributors | | | 0.0 | *% |
Marine | | | 0.0 | * |
| | | | |
| | | 103.3 | |
Liabilities in excess of other assets | | | (3.3 | ) |
| | | | |
| | | 100.0 | % |
| | | | |
Effects of Derivative Instruments on the Financial Statements and Primary Underlying Risk Exposure:
The Portfolio invested in derivative instruments during the reporting period. The primary type of risk associated with these derivative instruments is equity contracts risk. See the Notes to Financial Statements for additional detail regarding these derivative instruments and their risks. The effect of such derivative instruments on the Portfolio’s financial position and financial performance as reflected in the Statement of Assets and Liabilities and Statement of Operations is presented in the summary below.
Fair values of derivative instruments as of December 31, 2019 as presented in the Statement of Assets and Liabilities:
| | | | | | | | | | | | |
Derivatives not accounted for as hedging
instruments, carried at fair value | | Asset Derivatives | | | Liability Derivatives | |
| | Statement of
Assets and
Liabilities Location | | Fair Value | | | Statement of
Assets and
Liabilities Location | | Fair Value | |
Equity contracts | | Unaffiliated investments | | $ | 55,846 | | | — | | $ | — | |
| | | | | | | | | | | | |
The effects of derivative instruments on the Statement of Operations for the year ended December 31, 2019 are as follows:
| | | | |
Amount of Realized Gain (Loss) on Derivatives Recognized in Income | |
Derivatives not accounted for as hedging
instruments, carried at fair value | | Rights(1) | |
Equity contracts | | $ | 42,020 | |
| | | | |
| (1) | Included in net realized gain (loss) on investment transactions in the Statement of Operations. |
| | | | |
Change in Unrealized Appreciation (Depreciation) on Derivatives Recognized in Income | |
Derivatives not accounted for as hedging
instruments, carried at fair value | | Rights(2) | |
Equity contracts | | $ | 1,058 | |
| | | | |
| (2) | Included in net change in unrealized appreciation (depreciation) on investments in the Statement of Operations. |
Financial Instruments/Transactions—Summary of Offsetting and Netting Arrangements:
The Portfolio entered into financial instruments/transactions during the reporting period that are either offset in accordance with current requirements or are subject to enforceable master netting arrangements or similar agreements that permit offsetting. The information about offsetting and related netting arrangements for financial instruments/transactions where the legal right toset-off exists is presented in the summary below.
SEE NOTES TO FINANCIAL STATEMENTS.
A116
| | | | | | |
| | |
| | GLOBAL PORTFOLIO (continued) | | |
| | | | | | |
| |
| SCHEDULE OF INVESTMENTS | | as of December 31, 2019 |
Offsetting of financial instrument/transaction assets and liabilities:
| | | | | | | | | | | | |
Description | | Gross Market
Value of
Recognized
Assets/(Liabilities) | | | Collateral
Pledged/(Received)(1) | | | Net
Amount | |
Securities on Loan | | $ | 45,313,367 | | | $ | (45,313,367 | ) | | $ | — | |
| | | | | | | | | | | | |
| (1) | Collateral amount disclosed by the Portfolio is limited to the market value of financial instruments/transactions. |
SEE NOTES TO FINANCIAL STATEMENTS.
A117
| | | | | | |
| | |
| | GLOBAL PORTFOLIO (continued) | | |
STATEMENT OF ASSETS AND LIABILITIES
as of December 31, 2019
| | | | |
| ASSETS | | | | |
Investments at value, including securities on loan of $45,313,367: | | | | |
Unaffiliated investments (cost $831,416,814) | | $ | 1,223,632,089 | |
Affiliated investments (cost $81,808,313) | | | 81,817,355 | |
Foreign currency, at value (cost $4,446,417) | | | 4,473,990 | |
Cash | | | 13,011 | |
Tax reclaim receivable | | | 1,917,656 | |
Receivable for investments sold | | | 1,587,230 | |
Dividends and interest receivable | | | 1,178,191 | |
Receivable from affiliate | | | 3,282 | |
Receivable for Portfolio shares sold | | | 263 | |
Prepaid expenses and other assets | | | 8,664 | |
| | | | |
Total Assets | | | 1,314,631,731 | |
| | | | |
| LIABILITIES | | | | |
Payable to broker for collateral for securities on loan | | | 46,389,754 | |
Payable for investments purchased | | | 2,491,470 | |
Payable to affiliate | | | 868,812 | |
Management fee payable | | | 759,815 | |
Accrued expenses and other liabilities | | | 240,709 | |
Payable for Portfolio shares repurchased | | | 191,995 | |
Affiliated transfer agent fee payable | | | 980 | |
| | | | |
Total Liabilities | | | 50,943,535 | |
| | | | |
| NET ASSETS | | $ | 1,263,688,196 | |
| | | | |
Net assets were comprised of: | | | | |
Partners’ Equity | | $ | 1,263,688,196 | |
| | | | |
Net asset value and redemption price per share, $1,263,688,196 / 30,454,972 outstanding shares of beneficial interest | | $ | 41.49 | |
| | | | |
STATEMENT OF OPERATIONS
Year Ended December 31, 2019
| | | | |
| NET INVESTMENT INCOME (LOSS) | | | | |
| INCOME | | | | |
Unaffiliated dividend income (net of $1,471,487 foreign withholding tax, of which $135,890 is reimbursable by an affiliate) | | $ | 24,163,109 | |
Affiliated dividend income | | | 813,008 | |
Income from securities lending, net (including affiliated income of $109,841) | | | 208,435 | |
| | | | |
Total income | | | 25,184,552 | |
| | | | |
| EXPENSES | | | | |
Management fee | | | 8,681,603 | |
Custodian and accounting fees | | | 295,398 | |
Shareholders’ reports | | | 127,924 | |
Audit fee | | | 28,800 | |
Trustees’ fees | | | 23,000 | |
Legal fees and expenses | | | 15,877 | |
Transfer agent’s fees and expenses (including affiliated expense of $5,882) | | | 10,680 | |
Miscellaneous | | | 52,334 | |
| | | | |
Total expenses | | | 9,235,616 | |
Less: Fee waiver and/or expense reimbursement | | | (371,624 | ) |
| | | | |
Net expenses | | | 8,863,992 | |
| | | | |
| NET INVESTMENT INCOME (LOSS) | | | 16,320,560 | |
| | | | |
| REALIZED AND UNREALIZED GAIN (LOSS) ON INVESTMENT AND FOREIGN CURRENCY TRANSACTIONS | | | | |
Net realized gain (loss) on: | | | | |
Investment transactions (including affiliated of $1,109) | | | 49,111,917 | |
Foreign currency transactions | | | (67,538 | ) |
| | | | |
| | | 49,044,379 | |
| | | | |
Net change in unrealized appreciation (depreciation) on: | | | | |
Investments (including affiliated of $9,590) | | | 235,268,768 | |
Foreign currencies | | | 37,077 | |
| | | | |
| | | 235,305,845 | |
| | | | |
| NET GAIN (LOSS) ON INVESTMENT AND FOREIGN CURRENCY TRANSACTIONS | | | 284,350,224 | |
| | | | |
| NET INCREASE (DECREASE) IN NET ASSETS RESULTING FROM OPERATIONS | | $ | 300,670,784 | |
| | | | |
STATEMENTS OF CHANGES IN NET ASSETS
| | | | | | | | |
| | | Year Ended
December 31, 2019 | | | Year Ended
December 31, 2018 | |
| INCREASE (DECREASE) IN NET ASSETS | | | | | | | | |
| OPERATIONS | | | | | | | | |
Net investment income (loss) | | $ | 16,320,560 | | | $ | 15,130,916 | |
Net realized gain (loss) on investment and foreign currency transactions | | | 49,044,379 | | | | 72,526,568 | |
Net change in unrealized appreciation (depreciation) on investments and foreign currencies | | | 235,305,845 | | | | (166,392,080 | ) |
| | | | | | | | |
NET INCREASE (DECREASE) IN NET ASSETS RESULTING FROM OPERATIONS | | | 300,670,784 | | | | (78,734,596 | ) |
| | | | | | | | |
| PORTFOLIO SHARE TRANSACTIONS | | | | | | | | |
Portfolio shares sold [589,747 and 414,359 shares, respectively] | | | 22,043,834 | | | | 14,682,656 | |
Portfolio shares repurchased [1,764,963 and 1,780,900 shares, respectively] | | | (65,786,251 | ) | | | (62,730,947 | ) |
| | | | | | | | |
NET INCREASE (DECREASE) IN NET ASSETS FROM PORTFOLIO SHARE TRANSACTIONS | | | (43,742,417 | ) | | | (48,048,291 | ) |
| | | | | | | | |
| CAPITAL CONTRIBUTIONS | | | 85,664 | | | | 520,841 | |
| | | | | | | | |
| TOTAL INCREASE (DECREASE) | | | 257,014,031 | | | | (126,262,046 | ) |
| NET ASSETS: | | | | | | | | |
Beginning of year | | | 1,006,674,165 | | | | 1,132,936,211 | |
| | | | | | | | |
End of year | | $ | 1,263,688,196 | | | $ | 1,006,674,165 | |
| | | | | | | | |
SEE NOTES TO FINANCIAL STATEMENTS.
A118
| | | | | | |
| | |
| | GOVERNMENT INCOME PORTFOLIO | | |
| | | | | | |
| |
| SCHEDULE OF INVESTMENTS | | as of December 31, 2019 |
| | | | | | | | | | | | | | | | |
Interest
Rate | | Maturity
Date | | | | | | Principal
Amount
(000)# | | | Value | |
|
| LONG-TERM INVESTMENTS — 99.0% | |
|
| ASSET-BACKED SECURITIES — 10.1% | |
Collateralized Loan Obligations | |
Atlas Senior Loan Fund Ltd. (Cayman Islands), | |
Series2017-08A, Class A, 144A, 3 Month LIBOR + 1.300% (Cap N/A, Floor 0.000%) | |
3.301%(c) | | | 01/16/30 | | | | | | | | 250 | | | $ | 250,580 | |
Battalion CLO Ltd. (Cayman Islands), | |
Series2016-10A, Class A1R, 144A, 3 Month LIBOR + 1.250% (Cap N/A, Floor 1.250%) | |
3.186%(c) | | | 01/24/29 | | | | | | | | 500 | | | | 500,147 | |
Series2018-12A, Class A1, 144A, 3 Month LIBOR + 1.070% (Cap N/A, Floor 1.070%) | |
2.974%(c) | | | 05/17/31 | | | | | | | | 1,500 | | | | 1,484,016 | |
BlueMountain CLO Ltd. (Cayman Islands), | |
Series2015-01A, Class A1R, 144A, 3 Month LIBOR + 1.330% (Cap N/A, Floor 0.000%) | |
3.331%(c) | | | 04/13/27 | | | | | | | | 1,215 | | | | 1,215,369 | |
Carlyle Global Market Strategies CLO Ltd. (Cayman Islands), | |
Series2015-05A, Class A1R, 144A, 3 Month LIBOR + 1.320% (Cap N/A, Floor 1.320%) | |
3.286%(c) | | | 01/20/32 | | | | | | | | 750 | | | | 750,911 | |
Catamaran CLO Ltd. (Cayman Islands), | |
Series2014-01A, Class A1AR, 144A, 3 Month LIBOR + 1.260% (Cap N/A, Floor 0.000%) | |
3.213%(c) | | | 04/22/30 | | | | | | | | 2,000 | | | | 1,996,888 | |
Elevation CLO Ltd. (Cayman Islands), | |
Series2017-07A, Class A, 144A, 3 Month LIBOR + 1.220% (Cap N/A, Floor 0.000%) | |
3.221%(c) | | | 07/15/30 | | | | | | | | 2,000 | | | | 1,994,663 | |
ICG US CLO Ltd. (Cayman Islands), | |
Series2017-02A, Class A1, 144A, 3 Month LIBOR + 1.280% (Cap N/A, Floor 0.000%) | |
3.214%(c) | | | 10/23/29 | | | | | | | | 500 | | | | 500,053 | |
Mountain View CLO Ltd. (Cayman Islands), | |
Series2019-01A, Class A1, 144A, 3 Month LIBOR + 1.440% (Cap N/A, Floor 1.440%) | |
3.441%(c) | | | 04/15/29 | | | | | | | | 2,000 | | | | 2,004,767 | |
OCP CLO Ltd. (Cayman Islands), | |
Series2017-13A, Class A1A, 144A, 3 Month LIBOR + 1.260% (Cap N/A, Floor 0.000%) | |
3.261%(c) | | | 07/15/30 | | | | | | | | 250 | | | | 250,006 | |
OZLM Ltd. (Cayman Islands), | |
Series2015-11A, Class A1R, 144A, 3 Month LIBOR + 1.250% (Cap N/A, Floor 0.000%) | |
3.186%(c) | | | 10/30/30 | | | | | | | | 3,750 | | | | 3,741,236 | |
Park Avenue Institutional Advisers CLO Ltd. (Cayman Islands), | |
Series2019-01A, Class A1, 144A, 3 Month LIBOR + 1.480% (Cap N/A, Floor 1.480%) | |
3.390%(c) | | | 05/15/32 | | | | | | | | 2,000 | | | | 1,999,793 | |
Regatta Funding Ltd. (Cayman Islands), | |
Series2017-01A, Class A, 144A, 3 Month LIBOR + 1.250% (Cap N/A, Floor 0.000%) | |
3.252%(c) | | | 10/17/30 | | | | | | | | 1,000 | | | | 998,056 | |
Sound Point CLO Ltd. (Cayman Islands), | |
Series 2014-03RA, Class A1, 144A, 3 Month LIBOR + 1.250% (Cap N/A, Floor 1.250%) | |
3.184%(c) | | | 10/23/31 | | | | | | | | 1,000 | | | | 992,647 | |
| | | | | | | | | | | | | | | | |
Interest
Rate | | Maturity
Date | | | | | | Principal
Amount
(000)# | | | Value | |
|
| ASSET-BACKED SECURITIES (continued) | |
Collateralized Loan Obligations (continued) | |
Series2019-01A, Class A, 144A, 3 Month LIBOR + 1.370% (Cap N/A, Floor 1.370%) | |
3.336%(c) | | | 01/20/32 | | | | | | | | 1,000 | | | $ | 994,396 | |
Trimaran Cavu Ltd. (Cayman Islands), | |
Series2019-01A, Class A1, 144A, 3 Month LIBOR + 1.460% (Cap N/A, Floor 1.460%) | |
3.426%(c) | | | 07/20/32 | | | | | | | | 2,500 | | | | 2,493,102 | |
Wellfleet CLO Ltd. (Cayman Islands), | |
Series2017-02A, Class A1, 144A, 3 Month LIBOR + 1.250% (Cap N/A, Floor 0.000%) | |
3.216%(c) | | | 10/20/29 | | | | | | | | 2,000 | | | | 1,999,812 | |
| | | | | | | | | | | | | | | | |
TOTAL ASSET-BACKED SECURITIES
(cost $24,170,386) | | | | 24,166,442 | |
| | | | | | | | | | | | | | | | |
|
| COMMERCIAL MORTGAGE-BACKED SECURITIES — 18.6% | |
Barclays Commercial Mortgage Trust, | |
Series2019-C04, Class A4 | |
2.661% | | | 08/15/52 | | | | | | | | 3,000 | | | | 2,997,970 | |
CD Mortgage Trust, | | | | | | | | | | | | | |
Series 2019-CD08, Class A3 | |
2.657% | | | 08/15/57 | | | | | | | | 4,000 | | | | 4,000,979 | |
FannieMae-Aces, | |
Series2012-M02, Class A2 | |
2.717% | | | 02/25/22 | | | | | | | | 130 | | | | 130,738 | |
Series2015-M08, Class AB2 | |
2.829%(cc) | | | 01/25/25 | | | | | | | | 631 | | | | 647,202 | |
Series2015-M10, Class A2 | |
3.092%(cc) | | | 04/25/27 | | | | | | | | 1,600 | | | | 1,680,700 | |
Series2015-M17, Class A2 | |
2.934%(cc) | | | 11/25/25 | | | | | | | | 1,500 | | | | 1,552,662 | |
Series2016-M11, Class A2 | |
2.369%(cc) | | | 07/25/26 | | | | | | | | 1,200 | | | | 1,204,428 | |
Series2016-M13, Class A2 | |
2.483%(cc) | | | 09/25/26 | | | | | | | | 2,100 | | | | 2,128,064 | |
Series2018-M14, Class A1 | |
3.578%(cc) | | | 08/25/28 | | | | | | | | 927 | | | | 988,746 | |
Series2019-M01, Class A2 | |
3.555%(cc) | | | 09/25/28 | | | | | | | | 1,100 | | | | 1,187,541 | |
FHLMC Multifamily Structured Pass-Through Certificates, | |
Series K008, Class X1, IO | |
1.479%(cc) | | | 06/25/20 | | | | | | | | 14,220 | | | | 18,822 | |
Series K019, Class X1, IO | |
1.591%(cc) | | | 03/25/22 | | | | | | | | 15,538 | | | | 424,098 | |
Series K020, Class X1, IO | |
1.373%(cc) | | | 05/25/22 | | | | | | | | 8,160 | | | | 205,920 | |
Series K021, Class X1, IO | |
1.425%(cc) | | | 06/25/22 | | | | | | | | 8,820 | | | | 241,942 | |
Series K025, Class X1, IO | |
0.820%(cc) | | | 10/25/22 | | | | | | | | 24,694 | | | | 454,276 | |
Series K060, Class AM | |
3.300%(cc) | | | 10/25/26 | | | | | | | | 1,930 | | | | 2,036,390 | |
Series K064, Class AM | |
3.327%(cc) | | | 03/25/27 | | | | | | | | 1,100 | | | | 1,165,020 | |
Series K068, Class AM | |
3.315% | | | 08/25/27 | | | | | | | | 1,700 | | | | 1,795,798 | |
SEE NOTES TO FINANCIAL STATEMENTS.
A119
| | | | | | |
| | |
| | GOVERNMENT INCOME PORTFOLIO (continued) | | |
| | | | | | |
| |
| SCHEDULE OF INVESTMENTS | | as of December 31, 2019 |
| | | | | | | | | | | | | | | | |
Interest
Rate | | Maturity
Date | | | | | | Principal
Amount
(000)# | | | Value | |
|
| COMMERCIAL MORTGAGE-BACKED SECURITIES (continued) | |
Series K076, Class AM | |
3.900% | | | 04/25/28 | | | | | | | | 425 | | | $ | 466,545 | |
Series K077, Class A2 | |
3.850%(cc) | | | 05/25/28 | | | | | | | | 900 | | | | 989,246 | |
Series K077, Class AM | |
3.850%(cc) | | | 05/25/28 | | | | | | | | 180 | | | | 197,013 | |
Series K078, Class AM | |
3.920% | | | 06/25/28 | | | | | | | | 525 | | | | 577,406 | |
Series K079, Class AM | |
3.930% | | | 06/25/28 | | | | | | | | 675 | | | | 742,861 | |
Series K080, Class AM | |
3.986%(cc) | | | 07/25/28 | | | | | | | | 1,900 | | | | 2,099,208 | |
Series K081, Class AM | |
3.900%(cc) | | | 08/25/28 | | | | | | | | 1,500 | | | | 1,648,478 | |
Series K083, Class A2 | |
4.050%(cc) | | | 09/25/28 | | | | | | | | 625 | | | | 697,237 | |
Series K083, Class AM | |
4.030%(cc) | | | 10/25/28 | | | | | | | | 250 | | | | 277,170 | |
Series K084, Class AM | |
3.880%(cc) | | | 10/25/28 | | | | | | | | 1,300 | | | | 1,427,516 | |
Series K085, Class AM | |
4.060%(cc) | | | 10/25/28 | | | | | | | | 650 | | | | 722,193 | |
Series K086, Class A2 | |
3.859%(cc) | | | 11/25/28 | | | | | | | | 1,400 | | | | 1,543,248 | |
Series K086, Class AM | |
3.919%(cc) | | | 12/25/28 | | | | | | | | 200 | | | | 220,230 | |
Series K087, Class AM | |
3.832%(cc) | | | 12/25/28 | | | | | | | | 200 | | | | 219,024 | |
Series K088, Class AM | |
3.761%(cc) | | | 01/25/29 | | | | | | | | 520 | | | | 567,251 | |
Series K090, Class AM | |
3.492%(cc) | | | 03/25/29 | | | | | | | | 800 | | | | 858,473 | |
Series K091, Class AM | |
3.566% | | | 03/25/29 | | | | | | | | 850 | | | | 917,150 | |
Series K151, Class A3 | |
3.511% | | | 04/25/30 | | | | | | | | 400 | | | | 427,355 | |
Series K1514, Class A2 | |
2.859% | | | 10/25/34 | | | | | | | | 2,300 | | | | 2,329,680 | |
Series K157, Class A2 | |
3.990%(cc) | | | 05/25/33 | | | | | | | | 1,700 | | | | 1,917,543 | |
Series K158, Class A2 | |
3.900%(cc) | | | 12/25/30 | | | | | | | | 700 | | | | 783,728 | |
Series KC03, Class A2 | |
3.499% | | | 01/25/26 | | | | | | | | 650 | | | | 688,617 | |
Series W5FX, Class AFX | |
3.214%(cc) | | | 04/25/28 | | | | | | | | 1,100 | | | | 1,165,864 | |
| | | | | | | | | | | | | | | | |
TOTAL COMMERCIAL MORTGAGE-BACKED SECURITIES
(cost $42,521,008) | | | | 44,344,332 | |
| | | | | | | | | | | | | | | | |
|
| CORPORATE BONDS — 1.2% | |
Diversified Financial Services | |
Private Export Funding Corp., | |
Sr. Unsec’d. Notes, 144A | |
2.650% | | | 02/16/21 | | | | | | | | 1,655 | | | | 1,668,007 | |
| | | | | | | | | | | | | | | | |
Interest
Rate | | Maturity
Date | | | | | | Principal
Amount
(000)# | | | Value | |
|
| CORPORATE BONDS (continued) | |
Diversified Financial Services (continued) | |
Private Export Funding Corp., (continued) | |
U.S. Gov’t. Gtd. Notes, Series BB | |
4.300% | | | 12/15/21 | | | | | | | | 1,255 | | | $ | 1,312,677 | |
| | | | | | | | | | | | | | | | |
TOTAL CORPORATE BONDS
(cost $2,968,820) | | | | 2,980,684 | |
| | | | | | | | | | | | | | | | |
|
| RESIDENTIAL MORTGAGE-BACKED SECURITIES — 0.3% | |
Government National Mortgage Assoc., | |
Series2015-143, Class WA | |
4.000% | | | 10/20/45 | | | | | | | | 504 | | | | 537,707 | |
Merrill Lynch Mortgage Investors Trust, | |
Series2003-E, Class A1, 1 Month LIBOR + 0.620% (Cap 11.750%, Floor 0.310%) | |
2.412%(c) | | | 10/25/28 | | | | | | | | 15 | | | | 14,717 | |
Structured Adjustable Rate Mortgage Loan Trust, | |
Series2004-01, Class 4A3 | |
4.389%(cc) | | | 02/25/34 | | | | | | | | 69 | | | | 69,293 | |
| | | | | | | | | | | | | | | | |
TOTAL RESIDENTIAL MORTGAGE-BACKED SECURITIES
(cost $615,518) | | | | 621,717 | |
| | | | | | | | | | | | | | | | |
|
| U.S. GOVERNMENT AGENCY OBLIGATIONS — 40.5% | |
Fannie Mae Strips Principal, MTN | |
2.001%(s) | | | 10/08/27 | | | | | | | | 400 | | | | 333,227 | |
Federal Home Loan Bank | |
3.250% | | | 11/16/28 | | | | | | | | 1,025 | | | | 1,121,035 | |
Federal Home Loan Mortgage Corp. | |
2.000% | | | 01/01/32 | | | | | | | | 276 | | | | 273,699 | |
2.500% | | | 03/01/30 | | | | | | | | 494 | | | | 501,043 | |
3.000% | | | 06/01/29 | | | | | | | | 351 | | | | 361,630 | |
3.000% | | | 01/01/37 | | | | | | | | 738 | | | | 757,985 | |
3.000% | | | 06/01/45 | | | | | | | | 484 | | | | 497,903 | |
3.500% | | | 12/01/32 | | | | | | | | 647 | | | | 672,730 | |
3.500% | | | 07/01/42 | | | | | | | | 619 | | | | 652,510 | |
3.500% | | | 10/01/42 | | | | | | | | 993 | | | | 1,046,292 | |
3.500% | | | 08/01/43 | | | | | | | | 1,128 | | | | 1,188,475 | |
3.500% | | | 09/01/45 | | | | | | | | 451 | | | | 473,842 | |
3.500% | | | 10/01/45 | | | | | | | | 528 | | | | 552,457 | |
3.500% | | | 02/01/47 | | | | | | | | 480 | | | | 500,955 | |
3.500% | | | 03/01/48 | | | | | | | | 1,547 | | | | 1,595,170 | |
4.000% | | | 06/01/26 | | | | | | | | 46 | | | | 48,075 | |
4.000% | | | 09/01/26 | | | | | | | | 173 | | | | 181,196 | |
4.000% | | | 09/01/40 | | | | | | | | 359 | | | | 385,602 | |
4.000% | | | 12/01/40 | | | | | | | | 368 | | | | 395,116 | |
4.000% | | | 12/01/40 | | | | | | | | 393 | | | | 421,684 | |
4.000% | | | 11/01/43 | | | | | | | | 677 | | | | 722,915 | |
4.500% | | | 09/01/39 | | | | | | | | 1,266 | | | | 1,380,192 | |
4.500% | | | 08/01/48 | | | | | | | | 748 | | | | 790,472 | |
5.000% | | | 06/01/33 | | | | | | | | 266 | | | | 292,586 | |
5.000% | | | 05/01/34 | | | | | | | | 251 | | | | 278,012 | |
5.500% | | | 05/01/37 | | | | | | | | 49 | | | | 54,381 | |
5.500% | | | 02/01/38 | | | | | | | | 170 | | | | 190,036 | |
5.500% | | | 05/01/38 | | | | | | | | 71 | | | | 79,921 | |
6.000% | | | 09/01/34 | | | | | | | | 70 | | | | 77,963 | |
6.000% | | | 01/01/37 | | | | | | | | 75 | | | | 85,579 | |
6.000% | | | 09/01/38 | | | | | | | | 48 | | | | 54,590 | |
6.000% | | | 08/01/39 | | | | | | | | 58 | | | | 67,171 | |
SEE NOTES TO FINANCIAL STATEMENTS.
A120
| | | | | | |
| | |
| | GOVERNMENT INCOME PORTFOLIO (continued) | | |
| | | | | | |
| |
| SCHEDULE OF INVESTMENTS | | as of December 31, 2019 |
| | | | | | | | | | | | | | | | |
Interest
Rate | | Maturity
Date | | | | | | Principal
Amount
(000)# | | | Value | |
|
| U.S. GOVERNMENT AGENCY OBLIGATIONS (continued) | |
6.250% | | | 07/15/32 | | | | | | | | 30 | | | $ | 43,102 | |
6.500% | | | 09/01/32 | | | | | | | | 24 | | | | 26,121 | |
Federal National Mortgage Assoc. | |
2.000% | | | 08/01/31 | | | | | | | | 264 | | | | 261,345 | |
2.500% | | | 03/01/24 | | | | | | | | 79 | | | | 80,048 | |
2.500% | | | 06/01/28 | | | | | | | | 1,559 | | | | 1,577,979 | |
2.500% | | | 06/01/34 | | | | | | | | 746 | | | | 752,435 | |
2.500% | | | 11/01/34 | | | | | | | | 149 | | | | 150,154 | |
2.500% | | | 02/01/43 | | | | | | | | 184 | | | | 184,686 | |
2.500% | | | 12/01/46 | | | | | | | | 655 | | | | 652,749 | |
2.500% | | | 09/01/49 | | | | | | | | 363 | | | | 358,863 | |
2.500% | | | 12/01/49 | | | | | | | | 997 | | | | 986,458 | |
3.000% | | | 08/01/28 | | | | | | | | 809 | | | | 831,614 | |
3.000% | | | 02/01/31 | | | | | | | | 955 | | | | 981,444 | |
3.000% | | | 11/01/36 | | | | | | | | 684 | | | | 702,780 | |
3.000% | | | 03/01/43 | | | | | | | | 907 | | | | 932,642 | |
3.000% | | | 07/01/43 | | | | | | | | 816 | | | | 842,223 | |
3.000% | | | 07/01/43 | | | | | | | | 992 | | | | 1,020,512 | |
3.000% | | | 11/01/46 | | | | | | | | 415 | | | | 424,352 | |
3.000% | | | 12/01/47 | | | | | | | | 1,229 | | | | 1,260,233 | |
3.500% | | | TBA | | | | | | | | 3,500 | | | | 3,600,275 | |
3.500% | | | 07/01/31 | | | | | | | | 967 | | | | 1,012,201 | |
3.500% | | | 02/01/33 | | | | | | | | 196 | | | | 204,108 | |
3.500% | | | 06/01/39 | | | | | | | | 259 | | | | 272,629 | |
3.500% | | | 04/01/42 | | | | | | | | 437 | | | | 460,229 | |
3.500% | | | 06/01/42 | | | | | | | | 765 | | | | 796,022 | |
3.500% | | | 07/01/42 | | | | | | | | 515 | | | | 541,869 | |
3.500% | | | 07/01/42 | | | | | | | | 821 | | | | 864,476 | |
3.500% | | | 06/01/45 | | | | | | | | 1,780 | | | | 1,860,838 | |
3.500% | | | 07/01/46 | | | | | | | | 879 | | | | 916,127 | |
3.500% | | | 12/01/46 | | | | | | | | 396 | | | | 413,313 | |
3.500% | | | 12/01/46 | | | | | | | | 949 | | | | 998,888 | |
4.000% | | | 09/01/40 | | | | | | | | 1,333 | | | | 1,429,067 | |
4.000% | | | 06/01/42 | | | | | | | | 980 | | | | 1,049,530 | |
4.000% | | | 09/01/44 | | | | | | | | 699 | | | | 743,168 | |
4.000% | | | 09/01/44 | | | | | | | | 1,116 | | | | 1,187,056 | |
4.000% | | | 04/01/45 | | | | | | | | 651 | | | | 690,562 | |
4.000% | | | 07/01/45 | | | | | | | | 633 | | | | 671,412 | |
4.000% | | | 10/01/45 | | | | | | | | 831 | | | | 880,635 | |
4.000% | | | 10/01/46 | | | | | | | | 295 | | | | 311,107 | |
4.000% | | | 02/01/47 | | | | | | | | 384 | | | | 405,501 | |
4.000% | | | 06/01/47 | | | | | | | | 510 | | | | 536,035 | |
4.000% | | | 07/01/47 | | | | | | | | 558 | | | | 586,971 | |
4.000% | | | 10/01/47 | | | | | | | | 1,493 | | | | 1,569,473 | |
4.000% | | | 11/01/47 | | | | | | | | 401 | | | | 421,319 | |
4.000% | | | 11/01/47 | | | | | | | | 706 | | | | 742,598 | |
4.000% | | | 12/01/48 | | | | | | | | 1,647 | | | | 1,715,221 | |
4.500% | | | 05/01/40 | | | | | | | | 1,904 | | | | 2,068,789 | |
4.500% | | | 04/01/42 | | | | | | | | 689 | | | | 747,923 | |
4.500% | | | 01/01/49 | | | | | | | | 512 | | | | 540,973 | |
5.000% | | | 12/01/31 | | | | | | | | 26 | | | | 28,500 | |
5.000% | | | 03/01/34 | | | | | | | | 302 | | | | 331,563 | |
5.000% | | | 06/01/35 | | | | | | | | 133 | | | | 147,474 | |
5.000% | | | 07/01/35 | | | | | | | | 67 | | | | 74,563 | |
5.000% | | | 05/01/36 | | | | | | | | 90 | | | | 99,575 | |
5.500% | | | 02/01/34 | | | | | | | | 209 | | | | 234,507 | |
5.500% | | | 09/01/34 | | | | | | | | 233 | | | | 260,911 | |
5.500% | | | 02/01/35 | | | | | | | | 230 | | | | 258,028 | |
| | | | | | | | | | | | | | | | |
Interest
Rate | | Maturity
Date | | | | | | Principal
Amount
(000)# | | | Value | |
|
| U.S. GOVERNMENT AGENCY OBLIGATIONS (continued) | |
5.500% | | | 06/01/35 | | | | | | | | 35 | | | $ | 39,334 | |
5.500% | | | 06/01/35 | | | | | | | | 108 | | | | 121,339 | |
5.500% | | | 09/01/35 | | | | | | | | 39 | | | | 43,145 | |
5.500% | | | 09/01/35 | | | | | | | | 101 | | | | 112,716 | |
5.500% | | | 10/01/35 | | | | | | | | 233 | | | | 261,222 | |
5.500% | | | 11/01/35 | | | | | | | | 126 | | | | 141,309 | |
5.500% | | | 11/01/35 | | | | | | | | 335 | | | | 375,621 | |
5.500% | | | 11/01/35 | | | | | | | | 402 | | | | 450,615 | |
6.000% | | | 05/01/21 | | | | | | | | 7 | | | | 7,126 | |
6.000% | | | 12/01/33 | | | | | | | | 10 | | | | 11,010 | |
6.000% | | | 02/01/34 | | | | | | | | 103 | | | | 116,123 | |
6.000% | | | 08/01/34 | | | | | | | | — | (r) | | | 427 | |
6.000% | | | 11/01/34 | | | | | | | | 1 | | | | 564 | |
6.000% | | | 11/01/34 | | | | | | | | 1 | | | | 1,049 | |
6.000% | | | 12/01/34 | | | | | | | | 1 | | | | 964 | |
6.000% | | | 01/01/35 | | | | | | | | 21 | | | | 21,974 | |
6.000% | | | 01/01/36 | | | | | | | | 60 | | | | 66,931 | |
6.000% | | | 05/01/38 | | | | | | | | 40 | | | | 45,715 | |
6.500% | | | 07/01/32 | | | | | | | | 166 | | | | 191,463 | |
6.500% | | | 08/01/32 | | | | | | | | 68 | | | | 77,930 | |
6.500% | | | 10/01/32 | | | | | | | | 234 | | | | 270,863 | |
6.500% | | | 10/01/37 | | | | | | | | 105 | | | | 123,037 | |
6.625% | | | 11/15/30 | | | | | | | | 435 | | | | 619,464 | |
7.000% | | | 12/01/31 | | | | | | | | 1 | | | | 538 | |
7.000% | | | 12/01/31 | | | | | | | | 75 | | | | 88,025 | |
7.000% | | | 01/01/36 | | | | | | | | 16 | | | | 18,635 | |
8.000% | | | 10/01/23 | | | | | | | | — | (r) | | | 124 | |
8.000% | | | 09/01/24 | | | | | | | | 1 | | | | 902 | |
8.000% | | | 11/01/24 | | | | | | | | 1 | | | | 1,019 | |
8.000% | | | 01/01/26 | | | | | | | | — | (r) | | | 279 | |
9.000% | | | 02/01/25 | | | | | | | | 7 | | | | 7,763 | |
9.000% | | | 04/01/25 | | | | | | | | 3 | | | | 3,864 | |
Government National Mortgage Assoc. | |
2.500% | | | 12/20/46 | | | | | | | | 255 | | | | 256,981 | |
3.000% | | | 03/15/45 | | | | | | | | 1,382 | | | | 1,426,727 | |
3.000% | | | 09/20/46 | | | | | | | | 1,367 | | | | 1,410,126 | |
3.000% | | | 10/20/46 | | | | | | | | 340 | | | | 351,059 | |
3.000% | | | 04/20/47 | | | | | | | | 1,426 | | | | 1,469,642 | |
3.000% | | | 12/20/48 | | | | | | | | 944 | | | | 973,014 | |
3.500% | | | TBA | | | | | | | | 6,000 | | | | 6,184,200 | |
3.500% | | | 01/20/43 | | | | | | | | 982 | | | | 1,034,327 | |
3.500% | | | 04/20/43 | | | | | | | | 482 | | | | 506,345 | |
3.500% | | | 03/20/45 | | | | | | | | 819 | | | | 854,967 | |
3.500% | | | 04/20/45 | | | | | | | | 685 | | | | 714,578 | |
3.500% | | | 04/20/46 | | | | | | | | 1,143 | | | | 1,191,797 | |
3.500% | | | 07/20/46 | | | | | | | | 1,761 | | | | 1,836,235 | |
3.500% | | | 07/20/48 | | | | | | | | 1,754 | | | | 1,818,145 | |
3.500% | | | 01/20/49 | | | | | | | | 777 | | | | 806,725 | |
4.000% | | | 06/15/40 | | | | | | | | 164 | | | | 173,634 | |
4.000% | | | 08/20/46 | | | | | | | | 659 | | | | 691,444 | |
4.000% | | | 11/20/46 | | | | | | | | 410 | | | | 430,111 | |
4.000% | | | 09/20/47 | | | | | | | | 706 | | | | 738,803 | |
4.000% | | | 02/20/49 | | | | | | | | 1,457 | | | | 1,517,355 | |
4.500% | | | 02/20/41 | | | | | | | | 476 | | | | 511,762 | |
4.500% | | | 03/20/41 | | | | | | | | 408 | | | | 438,333 | |
4.500% | | | 06/20/44 | | | | | | | | 305 | | | | 328,895 | |
4.500% | | | 09/20/46 | | | | | | | | 389 | | | | 419,734 | |
4.500% | | | 11/20/46 | | | | | | | | 785 | | | | 847,157 | |
SEE NOTES TO FINANCIAL STATEMENTS.
A121
| | | | | | |
| | |
| | GOVERNMENT INCOME PORTFOLIO (continued) | | |
| | | | | | |
| |
| SCHEDULE OF INVESTMENTS | | as of December 31, 2019 |
| | | | | | | | | | | | | | | | |
Interest
Rate | | Maturity
Date | | | | | | Principal
Amount
(000)# | | | Value | |
|
| U.S. GOVERNMENT AGENCY OBLIGATIONS (continued) | |
4.500% | | | 01/20/47 | | | | | | | | 97 | | | $ | 104,099 | |
5.000% | | | 07/15/33 | | | | | | | | 131 | | | | 142,497 | |
5.000% | | | 09/15/33 | | | | | | | | 194 | | | | 211,268 | |
5.000% | | | 04/15/34 | | | | | | | | 79 | | | | 83,824 | |
5.000% | | | 10/20/48 | | | | | | | | 288 | | | | 303,369 | |
5.500% | | | 03/15/34 | | | | | | | | 252 | | | | 281,773 | |
5.500% | | | 03/15/36 | | | | | | | | 57 | | | | 63,478 | |
6.500% | | | 07/15/32 | | | | | | | | 17 | | | | 18,776 | |
6.500% | | | 08/15/32 | | | | | | | | 2 | | | | 2,253 | |
6.500% | | | 08/15/32 | | | | | | | | 3 | | | | 3,414 | |
6.500% | | | 08/15/32 | | | | | | | | 11 | | | | 12,731 | |
6.500% | | | 08/15/32 | | | | | | | | 79 | | | | 90,263 | |
7.000% | | | 05/15/23 | | | | | | | | 3 | | | | 2,666 | |
7.000% | | | 06/15/23 | | | | | | | | 1 | | | | 695 | |
7.000% | | | 06/15/23 | | | | | | | | 3 | | | | 3,339 | |
7.000% | | | 06/15/23 | | | | | | | | 7 | | | | 7,852 | |
7.000% | | | 07/15/23 | | | | | | | | — | (r) | | | 436 | |
7.000% | | | 07/15/23 | | | | | | | | 9 | | | | 9,708 | |
7.000% | | | 08/15/23 | | | | | | | | 2 | | | | 1,746 | |
7.000% | | | 08/15/23 | | | | | | | | 5 | | | | 4,729 | |
7.000% | | | 09/15/23 | | | | | | | | 1 | | | | 1,028 | |
7.000% | | | 10/15/23 | | | | | | | | 2 | | | | 2,027 | |
7.000% | | | 10/15/23 | | | | | | | | 2 | | | | 2,243 | |
7.000% | | | 11/15/23 | | | | | | | | 2 | | | | 2,479 | |
7.000% | | | 11/15/23 | | | | | | | | 6 | | | | 6,449 | |
7.000% | | | 01/15/24 | | | | | | | | 40 | | | | 43,224 | |
7.000% | | | 05/15/24 | | | | | | | | 32 | | | | 33,819 | |
7.000% | | | 08/15/28 | | | | | | | | 37 | | | | 40,437 | |
7.500% | | | 12/15/25 | | | | | | | | 3 | | | | 3,188 | |
7.500% | | | 12/15/25 | | | | | | | | 25 | | | | 26,819 | |
7.500% | | | 02/15/26 | | | | | | | | 5 | | | | 4,881 | |
8.500% | | | 09/15/24 | | | | | | | | 43 | | | | 44,921 | |
8.500% | | | 04/15/25 | | | | | | | | 5 | | | | 5,230 | |
Israel Government, USAID Bond, Gov’t. Gtd. Notes | |
2.744%(s) | | | 08/15/23 | | | | | | | | 145 | | | | 134,173 | |
2.923%(s) | | | 11/15/25 | | | | | | | | 450 | | | | 393,603 | |
2.961%(s) | | | 05/15/26 | | | | | | | | 440 | | | | 379,807 | |
2.997%(s) | | | 02/15/26 | | | | | | | | 325 | | | | 282,127 | |
3.040%(s) | | | 11/15/26 | | | | | | | | 400 | | | | 339,679 | |
3.329%(s) | | | 05/15/25 | | | | | | | | 555 | | | | 492,269 | |
5.500% | | | 09/18/33 | | | | | | | | 300 | | | | 409,794 | |
Residual Funding Corp. Strips Principal, Bonds, PO | |
2.260%(s) | | | 01/15/30 | | | | | | | | 160 | | | | 126,286 | |
3.168%(s) | | | 04/15/30 | | | | | | | | 2,305 | | | | 1,809,738 | |
Resolution Funding Corp., Strips Interest, Bonds | |
2.197%(s) | | | 01/15/30 | | | | | | | | 140 | | | | 109,636 | |
2.433%(s) | | | 04/15/28 | | | | | | | | 200 | | | | 162,046 | |
2.477%(s) | | | 01/15/29 | | | | | | | | 300 | | | | 236,317 | |
3.657%(s) | | | 04/15/30 | | | | | | | | 500 | | | | 388,483 | |
Tennessee Valley Authority, Sr. Unsec’d. Notes | |
2.875% | | | 02/01/27 | | | | | | | | 175 | | | | 184,082 | |
5.880% | | | 04/01/36 | | | | | | | | 230 | | | | 324,659 | |
6.750% | | | 11/01/25 | | | | | | | | 510 | | | | 644,852 | |
7.125% | | | 05/01/30 | | | | | | | | 530 | | | | 765,513 | |
| | | | | | | | | | | | | | | | |
TOTAL U.S. GOVERNMENT AGENCY OBLIGATIONS
(cost $94,567,643) | | | | 96,679,531 | |
| | | | | | | | | | | | | | | | |
| | | | | | | | | | | | | | | | |
Interest
Rate | | Maturity
Date | | | | | | Principal
Amount
(000)# | | | Value | |
|
| U.S. TREASURY OBLIGATIONS — 28.3% | |
U.S. Treasury Bonds | |
2.875% | | | 05/15/43 | (k) | | | | | | | 8,940 | | | $ | 9,743,203 | |
3.125% | | | 02/15/43 | | | | | | | | 1,530 | | | | 1,735,594 | |
3.625% | | | 08/15/43 | | | | | | | | 10,435 | | | | 12,800,810 | |
3.750% | | | 11/15/43 | | | | | | | | 16,690 | | | | 20,878,147 | |
U.S. Treasury Notes | |
1.750% | | | 12/31/24 | | | | | | | | 100 | | | | 100,273 | |
U.S. Treasury Strips Coupon | |
1.982%(s) | | | 08/15/39 | | | | | | | | 4,440 | | | | 2,761,298 | |
1.990%(s) | | | 02/15/39 | | | | | | | | 2,900 | | | | 1,829,379 | |
2.010%(s) | | | 08/15/30 | | | | | | | | 1,060 | | | | 848,787 | |
2.056%(s) | | | 11/15/38 | | | | | | | | 345 | | | | 219,776 | |
2.147%(s) | | | 05/15/39 | | | | | | | | 1,165 | | | | 730,673 | |
2.184%(s) | | | 02/15/28 | (k) | | | | | | | 550 | | | | 468,639 | |
2.334%(s) | | | 08/15/41 | | | | | | | | 3,115 | | | | 1,829,211 | |
2.353%(s) | | | 02/15/44 | | | | | | | | 780 | | | | 427,080 | |
2.365%(s) | | | 05/15/44 | | | | | | | | 2,860 | | | | 1,555,348 | |
2.380%(s) | | | 05/15/41 | | | | | | | | 1,855 | | | | 1,097,059 | |
2.384%(s) | | | 05/15/29 | | | | | | | | 565 | | | | 466,942 | |
2.434%(s) | | | 11/15/45 | | | | | | | | 540 | | | | 283,120 | |
2.436%(s) | | | 02/15/46 | | | | | | | | 390 | | | | 203,181 | |
2.499%(s) | | | 02/15/22 | | | | | | | | 835 | | | | 806,623 | |
2.506%(s) | | | 11/15/43 | | | | | | | | 4,315 | | | | 2,380,161 | |
2.750%(s) | | | 08/15/27 | | | | | | | | 2,575 | | | | 2,216,310 | |
2.783%(s) | | | 08/15/29 | | | | | | | | 500 | | | | 410,137 | |
2.878%(s) | | | 05/15/31 | | | | | | | | 500 | | | | 391,934 | |
3.042%(s) | | | 11/15/35 | | | | | | | | 1,000 | | | | 693,555 | |
3.202%(s) | | | 08/15/40 | | | | | | | | 800 | | | | 483,531 | |
4.138%(s) | | | 02/15/42 | (k) | | | | | | | 3,725 | | | | 2,154,389 | |
| | | | | | | | | | | | | | | | |
TOTAL U.S. TREASURY OBLIGATIONS
(cost $68,586,489) | | | | 67,515,160 | |
| | | | | | | | | | | | | | | | |
TOTAL LONG-TERM INVESTMENTS
(cost $233,429,864) | | | | 236,307,866 | |
| | | | | | | | | | | | | | | | |
| | | | |
| | | | | | | | | Shares | | | | |
|
| SHORT-TERM INVESTMENTS — 5.3% | |
|
| AFFILIATED MUTUAL FUNDS — 5.2% | |
PGIM Core Short-Term Bond Fund(w) | | | | 791,091 | | | | 7,285,947 | |
PGIM Core Ultra Short Bond Fund(w) | | | | 5,041,716 | | | | 5,041,716 | |
| | | | | | | | | | | | | | | | |
TOTAL AFFILIATED MUTUAL FUNDS
(cost $12,148,711) | | | | 12,327,663 | |
| | | | | | | | | | | | | | | | |
|
| OPTIONS PURCHASED*~ — 0.1% | |
(cost $7,009) | | | | | | | | | | | | 187,865 | |
| | | | | | | | | | | | | | | | |
TOTAL SHORT-TERM INVESTMENTS
(cost $12,155,720) | | | | 12,515,528 | |
| | | | | | | | | | | | | | | | |
TOTAL INVESTMENTS — 104.3%
(cost $245,585,584) | | | | | | | | 248,823,394 | |
Liabilities in excess of other assets(z) — (4.3)% | | | | (10,230,149 | ) |
| | | | | | | | | | | | | | | | |
NET ASSETS — 100.0% | | | | | | | | | | | $ | 238,593,245 | |
| | | | | | | | | | | | | | | | |
SEE NOTES TO FINANCIAL STATEMENTS.
A122
| | | | | | |
| | |
| | GOVERNMENT INCOME PORTFOLIO (continued) | | |
| | | | | | |
| |
| SCHEDULE OF INVESTMENTS | | as of December 31, 2019 |
See the Glossary for a list of the abbreviation(s) used in the annual report.
| * | Non-income producing security. |
| # | Principal or notional amount is shown in U.S. dollars unless otherwise stated. |
| ~ | See tables subsequent to the Schedule of Investments for options detail. |
| (c) | Variable rate instrument. The interest rate shown reflects the rate in effect at December 31, 2019. |
| (cc) | Variable rate instrument. The rate shown is based on the latest available information as of December 31, 2019. Certain variable rate securities are not based on a published reference rate and spread but are determined by the issuer or agent and are based on current market conditions. These securities do not indicate a reference rate and spread in their description. |
| (k) | Represents security, or a portion thereof, segregated as collateral for centrally cleared/exchange-traded derivatives. |
| (r) | Principal or notional amount is less than $500 par. |
| (s) | Represents zero coupon bond or principal only security. Rate represents yield to maturity at purchase date. |
| (w) | PGIM Investments LLC, the manager of the Portfolio, also serves as manager of the PGIM Core Short-Term Bond Fund and PGIM Core Ultra Short Bond Fund. |
| (z) | Includes net unrealized appreciation/(depreciation) and/or market value of the below holdings which are excluded from the Schedule of Investments: |
Options Purchased:
OTC Traded
| | | | | | | | | | | | | | | | | | | | | | | | |
Description | | Call/
Put | | Counterparty | | Expiration
Date | | | Strike | | | Contracts | | | Notional
Amount
(000)# | | | Value | |
2-Year 10 CMS Curve CAP | | Call | | Barclays Bank PLC | | | 07/12/21 | | | | 0.11% | | | | — | | | | 1,227 | | | $ | 12,781 | |
2-Year 10 CMS Curve CAP | | Call | | Barclays Bank PLC | | | 07/13/21 | | | | 0.11% | | | | — | | | | 1,193 | | | | 12,416 | |
2-Year 10 CMS Curve CAP | | Call | | Bank of America, N.A. | | | 08/16/21 | | | | 0.15% | | | | — | | | | 2,982 | | | | 28,460 | |
2-Year 10 CMS Curve CAP | | Call | | Bank of America, N.A. | | | 08/20/21 | | | | 0.15% | | | | — | | | | 5,920 | | | | 59,396 | |
2-Year 10 CMS Curve CAP | | Call | | Bank of America, N.A. | | | 09/13/21 | | | | 0.14% | | | | — | | | | 6,000 | | | | 63,126 | |
2-Year 10 CMS Curve CAP | | Call | | Barclays Bank PLC | | | 11/09/21 | | | | 0.21% | | | | — | | | | 1,193 | | | | 11,686 | |
| | | | | | | | | | | | | | | | | | | | | | | | |
| Total Options Purchased (cost $7,009) | | | | | | | | | | | | | | | | | | $ | 187,865 | |
| | | | | | | | | | | | | | | | | | | | | | | | |
Futures contracts outstanding at December 31, 2019:
| | | | | | | | | | | | | | | | |
Number of
Contracts | | Type | | | Expiration
Date | | | Current
Notional
Amount | | | Value /
Unrealized
Appreciation
(Depreciation) | |
| Long Positions: | | | | | | | | | | | | | | | | |
| 685 | | | 5 Year U.S. Treasury Notes | | | | Mar. 2020 | | | $ | 81,247,425 | | | $ | (258,495 | ) |
| 73 | | | 10 Year U.S. Treasury Notes | | | | Mar. 2020 | | | | 9,374,797 | | | | (39,968 | ) |
| 84 | | | 10 Year U.S. Ultra Treasury Notes | | | | Mar. 2020 | | | | 11,819,063 | | | | (140,979 | ) |
| | | | | | | | | | | | | | | | |
| | | | | | | | | | | | | | | (439,442 | ) |
| | | | | | | | | | | | | | | | |
| Short Positions: | | | | | | | | | | | | | | | | |
| 81 | | | 90 Day Euro | | | | Dec. 2020 | | | | 19,921,950 | | | | 51,005 | |
| 98 | | | 2 Year U.S. Treasury Notes | | | | Mar. 2020 | | | | 21,119,000 | | | | 11,686 | |
| 199 | | | 20 Year U.S. Treasury Bonds | | | | Mar. 2020 | | | | 31,025,344 | | | | 427,404 | |
| 122 | | | 30 Year U.S. Ultra Treasury Bonds | | | | Mar. 2020 | | | | 22,162,063 | | | | 603,766 | |
| | | | | | | | | | | | | | | | |
| | | | | | | | | | | | | | | 1,093,861 | |
| | | | | | | | | | | | | | | | |
| | | | | | | | | | | | | | $ | 654,419 | |
| | | | | | | | | | | | | | | | |
Interest rate swap agreements outstanding at December 31, 2019:
| | | | | | | | | | | | | | | | | | | | | | | | |
Notional
Amount
(000)# | | | Termination
Date | | | Fixed
Rate | | | Floating
Rate | | Value at
Trade
Date | | | Value at
December 31,
2019 | | | Unrealized
Appreciation
(Depreciation) | |
| | Centrally Cleared Interest Rate Swap Agreements: | |
| | 3,017 | | | | 03/31/21 | | | | 2.173%(A) | | | 1 Day USOIS(2)(A) | | $ | (917 | ) | | $ | 28,466 | | | $ | 29,383 | |
| | 27,209 | | | | 06/15/21 | | | | 1.830%(S) | | | 3 Month LIBOR(2)(Q) | | | — | | | | 43,244 | | | | 43,244 | |
| | 20,373 | | | | 09/15/21 | | | | 1.381%(S) | | | 3 Month LIBOR(2)(Q) | | | (41,934 | ) | | | (104,584 | ) | | | (62,650 | ) |
| | 13,720 | | | | 09/15/21 | | | | 1.480%(S) | | | 3 Month LIBOR(2)(Q) | | | 13,043 | | | | (47,987 | ) | | | (61,030 | ) |
| | 23,760 | | | | 09/15/21 | | | | 1.604%(S) | | | 3 Month LIBOR(2)(Q) | | | 43,238 | | | | (33,801 | ) | | | (77,039 | ) |
| | 1,640 | | | | 02/29/24 | | | | 1.520%(S) | | | 3 Month LIBOR(2)(Q) | | | — | | | | (11,875 | ) | | | (11,875 | ) |
| | 8,120 | | | | 03/29/24 | | | | 1.949%(A) | | | 1 Day USOIS(1)(A) | | | — | | | | (150,398 | ) | | | (150,398 | ) |
| | 17,565 | | | | 08/15/24 | | | | 2.170%(S) | | | 3 Month LIBOR(1)(Q) | | | (4,680 | ) | | | (451,629 | ) | | | (446,949 | ) |
SEE NOTES TO FINANCIAL STATEMENTS.
A123
| | | | | | |
| | |
| | GOVERNMENT INCOME PORTFOLIO (continued) | | |
| | | | | | |
| |
| SCHEDULE OF INVESTMENTS | | as of December 31, 2019 |
| | | | | | | | | | | | | | | | | | | | | | | | |
Notional
Amount
(000)# | | | Termination
Date | | | Fixed
Rate | | | Floating Rate | | Value at
Trade
Date | | | Value at
December 31,
2019 | | | Unrealized
Appreciation
(Depreciation) | |
| | Centrally Cleared Interest Rate Swap Agreements (continued): | |
| | 4,670 | | | | 11/15/24 | | | | 2.334%(S) | | | 3 Month LIBOR(1)(Q) | | $ | 14,367 | | | $ | (134,664 | ) | | $ | (149,031 | ) |
| | 3,785 | | | | 02/12/25 | | | | 2.408%(A) | | | 1 Day USOIS(1)(A) | | | — | | | | (178,584 | ) | | | (178,584 | ) |
| | 590 | | | | 02/28/25 | | | | 2.454%(A) | | | 1 Day USOIS(1)(A) | | | — | | | | (29,659 | ) | | | (29,659 | ) |
| | 1,669 | | | | 05/31/25 | | | | 2.998%(S) | | | 3 Month LIBOR(1)(Q) | | | (1,080 | ) | | | (110,070 | ) | | | (108,990 | ) |
| | 1,305 | | | | 07/31/25 | | | | 3.105%(S) | | | 3 Month LIBOR(1)(Q) | | | 1,030 | | | | (107,170 | ) | | | (108,200 | ) |
| | 4,951 | | | | 07/31/25 | | | | 3.109%(S) | | | 3 Month LIBOR(1)(Q) | | | 313 | | | | (407,851 | ) | | | (408,164 | ) |
| | 1,920 | | | | 01/08/26 | | | | 2.210%(S) | | | 3 Month LIBOR(1)(Q) | | | 70,520 | | | | (60,348 | ) | | | (130,868 | ) |
| | 370 | | | | 01/31/26 | | | | 2.236%(S) | | | 3 Month LIBOR(1)(Q) | | | — | | | | (12,357 | ) | | | (12,357 | ) |
| | 1,943 | | | | 01/31/26 | | | | 2.269%(A) | | | 1 Day USOIS(1)(A) | | | (5,490 | ) | | | (87,628 | ) | | | (82,138 | ) |
| | 1,377 | | | | 04/30/26 | | | | 1.876%(S) | | | 3 Month LIBOR(1)(Q) | | | (5,519 | ) | | | (8,461 | ) | | | (2,942 | ) |
| | 2,102 | | | | 02/15/27 | | | | 1.824%(A) | | | 1 Day USOIS(1)(A) | | | 29,738 | | | | (31,371 | ) | | | (61,109 | ) |
| | 790 | | | | 02/15/27 | | | | 1.899%(A) | | | 1 Day USOIS(1)(A) | | | 984 | | | | (16,361 | ) | | | (17,345 | ) |
| | 530 | | | | 02/15/27 | | | | 1.965%(A) | | | 1 Day USOIS(1)(A) | | | — | | | | (13,663 | ) | | | (13,663 | ) |
| | 1,445 | | | | 02/15/27 | | | | 2.067%(A) | | | 1 Day USOIS(1)(A) | | | (911 | ) | | | (48,663 | ) | | | (47,752 | ) |
| | 260 | | | | 05/15/27 | | | | 2.295%(S) | | | 3 Month LIBOR(1)(Q) | | | — | | | | (8,931 | ) | | | (8,931 | ) |
| | 7,914 | | | | 08/15/28 | | | | 2.579%(A) | | | 1 Day USOIS(1)(A) | | | (142,564 | ) | | | (644,154 | ) | | | (501,590 | ) |
| | 3,451 | | | | 08/15/28 | | | | 2.835%(S) | | | 3 Month LIBOR(1)(Q) | | | (13,709 | ) | | | (301,400 | ) | | | (287,691 | ) |
| | 145 | | | | 11/15/43 | | | | 2.659%(S) | | | 3 Month LIBOR(1)(Q) | | | — | | | | (16,315 | ) | | | (16,315 | ) |
| | 795 | | | | 08/09/49 | | | | 1.508%(A) | | | 1 Day USOIS(1)(A) | | | — | | | | 63,133 | | | | 63,133 | |
| | | | | | | | | | | | | | | | | | | | | | | | |
| | | | | | | | | | | | | | $ | (43,571 | ) | | $ | (2,883,081 | ) | | $ | (2,839,510 | ) |
| | | | | | | | | | | | | | | | | | | | | | | | |
| (1) | The Portfolio pays the fixed rate and receives the floating rate. |
| (2) | The Portfolio pays the floating rate and receives the fixed rate. |
Summary of Collateral for Centrally Cleared/Exchange-traded Derivatives:
Cash and securities segregated as collateral, including pending settlement for closed positions, to cover requirements for centrally cleared/exchange-traded derivatives are listed by broker as follows:
| | | | | | | | |
Broker | | Cash and/or Foreign Currency | | | Securities Market Value | |
Citigroup Global Markets, Inc. | | $ | — | | | $ | 2,566,396 | |
| | | | | | | | |
Fair Value Measurements:
Various inputs are used in determining the value of the Portfolio’s investments. These inputs are summarized in the three broad levels listed below.
| Level 1— | unadjusted quoted prices generally in active markets for identical securities. |
| Level 2— | quoted prices for similar securities, interest rates and yield curves, prepayment speeds, foreign currency exchange rates and other observable inputs. |
| Level 3— | unobservable inputs for securities valued in accordance with Board approved fair valuation procedures. |
The following is a summary of the inputs used as of December 31, 2019 in valuing such portfolio securities:
| | | | | | | | | | | | |
| | | Level 1 | | | Level 2 | | | Level 3 | |
Investments in Securities | | | | | | | | | | | | |
Assets | | | | | | | | | | | | |
Asset-Backed Securities | | | | | | | | | | | | |
Collateralized Loan Obligations | | $ | — | | | $ | 24,166,442 | | | $ | — | |
Commercial Mortgage-Backed Securities | | | — | | | | 44,344,332 | | | | — | |
Corporate Bonds | | | — | | | | 2,980,684 | | | | — | |
Residential Mortgage-Backed Securities | | | — | | | | 621,717 | | | | — | |
U.S. Government Agency Obligations | | | — | | | | 96,679,531 | | | | — | |
U.S. Treasury Obligations | | | — | | | | 67,515,160 | | | | — | |
Affiliated Mutual Funds | | | 12,327,663 | | | | — | | | | — | |
Options Purchased | | | — | | | | 187,865 | | | | — | |
| | | | | | | | | | | | |
Total | | $ | 12,327,663 | | | $ | 236,495,731 | | | $ | — | |
| | | | | | | | | | | | |
SEE NOTES TO FINANCIAL STATEMENTS.
A124
| | | | | | |
| | |
| | GOVERNMENT INCOME PORTFOLIO (continued) | | |
| | | | | | |
| |
| SCHEDULE OF INVESTMENTS | | as of December 31, 2019 |
| | | | | | | | | | | | |
| | | Level 1 | | | Level 2 | | | Level 3 | |
Other Financial Instruments* | | | | | | | | | | | | |
Assets | | | | | | | | | | | | |
Futures Contracts | | $ | 1,093,861 | | | $ | — | | | $ | — | |
Centrally Cleared Interest Rate Swap Agreements | | | — | | | | 135,760 | | | | — | |
| | | | | | | | | | | | |
Total | | $ | 1,093,861 | | | $ | 135,760 | | | $ | — | |
| | | | | | | | | | | | |
Liabilities | | | | | | | | | | | | |
Futures Contracts | | $ | (439,442 | ) | | $ | — | | | $ | — | |
Centrally Cleared Interest Rate Swap Agreements | | | — | | | | (2,975,270 | ) | | | — | |
| | | | | | | | | | | | |
Total | | $ | (439,442 | ) | | $ | (2,975,270 | ) | | $ | — | |
| | | | | | | | | | | | |
| * | Other financial instruments are derivative instruments not reflected in the Schedule of Investments, such as futures, forwards and centrally cleared swap contracts, which are recorded at the unrealized appreciation (depreciation) on the instrument, and OTC swap contracts which are recorded at fair value. |
Industry Classification:
The industry classification of investments and liabilities in excess of other assets shown as a percentage of net assets as of December 31, 2019 were as follows (unaudited):
| | | | |
U.S. Government Agency Obligations | | | 40.5 | % |
U.S. Treasury Obligations | | | 28.3 | |
Commercial Mortgage-Backed Securities | | | 18.6 | |
Collateralized Loan Obligations | | | 10.1 | |
Affiliated Mutual Funds | | | 5.2 | |
Diversified Financial Services | | | 1.2 | |
Residential Mortgage-Backed Securities | | | 0.3 | |
| | | | |
Options Purchased | | | 0.1 | % |
| | | | |
| | | 104.3 | |
Liabilities in excess of other assets | | | (4.3 | ) |
| | | | |
| | | 100.0 | % |
| | | | |
Effects of Derivative Instruments on the Financial Statements and Primary Underlying Risk Exposure:
The Portfolio invested in derivative instruments during the reporting period. The primary type of risk associated with these derivative instruments is interest rate contracts risk. See the Notes to Financial Statements for additional detail regarding these derivative instruments and their risks. The effect of such derivative instruments on the Portfolio’s financial position and financial performance as reflected in the Statement of Assets and Liabilities and Statement of Operations is presented in the summary below.
Fair values of derivative instruments as of December 31, 2019 as presented in the Statement of Assets and Liabilities:
| | | | | | | | | | | | |
| | | Asset Derivatives | | | Liability Derivatives | |
Derivatives not accounted for as hedging
instruments, carried at fair value | | Statement of
Assets and
Liabilities Location | | Fair Value | | | Statement of
Assets and
Liabilities Location | | Fair Value | |
Interest rate contracts | | Due from/to broker-variation margin futures | | $ | 1,093,861 | * | | Due from/to broker-variation margin futures | | $ | 439,442 | * |
Interest rate contracts | | Due from/to broker-variation margin swaps | | | 135,760 | * | | Due from/to broker-variation margin swaps | | | 2,975,270 | * |
Interest rate contracts | | Unaffiliated investments | | | 187,865 | | | — | | | — | |
| | | | | | | | | | | | |
| | | | $ | 1,417,486 | | | | | $ | 3,414,712 | |
| | | | | | | | | | | | |
| * | Includes cumulative appreciation (depreciation) as reported in the schedule of open futures and centrally cleared swap contracts. Only unsettled variation margin receivable (payable) is reported within the Statement of Assets and Liabilities. |
The effects of derivative instruments on the Statement of Operations for the year ended December 31, 2019 are as follows:
| | | | | | | | | | | | | | | | | | | | |
Amount of Realized Gain (Loss) on Derivatives Recognized in Income | |
Derivatives not accounted for as hedging
instruments, carried at fair value | | Options
Purchased(1) | | | Options
Written | | | Futures | | | Forward
Rate
Agreements | | | Swaps | |
Interest rate contracts | | $ | (210,751 | ) | | $ | 92,083 | | | $ | 5,706,135 | | | $ | (44,713 | ) | | $ | 378,349 | |
| | | | | | | | | | | | | | | | | | | | |
SEE NOTES TO FINANCIAL STATEMENTS.
A125
| | | | | | |
| | |
| | GOVERNMENT INCOME PORTFOLIO (continued) | | |
| | | | | | |
| |
| SCHEDULE OF INVESTMENTS | | as of December 31, 2019 |
| (1) | Included in net realized gain (loss) on investment transactions in the Statement of Operations. |
| | | | | | | | | | | | | | | | |
Change in Unrealized Appreciation (Depreciation) on Derivatives Recognized in Income | |
Derivatives not accounted for as hedging
instruments, carried at fair value | | Options
Purchased(2) | | | Futures | | | Forward
Rate
Agreements | | | Swaps | |
Interest rate contracts | | $ | 5,677 | | | $ | (140,150 | ) | | $ | 876 | | | $ | (3,329,004 | ) |
| | | | | | | | | | | | | | | | |
| (2) | Included in net change in unrealized appreciation (depreciation) on investments in the Statement of Operations. |
For the year ended December 31, 2019, the Portfolio’s average volume of derivative activities is as follows:
| | | | | | |
Options Purchased(1) | | Options Written(2) | | Futures Contracts— Long Positions(2) | | Futures Contracts— Short Positions(2) |
| $54,065 | | $383,800 | | $111,742,537 | | $54,657,715 |
| | | | |
Forward Rate Agreements(2) | | Inflation Swap Agreements(2) | | Interest Rate Swap Agreements(2) |
| $12,860,000 | | $672,000 | | $103,242,400 |
| (2) | Notional Amount in USD. |
Financial Instruments/Transactions—Summary of Offsetting and Netting Arrangements:
The Portfolio invested in OTC derivatives during the reporting period that are either offset in accordance with current requirements or are subject to enforceable master netting arrangements or similar agreements that permit offsetting. The information about offsetting and related netting arrangements for OTC derivatives where the legal right toset-off exists is presented in the summary below.
| | | | | | | | | | | | | | | | | | | | |
Counterparty | | Gross
Amounts of
Recognized
Assets(1) | | | Gross
Amounts of
Recognized
Liabilities(1) | | | Net
Amounts of
Recognized
Assets/
(Liabilities) | | | Collateral
Pledged/
(Received)(2) | | | Net Amount | |
Bank of America, N.A. | | $ | 150,982 | | | $ | — | | | $ | 150,982 | | | $ | — | | | $ | 150,982 | |
Barclays Bank PLC | | | 36,883 | | | | — | | | | 36,883 | | | | — | | | | 36,883 | |
| | | | | | | | | | | | | | | | | | | | |
| | $ | 187,865 | | | $ | — | | | $ | 187,865 | | | $ | — | | | $ | 187,865 | |
| | | | | | | | | | | | | | | | | | | | |
| (1) | Includes unrealized appreciation/(depreciation) on swaps and forwards, premiums paid/(received) on swap agreements and market value of purchased and written options, as represented on the Statement of Assets and Liabilities. |
| (2) | Collateral amount disclosed by the Portfolio is limited to the market value of financial instruments/transactions and the Portfolio’s OTC derivative exposure by counterparty. |
SEE NOTES TO FINANCIAL STATEMENTS.
A126
| | | | | | |
| | |
| | GOVERNMENT INCOME PORTFOLIO (continued) | | |
STATEMENT OF ASSETS AND LIABILITIES
as of December 31, 2019
| | | | |
| ASSETS | | | | |
Investments at value: | | | | |
Unaffiliated investments (cost $233,436,873) | | $ | 236,495,731 | |
Affiliated investments (cost $12,148,711) | | | 12,327,663 | |
Cash | | | 91,207 | |
Receivable for investments sold | | | 4,631,299 | |
Interest receivable | | | 906,711 | |
Due from broker-variation margin futures | | | 167,417 | |
Due from broker-variation margin swaps | | | 107,172 | |
Receivable for Portfolio shares sold | | | 28,807 | |
Prepaid expenses | | | 1,951 | |
| | | | |
Total Assets | | | 254,757,958 | |
| | | | |
| LIABILITIES | | | | |
Payable for investments purchased | | | 15,957,692 | |
Accrued expenses and other liabilities | | | 108,175 | |
Management fee payable | | | 81,481 | |
Payable for Portfolio shares repurchased | | | 16,385 | |
Affiliated transfer agent fee payable | | | 980 | |
| | | | |
Total Liabilities | | | 16,164,713 | |
| | | | |
| NET ASSETS | | $ | 238,593,245 | |
| | | | |
Net assets were comprised of: | | | | |
Partners’ Equity | | $ | 238,593,245 | |
| | | | |
Net asset value and redemption price per share, $238,593,245 / 17,617,014 outstanding shares of beneficial interest | | $ | 13.54 | |
| | | | |
STATEMENT OF OPERATIONS
Year Ended December 31, 2019
| | | | |
| NET INVESTMENT INCOME (LOSS) | | | | |
| INCOME | | | | |
Interest income | | $ | 6,052,832 | |
Affiliated dividend income | | | 668,628 | |
Income from securities lending, net (including affiliated income of $839) | | | 945 | |
| | | | |
Total income | | | 6,722,405 | |
| | | | |
| EXPENSES | | | | |
Management fee | | | 938,445 | |
Shareholders’ reports | | | 110,245 | |
Custodian and accounting fees | | | 92,227 | |
Audit fee | | | 35,800 | |
Legal fees and expenses | | | 12,704 | |
Trustees’ fees | | | 12,118 | |
Transfer agent’s fees and expenses (including affiliated expense of $5,882) | | | 10,682 | |
Miscellaneous | | | 17,916 | |
| | | | |
Total expenses | | | 1,230,137 | |
| | | | |
| NET INVESTMENT INCOME (LOSS) | | | 5,492,268 | |
| | | | |
| REALIZED AND UNREALIZED GAIN (LOSS) ON INVESTMENT TRANSACTIONS | | | | |
Net realized gain (loss) on: | | | | |
Investment transactions (including affiliated of $(1,036,590)) | | | 2,789,605 | |
Futures transactions | | | 5,706,135 | |
Forward rate agreement transactions | | | (44,713 | ) |
Options written transactions | | | 92,083 | |
Swap agreements transactions | | | 378,349 | |
| | | | |
| | | 8,921,459 | |
| | | | |
Net change in unrealized appreciation (depreciation) on: | | | | |
Investments (including affiliated of $1,126,863) | | | 4,187,461 | |
Futures | | | (140,150 | ) |
Forward rate agreements | | | 876 | |
Swap agreements | | | (3,329,004 | ) |
| | | | |
| | | 719,183 | |
| | | | |
| NET GAIN (LOSS) ON INVESTMENT TRANSACTIONS | | | 9,640,642 | |
| | | | |
| NET INCREASE (DECREASE) IN NET ASSETS RESULTING FROM OPERATIONS | | $ | 15,132,910 | |
| | | | |
STATEMENTS OF CHANGES IN NET ASSETS
| | | | | | | | |
| | | Year Ended
December 31, 2019 | | | Year Ended
December 31, 2018 | |
| INCREASE (DECREASE) IN NET ASSETS | | | | | | | | |
| OPERATIONS | | | | | | | | |
Net investment income (loss) | | $ | 5,492,268 | | | $ | 5,254,682 | |
Net realized gain (loss) on investment transactions | | | 8,921,459 | | | | (4,787,292 | ) |
Net change in unrealized appreciation (depreciation) on investments | | | 719,183 | | | | 470,821 | |
| | | | | | | | |
NET INCREASE (DECREASE) IN NET ASSETS RESULTING FROM OPERATIONS | | | 15,132,910 | | | | 938,211 | |
| | | | | | | | |
| PORTFOLIO SHARE TRANSACTIONS | | | | | | | | |
Portfolio shares sold [2,289,238 and 1,165,919 shares, respectively] | | | 29,826,157 | | | | 14,482,217 | |
Portfolio shares repurchased [2,084,878 and 3,097,890 shares, respectively] | | | (27,448,072 | ) | | | (38,486,314 | ) |
| | | | | | | | |
NET INCREASE (DECREASE) IN NET ASSETS FROM PORTFOLIO SHARE TRANSACTIONS | | | 2,378,085 | | | | (24,004,097 | ) |
| | | | | | | | |
| CAPITAL CONTRIBUTIONS | | | — | | | | 246 | |
| | | | | | | | |
| TOTAL INCREASE (DECREASE) | | | 17,510,995 | | | | (23,065,640 | ) |
| NET ASSETS: | | | | | | | | |
Beginning of year | | | 221,082,250 | | | | 244,147,890 | |
| | | | | | | | |
End of year | | $ | 238,593,245 | | | $ | 221,082,250 | |
| | | | | | | | |
SEE NOTES TO FINANCIAL STATEMENTS.
A127
| | | | | | |
| | |
| | GOVERNMENT MONEY MARKET PORTFOLIO | | |
| | | | | | |
| |
| SCHEDULE OF INVESTMENTS | | as of December 31, 2019 |
| | | | | | | | | | | | |
Interest
Rate | | Maturity
Date | | | Principal
Amount
(000)# | | | Value | |
|
| REPURCHASE AGREEMENT(m) — 4.7% | |
Bank of America Securities, Inc., 1.57%, dated 12/31/19, due 01/02/20 in the amount of $28,400,477 (amortized cost $28,398,000) | | | | 28,398 | | | $ | 28,398,000 | |
| | | | | | | | | | | | |
|
| U.S. GOVERNMENT AGENCY OBLIGATIONS — 86.5% | |
Federal Farm Credit Bank, Secured Overnight Financing Rate + 0.030% (Cap N/A, Floor 0.000%) | |
1.570%(c) | | | 02/06/20 | | | | 2,000 | | | | 1,999,980 | |
Federal Farm Credit Bank, US Federal Funds Effective Rate + 0.030% (Cap N/A, Floor 0.000%) | |
1.580%(c) | | | 07/28/20 | | | | 5,000 | | | | 5,000,000 | |
Federal Farm Credit Bank, 1 Month LIBOR + (0.080)% (Cap N/A, Floor 0.000%) | |
1.638%(c) | | | 05/11/20 | | | | 2,160 | | | | 2,159,161 | |
Federal Farm Credit Bank, 1 Month LIBOR + (0.050)% (Cap N/A, Floor 0.000%) | |
1.644%(c) | | | 02/04/20 | | | | 5,000 | | | | 5,000,000 | |
1.660%(c) | | | 01/08/20 | | | | 7,000 | | | | 7,000,000 | |
1.735%(c) | | | 07/21/20 | | | | 7,000 | | | | 7,000,157 | |
1.755%(c) | | | 05/29/20 | | | | 6,000 | | | | 5,998,766 | |
Federal Farm Credit Bank, 1 Month LIBOR + (0.040)% (Cap N/A, Floor 0.000%) | |
1.673%(c) | | | 02/06/20 | | | | 7,000 | | | | 6,999,931 | |
Federal Farm Credit Bank, 1 Month LIBOR + 0.000% (Cap N/A, Floor 0.000%) | |
1.710%(c) | | | 07/09/20 | | | | 5,000 | | | | 4,999,874 | |
1.740%(c) | | | 04/14/20 | | | | 8,000 | | | | 8,000,000 | |
1.745%(c) | | | 05/18/20 | | | | 7,000 | | | | 6,999,801 | |
1.792%(c) | | | 06/25/20 | | | | 7,000 | | | | 6,999,478 | |
1.792%(c) | | | 09/25/20 | | | | 4,500 | | | | 4,499,456 | |
Federal Farm Credit Bank, 1 Month LIBOR + (0.010)% (Cap N/A, Floor 0.000%) | |
1.730%(c) | | | 01/16/20 | | | | 12,000 | | | | 12,000,001 | |
Federal Farm Credit Bank, 1 Month LIBOR + (0.070)% (Cap N/A, Floor 0.000%) | |
1.735%(c) | | | 01/28/20 | | | | 9,000 | | | | 9,000,000 | |
Federal Farm Credit Bank, 1 Month LIBOR + 0.010% (Cap N/A, Floor 0.000%) | |
1.746%(c) | | | 08/12/20 | | | | 6,000 | | | | 5,999,813 | |
Federal Farm Credit Bank, 1 Month LIBOR + (0.045)% (Cap N/A, Floor 0.000%) | |
1.747%(c) | | | 02/25/20 | | | | 6,000 | | | | 6,000,000 | |
Federal Farm Credit Bank, 1 Month LIBOR + (0.025)% (Cap N/A, Floor 0.000%) | |
1.755%(c) | | | 01/24/20 | | | | 8,000 | | | | 8,000,040 | |
Federal Farm Credit Bank, 1 Month LIBOR + 0.050% (Cap N/A, Floor 0.000%) | |
1.765%(c) | | | 02/10/20 | | | | 4,500 | | | | 4,500,360 | |
1.835%(c) | | | 02/21/20 | | | | 4,000 | | | | 4,000,374 | |
Federal Farm Credit Bank, 1 Month LIBOR + 0.110% (Cap N/A, Floor 0.000%) | |
1.902%(c) | | | 03/25/21 | | | | 6,000 | | | | 5,999,031 | |
Federal Farm Credit Bank 2.034%(n) | | | 02/20/20 | | | | 4,000 | | | | 3,988,833 | |
Federal Home Loan Bank, Secured Overnight Financing Rate + 0.010% (Cap N/A, Floor 0.000%) | |
1.550%(c) | | | 01/24/20 | | | | 8,000 | | | | 8,000,000 | |
| | | | | | | | | | | | |
Interest
Rate | | Maturity
Date | | | Principal
Amount
(000)# | | | Value | |
|
| U.S. GOVERNMENT AGENCY OBLIGATIONS (continued) | |
Federal Home Loan Bank | | | | | | | | | | | | |
1.551%(n) | | | 02/05/20 | | | | 7,000 | | | $ | 6,989,485 | |
1.554%(n) | | | 01/06/20 | | | | 7,000 | | | | 6,998,493 | |
1.559%(n) | | | 01/13/20 | | | | 7,500 | | | | 7,496,113 | |
1.565%(n) | | | 01/23/20 | | | | 7,000 | | | | 6,993,327 | |
1.569%(n) | | | 01/15/20 | | | | 13,000 | | | | 12,992,086 | |
1.574%(n) | | | 02/07/20 | | | | 5,000 | | | | 4,991,932 | |
1.575%(n) | | | 02/19/20 | | | | 8,000 | | | | 7,982,915 | |
1.576%(n) | | | 02/14/20 | | | | 11,000 | | | | 10,978,886 | |
1.577%(n) | | | 02/21/20 | | | | 1,500 | | | | 1,496,662 | |
1.579%(n) | | | 02/10/20 | | | | 1,500 | | | | 1,497,375 | |
1.579%(n) | | | 02/18/20 | | | | 3,000 | | | | 2,993,700 | |
1.588%(n) | | | 01/29/20 | | | | 9,000 | | | | 8,988,912 | |
1.589%(n) | | | 02/03/20 | | | | 12,000 | | | | 11,982,565 | |
1.589%(n) | | | 02/13/20 | | | | 9,200 | | | | 9,182,583 | |
1.591%(n) | | | 03/20/20 | | | | 6,000 | | | | 5,979,131 | |
1.594%(n) | | | 03/06/20 | | | | 19,000 | | | | 18,945,545 | |
1.599%(n) | | | 01/30/20 | | | | 23,000 | | | | 22,970,448 | |
1.602%(n) | | | 02/26/20 | | | | 3,000 | | | | 2,992,552 | |
1.604%(n) | | | 01/22/20 | | | | 5,000 | | | | 4,995,333 | |
1.604%(n) | | | 02/28/20 | | | | 9,000 | | | | 8,976,829 | |
1.620% | | | 03/02/20 | | | | 7,000 | | | | 6,999,902 | |
1.685%(n) | | | 01/03/20 | | | | 1,000 | | | | 999,907 | |
1.690% | | | 04/15/20 | | | | 7,000 | | | | 6,999,743 | |
1.690% | | | 07/14/20 | | | | 8,000 | | | | 8,000,000 | |
1.750% | | | 08/26/20 | | | | 5,500 | | | | 5,499,943 | |
Federal Home Loan Bank, Secured Overnight Financing Rate + 0.020% | |
1.560%(c) | | | 05/22/20 | | | | 12,000 | | | | 12,000,000 | |
Federal Home Loan Bank, Secured Overnight Financing Rate + 0.025% (Cap N/A, Floor 0.000%) | |
1.565%(c) | | | 04/22/20 | | | | 5,000 | | | | 4,999,220 | |
Federal Home Loan Bank, Secured Overnight Financing Rate + 0.030% (Cap N/A, Floor 0.000%) | |
1.570%(c) | | | 03/06/20 | | | | 5,000 | | | | 5,000,000 | |
1.570%(c) | | | 07/17/20 | | | | 2,000 | | | | 2,000,000 | |
Federal Home Loan Bank, Secured Overnight Financing Rate + 0.035% (Cap N/A, Floor 0.000%) | |
1.575%(c) | | | 05/08/20 | | | | 9,000 | | | | 8,999,653 | |
Federal Home Loan Bank, Secured Overnight Financing Rate + 0.040% (Cap N/A, Floor 0.000%) | |
1.580%(c) | | | 08/25/20 | | | | 4,500 | | | | 4,500,273 | |
Federal Home Loan Bank, Secured Overnight Financing Rate + 0.045% (Cap N/A, Floor 0.000%) | |
1.585%(c) | | | 01/17/20 | | | | 6,000 | | | | 6,000,000 | |
1.585%(c) | | | 09/28/20 | | | | 2,000 | | | | 2,000,000 | |
Federal Home Loan Bank, Secured Overnight Financing Rate + 0.050% (Cap N/A, Floor 0.000%) | |
1.590%(c) | | | 01/17/20 | | | | 1,000 | | | | 1,000,000 | |
Federal Home Loan Bank, Secured Overnight Financing Rate + 0.060% (Cap N/A, Floor 0.000%) | |
1.600%(c) | | | 05/06/20 | | | | 6,000 | | | | 6,000,000 | |
Federal Home Loan Bank, US Treasury 3 Month Bill + 0.070% | |
1.621%(c) | | | 01/30/20 | | | | 3,000 | | | | 2,999,811 | |
Federal Home Loan Bank, Secured Overnight Financing Rate + 0.110% (Cap N/A, Floor 0.000%) | |
1.650%(c) | | | 06/10/20 | | | | 1,400 | | | | 1,400,431 | |
Federal Home Loan Bank, 1 Month LIBOR + (0.050)% (Cap N/A, Floor 0.000%) | |
1.654%(c) | | | 06/05/20 | | | | 9,000 | | | | 9,000,000 | |
SEE NOTES TO FINANCIAL STATEMENTS.
A128
| | | | | | |
| | |
| | GOVERNMENT MONEY MARKET PORTFOLIO (continued) | | |
| | | | | | |
| |
| SCHEDULE OF INVESTMENTS | | as of December 31, 2019 |
| | | | | | | | | | | | |
Interest
Rate | | Maturity
Date | | | Principal
Amount
(000)# | | | Value | |
|
| U.S. GOVERNMENT AGENCY OBLIGATIONS (continued) | |
Federal Home Loan Bank, Secured Overnight Financing Rate + 0.120% (Cap N/A, Floor 0.000%) | |
1.660%(c) | | | 10/07/20 | | | | 2,500 | | | $ | 2,500,000 | |
Federal Home Loan Bank, 1 Month LIBOR + (0.055)% (Cap N/A, Floor 0.000%) | |
1.681%(c) | | | 03/12/20 | | | | 5,000 | | | | 4,999,642 | |
Federal Home Loan Bank, 1 Month LIBOR + (0.010)% (Cap N/A, Floor 0.000%) | |
1.700%(c) | | | 01/07/20 | | | | 6,000 | | | | 6,000,120 | |
1.770%(c) | | | 04/24/20 | | | | 5,500 | | | | 5,500,000 | |
Federal Home Loan Bank, 1 Month LIBOR + (0.030)% (Cap N/A, Floor 0.000%) | |
1.706%(c) | | | 08/12/20 | | | | 8,000 | | | | 7,997,308 | |
1.755%(c) | | | 01/21/20 | | | | 6,200 | | | | 6,199,924 | |
Federal Home Loan Bank, 3 Month LIBOR + (0.210)% (Cap N/A, Floor 0.000%) | |
1.718%(c) | | | 06/22/20 | | | | 7,000 | | | | 6,996,572 | |
Federal Home Loan Bank, 1 Month LIBOR + (0.065)% (Cap N/A, Floor 0.000%) | |
1.720%(c) | | | 01/23/20 | | | | 1,000 | | | | 999,974 | |
Federal Home Loan Bank, 3 Month LIBOR + (0.175)% (Cap N/A, Floor 0.000%) | |
1.729%(c) | | | 05/08/20 | | | | 4,000 | | | | 3,999,133 | |
Federal Home Loan Bank, 3 Month LIBOR + (0.120)% (Cap N/A, Floor 0.000%) | |
1.789%(c) | | | 11/03/20 | | | | 6,000 | | | | 6,000,710 | |
Federal Home Loan Bank, 1 Month LIBOR + 0.050% (Cap N/A, Floor 0.000%) | |
1.842%(c) | | | 03/25/20 | | | | 6,000 | | | | 6,000,000 | |
Federal Home Loan Bank, 3 Month LIBOR + 0.125% (Cap N/A, Floor 0.000%) | |
2.034%(c) | | | 07/01/20 | | | | 3,000 | | | | 3,003,698 | |
Federal Home Loan Mortgage Corp., Secured Overnight Financing Rate + 0.020% (Cap N/A, Floor 0.000%) | |
1.560%(c) | | | 07/10/20 | | | | 13,000 | | | | 12,997,590 | |
Federal Home Loan Mortgage Corp., Secured Overnight Financing Rate + 0.025% (Cap N/A, Floor 0.000%) | |
1.565%(c) | | | 05/22/20 | | | | 8,000 | | | | 7,999,192 | |
Federal Home Loan Mortgage Corp., Secured Overnight Financing Rate + 0.040% (Cap N/A, Floor 0.000%) | |
1.580%(c) | | | 09/10/20 | | | | 6,000 | | | | 6,000,000 | |
| | | | | | | | | | | | |
Interest
Rate | | Maturity
Date | | | Principal
Amount
(000)# | | | Value | |
|
| U.S. GOVERNMENT AGENCY OBLIGATIONS (continued) | |
Federal Home Loan Mortgage Corp. | |
1.601%(n) | | | 01/22/20 | | | | 6,000 | | | $ | 5,994,411 | |
1.606%(n) | | | 02/26/20 | | | | 6,000 | | | | 5,985,067 | |
1.645%(n) | | | 01/09/20 | | | | 6,000 | | | | 5,997,813 | |
1.652%(n) | | | 03/18/20 | | | | 6,000 | | | | 5,978,953 | |
Federal National Mortgage Assoc., Secured Overnight Financing Rate + 0.060% (Cap N/A, Floor 0.000%) | |
1.600%(c) | | | 07/30/20 | | | | 2,000 | | | | 2,000,000 | |
Federal National Mortgage Assoc., Secured Overnight Financing Rate + 0.160% (Cap N/A, Floor 0.000%) | |
1.700%(c) | | | 01/30/20 | | | | 4,500 | | | | 4,500,497 | |
| | | | | | | | | | | | |
TOTAL U.S. GOVERNMENT AGENCY OBLIGATIONS
(amortized cost $518,619,415) | | | | 518,619,415 | |
| | | | | | | | | | | | |
|
| U.S. TREASURY OBLIGATIONS(n) — 8.5% | |
U.S. Treasury Bills | | | | | | | | | | | | |
1.400% | | | 01/09/20 | | | | 8,000 | | | | 7,997,511 | |
1.529% | | | 01/14/20 | | | | 1,060 | | | | 1,059,415 | |
1.545% | | | 01/07/20 | | | | 19,000 | | | | 18,995,117 | |
1.562% | | | 02/13/20 | | | | 14,000 | | | | 13,973,976 | |
1.595% | | | 01/28/20 | | | | 3,000 | | | | 2,996,420 | |
1.674% | | | 04/09/20 | | | | 6,000 | | | | 5,972,610 | |
| | | | | | | | | | | | |
TOTAL U.S. TREASURY OBLIGATIONS
(amortized cost $50,995,049) | | | | 50,995,049 | |
| | | | | | | | | | | | |
TOTAL INVESTMENTS — 99.7%
(amortized cost $598,012,464) | | | | 598,012,464 | |
Other assets in excess of liabilities — 0.3% | | | | 1,539,302 | |
| | | | | | | | | | | | |
NET ASSETS — 100.0% | | | $ | 599,551,766 | |
| | | | | | | | | | | | |
See the Glossary for a list of the abbreviation(s) used in the annual report.
| # | Principal amount is shown in U.S. dollars unless otherwise stated. |
| (c) | Variable rate instrument. The interest rate shown reflects the rate in effect at December 31, 2019. |
| (m) | Repurchase Agreements are collateralized by FHLMC (coupon rates3.500%-4.000%, maturity dates07/01/47-12/01/48), with the aggregate value, including accrued interest, of $28,965,961. |
(n) Rate shown reflects yield to maturity at purchased date.
Fair Value Measurements:
Various inputs are used in determining the value of the Portfolio’s investments. These inputs are summarized in the three broad levels listed below.
| Level 1— | unadjusted quoted prices generally in active markets for identical securities. |
| Level 2— | quoted prices for similar securities, interest rates and yield curves, prepayment speeds, foreign currency exchange rates and other observable inputs. |
| Level 3— | unobservable inputs for securities valued in accordance with Board approved fair valuation procedures. |
The following is a summary of the inputs used as of December 31, 2019 in valuing such portfolio securities:
| | | | | | | | | | | | |
| | | Level 1 | | | Level 2 | | | Level 3 | |
Investments in Securities | | | | | | | | | | | | |
Assets | | | | | | | | | | | | |
Repurchase Agreement | | $ | — | | | $ | 28,398,000 | | | $ | — | |
SEE NOTES TO FINANCIAL STATEMENTS.
A129
| | | | | | |
| | |
| | GOVERNMENT MONEY MARKET PORTFOLIO (continued) | | |
| | | | | | |
| |
| SCHEDULE OF INVESTMENTS | | as of December 31, 2019 |
| | | | | | | | | | | | |
| | | Level 1 | | | Level 2 | | | Level 3 | |
Investments in Securities (continued) | | | | | | | | | | | | |
Assets (continued) | | | | | | | | | | | | |
U.S. Government Agency Obligations | | $ | — | | | $ | 518,619,415 | | | $ | — | |
U.S. Treasury Obligations | | | — | | | | 50,995,049 | | | | — | |
| | | | | | | | | | | | |
Total | | $ | — | | | $ | 598,012,464 | | | $ | — | |
| | | | | | | | | | | | |
Industry Classification:
The industry classification of investments and other assets in excess of liabilities shown as a percentage of net assets as of December 31, 2019 were as follows (unaudited):
| | | | |
U.S. Government Agency Obligations | | | 86.5 | % |
U.S. Treasury Obligations | | | 8.5 | |
Repurchase Agreement | | | 4.7 | |
| | | | |
| | | 99.7 | |
Other assets in excess of liabilities | | | 0.3 | |
| | | | |
| | | 100.0 | % |
| | | | |
Financial Instruments/Transactions—Summary of Offsetting and Netting Arrangements:
The Portfolio entered into financial instruments/transactions during the reporting period that are either offset in accordance with current requirements or are subject to enforceable master netting arrangements or similar agreements that permit offsetting. The information about offsetting and related netting arrangements for financial instruments/transactions where the legal right toset-off exists is presented in the summary below.
Offsetting of financial instrument/transaction assets and liabilities:
| | | | | | | | | | | | | | | | |
Description | | Counterparty | | | Gross Market
Value of
Recognized
Assets/(Liabilities) | | | Collateral
Pledged/(Received)(1) | | | Net
Amount | |
Repurchase Agreements | | | Bank of America Securities, Inc. | | | $ | 28,398,000 | | | $ | (28,398,000 | ) | | $ | — | |
| | | | | | | | | | | | | | | | |
| (1) | Collateral amount disclosed by the Portfolio is limited to the market value of financial instruments/transactions. |
SEE NOTES TO FINANCIAL STATEMENTS.
A130
| | | | | | |
| | |
| | GOVERNMENT MONEY MARKET PORTFOLIO (continued) | | |
STATEMENT OF ASSETS AND LIABILITIES
as of December 31, 2019
| | | | |
| ASSETS | | | | |
Investments, at amortized cost which approximates fair value: | | $ | 598,012,464 | |
Cash | | | 796 | |
Receivable for Portfolio shares sold | | | 1,287,651 | |
Interest receivable | | | 528,104 | |
Prepaid expenses | | | 4,032 | |
| | | | |
Total Assets | | | 599,833,047 | |
| | | | |
| LIABILITIES | | | | |
Management fee payable | | | 153,139 | |
Shareholders’ reports payable | | | 52,736 | |
Payable for Portfolio shares repurchased | | | 34,225 | |
Custodian and accounting fees payable | | | 24,522 | |
Accrued expenses and other liabilities | | | 15,679 | |
Affiliated transfer agent fee payable | | | 980 | |
| | | | |
Total Liabilities | | | 281,281 | |
| | | | |
| NET ASSETS | | $ | 599,551,766 | |
| | | | |
Net assets were comprised of: | | | | |
Partners’ Equity | | $ | 599,551,766 | |
| | | | |
Net asset value and redemption price per share, $599,551,766 / 59,952,417 outstanding shares of beneficial interest | | $ | 10.00 | |
| | | | |
STATEMENT OF OPERATIONS
Year Ended December 31, 2019
| | | | |
| NET INVESTMENT INCOME (LOSS) | | | | |
Interest income | | $ | 12,560,366 | |
| | | | |
| EXPENSES | | | | |
Management fee | | | 1,689,001 | |
Shareholders’ reports | | | 116,869 | |
Custodian and accounting fees | | | 72,938 | |
Audit fee | | | 25,100 | |
Trustees’ fees | | | 15,950 | |
Legal fees and expenses | | | 13,921 | |
Transfer agent’s fees and expenses (including affiliated expense of $5,882) | | | 10,682 | |
Miscellaneous | | | 17,923 | |
| | | | |
Total expenses | | | 1,962,384 | |
| | | | |
| NET INVESTMENT INCOME (LOSS) | | | 10,597,982 | |
| | | | |
| REALIZED AND UNREALIZED GAIN (LOSS) ON INVESTMENT TRANSACTIONS | | | | |
Net realized gain (loss) on investment transactions | | | 59,675 | |
| | | | |
| NET INCREASE (DECREASE) IN NET ASSETS RESULTING FROM OPERATIONS | | $ | 10,657,657 | |
| | | | |
STATEMENTS OF CHANGES IN NET ASSETS
| | | | | | | | |
| | | Year Ended
December 31, 2019 | | | Year Ended
December 31, 2018 | |
| INCREASE (DECREASE) IN NET ASSETS | | | | | | | | |
| OPERATIONS | | | | | | | | |
Net investment income (loss) | | $ | 10,597,982 | | | $ | 8,494,528 | |
Net realized gain (loss) on investment transactions | | | 59,675 | | | | 2,882 | |
| | | | | | | | |
NET INCREASE (DECREASE) IN NET ASSETS RESULTING FROM OPERATIONS | | | 10,657,657 | | | | 8,497,410 | |
| | | | | | | | |
| DISTRIBUTIONS | | | (10,650,252 | ) | | | (8,508,150 | ) |
| | | | | | | | |
| PORTFOLIO SHARE TRANSACTIONS | | | | | | | | |
Portfolio shares sold [51,839,113 and 40,499,240 shares, respectively] | | | 518,391,129 | | | | 404,992,401 | |
Portfolio shares issued in reinvestment of distributions [1,065,025 and 850,815 shares, respectively] | | | 10,650,252 | | | | 8,508,150 | |
Portfolio shares repurchased [46,588,121 and 43,674,368 shares, respectively] | | | (465,881,208 | ) | | | (436,743,676 | ) |
| | | | | | | | |
NET INCREASE (DECREASE) IN NET ASSETS FROM PORTFOLIO SHARE TRANSACTIONS | | | 63,160,173 | | | | (23,243,125 | ) |
| | | | | | | | |
| TOTAL INCREASE (DECREASE) | | | 63,167,578 | | | | (23,253,865 | ) |
| NET ASSETS: | | | | | | | | |
Beginning of year | | | 536,384,188 | | | | 559,638,053 | |
| | | | | | | | |
End of year | | $ | 599,551,766 | | | $ | 536,384,188 | |
| | | | | | | | |
SEE NOTES TO FINANCIAL STATEMENTS.
A131
| | | | | | |
| | |
| | HIGH YIELD BOND PORTFOLIO | | |
| | | | | | |
| |
| SCHEDULE OF INVESTMENTS | | as of December 31, 2019 |
| | | | | | | | | | | | | | | | |
Interest
Rate | | Maturity
Date | | | | | | Principal
Amount
(000)# | | | Value | |
|
| LONG-TERM INVESTMENTS — 97.0% | |
|
| ASSET-BACKED SECURITIES — 11.0% | |
Collateralized Loan Obligations | |
Adams Mill CLO Ltd. (Cayman Islands), | |
Series2014-01A, Class A1R, 144A, 3 Month LIBOR + 1.100% (Cap N/A, Floor 0.000%) | |
3.101%(c) | | | 07/15/26 | | | | | | | | 1,276 | | | $ | 1,276,454 | |
Ballyrock CLO Ltd. (Cayman Islands), | |
Series2016-01A, Class AR, 144A, 3 Month LIBOR + 1.350% (Cap N/A, Floor 1.350%) | |
3.351%(c) | | | 10/15/28 | | | | | | | | 4,200 | | | | 4,203,354 | |
Cathedral Lake CLO Ltd. (Cayman Islands), | |
Series2016-04A, Class AR, 144A, 3 Month LIBOR + 1.250% (Cap N/A, Floor 1.250%) | |
3.216%(c) | | | 10/20/28 | | | | | | | | 5,000 | | | | 5,002,562 | |
Flatiron CLO Ltd. (Cayman Islands), | |
Series2015-01A, Class AR, 144A, 3 Month LIBOR + 0.890% (Cap N/A, Floor 0.000%) | |
2.891%(c) | | | 04/15/27 | | | | | | | | 1,405 | | | | 1,403,741 | |
JMP Credit Advisors CLO Ltd. (Cayman Islands), | |
Series2017-01A, Class AR, 144A, 3 Month LIBOR + 1.280% (Cap N/A, Floor 1.280%) | |
3.282%(c) | | | 07/17/29 | | | | | | | | 5,000 | | | | 4,992,252 | |
Mountain View CLO Ltd. (Cayman Islands), | |
Series2019-01A, Class A1, 144A, 3 Month LIBOR + 1.440% (Cap N/A, Floor 1.440%) | |
3.441%(c) | | | 04/15/29 | | | | | | | | 4,175 | | | | 4,184,951 | |
Ocean Trails CLO Ltd. (Cayman Islands), | |
Series2013-04A, Class AR, 144A, 3 Month LIBOR + 0.900% (Cap N/A, Floor 0.000%) | |
2.805%(c) | | | 08/13/25 | | | | | | | | 465 | | | | 465,104 | |
OZLM Ltd. (Cayman Islands), | |
Series2015-13A, Class A1R, 144A, 3 Month LIBOR + 1.080% (Cap N/A, Floor 0.000%) | |
3.016%(c) | | | 07/30/27 | | | | | | | | 2,000 | | | | 1,995,817 | |
Regatta Funding LP (Cayman Islands), | |
Series2013-02A, Class A1R2, 144A, 3 Month LIBOR + 1.250% (Cap N/A, Floor 0.000%) | |
3.251%(c) | | | 01/15/29 | | | | | | | | 5,000 | | | | 5,006,372 | |
Riserva CLO Ltd. (Cayman Islands), | |
Series2016-03A, Class AR, 144A, 3 Month LIBOR + 1.140% (Cap N/A, Floor 0.000%) | |
3.143%(c) | | | 10/18/28 | | | | | | | | 5,000 | | | | 5,002,193 | |
Silvermore CLO Ltd. (Cayman Islands), | |
Series2014-01A, Class A1R, 144A, 3 Month LIBOR + 1.170% (Cap N/A, Floor 0.000%) | |
3.080%(c) | | | 05/15/26 | | | | | | | | 1,212 | | | | 1,212,108 | |
Sound Point CLO Ltd. (Cayman Islands), | |
Series2016-02A, Class AR, 144A, 3 Month LIBOR + 1.290% (Cap N/A, Floor 1.290%) | |
3.256%(c) | | | 10/20/28 | | | | | | | | 2,500 | | | | 2,498,587 | |
Series2017-01A, Class AR, 144A, 3 Month LIBOR + 1.150% (Cap N/A, Floor 1.150%) | |
3.084%(c) | | | 01/23/29 | | | | | | | | 5,000 | | | | 4,999,162 | |
TICP CLO Ltd. (Cayman Islands), | |
Series2016-06A, Class AR, 144A, 3 Month LIBOR + 1.200% (Cap N/A, Floor 1.200%) | |
3.201%(c) | | | 01/15/29 | | | | | | | | 2,500 | | | | 2,505,384 | |
| | | | | | | | | | | | | | | | |
Interest
Rate | | Maturity
Date | | | | | | Principal
Amount
(000)# | | | Value | |
|
| ASSET-BACKED SECURITIES (continued) | |
Collateralized Loan Obligations (continued) | |
Series2018-IA, Class A1, 144A, 3 Month LIBOR + 0.830% (Cap N/A, Floor 0.830%) | |
2.766%(c) | | | 04/26/28 | | | | | | | | 5,000 | | | $ | 4,987,930 | |
Trinitas CLO Ltd. (Cayman Islands), | |
Series2017-06A, Class AR, 144A, 3 Month LIBOR + 1.170% (Cap N/A, Floor 1.170%) | |
3.110%(c) | | | 07/25/29 | | | | | | | | 5,000 | | | | 4,969,166 | |
Wellfleet CLO Ltd. (Cayman Islands), | |
Series2015-01A, Class AR3, 144A, 3 Month LIBOR + 1.280% (Cap N/A, Floor 1.280%) | |
3.246%(c) | | | 07/20/29 | | | | | | | | 2,000 | | | | 1,998,016 | |
West CLO Ltd. (Cayman Islands), | |
Series2014-01A, Class A1R, 144A, 3 Month LIBOR + 0.920% (Cap N/A, Floor 0.000%) | |
2.923%(c) | | | 07/18/26 | | | | | | | | 638 | | | | 637,077 | |
| | | | | | | | | | | | | | | | |
TOTAL ASSET-BACKED SECURITIES
(cost $57,347,568) | | | | 57,340,230 | |
| | | | | | | | | | | | | | | | |
|
| BANK LOANS — 4.8% | |
Chemicals — 0.6% | |
Solenis International LP, | |
First Lien Initial Dollar Term Loan, 3 Month LIBOR + 4.000% | |
5.909%(c) | | | 06/26/25 | | | | | | | | 844 | | | | 832,824 | |
Second Lien Initial Term Loan, 3 Month LIBOR + 8.500% | |
10.409%(c) | | | 06/26/26 | ^ | | | | | | | 1,931 | | | | 1,718,813 | |
Starfruit Finco BV (Netherlands), | |
Initial Dollar Term Loan, 1 Month LIBOR + 3.250% | |
4.960%(c) | | | 10/01/25 | | | | | | | | 599 | | | | 598,453 | |
| | | | | | | | | | | | | | | | |
| | | | | | | | | | | | | | | 3,150,090 | |
| | | | | | | | | | | | | | | | |
Computers — 1.0% | |
McAfee LLC, | |
Second Lien Initial Loan, 3 Month LIBOR + 8.500% | |
10.305%(c) | | | 09/29/25 | | | | | | | | 2,798 | | | | 2,810,252 | |
Term B USD Loan, 1 Month LIBOR + 3.750% | |
5.555%(c) | | | 09/30/24 | | | | | | | | 2,163 | | | | 2,171,894 | |
| | | | | | | | | | | | | | | | |
| | | | | | | | | | | | | | | 4,982,146 | |
| | | | | | | | | | | | | | | | |
Electric — 0.5% | |
Calpine Corp., | |
Term Loan (05/15), 3 Month LIBOR + 2.250% | |
4.200%(c) | | | 01/15/24 | | | | | | | | 738 | | | | 741,940 | |
Heritage Power LLC, | |
Term Loan B, 3 Month LIBOR + 6.000% | |
8.205%(c) | | | 07/30/26 | ^ | | | | | | | 1,995 | | | | 1,895,250 | |
| | | | | | | | | | | | | | | | |
| | | | | | | | | | | | | | | 2,637,190 | |
| | | | | | | | | | | | | | | | |
Entertainment — 0.5% | |
Playtika Holding Corp., | |
Term B Loan, 1 Month LIBOR + 6.000% | |
7.799%(c) | | | 12/10/24 | | | | | | | | 2,125 | | | | 2,145,187 | |
Scientific Games International, Inc., | |
Initial TermB-5 Loan, 1 Month LIBOR + 2.750% | |
4.501%(c) | | | 08/14/24 | | | | | | | | 546 | | | | 546,588 | |
| | | | | | | | | | | | | | | | |
| | | | | | | | | | | | | | | 2,691,775 | |
| | | | | | | | | | | | | | | | |
SEE NOTES TO FINANCIAL STATEMENTS.
A132
| | | | | | |
| | |
| | HIGH YIELD BOND PORTFOLIO (continued) | | |
| | | | | | |
| |
| SCHEDULE OF INVESTMENTS | | as of December 31, 2019 |
| | | | | | | | | | | | |
Interest
Rate | | Maturity
Date | | | Principal
Amount
(000)# | | | Value | |
|
| BANK LOANS (continued) | |
Healthcare-Services — 0.1% | |
MPH Acquisition Holdings LLC, | |
Initial Term Loan, 3 Month LIBOR + 2.750% | | | | | |
4.695%(c) | | | 06/07/23 | | | | 600 | | | $ | 590,750 | |
| | | | | | | | | | | | |
Mining — 0.3% | |
Aleris International, Inc., | |
Initial Term Loan, 1 Month LIBOR + 4.750% | | | | | |
6.549%(c) | | | 02/27/23 | | | | 1,554 | | | | 1,552,201 | |
| | | | | | | | | | | | |
Oil & Gas — 1.0% | |
Chesapeake Energy Corp., | |
Class A Loan, 3 Month LIBOR + 8.000% | | | | | |
9.928%(c) | | | 05/23/24 | | | | 3,600 | | | | 3,699,000 | |
CITGO Petroleum Corp., | |
2019 Incremental Term B Loan, 3 Month LIBOR + 5.000% | |
6.945%(c) | | | 03/28/24^ | | | | 844 | | | | 846,233 | |
Term B Loan, 3 Month LIBOR + 4.500% | | | | | |
6.445%(c) | | | 07/29/21 | | | | 668 | | | | 669,203 | |
| | | | | | | | | | | | |
| | | | | | | | | | | 5,214,436 | |
| | | | | | | | | | | | |
Pharmaceuticals — 0.1% | |
Mallinckrodt International Finance SA, | |
2017 Term B Loan, 3 Month LIBOR + 2.750% | | | | | |
4.695%(c) | | | 09/24/24 | | | | 424 | | | | 342,970 | |
2018 Incremental Term Loan, 3 Month LIBOR + 3.000% | |
4.909%(c) | | | 02/24/25 | | | | 174 | | | | 141,390 | |
| | | | | | | | | | | | |
| | | | | | | | | | | 484,360 | |
| | | | | | | | | | | | |
Retail — 0.1% | |
EG America LLC (United Kingdom), | |
Second Lien Facility (USD), 3 Month LIBOR + 8.000% | |
9.961%(c) | | | 04/20/26^ | | | | 567 | | | | 538,939 | |
| | | | | | | | | | | | |
Software — 0.6% | |
Boxer Parent Co., Inc., | |
Initial Dollar Term Loan, 1 Month LIBOR + 4.250% | | | | | |
6.049%(c) | | | 10/02/25 | | | | 1,218 | | | | 1,201,908 | |
Finastra USA, Inc., | |
Dollar Term Loan (Second Lien), 3 Month LIBOR + 7.250% | |
9.446%(c) | | | 06/13/25 | | | | 1,075 | | | | 1,048,125 | |
Kronos, Inc., | |
Second Lien Initial Term Loan, 3 Month LIBOR + 8.250% | |
10.159%(c) | | | 11/01/24 | | | | 525 | | | | 536,375 | |
TIBCO Software, Inc., | |
Term LoanB-2, 1 Month LIBOR + 4.000% | | | | | |
5.710%(c) | | | 06/30/26 | | | | 449 | | | | 450,558 | |
| | | | | | | | | | | | |
| | | | | | | | | | | 3,236,966 | |
| | | | | | | | | | | | |
TOTAL BANK LOANS
(cost $24,919,674) | | | | 25,078,853 | |
| | | | | | | | | | | | |
|
| CORPORATE BONDS — 80.2% | |
Advertising — 0.7% | |
Mood Media Borrower LLC/Mood MediaCo-Issuer, Inc., | |
Sec’d. Notes, 144A, Cash pays ((6 Month LIBOR +
14.000%)/(1–Statutory Reserves)) or PIK 8.000% (Cap N/A, Floor 1.000%) | |
16.213%(c) | | | 12/31/23 | | | | 292 | | | | 242,000 | |
| | | | | | | | | | | | |
Interest
Rate | | Maturity
Date | | | Principal
Amount
(000)# | | | Value | |
|
| CORPORATE BONDS (continued) | |
Advertising (continued) | |
National CineMedia LLC, | |
Sr. Sec’d. Notes, 144A | |
5.875% | | | 04/15/28 | (a) | | | 625 | | | $ | 665,643 | |
Sr. Unsec’d. Notes | |
5.750% | | | 08/15/26 | | | | 1,625 | | | | 1,584,380 | |
Terrier Media Buyer, Inc., | |
Gtd. Notes, 144A | |
8.875% | | | 12/15/27 | | | | 945 | | | | 998,195 | |
| | | | | | | | | | | | |
| | | | | | | | | | | 3,490,218 | |
| | | | | | | | | | | | |
Aerospace & Defense — 2.7% | |
Bombardier, Inc. (Canada), | |
Sr. Unsec’d. Notes, 144A | |
6.125% | | | 01/15/23 | | | | 250 | | | | 256,280 | |
7.450% | | | 05/01/34 | | | | 75 | | | | 73,707 | |
7.500% | | | 12/01/24 | | | | 3,525 | | | | 3,710,185 | |
7.500% | | | 03/15/25 | | | | 900 | | | | 928,743 | |
7.875% | | | 04/15/27 | | | | 3,825 | | | | 3,940,990 | |
8.750% | | | 12/01/21 | | | | 2,575 | | | | 2,824,590 | |
SSL Robotics LLC, | |
Sr. Sec’d. Notes, 144A | |
9.750% | | | 12/31/23 | | | | 975 | | | | 1,066,825 | |
TransDigm UK Holdings PLC, | |
Gtd. Notes | |
6.875% | | | 05/15/26 | | | | 200 | | | | 213,582 | |
TransDigm, Inc., | |
Gtd. Notes | |
6.375% | | | 06/15/26 | (a) | | | 332 | | | | 352,594 | |
6.500% | | | 07/15/24 | (a) | | | 625 | | | | 646,100 | |
6.500% | | | 05/15/25 | | | | 175 | | | | 182,633 | |
| | | | | | | | | | | | |
| | | | | | | | | | | 14,196,229 | |
| | | | | | | | | | | | |
Agriculture — 0.4% | |
Vector Group Ltd., | |
Gtd. Notes, 144A | |
10.500% | | | 11/01/26 | (a) | | | 450 | | | | 464,477 | |
Sr. Sec’d. Notes, 144A | |
6.125% | | | 02/01/25 | | | | 1,600 | | | | 1,575,012 | |
| | | | | | | | | | | | |
| | | | | | | | | | | 2,039,489 | |
| | | | | | | | | | | | |
Auto Manufacturers — 1.6% | |
Allison Transmission, Inc., | |
Sr. Unsec’d. Notes, 144A | |
4.750% | | | 10/01/27 | (a) | | | 350 | | | | 363,922 | |
5.875% | | | 06/01/29 | | | | 225 | | | | 247,760 | |
Ford Motor Co., | |
Sr. Unsec’d. Notes | |
4.750% | | | 01/15/43 | | | | 1,100 | | | | 976,933 | |
5.291% | | | 12/08/46 | | | | 3,575 | | | | 3,395,610 | |
Ford Motor Credit Co. LLC, | |
Sr. Unsec’d. Notes | |
5.584% | | | 03/18/24 | (a) | | | 625 | | | | 675,451 | |
General Motors Co., | |
Sr. Unsec’d. Notes | |
5.000% | | | 10/01/28 | (a) | | | 125 | | | | 136,042 | |
5.200% | | | 04/01/45 | | | | 150 | | | | 151,536 | |
SEE NOTES TO FINANCIAL STATEMENTS.
A133
| | | | | | |
| | |
| | HIGH YIELD BOND PORTFOLIO (continued) | | |
| | | | | | |
| |
| SCHEDULE OF INVESTMENTS | | as of December 31, 2019 |
| | | | | | | | | | | | |
Interest
Rate | | Maturity
Date | | | Principal
Amount
(000)# | | | Value | |
|
| CORPORATE BONDS (continued) | |
Auto Manufacturers (continued) | |
Navistar International Corp., | |
Gtd. Notes, 144A | |
6.625% | | | 11/01/25 | | | | 2,575 | | | $ | 2,633,465 | |
| | | | | | | | | | | | |
| | | | | | | | | | | 8,580,719 | |
| | | | | | | | | | | | |
Auto Parts & Equipment — 2.3% | |
Adient Global Holdings Ltd., | |
Gtd. Notes, 144A | |
4.875% | | | 08/15/26 | | | | 2,775 | | | | 2,488,968 | |
American Axle & Manufacturing, Inc., | |
Gtd. Notes | |
6.250% | | | 04/01/25 | (a) | | | 1,350 | | | | 1,405,661 | |
6.250% | | | 03/15/26 | | | | 2,623 | | | | 2,692,374 | |
6.500% | | | 04/01/27 | (a) | | | 650 | | | | 674,792 | |
Cooper-Standard Automotive, Inc., | |
Gtd. Notes, 144A | |
5.625% | | | 11/15/26 | (a) | | | 1,175 | | | | 1,114,385 | |
Dana Financing Luxembourg Sarl, | |
Gtd. Notes, 144A | |
5.750% | | | 04/15/25 | | | | 475 | | | | 497,803 | |
6.500% | | | 06/01/26 | (a) | | | 1,950 | | | | 2,082,084 | |
IHO Verwaltungs GmbH (Germany), | |
Sr. Sec’d. Notes, 144A, Cash coupon 4.750% or PIK 5.500% | |
4.750% | | | 09/15/26 | | | | 200 | | | | 203,625 | |
Titan International, Inc., | |
Sr. Sec’d. Notes | |
6.500% | | | 11/30/23 | | | | 1,100 | | | | 937,753 | |
| | | | | | | | | | | | |
| | | | | | | | | | | 12,097,445 | |
| | | | | | | | | | | | |
Banks — 0.2% | |
CIT Group, Inc., | |
Sub. Notes | |
6.125% | | | 03/09/28 | | | | 975 | | | | 1,151,949 | |
| | | | | | | | | | | | |
Building Materials — 1.5% | |
Cemex SAB de CV (Mexico), | |
Sr. Sec’d. Notes, 144A | |
5.450% | | | 11/19/29 | | | | 350 | | | | 364,918 | |
5.700% | | | 01/11/25 | | | | 320 | | | | 329,584 | |
Cornerstone Building Brands, Inc., | |
Gtd. Notes, 144A | |
8.000% | | | 04/15/26 | (a) | | | 1,050 | | | | 1,095,841 | |
Masonite International Corp., | |
Gtd. Notes, 144A | |
5.375% | | | 02/01/28 | | | | 650 | | | | 688,640 | |
Patrick Industries, Inc., | |
Sr. Unsec’d. Notes, 144A | |
7.500% | | | 10/15/27 | | | | 725 | | | | 774,749 | |
Standard Industries, Inc., | |
Sr. Unsec’d. Notes, 144A | |
4.750% | | | 01/15/28 | | | | 1,075 | | | | 1,102,361 | |
Summit Materials LLC/Summit Materials Finance Corp., | |
Gtd. Notes, 144A | |
5.125% | | | 06/01/25 | | | | 725 | | | | 747,506 | |
6.500% | | | 03/15/27 | | | | 400 | | | | 431,670 | |
| | | | | | | | | | | | |
Interest
Rate | | Maturity
Date | | | Principal
Amount
(000)# | | | Value | |
|
| CORPORATE BONDS (continued) | |
Building Materials (continued) | |
U.S. Concrete, Inc., | |
Gtd. Notes | |
6.375% | | | 06/01/24 | (a) | | | 2,000 | | | $ | 2,088,393 | |
| | | | | | | | | | | | |
| | | | | | | | | | | 7,623,662 | |
| | | | | | | | | | | | |
Chemicals — 4.1% | |
Ashland LLC, | |
Gtd. Notes | |
6.875% | | | 05/15/43 | | | | 1,705 | | | | 1,954,931 | |
Atotech Alpha 2 BV (Germany), | |
Sr. Unsec’d. Notes, 144A, Cash coupon 8.750% or PIK 9.500% | |
8.750% | | | 06/01/23 | | | | 1,775 | | | | 1,798,986 | |
Atotech Alpha 3 BV/Alpha US Bidco, Inc. (United Kingdom), | |
Gtd. Notes, 144A | |
6.250% | | | 02/01/25 | | | | 450 | | | | 463,547 | |
Chemours Co. (The), | |
Gtd. Notes | |
5.375% | | | 05/15/27 | | | | 1,690 | | | | 1,505,555 | |
6.625% | | | 05/15/23 | (a) | | | 250 | | | | 251,856 | |
7.000% | | | 05/15/25 | (a) | | | 1,355 | | | | 1,363,958 | |
Cornerstone Chemical Co., | |
Sr. Sec’d. Notes, 144A | |
6.750% | | | 08/15/24 | | | | 1,110 | | | | 1,032,301 | |
Element Solutions, Inc., | |
Gtd. Notes, 144A | |
5.875% | | | 12/01/25 | (a) | | | 390 | | | | 407,696 | |
Hexion, Inc., | |
Gtd. Notes, 144A | |
7.875% | | | 07/15/27 | (a) | | | 1,400 | | | | 1,456,733 | |
NOVA Chemicals Corp. (Canada), | |
Sr. Unsec’d. Notes, 144A | |
5.250% | | | 06/01/27 | | | | 2,626 | | | | 2,708,652 | |
Rain CII Carbon LLC/CII Carbon Corp., | |
Sec’d. Notes, 144A | |
7.250% | | | 04/01/25 | | | | 1,480 | | | | 1,437,963 | |
Starfruit Finco BV/Starfruit US Holdco LLC (Netherlands), | |
Sr. Unsec’d. Notes, 144A | |
8.000% | | | 10/01/26 | (a) | | | 1,665 | | | | 1,766,306 | |
TPC Group, Inc., | |
Sr. Sec’d. Notes, 144A | |
10.500% | | | 08/01/24 | | | | 1,120 | | | | 1,127,837 | |
Tronox Finance PLC, | |
Gtd. Notes, 144A | |
5.750% | | | 10/01/25 | | | | 1,700 | | | | 1,731,190 | |
Tronox, Inc., | |
Gtd. Notes, 144A | |
6.500% | | | 04/15/26 | (a) | | | 1,220 | | | | 1,258,300 | |
Venator Finance Sarl/Venator Materials LLC, | |
Gtd. Notes, 144A | |
5.750% | | | 07/15/25 | | | | 1,155 | | | | 1,064,091 | |
| | | | | | | | | | | | |
| | | | | | | | | | | 21,329,902 | |
| | | | | | | | | | | | |
Commercial Services — 2.3% | |
AMN Healthcare, Inc., | |
Gtd. Notes, 144A | |
4.625% | | | 10/01/27 | | | | 375 | | | | 376,457 | |
SEE NOTES TO FINANCIAL STATEMENTS.
A134
| | | | | | |
| | |
| | HIGH YIELD BOND PORTFOLIO (continued) | | |
| | | | | | |
| |
| SCHEDULE OF INVESTMENTS | | as of December 31, 2019 |
| | | | | | | | | | | | |
Interest
Rate | | Maturity
Date | | | Principal
Amount
(000)# | | | Value | |
|
| CORPORATE BONDS (continued) | |
Commercial Services (continued) | |
Laureate Education, Inc., | |
Gtd. Notes, 144A | |
8.250% | | | 05/01/25 | | | | 2,245 | | | $ | 2,420,323 | |
United Rentals North America, Inc., | |
Gtd. Notes | |
4.875% | | | 01/15/28 | | | | 4,700 | | | | 4,895,391 | |
5.250% | | | 01/15/30 | | | | 1,000 | | | | 1,076,745 | |
5.500% | | | 05/15/27 | | | | 650 | | | | 697,268 | |
6.500% | | | 12/15/26 | (a) | | | 650 | | | | 715,316 | |
Verscend Escrow Corp., | |
Sr. Unsec’d. Notes, 144A | |
9.750% | | | 08/15/26 | | | | 1,540 | | | | 1,688,065 | |
| | | | | | | | | | | | |
| | | | | | | | | | | 11,869,565 | |
| | | | | | | | | | | | |
Computers — 1.5% | |
Banff Merger Sub, Inc., | |
Sr. Unsec’d. Notes, 144A | |
9.750% | | | 09/01/26 | | | | 4,295 | | | | 4,357,994 | |
Everi Payments, Inc., | |
Gtd. Notes, 144A | |
7.500% | | | 12/15/25 | | | | 1,150 | | | | 1,233,386 | |
NCR Corp., | |
Gtd. Notes | |
5.000% | | | 07/15/22 | | | | 25 | | | | 25,259 | |
Gtd. Notes, 144A | |
5.750% | | | 09/01/27 | (a) | | | 725 | | | | 772,718 | |
Tempo Acquisition LLC/Tempo Acquisition Finance Corp., | |
Sr. Unsec’d. Notes, 144A | |
6.750% | | | 06/01/25 | | | | 1,219 | | | | 1,260,751 | |
| | | | | | | | | | | | |
| | | | | | | | | | | 7,650,108 | |
| | | | | | | | | | | | |
Distribution/Wholesale — 0.2% | |
Anixter, Inc., | |
Gtd. Notes | |
6.000% | | | 12/01/25 | | | | 750 | | | | 779,325 | |
H&E Equipment Services, Inc., | |
Gtd. Notes | |
5.625% | | | 09/01/25 | | | | 475 | | | | 498,915 | |
| | | | | | | | | | | | |
| | | | | | | | | | | 1,278,240 | |
| | | | | | | | | | | | |
Diversified Financial Services — 3.2% | |
Alliance Data Systems Corp., | |
Gtd. Notes, 144A | |
4.750% | | | 12/15/24 | | | | 800 | | | | 798,531 | |
Allied Universal Holdco LLC/Allied Universal Finance Corp., | |
Sr. Sec’d. Notes, 144A | |
6.625% | | | 07/15/26 | | | | 450 | | | | 483,437 | |
Sr. Unsec’d. Notes, 144A | |
9.750% | | | 07/15/27 | | | | 1,750 | | | | 1,871,085 | |
Fairstone Financial, Inc. (Canada), | |
Sr. Unsec’d. Notes, 144A | |
7.875% | | | 07/15/24 | | | | 755 | | | | 812,109 | |
LPL Holdings, Inc., | |
Gtd. Notes, 144A | |
5.750% | | | 09/15/25 | | | | 1,375 | | | | 1,440,546 | |
| | | | | | | | | | | | |
Interest
Rate | | Maturity
Date | | | Principal
Amount
(000)# | | | Value | |
|
| CORPORATE BONDS (continued) | |
Diversified Financial Services (continued) | |
Nationstar Mortgage Holdings, Inc., | |
Gtd. Notes, 144A | |
9.125% | | | 07/15/26 | | | | 4,650 | | | $ | 5,152,294 | |
Springleaf Finance Corp., | |
Gtd. Notes | |
5.375% | | | 11/15/29 | | | | 425 | | | | 443,739 | |
6.625% | | | 01/15/28 | | | | 1,125 | | | | 1,268,227 | |
6.875% | | | 03/15/25 | (a) | | | 1,100 | | | | 1,251,885 | |
7.125% | | | 03/15/26 | | | | 2,925 | | | | 3,383,834 | |
| | | | | | | | | | | | |
| | | | | | | | | | | 16,905,687 | |
| | | | | | | | | | | | |
Electric — 3.1% | |
Calpine Corp., | |
Sr. Unsec’d. Notes | |
5.750% | | | 01/15/25 | | | | 5,275 | | | | 5,424,964 | |
Sr. Unsec’d. Notes, 144A | |
5.125% | | | 03/15/28 | | | | 4,400 | | | | 4,486,584 | |
Keystone Power Pass-Through Holders LLC/Conemaugh Power Pass-Through Holders, | |
Gtd. Notes, 144A | |
9.000% | | | 12/01/23 | | | | 171 | | | | 172,285 | |
Sub. Notes, 144A, Cash coupon 13.000% or PIK N/A | |
13.000% | | | 06/01/24 | | | | 547 | | | | 542,585 | |
Mirant Corp., | |
Bonds, 144A | |
—%(p) | | | 07/15/49 | ^ | | | 250 | | | | 250 | |
NRG Energy, Inc., | |
Gtd. Notes | |
5.750% | | | 01/15/28 | (a) | | | 950 | | | | 1,035,358 | |
Gtd. Notes, 144A | |
5.250% | | | 06/15/29 | | | | 225 | | | | 244,012 | |
Vistra Operations Co. LLC, | |
Gtd. Notes, 144A | |
5.000% | | | 07/31/27 | | | | 815 | | | | 852,958 | |
5.500% | | | 09/01/26 | | | | 1,000 | | | | 1,060,850 | |
5.625% | | | 02/15/27 | | | | 2,350 | | | | 2,480,702 | |
| | | | | | | | | | | | |
| | | | | | | | | | | 16,300,548 | |
| | | | | | | | | | | | |
Electronics — 0.1% | |
Itron, Inc., | |
Gtd. Notes, 144A | |
5.000% | | | 01/15/26 | | | | 450 | | | | 467,194 | |
| | | | | | | | | | | | |
Energy-Alternate Sources — 0.1% | |
Enviva Partners LP/Enviva Partners Finance Corp., | |
Gtd. Notes, 144A | |
6.500% | | | 01/15/26 | | | | 450 | | | | 481,913 | |
| | | | | | | | | | | | |
Engineering & Construction — 0.7% | |
AECOM, | |
Gtd. Notes | |
5.125% | | | 03/15/27 | | | | 1,525 | | | | 1,639,335 | |
5.875% | | | 10/15/24 | | | | 525 | | | | 582,098 | |
TopBuild Corp., | |
Gtd. Notes, 144A | |
5.625% | | | 05/01/26 | | | | 1,425 | | | | 1,491,933 | |
| | | | | | | | | | | | |
| | | | | | | | | | | 3,713,366 | |
| | | | | | | | | | | | |
SEE NOTES TO FINANCIAL STATEMENTS.
A135
| | | | | | |
| | |
| | HIGH YIELD BOND PORTFOLIO (continued) | | |
| | | | | | |
| |
| SCHEDULE OF INVESTMENTS | | as of December 31, 2019 |
| | | | | | | | | | | | |
Interest
Rate | | Maturity
Date | | | Principal
Amount
(000)# | | | Value | |
|
| CORPORATE BONDS (continued) | |
Entertainment — 3.3% | |
AMC Entertainment Holdings, Inc., | |
Gtd. Notes | |
5.750% | | | 06/15/25 | (a) | | | 1,175 | | | $ | 1,086,974 | |
5.875% | | | 11/15/26 | (a) | | | 1,950 | | | | 1,759,113 | |
Caesars Resort Collection LLC/CRC Finco, Inc., | |
Gtd. Notes, 144A | |
5.250% | | | 10/15/25 | | | | 1,750 | | | | 1,812,606 | |
Golden Entertainment, Inc., | |
Sr. Unsec’d. Notes, 144A | |
7.625% | | | 04/15/26 | | | | 1,475 | | | | 1,571,922 | |
International Game Technology PLC, | |
Sr. Sec’d. Notes, 144A | |
6.250% | | | 01/15/27 | | | | 450 | | | | 506,067 | |
6.500% | | | 02/15/25 | (a) | | | 775 | | | | 871,932 | |
Jacobs Entertainment, Inc., | |
Sec’d. Notes, 144A | |
7.875% | | | 02/01/24 | | | | 1,325 | | | | 1,404,500 | |
Penn National Gaming, Inc., | |
Sr. Unsec’d. Notes, 144A | |
5.625% | | | 01/15/27 | (a) | | | 975 | | | | 1,033,215 | |
Scientific Games International, Inc., | |
Gtd. Notes | |
6.625% | | | 05/15/21 | | | | 3,337 | | | | 3,380,615 | |
Gtd. Notes, 144A | |
7.000% | | | 05/15/28 | | | | 350 | | | | 375,571 | |
7.250% | | | 11/15/29 | (a) | | | 525 | | | | 570,194 | |
8.250% | | | 03/15/26 | | | | 1,227 | | | | 1,352,492 | |
Twin River Worldwide Holdings, Inc., | |
Sr. Unsec’d. Notes, 144A | |
6.750% | | | 06/01/27 | | | | 1,000 | | | | 1,049,343 | |
Wynn Resorts Finance LLC/Wynn Resorts Capital Corp., | |
Gtd. Notes, 144A | |
5.125% | | | 10/01/29 | | | | 470 | | | | 505,206 | |
| | | | | | | | | | | | |
| | | | | | | | | | | 17,279,750 | |
| | | | | | | | | | | | |
Foods — 1.8% | |
B&G Foods, Inc., | |
Gtd. Notes | |
5.250% | | | 04/01/25 | (a) | | | 525 | | | | 541,139 | |
5.250% | | | 09/15/27 | (a) | | | 335 | | | | 337,666 | |
JBS USA LUX SA/JBS USA Finance, Inc., | |
Gtd. Notes, 144A | |
5.750% | | | 06/15/25 | | | | 1,325 | | | | 1,374,524 | |
JBS USA LUX SA/JBS USA Food Co./JBS USA Finance, Inc., | |
Gtd. Notes, 144A | |
6.500% | | | 04/15/29 | | | | 655 | | | | 730,502 | |
Sr. Unsec’d. Notes, 144A | |
5.500% | | | 01/15/30 | | | | 2,150 | | | | 2,310,057 | |
Pilgrim’s Pride Corp., | |
Gtd. Notes, 144A | |
5.875% | | | 09/30/27 | | | | 2,150 | | | | 2,324,553 | |
Post Holdings, Inc., | |
Gtd. Notes, 144A | |
5.500% | | | 12/15/29 | | | | 825 | | | | 880,760 | |
5.625% | | | 01/15/28 | (a) | | | 575 | | | | 620,662 | |
| | | | | | | | | | | | |
| | | | | | | | | | | 9,119,863 | |
| | | | | | | | | | | | |
| | | | | | | | | | | | |
Interest
Rate | | Maturity
Date | | | Principal
Amount
(000)# | | | Value | |
|
| CORPORATE BONDS (continued) | |
Gas — 0.9% | |
AmeriGas Partners LP/AmeriGas Finance Corp., | |
Sr. Unsec’d. Notes | |
5.500% | | | 05/20/25 | | | | 1,475 | | | $ | 1,595,868 | |
5.625% | | | 05/20/24 | | | | 250 | | | | 270,105 | |
5.750% | | | 05/20/27 | | | | 1,475 | | | | 1,621,243 | |
5.875% | | | 08/20/26 | | | | 975 | | | | 1,075,496 | |
| | | | | | | | | | | | |
| | | | | | | | | | | 4,562,712 | |
| | | | | | | | | | | | |
Healthcare-Services — 4.9% | |
Acadia Healthcare Co., Inc., | |
Gtd. Notes | |
6.500% | | | 03/01/24 | | | | 425 | | | | 440,824 | |
Centene Corp., | |
Sr. Unsec’d. Notes, 144A | |
4.250% | | | 12/15/27 | | | | 750 | | | | 772,251 | |
4.625% | | | 12/15/29 | | | | 210 | | | | 221,148 | |
CHS/Community Health Systems, Inc., | |
Sec’d. Notes, 144A | |
8.125% | | | 06/30/24 | (a) | | | 2,242 | | | | 1,836,599 | |
Encompass Health Corp., | |
Gtd. Notes | |
4.750% | | | 02/01/30 | | | | 100 | | | | 103,952 | |
Hadrian Merger Sub, Inc., | |
Sr. Unsec’d. Notes, 144A | |
8.500% | | | 05/01/26 | (a) | | | 650 | | | | 670,474 | |
HCA, Inc., | |
Gtd. Notes | |
5.375% | | | 02/01/25 | | | | 3,100 | | | | 3,430,674 | |
5.625% | | | 09/01/28 | (a) | | | 550 | | | | 627,316 | |
5.875% | | | 02/01/29 | | | | 900 | | | | 1,040,304 | |
MEDNAX, Inc., | |
Gtd. Notes, 144A | |
6.250% | | | 01/15/27 | | | | 2,175 | | | | 2,230,140 | |
Polaris Intermediate Corp., | |
Sr. Unsec’d. Notes, 144A, Cash coupon 8.500% or PIK 9.250% | |
8.500% | | | 12/01/22 | (a) | | | 1,910 | | | | 1,776,642 | |
RegionalCare Hospital Partners Holdings, Inc./LifePoint Health, Inc., | |
Gtd. Notes, 144A | |
9.750% | | | 12/01/26 | | | | 3,425 | | | | 3,876,362 | |
Surgery Center Holdings, Inc., | |
Gtd. Notes, 144A | |
6.750% | | | 07/01/25 | | | | 875 | | | | 874,743 | |
10.000% | | | 04/15/27 | (a) | | | 1,075 | | | | 1,178,131 | |
Tenet Healthcare Corp., | |
Sec’d. Notes, 144A | |
6.250% | | | 02/01/27 | (a) | | | 1,125 | | | | 1,214,035 | |
Sr. Sec’d. Notes, 144A | |
5.125% | | | 11/01/27 | | | | 400 | | | | 422,398 | |
Sr. Unsec’d. Notes | |
6.750% | | | 06/15/23 | (a) | | | 975 | | | | 1,072,035 | |
6.875% | | | 11/15/31 | (a) | | | 825 | | | | 835,624 | |
7.000% | | | 08/01/25 | (a) | | | 1,890 | | | | 1,996,604 | |
8.125% | | | 04/01/22 | (a) | | | 1,050 | | | | 1,160,862 | |
| | | | | | | | | | | | |
| | | | | | | | | | | 25,781,118 | |
| | | | | | | | | | | | |
SEE NOTES TO FINANCIAL STATEMENTS.
A136
| | | | | | |
| | |
| | HIGH YIELD BOND PORTFOLIO (continued) | | |
| | | | | | |
| |
| SCHEDULE OF INVESTMENTS | | as of December 31, 2019 |
| | | | | | | | | | | | |
Interest
Rate | | Maturity
Date | | | Principal
Amount
(000)# | | | Value | |
|
| CORPORATE BONDS (continued) | |
Home Builders — 4.9% | |
Ashton Woods USA LLC/Ashton Woods Finance Co., | |
Sr. Unsec’d. Notes, 144A | |
6.750% | | | 08/01/25 | | | | 1,375 | | | $ | 1,403,208 | |
9.875% | | | 04/01/27 | | | | 1,125 | | | | 1,268,788 | |
Beazer Homes USA, Inc., | |
Gtd. Notes | |
5.875% | | | 10/15/27 | | | | 1,300 | | | | 1,311,616 | |
6.750% | | | 03/15/25 | | | | 850 | | | | 894,916 | |
Sr. Unsec’d. Notes, 144A | |
7.250% | | | 10/15/29 | | | | 775 | | | | 828,281 | |
Brookfield Residential Properties, Inc./Brookfield Residential US Corp. (Canada), | |
Gtd. Notes, 144A | |
6.250% | | | 09/15/27 | | | | 475 | | | | 503,726 | |
6.375% | | | 05/15/25 | | | | 1,450 | | | | 1,509,745 | |
Century Communities, Inc., | |
Gtd. Notes, 144A | |
6.750% | | | 06/01/27 | | | | 1,400 | | | | 1,500,409 | |
Forestar Group, Inc., | |
Gtd. Notes, 144A | |
8.000% | | | 04/15/24 | | | | 750 | | | | 816,472 | |
KB Home, | |
Gtd. Notes | |
4.800% | | | 11/15/29 | | | | 375 | | | | 383,418 | |
6.875% | | | 06/15/27 | | | | 750 | | | | 871,093 | |
7.625% | | | 05/15/23 | | | | 675 | | | | 759,841 | |
Lennar Corp., | |
Gtd. Notes | |
5.250% | | | 06/01/26 | | | | 75 | | | | 82,246 | |
M/I Homes, Inc., | |
Gtd. Notes | |
5.625% | | | 08/01/25 | | | | 425 | | | | 446,304 | |
Mattamy Group Corp. (Canada), | |
Sr. Unsec’d. Notes, 144A | |
5.250% | | | 12/15/27 | | | | 425 | | | | 443,696 | |
6.500% | | | 10/01/25 | (a) | | | 775 | | | | 826,455 | |
Meritage Homes Corp., | |
Gtd. Notes | |
5.125% | | | 06/06/27 | (a) | | | 1,300 | | | | 1,387,443 | |
6.000% | | | 06/01/25 | | | | 1,275 | | | | 1,427,220 | |
New Home Co., Inc. (The), | |
Gtd. Notes | |
7.250% | | | 04/01/22 | | | | 825 | | | | 802,715 | |
PulteGroup, Inc., | |
Gtd. Notes | |
5.000% | | | 01/15/27 | (a) | | | 650 | | | | 708,481 | |
5.500% | | | 03/01/26 | | | | 400 | | | | 446,775 | |
Taylor Morrison Communities, Inc., | |
Gtd. Notes, 144A | |
5.875% | | | 06/15/27 | | | | 1,350 | | | | 1,483,446 | |
Taylor Morrison Communities, Inc./Taylor Morrison Holdings II, Inc., | |
Gtd. Notes, 144A | |
5.625% | | | 03/01/24 | | | | 275 | | | | 297,349 | |
5.875% | | | 04/15/23 | | | | 1,150 | | | | 1,241,692 | |
William Lyon Homes, Inc., | |
Gtd. Notes | |
5.875% | | | 01/31/25 | | | | 1,525 | | | | 1,566,342 | |
| | | | | | | | | | | | |
Interest
Rate | | Maturity
Date | | | Principal
Amount
(000)# | | | Value | |
|
| CORPORATE BONDS (continued) | |
Home Builders (continued) | |
William Lyon Homes, Inc., (continued) | |
6.000% | | | 09/01/23 | | | | 375 | | | $ | 391,875 | |
7.000% | | | 08/15/22 | | | | 184 | | | | 184,201 | |
Gtd. Notes, 144A | |
6.625% | | | 07/15/27 | | | | 1,875 | | | | 2,025,004 | |
| | | | | | | | | | | | |
| | | | | | | | | | | 25,812,757 | |
| | | | | | | | | | | | |
Household Products/Wares — 0.0% | |
Spectrum Brands, Inc., | |
Gtd. Notes, 144A | |
5.000% | | | 10/01/29 | | | | 200 | | | | 206,705 | |
| | | | | | | | | | | | |
Housewares — 0.1% | |
ScottsMiracle-Gro Co. (The), | |
Gtd. Notes, 144A | |
4.500% | | | 10/15/29 | | | | 625 | | | | 638,240 | |
| | | | | | | | | | | | |
Internet — 0.8% | |
Zayo Group LLC/Zayo Capital, Inc., | |
Gtd. Notes | |
6.000% | | | 04/01/23 | | | | 295 | | | | 302,583 | |
Gtd. Notes, 144A | |
5.750% | | | 01/15/27 | (a) | | | 3,815 | | | | 3,892,621 | |
| | | | | | | | | | | | |
| | | | | | | | | | | 4,195,204 | |
| | | | | | | | | | | | |
Iron/Steel — 0.5% | |
Cleveland-Cliffs, Inc., | |
Gtd. Notes | |
5.750% | | | 03/01/25 | | | | 515 | | | | 508,943 | |
Gtd. Notes, 144A | |
5.875% | | | 06/01/27 | | | | 2,080 | | | | 1,992,686 | |
| | | | | | | | | | | | |
| | | | | | | | | | | 2,501,629 | |
| | | | | | | | | | | | |
Lodging — 0.2% | |
MGM Resorts International, | |
Gtd. Notes | |
4.625% | | | 09/01/26 | | | | 75 | | | | 79,257 | |
Wyndham Destinations, Inc., | |
Sr. Sec’d. Notes, 144A | |
4.625% | | | 03/01/30 | (a) | | | 425 | | | | 424,299 | |
Wynn Macau Ltd. (Macau), | |
Sr. Unsec’d. Notes, 144A | |
5.125% | | | 12/15/29 | | | | 725 | | | | 739,703 | |
| | | | | | | | | | | | |
| | | | | | | | | | | 1,243,259 | |
| | | | | | | | | | | | |
Machinery-Diversified — 0.5% | |
ATS Automation Tooling Systems, Inc. (Canada), | |
Gtd. Notes, 144A | |
6.500% | | | 06/15/23 | | | | 600 | | | | 618,852 | |
Cloud Crane LLC, | |
Sec’d. Notes, 144A | |
10.125% | | | 08/01/24 | | | | 2,050 | | | | 2,155,186 | |
| | | | | | | | | | | | |
| | | | | | | | | | | 2,774,038 | |
| | | | | | | | | | | | |
Media — 5.7% | |
AMC Networks, Inc., | |
Gtd. Notes | |
4.750% | | | 08/01/25 | (a) | | | 635 | | | | 638,850 | |
SEE NOTES TO FINANCIAL STATEMENTS.
A137
| | | | | | |
| | |
| | HIGH YIELD BOND PORTFOLIO (continued) | | |
| | | | | | |
| |
| SCHEDULE OF INVESTMENTS | | as of December 31, 2019 |
| | | | | | | | | | | | | | | | |
Interest
Rate | | Maturity
Date | | | | | | Principal
Amount
(000)# | | | Value | |
|
| CORPORATE BONDS (continued) | |
Media (continued) | |
CCO Holdings LLC/CCO Holdings Capital Corp., | |
Sr. Unsec’d. Notes, 144A | |
4.750% | | | 03/01/30 | | | | | | | | 2,375 | | | $ | 2,422,252 | |
5.000% | | | 02/01/28 | | | | | | | | 1,905 | | | | 1,997,220 | |
5.125% | | | 05/01/23 | | | | | | | | 600 | | | | 614,033 | |
5.375% | | | 06/01/29 | | | | | | | | 200 | | | | 214,531 | |
Clear Channel Worldwide Holdings, Inc., | |
Gtd. Notes, 144A | |
9.250% | | | 02/15/24 | (a) | | | | | | | 5,440 | | | | 6,032,550 | |
Sr. Sec’d. Notes, 144A | |
5.125% | | | 08/15/27 | | | | | | | | 675 | | | | 702,598 | |
CSC Holdings LLC, | |
Gtd. Notes, 144A | |
5.375% | | | 02/01/28 | | | | | | | | 350 | | | | 374,023 | |
Sr. Unsec’d. Notes, 144A | |
7.500% | | | 04/01/28 | (a) | | | | | | | 275 | | | | 310,279 | |
Cumulus Media New Holdings, Inc., | |
Sr. Sec’d. Notes, 144A | |
6.750% | | | 07/01/26 | | | | | | | | 875 | | | | 940,262 | |
Diamond Sports Group LLC/Diamond Sports Finance Co., | |
Gtd. Notes, 144A | |
6.625% | | | 08/15/27 | (a) | | | | | | | 2,430 | | | | 2,364,020 | |
Sr. Sec’d. Notes, 144A | |
5.375% | | | 08/15/26 | | | | | | | | 675 | | | | 683,918 | |
DISH DBS Corp., | |
Gtd. Notes | |
7.750% | | | 07/01/26 | (a) | | | | | | | 4,210 | | | | 4,462,047 | |
Entercom Media Corp., | |
Sec’d. Notes, 144A | |
6.500% | | | 05/01/27 | (a) | | | | | | | 875 | | | | 935,641 | |
Gray Television, Inc., | |
Gtd. Notes, 144A | |
5.875% | | | 07/15/26 | (a) | | | | | | | 1,335 | | | | 1,420,456 | |
7.000% | | | 05/15/27 | (a) | | | | | | | 335 | | | | 373,211 | |
Midcontinent Communications/Midcontinent Finance Corp., | |
Gtd. Notes, 144A | |
5.375% | | | 08/15/27 | | | | | | | | 425 | | | | 449,786 | |
Quebecor Media, Inc. (Canada), | |
Sr. Unsec’d. Notes | |
5.750% | | | 01/15/23 | (a) | | | | | | | 410 | | | | 446,824 | |
Radiate Holdco LLC/Radiate Finance, Inc., | |
Sr. Unsec’d. Notes, 144A | |
6.625% | | | 02/15/25 | (a) | | | | | | | 900 | | | | 904,388 | |
6.875% | | | 02/15/23 | | | | | | | | 1,735 | | | | 1,773,714 | |
Scripps Escrow, Inc., | |
Gtd. Notes, 144A | |
5.875% | | | 07/15/27 | (a) | | | | | | | 360 | | | | 376,960 | |
Sinclair Television Group, Inc., | |
Gtd. Notes, 144A | |
5.875% | | | 03/15/26 | (a) | | | | | | | 275 | | | | 288,964 | |
Univision Communications, Inc., | |
Sr. Sec’d. Notes, 144A | |
5.125% | | | 02/15/25 | | | | | | | | 935 | | | | 923,940 | |
Videotron Ltd. (Canada), | |
Gtd. Notes | |
5.000% | | | 07/15/22 | | | | | | | | 50 | | | | 52,818 | |
| | | | | | | | | | | | | | | | |
| | | | | | | | | | | | | | | 29,703,285 | |
| | | | | | | | | | | | | | | | |
| | | | | | | | | | | | | | | | |
Interest
Rate | | Maturity
Date | | | | | | Principal
Amount
(000)# | | | Value | |
|
| CORPORATE BONDS (continued) | |
Metal Fabricate/Hardware — 0.1% | |
TriMas Corp., | |
Gtd. Notes, 144A | |
4.875% | | | 10/15/25 | | | | | | | | 337 | | | $ | 346,366 | |
Zekelman Industries, Inc., | |
Sr. Sec’d. Notes, 144A | |
9.875% | | | 06/15/23 | | | | | | | | 339 | | | | 356,832 | |
| | | | | | | | | | | | | | | | |
| | | | | | | | | | | | | | | 703,198 | |
| | | | | | | | | | | | | | | | |
Mining — 2.3% | |
Compass Minerals International, Inc., | |
Gtd. Notes, 144A | |
6.750% | | | 12/01/27 | | | | | | | | 600 | | | | 635,188 | |
Constellium SE, | |
Gtd. Notes, 144A | |
5.875% | | | 02/15/26 | (a) | | | | | | | 1,175 | | | | 1,243,934 | |
6.625% | | | 03/01/25 | (a) | | | | | | | 1,060 | | | | 1,102,519 | |
Eldorado Gold Corp. (Canada), | |
Sec’d. Notes, 144A | |
9.500% | | | 06/01/24 | | | | | | | | 1,300 | | | | 1,401,202 | |
First Quantum Minerals Ltd. (Zambia), | |
Gtd. Notes, 144A | |
6.500% | | | 03/01/24 | (a) | | | | | | | 920 | | | | 923,518 | |
7.000% | | | 02/15/21 | (a) | | | | | | | 215 | | | | 215,754 | |
7.500% | | | 04/01/25 | | | | | | | | 1,325 | | | | 1,365,110 | |
IAMGOLD Corp. (Canada), | |
Gtd. Notes, 144A | |
7.000% | | | 04/15/25 | | | | | | | | 1,385 | | | | 1,442,414 | |
New Gold, Inc. (Canada), | |
Gtd. Notes, 144A | |
6.250% | | | 11/15/22 | | | | | | | | 815 | | | | 813,802 | |
6.375% | | | 05/15/25 | | | | | | | | 1,015 | | | | 939,921 | |
Novelis Corp., | |
Gtd. Notes, 144A | |
5.875% | | | 09/30/26 | | | | | | | | 1,660 | | | | 1,769,384 | |
6.250% | | | 08/15/24 | | | | | | | | 100 | | | | 104,769 | |
| | | | | | | | | | | | | | | | |
| | | | | | | | | | | | | | | 11,957,515 | |
| | | | | | | | | | | | | | | | |
Miscellaneous Manufacturing — 0.4% | |
Amsted Industries, Inc., | |
Gtd. Notes, 144A | |
5.625% | | | 07/01/27 | | | | | | | | 425 | | | | 450,763 | |
Sr. Unsec’d. Notes, 144A | |
4.625% | | | 05/15/30 | | | | | | | | 570 | | | | 573,800 | |
FXI Holdings, Inc., | |
Sr. Sec’d. Notes, 144A | |
7.875% | | | 11/01/24 | (a) | | | | | | | 925 | | | | 888,492 | |
| | | | | | | | | | | | | | | | |
| | | | | | | | | | | | | | | 1,913,055 | |
| | | | | | | | | | | | | | | | |
Oil & Gas — 8.4% | |
Alta Mesa Holdings LP/Alta Mesa Finance Services Corp., | |
Gtd. Notes | |
7.875% | | | 12/15/24 | (d) | | | | | | | 5,200 | | | | 367,571 | |
Antero Resources Corp., | |
Gtd. Notes | |
5.000% | | | 03/01/25 | | | | | | | | 3,125 | | | | 2,354,631 | |
5.125% | | | 12/01/22 | | | | | | | | 775 | | | | 693,574 | |
5.625% | | | 06/01/23 | | | | | | | | 1,450 | | | | 1,169,038 | |
SEE NOTES TO FINANCIAL STATEMENTS.
A138
| | | | | | |
| | |
| | HIGH YIELD BOND PORTFOLIO (continued) | | |
| | | | | | |
| |
| SCHEDULE OF INVESTMENTS | | as of December 31, 2019 |
| | | | | | | | | | | | | | | | |
Interest
Rate | | Maturity
Date | | | | | | Principal
Amount
(000)# | | | Value | |
|
| CORPORATE BONDS (continued) | |
Oil & Gas (continued) | |
Ascent Resources Utica Holdings LLC/ARU Finance Corp., | |
Sr. Unsec’d. Notes, 144A | |
7.000% | | | 11/01/26 | | | | | | | | 1,825 | | | $ | 1,458,198 | |
10.000% | | | 04/01/22 | | | | | | | | 2,050 | | | | 2,037,374 | |
Centennial Resource Production LLC, | |
Gtd. Notes, 144A | |
5.375% | | | 01/15/26 | (a) | | | | | | | 425 | | | | 418,149 | |
Chesapeake Energy Corp., | |
Sec’d. Notes, 144A | |
11.500% | | | 01/01/25 | (a) | | | | | | | 3,080 | | | | 2,912,221 | |
Citgo Holding, Inc., | |
Sr. Sec’d. Notes, 144A | |
9.250% | | | 08/01/24 | | | | | | | | 1,475 | | | | 1,584,308 | |
CNX Resources Corp., | |
Gtd. Notes | |
5.875% | | | 04/15/22 | | | | | | | | 1,369 | | | | 1,369,103 | |
Gtd. Notes, 144A | |
7.250% | | | 03/14/27 | | | | | | | | 1,650 | | | | 1,444,314 | |
CrownRock LP/CrownRock Finance, Inc., | |
Sr. Unsec’d. Notes, 144A | |
5.625% | | | 10/15/25 | | | | | | | | 350 | | | | 356,788 | |
Denbury Resources, Inc., | |
Sec’d. Notes, 144A | |
9.000% | | | 05/15/21 | | | | | | | | 350 | | | | 342,045 | |
Diamond Offshore Drilling, Inc., | |
Sr. Unsec’d. Notes | |
7.875% | | | 08/15/25 | | | | | | | | 675 | | | | 586,532 | |
Endeavor Energy Resources LP/EER Finance, Inc., | |
Sr. Unsec’d. Notes, 144A | |
5.750% | | | 01/30/28 | | | | | | | | 1,550 | | | | 1,630,511 | |
Extraction Oil & Gas, Inc., | |
Gtd. Notes, 144A | |
5.625% | | | 02/01/26 | | | | | | | | 2,000 | | | | 1,193,991 | |
7.375% | | | 05/15/24 | | | | | | | | 950 | | | | 590,833 | |
Hilcorp Energy I LP/Hilcorp Finance Co., | |
Sr. Unsec’d. Notes, 144A | |
5.000% | | | 12/01/24 | | | | | | | | 75 | | | | 72,619 | |
5.750% | | | 10/01/25 | | | | | | | | 1,275 | | | | 1,242,285 | |
6.250% | | | 11/01/28 | | | | | | | | 900 | | | | 857,663 | |
MEG Energy Corp. (Canada), | |
Gtd. Notes, 144A | |
6.375% | | | 01/30/23 | | | | | | | | 3,750 | | | | 3,762,968 | |
7.000% | | | 03/31/24 | | | | | | | | 875 | | | | 883,173 | |
Nabors Industries, Inc., | |
Gtd. Notes | |
5.750% | | | 02/01/25 | | | | | | | | 2,750 | | | | 2,476,237 | |
Petrobras Global Finance BV (Brazil), | |
Gtd. Notes | |
7.375% | | | 01/17/27 | | | | | | | | 350 | | | | 426,932 | |
8.750% | | | 05/23/26 | | | | | | | | 425 | | | | 546,205 | |
Gtd. Notes, 144A | |
5.093% | | | 01/15/30 | | | | | | | | 135 | | | | 144,783 | |
Precision Drilling Corp. (Canada), | |
Gtd. Notes | |
7.750% | | | 12/15/23 | | | | | | | | 525 | | | | 523,168 | |
Gtd. Notes, 144A | |
7.125% | | | 01/15/26 | | | | | | | | 1,225 | | | | 1,166,605 | |
| | | | | | | | | | | | | | | | |
Interest
Rate | | Maturity
Date | | | | | | Principal
Amount
(000)# | | | Value | |
|
| CORPORATE BONDS (continued) | |
Oil & Gas (continued) | |
Range Resources Corp., | |
Gtd. Notes | |
4.875% | | | 05/15/25 | (a) | | | | | | | 775 | | | $ | 666,604 | |
5.000% | | | 03/15/23 | | | | | | | | 350 | | | | 322,510 | |
5.875% | | | 07/01/22 | | | | | | | | 2,125 | | | | 2,104,581 | |
Rowan Cos., Inc., | |
Gtd. Notes | |
7.375% | | | 06/15/25 | | | | | | | | 75 | | | | 45,555 | |
Seven Generations Energy Ltd. (Canada), | |
Gtd. Notes, 144A | |
5.375% | | | 09/30/25 | | | | | | | | 50 | | | | 50,375 | |
Seventy Seven Energy, Inc., | |
Sr. Unsec’d. Notes | |
6.500% | | | 07/15/22 | ^(d) | | | | | | | 275 | | | | 3 | |
Sunoco LP/Sunoco Finance Corp., | |
Gtd. Notes | |
5.500% | | | 02/15/26 | | | | | | | | 850 | | | | 882,902 | |
5.875% | | | 03/15/28 | | | | | | | | 100 | | | | 106,473 | |
Transocean Pontus Ltd., | |
Sr. Sec’d. Notes, 144A | |
6.125% | | | 08/01/25 | (a) | | | | | | | 356 | | | | 365,736 | |
Transocean, Inc., | |
Gtd. Notes, 144A | |
7.250% | | | 11/01/25 | (a) | | | | | | | 1,925 | | | | 1,895,358 | |
7.500% | | | 01/15/26 | (a) | | | | | | | 1,125 | | | | 1,110,525 | |
Valaris PLC, | |
Sr. Unsec’d. Notes | |
5.750% | | | 10/01/44 | | | | | | | | 400 | | | | 180,546 | |
7.750% | | | 02/01/26 | | | | | | | | 1,750 | | | | 987,928 | |
WPX Energy, Inc., | |
Sr. Unsec’d. Notes | |
5.250% | | | 09/15/24 | (a) | | | | | | | 525 | | | | 558,489 | |
5.250% | | | 10/15/27 | | | | | | | | 1,000 | | | | 1,053,740 | |
5.750% | | | 06/01/26 | (a) | | | | | | | 275 | | | | 294,002 | |
8.250% | | | 08/01/23 | (a) | | | | | | | 325 | | | | 374,089 | |
| | | | | | | | | | | | | | | | |
| | | | | | | | | | | | | | | 43,611,235 | |
| | | | | | | | | | | | | | | | |
Oil & Gas Services — 0.1% | |
Nine Energy Service, Inc., | |
Gtd. Notes, 144A | |
8.750% | | | 11/01/23 | | | | | | | | 400 | | | | 325,988 | |
| | | | | | | | | | | | | | | | |
Packaging & Containers — 0.4% | |
ARD Finance SA (Luxembourg), | |
Sr. Sec’d. Notes, 144A, Cash coupon 6.500% or PIK 7.250% | |
6.500% | | | 06/30/27 | | | | | | | | 950 | | | | 982,088 | |
Owens-Brockway Glass Container, Inc., | |
Gtd. Notes, 144A | |
6.375% | | | 08/15/25 | (a) | | | | | | | 200 | | | | 219,027 | |
Reynolds Group Issuer, Inc./Reynolds Group Issuer LLC/Reynolds Group Issuer Lu, | |
Gtd. Notes, 144A | |
7.000% | | | 07/15/24 | | | | | | | | 900 | | | | 931,173 | |
| | | | | | | | | | | | | | | | |
| | | | | | | | | | | | | | | 2,132,288 | |
| | | | | | | | | | | | | | | | |
SEE NOTES TO FINANCIAL STATEMENTS.
A139
| | | | | | |
| | |
| | HIGH YIELD BOND PORTFOLIO (continued) | | |
| | | | | | |
| |
| SCHEDULE OF INVESTMENTS | | as of December 31, 2019 |
| | | | | | | | | | | | | | | | |
Interest
Rate | | Maturity
Date | | | | | | Principal
Amount
(000)# | | | Value | |
|
| CORPORATE BONDS (continued) | |
Pharmaceuticals — 1.8% | |
Bausch Health Americas, Inc., | |
Gtd. Notes, 144A | |
8.500% | | | 01/31/27 | | | | | | | | 150 | | | $ | 171,039 | |
Bausch Health Cos., Inc., | |
Gtd. Notes, 144A | |
5.875% | | | 05/15/23 | | | | | | | | 468 | | | | 474,125 | |
6.125% | | | 04/15/25 | (a) | | | | | | | 2,450 | | | | 2,535,255 | |
7.000% | | | 01/15/28 | | | | | | | | 575 | | | | 635,807 | |
7.250% | | | 05/30/29 | | | | | | | | 1,035 | | | | 1,181,588 | |
Sr. Sec’d. Notes, 144A | |
5.750% | | | 08/15/27 | | | | | | | | 170 | | | | 184,651 | |
Sr. Unsec’d. Notes, 144A | |
5.000% | | | 01/30/28 | | | | | | | | 725 | | | | 743,830 | |
5.250% | | | 01/30/30 | | | | | | | | 725 | | | | 750,994 | |
Endo Dac/Endo Finance LLC/Endo Finco, Inc., | |
Gtd. Notes, 144A | |
6.000% | | | 02/01/25 | | | | | | | | 1,200 | | | | 812,390 | |
Mallinckrodt International Finance SA/Mallinckrodt CB LLC, | |
Gtd. Notes, 144A | |
5.750% | | | 08/01/22 | | | | | | | | 1,250 | | | | 511,958 | |
NVA Holdings, Inc., | |
Gtd. Notes, 144A | |
6.875% | | | 04/01/26 | | | | | | | | 1,135 | | | | 1,237,714 | |
| | | | | | | | | | | | | | | | |
| | | | | | | | | | | | | | | 9,239,351 | |
| | | | | | | | | | | | | | | | |
Pipelines — 2.2% | |
Antero Midstream Partners LP/Antero Midstream Finance Corp., | |
Gtd. Notes | |
5.375% | | | 09/15/24 | (a) | | | | | | | 375 | | | | 348,948 | |
Gtd. Notes, 144A | |
5.750% | | | 01/15/28 | (a) | | | | | | | 1,825 | | | | 1,592,586 | |
CNX Midstream Partners LP/CNX Midstream Finance Corp., | |
Sr. Unsec’d. Notes, 144A | |
6.500% | | | 03/15/26 | | | | | | | | 675 | | | | 621,731 | |
DCP Midstream Operating LP, | |
Gtd. Notes, 144A | |
6.450% | | | 11/03/36 | | | | | | | | 425 | | | | 446,787 | |
Global Partners LP/GLP Finance Corp., | |
Gtd. Notes | |
7.000% | | | 06/15/23 | | | | | | | | 950 | | | | 979,693 | |
Gtd. Notes, 144A | |
7.000% | | | 08/01/27 | | | | | | | | 360 | | | | 383,219 | |
NGPL PipeCo LLC, | |
Sr. Unsec’d. Notes, 144A | |
4.875% | | | 08/15/27 | | | | | | | | 175 | | | | 186,349 | |
7.768% | | | 12/15/37 | | | | | | | | 675 | | | | 863,690 | |
Rockies Express Pipeline LLC, | |
Sr. Unsec’d. Notes, 144A | |
6.875% | | | 04/15/40 | | | | | | | | 2,419 | | | | 2,526,936 | |
Tallgrass Energy Partners LP/Tallgrass Energy Finance Corp., | |
Gtd. Notes, 144A | |
5.500% | | | 09/15/24 | | | | | | | | 875 | | | | 878,047 | |
5.500% | | | 01/15/28 | | | | | | | | 2,025 | | | | 1,982,733 | |
Targa Resources Partners LP/Targa Resources Partners Finance Corp., | |
Gtd. Notes | |
6.750% | | | 03/15/24 | | | | | | | | 675 | | | | 700,314 | |
| | | | | | | | | | | | | | | | |
| | | | | | | | | | | | | | | 11,511,033 | |
| | | | | | | | | | | | | | | | |
| | | | | | | | | | | | | | | | |
Interest
Rate | | Maturity
Date | | | | | | Principal
Amount
(000)# | | | Value | |
|
| CORPORATE BONDS (continued) | |
Real Estate — 1.1% | |
Five Point Operating Co. LP/Five Point Capital Corp., | |
Gtd. Notes, 144A | |
7.875% | | | 11/15/25 | | | | | | | | 1,850 | | | $ | 1,865,535 | |
Greystar Real Estate Partners LLC, | |
Sr. Sec’d. Notes, 144A | |
5.750% | | | 12/01/25 | | | | | | | | 1,825 | | | | 1,894,336 | |
Hunt Cos., Inc., | |
Sr. Sec’d. Notes, 144A | |
6.250% | | | 02/15/26 | | | | | | | | 1,825 | | | | 1,812,131 | |
| | | | | | | | | | | | | | | | |
| | | | | | | | | | | | | | | 5,572,002 | |
| | | | | | | | | | | | | | | | |
Real Estate Investment Trusts (REITs) — 1.1% | |
GLP Capital LP/GLP Financing II, Inc., | |
Gtd. Notes | |
5.375% | | | 04/15/26 | | | | | | | | 730 | | | | 807,764 | |
MGM Growth Properties Operating Partnership LP/MGP FinanceCo-Issuer, Inc., | |
Gtd. Notes | |
4.500% | | | 01/15/28 | | | | | | | | 1,175 | | | | 1,228,416 | |
MPT Operating Partnership LP/MPT Finance Corp., | |
Gtd. Notes | |
5.000% | | | 10/15/27 | | | | | | | | 1,225 | | | | 1,301,916 | |
Sabra Health Care LP, | |
Gtd. Notes | |
5.125% | | | 08/15/26 | | | | | | | | 400 | | | | 432,290 | |
VICI Properties LP/VICI Note Co., Inc., | |
Gtd. Notes, 144A | |
4.250% | | | 12/01/26 | | | | | | | | 910 | | | | 939,026 | |
4.625% | | | 12/01/29 | | | | | | | | 745 | | | | 779,833 | |
| | | | | | | | | | | | | | | | |
| | | | | | | | | | | | | | | 5,489,245 | |
| | | | | | | | | | | | | | | | |
Retail — 4.9% | |
Brinker International, Inc., | |
Gtd. Notes, 144A | |
5.000% | | | 10/01/24 | | | | | | | | 175 | | | | 184,969 | |
CEC Entertainment, Inc., | |
Gtd. Notes | |
8.000% | | | 02/15/22 | | | | | | | | 1,975 | | | | 1,945,419 | |
eG Global Finance PLC (United Kingdom), | |
Sr. Sec’d. Notes, 144A | |
8.500% | | | 10/30/25 | | | | | | | | 1,075 | | | | 1,141,081 | |
Ferrellgas LP/Ferrellgas Finance Corp., | |
Gtd. Notes | |
6.750% | | | 06/15/23 | | | | | | | | 850 | | | | 715,024 | |
Sr. Unsec’d. Notes | |
6.500% | | | 05/01/21 | | | | | | | | 625 | | | | 538,337 | |
6.750% | | | 01/15/22 | | | | | | | | 975 | | | | 827,804 | |
Ferrellgas Partners LP/Ferrellgas Partners Finance Corp., | |
Sr. Unsec’d. Notes | |
8.625% | | | 06/15/20 | | | | | | | | 1,950 | | | | 1,168,920 | |
8.625% | | | 06/15/20 | | | | | | | | 2,825 | | | | 1,728,467 | |
Golden Nugget, Inc., | |
Gtd. Notes, 144A | |
8.750% | | | 10/01/25 | | | | | | | | 1,800 | | | | 1,927,536 | |
Sr. Unsec’d. Notes, 144A | |
6.750% | | | 10/15/24 | | | | | | | | 1,225 | | | | 1,267,402 | |
SEE NOTES TO FINANCIAL STATEMENTS.
A140
| | | | | | |
| | |
| | HIGH YIELD BOND PORTFOLIO (continued) | | |
| | | | | | |
| |
| SCHEDULE OF INVESTMENTS | | as of December 31, 2019 |
| | | | | | | | | | | | | | | | |
Interest
Rate | | Maturity
Date | | | | | | Principal
Amount
(000)# | | | Value | |
|
| CORPORATE BONDS (continued) | |
Retail (continued) | |
L Brands, Inc., | |
Gtd. Notes | |
6.750% | | | 07/01/36 | | | | | | | | 1,775 | | | $ | 1,554,646 | |
6.875% | | | 11/01/35 | | | | | | | | 1,006 | | | | 903,387 | |
Michaels Stores, Inc., | |
Gtd. Notes, 144A | |
8.000% | | | 07/15/27 | (a) | | | | | | | 1,625 | | | | 1,560,920 | |
PetSmart, Inc., | |
Gtd. Notes, 144A | |
7.125% | | | 03/15/23 | | | | | | | | 100 | | | | 98,025 | |
Sr. Sec’d. Notes, 144A | |
5.875% | | | 06/01/25 | (a) | | | | | | | 2,037 | | | | 2,080,190 | |
Rite Aid Corp., | |
Gtd. Notes, 144A | |
6.125% | | | 04/01/23 | | | | | | | | 2,925 | | | | 2,689,395 | |
Sally Holdings LLC/Sally Capital, Inc., | |
Gtd. Notes | |
5.625% | | | 12/01/25 | (a) | | | | | | | 2,600 | | | | 2,720,925 | |
Suburban Propane Partners LP/Suburban Energy Finance Corp., | |
Sr. Unsec’d. Notes | |
5.500% | | | 06/01/24 | | | | | | | | 1,175 | | | | 1,207,660 | |
5.750% | | | 03/01/25 | | | | | | | | 175 | | | | 179,813 | |
5.875% | | | 03/01/27 | | | | | | | | 150 | | | | 156,462 | |
Superior Plus LP/Superior General Partner, Inc. (Canada), | |
Sr. Unsec’d. Notes, 144A | |
7.000% | | | 07/15/26 | | | | | | | | 1,075 | | | | 1,150,077 | |
| | | | | | | | | | | | | | | | |
| | | | | | | | | | | | | | | 25,746,459 | |
| | | | | | | | | | | | | | | | |
Software — 0.6% | |
Dun & Bradstreet Corp. (The), | |
Sr. Sec’d. Notes, 144A | |
6.875% | | | 08/15/26 | | | | | | | | 285 | | | | 314,688 | |
Infor US, Inc., | |
Gtd. Notes | |
6.500% | | | 05/15/22 | | | | | | | | 595 | | | | 604,969 | |
Informatica LLC, | |
Sr. Unsec’d. Notes, 144A | |
7.125% | | | 07/15/23 | | | | | | | | 260 | | | | 264,344 | |
RP Crown Parent LLC, | |
Gtd. Notes, 144A | |
7.375% | | | 10/15/24 | | | | | | | | 1,555 | | | | 1,616,829 | |
TIBCO Software, Inc., | |
Sr. Unsec’d. Notes, 144A | |
11.375% | | | 12/01/21 | (a) | | | | | | | 530 | | | | 549,185 | |
| | | | | | | | | | | | | | | | |
| | | | | | | | | | | | | | | 3,350,015 | |
| | | | | | | | | | | | | | | | |
Telecommunications — 7.9% | |
C&W Senior Financing DAC (Ireland), | |
Sr. Unsec’d. Notes, 144A | |
6.875% | | | 09/15/27 | (a) | | | | | | | 975 | | | | 1,043,611 | |
CenturyLink, Inc., | |
Sr. Unsec’d. Notes, Series P | |
7.600% | | | 09/15/39 | (a) | | | | | | | 165 | | | | 172,130 | |
CommScope Technologies LLC, | |
Gtd. Notes, 144A | |
6.000% | | | 06/15/25 | | | | | | | | 2,345 | | | | 2,352,080 | |
| | | | | | | | | | | | | | | | |
Interest
Rate | | Maturity
Date | | | | | | Principal
Amount
(000)# | | | Value | |
|
| CORPORATE BONDS (continued) | |
Telecommunications (continued) | |
CommScope, Inc., | |
Gtd. Notes, 144A | |
8.250% | | | 03/01/27 | (a) | | | | | | | 895 | | | $ | 942,087 | |
Connect Finco SARL/Connect US Finco LLC (United Kingdom), | |
Sr. Sec’d. Notes, 144A | |
6.750% | | | 10/01/26 | | | | | | | | 1,225 | | | | 1,303,213 | |
Digicel Group One Ltd. (Jamaica), | |
Sr. Sec’d. Notes, 144A | |
8.250% | | | 12/30/22 | | | | | | | | 1,304 | | | | 737,403 | |
Digicel Group Two Ltd. (Jamaica), | |
Sr. Unsec’d. Notes, 144A | |
8.250% | | | 09/30/22 | | | | | | | | 1,181 | | | | 274,595 | |
Sr. Unsec’d. Notes, 144A, Cash coupon 9.125% or PIK 9.125% | |
9.125% | | | 04/01/24 | | | | | | | | 563 | | | | 84,853 | |
Digicel International Finance Ltd./Digicel Holdings Bermuda Ltd. (Saint Lucia), | |
Sr. Sec’d. Notes, 144A | |
8.750% | | | 05/25/24 | | | | | | | | 850 | | | | 828,530 | |
Digicel Ltd. (Jamaica), | |
Gtd. Notes, 144A | |
6.750% | | | 03/01/23 | | | | | | | | 4,710 | | | | 2,732,313 | |
Sr. Unsec’d. Notes, 144A | |
6.000% | | | 04/15/21 | | | | | | | | 1,125 | | | | 878,994 | |
Embarq Corp., | |
Sr. Unsec’d. Notes | |
7.995% | | | 06/01/36 | | | | | | | | 7,075 | | | | 7,489,725 | |
Intelsat Jackson Holdings SA (Luxembourg), | |
Gtd. Notes | |
5.500% | | | 08/01/23 | | | | | | | | 785 | | | | 673,803 | |
Gtd. Notes, 144A | |
9.750% | | | 07/15/25 | | | | | | | | 3,955 | | | | 3,660,401 | |
Intelsat Luxembourg SA (Luxembourg), | |
Gtd. Notes | |
8.125% | | | 06/01/23 | | | | | | | | 1,690 | | | | 998,506 | |
Intrado Corp., | |
Gtd. Notes, 144A | |
8.500% | | | 10/15/25 | (a) | | | | | | | 4,359 | | | | 3,509,440 | |
Iridium Communications, Inc., | |
Sr. Unsec’d. Notes, 144A | |
10.250% | | | 04/15/23 | | | | | | | | 625 | | | | 670,146 | |
Northwestern Bell Telephone, | |
Sr. Unsec’d. Notes | |
7.750% | | | 05/01/30 | | | | | | | | 100 | | | | 111,270 | |
ORBCOMM, Inc., | |
Sr. Sec’d. Notes, 144A | |
8.000% | | | 04/01/24 | | | | | | | | 1,850 | | | | 1,886,936 | |
Sprint Capital Corp., | |
Gtd. Notes | |
6.875% | | | 11/15/28 | (a) | | | | | | | 975 | | | | 1,054,196 | |
8.750% | | | 03/15/32 | | | | | | | | 2,451 | | | | 2,975,442 | |
Sprint Corp., | |
Gtd. Notes | |
7.125% | | | 06/15/24 | (a) | | | | | | | 595 | | | | 641,355 | |
7.625% | | | 02/15/25 | | | | | | | | 2,115 | | | | 2,326,399 | |
Telesat Canada/Telesat LLC (Canada), | |
Sr. Sec’d. Notes, 144A | |
4.875% | | | 06/01/27 | (a) | | | | | | | 275 | | | | 280,367 | |
SEE NOTES TO FINANCIAL STATEMENTS.
A141
| | | | | | |
| | |
| | HIGH YIELD BOND PORTFOLIO (continued) | | |
| | | | | | |
| |
| SCHEDULE OF INVESTMENTS | | as of December 31, 2019 |
| | | | | | | | | | | | | | | | |
Interest
Rate | | Maturity
Date | | | | | | Principal
Amount
(000)# | | | Value | |
|
| CORPORATE BONDS (continued) | |
Telecommunications (continued) | |
Xplornet Communications, Inc. (Canada), | |
Gtd. Notes, 144A, Cash coupon 9.625% or PIK 10.625% | |
9.625% | | | 06/01/22 | | | | | | | | 3,731 | | | $ | 3,723,819 | |
| | | | | | | | | | | | | | | | |
| | | | | | | | | | | | | | | 41,351,614 | |
| | | | | | | | | | | | | | | | |
Toys/Games/Hobbies — 0.1% | |
Mattel, Inc., | |
Gtd. Notes, 144A | |
5.875% | | | 12/15/27 | (a) | | | | | | | 425 | | | | 448,212 | |
| | | | | | | | | | | | | | | | |
Transportation — 0.5% | |
XPO Logistics, Inc., | |
Gtd. Notes, 144A | |
6.750% | | | 08/15/24 | (a) | | | | | | | 2,250 | | | | 2,444,443 | |
| | | | | | | | | | | | | | | | |
TOTAL CORPORATE BONDS
(cost $409,531,134) | | | | 418,790,447 | |
| | | | | | | | | | | | | | | | |
|
RESIDENTIAL MORTGAGE-BACKED
SECURITIES — 0.0% | |
Adjustable Rate Mortgage Trust, | |
Series2005-07, Class 1A1 | |
3.576%(cc) | | | 10/25/35 | | | | | | | | 5 | | | | 4,002 | |
Alternative Loan Trust, | |
Series2005-43, Class 4A3 | |
3.279%(cc) | | | 10/25/35 | | | | | | | | 2 | | | | 2,183 | |
Series 2006-HY13, Class 4A1 | |
4.242%(cc) | | | 02/25/37 | | | | | | | | 3 | | | | 2,939 | |
Series 2006-OA09, Class 2A1A, 1 Month LIBOR + 0.210% (Cap N/A, Floor 0.210%) | |
1.975%(c) | | | 07/20/46 | | | | | | | | 4 | | | | 3,106 | |
American Home Mortgage Assets Trust, | |
Series2006-04, Class 1A12, 1 Month LIBOR + 0.210% (Cap N/A, Floor 0.210%) | |
2.002%(c) | | | 10/25/46 | | | | | | | | 22 | | | | 14,509 | |
American Home Mortgage Investment Trust, | |
Series2005-02, Class 4A1, 6 Month LIBOR + 1.500% (Cap 11.000%, Floor 1.500%) | |
3.407%(c) | | | 09/25/45 | | | | | | | | 1 | | | | 916 | |
Banc of America Funding Trust, | |
Series2006-B, Class 2A1 | |
4.135%(cc) | | | 03/20/36 | | | | | | | | 5 | | | | 5,126 | |
Citigroup Mortgage Loan Trust, | |
Series2007-10, Class 22AA | |
4.169%(cc) | | | 09/25/37 | | | | | | | | 14 | | | | 13,504 | |
HarborView Mortgage Loan Trust, | |
Series2006-05, Class 2A1A, 1 Month LIBOR + 0.180% (Cap N/A, Floor 0.180%) | |
1.944%(c) | | | 07/19/46 | | | | | | | | 6 | | | | 4,166 | |
IndyMac INDX Mortgage Loan Trust, | |
Series 2006-AR12, Class A1, 1 Month LIBOR + 0.190% (Cap N/A, Floor 0.190%) | |
1.982%(c) | | | 09/25/46 | | | | | | | | 5 | | | | 4,760 | |
JPMorgan Mortgage Trust, | |
Series2007-S03, Class 1A96 | |
6.000% | | | 08/25/37 | | | | | | | | 14 | | | | 11,346 | |
MASTR Adjustable Rate Mortgages Trust, | |
Series 2006-OA01, Class 1A1, 1 Month LIBOR + 0.210% (Cap N/A, Floor 0.210%) | |
2.002%(c) | | | 04/25/46 | | | | | | | | 3 | | | | 3,006 | |
| | | | | | | | | | | | | | | | |
Interest
Rate | | Maturity
Date | | | | | | Principal
Amount
(000)# | | | Value | |
|
| RESIDENTIAL MORTGAGE-BACKED SECURITIES (continued) | |
RALI Trust, | |
Series 2006-QA02, Class 3A1 | |
5.718%(cc) | | | 02/25/36 | | | | | | | | 16 | | | $ | 14,334 | |
Series 2007-QS04, Class 2A1, 1 Month LIBOR + 0.330% (Cap 7.000%, Floor 0.330%) | |
2.122%(c) | | | 03/25/37 | | | | | | | | 12 | | | | 2,980 | |
Residential Asset Securitization Trust, | |
Series2007-A05, Class 2A3 | |
6.000% | | | 05/25/37 | | | | | | | | 3 | | | | 2,921 | |
SunTrust Alternative Loan Trust, | |
Series2006-01F, Class 3A, 1 Month LIBOR + 0.350% (Cap 7.500%, Floor 0.350%) | |
2.142%(c) | | | 04/25/36 | | | | | | | | 15 | | | | 4,087 | |
WaMu Mortgage Pass-Through Certificates Trust, | |
Series 2007-HY01, Class 2A3 | |
3.974%(cc) | | | 02/25/37 | | | | | | | | 3 | | | | 2,824 | |
Series 2007-HY01, Class 4A1 | |
4.035%(cc) | | | 02/25/37 | | | | | | | | 4 | | | | 3,706 | |
| | | | | | | | | | | | | | | | |
TOTAL RESIDENTIAL MORTGAGE-BACKED SECURITIES
(cost $100,484) | | | | 100,415 | |
| | | | | | | | | | | | | | | | |
| | | | |
| | | | | | | | | Shares | | | | |
|
| COMMON STOCKS — 0.9% | |
Chemicals — 0.1% | |
Hexion Holdings Corp. (Class B Stock)* | | | | 23,260 | | | | 280,283 | |
| | | | | | | | | | | | | | | | |
Electric Utilities — 0.6% | |
GenOn Energy Holdings, Inc. (Class A Stock)*^(a) | | | | 11,836 | | | | 2,426,380 | |
Keycon Power Holdings LLC* | | | | 2,150 | | | | 645,000 | |
| | | | | | | | | | | | | | | | |
| | | | | | | | | | | | | | | 3,071,380 | |
| | | | | | | | | | | | | | | | |
Independent Power & Renewable Electricity Producers — 0.2% | |
Vistra Energy Corp | | | | 44,042 | | | | 1,012,525 | |
| | | | | | | | | | | | | | | | |
Media — 0.0% | |
Mood Media Corp.*^ | | | | 88,166 | | | | 18 | |
Mood Media Corp.*^ | | | | 71,972 | | | | 14 | |
| | | | | | | | | | | | | | | | |
| | | | | | | | | | | | | | | 32 | |
| | | | | | | | | | | | | | | | |
Oil, Gas & Consumable Fuels — 0.0% | |
Ascent Resources - Marcellus LLC (Class A Stock)*^ | | | | 4,593 | | | | 7,464 | |
Frontera Energy Corp. (Colombia) | | | | 7,600 | | | | 57,228 | |
| | | | | | | | | | | | | | | | |
| | | | | | | | | | | | | | | 64,692 | |
| | | | | | | | | | | | | | | | |
TOTAL COMMON STOCKS
(cost $2,783,318) | | | | 4,428,912 | |
| | | | | | | | | | | | | | | | |
|
| PREFERRED STOCKS — 0.1% | |
Capital Markets — 0.1% | |
Goldman Sachs Group, Inc. (The), Series K, 6.375% | | | | 11,850 | | | | 337,369 | |
| | | | | | | | | | | | | | | | |
Construction Materials — 0.0% | |
New Millennium Homes LLC^ | | | | | | | | 408 | | | | 7,761 | |
| | | | | | | | | | | | | | | | |
SEE NOTES TO FINANCIAL STATEMENTS.
A142
| | | | | | |
| | |
| | HIGH YIELD BOND PORTFOLIO (continued) | | |
| | | | | | |
| |
| SCHEDULE OF INVESTMENTS | | as of December 31, 2019 |
| | | | | | | | |
| | | Shares | | | Value | |
|
| PREFERRED STOCKS (continued) | |
Media — 0.0% | | | | | |
Adelphia Communications Corp.^ | | | 700 | | | $ | 1 | |
| | | | | | | | |
TOTAL PREFERRED STOCKS
(cost $296,917) | | | | 345,131 | |
| | | | | | | | |
| | | Units | | | | |
| |
| WARRANTS* — 0.0% | | | | | |
Oil, Gas & Consumable Fuels | | | | | | | | |
Ascent Resources - Marcellus LLC, 2nd Lien Tranche A, expiring 03/30/23^ | | | 30,044 | | | | 3,755 | |
Ascent Resources - Marcellus LLC, 2nd Lien Tranche B, expiring 03/30/23^ | | | 23,368 | | | | 1,753 | |
| | | | | | | | |
TOTAL WARRANTS
(cost $6,843) | | | | 5,508 | |
| | | | | | | | |
TOTAL LONG-TERM INVESTMENTS
(cost $494,985,938) | | | | | | | 506,089,496 | |
| | | | | | | | |
| | | Shares | | | | |
| |
| SHORT-TERM INVESTMENTS — 16.3% | | | | | |
AFFILIATED MUTUAL FUNDS | | | | | | | | |
PGIM Core Ultra Short Bond Fund(w) | | | 2,970,312 | | | | 2,970,312 | |
PGIM Institutional Money Market Fund (cost $82,308,288; includes $82,162,638 of cash collateral for securities on loan)(b)(w) | | | 82,310,540 | | | | 82,327,001 | |
| | | | | | | | |
TOTAL SHORT-TERM INVESTMENTS
(cost $85,278,600) | | | | 85,297,313 | |
| | | | | | | | |
TOTAL INVESTMENTS — 113.3%(cost $580,264,538) | | | | | | | 591,386,809 | |
Liabilities in excess of other assets(z) — (13.3)% | | | | (69,385,122 | ) |
| | | | | | | | |
NET ASSETS — 100.0% | | | | | | $ | 522,001,687 | |
| | | | | | | | |
See the Glossary for a list of the abbreviation(s) used in the annual report.
| * | Non-income producing security. |
| # | Principal or notional amount is shown in U.S. dollars unless otherwise stated. |
| ^ | Indicates a Level 3 instrument. The aggregate value of Level 3 instruments is $7,446,634 and 1.4% of net assets. |
| (a) | All or a portion of security is on loan. The aggregate market value of such securities, including those sold and pending settlement, is $80,243,907; cash collateral of $82,162,638 (included in liabilities) was received with which the Portfolio purchased highly liquid short-term investments. |
| (b) | Represents security purchased with cash collateral received for securities on loan and includes dividend reinvestment. |
| (c) | Variable rate instrument. The interest rate shown reflects the rate in effect at December 31, 2019. |
| (cc) | Variable rate instrument. The rate shown is based on the latest available information as of December 31, 2019. Certain variable rate securities are not based on a published reference rate and spread but are determined by the issuer or agent and are based on current market conditions. These securities do not indicate a reference rate and spread in their description. |
| (d) | Represents issuer in default on interest payments and/or principal repayment.Non-income producing security. Such securities may be post-maturity. |
| (p) | Interest rate not available as of December 31, 2019. |
| (w) | PGIM Investments LLC, the manager of the Portfolio, also serves as manager of the PGIM Core Ultra Short Bond Fund and PGIM Institutional Money Market Fund. |
| (z) | Includes net unrealized appreciation/(depreciation) and/or market value of the below holdings which are excluded from the Schedule of Investments: |
Futures contracts outstanding at December 31, 2019:
| | | | | | | | | | | | | | | | |
Number of
Contracts | | Type | | | Expiration
Date | | | Current
Notional
Amount | | | Value /
Unrealized
Appreciation
(Depreciation) | |
| Long Positions: | | | | | | | | | | | | | | | | |
| 125 | | | 2 Year U.S. Treasury Notes | | | | Mar. 2020 | | | $ | 26,937,500 | | | $ | (11,994 | ) |
| 87 | | | 5 Year U.S. Treasury Notes | | | | Mar. 2020 | | | | 10,319,016 | | | | (19,634 | ) |
| 101 | | | 10 Year U.S. Treasury Notes | | | | Mar. 2020 | | | | 12,970,610 | | | | (87,029 | ) |
| 11 | | | 20 Year U.S. Treasury Bonds | | | | Mar. 2020 | | | | 1,714,969 | | | | (39,134 | ) |
| | | | | | | | | | | | | | | | |
| | | | | | | | | | | | | | | (157,791 | ) |
| | | | | | | | | | | | | | | | |
| Short Position: | | | | | | | | | | | | | | | | |
| 15 | | | 30 Year U.S. Ultra Treasury Bonds | | | | Mar. 2020 | | | | 2,724,843 | | | | 76,477 | |
| | | | | | | | | | | | | | | | |
| | | | | | | | | | | | | | $ | (81,314 | ) |
| | | | | | | | | | | | | | | | |
SEE NOTES TO FINANCIAL STATEMENTS.
A143
| | | | | | |
| | |
| | HIGH YIELD BOND PORTFOLIO (continued) | | |
| | | | | | |
| |
| SCHEDULE OF INVESTMENTS | | as of December 31, 2019 |
Credit default swap agreements outstanding at December 31, 2019:
| | | | | | | | | | | | | | | | | | | | | | | | |
Reference Entity/ Obligation | | Termination
Date | | | Fixed
Rate | | | Notional
Amount
(000)#(3) | | | Value at
Trade
Date | | | Value at
December 31,
2019 | | | Unrealized
Appreciation
(Depreciation) | |
Centrally Cleared Credit Default Swap Agreement on credit indices—Buy Protection(1): | |
CDX.NA.HY.33.V1 | | | 12/20/24 | | | | 5.000%(Q) | | | | 26,829 | | | $ | (1,775,335 | ) | | $ | (2,630,020 | ) | | $ | (854,685 | ) |
| | | | | | | | | | | | | | | | | | | | | | | | |
The Portfolio entered into credit default swaps (“CDS”) to provide a measure of protection against defaults or to take an active long or short position with respect to the likelihood of a particular issuer’s default or the reference entity’s credit soundness. CDS contracts generally trade based on a spread which represents the cost a protection buyer has to pay the protection seller. The protection buyer is said to be short the credit as the value of the contract rises the more the credit deteriorates. The value of the CDS contract increases for the protection buyer if the spread increases.
| (1) | If the Portfolio is a buyer of protection, it pays the fixed rate. When a credit event occurs, as defined under the terms of that particular swap agreement, the Portfolio will either (i) receive from the seller of protection an amount equal to the notional amount of the swap and make delivery of the referenced obligation or underlying securities comprising the referenced index or (ii) receive a net settlement amount in the form of cash or securities equal to the notional amount of the swap less the recovery value of the referenced obligation or underlying securities comprising the referenced index. |
| (2) | If the Portfolio is a seller of protection, it receives the fixed rate. When a credit event occurs, as defined under the terms of that particular swap agreement, the Portfolio will either (i) pay to the buyer of protection an amount equal to the notional amount of the swap and take delivery of the referenced obligation or underlying securities comprising the referenced index or (ii) pay a net settlement amount in the form of cash or securities equal to the notional amount of the swap less the recovery value of the referenced obligation or underlying securities comprising the referenced index. |
| (3) | Notional amount represents the maximum potential amount the Portfolio could be required to pay as a seller of credit protection or receive as a buyer of credit protection if a credit event occurs as defined under the terms of that particular swap agreement. |
| (4) | Implied credit spreads, represented in absolute terms, utilized in determining the fair value of credit default swap agreements where the Portfolio is the seller of protection as of the reporting date serve as an indicator of the current status of the payment/ performance risk and represent the likelihood of risk of default for the credit derivative. The implied credit spread of a particular referenced entity reflects the cost of buying/selling protection and may includeup-front payments required to be made to enter into the agreement. Wider credit spreads represent a deterioration of the referenced entity’s credit soundness and a greater likelihood of risk of default or other credit event occurring as defined under the terms of the agreement. |
Summary of Collateral for Centrally Cleared/Exchange-traded Derivatives:
Cash and securities segregated as collateral, including pending settlement for closed positions, to cover requirements for centrally cleared/exchange-traded derivatives are listed by broker as follows:
| | | | | | | | |
Broker | | Cash and/or Foreign Currency | | | Securities Market Value | |
Citigroup Global Markets, Inc. | | $ | 1,473,000 | | | $ | — | |
| | | | | | | | |
Fair Value Measurements:
Various inputs are used in determining the value of the Portfolio’s investments. These inputs are summarized in the three broad levels listed below.
| Level 1— | unadjusted quoted prices generally in active markets for identical securities. |
| Level 2— | quoted prices for similar securities, interest rates and yield curves, prepayment speeds, foreign currency exchange rates and other observable inputs. |
| Level 3— | unobservable inputs for securities valued in accordance with Board approved fair valuation procedures. |
The following is a summary of the inputs used as of December 31, 2019 in valuing such portfolio securities:
| | | | | | | | | | | | |
| | | Level 1 | | | Level 2 | | | Level 3 | |
Investments in Securities | | | | | | | | | | | | |
Assets | | | | | | | | | | | | |
Asset-Backed Securities | | | | | | | | | | | | |
Collateralized Loan Obligations | | $ | — | | | $ | 57,340,230 | | | $ | — | |
Bank Loans | | | — | | | | 20,079,618 | | | | 4,999,235 | |
Corporate Bonds | | | — | | | | 418,790,194 | | | | 253 | |
Residential Mortgage-Backed Securities | | | — | | | | 100,415 | | | | — | |
Common Stocks | | | 1,350,036 | | | | 645,000 | | | | 2,433,876 | |
SEE NOTES TO FINANCIAL STATEMENTS.
A144
| | | | | | |
| | |
| | HIGH YIELD BOND PORTFOLIO (continued) | | |
| | | | | | |
| |
| SCHEDULE OF INVESTMENTS | | as of December 31, 2019 |
| | | | | | | | | | | | |
| | | Level 1 | | | Level 2 | | | Level 3 | |
Investments in Securities (continued) | | | | | | | | | | | | |
Assets (continued) | | | | | | | | | | | | |
Preferred Stocks | | $ | 337,369 | | | $ | — | | | $ | 7,762 | |
Warrants | | | — | | | | — | | | | 5,508 | |
Affiliated Mutual Funds | | | 85,297,313 | | | | — | | | | — | |
| | | | | | | | | | | | |
Total | | $ | 86,984,718 | | | $ | 496,955,457 | | | $ | 7,446,634 | |
| | | | | | | | | | | | |
Other Financial Instruments* | | | | | | | | | | | | |
Assets | | | | | | | | | | | | |
Futures Contracts | | $ | 76,477 | | | $ | — | | | $ | — | |
| | | | | | | | | | | | |
Liabilities | | | | | | | | | | | | |
Futures Contracts | | $ | (157,791 | ) | | $ | — | | | $ | — | |
Centrally Cleared Credit Default Swap Agreement | | | — | | | | (854,685 | ) | | | — | |
| | | | | | | | | | | | |
Total | | $ | (157,791 | ) | | $ | (854,685 | ) | | $ | — | |
| | | | | | | | | | | | |
| * | Other financial instruments are derivative instruments not reflected in the Schedule of Investments, such as futures, forwards and centrally cleared swap contracts, which are recorded at the unrealized appreciation (depreciation) on the instrument, and OTC swap contracts which are recorded at fair value. |
The following is a reconciliation of assets in which unobservable inputs (Level 3) were used in determining fair value:
| | | | | | | | | | | | | | | | | | | | |
| | | Bank Loans | | | Corporate Bonds | | | Common Stocks | | | Preferred Stocks | | | Warrants | |
Balance as of 12/31/18 | | $ | 857,500 | | | $ | 1,622,128 | | | $ | 44,888 | | | $ | 10,621 | | | $ | 4,473 | |
Realized gain (loss) | | | 3,288 | | | | — | | | | (80 | ) | | | 2,860 | | | | — | |
Change in unrealized appreciation (depreciation) | | | (161,586 | ) | | | (1,621,875 | ) | | | 1,115,408 | | | | (2,860 | ) | | | 1,035 | |
Purchases/Exchanges/Issuances | | | 2,952,500 | | | | — | | | | 1,273,660 | | | | — | | | | — | |
Sales/Paydowns | | | (333,770 | ) | | | — | | | | — | | | | (2,859 | ) | | | — | |
Accrued discount/premium | | | 6,928 | | | | — | | | | — | | | | — | | | | — | |
Transfers into Level 3 | | | 1,674,375 | | | | — | | | | — | | | | — | | | | — | |
Transfers out of Level 3 | | | — | | | | — | | | | — | | | | — | | | | — | |
| | | | | | | | | | | | | | | | | | | | |
Balance as of 12/31/19 | | $ | 4,999,235 | | | $ | 253 | | | $ | 2,433,876 | | | $ | 7,762 | | | $ | 5,508 | |
| | | | | | | | | | | | | | | | | | | | |
Change in unrealized appreciation (depreciation) relating to securities still held at reporting period end | | $ | (161,586 | ) | | $ | — | | | $ | 1,115,408 | | | $ | (2,860 | ) | | $ | 1,035 | |
| | | | | | | | | | | | | | | | | | | | |
Level 3 securities as presented in the table above are being fair valued using pricing methodologies approved by Board, which contain unobservable inputs as follows:
| | | | | | | | |
Level 3 Securities | | Fair Value as of
December 31, 2019 | | | Valuation
Methodology | | Unobservable Inputs |
Bank Loans | | $ | 4,999,235 | | | Market Approach | | Single Broker Indicative Quote |
Corporate Bonds | | | 253 | | | Formula Pricing | | Estimated Future Distributions |
Common Stocks | | | 32 | | | Formula Pricing | | Estimated EBITDA |
Common Stocks | | | 2,433,844 | | | Market Approach | | Single Broker Indicative Quote |
Preferred Stocks | | | 7,762 | | | Formula Pricing | | Estimated Future Distributions |
Warrants | | | 5,508 | | | Market Approach | | Single Broker Indicative Quote |
| | | | | | | | |
| | $ | 7,446,634 | | | | | |
| | | | | | | | |
| | | | | | | | |
Investments in Securities | | Amount Transferred | | | Level Transfer | | Logic |
Bank Loans | | $ | 1,674,375 | | | L2 to L3 | | Multiple Broker Quotes to Single Broker Indicative Quote |
SEE NOTES TO FINANCIAL STATEMENTS.
A145
| | | | | | |
| | |
| | HIGH YIELD BOND PORTFOLIO (continued) | | |
| | | | | | |
| |
| SCHEDULE OF INVESTMENTS | | as of December 31, 2019 |
Industry Classification:
The industry classification of investments and liabilities in excess of other assets shown as a percentage of net assets as of December 31, 2019 were as follows (unaudited):
| | | | |
Affiliated Mutual Funds (15.7% represents investments purchased with collateral from securities on loan) | | | 16.3 | % |
Collateralized Loan Obligations | | | 11.0 | |
Oil & Gas | | | 9.4 | |
Telecommunications | | | 7.9 | |
Media | | | 5.7 | |
Healthcare-Services | | | 5.0 | |
Retail | | | 5.0 | |
Home Builders | | | 4.9 | |
Chemicals | | | 4.8 | |
Entertainment | | | 3.8 | |
Electric | | | 3.6 | |
Diversified Financial Services | | | 3.2 | |
Aerospace & Defense | | | 2.7 | |
Mining | | | 2.6 | |
Computers | | | 2.5 | |
Auto Parts & Equipment | | | 2.3 | |
Commercial Services | | | 2.3 | |
Pipelines | | | 2.2 | |
Pharmaceuticals | | | 1.9 | |
Foods | | | 1.8 | |
Auto Manufacturers | | | 1.6 | |
Building Materials | | | 1.5 | |
Software | | | 1.2 | |
Real Estate | | | 1.1 | |
Real Estate Investment Trusts (REITs) | | | 1.1 | |
Gas | | | 0.9 | |
Internet | | | 0.8 | |
Engineering & Construction | | | 0.7 | |
Advertising | | | 0.7 | |
| | | | |
Electric Utilities | | | 0.6 | % |
Machinery-Diversified | | | 0.5 | |
Iron/Steel | | | 0.5 | |
Transportation | | | 0.5 | |
Packaging & Containers | | | 0.4 | |
Agriculture | | | 0.4 | |
Miscellaneous Manufacturing | | | 0.4 | |
Distribution/Wholesale | | | 0.2 | |
Lodging | | | 0.2 | |
Banks | | | 0.2 | |
Independent Power & Renewable Electricity Producers | | | 0.2 | |
Metal Fabricate/Hardware | | | 0.1 | |
Housewares | | | 0.1 | |
Energy-Alternate Sources | | | 0.1 | |
Electronics | | | 0.1 | |
Toys/Games/Hobbies | | | 0.1 | |
Capital Markets | | | 0.1 | |
Oil & Gas Services | | | 0.1 | |
Household Products/Wares | | | 0.0 | * |
Residential Mortgage-Backed Securities | | | 0.0 | * |
Oil, Gas & Consumable Fuels | | | 0.0 | * |
Construction Materials | | | 0.0 | * |
| | | | |
| | | 113.3 | |
Liabilities in excess of other assets | | | (13.3 | ) |
| | | | |
| | | 100.0 | % |
| | | | |
Effects of Derivative Instruments on the Financial Statements and Primary Underlying Risk Exposure:
The Portfolio invested in derivative instruments during the reporting period. The primary types of risk associated with these derivative instruments are credit contracts risk, equity contracts risk and interest rate contracts risk. See the Notes to Financial Statements for additional detail regarding these derivative instruments and their risks. The effect of such derivative instruments on the Portfolio’s financial position and financial performance as reflected in the Statement of Assets and Liabilities and Statement of Operations is presented in the summary below.
Fair values of derivative instruments as of December 31, 2019 as presented in the Statement of Assets and Liabilities:
| | | | | | | | | | | | |
Derivatives not accounted for as hedging instruments, carried at fair value | | Asset Derivatives | | | Liability Derivatives | |
| | Statement of
Assets and
Liabilities Location | | Fair
Value | | | Statement of
Assets and
Liabilities Location | | Fair Value | |
Credit contracts | | — | | $ | — | | | Due from/to broker-variation margin swaps | | $ | 854,685 | |
Equity contracts | | Unaffiliated investments | | | 5,508 | | | — | | | — | |
Interest rate contracts | | Due from/to broker-variation margin futures | | | 76,477 | * | | Due from/to broker-variation margin futures | | | 157,791 | * |
| | | | | | | | | | | | |
| | | | $ | 81,985 | | | | | $ | 1,012,476 | |
| | | | | | | | | | | | |
| * | Includes cumulative appreciation (depreciation) as reported in the schedule of open futures and centrally cleared swap contracts. Only unsettled variation margin receivable (payable) is reported within the Statement of Assets and Liabilities. |
SEE NOTES TO FINANCIAL STATEMENTS.
A146
| | | | | | |
| | |
| | HIGH YIELD BOND PORTFOLIO (continued) | | |
| | | | | | |
| |
| SCHEDULE OF INVESTMENTS | | as of December 31, 2019 |
The effects of derivative instruments on the Statement of Operations for the year ended December 31, 2019 are as follows:
| | | | | | | | |
Amount of Realized Gain (Loss) on Derivatives Recognized in Income | |
Derivatives not accounted for as hedging
instruments, carried at fair value | | Futures | | | Swaps | |
Credit contracts | | $ | — | | | $ | (22,273 | ) |
Interest rate contracts | | | 248,518 | | | | — | |
| | | | | | | | |
Total | | $ | 248,518 | | | $ | (22,273 | ) |
| | | | | | | | |
| | | | | | | | | | | | |
Change in Unrealized Appreciation (Depreciation) on Derivatives Recognized in Income | |
Derivatives not accounted for as hedging
instruments, carried at fair value | | Warrants(2) | | | Futures | | | Swaps | |
Credit contracts | | $ | — | | | $ | — | | | $ | (854,685 | ) |
Equity contracts | | | 1,035 | | | | — | | | | — | |
Interest rate contracts | | | — | | | | (573,856 | ) | | | — | |
| | | | | | | | | | | | |
Total | | $ | 1,035 | | | $ | (573,856 | ) | | $ | (854,685 | ) |
| | | | | | | | | | | | |
| (2) | Included in net change in unrealized appreciation (depreciation) on investments in the Statement of Operations. |
For the year ended December 31, 2019, the Portfolio’s average volume of derivative activities is as follows:
| | |
Futures
Contracts—
Long
Positions(1) | | Futures
Contracts—
Short
Positions(1) |
| $43,426,144 | | $2,234,419 |
|
Credit Default
Swap Agreements—
Buy Protection(1) |
| $14,785,800 |
| (1) | Notional Amount in USD. |
Financial Instruments/Transactions—Summary of Offsetting and Netting Arrangements:
The Portfolio entered into financial instruments/transactions during the reporting period that are either offset in accordance with current requirements or are subject to enforceable master netting arrangements or similar agreements that permit offsetting. The information about offsetting and related netting arrangements for financial instruments/transactions where the legal right toset-off exists is presented in the summary below.
Offsetting of financial instrument/transaction assets and liabilities:
| | | | | | | | | | | | |
Description | | Gross Market
Value of
Recognized
Assets/(Liabilities) | | | Collateral
Pledged/(Received)(1) | | | Net
Amount | |
Securities on Loan | | $ | 80,243,907 | | | $ | (80,243,907 | ) | | $ | — | |
| | | | | | | | | | | | |
| (1) | Collateral amount disclosed by the Portfolio is limited to the market value of financial instruments/transactions. |
SEE NOTES TO FINANCIAL STATEMENTS.
A147
| | | | | | |
| | |
| | HIGH YIELD BOND PORTFOLIO (continued) | | |
STATEMENT OF ASSETS AND LIABILITIES
as of December 31, 2019
| | | | |
| ASSETS | | | | |
Investments at value, including securities on loan of $80,243,907: | | | | |
Unaffiliated investments (cost $494,985,938) | | $ | 506,089,496 | |
Affiliated investments (cost $85,278,600) | | | 85,297,313 | |
Cash | | | 25,894 | |
Dividends and interest receivable | | | 7,839,797 | |
Receivable for investments sold | | | 3,783,342 | |
Deposit with broker for centrally cleared/exchange-traded derivatives | | | 1,473,000 | |
Receivable for Portfolio shares sold | | | 20,871 | |
Due from broker-variation margin swaps | | | 12,894 | |
Due from broker-variation margin futures | | | 6,337 | |
Tax reclaim receivable | | | 4,036 | |
Prepaid expenses and other assets | | | 94,469 | |
| | | | |
Total Assets | | | 604,647,449 | |
| | | | |
| LIABILITIES | | | | |
Payable to broker for collateral for securities on loan | | | 82,162,638 | |
Accrued expenses and other liabilities | | | 241,171 | |
Management fee payable | | | 200,947 | |
Payable for Portfolio shares repurchased | | | 35,990 | |
Payable to affiliate | | | 4,036 | |
Affiliated transfer agent fee payable | | | 980 | |
| | | | |
Total Liabilities | | | 82,645,762 | |
| | | | |
| NET ASSETS | | $ | 522,001,687 | |
| | | | |
Net assets were comprised of: | | | | |
Partners’ Equity | | $ | 522,001,687 | |
| | | | |
Net asset value and redemption price per share, $522,001,687 / 90,512,902 outstanding shares of beneficial interest | | $ | 5.77 | |
| | | | |
STATEMENT OF OPERATIONS
Year Ended December 31, 2019
| | | | |
| NET INVESTMENT INCOME (LOSS) INCOME | | | | |
Interest income | | $ | 34,106,302 | |
Income from securities lending, net (including affiliated income of $266,368) | | | 290,409 | |
Affiliated dividend income | | | 231,218 | |
Unaffiliated dividend income (net of $1,329 foreign withholding tax, of which $94 is reimbursable by an affiliate) | | | 47,917 | |
| | | | |
Total income | | | 34,675,846 | |
| | | | |
| EXPENSES | | | | |
Management fee | | | 2,785,830 | |
Shareholders’ reports | | | 145,154 | |
Custodian and accounting fees | | | 115,638 | |
Audit fee | | | 44,300 | |
Trustees’ fees | | | 15,641 | |
Legal fees and expenses | | | 13,716 | |
Transfer agent’s fees and expenses (including affiliated expense of $5,882) | | | 10,682 | |
Miscellaneous | | | 25,714 | |
| | | | |
Total expenses | | | 3,156,675 | |
Less: Fee waiver and/or expense reimbursement | | | (269,526 | ) |
| | | | |
Net expenses | | | 2,887,149 | |
| | | | |
| NET INVESTMENT INCOME (LOSS) | | | 31,788,697 | |
| | | | |
| REALIZED AND UNREALIZED GAIN (LOSS) ON INVESTMENT AND FOREIGN CURRENCY TRANSACTIONS | | | | |
Net realized gain (loss) on: | | | | |
Investment transactions (including affiliated of $2,837) | | | 7,812,186 | |
Futures transactions | | | 248,518 | |
Swap agreements transactions | | | (22,273 | ) |
Foreign currency transactions | | | (1,461 | ) |
| | | | |
| | | 8,036,970 | |
| | | | |
Net change in unrealized appreciation (depreciation) on: | | | | |
Investments (including affiliated of $22,944) | | | 37,302,511 | |
Futures | | | (573,856 | ) |
Swap agreements | | | (854,685 | ) |
Foreign currencies | | | 570 | |
| | | | |
| | | 35,874,540 | |
| | | | |
| NET GAIN (LOSS) ON INVESTMENT AND FOREIGN CURRENCY TRANSACTIONS | | | 43,911,510 | |
| | | | |
| NET INCREASE (DECREASE) IN NET ASSETS RESULTING FROM OPERATIONS | | $ | 75,700,207 | |
| | | | |
STATEMENTS OF CHANGES IN NET ASSETS
| | | | | | | | |
| | | Year Ended
December 31, 2019 | | | Year Ended
December 31, 2018 | |
| INCREASE (DECREASE) IN NET ASSETS | | | | | | | | |
| OPERATIONS | | | | | | | | |
Net investment income (loss) | | $ | 31,788,697 | | | $ | 32,464,769 | |
Net realized gain (loss) on investment and foreign currency transactions | | | 8,036,970 | | | | 4,147,138 | |
Net change in unrealized appreciation (depreciation) on investments and foreign currencies | | | 35,874,540 | | | | (42,748,253 | ) |
| | | | | | | | |
NET INCREASE (DECREASE) IN NET ASSETS RESULTING FROM OPERATIONS | | | 75,700,207 | | | | (6,136,346 | ) |
| | | | | | | | |
| DISTRIBUTIONS | | | — | | | | (14,221,775 | ) |
| | | | | | | | |
| PORTFOLIO SHARE TRANSACTIONS | | | | | | | | |
Portfolio shares sold [2,682,266 and 4,306,490 shares, respectively] | | | 14,608,943 | | | | 21,980,492 | |
Portfolio shares issued in reinvestment of distributions [0 and 2,833,023 shares, respectively] | | | — | | | | 14,221,775 | |
Portfolio shares repurchased [7,713,371 and 9,834,319 shares, respectively] | | | (41,998,343 | ) | | | (50,202,169 | ) |
| | | | | | | | |
NET INCREASE (DECREASE) IN NET ASSETS FROM PORTFOLIO SHARE TRANSACTIONS | | | (27,389,400 | ) | | | (13,999,902 | ) |
| | | | | | | | |
| CAPITAL CONTRIBUTIONS | | | — | | | | 2,830 | |
| | | | | | | | |
| TOTAL INCREASE (DECREASE) | | | 48,310,807 | | | | (34,355,193 | ) |
| NET ASSETS: | | | | | | | | |
Beginning of year | | | 473,690,880 | | | | 508,046,073 | |
| | | | | | | | |
End of year | | $ | 522,001,687 | | | $ | 473,690,880 | |
| | | | | | | | |
SEE NOTES TO FINANCIAL STATEMENTS.
A148
| | | | | | |
| |
| SCHEDULE OF INVESTMENTS | | as of December 31, 2019 |
| | | | | | | | |
| LONG-TERM INVESTMENTS — 99.1% | |
| COMMON STOCKS | | Shares | | | Value | |
Aerospace & Defense — 4.1% | | | | | | | | |
Airbus SE (France) | | | 178,908 | | | $ | 26,226,615 | |
Boeing Co. (The) | | | 122,114 | | | | 39,779,856 | |
Safran SA (France) | | | 182,547 | | | | 28,221,025 | |
| | | | | | | | |
| | | | | | | 94,227,496 | |
| | | | | | | | |
Automobiles — 2.0% | | | | | | | | |
Tesla, Inc.*(a) | | | 111,094 | | | | 46,473,953 | |
| | | | | | | | |
Banks — 1.0% | | | | | | | | |
JPMorgan Chase & Co. | | | 167,269 | | | | 23,317,299 | |
| | | | | | | | |
Beverages — 0.5% | | | | | | | | |
Constellation Brands, Inc. (Class A Stock) | | | 62,482 | | | | 11,855,959 | |
| | | | | | | | |
Biotechnology — 1.9% | | | | | | | | |
BioMarin Pharmaceutical, Inc.* | | | 147,792 | | | | 12,495,814 | |
Exact Sciences Corp.* | | | 104,490 | | | | 9,663,235 | |
Vertex Pharmaceuticals, Inc.* | | | 101,590 | | | | 22,243,130 | |
| | | | | | | | |
| | | | | | | 44,402,179 | |
| | | | | | | | |
Capital Markets — 1.2% | | | | | | | | |
S&P Global, Inc. | | | 97,674 | | | | 26,669,886 | |
| | | | | | | | |
Entertainment — 4.5% | | | | | | | | |
Netflix, Inc.* | | | 206,621 | | | | 66,856,357 | |
Walt Disney Co. (The) | | | 256,512 | | | | 37,099,331 | |
| | | | | | | | |
| | | | | | | 103,955,688 | |
| | | | | | | | |
Food & Staples Retailing — 1.9% | | | | | | | | |
Costco Wholesale Corp. | | | 148,628 | | | | 43,684,742 | |
| | | | | | | | |
Health Care Equipment & Supplies — 4.5% | |
Boston Scientific Corp.* | | | 256,587 | | | | 11,602,864 | |
Danaher Corp. | | | 139,800 | | | | 21,456,504 | |
DexCom, Inc.* | | | 74,974 | | | | 16,399,813 | |
Edwards Lifesciences Corp.* | | | 95,217 | | | | 22,213,174 | |
Intuitive Surgical, Inc.* | | | 52,815 | | | | 31,221,587 | |
| | | | | | | | |
| | | | | | | 102,893,942 | |
| | | | | | | | |
Health Care Providers & Services — 0.3% | |
Guardant Health, Inc.*(a) | | | 93,594 | | | | 7,313,435 | |
| | | | | | | | |
Hotels, Restaurants & Leisure — 2.1% | |
Chipotle Mexican Grill, Inc.* | | | 30,454 | | | | 25,493,348 | |
Marriott International, Inc. (Class A Stock) | | | 156,091 | | | | 23,636,860 | |
| | | | | | | | |
| | | | | | | 49,130,208 | |
| | | | | | | | |
Interactive Media & Services — 9.0% | |
Alphabet, Inc. (Class A Stock)* | | | 52,200 | | | | 69,916,158 | |
Alphabet, Inc. (Class C Stock)* | | | 52,192 | | | | 69,781,748 | |
Facebook, Inc. (Class A Stock)* | | | 335,490 | | | | 68,859,322 | |
| | | | | | | | |
| | | | | | | 208,557,228 | |
| | | | | | | | |
Internet & Direct Marketing Retail — 9.1% | |
Alibaba Group Holding Ltd. (China), ADR* | | | 388,861 | | | | 82,477,418 | |
Amazon.com, Inc.* | | | 68,599 | | | | 126,759,976 | |
| | | | | | | | |
| | | | | | | 209,237,394 | |
| | | | | | | | |
| | | | | | | | |
COMMON STOCKS
(continued) | | Shares | | | Value | |
IT Services — 13.2% | | | | | | | | |
Adyen NV (Netherlands), 144A* | | | 36,004 | | | $ | 29,540,638 | |
FleetCor Technologies, Inc.* | | | 136,360 | | | | 39,233,499 | |
Mastercard, Inc. (Class A Stock) | | | 308,789 | | | | 92,201,308 | |
PayPal Holdings, Inc.* | | | 207,503 | | | | 22,445,600 | |
Shopify, Inc. (Canada) (Class A Stock)*(a) | | | 60,441 | | | | 24,030,133 | |
Square, Inc. (Class A Stock)* | | | 169,102 | | | | 10,579,021 | |
Twilio, Inc. (Class A Stock)*(a) | | | 109,066 | | | | 10,719,006 | |
Visa, Inc. (Class A Stock)(a) | | | 405,649 | | | | 76,221,447 | |
| | | | | | | | |
| | | | | | | 304,970,652 | |
| | | | | | | | |
Leisure Products — 0.2% | | | | | | | | |
Peloton Interactive, Inc.
(Class A Stock)*(a) | | | 168,660 | | | | 4,789,944 | |
| | | | | | | | |
Life Sciences Tools & Services — 1.4% | |
Illumina, Inc.* | | | 99,285 | | | | 32,936,806 | |
| | | | | | | | |
Personal Products — 1.6% | |
Estee Lauder Cos., Inc. (The)
(Class A Stock) | | | 181,089 | | | | 37,402,122 | |
| | | | | | | | |
Pharmaceuticals — 3.0% | |
AstraZeneca PLC (United Kingdom), ADR | | | 924,234 | | | | 46,082,307 | |
Eli Lilly & Co. | | | 123,071 | | | | 16,175,222 | |
Novartis AG (Switzerland), ADR | | | 72,222 | | | | 6,838,701 | |
| | | | | | | | |
| | | | | | | 69,096,230 | |
| | | | | | | | |
Road & Rail — 1.6% | |
Uber Technologies, Inc.* | | | 382,023 | | | | 11,361,364 | |
Union Pacific Corp. | | | 144,044 | | | | 26,041,715 | |
| | | | | | | | |
| | | | | | | 37,403,079 | |
| | | | | | | | |
Semiconductors & Semiconductor Equipment — 6.1% | |
Broadcom, Inc. | | | 91,324 | | | | 28,860,211 | |
NVIDIA Corp. | | | 247,984 | | | | 58,350,635 | |
QUALCOMM, Inc. | | | 368,319 | | | | 32,496,785 | |
Universal Display Corp. | | | 30,287 | | | | 6,241,242 | |
Xilinx, Inc. | | | 151,753 | | | | 14,836,891 | |
| | | | | | | | |
| | | | | | | 140,785,764 | |
| | | | | | | | |
Software — 16.1% | |
Adobe, Inc.* | | | 220,972 | | | | 72,878,775 | |
Coupa Software, Inc.*(a) | | | 95,602 | | | | 13,981,792 | |
Microsoft Corp. | | | 760,970 | | | | 120,004,969 | |
salesforce.com, Inc.* | | | 545,267 | | | | 88,682,225 | |
ServiceNow, Inc.*(a) | | | 88,848 | | | | 25,083,567 | |
Splunk, Inc.*(a) | | | 206,927 | | | | 30,991,457 | |
Workday, Inc. (Class A Stock)* | | | 126,637 | | | | 20,825,455 | |
| | | | | | | | |
| | | | | | | 372,448,240 | |
| | | | | | | | |
Specialty Retail — 1.2% | |
Home Depot, Inc. (The) | | | 123,971 | | | | 27,072,787 | |
| | | | | | | | |
Technology Hardware, Storage & Peripherals — 5.1% | |
Apple, Inc. | | | 396,245 | | | | 116,357,344 | |
| | | | | | | | |
Textiles, Apparel & Luxury Goods — 7.5% | |
adidas AG (Germany) | | | 92,820 | | | | 30,316,758 | |
Kering SA (France) | | | 71,129 | | | | 46,732,102 | |
Lululemon Athletica, Inc.* | | | 192,124 | | | | 44,509,367 | |
SEE NOTES TO FINANCIAL STATEMENTS.
A149
| | | | | | |
| | |
| | JENNISON PORTFOLIO (continued) | | |
| | | | | | |
| |
| SCHEDULE OF INVESTMENTS | | as of December 31, 2019 |
| | | | | | | | |
COMMON STOCKS
(continued) | | Shares | | | Value | |
Textiles, Apparel & Luxury Goods (continued) | | | | | |
NIKE, Inc. (Class B Stock) | | | 509,005 | | | $ | 51,567,297 | |
| | | | | | | | |
| | | | | | | 173,125,524 | |
| | | | | | | | |
TOTAL LONG-TERM INVESTMENTS
(cost $1,046,316,482) | | | | 2,288,107,901 | |
| | | | | | | | |
| |
| SHORT-TERM INVESTMENTS — 8.9% | | | | | |
AFFILIATED MUTUAL FUNDS | | | | | | | | |
PGIM Core Ultra Short Bond
Fund(w) | | | 5,324,539 | | | | 5,324,539 | |
PGIM Institutional Money Market Fund (cost $199,497,230; includes $199,193,548 of cash collateral for securities
on loan)(b)(w) | | | 199,501,408 | | | | 199,541,309 | |
| | | | | | | | |
TOTAL SHORT-TERM INVESTMENTS
(cost $204,821,769) | | | | 204,865,848 | |
| | | | | | | | |
TOTAL INVESTMENTS — 108.0%
(cost $1,251,138,251) | | | | 2,492,973,749 | |
Liabilities in excess of other assets — (8.0)% | | | | (185,157,136 | ) |
| | | | | | | | |
NET ASSETS — 100.0% | | | $ | 2,307,816,613 | |
| | | | | | | | |
See the Glossary for a list of the abbreviation(s) used in the annual report.
| * | Non-income producing security. |
| (a) | All or a portion of security is on loan. The aggregate market value of such securities, including those sold and pending settlement, is $195,789,722; cash collateral of $199,193,548 (included in liabilities) was received with which the Portfolio purchased highly liquid short-term investments. |
| (b) | Represents security purchased with cash collateral received for securities on loan and includes dividend reinvestment. |
| (w) | PGIM Investments LLC, the manager of the Portfolio, also serves as manager of the PGIM Core Ultra Short Bond Fund and PGIM Institutional Money Market Fund. |
Fair Value Measurements:
Various inputs are used in determining the value of the Portfolio’s investments. These inputs are summarized in the three broad levels listed below.
| Level 1— | unadjusted quoted prices generally in active markets for identical securities. |
| Level 2— | quoted prices for similar securities, interest rates and yield curves, prepayment speeds, foreign currency exchange rates and other observable inputs. |
| Level 3— | unobservable inputs for securities valued in accordance with Board approved fair valuation procedures. |
The following is a summary of the inputs used as of December 31, 2019 in valuing such portfolio securities:
| | | | | | | | | | | | |
| | | Level 1 | | | Level 2 | | | Level 3 | |
Investments in Securities | | | | | | | | | | | | |
Assets | | | | | | | | | | | | |
Common Stocks | | | | | | | | | | | | |
Aerospace & Defense | | $ | 39,779,856 | | | $ | 54,447,640 | | | $ | — | |
Automobiles | | | 46,473,953 | | | | — | | | | — | |
Banks | | | 23,317,299 | | | | — | | | | — | |
Beverages | | | 11,855,959 | | | | — | | | | — | |
Biotechnology | | | 44,402,179 | | | | — | | | | — | |
Capital Markets | | | 26,669,886 | | | | — | | | | — | |
Entertainment | | | 103,955,688 | | | | — | | | | — | |
Food & Staples Retailing | | | 43,684,742 | | | | — | | | | — | |
Health Care Equipment & Supplies | | | 102,893,942 | | | | — | | | | — | |
Health Care Providers & Services | | | 7,313,435 | | | | — | | | | — | |
Hotels, Restaurants & Leisure | | | 49,130,208 | | | | — | | | | — | |
Interactive Media & Services | | | 208,557,228 | | | | — | | | | — | |
Internet & Direct Marketing Retail | | | 209,237,394 | | | | — | | | | — | |
IT Services | | | 275,430,014 | | | | 29,540,638 | | | | — | |
Leisure Products | | | 4,789,944 | | | | — | | | | — | |
Life Sciences Tools & Services | | | 32,936,806 | | | | — | | | | — | |
Personal Products | | | 37,402,122 | | | | — | | | | — | |
Pharmaceuticals | | | 69,096,230 | | | | — | | | | — | |
Road & Rail | | | 37,403,079 | | | | — | | | | — | |
Semiconductors & Semiconductor Equipment | | | 140,785,764 | | | | — | | | | — | |
Software | | | 372,448,240 | | | | — | | | | — | |
SEE NOTES TO FINANCIAL STATEMENTS.
A150
| | | | | | |
| | |
| | JENNISON PORTFOLIO (continued) | | |
| | | | | | |
| |
| SCHEDULE OF INVESTMENTS | | as of December 31, 2019 |
| | | | | | | | | | | | |
| | | Level 1 | | | Level 2 | | | Level 3 | |
Investments in Securities (continued) | | | | | | | | | | | | |
Assets (continued) | | | | | | | | | | | | |
Common Stocks (continued) | | | | | | | | | | | | |
Specialty Retail | | $ | 27,072,787 | | | $ | — | | | $ | — | |
Technology Hardware, Storage & Peripherals | | | 116,357,344 | | | | — | | | | — | |
Textiles, Apparel & Luxury Goods | | | 96,076,664 | | | | 77,048,860 | | | | — | |
Affiliated Mutual Funds | | | 204,865,848 | | | | — | | | | — | |
| | | | | | | | | | | | |
Total | | $ | 2,331,936,611 | | | $ | 161,037,138 | | | $ | — | |
| | | | | | | | | | | | |
Industry Classification:
The industry classification of investments and liabilities in excess of other assets shown as a percentage of net assets as of December 31, 2019 were as follows (unaudited):
| | | | |
Software | | | 16.1 | % |
IT Services | | | 13.2 | |
Internet & Direct Marketing Retail | | | 9.1 | |
Interactive Media & Services | | | 9.0 | |
Affiliated Mutual Funds (8.6% represents investments purchased with collateral from securities on loan) | | | 8.9 | |
Textiles, Apparel & Luxury Goods | | | 7.5 | |
Semiconductors & Semiconductor Equipment | | | 6.1 | |
Technology Hardware, Storage & Peripherals | | | 5.1 | |
Entertainment | | | 4.5 | |
Health Care Equipment & Supplies | | | 4.5 | |
Aerospace & Defense | | | 4.1 | |
Pharmaceuticals | | | 3.0 | |
Hotels, Restaurants & Leisure | | | 2.1 | |
Automobiles | | | 2.0 | |
Biotechnology | | | 1.9 | |
| | | | |
Food & Staples Retailing | | | 1.9 | % |
Road & Rail | | | 1.6 | |
Personal Products | | | 1.6 | |
Life Sciences Tools & Services | | | 1.4 | |
Specialty Retail | | | 1.2 | |
Capital Markets | | | 1.2 | |
Banks | | | 1.0 | |
Beverages | | | 0.5 | |
Health Care Providers & Services | | | 0.3 | |
Leisure Products | | | 0.2 | |
| | | | |
| | | 108.0 | |
Liabilities in excess of other assets | | | (8.0 | ) |
| | | | �� |
| | | 100.0 | % |
| | | | |
Financial Instruments/Transactions — Summary of Offsetting and Netting Arrangements:
The Portfolio entered into financial instruments/transactions during the reporting period that are either offset in accordance with current requirements or are subject to enforceable master netting arrangements or similar agreements that permit offsetting. The information about offsetting and related netting arrangements for financial instruments/transactions where the legal right toset-off exists is presented in the summary below.
Offsetting of financial instrument/transaction assets and liabilities:
| | | | | | | | | | | | |
Description | | Gross Market
Value of
Recognized
Assets/(Liabilities) | | | Collateral
Pledged/(Received)(1) | | | Net
Amount | |
Securities on Loan | | $ | 195,789,722 | | | $ | (195,789,722 | ) | | $ | — | |
| | | | | | | | | | | | |
| (1) | Collateral amount disclosed by the Portfolio is limited to the market value of financial instruments/transactions. |
SEE NOTES TO FINANCIAL STATEMENTS.
A151
| | | | | | |
| | |
| | JENNISON PORTFOLIO (continued) | | |
STATEMENT OF ASSETS AND LIABILITIES
as of December 31, 2019
| | | | |
| ASSETS | | | | |
Investments at value, including securities on loan of $195,789,722: | | | | |
Unaffiliated investments (cost $1,046,316,482) | | $ | 2,288,107,901 | |
Affiliated investments (cost $204,821,769) | | | 204,865,848 | |
Receivable for investments sold | | | 26,656,001 | |
Dividends receivable | | | 417,164 | |
Tax reclaim receivable | | | 296,580 | |
Receivable for Portfolio shares sold | | | 132,852 | |
Prepaid expenses | | | 15,178 | |
| | | | |
Total Assets | | | 2,520,491,524 | |
| | | | |
| LIABILITIES | | | | |
Payable to broker for collateral for securities on loan | | | 199,193,548 | |
Payable for investments purchased | | | 11,236,710 | |
Management fee payable | | | 1,158,737 | |
Payable for Portfolio shares repurchased | | | 497,820 | |
Accrued expenses and other liabilities | | | 436,041 | |
Payable to affiliate | | | 128,722 | |
Distribution fee payable | | | 13,907 | |
Administration fee payable | | | 8,446 | |
Affiliated transfer agent fee payable | | | 980 | |
| | | | |
Total Liabilities | | | 212,674,911 | |
| | | | |
| NET ASSETS | | $ | 2,307,816,613 | |
| | | | |
Net assets were comprised of: | | | | |
Partners’ Equity | | $ | 2,307,816,613 | |
| | | | |
| Class I: | | | | |
Net asset value and redemption price per share, $2,241,509,346 / 27,463,915 outstanding shares of beneficial interest | | $ | 81.62 | |
| | | | |
| Class II: | | | | |
Net asset value and redemption price per share, $66,307,267 / 850,798 outstanding shares of beneficial interest | | $ | 77.94 | |
| | | | |
STATEMENT OF OPERATIONS
Year Ended December 31, 2019
| | | | |
| NET INVESTMENT INCOME (LOSS) | | | | |
| INCOME | | | | |
Unaffiliated dividend income (net of $191,199 foreign withholding tax) | | $ | 15,310,095 | |
Income from securities lending, net (including affiliated income of $406,759) | | | 525,069 | |
Affiliated dividend income | | | 219,406 | |
| | | | |
Total income | | | 16,054,570 | |
| | | | |
| EXPENSES | | | | |
Management fee | | | 12,821,153 | |
Distribution fee—Class II | | | 160,531 | |
Administration fee—Class II | | | 96,319 | |
Custodian and accounting fees | | | 191,713 | |
Shareholders’ reports | | | 170,453 | |
Trustees’ fees | | | 33,199 | |
Audit fee | | | 28,600 | |
Legal fees and expenses | | | 18,982 | |
Transfer agent’s fees and expenses (including affiliated expense of $5,882) | | | 10,680 | |
Miscellaneous | | | 48,581 | |
| | | | |
Total expenses | | | 13,580,211 | |
| | | | |
| NET INVESTMENT INCOME (LOSS) | | | 2,474,359 | |
| | | | |
| REALIZED AND UNREALIZED GAIN (LOSS) ON INVESTMENT AND FOREIGN CURRENCY TRANSACTIONS | | | | |
Net realized gain (loss) on: | | | | |
Investment transactions (including affiliated of $(15,672)) | | | 202,743,653 | |
Foreign currency transactions | | | (70,949 | ) |
| | | | |
| | | 202,672,704 | |
| | | | |
Net change in unrealized appreciation (depreciation) on: | | | | |
Investments (including affiliated of $43,735) | | | 396,792,225 | |
Foreign currencies | | | (664 | ) |
| | | | |
| | | 396,791,561 | |
| | | | |
| NET GAIN (LOSS) ON INVESTMENT AND FOREIGN CURRENCY TRANSACTIONS | | | 599,464,265 | |
| | | | |
| NET INCREASE (DECREASE) IN NET ASSETS RESULTING FROM OPERATIONS | | $ | 601,938,624 | |
| | | | |
STATEMENTS OF CHANGES IN NET ASSETS
| | | | | | | | |
| | | Year Ended
December 31, 2019 | | | Year Ended
December 31, 2018 | |
| INCREASE (DECREASE) IN NET ASSETS | | | | | | | | |
| OPERATIONS | | | | | | | | |
Net investment income (loss) | | $ | 2,474,359 | | | $ | 3,698,910 | |
Net realized gain (loss) on investment and foreign currency transactions | | | 202,672,704 | | | | 149,826,255 | |
Net change in unrealized appreciation (depreciation) on investments and foreign currencies | | | 396,791,561 | | | | (158,047,281 | ) |
| | | | | | | | |
NET INCREASE (DECREASE) IN NET ASSETS RESULTING FROM OPERATIONS | | | 601,938,624 | | | | (4,522,116 | ) |
| | | | | | | | |
| PORTFOLIO SHARE TRANSACTIONS | | | | | | | | |
Portfolio shares sold | | | 23,869,409 | | | | 46,087,602 | |
Portfolio shares repurchased | | | (182,369,022 | ) | | | (174,423,180 | ) |
| | | | | | | | |
NET INCREASE (DECREASE) IN NET ASSETS FROM PORTFOLIO SHARE TRANSACTIONS | | | (158,499,613 | ) | | | (128,335,578 | ) |
| | | | | | | | |
| CAPITAL CONTRIBUTIONS | | | 8,215 | | | | 142,910 | |
| | | | | | | | |
| TOTAL INCREASE (DECREASE) | | | 443,447,226 | | | | (132,714,784 | ) |
| NET ASSETS: | | | | | | | | |
Beginning of year | | | 1,864,369,387 | | | | 1,997,084,171 | |
| | | | | | | | |
End of year | | $ | 2,307,816,613 | | | $ | 1,864,369,387 | |
| | | | | | | | |
SEE NOTES TO FINANCIAL STATEMENTS.
A152
| | | | | | |
| | |
| | NATURAL RESOURCES PORTFOLIO | | |
| | | | | | |
| |
| SCHEDULE OF INVESTMENTS | | as of December 31, 2019 |
| | | | | | | | |
| LONG-TERM INVESTMENTS — 98.5% | | | | |
| COMMON STOCKS — 95.3% | | Shares | | | Value | |
Commodity Chemicals — 2.7% | | | | | | | | |
Dow, Inc. | | | 95,220 | | | $ | 5,211,390 | |
LyondellBasell Industries NV (Class A Stock) | | | 54,945 | | | | 5,191,204 | |
| | | | | | | | |
| | | | | | | 10,402,594 | |
| | | | | | | | |
Construction Materials — 2.1% | | | | | | | | |
CRH PLC (Ireland) | | | 62,150 | | | | 2,507,622 | |
Taiheiyo Cement Corp. (Japan) | | | 74,300 | | | | 2,179,982 | |
Vulcan Materials Co. | | | 24,290 | | | | 3,497,517 | |
| | | | | | | | |
| | | | | | | 8,185,121 | |
| | | | | | | | |
Copper — 4.5% | | | | | | | | |
Antofagasta PLC (Chile) | | | 114,730 | | | | 1,402,069 | |
First Quantum Minerals Ltd. (Zambia) | | | 541,990 | | | | 5,496,907 | |
Freeport-McMoRan, Inc. | | | 361,155 | | | | 4,738,354 | |
Lundin Mining Corp. (Chile) | | | 681,007 | | | | 4,069,627 | |
Southern Copper Corp. (Peru) | | | 31,830 | | | | 1,352,138 | |
| | | | | | | | |
| | | | | | | 17,059,095 | |
| | | | | | | | |
Diversified Metals & Mining — 7.9% | | | | | | | | |
BHP Group Ltd. (Australia) | | | 518,396 | | | | 14,179,797 | |
Rio Tinto PLC (Australia) | | | 173,531 | | | | 10,385,954 | |
Sumitomo Metal Mining Co. Ltd. (Japan) | | | 76,200 | | | | 2,463,531 | |
Teck Resources Ltd. (Canada), (Class B Stock) | | | 185,471 | | | | 3,216,516 | |
| | | | | | | | |
| | | | | | | 30,245,798 | |
| | | | | | | | |
Electric Utilities — 0.8% | | | | | | | | |
Orsted A/S (Denmark), 144A | | | 30,323 | | | | 3,139,268 | |
| | | | | | | | |
Electrical Components & Equipment — 1.5% | | | | | |
AMETEK, Inc. | | | 24,440 | | | | 2,437,646 | |
Eaton Corp. PLC | | | 24,090 | | | | 2,281,805 | |
Sunrun, Inc.* | | | 79,830 | | | | 1,102,452 | |
| | | | | | | | |
| | | | | | | 5,821,903 | |
| | | | | | | | |
Electronic Components — 0.5% | | | | | | | | |
Samsung SDI Co. Ltd. (South Korea)* | | | 9,110 | | | | 1,852,824 | |
| | | | | | | | |
Electronic Equipment & Instruments — 0.5% | | | | | |
Itron, Inc.* | | | 21,385 | | | | 1,795,271 | |
| | | | | | | | |
Fertilizers & Agricultural Chemicals — 2.1% | | | | | |
FMC Corp. | | | 46,130 | | | | 4,604,697 | |
Nutrien Ltd. (Canada) | | | 47,672 | | | | 2,282,367 | |
Sociedad Quimica y Minera de Chile SA (Chile), ADR(a) | | | 48,245 | | | | 1,287,659 | |
| | | | | | | | |
| | | | | | | 8,174,723 | |
| | | | | | | | |
Industrial Gases — 6.9% | | | | | | | | |
Air Liquide SA (France) | | | 43,807 | | | | 6,208,000 | |
Air Products & Chemicals, Inc. | | | 35,865 | | | | 8,427,916 | |
Linde PLC (United Kingdom) | | | 54,260 | | | | 11,551,954 | |
| | | | | | | | |
| | | | | | | 26,187,870 | |
| | | | | | | | |
Industrial Machinery — 1.1% | | | | | | | | |
Chart Industries, Inc.* | | | 38,080 | | | | 2,570,019 | |
| | | | | | | | |
COMMON STOCKS
(continued) | | Shares | | | Value | |
Industrial Machinery (continued) | | | | | | | | |
SMC Corp. (Japan) | | | 3,200 | | | $ | 1,460,108 | |
| | | | | | | | |
| | | | | | | 4,030,127 | |
| | | | | | | | |
Integrated Oil & Gas — 23.5% | | | | | | | | |
BP PLC (United Kingdom) | | | 1,328,106 | | | | 8,328,701 | |
Chevron Corp. | | | 154,615 | | | | 18,632,654 | |
Equinor ASA (Norway) | | | 190,625 | | | | 3,806,238 | |
Exxon Mobil Corp. | | | 336,250 | | | | 23,463,525 | |
Occidental Petroleum Corp. | | | 121,230 | | | | 4,995,888 | |
Royal Dutch Shell PLC (Netherlands), (Class A Stock) | | | 185,740 | | | | 5,515,675 | |
Royal Dutch Shell PLC (Netherlands), (Class B Stock) | | | 226,593 | | | | 6,744,485 | |
Suncor Energy, Inc. (Canada) | | | 187,259 | | | | 6,137,417 | |
TOTAL SA (France) | | | 215,206 | | | | 11,916,370 | |
| | | | | | | | |
| | | | | | | 89,540,953 | |
| | | | | | | | |
IT Consulting & Other Services — 0.6% | | | | | | | | |
NEC Corp. (Japan) | | | 51,600 | | | | 2,133,542 | |
| | | | | | | | |
Metal & Glass Containers — 0.9% | | | | | | | | |
Ball Corp. | | | 56,385 | | | | 3,646,418 | |
| | | | | | | | |
Oil & Gas Drilling — 0.5% | | | | | | | | |
Transocean Ltd.*(a) | | | 290,625 | | | | 1,999,500 | |
| | | | | | | | |
Oil & Gas Equipment & Services — 5.0% | | | | | |
Baker Hughes Co. | | | 153,710 | | | | 3,939,587 | |
Schlumberger Ltd. | | | 263,070 | | | | 10,575,414 | |
TechnipFMC PLC (United Kingdom) | | | 205,685 | | | | 4,409,887 | |
| | | | | | | | |
| | | | | | | 18,924,888 | |
| | | | | | | | |
Oil & Gas Exploration & Production — 14.5% | | | | | |
Canadian Natural Resources Ltd. (Canada) | | | 126,850 | | | | 4,102,807 | |
Concho Resources, Inc. | | | 45,230 | | | | 3,960,791 | |
ConocoPhillips | | | 163,660 | | | | 10,642,810 | |
Continental Resources, Inc. | | | 68,105 | | | | 2,336,001 | |
Devon Energy Corp. | | | 67,555 | | | | 1,754,403 | |
Diamondback Energy, Inc.(a) | | | 41,900 | | | | 3,890,834 | |
EOG Resources, Inc. | | | 85,746 | | | | 7,182,085 | |
Hess Corp. | | | 57,295 | | | | 3,827,879 | |
Noble Energy, Inc. | | | 145,145 | | | | 3,605,402 | |
Parsley Energy, Inc. (Class A Stock) | | | 74,480 | | | | 1,408,417 | |
Pioneer Natural Resources Co. | | | 43,261 | | | | 6,548,417 | |
SM Energy Co. | | | 123,790 | | | | 1,391,400 | |
Woodside Petroleum Ltd. (Australia) | | | 104,051 | | | | 2,526,551 | |
WPX Energy, Inc.* | | | 169,725 | | | | 2,332,021 | |
| | | | | | | | |
| | | | | | | 55,509,818 | |
| | | | | | | | |
Oil & Gas Refining & Marketing — 5.8% | | | | | | | | |
Marathon Petroleum Corp. | | | 99,485 | | | | 5,993,971 | |
Neste OYJ (Finland) | | | 118,007 | | | | 4,108,690 | |
Phillips 66 | | | 50,780 | | | | 5,657,400 | |
Valero Energy Corp. | | | 68,207 | | | | 6,387,586 | |
| | | | | | | | |
| | | | | | | 22,147,647 | |
| | | | | | | | |
Oil & Gas Storage & Transportation — 5.5% | | | | | |
Golar LNG Ltd. (Bermuda) | | | 111,335 | | | | 1,583,184 | |
Kinder Morgan, Inc. | | | 244,270 | | | | 5,171,196 | |
SEE NOTES TO FINANCIAL STATEMENTS.
A153
| | | | | | |
| | |
| | NATURAL RESOURCES PORTFOLIO (continued) | | |
| | | | | | |
| |
| SCHEDULE OF INVESTMENTS | | as of December 31, 2019 |
| | | | | | | | |
COMMON STOCKS
(continued) | | Shares | | | Value | |
Oil & Gas Storage & Transportation (continued) | | | | | |
ONEOK, Inc.(a) | | | 68,485 | | | $ | 5,182,260 | |
TC Energy Corp. (Canada)(a) | | | 74,513 | | | | 3,968,518 | |
Williams Cos., Inc. (The) | | | 220,045 | | | | 5,219,467 | |
| | | | | | | | |
| | | | | | | 21,124,625 | |
| | | | | | | | |
Paper Products — 0.5% | | | | | | | | |
Oji Holdings Corp. (Japan) | | | 324,900 | | | | 1,759,106 | |
| | | | | | | | |
Precious Metals & Minerals — 0.0% | | | | | | | | |
Sedibelo Platinum Mines Ltd. (South Africa), Private Placement (original cost $1,102,975; purchased 11/27/07)*^(f) | | | 129,100 | | | | — | |
| | | | | | | | |
Railroads — 2.0% | | | | | | | | |
Kansas City Southern(a) | | | 24,275 | | | | 3,717,959 | |
Union Pacific Corp. | | | 21,410 | | | | 3,870,714 | |
| | | | | | | | |
| | | | | | | 7,588,673 | |
| | | | | | | | |
Semiconductor Equipment — 0.6% | | | | | | | | |
Enphase Energy, Inc.*(a) | | | 36,095 | | | | 943,162 | |
SolarEdge Technologies, Inc.* | | | 12,745 | | | | 1,211,922 | |
| | | | | | | | |
| | | | | | | 2,155,084 | |
| | | | | | | | |
Semiconductors — 0.3% | | | | | | | | |
First Solar, Inc.* | | | 21,975 | | | | 1,229,721 | |
| | | | | | | | |
Specialty Chemicals — 5.0% | | | | | | | | |
Axalta Coating Systems Ltd.* | | | 63,020 | | | | 1,915,808 | |
Ecolab, Inc. | | | 40,083 | | | | 7,735,618 | |
Sherwin-Williams Co. (The) | | | 6,295 | | | | 3,673,385 | |
Shin-Etsu Chemical Co. Ltd. (Japan) | | | 34,300 | | | | 3,775,668 | |
Umicore SA (Belgium) | | | 37,865 | | | | 1,845,002 | |
| | | | | | | | |
| | | | | | | 18,945,481 | |
| | | | | | | | |
TOTAL COMMON STOCKS
(cost $304,512,411) | | | | 363,600,050 | |
| | | | | | | | |
| |
| EXCHANGE-TRADED FUNDS — 3.2% | | | | | |
Invesco Solar ETF(a) | | | 237,695 | | | | 7,321,006 | |
VanEck Vectors Gold Miners ETF | | | 171,980 | | | | 5,035,574 | |
| | | | | | | | |
TOTAL EXCHANGE-TRADED FUNDS
(cost $10,570,114) | | | | 12,356,580 | |
| | | | | | | | |
TOTAL LONG-TERM INVESTMENTS
(cost $315,082,525) | | | | 375,956,630 | |
| | | | | | | | |
| | | | | | | | |
| SHORT-TERM INVESTMENTS — 6.5% | | | | |
| | |
| | | Shares | | | Value | |
AFFILIATED MUTUAL FUNDS | | | | | | | | |
PGIM Core Ultra Short Bond Fund(w) | | | 5,623,570 | | | $ | 5,623,570 | |
PGIM Institutional Money Market Fund (cost $19,121,737; includes $19,090,293 of cash collateral for securities on loan)(b)(w) | | | 19,119,905 | | | | 19,123,729 | |
| | | | | | | | |
TOTAL SHORT-TERM INVESTMENTS
(cost $24,745,307) | | | | 24,747,299 | |
| | | | | | | | |
TOTAL INVESTMENTS — 105.0%
(cost $339,827,832) | | | | 400,703,929 | |
Liabilities in excess of other assets — (5.0)% | | | | (19,036,247 | ) |
| | | | | | | | |
NET ASSETS — 100.0% | | | $ | 381,667,682 | |
| | | | | | | | |
See the Glossary for a list of the abbreviation(s) used in the annual report:
| * | Non-income producing security. |
| ^ | Indicates a Level 3 instrument. The aggregate value of Level 3 instruments is $0 and 0.0% of net assets. |
| (a) | All or a portion of security is on loan. The aggregate market value of such securities, including those sold and pending settlement, is $18,781,682; cash collateral of $19,090,293 (included in liabilities) was received with which the Portfolio purchased highly liquid short-term investments. |
| (b) | Represents security purchased with cash collateral received for securities on loan and includes dividend reinvestment. |
| (f) | Indicates a restricted security; the original cost of such security is $1,102,975. The value of $0 is 0.0% of net assets. |
| (w) | PGIM Investments LLC, the manager of the Fund, also serves as manager of the PGIM Core Ultra Short Bond Fund and PGIM Institutional Money Market Fund. |
Fair Value Measurements:
Various inputs are used in determining the value of the Portfolio’s investments. These inputs are summarized in the three broad levels listed below.
| Level 1— | unadjusted quoted prices generally in active markets for identical securities. |
| Level 2— | quoted prices for similar securities, interest rates and yield curves, prepayment speeds, foreign currency exchange rates and other observable inputs. |
| Level 3— | unobservable inputs for securities valued in accordance with Board approved fair valuation procedures. |
SEE NOTES TO FINANCIAL STATEMENTS.
A154
| | | | | | |
| | |
| | NATURAL RESOURCES PORTFOLIO (continued) | | |
| | | | | | |
| |
| SCHEDULE OF INVESTMENTS | | as of December 31, 2019 |
The following is a summary of the inputs used as of December 31, 2019 in valuing such portfolio securities:
| | | | | | | | | | | | |
| | | Level 1 | | | Level 2 | | | Level 3 | |
Investments in Securities | | | | | | | | | | | | |
Assets | | | | | | | | | | | | |
Common Stocks | | | | | | | | | | | | |
Australia | | $ | — | | | $ | 27,092,302 | | | $ | — | |
Belgium | | | — | | | | 1,845,002 | | | | — | |
Bermuda | | | 1,583,184 | | | | — | | | | — | |
Canada | | | 19,707,625 | | | | — | | | | — | |
Chile | | | 5,357,286 | | | | 1,402,069 | | | | — | |
Denmark | | | — | | | | 3,139,268 | | | | — | |
Finland | | | — | | | | 4,108,690 | | | | — | |
France | | | — | | | | 18,124,370 | | | | — | |
Ireland | | | — | | | | 2,507,622 | | | | — | |
Japan | | | — | | | | 13,771,937 | | | | — | |
Netherlands | | | — | | | | 12,260,160 | | | | — | |
Norway | | | — | | | | 3,806,238 | | | | — | |
Peru | | | 1,352,138 | | | | — | | | | — | |
South Africa | | | — | | | | — | | | | — | |
South Korea | | | — | | | | 1,852,824 | | | | — | |
United Kingdom | | | 15,961,841 | | | | 8,328,701 | | | | — | |
United States | | | 215,901,886 | | | | — | | | | — | |
Zambia | | | 5,496,907 | | | | — | | | | — | |
Exchange-Traded Funds | | | | | | | | | | | | |
United States | | | 12,356,580 | | | | — | | | | — | |
Affiliated Mutual Funds | | | 24,747,299 | | | | — | | | | — | |
| | | | | | | | | | | | |
Total | | $ | 302,464,746 | | | $ | 98,239,183 | | | $ | — | |
| | | | | | | | | | | | |
Country Classification:
The country classification of investments and liabilities in excess of other assets shown as a percentage of net assets as of December 31, 2019 were as follows (unaudited):
| | | | |
United States (including 5.0% of collateral for securities on loan) | | | 66.1 | % |
Australia | | | 7.1 | |
United Kingdom | | | 6.5 | |
Canada | | | 5.1 | |
France | | | 4.7 | |
Japan | | | 3.8 | |
Netherlands | | | 3.2 | |
Chile | | | 1.8 | |
Zambia | | | 1.4 | |
Finland | | | 1.1 | |
Norway | | | 1.0 | |
Denmark | | | 0.8 | |
| | | | |
Ireland | | | 0.6 | % |
South Korea | | | 0.5 | |
Belgium | | | 0.5 | |
Bermuda | | | 0.4 | |
Peru | | | 0.4 | |
South Africa | | | 0.0 | * |
| | | | |
| | | 105.0 | |
Liabilities in excess of other assets | | | (5.0 | ) |
| | | | |
| | | 100.0 | % |
| | | | |
Financial Instruments/Transactions—Summary of Offsetting and Netting Arrangements:
The Portfolio entered into financial instruments/transactions during the reporting period that are either offset in accordance with current requirements or are subject to enforceable master netting arrangements or similar agreements that permit offsetting. The information about offsetting and related netting arrangements for financial instruments/transactions where the legal right toset-off exists is presented in the summary below.
SEE NOTES TO FINANCIAL STATEMENTS.
A155
| | | | | | |
| | |
| | NATURAL RESOURCES PORTFOLIO (continued) | | |
| | | | | | |
| |
| SCHEDULE OF INVESTMENTS | | as of December 31, 2019 |
Offsetting of financial instrument/transaction assets and liabilities:
| | | | | | | | | | | | |
Description | | Gross Market
Value of
Recognized
Assets/(Liabilities) | | | Collateral
Pledged/(Received)(1) | | | Net
Amount | |
Securities on Loan | | $ | 18,781,682 | | | $ | (18,781,682 | ) | | $ | — | |
| | | | | | | | | | | | |
| (1) | Collateral amount disclosed by the Portfolio is limited to the market value of financial instruments/transactions. |
SEE NOTES TO FINANCIAL STATEMENTS.
A156
| | | | | | |
| | |
| | NATURAL RESOURCES PORTFOLIO (continued) | | |
STATEMENT OF ASSETS AND LIABILITIES
as of December 31, 2019
| | | | |
| ASSETS | | | | |
Investments at value, including securities on loan of $18,781,682: | | | | |
Unaffiliated investments (cost $315,082,525) | | $ | 375,956,630 | |
Affiliated investments (cost $24,745,307) | | | 24,747,299 | |
Foreign currency, at value (cost $344,670) | | | 344,680 | |
Tax reclaim receivable | | | 744,362 | |
Dividends and interest receivable | | | 423,815 | |
Receivable for investments sold | | | 343,588 | |
Receivable for Portfolio shares sold | | | 42,488 | |
Prepaid expenses and other assets | | | 3,029 | |
| | | | |
Total Assets | | | 402,605,891 | |
| | | | |
| LIABILITIES | | | | |
Payable to broker for collateral for securities on loan | | | 19,090,293 | |
Payable for Portfolio shares repurchased | | | 634,611 | |
Payable to affiliate | | | 558,127 | |
Payable for investments purchased | | | 342,941 | |
Accrued expenses and other liabilities | | | 154,325 | |
Management fee payable | | | 140,200 | |
Distribution fee payable | | | 10,456 | |
Administration fee payable | | | 6,276 | |
Affiliated transfer agent fee payable | | | 980 | |
| | | | |
Total Liabilities | | | 20,938,209 | |
| | | | |
| NET ASSETS | | $ | 381,667,682 | |
| | | | |
Net assets were comprised of: | | | | |
Partners’ Equity | | $ | 381,667,682 | |
| | | | |
| Class I: | | | | |
Net asset value and redemption price per share, $332,217,020 / 13,647,626 outstanding shares of beneficial interest | | $ | 24.34 | |
| | | | |
| Class II: | | | | |
Net asset value and redemption price per share, $49,450,662 / 2,109,639 outstanding shares of beneficial interest | | $ | 23.44 | |
| | | | |
STATEMENT OF OPERATIONS
Year Ended December 31, 2019
| | | | |
| NET INVESTMENT INCOME (LOSS) INCOME | | | | |
Unaffiliated dividend income (net of $456,280 foreign withholding tax, of which $5,482 is reimbursable by an affiliate) | | $ | 13,594,710 | |
Affiliated dividend income | | | 167,111 | |
Income from securities lending, net (including affiliated income of $56,955) | | | 87,531 | |
| | | | |
Total income | | | 13,849,352 | |
| | | | |
| EXPENSES | | | | |
Management fee | | | 1,749,894 | |
Distribution fee—Class II | | | 125,163 | |
Administration fee—Class II | | | 75,098 | |
Shareholders’ reports | | | 149,438 | |
Custodian and accounting fees | | | 83,728 | |
Audit fee | | | 32,009 | |
Trustees’ fees | | | 13,930 | |
Legal fees and expenses | | | 13,263 | |
Transfer agent’s fees and expenses (including affiliated expense of $5,882) | | | 10,681 | |
Miscellaneous | | | 24,326 | |
| | | | |
Total expenses | | | 2,277,530 | |
Less: Fee waivers and/or expense reimbursement | | | (31,109 | ) |
| | | | |
Net expenses | | | 2,246,421 | |
| | | | |
| NET INVESTMENT INCOME (LOSS) | | | 11,602,931 | |
| | | | |
| REALIZED AND UNREALIZED GAIN (LOSS) ON INVESTMENT AND FOREIGN CURRENCY TRANSACTIONS | | | | |
Net realized gain (loss) on: | | | | |
Investment transactions (including affiliated of $(2,470)) | | | (12,664,122 | ) |
Foreign currency transactions | | | (77,938 | ) |
| | | | |
| | | (12,742,060 | ) |
| | | | |
Net change in unrealized appreciation (depreciation) on: | | | | |
Investments (including affiliated of $1,840) | | | 40,477,467 | |
Foreign currencies | | | 32,362 | |
| | | | |
| | | 40,509,829 | |
| | | | |
| NET GAIN (LOSS) ON INVESTMENT AND FOREIGN CURRENCY TRANSACTIONS | | | 27,767,769 | |
| | | | |
| NET INCREASE (DECREASE) IN NET ASSETS RESULTING FROM OPERATIONS | | $ | 39,370,700 | |
| | | | |
STATEMENTS OF CHANGES IN NET ASSETS
| | | | | | | | |
| | | Year Ended
December 31, 2019
| | | Year Ended
December 31, 2018 | |
| INCREASE (DECREASE) IN NET ASSETS | | | | | | | | |
| OPERATIONS | | | | | | | | |
Net investment income (loss) | | $ | 11,602,931 | | | $ | 10,152,169 | |
Net realized gain (loss) on investment and foreign currency transactions | | | (12,742,060 | ) | | | 12,374,583 | |
Net change in unrealized appreciation (depreciation) on investments and foreign currencies | | | 40,509,829 | | | | (105,102,532 | ) |
| | | | | | | | |
NET INCREASE (DECREASE) IN NET ASSETS RESULTING FROM OPERATIONS | | | 39,370,700 | | | | (82,575,780 | ) |
| | | | | | | | |
| PORTFOLIO SHARE TRANSACTIONS | | | | | | | | |
Portfolio shares sold | | | 11,326,229 | | | | 32,236,320 | |
Portfolio shares repurchased | | | (41,844,684 | ) | | | (54,963,059 | ) |
| | | | | | | | |
NET INCREASE (DECREASE) IN NET ASSETS FROM PORTFOLIO SHARE TRANSACTIONS | | | (30,518,455 | ) | | | (22,726,739 | ) |
| | | | | | | | |
| CAPITAL CONTRIBUTIONS | | | 6,508 | | | | 91,663 | |
| | | | | | | | |
| TOTAL INCREASE (DECREASE) | | | 8,858,753 | | | | (105,210,856 | ) |
| NET ASSETS: | | | | | | | | |
Beginning of year | | | 372,808,929 | | | | 478,019,785 | |
| | | | | | | | |
End of year | | $ | 381,667,682 | | | $ | 372,808,929 | |
| | | | | | | | |
SEE NOTES TO FINANCIAL STATEMENTS.
A157
| | | | | | |
| | |
| | SMALL CAPITALIZATION STOCK PORTFOLIO | | |
| | | | | | |
| |
| SCHEDULE OF INVESTMENTS | | as of December 31, 2019 |
| | | | | | | | |
| LONG-TERM INVESTMENTS — 99.3% | | | | |
| COMMON STOCKS — 98.7% | | Shares | | | Value | |
Aerospace & Defense — 1.6% | | | | | | | | |
AAR Corp. | | | 34,671 | | | $ | 1,563,662 | |
Aerojet Rocketdyne Holdings, Inc.*(a) | | | 76,305 | | | | 3,484,086 | |
AeroVironment, Inc.* | | | 22,834 | | | | 1,409,771 | |
Cubic Corp. | | | 32,953 | | | | 2,094,822 | |
Moog, Inc. (Class A Stock) | | | 33,974 | | | | 2,899,002 | |
National Presto Industries, Inc. | | | 5,369 | | | | 474,566 | |
Park Aerospace Corp. | | | 20,544 | | | | 334,251 | |
Triumph Group, Inc.(a) | | | 52,750 | | | | 1,332,993 | |
| | | | | | | | |
| | | | | | | 13,593,153 | |
| | | | | | | | |
Air Freight & Logistics — 0.6% | | | | | | | | |
Atlas Air Worldwide Holdings, Inc.* | | | 27,240 | | | | 751,007 | |
Echo Global Logistics, Inc.* | | | 28,730 | | | | 594,711 | |
Forward Air Corp. | | | 29,756 | | | | 2,081,432 | |
Hub Group, Inc. (Class A Stock)* | | | 35,230 | | | | 1,806,947 | |
| | | | | | | | |
| | | | | | | 5,234,097 | |
| | | | | | | | |
Airlines — 0.9% | | | | | | | | |
Allegiant Travel Co.(a) | | | 13,904 | | | | 2,419,852 | |
Hawaiian Holdings, Inc.(a) | | | 49,080 | | | | 1,437,553 | |
SkyWest, Inc. | | | 53,160 | | | | 3,435,731 | |
| | | | | | | | |
| | | | | | | 7,293,136 | |
| | | | | | | | |
Auto Components — 1.8% | | | | | | | | |
American Axle & Manufacturing Holdings, Inc.* | | | 118,390 | | | | 1,273,876 | |
Cooper Tire & Rubber Co. | | | 52,900 | | | | 1,520,875 | |
Cooper-Standard Holdings, Inc.* | | | 17,680 | | | | 586,269 | |
Dorman Products, Inc.*(a) | | | 30,770 | | | | 2,329,905 | |
Fox Factory Holding Corp.* | | | 40,600 | | | | 2,824,542 | |
Garrett Motion, Inc. (Switzerland)* | | | 78,600 | | | | 785,214 | |
Gentherm, Inc.* | | | 34,500 | | | | 1,531,455 | |
LCI Industries | | | 26,379 | | | | 2,825,982 | |
Motorcar Parts of America, Inc.*(a) | | | 19,880 | | | | 437,956 | |
Standard Motor Products, Inc. | | | 21,349 | | | | 1,136,194 | |
| | | | | | | | |
| | | | | | | 15,252,268 | |
| | | | | | | | |
Automobiles — 0.2% | | | | | | | | |
Winnebago Industries, Inc. | | | 35,481 | | | | 1,879,783 | |
| | | | | | | | |
Banks — 9.6% | | | | | | | | |
Allegiance Bancshares, Inc.*(a) | | | 20,200 | | | | 759,520 | |
Ameris Bancorp | | | 69,040 | | | | 2,936,962 | |
Banc of California, Inc.(a) | | | 47,220 | | | | 811,240 | |
Banner Corp. | | | 39,280 | | | | 2,222,855 | |
Berkshire Hills Bancorp, Inc. | | | 45,350 | | | | 1,491,108 | |
Boston Private Financial Holdings, Inc. | | | 87,412 | | | | 1,051,566 | |
Brookline Bancorp, Inc.(a) | | | 84,032 | | | | 1,383,167 | |
Cadence BanCorp. | | | 134,950 | | | | 2,446,643 | |
Central Pacific Financial Corp. | | | 29,870 | | | | 883,555 | |
City Holding Co. | | | 17,174 | | | | 1,407,409 | |
Columbia Banking System, Inc. | | | 76,098 | | | | 3,096,047 | |
Community Bank System, Inc. | | | 54,506 | | | | 3,866,656 | |
Customers Bancorp, Inc.* | | | 30,250 | | | | 720,252 | |
CVB Financial Corp.(a) | | | 140,200 | | | | 3,025,516 | |
Dime Community Bancshares, Inc. | | | 32,371 | | | | 676,230 | |
Eagle Bancorp, Inc. | | | 35,400 | | | | 1,721,502 | |
First BanCorp. (Puerto Rico) | | | 228,722 | | | | 2,422,166 | |
| | | | | | | | |
COMMON STOCKS
(continued) | | Shares | | | Value | |
Banks (continued) | | | | | | | | |
First Commonwealth Financial Corp. | | | 103,510 | | | $ | 1,501,930 | |
First Financial Bancorp | | | 104,753 | | | | 2,664,916 | |
First Midwest Bancorp, Inc. | | | 115,920 | | | | 2,673,115 | |
Franklin Financial Network, Inc. | | | 14,150 | | | | 485,770 | |
Glacier Bancorp, Inc.(a) | | | 90,433 | | | | 4,159,014 | |
Great Western Bancorp, Inc. | | | 59,280 | | | | 2,059,387 | |
Hanmi Financial Corp. | | | 32,836 | | | | 656,556 | |
Heritage Financial Corp.(a) | | | 38,650 | | | | 1,093,795 | |
Hope Bancorp, Inc. | | | 133,504 | | | | 1,983,869 | |
Independent Bank Corp. | | | 36,286 | | | | 3,020,809 | |
National Bank Holdings Corp. (Class A Stock) | | | 32,890 | | | | 1,158,386 | |
NBT Bancorp, Inc. | | | 46,210 | | | | 1,874,278 | |
OFG Bancorp (Puerto Rico) | | | 54,070 | | | | 1,276,593 | |
Old National Bancorp | | | 179,077 | | | | 3,275,318 | |
Opus Bank | | | 22,750 | | | | 588,542 | |
Pacific Premier Bancorp, Inc. | | | 62,570 | | | | 2,040,095 | |
Preferred Bank | | | 14,400 | | | | 865,296 | |
S&T Bancorp, Inc. | | | 40,623 | | | | 1,636,701 | |
Seacoast Banking Corp. of Florida* | | | 54,300 | | | | 1,659,951 | |
ServisFirst Bancshares, Inc.(a) | | | 48,550 | | | | 1,829,364 | |
Simmons First National Corp. (Class A Stock)(a) | | | 120,046 | | | | 3,216,032 | |
Southside Bancshares, Inc. | | | 33,536 | | | | 1,245,527 | |
Tompkins Financial Corp. | | | 12,934 | | | | 1,183,461 | |
Triumph Bancorp, Inc.* | | | 24,650 | | | | 937,193 | |
United Community Banks, Inc. | | | 83,327 | | | | 2,573,138 | |
Veritex Holdings, Inc. | | | 49,720 | | | | 1,448,344 | |
Westamerica Bancorporation(a) | | | 28,500 | | | | 1,931,445 | |
| | | | | | | | |
| | | | | | | 79,961,219 | |
| | | | | | | | |
Beverages — 0.3% | | | | | | | | |
Coca-Cola Consolidated, Inc.(a) | | | 4,950 | | | | 1,406,047 | |
MGP Ingredients, Inc.(a) | | | 14,050 | | | | 680,723 | |
National Beverage Corp.*(a) | | | 12,300 | | | | 627,546 | |
| | | | | | | | |
| | | | | | | 2,714,316 | |
| | | | | | | | |
Biotechnology — 2.7% | | | | | | | | |
Acorda Therapeutics, Inc.*(a) | | | 50,550 | | | | 103,122 | |
AMAG Pharmaceuticals, Inc.*(a) | | | 35,550 | | | | 432,644 | |
Anika Therapeutics, Inc.* | | | 15,100 | | | | 782,935 | |
Cytokinetics, Inc.*(a) | | | 61,950 | | | | 657,289 | |
Eagle Pharmaceuticals, Inc.* | | | 10,640 | | | | 639,251 | |
Emergent BioSolutions, Inc.* | | | 46,307 | | | | 2,498,263 | |
Enanta Pharmaceuticals, Inc.*(a) | | | 16,870 | | | | 1,042,229 | |
Medicines Co. (The)*(a) | | | 78,440 | | | | 6,662,694 | |
Momenta Pharmaceuticals, Inc.* | | | 119,440 | | | | 2,356,551 | |
Myriad Genetics, Inc.* | | | 78,400 | | | | 2,134,832 | |
Progenics Pharmaceuticals, Inc.* | | | 90,900 | | | | 462,681 | |
REGENXBIO, Inc.* | | | 33,050 | | | | 1,354,058 | |
Spectrum Pharmaceuticals, Inc.* | | | 118,400 | | | | 430,976 | |
Vanda Pharmaceuticals, Inc.* | | | 56,170 | | | | 921,750 | |
Xencor, Inc.*(a) | | | 51,970 | | | | 1,787,248 | |
| | | | | | | | |
| | | | | | | 22,266,523 | |
| | | | | | | | |
Building Products — 2.0% | | | | | | | | |
AAON, Inc. | | | 42,819 | | | | 2,115,687 | |
American Woodmark Corp.* | | | 16,480 | | | | 1,722,325 | |
SEE NOTES TO FINANCIAL STATEMENTS.
A158
| | | | | | |
| | |
| | SMALL CAPITALIZATION STOCK PORTFOLIO (continued) | | |
| | | | | | |
| |
| SCHEDULE OF INVESTMENTS | | as of December 31, 2019 |
| | | | | | | | |
COMMON STOCKS
(continued) | | Shares | | | Value | |
Building Products (continued) | | | | | | | | |
Apogee Enterprises, Inc. | | | 28,058 | | | $ | 911,885 | |
Gibraltar Industries, Inc.*(a) | | | 34,008 | | | | 1,715,364 | |
Griffon Corp. | | | 44,929 | | | | 913,407 | |
Insteel Industries, Inc. | | | 19,250 | | | | 413,682 | |
Patrick Industries, Inc. | | | 23,550 | | | | 1,234,726 | |
PGT Innovations, Inc.* | | | 61,420 | | | | 915,772 | |
Quanex Building Products Corp. | | | 34,928 | | | | 596,570 | |
Simpson Manufacturing Co., Inc. | | | 42,503 | | | | 3,410,016 | |
Universal Forest Products, Inc. | | | 64,752 | | | | 3,088,670 | |
| | | | | | | | |
| | | | | | | 17,038,104 | |
| | | | | | | | |
Capital Markets — 0.8% | | | | | | | | |
Blucora, Inc.* | | | 51,662 | | | | 1,350,445 | |
Donnelley Financial Solutions, Inc.* | | | 32,787 | | | | 343,280 | |
Greenhill & Co., Inc.(a) | | | 15,670 | | | | 267,644 | |
INTL. FCStone, Inc.* | | | 17,150 | | | | 837,434 | |
Piper Jaffray Cos | | | 15,165 | | | | 1,212,290 | |
Virtus Investment Partners, Inc. | | | 6,810 | | | | 828,913 | |
Waddell & Reed Financial, Inc. (Class A Stock)(a) | | | 74,000 | | | | 1,237,280 | |
WisdomTree Investments, Inc.(a) | | | 124,100 | | | | 600,644 | |
| | | | | | | | |
| | | | | | | 6,677,930 | |
| | | | | | | | |
Chemicals — 2.9% | | | | | | | | |
AdvanSix, Inc.* | | | 29,330 | | | | 585,427 | |
American Vanguard Corp. | | | 27,848 | | | | 542,200 | |
Balchem Corp. | | | 33,913 | | | | 3,446,578 | |
Ferro Corp.* | | | 86,240 | | | | 1,278,939 | |
FutureFuel Corp. | | | 27,100 | | | | 335,769 | |
GCP Applied Technologies, Inc.* | | | 56,650 | | | | 1,286,521 | |
Hawkins, Inc. | | | 10,000 | | | | 458,100 | |
HB Fuller Co.(a) | | | 53,738 | | | | 2,771,269 | |
Innophos Holdings, Inc. | | | 20,780 | | | | 664,544 | |
Innospec, Inc. | | | 25,820 | | | | 2,670,821 | |
Koppers Holdings, Inc.* | | | 21,880 | | | | 836,254 | |
Kraton Corp.* | | | 33,390 | | | | 845,435 | |
Livent Corp.*(a) | | | 153,660 | | | | 1,313,793 | |
LSB Industries, Inc.* | | | 23,000 | | | | 96,600 | |
Quaker Chemical Corp.(a) | | | 13,648 | | | | 2,245,369 | |
Rayonier Advanced Materials, Inc. | | | 52,470 | | | | 201,485 | |
Stepan Co. | | | 21,140 | | | | 2,165,582 | |
Tredegar Corp. | | | 25,985 | | | | 580,765 | |
Trinseo SA | | | 41,250 | | | �� | 1,534,912 | |
| | | | | | | | |
| | | | | | | 23,860,363 | |
| | | | | | | | |
Commercial Services & Supplies — 2.1% | | | | | |
ABM Industries, Inc.(a) | | | 70,083 | | | | 2,642,830 | |
Brady Corp. (Class A Stock) | | | 52,462 | | | | 3,003,974 | |
Interface, Inc. | | | 61,462 | | | | 1,019,655 | |
Matthews International Corp. (Class A Stock)(a) | | | 33,120 | | | | 1,264,190 | |
Mobile Mini, Inc. | | | 46,477 | | | | 1,761,943 | |
Pitney Bowes, Inc.(a) | | | 179,450 | | | | 723,184 | |
RR Donnelley & Sons Co.(a) | | | 74,033 | | | | 292,430 | |
Team, Inc.*(a) | | | 31,810 | | | | 508,006 | |
UniFirst Corp. | | | 16,160 | | | | 3,263,997 | |
US Ecology, Inc. | | | 26,850 | | | | 1,554,883 | |
| | | | | | | | |
COMMON STOCKS
(continued) | | Shares | | | Value | |
Commercial Services & Supplies (continued) | | | | | |
Viad Corp. | | | 21,477 | | | $ | 1,449,697 | |
| | | | | | | | |
| | | | | | | 17,484,789 | |
| | | | | | | | |
Communications Equipment — 1.1% | | | | | | | | |
ADTRAN, Inc. | | | 50,210 | | | | 496,577 | |
Applied Optoelectronics, Inc.*(a) | | | 19,800 | | | | 235,224 | |
CalAmp Corp.* | | | 35,540 | | | | 340,473 | |
Comtech Telecommunications Corp. | | | 25,759 | | | | 914,187 | |
Digi International, Inc.* | | | 29,864 | | | | 529,190 | |
Extreme Networks, Inc.* | | | 127,800 | | | | 941,886 | |
Harmonic, Inc.* | | | 94,824 | | | | 739,627 | |
NETGEAR, Inc.* | | | 31,816 | | | | 779,810 | |
Plantronics, Inc. | | | 34,550 | | | | 944,597 | |
Viavi Solutions, Inc.* | | | 242,090 | | | | 3,631,350 | |
| | | | | | | | |
| | | | | | | 9,552,921 | |
| | | | | | | | |
Construction & Engineering — 0.8% | | | | | | | | |
Aegion Corp.* | | | 32,357 | | | | 723,826 | |
Arcosa, Inc. | | | 51,050 | | | | 2,274,277 | |
Comfort Systems USA, Inc. | | | 38,634 | | | | 1,925,905 | |
Granite Construction, Inc.(a) | | | 49,200 | | | | 1,361,364 | |
MYR Group, Inc.* | | | 17,620 | | | | 574,236 | |
| | | | | | | | |
| | | | | | | 6,859,608 | |
| | | | | | | | |
Construction Materials — 0.1% | | | | | | | | |
U.S. Concrete, Inc.* | | | 16,700 | | | | 695,722 | |
| | | | | | | | |
Consumer Finance — 0.5% | | | | | | | | |
Encore Capital Group, Inc.*(a) | | | 29,090 | | | | 1,028,623 | |
Enova International, Inc.* | | | 35,539 | | | | 855,068 | |
EZCORP, Inc. (Class A Stock)* | | | 55,021 | | | | 375,243 | |
PRA Group, Inc.*(a) | | | 47,857 | | | | 1,737,209 | |
World Acceptance Corp.*(a) | | | 5,832 | | | | 503,885 | |
| | | | | | | | |
| | | | | | | 4,500,028 | |
| | | | | | | | |
Containers & Packaging — 0.1% | | | | | | | | |
Myers Industries, Inc. | | | 37,420 | | | | 624,166 | |
| | | | | | | | |
Distributors — 0.2% | | | | | | | | |
Core-Mark Holding Co., Inc. | | | 47,990 | | | | 1,304,848 | |
| | | | | | | | |
Diversified Consumer Services — 0.7% | | | | | | | | |
American Public Education, Inc.* | | | 16,283 | | | | 445,992 | |
Career Education Corp.* | | | 74,080 | | | | 1,362,331 | |
Regis Corp.*(a) | | | 25,300 | | | | 452,111 | |
Strategic Education, Inc. | | | 23,151 | | | | 3,678,694 | |
| | | | | | | | |
| | | | | | | 5,939,128 | |
| | | | | | | | |
Diversified Financial Services — 0.2% | | | | | | | | |
FGL Holdings. | | | 137,750 | | | | 1,467,038 | |
| | | | | | | | |
Diversified Telecommunication Services — 1.0% | | | | | |
ATN International, Inc. | | | 11,500 | | | | 636,985 | |
Cincinnati Bell, Inc.*(a) | | | 52,830 | | | | 553,130 | |
Cogent Communications Holdings, Inc. | | | 44,000 | | | | 2,895,640 | |
Consolidated Communications Holdings, Inc.(a) | | | 75,140 | | | | 291,543 | |
Iridium Communications, Inc.*(a) | | | 102,270 | | | | 2,519,933 | |
Vonage Holdings Corp.* | | | 240,300 | | | | 1,780,623 | |
| | | | | | | | |
| | | | | | | 8,677,854 | |
| | | | | | | | |
SEE NOTES TO FINANCIAL STATEMENTS.
A159
| | | | | | |
| | |
| | SMALL CAPITALIZATION STOCK PORTFOLIO (continued) | | |
| | | | | | |
| |
| SCHEDULE OF INVESTMENTS | | as of December 31, 2019 |
| | | | | | | | |
COMMON STOCKS
(continued) | | Shares | | | Value | |
Electric Utilities — 0.3% | | | | | | | | |
El Paso Electric Co. | | | 42,968 | | | $ | 2,917,098 | |
| | | | | | | | |
Electrical Equipment — 0.5% | | | | | | | | |
AZZ, Inc. | | | 27,592 | | | | 1,267,852 | |
Encore Wire Corp. | | | 22,091 | | | | 1,268,024 | |
Powell Industries, Inc. | | | 9,272 | | | | 454,235 | |
Vicor Corp.* | | | 19,381 | | | | 905,480 | |
| | | | | | | | |
| | | | | | | 3,895,591 | |
| | | | | | | | |
Electronic Equipment, Instruments & Components — 4.3% | |
Anixter International, Inc.* | | | 31,794 | | | | 2,928,227 | |
Arlo Technologies, Inc.* | | | 79,004 | | | | 332,607 | |
Badger Meter, Inc.(a) | | | 30,664 | | | | 1,991,013 | |
Bel Fuse, Inc. (Class B Stock) | | | 10,672 | | | | 218,776 | |
Benchmark Electronics, Inc. | | | 39,620 | | | | 1,361,343 | |
CTS Corp. | | | 34,404 | | | | 1,032,464 | |
Daktronics, Inc.(a) | | | 39,208 | | | | 238,777 | |
ePlus, Inc.* | | | 14,310 | | | | 1,206,190 | |
Fabrinet (Thailand)* | | | 39,080 | | | | 2,533,947 | |
FARO Technologies, Inc.* | | | 18,334 | | | | 923,117 | |
Insight Enterprises, Inc.* | | | 37,765 | | | | 2,654,502 | |
Itron, Inc.* | | | 37,130 | | | | 3,117,063 | |
KEMET Corp.(a) | | | 61,180 | | | | 1,654,919 | |
Knowles Corp.* | | | 90,650 | | | | 1,917,247 | |
Methode Electronics, Inc. | | | 39,046 | | | | 1,536,460 | |
MTS Systems Corp. | | | 18,785 | | | | 902,244 | |
OSI Systems, Inc.* | | | 18,050 | | | | 1,818,357 | |
Plexus Corp.* | | | 30,780 | | | | 2,368,213 | |
Rogers Corp.* | | | 19,631 | | | | 2,448,575 | |
Sanmina Corp.* | | | 73,740 | | | | 2,524,858 | |
ScanSource, Inc.* | | | 26,603 | | | | 982,981 | |
TTM Technologies, Inc.* | | | 103,299 | | | | 1,554,650 | |
| | | | | | | | |
| | | | | | | 36,246,530 | |
| | | | | | | | |
Energy Equipment & Services — 1.9% | | | | | | | | |
Archrock, Inc. | | | 134,310 | | | | 1,348,472 | |
Diamond Offshore Drilling, Inc.*(a) | | | 67,850 | | | | 487,842 | |
DMC Global, Inc.(a) | | | 15,450 | | | | 694,323 | |
Dril-Quip, Inc.*(a) | | | 38,200 | | | | 1,791,962 | |
Era Group, Inc.* | | | 20,721 | | | | 210,733 | |
Exterran Corp.* | | | 29,630 | | | | 232,003 | |
Geospace Technologies Corp.* | | | 14,350 | | | | 240,650 | |
Helix Energy Solutions Group, Inc.* | | | 148,810 | | | | 1,433,040 | |
KLX Energy Services Holdings, Inc.* | | | 22,050 | | | | 142,002 | |
Matrix Service Co.* | | | 28,563 | | | | 653,521 | |
McDermott International, Inc.*(a) | | | 191,150 | | | | 129,332 | |
Nabors Industries Ltd. | | | 356,150 | | | | 1,025,712 | |
Newpark Resources, Inc.* | | | 93,950 | | | | 589,067 | |
Noble Corp. PLC*(a) | | | 260,800 | | | | 318,176 | |
Oceaneering International, Inc.* | | | 104,000 | | | | 1,550,640 | |
Oil States International, Inc.* | | | 63,650 | | | | 1,038,131 | |
ProPetro Holding Corp.* | | | 86,750 | | | | 975,937 | |
RPC, Inc.(a) | | | 54,150 | | | | 283,746 | |
SEACOR Holdings, Inc.* | | | 18,491 | | | | 797,887 | |
TETRA Technologies, Inc.* | | | 131,191 | | | | 257,134 | |
US Silica Holdings, Inc.(a) | | | 77,120 | | | | 474,288 | |
Valaris PLC(a) | | | 208,000 | | | | 1,364,480 | |
| | | | | | | | |
| | | | | | | 16,039,078 | |
| | | | | | | | |
| | | | | | | | |
COMMON STOCKS
(continued) | | Shares | | | Value | |
Entertainment — 0.2% | | | | | | | | |
Glu Mobile, Inc.* | | | 121,400 | | | $ | 734,470 | |
Marcus Corp. (The) | | | 24,208 | | | | 769,088 | |
| | | | | | | | |
| | | | | | | 1,503,558 | |
| | | | | | | | |
Equity Real Estate Investment Trusts (REITs) — 6.9% | |
Acadia Realty Trust | | | 91,615 | | | | 2,375,577 | |
Agree Realty Corp.(a) | | | 44,710 | | | | 3,137,301 | |
American Assets Trust, Inc. | | | 50,580 | | | | 2,321,622 | |
Armada Hoffler Properties, Inc. | | | 58,270 | | | | 1,069,254 | |
CareTrust REIT, Inc. | | | 100,705 | | | | 2,077,544 | |
CBL & Associates Properties, Inc.(a) | | | 181,750 | | | | 190,838 | |
Cedar Realty Trust, Inc. | | | 89,416 | | | | 263,777 | |
Chatham Lodging Trust | | | 49,300 | | | | 904,162 | |
Community Healthcare Trust, Inc. | | | 20,050 | | | | 859,343 | |
DiamondRock Hospitality Co. | | | 211,020 | | | | 2,338,102 | |
Easterly Government Properties, Inc. | | | 78,100 | | | | 1,853,313 | |
Essential Properties Realty Trust, Inc. | | | 85,450 | | | | 2,120,014 | |
Four Corners Property Trust, Inc. | | | 72,609 | | | | 2,046,848 | |
Franklin Street Properties Corp. | | | 112,652 | | | | 964,301 | |
Getty Realty Corp. | | | 36,064 | | | | 1,185,424 | |
Global Net Lease, Inc. | | | 94,260 | | | | 1,911,593 | |
Hersha Hospitality Trust | | | 37,590 | | | | 546,935 | |
Independence Realty Trust, Inc. | | | 95,650 | | | | 1,346,752 | |
Industrial Logistics Properties Trust | | | 68,650 | | | | 1,539,133 | |
Innovative Industrial Properties, Inc.(a) | | | 12,550 | | | | 952,168 | |
iStar, Inc. | | | 62,250 | | | | 903,247 | |
Kite Realty Group Trust | | | 88,522 | | | | 1,728,835 | |
Lexington Realty Trust | | | 260,986 | | | | 2,771,671 | |
LTC Properties, Inc.(a) | | | 41,946 | | | | 1,877,922 | |
National Storage Affiliates Trust | | | 62,600 | | | | 2,104,612 | |
Office Properties Income Trust | | | 50,750 | | | | 1,631,105 | |
Pennsylvania Real Estate Investment Trust(a) | | | 62,722 | | | | 334,308 | |
Retail Opportunity Investments Corp. | | | 122,260 | | | | 2,159,112 | |
RPT Realty | | | 84,580 | | | | 1,272,083 | |
Safehold, Inc.(a) | | | 13,150 | | | | 529,945 | |
Saul Centers, Inc. | | | 12,470 | | | | 658,167 | |
Summit Hotel Properties, Inc.(a) | | | 110,750 | | | | 1,366,655 | |
Uniti Group, Inc.(a) | | | 203,600 | | | | 1,671,556 | |
Universal Health Realty Income Trust | | | 13,330 | | | | 1,564,409 | |
Urstadt Biddle Properties, Inc. (Class A Stock)(a) | | | 31,440 | | | | 780,970 | |
Washington Prime Group, Inc.(a) | | | 196,650 | | | | 715,806 | |
Washington Real Estate Investment Trust | | | 84,950 | | | | 2,478,841 | |
Whitestone REIT | | | 42,600 | | | | 580,212 | |
Xenia Hotels & Resorts, Inc. | | | 118,750 | | | | 2,566,187 | |
| | | | | | | | |
| | | | | | | 57,699,644 | |
| | | | | | | | |
Food & Staples Retailing — 0.6% | | | | | | | | |
Andersons, Inc. (The) | | | 34,324 | | | | 867,711 | |
Chefs’ Warehouse, Inc. (The)*(a) | | | 26,800 | | | | 1,021,348 | |
PriceSmart, Inc. | | | 23,500 | | | | 1,668,970 | |
SpartanNash Co. | | | 38,126 | | | | 542,914 | |
United Natural Foods, Inc.* | | | 55,800 | | | | 488,808 | |
| | | | | | | | |
| | | | | | | 4,589,751 | |
| | | | | | | | |
SEE NOTES TO FINANCIAL STATEMENTS.
A160
| | | | | | |
| | |
| | SMALL CAPITALIZATION STOCK PORTFOLIO (continued) | | |
| | | | | | |
| |
| SCHEDULE OF INVESTMENTS | | as of December 31, 2019 |
| | | | | | | | |
COMMON STOCKS
(continued) | | Shares | | | Value | |
Food Products — 1.7% | | | | | | | | |
B&G Foods, Inc.(a) | | | 67,380 | | | $ | 1,208,123 | |
Calavo Growers, Inc.(a) | | | 17,330 | | | | 1,569,925 | |
Cal-Maine Foods, Inc.(a) | | | 31,960 | | | | 1,366,290 | |
Darling Ingredients, Inc.* | | | 172,600 | | | | 4,846,608 | |
Fresh Del Monte Produce, Inc. | | | 32,000 | | | | 1,119,360 | |
J&J Snack Foods Corp. | | | 15,758 | | | | 2,903,727 | |
John B. Sanfilippo & Son, Inc. | | | 9,320 | | | | 850,729 | |
Seneca Foods Corp. (Class A Stock)* | | | 7,220 | | | | 294,504 | |
| | | | | | | | |
| | | | | | | 14,159,266 | |
| | | | | | | | |
Gas Utilities — 0.7% | | | | | | | | |
Northwest Natural Holding Co. | | | 32,105 | | | | 2,367,101 | |
South Jersey Industries, Inc.(a) | | | 97,464 | | | | 3,214,363 | |
| | | | | | | | |
| | | | | | | 5,581,464 | |
| | | | | | | | |
Health Care Equipment & Supplies — 3.2% | |
AngioDynamics, Inc.* | | | 39,400 | | | | 630,794 | |
Cardiovascular Systems, Inc.* | | | 37,090 | | | | 1,802,203 | |
CONMED Corp. | | | 29,979 | | | | 3,352,552 | |
CryoLife, Inc.* | | | 39,553 | | | | 1,071,491 | |
Cutera, Inc.* | | | 14,950 | | | | 535,359 | |
Heska Corp.*(a) | | | 7,450 | | | | 714,753 | |
Inogen, Inc.* | | | 19,300 | | | | 1,318,769 | |
Integer Holdings Corp.* | | | 34,504 | | | | 2,775,157 | |
Invacare Corp. | | | 35,352 | | | | 318,875 | |
Lantheus Holdings, Inc.* | | | 41,250 | | | | 846,037 | |
LeMaitre Vascular, Inc.(a) | | | 17,300 | | | | 621,935 | |
Meridian Bioscience, Inc. | | | 44,955 | | | | 439,210 | |
Merit Medical Systems, Inc.* | | | 58,208 | | | | 1,817,254 | |
Mesa Laboratories, Inc.(a) | | | 4,240 | | | | 1,057,456 | |
Natus Medical, Inc.* | | | 35,915 | | | | 1,184,836 | |
Neogen Corp.* | | | 55,273 | | | | 3,607,116 | |
OraSure Technologies, Inc.*(a) | | | 64,870 | | | | 520,906 | |
Orthofix Medical, Inc.* | | | 20,100 | | | | 928,218 | |
Surmodics, Inc.* | | | 14,342 | | | | 594,189 | |
Tactile Systems Technology, Inc.*(a) | | | 20,100 | | | | 1,356,951 | |
Varex Imaging Corp.* | | | 40,400 | | | | 1,204,324 | |
| | | | | | | | |
| | | | | | | 26,698,385 | |
| | | | | | | | |
Health Care Providers & Services — 3.2% | |
Addus HomeCare Corp.* | | | 14,300 | | | | 1,390,246 | |
AMN Healthcare Services, Inc.* | | | 49,269 | | | | 3,069,951 | |
BioTelemetry, Inc.* | | | 35,800 | | | | 1,657,540 | |
Community Health Systems, Inc.*(a) | | | 123,410 | | | | 357,889 | |
CorVel Corp.* | | | 9,470 | | | | 827,299 | |
Covetrus, Inc.*(a) | | | 102,700 | | | | 1,355,640 | |
Cross Country Healthcare, Inc.* | | | 38,823 | | | | 451,123 | |
Diplomat Pharmacy, Inc.* | | | 60,590 | | | | 242,360 | |
Ensign Group, Inc. (The) | | | 52,880 | | | | 2,399,166 | |
Hanger, Inc.* | | | 39,350 | | | | 1,086,454 | |
LHC Group, Inc.* | | | 31,228 | | | | 4,301,969 | |
Magellan Health, Inc.* | | | 22,961 | | | | 1,796,698 | |
Owens & Minor, Inc.(a) | | | 66,200 | | | | 342,254 | |
Pennant Group, Inc. (The)* | | | 27,665 | | | | 914,882 | |
Providence Service Corp. (The)* | | | 12,150 | | | | 719,037 | |
RadNet, Inc.* | | | 43,850 | | | | 890,155 | |
Select Medical Holdings Corp.* | | | 113,260 | | | | 2,643,489 | |
Tivity Health, Inc.*(a) | | | 45,418 | | | | 924,029 | |
| | | | | | | | |
COMMON STOCKS
(continued) | | Shares | | | Value | |
Health Care Providers & Services (continued) | | | | | |
US Physical Therapy, Inc.(a) | | | 13,540 | | | $ | 1,548,299 | |
| | | | | | | | |
| | | | | | | 26,918,480 | |
| | | | | | | | |
Health Care Technology — 1.1% | | | | | | | | |
Computer Programs & Systems, Inc. | | | 13,186 | | | | 348,111 | |
HealthStream, Inc.* | | | 27,010 | | | | 734,672 | |
HMS Holdings Corp.* | | | 92,870 | | | | 2,748,952 | |
NextGen Healthcare, Inc.* | | | 51,034 | | | | 820,116 | |
Omnicell, Inc.* | | | 44,232 | | | | 3,614,639 | |
Tabula Rasa HealthCare, Inc.*(a) | | | 20,750 | | | | 1,010,110 | |
| | | | | | | | |
| | | | | | | 9,276,600 | |
| | | | | | | | |
Hotels, Restaurants & Leisure — 1.5% | | | | | | | | |
BJ’s Restaurants, Inc. | | | 20,262 | | | | 769,146 | |
Bloomin’ Brands, Inc. | | | 91,430 | | | | 2,017,860 | |
Chuy’s Holdings, Inc.*(a) | | | 17,500 | | | | 453,600 | |
Dave & Buster’s Entertainment, Inc.(a) | | | 32,520 | | | | 1,306,328 | |
Dine Brands Global, Inc.(a) | | | 17,725 | | | | 1,480,392 | |
El Pollo Loco Holdings, Inc.*(a) | | | 20,300 | | | | 307,342 | |
Fiesta Restaurant Group, Inc.* | | | 22,500 | | | | 222,525 | |
Monarch Casino & Resort, Inc.* | | | 12,581 | | | | 610,808 | |
Red Robin Gourmet Burgers, Inc.*(a) | | | 13,663 | | | | 451,152 | |
Ruth’s Hospitality Group, Inc. | | | 28,648 | | | | 623,524 | |
Shake Shack, Inc. (Class A Stock)* | | | 32,790 | | | | 1,953,300 | |
Wingstop, Inc.(a) | | | 31,050 | | | | 2,677,441 | |
| | | | | | | | |
| | | | | | | 12,873,418 | |
| | | | | | | | |
Household Durables — 2.4% | | | | | | | | |
Cavco Industries, Inc.* | | | 9,100 | | | | 1,777,958 | |
Century Communities, Inc.* | | | 28,450 | | | | 778,108 | |
Ethan Allen Interiors, Inc.(a) | | | 25,689 | | | | 489,632 | |
Installed Building Products, Inc.* | | | 22,450 | | | | 1,546,131 | |
iRobot Corp.*(a) | | | 29,850 | | | | 1,511,306 | |
La-Z-Boy, Inc.(a) | | | 48,921 | | | | 1,540,033 | |
LGI Homes, Inc.*(a) | | | 21,030 | | | | 1,485,770 | |
M/I Homes, Inc.* | | | 29,720 | | | | 1,169,482 | |
MDC Holdings, Inc. | | | 52,765 | | | | 2,013,512 | |
Meritage Homes Corp.* | | | 37,987 | | | | 2,321,386 | |
TopBuild Corp.* | | | 35,850 | | | | 3,695,418 | |
Tupperware Brands Corp. | | | 51,200 | | | | 439,296 | |
Universal Electronics, Inc.* | | | 14,694 | | | | 767,908 | |
William Lyon Homes (Class A Stock)* | | | 34,800 | | | | 695,304 | |
| | | | | | | | |
| | | | | | | 20,231,244 | |
| | | | | | | | |
Household Products — 0.5% | | | | | | | | |
Central Garden & Pet Co.* | | | 10,350 | | | | 321,575 | |
Central Garden & Pet Co. (Class A Stock)* | | | 42,308 | | | | 1,242,163 | |
WD-40 Co.(a) | | | 14,459 | | | | 2,807,070 | |
| | | | | | | | |
| | | | | | | 4,370,808 | |
| | | | | | | | |
Industrial Conglomerates — 0.2% | | | | | | | | |
Raven Industries, Inc. | | | 37,680 | | | | 1,298,453 | |
| | | | | | | | |
Insurance — 2.6% | | | | | | | | |
Ambac Financial Group, Inc.* | | | 48,050 | | | | 1,036,438 | |
American Equity Investment Life Holding Co. | | | 96,020 | | | | 2,873,879 | |
AMERISAFE, Inc. | | | 20,414 | | | | 1,347,936 | |
SEE NOTES TO FINANCIAL STATEMENTS.
A161
| | | | | | |
| | |
| | SMALL CAPITALIZATION STOCK PORTFOLIO (continued) | | |
| | | | | | |
| |
| SCHEDULE OF INVESTMENTS | | as of December 31, 2019 |
| | | | | | | | |
COMMON STOCKS
(continued) | | Shares | | | Value | |
Insurance (continued) | | | | | | | | |
eHealth, Inc.*(a) | | | 21,491 | | | $ | 2,064,855 | |
Employers Holdings, Inc. | | | 33,565 | | | | 1,401,339 | |
HCI Group, Inc.(a) | | | 6,730 | | | | 307,225 | |
Horace Mann Educators Corp. | | | 43,420 | | | | 1,895,717 | |
James River Group Holdings Ltd. | | | 32,100 | | | | 1,322,841 | |
Kinsale Capital Group, Inc. | | | 21,800 | | | | 2,216,188 | |
ProAssurance Corp. | | | 56,696 | | | | 2,048,993 | |
Safety Insurance Group, Inc. | | | 15,460 | | | | 1,430,514 | |
Stewart Information Services Corp. | | | 24,962 | | | | 1,018,200 | |
Third Point Reinsurance Ltd. (Bermuda)* | | | 84,250 | | | | 886,310 | |
United Fire Group, Inc. | | | 22,401 | | | | 979,596 | |
United Insurance Holdings Corp. | | | 21,800 | | | | 274,898 | |
Universal Insurance Holdings, Inc. | | | 32,140 | | | | 899,599 | |
| | | | | | | | |
| | | | | | | 22,004,528 | |
| | | | | | | | |
Interactive Media & Services — 0.1% | | | | | | | | |
Care.com, Inc.* | | | 29,600 | | | | 444,888 | |
QuinStreet, Inc.* | | | 48,350 | | | | 740,239 | |
| | | | | | | | |
| | | | | | | 1,185,127 | |
| | | | | | | | |
Internet & Direct Marketing Retail — 0.4% | | | | | |
Liquidity Services, Inc.* | | | 28,150 | | | | 167,774 | |
PetMed Express, Inc.(a) | | | 21,181 | | | | 498,177 | |
Shutterstock, Inc.* | | | 20,150 | | | | 864,032 | |
Stamps.com, Inc.*(a) | | | 17,160 | | | | 1,433,203 | |
| | | | | | | | |
| | | | | | | 2,963,186 | |
| | | | | | | | |
IT Services — 2.1% | | | | | | | | |
Cardtronics PLC (Class A Stock)*(a) | | | 38,060 | | | | 1,699,379 | |
CSG Systems International, Inc.(a) | | | 34,704 | | | | 1,796,973 | |
EVERTEC, Inc. (Puerto Rico) | | | 63,000 | | | | 2,144,520 | |
ExlService Holdings, Inc.* | | | 35,950 | | | | 2,497,087 | |
ManTech International Corp. (Class A Stock) | | | 28,450 | | | | 2,272,586 | |
NIC, Inc. | | | 70,600 | | | | 1,577,910 | |
Perficient, Inc.* | | | 34,364 | | | | 1,583,149 | |
Sykes Enterprises, Inc.* | | | 40,610 | | | | 1,502,164 | |
TTEC Holdings, Inc. | | | 18,597 | | | | 736,813 | |
Unisys Corp.* | | | 54,450 | | | | 645,777 | |
Virtusa Corp.* | | | 31,450 | | | | 1,425,629 | |
| | | | | | | | |
| | | | | | | 17,881,987 | |
| | | | | | | | |
Leisure Products — 0.4% | | | | | | | | |
Callaway Golf Co.(a) | | | 99,240 | | | | 2,103,888 | |
Sturm Ruger & Co., Inc.(a) | | | 17,517 | | | | 823,825 | |
Vista Outdoor, Inc.*(a) | | | 60,750 | | | | 454,410 | |
| | | | | | | | |
| | | | | | | 3,382,123 | |
| | | | | | | | |
Life Sciences Tools & Services — 0.8% | | | | | | | | |
Luminex Corp. | | | 44,170 | | | | 1,022,977 | |
Medpace Holdings, Inc.* | | | 28,850 | | | | 2,425,131 | |
NeoGenomics, Inc.* | | | 110,100 | | | | 3,220,425 | |
| | | | | | | | |
| | | | | | | 6,668,533 | |
| | | | | | | | |
Machinery — 5.8% | | | | | | | | |
Actuant Corp. (Class A Stock) | | | 56,684 | | | | 1,475,485 | |
Alamo Group, Inc. | | | 10,260 | | | | 1,288,143 | |
| | | | | | | | |
COMMON STOCKS
(continued) | | Shares | | | Value | |
Machinery (continued) | | | | | | | | |
Albany International Corp. (Class A Stock) | | | 32,364 | | | $ | 2,457,075 | |
Astec Industries, Inc. | | | 23,790 | | | | 999,180 | |
Barnes Group, Inc. | | | 50,266 | | | | 3,114,481 | |
Briggs & Stratton Corp.(a) | | | 44,426 | | | | 295,877 | |
Chart Industries, Inc.* | | | 37,750 | | | | 2,547,747 | |
CIRCOR International, Inc.* | | | 20,978 | | | | 970,023 | |
EnPro Industries, Inc. | | | 21,978 | | | | 1,469,889 | |
ESCO Technologies, Inc. | | | 27,391 | | | | 2,533,667 | |
Federal Signal Corp. | | | 63,730 | | | | 2,055,292 | |
Franklin Electric Co., Inc. | | | 40,580 | | | | 2,326,046 | |
Greenbrier Cos., Inc. (The) | | | 34,430 | | | | 1,116,565 | |
Harsco Corp.* | | | 82,800 | | | | 1,905,228 | |
Hillenbrand, Inc. | | | 78,118 | | | | 2,602,111 | |
John Bean Technologies Corp. | | | 33,417 | | | | 3,764,759 | |
Lindsay Corp.(a) | | | 11,429 | | | | 1,097,070 | |
Lydall, Inc.* | | | 18,506 | | | | 379,743 | |
Mueller Industries, Inc. | | | 60,018 | | | | 1,905,572 | |
Proto Labs, Inc.* | | | 28,250 | | | | 2,868,787 | |
SPX Corp.* | | | 46,520 | | | | 2,366,938 | |
SPX FLOW, Inc.* | | | 44,930 | | | | 2,195,729 | |
Standex International Corp. | | | 13,120 | | | | 1,041,072 | |
Tennant Co. | | | 19,310 | | | | 1,504,635 | |
Titan International, Inc. | | | 51,700 | | | | 187,154 | |
Wabash National Corp.(a) | | | 56,740 | | | | 833,511 | |
Watts Water Technologies, Inc. (Class A Stock) | | | 29,161 | | | | 2,909,101 | |
| | | | | | | | |
| | | | | | | 48,210,880 | |
| | | | | | | | |
Marine — 0.2% | | | | | | | | |
Matson, Inc. | | | 45,200 | | | | 1,844,160 | |
| | | | | | | | |
Media — 0.4% | | | | | | | | |
EW Scripps Co. (The) (Class A Stock)(a) | | | 57,411 | | | | 901,927 | |
Gannett Co., Inc.(a) | | | 128,970 | | | | 822,829 | |
Scholastic Corp. | | | 32,470 | | | | 1,248,471 | |
TechTarget, Inc.* | | | 24,200 | | | | 631,620 | |
| | | | | | | | |
| | | | | | | 3,604,847 | |
| | | | | | | | |
Metals & Mining — 1.2% | | | | | | | | |
AK Steel Holding Corp.*(a) | | | 332,740 | | | | 1,094,715 | |
Century Aluminum Co.* | | | 52,393 | | | | 393,733 | |
Cleveland-Cliffs, Inc.(a) | | | 284,200 | | | | 2,387,280 | |
Haynes International, Inc. | | | 13,230 | | | | 473,369 | |
Kaiser Aluminum Corp. | | | 16,810 | | | | 1,864,061 | |
Materion Corp. | | | 21,578 | | | | 1,282,812 | |
Olympic Steel, Inc. | | | 9,518 | | | | 170,563 | |
SunCoke Energy, Inc. | | | 90,950 | | | | 566,619 | |
TimkenSteel Corp.*(a) | | | 41,510 | | | | 326,269 | |
Warrior Met Coal, Inc. | | | 53,750 | | | | 1,135,737 | |
| | | | | | | | |
| | | | | | | 9,695,158 | |
| | | | | | | | |
Mortgage Real Estate Investment Trusts (REITs) — 1.9% | |
Apollo Commercial Real Estate Finance, Inc.(a) | | | 150,550 | | | | 2,753,559 | |
ARMOUR Residential REIT, Inc. | | | 62,000 | | | | 1,107,940 | |
Capstead Mortgage Corp. | | | 99,400 | | | | 787,248 | |
Granite Point Mortgage Trust, Inc. | | | 57,700 | | | | 1,060,526 | |
SEE NOTES TO FINANCIAL STATEMENTS.
A162
| | | | | | |
| | |
| | SMALL CAPITALIZATION STOCK PORTFOLIO (continued) | | |
| | | | | | |
| |
| SCHEDULE OF INVESTMENTS | | as of December 31, 2019 |
| | | | | | | | |
COMMON STOCKS
(continued) | | Shares | | | Value | |
Mortgage Real Estate Investment Trusts (REITs) (continued) | |
Invesco Mortgage Capital, Inc. | | | 150,300 | | | $ | 2,502,495 | |
KKR Real Estate Finance Trust, Inc.(a) | | | 25,350 | | | | 517,647 | |
New York Mortgage Trust, Inc. | | | 307,050 | | | | 1,912,922 | |
PennyMac Mortgage Investment Trust | | | 105,380 | | | | 2,348,920 | |
Ready Capital Corp. | | | 36,900 | | | | 568,998 | |
Redwood Trust, Inc.(a) | | | 118,750 | | | | 1,964,125 | |
| | | | | | | | |
| | | | | | | 15,524,380 | |
| | | | | | | | |
Multiline Retail — 0.2% | |
Big Lots, Inc.(a) | | | 41,150 | | | | 1,181,828 | |
J.C. Penney Co., Inc.*(a) | | | 314,250 | | | | 351,960 | |
| | | | | | | | |
| | | | | | | 1,533,788 | |
| | | | | | | | |
Multi-Utilities — 0.4% | |
Avista Corp. | | | 70,373 | | | | 3,384,238 | |
| | | | | | | | |
Oil, Gas & Consumable Fuels — 2.3% | |
Bonanza Creek Energy, Inc.* | | | 19,500 | | | | 455,130 | |
Callon Petroleum Co.*(a) | | | 411,500 | | | | 1,987,545 | |
CONSOL Energy, Inc.* | | | 27,280 | | | | 395,833 | |
Denbury Resources, Inc.*(a) | | | 518,350 | | | | 730,873 | |
Green Plains, Inc.(a) | | | 35,340 | | | | 545,296 | |
Gulfport Energy Corp.*(a) | | | 152,350 | | | | 463,144 | |
HighPoint Resources Corp.*(a) | | | 113,930 | | | | 192,542 | |
Jagged Peak Energy, Inc.*(a) | | | 62,750 | | | | 532,748 | |
Laredo Petroleum, Inc.*(a) | | | 189,800 | | | | 544,726 | |
Oasis Petroleum, Inc.* | | | 304,400 | | | | 992,344 | |
Par Pacific Holdings, Inc.* | | | 38,800 | | | | 901,712 | |
PDC Energy, Inc.* | | | 62,006 | | | | 1,622,697 | |
Penn Virginia Corp.* | | | 14,250 | | | | 432,488 | |
QEP Resources, Inc. | | | 250,000 | | | | 1,125,000 | |
Range Resources Corp.(a) | | | 219,100 | | | | 1,062,635 | |
Renewable Energy Group, Inc.*(a) | | | 41,050 | | | | 1,106,297 | |
REX American Resources Corp.* | | | 5,930 | | | | 486,023 | |
Ring Energy, Inc.*(a) | | | 62,200 | | | | 164,208 | |
SM Energy Co.(a) | | | 111,600 | | | | 1,254,384 | |
Southwestern Energy Co.*(a) | | | 570,450 | | | | 1,380,489 | |
SRC Energy, Inc.* | | | 256,020 | | | | 1,054,802 | |
Talos Energy, Inc.* | | | 21,100 | | | | 636,165 | |
Whiting Petroleum Corp.*(a) | | | 96,100 | | | | 705,374 | |
| | | | | | | | |
| | | | | | | 18,772,455 | |
| | | | | | | | |
Paper & Forest Products — 0.7% | |
Boise Cascade Co. | | | 41,040 | | | | 1,499,191 | |
Clearwater Paper Corp.* | | | 17,350 | | | | 370,596 | |
Mercer International, Inc. (Germany) | | | 42,100 | | | | 517,830 | |
Neenah, Inc. | | | 17,738 | | | | 1,249,287 | |
P.H. Glatfelter Co. | | | 46,550 | | | | 851,865 | |
Schweitzer-Mauduit International, Inc. | | | 32,546 | | | | 1,366,607 | |
| | | | | | | | |
| | | | | | | 5,855,376 | |
| | | | | | | | |
Personal Products — 0.8% | | | | | | | | |
Avon Products, Inc. (United Kingdom)(a) | | | 466,400 | | | | 2,630,496 | |
Inter Parfums, Inc. | | | 18,650 | | | | 1,356,041 | |
Medifast, Inc.(a) | | | 12,290 | | | | 1,346,738 | |
USANA Health Sciences, Inc.* | | | 13,250 | | | | 1,040,788 | |
| | | | | | | | |
| | | | | | | 6,374,063 | |
| | | | | | | | |
| | | | | | | | |
COMMON STOCKS
(continued) | | Shares | | | Value | |
Pharmaceuticals — 1.1% | |
Akorn, Inc.* | | | 99,400 | | | $ | 149,100 | |
Amphastar Pharmaceuticals, Inc.* | | | 36,000 | | | | 694,440 | |
ANI Pharmaceuticals, Inc.* | | | 9,790 | | | | 603,749 | |
Corcept Therapeutics, Inc.*(a) | | | 108,250 | | | | 1,309,825 | |
Endo International PLC* | | | 212,450 | | | | 996,391 | |
Innoviva, Inc.* | | | 70,250 | | | | 994,740 | |
Lannett Co., Inc.*(a) | | | 35,250 | | | | 310,905 | |
Pacira BioSciences, Inc.* | | | 43,980 | | | | 1,992,294 | |
Phibro Animal Health Corp. (Class A Stock) | | | 21,300 | | | | 528,879 | |
Supernus Pharmaceuticals, Inc.* | | | 55,260 | | | | 1,310,767 | |
| | | | | | | | |
| | | | | | | 8,891,090 | |
| | | | | | | | |
Professional Services — 1.2% | | | | | | | | |
Exponent, Inc. | | | 54,640 | | | | 3,770,706 | |
Forrester Research, Inc.* | | | 11,182 | | | | 466,289 | |
Heidrick & Struggles International, Inc. | | | 20,224 | | | | 657,280 | |
Kelly Services, Inc. (Class A Stock) | | | 34,939 | | | | 788,923 | |
Korn Ferry | | | 58,350 | | | | 2,474,040 | |
Resources Connection, Inc. | | | 31,550 | | | | 515,212 | |
TrueBlue, Inc.* | | | 40,948 | | | | 985,209 | |
| | | | | | | | |
| | | | | | | 9,657,659 | |
| | | | | | | | |
Real Estate Management & Development — 0.4% | |
Marcus & Millichap, Inc.* | | | 24,700 | | | | 920,075 | |
RE/MAX Holdings, Inc. (Class A Stock)(a) | | | 18,850 | | | | 725,537 | |
Realogy Holdings Corp.(a) | | | 120,350 | | | | 1,164,988 | |
St. Joe Co. (The)*(a) | | | 33,000 | | | | 654,390 | |
| | | | | | | | |
| | | | | | | 3,464,990 | |
| | | | | | | | |
Road & Rail — 0.6% | | | | | | | | |
ArcBest Corp. | | | 26,945 | | | | 743,682 | |
Heartland Express, Inc. | | | 49,198 | | | | 1,035,618 | |
Marten Transport Ltd. | | | 40,850 | | | | 877,866 | |
Saia, Inc.* | | | 27,400 | | | | 2,551,488 | |
| | | | | | | | |
| | | | | | | 5,208,654 | |
| | | | | | | | |
Semiconductors & Semiconductor Equipment — 3.5% | |
Advanced Energy Industries, Inc.* | | | 40,437 | | | | 2,879,114 | |
Axcelis Technologies, Inc.* | | | 34,100 | | | | 821,640 | |
Brooks Automation, Inc. | | | 76,245 | | | | 3,199,240 | |
CEVA, Inc.* | | | 23,200 | | | | 625,472 | |
Cohu, Inc. | | | 43,397 | | | | 991,621 | |
Diodes, Inc.* | | | 43,620 | | | | 2,458,859 | |
DSP Group, Inc.* | | | 24,078 | | | | 378,988 | |
FormFactor, Inc.* | | | 79,750 | | | | 2,071,107 | |
Ichor Holdings Ltd.* | | | 23,750 | | | | 790,163 | |
Kulicke & Soffa Industries, Inc.
(Singapore)(a) | | | 66,882 | | | | 1,819,190 | |
MaxLinear, Inc.* | | | 68,550 | | | | 1,454,631 | |
Onto Innovation, Inc.* | | | 51,687 | | | | 1,888,643 | |
PDF Solutions, Inc.* | | | 29,250 | | | | 494,033 | |
Photronics, Inc.* | | | 70,630 | | | | 1,113,129 | |
Power Integrations, Inc. | | | 31,080 | | | | 3,074,123 | |
Rambus, Inc.* | | | 117,420 | | | | 1,617,460 | |
SMART Global Holdings, Inc.* | | | 13,850 | | | | 525,469 | |
Ultra Clean Holdings, Inc.* | | | 42,020 | | | | 986,209 | |
SEE NOTES TO FINANCIAL STATEMENTS.
A163
| | | | | | |
| | |
| | SMALL CAPITALIZATION STOCK PORTFOLIO (continued) | | |
| | | | | | |
| |
| SCHEDULE OF INVESTMENTS | | as of December 31, 2019 |
| | | | | | | | |
COMMON STOCKS
(continued) | | Shares | | | Value | |
Semiconductors & Semiconductor Equipment (continued) | |
Veeco Instruments, Inc.* | | | 51,293 | | | $ | 753,238 | |
Xperi Corp. | | | 52,067 | | | | 963,240 | |
| | | | | | | | |
| | | | | | | 28,905,569 | |
| | | | | | | | |
Software — 2.3% | | | | | | | | |
8x8, Inc.*(a) | | | 105,600 | | | | 1,932,480 | |
Agilysys, Inc.* | | | 21,432 | | | | 544,587 | |
Alarm.com Holdings, Inc.*(a) | | | 38,390 | | | | 1,649,618 | |
Bottomline Technologies DE, Inc.* | | | 40,160 | | | | 2,152,576 | |
Ebix, Inc.(a) | | | 23,447 | | | | 783,364 | |
LivePerson, Inc.*(a) | | | 64,860 | | | | 2,399,820 | |
MicroStrategy, Inc. (Class A Stock)* | | | 8,720 | | | | 1,243,734 | |
OneSpan, Inc.* | | | 34,100 | | | | 583,792 | |
Progress Software Corp. | | | 47,247 | | | | 1,963,113 | |
Qualys, Inc.* | | | 35,220 | | | | 2,936,292 | |
SPS Commerce, Inc.* | | | 36,700 | | | | 2,033,914 | |
TiVo Corp. | | | 133,250 | | | | 1,129,960 | |
| | | | | | | | |
| | | | | | | 19,353,250 | |
| | | | | | | | |
Specialty Retail — 3.7% | | | | | | | | |
Abercrombie & Fitch Co.
(Class A Stock)(a) | | | 66,100 | | | | 1,142,869 | |
Asbury Automotive Group, Inc.* | | | 20,460 | | | | 2,287,223 | |
Barnes & Noble Education, Inc.* | | | 40,026 | | | | 170,911 | |
Boot Barn Holdings, Inc.* | | | 30,120 | | | | 1,341,244 | |
Buckle, Inc. (The)(a) | | | 30,109 | | | | 814,147 | |
Caleres, Inc. | | | 42,804 | | | | 1,016,595 | |
Cato Corp. (The) (Class A Stock) | | | 22,703 | | | | 395,032 | |
Chico’s FAS, Inc.(a) | | | 124,350 | | | | 473,773 | |
Children’s Place, Inc. (The)(a) | | | 16,415 | | | | 1,026,266 | |
Conn’s, Inc.*(a) | | | 20,050 | | | | 248,420 | |
Designer Brands, Inc.
(Class A Stock)(a) | | | 57,900 | | | | 911,346 | |
Express, Inc.*(a) | | | 70,330 | | | | 342,507 | |
GameStop Corp. (Class A Stock)(a) | | | 68,830 | | | | 418,486 | |
Genesco, Inc.* | | | 15,012 | | | | 719,375 | |
Group 1 Automotive, Inc. | | | 18,504 | | | | 1,850,400 | |
Guess?, Inc.(a) | | | 44,920 | | | | 1,005,310 | |
Haverty Furniture Cos., Inc.(a) | | | 19,111 | | | | 385,278 | |
Hibbett Sports, Inc.*(a) | | | 18,596 | | | | 521,432 | |
Lithia Motors, Inc. (Class A Stock) | | | 23,940 | | | | 3,519,180 | |
Lumber Liquidators Holdings, Inc.* | | | 30,122 | | | | 294,292 | |
MarineMax, Inc.* | | | 22,442 | | | | 374,557 | |
Michaels Cos., Inc. (The)*(a) | | | 80,200 | | | | 648,818 | |
Monro, Inc.(a) | | | 35,152 | | | | 2,748,886 | |
Office Depot, Inc. | | | 575,750 | | | | 1,577,555 | |
Rent-A-Center, Inc. | | | 51,900 | | | | 1,496,796 | |
Shoe Carnival, Inc.(a) | | | 9,460 | | | | 352,669 | |
Signet Jewelers Ltd.(a) | | | 55,150 | | | | 1,198,961 | |
Sleep Number Corp.*(a) | | | 29,950 | | | | 1,474,738 | |
Sonic Automotive, Inc.
(Class A Stock)(a) | | | 25,597 | | | | 793,507 | |
Tailored Brands, Inc.(a) | | | 52,737 | | | | 218,331 | |
Zumiez, Inc.* | | | 21,450 | | | | 740,883 | |
| | | | | | | | |
| | | | | | | 30,509,787 | |
| | | | | | | | |
Technology Hardware, Storage & Peripherals — 0.2% | |
3D Systems Corp.*(a) | | | 124,600 | | | | 1,090,250 | |
| | | | | | | | |
COMMON STOCKS
(continued) | | Shares | | | Value | |
|
Technology Hardware, Storage & Peripherals (continued) | |
Diebold Nixdorf, Inc.*(a) | | | 80,800 | | | $ | 853,248 | |
| | | | | | | | |
| | | | | | | 1,943,498 | |
| | | | | | | | |
Textiles, Apparel & Luxury Goods — 1.9% | |
Crocs, Inc.* | | | 72,343 | | | | 3,030,448 | |
Fossil Group, Inc.*(a) | | | 48,650 | | | | 383,362 | |
G-III Apparel Group Ltd.* | | | 45,450 | | | | 1,522,575 | |
Kontoor Brands, Inc.(a) | | | 49,220 | | | | 2,066,748 | |
Movado Group, Inc.(a) | | | 17,217 | | | | 374,297 | |
Oxford Industries, Inc.(a) | | | 18,016 | | | | 1,358,767 | |
Steven Madden Ltd. | | | 81,535 | | | | 3,506,820 | |
Unifi, Inc.* | | | 15,380 | | | | 388,499 | |
Vera Bradley, Inc.* | | | 24,550 | | | | 289,690 | |
Wolverine World Wide, Inc.(a) | | | 85,324 | | | | 2,878,832 | |
| | | | | | | | |
| | | | | | | 15,800,038 | |
| | | | | | | | |
Thrifts & Mortgage Finance — 1.8% | | | | | | | | |
Axos Financial, Inc.*(a) | | | 56,240 | | | | 1,702,947 | |
Flagstar Bancorp, Inc. | | | 36,350 | | | | 1,390,388 | |
HomeStreet, Inc.* | | | 25,760 | | | | 875,840 | |
Meta Financial Group, Inc. | | | 36,500 | | | | 1,332,615 | |
NMI Holdings, Inc. (Class A Stock)* | | | 71,650 | | | | 2,377,347 | |
Northfield Bancorp, Inc. | | | 45,450 | | | | 770,832 | |
Northwest Bancshares, Inc. | | | 105,610 | | | | 1,756,294 | |
Provident Financial Services, Inc. | | | 63,210 | | | | 1,558,126 | |
TrustCo Bank Corp. | | | 101,845 | | | | 882,996 | |
Walker & Dunlop, Inc. | | | 30,220 | | | | 1,954,630 | |
| | | | | | | | |
| | | | | | | 14,602,015 | |
| | | | | | | | |
Tobacco — 0.4% | |
Universal Corp. | | | 26,200 | | | | 1,494,972 | |
Vector Group Ltd.(a) | | | 121,482 | | | | 1,626,644 | |
| | | | | | | | |
| | | | | | | 3,121,616 | |
| | | | | | | | |
Trading Companies & Distributors — 0.9% | |
Applied Industrial Technologies, Inc. | | | 40,738 | | | | 2,716,817 | |
DXP Enterprises, Inc.* | | | 16,900 | | | | 672,789 | |
Foundation Building Materials, Inc.* | | | 18,500 | | | | 357,975 | |
GMS, Inc.* | | | 44,400 | | | | 1,202,352 | |
Kaman Corp. | | | 29,352 | | | | 1,934,884 | |
Veritiv Corp.* | | | 13,390 | | | | 263,381 | |
| | | | | | | | |
| | | | | | | 7,148,198 | |
| | | | | | | | |
Water Utilities — 0.7% | |
American States Water Co. | | | 38,882 | | | | 3,368,736 | |
California Water Service Group | | | 50,810 | | | | 2,619,764 | |
| | | | | | | | |
| | | | | | | 5,988,500 | |
| | | | | | | | |
Wireless Telecommunication Services — 0.3% | |
Shenandoah Telecommunications Co. | | | 49,400 | | | | 2,055,534 | |
Spok Holdings, Inc. | | | 18,370 | | | | 224,665 | |
| | | | | | | | |
| | | | | | | 2,280,199 | |
| | | | | | | | |
TOTAL COMMON STOCKS
(cost $554,122,948) | | | | | | | 822,936,254 | |
| | | | | | | | |
|
| EXCHANGE-TRADED FUND — 0.6% | |
iShares Core S&PSmall-Cap ETF(a) (cost $4,769,782) | | | 61,800 | | | | 5,181,930 | |
| | | | | | | | |
SEE NOTES TO FINANCIAL STATEMENTS.
A164
| | | | | | |
| | |
| | SMALL CAPITALIZATION STOCK PORTFOLIO (continued) | | |
| | | | | | |
| |
| SCHEDULE OF INVESTMENTS | | as of December 31, 2019 |
| | | | | | | | |
| RIGHTS* — 0.0% | | Units | | | Value | |
Chemicals | | | | | | | | |
A. Schulman, Inc., CVR^ (cost $16,990) | | | 32,486 | | | $ | 3 | |
| | | | | | | | |
TOTAL LONG-TERM INVESTMENTS
(cost $558,909,720) | | | | 828,118,187 | |
| | | | | | | | |
| | |
| | | Shares | | | | |
|
| SHORT-TERM INVESTMENTS — 20.7% | |
AFFILIATED MUTUAL FUNDS — 20.7% | |
PGIM Core Ultra Short Bond Fund(w) | | | 1,885,364 | | | | 1,885,364 | |
PGIM Institutional Money Market Fund (cost $170,410,956; includes $170,153,850 of cash collateral for securities on loan)(b)(w) | | | 170,410,593 | | | | 170,444,676 | |
| | | | | | | | |
TOTAL AFFILIATED MUTUAL FUNDS
(cost $172,296,320) | | | | 172,330,040 | |
| | | | | | | | |
| | | | | | | | | | | | | | | | |
Interest
Rate | | Maturity
Date | | | | | | Principal
Amount
(000)# | | | | |
|
| U.S. TREASURY OBLIGATION(k)(n) — 0.0% | |
U.S. Treasury Bills 1.506% | | | 03/19/20 | | | | | | | | 250 | | | | 249,208 | |
| | | | | | | | | | | | | | | | |
(cost $249,187) | | | | | | | | | | | | | | | | |
TOTAL SHORT-TERM INVESTMENTS
(cost $172,545,507) | | | | 172,579,248 | |
| | | | | | | | | | | | | | | | |
TOTAL INVESTMENTS — 120.0%
(cost $731,455,227) | | | | 1,000,697,435 | |
Liabilities in excess of other assets(z) — (20.0)% | | | | (166,736,445 | ) |
| | | | | | | | | | | | | | | | |
NET ASSETS — 100.0% | | | $ | 833,960,990 | |
| | | | | | | | | | | | | | | | |
See the Glossary for a list of the abbreviation(s) used in the annual report.
| * | Non-income producing security. |
| # | Principal amount is shown in U.S. dollars unless otherwise stated. |
| ^ | Indicates a Level 3 instrument. The aggregate value of Level 3 instruments is $3 and 0.0% of net assets. |
| (a) | All or a portion of security is on loan. The aggregate market value of such securities, including those sold and pending settlement, is $167,377,227; cash collateral of $170,153,850 (included in liabilities) was received with which the Portfolio purchased highly liquid short-term investments. |
| (b) | Represents security purchased with cash collateral received for securities on loan and includes dividend reinvestment. |
| (k) | Represents security, or a portion thereof, segregated as collateral for centrally cleared/exchange-traded derivatives. |
| (n) | Rate shown reflects yield to maturity at purchased date. |
| (w) | PGIM Investments LLC, the manager of the Portfolio, also serves as manager of the PGIM Core Ultra Short Bond Fund and PGIM Institutional Money Market Fund. |
| (z) | Includes net unrealized appreciation/(depreciation) and/or market value of the below holdings which are excluded from the Schedule of Investments: |
Futures contracts outstanding at December 31, 2019:
| | | | | | | | | | | | | | | | |
Number of
Contracts | | Type | | | Expiration
Date | | | Current
Notional
Amount | | | Value /
Unrealized
Appreciation
(Depreciation) | |
| Long Position: | | | | | | | | | | | | | | | | |
| 65 | | | Russell 2000 E-Mini Index | | | | Mar. 2020 | | | $ | 5,429,450 | | | $ | 29,769 | |
| | | | | | | | | | | | | | | | |
Summary of Collateral for Centrally Cleared/Exchange-traded Derivatives:
Cash and securities segregated as collateral, including pending settlement for closed positions, to cover requirements for centrally cleared/exchange-traded derivatives are listed by broker as follows:
| | | | | | | | |
Broker | | Cash and/or Foreign Currency | | | Securities Market Value | |
UBS Securities LLC | | $ | — | | | $ | 249,208 | |
| | | | | | | | |
Fair Value Measurements:
Various inputs are used in determining the value of the Portfolio’s investments. These inputs are summarized in the three broad levels listed below.
| Level 1— | unadjusted quoted prices generally in active markets for identical securities. |
SEE NOTES TO FINANCIAL STATEMENTS.
A165
| | | | | | |
| | |
| | SMALL CAPITALIZATION STOCK PORTFOLIO (continued) | | |
| | | | | | |
| |
| SCHEDULE OF INVESTMENTS | | as of December 31, 2019 |
| Level 2— | quoted prices for similar securities, interest rates and yield curves, prepayment speeds, foreign currency exchange rates and other observable inputs. |
| Level 3— | unobservable inputs for securities valued in accordance with Board approved fair valuation procedures. |
The following is a summary of the inputs used as of December 31, 2019 in valuing such portfolio securities:
| | | | | | | | | | | | |
| | | Level 1 | | | Level 2 | | | Level 3 | |
Investments in Securities | | | | | | | | | | | | |
Assets | | | | | | | | | | | | |
Common Stocks | | | | | | | | | | | | |
Aerospace & Defense | | $ | 13,593,153 | | | $ | — | | | $ | — | |
Air Freight & Logistics | | | 5,234,097 | | | | — | | | | — | |
Airlines | | | 7,293,136 | | | | — | | | | — | |
Auto Components | | | 15,252,268 | | | | — | | | | — | |
Automobiles | | | 1,879,783 | | | | — | | | | — | |
Banks | | | 79,961,219 | | | | — | | | | — | |
Beverages | | | 2,714,316 | | | | — | | | | — | |
Biotechnology | | | 22,266,523 | | | | — | | | | — | |
Building Products | | | 17,038,104 | | | | — | | | | — | |
Capital Markets | | | 6,677,930 | | | | — | | | | — | |
Chemicals | | | 23,860,363 | | | | — | | | | — | |
Commercial Services & Supplies | | | 17,484,789 | | | | — | | | | — | |
Communications Equipment | | | 9,552,921 | | | | — | | | | — | |
Construction & Engineering | | | 6,859,608 | | | | — | | | | — | |
Construction Materials | | | 695,722 | | | | — | | | | — | |
Consumer Finance | | | 4,500,028 | | | | — | | | | — | |
Containers & Packaging | | | 624,166 | | | | — | | | | — | |
Distributors | | | 1,304,848 | | | | — | | | | — | |
Diversified Consumer Services | | | 5,939,128 | | | | — | | | | — | |
Diversified Financial Services | | | 1,467,038 | | | | — | | | | — | |
Diversified Telecommunication Services | | | 8,677,854 | | | | — | | | | — | |
Electric Utilities | | | 2,917,098 | | | | — | | | | — | |
Electrical Equipment | | | 3,895,591 | | | | — | | | | — | |
Electronic Equipment, Instruments & Components | | | 36,246,530 | | | | — | | | | — | |
Energy Equipment & Services | | | 16,039,078 | | | | — | | | | — | |
Entertainment | | | 1,503,558 | | | | — | | | | — | |
Equity Real Estate Investment Trusts (REITs) | | | 57,699,644 | | | | — | | | | — | |
Food & Staples Retailing | | | 4,589,751 | | | | — | | | | — | |
Food Products | | | 14,159,266 | | | | — | | | | — | |
Gas Utilities | | | 5,581,464 | | | | — | | | | — | |
Health Care Equipment & Supplies | | | 26,698,385 | | | | — | | | | — | |
Health Care Providers & Services | | | 26,918,480 | | | | — | | | | — | |
Health Care Technology | | | 9,276,600 | | | | — | | | | — | |
Hotels, Restaurants & Leisure | | | 12,873,418 | | | | — | | | | — | |
Household Durables | | | 20,231,244 | | | | — | | | | — | |
Household Products | | | 4,370,808 | | | | — | | | | — | |
Industrial Conglomerates | | | 1,298,453 | | | | — | | | | — | |
Insurance | | | 22,004,528 | | | | — | | | | — | |
Interactive Media & Services | | | 1,185,127 | | | | — | | | | — | |
Internet & Direct Marketing Retail | | | 2,963,186 | | | | — | | | | — | |
IT Services | | | 17,881,987 | | | | — | | | | — | |
Leisure Products | | | 3,382,123 | | | | — | | | | — | |
Life Sciences Tools & Services | | | 6,668,533 | | | | — | | | | — | |
Machinery | | | 48,210,880 | | | | — | | | | — | |
Marine | | | 1,844,160 | | | | — | | | | — | |
Media | | | 3,604,847 | | | | — | | | | — | |
Metals & Mining | | | 9,695,158 | | | | — | | | | — | |
Mortgage Real Estate Investment Trusts (REITs) | | | 15,524,380 | | | | — | | | | — | |
Multiline Retail | | | 1,533,788 | | | | — | | | | — | |
Multi-Utilities | | | 3,384,238 | | | | — | | | | — | |
Oil, Gas & Consumable Fuels | | | 18,772,455 | | | | — | | | | — | |
Paper & Forest Products | | | 5,855,376 | | | | — | | | | — | |
Personal Products | | | 6,374,063 | | | | — | | | | — | |
SEE NOTES TO FINANCIAL STATEMENTS.
A166
| | | | | | |
| | |
| | SMALL CAPITALIZATION STOCK PORTFOLIO (continued) | | |
| | | | | | |
| |
| SCHEDULE OF INVESTMENTS | | as of December 31, 2019 |
| | | | | | | | | | | | |
| | | Level 1 | | | Level 2 | | | Level 3 | |
Investments in Securities (continued) | | | | | | | | | | | | |
Assets (continued) | | | | | | | | | | | | |
Common Stocks (continued) | | | | | | | | | | | | |
Pharmaceuticals | | $ | 8,891,090 | | | $ | — | | | $ | — | |
Professional Services | | | 9,657,659 | | | | — | | | | — | |
Real Estate Management & Development | | | 3,464,990 | | | | — | | | | — | |
Road & Rail | | | 5,208,654 | | | | — | | | | — | |
Semiconductors & Semiconductor Equipment | | | 28,905,569 | | | | — | | | | — | |
Software | | | 19,353,250 | | | | — | | | | — | |
Specialty Retail | | | 30,509,787 | | | | — | | | | — | |
Technology Hardware, Storage & Peripherals | | | 1,943,498 | | | | — | | | | — | |
Textiles, Apparel & Luxury Goods | | | 15,800,038 | | | | — | | | | — | |
Thrifts & Mortgage Finance | | | 14,602,015 | | | | — | | | | — | |
Tobacco | | | 3,121,616 | | | | — | | | | — | |
Trading Companies & Distributors | | | 7,148,198 | | | | — | | | | — | |
Water Utilities | | | 5,988,500 | | | | — | | | | — | |
Wireless Telecommunication Services | | | 2,280,199 | | | | — | | | | — | |
Rights | | | | | | | | | | | | |
Chemicals | | | — | | | | — | | | | 3 | |
Exchange-Traded Fund | | | 5,181,930 | | | | — | | | | — | |
Affiliated Mutual Funds | | | 172,330,040 | | | | — | | | | — | |
U.S. Treasury Obligation | | | — | | | | 249,208 | | | | — | |
| | | | | | | | | | | | |
Total | | $ | 1,000,448,224 | | | $ | 249,208 | | | $ | 3 | |
| | | | | | | | | | | | |
Other Financial Instruments* | | | | | | | | | | | | |
Assets | | | | | | | | | | | | |
Futures Contracts | | $ | 29,769 | | | $ | — | | | $ | — | |
| | | | | | | | | | | | |
| * | Other financial instruments are derivative instruments not reflected in the Schedule of Investments, such as futures, forwards and centrally cleared swap contracts, which are recorded at the unrealized appreciation (depreciation) on the instrument, and OTC swap contracts which are recorded at fair value. |
Industry Classification:
The industry classification of investments and liabilities in excess of other assets shown as a percentage of net assets as of December 31, 2019 were as follows (unaudited):
| | | | |
Affiliated Mutual Funds (20.4% represents investments purchased with collateral from securities on loan) | | | 20.7 | % |
Banks | | | 9.6 | |
Equity Real Estate Investment Trusts (REITs) | | | 6.9 | |
Machinery | | | 5.8 | |
Electronic Equipment, Instruments & Components | | | 4.3 | |
Specialty Retail | | | 3.7 | |
Semiconductors & Semiconductor Equipment | | | 3.5 | |
Health Care Providers & Services | | | 3.2 | |
Health Care Equipment & Supplies | | | 3.2 | |
Chemicals | | | 2.9 | |
Biotechnology | | | 2.7 | |
Insurance | | | 2.6 | |
Household Durables | | | 2.4 | |
Software | | | 2.3 | |
Oil, Gas & Consumable Fuels | | | 2.3 | |
IT Services | | | 2.1 | |
Commercial Services & Supplies | | | 2.1 | |
Building Products | | | 2.0 | |
Energy Equipment & Services | | | 1.9 | |
Textiles, Apparel & Luxury Goods | | | 1.9 | |
Mortgage Real Estate Investment Trusts (REITs) | | | 1.9 | |
Auto Components | | | 1.8 | |
Thrifts & Mortgage Finance | | | 1.8 | |
| | | | |
Food Products | | | 1.7 | % |
Aerospace & Defense | | | 1.6 | |
Hotels, Restaurants & Leisure | | | 1.5 | |
Metals & Mining | | | 1.2 | |
Professional Services | | | 1.2 | |
Communications Equipment | | | 1.1 | |
Health Care Technology | | | 1.1 | |
Pharmaceuticals | | | 1.1 | |
Diversified Telecommunication Services | | | 1.0 | |
Airlines | | | 0.9 | |
Trading Companies & Distributors | | | 0.9 | |
Construction & Engineering | | | 0.8 | |
Capital Markets | | | 0.8 | |
Life Sciences Tools & Services | | | 0.8 | |
Personal Products | | | 0.8 | |
Water Utilities | | | 0.7 | |
Diversified Consumer Services | | | 0.7 | |
Paper & Forest Products | | | 0.7 | |
Gas Utilities | | | 0.7 | |
Air Freight & Logistics | | | 0.6 | |
Road & Rail | | | 0.6 | |
Exchange-Traded Fund | | | 0.6 | |
Food & Staples Retailing | | | 0.6 | |
Consumer Finance | | | 0.5 | |
SEE NOTES TO FINANCIAL STATEMENTS.
A167
| | | | | | |
| | |
| | SMALL CAPITALIZATION STOCK PORTFOLIO (continued) | | |
| | | | | | |
| |
| SCHEDULE OF INVESTMENTS | | as of December 31, 2019 |
| | | | |
Industry Classification (continued): | | | |
Household Products | | | 0.5 | % |
Electrical Equipment | | | 0.5 | |
Media | | | 0.4 | |
Real Estate Management & Development | | | 0.4 | |
Multi-Utilities | | | 0.4 | |
Leisure Products | | | 0.4 | |
Tobacco | | | 0.4 | |
Internet & Direct Marketing Retail | | | 0.4 | |
Electric Utilities | | | 0.3 | |
Beverages | | | 0.3 | |
Wireless Telecommunication Services | | | 0.3 | |
Technology Hardware, Storage & Peripherals | | | 0.2 | |
Automobiles | | | 0.2 | |
Marine | | | 0.2 | |
Multiline Retail | | | 0.2 | |
| | | | |
Entertainment | | | 0.2 | % |
Diversified Financial Services | | | 0.2 | |
Distributors | | | 0.2 | |
Industrial Conglomerates | | | 0.2 | |
Interactive Media & Services | | | 0.1 | |
Construction Materials | | | 0.1 | |
Containers & Packaging | | | 0.1 | |
U.S. Treasury Obligation | | | 0.0 | * |
| | | | |
| | | 120.0 | |
Liabilities in excess of other assets | | | (20.0 | ) |
| | | | |
| | | 100.0 | % |
| | | | |
Effects of Derivative Instruments on the Financial Statements and Primary Underlying Risk Exposure:
The Portfolio invested in derivative instruments during the reporting period. The primary type of risk associated with these derivative instruments is equity contracts risk. See the Notes to Financial Statements for additional detail regarding these derivative instruments and their risks. The effect of such derivative instruments on the Portfolio’s financial position and financial performance as reflected in the Statement of Assets and Liabilities and Statement of Operations is presented in the summary below.
Fair values of derivative instruments as of December 31, 2019 as presented in the Statement of Assets and Liabilities:
| | | | | | | | | | | | |
| | | Asset Derivatives | | | Liability Derivatives | |
Derivatives not accounted for as hedging
instruments, carried at fair value | | Statement of
Assets and
Liabilities Location | | Fair Value | | | Statement of
Assets and
Liabilities Location | | Fair Value | |
Equity contracts | | Due from/to broker — variation margin futures | | $ | 29,769 | * | | — | | $ | — | |
Equity contracts | | Unaffiliated investments | | | 3 | | | — | | | — | |
| | | | | | | | | | | | |
| | | | $ | 29,772 | | | | | $ | — | |
| | | | | | | | | | | | |
| * | Includes cumulative appreciation (depreciation) as reported in the schedule of open futures and centrally cleared swap contracts. Only unsettled variation margin receivable (payable) is reported within the Statement of Assets and Liabilities. |
The effects of derivative instruments on the Statement of Operations for the year ended December 31, 2019 are as follows:
| | | | |
Amount of Realized Gain (Loss) on Derivatives Recognized in Income | |
Derivatives not accounted for as hedging
instruments, carried at fair value | | Futures | |
Equity contracts | | $ | 450,466 | |
| | | | |
| | | | | | | | |
Change in Unrealized Appreciation (Depreciation) on Derivatives Recognized in Income | |
Derivatives not accounted for as hedging
instruments, carried at fair value | | Rights(1) | | | Futures | |
Equity contracts | | $ | (16,987 | ) | | $ | 79,009 | |
| | | | | | | | |
| (1) | Included in net change in unrealized appreciation (depreciation) on investments in the Statement of Operations. |
SEE NOTES TO FINANCIAL STATEMENTS.
A168
| | | | | | |
| | |
| | SMALL CAPITALIZATION STOCK PORTFOLIO (continued) | | |
| | | | | | |
| |
| SCHEDULE OF INVESTMENTS | | as of December 31, 2019 |
For the year ended December 31, 2019, the Portfolio’s average volume of derivative activities is as follows:
|
Futures
Contracts—
Long
Positions(1) |
| $3,405,857 |
| (1) | Notional Amount in USD. |
Financial Instruments/Transactions—Summary of Offsetting and Netting Arrangements:
The Portfolio entered into financial instruments/transactions during the reporting period that are either offset in accordance with current requirements or are subject to enforceable master netting arrangements or similar agreements that permit offsetting. The information about offsetting and related netting arrangements for financial instruments/transactions where the legal right toset-off exists is presented in the summary below.
Offsetting of financial instrument/transaction assets and liabilities:
| | | | | | | | | | | | |
Description | | Gross Market
Value of
Recognized
Assets/(Liabilities) | | | Collateral
Pledged/(Received)(1) | | | Net
Amount | |
Securities on Loan | | $ | 167,377,227 | | | $ | (167,377,227 | ) | | $ | — | |
| | | | | | | | | | | | |
| (1) | Collateral amount disclosed by the Portfolio is limited to the market value of financial instruments/transactions. |
SEE NOTES TO FINANCIAL STATEMENTS.
A169
| | | | | | |
| | |
| | SMALL CAPITALIZATION STOCK PORTFOLIO (continued) | | |
STATEMENT OF ASSETS AND LIABILITIES
as of December 31, 2019
| | | | |
| ASSETS | | | | |
Investments at value, including securities on loan of $167,377,227: | | | | |
Unaffiliated investments (cost $559,158,907) | | $ | 828,367,395 | |
Affiliated investments (cost $172,296,320) | | | 172,330,040 | |
Receivable for investments sold | | | 5,034,768 | |
Dividends receivable | | | 1,102,888 | |
Receivable for Portfolio shares sold | | | 17,730 | |
Due from broker-variation margin futures | | | 4,942 | |
Tax reclaim receivable | | | 1,318 | |
Prepaid expenses | | | 5,613 | |
| | | | |
Total Assets | | | 1,006,864,694 | |
| | | | |
| LIABILITIES | | | | |
Payable to broker for collateral for securities on loan | | | 170,153,850 | |
Payable for investments purchased | | | 2,059,809 | |
Accrued expenses and other liabilities | | | 342,382 | |
Management fee payable | | | 245,326 | |
Payable for Portfolio shares repurchased | | | 100,039 | |
Payable to affiliate | | | 1,318 | |
Affiliated transfer agent fee payable | | | 980 | |
| | | | |
Total Liabilities | | | 172,903,704 | |
| | | | |
| NET ASSETS | | $ | 833,960,990 | |
| | | | |
Net assets were comprised of: | | | | |
Partners’ Equity | | $ | 833,960,990 | |
| | | | |
| Net asset value and redemption price per share, $833,960,990 / 19,379,341 outstanding shares of beneficial interest | | $ | 43.03 | |
| | | | |
STATEMENT OF OPERATIONS
Year Ended December 31, 2019
| | | | |
| NET INVESTMENT INCOME (LOSS) | | | | |
| INCOME | | | | |
Unaffiliated dividend income (net of $4,984 foreign withholding tax) | | $ | 11,561,629 | |
Income from securities lending, net (including affiliated income of $481,229) | | | 626,958 | |
Affiliated dividend income | | | 55,288 | |
Interest income | | | 7,560 | |
| | | | |
Total income | | | 12,251,435 | |
| | | | |
| EXPENSES | | | | |
Management fee | | | 2,778,451 | |
Shareholders’ reports | | | 123,266 | |
Custodian and accounting fees | | | 102,571 | |
Audit fee | | | 25,600 | |
Trustees’ fees | | | 18,330 | |
Legal fees and expenses | | | 14,615 | |
Transfer agent’s fees and expenses (including affiliated expense of $5,882) | | | 10,682 | |
Miscellaneous | | | 20,005 | |
| | | | |
Total expenses | | | 3,093,520 | |
| | | | |
| NET INVESTMENT INCOME (LOSS) | | | 9,157,915 | |
| | | | |
| REALIZED AND UNREALIZED GAIN (LOSS) ON INVESTMENT TRANSACTIONS | | | | |
Net realized gain (loss) on: | | | | |
Investment transactions (including affiliated of $(833)) | | | 50,879,160 | |
Futures transactions | | | 450,466 | |
| | | | |
| | | 51,329,626 | |
| | | | |
Net change in unrealized appreciation (depreciation) on: | | | | |
Investments (including affiliated of $43,448) | | | 98,285,102 | |
Futures | | | 79,009 | |
| | | | |
| | | 98,364,111 | |
| | | | |
| NET GAIN (LOSS) ON INVESTMENT TRANSACTIONS | | | 149,693,737 | |
| | | | |
| NET INCREASE (DECREASE) IN NET ASSETS RESULTING FROM OPERATIONS | | $ | 158,851,652 | |
| | | | |
STATEMENTS OF CHANGES IN NET ASSETS
| | | | | | | | |
| | | Year Ended
December 31, 2019 | | | Year Ended
December 31, 2018 | |
| INCREASE (DECREASE) IN NET ASSETS | | | | | | | | |
| OPERATIONS | | | | | | | | |
Net investment income (loss) | | $ | 9,157,915 | | | $ | 8,573,028 | |
Net realized gain (loss) on investment transactions | | | 51,329,626 | | | | 85,710,946 | |
Net change in unrealized appreciation (depreciation) on investments | | | 98,364,111 | | | | (162,215,890 | ) |
| | | | | | | | |
NET INCREASE (DECREASE) IN NET ASSETS RESULTING FROM OPERATIONS | | | 158,851,652 | | | | (67,931,916 | ) |
| | | | | | | | |
| PORTFOLIO SHARE TRANSACTIONS | | | | | | | | |
Portfolio shares sold [457,311 and 490,945 shares, respectively] | | | 18,453,240 | | | | 20,132,914 | |
Portfolio shares repurchased [1,807,785 and 1,834,501 shares, respectively] | | | (71,967,512 | ) | | | (73,623,277 | ) |
| | | | | | | | |
NET INCREASE (DECREASE) IN NET ASSETS FROM PORTFOLIO SHARE TRANSACTIONS | | | (53,514,272 | ) | | | (53,490,363 | ) |
| | | | | | | | |
| CAPITAL CONTRIBUTIONS | | | — | | | | 57 | |
| | | | | | | | |
| TOTAL INCREASE (DECREASE) | | | 105,337,380 | | | | (121,422,222 | ) |
| NET ASSETS: | | | | | | | | |
Beginning of year | | | 728,623,610 | | | | 850,045,832 | |
| | | | | | | | |
End of year | | $ | 833,960,990 | | | $ | 728,623,610 | |
| | | | | | | | |
SEE NOTES TO FINANCIAL STATEMENTS.
A170
| | | | | | |
| |
| SCHEDULE OF INVESTMENTS | | as of December 31, 2019 |
| | | | | | | | |
| LONG-TERM INVESTMENTS — 97.9% | |
| COMMON STOCKS — 97.6% | | Shares | | | Value | |
Aerospace & Defense — 2.4% | |
Arconic, Inc. | | | 69,992 | | | $ | 2,153,654 | |
Boeing Co. (The) | | | 92,236 | | | | 30,046,799 | |
General Dynamics Corp. | | | 41,300 | | | | 7,283,255 | |
Huntington Ingalls Industries, Inc. | | | 7,600 | | | | 1,906,688 | |
L3Harris Technologies, Inc. | | | 38,180 | | | | 7,554,677 | |
Lockheed Martin Corp. | | | 42,958 | | | | 16,726,986 | |
Northrop Grumman Corp. | | | 27,326 | | | | 9,399,324 | |
Raytheon Co. | | | 48,318 | | | | 10,617,397 | |
Textron, Inc. | | | 41,450 | | | | 1,848,670 | |
TransDigm Group, Inc. | | | 8,400 | | | | 4,704,000 | |
United Technologies Corp. | | | 140,467 | | | | 21,036,338 | |
| | | | | | | | |
| | | | | | | 113,277,788 | |
| | | | | | | | |
Air Freight & Logistics — 0.5% | |
C.H. Robinson Worldwide, Inc.(a) | | | 24,100 | | | | 1,884,620 | |
Expeditors International of Washington, Inc. | | | 30,100 | | | | 2,348,402 | |
FedEx Corp. | | | 41,640 | | | | 6,296,384 | |
United Parcel Service, Inc. (Class B Stock) | | | 120,000 | | | | 14,047,200 | |
| | | | | | | | |
| | | | | | | 24,576,606 | |
| | | | | | | | |
Airlines — 0.4% | |
Alaska Air Group, Inc.(a) | | | 21,200 | | | | 1,436,300 | |
American Airlines Group, Inc.(a) | | | 70,100 | | | | 2,010,468 | |
Delta Air Lines, Inc. | | | 100,300 | | | | 5,865,544 | |
Southwest Airlines Co. | | | 84,637 | | | | 4,568,705 | |
United Airlines Holdings, Inc.* | | | 38,800 | | | | 3,417,892 | |
| | | | | | | | |
| | | | | | | 17,298,909 | |
| | | | | | | | |
Auto Components — 0.1% | |
Aptiv PLC | | | 44,300 | | | | 4,207,171 | |
BorgWarner, Inc. | | | 35,500 | | | | 1,539,990 | |
| | | | | | | | |
| | | | | | | 5,747,161 | |
| | | | | | | | |
Automobiles — 0.3% | |
Ford Motor Co. | | | 669,159 | | | | 6,223,179 | |
General Motors Co. | | | 219,700 | | | | 8,041,020 | |
Harley-Davidson, Inc.(a) | | | 28,400 | | | | 1,056,196 | |
| | | | | | | | |
| | | | | | | 15,320,395 | |
| | | | | | | | |
Banks — 5.6% | |
Bank of America Corp. | | | 1,419,282 | | | | 49,987,112 | |
Citigroup, Inc. | | | 385,022 | | | | 30,759,408 | |
Citizens Financial Group, Inc. | | | 77,400 | | | | 3,143,214 | |
Comerica, Inc. | | | 25,850 | | | | 1,854,737 | |
Fifth Third Bancorp | | | 128,849 | | | | 3,960,818 | |
First Republic Bank | | | 28,000 | | | | 3,288,600 | |
Huntington Bancshares, Inc.(a) | | | 183,075 | | | | 2,760,771 | |
JPMorgan Chase & Co. | | | 546,695 | | | | 76,209,283 | |
KeyCorp. | | | 177,600 | | | | 3,594,624 | |
M&T Bank Corp. | | | 23,700 | | | | 4,023,075 | |
People’s United Financial, Inc. | | | 72,700 | | | | 1,228,630 | |
PNC Financial Services Group, Inc. (The) | | | 77,193 | | | | 12,322,319 | |
Regions Financial Corp. | | | 176,712 | | | | 3,032,378 | |
SVB Financial Group* | | | 9,300 | | | | 2,334,672 | |
| | | | | | | | |
COMMON STOCKS
(continued) | | Shares | | | Value | |
Banks (continued) | | | | | | | | |
Truist Financial Corp. | | | 231,626 | | | $ | 13,045,176 | |
U.S. Bancorp | | | 249,181 | | | | 14,773,941 | |
Wells Fargo & Co. | | | 674,676 | | | | 36,297,569 | |
Zions Bancorp NA(a) | | | 31,700 | | | | 1,645,864 | |
| | | | | | | | |
| | | | | | | 264,262,191 | |
| | | | | | | | |
Beverages — 1.7% | |
Brown-Forman Corp. (Class B Stock)(a) | | | 29,825 | | | | 2,016,170 | |
Coca-Cola Co. (The) | | | 665,650 | | | | 36,843,727 | |
Constellation Brands, Inc. (Class A Stock) | | | 28,500 | | | | 5,407,875 | |
Molson Coors Brewing Co. (Class B Stock)(a) | | | 32,300 | | | | 1,740,970 | |
Monster Beverage Corp.* | | | 68,300 | | | | 4,340,465 | |
PepsiCo, Inc. | | | 241,994 | | | | 33,073,320 | |
| | | | | | | | |
| | | | | | | 83,422,527 | |
| | | | | | | | |
Biotechnology — 2.0% | |
AbbVie, Inc.(a) | | | 256,500 | | | | 22,710,510 | |
Alexion Pharmaceuticals, Inc.* | | | 38,700 | | | | 4,185,405 | |
Amgen, Inc. | | | 104,144 | | | | 25,105,994 | |
Biogen, Inc.* | | | 32,415 | | | | 9,618,503 | |
Gilead Sciences, Inc. | | | 220,400 | | | | 14,321,592 | |
Incyte Corp.* | | | 30,500 | | | | 2,663,260 | |
Regeneron Pharmaceuticals, Inc.* | | | 13,630 | | | | 5,117,792 | |
Vertex Pharmaceuticals, Inc.* | | | 44,400 | | | | 9,721,380 | |
| | | | | | | | |
| | | | | | | 93,444,436 | |
| | | | | | | | |
Building Products — 0.3% | |
A.O. Smith Corp. | | | 24,800 | | | | 1,181,472 | |
Allegion PLC | | | 16,533 | | | | 2,059,020 | |
Fortune Brands Home & Security, Inc. | | | 25,100 | | | | 1,640,034 | |
Johnson Controls International PLC | | | 139,115 | | | | 5,663,371 | |
Masco Corp. | | | 52,530 | | | | 2,520,915 | |
| | | | | | | | |
| | | | | | | 13,064,812 | |
| | | | | | | | |
Capital Markets — 2.7% | |
Ameriprise Financial, Inc. | | | 23,350 | | | | 3,889,643 | |
Bank of New York Mellon Corp. (The) | | | 150,349 | | | | 7,567,065 | |
BlackRock, Inc. | | | 20,540 | | | | 10,325,458 | |
Cboe Global Markets, Inc. | | | 19,300 | | | | 2,316,000 | |
Charles Schwab Corp. (The) | | | 202,600 | | | | 9,635,656 | |
CME Group, Inc. | | | 61,510 | | | | 12,346,287 | |
E*TRADE Financial Corp. | | | 41,210 | | | | 1,869,698 | |
Franklin Resources, Inc. | | | 50,800 | | | | 1,319,784 | |
Goldman Sachs Group, Inc. (The) | | | 56,720 | | | | 13,041,630 | |
Intercontinental Exchange, Inc. | | | 97,990 | | | | 9,068,974 | |
Invesco Ltd. | | | 70,800 | | | | 1,272,984 | |
MarketAxess Holdings, Inc. | | | 6,300 | | | | 2,388,393 | |
Moody’s Corp. | | | 28,420 | | | | 6,747,192 | |
Morgan Stanley | | | 220,610 | | | | 11,277,583 | |
MSCI, Inc. | | | 14,600 | | | | 3,769,428 | |
Nasdaq, Inc. | | | 20,100 | | | | 2,152,710 | |
Northern Trust Corp. | | | 37,500 | | | | 3,984,000 | |
Raymond James Financial, Inc. | | | 22,600 | | | | 2,021,796 | |
S&P Global, Inc. | | | 42,880 | | | | 11,708,384 | |
State Street Corp. | | | 65,575 | | | | 5,186,983 | |
SEE NOTES TO FINANCIAL STATEMENTS.
A171
| | | | | | |
| | |
| | STOCK INDEX PORTFOLIO (continued) | | |
| | | | | | |
| |
| SCHEDULE OF INVESTMENTS | | as of December 31, 2019 |
| | | | | | | | |
COMMON STOCKS
(continued) | | Shares | | | Value | |
Capital Markets (continued) | |
T. Rowe Price Group, Inc. | | | 41,100 | | | $ | 5,007,624 | |
| | | | | | | | |
| | | | | | | 126,897,272 | |
| | | | | | | | |
Chemicals — 1.8% | |
Air Products & Chemicals, Inc. | | | 37,800 | | | | 8,882,622 | |
Albemarle Corp.(a) | | | 17,800 | | | | 1,300,112 | |
Celanese Corp. | | | 21,400 | | | | 2,634,768 | |
CF Industries Holdings, Inc. | | | 39,800 | | | | 1,900,052 | |
Corteva, Inc. | | | 130,656 | | | | 3,862,191 | |
Dow, Inc. | | | 129,122 | | | | 7,066,847 | |
DuPont de Nemours, Inc. | | | 129,056 | | | | 8,285,395 | |
Eastman Chemical Co. | | | 24,400 | | | | 1,933,944 | |
Ecolab, Inc. | | | 43,600 | | | | 8,414,364 | |
FMC Corp. | | | 23,150 | | | | 2,310,833 | |
International Flavors & Fragrances,
Inc.(a) | | | 17,640 | | | | 2,275,913 | |
Linde PLC (United Kingdom) | | | 93,500 | | | | 19,906,150 | |
LyondellBasell Industries NV (Class A Stock) | | | 44,800 | | | | 4,232,704 | |
Mosaic Co. (The) | | | 60,800 | | | | 1,315,712 | |
PPG Industries, Inc. | | | 40,800 | | | | 5,446,392 | |
Sherwin-Williams Co. (The) | | | 14,200 | | | | 8,286,268 | |
| | | | | | | | |
| | | | | | | 88,054,267 | |
| | | | | | | | |
Commercial Services & Supplies — 0.4% | |
Cintas Corp. | | | 14,700 | | | | 3,955,476 | |
Copart, Inc.* | | | 35,100 | | | | 3,191,994 | |
Republic Services, Inc. | | | 37,435 | | | | 3,355,299 | |
Rollins, Inc. | | | 24,150 | | | | 800,814 | |
Waste Management, Inc. | | | 67,630 | | | | 7,707,115 | |
| | | | | | | | |
| | | | | | | 19,010,698 | |
| | | | | | | | |
Communications Equipment — 0.9% | |
Arista Networks, Inc.* | | | 9,200 | | | | 1,871,280 | |
Cisco Systems, Inc. | | | 734,975 | | | | 35,249,401 | |
F5 Networks, Inc.* | | | 10,600 | | | | 1,480,290 | |
Juniper Networks, Inc. | | | 59,700 | | | | 1,470,411 | |
Motorola Solutions, Inc. | | | 28,227 | | | | 4,548,499 | |
| | | | | | | | |
| | | | | | | 44,619,881 | |
| | | | | | | | |
Construction & Engineering — 0.1% | |
Jacobs Engineering Group, Inc. | | | 22,300 | | | | 2,003,209 | |
Quanta Services, Inc. | | | 26,200 | | | | 1,066,602 | |
| | | | | | | | |
| | | | | | | 3,069,811 | |
| | | | | | | | |
Construction Materials — 0.1% | |
Martin Marietta Materials, Inc. | | | 10,800 | | | | 3,020,112 | |
Vulcan Materials Co. | | | 22,700 | | | | 3,268,573 | |
| | | | | | | | |
| | | | | | | 6,288,685 | |
| | | | | | | | |
Consumer Finance — 0.7% | |
American Express Co. | | | 117,700 | | | | 14,652,473 | |
Capital One Financial Corp. | | | 82,069 | | | | 8,445,721 | |
Discover Financial Services | | | 55,805 | | | | 4,733,380 | |
Synchrony Financial | | | 105,730 | | | | 3,807,337 | |
| | | | | | | | |
| | | | | | | 31,638,911 | |
| | | | | | | | |
| | | | | | | | |
COMMON STOCKS
(continued) | | Shares | | | Value | |
Containers & Packaging — 0.3% | |
Amcor PLC(a) | | | 271,800 | | | $ | 2,946,312 | |
Avery Dennison Corp. | | | 14,900 | | | | 1,949,218 | |
Ball Corp. | | | 57,800 | | | | 3,737,926 | |
International Paper Co. | | | 70,167 | | | | 3,231,190 | |
Packaging Corp. of America(a) | | | 16,700 | | | | 1,870,233 | |
Sealed Air Corp. | | | 28,620 | | | | 1,139,935 | |
Westrock Co. | | | 43,561 | | | | 1,869,202 | |
| | | | | | | | |
| | | | | | | 16,744,016 | |
| | | | | | | | |
Distributors — 0.1% | |
Genuine Parts Co. | | | 25,325 | | | | 2,690,275 | |
LKQ Corp.* | | | 55,100 | | | | 1,967,070 | |
| | | | | | | | |
| | | | | | | 4,657,345 | |
| | | | | | | | |
Diversified Consumer Services — 0.0% | |
H&R Block, Inc.(a) | | | 35,900 | | | | 842,932 | |
| | | | | | | | |
Diversified Financial Services — 1.6% | |
Berkshire Hathaway, Inc.
(Class B Stock)* | | | 339,160 | | | | 76,819,740 | |
| | | | | | | | |
Diversified Telecommunication Services — 2.0% | |
AT&T, Inc. | | | 1,266,771 | | | | 49,505,411 | |
CenturyLink, Inc.(a) | | | 163,843 | | | | 2,164,366 | |
Verizon Communications, Inc. | | | 717,338 | | | | 44,044,553 | |
| | | | | | | | |
| | | | | | | 95,714,330 | |
| | | | | | | | |
Electric Utilities — 2.0% | |
Alliant Energy Corp. | | | 40,900 | | | | 2,238,048 | |
American Electric Power Co., Inc. | | | 84,740 | | | | 8,008,777 | |
Duke Energy Corp.(a) | | | 125,048 | | | | 11,405,628 | |
Edison International | | | 61,200 | | | | 4,615,092 | |
Entergy Corp. | | | 33,600 | | | | 4,025,280 | |
Evergy, Inc. | | | 40,700 | | | | 2,649,163 | |
Eversource Energy | | | 54,500 | | | | 4,636,315 | |
Exelon Corp. | | | 168,073 | | | | 7,662,448 | |
FirstEnergy Corp. | | | 92,080 | | | | 4,475,088 | |
NextEra Energy, Inc. | | | 84,275 | | | | 20,408,034 | |
Pinnacle West Capital Corp. | | | 19,600 | | | | 1,762,628 | |
PPL Corp. | | | 124,500 | | | | 4,467,060 | |
Southern Co. (The) | | | 179,300 | | | | 11,421,410 | |
Xcel Energy, Inc. | | | 88,695 | | | | 5,631,246 | |
| | | | | | | | |
| | | | | | | 93,406,217 | |
| | | | | | | | |
Electrical Equipment — 0.5% | |
AMETEK, Inc. | | | 40,200 | | | | 4,009,548 | |
Eaton Corp. PLC | | | 73,761 | | | | 6,986,642 | |
Emerson Electric Co. | | | 106,500 | | | | 8,121,690 | |
Rockwell Automation, Inc. | | | 20,820 | | | | 4,219,589 | |
| | | | | | | | |
| | | | | | | 23,337,469 | |
| | | | | | | | |
Electronic Equipment, Instruments & Components — 0.6% | |
Amphenol Corp. (Class A Stock) | | | 51,800 | | | | 5,606,314 | |
CDW Corp. | | | 24,500 | | | | 3,499,580 | |
Corning, Inc. | | | 137,200 | | | | 3,993,892 | |
FLIR Systems, Inc. | | | 24,100 | | | | 1,254,887 | |
IPG Photonics Corp.* | | | 6,200 | | | | 898,504 | |
Keysight Technologies, Inc.*(a) | | | 32,700 | | | | 3,356,001 | |
TE Connectivity Ltd. | | | 58,400 | | | | 5,597,056 | |
SEE NOTES TO FINANCIAL STATEMENTS.
A172
| | | | | | |
| | |
| | STOCK INDEX PORTFOLIO (continued) | | |
| | | | | | |
| |
| SCHEDULE OF INVESTMENTS | | as of December 31, 2019 |
| | | | | | | | |
COMMON STOCKS
(continued) | | Shares | | | Value | |
Electronic Equipment, Instruments & Components (continued) | |
Zebra Technologies Corp. (Class A Stock)* | | | 8,400 | | | $ | 2,145,696 | |
| | | | | | | | |
| | | | | | | 26,351,930 | |
| | | | | | | | |
Energy Equipment & Services — 0.4% | |
Baker Hughes Co. | | | 108,348 | | | | 2,776,959 | |
Halliburton Co.(a) | | | 150,200 | | | | 3,675,394 | |
Helmerich & Payne, Inc. | | | 18,900 | | | | 858,627 | |
National Oilwell Varco, Inc. | | | 66,200 | | | | 1,658,310 | |
Schlumberger Ltd. | | | 237,498 | | | | 9,547,420 | |
TechnipFMC PLC (United Kingdom) | | | 74,200 | | | | 1,590,848 | |
| | | | | | | | |
| | | | | | | 20,107,558 | |
| | | | | | | | |
Entertainment — 1.8% | |
Activision Blizzard, Inc. | | | 131,700 | | | | 7,825,614 | |
Electronic Arts, Inc.* | | | 51,000 | | | | 5,483,010 | |
Live Nation Entertainment, Inc.* | | | 20,500 | | | | 1,465,135 | |
Netflix, Inc.* | | | 75,390 | | | | 24,393,942 | |
Take-Two Interactive Software, Inc.* | | | 19,500 | | | | 2,387,385 | |
Walt Disney Co. (The) | | | 311,072 | | | | 44,990,344 | |
| | | | | | | | |
| | | | | | | 86,545,430 | |
| | | | | | | | |
Equity Real Estate Investment Trusts (REITs) — 2.8% | |
Alexandria Real Estate Equities, Inc. | | | 18,980 | | | | 3,066,788 | |
American Tower Corp. | | | 76,500 | | | | 17,581,230 | |
Apartment Investment & Management Co. (Class A Stock) | | | 27,387 | | | | 1,414,539 | |
AvalonBay Communities, Inc. | | | 23,718 | | | | 4,973,665 | |
Boston Properties, Inc. | | | 24,900 | | | | 3,432,714 | |
Crown Castle International Corp. | | | 71,700 | | | | 10,192,155 | |
Digital Realty Trust, Inc.(a) | | | 35,400 | | | | 4,238,796 | |
Duke Realty Corp. | | | 62,200 | | | | 2,156,474 | |
Equinix, Inc. | | | 14,665 | | | | 8,559,960 | |
Equity Residential | | | 60,300 | | | | 4,879,476 | |
Essex Property Trust, Inc. | | | 11,370 | | | | 3,420,778 | |
Extra Space Storage, Inc. | | | 22,000 | | | | 2,323,640 | |
Federal Realty Investment Trust | | | 12,400 | | | | 1,596,252 | |
Healthpeak Properties, Inc. | | | 82,300 | | | | 2,836,881 | |
Host Hotels & Resorts, Inc. | | | 127,426 | | | | 2,363,752 | |
Iron Mountain, Inc.(a) | | | 49,230 | | | | 1,568,960 | |
Kimco Realty Corp. | | | 71,800 | | | | 1,486,978 | |
Mid-America Apartment Communities, Inc. | | | 19,500 | | | | 2,571,270 | |
Prologis, Inc. | | | 108,128 | | | | 9,638,530 | |
Public Storage | | | 25,950 | | | | 5,526,312 | |
Realty Income Corp. | | | 54,100 | | | | 3,983,383 | |
Regency Centers Corp. | | | 29,700 | | | | 1,873,773 | |
SBA Communications Corp. | | | 19,530 | | | | 4,706,535 | |
Simon Property Group, Inc. | | | 53,061 | | | | 7,903,967 | |
SL Green Realty Corp. | | | 15,400 | | | | 1,414,952 | |
UDR, Inc. | | | 48,300 | | | | 2,255,610 | |
Ventas, Inc. | | | 64,004 | | | | 3,695,591 | |
Vornado Realty Trust | | | 27,457 | | | | 1,825,890 | |
Welltower, Inc. | | | 69,100 | | | | 5,650,998 | |
Weyerhaeuser Co. | | | 128,930 | | | | 3,893,686 | |
| | | | | | | | |
| | | | | | | 131,033,535 | |
| | | | | | | | |
| | | | | | | | |
COMMON STOCKS
(continued) | | Shares | | | Value | |
Food & Staples Retailing — 1.5% | |
Costco Wholesale Corp. | | | 76,292 | | | $ | 22,423,745 | |
Kroger Co. (The) | | | 137,400 | | | | 3,983,226 | |
Sysco Corp. | | | 88,800 | | | | 7,595,952 | |
Walgreens Boots Alliance, Inc. | | | 131,500 | | | | 7,753,240 | |
Walmart, Inc. | | | 245,600 | | | | 29,187,104 | |
| | | | | | | | |
| | | | | | | 70,943,267 | |
| | | | | | | | |
Food Products — 1.1% | |
Archer-Daniels-Midland Co. | | | 96,838 | | | | 4,488,441 | |
Campbell Soup Co.(a) | | | 31,700 | | | | 1,566,614 | |
Conagra Brands, Inc.(a) | | | 82,800 | | | | 2,835,072 | |
General Mills, Inc. | | | 102,900 | | | | 5,511,324 | |
Hershey Co. (The) | | | 25,400 | | | | 3,733,292 | |
Hormel Foods Corp.(a) | | | 47,500 | | | | 2,142,725 | |
J.M. Smucker Co. (The)(a) | | | 19,600 | | | | 2,040,948 | |
Kellogg Co. | | | 43,700 | | | | 3,022,292 | |
Kraft Heinz Co. (The) | | | 107,137 | | | | 3,442,312 | |
Lamb Weston Holdings, Inc. | | | 25,000 | | | | 2,150,750 | |
McCormick & Co., Inc.(a) | | | 20,800 | | | | 3,530,384 | |
Mondelez International, Inc. (Class A Stock) | | | 249,411 | | | | 13,737,558 | |
Tyson Foods, Inc. (Class A Stock) | | | 50,500 | | | | 4,597,520 | |
| | | | | | | | |
| | | | | | | 52,799,232 | |
| | | | | | | | |
Gas Utilities — 0.0% | |
Atmos Energy Corp. | | | 19,500 | | | | 2,181,270 | |
| | | | | | | | |
Health Care Equipment & Supplies — 3.5% | |
Abbott Laboratories | | | 304,425 | | | | 26,442,355 | |
ABIOMED, Inc.* | | | 7,900 | | | | 1,347,661 | |
Align Technology, Inc.* | | | 12,600 | | | | 3,515,904 | |
Baxter International, Inc. | | | 87,100 | | | | 7,283,302 | |
Becton, Dickinson & Co. | | | 46,949 | | | | 12,768,720 | |
Boston Scientific Corp.* | | | 238,699 | | | | 10,793,969 | |
Cooper Cos., Inc. (The) | | | 8,630 | | | | 2,772,733 | |
Danaher Corp. | | | 110,200 | | | | 16,913,496 | |
DENTSPLY SIRONA, Inc. | | | 39,300 | | | | 2,223,987 | |
Edwards Lifesciences Corp.* | | | 36,050 | | | | 8,410,105 | |
Hologic, Inc.* | | | 47,400 | | | | 2,474,754 | |
IDEXX Laboratories, Inc.* | | | 15,000 | | | | 3,916,950 | |
Intuitive Surgical, Inc.* | | | 19,890 | | | | 11,757,973 | |
Medtronic PLC | | | 232,428 | | | | 26,368,957 | |
ResMed, Inc. | | | 24,800 | | | | 3,843,256 | |
STERIS PLC | | | 13,000 | | | | 1,981,460 | |
Stryker Corp. | | | 55,200 | | | | 11,588,688 | |
Teleflex, Inc. | | | 7,900 | | | | 2,973,876 | |
Varian Medical Systems, Inc.* | | | 15,800 | | | | 2,243,758 | |
Zimmer Biomet Holdings, Inc. | | | 35,286 | | | | 5,281,608 | |
| | | | | | | | |
| | | | | | | 164,903,512 | |
| | | | | | | | |
Health Care Providers & Services — 2.8% | |
AmerisourceBergen Corp. | | | 27,800 | | | | 2,363,556 | |
Anthem, Inc. | | | 44,600 | | | | 13,470,538 | |
Cardinal Health, Inc. | | | 53,075 | | | | 2,684,534 | |
Centene Corp.*(a) | | | 70,900 | | | | 4,457,483 | |
Cigna Corp. | | | 65,852 | | | | 13,466,076 | |
CVS Health Corp. | | | 223,799 | | | | 16,626,028 | |
DaVita, Inc.* | | | 16,800 | | | | 1,260,504 | |
HCA Healthcare, Inc. | | | 46,400 | | | | 6,858,384 | |
SEE NOTES TO FINANCIAL STATEMENTS.
A173
| | | | | | |
| | |
| | STOCK INDEX PORTFOLIO (continued) | | |
| | | | | | |
| |
| SCHEDULE OF INVESTMENTS | | as of December 31, 2019 |
| | | | | | | | |
COMMON STOCKS
(continued) | | Shares | | | Value | |
Health Care Providers & Services (continued) | |
Henry Schein, Inc.*(a) | | | 26,500 | | | $ | 1,768,080 | |
Humana, Inc. | | | 23,670 | | | | 8,675,528 | |
Laboratory Corp. of America Holdings* | | | 17,400 | | | | 2,943,558 | |
McKesson Corp. | | | 32,307 | | | | 4,468,704 | |
Quest Diagnostics, Inc. | | | 23,300 | | | | 2,488,207 | |
UnitedHealth Group, Inc. | | | 164,130 | | | | 48,250,937 | |
Universal Health Services, Inc. (Class B Stock) | | | 14,800 | | | | 2,123,208 | |
WellCare Health Plans, Inc.* | | | 8,600 | | | | 2,839,806 | |
| | | | | | | | |
| | | | | | | 134,745,131 | |
| | | | | | | | |
Health Care Technology — 0.1% | |
Cerner Corp. | | | 55,100 | | | | 4,043,789 | |
| | | | | | | | |
Hotels, Restaurants & Leisure — 1.8% | |
Carnival Corp.(a) | | | 68,900 | | | | 3,502,187 | |
Chipotle Mexican Grill, Inc.* | | | 4,440 | | | | 3,716,768 | |
Darden Restaurants, Inc.(a) | | | 21,550 | | | | 2,349,166 | |
Hilton Worldwide Holdings, Inc. | | | 49,700 | | | | 5,512,227 | |
Las Vegas Sands Corp. | | | 57,400 | | | | 3,962,896 | |
Marriott International, Inc. (Class A Stock) | | | 47,723 | | | | 7,226,694 | |
McDonald’s Corp. | | | 131,310 | | | | 25,948,169 | |
MGM Resorts International | | | 86,500 | | | | 2,877,855 | |
Norwegian Cruise Line Holdings Ltd.* | | | 37,500 | | | | 2,190,375 | |
Royal Caribbean Cruises Ltd. | | | 29,800 | | | | 3,978,598 | |
Starbucks Corp. | | | 207,400 | | | | 18,234,608 | |
Wynn Resorts Ltd. | | | 16,000 | | | | 2,221,920 | |
Yum! Brands, Inc. | | | 53,100 | | | | 5,348,763 | |
| | | | | | | | |
| | | | | | | 87,070,226 | |
| | | | | | | | |
Household Durables — 0.4% | |
D.R. Horton, Inc. | | | 59,600 | | | | 3,143,900 | |
Garmin Ltd. | | | 23,900 | | | | 2,331,684 | |
Leggett & Platt, Inc.(a) | | | 22,700 | | | | 1,153,841 | |
Lennar Corp. (Class A Stock) | | | 49,900 | | | | 2,783,921 | |
Mohawk Industries, Inc.* | | | 10,900 | | | | 1,486,542 | |
Newell Brands, Inc. | | | 71,149 | | | | 1,367,484 | |
NVR, Inc.* | | | 570 | | | | 2,170,794 | |
PulteGroup, Inc. | | | 45,185 | | | | 1,753,178 | |
Whirlpool Corp.(a) | | | 10,967 | | | | 1,617,961 | |
| | | | | | | | |
| | | | | | | 17,809,305 | |
| | | | | | | | |
Household Products — 1.7% | |
Church & Dwight Co., Inc. | | | 42,300 | | | | 2,975,382 | |
Clorox Co. (The)(a) | | | 21,900 | | | | 3,362,526 | |
Colgate-Palmolive Co. | | | 148,900 | | | | 10,250,276 | |
Kimberly-Clark Corp.(a) | | | 59,588 | | | | 8,196,329 | |
Procter & Gamble Co. (The) | | | 433,176 | | | | 54,103,683 | |
| | | | | | | | |
| | | | | | | 78,888,196 | |
| | | | | | | | |
Independent Power & Renewable Electricity Producers — 0.1% | |
AES Corp. | | | 113,400 | | | | 2,256,660 | |
NRG Energy, Inc. | | | 46,800 | | | | 1,860,300 | |
| | | | | | | | |
| | | | | | | 4,116,960 | |
| | | | | | | | |
Industrial Conglomerates — 1.3% | |
3M Co. | | | 99,870 | | | | 17,619,065 | |
General Electric Co. | | | 1,504,347 | | | | 16,788,513 | |
| | | | | | | | |
COMMON STOCKS
(continued) | | Shares | | | Value | |
Industrial Conglomerates (continued) | |
Honeywell International, Inc. | | | 124,700 | | | $ | 22,071,900 | |
Roper Technologies, Inc. | | | 17,900 | | | | 6,340,717 | |
| | | | | | | | |
| | | | | | | 62,820,195 | |
| | | | | | | | |
Insurance — 2.1% | |
Aflac, Inc. | | | 129,200 | | | | 6,834,680 | |
Allstate Corp. (The) | | | 57,988 | | | | 6,520,751 | |
American International Group, Inc. | | | 151,529 | | | | 7,777,983 | |
Aon PLC | | | 41,025 | | | | 8,545,097 | |
Arthur J Gallagher & Co. | | | 31,400 | | | | 2,990,222 | |
Assurant, Inc. | | | 9,900 | | | | 1,297,692 | |
Chubb Ltd. | | | 79,230 | | | | 12,332,942 | |
Cincinnati Financial Corp. | | | 26,128 | | | | 2,747,359 | |
Everest Re Group Ltd. | | | 7,000 | | | | 1,937,880 | |
Globe Life, Inc. | | | 17,575 | | | | 1,849,769 | |
Hartford Financial Services Group, Inc. (The) | | | 62,300 | | | | 3,785,971 | |
Lincoln National Corp. | | | 36,263 | | | | 2,139,880 | |
Loews Corp. | | | 46,026 | | | | 2,415,905 | |
Marsh & McLennan Cos., Inc.(a) | | | 87,700 | | | | 9,770,657 | |
MetLife, Inc. | | | 137,980 | | | | 7,032,840 | |
Principal Financial Group, Inc.(a) | | | 45,700 | | | | 2,513,500 | |
Progressive Corp. (The) | | | 100,300 | | | | 7,260,717 | |
Travelers Cos., Inc. (The) | | | 45,698 | | | | 6,258,341 | |
Unum Group | | | 37,456 | | | | 1,092,217 | |
W.R. Berkley Corp. | | | 22,600 | | | | 1,561,660 | |
Willis Towers Watson PLC | | | 22,500 | | | | 4,543,650 | |
| | | | | | | | |
| | | | | | | 101,209,713 | |
| | | | | | | | |
Interactive Media & Services — 4.8% | |
Alphabet, Inc. (Class A Stock)* | | | 51,949 | | | | 69,579,971 | |
Alphabet, Inc. (Class C Stock)* | | | 52,180 | | | | 69,765,704 | |
Facebook, Inc. (Class A Stock)* | | | 416,120 | | | | 85,408,630 | |
Twitter, Inc.* | | | 130,700 | | | | 4,188,935 | |
| | | | | | | | |
| | | | | | | 228,943,240 | |
| | | | | | | | |
Internet & Direct Marketing Retail — 3.3% | |
Amazon.com, Inc.* | | | 72,130 | | | | 133,284,699 | |
Booking Holdings, Inc.*(a) | | | 7,430 | | | | 15,259,214 | |
eBay, Inc. | | | 136,300 | | | | 4,921,793 | |
Expedia Group, Inc. | | | 23,700 | | | | 2,562,918 | |
| | | | | | | | |
| | | | | | | 156,028,624 | |
| | | | | | | | |
IT Services — 5.3% | |
Accenture PLC (Class A Stock) | | | 110,500 | | | | 23,267,985 | |
Akamai Technologies, Inc.* | | | 28,500 | | | | 2,461,830 | |
Alliance Data Systems Corp. | | | 7,610 | | | | 853,842 | |
Automatic Data Processing, Inc. | | | 75,160 | | | | 12,814,780 | |
Broadridge Financial Solutions, Inc. | | | 20,500 | | | | 2,532,570 | |
Cognizant Technology Solutions Corp. (Class A Stock) | | | 96,700 | | | | 5,997,334 | |
DXC Technology Co. | | | 45,350 | | | | 1,704,707 | |
Fidelity National Information Services, Inc. | | | 105,400 | | | | 14,660,086 | |
Fiserv, Inc.* | | | 97,900 | | | | 11,320,177 | |
FleetCor Technologies, Inc.*(a) | | | 15,200 | | | | 4,373,344 | |
Gartner, Inc.* | | | 15,700 | | | | 2,419,370 | |
Global Payments, Inc. | | | 51,463 | | | | 9,395,085 | |
SEE NOTES TO FINANCIAL STATEMENTS.
A174
| | | | | | |
| | |
| | STOCK INDEX PORTFOLIO (continued) | | |
| | | | | | |
| |
| SCHEDULE OF INVESTMENTS | | as of December 31, 2019 |
| | | | | | | | |
COMMON STOCKS
(continued) | | Shares | | | Value | |
IT Services (continued) | | | | | | | | |
International Business Machines Corp. | | | 154,025 | | | $ | 20,645,511 | |
Jack Henry & Associates, Inc. | | | 12,600 | | | | 1,835,442 | |
Leidos Holdings, Inc. | | | 24,200 | | | | 2,368,938 | |
Mastercard, Inc. (Class A Stock) | | | 154,700 | | | | 46,191,873 | |
Paychex, Inc. | | | 55,350 | | | | 4,708,071 | |
PayPal Holdings, Inc.* | | | 202,600 | | | | 21,915,242 | |
VeriSign, Inc.* | | | 18,200 | | | | 3,506,776 | |
Visa, Inc. (Class A Stock)(a) | | | 298,900 | | | | 56,163,310 | |
Western Union Co. (The)(a) | | | 77,404 | | | | 2,072,879 | |
| | | | | | | | |
| | | | | | | 251,209,152 | |
| | | | | | | | |
Leisure Products — 0.0% | | | | | | | | |
Hasbro, Inc. | | | 20,850 | | | | 2,201,968 | |
| | | | | | | | |
Life Sciences Tools & Services — 1.0% | | | | | | | | |
Agilent Technologies, Inc. | | | 54,782 | | | | 4,673,452 | |
Illumina, Inc.* | | | 25,400 | | | | 8,426,196 | |
IQVIA Holdings, Inc.* | | | 31,200 | | | | 4,820,712 | |
Mettler-Toledo International, Inc.* | | | 4,320 | | | | 3,426,970 | |
PerkinElmer, Inc. | | | 19,200 | | | | 1,864,320 | |
Thermo Fisher Scientific, Inc. | | | 69,700 | | | | 22,643,439 | |
Waters Corp.*(a) | | | 11,600 | | | | 2,710,340 | |
| | | | | | | | |
| | | | | | | 48,565,429 | |
| | | | | | | | |
Machinery — 1.6% | | | | | | | | |
Caterpillar, Inc. | | | 97,300 | | | | 14,369,264 | |
Cummins, Inc. | | | 26,600 | | | | 4,760,336 | |
Deere & Co. | | | 54,450 | | | | 9,434,007 | |
Dover Corp. | | | 25,600 | | | | 2,950,656 | |
Flowserve Corp. | | | 22,500 | | | | 1,119,825 | |
Fortive Corp. | | | 50,600 | | | | 3,865,334 | |
IDEX Corp. | | | 12,500 | | | | 2,150,000 | |
Illinois Tool Works, Inc. | | | 51,075 | | | | 9,174,602 | |
Ingersoll-Rand PLC | | | 42,200 | | | | 5,609,224 | |
PACCAR, Inc. | | | 60,128 | | | | 4,756,125 | |
Parker-Hannifin Corp. | | | 22,387 | | | | 4,607,692 | |
Pentair PLC | | | 28,707 | | | | 1,316,790 | |
Snap-on, Inc. | | | 9,900 | | | | 1,677,060 | |
Stanley Black & Decker, Inc. | | | 25,935 | | | | 4,298,467 | |
Westinghouse Air Brake Technologies Corp. | | | 30,212 | | | | 2,350,494 | |
Xylem, Inc. | | | 31,200 | | | | 2,458,248 | |
| | | | | | | | |
| | | | | | | 74,898,124 | |
| | | | | | | | |
Media — 1.4% | | | | | | | | |
Charter Communications, Inc. (Class A Stock)*(a) | | | 28,080 | | | | 13,621,047 | |
Comcast Corp. (Class A Stock) | | | 782,992 | | | | 35,211,150 | |
Discovery, Inc. (Class A Stock)*(a) | | | 26,300 | | | | 861,062 | |
Discovery, Inc. (Class C Stock)* | | | 61,400 | | | | 1,872,086 | |
DISH Network Corp. (Class A Stock)* | | | 45,075 | | | | 1,598,810 | |
Fox Corp. (Class A Stock) | | | 60,466 | | | | 2,241,475 | |
Fox Corp. (Class B Stock) | | | 28,066 | | | | 1,021,602 | |
Interpublic Group of Cos., Inc. (The) | | | 66,762 | | | | 1,542,202 | |
News Corp. (Class A Stock) | | | 63,625 | | | | 899,658 | |
News Corp. (Class B Stock) | | | 19,300 | | | | 280,043 | |
Omnicom Group, Inc.(a) | | | 37,600 | | | | 3,046,352 | |
| | | | | | | | |
COMMON STOCKS
(continued) | | Shares | | | Value | |
Media (continued) | | | | | | | | |
ViacomCBS, Inc. (Class B Stock) | | | 92,666 | | | $ | 3,889,192 | |
| | | | | | | | |
| | | | | | | 66,084,679 | |
| | | | | | | | |
Metals & Mining — 0.3% | | | | | | | | |
Freeport-McMoRan, Inc. | | | 248,512 | | | | 3,260,478 | |
Newmont Goldcorp Corp. | | | 140,503 | | | | 6,104,855 | |
Nucor Corp. | | | 52,800 | | | | 2,971,584 | |
| | | | | | | | |
| | | | | | | 12,336,917 | |
| | | | | | | | |
Multiline Retail — 0.5% | | | | | | | | |
Dollar General Corp. | | | 44,800 | | | | 6,987,904 | |
Dollar Tree, Inc.* | | | 40,647 | | | | 3,822,851 | |
Kohl’s Corp.(a) | | | 28,500 | | | | 1,452,075 | |
Macy’s, Inc.(a) | | | 53,620 | | | | 911,540 | |
Nordstrom, Inc.(a) | | | 20,000 | | | | 818,600 | |
Target Corp. | | | 88,868 | | | | 11,393,766 | |
| | | | | | | | |
| | | | | | | 25,386,736 | |
| | | | | | | | |
Multi-Utilities — 1.0% | | | | | | | | |
Ameren Corp. | | | 42,300 | | | | 3,248,640 | |
CenterPoint Energy, Inc. | | | 85,510 | | | | 2,331,858 | |
CMS Energy Corp. | | | 48,800 | | | | 3,066,592 | |
Consolidated Edison, Inc. | | | 56,700 | | | | 5,129,649 | |
Dominion Energy, Inc.(a) | | | 140,840 | | | | 11,664,369 | |
DTE Energy Co. | | | 31,600 | | | | 4,103,892 | |
NiSource, Inc. | | | 62,000 | | | | 1,726,080 | |
Public Service Enterprise Group, Inc. | | | 86,800 | | | | 5,125,540 | |
Sempra Energy | | | 47,154 | | | | 7,142,888 | |
WEC Energy Group, Inc. | | | 54,576 | | | | 5,033,544 | |
| | | | | | | | |
| | | | | | | 48,573,052 | |
| | | | | | | | |
Oil, Gas & Consumable Fuels — 3.8% | | | | | | | | |
Apache Corp. | | | 64,550 | | | | 1,651,834 | |
Cabot Oil & Gas Corp. | | | 75,300 | | | | 1,310,973 | |
Chevron Corp. | | | 328,262 | | | | 39,558,854 | |
Cimarex Energy Co. | | | 16,600 | | | | 871,334 | |
Concho Resources, Inc. | | | 34,200 | | | | 2,994,894 | |
ConocoPhillips | | | 192,329 | | | | 12,507,155 | |
Devon Energy Corp. | | | 72,800 | | | | 1,890,616 | |
Diamondback Energy, Inc.(a) | | | 26,900 | | | | 2,497,934 | |
EOG Resources, Inc. | | | 99,200 | | | | 8,308,992 | |
Exxon Mobil Corp. | | | 732,604 | | | | 51,121,107 | |
Hess Corp. | | | 44,075 | | | | 2,944,651 | |
HollyFrontier Corp. | | | 26,200 | | | | 1,328,602 | |
Kinder Morgan, Inc. | | | 337,343 | | | | 7,141,551 | |
Marathon Oil Corp. | | | 142,994 | | | | 1,941,858 | |
Marathon Petroleum Corp. | | | 113,887 | | | | 6,861,692 | |
Noble Energy, Inc.(a) | | | 82,700 | | | | 2,054,268 | |
Occidental Petroleum Corp. | | | 155,328 | | | | 6,401,067 | |
ONEOK, Inc.(a) | | | 70,740 | | | | 5,352,896 | |
Phillips 66 | | | 77,864 | | | | 8,674,828 | |
Pioneer Natural Resources Co. | | | 29,400 | | | | 4,450,278 | |
Valero Energy Corp. | | | 72,200 | | | | 6,761,530 | |
Williams Cos., Inc. (The) | | | 208,300 | | | | 4,940,876 | |
| | | | | | | | |
| | | | | | | 181,567,790 | |
| | | | | | | | |
Personal Products — 0.2% | | | | | | | | |
Coty, Inc. (Class A Stock) | | | 56,000 | | | | 630,000 | |
SEE NOTES TO FINANCIAL STATEMENTS.
A175
| | | | | | |
| | |
| | STOCK INDEX PORTFOLIO (continued) | | |
| | | | | | |
| |
| SCHEDULE OF INVESTMENTS | | as of December 31, 2019 |
| | | | | | | | |
COMMON STOCKS
(continued) | | Shares | | | Value | |
Personal Products (continued) | | | | | | | | |
Estee Lauder Cos., Inc. (The) (Class A Stock) | | | 38,100 | | | $ | 7,869,174 | |
| | | | | | | | |
| | | | | | | 8,499,174 | |
| | | | | | | | |
Pharmaceuticals — 4.5% | | | | | | | | |
Allergan PLC | | | 56,256 | | | | 10,754,460 | |
Bristol-Myers Squibb Co. | | | 403,740 | | | | 25,916,071 | |
Eli Lilly & Co. | | | 147,600 | | | | 19,399,068 | |
Johnson & Johnson | | | 457,296 | | | | 66,705,767 | |
Merck & Co., Inc. | | | 443,603 | | | | 40,345,693 | |
Mylan NV* | | | 89,200 | | | | 1,792,920 | |
Perrigo Co. PLC(a) | | | 21,800 | | | | 1,126,188 | |
Pfizer, Inc. | | | 960,123 | | | | 37,617,619 | |
Zoetis, Inc. | | | 82,400 | | | | 10,905,640 | |
| | | | | | | | |
| | | | | | | 214,563,426 | |
| | | | | | | | |
Professional Services — 0.3% | | | | | | | | |
Equifax, Inc. | | | 21,000 | | | | 2,942,520 | |
IHS Markit Ltd.*(a) | | | 67,700 | | | | 5,101,195 | |
Nielsen Holdings PLC | | | 60,500 | | | | 1,228,150 | |
Robert Half International, Inc. | | | 21,600 | | | | 1,364,040 | |
Verisk Analytics, Inc. | | | 28,100 | | | | 4,196,454 | |
| | | | | | | | |
| | | | | | | 14,832,359 | |
| | | | | | | | |
Real Estate Management & Development — 0.1% | | | | | |
CBRE Group, Inc. (Class A Stock)* | | | 57,400 | | | | 3,518,046 | |
| | | | | | | | |
Road & Rail — 1.0% | | | | | | | | |
CSX Corp. | | | 137,172 | | | | 9,925,766 | |
J.B. Hunt Transport Services, Inc.(a) | | | 15,100 | | | | 1,763,378 | |
Kansas City Southern(a) | | | 17,500 | | | | 2,680,300 | |
Norfolk Southern Corp. | | | 45,700 | | | | 8,871,741 | |
Old Dominion Freight Line, Inc. | | | 9,300 | | | | 1,764,954 | |
Union Pacific Corp. | | | 121,400 | | | | 21,947,906 | |
| | | | | | | | |
| | | | | | | 46,954,045 | |
| | | | | | | | |
Semiconductors & Semiconductor Equipment — 4.1% | |
Advanced Micro Devices, Inc.*(a) | | | 185,700 | | | | 8,516,202 | |
Analog Devices, Inc. | | | 63,823 | | | | 7,584,725 | |
Applied Materials, Inc. | | | 161,100 | | | | 9,833,544 | |
Broadcom, Inc. | | | 68,860 | | | | 21,761,137 | |
Intel Corp. | | | 763,500 | | | | 45,695,475 | |
KLA Corp. | | | 27,600 | | | | 4,917,492 | |
Lam Research Corp. | | | 25,100 | | | | 7,339,240 | |
Maxim Integrated Products, Inc. | | | 46,300 | | | | 2,847,913 | |
Microchip Technology, Inc.(a) | | | 40,600 | | | | 4,251,632 | |
Micron Technology, Inc.* | | | 192,700 | | | | 10,363,406 | |
NVIDIA Corp. | | | 105,550 | | | | 24,835,915 | |
Qorvo, Inc.* | | | 21,286 | | | | 2,474,072 | |
QUALCOMM, Inc. | | | 199,450 | | | | 17,597,474 | |
Skyworks Solutions, Inc.(a) | | | 30,400 | | | | 3,674,752 | |
Texas Instruments, Inc. | | | 162,000 | | | | 20,782,980 | |
Xilinx, Inc. | | | 43,600 | | | | 4,262,772 | |
| | | | | | | | |
| | | | | | | 196,738,731 | |
| | | | | | | | |
Software — 6.9% | | | | | | | | |
Adobe, Inc.* | | | 84,275 | | | | 27,794,738 | |
ANSYS, Inc.* | | | 14,500 | | | | 3,732,445 | |
Autodesk, Inc.* | | | 37,770 | | | | 6,929,284 | |
| | | | | | | | |
COMMON STOCKS
(continued) | | Shares | | | Value | |
Software (continued) | | | | | | | | |
Cadence Design Systems, Inc.* | | | 49,000 | | | $ | 3,398,640 | |
Citrix Systems, Inc. | | | 22,100 | | | | 2,450,890 | |
Fortinet, Inc.* | | | 25,400 | | | | 2,711,704 | |
Intuit, Inc. | | | 45,000 | | | | 11,786,850 | |
Microsoft Corp. | | | 1,322,830 | | | | 208,610,291 | |
NortonLifeLock, Inc. | | | 102,411 | | | | 2,613,529 | |
Oracle Corp. | | | 381,495 | | | | 20,211,605 | |
salesforce.com, Inc.* | | | 152,200 | | | | 24,753,808 | |
ServiceNow, Inc.*(a) | | | 32,100 | | | | 9,062,472 | |
Synopsys, Inc.* | | | 25,600 | | | | 3,563,520 | |
| | | | | | | | |
| | | | | | | 327,619,776 | |
| | | | | | | | |
Specialty Retail — 2.2% | | | | | | | | |
Advance Auto Parts, Inc. | | | 12,560 | | | | 2,011,610 | |
AutoZone, Inc.* | | | 4,280 | | | | 5,098,807 | |
Best Buy Co., Inc. | | | 41,425 | | | | 3,637,115 | |
CarMax, Inc.* | | | 29,700 | | | | 2,603,799 | |
Gap, Inc. (The)(a) | | | 37,187 | | | | 657,466 | |
Home Depot, Inc. (The) | | | 189,769 | | | | 41,441,754 | |
L Brands, Inc. | | | 39,696 | | | | 719,291 | |
Lowe’s Cos., Inc. | | | 133,875 | | | | 16,032,870 | |
O’Reilly Automotive, Inc.* | | | 13,360 | | | | 5,855,154 | |
Ross Stores, Inc. | | | 63,200 | | | | 7,357,744 | |
Tiffany & Co. | | | 18,500 | | | | 2,472,525 | |
TJX Cos., Inc. (The) | | | 210,200 | | | | 12,834,812 | |
Tractor Supply Co. | | | 21,200 | | | | 1,980,928 | |
Ulta Beauty, Inc.* | | | 9,900 | | | | 2,506,086 | |
| | | | | | | | |
| | | | | | | 105,209,961 | |
| | | | | | | | |
Technology Hardware, Storage & Peripherals — 4.9% | |
Apple, Inc. | | | 726,475 | | | | 213,329,384 | |
Hewlett Packard Enterprise Co. | | | 232,166 | | | | 3,682,153 | |
HP, Inc. | | | 257,166 | | | | 5,284,761 | |
NetApp, Inc. | | | 41,200 | | | | 2,564,700 | |
Seagate Technology PLC | | | 41,100 | | | | 2,445,450 | |
Western Digital Corp. | | | 50,868 | | | | 3,228,592 | |
Xerox Holdings Corp. | | | 32,902 | | | | 1,213,097 | |
| | | | | | | | |
| | | | | | | 231,748,137 | |
| | | | | | | | |
Textiles, Apparel & Luxury Goods — 0.7% | |
Capri Holdings Ltd.* | | | 26,500 | | | | 1,010,975 | |
Hanesbrands, Inc.(a) | | | 62,100 | | | | 922,185 | |
NIKE, Inc. (Class B Stock) | | | 216,500 | | | | 21,933,615 | |
PVH Corp. | | | 13,300 | | | | 1,398,495 | |
Ralph Lauren Corp. | | | 9,500 | | | | 1,113,590 | |
Tapestry, Inc. | | | 50,300 | | | | 1,356,591 | |
Under Armour, Inc.
(Class A Stock)*(a) | | | 31,200 | | | | 673,920 | |
Under Armour, Inc.
(Class C Stock)*(a) | | | 33,303 | | | | 638,752 | |
VF Corp. | | | 55,744 | | | | 5,555,447 | |
| | | | | | | | |
| | | | | | | 34,603,570 | |
| | | | | | | | |
Tobacco — 0.8% | | | | | | | | |
Altria Group, Inc. | | | 324,900 | | | | 16,215,759 | |
Philip Morris International, Inc. | | | 269,500 | | | | 22,931,755 | |
| | | | | | | | |
| | | | | | | 39,147,514 | |
| | | | | | | | |
Trading Companies & Distributors — 0.2% | |
Fastenal Co.(a) | | | 98,500 | | | | 3,639,575 | |
SEE NOTES TO FINANCIAL STATEMENTS.
A176
| | | | | | |
| | |
| | STOCK INDEX PORTFOLIO (continued) | | |
| | | | | | |
| |
| SCHEDULE OF INVESTMENTS | | as of December 31, 2019 |
| | | | | | | | |
COMMON STOCKS
(continued) | | Shares | | | Value | |
Trading Companies & Distributors (continued) | | | | | |
United Rentals, Inc.* | | | 13,740 | | | $ | 2,291,420 | |
W.W. Grainger, Inc. | | | 8,020 | | | | 2,714,930 | |
| | | | | | | | |
| | | | | | | 8,645,925 | |
| | | | | | | | |
Water Utilities — 0.1% | | | | | | | | |
American Water Works Co., Inc. | | | 31,400 | | | | 3,857,490 | |
| | | | | | | | |
Wireless Telecommunication Services — 0.1% | | | | | |
T-Mobile US, Inc.* | | | 54,200 | | | | 4,250,364 | |
| | | | | | | | |
TOTAL COMMON STOCKS
(cost $1,310,187,518) | | | | 4,643,069,877 | |
| | | | | | | | |
| |
| EXCHANGE-TRADED FUNDS — 0.3% | | | | | |
iShares Core S&P 500 ETF | | | 37,900 | | | | 12,250,796 | |
SPDR S&P 500 ETF Trust | | | 14,000 | | | | 4,506,040 | |
| | | | | | | | |
TOTAL EXCHANGE-TRADED FUNDS
(cost $13,999,285) | | | | 16,756,836 | |
| | | | | | | | |
TOTAL LONG-TERM INVESTMENTS
(cost $1,324,186,803) | | | | 4,659,826,713 | |
| | | | | | | | |
| |
| SHORT-TERM INVESTMENTS — 7.0% | | | | | |
AFFILIATED MUTUAL FUNDS — 6.9% | | | | | |
PGIM Core Ultra Short Bond Fund(w) | | | 88,663,837 | | | | 88,663,837 | |
PGIM Institutional Money Market Fund (cost $238,502,910; includes $238,087,714 of cash collateral for securities on loan)(b)(w) | | | 238,497,036 | | | | 238,544,735 | |
| | | | | | | | |
TOTAL AFFILIATED MUTUAL FUNDS
(cost $327,166,747) | | | | 327,208,572 | |
| | | | | | | | |
| | | | | | | | | | | | |
Interest
Rate | | Maturity
Date | | | Principal
Amount
(000)# | | | | |
|
| U.S. TREASURY OBLIGATION(k)(n) — 0.1% | |
U.S. Treasury Bills | | | | | | | | | |
1.506% | | | 03/19/20 | | | | 4,000 | | | | 3,987,330 | |
| | | | | | | | | | | | |
(cost $3,987,000) | | | | | | | | | |
TOTAL SHORT-TERM INVESTMENTS
(cost $331,153,747) | | | | 331,195,902 | |
| | | | | | | | | | | | |
TOTAL INVESTMENTS — 104.9%
(cost $1,655,340,550) | | | | 4,991,022,615 | |
Liabilities in excess of other assets(z) — (4.9)% | | | | (234,121,615 | ) |
| | | | | | | | | | | | |
NET ASSETS — 100.0% | | | $ | 4,756,901,000 | |
| | | | | | | | | | | | |
See the Glossary for a list of the abbreviation(s) used in the annual report.
| * | Non-income producing security. |
| # | Principal amount is shown in U.S. dollars unless otherwise stated. |
| (a) | All or a portion of security is on loan. The aggregate market value of such securities, including those sold and pending settlement, is $233,681,699; cash collateral of $238,087,714 (included in liabilities) was received with which the Portfolio purchased highly liquid short-term investments. |
| (b) | Represents security purchased with cash collateral received for securities on loan and includes dividend reinvestment. |
| (k) | Represents security, or a portion thereof, segregated as collateral for centrally cleared/exchange-traded derivatives. |
| (n) | Rate shown reflects yield to maturity at purchased date. |
| (w) | PGIM Investments LLC, the manager of the Portfolio, also serves as manager of the PGIM Core Ultra Short Bond Fund and PGIM Institutional Money Market Fund. |
| (z) | Includes net unrealized appreciation/(depreciation) and/or market value of the below holdings which are excluded from the Schedule of Investments: |
Futures contracts outstanding at December 31, 2019:
| | | | | | | | | | | | | | | | |
Number of
Contracts | | Type | | | Expiration
Date | | | Current
Notional
Amount | | | Value /
Unrealized
Appreciation
(Depreciation) | |
Long Positions: | | | | | | | | | | | | | |
| 296 | | | S&P 500 E-Mini Index | | | | Mar. 2020 | | | $ | 47,820,280 | | | $ | 689,941 | |
| 57 | | | S&P 500 Stock Index | | | | Mar. 2020 | | | | 46,043,175 | | | | 579,106 | |
| | | | | | | | | | | | | | | | |
| | | | | | | | | | | | | | $ | 1,269,047 | |
| | | | | | | | | | | | | | | | |
SEE NOTES TO FINANCIAL STATEMENTS.
A177
| | | | | | |
| | |
| | STOCK INDEX PORTFOLIO (continued) | | |
| | | | | | |
| |
| SCHEDULE OF INVESTMENTS | | as of December 31, 2019 |
Summary of Collateral for Centrally Cleared/Exchange-traded Derivatives:
Cash and securities segregated as collateral, including pending settlement for closed positions, to cover requirements for centrally cleared/exchange-traded derivatives are listed by broker as follows:
| | | | | | | | |
Broker | | Cash and/or Foreign Currency | | | Securities Market Value | |
UBS Securities LLC | | $ | — | | | $ | 3,987,330 | |
| | | | | | | | |
Fair Value Measurements:
Various inputs are used in determining the value of the Portfolio’s investments. These inputs are summarized in the three broad levels listed below.
| Level 1— | unadjusted quoted prices generally in active markets for identical securities. |
| Level 2— | quoted prices for similar securities, interest rates and yield curves, prepayment speeds, foreign currency exchange rates and other observable inputs. |
| Level 3— | unobservable inputs for securities valued in accordance with Board approved fair valuation procedures. |
The following is a summary of the inputs used as of December 31, 2019 in valuing such portfolio securities:
| | | | | | | | | | | | |
| | | Level 1 | | | Level 2 | | | Level 3 | |
Investments in Securities | | | | | | | | | | | | |
Assets | | | | | | | | | | | | |
Common Stocks | | | | | | | | | | | | |
Aerospace & Defense | | $ | 113,277,788 | | | $ | — | | | $ | — | |
Air Freight & Logistics | | | 24,576,606 | | | | — | | | | — | |
Airlines | | | 17,298,909 | | | | — | | | | — | |
Auto Components | | | 5,747,161 | | | | — | | | | — | |
Automobiles | | | 15,320,395 | | | | — | | | | — | |
Banks | | | 264,262,191 | | | | — | | | | — | |
Beverages | | | 83,422,527 | | | | — | | | | — | |
Biotechnology | | | 93,444,436 | | | | — | | | | — | |
Building Products | | | 13,064,812 | | | | — | | | | — | |
Capital Markets | | | 126,897,272 | | | | — | | | | — | |
Chemicals | | | 88,054,267 | | | | — | | | | — | |
Commercial Services & Supplies | | | 19,010,698 | | | | — | | | | — | |
Communications Equipment | | | 44,619,881 | | | | — | | | | — | |
Construction & Engineering | | | 3,069,811 | | | | — | | | | — | |
Construction Materials | | | 6,288,685 | | | | — | | | | — | |
Consumer Finance | | | 31,638,911 | | | | — | | | | — | |
Containers & Packaging | | | 16,744,016 | | | | — | | | | — | |
Distributors | | | 4,657,345 | | | | — | | | | — | |
Diversified Consumer Services | | | 842,932 | | | | — | | | | — | |
Diversified Financial Services | | | 76,819,740 | | | | — | | | | — | |
Diversified Telecommunication Services | | | 95,714,330 | | | | — | | | | — | |
Electric Utilities | | | 93,406,217 | | | | — | | | | — | |
Electrical Equipment | | | 23,337,469 | | | | — | | | | — | |
Electronic Equipment, Instruments & Components | | | 26,351,930 | | | | — | | | | — | |
Energy Equipment & Services | | | 20,107,558 | | | | — | | | | — | |
Entertainment | | | 86,545,430 | | | | — | | | | — | |
Equity Real Estate Investment Trusts (REITs) | | | 131,033,535 | | | | — | | | | — | |
Food & Staples Retailing | | | 70,943,267 | | | | — | | | | — | |
Food Products | | | 52,799,232 | | | | — | | | | — | |
Gas Utilities | | | 2,181,270 | | | | — | | | | — | |
Health Care Equipment & Supplies | | | 164,903,512 | | | | — | | | | — | |
Health Care Providers & Services | | | 134,745,131 | | | | — | | | | — | |
Health Care Technology | | | 4,043,789 | | | | — | | | | — | |
Hotels, Restaurants & Leisure | | | 87,070,226 | | | | — | | | | — | |
Household Durables | | | 17,809,305 | | | | — | | | | — | |
Household Products | | | 78,888,196 | | | | — | | | | — | |
Independent Power & Renewable Electricity Producers | | | 4,116,960 | | | | — | | | | — | |
Industrial Conglomerates | | | 62,820,195 | | | | — | | | | — | |
Insurance | | | 101,209,713 | | | | — | | | | — | |
Interactive Media & Services | | | 228,943,240 | | | | — | | | | — | |
SEE NOTES TO FINANCIAL STATEMENTS.
A178
| | | | | | |
| | |
| | STOCK INDEX PORTFOLIO (continued) | | |
| | | | | | |
| |
| SCHEDULE OF INVESTMENTS | | as of December 31, 2019 |
| | | | | | | | | | | | |
| | | Level 1 | | | Level 2 | | | Level 3 | |
Investments in Securities (continued) | | | | | | | | | | | | |
Assets (continued) | | | | | | | | | | | | |
Common Stocks (continued) | | | | | | | | | | | | |
Internet & Direct Marketing Retail | | $ | 156,028,624 | | | $ | — | | | $ | — | |
IT Services | | | 251,209,152 | | | | — | | | | — | |
Leisure Products | | | 2,201,968 | | | | — | | | | — | |
Life Sciences Tools & Services | | | 48,565,429 | | | | — | | | | — | |
Machinery | | | 74,898,124 | | | | — | | | | — | |
Media | | | 66,084,679 | | | | — | | | | — | |
Metals & Mining | | | 12,336,917 | | | | — | | | | — | |
Multiline Retail | | | 25,386,736 | | | | — | | | | — | |
Multi-Utilities | | | 48,573,052 | | | | — | | | | — | |
Oil, Gas & Consumable Fuels | | | 181,567,790 | | | | — | | | | — | |
Personal Products | | | 8,499,174 | | | | — | | | | — | |
Pharmaceuticals | | | 214,563,426 | | | | — | | | | — | |
Professional Services | | | 14,832,359 | | | | — | | | | — | |
Real Estate Management & Development | | | 3,518,046 | | | | — | | | | — | |
Road & Rail | | | 46,954,045 | | | | — | | | | — | |
Semiconductors & Semiconductor Equipment | | | 196,738,731 | | | | — | | | | — | |
Software | | | 327,619,776 | | | | — | | | | — | |
Specialty Retail | | | 105,209,961 | | | | — | | | | — | |
Technology Hardware, Storage & Peripherals | | | 231,748,137 | | | | — | | | | — | |
Textiles, Apparel & Luxury Goods | | | 34,603,570 | | | | — | | | | — | |
Tobacco | | | 39,147,514 | | | | — | | | | — | |
Trading Companies & Distributors | | | 8,645,925 | | | | — | | | | — | |
Water Utilities | | | 3,857,490 | | | | — | | | | — | |
Wireless Telecommunication Services | | | 4,250,364 | | | | — | | | | — | |
Exchange-Traded Funds | | | 16,756,836 | | | | — | | | | — | |
Affiliated Mutual Funds | | | 327,208,572 | | | | — | | | | — | |
U.S. Treasury Obligation | | | — | | | | 3,987,330 | | | | — | |
| | | | | | | | | | | | |
Total | | $ | 4,987,035,285 | | | $ | 3,987,330 | | | $ | — | |
| | | | | | | | | | | | |
Other Financial Instruments* | | | | | | | | | | | | |
Assets | | | | | | | | | | | | |
Futures Contracts | | $ | 1,269,047 | | | $ | — | | | $ | — | |
| | | | | | | | | | | | |
| * | Other financial instruments are derivative instruments not reflected in the Schedule of Investments, such as futures, forwards and centrally cleared swap contracts, which are recorded at the unrealized appreciation (depreciation) on the instrument, and OTC swap contracts which are recorded at fair value. |
Industry Classification:
The industry classification of investments and liabilities in excess of other assets shown as a percentage of net assets as of December 31, 2019 were as follows (unaudited):
| | | | |
Software | | | 6.9 | % |
Affiliated Mutual Funds (5.0% represents investments purchased with collateral from securities on loan) | | | 6.9 | |
Banks | | | 5.6 | |
IT Services | | | 5.3 | |
Technology Hardware, Storage & Peripherals | | | 4.9 | |
Interactive Media & Services | | | 4.8 | |
Pharmaceuticals | | | 4.5 | |
Semiconductors & Semiconductor Equipment | | | 4.1 | |
Oil, Gas & Consumable Fuels | | | 3.8 | |
Health Care Equipment & Supplies | | | 3.5 | |
Internet & Direct Marketing Retail | | | 3.3 | |
Health Care Providers & Services | | | 2.8 | |
Equity Real Estate Investment Trusts (REITs) | | | 2.8 | |
Capital Markets | | | 2.7 | |
Aerospace & Defense | | | 2.4 | |
| | | | |
Specialty Retail | | | 2.2 | % |
Insurance | | | 2.1 | |
Diversified Telecommunication Services | | | 2.0 | |
Biotechnology | | | 2.0 | |
Electric Utilities | | | 2.0 | |
Chemicals | | | 1.8 | |
Hotels, Restaurants & Leisure | | | 1.8 | |
Entertainment | | | 1.8 | |
Beverages | | | 1.7 | |
Household Products | | | 1.7 | |
Diversified Financial Services | | | 1.6 | |
Machinery | | | 1.6 | |
Food & Staples Retailing | | | 1.5 | |
Media | | | 1.4 | |
Industrial Conglomerates | | | 1.3 | |
Food Products | | | 1.1 | |
SEE NOTES TO FINANCIAL STATEMENTS.
A179
| | | | | | |
| | |
| | STOCK INDEX PORTFOLIO (continued) | | |
| | | | | | |
| |
| SCHEDULE OF INVESTMENTS | | as of December 31, 2019 |
| | | | |
Industry Classification (continued): | | | |
Multi-Utilities | | | 1.0 | % |
Life Sciences Tools & Services | | | 1.0 | |
Road & Rail | | | 1.0 | |
Communications Equipment | | | 0.9 | |
Tobacco | | | 0.8 | |
Textiles, Apparel & Luxury Goods | | | 0.7 | |
Consumer Finance | | | 0.7 | |
Electronic Equipment, Instruments & Components | | | 0.6 | |
Multiline Retail | | | 0.5 | |
Air Freight & Logistics | | | 0.5 | |
Electrical Equipment | | | 0.5 | |
Energy Equipment & Services | | | 0.4 | |
Commercial Services & Supplies | | | 0.4 | |
Household Durables | | | 0.4 | |
Airlines | | | 0.4 | |
Exchange-Traded Funds | | | 0.3 | |
Containers & Packaging | | | 0.3 | |
Automobiles | | | 0.3 | |
Professional Services | | | 0.3 | |
Building Products | | | 0.3 | |
Metals & Mining | | | 0.3 | |
Trading Companies & Distributors | | | 0.2 | |
| | | | |
Personal Products | | | 0.2 | % |
Construction Materials | | | 0.1 | |
Auto Components | | | 0.1 | |
Distributors | | | 0.1 | |
Wireless Telecommunication Services | | | 0.1 | |
Independent Power & Renewable Electricity Producers | | | 0.1 | |
Health Care Technology | | | 0.1 | |
U.S. Treasury Obligation | | | 0.1 | |
Water Utilities | | | 0.1 | |
Real Estate Management & Development | | | 0.1 | |
Construction & Engineering | | | 0.1 | |
Leisure Products | | | 0.0 | * |
Gas Utilities | | | 0.0 | * |
Diversified Consumer Services | | | 0.0 | * |
| | | | |
| | | 104.9 | |
Liabilities in excess of other assets | | | (4.9 | ) |
| | | | |
| | | 100.0 | % |
| | | | |
Effects of Derivative Instruments on the Financial Statements and Primary Underlying Risk Exposure:
The Portfolio invested in derivative instruments during the reporting period. The primary type of risk associated with these derivative instruments is equity contracts risk. See the Notes to Financial Statements for additional detail regarding these derivative instruments and their risks. The effect of such derivative instruments on the Portfolio’s financial position and financial performance as reflected in the Statement of Assets and Liabilities and Statement of Operations is presented in the summary below.
Fair values of derivative instruments as of December 31, 2019 as presented in the Statement of Assets and Liabilities:
| | | | | | | | | | | | |
Derivatives not accounted for as hedging
instruments, carried at fair value | | Asset Derivatives | | | Liability Derivatives | |
| | Statement of
Assets and
Liabilities Location | | Fair Value | | | Statement of
Assets and
Liabilities Location | | Fair Value | |
Equity contracts | | Due from/to broker-variation margin futures | | $ | 1,269,047 | * | | — | | $ | — | |
| | | | | | | | | | | | |
| * | Includes cumulative appreciation (depreciation) as reported in the schedule of open futures and centrally cleared swap contracts. Only unsettled variation margin receivable (payable) is reported within the Statement of Assets and Liabilities. |
The effects of derivative instruments on the Statement of Operations for the year ended December 31, 2019 are as follows:
| | |
Amount of Realized Gain (Loss) on Derivatives Recognized in Income |
Derivatives not accounted for as hedging
instruments, carried at fair value | | Futures |
Equity contracts | | $19,908,862 |
| | |
| | |
Change in Unrealized Appreciation (Depreciation) on Derivatives Recognized in Income |
Derivatives not accounted for as hedging
instruments, carried at fair value | | Futures |
Equity contracts | | $4,143,826 |
| | |
SEE NOTES TO FINANCIAL STATEMENTS.
A180
| | | | | | |
| | |
| | STOCK INDEX PORTFOLIO (continued) | | |
| | | | | | |
| |
| SCHEDULE OF INVESTMENTS | | as of December 31, 2019 |
For the year ended December 31, 2019, the Portfolio’s average volume of derivative activities is as follows:
| | | | | | | | |
| | | Futures
Contracts—
Long
Positions(1) | | | | |
| | $ | 93,221,609 | | | | | |
| (1) | Notional Amount in USD. |
Financial Instruments/Transactions—Summary of Offsetting and Netting Arrangements:
The Portfolio entered into financial instruments/transactions during the reporting period that are either offset in accordance with current requirements or are subject to enforceable master netting arrangements or similar agreements that permit offsetting. The information about offsetting and related netting arrangements for financial instruments/transactions where the legal right toset-off exists is presented in the summary below.
Offsetting of financial instrument/transaction assets and liabilities:
| | | | | | | | | | | | |
Description | | Gross Market
Value of
Recognized
Assets/(Liabilities) | | | Collateral
Pledged/(Received)(1) | | | Net
Amount | |
Securities on Loan | | $ | 233,681,699 | | | $ | (233,681,699 | ) | | $ | — | |
| | | | | | | | | | | | |
| (1) | Collateral amount disclosed by the Portfolio is limited to the market value of financial instruments/transactions. |
SEE NOTES TO FINANCIAL STATEMENTS.
A181
| | | | | | |
| | |
| | STOCK INDEX PORTFOLIO (continued) | | |
STATEMENT OF ASSETS AND LIABILITIES
as of December 31, 2019
| | | | |
| ASSETS | | | | |
Investments at value, including securities on loan of $233,681,699: | | | | |
Unaffiliated investments (cost $1,328,173,803) | | $ | 4,663,814,043 | |
Affiliated investments (cost $327,166,747) | | | 327,208,572 | |
Cash | | | 22,366 | |
Dividends and interest receivable | | | 4,748,220 | |
Receivable for investments sold | | | 3,590,382 | |
Due from broker-variation margin futures | | | 223,685 | |
Receivable for Portfolio shares sold | | | 142,318 | |
Prepaid expenses | | | 30,278 | |
| | | | |
Total Assets | | | 4,999,779,864 | |
| | | | |
| LIABILITIES | | | | |
Payable to broker for collateral for securities on loan | | | 238,087,714 | |
Payable for investments purchased | | | 2,669,216 | |
Management fee payable | | | 1,164,283 | |
Accrued expenses and other liabilities | | | 571,871 | |
Payable for Portfolio shares repurchased | | | 384,800 | |
Affiliated transfer agent fee payable | | | 980 | |
| | | | |
Total Liabilities | | | 242,878,864 | |
| | | | |
| NET ASSETS | | $ | 4,756,901,000 | |
| | | | |
Net assets were comprised of: | | | | |
Partners’ Equity | | $ | 4,756,901,000 | |
| | | | |
Net asset value and redemption price per share, $4,756,901,000 / 64,070,473 outstanding shares of beneficial interest | | $ | 74.24 | |
| | | | |
STATEMENT OF OPERATIONS
Year Ended December 31, 2019
| | | | |
| NET INVESTMENT INCOME (LOSS) INCOME | | | | |
Unaffiliated dividend income (net of $10 foreign withholding tax) | | $ | 83,266,153 | |
Affiliated dividend income | | | 2,124,764 | |
Income from securities lending, net (including affiliated income of $379,653) | | | 409,912 | |
Interest income (net of $10 foreign withholding tax) | | | 97,919 | |
| | | | |
Total income | | | 85,898,748 | |
| | | | |
| EXPENSES | | | | |
Management fee | | | 12,745,382 | |
Custodian and accounting fees | | | 256,987 | |
Shareholders’ reports | | | 175,973 | |
Trustees’ fees | | | 58,030 | |
Legal fees and expenses | | | 26,168 | |
Audit fee | | | 25,100 | |
Transfer agent’s fees and expenses (including affiliated expense of $5,882) | | | 10,681 | |
Miscellaneous | | | 76,329 | |
| | | | |
Total expenses | | | 13,374,650 | |
| | | | |
| NET INVESTMENT INCOME (LOSS) | | | 72,524,098 | |
| | | | |
| REALIZED AND UNREALIZED GAIN (LOSS) ON INVESTMENT TRANSACTIONS | | | | |
Net realized gain (loss) on: | | | | |
Investment transactions (including affiliated of $(12,869)) | | | 59,153,534 | |
Futures transactions | | | 19,908,862 | |
| | | | |
| | | 79,062,396 | |
| | | | |
Net change in unrealized appreciation (depreciation) on: | | | | |
Investments (including affiliated of $43,282) | | | 984,819,766 | |
Futures | | | 4,143,826 | |
| | | | |
| | | 988,963,592 | |
| | | | |
| NET GAIN (LOSS) ON INVESTMENT TRANSACTIONS | | | 1,068,025,988 | |
| | | | |
| NET INCREASE (DECREASE) IN NET ASSETS RESULTING FROM OPERATIONS | | $ | 1,140,550,086 | |
| | | | |
STATEMENTS OF CHANGES IN NET ASSETS
| | | | | | | | |
| | | Year Ended
December 31, 2019 | | | Year Ended
December 31, 2018 | |
INCREASE (DECREASE) IN NET ASSETS
OPERATIONS | | | | | | | | |
Net investment income (loss) | | $ | 72,524,098 | | | $ | 66,061,210 | |
Net realized gain (loss) on investment transactions | | | 79,062,396 | | | | 100,320,190 | |
Net change in unrealized appreciation (depreciation) on investments | | | 988,963,592 | | | | (339,473,709 | ) |
| | | | | | | | |
NET INCREASE (DECREASE) IN NET ASSETS RESULTING FROM OPERATIONS | | | 1,140,550,086 | | | | (173,092,309 | ) |
| | | | | | | | |
| PORTFOLIO SHARE TRANSACTIONS | | | | | | | | |
Portfolio shares sold [2,978,605 and 3,148,487 shares, respectively] | | | 192,206,253 | | | | 190,000,727 | |
Portfolio shares repurchased [3,748,907 and 4,457,788 shares, respectively] | | | (248,177,505 | ) | | | (272,872,840 | ) |
| | | | | | | | |
NET INCREASE (DECREASE) IN NET ASSETS FROM PORTFOLIO SHARE TRANSACTIONS | | | (55,971,252 | ) | | | (82,872,113 | ) |
| | | | | | | | |
| TOTAL INCREASE (DECREASE) | | | 1,084,578,834 | | | | (255,964,422 | ) |
| NET ASSETS: | | | | | | | | |
Beginning of year | | | 3,672,322,166 | | | | 3,928,286,588 | |
| | | | | | | | |
End of year | | $ | 4,756,901,000 | | | $ | 3,672,322,166 | |
| | | | | | | | |
SEE NOTES TO FINANCIAL STATEMENTS.
A182
| | | | | | |
| |
| SCHEDULE OF INVESTMENTS | | as of December 31, 2019 |
| | | | | | | | |
| LONG-TERM INVESTMENTS — 97.8% | | | | |
| COMMON STOCKS | | Shares | | | Value | |
Aerospace & Defense — 4.0% | | | | | | | | |
Airbus SE (France) | | | 117,873 | | | $ | 17,279,327 | |
Boeing Co. (The) | | | 49,408 | | | | 16,095,150 | |
United Technologies Corp. | | | 160,919 | | | | 24,099,229 | |
| | | | | | | | |
| | | | | | | 57,473,706 | |
| | | | | | | | |
Banks — 15.3% | | | | | | | | |
Bank of America Corp. | | | 1,261,554 | | | | 44,431,932 | |
Citigroup, Inc. | | | 446,686 | | | | 35,685,744 | |
JPMorgan Chase & Co. | | | 494,230 | | | | 68,895,662 | |
PNC Financial Services Group, Inc. (The) | | | 166,883 | | | | 26,639,533 | |
Truist Financial Corp. | | | 521,133 | | | | 29,350,211 | |
Wells Fargo & Co. | | | 285,034 | | | | 15,334,829 | |
| | | | | | | | |
| | | | | | | 220,337,911 | |
| | | | | | | | |
Beverages — 1.4% | | | | | | | | |
PepsiCo, Inc. | | | 151,559 | | | | 20,713,568 | |
| | | | | | | | |
Building Products — 1.5% | | | | | | | | |
Johnson Controls International PLC | | | 523,094 | | | | 21,295,157 | |
| | | | | | | | |
Capital Markets — 1.5% | | | | | | | | |
Goldman Sachs Group, Inc. (The) | | | 94,779 | | | | 21,792,535 | |
| | | | | | | | |
Chemicals — 4.4% | | | | | | | | |
Dow, Inc. | | | 198,638 | | | | 10,871,458 | |
FMC Corp. | | | 205,946 | | | | 20,557,529 | |
Linde PLC (United Kingdom) | | | 146,712 | | | | 31,234,985 | |
| | | | | | | | |
| | | | | | | 62,663,972 | |
| | | | | | | | |
Communications Equipment — 0.5% | | | | | | | | |
Cisco Systems, Inc. | | | 154,711 | | | | 7,419,940 | |
| | | | | | | | |
Consumer Finance — 2.8% | | | | | | | | |
Capital One Financial Corp. | | | 264,488 | | | | 27,218,460 | |
SLM Corp. | | | 1,526,236 | | | | 13,598,763 | |
| | | | | | | | |
| | | | | | | 40,817,223 | |
| | | | | | | | |
Diversified Telecommunication Services — 3.4% | | | | | |
AT&T, Inc. | | | 460,886 | | | | 18,011,425 | |
Verizon Communications, Inc. | | | 499,296 | | | | 30,656,774 | |
| | | | | | | | |
| | | | | | | 48,668,199 | |
| | | | | | | | |
Electric Utilities — 2.5% | | | | | | | | |
American Electric Power Co., Inc. | | | 375,731 | | | | 35,510,337 | |
| | | | | | | | |
Electrical Equipment — 1.3% | | | | | | | | |
Emerson Electric Co. | | | 241,325 | | | | 18,403,444 | |
| | | | | | | | |
Energy Equipment & Services — 1.0% | | | | | | | | |
Schlumberger Ltd. | | | 352,093 | | | | 14,154,139 | |
| | | | | | | | |
Entertainment — 2.2% | | | | | | | | |
Walt Disney Co. (The) | | | 216,047 | | | | 31,246,878 | |
| | | | | | | | |
Equity Real Estate Investment Trusts (REITs) — 3.1% | |
American Campus Communities, Inc. | | | 284,610 | | | | 13,385,208 | |
American Tower Corp. | | | 65,299 | | | | 15,007,016 | |
Boston Properties, Inc. | | | 114,453 | | | | 15,778,491 | |
| | | | | | | | |
| | | | | | | 44,170,715 | |
| | | | | | | | |
Food & Staples Retailing — 2.5% | | | | | | | | |
Walmart, Inc. | | | 306,505 | | | | 36,425,054 | |
| | | | | | | | |
| | | | | | | | |
COMMON STOCKS
(continued) | | Shares | | | Value | |
Food Products — 3.5% | | | | | | | | |
Conagra Brands, Inc.(a) | | | 424,898 | | | $ | 14,548,507 | |
Danone SA (France), ADR | | | 694,889 | | | | 11,458,720 | |
Mondelez International, Inc.
(Class A Stock) | | | 453,828 | | | | 24,996,846 | |
| | | | | | | | |
| | | | | | | 51,004,073 | |
| | | | | | | | |
Health Care Equipment & Supplies — 1.9% | | | | | |
Zimmer Biomet Holdings, Inc. | | | 181,090 | | | | 27,105,551 | |
| | | | | | | | |
Health Care Providers & Services — 2.5% | | | | | |
Cigna Corp. | | | 78,956 | | | | 16,145,712 | |
Laboratory Corp. of America Holdings* | | | 119,427 | | | | 20,203,466 | |
| | | | | | | | |
| | | | | | | 36,349,178 | |
| | | | | | | | |
Hotels, Restaurants & Leisure — 1.3% | | | | | |
McDonald’s Corp. | | | 91,370 | | | | 18,055,626 | |
| | | | | | | | |
Household Products — 2.0% | | | | | | | | |
Procter & Gamble Co. (The) | | | 229,412 | | | | 28,653,559 | |
| | | | | | | | |
Insurance — 4.3% | | | | | | | | |
Brighthouse Financial, Inc.* | | | 174,560 | | | | 6,847,989 | |
Chubb Ltd. | | | 204,273 | | | | 31,797,135 | |
MetLife, Inc. | | | 452,906 | | | | 23,084,619 | |
| | | | | | | | |
| | | | | | | 61,729,743 | |
| | | | | | | | |
Interactive Media & Services — 1.4% | | | | | | | | |
Alphabet, Inc. (Class A Stock)* | | | 14,567 | | | | 19,510,894 | |
| | | | | | | | |
Media — 2.2% | | | | | | | | |
Comcast Corp. (Class A Stock) | | | 704,041 | | | | 31,660,724 | |
| | | | | | | | |
Multiline Retail — 0.6% | | | | | | | | |
Dollar Tree, Inc.* | | | 98,516 | | | | 9,265,430 | |
| | | | | | | | |
Multi-Utilities — 2.3% | | | | | | | | |
Ameren Corp. | | | 283,577 | | | | 21,778,714 | |
Dominion Energy, Inc. | | | 134,539 | | | | 11,142,520 | |
| | | | | | | | |
| | | | | | | 32,921,234 | |
| | | | | | | | |
Oil, Gas & Consumable Fuels — 7.2% | | | | | | | | |
Chevron Corp. | | | 349,677 | | | | 42,139,575 | |
Noble Energy, Inc.(a) | | | 490,006 | | | | 12,171,749 | |
Royal Dutch Shell PLC (Netherlands) (Class A Stock), ADR(a) | | | 291,383 | | | | 17,185,770 | |
Suncor Energy, Inc. (Canada) | | | 598,657 | | | | 19,635,950 | |
Williams Cos., Inc. (The) | | | 532,531 | | | | 12,631,635 | |
| | | | | | | | |
| | | | | | | 103,764,679 | |
| | | | | | | | |
Pharmaceuticals — 7.2% | | | | | | | | |
AstraZeneca PLC (United Kingdom), ADR | | | 374,613 | | | | 18,678,204 | |
Bristol-Myers Squibb Co. | | | 272,058 | | | | 17,463,403 | |
Elanco Animal Health, Inc.* | | | 249,143 | | | | 7,337,262 | |
Eli Lilly & Co. | | | 152,203 | | | | 20,004,040 | |
Merck & Co., Inc. | | | 196,574 | | | | 17,878,405 | |
Pfizer, Inc. | | | 581,366 | | | | 22,777,920 | |
| | | | | | | | |
| | | | | | | 104,139,234 | |
| | | | | | | | |
Road & Rail — 1.9% | | | | | | | | |
Union Pacific Corp. | | | 148,318 | | | | 26,814,411 | |
| | | | | | | | |
SEE NOTES TO FINANCIAL STATEMENTS.
A183
| | | | | | |
| | |
| | VALUE PORTFOLIO (continued) | | |
| | | | | | |
| |
| SCHEDULE OF INVESTMENTS | | as of December 31, 2019 |
| | | | | | | | |
COMMON STOCKS
(continued) | | Shares | | | Value | |
Semiconductors & Semiconductor Equipment — 3.6% | |
Broadcom, Inc. | | | 59,293 | | | $ | 18,737,774 | |
QUALCOMM, Inc. | | | 182,409 | | | | 16,093,946 | |
Texas Instruments, Inc. | | | 127,540 | | | | 16,362,106 | |
| | | | | | | | |
| | | | | | | 51,193,826 | |
| | | | | | | | |
Software — 2.4% | | | | | | | | |
Microsoft Corp. | | | 137,059 | | | | 21,614,204 | |
SAP SE (Germany), ADR(a) | | | 93,736 | | | | 12,559,687 | |
| | | | | | | | |
| | | | | | | 34,173,891 | |
| | | | | | | | |
Specialty Retail — 3.4% | | | | | | | | |
Advance Auto Parts, Inc. | | | 59,787 | | | | 9,575,486 | |
Lowe’s Cos., Inc. | | | 142,369 | | | | 17,050,112 | |
Ross Stores, Inc. | | | 197,922 | | | | 23,042,079 | |
| | | | | | | | |
| | | | | | | 49,667,677 | |
| | | | | | | | |
Technology Hardware, Storage & Peripherals — 1.5% | |
Apple, Inc. | | | 73,526 | | | | 21,590,910 | |
| | | | | | | | |
Trading Companies & Distributors — 1.2% | | | | | |
United Rentals, Inc.* | | | 108,100 | | | | 18,027,837 | |
| | | | | | | | |
TOTAL LONG-TERM INVESTMENTS(cost $935,147,413) | | | | | | | 1,406,721,255 | |
| | | | | | | | |
SHORT-TERM INVESTMENTS — 4.5% | | | | | |
AFFILIATED MUTUAL FUNDS | | | | | | | | |
PGIM Core Ultra Short Bond Fund(w) | | | 30,863,588 | | | | 30,863,588 | |
| | | | | | | | |
AFFILIATED MUTUAL FUNDS
(continued) | | Shares | | | Value | |
PGIM Institutional Money Market Fund (cost $34,629,439; includes $34,556,822 of cash collateral for securities on loan)(b)(w) | | | 34,632,311 | | | $ | 34,639,237 | |
| | | | | | | | |
TOTAL SHORT-TERM INVESTMENTS
(cost $65,493,027) | | | | | | | 65,502,825 | |
| | | | | | | | |
TOTAL INVESTMENTS — 102.3%
(cost $1,000,640,440) | | | | | | | 1,472,224,080 | |
Liabilities in excess
of other assets — (2.3)% | | | | (33,601,647 | ) |
| | | | | | | | |
NET ASSETS — 100.0% | | | | | | $ | 1,438,622,433 | |
| | | | | | | | |
See the Glossary for a list of the abbreviation(s) used in the annual report.
| * | Non-income producing security. |
| (a) | All or a portion of security is on loan. The aggregate market value of such securities, including those sold and pending settlement, is $34,094,936; cash collateral of $34,556,822 (included in liabilities) was received with which the Portfolio purchased highly liquid short-term investments. |
| (b) | Represents security purchased with cash collateral received for securities on loan and includes dividend reinvestment. |
| (w) | PGIM Investments LLC, the manager of the Portfolio, also serves as manager of the PGIM Core Ultra Short Bond Fund and PGIM Institutional Money Market Fund. |
Fair Value Measurements:
Various inputs are used in determining the value of the Portfolio’s investments. These inputs are summarized in the three broad levels listed below.
| Level 1— | unadjusted quoted prices generally in active markets for identical securities. |
| Level 2— | quoted prices for similar securities, interest rates and yield curves, prepayment speeds, foreign currency exchange rates and other observable inputs. |
| Level 3— | unobservable inputs for securities valued in accordance with Board approved fair valuation procedures. |
The following is a summary of the inputs used as of December 31, 2019 in valuing such portfolio securities:
| | | | | | | | | | | | |
| | | Level 1 | | | Level 2 | | | Level 3 | |
Investments in Securities | | | | | | | | | | | | |
Assets | | | | | | | | | | | | |
Common Stocks | | | | | | | | | | | | |
Aerospace & Defense | | $ | 40,194,379 | | | $ | 17,279,327 | | | $ | — | |
Banks | | | 220,337,911 | | | | — | | | | — | |
Beverages | | | 20,713,568 | | | | — | | | | — | |
Building Products | | | 21,295,157 | | | | — | | | | — | |
Capital Markets | | | 21,792,535 | | | | — | | | | — | |
Chemicals | | | 62,663,972 | | | | — | | | | — | |
Communications Equipment | | | 7,419,940 | | | | — | | | | — | |
Consumer Finance | | | 40,817,223 | | | | — | | | | — | |
Diversified Telecommunication Services | | | 48,668,199 | | | | — | | | | — | |
Electric Utilities | | | 35,510,337 | | | | — | | | | — | |
Electrical Equipment | | | 18,403,444 | | | | — | | | | — | |
Energy Equipment & Services | | | 14,154,139 | | | | — | | | | — | |
Entertainment | | | 31,246,878 | | | | — | | | | — | |
Equity Real Estate Investment Trusts (REITs) | | | 44,170,715 | | | | — | | | | — | |
Food & Staples Retailing | | | 36,425,054 | | | | — | | | | — | |
Food Products | | | 51,004,073 | | | | — | | | | — | |
SEE NOTES TO FINANCIAL STATEMENTS.
A184
| | | | | | |
| | |
| | VALUE PORTFOLIO (continued) | | |
| | | | | | |
| |
| SCHEDULE OF INVESTMENTS | | as of December 31, 2019 |
| | | | | | | | | | | | |
| | | Level 1 | | | Level 2 | | | Level 3 | |
Investments in Securities (continued) | | | | | | | | | | | | |
Assets (continued) | | | | | | | | | | | | |
Common Stocks (continued) | | | | | | | | | | | | |
Health Care Equipment & Supplies | | $ | 27,105,551 | | | $ | — | | | $ | — | |
Health Care Providers & Services | | | 36,349,178 | | | | — | | | | — | |
Hotels, Restaurants & Leisure | | | 18,055,626 | | | | — | | | | — | |
Household Products | | | 28,653,559 | | | | — | | | | — | |
Insurance | | | 61,729,743 | | | | — | | | | — | |
Interactive Media & Services | | | 19,510,894 | | | | — | | | | — | |
Media | | | 31,660,724 | | | | — | | | | — | |
Multiline Retail | | | 9,265,430 | | | | — | | | | — | |
Multi-Utilities | | | 32,921,234 | | | | — | | | | — | |
Oil, Gas & Consumable Fuels | | | 103,764,679 | | | | — | | | | — | |
Pharmaceuticals | | | 104,139,234 | | | | — | | | | — | |
Road & Rail | | | 26,814,411 | | | | — | | | | — | |
Semiconductors & Semiconductor Equipment | | | 51,193,826 | | | | — | | | | — | |
Software | | | 34,173,891 | | | | — | | | | — | |
Specialty Retail | | | 49,667,677 | | | | — | | | | — | |
Technology Hardware, Storage & Peripherals | | | 21,590,910 | | | | — | | | | — | |
Trading Companies & Distributors | | | 18,027,837 | | | | — | | | | — | |
Affiliated Mutual Funds | | | 65,502,825 | | | | — | | | | — | |
| | | | | | | | | | | | |
Total | | $ | 1,454,944,753 | | | $ | 17,279,327 | | | $ | — | |
| | | | | | | | | | | | |
Industry Classification:
The industry classification of investments and liabilities in excess of other assets shown as a percentage of net assets as of December 31, 2019 were as follows (unaudited):
| | | | |
Banks | | | 15.3 | % |
Pharmaceuticals | | | 7.2 | |
Oil, Gas & Consumable Fuels | | | 7.2 | |
Affiliated Mutual Funds (2.4% represents investments purchased with collateral from securities on loan) | | | 4.5 | |
Chemicals | | | 4.4 | |
Insurance | | | 4.3 | |
Aerospace & Defense | | | 4.0 | |
Semiconductors & Semiconductor Equipment | | | 3.6 | |
Food Products | | | 3.5 | |
Specialty Retail | | | 3.4 | |
Diversified Telecommunication Services | | | 3.4 | |
Equity Real Estate Investment Trusts (REITs) | | | 3.1 | |
Consumer Finance | | | 2.8 | |
Food & Staples Retailing | | | 2.5 | |
Health Care Providers & Services | | | 2.5 | |
Electric Utilities | | | 2.5 | |
Software | | | 2.4 | |
Multi-Utilities | | | 2.3 | |
Media | | | 2.2 | |
| | | | |
Entertainment | | | 2.2 | % |
Household Products | | | 2.0 | |
Health Care Equipment & Supplies | | | 1.9 | |
Road & Rail | | | 1.9 | |
Capital Markets | | | 1.5 | |
Technology Hardware, Storage & Peripherals | | | 1.5 | |
Building Products | | | 1.5 | |
Beverages | | | 1.4 | |
Interactive Media & Services | | | 1.4 | |
Electrical Equipment | | | 1.3 | |
Hotels, Restaurants & Leisure | | | 1.3 | |
Trading Companies & Distributors | | | 1.2 | |
Energy Equipment & Services | | | 1.0 | |
Multiline Retail | | | 0.6 | |
Communications Equipment | | | 0.5 | |
| | | | |
| | | 102.3 | |
Liabilities in excess of other assets | | | (2.3 | ) |
| | | | |
| | | 100.0 | % |
| | | | |
Financial Instruments/Transactions — Summary of Offsetting and Netting Arrangements:
The Portfolio entered into financial instruments/transactions during the reporting period that are either offset in accordance with current requirements or are subject to enforceable master netting arrangements or similar agreements that permit offsetting. The information about offsetting and related netting arrangements for financial instruments/transactions where the legal right toset-off exists is presented in the summary below.
SEE NOTES TO FINANCIAL STATEMENTS.
A185
| | | | | | |
| | |
| | VALUE PORTFOLIO (continued) | | |
| | | | | | |
| |
| SCHEDULE OF INVESTMENTS | | as of December 31, 2019 |
Offsetting of financial instrument/transaction assets and liabilities:
| | | | | | | | | | | | |
Description | | Gross Market
Value of
Recognized
Assets/(Liabilities) | | | Collateral
Pledged/(Received)(1) | | | Net
Amount | |
Securities on Loan | | $ | 34,094,936 | | | $ | (34,094,936 | ) | | $ | — | |
| | | | | | | | | | | | |
| (1) | Collateral amount disclosed by the Portfolio is limited to the market value of financial instruments/transactions. |
SEE NOTES TO FINANCIAL STATEMENTS.
A186
| | | | | | |
| | |
| | VALUE PORTFOLIO (continued) | | |
STATEMENT OF ASSETS AND LIABILITIESas of December 31, 2019
| | | | |
| ASSETS | | | | |
Investments at value, including securities on loan of $34,094,936: | | | | |
Unaffiliated investments (cost $935,147,413) | | $ | 1,406,721,255 | |
Affiliated investments (cost $65,493,027) | | | 65,502,825 | |
Cash | | | 49 | |
Dividends receivable | | | 1,531,073 | |
Tax reclaim receivable | | | 967,811 | |
Receivable for Portfolio shares sold | | | 1,219 | |
Prepaid expenses and other assets | | | 27,591 | |
| | | | |
Total Assets | | | 1,474,751,823 | |
| | | | |
| LIABILITIES | | | | |
Payable to broker for collateral for securities on loan | | | 34,556,822 | |
Payable to affiliate | | | 717,249 | |
Management fee payable | | | 482,064 | |
Payable for Portfolio shares repurchased | | | 185,273 | |
Accrued expenses and other liabilities | | | 184,079 | |
Distribution fee payable | | | 1,827 | |
Administration fee payable | | | 1,096 | |
Affiliated transfer agent fee payable | | | 980 | |
| | | | |
Total Liabilities | | | 36,129,390 | |
| | | | |
| NET ASSETS | | $ | 1,438,622,433 | |
| | | | |
Net assets were comprised of: | | | | |
Partners’ Equity | | $ | 1,438,622,433 | |
| | | | |
| Class I: | | | | |
Net asset value and redemption price per share, $1,429,941,294 / 39,728,298 outstanding shares of beneficial interest | | $ | 35.99 | |
| | | | |
| Class II: | | | | |
Net asset value and redemption price per share, $8,681,139 / 246,285 outstanding shares of beneficial interest | | $ | 35.25 | |
| | | | |
STATEMENT OF OPERATIONS
Year Ended December 31, 2019
| | | | |
| NET INVESTMENT INCOME (LOSS) INCOME | | | | |
Unaffiliated dividend income (net of $375,503 foreign withholding tax) | | $ | 32,339,701 | |
Affiliated dividend income | | | 856,879 | |
Income from securities lending, net (including affiliated income of $203,068) | | | 396,891 | |
| | | | |
Total income | | | 33,593,471 | |
| | | | |
| EXPENSES | | | | |
Management fee | | | 5,446,077 | |
Distribution fee—Class II | | | 18,455 | |
Administration fee—Class II | | | 11,073 | |
Shareholders’ reports | | | 149,407 | |
Custodian and accounting fees | | | 109,093 | |
Audit fee | | | 28,600 | |
Trustees’ fees | | | 25,010 | |
Legal fees and expenses | | | 16,491 | |
Transfer agent’s fees and expenses (including affiliated expense of $5,882) | | | 10,682 | |
Miscellaneous | | | 36,494 | |
| | | | |
Total expenses | | | 5,851,382 | |
| | | | |
| NET INVESTMENT INCOME (LOSS) | | | 27,742,089 | |
| | | | |
| REALIZED AND UNREALIZED GAIN (LOSS) ON INVESTMENT AND FOREIGN CURRENCY TRANSACTIONS | | | | |
Net realized gain (loss) on: | | | | |
Investment transactions (including affiliated of $867) | | | 77,257,198 | |
Foreign currency transactions | | | 34,268 | |
| | | | |
| | | 77,291,466 | |
| | | | |
Net change in unrealized appreciation (depreciation) on: | | | | |
Investments (including affiliated of $11,998) | | | 205,741,489 | |
Foreign currencies | | | (32,314 | ) |
| | | | |
| | | 205,709,175 | |
| | | | |
| NET GAIN (LOSS) ON INVESTMENT AND FOREIGN CURRENCY TRANSACTIONS | | | 283,000,641 | |
| | | | |
| NET INCREASE (DECREASE) IN NET ASSETS RESULTING FROM OPERATIONS | | $ | 310,742,730 | |
| | | | |
STATEMENTS OF CHANGES IN NET ASSETS
| | | | | | | | |
| | | Year Ended
December 31, 2019 | | | Year Ended
December 31, 2018 | |
| INCREASE (DECREASE) IN NET ASSETS | | | | | | | | |
| OPERATIONS | | | | | | | | |
Net investment income (loss) | | $ | 27,742,089 | | | $ | 25,041,785 | |
Net realized gain (loss) on investment and foreign currency transactions | | | 77,291,466 | | | | 69,745,880 | |
Net change in unrealized appreciation (depreciation) on investments and foreign currencies | | | 205,709,175 | | | | (230,175,408 | ) |
| | | | | | | | |
NET INCREASE (DECREASE) IN NET ASSETS RESULTING FROM OPERATIONS | | | 310,742,730 | | | | (135,387,743 | ) |
| | | | | | | | |
| PORTFOLIO SHARE TRANSACTIONS | | | | | | | | |
Portfolio shares sold | | | 9,202,811 | | | | 7,491,489 | |
Portfolio shares repurchased | | | (113,897,764 | ) | | | (128,220,347 | ) |
| | | | | | | | |
NET INCREASE (DECREASE) IN NET ASSETS FROM PORTFOLIO SHARE TRANSACTIONS | | | (104,694,953 | ) | | | (120,728,858 | ) |
| | | | | | | | |
| CAPITAL CONTRIBUTIONS | | | 1,759 | | | | 937,697 | |
| | | | | | | | |
| TOTAL INCREASE (DECREASE) | | | 206,049,536 | | | | (255,178,904 | ) |
| NET ASSETS: | | | | | | | | |
Beginning of year | | | 1,232,572,897 | | | | 1,487,751,801 | |
| | | | | | | | |
End of year | | $ | 1,438,622,433 | | | $ | 1,232,572,897 | |
| | | | | | | | |
SEE NOTES TO FINANCIAL STATEMENTS.
A187
NOTES TO FINANCIAL STATEMENTS OF
THE PRUDENTIAL SERIES FUND
The Prudential Series Fund (“Series Fund”) is registered under the Investment Company Act of 1940, as amended (“1940 Act”), as anopen-end management investment company. The Series Fund is composed of seventeen Portfolios (each, a “Portfolio” and collectively, the “Portfolios”). The information presented in these financial statements pertains to the 13 Portfolios listed below together with their investment objectives. Each Portfolio is a diversified portfolio except Natural Resources Portfolio which is anon-diversified portfolio for purposes of the 1940 Act.
Conservative Balanced Portfolio: Total investment return consistent with a conservatively managed diversified portfolio.
Diversified Bond Portfolio: High level of income over a longer term while providing reasonable safety of capital.
Equity Portfolio: Long-term growth of capital.
Flexible Managed Portfolio: Total return consistent with an aggressively managed diversified portfolio.
Global Portfolio: Long-term growth of capital.
Government Income Portfolio: High level of income over the long-term consistent with the preservation of capital.
Government Money Market Portfolio: Maximum current income consistent with the stability of capital and maintenance of liquidity.
High Yield Bond Portfolio: High total return.
Jennison Portfolio: Long-term growth of capital.
Natural Resources Portfolio: Long-term growth of capital.
Small Capitalization Stock Portfolio: Long-term growth of capital.
Stock Index Portfolio: Achieve investment results that generally correspond to the performance of publicly traded common stocks.
Value Portfolio: Capital appreciation.
The Series Fund follows the investment company accounting and reporting guidance of the Financial Accounting Standards Board (“FASB”) Accounting Standard Codification (“ASC”) Topic 946 Financial Services —Investment Companies. The following accounting policies conform to U.S. generally accepted accounting principles. The Series Fund and the Portfolios consistently follow such policies in the preparation of their financial statements.
Securities Valuation: Each Portfolio holds securities and other assets and liabilities that are fair valued at the close of each day (generally, 4:00 PM Eastern time) the New York Stock Exchange (“NYSE”) is open for trading. Fair value is the price that would be received to sell an asset or paid to transfer a liability in an orderly transaction between market participants on the measurement date. The Series Fund’s Board of Trustees (the “Board”) has adopted valuation procedures for security valuation under which fair valuation responsibilities have been delegated to PGIM Investments LLC (“PGIM Investments” or the “Manager”). Pursuant to the Board’s delegation, the Manager has established a Valuation Committee responsible for supervising the fair valuation of portfolio securities and other assets and liabilities. The valuation procedures permit a Portfolio to utilize independent pricing vendor services, quotations from market makers, and alternative valuation methods when market quotations are either not readily available or not deemed representative of fair value. A record of the Valuation Committee’s actions is subject to the Board’s review, approval, and ratification at its next regularly scheduled quarterly meeting.
For the fiscal reportingyear-end, securities and other assets and liabilities were fair valued at the close of the last U.S. business day. Trading in certain foreign securities may occur when the NYSE is closed (including weekends and holidays). Because such foreign securities trade in markets that are open on weekends and U.S. holidays, the values of some of the Portfolios’ foreign investments may change on days when investors cannot purchase or redeem Portfolio shares.
B1
Various inputs determine how the Portfolios’ investments are valued, all of which are categorized according to the three broad levels (Level 1, 2, or 3) detailed in the Schedule of Investments and referred to herein as the “fair value hierarchy” in accordance with FASB ASC Topic 820 - Fair Value Measurements and Disclosures.
Common and preferred stocks, exchange-traded funds, and derivative instruments, such as futures or options, that are traded on a national securities exchange are valued at the last sale price as of the close of trading on the applicable exchange where the security principally trades. Securities traded via NASDAQ are valued at the NASDAQ official closing price. To the extent these securities are valued at the last sale price or NASDAQ official closing price, they are classified as Level 1 in the fair value hierarchy. In the event that no sale or official closing price on valuation date exists, these securities are generally valued at the mean between the last reported bid and ask prices, or at the last bid price in the absence of an ask price. These securities are classified as Level 2 in the fair value hierarchy.
Foreign equities traded on foreign securities exchanges are generally valued using pricing vendor services that provide model prices derived using adjustment factors based on information such as local closing price, relevant general and sector indices, currency fluctuations, depositary receipts, and futures, as applicable. Securities valued using such model prices are classified as Level 2 in the fair value hierarchy. The models generate an evaluated adjustment factor for each security, which is applied to the local closing price to adjust it for post closing market movements up to the time each Portfolio is valued. Utilizing that evaluated adjustment factor, the vendor provides an evaluated price for each security. If the vendor does not provide an evaluated price, securities are valued in accordance with exchange-traded common and preferred stock valuation policies discussed above.
Investments inopen-end,non-exchange-traded mutual funds are valued at their net asset values as of the close of the NYSE on the date of valuation. These securities are classified as Level 1 in the fair value hierarchy since they may be purchased or sold at their net asset values on the date of valuation.
Fixed income securities traded in the OTC market are generally classified as Level 2 in the fair value hierarchy. Such fixed income securities are typically valued using the market approach which generally involves obtaining data from an approved independent third-party vendor source. The Portfolios utilize the market approach as the primary method to value securities when market prices of identical or comparable instruments are available. The third-party vendors’ valuation techniques used to derive the evaluated bid price are based on evaluating observable inputs, including but not limited to, yield curves, yield spreads, credit ratings, deal terms, tranche level attributes, default rates, cash flows, prepayment speeds, broker/dealer quotations and reported trades. Certain Level 3 securities are also valued using the market approach when obtaining a single broker quote or when utilizing transaction prices for identical securities that have been used in excess of five business days. During the reporting period, there were no changes to report with respect to the valuation approach and/or valuation techniques discussed above.
The Government Money Market Portfolio values all of its securities of sufficient credit quality at amortized cost, which approximates fair value. The amortized cost method involves valuing a security at its cost on the date of purchase and thereafter assuming a constant amortization to maturity of the difference between the principal amount due at maturity and cost. These securities are categorized as Level 2 of the fair value hierarchy.
Bank loans are generally valued at prices provided by approved independent pricing vendors. The pricing vendors utilize broker/dealer quotations and provide prices based on the average of such quotations. Bank loans valued using such vendor prices are generally classified as Level 2 in the fair value hierarchy. Bank loans valued based on a single broker quote or at the original transaction price in excess of five business days are classified as Level 3 in the fair value hierarchy.
OTC and centrally cleared derivative instruments are generally classified as Level 2 in the fair value hierarchy. Such derivative instruments are typically valued using the market approach and/or income approach which generally involves obtaining data from an approved independent third-party vendor source. The Portfolios utilize the market approach when quoted prices in broker-dealer markets are available but also includes consideration of alternative valuation approaches, including the income approach. In the absence of reliable market quotations, the income approach is typically utilized for purposes of valuing derivatives such as interest rate swaps based on a discounted cash flow analysis whereby the value of the instrument is equal to the present value of its future cash inflows or outflows. Such analysis includes projecting future cash flows and determining the discount rate (including the present value factors that affect the discount rate) used to discount the future cash flows. In addition, the third-party vendors’ valuation techniques used to derive the evaluated derivative price is based on evaluating observable inputs, including but not limited to, underlying asset prices, indices, spreads, interest rates and exchange rates. Certain derivatives may be classified as Level 3 when valued using the market approach by
B2
obtaining a single broker quote or when utilizing unobservable inputs in the income approach. During the reporting period, there were no changes to report with respect to the valuation approach and/or valuation techniques discussed above.
Securities and other assets that cannot be priced according to the methods described above are valued based on pricing methodologies approved by the Board. In the event that unobservable inputs are used when determining such valuations, the securities will be classified as Level 3 in the fair value hierarchy.
When determining the fair value of securities, some of the factors influencing the valuation include: the nature of any restrictions on disposition of the securities; assessment of the general liquidity of the securities; the issuer’s financial condition and the markets in which it does business; the cost of the investment; the size of the holding and the capitalization of the issuer; the prices of any recent transactions or bids/offers for such securities or any comparable securities; any available analyst media or other reports or information deemed reliable by the Manager regarding the issuer or the markets or industry in which it operates. Using fair value to price securities may result in a value that is different from a security’s most recent closing price and from the price used by other unaffiliated mutual funds to calculate their net asset values.
Illiquid Securities: Pursuant to Rule22e-4 under the 1940 Act, the Series Fund has adopted a Board approved Liquidity Risk Management Program (“LRMP”) that requires, among other things, that each Portfolio limit its illiquid investments that are assets to no more than 15% of net assets. Illiquid securities are those that, because of the absence of a readily available market or due to legal or contractual restrictions on resale, may not reasonably be expected to be sold or disposed of in current market conditions in seven calendar days or less without the sale or disposition significantly changing the market value of the investment. A Portfolio may find it difficult to sell illiquid securities at the time considered most advantageous by its subadviser(s) and may incur transaction costs that would not be incurred in the sale of securities that were freely marketable.
Restricted Securities: Securities acquired in unregistered, private sales from the issuing company or from an affiliate of the issuer are considered restricted as to disposition under federal securities law (“restricted securities”). Such restricted securities are valued pursuant to the valuation procedures noted above. Restricted securities that would otherwise be considered illiquid investments pursuant to the Portfolios’ LRMP because of legal restrictions on resale to the general public may be traded among qualified institutional buyers under Rule 144A of the Securities Act of 1933. Therefore, these Rule 144A securities, as well as commercial paper that is sold in private placements under Section 4(2) of the Securities Act of 1933, may be classified higher than “illiquid” under the LRMP (i.e. “moderately liquid” or “less liquid” investments). However, the liquidity of the Portfolios’ investments in restricted securities could be impaired if trading does not develop or declines.
Connecticut Avenue Securities (CAS) and Structured Agency Credit Risk (STACR): �� Certain Portfolios purchased government controlled Fannie Mae and Freddie Mac securities that transfer most of the cost of defaults to private investors including the Portfolios. These are insurance-like products that are called CAS by Fannie Mae and STACR securities by Freddie Mac. Payments on the securities are based primarily on the performance of a reference pool of underlying mortgages. With such securities, the Portfolios could lose some or all of their principal if the underlying mortgages experience credit defaults.
Foreign Currency Translation: The books and records of the Portfolios are maintained in U.S. dollars. Foreign currency amounts are translated into U.S. dollars on the following basis:
(i) market value of investment securities, other assets and liabilities — at the current rates of exchange;
(ii) purchases and sales of investment securities, income and expenses — at the rates of exchange prevailing on the respective dates of such transactions.
Although the net assets of the Portfolios are presented at the foreign exchange rates and market values at the close of the period, the Portfolios do not generally isolate that portion of the results of operations arising as a result of changes in the foreign exchange rates from the fluctuations arising from changes in the market prices of long-term portfolio securities held at the end of the period. Similarly, the Portfolios do not isolate the effect of changes in foreign exchange rates from the fluctuations arising from changes in the market prices of long-term portfolio securities sold during the period. Accordingly, holding period realized foreign currency gains (losses) are included in the reported net realized gains (losses) on investment transactions. Notwithstanding the above, the Portfolios do isolate the effect of fluctuations in foreign currency exchange rates when determining the gain (loss) upon the sale or maturity of foreign currency denominated debt obligations; such amounts are included in net realized gains (losses) on foreign currency transactions.
B3
Additionally, net realized gains (losses) on foreign currency transactions represent net foreign exchange gains (losses) from the disposition of holdings of foreign currencies, currency gains (losses) realized between the trade and settlement dates on investment transactions, and the difference between the amounts of interest, dividends and foreign withholding taxes recorded on the Portfolios’ books and the U.S. dollar equivalent amounts actually received or paid. Net unrealized currency gains (losses) arise from valuing foreign currency denominated assets and liabilities (other than investments) at period end exchange rates.
Forward and Cross Currency Contracts: A forward currency contract is a commitment to purchase or sell a foreign currency at a future date at a negotiated forward rate. Certain Portfolios entered into forward currency contracts, as defined in the prospectus, in order to hedge their exposure to changes in foreign currency exchange rates on their foreign portfolio holdings or on specific receivables and payables denominated in a foreign currency and to gain exposures to certain currencies. The contracts are valued daily at current forward exchange rates and any unrealized gain (loss) is included in net unrealized appreciation (depreciation) on forward and cross currency contracts. Gain (loss) is realized on the settlement date of the contract equal to the difference between the settlement value of the original and negotiated forward contracts. This gain (loss), if any, is included in net realized gain (loss) on forward and cross currency contract transactions. Risks may arise upon entering into these contracts from the potential inability of the counterparties to meet the terms of their contracts. Forward currency contracts involve risks from currency exchange rate and credit risk in excess of the amounts reflected on the Statement of Assets and Liabilities. The Portfolios’ maximum risk of loss from counterparty credit risk is the net value of the cash flows to be received from the counterparty at the end of the contract’s life. A cross currency contract is a forward contract where a specified amount of one foreign currency will be exchanged for a specified amount of another foreign currency.
Options: Certain Portfolios purchased or wrote options in order to hedge against adverse market movements or fluctuations in value caused by changes in prevailing interest rates, value of equities or foreign currency exchange rates with respect to securities or financial instruments which the Portfolio currently owns or intends to purchase. The Portfolios may also use options to gain additional market exposure. The Portfolios’ principal reason for writing options is to realize, through receipt of premiums, a greater current return than would be realized on the underlying security alone. When the Portfolio purchases an option, it pays a premium and an amount equal to that premium is recorded as an asset. When the Portfolio writes an option, it receives a premium and an amount equal to that premium is recorded as a liability. The asset or liability is adjusted daily to reflect the current market value of the option. If an option expires unexercised, the Portfolio realizes a gain (loss) to the extent of the premium received or paid. If an option is exercised, the premium received or paid is recorded as an adjustment to the proceeds from the sale or the cost of the purchase in determining whether the Portfolio has realized a gain (loss). The difference between the premium and the amount received or paid at the closing of a purchase or sale transaction is also treated as a realized gain (loss). Gain (loss) on purchased options is included in net realized gain (loss) on investment transactions. Gain (loss) on written options is presented separately as net realized gain (loss) on options written transactions.
The Portfolio, as writer of an option, may have no control over whether the underlying securities or financial instruments may be sold (called) or purchased (put). As a result, the Portfolio bears the market risk of an unfavorable change in the price of the security or financial instrument underlying the written option. The Portfolio, as purchaser of an OTC option, bears the risk of the potential inability of the counterparties to meet the terms of their contracts. With exchange-traded options contracts, there is minimal counterparty credit risk to the Portfolio since the exchanges’ clearinghouse acts as counterparty to all exchange-traded options and guarantees the options contracts against default.
When a Portfolio writes an option on a swap, an amount equal to any premium received by the Portfolio is recorded as a liability and is subsequently adjusted to the current market value of the written option on the swap. If a call option on a swap is exercised, the Portfolio becomes obligated to pay a fixed interest rate (noted as the strike price) and receive a variable interest rate on a notional amount. If a put option on a swap is exercised, the Portfolio becomes obligated to pay a variable interest rate and receive a fixed interest rate (noted as the strike price) on a notional amount. Premiums received from writing options on swaps that expire or are exercised are treated as realized gains upon the expiration or exercise of such options on swaps. The risk associated with writing put and call options on swaps is that the Portfolio will be obligated to be party to a swap agreement if an option on a swap is exercised.
Financial Futures Contracts: A financial futures contract is an agreement to purchase (long) or sell (short) an agreed amount of securities at a set price for delivery on a future date. Upon entering into a financial futures contract, the Portfolios are required to pledge to the broker an amount of cash and/or other assets equal to a
B4
certain percentage of the contract amount. This amount is known as the “initial margin.” Subsequent payments, known as “variation margin,” are made or received by the Portfolios each day, depending on the daily fluctuations in the value of the underlying security. Such variation margin is recorded for financial statement purposes on a daily basis as unrealized gain (loss). When the contract expires or is closed, the gain (loss) is realized and is presented in the Statement of Operations as net realized gain (loss) on futures transactions.
Certain Portfolios invested in financial futures contracts in order to hedge their existing portfolio securities, or securities the Portfolios intend to purchase, against fluctuations in value caused by changes in prevailing interest rates. Should interest rates move unexpectedly, the Portfolios may not achieve the anticipated benefits of the financial futures contracts and may realize a loss. The use of futures transactions involves the risk of imperfect correlation in movements in the price of futures contracts, interest rates and the underlying hedged assets. Since futures contracts are exchange-traded, there is minimal counterparty credit risk to the Portfolios since the exchanges’ clearinghouse acts as counterparty to all exchange-traded futures and guarantees the futures contracts against default.
Bank Loans: Certain Portfolios invested in bank loans. Bank loans include fixed and floating rate loans that are privately negotiated between a corporate borrower and one or more financial institutions, including, but not limited to, term loans, revolvers, and other instruments issued in the bank loan market. The Portfolios acquired interests in loans directly (by way of assignment from the selling institution) or indirectly (by way of the purchase of a participation interest from the selling institution). Under a bank loan assignment, the Portfolios generally will succeed to all the rights and obligations of an assigning lending institution and becomes a lender under the loan agreement with the relevant borrower in connection with that loan. Under a bank loan participation, the Portfolios generally will have a contractual relationship only with the lender, not with the relevant borrower. As a result, the Portfolios generally will have the right to receive payments of principal, interest, and any fees to which it is entitled only from the lender selling the participation and only upon receipt by the lender of the payments from the relevant borrower. The Portfolios may not directly benefit from the collateral supporting the debt obligation in which it has purchased the participation. As a result, the Portfolios will assume the credit risk of both the borrower and the institution selling the participation to the Portfolios.
Repurchase Agreements: In connection with transactions in repurchase agreements with United States financial institutions, it is each Portfolio’s policy that its custodian or designated subcustodians under triparty repurchase agreements, as the case may be, take possession of the underlying collateral securities, the value of which exceeds the principal amount of the repurchase transactions, including accrued interest. To the extent that any repurchase transaction exceeds one business day, the value of the collateral ismarked-to-market on a daily basis to ensure the adequacy of the collateral. If the seller defaults and the value of the collateral declines or, if bankruptcy proceedings are commenced with respect to the seller of the security, realization of the collateral by the Portfolio may be delayed or limited.
Forward Rate Agreements: Forward rate agreements represent an agreement between counterparties to exchange cash flows based on the difference between two interest rates, applied to a notional principal amount on a fixed future date. Certain Portfolios entered into forward rate agreements to gain yield exposure based on anticipated market conditions at the specified termination date of the agreement.
Swap Agreements: Certain Portfolios entered into certain types of swap agreements detailed in the disclosures below. A swap agreement is an agreement to exchange the return generated by one instrument for the return generated by another instrument. Swap agreements are negotiated in the OTC market and may be executed either directly with a counterparty(“OTC-traded”) or through a central clearing facility, such as a registered exchange. Swap agreements are valued daily at current market value and any change in value is included in the net unrealized appreciation (depreciation) on swap agreements. Centrally cleared swaps pay or receive an amount known as “variation margin”, based on daily changes in the valuation of the swap contract. ForOTC-traded, upfront premiums paid and received are shown as swap premiums paid and swap premiums received in the Statement of Assets and Liabilities. Risk of loss may exceed amounts recognized on the Statement of Assets and Liabilities. Swap agreements outstanding at period end, if any, are listed on the Schedule of Investments.
Interest Rate Swaps: Interest rate swaps represent an agreement between counterparties to exchange cash flows based on the difference between two interest rates, applied to a notional principal amount for a specified period. Certain Portfolios are subject to interest rate risk exposure in the normal course of pursuing their investment objective. Certain Portfolios used interest rate swaps to maintain their ability to generate steady cash flow by
B5
receiving a stream of fixed rate payments or to increase exposure to prevailing market rates by receiving floating rate payments. The Portfolios’ maximum risk of loss from counterparty credit risk is the discounted net present value of the cash flows to be received from the counterparty over the contract’s remaining life.
Inflation Swaps: Certain Portfolios entered into inflation swap agreements to protect against fluctuations in inflation rates. Inflation swaps are characterized by one party paying a fixed rate in exchange for a floating rate that is derived from an inflation index, such as the Consumer Price Index or UK Retail Price Index. Inflation swaps subject the Portfolios to interest rate risk.
Credit Default Swaps (“CDS”): CDS involve one party (the protection buyer) making a stream of payments to another party (the protection seller) in exchange for the right to receive a specified payment in the event of a default or as a result of a default (collectively a “credit event”) for the referenced entity (typically corporate issues or sovereign issues of an emerging country) on its obligation; or in the event of a write-down, principal shortfall, interest shortfall or default of all or part of the referenced entities comprising a credit index.
Certain Portfolios are subject to credit risk in the normal course of pursuing their investment objectives, and as such, have entered into CDS contracts to provide a measure of protection against defaults or to take an active long or short position with respect to the likelihood of a particular issuer’s default or the reference entity’s credit soundness. CDS contracts generally trade based on a spread which represents the cost a protection buyer has to pay the protection seller. The protection buyer is said to be short the credit as the value of the contract rises the more the credit deteriorates. The value of the CDS contract increases for the protection buyer if the spread increases. A Portfolio’s maximum risk of loss from counterparty credit risk for purchased CDS is the inability of the counterparty to honor the contract up to the notional value due to a credit event.
As a seller of protection on credit default swap agreements, the Portfolio generally receives an agreed upon payment from the buyer of protection throughout the term of the swap, provided no credit event occurs. As the seller, the Portfolio effectively increases its investment risk because, in addition to its total net assets, the Portfolio may be subject to investment exposure on the notional amount of the swap.
The maximum amount of the payment that the Portfolio, as a seller of protection, could be required to make under a credit default swap agreement would be equal to the notional amount of the underlying security or index contract as a result of a credit event. This potential amount will be partially offset by any recovery values of the respective referenced obligations, or net amounts received from the settlement of buy protection credit default swap agreements which the Portfolio entered into for the same referenced entity or index. As a buyer of protection, the Portfolio generally receives an amount up to the notional value of the swap if a credit event occurs.
Implied credit spreads, represented in absolute terms, utilized in determining the market value of credit default swap agreements where the Portfolio is the seller of protection as of period end are disclosed in the footnotes to the Schedule of Investments, if applicable. These spreads serve as indicators of the current status of the payment/performance risk and represent the likelihood of default risk for the credit derivative. The implied credit spread of a particular referenced entity reflects the cost of buying/selling protection and may include upfront payments required to enter into the agreement. Wider credit spreads and increased market value in absolute terms, when compared to the notional amount of the swap, represent a deterioration of the referenced entity’s credit soundness and a greater likelihood of risk of default or other credit event occurring as defined under the terms of the agreement.
Total Return Swaps: In a total return swap, one party receives payments based on the market value of the security or the commodity involved, or total return of a specific referenced asset, such as an equity, index or bond, and in return pays a defined amount. Certain Portfolios are subject to risk exposures associated with the referenced asset in the normal course of pursuing their investment objectives. Certain Portfolios entered into total return swaps to manage their exposure to a security or an index. The Portfolios’ maximum risk of loss from counterparty credit risk is the change in the value of the security, in favor of the Portfolio, from the point of entering into the contract.
Master Netting Arrangements: The Series Fund, on behalf of certain Portfolios, is subject to various Master Agreements, or netting arrangements, with select counterparties. These are agreements which a subadviser may have negotiated and entered into on behalf of all or a portion of a Portfolio. For multi-sleeve Portfolios, different subadvisers who manage their respective sleeve, may enter into such agreements with the same counterparty and are disclosed separately for each sleeve when presenting information about offsetting and related netting arrangements for OTC derivatives. A master netting arrangement between the Portfolio and the counterparty permits the Portfolio to offset amounts payable by the Portfolio to the same counterparty against amounts to be
B6
received; and by the receipt of collateral from the counterparty by the Portfolios to cover the Portfolios’ exposure to the counterparty. However, there is no assurance that such mitigating factors are easily enforceable. In addition to master netting arrangements, the right toset-off exists when all the conditions are met such that each of the parties owes the other determinable amounts, the reporting party has the right toset-off the amount owed with the amount owed by the other party, the reporting party intends toset-off and the right ofset-off is enforceable by law. During the reporting period, there was no intention to settle on a net basis and all amounts are presented on a gross basis on the Statement of Assets and Liabilities.
The Series Fund, on behalf of certain Portfolios, is a party to International Swaps and Derivatives Association, Inc. (“ISDA”) Master Agreements with certain counterparties that govern OTC derivative and foreign exchange contracts entered into from time to time. The Master Agreements may contain provisions regarding, among other things, the parties’ general obligations, representations, agreements, collateral requirements, events of default and early termination. With respect to certain counterparties, in accordance with the terms of the Master Agreements, collateral posted to the Portfolio is held in a segregated account by the Portfolio’s custodian and with respect to those amounts which can be sold orre-pledged, are presented in the Schedule of Investments. Collateral pledged by the Portfolio is segregated by the Portfolio’s custodian and identified in the Schedule of Investments. Collateral can be in the form of cash or debt securities issued by the U.S. Government or related agencies or other securities as agreed to by the Portfolio and the applicable counterparty. Collateral requirements are determined based on the Portfolio’s net position with each counterparty. Termination events applicable to the Portfolio may occur upon a decline in the Portfolio’s net assets below a specified threshold over a certain period of time. Termination events applicable to counterparties may occur upon a decline in the counterparty’s long-term and short-term credit ratings below a specified level. In each case, upon occurrence, the other party may elect to terminate early and cause settlement of all derivative and foreign exchange contracts outstanding, including the payment of any losses and costs resulting from such early termination, as reasonably determined by the terminating party. Any decision by one or more of the Portfolio’s counterparties to elect early termination could impact the Portfolio’s future derivative activity.
In addition to each instrument’s primary underlying risk exposure (e.g. interest rate, credit, equity or foreign exchange, etc.), swap agreements involve, to varying degrees, elements of credit, market and documentation risk. Such risks involve the possibility that no liquid market for these agreements will exist, the counterparty to the agreement may default on its obligation to perform or disagree on the contractual terms of the agreement, and changes in net interest rates will be unfavorable. In connection with these agreements, securities in a portfolio may be identified or received as collateral from the counterparty in accordance with the terms of the respective swap agreements to provide or receive assets of value and to serve as recourse in the event of default or bankruptcy/ insolvency of either party. Such OTC derivative agreements include conditions which, when materialized, give the counterparty the right to cause an early termination of the transactions under those agreements. Any election by the counterparty for early termination of the contract(s) may impact the amounts reported on financial statements.
As of December 31, 2019, none of the Portfolios have met conditions under such agreements which give the counterparty the right to call for an early termination.
Forward currency contracts, forward rate agreements, written options, short sales, swaps and financial futures contracts involve elements of both market and credit risk in excess of the amounts reflected on the Statement of Assets and Liabilities. Such risks may be mitigated by engaging in master netting arrangements.
Warrants and Rights: Certain Portfolios held warrants and rights acquired either through a direct purchase or pursuant to corporate actions. Warrants and rights entitle the holder to buy a proportionate amount of common stock, or such other security that the issuer may specify, at a specific price and time through the expiration dates. Such warrants and rights are held as long positions by the Portfolios until exercised, sold or expired. Warrants and rights are valued at fair value in accordance with the Board approved fair valuation procedures.
Payment-In-Kind: Certain fixed income Portfolios invested in the open market or receive pursuant to debt restructuring, securities thatpay-in-kind (PIK) the interest due on such debt instruments. The PIK interest, computed at the contractual rate specified, is added to the existing principal balance of the debt when issued bonds have same terms as the bond or recorded as a separate bond when terms are different from the existing debt, and is recorded as interest income.
Delayed-Delivery Transactions: Certain Portfolios purchased or sold securities on a when-issued or delayed-delivery and forward commitment basis. These transactions involve a commitment by the Portfolio to purchase or sell securities for a predetermined price or yield, with payment and delivery taking place beyond the customary settlement period. When delayed-delivery purchases are outstanding, the Portfolio will set aside and
B7
maintain an amount of liquid assets sufficient to meet the purchase price in a segregated account until the settlement date. When purchasing a security on a delayed-delivery basis, the Portfolio assumes the rights and risks of ownership of the security, including the risk of price and yield fluctuations, and takes such fluctuations into account when determining its net asset value. The Portfolio may dispose of or renegotiate a delayed-delivery transaction subsequent to establishment, and may sell when-issued securities before they are delivered, which may result in a realized gain (loss). When selling a security on a delayed-delivery basis, the Portfolio forfeits its eligibility to realize future gains (losses) with respect to the security.
Securities Lending: Certain Portfolios lend their portfolio securities to banks and broker-dealers. The loans are secured by collateral at least equal to the market value of the securities loaned. Collateral pledged by each borrower is invested in an affiliated money market fund and is marked to market daily, based on the previous day’s market value, such that the value of the collateral exceeds the value of the loaned securities. In the event of significant appreciation in value of securities on loan on the last business day of the reporting period, the financial statements may reflect a collateral value that is less than the market value of the loaned securities. Such shortfall is remedied as described above. Loans are subject to termination at the option of the borrower or the Portfolio. Upon termination of the loan, the borrower will return to the Portfolio securities identical to the loaned securities. Should the borrower of the securities fail financially, the Portfolio has the right to repurchase the securities in the open market using the collateral.
The Portfolio recognizes income, net of any rebate and securities lending agent fees, for lending its securities in the form of fees or interest on the investment of any cash received as collateral. The borrower receives all interest and dividends from the securities loaned and such payments are passed back to the lender in amounts equivalent thereto. The Portfolio also continues to recognize any unrealized gain (loss) in the market price of the securities loaned and on the change in the value of the collateral invested that may occur during the term of the loan. In addition, realized gain (loss) is recognized on changes in the value of the collateral invested upon liquidation of the collateral. Net earnings from securities lending are disclosed in the Statement of Operations.
Mortgage Dollar Rolls: Certain Portfolios entered into mortgage dollar rolls in which the Portfolios sell mortgage securities for delivery in the current month, realizing a gain (loss), and simultaneously enter into contracts to repurchase somewhat similar (same type, coupon and maturity) securities on a specified future date. During the roll period, the Portfolios forgo principal and interest paid on the securities. The Portfolios are compensated by the interest earned on the cash proceeds of the initial sale and by the lower repurchase price at the future date. The difference between the sale proceeds and the lower repurchase price is recorded as a realized gain on investment transactions. The Portfolios maintain a segregated account, the dollar value of which is at least equal to its obligations, with respect to dollar rolls. The Portfolios are subject to the risk that the market value of the securities the Portfolios are obligated to repurchase under the agreement may decline below the repurchase price.
Equity and Mortgage Real Estate Investment Trusts (collectively equity REITs): Certain Portfolios invested in equity REITs, which report information on the source of their distributions annually. Based on current and historical information, a portion of distributions received from equity REITs during the period is estimated to be dividend income, capital gain or return of capital and recorded accordingly. When material, these estimates are adjusted periodically when the actual source of distributions is disclosed by the equity REITs.
Securities Transactions and Net Investment Income: Securities transactions are recorded on the trade date. Realized gains (losses) from investment and currency transactions are calculated on the specific identification method. Dividend income is recorded on theex-date, or for certain foreign securities, when the Portfolio becomes aware of such dividends. Interest income, including amortization of premium and accretion of discount on debt securities, as required, is recorded on the accrual basis. Expenses are recorded on an accrual basis, which may require the use of certain estimates by management that may differ from actual. For Portfolios with multiple classes of shares, net investment income or loss (other than administration and distribution fees which are charged directly to the respective class) and unrealized and realized gains (losses) are allocated daily to each class of shares based upon the relative proportion of adjusted net assets of each class at the beginning of the day.
Taxes: For federal income tax purposes, each Portfolio is treated as a separate taxpaying entity. Each Portfolio is treated as a partnership for tax purposes. No provision has been made in the financial statements for U.S. federal, state, or local taxes, as any tax liability arising from operations of the Portfolios is the responsibility of the Portfolio’s shareholders (participating insurance companies). Each Portfolio is not generally subject to entity-level taxation. Shareholders of each Portfolio are subject to taxes on their distributive share of partnership items. Withholding taxes on foreign dividends, interest and capital gains are accrued in accordance with each Portfolio’s understanding of the applicable country’s tax rules and regulations. Such taxes are accrued net of reclaimable
B8
amounts, at the time the related income/gain is recorded taking into account any agreements in place with Prudential Financial, Inc. (“Prudential”) as referenced in Note 3. Each Portfolio generally attempts to manage its diversification in a manner that supports the diversification requirements of the underlying separate accounts.
Distributions: Distributions, if any, from each Portfolio are made in cash and automatically reinvested in additional shares of the Portfolio. The Government Money Market Portfolio declares and reinvests distributions, if any, daily. Distributions are recorded on theex-date.
Estimates: The preparation of financial statements requires management to make estimates and assumptions that affect the reported amounts and disclosures in the financial statements. Actual results could differ from those estimates.
The Series Fund, on behalf of the Portfolios, has a management agreement with PGIM Investments. Pursuant to this agreement, the Manager has responsibility for all investment management services and supervises the subadvisers’ performance of such services. The Manager has entered into subadvisory agreements with PGIM, Inc., which provides subadvisory services to the Portfolios through its PGIM Fixed Income unit (“PFI”) (a wholly-owned subsidiary of PGIM, Inc.), Jennison Associates LLC (“Jennison”) (a wholly-owned subsidiary of PGIM, Inc.), Allianz Global Investors U.S. LLC (“Allianz”), Brown Advisory LLC (“Brown”), LSV Asset Management (“LSV”), QMA LLC (“QMA”) (formerly known as Quantitative Management Associates LLC) (a wholly-owned subsidiary of PGIM, Inc.), T. Rowe Price Associates, Inc. (“T. Rowe”) and William Blair & Co. LLC (“William Blair”) (collectively, the “subadvisers”), under which each provides investment advisory services for certain Portfolios of the Series Fund. The Manager pays for the services of the subadvisers, cost of compensation of officers of the Portfolio, occupancy and certain clerical and administrative expenses of the Portfolios. The Portfolios bear all other costs and expenses.
The management fee paid to the Manager is accrued daily and payable monthly, using the value of each Portfolio’s average daily net assets, at the respective annual rates specified below.
| | | | | | |
Portfolio | | Management Fee | | Effective
Management Fee,
Net of Waiver,
if Applicable | |
Conservative Balanced Portfolio | | 0.55% | | | 0.55 | % |
Diversified Bond Portfolio | | 0.40 | | | 0.40 | |
Equity Portfolio | | 0.45 | | | 0.45 | |
Flexible Managed Portfolio | | 0.60 | | | 0.60 | |
Global Portfolio | | 0.75 | | | 0.72 | * |
Government Income Portfolio | | 0.40 | | | 0.40 | |
Government Money Market Portfolio | | 0.30 | | | 0.30 | |
High Yield Bond | | 0.55 | | | 0.50 | ** |
Jennison Portfolio | | 0.60 | | | 0.60 | |
Natural Resources Portfolio | | 0.45 | | | 0.44 | *** |
Small Capitalization Stock Portfolio | | 0.35 | | | 0.35 | |
Stock Index Portfolio | | 0.30% up to $4 billion | | | | |
| | 0.25% over $ 4 billion | | | 0.30 | |
Value Portfolio | | 0.40 | | | 0.40 | |
| | * | The Manager has contractually agreed, through June 30, 2020, to waive a portion of its management fee equal to an annual rate of 0.032% of the average daily net assets of the Portfolio. Effective September 1, 2019, the Manager has contractually agreed to waive an additional 0.0003% of its investment management fee through June 30, 2021. |
| | ** | The Manager has contractually agreed through June 30, 2020 to limit the net annual operating expenses (exclusive of distribution and service(12b-1) fees, administrative fees, taxes (such as income and foreign withholdings taxes, stamp duty and deferred tax expenses), interest, acquired fund fees and expenses, brokerage, extraordinary and certain other expenses such as dividend, broker charges and interest expense on short sales) of the Portfolio to 0.57% of the Portfolio’s average daily net assets. Expenses waived/reimbursed by the Manager in accordance with this agreement may be recouped by the Manager within the same fiscal year during which such |
B9
| | waiver/reimbursement is made if such recoupment can be realized without exceeding the expense limit in effect at the time of the recoupment for that fiscal year. |
| | *** | The Manager has contractually agreed, through June 30, 2020, to waive a portion of its management fee equal to an annual rate of 0.008% of the average daily net assets of the Portfolio. |
At December 31, 2019, the subadvisers that provide investment advisory services to the Portfolios are listed directly below. Where more than one subadviser is listed, each subadviser provides services to a segment of the Portfolio:
| | |
Portfolio | | Subadviser(s) |
Conservative Balanced Portfolio | | PFI & QMA |
Diversified Bond Portfolio | | PFI |
Equity Portfolio | | Jennison |
Flexible Managed Portfolio | | PFI & QMA |
Global Portfolio | | Brown, LSV, QMA, T. Rowe & William Blair |
Government Income Portfolio | | PFI |
Government Money Market Portfolio | | PFI |
High Yield Bond Portfolio | | PFI |
Jennison Portfolio | | Jennison |
Natural Resources Portfolio | | Allianz |
Small Capitalization Stock Portfolio | | QMA |
Stock Index Portfolio | | QMA |
Value Portfolio | | Jennison |
The Series Fund, on behalf of the Portfolios, has a distribution agreement, pursuant to Rule12b-1 under the 1940 Act, with Prudential Investment Management Services LLC (“PIMS”), which acts as the distributor of the Class I and Class II shares of the Portfolios. The Portfolios compensate PIMS for distributing and servicing the Portfolios’ Class II shares pursuant to a plan of distribution (the “Class II Plan”), regardless of expenses actually incurred by PIMS. The distribution fees are accrued daily and payable monthly. No distribution or service fees are paid to PIMS as distributor of the Class I shares of the Portfolios. Pursuant to the Class II Plan, the Class II shares of each Portfolio compensate PIMS for distribution-related activities at an annual rate of 0.25% of the average daily net assets of the Class II shares.
The Series Fund has an administration agreement with the Manager, which acts as the administrator of the Class II shares of the Portfolios. The administration fee paid to the Manager is accrued daily and payable monthly, at the annual rate of 0.15% of the average daily net assets of the Class II shares.
The Series Fund, on behalf of the Portfolios, has entered into brokerage commission recapture agreements with certain registered broker-dealers. Under the brokerage commission recapture program, a portion of the commission is returned to the Portfolio on whose behalf the trades were made. Commission recapture is paid solely to those Portfolios generating the applicable trades. Such amounts are included within realized gain (loss) on investment transactions presented in the Statement of Operations. For the reporting period ended December 31, 2019, brokerage commission recaptured under these agreements was as follows:
| | | | |
Portfolio | | Amount | |
Equity Portfolio | | $ | 140,611 | |
Global Portfolio | | | 28,947 | |
Jennison Portfolio | | | 52,370 | |
Value Portfolio | | | 45,696 | |
PIMS, PGIM Investments, PGIM, Inc., QMA and Jennison are indirect, wholly-owned subsidiaries of Prudential.
| 3. | | Other Transactions with Affiliates |
a.) Related Parties
Prudential Mutual Fund Services LLC (“PMFS”), an affiliate of PGIM Investments and an indirect, wholly-owned subsidiary of Prudential, serves as the transfer agent of the Portfolios. The transfer agent’s fees and expenses in
B10
the Statement of Operations include certainout-of-pocket expenses paid tonon-affiliates, where applicable.
The Portfolios may invest their overnight sweep cash in the PGIM Core Ultra Short Bond Fund (the “Core Fund”) and their securities lending cash collateral in the PGIM Institutional Money Market Fund (the “Money Market Fund”), each a series of Prudential Investment Portfolios 2, registered under the 1940 Act and managed by PGIM Investments. The Portfolios may also invest in the PGIM Core Short-Term Bond Fund, pursuant to an exemptive order received from Securities Exchange Commission (“SEC”), a series of Prudential Investment Portfolios 2 (together with PGIM Core Ultra Short Bond Fund, the “Core Funds”) registered under the 1940 Act and managed by PGIM Investments. Through the Portfolios’ investments in the mentioned underlying funds, PGIM Investments and/or its affiliates are paid fees or reimbursed for providing their services. In addition to the realized and unrealized gains on investments in the Core Funds and Money Market Fund, earnings from such investments are disclosed on the Statement of Operations as “Affiliated dividend income” and “Income from securities lending, net”, respectively.
Certain Portfolios may enter into certain securities purchase or sale transactions under Board approved Rule17a-7 procedures. Rule17a-7 is an exemptive rule under the 1940 Act, that subject to certain conditions, permits purchase and sale transactions among affiliated investment companies, or between an investment company and a person that is affiliated solely by reason of having a common (or affiliated) investment adviser, common directors, and/or common officers. Pursuant to the Rule17a-7 procedures and consistent with guidance issued by the Securities and Exchange Commission (“SEC”), the Series Fund’s Chief Compliance Officer (“CCO”) prepares a quarterly summary of all such transactions for submission to the Board, together with the CCO’s written representation that all such17a-7 transactions were effected in accordance with the Series Fund’s Rule17a-7 procedures. For the reporting period ended December 31, 2019, no17a-7 transactions were entered into by the Portfolios.
b.) Securities Lending and Foreign Withholding Tax Reclaim Matters
In September 2019, the Manager reached a settlement with the SEC relating to the securities lending and foreign withholding tax reclaim matters described below. Under the settlement, the Manager agreed to pay to the SEC disgorgement of fees and a civil penalty. The settlement does not affect the Manager’s ability to manage the Portfolios.
In February 2016, Prudential, the parent company of the Manager, self-reported to the SEC and certain other regulators that, in some cases, it failed to maximize securities lending income for certain Portfolios of the Series Fund due to a long-standing restriction benefitting Prudential. The Board was not notified of the restriction until after it had been removed. Prudential paid each of the affected Portfolios an amount equal to the estimated loss associated with the unauthorized restriction. At the Board’s direction, this payment occurred on June 30, 2016. The estimated opportunity loss was calculated by an independent consultant hired by Prudential whose calculation methodology was subsequently reviewed by a consultant retained by the independent trustees of the Portfolios. The per share amount of opportunity loss payment to the Portfolios is disclosed in the Portfolios’ “Financial Highlights” as “Capital Contributions” for the fiscal year ended December 31, 2016.
In March 2018, Prudential further notified the SEC that it failed to timely reimburse certain Portfolios for amounts due under protocols established to ensure that the Portfolios were not harmed as a result of their tax status as partnerships instead of regulated investment companies (RICs). Specifically, as a result of their partnership status, the Portfolios are subject to higher foreign withholding tax rates on dividend and interest income in certain foreign jurisdictions and/or are subject to delays in repayment of taxes withheld by certain foreign jurisdictions (collectively, “excess withholding tax”). Prudential’s protocols were intended to protect the Portfolios from these differences and delays. In consultation with the Series Fund’s independent trustees, Prudential paid each of the affected Portfolios an amount equal to the excess withholding tax in addition to an amount equal to the applicable Portfolio’s rate of return (“opportunity loss”) applied to these excess withholding tax amounts for periods from the various transaction dates, beginning January 2, 2006 (the date when the Portfolios were converted to partnerships for tax purposes), through February 28, 2018 (the date through which the previously established protocols were not uniformly implemented). The amount due to each Portfolio was calculated by Prudential with the help of a third-party consultant. Those amounts and the methodology used by Prudential to derive them, were evaluated and confirmed by a consultant retained by the Series Fund’s independent trustees. The excess withholding tax analysis considered detriments to the Portfolios due to their tax status as partnerships arising from both timing differences (i.e., jurisdictions in which the Portfolio was subject to a higher withholding tax rate due to its tax status which is reclaimable) as described above as well as permanent tax detriments (i.e., jurisdictions in which the Portfolio was subject to a higher withholding tax rate due to its tax status which is not reclaimable). Further, the
B11
opportunity loss due to each Portfolio also was calculated by a third-party consultant hired by Prudential whose calculation methodology was subsequently reviewed by a consultant retained by the Series Fund’s independent trustees. In May 2019, Prudential made an additional payment to the Portfolios relating to the opportunity loss upon the final review of the methodology used for the Portfolios’ rate of return calculation. The aggregate previously unreimbursed excess withholding tax and/or opportunity loss payments for each affected Portfolio are disclosed in the Portfolios’ “Statements of Changes in Net Assets” and “Financial Highlights” as “Capital Contributions” for the fiscal years ended December 31, 2018 and December 31, 2019.
In addition to the above, Prudential committed to the Series Fund’s independent trustees that it would pay all consulting, legal, audit, and other charges, fees and expenses incurred with the matters described above. Prudential has made and continues to make these payments.
During the reporting period and in consultation with the Series Fund’s independent trustees, Prudential instituted a process to reimburse the affected Portfolios for any future excess withholding tax on the first business day following thepay-date of the applicable dividend or interest income event regardless of whether the excess withholding tax is due to timing differences or permanent detriments resulting from the Portfolios’ partnership tax status.
In cases in which the excess withholding tax is due to timing differences and is reclaimable from the foreign jurisdiction, the affected Portfolios have the ability to recover the excess withholding tax withheld by filing a reclaim with the relevant foreign tax authority. To avoid a Portfolio receiving and retaining a duplicate payment for the same excess withholding tax, payments received by an applicable Portfolio from a foreign tax authority for reclaims for which a Portfolio previously received reimbursement from Prudential will be payable to Prudential. Pending tax reclaim amounts due to Prudential for excess withholding tax which Prudential previously paid to the Portfolios are reported as “Payable to affiliate” on the “Statement of Assets and Liabilities” and any amounts accrued but not yet reimbursed by Prudential for excess withholding tax is recorded as “Receivable from affiliate” on the Statement of Assets and Liabilities. The full amount of tax reclaims due to a Portfolio, inclusive of timing differences and routine tax reclaims for foreign jurisdictions where the Portfolios do not incur an excess withholding tax is included as “Tax reclaim receivable” on the “Statement of Assets and Liabilities.” To the extent that there are costs associated with the filing of any reclaim attributable to excess withholding tax, those costs are borne by Prudential.
The following amounts have been paid by Prudential for excess withholding taxes related to permanent tax detriments as described above for certain countries due to the Portfolios’ status as partnership for tax purposes.
| | | | |
Portfolio | | 2019 Payments | |
Conservative Balanced Portfolio | | $ | 11,450 | |
Equity Portfolio | | | 13,151 | |
Flexible Managed Portfolio | | | 19,183 | |
Global Portfolio | | | 135,890 | |
High Yield Bond Portfolio | | | 94 | |
Natural Resources Portfolio | | | 5,482 | |
The following amounts have been paid by Prudential for excess withholding taxes related to timing differences as described above for certain countries due to the Portfolios’ status as partnerships for tax purposes.
| | | | |
Portfolio | | 2019 Payments | |
Conservative Balanced Portfolio | | $ | 31,171 | |
Equity Portfolio | | | 187,890 | |
Flexible Managed Portfolio | | | 34,603 | |
Global Portfolio | | | 222,184 | |
High Yield Bond Portfolio | | | 731 | |
Jennison Portfolio | | | 89,894 | |
Natural Resources Portfolio | | | 42,263 | |
Value Portfolio | | | 109,344 | |
B12
The following capital contributions, as described above, have been paid in 2019 by Prudential for the opportunity loss associated with excess withholding taxes related to permanent tax detriments and timing differences for certain countries due to the Portfolios’ status as partnerships for tax purposes.
| | | | |
Portfolio | | Capital Contributions | |
Conservative Balanced Portfolio | | $ | 13,184 | |
Equity Portfolio | | | 3 | |
Flexible Managed Portfolio | | | 14,632 | |
Global Portfolio | | | 85,664 | |
Jennison Portfolio | | | 8,215 | |
Natural Resources Portfolio | | | 6,508 | |
Value Portfolio | | | 1,759 | |
The aggregate cost of purchases and proceeds from sales of portfolio securities (excluding short-term investments and U.S. Government securities) for the year ended December 31, 2019, were as follows:
| | | | | | | | |
Portfolio | | Cost of
Purchases | | | Proceeds
from Sales | |
Conservative Balanced Portfolio | | $ | 1,876,818,723 | | | $ | 1,896,917,185 | |
Diversified Bond Portfolio | | | 383,279,866 | | | | 360,747,528 | |
Equity Portfolio | | | 1,834,193,725 | | | | 2,024,794,274 | |
Flexible Managed Portfolio | | | 4,740,353,234 | | | | 4,778,320,384 | |
Global Portfolio | | | 285,003,496 | | | | 319,000,008 | |
Government Income Portfolio | | | 466,444,350 | | | | 485,787,002 | |
High Yield Bond Portfolio | | | 288,343,275 | | | | 285,174,928 | |
Jennison Portfolio | | | 878,161,179 | | | | 1,051,159,539 | |
Natural Resources Portfolio | | | 498,249,184 | | | | 505,263,973 | |
Small Capitalization Stock Portfolio | | | 153,267,829 | | | | 199,065,755 | |
Stock Index Portfolio | | | 164,473,500 | | | | 132,441,268 | |
Value Portfolio | | | 330,469,948 | | | | 387,324,855 | |
A summary of the cost of purchases and proceeds from sales of shares of affiliated investments for the year ended December 31, 2019, is presented as follows:
Conservative Balanced Portfolio
| | | | | | | | | | | | | | | | | | | | | | | | | | | | | | |
Value,
Beginning
of Year | | | Cost of
Purchases | | | Proceeds
from Sales | | | Change in
Unrealized
Gain
(Loss) | | | Realized
Gain (Loss) | | | Value,
End of Year | | | Shares,
End of Year | | | Income | |
| | PGIM Core Short-Term Bond Fund* | | | | | | | | | | | | | | | | | | | | | |
| $ | 60,098,231 | | | $ | 1,330,960 | | | $ | 61,559,701 | | | $ | 158,905 | | | $ | (28,395 | ) | | $ | — | | | | — | | | $ | 1,330,768 | |
| | PGIM Core Ultra Short Bond Fund* | | | | | | | | | | | | | | | | | | | | | |
| | 321,028,979 | | | | 505,300,425 | | | | 571,183,231 | | | | — | | | | — | | | | 255,146,173 | | | | 255,146,173 | | | | 6,682,172 | |
| | PGIM Institutional Money Market Fund* | | | | | | | | | | | | | | | | | |
| | 35,065,786 | | | | 440,832,094 | | | | 400,689,599 | | | | 14,716 | | | | 2,308 | | | | 75,225,305 | | | | 75,210,263 | | | | 127,815 | ** |
| | | | | | | | | | | | | | | | | | | | | | | | | | | | | | |
| $ | 416,192,996 | | | $ | 947,463,479 | | | $ | 1,033,432,531 | | | $ | 173,621 | | | $ | (26,087 | ) | | $ | 330,371,478 | | | | | | | $ | 8,140,755 | |
| | | | | | | | | | | | | | | | | | | | | | | | | | | | | | |
B13
Diversified Bond Portfolio
| | | | | | | | | | | | | | | | | | | | | | | | | | | | | | |
Value,
Beginning
of Year | | | Cost of
Purchases | | | Proceeds
from Sales | | | Change in
Unrealized
Gain
(Loss) | | | Realized
Gain (Loss) | | | Value,
End of Year | | | Shares,
End
of Year | | | Income | |
| | PGIM Core Short-Term Bond Fund* | | | | | | | | | | | | | | | | | | | | | |
| $ | 36,166,743 | | | $ | 880,128 | | | $ | 37,125,412 | | | $ | 545,350 | | | $ | (466,809 | ) | | $ | — | | | | — | | | $ | 877,152 | |
| | PGIM Core Ultra Short Bond Fund* | | | | | | | | | | | | | | | | | | | | | |
| | 3,312,505 | | | | 317,082,539 | | | | 317,504,597 | | | | — | | | | — | | | | 2,890,447 | | | | 2,890,447 | | | | 387,227 | |
| | PGIM Institutional Money Market Fund* | | | | | | | | | | | | | | | | | | | | | |
| | 5,294,940 | | | | 121,153,109 | | | | 93,136,969 | | | | 4,275 | | | | (320 | ) | | | 33,315,035 | | | | 33,308,374 | | | | 38,088 | ** |
| | | | | | | | | | | | | | | | | | | | | | | | | | | | | | |
| $ | 44,774,188 | | | $ | 439,115,776 | | | $ | 447,766,978 | | | $ | 549,625 | | | $ | (467,129 | ) | | $ | 36,205,482 | | | | | | | $ | 1,302,467 | |
| | | | | | | | | | | | | | | | | | | | | | | | | | | | | | |
Equity Portfolio
| | | | | | | | | | | | | | | | | | | | | | | | | | | | | | |
Value,
Beginning
of Year | | | Cost of
Purchases | | | Proceeds
from Sales | | | Change in
Unrealized
Gain
(Loss) | | | Realized
Gain (Loss) | | | Value,
End of Year | | | Shares,
End
of Year | | | Income | |
| | PGIM Core Ultra Short Bond Fund* | | | | | | | | | | | | | | | | | | | | | |
| $ | 122,077,957 | | | $ | 865,779,166 | | | $ | 933,492,213 | | | $ | — | | | $ | — | | | $ | 54,364,910 | | | | 54,364,910 | | | $ | 2,362,922 | |
| | PGIM Institutional Money Market Fund* | | | | | | | | | | | | | | | | | | | | | |
| | 233,962,135 | | | | 2,642,825,449 | | | | 2,655,942,877 | | | | 58,738 | | | | (2,168 | ) | | | 220,901,277 | | | | 220,857,106 | | | | 660,547 | ** |
| | | | | | | | | | | | | | | | | | | | | | | | | | | | | | |
| $ | 356,040,092 | | | $ | 3,508,604,615 | | | $ | 3,589,435,090 | | | $ | 58,738 | | | $ | (2,168 | ) | | $ | 275,266,187 | | | | | | | $ | 3,023,469 | |
| | | | | | | | | | | | | | | | | | | | | | | | | | | | | | |
Flexible Managed Portfolio
| | | | | | | | | | | | | | | | | | | | | | | | | | | | | | |
Value,
Beginning
of Year | | | Cost of
Purchases | | | Proceeds
from Sales | | | Change in
Unrealized
Gain
(Loss) | | | Realized
Gain (Loss) | | | Value,
End of Year | | | Shares,
End
of Year | | | Income | |
| | PGIM Core Short-Term Bond Fund* | | | | | | | | | | | | | | | | | | | | | |
| $ | 76,993,820 | | | $ | 1,705,137 | | | $ | 78,866,158 | | | $ | 3,561,970 | | | $ | (3,394,769 | ) | | $ | — | | | | — | | | $ | 1,705,137 | |
| | PGIM Core Ultra Short Bond Fund* | | | | | | | | | | | | | | | | | | | | | |
| | 219,948,136 | | | | 830,528,398 | | | | 897,097,477 | | | | — | | | | — | | | | 153,379,057 | | | | 153,379,057 | | | | 4,195,024 | |
| | PGIM Institutional Money Market Fund* | | | | | | | | | | | | | | | | | | | | | |
| | 42,949,501 | | | | 987,682,405 | | | | 912,982,063 | | | | 24,987 | | | | (64 | ) | | | 117,674,766 | | | | 117,651,235 | | | | 234,519 | ** |
| | | | | | | | | | | | | | | | | | | | | | | | | | | | | | |
| $ | 339,891,457 | | | $ | 1,819,915,940 | | | $ | 1,888,945,698 | | | $ | 3,586,957 | | | $ | (3,394,833 | ) | | $ | 271,053,823 | | | | | | | $ | 6,134,680 | |
| | | | | | | | | | | | | | | | | | | | | | | | | | | | | | |
Global Portfolio
| | | | | | | | | | | | | | | | | | | | | | | | | | | | | | |
Value,
Beginning
of Year | | | Cost of
Purchases | | | Proceeds
from Sales | | | Change in
Unrealized
Gain
(Loss) | | | Realized
Gain (Loss) | | | Value,
End of Year | | | Shares,
End
of Year | | | Income | |
| | PGIM Core Ultra Short Bond Fund* | | | | | | | | | | | | | | | | | | | | | |
| $ | 29,089,153 | | | $ | 312,197,791 | | | $ | 305,936,148 | | | $ | — | | | $ | — | | | $ | 35,350,796 | | | | 35,350,796 | | | $ | 813,008 | |
| | PGIM Institutional Money Market Fund* | | | | | | | | | | | | | | | | | |
| | 42,891,241 | | | | 335,531,047 | | | | 331,966,428 | | | | 9,590 | | | | 1,109 | | | | 46,466,559 | | | | 46,457,268 | | | | 109,841 | ** |
| | | | | | | | | | | | | | | | | | | | | | | | | | | | | | |
| $ | 71,980,394 | | | $ | 647,728,838 | | | $ | 637,902,576 | | | $ | 9,590 | | | $ | 1,109 | | | $ | 81,817,355 | | | | | | | $ | 922,849 | |
| | | | | | | | | | | | | | | | | | | | | | | | | | | | | | |
B14
Government Income Portfolio
| | | | | | | | | | | | | | | | | | | | | | | | | | | | | | |
Value,
Beginning
of Year | | | Cost of
Purchases | | | Proceeds
from Sales | | | Change in
Unrealized
Gain
(Loss) | | | Realized
Gain (Loss) | | | Value,
End of Year | | | Shares,
End
of Year | | | Income | |
| | PGIM Core Short-Term Bond Fund* | | | | | | | | | | | | | | | | | | | | | |
| $ | 22,597,532 | | | $ | 598,142 | | | $ | 16,000,000 | | | $ | 1,126,863 | | | $ | (1,036,590 | ) | | $ | 7,285,947 | | | | 791,091 | | | $ | 428,785 | |
| | PGIM Core Ultra Short Bond Fund* | | | | | | | | | | | | | | | | | | | | | |
| | 2,506 | | | | 107,010,380 | | | | 101,971,170 | | | | — | | | | — | | | | 5,041,716 | | | | 5,041,716 | | | | 239,843 | |
| | PGIM Institutional Money Market Fund* | | | | | | | | | | | | | | | | | |
| | — | | | | 3,448,593 | | | | 3,448,593 | | | | — | | | | — | | | | — | | | | — | | | | 839 | ** |
| | | | | | | | | | | | | | | | | | | | | | | | | | | | | | |
| $ | 22,600,038 | | | $ | 111,057,115 | | | $ | 121,419,763 | | | $ | 1,126,863 | | | $ | (1,036,590 | ) | | $ | 12,327,663 | | | | | | | $ | 669,467 | |
| | | | | | | | | | | | | | | | | | | | | | | | | | | | | | |
High Yield Bond Portfolio
| | | | | | | | | | | | | | | | | | | | | | | | | | | | | | |
Value,
Beginning
of Year | | | Cost of
Purchases | | | Proceeds
from Sales | | | Change in
Unrealized
Gain
(Loss) | | | Realized
Gain (Loss) | | | Value,
End of Year | | | Shares,
End
of Year | | | Income | |
| | PGIM Core Ultra Short Bond Fund* | | | | | | | | | | | | | | | | | | | | | |
| $ | 11,299,269 | | | $ | 151,979,598 | | | $ | 160,308,555 | | | $ | — | | | $ | — | | | $ | 2,970,312 | | | | 2,970,312 | | | $ | 231,218 | |
| | PGIM Institutional Money Market Fund* | | | | | | | | | | | | | | | | | |
| | 77,044,159 | | | | 243,939,395 | | | | 238,682,334 | | | | 22,944 | | | | 2,837 | | | | 82,327,001 | | | | 82,310,540 | | | | 266,368 | ** |
| | | | | | | | | | | | | | | | | | | | | | | | | | | | | | |
| $ | 88,343,428 | | | $ | 395,918,993 | | | $ | 398,990,889 | | | $ | 22,944 | | | $ | 2,837 | | | $ | 85,297,313 | | | | | | | $ | 497,586 | |
| | | | | | | | | | | | | | | | | | | | | | | | | | | | | | |
Jennison Portfolio
| | | | | | | | | | | | | | | | | | | | | | | | | | | | | | |
Value,
Beginning
of Year | | | Cost of
Purchases | | | Proceeds
from Sales | | | Change in
Unrealized
Gain
(Loss) | | | Realized
Gain (Loss) | | | Value,
End of Year | | | Shares,
End
of Year | | | Income | |
| | PGIM Core Ultra Short Bond Fund* | | | | | | | | | | | | | | | | | | | | | |
| $ | 3,388,912 | | | $ | 433,804,502 | | | $ | 431,868,875 | | | $ | — | | | $ | — | | | $ | 5,324,539 | | | | 5,324,539 | | | $ | 219,406 | |
| | PGIM Institutional Money Market Fund* | | | | | | | | | | | | | | | | | |
| | 121,502,704 | | | | 1,317,545,167 | | | | 1,239,534,625 | | | | 43,735 | | | | (15,672 | ) | | | 199,541,309 | | | | 199,501,408 | | | | 406,759 | ** |
| | | | | | | | | | | | | | | | | | | | | | | | | | | | | | |
| $ | 124,891,616 | | | $ | 1,751,349,669 | | | $ | 1,671,403,500 | | | $ | 43,735 | | | $ | (15,672 | ) | | $ | 204,865,848 | | | | | | | $ | 626,165 | |
| | | | | | | | | | | | | | | | | | | | | | | | | | | | | | |
Natural Resources Portfolio
| | | | | | | | | | | | | | | | | | | | | | | | | | | | | | |
Value,
Beginning
of Year | | | Cost of
Purchases | | | Proceeds
from Sales | | | Change in
Unrealized
Gain
(Loss) | | | Realized
Gain (Loss) | | | Value,
End of Year | | | Shares,
End
of Year | | | Income | |
| | PGIM Core Ultra Short Bond Fund* | | | | | | | | | | | | | | | | | | | | | |
| $ | 16,380,536 | | | $ | 163,122,796 | | | $ | 173,879,762 | | | $ | — | | | $ | — | | | $ | 5,623,570 | | | | 5,623,570 | | | $ | 167,111 | |
| | PGIM Institutional Money Market Fund* | | | | | | | | | | | | | | | | | |
| | 21,775,231 | | | | 276,054,800 | | | | 278,705,672 | | | | 1,840 | | | | (2,470 | ) | | | 19,123,729 | | | | 19,119,905 | | | | 56,955 | ** |
| | | | | | | | | | | | | | | | | | | | | | | | | | | | | | |
| $ | 38,155,767 | | | $ | 439,177,596 | | | $ | 452,585,434 | | | $ | 1,840 | | | $ | (2,470 | ) | | $ | 24,747,299 | | | | | | | $ | 224,066 | |
| | | | | | | | | | | | | | | | | | | | | | | | | | | | | | |
Small Capitalization Stock Portfolio
| | | | | | | | | | | | | | | | | | | | | | | | | | | | | | |
Value,
Beginning
of Year | | | Cost of
Purchases | | | Proceeds
from Sales | | | Change in
Unrealized
Gain
(Loss) | | | Realized
Gain (Loss) | | | Value,
End of Year | | | Shares,
End
of Year | | | Income | |
| | PGIM Core Ultra Short Bond Fund* | | | | | | | | | | | | | | | | | |
| $ | 1,836,274 | | | $ | 80,017,876 | | | $ | 79,968,786 | | | $ | — | | | $ | — | | | $ | 1,885,364 | | | | 1,885,364 | | | $ | 55,288 | |
B15
| | | | | | | | | | | | | | | | | | | | | | | | | | | | | | |
Value,
Beginning
of Year | | | Cost of
Purchases | | | Proceeds
from Sales | | | Change in
Unrealized
Gain
(Loss) | | | Realized
Gain (Loss) | | | Value,
End of Year | | | Shares,
End
of Year | | | Income | |
| | PGIM Institutional Money Market Fund* | | | | | | | | | | | | | | | | | |
| | 138,987,251 | | | $ | 330,263,254 | | | $ | 298,848,444 | | | $ | 43,448 | | | $ | (833 | ) | | $ | 170,444,676 | | | | 170,410,593 | | | | 481,229 | ** |
| | | | | | | | | | | | | | | | | | | | | | | | | | | | | | |
| $ | 140,823,525 | | | $ | 410,281,130 | | | $ | 378,817,230 | | | $ | 43,448 | | | $ | (833 | ) | | $ | 172,330,040 | | | | | | | $ | 536,517 | |
| | | | | | | | | | | | | | | | | | | | | | | | | | | | | | |
Stock Index Portfolio
| | | | | | | | | | | | | | | | | | | | | | | | | | | | | | |
Value,
Beginning
of Year | | | Cost of
Purchases | | | Proceeds
from Sales | | | Change in
Unrealized
Gain
(Loss) | | | Realized
Gain (Loss) | | | Value,
End of Year | | | Shares,
End
of Year | | | Income | |
| | PGIM Core Ultra Short Bond Fund* | | | | | | | | | | | | | | | | | | | | | |
| $ | 78,324,947 | | | $ | 250,444,709 | | | $ | 240,105,819 | | | $ | — | | | $ | — | | | $ | 88,663,837 | | | | 88,663,837 | | | $ | 2,124,764 | |
| | PGIM Institutional Money Market Fund* | | | | | | | | | | | | | | | | | | | | | |
| | 95,420,772 | | | | 1,717,720,050 | | | | 1,574,626,500 | | | | 43,282 | | | | (12,869 | ) | | | 238,544,735 | | | | 238,497,036 | | | | 379,653 | ** |
| | | | | | | | | | | | | | | | | | | | | | | | | | | | | | |
| $ | 173,745,719 | | | $ | 1,968,164,759 | | | $ | 1,814,732,319 | | | $ | 43,282 | | | $ | (12,869 | ) | | $ | 327,208,572 | | | | | | | $ | 2,504,417 | |
| | | | | | | | | | | | | | | | | | | | | | | | | | | | | | |
Value Portfolio
| | | | | | | | | | | | | | | | | | | | | | | | | | | | | | |
Value,
Beginning of
Year | | | Cost of
Purchases | | | Proceeds
from Sales | | | Change in
Unrealized
Gain
(Loss) | | | Realized
Gain (Loss) | | | Value,
End of Year | | | Shares,
End
of Year | | | Income | |
| | PGIM Core Ultra Short Bond Fund* | | | | | | | | | | | | | | | | | | | | | |
| $ | 50,056,662 | | | $ | 180,412,736 | | | $ | 199,605,810 | | | $ | — | | | $ | — | | | $ | 30,863,588 | | | | 30,863,588 | | | $ | 856,879 | |
| | PGIM Institutional Money Market Fund* | | | | | | | | | | | | | | | | | | | | | |
| | 50,976,349 | | | | 1,073,866,230 | | | | 1,090,216,207 | | | | 11,998 | | | | 867 | | | | 34,639,237 | | | | 34,632,311 | | | | 203,068 | ** |
| | | | | | | | | | | | | | | | | | | | | | | | | | | | | | |
| $ | 101,033,011 | | | $ | 1,254,278,966 | | | $ | 1,289,822,017 | | | $ | 11,998 | | | $ | 867 | | | $ | 65,502,825 | | | | | | | $ | 1,059,947 | |
| | | | | | | | | | | | | | | | | | | | | | | | | | | | | | |
| | * | The Fund did not have any capital gain distributions during the reporting period. |
| | ** | Represents the affiliated amount of securities lending income shown on the Statement of Operations. |
All Portfolios are treated as partnerships for federal income tax purposes. The character of the cash distributions, if any, made by the partnerships is generally classified as nontaxable return of capital distributions.After each fiscal year each shareholder of record will receive information regarding their distributive allocable share of the partnership’s income, gains, losses and deductions.
With respect to the Portfolios, book cost of assets differs from tax cost of assets as a result of each Portfolio’s adoption of a mark to market method of accounting for tax purposes. Under this method, tax cost of assets will approximate fair market value.
The Manager has analyzed the Portfolios’ tax positions taken on federal, state and local income tax returns for all open tax years and has concluded that no provision for income tax is required in the Portfolios’ financial statements for the current reporting period. Since tax authorities can examine previously filed tax returns, the Portfolios’ U.S. federal and state tax returns for each of the four fiscal years up to the most recent fiscal year ended December 31, 2019 are subject to such review.
The Series Fund, on behalf of the Portfolios, (excluding the Government Money Market Portfolio), along with other affiliated registered investment companies (the “Funds”), is a party to a Syndicated Credit Agreement (“SCA”) with
B16
a group of banks. The purpose of the SCA is to provide an alternative source of temporary funding for capital share redemptions. The table below provides details of the current SCA in effect at the reportingperiod-end as well as the prior SCA.
| | | | |
| | | Current SCA | | Prior SCA |
Term of Commitment | | 10/3/2019—10/1/2020 | | 10/4/2018—10/2/2019 |
Total Commitment | | $900 million | | $900 million |
| Annualized Commitment Fee on the Unused Portion of the SCA | | 0.15% | | 0.15% |
| Annualized Interest Rate on Borrowings | | 1.20% plus the higher of (1)
the effective federal funds
rate, (2) theone-month
LIBOR rate or (3) zero
percent | | 1.25% plus the higher of (1)
the effective federal funds
rate, (2) theone-month
LIBOR rate or (3) zero
percent |
Certain affiliated registered investment companies that are parties to the SCA include portfolios that are subject to a predetermined mathematical formula used to manage certain benefit guarantees offered under variable annuity contracts. The formula may result in large scale asset flows into and out of these portfolios. Consequently, these portfolios may be more likely to utilize the SCA for purposes of funding redemptions. It may be possible for those portfolios to fully exhaust the committed amount of the SCA, thereby requiring the Manager to allocate available funding per a Board-approved methodology designed to treat the Funds in the SCA equitably.
The following Funds utilized the SCA during the year ended December 31, 2019. The average balance outstanding is for the number of days the Portfolios had utilized the credit facility.
| | | | | | | | | | | | | | | | | | | | |
Portfolio | | Average
Balance
Outstanding | | | Weighted
Average
Interest Rates | | | Number
of Days
Outstanding | | | Maximum
Balance
Outstanding | | | Balance
Outstanding at
December 31, 2019 | |
Diversified Bond Portfolio | | $ | 408,500 | | | | 3.50 | % | | | 6 | | | $ | 708,000 | | | $ | — | |
Equity Portfolio | | | 279,000 | | | | 3.05 | | | | 1 | | | | 279,000 | | | | — | |
Global Portfolio | | | 142,000 | | | | 3.26 | | | | 4 | | | | 190,000 | | | | — | |
Government Income | | | | | | | | | | | | | | | | | | | | |
Portfolio | | | 403,250 | | | | 3.70 | | | | 16 | | | | 2,535,000 | | | | — | |
High Yield Bond Portfolio | | | 156,000 | | | | 3.65 | | | | 1 | | | | 156,000 | | | | — | |
Jennison Portfolio | | | 851,615 | | | | 3.46 | | | | 13 | | | | 1,523,000 | | | | — | |
Natural Resources Portfolio | | | 135,750 | | | | 3.48 | | | | 4 | | | | 167,000 | | | | — | |
Small Capitalization Stock | | | | | | | | | | | | | | | | | | | | |
Portfolio | | | 298,375 | | | | 3.48 | | | | 8 | | | | 378,000 | | | | — | |
Value Portfolio | | | 510,000 | | | | 3.70 | | | | 3 | | | | 510,000 | | | | — | |
The Portfolios offer Class I shares and certain Portfolios offer Class II shares. Neither Class I nor Class II shares of a Portfolio are subject to any sales charge or redemption charge and are sold at the net asset value of the Portfolio. Class I shares are sold only to certain separate accounts of Prudential to fund benefits under certain variable life insurance and variable annuity contracts (“contracts”). Class II shares are sold only to separate accounts ofnon-Prudential insurance companies as investment options under certain contracts. Class I shares are also offered to separate accounts ofnon-affiliated insurers for which Prudential or its affiliates administer and/or reinsure the variable life insurance or variable annuity contracts issued in connection with the separate accounts. The separate accounts invest in shares of the Portfolios through subaccounts that correspond to the Portfolios. The separate accounts will redeem shares of the Portfolios to the extent necessary to provide benefits under the contracts or for such other purposes as may be consistent with the contracts.
As of December 31, 2019, the following number of shares of the Portfolios were owned of record directly or by other Portfolios as part of their investments by insurance affiliates of Prudential Financial, Inc.
| | | | | | | | |
Portfolio | | Number of Shares | | | Percentage of
Outstanding Shares | |
Conservative Balanced Portfolio | | | 82,701,191 | | | | 100 | % |
Diversified Bond Portfolio | | | 80,351,744 | | | | 98 | % |
Equity Portfolio—Class I | | | 74,563,997 | | | | 100 | % |
B17
| | | | | | | | |
Portfolio | | Number of Shares | | | Percentage of
Outstanding Shares | |
Flexible Managed Portfolio | | | 126,104,682 | | | | 100 | % |
Global Portfolio | | | 30,454,972 | | | | 100 | % |
Government Income Portfolio | | | 17,617,014 | | | | 100 | % |
Government Money Market Portfolio | | | 59,897,412 | | | | 100 | % |
High Yield Bond Portfolio | | | 90,512,902 | | | | 100 | % |
Jennison Portfolio—Class I | | | 27,463,915 | | | | 100 | % |
Natural Resources Portfolio—Class I | | | 13,647,626 | | | | 100 | % |
Small Capitalization Stock Portfolio | | | 19,379,341 | | | | 100 | % |
Stock Index Portfolio | | | 64,070,473 | | | | 100 | % |
Value Portfolio—Class I | | | 39,728,298 | | | | 100 | % |
The following number of shareholders of record, each holding greater than 5% of the Portfolio, held the following percentage of outstanding shares, on behalf of multiple beneficial owners:
| | | | | | | | | | | | | | | | |
| | | Affiliated | | | Unaffiliated | |
Portfolio | | Number of
Shareholders | | | Percentage of
Outstanding Shares | | | Number of
Shareholders | | | Percentage of
Outstanding Shares | |
Conservative Balanced Portfolio | | | 3 | | | | 100 | % | | | — | | | | — | % |
Diversified Bond Portfolio | | | 3 | | | | 98 | | | | — | | | | — | |
Equity Portfolio | | | 3 | | | | 100 | | | | — | | | | — | |
Flexible Managed Portfolio | | | 3 | | | | 100 | | | | — | | | | — | |
Global Portfolio | | | 2 | | | | 98 | | | | — | | | | — | |
Government Income Portfolio | | | 2 | | | | 98 | | | | — | | | | — | |
Government Money Market Portfolio | | | 2 | | | | 95 | | | | — | | | | — | |
High Yield Bond Portfolio | | | 3 | | | | 100 | | | | — | | | | — | |
Jennison Portfolio | | | 2 | | | | 93 | | | | — | | | | — | |
Natural Resources Portfolio | | | 2 | | | | 85 | | | | 1 | | | | 10 | |
Small Capitalization Stock Portfolio | | | 2 | | | | 97 | | | | — | | | | — | |
Stock Index Portfolio | | | 3 | | | | 100 | | | | — | | | | — | |
Value Portfolio | | | 2 | | | | 95 | | | | — | | | | — | |
Transactions in shares of beneficial interest of the Equity, Jennison, Natural Resources and Value Portfolios were as follows:
Equity Portfolio
| | | | | | | | |
Class I: | | Shares | | | Amount | |
Year ended December 31, 2019: | | | | | | | | |
Portfolio shares sold | | | 102,565 | | | $ | 5,848,661 | |
Portfolio shares repurchased | | | (5,496,601 | ) | | | (313,401,998 | ) |
Capital contributions | | | — | | | | 3 | |
| | | | | | | | |
Net increase (decrease) in shares outstanding | | | (5,394,036 | ) | | $ | (307,553,334 | ) |
| | | | | | | | |
Year ended December 31, 2018: | | | | | | | | |
Portfolio shares sold | | | 288,901 | | | $ | 15,724,745 | |
Portfolio shares repurchased | | | (6,033,417 | ) | | | (328,510,611 | ) |
Capital contributions | | | — | | | | 3,503,826 | |
| | | | | | | | |
Net increase (decrease) in shares outstanding | | | (5,744,516 | ) | | $ | (309,282,040 | ) |
| | | | | | | | |
B18
| | | | | | | | |
Class II: | | Shares | | | Amount | |
Year ended December 31, 2019: | | | | | | | | |
Portfolio shares sold | | | 1 | | | $ | 39 | |
Portfolio shares repurchased | | | (2,102 | ) | | | (115,498 | ) |
| | | | | | | | |
Net increase (decrease) in shares outstanding | | | (2,101 | ) | | $ | (115,459 | ) |
| | | | | | | | |
Year ended December 31, 2018: | | | | | | | | |
Portfolio shares sold | | | 9,548 | | | $ | 526,666 | |
Portfolio shares repurchased | | | (12,293 | ) | | | (673,039 | ) |
Capital contributions | | | — | | | | 1,333 | |
| | | | | | | | |
Net increase (decrease) in shares outstanding | | | (2,745 | ) | | $ | (145,040 | ) |
| | | | | | | | |
Jennison Portfolio
| | | | | | | | |
Class I: | | Shares | | | Amount | |
Year ended December 31, 2019: | | | | | | | | |
Portfolio shares sold | | | 235,080 | | | $ | 17,277,706 | |
Portfolio shares repurchased | | | (2,232,184 | ) | | | (162,672,928 | ) |
Capital contributions | | | — | | | | 7,972 | |
| | | | | | | | |
Net increase (decrease) in shares outstanding | | | (1,997,104 | ) | | $ | (145,387,250 | ) |
| | | | | | | | |
Year ended December 31, 2018: | | | | | | | | |
Portfolio shares sold | | | 286,745 | | | $ | 19,297,456 | |
Portfolio shares repurchased | | | (2,220,756 | ) | | | (149,829,068 | ) |
Capital contributions | | | — | | | | 138,296 | |
| | | | | | | | |
Net increase (decrease) in shares outstanding | | | (1,934,011 | ) | | $ | (130,393,316 | ) |
| | | | | | | | |
| | |
| Class II: | | | | | | |
Year ended December 31, 2019: | | | | | | | | |
Portfolio shares sold | | | 95,620 | | | $ | 6,591,703 | |
Portfolio shares repurchased | | | (286,365 | ) | | | (19,696,094 | ) |
Capital contributions | | | — | | | | 243 | |
| | | | | | | | |
Net increase (decrease) in shares outstanding | | | (190,745 | ) | | $ | (13,104,148 | ) |
| | | | | | | | |
Year ended December 31, 2018: | | | | | | | | |
Portfolio shares sold | | | 408,588 | | | $ | 26,790,146 | |
Portfolio shares repurchased | | | (383,201 | ) | | | (24,594,112 | ) |
Capital contributions | | | — | | | | 4,614 | |
| | | | | | | | |
Net increase (decrease) in shares outstanding | | | 25,387 | | | $ | 2,200,648 | |
| | | | | | | | |
Natural Resources Portfolio
| | | | | | | | |
Class I: | | Shares | | | Amount | |
Year ended December 31, 2019: | | | | | | | | |
Portfolio shares sold | | | 141,517 | | | $ | 3,361,228 | |
Portfolio shares repurchased | | | (1,244,941 | ) | | | (29,748,209 | ) |
Capital contributions | | | — | | | | 5,677 | |
| | | | | | | | |
Net increase (decrease) in shares outstanding | | | (1,103,424 | ) | | $ | (26,381,304 | ) |
| | | | | | | | |
Year ended December 31, 2018: | | | | | | | | |
Portfolio shares sold | | | 302,691 | | | $ | 7,763,447 | |
Portfolio shares repurchased | | | (1,369,097 | ) | | | (35,904,874 | ) |
Capital contributions | | | — | | | | 79,822 | |
| | | | | | | | |
Net increase (decrease) in shares outstanding | | | (1,066,406 | ) | | $ | (28,061,605 | ) |
| | | | | | | | |
B19
| | | | | | | | |
Class II: | | Shares | | | Amount | |
Year ended December 31, 2019: | | | | | | | | |
Portfolio shares sold | | | 350,913 | | | $ | 7,965,001 | |
Portfolio shares repurchased | | | (520,257 | ) | | | (12,096,475 | ) |
Capital contributions | | | — | | | | 831 | |
| | | | | | | | |
Net increase (decrease) in shares outstanding | | | (169,344 | ) | | $ | (4,130,643 | ) |
| | | | | | | | |
Year ended December 31, 2018: | | | | | | | | |
Portfolio shares sold | | | 974,088 | | | $ | 24,472,873 | |
Portfolio shares repurchased | | | (745,534 | ) | | | (19,058,185 | ) |
Capital contributions | | | — | | | | 11,841 | |
| | | | | | | | |
Net increase (decrease) in shares outstanding | | | 228,554 | | | $ | 5,426,529 | |
| | | | | | | | |
Value Portfolio
| | | | | | | | |
Class I: | | Shares | | | Amount | |
Year ended December 31, 2019: | | | | | | | | |
Portfolio shares sold | | | 236,977 | | | $ | 7,891,251 | |
Portfolio shares repurchased | | | (3,462,544 | ) | | | (113,465,025 | ) |
Capital contributions | | | — | | | | 1,750 | |
| | | | | | | | |
Net increase (decrease) in shares outstanding | | | (3,225,567 | ) | | $ | (105,572,024 | ) |
| | | | | | | | |
Year ended December 31, 2018: | | | | | | | | |
Portfolio shares sold | | | 234,464 | | | $ | 7,379,990 | |
Portfolio shares repurchased | | | (4,008,985 | ) | | | (127,480,952 | ) |
Capital contributions | | | — | | | | 933,024 | |
| | | | | | | | |
Net increase (decrease) in shares outstanding | | | (3,774,521 | ) | | $ | (119,167,938 | ) |
| | | | | | | | |
| | |
| Class II: | | | | | | |
Year ended December 31, 2019: | | | | | | | | |
Portfolio shares sold | | | 41,074 | | | $ | 1,311,560 | |
Portfolio shares repurchased | | | (13,237 | ) | | | (432,739 | ) |
Capital contributions | | | — | | | | 9 | |
| | | | | | | | |
Net increase (decrease) in shares outstanding | | | 27,837 | | | $ | 878,830 | |
| | | | | | | | |
Year ended December 31, 2018: | | | | | | | | |
Portfolio shares sold | | | 3,613 | | | $ | 111,499 | |
Portfolio shares repurchased | | | (23,499 | ) | | | (739,395 | ) |
Capital contributions | | | — | | | | 4,673 | |
| | | | | | | | |
Net increase (decrease) in shares outstanding | | | (19,886 | ) | | $ | (623,223 | ) |
| | | | | | | | |
| 8. | | Risks of Investing in the Portfolios |
The Portfolios’ risks include, but are not limited to, some or all of the risks discussed below:
Bond Obligations Risk: The Portfolios’ holdings, share price, yield and total return may fluctuate in response to bond market movements. The value of bonds may decline for issuer-related reasons, including management performance, financial leverage and reduced demand for the issuer’s goods and services. Certain types of fixed-income obligations also may be subject to “call and redemption risk,” which is the risk that the issuer may call a bond held by the Portfolios for redemption before it matures and the Portfolios may not be able to reinvest at the same level and therefore would earn less income.
Derivatives Risk: Derivatives involve special risks and costs and may result in losses to the Portfolios. The successful use of derivatives requires sophisticated management, and, to the extent that derivatives are used, the Portfolios will depend on the subadviser’s ability to analyze and manage derivative transactions. The prices of derivatives may move in unexpected ways, especially in abnormal market conditions. Some derivatives are “leveraged” and therefore may magnify or otherwise increase investment losses to the Portfolios. Other risks arise
B20
from the potential inability to terminate or sell derivatives positions. A liquid secondary market may not always exist for the Portfolios’ derivatives positions. In fact, many OTC derivative instruments will not have liquidity beyond the counterparty to the instrument. OTC derivative instruments also involve the risk that the other party will not meet its obligations to the Portfolios.
Emerging Markets Risk: The risks of foreign investments are greater for investments in or exposed to emerging markets. Emerging market countries typically have economic and political systems that are less fully developed, and can be expected to be less stable, than those of more developed countries. For example, the economies of such countries can be subject to rapid and unpredictable rates of inflation or deflation. Low trading volumes may result in a lack of liquidity and price volatility.
Equity and Equity-Related Securities Risks: The value of a particular security could go down and you could lose money. In addition to an individual security losing value, the value of the equity markets or a sector in which the Portfolios invest could go down. The Portfolios’ holdings can vary significantly from broad market indexes and the performance of the Portfolios can deviate from the performance of these indexes. Different parts of a market can react differently to adverse issuer, market, regulatory, political and economic developments.
Foreign Securities Risk: The Portfolios’ investments in securities of foreign issuers or issuers with significant exposure to foreign markets involve additional risk. Foreign countries in which the Portfolios may invest may have markets that are less liquid, less regulated and more volatile than US markets. The value of the Portfolios’ investments may decline because of factors affecting the particular issuer as well as foreign markets and issuers generally, such as unfavorable government actions, and political or financial instability.
Geographic Concentration Risk: The Portfolios’ performance may be closely tied to the market, economic, political, regulatory or other conditions in the countries or regions in which the Portfolios invest. This can result in more pronounced risks based upon conditions that impact one or more countries or regions more or less than other countries or regions.
Interest Rate Risk: The value of an investment may go down when interest rates rise. A rise in rates tends to have a greater impact on the prices of longer term or duration securities. When interest rates fall, the issuers of debt obligations may prepay principal more quickly than expected, and the Portfolios may be required to reinvest the proceeds at a lower interest rate. This is referred to as “prepayment risk.” When interest rates rise, debt obligations may be repaid more slowly than expected, and the value of the Portfolios’ holdings may fall sharply. This is referred to as “extension risk”. The Portfolios may face a heightened level of interest rate risk as a result of the U.S. Federal Reserve Board’s policies. The Portfolios’ investments may lose value if short-term or long-term interest rates rise sharply or in a manner not anticipated by the subadviser.
Liquidity Risk: The Portfolios may invest in instruments that trade in lower volumes and are less liquid than other investments. Liquidity risk exists when particular investments made by the Portfolios are difficult to purchase or sell. Liquidity risk includes the risk that the Portfolios may make investments that may become less liquid in response to market developments or adverse investor perceptions. Investments that are illiquid or that trade in lower volumes may be more difficult to value. If the Portfolios are forced to sell these investments to pay redemption proceeds or for other reasons, the Portfolios may lose money. In addition, when there is no willing buyer and investments may not reasonably be expected to be sold or disposed of in current market conditions in seven calendar days or less without the sale or disposition significantly changing the market value of the investment, the Portfolios may incur higher transaction costs when executing trade orders of a given size. The reduction in dealer market-making capacity in the fixed-income markets that has occurred in recent years also has the potential to reduce liquidity. An inability to sell a portfolio position can adversely affect the Portfolios’ value or prevent the Portfolios from being able to take advantage of other investment opportunities.
Market and Credit Risk: Securities markets may be volatile and the market prices of the Portfolios’ securities may decline. Securities fluctuate in price based on changes in an issuer’s financial condition and overall market and economic conditions. If the market prices of the securities owned by the Portfolios fall, the value of an investment in the Portfolios will decline.Additionally, the Portfolios may also be exposed to credit risk in the event that an issuer or guarantor fails to perform or that an institution or entity with which the Portfolios have unsettled or open transactions defaults.
Non-diversification Risk: Anon-diversified Portfolio may invest a greater percentage of its assets in the securities of a single company or industry than a diversified portfolio. Investing in anon-diversified portfolio involves greater risk than investing in a diversified portfolio because a loss resulting from the decline in value of any one security may represent a greater portion of the total assets of anon-diversified portfolio.
B21
Risks of Investing in equity REITs: Real estate securities are subject to similar risks as direct investments in real estate and mortgages, and their value will depend on the value of the underlying properties or the underlying loans or interests. The underlying loans may be subject to the risks of default or of payments that occur earlier or later than expected, and such loans may also includeso-called “subprime” mortgages. The value of these securities will rise and fall in response to many factors, including economic conditions, the demand for rental property and interest rates. In particular, the value of these securities may decline when interest rates rise and will also be affected by the real estate market and by the management of the underlying properties.
In addition, investing in equity REITs involves certain unique risks in addition to those risks associated with investing in the real estate industry in general. Equity REITs may be affected by changes in the value of the underlying property owned by the equity REITs, while mortgage REITs may be affected by the quality of any credit extended. Equity REITs are dependent upon management skills, may not be diversified geographically or by property/mortgage asset type, and are subject to heavy cash flow dependency, default by borrowers and self-liquidation. Since equity REITs are relatively smaller in size when compared to the broader market, and smaller companies tend to be more volatile than larger companies, they may be more volatile and/or more illiquid than other types of equity securities. Equity REITs are subject to interest rate risks. Equity REITs may incur significant amounts of leverage. The Portfolios will indirectly bear a portion of the expenses, including management fees, paid by each equity REIT in which they invest, in addition to the expenses of the Portfolios.
Risks of Investing in Treasury Inflation Protected Securities (TIPS): The value of TIPS generally fluctuates in response to inflationary concerns. As inflationary expectations increase, TIPS will become more attractive, because they protect future interest payments against inflation. Conversely, as inflationary concerns decrease, TIPS will become less attractive and less valuable. Although the principal value of TIPS declines in periods of deflation, holders at maturity receive no less than the par value of the bond. However, if the Portfolios purchase TIPS in the secondary market, where principal values have been adjusted upward due to inflation since issuance, they may experience a loss if there is a subsequent period of deflation. If inflation is lower than expected during the period the Portfolios hold TIPS, the Portfolios may earn less on the security than on a conventional bond.
U.S. Government and Agency Securities Risk: U.S. Government and agency securities are subject to market risk, interest rate risk and credit risk. Not all U.S. Government securities are insured or guaranteed by the full faith and credit of the U.S. Government; some are only insured or guaranteed by the issuing agency, which must rely on its own resources to repay the debt. In addition, the value of U.S. Government securities may be affected by changes in the credit rating of the U.S. Government.
| 9. | | Recent Accounting Pronouncements and Reporting Updates |
In August 2018, the FASB issued Accounting Standards Update (“ASU”)No. 2018-13, which changes certain fair value measurement disclosure requirements. The new ASU, in addition to other modifications and additions, removes the requirement to disclose the amount and reasons for transfers between Level 1 and Level 2 of the fair value hierarchy, and the Portfolios’ policy for the timing of transfers between levels. The amendments are effective for financial statements issued for fiscal years beginning after December 15, 2019, and interim periods within those fiscal years. The Manager has evaluated the implications of certain provisions of the ASU and has adopted the aspects related to the removal and modification of certain fair value measurement disclosures under the ASU. The Manager continues to evaluate certain other provisions of the ASU and does not expect a material impact to financial statement disclosures.
B22
Financial Highlights
Conservative Balanced Portfolio
| | | | | | | | | | | | | | | | | | | | |
| | | Year Ended December 31, | |
| | | 2019 | | | 2018 | | | 2017 | | | 2016 | | | 2015 | |
Per Share Operating Performance(a): | | | | | | | | | | | | | | | | | | | | |
Net Asset Value, beginning of year | | $ | 26.50 | | | $ | 27.17 | | | $ | 24.18 | | | $ | 22.54 | | | $ | 22.45 | |
| | | | | | | | | | | | | | | | | | | | |
Income (Loss) From Investment Operations: | | | | | | | | | | | | | | | | | | | | |
Net investment income (loss) | | | 0.59 | | | | 0.53 | | | | 0.45 | | | | 0.42 | | | | 0.39 | |
Net realized and unrealized gain (loss) on investment and foreign currency transactions | | | 4.31 | | | | (1.20 | ) | | | 2.54 | | | | 1.20 | | | | (0.30 | ) |
| | | | | | | | | | | | | | | | | | | | |
Total from investment operations | | | 4.90 | | | | (0.67 | ) | | | 2.99 | | | | 1.62 | | | | 0.09 | |
| | | | | | | | | | | | | | | | | | | | |
Capital Contributions | | | — | (b)(c) | | | — | (b)(c) | | | — | | | | 0.02 | (d) | | | — | |
| | | | | | | | | | | | | | | | | | | | |
Net Asset Value, end of year | | $ | 31.40 | | | $ | 26.50 | | | $ | 27.17 | | | $ | 24.18 | | | $ | 22.54 | |
| | | | | | | | | | | | | | | | | | | | |
Total Return(e) | | | 18.49 | %(f) | | | (2.47 | )%(f) | | | 12.37 | % | | | 7.28 | %(g) | | | 0.40 | % |
Ratios/Supplemental Data: | | | | | | | | | | | | | | | | | | | | |
Net assets, end of year (in millions) | | $ | 2,597 | | | $ | 2,370 | | | $ | 2,595 | | | $ | 2,473 | | | $ | 2,554 | |
Average net assets (in millions) | | $ | 2,506 | | | $ | 2,535 | | | $ | 2,535 | | | $ | 2,487 | | | $ | 2,522 | |
Ratios to average net assets(h): | | | | | | | | | | | | | | | | | | | | |
Expenses after waivers and/or expense reimbursement | | | 0.59 | % | | | 0.59 | % | | | 0.58 | % | | | 0.58 | % | | | 0.58 | % |
Expenses before waivers and/or expense reimbursement | | | 0.59 | % | | | 0.59 | % | | | 0.58 | % | | | 0.58 | % | | | 0.58 | % |
Net investment income (loss) | | | 2.02 | % | | | 1.94 | % | | | 1.75 | % | | | 1.79 | % | | | 1.70 | % |
Portfolio turnover rate(i) | | | 90 | % | | | 101 | % | | | 136 | % | | | 185 | % | | | 208 | % |
Diversified Bond Portfolio
| | | | | | | | | | | | | | | | | | | | |
| | | Year Ended December 31, | |
| | | 2019 | | | 2018 | | | 2017 | | | 2016 | | | 2015 | |
Per Share Operating Performance(a): | | | | | | | | | | | | | | | | | | | | |
Net Asset Value, beginning of year | | $ | 13.12 | | | $ | 13.14 | | | $ | 12.28 | | | $ | 11.64 | | | $ | 11.66 | |
| | | | | | | | | | | | | | | | | | | | |
Income (Loss) From Investment Operations: | | | | | | | | | | | | | | | | | | | | |
Net investment income (loss) | | | 0.49 | | | | 0.45 | | | | 0.42 | | | | 0.43 | | | | 0.41 | |
Net realized and unrealized gain (loss) on investment and foreign currency transactions | | | 0.94 | | | | (0.48 | ) | | | 0.44 | | | | 0.21 | | | | (0.43 | ) |
| | | | | | | | | | | | | | | | | | | | |
Total from investment operations | | | 1.43 | | | | (0.03 | ) | | | 0.86 | | | | 0.64 | | | | (0.02 | ) |
| | | | | | | | | | | | | | | | | | | | |
Capital Contributions | | | — | | | | 0.01 | (b) | | | — | | | | — | (c)(d) | | | — | |
| | | | | | | | | | | | | | | | | | | | |
Net Asset Value, end of year | | $ | 14.55 | | | $ | 13.12 | | | $ | 13.14 | | | $ | 12.28 | | | $ | 11.64 | |
| | | | | | | | | | | | | | | | | | | | |
Total Return(e) | | | 10.90 | % | | | (0.15 | )%(j) | | | 7.00 | % | | | 5.50 | %(f) | | | (0.17 | )% |
Ratios/Supplemental Data: | | | | | | | | | | | | | | | | | | | | |
Net assets, end of year (in millions) | | $ | 1,190 | | | $ | 1,123 | | | $ | 1,145 | | | $ | 1,105 | | | $ | 1,085 | |
Average net assets (in millions) | | $ | 1,166 | | | $ | 1,132 | | | $ | 1,123 | | | $ | 1,121 | | | $ | 1,074 | |
Ratios to average net assets(h): | | | | | | | | | | | | | | | | | | | | |
Expenses after waivers and/or expense reimbursement | | | 0.44 | % | | | 0.44 | % | | | 0.44 | % | | | 0.44 | % | | | 0.46 | % |
Expenses before waivers and/or expense reimbursement | | | 0.44 | % | | | 0.44 | % | | | 0.44 | % | | | 0.44 | % | | | 0.46 | % |
Net investment income (loss) | | | 3.53 | % | | | 3.44 | % | | | 3.28 | % | | | 3.52 | % | | | 3.48 | % |
Portfolio turnover rate(i) | | | 48 | % | | | 51 | % | | | 71 | % | | | 49 | % | | | 81 | % |
| (a) | Calculated based on average shares outstanding during the year. |
| (b) | Represents payment received by the Portfolio, from Prudential, in connection with the failure to timely compensate the Portfolio for the excess foreign withholding tax withheld on dividends and interest from certain countries due to the Portfolio’s tax status as a partnership. |
| (c) | Less than $0.005 per share. |
| (d) | Represents payment received by the Portfolio, from Prudential, in connection with the failure to maximize securities lending income due to a restriction that benefited Prudential. |
| (e) | Total return is calculated assuming a purchase of a share on the first day and a sale on the last day of each year reported and includes reinvestment of distributions, if any, and does not reflect the effect of insurance contract charges. Total return does not reflect expenses associated with the separate account such as administrative fees, account charges and surrender charges which, if reflected, would reduce the total returns for all years shown. Performance figures may reflect fee waivers and/or expense reimbursements. In the absence of fee waivers and/or expense reimbursements, the total return would be lower. Past performance is no guarantee of future results. Total returns may reflect adjustments to conform to generally accepted accounting principles. |
| (f) | Total return for the year includes the impact of the capital contribution, which was not material to the total return. |
| (g) | Total return for the year includes the impact of the capital contribution. Excluding the capital contribution, the total return would have been 7.19%. |
| (h) | Does not include expenses of the underlying funds in which the Portfolio invests. |
| (i) | The Portfolio’s portfolio turnover rate is calculated in accordance with regulatory requirements, without regard to transactions involving short-term investments and certain derivatives. If such transactions were included, the Portfolio’s portfolio turnover rate may be higher. |
| (j) | Total return for the year includes the impact of the capital contribution. Excluding the capital contribution, the total return would have been (0.23)%. |
SEE NOTES TO FINANCIAL STATEMENTS.
C1
Financial Highlights
Equity Portfolio—Class I
| | | | | | | | | | | | | | | | | | | | |
| | | Year Ended December 31, | |
| | | 2019 | | | 2018 | | | 2017 | | | 2016 | | | 2015 | |
Per Share Operating Performance(a): | | | | | | | | | | | | | | | | | | | | |
Net Asset Value, beginning of year | | $ | 49.02 | | | $ | 51.52 | | | $ | 40.96 | | | $ | 39.47 | | | $ | 38.56 | |
| | | | | | | | | | | | | | | | | | | | |
Income (Loss) From Investment Operations: | | | | | | | | | | | | | | | | | | | | |
Net investment income (loss) | | | 0.66 | | | | 0.53 | | | | 0.41 | | | | 0.38 | | | | 0.34 | |
Net realized and unrealized gain (loss) on investment and foreign currency transactions | | | 13.50 | | | | (3.07 | ) | | | 10.15 | | | | 1.07 | | | | 0.57 | |
| | | | | | | | | | | | | | | | | | | | |
Total from investment operations | | | 14.16 | | | | (2.54 | ) | | | 10.56 | | | | 1.45 | | | | 0.91 | |
| | | | | | | | | | | | | | | | | | | | |
Capital Contributions | | | — | (b)(c) | | | 0.04 | (b) | | | — | | | | 0.04 | (d) | | | — | |
| | | | | | | | | | | | | | | | | | | | |
Net Asset Value, end of year | | $ | 63.18 | | | $ | 49.02 | | | $ | 51.52 | | | $ | 40.96 | | | $ | 39.47 | |
| | | | | | | | | | | | | | | | | | | | |
Total Return(e) | | | 28.89 | %(f) | | | (4.85 | )%(g) | | | 25.78 | % | | | 3.78 | %(h) | | | 2.36 | % |
Ratios/Supplemental Data: | | | | | | | | | | | | | | | | | | | | |
Net assets, end of year (in millions) | | $ | 4,711 | | | $ | 3,920 | | | $ | 4,416 | | | $ | 3,742 | | | $ | 3,846 | |
Average net assets (in millions) | | $ | 4,407 | | | $ | 4,497 | | | $ | 4,099 | | | $ | 3,615 | | | $ | 3,959 | |
Ratios to average net assets(i): | | | | | | | | | | | | | | | | | | | | |
Expenses after waivers and/or expense reimbursement | | | 0.47 | % | | | 0.47 | % | | | 0.47 | % | | | 0.47 | % | | | 0.47 | % |
Expenses before waivers and/or expense reimbursement | | | 0.47 | % | | | 0.47 | % | | | 0.47 | % | | | 0.47 | % | | | 0.47 | % |
Net investment income (loss) | | | 1.16 | % | | | 0.98 | % | | | 0.89 | % | | | 1.01 | % | | | 0.86 | % |
Portfolio turnover rate(j) | | | 43 | % | | | 37 | % | | | 55 | % | | | 39 | % | | | 37 | % |
Equity Portfolio—Class II
| | | | | | | | | | | | | | | | | | | | |
| | | Year Ended December 31, | |
| | | 2019 | | | 2018 | | | 2017 | | | 2016 | | | 2015 | |
Per Share Operating Performance(a): | | | | | | | | | | | | | | | | | | | | |
Net Asset Value, beginning of year | | $ | 48.37 | | | $ | 51.04 | | | $ | 40.74 | | | $ | 39.42 | | | $ | 38.66 | |
| | | | | | | | | | | | | | | | | | | | |
Income (Loss) From Investment Operations: | | | | | | | | | | | | | | | | | | | | |
Net investment income (loss) | | | 0.43 | | | | 0.32 | | | | 0.23 | | | | 0.23 | | | | 0.18 | |
Net realized and unrealized gain (loss) on investment and foreign currency transactions | | | 13.29 | | | | (3.03 | ) | | | 10.07 | | | | 1.05 | | | | 0.58 | |
| | | | | | | | | | | | | | | | | | | | |
Total from investment operations | | | 13.72 | | | | (2.71 | ) | | | 10.30 | | | | 1.28 | | | | 0.76 | |
| | | | | | | | | | | | | | | | | | | | |
Capital Contributions | | | — | (b)(c) | | | 0.04 | (b) | | | — | | | | 0.04 | (d) | | | — | |
| | | | | | | | | | | | | | | | | | | | |
Net Asset Value, end of year | | $ | 62.09 | | | $ | 48.37 | | | $ | 51.04 | | | $ | 40.74 | | | $ | 39.42 | |
| | | | | | | | | | | | | | | | | | | | |
Total Return(e) | | | 28.36 | %(f) | | | (5.23 | )%(g) | | | 25.28 | % | | | 3.35 | %(h) | | | 1.97 | % |
Ratios/Supplemental Data: | | | | | | | | | | | | | | | | | | | | |
Net assets, end of year (in millions) | | $ | 2 | | | $ | 2 | | | $ | 2 | | | $ | 2 | | | $ | 2 | |
Average net assets (in millions) | | $ | 2 | | | $ | 2 | | | $ | 2 | | | $ | 2 | | | $ | 2 | |
Ratios to average net assets(i): | | | | | | | | | | | | | | | | | | | | |
Expenses after waivers and/or expense reimbursement | | | 0.87 | % | | | 0.87 | % | | | 0.87 | % | | | 0.87 | % | | | 0.87 | % |
Expenses before waivers and/or expense reimbursement | | | 0.87 | % | | | 0.87 | % | | | 0.87 | % | | | 0.87 | % | | | 0.87 | % |
Net investment income (loss) | | | 0.76 | % | | | 0.59 | % | | | 0.50 | % | | | 0.61 | % | | | 0.46 | % |
Portfolio turnover rate(j) | | | 43 | % | | | 37 | % | | | 55 | % | | | 39 | % | | | 37 | % |
| (a) | Calculated based on average shares outstanding during the year. |
| (b) | Represents payment received by the Portfolio, from Prudential, in connection with the failure to timely compensate the Portfolio for the excess foreign withholding tax withheld on dividends and interest from certain countries due to the Portfolio’s tax status as a partnership. |
| (c) | Less than $0.005 per share. |
| (d) | Represents payment received by the Portfolio, from Prudential, in connection with the failure to maximize securities lending income due to a restriction that benefited Prudential. |
| (e) | Total return is calculated assuming a purchase of a share on the first day and a sale on the last day of each year reported and includes reinvestment of distributions, if any, and does not reflect the effect of insurance contract charges. Total return does not reflect expenses associated with the separate account such as administrative fees, account charges and surrender charges which, if reflected, would reduce the total returns for all years shown. Performance figures may reflect fee waivers and/or expense reimbursements. In the absence of fee waivers and/or expense reimbursements, the total return would be lower. Past performance is no guarantee of future results. Total returns may reflect adjustments to conform to generally accepted accounting principles. |
| (f) | Total return for the year includes the impact of the capital contribution, which was not material to the total return. |
| (g) | Total return for the year includes the impact of the capital contribution. Excluding the capital contribution, the total return would have been (4.93)% and (5.31)% for Class I and Class II, respectively. |
| (h) | Total return for the year includes the impact of the capital contribution. Excluding the capital contribution, the total return would have been 3.68% and 3.25% for Class I and Class II, respectively. |
| (i) | Does not include expenses of the underlying funds in which the Portfolio invests. |
| (j) | The Portfolio’s portfolio turnover rate is calculated in accordance with regulatory requirements, without regard to transactions involving short-term investments and certain derivatives. If such transactions were included, the Portfolio’s portfolio turnover rate may be higher. |
SEE NOTES TO FINANCIAL STATEMENTS.
C2
Financial Highlights
Flexible Managed Portfolio
| | | | | | | | | | | | | | | | | | | | |
| | | Year Ended December 31, | |
| | | 2019 | | | 2018 | | | 2017 | | | 2016 | | | 2015 | |
Per Share Operating Performance(a): | | | | | | | | | | | | | | | | | | | | |
Net Asset Value, beginning of year | | $ | 28.63 | | | $ | 29.88 | | | $ | 25.99 | | | $ | 23.95 | | | $ | 23.71 | |
| | | | | | | | | | | | | | | | | | | | |
Income (Loss) From Investment Operations: | | | | | | | | | | | | | | | | | | | | |
Net investment income (loss) | | | 0.61 | | | | 0.53 | | | | 0.45 | | | | 0.44 | | | | 0.42 | |
Net realized and unrealized gain (loss) on investment and foreign currency transactions | | | 5.08 | | | | (1.78 | ) | | | 3.44 | | | | 1.58 | | | | (0.18 | ) |
| | | | | | | | | | | | | | | | | | | | |
Total from investment operations | | | 5.69 | | | | (1.25 | ) | | | 3.89 | | | | 2.02 | | | | 0.24 | |
| | | | | | | | | | | | | | | | | | | | |
Capital Contributions | | | — | (b)(c) | | | — | (b)(c) | | | — | | | | 0.02 | (d) | | | — | |
| | | | | | | | | | | | | | | | | | | | |
Net Asset Value, end of year | | $ | 34.32 | | | $ | 28.63 | | | $ | 29.88 | | | $ | 25.99 | | | $ | 23.95 | |
| | | | | | | | | | | | | | | | | | | | |
Total Return(e) | | | 19.87 | %(f) | | | (4.18 | )%(f) | | | 14.97 | % | | | 8.52 | %(g) | | | 1.01 | % |
Ratios/Supplemental Data: | | | | | | | | | | | | | | | | | | | | |
Net assets, end of year (in millions) | | $ | 4,328 | | | $ | 3,834 | | | $ | 4,230 | | | $ | 3,890 | | | $ | 3,769 | |
Average net assets (in millions) | | $ | 4,127 | | | $ | 4,157 | | | $ | 4,043 | | | $ | 3,799 | | | $ | 3,878 | |
Ratios to average net assets(h): | | | | | | | | | | | | | | | | | | | | |
Expenses after waivers and/or expense reimbursement | | | 0.63 | % | | | 0.63 | % | | | 0.62 | % | | | 0.63 | % | | | 0.63 | % |
Expenses before waivers and/or expense reimbursement | | | 0.63 | % | | | 0.63 | % | | | 0.62 | % | | | 0.63 | % | | | 0.63 | % |
Net investment income (loss) | | | 1.92 | % | | | 1.75 | % | | | 1.62 | % | | | 1.78 | % | | | 1.74 | % |
Portfolio turnover rate(i)(j) | | | 125 | % | | | 139 | % | | | 175 | % | | | 203 | % | | | 213 | % |
Global Portfolio
| | | | | | | | | | | | | | | | | | | | |
| | | Year Ended December 31, | |
| | | 2019 | | | 2018 | | | 2017 | | | 2016 | | | 2015 | |
Per Share Operating Performance(a): | | | | | | | | | | | | | | | | | | | | |
Net Asset Value, beginning of year | | $ | 31.83 | | | $ | 34.33 | | | $ | 27.50 | | | $ | 26.33 | | | $ | 25.72 | |
| | | | | | | | | | | | | | | | | | | | |
Income (Loss) From Investment Operations: | | | | | | | | | | | | | | | | | | | | |
Net investment income (loss) | | | 0.52 | | | | 0.47 | | | | 0.42 | | | | 0.34 | | | | 0.34 | |
Net realized and unrealized gain (loss) on investment and foreign currency transactions | | | 9.14 | | | | (2.99 | ) | | | 6.41 | | | | 0.81 | | | | 0.27 | |
| | | | | | | | | | | | | | | | | | | | |
Total from investment operations | | | 9.66 | | | | (2.52 | ) | | | 6.83 | | | | 1.15 | | | | 0.61 | |
| | | | | | | | | | | | | | | | | | | | |
Capital Contributions | | | — | (b)(c) | | | 0.02 | (b) | | | — | | | | 0.02 | (d) | | | — | |
| | | | | | | | | | | | | | | | | | | | |
Net Asset Value, end of year | | $ | 41.49 | | | $ | 31.83 | | | $ | 34.33 | | | $ | 27.50 | | | $ | 26.33 | |
| | | | | | | | | | | | | | | | | | | | |
Total Return(e) | | | 30.39 | %(f) | | | (7.28 | )%(k) | | | 24.84 | % | | | 4.44 | %(l) | | | 2.37 | % |
Ratios/Supplemental Data: | | | | | | | | | | | | | | | | | | | | |
Net assets, end of year (in millions) | | $ | 1,264 | | | $ | 1,007 | | | $ | 1,133 | | | $ | 955 | | | $ | 965 | |
Average net assets (in millions) | | $ | 1,158 | | | $ | 1,140 | | | $ | 1,052 | | | $ | 942 | | | $ | 813 | |
Ratios to average net assets(h): | | | | | | | | | | | | | | | | | | | | |
Expenses after waivers and/or expense reimbursement | | | 0.77 | % | | | 0.77 | % | | | 0.79 | % | | | 0.80 | % | | | 0.81 | % |
Expenses before waivers and/or expense reimbursement | | | 0.80 | % | | | 0.80 | % | | | 0.81 | % | | | 0.81 | % | | | 0.82 | % |
Net investment income (loss) | | | 1.41 | % | | | 1.33 | % | | | 1.34 | % | | | 1.29 | % | | | 1.28 | % |
Portfolio turnover rate(i) | | | 26 | % | | | 28 | % | | | 33 | % | | | 40 | % | | | 33 | % |
| (a) | Calculated based on average shares outstanding during the year. |
| (b) | Represents payment received by the Portfolio, from Prudential, in connection with the failure to timely compensate the Portfolio for the excess foreign withholding tax withheld on dividends and interest from certain countries due to the Portfolio’s tax status as a partnership. |
| (c) | Less than $0.005 per share. |
| (d) | Represents payment received by the Portfolio, from Prudential, in connection with the failure to maximize securities lending income due to a restriction that benefited Prudential. |
| (e) | Total return is calculated assuming a purchase of a share on the first day and a sale on the last day of each year reported and includes reinvestment of distributions, if any, and does not reflect the effect of insurance contract charges. Total return does not reflect expenses associated with the separate account such as administrative fees, account charges and surrender charges which, if reflected, would reduce the total returns for all years shown. Performance figures may reflect fee waivers and/or expense reimbursements. In the absence of fee waivers and/or expense reimbursements, the total return would be lower. Past performance is no guarantee of future results. Total returns may reflect adjustments to conform to generally accepted accounting principles. |
| (f) | Total return for the year includes the impact of the capital contribution, which was not material to the total return. |
| (g) | Total return for the year includes the impact of the capital contribution. Excluding the capital contribution, the total return would have been 8.44%. |
| (h) | Does not include expenses of the underlying funds in which the Portfolio invests. |
| (i) | The Portfolio’s portfolio turnover rate is calculated in accordance with regulatory requirements, without regard to transactions involving short-term investments and certain derivatives. If such transactions were included, the Portfolio’s portfolio turnover rate may be higher. |
| (j) | The Portfolio accounts for mortgage dollar roll transactions as purchases and sales which, as a result, can increase its portfolio turnover rate. |
| (k) | Total return for the period includes the impact of the capital contribution. Excluding the capital contribution, the total return would have been (7.34)%. |
| (l) | Total return for the period includes the impact of the capital contribution. Excluding the capital contribution, the total return would have been 4.36%. |
SEE NOTES TO FINANCIAL STATEMENTS.
C3
Financial Highlights
Government Income Portfolio
| | | | | | | | | | | | | | | | | | | | |
| | | Year Ended December 31, | |
| | | 2019 | | | 2018 | | | 2017 | | | 2016 | | | 2015 | |
Per Share Operating Performance(a): | | | | | | | | | | | | | | | | | | | | |
Net Asset Value, beginning of year | | $ | 12.70 | | | $ | 12.62 | | | $ | 12.26 | | | $ | 12.00 | | | $ | 11.92 | |
| | | | | | | | | | | | | | | | | | | | |
Income (Loss) From Investment Operations: | | | | | | | | | | | | | | | | | | | | |
Net investment income (loss) | | | 0.31 | | | | 0.28 | | | | 0.23 | | | | 0.20 | | | | 0.18 | |
Net realized and unrealized gain (loss) on investment transactions | | | 0.53 | | | | (0.20 | ) | | | 0.13 | | | | 0.06 | | | | (0.10 | ) |
| | | | | | | | | | | | | | | | | | | | |
Total from investment operations | | | 0.84 | | | | 0.08 | | | | 0.36 | | | | 0.26 | | | | 0.08 | |
| | | | | | | | | | | | | | | | | | | | |
Capital Contributions | | | — | | | | — | (b)(c) | | | — | | | | — | (c)(d) | | | — | |
| | | | | | | | | | | | | | | | | | | | |
Net Asset Value, end of year | | $ | 13.54 | | | $ | 12.70 | | | $ | 12.62 | | | $ | 12.26 | | | $ | 12.00 | |
| | | | | | | | | | | | | | | | | | | | |
Total Return(e) | | | 6.61 | % | | | 0.63 | %(f) | | | 2.94 | % | | | 2.17 | %(f) | | | 0.67 | % |
Ratios/Supplemental Data: | | | | | | | | | | | | | | | | | | | | |
Net assets, end of year (in millions) | | $ | 239 | | | $ | 221 | | | $ | 244 | | | $ | 226 | | | $ | 232 | |
Average net assets (in millions) | | $ | 235 | | | $ | 231 | | | $ | 252 | | | $ | 236 | | | $ | 325 | |
Ratios to average net assets(g): | | | | | | | | | | | | | | | | | | | | |
Expenses after waivers and/or expense reimbursement | | | 0.52 | % | | | 0.51 | % | | | 0.53 | % | | | 0.51 | % | | | 0.48 | % |
Expenses before waivers and/or expense reimbursement | | | 0.52 | % | | | 0.51 | % | | | 0.53 | % | | | 0.51 | % | �� | | 0.48 | % |
Net investment income (loss) | | | 2.34 | % | | | 2.28 | % | | | 1.84 | % | | | 1.60 | % | | | 1.48 | % |
Portfolio turnover rate(h)(i) | | | 269 | % | | | 284 | % | | | 495 | % | | | 705 | % | | | 746 | % |
Government Money Market Portfolio
| | | | | | | | | | | | | | | | | | | | |
| | | Year Ended December 31, | |
| | | 2019 | | | 2018 | | | 2017 | | | 2016 | | | 2015 | |
Per Share Operating Performance(a): | | | | | | | | | | | | | | | | | | | | |
Net Asset Value, beginning of year | | $ | 10.00 | | | $ | 10.00 | | | $ | 10.00 | | | $ | 10.00 | | | $ | 10.00 | |
| | | | | | | | | | | | | | | | | | | | |
Income (Loss) From Investment Operations: | | | | | | | | | | | | | | | | | | | | |
Net investment income (loss) and realized gains (losses) | | | 0.19 | | | | 0.15 | | | | 0.06 | | | | 0.01 | | | | — | (c) |
Less Dividends and Distributions | | | (0.19 | ) | | | (0.15 | ) | | | (0.06 | ) | | | (0.01 | ) | | | — | (c) |
| | | | | | | | | | | | | | | | | | | | |
Net Asset Value, end of year | | $ | 10.00 | | | $ | 10.00 | | | $ | 10.00 | | | $ | 10.00 | | | $ | 10.00 | |
| | | | | | | | | | | | | | | | | | | | |
Total Return(e) | | | 1.92 | % | | | 1.53 | % | | | 0.56 | % | | | 0.10 | % | | | — | %(j) |
Ratios/Supplemental Data: | | | | | | | | | | | | | | | | | | | | |
Net assets, end of year (in millions) | | $ | 600 | | | $ | 536 | | | $ | 560 | | | $ | 724 | | | $ | 651 | |
Average net assets (in millions) | | $ | 563 | | | $ | 560 | | | $ | 665 | | | $ | 717 | | | $ | 725 | |
Ratios to average net assets(g): | | | | | | | | | | | | | | | | | | | | |
Expenses after waivers and/or expense reimbursement | | | 0.35 | % | | | 0.35 | % | | | 0.35 | % | | | 0.35 | % | | | 0.19 | % |
Expenses before waivers and/or expense reimbursement | | | 0.35 | % | | | 0.35 | % | | | 0.35 | % | | | 0.35 | % | | | 0.44 | % |
Net investment income (loss) | | | 1.88 | % | | | 1.52 | % | | | 0.55 | % | | | 0.09 | % | | | — | %(j) |
| (a) | Calculated based on average shares outstanding during the year. |
| (b) | Represents payment received by the Portfolio, from Prudential, in connection with the failure to timely compensate the Portfolio for the excess foreign withholding tax withheld on dividends and interest from certain countries due to the Portfolio’s tax status as a partnership. |
| (c) | Less than $0.005 per share. |
| (d) | Represents payment received by the Portfolio, from Prudential, in connection with the failure to maximize securities lending income due to a restriction that benefited Prudential. |
| (e) | Total return is calculated assuming a purchase of a share on the first day and a sale on the last day of each year reported and includes reinvestment of distributions, if any, and does not reflect the effect of insurance contract charges. Total return does not reflect expenses associated with the separate account such as administrative fees, account charges and surrender charges which, if reflected, would reduce the total returns for all years shown. Performance figures may reflect fee waivers and/or expense reimbursements. In the absence of fee waivers and/or expense reimbursements, the total return would be lower. Past performance is no guarantee of future results. Total returns may reflect adjustments to conform to generally accepted accounting principles. |
| (f) | Total return for the year includes the impact of the capital contribution, which was not material to the total return. |
| (g) | Does not include expenses of the underlying funds in which the Portfolio invests. |
| (h) | The Portfolio accounts for mortgage dollar roll transactions, when applicable, as purchases and sales which, as a result, can increase its portfolio turnover rate. |
| (i) | The Portfolio’s portfolio turnover rate is calculated in accordance with regulatory requirements, without regard to transactions involving short-term investments and certain derivatives. If such transactions were included, the Portfolio’s portfolio turnover rate may be higher. |
SEE NOTES TO FINANCIAL STATEMENTS.
C4
Financial Highlights
High Yield Bond Portfolio
| | | | | | | | | | | | | | | | | | | | |
| | | Year Ended December 31, | |
| | | 2019 | | | 2018 | | | 2017 | | | 2016 | | | 2015 | |
Per Share Operating Performance(a): | | | | | | | | | | | | | | | | | | | | |
Net Asset Value, beginning of year | | $ | 4.96 | | | $ | 5.17 | | | $ | 5.10 | | | $ | 4.68 | | | $ | 5.11 | |
| | | | | | | | | | | | | | | | | | | | |
Income (Loss) From Investment Operations: | | | | | | | | | | | | | | | | | | | | |
Net investment income (loss) | | | 0.34 | | | | 0.33 | | | | 0.32 | | | | 0.32 | | | | 0.31 | |
Net realized and unrealized gain (loss) on investment and foreign currency transactions | | | 0.47 | | | | (0.39 | ) | | | 0.07 | | | | 0.42 | | | | (0.42 | ) |
| | | | | | | | | | | | | | | | | | | | |
Total from investment operations | | | 0.81 | | | | (0.06 | ) | | | 0.39 | | | | 0.74 | | | | (0.11 | ) |
| | | | | | | | | | | | | | | | | | | | |
Less Dividends and Distributions | | | — | | | | (0.15 | ) | | | (0.32 | ) | | | (0.32 | ) | | | (0.32 | ) |
Capital Contributions | | | — | | | | — | (b)(c) | | | — | | | | — | (c)(d) | | | — | |
| | | | | | | | | | | | | | | | | | | | |
Net Asset Value, end of year | | $ | 5.77 | | | $ | 4.96 | | | $ | 5.17 | | | $ | 5.10 | | | $ | 4.68 | |
| | | | | | | | | | | | | | | | | | | | |
Total Return(e) | | | 16.33 | % | | | (1.26 | )%(f) | | | 7.80 | % | | | 16.24 | %(f) | | | (2.45 | )% |
Ratios/Supplemental Data: | | | | | | | | | | | | | | | | | | | | |
Net assets, end of year (in millions) | | $ | 522 | | | $ | 474 | | | $ | 508 | | | $ | 3,568 | | | $ | 3,160 | |
Average net assets (in millions) | | $ | 507 | | | $ | 499 | | | $ | 3,549 | | | $ | 3,362 | | | $ | 3,251 | |
Ratios to average net assets(g): | | | | | | | | | | | | | | | | | | | | |
Expenses after waivers and/or expense reimbursement | | | 0.57 | % | | | 0.57 | % | | | 0.57 | % | | | 0.57 | % | | | 0.57 | % |
Expenses before waivers and/or expense reimbursement | | | 0.62 | % | | | 0.62 | % | | | 0.57 | % | | | 0.57 | % | | | 0.57 | % |
Net investment income (loss) | | | 6.28 | % | | | 6.50 | % | | | 6.17 | % | | | 6.61 | % | | | 6.21 | % |
Portfolio turnover rate(h) | | | 58 | % | | | 47 | % | | | 54 | %(i) | | | 39 | % | | | 46 | % |
| (a) | Calculated based on average shares outstanding during the year. |
| (b) | Represents payment received by the Portfolio, from Prudential, in connection with the failure to timely compensate the Portfolio for the excess foreign withholding tax withheld on dividends and interest from certain countries due to the Portfolio’s tax status as a partnership. |
| (c) | Less than $0.005 per share. |
| (d) | Represents payment received by the Portfolio, from Prudential, in connection with the failure to maximize securities lending income due to a restriction that benefited Prudential. |
| (e) | Total return is calculated assuming a purchase of a share on the first day and a sale on the last day of each year reported and includes reinvestment of distributions, if any, and does not reflect the effect of insurance contract charges. Total return does not reflect expenses associated with the separate account such as administrative fees, account charges and surrender charges which, if reflected, would reduce the total returns for all years shown. Performance figures may reflect fee waivers and/or expense reimbursements. In the absence of fee waivers and/or expense reimbursements, the total return would be lower. Past performance is no guarantee of future results. Total returns may reflect adjustments to conform to generally accepted accounting principles. |
| (f) | Total return for the year includes the impact of the capital contribution, which was not material to the total return. |
| (g) | Does not include expenses of the underlying funds in which the Portfolio invests. |
| (h) | The Portfolio’s portfolio turnover rate is calculated in accordance with regulatory requirements, without regard to transactions involving short-term investments and certain derivatives. If such transactions were included, the Portfolio’s portfolio turnover rate may be higher. |
| (i) | The Portfolio turnover rate is calculated in accordance with regulatory requirements and excludes portfolio securities transferred as a result ofin-kind transactions. If such transactions were included, the portfolio turnover rate may be higher. |
SEE NOTES TO FINANCIAL STATEMENTS.
C5
Financial Highlights
Jennison Portfolio—Class I
| | | | | | | | | | | | | | | | | | | | |
| | | Year Ended December 31, | |
| | | 2019 | | | 2018 | | | 2017 | | | 2016 | | | 2015 | |
Per Share Operating Performance(a): | | | | | | | | | | | | | | | | | | | | |
Net Asset Value, beginning of year | | $ | 61.21 | | | $ | 61.69 | | | $ | 45.13 | | | $ | 45.54 | | | $ | 40.85 | |
| | | | | | | | | | | | | | | | | | | | |
Income (Loss) From Investment Operations: | | | | | | | | | | | | | | | | | | | | |
Net investment income (loss) | | | 0.09 | | | | 0.13 | | | | 0.13 | | | | 0.10 | | | | 0.06 | |
Net realized and unrealized gain (loss) on investment and foreign currency transactions | | | 20.32 | | | | (0.61 | ) | | | 16.43 | | | | (0.55 | ) | | | 4.63 | |
| | | | | | | | | | | | | | | | | | | | |
Total from investment operations | | | 20.41 | | | | (0.48 | ) | | | 16.56 | | | | (0.45 | ) | | | 4.69 | |
| | | | | | | | | | | | | | | | | | | | |
Capital Contributions | | | — | (b)(c) | | | — | (b)(c) | | | — | | | | 0.04 | (d) | | | — | |
| | | | | | | | | | | | | | | | | | | | |
Net Asset Value, end of year | | $ | 81.62 | | | $ | 61.21 | | | $ | 61.69 | | | $ | 45.13 | | | $ | 45.54 | |
| | | | | | | | | | | | | | | | | | | | |
Total Return(e) | | | 33.34 | %(f) | | | (0.78 | )%(f) | | | 36.69 | % | | | (0.90 | )%(g) | | | 11.48 | % |
Ratios/Supplemental Data: | | | | | | | | | | | | | | | | | | | | |
Net assets, end of year (in millions) | | $ | 2,242 | | | $ | 1,803 | | | $ | 1,937 | | | $ | 1,520 | | | $ | 1,655 | |
Average net assets (in millions) | | $ | 2,073 | | | $ | 2,052 | | | $ | 1,761 | | | $ | 1,529 | | | $ | 1,651 | |
Ratios to average net assets(h): | | | | | | | | | | | | | | | | | | | | |
Expenses after waivers and/or expense reimbursement | | | 0.62 | % | | | 0.62 | % | | | 0.63 | % | | | 0.63 | % | | | 0.63 | % |
Expenses before waivers and/or expense reimbursement | | | 0.62 | % | | | 0.62 | % | | | 0.63 | % | | | 0.63 | % | | | 0.63 | % |
Net investment income (loss) | | | 0.13 | % | | | 0.19 | % | | | 0.25 | % | | | 0.23 | % | | | 0.14 | % |
Portfolio turnover rate(i) | | | 41 | % | | | 38 | % | | | 51 | % | | | 35 | % | | | 31 | % |
Jennison Portfolio—Class II
| | | | | | | | | | | | | | | | | | | | |
| | | Year Ended December 31, | |
| | | 2019 | | | 2018 | | | 2017 | | | 2016 | | | 2015 | |
Per Share Operating Performance(a): | | | | | | | | | | | | | | | | | | | | |
Net Asset Value, beginning of year | | $ | 58.68 | | | $ | 59.38 | | | $ | 43.62 | | | $ | 44.19 | | | $ | 39.80 | |
| | | | | | | | | | | | | | | | | | | | |
Income (Loss) From Investment Operations: | | | | | | | | | | | | | | | | | | | | |
Net investment income (loss) | | | (0.19 | ) | | | (0.14 | ) | | | (0.08 | ) | | | (0.07 | ) | | | (0.11 | ) |
Net realized and unrealized gain (loss) on investment and foreign currency transactions | | | 19.45 | | | | (0.56 | ) | | | 15.84 | | | | (0.54 | ) | | | 4.50 | |
| | | | | | | | | | | | | | | | | | | | |
Total from investment operations | | | 19.26 | | | | (0.70 | ) | | | 15.76 | | | | (0.61 | ) | | | 4.39 | |
| | | | | | | | | | | | | | | | | | | | |
Capital Contributions | | | — | (b)(c) | | | — | (b)(c) | | | — | | | | 0.04 | (d) | | | — | |
| | | | | | | | | | | | | | | | | | | | |
Net Asset Value, end of year | | $ | 77.94 | | | $ | 58.68 | | | $ | 59.38 | | | $ | 43.62 | | | $ | 44.19 | |
| | | | | | | | | | | | | | | | | | | | |
Total Return(e) | | | 32.82 | %(f) | | | (1.18 | )%(f) | | | 36.13 | % | | | (1.29 | )%(g) | | | 11.03 | % |
Ratios/Supplemental Data: | | | | | | | | | | | | | | | | | | | | |
Net assets, end of year (in millions) | | $ | 66 | | | $ | 61 | | | $ | 60 | | | $ | 41 | | | $ | 60 | |
Average net assets (in millions) | | $ | 64 | | | $ | 70 | | | $ | 49 | | | $ | 50 | | | $ | 50 | |
Ratios to average net assets(h): | | | | | | | | | | | | | | | | | | | | |
Expenses after waivers and/or expense reimbursement | | | 1.02 | % | | | 1.02 | % | | | 1.03 | % | | | 1.03 | % | | | 1.03 | % |
Expenses before waivers and/or expense reimbursement | | | 1.02 | % | | | 1.02 | % | | | 1.03 | % | | | 1.03 | % | | | 1.03 | % |
Net investment income (loss) | | | (0.27 | )% | | | (0.22 | )% | | | (0.16 | )% | | | (0.17 | )% | | | (0.26 | )% |
Portfolio turnover rate(i) | | | 41 | % | | | 38 | % | | | 51 | % | | | 35 | % | | | 31 | % |
| (a) | Calculated based on average shares outstanding during the year. |
| (b) | Represents payment received by the Portfolio, from Prudential, in connection with the failure to timely compensate the Portfolio for the excess foreign withholding tax withheld on dividends and interest from certain countries due to the Portfolio’s tax status as a partnership. |
| (c) | Less than $0.005 per share. |
| (d) | Represents payment received by the Portfolio, from Prudential, in connection with the failure to maximize securities lending income due to a restriction that benefited Prudential. |
| (e) | Total return is calculated assuming a purchase of a share on the first day and a sale on the last day of each year reported and includes reinvestment of distributions, if any, and does not reflect the effect of insurance contract charges. Total return does not reflect expenses associated with the separate account such as administrative fees, account charges and surrender charges which, if reflected, would reduce the total returns for all years shown. Performance figures may reflect fee waivers and/or expense reimbursements. In the absence of fee waivers and/or expense reimbursements, the total return would be lower. Past performance is no guarantee of future results. Total returns may reflect adjustments to conform to generally accepted accounting principles. |
| (f) | Total return for the year includes the impact of the capital contribution, which was not material to the total return. |
| (g) | Total return for the year includes the impact of the capital contribution. Excluding the capital contribution, the total return would have been (0.99)% and (1.38)% for Class I and Class II, respectively. |
| (h) | Does not include expenses of the underlying funds in which the Portfolio invests. |
| (i) | The Portfolio’s portfolio turnover rate is calculated in accordance with regulatory requirements, without regard to transactions involving short-term investments and certain derivatives. If such transactions were included, the Portfolio’s portfolio turnover rate may be higher. |
SEE NOTES TO FINANCIAL STATEMENTS.
C6
Financial Highlights
Natural Resources Portfolio—Class I
| | | | | | | | | | | | | | | | | | | | |
| | | Year Ended December 31, | |
| | | 2019 | | | 2018 | | | 2017 | | | 2016 | | | 2015 | |
Per Share Operating Performance(a): | | | | | | | | | | | | | | | | | | | | |
Net Asset Value, beginning of year | | $ | 21.99 | | | $ | 26.84 | | | $ | 26.89 | | | $ | 21.45 | | | $ | 29.87 | |
| | | | | | | | | | | | | | | | | | | | |
Income (Loss) From Investment Operations: | | | | | | | | | | | | | | | | | | | | |
Net investment income (loss) | | | 0.72 | | | | 0.60 | | | | 0.40 | | | | 0.26 | | | | 0.29 | |
Net realized and unrealized gain (loss) on investment and foreign currency transactions | | | 1.63 | | | | (5.46 | ) | | | (0.45 | ) | | | 5.15 | | | | (8.71 | ) |
| | | | | | | | | | | | | | | | | | | | |
Total from investment operations | | | 2.35 | | | | (4.86 | ) | | | (0.05 | ) | | | 5.41 | | | | (8.42 | ) |
| | | | | | | | | | | | | | | | | | | | |
Capital Contributions | | | — | (b)(c) | | | 0.01 | (b) | | | — | | | | 0.03 | (d) | | | — | |
Net Asset Value, end of year | | $ | 24.34 | | | $ | 21.99 | | | $ | 26.84 | | | $ | 26.89 | | | $ | 21.45 | |
| | | | | | | | | | | | | | | | | | | | |
Total Return(e) | | | 10.69 | %(f) | | | (18.07 | )%(g) | | | (0.19 | )% | | | 25.36 | %(h) | | | (28.19 | )% |
Ratios/Supplemental Data: | | | | | | | | | | | | | | | | | | | | |
Net assets, end of year (in millions) | | $ | 332 | | | $ | 324 | | | $ | 425 | | | $ | 456 | | | $ | 386 | |
Average net assets (in millions) | | $ | 339 | | | $ | 398 | | | $ | 410 | | | $ | 416 | | | $ | 515 | |
Ratios to average net assets(i): | | | | | | | | | | | | | | | | | | | | |
Expenses after waivers and/or expense reimbursement | | | 0.53 | % | | | 0.51 | % | | | 0.52 | % | | | 0.56 | % | | | 0.48 | % |
Expenses before waivers and/or expense reimbursement | | | 0.54 | % | | | 0.52 | % | | | 0.53 | % | | | 0.57 | % | | | 0.51 | % |
Net investment income (loss) | | | 3.04 | % | | | 2.30 | % | | | 1.60 | % | | | 1.08 | % | | | 1.06 | % |
Portfolio turnover rate(j) | | | 132 | % | | | 108 | % | | | 114 | % | | | 140 | % | | | 29 | % |
Natural Resources Portfolio—Class II
| | | | | | | | | | | | | | | | | | | | |
| | | Year Ended December 31, | |
| | | 2019 | | | 2018 | | | 2017 | | | 2016 | | | 2015 | |
Per Share Operating Performance(a): | | | | | | | | | | | | | | | | | | | | |
Net Asset Value, beginning of year | | $ | 21.26 | | | $ | 26.06 | | | $ | 26.20 | | | $ | 20.99 | | | $ | 29.35 | |
| | | | | | | | | | | | | | | | | | | | |
Income (Loss) From Investment Operations: | | | | | | | | | | | | | | | | | | | | |
Net investment income (loss) | | | 0.61 | | | | 0.49 | | | | 0.29 | | | | 0.15 | | | | 0.18 | |
Net realized and unrealized gain (loss) on investment and foreign currency transactions | | | 1.57 | | | | (5.30 | ) | | | (0.43 | ) | | | 5.03 | | | | (8.54 | ) |
| | | | | | | | | | | | | | | | | | | | |
Total from investment operations | | | 2.18 | | | | (4.81 | ) | | | (0.14 | ) | | | 5.18 | | | | (8.36 | ) |
| | | | | | | | | | | | | | | | | | | | |
Capital Contributions | | | — | (b)(c) | | | 0.01 | (b) | | | — | | | | 0.03 | (d) | | | — | |
| | | | | | | | | | | | | | | | | | | | |
Net Asset Value, end of year | | $ | 23.44 | | | $ | 21.26 | | | $ | 26.06 | | | $ | 26.20 | | | $ | 20.99 | |
| | | | | | | | | | | | | | | | | | | | |
Total Return(e) | | | 10.25 | %(f) | | | (18.42 | )%(g) | | | (0.53 | )% | | | 24.82 | %(h) | | | (28.48 | )% |
Ratios/Supplemental Data: | | | | | | | | | | | | | | | | | | | | |
Net assets, end of year (in millions) | | $ | 49 | | | $ | 48 | | | $ | 53 | | | $ | 42 | | | $ | 30 | |
Average net assets (in millions) | | $ | 50 | | | $ | 52 | | | $ | 48 | | | $ | 38 | | | $ | 41 | |
Ratios to average net assets(i): | | | | | | | | | | | | | | | | | | | | |
Expenses after waivers and/or expense reimbursement | | | 0.93 | % | | | 0.91 | % | | | 0.92 | % | | | 0.96 | % | | | 0.88 | % |
Expenses before waivers and/or expense reimbursement | | | 0.94 | % | | | 0.92 | % | | | 0.93 | % | | | 0.97 | % | | | 0.91 | % |
Net investment income (loss) | | | 2.63 | % | | | 1.93 | % | | | 1.21 | % | | | 0.64 | % | | | 0.66 | % |
Portfolio turnover rate(j) | | | 132 | % | | | 108 | % | | | 114 | % | | | 140 | % | | | 29 | % |
| (a) | Calculated based on average shares outstanding during the year. |
| (b) | Represents payment received by the Portfolio, from Prudential, in connection with the failure to timely compensate the Portfolio for the excess foreign withholding tax withheld on dividends and interest from certain countries due to the Portfolio’s tax status as a partnership. |
| (c) | Less than $0.005 per share. |
| (d) | Represents payment received by the Portfolio, from Prudential, in connection with the failure to maximize securities lending income due to a restriction that benefited Prudential. |
| (e) | Total return is calculated assuming a purchase of a share on the first day and a sale on the last day of each year reported and includes reinvestment of distributions, if any, and does not reflect the effect of insurance contract charges. Total return does not reflect expenses associated with the separate account such as administrative fees, account charges and surrender charges which, if reflected, would reduce the total returns for all years shown. Performance figures may reflect fee waivers and/or expense reimbursements. In the absence of fee waivers and/or expense reimbursements, the total return would be lower. Past performance is no guarantee of future results. Total returns may reflect adjustments to conform to generally accepted accounting principles. |
| (f) | Total return for the year includes the impact of the capital contribution, which was not material to the total return. |
| (g) | Total return for the year includes the impact of the capital contribution. Excluding the capital contribution, the total return would have been (18.11)% and (18.46)% for Class I and Class II, respectively. |
| (h) | Total return for the year includes the impact of the capital contribution. Excluding the capital contribution, the total return would have been 25.22% and 24.68% for Class I and Class II, respectively. |
| (i) | Does not include expenses of the underlying funds in which the Portfolio invests. |
| (j) | The Portfolio’s portfolio turnover rate is calculated in accordance with regulatory requirements, without regard to transactions involving short-term investments and certain derivatives. If such transactions were included, the Portfolio’s portfolio turnover rate may be higher. |
SEE NOTES TO FINANCIAL STATEMENTS.
C7
Financial Highlights
Small Capitalization Stock Portfolio
| | | | | | | | | | | | | | | | | | | | |
| | | Year Ended December 31, | |
| | | 2019 | | | 2018 | | | 2017 | | | 2016 | | | 2015 | |
Per Share Operating Performance(a): | | | | | | | | | | | | | | | | | | | | |
Net Asset Value, beginning of year | | $ | 35.15 | | | $ | 38.51 | | | $ | 34.08 | | | $ | 26.94 | | | $ | 27.57 | |
| | | | | | | | | | | | | | | | | | | | |
Income (Loss) From Investment Operations: | | | | | | | | | | | | | | | | | | | | |
Net investment income (loss) | | | 0.46 | | | | 0.40 | | | | 0.39 | | | | 0.35 | | | | 0.30 | |
Net realized and unrealized gain (loss) on investment transactions | | | 7.42 | | | | (3.76 | ) | | | 4.04 | | | | 6.72 | | | | (0.93 | ) |
| | | | | | | | | | | | | | | | | | | | |
Total from investment operations | | | 7.88 | | | | (3.36 | ) | | | 4.43 | | | | 7.07 | | | | (0.63 | ) |
| | | | | | | | | | | | | | | | | | | | |
Capital Contributions | | | — | | | | — | (b)(c) | | | — | | | | 0.07 | (d) | | | — | |
| | | | | | | | | | | | | | | | | | | | |
Net Asset Value, end of year | | $ | 43.03 | | | $ | 35.15 | | | $ | 38.51 | | | $ | 34.08 | | | $ | 26.94 | |
| | | | | | | | | | | | | | | | | | | | |
Total Return(e) | | | 22.42 | % | | | (8.73 | )%(f) | | | 13.00 | % | | | 26.50 | %(g) | | | (2.29 | )% |
Ratios/Supplemental Data: | | | | | | | | | | | | | | | | | | | | |
Net assets, end of year (in millions) | | $ | 834 | | | $ | 729 | | | $ | 850 | | | $ | 811 | | | $ | 682 | |
Average net assets (in millions) | | $ | 794 | | | $ | 871 | | | $ | 811 | | | $ | 704 | | | $ | 732 | |
Ratios to average net assets(h): | | | | | | | | | | | | | | | | | | | | |
Expenses after waivers and/or expense reimbursement | | | 0.39 | % | | | 0.39 | % | | | 0.40 | % | | | 0.40 | % | | | 0.40 | % |
Expenses before waivers and/or expense reimbursement | | | 0.39 | % | | | 0.39 | % | | | 0.40 | % | | | 0.42 | % | | | 0.45 | % |
Net investment income (loss) | | | 1.15 | % | | | 0.98 | % | | | 1.11 | % | | | 1.21 | % | | | 1.06 | % |
Portfolio turnover rate(i) | | | 19 | % | | | 18 | % | | | 17 | % | | | 20 | % | | | 16 | % |
Stock Index Portfolio
| | | | | | | | | | | | | | | | | | | | |
| | | Year Ended December 31, | |
| | | 2019 | | | 2018 | | | 2017 | | | 2016 | | | 2015 | |
Per Share Operating Performance(a): | | | | | | | | | | | | | | | | | | | | |
Net Asset Value, beginning of year | | $ | 56.64 | | | $ | 59.38 | | | $ | 50.70 | | | $ | 48.59 | | | $ | 49.33 | |
| | | | | | | | | | | | | | | | | | | | |
Income (Loss) From Investment Operations: | | | | | | | | | | | | | | | | | | | | |
Net investment income (loss) | | | 1.12 | | | | 1.00 | | | | 0.92 | | | | 0.89 | | | | 0.86 | |
Net realized and unrealized gain (loss) on investment transactions | | | 16.48 | | | | (3.74 | ) | | | 9.75 | | | | 4.52 | | | | (0.26 | ) |
| | | | | | | | | | | | | | | | | | | | |
Total from investment operations | | | 17.60 | | | | (2.74 | ) | | | 10.67 | | | | 5.41 | | | | 0.60 | |
| | | | | | | | | | | | | | | | | | | | |
Less Dividends and Distributions | | | — | | | | — | | | | (1.99 | ) | | | (3.37 | ) | | | (1.34 | ) |
Capital Contributions | | | — | | | | — | | | | — | | | | 0.07 | (d) | | | — | |
| | | | | | | | | | | | | | | | | | | | |
Net Asset Value, end of year | | $ | 74.24 | | | $ | 56.64 | | | $ | 59.38 | | | $ | 50.70 | | | $ | 48.59 | |
| | | | | | | | | | | | | | | | | | | | |
Total Return(e) | | | 31.07 | % | | | (4.61 | )% | | | 21.46 | % | | | 11.83 | %(j) | | | 1.18 | % |
Ratios/Supplemental Data: | | | | | | | | | | | | | | | | | | | | |
Net assets, end of year (in millions) | | $ | 4,757 | | | $ | 3,672 | | | $ | 3,928 | | | $ | 3,305 | | | $ | 3,010 | |
Average net assets (in millions) | | $ | 4,298 | | | $ | 4,051 | | | $ | 3,630 | | | $ | 3,122 | | | $ | 3,299 | |
Ratios to average net assets(h): | | | | | | | | | | | | | | | | | | | | |
Expenses after waivers and/or expense reimbursement | | | 0.31 | % | | | 0.31 | % | | | 0.32 | % | | | 0.32 | % | | | 0.32 | % |
Expenses before waivers and/or expense reimbursement | | | 0.31 | % | | | 0.31 | % | | | 0.32 | % | | | 0.34 | % | | | 0.37 | % |
Net investment income (loss) | | | 1.69 | % | | | 1.63 | % | | | 1.69 | % | | | 1.84 | % | | | 1.74 | % |
Portfolio turnover rate(i) | | | 3 | % | | | 4 | % | | | 4 | % | | | 5 | % | | | 9 | % |
| (a) | Calculated based on average shares outstanding during the year. |
| (b) | Represents payment received by the Portfolio, from Prudential, in connection with the failure to timely compensate the Portfolio for the excess foreign withholding tax withheld on dividends and interest from certain countries due to the Portfolio’s tax status as a partnership. |
| (c) | Less than $0.005 per share. |
| (d) | Represents payment received by the Portfolio, from Prudential, in connection with the failure to maximize securities lending income due to a restriction that benefited Prudential. |
| (e) | Total return is calculated assuming a purchase of a share on the first day and a sale on the last day of each year reported and includes reinvestment of distributions, if any, and does not reflect the effect of insurance contract charges. Total return does not reflect expenses associated with the separate account such as administrative fees, account charges and surrender charges which, if reflected, would reduce the total returns for all years shown. Performance figures may reflect fee waivers and/or expense reimbursements. In the absence of fee waivers and/or expense reimbursements, the total return would be lower. Past performance is no guarantee of future results. Total returns may reflect adjustments to conform to generally accepted accounting principles. |
| (f) | Total return for the year includes the impact of the capital contribution, which was not material to the total return. |
| (g) | Total return for the year includes the impact of the capital contribution. Excluding the capital contribution, the total return would have been 26.24%. |
| (h) | Does not include expenses of the underlying funds in which the Portfolio invests. |
| (i) | The Portfolio’s portfolio turnover rate is calculated in accordance with regulatory requirements, without regard to transactions involving short-term investments and certain derivatives. If such transactions were included, the Portfolio’s portfolio turnover rate may be higher. |
| (j) | Total return for the year includes the impact of the capital contribution. Excluding the capital contribution, the total return would have been 11.69%. |
SEE NOTES TO FINANCIAL STATEMENTS.
C8
Financial Highlights
Value Portfolio—Class I
| | | | | | | | | | | | | | | | | | | | |
| | | Year Ended December 31, | |
| | | 2019 | | | 2018 | | | 2017 | | | 2016 | | | 2015 | |
Per Share Operating Performance(a): | | | | | | | | | | | | | | | | | | | | |
Net Asset Value, beginning of year | | $ | 28.55 | | | $ | 31.68 | | | $ | 27.08 | | | $ | 24.31 | | | $ | 26.48 | |
| | | | | | | | | | | | | | | | | | | | |
Income (Loss) From Investment Operations: | | | | | | | | | | | | | | | | | | | | |
Net investment income (loss) | | | 0.67 | | | | 0.56 | | | | 0.47 | | | | 0.46 | | | | 0.39 | |
Net realized and unrealized gain (loss) on investment and foreign currency transactions | | | 6.77 | | | | (3.71 | ) | | | 4.13 | | | | 2.28 | | | | (2.56 | ) |
| | | | | | | | | | | | | | | | | | | | |
Total from investment operations | | | 7.44 | | | | (3.15 | ) | | | 4.60 | | | | 2.74 | | | | (2.17 | ) |
| | | | | | | | | | | | | | | | | | | | |
Capital Contributions | | | — | (b)(c) | | | 0.02 | (b) | | | — | | | | 0.03 | (d) | | | — | |
| | | | | | | | | | | | | | | | | | | | |
Net Asset Value, end of year | | $ | 35.99 | | | $ | 28.55 | | | $ | 31.68 | | | $ | 27.08 | | | $ | 24.31 | |
| | | | | | | | | | | | | | | | | | | | |
Total Return(e) | | | 26.06 | %(f) | | | (9.88 | )%(g) | | | 16.99 | % | | | 11.39 | %(h) | | | (8.19 | )% |
Ratios/Supplemental Data: | | | | | | | | | | | | | | | | | | | | |
Net assets, end of year (in millions) | | $ | 1,430 | | | $ | 1,226 | | | $ | 1,480 | | | $ | 1,375 | | | $ | 1,355 | |
Average net assets (in millions) | | $ | 1,354 | | | $ | 1,417 | | | $ | 1,413 | | | $ | 1,290 | | | $ | 1,493 | |
Ratios to average net assets(i): | | | | | | | | | | | | | | | | | | | | |
Expenses after waivers and/or expense reimbursement | | | 0.43 | % | | | 0.43 | % | | | 0.43 | % | | | 0.42 | % | | | 0.43 | % |
Expenses before waivers and/or expense reimbursement | | | 0.43 | % | | | 0.43 | % | | | 0.43 | % | | | 0.42 | % | | | 0.43 | % |
Net investment income (loss) | | | 2.04 | % | | | 1.76 | % | | | 1.63 | % | | | 1.90 | % | | | 1.52 | % |
Portfolio turnover rate(j) | | | 25 | % | | | 23 | % | | | 16 | % | | | 24 | % | | | 32 | % |
Value Portfolio—Class II
| | | | | | | | | | | | | | | | | | | | |
| | | Year Ended December 31, | |
| | | 2019 | | | 2018 | | | 2017 | | | 2016 | | | 2015 | |
Per Share Operating Performance(a): | | | | | | | | | | | | | | | | | | | | |
Net Asset Value, beginning of year | | $ | 28.07 | | | $ | 31.27 | | | $ | 26.84 | | | $ | 24.19 | | | $ | 26.45 | |
| | | | | | | | | | | | | | | | | | | | |
Income (Loss) From Investment Operations: | | | | | | | | | | | | | | | | | | | | |
Net investment income (loss) | | | 0.53 | | | | 0.42 | | | | 0.35 | | | | 0.37 | | | | 0.29 | |
Net realized and unrealized gain (loss) on investment and foreign currency transactions | | | 6.65 | | | | (3.64 | ) | | | 4.08 | | | | 2.25 | | | | (2.55 | ) |
| | | | | | | | | | | | | | | | | | | | |
Total from investment operations | | | 7.18 | | | | (3.22 | ) | | | 4.43 | | | | 2.62 | | | | (2.26 | ) |
| | | | | | | | | | | | | | | | | | | | |
Capital Contributions | | | — | (b)(c) | | | 0.02 | (b) | | | — | | | | 0.03 | (d) | | | — | |
| | | | | | | | | | | | | | | | | | | | |
Net Asset Value, end of year | | $ | 35.25 | | | $ | 28.07 | | | $ | 31.27 | | | $ | 26.84 | | | $ | 24.19 | |
| | | | | | | | | | | | | | | | | | | | |
Total Return(e) | | | 25.58 | %(f) | | | (10.23 | )%(g) | | | 16.51 | % | | | 10.95 | %(h) | | | (8.54 | )% |
Ratios/Supplemental Data: | | | | | | | | | | | | | | | | | | | | |
Net assets, end of year (in millions) | | $ | 9 | | | $ | 6 | | | $ | 8 | | | $ | 7 | | | $ | 10 | |
Average net assets (in millions) | | $ | 7 | | | $ | 7 | | | $ | 7 | | | $ | 8 | | | $ | 10 | |
Ratios to average net assets(i): | | | | | | | | | | | | | | | | | | | | |
Expenses after waivers and/or expense reimbursement | | | 0.83 | % | | | 0.83 | % | | | 0.83 | % | | | 0.82 | % | | | 0.83 | % |
Expenses before waivers and/or expense reimbursement | | | 0.83 | % | | | 0.83 | % | | | 0.83 | % | | | 0.82 | % | | | 0.83 | % |
Net investment income (loss) | | | 1.63 | % | | | 1.36 | % | | | 1.23 | % | | | 1.53 | % | | | 1.12 | % |
Portfolio turnover rate(j) | | | 25 | % | | | 23 | % | | | 16 | % | | | 24 | % | | | 32 | % |
| (a) | Calculated based on average shares outstanding during the year. |
| (b) | Represents payment received by the Portfolio, from Prudential, in connection with the failure to timely compensate the Portfolio for the excess foreign withholding tax withheld on dividends and interest from certain countries due to the Portfolio’s tax status as a partnership. |
| (c) | Less than $0.005 per share. |
| (d) | Represents payment received by the Portfolio, from Prudential, in connection with the failure to maximize securities lending income due to a restriction that benefited Prudential. |
| (e) | Total return is calculated assuming a purchase of a share on the first day and a sale on the last day of each year reported and includes reinvestment of distributions, if any, and does not reflect the effect of insurance contract charges. Total return does not reflect expenses associated with the separate account such as administrative fees, account charges and surrender charges which, if reflected, would reduce the total returns for all years shown. Performance figures may reflect fee waivers and/or expense reimbursements. In the absence of fee waivers and/or expense reimbursements, the total return would be lower. Past performance is no guarantee of future results. Total returns may reflect adjustments to conform to generally accepted accounting principles. |
| (f) | Total return for the year includes the impact of the capital contribution, which was not material to the total return. |
| (g) | Total return for the year includes the impact of the capital contribution. Excluding the capital contribution, the total return would have been (9.94)% and (10.29)% for Class I and Class II, respectively. |
| (h) | Total return for the year includes the impact of the capital contribution. Excluding the capital contribution, the total return would have been 11.27% and 10.83% for Class I and Class II, respectively. |
| (i) | Does not include expenses of the underlying funds in which the Portfolio invests. |
| (j) | The Portfolio’s portfolio turnover rate is calculated in accordance with regulatory requirements, without regard to transactions involving short-term investments and certain derivatives. If such transactions were included, the Portfolio’s portfolio turnover rate may be higher. |
SEE NOTES TO FINANCIAL STATEMENTS.
C9
REPORT OF INDEPENDENT REGISTERED PUBLIC ACCOUNTING FIRM
TO THE SHAREHOLDERS OF THE PORTFOLIOS AND BOARD OF TRUSTEES
THE PRUDENTIAL SERIES FUND:
Opinion on the Financial Statements
We have audited the accompanying statement of assets and liabilities of each of the portfolios listed in Appendix A, each a portfolio of The Prudential Series Fund, (the Portfolios), including the schedule of investments, as of December 31, 2019, the related statement of operations for the year then ended, the statements of changes in net assets for each of the years in the two-year period then ended, and the related notes (collectively, the financial statements) and the financial highlights for each of the years indicated therein. In our opinion, the financial statements and financial highlights present fairly, in all material respects, the financial position of each of the Portfolios as of December 31, 2019, the results of its operations for the year then ended, the changes in its net assets for each of the years in the two-year period then ended, and the financial highlights for each of the years indicated therein, in conformity with U.S. generally accepted accounting principles.
Basis for Opinion
These financial statements and financial highlights are the responsibility of the Portfolios’ management. Our responsibility is to express an opinion on these financial statements and financial highlights based on our audits. We are a public accounting firm registered with the Public Company Accounting Oversight Board (United States) (PCAOB) and are required to be independent with respect to the Portfolios in accordance with the U.S. federal securities laws and the applicable rules and regulations of the Securities and Exchange Commission and the PCAOB.
We conducted our audits in accordance with the standards of the PCAOB. Those standards require that we plan and perform the audit to obtain reasonable assurance about whether the financial statements and financial highlights are free of material misstatement, whether due to error or fraud. Our audits included performing procedures to assess the risks of material misstatement of the financial statements and financial highlights, whether due to error or fraud, and performing procedures that respond to those risks. Such procedures included examining, on a test basis, evidence regarding the amounts and disclosures in the financial statements and financial highlights. Such procedures also included confirmation of securities owned as of December 31, 2019, by correspondence with the custodian, transfer agent, or brokers, or by other appropriate auditing procedures when replies were not received. Our audits also included evaluating the accounting principles used and significant estimates made by management, as well as evaluating the overall presentation of the financial statements and financial highlights. We believe that our audits provide a reasonable basis for our opinion.

We have served as the auditor of one or more PGIM and/or Prudential Insurance investment companies since 2003.
New York, New York
February 14, 2020
D1
Appendix A
Conservative Balanced Portfolio
Diversified Bond Portfolio
Equity Portfolio
Flexible Managed Portfolio
Global Portfolio
Government Income Portfolio
Government Money Market Portfolio
High Yield Bond Portfolio
Jennison Portfolio
Natural Resources Portfolio
Small Capitalization Stock Portfolio
Stock Index Portfolio
Value Portfolio
D2
INFORMATION ABOUT TRUSTEES AND OFFICERS (Unaudited)
Information about the Trustees and the officers of the Trust is set forth below. Trustees who are not deemed to be “interested persons” of the Trust, as defined in the Investment Company Act of 1940 (1940 Act), are referred to as “Independent Trustees.” Trustees who are deemed to be “interested persons” of the Trust are referred to as “Interested Trustees.” The Trustees oversee the operations of the Trust and appoint officers who are responsible forday-to-day business decisions based on policies set by the Board.
| | | | | | |
| |
| Independent Trustees |
Name Date of Birth No. of Portfolios Overseen | | Principal Occupation(s) During Past Five Years | | Other Directorships Held | | Length of Board Service |
Susan Davenport Austin 10/19/1967 No. of Portfolios Overseen: 109 | | Chief Financial Officer of Grace Church School (Since September 2019); formerly Senior Managing Director of Brock Capital (2014-2019); formerly Vice Chairman (2013-2017), Senior Vice President and Chief Financial Officer (2007-2012) and Vice President of Strategic Planning and Treasurer (2002-2007) of Sheridan Broadcasting Corporation; formerly President of Sheridan Gospel Network (2004-2014); formerly Vice President, Goldman, Sachs & Co. (2000-2001); formerly Associate Director, Bear, Stearns & Co. Inc. (1997-2000); formerly Vice President, Salomon Brothers Inc. (1993-1997); Member of the Board of Directors, The MacDowell Colony (Since 2010); formerly Chairman (2011-2014), formerly Presiding Director (2014-2017) and currently a Member (2007-present) of the Board of Directors, Broadcast Music, Inc.; Member of the Board of Directors, Hubbard Radio, LLC (Since 2011); President, Candide Business Advisors, Inc. (Since 2011); formerly Member of the Board of Directors, National Association of Broadcasters (2004-2010). | | Director of NextEra Energy Partners, LP (NYSE: NEP) (Since February 2015); Director of Broadcast Music, Inc. (Since 2007). | | Since February 2011 |
Sherry S. Barrat 11/13/1949 No. of Portfolios Overseen: 109 | | Formerly Vice Chairman of Northern Trust Corporation (financial services and banking institution) (2011-June 2012); formerly President, Personal Financial Services, Northern Trust Corporation (2006-2010); formerly Chairman & CEO, Western US Region, Northern Trust Corporation (1999-2005); formerly President & CEO, Palm Beach/Martin County Region, Northern Trust. | | Director of NextEra Energy, Inc. (NYSE: NEE) (1998-Present); Director of Arthur J. Gallagher & Company (Since July 2013). | | Since January 2013 |
Jessica M. Bibliowicz 11/28/1959 No. of Portfolios Overseen: 109 | | Formerly Senior Adviser (2013-2019) of Bridge Growth Partners (private equity firm); formerly Director (2013-2016) of Realogy Holdings Corp. (residential real estate services); formerly Chief Executive Officer (1999-2013) of National Financial Partners (independent distributor of financial services products). | | Formerly Director (2006-2019) of The Asia Pacific Fund, Inc.; Sotheby’s (Since 2014) (auction house andart-related finance). | | Since September 2014 |
Kay Ryan Booth 11/1/1950 No. of Portfolios Overseen: 109 | | Partner, Trinity Private Equity Group (Since September 2014); formerly, Managing Director of Cappello Waterfield & Co. LLC (2011-2014); formerly Vice Chair, Global Research, J.P. Morgan (financial services and investment banking institution) (June 2008-January 2009); formerly Global Director of Equity Research, Bear Stearns & Co., Inc. (financial services and investment banking institution) (1995-2008); formerly Associate Director of Equity Research, Bear Stearns & Co., Inc.(1987-1995). | | None. | | Since January 2013 |
Stephen M. Chipman 10/26/1961 No. of Portfolios Overseen: 109 | | Formerly Group Managing Director, International Expansion and Regional Managing Director, Americas of Vistra (June 2018-June 2019); formerly Chief Executive Officer and Director of Radius (2016-2018); formerly Senior Vice Chairman (January 2015-October 2015) and Chief Executive Officer (January 2010-December 2014) of Grant Thornton LLP. | | Non-Executive Chairman (Since September 2019) of Litera Microsystems. | | Since January 2018 |
Robert F. Gunia 12/15/1946 No. of Portfolios Overseen: 109 | | Formerly Director of ICI Mutual Insurance Company (June 2016-June 2019; June 2012-June 2015); formerly Chief Administrative Officer (September 1999-September 2009) and Executive Vice President (December 1996-September 2009) of PGIM Investments LLC; formerly Executive Vice President (March 1999-September 2009) and Treasurer (May 2000-September 2009) of Prudential Mutual Fund Services LLC; formerly President (April 1999-December 2008) and Executive Vice President and Chief Operating Officer (December 2008-December 2009) of Prudential Investment Management Services LLC; formerly Chief Administrative Officer, Executive Vice President and Director(May 2003-September 2009) of AST Investment Services, Inc. | | Formerly Director (1989-2019) of The Asia Pacific Fund, Inc. | | Since July 2003 |
Thomas T. Mooney 11/11/1941 No. of Portfolios Overseen: 109 | | Formerly Chief Executive Officer, Excell Partners, Inc. (2005-2007); founding partner of High Technology of Rochester and the Lennox Technology Center; formerly President of the Greater Rochester Metro Chamber of Commerce (1976-2004); formerly Rochester City Manager (1973); formerly Deputy Monroe County Executive (1974-1976). | | None. | | Since July 2003 |
E1
| | | | | | |
| |
| Independent Trustees |
Name Date of Birth No. of Portfolios Overseen | | Principal Occupation(s) During Past Five Years | | Other Directorships Held | | Length of Board Service |
Thomas M. O’Brien 12/5/1950 No. of Portfolios Overseen: 109 | | Vice Chairman of Emigrant Bank and President of its Naples Commercial Finance Division (Since October 2018); formerly Director, President and CEO Sun Bancorp, Inc. N.A. (NASDAQ: SNBC) and Sun National Bank (July 2014-February 2018); formerly Consultant, Valley National Bancorp, Inc. and Valley National Bank (January 2012-June 2012); formerly President and COO (November 2006-April 2017) and CEO (April 2007-December 2011) of State Bancorp, Inc. and State Bank; formerly Vice Chairman (January 1997-April 2000) of North Fork Bank; formerly President and Chief Executive Officer (December 1984-December 1996) of North Side Savings Bank; formerly President and Chief Executive Officer (May 2000-June 2006) Atlantic Bank of New York. | | Formerly Director, Sun Bancorp, Inc. N.A. (NASDAQ: SNBC) and Sun National Bank (July 2014-February 2018); formerly Director, BankUnited, Inc. and BankUnited N.A. (NYSE: BKU) (May 2012-April 2014); formerly Director (April 2008-January 2012) of Federal Home Loan Bank of New York; formerly Director (December 1996-May 2000) of North Fork Bancorporation, Inc.; formerly Director (May 2000-April 2006) of Atlantic Bank of New York; Director (November 2006-January 2012) of State Bancorp, Inc. (NASDAQ: STBC) and State Bank of Long Island. | | Since July 2003 |
| |
| Interested Trustee |
Timothy S. Cronin 12/21/1965 No. of Portfolios Overseen: 109 | | Vice President of Prudential Annuities (Since June 2015); Senior Vice President of PGIM Investments LLC (Since May 2009); Chief Investment Officer and Strategist of Prudential Annuities (Since January 2004); Director of Investment & Research Strategy (Since February 1998); President of AST Investment Services, Inc. (Since June 2005). | | None. | | Since October 2009 |
| | | | |
| |
| Trust Officers(a) |
Name Date of Birth Position with the Trust | | Principal Occupation(s) During the Past Five Years | | Length of Service as Trust Officer |
Ken Allen 1/24/1969 Vice President | | Vice President of Investment Management (since December 2009) | | Since June 2019 |
Raymond A. O’Hara 9/19/1955 Chief Legal Officer | | Vice President and Corporate Counsel (since July 2010) of Prudential Insurance Company of America (Prudential); Vice President (March 2011-Present) of Pruco Life Insurance Company and Pruco Life Insurance Company of New Jersey; Vice President and Corporate Counsel (March 2011-Present) of Prudential Annuities Life Assurance Corporation; Chief Legal Officer of PGIM Investments LLC (since June 2012); Chief Legal Officer of Prudential Mutual Fund Services LLC (since June 2012) and Corporate Counsel of AST Investment Services, Inc. (since June 2012); formerly Assistant Vice President and Corporate Counsel (September 2008-July 2010) of The Hartford Financial Services Group, Inc.; formerly Associate (September 1980-December 1987) and Partner (January 1988-August 2008) of Blazzard & Hasenauer, P.C. (formerly, Blazzard, Grodd & Hasenauer, P.C.). | | Since June 2012 |
Andrew R. French 12/22/1962 Secretary | | Vice President within PGIM Investments LLC (December 2018-Present); formerly Vice President and Corporate Counsel (February 2010-December 2018) of Prudential; formerly Director and Corporate Counsel (2006-2010) of Prudential; Vice President and Assistant Secretary (since January 2007) of PGIM Investments LLC; Vice President and Assistant Secretary (since January 2007) of Prudential Mutual Fund Services LLC. | | Since October 2006 |
Jonathan D. Shain 8/9/1958 Assistant Secretary | | Vice President and Corporate Counsel (since August 1998) of Prudential; Vice President and Assistant Secretary (since May 2001) of PGIM Investments LLC; Vice President and Assistant Secretary (since February 2001) of Prudential Mutual Fund Services LLC; formerly Vice President and Assistant Secretary (May 2003-June 2005) of AST Investment Services, Inc. | | Since May 2005 |
Claudia DiGiacomo 10/14/1974 Assistant Secretary | | Vice President and Corporate Counsel (since January 2005) of Prudential; Vice President and Assistant Secretary of PGIM Investments LLC (since December 2005); Associate at Sidley Austin Brown Wood LLP (1999-2004). | | Since December 2005 |
Melissa Gonzalez 2/10/1980 Assistant Secretary | | Vice President and Corporate Counsel (since September 2018) of Prudential; formerly Director and Corporate Counsel (March 2014-September 2018) of Prudential. | | Since March 2019 |
Dino Capasso 8/19/1974 Chief Compliance Officer | | Chief Compliance Officer (July 2019-Present) of PGIM Investments LLC; Chief Compliance Officer (July 2019-Present) of the PGIM Funds, Target Funds, Advanced Series Trust, The Prudential Series Fund, Prudential’s Gibraltar Fund, Inc., PGIM Global High Yield Fund, Inc., and PGIM High Yield Bond Fund, Inc.; Vice President and Deputy Chief Compliance Officer (June 2017-July 2019) of PGIM Investments LLC; formerly, Senior Vice President and Senior Counsel (January 2016-June 2017), and Vice President and Counsel (February 2012-December 2015) of Pacific Investment Management Company LLC. | | Since March 2018 |
E2
| | | | |
| |
| Trust Officers(a) |
Name Date of Birth Position with the Trust | | Principal Occupation(s) During the Past Five Years | | Length of Service as Trust Officer |
Charles H. Smith 1/11/1973 Anti-Money Laundering Compliance Officer | | Vice President, Corporate Compliance, Anti-Money Laundering Unit (since January 2015) of Prudential; committee member of the American Council of Life Insurers Anti-Money Laundering and Critical Infrastructure Committee (since January 2016); formerly Global Head of Economic Sanctions Compliance at AIG Property Casualty (February 2007-December 2014); Assistant Attorney General at the New York State Attorney General’s Office, Division of Public Advocacy (August 1998-January 2007). | | Since January 2017 |
Christian J. Kelly 5/5/1975 Treasurer and Principal Financial and Accounting Officer | | Vice President, Head of Fund Administration of PGIM Investments LLC (since November 2018); formerly, Director of Fund Administration of Lord Abbett & Co. LLC (2009-2018), Treasurer and Principal Accounting Officer of the Lord Abbett Family of Funds (2017-2018); Director of Accounting, Avenue Capital Group (2008-2009); Senior Manager, Investment Management Practice of Deloitte & Touche LLP (1998-2007). | | Since January 2019 |
Lana Lomuti 6/7/1967 Assistant Treasurer | | Vice President (since 2007) and Director (2005-2007), within PGIM Investments Fund Administration; formerly Assistant Treasurer (December 2007-February 2014) of The Greater China Fund, Inc. | | Since April 2014 |
Russ Shupak 10/08/73 Assistant Treasurer | | Vice President (since 2017) and Director (2013-2017), within PGIM Investments Fund Administration. | | Since October 2019 |
Deborah Conway 3/26/69 Assistant Treasurer | | Vice President (since 2017) and Director (2007-2017), within PGIM Investments Fund Administration. | | Since October 2019 |
Elyse M. McLaughlin 1/20/74 Assistant Treasurer | | Vice President (since 2017) and Director (2011-2017), within PGIM Investments Fund Administration. | | Since October 2019 |
Alina Srodecka, CPA 8/19/1966 Assistant Treasurer | | Vice President of Tax at Prudential Financial, Inc. (Since August 2007); formerly Director of Tax at MetLife (January 2003-May 2006); formerly Tax Manager at Deloitte & Touché (October 1997-January 2003); formerly Staff Accountant at Marsh & McLennan (May 1994-May 1997). | | Since June 2017 |
(a) Excludes Mr. Cronin, an Interested Trustee who also serves as President.
Explanatory Notes to Tables:
Trustees are deemed to be “Interested,” as defined in the 1940 Act, by reason of their affiliation with PGIM Investments and/or an affiliate of PGIM Investments. Timothy S. Cronin is an Interested Trustee because he is employed by an affiliate of the Manager.
Unless otherwise noted, the address of all Trustees and Officers is c/o PGIM Investments LLC, 655 Broad Street, Newark, New Jersey 07102.
There is no set term of office for Trustees or Officers. The Independent Trustees have adopted a retirement policy, which calls for the retirement of Trustees on December 31 of the year in which they reach the age of 78, provided that the Board may extend the retirement age on ayear-by-year basis for a Trustee.
“Other Directorships Held” includes only directorships of companies required to register or file reports with the SEC under the 1934 Act (that is, “public companies”) or other investment companies registered under the 1940 Act.
“No. of Portfolios Overseen” includes all investment companies managed by PGIM Investments and/or ASTIS that are overseen by the Trustee. The investment companies for which PGIM Investments and/or ASTIS serves as Manager include The Prudential Variable Contract Accounts, The Prudential Series Fund, Advanced Series Trust, Prudential’s Gibraltar Fund, Inc., the PGIM Funds, the PGIM High Yield Bond Fund, Inc. and PGIM Global High Yield Fund, Inc.
E3
The prospectuses for the Prudential Series Fund portfolios and the applicable variable annuity or variable life prospectuses contain information on the investment objectives, risks, charges and expenses of the portfolios and on the contracts and should be read carefully.
Information regarding how the Fund voted proxies relating to portfolio securities during the most recent12-month period ended June 30 is available on the website of the Securities and Exchange Commission (the Commission) atwww.sec.gov and on the Fund’s website atwww.prudential.com/variableinsuranceportfolios.
The Fund files with the Commission a complete listing of portfolio holdings as of its first and third calendar quarter-end on Form N-PORT. Form N-PORT is available on the Commission’s website atwww.sec.gov or call (800) SEC-0330.
The Fund’s Statement of Additional Information contains additional information about the Fund’s Trustees and is available without charge upon request by calling the appropriate phone number listed below.
To contact your client services representative, please call the phone number listed below. Thank you.
Owners of Individual Annuity contracts should call (888) 778-2888.
Owners of Individual Life Insurance contracts should call (800) 778-2255.
Owners of Group Variable Universal Life Insurance contracts should call (800) 562-9874.
Owners of Group Variable Universal Life Insurance contracts through AICPA should call (800) 223-7473.
The Prudential Series Fund may offer two classes of shares in each portfolio: Class I and Class II. Class I shares are sold only to separate accounts of The Prudential Insurance Company of America, Pruco Life Insurance Company, and Pruco Life Insurance Company of New Jersey (collectively, Prudential) and to separate accounts of insurance companies not affiliated with Prudential where Prudential has assumed responsibility for the administration of contracts issued through such non-affiliated insurance companies, as investment options under variable life insurance and variable annuity contracts (the Contracts). (A separate account keeps the assets supporting certain insurance contracts separate from the general assets and liabilities of the insurance company.) Class II shares are offered only to separate accounts of non-Prudential insurance companies for the same types of Contracts.
Annuity and life insurance contracts contain exclusions, limitations, reductions of benefits, and terms for keeping them in force. Your licensed financial professional can provide you with costs and complete details. Contract guarantees are based on the claims-paying ability of the issuing company.
The Prudential Insurance Company of America
751 Broad Street
Newark, NJ 07102-3777
Presorted
Standard
U.S. Postage
PAID
Prudential
The Audited Financial Statements of Pruco Life Insurance Company, Pruco Life Insurance Company of New Jersey, Prudential Annuities Life Assurance Corporation, and The Prudential Insurance Company of America are available upon request. You may call(800) 778-2255 to obtain a free copy of the audited financial statements of the insurance company that issued your contract.
To reduce costs, we now generally send only a single copy of prospectuses and shareholder reports to each household (householding) in lieu of sending a copy to each Contract Owner who resides in the household. Householding is not yet available on all products. You should be aware that by calling (877) 778-5008, you can revoke, or “opt out,” of householding at any time, which may increase the volume of mail you will receive.
©2020 Prudential Financial, Inc. and its related entities. PGIM Investments, the Prudential logo, the Rock symbol, and Bring Your Challenges are service marks of Prudential Financial, Inc. and its related entities, registered in many jurisdictions worldwide.
PSF-AR-A

The Prudential Series Fund
| | |
| ANNUAL REPORT | | December 31, 2019 |

Based on the variable contract you own or the portfolios you invested in, you may receive additional reports for other portfolios. Please refer to your variable annuity or variable life insurance contract prospectus to determine which portfolios are available to you.
The views expressed in this report and information about each portfolio’s holdings are for the period covered by this report and are subject to change thereafter.
Please note that this report may include prospectus supplements that are separate from and not a part of this report. Please refer to your variable annuity or variable life insurance contract prospectus to determine which supplements are applicable to you.
SP International Growth Portfolio

Join the e-movement.SM
Enroll in e-delivery today!
By enrolling in e-Delivery, you’ll gain secure, online access to important documents with the flexibility to choose which documents you receive in the mail… and which ones you don’t!
Individual Annuity Contract Owners
Get started by visiting www.prudential.com/login and follow the instructions on the screen, or scan the code below.
Individual Life Insurance Contract Owners
To receive your reports online, go to www.prudential.com/edelivery, or scan the code below.
Group Variable Universal Life Contract Owners
To receive your reports online, go to www.prudential.com/gulgvul, or scan the code.
| | |
| |
| | Save paper and reduce clutter. Receive Prospectuses and Reports electronically by enrolling today! |
| | | | |
The Prudential Series Fund Table of Contents | | Annual Report | | December 31, 2019 |
| | ∎ | | LETTER TO CONTRACT OWNERS |
| | ∎ | | REPORT OF THE INVESTMENT MANAGERS AND PRESENTATION OF PORTFOLIO HOLDINGS |
| | | | |
| Section A | | Schedule of Investments and Financial Statements |
| Section B | | Notes to Financial Statements | | |
| Section C | | Financial Highlights | | |
| Section D | | Report of Independent Registered Public Accounting Firm | | |
| Section E | | Information about Trustees and Officers | | |
This report may include financial information pertaining to certain portfolios that are not available through the variable life insurance policy or variable annuity contract that you have chosen. Please refer to your variable life insurance or variable annuity prospectus to determine which portfolios are available to you.
| | | | |
The Prudential Series Fund Letter to Contract Owners | | Annual Report | | December 31, 2019 |
At Prudential, our primary objective is to help investors achieve and maintain long-term financial success. This Prudential Series Fund annual report outlines our efforts to achieve this goal. We hope you find it informative and useful.
Prudential has been building on a heritage of success for more than 135 years. We believe the array of our products provides a highly attractive value proposition to clients like you who are focused on financial security.
Your financial professional is the best resource to help you make the most informed investment decisions. Together, you can build a diversified investment portfolio that aligns with your long-term financial goals. Please keep in mind that diversification and asset allocation strategies do not assure a profit or protect against loss in declining markets.
Thank you for selecting Prudential as one of your financial partners. We value your trust and appreciate the opportunity to help you achieve financial security.
Sincerely,
Timothy S. Cronin
President,
The Prudential Series Fund | January 31, 2020 |
| | | | |
| Market Overview — unaudited | | Annual Report | | December 31, 2019 |
Equity Market Overview
US and international stock markets posted stellar returns in 2019 as many central banks, including the Federal Reserve (the Fed), cut interest rates or used other stimuli to spur growth. Although the markets fluctuated sharply at times in reaction to on-again-off-again trade tensions between the US and China, concerns about tariffs subsided later in the year.
In the US, the broad-based S&P 500® Index and Russell 3000® Index returned 31.46% and 31.02%, respectively, for the year. Internationally, the MSCI ACWI Ex-US Index, a broad measure of stock performance in developed and emerging markets outside the US, returned 21.51%. (All returns cited are in US dollars and include dividends.)
Global economic growth slowed, central banks cut rates
During 2019, the pace of global growth slowed and concerns about the economic outlook rose due in part to uncertainties regarding US-China tariffs and other geopolitical factors, which created a drag on manufacturing and export activity. Many central banks responded by loosening monetary policy — in some cases reversing their positions. For example, the Fed, which hiked rates four times in 2018, cut its federal funds rate target three times in 2019 and moved from tapering its balance sheet to expanding it through asset purchases. The European Central Bank, which had been rolling back its bond-buying program in 2018, restarted it to stimulate the eurozone economy.
Although US real gross domestic product (GDP) growth rose 2.1% (annualized) in the third quarter, down from 3.1% in the first quarter, the US economy expanded at a moderate pace. (Fourth-quarter GDP data had not been released when this overview was published.) Corporate earnings, consumer spending, and the labor market were strong, while inflation remained low.
Stock markets rallied, retreated, and rebounded to record highs
Early in the first quarter, stocks rallied as US-China trade negotiations appeared to be progressing, the Fed signaled that it planned to pause from hiking rates unless warranted, the US government’s partial shutdown ended, and corporate earnings rose sharply despite slower growth. The S&P 500 jumped nearly 8.0% in January alone.
Stocks sold off in May as trade-war worries resurfaced. However, equity markets rallied in June in anticipation of possible rate cuts and on hopes for a trade deal. During the first half of 2019, the Fed maintained its interest rate target.
Trade concerns re-emerged in the third quarter amid signs of slowing growth and renewed trade frictions. With inflation below its target, the Fed cut rates in July for the first time since the financial crisis in 2008 as a pre-emptive measure to help sustain the US economy’s expansion and withstand the risk of a global economic slowdown and further drop in business investment.
In August, concerns about tariffs, the growth of China’s industrial output, and the global economy intensified, driving investors toward less-risky investments like US Treasuries. The yield on the 10-year US Treasury note, which moves opposite to its price, briefly dropped below the rate on two-year Treasuries. Although many analysts didn’t interpret this particular “yield curve inversion” as indicative of a looming recession, as they often have in the past, stock prices — particularly in emerging markets — dropped sharply.
Although the Fed cut rates again in September and October to a range of 1.50%-1.75%, Chairman Jerome Powell conveyed that the central bank did not plan to cut rates further unless incoming information required its members to materially reassess their outlook for the economy. As expected, the Fed did not adjust rates through the remainder of the year.
During the fourth quarter, US stock indexes surged to new highs and emerging market stocks rallied amid reports the US and China were moving toward a “phase one” partial trade deal. (The agreement was signed in January 2020 after the reporting period ended.) Eurozone stock markets rose in reaction to improved economic results from Germany. United Kingdom investors were encouraged by the outcome of December elections that many hope will lead to a smoother potential exit of the UK from the European Union.
All S&P 500 sectors rose
The best-performing sectors in the S&P 500 were information technology (+50.3%), communication services (+32.7%), and financials (+32.1%). Next in line were industrials (+29.4%), real estate (+29.0%), consumer discretionary (+27.9%), consumer staples (+27.6%), utilities (+26.4%), materials (+24.6%), health care (+20.8%), and energy (+11.8%).
| | | | |
| Market Overview — unaudited(continued) | | Annual Report | | December 31, 2019 |
Growth outperformed value, large-cap stocks topped small caps
For the year, the Russell 3000® Growth Index returned 35.85%, outperforming the Russell 3000® Value Index, which rose 26.26%. Large-cap stocks, as measured by the Russell 1000® Index, rose 31.43%. The Russell Midcap® Index returned 30.54%, and the small-cap Russell 2000® Index lagged yet still returned 25.52%.
International stocks collectively rose but underperformed US equities
Stocks trading in emerging markets, as measured by the MSCI Emerging Markets Index, returned 18.4% for the year. Notable top-performing country components in the index included Russia (+50.9%), supported by a jump in oil prices, Taiwan (+36.4%), Brazil (+26.3%), and China (23.5%). Taiwan’s and China’s markets advanced in the fourth quarter as trade frictions diminished, although weak economic data from China dampened investor sentiment during the year. Notable countries that underperformed the index but still contributed positively to performance included South Korea (+12.5%), Mexico (+11.4%), and India (+7.6%). Malaysia (-2.0%) detracted from the index’s performance.
Equities in developed markets outside the US and Canada, as measured by the MSCI EAFE Index, rose 22.01%. For the year, the MSCI Europe Index rose 23.77%, the MSCI UK Index returned 21.05%, and the MSCI Japan Index rose 19.61%.
Fixed Income Market Overview
In 2019, for the first time in more than a decade, the Federal Reserve (the Fed) cut interest rates to help sustain the US economy’s expansion in the face of slowing global economic growth and US-China trade-war risks. The central bank was merely one of dozens that reduced rates throughout the year, igniting rallies in numerous global bond markets. During 2019, emerging markets debt, US high yield bonds, and corporate investment-grade bonds delivered robust returns, yet US government bonds and many other fixed income categories also posted solid results.
In the US, the economy grew at a healthy but slow pace. Although real gross domestic product (GDP) growth dropped from 3.1% (annualized) in the first quarter to 2.1% in the third, the economy continued to expand. (Fourth-quarter GDP data had not been released when this overview was published.) The national unemployment rate dropped to a 50-year low of 3.5% in September, corporate earnings were generally strong, and inflation remained low. Elsewhere, the European economy grew weakly. Notably, China’s growth rate dropped significantly from 6.6% in 2018 to 6.1% in 2019.
Bond markets fluctuated but closed higher
During the first quarter of 2019, global growth expectations softened. The Fed, which increased rates four times in 2018, signaled it would pause from hiking rates further based on its outlook at the time, sending bond markets higher. US high yield and emerging market bond prices rose sharply, supported by a tailwind of receding tariff worries and favorable corporate earnings.
In May, worries about the US-China trade war surfaced again. US Treasuries rallied while riskier assets such as high yield bonds dropped in price. The following month, however, the Fed hinted at the possibility of interest rate cuts ahead, trade fears cooled, and the high yield bond market rebounded. The Fed did not adjust rates during the first half of the year.
In July, the global economy showed signs of a slowdown and tariff fears returned. Later that month, for the first time since the financial crisis in 2008, the Fed cut rates as a pre-emptive measure to help sustain the expansion of the US economy and provide a cushion against the risk of a global economic slowdown. During August, the yield on 10-year US Treasuries dropped below yields on two-year Treasuries. Historically, when yields on longer-term Treasuries fall below yields on shorter-term issues, recessions have often followed. While many analysts questioned the “yield curve inversion” as a recessionary indicator in this instance, investors concerned about the economy gravitated to “safe-haven” securities like longer-term US Treasuries and other high-quality credits.
The investment-grade Bloomberg Barclays US Aggregate Bond Index returned 2.59% in August. US high yield bonds finished virtually flat, whereas emerging market sovereign debt markets dropped sharply due in part to a stronger US dollar versus most currencies.
In September, the Fed cut rates again and the European Central Bank restarted its bond-buying program to help stimulate the eurozone economy after rolling it back the previous year. After the Fed dropped its rate target to a range of 1.50% to 1.75% in October, Chairman Jerome Powell conveyed that the central bank had no plans for further cuts unless incoming data compelled its members to materially reassess their outlook for the economy. As expected, the Fed maintained its rate target through the remainder of the year.
During the fourth quarter, stronger-than-expected economic data and reports that the US and China were moving toward a “phase one” partial trade deal led to a “risk-on” rally. (The agreement was signed in January 2020 after the reporting period ended.) Over the final month of the year, high yield bonds and emerging markets bonds posted solid gains, while investment-grade US bonds dropped slightly.
| | | | |
| Market Overview — unaudited(continued) | | Annual Report | | December 31, 2019 |
Emerging market debt and high yield bonds surged by double digits
For the year, the Bloomberg Barclays Global Aggregate Bond Index (unhedged), which measures global investment-grade debt performance, returned 6.84%. (All returns cited are in US dollars.) Bonds trading in the US, based on the Bloomberg Barclays US Aggregate Bond Index, rose 8.72%. The US index’s leading component sectors included investment-grade corporate bonds (+14.5%), which benefited from the interest rate cuts and solid fundamentals, along with Treasury inflation-protected securities (+8.4%), commercial mortgage-backed securities (+8.3%), and US Treasury securities (+6.9%). Treasuries with longer maturities rallied in the second and third quarters when trade tensions escalated, which triggered a “flight to quality.” The 10-year US Treasury note’s yield, which moves opposite to its price, opened 2019 at approximately 2.65% and closed the year at 1.92% as trade tensions eased.
The Bloomberg Barclays Municipal Bond Index returned 7.54% for the year. US high yield bonds (debt rated below investment grade), as measured by the ICE BofAML US Cash High Yield Index, returned 14.40%. Accommodative monetary policies, strong corporate earnings, and investors’ quest for enhanced yield supported demand for high yield opportunities. Emerging market debt, based on the J.P. Morgan EMBI Global Diversified Index surged 15.04%. Despite a strong US dollar (relative to most currencies), sovereign debt yields in general drifted lower as inflation was contained in many countries, providing their central banks with latitude to reduce interest rates, which bolstered bond prices.
| | |
The Prudential Series Fund, SP International Growth Portfolio | | December 31, 2019 |
Report of the Investment Manager - As of December 31, 2019 (Unaudited)
| | | | | | | | | | | | |
| Average Annual Total Returns | | 1 Year | | | 5 Years | | | 10 Years | |
Portfolio: Class I | | | 32.38 | % | | | 9.33 | % | | | 7.59 | % |
Portfolio: Class II | | | 31.91 | | | | 8.90 | | | | 7.19 | |
MSCI EAFE® Index (GD) | | | 22.66 | | | | 6.18 | | | | 6.00 | |
Past performance does not guarantee future returns. The investment return and principal value of an investment will fluctuate, so that shares, when redeemed, may be worth more or less than their original cost. Current performance may be lower or higher than the past performance.
Portfolio performance is net of fund expenses, but not contract charges, which, if included, would significantly lower the performance quoted. Performance figures may reflect fee waivers and/or expense reimbursements. In the absence of such fee waivers and/or expense reimbursements, performance would be lower.
$10,000 INVESTED OVER 10 YEARS1
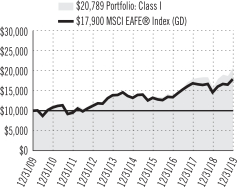
For the year ended December 31, 2019 the SP International Growth Portfolio Class I shares returned 32.38% and the Class II shares returned 31.91%. The Portfolio’s Class I & II shares outperformed the MSCI EAFE Index (GD).
The Portfolio’s investment objective is long-term growth of capital.
What were the market conditions during the reporting period?
For 2019, the MSCI EAFE Index (the Index) was up 22.66% (including dividends), despite a strong dollar, trade war tensions, an impasse over negotiations on the United Kingdom’s pending exit from the European Union (known as Brexit), and downward global earnings revisions for most of the year. By year-end, most of these worries were alleviated, as China and the US agreed on a trade deal, Boris Johnson won his UK referendum, and global earnings trends started to stabilize. Stronger international stock market returns were also attributable to the Federal Reserve reversing course and cutting rates three times in the second half of the year, increasing liquidity. Investors, in turn, started to embrace risk, as volatility, momentum, and small-capitalization stocks came back into favor during the fourth quarter. From a sector perspective, information technology and health care (especially biotechnology) advanced, while energy and communications lagged. In general, the performance of western European equity markets substantially improved over their 2018 performance.
What strategies or holdings affected the Portfolio’s performance?
Stock selection added to relative performance as all three subadvisors (Jennison Associates, Neuberger Berman, and William Blair & Co.) tended to invest in technology stocks and avoid energy equities. Stocks in the latter area tend to have slower earnings-growth rates, so the subadvisors avoided them. Instead, they invested in internet retail, software, and services industries, which all advanced during the period. Given their growth mandate, the subadvisors favored companies in these faster-growing industries and were rewarded.
Volatility and price momentum were also key factors that determined positive relative returns in 2019. Jennison typically has a more aggressive portfolio, while William Blair incorporates momentum as part of its process. In addition, each subadvisor’s underexposure to companies with lower price-to-book ratios further enhanced results as value was out of favor for the year. These exposures are a residual of the subadvisors’ processes.
Finally, all three subadvisors had a substantial underweight to Japan, which tends to have lower growth and profitability rates than many nations in the rest of the developed world. Japan’s forward earnings estimates and wage-growth rates have been declining over the last couple of years. As a result, the country underperformed the MSCI EAFE Index. Since the subadvisors were underweight, the Portfolio benefited.
| 1 | The graph is based on the performance of Class I shares. Performance of Class II shares will be lower due to differences in the fee structure. Class II shares have associated12b-1 and administrative fees at an annual rate of 0.25% and 0.15% respectively of the average daily net assets of the Class II shares. |
For a complete list of holdings, please refer to the Schedule of Investments section of this report. Holdings reflect only long-term investments. Credit Quality/Country Allocation/Holdings/Line of Business are subject to change.
1
| | |
The Prudential Series Fund, SP International Growth Portfolio | | December 31, 2019 |
Report of the Investment Manager - As of December 31, 2019 (Unaudited) (Continued)
Presentation of Portfolio Holdings — unaudited
| | | | | | | | |
| SP International Growth Portfolio (As of 12/31/2019) | |
| Ten Largest Holdings | | Line of Business | | Country | | | (% of Net Assets | ) |
| Alibaba Group Holding Ltd. | | Internet & Direct Marketing Retail | | China | | | 3.1% | |
| LVMH Moet Hennessy Louis Vuitton SE | | Textiles, Apparel & Luxury Goods | | France | | | 2.3% | |
| AIA Group Ltd. | | Insurance | | Hong Kong | | | 2.1% | |
| Airbus SE | | Aerospace & Defense | | France | | | 1.9% | |
| ASML Holding NV | | Semiconductors & Semiconductor Equipment | | Netherlands | | | 1.8% | |
| Adyen NV | | IT Services | | Netherlands | | | 1.8% | |
| Experian PLC | | Professional Services | | United Kingdom | | | 1.8% | |
| L’Oreal SA | | Personal Products | | France | | | 1.8% | |
| Safran SA | | Aerospace & Defense | | France | | | 1.8% | |
| Ferrari NV | | Automobiles | | Italy | | | 1.4% | |
For a complete list of holdings, please refer to the Schedule of Investments section of this report. Holdings reflect only long-term investments. Credit Quality/Country Allocation/Holdings/Line of Business are subject to change.
2
| | |
The Prudential Series Fund Benchmark Glossary — unaudited | | December 31, 2019 |
The indexes are unmanaged and include reinvestment of any income or distributions. They do not reflect any fees, expenses or sales charges. Investors cannot invest directly in a market index.
MSCI EAFE (Morgan Stanley Capital International Europe, Australasia, Far East) Index (GD) is an unmanaged, capitalization-weighted index generally accepted as a benchmark for major overseas markets. The GD version does not reflect the impact of withholding taxes on reinvested dividends.
| | |
The Prudential Series Fund Fees and Expenses — unaudited | | December 31, 2019 |
As a contract owner investing in the Portfolio through a variable annuity or variable life contract, you incur ongoing costs, including management fees, and other Portfolio expenses. This example is intended to help you understand your ongoing costs (in dollars) of investing in the Fund and to compare these costs with the ongoing costs of investing in other investment options. This example does not reflect fees and charges under your variable annuity or variable life contract. If contract charges were included, the costs shown below would be higher. Please consult the prospectus for your contract for more information about contract fees and charges.
The example is based on an investment of $1,000 invested at the beginning of the period and held for the entire period July 1, 2019 through December 31, 2019.
Actual Expenses
The first line of the table below provides information about actual account values and actual expenses. You may use this information, together with the amount you invested, to estimate the Portfolio expenses that you paid over the period. Simply divide your account value by $1,000 (for example, an $8,600 account value divided by $1,000 = 8.6), then multiply the result by the number in the first line under the heading entitled “Expenses Paid During the Six-Month Period” to estimate the Portfolio expenses you paid on your account during this period. As noted above, the table does not reflect variable contract fees and charges.
Hypothetical Example for Comparison Purposes
The second line of the table below provides information about hypothetical account values and hypothetical expenses based on the Portfolio’s actual expense ratio and an assumed rate of return of 5% per year before expenses, which is not the Portfolio’s actual return. The hypothetical account values and expenses may not be used to estimate the actual ending account balance or expenses you paid for the period. You may use this information to compare the ongoing costs of investing in the Portfolio and other investment options. To do so, compare this 5% hypothetical example with the 5% hypothetical examples that appear in the shareholder reports of the other investment options.
Please note that the expenses shown in the table are meant to highlight your ongoing Portfolio costs only and do not reflect any contract fees and charges, such as sales charges (loads), insurance charges or administrative charges. Therefore the second line of the table is useful to compare ongoing investment option costs only, and will not help you determine the relative total costs of owning different contracts. In addition, if these contract fee and charges were included, your costs would have been higher.
| | | | | | | | | | | | | | | | | | |
| The Prudential Series Fund Portfolio | | Beginning
Account Value
July 1, 2019 | | | Ending
Account Value
December 31, 2019 | | | Annualized Expense
Ratio based on the
Six-Month period | | | Expenses Paid
During the
Six-Month period* | |
| | | | | |
SP International Growth (Class I) | | Actual | | $ | 1,000.00 | | | $ | 1,091.80 | | | | 1.01 | % | | $ | 5.33 | |
| | Hypothetical | | $ | 1,000.00 | | | $ | 1,020.11 | | | | 1.01 | % | | $ | 5.14 | |
| | | | | |
SP International Growth (Class II) | | Actual | | $ | 1,000.00 | | | $ | 1,089.00 | | | | 1.41 | % | | $ | 7.42 | |
| | Hypothetical | | $ | 1,000.00 | | | $ | 1,018.10 | | | | 1.41 | % | | $ | 7.17 | |
* Portfolio expenses (net of fee waivers or subsidies, if any) for each share class are equal to the annualized expense ratio for each share class (provided in the table), multiplied by the average account value over the period, multiplied by the 184 days in the six-month period ended December 31, 2019, and divided by the 365 days in the Portfolio’s fiscal year ended December 31, 2019 (to reflect the six-month period). Expenses presented in the table include the expenses of any underlying portfolios in which the Portfolio may invest.
| | | | | | |
| | |
| | SP INTERNATIONAL GROWTH PORTFOLIO | | |
| | | | | | |
| |
| SCHEDULE OF INVESTMENTS | | as of December 31, 2019 |
| | | | | | | | |
| LONG-TERM INVESTMENTS — 97.6% | | | | |
| | |
| COMMON STOCKS — 96.3% | | Shares | | | Value | |
Argentina — 1.0% | | | | | | | | |
MercadoLibre, Inc.* | | | 1,512 | | | $ | 864,773 | |
| | | | | | | | |
Australia — 2.8% | | | | | | | | |
Aristocrat Leisure Ltd. | | | 13,949 | | | | 330,485 | |
Cochlear Ltd. | | | 3,836 | | | | 606,461 | |
CSL Ltd. | | | 3,311 | | | | 641,136 | |
Insurance Australia Group Ltd. | | | 32,681 | | | | 175,693 | |
Macquarie Group Ltd. | | | 6,284 | | | | 608,099 | |
| | | | | | | | |
| | | | | | | 2,361,874 | |
| | | | | | | | |
Austria — 0.4% | | | | | | | | |
BAWAG Group AG, 144A* | | | 8,053 | | | | 366,680 | |
| | | | | | | | |
Belgium — 0.4% | | | | | | | | |
KBC Group NV | | | 4,917 | | | | 370,407 | |
| | | | | | | | |
Canada — 4.5% | | | | | | | | |
Alimentation Couche-Tard, Inc.
(Class B Stock) | | | 9,854 | | | | 312,721 | |
Brookfield Asset Management, Inc. (Class A Stock) | | | 12,234 | | | | 707,125 | |
Canadian National Railway Co. | | | 7,712 | | | | 697,646 | |
Dollarama, Inc. | | | 9,306 | | | | 319,839 | |
Shopify, Inc. (Class A Stock)* | | | 2,383 | | | | 947,433 | |
Suncor Energy, Inc. | | | 9,328 | | | | 305,725 | |
Toronto-Dominion Bank (The) | | | 10,369 | | | | 581,552 | |
| | | | | | | | |
| | | | | | | 3,872,041 | |
| | | | | | | | |
China — 8.9% | | | | | | | | |
Alibaba Group Holding Ltd., ADR* | | | 12,695 | | | | 2,692,609 | |
Budweiser Brewing Co. APAC Ltd., 144A* | | | 16,500 | | | | 55,805 | |
China Merchants Bank Co. Ltd.
(Class H Stock) | | | 114,000 | | | | 587,304 | |
Jiangsu Hengrui Medicine Co. Ltd.
(Class A Stock) | | | 42,153 | | | | 530,751 | |
Kweichow Moutai Co. Ltd. (Class A Stock) | | | 5,214 | | | | 886,965 | |
Meituan Dianping (Class B Stock)* | | | 58,407 | | | | 764,718 | |
NetEase, Inc., ADR | | | 1,579 | | | | 484,185 | |
TAL Education Group, ADR* | | | 2,020 | | | | 97,364 | |
Tencent Holdings Ltd. | | | 14,000 | | | | 673,873 | |
Wuxi Biologics Cayman, Inc., 144A* | | | 69,816 | | | | 885,909 | |
| | | | | | | | |
| | | | | | | 7,659,483 | |
| | | | | | | | |
Denmark — 2.7% | | | | | | | | |
Coloplast A/S (Class B Stock) | | | 4,260 | | | | 528,057 | |
DSV Panalpina A/S | | | 2,250 | | | | 259,270 | |
Novo Nordisk A/S (Class B Stock) | | | 17,478 | | | | 1,014,847 | |
Orsted A/S, 144A | | | 5,299 | | | | 548,593 | |
| | | | | | | | |
| | | | | | | 2,350,767 | |
| | | | | | | | |
Finland — 0.2% | | | | | | | | |
Neste OYJ | | | 3,720 | | | | 129,520 | |
| | | | | | | | |
France — 13.3% | | | | | | | | |
Air Liquide SA | | | 1,627 | | | | 230,566 | |
Airbus SE | | | 11,014 | | | | 1,614,573 | |
Arkema SA | | | 1,585 | | | | 168,429 | |
Capgemini SE | | | 4,202 | | | | 513,411 | |
| | | | | | | | |
COMMON STOCKS
(continued) | | Shares | | | Value | |
France (continued) | | | | | | | | |
Dassault Systemes SE | | | 6,871 | | | $ | 1,131,835 | |
Kering SA | | | 848 | | | | 557,140 | |
L’Oreal SA | | | 5,130 | | | | 1,520,504 | |
LVMH Moet Hennessy Louis Vuitton SE | | | 4,242 | | | | 1,975,214 | |
Pernod Ricard SA | | | 6,703 | | | | 1,200,551 | |
Remy Cointreau SA(a) | | | 2,116 | | | | 259,932 | |
Safran SA | | | 9,755 | | | | 1,508,084 | |
Schneider Electric SE | | | 2,346 | | | | 241,056 | |
TOTAL SA | | | 8,285 | | | | 458,756 | |
| | | | | | | | |
| | | | | | | 11,380,051 | |
| | | | | | | | |
Germany — 6.6% | | | | | | | | |
adidas AG | | | 2,333 | | | | 762,002 | |
Brenntag AG | | | 5,848 | | | | 320,138 | |
Continental AG | | | 1,537 | | | | 197,794 | |
CTS Eventim AG & Co. KGaA | | | 6,746 | | | | 424,901 | |
Deutsche Boerse AG | | | 1,613 | | | | 254,315 | |
Gerresheimer AG | | | 6,167 | | | | 480,218 | |
Infineon Technologies AG | | | 39,929 | | | | 912,470 | |
Rational AG | | | 447 | | | | 359,662 | |
SAP SE | | | 8,203 | | | | 1,112,994 | |
SAP SE, ADR(a) | | | 3,957 | | | | 530,198 | |
Scout24 AG, 144A | | | 4,215 | | | | 279,610 | |
| | | | | | | | |
| | | | | | | 5,634,302 | |
| | | | | | | | |
Hong Kong — 3.0% | | | | | | | | |
AIA Group Ltd. | | | 170,466 | | | | 1,791,677 | |
Techtronic Industries Co. Ltd. | | | 98,283 | | | | 804,897 | |
| | | | | | | | |
| | | | | | | 2,596,574 | |
| | | | | | | | |
India — 1.4% | | | | | | | | |
HDFC Bank Ltd., ADR | | | 14,371 | | | | 910,690 | |
Reliance Industries Ltd., 144A, GDR | | | 6,318 | | | | 269,111 | |
| | | | | | | | |
| | | | | | | 1,179,801 | |
| | | | | | | | |
Ireland — 2.2% | | | | | | | | |
AerCap Holdings NV* | | | 6,501 | | | | 399,617 | |
CRH PLC | | | 11,295 | | | | 455,729 | |
Kerry Group PLC (Class A Stock) | | | 3,723 | | | | 464,203 | |
Kingspan Group PLC | | | 9,103 | | | | 556,485 | |
| | | | | | | | |
| | | | | | | 1,876,034 | |
| | | | | | | | |
Israel — 1.1% | | | | | | | | |
Check Point Software Technologies
Ltd.*(a) | | | 8,261 | | | | 916,641 | |
| | | | | | | | |
Italy — 2.6% | | | | | | | | |
Brunello Cucinelli SpA | | | 19,124 | | | | 677,826 | |
Ferrari NV | | | 7,491 | | | | 1,241,283 | |
Nexi SpA, 144A* | | | 22,060 | | | | 307,138 | |
| | | | | | | | |
| | | | | | | 2,226,247 | |
| | | | | | | | |
Japan — 7.6% | | | | | | | | |
Asahi Intecc Co. Ltd. | | | 5,500 | | | | 160,791 | |
Bridgestone Corp. | | | 7,800 | | | | 289,743 | |
Daikin Industries Ltd. | | | 5,900 | | | | 831,917 | |
Freee KK, 144A* | | | 1,195 | | | | 35,469 | |
Hoya Corp. | | | 8,500 | | | | 812,869 | |
SEE NOTES TO FINANCIAL STATEMENTS.
A1
| | | | | | |
| | |
| | SP INTERNATIONAL GROWTH PORTFOLIO (continued) | | |
| | | | | | |
| |
| SCHEDULE OF INVESTMENTS | | as of December 31, 2019 |
| | | | | | | | |
COMMON STOCKS
(continued) | | Shares | | | Value | |
Japan (continued) | | | | | | | | |
Kao Corp. | | | 3,300 | | | $ | 272,396 | |
Keyence Corp. | | | 2,900 | | | | 1,021,038 | |
Kose Corp. | | | 2,200 | | | | 321,082 | |
Nitori Holdings Co. Ltd. | | | 1,800 | | | | 284,319 | |
Persol Holdings Co. Ltd. | | | 12,500 | | | | 233,769 | |
Sanwa Holdings Corp. | | | 30,700 | | | | 344,107 | |
Shionogi & Co. Ltd. | | | 6,300 | | | | 389,794 | |
Shiseido Co. Ltd. | | | 6,700 | | | | 476,093 | |
SMC Corp. | | | 1,100 | | | | 501,912 | |
Terumo Corp. | | | 6,000 | | | | 213,313 | |
Toyota Motor Corp. | | | 5,100 | | | | 359,498 | |
| | | | | | | | |
| | | | | | | 6,548,110 | |
| | | | | | | | |
Luxembourg — 0.2% | | | | | | | | |
Tenaris SA | | | 16,089 | | | | 181,716 | |
| | | | | | | | |
Macau — 0.5% | | | | | | | | |
Galaxy Entertainment Group Ltd. | | | 53,000 | | | | 390,867 | |
| | | | | | | | |
Netherlands — 5.1% | | | | | | | | |
Adyen NV, 144A* | | | 1,889 | | | | 1,549,891 | |
ASML Holding NV | | | 5,297 | | | | 1,575,469 | |
Heineken NV | | | 4,641 | | | | 494,305 | |
Koninklijke Philips NV | | | 11,483 | | | | 561,559 | |
NXP Semiconductors NV | | | 1,726 | | | | 219,651 | |
| | | | | | | | |
| | | | | | | 4,400,875 | |
| | | | | | | | |
Portugal — 0.2% | | | | | | | | |
Galp Energia SGPS SA | | | 12,395 | | | | 207,736 | |
| | | | | | | | |
Singapore — 0.4% | | | | | | | | |
DBS Group Holdings Ltd. | | | 19,700 | | | | 379,412 | |
| | | | | | | | |
Spain — 1.2% | | | | | | | | |
ACS Actividades de Construccion y Servicios SA | | | 11,033 | | | | 442,242 | |
Amadeus IT Group SA | | | 6,822 | | | | 557,680 | |
| | | | | | | | |
| | | | | | | 999,922 | |
| | | | | | | | |
Sweden — 1.8% | | | | | | | | |
Assa Abloy AB (Class B Stock) | | | 11,366 | | | | 265,646 | |
Atlas Copco AB (Class A Stock) | | | 15,999 | | | | 637,967 | |
Hexagon AB (Class B Stock) | | | 9,170 | | | | 513,409 | |
Swedbank AB (Class A Stock) | | | 8,448 | | | | 125,676 | |
| | | | | | | | |
| | | | | | | 1,542,698 | |
| | | | | | | | |
Switzerland — 10.9% | | | | | | | | |
Alcon, Inc.* | | | 10,060 | | | | 569,075 | |
Cie Financiere Richemont SA | | | 2,308 | | | | 181,542 | |
Givaudan SA | | | 342 | | | | 1,071,262 | |
Julius Baer Group Ltd.* | | | 7,008 | | | | 361,567 | |
Lonza Group AG* | | | 2,596 | | | | 947,270 | |
Novartis AG | | | 13,046 | | | | 1,237,484 | |
Partners Group Holding AG | | | 945 | | | | 867,904 | |
Roche Holding AG | | | 1,730 | | | | 561,386 | |
SGS SA | | | 119 | | | | 326,126 | |
SIG Combibloc Group AG* | | | 23,769 | | | | 380,473 | |
Sika AG | | | 2,402 | | | | 451,463 | |
Sonova Holding AG | | | 2,104 | | | | 481,444 | |
Straumann Holding AG | | | 1,131 | | | | 1,111,396 | |
Temenos AG* | | | 2,997 | | | | 475,813 | |
| | | | | | | | |
COMMON STOCKS
(continued) | | Shares | | | Value | |
Switzerland (continued) | | | | | | | | |
UBS Group AG* | | | 23,781 | | | $ | 300,275 | |
| | | | | | | | |
| | | | | | | 9,324,480 | |
| | | | | | | | |
Taiwan — 1.7% | | | | | | | | |
Sea Ltd., ADR*(a) | | | 13,171 | | | | 529,738 | |
Taiwan Semiconductor Manufacturing Co. Ltd. | | | 86,000 | | | | 954,760 | |
| | | | | | | | |
| | | | | | | 1,484,498 | |
| | | | | | | | |
United Kingdom — 12.1% | | | | | | | | |
Abcam PLC | | | 6,800 | | | | 121,869 | |
Ashtead Group PLC | | | 15,518 | | | | 496,978 | |
AstraZeneca PLC | | | 6,468 | | | | 652,667 | |
Barratt Developments PLC | | | 15,128 | | | | 150,282 | |
Bunzl PLC | | | 18,990 | | | | 519,642 | |
Compass Group PLC | | | 34,575 | | | | 867,531 | |
DCC PLC | | | 3,453 | | | | 299,836 | |
Diageo PLC | | | 11,603 | | | | 492,981 | |
Electrocomponents PLC | | | 35,198 | | | | 316,080 | |
Experian PLC | | | 45,592 | | | | 1,541,645 | |
Fevertree Drinks PLC | | | 14,729 | | | | 409,389 | |
London Stock Exchange Group PLC | | | 8,883 | | | | 914,622 | |
Prudential PLC | | | 20,193 | | | | 388,623 | |
Reckitt Benckiser Group PLC | | | 4,736 | | | | 384,572 | |
RELX PLC | | | 39,851 | | | | 1,006,447 | |
Rentokil Initial PLC | | | 44,541 | | | | 267,715 | |
Segro PLC, REIT | | | 43,337 | | | | 516,310 | |
Spectris PLC | | | 7,171 | | | | 276,067 | |
St. James’s Place PLC | | | 40,039 | | | | 619,933 | |
Trainline PLC, 144A* | | | 23,972 | | | | 161,038 | |
| | | | | | | | |
| | | | | | | 10,404,227 | |
| | | | | | | | |
United States — 3.5% | | | | | | | | |
Aon PLC | | | 2,072 | | | | 431,577 | |
Core Laboratories NV | | | 807 | | | | 30,400 | |
Ferguson PLC | | | 4,250 | | | | 386,218 | |
Lululemon Athletica, Inc.* | | | 4,117 | | | | 953,785 | |
QIAGEN NV (NYSE)* | | | 1,792 | | | | 60,570 | |
QIAGEN NV (TRQX)* | | | 6,306 | | | | 215,670 | |
Samsonite International SA, 144A | | | 179,092 | | | | 431,768 | |
Sensata Technologies Holding PLC* | | | 8,614 | | | | 464,036 | |
| | | | | | | | |
| | | | | | | 2,974,024 | |
| | | | | | | | |
TOTAL COMMON STOCKS
(cost $56,579,250) | | | | | | | 82,623,760 | |
| | | | | | | | |
| |
| PREFERRED STOCK — 1.3% | | | | | |
Germany | | | | | | | | |
Sartorius AG (PRFC)
(cost $404,154) | | | 5,084 | | | | 1,094,279 | |
| | | | | | | | |
TOTAL LONG-TERM INVESTMENTS
(cost $56,983,404) | | | | 83,718,039 | |
| | | | | | | | |
| |
| SHORT-TERM INVESTMENTS — 4.8% | | | | | |
AFFILIATED MUTUAL FUNDS — 3.7% | | | | | |
PGIM Core Ultra Short Bond Fund(w) | | | 1,090,611 | | | | 1,090,611 | |
SEE NOTES TO FINANCIAL STATEMENTS.
A2
| | | | | | |
| | |
| | SP INTERNATIONAL GROWTH PORTFOLIO (continued) | | |
| | | | | | |
| |
| SCHEDULE OF INVESTMENTS | | as of December 31, 2019 |
| | | | | | | | |
| | | Shares | | | Value | |
AFFILIATED MUTUAL FUNDS (continued) | | | | | |
PGIM Institutional Money Market Fund (cost $2,068,550; includes $2,064,811 of cash collateral for securities on loan)(b)(w) | | | 2,068,447 | | | $ | 2,068,861 | |
| | | | | | | | |
TOTAL AFFILIATED MUTUAL FUNDS
(cost $3,159,161) | | | | | | | 3,159,472 | |
| | | | | | | | |
| | |
| UNAFFILIATED FUND — 1.1% | | | | | | | | |
BlackRock Liquidity FedFund
(cost $948,563) | | | 948,563 | | | | 948,563 | |
| | | | | | | | |
TOTAL SHORT-TERM INVESTMENTS
(cost $4,107,724) | | | | | | | 4,108,035 | |
| | | | | | | | |
TOTAL INVESTMENTS — 102.4%
(cost $61,091,128) | | | | | | | 87,826,074 | |
Liabilities in excess of other
assets — (2.4)% | | | | (2,081,610 | ) |
| | | | | | | | |
NET ASSETS — 100.0% | | | | | | $ | 85,744,464 | |
| | | | | | | | |
Below is a list of the abbreviation(s) used in the annual report:
| | | | |
| 144A | | — | | Security was purchased pursuant to Rule 144A under the Securities Act of 1933 and, pursuant to the requirements of Rule 144A, may not be resold except to qualified institutional buyers. |
| | | | |
| ADR | | — | | American Depositary Receipt |
| GDR | | — | | Global Depositary Receipt |
| LIBOR | | — | | London Interbank Offered Rate |
| NYSE | | — | | New York Stock Exchange |
| OTC | | — | | Over-the-counter |
| PRFC | | — | | Preference Shares |
| REITs | | — | | Real Estate Investment Trust |
| TRQX | | — | | Turquoise Stock Exchange |
| * | Non-income producing security. |
| (a) | All or a portion of security is on loan. The aggregate market value of such securities, including those sold and pending settlement, is $2,026,180; cash collateral of $2,064,811 (included in liabilities) was received with which the Portfolio purchased highly liquid short-term investments. |
| (b) | Represents security purchased with cash collateral received for securities on loan and includes dividend reinvestment. |
| (w) | PGIM Investments LLC, the manager of the Portfolio, also serves as manager of the PGIM Core Ultra Short Bond Fund and PGIM Institutional Money Market Fund. |
Fair Value Measurements:
Various inputs are used in determining the value of the Portfolio’s investments. These inputs are summarized in the three broad levels listed below.
| Level 1— | unadjusted quoted prices generally in active markets for identical securities. |
| Level 2— | quoted prices for similar securities, interest rates and yield curves, prepayment speeds, foreign currency exchange rates and other observable inputs. |
| Level 3— | unobservable inputs for securities valued in accordance with Board approved fair valuation procedures. |
The following is a summary of the inputs used as of December 31, 2019 in valuing such portfolio securities:
| | | | | | | | | | | | |
| | | Level 1 | | | Level 2 | | | Level 3 | |
Investments in Securities | | | | | | | | | | | | |
Assets | | | | | | | | | | | | |
Common Stocks | | | | | | | | | | | | |
Argentina | | $ | 864,773 | | | $ | — | | | $ | — | |
Australia | | | — | | | | 2,361,874 | | | | — | |
Austria | | | — | | | | 366,680 | | | | — | |
Belgium | | | — | | | | 370,407 | | | | — | |
Canada | | | 3,872,041 | | | | — | | | | — | |
China | | | 3,274,158 | | | | 4,385,325 | | | | — | |
Denmark | | | — | | | | 2,350,767 | | | | — | |
Finland | | | — | | | | 129,520 | | | | — | |
France | | | — | | | | 11,380,051 | | | | — | |
Germany | | | 530,198 | | | | 5,104,104 | | | | — | |
Hong Kong | | | — | | | | 2,596,574 | | | | — | |
India | | | 910,690 | | | | 269,111 | | | | — | |
Ireland | | | 399,617 | | | | 1,476,417 | | | | — | |
Israel | | | 916,641 | | | | — | | | | — | |
Italy | | | — | | | | 2,226,247 | | | | — | |
Japan | | | 35,469 | | | | 6,512,641 | | | | — | |
Luxembourg | | | — | | | | 181,716 | | | | — | |
Macau | | | — | | | | 390,867 | | | | — | |
SEE NOTES TO FINANCIAL STATEMENTS.
A3
| | | | | | |
| | |
| | SP INTERNATIONAL GROWTH PORTFOLIO (continued) | | |
| | | | | | |
| |
| SCHEDULE OF INVESTMENTS | | as of December 31, 2019 |
| | | | | | | | | | | | |
| | | Level 1 | | | Level 2 | | | Level 3 | |
Investments in Securities (continued) | | | | | | | | | | | | |
Assets (continued) | | | | | | | | | | | | |
Common Stocks (continued) | | | | | | | | | | | | |
Netherlands | | $ | 219,651 | | | $ | 4,181,224 | | | $ | — | |
Portugal | | | — | | | | 207,736 | | | | — | |
Singapore | | | — | | | | 379,412 | | | | — | |
Spain | | | — | | | | 999,922 | | | | — | |
Sweden | | | — | | | | 1,542,698 | | | | — | |
Switzerland | | | — | | | | 9,324,480 | | | | — | |
Taiwan | | | 529,738 | | | | 954,760 | | | | — | |
United Kingdom | | | — | | | | 10,404,227 | | | | — | |
United States | | | 1,940,368 | | | | 1,033,656 | | | | — | |
Preferred Stock | | | | | | | | | | | | |
Germany | | | — | | | | 1,094,279 | | | | — | |
Affiliated Mutual Funds | | | 3,159,472 | | | | — | | | | — | |
Unaffiliated Fund | | | 948,563 | | | | — | | | | — | |
| | | | | | | | | | | | |
Total | | $ | 17,601,379 | | | $ | 70,224,695 | | | $ | — | |
| | | | | | | | | | | | |
Industry Classification:
The industry classification of investments and liabilities in excess of other assets shown as a percentage of net assets as of December 31, 2019 were as follows (unaudited):
| | | | |
Health Care Equipment & Supplies | | | 7.1 | % |
Textiles, Apparel & Luxury Goods | | | 6.4 | |
Capital Markets | | | 5.4 | |
Internet & Direct Marketing Retail | | | 5.2 | |
Pharmaceuticals | | | 5.2 | |
Software | | | 4.9 | |
IT Services | | | 4.6 | |
Beverages | | | 4.5 | |
Semiconductors & Semiconductor Equipment | | | 4.3 | |
Banks | | | 3.9 | |
Aerospace & Defense | | | 3.7 | |
Professional Services | | | 3.7 | |
Affiliated Mutual Funds (2.4% represents investments purchased with collateral from securities on loan) | | | 3.7 | |
Insurance | | | 3.2 | |
Personal Products | | | 3.1 | |
Life Sciences Tools & Services | | | 3.1 | |
Machinery | | | 2.6 | |
Trading Companies & Distributors | | | 2.6 | |
Electronic Equipment, Instruments & Components | | | 2.5 | |
Building Products | | | 2.4 | |
Chemicals | | | 2.2 | |
Hotels, Restaurants & Leisure | | | 1.9 | |
Automobiles | | | 1.8 | |
Entertainment | | | 1.7 | |
Oil, Gas & Consumable Fuels | | | 1.5 | |
Interactive Media & Services | | | 1.1 | |
| | | | |
Unaffiliated Fund | | | 1.1 | % |
Biotechnology | | | 0.9 | |
Electrical Equipment | | | 0.8 | |
Road & Rail | | | 0.8 | |
Electric Utilities | | | 0.6 | |
Equity Real Estate Investment Trusts (REITs) | | | 0.6 | |
Auto Components | | | 0.5 | |
Food Products | | | 0.5 | |
Construction Materials | | | 0.5 | |
Construction & Engineering | | | 0.5 | |
Household Products | | | 0.4 | |
Containers & Packaging | | | 0.4 | |
Multiline Retail | | | 0.4 | |
Food & Staples Retailing | | | 0.4 | |
Industrial Conglomerates | | | 0.3 | |
Specialty Retail | | | 0.3 | |
Commercial Services & Supplies | | | 0.3 | |
Air Freight & Logistics | | | 0.3 | |
Energy Equipment & Services | | | 0.2 | |
Household Durables | | | 0.2 | |
Diversified Consumer Services | | | 0.1 | |
| | | | |
| | | 102.4 | |
Liabilities in excess of other assets | | | (2.4 | ) |
| | | | |
| | | 100.0 | % |
| | | | |
Financial Instruments/Transactions — Summary of Offsetting and Netting Arrangements:
The Portfolio entered into financial instruments/transactions during the reporting period that are either offset in accordance with current requirements or are subject to enforceable master netting arrangements or similar agreements that permit offsetting. The information about offsetting and related netting arrangements for financial instruments/transactions where the legal right toset-off exists is presented in the summary below.
SEE NOTES TO FINANCIAL STATEMENTS.
A4
| | | | | | |
| | |
| | SP INTERNATIONAL GROWTH PORTFOLIO (continued) | | |
| | | | | | |
| |
| SCHEDULE OF INVESTMENTS | | as of December 31, 2019 |
Offsetting of financial instrument/transaction assets and liabilities:
| | | | | | | | | | | | |
| | | |
| | | | | | | | | | | | |
Description | | Gross Market
Value of
Recognized
Assets/(Liabilities) | | | Collateral
Pledged/(Received)(1) | | | Net
Amount | |
Securities on Loan | | $ | 2,026,180 | | | $ | (2,026,180 | ) | | $ | — | |
| | | | | | | | | | | | |
| (1) | Collateral amount disclosed by the Portfolio is limited to the market value of financial instruments/transactions. |
SEE NOTES TO FINANCIAL STATEMENTS.
A5
| | | | | | |
| | |
| | SP INTERNATIONAL GROWTH PORTFOLIO (continued) | | |
STATEMENT OF ASSETS AND LIABILITIES
as of December 31, 2019
| | | | |
| ASSETS | | | | |
Investments at value, including securities on loan of $2,026,180: | | | | |
Unaffiliated investments (cost $57,931,967) | | $ | 84,666,602 | |
Affiliated investments (cost $3,159,161) | | | 3,159,472 | |
Foreign currency, at value (cost $62,959) | | | 63,695 | |
Cash | | | 1,654 | |
Tax reclaim receivable | | | 324,093 | |
Receivable for Portfolio shares sold | | | 23,049 | |
Dividends and interest receivable | | | 22,128 | |
Receivable for investments sold | | | 15,866 | |
Receivable from affiliate | | | 508 | |
Prepaid expenses and other assets | | | 1,233 | |
| | | | |
Total Assets | | | 88,278,300 | |
| | | | |
| LIABILITIES | | | | |
Payable to broker for collateral for securities on loan | | | 2,064,811 | |
Payable to affiliate | | | 183,508 | |
Accrued expenses and other liabilities | | | 114,597 | |
Payable for investments purchased | | | 114,170 | |
Management fee payable | | | 39,858 | |
Payable for Portfolio shares repurchased | | | 15,864 | |
Affiliated transfer agent fee payable | | | 980 | |
Distribution fee payable | | | 30 | |
Administration fee payable | | | 18 | |
| | | | |
Total Liabilities | | | 2,533,836 | |
| | | | |
| NET ASSETS | | $ | 85,744,464 | |
| | | | |
Net assets were comprised of: | | | | |
Partners’ Equity | | $ | 85,744,464 | |
| | | | |
| Class I: | | | | |
Net asset value and redemption price per share, $85,605,004 / 9,226,258 outstanding shares of beneficial interest | | $ | 9.28 | |
| | | | |
| Class II: | | | | |
Net asset value and redemption price per share, $139,460 / 15,615 outstanding shares of beneficial interest | | $ | 8.93 | |
| | | | |
STATEMENT OF OPERATIONS
Year Ended December 31, 2019
| | | | |
| NET INVESTMENT INCOME (LOSS) | | | | |
| INCOME | | | | |
Unaffiliated dividend income (net of $133,080 foreign withholding tax, of which $7,142 is reimbursable by an affiliate) | | $ | 1,279,712 | |
Affiliated dividend income | | | 24,156 | |
Income from securities lending, net (including affiliated income of $8,456) | | | 13,343 | |
| | | | |
Total income | | | 1,317,211 | |
| | | | |
| EXPENSES | | | | |
Management fee | | | 677,320 | |
Distribution fee—Class II | | | 333 | |
Administration fee—Class II | | | 200 | |
Custodian and accounting fees | | | 155,050 | |
Shareholders’ reports | | | 49,445 | |
Audit fee | | | 30,300 | |
Legal fees and expenses | | | 12,298 | |
Trustees’ fees | | | 10,720 | |
Transfer agent’s fees and expenses (including affiliated expense of $5,882) | | | 10,684 | |
Miscellaneous | | | 43,198 | |
| | | | |
Total expenses | | | 989,548 | |
Less: Fee waivers and/or expense reimbursement | | | (184,199 | ) |
| | | | |
Net expenses | | | 805,349 | |
| | | | |
| NET INVESTMENT INCOME (LOSS) | | | 511,862 | |
| | | | |
| REALIZED AND UNREALIZED GAIN (LOSS) ON INVESTMENT AND FOREIGN CURRENCY TRANSACTIONS | | | | |
Net realized gain (loss) on: | | | | |
Investment transactions (including affiliated of $456) | | | 4,004,680 | |
Foreign currency transactions | | | (3,993 | ) |
| | | | |
| | | 4,000,687 | |
| | | | |
Net change in unrealized appreciation (depreciation) on: | | | | |
Investments (including affiliated of $332) | | | 17,478,194 | |
Foreign currencies | | | (5,538 | ) |
| | | | |
| | | 17,472,656 | |
| | | | |
| NET GAIN (LOSS) ON INVESTMENT AND FOREIGN CURRENCY TRANSACTIONS | | | 21,473,343 | |
| | | | |
| NET INCREASE (DECREASE) IN NET ASSETS RESULTING FROM OPERATIONS | | $ | 21,985,205 | |
| | | | |
STATEMENTS OF CHANGES IN NET ASSETS
| | | | | | | | |
| | | Year Ended
December 31, 2019 | | | Year Ended
December 31, 2018 | |
| INCREASE (DECREASE) IN NET ASSETS | | | | | | | | |
| OPERATIONS | | | | | | | | |
Net investment income (loss) | | $ | 511,862 | | | $ | 683,634 | |
Net realized gain (loss) on investment and foreign currency transactions | | | 4,000,687 | | | | 3,665,756 | |
Net change in unrealized appreciation (depreciation) on investments and foreign currencies | | | 17,472,656 | | | | (14,941,382 | ) |
| | | | | | | | |
NET INCREASE (DECREASE) IN NET ASSETS RESULTING FROM OPERATIONS | | | 21,985,205 | | | | (10,591,992 | ) |
| | | | | | | | |
| PORTFOLIO SHARE TRANSACTIONS | | | | | | | | |
Portfolio shares sold | | | 2,564,427 | | | | 5,226,397 | |
Portfolio shares repurchased | | | (9,145,577 | ) | | | (8,903,625 | ) |
| | | | | | | | |
NET INCREASE (DECREASE) IN NET ASSETS FROM PORTFOLIO SHARE TRANSACTIONS | | | (6,581,150 | ) | | | (3,677,228 | ) |
| | | | | | | | |
| CAPITAL CONTRIBUTIONS | | | 87,941 | | | | 87,325 | |
| | | | | | | | |
| TOTAL INCREASE (DECREASE) | | | 15,491,996 | | | | (14,181,895 | ) |
| NET ASSETS: | | | | | | | | |
Beginning of year | | | 70,252,468 | | | | 84,434,363 | |
| | | | | | | | |
End of year | | $ | 85,744,464 | | | $ | 70,252,468 | |
| | | | | | | | |
SEE NOTES TO FINANCIAL STATEMENTS.
A6
NOTES TO FINANCIAL STATEMENTS OF
THE PRUDENTIAL SERIES FUND
The Prudential Series Fund (“Series Fund”) is registered under the Investment Company Act of 1940, as amended (“1940 Act”), as anopen-end management investment company. The Series Fund is composed of seventeen Portfolios (“Portfolios”), each with separate series shares. The information presented in these financial statements pertains to the SP International Growth Portfolio (the “Portfolio”). The Portfolio is a diversified portfolio.
The investment objective of the Portfolio is long-term growth of capital.
The Series Fund follows the investment company accounting and reporting guidance of the Financial Accounting Standards Board (“FASB”) Accounting Standard Codification (“ASC”) Topic 946 Financial Services —Investment Companies. The following accounting policies conform to U.S. generally accepted accounting principles. The Series Fund and the Portfolio consistently follow such policies in the preparation of their financial statements.
Securities Valuation: The Portfolio holds securities and other assets and liabilities that are fair valued at the close of each day (generally, 4:00 PM Eastern time) the New York Stock Exchange (“NYSE”) is open for trading. Fair value is the price that would be received to sell an asset or paid to transfer a liability in an orderly transaction between market participants on the measurement date. The Series Fund’s Board of Trustees (the “Board”) has adopted valuation procedures for security valuation under which fair valuation responsibilities have been delegated to PGIM Investments LLC (“PGIM Investments” or the “Manager”). Pursuant to the Board’s delegation, the Manager has established a Valuation Committee responsible for supervising the fair valuation of portfolio securities and other assets and liabilities. The valuation procedures permit the Portfolio to utilize independent pricing vendor services, quotations from market makers, and alternative valuation methods when market quotations are either not readily available or not deemed representative of fair value. A record of the Valuation Committee’s actions is subject to the Board’s review, approval, and ratification at its next regularly scheduled quarterly meeting.
For the fiscal reportingyear-end, securities and other assets and liabilities were fair valued at the close of the last U.S. business day. Trading in certain foreign securities may occur when the NYSE is closed (including weekends and holidays). Because such foreign securities trade in markets that are open on weekends and U.S. holidays, the values of some of the Portfolio’s foreign investments may change on days when investors cannot purchase or redeem Portfolio shares.
Various inputs determine how the Portfolio’s investments are valued, all of which are categorized according to the three broad levels (Level 1, 2, or 3) detailed in the Schedule of Investments and referred to herein as the “fair value hierarchy” in accordance with FASB ASC Topic 820 — Fair Value Measurements and Disclosures.
Common and preferred stocks, exchange-traded funds, and derivative instruments, such as futures or options, that are traded on a national securities exchange are valued at the last sale price as of the close of trading on the applicable exchange where the security principally trades. Securities traded via NASDAQ are valued at the NASDAQ official closing price. To the extent these securities are valued at the last sale price or NASDAQ official closing price, they are classified as Level 1 in the fair value hierarchy. In the event that no sale or official closing price on valuation date exists, these securities are generally valued at the mean between the last reported bid and ask prices, or at the last bid price in the absence of an ask price. These securities are classified as Level 2 in the fair value hierarchy.
Foreign equities traded on foreign securities exchanges are generally valued using pricing vendor services that provide model prices derived using adjustment factors based on information such as local closing price, relevant general and sector indices, currency fluctuations, depositary receipts, and futures, as applicable. Securities valued using such model prices are classified as Level 2 in the fair value hierarchy. The models generate an evaluated adjustment factor for each security, which is applied to the local closing price to adjust it for post closing market movements up to the time the Portfolio is valued. Utilizing that evaluated adjustment factor, the vendor provides an evaluated price for each security. If the vendor does not provide an evaluated price, securities are valued in accordance with exchange-traded common and preferred stock valuation policies discussed above.
Investments inopen-end,non-exchange-traded mutual funds are valued at their net asset values as of the close of the NYSE on the date of valuation. These securities are classified as Level 1 in the fair value hierarchy since they may be purchased or sold at their net asset values on the date of valuation.
B1
Securities and other assets that cannot be priced according to the methods described above are valued based on pricing methodologies approved by the Board. In the event that unobservable inputs are used when determining such valuations, the securities will be classified as Level 3 in the fair value hierarchy.
When determining the fair value of securities, some of the factors influencing the valuation include: the nature of any restrictions on disposition of the securities; assessment of the general liquidity of the securities; the issuer’s financial condition and the markets in which it does business; the cost of the investment; the size of the holding and the capitalization of the issuer; the prices of any recent transactions or bids/offers for such securities or any comparable securities; any available analyst media or other reports or information deemed reliable by the Manager regarding the issuer or the markets or industry in which it operates. Using fair value to price securities may result in a value that is different from a security’s most recent closing price and from the price used by other unaffiliated mutual funds to calculate their net asset values.
Illiquid Securities: Pursuant to Rule22e-4 under the 1940 Act, the Series Fund has adopted a Board approved Liquidity Risk Management Program (“LRMP”) that requires, among other things, that the Portfolio limit its illiquid investments that are assets to no more than 15% of net assets. Illiquid securities are those that, because of the absence of a readily available market or due to legal or contractual restrictions on resale, may not reasonably be expected to be sold or disposed of in current market conditions in seven calendar days or less without the sale or disposition significantly changing the market value of the investment. The Portfolio may find it difficult to sell illiquid securities at the time considered most advantageous by its subadviser(s) and may incur transaction costs that would not be incurred in the sale of securities that were freely marketable.
Restricted Securities: Securities acquired in unregistered, private sales from the issuing company or from an affiliate of the issuer are considered restricted as to disposition under federal securities law (“restricted securities”). Such restricted securities are valued pursuant to the valuation procedures noted above. Restricted securities that would otherwise be considered illiquid investments pursuant to the Portfolio’s LRMP because of legal restrictions on resale to the general public may be traded among qualified institutional buyers under Rule 144A of the Securities Act of 1933. Therefore, these Rule 144A securities, as well as commercial paper that is sold in private placements under Section 4(2) of the Securities Act of 1933, may be classified higher than “illiquid” under the LRMP (i.e. “moderately liquid” or “less liquid” investments). However, the liquidity of the Portfolio’s investments in restricted securities could be impaired if trading does not develop or declines.
Foreign Currency Translation: The books and records of the Portfolio are maintained in U.S. dollars. Foreign currency amounts are translated into U.S. dollars on the following basis:
(i) market value of investment securities, other assets and liabilities — at the current rates of exchange;
(ii) purchases and sales of investment securities, income and expenses — at the rates of exchange prevailing on the respective dates of such transactions.
Although the net assets of the Portfolio are presented at the foreign exchange rates and market values at the close of the period, the Portfolio does not generally isolate that portion of the results of operations arising as a result of changes in the foreign exchange rates from the fluctuations arising from changes in the market prices of long-term portfolio securities held at the end of the period. Similarly, the Portfolio does not isolate the effect of changes in foreign exchange rates from the fluctuations arising from changes in the market prices of long-term portfolio securities sold during the period. Accordingly, holding period realized foreign currency gains (losses) are included in the reported net realized gains (losses) on investment transactions.
Net realized gains (losses) on foreign currency transactions represent net foreign exchange gains (losses) from the disposition of holdings of foreign currencies, currency gains (losses) realized between the trade and settlement dates on investment transactions, and the difference between the amounts of interest, dividends and foreign withholding taxes recorded on the Portfolio’s books and the U.S. dollar equivalent amounts actually received or paid. Net unrealized currency gains (losses) arise from valuing foreign currency denominated assets and liabilities (other than investments) at period end exchange rates.
Master Netting Arrangements: The Series Fund, on behalf of the Portfolio, is subject to various Master Agreements, or netting arrangements, with select counterparties. These are agreements which a subadviser may have negotiated and entered into on behalf of all or a portion of the Portfolio. For multi-sleeve Portfolios, different subadvisers who manage their respective sleeve, may enter into such agreements with the same counterparty and are disclosed separately for each sleeve when presenting information about offsetting and related netting arrangements for OTC derivatives. A master netting arrangement between the Portfolio and the counterparty permits the Portfolio to offset amounts payable by the Portfolio to the same counterparty against amounts to be
B2
received; and by the receipt of collateral from the counterparty by the Portfolio to cover the Portfolio’s exposure to the counterparty. However, there is no assurance that such mitigating factors are easily enforceable. In addition to master netting arrangements, the right toset-off exists when all the conditions are met such that each of the parties owes the other determinable amounts, the reporting party has the right toset-off the amount owed with the amount owed by the other party, the reporting party intends toset-off and the right ofset-off is enforceable by law. During the reporting period, there was no intention to settle on a net basis and all amounts are presented on a gross basis on the Statement of Assets and Liabilities.
Securities Lending: The Portfolio lends its portfolio securities to banks and broker-dealers. The loans are secured by collateral at least equal to the market value of the securities loaned. Collateral pledged by each borrower is invested in an affiliated money market fund and is marked to market daily, based on the previous day’s market value, such that the value of the collateral exceeds the value of the loaned securities. In the event of significant appreciation in value of securities on loan on the last business day of the reporting period, the financial statements may reflect a collateral value that is less than the market value of the loaned securities. Such shortfall is remedied as described above. Loans are subject to termination at the option of the borrower or the Portfolio. Upon termination of the loan, the borrower will return to the Portfolio securities identical to the loaned securities. Should the borrower of the securities fail financially, the Portfolio has the right to repurchase the securities in the open market using the collateral.
The Portfolio recognizes income, net of any rebate and securities lending agent fees, for lending its securities in the form of fees or interest on the investment of any cash received as collateral. The borrower receives all interest and dividends from the securities loaned and such payments are passed back to the lender in amounts equivalent thereto. The Portfolio also continues to recognize any unrealized gain (loss) in the market price of the securities loaned and on the change in the value of the collateral invested that may occur during the term of the loan. In addition, realized gain (loss) is recognized on changes in the value of the collateral invested upon liquidation of the collateral. Net earnings from securities lending are disclosed in the Statement of Operations.
Equity and Mortgage Real Estate Investment Trusts (collectively equity REITs): The Portfolio invested in equity REITs, which report information on the source of their distributions annually. Based on current and historical information, a portion of distributions received from equity REITs during the period is estimated to be dividend income, capital gain or return of capital and recorded accordingly. When material, these estimates are adjusted periodically when the actual source of distributions is disclosed by the equity REITs.
Securities Transactions and Net Investment Income: Securities transactions are recorded on the trade date. Realized gains (losses) from investment and currency transactions are calculated on the specific identification method. Dividend income is recorded on theex-date, or for certain foreign securities, when the Portfolio becomes aware of such dividends. Interest income, including amortization of premium and accretion of discount on debt securities, as required, is recorded on the accrual basis. Expenses are recorded on an accrual basis, which may require the use of certain estimates by management that may differ from actual. Net investment income or loss (other than administration and distribution fees which are charged directly to the respective class) and unrealized and realized gains (losses) are allocated daily to each class of shares based upon the relative proportion of adjusted net assets of each class at the beginning of the day.
Taxes: For federal income tax purposes, the Portfolio is treated as a separate taxpaying entity. The Portfolio is treated as a partnership for tax purposes. No provision has been made in the financial statements for U.S. federal, state, or local taxes, as any tax liability arising from operations of the Portfolio is the responsibility of the Portfolio’s shareholders (participating insurance companies). The Portfolio is not generally subject to entity-level taxation. Shareholders of the Portfolio are subject to taxes on their distributive share of partnership items. Withholding taxes on foreign dividends, interest and capital gains are accrued in accordance with the Portfolio’s understanding of the applicable country’s tax rules and regulations. Such taxes are accrued net of reclaimable amounts, at the time the related income/gain is recorded taking into account any agreements in place with Prudential Financial, Inc. (“Prudential”) as referenced in Note 3. The Portfolio generally attempts to manage its diversification in a manner that supports the diversification requirements of the underlying separate accounts.
Distributions: Distributions, if any, from the Portfolio are made in cash and automatically reinvested in additional shares of the Portfolio. Distributions are recorded on theex-date.
Estimates: The preparation of financial statements requires management to make estimates and assumptions that affect the reported amounts and disclosures in the financial statements. Actual results could differ from those estimates.
B3
The Series Fund, on behalf of the Portfolio, has entered into an investment management agreement with the Manager. Pursuant to this agreement, the Manager has responsibility for all investment management services and supervises the subadviser’s performance of such services. The Manager has entered into separate subadvisory agreements with each of Jennison Associates LLC (“Jennison”), Neuberger Berman Investment Advisors, LLC and William Blair & Company LLC (collectively, the “subadvisers”), under which the subadvisers provide investment advisory services for the Portfolio. The Manager pays for the services of the subadvisers, the cost of compensation of officers of the Portfolio, occupancy and certain clerical and administrative expenses of the Portfolio. The Portfolio bears all other costs and expenses.
The management fee paid to the Manager is accrued daily and payable monthly at an annual rate of 0.85% of the Portfolio’s average daily net assets of the Fund. The Manager has contractually agreed through June 30, 2020 to waive a portion of its management fee equal to an annual rate of 0.019% of the average daily net assets of the Portfolio. All amounts paid or payable by the Portfolio to the Manager, under the agreement, are reflected in the Statement of Operations.
The Manager has contractually agreed through June 30, 2020 to limit the net annual operating expenses (exclusive of distribution and service(12b-1) fees, administrative fees, taxes (such as income and foreign withholdings taxes, stamp duty and deferred tax expenses), interest, underlying funds, brokerage, extraordinary and certain other expenses such as dividend, broker charges and interest expense on short sales) of each class of shares of the Portfolio to 1.01% of the Portfolio’s average daily net assets. Expenses waived/reimbursed by the Manager in accordance with this agreement may be recouped by the Manager within the same fiscal year during which such waiver/reimbursement is made if such recoupment can be realized without exceeding the expense limit in effect at the time of the recoupment for that fiscal year. The effective management fee rate net of waivers and/or expense reimbursements was 0.62% for the year ended December 31, 2019.
The Series Fund, on behalf of the Portfolio, has a distribution agreement, pursuant to Rule12b-1 under the 1940 Act, with Prudential Investment Management Services LLC (“PIMS”), which acts as the distributor of the Class I and Class II shares of the Portfolio. The Portfolio compensates PIMS for distributing and servicing the Portfolio’s Class II shares pursuant to a plan of distribution (the “Class II Plan”), regardless of expenses actually incurred by PIMS. The distribution fees are accrued daily and payable monthly. No distribution or service fees are paid to PIMS as distributor of the Class I shares of the Portfolio. Pursuant to the Class II Plan, the Class II shares of the Portfolio compensate PIMS for distribution-related activities at an annual rate of 0.25% of the average daily net assets of the Class II shares.
The Series Fund has an administration agreement with the Manager, which acts as the administrator of the Class II shares of the Portfolio. The administration fee paid to the Manager is accrued daily and payable monthly, at the annual rate of 0.15% of the average daily net assets of the Class II shares.
The Series Fund, on behalf of the Portfolio, has entered into brokerage commission recapture agreements with certain registered broker-dealers. Under the brokerage commission recapture program, a portion of the commission is returned to the Portfolio on whose behalf the trades were made. Commission recapture is paid solely to those portfolios generating the applicable trades. Such amounts are included within realized gain (loss) on investment transactions presented in the Statement of Operations. For the reporting period ended December 31, 2019, brokerage commission recaptured under these agreements was $2,876.
PGIM Investments, PIMS and Jennison are indirect, wholly-owned subsidiaries of Prudential.
| 3. | | Other Transactions with Affiliates |
a.) Related Parties
Prudential Mutual Fund Services LLC (“PMFS”), an affiliate of PGIM Investments and an indirect, wholly-owned subsidiary of Prudential, serves as the transfer agent of the Portfolio. The transfer agent’s fees and expenses in the Statement of Operations include certainout-of-pocket expenses paid tonon-affiliates, where applicable.
The Portfolio may invest its overnight sweep cash in the PGIM Core Ultra Short Bond Fund (the “Core Fund”) and its securities lending cash collateral in the PGIM Institutional Money Market Fund (the “Money Market Fund”), each a series of Prudential Investment Portfolios 2, registered under the 1940 Act and managed by PGIM Investments. Through the Portfolio’s investments in the mentioned underlying funds, PGIM Investments and/or its affiliates are
B4
paid fees or reimbursed for providing their services. In addition to the realized and unrealized gains on investments in the Core Fund and Money Market Fund, earnings from such investments are disclosed on the Statement of Operations as “Affiliated dividend income” and “Income from securities lending, net”, respectively.
The Portfolio may enter into certain securities purchase or sale transactions under Board approved Rule17a-7 procedures. Rule17a-7 is an exemptive rule under the 1940 Act, that subject to certain conditions, permits purchase and sale transactions among affiliated investment companies, or between an investment company and a person that is affiliated solely by reason of having a common (or affiliated) investment adviser, common directors, and/or common officers. Pursuant to the Rule17a-7 procedures and consistent with guidance issued by the Securities and Exchange Commission (“SEC”), the Series Fund’s Chief Compliance Officer (“CCO”) prepares a quarterly summary of all such transactions for submission to the Board, together with the CCO’s written representation that all such17a-7 transactions were effected in accordance with the Series Fund’sRule 17a-7 procedures. For the reporting period ended December 31, 2019, no17a-7 transactions were entered into by the Portfolio.
In March 2019, the following Portfolio was reimbursed by the Investment Manager for costs incurred due to a portfolio allocation error. The reimbursement amount for the affected Portfolio is disclosed below and such amount is also disclosed in the Portfolio’s “Statements of Changes in Net Assets” and “Financial Highlights” as “Capital Contributions” for the year ended December 31, 2019.
| | | | |
Portfolio | | Capital Contributions | |
SP International Growth Portfolio | | $ | 12 | |
b.) Securities Lending and Foreign Withholding Tax Reclaim Matters
In September 2019, the Manager reached a settlement with the SEC relating to the securities lending and foreign withholding tax reclaim matters described below. Under the settlement, the Manager agreed to pay to the SEC disgorgement of fees and a civil penalty. The settlement does not affect the Manager’s ability to manage the Portfolio.
In February 2016, Prudential, the parent company of the Manager, self-reported to the SEC and certain other regulators that, in some cases, it failed to maximize securities lending income for certain Portfolios of the Series Fund due to a long-standing restriction benefitting Prudential. The Board was not notified of the restriction until after it had been removed. Prudential paid each of the affected Portfolios an amount equal to the estimated loss associated with the unauthorized restriction. At the Board’s direction, this payment occurred on June 30, 2016. The estimated opportunity loss was calculated by an independent consultant hired by Prudential whose calculation methodology was subsequently reviewed by a consultant retained by the independent trustees of the Portfolios. The per share amount of opportunity loss payment to the Portfolios is disclosed in the Portfolio’s “Financial Highlights” as “Capital Contributions” for the fiscal year ended December 31, 2016.
In March 2018, Prudential further notified the SEC that it failed to timely reimburse certain Portfolios for amounts due under protocols established to ensure that the Portfolios were not harmed as a result of their tax status as partnerships instead of regulated investment companies (RICs). Specifically, as a result of their partnership status, the Portfolios are subject to higher foreign withholding tax rates on dividend and interest income in certain foreign jurisdictions and/or are subject to delays in repayment of taxes withheld by certain foreign jurisdictions (collectively, “excess withholding tax”). Prudential’s protocols were intended to protect the Portfolios from these differences and delays. In consultation with the Series Fund’s independent trustees, Prudential paid each of the affected Portfolios an amount equal to the excess withholding tax in addition to an amount equal to the applicable Portfolio’s rate of return (“opportunity loss”) applied to these excess withholding tax amounts for periods from the various transaction dates, beginning January 2, 2006 (the date when the Portfolios were converted to partnerships for tax purposes), through February 28, 2018 (the date through which the previously established protocols were not uniformly implemented). The amount due to each Portfolio was calculated by Prudential with the help of a third-party consultant. Those amounts and the methodology used by Prudential to derive them, were evaluated and confirmed by a consultant retained by the Series Fund’s independent trustees. The excess withholding tax analysis considered detriments to the Portfolios due to their tax status as partnerships arising from both timing differences (i.e., jurisdictions in which the Portfolio was subject to a higher withholding tax rate due to its tax status which is reclaimable) as described above as well as permanent tax detriments (i.e., jurisdictions in which the Portfolio was subject to a higher withholding tax rate due to its tax status which is not reclaimable). Further, the opportunity loss due to each Portfolio also was calculated by a third-party consultant hired by Prudential whose calculation methodology was subsequently reviewed by a consultant retained by the Series Fund’s independent
B5
trustees. In May 2019, Prudential made an additional payment to the Portfolio relating to the opportunity loss upon the final review of the methodology used for the Portfolio’s rate of return calculation. The aggregate previously unreimbursed excess withholding tax and/or opportunity loss payment for the Portfolio are disclosed in the Portfolio’s “Statements of Changes in Net Assets” and “Financial Highlights” as “Capital Contributions” for the fiscal years ended December 31, 2018 and December 31, 2019.
In addition to the above, Prudential committed to the Series Fund’s independent trustees that it would pay all consulting, legal, audit, and other charges, fees and expenses incurred with the matters described above. Prudential has made and continues to make these payments.
During the reporting period and in consultation with the Series Fund’s independent trustees, Prudential instituted a process to reimburse the affected Portfolios for any future excess withholding tax on the first business day following thepay-date of the applicable dividend or interest income event regardless of whether the excess withholding tax is due to timing differences or permanent detriments resulting from the Portfolios’ partnership tax status.
In cases in which the excess withholding tax is due to timing differences and is reclaimable from the foreign jurisdiction, the affected Portfolios have the ability to recover the excess withholding tax withheld by filing a reclaim with the relevant foreign tax authority. To avoid a Portfolio receiving and retaining a duplicate payment for the same excess withholding tax, payments received by an applicable Portfolio from a foreign tax authority for reclaims for which a Portfolio previously received reimbursement from Prudential will be payable to Prudential. Pending tax reclaim amounts due to Prudential for excess withholding tax which Prudential previously paid to the Portfolios are reported as “Payable to affiliate” on the “Statement of Assets and Liabilities” and any amounts accrued but not yet reimbursed by Prudential for excess withholding tax is recorded as “Receivable from affiliate” on the Statement of Assets and Liabilities. The full amount of tax reclaims due to a Portfolio, inclusive of timing differences and routine tax reclaims for foreign jurisdictions where the Portfolios do not incur an excess withholding tax is included as “Tax reclaim receivable” on the “Statement of Assets and Liabilities.” To the extent that there are costs associated with the filing of any reclaim attributable to excess withholding tax, those costs are borne by Prudential.
The following amount has been paid by Prudential for excess withholding taxes related to permanent tax detriments as described above for certain countries due to the Portfolio’s status as partnership for tax purposes.
| | | | |
Portfolio | | 2019 Payments | |
SP International Growth Portfolio | | $ | 7,142 | |
The following amount has been paid by Prudential for excess withholding taxes related to timing differences as described above for certain countries due to the Portfolio’s status as a partnership for tax purposes.
| | | | |
Portfolio | | 2019 Payments | |
SP International Growth Portfolio | | $ | 31,648 | |
The following capital contributions, as described above, has been paid in 2019 by Prudential for the opportunity loss associated with excess withholding taxes related to permanent tax detriments and timing differences for certain countries due to the Portfolio’s status as partnerships for tax purposes.
| | | | |
Portfolio | | Capital Contributions | |
SP International Growth Portfolio | | $ | 87,929 | |
The aggregate cost of purchases and proceeds from sales of portfolio securities (excluding short-term investments and U.S. Government securities) for the year ended December 31, 2019, were $20,047,383 and $26,034,385, respectively.
A summary of the cost of purchases and proceeds from sales of shares of affiliated investments for the year ended December 31, 2019, is presented as follows:
B6
| | | | | | | | | | | | | | | | | | | | | | | | | | | | | | |
Value,
Beginning
of Year | | | Cost of
Purchases | | | Proceeds
from Sales | | | Change in
Unrealized
Gain
(Loss) | | | Realized
Gain
(Loss) | | | Value,
End of Year | | | Shares,
End
of Year | | | Income | |
| | PGIM Core Ultra Short Bond Fund* | |
| $ | 940,237 | | | $ | 13,670,105 | | | $ | 13,519,731 | | | $ | — | | | $ | — | | | $ | 1,090,611 | | | | 1,090,611 | | | $ | 24,156 | |
| | PGIM Institutional Money Market Fund* | |
| | 4,201,382 | | | | 32,231,041 | | | | 34,364,350 | | | | 332 | | | | 456 | | | | 2,068,861 | | | | 2,068,447 | | | | 8,456 | ** |
| | | | | | | | | | | | | | | | | | | | | | | | | | | | | | |
| $ | 5,141,619 | | | $ | 45,901,146 | | | $ | 47,884,081 | | | $ | 332 | | | $ | 456 | | | $ | 3,159,472 | | | | | | | $ | 32,612 | |
| | | | | | | | | | | | | | | | | | | | | | | | | | | | | | |
| * | The Fund did not have any capital gain distributions during the reporting period. |
| ** | Represents the affiliated amount of securities lending income shown on the Statement of Operations. |
The Portfolio is treated as a partnership for federal income tax purposes. The character of the cash distributions, if any, made by the partnership is generally classified as nontaxable return of capital distributions. After each fiscal year each shareholder of record will receive information regarding their distributive allocable share of the partnership’s income, gains, losses and deductions.
With respect to the Portfolio, book cost of assets differs from tax cost of assets as a result of the Portfolio’s adoption of a mark to market method of accounting for tax purposes. Under this method, tax cost of assets will approximate fair market value.
The Manager has analyzed the Portfolio’s tax positions taken on federal, state and local income tax returns for all open tax years and has concluded that no provision for income tax is required in the Portfolio’s financial statements for the current reporting period. Since tax authorities can examine previously filed tax returns, the Portfolio’s U.S. federal and state tax returns for each of the four fiscal years up to the most recent fiscal year ended December 31, 2019 are subject to such review.
The Series Fund, on behalf of the Portfolio, along with other affiliated registered investment companies (the “Funds”), is a party to a Syndicated Credit Agreement (“SCA”) with a group of banks. The purpose of the SCA is to provide an alternative source of temporary funding for capital share redemptions. The table below provides details of the current SCA in effect at the reportingperiod-end as well as the prior SCA.
| | | | |
| | | Current SCA | | Prior SCA |
| | |
| Term of Commitment | | 10/3/2019 – 10/1/2020 | | 10/4/2018 – 10/2/2019 |
| | |
| Total Commitment | | $ 900 million | | $ 900 million |
| | |
| Annualized Commitment Fee on the Unused Portion of the SCA | | 0.15% | | 0.15% |
| | |
Annualized Interest Rate on
Borrowings | | 1.20% plus the higher of (1) the effective federal funds rate, (2) theone-month LIBOR rate or (3) zero percent | | 1.25% plus the higher of (1) the effective federal funds rate, (2) theone-month LIBOR rate or (3) zero percent |
Certain affiliated registered investment companies that are parties to the SCA include portfolios that are subject to a predetermined mathematical formula used to manage certain benefit guarantees offered under variable annuity contracts. The formula may result in large scale asset flows into and out of these portfolios. Consequently, these portfolios may be more likely to utilize the SCA for purposes of funding redemptions. It may be possible for those portfolios to fully exhaust the committed amount of the SCA, thereby requiring the Manager to allocate available funding per a Board-approved methodology designed to treat the Funds in the SCA equitably.
The Portfolio did not utilize the SCA during the year ended December 31, 2019.
B7
The Portfolio offers Class I and Class II shares. Neither Class I nor Class II shares of the Portfolio are subject to any sales charge or redemption charge and are sold at the net asset value of the Portfolio. Class I shares are sold only to certain separate accounts of Prudential to fund benefits under certain variable life insurance and variable annuity contracts (“contracts”). Class II shares are sold only to separate accounts ofnon-Prudential insurance companies as investment options under certain contracts. Class I shares are also offered to separate accounts ofnon-affiliated insurers for which Prudential or its affiliates administer and/or reinsure the variable life insurance or variable annuity contracts issued in connection with the separate accounts. The separate accounts invest in shares of the Portfolio through subaccounts that correspond to the Portfolio. The separate accounts will redeem shares of the Portfolio to the extent necessary to provide benefits under the contracts or for such other purposes as may be consistent with the contracts.
As of December 31, 2019, the following number of shares of the Portfolio were owned of record directly or by other Portfolios as part of their investments by insurance affiliates of Prudential Financial, Inc.
| | | | | | | | |
Portfolio | | Number of Shares | | | Percentage of
Outstanding Shares | |
SP International Growth Portfolio—Class I | | | 9,226,258 | | | | 100 | % |
The following number of shareholders of record, each holding greater than 5% of the Portfolio, held the following percentage of outstanding shares, on behalf of multiple beneficial owners:
| | | | | | | | | | | | | | |
| | | Affiliated | | | Unaffiliated | |
Portfolio | | Number of
Shareholders | | | Percentage of
Outstanding Shares | | | Number
of Shareholders | | Percentage of
Outstanding Shares | |
SP International Growth Portfolio | | | 4 | | | | 100 | % | | — | | | — | % |
Transactions in shares of beneficial interest were as follows:
| | | | | | | | |
Class I: | | Shares | | | Amount | |
Year ended December 31, 2019: | | | | | | | | |
Portfolio shares sold | | | 315,282 | | | $ | 2,564,427 | |
Portfolio shares repurchased | | | (1,100,350 | ) | | | (9,130,186 | ) |
Capital contributions | | | — | | | | 87,795 | |
| | | | | | | | |
Net increase (decrease) in shares outstanding | | | (785,068 | ) | | $ | (6,477,964 | ) |
| | | | | | | | |
Year ended December 31, 2018: | | | | | | | | |
Portfolio shares sold | | | 650,361 | | | $ | 5,226,397 | |
Portfolio shares repurchased | | | (1,104,289 | ) | | | (8,893,515 | ) |
Capital contributions | | | — | | | | 87,174 | |
| | | | | | | | |
Net increase (decrease) in shares outstanding | | | (453,928 | ) | | $ | (3,579,944 | ) |
| | | | | | | | |
| | |
| Class II: | | | | | | |
Year ended December 31, 2019: | | | | | | | | |
Portfolio shares repurchased | | | (1,885 | ) | | $ | (15,391 | ) |
Capital contributions | | | — | | | | 146 | |
| | | | | | | | |
Net increase (decrease) in shares outstanding | | | (1,885 | ) | | $ | (15,245 | ) |
| | | | | | | | |
Year ended December 31, 2018: | | | | | | | | |
Portfolio shares repurchased | | | (1,392 | ) | | $ | (10,110 | ) |
Capital contributions | | | — | | | | 151 | |
| | | | | | | | |
Net increase (decrease) in shares outstanding | | | (1,392 | ) | | $ | (9,959 | ) |
| | | | | | | | |
| 8. | | Risks of Investing in the Portfolio |
The Portfolio’s risks include, but are not limited to, some or all of the risks discussed below:
Emerging Markets and Foreign Securities Risk:The risks of foreign investments are greater for investments in or exposed to emerging markets. Emerging market countries typically have economic and political systems that are
B8
less fully developed, and can be expected to be less stable, than those of more developed countries. The Portfolio’s investments in securities of foreign issuers or issuers with significant exposure to foreign markets involve additional risk. Foreign countries in which the Portfolio may invest may have markets that are less liquid, less regulated and more volatile than US markets.
Equity and Equity-Related Securities Risks: The value of a particular security could go down and you could lose money. In addition to an individual security losing value, the value of the equity markets or a sector in which the Portfolio invests could go down. The Portfolio’s holdings can vary significantly from broad market indexes and the performance of the Portfolio can deviate from the performance of these indexes. Different parts of a market can react differently to adverse issuer, market, regulatory, political and economic developments.
Geographic Concentration Risk: The Portfolio’s performance may be closely tied to the market, economic, political, regulatory or other conditions in the countries or regions in which the Portfolio invests. This can result in more pronounced risks based upon conditions that impact one or more countries or regions more or less than other countries or regions.
Market and Credit Risk: Securities markets may be volatile and the market prices of the Portfolio’s securities may decline. Securities fluctuate in price based on changes in an issuer’s financial condition and overall market and economic conditions. If the market prices of the securities owned by the Portfolio fall, the value of an investment in the Portfolio will decline. Additionally, the Portfolio may also be exposed to credit risk in the event that an issuer or guarantor fails to perform or that an institution or entity with which the Portfolio has unsettled or open transactions defaults.
| 9. | | Recent Accounting Pronouncements and Reporting Updates |
In August 2018, the FASB issued Accounting Standards Update (“ASU”)No. 2018-13, which changes certain fair value measurement disclosure requirements. The new ASU, in addition to other modifications and additions, removes the requirement to disclose the amount and reasons for transfers between Level 1 and Level 2 of the fair value hierarchy, and the Portfolio’s policy for the timing of transfers between levels. The amendments are effective for financial statements issued for fiscal years beginning after December 15, 2019, and interim periods within those fiscal years. The Manager has evaluated the implications of certain provisions of the ASU and has adopted the aspects related to the removal and modification of certain fair value measurement disclosures under the ASU. The Manager continues to evaluate certain other provisions of the ASU and does not expect a material impact to financial statement disclosures.
B9
Financial Highlights
| | | | | | | | | | | | | | | | | | | | |
| | | SP International Growth Portfolio | |
| | | Class I | |
| | | Year Ended December 31, | |
| | | 2019 | | | 2018 | | | 2017 | | | 2016 | | | 2015 | |
Per Share Operating Performance(a): | | | | | | | | | | | | | | | | | | | | |
Net Asset Value, beginning of year | | $ | 7.01 | | | $ | 8.05 | | | $ | 5.92 | | | $ | 6.14 | | | $ | 5.94 | |
| | | | | | | | | | | | | | | | | | | | |
Income (Loss) From Investment Operations: | | | | | | | | | | | | | | | | | | | | |
Net investment income (loss) | | | 0.05 | | | | 0.07 | | | | 0.05 | | | | 0.05 | | | | 0.03 | |
Net realized and unrealized gain (loss) on investment and foreign currency transactions | | | 2.21 | | | | (1.12 | ) | | | 2.08 | | | | (0.28 | ) | | | 0.17 | |
| | | | | | | | | | | | | | | | | | | | |
Total from investment operations | | | 2.26 | | | | (1.05 | ) | | | 2.13 | | | | (0.23 | ) | | | 0.20 | |
| | | | | | | | | | | | | | | | | | | | |
Capital Contributions | | | 0.01 | (b)(c) | | | 0.01 | (c) | | | — | | | | 0.01 | (d) | | | — | |
| | | | | | | | | | | | | | | | | | | | |
Net Asset Value, end of year | | $ | 9.28 | | | $ | 7.01 | | | $ | 8.05 | | | $ | 5.92 | | | $ | 6.14 | |
| | | | | | | | | | | | | | | | | | | | |
Total Return(e) | | | 32.38 | %(f) | | | (12.92 | )%(g) | | | 35.98 | % | | | (3.58 | )%(h) | | | 3.37 | % |
Ratios/Supplemental Data: | | | | | | | | | | | | | | | | | | | | |
Net assets, end of year (in millions) | | $ | 85.6 | | | $ | 70.1 | | | $ | 84.3 | | | $ | 63.9 | | | $ | 71.5 | |
Average net assets (in millions) | | $ | 79.6 | | | $ | 81.8 | | | $ | 75.1 | | | $ | 66.7 | | | $ | 76.2 | |
Ratios to average net assets(i): | | | | | | | | | | | | | | | | | | | | |
Expenses after waivers and/or expense reimbursement | | | 1.01 | % | | | 1.01 | % | | | 1.01 | % | | | 1.03 | % | | | 1.22 | % |
Expenses before waivers and/or expense reimbursement | | | 1.24 | % | | | 1.20 | % | | | 1.34 | % | | | 1.25 | % | | | 1.23 | % |
Net investment income (loss) | | | 0.64 | % | | | 0.83 | % | | | 0.67 | % | | | 0.80 | % | | | 0.51 | % |
Portfolio turnover rate(j) | | | 26 | % | | | 37 | % | | | 45 | % | | | 57 | % | | | 48 | % |
| |
| | | SP International Growth Portfolio | |
| | | Class II | |
| | | Year Ended December 31, | |
| | | 2019 | | | 2018 | | | 2017 | | | 2016 | | | 2015 | |
Per Share Operating Performance(a): | | | | | | | | | | | | | | | | | | | | |
Net Asset Value, beginning of year | | $ | 6.77 | | | $ | 7.81 | | | $ | 5.76 | | | $ | 6.01 | | | $ | 5.83 | |
| | | | | | | | | | | | | | | | | | | | |
Income (Loss) From Investment Operations: | | | | | | | | | | | | | | | | | | | | |
Net investment income (loss) | | | 0.02 | | | | 0.03 | | | | 0.03 | | | | 0.04 | | | | 0.01 | |
Net realized and unrealized gain (loss) on investment and foreign currency transactions | | | 2.13 | | | | (1.08 | ) | | | 2.02 | | | | (0.30 | ) | | | 0.17 | |
| | | | | | | | | | | | | | | | | | | | |
Total from investment operations | | | 2.15 | | | | (1.05 | ) | | | 2.05 | | | | (0.26 | ) | | | 0.18 | |
| | | | | | | | | | | | | | | | | | | | |
Capital Contributions | | | 0.01 | (b)(c) | | | 0.01 | (c) | | | — | | | | 0.01 | (d) | | | — | |
| | | | | | | | | | | | | | | | | | | | |
Net Asset Value, end of year | | $ | 8.93 | | | $ | 6.77 | | | $ | 7.81 | | | $ | 5.76 | | | $ | 6.01 | |
| | | | | | | | | | | | | | | | | | | | |
Total Return(e) | | | 31.91 | %(f) | | | (13.32 | )%(g) | | | 35.59 | % | | | (4.16 | )%(h) | | | 3.09 | % |
Ratios/Supplemental Data: | | | | | | | | | | | | | | | | | | | | |
Net assets, end of year (in millions) | | $ | 0.1 | | | $ | 0.1 | | | $ | 0.1 | | | $ | 0.3 | | | $ | 6.1 | |
Average net assets (in millions) | | $ | 0.1 | | | $ | 0.1 | | | $ | 0.3 | | | $ | 4.3 | | | $ | 6.8 | |
Ratios to average net assets(i): | | | | | | | | | | | | | | | | | | | | |
Expenses after waivers and/or expense reimbursement | | | 1.41 | % | | | 1.41 | % | | | 1.41 | % | | | 1.43 | % | | | 1.62 | % |
Expenses before waivers and/or expense reimbursement | | | 1.64 | % | | | 1.60 | % | | | 1.72 | % | | | 1.65 | % | | | 1.63 | % |
Net investment income (loss) | | | 0.24 | % | | | 0.44 | % | | | 0.39 | % | | | 0.61 | % | | | 0.13 | % |
Portfolio turnover rate(j) | | | 26 | % | | | 37 | % | | | 45 | % | | | 57 | % | | | 48 | % |
| (a) | Calculated based on average shares outstanding during the year. |
| (b) | Represents payment received by the Portfolio, from the Investment Manager, in connection for costs incurred due to a portfolio allocation error. |
| (c) | Represents payment received by the Portfolio, from Prudential, in connection with the failure to timely compensate the Portfolio for the excess foreign withholding tax withheld on dividends and interest from certain countries due to the Portfolio’s tax status as a partnership. |
| (d) | Represents payment received by the Portfolio, from Prudential, in connection with the failure to maximize securities lending income due to a restriction that benefited Prudential. |
| (e) | Total return is calculated assuming a purchase of a share on the first day and a sale on the last day of each year reported and includes reinvestment of distributions, if any, and does not reflect the effect of insurance contract charges. Total return does not reflect expenses associated with the separate account such as administrative fees, account charges and surrender charges which, if reflected, would reduce the total returns for all years shown. Performance figures may reflect fee waivers and/or expense reimbursements. In the absence of fee waivers and/or expense reimbursements, the total return would be lower. Past performance is no guarantee of future results. Total returns may reflect adjustments to conform to generally accepted accounting principles. |
| (f) | Total return for the year includes the impact of the capital contribution. Excluding the capital contribution, the total return would have been 32.24% and 31.76% for Class I and Class II, respectively. |
| (g) | Total return for the year includes the impact of the capital contribution. Excluding the capital contribution, the total return would have been (13.04)% and (13.45)% for Class I and Class II, respectively. |
| (h) | Total return for the year includes the impact of the capital contribution. Excluding the capital contribution, the total return would have been (3.74)% and (4.33)% for Class I and Class II, respectively. |
| (i) | Does not include expenses of the underlying funds in which the Portfolio invests. |
| (j) | The Portfolio’s portfolio turnover rate is calculated in accordance with regulatory requirements, without regard to transactions involving short-term investments and certain derivatives. If such transactions were included, the Portfolio’s portfolio turnover rate may be higher. |
SEE NOTES TO FINANCIAL STATEMENTS.
C1
REPORT OF INDEPENDENT REGISTERED PUBLIC ACCOUNTING FIRM
TO THE SHAREHOLDERS OF SP INTERNATIONAL GROWTH PORTFOLIO AND THE BOARD OF TRUSTEES
THE PRUDENTIAL SERIES FUND:
Opinion on the Financial Statements
We have audited the accompanying statement of assets and liabilities of SP International Growth Portfolio, a portfolio of The Prudential Series Fund, (the Portfolio), including the schedule of investments, as of December 31, 2019, the related statement of operations for the year then ended, the statements of changes in net assets for each of the years in the two-year period then ended, and the related notes (collectively, the financial statements) and the financial highlights for each of the years indicated therein. In our opinion, the financial statements and financial highlights present fairly, in all material respects, the financial position of the Portfolio as of December 31, 2019, the results of its operations for the year then ended, the changes in its net assets for each of the years in the two-year period then ended, and the financial highlights for the each of the years indicated therein, in conformity with U.S. generally accepted accounting principles.
Basis for Opinion
These financial statements and financial highlights are the responsibility of the Portfolio’s management. Our responsibility is to express an opinion on these financial statements and financial highlights based on our audits. We are a public accounting firm registered with the Public Company Accounting Oversight Board (United States) (PCAOB) and are required to be independent with respect to the Portfolio in accordance with the U.S. federal securities laws and the applicable rules and regulations of the Securities and Exchange Commission and the PCAOB.
We conducted our audits in accordance with the standards of the PCAOB. Those standards require that we plan and perform the audit to obtain reasonable assurance about whether the financial statements and financial highlights are free of material misstatement, whether due to error or fraud. Our audits included performing procedures to assess the risks of material misstatement of the financial statements and financial highlights, whether due to error or fraud, and performing procedures that respond to those risks. Such procedures included examining, on a test basis, evidence regarding the amounts and disclosures in the financial statements and financial highlights. Such procedures also included confirmation of securities owned as of December 31, 2019, by correspondence with the custodian, transfer agents, and brokers, or by other appropriate auditing procedures when replies were not received. Our audits also included evaluating the accounting principles used and significant estimates made by management, as well as evaluating the overall presentation of the financial statements and financial highlights. We believe that our audits provide a reasonable basis for our opinion.
We have served as the auditor of one or more PGIM and/or Prudential Insurance investment companies since 2003.
New York, New York
February 14, 2020
D1
INFORMATION ABOUT TRUSTEES AND OFFICERS (Unaudited)
Information about the Trustees and the officers of the Trust is set forth below. Trustees who are not deemed to be “interested persons” of the Trust, as defined in the Investment Company Act of 1940 (1940 Act), are referred to as “Independent Trustees.” Trustees who are deemed to be “interested persons” of the Trust are referred to as “Interested Trustees.” The Trustees oversee the operations of the Trust and appoint officers who are responsible forday-to-day business decisions based on policies set by the Board.
| | | | | | |
| |
| Independent Trustees |
Name Date of Birth No. of Portfolios Overseen | | Principal Occupation(s) During Past Five Years | | Other Directorships Held | | Length of Board Service |
Susan Davenport Austin 10/19/1967 No. of Portfolios Overseen: 109 | | Chief Financial Officer of Grace Church School (Since September 2019); formerly Senior Managing Director of Brock Capital (2014-2019); formerly Vice Chairman (2013-2017), Senior Vice President and Chief Financial Officer (2007-2012) and Vice President of Strategic Planning and Treasurer (2002-2007) of Sheridan Broadcasting Corporation; formerly President of Sheridan Gospel Network (2004-2014); formerly Vice President, Goldman, Sachs & Co. (2000-2001); formerly Associate Director, Bear, Stearns & Co. Inc. (1997-2000); formerly Vice President, Salomon Brothers Inc. (1993-1997); Member of the Board of Directors, The MacDowell Colony (Since 2010); formerly Chairman (2011-2014), formerly Presiding Director (2014-2017) and currently a Member (2007-present) of the Board of Directors, Broadcast Music, Inc.; Member of the Board of Directors, Hubbard Radio, LLC (Since 2011); President, Candide Business Advisors, Inc. (Since 2011); formerly Member of the Board of Directors, National Association of Broadcasters (2004-2010). | | Director of NextEra Energy Partners, LP (NYSE: NEP) (Since February 2015); Director of Broadcast Music, Inc. (Since 2007). | | Since February 2011 |
Sherry S. Barrat 11/13/1949 No. of Portfolios Overseen: 109 | | Formerly Vice Chairman of Northern Trust Corporation (financial services and banking institution) (2011-June 2012); formerly President, Personal Financial Services, Northern Trust Corporation (2006-2010); formerly Chairman & CEO, Western US Region, Northern Trust Corporation (1999-2005); formerly President & CEO, Palm Beach/Martin County Region, Northern Trust. | | Director of NextEra Energy, Inc. (NYSE: NEE) (1998-Present); Director of Arthur J. Gallagher & Company (Since July 2013). | | Since January 2013 |
Jessica M. Bibliowicz 11/28/1959 No. of Portfolios Overseen: 109 | | Formerly Senior Adviser (2013-2019) of Bridge Growth Partners (private equity firm); formerly Director (2013-2016) of Realogy Holdings Corp. (residential real estate services); formerly Chief Executive Officer (1999-2013) of National Financial Partners (independent distributor of financial services products). | | Formerly Director (2006-2019) of The Asia Pacific Fund, Inc.; Sotheby’s (Since 2014) (auction house andart-related finance). | | Since September 2014 |
Kay Ryan Booth 11/1/1950 No. of Portfolios Overseen: 109 | | Partner, Trinity Private Equity Group (Since September 2014); formerly, Managing Director of Cappello Waterfield & Co. LLC (2011-2014); formerly Vice Chair, Global Research, J.P. Morgan (financial services and investment banking institution) (June 2008-January 2009); formerly Global Director of Equity Research, Bear Stearns & Co., Inc. (financial services and investment banking institution) (1995-2008); formerly Associate Director of Equity Research, Bear Stearns & Co., Inc.(1987-1995). | | None. | | Since January 2013 |
Stephen M. Chipman 10/26/1961 No. of Portfolios Overseen: 109 | | Formerly Group Managing Director, International Expansion and Regional Managing Director, Americas of Vistra (June 2018-June 2019); formerly Chief Executive Officer and Director of Radius (2016-2018); formerly Senior Vice Chairman (January 2015-October 2015) and Chief Executive Officer (January 2010-December 2014) of Grant Thornton LLP. | | Non-Executive Chairman (Since September 2019) of Litera Microsystems. | | Since January 2018 |
Robert F. Gunia 12/15/1946 No. of Portfolios Overseen: 109 | | Formerly Director of ICI Mutual Insurance Company (June 2016-June 2019; June 2012-June 2015); formerly Chief Administrative Officer (September 1999-September 2009) and Executive Vice President (December 1996-September 2009) of PGIM Investments LLC; formerly Executive Vice President (March 1999-September 2009) and Treasurer (May 2000-September 2009) of Prudential Mutual Fund Services LLC; formerly President (April 1999-December 2008) and Executive Vice President and Chief Operating Officer (December 2008-December 2009) of Prudential Investment Management Services LLC; formerly Chief Administrative Officer, Executive Vice President and Director(May 2003-September 2009) of AST Investment Services, Inc. | | Formerly Director (1989-2019) of The Asia Pacific Fund, Inc. | | Since July 2003 |
Thomas T. Mooney 11/11/1941 No. of Portfolios Overseen: 109 | | Formerly Chief Executive Officer, Excell Partners, Inc. (2005-2007); founding partner of High Technology of Rochester and the Lennox Technology Center; formerly President of the Greater Rochester Metro Chamber of Commerce (1976-2004); formerly Rochester City Manager (1973); formerly Deputy Monroe County Executive (1974-1976). | | None. | | Since July 2003 |
E1
| | | | | | |
| |
| Independent Trustees |
Name Date of Birth No. of Portfolios Overseen | | Principal Occupation(s) During Past Five Years | | Other Directorships Held | | Length of Board Service |
Thomas M. O’Brien 12/5/1950 No. of Portfolios Overseen: 109 | | Vice Chairman of Emigrant Bank and President of its Naples Commercial Finance Division (Since October 2018); formerly Director, President and CEO Sun Bancorp, Inc. N.A. (NASDAQ: SNBC) and Sun National Bank (July 2014-February 2018); formerly Consultant, Valley National Bancorp, Inc. and Valley National Bank (January 2012-June 2012); formerly President and COO (November 2006-April 2017) and CEO (April 2007-December 2011) of State Bancorp, Inc. and State Bank; formerly Vice Chairman (January 1997-April 2000) of North Fork Bank; formerly President and Chief Executive Officer (December 1984-December 1996) of North Side Savings Bank; formerly President and Chief Executive Officer (May 2000-June 2006) Atlantic Bank of New York. | | Formerly Director, Sun Bancorp, Inc. N.A. (NASDAQ: SNBC) and Sun National Bank (July 2014-February 2018); formerly Director, BankUnited, Inc. and BankUnited N.A. (NYSE: BKU) (May 2012-April 2014); formerly Director (April 2008-January 2012) of Federal Home Loan Bank of New York; formerly Director (December 1996-May 2000) of North Fork Bancorporation, Inc.; formerly Director (May 2000-April 2006) of Atlantic Bank of New York; Director (November 2006-January 2012) of State Bancorp, Inc. (NASDAQ: STBC) and State Bank of Long Island. | | Since July 2003 |
| |
| Interested Trustee |
Timothy S. Cronin 12/21/1965 No. of Portfolios Overseen: 109 | | Vice President of Prudential Annuities (Since June 2015); Senior Vice President of PGIM Investments LLC (Since May 2009); Chief Investment Officer and Strategist of Prudential Annuities (Since January 2004); Director of Investment & Research Strategy (Since February 1998); President of AST Investment Services, Inc. (Since June 2005). | | None. | | Since October 2009 |
| | | | |
| |
| Trust Officers(a) |
Name Date of Birth Position with the Trust | | Principal Occupation(s) During the Past Five Years | | Length of Service as Trust Officer |
Ken Allen 1/24/1969 Vice President | | Vice President of Investment Management (since December 2009) | | Since June 2019 |
Raymond A. O’Hara 9/19/1955 Chief Legal Officer | | Vice President and Corporate Counsel (since July 2010) of Prudential Insurance Company of America (Prudential); Vice President (March 2011-Present) of Pruco Life Insurance Company and Pruco Life Insurance Company of New Jersey; Vice President and Corporate Counsel (March 2011-Present) of Prudential Annuities Life Assurance Corporation; Chief Legal Officer of PGIM Investments LLC (since June 2012); Chief Legal Officer of Prudential Mutual Fund Services LLC (since June 2012) and Corporate Counsel of AST Investment Services, Inc. (since June 2012); formerly Assistant Vice President and Corporate Counsel (September 2008-July 2010) of The Hartford Financial Services Group, Inc.; formerly Associate (September 1980-December 1987) and Partner (January 1988-August 2008) of Blazzard & Hasenauer, P.C. (formerly, Blazzard, Grodd & Hasenauer, P.C.). | | Since June 2012 |
Andrew R. French 12/22/1962 Secretary | | Vice President within PGIM Investments LLC (December 2018-Present); formerly Vice President and Corporate Counsel (February 2010-December 2018) of Prudential; formerly Director and Corporate Counsel (2006-2010) of Prudential; Vice President and Assistant Secretary (since January 2007) of PGIM Investments LLC; Vice President and Assistant Secretary (since January 2007) of Prudential Mutual Fund Services LLC. | | Since October 2006 |
Jonathan D. Shain 8/9/1958 Assistant Secretary | | Vice President and Corporate Counsel (since August 1998) of Prudential; Vice President and Assistant Secretary (since May 2001) of PGIM Investments LLC; Vice President and Assistant Secretary (since February 2001) of Prudential Mutual Fund Services LLC; formerly Vice President and Assistant Secretary (May 2003-June 2005) of AST Investment Services, Inc. | | Since May 2005 |
Claudia DiGiacomo 10/14/1974 Assistant Secretary | | Vice President and Corporate Counsel (since January 2005) of Prudential; Vice President and Assistant Secretary of PGIM Investments LLC (since December 2005); Associate at Sidley Austin Brown Wood LLP (1999-2004). | | Since December 2005 |
Melissa Gonzalez 2/10/1980 Assistant Secretary | | Vice President and Corporate Counsel (since September 2018) of Prudential; formerly Director and Corporate Counsel (March 2014-September 2018) of Prudential. | | Since March 2019 |
Dino Capasso 8/19/1974 Chief Compliance Officer | | Chief Compliance Officer (July 2019-Present) of PGIM Investments LLC; Chief Compliance Officer (July 2019-Present) of the PGIM Funds, Target Funds, Advanced Series Trust, The Prudential Series Fund, Prudential’s Gibraltar Fund, Inc., PGIM Global High Yield Fund, Inc., and PGIM High Yield Bond Fund, Inc.; Vice President and Deputy Chief Compliance Officer (June 2017-July 2019) of PGIM Investments LLC; formerly, Senior Vice President and Senior Counsel (January 2016-June 2017), and Vice President and Counsel (February 2012-December 2015) of Pacific Investment Management Company LLC. | | Since March 2018 |
E2
| | | | |
| |
| Trust Officers(a) |
Name Date of Birth Position with the Trust | | Principal Occupation(s) During the Past Five Years | | Length of Service as Trust Officer |
Charles H. Smith 1/11/1973 Anti-Money Laundering Compliance Officer | | Vice President, Corporate Compliance, Anti-Money Laundering Unit (since January 2015) of Prudential; committee member of the American Council of Life Insurers Anti-Money Laundering and Critical Infrastructure Committee (since January 2016); formerly Global Head of Economic Sanctions Compliance at AIG Property Casualty (February 2007-December 2014); Assistant Attorney General at the New York State Attorney General’s Office, Division of Public Advocacy (August 1998-January 2007). | | Since January 2017 |
Christian J. Kelly 5/5/1975 Treasurer and Principal Financial and Accounting Officer | | Vice President, Head of Fund Administration of PGIM Investments LLC (since November 2018); formerly, Director of Fund Administration of Lord Abbett & Co. LLC (2009-2018), Treasurer and Principal Accounting Officer of the Lord Abbett Family of Funds (2017-2018); Director of Accounting, Avenue Capital Group (2008-2009); Senior Manager, Investment Management Practice of Deloitte & Touche LLP (1998-2007). | | Since January 2019 |
Lana Lomuti 6/7/1967 Assistant Treasurer | | Vice President (since 2007) and Director (2005-2007), within PGIM Investments Fund Administration; formerly Assistant Treasurer (December 2007-February 2014) of The Greater China Fund, Inc. | | Since April 2014 |
Russ Shupak 10/08/73 Assistant Treasurer | | Vice President (since 2017) and Director (2013-2017), within PGIM Investments Fund Administration. | | Since October 2019 |
Deborah Conway 3/26/69 Assistant Treasurer | | Vice President (since 2017) and Director (2007-2017), within PGIM Investments Fund Administration. | | Since October 2019 |
Elyse M. McLaughlin 1/20/74 Assistant Treasurer | | Vice President (since 2017) and Director (2011-2017), within PGIM Investments Fund Administration. | | Since October 2019 |
Alina Srodecka, CPA 8/19/1966 Assistant Treasurer | | Vice President of Tax at Prudential Financial, Inc. (Since August 2007); formerly Director of Tax at MetLife (January 2003-May 2006); formerly Tax Manager at Deloitte & Touché (October 1997-January 2003); formerly Staff Accountant at Marsh & McLennan (May 1994-May 1997). | | Since June 2017 |
(a) Excludes Mr. Cronin, an Interested Trustee who also serves as President.
Explanatory Notes to Tables:
Trustees are deemed to be “Interested,” as defined in the 1940 Act, by reason of their affiliation with PGIM Investments and/or an affiliate of PGIM Investments. Timothy S. Cronin is an Interested Trustee because he is employed by an affiliate of the Manager.
Unless otherwise noted, the address of all Trustees and Officers is c/o PGIM Investments LLC, 655 Broad Street, Newark, New Jersey 07102.
There is no set term of office for Trustees or Officers. The Independent Trustees have adopted a retirement policy, which calls for the retirement of Trustees on December 31 of the year in which they reach the age of 78, provided that the Board may extend the retirement age on ayear-by-year basis for a Trustee.
“Other Directorships Held” includes only directorships of companies required to register or file reports with the SEC under the 1934 Act (that is, “public companies”) or other investment companies registered under the 1940 Act.
“No. of Portfolios Overseen” includes all investment companies managed by PGIM Investments and/or ASTIS that are overseen by the Trustee. The investment companies for which PGIM Investments and/or ASTIS serves as Manager include The Prudential Variable Contract Accounts, The Prudential Series Fund, Advanced Series Trust, Prudential’s Gibraltar Fund, Inc., the PGIM Funds, the PGIM High Yield Bond Fund, Inc. and PGIM Global High Yield Fund, Inc.
E3
The prospectuses for the Prudential Series Fund portfolios and the applicable variable annuity or variable life prospectuses contain information on the investment objectives, risks, charges and expenses of the portfolios and on the contracts and should be read carefully.
Information regarding how the Fund voted proxies relating to portfolio securities during the most recent12-month period ended June 30 is available on the website of the Securities and Exchange Commission (the Commission) atwww.sec.gov and on the Fund’s website atwww.prudential.com/variableinsuranceportfolios.
The Fund files with the Commission a complete listing of portfolio holdings as of its first and third calendar quarter-end on Form N-PORT. Form N-PORT is available on the Commission’s website atwww.sec.gov or call (800) SEC-0330.
The Fund’s Statement of Additional Information contains additional information about the Fund’s Trustees and is available without charge upon request by calling the appropriate phone number listed below.
To contact your client services representative, please call the phone number listed below. Thank you.
Owners of Individual Annuity contracts should call (888) 778-2888.
Owners of Individual Life Insurance contracts should call (800) 778-2255.
Owners of Group Variable Universal Life Insurance contracts should call (800) 562-9874.
Owners of Group Variable Universal Life Insurance contracts through AICPA should call (800) 223-7473.
The Prudential Series Fund may offer two classes of shares in each portfolio: Class I and Class II. Class I shares are sold only to separate accounts of The Prudential Insurance Company of America, Pruco Life Insurance Company, and Pruco Life Insurance Company of New Jersey (collectively, Prudential) and to separate accounts of insurance companies not affiliated with Prudential where Prudential has assumed responsibility for the administration of contracts issued through such non-affiliated insurance companies, as investment options under variable life insurance and variable annuity contracts (the Contracts). (A separate account keeps the assets supporting certain insurance contracts separate from the general assets and liabilities of the insurance company.) Class II shares are offered only to separate accounts of non-Prudential insurance companies for the same types of Contracts.
Annuity and life insurance contracts contain exclusions, limitations, reductions of benefits, and terms for keeping them in force. Your licensed financial professional can provide you with costs and complete details. Contract guarantees are based on the claims-paying ability of the issuing company.
The Prudential Insurance Company of America
751 Broad Street
Newark, NJ 07102-3714
Presorted
Standard
U.S. Postage
PAID
Prudential
The Audited Financial Statements of Pruco Life Insurance Company, Pruco Life Insurance Company of New Jersey, Prudential Annuities Life Assurance Corporation, and The Prudential Insurance Company of America are available upon request. You may call(800) 778-2255 to obtain a free copy of the audited financial statements of the insurance company that issued your contract.
To reduce costs, we now generally send only a single copy of prospectuses and shareholder reports to each household (householding) in lieu of sending a copy to each Contract Owner who resides in the household. Householding is not yet available on all products. You should be aware that by calling (877) 778-5008, you can revoke, or “opt out,” of householding at any time, which may increase the volume of mail you will receive.
©2020 Prudential Financial, Inc. and its related entities. PGIM Investments, the Prudential logo, the Rock symbol, and Bring Your Challenges are service marks of Prudential Financial, Inc. and its related entities, registered in many jurisdictions worldwide.
PSF-AR-SP INTL GROWTH

The Prudential Series Fund
| | |
| ANNUAL REPORT | | December 31, 2019 |

Based on the variable contract you own or the portfolios you invested in, you may receive additional reports for other portfolios. Please refer to your variable annuity or variable life insurance contract prospectus to determine which portfolios are available to you.
The views expressed in this report and information about each portfolio’s holdings are for the period covered by this report and are subject to change thereafter.
Please note that this report may include prospectus supplements that are separate from and not a part of this report. Please refer to your variable annuity or variable life insurance contract prospectus to determine which supplements are applicable to you.
SP Prudential U.S. Emerging Growth Portfolio

Join the e-movement.SM
Enroll in e-delivery today!
By enrolling in e-Delivery, you’ll gain secure, online access to important documents with the flexibility to choose which documents you receive in the mail… and which ones you don’t!
Individual Annuity Contract Owners
Get started by visiting www.prudential.com/login and follow the instructions on the screen, or scan the code below.
Individual Life Insurance Contract Owners
To receive your reports online, go to www.prudential.com/edelivery, or scan the code below.
Group Variable Universal Life Contract Owners
To receive your reports online, go to www.prudential.com/gulgvul, or scan the code.
| | |
| |
| | Save paper and reduce clutter. Receive Prospectuses and Reports electronically by enrolling today! |
| | | | |
The Prudential Series Fund Table of Contents | | Annual Report | | December 31, 2019 |
| | ∎ | | LETTER TO CONTRACT OWNERS |
| | ∎ | | REPORT OF THE INVESTMENT MANAGERS AND PRESENTATION OF PORTFOLIO HOLDINGS |
| | | | |
| Section A | | Schedule of investments and Financial Statements |
| Section B | | Notes to Financial Statements | | |
| Section C | | Financial Highlights | | |
| Section D | | Report of Independent Registered Public Accounting Firm | | |
| Section E | | Information about Trustees and Officers | | |
This report may include financial information pertaining to certain portfolios that are not available through the variable life insurance policy or variable annuity contract that you have chosen. Please refer to your variable life insurance or variable annuity prospectus to determine which portfolios are available to you.
| | | | |
The Prudential Series Fund Letter to Contract Owners | | Annual Report | | December 31, 2019 |
At Prudential, our primary objective is to help investors achieve and maintain long-term financial success. This Prudential Series Fund annual report outlines our efforts to achieve this goal. We hope you find it informative and useful.
Prudential has been building on a heritage of success for more than 135 years. We believe the array of our products provides a highly attractive value proposition to clients like you who are focused on financial security.
Your financial professional is the best resource to help you make the most informed investment decisions. Together, you can build a diversified investment portfolio that aligns with your long-term financial goals. Please keep in mind that diversification and asset allocation strategies do not assure a profit or protect against loss in declining markets.
Thank you for selecting Prudential as one of your financial partners. We value your trust and appreciate the opportunity to help you achieve financial security.
Sincerely,
Timothy S. Cronin
President,
The Prudential Series Fund | January 31, 2020 |
| | | | |
| Market Overview — unaudited | | Annual Report | | December 31, 2019 |
Equity Market Overview
US and international stock markets posted stellar returns in 2019 as many central banks, including the Federal Reserve (the Fed), cut interest rates or used other stimuli to spur growth. Although the markets fluctuated sharply at times in reaction to on-again-off-again trade tensions between the US and China, concerns about tariffs subsided later in the year.
In the US, the broad-based S&P 500® Index and Russell 3000® Index returned 31.46% and 31.02%, respectively, for the year. Internationally, the MSCI ACWI Ex-US Index, a broad measure of stock performance in developed and emerging markets outside the US, returned 21.51%. (All returns cited are in US dollars and include dividends.)
Global economic growth slowed, central banks cut rates
During 2019, the pace of global growth slowed and concerns about the economic outlook rose due in part to uncertainties regarding US-China tariffs and other geopolitical factors, which created a drag on manufacturing and export activity. Many central banks responded by loosening monetary policy — in some cases reversing their positions. For example, the Fed, which hiked rates four times in 2018, cut its federal funds rate target three times in 2019 and moved from tapering its balance sheet to expanding it through asset purchases. The European Central Bank, which had been rolling back its bond-buying program in 2018, restarted it to stimulate the eurozone economy.
Although US real gross domestic product (GDP) growth rose 2.1% (annualized) in the third quarter, down from 3.1% in the first quarter, the US economy expanded at a moderate pace. (Fourth-quarter GDP data had not been released when this overview was published.) Corporate earnings, consumer spending, and the labor market were strong, while inflation remained low.
Stock markets rallied, retreated, and rebounded to record highs
Early in the first quarter, stocks rallied as US-China trade negotiations appeared to be progressing, the Fed signaled that it planned to pause from hiking rates unless warranted, the US government’s partial shutdown ended, and corporate earnings rose sharply despite slower growth. The S&P 500 jumped nearly 8.0% in January alone.
Stocks sold off in May as trade-war worries resurfaced. However, equity markets rallied in June in anticipation of possible rate cuts and on hopes for a trade deal. During the first half of 2019, the Fed maintained its interest rate target.
Trade concerns re-emerged in the third quarter amid signs of slowing growth and renewed trade frictions. With inflation below its target, the Fed cut rates in July for the first time since the financial crisis in 2008 as a pre-emptive measure to help sustain the US economy’s expansion and withstand the risk of a global economic slowdown and further drop in business investment.
In August, concerns about tariffs, the growth of China’s industrial output, and the global economy intensified, driving investors toward less-risky investments like US Treasuries. The yield on the 10-year US Treasury note, which moves opposite to its price, briefly dropped below the rate on two-year Treasuries. Although many analysts didn’t interpret this particular “yield curve inversion” as indicative of a looming recession, as they often have in the past, stock prices — particularly in emerging markets — dropped sharply.
Although the Fed cut rates again in September and October to a range of 1.50%-1.75%, Chairman Jerome Powell conveyed that the central bank did not plan to cut rates further unless incoming information required its members to materially reassess their outlook for the economy. As expected, the Fed did not adjust rates through the remainder of the year.
During the fourth quarter, US stock indexes surged to new highs and emerging market stocks rallied amid reports the US and China were moving toward a “phase one” partial trade deal. (The agreement was signed in January 2020 after the reporting period ended.) Eurozone stock markets rose in reaction to improved economic results from Germany. United Kingdom investors were encouraged by the outcome of December elections that many hope will lead to a smoother potential exit of the UK from the European Union.
All S&P 500 sectors rose
The best-performing sectors in the S&P 500 were information technology (+50.3%), communication services (+32.7%), and financials (+32.1%). Next in line were industrials (+29.4%), real estate (+29.0%), consumer discretionary (+27.9%), consumer staples (+27.6%), utilities (+26.4%), materials (+24.6%), health care (+20.8%), and energy (+11.8%).
| | | | |
| Market Overview — unaudited(continued) | | Annual Report | | December 31, 2019 |
Growth outperformed value, large-cap stocks topped small caps
For the year, the Russell 3000® Growth Index returned 35.85%, outperforming the Russell 3000® Value Index, which rose 26.26%. Large-cap stocks, as measured by the Russell 1000® Index, rose 31.43%. The Russell Midcap® Index returned 30.54%, and the small-cap Russell 2000® Index lagged yet still returned 25.52%.
International stocks collectively rose but underperformed US equities
Stocks trading in emerging markets, as measured by the MSCI Emerging Markets Index, returned 18.4% for the year. Notable top-performing country components in the index included Russia (+50.9%), supported by a jump in oil prices, Taiwan (+36.4%), Brazil (+26.3%), and China (23.5%). Taiwan’s and China’s markets advanced in the fourth quarter as trade frictions diminished, although weak economic data from China dampened investor sentiment during the year. Notable countries that underperformed the index but still contributed positively to performance included South Korea (+12.5%), Mexico (+11.4%), and India (+7.6%). Malaysia (-2.0%) detracted from the index’s performance.
Equities in developed markets outside the US and Canada, as measured by the MSCI EAFE Index, rose 22.01%. For the year, the MSCI Europe Index rose 23.77%, the MSCI UK Index returned 21.05%, and the MSCI Japan Index rose 19.61%.
Fixed Income Market Overview
In 2019, for the first time in more than a decade, the Federal Reserve (the Fed) cut interest rates to help sustain the US economy’s expansion in the face of slowing global economic growth and US-China trade-war risks. The central bank was merely one of dozens that reduced rates throughout the year, igniting rallies in numerous global bond markets. During 2019, emerging markets debt, US high yield bonds, and corporate investment-grade bonds delivered robust returns, yet US government bonds and many other fixed income categories also posted solid results.
In the US, the economy grew at a healthy but slow pace. Although real gross domestic product (GDP) growth dropped from 3.1% (annualized) in the first quarter to 2.1% in the third, the economy continued to expand. (Fourth-quarter GDP data had not been released when this overview was published.) The national unemployment rate dropped to a 50-year low of 3.5% in September, corporate earnings were generally strong, and inflation remained low. Elsewhere, the European economy grew weakly. Notably, China’s growth rate dropped significantly from 6.6% in 2018 to 6.1% in 2019.
Bond markets fluctuated but closed higher
During the first quarter of 2019, global growth expectations softened. The Fed, which increased rates four times in 2018, signaled it would pause from hiking rates further based on its outlook at the time, sending bond markets higher. US high yield and emerging market bond prices rose sharply, supported by a tailwind of receding tariff worries and favorable corporate earnings.
In May, worries about the US-China trade war surfaced again. US Treasuries rallied while riskier assets such as high yield bonds dropped in price. The following month, however, the Fed hinted at the possibility of interest rate cuts ahead, trade fears cooled, and the high yield bond market rebounded. The Fed did not adjust rates during the first half of the year.
In July, the global economy showed signs of a slowdown and tariff fears returned. Later that month, for the first time since the financial crisis in 2008, the Fed cut rates as a pre-emptive measure to help sustain the expansion of the US economy and provide a cushion against the risk of a global economic slowdown. During August, the yield on 10-year US Treasuries dropped below yields on two-year Treasuries. Historically, when yields on longer-term Treasuries fall below yields on shorter-term issues, recessions have often followed. While many analysts questioned the “yield curve inversion” as a recessionary indicator in this instance, investors concerned about the economy gravitated to “safe-haven” securities like longer-term US Treasuries and other high-quality credits.
The investment-grade Bloomberg Barclays US Aggregate Bond Index returned 2.59% in August. US high yield bonds finished virtually flat, whereas emerging market sovereign debt markets dropped sharply due in part to a stronger US dollar versus most currencies.
In September, the Fed cut rates again and the European Central Bank restarted its bond-buying program to help stimulate the eurozone economy after rolling it back the previous year. After the Fed dropped its rate target to a range of 1.50% to 1.75% in October, Chairman Jerome Powell conveyed that the central bank had no plans for further cuts unless incoming data compelled its members to materially reassess their outlook for the economy. As expected, the Fed maintained its rate target through the remainder of the year.
During the fourth quarter, stronger-than-expected economic data and reports that the US and China were moving toward a “phase one” partial trade deal led to a “risk-on” rally. (The agreement was signed in January 2020 after the reporting period ended.) Over the final month of the year, high yield bonds and emerging markets bonds posted solid gains, while investment-grade US bonds dropped slightly.
| | | | |
| Market Overview — unaudited(continued) | | Annual Report | | December 31, 2019 |
Emerging market debt and high yield bonds surged by double digits
For the year, the Bloomberg Barclays Global Aggregate Bond Index (unhedged), which measures global investment-grade debt performance, returned 6.84%. (All returns cited are in US dollars.) Bonds trading in the US, based on the Bloomberg Barclays US Aggregate Bond Index, rose 8.72%. The US index’s leading component sectors included investment-grade corporate bonds (+14.5%), which benefited from the interest rate cuts and solid fundamentals, along with Treasury inflation-protected securities (+8.4%), commercial mortgage-backed securities (+8.3%), and US Treasury securities (+6.9%). Treasuries with longer maturities rallied in the second and third quarters when trade tensions escalated, which triggered a “flight to quality.” The 10-year US Treasury note’s yield, which moves opposite to its price, opened 2019 at approximately 2.65% and closed the year at 1.92% as trade tensions eased.
The Bloomberg Barclays Municipal Bond Index returned 7.54% for the year. US high yield bonds (debt rated below investment grade), as measured by the ICE BofAML US Cash High Yield Index, returned 14.40%. Accommodative monetary policies, strong corporate earnings, and investors’ quest for enhanced yield supported demand for high yield opportunities. Emerging market debt, based on the J.P. Morgan EMBI Global Diversified Index surged 15.04%. Despite a strong US dollar (relative to most currencies), sovereign debt yields in general drifted lower as inflation was contained in many countries, providing their central banks with latitude to reduce interest rates, which bolstered bond prices.
| | |
The Prudential Series Fund, SP Prudential U.S. Emerging Growth Portfolio | | December 31, 2019 |
Report of the Investment Managers - As of December 31, 2019 (Unaudited)
| | | | | | | | | | | | |
| Average Annual Total Returns | | 1 Year | | | 5 Years | | | 10 Years | |
Portfolio: Class I | | | 37.71 | % | | | 9.62 | % | | | 12.35 | % |
Portfolio: Class II | | | 37.16 | | | | 9.17 | | | | 11.89 | |
Russell Midcap® Growth Index | | | 35.47 | | | | 11.60 | | | | 14.24 | |
S&P Midcap 400 Index | | | 26.20 | | | | 9.03 | | | | 12.72 | |
Past performance does not guarantee future returns. The investment return and principal value of an investment will fluctuate, so that shares, when redeemed, may be worth more or less than their original cost. Current performance may be lower or higher than the past performance.
Portfolio performance is net of fund expenses, but not contract charges, which, if included, would significantly lower the performance quoted. Performance figures may reflect fee waivers and/or expense reimbursements. In the absence of such fee waivers and/or expense reimbursements, performance would be lower.
The Russell Midcap® Growth Index is a trademark/service mark of the Frank Russell Company. Russell® is a trademark of the Frank Russell Company.
$10,000 INVESTED OVER 10 YEARS1
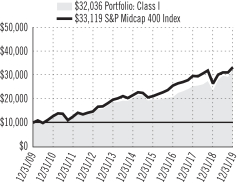
For the year ended December 31, 2019, the SP Prudential U.S. Emerging Growth Portfolio Class I shares returned 37.71% and Class II shares returned 37.16%. The Portfolio’s Class I & II shares outperformed both the Russell Midcap Growth Index and the S&P Midcap 400 Index.
The Portfolio’s investment objective is long-term capital appreciation.
What were the market conditions during the reporting period?
The S&P 500 Index returned 31.46% in 2019 (the reporting period), making it the strongest calendar year for the US equity market since 2013. Within mid-caps, it was a positive year for growth, with the Russell Midcap Growth Index returning 35.47% versus 27.06% for the Russell Midcap Value Index. Within the Russell Midcap Growth Index, every sector posted a positive return. The utilities (+51.7%) and financial services (+44.7%) sectors had the highest returns, while the energy (+8.0%) and consumer staples (+20.9%) sectors lagged.
What strategies or holdings affected the Portfolio’s performance?
Stock selection in the health care sector was the primary positive contributor to performance, followed by choices in the producer durables market segment. Conversely, stock selection in energy was the top detractor from relative performance. An underweight allocation to the utilities sector also detracted, albeit modestly.
From an individual stock perspective, overweight positions in Advanced Micro Devices Inc. and Shopify Inc. were the top contributors to the Portfolio’s relative performance. Advanced Micro Devices outperformed toward the end of the year due to the company’s strengthened competitive position heading into 2020. Shopify was a top contributor on reports of strong revenue growth throughout the year, highlighted by substantial growth in its merchant and subscription solutions segments.
Overweight positions in Concho Resources Inc. and TD Ameritrade Holding Corp. were the top detractors from performance. Much of the underperformance for Concho Resources came during the third quarter when it released a weaker-than-expected earnings report due to disappointing oil production at its new well sites. TD Ameritrade traded lower early in the fourth quarter after its peers eliminated online trade commissions, a policy the company subsequently adopted. Its performance improved later in the quarter when Charles Schwab announced plans to acquire the company.
From a positioning perspective, producer durables was the Portfolio’s largest overweight exposure at the end of the reporting period. Consumer discretionary, which started the period as an underweight, was the second-largest overweight at the end of the period as the subadvisor initiated new positions and added to existing positions. Health care, which started the period as a significant overweight, ended the period as a rather neutral weight as exposure was pared back throughout the year. Consumer staples remained the Portfolio’s largest underweight exposure along with information technology, which started the period as an overweight but was reduced throughout the year.
| 1 | The graph is based on the performance of Class I shares. Performance of Class II shares will be lower due to differences in the fee structure. Class II shares have associated12b-1 and administrative fees at an annual rate of 0.25% and 0.15% respectively of the average daily net assets of the Class II shares. |
For a complete list of holdings, refer to the Schedule of Investments section of this report.
1
| | |
| The Prudential Series Fund, SP Prudential U.S. Emerging Growth Portfolio | | December 31, 2019 |
Report of the Investment Managers - As of December 31, 2019 (Unaudited) (Continued)
Presentation of Portfolio Holdings — unaudited
| | | | | | |
| SP Prudential U.S. Emerging Growth Portfolio (As of 12/31/2019) | |
| Ten Largest Holdings | | Line of Business | | | (% of Net Assets | ) |
| Advanced Micro Devices, Inc. | | Semiconductors & Semiconductor Equipment | | | 3.1% | |
| Global Payments, Inc. | | IT Services | | | 3.0% | |
| O’Reilly Automotive, Inc. | | Specialty Retail | | | 2.8% | |
| Fiserv, Inc. | | IT Services | | | 2.7% | |
| Synopsys, Inc. | | Software | | | 1.7% | |
| Lam Research Corp. | | Semiconductors & Semiconductor Equipment | | | 1.7% | |
| Ingersoll-Rand PLC | | Machinery | | | 1.6% | |
| Waste Connections, Inc. | | Commercial Services & Supplies | | | 1.6% | |
| Lululemon Athletica, Inc. | | Textiles, Apparel & Luxury Goods | | | 1.6% | |
| Zebra Technologies Corp. (Class A Stock) | | Electronic Equipment, Instruments & Components | | | 1.5% | |
For a complete list of holdings, please refer to the Schedule of Investments section of this report. Holdings reflect only long-term investments. Credit Quality/Country Allocation/Holdings/Line of Business are subject to change.
2
| | |
The Prudential Series Fund Benchmark Glossary — unaudited | | December 31, 2019 |
The indexes are unmanaged and include reinvestment of any income or distributions. They do not reflect any fees, expenses or sales charges. Investors cannot invest directly in a market index.
For Russell Indexes: Russell Investment Group is the source and owner of the trademarks, service marks and copyrights related to the Russell Indexes. Russell® is a trademark of Russell Investment Group.
Russell Midcap Growth Index is an unmanaged market cap-weighted index that measures the performance of those Russell Midcap companies with higher price-to-book ratios and higher forecasted growth values.
S&P Midcap 400 Index is a widely accepted, unmanaged total return index of 400 domestic stocks measuring the performance of the midsize company segment of the U.S. stock market.
| | |
The Prudential Series Fund Fees and Expenses — unaudited | | December 31, 2019 |
As a contract owner investing in the Portfolio through a variable annuity or variable life contract, you incur ongoing costs, including management fees, and other Portfolio expenses. This example is intended to help you understand your ongoing costs (in dollars) of investing in the Fund and to compare these costs with the ongoing costs of investing in other investment options. This example does not reflect fees and charges under your variable annuity or variable life contract. If contract charges were included, the costs shown below would be higher. Please consult the prospectus for your contract for more information about contract fees and charges.
The example is based on an investment of $1,000 invested at the beginning of the period and held for the entire period July 1, 2019 through December 31, 2019.
Actual Expenses
The first line of the table below provides information about actual account values and actual expenses. You may use this information, together with the amount you invested, to estimate the Portfolio expenses that you paid over the period. Simply divide your account value by $1,000 (for example, an $8,600 account value divided by $1,000 = 8.6), then multiply the result by the number in the first line under the heading entitled “Expenses Paid During the Six-Month Period” to estimate the Portfolio expenses you paid on your account during this period. As noted above, the table does not reflect variable contract fees and charges.
Hypothetical Example for Comparison Purposes
The second line of the table below provides information about hypothetical account values and hypothetical expenses based on the Portfolio’s actual expense ratio and an assumed rate of return of 5% per year before expenses, which is not the Portfolio’s actual return. The hypothetical account values and expenses may not be used to estimate the actual ending account balance or expenses you paid for the period. You may use this information to compare the ongoing costs of investing in the Portfolio and other investment options. To do so, compare this 5% hypothetical example with the 5% hypothetical examples that appear in the shareholder reports of the other investment options.
Please note that the expenses shown in the table are meant to highlight your ongoing Portfolio costs only and do not reflect any contract fees and charges, such as sales charges (loads), insurance charges or administrative charges. Therefore the second line of the table is useful to compare ongoing investment option costs only, and will not help you determine the relative total costs of owning different contracts. In addition, if these contract fee and charges were included, your costs would have been higher.
| | | | | | | | | | | | | | | | | | |
| The Prudential Series Fund Portfolio | | Beginning
Account Value
July 1, 2019 | | | Ending
Account Value
December 31, 2019 | | | Annualized Expense
Ratio based on the
Six-Month period | | | Expenses Paid
During the
Six-Month period* | |
| | | | | |
| SP Prudential US Emerging Growth (Class I) | | Actual | | $ | 1,000.00 | | | $ | 1,080.60 | | | | 0.72 | % | | $ | 3.78 | |
| | Hypothetical | | $ | 1,000.00 | | | $ | 1,021.58 | | | | 0.72 | % | | $ | 3.67 | |
| | | | | |
| SP Prudential US Emerging Growth (Class II) | | Actual | | $ | 1,000.00 | | | $ | 1,077.90 | | | | 1.12 | % | | $ | 5.87 | |
| | Hypothetical | | $ | 1,000.00 | | | $ | 1,019.56 | | | | 1.12 | % | | $ | 5.70 | |
* Portfolio expenses (net of fee waivers or subsidies, if any) for each share class are equal to the annualized expense ratio for each share class (provided in the table), multiplied by the average account value over the period, multiplied by the 184 days in the six-month period ended December 31, 2019, and divided by the 365 days in the Portfolio’s fiscal year ended December 31, 2019 (to reflect the six-month period). Expenses presented in the table include the expenses of any underlying portfolios in which the Portfolio may invest.
| | | | | | |
| | |
| | SP PRUDENTIAL U.S. EMERGING GROWTH PORTFOLIO | | |
| | | | | | |
| |
| SCHEDULE OF INVESTMENTS | | as of December 31, 2019 |
| | | | | | | | |
| LONG-TERM INVESTMENTS — 99.2% | |
| COMMON STOCKS | | Shares | | | Value | |
Aerospace & Defense — 0.9% | | | | | | | | |
HEICO Corp. (Class A Stock) | | | 27,767 | | | $ | 2,485,980 | |
| | | | | | | | |
Auto Components — 0.6% | | | | | | | | |
Aptiv PLC. | | | 17,599 | | | | 1,671,377 | |
| | | | | | | | |
Automobiles — 1.5% | | | | | | | | |
Tesla, Inc.*(a) | | | 6,542 | | | | 2,736,715 | |
Thor Industries, Inc. | | | 20,781 | | | | 1,543,820 | |
| | | | | | | | |
| | | | | | | 4,280,535 | |
| | | | | | | | |
Banks — 1.6% | | | | | | | | |
East West Bancorp, Inc. | | | 35,968 | | | | 1,751,641 | |
First Republic Bank | | | 23,526 | | | | 2,763,129 | |
| | | | | | | | |
| | | | | | | 4,514,770 | |
| | | | | | | | |
Biotechnology — 3.4% | | | | | | | | |
Agios Pharmaceuticals, Inc.*(a) | | | 15,675 | | | | 748,481 | |
Alnylam Pharmaceuticals, Inc.* | | | 12,263 | | | | 1,412,330 | |
BioMarin Pharmaceutical, Inc.* | | | 9,647 | | | | 815,654 | |
Exact Sciences Corp.* | | | 31,500 | | | | 2,913,120 | |
Exelixis, Inc.* | | | 77,628 | | | | 1,367,805 | |
Intercept Pharmaceuticals, Inc.*(a) | | | 10,465 | | | | 1,296,823 | |
Sage Therapeutics, Inc.*(a) | | | 13,789 | | | | 995,428 | |
| | | | | | | | |
| | | | | | | 9,549,641 | |
| | | | | | | | |
Building Products — 1.0% | | | | | | | | |
Fortune Brands Home & Security, Inc. | | | 44,268 | | | | 2,892,471 | |
| | | | | | | | |
Capital Markets — 3.8% | | | | | | | | |
MarketAxess Holdings, Inc. | | | 4,649 | | | | 1,762,482 | |
MSCI, Inc. | | | 9,927 | | | | 2,562,953 | |
Nasdaq, Inc. | | | 22,380 | | | | 2,396,898 | |
S&P Global, Inc. | | | 10,605 | | | | 2,895,695 | |
TD Ameritrade Holding Corp. | | | 18,941 | | | | 941,368 | |
| | | | | | | | |
| | | | | | | 10,559,396 | |
| | | | | | | | |
Commercial Services & Supplies — 3.1% | |
Copart, Inc.* | | | 46,400 | | | | 4,219,616 | |
Waste Connections, Inc. | | | 48,303 | | | | 4,385,429 | |
| | | | | | | | |
| | | | | | | 8,605,045 | |
| | | | | | | | |
Communications Equipment — 0.8% | | | | | | | | |
Arista Networks, Inc.* | | | 10,876 | | | | 2,212,178 | |
| | | | | | | | |
Construction Materials — 1.5% | | | | | | | | |
Vulcan Materials Co. | | | 28,344 | | | | 4,081,253 | |
| | | | | | | | |
Containers & Packaging — 2.5% | | | | | | | | |
Avery Dennison Corp. | | | 25,243 | | | | 3,302,289 | |
Ball Corp. | | | 56,989 | | | | 3,685,479 | |
| | | | | | | | |
| | | | | | | 6,987,768 | |
| | | | | | | | |
Diversified Consumer Services — 0.9% | | | | | |
Bright Horizons Family Solutions, Inc.* | | | 16,521 | | | | 2,482,941 | |
| | | | | | | | |
Electrical Equipment — 2.4% | | | | | | | | |
AMETEK, Inc. | | | 38,771 | | | | 3,867,019 | |
Generac Holdings, Inc.* | | | 29,905 | | | | 3,008,144 | |
| | | | | | | | |
| | | | | | | 6,875,163 | |
| | | | | | | | |
| | | | | | | | |
COMMON STOCKS
(continued) | | Shares | | | Value | |
Electronic Equipment, Instruments & Components — 5.1% | |
Amphenol Corp. (Class A Stock) | | | 39,202 | | | $ | 4,242,832 | |
FLIR Systems, Inc. | | | 31,221 | | | | 1,625,678 | |
Keysight Technologies, Inc.*(a) | | | 41,443 | | | | 4,253,295 | |
Zebra Technologies Corp. (Class A Stock)* | | | 16,775 | | | | 4,285,006 | |
| | | | | | | | |
| | | | | | | 14,406,811 | |
| | | | | | | | |
Entertainment — 2.7% | | | | | | | | |
Spotify Technology SA* | | | 23,454 | | | | 3,507,546 | |
Take-Two Interactive Software, Inc.* | | | 32,833 | | | | 4,019,744 | |
| | | | | | | | |
| | | | | | | 7,527,290 | |
| | | | | | | | |
Health Care Equipment & Supplies — 3.6% | | | | | |
DexCom, Inc.* | | | 17,378 | | | | 3,801,264 | |
Insulet Corp.* | | | 17,340 | | | | 2,968,608 | |
ResMed, Inc. | | | 22,065 | | | | 3,419,413 | |
| | | | | | | | |
| | | | | | | 10,189,285 | |
| | | | | | | | |
Health Care Providers & Services — 2.7% | | | | | |
Acadia Healthcare Co., Inc.*(a) | | | 37,824 | | | | 1,256,513 | |
Centene Corp.*(a) | | | 34,551 | | | | 2,172,221 | |
WellCare Health Plans, Inc.* | | | 12,197 | | | | 4,027,572 | |
| | | | | | | | |
| | | | | | | 7,456,306 | |
| | | | | | | | |
Health Care Technology — 1.9% | | | | | | | | |
Teladoc Health, Inc.*(a) | | | 34,078 | | | | 2,853,010 | |
Veeva Systems, Inc. (Class A Stock)* | | | 18,061 | | | | 2,540,460 | |
| | | | | | | | |
| | | | | | | 5,393,470 | |
| | | | | | | | |
Hotels, Restaurants & Leisure — 2.7% | | | | | |
Chipotle Mexican Grill, Inc.* | | | 2,207 | | | | 1,847,502 | |
Hilton Worldwide Holdings, Inc. | | | 36,410 | | | | 4,038,233 | |
Red Rock Resorts, Inc. (Class A Stock) | | | 66,555 | | | | 1,593,992 | |
| | | | | | | | |
| | | | | | | 7,479,727 | |
| | | | | | | | |
Household Durables — 1.7% | | | | | | | | |
Garmin Ltd. | | | 22,659 | | | | 2,210,612 | |
NVR, Inc.* | | | 660 | | | | 2,513,551 | |
| | | | | | | | |
| | | | | | | 4,724,163 | |
| | | | | | | | |
Industrial Conglomerates — 0.8% | | | | | | | | |
Carlisle Cos., Inc. | | | 14,039 | | | | 2,272,072 | |
| | | | | | | | |
Insurance — 0.8% | | | | | | | | |
Progressive Corp. (The) | | | 29,894 | | | | 2,164,027 | |
| | | | | | | | |
IT Services — 11.2% | | | | | | | | |
Black Knight, Inc.* | | | 25,730 | | | | 1,659,070 | |
Booz Allen Hamilton Holding Corp. | | | 58,402 | | | | 4,154,134 | |
Fidelity National Information Services, Inc. | | | 8,794 | | | | 1,223,158 | |
Fiserv, Inc.* | | | 64,295 | | | | 7,434,431 | |
FleetCor Technologies, Inc.*(a) | | | 9,038 | | | | 2,600,413 | |
Global Payments, Inc. | | | 46,529 | | | | 8,494,334 | |
MongoDB, Inc.*(a) | | | 10,604 | | | | 1,395,593 | |
Okta, Inc.*(a) | | | 18,663 | | | | 2,153,150 | |
Shopify, Inc. (Canada) (Class A Stock)*(a) | | | 5,991 | | | | 2,381,902 | |
| | | | | | | | |
| | | | | | | 31,496,185 | |
| | | | | | | | |
SEE NOTES TO FINANCIAL STATEMENTS.
A1
| | | | | | |
| | |
| | SP PRUDENTIAL U.S. EMERGING GROWTH PORTFOLIO (continued) | | |
| | | | | | |
| |
| SCHEDULE OF INVESTMENTS | | as of December 31, 2019 |
| | | | | | | | |
COMMON STOCKS
(continued) | | Shares | | | Value | |
Life Sciences Tools & Services — 0.5% | |
Illumina, Inc.* | | | 4,442 | | | $ | 1,473,589 | |
| | | | | | | | |
Machinery — 4.4% | | | | | | | | |
Gardner Denver Holdings, Inc.* | | | 28,377 | | | | 1,040,868 | |
Ingersoll-Rand PLC | | | 33,921 | | | | 4,508,779 | |
Nordson Corp. | | | 13,653 | | | | 2,223,255 | |
Parker-Hannifin Corp. | | | 7,623 | | | | 1,568,966 | |
Stanley Black & Decker, Inc. | | | 18,435 | | | | 3,055,417 | |
| | | | | | | | |
| | | | | | | 12,397,285 | |
| | | | | | | | |
Media — 0.6% | | | | | | | | |
New York Times Co. (The)
(Class A Stock)(a) | | | 50,755 | | | | 1,632,788 | |
| | | | | | | | |
Multiline Retail — 1.1% | | | | | | | | |
Dollar General Corp. | | | 19,818 | | | | 3,091,212 | |
| | | | | | | | |
Oil, Gas & Consumable Fuels — 0.7% | | | | | | | | |
Concho Resources, Inc. | | | 21,715 | | | | 1,901,583 | |
| | | | | | | | |
Pharmaceuticals — 2.3% | | | | | | | | |
Catalent, Inc.* | | | 27,199 | | | | 1,531,304 | |
Elanco Animal Health, Inc.* | | | 64,258 | | | | 1,892,398 | |
Jazz Pharmaceuticals PLC* | | | 20,344 | | | | 3,036,952 | |
| | | | | | | | |
| | | | | | | 6,460,654 | |
| | | | | | | | |
Professional Services — 2.8% | | | | | |
CoStar Group, Inc.* | | | 4,401 | | | | 2,633,118 | |
FTI Consulting, Inc.* | | | 14,334 | | | | 1,586,201 | |
IHS Markit Ltd.*(a) | | | 50,097 | | | | 3,774,809 | |
| | | | | | | | |
| | | | | | | 7,994,128 | |
| | | | | | | | |
Real Estate Management & Development — 1.1% | |
CBRE Group, Inc. (Class A Stock)* | | | 52,330 | | | | 3,207,306 | |
| | | | | | | | |
Road & Rail — 1.4% | | | | | | | | |
Lyft, Inc. (Class A Stock)*(a) | | | 27,521 | | | | 1,183,954 | |
Old Dominion Freight Line, Inc. | | | 14,621 | | | | 2,774,773 | |
| | | | | | | | |
| | | | | | | 3,958,727 | |
| | | | | | | | |
Semiconductors & Semiconductor Equipment — 8.8% | |
Advanced Micro Devices, Inc.*(a) | | | 191,736 | | | | 8,793,013 | |
KLA Corp. | | | 18,865 | | | | 3,361,177 | |
Lam Research Corp. | | | 16,306 | | | | 4,767,874 | |
Marvell Technology Group Ltd. | | | 91,599 | | | | 2,432,870 | |
Microchip Technology, Inc.(a) | | | 18,796 | | | | 1,968,317 | |
Xilinx, Inc. | | | 33,151 | | | | 3,241,173 | |
| | | | | | | | |
| | | | | | | 24,564,424 | |
| | | | | | | | |
Software — 9.7% | | | | | | | | |
Anaplan, Inc.* | | | 34,961 | | | | 1,831,956 | |
Crowdstrike Holdings, Inc.
(Class A Stock)* | | | 23,717 | | | | 1,182,767 | |
Fair Isaac Corp.* | | | 5,389 | | | | 2,019,150 | |
Intuit, Inc. | | | 9,187 | | | | 2,406,351 | |
Paycom Software, Inc.* | | | 7,601 | | | | 2,012,441 | |
Proofpoint, Inc.* | | | 13,456 | | | | 1,544,480 | |
RingCentral, Inc. (Class A Stock)* | | | 12,081 | | | | 2,037,702 | |
| | | | | | | | |
COMMON STOCKS
(continued) | | Shares | | | Value | |
Software (continued) | | | | | | | | |
ServiceNow, Inc.*(a) | | | 7,104 | | | $ | 2,005,601 | |
Slack Technologies, Inc.
(Class A Stock)*(a) | | | 23,516 | | | | 528,640 | |
Splunk, Inc.*(a) | | | 17,228 | | | | 2,580,238 | |
Synopsys, Inc.* | | | 34,661 | | | | 4,824,811 | |
Trade Desk, Inc. (The)
(Class A Stock)*(a) | | | 12,376 | | | | 3,215,037 | |
Zscaler, Inc.*(a) | | | 19,480 | | | | 905,820 | |
| | | | | | | | |
| | | | | | | 27,094,994 | |
| | | | | | | | |
Specialty Retail — 7.0% | | | | | | | | |
Burlington Stores, Inc.* | | | 12,434 | | | | 2,835,325 | |
National Vision Holdings, Inc.*(a) | | | 58,329 | | | | 1,891,609 | |
O’Reilly Automotive, Inc.* | | | 17,734 | | | | 7,772,103 | |
Ross Stores, Inc. | | | 35,867 | | | | 4,175,636 | |
Tractor Supply Co. | | | 31,186 | | | | 2,914,020 | |
| | | | | | | | |
| | | | | | | 19,588,693 | |
| | | | | | | | |
Textiles, Apparel & Luxury Goods — 1.6% | |
Lululemon Athletica, Inc.* | | | 18,828 | | | | 4,361,883 | |
| | | | | | | | |
TOTAL LONG-TERM INVESTMENTS
(cost $208,153,130) | | | | 278,035,120 | |
| | | | | | | | |
|
| SHORT-TERM INVESTMENTS — 14.6% | |
AFFILIATED MUTUAL FUNDS | | | | | | | | |
PGIM Core Ultra Short Bond Fund(w) | | | 2,356,856 | | | | 2,356,856 | |
PGIM Institutional Money Market Fund
(cost $38,475,901; includes $38,411,529 of cash collateral for securities on loan)(b)(w) | | | 38,472,231 | | | | 38,479,925 | |
| | | | | | | | |
TOTAL SHORT-TERM INVESTMENTS
(cost $40,832,757) | | | | 40,836,781 | |
| | | | | | | | |
TOTAL INVESTMENTS — 113.8%
(cost $248,985,887) | | | | 318,871,901 | |
Liabilities in excess of other assets — (13.8)% | | | | (38,621,740 | ) |
| | | | | | | | |
NET ASSETS — 100.0% | | | | | | $ | 280,250,161 | |
| | | | | | | | |
Below is a list of the abbreviation(s) used in the annual report:
| | |
| LIBOR | | London Interbank Offered Rate |
| * | Non-income producing security. |
| (a) | All or a portion of security is on loan. The aggregate market value of such securities, including those sold and pending settlement, is $37,827,991; cash collateral of $38,411,529 (included in liabilities) was received with which the Portfolio purchased highly liquid short-term investments. |
| (b) | Represents security purchased with cash collateral received for securities on loan and includes dividend reinvestment. |
| (w) | PGIM Investments LLC, the manager of the Portfolio, also serves as manager of the PGIM Core Ultra Short Bond Fund and PGIM Institutional Money Market Fund. |
SEE NOTES TO FINANCIAL STATEMENTS.
A2
| | | | | | |
| | |
| | SP PRUDENTIAL U.S. EMERGING GROWTH PORTFOLIO (continued) | | |
| | | | | | |
| |
| SCHEDULE OF INVESTMENTS | | as of December 31, 2019 |
Fair Value Measurements:
Various inputs are used in determining the value of the Portfolio’s investments. These inputs are summarized in the three broad levels listed below.
| Level 1— | unadjusted quoted prices generally in active markets for identical securities. |
| Level 2— | quoted prices for similar securities, interest rates and yield curves, prepayment speeds, foreign currency exchange rates and other observable inputs. |
| Level 3— | unobservable inputs for securities valued in accordance with Board approved fair valuation procedures. |
The following is a summary of the inputs used as of December 31, 2019 in valuing such portfolio securities:
| | | | | | | | | | | | |
| | | Level 1 | | | Level 2 | | | Level 3 | |
Investments in Securities | | | | | | | | | | | | |
Assets | | | | | | | | | | | | |
Common Stocks | | | | | | | | | | | | |
Aerospace & Defense | | $ | 2,485,980 | | | $ | — | | | $ | — | |
Auto Components | | | 1,671,377 | | | | — | | | | — | |
Automobiles | | | 4,280,535 | | | | — | | | | — | |
Banks | | | 4,514,770 | | | | — | | | | — | |
Biotechnology | | | 9,549,641 | | | | — | | | | — | |
Building Products | | | 2,892,471 | | | | — | | | | — | |
Capital Markets | | | 10,559,396 | | | | — | | | | — | |
Commercial Services & Supplies | | | 8,605,045 | | | | — | | | | — | |
Communications Equipment | | | 2,212,178 | | | | — | | | | — | |
Construction Materials | | | 4,081,253 | | | | — | | | | — | |
Containers & Packaging | | | 6,987,768 | | | | — | | | | — | |
Diversified Consumer Services | | | 2,482,941 | | | | — | | | | — | |
Electrical Equipment | | | 6,875,163 | | | | — | | | | — | |
Electronic Equipment, Instruments & Components | | | 14,406,811 | | | | — | | | | — | |
Entertainment | | | 7,527,290 | | | | — | | | | — | |
Health Care Equipment & Supplies | | | 10,189,285 | | | | — | | | | — | |
Health Care Providers & Services | | | 7,456,306 | | | | — | | | | — | |
Health Care Technology | | | 5,393,470 | | | | — | | | | — | |
Hotels, Restaurants & Leisure | | | 7,479,727 | | | | — | | | | — | |
Household Durables | | | 4,724,163 | | | | — | | | | — | |
Industrial Conglomerates | | | 2,272,072 | | | | — | | | | — | |
Insurance | | | 2,164,027 | | | | — | | | | — | |
IT Services | | | 31,496,185 | | | | — | | | | — | |
Life Sciences Tools & Services | | | 1,473,589 | | | | — | | | | — | |
Machinery | | | 12,397,285 | | | | — | | | | — | |
Media | | | 1,632,788 | | | | — | | | | — | |
Multiline Retail | | | 3,091,212 | | | | — | | | | — | |
Oil, Gas & Consumable Fuels | | | 1,901,583 | | | | — | | | | — | |
Pharmaceuticals | | | 6,460,654 | | | | — | | | | — | |
Professional Services | | | 7,994,128 | | | | — | | | | — | |
Real Estate Management & Development | | | 3,207,306 | | | | — | | | | — | |
Road & Rail | | | 3,958,727 | | | | — | | | | — | |
Semiconductors & Semiconductor Equipment | | | 24,564,424 | | | | — | | | | — | |
Software | | | 27,094,994 | | | | — | | | | — | |
Specialty Retail | | | 19,588,693 | | | | — | | | | — | |
Textiles, Apparel & Luxury Goods | | | 4,361,883 | | | | — | | | | — | |
Affiliated Mutual Funds | | | 40,836,781 | | | | — | | | | — | |
| | | | | | | | | | | | |
Total | | $ | 318,871,901 | | | $ | — | | | $ | — | |
| | | | | | | | | | | | |
Industry Classification:
The industry classification of investments and liabilities in excess of other assets shown as a percentage of net assets as of December 31, 2019 were as follows (unaudited):
| | | | |
Affiliated Mutual Funds (13.7% represents investments purchased with collateral from securities on loan) | | | 14.6 | % |
IT Services | | | 11.2 | |
| | | | |
Software | | | 9.7 | % |
Semiconductors & Semiconductor Equipment | | | 8.8 | |
Specialty Retail | | | 7.0 | |
SEE NOTES TO FINANCIAL STATEMENTS.
A3
| | | | | | |
| | |
| | SP PRUDENTIAL U.S. EMERGING GROWTH PORTFOLIO (continued) | | |
| | | | | | |
| |
| SCHEDULE OF INVESTMENTS | | as of December 31, 2019 |
Industry Classification (continued):
| | | | |
Electronic Equipment, Instruments & Components | | | 5.1 | % |
Machinery | | | 4.4 | |
Capital Markets | | | 3.8 | |
Health Care Equipment & Supplies | | | 3.6 | |
Biotechnology | | | 3.4 | |
Commercial Services & Supplies | | | 3.1 | |
Professional Services | | | 2.8 | |
Entertainment | | | 2.7 | |
Hotels, Restaurants & Leisure | | | 2.7 | |
Health Care Providers & Services | | | 2.7 | |
Containers & Packaging | | | 2.5 | |
Electrical Equipment | | | 2.4 | |
Pharmaceuticals | | | 2.3 | |
Health Care Technology | | | 1.9 | |
Household Durables | | | 1.7 | |
Banks | | | 1.6 | |
Textiles, Apparel & Luxury Goods | | | 1.6 | |
Automobiles | | | 1.5 | |
Construction Materials | | | 1.5 | |
| | | | |
Road & Rail | | | 1.4 | % |
Real Estate Management & Development | | | 1.1 | |
Multiline Retail | | | 1.1 | |
Building Products | | | 1.0 | |
Aerospace & Defense | | | 0.9 | |
Diversified Consumer Services | | | 0.9 | |
Industrial Conglomerates | | | 0.8 | |
Communications Equipment | | | 0.8 | |
Insurance | | | 0.8 | |
Oil, Gas & Consumable Fuels | | | 0.7 | |
Auto Components | | | 0.6 | |
Media | | | 0.6 | |
Life Sciences Tools & Services | | | 0.5 | |
| | | | |
| | | 113.8 | |
Liabilities in excess of other assets | | | (13.8 | ) |
| | | | |
| | | 100.0 | % |
| | | | |
Financial Instruments/Transactions — Summary of Offsetting and Netting Arrangements:
The Portfolio entered into financial instruments/transactions during the reporting period that are either offset in accordance with current requirements or are subject to enforceable master netting arrangements or similar agreements that permit offsetting. The information about offsetting and related netting arrangements for financial instruments/transactions where the legal right toset-off exists is presented in the summary below.
Offsetting of financial instrument/transaction assets and liabilities:
| | | | | | | | | | | | |
Description | | Gross Market
Value of
Recognized
Assets/(Liabilities) | | | Collateral
Pledged/(Received)(1) | | | Net
Amount | |
Securities on Loan | | $ | 37,827,991 | | | $ | (37,827,991 | ) | | $ | — | |
| | | | | �� | | | | | | | |
| (1) | Collateral amount disclosed by the Portfolio is limited to the market value of financial instruments/transactions. |
SEE NOTES TO FINANCIAL STATEMENTS.
A4
| | | | | | |
| | |
| | SP PRUDENTIAL U.S. EMERGING GROWTH PORTFOLIO (continued) | | |
STATEMENT OF ASSETS AND LIABILITIES
as of December 31, 2019
| | | | |
| ASSETS | | | | |
Investments at value, including securities on loan of $37,827,991: | | | | |
Unaffiliated investments (cost $208,153,130) | | $ | 278,035,120 | |
Affiliated investments (cost $40,832,757) | | | 40,836,781 | |
Cash | | | 18,114 | |
Receivable for investments sold | | | 72,567 | |
Dividends receivable | | | 53,880 | |
Receivable for Portfolio shares sold | | | 18,189 | |
Tax reclaim receivable | | | 8,046 | |
Prepaid expenses | | | 2,089 | |
| | | | |
Total Assets | | | 319,044,786 | |
| | | | |
| LIABILITIES | | | | |
Payable to broker for collateral for securities on loan | | | 38,411,529 | |
Accrued expenses and other liabilities | | | 154,563 | |
Management fee payable | | | 141,533 | |
Payable for Portfolio shares repurchased | | | 39,049 | |
Payable for investments purchased | | | 38,764 | |
Payable to affiliate | | | 8,046 | |
Affiliated transfer agent fee payable | | | 980 | |
Distribution fee payable | | | 101 | |
Administration fee payable | | | 60 | |
| | | | |
Total Liabilities | | | 38,794,625 | |
| | | | |
| NET ASSETS | | $ | 280,250,161 | |
| | | | |
Net assets were comprised of: | | | | |
Partners’ Equity | | $ | 280,250,161 | |
| | | | |
| Class I: | | | | |
Net asset value and redemption price per share, $279,778,018 / 14,905,489 outstanding shares of beneficial interest | | $ | 18.77 | |
| | | | |
| Class II: | | | | |
Net asset value and redemption price per share, $472,143 / 26,871 outstanding shares of beneficial interest | | $ | 17.57 | |
| | | | |
STATEMENT OF OPERATIONS
Year Ended December 31, 2019
| | | | |
| NET INVESTMENT INCOME (LOSS) | | | | |
| INCOME | | | | |
Unaffiliated dividend income (net of $6,589 foreign withholding tax) | | $ | 1,438,658 | |
Affiliated dividend income | | | 178,680 | |
Income from securities lending, net (including affiliated income of $80,098) | | | 174,736 | |
| | | | |
Total income | | | 1,792,074 | |
| | | | |
| EXPENSES | | | | |
Management fee | | | 1,545,521 | |
Distribution fee—Class II | | | 1,431 | |
Administration fee—Class II | | | 859 | |
Shareholders’ reports | | | 122,107 | |
Custodian and accounting fees | | | 61,719 | |
Audit fee | | | 27,700 | |
Legal fees and expenses | | | 12,737 | |
Trustees’ fees | | | 12,159 | |
Transfer agent’s fees and expenses (including affiliated expense of $5,882) | | | 10,683 | |
Miscellaneous | | | 17,372 | |
| | | | |
Total expenses | | | 1,812,288 | |
| | | | |
| NET INVESTMENT INCOME (LOSS) | | | (20,214 | ) |
| | | | |
| REALIZED AND UNREALIZED GAIN (LOSS) ON INVESTMENT TRANSACTIONS | | | | |
Net realized gain (loss) on investment transactions (including affiliated of $(5,020)) | | | 49,633,228 | |
| | | | |
Net change in unrealized appreciation (depreciation) on: | | | | |
Investments (including affiliated of $3,725) | | | 29,910,391 | |
| | | | |
| NET GAIN (LOSS) ON INVESTMENT TRANSACTIONS | | | 79,543,619 | |
| | | | |
| NET INCREASE (DECREASE) IN NET ASSETS RESULTING FROM OPERATIONS | | $ | 79,523,405 | |
| | | | |
STATEMENTS OF CHANGES IN NET ASSETS
| | | | | | | | |
| | | Year Ended | | | Year Ended | |
| | | December 31, 2019 | | | December 31, 2018 | |
| INCREASE (DECREASE) IN NET ASSETS | | | | | | | | |
| OPERATIONS | �� | | | | | | | |
Net investment income (loss) | | $ | (20,214 | ) | | $ | 379,610 | |
Net realized gain (loss) on investment transactions | | | 49,633,228 | | | | 16,268,452 | |
Net change in unrealized appreciation (depreciation) on investments | | | 29,910,391 | | | | (34,364,908 | ) |
| | | | | | | | |
NET INCREASE (DECREASE) IN NET ASSETS RESULTING FROM OPERATIONS | | | 79,523,405 | | | | (17,716,846 | ) |
| | | | | | | | |
| PORTFOLIO SHARE TRANSACTIONS | | | | | | | | |
Portfolio shares sold | | | 9,574,970 | | | | 8,022,446 | |
Portfolio shares repurchased | | | (24,181,462 | ) | | | (25,384,122 | ) |
| | | | | | | | |
NET INCREASE (DECREASE) IN NET ASSETS FROM PORTFOLIO SHARE TRANSACTIONS | | | (14,606,492 | ) | | | (17,361,676 | ) |
| | | | | | | | |
| CAPITAL CONTRIBUTIONS | | | — | | | | 11,284 | |
| | | | | | | | |
| TOTAL INCREASE (DECREASE) | | | 64,916,913 | | | | (35,067,238 | ) |
| NET ASSETS: | | | | | | | | |
Beginning of year | | | 215,333,248 | | | | 250,400,486 | |
| | | | | | | | |
End of year | | $ | 280,250,161 | | | $ | 215,333,248 | |
| | | | | | | | |
SEE NOTES TO FINANCIAL STATEMENTS.
A5
NOTES TO FINANCIAL STATEMENTS OF
THE PRUDENTIAL SERIES FUND
The Prudential Series Fund (“Series Fund”) is registered under the Investment Company Act of 1940, as amended (“1940 Act”), as anopen-end management investment company. The Series Fund is composed of seventeen Portfolios (“Portfolios”), each with separate series shares. The information presented in these financial statements pertains to the SP Prudential U.S. Emerging Growth Portfolio (the “Portfolio”). The Portfolio is a diversified portfolio.
The investment objective of the Portfolio is long-term capital appreciation.
The Series Fund follows the investment company accounting and reporting guidance of the Financial Accounting Standards Board (“FASB”) Accounting Standard Codification (“ASC”) Topic 946 Financial Services —Investment Companies.The following accounting policies conform to U.S. generally accepted accounting principles. The Series Fund and the Portfolio consistently follow such policies in the preparation of their financial statements.
Securities Valuation: The Portfolio holds securities and other assets and liabilities that are fair valued at the close of each day (generally, 4:00 PM Eastern time) the New York Stock Exchange (“NYSE”) is open for trading. Fair value is the price that would be received to sell an asset or paid to transfer a liability in an orderly transaction between market participants on the measurement date. The Series Fund’s Board of Trustees (the “Board”) has adopted valuation procedures for security valuation under which fair valuation responsibilities have been delegated to PGIM Investments LLC (“PGIM Investments” or the “Manager”). Pursuant to the Board’s delegation, the Manager has established a Valuation Committee responsible for supervising the fair valuation of portfolio securities and other assets and liabilities. The valuation procedures permit the Portfolio to utilize independent pricing vendor services, quotations from market makers, and alternative valuation methods when market quotations are either not readily available or not deemed representative of fair value. A record of the Valuation Committee’s actions is subject to the Board’s review, approval, and ratification at its next regularly scheduled quarterly meeting.
For the fiscal reportingyear-end, securities and other assets and liabilities were fair valued at the close of the last U.S. business day. Trading in certain foreign securities may occur when the NYSE is closed (including weekends and holidays). Because such foreign securities trade in markets that are open on weekends and U.S. holidays, the values of some of the Portfolio’s foreign investments may change on days when investors cannot purchase or redeem Portfolio shares.
Various inputs determine how the Portfolio’s investments are valued, all of which are categorized according to the three broad levels (Level 1, 2, or 3) detailed in the Schedule of Investments and referred to herein as the “fair value hierarchy” in accordance with FASB ASC Topic 820 — Fair Value Measurements and Disclosures.
Common and preferred stocks, exchange-traded funds, and derivative instruments, such as futures or options, that are traded on a national securities exchange are valued at the last sale price as of the close of trading on the applicable exchange where the security principally trades. Securities traded via NASDAQ are valued at the NASDAQ official closing price. To the extent these securities are valued at the last sale price or NASDAQ official closing price, they are classified as Level 1 in the fair value hierarchy. In the event that no sale or official closing price on valuation date exists, these securities are generally valued at the mean between the last reported bid and ask prices, or at the last bid price in the absence of an ask price. These securities are classified as Level 2 in the fair value hierarchy.
Foreign equities traded on foreign securities exchanges are generally valued using pricing vendor services that provide model prices derived using adjustment factors based on information such as local closing price, relevant general and sector indices, currency fluctuations, depositary receipts, and futures, as applicable. Securities valued using such model prices are classified as Level 2 in the fair value hierarchy. The models generate an evaluated adjustment factor for each security, which is applied to the local closing price to adjust it for post closing market movements up to the time the Portfolio is valued. Utilizing that evaluated adjustment factor, the vendor provides an evaluated price for each security. If the vendor does not provide an evaluated price, securities are valued in accordance with exchange-traded common and preferred stock valuation policies discussed above.
Investments inopen-end,non-exchange-traded mutual funds are valued at their net asset values as of the close of the NYSE on the date of valuation. These securities are classified as Level 1 in the fair value hierarchy since
B1
they may be purchased or sold at their net asset values on the date of valuation.
Securities and other assets that cannot be priced according to the methods described above are valued based on pricing methodologies approved by the Board. In the event that unobservable inputs are used when determining such valuations, the securities will be classified as Level 3 in the fair value hierarchy.
When determining the fair value of securities, some of the factors influencing the valuation include: the nature of any restrictions on disposition of the securities; assessment of the general liquidity of the securities; the issuer’s financial condition and the markets in which it does business; the cost of the investment; the size of the holding and the capitalization of the issuer; the prices of any recent transactions or bids/offers for such securities or any comparable securities; any available analyst media or other reports or information deemed reliable by the Manager regarding the issuer or the markets or industry in which it operates. Using fair value to price securities may result in a value that is different from a security’s most recent closing price and from the price used by other unaffiliated mutual funds to calculate their net asset values.
Illiquid Securities: Pursuant to Rule22e-4 under the 1940 Act, the Series Fund has adopted a Board approved Liquidity Risk Management Program (“LRMP”) that requires, among other things, that the Portfolio limit its illiquid investments that are assets to no more than 15% of net assets. Illiquid securities are those that, because of the absence of a readily available market or due to legal or contractual restrictions on resale, may not reasonably be expected to be sold or disposed of in current market conditions in seven calendar days or less without the sale or disposition significantly changing the market value of the investment. The Portfolio may find it difficult to sell illiquid securities at the time considered most advantageous by its subadviser(s) and may incur transaction costs that would not be incurred in the sale of securities that were freely marketable.
Restricted Securities: Securities acquired in unregistered, private sales from the issuing company or from an affiliate of the issuer are considered restricted as to disposition under federal securities law (“restricted securities”). Such restricted securities are valued pursuant to the valuation procedures noted above. Restricted securities that would otherwise be considered illiquid investments pursuant to the Portfolio’s LRMP because of legal restrictions on resale to the general public may be traded among qualified institutional buyers under Rule 144A of the Securities Act of 1933. Therefore, these Rule 144A securities, as well as commercial paper that is sold in private placements under Section 4(2) of the Securities Act of 1933, may be classified higher than “illiquid” under the LRMP (i.e. “moderately liquid” or “less liquid” investments). However, the liquidity of the Portfolio’s investments in restricted securities could be impaired if trading does not develop or declines.
Foreign Currency Translation: The books and records of the Portfolio are maintained in U.S. dollars. Foreign currency amounts are translated into U.S. dollars on the following basis:
(i) market value of investment securities, other assets and liabilities — at the current rates of exchange;
(ii) purchases and sales of investment securities, income and expenses — at the rates of exchange prevailing on the respective dates of such transactions.
Although the net assets of the Portfolio are presented at the foreign exchange rates and market values at the close of the period, the Portfolio does not generally isolate that portion of the results of operations arising as a result of changes in the foreign exchange rates from the fluctuations arising from changes in the market prices of long-term portfolio securities held at the end of the period. Similarly, the Portfolio does not isolate the effect of changes in foreign exchange rates from the fluctuations arising from changes in the market prices of long-term portfolio securities sold during the period. Accordingly, holding period realized foreign currency gains (losses) are included in the reported net realized gains (losses) on investment transactions.
Net realized gains (losses) on foreign currency transactions represent net foreign exchange gains (losses) from the disposition of holdings of foreign currencies, currency gains (losses) realized between the trade and settlement dates on investment transactions, and the difference between the amounts of interest, dividends and foreign withholding taxes recorded on the Portfolio’s books and the U.S. dollar equivalent amounts actually received or paid. Net unrealized currency gains (losses) arise from valuing foreign currency denominated assets and liabilities (other than investments) at period end exchange rates.
Master Netting Arrangements: The Series Fund, on behalf of the Portfolio, is subject to various Master Agreements, or netting arrangements, with select counterparties. These are agreements which a subadviser may have negotiated and entered into on behalf of all or a portion of the Portfolio. A master netting arrangement between the Portfolio and the counterparty permits the Portfolio to offset amounts payable by the Portfolio to the same counterparty against amounts to be received; and by the receipt of collateral from the counterparty by the
B2
Portfolio to cover the Portfolio’s exposure to the counterparty. However, there is no assurance that such mitigating factors are easily enforceable. In addition to master netting arrangements, the right toset-off exists when all the conditions are met such that each of the parties owes the other determinable amounts, the reporting party has the right toset-off the amount owed with the amount owed by the other party, the reporting party intends toset-off and the right ofset-off is enforceable by law. During the reporting period, there was no intention to settle on a net basis and all amounts are presented on a gross basis on the Statement of Assets and Liabilities.
Securities Lending: The Portfolio lends its portfolio securities to banks and broker-dealers. The loans are secured by collateral at least equal to the market value of the securities loaned. Collateral pledged by each borrower is invested in an affiliated money market fund and is marked to market daily, based on the previous day’s market value, such that the value of the collateral exceeds the value of the loaned securities. In the event of significant appreciation in value of securities on loan on the last business day of the reporting period, the financial statements may reflect a collateral value that is less than the market value of the loaned securities. Such shortfall is remedied as described above. Loans are subject to termination at the option of the borrower or the Portfolio. Upon termination of the loan, the borrower will return to the Portfolio securities identical to the loaned securities. Should the borrower of the securities fail financially, the Portfolio has the right to repurchase the securities in the open market using the collateral.
The Portfolio recognizes income, net of any rebate and securities lending agent fees, for lending its securities in the form of fees or interest on the investment of any cash received as collateral. The borrower receives all interest and dividends from the securities loaned and such payments are passed back to the lender in amounts equivalent thereto. The Portfolio also continues to recognize any unrealized gain (loss) in the market price of the securities loaned and on the change in the value of the collateral invested that may occur during the term of the loan. In addition, realized gain (loss) is recognized on changes in the value of the collateral invested upon liquidation of the collateral. Net earnings from securities lending are disclosed in the Statement of Operations.
Securities Transactions and Net Investment Income: Securities transactions are recorded on the trade date. Realized gains (losses) from investment and currency transactions are calculated on the specific identification method. Dividend income is recorded on theex-date, or for certain foreign securities, when the Portfolio becomes aware of such dividends. Interest income, including amortization of premium and accretion of discount on debt securities, as required, is recorded on the accrual basis. Expenses are recorded on an accrual basis, which may require the use of certain estimates by management that may differ from actual. Net investment income or loss (other than administration and distribution fees which are charged directly to the respective class) and unrealized and realized gains (losses) are allocated daily to each class of shares based upon the relative proportion of adjusted net assets of each class at the beginning of the day.
Taxes: For federal income tax purposes, the Portfolio is treated as a separate taxpaying entity. The Portfolio is treated as a partnership for tax purposes. No provision has been made in the financial statements for U.S. federal, state, or local taxes, as any tax liability arising from operations of the Portfolio is the responsibility of the Portfolio’s shareholders (participating insurance companies). The Portfolio is not generally subject to entity-level taxation. Shareholders of the Portfolio are subject to taxes on their distributive share of partnership items. Withholding taxes on foreign dividends, interest and capital gains are accrued in accordance with the Portfolio’s understanding of the applicable country’s tax rules and regulations. Such taxes are accrued net of reclaimable amounts, at the time the related income/gain is recorded taking into account any agreements in place with Prudential Financial, Inc. (“Prudential”) as referenced in Note 3. The Portfolio generally attempts to manage its diversification in a manner that supports the diversification requirements of the underlying separate accounts.
Distributions: Distributions, if any, from the Portfolio are made in cash and automatically reinvested in additional shares of the Portfolio. Distributions are recorded on theex-date.
Estimates: The preparation of financial statements requires management to make estimates and assumptions that affect the reported amounts and disclosures in the financial statements. Actual results could differ from those estimates.
The Series Fund, on behalf of the Portfolio, has entered into an investment management agreement with the Manager. Pursuant to this agreement, the Manager has responsibility for all investment management services and supervises the subadviser’s performance of such services. Effective January 26, 2019, the Manager has entered into a subadvisory agreement with J.P. Morgan Investment Management, Inc. (“J.P. Morgan”) (the “subadviser”), under which J.P. Morgan provides investment advisory services for the Portfolio. The Manager pays for the
B3
services of the subadviser, the cost of compensation of officers of the Portfolio, occupancy and certain clerical and administrative expenses of the Portfolio. The Portfolio bears all other costs and expenses. Prior to January 26, 2019, the Manager had a subadvisory agreement with Jennison Associates LLC.
The management fee paid to the Manager is accrued daily and payable monthly at an annual rate of 0.60% of the Portfolio’s average daily net assets of the Fund. All amounts paid or payable by the Portfolio to the Manager, under the agreement, are reflected in the Statement of Operations.
The Series Fund, on behalf of the Portfolio, has a distribution agreement, pursuant to Rule12b-1 under the 1940 Act, with Prudential Investment Management Services LLC (“PIMS”), which acts as the distributor of the Class I and Class II shares of the Portfolio. The Portfolio compensates PIMS for distributing and servicing the Portfolio’s Class II shares pursuant to a plan of distribution (the “Class II Plan”), regardless of expenses actually incurred by PIMS. The distribution fees are accrued daily and payable monthly. No distribution or service fees are paid to PIMS as distributor of the Class I shares of the Portfolio. Pursuant to the Class II Plan, the Class II shares of the Portfolio compensate PIMS for distribution-related activities at an annual rate of 0.25% of the average daily net assets of the Class II shares.
The Series Fund has an administration agreement with the Manager, which acts as the administrator of the Class II shares of the Portfolio. The administration fee paid to the Manager is accrued daily and payable monthly, at the annual rate of 0.15% of the average daily net assets of the Class II shares.
The Series Fund, on behalf of the Portfolio, has entered into brokerage commission recapture agreements with certain registered broker-dealers. Under the brokerage commission recapture program, a portion of the commission is returned to the Portfolio on whose behalf the trades were made. Commission recapture is paid solely to those portfolios generating the applicable trades. Such amounts are included within realized gain (loss) on investment transactions presented in the Statement of Operations. For the reporting period ended December 31, 2019, brokerage commission recaptured under these agreements was $1,390.
PGIM Investments and PIMS are indirect, wholly-owned subsidiaries of Prudential.
| 3. | | Other Transactions with Affiliates |
a.) Related Parties
Prudential Mutual Fund Services LLC (“PMFS”), an affiliate of PGIM Investments and an indirect, wholly-owned subsidiary of Prudential, serves as the transfer agent of the Portfolio. The transfer agent’s fees and expenses in the Statement of Operations include certainout-of-pocket expenses paid tonon-affiliates, where applicable.
The Portfolio may invest its overnight sweep cash in the PGIM Core Ultra Short Bond Fund (the “Core Fund”) and its securities lending cash collateral in the PGIM Institutional Money Market Fund (the “Money Market Fund”), each a series of Prudential Investment Portfolios 2, registered under the 1940 Act and managed by PGIM Investments. Through the Portfolio’s investments in the mentioned underlying funds, PGIM Investments and/or its affiliates are paid fees or reimbursed for providing their services. In addition to the realized and unrealized gains on investments in the Core Fund and Money Market Fund, earnings from such investments are disclosed on the Statement of Operations as “Affiliated dividend income” and “Income from securities lending, net”, respectively.
The Portfolio may enter into certain securities purchase or sale transactions under Board approved Rule17a-7 procedures. Rule17a-7 is an exemptive rule under the 1940 Act, that subject to certain conditions, permits purchase and sale transactions among affiliated investment companies, or between an investment company and a person that is affiliated solely by reason of having a common (or affiliated) investment adviser, common directors, and/or common officers. Pursuant to the Rule17a-7 procedures and consistent with guidance issued by the Securities and Exchange Commission (“SEC”), the Series Fund’s Chief Compliance Officer (“CCO”) prepares a quarterly summary of all such transactions for submission to the Board, together with the CCO’s written representation that all such17a-7 transactions were effected in accordance with the Series Fund’s Rule17a-7 procedures. For the reporting period ended December 31, 2019, no17a-7 transactions were entered into by the Portfolio.
b.) Securities Lending and Foreign Withholding Tax Reclaim Matters
B4
In September 2019, the Manager reached a settlement with the SEC relating to the securities lending and foreign withholding tax reclaim matters described below. Under the settlement, the Manager agreed to pay to the SEC disgorgement of fees and a civil penalty. The settlement does not affect the Manager’s ability to manage the Portfolio.
In February 2016, Prudential, the parent company of the Manager, self-reported to the SEC and certain other regulators that, in some cases, it failed to maximize securities lending income for certain Portfolios of the Series Fund due to a long-standing restriction benefitting Prudential. The Board was not notified of the restriction until after it had been removed. Prudential paid each of the affected Portfolios an amount equal to the estimated loss associated with the unauthorized restriction. At the Board’s direction, this payment occurred on June 30, 2016. The estimated opportunity loss was calculated by an independent consultant hired by Prudential whose calculation methodology was subsequently reviewed by a consultant retained by the independent trustees of the Portfolios. The per share amount ofopportunity loss payment to the Portfolios is disclosed in the Portfolio’s “Financial Highlights” as “Capital Contributions” for the fiscal year ended December 31, 2016.
In March 2018, Prudential further notified the SEC that it failed to timely reimburse certain Portfolios for amounts due under protocols established to ensure that the Portfolios were not harmed as a result of their tax status as partnerships instead of regulated investment companies (RICs). Specifically, as a result of their partnership status, the Portfolios are subject to higher foreign withholding tax rates on dividend and interest income in certain foreign jurisdictions and/or are subject to delays in repayment of taxes withheld by certain foreign jurisdictions (collectively, “excess withholding tax”). Prudential’s protocols were intended to protect the Portfolios from these differences and delays. In consultation with the Series Fund’s independent trustees, Prudential paid each of the affected Portfolios an amount equal to the excess withholding tax in addition to an amount equal to the applicable Portfolio’s rate of return (“opportunity loss”) applied to these excess withholding tax amounts for periods from the various transaction dates, beginning January 2, 2006 (the date when the Portfolios were converted to partnerships for tax purposes), through February 28, 2018 (the date through which the previously established protocols were not uniformly implemented). The amount due to each Portfolio was calculated by Prudential with the help of a third-party consultant. Those amounts and the methodology used by Prudential to derive them, were evaluated and confirmed by a consultant retained by the Series Fund’s independent trustees. The excess withholding tax analysis considered detriments to the Portfolios due to their tax status as partnerships arising from both timing differences (i.e., jurisdictions in which the Portfolio was subject to a higher withholding tax rate due to its tax status which is reclaimable) as described above as well as permanent tax detriments (i.e., jurisdictions in which the Portfolio was subject to a higher withholding tax rate due to its tax status which is not reclaimable). Further, the opportunity loss due to each Portfolio also was calculated by a third-party consultant hired by Prudential whose calculation methodology was subsequently reviewed by a consultant retained by the Series Fund’s independent trustees. The aggregate previously unreimbursed excess withholding tax and/or opportunity loss payment for the Portfolio are disclosed in the Portfolio’s “Statements of Changes in Net Assets” and “Financial Highlights” as “Capital Contributions” for the fiscal year ending December 31, 2018.
In addition to the above, Prudential committed to the Series Fund’s independent trustees that it would pay all consulting, legal, audit, and other charges, fees and expenses incurred with the matters described above. Prudential has made and continues to make these payments.
During the reporting period and in consultation with the Series Fund’s independent trustees, Prudential instituted a process to reimburse the affected Portfolios for any future excess withholding tax on the first business day following thepay-date of the applicable dividend or interest income event regardless of whether the excess withholding tax is due to timing differences or permanent detriments resulting from the Portfolios’ partnership tax status.
In cases in which the excess withholding tax is due to timing differences and is reclaimable from the foreign jurisdiction, the affected Portfolios have the ability to recover the excess withholding tax withheld by filing a reclaim with the relevant foreign tax authority. To avoid a Portfolio receiving and retaining a duplicate payment for the same excess withholding tax, payments received by an applicable Portfolio from a foreign tax authority for reclaims for which a Portfolio previously received reimbursement from Prudential will be payable to Prudential. Pending tax reclaim amounts due to Prudential for excess withholding tax which Prudential previously paid to the Portfolios are reported as “Payable to affiliate” on the “Statement of Assets and Liabilities” and any amounts accrued but not yet reimbursed by Prudential for excess withholding tax is recorded as “Receivable from affiliate” on the Statement of Assets and Liabilities. The full amount of tax reclaims due to a Portfolio, inclusive of timing differences and routine tax reclaims for foreign jurisdictions where the Portfolios do not incur an excess withholding tax is included as “Tax reclaim receivable” on the “Statement of Assets and Liabilities.” To the extent that there are costs associated with
B5
the filing of any reclaim attributable to excess withholding tax, those costs are borne by Prudential.
The following amount has been paid by Prudential for excess withholding taxes related to timing differences as described above for certain countries due to the Portfolio’s status as a partnership for tax purposes.
| | | | |
Portfolio | | 2019 Payment | |
SP Prudential U.S. Emerging Growth Portfolio | | $ | 4,390 | |
The aggregate cost of purchases and proceeds from sales of portfolio securities (excluding short-term investments and U.S. Government securities) for the year ended December 31, 2019, were $263,857,188 and $270,535,654, respectively.
A summary of the cost of purchases and proceeds from sales of shares of affiliated investments for the year ended December 31, 2019, is presented as follows:
| | | | | | | | | | | | | | | | | | | | | | | | | | | | | | |
Value,
Beginning of
Year | | | Cost of
Purchases | | | Proceeds
from Sales | | | Change in
Unrealized
Gain
(Loss) | | | Realized
Gain
(Loss) | | | Value,
End of Year | | | Shares,
End
of Year | | | Income | |
| | PGIM Core Ultra Short Bond Fund* | |
| $ | 11,121,333 | | | $ | 65,154,195 | | | $ | 73,918,672 | | | $ | — | | | $ | — | | | $ | 2,356,856 | | | | 2,356,856 | | | $ | 178,680 | |
| | PGIM Institutional Money Market Fund* | | | | | | | | | | | | | | | | | | | | | |
| | 19,740,874 | | | | 243,316,055 | | | | 224,575,709 | | | | 3,725 | | | | (5,020 | ) | | | 38,479,925 | | | | 38,472,231 | | | | 80,098 | ** |
| | | | | | | | | | | | | | | | | | | | | | | | | | | | | | |
| $ | 30,862,207 | | | $ | 308,470,250 | | | $ | 298,494,381 | | | $ | 3,725 | | | $ | (5,020 | ) | | $ | 40,836,781 | | | | | | | $ | 258,778 | |
| | | | | | | | | | | | | | | | | | | | | | | | | | | | | | |
| | * | The Fund did not have any capital gain distributions during the reporting period. |
| | ** | Represents the affiliated amount of securities lending income shown on the Statement of Operations. |
The Portfolio is treated as a partnership for federal income tax purposes. The character of the cash distributions, if any, made by the partnership is generally classified as nontaxable return of capital distributions. After each fiscal year each shareholder of record will receive information regarding their distributive allocable share of the partnership’s income, gains, losses and deductions.
With respect to the Portfolio, book cost of assets differs from tax cost of assets as a result of the Portfolio’s adoption of a mark to market method of accounting for tax purposes. Under this method, tax cost of assets will approximate fair market value.
The Manager has analyzed the Portfolio’s tax positions taken on federal, state and local income tax returns for all open tax years and has concluded that no provision for income tax is required in the Portfolio’s financial statements for the current reporting period. Since tax authorities can examine previously filed tax returns, the Portfolio’s U.S. federal and state tax returns for each of the four fiscal years up to the most recent fiscal year ended December 31, 2019 are subject to such review.
The Series Fund, on behalf of the Portfolio, along with other affiliated registered investment companies (the “Funds”), is a party to a Syndicated Credit Agreement (“SCA”) with a group of banks. The purpose of the SCA is to provide an alternative source of temporary funding for capital share redemptions. The table below provides details of the current SCA in effect at the reportingperiod-end as well as the prior SCA.
| | | | |
| | Current SCA | | Prior SCA |
Term of Commitment | | 10/3/2019 – 10/1/2020 | | 10/4/2018 – 10/2/2019 |
Total Commitment | | $ 900 million | | $ 900 million |
Annualized Commitment Fee on the Unused Portion of the SCA | | 0.15% | | 0.15% |
B6
| | | | |
| | Current SCA | | Prior SCA |
Annualized Interest Rate on Borrowings | | 1.20% plus the higher of (1) the effective federal funds rate, (2) theone-month LIBOR rate or (3) zero percent | | 1.25% plus the higher of (1) the effective federal funds rate, (2) theone-month LIBOR rate or (3) zero percent |
Certain affiliated registered investment companies that are parties to the SCA include portfolios that are subject to a predetermined mathematical formula used to manage certain benefit guarantees offered under variable annuity contracts. The formula may result in large scale asset flows into and out of these portfolios. Consequently, these portfolios may be more likely to utilize the SCA for purposes of funding redemptions. It may be possible for those portfolios to fully exhaust the committed amount of the SCA, thereby requiring the Manager to allocate available funding per a Board-approved methodology designed to treat the Funds in the SCA equitably.
The Portfolio utilized the SCA during the year ended December 31, 2019. The average daily balance for the 1 day that the Portfolio had loans outstanding during the period was approximately $164,000, borrowed at a weighted average interest rate of 3.01%. The maximum loan outstanding amount during the period was $164,000. At December 31, 2019, the Portfolio did not have an outstanding loan amount.
The Portfolio offers Class I and Class II shares. Neither Class I nor Class II shares of the Portfolio are subject to any sales charge or redemption charge and are sold at the net asset value of the Portfolio. Class I shares are sold only to certain separate accounts of Prudential to fund benefits under certain variable life insurance and variable annuity contracts (“contracts”). Class II shares are sold only to separate accounts ofnon-Prudential insurance companies as investment options under certain contracts. Class I shares are also offered to separate accounts ofnon-affiliated insurers for which Prudential or its affiliates administer and/or reinsure the variable life insurance or variable annuity contracts issued in connection with the separate accounts. The separate accounts invest in shares of the Portfolio through subaccounts that correspond to the Portfolio. The separate accounts will redeem shares of the Portfolio to the extent necessary to provide benefits under the contracts or for such other purposes as may be consistent with the contracts.
As of December 31, 2019, the following number of shares of the Portfolio were owned of record directly or by other Portfolios as part of their investments by insurance affiliates of Prudential Financial, Inc.
| | | | | | | | |
Portfolio | | Number of Shares | | | Percentage of
Outstanding Shares | |
SP Prudential U.S. Emerging Growth Portfolio — Class I | | | 14,905,489 | | | | 100 | % |
The following number of shareholders of record, each holding greater than 5% of the Portfolio, held the following percentage of outstanding shares, on behalf of multiple beneficial owners:
| | | | | | | | | | | | | | | | |
| | | Affiliated | | | Unaffiliated | |
Portfolio | | Number of
Shareholders | | | Percentage of
Outstanding
Shares | | | Number of
Shareholders | | | Percentage of
Outstanding
Shares | |
SP Prudential U.S. Emerging Growth Portfolio | | | 2 | | | | 99 | % | | | — | | | | — | % |
Transactions in shares of beneficial interest were as follows:
| | | | | | | | |
| Class I: | | Shares | | | Amount | |
Year ended December 31, 2019: | | | | | | | | |
Portfolio shares sold | | | 561,212 | | | $ | 9,543,598 | |
Portfolio shares repurchased | | | (1,420,719 | ) | | | (23,926,134 | ) |
| | | | | | | | |
Net increase (decrease) in shares outstanding | | | (859,507 | ) | | $ | (14,382,536 | ) |
| | | | | | | | |
Year ended December 31, 2018: | | | | | | | | |
Portfolio shares sold | | | 526,326 | | | $ | 7,945,032 | |
Portfolio shares repurchased | | | (1,659,004 | ) | | | (25,324,498 | ) |
Capital contributions | | | — | | | | 11,256 | |
| | | | | | | | |
Net increase (decrease) in shares outstanding | | | (1,132,678 | ) | | $ | (17,368,210 | ) |
| | | | | | | | |
B7
| | | | | | | | |
| Class II: | | Shares | | | Amount | |
Year ended December 31, 2019: | | | | | | | | |
Portfolio shares sold | | | 1,978 | | | $ | 31,372 | |
Portfolio shares repurchased | | | (16,204 | ) | | | (255,328 | ) |
| | | | | | | | |
Net increase (decrease) in shares outstanding | | | (14,226 | ) | | $ | (223,956 | ) |
| | | | | | | | |
Year ended December 31, 2018: | | | | | | | | |
Portfolio shares sold | | | 5,372 | | | $ | 77,414 | |
Portfolio shares repurchased | | | (4,223 | ) | | | (59,624 | ) |
Capital contributions | | | — | | | | 28 | |
| | | | | | | | |
Net increase (decrease) in shares outstanding | | | 1,149 | | | $ | 17,818 | |
| | | | | | | | |
| 8. | | Risks of Investing in the Portfolio |
The Portfolio’s risks include, but are not limited to, some or all of the risks discussed below:
Emerging Markets Risk:The risks of foreign investments are greater for investments in or exposed to emerging markets. Emerging market countries typically have economic and political systems that are less fully developed, and can be expected to be less stable, than those of more developed countries. For example, the economies of such countries can be subject to rapid and unpredictable rates of inflation or deflation. Low trading volumes may result in a lack of liquidity and price volatility.
Equity and Equity-Related Securities Risks:The value of a particular security could go down and you could lose money. In addition to an individual security losing value, the value of the equity markets or a sector in which the Portfolio invests could go down. The Portfolio’s holdings can vary significantly from broad market indexes and the performance of the Portfolio can deviate from the performance of these indexes. Different parts of a market can react differently to adverse issuer, market, regulatory, political and economic developments.
Market and Credit Risk:Securities markets may be volatile and the market prices of the Portfolio’s securities may decline. Securities fluctuate in price based on changes in an issuer’s financial condition and overall market and economic conditions. If the market prices of the securities owned by the Portfolio fall, the value of an investment in the Portfolio will decline. Additionally, the Portfolio may also be exposed to credit risk in the event that an issuer or guarantor fails to perform or that an institution or entity with which the Portfolio has unsettled or open transactions defaults.
| 9. | | Recent Accounting Pronouncements and Reporting Updates |
In August 2018, the FASB issued Accounting Standards Update (“ASU”)No. 2018-13, which changes certain fair value measurement disclosure requirements. The new ASU, in addition to other modifications and additions, removes the requirement to disclose the amount and reasons for transfers between Level 1 and Level 2 of the fair value hierarchy, and the Portfolio’s policy for the timing of transfers between levels. The amendments are effective for financial statements issued for fiscal years beginning after December 15, 2019, and interim periods within those fiscal years. The Manager has evaluated the implications of certain provisions of the ASU and has adopted the aspects related to the removal and modification of certain fair value measurement disclosures under the ASU. The Manager continues to evaluate certain other provisions of the ASU and does not expect a material impact to financial statement disclosures.
B8
Financial Highlights
| | | | | | | | | | | | | | | | | | | | |
| | | SP Prudential U.S. Emerging Growth Portfolio—Class I | |
| | | Year Ended December 31, | |
| | | 2019 | | | 2018 | | | 2017 | | | 2016 | | | 2015 | |
Per Share Operating Performance(a): | | | | | | | | | | | | | | | | | | | | |
Net Asset Value, beginning of year | | $ | 13.63 | | | $ | 14.79 | | | $ | 12.08 | | | $ | 11.58 | | | $ | 11.86 | |
| | | | | | | | | | | | | | | | | | | | |
Income (Loss) From Investment Operations: | | | | | | | | | | | | | | | | | | | | |
Net investment income (loss) | | | (— | )(b) | | | 0.02 | | | | 0.02 | | | | 0.01 | | | | — | (c) |
Net realized and unrealized gain (loss) on investment transactions | | | 5.14 | | | | (1.18 | ) | | | 2.69 | | | | 0.47 | | | | (0.28 | ) |
| | | | | | | | | | | | | | | | | | | | |
Total from investment operations | | | 5.14 | | | | (1.16 | ) | | | 2.71 | | | | 0.48 | | | | (0.28 | ) |
| | | | | | | | | | | | | | | | | | | | |
Capital Contributions | | | — | | | | — | (c)(d) | | | — | | | | 0.02 | (e) | | | — | |
| | | | | | | | | | | | | | | | | | | | |
Net Asset Value, end of year | | $ | 18.77 | | | $ | 13.63 | | | $ | 14.79 | | | $ | 12.08 | | | $ | 11.58 | |
| | | | | | | | | | | | | | | | | | | | |
Total Return(f) | | | 37.71 | % | | | (7.84 | )%(g) | | | 22.43 | % | | | 4.32 | %(h) | | | (2.36 | )% |
Ratios/Supplemental Data: | | | | | | | | | | | | | | | | | | | | |
Net assets, end of year (in millions) | | $ | 279.8 | | | $ | 214.8 | | | $ | 249.8 | | | $ | 217.7 | | | $ | 223.3 | |
Average net assets (in millions) | | $ | 257.0 | | | $ | 248.2 | | | $ | 235.7 | | | $ | 215.0 | | | $ | 244.7 | |
Ratios to average net assets(i): | | | | | | | | | | | | | | | | | | | | |
Expenses after waivers and/or expense reimbursement | | | 0.70 | % | | | 0.68 | % | | | 0.71 | % | | | 0.69 | % | | | 0.67 | % |
Expenses before waivers and/or expense reimbursement | | | 0.70 | % | | | 0.68 | % | | | 0.71 | % | | | 0.69 | % | | | 0.67 | % |
Net investment income (loss) | | | (0.01 | )% | | | 0.15 | % | | | 0.18 | % | | | 0.10 | % | | | (0.01 | )% |
Portfolio turnover rate(j) | | | 106 | % | | | 43 | % | | | 39 | % | | | 35 | % | | | 34 | % |
| |
| | | SP Prudential U.S. Emerging Growth Portfolio—Class II | |
| | | Year Ended December 31, | |
| | | 2019 | | | 2018 | | | 2017 | | | 2016 | | | 2015 | |
Per Share Operating Performance(a): | | | | | | | | | | | | | | | | | | | | |
Net Asset Value, beginning of year | | $ | 12.81 | | | $ | 13.95 | | | $ | 11.44 | | | $ | 11.02 | | | $ | 11.33 | |
| | | | | | | | | | | | | | | | | | | | |
Income (Loss) From Investment Operations: | | | | | | | | | | | | | | | | | | | | |
Net investment income (loss) | | | (0.06 | ) | | | (0.03 | ) | | | (0.03 | ) | | | (0.03 | ) | | | (0.05 | ) |
Net realized and unrealized gain (loss) on investment transactions | | | 4.82 | | | | (1.11 | ) | | | 2.54 | | | | 0.43 | | | | (0.26 | ) |
| | | | | | | | | | | | | | | | | | | | |
Total from investment operations | | | 4.76 | | | | (1.14 | ) | | | 2.51 | | | | 0.40 | | | | (0.31 | ) |
| | | | | | | | | | | | | | | | | | | | |
Capital Contributions | | | — | | | | — | (c)(d) | | | — | | | | 0.02 | (e) | | | — | |
| | | | | | | | | | | | | | | | | | | | |
Net Asset Value, end of year | | $ | 17.57 | | | $ | 12.81 | | | $ | 13.95 | | | $ | 11.44 | | | $ | 11.02 | |
| | | | | | | | | | | | | | | | | | | | |
Total Return(f) | | | 37.16 | % | | | (8.17 | )%(g) | | | 21.94 | % | | | 3.81 | %(h) | | | (2.74 | )% |
Ratios/Supplemental Data: | | | | | | | | | | | | | | | | | | | | |
Net assets, end of year (in millions) | | $ | 0.5 | | | $ | 0.5 | | | $ | 0.6 | | | $ | 0.8 | | | $ | 0.8 | |
Average net assets (in millions) | | $ | 0.6 | | | $ | 0.6 | | | $ | 0.8 | | | $ | 0.8 | | | $ | 1.0 | |
Ratios to average net assets(i): | | | | | | | | | | | | | | | | | | | | |
Expenses after waivers and/or expense reimbursement | | | 1.10 | % | | | 1.08 | % | | | 1.10 | % | | | 1.09 | % | | | 1.07 | % |
Expenses before waivers and/or expense reimbursement | | | 1.10 | % | | | 1.08 | % | | | 1.10 | % | | | 1.09 | % | | | 1.07 | % |
Net investment income (loss) | | | (0.40 | )% | | | (0.24 | )% | | | (0.22 | )% | | | (0.30 | )% | | | (0.40 | )% |
Portfolio turnover rate(j) | | | 106 | % | | | 43 | % | | | 39 | % | | | 35 | % | | | 34 | % |
| (a) | Calculated based on average shares outstanding during the year. |
| (b) | Less than $(0.005) per share. |
| (c) | Less than $0.005 per share. |
| (d) | Represents payment received by the Portfolio, from Prudential, in connection with the failure to timely compensate the Portfolio for the excess foreign withholding tax withheld on dividends and interest from certain countries due to the Portfolio’s tax status as a partnership. |
| (e) | Represents payment received by the Portfolio, from Prudential, in connection with the failure to maximize securities lending income due to a restriction that benefited Prudential. |
| (f) | Total return is calculated assuming a purchase of a share on the first day and a sale on the last day of each year reported and includes reinvestment of dividends and distributions, if any, and does not reflect the effect of insurance contract charges. Total return does not reflect expenses associated with the separate account such as administrative fees, account charges and surrender charges which, if reflected, would reduce the total return for all years shown. Performance figures may reflect fee waivers and/or expense reimbursements. In the absence of fee waivers and/or expense reimbursements, the total return would be lower. Past performance is no guarantee of future results. Total returns may reflect adjustments to conform to generally accepted accounting principles. |
| (g) | Total return for the year includes the impact of the capital contribution, which was not material to the total return. |
| (h) | Total return for the year includes the impact of the capital contribution. Excluding the capital contribution, the total return would have been 4.15% and 3.63% for Class I and Class II, respectively. |
| (i) | Does not include expenses of the investment companies in which the Portfolio invests. |
| (j) | The Portfolio’s portfolio turnover rate is calculated in accordance with regulatory requirements, without regard to transactions involving short-term investments and certain derivatives. If such transactions were included, the Portfolio’s portfolio turnover rate may be higher. |
SEE NOTES TO FINANCIAL STATEMENTS.
C1
REPORT OF INDEPENDENT REGISTERED PUBLIC ACCOUNTING FIRM
TO THE SHAREHOLDERS OF SP PRUDENTIAL U.S. EMERGING GROWTH PORTFOLIO AND BOARD OF TRUSTEES
THE PRUDENTIAL SERIES FUND:
Opinion on the Financial Statements
We have audited the accompanying statement of assets and liabilities of SP Prudential U.S. Emerging Growth Portfolio, a portfolio of The Prudential Series Fund, (the Portfolio), including the schedule of investments, as of December 31, 2019, the related statement of operations for the year then ended, the statements of changes in net assets for each of the years in thetwo-year period then ended, and the related notes (collectively, the financial statements) and the financial highlights for the each of the years indicated therein. In our opinion, the financial statements and financial highlights present fairly, in all material respects, the financial position of the Portfolio as of December 31, 2019, the results of its operations for the year then ended, the changes in its net assets for each of the years in thetwo-year period then ended, and the financial highlights for each of the years indicated therein, in conformity with U.S. generally accepted accounting principles.
Basis for Opinion
These financial statements and financial highlights are the responsibility of the Portfolio’s management. Our responsibility is to express an opinion on these financial statements and financial highlights based on our audits. We are a public accounting firm registered with the Public Company Accounting Oversight Board (United States) (PCAOB) and are required to be independent with respect to the Portfolio in accordance with the U.S. federal securities laws and the applicable rules and regulations of the Securities and Exchange Commission and the PCAOB.
We conducted our audits in accordance with the standards of the PCAOB. Those standards require that we plan and perform the audit to obtain reasonable assurance about whether the financial statements and financial highlights are free of material misstatement, whether due to error or fraud. Our audits included performing procedures to assess the risks of material misstatement of the financial statements and financial highlights, whether due to error or fraud, and performing procedures that respond to those risks. Such procedures included examining, on a test basis, evidence regarding the amounts and disclosures in the financial statements and financial highlights. Such procedures also included confirmation of securities owned as of December 31, 2019, by correspondence with the custodian, transfer agent, and brokers, or by other appropriate auditing procedures when replies were not received. Our audits also included evaluating the accounting principles used and significant estimates made by management, as well as evaluating the overall presentation of the financial statements and financial highlights. We believe that our audits provide a reasonable basis for our opinion.

We have served as the auditor of one or more PGIM and/or Prudential Insurance investment companies since 2003.
New York, New York
February 14, 2020
D1
INFORMATION ABOUT TRUSTEES AND OFFICERS (Unaudited)
Information about the Trustees and the officers of the Trust is set forth below. Trustees who are not deemed to be “interested persons” of the Trust, as defined in the Investment Company Act of 1940 (1940 Act), are referred to as “Independent Trustees.” Trustees who are deemed to be “interested persons” of the Trust are referred to as “Interested Trustees.” The Trustees oversee the operations of the Trust and appoint officers who are responsible forday-to-day business decisions based on policies set by the Board.
| | | | | | |
| |
| Independent Trustees |
Name Date of Birth No. of Portfolios Overseen | | Principal Occupation(s) During Past Five Years | | Other Directorships Held | | Length of Board Service |
Susan Davenport Austin 10/19/1967 No. of Portfolios Overseen: 109 | | Chief Financial Officer of Grace Church School (Since September 2019); formerly Senior Managing Director of Brock Capital (2014-2019); formerly Vice Chairman (2013-2017), Senior Vice President and Chief Financial Officer (2007-2012) and Vice President of Strategic Planning and Treasurer (2002-2007) of Sheridan Broadcasting Corporation; formerly President of Sheridan Gospel Network (2004-2014); formerly Vice President, Goldman, Sachs & Co. (2000-2001); formerly Associate Director, Bear, Stearns & Co. Inc. (1997-2000); formerly Vice President, Salomon Brothers Inc. (1993-1997); Member of the Board of Directors, The MacDowell Colony (Since 2010); formerly Chairman (2011-2014), formerly Presiding Director (2014-2017) and currently a Member (2007-present) of the Board of Directors, Broadcast Music, Inc.; Member of the Board of Directors, Hubbard Radio, LLC (Since 2011); President, Candide Business Advisors, Inc. (Since 2011); formerly Member of the Board of Directors, National Association of Broadcasters (2004-2010). | | Director of NextEra Energy Partners, LP (NYSE: NEP) (Since February 2015); Director of Broadcast Music, Inc. (Since 2007). | | Since February 2011 |
Sherry S. Barrat 11/13/1949 No. of Portfolios Overseen: 109 | | Formerly Vice Chairman of Northern Trust Corporation (financial services and banking institution) (2011-June 2012); formerly President, Personal Financial Services, Northern Trust Corporation (2006-2010); formerly Chairman & CEO, Western US Region, Northern Trust Corporation (1999-2005); formerly President & CEO, Palm Beach/Martin County Region, Northern Trust. | | Director of NextEra Energy, Inc. (NYSE: NEE) (1998-Present); Director of Arthur J. Gallagher & Company (Since July 2013). | | Since January 2013 |
Jessica M. Bibliowicz 11/28/1959 No. of Portfolios Overseen: 109 | | Formerly Senior Adviser (2013-2019) of Bridge Growth Partners (private equity firm); formerly Director (2013-2016) of Realogy Holdings Corp. (residential real estate services); formerly Chief Executive Officer (1999-2013) of National Financial Partners (independent distributor of financial services products). | | Formerly Director (2006-2019) of The Asia Pacific Fund, Inc.; Sotheby’s (Since 2014) (auction house andart-related finance). | | Since September 2014 |
Kay Ryan Booth 11/1/1950 No. of Portfolios Overseen: 109 | | Partner, Trinity Private Equity Group (Since September 2014); formerly, Managing Director of Cappello Waterfield & Co. LLC (2011-2014); formerly Vice Chair, Global Research, J.P. Morgan (financial services and investment banking institution) (June 2008-January 2009); formerly Global Director of Equity Research, Bear Stearns & Co., Inc. (financial services and investment banking institution) (1995-2008); formerly Associate Director of Equity Research, Bear Stearns & Co., Inc.(1987-1995). | | None. | | Since January 2013 |
Stephen M. Chipman 10/26/1961 No. of Portfolios Overseen: 109 | | Formerly Group Managing Director, International Expansion and Regional Managing Director, Americas of Vistra (June 2018-June 2019); formerly Chief Executive Officer and Director of Radius (2016-2018); formerly Senior Vice Chairman (January 2015-October 2015) and Chief Executive Officer (January 2010-December 2014) of Grant Thornton LLP. | | Non-Executive Chairman (Since September 2019) of Litera Microsystems. | | Since January 2018 |
Robert F. Gunia 12/15/1946 No. of Portfolios Overseen: 109 | | Formerly Director of ICI Mutual Insurance Company (June 2016-June 2019; June 2012-June 2015); formerly Chief Administrative Officer (September 1999-September 2009) and Executive Vice President (December 1996-September 2009) of PGIM Investments LLC; formerly Executive Vice President (March 1999-September 2009) and Treasurer (May 2000-September 2009) of Prudential Mutual Fund Services LLC; formerly President (April 1999-December 2008) and Executive Vice President and Chief Operating Officer (December 2008-December 2009) of Prudential Investment Management Services LLC; formerly Chief Administrative Officer, Executive Vice President and Director(May 2003-September 2009) of AST Investment Services, Inc. | | Formerly Director (1989-2019) of The Asia Pacific Fund, Inc. | | Since July 2003 |
Thomas T. Mooney 11/11/1941 No. of Portfolios Overseen: 109 | | Formerly Chief Executive Officer, Excell Partners, Inc. (2005-2007); founding partner of High Technology of Rochester and the Lennox Technology Center; formerly President of the Greater Rochester Metro Chamber of Commerce (1976-2004); formerly Rochester City Manager (1973); formerly Deputy Monroe County Executive (1974-1976). | | None. | | Since July 2003 |
E1
| | | | | | |
| |
| Independent Trustees |
Name Date of Birth No. of Portfolios Overseen | | Principal Occupation(s) During Past Five Years | | Other Directorships Held | | Length of Board Service |
Thomas M. O’Brien 12/5/1950 No. of Portfolios Overseen: 109 | | Vice Chairman of Emigrant Bank and President of its Naples Commercial Finance Division (Since October 2018); formerly Director, President and CEO Sun Bancorp, Inc. N.A. (NASDAQ: SNBC) and Sun National Bank (July 2014-February 2018); formerly Consultant, Valley National Bancorp, Inc. and Valley National Bank (January 2012-June 2012); formerly President and COO (November 2006-April 2017) and CEO (April 2007-December 2011) of State Bancorp, Inc. and State Bank; formerly Vice Chairman (January 1997-April 2000) of North Fork Bank; formerly President and Chief Executive Officer (December 1984-December 1996) of North Side Savings Bank; formerly President and Chief Executive Officer (May 2000-June 2006) Atlantic Bank of New York. | | Formerly Director, Sun Bancorp, Inc. N.A. (NASDAQ: SNBC) and Sun National Bank (July 2014-February 2018); formerly Director, BankUnited, Inc. and BankUnited N.A. (NYSE: BKU) (May 2012-April 2014); formerly Director (April 2008-January 2012) of Federal Home Loan Bank of New York; formerly Director (December 1996-May 2000) of North Fork Bancorporation, Inc.; formerly Director (May 2000-April 2006) of Atlantic Bank of New York; Director (November 2006-January 2012) of State Bancorp, Inc. (NASDAQ: STBC) and State Bank of Long Island. | | Since July 2003 |
| |
| Interested Trustee |
Timothy S. Cronin 12/21/1965 No. of Portfolios Overseen: 109 | | Vice President of Prudential Annuities (Since June 2015); Senior Vice President of PGIM Investments LLC (Since May 2009); Chief Investment Officer and Strategist of Prudential Annuities (Since January 2004); Director of Investment & Research Strategy (Since February 1998); President of AST Investment Services, Inc. (Since June 2005). | | None. | | Since October 2009 |
| | | | |
| |
| Trust Officers(a) |
Name Date of Birth Position with the Trust | | Principal Occupation(s) During the Past Five Years | | Length of Service as Trust Officer |
Ken Allen 1/24/1969 Vice President | | Vice President of Investment Management (since December 2009) | | Since June 2019 |
Raymond A. O’Hara 9/19/1955 Chief Legal Officer | | Vice President and Corporate Counsel (since July 2010) of Prudential Insurance Company of America (Prudential); Vice President (March 2011-Present) of Pruco Life Insurance Company and Pruco Life Insurance Company of New Jersey; Vice President and Corporate Counsel (March 2011-Present) of Prudential Annuities Life Assurance Corporation; Chief Legal Officer of PGIM Investments LLC (since June 2012); Chief Legal Officer of Prudential Mutual Fund Services LLC (since June 2012) and Corporate Counsel of AST Investment Services, Inc. (since June 2012); formerly Assistant Vice President and Corporate Counsel (September 2008-July 2010) of The Hartford Financial Services Group, Inc.; formerly Associate (September 1980-December 1987) and Partner (January 1988-August 2008) of Blazzard & Hasenauer, P.C. (formerly, Blazzard, Grodd & Hasenauer, P.C.). | | Since June 2012 |
Andrew R. French 12/22/1962 Secretary | | Vice President within PGIM Investments LLC (December 2018-Present); formerly Vice President and Corporate Counsel (February 2010-December 2018) of Prudential; formerly Director and Corporate Counsel (2006-2010) of Prudential; Vice President and Assistant Secretary (since January 2007) of PGIM Investments LLC; Vice President and Assistant Secretary (since January 2007) of Prudential Mutual Fund Services LLC. | | Since October 2006 |
Jonathan D. Shain 8/9/1958 Assistant Secretary | | Vice President and Corporate Counsel (since August 1998) of Prudential; Vice President and Assistant Secretary (since May 2001) of PGIM Investments LLC; Vice President and Assistant Secretary (since February 2001) of Prudential Mutual Fund Services LLC; formerly Vice President and Assistant Secretary (May 2003-June 2005) of AST Investment Services, Inc. | | Since May 2005 |
Claudia DiGiacomo 10/14/1974 Assistant Secretary | | Vice President and Corporate Counsel (since January 2005) of Prudential; Vice President and Assistant Secretary of PGIM Investments LLC (since December 2005); Associate at Sidley Austin Brown Wood LLP (1999-2004). | | Since December 2005 |
Melissa Gonzalez 2/10/1980 Assistant Secretary | | Vice President and Corporate Counsel (since September 2018) of Prudential; formerly Director and Corporate Counsel (March 2014-September 2018) of Prudential. | | Since March 2019 |
Dino Capasso 8/19/1974 Chief Compliance Officer | | Chief Compliance Officer (July 2019-Present) of PGIM Investments LLC; Chief Compliance Officer (July 2019-Present) of the PGIM Funds, Target Funds, Advanced Series Trust, The Prudential Series Fund, Prudential’s Gibraltar Fund, Inc., PGIM Global High Yield Fund, Inc., and PGIM High Yield Bond Fund, Inc.; Vice President and Deputy Chief Compliance Officer (June 2017-July 2019) of PGIM Investments LLC; formerly, Senior Vice President and Senior Counsel (January 2016-June 2017), and Vice President and Counsel (February 2012-December 2015) of Pacific Investment Management Company LLC. | | Since March 2018 |
E2
| | | | |
| |
| Trust Officers(a) |
Name Date of Birth Position with the Trust | | Principal Occupation(s) During the Past Five Years | | Length of Service as Trust Officer |
Charles H. Smith 1/11/1973 Anti-Money Laundering Compliance Officer | | Vice President, Corporate Compliance, Anti-Money Laundering Unit (since January 2015) of Prudential; committee member of the American Council of Life Insurers Anti-Money Laundering and Critical Infrastructure Committee (since January 2016); formerly Global Head of Economic Sanctions Compliance at AIG Property Casualty (February 2007-December 2014); Assistant Attorney General at the New York State Attorney General’s Office, Division of Public Advocacy (August 1998-January 2007). | | Since January 2017 |
Christian J. Kelly 5/5/1975 Treasurer and Principal Financial and Accounting Officer | | Vice President, Head of Fund Administration of PGIM Investments LLC (since November 2018); formerly, Director of Fund Administration of Lord Abbett & Co. LLC (2009-2018), Treasurer and Principal Accounting Officer of the Lord Abbett Family of Funds (2017-2018); Director of Accounting, Avenue Capital Group (2008-2009); Senior Manager, Investment Management Practice of Deloitte & Touche LLP (1998-2007). | | Since January 2019 |
Lana Lomuti 6/7/1967 Assistant Treasurer | | Vice President (since 2007) and Director (2005-2007), within PGIM Investments Fund Administration; formerly Assistant Treasurer (December 2007-February 2014) of The Greater China Fund, Inc. | | Since April 2014 |
Russ Shupak 10/08/73 Assistant Treasurer | | Vice President (since 2017) and Director (2013-2017), within PGIM Investments Fund Administration. | | Since October 2019 |
Deborah Conway 3/26/69 Assistant Treasurer | | Vice President (since 2017) and Director (2007-2017), within PGIM Investments Fund Administration. | | Since October 2019 |
Elyse M. McLaughlin 1/20/74 Assistant Treasurer | | Vice President (since 2017) and Director (2011-2017), within PGIM Investments Fund Administration. | | Since October 2019 |
Alina Srodecka, CPA 8/19/1966 Assistant Treasurer | | Vice President of Tax at Prudential Financial, Inc. (Since August 2007); formerly Director of Tax at MetLife (January 2003-May 2006); formerly Tax Manager at Deloitte & Touché (October 1997-January 2003); formerly Staff Accountant at Marsh & McLennan (May 1994-May 1997). | | Since June 2017 |
(a) Excludes Mr. Cronin, an Interested Trustee who also serves as President.
Explanatory Notes to Tables:
Trustees are deemed to be “Interested,” as defined in the 1940 Act, by reason of their affiliation with PGIM Investments and/or an affiliate of PGIM Investments. Timothy S. Cronin is an Interested Trustee because he is employed by an affiliate of the Manager.
Unless otherwise noted, the address of all Trustees and Officers is c/o PGIM Investments LLC, 655 Broad Street, Newark, New Jersey 07102.
There is no set term of office for Trustees or Officers. The Independent Trustees have adopted a retirement policy, which calls for the retirement of Trustees on December 31 of the year in which they reach the age of 78, provided that the Board may extend the retirement age on ayear-by-year basis for a Trustee.
“Other Directorships Held” includes only directorships of companies required to register or file reports with the SEC under the 1934 Act (that is, “public companies”) or other investment companies registered under the 1940 Act.
“No. of Portfolios Overseen” includes all investment companies managed by PGIM Investments and/or ASTIS that are overseen by the Trustee. The investment companies for which PGIM Investments and/or ASTIS serves as Manager include The Prudential Variable Contract Accounts, The Prudential Series Fund, Advanced Series Trust, Prudential’s Gibraltar Fund, Inc., the PGIM Funds, the PGIM High Yield Bond Fund, Inc. and PGIM Global High Yield Fund, Inc.
E3
The prospectuses for the Prudential Series Fund portfolios and the applicable variable annuity or variable life prospectuses contain information on the investment objectives, risks, charges and expenses of the portfolios and on the contracts and should be read carefully.
Information regarding how the Fund voted proxies relating to portfolio securities during the most recent12-month period ended June 30 is available on the website of the Securities and Exchange Commission (the Commission) atwww.sec.gov and on the Fund’s website atwww.prudential.com/variableinsuranceportfolios.
The Fund files with the Commission a complete listing of portfolio holdings as of its first and third calendar quarter-end on Form N-PORT. Form N-PORT is available on the Commission’s website atwww.sec.gov or call (800) SEC-0330.
The Fund’s Statement of Additional Information contains additional information about the Fund’s Trustees and is available without charge upon request by calling the appropriate phone number listed below.
To contact your client services representative, please call the phone number listed below. Thank you.
Owners of Individual Annuity contracts should call (888) 778-2888.
Owners of Individual Life Insurance contracts should call (800) 778-2255.
Owners of Group Variable Universal Life Insurance contracts should call (800) 562-9874.
Owners of Group Variable Universal Life Insurance contracts through AICPA should call (800) 223-7473.
The Prudential Series Fund may offer two classes of shares in each portfolio: Class I and Class II. Class I shares are sold only to separate accounts of The Prudential Insurance Company of America, Pruco Life Insurance Company, and Pruco Life Insurance Company of New Jersey (collectively, Prudential) and to separate accounts of insurance companies not affiliated with Prudential where Prudential has assumed responsibility for the administration of contracts issued through such non-affiliated insurance companies, as investment options under variable life insurance and variable annuity contracts (the Contracts). (A separate account keeps the assets supporting certain insurance contracts separate from the general assets and liabilities of the insurance company.) Class II shares are offered only to separate accounts of non-Prudential insurance companies for the same types of Contracts.
Annuity and life insurance contracts contain exclusions, limitations, reductions of benefits, and terms for keeping them in force. Your licensed financial professional can provide you with costs and complete details. Contract guarantees are based on the claims-paying ability of the issuing company.
The Prudential Insurance Company of America
751 Broad Street
Newark, NJ 07102-3714
Presorted
Standard
U.S. Postage
PAID
Prudential
The Audited Financial Statements of Pruco Life Insurance Company, Pruco Life Insurance Company of New Jersey, Prudential Annuities Life Assurance Corporation, and The Prudential Insurance Company of America are available upon request. You may call(800) 778-2255 to obtain a free copy of the audited financial statements of the insurance company that issued your contract.
To reduce costs, we now generally send only a single copy of prospectuses and shareholder reports to each household (householding) in lieu of sending a copy to each Contract Owner who resides in the household. Householding is not yet available on all products. You should be aware that by calling (877) 778-5008, you can revoke, or “opt out,” of householding at any time, which may increase the volume of mail you will receive.
©2020 Prudential Financial, Inc. and its related entities. PGIM Investments, the Prudential logo, the Rock symbol, and Bring Your Challenges are service marks of Prudential Financial, Inc. and its related entities, registered in many jurisdictions worldwide.
PSF-AR-SP US EM GROWTH

The Prudential Series Fund
| | |
| ANNUAL REPORT | | December 31, 2019 |

Based on the variable contract you own or the portfolios you invested in, you may receive additional reports for other portfolios. Please refer to your variable annuity or variable life insurance contract prospectus to determine which portfolios are available to you.
The views expressed in this report and information about each portfolio’s holdings are for the period covered by this report and are subject to change thereafter.
Please note that this report may include prospectus supplements that are separate from and not a part of this report. Please refer to your variable annuity or variable life insurance contract prospectus to determine which supplements are applicable to you.
SP Small Cap Value Portfolio

Join the e-movement.SM
Enroll in e-delivery today!
By enrolling in e-Delivery, you’ll gain secure, online access to important documents with the flexibility to choose which documents you receive in the mail… and which ones you don’t!
Individual Annuity Contract Owners
Get started by visiting www.prudential.com/login and follow the instructions on the screen, or scan the code below.
Individual Life Insurance Contract Owners
To receive your reports online, go to www.prudential.com/edelivery, or scan the code below.
Group Variable Universal Life Contract Owners
To receive your reports online, go to www.prudential.com/gulgvul, or scan the code.
| | |
| |
| | Save paper and reduce clutter. Receive Prospectuses and Reports electronically by enrolling today! |
| | | | |
The Prudential Series Fund Table of Contents | | Annual Report | | December 31, 2019 |
| | ∎ | | LETTER TO CONTRACT OWNERS |
| | ∎ | | REPORT OF THE INVESTMENT MANAGERS AND PRESENTATION OF PORTFOLIO HOLDINGS |
| | | | |
| Section A | | Schedule of Investments and Financial Statements |
| Section B | | Notes to Financial Statements | | |
| Section C | | Financial Highlights | | |
| Section D | | Report of Independent Registered Public Accounting Firm | | |
| Section E | | Information about Trustees and Officers | | |
This report may include financial information pertaining to certain portfolios that are not available through the variable life insurance policy or variable annuity contract that you have chosen. Please refer to your variable life insurance or variable annuity prospectus to determine which portfolios are available to you.
| | | | |
The Prudential Series Fund Letter to Contract Owners | | Annual Report | | December 31, 2019 |
At Prudential, our primary objective is to help investors achieve and maintain long-term financial success. This Prudential Series Fund annual report outlines our efforts to achieve this goal. We hope you find it informative and useful.
Prudential has been building on a heritage of success for more than 135 years. We believe the array of our products provides a highly attractive value proposition to clients like you who are focused on financial security.
Your financial professional is the best resource to help you make the most informed investment decisions. Together, you can build a diversified investment portfolio that aligns with your long-term financial goals. Please keep in mind that diversification and asset allocation strategies do not assure a profit or protect against loss in declining markets.
Thank you for selecting Prudential as one of your financial partners. We value your trust and appreciate the opportunity to help you achieve financial security.
Sincerely,
Timothy S. Cronin
President,
The Prudential Series Fund | January 31, 2020 |
| | | | |
| Market Overview — unaudited | | Annual Report | | December 31, 2019 |
Equity Market Overview
US and international stock markets posted stellar returns in 2019 as many central banks, including the Federal Reserve (the Fed), cut interest rates or used other stimuli to spur growth. Although the markets fluctuated sharply at times in reaction to on-again-off-again trade tensions between the US and China, concerns about tariffs subsided later in the year.
In the US, the broad-based S&P 500® Index and Russell 3000® Index returned 31.46% and 31.02%, respectively, for the year. Internationally, the MSCI ACWI Ex-US Index, a broad measure of stock performance in developed and emerging markets outside the US, returned 21.51%. (All returns cited are in US dollars and include dividends.)
Global economic growth slowed, central banks cut rates
During 2019, the pace of global growth slowed and concerns about the economic outlook rose due in part to uncertainties regarding US-China tariffs and other geopolitical factors, which created a drag on manufacturing and export activity. Many central banks responded by loosening monetary policy — in some cases reversing their positions. For example, the Fed, which hiked rates four times in 2018, cut its federal funds rate target three times in 2019 and moved from tapering its balance sheet to expanding it through asset purchases. The European Central Bank, which had been rolling back its bond-buying program in 2018, restarted it to stimulate the eurozone economy.
Although US real gross domestic product (GDP) growth rose 2.1% (annualized) in the third quarter, down from 3.1% in the first quarter, the US economy expanded at a moderate pace. (Fourth-quarter GDP data had not been released when this overview was published.) Corporate earnings, consumer spending, and the labor market were strong, while inflation remained low.
Stock markets rallied, retreated, and rebounded to record highs
Early in the first quarter, stocks rallied as US-China trade negotiations appeared to be progressing, the Fed signaled that it planned to pause from hiking rates unless warranted, the US government’s partial shutdown ended, and corporate earnings rose sharply despite slower growth. The S&P 500 jumped nearly 8.0% in January alone.
Stocks sold off in May as trade-war worries resurfaced. However, equity markets rallied in June in anticipation of possible rate cuts and on hopes for a trade deal. During the first half of 2019, the Fed maintained its interest rate target.
Trade concerns re-emerged in the third quarter amid signs of slowing growth and renewed trade frictions. With inflation below its target, the Fed cut rates in July for the first time since the financial crisis in 2008 as a pre-emptive measure to help sustain the US economy’s expansion and withstand the risk of a global economic slowdown and further drop in business investment.
In August, concerns about tariffs, the growth of China’s industrial output, and the global economy intensified, driving investors toward less-risky investments like US Treasuries. The yield on the 10-year US Treasury note, which moves opposite to its price, briefly dropped below the rate on two-year Treasuries. Although many analysts didn’t interpret this particular “yield curve inversion” as indicative of a looming recession, as they often have in the past, stock prices — particularly in emerging markets — dropped sharply.
Although the Fed cut rates again in September and October to a range of 1.50%-1.75%, Chairman Jerome Powell conveyed that the central bank did not plan to cut rates further unless incoming information required its members to materially reassess their outlook for the economy. As expected, the Fed did not adjust rates through the remainder of the year.
During the fourth quarter, US stock indexes surged to new highs and emerging market stocks rallied amid reports the US and China were moving toward a “phase one” partial trade deal. (The agreement was signed in January 2020 after the reporting period ended.) Eurozone stock markets rose in reaction to improved economic results from Germany. United Kingdom investors were encouraged by the outcome of December elections that many hope will lead to a smoother potential exit of the UK from the European Union.
All S&P 500 sectors rose
The best-performing sectors in the S&P 500 were information technology (+50.3%), communication services (+32.7%), and financials (+32.1%). Next in line were industrials (+29.4%), real estate (+29.0%), consumer discretionary (+27.9%), consumer staples (+27.6%), utilities (+26.4%), materials (+24.6%), health care (+20.8%), and energy (+11.8%).
| | | | |
| Market Overview — unaudited(continued) | | Annual Report | | December 31, 2019 |
Growth outperformed value, large-cap stocks topped small caps
For the year, the Russell 3000® Growth Index returned 35.85%, outperforming the Russell 3000® Value Index, which rose 26.26%. Large-cap stocks, as measured by the Russell 1000® Index, rose 31.43%. The Russell Midcap® Index returned 30.54%, and the small-cap Russell 2000® Index lagged yet still returned 25.52%.
International stocks collectively rose but underperformed US equities
Stocks trading in emerging markets, as measured by the MSCI Emerging Markets Index, returned 18.4% for the year. Notable top-performing country components in the index included Russia (+50.9%), supported by a jump in oil prices, Taiwan (+36.4%), Brazil (+26.3%), and China (23.5%). Taiwan’s and China’s markets advanced in the fourth quarter as trade frictions diminished, although weak economic data from China dampened investor sentiment during the year. Notable countries that underperformed the index but still contributed positively to performance included South Korea (+12.5%), Mexico (+11.4%), and India (+7.6%). Malaysia (-2.0%) detracted from the index’s performance.
Equities in developed markets outside the US and Canada, as measured by the MSCI EAFE Index, rose 22.01%. For the year, the MSCI Europe Index rose 23.77%, the MSCI UK Index returned 21.05%, and the MSCI Japan Index rose 19.61%.
Fixed Income Market Overview
In 2019, for the first time in more than a decade, the Federal Reserve (the Fed) cut interest rates to help sustain the US economy’s expansion in the face of slowing global economic growth and US-China trade-war risks. The central bank was merely one of dozens that reduced rates throughout the year, igniting rallies in numerous global bond markets. During 2019, emerging markets debt, US high yield bonds, and corporate investment-grade bonds delivered robust returns, yet US government bonds and many other fixed income categories also posted solid results.
In the US, the economy grew at a healthy but slow pace. Although real gross domestic product (GDP) growth dropped from 3.1% (annualized) in the first quarter to 2.1% in the third, the economy continued to expand. (Fourth-quarter GDP data had not been released when this overview was published.) The national unemployment rate dropped to a 50-year low of 3.5% in September, corporate earnings were generally strong, and inflation remained low. Elsewhere, the European economy grew weakly. Notably, China’s growth rate dropped significantly from 6.6% in 2018 to 6.1% in 2019.
Bond markets fluctuated but closed higher
During the first quarter of 2019, global growth expectations softened. The Fed, which increased rates four times in 2018, signaled it would pause from hiking rates further based on its outlook at the time, sending bond markets higher. US high yield and emerging market bond prices rose sharply, supported by a tailwind of receding tariff worries and favorable corporate earnings.
In May, worries about the US-China trade war surfaced again. US Treasuries rallied while riskier assets such as high yield bonds dropped in price. The following month, however, the Fed hinted at the possibility of interest rate cuts ahead, trade fears cooled, and the high yield bond market rebounded. The Fed did not adjust rates during the first half of the year.
In July, the global economy showed signs of a slowdown and tariff fears returned. Later that month, for the first time since the financial crisis in 2008, the Fed cut rates as a pre-emptive measure to help sustain the expansion of the US economy and provide a cushion against the risk of a global economic slowdown. During August, the yield on 10-year US Treasuries dropped below yields on two-year Treasuries. Historically, when yields on longer-term Treasuries fall below yields on shorter-term issues, recessions have often followed. While many analysts questioned the “yield curve inversion” as a recessionary indicator in this instance, investors concerned about the economy gravitated to “safe-haven” securities like longer-term US Treasuries and other high-quality credits.
The investment-grade Bloomberg Barclays US Aggregate Bond Index returned 2.59% in August. US high yield bonds finished virtually flat, whereas emerging market sovereign debt markets dropped sharply due in part to a stronger US dollar versus most currencies.
In September, the Fed cut rates again and the European Central Bank restarted its bond-buying program to help stimulate the eurozone economy after rolling it back the previous year. After the Fed dropped its rate target to a range of 1.50% to 1.75% in October, Chairman Jerome Powell conveyed that the central bank had no plans for further cuts unless incoming data compelled its members to materially reassess their outlook for the economy. As expected, the Fed maintained its rate target through the remainder of the year.
During the fourth quarter, stronger-than-expected economic data and reports that the US and China were moving toward a “phase one” partial trade deal led to a “risk-on” rally. (The agreement was signed in January 2020 after the reporting period ended.) Over the final month of the year, high yield bonds and emerging markets bonds posted solid gains, while investment-grade US bonds dropped slightly.
| | | | |
| Market Overview — unaudited(continued) | | Annual Report | | December 31, 2019 |
Emerging market debt and high yield bonds surged by double digits
For the year, the Bloomberg Barclays Global Aggregate Bond Index (unhedged), which measures global investment-grade debt performance, returned 6.84%. (All returns cited are in US dollars.) Bonds trading in the US, based on the Bloomberg Barclays US Aggregate Bond Index, rose 8.72%. The US index’s leading component sectors included investment-grade corporate bonds (+14.5%), which benefited from the interest rate cuts and solid fundamentals, along with Treasury inflation-protected securities (+8.4%), commercial mortgage-backed securities (+8.3%), and US Treasury securities (+6.9%). Treasuries with longer maturities rallied in the second and third quarters when trade tensions escalated, which triggered a “flight to quality.” The 10-year US Treasury note’s yield, which moves opposite to its price, opened 2019 at approximately 2.65% and closed the year at 1.92% as trade tensions eased.
The Bloomberg Barclays Municipal Bond Index returned 7.54% for the year. US high yield bonds (debt rated below investment grade), as measured by the ICE BofAML US Cash High Yield Index, returned 14.40%. Accommodative monetary policies, strong corporate earnings, and investors’ quest for enhanced yield supported demand for high yield opportunities. Emerging market debt, based on the J.P. Morgan EMBI Global Diversified Index surged 15.04%. Despite a strong US dollar (relative to most currencies), sovereign debt yields in general drifted lower as inflation was contained in many countries, providing their central banks with latitude to reduce interest rates, which bolstered bond prices.
| | |
The Prudential Series Fund, SP Small Cap Value Portfolio | | December 31, 2019 |
Report of the Investment Manager - As of December 31, 2019 (Unaudited)
| | | | | | | | | | | | |
| Average Annual Total Returns | | 1 Year | | | 5 Years | | | 10 Years | |
Portfolio | | | 22.79 | % | | | 7.11 | % | | | 11.23 | % |
Russell 2000® Value Index | | | 22.39 | | | | 6.99 | | | | 10.56 | |
Russell 2500™ Index | | | 27.77 | | | | 8.93 | | | | 12.58 | |
Past performance does not guarantee future returns. The investment return and principal value of an investment will fluctuate, so that shares, when redeemed, may be worth more or less than their original cost. Current performance may be lower or higher than the past performance.
Portfolio performance is net of fund expenses, but not contract charges, which, if included, would significantly lower the performance quoted. Performance figures may reflect fee waivers and/or expense reimbursements. In the absence of such fee waivers and/or expense reimbursements, performance would be lower.
The Russell 2000® Value and Russell 2500TM Index are trademark/service marks of the Frank Russell Company. Russell® is a trademark of the Frank Russell Company.
$10,000 INVESTED OVER 10 YEARS
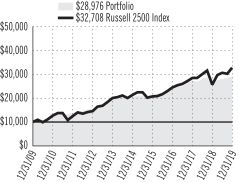
For the year ended December 31, 2019, the SP Small Cap Value Portfolio returned 22.79%. The Portfolio outperformed the Russell 2000 Value Index and underperformed the Russell 2500 Index.
The Portfolio’s investment objective is long-term growth of capital.
What were the market conditions during the reporting period?
The US equity market delivered one of its strongest years of performance in 2019, with the S&P 500 Index returning over 30% and the Russell 2000 Index, a proxy for small-market-capitalization stocks, returning slightly over 25%. The US equity market rallied at the start of the year, almost completely recovering from a sell-off at the end of 2018. After four gradual rate hikes in 2018, the Federal Reserve (the Fed) cut rates three times in 2019 to keep the economic expansion intact amid trade uncertainties. The trade war between the US and China continued to pressure macroeconomic indicators throughout the first half of the year but did little to suppress a resilient consumer, which ultimately outweighed manufacturing weakness.
In the fourth quarter, stock returns accelerated with an uptick of US manufacturing- and service-sector business surveys, as well as a consistently strong labor market supported by strong nonfarm-payroll numbers in November. These developments helped restore market confidence, while fundamentals of low core inflation, contained financial imbalances, and muted trade war concerns fended off imminent recession risk. The best-performing sectors over the year were information technology, communication services, and financials, while the worst-performing sectors were energy, health care, and materials.
What strategies or holdings affected the Portfolio’s performance?
During 2019, the Portfolio outperformed the Russell 2000 Value Index (gross returns). For the year, stock selection in the consumer discretionary sector contributed to returns, while investments in real estate detracted.
Lattice Semiconductor Corp. (not held in the Portfolio at the end of the reporting period), a semiconductor company that produces programmable logic devices used in the circuits of mobile phones, other telecommunications devices, and Internet-of-Things (IoT), was a top contributor for the year. At the end of 2018, the company named Jim Anderson, a former vice president who turned around operations at chipmaker Advanced Micro Devices Inc., as the new president and chief executive officer. Under his tenure, Anderson has driven revenue growth and executed on company expectations, as evidenced in the company’s 2019 earnings reports. Due to the stock’s significant appreciation in 2019, Goldman Sachs sold the position in the summer. Lattice shares contributed to the Portfolio’s returns for 2019 and also since they were first purchased in the Portfolio’s Small-Cap Value strategy in 2017.
CommVault Systems Inc. (0.2% of the Portfolio at the end of the period), a data-software company that provides the US government with data-protection services, was a top detractor from Portfolio returns for the year. A majority of the stock’s underperformance can be explained by the market’s reaction to mixed earnings reports. The first occurrence was in late April, when the stock dropped following the release of fourth-quarter earnings of fiscal year 2019. The company experienced large deal weakness and challenged channel execution in the quarter. Subsequently, management revised forward guidance downward, expecting improvement in the back half of fiscal 2020. However, the stock was off to a rocky start when it missed fiscal first-quarter earnings expectations at the end of July. Despite some of the near-term issues, Goldman Sachs believes that a new
For a complete list of holdings, please refer to the Schedule of Investments section of this report. Holdings reflect only long-term investments. Credit Quality/Country Allocation/Holdings/Line of Business are subject to change.
1
| | |
The Prudential Series Fund, SP Small Cap Value Portfolio | | December 31, 2019 |
Report of the Investment Manager - As of December 31, 2019 (Unaudited) (Continued)
chief executive officer and chief revenue officer, both appointed in 2019, can correct mid-market execution issues and simplify the sales organization to better monetize CommVault’s products. In Goldman Sachs’ view, the stock is under-earning its potential with a sizeable market opportunity given the growing demand for cloud data.
Presentation of Portfolio Holdings — unaudited
| | | | | | |
| SP Small Cap Value Portfolio (As of 12/31/2019) | |
| Ten Largest Holdings | | Line of Business | | | (% of Net Assets | ) |
| iShares Russell 2000 Value ETF | | Exchange-Traded Fund | | | 1.7% | |
| Portland General Electric Co. | | Electric Utilities | | | 1.2% | |
| Marriott Vacations Worldwide Corp. | | Hotels, Restaurants & Leisure | | | 1.2% | |
| SkyWest, Inc. | | Airlines | | | 1.0% | |
| Rexnord Corp. | | Machinery | | | 1.0% | |
| Glacier Bancorp, Inc. | | Banks | | | 1.0% | |
| Lumentum Holdings, Inc. | | Communications Equipment | | | 1.0% | |
| KBR, Inc. | | IT Services | | | 0.9% | |
| Healthcare Realty Trust, Inc. | | Equity Real Estate Investment Trusts (REITs) | | | 0.9% | |
| STAG Industrial, Inc. | | Equity Real Estate Investment Trusts (REITs) | | | 0.9% | |
For a complete list of holdings, please refer to the Schedule of Investments section of this report. Holdings reflect only long-term investments. Credit Quality/Country Allocation/Holdings/Line of Business are subject to change.
2
| | |
The Prudential Series Fund Benchmark Glossary — unaudited | | December 31, 2019 |
The indexes are unmanaged and include reinvestment of any income or distributions. They do not reflect any fees, expenses or sales charges. Investors cannot invest directly in a market index.
For Russell Indexes: Russell Investment Group is the source and owner of the trademarks, service marks and copyrights related to the Russell Indexes. Russell® is a trademark of Russell Investment Group.
Russell 2000 Value Index is an unmanaged index that measures the performance of those Russell 2000 companies with lower forecasted growth values.
Russell 2500 Index is an unmanaged market cap-weighted index that measures the performance of the 2,500 smallest companies in the Russell 3000 Index, which represents approximately 17% of the total market capitalization of the Russell 3000 Index.
| | |
The Prudential Series Fund Fees and Expenses — unaudited | | December 31, 2019 |
As a contract owner investing in the Portfolio through a variable annuity or variable life contract, you incur ongoing costs, including management fees, and other Portfolio expenses. This example is intended to help you understand your ongoing costs (in dollars) of investing in the Fund and to compare these costs with the ongoing costs of investing in other investment options. This example does not reflect fees and charges under your variable annuity or variable life contract. If contract charges were included, the costs shown below would be higher. Please consult the prospectus for your contract for more information about contract fees and charges.
The example is based on an investment of $1,000 invested at the beginning of the period and held for the entire period July 1, 2019 through December 31, 2019.
Actual Expenses
The first line of the table below provides information about actual account values and actual expenses. You may use this information, together with the amount you invested, to estimate the Portfolio expenses that you paid over the period. Simply divide your account value by $1,000 (for example, an $8,600 account value divided by $1,000 = 8.6), then multiply the result by the number in the first line under the heading entitled “Expenses Paid During the Six-Month Period” to estimate the Portfolio expenses you paid on your account during this period. As noted above, the table does not reflect variable contract fees and charges.
Hypothetical Example for Comparison Purposes
The second line of the table below provides information about hypothetical account values and hypothetical expenses based on the Portfolio’s actual expense ratio and an assumed rate of return of 5% per year before expenses, which is not the Portfolio’s actual return. The hypothetical account values and expenses may not be used to estimate the actual ending account balance or expenses you paid for the period. You may use this information to compare the ongoing costs of investing in the Portfolio and other investment options. To do so, compare this 5% hypothetical example with the 5% hypothetical examples that appear in the shareholder reports of the other investment options.
Please note that the expenses shown in the table are meant to highlight your ongoing Portfolio costs only and do not reflect any contract fees and charges, such as sales charges (loads), insurance charges or administrative charges. Therefore the second line of the table is useful to compare ongoing investment option costs only, and will not help you determine the relative total costs of owning different contracts. In addition, if these contract fee and charges were included, your costs would have been higher.
| | | | | | | | | | | | | | | | | | |
| The Prudential Series Fund Portfolio | | Beginning
Account Value
July 1, 2019 | | | Ending
Account Value
December 31, 2019 | | | Annualized Expense
Ratio based on the
Six-Month period | | | Expenses Paid
During the
Six-Month period* | |
| | | | | |
| SP Small Cap Value (Class I) | | Actual | | $ | 1,000.00 | | | $ | 1,060.10 | | | | 1.02 | % | | $ | 5.30 | |
| | Hypothetical | | $ | 1,000.00 | | | $ | 1,020.06 | | | | 1.02 | % | | $ | 5.19 | |
* Portfolio expenses (net of fee waivers or subsidies, if any) are equal to the annualized expense ratio (provided in the table), multiplied by the average account value over the period, multiplied by the 184 days in the six-month period ended December 31, 2019, and divided by the 365 days in the Portfolio’s fiscal year ended December 31, 2019 (to reflect the six-month period). Expenses presented in the table include the expenses of any underlying portfolios in which the Portfolio may invest.
| | | | | | |
| | |
| | SP SMALL CAP VALUE PORTFOLIO | | |
| | | | | | |
| |
| SCHEDULE OF INVESTMENTS | | as of December 31, 2019 |
| | | | | | | | |
| LONG-TERM INVESTMENTS — 98.0% | | | | |
COMMON STOCKS — 96.3% | | Shares | | | Value | |
Aerospace & Defense — 1.1% | | | | | | | | |
Aerojet Rocketdyne Holdings, Inc.* | | | 15,615 | | | $ | 712,981 | |
Curtiss-Wright Corp. | | | 1,539 | | | | 216,830 | |
Ducommun, Inc.* | | | 9,082 | | | | 458,913 | |
Triumph Group, Inc.(a) | | | 39,269 | | | | 992,328 | |
| | | | | | | | |
| | | | | | | 2,381,052 | |
| | | | | | | | |
Air Freight & Logistics — 0.4% | | | | | | | | |
Air Transport Services Group, Inc.* | | | 26,769 | | | | 628,001 | |
Atlas Air Worldwide Holdings, Inc.* | | | 6,532 | | | | 180,087 | |
| | | | | | | | |
| | | | | | | 808,088 | |
| | | | | | | | |
Airlines — 1.0% | | | | | | | | |
SkyWest, Inc. | | | 35,114 | | | | 2,269,418 | |
| | | | | | | | |
Auto Components — 1.3% | | | | | | | | |
Adient PLC* | | | 9,280 | | | | 197,200 | |
American Axle & Manufacturing Holdings, Inc.* | | | 24,240 | | | | 260,822 | |
Dana, Inc. | | | 70,071 | | | | 1,275,292 | |
Dorman Products, Inc.*(a) | | | 5,867 | | | | 444,249 | |
Tenneco, Inc. (Class A Stock) | | | 26,646 | | | | 349,063 | |
Visteon Corp.* | | | 4,523 | | | | 391,647 | |
| | | | | | | | |
| | | | | | | 2,918,273 | |
| | | | | | | | |
Banks — 18.2% | | | | | | | | |
Amalgamated Bank (Class A Stock) | | | 13,370 | | | | 260,046 | |
Ameris Bancorp | | | 29,416 | | | | 1,251,357 | |
Atlantic Union Bankshares Corp. | | | 45,685 | | | | 1,715,472 | |
BancorpSouth Bank | | | 46,913 | | | | 1,473,537 | |
Bank of Hawaii Corp.(a) | | | 6,138 | | | | 584,092 | |
Banner Corp. | | | 30,176 | | | | 1,707,660 | |
Brookline Bancorp, Inc. | | | 49,657 | | | | 817,354 | |
Bryn Mawr Bank Corp. | | | 13,104 | | | | 540,409 | |
CenterState Bank Corp. | | | 77,622 | | | | 1,938,998 | |
Columbia Banking System, Inc. | | | 46,670 | | | | 1,898,769 | |
Community Bank System, Inc. | | | 25,036 | | | | 1,776,054 | |
ConnectOne Bancorp, Inc. | | | 32,991 | | | | 848,528 | |
CVB Financial Corp. | | | 79,465 | | | | 1,714,855 | |
FB Financial Corp. | | | 24,512 | | | | 970,430 | |
First Financial Bankshares, Inc.(a) | | | 35,975 | | | | 1,262,722 | |
First Merchants Corp. | | | 42,278 | | | | 1,758,342 | |
First Midwest Bancorp, Inc. | | | 45,127 | | | | 1,040,629 | |
First of Long Island Corp. (The) | | | 7,902 | | | | 198,182 | |
Flushing Financial Corp. | | | 11,112 | | | | 240,075 | |
German American Bancorp, Inc. | | | 12,636 | | | | 450,094 | |
Glacier Bancorp, Inc.(a) | | | 46,587 | | | | 2,142,536 | |
Great Western Bancorp, Inc. | | | 38,507 | | | | 1,337,733 | |
Heritage Financial Corp. | | | 25,182 | | | | 712,651 | |
Home BancShares, Inc. | | | 38,785 | | | | 762,513 | |
Independent Bank Corp.(a) | | | 21,584 | | | | 1,796,868 | |
Independent Bank Group, Inc. | | | 4,781 | | | | 265,059 | |
Lakeland Financial Corp. | | | 24,709 | | | | 1,209,011 | |
Pacific Premier Bancorp, Inc. | | | 24,770 | | | | 807,626 | |
Pinnacle Financial Partners, Inc. | | | 14,837 | | | | 949,568 | |
Prosperity Bancshares, Inc.(a) | | | 6,163 | | | | 443,058 | |
Renasant Corp. | | | 45,224 | | | | 1,601,834 | |
Sandy Spring Bancorp, Inc. | | | 14,099 | | | | 534,070 | |
South State Corp. | | | 14,829 | | | | 1,286,416 | |
| | | | | | | | |
COMMON STOCKS
(continued) | | Shares | | | Value | |
Banks (continued) | | | | | | | | |
TCF Financial Corp. | | | 7,668 | | | $ | 358,862 | |
Towne Bank | | | 24,052 | | | | 669,127 | |
TriCo Bancshares(a) | | | 21,784 | | | | 889,005 | |
United Community Banks, Inc. | | | 62,478 | | | | 1,929,321 | |
| | | | | | | | |
| | | | | | | 40,142,863 | |
| | | | | | | | |
Biotechnology — 0.3% | | | | | | | | |
Emergent BioSolutions, Inc.* | | | 11,577 | | | | 624,579 | |
| | | | | | | | |
Building Products — 0.5% | | | | | | | | |
American Woodmark Corp.* | | | 4,465 | | | | 466,637 | |
Patrick Industries, Inc. | | | 12,214 | | | | 640,380 | |
| | | | | | | | |
| | | | | | | 1,107,017 | |
| | | | | | | | |
Capital Markets — 1.6% | | | | | | | | |
Brightsphere Investment Group, Inc. | | | 9,611 | | | | 98,224 | |
Houlihan Lokey, Inc. | | | 21,279 | | | | 1,039,905 | |
PJT Partners, Inc. (Class A Stock) | | | 9,785 | | | | 441,597 | |
Stifel Financial Corp. | | | 27,438 | | | | 1,664,115 | |
Virtu Financial, Inc. (Class A Stock)(a) | | | 20,145 | | | | 322,118 | |
| | | | | | | | |
| | | | | | | 3,565,959 | |
| | | | | | | | |
Chemicals — 1.6% | | | | | | | | |
HB Fuller Co.(a) | | | 17,169 | | | | 885,405 | |
Ingevity Corp.* | | | 8,451 | | | | 738,448 | |
Innospec, Inc. | | | 4,200 | | | | 434,448 | |
Kraton Corp.* | | | 8,607 | | | | 217,929 | |
PolyOne Corp. | | | 24,958 | | | | 918,205 | |
Quaker Chemical Corp. | | | 1,974 | | | | 324,763 | |
Tronox Holdings PLC (Class A Stock) | | | 9,619 | | | | 109,849 | |
| | | | | | | | |
| | | | | | | 3,629,047 | |
| | | | | | | | |
Commercial Services & Supplies — 0.3% | | | | | | | | |
ABM Industries, Inc.(a) | | | 19,689 | | | | 742,472 | |
| | | | | | | | |
Communications Equipment — 1.9% | | | | | | | | |
Lumentum Holdings, Inc.* | | | 26,494 | | | | 2,100,974 | |
NetScout Systems, Inc.* | | | 42,939 | | | | 1,033,542 | |
Viavi Solutions, Inc.* | | | 63,963 | | | | 959,445 | |
| | | | | | | | |
| | | | | | | 4,093,961 | |
| | | | | | | | |
Construction & Engineering — 0.7% | | | | | | | | |
EMCOR Group, Inc. | | | 12,908 | | | | 1,113,960 | |
Granite Construction, Inc.(a) | | | 18,049 | | | | 499,416 | |
| | | | | | | | |
| | | | | | | 1,613,376 | |
| | | | | | | | |
Construction Materials — 0.4% | | | | | | | | |
Summit Materials, Inc. (Class A Stock)* | | | 34,295 | | | | 819,651 | |
| | | | | | | | |
Consumer Finance — 0.3% | | | | | | | | |
FirstCash, Inc. | | | 5,425 | | | | 437,418 | |
Oportun Financial Corp.*(a) | | | 10,736 | | | | 255,517 | |
| | | | | | | | |
| | | | | | | 692,935 | |
| | | | | | | | |
Diversified Consumer Services — 0.6% | | | | | | | | |
Chegg, Inc.* | | | 3,232 | | | | 122,525 | |
Laureate Education, Inc. (Class A Stock)* | | | 12,718 | | | | 223,964 | |
OneSpaWorld Holdings Ltd. (Bahamas)*(a) | | | 33,460 | | | | 563,467 | |
SEE NOTES TO FINANCIAL STATEMENTS.
A1
| | | | | | |
| | |
| | SP SMALL CAP VALUE PORTFOLIO (continued) | | |
| | | | | | |
| |
| SCHEDULE OF INVESTMENTS | | as of December 31, 2019 |
| | | | | | | | |
COMMON STOCKS
(continued) | | Shares | | | Value | |
Diversified Consumer Services (continued) | |
WW International, Inc.*(a) | | | 13,553 | | | $ | 517,860 | |
| | | | | | | | |
| | | | | | | 1,427,816 | |
| | | | | | | | |
Diversified Financial Services — 0.1% | | | | | | | | |
Alerus Financial Corp. | | | 7,148 | | | | 163,332 | |
| | | | | | | | |
Electric Utilities — 3.3% | | | | | | | | |
ALLETE, Inc. | | | 21,713 | | | | 1,762,444 | |
IDACORP, Inc. | | | 9,929 | | | | 1,060,417 | |
PNM Resources, Inc. | | | 32,947 | | | | 1,670,742 | |
Portland General Electric Co. | | | 48,516 | | | | 2,706,708 | |
| | | | | | | | |
| | | | | | | 7,200,311 | |
| | | | | | | | |
Electrical Equipment — 0.4% | | | | | | | | |
nVent Electric PLC | | | 32,732 | | | | 837,285 | |
| | | | | | | | |
Electronic Equipment, Instruments & Components — 2.8% | |
Anixter International, Inc.* | | | 7,338 | | | | 675,830 | |
CTS Corp. | | | 26,205 | | | | 786,412 | |
FARO Technologies, Inc.* | | | 11,226 | | | | 565,229 | |
II-VI, Inc.* | | | 15,604 | | | | 525,387 | |
Knowles Corp.* | | | 41,411 | | | | 875,843 | |
SYNNEX Corp. | | | 8,513 | | | | 1,096,474 | |
TTM Technologies, Inc.* | | | 47,430 | | | | 713,821 | |
Vishay Intertechnology, Inc. | | | 43,932 | | | | 935,312 | |
| | | | | | | | |
| | | | | | | 6,174,308 | |
| | | | | | | | |
Energy Equipment & Services — 1.3% | | | | | | | | |
Apergy Corp.* | | | 44,926 | | | | 1,517,600 | |
Cactus, Inc. (Class A Stock) | | | 41,123 | | | | 1,411,342 | |
| | | | | | | | |
| | | | | | | 2,928,942 | |
| | | | | | | | |
Entertainment — 0.1% | | | | | | | | |
Live Nation Entertainment, Inc.* | | | 3,382 | | | | 241,712 | |
| | | | | | | | |
Equity Real Estate Investment Trusts (REITs) — 9.8% | |
Acadia Realty Trust | | | 64,908 | | | | 1,683,065 | |
Chatham Lodging Trust | | | 21,960 | | | | 402,746 | |
Columbia Property Trust, Inc. | | | 65,032 | | | | 1,359,819 | |
CyrusOne, Inc. | | | 27,590 | | | | 1,805,214 | |
Healthcare Realty Trust, Inc. | | | 58,699 | | | | 1,958,786 | |
Hudson Pacific Properties, Inc. | | | 31,736 | | | | 1,194,861 | |
Life Storage, Inc. | | | 8,311 | | | | 899,915 | |
National Health Investors, Inc. | | | 19,918 | | | | 1,622,919 | |
Park Hotels & Resorts, Inc. | | | 51,217 | | | | 1,324,984 | |
Pebblebrook Hotel Trust | | | 68,972 | | | | 1,849,139 | |
Preferred Apartment Communities, Inc. (Class A Stock) | | | 28,453 | | | | 378,994 | |
PS Business Parks, Inc. | | | 10,822 | | | | 1,784,223 | |
RLJ Lodging Trust | | | 89,738 | | | | 1,590,157 | |
Safehold, Inc.(a) | | | 20,010 | | | | 806,403 | |
STAG Industrial, Inc. | | | 61,904 | | | | 1,954,309 | |
Urban Edge Properties | | | 49,896 | | | | 957,005 | |
| | | | | | | | |
| | | | | | | 21,572,539 | |
| | | | | | | | |
Food & Staples Retailing — 0.4% | | | | | | | | |
BJ’s Wholesale Club Holdings, Inc.*(a) | | | 19,973 | | | | 454,186 | |
Grocery Outlet Holding Corp.* | | | 4,066 | | | | 131,942 | |
Performance Food Group Co.* | | | 7,593 | | | | 390,887 | |
| | | | | | | | |
| | | | | | | 977,015 | |
| | | | | | | | |
| | | | | | | | |
COMMON STOCKS
(continued) | | Shares | | | Value | |
Food Products — 1.5% | | | | | | | | |
Darling Ingredients, Inc.* | | | 42,814 | | | $ | 1,202,217 | |
Hostess Brands, Inc.*(a) | | | 47,569 | | | | 691,653 | |
Nomad Foods Ltd. (United Kingdom)* | | | 40,305 | | | | 901,623 | |
Simply Good Foods Co. (The)* | | | 22,155 | | | | 632,304 | |
| | | | | | | | |
| | | | | | | 3,427,797 | |
| | | | | | | | |
Gas Utilities — 1.3% | | | | | | | | |
Chesapeake Utilities Corp. | | | 13,815 | | | | 1,323,892 | |
ONE Gas, Inc. | | | 16,760 | | | | 1,568,233 | |
| | | | | | | | |
| | | | | | | 2,892,125 | |
| | | | | | | | |
Health Care Equipment & Supplies — 1.3% | | | | | | | | |
Avanos Medical, Inc.* | | | 26,871 | | | | 905,553 | |
CONMED Corp. | | | 8,706 | | | | 973,592 | |
Integra LifeSciences Holdings Corp.* | | | 9,515 | | | | 554,534 | |
Orthofix Medical, Inc.* | | | 9,359 | | | | 432,199 | |
| | | | | | | | |
| | | | | | | 2,865,878 | |
| | | | | | | | |
Health Care Providers & Services — 0.7% | | | | | | | | |
Acadia Healthcare Co., Inc.*(a) | | | 24,355 | | | | 809,073 | |
AMN Healthcare Services, Inc.* | | | 12,539 | | | | 781,305 | |
| | | | | | | | |
| | | | | | | 1,590,378 | |
| | | | | | | | |
Health Care Technology — 0.9% | | | | | | | | |
Allscripts Healthcare Solutions, Inc.*(a) | | | 111,524 | | | | 1,094,608 | |
HMS Holdings Corp.* | | | 19,362 | | | | 573,115 | |
Vocera Communications, Inc.* | | | 13,021 | | | | 270,316 | |
| | | | | | | | |
| | | | | | | 1,938,039 | |
| | | | | | | | |
Hotels, Restaurants & Leisure — 2.6% | | | | | | | | |
Boyd Gaming Corp.(a) | | | 39,868 | | | | 1,193,648 | |
Eldorado Resorts, Inc.*(a) | | | 13,383 | | | | 798,162 | |
Jack in the Box, Inc. | | | 5,589 | | | | 436,110 | |
Marriott Vacations Worldwide Corp. | | | 20,692 | | | | 2,664,302 | |
Wendy’s Co. (The) | | | 24,649 | | | | 547,454 | |
| | | | | | | | |
| | | | | | | 5,639,676 | |
| | | | | | | | |
Household Durables — 1.4% | | | | | | | | |
KB Home | | | 35,775 | | | | 1,226,009 | |
Meritage Homes Corp.* | | | 12,576 | | | | 768,520 | |
TopBuild Corp.* | | | 9,875 | | | | 1,017,915 | |
| | | | | | | | |
| | | | | | | 3,012,444 | |
| | | | | | | | |
Household Products — 0.1% | | | | | | | | |
Central Garden & Pet Co. (Class A Stock)* | | | 9,662 | | | | 283,676 | |
| | | | | | | | |
Insurance — 3.9% | | | | | | | | |
AMERISAFE, Inc. | | | 9,701 | | | | 640,557 | |
BRP Group, Inc. (Class A Stock)* | | | 12,115 | | | | 194,446 | |
CNO Financial Group, Inc. | | | 16,028 | | | | 290,588 | |
Enstar Group Ltd. (Bermuda)* | | | 5,001 | | | | 1,034,507 | |
Kemper Corp. | | | 11,776 | | | | 912,640 | |
Kinsale Capital Group, Inc. | | | 14,012 | | | | 1,424,460 | |
Primerica, Inc. | | | 7,755 | | | | 1,012,493 | |
ProAssurance Corp. | | | 7,802 | | | | 281,964 | |
RLI Corp. | | | 13,980 | | | | 1,258,479 | |
SEE NOTES TO FINANCIAL STATEMENTS.
A2
| | | | | | |
| | |
| | SP SMALL CAP VALUE PORTFOLIO (continued) | | |
| | | | | | |
| |
| SCHEDULE OF INVESTMENTS | | as of December 31, 2019 |
| | | | | | | | |
COMMON STOCKS (continued) | | Shares | | | Value | |
Insurance (continued) | | | | | | | | |
Selective Insurance Group, Inc. | | | 24,463 | | | $ | 1,594,743 | |
| | | | | | | | |
| | | | | | | 8,644,877 | |
| | | | | | | | |
Interactive Media & Services — 0.2% | |
Cars.com, Inc.*(a) | | | 39,051 | | | | 477,203 | |
| | | | | | | | |
IT Services — 1.4% | |
KBR, Inc. | | | 64,732 | | | | 1,974,326 | |
LiveRamp Holdings, Inc.* | | | 24,628 | | | | 1,183,868 | |
| | | | | | | | |
| | | | | | | 3,158,194 | |
| | | | | | | | |
Leisure Products — 0.6% | |
Callaway Golf Co. | | | 58,549 | | | | 1,241,239 | |
| | | | | | | | |
Life Sciences Tools & Services — 0.7% | |
Syneos Health, Inc.* | | | 26,588 | | | | 1,581,321 | |
| | | | | | | | |
Machinery — 4.7% | |
Alamo Group, Inc. | | | 4,879 | | | | 612,559 | |
Altra Industrial Motion Corp. | | | 4,968 | | | | 179,891 | |
CIRCOR International, Inc.* | | | 17,556 | | | | 811,789 | |
Columbus McKinnon Corp. | | | 10,410 | | | | 416,712 | |
Federal Signal Corp. | | | 28,031 | | | | 904,000 | |
Kennametal, Inc. | | | 38,756 | | | | 1,429,709 | |
Navistar International Corp.* | | | 13,198 | | | | 381,950 | |
RBC Bearings, Inc.* | | | 2,612 | | | | 413,584 | |
Rexnord Corp.* | | | 66,732 | | | | 2,176,798 | |
Terex Corp. | | | 22,562 | | | | 671,896 | |
TriMas Corp.* | | | 39,235 | | | | 1,232,371 | |
Watts Water Technologies, Inc. (Class A Stock) | | | 11,381 | | | | 1,135,369 | |
| | | | | | | | |
| | | | | | | 10,366,628 | |
| | | | | | | | |
Media — 1.6% | |
Gray Television, Inc.* | | | 37,503 | | | | 804,064 | |
Liberty Latin America Ltd. (Chile) (Class C Stock)* | | | 51,938 | | | | 1,010,714 | |
Nexstar Media Group, Inc.
(Class A Stock) | | | 10,749 | | | | 1,260,320 | |
TEGNA, Inc. | | | 25,499 | | | | 425,578 | |
| | | | | | | | |
| | | | | | | 3,500,676 | |
| �� | | | | | | | |
Metals & Mining — 2.1% | |
Allegheny Technologies, Inc.* | | | 40,141 | | | | 829,313 | |
Carpenter Technology Corp. | | | 9,978 | | | | 496,705 | |
Cleveland-Cliffs, Inc.(a) | | | 30,220 | | | | 253,848 | |
Coeur Mining, Inc.* | | | 36,309 | | | | 293,377 | |
Commercial Metals Co. | | | 50,613 | | | | 1,127,151 | |
Constellium SE* | | | 79,049 | | | | 1,059,256 | |
Kaiser Aluminum Corp. | | | 6,094 | | | | 675,764 | |
| | | | | | | | |
| | | | | | | 4,735,414 | |
| | | | | | | | |
Mortgage Real Estate Investment Trusts (REITs) — 2.4% | |
Granite Point Mortgage Trust, Inc. | | | 21,716 | | | | 399,140 | |
MFA Financial, Inc. | | | 171,275 | | | | 1,310,254 | |
PennyMac Mortgage Investment Trust | | | 43,165 | | | | 962,148 | |
Redwood Trust, Inc.(a) | | | 78,574 | | | | 1,299,614 | |
Two Harbors Investment Corp. | | | 86,880 | | | | 1,270,185 | |
| | | | | | | | |
| | | | | | | 5,241,341 | |
| | | | | | | | |
| | | | | | | | |
COMMON STOCKS (continued) | | Shares | | | Value | |
Oil, Gas & Consumable Fuels — 4.4% | |
Brigham Minerals, Inc. (Class A Stock) | | | 34,762 | | | $ | 745,297 | |
Delek US Holdings, Inc.(a) | | | 18,967 | | | | 635,964 | |
Euronav NV (Belgium) | | | 57,513 | | | | 721,213 | |
Falcon Minerals Corp. | | | 61,038 | | | | 430,928 | |
Golar LNG Ltd. (Bermuda) | | | 83,817 | | | | 1,191,878 | |
Matador Resources Co.*(a) | | | 52,589 | | | | 945,024 | |
PBF Energy, Inc. (Class A Stock) | | | 8,849 | | | | 277,593 | |
PDC Energy, Inc.* | | | 22,688 | | | | 593,745 | |
Rattler Midstream, MLP | | | 35,230 | | | | 626,742 | |
Viper Energy Partners, MLP | | | 77,399 | | | | 1,908,659 | |
WPX Energy, Inc.* | | | 112,981 | | | | 1,552,359 | |
| | | | | | | | |
| | | | | | | 9,629,402 | |
| | | | | | | | |
Personal Products — 0.2% | |
BellRing Brands, Inc. (Class A Stock)* | | | 20,111 | | | | 428,163 | |
| | | | | | | | |
Pharmaceuticals — 0.5% | |
Prestige Consumer Healthcare, Inc.*(a) | | | 26,784 | | | | 1,084,752 | |
| | | | | | | | |
Professional Services — 0.8% | |
ASGN, Inc.* | | | 15,755 | | | | 1,118,132 | |
ICF International, Inc. | | | 6,493 | | | | 594,889 | |
| | | | | | | | |
| | | | | | | 1,713,021 | |
| | | | | | | | |
Real Estate Management & Development — 0.5% | |
Kennedy-Wilson Holdings, Inc. | | | 48,684 | | | | 1,085,653 | |
| | | | | | | | |
Road & Rail — 1.2% | |
Saia, Inc.* | | | 19,899 | | | | 1,852,995 | |
Werner Enterprises, Inc. | | | 20,928 | | | | 761,570 | |
| | | | | | | | |
| | | | | | | 2,614,565 | |
| | | | | | | | |
Semiconductors & Semiconductor Equipment — 2.4% | |
Cohu, Inc. | | | 11,366 | | | | 259,713 | |
Entegris, Inc. | | | 15,126 | | | | 757,661 | |
MACOM Technology Solutions Holdings, Inc.* | | | 37,016 | | | | 984,626 | |
Onto Innovation, Inc.* | | | 27,586 | | | | 1,007,993 | |
Semtech Corp.* | | | 16,848 | | | | 891,259 | |
Silicon Laboratories, Inc.* | | | 5,231 | | | | 606,691 | |
Synaptics, Inc.* | | | 12,197 | | | | 802,197 | |
| | | | | | | | |
| | | | | | | 5,310,140 | |
| | | | | | | | |
Software — 1.5% | |
Avaya Holdings Corp.* | | | 24,482 | | | | 330,507 | |
Bottomline Technologies DE, Inc.* | | | 11,977 | | | | 641,967 | |
CommVault Systems, Inc.* | | | 9,055 | | | | 404,215 | |
Cornerstone OnDemand, Inc.* | | | 15,241 | | | | 892,361 | |
Verint Systems, Inc.* | | | 18,252 | | | | 1,010,431 | |
| | | | | | | | |
| | | | | | | 3,279,481 | |
| | | | | | | | |
Specialty Retail — 2.8% | |
Aaron’s, Inc. | | | 7,761 | | | | 443,231 | |
Asbury Automotive Group, Inc.* | | | 4,120 | | | | 460,575 | |
Bed Bath & Beyond, Inc. | | | 15,990 | | | | 276,627 | |
Burlington Stores, Inc.* | | | 3,139 | | | | 715,786 | |
Dick’s Sporting Goods, Inc. | | | 10,252 | | | | 507,371 | |
Genesco, Inc.* | | | 6,941 | | | | 332,613 | |
Group 1 Automotive, Inc. | | | 11,131 | | | | 1,113,100 | |
Guess?, Inc.(a) | | | 21,808 | | | | 488,063 | |
SEE NOTES TO FINANCIAL STATEMENTS.
A3
| | | | | | |
| | |
| | SP SMALL CAP VALUE PORTFOLIO (continued) | | |
| | | | | | |
| |
| SCHEDULE OF INVESTMENTS | | as of December 31, 2019 |
| | | | | | | | |
COMMON STOCKS
(continued) | | Shares | | | Value | |
Specialty Retail (continued) | |
Rent-A-Center, Inc. | | | 4,529 | | | $ | 130,616 | |
RH*(a) | | | 5,604 | | | | 1,196,454 | |
Sally Beauty Holdings, Inc.*(a) | | | 13,850 | | | | 252,763 | |
Shoe Carnival, Inc.(a) | | | 7,511 | | | | 280,010 | |
| | | | | | | | |
| | | | | | | 6,197,209 | |
| | | | | | | | |
Textiles, Apparel & Luxury Goods — 1.0% | |
Columbia Sportswear Co. | | | 1,165 | | | | 116,721 | |
Crocs, Inc.* | | | 25,033 | | | | 1,048,632 | |
Deckers Outdoor Corp.* | | | 3,947 | | | | 666,491 | |
G-III Apparel Group Ltd.* | | | 11,440 | | | | 383,240 | |
| | | | | | | | |
| | | | | | | 2,215,084 | |
| | | | | | | | |
Thrifts & Mortgage Finance — 2.5% | |
MGIC Investment Corp. | | | 134,698 | | | | 1,908,671 | |
OceanFirst Financial Corp. | | | 44,728 | | | | 1,142,353 | |
Provident Financial Services, Inc. | | | 35,150 | | | | 866,448 | |
Washington Federal, Inc. | | | 41,956 | | | | 1,537,687 | |
| | | | | | | | |
| | | | | | | 5,455,159 | |
| | | | | | | | |
Trading Companies & Distributors — 2.4% | |
Beacon Roofing Supply, Inc.* | | | 43,880 | | | | 1,403,283 | |
Foundation Building Materials, Inc.* | | | 13,337 | | | | 258,071 | |
H&E Equipment Services, Inc. | | | 24,380 | | | | 815,023 | |
Herc Holdings, Inc.* | | | 17,251 | | | | 844,264 | |
Kaman Corp. | | | 16,924 | | | | 1,115,630 | |
Univar Solutions, Inc.* | | | 34,247 | | | | 830,147 | |
| | | | | | | | |
| | | | | | | 5,266,418 | |
| | | | | | | | |
Water Utilities — 0.3% | |
SJW Group | | | 8,790 | | | | 624,617 | |
| | | | | | | | |
TOTAL COMMON STOCKS
(cost $169,358,483) | | | | 212,432,521 | |
| | | | | | | | |
|
| EXCHANGE-TRADED FUND — 1.7% | |
iShares Russell 2000 Value ETF(a)
(cost $3,534,200) | | | 29,213 | | | | 3,756,207 | |
| | | | | | | | |
TOTAL LONG-TERM INVESTMENTS
(cost $172,892,683) | | | | 216,188,728 | |
| | | | | | | | |
| | | | | | | | |
SHORT-TERM
INVESTMENTS — 10.9% | | Shares | | | Value | |
AFFILIATED MUTUAL FUNDS | | | | | | | | |
PGIM Core Ultra Short Bond Fund(w) | | | 4,283,369 | | | $ | 4,283,369 | |
PGIM Institutional Money Market Fund (cost $19,863,527; includes $19,827,671 of cash collateral for securities on loan)(b)(w) | | | 19,864,466 | | | | 19,868,439 | |
| | | | | | | | |
TOTAL SHORT-TERM INVESTMENTS
(cost $24,146,896) | | | | 24,151,808 | |
| | | | | | | | |
TOTAL INVESTMENTS — 108.9%
(cost $197,039,579) | | | | 240,340,536 | |
LIABILITIES IN EXCESS OF OTHER
ASSETS — (8.9)% | | | | (19,735,936 | ) |
| | | | | | | | |
NET ASSETS — 100.0% | | | | | | $ | 220,604,600 | |
| | | | | | | | |
Below is a list of the abbreviation(s) used in the annual report:
| | |
ETF — Exchange Traded Fund |
LIBOR — London Interbank Offered Rate |
MLP — Master Limited Partnership |
REITs — Real Estate Investment Trust |
| * | Non-income producing security. |
| (a) | All or a portion of security is on loan. The aggregate market value of such securities, including those sold and pending settlement, is $19,415,669; cash collateral of $19,827,671 (included in liabilities) was received with which the Portfolio purchased highly liquid short-term investments. |
| (b) | Represents security purchased with cash collateral received for securities on loan and includes dividend reinvestment. (w) PGIM Investments LLC, the manager of the Fund, also serves as manager of the PGIM Core Ultra Short Bond Fund and PGIM Institutional Money Market Fund. |
Fair Value Measurements:
Various inputs are used in determining the value of the Portfolio’s investments. These inputs are summarized in the three broad levels listed below.
| Level 1— | unadjusted quoted prices generally in active markets for identical securities. |
| Level 2— | quoted prices for similar securities, interest rates and yield curves, prepayment speeds, foreign currency exchange rates and other observable inputs. |
| Level 3— | unobservable inputs for securities valued in accordance with Board approved fair valuation procedures. |
The following is a summary of the inputs used as of December 31, 2019 in valuing such portfolio securities:
| | | | | | | | | | | | |
| | | Level 1 | | | Level 2 | | | Level 3 | |
Investments in Securities | | | | | | | | | | | | |
Assets | | | | | | | | | | | | |
Common Stocks | | | | | | | | | | | | |
Aerospace & Defense | | $ | 2,381,052 | | | $ | — | | | $ | — | |
Air Freight & Logistics | | | 808,088 | | | | — | | | | — | |
Airlines | | | 2,269,418 | | | | — | | | | — | |
SEE NOTES TO FINANCIAL STATEMENTS.
A4
| | | | | | |
| | |
| | SP SMALL CAP VALUE PORTFOLIO (continued) | | |
| | | | | | |
| |
| SCHEDULE OF INVESTMENTS | | as of December 31, 2019 |
| | | | | | | | | | | | |
| | | Level 1 | | | Level 2 | | | Level 3 | |
Investments in Securities (continued) | | | | | | | | | | | | |
Assets (continued) | | | | | | | | | | | | |
Common Stocks (continued) | | | | | | | | | | | | |
Auto Components | | $ | 2,918,273 | | | $ | — | | | $ | — | |
Banks | | | 40,142,863 | | | | — | | | | — | |
Biotechnology | | | 624,579 | | | | — | | | | — | |
Building Products | | | 1,107,017 | | | | — | | | | — | |
Capital Markets | | | 3,565,959 | | | | — | | | | — | |
Chemicals | | | 3,629,047 | | | | — | | | | — | |
Commercial Services & Supplies | | | 742,472 | | | | — | | | | — | |
Communications Equipment | | | 4,093,961 | | | | — | | | | — | |
Construction & Engineering | | | 1,613,376 | | | | — | | | | — | |
Construction Materials | | | 819,651 | | | | — | | | | — | |
Consumer Finance | | | 692,935 | | | | — | | | | — | |
Diversified Consumer Services | | | 1,427,816 | | | | — | | | | — | |
Diversified Financial Services | | | 163,332 | | | | — | | | | — | |
Electric Utilities | | | 7,200,311 | | | | — | | | | — | |
Electrical Equipment | | | 837,285 | | | | — | | | | — | |
Electronic Equipment, Instruments & Components | | | 6,174,308 | | | | — | | | | — | |
Energy Equipment & Services | | | 2,928,942 | | | | — | | | | — | |
Entertainment | | | 241,712 | | | | — | | | | — | |
Equity Real Estate Investment Trusts (REITs) | | | 21,572,539 | | | | — | | | | — | |
Food & Staples Retailing | | | 977,015 | | | | — | | | | — | |
Food Products | | | 3,427,797 | | | | — | | | | — | |
Gas Utilities | | | 2,892,125 | | | | — | | | | — | |
Health Care Equipment & Supplies | | | 2,865,878 | | | | — | | | | — | |
Health Care Providers & Services | | | 1,590,378 | | | | — | | | | — | |
Health Care Technology | | | 1,938,039 | | | | — | | | | — | |
Hotels, Restaurants & Leisure | | | 5,639,676 | | | | — | | | | — | |
Household Durables | | | 3,012,444 | | | | — | | | | — | |
Household Products | | | 283,676 | | | | — | | | | — | |
Insurance | | | 8,644,877 | | | | — | | | | — | |
Interactive Media & Services | | | 477,203 | | | | — | | | | — | |
IT Services | | | 3,158,194 | | | | — | | | | — | |
Leisure Products | | | 1,241,239 | | | | — | | | | — | |
Life Sciences Tools & Services | | | 1,581,321 | | | | — | | | | — | |
Machinery | | | 10,366,628 | | | | — | | | | — | |
Media | | | 3,500,676 | | | | — | | | | — | |
Metals & Mining | | | 4,735,414 | | | | — | | | | — | |
Mortgage Real Estate Investment Trusts (REITs) | | | 5,241,341 | | | | — | | | | — | |
Oil, Gas & Consumable Fuels | | | 9,629,402 | | | | — | | | | — | |
Personal Products | | | 428,163 | | | | — | | | | — | |
Pharmaceuticals | | | 1,084,752 | | | | — | | | | — | |
Professional Services | | | 1,713,021 | | | | — | | | | — | |
Real Estate Management & Development | | | 1,085,653 | | | | — | | | | — | |
Road & Rail | | | 2,614,565 | | | | — | | | | — | |
Semiconductors & Semiconductor Equipment | | | 5,310,140 | | | | — | | | | — | |
Software | | | 3,279,481 | | | | — | | | | — | |
Specialty Retail | | | 6,197,209 | | | | — | | | | — | |
Textiles, Apparel & Luxury Goods | | | 2,215,084 | | | | — | | | | — | |
Thrifts & Mortgage Finance | | | 5,455,159 | | | | — | | | | — | |
Trading Companies & Distributors | | | 5,266,418 | | | | — | | | | — | |
Water Utilities | | | 624,617 | | | | — | | | | — | |
Exchange-Traded Fund | | | 3,756,207 | | | | — | | | | — | |
Affiliated Mutual Funds | | | 24,151,808 | | | | — | | | | — | |
| | | | | | | | | | | | |
Total | | $ | 240,340,536 | | | $ | — | | | $ | — | |
| | | | | | | | | | | | |
Industry Classification:
The industry classification of investments and liabilities in excess of other assets shown as a percentage of net assets as of December 31, 2019 were as follows (unaudited):
SEE NOTES TO FINANCIAL STATEMENTS.
A5
| | | | | | |
| | |
| | SP SMALL CAP VALUE PORTFOLIO (continued) | | |
| | | | | | |
| |
| SCHEDULE OF INVESTMENTS | | as of December 31, 2019 |
| | | | |
Industry Classification (continued): | | | | |
Banks | | | 18.2 | % |
Affiliated Mutual Funds (9.0% represents investments purchased with collateral from securities on loan) | | | 10.9 | |
Equity Real Estate Investment Trusts (REITs) | | | 9.8 | |
Machinery | | | 4.7 | |
Oil, Gas & Consumable Fuels | | | 4.4 | |
Insurance | | | 3.9 | |
Electric Utilities | | | 3.3 | |
Specialty Retail | | | 2.8 | |
Electronic Equipment, Instruments & Components | | | 2.8 | |
Hotels, Restaurants & Leisure | | | 2.6 | |
Thrifts & Mortgage Finance | | | 2.5 | |
Semiconductors & Semiconductor Equipment | | | 2.4 | |
Trading Companies & Distributors | | | 2.4 | |
Mortgage Real Estate Investment Trusts (REITs) | | | 2.4 | |
Metals & Mining | | | 2.1 | |
Communications Equipment | | | 1.9 | |
Exchange-Traded Fund | | | 1.7 | |
Chemicals | | | 1.6 | |
Capital Markets | | | 1.6 | |
Media | | | 1.6 | |
Food Products | | | 1.5 | |
Software | | | 1.5 | |
IT Services | | | 1.4 | |
Household Durables | | | 1.4 | |
Energy Equipment & Services | | | 1.3 | |
Auto Components | | | 1.3 | |
Gas Utilities | | | 1.3 | |
Health Care Equipment & Supplies | | | 1.3 | |
Road & Rail | | | 1.2 | |
Aerospace & Defense | | | 1.1 | |
| | | | |
Airlines | | | 1.0 | % |
Textiles, Apparel & Luxury Goods | | | 1.0 | |
Health Care Technology | | | 0.9 | |
Professional Services | | | 0.8 | |
Construction & Engineering | | | 0.7 | |
Health Care Providers & Services | | | 0.7 | |
Life Sciences Tools & Services | | | 0.7 | |
Diversified Consumer Services | | | 0.6 | |
Leisure Products | | | 0.6 | |
Building Products | | | 0.5 | |
Real Estate Management & Development | | | 0.5 | |
Pharmaceuticals | | | 0.5 | |
Food & Staples Retailing | | | 0.4 | |
Electrical Equipment | | | 0.4 | |
Construction Materials | | | 0.4 | |
Air Freight & Logistics | | | 0.4 | |
Commercial Services & Supplies | | | 0.3 | |
Consumer Finance | | | 0.3 | |
Water Utilities | | | 0.3 | |
Biotechnology | | | 0.3 | |
Interactive Media & Services | | | 0.2 | |
Personal Products | | | 0.2 | |
Household Products | | | 0.1 | |
Entertainment | | | 0.1 | |
Diversified Financial Services | | | 0.1 | |
| | | | |
| | | 108.9 | |
Liabilities in excess of other assets | | | (8.9 | ) |
| | | | |
| | | 100.0 | % |
| | | | |
Financial Instruments/Transactions—Summary of Offsetting and Netting Arrangements:
The Portfolio entered into financial instruments/transactions during the reporting period that are either offset in accordance with current requirements or are subject to enforceable master netting arrangements or similar agreements that permit offsetting. The information about offsetting and related netting arrangements for financial instruments/transactions where the legal right to set-off exists is presented in the summary below.
Offsetting of financial instrument/transaction assets and liabilities:
| | | | | | | | | | | | |
Description | | Gross Market
Value of
Recognized
Assets/(Liabilities) | | | Collateral
Pledged/
(Received)(1) | | | Net
Amount | |
Securities on Loan | | $ | 19,415,669 | | | $ | (19,415,669 | ) | | $ | — | |
| | | | | | | | | | | | |
| (1) | Collateral amount disclosed by the Portfolio is limited to the market value of financial instruments/transactions. |
SEE NOTES TO FINANCIAL STATEMENTS.
A6
| | | | | | |
| | |
| | SP SMALL CAP VALUE PORTFOLIO (continued) | | |
STATEMENT OF ASSETS AND LIABILITIES
as of December 31, 2019
| | | | |
| ASSETS | | | | |
Investments at value, including securities on loan of $19,415,669: | | | | |
Unaffiliated investments (cost $172,892,683) | | $ | 216,188,728 | |
Affiliated investments (cost $24,146,896) | | | 24,151,808 | |
Receivable for investments sold | | | 580,595 | |
Dividends receivable | | | 433,571 | |
Receivable for Portfolio shares sold | | | 24,116 | |
Tax reclaim receivable | | | 5,925 | |
Prepaid expenses | | | 1,744 | |
| | | | |
Total Assets | | | 241,386,487 | |
| | | | |
| LIABILITIES | | | | |
Payable to broker for collateral for securities on loan | | | 19,827,671 | |
Payable for investments purchased | | | 666,676 | |
Management fee payable | | | 163,970 | |
Accrued expenses and other liabilities | | | 102,611 | |
Payable for Portfolio shares repurchased | | | 14,054 | |
Payable to affiliate | | | 5,925 | |
Affiliated transfer agent fee payable | | | 980 | |
| | | | |
Total Liabilities | | | 20,781,887 | |
| | | | |
| NET ASSETS | | $ | 220,604,600 | |
| | | | |
Net assets were comprised of: | | | | |
Partners’ Equity | | $ | 220,604,600 | |
| | | | |
Net asset value and redemption price per share, $220,604,600 / 7,917,819 outstanding shares of beneficial interest | | $ | 27.86 | |
| | | | |
STATEMENT OF OPERATIONS
Year Ended December 31, 2019
| | | | |
| NET INVESTMENT INCOME (LOSS) | | | | |
| INCOME | | | | |
Unaffiliated dividend income | | $ | 3,474,329 | |
Affiliated dividend income | | | 110,903 | |
Income from securities lending, net (including affiliated income of $60,923) | | | 62,862 | |
| | | | |
Total income | | | 3,648,094 | |
| | | | |
| EXPENSES | | | | |
Management fee | | | 1,861,071 | |
Shareholders’ reports | | | 92,448 | |
Custodian and accounting fees | | | 67,347 | |
Audit fee | | | 29,300 | |
Legal fees and expenses | | | 12,691 | |
Trustees’ fees | | | 12,081 | |
Transfer agent’s fees and expenses (including affiliated expense of $5,882) | | | 10,682 | |
Miscellaneous | | | 17,119 | |
| | | | |
Total expenses | | | 2,102,739 | |
Less: Fee waiver and/or expense reimbursement | | | (16,543 | ) |
| | | | |
Net expenses | | | 2,086,196 | |
| | | | |
| NET INVESTMENT INCOME (LOSS) | | | 1,561,898 | |
| | | | |
| REALIZED AND UNREALIZED GAIN (LOSS) ON INVESTMENT AND FOREIGN CURRENCY TRANSACTIONS | | | | |
Net realized gain (loss) on: | | | | |
Investment transactions (including affiliated of $2,248) | | | 9,491,055 | |
Foreign currency transactions | | | (517 | ) |
| | | | |
| | | 9,490,538 | |
| | | | |
Net change in unrealized appreciation (depreciation) on: | | | | |
Investments (including affiliated of $5,902) | | | 30,049,394 | |
Foreign currencies | | | 517 | |
| | | | |
| | | 30,049,911 | |
| | | | |
| NET GAIN (LOSS) ON INVESTMENT AND FOREIGN CURRENCY TRANSACTIONS | | | 39,540,449 | |
| | | | |
| NET INCREASE (DECREASE) IN NET ASSETS RESULTING FROM OPERATIONS | | $ | 41,102,347 | |
| | | | |
STATEMENTS OF CHANGES IN NET ASSETS
| | | | | | | | |
| | | Year Ended
December 31, 2019 | | | Year Ended
December 31, 2018 | |
| INCREASE (DECREASE) IN NET ASSETS | | | | | | | | |
| OPERATIONS | | | | | | | | |
Net investment income (loss) | | $ | 1,561,898 | | | $ | 1,011,136 | |
Net realized gain (loss) on investment and foreign currency transactions | | | 9,490,538 | | | | 13,544,446 | |
Net change in unrealized appreciation (depreciation) on investments and foreign currencies | | | 30,049,911 | | | | (43,215,396 | ) |
| | | | | | | | |
NET INCREASE (DECREASE) IN NET ASSETS RESULTING FROM OPERATIONS | | | 41,102,347 | | | | (28,659,814 | ) |
| | | | | | | | |
| PORTFOLIO SHARE TRANSACTIONS | | | | | | | | |
Portfolio shares sold [623,842 and 391,841 shares, respectively] | | | 16,249,716 | | | | 10,182,721 | |
Portfolio shares repurchased [640,774 and 603,195 shares, respectively] | | | (16,750,272 | ) | | | (15,962,030 | ) |
| | | | | | | | |
NET INCREASE (DECREASE) IN NET ASSETS FROM PORTFOLIO SHARE TRANSACTIONS | | | (500,556 | ) | | | (5,779,309 | ) |
| | | | | | | | |
Capital Contributions | | | — | | | | 8,507 | |
| | | | | | | | |
| TOTAL INCREASE (DECREASE) | | | 40,601,791 | | | | (34,430,616 | ) |
| NET ASSETS: | | | | | | | | |
Beginning of year | | | 180,002,809 | | | | 214,433,425 | |
| | | | | | | | |
End of year | | $ | 220,604,600 | | | $ | 180,002,809 | |
| | | | | | | | |
SEE NOTES TO FINANCIAL STATEMENTS.
A7
NOTES TO FINANCIAL STATEMENTS OF
THE PRUDENTIAL SERIES FUND
The Prudential Series Fund (“Series Fund”) is registered under the Investment Company Act of 1940, as amended (“1940 Act”), as an open-end management investment company. The Series Fund is composed of seventeen Portfolios (“Portfolios”), each with separate series shares. The information presented in these financial statements pertains to the SP Small Cap Value Portfolio (the “Portfolio”). The Portfolio is a diversified portfolio.
The investment objective of the Portfolio is long-term growth of capital.
The Series Fund follows the investment company accounting and reporting guidance of the Financial Accounting Standards Board (“FASB”) Accounting Standard Codification (“ASC”) Topic 946 Financial Services — Investment Companies.The following accounting policies conform to U.S. generally accepted accounting principles. The Series Fund and the Portfolio consistently follow such policies in the preparation of their financial statements.
Securities Valuation: The Portfolio holds securities and other assets and liabilities that are fair valued at the close of each day (generally, 4:00 PM Eastern time) the New York Stock Exchange (“NYSE”) is open for trading. Fair value is the price that would be received to sell an asset or paid to transfer a liability in an orderly transaction between market participants on the measurement date. The Series Fund’s Board of Trustees (the “Board”) has adopted valuation procedures for security valuation under which fair valuation responsibilities have been delegated to PGIM Investments LLC (“PGIM Investments” or the “Manager”). Pursuant to the Board’s delegation, the Manager has established a Valuation Committee responsible for supervising the fair valuation of portfolio securities and other assets and liabilities. The valuation procedures permit the Portfolio to utilize independent pricing vendor services, quotations from market makers, and alternative valuation methods when market quotations are either not readily available or not deemed representative of fair value. A record of the Valuation Committee’s actions is subject to the Board’s review, approval, and ratification at its next regularly scheduled quarterly meeting.
For the fiscal reporting year-end, securities and other assets and liabilities were fair valued at the close of the last U.S. business day. Trading in certain foreign securities may occur when the NYSE is closed (including weekends and holidays). Because such foreign securities trade in markets that are open on weekends and U.S. holidays, the values of some of the Portfolio’s foreign investments may change on days when investors cannot purchase or redeem Portfolio shares.
Various inputs determine how the Portfolio’s investments are valued, all of which are categorized according to the three broad levels (Level 1, 2, or 3) detailed in the Schedule of Investments and referred to herein as the “fair value hierarchy” in accordance with FASB ASC Topic 820 — Fair Value Measurements and Disclosures.
Common and preferred stocks, exchange-traded funds, and derivative instruments, such as futures or options, that are traded on a national securities exchange are valued at the last sale price as of the close of trading on the applicable exchange where the security principally trades. Securities traded via NASDAQ are valued at the NASDAQ official closing price. To the extent these securities are valued at the last sale price or NASDAQ official closing price, they are classified as Level 1 in the fair value hierarchy. In the event that no sale or official closing price on valuation date exists, these securities are generally valued at the mean between the last reported bid and ask prices, or at the last bid price in the absence of an ask price. These securities are classified as Level 2 in the fair value hierarchy.
Foreign equities traded on foreign securities exchanges are generally valued using pricing vendor services that provide model prices derived using adjustment factors based on information such as local closing price, relevant general and sector indices, currency fluctuations, depositary receipts, and futures, as applicable. Securities valued using such model prices are classified as Level 2 in the fair value hierarchy. The models generate an evaluated adjustment factor for each security, which is applied to the local closing price to adjust it for post closing market movements up to the time the Portfolio is valued. Utilizing that evaluated adjustment factor, the vendor provides an evaluated price for each security. If the vendor does not provide an evaluated price, securities are valued in accordance with exchange-traded common and preferred stock valuation policies discussed above.
Investments in open-end, non-exchange-traded mutual funds are valued at their net asset values as of the close of the NYSE on the date of valuation. These securities are classified as Level 1 in the fair value hierarchy since they may be purchased or sold at their net asset values on the date of valuation.
B1
Securities and other assets that cannot be priced according to the methods described above are valued based on pricing methodologies approved by the Board. In the event that unobservable inputs are used when determining such valuations, the securities will be classified as Level 3 in the fair value hierarchy.
When determining the fair value of securities, some of the factors influencing the valuation include: the nature of any restrictions on disposition of the securities; assessment of the general liquidity of the securities; the issuer’s financial condition and the markets in which it does business; the cost of the investment; the size of the holding and the capitalization of the issuer; the prices of any recent transactions or bids/offers for such securities or any comparable securities; any available analyst media or other reports or information deemed reliable by the Manager regarding the issuer or the markets or industry in which it operates. Using fair value to price securities may result in a value that is different from a security’s most recent closing price and from the price used by other unaffiliated mutual funds to calculate their net asset values.
Illiquid Securities: Pursuant to Rule 22e-4 under the 1940 Act, the Series Fund has adopted a Board approved Liquidity Risk Management Program (“LRMP”) that requires, among other things, that the Portfolio limit its illiquid investments that are assets to no more than 15% of net assets. Illiquid securities are those that, because of the absence of a readily available market or due to legal or contractual restrictions on resale, may not reasonably be expected to be sold or disposed of in current market conditions in seven calendar days or less without the sale or disposition significantly changing the market value of the investment. The Portfolio may find it difficult to sell illiquid securities at the time considered most advantageous by its subadviser(s) and may incur transaction costs that would not be incurred in the sale of securities that were freely marketable.
Restricted Securities: Securities acquired in unregistered, private sales from the issuing company or from an affiliate of the issuer are considered restricted as to disposition under federal securities law (“restricted securities”). Such restricted securities are valued pursuant to the valuation procedures noted above. Restricted securities that would otherwise be considered illiquid investments pursuant to the Portfolio’s LRMP because of legal restrictions on resale to the general public may be traded among qualified institutional buyers under Rule 144A of the Securities Act of 1933. Therefore, these Rule 144A securities, as well as commercial paper that is sold in private placements under Section 4(2) of the Securities Act of 1933, may be classified higher than “illiquid” under the LRMP (i.e. “moderately liquid” or “less liquid” investments). However, the liquidity of the Portfolio’s investments in restricted securities could be impaired if trading does not develop or declines.
Foreign Currency Translation: The books and records of the Portfolio are maintained in U.S. dollars. Foreign currency amounts are translated into U.S. dollars on the following basis:
(i) market value of investment securities, other assets and liabilities — at the current rates of exchange;
(ii) purchases and sales of investment securities, income and expenses — at the rates of exchange prevailing on the respective dates of such transactions.
Although the net assets of the Portfolio are presented at the foreign exchange rates and market values at the close of the period, the Portfolio does not generally isolate that portion of the results of operations arising as a result of changes in the foreign exchange rates from the fluctuations arising from changes in the market prices of long-term portfolio securities held at the end of the period. Similarly, the Portfolio does not isolate the effect of changes in foreign exchange rates from the fluctuations arising from changes in the market prices of long-term portfolio securities sold during the period. Accordingly, holding period realized foreign currency gains (losses) are included in the reported net realized gains (losses) on investment transactions.
Net realized gains (losses) on foreign currency transactions represent net foreign exchange gains (losses) from the disposition of holdings of foreign currencies, currency gains (losses) realized between the trade and settlement dates on investment transactions, and the difference between the amounts of interest, dividends and foreign withholding taxes recorded on the Portfolio’s books and the U.S. dollar equivalent amounts actually received or paid. Net unrealized currency gains (losses) arise from valuing foreign currency denominated assets and liabilities (other than investments) at period end exchange rates.
Master Netting Arrangements: The Series Fund, on behalf of the Portfolio, is subject to various Master Agreements, or netting arrangements, with select counterparties. These are agreements which a subadviser may have negotiated and entered into on behalf of all or a portion of the Portfolio. A master netting arrangement between the Portfolio and the counterparty permits the Portfolio to offset amounts payable by the Portfolio to the same counterparty against amounts to be received; and by the receipt of collateral from the counterparty by the Portfolio to cover the Portfolio’s exposure to the counterparty. However, there is no assurance that such mitigating factors are easily enforceable. In addition to master netting arrangements, the right to set-off exists when all the
B2
conditions are met such that each of the parties owes the other determinable amounts, the reporting party has the right to set-off the amount owed with the amount owed by the other party, the reporting party intends to set-off and the right of set-off is enforceable by law. During the reporting period, there was no intention to settle on a net basis and all amounts are presented on a gross basis on the Statement of Assets and Liabilities.
Securities Lending: The Portfolio lends its portfolio securities to banks and broker-dealers. The loans are secured by collateral at least equal to the market value of the securities loaned. Collateral pledged by each borrower is invested in an affiliated money market fund and is marked to market daily, based on the previous day’s market value, such that the value of the collateral exceeds the value of the loaned securities. In the event of significant appreciation in value of securities on loan on the last business day of the reporting period, the financial statements may reflect a collateral value that is less than the market value of the loaned securities. Such shortfall is remedied as described above. Loans are subject to termination at the option of the borrower or the Portfolio. Upon termination of the loan, the borrower will return to the Portfolio securities identical to the loaned securities. Should the borrower of the securities fail financially, the Portfolio has the right to repurchase the securities in the open market using the collateral.
The Portfolio recognizes income, net of any rebate and securities lending agent fees, for lending its securities in the form of fees or interest on the investment of any cash received as collateral. The borrower receives all interest and dividends from the securities loaned and such payments are passed back to the lender in amounts equivalent thereto. The Portfolio also continues to recognize any unrealized gain (loss) in the market price of the securities loaned and on the change in the value of the collateral invested that may occur during the term of the loan. In addition, realized gain (loss) is recognized on changes in the value of the collateral invested upon liquidation of the collateral. Net earnings from securities lending are disclosed in the Statement of Operations.
Equity and Mortgage Real Estate Investment Trusts (collectively equity REITs): The Portfolio invested in equity REITs, which report information on the source of their distributions annually. Based on current and historical information, a portion of distributions received from equity REITs during the period is estimated to be dividend income, capital gain or return of capital and recorded accordingly. When material, these estimates are adjusted periodically when the actual source of distributions is disclosed by the equity REITs.
Master Limited Partnerships (MLPs): The Portfolio invested in MLPs. Distributions received from the Portfolio’s investment in MLPs generally are comprised of income and return of capital. The Portfolio records investment income and return of capital based on estimates made at the time such distributions are received. Such estimates are based on historical information available from each MLP and other industry sources. These estimates may subsequently be revised based on information received from MLPs after their respective tax reporting periods have concluded.
Securities Transactions and Net Investment Income: Securities transactions are recorded on the trade date. Realized gains (losses) from investment and currency transactions are calculated on the specific identification method. Dividend income is recorded on the ex-date, or for certain foreign securities, when the Portfolio becomes aware of such dividends. Interest income, including amortization of premium and accretion of discount on debt securities, as required, is recorded on the accrual basis. Expenses are recorded on an accrual basis, which may require the use of certain estimates by management that may differ from actual.
Taxes: For federal income tax purposes, the Portfolio is treated as a separate taxpaying entity. The Portfolio is treated as a partnership for tax purposes. No provision has been made in the financial statements for U.S. federal, state, or local taxes, as any tax liability arising from operations of the Portfolio is the responsibility of the Portfolio’s shareholders (participating insurance companies). The Portfolio is not generally subject to entity-level taxation. Shareholders of the Portfolio are subject to taxes on their distributive share of partnership items. Withholding taxes on foreign dividends, interest and capital gains are accrued in accordance with the Portfolio’s understanding of the applicable country’s tax rules and regulations. Such taxes are accrued net of reclaimable amounts, at the time the related income/gain is recorded taking into account any agreements in place with Prudential Financial, Inc. (“Prudential”) as referenced in Note 3. The Portfolio generally attempts to manage its diversification in a manner that supports the diversification requirements of the underlying separate accounts.
Distributions: Distributions, if any, from the Portfolio are made in cash and automatically reinvested in additional shares of the Portfolio. Distributions are recorded on the ex-date.
Estimates: The preparation of financial statements requires management to make estimates and assumptions that affect the reported amounts and disclosures in the financial statements. Actual results could differ from those estimates.
B3
The Series Fund, on behalf of the Portfolio, has entered into an investment management agreement with the Manager. Pursuant to this agreement, the Manager has responsibility for all investment management services and supervises the subadviser’s performance of such services. The Manager has entered into a subadvisory agreement with Goldman Sachs Asset Management, L.P. (“GSAM”) (the “subadviser”), under which GSAM provides investment advisory services for the Portfolio. The Manager pays for the services of the subadviser, the cost of compensation of officers of the Portfolio, occupancy and certain clerical and administrative expenses of the Portfolio. The Portfolio bears all other costs and expenses.
The management fee paid to the Manager is accrued daily and payable monthly at an annual rate of 0.90% of the Portfolio’s average daily net assets of the Fund. The Manager has contractually agreed through June 30, 2020 to waive a portion of its management fee equal to an annual rate of 0.008% of the average daily net assets of the Portfolio. The effective management fee rate net of waiver was 0.89% for the year ended December 31, 2019. All amounts paid or payable by the Portfolio to the Manager, under the agreement, are reflected in the Statement of Operations.
The Series Fund, on behalf of the Portfolio, has entered into brokerage commission recapture agreements with certain registered broker-dealers. Under the brokerage commission recapture program, a portion of the commission is returned to the Portfolio on whose behalf the trades were made. Commission recapture is paid solely to those portfolios generating the applicable trades. Such amounts are included within realized gain (loss) on investment transactions presented in the Statement of Operations. For the reporting period ended December 31, 2019, brokerage commission recaptured under these agreements was $0.
PGIM Investments is an indirect, wholly-owned subsidiary of Prudential.
| 3. | | Other Transactions with Affiliates |
Prudential Mutual Fund Services LLC (“PMFS”), an affiliate of PGIM Investments and an indirect, wholly-owned subsidiary of Prudential, serves as the transfer agent of the Portfolio. The transfer agent’s fees and expenses in the Statement of Operations include certain out-of-pocket expenses paid to non-affiliates, where applicable.
The Portfolio may invest its overnight sweep cash in the PGIM Core Ultra Short Bond Fund (the “Core Fund”) and its securities lending cash collateral in the PGIM Institutional Money Market Fund (the “Money Market Fund”), each a series of Prudential Investment Portfolios 2, registered under the 1940 Act and managed by PGIM Investments. Through the Portfolio’s investments in the mentioned underlying funds, PGIM Investments and/or its affiliates are paid fees or reimbursed for providing their services. In addition to the realized and unrealized gains on investments in the Core Fund and Money Market Fund, earnings from such investments are disclosed on the Statement of Operations as “Affiliated dividend income” and “Income from securities lending, net”, respectively.
The Portfolio may enter into certain securities purchase or sale transactions under Board approved Rule 17a-7 procedures. Rule 17a-7 is an exemptive rule under the 1940 Act, that subject to certain conditions, permits purchase and sale transactions among affiliated investment companies, or between an investment company and a person that is affiliated solely by reason of having a common (or affiliated) investment adviser, common directors, and/or common officers. Pursuant to the Rule 17a-7 procedures and consistent with guidance issued by the Securities and Exchange Commission (“SEC”), the Series Fund’s Chief Compliance Officer (“CCO”) prepares a quarterly summary of all such transactions for submission to the Board, together with the CCO’s written representation that all such 17a-7 transactions were effected in accordance with the Series Fund’s Rule 17a-7 procedures. For the reporting period ended December 31, 2019, no 17a-7 transactions were entered into by the Portfolio.
| | b.) | | Securities Lending and Foreign Withholding Tax Reclaim Matters |
In September 2019, the Manager reached a settlement with the SEC relating to the securities lending and foreign withholding tax reclaim matters described below. Under the settlement, the Manager agreed to pay to the SEC disgorgement of fees and a civil penalty. The settlement does not affect the Manager’s ability to manage the Portfolio.
In February 2016, Prudential, the parent company of the Manager, self-reported to the SEC and certain other regulators that, in some cases, it failed to maximize securities lending income for certain Portfolios of the Series
B4
Fund due to a long-standing restriction benefitting Prudential. The Board was not notified of the restriction until after it had been removed. Prudential paid each of the affected Portfolios an amount equal to the estimated loss associated with the unauthorized restriction. At the Board’s direction, this payment occurred on June 30, 2016. The estimated opportunity loss was calculated by an independent consultant hired by Prudential whose calculation methodology was subsequently reviewed by a consultant retained by the independent trustees of the Portfolios. The per share amount of opportunity loss payment to the Portfolios is disclosed in the Portfolio’s “Financial Highlights” as “Capital Contributions” for the fiscal year ended December 31, 2016.
In March 2018, Prudential further notified the SEC that it failed to timely reimburse certain Portfolios for amounts due under protocols established to ensure that the Portfolios were not harmed as a result of their tax status as partnerships instead of regulated investment companies (RICs). Specifically, as a result of their partnership status, the Portfolios are subject to higher foreign withholding tax rates on dividend and interest income in certain foreign jurisdictions and/or are subject to delays in repayment of taxes withheld by certain foreign jurisdictions (collectively, “excess withholding tax”). Prudential’s protocols were intended to protect the Portfolios from these differences and delays. In consultation with the Series Fund’s independent trustees, Prudential paid each of the affected Portfolios an amount equal to the excess withholding tax in addition to an amount equal to the applicable Portfolio’s rate of return (“opportunity loss”) applied to these excess withholding tax amounts for periods from the various transaction dates, beginning January 2, 2006 (the date when the Portfolios were converted to partnerships for tax purposes), through February 28, 2018 (the date through which the previously established protocols were not uniformly implemented). The amount due to each Portfolio was calculated by Prudential with the help of a third-party consultant. Those amounts and the methodology used by Prudential to derive them, were evaluated and confirmed by a consultant retained by the Series Fund’s independent trustees. The excess withholding tax analysis considered detriments to the Portfolios due to their tax status as partnerships arising from both timing differences (i.e., jurisdictions in which the Portfolio was subject to a higher withholding tax rate due to its tax status which is reclaimable) as described above as well as permanent tax detriments (i.e., jurisdictions in which the Portfolio was subject to a higher withholding tax rate due to its tax status which is not reclaimable). Further, the opportunity loss due to each Portfolio also was calculated by a third-party consultant hired by Prudential whose calculation methodology was subsequently reviewed by a consultant retained by the Series Fund’s independent trustees. The aggregate previously unreimbursed excess withholding tax and/or opportunity loss payment for the Portfolio are disclosed in the Portfolio’s “Statements of Changes in Net Assets” and “Financial Highlights” as “Capital Contributions” for the fiscal year ended December 31, 2018.
In addition to the above, Prudential committed to the Series Fund’s independent trustees that it would pay all consulting, legal, audit, and other charges, fees and expenses incurred with the matters described above. Prudential has made and continues to make these payments.
During the reporting period and in consultation with the Series Fund’s independent trustees, Prudential instituted a process to reimburse the affected Portfolios for any future excess withholding tax on the first business day following the pay-date of the applicable dividend or interest income event regardless of whether the excess withholding tax is due to timing differences or permanent detriments resulting from the Portfolios’ partnership tax status.
In cases in which the excess withholding tax is due to timing differences and is reclaimable from the foreign jurisdiction, the affected Portfolios have the ability to recover the excess withholding tax withheld by filing a reclaim with the relevant foreign tax authority. To avoid a Portfolio receiving and retaining a duplicate payment for the same excess withholding tax, payments received by an applicable Portfolio from a foreign tax authority for reclaims for which a Portfolio previously received reimbursement from Prudential will be payable to Prudential. Pending tax reclaim amounts due to Prudential for excess withholding tax which Prudential previously paid to the Portfolios are reported as “Payable to affiliate” on the “Statement of Assets and Liabilities” and any amounts accrued but not yet reimbursed by Prudential for excess withholding tax is recorded as “Receivable from affiliate” on the Statement of Assets and Liabilities. The full amount of tax reclaims due to a Portfolio, inclusive of timing differences and routine tax reclaims for foreign jurisdictions where the Portfolios do not incur an excess withholding tax is included as “Tax reclaim receivable” on the “Statement of Assets and Liabilities.” To the extent that there are costs associated with the filing of any reclaim attributable to excess withholding tax, those costs are borne by Prudential.
The aggregate cost of purchases and proceeds from sales of portfolio securities (excluding short-term investments and U.S. Government securities) for the year ended December 31, 2019, were $114,925,983 and $113,482,931, respectively.
B5
A summary of the cost of purchases and proceeds from sales of shares of affiliated investments for the year ended December 31, 2019, is presented as follows:
| | | | | | | | | | | | | | | | | | | | | | | | | | | | | | |
Value,
Beginning of
Year | | | Cost of
Purchases | | | Proceeds
from Sales | | | Change in
Unrealized
Gain
(Loss) | | | Realized
Gain
(Loss) | | | Value,
End of Year | | | Shares,
End of
Year | | | Income | |
| | PGIM Core Ultra Short Bond Fund* | | | | | | | | | | | | | | | | | | | | | |
| $ | 4,136,174 | | | $ | 38,092,750 | | | $ | 37,945,555 | | | $ | — | | | $ | — | | | $ | 4,283,369 | | | | 4,283,369 | | | $ | 110,903 | |
| | PGIM Institutional Money Market Fund* | | | | | | | | | | | | | | | | | | | | | |
| | 24,086,172 | | | | 101,072,846 | | | | 105,298,729 | | | | 5,902 | | | | 2,248 | | | | 19,868,439 | | | | 19,864,466 | | | | 60,923 | ** |
| | | | | | | | | | | | | | | | | | | | | | | | | | | | | | |
| $ | 28,222,346 | | | $ | 139,165,596 | | | $ | 143,244,284 | | | $ | 5,902 | | | $ | 2,248 | | | $ | 24,151,808 | | | | | | | $ | 171,826 | |
| | | | | | | | | | | | | | | | | | | | | | | | | | | | | | |
| * | The Fund did not have any capital gain distributions during the reporting period. |
| ** | Represents the affiliated amount of securities lending income shown on the Statement of Operations. |
The Portfolio is treated as a partnership for federal income tax purposes. The character of the cash distributions, if any, made by the partnership is generally classified as nontaxable return of capital distributions. After each fiscal year each shareholder of record will receive information regarding their distributive allocable share of the partnership’s income, gains, losses and deductions.
With respect to the Portfolio, book cost of assets differs from tax cost of assets as a result of the Portfolio’s adoption of a mark to market method of accounting for tax purposes. Under this method, tax cost of assets will approximate fair market value.
The Manager has analyzed the Portfolio’s tax positions taken on federal, state and local income tax returns for all open tax years and has concluded that no provision for income tax is required in the Portfolio’s financial statements for the current reporting period. Since tax authorities can examine previously filed tax returns, the Portfolio’s U.S. federal and state tax returns for each of the four fiscal years up to the most recent fiscal year ended December 31, 2019 are subject to such review.
The Series Fund, on behalf of the Portfolio, along with other affiliated registered investment companies (the “Funds”), is a party to a Syndicated Credit Agreement (“SCA”) with a group of banks. The purpose of the SCA is to provide an alternative source of temporary funding for capital share redemptions. The table below provides details of the current SCA in effect at the reporting period-end as well as the prior SCA.
| | | | |
| | | Current SCA | | Prior SCA |
Term of Commitment | | 10/3/2019 – 10/1/2020 | | 10/4/2018 – 10/2/2019 |
Total Commitment | | $ 900 million | | $ 900 million |
Annualized Commitment Fee on the Unused Portion of the SCA | | 0.15% | | 0.15% |
Annualized Interest Rate on Borrowings | | 1.20% plus the higher of (1) the effective federal funds rate, (2) the one-month LIBOR rate or (3) zero percent | | 1.25% plus the higher of (1) the effective federal funds rate, (2) the one-month LIBOR rate or (3) zero percent |
Certain affiliated registered investment companies that are parties to the SCA include portfolios that are subject to a predetermined mathematical formula used to manage certain benefit guarantees offered under variable annuity contracts. The formula may result in large scale asset flows into and out of these portfolios. Consequently, these portfolios may be more likely to utilize the SCA for purposes of funding redemptions. It may be possible for those portfolios to fully exhaust the committed amount of the SCA, thereby requiring the Manager to allocate available funding per a Board-approved methodology designed to treat the Funds in the SCA equitably.
The Portfolio did not utilize the SCA during the year ended December 31, 2019.
B6
The shares of the Portfolio are not subject to any sales charge or redemption charge and are sold at the net asset value of the Portfolio. Shares are sold only to certain separate accounts of Prudential to fund benefits under certain variable life insurance and variable annuity contracts (“contracts”). The separate accounts invest in shares of the Portfolio through subaccounts that correspond to the Portfolio. The separate accounts will redeem shares of the Portfolio to the extent necessary to provide benefits under the contracts or for such other purposes as may be consistent with the contracts.
As of December 31, 2019, the following number of shares of the Portfolio were owned of record directly or by other Portfolios as part of their investments by insurance affiliates of Prudential Financial, Inc.
| | | | | | | | |
Portfolio | | Number of Shares | | | Percentage of
Outstanding Shares | |
SP Small Cap Value Portfolio | | | 7,917,819 | | | | 100 | % |
The following number of shareholders of record, each holding greater than 5% of the Portfolio, held the following percentage of outstanding shares, on behalf of multiple beneficial owners:
| | | | | | | | | | | | | | | | |
| | | Affiliated | | | Unaffiliated | |
Portfolio | | Number of
Shareholders | | | Percentage of
Outstanding Shares | | | Number of
Shareholders | | | Percentage of
Outstanding Shares | |
SP Small Cap Value Portfolio | | | 2 | | | | 99 | % | | | — | | | | — | % |
| 8. | | Risks of Investing in the Portfolio |
The Portfolio’s risks include, but are not limited to, some or all of the risks discussed below:
Equity and Equity-Related Securities Risks: The value of a particular security could go down and you could lose money. In addition to an individual security losing value, the value of the equity markets or a sector in which the Portfolio invests could go down. The Portfolio’s holdings can vary significantly from broad market indexes and the performance of the Portfolio can deviate from the performance of these indexes. Different parts of a market can react differently to adverse issuer, market, regulatory, political and economic developments.
Foreign Securities Risk: The Portfolio’s investments in securities of foreign issuers or issuers with significant exposure to foreign markets involve additional risk. Foreign countries in which the Portfolio may invest may have markets that are less liquid, less regulated and more volatile than US markets. The value of the Portfolio’s investments may decline because of factors affecting the particular issuer as well as foreign markets and issuers generally, such as unfavorable government actions, and political or financial instability.
Market and Credit Risk: Securities markets may be volatile and the market prices of the Portfolio’s securities may decline. Securities fluctuate in price based on changes in an issuer’s financial condition and overall market and economic conditions. If the market prices of the securities owned by the Portfolio fall, the value of an investment in the Portfolio will decline. Additionally, the Portfolio may also be exposed to credit risk in the event that an issuer or guarantor fails to perform or that an institution or entity with which the Portfolio has unsettled or open transactions defaults.
Risks of Investing in equity REITs: Real estate securities are subject to similar risks as direct investments in real estate and mortgages, and their value will depend on the value of the underlying properties or the underlying loans or interests. The underlying loans may be subject to the risks of default or of payments that occur earlier or later than expected, and such loans may also include so-called “subprime” mortgages. The value of these securities will rise and fall in response to many factors, including economic conditions, the demand for rental property and interest rates. In particular, the value of these securities may decline when interest rates rise and will also be affected by the real estate market and by the management of the underlying properties.
In addition, investing in equity REITs involves certain unique risks in addition to those risks associated with investing in the real estate industry in general. Equity REITs may be affected by changes in the value of the underlying property owned by the equity REITs, while mortgage REITs may be affected by the quality of any credit extended. Equity REITs are dependent upon management skills, may not be diversified geographically or by property/mortgage asset type, and are subject to heavy cash flow dependency, default by borrowers and self-liquidation. Since equity REITs are relatively smaller in size when compared to the broader market, and smaller companies tend to be more volatile than larger companies, they may be more volatile and/or more illiquid
B7
than other types of equity securities. Equity REITs are subject to interest rate risks. Equity REITs may incur significant amounts of leverage. The Portfolio will indirectly bear a portion of the expenses, including management fees, paid by each equity REIT in which it invests, in addition to the expenses of the Portfolio.
Small Company Risk: Small company stocks present above-average risks in comparison to larger companies. Small companies usually offer a smaller range of products and services than larger companies. Smaller companies may also have limited financial resources and may lack management depth. As a result, stocks issued by smaller companies may be less liquid and fluctuate in value more than the stocks of larger, more established companies.
| 9. | | Recent Accounting Pronouncements and Reporting Updates |
In August 2018, the FASB issued Accounting Standards Update (“ASU”) No. 2018-13, which changes certain fair value measurement disclosure requirements. The new ASU, in addition to other modifications and additions, removes the requirement to disclose the amount and reasons for transfers between Level 1 and Level 2 of the fair value hierarchy, and the Portfolio’s policy for the timing of transfers between levels. The amendments are effective for financial statements issued for fiscal years beginning after December 15, 2019, and interim periods within those fiscal years. The Manager has evaluated the implications of certain provisions of the ASU and has adopted the aspects related to the removal and modification of certain fair value measurement disclosures under the ASU. The Manager continues to evaluate certain other provisions of the ASU and does not expect a material impact to financial statement disclosures.
B8
Financial Highlights
| | | | | | | | | | | | | | | | | | | | |
| | | SP Small Cap Value Portfolio | |
| | | Year Ended December 31, | |
| | | 2019 | | | 2018 | | | 2017 | | | 2016 | | | 2015 | |
Per Share Operating Performance(a): | | | | | | | | | | | | | | | | | | | | |
Net Asset Value, beginning of year | | $ | 22.69 | | | $ | 26.32 | | | $ | 23.46 | | | $ | 18.70 | | | $ | 19.76 | |
| | | | | | | | | | | | | | | | | | | | |
Income (Loss) From Investment Operations: | | | | | | | | | | | | | | | | | | | | |
Net investment income (loss) | | | 0.20 | | | | 0.13 | | | | 0.12 | | | | 0.15 | | | | 0.10 | |
Net realized and unrealized gain (loss) on investment and foreign currency transactions | | | 4.97 | | | | (3.76 | ) | | | 2.74 | | | | 4.60 | | | | (1.16 | ) |
| | | | | | | | | | | | | | | | | | | | |
Total from investment operations | | | 5.17 | | | | (3.63 | ) | | | 2.86 | | | | 4.75 | | | | (1.06 | ) |
| | | | | | | | | | | | | | | | | | | | |
Capital Contributions | | | — | | | | — | (b)(c) | | | — | | | | 0.01 | (d) | | | — | |
| | | | | | | | | | | | | | | | | | | | |
Net Asset Value, end of year | | $ | 27.86 | | | $ | 22.69 | | | $ | 26.32 | | | $ | 23.46 | | | $ | 18.70 | |
| | | | | | | | | | | | | | | | | | | | |
Total Return(e) | | | 22.79 | % | | | (13.79 | )%(f) | | | 12.19 | % | | | 25.45 | %(g) | | | (5.36 | )% |
Ratios/Supplemental Data: | | | | | | | | | | | | | | | | | | | | |
Net assets, end of year (in millions) | | $ | 221 | | | $ | 180 | | | $ | 214 | | | $ | 211 | | | $ | 190 | |
Average net assets (in millions) | | $ | 207 | | | $ | 211 | | | $ | 208 | | | $ | 189 | | | $ | 207 | |
Ratios to average net assets(h): | | | | | | | | | | | | | | | | | | | | |
Expenses after waivers and/or expense reimbursement | | | 1.01 | % | | | 0.99 | % | | | 1.01 | % | | | 1.01 | % | | | 1.02 | % |
Expenses before waivers and/or expense reimbursement | | | 1.02 | % | | | 1.00 | % | | | 1.02 | % | | | 1.02 | % | | | 1.03 | % |
Net investment income (loss) | | | 0.76 | % | | | 0.48 | % | | | 0.51 | % | | | 0.75 | % | | | 0.54 | % |
Portfolio turnover rate(i) | | | 56 | % | | | 58 | % | | | 62 | % | | | 57 | % | | | 94 | % |
| (a) | Calculated based on average shares outstanding during the year. |
| (b) | Represents payment received by the Portfolio, from Prudential, in connection with the failure to timely compensate the Portfolio for the excess foreign withholding tax withheld on dividends and interest from certain countries due to the Portfolio’s tax status as a partnership. |
| (c) | Less than $0.005 per share. |
| (d) | Represents payment received by the Portfolio, from Prudential, in connection with the failure to maximize securities lending income due to a restriction that benefited Prudential. |
| (e) | Total return is calculated assuming a purchase of a share on the first day and a sale on the last day of each year reported and includes reinvestment of distributions, if any, and does not reflect the effect of insurance contract charges. Total return does not reflect expenses associated with the separate account such as administrative fees, account charges and surrender charges which, if reflected, would reduce the total returns for all years shown. Performance figures may reflect fee waivers and/or expense reimbursements. In the absence of fee waivers and/or expense reimbursements, the total return would be lower. Past performance is no guarantee of future results. Total returns may reflect adjustments to conform to generally accepted accounting principles. |
| (f) | Total return for the year includes the impact of capital contribution, which was not material to the total return. |
| (g) | Total return for the year includes the impact of the capital contribution. Excluding the capital contribution, the total return would have been 25.40%. |
| (h) | Does not include expenses of the underlying funds in which the Portfolio invests. |
| (i) | The Portfolio’s portfolio turnover rate is calculated in accordance with regulatory requirements, without regard to transactions involving short-term investments and certain derivatives. If such transactions were included, the Portfolio’s portfolio turnover rate may be higher. |
SEE NOTES TO FINANCIAL STATEMENTS.
C1
REPORT OF INDEPENDENT REGISTERED PUBLIC ACCOUNTING FIRM
TO THE SHAREHOLDERS OF SP SMALL CAP VALUE PORTFOLIO AND BOARD OF TRUSTEES
THE PRUDENTIAL SERIES FUND:
Opinion on the Financial Statements
We have audited the accompanying statement of assets and liabilities of SP Small Cap Value Portfolio, a portfolio of The Prudential Series Fund, (the Portfolio), including the schedule of investments, as of December 31, 2019, the related statement of operations for the year then ended, the statements of changes in net assets for each of the years in thetwo-year period then ended, and the related notes (collectively, the financial statements) and the financial highlights for each of the years indicated therein. In our opinion, the financial statements and financial highlights present fairly, in all material respects, the financial position of the Portfolio as of December 31, 2019, the results of its operations for the year then ended, the changes in its net assets for each of the years in thetwo-year period then ended, and the financial highlights for each of the years indicated therein, in conformity with U.S. generally accepted accounting principles.
Basis for Opinion
These financial statements and financial highlights are the responsibility of the Portfolio’s management. Our responsibility is to express an opinion on these financial statements and financial highlights based on our audits. We are a public accounting firm registered with the Public Company Accounting Oversight Board (United States) (PCAOB) and are required to be independent with respect to the Portfolio in accordance with the U.S. federal securities laws and the applicable rules and regulations of the Securities and Exchange Commission and the PCAOB.
We conducted our audits in accordance with the standards of the PCAOB. Those standards require that we plan and perform the audit to obtain reasonable assurance about whether the financial statements and financial highlights are free of material misstatement, whether due to error or fraud. Our audits included performing procedures to assess the risks of material misstatement of the financial statements and financial highlights, whether due to error or fraud, and performing procedures that respond to those risks. Such procedures included examining, on a test basis, evidence regarding the amounts and disclosures in the financial statements and financial highlights. Such procedures also included confirmation of securities owned as of December 31, 2019, by correspondence with the custodian, transfer agent, and brokers, or by other appropriate auditing procedures when replies were not received. Our audits also included evaluating the accounting principles used and significant estimates made by management, as well as evaluating the overall presentation of the financial statements and financial highlights. We believe that our audits provide a reasonable basis for our opinion.

We have served as the auditor of one or more PGIM and/or Prudential Insurance investment companies since 2003.
New York, New York
February 14, 2020
D1
INFORMATION ABOUT TRUSTEES AND OFFICERS (Unaudited)
Information about the Trustees and the officers of the Trust is set forth below. Trustees who are not deemed to be “interested persons” of the Trust, as defined in the Investment Company Act of 1940 (1940 Act), are referred to as “Independent Trustees.” Trustees who are deemed to be “interested persons” of the Trust are referred to as “Interested Trustees.” The Trustees oversee the operations of the Trust and appoint officers who are responsible forday-to-day business decisions based on policies set by the Board.
| | | | | | |
| |
| Independent Trustees |
Name Date of Birth No. of Portfolios Overseen | | Principal Occupation(s) During Past Five Years | | Other Directorships Held | | Length of Board Service |
Susan Davenport Austin 10/19/1967 No. of Portfolios Overseen: 109 | | Chief Financial Officer of Grace Church School (Since September 2019); formerly Senior Managing Director of Brock Capital (2014-2019); formerly Vice Chairman (2013-2017), Senior Vice President and Chief Financial Officer (2007-2012) and Vice President of Strategic Planning and Treasurer (2002-2007) of Sheridan Broadcasting Corporation; formerly President of Sheridan Gospel Network (2004-2014); formerly Vice President, Goldman, Sachs & Co. (2000-2001); formerly Associate Director, Bear, Stearns & Co. Inc. (1997-2000); formerly Vice President, Salomon Brothers Inc. (1993-1997); Member of the Board of Directors, The MacDowell Colony (Since 2010); formerly Chairman (2011-2014), formerly Presiding Director (2014-2017) and currently a Member (2007-present) of the Board of Directors, Broadcast Music, Inc.; Member of the Board of Directors, Hubbard Radio, LLC (Since 2011); President, Candide Business Advisors, Inc. (Since 2011); formerly Member of the Board of Directors, National Association of Broadcasters (2004-2010). | | Director of NextEra Energy Partners, LP (NYSE: NEP) (Since February 2015); Director of Broadcast Music, Inc. (Since 2007). | | Since February 2011 |
Sherry S. Barrat 11/13/1949 No. of Portfolios Overseen: 109 | | Formerly Vice Chairman of Northern Trust Corporation (financial services and banking institution) (2011-June 2012); formerly President, Personal Financial Services, Northern Trust Corporation (2006-2010); formerly Chairman & CEO, Western US Region, Northern Trust Corporation (1999-2005); formerly President & CEO, Palm Beach/Martin County Region, Northern Trust. | | Director of NextEra Energy, Inc. (NYSE: NEE) (1998-Present); Director of Arthur J. Gallagher & Company (Since July 2013). | | Since January 2013 |
Jessica M. Bibliowicz 11/28/1959 No. of Portfolios Overseen: 109 | | Formerly Senior Adviser (2013-2019) of Bridge Growth Partners (private equity firm); formerly Director (2013-2016) of Realogy Holdings Corp. (residential real estate services); formerly Chief Executive Officer (1999-2013) of National Financial Partners (independent distributor of financial services products). | | Formerly Director (2006-2019) of The Asia Pacific Fund, Inc.; Sotheby’s (Since 2014) (auction house andart-related finance). | | Since September 2014 |
Kay Ryan Booth 11/1/1950 No. of Portfolios Overseen: 109 | | Partner, Trinity Private Equity Group (Since September 2014); formerly, Managing Director of Cappello Waterfield & Co. LLC (2011-2014); formerly Vice Chair, Global Research, J.P. Morgan (financial services and investment banking institution) (June 2008-January 2009); formerly Global Director of Equity Research, Bear Stearns & Co., Inc. (financial services and investment banking institution) (1995-2008); formerly Associate Director of Equity Research, Bear Stearns & Co., Inc.(1987-1995). | | None. | | Since January 2013 |
Stephen M. Chipman 10/26/1961 No. of Portfolios Overseen: 109 | | Formerly Group Managing Director, International Expansion and Regional Managing Director, Americas of Vistra (June 2018-June 2019); formerly Chief Executive Officer and Director of Radius (2016-2018); formerly Senior Vice Chairman (January 2015-October 2015) and Chief Executive Officer (January 2010-December 2014) of Grant Thornton LLP. | | Non-Executive Chairman (Since September 2019) of Litera Microsystems. | | Since January 2018 |
Robert F. Gunia 12/15/1946 No. of Portfolios Overseen: 109 | | Formerly Director of ICI Mutual Insurance Company (June 2016-June 2019; June 2012-June 2015); formerly Chief Administrative Officer (September 1999-September 2009) and Executive Vice President (December 1996-September 2009) of PGIM Investments LLC; formerly Executive Vice President (March 1999-September 2009) and Treasurer (May 2000-September 2009) of Prudential Mutual Fund Services LLC; formerly President (April 1999-December 2008) and Executive Vice President and Chief Operating Officer (December 2008-December 2009) of Prudential Investment Management Services LLC; formerly Chief Administrative Officer, Executive Vice President and Director(May 2003-September 2009) of AST Investment Services, Inc. | | Formerly Director (1989-2019) of The Asia Pacific Fund, Inc. | | Since July 2003 |
Thomas T. Mooney 11/11/1941 No. of Portfolios Overseen: 109 | | Formerly Chief Executive Officer, Excell Partners, Inc. (2005-2007); founding partner of High Technology of Rochester and the Lennox Technology Center; formerly President of the Greater Rochester Metro Chamber of Commerce (1976-2004); formerly Rochester City Manager (1973); formerly Deputy Monroe County Executive (1974-1976). | | None. | | Since July 2003 |
E1
| | | | | | |
| |
| Independent Trustees |
Name Date of Birth No. of Portfolios Overseen | | Principal Occupation(s) During Past Five Years | | Other Directorships Held | | Length of Board Service |
Thomas M. O’Brien 12/5/1950 No. of Portfolios Overseen: 109 | | Vice Chairman of Emigrant Bank and President of its Naples Commercial Finance Division (Since October 2018); formerly Director, President and CEO Sun Bancorp, Inc. N.A. (NASDAQ: SNBC) and Sun National Bank (July 2014-February 2018); formerly Consultant, Valley National Bancorp, Inc. and Valley National Bank (January 2012-June 2012); formerly President and COO (November 2006-April 2017) and CEO (April 2007-December 2011) of State Bancorp, Inc. and State Bank; formerly Vice Chairman (January 1997-April 2000) of North Fork Bank; formerly President and Chief Executive Officer (December 1984-December 1996) of North Side Savings Bank; formerly President and Chief Executive Officer (May 2000-June 2006) Atlantic Bank of New York. | | Formerly Director, Sun Bancorp, Inc. N.A. (NASDAQ: SNBC) and Sun National Bank (July 2014-February 2018); formerly Director, BankUnited, Inc. and BankUnited N.A. (NYSE: BKU) (May 2012-April 2014); formerly Director (April 2008-January 2012) of Federal Home Loan Bank of New York; formerly Director (December 1996-May 2000) of North Fork Bancorporation, Inc.; formerly Director (May 2000-April 2006) of Atlantic Bank of New York; Director (November 2006-January 2012) of State Bancorp, Inc. (NASDAQ: STBC) and State Bank of Long Island. | | Since July 2003 |
| |
| Interested Trustee |
Timothy S. Cronin 12/21/1965 No. of Portfolios Overseen: 109 | | Vice President of Prudential Annuities (Since June 2015); Senior Vice President of PGIM Investments LLC (Since May 2009); Chief Investment Officer and Strategist of Prudential Annuities (Since January 2004); Director of Investment & Research Strategy (Since February 1998); President of AST Investment Services, Inc. (Since June 2005). | | None. | | Since October 2009 |
| | | | |
| |
| Trust Officers(a) |
Name Date of Birth Position with the Trust | | Principal Occupation(s) During the Past Five Years | | Length of Service as Trust Officer |
Ken Allen 1/24/1969 Vice President | | Vice President of Investment Management (since December 2009) | | Since June 2019 |
Raymond A. O’Hara 9/19/1955 Chief Legal Officer | | Vice President and Corporate Counsel (since July 2010) of Prudential Insurance Company of America (Prudential); Vice President (March 2011-Present) of Pruco Life Insurance Company and Pruco Life Insurance Company of New Jersey; Vice President and Corporate Counsel (March 2011-Present) of Prudential Annuities Life Assurance Corporation; Chief Legal Officer of PGIM Investments LLC (since June 2012); Chief Legal Officer of Prudential Mutual Fund Services LLC (since June 2012) and Corporate Counsel of AST Investment Services, Inc. (since June 2012); formerly Assistant Vice President and Corporate Counsel (September 2008-July 2010) of The Hartford Financial Services Group, Inc.; formerly Associate (September 1980-December 1987) and Partner (January 1988-August 2008) of Blazzard & Hasenauer, P.C. (formerly, Blazzard, Grodd & Hasenauer, P.C.). | | Since June 2012 |
Andrew R. French 12/22/1962 Secretary | | Vice President within PGIM Investments LLC (December 2018-Present); formerly Vice President and Corporate Counsel (February 2010-December 2018) of Prudential; formerly Director and Corporate Counsel (2006-2010) of Prudential; Vice President and Assistant Secretary (since January 2007) of PGIM Investments LLC; Vice President and Assistant Secretary (since January 2007) of Prudential Mutual Fund Services LLC. | | Since October 2006 |
Jonathan D. Shain 8/9/1958 Assistant Secretary | | Vice President and Corporate Counsel (since August 1998) of Prudential; Vice President and Assistant Secretary (since May 2001) of PGIM Investments LLC; Vice President and Assistant Secretary (since February 2001) of Prudential Mutual Fund Services LLC; formerly Vice President and Assistant Secretary (May 2003-June 2005) of AST Investment Services, Inc. | | Since May 2005 |
Claudia DiGiacomo 10/14/1974 Assistant Secretary | | Vice President and Corporate Counsel (since January 2005) of Prudential; Vice President and Assistant Secretary of PGIM Investments LLC (since December 2005); Associate at Sidley Austin Brown Wood LLP (1999-2004). | | Since December 2005 |
Melissa Gonzalez 2/10/1980 Assistant Secretary | | Vice President and Corporate Counsel (since September 2018) of Prudential; formerly Director and Corporate Counsel (March 2014-September 2018) of Prudential. | | Since March 2019 |
Dino Capasso 8/19/1974 Chief Compliance Officer | | Chief Compliance Officer (July 2019-Present) of PGIM Investments LLC; Chief Compliance Officer (July 2019-Present) of the PGIM Funds, Target Funds, Advanced Series Trust, The Prudential Series Fund, Prudential’s Gibraltar Fund, Inc., PGIM Global High Yield Fund, Inc., and PGIM High Yield Bond Fund, Inc.; Vice President and Deputy Chief Compliance Officer (June 2017-July 2019) of PGIM Investments LLC; formerly, Senior Vice President and Senior Counsel (January 2016-June 2017), and Vice President and Counsel (February 2012-December 2015) of Pacific Investment Management Company LLC. | | Since March 2018 |
E2
| | | | |
| |
| Trust Officers(a) |
Name Date of Birth Position with the Trust | | Principal Occupation(s) During the Past Five Years | | Length of Service as Trust Officer |
Charles H. Smith 1/11/1973 Anti-Money Laundering Compliance Officer | | Vice President, Corporate Compliance, Anti-Money Laundering Unit (since January 2015) of Prudential; committee member of the American Council of Life Insurers Anti-Money Laundering and Critical Infrastructure Committee (since January 2016); formerly Global Head of Economic Sanctions Compliance at AIG Property Casualty (February 2007-December 2014); Assistant Attorney General at the New York State Attorney General’s Office, Division of Public Advocacy (August 1998-January 2007). | | Since January 2017 |
Christian J. Kelly 5/5/1975 Treasurer and Principal Financial and Accounting Officer | | Vice President, Head of Fund Administration of PGIM Investments LLC (since November 2018); formerly, Director of Fund Administration of Lord Abbett & Co. LLC (2009-2018), Treasurer and Principal Accounting Officer of the Lord Abbett Family of Funds (2017-2018); Director of Accounting, Avenue Capital Group (2008-2009); Senior Manager, Investment Management Practice of Deloitte & Touche LLP (1998-2007). | | Since January 2019 |
Lana Lomuti 6/7/1967 Assistant Treasurer | | Vice President (since 2007) and Director (2005-2007), within PGIM Investments Fund Administration; formerly Assistant Treasurer (December 2007-February 2014) of The Greater China Fund, Inc. | | Since April 2014 |
Russ Shupak 10/08/73 Assistant Treasurer | | Vice President (since 2017) and Director (2013-2017), within PGIM Investments Fund Administration. | | Since October 2019 |
Deborah Conway 3/26/69 Assistant Treasurer | | Vice President (since 2017) and Director (2007-2017), within PGIM Investments Fund Administration. | | Since October 2019 |
Elyse M. McLaughlin 1/20/74 Assistant Treasurer | | Vice President (since 2017) and Director (2011-2017), within PGIM Investments Fund Administration. | | Since October 2019 |
Alina Srodecka, CPA 8/19/1966 Assistant Treasurer | | Vice President of Tax at Prudential Financial, Inc. (Since August 2007); formerly Director of Tax at MetLife (January 2003-May 2006); formerly Tax Manager at Deloitte & Touché (October 1997-January 2003); formerly Staff Accountant at Marsh & McLennan (May 1994-May 1997). | | Since June 2017 |
(a) Excludes Mr. Cronin, an Interested Trustee who also serves as President.
Explanatory Notes to Tables:
Trustees are deemed to be “Interested,” as defined in the 1940 Act, by reason of their affiliation with PGIM Investments and/or an affiliate of PGIM Investments. Timothy S. Cronin is an Interested Trustee because he is employed by an affiliate of the Manager.
Unless otherwise noted, the address of all Trustees and Officers is c/o PGIM Investments LLC, 655 Broad Street, Newark, New Jersey 07102.
There is no set term of office for Trustees or Officers. The Independent Trustees have adopted a retirement policy, which calls for the retirement of Trustees on December 31 of the year in which they reach the age of 78, provided that the Board may extend the retirement age on ayear-by-year basis for a Trustee.
“Other Directorships Held” includes only directorships of companies required to register or file reports with the SEC under the 1934 Act (that is, “public companies”) or other investment companies registered under the 1940 Act.
“No. of Portfolios Overseen” includes all investment companies managed by PGIM Investments and/or ASTIS that are overseen by the Trustee. The investment companies for which PGIM Investments and/or ASTIS serves as Manager include The Prudential Variable Contract Accounts, The Prudential Series Fund, Advanced Series Trust, Prudential’s Gibraltar Fund, Inc., the PGIM Funds, the PGIM High Yield Bond Fund, Inc. and PGIM Global High Yield Fund, Inc.
E3
The prospectuses for the Prudential Series Fund portfolios and the applicable variable annuity or variable life prospectuses contain information on the investment objectives, risks, charges and expenses of the portfolios and on the contracts and should be read carefully.
Information regarding how the Fund voted proxies relating to portfolio securities during the most recent12-month period ended June 30 is available on the website of the Securities and Exchange Commission (the Commission) atwww.sec.gov and on the Fund’s website atwww.prudential.com/variableinsuranceportfolios.
The Fund files with the Commission a complete listing of portfolio holdings as of its first and third calendar quarter-end on Form N-PORT. Form N-PORT is available on the Commission’s website atwww.sec.gov or call (800) SEC-0330.
The Fund’s Statement of Additional Information contains additional information about the Fund’s Trustees and is available without charge upon request by calling the appropriate phone number listed below.
To contact your client services representative, please call the phone number listed below. Thank you.
Owners of Individual Annuity contracts should call (888) 778-2888.
Owners of Individual Life Insurance contracts should call (800) 778-2255.
Owners of Group Variable Universal Life Insurance contracts should call (800) 562-9874.
Owners of Group Variable Universal Life Insurance contracts through AICPA should call (800) 223-7473.
The Prudential Series Fund may offer two classes of shares in each portfolio: Class I and Class II. Class I shares are sold only to separate accounts of The Prudential Insurance Company of America, Pruco Life Insurance Company, and Pruco Life Insurance Company of New Jersey (collectively, Prudential) and to separate accounts of insurance companies not affiliated with Prudential where Prudential has assumed responsibility for the administration of contracts issued through such non-affiliated insurance companies, as investment options under variable life insurance and variable annuity contracts (the Contracts). (A separate account keeps the assets supporting certain insurance contracts separate from the general assets and liabilities of the insurance company.) Class II shares are offered only to separate accounts of non-Prudential insurance companies for the same types of Contracts.
Annuity and life insurance contracts contain exclusions, limitations, reductions of benefits, and terms for keeping them in force. Your licensed financial professional can provide you with costs and complete details. Contract guarantees are based on the claims-paying ability of the issuing company.
The Prudential Insurance Company of America
751 Broad Street
Newark, NJ 07102-3714
Presorted
Standard
U.S. Postage
PAID
Prudential
The Audited Financial Statements of Pruco Life Insurance Company, Pruco Life Insurance Company of New Jersey, Prudential Annuities Life Assurance Corporation, and The Prudential Insurance Company of America are available upon request. You may call(800) 778-2255 to obtain a free copy of the audited financial statements of the insurance company that issued your contract.
To reduce costs, we now generally send only a single copy of prospectuses and shareholder reports to each household (householding) in lieu of sending a copy to each Contract Owner who resides in the household. Householding is not yet available on all products. You should be aware that by calling (877) 778-5008, you can revoke, or “opt out,” of householding at any time, which may increase the volume of mail you will receive.
©2020 Prudential Financial, Inc. and its related entities. PGIM Investments, the Prudential logo, the Rock symbol, and Bring Your Challenges are service marks of Prudential Financial, Inc. and its related entities, registered in many jurisdictions worldwide.
PSF-AR-SP SMALL CAP VAL

The Prudential Series Fund
| | |
| ANNUAL REPORT | | December 31, 2019 |

Based on the variable contract you own or the portfolios you invested in, you may receive additional reports for other portfolios. Please refer to your variable annuity or variable life insurance contract prospectus to determine which portfolios are available to you.
The views expressed in this report and information about each portfolio’s holdings are for the period covered by this report and are subject to change thereafter.
Please note that this report may include prospectus supplements that are separate from and not a part of this report. Please refer to your variable annuity or variable life insurance contract prospectus to determine which supplements are applicable to you.
Jennison 20/20 Focus Portfolio

Join the e-movement.SM
Enroll in e-delivery today!
By enrolling in e-Delivery, you’ll gain secure, online access to important documents with the flexibility to choose which documents you receive in the mail… and which ones you don’t!
Individual Annuity Contract Owners
Get started by visiting www.prudential.com/login and follow the instructions on the screen, or scan the code below.
Individual Life Insurance Contract Owners
To receive your reports online, go to www.prudential.com/edelivery, or scan the code below.
Group Variable Universal Life Contract Owners
To receive your reports online, go to www.prudential.com/gulgvul, or scan the code.
| | |
| |
| | Save paper and reduce clutter. Receive Prospectuses and Reports electronically by enrolling today! |
| | | | |
The Prudential Series Fund Table of Contents | | Annual Report | | December 31, 2019 |
| | ∎ | | LETTER TO CONTRACT OWNERS |
| | ∎ | | REPORT OF THE INVESTMENT MANAGERS AND PRESENTATION OF PORTFOLIO HOLDINGS |
| | |
| Section A | | Schedule of Investments and Financial Statements |
| Section B | | Notes to Financial Statements |
| Section C | | Financial Highlights |
| Section D | | Report of Independent Registered Public Accounting Firm |
| Section E | | Information about Trustees and Officers |
| | | | |
The Prudential Series Fund Letter to Contract Owners | | Annual Report | | December 31, 2019 |
At Prudential, our primary objective is to help investors achieve and maintain long-term financial success. This Prudential Series Fund annual report outlines our efforts to achieve this goal. We hope you find it informative and useful.
Prudential has been building on a heritage of success for more than 135 years. We believe the array of our products provides a highly attractive value proposition to clients like you who are focused on financial security.
Your financial professional is the best resource to help you make the most informed investment decisions. Together, you can build a diversified investment portfolio that aligns with your long-term financial goals. Please keep in mind that diversification and asset allocation strategies do not assure a profit or protect against loss in declining markets.
Thank you for selecting Prudential as one of your financial partners. We value your trust and appreciate the opportunity to help you achieve financial security.
Sincerely,
Timothy S. Cronin
President,
The Prudential Series Fund | January 31, 2020 |
| | | | |
| Market Overview — unaudited | | Annual Report | | December 31, 2019 |
Equity Market Overview
US and international stock markets posted stellar returns in 2019 as many central banks, including the Federal Reserve (the Fed), cut interest rates or used other stimuli to spur growth. Although the markets fluctuated sharply at times in reaction to on-again-off-again trade tensions between the US and China, concerns about tariffs subsided later in the year.
In the US, the broad-based S&P 500® Index and Russell 3000® Index returned 31.46% and 31.02%, respectively, for the year. Internationally, the MSCI ACWI Ex-US Index, a broad measure of stock performance in developed and emerging markets outside the US, returned 21.51%. (All returns cited are in US dollars and include dividends.)
Global economic growth slowed, central banks cut rates
During 2019, the pace of global growth slowed and concerns about the economic outlook rose due in part to uncertainties regarding US-China tariffs and other geopolitical factors, which created a drag on manufacturing and export activity. Many central banks responded by loosening monetary policy — in some cases reversing their positions. For example, the Fed, which hiked rates four times in 2018, cut its federal funds rate target three times in 2019 and moved from tapering its balance sheet to expanding it through asset purchases. The European Central Bank, which had been rolling back its bond-buying program in 2018, restarted it to stimulate the eurozone economy.
Although US real gross domestic product (GDP) growth rose 2.1% (annualized) in the third quarter, down from 3.1% in the first quarter, the US economy expanded at a moderate pace. (Fourth-quarter GDP data had not been released when this overview was published.) Corporate earnings, consumer spending, and the labor market were strong, while inflation remained low.
Stock markets rallied, retreated, and rebounded to record highs
Early in the first quarter, stocks rallied as US-China trade negotiations appeared to be progressing, the Fed signaled that it planned to pause from hiking rates unless warranted, the US government’s partial shutdown ended, and corporate earnings rose sharply despite slower growth. The S&P 500 jumped nearly 8.0% in January alone.
Stocks sold off in May as trade-war worries resurfaced. However, equity markets rallied in June in anticipation of possible rate cuts and on hopes for a trade deal. During the first half of 2019, the Fed maintained its interest rate target.
Trade concerns re-emerged in the third quarter amid signs of slowing growth and renewed trade frictions. With inflation below its target, the Fed cut rates in July for the first time since the financial crisis in 2008 as a pre-emptive measure to help sustain the US economy’s expansion and withstand the risk of a global economic slowdown and further drop in business investment.
In August, concerns about tariffs, the growth of China’s industrial output, and the global economy intensified, driving investors toward less-risky investments like US Treasuries. The yield on the 10-year US Treasury note, which moves opposite to its price, briefly dropped below the rate on two-year Treasuries. Although many analysts didn’t interpret this particular “yield curve inversion” as indicative of a looming recession, as they often have in the past, stock prices — particularly in emerging markets — dropped sharply.
Although the Fed cut rates again in September and October to a range of 1.50%-1.75%, Chairman Jerome Powell conveyed that the central bank did not plan to cut rates further unless incoming information required its members to materially reassess their outlook for the economy. As expected, the Fed did not adjust rates through the remainder of the year.
During the fourth quarter, US stock indexes surged to new highs and emerging market stocks rallied amid reports the US and China were moving toward a “phase one” partial trade deal. (The agreement was signed in January 2020 after the reporting period ended.) Eurozone stock markets rose in reaction to improved economic results from Germany. United Kingdom investors were encouraged by the outcome of December elections that many hope will lead to a smoother potential exit of the UK from the European Union.
All S&P 500 sectors rose
The best-performing sectors in the S&P 500 were information technology (+50.3%), communication services (+32.7%), and financials (+32.1%). Next in line were industrials (+29.4%), real estate (+29.0%), consumer discretionary (+27.9%), consumer staples (+27.6%), utilities (+26.4%), materials (+24.6%), health care (+20.8%), and energy (+11.8%).
| | | | |
| Market Overview — unaudited(continued) | | Annual Report | | December 31, 2019 |
Growth outperformed value, large-cap stocks topped small caps
For the year, the Russell 3000® Growth Index returned 35.85%, outperforming the Russell 3000® Value Index, which rose 26.26%. Large-cap stocks, as measured by the Russell 1000® Index, rose 31.43%. The Russell Midcap® Index returned 30.54%, and the small-cap Russell 2000® Index lagged yet still returned 25.52%.
International stocks collectively rose but underperformed US equities
Stocks trading in emerging markets, as measured by the MSCI Emerging Markets Index, returned 18.4% for the year. Notable top-performing country components in the index included Russia (+50.9%), supported by a jump in oil prices, Taiwan (+36.4%), Brazil (+26.3%), and China (23.5%). Taiwan’s and China’s markets advanced in the fourth quarter as trade frictions diminished, although weak economic data from China dampened investor sentiment during the year. Notable countries that underperformed the index but still contributed positively to performance included South Korea (+12.5%), Mexico (+11.4%), and India (+7.6%). Malaysia (-2.0%) detracted from the index’s performance.
Equities in developed markets outside the US and Canada, as measured by the MSCI EAFE Index, rose 22.01%. For the year, the MSCI Europe Index rose 23.77%, the MSCI UK Index returned 21.05%, and the MSCI Japan Index rose 19.61%.
Fixed Income Market Overview
In 2019, for the first time in more than a decade, the Federal Reserve (the Fed) cut interest rates to help sustain the US economy’s expansion in the face of slowing global economic growth and US-China trade-war risks. The central bank was merely one of dozens that reduced rates throughout the year, igniting rallies in numerous global bond markets. During 2019, emerging markets debt, US high yield bonds, and corporate investment-grade bonds delivered robust returns, yet US government bonds and many other fixed income categories also posted solid results.
In the US, the economy grew at a healthy but slow pace. Although real gross domestic product (GDP) growth dropped from 3.1% (annualized) in the first quarter to 2.1% in the third, the economy continued to expand. (Fourth-quarter GDP data had not been released when this overview was published.) The national unemployment rate dropped to a 50-year low of 3.5% in September, corporate earnings were generally strong, and inflation remained low. Elsewhere, the European economy grew weakly. Notably, China’s growth rate dropped significantly from 6.6% in 2018 to 6.1% in 2019.
Bond markets fluctuated but closed higher
During the first quarter of 2019, global growth expectations softened. The Fed, which increased rates four times in 2018, signaled it would pause from hiking rates further based on its outlook at the time, sending bond markets higher. US high yield and emerging market bond prices rose sharply, supported by a tailwind of receding tariff worries and favorable corporate earnings.
In May, worries about the US-China trade war surfaced again. US Treasuries rallied while riskier assets such as high yield bonds dropped in price. The following month, however, the Fed hinted at the possibility of interest rate cuts ahead, trade fears cooled, and the high yield bond market rebounded. The Fed did not adjust rates during the first half of the year.
In July, the global economy showed signs of a slowdown and tariff fears returned. Later that month, for the first time since the financial crisis in 2008, the Fed cut rates as a pre-emptive measure to help sustain the expansion of the US economy and provide a cushion against the risk of a global economic slowdown. During August, the yield on 10-year US Treasuries dropped below yields on two-year Treasuries. Historically, when yields on longer-term Treasuries fall below yields on shorter-term issues, recessions have often followed. While many analysts questioned the “yield curve inversion” as a recessionary indicator in this instance, investors concerned about the economy gravitated to “safe-haven” securities like longer-term US Treasuries and other high-quality credits.
The investment-grade Bloomberg Barclays US Aggregate Bond Index returned 2.59% in August. US high yield bonds finished virtually flat, whereas emerging market sovereign debt markets dropped sharply due in part to a stronger US dollar versus most currencies.
In September, the Fed cut rates again and the European Central Bank restarted its bond-buying program to help stimulate the eurozone economy after rolling it back the previous year. After the Fed dropped its rate target to a range of 1.50% to 1.75% in October, Chairman Jerome Powell conveyed that the central bank had no plans for further cuts unless incoming data compelled its members to materially reassess their outlook for the economy. As expected, the Fed maintained its rate target through the remainder of the year.
During the fourth quarter, stronger-than-expected economic data and reports that the US and China were moving toward a “phase one” partial trade deal led to a “risk-on” rally. (The agreement was signed in January 2020 after the reporting period ended.) Over the final month of the year, high yield bonds and emerging markets bonds posted solid gains, while investment-grade US bonds dropped slightly.
| | | | |
| Market Overview — unaudited(continued) | | Annual Report | | December 31, 2019 |
Emerging market debt and high yield bonds surged by double digits
For the year, the Bloomberg Barclays Global Aggregate Bond Index (unhedged), which measures global investment-grade debt performance, returned 6.84%. (All returns cited are in US dollars.) Bonds trading in the US, based on the Bloomberg Barclays US Aggregate Bond Index, rose 8.72%. The US index’s leading component sectors included investment-grade corporate bonds (+14.5%), which benefited from the interest rate cuts and solid fundamentals, along with Treasury inflation-protected securities (+8.4%), commercial mortgage-backed securities (+8.3%), and US Treasury securities (+6.9%). Treasuries with longer maturities rallied in the second and third quarters when trade tensions escalated, which triggered a “flight to quality.” The 10-year US Treasury note’s yield, which moves opposite to its price, opened 2019 at approximately 2.65% and closed the year at 1.92% as trade tensions eased.
The Bloomberg Barclays Municipal Bond Index returned 7.54% for the year. US high yield bonds (debt rated below investment grade), as measured by the ICE BofAML US Cash High Yield Index, returned 14.40%. Accommodative monetary policies, strong corporate earnings, and investors’ quest for enhanced yield supported demand for high yield opportunities. Emerging market debt, based on the J.P. Morgan EMBI Global Diversified Index surged 15.04%. Despite a strong US dollar (relative to most currencies), sovereign debt yields in general drifted lower as inflation was contained in many countries, providing their central banks with latitude to reduce interest rates, which bolstered bond prices.
| | |
| The Prudential Series Fund, Jennison 20/20 Focus Portfolio | | December 31, 2019 |
Report of the Investment Manager - As of December 31, 2019 (Unaudited)
| | | | | | | | | | | | |
| Average Annual Total Returns | | 1 Year | | | 5 Years | | | 10 Years | |
Portfolio: Class I | | | 28.93 | % | | | 11.41 | % | | | 10.61 | % |
Portfolio: Class II | | | 28.40 | | | | 10.97 | | | | 10.17 | |
Russell 1000® Index | | | 31.43 | | | | 11.48 | | | | 13.54 | |
S&P 500 Index | | | 31.46 | | | | 11.69 | | | | 13.55 | |
Past performance does not guarantee future returns. The investment return and principal value of an investment will fluctuate, so that shares, when redeemed, may be worth more or less than their original cost. Current performance may be lower or higher than the past performance.
Portfolio performance is net of fund expenses, but not contract charges, which, if included, would significantly lower the performance quoted. Performance figures may reflect fee waivers and/or expense reimbursements. In the absence of such fee waivers and/or expense reimbursements, performance would be lower.
The Russell 1000® Index is a trademark/service mark of the Frank Russell Company. Russell® is a trademark of the Frank Russell Company.
$10,000 INVESTED OVER 10 YEARS
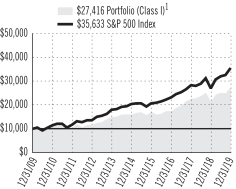
For the year ended December 31, 2019, the Jennison 20/20 Focus Portfolio’s Class I shares returned 28.93% and Class II shares returned 28.40%. The Portfolio’s Class I & II shares underperformed the Russell 1000 Index and the S&P 500 Index.
The Portfolio’s investment objective is long-term growth of capital.
What were market conditions during the reporting period?
US equity markets were highly volatile in 2019, unsettled by US-China trade discord; softening economic growth in the US, Europe, and China; and geopolitical uncertainty. Companies across sectors cited trade tensions as the source of heightened caution in planning and investing. The US political landscape was likewise unsettled, as investigations of interference in the 2016 presidential election unfolded, impeachment hearings against President Donald Trump proceeded, and the 2020 election cycle ramped up. US economic activity showed signs of tempering, with job growth and business activity moderating.
The S&P 500 Index rose 31.46% in 2019, as all 11 sectors within the index posted positive total returns. Index gains came predominately from the information technology sector, which comprised just over 30% of the index’s total return. Financials and communication services also drove gains. Energy, materials, and real estate — while still in positive return territory — lagged the other sectors. Top index individual stock contributors included Apple Inc., Microsoft Corp., Facebook Inc., Amazon.com Inc., and JPMorgan Chase & Co. Top detractors included Pfizer Inc., Occidental Petroleum Corp., PG&E Corp, Walgreens Boots Alliance Inc., and The Kraft Heinz Co.
What strategies or holdings affected the Portfolio’s performance?
Holdings within the information technology sector contributed to the Portfolio’s overall performance, specifically allocations to the systems software and application software segments. Information technology holdings such as Microsoft, Mastercard Inc., and Apple were among the top absolute contributors to the Portfolio’s performance for the period. Mastercard delivered solid revenues, and its earnings exceeded consensus estimates while seeing solid growth in gross dollar volume — the total value of cardholder transactions and transactions processed — as it benefited from consumers’ long-term shift from cash to electronic credit and debit transactions. With its huge installed base, Apple is now benefiting from rapid growth in service business subscriptions and a potentially robust product cycle that incorporates fifth-generation (5G) wireless standards.
Positive stock selection within the consumer discretionary sector helped gains, driven by Lululemon Athletica Inc., The company’s new products, integrated marketing, and online sales momentum combined with a high-end customer base and athleisure fashion trends are driving strong customer traffic, sales conversion, and comparable-store sales. Other notable contributors included financial services giant JPMorgan Chase, as investors’ expectations for moderate but positive growth in gross domestic product, along with a stable yield curve, helped to shift market sentiment and lift financial stocks over the period.
| 1 | The graph is based on the performance of Class I shares. Performance of Class II shares will be lower due to differences in the fee structure. Class II shares have associated 12b-1 and administrative fees at an annual rate of 0.25% and 0.15%, respectively, of the average daily net assets of the Class II shares. |
For a complete list of holdings, refer to the Schedule of Investments section of this report.
1
| | |
The Prudential Series Fund, Jennison 20/20 Focus Portfolio | | December 31, 2019 |
Report of the Investment Manager - As of December 31, 2019 (Unaudited) (Continued)
Health care sector stocks struggled throughout the year after drug pricing rhetoric and “Medicare for All” political commentary seemingly took the oxygen out of the entire sector, including pharmaceuticals. Shares of drug maker Pfizer Inc. faced additional pressure after news of the potential combination of Pfizer’s Upjohn unit (off-patent branded drugs business) with generic pharmaceutical firm Mylan was ill-received by the market. SAP, the world’s largest vendor of enterprise resource planning software, faced challenges as it stepped up its cloud-based offerings. Shares of electric car maker Tesla Inc. struggled over the period amid ongoing controversy surrounding CEO Elon Musk, along with investor concerns about vehicle production volumes and sustained demand for its Model 3 vehicle. Despite the stock pressure, the company’s third-quarter earnings and free cash flow significantly beat consensus estimates on strong demand and higher margins, driven by solid sales of higher-priced Model 3 variants.
Presentation of Portfolio Holdings — unaudited
| | | | | | |
| Jennison 20/20 Focus Portfolio (As of 12/31/2019) | |
| Ten Largest Holdings | | Line of Business | | | (% of Net Assets | ) |
| Microsoft Corp. | | Software | | | 6.4% | |
| Alphabet, Inc. (Class A Stock) | | Interactive Media & Services | | | 4.9% | |
| AstraZeneca PLC (United Kingdom), ADR | | Pharmaceuticals | | | 4.2% | |
| American Electric Power Co., Inc. | | Electric Utilities | | | 3.9% | |
| Apple, Inc. | | Technology Hardware, Storage & Peripherals | | | 3.9% | |
| JPMorgan Chase & Co. | | Banks | | | 3.6% | |
| Walmart, Inc. | | Food & Staples Retailing | | | 3.4% | |
| PNC Financial Services Group, Inc. (The) | | Banks | | | 3.2% | |
| Amazon.com, Inc. | | Internet & Direct Marketing Retail | | | 3.1% | |
| Alibaba Group Holding Ltd. (China), ADR | | Internet & Direct Marketing Retail | | | 3.1% | |
For a complete list of holdings, please refer to the Schedule of Investments section of this report. Holdings reflect only long-term investments. Credit Quality/Country Allocation/Holdings/Line of Business are subject to change.
2
| | |
The Prudential Series Fund Benchmark Glossary — unaudited | | December 31, 2019 |
The indexes are unmanaged and include reinvestment of any income or distributions. They do not reflect any fees, expenses or sales charges. Investors cannot invest directly in a market index.
For Russell Indexes: Russell Investment Group is the source and owner of the trademarks, service marks and copyrights related to the Russell Indexes. Russell® is a trademark of Russell Investment Group.
Russell 1000® Index is an unmanaged market cap-weighted index that measures the performance of the 1,000 largest companies in the Russell 3000 Index, which represents approximately 92% of the total market.
S&P 500 Index is an unmanaged, market value-weighted index of over 500 stocks generally representative of the broad stock market.
| | |
The Prudential Series Fund Fees and Expenses — unaudited | | December 31, 2019 |
As a contract owner investing in the Portfolio through a variable annuity or variable life contract, you incur ongoing costs, including management fees, and other Portfolio expenses. This example is intended to help you understand your ongoing costs (in dollars) of investing in the Fund and to compare these costs with the ongoing costs of investing in other investment options. This example does not reflect fees and charges under your variable annuity or variable life contract. If contract charges were included, the costs shown below would be higher. Please consult the prospectus for your contract for more information about contract fees and charges.
The example is based on an investment of $1,000 invested at the beginning of the period and held for the entire period July 1, 2019 through December 31, 2019.
Actual Expenses
The first line of the table below provides information about actual account values and actual expenses. You may use this information, together with the amount you invested, to estimate the Portfolio expenses that you paid over the period. Simply divide your account value by $1,000 (for example, an $8,600 account value divided by $1,000 = 8.6), then multiply the result by the number in the first line under the heading entitled “Expenses Paid During the Six-Month Period” to estimate the Portfolio expenses you paid on your account during this period. As noted above, the table does not reflect variable contract fees and charges.
Hypothetical Example for Comparison Purposes
The second line of the table below provides information about hypothetical account values and hypothetical expenses based on the Portfolio’s actual expense ratio and an assumed rate of return of 5% per year before expenses, which is not the Portfolio’s actual return. The hypothetical account values and expenses may not be used to estimate the actual ending account balance or expenses you paid for the period. You may use this information to compare the ongoing costs of investing in the Portfolio and other investment options. To do so, compare this 5% hypothetical example with the 5% hypothetical examples that appear in the shareholder reports of the other investment options.
Please note that the expenses shown in the table are meant to highlight your ongoing Portfolio costs only and do not reflect any contract fees and charges, such as sales charges (loads), insurance charges or administrative charges. Therefore the second line of the table is useful to compare ongoing investment option costs only, and will not help you determine the relative total costs of owning different contracts. In addition, if these contract fee and charges were included, your costs would have been higher.
| | | | | | | | | | | | | | | | | | |
| The Prudential Series Fund Portfolio | | Beginning Account Value July 1, 2019 | | | Ending Account Value December 31, 2019 | | | Annualized Expense Ratio based on the
Six-Month period | | | Expenses Paid
During the
Six-Month period* | |
| | | | | |
| Jennison 20/20 Focus (Class I) | | Actual | | $ | 1,000.00 | | | $ | 1,097.80 | | | | 0.87 | % | | $ | 4.60 | |
| | | Hypothetical | | $ | 1,000.00 | | | $ | 1,020.82 | | | | 0.87 | % | | $ | 4.43 | |
| | | | | |
| Jennison 20/20 Focus (Class II) | | Actual | | $ | 1,000.00 | | | $ | 1,095.70 | | | | 1.27 | % | | $ | 6.71 | |
| | | Hypothetical | | $ | 1,000.00 | | | $ | 1,018.80 | | | | 1.27 | % | | $ | 6.46 | |
* Portfolio expenses (net of fee waivers or subsidies, if any) for each share class are equal to the annualized expense ratio for each share class (provided in the table), multiplied by the average account value over the period, multiplied by the 184 days in the six-month period ended December 31, 2019, and divided by the 365 days in the Portfolio’s fiscal year ended December 31, 2019 (to reflect the six-month period). Expenses presented in the table include the expenses of any underlying portfolios in which the Portfolio may invest.
| | | | | | |
| | |
| | JENNISON 20/20 FOCUS PORTFOLIO | | |
| | | | | | |
| |
| SCHEDULE OF INVESTMENTS | | as of December 31, 2019 |
| | | | | | | | |
| LONG-TERM INVESTMENTS — 99.4% | | | | |
| COMMON STOCKS | | Shares | | | Value | |
Aerospace & Defense — 3.5% | | | | | | | | |
Airbus SE (France) | | | 15,243 | | | $ | 2,234,513 | |
United Technologies Corp. | | | 30,668 | | | | 4,592,840 | |
| | | | | | | | |
| | | | | | | 6,827,353 | |
| | | | | | | | |
Automobiles — 1.2% | | | | | | | | |
Tesla, Inc.* | | | 5,377 | | | | 2,249,360 | |
| | | | | | | | |
Banks — 6.8% | | | | | | | | |
JPMorgan Chase & Co. | | | 49,603 | | | | 6,914,658 | |
PNC Financial Services Group, Inc. (The) | | | 38,685 | | | | 6,175,287 | |
| | | | | | | | |
| | | | | | | 13,089,945 | |
| | | | | | | | |
Chemicals — 1.7% | | | | | | | | |
Linde PLC (United Kingdom) | | | 15,012 | | | | 3,196,055 | |
| | | | | | | | |
Consumer Finance — 2.0% | | | | | | | | |
SLM Corp. | | | 425,950 | | | | 3,795,215 | |
| | | | | | | | |
Electric Utilities — 3.9% | | | | | | | | |
American Electric Power Co., Inc. | | | 80,136 | | | | 7,573,653 | |
| | | | | | | | |
Energy Equipment & Services — 0.9% | | | | | |
Schlumberger Ltd. | | | 45,572 | | | | 1,831,994 | |
| | | | | | | | |
Entertainment — 4.5% | | | | | | | | |
Netflix, Inc.* | | | 12,087 | | | | 3,910,991 | |
Walt Disney Co. (The) | | | 33,473 | | | | 4,841,200 | |
| | | | | | | | |
| | | | | | | 8,752,191 | |
| | | | | | | | |
Food & Staples Retailing — 3.4% | | | | | |
Walmart, Inc. | | | 55,655 | | | | 6,614,040 | |
| | | | | | | | |
Food Products — 2.8% | | | | | | | | |
Mondelez International, Inc. (Class A Stock) | | | 96,583 | | | | 5,319,792 | |
| | | | | | | | |
Health Care Equipment & Supplies — 2.3% | |
Zimmer Biomet Holdings, Inc. | | | 29,451 | | | | 4,408,226 | |
| | | | | | | | |
Insurance — 2.7% | | | | | | | | |
MetLife, Inc. | | | 101,016 | | | | 5,148,786 | |
| | | | | | | | |
Interactive Media & Services — 4.9% | | | | | | | | |
Alphabet, Inc. (Class A Stock)* | | | 7,038 | | | | 9,426,627 | |
| | | | | | | | |
Internet & Direct Marketing Retail — 6.2% | |
Alibaba Group Holding Ltd. (China), ADR* | | | 28,116 | | | | 5,963,404 | |
Amazon.com, Inc.* | | | 3,297 | | | | 6,092,328 | |
| | | | | | | | |
| | | | | | | 12,055,732 | |
| | | | | | | | |
IT Services — 7.5% | | | | | | | | |
Adyen NV (Netherlands), 144A* | | | 5,747 | | | | 4,715,311 | |
FleetCor Technologies, Inc.* | | | 14,506 | | | | 4,173,666 | |
Mastercard, Inc. (Class A Stock) | | | 18,577 | | | | 5,546,906 | |
| | | | | | | | |
| | | | | | | 14,435,883 | |
| | | | | | | | |
Life Sciences Tools & Services — 1.3% | | | | | |
Illumina, Inc.* | | | 7,519 | | | | 2,494,353 | |
| | | | | | | | |
Media — 2.2% | | | | | | | | |
Comcast Corp. (Class A Stock) | | | 96,458 | | | | 4,337,716 | |
| | | | | | | | |
Multi-Utilities — 0.8% | | | | | | | | |
Dominion Energy, Inc. | | | 18,221 | | | | 1,509,063 | |
| | | | | | | | |
| | | | | | | | |
COMMON STOCKS
(continued) | | Shares | | | Value | |
Oil, Gas & Consumable Fuels — 2.4% | |
Noble Energy, Inc.(a) | | | 80,609 | | | $ | 2,002,328 | |
Royal Dutch Shell PLC (Netherlands) (Class A Stock), ADR | | | 44,077 | | | | 2,599,661 | |
| | | | | | | | |
| | | | | | | 4,601,989 | |
| | | | | | | | |
Pharmaceuticals — 5.9% | | | | | | | | |
AstraZeneca PLC (United Kingdom), ADR | | | 163,102 | | | | 8,132,266 | |
Eli Lilly & Co. | | | 25,358 | | | | 3,332,802 | |
| | | | | | | | |
| | | | | | | 11,465,068 | |
| | | | | | | | |
Semiconductors & Semiconductor Equipment — 8.2% | |
NVIDIA Corp. | | | 24,553 | | | | 5,777,321 | |
QUALCOMM, Inc. | | | 56,808 | | | | 5,012,170 | |
Texas Instruments, Inc. | | | 40,072 | | | | 5,140,837 | |
| | | | | | | | |
| | | | | | | 15,930,328 | |
| | | | | | | | |
Software — 11.7% | | | | | | | | |
Adobe, Inc.* | | | 15,824 | | | | 5,218,914 | |
Microsoft Corp. | | | 78,059 | | | | 12,309,904 | |
salesforce.com, Inc.* | | | 31,527 | | | | 5,127,551 | |
| | | | | | | | |
| | | | | | | 22,656,369 | |
| | | | | | | | |
Specialty Retail — 1.2% | | | | | | | | |
Lowe’s Cos., Inc. | | | 18,911 | | | | 2,264,781 | |
| | | | | | | | |
Technology Hardware, Storage & Peripherals — 3.9% | |
Apple, Inc. | | | 25,588 | | | | 7,513,916 | |
| | | | | | | | |
Textiles, Apparel & Luxury Goods — 7.5% | |
Kering SA (France) | | | 6,263 | | | | 4,114,821 | |
Lululemon Athletica, Inc.* | | | 21,543 | | | | 4,990,867 | |
NIKE, Inc. (Class B Stock) | | | 52,361 | | | | 5,304,693 | |
| | | | | | | | |
| | | | | | | 14,410,381 | |
| | | | | | | | |
TOTAL LONG-TERM INVESTMENTS
(cost $128,716,823) | | | | 191,908,816 | |
| | | | | | | | |
|
| SHORT-TERM INVESTMENTS — 1.2% | |
AFFILIATED MUTUAL FUNDS | | | | | |
PGIM Core Ultra Short Bond Fund(w) | | | 1,649,184 | | | | 1,649,184 | |
PGIM Institutional Money Market Fund (cost $549,861; includes $547,264 of cash collateral for securities on loan)(b)(w) | | | 549,905 | | | | 550,015 | |
| | | | | | | | |
TOTAL SHORT-TERM INVESTMENTS
(cost $2,199,045) | | | | 2,199,199 | |
| | | | | | | | |
TOTAL INVESTMENTS — 100.6%
(cost $130,915,868) | | | | 194,108,015 | |
Liabilities in excess of
other assets — (0.6)% | | | | (1,062,120 | ) |
| | | | | | | | |
NET ASSETS — 100.0% | | | $ | 193,045,895 | |
| | | | | | | | |
Below is a list of the abbreviation(s) used in the annual report:
| | |
| 144A — | | Security was purchased pursuant to Rule 144A under the Securities Act of 1933 and, pursuant to the requirements of Rule 144A, may not be resold except to qualified institutional buyers. |
| ADR — | | American Depositary Receipt |
SEE NOTES TO FINANCIAL STATEMENTS.
A1
| | | | | | |
| | |
| | JENNISON 20/20 FOCUS PORTFOLIO (continued) | | |
| | | | | | |
| |
| SCHEDULE OF INVESTMENTS | | as of December 31, 2019 |
LIBOR — London Interbank Offered Rate
OTC —Over-the-counter
| * | Non-income producing security. |
| (a) | All or a portion of security is on loan. The aggregate market value of such securities, including those sold and pending settlement, is $543,996; cash collateral of $547,264 (included in liabilities) was received with which the Portfolio purchased highly liquid short-term investments. |
| (b) | Represents security purchased with cash collateral received for securities on loan and includes dividend reinvestment. |
| (w) | PGIM Investments LLC, the manager of the Portfolio, also serves as manager of the PGIM Core Ultra Short Bond Fund and PGIM Institutional Money Market Fund. |
Fair Value Measurements:
Various inputs are used in determining the value of the Portfolio’s investments. These inputs are summarized in the three broad levels listed below.
| Level 1— | unadjusted quoted prices generally in active markets for identical securities. |
| Level 2— | quoted prices for similar securities, interest rates and yield curves, prepayment speeds, foreign currency exchange rates and other observable inputs. |
| Level 3— | unobservable inputs for securities valued in accordance with Board approved fair valuation procedures. |
The following is a summary of the inputs used as of December 31, 2019 in valuing such portfolio securities:
| | | | | | | | | | | | |
| | | Level 1 | | | Level 2 | | | Level 3 | |
Investments in Securities | |
Assets | |
Common Stocks | | | | | | | | | | | | |
Aerospace & Defense | | $ | 4,592,840 | | | $ | 2,234,513 | | | $ | — | |
Automobiles | | | 2,249,360 | | | | — | | | | — | |
Banks | | | 13,089,945 | | | | — | | | | — | |
Chemicals | | | 3,196,055 | | | | — | | | | — | |
Consumer Finance | | | 3,795,215 | | | | — | | | | — | |
Electric Utilities | | | 7,573,653 | | | | — | | | | — | |
Energy Equipment & Services | | | 1,831,994 | | | | — | | | | — | |
Entertainment | | | 8,752,191 | | | | — | | | | — | |
Food & Staples Retailing | | | 6,614,040 | | | | — | | | | — | |
Food Products | | | 5,319,792 | | | | — | | | | — | |
Health Care Equipment & Supplies | | | 4,408,226 | | | | — | | | | — | |
Insurance | | | 5,148,786 | | | | — | | | | — | |
Interactive Media & Services | | | 9,426,627 | | | | — | | | | — | |
Internet & Direct Marketing Retail | | | 12,055,732 | | | | — | | | | — | |
IT Services | | | 9,720,572 | | | | 4,715,311 | | | | — | |
Life Sciences Tools & Services | | | 2,494,353 | | | | — | | | | — | |
Media | | | 4,337,716 | | | | — | | | | — | |
Multi-Utilities | | | 1,509,063 | | | | — | | | | — | |
Oil, Gas & Consumable Fuels | | | 4,601,989 | | | | — | | | | — | |
Pharmaceuticals | | | 11,465,068 | | | | — | | | | — | |
Semiconductors & Semiconductor Equipment | | | 15,930,328 | | | | — | | | | — | |
Software | | | 22,656,369 | | | | — | | | | — | |
Specialty Retail | | | 2,264,781 | | | | — | | | | — | |
Technology Hardware, Storage & Peripherals | | | 7,513,916 | | | | — | | | | — | |
Textiles, Apparel & Luxury Goods | | | 10,295,560 | | | | 4,114,821 | | | | — | |
Affiliated Mutual Funds | | | 2,199,199 | | | | — | | | | — | |
| | | | | | | | | | | | |
Total | | $ | 183,043,370 | | | $ | 11,064,645 | | | $ | — | |
| | | | | | | | | | | | |
SEE NOTES TO FINANCIAL STATEMENTS.
A2
| | | | | | |
| | |
| | JENNISON 20/20 FOCUS PORTFOLIO (continued) | | |
| | | | | | |
| |
| SCHEDULE OF INVESTMENTS | | as of December 31, 2019 |
Industry Classification:
The industry classification of investments and liabilities in excess of other assets shown as a percentage of net assets as of December 31, 2019 were as follows (unaudited):
| | | | |
Software | | | 11.7 | % |
Semiconductors & Semiconductor Equipment | | | 8.2 | |
IT Services | | | 7.5 | |
Textiles, Apparel & Luxury Goods | | | 7.5 | |
Banks | | | 6.8 | |
Internet & Direct Marketing Retail | | | 6.2 | |
Pharmaceuticals | | | 5.9 | |
Interactive Media & Services | | | 4.9 | |
Entertainment | | | 4.5 | |
Electric Utilities | | | 3.9 | |
Technology Hardware, Storage & Peripherals | | | 3.9 | |
Aerospace & Defense | | | 3.5 | |
Food & Staples Retailing | | | 3.4 | |
Food Products | | | 2.8 | |
Insurance | | | 2.7 | |
Oil, Gas & Consumable Fuels | | | 2.4 | |
| | | | |
Health Care Equipment & Supplies | | | 2.3 | % |
Media | | | 2.2 | |
Consumer Finance | | | 2.0 | |
Chemicals | | | 1.7 | |
Life Sciences Tools & Services | | | 1.3 | |
Specialty Retail | | | 1.2 | |
Automobiles | | | 1.2 | |
Affiliated Mutual Funds (0.3% represents investments purchased with collateral from securities on loan) | | | 1.2 | |
Energy Equipment & Services | | | 0.9 | |
Multi-Utilities | | | 0.8 | |
| | | | |
| | | 100.6 | |
Liabilities in excess of other assets | | | (0.6 | ) |
| | | | |
| | | 100.0 | % |
| | | | |
Financial Instruments/Transactions — Summary of Offsetting and Netting Arrangements:
The Portfolio entered into financial instruments/transactions during the reporting period that are either offset in accordance with current requirements or are subject to enforceable master netting arrangements or similar agreements that permit offsetting. The information about offsetting and related netting arrangements for financial instruments/transactions where the legal right toset-off exists is presented in the summary below.
Offsetting of financial instrument/transaction assets and liabilities:
| | | | | | | | | | | | |
Description | | Gross Market
Value of
Recognized
Assets/(Liabilities) | | | Collateral
Pledged/(Received)(1) | | | Net Amount | |
Securities on Loan | | $ | 543,996 | | | $ | (543,996 | ) | | $ | — | |
| | | | | | | | | | | | |
| (1) | Collateral amount disclosed by the Portfolio is limited to the market value of financial instruments/transactions. |
SEE NOTES TO FINANCIAL STATEMENTS.
A3
| | | | | | |
| | |
| | JENNISON 20/20 FOCUS PORTFOLIO (continued) | | |
STATEMENT OF ASSETS AND LIABILITIES
as of December 31, 2019
| | | | |
| ASSETS | | | | |
Investments at value, including securities on loan of $543,996: | | | | |
Unaffiliated investments (cost $128,716,823) | | $ | 191,908,816 | |
Affiliated investments (cost $2,199,045) | | | 2,199,199 | |
Receivable for investments sold | | | 339,236 | |
Dividends receivable | | | 130,422 | |
Tax reclaim receivable | | | 49,057 | |
Receivable for Portfolio shares sold | | | 20,856 | |
Prepaid expenses | | | 1,612 | |
| | | | |
Total Assets | | | 194,649,198 | |
| | | | |
| LIABILITIES | | | | |
Payable for investments purchased | | | 596,797 | |
Payable to broker for collateral for securities on loan | | | 547,264 | |
Payable for Portfolio shares repurchased | | | 199,674 | |
Management fee payable | | | 121,149 | |
Accrued expenses and other liabilities | | | 78,897 | |
Distribution fee payable | | | 25,499 | |
Payable to affiliate | | | 17,742 | |
Administration fee payable | | | 15,301 | |
Affiliated transfer agent fee payable | | | 980 | |
| | | | |
Total Liabilities | | | 1,603,303 | |
| | | | |
| NET ASSETS | | $ | 193,045,895 | |
| | | | |
Net assets were comprised of: | | | | |
Partners’ Equity | | $ | 193,045,895 | |
| | | | |
| Class I: | | | | |
Net asset value and redemption price per share, $71,694,371 / 1,883,533 outstanding shares of beneficial interest | | $ | 38.06 | |
| | | | |
| Class II: | | | | |
Net asset value and redemption price per share, $121,351,524 / 3,354,702 outstanding shares of beneficial interest | | $ | 36.17 | |
| | | | |
STATEMENT OF OPERATIONS
Year Ended December 31, 2019
| | | | |
| NET INVESTMENT INCOME (LOSS) | | | | |
| INCOME | | | | |
Unaffiliated dividend income (net of $22,960 foreign withholding tax) | | $ | 2,725,043 | |
Affiliated dividend income | | | 72,650 | |
Income from securities lending, net (including affiliated income of $19,914) | | | 27,509 | |
| | | | |
Total income | | | 2,825,202 | |
| | | | |
| EXPENSES | | | | |
Management fee | | | 1,382,762 | |
Distribution fee—Class II | | | 295,227 | |
Administration fee—Class II | | | 177,136 | |
Custodian and accounting fees | | | 89,030 | |
Shareholders’ reports | | | 48,912 | |
Audit fee | | | 24,600 | |
Legal fees and expenses | | | 12,655 | |
Trustees’ fees | | | 11,959 | |
Transfer agent’s fees and expenses (including affiliated expense of $5,882) | | | 10,680 | |
Miscellaneous | | | 21,243 | |
| | | | |
Total expenses | | | 2,074,204 | |
| | | | |
| NET INVESTMENT INCOME (LOSS) | | | 750,998 | |
| | | | |
| REALIZED AND UNREALIZED GAIN (LOSS) ON INVESTMENT AND FOREIGN CURRENCY TRANSACTIONS | | | | |
Net realized gain (loss) on: | | | | |
Investment transactions (including affiliated of $2,164) | | | 17,372,579 | |
Foreign currency transactions | | | (2,386 | ) |
| | | | |
| | | 17,370,193 | |
| | | | |
Net change in unrealized appreciation (depreciation) on: | | | | |
Investments (including affiliated of $151) | | | 28,285,936 | |
Foreign currencies | | | 160 | |
| | | | |
| | | 28,286,096 | |
| | | | |
| NET GAIN (LOSS) ON INVESTMENT AND FOREIGN CURRENCY TRANSACTIONS | | | 45,656,289 | |
| | | | |
| NET INCREASE (DECREASE) IN NET ASSETS RESULTING FROM OPERATIONS | | $ | 46,407,287 | |
| | | | |
STATEMENTS OF CHANGES IN NET ASSETS
| | | | | | | | |
| | | Year Ended
December 31, 2019 | | | Year Ended
December 31, 2018 | |
INCREASE (DECREASE) IN NET ASSETS
OPERATIONS | | | | | | | | |
Net investment income (loss) | | $ | 750,998 | | | $ | 1,138,340 | |
Net realized gain (loss) on investment and foreign currency transactions | | | 17,370,193 | | | | 7,095,611 | |
Net change in unrealized appreciation (depreciation) on investments and foreign currencies | | | 28,286,096 | | | | (17,157,347 | ) |
| | | | | | | | |
NET INCREASE (DECREASE) IN NET ASSETS RESULTING FROM OPERATIONS | | | 46,407,287 | | | | (8,923,396 | ) |
| | | | | | | | |
| PORTFOLIO SHARE TRANSACTIONS | | | | | | | | |
Portfolio shares sold | | | 6,953,016 | | | | 14,559,333 | |
Portfolio shares repurchased | | | (37,881,197 | ) | | | (53,237,975 | ) |
| | | | | | | | |
NET INCREASE (DECREASE) IN NET ASSETS FROM PORTFOLIO SHARE TRANSACTIONS | | | (30,928,181 | ) | | | (38,678,642 | ) |
| | | | | | | | |
| CAPITAL CONTRIBUTIONS | | | — | | | | 106,774 | |
| | | | | | | | |
| TOTAL INCREASE (DECREASE) | | | 15,479,106 | | | | (47,495,264 | ) |
| NET ASSETS: | | | | | | | | |
Beginning of year | | | 177,566,789 | | | | 225,062,053 | |
| | | | | | | | |
End of year | | $ | 193,045,895 | | | $ | 177,566,789 | |
| | | | | | | | |
SEE NOTES TO FINANCIAL STATEMENTS.
A4
NOTES TO FINANCIAL STATEMENTS OF
THE PRUDENTIAL SERIES FUND
The Prudential Series Fund (“Series Fund”) is registered under the Investment Company Act of 1940, as amended (“1940 Act”), as anopen-end management investment company. The Series Fund is composed of seventeen Portfolios (“Portfolios”), each with separate series shares. The information presented in these financial statements pertains to the Jennison 20/20 Focus Portfolio (the “Portfolio”). The Portfolio is a diversified portfolio.
The investment objective of the Portfolio is long-term growth of capital.
The Series Fund follows the investment company accounting and reporting guidance of the Financial Accounting Standards Board (“FASB”) Accounting Standard Codification (“ASC”) Topic 946 Financial Services —Investment Companies. The following accounting policies conform to U.S. generally accepted accounting principles. The Series Fund and the Portfolio consistently follow such policies in the preparation of their financial statements.
Securities Valuation: The Portfolio holds securities and other assets and liabilities that are fair valued at the close of each day (generally, 4:00 PM Eastern time) the New York Stock Exchange (“NYSE”) is open for trading. Fair value is the price that would be received to sell an asset or paid to transfer a liability in an orderly transaction between market participants on the measurement date. The Series Fund’s Board of Trustees (the “Board”) has adopted valuation procedures for security valuation under which fair valuation responsibilities have been delegated to PGIM Investments LLC (“PGIM Investments” or the “Manager”). Pursuant to the Board’s delegation, the Manager has established a Valuation Committee responsible for supervising the fair valuation of portfolio securities and other assets and liabilities. The valuation procedures permit the Portfolio to utilize independent pricing vendor services, quotations from market makers, and alternative valuation methods when market quotations are either not readily available or not deemed representative of fair value. A record of the Valuation Committee’s actions is subject to the Board’s review, approval, and ratification at its next regularly scheduled quarterly meeting.
For the fiscal reportingyear-end, securities and other assets and liabilities were fair valued at the close of the last U.S. business day. Trading in certain foreign securities may occur when the NYSE is closed (including weekends and holidays). Because such foreign securities trade in markets that are open on weekends and U.S. holidays, the values of some of the Portfolio’s foreign investments may change on days when investors cannot purchase or redeem Portfolio shares.
Various inputs determine how the Portfolio’s investments are valued, all of which are categorized according to the three broad levels (Level 1, 2, or 3) detailed in the Schedule of Investments and referred to herein as the “fair value hierarchy” in accordance with FASB ASC Topic 820 — Fair Value Measurements and Disclosures.
Common and preferred stocks, exchange-traded funds, and derivative instruments, such as futures or options, that are traded on a national securities exchange are valued at the last sale price as of the close of trading on the applicable exchange where the security principally trades. Securities traded via NASDAQ are valued at the NASDAQ official closing price. To the extent these securities are valued at the last sale price or NASDAQ official closing price, they are classified as Level 1 in the fair value hierarchy. In the event that no sale or official closing price on valuation date exists, these securities are generally valued at the mean between the last reported bid and ask prices, or at the last bid price in the absence of an ask price. These securities are classified as Level 2 in the fair value hierarchy.
Foreign equities traded on foreign securities exchanges are generally valued using pricing vendor services that provide model prices derived using adjustment factors based on information such as local closing price, relevant general and sector indices, currency fluctuations, depositary receipts, and futures, as applicable. Securities valued using such model prices are classified as Level 2 in the fair value hierarchy. The models generate an evaluated adjustment factor for each security, which is applied to the local closing price to adjust it for post closing market movements up to the time the Portfolio is valued. Utilizing that evaluated adjustment factor, the vendor provides an evaluated price for each security. If the vendor does not provide an evaluated price, securities are valued in accordance with exchange-traded common and preferred stock valuation policies discussed above.
Investments inopen-end,non-exchange-traded mutual funds are valued at their net asset values as of the close of the NYSE on the date of valuation. These securities are classified as Level 1 in the fair value hierarchy since they may be purchased or sold at their net asset values on the date of valuation.
B1
Securities and other assets that cannot be priced according to the methods described above are valued based on pricing methodologies approved by the Board. In the event that unobservable inputs are used when determining such valuations, the securities will be classified as Level 3 in the fair value hierarchy.
When determining the fair value of securities, some of the factors influencing the valuation include: the nature of any restrictions on disposition of the securities; assessment of the general liquidity of the securities; the issuer’s financial condition and the markets in which it does business; the cost of the investment; the size of the holding and the capitalization of the issuer; the prices of any recent transactions or bids/offers for such securities or any comparable securities; any available analyst media or other reports or information deemed reliable by the Manager regarding the issuer or the markets or industry in which it operates. Using fair value to price securities may result in a value that is different from a security’s most recent closing price and from the price used by other unaffiliated mutual funds to calculate their net asset values.
Illiquid Securities: Pursuant to Rule22e-4 under the 1940 Act, the Series Fund has adopted a Board approved Liquidity Risk Management Program (“LRMP”) that requires, among other things, that the Portfolio limit its illiquid investments that are assets to no more than 15% of net assets. Illiquid securities are those that, because of the absence of a readily available market or due to legal or contractual restrictions on resale, may not reasonably be expected to be sold or disposed of in current market conditions in seven calendar days or less without the sale or disposition significantly changing the market value of the investment. The Portfolio may find it difficult to sell illiquid securities at the time considered most advantageous by its subadviser(s) and may incur transaction costs that would not be incurred in the sale of securities that were freely marketable.
Restricted Securities: Securities acquired in unregistered, private sales from the issuing company or from an affiliate of the issuer are considered restricted as to disposition under federal securities law (“restricted securities”). Such restricted securities are valued pursuant to the valuation procedures noted above. Restricted securities that would otherwise be considered illiquid investments pursuant to the Portfolio’s LRMP because of legal restrictions on resale to the general public may be traded among qualified institutional buyers under Rule 144A of the Securities Act of 1933. Therefore, these Rule 144A securities, as well as commercial paper that is sold in private placements under Section 4(2) of the Securities Act of 1933, may be classified higher than “illiquid” under the LRMP (i.e. “moderately liquid” or “less liquid” investments). However, the liquidity of the Portfolio’s investments in restricted securities could be impaired if trading does not develop or declines.
Foreign Currency Translation: The books and records of the Portfolio are maintained in U.S. dollars. Foreign currency amounts are translated into U.S. dollars on the following basis:
(i) market value of investment securities, other assets and liabilities — at the current rates of exchange;
(ii) purchases and sales of investment securities, income and expenses — at the rates of exchange prevailing on the respective dates of such transactions.
Although the net assets of the Portfolio are presented at the foreign exchange rates and market values at the close of the period, the Portfolio does not generally isolate that portion of the results of operations arising as a result of changes in the foreign exchange rates from the fluctuations arising from changes in the market prices of long-term portfolio securities held at the end of the period. Similarly, the Portfolio does not isolate the effect of changes in foreign exchange rates from the fluctuations arising from changes in the market prices of long-term portfolio securities sold during the period. Accordingly, holding period realized foreign currency gains (losses) are included in the reported net realized gains (losses) on investment transactions.
Net realized gains (losses) on foreign currency transactions represent net foreign exchange gains (losses) from the disposition of holdings of foreign currencies, currency gains (losses) realized between the trade and settlement dates on investment transactions, and the difference between the amounts of interest, dividends and foreign withholding taxes recorded on the Portfolio’s books and the U.S. dollar equivalent amounts actually received or paid. Net unrealized currency gains (losses) arise from valuing foreign currency denominated assets and liabilities (other than investments) at period end exchange rates.
Master Netting Arrangements: The Series Fund, on behalf of the Portfolio, is subject to various Master Agreements, or netting arrangements, with select counterparties. These are agreements which a subadviser may have negotiated and entered into on behalf of all or a portion of the Portfolio. For multi-sleeve Portfolios, different subadvisers who manage their respective sleeve, may enter into such agreements with the same counterparty and are disclosed separately for each sleeve when presenting information about offsetting and related netting arrangements for OTC derivatives. A master netting arrangement between the Portfolio and the counterparty permits the Portfolio to offset amounts payable by the Portfolio to the same counterparty against amounts to be
B2
received; and by the receipt of collateral from the counterparty by the Portfolio to cover the Portfolio’s exposure to the counterparty. However, there is no assurance that such mitigating factors are easily enforceable. In addition to master netting arrangements, the right toset-off exists when all the conditions are met such that each of the parties owes the other determinable amounts, the reporting party has the right toset-off the amount owed with the amount owed by the other party, the reporting party intends toset-off and the right ofset-off is enforceable by law. During the reporting period, there was no intention to settle on a net basis and all amounts are presented on a gross basis on the Statement of Assets and Liabilities.
Securities Lending: The Portfolio lends its portfolio securities to banks and broker-dealers. The loans are secured by collateral at least equal to the market value of the securities loaned. Collateral pledged by each borrower is invested in an affiliated money market fund and is marked to market daily, based on the previous day’s market value, such that the value of the collateral exceeds the value of the loaned securities. In the event of significant appreciation in value of securities on loan on the last business day of the reporting period, the financial statements may reflect a collateral value that is less than the market value of the loaned securities. Such shortfall is remedied as described above. Loans are subject to termination at the option of the borrower or the Portfolio. Upon termination of the loan, the borrower will return to the Portfolio securities identical to the loaned securities. Should the borrower of the securities fail financially, the Portfolio has the right to repurchase the securities in the open market using the collateral.
The Portfolio recognizes income, net of any rebate and securities lending agent fees, for lending its securities in the form of fees or interest on the investment of any cash received as collateral. The borrower receives all interest and dividends from the securities loaned and such payments are passed back to the lender in amounts equivalent thereto. The Portfolio also continues to recognize any unrealized gain (loss) in the market price of the securities loaned and on the change in the value of the collateral invested that may occur during the term of the loan. In addition, realized gain (loss) is recognized on changes in the value of the collateral invested upon liquidation of the collateral. Net earnings from securities lending are disclosed in the Statement of Operations.
Securities Transactions and Net Investment Income: Securities transactions are recorded on the trade date. Realized gains (losses) from investment and currency transactions are calculated on the specific identification method. Dividend income is recorded on theex-date, or for certain foreign securities, when the Portfolio becomes aware of such dividends. Interest income, including amortization of premium and accretion of discount on debt securities, as required, is recorded on the accrual basis. Expenses are recorded on an accrual basis, which may require the use of certain estimates by management that may differ from actual. Net investment income or loss (other than administration and distribution fees which are charged directly to the respective class) and unrealized and realized gains (losses) are allocated daily to each class of shares based upon the relative proportion of adjusted net assets of each class at the beginning of the day.
Taxes: For federal income tax purposes, the Portfolio is treated as a separate taxpaying entity. The Portfolio is treated as a partnership for tax purposes. No provision has been made in the financial statements for U.S. federal, state, or local taxes, as any tax liability arising from operations of the Portfolios is the responsibility of the Portfolio’s shareholders (participating insurance companies). The Portfolio is not generally subject to entity-level taxation. Shareholders of the Portfolio are subject to taxes on their distributive share of partnership items. Withholding taxes on foreign dividends, interest and capital gains are accrued in accordance with the Portfolio’s understanding of the applicable country’s tax rules and regulations. Such taxes are accrued net of reclaimable amounts, at the time the related income/gain is recorded taking into account any agreements in place with Prudential Financial, Inc. (“Prudential”) as referenced in Note 3. The Portfolio generally attempts to manage its diversification in a manner that supports the diversification requirements of the underlying separate accounts.
Distributions: Distributions, if any, from the Portfolio are made in cash and automatically reinvested in additional shares of the Portfolio. Distributions are recorded on theex-date.
Estimates: The preparation of financial statements requires management to make estimates and assumptions that affect the reported amounts and disclosures in the financial statements. Actual results could differ from those estimates.
The Series Fund, on behalf of the Portfolio, has entered into an investment management agreement with the Manager. Pursuant to this agreement, the Manager has responsibility for all investment advisory services and supervises the subadviser’s performance of such services. The Manager has entered into a subadvisory agreement with Jennison Associates LLC (“Jennison”) (the “subadviser”), under which Jennison provides
B3
investment advisory services for the Portfolio. The Manager pays for the services of the subadviser, cost of compensation of officers of the Portfolio, occupancy and certain clerical and administrative expenses of the Portfolio. The Portfolio bears all other costs and expenses.
The management fee paid to the Manager is accrued daily and payable monthly at an annual rate of 0.75% of the Portfolio’s average daily net assets of the Portfolio. All amounts paid or payable by the Portfolio to the Manager, under the agreement, are reflected in the Statement of Operations.
The Series Fund, on behalf of the Portfolio, has a distribution agreement, pursuant to Rule12b-1 under the 1940 Act, with Prudential Investment Management Services LLC (“PIMS”), which acts as the distributor of the Class I and Class II shares of the Portfolio. The Portfolio compensates PIMS for distributing and servicing the Portfolio’s Class II shares pursuant to a plan of distribution (the “Class II Plan”), regardless of expenses actually incurred by PIMS. The distribution fees are accrued daily and payable monthly. No distribution or service fees are paid to PIMS as distributor of the Class I shares of the Portfolio. Pursuant to the Class II Plan, the Class II shares of the Portfolio compensate PIMS for distribution-related activities at an annual rate of 0.25% of the average daily net assets of the Class II shares.
The Series Fund has an administration agreement with the Manager, which acts as the administrator of the Class II shares of the Portfolio. The administration fee paid to the Manager is accrued daily and payable monthly, at the annual rate of 0.15% of the average daily net assets of the Class II shares.
The Series Fund, on behalf of the Portfolio, has entered into brokerage commission recapture agreements with certain registered broker-dealers. Under the brokerage commission recapture program, a portion of the commission is returned to the Portfolio on whose behalf the trades were made. Commission recapture is paid solely to those portfolios generating the applicable trades. Such amounts are included within realized gain (loss) on investment transactions presented in the Statement of Operations. For the reporting period ended December 31, 2019, brokerage commission recaptured under these agreements was $5,937.
PGIM Investments, PIMS and Jennison are indirect, wholly-owned subsidiaries of Prudential.
| 3. | | Other Transactions with Affiliates |
a.) Related Parties
Prudential Mutual Fund Services LLC (“PMFS”), an affiliate of PGIM Investments and an indirect, wholly-owned subsidiary of Prudential, serves as the transfer agent of the Portfolios. The transfer agent’s fees and expenses in the Statement of Operations include certainout-of-pocket expenses paid tonon-affiliates, where applicable.
The Portfolio may invest its overnight sweep cash in the PGIM Core Ultra Short Bond Fund (the “Core Fund”) and its securities lending cash collateral in the PGIM Institutional Money Market Fund (the “Money Market Fund”), each a series of Prudential Investment Portfolios 2, registered under the 1940 Act and managed by PGIM Investments. Through the Portfolio’s investments in the mentioned underlying funds, PGIM Investments and/or its affiliates are paid fees or reimbursed for providing their services. In addition to the realized and unrealized gains on investments in the Core Fund and Money Market Fund, earnings from such investments are disclosed on the Statement of Operations as “Affiliated dividend income” and “Income from securities lending, net”, respectively.
The Portfolio may enter into certain securities purchase or sale transactions under Board approved Rule17a-7 procedures. Rule17a-7 is an exemptive rule under the 1940 Act, that subject to certain conditions, permits purchase and sale transactions among affiliated investment companies, or between an investment company and a person that is affiliated solely by reason of having a common (or affiliated) investment adviser, common directors, and/or common officers. Pursuant to the Rule17a-7 procedures and consistent with guidance issued by the Securities and Exchange Commission (“SEC”), the Series Fund’s Chief Compliance Officer (“CCO”) prepares a quarterly summary of all such transactions for submission to the Board, together with the CCO’s written representation that all such17a-7 transactions were effected in accordance with the Series Fund’sRule 17a-7 procedures. For the reporting period ended December 31, 2019, no such transactions were entered into by the Portfolio.
b.) Securities Lending and Foreign Withholding Tax Reclaim Matters
B4
In September 2019, the Manager reached a settlement with the SEC relating to the securities lending and foreign withholding tax reclaim matters described below. Under the settlement, the Manager agreed to pay to the SEC disgorgement of fees and a civil penalty. The settlement does not affect the Manager’s ability to manage the Portfolio.
In February 2016, Prudential, the parent company of the Manager, self-reported to the SEC and certain other regulators that, in some cases, it failed to maximize securities lending income for certain Portfolios of the Series Fund due to a long-standing restriction benefitting Prudential. The Board was not notified of the restriction until after it had been removed. Prudential paid each of the affected Portfolios an amount equal to the estimated loss associated with the unauthorized restriction. At the Board’s direction, this payment occurred on June 30, 2016. The estimated opportunity loss was calculated by an independent consultant hired by Prudential whose calculation methodology was subsequently reviewed by a consultant retained by the independent trustees of the Portfolios. The per share amount of opportunity loss payment to the Portfolios is disclosed in the Portfolio’s “Financial Highlights” as “Capital Contributions” for the fiscal year ended December 31, 2016.
In March 2018, Prudential further notified the SEC that it failed to timely reimburse certain Portfolios for amounts due under protocols established to ensure that the Portfolios were not harmed as a result of their tax status as partnerships instead of regulated investment companies (RICs). Specifically, as a result of their partnership status, the Portfolios are subject to higher foreign withholding tax rates on dividend and interest income in certain foreign jurisdictions and/or are subject to delays in repayment of taxes withheld by certain foreign jurisdictions (collectively, “excess withholding tax”). Prudential’s protocols were intended to protect the Portfolios from these differences and delays. In consultation with the Series Fund’s independent trustees, Prudential paid each of the affected Portfolios an amount equal to the excess withholding tax in addition to an amount equal to the applicable Portfolio’s rate of return (“opportunity loss”) applied to these excess withholding tax amounts for periods from the various transaction dates, beginning January 2, 2006 (the date when the Portfolios were converted to partnerships for tax purposes), through February 28, 2018 (the date through which the previously established protocols were not uniformly implemented). The amount due to each Portfolio was calculated by Prudential with the help of a third-party consultant. Those amounts and the methodology used by Prudential to derive them, were evaluated and confirmed by a consultant retained by the Series Fund’s independent trustees. The excess withholding tax analysis considered detriments to the Portfolios due to their tax status as partnerships arising from both timing differences (i.e., jurisdictions in which the Portfolio was subject to a higher withholding tax rate due to its tax status which is reclaimable) as described above as well as permanent tax detriments (i.e., jurisdictions in which the Portfolio was subject to a higher withholding tax rate due to its tax status which is not reclaimable). Further, the opportunity loss due to each Portfolio also was calculated by a third-party consultant hired by Prudential whose calculation methodology was subsequently reviewed by a consultant retained by the Series Fund’s independent trustees. The aggregate previously unreimbursed excess withholding tax and/or opportunity loss payments for the Portfolio are disclosed in the Portfolio’s “Statements of Changes in Net Assets” and “Financial Highlights” as “Capital Contributions” for the fiscal year ended December 31, 2018.
In addition to the above, Prudential committed to the Series Fund’s independent trustees that it would pay all consulting, legal, audit, and other charges, fees and expenses incurred with the matters described above. Prudential has made and continues to make these payments.
During the reporting period and in consultation with the Series Fund’s independent trustees, Prudential instituted a process to reimburse the affected Portfolios for any future excess withholding tax on the first business day following the pay date of the applicable dividend or interest income event regardless of whether the excess withholding tax is due to timing differences or permanent detriments resulting from the Portfolios’ partnership tax status.
In cases in which the excess withholding tax is due to timing differences and is reclaimable from the foreign jurisdiction, the affected Portfolios have the ability to recover the excess withholding tax withheld by filing a reclaim with the relevant foreign tax authority. To avoid a Portfolio receiving and retaining a duplicate payment for the same excess withholding tax, payments received by an applicable Portfolio from a foreign tax authority for reclaims for which a Portfolio previously received reimbursement from Prudential will be payable to Prudential. Pending tax reclaim amounts due to Prudential for excess withholding tax which Prudential previously paid to the Portfolios are reported as “Payable to affiliate” on the “Statement of Assets and Liabilities” and any amounts accrued but not yet reimbursed by Prudential for excess withholding tax is recorded as “Receivable from affiliate” on the Statement of Assets and Liabilities. The full amount of tax reclaims due to a Portfolio, inclusive of timing differences and routine tax reclaims for foreign jurisdictions where the Portfolios do not incur an excess withholding tax is included as “Tax reclaim receivable” on the “Statement of Assets and Liabilities.” To the extent that there are costs associated with
B5
the filing of any reclaim attributable to excess withholding tax, those costs are borne by Prudential.
The aggregate cost of purchases and proceeds from sales of portfolio securities (excluding short-term investments and U.S. Government securities) for the year ended December 31, 2019, were $110,537,791 and $135,312,114, respectively.
A summary of the cost of purchases and proceeds from sales of shares of affiliated investments for the year ended December 31, 2019, is presented as follows:
| | | | | | | | | | | | | | | | | | | | | | | | | | | | | | |
Value,
Beginning
of Year | | | Cost of
Purchases | | | Proceeds
from Sales | | | Change in
Unrealized
Gain
(Loss) | | | Realized
Gain
(Loss) | | | Value,
End of Year | | | Shares,
End of Year | | | Income | |
| | PGIM Core Ultra Short Bond Fund* | | | | | | | | | | | | | | | | | | | | | |
| $ | 5,478,500 | | | $ | 67,886,170 | | | $ | 71,715,486 | | | $ | — | | | $ | — | | | $ | 1,649,184 | | | | 1,649,184 | | | $ | 72,650 | |
| | PGIM Institutional Money Market Fund* | |
| | 7,706,108 | | | | 120,922,342 | | | | 128,080,750 | | | | 151 | | | | 2,164 | | | | 550,015 | | | | 549,905 | | | | 19,914 | ** |
| | | | | | | | | | | | | | | | | | | | | | | | | | | | | | |
| $ | 13,184,608 | | | $ | 188,808,512 | | | $ | 199,796,236 | | | $ | 151 | | | $ | 2,164 | | | $ | 2,199,199 | | | | | | | $ | 92,564 | |
| | | | | | | | | | | | | | | | | | | | | | | | | | | | | | |
| * | The Fund did not have any capital gain distributions during the reporting period. |
| ** | Represents the affiliated amount of securities lending income shown on the Statement of Operations. |
The Portfolio is treated as a partnership for federal income tax purposes. The character of the cash distributions, if any, made by the partnership is generally classified as nontaxable return of capital distributions. After each fiscal year each shareholder of record will receive information regarding their distributive allocable share of the partnership’s income, gains, losses and deductions.
With respect to the Portfolio, book cost of assets differs from tax cost of assets as a result of the Portfolio’s adoption of a mark to market method of accounting for tax purposes. Under this method, tax cost of assets will approximate fair market value.
The Manager has analyzed the Portfolio’s tax positions taken on federal, state and local income tax returns for all open tax years and has concluded that no provision for income tax is required in the Portfolio’s financial statements for the current reporting period. Since tax authorities can examine previously filed tax returns, the Portfolio’s U.S. federal and state tax returns for each of the four fiscal years up to the most recent fiscal year ended December 31, 2019 are subject to such review.
The Series Fund, on behalf of the Portfolio, along with other affiliated registered investment companies (the “Funds”), is a party to a Syndicated Credit Agreement (“SCA”) with a group of banks. The purpose of the SCA is to provide an alternative source of temporary funding for capital share redemptions. The table below provides details of the current SCA in effect at the reportingperiod-end as well as the prior SCA.
| | | | |
| | Current SCA | | Prior SCA |
Term of Commitment | | 10/3/2019 – 10/1/2020 | | 10/4/2018 – 10/2/2019 |
Total Commitment | | $ 900 million | | $ 900 million |
Annualized Commitment Fee on the Unused Portion of the SCA | | 0.15% | | 0.15% |
Annualized Interest Rate on Borrowings | | 1.20% plus the higher of (1) the effective federal funds rate, (2) theone-month LIBOR rate or (3) zero percent | | 1.25% plus the higher of (1) the effective federal funds rate, (2) theone-month LIBOR rate or (3) zero percent |
Certain affiliated registered investment companies that are parties to the SCA include portfolios that are subject to a predetermined mathematical formula used to manage certain benefit guarantees offered under variable annuity
B6
contracts. The formula may result in large scale asset flows into and out of these portfolios. Consequently, these portfolios may be more likely to utilize the SCA for purposes of funding redemptions. It may be possible for those portfolios to fully exhaust the committed amount of the SCA, thereby requiring the Manager to allocate available funding per a Board-approved methodology designed to treat the Funds in the SCA equitably.
The Portfolio utilized the SCA during the year ended December 31, 2019. The average daily balance for the 15 days that the Portfolio had loans outstanding during the period was approximately $410,267, borrowed at a weighted average interest rate of 3.70%. The maximum loan outstanding amount during the period was $1,216,000. At December 31, 2019, the Portfolio did not have an outstanding loan amount.
The Portfolio offers Class I and Class II shares. Neither Class I nor Class II shares of the Portfolio are subject to any sales charge or redemption charge and are sold at the net asset value of the Portfolio. Class I shares are sold only to certain separate accounts of Prudential to fund benefits under certain variable life insurance and variable annuity contracts (“contracts”). Class II shares are sold only to separate accounts ofnon-Prudential insurance companies as investment options under certain contracts. Class I shares are also offered to separate accounts ofnon-affiliated insurers for which Prudential or its affiliates administer and/or reinsure the variable life insurance or variable annuity contracts issued in connection with the separate accounts. The separate accounts invest in shares of the Portfolio through subaccounts that correspond to the Portfolio. The separate accounts will redeem shares of the Portfolio to the extent necessary to provide benefits under the contracts or for such other purposes as may be consistent with the contracts.
As of December 31, 2019, the following number of shares of the Portfolio were owned of record directly or by other Portfolios as part of their investments by insurance affiliates of Prudential Financial, Inc.
| | | | | | | | |
Portfolio | | Number of Shares | | | Percentage of
Outstanding Shares | |
Jennison 20/20 Focus Portfolio - Class I | | | 1,883,533 | | | | 100 | % |
The following number of shareholders of record, each holding greater than 5% of the Portfolio, held the following percentage of outstanding shares, on behalf of multiple beneficial owners:
| | | | | | | | | | | | |
| | | Affiliated | | | Unaffiliated | |
Portfolio | | Number of
Shareholders | | Percentage of
Outstanding
Shares | | | Number of
Shareholders | | Percentage of
Outstanding
Shares | |
Jennison 20/20 Focus Portfolio | | 1 | | | 33 | % | | 2 | | | 58 | % |
Transactions in shares of beneficial interest were as follows:
| | | | | | | | |
Class I: | | Shares | | | Amount | |
Year ended December 31, 2019: | | | | | | | | |
Portfolio shares sold | | | 98,778 | | | $ | 3,376,115 | |
Portfolio shares repurchased | | | (212,525 | ) | | | (7,260,173 | ) |
| | | | | | | | |
Net increase (decrease) in shares outstanding | | | (113,747 | ) | | $ | (3,884,058 | ) |
| | | | | | | | |
Year ended December 31, 2018: | | | | | | | | |
Portfolio shares sold | | | 155,156 | | | $ | 5,029,990 | |
Portfolio shares repurchased | | | (367,935 | ) | | | (12,015,117 | ) |
Capital contributions | | | — | | | | 35,270 | |
| | | | | | | | |
Net increase (decrease) in shares outstanding | | | (212,779 | ) | | $ | (6,949,857 | ) |
| | | | | | | | |
B7
| | | | | | | | |
Class II: | | Shares | | | Amount | |
Year ended December 31, 2019: | | | | | | | | |
Portfolio shares sold | | | 110,457 | | | $ | 3,576,901 | |
Portfolio shares repurchased | | | (966,559 | ) | | | (30,621,024 | ) |
| | | | | | | | |
Net increase (decrease) in shares outstanding | | | (856,102 | ) | | $ | (27,044,123 | ) |
| | | | | | | | |
Year ended December 31, 2018: | | | | | | | | |
Portfolio shares sold | | | 306,232 | | | $ | 9,529,343 | |
Portfolio shares repurchased | | | (1,320,167 | ) | | | (41,222,858 | ) |
Capital contributions | | | — | | | | 71,504 | |
| | | | | | | | |
Net increase (decrease) in shares outstanding | | | (1,013,935 | ) | | $ | (31,622,011 | ) |
| | | | | | | | |
| 8. | | Risks of Investing in the Portfolio |
The Portfolio’s risks include, but are not limited to, some or all of the risks discussed below:
Equity and Equity-Related Securities Risks: The value of a particular security could go down and you could lose money. In addition to an individual security losing value, the value of the equity markets or a sector in which the Portfolio invests could go down. The Portfolio’s holdings can vary significantly from broad market indexes and the performance of the Portfolio can deviate from the performance of these indexes. Different parts of a market can react differently to adverse issuer, market, regulatory, political and economic developments.
Foreign Securities Risk: The Portfolio’s investments in securities of foreign issuers or issuers with significant exposure to foreign markets involve additional risk. Foreign countries in which the Portfolio may invest may have markets that are less liquid, less regulated and more volatile than US markets. The value of the Portfolio’s investments may decline because of factors affecting the particular issuer as well as foreign markets and issuers generally, such as unfavorable government actions, and political or financial instability.
Market and Credit Risk: Securities markets may be volatile and the market prices of the Portfolio’s securities may decline. Securities fluctuate in price based on changes in an issuer’s financial condition and overall market and economic conditions. If the market prices of the securities owned by the Portfolio fall, the value of an investment in the Portfolio will decline. Additionally, the Portfolio may also be exposed to credit risk in the event that an issuer or guarantor fails to perform or that an institution or entity with which the Portfolio has unsettled or open transactions defaults.
| 9. | | Recent Accounting Pronouncements and Reporting Updates |
In August 2018, the FASB issued Accounting Standards Update (“ASU”)No. 2018-13, which changes certain fair value measurement disclosure requirements. The new ASU, in addition to other modifications and additions, removes the requirement to disclose the amount and reasons for transfers between Level 1 and Level 2 of the fair value hierarchy, and the Portfolio’s policy for the timing of transfers between levels. The amendments are effective for financial statements issued for fiscal years beginning after December 15, 2019, and interim periods within those fiscal years. The Manager has evaluated the implications of certain provisions of the ASU and has adopted the aspects related to the removal and modification of certain fair value measurement disclosures under the ASU. The Manager continues to evaluate certain other provisions of the ASU and does not expect a material impact to financial statement disclosures.
B8
Financial Highlights
| | | | | | | | | | | | | | | | | | | | |
| | | Jennison 20/20 Focus Portfolio | |
| | | Class I | |
| | | Year Ended December 31, | |
| | | 2019 | | | 2018 | | | 2017 | | | 2016 | | | 2015 | |
Per Share Operating Performance(a): | | | | | | | | | | | | | | | | | | | | |
Net Asset Value, beginning of year | | $ | 29.52 | | | $ | 31.19 | | | $ | 23.94 | | | $ | 23.56 | | | $ | 22.16 | |
| | | | | | | | | | | | | | | | | | | | |
Income (Loss) From Investment Operations: | | | | | | | | | | | | | | | | | | | | |
Net investment income (loss) | | | 0.23 | | | | 0.26 | | | | 0.10 | | | | 0.09 | | | | 0.07 | |
Net realized and unrealized gain (loss) on investment and foreign currency transactions | | | 8.31 | | | | (1.95 | ) | | | 7.15 | | | | 0.27 | | | | 1.33 | |
| | | | | | | | | | | | | | | | | | | | |
Total from investment operations | | | 8.54 | | | | (1.69 | ) | | | 7.25 | | | | 0.36 | | | | 1.40 | |
| | | | | | | | | | | | | | | | | | | | |
Capital Contributions | | | — | | | | 0.02 | (c) | | | — | | | | 0.02 | (d) | | | — | |
| | | | | | | | | | | | | | | | | | | | |
Net Asset Value, end of year | | $ | 38.06 | | | $ | 29.52 | | | $ | 31.19 | | | $ | 23.94 | | | $ | 23.56 | |
| | | | | | | | | | | | | | | | | | | | |
Total Return(e) | | | 28.93 | % | | | (5.35 | )%(f) | | | 30.28 | % | | | 1.61 | %(g) | | | 6.32 | % |
Ratios/Supplemental Data: | | | | | | | | | | | | | | | | | | | | |
Net assets, end of year (in millions) | | $ | 72 | | | $ | 59 | | | $ | 69 | | | $ | 59 | | | $ | 65 | |
Average net assets (in millions) | | $ | 66 | | | $ | 69 | | | $ | 65 | | | $ | 60 | | | $ | 67 | |
Ratios to average net assets(h): | | | | | | | | | | | | | | | | | | | | |
Expenses after waivers and/or expense reimbursement | | | 0.87 | % | | | 0.82 | % | | | 0.82 | % | | | 0.83 | % | | | 0.83 | % |
Expenses before waivers and/or expense reimbursement | | | 0.87 | % | | | 0.84 | % | | | 0.87 | % | | | 0.83 | % | | | 0.83 | % |
Net investment income (loss) | | | 0.66 | % | | | 0.80 | % | | | 0.36 | % | | | 0.39 | % | | | 0.30 | % |
Portfolio turnover rate(i) | | | 61 | % | | | 42 | % | | | 99 | % | | | 69 | % | | | 64 | % |
| |
| | | Jennison 20/20 Focus Portfolio | |
| | | Class II | |
| | | Year Ended December 31, | |
| | | 2019 | | | 2018 | | | 2017 | | | 2016 | | | 2015 | |
Per Share Operating Performance(a): | | | | | | | | | | | | | | | | | | | | |
Net Asset Value, beginning of year | | $ | 28.17 | | | $ | 29.88 | | | $ | 23.03 | | | $ | 22.75 | | | $ | 21.49 | |
| | | | | | | | | | | | | | | | | | | | |
Income (Loss) From Investment Operations: | | | | | | | | | | | | | | | | | | | | |
Net investment income (loss) | | | 0.09 | | | | 0.13 | | | | (0.01 | ) | | | — | (b) | | | (0.02 | ) |
Net realized and unrealized gain (loss) on investment and foreign currency transactions | | | 7.91 | | | | (1.86 | ) | | | 6.86 | | | | 0.26 | | | | 1.28 | |
| | | | | | | | | | | | | | | | | | | | |
Total from investment operations | | | 8.00 | | | | (1.73 | ) | | | 6.85 | | | | 0.26 | | | | 1.26 | |
| | | | | | | | | | | | | | | | | | | | |
Capital Contributions | | | — | | | | 0.02 | (c) | | | — | | | | 0.02 | (d) | | | — | |
| | | | | | | | | | | | | | | | | | | | |
Net Asset Value, end of year | | $ | 36.17 | | | $ | 28.17 | | | $ | 29.88 | | | $ | 23.03 | | | $ | 22.75 | |
| | | | | | | | | | | | | | | | | | | | |
Total Return(e) | | | 28.40 | % | | | (5.72 | )%(f) | | | 29.74 | % | | | 1.23 | %(g) | | | 5.86 | % |
Ratios/Supplemental Data: | | | | | | | | | | | | | | | | | | | | |
Net assets, end of year (in millions) | | $ | 121 | | | $ | 119 | | | $ | 156 | | | $ | 143 | | | $ | 160 | |
Average net assets (in millions) | | $ | 118 | | | $ | 147 | | | $ | 151 | | | $ | 146 | | | $ | 169 | |
Ratios to average net assets(h): | | | | | | | | | | | | | | | | | | | | |
Expenses after waivers and/or expense reimbursement | | | 1.27 | % | | | 1.22 | % | | | 1.22 | % | | | 1.23 | % | | | 1.23 | % |
Expenses before waivers and/or expense reimbursement | | | 1.27 | % | | | 1.24 | % | | | 1.27 | % | | | 1.23 | % | | | 1.23 | % |
Net investment income (loss) | | | 0.26 | % | | | 0.40 | % | | | (0.04 | )% | | | (0.01 | )% | | | (0.10 | )% |
Portfolio turnover rate(i) | | | 61 | % | | | 42 | % | | | 99 | % | | | 69 | % | | | 64 | % |
| (a) | Calculated based on average shares outstanding during the year. |
| (b) | Less than $0.005 per share. |
| (c) | Represents payment received by the Portfolio, from Prudential, in connection with the failure to timely compensate the Portfolio for the excess foreign withholding tax withheld on dividends and interest from certain countries due to the Portfolio’s tax status as a partnership. |
| (d) | Represents payment received by the Portfolio, from Prudential, in connection with the failure to maximize securities lending income due to a restriction that benefited Prudential. |
| (e) | Total return is calculated assuming a purchase of a share on the first day and a sale on the last day of each year reported and includes reinvestment of distributions, if any, and does not reflect the effect of insurance contract charges. Total return does not reflect expenses associated with the separate account such as administrative fees, account charges and surrender charges which, if reflected, would reduce the total returns for all years shown. Performance figures may reflect fee waivers and/or expense reimbursements. In the absence of fee waivers and/or expense reimbursements, the total return would be lower. Past performance is no guarantee of future results. Total returns may reflect adjustments to conform to generally accepted accounting principles. |
| (f) | Total return for the year includes the impact of the capital contribution. Excluding the capital contribution, the total return would have been (5.41)% and (5.79)% for Class I and Class II, respectively. |
| (g) | Total return for the year includes the impact of the capital contribution. Excluding the capital contribution, the total return would have been 1.53% and 1.14% for Class I and Class II, respectively. |
| (h) | Does not include expenses of the underlying funds in which the Portfolio invests. |
| (i) | The Portfolio’s turnover rate is calculated in accordance with regulatory requirements, without regard to transactions involving short-term investments. |
SEE NOTES TO FINANCIAL STATEMENTS.
C1
REPORT OF INDEPENDENT REGISTERED PUBLIC ACCOUNTING FIRM
TO THE SHAREHOLDERS OF JENNISON 20/20 FOCUS PORTFOLIO AND BOARD OF TRUSTEES
THE PRUDENTIAL SERIES FUND:
Opinion on the Financial Statements
We have audited the accompanying statement of assets and liabilities of Jennison 20/20 Focus Portfolio, a portfolio of The Prudential Series Fund, (the Portfolio), including the schedule of investments, as of December 31, 2019, the related statement of operations for the year then ended, the statements of changes in net assets for each of the years in thetwo-year period then ended, and the related notes (collectively, the financial statements) and the financial highlights for each of the years indicated therein. In our opinion, the financial statements and financial highlights present fairly, in all material respects, the financial position of the Portfolio as of December 31, 2019, the results of its operations for the year then ended, the changes in its net assets for each of the years in thetwo-year period then ended, and the financial highlights for each of the years indicated therein, in conformity with U.S. generally accepted accounting principles.
Basis for Opinion
These financial statements and financial highlights are the responsibility of the Portfolio’s management. Our responsibility is to express an opinion on these financial statements and financial highlights based on our audits. We are a public accounting firm registered with the Public Company Accounting Oversight Board (United States) (PCAOB) and are required to be independent with respect to the Portfolio in accordance with the U.S. federal securities laws and the applicable rules and regulations of the Securities and Exchange Commission and the PCAOB.
We conducted our audits in accordance with the standards of the PCAOB. Those standards require that we plan and perform the audit to obtain reasonable assurance about whether the financial statements and financial highlights are free of material misstatement, whether due to error or fraud. Our audits included performing procedures to assess the risks of material misstatement of the financial statements and financial highlights, whether due to error or fraud, and performing procedures that respond to those risks. Such procedures included examining, on a test basis, evidence regarding the amounts and disclosures in the financial statements and financial highlights. Such procedures also included confirmation of securities owned as of December 31, 2019, by correspondence with the custodian, transfer agent, and brokers, or by other appropriate auditing procedures when replies were not received. Our audits also included evaluating the accounting principles used and significant estimates made by management, as well as evaluating the overall presentation of the financial statements and financial highlights. We believe that our audits provide a reasonable basis for our opinion.

We have served as the auditor of one or more PGIM and/or Prudential Insurance investment companies since 2003.
New York, New York
February 12, 2020
D1
INFORMATION ABOUT TRUSTEES AND OFFICERS (Unaudited)
Information about the Trustees and the officers of the Trust is set forth below. Trustees who are not deemed to be “interested persons” of the Trust, as defined in the Investment Company Act of 1940 (1940 Act), are referred to as “Independent Trustees.” Trustees who are deemed to be “interested persons” of the Trust are referred to as “Interested Trustees.” The Trustees oversee the operations of the Trust and appoint officers who are responsible forday-to-day business decisions based on policies set by the Board.
| | | | | | |
| |
| Independent Trustees |
Name Date of Birth No. of Portfolios Overseen | | Principal Occupation(s) During Past Five Years | | Other Directorships Held | | Length of Board Service |
Susan Davenport Austin 10/19/1967 No. of Portfolios Overseen: 109 | | Chief Financial Officer of Grace Church School (Since September 2019); formerly Senior Managing Director of Brock Capital (2014-2019); formerly Vice Chairman (2013-2017), Senior Vice President and Chief Financial Officer (2007-2012) and Vice President of Strategic Planning and Treasurer (2002-2007) of Sheridan Broadcasting Corporation; formerly President of Sheridan Gospel Network (2004-2014); formerly Vice President, Goldman, Sachs & Co. (2000-2001); formerly Associate Director, Bear, Stearns & Co. Inc. (1997-2000); formerly Vice President, Salomon Brothers Inc. (1993-1997); Member of the Board of Directors, The MacDowell Colony (Since 2010); formerly Chairman (2011-2014), formerly Presiding Director (2014-2017) and currently a Member (2007-present) of the Board of Directors, Broadcast Music, Inc.; Member of the Board of Directors, Hubbard Radio, LLC (Since 2011); President, Candide Business Advisors, Inc. (Since 2011); formerly Member of the Board of Directors, National Association of Broadcasters (2004-2010). | | Director of NextEra Energy Partners, LP (NYSE: NEP) (Since February 2015); Director of Broadcast Music, Inc. (Since 2007). | | Since February 2011 |
Sherry S. Barrat 11/13/1949 No. of Portfolios Overseen: 109 | | Formerly Vice Chairman of Northern Trust Corporation (financial services and banking institution) (2011-June 2012); formerly President, Personal Financial Services, Northern Trust Corporation (2006-2010); formerly Chairman & CEO, Western US Region, Northern Trust Corporation (1999-2005); formerly President & CEO, Palm Beach/Martin County Region, Northern Trust. | | Director of NextEra Energy, Inc. (NYSE: NEE) (1998-Present); Director of Arthur J. Gallagher & Company (Since July 2013). | | Since January 2013 |
Jessica M. Bibliowicz 11/28/1959 No. of Portfolios Overseen: 109 | | Formerly Senior Adviser (2013-2019) of Bridge Growth Partners (private equity firm); formerly Director (2013-2016) of Realogy Holdings Corp. (residential real estate services); formerly Chief Executive Officer (1999-2013) of National Financial Partners (independent distributor of financial services products). | | Formerly Director (2006-2019) of The Asia Pacific Fund, Inc.; Sotheby’s (Since 2014) (auction house andart-related finance). | | Since September 2014 |
Kay Ryan Booth 11/1/1950 No. of Portfolios Overseen: 109 | | Partner, Trinity Private Equity Group (Since September 2014); formerly, Managing Director of Cappello Waterfield & Co. LLC (2011-2014); formerly Vice Chair, Global Research, J.P. Morgan (financial services and investment banking institution) (June 2008-January 2009); formerly Global Director of Equity Research, Bear Stearns & Co., Inc. (financial services and investment banking institution) (1995-2008); formerly Associate Director of Equity Research, Bear Stearns & Co., Inc.(1987-1995). | | None. | | Since January 2013 |
Stephen M. Chipman 10/26/1961 No. of Portfolios Overseen: 109 | | Formerly Group Managing Director, International Expansion and Regional Managing Director, Americas of Vistra (June 2018-June 2019); formerly Chief Executive Officer and Director of Radius (2016-2018); formerly Senior Vice Chairman (January 2015-October 2015) and Chief Executive Officer (January 2010-December 2014) of Grant Thornton LLP. | | Non-Executive Chairman (Since September 2019) of Litera Microsystems. | | Since January 2018 |
Robert F. Gunia 12/15/1946 No. of Portfolios Overseen: 109 | | Formerly Director of ICI Mutual Insurance Company (June 2016-June 2019; June 2012-June 2015); formerly Chief Administrative Officer (September 1999-September 2009) and Executive Vice President (December 1996-September 2009) of PGIM Investments LLC; formerly Executive Vice President (March 1999-September 2009) and Treasurer (May 2000-September 2009) of Prudential Mutual Fund Services LLC; formerly President (April 1999-December 2008) and Executive Vice President and Chief Operating Officer (December 2008-December 2009) of Prudential Investment Management Services LLC; formerly Chief Administrative Officer, Executive Vice President and Director(May 2003-September 2009) of AST Investment Services, Inc. | | Formerly Director (1989-2019) of The Asia Pacific Fund, Inc. | | Since July 2003 |
Thomas T. Mooney 11/11/1941 No. of Portfolios Overseen: 109 | | Formerly Chief Executive Officer, Excell Partners, Inc. (2005-2007); founding partner of High Technology of Rochester and the Lennox Technology Center; formerly President of the Greater Rochester Metro Chamber of Commerce (1976-2004); formerly Rochester City Manager (1973); formerly Deputy Monroe County Executive (1974-1976). | | None. | | Since July 2003 |
E1
| | | | | | |
| |
| Independent Trustees |
Name Date of Birth No. of Portfolios Overseen | | Principal Occupation(s) During Past Five Years | | Other Directorships Held | | Length of Board Service |
Thomas M. O’Brien 12/5/1950 No. of Portfolios Overseen: 109 | | Vice Chairman of Emigrant Bank and President of its Naples Commercial Finance Division (Since October 2018); formerly Director, President and CEO Sun Bancorp, Inc. N.A. (NASDAQ: SNBC) and Sun National Bank (July 2014-February 2018); formerly Consultant, Valley National Bancorp, Inc. and Valley National Bank (January 2012-June 2012); formerly President and COO (November 2006-April 2017) and CEO (April 2007-December 2011) of State Bancorp, Inc. and State Bank; formerly Vice Chairman (January 1997-April 2000) of North Fork Bank; formerly President and Chief Executive Officer (December 1984-December 1996) of North Side Savings Bank; formerly President and Chief Executive Officer (May 2000-June 2006) Atlantic Bank of New York. | | Formerly Director, Sun Bancorp, Inc. N.A. (NASDAQ: SNBC) and Sun National Bank (July 2014-February 2018); formerly Director, BankUnited, Inc. and BankUnited N.A. (NYSE: BKU) (May 2012-April 2014); formerly Director (April 2008-January 2012) of Federal Home Loan Bank of New York; formerly Director (December 1996-May 2000) of North Fork Bancorporation, Inc.; formerly Director (May 2000-April 2006) of Atlantic Bank of New York; Director (November 2006-January 2012) of State Bancorp, Inc. (NASDAQ: STBC) and State Bank of Long Island. | | Since July 2003 |
| |
| Interested Trustee |
Timothy S. Cronin 12/21/1965 No. of Portfolios Overseen: 109 | | Vice President of Prudential Annuities (Since June 2015); Senior Vice President of PGIM Investments LLC (Since May 2009); Chief Investment Officer and Strategist of Prudential Annuities (Since January 2004); Director of Investment & Research Strategy (Since February 1998); President of AST Investment Services, Inc. (Since June 2005). | | None. | | Since October 2009 |
| | | | |
| |
| Trust Officers(a) |
Name Date of Birth Position with the Trust | | Principal Occupation(s) During the Past Five Years | | Length of Service as Trust Officer |
Ken Allen 1/24/1969 Vice President | | Vice President of Investment Management (since December 2009) | | Since June 2019 |
Raymond A. O’Hara 9/19/1955 Chief Legal Officer | | Vice President and Corporate Counsel (since July 2010) of Prudential Insurance Company of America (Prudential); Vice President (March 2011-Present) of Pruco Life Insurance Company and Pruco Life Insurance Company of New Jersey; Vice President and Corporate Counsel (March 2011-Present) of Prudential Annuities Life Assurance Corporation; Chief Legal Officer of PGIM Investments LLC (since June 2012); Chief Legal Officer of Prudential Mutual Fund Services LLC (since June 2012) and Corporate Counsel of AST Investment Services, Inc. (since June 2012); formerly Assistant Vice President and Corporate Counsel (September 2008-July 2010) of The Hartford Financial Services Group, Inc.; formerly Associate (September 1980-December 1987) and Partner (January 1988-August 2008) of Blazzard & Hasenauer, P.C. (formerly, Blazzard, Grodd & Hasenauer, P.C.). | | Since June 2012 |
Andrew R. French 12/22/1962 Secretary | | Vice President within PGIM Investments LLC (December 2018-Present); formerly Vice President and Corporate Counsel (February 2010-December 2018) of Prudential; formerly Director and Corporate Counsel (2006-2010) of Prudential; Vice President and Assistant Secretary (since January 2007) of PGIM Investments LLC; Vice President and Assistant Secretary (since January 2007) of Prudential Mutual Fund Services LLC. | | Since October 2006 |
Jonathan D. Shain 8/9/1958 Assistant Secretary | | Vice President and Corporate Counsel (since August 1998) of Prudential; Vice President and Assistant Secretary (since May 2001) of PGIM Investments LLC; Vice President and Assistant Secretary (since February 2001) of Prudential Mutual Fund Services LLC; formerly Vice President and Assistant Secretary (May 2003-June 2005) of AST Investment Services, Inc. | | Since May 2005 |
Claudia DiGiacomo 10/14/1974 Assistant Secretary | | Vice President and Corporate Counsel (since January 2005) of Prudential; Vice President and Assistant Secretary of PGIM Investments LLC (since December 2005); Associate at Sidley Austin Brown Wood LLP (1999-2004). | | Since December 2005 |
Melissa Gonzalez 2/10/1980 Assistant Secretary | | Vice President and Corporate Counsel (since September 2018) of Prudential; formerly Director and Corporate Counsel (March 2014-September 2018) of Prudential. | | Since March 2019 |
Dino Capasso 8/19/1974 Chief Compliance Officer | | Chief Compliance Officer (July 2019-Present) of PGIM Investments LLC; Chief Compliance Officer (July 2019-Present) of the PGIM Funds, Target Funds, Advanced Series Trust, The Prudential Series Fund, Prudential’s Gibraltar Fund, Inc., PGIM Global High Yield Fund, Inc., and PGIM High Yield Bond Fund, Inc.; Vice President and Deputy Chief Compliance Officer (June 2017-July 2019) of PGIM Investments LLC; formerly, Senior Vice President and Senior Counsel (January 2016-June 2017), and Vice President and Counsel (February 2012-December 2015) of Pacific Investment Management Company LLC. | | Since March 2018 |
E2
| | | | |
| |
| Trust Officers(a) |
Name Date of Birth Position with the Trust | | Principal Occupation(s) During the Past Five Years | | Length of Service as Trust Officer |
Charles H. Smith 1/11/1973 Anti-Money Laundering Compliance Officer | | Vice President, Corporate Compliance, Anti-Money Laundering Unit (since January 2015) of Prudential; committee member of the American Council of Life Insurers Anti-Money Laundering and Critical Infrastructure Committee (since January 2016); formerly Global Head of Economic Sanctions Compliance at AIG Property Casualty (February 2007-December 2014); Assistant Attorney General at the New York State Attorney General’s Office, Division of Public Advocacy (August 1998-January 2007). | | Since January 2017 |
Christian J. Kelly 5/5/1975 Treasurer and Principal Financial and Accounting Officer | | Vice President, Head of Fund Administration of PGIM Investments LLC (since November 2018); formerly, Director of Fund Administration of Lord Abbett & Co. LLC (2009-2018), Treasurer and Principal Accounting Officer of the Lord Abbett Family of Funds (2017-2018); Director of Accounting, Avenue Capital Group (2008-2009); Senior Manager, Investment Management Practice of Deloitte & Touche LLP (1998-2007). | | Since January 2019 |
Lana Lomuti 6/7/1967 Assistant Treasurer | | Vice President (since 2007) and Director (2005-2007), within PGIM Investments Fund Administration; formerly Assistant Treasurer (December 2007-February 2014) of The Greater China Fund, Inc. | | Since April 2014 |
Russ Shupak 10/08/73 Assistant Treasurer | | Vice President (since 2017) and Director (2013-2017), within PGIM Investments Fund Administration. | | Since October 2019 |
Deborah Conway 3/26/69 Assistant Treasurer | | Vice President (since 2017) and Director (2007-2017), within PGIM Investments Fund Administration. | | Since October 2019 |
Elyse M. McLaughlin 1/20/74 Assistant Treasurer | | Vice President (since 2017) and Director (2011-2017), within PGIM Investments Fund Administration. | | Since October 2019 |
Alina Srodecka, CPA 8/19/1966 Assistant Treasurer | | Vice President of Tax at Prudential Financial, Inc. (Since August 2007); formerly Director of Tax at MetLife (January 2003-May 2006); formerly Tax Manager at Deloitte & Touché (October 1997-January 2003); formerly Staff Accountant at Marsh & McLennan (May 1994-May 1997). | | Since June 2017 |
(a) Excludes Mr. Cronin, an Interested Trustee who also serves as President.
Explanatory Notes to Tables:
Trustees are deemed to be “Interested,” as defined in the 1940 Act, by reason of their affiliation with PGIM Investments and/or an affiliate of PGIM Investments. Timothy S. Cronin is an Interested Trustee because he is employed by an affiliate of the Manager.
Unless otherwise noted, the address of all Trustees and Officers is c/o PGIM Investments LLC, 655 Broad Street, Newark, New Jersey 07102.
There is no set term of office for Trustees or Officers. The Independent Trustees have adopted a retirement policy, which calls for the retirement of Trustees on December 31 of the year in which they reach the age of 78, provided that the Board may extend the retirement age on ayear-by-year basis for a Trustee.
“Other Directorships Held” includes only directorships of companies required to register or file reports with the SEC under the 1934 Act (that is, “public companies”) or other investment companies registered under the 1940 Act.
“No. of Portfolios Overseen” includes all investment companies managed by PGIM Investments and/or ASTIS that are overseen by the Trustee. The investment companies for which PGIM Investments and/or ASTIS serves as Manager include The Prudential Variable Contract Accounts, The Prudential Series Fund, Advanced Series Trust, Prudential’s Gibraltar Fund, Inc., the PGIM Funds, the PGIM High Yield Bond Fund, Inc. and PGIM Global High Yield Fund, Inc.
E3
The prospectuses for the Prudential Series Fund portfolios and the applicable variable annuity or variable life prospectuses contain information on the investment objectives, risks, charges and expenses of the portfolios and on the contracts and should be read carefully.
Information regarding how the Fund voted proxies relating to portfolio securities during the most recent12-month period ended June 30 is available on the website of the Securities and Exchange Commission (the Commission) atwww.sec.gov and on the Fund’s website atwww.prudential.com/variableinsuranceportfolios.
The Fund files with the Commission a complete listing of portfolio holdings as of its first and third calendar quarter-end on Form N-PORT. Form N-PORT is available on the Commission’s website atwww.sec.gov or call (800) SEC-0330.
The Fund’s Statement of Additional Information contains additional information about the Fund’s Trustees and is available without charge upon request by calling the appropriate phone number listed below.
To contact your client services representative, please call the phone number listed below. Thank you.
Owners of Individual Annuity contracts should call (888) 778-2888.
Owners of Individual Life Insurance contracts should call (800) 778-2255.
Owners of Group Variable Universal Life Insurance contracts should call (800) 562-9874.
Owners of Group Variable Universal Life Insurance contracts through AICPA should call (800) 223-7473.
The Prudential Series Fund may offer two classes of shares in each portfolio: Class I and Class II. Class I shares are sold only to separate accounts of The Prudential Insurance Company of America, Pruco Life Insurance Company, and Pruco Life Insurance Company of New Jersey (collectively, Prudential) and to separate accounts of insurance companies not affiliated with Prudential where Prudential has assumed responsibility for the administration of contracts issued through such non-affiliated insurance companies, as investment options under variable life insurance and variable annuity contracts (the Contracts). (A separate account keeps the assets supporting certain insurance contracts separate from the general assets and liabilities of the insurance company.) Class II shares are offered only to separate accounts of non-Prudential insurance companies for the same types of Contracts.
Annuity and life insurance contracts contain exclusions, limitations, reductions of benefits, and terms for keeping them in force. Your licensed financial professional can provide you with costs and complete details. Contract guarantees are based on the claims-paying ability of the issuing company.
The Prudential Insurance Company of America
751 Broad Street
Newark, NJ 07102-3714
Presorted
Standard
U.S. Postage
PAID
Prudential
The Audited Financial Statements of Pruco Life Insurance Company, Pruco Life Insurance Company of New Jersey, Prudential Annuities Life Assurance Corporation, and The Prudential Insurance Company of America are available upon request. You may call (800) 778-2255 to obtain a free copy of the audited financial statements of the insurance company that issued your contract.
To reduce costs, we now generally send only a single copy of prospectuses and shareholder reports to each household (householding) in lieu of sending a copy to each Contract Owner who resides in the household. Householding is not yet available on all products. You should be aware that by calling (877) 778-5008, you can revoke, or “opt out,” of householding at any time, which may increase the volume of mail you will receive.
©2020 Prudential Financial, Inc. and its related entities. PGIM Investments, the Prudential logo, the Rock symbol, and Bring Your Challenges are service marks of Prudential Financial, Inc. and its related entities, registered in many jurisdictions worldwide.
PSF-AR-20/20 Focus
Item 2 – Code of Ethics —See Exhibit (a)
As of the end of the period covered by this report, the registrant has adopted a code of ethics (the “Section 406 Standards for Investment Companies – Ethical Standards for Principal Executive and Financial Officers”) that applies to the registrant’s Principal Executive Officer and Principal Financial Officer; the registrant’s Principal Financial Officer also serves as the Principal Accounting Officer.
The registrant hereby undertakes to provide any person, without charge, upon request, a copy of the code of ethics. To request a copy of the code of ethics, contact the registrant 800-225-1852, and ask for a copy of the Section 406 Standards for Investment Companies - Ethical Standards for Principal Executive and Financial Officers.
Item 3 – Audit Committee Financial Expert –
The registrant’s Board has determined that Mr. Thomas O’Brien, member of the Board’s Audit Committee is an “audit committee financial expert,” and that he is “independent,” for purposes of this Item.
Item 4 – Principal Accountant Fees and Services –
(a)Audit Fees
For the fiscal years ended December 31, 2019 and December 31, 2018, KPMG LLP (“KPMG”), the Registrant’s principal accountant, billed the Registrant $572,218 and $570,718 respectively, for professional services rendered for the audit of the Registrant’s annual financial statements or services that are normally provided in connection with statutory and regulatory filings.
(b)Audit-Related Fees
For the fiscal year ended December 31, 2019, fees of $24,097 were billed to the Registrant for services rendered by KPMG in connection with an accounting system conversion and were paid by The Bank of New York Mellon. For the fiscal year ended December 31, 2018, there are no fees to report.
For the fiscal year ended December 31, 2019 and December 31, 2018, $51,265 and $43,284 respectively, of fees for services rendered by KPMG in connection with matters relating to foreign tax reclaims and securities lending were paid by Prudential Financial, Inc. and/or its affiliates.
(c)Tax Fees
For the fiscal years ended December 31, 2019 and December 31, 2018: none.
(d)All Other Fees
For the fiscal years ended December 31, 2019 and December 31, 2018: none.
(e) (1)Audit CommitteePre-Approval Policies and Procedures
THE PGIM MUTUAL FUNDS
AUDIT COMMITTEE POLICY
on
Pre-Approval of Services Provided by the Independent Accountants
The Audit Committee of each PGIM Mutual Fund is charged with the responsibility to monitor the independence of the Fund’s independent accountants. As part of this responsibility, the Audit Committee mustpre-approve the independent accounting firm’s engagement to render audit and/or permissiblenon-audit services, as required by law. In evaluating a proposed engagement of the independent accountants, the Audit Committee will assess the effect that the engagement might reasonably be expected to have on the accountant’s independence. The Committee’s evaluation will be based on:
| | • | | a review of the nature of the professional services expected to be provided, |
| | • | | a review of the safeguards put into place by the accounting firm to safeguard independence, and |
| | • | | periodic meetings with the accounting firm. |
Policy for Audit andNon-Audit Services Provided to the Funds
On an annual basis, the scope of audits for each Fund, audit fees and expenses, and audit-related andnon-audit services (and fees proposed in respect thereof) proposed to be performed by the Fund’s independent accountants will be presented by the Treasurer and the independent accountants to the Audit Committee for review and, as appropriate, approval prior to the initiation of such services.
Such presentation shall be accompanied by confirmation by both the Treasurer and the independent accountants that the proposednon-audit services will not adversely affect the independence of the independent accountants. Such proposednon-audit services shall be described in sufficient detail to enable the Audit Committee to assess the appropriateness of such services and fees, and the compatibility of the provision of such services with the auditor’s independence. The Committee shall receive periodic reports on the progress of the audit and other services which are approved by the Committee or by the Committee Chair pursuant to authority delegated in this Policy.
The categories of services enumerated under “Audit Services”, “Audit-related Services”, and “Tax Services” are intended to provide guidance to the Treasurer and the independent accountants as to those categories of services which the Committee believes are generally consistent with the independence of the independent accountants and which the Committee (or the Committee Chair) would expect upon the presentation of specific proposals topre-approve. The enumerated categories are not intended as an exclusive list of audit, audit-related or tax services, which the Committee (or the Committee Chair) would consider forpre-approval.
Audit Services
The following categories of audit services are considered to be consistent with the role of the Fund’s independent accountants:
| | • | | Annual Fund financial statement audits |
| | • | | Seed audits (related to new product filings, as required) |
| | • | | SEC and regulatory filings and consents |
Audit-related Services
The following categories of audit-related services are considered to be consistent with the role of the Fund’s independent accountants:
| | • | | Accounting consultations |
| | • | | Fund merger support services |
| | • | | Agreed Upon Procedure Reports |
| | • | | Other Internal Control Reports |
Individual audit-related services that fall within one of these categories (except for fund merger support services) and are not presented to the Audit Committee as part of the annualpre-approval process are subject to an authorizedpre-approval by the Audit Committee so long as the estimated fee for those services does not exceed $30,000. Any services provided under suchpre-approval will be reported to the Audit Committee at its next regular meeting. Should the amount of such services exceed $30,000 any additional fees will be subject topre-approval by the Committee Chair (or any other Committee member on whom this responsibility has been delegated). Fees related to fund merger support services are subject to a separate authorizedpre-approval by the Audit Committee with fees determined on a per occurrence and merger complexity basis.
Tax Services
The following categories of tax services are considered to be consistent with the role of the Fund’s independent accountants:
| | • | | Tax compliance services related to the filing or amendment of the following: |
| | • | | Federal, state and local income tax compliance; and, |
| | • | | Sales and use tax compliance |
| | • | | Timely RIC qualification reviews |
| | • | | Tax distribution analysis and planning |
| | • | | Tax authority examination services |
| | • | | Tax appeals support services |
| | • | | Accounting methods studies |
| | • | | Fund merger support services |
| | • | | Tax consulting services and related projects |
Individual tax services that fall within one of these categories and are not presented to the Audit Committee as part of the annualpre-approval process are subject to an authorizedpre-approval by the Audit Committee so long as the estimated fee for those services does not exceed $30,000. Any services provided under suchpre-approval will be reported to the Audit Committee at its next regular meeting. Should the amount of such services exceed $30,000 any additional fees will be subject topre-approval by the Committee Chair (or any other Committee member on whom this responsibility has been delegated).
OtherNon-Audit Services
Certainnon-audit services that the independent accountants are legally permitted to render will be subject topre-approval by the Committee or by one or more Committee members to whom the Committee has delegated this authority and who will report to the full Committee anypre-approval decisions made pursuant to this Policy.Non-audit services presented forpre-approval pursuant to this paragraph will be accompanied by a confirmation from both the Treasurer and the independent accountants that the proposed services will not adversely affect the independence of the independent accountants.
Proscribed Services
The Fund’s independent accountants will not render services in the following categories ofnon-audit services:
| | • | | Bookkeeping or other services related to the accounting records or financial statements of the Fund |
| | • | | Financial information systems design and implementation |
| | • | | Appraisal or valuation services, fairness opinions, orcontribution-in-kind reports |
| | • | | Internal audit outsourcing services |
| | • | | Management functions or human resources |
| | • | | Broker or dealer, investment adviser, or investment banking services |
| | • | | Legal services and expert services unrelated to the audit |
| | • | | Any other service that the Public Company Accounting Oversight Board determines, by regulation, is impermissible. |
Pre-approval ofNon-Audit Services Provided to Other Entities Within the PGIM Fund Complex
Certainnon-audit services provided to PGIM Investments LLC or any of its affiliates that also provide ongoing services to the PGIM Mutual Funds will be subject topre-approval by the Audit Committee. The onlynon-audit services provided to these entities that will requirepre-approval are thoserelated directly to the operations and financial reporting of the Funds. Individual projects that are not presented to the Audit Committee as part of the annualpre-approval process will be subject topre-approval by the Committee Chair (or any other Committee member on whom this responsibility has been delegated) so long as the estimated fee for those services does not exceed $30,000. Services presented forpre-approval pursuant to this paragraph will be accompanied by a confirmation from both the Treasurer and the independent accountants that the proposed services will not adversely affect the independence of the independent accountants.
Although the Audit Committee will notpre-approve all services provided to PGIM Investments LLC and its affiliates, the Committee will receive an annual report from the Fund’s independent accounting firm showing the aggregate fees for all services provided to PGIM Investments and its affiliates.
(e) (2)Percentage of services referred to in 4(b) – 4(d) that were approved by the audit committee –
For the fiscal year ended December 31, 2019 and December 31, 2018, 100% of the services referred to in Item 4(b) was approved by the audit committee.
(f)Percentage of hours expended attributable to work performed by other than full time employees of principal accountant if greater than 50%.
The percentage of hours expended on the principal accountant’s engagement to audit the registrant’s financial statements for the most recent fiscal year that were attributed to work performed by persons other than the principal accountant’s full-time, permanent employees was 0%.
(g)Non-Audit Fees
The aggregate non-audit fees billed by KPMG for services rendered to the registrant’s investment adviser and any entity controlling, controlled by, or under common control with the investment adviser that provides ongoing services to the registrant for the fiscal years ended December 31, 2019 and December 31, 2018 was $0 and $0, respectively.
(h)Principal Accountant’s Independence
Not applicable as KPMG has not providednon-audit services to the registrant’s investment adviser and any entity controlling, controlled by, or under common control with the investment adviser that provides ongoing services to the registrant that were notpre-approved pursuant toRule 2-01(c)(7)(ii) ofRegulation S-X.
Item 5 – Audit Committee of Listed Registrants – Not applicable.
Item 6 – Schedule of Investments – The schedule is included as part of the report to shareholders filed under Item 1 of this Form.
Item 7 – Disclosure of Proxy Voting Policies and Procedures forClosed-End Management Investment Companies – Not applicable.
Item 8 – Portfolio Managers ofClosed-End Management Investment Companies – Not applicable.
Item 9 – Purchases of Equity Securities byClosed-End Management Investment Company and Affiliated Purchasers – Not applicable.
Item 10 – Submission of Matters to a Vote of Security Holders – There have been no material changes to these procedures.
Item 11 – Controls and Procedures
| | (a) | It is the conclusion of the registrant’s principal executive officer and principal financial officer that the effectiveness of the registrant’s current disclosure controls and procedures (such disclosure controls and procedures having been evaluated within 90 days of the date of this filing) provide reasonable assurance that the information required to be disclosed by the registrant has been recorded, processed, summarized and reported within the time period specified in the Commission’s rules and forms and that the information required to be disclosed by the registrant has been accumulated and communicated to the registrant’s principal executive officer and principal financial officer in order to allow timely decisions regarding required disclosure. |
| | (b) | There has been no significant change in the registrant’s internal control over financial reporting that occurred during the registrant’s most recent fiscal quarter of the period covered by this report that has materially affected, or is likely to materially affect, the registrant’s internal control over financial reporting. |
Item 12 – Controls and Procedures - Disclosure of Securities Lending Activities for Closed-End Management Investment Companies – Not applicable.
Item 13 – Exhibits
| | (a) (1) Code | of Ethics – Attached hereto as ExhibitEX-99.CODE-ETH |
| | (2) | Certifications pursuant to Section 302 of the Sarbanes-Oxley Act – Attached hereto as ExhibitEX-99.CERT. |
| | (3) | Any written solicitation to purchase securities under Rule23c-1 – Not applicable. |
| | (4) | Registrant’s Independent Public Accountant, attached as Exhibit 99.ACCT |
| | (b) | Certifications pursuant to Section 906 of the Sarbanes-Oxley Act – Attached hereto as ExhibitEX-99.906CERT. |
SIGNATURES
Pursuant to the requirements of the Securities Exchange Act of 1934 and the Investment Company Act of 1940, the registrant has duly caused this report to be signed on its behalf by the undersigned, thereunto duly authorized.
| | |
| Registrant: | | The Prudential Series Fund |
| |
| By: | | /s/ Andrew R. French |
| | Andrew R. French |
| | Secretary |
| |
| Date: | | February 14, 2020 |
Pursuant to the requirements of the Securities Exchange Act of 1934 and the Investment Company Act of 1940, this report has been signed below by the following persons on behalf of the registrant and in the capacities and on the dates indicated.
| | |
| By: | | /s/ Timothy S. Cronin |
| | Timothy S. Cronin |
| | President and Principal Executive Officer |
| |
| Date: | | February 14, 2020 |
| |
| By: | | /s/ Christian J. Kelly |
| | Christian J. Kelly |
| | Treasurer and Principal Financial and Accounting Officer |
| |
| Date: | | February 14, 2020 |