UNITED STATES
SECURITIES AND EXCHANGE COMMISSION
Washington, D.C. 20549
FORM N-CSR
CERTIFIED SHAREHOLDER REPORT OF REGISTERED MANAGEMENT INVESTMENT COMPANIES
| | |
| Investment Company Act file number: | | 811-03623 |
| |
| Exact name of registrant as specified in charter: | | The Prudential Series Fund |
| |
| Address of principal executive offices: | | 655 Broad Street, 6th Floor |
| | Newark, New Jersey 07102 |
| |
| Name and address of agent for service: | | Andrew R. French |
| | 655 Broad Street, 6th Floor |
| | Newark, New Jersey 07102 |
| |
| Registrant’s telephone number, including area code: | | 800-225-1852 |
| |
| Date of fiscal year end: | | 12/31/2022 |
| |
| Date of reporting period: | | 12/31/2022 |
Item 1 – Reports to Stockholders

The Prudential Series Fund
ANNUAL REPORT December 31, 2022
| | |

| | PSF Global Portfolio PSF International Growth Portfolio PSF Mid-Cap Growth Portfolio PSF Natural Resources Portfolio PSF PGIM 50/50 Balanced Portfolio PSF PGIM Flexible Managed Portfolio PSF PGIM Government Income Portfolio PSF PGIM Government Money Market Portfolio PSF PGIM High Yield Bond Portfolio PSF PGIM Jennison Blend Portfolio PSF PGIM Jennison Focused Blend Portfolio PSF PGIM Jennison Growth Portfolio PSF PGIM Jennison Value Portfolio PSF PGIM Total Return Bond Portfolio PSF Small-Cap Stock Index Portfolio PSF Small-Cap Value Portfolio PSF Stock Index Portfolio |
| |
| Based on the variable contract you own or the portfolios you invested in, you may receive additional reports for other portfolios. Please refer to your variable annuity or variable life insurance contract prospectus to determine which portfolios are available to you. | | |
| |
| The views expressed in this report and information about each portfolio’s holdings are for the period covered by this report and are subject to change thereafter. | | |
| |
| Please note that this report may include prospectus supplements that are separate from and not a part of this report. Please refer to your variable annuity or variable life insurance contract prospectus to determine which supplements are applicable to you. | | |

Join the e-movement.SM
Enroll in e-delivery today!
By enrolling in e-Delivery, you’ll gain secure, online access to important documents with the flexibility to choose which documents you receive in the mail… and which ones you don’t!
Individual Annuity Contract Owners
Get started by visiting www.prudential.com/login and follow the instructions on the screen, or scan the code below.

Individual Life Insurance Contract Owners
To receive your reports online, go to www.prudential.com/edelivery, or scan the code below.

Group Variable Universal Life Contract Owners
To receive your reports online, go to www.prudential.com/gulgvul, or scan the code.

The Prudential Series Fund may offer three classes of shares in each portfolio: Class I, Class II and Class III. Class I and Class III shares are sold to separate accounts of The Prudential Insurance Company of America, Pruco Life Insurance Company, and Pruco Life Insurance Company of New Jersey (collectively, Prudential) as investment options under variable life insurance and variable annuity contracts (Contracts). Class I shares are also sold to separate accounts of insurance companies not affiliated with Prudential where Prudential has assumed responsibility for the administration of contracts issued through such nonaffiliated insurance companies for the same types of Contracts. (A separate account keeps the assets supporting certain insurance contracts separate from the general assets and liabilities of the insurance company.) Class II shares are offered only to separate accounts of non-Prudential insurance companies for the same types of Contracts.
| | | | |
Prudential Series Table of Contents | | Annual Report | | December 31, 2022 |
| | | | |
| ∎ | | LETTER TO CONTRACT OWNERS |
| ∎ | | REPORT OF THE INVESTMENT MANAGERS AND PRESENTATION OF PORTFOLIO HOLDINGS |
This report may include financial information pertaining to certain portfolios that are not available through the variable life insurance policy or variable annuity contract that you have chosen. Please refer to your variable life insurance or variable annuity prospectus to determine which portfolios are available to you.
| | | | |
The Prudential Series Fund Letter to Contract Owners | | Annual Report | | December 31, 2022 |
| | | | |
At Prudential, our primary objective is to help investors achieve and maintain long-term financial success. Despite today’s uncertainties, we remain strong and ready to serve and support you. This Prudential Series Fund annual report outlines our efforts to achieve this goal. We hope you find it informative and useful.
Prudential has been building on a heritage of success for more than 145 years. You can count on our history of financial stability. We are diversified for endurance. Our balanced mix of risks and businesses positions us well to manage through any economic environment. We’ve applied the lessons from decades of challenges to be stronger, because we are committed to keeping our promises to you.
Your financial professional is the best resource to help you make the most informed investment decisions. Together, you can build a diversified investment portfolio that aligns with your long-term financial goals. Please keep in mind that diversification and asset allocation strategies do not assure a profit or protect against loss in declining markets.
Thank you for selecting Prudential as one of your financial partners. A strong sense of social responsibility for our clients, our employees, and our communities has been embedded in the company since our founding. It guides our efforts to help our customers achieve peace of mind through financial wellness.
We value your trust and appreciate the opportunity to help you achieve financial security.
Sincerely,

| | | | |
Timothy S. Cronin | | | | |
President, | | | | |
The Prudential Series Fund | | | | January 31, 2023 |
| | | | |
| Market Overview — unaudited | | Annual Report | | December 31, 2022 |
| | | | |
Equity Market Overview
Across the majority of asset classes and regions, equities posted losses in 2022. Recession fears—spurred by the highest inflation in decades and aggressive central bank interest-rate hikes—were the main headwinds. Bond markets also suffered as yields spiked and the US Treasury yield curve inverted. However, commodities gained as oil and gas prices benefited from supply-chain woes following the onset of Russia’s invasion of Ukraine.
Equities end the year lower
US equity losses were widespread, as the large-cap S&P 500 Index fell 18.10%, the broad-based Russell 3000 Index declined 19.21%, and the tech-heavy Nasdaq Composite Index plummeted 33.10% during the year. Internationally, the MSCI ACWI Ex-US Index, a gauge of stock performance in developed and emerging markets outside the US, slid 15.57%. (Performance is based on net returns in US dollars unless stated otherwise and assumes reinvestment of dividends.)
Central bank activity dominates market sentiments
The US equity market suffered its worst year since 2008 as the US Federal Reserve (the Fed) aggressively tightened monetary policy in an attempt to lower inflation. The Fed raised its federal funds rate, which began the year at around 0%, seven times throughout 2022 to close the year in a range of 4.25% to 4.50%. The impact of higher rates punished the housing market, as housing starts and building permits declined, largely in response to rising mortgage rates. While inflation remained high for most of 2022, markets cheered by year-end as both the Consumer Price Index and the Personal Consumption Expenditures Price Index had slowed. During the same period, unemployment remained historically low.
Energy prices and the US dollar both posted gains for the year. Oil prices spiked in the first half of 2022, at one point rising above $100 per barrel for the first time since 2014. Supply concerns were exacerbated by Russia’s invasion of Ukraine and resulting sanctions against Russia. The US dollar benefited from rising rates, climbing 7.87% against a basket of developed market currencies.
US stocks swoon as inflation soars
Stocks started 2022 on solid ground, with the S&P 500 hitting a record high in January, but quickly retreated and spent the rest of the year in negative territory. Inflationary pressures reached multi-decade highs and the Fed began raising interest rates, sending markets lower. Geopolitical woes were heightened when Russia invaded Ukraine in February, creating new supply-chain issues. Economic data was disappointing, with US gross domestic product declining in both the first and second quarters.
As inflation increased and central banks worldwide hiked interest rates, equity markets briefly fell into bear market territory, defined as a drop of 20% or more from a recent high. Earnings expectations were revised downward as inflation began to crimp profit margins. Toward the end of 2022, equity markets began to slowly recover as inflation moderated.
Energy sector up, all other sectors down
In 2022, the top-performing sector in the S&P 500 Index was energy, rising 65.72% amid tight supply and rising demand. Other sectors posted negative returns, most significantly communication services (-39.89%) and consumer discretionary (-37.03%).
Tech darlings fall out of favor as value stocks lead
Recession fears drove large-cap technology equities sharply lower in 2022, as investors shifted away from the mega-cap tech stocks that they favored during the COVID-19 pandemic to more economically sensitive value stocks. Worries about slowing earnings growth led value stocks to significantly outperform growth stocks across market capitalizations.
During the year, the Russell 3000 Value Index declined 7.98%, significantly outperforming the Russell 3000 Growth Index, which fell 28.97%. The large-cap Russell 1000 Index fell 19.13%, the Russell Midcap Index slipped 17.32%, and the small-cap Russell 2000 Index dropped 20.44%.
Rising inflation and energy pressures sink international developed stocks
Central banks outside the US also tightened monetary policy in response to rising inflation, including the European Central Bank, which raised rates for the first time in more than 10 years. In addition to inflationary pressures, European markets faced energy-supply issues due to Russia’s invasion of Ukraine. A tax-cutting plan to shore up the economy in the United Kingdom backfired, causing a near collapse of the British pound sterling and requiring central bank intervention. In December, Japan jolted global financial markets when it loosened the tight limits it had been imposing on bond yields.
Developed equity markets outside the US and Canada, as measured by the MSCI EAFE Index, declined 14.45% during the year, and the MSCI Europe Index dropped 15.06%. The MSCI Japan Index dipped 16.65%.
| | | | |
| Market Overview — unaudited (continued) | | Annual Report | | December 31, 2022 |
| | | | |
Emerging market stocks suffer
A surging US dollar, spiking food and fuel prices, and Russia’s invasion of Ukraine hurt high-risk assets, including emerging market stocks, during 2022. The MSCI Emerging Markets Index declined 20.09%. While many emerging market countries began raising rates before their developed market counterparts, China—the world’s second-largest economy—was forced to trim key rates in response to slowing growth caused by its zero-COVID policy, and its lockdown measures were dropped by the end of the year. The MSCI China Index declined 21.93%.
Fixed Income Market Overview
In response to rampant inflation, central banks hiked interest rates aggressively in 2022, sending bond yields higher and prices significantly lower. Bonds failed to provide a safe haven for investors as carnage spread across most sectors, including government bonds, high yield issues, and emerging-market fixed income.
US Treasury yields increased dramatically during the year, sending the Bloomberg US Aggregate Bond Index lower by 13.01%—one of the worst years ever for US investment-grade fixed income. Bonds issued by the US government and indexed to inflation, or TIPS, declined 11.85%. High yield bonds (i.e., debt rated below investment grade) as measured by the Bloomberg US Corporate High Yield Index, fell 11.19%, outperforming their investment-grade counterparts. Emerging market debt, based on the J.P. Morgan EMBI Global Diversified Index, declined 17.78%. (All returns cited are in US dollars unless stated otherwise.)
Central banks shift gears to fight record-high inflation
Across most of the world, inflationary pressures intensified in 2022, leading central banks to begin tightening monetary policy after injecting aggressive stimulus into their economies in 2020 and 2021. Consumer prices, particularly food and fuel, spiked and remained elevated throughout the year, as inflation rose to a 40-year high in many countries.
The US Federal Reserve raised the federal funds rate seven times in 2022. The rate began the year at around 0% and ended it in a range between 4.25% and 4.50%. While the Bank of England began raising rates in late 2021, the European Central Bank held steadfast until July 2022, when it raised rates for the first time in 11 years. Even Japan, which had kept interest rates below zero since 2016, altered its bond policy in December 2022, allowing 10-year yields to rise.
Labor markets remain robust despite slowing economic growth
Economic growth was uneven during 2022. US gross domestic product declined in the first and second quarters. While growth resumed in the third quarter, it was boosted by the largest rise in real net exports in over 40 years, which many economists do not consider sustainable. However, the labor market remained shielded, as unemployment remained low and hourly earnings steadily increased.
Commodities gain
Crude oil prices rocketed above $100 per barrel following the onset of Russia’s invasion of Ukraine in February. However, gains were muted by year-end as recession fears increased. Further impacting energy prices was the decision by the Organization of the Petroleum Exporting Countries and its major allies to cut oil production in the fall, as well as efforts to cap the price of Russian oil.
Falling bond prices lead to yield curve inversion
Longer-term US Treasuries were one of the worst-performing sectors of the bond market in 2022, as the Bloomberg US 10+ Year Corporate Index dropped 25.62%, significantly underperforming its 1-5 year counterpart, which fell 5.56%.
The impact of rising rates sent bond prices lower across the spectrum. However, the negative impact was particularly strong for longer-dated debt, resulting in an inversion in Treasury yields. The 10-year US Treasury yield began the year at 1.51% and spiked over 4% before ending the year at 3.88%. Meanwhile, the shorter-dated 2-year Treasury note traded at around 4.42% at year-end. Yield inversion—when the yield on a shorter-term bond is higher than a longer-term bond—has been a historical harbinger of a recession.
Rising dollar pressures emerging market bonds
Emerging-market central banks began tightening monetary policy in early 2021, nearly a full year before the Fed, in their battle against surging food and fuel costs. However, Russia’s invasion of Ukraine increased pricing pressures further, and the surging US dollar—which had one of its best performances in years—threatened many emerging economies by making foreign debt payments more difficult.
| | |
| The Prudential Series Fund, PSF Global Portfolio | | December 31, 2022 |
| | |
Report of the Investment Manager - As of December 31, 2022 (Unaudited)
| | | | | | | | | | |
| Average Annual Total Returns | | 1 Year | | 5 Years | | 10 Years | | Since Inception | | 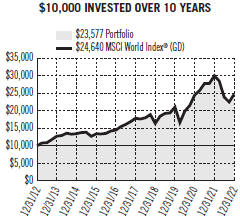
|
Portfolio: Class I | | -18.80% | | 6.09% | | 8.96% | | — |
Portfolio: Class III | | -19.01 | | N/A | | N/A | | -8.27 |
MSCI World Index® (GD) | | -17.73 | | 6.69 | | 9.44 | | — |
Past performance does not guarantee future returns. The investment return and principal value of an investment will fluctuate, so that shares, when redeemed, may be worth more or less than their original cost. Current performance may be lower or higher than the past performance. |
Portfolio Class III inception: 04/26/2021. Portfolio performance is net of fund expenses, but not contract charges, which, if included, would significantly lower the performance quoted. Performance figures may reflect fee waivers and/or expense reimbursements. In the absence of such fee waivers and/or expense reimbursements, performance would be lower. Unless noted otherwise, Index returns are based on the Portfolio’s Class I shares. |
The graph is based on the performance of Class I shares. Performance of Class III shares will be lower due to differences in the fee structure. Class III shares have associated 12b-1 fees at an annual rate of 0.25%, of the average daily net assets of the Class III shares. |
For the year ended December 31, 2022, the PSF Global Portfolio Class I shares returned -18.80%. The Portfolio’s Class I shares underperformed the MSCI World Index (GD).
What were the market conditions during the reporting period?
Aggressive interest rate hikes by global central banks aimed at combating inflation that soared to its highest level since the early 1980s weighed on financial markets in calendar-year 2022 (the reporting period). In addition to higher interest rates, investors grappled with Russia’s invasion of Ukraine and rising fears of recession.
Equity markets were under pressure for most of the reporting period. In the US, the S&P 500 Index declined 18.10%, its worst year since the Global Financial Crisis of 2008. Growth stocks endured an especially difficult year, with the Russell 1000 Growth Index declining 29.14% during the reporting period as rising interest rates had a disproportionately negative impact on the longer-duration nature of their expected earnings. Additionally, international developed equities declined 14.01%, as measured by the MSCI EAFE Index (GD), and emerging market equities fell 19.74%, as measured by the MSCI Emerging Markets Index (GD).
The US Federal Reserve raised the federal funds rate at the fastest pace in decades during the reporting period. The result was a 13.01% decline in the Bloomberg US Aggregate Bond Index for the reporting period. Hawkish global central banks also put downward pressure on investment-grade bond prices, with the Bloomberg Global Aggregate Index declining 13.02% during the reporting period. (Hawkish tends to suggest higher interest rates, opposite of dovish.) At the same time, spread widening, or greater yield differentials to government bonds, led to losses for riskier high yield bonds, which declined 12.71%, as measured by the Bloomberg Global High Yield Index.
What strategies or holdings affected the Portfolio’s performance?*
During the reporting period, the Portfolio had average overweights of +1.27% and +0.61%, respectively, in its US Large Cap Value and International Value sleeves. This contributed positively to the Portfolio’s performance relative to its benchmark. The Portfolio had average underweights of -1.25% and -0.96% in its US Large Cap Growth and International Growth sleeves. The Portfolio had an 0.33% allocation to cash, which modestly added to performance given all styles declined during the reporting period. Asset allocation added about 21 basis points (bps) to Portfolio performance relative to its benchmark, while selection effects detracted 87 bps. (One basis point equals 0.01%.)
Manager performance was mixed during the reporting period. In April 2022, the Large Cap Growth sleeve managed by Brown Advisors was transitioned to MFS. MFS subsequently outperformed its Russell 1000 Growth Index benchmark, but not by enough to offset the underperformance of Brown Advisors earlier in the reporting period. In International, the high-growth William Blair sleeve underperformed its MSCI EAFE Growth Index benchmark. Growth managers in general struggled as the rising global rate environment caused significant repricing of high-growth stocks. The Large Cap Value sleeve managed by T. Rowe Price was a solid performer throughout the reporting period, offsetting some of the negative performance from the other asset classes.
For a complete list of holdings, please refer to the Schedule of Investments section of this report. Holdings reflect only long-term investments.
| | |
| The Prudential Series Fund, PSF Global Portfolio | | December 31, 2022 |
| | |
Report of the Investment Manager - As of December 31, 2022 (Unaudited) (Continued)
* This strategy and performance overview, which discusses what strategies or holdings (including derivatives, if applicable) affected the Portfolio’s performance, is compiled based on how the Portfolio performed relative to the Portfolio’s assigned index and is viewed for performance attribution purposes at the aggregate Portfolio level, which in most instances will not directly correlate to the amounts disclosed in the Statement of Operations which conform to U.S. generally accepted accounting principles.
Presentation of Portfolio Holdings — unaudited
| | | | | | | | |
|
PSF Global Portfolio (As of 12/31/2022) | |
| | | |
Ten Largest Holdings | | Line of Business | | Country | | | % of Net Assets | |
Microsoft Corp. | | Software | | United States | | | 3.7% | |
Alphabet, Inc. (Class A Stock) | | Interactive Media & Services | | United States | | | 1.6% | |
Apple, Inc. | | Technology Hardware, Storage & Peripherals | | United States | | | 1.4% | |
Amazon.com, Inc. | | Internet & Direct Marketing Retail | | United States | | | 1.3% | |
Mastercard, Inc. (Class A Stock) | | IT Services | | United States | | | 1.2% | |
Southern Co. (The) | | Electric Utilities | | United States | | | 1.2% | |
TotalEnergies SE, ADR | | Oil, Gas & Consumable Fuels | | France | | | 1.2% | |
Johnson & Johnson | | Pharmaceuticals | | United States | | | 1.1% | |
Becton, Dickinson & Co. | | Health Care Equipment & Supplies | | United States | | | 1.1% | |
Wells Fargo & Co. | | Banks | | United States | | | 1.1% | |
For a complete list of holdings, please refer to the Schedule of Investments section of this report. Holdings reflect only long-term investments.
| | |
| The Prudential Series Fund, PSF International Growth Portfolio | | December 31, 2022 |
| | |
Report of the Investment Manager - As of December 31, 2022 (Unaudited)
| | | | | | | | |
| Average Annual Total Returns | | 1 Year | | 5 Years | | 10 Years | | 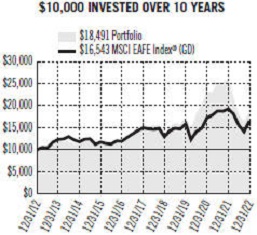
|
Portfolio: Class I | | -28.93% | | 4.04% | | 6.34% |
Portfolio: Class II | | -29.16 | | 3.65 | | 5.94 |
MSCI EAFE Index® (GD) | | -14.01 | | 2.03 | | 5.16 |
Past performance does not guarantee future returns. The investment return and principal value of an investment will fluctuate, so that shares, when redeemed, may be worth more or less than their original cost. Current performance may be lower or higher than the past performance. |
Portfolio performance is net of fund expenses, but not contract charges, which, if included, would significantly lower the performance quoted. Performance figures may reflect fee waivers and/or expense reimbursements. In the absence of such fee waivers and/or expense reimbursements, performance would be lower. |
The graph is based on the performance of Class I shares. Performance of Class II shares will be lower due to differences in the fee structure. Class II shares have associated 12b-1 and administrative fees at an annual rate of 0.25% and 0.15% respectively of the average daily net assets of the Class II shares. |
For the year ended December 31, 2022, the PSF International Growth Portfolio Class I shares returned -28.93%. The Portfolio’s Class I shares underperformed the MSCI EAFE Index (GD).
What were the market conditions during the reporting period?
Aggressive interest rate hikes by global central banks aimed at combating inflation that soared to its highest level since the early 1980s weighed on financial markets in calendar-year 2022 (the reporting period). In addition to higher interest rates, investors grappled with Russia’s invasion of Ukraine, China’s “zero-COVID” policy, soaring energy prices, and rising fears of recession. In all, the reporting period was historically challenging for both global equities and fixed income.
Equity markets were under pressure for most of the reporting period. International developed equities declined 14.01%, as measured by the MSCI EAFE Index (GD). It was especially difficult for growth stocks, with the MSCI EAFE Growth Index (GD) tumbling 22.69% as rising interest rates had a disproportionately negative impact on the longer-duration nature of their expected earnings. Emerging market equities struggled as well, with the MSCI Emerging Markets Index (GD) falling 19.74% during the reporting period.
What strategies or holdings affected the Portfolio’s performance?*
Risk exposures had the largest negative impact on the Portfolio’s relative performance during the reporting period, as large underexposures to value factors (defined as lower price-to-earnings and price-to-book ratios) as well overexposures to earnings momentum and volatility factors all sharply detracted from the Portfolio’s performance. This was in contrast to the three previous years when these exposures helped significantly. All of the Portfolio’s subadvisors (Jennison, Neuberger Berman, and William Blair) had underexposures to value factors, as this Portfolio is more focused on companies with strong earnings growth rates than on undervalued securities. Meanwhile, William Blair and Jennison had overexposures to earnings momentum factors. William Blair incorporates momentum as part of its process, while Jennison’s momentum exposure was more of a residual of its bottom-up stock selection process. To summarize, the market favored value over growth characteristics during the reporting period, as interest rates rose and investors avoided the higher valuations associated with higher earnings growth rates.
Additionally, all three subadvisors were overweight information technology services and software stocks, which declined sharply. These are examples of high-growth stocks that are normally discounted once interest rates start to rise. Likewise, all of the subadvisors were underweight integrated oil and gas, as well as oil and gas exploration and production stocks. These stocks did especially well as oil and gas prices rose during the reporting period. Given that these industries are more capital intensive, they are normally not fast growers. As such, it was not surprising that these subadvisors were all underweight oil and gas-related industries. All industry weightings were within the subadvisors’ historical allocations.
For a complete list of holdings, please refer to the Schedule of Investments section of this report. Holdings reflect only long-term investments.
| | |
| The Prudential Series Fund, PSF International Growth Portfolio | | December 31, 2022 |
| | |
Report of the Investment Manager - As of December 31, 2022 (Unaudited) (Continued)
From a country standpoint, all three subadvisors held Chinese securities during the reporting period, as these securities (especially the information technology stocks) had been some of the fastest-growing stocks in the world. China’s economy slowed in the reporting period due to its “zero-COVID” policy, and the Chinese market suffered accordingly. Thus, the subadvisors’ allocation to Chinese stocks hurt the Portfolio’s relative performance during the reporting period. On the other hand, some of this underperformance was mitigated by all of the subadvisors’ underweight to Japan, which has an aging population and slower growth rates. As a result, the subadvisors inherently tend to be underweight Japan given the Portfolio’s growth mandate. In the reporting period, Japan suffered as the Japanese yen declined versus the US dollar. Since the subadvisors were underweight Japan, the Portfolio benefited.
Finally, security selection overall detracted from the Portfolio’s performance in the reporting period. Specifically, all three subadvisors’ information technology (IT) and healthcare holdings detracted from the Portfolio’s performance. IT especially suffered as interest rates rose and many workers returned to the office. Meanwhile, some of the more growth-oriented biotechnology companies within the healthcare sector declined as growth rates and valuations came under investor scrutiny. Given the Portfolio’s growth mandate, the subadvisors faced headwinds because they favored companies in these faster-growing areas. Partially mitigating these detractors was all three subadvisors’ stock selection in the financials sector, which aided the Portfolio’s relative performance.
* This strategy and performance overview, which discusses what strategies or holdings (including derivatives, if applicable) affected the Portfolio’s performance, is compiled based on how the Portfolio performed relative to the Portfolio’s assigned index and is viewed for performance attribution purposes at the aggregate Portfolio level, which in most instances will not directly correlate to the amounts disclosed in the Statement of Operations which conform to U.S. generally accepted accounting principles.
Presentation of Portfolio Holdings — unaudited
| | | | | | | | |
|
PSF International Growth Portfolio (As of 12/31/2022) | |
| | | |
Ten Largest Holdings | | Line of Business | | Country | | | % of Net Assets | |
AstraZeneca PLC | | Pharmaceuticals | | United Kingdom | | | 3.0% | |
Novo Nordisk A/S (Class B Stock) | | Pharmaceuticals | | Denmark | | | 2.6% | |
LVMH Moet Hennessy Louis Vuitton SE | | Textiles, Apparel & Luxury Goods | | France | | | 2.6% | |
Compass Group PLC | | Hotels, Restaurants & Leisure | | United Kingdom | | | 2.5% | |
ASML Holding NV | | Semiconductors & Semiconductor Equipment | | Netherlands | | | 2.0% | |
Pernod Ricard SA | | Beverages | | France | | | 1.7% | |
HDFC Bank Ltd., ADR | | Banks | | India | | | 1.6% | |
L’Oreal SA | | Personal Products | | France | | | 1.6% | |
Keyence Corp. | | Electronic Equipment, Instruments & Components | | Japan | | | 1.5% | |
ICON PLC | | Life Sciences Tools & Services | | United States | | | 1.5% | |
For a complete list of holdings, please refer to the Schedule of Investments section of this report. Holdings reflect only long-term investments.
| | |
The Prudential Series Fund, PSF Mid-Cap Growth Portfolio | | December 31, 2022 |
| | |
Report of the Investment Manager - As of December 31, 2022 (Unaudited)
| | | | | | | | | | |
| | | | | | | | | | | 
|
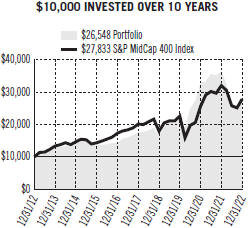
| Average Annual Total Returns | | 1 Year | | 5 Years | | 10 Years | | Since Inception |
Portfolio: Class I | | -26.96% | | 8.64% | | 10.26% | | — |
Portfolio: Class II | | -27.24 | | 8.21 | | 9.81 | | — |
Portfolio: Class III | | -27.16 | | N/A | | N/A | | -15.79 |
Russell MidCap® Growth Index | | -26.72 | | 7.64 | | 11.41 | | — |
S&P MidCap 400 Index | | -13.06 | | 6.71 | | 10.78 | | — |
Past performance does not guarantee future returns. The investment return and principal value of an investment will fluctuate, so that shares, when redeemed, may be worth more or less than their original cost. Current performance may be lower or higher than the past performance. |
Portfolio Class III inception: 04/26/2021. Portfolio performance is net of fund expenses, but not contract charges, which, if included, would significantly lower the performance quoted. Performance figures may reflect fee waivers and/or expense reimbursements. In the absence of such fee waivers and/or expense reimbursements, performance would be lower. Unless noted otherwise, Index returns are based on the Portfolio’s Class I shares. |
The Russell Midcap® Growth Index is a trademark/service mark of the Frank Russell Company. Russell® is a trademark of the Frank Russell Company. |
The graph is based on the performance of Class I shares. Performance of Class II and Class III shares will be lower due to differences in the fee structure. Class II shares have associated 12b-1 and administrative fees at an annual rate of 0.25% and 0.15%, respectively, of the average daily net assets of the Class II shares. Class III shares have associated 12b-1 fees at an annual rate of 0.25%, of the average daily net assets of the Class III shares. |
For the year ended December 31, 2022, the PSF Mid-Cap Growth Portfolio Class I shares returned -26.96%. The Portfolio’s Class I shares underperformed both the Russell Midcap Growth Index and the S&P Midcap 400 Index.
What were the market conditions during the reporting period?
After three years of strength, US equity markets experienced a volatile calendar-year 2022 (the reporting period), with the S&P 500 Index returning -18.10%—its worst year since 2008. Across market capitalizations, growth as a style was at the epicenter of volatility. Companies at the highest end of the growth spectrum entered this reporting period with two characteristics: high valuations when compared to history and high expectations. The US Federal Reserve’s (the Fed’s) abrupt shift to quantitative tightening sparked a sharp move higher in interest rates and future rate expectations, which, in turn, caused multiples (i.e., price/earnings ratios) to compress. Within the mid-cap segment of the US equity market, value stocks meaningfully outperformed growth stocks during the reporting period, with the Russell Midcap Value Index returning -12.03% compared to -26.72% for the Russell Midcap Growth Index. Within the Russell Midcap Growth Index, the energy (+40.23%) and utilities (+1.22%) sectors had the highest returns. The communication services (-42.54%) and information technology (-37.93%) sectors were the only sectors to post negative returns for the reporting period.
What strategies or holdings affected the Portfolio’s performance?*
Stock selection and an overweight allocation within healthcare was the top positive contributor during the reporting period, as the Portfolio’s preference for companies with more stable and consistent business models was rewarded. Stock selection within consumer staples also contributed positively to the Portfolio’s performance. On the other hand, stock selection within information technology was the top detractor, despite an underweight allocation which contributed positively. Stock selection within energy also detracted from the Portfolio’s performance.
EOG Resources Inc. (EOG) was the top positive individual stock contributor after benefitting from rising oil prices, which were driven by recovering demand and a gradual return of OPEC+ (Organization of the Petroleum Exporting Countries) production early in the reporting period. The Portfolio trimmed its EOG position following the sharp appreciation in oil prices in the first half of the reporting period but continued to have conviction in EOG’s focus on returns and cash generation through the cycle. Quanta Services Inc. also contributed positively after reporting strong quarterly results that highlighted continued strength within utility infrastructure maintenance and expansion. At the end of the reporting period, Quanta remained a top holding that the Portfolio’s managers believed was well positioned to benefit from accelerating utility-scale wind and solar deployments within renewables.
For a complete list of holdings, please refer to the Schedule of Investments section of this report. Holdings reflect only long-term investments.
| | |
The Prudential Series Fund, PSF Mid-Cap Growth Portfolio | | December 31, 2022 |
| | |
Report of the Investment Manager - As of December 31, 2022 (Unaudited) (Continued)
An underweight position in Enphase Energy Inc. was the top detractor from Portfolio results in the reporting period after Enphase posted strong third-calendar quarter results, driven by increased European revenues due to rising energy costs. The Portfolio initiated this position based on Enphase’s domestic focus, new product cycle, and long-term benefits from the Inflation Reduction Act. The Portfolio remained underweight relative to the index given heightened investor consensus expectations for Enphase. A position in Marvell Technology Inc. also detracted, as higher-multiple stocks, including semiconductor companies, came under pressure during the reporting period with growing concerns over sustainability of data-center spending. The Portfolio remains constructive on Marvell long term but is taking a cautious approach and tracking the company’s inventory levels.
Portfolio positioning at the end of the reporting period was skewed toward what its managers viewed as resilient, high-quality growth franchises with strong financial characteristics and solid fundamentals. While there were growing prospects within the higher-growth segment of the market, notably within technology, the Portfolio remained selective, only incrementally adding to names with strong financial profiles and underappreciated fundamental opportunities. Healthcare and financials remained the top Portfolio overweights, anchored in durable, steady growth businesses executing on company-specific catalysts. The Portfolio also identified emerging areas of leadership across sectors believed to be poised to benefit from increased spending toward renewables and infrastructure. The Portfolio continued to be cautious on companies exhibiting deep cyclicality and those with exposure to consumer end markets such as housing and autos. Information technology and real estate remained top Portfolio underweights at the end of the reporting period.
* This strategy and performance overview, which discusses what strategies or holdings (including derivatives, if applicable) affected the Portfolio’s performance, is compiled based on how the Portfolio performed relative to the Portfolio’s assigned index and is viewed for performance attribution purposes at the aggregate Portfolio level, which in most instances will not directly correlate to the amounts disclosed in the Statement of Operations which conform to U.S. generally accepted accounting principles.
Presentation of Portfolio Holdings — unaudited
| | | | |
|
| PSF Mid-Cap Growth Portfolio (As of 12/31/2022) |
| | |
Ten Largest Holdings | | Line of Business | | % of Net Assets |
Horizon Therapeutics PLC | | Biotechnology | | 2.3% |
Trane Technologies PLC | | Building Products | | 2.2% |
Quanta Services, Inc. | | Construction & Engineering | | 2.2% |
Dexcom, Inc. | | Health Care Equipment & Supplies | | 2.1% |
Agilent Technologies, Inc. | | Life Sciences Tools & Services | | 2.0% |
Synopsys, Inc. | | Software | | 2.0% |
Cheniere Energy, Inc. | | Oil, Gas & Consumable Fuels | | 1.9% |
Copart, Inc. | | Commercial Services & Supplies | | 1.8% |
Hilton Worldwide Holdings, Inc. | | Hotels, Restaurants & Leisure | | 1.8% |
Cadence Design Systems, Inc. | | Software | | 1.7% |
For a complete list of holdings, please refer to the Schedule of Investments section of this report. Holdings reflect only long-term investments.
| | |
The Prudential Series Fund, PSF Natural Resources Portfolio | | December 31, 2022 |
| | |
Report of the Investment Manager - As of December 31, 2022 (Unaudited)
| | | | | | | | | | |
| | | | | | |
| Average Annual Total Returns | | 1 Year | | 5 Years | | 10 Years | | Since Inception | | 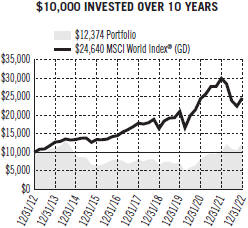
|
Portfolio: Class I | | 22.04% | | 9.30% | | 2.15% | | — |
Portfolio: Class II | | 21.54 | | 8.85 | | 1.74 | | — |
Portfolio: Class III | | 21.88 | | N/A | | N/A | | 19.26 |
Blended Index | | 21.11 | | 6.06 | | 4.64 | | — |
| Lipper Global Natural Resources Funds Index | | 21.12 | | 6.66 | | 3.83 | | — |
| MSCI World Index® (GD) | | -17.73 | | 6.69 | | 9.44 | | — |
Past performance does not guarantee future returns. The investment return and principal value of an investment will fluctuate, so that shares, when redeemed, may be worth more or less than their original cost. Current performance may be lower or higher than the past performance. |
Portfolio Class III inception: 04/26/2021. Portfolio performance is net of fund expenses, but not contract charges, which, if included, would significantly lower the performance quoted. Performance figures may reflect fee waivers and/or expense reimbursements. In the absence of such fee waivers and/or expense reimbursements, performance would be lower. Unless noted otherwise, Index returns are based on the Portfolio’s Class I shares. |
The graph is based on the performance of Class I shares. Performance of Class II and Class III shares will be lower due to differences in the fee structure. Class II shares have associated 12b-1 and administrative fees at an annual rate of 0.25% and 0.15%, respectively, of the average daily net assets of the Class II shares. Class III shares have associated 12b-1 fees at an annual rate of 0.25%, of the average daily net assets of the Class III shares. |
For the year ended December 31, 2022, the PSF Natural Resources Portfolio Class I shares returned 22.04%. The Portfolio’s Class I shares outperformed the Blended Index, the Lipper Global Natural Resources Funds Index, and the MSCI World Index (GD).
What were the market conditions during the reporting period?
The geopolitical climate during the reporting period exacerbated near-term uncertainty around the timing of commodity price normalization. Predicting the magnitude and duration of multiple exogenous factors—including weather-related issues, policy and recession risks, geopolitics, and broader economic supply-chain and inflation challenges—was complicated, and the Portfolio remained focused where it believed it had an investment edge—specifically, in the multi-year structural commodity call. Overall, the Portfolio’s bearish long-term outlook for commodities has not changed; and toward the end of the reporting period, it was adding to companies it believed to have strong core businesses and idiosyncratic drivers to help mitigate the risks of an uncertain environment. The Portfolio also favored beneficiaries of commodity deflation—including utilities, packaging, and specialty chemicals—as well as paper and forest products.
What strategies or holdings affected the Portfolio’s performance?*
Precious metals and minerals posted losses, weighed down by interest rate hikes and a stronger US dollar, and so the Portfolio’s underweight allocation in the industry added value. The Portfolio’s overweight to US-based oil explorers and producers also boosted relative performance, as the industry generated gains due to elevated oil prices and meaningfully outperformed the commodities complex.
The Portfolio’s overweight in construction, farm machinery, and heavy trucks proved beneficial as well. The group surged during the reporting period as demand picked up due to expanding manufacturing activity and pricing actions to manage increased costs and supply-chain disruptions. Conversely, the Portfolio’s overweight allocation in paper and forest products, coupled with adverse stock selection, detracted most from relative returns, as the industry was pressured by weak demand, increased input costs, and elevated inventories. The Portfolio’s underweight position in the integrated oil and gas industry and its lack of exposure to oil and gas refining and marketing firms also hampered relative performance, as those groups benefited from elevated oil prices, particularly early in the reporting period, and outperformed the benchmark.
* This strategy and performance overview, which discusses what strategies or holdings (including derivatives, if applicable) affected the Portfolio’s performance, is compiled based on how the Portfolio performed relative to the Portfolio’s assigned index and is viewed for performance attribution purposes at the aggregate Portfolio level, which in most instances will not directly correlate to the amounts disclosed in the Statement of Operations which conform to U.S. generally accepted accounting principles.
For a complete list of holdings, please refer to the Schedule of Investments section of this report. Holdings reflect only long-term investments.
| | |
The Prudential Series Fund, PSF Natural Resources Portfolio | | December 31, 2022 |
| | |
Report of the Investment Manager - As of December 31, 2022 (Unaudited) (Continued)
Presentation of Portfolio Holdings — unaudited
| | | | | | | | |
|
| PSF Natural Resources Portfolio (As of 12/31/2022) | |
| | | |
Ten Largest Holdings | | Line of Business | | Country | | | % of Net Assets | |
ConocoPhillips | | Oil & Gas Exploration & Production | | United States | | | 5.8% | |
TotalEnergies SE | | Integrated Oil & Gas | | France | | | 5.4% | |
EOG Resources, Inc. | | Oil & Gas Exploration & Production | | United States | | | 3.7% | |
Chevron Corp. | | Integrated Oil & Gas | | United States | | | 3.7% | |
Hess Corp. | | Oil & Gas Exploration & Production | | United States | | | 3.3% | |
Equinor ASA | | Integrated Oil & Gas | | Norway | | | 3.2% | |
Linde PLC | | Industrial Gases | | United Kingdom | | | 2.9% | |
Pioneer Natural Resources Co. | | Oil & Gas Exploration & Production | | United States | | | 2.7% | |
Devon Energy Corp. | | Oil & Gas Exploration & Production | | United States | | | 2.4% | |
BHP Group Ltd. | | Diversified Metals & Mining | | Australia | | | 2.1% | |
For a complete list of holdings, please refer to the Schedule of Investments section of this report. Holdings reflect only long-term investments.
| | |
The Prudential Series Fund, PSF PGIM 50/50 Balanced Portfolio | | December 31, 2022 |
| | |
Report of the Investment Manager - As of December 31, 2022 (Unaudited)
| | | | | | | | | | |
| | | | | | |
| Average Annual Total Returns | | 1 Year | | 5 Years | | 10 Years | | Since Inception | | 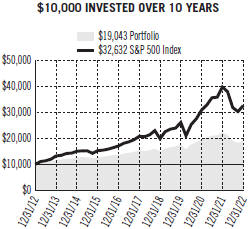
|
Portfolio: Class I | | -14.70% | | 4.49% | | 6.65% | | — |
Portfolio: Class III | | -14.90 | | N/A | | N/A | | -5.02 |
Blended Index | | -13.88 | | 5.17 | | 6.91 | | — |
S&P 500 Index | | -18.10 | | 9.42 | | 12.55 | | — |
Past performance does not guarantee future returns. The investment return and principal value of an investment will fluctuate, so that shares, when redeemed, may be worth more or less than their original cost. Current performance may be lower or higher than the past performance. |
Portfolio Class III inception: 04/26/2021. Portfolio performance is net of fund expenses, but not contract charges, which, if included, would significantly lower the performance quoted. Performance figures may reflect fee waivers and/or expense reimbursements. In the absence of such fee waivers and/or expense reimbursements, performance would be lower. Unless noted otherwise, Index returns are based on the Portfolio’s Class I shares. |
The graph is based on the performance of Class I shares. Performance of Class III shares will be lower due to differences in the fee structure. Class III shares have associated 12b-1 fees at an annual rate of 0.25%, of the average daily net assets of the Class III shares. |
For the year ended December 31, 2022, the PSF PGIM 50/50 Balanced Portfolio Class I shares returned -14.70%. The Portfolio’s Class I shares underperformed the Blended Index and outperformed the S&P 500 Index.
What were the market conditions during the reporting period?
At the beginning of calendar-year 2022 (the reporting period), the global economy was experiencing high levels of uncertainty about an expected slowdown from strong 2021 growth, high levels of inflation, the ongoing impact of COVID-19 on global supply chains and demand, and the expected unwinding of unprecedented levels of monetary and fiscal support. Russia’s invasion of Ukraine propelled already-concerning levels of inflation to new heights, prompting aggressive central bank tightening and contributing to significantly higher sovereign bond yields and a surge in the value of the US dollar. US stocks, particularly growth stocks, saw sharp declines during the reporting period, while the pullback in value stocks was more modest. The S&P 500 Index declined 18.10% during the reporting period. EAFE (Europe, Australasia, and the Far East) stocks saw comparatively lower double-digit percentage declines.
Global bonds also fell, as yields rose sharply. In the US, the 10-year Treasury yield was 1.51% at the beginning of the reporting period and rose to a high of around 4.23% in October 2022, before easing back to around 3.55% at the end of the reporting period. The Bloomberg US Aggregate Bond Index fell 13.01%, making 2022 a year of sharp declines for both stocks and bonds. In an environment of rising interest rates, the 3-month Treasury bill outperformed both stocks and bonds, finishing the reporting period gaining 1.46%.
What strategies or holdings affected the Portfolio’s performance?*
During the reporting period, the impact of asset allocation decisions on Portfolio performance was roughly neutral. While the Portfolio was overweight stocks relative to its benchmark index at the beginning of the reporting period, funded by an underweight to bonds, the Portfolio’s stock positions were soon reduced as the headwinds to risk assets became apparent, with the Federal Reserve embarking on its rate-hiking cycle and with Russia’s invasion of Ukraine. By the second quarter of 2022, the Portfolio was roughly neutral in stocks. It had an out-of-benchmark position in EAFE stocks at that time, which was expected to be relatively defensive compared to US stocks. Further, the Portfolio had a significant overweight in cash.
This positioning was largely maintained during the third quarter of 2022. In the fourth quarter, while the stock positions were roughly maintained, the Portfolio’s underweight to bonds was reduced, given that bond yields had risen sharply in previous months. In addition, by the end of the reporting period, the Portfolio’s overweight in cash was gradually reduced to close to neutral. As for stock selection by the Portfolio’s subadvisor, it was a slight drag on the Portfolio’s performance during the reporting period. At the close of the reporting period, the Portfolio was positioned with relatively neutral exposure to equities, a small position in international equities, and neutral exposures to fixed income and cash.
During the period, the Portfolio used interest rate swaps to help manage duration and yield curve exposure. In aggregate, the use of interest rate swaps had a negligible impact on performance during the period. In addition, the Portfolio used futures to manage interest rate risk, a more efficient way of managing interest rate risk than through the purchase and sale of cash bonds. The use of futures had a negative impact on performance for the period.
For a complete list of holdings, please refer to the Schedule of Investments section of this report. Holdings reflect only long-term investments.
| | |
The Prudential Series Fund, PSF PGIM 50/50 Balanced Portfolio | | December 31, 2022 |
| | |
Report of the Investment Manager - As of December 31, 2022 (Unaudited) (Continued)
The Portfolio also used credit derivatives in the form of the Credit Default Swap Index (CDX) to manage credit risk. The use of CDX contributed to performance. Additionally, the Portfolio used S&P 500 Index and MSCI EAFE Mini Futures to maintain exposure to equities and provide portfolio liquidity. These futures had minimal impact on performance.
* This strategy and performance overview, which discusses what strategies or holdings (including derivatives, if applicable) affected the Portfolio’s performance, is compiled based on how the Portfolio performed relative to the Portfolio’s assigned index and is viewed for performance attribution purposes at the aggregate Portfolio level, which in most instances will not directly correlate to the amounts disclosed in the Statement of Operations which conform to U.S. generally accepted accounting principles.
Presentation of Portfolio Holdings — unaudited
| | | | |
|
| PSF PGIM 50/50 Balanced Portfolio (As of 12/31/2022) |
| | |
Ten Largest Holdings | | Line of Business | | % of Net Assets |
Apple, Inc. | | Technology Hardware, Storage & Peripherals | | 2.9% |
Microsoft Corp. | | Software | | 2.7% |
Federal National Mortgage Assoc., 4.500%, TBA | | U.S. Government Agency Obligations | | 1.3% |
Amazon.com, Inc. | | Internet & Direct Marketing Retail | | 1.1% |
Berkshire Hathaway, Inc. (Class B Stock) | | Diversified Financial Services | | 0.8% |
Alphabet, Inc. (Class A Stock) | | Interactive Media & Services | | 0.8% |
UnitedHealth Group, Inc. | | Health Care Providers & Services | | 0.7% |
Alphabet, Inc. (Class C Stock) | | Interactive Media & Services | | 0.7% |
Johnson & Johnson | | Pharmaceuticals | | 0.7% |
Exxon Mobil Corp. | | Oil, Gas & Consumable Fuels | | 0.7% |
For a complete list of holdings, please refer to the Schedule of Investments section of this report. Holdings reflect only long-term investments.
| | |
The Prudential Series Fund, PSF PGIM Flexible Managed Portfolio | | December 31, 2022 |
| | |
Report of the Investment Manager - As of December 31, 2022 (Unaudited)
| | | | | | | | | | |
| | | | | | |
| Average Annual Total Returns | | 1 Year | | 5 Years | | 10 Years | | Since Inception | | 
|
| Portfolio: Class I | | -14.70% | | 4.73% | | 7.80% | | — |
| Portfolio: Class III | | -14.91 | | N/A | | N/A | | -4.80 |
| Blended Index | | -15.10 | | 6.03 | | 8.07 | | — |
| S&P 500 Index | | -18.10 | | 9.42 | | 12.55 | | — |
Past performance does not guarantee future returns. The investment return and principal value of an investment will fluctuate, so that shares, when redeemed, may be worth more or less than their original cost. Current performance may be lower or higher than the past performance. |
Portfolio Class III inception: 04/26/2021. Portfolio performance is net of fund expenses, but not contract charges, which, if included, would significantly lower the performance quoted. Performance figures may reflect fee waivers and/or expense reimbursements. In the absence of such fee waivers and/or expense reimbursements, performance would be lower. Unless noted otherwise, Index returns are based on the Portfolio’s Class I shares. |
The graph is based on the performance of Class I shares. Performance of Class III shares will be lower due to differences in the fee structure. Class III shares have associated 12b-1 fees at an annual rate of 0.25%, of the average daily net assets of the Class III shares. |
For the year ended December 31, 2022, the PSF PGIM Flexible Managed Portfolio Class I shares returned -14.70%. The Portfolio’s Class I shares outperformed both the Blended Index and the S&P 500 Index.
What were the market conditions during the reporting period?
At the beginning of calendar-year 2022 (the reporting period), the global economy was experiencing high levels of uncertainty about an expected slowdown from strong growth in 2021, high levels of inflation, the ongoing impact of COVID-19 on global supply chains and demand, and the expected unwinding of unprecedented levels of monetary and fiscal support. Russia’s invasion of Ukraine propelled already-concerning levels of inflation to new heights, prompting aggressive central bank tightening and contributing to significantly higher sovereign bond yields and a surge in the value of the US dollar. US stocks, particularly growth stocks, saw sharp declines during the reporting period, while the pullback in value stocks was more modest. The S&P 500 Index declined 18.10% in the reporting period. EAFE (Europe, Australasia, Far East) stocks saw comparatively lower double-digit percentage declines. Global bonds also fell, as yields rose sharply. In the US, the 10-year US Treasury yield began the reporting period at 1.51% and rose to a high of around 4.23% in October 2022, before easing back to around 3.55% by the end of the reporting period. The Bloomberg US Aggregate Bond Index fell 13.01%, making the reporting period a year of sharp declines for both stocks and bonds. In an environment of rising interest rates, cash (3-month Treasuries) outperformed both stocks and bonds, finishing the reporting period with gains of 1.46%.
What strategies or holdings affected the Portfolio’s performance?*
During the reporting period, the impact of asset allocation decisions on the Portfolio’s performance was roughly neutral. The Portfolio was overweight stocks relative to its benchmark index at the beginning of the reporting period, funded by an underweight in bonds. The stock positions were subsequently reduced because of increased headwinds for risk assets, including the US Federal Reserve (the Fed) embarking on its rate-hiking cycle and Russia’s invasion of Ukraine. By the second quarter of the reporting period, the Portfolio had just a small overweight in stocks overall. It also had an out-of-index position in EAFE stocks, which was expected to be relatively defensive compared to US stocks. Further, the Portfolio had a significant overweight in cash, which was largely maintained during the third quarter of the reporting period. In the fourth quarter of the reporting period, the Portfolio’s underweight in bonds was reduced, given that bond yields had risen sharply in previous months and because the Fed’s rate-hiking cycle appeared to be closer to its end. In addition, by the end of the reporting period, the Portfolio’s overweight in cash was gradually reduced to a small overweight. As for manager performance, it was a significantly positive contributor to the Portfolio’s performance during the reporting period. At the close of the reporting period, the Portfolio was positioned with relatively neutral exposure to equities, a small out of-index position in international equities, and close to neutral exposures to fixed income and cash.
During the period, the Portfolio used interest rate swaps to help manage duration and yield curve exposure. In aggregate, the use of interest rate swaps had a negligible impact on performance during the period. In addition, the Portfolio used futures to manage interest rate risk, a more efficient way of managing interest rate risk than through the purchase and sale of cash bonds. The use of futures had a negative impact on performance for the period.
For a complete list of holdings, please refer to the Schedule of Investments section of this report. Holdings reflect only long-term investments.
| | |
The Prudential Series Fund, PSF PGIM Flexible Managed Portfolio | | December 31, 2022 |
| | |
Report of the Investment Manager - As of December 31, 2022 (Unaudited) (Continued)
The Portfolio also used credit derivatives in the form of the Credit Default Swap Index (CDX) to manage credit risk. The use of CDX had a negligible impact on performance. Additionally, the Portfolio used S&P 500 Index and MSCI EAFE Mini Futures to maintain exposure to equities and provide portfolio liquidity. These futures had minimal impact on performance.
* This strategy and performance overview, which discusses what strategies or holdings (including derivatives, if applicable) affected the Portfolio’s performance, is compiled based on how the Portfolio performed relative to the Portfolio’s assigned index and is viewed for performance attribution purposes at the aggregate Portfolio level, which in most instances will not directly correlate to the amounts disclosed in the Statement of Operations which conform to U.S. generally accepted accounting principles.
Presentation of Portfolio Holdings — unaudited
| | | | |
|
PSF PGIM Flexible Managed Portfolio (As of 12/31/2022) |
| | |
Ten Largest Holdings | | Line of Business | | % of Net Assets |
Apple, Inc. | | Technology Hardware, Storage & Peripherals | | 3.4% |
Microsoft Corp. | | Software | | 3.4% |
UnitedHealth Group, Inc. | | Health Care Providers & Services | | 1.2% |
Amazon.com, Inc. | | Internet & Direct Marketing Retail | | 1.1% |
Berkshire Hathaway, Inc. (Class B Stock) | | Diversified Financial Services | | 0.9% |
Alphabet, Inc. (Class A Stock) | | Interactive Media & Services | | 0.9% |
Alphabet, Inc. (Class C Stock) | | Interactive Media & Services | | 0.9% |
Johnson & Johnson | | Pharmaceuticals | | 0.9% |
Exxon Mobil Corp. | | Oil, Gas & Consumable Fuels | | 0.8% |
Visa, Inc. (Class A Stock) | | IT Services | | 0.8% |
For a complete list of holdings, please refer to the Schedule of Investments section of this report. Holdings reflect only long-term investments.
| | |
The Prudential Series Fund, PSF PGIM Government Income Portfolio | | December 31, 2022 |
| | |
Report of the Investment Manager - As of December 31, 2022 (Unaudited)
| | | | | | | | | | |
| Average Annual Total Returns | | 1 Year | | 5 Years | | 10 Years | | Since Inception | | 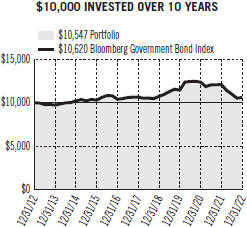
|
Portfolio: Class I | | -13.45% | | -0.74% | | 0.53% | | — |
Portfolio: Class III | | -13.68 | | N/A | | N/A | | -8.91 |
Bloomberg Government Bond Index | | -12.32 | | -0.06 | | 0.60 | | — |
Past performance does not guarantee future returns. The investment return and principal value of an investment will fluctuate, so that shares, when redeemed, may be worth more or less than their original cost. Current performance may be lower or higher than the past performance. |
Portfolio Class III inception: 04/26/2021. Portfolio performance is net of fund expenses, but not contract charges, which, if included, would significantly lower the performance quoted. Performance figures may reflect fee waivers and/or expense reimbursements. In the absence of such fee waivers and/or expense reimbursements, performance would be lower. Unless noted otherwise, Index returns are based on the Portfolio’s Class I shares. |
| |
The graph is based on the performance of Class I shares. Performance of Class III shares will be lower due to differences in the fee structure. Class III shares have associated 12b-1 fees at an annual rate of 0.25%, of the average daily net assets of the Class III shares. |
For the year ended December 31, 2022, the PSF PGIM Government Income Portfolio Class I shares returned -13.45%. The Portfolio’s Class I shares underperformed the Bloomberg Government Bond Index.
What were the market conditions during the reporting period?
From a starting point of low yields, tight spreads (yield differentials), and high equity multiples, the shift in fundamentals—most notably, high inflation—drove a wholesale repricing of markets in calendar-year 2022 (the reporting period). Concerns about central bank tightening, hard economic landings, and Russia’s invasion of Ukraine led credit spreads notably wider, while rate volatility increased as markets first began pricing in more aggressive Federal Open Market Committee policy tightening and then later began to price in a hard economic landing. (A hard landing refers to a marked economic slowdown or downturn.)
Against the backdrop of historic lows in unemployment and generational highs in inflation, central banks signaled an increased willingness to accept more economic and market pain than what was experienced over the prior decade of low inflation. A succession of federal funds rate hikes—by over 400 basis points (bps) in the reporting period—confirmed to markets that the US Federal Reserve (the Fed) was fully focused on tackling inflation. (One basis point equals 0.01%.)
As a result, enormous volatility continued to be priced into US Treasuries, with sharply higher front-end rates and lower long-dated yields forming a substantially flatter US Treasury yield curve before the curve finally inverted in the last six months of the reporting period. (A yield curve is a line graph that illustrates the relationship between the yields and maturities of fixed income securities. It is created by plotting the yields of different maturities for the same type of bonds.) From 0.78% on December 31, 2021, the 10-year/2-year Treasury spread declined to -0.54% by the end of the reporting period. US 10-year Treasury yields began the reporting period at 1.51% and ended it at 3.88%. Meanwhile, the yield on the 2-year Treasury note ended the reporting period at 4.42%, a rise of 369 bps since the beginning of the reporting period.
Agency mortgage-backed securities (MBS) underperformed US Treasuries on concerns that the Fed may begin selling MBS if Fed officials need to step up their inflation fight. Meanwhile, high inflation and recession concerns generally kept securitized credit on a widening trajectory as well, with high-quality collateralized loan obligation (CLO) and commercial mortgage-backed securities (CMBS) spreads trading well above their recent tights by the end of the reporting period.
What strategies or holdings affected the Portfolio’s performance?*
During the reporting period, the combined impact of the Portfolio’s duration and yield curve strategies were the main drivers of underperformance. (Duration measures the sensitivity of the price—the value of principal—of a bond to a change in interest rates.) Individual security selection and sector allocation also detracted from the Portfolio’s performance. Within security selection, positioning in US Treasuries was the largest detractor. This was partially offset
For a complete list of holdings, please refer to the Schedule of Investments section of this report. Holdings reflect only long-term investments.
| | |
The Prudential Series Fund, PSF PGIM Government Income Portfolio | | December 31, 2022 |
| | |
Report of the Investment Manager - As of December 31, 2022 (Unaudited) (Continued)
by selection in CMBS, CLOs, and agency securities, which contributed to the Portfolio’s performance. Within sector allocation, overweights relative to the benchmark index in CLOs, agency securities, and CMBS detracted from the Portfolio’s performance. This was partially offset by an underweight to MBS, which contributed to the Portfolio’s performance.
During the reporting period, the Portfolio used interest rate swaps to help manage duration and yield curve exposure. The use of interest rate swaps had a positive impact on performance during the reporting period. The Portfolio used futures to manage the Fund’s interest rate risk, which is a more efficient way of managing interest rate risk than through the purchase and sale of cash bonds. The use of futures detracted from the Portfolio’s performance during the reporting period.
* This strategy and performance overview, which discusses what strategies or holdings (including derivatives, if applicable) affected the Portfolio’s performance, is compiled based on how the Portfolio performed relative to the Portfolio’s assigned index and is viewed for performance attribution purposes at the aggregate Portfolio level, which in most instances will not directly correlate to the amounts disclosed in the Statement of Operations which conform to U.S. generally accepted accounting principles.
Presentation of Portfolio Holdings — unaudited
| | | | |
|
| PSF PGIM Government Income Portfolio (As of 12/31/2022) | |
Credit Quality | | | % of Total Investments | |
AAA | | | 99.1% | |
Cash/Cash Equivalents | | | 0.9% | |
Total Investments | | | 100.0% | |
Credit ratings reflect the middle rating assigned by a nationally recognized statistical rating organization (NRSRO) such as Moody’s Investor Service, Inc. (Moody’s), S&P Global Ratings (S&P), or Fitch, Inc. (Fitch). Credit ratings reflect the common nomenclature used by both S&P and Fitch. Where applicable, ratings are converted to the comparable S&P/Fitch rating tier nomenclature. These rating agencies are independent, and are widely used. The Not Rated (NR) category consists of securities that have not been rated by a NRSRO. Ratings category may include derivative instruments that could have a negative value. Credit ratings are subject to change.
| | |
| The Prudential Series Fund, PSF PGIM Government Money Market Portfolio | | December 31, 2022 |
| | |
Report of the Investment Manager - As of December 31, 2022 (Unaudited)
| | | | | | | | | | | | | | | | |
| | | Average Annual Total Returns | | 7-Day* Current Net Yield | | 1 Year | | 5 Years | | 10 Years | | Since Inception | | 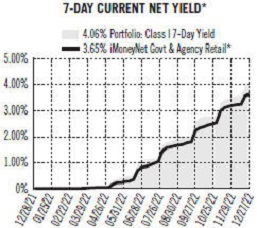
| | |
| | Portfolio: Class I | | 4.06% | | 1.39% | | 1.03% | | 0.58% | | — |
| | Portfolio: Class III | | 4.06 | | 1.22 | | N/A | | N/A | | 0.48 |
| | Lipper US Government Money Market Index | | N/A | | 1.18 | | 0.91 | | 0.51 | | — |
| | Past performance does not guarantee future returns. The investment return and principal value of an investment will fluctuate, so that shares, when redeemed, may be worth more or less than their original cost. Current performance may be lower or higher than the past performance. |
| | The Portfolio Class III inception: 05/18/2020. The yield quotation more closely reflects the current earnings of the Portfolio than the total return quotation. Portfolio performance is net of fund expenses, but not contract charges, which, if included, would significantly lower the performance quoted. Performance figures may reflect fee waivers and/or expense reimbursements. In the absence of such fee waivers and/or expense reimbursements, performance would be lower. Unless noted otherwise, Index returns are based on the Portfolio’s Class I shares. |
| | The graph is based on the performance of Class I shares. Performance of Class III shares will be lower due to differences in the fee structure. Class III shares have associated 12b-1 fees at an annual rate of 0.25%, of the average daily net assets of the Class III shares. | | |
| | * Source: The iMoneyNet Govt & Agency Retail Average is comprised of 167 funds. The weekly 7-day current net yields of the Government Money Market Portfolio and the iMoneyNet Govt & Agency Retail Average universe are as of 12/31/2022. The graph is based on the 7-day current net yields of Class I shares. | | |
| | An investment in the Government Money Market Portfolio is not insured or guaranteed by the Federal Deposit Insurance Corporation or any other government agency. Although the Portfolio seeks to preserve the value of your investment at $10.00 per share, it is possible to lose money by investing in the Portfolio. | | |
For the year ended December 31, 2022, the PSF PGIM Government Money Market Portfolio Class I shares returned 1.39%. The Portfolio’s Class I shares outperformed the Lipper US Government Money Market Index.
What were the market conditions during the reporting period?
From a starting point of low yields, tight spreads (yield differentials), and high equity multiples, the shift in fundamentals—most notably, high inflation—drove a wholesale repricing of markets in calendar-year 2022 (the reporting period). Concerns about central bank tightening, hard economic landings, and Russia’s invasion of Ukraine led credit spreads notably wider, while rate volatility increased as markets first began pricing in more aggressive Federal Open Market Committee policy tightening and then later began to price in a hard economic landing. (A hard landing refers to a marked economic slowdown or downturn.)
Against the backdrop of historic lows in unemployment and generational highs in inflation, central banks signaled an increased willingness to accept more economic and market pain than what was experienced over the prior decade of low inflation. A succession of federal funds rate hikes—by over 400 basis points (bps) in the reporting period—confirmed to markets that the US Federal Reserve (the Fed) was fully focused on tackling inflation. (One basis point equals 0.01%.)
As a result, enormous volatility continued to be priced into US Treasuries, with sharply higher front-end rates and lower long-dated yields forming a substantially flatter US Treasury yield curve before the curve finally inverted in the last six months of the reporting period. (A yield curve is a line graph that illustrates the relationship between the yields and maturities of fixed income securities. It is created by plotting the yields of different maturities for the same type of bonds.) The 10-year/2-year Treasury spread declined from 0.78% on December 31, 2021, to -0.54% at the end of the reporting period, while the yield on the 2-year Treasury note ended the reporting period at 4.42%, a rise of 369 bps since the beginning of the period. At the same time, the yield on the 3-month Treasury bill rose from 0.05% to 4.42%, while the 3-month LIBOR (London Interbank Offered Rate) and SOFR (Secured Overnight Financing Rate) rose 455 bps and 425 bps, respectively, to end the reporting period at 4.77% and 4.30%. In the short-term credit markets, investment-grade credit spreads widened during the reporting period. The Bloomberg 1-3 Year Credit Index, a proxy for the short-term spread market, underperformed short-duration Treasuries by 0.10% during the reporting period. (Duration measures the sensitivity of the price—the value of principal—of a bond to a change in interest rates.)
For a complete list of holdings, please refer to the Schedule of Investments section of this report. Holdings reflect only short-term investments.
| | |
| The Prudential Series Fund, PSF PGIM Government Money Market Portfolio | | December 31, 2022 |
| | |
Report of the Investment Manager - As of December 31, 2022 (Unaudited) (Continued)
What strategies or holdings affected the Portfolio’s performance?*
The Portfolio’s weighted average maturity remained shorter than peers during almost all of the reporting period before extending over the period’s final weeks as it became clear the Fed was nearing the end of its tightening cycle. The Portfolio’s weighted average life began the reporting period shorter than peers but extended in the middle of the second quarter of the period and remained longer than peers throughout most of the remainder of the period.
To take advantage of changing relative value between the sectors, the Portfolio shifted its positioning in agency discount notes, repurchase agreements, and US Treasuries throughout the reporting period. During the period, the Portfolio increased its positions in floating rate agency securities and agency discount notes, while reducing its position in short, fixed-rate US Treasuries to offset that trade.
Additionally, the Portfolio took advantage of changing floating rate spreads and shifted positioning across SOFR floaters accordingly. (Floaters are bonds or other types of debt whose coupon rate changes with short-term interest rates.)
* This strategy and performance overview, which discusses what strategies or holdings (including derivatives, if applicable) affected the Portfolio’s performance, is compiled based on how the Portfolio performed relative to the Portfolio’s assigned index and is viewed for performance attribution purposes at the aggregate Portfolio level, which in most instances will not directly correlate to the amounts disclosed in the Statement of Operations which conform to U.S. generally accepted accounting principles.
Presentation of Portfolio Holdings — unaudited
| | | | | | | | |
|
| PSF PGIM Government Money Market Portfolio (As of 12/31/2022) | |
| | | |
Ten Largest Holdings | | Interest Rate | | Maturity Date | | | % of Net Assets | |
Federal Home Loan Bank | | 4.289% | | 02/17/2023 | | | 3.6% | |
Federal Home Loan Bank | | 4.111% | | 01/27/2023 | | | 2.3% | |
Federal Home Loan Bank | | 4.229% | | 02/08/2023 | | | 1.8% | |
Federal Home Loan Bank | | 4.400% | | 02/22/2023 | | | 1.8% | |
Federal Home Loan Bank | | 4.495% | | 03/22/2023 | | | 1.8% | |
Federal Home Loan Bank | | 4.360% | | 05/01/2023 | | | 1.8% | |
Federal Home Loan Bank | | 4.480% | | 03/15/2023 | | | 1.8% | |
Federal Home Loan Bank | | 4.417% | | 03/01/2023 | | | 1.8% | |
Federal Home Loan Bank | | 4.330% | | 01/19/2023 | | | 1.7% | |
Federal Home Loan Bank | | 4.330% | | 02/28/2023 | | | 1.7% | |
Holdings reflect only short-term investments.
For a complete list of holdings, please refer to the Schedule of Investments section of this report. Holdings reflect only short-term investments.
| | |
| The Prudential Series Fund, PSF PGIM High Yield Bond Portfolio | | December 31, 2022 |
| | |
Report of the Investment Manager - As of December 31, 2022 (Unaudited)
| | | | | | | | | | |
| Average Annual Total Returns | | 1 Year | | 5 Years | | 10 Years | | Since Inception | | 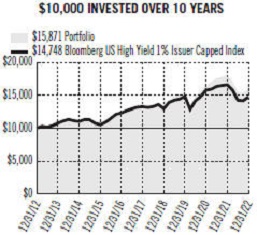
|
Portfolio: Class I | | -11.24% | | 3.34% | | 4.73% | | — |
Portfolio: Class III | | -11.41 | | N/A | | N/A | | -4.80 |
| Bloomberg US High Yield 1% Issuer Capped Index | | -11.11 | | 2.17 | | 3.96 | | — |
Past performance does not guarantee future returns. The investment return and principal value of an investment will fluctuate, so that shares, when redeemed, may be worth more or less than their original cost. Current performance may be lower or higher than the past performance. |
Portfolio Class III inception: 04/26/2021. Portfolio performance is net of fund expenses, but not contract charges, which, if included, would significantly lower the performance quoted. Performance figures may reflect fee waivers and/or expense reimbursements. In the absence of such fee waivers and/or expense reimbursements, performance would be lower. Unless noted otherwise, Index returns are based on the Portfolio’s Class I shares. |
The graph is based on the performance of Class I shares. Performance of Class III shares will be lower due to differences in the fee structure. Class III shares have associated 12b-1 fees at an annual rate of 0.25%, of the average daily net assets of the Class III shares. |
For the year ended December 31, 2022, the PSF PGIM High Yield Bond Portfolio Class I shares returned -11.24%. The Portfolio’s Class I shares underperformed the Bloomberg US High Yield 1% Issuer Capped Index.
What were market conditions during the reporting period?
US high yield corporate bonds posted significant declines during calendar-year 2022 (the reporting period), as interest rate hike concerns, high and persistent inflation, and recession fears overshadowed the strength of corporate earnings and credit fundamentals. Retail demand for high yield corporate bonds remained negative throughout much of the reporting period, as a combination of slowing global growth and an increasingly hawkish US Federal Reserve drove outflows from high yield bond mutual funds. However, subdued primary market activity combined with a high volume of calls, tenders, and coupon payments provided a relatively solid technical backdrop. For the full reporting period, the Bloomberg US High Yield 1% Issuer Constrained Bond Index returned -11.19% on a total-return basis and -3.71% on an excess-return basis. By quality, higher-quality (BB-rated and B-rated) credits outperformed their lower-quality (CCC-rated) peers during the reporting period, as investors sought out the relative safety of higher-rated credits. The high yield primary market remained muted as issuers sat out the volatility. For the reporting period, high yield issuance totaled $106 billion, which was down from $483 billion in 2021. The 12-month trailing, par-weighted default rate (including distressed exchanges) rose to 1.65% as of the end of the reporting period—its highest level since June 2021.
What strategies or holdings affected the Portfolio’s performance?*
During the reporting period, the Portfolio’s performance was driven primarily by overall sector allocation, with overweights relative to the benchmark index in upstream energy and electric utilities, along with underweights to media & entertainment and retailers & restaurants, contributing the most. This was partially offset by underweights to gaming/lodging/leisure and paper & packaging, along with overweights to cable & satellite and healthcare & pharmaceuticals, all of which detracted from the Portfolio’s performance. Overall security selection detracted from the Portfolio’s relative performance during the reporting period, with selection in telecom, media & entertainment, and electric utilities detracting the most. This was partially offset by selection in upstream energy, retailers & restaurants, and healthcare & pharmaceuticals, which contributed to the Portfolio’s performance. From a beta perspective, on average, having less risk in the Portfolio relative to the benchmark was a contributor to returns during the reporting period. (Beta is a measure of the volatility or risk of a security or portfolio compared to the market or index.)
Among the largest single-name contributors to the Portfolio’s performance were positions in Chesapeake Energy Corp. (upstream energy), Ferrellgas Escrow, LLC (midstream energy), and Carvana Co. (retailers & restaurants). Overweights to Digicel International (telecom), Venator Finance SARL (chemicals), and Diamond Sports Group (media & entertainment) were the largest single-name detractors from the Portfolio’s performance.
During the reporting period, the Portfolio used US Treasury futures to manage interest rate risk, a more efficient way of managing interest rate risk than through the purchase and sale of cash bonds. The impact of futures had no impact on the Portfolio’s performance during the reporting period. The Portfolio used credit derivatives to manage its overall risk profile, which positively impacted the Portfolio’s performance.
For a complete list of holdings, please refer to the Schedule of Investments section of this report. Holdings reflect only long-term investments.
| | |
| The Prudential Series Fund, PSF PGIM High Yield Bond Portfolio | | December 31, 2022 |
| | |
Report of the Investment Manager - As of December 31, 2022 (Unaudited) (Continued)
* This strategy and performance overview, which discusses what strategies or holdings (including derivatives, if applicable) affected the Portfolio’s performance, is compiled based on how the Portfolio performed relative to the Portfolio’s assigned index and is viewed for performance attribution purposes at the aggregate Portfolio level, which in most instances will not directly correlate to the amounts disclosed in the Statement of Operations which conform to U.S. generally accepted accounting principles.
Presentation of Portfolio Holdings — unaudited
| | | | |
|
| PSF PGIM High Yield Bond Portfolio (As of 12/31/2022) | |
| |
Credit Quality | | | % of Total Investments | |
AAA | | | 11.2% | |
BBB | | | 3.5% | |
BB | | | 29.0% | |
B | | | 35.5% | |
CCC | | | 11.5% | |
CC | | | 1.9% | |
C | | | 0.1% | |
NR | | | 3.2% | |
Cash/Cash Equivalents | | | 4.1% | |
Total Investments | | | 100.0% | |
Credit ratings reflect the middle rating assigned by a nationally recognized statistical rating organization (NRSRO) such as Moody’s Investor Service, Inc. (Moody’s), S&P Global Ratings (S&P), or Fitch, Inc. (Fitch). Credit ratings reflect the common nomenclature used by both S&P and Fitch. Where applicable, ratings are converted to the comparable S&P/Fitch rating tier nomenclature. These rating agencies are independent, and are widely used. The Not Rated (NR) category consists of securities that have not been rated by a NRSRO. Ratings category may include derivative instruments that could have a negative value. Credit ratings are subject to change.
| | |
| The Prudential Series Fund, PSF PGIM Jennison Blend Portfolio | | December 31, 2022 |
| | |
Report of the Investment Manager - As of December 31, 2022 (Unaudited)
| | | | | | | | | | |
| Average Annual Total Returns | | 1 Year | | 5 Years | | 10 Years | | Since Inception | | 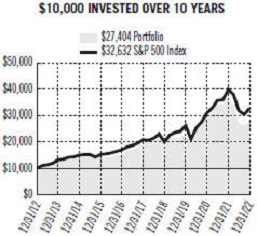
|
Portfolio: Class I | | -25.10% | | 7.36% | | 10.61% | | — |
Portfolio: Class II | | -25.40 | | 6.93 | | 10.16 | | — |
Portfolio: Class III | | -25.29 | | N/A | | N/A | | -10.23 |
Russell 1000® Index | | -19.13 | | 9.13 | | 12.37 | | — |
S&P 500 Index | | -18.10 | | 9.42 | | 12.55 | | — |
Past performance does not guarantee future returns. The investment return and principal value of an investment will fluctuate, so that shares, when redeemed, may be worth more or less than their original cost. Current performance may be lower or higher than the past performance. |
Portfolio Class III inception: 04/26/2021. Portfolio performance is net of fund expenses, but not contract charges, which, if included, would significantly lower the performance quoted. Performance figures may reflect fee waivers and/or expense reimbursements. In the absence of such fee waivers and/or expense reimbursements, performance would be lower. Unless noted otherwise, Index returns are based on the Portfolio’s Class I shares. |
The Russell 1000® Index is a trademark/service mark of the Frank Russell Company. Russell® is a trademark of the Frank Russell Company. |
The graph is based on the performance of Class I shares. Performance of Class II and Class III shares will be lower due to differences in the fee structure. Class II shares have associated 12b-1 and administrative fees at an annual rate of 0.25% and 0.15%, respectively, of the average daily net assets of the Class II shares. Class III shares have associated 12b-1 fees at an annual rate of 0.25%, of the average daily net assets of the Class III shares. |
For the year ended December 31, 2022, the PSF PGIM Jennison Blend Portfolio Class I shares returned -25.10%. The Portfolio’s Class I shares underperformed both the Russell 1000 Index and the S&P 500 Index.
What were the market conditions during the reporting period?
Calendar-year 2022 (the reporting period) was challenging for equity markets, with major indices closing at or near their lows for the reporting period. Uncertainty and volatility were enduring constants.
In response to signs of an economic slowdown, around the world and across industries, many companies that had benefited most from the COVID-19 pandemic began to reduce headcount and take operational steps to mitigate expected weakness. Commodity prices continued their retreat into the end of the reporting period, despite the lingering impact of Russia’s invasion of Ukraine. China took steps to ease its restrictive “zero-COVID” policy, resulting in a wave of infections, hospitalizations, and further economic dislocation as the reporting period ended.
Economic data reflected a mix of contrasting trends, with strength in employment, wages, and savings largely offsetting the effects of consumer price inflation, falling house prices, and waning spending by lower-income households. The persistence of labor-market tightness kept the US Federal Reserve (the Fed) on a tightening path, with the federal funds rate closing the reporting period in the range of 4.25% to 4.50%, levels last seen in 2007. Inflation was a global phenomenon, and central banks in many countries followed a path similar to that of the Fed, leading to a partial retracement of the US dollar’s significant appreciation since the end of 2021.
The S&P 500 Index declined 18.10% in the reporting period. Communication services, consumer discretionary, information technology, and real estate saw the biggest declines. The energy sector posted, by far, the largest gain. The utilities sector managed modestly positive returns, while other defensive value sectors such as consumer staples and healthcare were down slightly but held up better than the S&P 500 Index overall.
What strategies or holdings affected the Portfolio’s performance?*
Relative to the Portfolio’s benchmark index, stock selection in information technology and communication services detracted the most from the Portfolio’s performance during the reporting period. Stock selection in healthcare, along with an overweight allocation to energy and underweight allocations to information technology and communication services, contributed the most to the Portfolio’s relative results.
For a complete list of holdings, please refer to the Schedule of Investments section of this report. Holdings reflect only long-term investments.
| | |
| The Prudential Series Fund, PSF PGIM Jennison Blend Portfolio | | December 31, 2022 |
| | |
Report of the Investment Manager - As of December 31, 2022 (Unaudited) (Continued)
The most notable stocks to contribute positively to the overall Portfolio’s performance during the reporting period included Eli Lilly & Co., ConocoPhillips Co., Cigna Corp., McDonald’s Corp., and AbbVie Inc. Top individual stock detractors from the Portfolio’s performance for the reporting period included Tesla Inc., Alphabet Inc., Amazon.com Inc., Apple Inc., and NVIDIA Corp.
* This strategy and performance overview, which discusses what strategies or holdings (including derivatives, if applicable) affected the Portfolio’s performance, is compiled based on how the Portfolio performed relative to the Portfolio’s assigned index and is viewed for performance attribution purposes at the aggregate Portfolio level, which in most instances will not directly correlate to the amounts disclosed in the Statement of Operations which conform to U.S. generally accepted accounting principles.
Presentation of Portfolio Holdings — unaudited
| | | | | | |
|
| PSF PGIM Jennison Blend Portfolio (As of 12/31/2022) | |
| | |
Ten Largest Holdings | | Line of Business | | | % of Net Assets | |
ConocoPhillips | | Oil, Gas & Consumable Fuels | | | 6.1% | |
Apple, Inc. | | Technology Hardware, Storage & Peripherals | | | 4.7% | |
Microsoft Corp. | | Software | | | 4.5% | |
Eli Lilly & Co. | | Pharmaceuticals | | | 3.7% | |
Alphabet, Inc. (Class A Stock) | | Interactive Media & Services | | | 2.4% | |
Amazon.com, Inc. | | Internet & Direct Marketing Retail | | | 2.4% | |
AstraZeneca PLC (United Kingdom), ADR | | Pharmaceuticals | | | 2.1% | |
Danaher Corp. | | Life Sciences Tools & Services | | | 2.0% | |
Bristol-Myers Squibb Co. | | Pharmaceuticals | | | 1.9% | |
Goldman Sachs Group, Inc. (The) | | Capital Markets | | | 1.8% | |
For a complete list of holdings, please refer to the Schedule of Investments section of this report. Holdings reflect only long-term investments.
| | |
| The Prudential Series Fund, PSF PGIM Jennison Focused Blend Portfolio | | December 31, 2022 |
| | |
Report of the Investment Manager - As of December 31, 2022 (Unaudited)
| | | | | | | | | | |
| Average Annual Total Returns | | 1 Year | | 5 Years | | 10 Years | | Since Inception | | 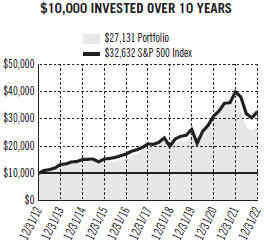
|
Portfolio: Class I | | -25.76% | | 6.74% | | 10.50% | | — |
Portfolio: Class II | | -26.04 | | 6.32 | | 10.06 | | — |
Portfolio: Class III | | -25.95 | | N/A | | N/A | | -12.79 |
Russell 1000® Index | | -19.13 | | 9.13 | | 12.37 | | — |
S&P 500 Index | | -18.10 | | 9.42 | | 12.55 | | — |
Past performance does not guarantee future returns. The investment return and principal value of an investment will fluctuate, so that shares, when redeemed, may be worth more or less than their original cost. Current performance may be lower or higher than the past performance. |
Portfolio Class III inception: 04/26/2021. Portfolio performance is net of fund expenses, but not contract charges, which, if included, would significantly lower the performance quoted. Performance figures may reflect fee waivers and/or expense reimbursements. In the absence of such fee waivers and/or expense reimbursements, performance would be lower. Unless noted otherwise, Index returns are based on the Portfolio’s Class I shares. |
The Russell 1000® Index is a trademark/service mark of the Frank Russell Company. Russell® is a trademark of the Frank Russell Company. |
The graph is based on the performance of Class I shares. Performance of Class II and Class III shares will be lower due to differences in the fee structure. Class II shares have associated 12b-1 and administrative fees at an annual rate of 0.25% and 0.15%, respectively, of the average daily net assets of the Class II shares. Class III shares have associated 12b-1 fees at an annual rate of 0.25%, of the average daily net assets of the Class III shares. |
For the year ended December 31, 2022, the PSF PGIM Jennison Focused Blend Portfolio Class I shares returned -25.76%. The Portfolio’s Class I shares underperformed both the Russell 1000 Index and the S&P 500 Index.
What were market conditions during the reporting period?
Calendar-year 2022 (the reporting period) was challenging for equity markets, with major indices closing at or near their lows for the reporting period. Uncertainty and volatility were enduring constants.
In response to signs of an economic slowdown, around the world and across industries, many companies that had benefited most from the COVID-19 pandemic began to reduce headcount and take operational steps to mitigate expected weakness. Commodity prices continued their retreat into the end of the reporting period, despite the lingering impact of Russia’s invasion of Ukraine. China took steps to ease its restrictive “zero-COVID” policy, resulting in a wave of infections, hospitalizations, and further economic dislocation as the reporting period ended.
Economic data reflected a mix of contrasting trends, with strength in employment, wages, and savings largely offsetting the effects of consumer price inflation, falling house prices, and waning spending by lower-income households. The persistence of labor-market tightness kept the US Federal Reserve (the Fed) on a tightening path, with the federal funds rate closing the reporting period in the range of 4.25% to 4.50%, levels last seen in 2007. Inflation was a global phenomenon, and central banks in many countries followed a path similar to that of the Fed, leading to a partial retracement of the US dollar’s significant appreciation since the end of 2021.
The S&P 500 Index declined 18.10% in the reporting period. Communication services, consumer discretionary, information technology, and real estate saw the biggest declines. The energy sector posted, by far, the largest gain. The utilities sector managed modestly positive returns, while other defensive value sectors such as consumer staples and healthcare were down slightly but held up better than the S&P 500 Index overall.
What strategies or holdings affected the Portfolio’s performance?*
Relative to the Portfolio’s benchmark index, stock selection in information technology and consumer discretionary, along with an overweight allocation to consumer discretionary, detracted the most from the Portfolio’s performance during the reporting period. An underweight allocation to information technology and overweight allocations to energy and healthcare were the top positive contributors to the Portfolio’s relative results.
For a complete list of holdings, please refer to the Schedule of Investments section of this report. Holdings reflect only long-term investments.
| | |
| The Prudential Series Fund, PSF PGIM Jennison Focused Blend Portfolio | | December 31, 2022 |
| | |
Report of the Investment Manager - As of December 31, 2022 (Unaudited) (Continued)
The most notable stocks to contribute positively to the overall Portfolio’s performance included ConocoPhillips Co., Eli Lilly & Co., Novo Nordisk A/S, AstraZeneca plc, and Chubb Ltd. Top individual stock detractors from the Portfolio’s performance during the reporting period included Tesla Inc., Alphabet Inc., Amazon.com Inc., Microsoft Corp., and NVIDIA Corp.
* This strategy and performance overview, which discusses what strategies or holdings (including derivatives, if applicable) affected the Portfolio’s performance, is compiled based on how the Portfolio performed relative to the Portfolio’s assigned index and is viewed for performance attribution purposes at the aggregate Portfolio level, which in most instances will not directly correlate to the amounts disclosed in the Statement of Operations which conform to U.S. generally accepted accounting principles.
Presentation of Portfolio Holdings — unaudited
| | | | | | |
|
| PSF PGIM Jennison Focused Blend Portfolio (As of 12/31/2022) | |
| | |
Ten Largest Holdings | | Line of Business | | | % of Net Assets | |
ConocoPhillips | | Oil, Gas & Consumable Fuels | | | 6.0% | |
Eli Lilly & Co. | | Pharmaceuticals | | | 5.4% | |
Microsoft Corp. | | Software | | | 4.9% | |
Apple, Inc. | | Technology Hardware, Storage & Peripherals | | | 2.8% | |
Alphabet, Inc. (Class A Stock) | | Interactive Media & Services | | | 2.7% | |
Chubb Ltd. | | Insurance | | | 2.6% | |
AstraZeneca PLC (United Kingdom), ADR | | Pharmaceuticals | | | 2.5% | |
Walmart, Inc. | | Food & Staples Retailing | | | 2.4% | |
Amazon.com, Inc. | | Internet & Direct Marketing Retail | | | 2.4% | |
LVMH Moet Hennessy Louis Vuitton SE (France) | | Textiles, Apparel & Luxury Goods | | | 2.3% | |
For a complete list of holdings, please refer to the Schedule of Investments section of this report. Holdings reflect only long-term investments.
| | |
| The Prudential Series Fund, PSF PGIM Jennison Growth Portfolio | | December 31, 2022 |
| | |
Report of the Investment Manager - As of December 31, 2022 (Unaudited)
| | | | | | | | | | |
| Average Annual Total Returns | | 1 Year | | 5 Years | | 10 Years | | Since Inception | | 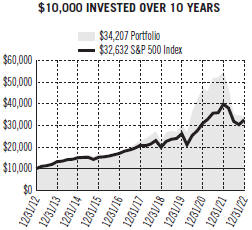 |
Portfolio: Class I | | -37.60% | | 8.39% | | 13.09% | | — |
Portfolio: Class II | | -37.85 | | 7.96 | | 12.64 | | — |
Portfolio: Class III | | -37.75 | | N/A | | N/A | | -19.71 |
Russell 1000® Growth Index | | -29.14 | | 10.96 | | 14.10 | | — |
S&P 500 Index | | -18.10 | | 9.42 | | 12.55 | | — |
Past performance does not guarantee future returns. The investment return and principal value of an investment will fluctuate, so that shares, when redeemed, may be worth more or less than their original cost. Current performance may be lower or higher than the past performance. |
Portfolio Class III inception: 04/26/2021. Portfolio performance is net of fund expenses, but not contract charges, which, if included, would significantly lower the performance quoted. Performance figures may reflect fee waivers and/or expense reimbursements. In the absence of such fee waivers and/or expense reimbursements, performance would be lower. Unless noted otherwise, Index returns are based on the Portfolio’s Class I shares. |
The Russell 1000® Growth Index is a trademark/service of the Frank Russell Company. Russell® is a trademark of the Frank Russell Company. |
The graph is based on the performance of Class I shares. Performance of Class II and Class III shares will be lower due to differences in the fee structure. Class II shares have associated 12b-1 and administrative fees at an annual rate of 0.25% and 0.15%, respectively, of the average daily net assets of the Class II shares. Class III shares have associated 12b-1 fees at an annual rate of 0.25%, of the average daily net assets of the Class III shares. |
For the year ended December 31, 2022, the PSF PGIM Jennison Growth Portfolio Class I shares returned -37.60%. The Portfolio’s Class I shares underperformed both the Russell 1000 Growth Index and the S&P 500 Index.
What were the market conditions during the reporting period?
Equity markets finished out a challenging calendar-year 2022 (the reporting period), with major indices closing at or near their lows for the reporting period as uncertainty and volatility endured. Persistently high inflation, resulting in part from accommodative fiscal policies during the COVID-19 pandemic, brought about a sharp reversal in monetary policy globally and an unusually abrupt tightening of financial conditions. In response, growth equities went through a grinding period of adjustment.
What strategies or holdings affected the Portfolio’s performance?*
The Portfolio underperformed its benchmark index during the reporting period. This underperformance, in large part, reflected the higher expected growth and higher valuations of the Portfolio’s holdings. These valuations proved to be particularly vulnerable to the significant de-rating that occurred, as interest rates moved sharply higher. (A de-rating is a negative change in the rating of a stock’s or group of stocks’ expected performance, issued by a financial services analyst.) This was most evident in high-growth companies requiring very high reinvestment rates, often utilizing most, if not all, available free cash flow to fuel their growth.
Portfolio underperformance was also driven by the selection of positions with disappointing fundamentals. Two names with outsized impact were Shopify Inc. and Snap Inc. (Snap). E-commerce leader Shopify suffered a meaningful deceleration after economies reopened from pandemic lockdowns. Shopify has been working to right-size itself for a slower growth trajectory. However, Jennison reduced and ultimately exited the stock, as it became clear the need for reinvestment into sales, technology, and physical fulfillment networks would be more significant for longer than Jennison had envisioned. In the case of Snap, social-media stocks reported disappointing results in the reporting period, and the Portfolio’s position in Snap detracted from the Portfolio’s performance. The company faced revenue pressures from Apple Inc.’s privacy changes, given the difficulty in demonstrating the effectiveness of target-marketing campaigns, which led to disappointing earnings. Jennison exited the stock, expecting resolution of these challenges to take some time.
Following significant outperformance, Tesla Inc. was an underperformer during the reporting period. Economic sensitivity began to weigh on automobile sales, including electric vehicles (EVs), in the second half of the reporting period, which prompted Tesla to make several pricing adjustments in the fourth quarter of the reporting period. In the US, the company offered incentives to encourage customers to take possession of vehicles before the end of the reporting period, in part to address buyer confusion regarding eligibility for upcoming EV tax credits. In China, pandemic lockdowns, coupled with the
For a complete list of holdings, please refer to the Schedule of Investments section of this report. Holdings reflect only long-term investments.
| | |
| The Prudential Series Fund, PSF PGIM Jennison Growth Portfolio | | December 31, 2022 |
| | |
Report of the Investment Manager - As of December 31, 2022 (Unaudited) (Continued)
ensuing COVID-19 spread upon reopening, severely impacted auto demand, particularly in Tesla’s segment. These factors were compounded by the negative impact of Elon Musk’s purchase of Twitter Inc., which closed in the fourth quarter of the reporting period after Mr. Musk’s unsuccessful attempts to walk away from the deal. Jennison lowered its estimates on Tesla to reflect these developments, which, along with elevated uncertainty broadly, led Jennison to reduce the Portfolio’s position in Tesla.
As a group, software stocks also weighed on the Portfolio’s relative returns during the reporting period. While many of the Portfolio’s software holdings reported recurring revenue growth in excess of 25%, the slowing economy led to longer sales cycles, postponed investments, and lower-than-consensus anticipated revenue growth. The resetting of growth expectations lowered the valuations investors were willing to pay for long-duration growth stocks, and Jennison reduced the Portfolio’s exposure to this industry accordingly.
On the positive side, Portfolio holdings in healthcare (Eli Lilly and Co., Novo Nordisk A/S), luxury consumer (LVMH Moet Hennessy Louis Vuitton SE), and energy (Schlumberger Ltd.) helped the Portfolio’s relative returns during the reporting period. Adding exposure to healthcare stocks with strong fundamentals and positive multi-year catalysts was an important positive change in the Portfolio over the course of the reporting period.
* This strategy and performance overview, which discusses what strategies or holdings (including derivatives, if applicable) affected the Portfolio’s performance, is compiled based on how the Portfolio performed relative to the Portfolio’s assigned index and is viewed for performance attribution purposes at the aggregate Portfolio level, which in most instances will not directly correlate to the amounts disclosed in the Statement of Operations which conform to U.S. generally accepted accounting principles.
Presentation of Portfolio Holdings — unaudited
| | | | | | |
|
| PSF PGIM Jennison Growth Portfolio (As of 12/31/2022) | |
| | |
Ten Largest Holdings | | Line of Business | | | % of Net Assets | |
Apple, Inc. | | Technology Hardware, Storage & Peripherals | | | 6.3% | |
Microsoft Corp. | | Software | | | 6.2% | |
Amazon.com, Inc. | | Internet & Direct Marketing Retail | | | 4.9% | |
NVIDIA Corp. | | Semiconductors & Semiconductor Equipment | | | 4.6% | |
Eli Lilly & Co. | | Pharmaceuticals | | | 3.9% | |
Visa, Inc. (Class A Stock) | | IT Services | | | 3.7% | |
Mastercard, Inc. (Class A Stock) | | IT Services | | | 3.2% | |
LVMH Moet Hennessy Louis Vuitton SE (France) | | Textiles, Apparel & Luxury Goods | | | 3.0% | |
Tesla, Inc. | | Automobiles | | | 3.0% | |
Alphabet, Inc. (Class C Stock) | | Interactive Media & Services | | | 2.9% | |
For a complete list of holdings, please refer to the Schedule of Investments section of this report. Holdings reflect only long-term investments.
| | |
| The Prudential Series Fund, PSF PGIM Jennison Value Portfolio | | December 31, 2022 |
| | |
Report of the Investment Manager - As of December 31, 2022 (Unaudited)
| | | | | | | | | | | | | | | | |
| Average Annual Total Returns | | 1 Year | | | 5 Years | | | 10 Years | | | Since Inception | | 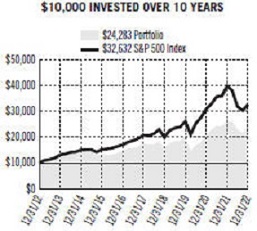
|
Portfolio: Class I | | | -7.89% | | | | 6.73% | | | | 9.28% | | | — |
Portfolio: Class II | | | -8.25 | | | | 6.31 | | | | 8.84 | | | — |
Portfolio: Class III | | | -8.12 | | | | N/A | | | | N/A | | | 1.29 |
Russell 1000® Value Index | | | -7.54 | | | | 6.67 | | | | 10.29 | | | — |
S&P 500 Index | | | -18.10 | | | | 9.42 | | | | 12.55 | | | — |
Past performance does not guarantee future returns. The investment return and principal value of an investment will fluctuate, so that shares, when redeemed, may be worth more or less than their original cost. Current performance may be lower or higher than the past performance. Portfolio Class III inception: 04/26/2021. Portfolio performance is net of fund expenses, but not contract charges, which, if included, would significantly lower the performance quoted. Performance figures may reflect fee waivers and/or expense reimbursements. In the absence of such fee waivers and/or expense reimbursements, performance would be lower. Unless noted otherwise, Index returns are based on the Portfolio’s Class I shares. The Russell 1000® Value Index is a trademark/service mark of the Frank Russell Company. Russell® is a trademark of the Frank Russell Company. |
|
The graph is based on the performance of Class I shares. Performance of Class II and Class III shares will be lower due to differences in the fee structure. Class II shares have associated 12b-1 and administrative fees at an annual rate of 0.25% and 0.15%, respectively, of the average daily net assets of the Class II shares. Class III shares have associated 12b-1 fees at an annual rate of 0.25%, of the average daily net assets of the Class III shares. |
For the year ended December 31, 2022, the PSF PGIM Jennison Value Portfolio Class I shares returned -7.89%. The Portfolio’s Class I shares underperformed the Russell 1000 Value Index and outperformed the S&P 500 Index.
What were the market conditions during the reporting period?
Calendar-year 2022 (the reporting period) was challenging for equity markets, with major indices closing at or near their lows for the reporting period. Uncertainty and volatility were enduring constants.
In response to signs of an economic slowdown, around the world and across industries, many companies that had benefited most from the COVID-19 pandemic began to reduce headcount and take operational steps to mitigate expected weakness. Commodity prices continued their retreat into the end of the reporting period, despite the lingering impact of Russia’s invasion of Ukraine. China took steps to ease its restrictive “zero-COVID” policy, resulting in a wave of infections, hospitalizations, and further economic dislocation as the reporting period ended.
Economic data reflected a mix of contrasting trends, with strength in employment, wages, and savings largely offsetting the effects of consumer price inflation, falling house prices, and waning spending by lower-income households. The persistence of labor-market tightness kept the US Federal Reserve (the Fed) on a tightening path, with the federal funds rate closing the reporting period in the range of 4.25% to 4.50%, levels last seen in 2007. Inflation was a global phenomenon, and central banks in many countries followed a path similar to that of the Fed, leading to a partial retracement of the US dollar’s significant appreciation since the end of 2021.
The Russell 1000 Value Index declined 7.54% in the reporting period. The information technology, communication services, real estate, and consumer discretionary sectors declined the most during the reporting period while the energy sector posted, by far, the largest gain. Defensive value sectors like consumer staples, utilities, and healthcare saw modest gains.
What strategies or holdings affected the Portfolio’s performance?*
Relative to the Portfolio’s benchmark index, stock selection in the healthcare and industrials sectors, along with an overweight allocation to the energy sector and underweight allocations to communication services and real estate, benefited the Portfolio’s performance during the reporting period. Stock selection in the communication services and consumer discretionary sectors, along with a slight overweight to the information technology sector, were the largest detractors from the Portfolio’s relative results during the reporting period.
For a complete list of holdings, please refer to the Schedule of Investments section of this report. Holdings reflect only long-term investments.
| | |
| The Prudential Series Fund, PSF PGIM Jennison Value Portfolio | | December 31, 2022 |
| | |
Report of the Investment Manager - As of December 31, 2022 (Unaudited) (Continued)
The most notable stocks to contribute positively to the overall Portfolio’s performance during the reporting period included Chevron Corp., ConocoPhillips Co., Eli Lilly & Co., Hess Corp., and AbbVie Inc. Top detractors from the Portfolio’s performance for the reporting period included Alphabet Inc., General Motors Co., Qualcomm Inc., Crown Holdings Inc., and Meta Platforms Inc.
* This strategy and performance overview, which discusses what strategies or holdings (including derivatives, if applicable) affected the Portfolio’s performance, is compiled based on how the Portfolio performed relative to the Portfolio’s assigned index and is viewed for performance attribution purposes at the aggregate Portfolio level, which in most instances will not directly correlate to the amounts disclosed in the Statement of Operations which conform to U.S. generally accepted accounting principles.
Presentation of Portfolio Holdings — unaudited
| | | | |
|
| PSF PGIM Jennison Value Portfolio (As of 12/31/2022) |
| | |
Ten Largest Holdings | | Line of Business | | % of Net Assets |
Chevron Corp. | | Oil, Gas & Consumable Fuels | | 3.8% |
Eli Lilly & Co. | | Pharmaceuticals | | 3.4% |
Bristol-Myers Squibb Co. | | Pharmaceuticals | | 3.2% |
JPMorgan Chase & Co. | | Banks | | 3.1% |
Chubb Ltd. | | Insurance | | 3.0% |
ConocoPhillips | | Oil, Gas & Consumable Fuels | | 2.7% |
AbbVie, Inc. | | Biotechnology | | 2.5% |
Linde PLC (United Kingdom) | | Chemicals | | 2.3% |
Bank of America Corp. | | Banks | | 2.2% |
Goldman Sachs Group, Inc. (The) | | Capital Markets | | 2.2% |
For a complete list of holdings, please refer to the Schedule of Investments section of this report. Holdings reflect only long-term investments.
| | |
| The Prudential Series Fund, PSF PGIM Total Return Bond Portfolio | | December 31, 2022 |
| | |
Report of the Investment Manager - As of December 31, 2022 (Unaudited)
| | | | | | | | | | | | | | |
| Average Annual Total Returns | | 1 Year | | 5 Years | | | 10 Years | | | Since Inception | | 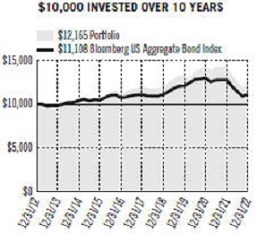
|
Portfolio: Class I | | -14.81% | | | 0.30% | | | | 1.98% | | | — |
Portfolio: Class III | | -15.09 | | | N/A | | | | N/A | | | -8.24 |
Bloomberg US Aggregate Bond Index | | -13.01 | | | 0.02 | | | | 1.06 | | | — |
Past performance does not guarantee future returns. The investment return and principal value of an investment will fluctuate, so that shares, when redeemed, may be worth more or less than their original cost. Current performance may be lower or higher than the past performance. Portfolio Class III inception: 04/26/2021. Portfolio performance is net of fund expenses, but not contract charges, which, if included, would significantly lower the performance quoted. Performance figures may reflect fee waivers and/or expense reimbursements. In the absence of such fee waivers and/or expense reimbursements, performance would be lower. Unless noted otherwise, Index returns are based on the Portfolio’s Class I shares. |
|
The graph is based on the performance of Class I shares. Performance of Class III shares will be lower due to differences in the fee structure. Class III shares have associated 12b-1 fees at an annual rate of 0.25%, of the average daily net assets of the Class III shares. |
For the year ended December 31, 2022, the PSF PGIM Total Return Bond Portfolio Class I shares returned -14.81%. The Portfolio’s Class I shares underperformed the Bloomberg US Aggregate Bond Index.
What were the market conditions during the reporting period?
From a starting point of low yields, tight spreads (yield differentials), and high equity multiples, the shift in fundamentals—most notably, high inflation—drove a wholesale repricing of markets in calendar-year 2022 (the reporting period). Concerns about central bank tightening, hard economic landings, and Russia’s invasion of Ukraine led credit spreads notably wider, while rate volatility increased as markets first began pricing in more aggressive Federal Open Market Committee policy tightening and then later began to price in a hard economic landing. (A hard landing refers to a marked economic slowdown or downturn.)
Against the backdrop of historic lows in unemployment and generational highs in inflation, central banks signaled an increased willingness to accept more economic and market pain than what was experienced over the prior decade of low inflation. A succession of federal funds rate hikes—by over 400 basis points (bps) in the reporting period—confirmed to markets that the US Federal Reserve (the Fed) was fully focused on tackling inflation. (One basis point equals 0.01%.)
As a result, enormous volatility continued to be priced into US Treasuries, with sharply higher front-end rates and lower long-dated yields forming a substantially flatter US Treasury yield curve before the curve finally inverted in the last six months of the reporting period. (A yield curve is a line graph that illustrates the relationship between the yields and maturities of fixed income securities. It is created by plotting the yields of different maturities for the same type of bonds.) From 0.78% on December 31, 2021, the 10-year/2-year Treasury spread declined to -0.54% by the end of the reporting period. US 10-year Treasury yields began the reporting period at 1.51% and ended it at 3.88%. Meanwhile, the yield on the 2-year Treasury note ended the reporting period at 4.42%, a rise of 369 bps since the beginning of the reporting period.
US investment-grade corporate spreads widened significantly as corporates were challenged by elevated inflationary pressures, a slower growth outlook, and higher event and geopolitical risk. US high yield bonds posted significant declines through much of the reporting period as rate-hike concerns, high and persistent inflation, and recession fears overshadowed the strength of earnings and credit fundamentals. Securitized credit spreads, including collateralized loan obligations (CLO) and commercial mortgage-backed securities (CMBS), also widened. The emerging markets sector posted negative total returns, and spreads widened as markets were pressured by tightening financial conditions and slowing growth in China and Europe. Meanwhile, agency mortgage-backed securities (MBS) underperformed US Treasuries on concerns that the Fed may begin selling MBS if Fed officials need to step up their inflation fight.
For a complete list of holdings, please refer to the Schedule of Investments section of this report. Holdings reflect only long-term investments.
| | |
| The Prudential Series Fund, PSF PGIM Total Return Bond Portfolio | | December 31, 2022 |
| | |
Report of the Investment Manager - As of December 31, 2022 (Unaudited) (Continued)
What strategies or holdings affected the Portfolio’s performance?*
During the reporting period, individual security selection and sector allocation were the main drivers of the Portfolio’s underperformance. Within security selection, positioning in US Treasuries, emerging markets debt, and investment-grade corporate bonds were the largest detractors. This was partially offset by selection in CLOs, high yield corporate bonds, and agency securities, all of which contributed to the Portfolio’s performance. Within sector allocation, overweights relative to the benchmark index in high yield corporate bonds, CLOs, and CMBS, along with a duration underweight to investment-grade corporate bonds, detracted from the Portfolio’s performance. (A duration underweight means having less exposure than the benchmark to higher-duration bonds. Duration measures the sensitivity of the price—the value of principal—of a bond to a change in interest rates.) This was partially offset by an underweight to MBS, which contributed to the Portfolio’s performance. Within credit, selection in upstream energy, aerospace & defense, and midstream energy contributed to the Portfolio’s performance. Selection in foreign non-corporate bonds, banking, and healthcare & pharmaceuticals detracted from the Portfolio’s performance. The Portfolio’s duration positioning also detracted from performance during the period, while its yield curve strategies contributed to the Portfolio’s performance.
During the reporting period, the Portfolio used interest rate swaps to help manage duration and yield curve exposure. In aggregate, the use of interest rate swaps had a negative impact on the Portfolio’s performance during the reporting period. In addition, the Portfolio used futures to manage interest rate risk, a more efficient way of managing interest rate risk than through the purchase and sale of cash bonds. The use of futures had a negative impact on the Portfolio’s performance during the reporting period. The Portfolio also used credit derivatives in the form of the Credit Default Swap Index (CDX) to manage credit risk. The use of CDX contributed to the Portfolio’s performance for the reporting period.
* This strategy and performance overview, which discusses what strategies or holdings (including derivatives, if applicable) affected the Portfolio’s performance, is compiled based on how the Portfolio performed relative to the Portfolio’s assigned index and is viewed for performance attribution purposes at the aggregate Portfolio level, which in most instances will not directly correlate to the amounts disclosed in the Statement of Operations which conform to U.S. generally accepted accounting principles.
Presentation of Portfolio Holdings — unaudited
| | | | |
|
| PSF PGIM Total Return Bond Portfolio (As of 12/31/2022) |
| | |
Credit Quality | | | | % of Total Investments |
AAA | | | | 56.7% |
AA | | | | 3.7% |
A | | | | 10.6% |
BBB | | | | 17.7% |
BB | | | | 9.1% |
B | | | | 4.4% |
CCC | | | | 0.9% |
CC | | | | 0.2% |
NR | | | | 5.0% |
Cash/Cash Equivalents | | | | -8.3% |
Total Investments | | | | 100.0% |
Credit ratings reflect the middle rating assigned by a nationally recognized statistical rating organization (NRSRO) such as Moody’s Investor Service, Inc. (Moody’s), S&P Global Ratings (S&P), or Fitch, Inc. (Fitch). Credit ratings reflect the common nomenclature used by both S&P and Fitch. Where applicable, ratings are converted to the comparable S&P/Fitch rating tier nomenclature. These rating agencies are independent, and are widely used. The Not Rated (NR) category consists of securities that have not been rated by a NRSRO. Ratings category may include derivative instruments that could have a negative value. Credit ratings are subject to change.
| | |
| The Prudential Series Fund, PSF Small-Cap Stock Index Portfolio | | December 31, 2022 |
| | |
Report of the Investment Manager - As of December 31, 2022 (Unaudited)
| | | | | | | | | | | | | | |
| Average Annual Total Returns | | 1 Year | | 5 Years | | | 10 Years | | | Since Inception | | 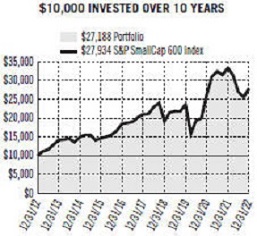
|
Portfolio: Class I | | -16.37% | | | 5.55% | | | | 10.52% | | | — |
Portfolio: Class III | | -16.58 | | | N/A | | | | N/A | | | -7.91 |
S&P SmallCap 600 Index | | -16.10 | | | 5.88 | | | | 10.82 | | | — |
Past performance does not guarantee future returns. The investment return and principal value of an investment will fluctuate, so that shares, when redeemed, may be worth more or less than their original cost. Current performance may be lower or higher than the past performance. Portfolio Class III inception: 04/26/2021. Portfolio performance is net of fund expenses, but not contract charges, which, if included, would significantly lower the performance quoted. Performance figures may reflect fee waivers and/or expense reimbursements. In the absence of such fee waivers and/or expense reimbursements, performance would be lower. Unless noted otherwise, Index returns are based on the Portfolio’s Class I shares. |
|
The graph is based on the performance of Class I shares. Performance of Class III shares will be lower due to differences in the fee structure. Class III shares have associated 12b-1 fees at an annual rate of 0.25%, of the average daily net assets of the Class III shares. |
For the year ended December 31, 2022, the PSF Small-Cap Stock Index Portfolio Class I shares returned -16.37%. The Portfolio’s Class I shares underperformed the S&P SmallCap 600 Index.
What were the market conditions during the reporting period?
US equities experienced their worst full-year performance in calendar-year 2022 (the reporting period) since the Global Financial Crisis of 2008. Peaking in the first week of the reporting period, equities continued a downward path through the end of the third quarter, before making up some lost ground in the fourth quarter of the reporting period. While most sectors posted negative returns for the full reporting period, commodity-related equities were an exception, advancing by double digits and further burnishing their credentials as effective inflation hedges. There was also a large disparity between growth and value equities, with the latter outperforming the former by more than 20% as sky-high valuations for growth stocks succumbed to rising interest rates and more realistic profitability outlooks. Despite the steep declines, valuations for US equities remained historically high at the end of the reporting period, supported by a favorable earnings growth outlook, especially when compared to other developed markets. Despite predictions of a mild economic recession in 2023, full-year earnings growth was still expected to be positive, albeit in the single-digit range.
What strategies or holdings affected the Portfolio’s performance?*
Cash flows, brokerage costs, and other Portfolio costs and expenses caused the Portfolio’s return to slightly differ from the return of its benchmark, the S&P Small-Cap 600 Index (the Index).
In terms of positions, PBF Energy, Inc. and Helmerich & Payne, Inc. were the largest positive contributors to the Portfolio’s performance, while Innovative Industrial Properties, Inc. was the largest detractor.
The Portfolio closely tracked the Index during the reporting period. Most of the buy or sell trades and trades made to increase or decrease the number of shares held in a position were traded market-on-close, or as close as possible to the end of the market day, to more closely track the Index. Securities lending income consistently added to Portfolio returns. The income was greater for small-cap equities because it is often more difficult to borrow shares of some of the small-cap stocks, which are not typically as widely traded as large-cap stocks.
The Portfolio had a small exposure to derivative instruments during the reporting period to help enhance liquidity, but the position did not have a material impact on the Portfolio’s performance.
* This strategy and performance overview, which discusses what strategies or holdings (including derivatives, if applicable) affected the Portfolio’s performance, is compiled based on how the Portfolio performed relative to the Portfolio’s assigned index and is viewed for performance attribution purposes at the aggregate Portfolio level, which in most instances will not directly correlate to the amounts disclosed in the Statement of Operations which conform to U.S. generally accepted accounting principles.
For a complete list of holdings, please refer to the Schedule of Investments section of this report. Holdings reflect only long-term investments.
| | |
The Prudential Series Fund, PSF Small-Cap Stock Index Portfolio | | December 31, 2022 |
| | |
Report of the Investment Manager - As of December 31, 2022 (Unaudited) (Continued)
Presentation of Portfolio Holdings — unaudited
| | | | |
|
| PSF Small-Cap Stock Index Portfolio (As of 12/31/2022) |
| | |
Ten Largest Holdings | | Asset Class/Line of Business | | % of Net Assets |
iShares Core S&P Small-Cap ETF | | Exchange-Traded Funds | | 1.3% |
Agree Realty Corp., | | Equity Real Estate Investment Trusts (REITs) | | 0.7% |
Ensign Group, Inc. (The) | | Health Care Providers & Services | | 0.6% |
Helmerich & Payne, Inc. | | Energy Equipment & Services | | 0.6% |
Exponent, Inc. | | Professional Services | | 0.5% |
UFP Industries, Inc. | | Building Products | | 0.5% |
Applied Industrial Technologies, Inc. | | Trading Companies & Distributors | | 0.5% |
Fabrinet (Thailand) | | Electronic Equipment, Instruments & Components | | 0.5% |
SPS Commerce, Inc. | | Software | | 0.5% |
AMN Healthcare Services, Inc. | | Health Care Providers & Services | | 0.5% |
For a complete list of holdings, please refer to the Schedule of Investments section of this report. Holdings reflect only long-term investments.
| | |
The Prudential Series Fund, PSF Small-Cap Value Portfolio | | December 31, 2022 |
| | |
Report of the Investment Manager - As of December 31, 2022 (Unaudited)
| | | | | | | | |
| Average Annual Total Returns | | 1 Year | | 5 Years | | 10 Years | | 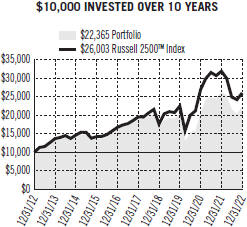
|
Portfolio | | -14.65% | | 3.09% | | 8.38% |
Russell 2000® Value Index | | -14.48 | | 4.13 | | 8.48 |
Russell 2500™ Index | | -18.37 | | 5.89 | | 10.03 |
Past performance does not guarantee future returns. The investment return and principal value of an investment will fluctuate, so that shares, when redeemed, may be worth more or less than their original cost. Current performance may be lower or higher than the past performance. |
Portfolio performance is net of fund expenses, but not contract charges, which, if included, would significantly lower the performance quoted. Performance figures may reflect fee waivers and/or expense reimbursements. In the absence of such fee waivers and/or expense reimbursements, performance would be lower. The Russell 2000® Value and Russell 2500™Index are trademark/service marks of the Frank Russell Company. Russell® is a trademark of the Frank Russell Company. |
For the year ended December 31, 2022, the PSF Small-Cap Value Portfolio returned -14.65%. The Portfolio underperformed the Russell 2000 Value Index and outperformed the Russell 2500 Index.
What were the market conditions during the reporting period?
The Russell 2000 Value Index (the Index), a proxy for small-capitalization value stocks, returned -14.48% in calendar-year 2022 (the reporting period). The reporting period saw heightened volatility, with negative returns in the first three quarters and a slight rebound in the fourth quarter. During the reporting period, small-cap value stocks outperformed small-cap growth stocks overall. The fourth quarter of 2022 marked the seventh of the last eight quarters in which small-cap value stocks outperformed small-cap growth stocks and the first time value had outperformed growth in two consecutive years since 2005-2006. Within the small-cap value market segment, energy was the only positively contributing sector, while real estate and financials detracted most.
What strategies or holdings affected the Portfolio’s performance?*
Stock selection in financials and communication services contributed positively to the Portfolio’s relative returns, while investments in real estate and energy detracted from relative returns.
Antero Resources Corp., an independent oil and gas company that engages in the development, production, exploration, and acquisition of natural gas, was a top positive contributor to the Portfolio’s relative returns during the reporting period. Supported by an increase in commodity prices, shares of the company rose to start the reporting period. The market also reacted positively to an earlier-than-expected share repurchasing program. Following a run-up in the stock price, the Portfolio’s position in Antero Resources was sold and proceeds of the sale reallocated. Professional services firm KBR, Inc. was another top contributor. Despite some volatility during the reporting period, KBR’s stock price ended higher after the company was awarded a $156.7 million contract to update the US Army’s Utility Helicopter 60 Variant fleet. At the end of the reporting period, the Portfolio continued to see upside potential for KBR given the opportunity for continued strong organic growth, capital deployment via mergers and acquisitions, and re-rating of the company’s sustainable technology business segment.
Hudson Pacific Properties, Inc., an office, media, and entertainment property real estate investment trust (REIT), was a top detractor from the Portfolio’s relative return during the reporting period. Despite largely in-line or above-expectation earnings results, softer guidance and broad weakness in its peer group drove its stock lower. The market also reacted negatively to Hudson Pacific’s completion of its previously announced acquisition of Washington 1000, a fully entitled, state-of-the-art office development site in Seattle. Despite recent weakness, the Portfolio continued to hold shares of Hudson Pacific at the end of the reporting period, as leasing volumes were recovering, mark to market remained intact, and the company was aggressively repurchasing stock. (Mark to market refers to an accounting tool used to record the value of an asset with respect to its current market price.) Cell tower and data center REIT DigitalBridge Group, Inc. was another top detractor. During the reporting period, the data center space sold off broadly as a result of the rotation away from higher-growth sectors in light of the macroeconomic backdrop. The Portfolio exited its position in November 2022 on some strength and reallocated proceeds to what it saw as better risk-reward opportunities elsewhere in the Portfolio.
For a complete list of holdings, please refer to the Schedule of Investments section of this report. Holdings reflect only long-term investments.
| | |
The Prudential Series Fund, PSF Small-Cap Value Portfolio | | December 31, 2022 |
| | |
Report of the Investment Manager - As of December 31, 2022 (Unaudited) (Continued)
* This strategy and performance overview, which discusses what strategies or holdings (including derivatives, if applicable) affected the Portfolio’s performance, is compiled based on how the Portfolio performed relative to the Portfolio’s assigned index and is viewed for performance attribution purposes at the aggregate Portfolio level, which in most instances will not directly correlate to the amounts disclosed in the Statement of Operations which conform to U.S. generally accepted accounting principles.
Presentation of Portfolio Holdings — unaudited
| | | | |
|
| PSF Small-Cap Value Portfolio (As of 12/31/2022) |
| | |
Ten Largest Holdings | | Asset Class/Line of Business | | % of Net Assets |
iShares Russell 2000 Value ETF | | Exchange-Traded Fund | | 1.5% |
Physicians Realty Trust | | Equity Real Estate Investment Trusts (REITs) | | 1.3% |
STAG Industrial, Inc. | | Equity Real Estate Investment Trusts (REITs) | | 1.1% |
KBR, Inc. | | Professional Services | | 1.1% |
Hancock Whitney Corp. | | Banks | | 1.1% |
Selective Insurance Group, Inc. | | Insurance | | 1.0% |
ABM Industries, Inc. | | Commercial Services & Supplies | | 1.0% |
Terreno Realty Corp. | | Equity Real Estate Investment Trusts (REITs) | | 1.0% |
Hostess Brands, Inc. | | Food Products | | 0.9% |
United Community Banks, Inc. | | Banks | | 0.9% |
For a complete list of holdings, please refer to the Schedule of Investments section of this report. Holdings reflect only long-term investments.
| | |
| The Prudential Series Fund, PSF Stock Index Portfolio | | December 31, 2022 |
| | |
Report of the Investment Manager - As of December 31, 2022 (Unaudited)
| | | | | | | | | | |
| Average Annual Total Returns | | 1 Year | | 5 Years | | 10 Years | | Since Inception | | 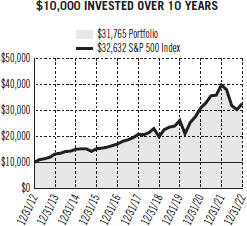
|
Portfolio: Class I | | -18.34% | | 9.11% | | 12.25% | | — |
Portfolio: Class III | | -18.54 | | N/A | | N/A | | -3.97 |
S&P 500 Index | | -18.10 | | 9.42 | | 12.55 | | — |
Past performance does not guarantee future returns. The investment return and principal value of an investment will fluctuate, so that shares, when redeemed, may be worth more or less than their original cost. Current performance may be lower or higher than the past performance. |
Portfolio Class III inception: 04/26/2021. Portfolio performance is net of fund expenses, but not contract charges, which, if included, would significantly lower the performance quoted. Performance figures may reflect fee waivers and/or expense reimbursements. In the absence of such fee waivers and/or expense reimbursements, performance would be lower. Unless noted otherwise, Index returns are based on the Portfolio’s Class I shares. |
The graph is based on the performance of Class I shares. Performance of Class III shares will be lower due to differences in the fee structure. Class III shares have associated 12b-1 fees at an annual rate of 0.25%, of the average daily net assets of the Class III shares. |
For the year ended December 31, 2022, the PSF Stock Index Portfolio Class I shares returned -18.34%. The Portfolio’s Class I shares underperformed the S&P 500 Index.
What were the market conditions during the reporting period?
US equities experienced their worst full-year performance in calendar-year 2022 (the reporting period) since the Global Financial Crisis of 2008. Peaking in the first week of the reporting period, equities continued a downward path through the end of the third quarter, before making up some lost ground in the fourth quarter of the reporting period. While most sectors posted negative returns for the full reporting period, commodity-related equities were an exception, advancing by double digits and further burnishing their credentials as effective inflation hedges. There was also a large disparity between growth and value equities, with the latter outperforming the former by more than 20% as sky-high valuations for growth stocks succumbed to rising interest rates and more realistic profitability outlooks. Despite the steep declines, valuations for US equities remained historically high at the end of the reporting period, supported by a favorable earnings growth outlook, especially when compared to other developed markets. Despite predictions of a mild economic recession in 2023, full-year earnings growth was still expected to be positive, albeit in the single-digit range.
What strategies or holdings affected the Portfolio’s performance?*
Cash flows, brokerage costs, and other Portfolio costs and expenses caused the Portfolio’s return to slightly differ from the return of its benchmark, the S&P 500 Index (the Index).
In terms of positions, ExxonMobil Corp. and Chevron Corp. were the largest positive contributors to the Portfolio’s performance during the reporting period, while Apple Inc. was the largest detractor.
The Portfolio closely tracked the Index during the reporting period. Most of the buy or sell trades and trades made to increase or decrease the number of shares held in a position were traded market-on-close, or as close as possible to the end of the market day, to more closely track the Index. Securities lending income consistently added to Portfolio returns. The income was greater for small-cap equities because it is often more difficult to borrow shares of some of the small-cap stocks, which are not typically as widely traded as large-cap stocks.
The Portfolio had a small exposure to derivative instruments during the reporting period to help enhance liquidity, but the position did not have a material impact on the Portfolio’s performance.
* This strategy and performance overview, which discusses what strategies or holdings (including derivatives, if applicable) affected the Portfolio’s performance, is compiled based on how the Portfolio performed relative to the Portfolio’s assigned index and is viewed for performance attribution purposes at the aggregate Portfolio level, which in most instances will not directly correlate to the amounts disclosed in the Statement of Operations which conform to U.S. generally accepted accounting principles.
For a complete list of holdings, please refer to the Schedule of Investments section of this report. Holdings reflect only long-term investments.
| | |
| The Prudential Series Fund, PSF Stock Index Portfolio | | December 31, 2022 |
| | |
Report of the Investment Manager - As of December 31, 2022 (Unaudited) (Continued)
Presentation of Portfolio Holdings — unaudited
| | | | |
|
| PSF Stock Index Portfolio (As of 12/31/2022) |
| | |
Ten Largest Holdings | | Line of Business | | % of Net Assets |
Apple, Inc. | | Technology Hardware, Storage & Peripherals | | 5.9% |
Microsoft Corp. | | Software | | 5.4% |
Amazon.com, Inc. | | Internet & Direct Marketing Retail | | 2.3% |
Berkshire Hathaway, Inc. (Class B Stock) | | Diversified Financial Services | | 1.7% |
Alphabet, Inc. (Class A Stock) | | Interactive Media & Services | | 1.6% |
UnitedHealth Group, Inc. | | Health Care Providers & Services | | 1.5% |
Alphabet, Inc. (Class C Stock) | | Interactive Media & Services | | 1.4% |
Johnson & Johnson | | Pharmaceuticals | | 1.4% |
Exxon Mobil Corp. | | Oil, Gas & Consumable Fuels | | 1.4% |
JPMorgan Chase & Co. | | Banks | | 1.2% |
For a complete list of holdings, please refer to the Schedule of Investments section of this report. Holdings reflect only long-term investments.
| | |
| The Prudential Series Fund | | December 31, 2022 |
Benchmark Glossary — unaudited | | |
The The indexes are unmanaged and include reinvestment of any income or distributions. They do not reflect any fees, expenses or sales charges. Investors cannot invest directly in a market index.
Bloomberg Government Bond Index is a weighted unmanaged index comprised of securities issued or backed by the US Government, its agencies, and instrumentalities with a remaining maturity of one to 30 years.
Bloomberg US Aggregate Bond Index is an unmanaged index comprised of more than 5,000 government and corporate bonds.
Bloomberg US High Yield 1% Issuer Capped Index is an unmanaged index that covers the universe of US dollar denominated, non-convertible, fixed-rate, non-investment-grade debt. Issuers are capped at 1% of the Index. Index holdings must have at least one year to final maturity, at least $150 million par amount outstanding, and be publicly issued with a rating of Ba1 or lower.
Lipper Global Natural Resources Funds Index is an unmanaged index of funds that invest primarily in the equity securities of domestic and foreign companies engaged in the exploration, development, production, or distribution of natural resources (including oil, natural gas, and base minerals) and/or alternative energy sources (including solar, wind, hydro, tidal, and geothermal). Returns for the Lipper Average reflect the deduction of operating expenses. Natural Resources funds are defined as funds that invest primarily in the equity securities of domestic and foreign companies engaged in natural resources.
Lipper US Government Money Market Index invests principally in financial instruments issued or guaranteed by the US government, its agencies, or its instrumentalities, with dollar-weighted average maturities of less than 90 days.
MSCI EAFE (Morgan Stanley Capital International Europe, Australasia, Far East) Index (GD) is an unmanaged, capitalization-weighted index generally accepted as a benchmark for major overseas markets. TheGDversion does not reflect the impact of withholding taxes on reinvested dividends
MSCI World Index (GD) - The Morgan Stanley Capital International World Index is an unmanaged capitalization weighted index which includes the equity markets of Australia, Austria, Belgium, Canada, Denmark, Finland, France, Germany, Hong Kong, Ireland, Italy, Japan, Malaysia, Netherlands, New Zealand, Norway, Singapore, Spain, Sweden, Switzerland, United Kingdom, and United States. The GD version does not reflect the impact of withholding taxes on reinvested dividends.
PSF PGIM 50/50 Balanced Portfolio Blended Index consists of the S&P 500 Index (50%), an unmanaged, market value-weighted index of over 500 stocks generally representative of the broad stock market, Bloomberg US Aggregate Bond Index (40%), an unmanaged index comprised of more than 5,000 government and corporate bonds, and the FTSE 3-Month T-Bill Index (10%), an unmanaged market value-weighted index of investment grade fixed rate public obligations of the US Treasury with maturities of three months, excluding zero coupon strips.
PSF PGIM Flexible Managed Portfolio Blended Index consists of the S&P 500 Index (60%), an unmanaged, market value-weighted index of over 500 stocks generally representative of the broad stock market, Bloomberg US Aggregate Bond Index (35%), an unmanaged index comprised of more than 5,000 government and corporate bonds, and the FTSE 3-Month T-Bill Index (5%), an unmanaged market value-weighted index of investment grade fixed rate public obligations of the U.S.Treasury with maturities of three months, excluding zero coupon strips.
PSF Natural Resources Portfolio Blended Index consists of the MSCI (Morgan Stanley Capital International) World Energy Index(ND) (60%), an unmanaged capitalization-weighted index that is designed to capture the large and mid-cap segments across twenty-three Developed Markets countries. All securities in the index are classified in the Energy sector. MSCI (Morgan Stanley Capital International) World Materials Index (ND) (40%), an unmanaged capitalization-weighted index that is designed to capture the large and mid-cap segments across twenty-three Developed Markets countries. All securities in the index are classified in the Materials sector.
Russell 1000 Index is an unmanaged market cap-weighted index that measures the performance of the 1,000 largest companies in the Russell 3000 Index, which represents approximately 92% of the total market.
Russell 1000 Growth Index is an unmanaged market cap-weighted index that measures the performance of those Russell 1000 companies with higher price-to-book ratios and higher forecasted growth values.
Russell 1000 Value Index is an unmanaged market cap-weighted index that measures the performance of those Russell 1000 companies with lower price-to-book ratios and lower forecasted growth values.
| | |
| The Prudential Series Fund | | December 31, 2022 |
Benchmark Glossary — unaudited (continued) | | |
Russell 2000 Value Index is an unmanaged index that measures the performance of those Russell 2000 companies with lower forecasted growth values.
Russell 2500 Index is an unmanaged market cap-weighted index that measures the performance of the 2,500 smallest companies in the Russell 3000 Index, which represents approximately 17% of the total market capitalization of the Russell 3000 Index.
Russell Midcap Growth Index is an unmanaged market cap-weighted index that measures the performance of those Russell Midcap companies with higher price-to-book ratios and higher forecasted growth values.
S&P Midcap 400 Index is a widely accepted, unmanaged total return index of 400 domestic stocks measuring the performance of the midsize company segment of the U.S. stock market.
S&P 500 Index is an unmanaged, market value-weighted index of over 500 stocks generally representative of the broad stock market.
S&P SmallCap 600 Index is an unmanaged index representing the aggregate market value of the common equity of 600 small company stocks.
For Russell Indexes: Russell Investment Group is the source and owner of the trademarks, service marks and copyrights related to the Russell Indexes. Russell® is a trademark of Russell Investment Group.
The S&P 500, S&P MidCap 400, and S&P SmallCap 600 indexes are products of S&P DowJones Indices LLC and/or its affiliates and have been licensed for use by PGIM, Inc. and/or its affiliates. Copyright © 2023 S&P Dow Jones Indices LLC, a division of S&P Global, Inc., and/or its affiliates. All rights reserved. Redistribution or reproduction in whole or in part are prohibited without written permission of S&P Dow Jones Indices LLC. For more information on any of S&P Dow Jones Indices LLC’s indices please visit www.spdji.com. S&P® is a registered trademark of S&P Global and Dow Jones® is a registered trademark of Dow Jones Trademark Holdings LLC.
The PSF PGIM 50/50 Balanced Portfolio Blended Index and the PSF PGIM Flexible Managed Portfolio Blended Index are calculated by PGIM, Inc. and/or its affiliates with permission from S&P Dow Jones Indices LLC and/or its affiliates. Neither S&P Dow Jones Indices LLC, Dow Jones Trademark Holdings LLC, their affiliates nor their third party licensors make any representation or warranty, express or implied, as to the ability of any index, including the PSF PGIM 50/50 Balanced Portfolio Blended Index and the PSF PGIM Flexible Managed Portfolio Blended Index, to accurately represent the asset class or market sector that it purports to represent and neither S&P Dow Jones Indices LLC, Dow Jones Trademark Holdings LLC, their affiliates nor their third party licensors shall have any liability for any errors, omissions, or interruptions of any index, including the PSF PGIM 50/50 Balanced Portfolio Blended Index and the PSF PGIM Flexible Managed Portfolio Blended Index, or the data included therein.
| | |
| The Prudential Series Fund | | December 31, 2022 |
Fees and Expenses — unaudited | | |
As a contract owner investing in Portfolios of the Fund through a variable annuity or variable life contract, you incur ongoing costs, including management fees, and other Portfolio expenses. This example is intended to help you understand your ongoing costs (in dollars) of investing in the Fund and to compare these costs with the ongoing costs of investing in other investment options. This example does not reflect fees and charges under your variable annuity or variable life contract. If contract charges were included, the costs shown below would be higher. Please consult the prospectus for your contract for more information about contract fees and charges.
The example is based on an investment of $1,000 invested at the beginning of the period and held for the entire period July 1, 2022 through December 31, 2022.
Actual Expenses
The first line of the table below provides information about actual account values and actual expenses. You may use this information, together with the amount you invested, to estimate the Portfolio expenses that you paid over the period. Simply divide your account value by $1,000 (for example, an $8,600 account value divided by $1,000 = 8.6), then multiply the result by the number in the first line under the heading entitled “Expenses Paid During the Six-Month Period” to estimate the Portfolio expenses you paid on your account during this period. As noted above, the table does not reflect variable contract fees and charges.
Hypothetical Example for Comparison Purposes
The second line of the table below provides information about hypothetical account values and hypothetical expenses based on the Portfolio’s actual expense ratio and an assumed rate of return of 5% per year before expenses, which is not the Portfolio’s actual return. The hypothetical account values and expenses may not be used to estimate the actual ending account balance or expenses you paid for the period. You may use this information to compare the ongoing costs of investing in the Portfolio and other investment options. To do so, compare this 5% hypothetical example with the 5% hypothetical examples that appear in the shareholder reports of the other investment options.
Please note that the expenses shown in the table are meant to highlight your ongoing Portfolio costs only and do not reflect any contract fees and charges, such as sales charges (loads), insurance charges or administrative charges. Therefore the second line of the table is useful to compare ongoing investment option costs only, and will not help you determine the relative total costs of owning different contracts. In addition, if these contract fees and charges were included, your costswould have been higher.
| | | | | | | | | | |
| | | | | |
| The Prudential Series Fund Portfolios | | Beginning
Account Value
July 1, 2022 | | Ending
Account Value
December 31, 2022 | | Annualized Expense
Ratio Based on the
Six-Month Period | | Expenses Paid
During the
Six-Month Period* |
| | | | | |
PSF Global (Class I) | | Actual | | $1,000.00 | | $1,028.30 | | 0.75% | | $3.83 |
| | | | | |
| | | Hypothetical | | $1,000.00 | | $1,021.42 | | 0.75% | | $3.82 |
| | | | | |
PSF Global (Class III) | | Actual | | $1,000.00 | | $1,027.10 | | 1.00% | | $5.11 |
| | | | | |
| | | Hypothetical | | $1,000.00 | | $1,020.16 | | 1.00% | | $5.09 |
| | | | | |
PSF International Growth (Class I) | | Actual | | $1,000.00 | | $1,035.90 | | 1.01% | | $5.18 |
| | | | | |
| | | Hypothetical | | $1,000.00 | | $1,020.11 | | 1.01% | | $5.14 |
| | | | | |
PSF International Growth (Class II) | | Actual | | $1,000.00 | | $1,034.40 | | 1.41% | | $7.18 |
| | | | | |
| | | Hypothetical | | $1,000.00 | | $1,018.15 | | 1.41% | | $7.12 |
| | | | | |
PSF Mid-Cap Growth (Class I) | | Actual | | $1,000.00 | | $1,042.40 | | 0.66% | | $3.40 |
| | | | | |
| | | Hypothetical | | $1,000.00 | | $1,021.88 | | 0.66% | | $3.36 |
| | | | | |
PSF Mid-Cap Growth (Class II) | | Actual | | $1,000.00 | | $1,040.70 | | 1.06% | | $5.45 |
| | | | | |
| | | Hypothetical | | $1,000.00 | | $1,019.86 | | 1.06% | | $5.40 |
| | | | | |
PSF Mid-Cap Growth (Class III) | | Actual | | $1,000.00 | | $1,041.10 | | 0.91% | | $4.68 |
| | | | | |
| | | Hypothetical | | $1,000.00 | | $1,020.62 | | 0.91% | | $4.63 |
| | | | | |
PSF Natural Resources (Class I) | | Actual | | $1,000.00 | | $1,139.40 | | 0.48% | | $2.59 |
| | | | | |
| | | Hypothetical | | $1,000.00 | | $1,022.79 | | 0.48% | | $2.45 |
| | | | | |
PSF Natural Resources (Class II) | | Actual | | $1,000.00 | | $1,137.00 | | 0.88% | | $4.74 |
| | | | | |
| | | Hypothetical | | $1,000.00 | | $1,020.77 | | 0.88% | | $4.48 |
| | |
| The Prudential Series Fund | | December 31, 2022 |
Fees and Expenses — unaudited (continued) | | |
| | | | | | | | | | |
| | | | | |
| The Prudential Series Fund Portfolios | | Beginning
Account Value
July 1, 2022 | | Ending
Account Value
December 31, 2022 | | Annualized Expense
Ratio Based on the
Six-Month Period | | Expenses Paid
During the Six-Month Period* |
| | | | | |
PSF Natural Resources (Class III) | | Actual | | $1,000.00 | | $1,138.00 | | 0.73% | | $3.93 |
| | | | | |
| | | Hypothetical | | $1,000.00 | | $1,021.53 | | 0.73% | | $3.72 |
| | | | | |
PSF PGIM 50/50 Balanced (Class I) | | Actual | | $1,000.00 | | $1,000.60 | | 0.57% | | $2.87 |
| | | | | |
| | | Hypothetical | | $1,000.00 | | $1,022.33 | | 0.57% | | $2.91 |
| | | | | |
PSF PGIM 50/50 Balanced | | Actual | | $1,000.00 | | $ 999.40 | | 0.82% | | $4.13 |
| | | | | |
(Class III) | | Hypothetical | | $1,000.00 | | $1,021.07 | | 0.82% | | $4.18 |
| | | | | |
PSF PGIM Flexible Managed | | Actual | | $1,000.00 | | $ 998.90 | | 0.61% | | $3.07 |
| | | | | |
(Class I) | | Hypothetical | | $1,000.00 | | $1,022.13 | | 0.61% | | $3.11 |
| | | | | |
PSF PGIM Flexible Managed | | Actual | | $1,000.00 | | $ 997.60 | | 0.86% | | $4.33 |
| | | | | |
(Class III) | | Hypothetical | | $1,000.00 | | $1,020.87 | | 0.86% | | $4.38 |
| | | | | |
PSF PGIM Government Income | | Actual | | $1,000.00 | | $ 962.80 | | 0.49% | | $2.42 |
| | | | | |
(Class I) | | Hypothetical | | $1,000.00 | | $1,022.74 | | 0.49% | | $2.50 |
| | | | | |
PSF PGIM Government Income | | Actual | | $1,000.00 | | $ 961.90 | | 0.74% | | $3.66 |
| | | | | |
(Class III) | | Hypothetical | | $1,000.00 | | $1,021.48 | | 0.74% | | $3.77 |
| | | | | |
PSF PGIM Government Money | | Actual | | $1,000.00 | | $1,012.90 | | 0.33% | | $1.67 |
| | | | | |
Market (Class I) | | Hypothetical | | $1,000.00 | | $1,023.54 | | 0.33% | | $1.68 |
| | | | | |
PSF PGIM Government Money | | Actual | | $1,000.00 | | $1,011.60 | | 0.58% | | $2.94 |
| | | | | |
Market (Class III) | | Hypothetical | | $1,000.00 | | $1,022.28 | | 0.58% | | $2.96 |
| | | | | |
PSF PGIM High Yield Bond | | Actual | | $1,000.00 | | $1,024.20 | | 0.57% | | $2.91 |
| | | | | |
(Class I) | | Hypothetical | | $1,000.00 | | $1,022.33 | | 0.57% | | $2.91 |
| | | | | |
PSF PGIM High Yield Bond (Class III) | | Actual | | $1,000.00 | | $1,022.50 | | 0.82% | | $4.18 |
| | | | | |
| | | Hypothetical | | $1,000.00 | | $1,021.07 | | 0.82% | | $4.18 |
| | | | | |
PSF PGIM Jennison Blend (Class I) | | Actual | | $1,000.00 | | $1,017.70 | | 0.46% | | $2.34 |
| | | | | |
| | | Hypothetical | | $1,000.00 | | $1,022.89 | | 0.46% | | $2.35 |
| | | | | |
PSF PGIM Jennison Blend (Class II) | | Actual | | $1,000.00 | | $1,015.80 | | 0.86% | | $4.37 |
| | | | | |
| | | Hypothetical | | $1,000.00 | | $1,020.87 | | 0.86% | | $4.38 |
| | | | | |
PSF PGIM Jennison Blend (Class III) | | Actual | | $1,000.00 | | $1,016.50 | | 0.71% | | $3.61 |
| | | | | |
| | | Hypothetical | | $1,000.00 | | $1,021.63 | | 0.71% | | $3.62 |
| | | | | |
PSF PGIM Jennison Focused Blend (Class I) | | Actual | | $1,000.00 | | $1,019.80 | | 0.88% | | $4.48 |
| | | | | |
| | | Hypothetical | | $1,000.00 | | $1,020.77 | | 0.88% | | $4.48 |
| | | | | |
PSF PGIM Jennison Focused Blend (Class II) | | Actual | | $1,000.00 | | $1,017.80 | | 1.28% | | $6.51 |
| | | | | |
| | | Hypothetical | | $1,000.00 | | $1,018.75 | | 1.28% | | $6.51 |
| | | | | |
PSF PGIM Jennison Focused Blend (Class III) | | Actual | | $1,000.00 | | $1,018.50 | | 1.13% | | $5.75 |
| | | | | |
| | | Hypothetical | | $1,000.00 | | $1,019.51 | | 1.13% | | $5.75 |
| | | | | |
PSF PGIM Jennison Growth (Class I) | | Actual | | $1,000.00 | | $ 970.70 | | 0.61% | | $3.03 |
| | | | | |
| | | Hypothetical | | $1,000.00 | | $1,022.13 | | 0.61% | | $3.11 |
| | | | | |
PSF PGIM Jennison Growth (Class II) | | Actual | | $1,000.00 | | $ 968.70 | | 1.01% | | $5.01 |
| | | | | |
| | | Hypothetical | | $1,000.00 | | $1,020.11 | | 1.01% | | $5.14 |
| | | | | |
PSF PGIM Jennison Growth (Class III) | | Actual | | $1,000.00 | | $ 969.50 | | 0.86% | | $4.27 |
| | | | | |
| | | Hypothetical | | $1,000.00 | | $1,020.87 | | 0.86% | | $4.38 |
| | | | | |
PSF PGIM Jennison Value (Class I) | | Actual | | $1,000.00 | | $1,063.00 | | 0.42% | | $2.18 |
| | | | | |
| | | Hypothetical | | $1,000.00 | | $1,023.09 | | 0.42% | | $2.14 |
| | | | | |
PSF PGIM Jennison Value (Class II) | | Actual | | $1,000.00 | | $1,060.70 | | 0.82% | | $4.26 |
| | | | | |
| | | Hypothetical | | $1,000.00 | | $1,021.07 | | 0.82% | | $4.18 |
| | |
| The Prudential Series Fund | | December 31, 2022 |
Fees and Expenses — unaudited (continued) | | |
| | | | | | | | | | |
| | | | | |
| The Prudential Series Fund Portfolios | | Beginning
Account Value
July 1, 2022 | | Ending
Account Value
December 31, 2022 | | Annualized Expense
Ratio Based on the
Six-Month Period | | Expenses Paid
During the
Six-Month Period* |
| | | | | |
PSF PGIM Jennison Value | | Actual | | $1,000.00 | | $1,061.70 | | 0.67% | | $3.48 |
| | | | | |
(Class III) | | Hypothetical | | $1,000.00 | | $1,021.83 | | 0.67% | | $3.41 |
| | | | | |
PSF PGIM Total Return Bond | | Actual | | $1,000.00 | | $ 973.70 | | 0.44% | | $2.19 |
| | | | | |
(Class I) | | Hypothetical | | $1,000.00 | | $1,022.99 | | 0.44% | | $2.24 |
| | | | | |
PSF PGIM Total Return Bond | | Actual | | $1,000.00 | | $ 972.20 | | 0.69% | | $3.43 |
| | | | | |
(Class III) | | Hypothetical | | $1,000.00 | | $1,021.73 | | 0.69% | | $3.52 |
| | | | | |
PSF Small-Cap Stock Index | | Actual | | $1,000.00 | | $1,033.80 | | 0.38% | | $1.95 |
| | | | | |
(Class I) | | Hypothetical | | $1,000.00 | | $1,023.29 | | 0.38% | | $1.94 |
| | | | | |
PSF Small-Cap Stock Index | | Actual | | $1,000.00 | | $1,032.50 | | 0.63% | | $3.23 |
| | | | | |
(Class III) | | Hypothetical | | $1,000.00 | | $1,022.03 | | 0.63% | | $3.21 |
| | | | | |
PSF Small-Cap Value (Class I) | | Actual | | $1,000.00 | | $1,039.00 | | 0.97% | | $4.99 |
| | | | | |
| | | Hypothetical | | $1,000.00 | | $1,020.32 | | 0.97% | | $4.94 |
| | | | | |
PSF Stock Index (Class I) | | Actual | | $1,000.00 | | $1,021.70 | | 0.29% | | $1.48 |
| | | | | |
| | | Hypothetical | | $1,000.00 | | $1,023.74 | | 0.29% | | $1.48 |
| | | | | |
PSF Stock Index (Class III) | | Actual | | $1,000.00 | | $1,020.40 | | 0.54% | | $2.75 |
| | | | | |
| | | Hypothetical | | $1,000.00 | | $1,022.48 | | 0.54% | | $2.75 |
* Portfolio expenses (net of fee waivers or subsidies, if any) for each share class are equal to the annualized expense ratio for each share class (provided in the table), multiplied by the average account value over the period, multiplied by the 184 days in the six-month period ended December 31, 2022, and divided by the 365 days in the Portfolio’s fiscal year ended December 31, 2022 (to reflect the six-month period). Expenses presented in the table include the expenses of any underlying portfolios in which the Portfolio may invest.
The following abbreviations are used in the Portfolios’ descriptions:
| | |
CAD | | Canadian Dollar |
EUR | | Euro |
GBP | | British Pound |
MXN | | Mexican Peso |
USD | | US Dollar |
ZAR | | South African Rand |
|
144A — Security was purchased pursuant to Rule 144A under the Securities Act of 1933 and, pursuant to the requirements of Rule 144A, may not be resold except to qualified institutional buyers. |
A — Annual payment frequency for swaps |
ABS — Asset-Backed Security |
Aces — Alternative Credit Enhancements Securities |
ADR — American Depositary Receipt |
BABs — Build America Bonds |
BARC — Barclays Bank PLC |
BATE — CBOE- Europe – BXE Order Books |
BNP — BNP Paribas S.A. |
BOA — Bank of America, N.A. |
BOS — Bank of America Securities, Inc. |
CAG — Credit Agricole Corporate & Investment Bank |
CDX — Credit Derivative Index |
CIBC — Canadian Imperial Bank of Commerce |
CIGM — Citigroup Global Markets, Inc. |
CITI — Citibank, N.A. |
CLO — Collateralized Loan Obligation |
CSI — Credit Suisse International |
CVA — Certificate Van Aandelen (Bearer) |
CVR — Contingent Value Rights |
CVT — Convertible Security |
EAFE — Europe, Australasia, Far East |
EMTN — Euro Medium Term Note |
ETF — Exchange-Traded Fund |
EURIBOR — Euro Interbank Offered Rate |
FHLMC — Federal Home Loan Mortgage Corporation |
FNMA — Federal National Mortgage Association |
GDR — Global Depositary Receipt |
GMTN — Global Medium Term Note |
GNMA — Government National Mortgage Association |
|
GS — Goldman Sachs & Co. LLC |
GSI — Goldman Sachs International |
HSBC — HSBC Bank PLC |
ING — ING Financial Markets LLC |
IO — Interest Only (Principal amount represents notional) |
JPM — JPMorgan Chase Bank N.A. |
LIBOR — London Interbank Offered Rate |
LP — Limited Partnership |
M — Monthly payment frequency for swaps |
MASTR — Morgan Stanley Structured Asset Security |
MSCI — Morgan Stanley Capital International |
MSI — Morgan Stanley & Co International PLC |
MTN — Medium Term Note |
NWS — NatWest Markets Securities, Inc. |
OTC — Over-the-counter |
PIK — Payment-in-Kind |
PJSC — Public Joint-Stock Company |
PRFC — Preference Shares |
Q — Quarterly payment frequency for swaps |
REITs — Real Estate Investment Trust |
REMIC — Real Estate Mortgage Investment Conduit |
S&P — Standard & Poor’s |
SCB — Standard Chartered Bank |
SOFR — Secured Overnight Financing Rate |
SONIA — Sterling Overnight Index Average |
SPDR — Standard & Poor’s Depositary Receipts |
SSB — State Street Bank |
STRIPs — Separate Trading of Registered Interest and
Principal of Securities |
T — Swap payment upon termination |
TBA — To Be Announced |
TD — The Toronto-Dominion Bank |
TDM — TD Securities (USA) LLC |
UBS — UBS Securities LLC |
USAID — United States Agency for International
Development |
USOIS — United States Overnight Index Swap |
XNGS — NASDAQ Global Select Exchange |
SEE NOTES TO FINANCIAL STATEMENTS.
A1
| | | | |
| | PSF GLOBAL PORTFOLIO | | |
SCHEDULE OF INVESTMENTS | | | | as of December 31, 2022 |
| | | | | | | | |
| | | Shares | | | Value | |
LONG-TERM INVESTMENTS — 96.9% | |
COMMON STOCKS — 96.8% | | | | | | | | |
Australia — 1.2% | | | | | | | | |
ANZ Group Holdings Ltd. | | | 65,280 | | | $ | 1,051,590 | |
Aristocrat Leisure Ltd. | | | 56,893 | | | | 1,172,326 | |
Aurizon Holdings Ltd. | | | 303,400 | | | | 768,646 | |
Bank of Queensland Ltd. | | | 148,800 | | | | 695,814 | |
Beach Energy Ltd. | | | 395,200 | | | | 429,131 | |
BHP Group Ltd. | | | 64,500 | | | | 1,998,013 | |
Fortescue Metals Group Ltd. | | | 86,570 | | | | 1,210,002 | |
Harvey Norman Holdings Ltd. | | | 315,300 | | | | 883,470 | |
Inghams Group Ltd. | | | 420,300 | | | | 814,867 | |
JB Hi-Fi Ltd. | | | 5,660 | | | | 161,320 | |
Metcash Ltd. | | | 333,000 | | | | 900,519 | |
New Hope Corp. Ltd. | | | 175,600 | | | | 754,144 | |
Perenti Ltd.* | | | 432,300 | | | | 387,185 | |
Rio Tinto Ltd. | | | 20,600 | | | | 1,625,867 | |
St. Barbara Ltd.* | | | 343,600 | | | | 183,667 | |
Stockland, REIT | | | 279,500 | | | | 688,369 | |
Super Retail Group Ltd. | | | 105,600 | | | | 766,438 | |
Woodside Energy Group Ltd. | | | 11,655 | | | | 282,263 | |
| | | | | | | | |
| | |
| | | | | | | 14,773,631 | |
| | | | | | | | |
Austria — 0.3% | | | | | | | | |
BAWAG Group AG, 144A* | | | 16,000 | | | | 852,645 | |
OMV AG | | | 33,700 | | | | 1,733,561 | |
Wienerberger AG | | | 26,400 | | | | 636,343 | |
| | | | | | | | |
| | |
| | | | | | | 3,222,549 | |
| | | | | | | | |
Belgium — 0.3% | | | | | | | | |
Bekaert SA | | | 22,500 | | | | 874,418 | |
KBC Group NV | | | 40,493 | | | | 2,607,155 | |
Telenet Group Holding NV | | | 23,500 | | | | 383,856 | |
| | | | | | | | |
| | |
| | | | | | | 3,865,429 | |
| | | | | | | | |
Brazil — 0.3% | | | | | | | | |
B3 SA - Brasil Bolsa Balcao | | | 490,500 | | | | 1,225,575 | |
MercadoLibre, Inc.* | | | 1,685 | | | | 1,425,914 | |
Yara International ASA | | | 18,800 | | | | 825,639 | |
| | | | | | | | |
| | |
| | | | | | | 3,477,128 | |
| | | | | | | | |
Canada — 2.3% | | | | | | | | |
Canadian Pacific Railway Ltd.(a) | | | 114,042 | | | | 8,506,393 | |
Dollarama, Inc. | | | 55,332 | | | | 3,236,146 | |
Intact Financial Corp. | | | 19,368 | | | | 2,788,048 | |
Magna International, Inc.(a) | | | 35,573 | | | | 1,998,491 | |
TC Energy Corp.(a) | | | 189,469 | | | | 7,552,234 | |
Toronto-Dominion Bank (The) | | | 49,674 | | | | 3,216,336 | |
| | | | | | | | |
| | |
| | | | | | | 27,297,648 | |
| | | | | | | | |
China — 0.4% | | | | | | | | |
China Resources Cement Holdings Ltd. | | | 1,042,000 | | | | 550,647 | |
China Tourism Group Duty Free Corp. Ltd. (Class H Stock), 144A* | | | 65,200 | | | | 1,910,961 | |
Kingboard Holdings Ltd. | | | 216,000 | | | | 684,964 | |
Lee & Man Paper Manufacturing Ltd. | | | 1,049,000 | | | | 460,001 | |
Xinyi Glass Holdings Ltd. | | | 328,000 | | | | 606,005 | |
| | | | | | | | |
| | |
| | | | | | | 4,212,578 | |
| | | | | | | | |
| | | | | | | | |
| | | Shares | | | Value | |
COMMON STOCKS (continued) | | | | | | | | |
Denmark — 1.1% | | | | | | | | |
AP Moller - Maersk A/S (Class B Stock) | | | 200 | | | $ | 447,721 | |
Coloplast A/S (Class B Stock) | | | 13,182 | | | | 1,544,307 | |
D/S Norden A/S | | | 18,400 | | | | 1,108,873 | |
Danske Bank A/S | | | 43,400 | | | | 855,983 | |
DSV A/S | | | 14,784 | | | | 2,337,900 | |
Jyske Bank A/S* | | | 19,600 | | | | 1,270,900 | |
Novo Nordisk A/S (Class B Stock) | | | 33,232 | | | | 4,513,423 | |
Pandora A/S | | | 9,500 | | | | 671,474 | |
Spar Nord Bank A/S | | | 17,570 | | | | 269,053 | |
| | | | | | | | |
| | |
| | | | | | | 13,019,634 | |
| | | | | | | | |
Finland — 0.4% | | | | | | | | |
Neste OYJ | | | 51,657 | | | | 2,382,265 | |
Nokia OYJ | | | 243,000 | | | | 1,128,906 | |
Nordea Bank Abp | | | 83,600 | | | | 895,520 | |
Valmet OYJ | | | 27,100 | | | | 731,556 | |
| | | | | | | | |
| | |
| | | | | | | 5,138,247 | |
| | | | | | | | |
France — 5.3% | | | | | | | | |
Airbus SE | | | 27,127 | | | | 3,225,468 | |
Arkema SA | | | 8,700 | | | | 782,521 | |
AXA SA | | | 54,100 | | | | 1,506,985 | |
BNP Paribas SA | | | 28,200 | | | | 1,605,685 | |
Bouygues SA | | | 39,800 | | | | 1,193,672 | |
Capgemini SE | | | 4,000 | | | | 668,705 | |
Carrefour SA | | | 89,600 | | | | 1,498,645 | |
Cie de Saint-Gobain | | | 15,800 | | | | 772,949 | |
Cie Generale des Etablissements Michelin SCA | | | 22,400 | | | | 624,004 | |
Credit Agricole SA | | | 78,500 | | | | 825,769 | |
Dassault Systemes SE | | | 32,775 | | | | 1,178,578 | |
Euroapi SA* | | | 1 | | | | 15 | |
Faurecia SE* | | | 1,269 | | | | 19,207 | |
Ipsen SA | | | 7,557 | | | | 812,836 | |
Kering SA | | | 1,205 | | | | 613,258 | |
L’Oreal SA | | | 6,201 | | | | 2,220,564 | |
LVMH Moet Hennessy Louis Vuitton SE | | | 11,690 | | | | 8,506,734 | |
Nexity SA | | | 13,100 | | | | 365,910 | |
Orange SA | | | 140,000 | | | | 1,389,097 | |
Rubis SCA | | | 22,100 | | | | 581,940 | |
Safran SA | | | 21,322 | | | | 2,670,666 | |
Sanofi | | | 31,700 | | | | 3,056,723 | |
Sartorius Stedim Biotech | | | 6,161 | | | | 2,002,128 | |
Societe BIC SA | | | 15,900 | | | | 1,088,402 | |
Societe Generale SA | | | 28,600 | | | | 717,393 | |
Sopra Steria Group SACA | | | 7,100 | | | | 1,074,963 | |
Teleperformance | | | 7,714 | | | | 1,844,151 | |
TotalEnergies SE | | | 58,800 | | | | 3,691,064 | |
TotalEnergies SE, ADR | | | 224,658 | | | | 13,946,769 | |
Vinci SA | | | 46,671 | | | | 4,652,493 | |
| | | | | | | | |
| | |
| | | | | | | 63,137,294 | |
| | | | | | | | |
Germany — 2.1% | | | | | | | | |
Allianz SE | | | 5,000 | | | | 1,067,789 | |
Aurubis AG | | | 10,800 | | | | 879,133 | |
Bayer AG | | | 23,300 | | | | 1,199,253 | |
SEE NOTES TO FINANCIAL STATEMENTS.
A2
| | | | |
| | PSF GLOBAL PORTFOLIO (CONTINUED) | | |
SCHEDULE OF INVESTMENTS | | | | as of December 31, 2022 |
| | | | | | | | |
| | | Shares | | | Value | |
COMMON STOCKS (continued) | |
Germany (cont’d.) | | | | | | | | |
Bayerische Motoren Werke AG | | | 15,630 | | | $ | 1,383,803 | |
Daimler Truck Holding AG* | | | 8,800 | | | | 270,527 | |
Deutsche Post AG | | | 63,500 | | | | 2,376,594 | |
Deutsche Telekom AG | | | 45,300 | | | | 901,315 | |
Fresenius SE & Co. KGaA | | | 18,600 | | | | 519,534 | |
HOCHTIEF AG | | | 752 | | | | 42,237 | |
Infineon Technologies AG | | | 119,557 | | | | 3,633,568 | |
Mercedes-Benz Group AG | | | 25,800 | | | | 1,687,190 | |
Muenchener Rueckversicherungs-Gesellschaft AG in Muenchen | | | 2,600 | | | | 841,024 | |
Rational AG | | | 259 | | | | 153,801 | |
Rheinmetall AG | | | 4,910 | | | | 977,464 | |
Siemens AG, ADR | | | 96,520 | | | | 6,639,611 | |
Siltronic AG | | | 8,900 | | | | 647,390 | |
United Internet AG | | | 18,400 | | | | 371,029 | |
Volkswagen AG | | | 7,100 | | | | 1,113,819 | |
| | | | | | | | |
| | |
| | | | | | | 24,705,081 | |
| | | | | | | | |
| | |
Hong Kong — 0.5% | | | | | | | | |
AIA Group Ltd. | | | 251,000 | | | | 2,771,891 | |
PAX Global Technology Ltd. | | | 933,000 | | | | 803,085 | |
Techtronic Industries Co. Ltd. | | | 42,000 | | | | 466,487 | |
Tongda Group Holdings Ltd.* | | | 8,180,000 | | | | 134,777 | |
WH Group Ltd., 144A | | | 2,038,000 | | | | 1,188,640 | |
Yue Yuen Industrial Holdings Ltd. | | | 296,500 | | | | 414,943 | |
| | | | | | | | |
| | |
| | | | | | | 5,779,823 | |
| | | | | | | | |
| | |
India — 0.8% | | | | | | | | |
HDFC Bank Ltd., ADR(a) | | | 42,505 | | | | 2,907,767 | |
Infosys Ltd., ADR(a) | | | 130,094 | | | | 2,342,993 | |
Reliance Industries Ltd., 144A, GDR | | | 78,479 | | | | 4,814,203 | |
| | | | | | | | |
| | |
| | | | | | | 10,064,963 | |
| | | | | | | | |
| | |
Indonesia — 0.0% | | | | | | | | |
First Resources Ltd. | | | 552,800 | | | | 612,224 | |
| | | | | | | | |
| | |
Italy — 0.4% | | | | | | | | |
A2A SpA | | | 546,200 | | | | 728,229 | |
Coca-Cola HBC AG* | | | 20,738 | | | | 490,222 | |
Enel SpA | | | 17,300 | | | | 93,042 | |
Leonardo SpA | | | 97,000 | | | | 836,603 | |
Mediobanca Banca di Credito Finanziario SpA | | | 87,600 | | | | 841,754 | |
Piaggio & C SpA | | | 176,400 | | | | 529,226 | |
Pirelli & C SpA, 144A | | | 171,800 | | | | 736,430 | |
UnipolSai Assicurazioni SpA | | | 253,700 | | | | 624,596 | |
| | | | | | | | |
| | |
| | | | | | | 4,880,102 | |
| | | | | | | | |
| | |
Japan — 4.8% | | | | | | | | |
AGC, Inc.(a) | | | 21,300 | | | | 706,856 | |
Aozora Bank Ltd. | | | 36,000 | | | | 707,568 | |
Bell System24 Holdings, Inc. | | | 36,000 | | | | 371,000 | |
BIPROGY, Inc. | | | 14,100 | | | | 357,254 | |
Brother Industries Ltd. | | | 44,300 | | | | 669,536 | |
Citizen Watch Co. Ltd. | | | 149,100 | | | | 669,445 | |
Credit Saison Co. Ltd. | | | 42,600 | | | | 549,277 | |
Daihen Corp. | | | 25,000 | | | | 731,475 | |
Dai-ichi Life Holdings, Inc. | | | 39,900 | | | | 901,077 | |
| | | | | | | | |
| | | Shares | | | Value | |
COMMON STOCKS (continued) | |
Japan (cont’d.) | | | | | | | | |
Daikin Industries Ltd. | | | 16,200 | | | $ | 2,457,760 | |
Daiwa House Industry Co. Ltd. | | | 31,900 | | | | 734,857 | |
DCM Holdings Co. Ltd. | | | 71,900 | | | | 656,070 | |
DTS Corp. | | | 17,400 | | | | 392,104 | |
EDION Corp. | | | 63,900 | | | | 624,960 | |
Fuji Corp. | | | 34,400 | | | | 501,205 | |
GungHo Online Entertainment, Inc.* | | | 31,100 | | | | 502,329 | |
Gunze Ltd. | | | 17,000 | | | | 543,461 | |
Haseko Corp. | | | 30,900 | | | | 345,133 | |
Hazama Ando Corp. | | | 119,600 | | | | 763,331 | |
Honda Motor Co. Ltd. | | | 61,600 | | | | 1,405,035 | |
Hoya Corp. | | | 20,100 | | | | 1,925,150 | |
Isuzu Motors Ltd. | | | 78,200 | | | | 906,563 | |
ITOCHU Corp. | | | 44,400 | | | | 1,392,950 | |
Itoham Yonekyu Holdings, Inc. | | | 117,500 | | | | 623,502 | |
Japan Airlines Co. Ltd.* | | | 25,000 | | | | 509,192 | |
Japan Aviation Electronics Industry Ltd. | | | 46,000 | | | | 733,789 | |
Japan Lifeline Co. Ltd. | | | 79,400 | | | | 549,632 | |
KDDI Corp. | | | 29,700 | | | | 900,709 | |
Keiyo Bank Ltd. (The) | | | 76,500 | | | | 340,165 | |
Keyence Corp. | | | 8,300 | | | | 3,222,432 | |
Komeri Co. Ltd. | | | 17,200 | | | | 356,521 | |
Lintec Corp. | | | 30,000 | | | | 486,954 | |
Marubeni Corp. | | | 85,400 | | | | 978,338 | |
Mitsubishi Gas Chemical Co., Inc. | | | 26,000 | | | | 357,411 | |
Mitsubishi HC Capital, Inc. | | | 210,100 | | | | 1,033,387 | |
Mitsubishi UFJ Financial Group, Inc. | | | 214,300 | | | | 1,438,685 | |
Mitsui & Co. Ltd. | | | 36,000 | | | | 1,048,526 | |
Mitsui Chemicals, Inc. | | | 42,400 | | | | 952,338 | |
Mizuho Financial Group, Inc. | | | 73,620 | | | | 1,037,180 | |
Nippon Telegraph & Telephone Corp. | | | 107,900 | | | | 3,077,147 | |
Nishi-Nippon Financial Holdings, Inc. | | | 48,600 | | | | 355,158 | |
Nomura Holdings, Inc. | | | 270,700 | | | | 1,003,072 | |
Nomura Real Estate Holdings, Inc. | | | 19,200 | | | | 410,550 | |
Obayashi Corp. | | | 97,500 | | | | 736,475 | |
Ono Pharmaceutical Co. Ltd. | | | 43,000 | | | | 1,005,064 | |
ORIX Corp. | | | 65,000 | | | | 1,040,433 | |
Resona Holdings, Inc. | | | 366,600 | | | | 2,013,520 | |
Sankyu, Inc. | | | 18,100 | | | | 662,206 | |
Sawai Group Holdings Co. Ltd. | | | 9,800 | | | | 305,768 | |
Seino Holdings Co. Ltd. | | | 72,500 | | | | 642,653 | |
Shin-Etsu Chemical Co. Ltd. | | | 13,900 | | | | 1,697,360 | |
SKY Perfect JSAT Holdings, Inc. | | | 151,000 | | | | 554,924 | |
SMC Corp. | | | 3,800 | | | | 1,586,704 | |
Sompo Holdings, Inc. | | | 15,600 | | | | 690,193 | |
Sumitomo Heavy Industries Ltd. | | | 32,300 | | | | 644,848 | |
Sumitomo Mitsui Financial Group, Inc. | | | 31,100 | | | | 1,251,229 | |
Taisei Corp. | | | 19,200 | | | | 619,108 | |
Teijin Ltd. | | | 67,300 | | | | 655,853 | |
Toagosei Co. Ltd. | | | 44,900 | | | | 376,893 | |
Tokuyama Corp. | | | 26,500 | | | | 359,703 | |
Tokyo Seimitsu Co. Ltd. | | | 20,300 | | | | 655,858 | |
Towa Pharmaceutical Co. Ltd. | | | 28,200 | | | | 455,219 | |
Transcosmos, Inc. | | | 25,100 | | | | 616,378 | |
Tsubakimoto Chain Co. | | | 17,000 | | | | 383,500 | |
UBE Corp. | | | 41,500 | | | | 608,290 | |
Yokohama Rubber Co. Ltd. (The)(a) | | | 62,000 | | | | 959,364 | |
| | | | | | | | |
| | |
| | | | | | | 56,750,627 | |
| | | | | | | | |
SEE NOTES TO FINANCIAL STATEMENTS.
A3
| | | | |
| | PSF GLOBAL PORTFOLIO (CONTINUED) | | |
SCHEDULE OF INVESTMENTS | | | | as of December 31, 2022 |
| | | | | | | | |
| | | Shares | | | Value | |
COMMON STOCKS (continued) | |
Netherlands — 1.8% | | | | | | | | |
ABN AMRO Bank NV, 144A, CVA | | | 56,900 | | | $ | 787,950 | |
Adyen NV, 144A* | | | 1,744 | | | | 2,421,108 | |
Aegon NV | | | 215,700 | | | | 1,092,882 | |
ASML Holding NV (BATE) | | | 5,916 | | | | 3,225,711 | |
ASML Holding NV (XNGS) | | | 7,172 | | | | 3,918,781 | |
ASR Nederland NV | | | 21,200 | | | | 1,007,297 | |
ING Groep NV | | | 71,300 | | | | 868,517 | |
Koninklijke Ahold Delhaize NV | | | 89,100 | | | | 2,561,740 | |
NN Group NV | | | 18,700 | | | | 764,684 | |
Randstad NV | | | 14,700 | | | | 898,206 | |
Shell PLC | | | 141,000 | | | | 3,974,905 | |
| | | | | | | | |
| | |
| | | | | | | 21,521,781 | |
| | | | | | | | |
| | |
New Zealand — 0.1% | | | | | | | | |
Air New Zealand Ltd.* | | | 1,456,800 | | | | 686,805 | |
| | | | | | | | |
| | |
Norway — 0.4% | | | | | | | | |
DNB Bank ASA | | | 53,600 | | | | 1,058,607 | |
Equinor ASA | | | 112,374 | | | | 4,038,752 | |
TOMRA Systems ASA | | | 4,472 | | | | 75,426 | |
| | | | | | | | |
| | |
| | | | | | | 5,172,785 | |
| | | | | | | | |
| | |
Singapore — 0.1% | | | | | | | | |
DBS Group Holdings Ltd. | | | 41,200 | | | | 1,042,838 | |
Venture Corp. Ltd. | | | 26,000 | | | | 331,401 | |
| | | | | | | | |
| | |
| | | | | | | 1,374,239 | |
| | | | | | | | |
| | |
South Africa — 0.2% | | | | | | | | |
Anglo American PLC | | | 48,300 | | | | 1,891,423 | |
| | | | | | | | |
| | |
South Korea — 0.1% | | | | | | | | |
LG Energy Solution Ltd.* | | | 1,963 | | | | 676,561 | |
| | | | | | | | |
| | |
Spain — 0.8% | | | | | | | | |
Amadeus IT Group SA* | | | 78,651 | | | | 4,080,239 | |
Banco Santander SA | | | 249,200 | | | | 745,137 | |
Endesa SA | | | 37,700 | | | | 710,515 | |
Mapfre SA(a) | | | 494,400 | | | | 956,419 | |
Repsol SA | | | 117,700 | | | | 1,873,433 | |
Telefonica SA | | | 176,500 | | | | 638,949 | |
| | | | | | | | |
| | |
| | | | | | | 9,004,692 | |
| | | | | | | | |
| | |
Sweden — 1.3% | | | | | | | | |
Atlas Copco AB (Class A Stock) | | | 196,764 | | | | 2,331,338 | |
Boliden AB | | | 35,400 | | | | 1,329,702 | |
Electrolux AB (Class B Stock)(a) | | | 38,800 | | | | 524,224 | |
Evolution AB, 144A | | | 25,800 | | | | 2,513,035 | |
Hexagon AB (Class B Stock) | | | 265,118 | | | | 2,779,787 | |
Husqvarna AB (Class B Stock) | | | 39,300 | | | | 276,021 | |
Indutrade AB | | | 41,314 | | | | 837,827 | |
Securitas AB (Class B Stock) | | | 103,242 | | | | 861,498 | |
Skanska AB (Class B Stock) | | | 31,100 | | | | 493,012 | |
SKF AB (Class B Stock) | | | 70,400 | | | | 1,075,256 | |
Swedbank AB (Class A Stock) | | | 27,700 | | | | 471,151 | |
Telefonaktiebolaget LM Ericsson (Class B Stock) | | | 80,900 | | | | 474,026 | |
Volvo AB (Class B Stock) | | | 100,500 | | | | 1,815,392 | |
| | | | | | | | |
| | |
| | | | | | | 15,782,269 | |
| | | | | | | | |
| | | | | | | | |
| | | Shares | | | Value | |
COMMON STOCKS (continued) | |
Switzerland — 2.3% | | | | | | | | |
Adecco Group AG | | | 25,100 | | | $ | 825,661 | |
Baloise Holding AG | | | 6,000 | | | | 925,241 | |
Credit Suisse Group AG | | | 75,100 | | | | 224,207 | |
Forbo Holding AG | | | 500 | | | | 587,581 | |
Helvetia Holding AG | | | 10,600 | | | | 1,233,445 | |
Julius Baer Group Ltd. | | | 25,700 | | | | 1,495,769 | |
Lonza Group AG | | | 5,206 | | | | 2,555,498 | |
Novartis AG | | | 47,700 | | | | 4,316,729 | |
Partners Group Holding AG | | | 2,115 | | | | 1,872,798 | |
Sika AG | | | 5,732 | | | | 1,377,991 | |
Straumann Holding AG | | | 17,227 | | | | 1,975,441 | |
Swiss Life Holding AG | | | 1,417 | | | | 730,405 | |
TE Connectivity Ltd. | | | 13,125 | | | | 1,506,750 | |
UBS Group AG | | | 166,700 | | | | 3,098,324 | |
Zurich Insurance Group AG | | | 9,170 | | | | 4,383,969 | |
| | | | | | | | |
| | |
| | | | | | | 27,109,809 | |
| | | | | | | | |
| | |
Taiwan — 0.3% | | | | | | | | |
Taiwan Semiconductor Manufacturing Co. Ltd. | | | 223,000 | | | | 3,238,732 | |
| | | | | | | | |
| | |
United Kingdom — 4.8% | | | | | | | | |
3i Group PLC | | | 52,800 | | | | 851,524 | |
Ashtead Group PLC | | | 42,348 | | | | 2,405,569 | |
Associated British Foods PLC | | | 39,200 | | | | 743,184 | |
AstraZeneca PLC | | | 37,646 | | | | 5,094,233 | |
Aviva PLC | | | 149,720 | | | | 794,211 | |
BAE Systems PLC | | | 168,800 | | | | 1,743,434 | |
Barratt Developments PLC | | | 61,900 | | | | 295,653 | |
Bellway PLC | | | 23,200 | | | | 530,543 | |
British American Tobacco PLC | | | 63,000 | | | | 2,492,164 | |
BT Group PLC | | | 455,900 | | | | 615,590 | |
Bunzl PLC | | | 94,517 | | | | 3,144,596 | |
Centrica PLC | | | 457,200 | | | | 531,752 | |
CK Hutchison Holdings Ltd. | | | 117,500 | | | | 703,925 | |
CNH Industrial NV | | | 79,500 | | | | 1,275,339 | |
Coca-Cola Europacific Partners PLC | | | 1,200 | | | | 66,384 | |
Compass Group PLC | | | 213,659 | | | | 4,933,821 | |
Crest Nicholson Holdings PLC | | | 143,814 | | | | 409,416 | |
Diageo PLC | | | 72,621 | | | | 3,178,757 | |
Experian PLC | | | 77,240 | | | | 2,615,990 | |
Halma PLC | | | 66,041 | | | | 1,572,763 | |
Imperial Brands PLC | | | 56,400 | | | | 1,404,988 | |
International Consolidated Airlines Group SA* | | | 150,000 | | | | 223,374 | |
Investec PLC | | | 79,700 | | | | 487,228 | |
J Sainsbury PLC | | | 458,700 | | | | 1,203,087 | |
Keller Group PLC | | | 48,200 | | | | 465,178 | |
Kingfisher PLC | | | 357,200 | | | | 1,014,886 | |
Legal & General Group PLC | | | 220,600 | | | | 661,388 | |
Linde PLC | | | 14,229 | | | | 4,641,215 | |
Lloyds Banking Group PLC | | | 1,666,000 | | | | 909,160 | |
London Stock Exchange Group PLC | | | 32,195 | | | | 2,766,233 | |
Marks & Spencer Group PLC* | | | 279,900 | | | | 412,923 | |
Paragon Banking Group PLC | | | 105,900 | | | | 720,018 | |
Premier Foods PLC | | | 357,756 | | | | 466,169 | |
Redde Northgate PLC | | | 108,700 | | | | 540,751 | |
Redrow PLC | | | 77,600 | | | | 425,240 | |
Rentokil Initial PLC | | | 449,071 | | | | 2,758,988 | |
SEE NOTES TO FINANCIAL STATEMENTS.
A4
| | | | |
| | PSF GLOBAL PORTFOLIO (CONTINUED) | | |
SCHEDULE OF INVESTMENTS | | | | as of December 31, 2022 |
| | | | | | | | |
| | | Shares | | | Value | |
COMMON STOCKS (continued) | |
United Kingdom (cont’d.) | | | | | | | | |
Segro PLC, REIT | | | 129,323 | | | $ | 1,191,357 | |
Spirax-Sarco Engineering PLC | | | 9,533 | | | | 1,217,656 | |
Tate & Lyle PLC | | | 34,250 | | | | 293,428 | |
Taylor Wimpey PLC | | | 263,400 | | | | 322,586 | |
Tesco PLC | | | 213,800 | | | | 576,163 | |
Vistry Group PLC | | | 29,222 | | | | 220,099 | |
| | | | | | | | |
| | |
| | | | | | | 56,920,963 | |
| | | | | | | | |
| | |
United States — 64.4% | | | | | | | | |
Abbott Laboratories | | | 66,930 | | | | 7,348,245 | |
AbbVie, Inc. | | | 39,672 | | | | 6,411,392 | |
Accenture PLC (Class A Stock) | | | 3,878 | | | | 1,034,806 | |
Adobe, Inc.* | | | 25,487 | | | | 8,577,140 | |
Agilent Technologies, Inc. | | | 9,220 | | | | 1,379,773 | |
Air Products & Chemicals, Inc. | | | 16,902 | | | | 5,210,211 | |
Alphabet, Inc. (Class A Stock)* | | | 211,582 | | | | 18,667,880 | |
Alphabet, Inc. (Class C Stock)* | | | 66,254 | | | | 5,878,717 | |
Amazon.com, Inc.* | | | 185,293 | | | | 15,564,612 | |
Ameren Corp. | | | 57,212 | | | | 5,087,291 | |
American Express Co. | | | 6,553 | | | | 968,206 | |
American International Group, Inc. | | | 155,046 | | | | 9,805,109 | |
American Tower Corp., REIT | | | 21,354 | | | | 4,524,058 | |
AMETEK, Inc. | | | 34,717 | | | | 4,850,659 | |
Amphenol Corp. (Class A Stock) | | | 16,508 | | | | 1,256,919 | |
Aon PLC (Class A Stock) | | | 21,040 | | | | 6,314,946 | |
Apple, Inc. | | | 125,734 | | | | 16,336,619 | |
Applied Materials, Inc. | | | 23,276 | | | | 2,266,617 | |
Arthur J. Gallagher & Co. | | | 9,583 | | | | 1,806,779 | |
Autodesk, Inc.* | | | 5,208 | | | | 973,219 | |
AvalonBay Communities, Inc., REIT | | | 60,949 | | | | 9,844,482 | |
Bank of America Corp. | | | 233,235 | | | | 7,724,743 | |
Becton, Dickinson & Co. | | | 50,179 | | | | 12,760,520 | |
Best Buy Co., Inc. | | | 56,659 | | | | 4,544,618 | |
Black Knight, Inc.* | | | 15,717 | | | | 970,525 | |
Block, Inc.* | | | 16,272 | | | | 1,022,532 | |
Boston Scientific Corp.* | | | 160,292 | | | | 7,416,711 | |
Bristol-Myers Squibb Co. | | | 49,491 | | | | 3,560,877 | |
Cadence Design Systems, Inc.* | | | 18,501 | | | | 2,972,001 | |
CF Industries Holdings, Inc. | | | 39,194 | | | | 3,339,329 | |
Charles Schwab Corp. (The) | | | 67,184 | | �� | | 5,593,740 | |
Chipotle Mexican Grill, Inc.* | | | 1,473 | | | | 2,043,773 | |
Chubb Ltd. | | | 51,063 | | | | 11,264,498 | |
Cigna Corp. | | | 26,468 | | | | 8,769,907 | |
Cisco Systems, Inc. | | | 57,102 | | | | 2,720,339 | |
Citigroup, Inc. | | | 89,601 | | | | 4,052,653 | |
CME Group, Inc. | | | 16,125 | | | | 2,711,580 | |
Coca-Cola Co. (The) | | | 59,246 | | | | 3,768,638 | |
Colgate-Palmolive Co. | | | 54,620 | | | | 4,303,510 | |
Comcast Corp. (Class A Stock) | | | 89,694 | | | | 3,136,599 | |
Conagra Brands, Inc. | | | 225,274 | | | | 8,718,104 | |
ConocoPhillips | | | 62,171 | | | | 7,336,178 | |
CoStar Group, Inc.* | | | 58,038 | | | | 4,485,177 | |
CSL Ltd. | | | 12,546 | | | | 2,446,396 | |
Cummins, Inc.(a) | | | 30,291 | | | | 7,339,206 | |
CVS Health Corp. | | | 41,112 | | | | 3,831,227 | |
Danaher Corp. | | | 32,455 | | | | 8,614,206 | |
Dollar Tree, Inc.* | | | 12,991 | | | | 1,837,447 | |
Dominion Energy, Inc. | | | 76,250 | | | | 4,675,650 | |
Eaton Corp. PLC | | | 9,414 | | | | 1,477,527 | |
| | | | | | | | |
| | | Shares | | | Value | |
COMMON STOCKS (continued) | |
United States (cont’d.) | | | | | | | | |
Elanco Animal Health, Inc.* | | | 226,561 | | | $ | 2,768,575 | |
Electronic Arts, Inc. | | | 29,618 | | | | 3,618,727 | |
Elevance Health, Inc. | | | 18,244 | | | | 9,358,625 | |
Enphase Energy, Inc.* | | | 2,880 | | | | 763,085 | |
Entergy Corp. | | | 17,173 | | | | 1,931,962 | |
EOG Resources, Inc. | | | 17,494 | | | | 2,265,823 | |
Equifax, Inc. | | | 12,486 | | | | 2,426,779 | |
Equinix, Inc., REIT | | | 6,435 | | | | 4,215,118 | |
Equitable Holdings, Inc. | | | 209,889 | | | | 6,023,814 | |
Estee Lauder Cos., Inc. (The) (Class A Stock) | | | 21,707 | | | | 5,385,724 | |
Exxon Mobil Corp. | | | 67,562 | | | | 7,452,089 | |
Fifth Third Bancorp | | | 108,488 | | | | 3,559,491 | |
Fiserv, Inc.* | | | 100,167 | | | | 10,123,879 | |
Gartner, Inc.* | | | 8,590 | | | | 2,887,443 | |
General Electric Co. | | | 93,584 | | | | 7,841,403 | |
Globant SA*(a) | | | 4,718 | | | | 793,379 | |
Goldman Sachs Group, Inc. (The) | | | 8,494 | | | | 2,916,670 | |
GSK PLC | | | 181,680 | | | | 3,140,018 | |
Haleon PLC* | | | 227,100 | | | | 898,548 | |
Hartford Financial Services Group, Inc. (The) | | | 91,343 | | | | 6,926,540 | |
Hess Corp. | | | 18,840 | | | | 2,671,889 | |
Hilton Worldwide Holdings, Inc. | | | 31,795 | | | | 4,017,616 | |
Holcim AG* | | | 20,100 | | | | 1,040,442 | |
Hologic, Inc.* | | | 36,965 | | | | 2,765,352 | |
Huntington Bancshares, Inc.(a) | | | 390,974 | | | | 5,512,733 | |
ICON PLC* | | | 33,459 | | | | 6,499,411 | |
International Flavors & Fragrances, Inc. | | | 56,346 | | | | 5,907,315 | |
International Paper Co.(a) | | | 214,537 | | | | 7,429,416 | |
Intuit, Inc. | | | 21,985 | | | | 8,557,002 | |
Johnson & Johnson | | | 74,576 | | | | 13,173,850 | |
Johnson Controls International PLC | | | 68,413 | | | | 4,378,432 | |
Kimberly-Clark Corp. | | | 51,527 | | | | 6,994,790 | |
Kohl’s Corp.(a) | | | 74,808 | | | | 1,888,902 | |
L3Harris Technologies, Inc. | | | 32,992 | | | | 6,869,264 | |
Lam Research Corp. | | | 6,703 | | | | 2,817,271 | |
Las Vegas Sands Corp.*(a) | | | 50,792 | | | | 2,441,571 | |
Lululemon Athletica, Inc.* | | | 14,832 | | | | 4,751,876 | |
Martin Marietta Materials, Inc. | | | 3,124 | | | | 1,055,818 | |
Mastercard, Inc. (Class A Stock) | | | 42,638 | | | | 14,826,512 | |
Match Group, Inc.* | | | 29,586 | | | | 1,227,523 | |
Medtronic PLC | | | 88,899 | | | | 6,909,230 | |
Merck & Co., Inc. | | | 52,931 | | | | 5,872,694 | |
Meta Platforms, Inc. (Class A Stock)* | | | 29,900 | | | | 3,598,166 | |
Microsoft Corp. | | | 183,670 | | | | 44,047,739 | |
MSCI, Inc. | | | 16,455 | | | | 7,654,372 | |
News Corp. (Class A Stock) | | | 350,995 | | | | 6,388,109 | |
NVIDIA Corp. | | | 46,998 | | | | 6,868,288 | |
O’Reilly Automotive, Inc.* | | | 3,708 | | | | 3,129,663 | |
Pfizer, Inc. | | | 95,311 | | | | 4,883,736 | |
Philip Morris International, Inc. | | | 100,794 | | | | 10,201,361 | |
QUALCOMM, Inc. | | | 85,196 | | | | 9,366,448 | |
Regeneron Pharmaceuticals, Inc.* | | | 4,291 | | | | 3,095,914 | |
Roche Holding AG | | | 13,400 | | | | 4,210,783 | |
Rockwell Automation, Inc. | | | 4,274 | | | | 1,100,854 | |
RPM International, Inc. | | | 32,493 | | | | 3,166,443 | |
Sempra Energy | | | 56,440 | | | | 8,722,238 | |
ServiceNow, Inc.* | | | 8,176 | | | | 3,174,496 | |
SEE NOTES TO FINANCIAL STATEMENTS.
A5
| | | | |
| | PSF GLOBAL PORTFOLIO (CONTINUED) | | |
SCHEDULE OF INVESTMENTS | | | | as of December 31, 2022 |
| | | | | | | | |
| | | Shares | | | Value | |
|
COMMON STOCKS (continued) | |
United States (cont’d.) | |
Sherwin-Williams Co. (The) | | | 25,314 | | | $ | 6,007,772 | |
Signify NV, 144A | | | 27,400 | | | | 922,354 | |
Southern Co. (The) | | | 195,711 | | | | 13,975,723 | |
Southwest Airlines Co.* | | | 58,785 | | | | 1,979,291 | |
Stanley Black & Decker, Inc. | | | 63,800 | | | | 4,792,656 | |
Stellantis NV | | | 74,557 | | | | 1,059,263 | |
Stericycle, Inc.* | | | 18,111 | | | | 903,558 | |
STERIS PLC | | | 9,286 | | | | 1,715,031 | |
Synopsys, Inc.* | | | 4,987 | | | | 1,592,299 | |
Take-Two Interactive Software, Inc.* | | | 12,873 | | | | 1,340,465 | |
Tenaris SA | | | 252,604 | | | | 4,430,097 | |
Texas Instruments, Inc. | | | 17,699 | | | | 2,924,229 | |
Thermo Fisher Scientific, Inc. | | | 22,414 | | | | 12,343,166 | |
TJX Cos., Inc. (The) | | | 34,854 | | | | 2,774,378 | |
TransUnion | | | 30,541 | | | | 1,733,202 | |
U.S. Bancorp | | | 116,196 | | | | 5,067,308 | |
United Parcel Service, Inc. (Class B Stock) | | | 41,453 | | | | 7,206,190 | |
UnitedHealth Group, Inc. | | | 15,782 | | | | 8,367,301 | |
Veeva Systems, Inc. (Class A Stock)* | | | 2,236 | | | | 360,846 | |
Verisk Analytics, Inc. | | | 35,070 | | | | 6,187,049 | |
Verizon Communications, Inc. | | | 32,000 | | | | 1,260,800 | |
Vertex Pharmaceuticals, Inc.* | | | 20,316 | | | | 5,866,854 | |
Visa, Inc. (Class A Stock)(a) | | | 57,788 | | | | 12,006,035 | |
Vulcan Materials Co. | | | 37,834 | | | | 6,625,112 | |
Walmart, Inc. | | | 70,584 | | | | 10,008,105 | |
Walt Disney Co. (The)* | | | 81,808 | | | | 7,107,479 | |
Wells Fargo & Co. | | | 307,441 | | | | 12,694,239 | |
Western Digital Corp.* | | | 138,150 | | | | 4,358,632 | |
Weyerhaeuser Co., REIT | | | 220,877 | | | | 6,847,187 | |
Zimmer Biomet Holdings, Inc. | | | 69,513 | | | | 8,862,907 | |
Zoetis, Inc. | | | 25,107 | | | | 3,679,431 | |
| | | | | | | | |
| | |
| | | | | | | 765,060,061 | |
| | | | | | | | |
TOTAL COMMON STOCKS
(cost $1,018,127,121) | | | | 1,149,377,078 | |
| | | | | | | | |
| |
PREFERRED STOCKS — 0.1% | | | | | |
Germany — 0.0% | | | | | | | | |
Porsche Automobil Holding SE (PRFC) | | | 11,600 | | | | 632,617 | |
| | | | | | | | |
United States — 0.1% | | | | | | | | |
Becton, Dickinson & Co., Series B, CVT, 6.000%, Maturing 06/01/23(a) | | | 18,231 | | | | 913,009 | |
Elanco Animal Health, Inc., CVT, 5.000%, Maturing 02/01/23 | | | 2,497 | | | | 48,766 | |
| | | | | | | | |
| | |
| | | | | | | 961,775 | |
| | | | | | | | |
TOTAL PREFERRED STOCKS
(cost $1,703,094) | | | | 1,594,392 | |
| | | | | | | | |
| |
TOTAL LONG-TERM INVESTMENTS
(cost $1,019,830,215) | | | | 1,150,971,470 | |
| | | | | | | | |
| | | | | | | | |
| | | Shares | | | Value | |
|
SHORT-TERM INVESTMENTS — 6.6% | |
AFFILIATED MUTUAL FUNDS — 5.7% | |
PGIM Core Ultra Short Bond Fund(wa) | | | 20,822,837 | | | $ | 20,822,837 | |
PGIM Institutional Money Market Fund (cost $46,479,819; includes $46,316,049 of cash collateral for securities on
loan)(b)(wa) | | | 46,535,263 | | | | 46,511,994 | |
| | | | | | | | |
| |
TOTAL AFFILIATED MUTUAL FUNDS
(cost $67,302,656) | | | | 67,334,831 | |
| | | | | | | | |
| |
UNAFFILIATED FUND — 0.9% | | | | | |
Dreyfus Government Cash Management (Institutional Shares) | | | 10,665,495 | | | | 10,665,495 | |
| | | | | | | | |
(cost $10,665,495) | | | | | | | | |
| |
TOTAL SHORT-TERM INVESTMENTS
(cost $77,968,151) | | | | 78,000,326 | |
| | | | | | | | |
| | |
TOTAL INVESTMENTS—103.5%
(cost $1,097,798,366) | | | | | | | 1,228,971,796 | |
| |
Liabilities in excess of other assets — (3.5)% | | | | (41,468,235 | ) |
| | | | | | | | |
| | |
NET ASSETS — 100.0% | | | | | | $ | 1,187,503,561 | |
| | | | | | | | |
See the Glossary for a list of the abbreviation(s) used in the annual report.
| * | Non-income producing security. |
| (a) | All or a portion of security is on loan. The aggregate market value of such securities, including those sold and pending settlement, is $45,187,084; cash collateral of $46,316,049 (included in liabilities) was received with which the Portfolio purchased highly liquid short-term investments. In the event of significant appreciation in value of securities on loan on the last business day of the reporting period, the Portfolio may reflect a collateral value that is less than the market value of the loaned securities and such shortfall is remedied the following business day. |
| (b) | Represents security, or portion thereof, purchased with cash collateral received for securities on loan and includes dividend reinvestment. |
| (wa) | PGIM Investments LLC, the manager of the Portfolio, also serves as manager of the PGIM Core Ultra Short Bond Fund and PGIM Institutional Money Market Fund, if applicable. |
Fair Value Measurements:
Various inputs are used in determining the value of the Portfolio’s investments. These inputs are summarized in the three broad levels listed below.
Level 1—unadjusted quoted prices generally in active markets for identical securities.
SEE NOTES TO FINANCIAL STATEMENTS.
A6
| | | | |
| | PSF GLOBAL PORTFOLIO (CONTINUED) | | |
SCHEDULE OF INVESTMENTS | | | | as of December 31, 2022 |
Level 2—quoted prices for similar securities, interest rates and yield curves, prepayment speeds, foreign currency exchange rates and other observable inputs.
Level 3—unobservable inputs for securities valued in accordance with Board approved fair valuation procedures.
The following is a summary of the inputs used as of December 31, 2022 in valuing such portfolio securities:
| | | | | | | | | | | | |
| | | Level 1 | | | Level 2 | | | Level 3 | |
Investments in Securities | | | | | | | | | | | | |
Assets | | | | | | | | | | | | |
Long-Term Investments | | | | | | | | | | | | |
Common Stocks | | | | | | | | | | | | |
Australia | | $ | 1,051,590 | | | $ | 13,722,041 | | | | $— | |
Austria | | | — | | | | 3,222,549 | | | | — | |
Belgium | | | — | | | | 3,865,429 | | | | — | |
Brazil | | | 1,425,914 | | | | 2,051,214 | | | | — | |
Canada | | | 27,297,648 | | | | — | | | | — | |
China | | | — | | | | 4,212,578 | | | | — | |
Denmark | | | — | | | | 13,019,634 | | | | — | |
Finland | | | — | | | | 5,138,247 | | | | — | |
France | | | 13,946,769 | | | | 49,190,525 | | | | — | |
Germany | | | 6,639,611 | | | | 18,065,470 | | | | — | |
Hong Kong | | | — | | | | 5,779,823 | | | | — | |
India | | | 5,250,760 | | | | 4,814,203 | | | | — | |
Indonesia | | | — | | | | 612,224 | | | | — | |
Italy | | | — | | | | 4,880,102 | | | | — | |
Japan | | | — | | | | 56,750,627 | | | | — | |
Netherlands | | | 3,918,781 | | | | 17,603,000 | | | | — | |
New Zealand | | | — | | | | 686,805 | | | | — | |
Norway | | | — | | | | 5,172,785 | | | | — | |
Singapore | | | — | | | | 1,374,239 | | | | — | |
South Africa | | | — | | | | 1,891,423 | | | | — | |
South Korea | | | — | | | | 676,561 | | | | — | |
Spain | | | — | | | | 9,004,692 | | | | — | |
Sweden | | | — | | | | 15,782,269 | | | | — | |
Switzerland | | | 1,506,750 | | | | 25,603,059 | | | | — | |
Taiwan | | | — | | | | 3,238,732 | | | | — | |
United Kingdom | | | 4,707,599 | | | | 52,213,364 | | | | — | |
United States | | | 746,912,160 | | | | 18,147,901 | | | | — | |
Preferred Stocks | | | | | | | | | | | | |
Germany | | | — | | | | 632,617 | | | | — | |
United States | | | 961,775 | | | | — | | | | — | |
Short-Term Investments | | | | | | | | | | | | |
Affiliated Mutual Funds | | | 67,334,831 | | | | — | | | | — | |
Unaffiliated Fund | | | 10,665,495 | | | | — | | | | — | |
| | | | | | | | | | | | |
Total | | $ | 891,619,683 | | | $ | 337,352,113 | | | | $— | |
| | | | | | | | | | | | |
Industry Classification:
The industry classification of investments and liabilities in excess of other assets shown as a percentage of net assets as of December 31, 2022 were as follows:
| | | | |
Software | | | 6.1 | % |
Banks | | | 6.1 | |
Affiliated Mutual Funds (3.9% represents investments purchased with collateral from securities on loan) | | | 5.7 | |
Oil, Gas & Consumable Fuels | | | 5.3 | |
Pharmaceuticals | | | 5.3 | |
Insurance | | | 5.1 | |
IT Services | | | 4.5 | |
Health Care Equipment & Supplies | | | 4.5 | |
Semiconductors & Semiconductor Equipment | | | 3.5 | |
Chemicals | | | 3.0 | |
| | | | |
Life Sciences Tools & Services | | | 2.7 | % |
Capital Markets | | | 2.5 | |
Health Care Providers & Services | | | 2.5 | |
Interactive Media & Services | | | 2.5 | |
Equity Real Estate Investment Trusts (REITs) | | | 2.3 | |
Machinery | | | 2.1 | |
Technology Hardware, Storage & Peripherals | | | 1.9 | |
Professional Services | | | 1.7 | |
Multi-Utilities | | | 1.7 | |
Biotechnology | | | 1.5 | |
Electric Utilities | | | 1.5 | |
SEE NOTES TO FINANCIAL STATEMENTS.
A7
| | | | |
| | PSF GLOBAL PORTFOLIO (CONTINUED) | | |
SCHEDULE OF INVESTMENTS | | | | as of December 31, 2022 |
Industry Classification (continued):
| | | | |
Aerospace & Defense | | | 1.5 | % |
Specialty Retail | | | 1.5 | |
Food & Staples Retailing | | | 1.4 | |
Hotels, Restaurants & Leisure | | | 1.4 | |
Internet & Direct Marketing Retail | | | 1.4 | |
Industrial Conglomerates | | | 1.4 | |
Textiles, Apparel & Luxury Goods | | | 1.2 | |
Tobacco | | | 1.2 | |
Electronic Equipment, Instruments & Components | | | 1.2 | |
Food Products | | | 1.1 | |
Road & Rail | | | 1.1 | |
Entertainment | | | 1.0 | |
Air Freight & Logistics | | | 1.0 | |
Household Products | | | 1.0 | |
Metals & Mining | | | 0.9 | |
Construction Materials | | | 0.9 | |
Electrical Equipment | | | 0.9 | |
Building Products | | | 0.9 | |
Unaffiliated Fund | | | 0.9 | |
Media | | | 0.8 | |
Trading Companies & Distributors | | | 0.8 | |
Personal Products | | | 0.8 | |
Multiline Retail | | | 0.8 | |
Construction & Engineering | | | 0.7 | |
Diversified Telecommunication Services | | | 0.7 | |
| | | | |
Diversified Financial Services | | | 0.7 | % |
Automobiles | | | 0.6 | |
Beverages | | | 0.6 | |
Containers & Packaging | | | 0.6 | |
Commercial Services & Supplies | | | 0.5 | |
Energy Equipment & Services | | | 0.4 | |
Auto Components | | | 0.4 | |
Communications Equipment | | | 0.3 | |
Airlines | | | 0.3 | |
Household Durables | | | 0.1 | |
Marine | | | 0.1 | |
Consumer Finance | | | 0.1 | |
Real Estate Management & Development | | | 0.1 | |
Wireless Telecommunication Services | | | 0.1 | |
Thrifts & Mortgage Finance | | | 0.1 | |
Gas Utilities | | | 0.0 | * |
Paper & Forest Products | | | 0.0 | * |
Health Care Technology | | | 0.0 | * |
| | | | |
| | | 103.5 | |
Liabilities in excess of other assets | | | (3.5 | ) |
| | | | |
| |
| | | 100.0 | % |
| | | | |
* Less than +/- 0.05%
Financial Instruments/Transactions—Summary of Offsetting and Netting Arrangements:
The Portfolio entered into financial instruments/transactions during the reporting period that are either offset in accordance with current requirements or are subject to enforceable master netting arrangements or similar agreements that permit offsetting. The information about offsetting and related netting arrangements for financial instruments/transactions where the legal right to set-off exists is presented in the summary below.
Offsetting of financial instrument/transaction assets and liabilities:
| | | | | | |
| Description | | Gross Market Value of Recognized Assets/(Liabilities) | | Collateral Pledged/(Received)(1) | | Net Amount |
Securities on Loan | | $45,187,084 | | $(45,187,084) | | $— |
(1) Collateral amount disclosed by the Portfolio is limited to the market value of financial instruments/transactions.
SEE NOTES TO FINANCIAL STATEMENTS.
A8
| | | | |
| | PSF GLOBAL PORTFOLIO (CONTINUED) | | |
| | | | |
STATEMENT OF ASSETS AND LIABILITIES
as of December 31, 2022
| | | | |
ASSETS | | | | |
Investments at value, including securities on loan of $45,187,084: | | | | |
Unaffiliated investments (cost $1,030,495,710) | | $ | 1,161,636,965 | |
Affiliated investments (cost $67,302,656) | | | 67,334,831 | |
Foreign currency, at value (cost $3,269,516) | | | 3,220,673 | |
Tax reclaim receivable | | | 2,204,535 | |
Dividends receivable | | | 1,779,079 | |
Receivable for investments sold | | | 288,671 | |
Receivable for Portfolio shares sold | | | 70,203 | |
Receivable from affiliate | | | 3,611 | |
Prepaid expenses and other assets | | | 17,327 | |
| | | | |
Total Assets | | | 1,236,555,895 | |
| | | | |
LIABILITIES | | | | |
Payable to broker for collateral for securities on loan | | | 46,316,049 | |
Payable to affiliate | | | 956,143 | |
Management fee payable | | | 720,179 | |
Payable for investments purchased | | | 667,783 | |
Accrued expenses and other liabilities | | | 281,387 | |
Payable for Portfolio shares purchased | | | 103,341 | |
Payable to custodian | | | 5,369 | |
Affiliated transfer agent fee payable | | | 980 | |
Trustees’ fees payable | | | 970 | |
Distribution fee payable | | | 133 | |
| | | | |
Total Liabilities | | | 49,052,334 | |
| | | | |
NET ASSETS | | $ | 1,187,503,561 | |
| | | | |
Net assets were comprised of: | | | | |
Partners’ Equity | | $ | 1,187,503,561 | |
| | | | |
Class I: | | | | |
Net asset value and redemption price per share, $1,186,876,797 / 25,723,941 outstanding shares of beneficial interest | | $ | 46.14 | |
| | | | |
Class III: | | | | |
Net asset value and redemption price per share, $626,764 / 13,643 outstanding shares of beneficial interest | | $ | 45.94 | |
| | | | |
STATEMENT OF OPERATIONS
Year Ended December 31, 2022
| | | | |
NET INVESTMENT INCOME (LOSS) | | | | |
INCOME | | | | |
Unaffiliated dividend income (net of $1,648,016 foreign withholding tax, of which $183,783 is reimbursable by an affiliate) | | $ | 25,335,481 | |
Affiliated dividend income | | | 333,216 | |
Income from securities lending, net (including affiliated income of $74,071) | | | 127,148 | |
Interest income | | | 92,874 | |
| | | | |
Total income | | | 25,888,719 | |
| | | | |
EXPENSES | | | | |
Management fee | | | 9,474,806 | |
Distribution fee—Class III | | | 1,298 | |
Custodian and accounting fees | | | 209,072 | |
Shareholders’ reports | | | 111,595 | |
Legal fees and expenses | | | 30,328 | |
Audit fee | | | 28,800 | |
Trustees’ fees | | | 28,070 | |
Transfer agent’s fees and expenses (including affiliated expense of $5,882) | | | 10,682 | |
Miscellaneous | | | 78,409 | |
| | | | |
Total expenses | | | 9,973,060 | |
Less: Fee waivers and/or expense reimbursement | | | (547,803 | ) |
| | | | |
Net expenses | | | 9,425,257 | |
| | | | |
NET INVESTMENT INCOME (LOSS) | | | 16,463,462 | |
| | | | |
| REALIZED AND UNREALIZED GAIN (LOSS) ON INVESTMENT AND FOREIGN CURRENCY TRANSACTIONS | | | | |
Net realized gain (loss) on: | | | | |
Investment transactions (including affiliated of $6,949) | | | 149,841,797 | |
Foreign currency transactions | | | (500,862 | ) |
| | | | |
| | | 149,340,935 | |
| | | | |
Net change in unrealized appreciation (depreciation) on: | | | | |
Investments (including affiliated of $15,218) | | | (448,865,494 | ) |
Foreign currencies | | | (79,315 | ) |
| | | | |
| | | (448,944,809 | ) |
| | | | |
NET GAIN (LOSS) ON INVESTMENT AND FOREIGN CURRENCY TRANSACTIONS | | | (299,603,874 | ) |
| | | | |
NET INCREASE (DECREASE) IN NET ASSETS RESULTING FROM OPERATIONS | | $ | (283,140,412 | ) |
| | | | |
STATEMENTS OF CHANGES IN NET ASSETS
| | | | | | | | | | | | | | | | | | | | | | | | |
| | | Year Ended December 31, 2022 | | | Year Ended December 31, 2021 | |
INCREASE (DECREASE) IN NET ASSETS | | | | | | | | | | | | | | | | | | | | | | | | |
OPERATIONS | | | | | | | | | | | | | | | | | | | | | | | | |
Net investment income (loss) | | | | | | $ | 16,463,462 | | | | | | | | | | | $ | 12,649,098 | | | | | |
Net realized gain (loss) on investment and foreign currency transactions | | | | | | | 149,340,935 | | | | | | | | | | | | 117,432,711 | | | | | |
Net change in unrealized appreciation (depreciation) on investments and foreign currencies | | | | | | | (448,944,809 | ) | | | | | | | | | | | 113,015,658 | | | | | |
| | | | | | | | | | | | | | | | | | | | | | | | |
NET INCREASE (DECREASE) IN NET ASSETS RESULTING FROM OPERATIONS | | | | | | | (283,140,412 | ) | | | | | | | | | | | 243,097,467 | | | | | |
| | | | | | | | | | | | | | | | | | | | | | | | |
PORTFOLIO SHARE TRANSACTIONS | | | | | | | | | | | | | | | | | | | | | | | | |
Portfolio shares sold | | | | | | | 17,030,984 | | | | | | | | | | | | 17,833,148 | | | | | |
Portfolio shares purchased | | | | | | | (65,062,909 | ) | | | | | | | | | | | (119,303,863 | ) | | | | |
| | | | | | | | | | | | | | | | | | | | | | | | |
NET INCREASE (DECREASE) IN NET ASSETS FROM PORTFOLIO SHARE TRANSACTIONS | | | | | | | (48,031,925 | ) | | | | | | | | | | | (101,470,715 | ) | | | | |
| | | | | | | | | | | | | | | | | | | | | | | | |
TOTAL INCREASE (DECREASE) | | | | | | | (331,172,337 | ) | | | | | | | | | | | 141,626,752 | | | | | |
NET ASSETS: | | | | | | | | | | | | | | | | | | | | | | | | |
Beginning of year | | | | | | | 1,518,675,898 | | | | | | | | | | | | 1,377,049,146 | | | | | |
| | | | | | | | | | | | | | | | | | | | | | | | |
End of year | | | | | | $ | 1,187,503,561 | | | | | | | | | | | $ | 1,518,675,898 | | | | | |
| | | | | | | | | | | | | | | | | | | | | | | | |
SEE NOTES TO FINANCIAL STATEMENTS.
A9
| | | | |
| | PSF GLOBAL PORTFOLIO (CONTINUED) | | |
FINANCIAL HIGHLIGHTS | | | | |
| | | | | | | | | | | | | | | | | | | | |
Class I | | | | | | | | | | | | | | | |
| | | Year Ended December 31, | |
| | | 2022 | | | 2021 | | | 2020 | | | 2019 | | | 2018 | |
Per Share Operating Performance(a): | | | | | | | | | | | | | | | | | | | | |
Net Asset Value, beginning of year | | $ | 56.82 | | | $ | 48.06 | | | $ | 41.49 | | | $ | 31.83 | | | $ | 34.33 | |
| | | | | | | | | | | | | | | | | | | | |
Income (Loss) From Investment Operations: | | | | | | | | | | | | | | | | | | | | |
Net investment income (loss) | | | 0.63 | | | | 0.46 | | | | 0.41 | | | | 0.52 | | | | 0.47 | |
Net realized and unrealized gain (loss) on investment and foreign currency transactions | | | (11.31 | ) | | | 8.30 | | | | 6.16 | | | | 9.14 | | | | (2.99 | ) |
| | | | | | | | | | | | | | | | | | | | |
Total from investment operations | | | (10.68 | ) | | | 8.76 | | | | 6.57 | | | | 9.66 | | | | (2.52 | ) |
| | | | | | | | | | | | | | | | | | | | |
Capital Contributions | | | — | | | | — | | | | — | | | | — | (b)(c) | | | 0.02 | (b) |
| | | | | | | | | | | | | | | | | | | | |
Net Asset Value, end of year | | $ | 46.14 | | | $ | 56.82 | | | $ | 48.06 | | | $ | 41.49 | | | $ | 31.83 | |
| | | | | | | | | | | | | | | | | | | | |
Total Return(d) | | | (18.80 | )% | | | 18.23 | % | | | 15.84 | % | | | 30.39 | %(e) | | | (7.28 | )%(f) |
Ratios/Supplemental Data: | | | | | | | | | | | | | | | | | | | | |
Net assets, end of year (in millions) | | $ | 1,186.9 | | | $ | 1,518.5 | | | $ | 1,377.0 | | | $ | 1,263.7 | | | $ | 1,006.6 | |
Average net assets (in millions) | | $ | 1,262.8 | | | $ | 1,472.2 | | | $ | 1,190.6 | | | $ | 1,157.5 | | | $ | 1,139.9 | |
Ratios to average net assets(g): | | | | | | | | | | | | | | | | | | | | |
Expenses after waivers and/or expense reimbursement | | | 0.75 | % | | | 0.74 | % | | | 0.76 | % | | | 0.77 | % | | | 0.77 | % |
Expenses before waivers and/or expense reimbursement | | | 0.79 | % | | | 0.78 | % | | | 0.80 | % | | | 0.80 | % | | | 0.80 | % |
Net investment income (loss) | | | 1.30 | % | | | 0.86 | % | | | 1.01 | % | | | 1.41 | % | | | 1.33 | % |
Portfolio turnover rate(h) | | | 52 | % | | | 21 | % | | | 34 | % | | | 26 | % | | | 28 | % |
| | | | | | | | | | | | | | | | |
Class III | | | | | | | | | | | | | | |
| | | Year Ended December 31, 2022 | | April 26, 2021(i) through December 31, 2021 |
Per Share Operating Performance(a): | | | | | | | | | | | | | | | | |
Net Asset Value, beginning of period | | | | $ | 56.72 | | | | | | | $ | 53.13 | | | |
| | | | | | | | | | | | | | | | |
Income (Loss) From Investment Operations: | | | | | | | | | | | | | | | | |
Net investment income (loss) | | | | | 0.54 | | | | | | | | 0.15 | | | |
Net realized and unrealized gain (loss) on investment and foreign currency transactions | | | | | (11.32 | ) | | | | | | | 3.44 | | | |
| | | | | | | | | | | | | | | | |
Total from investment operations | | | | | (10.78 | ) | | | | | | | 3.59 | | | |
| | | | | | | | | | | | | | | | |
Net Asset Value, end of period | | | | $ | 45.94 | | | | | | | $ | 56.72 | | | |
| | | | | | | | | | | | | | | | |
Total Return(d) | | | | | (19.01 | )% | | | | | | | 6.76 | % | | |
Ratios/Supplemental Data: | | | | | | | | | | | | | | | | |
Net assets, end of period (in millions) | | | | $ | 0.6 | | | | | | | $ | 0.2 | | | |
Average net assets (in millions) | | | | $ | 0.5 | | | | | | | $ | 0.1 | | | |
Ratios to average net assets(g): | | | | | | | | | | | | | | | | |
Expenses after waivers and/or expense reimbursement | | | | | 1.00 | % | | | | | | | 0.99 | %(j) | | |
Expenses before waivers and/or expense reimbursement | | | | | 1.04 | % | | | | | | | 1.03 | %(j) | | |
Net investment income (loss) | | | | | 1.14 | % | | | | | | | 0.40 | %(j) | | |
Portfolio turnover rate(h) | | | | | 52 | % | | | | | | | 21 | % | | |
| (a) | Calculated based on average shares outstanding during the period. |
| (b) | Represents payment received by the Portfolio, from Prudential, in connection with excess foreign withholding tax withheld on dividends and interest from certain countries due to the Portfolio’s tax status as a partnership. |
| (c) | Amount rounds to zero. |
| (d) | Total return is calculated assuming a purchase of a share on the first day and a sale on the last day of each period reported and includes reinvestment of dividends and distributions, if any, and does not reflect the effect of insurance contract charges. Total return does not reflect expenses associated with the separate account such as administrative fees, account charges and surrender charges which, if reflected, would reduce the total returns for all periods shown. Performance figures may reflect fee waivers and/or expense reimbursements. In the absence of fee waivers and/or expense reimbursements, the total return would be lower. Past performance is no guarantee of future results. Total returns may reflect adjustments to conform to GAAP. Total returns for periods less than one full year are not annualized. |
| (e) | Total return for the year includes the impact of the capital contribution, which was not material to the total return. |
| (f) | Total return for the year includes the impact of the capital contribution. Excluding the capital contribution, the total return would have been (7.34)%. |
| (g) | Does not include expenses of the underlying funds in which the Portfolio invests. |
| (h) | The Portfolio’s portfolio turnover rate is calculated in accordance with regulatory requirements, without regard to transactions involving short-term investments, certain derivatives and in-kind transactions (if any). If such transactions were included, the Portfolio’s portfolio turnover rate may be higher. |
| (i) | Commencement of offering. |
| (j) | Annualized, with the exception of certain non-recurring expenses. |
SEE NOTES TO FINANCIAL STATEMENTS.
A10
| | | | |
| | PSF INTERNATIONAL GROWTH PORTFOLIO | | |
SCHEDULE OF INVESTMENTS | | | | as of December 31, 2022 |
| | | | | | | | |
| | | Shares | | | Value | |
|
LONG-TERM INVESTMENTS — 98.6% | |
COMMON STOCKS — 97.3% | | | | | | | | |
Australia — 0.2% | | | | | | | | |
Aristocrat Leisure Ltd. | | | 8,334 | | | $ | 171,729 | |
| | | | | | | | |
Austria — 0.6% | | | | | | | | |
BAWAG Group AG, 144A* | | | 7,372 | | | | 392,856 | |
| | | | | | | | |
Belgium — 0.5% | | | | | | | | |
KBC Group NV | | | 5,932 | | | | 381,934 | |
| | | | | | | | |
Brazil — 2.0% | | | | | | | | |
B3 SA - Brasil Bolsa Balcao | | | 72,000 | | | | 179,901 | |
MercadoLibre, Inc.* | | | 1,066 | | | | 902,092 | |
NU Holdings Ltd. (Class A Stock)*(a) | | | 86,505 | | | | 352,075 | |
| | | | | | | | |
| | |
| | | | | | | 1,434,068 | |
| | | | | | | | |
Canada — 3.9% | | | | | | | | |
Canadian Pacific Railway Ltd.(a) | | | 9,979 | | | | 744,334 | |
Cenovus Energy, Inc. | | | 18,470 | | | | 358,503 | |
Dollarama, Inc. | | | 8,073 | | | | 472,157 | |
Intact Financial Corp. | | | 2,826 | | | | 406,806 | |
Toronto-Dominion Bank (The) | | | 12,206 | | | | 790,325 | |
| | | | | | | | |
| | |
| | | | | | | 2,772,125 | |
| | | | | | | | |
China — 0.7% | | | | | | | | |
China Tourism Group Duty Free Corp. Ltd. (Class H Stock), 144A* | | | 9,500 | | | | 278,437 | |
Shenzhou International Group Holdings Ltd. | | | 20,800 | | | | 231,959 | |
| | | | | | | | |
| | |
| | | | | | | 510,396 | |
| | | | | | | | |
Denmark — 3.4% | | | | | | | | |
Coloplast A/S (Class B Stock) | | | 1,931 | | | | 226,222 | |
DSV A/S | | | 2,166 | | | | 342,525 | |
Novo Nordisk A/S (Class B Stock) | | | 13,913 | | | | 1,889,602 | |
| | | | | | | | |
| | |
| | | | | | | 2,458,349 | |
| | | | | | | | |
Finland — 0.9% | | | | | | | | |
Neste OYJ | | | 7,567 | | | | 348,967 | |
Nordea Bank Abp | | | 28,581 | | | | 306,159 | |
| | | | | | | | |
| | |
| | | | | | | 655,126 | |
| | | | | | | | |
France — 14.3% | | | | | | | | |
Air Liquide SA | | | 2,324 | | | | 329,858 | |
Airbus SE | | | 3,960 | | | | 470,854 | |
Bureau Veritas SA | | | 15,039 | | | | 396,338 | |
Dassault Systemes SE | | | 14,833 | | | | 533,390 | |
Hermes International | | | 571 | | | | 883,824 | |
Kering SA | | | 382 | | | | 194,410 | |
L’Oreal SA | | | 3,131 | | | | 1,121,204 | |
LVMH Moet Hennessy Louis Vuitton SE | | | 2,593 | | | | 1,886,909 | |
Pernod Ricard SA | | | 6,224 | | | | 1,224,402 | |
Remy Cointreau SA | | | 1,728 | | | | 291,364 | |
Safran SA | | | 7,315 | | | | 916,233 | |
Sartorius Stedim Biotech | | | 902 | | | | 293,121 | |
Teleperformance | | | 2,371 | | | | 566,824 | |
TotalEnergies SE | | | 7,481 | | | | 469,606 | |
Vinci SA | | | 6,809 | | | | 678,769 | |
| | | | | | | | |
| | |
| | | | | | | 10,257,106 | |
| | | | | | | | |
| | | | | | | | |
| | | Shares | | | Value | |
|
COMMON STOCKS (continued) | |
Germany — 3.9% | | | | | | | | |
adidas AG | | | 1,537 | | | $ | 208,304 | |
Beiersdorf AG | | | 3,087 | | | | 352,757 | |
Brenntag SE | | | 6,947 | | | | 443,044 | |
Deutsche Boerse AG | | | 2,548 | | | | 438,741 | |
HelloFresh SE* | | | 5,081 | | | | 110,892 | |
Infineon Technologies AG | | | 12,929 | | | | 392,937 | |
Rational AG | | | 39 | | | | 23,160 | |
SAP SE, ADR(a) | | | 3,138 | | | | 323,810 | |
Symrise AG | | | 4,388 | | | | 476,559 | |
| | | | | | | | |
| | |
| | | | | | | 2,770,204 | |
| | | | | | | | |
Hong Kong — 2.4% | | | | | | | | |
AIA Group Ltd. | | | 81,200 | | | | 896,723 | |
Prudential PLC | | | 28,298 | | | | 385,852 | |
Techtronic Industries Co. Ltd. | | | 39,200 | | | | 435,388 | |
| | | | | | | | |
| | |
| | | | | | | 1,717,963 | |
| | | | | | | | |
India — 3.6% | | | | | | | | |
HDFC Bank Ltd., ADR(a) | | | 16,391 | | | | 1,121,308 | |
ICICI Bank Ltd., ADR(a) | | | 17,894 | | | | 391,700 | |
Infosys Ltd., ADR(a) | | | 19,286 | | | | 347,341 | |
Reliance Industries Ltd., 144A, GDR | | | 11,456 | | | | 702,755 | |
| | | | | | | | |
| | |
| | | | | | | 2,563,104 | |
| | | | | | | | |
Indonesia — 0.5% | | | | | | | | |
Bank Central Asia Tbk PT | | | 673,926 | | | | 369,539 | |
| | | | | | | | |
Ireland — 1.9% | | | | | | | | |
Bank of Ireland Group PLC | | | 34,737 | | | | 331,020 | |
CRH PLC | | | 8,159 | | | | 324,686 | |
Kerry Group PLC (Class A Stock) | | | 3,844 | | | | 347,230 | |
Smurfit Kappa Group PLC | | | 8,887 | | | | 329,355 | |
| | | | | | | | |
| | |
| | | | | | | 1,332,291 | |
| | | | | | | | |
Italy — 3.1% | | | | | | | | |
Brunello Cucinelli SpA | | | 12,585 | | | | 931,176 | |
Ferrari NV | | | 4,707 | | | | 1,009,363 | |
Nexi SpA, 144A* | | | 32,321 | | | | 255,140 | |
| | | | | | | | |
| | |
| | | | | | | 2,195,679 | |
| | | | | | | | |
Japan — 9.5% | | | | | | | | |
Daikin Industries Ltd. | | | 2,400 | | | | 364,113 | |
Disco Corp. | | | 1,400 | | | | 399,030 | |
Fujitsu Ltd. | | | 2,900 | | | | 386,621 | |
GMO Payment Gateway, Inc. | | | 1,032 | | | | 85,345 | |
Hitachi Ltd. | | | 5,100 | | | | 256,613 | |
Hoya Corp. | | | 2,900 | | | | 277,758 | |
Keyence Corp. | | | 2,722 | | | | 1,056,802 | |
Koito Manufacturing Co. Ltd. | | | 9,400 | | | | 140,137 | |
Lasertec Corp. | | | 1,941 | | | | 316,908 | |
Olympus Corp. | | | 19,100 | | | | 336,878 | |
Otsuka Corp. | | | 8,400 | | | | 264,771 | |
SCSK Corp. | | | 21,900 | | | | 331,495 | |
Shin-Etsu Chemical Co. Ltd. | | | 2,000 | | | | 244,224 | |
SMC Corp. | | | 1,400 | | | | 584,575 | |
Sony Group Corp. | | | 8,400 | | | | 640,262 | |
TechnoPro Holdings, Inc. | | | 18,100 | | | | 481,881 | |
Terumo Corp. | | | 12,100 | | | | 343,042 | |
SEE NOTES TO FINANCIAL STATEMENTS.
A11
| | | | |
| | PSF INTERNATIONAL GROWTH PORTFOLIO (CONTINUED) | | |
SCHEDULE OF INVESTMENTS | | | | as of December 31, 2022 |
| | | | | | | | |
| | | Shares | | | Value | |
|
COMMON STOCKS (continued) | |
Japan (cont’d.) | | | | | | | | |
Tokyo Electron Ltd. | | | 1,000 | | | $ | 293,829 | |
| | | | | | | | |
| | |
| | | | | | | 6,804,284 | |
| | | | | | | | |
Netherlands — 6.1% | | | | | | | | |
Adyen NV, 144A* | | | 546 | | | | 757,985 | |
Argenx SE, ADR* | | | 1,611 | | | | 610,295 | |
ASML Holding NV | | | 2,563 | | | | 1,397,481 | |
Heineken NV | | | 5,519 | | | | 519,847 | |
Koninklijke DSM NV | | | 2,192 | | | | 269,166 | |
Shell PLC | | | 16,515 | | | | 465,571 | |
Universal Music Group NV | | | 13,986 | | | | 338,219 | |
| | | | | | | | |
| | |
| | | | | | | 4,358,564 | |
| | | | | | | | |
Norway — 0.5% | | | | | | | | |
Equinor ASA | | | 10,389 | | | | 373,383 | |
TOMRA Systems ASA | | | 659 | | | | 11,115 | |
| | | | | | | | |
| | |
| | | | | | | 384,498 | |
| | | | | | | | |
Singapore — 0.7% | | | | | | | | |
DBS Group Holdings Ltd. | | | 18,864 | | | | 477,478 | |
| | | | | | | | |
South Korea — 1.1% | | | | | | | | |
Coupang, Inc.* | | | 19,944 | | | | 293,376 | |
LG Energy Solution Ltd.* | | | 398 | | | | 137,174 | |
Samsung SDI Co. Ltd. | | | 725 | | | | 340,418 | |
| | | | | | | | |
| | |
| | | | | | | 770,968 | |
| | | | | | | | |
Spain — 1.0% | | | | | | | | |
Amadeus IT Group SA* | | | 11,521 | | | | 597,684 | |
Bankinter SA | | | 21,928 | | | | 146,907 | |
| | | | | | | | |
| | |
| | | | | | | 744,591 | |
| | | | | | | | |
Sweden — 2.5% | | | | | | | | |
Atlas Copco AB (Class A Stock) | | | 61,329 | | | | 726,650 | |
Autoliv, Inc. | | | 2,349 | | | | 179,886 | |
Evolution AB, 144A | | | 3,790 | | | | 369,163 | |
Hexagon AB (Class B Stock) | | | 38,837 | | | | 407,210 | |
Indutrade AB | | | 6,092 | | | | 123,543 | |
| | | | | | | | |
| | |
| | | | | | | 1,806,452 | |
| | | | | | | | |
Switzerland — 7.0% | | | | | | | | |
Alcon, Inc. | | | 4,840 | | | | 332,116 | |
Cie Financiere Richemont SA (Class A Stock) | | | 4,685 | | | | 607,457 | |
Julius Baer Group Ltd. | | | 5,832 | | | | 339,429 | |
Lonza Group AG | | | 1,602 | | | | 786,382 | |
Novartis AG | | | 9,866 | | | | 892,848 | |
Partners Group Holding AG | | | 310 | | | | 274,500 | |
SIG Group AG* | | | 12,912 | | | | 282,142 | |
Sika AG | | | 837 | | | | 201,218 | |
Straumann Holding AG | | | 2,514 | | | | 288,283 | |
UBS Group AG | | | 17,858 | | | | 331,913 | |
Zurich Insurance Group AG | | | 1,338 | | | | 639,668 | |
| | | | | | | | |
| | |
| | | | | | | 4,975,956 | |
| | | | | | | | |
Taiwan — 0.7% | | | | | | | | |
Taiwan Semiconductor Manufacturing Co. Ltd. | | | 33,000 | | | | 479,274 | |
| | | | | | | | |
| | | | | | | | |
| | | Shares | | | Value | |
|
COMMON STOCKS (continued) | |
United Kingdom — 17.1% | | | | | | | | |
Ashtead Group PLC | | | 17,685 | | | $ | 1,004,593 | |
AstraZeneca PLC | | | 15,927 | | | | 2,155,232 | |
BAE Systems PLC | | | 31,973 | | | | 330,230 | |
Bunzl PLC | | | 27,659 | | | | 920,219 | |
Compass Group PLC | | | 77,649 | | | | 1,793,073 | |
DCC PLC | | | 5,100 | | | | 250,777 | |
Diageo PLC | | | 18,058 | | | | 790,432 | |
Experian PLC | | | 22,705 | | | | 768,981 | |
Fevertree Drinks PLC | | | 2,931 | | | | 36,455 | |
Halma PLC | | | 9,655 | | | | 229,933 | |
Linde PLC | | | 1,347 | | | | 439,364 | |
Lloyds Banking Group PLC | | | 703,116 | | | | 383,700 | |
London Stock Exchange Group PLC | | | 10,741 | | | | 922,880 | |
Petershill Partners PLC, 144A | | | 107,935 | | | | 220,841 | |
RELX PLC | | | 21,384 | | | | 591,226 | |
Rentokil Initial PLC | | | 65,784 | | | | 404,162 | |
Segro PLC, REIT | | | 18,944 | | | | 174,517 | |
Smith & Nephew PLC | | | 23,654 | | | | 315,895 | |
Spirax-Sarco Engineering PLC | | | 1,404 | | | | 179,334 | |
Travis Perkins PLC | | | 1,807 | | | | 19,319 | |
Unilever PLC | | | 6,469 | | | | 324,594 | |
| | | | | | | | |
| | |
| | | | | | | 12,255,757 | |
| | | | | | | | |
United States — 9.2% | | | | | | | | |
Aon PLC (Class A Stock) | | | 1,869 | | | | 560,962 | |
CSL Ltd | | | 1,838 | | | | 358,399 | |
CyberArk Software Ltd.* | | | 2,530 | | | | 328,014 | |
Globant SA*(a) | | | 691 | | | | 116,199 | |
ICON PLC* | | | 5,347 | | | | 1,038,655 | |
Lululemon Athletica, Inc.* | | | 1,877 | | | | 601,353 | |
Nestle SA. | | | 4,529 | | | | 523,142 | |
QIAGEN NV* | | | 9,385 | | | | 468,030 | |
Roche Holding AG | | | 2,955 | | | | 928,572 | |
Schlumberger Ltd | | | 11,034 | | | | 589,878 | |
Schneider Electric SE | | | 2,717 | | | | 381,561 | |
Tenaris SA | | | 36,856 | | | | 646,370 | |
| | | | | | | | |
| | |
| | | | | | | 6,541,135 | |
| | | | | | | | |
| |
TOTAL COMMON STOCKS
(cost $59,215,076) | | | | 69,581,426 | |
| | | | | | | | |
| | |
PREFERRED STOCKS — 1.3% | | | | | | | | |
Germany | | | | | | | | |
Dr. Ing. h.c. F. Porsche AG (PRFC)* | | | 2,424 | | | | 244,614 | |
Sartorius AG (PRFC) | | | 1,663 | | | | 656,679 | |
| | | | | | | | |
| |
TOTAL PREFERRED STOCKS
(cost $350,361) | | | | 901,293 | |
| | | | | | | | |
| |
TOTAL LONG-TERM INVESTMENTS
(cost $59,565,437) | | | | 70,482,719 | |
| | | | | | | | |
|
SHORT-TERM INVESTMENTS — 5.9% | |
AFFILIATED MUTUAL FUNDS — 5.7% | |
PGIM Core Ultra Short Bond Fund(wa) | | | 797,800 | | | | 797,800 | |
SEE NOTES TO FINANCIAL STATEMENTS.
A12
| | | | |
| | PSF INTERNATIONAL GROWTH PORTFOLIO (CONTINUED) | | |
SCHEDULE OF INVESTMENTS | | | | as of December 31, 2022 |
| | | | | | | | |
| | | Shares | | | Value | |
| |
AFFILIATED MUTUAL FUNDS (continued) | | | | | |
PGIM Institutional Money Market Fund (cost $3,279,105; includes $3,266,949 of cash collateral for securities on loan)(b)(wa) | | | 3,282,365 | | | $ | 3,280,723 | |
| | | | | | | | |
| |
TOTAL AFFILIATED MUTUAL FUNDS
(cost $4,076,905) | | | | 4,078,523 | |
| | | | | | | | |
| |
UNAFFILIATED FUND — 0.2% | | | | | |
BlackRock Liquidity FedFund (Institutional Shares) | | | 181,292 | | | | 181,292 | |
| | | | | | | | |
(cost $181,292) | | | | | | | | |
| |
TOTAL SHORT-TERM INVESTMENTS
(cost $4,258,197) | | | | 4,259,815 | |
| | | | | | | | |
| |
TOTAL INVESTMENTS—104.5%
(cost $63,823,634) | | | | 74,742,534 | |
| |
Liabilities in excess of other assets — (4.5)% | | | | (3,243,954 | ) |
| | | | | | | | |
| | |
NET ASSETS — 100.0% | | | | | | $ | 71,498,580 | |
| | | | | | | | |
See the Glossary for a list of the abbreviation(s) used in the annual report.
| * | Non-income producing security. |
| (a) | All or a portion of security is on loan. The aggregate market value of such securities, including those sold and pending settlement, is $3,182,292; cash collateral of $3,266,949 (included in liabilities) was received with which the Portfolio purchased highly liquid short-term investments. In the event of significant appreciation in value of securities on loan on the last business day of the reporting period, the Portfolio may reflect a collateral value that is less than the market value of the loaned securities and such shortfall is remedied the following business day. |
| (b) | Represents security, or portion thereof, purchased with cash collateral received for securities on loan and includes dividend reinvestment. |
| (wa) | PGIM Investments LLC, the manager of the Portfolio, also serves as manager of the PGIM Core Ultra Short Bond Fund and PGIM Institutional Money Market Fund, if applicable. |
Fair Value Measurements:
Various inputs are used in determining the value of the Portfolio’s investments. These inputs are summarized in the three broad levels listed below.
Level 1—unadjusted quoted prices generally in active markets for identical securities.
Level 2—quoted prices for similar securities, interest rates and yield curves, prepayment speeds, foreign currency exchange rates and other observable inputs.
Level 3—unobservable inputs for securities valued in accordance with Board approved fair valuation procedures.
The following is a summary of the inputs used as of December 31, 2022 in valuing such portfolio securities:
| | | | | | | | | | | | | | | | | | | | |
| | | Level 1 | | | Level 2 | | | Level 3 | |
Investments in Securities | | | | | | | | | | | | | | | | | | | | |
Assets | | | | | | | | | | | | | | | | | | | | |
Long-Term Investments | | | | | | | | | | | | | | | | | | | | |
Common Stocks | | | | | | | | | | | | | | | | | | | | |
Australia | | $ | — | | | $ | 171,729 | | | | | | | $ | — | | | | | |
Austria | | | — | | | | 392,856 | | | | | | | | — | | | | | |
Belgium | | | — | | | | 381,934 | | | | | | | | — | | | | | |
Brazil | | | 1,254,167 | | | | 179,901 | | | | | | | | — | | | | | |
Canada | | | 2,772,125 | | | | — | | | | | | | | — | | | | | |
China | | | — | | | | 510,396 | | | | | | | | — | | | | | |
Denmark | | | — | | | | 2,458,349 | | | | | | | | — | | | | | |
Finland | | | — | | | | 655,126 | | | | | | | | — | | | | | |
France | | | — | | | | 10,257,106 | | | | | | | | — | | | | | |
Germany | | | 323,810 | | | | 2,446,394 | | | | | | | | — | | | | | |
Hong Kong | | | — | | | | 1,717,963 | | | | | | | | — | | | | | |
India | | | 1,860,349 | | | | 702,755 | | | | | | | | — | | | | | |
Indonesia | | | — | | | | 369,539 | | | | | | | | — | | | | | |
Ireland | | | — | | | | 1,332,291 | | | | | | | | — | | | | | |
Italy | | | — | | | | 2,195,679 | | | | | | | | — | | | | | |
Japan | | | — | | | | 6,804,284 | | | | | | | | — | | | | | |
Netherlands | | | 610,295 | | | | 3,748,269 | | | | | | | | — | | | | | |
Norway | | | — | | | | 384,498 | | | | | | | | — | | | | | |
Singapore | | | — | | | | 477,478 | | | | | | | | — | | | | | |
South Korea | | | 293,376 | | | | 477,592 | | | | | | | | — | | | | | |
Spain | | | — | | | | 744,591 | | | | | | | | — | | | | | |
Sweden | | | 179,886 | | | | 1,626,566 | | | | | | | | — | | | | | |
SEE NOTES TO FINANCIAL STATEMENTS.
A13
| | | | |
| | PSF INTERNATIONAL GROWTH PORTFOLIO (CONTINUED) | | |
SCHEDULE OF INVESTMENTS | | | | as of December 31, 2022 |
| | | | | | | | | | | | | | | | | | | | |
| | | Level 1 | | | Level 2 | | | Level 3 | |
Investments in Securities (continued) | | | | | | | | | | | | | | | | | | | | |
Assets (continued) | | | | | | | | | | | | | | | | | | | | |
Long-Term Investments (continued) | | | | | | | | | | | | | | | | | | | | |
Common Stocks (continued) | | | | | | | | | | | | | | | | | | | | |
Switzerland | | $ | — | | | $ | 4,975,956 | | | | | | | $ | — | | | | | |
Taiwan | | | — | | | | 479,274 | | | | | | | | — | | | | | |
United Kingdom | | | 439,364 | | | | 11,816,393 | | | | | | | | — | | | | | |
United States | | | 3,703,091 | | | | 2,838,044 | | | | | | | | — | | | | | |
Preferred Stocks | | | | | | | | | | | | | | | | | | | | |
Germany | | | — | | | | 901,293 | | | | | | | | — | | | | | |
Short-Term Investments | | | | | | | | | | | | | | | | | | | | |
Affiliated Mutual Funds | | | 4,078,523 | | | | — | | | | | | | | — | | | | | |
Unaffiliated Fund | | | 181,292 | | | | — | | | | | | | | — | | | | | |
| | | | | | | | | | | | | | | | | | | | |
| | | | | |
Total | | $ | 15,696,278 | | | $ | 59,046,256 | | | | | | | $ | — | | | | | |
| | | | | | | | | | | | |
Industry Classification:
The industry classification of investments and liabilities in excess of other assets shown as a percentage of net assets as of December 31, 2022 were as follows:
| | | | |
Pharmaceuticals | | | 8.1 | % |
Textiles, Apparel & Luxury Goods | | | 7.6 | |
Banks | | | 7.6 | |
Affiliated Mutual Funds (4.6% represents investments
purchased with collateral from securities on loan) | | | 5.7 | |
Life Sciences Tools & Services | | | 4.6 | |
Semiconductors & Semiconductor Equipment | | | 4.5 | |
IT Services | | | 4.5 | |
Insurance | | | 4.1 | |
Beverages | | | 4.0 | |
Professional Services | | | 3.9 | |
Oil, Gas & Consumable Fuels | | | 3.8 | |
Capital Markets | | | 3.8 | |
Trading Companies & Distributors | | | 3.3 | |
Hotels, Restaurants & Leisure | | | 3.2 | |
Health Care Equipment & Supplies | | | 3.0 | |
Machinery | | | 2.9 | |
Electronic Equipment, Instruments & Components | | | 2.9 | |
Chemicals | | | 2.8 | |
Personal Products | | | 2.6 | |
Aerospace & Defense | | | 2.5 | |
Automobiles | | | 1.8 | |
Energy Equipment & Services | | | 1.7 | |
Internet & Direct Marketing Retail | | | 1.7 | |
Software | | | 1.7 | |
| | | | |
Biotechnology | | | 1.3 | % |
Food Products | | | 1.2 | |
Road & Rail | | | 1.0 | |
Construction & Engineering | | | 0.9 | |
Household Durables | | | 0.9 | |
Containers & Packaging | | | 0.9 | |
Electrical Equipment | | | 0.7 | |
Industrial Conglomerates | | | 0.7 | |
Multiline Retail | | | 0.7 | |
Commercial Services & Supplies | | | 0.6 | |
Building Products | | | 0.5 | |
Air Freight & Logistics | | | 0.5 | |
Entertainment | | | 0.5 | |
Construction Materials | | | 0.4 | |
Auto Components | | | 0.4 | |
Specialty Retail | | | 0.4 | |
Equity Real Estate Investment Trusts (REITs) | | | 0.2 | |
Food & Staples Retailing | | | 0.2 | |
Unaffiliated Fund | | | 0.2 | |
| | | | |
| |
| | | 104.5 | |
Liabilities in excess of other assets | | | (4.5 | ) |
| | | | |
| |
| | | 100.0 | % |
| | | | |
SEE NOTES TO FINANCIAL STATEMENTS.
A14
| | | | |
| | PSF INTERNATIONAL GROWTH PORTFOLIO (CONTINUED) | | |
SCHEDULE OF INVESTMENTS | | | | as of December 31, 2022 |
Financial Instruments/Transactions—Summary of Offsetting and Netting Arrangements:
The Portfolio entered into financial instruments/transactions during the reporting period that are either offset in accordance with current requirements or are subject to enforceable master netting arrangements or similar agreements that permit offsetting. The information about offsetting and related netting arrangements for financial instruments/transactions where the legal right to set-off exists is presented in the summary below.
Offsetting of financial instrument/transaction assets and liabilities:
| | | | | | |
| Description | | Gross Market Value of Recognized Assets/(Liabilities) | | Collateral
Pledged/(Received)(1) | | Net Amount |
Securities on Loan | | $3,182,292 | | $(3,182,292) | | $— |
| (1) | Collateral amount disclosed by the Portfolio is limited to the market value of financial instruments/transactions. |
SEE NOTES TO FINANCIAL STATEMENTS.
A15
| | | | |
| | PSF INTERNATIONAL GROWTH PORTFOLIO (CONTINUED) | | |
STATEMENT OF ASSETS AND LIABILITIES
as of December 31, 2022
| | | | |
ASSETS | | | | |
Investments at value, including securities on loan of $3,182,292: | | | | |
Unaffiliated investments (cost $59,746,729) | | $ | 70,664,011 | |
Affiliated investments (cost $4,076,905) | | | 4,078,523 | |
Foreign currency, at value (cost $73,054) | | | 73,210 | |
Tax reclaim receivable | | | 247,939 | |
Receivable for investments sold | | | 68,690 | |
Dividends receivable | | | 26,174 | |
Receivable from affiliate | | | 1,129 | |
Receivable for Portfolio shares sold | | | 426 | |
Prepaid expenses and other assets | | | 1,379 | |
| | | | |
Total Assets | | | 75,161,481 | |
| | | | |
LIABILITIES | | | | |
Payable to broker for collateral for securities on loan | | | 3,266,949 | |
Payable for investments purchased | | | 133,892 | |
Accrued expenses and other liabilities | | | 104,538 | |
Payable to affiliate | | | 95,385 | |
Payable for Portfolio shares purchased | | | 31,316 | |
Management fee payable | | | 27,632 | |
Payable to custodian | | | 1,831 | |
Affiliated transfer agent fee payable | | | 980 | |
Trustees’ fees payable | | | 341 | |
Distribution fee payable | | | 23 | |
Administration fee payable | | | 14 | |
| | | | |
Total Liabilities | | | 3,662,901 | |
| | | | |
NET ASSETS | | $ | 71,498,580 | |
| | | | |
Net assets were comprised of: | | | | |
Partners’ Equity | | $ | 71,498,580 | |
| | | | |
Class I: | | | | |
Net asset value and redemption price per share, $71,393,549 / 7,281,484 outstanding shares of beneficial interest | | $ | 9.80 | |
| | | | |
Class II: | | | | |
Net asset value and redemption price per share, $105,031 / 11,263 outstanding shares of beneficial interest | | $ | 9.33 | |
| | | | |
STATEMENT OF OPERATIONS
Year Ended December 31, 2022
| | | | |
NET INVESTMENT INCOME (LOSS) | | | | |
INCOME | | | | |
Unaffiliated dividend income (net of $128,112 foreign withholding tax, of which $19,107 is reimbursable by an affiliate) | | $ | 1,089,017 | |
Affiliated dividend income | | | 24,644 | |
Income from securities lending, net (including affiliated income of $3,705) | | | 10,637 | |
| | | | |
Total income | | | 1,124,298 | |
| | | | |
EXPENSES | | | | |
Management fee | | | 657,039 | |
Distribution fee—Class II | | | 302 | |
Administration fee—Class II | | | 181 | |
Custodian and accounting fees | | | 128,025 | |
Shareholders’ reports | | | 43,837 | |
Legal fees and expenses | | | 28,267 | |
Audit fee | | | 27,700 | |
Transfer agent’s fees and expenses (including affiliated expense of $5,882) | | | 10,682 | |
Trustees’ fees | | | 9,561 | |
Miscellaneous | | | 34,696 | |
| | | | |
Total expenses | | | 940,290 | |
Less: Fee waivers and/or expense reimbursement | | | (158,900 | ) |
| | | | |
Net expenses | | | 781,390 | |
| | | | |
NET INVESTMENT INCOME (LOSS) | | | 342,908 | |
| | | | |
| REALIZED AND UNREALIZED GAIN (LOSS) ON INVESTMENT AND FOREIGN CURRENCY TRANSACTIONS | | | | |
Net realized gain (loss) on: | | | | |
Investment transactions (including affiliated of $(162)) | | | 3,497,798 | |
Foreign currency transactions | | | (28,340 | ) |
| | | | |
| | | 3,469,458 | |
| | | | |
Net change in unrealized appreciation (depreciation) on: | | | | |
Investments (including affiliated of $1,272) | | | (34,285,471 | ) |
Foreign currencies | | | (6,378 | ) |
| | | | |
| | | (34,291,849 | ) |
| | | | |
NET GAIN (LOSS) ON INVESTMENT AND FOREIGN CURRENCY TRANSACTIONS | | | (30,822,391 | ) |
| | | | |
| |
NET INCREASE (DECREASE) IN NET ASSETS RESULTING FROM OPERATIONS | | $ | (30,479,483 | ) |
| | | | |
STATEMENTS OF CHANGES IN NET ASSETS
| | | | | | | | | | | | | | | | |
| | | Year Ended December 31, 2022 | | Year Ended December 31, 2021 |
| | | | | | | | | | | | | | | |
INCREASE (DECREASE) IN NET ASSETS | | | | | | | | | | | | | | | | |
OPERATIONS | | | | | | | | | | | | | | | | |
Net investment income (loss) | | | | $ | 342,908 | | | | | | | $ | (3,065 | ) | | |
Net realized gain (loss) on investment and foreign currency transactions | | | | | 3,469,458 | | | | | | | | 10,840,067 | | | |
Net change in unrealized appreciation (depreciation) on investments and foreign currencies | | | | | (34,291,849 | ) | | | | | | | 1,949,470 | | | |
| | | | | | | | | | | | | | | | |
NET INCREASE (DECREASE) IN NET ASSETS RESULTING FROM OPERATIONS | | | | | (30,479,483 | ) | | | | | | | 12,786,472 | | | |
| | | | | | | | | | | | | | | | |
PORTFOLIO SHARE TRANSACTIONS | | | | | | | | | | | | | | | | |
Portfolio shares sold | | | | | 5,694,785 | | | | | | | | 4,771,632 | | | |
Portfolio shares purchased | | | | | (11,968,971 | ) | | | | | | | (12,643,096 | ) | | |
| | | | | | | | | | | | | | | | |
NET INCREASE (DECREASE) IN NET ASSETS FROM PORTFOLIO SHARE TRANSACTIONS | | | | | (6,274,186 | ) | | | | | | | (7,871,464 | ) | | |
| | | | | | | | | | | | | | | | |
TOTAL INCREASE (DECREASE) | | | | | (36,753,669 | ) | | | | | | | 4,915,008 | | | |
NET ASSETS: | | | | | | | | | | | | | | | | |
Beginning of year | | | | | 108,252,249 | | | | | | | | 103,337,241 | | | |
| | | | | | | | | | | | | | | | |
End of year | | | | $ | 71,498,580 | | | | | | | $ | 108,252,249 | | | |
| | | | | | | | | | | | | | | | |
SEE NOTES TO FINANCIAL STATEMENTS.
A16
| | | | |
| | PSF INTERNATIONAL GROWTH PORTFOLIO (CONTINUED) | | |
FINANCIAL HIGHLIGHTS
| | | | | | | | | | | | | | | | | | | | | | |
Class I | | | | | | | | | | | | | | | | | |
| | | | | Year Ended December 31, | |
| | | | | 2022 | | | 2021 | | | 2020 | | | 2019 | | | 2018 | |
Per Share Operating Performance(a): | | | | | | | | | | | | | | | | | | | | | | |
Net Asset Value, beginning of year | | | | $ | 13.79 | | | $ | 12.26 | | | $ | 9.28 | | | $ | 7.01 | | | $ | 8.05 | |
| | | | | | | | | | | | | | | | | | | | | | |
Income (Loss) From Investment Operations: | | | | | | | | | | | | | | | | | | | | | | |
Net investment income (loss) | | | | | 0.05 | | | | — | (b) | | | — | (b) | | | 0.05 | | | | 0.07 | |
Net realized and unrealized gain (loss) on investment and foreign currency transactions | | | | | (4.04 | ) | | | 1.53 | | | | 2.98 | | | | 2.21 | | | | (1.12 | ) |
| | | | | | | | | | | | | | | | | | | | | | |
Total from investment operations | | | | | (3.99 | ) | | | 1.53 | | | | 2.98 | | | | 2.26 | | | | (1.05 | ) |
| | | | | | | | | | | | | | | | | | | | | | |
Capital Contributions | | | | | — | | | | — | | | | — | | | | 0.01 | (c)(d) | | | 0.01 | (d) |
| | | | | | | | | | | | | | | | | | | | | | |
Net Asset Value, end of year | | | | $ | 9.80 | | | $ | 13.79 | | | $ | 12.26 | | | $ | 9.28 | | | $ | 7.01 | |
| | | | | | | | | | | | | | | | | | | | | | |
Total Return(e) | | | | | (28.93 | )% | | | 12.48 | % | | | 32.11 | % | | | 32.38 | %(f) | | | (12.92 | )%(g) |
Ratios/Supplemental Data: | | | | | | | | | | | | | | | | | | | | | | |
Net assets, end of year (in millions) | | | | $ | 71.4 | | | $ | 108.1 | | | $ | 103.2 | | | $ | 85.6 | | | $ | 70.1 | |
Average net assets (in millions) | | | | $ | 77.2 | | | $ | 108.3 | | | $ | 86.3 | | | $ | 79.6 | | | $ | 81.8 | |
Ratios to average net assets(h): | | | | | | | | | | | | | | | | | | | | | | |
Expenses after waivers and/or expense reimbursement | | | | | 1.01 | % | | | 1.01 | % | | | 1.01 | % | | | 1.01 | % | | | 1.01 | % |
Expenses before waivers and/or expense reimbursement | | | | | 1.22 | % | | | 1.07 | % | | | 1.21 | % | | | 1.24 | % | | | 1.20 | % |
Net investment income (loss) | | | | | 0.44 | % | | | — | %(b) | | | 0.05 | % | | | 0.64 | % | | | 0.83 | % |
Portfolio turnover rate(i) | | | | | 53 | % | | | 27 | % | | | 44 | % | | | 26 | % | | | 37 | % |
| | | | | | |
Class II | | | | | | | | | | | | | | | | | |
| | | | | Year Ended December 31, | |
| | | | | 2022 | | | 2021 | | | 2020 | | | 2019 | | | 2018 | |
Per Share Operating Performance(a): | | | | | | | | | | | | | | | | | | | | | | |
Net Asset Value, beginning of year | | | | $ | 13.17 | | | $ | 11.75 | | | $ | 8.93 | | | $ | 6.77 | | | $ | 7.81 | |
| | | | | | | | | | | | | | | | | | | | | | |
Income (Loss) From Investment Operations: | | | | | | | | | | | | | | | | | | | | | | |
Net investment income (loss) | | | | | — | (b) | | | (0.05 | ) | | | (0.03 | ) | | | 0.02 | | | | 0.03 | |
Net realized and unrealized gain (loss) on investment and foreign currency transactions | | | | | (3.84 | ) | | | 1.47 | | | | 2.85 | | | | 2.13 | | | | (1.08 | ) |
| | | | | | | | | | | | | | | | | | | | | | |
Total from investment operations | | | | | (3.84 | ) | | | 1.42 | | | | 2.82 | | | | 2.15 | | | | (1.05 | ) |
| | | | | | | | | | | | | | | | | | | | | | |
Capital Contributions | | | | | — | | | | — | | | | — | | | | 0.01 | (c)(d) | | | 0.01 | (d) |
| | | | | | | | | | | | | | | | | | | | | | |
Net Asset Value, end of year | | | | $ | 9.33 | | | $ | 13.17 | | | $ | 11.75 | | | $ | 8.93 | | | $ | 6.77 | |
| | | | | | | | | | | | | | | | | | | | | | |
Total Return(e) | | | | | (29.16 | )% | | | 12.09 | % | | | 31.58 | % | | | 31.91 | %(f) | | | (13.32 | )%(g) |
Ratios/Supplemental Data: | | | | | | | | | | | | | | | | | | | | | | |
Net assets, end of year (in millions) | | | | $ | 0.1 | | | $ | 0.2 | | | $ | 0.2 | | | $ | 0.1 | | | $ | 0.1 | |
Average net assets (in millions) | | | | $ | 0.1 | | | $ | 0.2 | | | $ | 0.1 | | | $ | 0.1 | | | $ | 0.1 | |
Ratios to average net assets(h): | | | | | | | | | | | | | | | | | | | | | | |
Expenses after waivers and/or expense reimbursement | | | | | 1.41 | % | | | 1.41 | % | | | 1.41 | % | | | 1.41 | % | | | 1.41 | % |
Expenses before waivers and/or expense reimbursement | | | | | 1.62 | % | | | 1.47 | % | | | 1.61 | % | | | 1.64 | % | | | 1.60 | % |
Net investment income (loss) | | | | | 0.02 | % | | | (0.39 | )% | | | (0.36 | )% | | | 0.24 | % | | | 0.44 | % |
Portfolio turnover rate(i) | | | | | 53 | % | | | 27 | % | | | 44 | % | | | 26 | % | | | 37 | % |
| (a) | Calculated based on average shares outstanding during the year. |
| (b) | Amount rounds to zero. |
| (c) | Represents payment received by the Portfolio, from the Investment Manager, in connection for costs incurred due to a portfolio allocation error. |
| (d) | Represents payment received by the Portfolio, from Prudential, in connection with excess foreign withholding tax withheld on dividends and interest from certain countries due to the Portfolio’s tax status as a partnership. |
| (e) | Total return is calculated assuming a purchase of a share on the first day and a sale on the last day of each year reported and includes reinvestment of dividends and distributions, if any, and does not reflect the effect of insurance contract charges. Total return does not reflect expenses associated with the separate account such as administrative fees, account charges and surrender charges which, if reflected, would reduce the total returns for all years shown. Performance figures may reflect fee waivers and/or expense reimbursements. In the absence of fee waivers and/or expense reimbursements, the total return would be lower. Past performance is no guarantee of future results. Total returns may reflect adjustments to conform to GAAP. |
| (f) | Total return for the year includes the impact of the capital contribution. Excluding the capital contribution, the total return would have been 32.24% and 31.76% for Class I and Class II, respectively. |
| (g) | Total return for the year includes the impact of the capital contribution. Excluding the capital contribution, the total return would have been (13.04)% and (13.45)% for Class I and Class II, respectively. |
| (h) | Does not include expenses of the underlying funds in which the Portfolio invests. |
| (i) | The Portfolio’s portfolio turnover rate is calculated in accordance with regulatory requirements, without regard to transactions involving short-term investments, certain derivatives and in-kind transactions (if any). If such transactions were included, the Portfolio’s portfolio turnover rate may be higher. |
SEE NOTES TO FINANCIAL STATEMENTS.
A17
| | | | |
| | PSF MID-CAP GROWTH PORTFOLIO | | |
SCHEDULE OF INVESTMENTS | | | | as of December 31, 2022 |
| | | | | | | | |
| | | Shares | | | Value | |
|
LONG-TERM INVESTMENTS — 97.4% | |
COMMON STOCKS | |
Aerospace & Defense — 0.7% | |
HEICO Corp. (Class A Stock) | | | 19,290 | | | $ | 2,311,906 | |
| | | | | | | | |
Airlines — 0.7% | | | | | | | | |
Delta Air Lines, Inc.* | | | 64,101 | | | | 2,106,359 | |
| | | | | | | | |
Banks — 1.7% | | | | | | | | |
East West Bancorp, Inc. | | | 35,731 | | | | 2,354,673 | |
First Republic Bank | | | 15,220 | | | | 1,855,166 | |
SVB Financial Group* | | | 3,918 | | | | 901,688 | |
| | | | | | | | |
| | |
| | | | | | | 5,111,527 | |
| | | | | | | | |
Beverages — 1.0% | |
Constellation Brands, Inc. (Class A Stock) | | | 13,048 | | | | 3,023,874 | |
| | | | | | | | |
Biotechnology — 7.1% | |
Alnylam Pharmaceuticals, Inc.* | | | 18,480 | | | | 4,391,772 | |
Exact Sciences Corp.*(a) | | | 46,445 | | | | 2,299,492 | |
Exelixis, Inc.* | | | 116,073 | | | | 1,861,811 | |
Horizon Therapeutics PLC* | | | 62,109 | | | | 7,068,004 | |
Natera, Inc.* | | | 38,254 | | | | 1,536,663 | |
Neurocrine Biosciences, Inc.* | | | 24,181 | | | | 2,888,179 | |
Seagen, Inc.* | | | 15,653 | | | | 2,011,567 | |
| | | | | | | | |
| | |
| | | | | | | 22,057,488 | |
| | | | | | | | |
Building Products — 2.2% | |
Trane Technologies PLC | | | 40,857 | | | | 6,867,653 | |
| | | | | | | | |
Capital Markets — 7.3% | |
Ares Management Corp. (Class A Stock)(a) | | | 49,740 | | | | 3,404,205 | |
FactSet Research Systems, Inc. | | | 7,420 | | | | 2,976,978 | |
LPL Financial Holdings, Inc. | | | 20,593 | | | | 4,451,589 | |
Morningstar, Inc. | | | 9,261 | | | | 2,005,840 | |
MSCI, Inc. | | | 8,939 | | | | 4,158,155 | |
S&P Global, Inc. | | | 8,384 | | | | 2,808,137 | |
Tradeweb Markets, Inc. (Class A Stock) | | | 41,733 | | | | 2,709,724 | |
| | | | | | | | |
| | |
| | | | | | | 22,514,628 | |
| | | | | | | | |
Commercial Services & Supplies — 2.3% | |
Cintas Corp | | | 3,463 | | | | 1,563,960 | |
Copart, Inc.* | | | 92,664 | | | | 5,642,311 | |
| | | | | | | | |
| | |
| | | | | | | 7,206,271 | |
| | | | | | | | |
Communications Equipment — 1.7% | |
Arista Networks, Inc.* | | | 26,589 | | | | 3,226,575 | |
F5, Inc.* | | | 13,765 | | | | 1,975,415 | |
| | | | | | | | |
| | |
| | | | | | | 5,201,990 | |
| | | | | | | | |
Construction & Engineering — 3.5% | |
AECOM | | | 28,044 | | | | 2,381,777 | |
Quanta Services, Inc.(a) | | | 47,353 | | | | 6,747,802 | |
Valmont Industries, Inc. | | | 4,831 | | | | 1,597,467 | |
| | | | | | | | |
| | |
| | | | | | | 10,727,046 | |
| | | | | | | | |
Diversified Consumer Services — 0.4% | |
Bright Horizons Family Solutions, Inc.* | | | 22,060 | | | | 1,391,986 | |
| | | | | | | | |
Electrical Equipment — 2.2% | | | | | | | | |
AMETEK, Inc. | | | 27,175 | | | | 3,796,891 | |
| | | | | | | | |
| | | Shares | | | Value | |
|
COMMON STOCKS (continued) | |
Electrical Equipment (cont’d.) | |
Hubbell, Inc. | | | 12,379 | | | $ | 2,905,104 | |
| | | | | | | | |
| | |
| | | | | | | 6,701,995 | |
| | | | | | | | |
Electronic Equipment, Instruments & Components — 2.8% | |
Jabil, Inc. | | | 13,618 | | | | 928,748 | |
Keysight Technologies, Inc.* | | | 18,764 | | | | 3,209,957 | |
Teledyne Technologies, Inc.* | | | 5,734 | | | | 2,293,084 | |
| | | | | | | | |
Zebra Technologies Corp. (Class A Stock)* | | | 9,052 | | | | 2,321,023 | |
| | | | | | | | |
| | |
| | | | | | | 8,752,812 | |
| | | | | | | | |
Energy Equipment & Services — 0.5% | |
Baker Hughes Co.(a) | | | 53,301 | | | | 1,573,979 | |
| | | | | | | | |
Entertainment — 1.0% | |
Take-Two Interactive Software, Inc.* | | | 29,243 | | | | 3,045,074 | |
| | | | | | | | |
Health Care Equipment & Supplies — 7.7% | |
Cooper Cos., Inc. (The) | | | 10,479 | | | | 3,465,091 | |
Dexcom, Inc.*(a) | | | 56,264 | | | | 6,371,335 | |
Hologic, Inc.* | | | 38,486 | | | | 2,879,138 | |
IDEXX Laboratories, Inc.* | | | 5,767 | | | | 2,352,705 | |
Insulet Corp.* | | | 14,974 | | | | 4,408,196 | |
Novocure Ltd.*(a) | | | 6,327 | | | | 464,086 | |
ResMed, Inc. | | | 18,371 | | | | 3,823,556 | |
| | | | | | | | |
| | |
| | | | | | | 23,764,107 | |
| | | | | | | | |
Health Care Providers & Services — 4.3% | |
Acadia Healthcare Co., Inc.* | | | 42,608 | | | | 3,507,490 | |
Amedisys, Inc.* | | | 21,626 | | | | 1,806,636 | |
Centene Corp.* | | | 51,466 | | | | 4,220,727 | |
McKesson Corp. | | | 9,760 | | | | 3,661,171 | |
| | | | | | | | |
| | |
| | | | | | | 13,196,024 | |
| | | | | | | | |
Hotels, Restaurants & Leisure — 5.6% | |
Aramark | | | 93,986 | | | | 3,885,381 | |
Booking Holdings, Inc.* | | | 694 | | | | 1,398,605 | |
Chipotle Mexican Grill, Inc.* | | | 3,699 | | | | 5,132,326 | |
Hilton Worldwide Holdings, Inc. | | | 43,706 | | | | 5,522,690 | |
Royal Caribbean Cruises Ltd.*(a) | | | 27,624 | | | | 1,365,454 | |
| | | | | | | | |
| | |
| | | | | | | 17,304,456 | |
| | | | | | | | |
Household Durables — 1.0% | |
Garmin Ltd. | | | 15,211 | | | | 1,403,823 | |
Helen of Troy Ltd.*(a) | | | 14,540 | | | | 1,612,632 | |
| | | | | | | | |
| | |
| | | | | | | 3,016,455 | |
| | | | | | | | |
Insurance — 1.3% | |
Progressive Corp. (The) | | | 30,046 | | | | 3,897,267 | |
| | | | | | | | |
Interactive Media & Services — 0.5% | |
Bumble, Inc. (Class A Stock)* | | | 77,132 | | | | 1,623,629 | |
| | | | | | | | |
Internet & Direct Marketing Retail — 0.5% | |
Chewy, Inc. (Class A Stock)*(a) | | | 38,935 | | | | 1,443,710 | |
| | | | | | | | |
IT Services — 3.2% | | | | | | | | |
Global Payments, Inc. | | | 24,094 | | | | 2,393,016 | |
Globant SA*(a) | | | 16,903 | | | | 2,842,408 | |
MongoDB, Inc.*(a) | | | 16,083 | | | | 3,165,778 | |
SEE NOTES TO FINANCIAL STATEMENTS.
A18
| | | | |
| | PSF MID-CAP GROWTH PORTFOLIO (CONTINUED) | | |
SCHEDULE OF INVESTMENTS | | | | as of December 31, 2022 |
| | | | | | | | |
| | | Shares | | | Value | |
|
COMMON STOCKS (continued) | |
IT Services (cont’d.) | | | | | | | | |
Remitly Global, Inc.*(a) | | | 128,766 | | | $ | 1,474,371 | |
| | | | | | | | |
| | |
| | | | | | | 9,875,573 | |
| | | | | | | | |
Life Sciences Tools & Services — 4.6% | |
10X Genomics, Inc. (Class A Stock)* | | | 26,473 | | | | 964,676 | |
Agilent Technologies, Inc. | | | 40,794 | | | | 6,104,822 | |
Maravai LifeSciences Holdings, Inc. (Class A Stock)* | | | 65,830 | | | | 942,027 | |
Mettler-Toledo International, Inc.* | | | 3,317 | | | | 4,794,558 | |
West Pharmaceutical Services, Inc. | | | 5,463 | | | | 1,285,717 | |
| | | | | | | | |
| | |
| | | | | | | 14,091,800 | |
| | | | | | | | |
Machinery — 3.1% | |
Ingersoll Rand, Inc. | | | 55,227 | | | | 2,885,611 | |
ITT, Inc. | | | 36,776 | | | | 2,982,533 | |
Toro Co. (The) | | | 33,875 | | | | 3,834,650 | |
| | | | | | | | |
| | |
| | | | | | | 9,702,794 | |
| | | | | | | | |
Media — 1.0% | | | | | | | | |
Trade Desk, Inc. (The)
(Class A Stock)*(a) | | | 70,121 | | | | 3,143,524 | |
| | | | | | | | |
Metals & Mining — 0.6% | |
Freeport-McMoRan, Inc. | | | 48,880 | | | | 1,857,440 | |
| | | | | | | | |
Oil, Gas & Consumable Fuels — 3.7% | |
Antero Resources Corp.*(a) | | | 43,460 | | | | 1,346,826 | |
Cheniere Energy, Inc. | | | 37,955 | | | | 5,691,732 | |
EOG Resources, Inc. | | | 33,918 | | | | 4,393,059 | |
| | | | | | | | |
| | |
| | | | | | | 11,431,617 | |
| | | | | | | | |
Pharmaceuticals — 1.6% | |
Jazz Pharmaceuticals PLC* | | | 13,973 | | | | 2,226,039 | |
Royalty Pharma PLC (Class A Stock) | | | 67,755 | | | | 2,677,677 | |
| | | | | | | | |
| | |
| | | | | | | 4,903,716 | |
| | | | | | | | |
Professional Services — 0.8% | |
Equifax, Inc. | | | 13,197 | | | | 2,564,969 | |
| | | | | | | | |
Road & Rail — 0.9% | | | | | | | | |
Old Dominion Freight Line, Inc. | | | 9,355 | | | | 2,654,762 | |
| | | | | | | | |
Semiconductors & Semiconductor Equipment — 4.2% | |
Advanced Micro Devices, Inc.* | | | 23,654 | | | | 1,532,069 | |
Enphase Energy, Inc.* | | | 6,096 | | | | 1,615,196 | |
Entegris, Inc. | | | 32,720 | | | | 2,146,105 | |
Marvell Technology, Inc. | | | 42,402 | | | | 1,570,570 | |
SolarEdge Technologies, Inc.*(a) | | | 10,599 | | | | 3,002,379 | |
Teradyne, Inc.(a) | | | 18,530 | | | | 1,618,595 | |
Wolfspeed, Inc.*(a) | | | 19,841 | | | | 1,369,823 | |
| | | | | | | | |
| | |
| | | | | | | 12,854,737 | |
| | | | | | | | |
Software — 10.5% | | | | | | | | |
Cadence Design Systems, Inc.* | | | 32,389 | | | | 5,202,969 | |
Clear Secure, Inc. (Class A Stock)(a) | | | 32,666 | | | | 896,028 | |
Confluent, Inc. (Class A Stock)*(a) | | | 78,818 | | | | 1,752,912 | |
Crowdstrike Holdings, Inc. (Class A Stock)* | | | 30,164 | | | | 3,175,968 | |
Five9, Inc.* | | | 19,963 | | | | 1,354,689 | |
HashiCorp, Inc. (Class A Stock)*(a) | | | 60,081 | | | | 1,642,615 | |
HubSpot, Inc.* | | | 7,434 | | | | 2,149,392 | |
| | | | | | | | |
| | | Shares | | | Value | |
|
COMMON STOCKS (continued) | |
Software (cont’d.) | |
Palo Alto Networks, Inc.* | | | 26,414 | | | $ | 3,685,810 | |
Procore Technologies, Inc.*(a) | | | 39,326 | | | | 1,855,401 | |
Synopsys, Inc.* | | | 19,032 | | | | 6,076,727 | |
Zoom Video Communications, Inc. (Class A Stock)* | | | 39,369 | | | | 2,666,856 | |
Zscaler, Inc.*(a) | | | 16,398 | | | | 1,834,936 | |
| | | | | | | | |
| | |
| | | | | | | 32,294,303 | |
| | | | | | | | |
Specialty Retail — 6.0% | | | | | | | | |
AutoZone, Inc.* | | | 2,072 | | | | 5,109,925 | |
Burlington Stores, Inc.*(a) | | | 17,495 | | | | 3,547,286 | |
CarMax, Inc.*(a) | | | 22,931 | | | | 1,396,269 | |
National Vision Holdings, Inc.*(a) | | | 41,720 | | | | 1,617,067 | |
Ross Stores, Inc. | | | 21,034 | | | | 2,441,416 | |
Tractor Supply Co. | | | 19,574 | | | | 4,403,563 | |
| | | | | | | | |
| | |
| | | | | | | 18,515,526 | |
| | | | | | | | |
Textiles, Apparel & Luxury Goods — 0.5% | |
Lululemon Athletica, Inc.* | | | 5,041 | | | | 1,615,036 | |
| | | | | | | | |
Trading Companies & Distributors — 0.7% | |
Air Lease Corp. | | | 60,232 | | | | 2,314,113 | |
| | | | | | | | |
TOTAL LONG-TERM INVESTMENTS
(cost $261,937,715) | | | | 300,660,146 | |
| | | | | | | | |
|
SHORT-TERM INVESTMENTS — 17.3% | |
AFFILIATED MUTUAL FUNDS | |
PGIM Core Ultra Short Bond Fund(wa) | | | 8,340,520 | | | | 8,340,520 | |
PGIM Institutional Money Market Fund (cost $45,106,864; includes $44,930,929 of cash collateral for securities on loan)(b)(wa) | | | 45,191,291 | | | | 45,168,695 | |
| | | | | | | | |
| |
TOTAL SHORT-TERM INVESTMENTS
(cost $53,447,384) | | | | 53,509,215 | |
| | | | | | | | |
| |
TOTAL INVESTMENTS—114.7%
(cost $315,385,099) | | | | 354,169,361 | |
Liabilities in excess of other assets — (14.7)% | | | | (45,425,580 | ) |
| | | | | | | | |
| |
NET ASSETS — 100.0% | | | $ | 308,743,781 | |
| | | | | | | | |
See the Glossary for a list of the abbreviation(s) used in the annual report.
| * | Non-income producing security. |
| (a) | All or a portion of security is on loan. The aggregate market value of such securities, including those sold and pending settlement, is $44,057,756; cash collateral of $44,930,929 (included in liabilities) was received with which the Portfolio purchased highly liquid short-term investments. In the event of significant appreciation in value of securities on loan on the last business day of the reporting period, the Portfolio may reflect a collateral value that is less than the market value of the loaned securities and such shortfall is remedied the following business day. |
| (b) | Represents security, or portion thereof, purchased with cash collateral received for securities on loan and includes dividend reinvestment. |
| (wa) | PGIM Investments LLC, the manager of the Portfolio, also serves as manager of the PGIM Core Ultra Short Bond Fund and PGIM Institutional Money Market Fund, if applicable. |
SEE NOTES TO FINANCIAL STATEMENTS.
A19
| | | | |
| | PSF MID-CAP GROWTH PORTFOLIO (CONTINUED) | | |
SCHEDULE OF INVESTMENTS | | | | as of December 31, 2022 |
Fair Value Measurements:
Various inputs are used in determining the value of the Portfolio’s investments. These inputs are summarized in the three broad levels listed below.
Level 1—unadjusted quoted prices generally in active markets for identical securities.
Level 2—quoted prices for similar securities, interest rates and yield curves, prepayment speeds, foreign currency exchange rates and other observable inputs.
Level 3—unobservable inputs for securities valued in accordance with Board approved fair valuation procedures.
The following is a summary of the inputs used as of December 31, 2022 in valuing such portfolio securities:
| | | | | | | | | | | | | | | | | | | | |
| | | Level 1 | | | Level 2 | | Level 3 |
Investments in Securities | | | | | | | | | | | | | | | | | | | | |
Assets | | | | | | | | | | | | | | | | | | | | |
Long-Term Investments | | | | | | | | | | | | | | | | | | | | |
Common Stocks | | | | | | | | | | | | | | | | | | | | |
Aerospace & Defense | | $ | 2,311,906 | | | | | $ | — | | | | | | | | | $— | | |
Airlines | | | 2,106,359 | | | | | | — | | | | | | | | | — | | |
Banks | | | 5,111,527 | | | | | | — | | | | | | | | | — | | |
Beverages | | | 3,023,874 | | | | | | — | | | | | | | | | — | | |
Biotechnology | | | 22,057,488 | | | | | | — | | | | | | | | | — | | |
Building Products | | | 6,867,653 | | | | | | — | | | | | | | | | — | | |
Capital Markets | | | 22,514,628 | | | | | | — | | | | | | | | | — | | |
Commercial Services & Supplies | | | 7,206,271 | | | | | | — | | | | | | | | | — | | |
Communications Equipment | | | 5,201,990 | | | | | | — | | | | | | | | | — | | |
Construction & Engineering | | | 10,727,046 | | | | | | — | | | | | | | | | — | | |
Diversified Consumer Services | | | 1,391,986 | | | | | | — | | | | | | | | | — | | |
Electrical Equipment | | | 6,701,995 | | | | | | — | | | | | | | | | — | | |
Electronic Equipment, Instruments & Components | | | 8,752,812 | | | | | | — | | | | | | | | | — | | |
Energy Equipment & Services | | | 1,573,979 | | | | | | — | | | | | | | | | — | | |
Entertainment | | | 3,045,074 | | | | | | — | | | | | | | | | — | | |
Health Care Equipment & Supplies | | | 23,764,107 | | | | | | — | | | | | | | | | — | | |
Health Care Providers & Services | | | 13,196,024 | | | | | | — | | | | | | | | | — | | |
Hotels, Restaurants & Leisure | | | 17,304,456 | | | | | | — | | | | | | | | | — | | |
Household Durables | | | 3,016,455 | | | | | | — | | | | | | | | | — | | |
Insurance | | | 3,897,267 | | | | | | — | | | | | | | | | — | | |
Interactive Media & Services | | | 1,623,629 | | | | | | — | | | | | | | | | — | | |
Internet & Direct Marketing Retail | | | 1,443,710 | | | | | | — | | | | | | | | | — | | |
IT Services | | | 9,875,573 | | | | | | — | | | | | | | | | — | | |
Life Sciences Tools & Services | | | 14,091,800 | | | | | | — | | | | | | | | | — | | |
Machinery | | | 9,702,794 | | | | | | — | | | | | | | | | — | | |
Media | | | 3,143,524 | | | | | | — | | | | | | | | | — | | |
Metals & Mining | | | 1,857,440 | | | | | | — | | | | | | | | | — | | |
Oil, Gas & Consumable Fuels | | | 11,431,617 | | | | | | — | | | | | | | | | — | | |
Pharmaceuticals | | | 4,903,716 | | | | | | — | | | | | | | | | — | | |
Professional Services | | | 2,564,969 | | | | | | — | | | | | | | | | — | | |
Road & Rail | | | 2,654,762 | | | | | | — | | | | | | | | | — | | |
Semiconductors & Semiconductor Equipment | | | 12,854,737 | | | | | | — | | | | | | | | | — | | |
Software | | | 32,294,303 | | | | | | — | | | | | | | | | — | | |
Specialty Retail | | | 18,515,526 | | | | | | — | | | | | | | | | — | | |
Textiles, Apparel & Luxury Goods | | | 1,615,036 | | | | | | — | | | | | | | | | — | | |
Trading Companies & Distributors | | | 2,314,113 | | | | | | — | | | | | | | | | — | | |
Short-Term Investments | | | | | | | | | | | | | | | | | | | | |
Affiliated Mutual Funds | | | 53,509,215 | | | | | | — | | | | | | | | | — | | |
| | | | | | | | | | | | | | | | | | | | |
Total | | $ | 354,169,361 | | | | | $ | — | | | | | | | | | $— | | |
| | | | | | | | | |
SEE NOTES TO FINANCIAL STATEMENTS.
A20
| | | | |
| | PSF MID-CAP GROWTH PORTFOLIO (CONTINUED) | | |
SCHEDULE OF INVESTMENTS | | | | as of December 31, 2022 |
Industry Classification:
The industry classification of investments and liabilities in excess of other assets shown as a percentage of net assets as of December 31, 2022 were as follows:
| | | | |
Affiliated Mutual Funds (14.6% represents investments purchased with collateral from securities on loan) | | | 17.3 | % |
Software | | | 10.5 | |
Health Care Equipment & Supplies | | | 7.7 | |
Capital Markets | | | 7.3 | |
Biotechnology | | | 7.1 | |
Specialty Retail | | | 6.0 | |
Hotels, Restaurants & Leisure | | | 5.6 | |
Life Sciences Tools & Services | | | 4.6 | |
Health Care Providers & Services | | | 4.3 | |
Semiconductors & Semiconductor Equipment | | | 4.2 | |
Oil, Gas & Consumable Fuels | | | 3.7 | |
Construction & Engineering | | | 3.5 | |
IT Services | | | 3.2 | |
Machinery | | | 3.1 | |
Electronic Equipment, Instruments & Components | | | 2.8 | |
Commercial Services & Supplies | | | 2.3 | |
Building Products | | | 2.2 | |
Electrical Equipment | | | 2.2 | |
Communications Equipment | | | 1.7 | |
Banks | | | 1.7 | |
Pharmaceuticals | | | 1.6 | |
| | | | |
Insurance | | | 1.3 | % |
Media | | | 1.0 | |
Entertainment | | | 1.0 | |
Beverages | | | 1.0 | |
Household Durables | | | 1.0 | |
Road & Rail | | | 0.9 | |
Professional Services | | | 0.8 | |
Trading Companies & Distributors | | | 0.7 | |
Aerospace & Defense | | | 0.7 | |
Airlines | | | 0.7 | |
Metals & Mining | | | 0.6 | |
Interactive Media & Services | | | 0.5 | |
Textiles, Apparel & Luxury Goods | | | 0.5 | |
Energy Equipment & Services | | | 0.5 | |
Internet & Direct Marketing Retail | | | 0.5 | |
Diversified Consumer Services | | | 0.4 | |
| | | | |
| | | 114.7 | |
Liabilities in excess of other assets | | | (14.7 | ) |
| | | | |
| |
| | | 100.0 | % |
| | | | |
Financial Instruments/Transactions—Summary of Offsetting and Netting Arrangements:
The Portfolio entered into financial instruments/transactions during the reporting period that are either offset in accordance with current requirements or are subject to enforceable master netting arrangements or similar agreements that permit offsetting. The information about offsetting and related netting arrangements for financial instruments/transactions where the legal right to set-off exists is presented in the summary below.
Offsetting of financial instrument/transaction assets and liabilities:
| | | | | | | | | | | | | | | |
| Description | | Gross Market Value of Recognized Assets/(Liabilities) | | Collateral
Pledged/(Received)(1) | | Net Amount |
Securities on Loan | | $44,057,756 | | $(44,057,756) | | $— |
| (1) | Collateral amount disclosed by the Portfolio is limited to the market value of financial instruments/transactions. |
SEE NOTES TO FINANCIAL STATEMENTS.
A21
| | | | |
| | PSF MID-CAP GROWTH PORTFOLIO (CONTINUED) | | |
| | | | |
STATEMENT OF ASSETS AND LIABILITIES | | | | |
as of December 31, 2022 | | | | |
| |
ASSETS | | | | |
Investments at value, including securities on loan of $44,057,756: | | | | |
Unaffiliated investments (cost $261,937,715) | | $ | 300,660,146 | |
Affiliated investments (cost $53,447,384) | | | 53,509,215 | |
Receivable for Portfolio shares sold | | | 76,641 | |
Dividends receivable | | | 44,038 | |
Tax reclaim receivable | | | 43,656 | |
Prepaid expenses and other assets | | | 9,653 | |
| | | | |
Total Assets | | | 354,343,349 | |
| | | | |
LIABILITIES | | | | |
Payable to broker for collateral for securities on loan | | | 44,930,929 | |
Accrued expenses and other liabilities | | | 268,684 | |
Payable for Portfolio shares purchased | | | 233,731 | |
Management fee payable | | | 157,182 | |
Payable to affiliate | | | 7,293 | |
Affiliated transfer agent fee payable | | | 980 | |
Trustees’ fees payable | | | 479 | |
Distribution fee payable | | | 270 | |
Administration fee payable | | | 20 | |
| | | | |
Total Liabilities | | | 45,599,568 | |
| | | | |
NET ASSETS | | $ | 308,743,781 | |
| | | | |
Net assets were comprised of: | | | | |
Partners’ Equity | | $ | 308,743,781 | |
| | | | |
Class I: | | | | |
Net asset value and redemption price per share, $307,490,353 / 13,738,534 outstanding shares of beneficial interest | | $ | 22.38 | |
| | | | |
Class II: | | | | |
Net asset value and redemption price per share, $158,983 / 7,681 outstanding shares of beneficial interest | | $ | 20.70 | |
| | | | |
Class III: | | | | |
Net asset value and redemption price per share, $1,094,445 / 49,098 outstanding shares of beneficial interest | | $ | 22.29 | |
| | | | |
| | | | |
STATEMENT OF OPERATIONS | | | | |
Year Ended December 31, 2022 | | | | |
| |
NET INVESTMENT INCOME (LOSS) | | | | |
INCOME | | | | |
Unaffiliated dividend income | | $ | 1,489,203 | |
Affiliated dividend income | | | 176,715 | |
Income from securities lending, net (including affiliated income of $77,485) | | | 79,341 | |
| | | | |
Total income | | | 1,745,259 | |
| | | | |
EXPENSES | | | | |
Management fee | | | 1,984,866 | |
Distribution fee—Class II | | | 474 | |
Distribution fee—Class III | | | 2,420 | |
Administration fee—Class II | | | 284 | |
Custodian and accounting fees | | | 53,633 | |
Shareholders’ reports | | | 44,107 | |
Audit fee | | | 29,300 | |
Legal fees and expenses | | | 22,857 | |
Trustees’ fees | | | 13,608 | |
Transfer agent’s fees and expenses (including affiliated expense of $5,882) | | | 10,682 | |
Miscellaneous | | | 22,980 | |
| | | | |
Total expenses | | | 2,185,211 | |
Less: Fee waivers and/or expense
reimbursement | | | (3,242 | ) |
| | | | |
Net expenses | | | 2,181,969 | |
| | | | |
NET INVESTMENT INCOME (LOSS) | | | (436,710 | ) |
| | | | |
| REALIZED AND UNREALIZED GAIN (LOSS) ON INVESTMENT TRANSACTIONS | | | | |
Net realized gain (loss) on investment transactions (including affiliated of $7,708) | | | (9,216,436 | ) |
| | | | |
Net change in unrealized appreciation (depreciation) on: | | | | |
Investments (including affiliated of $12,950) | | | (104,430,291 | ) |
| | | | |
NET GAIN (LOSS) ON INVESTMENT TRANSACTIONS | | | (113,646,727 | ) |
| | | | |
NET INCREASE (DECREASE) IN NET ASSETS RESULTING FROM OPERATIONS | | $ | (114,083,437 | ) |
| | | | |
STATEMENTS OF CHANGES IN NET ASSETS
| | | | | | | | | | | | | | | | | | | | | | | | |
| | | Year Ended | | | Year Ended | |
| | | December 31, 2022 | | | December 31, 2021 | |
| | | | | | | | | | | | | | | | | | | |
INCREASE (DECREASE) IN NET ASSETS | | | | | | | | | | | | | | | | | | | | | | | | |
OPERATIONS | | | | | | | | | | | | | | | | | | | | | | | | |
Net investment income (loss) | | | | | | $ | (436,710 | ) | | | | | | | | | | $ | (1,147,737 | ) | | | | |
Net realized gain (loss) on investment and foreign currency transactions | | | | | | | (9,216,436 | ) | | | | | | | | | | | 48,576,165 | | | | | |
Net change in unrealized appreciation (depreciation) on investments | | | | | | | (104,430,291 | ) | | | | | | | | | | | (7,196,032 | ) | | | | |
| | | | | | | | | | | | | | | | | | | | | | | | |
NET INCREASE (DECREASE) IN NET ASSETS RESULTING FROM OPERATIONS | | | | | | | (114,083,437 | ) | | | | | | | | | | | 40,232,396 | | | | | |
| | | | | | | | | | | | | | | | | | | | | | | | |
PORTFOLIO SHARE TRANSACTIONS | | | | | | | | | | | | | | | | | | | | | | | | |
Portfolio shares sold | | | | | | | 21,009,623 | | | | | | | | | | | | 36,381,574 | | | | | |
Portfolio shares purchased | | | | | | | (23,921,060 | ) | | | | | | | | | | | (33,319,232 | ) | | | | |
| | | | | | | | | | | | | | | | | | | | | | | | |
NET INCREASE (DECREASE) IN NET ASSETS FROM PORTFOLIO SHARE TRANSACTIONS | | | | | | | (2,911,437 | ) | | | | | | | | | | | 3,062,342 | | | | | |
| | | | | | | | | | | | | | | | | | | | | | | | |
TOTAL INCREASE (DECREASE) | | | | | | | (116,994,874 | ) | | | | | | | | | | | 43,294,738 | | | | | |
NET ASSETS: | | | | | | | | | | | | | | | | | | | | | | | | |
Beginning of year | | | | | | | 425,738,655 | | | | | | | | | | | | 382,443,917 | | | | | |
| | | | | | | | | | | | | | | | | | | | | | | | |
End of year | | | | | | $ | 308,743,781 | | | | | | | | | | | $ | 425,738,655 | | | | | |
| | | | | | | | | | | | | | | | | | | | | | | | |
SEE NOTES TO FINANCIAL STATEMENTS.
A22
| | | | |
| | PSF MID-CAP GROWTH PORTFOLIO (CONTINUED) | | |
FINANCIAL HIGHLIGHTS
| | | | | | | | | | | | | | | | | | | | | | |
Class I | | | | | | | | | | | | | | | | | | | | | | |
| | | | | Year Ended December 31, | |
| | | | | 2022 | | | 2021 | | | 2020 | | | 2019 | | | 2018 | |
Per Share Operating Performance(a): | | | | | | | | | | | | | | | | | | | | | | |
Net Asset Value, beginning of year | | | | $ | 30.64 | | | $ | 27.68 | | | $ | 18.77 | | | $ | 13.63 | | | $ | 14.79 | |
| | | | | | | | | | | | | | | | | | | | | | |
Income (Loss) From Investment Operations: | | | | | | | | | | | | | | | | | | | | | | |
Net investment income (loss) | | | | | (0.03 | ) | | | (0.08 | ) | | | (0.03 | ) | | | — | (b) | | | 0.02 | |
Net realized and unrealized gain (loss) on investment transactions | | | | | (8.23 | ) | | | 3.04 | | | | 8.94 | | | | 5.14 | | | | (1.18 | ) |
| | | | | | | | | | | | | | | | | | | | | | |
Total from investment operations | | | | | (8.26 | ) | | | 2.96 | | | | 8.91 | | | | 5.14 | | | | (1.16 | ) |
| | | | | | | | | | | | | | | | | | | | | | |
Capital Contributions | | | | | — | | | | — | | | | — | | | | — | | | | — | (b)(c) |
| | | | | | | | | | | | | | | | | | | | | | |
Net Asset Value, end of year | | | | $ | 22.38 | | | $ | 30.64 | | | $ | 27.68 | | | $ | 18.77 | | | $ | 13.63 | |
| | | | | | | | | | | | | | | | | | | | | | |
| | | | | | |
Total Return(d) | | | | | (26.96 | )% | | | 10.69 | % | | | 47.47 | % | | | 37.71 | % | | | (7.84 | )%(e) |
Ratios/Supplemental Data: | | | | | | | | | | | | | | | | | | | | | | |
Net assets, end of year (in millions) | | | | $ | 307.5 | | | $ | 424.7 | | | $ | 382.1 | | | $ | 279.8 | | | $ | 214.8 | |
Average net assets (in millions) | | | | $ | 329.7 | | | $ | 407.5 | | | $ | 302.1 | | | $ | 257.0 | | | $ | 248.2 | |
Ratios to average net assets(f): | | | | | | | | | | | | | | | | | | | | | | |
Expenses after waivers and/or expense reimbursement | | | | | 0.66 | % | | | 0.64 | % | | | 0.67 | % | | | 0.70 | % | | | 0.68 | % |
Expenses before waivers and/or expense reimbursement | | | | | 0.66 | % | | | 0.64 | % | | | 0.67 | % | | | 0.70 | % | | | 0.68 | % |
Net investment income (loss) | | | | | (0.13 | )% | | | (0.28 | )% | | | (0.15 | )% | | | (0.01 | )% | | | 0.15 | % |
Portfolio turnover rate(g) | | | | | 43 | % | | | 46 | % | | | 63 | % | | | 106 | % | | | 43 | % |
| | | | | | |
| Class II | | | | | | | | | | | | | | | | | |
| | | | | Year Ended December 31, | |
| | | | | 2022 | | | 2021 | | | 2020 | | | 2019 | | | 2018 | |
Per Share Operating Performance(a): | | | | | | | | | | | | | | | | | | | | | | |
Net Asset Value, beginning of year | | | | $ | 28.45 | | | $ | 25.81 | | | $ | 17.57 | | | $ | 12.81 | | | $ | 13.95 | |
| | | | | | | | | | | | | | | | | | | | | | |
Income (Loss) From Investment Operations: | | | | | | | | | | | | | | | | | | | | | | |
Net investment income (loss) | | | | | (0.12 | ) | | | (0.19 | ) | | | (0.10 | ) | | | (0.06 | ) | | | (0.03 | ) |
Net realized and unrealized gain (loss) on investment transactions | | | | | (7.63 | ) | | | 2.83 | | | | 8.34 | | | | 4.82 | | | | (1.11 | ) |
| | | | | | | | | | | | | | | | | | | | | | |
Total from investment operations | | | | | (7.75 | ) | | | 2.64 | | | | 8.24 | | | | 4.76 | | | | (1.14 | ) |
| | | | | | | | | | | | | | | | | | | | | | |
Capital Contributions | | | | | — | | | | — | | | | — | | | | — | | | | — | (b)(c) |
| | | | | | | | | | | | | | | | | | | | | | |
Net Asset Value, end of year | | | | $ | 20.70 | | | $ | 28.45 | | | $ | 25.81 | | | $ | 17.57 | | | $ | 12.81 | |
| | | | | | | | | | | | | | | | | | | | | | |
| | | | | | |
Total Return(d) | | | | | (27.24 | )% | | | 10.23 | % | | | 46.90 | % | | | 37.16 | % | | | (8.17 | )%(e) |
Ratios/Supplemental Data: | | | | | | | | | | | | | | | | | | | | | | |
Net assets, end of year (in millions) | | | | $ | 0.2 | | | $ | 0.3 | | | $ | 0.3 | | | $ | 0.5 | | | $ | 0.5 | |
Average net assets (in millions) | | | | $ | 0.2 | | | $ | 0.3 | | | $ | 0.4 | | | $ | 0.6 | | | $ | 0.6 | |
Ratios to average net assets(f): | | | | | | | | | | | | | | | | | | | | | | |
Expenses after waivers and/or expense reimbursement | | | | | 1.06 | % | | | 1.05 | % | | | 1.07 | % | | | 1.10 | % | | | 1.08 | % |
Expenses before waivers and/or expense reimbursement | | | | | 1.06 | % | | | 1.05 | % | | | 1.07 | % | | | 1.10 | % | | | 1.08 | % |
Net investment income (loss) | | | | | (0.54 | )% | | | (0.68 | )% | | | (0.53 | )% | | | (0.40 | )% | | | (0.24 | )% |
Portfolio turnover rate(g) | | | | | 43 | % | | | 46 | % | | | 63 | % | | | 106 | % | | | 43 | % |
SEE NOTES TO FINANCIAL STATEMENTS.
A23
| | | | |
| | PSF MID-CAP GROWTH PORTFOLIO (CONTINUED) | | |
FINANCIAL HIGHLIGHTS
| | | | | | | | | | | | | | | | | | | | | | | | | | |
Class III | | | | | | | | |
| | | | | Year Ended December 31,
2022 | | | April 26, 2021(h)
through December 31,
2021 | |
| | | | | | | | | | | | | | | | | | | | | |
Per Share Operating Performance(a): | | | | | | | | | | | | | | | | | | | | | | | | | | |
Net Asset Value, beginning of period | | | | | | | | $ | 30.60 | | | | | | | | | | | $ | 29.77 | | | | | |
| | | | | | | | | | | | | | | | | | | | | | | | | | |
Income (Loss) From Investment Operations: | | | | | | | | | | | | | | | | | | | | | | | | | | |
Net investment income (loss) | | | | | | | | | (0.09 | ) | | | | | | | | | | | (0.11 | ) | | | | |
Net realized and unrealized gain (loss) on investment transactions | | | | | | | | | (8.22 | ) | | | | | | | | | | | 0.94 | | | | | |
| | | | | | | | | | | | | | | | | | | | | | | | | | |
Total from investment operations | | | | | | | | | (8.31 | ) | | | | | | | | | | | 0.83 | | | | | |
| | | | | | | | | | | | | | | | | | | | | | | | | | |
Net Asset Value, end of period | | | | | | | | $ | 22.29 | | | | | | | | | | | $ | 30.60 | | | | | |
| | | | | | | | | | | | | | | | | | | | | | | | | | |
Total Return(d) | | | | | | | | | (27.16 | )% | | | | | | | | | | | 2.79 | % | | | | |
Ratios/Supplemental Data: | | | | | | | | | | | | | | | | | | | | | | | | | | |
Net assets, end of period (in millions) | | | | | | | | $ | 1.1 | | | | | | | | | | | $ | 0.8 | | | | | |
Average net assets (in millions) | | | | | | | | $ | 1.0 | | | | | | | | | | | $ | 0.3 | | | | | |
Ratios to average net assets(f): | | | | | | | | | | | | | | | | | | | | | | | | | | |
Expenses after waivers and/or expense reimbursement | | | | | | | | | 0.91 | % | | | | | | | | | | | 0.88 | %(i) | | | | |
Expenses before waivers and/or expense reimbursement | | | | | | | | | 0.91 | % | | | | | | | | | | | 0.88 | %(i) | | | | |
Net investment income (loss) | | | | | | | | | (0.37 | )% | | | | | | | | | | | (0.53 | )%(i) | | | | |
Portfolio turnover rate(g) | | | | | | | | | 43 | % | | | | | | | | | | | 46 | % | | | | |
| (a) | Calculated based on average shares outstanding during the period. |
| (b) | Amount rounds to zero. |
| (c) | Represents payment received by the Portfolio, from Prudential, in connection with excess foreign withholding tax withheld on dividends and interest from certain countries due to the Portfolio’s tax status as a partnership. |
| (d) | Total return is calculated assuming a purchase of a share on the first day and a sale on the last day of each period reported and includes reinvestment of dividends and distributions, if any, and does not reflect the effect of insurance contract charges. Total return does not reflect expenses associated with the separate account such as administrative fees, account charges and surrender charges which, if reflected, would reduce the total returns for all periods shown. Performance figures may reflect fee waivers and/or expense reimbursements. In the absence of fee waivers and/or expense reimbursements, the total return would be lower. Past performance is no guarantee of future results. Total returns may reflect adjustments to conform to GAAP. Total returns for periods less than one full year are not annualized. |
| (e) | Total return for the year includes the impact of the capital contribution, which was not material to the total return. |
| (f) | Does not include expenses of the underlying funds in which the Portfolio invests. |
| (g) | The Portfolio’s portfolio turnover rate is calculated in accordance with regulatory requirements, without regard to transactions involving short-term investments, certain derivatives and in-kind transactions (if any). If such transactions were included, the Portfolio’s portfolio turnover rate may be higher. |
| (h) | Commencement of offering. |
| (i) | Annualized, with the exception of certain non-recurring expenses. |
SEE NOTES TO FINANCIAL STATEMENTS.
A24
| | | | |
| | PSF NATURAL RESOURCES PORTFOLIO | | |
SCHEDULE OF INVESTMENTS | | | | as of December 31, 2022 |
| | | | | | | | |
| | | Shares | | | Value | |
LONG-TERM INVESTMENTS — 98.5% | |
COMMON STOCKS — 97.2% | |
Agricultural & Farm Machinery — 1.3% | |
AGCO Corp. | | | 19,840 | | | $ | 2,751,610 | |
Deere & Co. | | | 10,412 | | | | 4,464,249 | |
| | | | | | | | |
| | |
| | | | | | | 7,215,859 | |
| | | | | | | | |
Agricultural Products — 1.3% | | | | | | | | |
Darling Ingredients, Inc.* | | | 115,701 | | | | 7,241,726 | |
| | | | | | | | |
Aluminum — 0.7% | | | | | | | | |
Norsk Hydro ASA (Norway) | | | 531,453 | | | | 3,971,212 | |
| | | | | | | | |
Building Products — 0.4% | | | | | | | | |
ROCKWOOL A/S (Denmark)(Class B Stock) | | | 9,487 | | | | 2,220,934 | |
| | | | | | | | |
Coal & Consumable Fuels — 0.3% | |
NAC Kazatomprom JSC (Kazakhstan), GDR | | | 55,412 | | | | 1,556,166 | |
| | | | | | | | |
Construction & Engineering — 0.7% | |
Quanta Services, Inc. | | | 26,892 | | | | 3,832,110 | |
| | | | | | | | |
Construction Machinery & Heavy Trucks — 2.8% | |
Caterpillar, Inc. | | | 18,093 | | | | 4,334,359 | |
Cummins, Inc. | | | 26,391 | | | | 6,394,276 | |
Epiroc AB (Sweden)(Class B Stock) | | | 254,719 | | | | 4,097,715 | |
| | | | | | | | |
| | |
| | | | | | | 14,826,350 | |
| | | | | | | | |
Construction Materials — 1.3% | | | | | | | | |
Martin Marietta Materials, Inc. | | | 8,967 | | | | 3,030,577 | |
Vulcan Materials Co. | | | 21,386 | | | | 3,744,902 | |
| | | | | | | | |
| | |
| | | | | | | 6,775,479 | |
| | | | | | | | |
Copper — 2.2% | | | | | | | | |
ERO Copper Corp. (Brazil)* | | | 154,444 | | | | 2,126,171 | |
OZ Minerals Ltd. (Australia) | | | 176,539 | | | | 3,327,612 | |
Southern Copper Corp. (Mexico) | | | 109,432 | | | | 6,608,599 | |
| | | | | | | | |
| | |
| | | | | | | 12,062,382 | |
| | | | | | | | |
Diversified Metals & Mining — 7.6% | |
Anglo American PLC (South Africa) | | | 89,809 | | | | 3,516,910 | |
BHP Group Ltd. (Australia) | | | 369,025 | | | | 11,431,267 | |
Boliden AB (Sweden) | | | 250,270 | | | | 9,400,691 | |
Grupo Mexico SAB de CV (Mexico)(Class B Stock) | | | 991,673 | | | | 3,496,161 | |
IGO Ltd. (Australia) | | | 597,227 | | | | 5,463,046 | |
Rio Tinto Ltd. (Australia) | | | 29,232 | | | | 2,307,153 | |
South32 Ltd. (Australia) | | | 1,844,563 | | | | 5,057,108 | |
| | | | | | | | |
| | |
| | | | | | | 40,672,336 | |
| | | | | | | | |
Electric Utilities — 1.7% | | | | | | | | |
Iberdrola SA (Spain) | | | 134,927 | | | | 1,575,071 | |
NextEra Energy, Inc. | | | 21,045 | | | | 1,759,362 | |
Southern Co. (The) | | | 57,814 | | | | 4,128,498 | |
Xcel Energy, Inc. | | | 25,266 | | | | 1,771,399 | |
| | | | | | | | |
| | |
| | | | | | | 9,234,330 | |
| | | | | | | | |
Electrical Components & Equipment — 2.9% | |
Hubbell, Inc. | | | 24,409 | | | | 5,728,304 | |
Legrand SA (France) | | | 30,408 | | | | 2,438,166 | |
Schneider Electric SE | | | 31,143 | | | | 4,373,556 | |
| | | | | | | | |
| | | Shares | | | Value | |
|
COMMON STOCKS (continued) | |
Electrical Components & Equipment (cont’d.) | |
Shoals Technologies Group, Inc. (Class A Stock)* | | | 132,023 | | | $ | 3,257,008 | |
| | | | | | | | |
| | |
| | | | | | | 15,797,034 | |
| | | | | | | | |
Fertilizers & Agricultural Chemicals — 4.3% | |
CF Industries Holdings, Inc. | | | 67,765 | | | | 5,773,578 | |
FMC Corp. | | | 65,083 | | | | 8,122,358 | |
Nutrien Ltd. (Canada) | | | 123,920 | | | | 9,049,878 | |
| | | | | | | | |
| | |
| �� | | | | | | 22,945,814 | |
| | | | | | | | |
Forest Products — 0.8% | | | | | | | | |
Svenska Cellulosa AB SCA (Sweden)(Class B Stock) | | | 212,912 | | | | 2,696,461 | |
West Fraser Timber Co. Ltd. (Canada) | | | 19,164 | | | | 1,383,799 | |
| | | | | | | | |
| | |
| | | | | | | 4,080,260 | |
| | | | | | | | |
Gold — 1.8% | | | | | | | | |
Franco-Nevada Corp. (Canada) | | | 23,040 | | | | 3,140,689 | |
Northern Star Resources Ltd. (Australia) | | | 405,446 | | | | 3,034,081 | |
Perseus Mining Ltd. (Australia) | | | 1,178,948 | | | | 1,696,466 | |
Wesdome Gold Mines Ltd. (Canada)* | | | 329,965 | | | | 1,822,849 | |
| | | | | | | | |
| | |
| | | | | | | 9,694,085 | |
| | | | | | | | |
Industrial Gases — 4.3% | | | | | | | | |
Air Products & Chemicals, Inc. | | | 24,759 | | | | 7,632,209 | |
Linde PLC (United Kingdom) | | | 47,092 | | | | 15,360,469 | |
| | | | | | | | |
| | |
| | | | | | | 22,992,678 | |
| | | | | | | | |
Industrial Machinery — 2.0% | | | | | | | | |
Alfa Laval AB (Sweden) | | | 101,209 | | | | 2,927,707 | |
Sandvik AB (Sweden) | | | 214,963 | | | | 3,884,722 | |
Weir Group PLC (The) (United Kingdom) | | | 204,711 | | | | 4,117,647 | |
| | | | | | | | |
| | |
| | | | | | | 10,930,076 | |
| | | | | | | | |
Integrated Oil & Gas — 15.7% | | | | | | | | |
Chevron Corp. | | | 109,521 | | | | 19,657,924 | |
Equinor ASA (Norway) | | | 481,690 | | | | 17,312,072 | |
Galp Energia SGPS SA (Portugal) | | | 551,393 | | | | 7,438,643 | |
Shell PLC (Netherlands) | | | 383,101 | | | | 10,799,930 | |
TotalEnergies SE (France) | | | 465,284 | | | | 29,207,367 | |
| | | | | | | | |
| | |
| | | | | | | 84,415,936 | |
| | | | | | | | |
Metal & Glass Containers — 1.6% | |
Ball Corp. | | | 92,781 | | | | 4,744,820 | |
Verallia SA (France), 144A | | | 111,898 | | | | 3,792,191 | |
| | | | | | | | |
| | |
| | | | | | | 8,537,011 | |
| | | | | | | | |
Multi-Utilities — 2.6% | | | | | | | | |
Ameren Corp. | | | 28,503 | | | | 2,534,487 | |
CMS Energy Corp. | | | 31,411 | | | | 1,989,259 | |
Dominion Energy, Inc. | | | 40,742 | | | | 2,498,299 | |
DTE Energy Co. | | | 20,300 | | | | 2,385,859 | |
Sempra Energy | | | 28,444 | | | | 4,395,736 | |
| | | | | | | | |
| | |
| | | | | | | 13,803,640 | |
| | | | | | | | |
SEE NOTES TO FINANCIAL STATEMENTS.
A25
| | | | |
| | PSF NATURAL RESOURCES PORTFOLIO (CONTINUED) | | |
SCHEDULE OF INVESTMENTS | | | | as of December 31, 2022 |
| | | | | | | | |
| | | Shares | | | Value | |
|
COMMON STOCKS (continued) | |
Oil & Gas Equipment & Services — 5.6% | |
Baker Hughes Co. | | | 113,269 | | | $ | 3,344,834 | |
Cactus, Inc. (Class A Stock) | | | 78,543 | | | | 3,947,571 | |
ChampionX Corp. | | | 123,928 | | | | 3,592,673 | |
Halliburton Co. | | | 101,768 | | | | 4,004,571 | |
Liberty Energy, Inc. (Class A Stock) | | | 92,609 | | | | 1,482,670 | |
Schlumberger Ltd. | | | 53,300 | | | | 2,849,418 | |
TechnipFMC PLC (United Kingdom)* | | | 424,558 | | | | 5,175,362 | |
Tenaris SA, ADR | | | 90,600 | | | | 3,185,496 | |
TGS ASA (Norway) | | | 197,881 | | | | 2,675,830 | |
| | | | | | | | |
| | |
| | | | | | | 30,258,425 | |
| | | | | | | | |
Oil & Gas Exploration & Production — 21.2% | |
Canadian Natural Resources Ltd. (Canada) | | | 125,757 | | | | 6,983,507 | |
Chesapeake Energy Corp. | | | 54,500 | | | | 5,143,165 | |
ConocoPhillips | | | 265,117 | | | | 31,283,806 | |
Devon Energy Corp. | | | 213,183 | | | | 13,112,886 | |
EOG Resources, Inc. | | | 153,918 | | | | 19,935,459 | |
Hess Corp. | | | 126,867 | | | | 17,992,278 | |
Magnolia Oil & Gas Corp. (Class A Stock) | | | 234,606 | | | | 5,501,511 | |
Pioneer Natural Resources Co. | | | 62,343 | | | | 14,238,518 | |
| | | | | | | | |
| | |
| | | | | | | 114,191,130 | |
| | | | | | | | |
Oil & Gas Storage & Transportation — 0.8% | |
TC Energy Corp. (Canada) | | | 103,530 | | | | 4,126,706 | |
| | | | | | | | |
Packaged Foods & Meats — 1.1% | |
Bakkafrost P/F (Faroe Islands) | | | 90,844 | | | | 5,671,138 | |
| | | | | | | | |
Paper Packaging — 3.0% | | | | | | | | |
Avery Dennison Corp. | | | 21,519 | | | | 3,894,939 | |
International Paper Co. | | | 105,845 | | | | 3,665,412 | |
Packaging Corp. of America | | | 52,245 | | | | 6,682,658 | |
Westrock Co. | | | 54,021 | | �� | | 1,899,379 | |
| | | | | | | | |
| | |
| | | | | | | 16,142,388 | |
| | | | | | | | |
Paper Products — 1.2% | | | | | | | | |
Mondi PLC (Austria) | | | 54,654 | | | | 924,249 | |
UPM-Kymmene OYJ (Finland) | | | 151,275 | | | | 5,660,920 | |
| | | | | | | | |
| | |
| | | | | | | 6,585,169 | |
| | | | | | | | |
Precious Metals & Minerals — 0.0% | |
Sedibelo Platinum Mines Ltd. (South Africa) Private Placement (original cost $1,102,975; purchased 11/27/07)*^(f) | | | 129,100 | | | | 20,290 | |
| | | | | | | | |
Railroads — 1.2% | | | | | | | | |
Norfolk Southern Corp. | | | 12,874 | | | | 3,172,411 | |
Union Pacific Corp. | | | 14,945 | | | | 3,094,661 | |
| | | | | | | | |
| | |
| | | | | | | 6,267,072 | |
| | | | | | | | |
| | | | | | | | |
| | | Shares | | | Value | |
|
COMMON STOCKS (continued) | |
Specialized REITs — 1.0% | | | | | | | | |
Rayonier, Inc., REIT | | | 91,666 | | | $ | 3,021,311 | |
Weyerhaeuser Co., REIT | | | 84,000 | | | | 2,604,000 | |
| | | | | | | | |
| | |
| | | | | | | 5,625,311 | |
| | | | | | | | |
Specialty Chemicals — 5.3% | |
Akzo Nobel NV (Netherlands) | | | 57,418 | | | | 3,852,896 | |
Albemarle Corp. | | | 8,861 | | | | 1,921,596 | |
Element Solutions, Inc. | | | 145,131 | | | | 2,639,933 | |
RPM International, Inc. | | | 75,397 | | | | 7,347,438 | |
Sherwin-Williams Co. (The) | | | 46,172 | | | | 10,958,001 | |
Shin-Etsu Chemical Co. Ltd. (Japan) | | | 13,300 | | | | 1,624,092 | |
| | | | | | | | |
| | |
| | | | | | | 28,343,956 | |
| | | | | | | | |
Steel — 0.5% | | | | | | | | |
Reliance Steel & Aluminum Co. | | | 14,558 | | | | 2,947,122 | |
| | | | | | | | |
| |
TOTAL COMMON STOCKS
(cost $421,828,724) | | | | 522,984,125 | |
| | | | | | | | |
|
PREFERRED STOCK — 1.3% | |
Electric Utilities | | | | | | | | |
NextEra Energy, Inc., CVT, 5.279%, Maturing 03/01/23 | | | 132,925 | | | | 6,739,297 | |
| | | | | | | | |
(cost $6,430,746) | | | | | | | | |
| |
TOTAL LONG-TERM INVESTMENTS
(cost $428,259,470) | | | | 529,723,422 | |
| | | | | | | | |
| |
SHORT-TERM INVESTMENT — 1.6% | | | | | |
AFFILIATED MUTUAL FUND | | | | | |
PGIM Core Ultra Short Bond Fund
(cost $8,528,614)(wa) | | | 8,528,614 | | | | 8,528,614 | |
| | | | | | | | |
| |
TOTAL INVESTMENTS—100.1%
(cost $436,788,084) | | | | 538,252,036 | |
Liabilities in excess of other assets — (0.1)% | | | | (278,720 | ) |
| | | | | | | | |
| |
NET ASSETS — 100.0% | | | $ | 537,973,316 | |
| | | | | | | | |
See the Glossary for a list of the abbreviation(s) used in the annual report:
| * | Non-income producing security. |
| ^ | Indicates a Level 3 instrument. The aggregate value of Level 3 instruments is $20,290 and 0.0% of net assets. |
| (f) | Indicates a restricted security that is acquired in unregistered, private sales from the issuing company or from an affiliate of the issuer and is considered restricted as to disposition under federal securities law; the original cost of such security is $1,102,975. The value of $20,290 is 0.0% of net assets. |
| (wa) | PGIM Investments LLC, the manager of the Portfolio, also serves as manager of the PGIM Core Ultra Short Bond Fund and PGIM Institutional Money Market Fund, if applicable. |
Fair Value Measurements:
Various inputs are used in determining the value of the Portfolio’s investments. These inputs are summarized in the three broad levels listed below.
Level 1—unadjusted quoted prices generally in active markets for identical securities.
Level 2—quoted prices for similar securities, interest rates and yield curves, prepayment speeds, foreign currency exchange rates and other observable inputs.
SEE NOTES TO FINANCIAL STATEMENTS.
A26
| | | | |
| | PSF NATURAL RESOURCES PORTFOLIO (CONTINUED) | | |
SCHEDULE OF INVESTMENTS | | | | as of December 31, 2022 |
Level 3—unobservable inputs for securities valued in accordance with Board approved fair valuation procedures.
The following is a summary of the inputs used as of December 31, 2022 in valuing such portfolio securities:
| | | | | | | | | | | | |
| | | Level 1 | | | Level 2 | | | Level 3 | |
Investments in Securities | | | | | | | | | | | | |
Assets | | | | | | | | | | | | |
Long-Term Investments | | | | | | | | | | | | |
Common Stocks | | | | | | | | | | | | |
Australia | | $ | — | | | $ | 32,316,733 | | | $ | — | |
Austria | | | — | | | | 924,249 | | | | — | |
Brazil | | | 2,126,171 | | | | — | | | | — | |
Canada | | | 26,507,428 | | | | — | | | | — | |
Denmark | | | — | | | | 2,220,934 | | | | — | |
Faroe Islands | | | — | | | | 5,671,138 | | | | — | |
Finland | | | — | | | | 5,660,920 | | | | — | |
France | | | — | | | | 35,437,724 | | | | — | |
Japan | | | — | | | | 1,624,092 | | | | — | |
Kazakhstan | | | — | | | | 1,556,166 | | | | — | |
Mexico | | | 10,104,760 | | | | — | | | | — | |
Netherlands | | | — | | | | 14,652,826 | | | | — | |
Norway | | | — | | | | 23,959,114 | | | | — | |
Portugal | | | — | | | | 7,438,643 | | | | — | |
South Africa | | | — | | | | 3,516,910 | | | | 20,290 | |
Spain | | | — | | | | 1,575,071 | | | | — | |
Sweden | | | — | | | | 23,007,296 | | | | — | |
United Kingdom | | | 20,535,831 | | | | 4,117,647 | | | | — | |
United States | | | 295,636,626 | | | | 4,373,556 | | | | — | |
Preferred Stock | | | | | | | | | | | | |
United States | | | 6,739,297 | | | | — | | | | — | |
Short-Term Investment | | | | | | | | | | | | |
Affiliated Mutual Fund | | | 8,528,614 | | | | — | | | | — | |
| | | | | | | | | | | | |
Total | | $ | 370,178,727 | | | $ | 168,053,019 | | | $ | 20,290 | |
| | | | | | | | | | | | |
Country Classification:
The country classification of investments and liabilities in excess of other assets shown as a percentage of net assets as of December 31, 2022 were as follows:
| | | | |
United States | | | 58.6 | % |
France | | | 6.5 | |
Australia | | | 5.9 | |
Canada | | | 5.0 | |
United Kingdom | | | 4.7 | |
Norway | | | 4.4 | |
Sweden | | | 4.3 | |
Netherlands | | | 2.7 | |
Mexico | | | 1.9 | |
Portugal | | | 1.4 | |
Faroe Islands | | | 1.1 | |
Finland | | | 1.0 | |
| | | | |
South Africa | | | 0.7 | % |
Denmark | | | 0.4 | |
Brazil | | | 0.4 | |
Japan | | | 0.3 | |
Spain | | | 0.3 | |
Kazakhstan | | | 0.3 | |
Austria | | | 0.2 | |
| | | | |
| | | 100.1 | |
Liabilities in excess of other assets | | | (0.1 | ) |
| | | | |
| |
| | | 100.0 | % |
| | | | |
SEE NOTES TO FINANCIAL STATEMENTS.
A27
| | | | |
| | PSF NATURAL RESOURCES PORTFOLIO (CONTINUED) | | |
| | | | |
STATEMENT OF ASSETS AND LIABILITIES
as of December 31, 2022
| | | | |
ASSETS | | | | |
Investments at value: | | | | |
Unaffiliated investments (cost $428,259,470) | | $ | 529,723,422 | |
Affiliated investments (cost $8,528,614) | | | 8,528,614 | |
Foreign currency, at value (cost $788) | | | 796 | |
Tax reclaim receivable | | | 1,274,977 | |
Receivable for investments sold | | | 782,630 | |
Dividends receivable | | | 575,668 | |
Receivable for Portfolio shares sold | | | 23,298 | |
Prepaid expenses | | | 4,935 | |
| | | | |
Total Assets | | | 540,914,340 | |
| | | | |
LIABILITIES | | | | |
Payable for investments purchased | | | 1,479,496 | |
Payable to affiliate | | | 977,509 | |
Management fee payable | | | 203,896 | |
Payable for Portfolio shares purchased | | | 186,375 | |
Accrued expenses and other liabilities | | | 79,191 | |
Distribution fee payable | | | 8,574 | |
Administration fee payable | | | 4,383 | |
Affiliated transfer agent fee payable | | | 980 | |
Trustees’ fees payable | | | 620 | |
| | | | |
Total Liabilities | | | 2,941,024 | |
| | | | |
NET ASSETS | | $ | 537,973,316 | |
| | | | |
Net assets were comprised of: | | | | |
Partners’ Equity | | $ | 537,973,316 | |
| | | | |
Class I: | | | | |
Net asset value and redemption price per share, $497,926,057 / 11,895,660 outstanding shares of beneficial interest | | $ | 41.86 | |
| | | | |
Class II: | | | | |
Net asset value and redemption price per share, $33,969,694 / 852,929 outstanding shares of beneficial interest | | $ | 39.83 | |
| | | | |
Class III: | | | | |
Net asset value and redemption price per share, $6,077,565 / 145,629 outstanding shares of beneficial interest | | $ | 41.73 | |
| | | | |
STATEMENT OF OPERATIONS
Year Ended December 31, 2022
| | | | |
NET INVESTMENT INCOME (LOSS) | | | | |
INCOME | | | | |
Unaffiliated dividend income (net of $840,550 foreign withholding tax, of which $23,953 is reimbursable by an affiliate) | | $ | 18,538,712 | |
Affiliated dividend income | | | 120,340 | |
Income from securities lending, net (including affiliated income of $17,334) | | | 21,558 | |
| | | | |
Total income | | | 18,680,610 | |
| | | | |
EXPENSES | | | | |
Management fee | | | 2,317,253 | |
Distribution fee—Class II | | | 83,858 | |
Distribution fee—Class III | | | 9,330 | |
Administration fee—Class II | | | 50,315 | |
Custodian and accounting fees | | | 69,783 | |
Shareholders’ reports | | | 45,803 | |
Audit fee | | | 28,000 | |
Legal fees and expenses | | | 23,835 | |
Trustees’ fees | | | 16,782 | |
Transfer agent’s fees and expenses (including affiliated expense of $5,882) | | | 10,682 | |
Miscellaneous | | | 30,298 | |
| | | | |
Total expenses | | | 2,685,939 | |
Less: Fee waivers and/or expense reimbursement | | | (41,196 | ) |
| | | | |
Net expenses | | | 2,644,743 | |
| | | | |
NET INVESTMENT INCOME (LOSS) | | | 16,035,867 | |
| | | | |
REALIZED AND UNREALIZED GAIN (LOSS) ON INVESTMENT AND FOREIGN CURRENCY TRANSACTIONS | |
Net realized gain (loss) on: | | | | |
Investment transactions (including affiliated of $17,489) | | | 108,897,915 | |
Foreign currency transactions | | | (355,653 | ) |
| | | | |
| |
| | | 108,542,262 | |
| | | | |
Net change in unrealized appreciation (depreciation) on: | |
Investments (including affiliated of $(18,740)) | | | (26,508,654 | ) |
Foreign currencies | | | (1,854 | ) |
| | | | |
| |
| | | (26,510,508 | ) |
| | | | |
NET GAIN (LOSS) ON INVESTMENT AND FOREIGN CURRENCY TRANSACTIONS | | | 82,031,754 | |
| | | | |
NET INCREASE (DECREASE) IN NET ASSETS RESULTING FROM OPERATIONS | | $ | 98,067,621 | |
| | | | |
STATEMENTS OF CHANGES IN NET ASSETS
| | | | | | | | | | | | | | | | | | | | | | | | |
| | | Year Ended December 31, 2022 | | | Year Ended December 31, 2021 | |
INCREASE (DECREASE) IN NET ASSETS | | | | | | | | | | | | | | | | | | | | | | | | |
OPERATIONS | | | | | | | | | | | | | | | | | | | | | | | | |
Net investment income (loss) | | | | | | $ | 16,035,867 | | | | | | | | | | | $ | 10,161,929 | | | | | |
Net realized gain (loss) on investment and foreign currency transactions | | | | | | | 108,542,262 | | | | | | | | | | | | 83,447,598 | | | | | |
Net change in unrealized appreciation (depreciation) on investments and foreign currencies | | | | | | | (26,510,508 | ) | | | | | | | | | | | (115,008 | ) | | | | |
| | | | | | | | | | | | | | | | | | | | | | | | |
NET INCREASE (DECREASE) IN NET ASSETS RESULTING FROM OPERATIONS | | | | | | | 98,067,621 | | | | | | | | | | | | 93,494,519 | | | | | |
| | | | | | | | | | | | | | | | | | | | | | | | |
PORTFOLIO SHARE TRANSACTIONS | | | | | | | | | | | | | | | | | | | | | | | | |
Portfolio shares sold | | | | | | | 43,768,480 | | | | | | | | | | | | 24,288,772 | | | | | |
Portfolio shares purchased | | | | | | | (49,650,926 | ) | | | | | | | | | | | (56,248,016 | ) | | | | |
| | | | | | | | | | | | | | | | | | | | | | | | |
NET INCREASE (DECREASE) IN NET ASSETS FROM PORTFOLIO SHARE TRANSACTIONS | | | | | | | (5,882,446 | ) | | | | | | | | | | | (31,959,244 | ) | | | | |
| | | | | | | | | | | | | | | | | | | | | | | | |
TOTAL INCREASE (DECREASE) | | | | | | | 92,185,175 | | | | | | | | | | | | 61,535,275 | | | | | |
NET ASSETS: | | | | | | | | | | | | | | | | | | | | | | | | |
Beginning of year | | | | | | | 445,788,141 | | | | | | | | | | | | 384,252,866 | | | | | |
| | | | | | | | | | | | | | | | | | | | | | | | |
End of year | | | | | | $ | 537,973,316 | | | | | | | | | | | $ | 445,788,141 | | | | | |
| | | | | | | | | | | | | | | | | | | | | | | | |
SEE NOTES TO FINANCIAL STATEMENTS.
A28
| | | | |
| | PSF NATURAL RESOURCES PORTFOLIO (CONTINUED) | | |
| | | | |
FINANCIAL HIGHLIGHTS
| | | | | | | | | | | | | | | | | | | | | | |
Class I | | | | | | | | | | | | | | | | | |
| | | | | Year Ended December 31, | |
| | | | | 2022 | | | 2021 | | | 2020 | | | 2019 | | | 2018 | |
Per Share Operating Performance(a): | | | | | | | | | | | | | | | | | | | | | | |
Net Asset Value, beginning of year | | | | $ | 34.30 | | | $ | 27.33 | | | $ | 24.34 | | | $ | 21.99 | | | $ | 26.84 | |
| | | | | | | | | | | | | | | | | | | | | | |
Income (Loss) From Investment Operations: | | | | | | | | | | | | | | | | | | | | | | |
Net investment income (loss) | | | | | 1.23 | | | | 0.77 | | | | 0.49 | | | | 0.72 | | | | 0.60 | |
Net realized and unrealized gain (loss) on investment and foreign currency transactions | | | | | 6.33 | | | | 6.20 | | | | 2.50 | | | | 1.63 | | | | (5.46 | ) |
| | | | | | | | | | | | | | | | | | | | | | |
Total from investment operations | | | | | 7.56 | | | | 6.97 | | | | 2.99 | | | | 2.35 | | | | (4.86 | ) |
| | | | | | | | | | | | | | | | | | | | | | |
Capital Contributions | | | | | — | | | | — | | | | — | | | | — | (b)(c) | | | 0.01 | (b) |
| | | | | | | | | | | | | | | | | | | | | | |
Net Asset Value, end of year | | | | $ | 41.86 | | | $ | 34.30 | | | $ | 27.33 | | | $ | 24.34 | | | $ | 21.99 | |
| | | | | | | | | | | | | | | | | | | | | | |
Total Return(d) | | | | | 22.04 | % | | | 25.50 | % | | | 12.28 | % | | | 10.69 | %(e) | | | (18.07 | )%(f) |
Ratios/Supplemental Data: | | | | | | | | | | | | | | | | | | | | | | |
Net assets, end of year (in millions) | | | | $ | 497.9 | | | $ | 419.2 | | | $ | 351.8 | | | $ | 332.2 | | | $ | 324.3 | |
Average net assets (in millions) | | | | $ | 477.7 | | | $ | 402.7 | | | $ | 284.9 | | | $ | 338.8 | | | $ | 398.1 | |
Ratios to average net assets(g): | | | | | | | | | | | | | | | | | | | | | | |
Expenses after waivers and/or expense reimbursement | | | | | 0.49 | % | | | 0.50 | % | | | 0.54 | % | | | 0.53 | % | | | 0.51 | % |
Expenses before waivers and/or expense reimbursement | | | | | 0.50 | % | | | 0.51 | % | | | 0.55 | % | | | 0.54 | % | | | 0.52 | % |
Net investment income (loss) | | | | | 3.14 | % | | | 2.39 | % | | | 2.28 | % | | | 3.04 | % | | | 2.30 | % |
Portfolio turnover rate(h) | | | | | 109 | % | | | 79 | % | | | 136 | % | | | 132 | % | | | 108 | % |
| | | | | | |
Class II | | | | | | | | | | | | | | | | | |
| | | | | Year Ended December 31, | |
| | | | | 2022 | | | 2021 | | | 2020 | | | 2019 | | | 2018 | |
Per Share Operating Performance(a): | | | | | | | | | | | | | | | | | | | | | | |
Net Asset Value, beginning of year | | | | $ | 32.77 | | | $ | 26.21 | | | $ | 23.44 | | | $ | 21.26 | | | $ | 26.06 | |
| | | | | | | | | | | | | | | | | | | | | | |
Income (Loss) From Investment Operations: | | | | | | | | | | | | | | | | | | | | | | |
Net investment income (loss) | | | | | 1.04 | | | | 0.58 | | | | 0.41 | | | | 0.61 | | | | 0.49 | |
Net realized and unrealized gain (loss) on investment and foreign currency transactions | | | | | 6.02 | | | | 5.98 | | | | 2.36 | | | | 1.57 | | | | (5.30 | ) |
| | | | | | | | | | | | | | | | | | | | | | |
Total from investment operations | | | | | 7.06 | | | | 6.56 | | | | 2.77 | | | | 2.18 | | | | (4.81 | ) |
| | | | | | | | | | | | | | | | | | | | | | |
Capital Contributions | | | | | — | | | | — | | | | — | | | | — | (b)(c) | | | 0.01 | (b) |
| | | | | | | | | | | | | | | | | | | | | | |
Net Asset Value, end of year | | | | $ | 39.83 | | | $ | 32.77 | | | $ | 26.21 | | | $ | 23.44 | | | $ | 21.26 | |
| | | | | | | | | | | | | | | | | | | | | | |
Total Return(d) | | | | | 21.54 | % | | | 25.03 | % | | | 11.82 | % | | | 10.25 | %(e) | | | (18.42 | )%(f) |
Ratios/Supplemental Data: | | | | | | | | | | | | | | | | | | | | | | |
Net assets, end of year (in millions) | | | | $ | 34.0 | | | $ | 25.6 | | | $ | 32.5 | | | $ | 49.5 | | | $ | 48.4 | |
Average net assets (in millions) | | | | $ | 33.5 | | | $ | 27.8 | | | $ | 37.6 | | | $ | 50.1 | | | $ | 52.0 | |
Ratios to average net assets(g): | | | | | | | | | | | | | | | | | | | | | | |
Expenses after waivers and/or expense reimbursement | | | | | 0.89 | % | | | 0.90 | % | | | 0.94 | % | | | 0.93 | % | | | 0.91 | % |
Expenses before waivers and/or expense reimbursement | | | | | 0.90 | % | | | 0.91 | % | | | 0.95 | % | | | 0.94 | % | | | 0.92 | % |
Net investment income (loss) | | | | | 2.77 | % | | | 1.89 | % | | | 2.05 | % | | | 2.63 | % | | | 1.93 | % |
Portfolio turnover rate(h) | | | | | 109 | % | | | 79 | % | | | 136 | % | | | 132 | % | | | 108 | % |
SEE NOTES TO FINANCIAL STATEMENTS.
A29
| | | | |
| | PSF NATURAL RESOURCES PORTFOLIO (CONTINUED) | | |
| | | | |
FINANCIAL HIGHLIGHTS
| | | | | | | | | | | | | | | | | | | | |
Class III | | | | | |
| | | Year Ended December 31, 2022 | | April 26, 2021(i)
through December 31,
2021 | |
Per Share Operating Performance(a): | | | | | | | | | | | | | | | | | | | | |
Net Asset Value, beginning of period | | | | $ | 34.24 | | | | | | | | | $ | 31.02 | | | | | |
| | | | | | | | | | | | | | | | | | | | |
Income (Loss) From Investment Operations: | | | | | | | | | | | | | | | | | | | | |
Net investment income (loss) | | | | | 1.17 | | | | | | | | | | 0.20 | | | | | |
Net realized and unrealized gain (loss) on investment and foreign currency transactions | | | | | 6.32 | | | | | | | | | | 3.02 | | | | | |
| | | | | | | | | | | | | | | | | | | | |
Total from investment operations | | | | | 7.49 | | | | | | | | | | 3.22 | | | | | |
| | | | | | | | | | | | | | | | | | | | |
Net Asset Value, end of period | | | | $ | 41.73 | | | | | | | | | $ | 34.24 | | | | | |
| | | | | | | | | | | | | | | | | | | | |
Total Return(d) | | | | | 21.88 | % | | | | | | | | | 10.38 | % | | | | |
Ratios/Supplemental Data: | | | | | | | | | | | | | | | | | | | | |
Net assets, end of period (in millions) | | | | $ | 6.1 | | | | | | | | | $ | 1.0 | | | | | |
Average net assets (in millions) | | | | $ | 3.7 | | | | | | | | | $ | 0.3 | | | | | |
Ratios to average net assets(g): | | | | | | | | | | | | | | | | | | | | |
Expenses after waivers and/or expense reimbursement | | | | | 0.73 | % | | | | | | | | | 0.72 | %(j) | | | | |
Expenses before waivers and/or expense reimbursement | | | | | 0.74 | % | | | | | | | | | 0.73 | %(j) | | | | |
Net investment income (loss) | | | | | 2.95 | % | | | | | | | | | 0.82 | %(j) | | | | |
Portfolio turnover rate(h) | | | | | 109 | % | | | | | | | | | 79 | % | | | | |
| (a) | Calculated based on average shares outstanding during the period. |
| (b) | Represents payment received by the Portfolio, from Prudential, in connection with excess foreign withholding tax withheld on dividends and interest from certain countries due to the Portfolio’s tax status as a partnership. |
| (c) | Amount rounds to zero. |
| (d) | Total return is calculated assuming a purchase of a share on the first day and a sale on the last day of each period reported and includes reinvestment of dividends and distributions, if any, and does not reflect the effect of insurance contract charges. Total return does not reflect expenses associated with the separate account such as administrative fees, account charges and surrender charges which, if reflected, would reduce the total returns for all periods shown. Performance figures may reflect fee waivers and/or expense reimbursements. In the absence of fee waivers and/or expense reimbursements, the total return would be lower. Past performance is no guarantee of future results. Total returns may reflect adjustments to conform to GAAP. Total returns for periods less than one full year are not annualized. |
| (e) | Total return for the year includes the impact of the capital contribution, which was not material to the total return. |
| (f) | Total return for the year includes the impact of the capital contribution. Excluding the capital contribution, the total return would have been (18.11)% and (18.46)% for Class I and Class II, respectively. |
| (g) | Does not include expenses of the underlying funds in which the Portfolio invests. |
| (h) | The Portfolio’s portfolio turnover rate is calculated in accordance with regulatory requirements, without regard to transactions involving short-term investments, certain derivatives and in-kind transactions (if any). If such transactions were included, the Portfolio’s portfolio turnover rate may be higher. |
| (i) | Commencement of offering. |
| (j) | Annualized, with the exception of certain non-recurring expenses. |
SEE NOTES TO FINANCIAL STATEMENTS.
A30
| | | | |
| | PSF PGIM 50/50 BALANCED PORTFOLIO | | |
SCHEDULE OF INVESTMENTS | | | | as of December 31, 2022 |
| | | | | | | | |
| | | Shares | | | Value | |
|
LONG-TERM INVESTMENTS — 90.3% | |
COMMON STOCKS — 48.9% | |
Aerospace & Defense — 0.9% | | | | | | | | |
BAE Systems PLC (United Kingdom) | | | 6,901 | | | $ | 71,276 | |
Boeing Co. (The)* | | | 19,250 | | | | 3,666,933 | |
General Dynamics Corp. | | | 7,800 | | | | 1,935,258 | |
Howmet Aerospace, Inc. | | | 13,080 | | | | 515,483 | |
Huntington Ingalls Industries, Inc. | | | 1,400 | | | | 322,952 | |
Kongsberg Gruppen ASA (Norway) | | | 195 | | | | 8,300 | |
L3Harris Technologies, Inc. | | | 6,570 | | | | 1,367,940 | |
Lockheed Martin Corp. | | | 8,020 | | | | 3,901,650 | |
MTU Aero Engines AG (Germany) | | | 830 | | | | 178,562 | |
Northrop Grumman Corp. | | | 5,022 | | | | 2,740,053 | |
Raytheon Technologies Corp. | | | 50,955 | | | | 5,142,379 | |
Textron, Inc. | | | 7,500 | | | | 531,000 | |
Thales SA (France) | | | 232 | | | | 29,642 | |
TransDigm Group, Inc. | | | 1,820 | | | | 1,145,963 | |
| | | | | | | | |
| | |
| | | | | | | 21,557,391 | |
| | | | | | | | |
Air Freight & Logistics — 0.3% | | | | | | | | |
C.H. Robinson Worldwide, Inc.(a) | | | 4,400 | | | | 402,864 | |
Expeditors International of Washington, Inc. | | | 5,600 | | | | 581,952 | |
FedEx Corp. | | | 8,180 | | | | 1,416,776 | |
United Parcel Service, Inc. (Class B Stock) | | | 25,200 | | | | 4,380,768 | |
| | | | | | | | |
| | |
| | | | | | | 6,782,360 | |
| | | | | | | | |
Airlines — 0.1% | | | | | | | | |
Alaska Air Group, Inc.* | | | 4,300 | | | | 184,642 | |
American Airlines Group, Inc.*(a) | | | 22,500 | | | | 286,200 | |
Delta Air Lines, Inc.* | | | 22,200 | | | | 729,492 | |
Deutsche Lufthansa AG (Germany)* | | | 1,320 | | | | 10,881 | |
Qantas Airways Ltd. (Australia)* | | | 1,812 | | | | 7,334 | |
Singapore Airlines Ltd. (Singapore) | | | 3,000 | | | | 12,387 | |
Southwest Airlines Co.* | | | 20,600 | | | | 693,602 | |
United Airlines Holdings, Inc.* | | | 11,200 | | | | 422,240 | |
| | | | | | | | |
| | |
| | | | | | | 2,346,778 | |
| | | | | | | | |
Auto Components — 0.1% | | | | | | | | |
Aptiv PLC* | | | 9,400 | | | | 875,422 | |
BorgWarner, Inc. | | | 8,700 | | | | 350,175 | |
| | | | | | | | |
| | |
| | | | | | | 1,225,597 | |
| | | | | | | | |
Automobiles — 0.7% | | | | | | | | |
Bayerische Motoren Werke AG (Germany) | | | 734 | | | | 64,985 | |
Ferrari NV (Italy) | | | 270 | | | | 57,898 | |
Ford Motor Co. | | | 136,285 | | | | 1,584,995 | |
General Motors Co. | | | 49,200 | | | | 1,655,088 | |
Honda Motor Co. Ltd. (Japan) | | | 3,500 | | | | 79,832 | |
Isuzu Motors Ltd. (Japan) | | | 1,200 | | | | 13,911 | |
Mazda Motor Corp. (Japan) | | | 8,900 | | | | 66,715 | |
Mercedes-Benz Group AG (Germany) | | | 181 | | | | 11,836 | |
Stellantis NV | | | 17,964 | | | | 255,275 | |
Subaru Corp. (Japan) | | | 12,500 | | | | 189,251 | |
Suzuki Motor Corp. (Japan) | | | 700 | | | | 22,419 | |
Tesla, Inc.* | | | 93,020 | | | | 11,458,204 | |
Toyota Motor Corp. (Japan) | | | 9,500 | | | | 129,604 | |
| | | | | | | | |
| | | Shares | | | Value | |
|
COMMON STOCKS (continued) | |
Automobiles (cont’d.) | | | | | | | | |
Volkswagen AG (Germany) | | | 65 | | | $ | 10,197 | |
| | | | | | | | |
| | |
| | | | | | | 15,600,210 | |
| | | | | | | | |
Banks — 1.9% | | | | | | | | |
ABN AMRO Bank NV (Netherlands), 144A, CVA | | | 1,566 | | | | 21,686 | |
ANZ Group Holdings Ltd. (Australia) | | | 10,164 | | | | 163,731 | |
Bank Hapoalim BM (Israel) | | | 3,139 | | | | 28,263 | |
Bank Leumi Le-Israel BM (Israel) | | | 24,516 | | | | 204,189 | |
Bank of America Corp. | | | 241,241 | | | | 7,989,902 | |
Barclays PLC (United Kingdom) | | | 136,650 | | | | 260,019 | |
Citigroup, Inc. | | | 66,835 | | | | 3,022,947 | |
Citizens Financial Group, Inc. | | | 17,100 | | | | 673,227 | |
Comerica, Inc. | | | 4,500 | | | | 300,825 | |
Commerzbank AG (Germany)* | | | 2,349 | | | | 21,962 | |
Commonwealth Bank of Australia (Australia) | | | 3,555 | | | | 246,912 | |
DBS Group Holdings Ltd. (Singapore) | | | 12,300 | | | | 311,333 | |
DNB Bank ASA (Norway) | | | 6,175 | | | | 121,957 | |
Fifth Third Bancorp | | | 23,721 | | | | 778,286 | |
FinecoBank Banca Fineco SpA (Italy) | | | 1,332 | | | | 22,119 | |
First Republic Bank | | | 6,400 | | | | 780,096 | |
HSBC Holdings PLC
(United Kingdom) | | | 12,210 | | | | 75,672 | |
Huntington Bancshares, Inc.(a) | | | 50,236 | | | | 708,328 | |
ING Groep NV (Netherlands) | | | 23,038 | | | | 280,630 | |
Israel Discount Bank Ltd. (Israel) (Class A Stock) | | | 2,713 | | | | 14,243 | |
JPMorgan Chase & Co. | | | 101,645 | | | | 13,630,594 | |
KeyCorp. | | | 32,300 | | | | 562,666 | |
Lloyds Banking Group PLC (United Kingdom) | | | 500,453 | | | | 273,104 | |
M&T Bank Corp. | | | 6,005 | | | | 871,085 | |
Mizrahi Tefahot Bank Ltd. (Israel) | | | 340 | | | | 10,974 | |
National Australia Bank Ltd. (Australia) | | | 3,571 | | | | 72,504 | |
NatWest Group PLC (United Kingdom) | | | 11,717 | | | | 37,368 | |
Nordea Bank Abp (Finland) | | | 7,380 | | | | 79,054 | |
Oversea-Chinese Banking Corp. Ltd. (Singapore) | | | 11,400 | | | | 103,695 | |
PNC Financial Services Group, Inc. (The) | | | 14,133 | | | | 2,232,166 | |
Regions Financial Corp. | | | 33,103 | | | | 713,701 | |
Signature Bank | | | 2,300 | | | | 265,006 | |
Skandinaviska Enskilda Banken AB (Sweden) (Class A Stock) | | | 3,484 | | | | 40,111 | |
Sumitomo Mitsui Financial Group, Inc. (Japan) | | | 2,700 | | | | 108,628 | |
SVB Financial Group* | | | 2,040 | | | | 469,486 | |
Swedbank AB (Sweden) (Class A Stock) | | | 1,800 | | | | 30,616 | |
Truist Financial Corp. | | | 46,301 | | | | 1,992,332 | |
U.S. Bancorp | | | 46,585 | | | | 2,031,572 | |
Wells Fargo & Co. | | | 132,064 | | | | 5,452,923 | |
Zions Bancorp NA | | | 5,650 | | | | 277,754 | |
| | | | | | | | |
| | |
| | | | | | | 45,281,666 | |
| | | | | | | | |
Beverages — 0.9% | | | | | | | | |
Brown-Forman Corp. (Class B Stock) | | | 6,375 | | | | 418,710 | |
Coca-Cola Co. (The) | | | 134,801 | | | | 8,574,692 | |
Coca-Cola HBC AG (Italy)* | | | 434 | | | | 10,259 | |
SEE NOTES TO FINANCIAL STATEMENTS.
A31
| | | | |
| | PSF PGIM 50/50 BALANCED PORTFOLIO (CONTINUED) | | |
SCHEDULE OF INVESTMENTS | | | | as of December 31, 2022 |
| | | | | | | | |
| | | Shares | | | Value | |
|
COMMON STOCKS (continued) | |
Beverages (cont’d.) | |
Constellation Brands, Inc. (Class A Stock) | | | 5,540 | | | $ | 1,283,895 | |
Diageo PLC (United Kingdom) | | | 931 | | | | 40,752 | |
Heineken Holding NV (Netherlands) | | | 248 | | | | 19,153 | |
Heineken NV (Netherlands) | | | 564 | | | | 53,124 | |
Keurig Dr. Pepper, Inc. | | | 30,200 | | | | 1,076,932 | |
Molson Coors Beverage Co. (Class B Stock) | | | 6,500 | | | | 334,880 | |
Monster Beverage Corp.* | | | 13,400 | | | | 1,360,502 | |
PepsiCo, Inc. | | | 48,007 | | | | 8,672,945 | |
| | | | | | | | |
| |
| | | | 21,845,844 | |
| | | | | | | | |
Biotechnology — 1.2% | |
AbbVie, Inc. | | | 61,501 | | | | 9,939,177 | |
Amgen, Inc. | | | 18,437 | | | | 4,842,294 | |
Biogen, Inc.* | | | 4,860 | | | | 1,345,831 | |
Gilead Sciences, Inc. | | | 43,400 | | | | 3,725,890 | |
Incyte Corp.* | | | 6,300 | | | | 506,016 | |
Moderna, Inc.* | | | 11,550 | | | | 2,074,611 | |
Regeneron Pharmaceuticals, Inc.* | | | 3,740 | | | | 2,698,372 | |
Vertex Pharmaceuticals, Inc.* | | | 8,800 | | | | 2,541,264 | |
| | | | | | | | |
| |
| | | | 27,673,455 | |
| | | | | | | | |
Building Products — 0.2% | |
A.O. Smith Corp. | | | 4,600 | | | | 263,304 | |
Allegion PLC | | | 3,133 | | | | 329,780 | |
Assa Abloy AB (Sweden) (Class B Stock) | | | 2,184 | | | | 46,976 | |
Carrier Global Corp. | | | 29,002 | | | | 1,196,333 | |
Cie de Saint-Gobain (France) | | | 1,050 | | | | 51,367 | |
Johnson Controls International PLC | | | 24,022 | | | | 1,537,408 | |
Lixil Corp. (Japan) | | | 1,000 | | | | 15,076 | |
Masco Corp.(a) | | | 7,800 | | | | 364,026 | |
Nibe Industrier AB (Sweden) (Class B Stock) | | | 3,162 | | | | 29,513 | |
Trane Technologies PLC | | | 8,000 | | | | 1,344,720 | |
Xinyi Glass Holdings Ltd. (China) | | | 4,000 | | | | 7,390 | |
| | | | | | | | |
| |
| | | | 5,185,893 | |
| | | | | | | | |
Capital Markets — 1.5% | |
3i Group PLC (United Kingdom) | | | 11,134 | | | | 179,562 | |
Ameriprise Financial, Inc. | | | 3,620 | | | | 1,127,159 | |
Bank of New York Mellon Corp. (The) | | | 25,358 | | | | 1,154,296 | |
BlackRock, Inc. | | | 5,190 | | | | 3,677,790 | |
Cboe Global Markets, Inc. | | | 3,700 | | | | 464,239 | |
Charles Schwab Corp. (The) | | | 52,650 | | | | 4,383,639 | |
CME Group, Inc. | | | 12,400 | | | | 2,085,184 | |
Deutsche Bank AG (Germany) | | | 21,466 | | | | 241,312 | |
Deutsche Boerse AG (Germany) | | | 411 | | | | 70,770 | |
FactSet Research Systems, Inc. | | | 1,200 | | | | 481,452 | |
Franklin Resources, Inc.(a) | | | 9,700 | | | | 255,886 | |
Goldman Sachs Group, Inc. (The) | | | 11,680 | | | | 4,010,678 | |
Hargreaves Lansdown PLC
(United Kingdom) | | | 780 | | | | 8,032 | |
Intercontinental Exchange, Inc. | | | 19,455 | | | | 1,995,888 | |
Invesco Ltd. | | | 16,200 | | | | 291,438 | |
Julius Baer Group Ltd. (Switzerland) | | | 1,818 | | | | 105,810 | |
Macquarie Group Ltd. (Australia) | | | 1,318 | | | | 148,787 | |
| | | | | | | | |
| | | Shares | | | Value | |
|
COMMON STOCKS (continued) | |
Capital Markets (cont’d.) | |
MarketAxess Holdings, Inc. | | | 1,420 | | | $ | 396,024 | |
Moody’s Corp. | | | 5,550 | | | | 1,546,341 | |
Morgan Stanley | | | 45,619 | | | | 3,878,527 | |
MSCI, Inc. | | | 2,780 | | | | 1,293,173 | |
Nasdaq, Inc. | | | 12,000 | | | | 736,200 | |
Northern Trust Corp. | | | 7,200 | | | | 637,128 | |
Partners Group Holding AG (Switzerland) | | | 49 | | | | 43,389 | |
Raymond James Financial, Inc. | | | 6,750 | | | | 721,238 | |
S&P Global, Inc. | | | 11,560 | | | | 3,871,906 | |
Singapore Exchange Ltd. (Singapore) | | | 7,700 | | | | 51,489 | |
State Street Corp. | | | 12,700 | | | | 985,139 | |
T. Rowe Price Group, Inc.(a) | | | 7,700 | | | | 839,762 | |
UBS Group AG (Switzerland) | | | 19,799 | | | | 367,989 | |
| | | | | | | | |
| |
| | | | 36,050,227 | |
| | | | | | | | |
Chemicals — 0.9% | |
Air Products & Chemicals, Inc. | | | 7,700 | | | | 2,373,602 | |
Albemarle Corp. | | | 4,000 | | | | 867,440 | |
BASF SE (Germany) | | | 756 | | | | 37,224 | |
Celanese Corp. | | | 3,500 | | | | 357,840 | |
CF Industries Holdings, Inc. | | | 6,800 | | | | 579,360 | |
Clariant AG (Switzerland)* | | | 496 | | | | 7,877 | |
Corteva, Inc. | | | 24,747 | | | | 1,454,629 | |
Dow, Inc. | | | 24,747 | | | | 1,247,001 | |
DuPont de Nemours, Inc.(a) | | | 17,247 | | | | 1,183,662 | |
Eastman Chemical Co. | | | 4,200 | | | | 342,048 | |
Ecolab, Inc. | | | 8,500 | | | | 1,237,260 | |
FMC Corp. | | | 4,300 | | | | 536,640 | |
ICL Group Ltd. (Israel) | | | 1,494 | | | | 10,795 | |
International Flavors & Fragrances, Inc. | | | 8,800 | | | | 922,592 | |
Linde PLC (United Kingdom) | | | 17,200 | | | | 5,610,296 | |
LyondellBasell Industries NV (Class A Stock) | | | 9,100 | | | | 755,573 | |
Mitsubishi Chemical Group Corp. (Japan) | | | 2,800 | | | | 14,496 | |
Mosaic Co. (The) | | | 12,300 | | | | 539,601 | |
Nitto Denko Corp. (Japan) | | | 300 | | | | 17,278 | |
OCI NV (Netherlands) | | | 1,046 | | | | 37,397 | |
PPG Industries, Inc. | | | 8,200 | | | | 1,031,068 | |
Sherwin-Williams Co. (The) | | | 8,150 | | | | 1,934,239 | |
Shin-Etsu Chemical Co. Ltd. (Japan) | | | 800 | | | | 97,690 | |
Solvay SA (Belgium) | | | 2,036 | | | | 205,852 | |
Tosoh Corp. (Japan) | | | 600 | | | | 7,135 | |
Yara International ASA (Brazil) | | | 4,497 | | | | 197,495 | |
| | | | | | | | |
| |
| | | | 21,606,090 | |
| | | | | | | | |
Commercial Services & Supplies — 0.2% | |
Cintas Corp. | | | 3,020 | | | | 1,363,892 | |
Copart, Inc.* | | | 14,700 | | | | 895,083 | |
Republic Services, Inc. | | | 7,265 | | | | 937,112 | |
Rollins, Inc. | | | 8,700 | | | | 317,898 | |
Securitas AB (Sweden) (Class B Stock) | | | 1,050 | | | | 8,762 | |
Waste Management, Inc. | | | 13,142 | | | | 2,061,717 | |
| | | | | | | | |
| |
| | | | 5,584,464 | |
| | | | | | | | |
Communications Equipment — 0.4% | |
Arista Networks, Inc.* | | | 8,700 | | | | 1,055,745 | |
SEE NOTES TO FINANCIAL STATEMENTS.
A32
| | | | |
| | PSF PGIM 50/50 BALANCED PORTFOLIO (CONTINUED) | | |
SCHEDULE OF INVESTMENTS | | | | as of December 31, 2022 |
| | | | | | | | |
| | | Shares | | | Value | |
|
COMMON STOCKS (continued) | |
Communications Equipment (cont’d.) | |
Cisco Systems, Inc. | | | 142,900 | | | $ | 6,807,756 | |
F5, Inc.* | | | 2,200 | | | | 315,722 | |
Juniper Networks, Inc. | | | 11,000 | | | | 351,560 | |
Motorola Solutions, Inc. | | | 5,689 | | | | 1,466,112 | |
Nokia OYJ (Finland) | | | 11,812 | | | | 54,875 | |
| | | | | | | | |
| |
| | | | 10,051,770 | |
| | | | | | | | |
Construction & Engineering — 0.1% | |
Eiffage SA (France) | | | 642 | | | | 63,150 | |
Kajima Corp. (Japan) | | | 1,000 | | | | 11,637 | |
Quanta Services, Inc.(a) | | | 5,100 | | | | 726,750 | |
Vinci SA (France) | | | 3,095 | | | | 308,531 | |
| | | | | | | | |
| |
| | | | 1,110,068 | |
| | | | | | | | |
Construction Materials — 0.1% | |
HeidelbergCement AG (Germany) | | | 325 | | | | 18,416 | |
Martin Marietta Materials, Inc. | | | 2,080 | | | | 702,978 | |
Vulcan Materials Co. | | | 4,600 | | | | 805,506 | |
| | | | | | | | |
| |
| | | | 1,526,900 | |
| | | | | | | | |
Consumer Finance — 0.2% | |
American Express Co. | | | 20,700 | | | | 3,058,425 | |
Capital One Financial Corp. | | | 13,261 | | | | 1,232,743 | |
Discover Financial Services | | | 9,440 | | | | 923,515 | |
Synchrony Financial | | | 15,572 | | | | 511,696 | |
| | | | | | | | |
| |
| | | | 5,726,379 | |
| | | | | | | | |
Containers & Packaging — 0.1% | |
Amcor PLC(a) | | | 53,250 | | | | 634,208 | |
Avery Dennison Corp. | | | 2,700 | | | | 488,700 | |
Ball Corp. | | | 11,200 | | | | 572,768 | |
International Paper Co.(a) | | | 12,473 | | | | 431,940 | |
Packaging Corp. of America | | | 3,200 | | | | 409,312 | |
Sealed Air Corp. | | | 5,100 | | | | 254,388 | |
Westrock Co. | | | 8,744 | | | | 307,439 | |
| | | | | | | | |
| |
| | | | 3,098,755 | |
| | | | | | | | |
Distributors — 0.1% | |
D’ieteren Group (Belgium) | | | 54 | | | | 10,363 | |
Genuine Parts Co. | | | 4,900 | | | | 850,199 | |
LKQ Corp. | | | 9,300 | | | | 496,713 | |
Pool Corp. | | | 1,280 | | | | 386,983 | |
| | | | | | | | |
| |
| | | | 1,744,258 | |
| | | | | | | | |
Diversified Financial Services — 0.8% | |
Berkshire Hathaway, Inc. (Class B Stock)* | | | 62,380 | | | | 19,269,182 | |
Industrivarden AB (Sweden) (Class A Stock) | | | 49 | | | | 1,192 | |
Investor AB (Sweden) (Class A Stock) | | | 1,064 | | | | 19,795 | |
ORIX Corp. (Japan) | | | 7,900 | | | | 126,453 | |
| | | | | | | | |
| |
| | | | 19,416,622 | |
| | | | | | | | |
Diversified Telecommunication Services — 0.5% | |
AT&T, Inc. | | | 246,936 | | | | 4,546,092 | |
Bezeq The Israeli Telecommunication Corp. Ltd. (Israel) | | | 48,174 | | | | 82,643 | |
Deutsche Telekom AG (Germany) | | | 9,843 | | | | 195,842 | |
| | | | | | | | |
| | | Shares | | | Value | |
|
COMMON STOCKS (continued) | |
Diversified Telecommunication Services (cont’d.) | |
HKT Trust & HKT Ltd. (Hong Kong) | | | 9,000 | | | $ | 11,017 | |
Koninklijke KPN NV (Netherlands) | | | 7,015 | | | | 21,713 | |
Lumen Technologies, Inc.(a) | | | 33,779 | | | | 176,326 | |
Nippon Telegraph & Telephone Corp. (Japan) | | | 1,600 | | | | 45,630 | |
Spark New Zealand Ltd. (New Zealand) | | | 20,926 | | | | 71,646 | |
Telefonica Deutschland Holding AG (Germany) | | | 20,863 | | | | 51,240 | |
Telstra Group Ltd. (Australia) | | | 9,102 | | | | 24,616 | |
Verizon Communications, Inc. | | | 144,876 | | | | 5,708,114 | |
| | | | | | | | |
| |
| | | | 10,934,879 | |
| | | | | | | | |
Electric Utilities — 1.0% | |
Alliant Energy Corp. | | | 8,700 | | | | 480,327 | |
American Electric Power Co., Inc. | | | 17,660 | | | | 1,676,817 | |
CK Infrastructure Holdings Ltd.
(Hong Kong) | | | 1,500 | | | | 7,827 | |
Constellation Energy Corp. | | | 11,304 | | | | 974,518 | |
Duke Energy Corp. | | | 26,561 | | | | 2,735,517 | |
Edison International | | | 13,200 | | | | 839,784 | |
Endesa SA (Spain) | | | 1,511 | | | | 28,477 | |
Enel SpA (Italy) | | | 51,097 | | | | 274,807 | |
Entergy Corp. | | | 7,000 | | | | 787,500 | |
Evergy, Inc. | | | 7,900 | | | | 497,147 | |
Eversource Energy | | | 11,900 | | | | 997,696 | |
Exelon Corp. | | | 34,713 | | | | 1,500,643 | |
FirstEnergy Corp. | | | 18,956 | | | | 795,015 | |
Fortum OYJ (Finland) | | | 988 | | | | 16,454 | |
Iberdrola SA (Spain) | | | 12,911 | | | | 150,717 | |
NextEra Energy, Inc. | | | 68,800 | | | | 5,751,680 | |
NRG Energy, Inc. | | | 8,700 | | | | 276,834 | |
Origin Energy Ltd. (Australia) | | | 3,750 | | | | 19,627 | |
PG&E Corp.* | | | 54,400 | | | | 884,544 | |
Pinnacle West Capital Corp. | | | 4,100 | | | | 311,764 | |
Power Assets Holdings Ltd. (Hong Kong) | | | 3,000 | | | | 16,396 | |
PPL Corp. | | | 26,100 | | | | 762,642 | |
Southern Co. (The) | | | 37,700 | | | | 2,692,157 | |
SSE PLC (United Kingdom) | | | 7,676 | | | | 157,872 | |
Terna - Rete Elettrica Nazionale (Italy) | | | 3,112 | | | | 22,983 | |
Xcel Energy, Inc. | | | 19,110 | | | | 1,339,802 | |
| | | | | | | | |
| |
| | | | 23,999,547 | |
| | | | | | | | |
Electrical Equipment — 0.3% | |
ABB Ltd. (Switzerland) | | | 3,540 | | | | 107,890 | |
AMETEK, Inc. | | | 8,000 | | | | 1,117,760 | |
Eaton Corp. PLC | | | 13,737 | | | | 2,156,022 | |
Emerson Electric Co. | | | 20,400 | | | | 1,959,624 | |
Fuji Electric Co. Ltd. (Japan) | | | 300 | | | | 11,322 | |
Generac Holdings, Inc.*(a) | | | 2,100 | | | | 211,386 | |
Prysmian SpA (Italy) | | | 558 | | | | 20,733 | |
Rockwell Automation, Inc.(a) | | | 4,000 | | | | 1,030,280 | |
| | | | | | | | |
| |
| | | | 6,615,017 | |
| | | | | | | | |
Electronic Equipment, Instruments & Components — 0.3% | |
Amphenol Corp. (Class A Stock) | | | 20,500 | | | | 1,560,870 | |
CDW Corp. | | | 4,650 | | | | 830,397 | |
SEE NOTES TO FINANCIAL STATEMENTS.
A33
| | | | |
| | PSF PGIM 50/50 BALANCED PORTFOLIO (CONTINUED) | | |
SCHEDULE OF INVESTMENTS | | | | as of December 31, 2022 |
| | | | | | | | |
| | | Shares | | | Value | |
|
COMMON STOCKS (continued) | |
Electronic Equipment, Instruments & Components (cont’d.) | |
Corning, Inc. | | | 26,700 | | | $ | 852,798 | |
Halma PLC (United Kingdom) | | | 836 | | | | 19,909 | |
Hamamatsu Photonics KK (Japan) | | | 400 | | | | 19,091 | |
Hirose Electric Co. Ltd. (Japan) | | | 500 | | | | 62,711 | |
Keysight Technologies, Inc.* | | | 6,200 | | | | 1,060,634 | |
TE Connectivity Ltd. (Switzerland) | | | 11,000 | | | | 1,262,800 | |
Teledyne Technologies, Inc.* | | | 1,560 | | | | 623,860 | |
Trimble, Inc.* | | | 8,700 | | | | 439,872 | |
Venture Corp. Ltd. (Singapore) | | | 2,000 | | | | 25,492 | |
Yokogawa Electric Corp. (Japan) | | | 500 | | | | 7,935 | |
Zebra Technologies Corp. (Class A Stock)* | | | 1,770 | | | | 453,846 | |
| | | | | | | | |
| |
| | | | 7,220,215 | |
| | | | | | | | |
Energy Equipment & Services — 0.2% | |
Baker Hughes Co. | | | 34,898 | | | | 1,030,538 | |
Halliburton Co. | | | 31,300 | | | | 1,231,655 | |
Schlumberger Ltd. | | | 48,824 | | | | 2,610,131 | |
| | | | | | | | |
| |
| | | | 4,872,324 | |
| | | | | | | | |
Entertainment — 0.6% | |
Activision Blizzard, Inc. | | | 24,500 | | | | 1,875,475 | |
Electronic Arts, Inc. | | | 9,100 | | | | 1,111,838 | |
Live Nation Entertainment, Inc.* | | | 4,900 | | | | 341,726 | |
Netflix, Inc.* | | | 15,310 | | | | 4,514,613 | |
Nintendo Co. Ltd. (Japan) | | | 2,400 | | | | 100,912 | |
Take-Two Interactive Software, Inc.* | | | 5,400 | | | | 562,302 | |
Walt Disney Co. (The)* | | | 62,882 | | | | 5,463,188 | |
Warner Bros Discovery, Inc.* | | | 76,976 | | | | 729,732 | |
| | | | | | | | |
| |
| | | | 14,699,786 | |
| | | | | | | | |
Equity Real Estate Investment Trusts (REITs) — 1.3% | |
Alexandria Real Estate Equities, Inc. | | | 5,280 | | | | 769,138 | |
American Tower Corp. | | | 16,060 | | | | 3,402,472 | |
AvalonBay Communities, Inc. | | | 4,875 | | | | 787,410 | |
Boston Properties, Inc.(a) | | | 4,900 | | | | 331,142 | |
Camden Property Trust | | | 3,800 | | | | 425,144 | |
Crown Castle, Inc. | | | 15,100 | | | | 2,048,164 | |
Dexus (Australia) | | | 2,321 | | | | 12,185 | |
Digital Realty Trust, Inc. | | | 10,100 | | | | 1,012,727 | |
Equinix, Inc. | | | 3,184 | | | | 2,085,616 | |
Equity Residential | | | 11,700 | | | | 690,300 | |
Essex Property Trust, Inc. | | | 2,150 | | | | 455,628 | |
Extra Space Storage, Inc. | | | 4,600 | | | | 677,028 | |
Federal Realty Investment Trust | | | 2,400 | | | | 242,496 | |
GLP J-REIT (Japan) | | | 9 | | | | 10,365 | |
Goodman Group (Australia) | | | 14,090 | | | | 165,703 | |
Healthpeak Properties, Inc. | | | 18,700 | | | | 468,809 | |
Host Hotels & Resorts, Inc. | | | 24,782 | | | | 397,751 | |
Invitation Homes, Inc. | | | 20,600 | | | | 610,584 | |
Iron Mountain, Inc.(a) | | | 10,002 | | | | 498,600 | |
Japan Real Estate Investment Corp. (Japan) | | | 10 | | | | 43,923 | |
Kimco Realty Corp. | | | 21,400 | | | | 453,252 | |
Klepierre SA (France)* | | | 8,956 | | | | 206,710 | |
Mid-America Apartment Communities, Inc. | | | 4,000 | | | | 627,960 | |
| | | | | | | | |
| | | Shares | | | Value | |
|
COMMON STOCKS (continued) | |
Equity Real Estate Investment Trusts (REITs) (cont’d.) | |
Nomura Real Estate Master Fund, Inc. (Japan) | | | 9 | | | $ | 11,150 | |
Prologis, Inc. | | | 32,084 | | | | 3,616,829 | |
Public Storage | | | 5,420 | | | | 1,518,630 | |
Realty Income Corp. | | | 21,300 | | | | 1,351,059 | |
Regency Centers Corp. | | | 5,600 | | | | 350,000 | |
SBA Communications Corp. | | | 3,800 | | | | 1,065,178 | |
Scentre Group (Australia) | | | 11,818 | | | | 23,004 | |
Simon Property Group, Inc. | | | 11,293 | | | | 1,326,702 | |
Stockland (Australia) | | | 5,072 | | | | 12,492 | |
UDR, Inc. | | | 10,300 | | | | 398,919 | |
Unibail-Rodamco-Westfield (France)* | | | 264 | | | | 13,801 | |
Ventas, Inc. | | | 13,868 | | | | 624,753 | |
VICI Properties, Inc.(a) | | | 33,100 | | | | 1,072,440 | |
Vicinity Ltd. (Australia) | | | 8,550 | | | | 11,545 | |
Vornado Realty Trust(a) | | | 6,125 | | | | 127,461 | |
Warehouses De Pauw CVA (Belgium) | | | 323 | | | | 9,253 | |
Welltower, Inc. | | | 16,100 | | | | 1,055,355 | |
Weyerhaeuser Co. | | | 26,018 | | | | 806,558 | |
| | | | | | | | |
| |
| | | | 29,818,236 | |
| | | | | | | | |
Food & Staples Retailing — 0.8% | |
Carrefour SA (France) | | | 1,080 | | | | 18,064 | |
Coles Group Ltd. (Australia) | | | 2,544 | | | | 28,838 | |
Costco Wholesale Corp. | | | 15,220 | | | | 6,947,930 | |
Endeavour Group Ltd. (Australia) | | | 2,976 | | | | 12,951 | |
J Sainsbury PLC (United Kingdom) | | | 3,717 | | | | 9,749 | |
Jeronimo Martins SGPS SA (Portugal) | | | 496 | | | | 10,731 | |
Kesko OYJ (Finland) (Class B Stock) | | | 2,192 | | | | 48,435 | |
Koninklijke Ahold Delhaize NV (Netherlands) | | | 9,594 | | | | 275,840 | |
Kroger Co. (The) | | | 22,792 | | | | 1,016,068 | |
Sysco Corp. | | | 17,500 | | | | 1,337,875 | |
Tesco PLC (United Kingdom) | | | 2,038 | | | | 5,492 | |
Walgreens Boots Alliance, Inc.(a) | | | 25,000 | | | | 934,000 | |
Walmart, Inc. | | | 49,200 | | | | 6,976,068 | |
Woolworths Group Ltd. (Australia) | | | 2,698 | | | | 61,610 | |
| | | | | | | | |
| |
| | | | 17,683,651 | |
| | | | | | | | |
Food Products — 0.6% | |
Archer-Daniels-Midland Co. | | | 19,026 | | | | 1,766,564 | |
Campbell Soup Co.(a) | | | 7,000 | | | | 397,250 | |
Conagra Brands, Inc. | | | 16,700 | | | | 646,290 | |
General Mills, Inc. | | | 20,800 | | | | 1,744,080 | |
Hershey Co. (The) | | | 5,000 | | | | 1,157,850 | |
Hormel Foods Corp. | | | 10,300 | | | | 469,165 | |
J.M. Smucker Co. (The) | | | 3,900 | | | | 617,994 | |
Kellogg Co. | | | 8,900 | | | | 634,036 | |
Kraft Heinz Co. (The) | | | 28,267 | | | | 1,150,750 | |
Lamb Weston Holdings, Inc. | | | 5,000 | | | | 446,800 | |
McCormick & Co., Inc. | | | 8,740 | | | | 724,459 | |
Mondelez International, Inc. (Class A Stock) | | | 47,953 | | | | 3,196,067 | |
Mowi ASA (Norway) | | | 910 | | | | 15,507 | |
Nestle SA | | | 4,419 | | | | 510,436 | |
Orkla ASA (Norway) | | | 22,383 | | | | 161,545 | |
Tyson Foods, Inc. (Class A Stock) | | | 10,200 | | | | 634,950 | |
WH Group Ltd. (Hong Kong), 144A | | | 151,500 | | | | 88,361 | |
SEE NOTES TO FINANCIAL STATEMENTS.
A34
| | | | |
| | PSF PGIM 50/50 BALANCED PORTFOLIO (CONTINUED) | | |
SCHEDULE OF INVESTMENTS | | | | as of December 31, 2022 |
| | | | | | | | |
| | | Shares | | | Value | |
|
COMMON STOCKS (continued) | |
Food Products (cont’d.) | |
Wilmar International Ltd. (China) | | | 74,800 | | | $ | 233,030 | |
| | | | | | | | |
| |
| | | | 14,595,134 | |
| | | | | | | | |
Gas Utilities — 0.0% | |
Atmos Energy Corp. | | | 4,800 | | | | 537,936 | |
Osaka Gas Co. Ltd. (Japan) | | | 800 | | | | 12,890 | |
Tokyo Gas Co. Ltd. (Japan) | | | 900 | | | | 17,622 | |
| | | | | | | | |
| |
| | | | 568,448 | |
| | | | | | | | |
Health Care Equipment & Supplies — 1.3% | |
Abbott Laboratories | | | 60,450 | | | | 6,636,805 | |
Align Technology, Inc.* | | | 2,440 | | | | 514,596 | |
Baxter International, Inc. | | | 17,900 | | | | 912,363 | |
Becton, Dickinson & Co. | | | 9,910 | | | | 2,520,113 | |
BioMerieux (France) | | | 90 | | | | 9,456 | |
Boston Scientific Corp.* | | | 49,367 | | | | 2,284,211 | |
Cochlear Ltd. (Australia) | | | 140 | | | | 19,335 | |
Cooper Cos., Inc. (The) | | | 1,640 | | | | 542,299 | |
DENTSPLY SIRONA, Inc. | | | 8,000 | | | | 254,720 | |
Dexcom, Inc.* | | | 13,360 | | | | 1,512,886 | |
Edwards Lifesciences Corp.* | | | 21,700 | | | | 1,619,037 | |
Hologic, Inc.* | | | 8,800 | | | | 658,328 | |
IDEXX Laboratories, Inc.* | | | 2,940 | | | | 1,199,402 | |
Intuitive Surgical, Inc.* | | | 12,260 | | | | 3,253,191 | |
Medtronic PLC | | | 45,790 | | | | 3,558,799 | |
Olympus Corp. (Japan) | | | 7,100 | | | | 125,227 | |
ResMed, Inc. | | | 5,000 | | | | 1,040,650 | |
STERIS PLC | | | 3,450 | | | | 637,181 | |
Straumann Holding AG (Switzerland) | | | 240 | | | | 27,521 | |
Stryker Corp. | | | 11,600 | | | | 2,836,084 | |
Teleflex, Inc. | | | 1,600 | | | | 399,408 | |
Zimmer Biomet Holdings, Inc. | | | 7,200 | | | | 918,000 | |
| | | | | | | | |
| |
| | | | 31,479,612 | |
| | | | | | | | |
Health Care Providers & Services — 1.8% | |
AmerisourceBergen Corp. | | | 5,600 | | | | 927,976 | |
Cardinal Health, Inc. | | | 9,350 | | | | 718,735 | |
Centene Corp.* | | | 19,950 | | | | 1,636,099 | |
Cigna Corp. | | | 10,500 | | | | 3,479,070 | |
CVS Health Corp. | | | 45,283 | | | | 4,219,923 | |
DaVita, Inc.* | | | 1,900 | | | | 141,873 | |
Elevance Health, Inc. | | | 8,280 | | | | 4,247,392 | |
Fresenius SE & Co. KGaA (Germany) | | | 1,746 | | | | 48,769 | |
HCA Healthcare, Inc. | | | 7,400 | | | | 1,775,704 | |
Henry Schein, Inc.*(a) | | | 4,800 | | | | 383,376 | |
Humana, Inc. | | | 4,370 | | | | 2,238,270 | |
Laboratory Corp. of America Holdings | | | 3,100 | | | | 729,988 | |
McKesson Corp. | | | 4,930 | | | | 1,849,342 | |
Molina Healthcare, Inc.* | | | 1,950 | | | | 643,929 | |
Quest Diagnostics, Inc. | | | 4,200 | | | | 657,048 | |
Sonic Healthcare Ltd. (Australia) | | | 9,946 | | | | 202,411 | |
UnitedHealth Group, Inc. | | | 32,380 | | | | 17,167,228 | |
Universal Health Services, Inc. (Class B Stock) | | | 2,200 | | | | 309,958 | |
| | | | | | | | |
| |
| | | | 41,377,091 | |
| | | | | | | | |
Hotels, Restaurants & Leisure — 1.0% | |
Aristocrat Leisure Ltd. (Australia) | | | 1,276 | | | | 26,293 | |
| | | | | | | | |
| | | Shares | | | Value | |
|
COMMON STOCKS (continued) | |
Hotels, Restaurants & Leisure (cont’d.) | |
Booking Holdings, Inc.* | | | 1,340 | | | $ | 2,700,475 | |
Caesars Entertainment, Inc.* | | | 7,400 | | | | 307,840 | |
Carnival Corp.*(a) | | | 33,400 | | | | 269,204 | |
Chipotle Mexican Grill, Inc.* | | | 970 | | | | 1,345,865 | |
Compass Group PLC
(United Kingdom) | | | 10,209 | | | | 235,747 | |
Darden Restaurants, Inc. | | | 4,450 | | | | 615,568 | |
Domino’s Pizza, Inc. | | | 1,160 | | | | 401,824 | |
Evolution AB (Sweden), 144A | | | 890 | | | | 86,690 | |
Expedia Group, Inc.* | | | 5,250 | | | | 459,900 | |
Hilton Worldwide Holdings, Inc. | | | 9,400 | | | | 1,187,784 | |
InterContinental Hotels Group PLC (United Kingdom) | | | 411 | | | | 23,583 | |
La Francaise des Jeux SAEM (France), 144A | | | 4,835 | | | | 194,553 | |
Las Vegas Sands Corp.* | | | 11,650 | | | | 560,015 | |
Marriott International, Inc.
(Class A Stock) | | | 9,328 | | | | 1,388,846 | |
McDonald’s Corp. | | | 25,700 | | | | 6,772,721 | |
MGM Resorts International | | | 11,600 | | | | 388,948 | |
Norwegian Cruise Line Holdings Ltd.*(a) | | | 13,800 | | | | 168,912 | |
Oriental Land Co. Ltd. (Japan) | | | 1,100 | | | | 160,077 | |
Royal Caribbean Cruises Ltd.*(a) | | | 7,800 | | | | 385,554 | |
Sodexo SA (France) | | | 184 | | | | 17,605 | |
Starbucks Corp. | | | 39,600 | | | | 3,928,320 | |
Whitbread PLC
(United Kingdom) | | | 456 | | | | 14,099 | |
Wynn Resorts Ltd.* | | | 3,500 | | | | 288,645 | |
Yum! Brands, Inc. | | | 10,200 | | | | 1,306,416 | |
| | | | | | | | |
| |
| | | | 23,235,484 | |
| | | | | | | | |
Household Durables — 0.2% | |
D.R. Horton, Inc.(a) | | | 10,900 | | | | 971,626 | |
Garmin Ltd. | | | 5,300 | | | | 489,137 | |
Lennar Corp. (Class A Stock) | | | 8,900 | | | | 805,450 | |
Mohawk Industries, Inc.* | | | 1,940 | | | | 198,307 | |
Newell Brands, Inc.(a) | | | 13,814 | | | | 180,687 | |
NVR, Inc.* | | | 110 | | | | 507,384 | |
PulteGroup, Inc. | | | 8,222 | | | | 374,348 | |
Sekisui Chemical Co. Ltd. (Japan) | | | 800 | | | | 11,150 | |
Sony Group Corp. (Japan) | | | 400 | | | | 30,489 | |
Whirlpool Corp.(a) | | | 1,826 | | | | 258,306 | |
| | | | | | | | |
| |
| | | | 3,826,884 | |
| | | | | | | | |
Household Products — 0.8% | |
Church & Dwight Co., Inc. | | | 8,500 | | | | 685,185 | |
Clorox Co. (The)(a) | | | 4,200 | | | | 589,386 | |
Colgate-Palmolive Co. | | | 29,800 | | | | 2,347,942 | |
Essity AB (Sweden) (Class B Stock) | | | 531 | | | | 13,905 | |
Henkel AG & Co. KGaA (Germany) | | | 198 | | | | 12,725 | |
Kimberly-Clark Corp. | | | 12,200 | | | | 1,656,150 | |
Procter & Gamble Co. (The) | | | 82,625 | | | | 12,522,645 | |
Reckitt Benckiser Group PLC (United Kingdom) | | | 3,660 | | | | 253,698 | |
| | | | | | | | |
| |
| | | | 18,081,636 | |
| | | | | | | | |
Independent Power & Renewable Electricity Producers — 0.0% | |
AES Corp. (The) | | | 23,000 | | | | 661,480 | |
SEE NOTES TO FINANCIAL STATEMENTS.
A35
| | | | |
| | PSF PGIM 50/50 BALANCED PORTFOLIO (CONTINUED) | | |
SCHEDULE OF INVESTMENTS | | | | as of December 31, 2022 |
| | | | | | | | |
| | | Shares | | | Value | |
|
COMMON STOCKS (continued) | |
Independent Power & Renewable Electricity Producers (cont’d.) | |
Meridian Energy Ltd. (New Zealand) | | | 2,880 | | | $ | 9,579 | |
| | | | | | | | |
| | |
| | | | | | | 671,059 | |
| | | | | | | | |
Industrial Conglomerates — 0.5% | |
3M Co. | | | 19,080 | | | | 2,288,074 | |
General Electric Co. | | | 37,778 | | | | 3,165,419 | |
Hitachi Ltd. (Japan) | | | 3,600 | | | | 181,139 | |
Honeywell International, Inc. | | | 23,612 | | | | 5,060,051 | |
Jardine Matheson Holdings Ltd.
(Hong Kong) | | | 4,100 | | | | 208,570 | |
Smiths Group PLC (United Kingdom) | | | 8,533 | | | | 163,766 | |
| | | | | | | | |
| | |
| | | | | | | 11,067,019 | |
| | | | | | | | |
Insurance — 1.2% | | | | | | | | |
Aflac, Inc. | | | 20,100 | | | | 1,445,994 | |
Ageas SA/NV (Belgium) | | | 364 | | | | 16,151 | |
AIA Group Ltd. (Hong Kong) | | | 5,800 | | | | 64,052 | |
Allstate Corp. (The) | | | 9,300 | | | | 1,261,080 | |
American International Group, Inc. | | | 26,239 | | | | 1,659,354 | |
Aon PLC (Class A Stock) | | | 7,400 | | | | 2,221,036 | |
Arch Capital Group Ltd.* | | | 13,000 | | | | 816,140 | |
Arthur J. Gallagher & Co. | | | 7,200 | | | | 1,357,488 | |
Assurant, Inc. | | | 2,000 | | | | 250,120 | |
AXA SA (France) | | | 11,788 | | | | 328,361 | |
Brown & Brown, Inc. | | | 8,500 | | | | 484,245 | |
Chubb Ltd. | | | 14,586 | | | | 3,217,672 | |
Cincinnati Financial Corp. | | | 5,637 | | | | 577,172 | |
Dai-ichi Life Holdings, Inc. (Japan) | | | 12,800 | | | | 289,067 | |
Everest Re Group Ltd. | | | 1,340 | | | | 443,902 | |
Gjensidige Forsikring ASA (Norway) | | | 448 | | | | 8,787 | |
Globe Life, Inc. | | | 3,125 | | | | 376,719 | |
Hartford Financial Services Group, Inc. (The) | | | 11,300 | | | | 856,879 | |
Japan Post Holdings Co. Ltd. (Japan) | | | 29,400 | | | | 247,370 | |
Japan Post Insurance Co. Ltd. (Japan) | | | 12,200 | | | | 214,563 | |
Legal & General Group PLC
(United Kingdom) | | | 10,970 | | | | 32,890 | |
Lincoln National Corp.(a) | | | 5,518 | | | | 169,513 | |
Loews Corp. | | | 6,975 | | | | 406,852 | |
Marsh & McLennan Cos., Inc. | | | 17,200 | | | | 2,846,256 | |
MetLife, Inc. | | | 23,450 | | | | 1,697,076 | |
NN Group NV (Netherlands) | | | 4,860 | | | | 198,736 | |
Poste Italiane SpA (Italy), 144A | | | 6,182 | | | | 60,315 | |
Principal Financial Group, Inc.(a) | | | 8,100 | | | | 679,752 | |
Progressive Corp. (The) | | | 20,200 | | | | 2,620,142 | |
Sampo OYJ (Finland) (Class A Stock) | | | 1,390 | | | | 72,599 | |
Tokio Marine Holdings, Inc. (Japan) | | | 6,800 | | | | 145,264 | |
Travelers Cos., Inc. (The) | | | 8,235 | | | | 1,543,980 | |
W.R. Berkley Corp. | | | 7,200 | | | | 522,504 | |
Willis Towers Watson PLC(a) | | | 3,740 | | | | 914,729 | |
Zurich Insurance Group AG (Switzerland) | | | 330 | | | | 157,766 | |
| | | | | | | | |
| | |
| | | | | | | 28,204,526 | |
| | | | | | | | |
Interactive Media & Services — 1.9% | |
Alphabet, Inc. (Class A Stock)* | | | 206,900 | | | | 18,254,787 | |
Alphabet, Inc. (Class C Stock)* | | | 183,460 | | | | 16,278,406 | |
Match Group, Inc.* | | | 10,200 | | | | 423,198 | |
| | | | | | | | |
| | | Shares | | | Value | |
|
COMMON STOCKS (continued) | |
Interactive Media & Services (cont’d.) | |
Meta Platforms, Inc. (Class A Stock)* | | | 77,930 | | | $ | 9,378,096 | |
Scout24 SE (Germany), 144A | | | 176 | | | | 8,859 | |
| | | | | | | | |
| | |
| | | | | | | 44,343,346 | |
| | | | | | | | |
Internet & Direct Marketing Retail — 1.2% | |
Amazon.com, Inc.* | | | 307,500 | | | | 25,830,000 | |
eBay, Inc. | | | 18,900 | | | | 783,783 | |
Etsy, Inc.*(a) | | | 4,400 | | | | 527,032 | |
| | | | | | | | |
| | |
| | | | | | | 27,140,815 | |
| | | | | | | | |
IT Services — 2.2% | |
Accenture PLC (Class A Stock) | | | 21,800 | | | | 5,817,112 | |
Akamai Technologies, Inc.*(a) | | | 5,600 | | | | 472,080 | |
Automatic Data Processing, Inc. | | | 14,300 | | | | 3,415,698 | |
Bechtle AG (Germany) | | | 176 | | | | 6,221 | |
Broadridge Financial Solutions, Inc. | | | 4,200 | | | | 563,346 | |
Capgemini SE (France) | | | 938 | | | | 156,811 | |
Cognizant Technology Solutions Corp. (Class A Stock) | | | 18,200 | | | | 1,040,858 | |
Computershare Ltd. | | | 12,943 | | | | 228,004 | |
DXC Technology Co.* | | | 7,828 | | | | 207,442 | |
Edenred (France) | | | 530 | | | | 28,845 | |
EPAM Systems, Inc.* | | | 1,940 | | | | 635,816 | |
Fidelity National Information Services, Inc. | | | 20,500 | | | | 1,390,925 | |
Fiserv, Inc.* | | | 22,000 | | | | 2,223,540 | |
FleetCor Technologies, Inc.* | | | 2,500 | | | | 459,200 | |
Gartner, Inc.* | | | 2,800 | | | | 941,192 | |
Global Payments, Inc. | | | 9,677 | | | | 961,120 | |
International Business Machines Corp. | | | 31,300 | | | | 4,409,857 | |
Jack Henry & Associates, Inc. | | | 2,500 | | | | 438,900 | |
Mastercard, Inc. (Class A Stock) | | | 29,450 | | | | 10,240,648 | |
NEC Corp. (Japan) | | | 600 | | | | 21,042 | |
NTT Data Corp. (Japan) | | | 1,300 | | | | 18,945 | |
Otsuka Corp. (Japan) | | | 2,300 | | | | 72,497 | |
Paychex, Inc. | | | 11,000 | | | | 1,271,160 | |
PayPal Holdings, Inc.* | | | 39,900 | | | | 2,841,678 | |
TIS, Inc. (Japan) | | | 500 | | | | 13,141 | |
VeriSign, Inc.* | | | 3,100 | | | | 636,864 | |
Visa, Inc. (Class A Stock)(a) | | | 56,600 | | | | 11,759,216 | |
| | | | | | | | |
| | |
| | | | | | | 50,272,158 | |
| | | | | | | | |
Leisure Products — 0.0% | |
Bandai Namco Holdings, Inc. (Japan) | | | 700 | | | | 43,875 | |
Hasbro, Inc. | | | 4,700 | | | | 286,747 | |
Shimano, Inc. (Japan) | | | 200 | | | | 31,604 | |
| | | | | | | | |
| | |
| | | | | | | 362,226 | |
| | | | | | | | |
Life Sciences Tools & Services — 0.9% | |
Agilent Technologies, Inc. | | | 10,314 | | | | 1,543,490 | |
Bio-Rad Laboratories, Inc. (Class A Stock)* | | | 740 | | | | 311,163 | |
Bio-Techne Corp. | | | 5,600 | | | | 464,128 | |
Charles River Laboratories International, Inc.* | | | 1,760 | | | | 383,504 | |
Danaher Corp. | | | 22,600 | | | | 5,998,492 | |
Illumina, Inc.* | | | 5,400 | | | | 1,091,880 | |
IQVIA Holdings, Inc.* | | | 6,400 | | | | 1,311,296 | |
SEE NOTES TO FINANCIAL STATEMENTS.
A36
| | | | |
| | PSF PGIM 50/50 BALANCED PORTFOLIO (CONTINUED) | | |
SCHEDULE OF INVESTMENTS | | | | as of December 31, 2022 |
| | | | | | | | |
| | | Shares | | | Value | |
|
COMMON STOCKS (continued) | |
Life Sciences Tools & Services (cont’d.) | |
Mettler-Toledo International, Inc.* | | | 770 | | | $ | 1,112,996 | |
PerkinElmer, Inc. | | | 4,300 | | | | 602,946 | |
Thermo Fisher Scientific, Inc. | | | 13,580 | | | | 7,478,370 | |
Waters Corp.* | | | 2,000 | | | | 685,160 | |
West Pharmaceutical Services, Inc. | | | 2,500 | | | | 588,375 | |
| | | | | | | | |
| |
| | | | 21,571,800 | |
| | | | | | | | |
Machinery — 0.9% | |
Alfa Laval AB (Sweden) | | | 630 | | | | 18,224 | |
Atlas Copco AB (Sweden) (Class A Stock) | | | 7,677 | | | | 90,960 | |
Atlas Copco AB (Sweden) (Class B Stock) | | | 3,016 | | | | 32,180 | |
Caterpillar, Inc. | | | 18,000 | | | | 4,312,080 | |
CNH Industrial NV (United Kingdom) | | | 2,204 | | | | 35,357 | |
Cummins, Inc. | | | 4,900 | | | | 1,187,221 | |
Daimler Truck Holding AG (Germany)* | | | 968 | | | | 29,758 | |
Deere & Co. | | | 9,540 | | | | 4,090,370 | |
Dover Corp. | | | 5,000 | | | | 677,050 | |
Epiroc AB (Sweden) (Class A Stock) | | | 1,392 | | | | 25,347 | |
Epiroc AB (Sweden) (Class B Stock) | | | 784 | | | | 12,612 | |
Fortive Corp. | | | 12,450 | | | | 799,912 | |
GEA Group AG (Germany) | | | 1,275 | | | | 51,851 | |
Hitachi Construction Machinery Co. Ltd. (Japan) | | | 8,800 | | | | 196,121 | |
IDEX Corp. | | | 2,510 | | | | 573,108 | |
Illinois Tool Works, Inc. | | | 9,600 | | | | 2,114,880 | |
Indutrade AB (Sweden) | | | 580 | | | | 11,762 | |
Ingersoll Rand, Inc. | | | 14,100 | | | | 736,725 | |
Komatsu Ltd. (Japan) | | | 10,100 | | | | 218,303 | |
Nordson Corp. | | | 1,900 | | | | 451,668 | |
Otis Worldwide Corp. | | | 14,501 | | | | 1,135,573 | |
PACCAR, Inc. | | | 12,143 | | | | 1,201,793 | |
Parker-Hannifin Corp. | | | 4,465 | | | | 1,299,315 | |
Pentair PLC | | | 5,977 | | | | 268,845 | |
Sandvik AB (Sweden) | | | 2,340 | | | | 42,288 | |
Schindler Holding AG (Switzerland) | | | 71 | | | | 12,805 | |
Snap-on, Inc.(a) | | | 1,900 | | | | 434,131 | |
Spirax-Sarco Engineering PLC
(United Kingdom) | | | 160 | | | | 20,437 | |
Stanley Black & Decker, Inc. | | | 5,047 | | | | 379,131 | |
Volvo AB (Sweden) (Class A Stock) | | | 442 | | | | 8,392 | |
Volvo AB (Sweden) (Class B Stock) | | | 13,266 | | | | 239,632 | |
Westinghouse Air Brake Technologies Corp. | | | 6,451 | | | | 643,874 | |
Xylem, Inc. | | | 6,200 | | | | 685,534 | |
| | | | | | | | |
| |
| | | | 22,037,239 | |
| | | | | | | | |
Marine — 0.0% | |
AP Moller - Maersk A/S (Denmark) (Class A Stock) | | | 6 | | | | 13,223 | |
AP Moller - Maersk A/S (Denmark) (Class B Stock) | | | 67 | | | | 149,986 | |
Kuehne + Nagel International AG (Switzerland) | | | 118 | | | | 27,433 | |
Nippon Yusen KK (Japan) | | | 1,200 | | | | 28,297 | |
| | | | | | | | |
| | | Shares | | | Value | |
|
COMMON STOCKS (continued) | |
Marine (cont’d.) | |
SITC International Holdings Co. Ltd. (China) | | | 47,000 | | | $ | 104,173 | |
| | | | | | | | |
| |
| | | | 323,112 | |
| | | | | | | | |
Media — 0.4% | |
Charter Communications, Inc. (Class A Stock)* | | | 3,660 | | | | 1,241,106 | |
Comcast Corp. (Class A Stock) | | | 149,480 | | | | 5,227,316 | |
Dentsu Group, Inc. (Japan) | | | 5,900 | | | | 185,087 | |
DISH Network Corp. (Class A Stock)* | | | 9,017 | | | | 126,599 | |
Fox Corp. (Class A Stock) | | | 11,100 | | | | 337,107 | |
Fox Corp. (Class B Stock) | | | 5,733 | | | | 163,104 | |
Informa PLC (United Kingdom) | | | 3,268 | | | | 24,378 | |
Interpublic Group of Cos., Inc. (The)(a) | | | 13,631 | | | | 454,049 | |
News Corp. (Class A Stock) | | | 13,675 | | | | 248,885 | |
News Corp. (Class B Stock) | | | 4,800 | | | | 88,512 | |
Omnicom Group, Inc. | | | 7,300 | | | | 595,461 | |
Paramount Global (Class B Stock)(a) | | | 17,930 | | | | 302,658 | |
Publicis Groupe SA (France) | | | 4,102 | | | | 262,045 | |
WPP PLC (United Kingdom) | | | 19,618 | | | | 193,826 | |
| | | | | | | | |
| |
| | | | 9,450,133 | |
| | | | | | | | |
Metals & Mining — 0.3% | |
ArcelorMittal SA (Luxembourg) | | | 1,135 | | | | 29,944 | |
BHP Group Ltd. (Australia) | | | 11,806 | | | | 365,714 | |
BlueScope Steel Ltd. (Australia) | | | 17,094 | | | | 194,824 | |
Boliden AB (Sweden) | | | 592 | | | | 22,237 | |
Fortescue Metals Group Ltd. (Australia) | | | 18,238 | | | | 254,915 | |
Freeport-McMoRan, Inc.(a) | | | 49,288 | | | | 1,872,944 | |
Glencore PLC (Australia) | | | 30,896 | | | | 206,035 | |
Newmont Corp. | | | 27,400 | | | | 1,293,280 | |
Nippon Steel Corp. (Japan) | | | 13,000 | | | | 225,565 | |
Norsk Hydro ASA (Norway) | | | 2,850 | | | | 21,296 | |
Nucor Corp. | | | 9,100 | | | | 1,199,471 | |
Pilbara Minerals Ltd. (Australia)* | | | 5,454 | | | | 13,811 | |
Rio Tinto Ltd. (Australia) | | | 817 | | | | 64,482 | |
Rio Tinto PLC (Australia) | | | 2,146 | | | | 151,044 | |
South32 Ltd. (Australia) | | | 10,304 | | | | 28,250 | |
Steel Dynamics, Inc. | | | 5,750 | | | | 561,775 | |
Sumitomo Metal Mining Co. Ltd. (Japan) | | | 600 | | | | 21,083 | |
voestalpine AG (Austria) | | | 240 | | | | 6,357 | |
| | | | | | | | |
| |
| | | | 6,533,027 | |
| | | | | | | | |
Multiline Retail — 0.2% | |
Dollar General Corp. | | | 7,800 | | | | 1,920,750 | |
Dollar Tree, Inc.* | | | 7,465 | | | | 1,055,850 | |
Target Corp. | | | 15,960 | | | | 2,378,678 | |
Wesfarmers Ltd. (Australia) | | | 2,031 | | | | 63,341 | |
| | | | | | | | |
| |
| | | | 5,418,619 | |
| | | | | | | | |
Multi-Utilities — 0.5% | |
Ameren Corp. | | | 8,900 | | | | 791,388 | |
CenterPoint Energy, Inc. | | | 21,800 | | | | 653,782 | |
CMS Energy Corp. | | | 10,000 | | | | 633,300 | |
Consolidated Edison, Inc. | | | 12,300 | | | | 1,172,313 | |
Dominion Energy, Inc. | | | 29,115 | | | | 1,785,332 | |
DTE Energy Co. | | | 6,700 | | | | 787,451 | |
SEE NOTES TO FINANCIAL STATEMENTS.
A37
| | | | |
| | PSF PGIM 50/50 BALANCED PORTFOLIO (CONTINUED) | | |
SCHEDULE OF INVESTMENTS | | | | as of December 31, 2022 |
| | | | | | | | |
| | | Shares | | | Value | |
|
COMMON STOCKS (continued) | |
Multi-Utilities (cont’d.) | |
E.ON SE (Germany) | | | 26,183 | | | $ | 260,312 | |
Engie SA (France) | | | 16,970 | | | | 242,774 | |
NiSource, Inc. | | | 13,600 | | | | 372,912 | |
Public Service Enterprise Group, Inc. | | | 17,600 | | | | 1,078,352 | |
Sempra Energy | | | 10,819 | | | | 1,671,968 | |
WEC Energy Group, Inc. | | | 10,813 | | | | 1,013,827 | |
| | | | | | | | |
| | |
| | | | | | | 10,463,711 | |
| | | | | | | | |
Oil, Gas & Consumable Fuels — 2.4% | |
APA Corp. | | | 11,614 | | | | 542,141 | |
BP PLC (United Kingdom) | | | 41,816 | | | | 241,276 | |
Chevron Corp. | | | 61,622 | | | | 11,060,533 | |
ConocoPhillips | | | 43,119 | | | | 5,088,042 | |
Coterra Energy, Inc. | | | 28,300 | | | | 695,331 | |
Devon Energy Corp. | | | 22,600 | | | | 1,390,126 | |
Diamondback Energy, Inc. | | | 6,300 | | | | 861,714 | |
Eni SpA (Italy) | | | 18,773 | | | | 266,942 | |
EOG Resources, Inc. | | | 20,200 | | | | 2,616,304 | |
EQT Corp.(a) | | | 12,500 | | | | 422,875 | |
Equinor ASA (Norway) | | | 7,504 | | | | 269,696 | |
Exxon Mobil Corp. | | | 142,699 | | | | 15,739,700 | |
Hess Corp. | | | 9,600 | | | | 1,361,472 | |
Inpex Corp. (Japan) | | | 15,600 | | | | 167,628 | |
Kinder Morgan, Inc. | | | 68,398 | | | | 1,236,636 | |
Marathon Oil Corp. | | | 21,982 | | | | 595,053 | |
Marathon Petroleum Corp. | | | 16,219 | | | | 1,887,729 | |
Occidental Petroleum Corp. | | | 25,204 | | | | 1,587,600 | |
ONEOK, Inc. | | | 15,500 | | | | 1,018,350 | |
Phillips 66 | | | 16,538 | | | | 1,721,275 | |
Pioneer Natural Resources Co. | | | 8,250 | | | | 1,884,217 | |
Repsol SA (Spain) | | | 1,785 | | | | 28,412 | |
Shell PLC (Netherlands) | | | 16,748 | | | | 472,140 | |
Targa Resources Corp. | | | 7,700 | | | | 565,950 | |
TotalEnergies SE (France) | | | 5,455 | | | | 342,428 | |
Valero Energy Corp. | | | 13,300 | | | | 1,687,238 | |
Williams Cos., Inc. (The) | | | 42,000 | | | | 1,381,800 | |
| | | | | | | | |
| | |
| | | | | | | 55,132,608 | |
| | | | | | | | |
Paper & Forest Products — 0.0% | |
Oji Holdings Corp. (Japan) | | | 12,400 | | | | 50,083 | |
Stora Enso OYJ (Finland) (Class R Stock) | | | 1,224 | | | | 17,258 | |
| | | | | | | | |
| | |
| | | | | | | 67,341 | |
| | | | | | | | |
Personal Products — 0.1% | |
Estee Lauder Cos., Inc. (The) (Class A Stock) | | | 8,000 | | | | 1,984,880 | |
Haleon PLC* | | | 12,233 | | | | 48,401 | |
L’Oreal SA (France) | | | 513 | | | | 183,704 | |
Unilever PLC (United Kingdom) | | | 9,174 | | | | 463,176 | |
| | | | | | | | |
| | |
| | | | | | | 2,680,161 | |
| | | | | | | | |
Pharmaceuticals — 2.5% | |
Astellas Pharma, Inc. (Japan) | | | 4,000 | | | | 60,823 | |
AstraZeneca PLC (United Kingdom) | | | 1,676 | | | | 226,795 | |
Bayer AG (Germany) | | | 3,972 | | | | 204,439 | |
Bristol-Myers Squibb Co. | | | 73,670 | | | | 5,300,557 | |
Catalent, Inc.* | | | 6,300 | | | | 283,563 | |
| | | | | | | | |
| | | Shares | | | Value | |
|
COMMON STOCKS (continued) | |
Pharmaceuticals (cont’d.) | |
Chugai Pharmaceutical Co. Ltd. (Japan) | | | 1,400 | | | $ | 35,709 | |
Eli Lilly & Co. | | | 27,200 | | | | 9,950,848 | |
GSK PLC | | | 19,993 | | | | 345,544 | |
Ipsen SA (France) | | | 2,086 | | | | 224,371 | |
Johnson & Johnson | | | 91,158 | | | | 16,103,061 | |
Kyowa Kirin Co. Ltd. (Japan) | | | 600 | | | | 13,742 | |
Merck & Co., Inc. | | | 87,833 | | | | 9,745,071 | |
Merck KGaA (Germany) | | | 279 | | | | 53,830 | |
Novartis AG (Switzerland) | | | 7,176 | | | | 649,410 | |
Novo Nordisk A/S (Denmark) (Class B Stock) | | | 3,549 | | | | 482,009 | |
Ono Pharmaceutical Co. Ltd. (Japan) | | | 3,000 | | | | 70,121 | |
Organon & Co. | | | 8,753 | | | | 244,471 | |
Orion OYJ (Finland) (Class B Stock) | | | 240 | | | | 13,158 | |
Pfizer, Inc. | | | 194,470 | | | | 9,964,643 | |
Roche Holding AG | | | 2,027 | | | | 636,960 | |
Sanofi (France) | | | 4,812 | | | | 464,005 | |
Shionogi & Co. Ltd. (Japan) | | | 600 | | | | 29,936 | |
Viatris, Inc. | | | 41,986 | | | | 467,304 | |
Zoetis, Inc. | | | 16,100 | | | | 2,359,455 | |
| | | | | | | | |
| |
| | | | 57,929,825 | |
| | | | | | | | |
Professional Services — 0.2% | |
CoStar Group, Inc.* | | | 14,100 | | | | 1,089,648 | |
Equifax, Inc. | | | 4,200 | | | | 816,312 | |
Jacobs Solutions, Inc. | | | 4,500 | | | | 540,315 | |
Leidos Holdings, Inc. | | | 4,900 | | | | 515,431 | |
Randstad NV (Netherlands) | | | 272 | | | | 16,620 | |
RELX PLC (United Kingdom) | | | 4,200 | | | | 116,121 | |
Robert Half International, Inc.(a) | | | 3,800 | | | | 280,554 | |
Verisk Analytics, Inc. | | | 5,300 | | | | 935,026 | |
Wolters Kluwer NV (Netherlands) | | | 1,857 | | | | 194,308 | |
| | | | | | | | |
| |
| | | | 4,504,335 | |
| | | | | | | | |
Real Estate Management & Development — 0.0% | |
Aroundtown SA (Germany) | | | 2,214 | | | | 5,157 | |
Capitaland Investment Ltd. (Singapore) | | | 5,800 | | | | 16,029 | |
CBRE Group, Inc. (Class A Stock)* | | | 11,100 | | | | 854,256 | |
CK Asset Holdings Ltd. (Hong Kong) | | | 4,500 | | | | 27,599 | |
Daito Trust Construction Co. Ltd. (Japan) | | | 200 | | | | 20,477 | |
New World Development Co. Ltd.
(Hong Kong) | | | 4,000 | | | | 11,221 | |
Nomura Real Estate Holdings, Inc. (Japan) | | | 2,000 | | | | 42,766 | |
Sagax AB (Sweden) (Class B Stock) | | | 420 | | | | 9,543 | |
Sino Land Co. Ltd. (Hong Kong) | | | 8,000 | | | | 9,978 | |
Swire Pacific Ltd. (Hong Kong) (Class A Stock) | | | 1,500 | | | | 13,149 | |
| | | | | | | | |
| |
| | | | 1,010,175 | |
| | | | | | | | |
Road & Rail — 0.4% | |
CSX Corp. | | | 72,800 | | | | 2,255,344 | |
J.B. Hunt Transport Services, Inc. | | | 2,800 | | | | 488,208 | |
Norfolk Southern Corp. | | | 8,000 | | | | 1,971,360 | |
Old Dominion Freight Line, Inc. | | | 3,165 | | | | 898,164 | |
SEE NOTES TO FINANCIAL STATEMENTS.
A38
| | | | |
| | PSF PGIM 50/50 BALANCED PORTFOLIO (CONTINUED) | | |
SCHEDULE OF INVESTMENTS | | | | as of December 31, 2022 |
| | | | | | | | |
| | | Shares | | | Value | |
|
COMMON STOCKS (continued) | |
Road & Rail (cont’d.) | |
Union Pacific Corp. | | | 21,260 | | | $ | 4,402,308 | |
| | | | | | | | |
| |
| | | | 10,015,384 | |
| | | | | | | | |
Semiconductors & Semiconductor Equipment — 2.5% | |
Advanced Micro Devices, Inc.* | | | 55,699 | | | | 3,607,624 | |
Analog Devices, Inc. | | | 17,947 | | | | 2,943,846 | |
Applied Materials, Inc. | | | 30,000 | | | | 2,921,400 | |
ASML Holding NV (Netherlands) | | | 482 | | | | 262,812 | |
Broadcom, Inc. | | | 14,040 | | | | 7,850,185 | |
Disco Corp. (Japan) | | | 100 | | | | 28,502 | |
Enphase Energy, Inc.* | | | 4,700 | | | | 1,245,312 | |
First Solar, Inc.* | | | 3,400 | | | | 509,286 | |
Infineon Technologies AG (Germany) | | | 8,252 | | | | 250,794 | |
Intel Corp. | | | 143,000 | | | | 3,779,490 | |
KLA Corp. | | | 4,850 | | | | 1,828,596 | |
Lam Research Corp. | | | 4,690 | | | | 1,971,207 | |
Microchip Technology, Inc. | | | 19,300 | | | | 1,355,825 | |
Micron Technology, Inc. | | | 38,000 | | | | 1,899,240 | |
Monolithic Power Systems, Inc. | | | 1,600 | | | | 565,776 | |
NVIDIA Corp. | | | 86,360 | | | | 12,620,650 | |
NXP Semiconductors NV (China) | | | 9,000 | | | | 1,422,270 | |
ON Semiconductor Corp.* | | | 14,900 | | | | 929,313 | |
Qorvo, Inc.* | | | 3,607 | | | | 326,939 | |
QUALCOMM, Inc. | | | 38,700 | | | | 4,254,678 | |
Renesas Electronics Corp. (Japan)* | | | 8,500 | | | | 75,125 | |
Skyworks Solutions, Inc. | | | 5,700 | | | | 519,441 | |
SolarEdge Technologies, Inc.*(a) | | | 2,000 | | | | 566,540 | |
STMicroelectronics NV (Singapore) | | | 1,466 | | | | 52,096 | |
SUMCO Corp. (Japan) | | | 13,500 | | | | 178,856 | |
Teradyne, Inc. | | | 5,600 | | | | 489,160 | |
Texas Instruments, Inc. | | | 31,500 | | | | 5,204,430 | |
| | | | | | | | |
| |
| | | | 57,659,393 | |
| | | | | | | | |
Software — 4.0% | |
Adobe, Inc.* | | | 16,080 | | | | 5,411,402 | |
ANSYS, Inc.* | | | 3,000 | | | | 724,770 | |
Autodesk, Inc.* | | | 7,600 | | | | 1,420,212 | |
Cadence Design Systems, Inc.* | | | 9,400 | | | | 1,510,016 | |
Ceridian HCM Holding, Inc.* | | | 5,550 | | | | 356,033 | |
Check Point Software Technologies Ltd. (Israel)* | | | 1,600 | | | | 201,856 | |
Dassault Systemes SE (France) | | | 2,035 | | | | 73,178 | |
Fortinet, Inc.* | | | 22,600 | | | | 1,104,914 | |
Gen Digital, Inc. | | | 20,878 | | | | 447,416 | |
Intuit, Inc. | | | 9,780 | | | | 3,806,572 | |
Microsoft Corp. | | | 258,320 | | | | 61,950,302 | |
Nice Ltd. (Israel)* | | | 66 | | | | 12,697 | |
Oracle Corp. | | | 53,250 | | | | 4,352,655 | |
Paycom Software, Inc.* | | | 1,520 | | | | 471,671 | |
PTC, Inc.* | | | 3,600 | | | | 432,144 | |
Roper Technologies, Inc. | | | 3,580 | | | | 1,546,882 | |
Sage Group PLC (The)
(United Kingdom) | | | 2,208 | | | | 19,882 | |
Salesforce, Inc.* | | | 34,650 | | | | 4,594,243 | |
SAP SE (Germany) | | | 237 | | | | 24,468 | |
ServiceNow, Inc.* | | | 7,050 | | | | 2,737,304 | |
Synopsys, Inc.* | | | 5,300 | | | | 1,692,237 | |
Tyler Technologies, Inc.* | | | 1,510 | | | | 486,839 | |
| | | | | | | | |
| | | Shares | | | Value | |
|
COMMON STOCKS (continued) | |
Software (cont’d.) | |
WiseTech Global Ltd. (Australia) | | | 320 | | | $ | 11,006 | |
| | | | | | | | |
| |
| | | | 93,388,699 | |
| | | | | | | | |
Specialty Retail — 1.2% | |
Advance Auto Parts, Inc. | | | 2,100 | | | | 308,763 | |
AutoZone, Inc.* | | | 660 | | | | 1,627,679 | |
Bath & Body Works, Inc. | | | 8,106 | | | | 341,587 | |
Best Buy Co., Inc. | | | 6,875 | | | | 551,444 | |
CarMax, Inc.*(a) | | | 5,600 | | | | 340,984 | |
Fast Retailing Co. Ltd. (Japan) | | | 400 | | | | 243,413 | |
Home Depot, Inc. (The) | | | 35,450 | | | | 11,197,237 | |
Industria de Diseno Textil SA (Spain) | | | 10,125 | | | | 268,931 | |
JD Sports Fashion PLC (United Kingdom) | | | 140,528 | | | | 213,550 | |
Lowe’s Cos., Inc. | | | 21,500 | | | | 4,283,660 | |
O’Reilly Automotive, Inc.* | | | 2,190 | | | | 1,848,426 | |
Ross Stores, Inc. | | | 12,000 | | | | 1,392,840 | |
TJX Cos., Inc. (The) | | | 40,400 | | | | 3,215,840 | |
Tractor Supply Co. | | | 3,700 | | | | 832,389 | |
Ulta Beauty, Inc.* | | | 1,700 | | | | 797,419 | |
USS Co. Ltd. (Japan) | | | 500 | | | | 7,933 | |
| | | | | | | | |
| |
| | | | 27,472,095 | |
| | | | | | | | |
Technology Hardware, Storage & Peripherals — 3.0% | |
Apple, Inc. | | | 518,140 | | | | 67,321,930 | |
Hewlett Packard Enterprise Co. | | | 45,448 | | | | 725,350 | |
HP, Inc. | | | 30,648 | | | | 823,512 | |
NetApp, Inc. | | | 7,700 | | | | 462,462 | |
Seagate Technology Holdings PLC(a) | | | 7,100 | | | | 373,531 | |
Seiko Epson Corp. (Japan) | | | 12,500 | | | | 181,863 | |
Western Digital Corp.* | | | 11,303 | | | | 356,610 | |
| | | | | | | | |
| |
| | | | 70,245,258 | |
| | | | | | | | |
Textiles, Apparel & Luxury Goods — 0.3% | |
Burberry Group PLC
(United Kingdom) | | | 874 | | | | 21,249 | |
Cie Financiere Richemont SA (Switzerland) (Class A Stock) | | | 2,265 | | | | 293,680 | |
Hermes International (France) | | | 86 | | | | 133,115 | |
LVMH Moet Hennessy Louis Vuitton SE (France) | | | 598 | | | | 435,160 | |
NIKE, Inc. (Class B Stock) | | | 43,600 | | | | 5,101,636 | |
Ralph Lauren Corp.(a) | | | 1,400 | | | | 147,938 | |
Swatch Group AG (The) (Switzerland) | | | 77 | | | | 4,004 | |
Tapestry, Inc. | | | 8,300 | | | | 316,064 | |
VF Corp.(a) | | | 11,300 | | | | 311,993 | |
| | | | | | | | |
| |
| | | | 6,764,839 | |
| | | | | | | | |
Tobacco — 0.4% | |
Altria Group, Inc. | | | 63,000 | | | | 2,879,730 | |
British American Tobacco PLC (United Kingdom) | | | 9,851 | | | | 389,687 | |
Imperial Brands PLC (United Kingdom) | | | 1,916 | | | | 47,730 | |
Japan Tobacco, Inc. (Japan) | | | 12,200 | | | | 245,955 | |
Philip Morris International, Inc. | | | 54,300 | | | | 5,495,703 | |
| | | | | | | | |
| |
| | | | 9,058,805 | |
| | | | | | | | |
Trading Companies & Distributors — 0.2% | |
Ashtead Group PLC (United Kingdom) | | | 1,650 | | | | 93,728 | |
SEE NOTES TO FINANCIAL STATEMENTS.
A39
| | | | |
| | PSF PGIM 50/50 BALANCED PORTFOLIO (CONTINUED) | | |
SCHEDULE OF INVESTMENTS | | | | as of December 31, 2022 |
| | | | | | | | |
| | | | | | | |
| | | Shares | | | Value | |
| | | | | | | |
|
COMMON STOCKS (continued) | |
Trading Companies & Distributors (cont’d.) | |
Brenntag SE (Germany) | | | 2,571 | | | $ | 163,965 | |
Bunzl PLC (United Kingdom) | | | 700 | | | | 23,289 | |
Fastenal Co.(a) | | | 20,000 | | | | 946,400 | |
IMCD NV (Netherlands) | | | 120 | | | | 17,165 | |
ITOCHU Corp. (Japan) | | | 5,700 | | | | 178,825 | |
Marubeni Corp. (Japan) | | | 22,800 | | | | 261,196 | |
Mitsubishi Corp. (Japan) | | | 4,000 | | | | 129,859 | |
MonotaRO Co. Ltd. (Japan) | | | 600 | | | | 8,452 | |
Sumitomo Corp. (Japan) | | | 2,400 | | | | 39,895 | |
Toyota Tsusho Corp. (Japan) | | | 5,300 | | | | 194,957 | |
United Rentals, Inc.* | | | 2,400 | | | | 853,008 | |
W.W. Grainger, Inc. | | | 1,600 | | | | 890,000 | |
| | | | | | | | |
| | |
| | | | | | | 3,800,739 | |
| | | | | | | | |
Water Utilities — 0.0% | | | | | |
American Water Works Co., Inc. | | | 6,200 | | | | 945,004 | |
| | | | | | | | |
Wireless Telecommunication Services — 0.1% | | | | | |
KDDI Corp. (Japan) | | | 3,300 | | | | 100,079 | |
T-Mobile US, Inc.* | | | 20,700 | | | | 2,898,000 | |
| | | | | | | | |
| | |
| | | | | | | 2,998,079 | |
| | | | | | | | |
TOTAL COMMON STOCKS
(cost $310,231,254) | | | | | | | 1,143,954,201 | |
| | | | | | | | |
EXCHANGE-TRADED FUNDS — 0.6% | |
iShares Core S&P 500 ETF | | | 35,000 | | | | 13,447,350 | |
iShares MSCI EAFE ETF(a) | | | 1,759 | | | | 115,461 | |
| | | | | | | | |
TOTAL EXCHANGE-TRADED FUNDS
(cost $11,820,146) | | | | 13,562,811 | |
| | | | | | | | |
PREFERRED STOCKS — 0.1% | |
Automobiles — 0.0% | | | | | | | | |
Bayerische Motoren Werke AG (Germany) (PRFC) | | | 75 | | | | 6,329 | |
Porsche Automobil Holding SE (Germany) (PRFC) | | | 2,929 | | | | 159,736 | |
| | | | | | | | |
| | |
| | | | | | | 166,065 | |
| | | | | | | | |
Banks — 0.0% | | | | | | | | |
Citigroup Capital XIII, 10.785%(c),
3 Month LIBOR + 6.370%, Maturing 10/30/40(a) | | | 20,000 | | | | 568,000 | |
| | | | | | | | |
Capital Markets — 0.1% | | | | | | | | |
State Street Corp., 5.350%(c),
3 Month LIBOR + 3.709%, Series G, Maturing 03/15/26(oo) | | | 30,000 | | | | 705,300 | |
| | | | | | | | |
TOTAL PREFERRED STOCKS
(cost $1,435,941) | | | | 1,439,365 | |
| | | | | | | | |
| | | Units | | | | |
RIGHTS* — 0.0% | | | | | | | | |
Health Care Equipment & Supplies | | | | | |
ABIOMED, Inc., expiring 12/31/23^ (cost $0) | | | 1,460 | | | | — | |
| | | | | | | | |
| | | | | | | | | | | | | | | | | | |
Interest Rate | | Maturity Date | | | | | Principal
Amount
(000)# | | | Value | |
| | | | | | | | | | | | | | | |
|
ASSET-BACKED SECURITIES — 7.5% | |
Automobiles — 2.0% | | | | | | | | | | | | | |
AmeriCredit Automobile Receivables Trust, | | | | | |
Series 2019-02, Class C | | | | | | | | | | | | | |
2.740% | | 04/18/25 | | | | | | | | | | | 1,177 | | | $ | 1,165,792 | |
Series 2019-03, Class C | | | | | | | | | | | | | |
2.320% | | 07/18/25 | | | | | | | | | | | 2,300 | | | | 2,258,750 | |
Series 2021-02, Class C | | | | | | | | | | | | | |
1.010% | | 01/19/27 | | | | | | | | | | | 900 | | | | 818,249 | |
Series 2021-03, Class C | | | | | | | | | | | | | |
1.410% | | 08/18/27 | | | | | | | | | | | 900 | | | | 810,363 | |
Avis Budget Rental Car Funding AESOP LLC, | | | | | |
Series 2019-02A, Class A, 144A | | | | | | | | | | | | | |
3.350% | | 09/22/25 | | | | | | | | | | | 2,000 | | | | 1,932,357 | |
Series 2019-03A, Class A, 144A | | | | | | | | | | | | | |
2.360% | | 03/20/26 | | | | | | | | | | | 2,700 | | | | 2,512,914 | |
Series 2020-01A, Class A, 144A | | | | | | | | | | | | | |
2.330% | | 08/20/26 | | | | | | | | | | | 1,300 | | | | 1,202,956 | |
Series 2021-01A, Class A, 144A | | | | | | | | | | | | | |
1.380% | | 08/20/27 | | | | | | | | | | | 2,400 | | | | 2,089,574 | |
Series 2021-02A, Class A, 144A | | | | | | | | | | | | | |
1.660% | | 02/20/28 | | | | | | | | | | | 2,600 | | | | 2,249,750 | |
Series 2022-01A, Class A, 144A | | | | | | | | | | | | | |
3.830% | | 08/21/28 | | | | | | | | | | | 2,900 | | | | 2,760,694 | |
CarMax Auto Owner Trust, | | | | | | | | | | | | | |
Series 2021-02, Class C | | | | | | | | | | | | | |
1.340% | | 02/16/27 | | | | | | | | | | | 800 | | | | 723,104 | |
Series 2021-04, Class C | | | | | | | | | | | | | |
1.380% | | 07/15/27 | | | | | | | | | | | 600 | | | | 527,799 | |
Ford Credit Auto Owner Trust, | | | | | | | | | | | | | |
Series 2018-01, Class A, 144A | | | | | | | | | | | | | |
3.190% | | 07/15/31 | | | | | | | | | | | 1,800 | | | | 1,719,374 | |
Series 2019-01, Class A, 144A | | | | | | | | | | | | | |
3.520% | | 07/15/30 | | | | | | | | | | | 3,300 | | | | 3,235,466 | |
Series 2020-01, Class A, 144A | | | | | | | | | | | | | |
2.040% | | 08/15/31 | | | | | | | | | | | 2,500 | | | | 2,345,087 | |
Series 2020-02, Class A, 144A | | | | | | | | | | | | | |
1.060% | | 04/15/33 | | | | | | | | | | | 900 | | | | 805,869 | |
Series 2021-02, Class B, 144A | | | | | | | | | | | | | |
1.910% | | 05/15/34 | | | | | | | | | | | 400 | | | | 343,751 | |
GM Financial Revolving Receivables Trust, | | | | | |
Series 2021-01, Class B, 144A | | | | | | | | | | | | | |
1.490% | | 06/12/34 | | | | | | | | | | | 200 | | | | 170,308 | |
Hertz Vehicle Financing III LP, | | | | | | | | | | | | | |
Series 2021-02A, Class A, 144A | | | | | | | | | | | | | |
1.680% | | 12/27/27 | | | | | | | | | | | 1,300 | | | | 1,131,462 | |
Hertz Vehicle Financing LLC, | | | | | | | | | | | | | |
Series 2021-01A, Class A, 144A | | | | | | | | | | | | | |
1.210% | | 12/26/25 | | | | | | | | | | | 1,500 | | | | 1,385,826 | |
Series 2022-02A, Class A, 144A | | | | | | | | | | | | | |
2.330% | | 06/26/28 | | | | | | | | | | | 3,300 | | | | 2,892,539 | |
OneMain Direct Auto Receivables Trust, | | | | | | | | | | | | | |
Series 2019-01A, Class A, 144A | | | | | | | | | | | | | |
3.630% | | 09/14/27 | | | | | | | | | | | 4,100 | | | | 3,935,059 | |
Series 2021-01A, Class B, 144A | | | | | | | | | | | | | |
1.260% | | 07/14/28 | | | | | | | | | | | 1,800 | | | | 1,566,551 | |
Santander Drive Auto Receivables Trust, | | | | | | | | | | | | | |
Series 2020-02, Class C | | | | | | | | | | | | | |
1.460% | | 09/15/25 | | | | | | | | | | | 141 | | | | 140,823 | |
SEE NOTES TO FINANCIAL STATEMENTS.
A40
| | | | |
| | PSF PGIM 50/50 BALANCED PORTFOLIO (CONTINUED) | | |
SCHEDULE OF INVESTMENTS | | | | as of December 31, 2022 |
| | | | | | | | | | | | | | | | | | |
| | | | | | Principal | | | | |
| Interest | | Maturity | | | | | Amount | | | | |
Rate | | Date | | | | | (000)# | | | Value | |
| | | | | | | | | | | | | | | |
|
ASSET-BACKED SECURITIES (continued) | |
Automobiles (cont’d.) | |
Series 2020-03, Class C | |
1.120% | | 01/15/26 | | | | | | | | | | | 797 | | | $ | 789,696 | |
Series 2020-04, Class C | |
1.010% | | 01/15/26 | | | | | | | | | | | 690 | | | | 682,890 | |
Series 2021-02, Class C | |
0.900% | | 06/15/26 | | | | | | | | | | | 800 | | | | 778,229 | |
Series 2021-02, Class D | |
1.350% | | 07/15/27 | | | | | | | | | | | 1,700 | | | | 1,589,400 | |
Series 2021-03, Class C | |
0.950% | | 09/15/27 | | | | | | | | | | | 1,400 | | | | 1,346,582 | |
Series 2021-04, Class C | |
1.260% | | 02/16/27 | | | | | | | | | | | 1,900 | | | | 1,805,979 | |
Series 2022-01, Class C | |
2.560% | | 04/17/28 | | | | | | | | | | | 1,100 | | | | 1,050,878 | |
World Omni Select Auto Trust, | |
Series 2021-A, Class C | |
1.090% | | 11/15/27 | | | | | | | | | | | 400 | | | | 364,135 | |
| | | | | | | | | | | | | | | | | | |
| |
| | | | 47,132,206 | |
| | | | | | | | | | | | | | | | | | |
Collateralized Loan Obligations — 4.5% | |
Balboa Bay Loan Funding Ltd. (Cayman Islands), | |
Series 2021-01A, Class A, 144A, 3 Month LIBOR + 1.200% (Cap N/A, Floor 1.200%) | |
5.443%(c) | | 07/20/34 | | | | | | | | | | | 2,500 | | | | 2,434,299 | |
Battalion CLO Ltd. (Cayman Islands), | |
Series 2016-10A, Class A1R2, 144A, 3 Month LIBOR + 1.170% (Cap N/A, Floor 1.170%) | |
5.495%(c) | | 01/25/35 | | | | | | | | | | | 500 | | | | 487,055 | |
Benefit Street Partners CLO Ltd. (Cayman Islands), | |
Series 2013-IIA, Class A1R2, 144A, 3 Month LIBOR + 0.870% (Cap N/A, Floor 0.870%) | |
4.949%(c) | | 07/15/29 | | | | | | | | | | | 534 | | | | 529,729 | |
BNPP AM Euro CLO DAC (Ireland), | |
Series 2018-01A, Class AR, 144A, 3 Month EURIBOR + 0.600% (Cap N/A, Floor 0.600%) | |
1.978%(c) | | 04/15/31 | | | | | | | EUR | | | | 1,750 | | | | 1,813,402 | |
Canyon Capital CLO Ltd. (Cayman Islands), | |
Series 2017-01A, Class AR, 144A, 3 Month LIBOR + 1.000% (Cap N/A, Floor 1.000%) | |
5.079%(c) | | 07/15/30 | | | | | | | | | | | 2,735 | | | | 2,708,037 | |
Carlyle Global Market Strategies CLO Ltd. (Cayman Islands), | |
Series 2015-05A, Class A1RR, 144A, 3 Month LIBOR + 1.080% (Cap N/A, Floor 1.080%) | |
5.323%(c) | | 01/20/32 | | | | | | | | | | | 6,750 | | | | 6,625,061 | |
CIFC Funding Ltd. (Cayman Islands), | |
Series 2014-05A, Class A1R2, 144A, 3 Month LIBOR + 1.200% (Cap N/A, Floor 1.200%) | |
5.279%(c) | | 10/17/31 | | | | | | | | | | | 7,000 | | | | 6,913,738 | |
CVC Cordatus Loan Fund DAC (Ireland), | |
Series 14A, Class A1R, 144A, 3 Month EURIBOR + 0.850% (Cap N/A, Floor 0.850%) | |
2.671%(c) | | 05/22/32 | | | | | | | EUR | | | | 1,750 | | | | 1,825,163 | |
Series 14A, Class A2R, 144A | |
1.250% | | 05/22/32 | | | | | | | EUR | | | | 3,800 | | | | 3,742,485 | |
Elevation CLO Ltd. (Cayman Islands), | |
Series 2017-06A, Class A1, 144A, 3 Month LIBOR + 1.280% (Cap N/A, Floor 1.280%) | |
5.359%(c) | | 07/15/29 | | | | | | | | | | | 415 | | | | 410,073 | |
| | | | | | | | | | | | | | | | | | |
| | | | | | Principal | | | | |
| Interest | | Maturity | | | | | Amount | | | | |
Rate | | Date | | | | | (000)# | | | Value | |
| | | | | | | | | | | | | | | |
|
ASSET-BACKED SECURITIES (continued) | |
Collateralized Loan Obligations (cont’d.) | |
Greenwood Park CLO Ltd. (Cayman Islands), | |
Series 2018-01A, Class A2, 144A, 3 Month LIBOR + 1.010% (Cap N/A, Floor 0.000%) | |
5.089%(c) | | 04/15/31 | | | | | | | | | | | 1,000 | | | $ | 986,887 | |
HPS Loan Management Ltd. (Cayman Islands), | |
Series 2015-06A, Class A1R, 144A, 3 Month LIBOR + 1.000% (Cap N/A, Floor 0.000%) | |
5.532%(c) | | 02/05/31 | | | | | | | | | | | 248 | | | | 245,498 | |
ICG US CLO Ltd. (Cayman Islands), | |
Series 2015-01A, Class A1R, 144A, 3 Month LIBOR + 1.140% (Cap N/A, Floor 1.140%) | |
5.367%(c) | | 10/19/28 | | | | | | | | | | | 4,733 | | | | 4,669,598 | |
Jamestown CLO Ltd. (Cayman Islands), | |
Series 2019-01A, Class A1, 144A, 3 Month LIBOR + 1.470% (Cap N/A, Floor 1.470%) | |
5.713%(c) | | 04/20/32 | | | | | | | | | | | 7,500 | | | | 7,404,937 | |
Jefferson Mill CLO Ltd. (Cayman Islands), | |
Series 2015-01A, Class AR, 144A, 3 Month LIBOR + 1.175% (Cap N/A, Floor 0.000%) | |
5.418%(c) | | 10/20/31 | | | | | | | | | | | 4,237 | | | | 4,128,395 | |
KKR Static CLO Ltd. (Cayman Islands), | |
Series 2022-02A, Class A1, 144A, 3 Month SOFR + 2.220% (Cap N/A, Floor 2.220%) | |
6.738%(c) | | 10/20/31 | | | | | | | | | | | 2,000 | | | | 1,999,362 | |
Madison Park Funding Ltd. (Cayman Islands), | |
Series 2019-33A, Class AR, 144A, 3 Month SOFR + 1.290% (Cap N/A, Floor 1.290%) | |
5.154%(c) | | 10/15/32 | | | | | | | | | | | 6,000 | | | | 5,884,286 | |
MidOcean Credit CLO (Cayman Islands), | |
Series 2014-03A, Class A1R, 144A, 3 Month LIBOR + 1.120% (Cap N/A, Floor 1.120%) | |
5.398%(c) | | 04/21/31 | | | | | | | | | | | 3,459 | | | | 3,391,726 | |
Mountain View CLO Ltd. (Cayman Islands), | |
Series 2015-09A, Class A1R, 144A, 3 Month LIBOR + 1.120% (Cap N/A, Floor 0.000%) | |
5.199%(c) | | 07/15/31 | | | | | | | | | | | 2,500 | | | | 2,450,087 | |
Northwoods Capital Ltd. (Cayman Islands), | |
Series 2020-22A, Class AR, 144A, 3 Month SOFR + 1.450% (Cap N/A, Floor 1.450%) | |
5.854%(c) | | 09/01/31 | | | | | | | | | | | 4,000 | | | | 3,932,240 | |
OCP CLO Ltd. (Cayman Islands), | |
Series 2015-09A, Class A1R2, 144A, 3 Month SOFR + 1.250% (Cap N/A, Floor 1.250%) | |
5.114%(c) | | 01/15/33 | | | | | | | | | | | 2,500 | | | | 2,449,159 | |
Octagon Investment Partners 31 Ltd. (Cayman Islands), | |
Series 2017-01A, Class AR, 144A, 3 Month LIBOR + 1.050% (Cap N/A, Floor 1.050%) | |
5.293%(c) | | 07/20/30 | | | | | | | | | | | 2,500 | | | | 2,465,433 | |
OZLM Ltd. (Cayman Islands), | |
Series 2014-06A, Class A1S, 144A, 3 Month LIBOR + 1.080% (Cap N/A, Floor 0.000%) | |
5.159%(c) | | 04/17/31 | | | | | | | | | | | 2,956 | | | | 2,888,368 | |
Series 2015-11A, Class A1R, 144A, 3 Month LIBOR + 1.250% (Cap N/A, Floor 0.000%) | |
5.665%(c) | | 10/30/30 | | | | | | | | | | | 742 | | | | 730,767 | |
SEE NOTES TO FINANCIAL STATEMENTS.
A41
| | | | |
| | PSF PGIM 50/50 BALANCED PORTFOLIO (CONTINUED) | | |
SCHEDULE OF INVESTMENTS | | | | as of December 31, 2022 |
| | | | | | | | | | | | | | | | | | |
| | | | | | Principal | | | | |
| Interest | | Maturity | | | | | Amount | | | | |
Rate | | Date | | | | | (000)# | | | Value | |
| | | | | | | | | | | | | | | |
|
ASSET-BACKED SECURITIES (continued) | |
Collateralized Loan Obligations (cont’d.) | |
Palmer Square CLO Ltd. (Cayman Islands), | |
Series 2015-02A, Class A1R2, 144A, 3 Month LIBOR + 1.100% (Cap N/A, Floor 0.000%) | |
5.343%(c) | | 07/20/30 | | | | | | | | | | | 4,936 | | | $ | 4,869,357 | |
Regatta Funding Ltd. (Cayman Islands), | |
Series 2016-01A, Class A1R2, 144A, 3 Month LIBOR + 1.150% (Cap N/A, Floor 1.150%) | |
5.896%(c) | | 06/20/34 | | | | | | | | | | | 3,750 | | | | 3,668,495 | |
Sixth Street CLO Ltd. (Cayman Islands), | |
Series 2020-16A, Class A1A, 144A, 3 Month LIBOR + 1.320% (Cap N/A, Floor 1.320%) | |
5.563%(c) | | 10/20/32 | | | | | | | | | | | 2,500 | | | | 2,479,663 | |
TCW CLO Ltd. (Cayman Islands), | |
Series 2021-02A, Class AS, 144A, 3 Month LIBOR + 1.180% (Cap N/A, Floor 1.180%) | |
5.538%(c) | | 07/25/34 | | | | | | | | | | | 4,750 | | | | 4,623,937 | |
TIAA CLO Ltd. (Cayman Islands), | |
Series 2016-01A, Class AR, 144A, 3 Month LIBOR + 1.200% (Cap N/A, Floor 0.000%) | |
5.443%(c) | | 07/20/31 | | | | | | | | | | | 1,750 | | | | 1,719,985 | |
Toro European CLO DAC (Ireland), | |
Series 02A, Class ARR, 144A, 3 Month EURIBOR + 0.990% (Cap N/A, Floor 0.990%) | |
2.533%(c) | | 07/25/34 | | | | | | | EUR | | | | 3,000 | | | | 3,075,950 | |
Trimaran Cavu Ltd., | |
Series 2019-01A, Class A1, 144A, 3 Month LIBOR + 1.460% (Cap N/A, Floor 1.460%) | |
5.703%(c) | | 07/20/32 | | | | | | | | | | | 7,500 | | | | 7,345,707 | |
Venture CLO Ltd. (Cayman Islands), | |
Series 2015-21A, Class AR, 144A, 3 Month LIBOR + 0.880% (Cap N/A, Floor 0.000%) | |
4.959%(c) | | 07/15/27 | | | | | | | | | | | 53 | | | | 52,905 | |
Wellfleet CLO Ltd., | |
Series 2017-03A, Class A1, 144A, 3 Month LIBOR + 1.150% (Cap N/A, Floor 1.150%) | |
5.229%(c) | | 01/17/31 | | | | | | | | | | | 2,000 | | | | 1,961,565 | |
Series 2018-02A, Class A1, 144A, 3 Month LIBOR + 1.200% (Cap N/A, Floor 1.200%) | |
5.443%(c) | | 10/20/31 | | | | | | | | | | | 3,750 | | | | 3,647,460 | |
| | | | | | | | | | | | | | | �� | | | |
| |
| | | | 104,560,809 | |
| | | | | | | | | | | | | | | | | | |
Consumer Loans — 0.3% | |
Lendmark Funding Trust, | |
Series 2019-02A, Class A, 144A | |
2.780% | | 04/20/28 | | | | | | | | | | | 1,830 | | | | 1,775,730 | |
OneMain Financial Issuance Trust, | |
Series 2020-01A, Class A, 144A | |
3.840% | | 05/14/32 | | | | | | | | | | | 360 | | | | 357,446 | |
Series 2020-02A, Class A, 144A | |
1.750% | | 09/14/35 | | | | | | | | | | | 1,900 | | | | 1,659,784 | |
Series 2021-01A, Class A2, 144A, 30 Day Average SOFR + 0.760% (Cap N/A, Floor 0.000%) | |
4.567%(c) | | 06/16/36 | | | | | | | | | | | 2,000 | | | | 1,910,948 | |
Oportun Funding XIV LLC, | |
Series 2021-A, Class A, 144A | |
1.210% | | 03/08/28 | | | | | | | | | | | 800 | | | | 744,943 | |
| | | | | | | | | | | | | | | | | | |
| |
| | | | 6,448,851 | |
| | | | | | | | | | | | | | | | | | |
| | | | | | | | | | | | | | | | | | |
| | | | | | Principal | | | | |
| Interest | | Maturity | | | | | Amount | | | | |
Rate | | Date | | | | | (000)# | | | Value | |
| | | | | | | | | | | | | | | |
|
ASSET-BACKED SECURITIES (continued) | |
Equipment — 0.2% | |
MMAF Equipment Finance LLC, | |
Series 2017-B, Class A5, 144A | |
2.720% | | 06/15/40 | | | | | | | | | | | 1,964 | | | $ | 1,908,992 | |
Series 2018-A, Class A5, 144A | |
3.610% | | 03/10/42 | | | | | | | | | | | 500 | | | | 485,412 | |
Series 2019-A, Class A5, 144A | |
3.080% | | 11/12/41 | | | | | | | | | | | 1,600 | | | | 1,545,099 | |
Series 2019-B, Class A5, 144A | |
2.290% | | 11/12/41 | | | | | | | | | | | 1,600 | | | | 1,460,516 | |
| | | | | | | | | | | | | | | | | | |
| |
| | | | 5,400,019 | |
| | | | | | | | | | | | | | | | | | |
Other — 0.1% | |
Home Partners of America Trust, | |
Series 2021-03, Class A, 144A | |
2.200% | | 01/17/41 | | | | | | | | | | | 921 | | | | 774,953 | |
TH MSR Issuer Trust, | |
Series 2019-FT01, Class A, 144A, 1 Month LIBOR + 2.800% (Cap N/A, Floor 2.800%) | |
7.189%(c) | | 06/25/24 | | | | | | | | | | | 2,240 | | | | 2,095,829 | |
| | | | | | | | | | | | | | | | | | |
| |
| | | | 2,870,782 | |
| | | | | | | | | | | | | | | | | | |
Residential Mortgage-Backed Securities — 0.1% | |
Countrywide Asset-Backed Certificates, | |
Series 2004-01, Class M1, 1 Month LIBOR + 0.750% (Cap N/A, Floor 0.750%) | |
5.139%(c) | | 03/25/34 | | | | | | | | | | | 144 | | | | 139,615 | |
Long Beach Mortgage Loan Trust, | |
Series 2004-02, Class M1, 1 Month LIBOR + 0.795% (Cap N/A, Floor 0.795%) | |
5.184%(c) | | 06/25/34 | | | | | | | | | | | 111 | | | | 105,649 | |
TFS (Spain), | |
Series 2018-03, Class A1, 1 Month EURIBOR + 3.000% | |
4.686%(c) | | 04/16/23^ | | | | | | | EUR | | | | 890 | | | | 903,007 | |
| | | | | | | | | | | | | | | | | | |
| |
| | | | 1,148,271 | |
| | | | | | | | | | | | | | | | | | |
Student Loans — 0.3% | |
Commonbond Student Loan Trust, | |
Series 2017-BGS, Class A1, 144A | |
2.680% | | 09/25/42 | | | | | | | | | | | 529 | | | | 486,329 | |
Series 2018-AGS, Class A1, 144A | |
3.210% | | 02/25/44 | | | | | | | | | | | 380 | | | | 351,541 | |
Series 2018-CGS, Class A1, 144A | |
3.870% | | 02/25/46 | | | | | | | | | | | 102 | | | | 98,047 | |
Laurel Road Prime Student Loan Trust, | |
Series 2017-C, Class A2B, 144A | |
2.810% | | 11/25/42 | | | | | | | | | | | 85 | | | | 82,943 | |
Series 2018-B, Class A2FX, 144A | |
3.540% | | 05/26/43 | | | | | | | | | | | 161 | | | | 157,566 | |
Series 2019-A, Class A2FX, 144A | |
2.730% | | 10/25/48 | | | | | | | | | | | 191 | | | | 185,922 | |
Navient Private Education Refi Loan Trust, | |
Series 2018-A, Class A2, 144A | |
3.190% | | 02/18/42 | | | | | | | | | | | 176 | | | | 174,699 | |
Series 2018-CA, Class A2, 144A | |
3.520% | | 06/16/42 | | | | | | | | | | | 171 | | | | 168,052 | |
Series 2019-CA, Class A2, 144A | |
3.130% | | 02/15/68 | | | | | | | | | | | 560 | | | | 528,469 | |
SEE NOTES TO FINANCIAL STATEMENTS.
A42
| | | | |
| | PSF PGIM 50/50 BALANCED PORTFOLIO (CONTINUED) | | |
SCHEDULE OF INVESTMENTS | | | | as of December 31, 2022 |
| | | | | | | | | | | | | | | | | | |
| | | | Principal | | | | |
| Interest | | Maturity | | | | | Amount | | | | |
Rate | | Date | | | | | (000)# | | | Value | |
| | | | | | | | | | | | | | | |
|
ASSET-BACKED SECURITIES (continued) | |
Student Loans (cont’d.) | |
Series 2020-BA, Class A2, 144A | |
2.120% | | 01/15/69 | | | | | | | | | | | 592 | | | $ | 537,808 | |
Pennsylvania Higher Education Assistance Agency, | |
Series 2021-01A, Class A, 144A, 1 Month LIBOR + 0.530% (Cap N/A, Floor 0.530%) | |
4.919%(c) | | 05/25/70 | | | | | | | | | | | 1,322 | | | | 1,287,056 | |
SoFi Professional Loan Program LLC, | |
Series 2019-A, Class A2FX, 144A | |
3.690% | | 06/15/48 | | | | | | | | | | | 475 | | | | 458,782 | |
Series 2019-B, Class A2FX, 144A | |
3.090% | | 08/17/48 | | | | | | | | | | | 562 | | | | 528,297 | |
Series 2019-C, Class A2FX, 144A | |
2.370% | | 11/16/48 | | | | | | | | | | | 868 | | | | 806,280 | |
SoFi Professional Loan Program Trust, | |
Series 2018-B, Class A2FX, 144A | |
3.340% | | 08/25/47 | | | | | | | | | | | 546 | | | | 528,666 | |
Series 2020-A, Class A2FX, 144A | |
2.540% | | 05/15/46 | | | | | | | | | | | 1,173 | | | | 1,061,906 | |
| | | | | | | | | | | | | | | | | | |
| |
| | | | 7,442,363 | |
| | | | | | | | | | | | | | | | | | |
TOTAL ASSET-BACKED SECURITIES
(cost $183,703,422) | | | | 175,003,301 | |
| | | | | | | | | | | | | | | | | | |
COMMERCIAL MORTGAGE-BACKED SECURITIES — 5.9% | |
Assurant Commercial Mortgage Trust, | |
Series 2016-01A, Class AS, 144A | |
3.172% | | 05/15/49 | | | | | | | | | | | 3,100 | | | | 2,954,047 | |
BANK, | |
Series 2021-BN35, Class A3 | |
1.717% | | 06/15/64 | | | | | | | | | | | 3,500 | | | | 2,924,079 | |
Series 2021-BN35, Class ASB | |
2.067% | | 06/15/64 | | | | | | | | | | | 2,300 | | | | 1,939,357 | |
Series 2021-BN37, Class A4 | |
2.370% | | 11/15/64 | | | | | | | | | | | 3,900 | | | | 3,151,193 | |
Barclays Commercial Mortgage Securities Trust, | |
Series 2018-C02, Class A4 | |
4.047% | | 12/15/51 | | | | | | | | | | | 3,850 | | | | 3,621,572 | |
Series 2021-C12, Class A4 | |
2.421% | | 11/15/54 | | | | | | | | | | | 4,500 | | | | 3,694,562 | |
Benchmark Mortgage Trust, | |
Series 2018-B03, Class A4 | |
3.761% | | 04/10/51 | | | | | | | | | | | 3,600 | | | | 3,366,534 | |
Series 2021-B24, Class A3 | |
2.010% | | 03/15/54 | | | | | | | | | | | 2,000 | | | | 1,713,219 | |
BXP Trust, | |
Series 2021-601L, Class A, 144A | |
2.618% | | 01/15/44 | | | | | | | | | | | 5,500 | | | | 4,111,636 | |
CFCRE Commercial Mortgage Trust, | |
Series 2016-C04, Class A3 | |
3.014% | | 05/10/58 | | | | | | | | | | | 2,090 | | | | 1,944,490 | |
Citigroup Commercial Mortgage Trust, | |
Series 2014-GC21, Class A4 | |
3.575% | | 05/10/47 | | | | | | | | | | | 632 | | | | 615,940 | |
Series 2016-C01, Class A3 | |
2.944% | | 05/10/49 | | | | | | | | | | | 2,700 | | | | 2,497,763 | |
Series 2017-P07, Class A3 | |
3.442% | | 04/14/50 | | | | | | | | | | | 3,721 | | | | 3,464,283 | |
| | | | | | | | | | | | | | | | | | |
| | | | Principal | | | | |
| Interest | | Maturity | | | | | Amount | | | | |
Rate | | Date | | | | | (000)# | | | Value | |
| | | | | | | | | | | | | | | |
|
| COMMERCIAL MORTGAGE-BACKED SECURITIES (continued) | |
Commercial Mortgage Trust, | |
Series 2014-CR18, Class A4 | |
3.550% | | 07/15/47 | | | | | | | | | | | 1,744 | | | $ | 1,688,223 | |
Series 2014-LC17, Class A4 | |
3.648% | | 10/10/47 | | | | | | | | | | | 3,024 | | | | 2,919,713 | |
CSAIL Commercial Mortgage Trust, | |
Series 2015-C04, Class A3 | |
3.544% | | 11/15/48 | | | | | | | | | | | 2,482 | | | | 2,357,787 | |
Series 2017-C08, Class A3 | |
3.127% | | 06/15/50 | | | | | | | | | | | 3,678 | | | | 3,302,226 | |
FHLMC Multifamily Structured Pass-Through Certificates, | |
Series K055, Class X1, IO | |
1.346%(cc) | | 03/25/26 | | | | | | | | | | | 4,302 | | | | 149,481 | |
GS Mortgage Securities Corp. Trust, | |
Series 2021-RENT, Class A, 144A, 1 Month LIBOR + 0.700% (Cap N/A, Floor 0.700%) | |
5.054%(c) | | 11/21/35 | | | | | | | | | | | 1,064 | | | | 989,831 | |
GS Mortgage Securities Trust, | |
Series 2015-GC28, Class A4 | |
3.136% | | 02/10/48 | | | | | | | | | | | 2,763 | | | | 2,646,960 | |
Series 2015-GC34, Class A3 | |
3.244% | | 10/10/48 | | | | | | | | | | | 4,545 | | | | 4,289,211 | |
Series 2016-GS03, Class A3 | |
2.592% | | 10/10/49 | | | | | | | | | | | 3,901 | | | | 3,541,802 | |
Series 2016-GS04, Class A3 | |
3.178% | | 11/10/49 | | | | | | | | | | | 3,795 | | | | 3,497,927 | |
Series 2020-GSA02, Class A4 | |
1.721% | | 12/12/53 | | | | | | | | | | | 4,150 | | | | 3,255,602 | |
JPMBB Commercial Mortgage Securities Trust, | |
Series 2014-C25, Class A4A1 | |
3.408% | | 11/15/47 | | | | | | | | | | | 532 | | | | 510,180 | |
Series 2015-C27, Class A3A1 | |
2.920% | | 02/15/48 | | | | | | | | | | | 3,978 | | | | 3,742,187 | |
JPMCC Commercial Mortgage Securities Trust, | |
Series 2017-JP06, Class A3 | |
3.109% | | 07/15/50 | | | | | | | | | | | 2,717 | | | | 2,619,276 | |
JPMDB Commercial Mortgage Securities Trust, | |
Series 2016-C02, Class A3A | |
2.881% | | 06/15/49 | | | | | | | | | | | 2,500 | | | | 2,326,110 | |
MHC Commercial Mortgage Trust, | |
Series 2021-MHC, Class C, 144A, 1 Month LIBOR + 1.351% (Cap N/A, Floor 1.351%) | |
5.669%(c) | | 04/15/38 | | | | | | | | | | | 2,150 | | | | 2,054,996 | |
Morgan Stanley Capital I Trust, | |
Series 2015-UBS08, Class A3 | |
3.540% | | 12/15/48 | | | | | | | | | | | 4,782 | | | | 4,494,936 | |
Series 2016-BNK02, Class A3 | |
2.791% | | 11/15/49 | | | | | | | | | | | 2,000 | | | | 1,815,255 | |
Series 2016-UB11, Class A3 | |
2.531% | | 08/15/49 | | | | | | | | | | | 6,152 | | | | 5,530,358 | |
Series 2019-H06, Class A3 | |
3.158% | | 06/15/52 | | | | | | | | | | | 5,000 | | | | 4,427,357 | |
Series 2019-H07, Class A2 | |
2.492% | | 07/15/52 | | | | | | | | | | | 9,400 | | | | 8,936,949 | |
UBS Commercial Mortgage Trust, | |
Series 2017-C02, Class ASB | |
3.264% | | 08/15/50 | | | | | | | | | | | 2,318 | | | | 2,208,716 | |
SEE NOTES TO FINANCIAL STATEMENTS.
A43
| | | | |
| | PSF PGIM 50/50 BALANCED PORTFOLIO (CONTINUED) | | |
SCHEDULE OF INVESTMENTS | | | | as of December 31, 2022 |
| | | | | | | | | | | | | | | | | | |
| | | | Principal | | | | |
| Interest | | Maturity | | | | | Amount | | | | |
Rate | | Date | | | | | (000)# | | | Value | |
| | | | | | | | | | | | | | | |
|
| COMMERCIAL MORTGAGE-BACKED SECURITIES (continued) | |
Series 2017-C05, Class A4 | |
3.212% | | 11/15/50 | | | | | | | | | | | 5,000 | | | $ | 4,606,020 | |
Series 2018-C09, Class A3 | |
3.854% | | 03/15/51 | | | | | | | | | | | 1,800 | | | | 1,677,599 | |
Series 2018-C14, Class A3 | |
4.180% | | 12/15/51 | | | | | | | | | | | 2,708 | | | | 2,551,156 | |
Wells Fargo Commercial Mortgage Trust, | |
Series 2016-NXS06, Class A3 | |
2.642% | | 11/15/49 | | | | | | | | | | | 4,500 | | | | 4,136,584 | |
Series 2017-C38, Class A4 | |
3.190% | | 07/15/50 | | | | | | | | | | | 3,185 | | | | 2,914,419 | |
Series 2019-C49, Class A3 | |
3.749% | | 03/15/52 | | | | | | | | | | | 7,300 | | | | 6,932,553 | |
Series 2020-C58, Class A3 | |
1.810% | | 07/15/53 | | | | | | | | | | | 5,000 | | | | 3,974,876 | |
Series 2021-C61, Class A3 | |
2.406% | | 11/15/54 | | | | | | | | | | | 9,000 | | | | 7,281,733 | |
| | | | | | | | | | | | | | | | | | |
TOTAL COMMERCIAL MORTGAGE-BACKED SECURITIES
(cost $154,019,822) | | | | 137,378,698 | |
| | | | | | | | | | | | | | | | | | |
CORPORATE BONDS — 10.8% | |
Aerospace & Defense — 0.3% | |
Boeing Co. (The), | |
Sr. Unsec’d. Notes | |
2.196% | | 02/04/26 | | | | | | | | | | | 1,610 | | | | 1,463,364 | |
3.300% | | 03/01/35 | | | | | | | | | | | 1,920 | | | | 1,423,877 | |
3.900% | | 05/01/49 | | | | | | | | | | | 1,500 | | | | 1,057,322 | |
Embraer Netherlands Finance BV (Brazil), | |
Gtd. Notes | |
5.050% | | 06/15/25 | | | | | | | | | | | 551 | | | | 534,573 | |
Embraer Overseas Ltd. (Brazil), | |
Gtd. Notes, 144A | |
5.696% | | 09/16/23 | | | | | | | | | | | 765 | | | | 763,853 | |
Lockheed Martin Corp., | |
Sr. Unsec’d. Notes | |
5.700% | | 11/15/54 | | | | | | | | | | | 565 | | | | 599,175 | |
Raytheon Technologies Corp., | |
Sr. Unsec’d. Notes | |
4.125% | | 11/16/28 | | | | | | | | | | | 910 | | | | 872,079 | |
| | | | | | | | | | | | | | | | | | |
| |
| | | | 6,714,243 | |
| | | | | | | | | | | | | | | | | | |
Agriculture — 0.2% | |
BAT Capital Corp. (United Kingdom), | |
Gtd. Notes | |
2.259% | | 03/25/28(a) | | | | | | | | | | | 3,190 | | | | 2,654,996 | |
3.557% | | 08/15/27 | | | | | | | | | | | 1,365 | | | | 1,242,951 | |
Vector Group Ltd., | |
Sr. Sec’d. Notes, 144A | |
5.750% | | 02/01/29 | | | | | | | | | | | 875 | | | | 759,369 | |
| | | | | | | | | | | | | | | | | | |
| |
| | | | 4,657,316 | |
| | | | | | | | | | | | | | | | | | |
Airlines — 0.1% | |
American Airlines 2015-1 Class A Pass-Through Trust, | |
Pass-Through Certificates | |
3.375% | | 11/01/28 | | | | | | | | | | | 1,649 | | | | 1,374,778 | |
| | | | | | | | | | | | | | | | | | |
| | | | Principal | | | | |
| Interest | | Maturity | | | | | Amount | | | | |
Rate | | Date | | | | | (000)# | | | Value | |
| | | | | | | | | | | | | | | |
|
CORPORATE BONDS (continued) | |
Airlines (cont’d.) | |
Continental Airlines 2012-2 Class A Pass-Through Trust, | |
Pass-Through Certificates | |
4.000% | | 04/29/26(a) | | | | | | | | | | | 224 | | | $ | 213,313 | |
Southwest Airlines Co., | |
Sr. Unsec’d. Notes | |
2.625% | | 02/10/30(a) | | | | | | | | | | | 1,375 | | | | 1,137,920 | |
United Airlines, Inc., | |
Sr. Sec’d. Notes, 144A | |
4.375% | | 04/15/26 | | | | | | | | | | | 590 | | | | 549,511 | |
4.625% | | 04/15/29 | | | | | | | | | | | 115 | | | | 100,362 | |
| | | | | | | | | | | | | | | | | | |
| |
| | | | 3,375,884 | |
| | | | | | | | | | | | | | | | | | |
Apparel — 0.0% | |
Wolverine World Wide, Inc., | |
Gtd. Notes, 144A | |
4.000% | | 08/15/29 | | | | | | | | | | | 550 | | | | 416,463 | |
| | | | | | | | | | | | | | | | | | |
Auto Manufacturers — 0.3% | |
Daimler Trucks Finance North America LLC (Germany), | |
Gtd. Notes, 144A | |
1.625% | | 12/13/24 | | | | | | | | | | | 3,770 | | | | 3,505,942 | |
Ford Motor Co., | |
Sr. Unsec’d. Notes | |
5.291% | | 12/08/46 | | | | | | | | | | | 665 | | | | 511,385 | |
Ford Motor Credit Co. LLC, | |
Sr. Unsec’d. Notes | |
2.900% | | 02/16/28 | | | | | | | | | | | 200 | | | | 165,260 | |
General Motors Co., | |
Sr. Unsec’d. Notes | |
6.250% | | 10/02/43 | | | | | | | | | | | 740 | | | | 685,700 | |
6.600% | | 04/01/36 | | | | | | | | | | | 585 | | | | 573,703 | |
General Motors Financial Co., Inc., | |
Gtd. Notes | |
3.950% | | 04/13/24 | | | | | | | | | | | 1,700 | | | | 1,666,521 | |
| | | | | | | | | | | | | | | | | | |
| |
| | | | 7,108,511 | |
| | | | | | | | | | | | | | | | | | |
Banks — 3.1% | |
Banco Santander SA (Spain), | |
Sr. Unsec’d. Notes | |
1.849% | | 03/25/26 | | | | | | | | | | | 800 | | | | 707,396 | |
Sr. Unsec’d. Notes, 3 Month LIBOR + 1.120% | |
5.039%(c) | | 04/12/23 | | | | | | | | | | | 400 | | | | 399,686 | |
Bank of America Corp., | |
Jr. Sub. Notes, Series JJ | |
5.125%(ff) | | 06/20/24(a)(oo) | | | | | | | | | | | 1,145 | | | | 1,067,214 | |
Sr. Unsec’d. Notes, MTN | |
1.898%(ff) | | 07/23/31 | | | | | | | | | | | 1,805 | | | | 1,387,766 | |
2.496%(ff) | | 02/13/31 | | | | | | | | | | | 5,165 | | | | 4,196,077 | |
3.194%(ff) | | 07/23/30 | | | | | | | | | | | 1,050 | | | | 903,671 | |
3.824%(ff) | | 01/20/28 | | | | | | | | | | | 615 | | | | 574,134 | |
Sub. Notes, MTN | |
4.000% | | 01/22/25 | | | | | | | | | | | 1,700 | | | | 1,663,983 | |
4.200% | | 08/26/24 | | | | | | | | | | | 745 | | | | 733,493 | |
4.450% | | 03/03/26 | | | | | | | | | | | 4,790 | | | | 4,692,930 | |
Bank of America NA, | |
Sub. Notes | |
6.000% | | 10/15/36(a) | | | | | | | | | | | 805 | | | | 825,332 | |
SEE NOTES TO FINANCIAL STATEMENTS.
A44
| | | | |
| | PSF PGIM 50/50 BALANCED PORTFOLIO (CONTINUED) | | |
SCHEDULE OF INVESTMENTS | | | | as of December 31, 2022 |
| | | | | | | | | | | | | | | | | | |
| | | | Principal | | | | |
| Interest | | Maturity | | | | | Amount | | | | |
Rate | | Date | | | | | (000)# | | | Value | |
| | | | | | | | | | | | | | | |
|
CORPORATE BONDS (continued) | |
Banks (cont’d.) | |
Barclays PLC (United Kingdom), | |
Sr. Unsec’d. Notes | |
3.650% | | 03/16/25 | | | | | | | | | | | 935 | | | $ | 897,439 | |
3.932%(ff) | | 05/07/25 | | | | | | | | | | | 320 | | | | 310,687 | |
Sr. Unsec’d. Notes, MTN | |
4.972%(ff) | | 05/16/29 | | | | | | | | | | | 705 | | | | 662,195 | |
BNP Paribas SA (France), | |
Sr. Unsec’d. Notes, 144A | |
2.219%(ff) | | 06/09/26 | | | | | | | | | | | 480 | | | | 441,296 | |
2.591%(ff) | | 01/20/28 | | | | | | | | | | | 800 | | | | 704,010 | |
3.132%(ff) | | 01/20/33 | | | | | | | | | | | 1,335 | | | | 1,049,422 | |
Citigroup, Inc., | |
Jr. Sub. Notes, Series V | |
4.700%(ff) | | 01/30/25(oo) | | | | | | | | | | | 1,675 | | | | 1,394,757 | |
Sr. Unsec’d. Notes | |
2.561%(ff) | | 05/01/32 | | | | | | | | | | | 2,100 | | | | 1,658,203 | |
3.200% | | 10/21/26 | | | | | | | | | | | 670 | | | | 621,066 | |
3.700% | | 01/12/26 | | | | | | | | | | | 1,610 | | | | 1,549,118 | |
3.887%(ff) | | 01/10/28 | | | | | | | | | | | 560 | | | | 523,389 | |
Sub. Notes | |
4.450% | | 09/29/27 | | | | | | | | | | | 1,485 | | | | 1,418,451 | |
4.750% | | 05/18/46 | | | | | | | | | | | 440 | | | | 363,995 | |
Credit Suisse Group AG (Switzerland), | |
Sr. Unsec’d. Notes | |
4.550% | | 04/17/26 | | | | | | | | | | | 6,000 | | | | 5,300,510 | |
Sr. Unsec’d. Notes, 144A | |
2.193%(ff) | | 06/05/26 | | | | | | | | | | | 1,100 | | | | 935,398 | |
3.091%(ff) | | 05/14/32 | | | | | | | | | | | 560 | | | | 385,373 | |
4.282% | | 01/09/28 | | | | | | | | | | | 980 | | | | 808,993 | |
Deutsche Bank AG (Germany), | |
Sr. Unsec’d. Notes | |
2.129%(ff) | | 11/24/26 | | | | | | | | | | | 460 | | | | 405,525 | |
Discover Bank, | |
Sr. Unsec’d. Notes | |
4.250% | | 03/13/26 | | | | | | | | | | | 595 | | | | 569,108 | |
Goldman Sachs Group, Inc. (The), | |
Sr. Unsec’d. Notes | |
1.542%(ff) | | 09/10/27 | | | | | | | | | | | 2,345 | | | | 2,025,853 | |
3.750% | | 02/25/26 | | | | | | | | | | | 1,165 | | | | 1,122,747 | |
3.814%(ff) | | 04/23/29 | | | | | | | | | | | 440 | | | | 400,308 | |
3.850% | | 01/26/27 | | | | | | | | | | | 2,625 | | | | 2,499,374 | |
Sub. Notes | |
6.750% | | 10/01/37 | | | | | | | | | | | 225 | | | | 239,637 | |
ING Groep NV (Netherlands), | |
Sr. Unsec’d. Notes | |
3.550% | | 04/09/24 | | | | | | | | | | | 400 | | | | 391,176 | |
JPMorgan Chase & Co., | |
Jr. Sub. Notes, Series FF | |
5.000%(ff) | | 08/01/24(oo) | | | | | | | | | | | 540 | | | | 496,279 | |
Jr. Sub. Notes, Series HH | |
4.600%(ff) | | 02/01/25(oo) | | | | | | | | | | | 1,245 | | | | 1,105,469 | |
Jr. Sub. Notes, Series II | |
4.000%(ff) | | 04/01/25(oo) | | | | | | | | | | | 230 | | | | 196,400 | |
Sr. Unsec’d. Notes | |
2.580%(ff) | | 04/22/32 | | | | | | | | | | | 1,585 | | | | 1,268,063 | |
3.782%(ff) | | 02/01/28 | | | | | | | | | | | 270 | | | | 252,546 | |
3.964%(ff) | | 11/15/48 | | | | | | | | | | | 2,240 | | | | 1,753,620 | |
| | | | | | | | | | | | | | | | | | |
| | | | Principal | | | | |
| Interest | | Maturity | | | | | Amount | | | | |
Rate | | Date | | | | | (000)# | | | Value | |
| | | | | | | | | | | | | | | |
|
CORPORATE BONDS (continued) | |
Banks (cont’d.) | |
4.005%(ff) | | 04/23/29 | | | | | | | | | | | 1,360 | | | $ | 1,259,800 | |
Sub. Notes | |
3.875% | | 09/10/24(a) | | | | | | | | | | | 3,525 | | | | 3,448,105 | |
Morgan Stanley, | |
Sr. Unsec’d. Notes, GMTN | |
2.239%(ff) | | 07/21/32 | | | | | | | | | | | 2,770 | | | | 2,122,293 | |
3.772%(ff) | | 01/24/29 | | | | | | | | | | | 1,295 | | | | 1,185,242 | |
3.875% | | 01/27/26 | | | | | | | | | | | 550 | | | | 532,636 | |
4.431%(ff) | | 01/23/30 | | | | | | | | | | | 455 | | | | 424,776 | |
Sr. Unsec’d. Notes, MTN | |
3.591%(ff) | | 07/22/28 | | | | | | | | | | | 1,030 | | | | 946,719 | |
Sub. Notes, GMTN | |
4.350% | | 09/08/26 | | | | | | | | | | | 3,050 | | | | 2,964,540 | |
NatWest Group PLC (United Kingdom), | |
Sr. Unsec’d. Notes | |
5.076%(ff) | | 01/27/30 | | | | | | | | | | | 1,570 | | | | 1,476,952 | |
Societe Generale SA (France), | |
Sr. Unsec’d. Notes, 144A | |
1.488%(ff) | | 12/14/26 | | | | | | | | | | | 3,200 | | | | 2,785,747 | |
State Bank of India (India), | |
Sr. Unsec’d. Notes, 144A | |
4.375% | | 01/24/24 | | | | | | | | | | | 1,255 | | | | 1,236,803 | |
UBS Group AG (Switzerland), | |
Sr. Unsec’d. Notes, 144A | |
1.364%(ff) | | 01/30/27 | | | | | | | | | | | 2,250 | | | | 1,967,791 | |
Wells Fargo & Co., | |
Sr. Unsec’d. Notes, MTN | |
2.572%(ff) | | 02/11/31 | | | | | | | | | | | 2,895 | | | | 2,394,412 | |
| | | | | | | | | | | | | | | | | | |
| |
| | | | 71,647,905 | |
| | | | | | | | | | | | | | | | | | |
Beverages — 0.1% | |
Anheuser-Busch Cos. LLC/Anheuser-Busch InBev Worldwide, Inc. (Belgium), | |
Gtd. Notes | |
4.700% | | 02/01/36 | | | | | | | | | | | 1,220 | | | | 1,150,183 | |
Constellation Brands, Inc., | |
Sr. Unsec’d. Notes | |
2.250% | | 08/01/31(a) | | | | | | | | | | | 780 | | | | 619,124 | |
| | | | | | | | | | | | | | | | | | |
| |
| | | | 1,769,307 | |
| | | | | | | | | | | | | | | | | | |
Biotechnology — 0.1% | |
Amgen, Inc., | |
Sr. Unsec’d. Notes | |
2.800% | | 08/15/41 | | | | | | | | | | | 2,840 | | | | 1,971,290 | |
| | | | | | | | | | | | | | | | | | |
Building Materials — 0.0% | |
Masonite International Corp., | |
Gtd. Notes, 144A | |
3.500% | | 02/15/30(a) | | | | | | | | | | | 400 | | | | 322,000 | |
Standard Industries, Inc., | |
Sr. Unsec’d. Notes, 144A | |
4.750% | | 01/15/28 | | | | | | | | | | | 300 | | | | 269,966 | |
| | | | | | | | | | | | | | | | | | |
| |
| | | | 591,966 | |
| | | | | | | | | | | | | | | | | | |
Chemicals — 0.1% | |
Dow Chemical Co. (The), | |
Sr. Unsec’d. Notes | |
4.375% | | 11/15/42 | | | | | | | | | | | 5 | | | | 4,134 | |
SEE NOTES TO FINANCIAL STATEMENTS.
A45
| | | | |
| | PSF PGIM 50/50 BALANCED PORTFOLIO (CONTINUED) | | |
SCHEDULE OF INVESTMENTS | | | | as of December 31, 2022 |
| | | | | | | | | | | | | | | | | | |
Interest Rate | | Maturity Date | | | | | Principal
Amount
(000)# | | | Value | |
| | | | | | | | | | | | | | | |
|
CORPORATE BONDS (continued) | |
Chemicals (cont’d.) | |
6.900% | | 05/15/53 | | | | | | | | | | | 260 | | | $ | 283,626 | |
9.400% | | 05/15/39 | | | | | | | | | | | 15 | | | | 19,799 | |
LYB International Finance BV, | |
Gtd. Notes | |
5.250% | | 07/15/43 | | | | | | | | | | | 620 | | | | 547,260 | |
NOVA Chemicals Corp. (Canada), | |
Sr. Unsec’d. Notes, 144A | |
4.875% | | 06/01/24 | | | | | | | | | | | 875 | | | | 845,469 | |
Sasol Financing USA LLC (South Africa), | |
Gtd. Notes | |
5.875% | | 03/27/24 | | | | | | | | | | | 600 | | | | 585,000 | |
6.500% | | 09/27/28 | | | | | | | | | | | 405 | | | | 367,133 | |
| | | | | | | | | | | | | | | | | | |
| |
| | | | 2,652,421 | |
| | | | | | | | | | | | | | | | | | |
Commercial Services — 0.1% | |
ERAC USA Finance LLC, | |
Gtd. Notes, 144A | |
4.200% | | 11/01/46 | | | | | | | | | | | 875 | | | | 682,016 | |
7.000% | | 10/15/37 | | | | | | | | | | | 390 | | | | 424,923 | |
United Rentals North America, Inc., | |
Gtd. Notes | |
3.750% | | 01/15/32 | | | | | | | | | | | 250 | | | | 204,213 | |
4.875% | | 01/15/28(a) | | | | | | | | | | | 735 | | | | 696,420 | |
5.250% | | 01/15/30 | | | | | | | | | | | 265 | | | | 248,882 | |
University of Miami, | |
Sr. Unsec’d. Notes, Series 2022 | |
4.063% | | 04/01/52 | | | | | | | | | | | 815 | | | | 669,162 | |
| | | | | | | | | | | | | | | | | | |
| |
| | | | 2,925,616 | |
| | | | | | | | | | | | | | | | | | |
Diversified Financial Services — 0.3% | |
BOC Aviation USA Corp. (Singapore), | |
Gtd. Notes, 144A, MTN | |
1.625% | | 04/29/24 | | | | | | | | | | | 445 | | | | 422,513 | |
Cantor Fitzgerald LP, | |
Sr. Unsec’d. Notes, 144A | |
4.500% | | 04/14/27 | | | | | | | | | | | 3,485 | | | | 3,235,563 | |
CDP Financial, Inc. (Canada), | |
Gtd. Notes, 144A | |
3.150% | | 07/24/24 | | | | | | | | | | | 445 | | | | 433,748 | |
Nomura Holdings, Inc. (Japan), | |
Sr. Unsec’d. Notes | |
2.608% | | 07/14/31 | | | | | | | | | | | 1,490 | | | | 1,148,928 | |
OneMain Finance Corp., | |
Gtd. Notes | |
8.250% | | 10/01/23 | | | | | | | | | | | 1,100 | | | | 1,105,807 | |
Private Export Funding Corp., | |
U.S. Gov’t. Gtd. Notes, Series NN | |
3.250% | | 06/15/25 | | | | | | | | | | | 255 | | | | 245,545 | |
| | | | | | | | | | | | | | | | | | |
| |
| | | | 6,592,104 | |
| | | | | | | | | | | | | | | | | | |
Electric — 1.1% | |
Abu Dhabi National Energy Co. PJSC (United Arab Emirates), | |
Sr. Unsec’d. Notes, 144A, MTN | |
2.000% | | 04/29/28(a) | | | | | | | | | | | 370 | | | | 327,866 | |
Alfa Desarrollo SpA (Chile), | |
Sr. Sec’d. Notes, 144A | |
4.550% | | 09/27/51 | | | | | | | | | | | 438 | | | | 333,181 | |
| | | | | | | | | | | | | | | | | | |
Interest Rate | | Maturity Date | | | | | Principal
Amount
(000)# | | | Value | |
| | | | | | | | | | | | | | | |
|
CORPORATE BONDS (continued) | |
Electric (cont’d.) | |
Baltimore Gas & Electric Co., | |
Sr. Unsec’d. Notes | |
6.350% | | 10/01/36 | | | | | | | | | | | 530 | | | $ | 566,206 | |
Berkshire Hathaway Energy Co., | |
Sr. Unsec’d. Notes | |
5.950% | | 05/15/37 | | | | | | | | | | | 335 | | | | 346,615 | |
Calpine Corp., | |
Sr. Sec’d. Notes, 144A | |
3.750% | | 03/01/31 | | | | | | | | | | | 1,400 | | | | 1,132,021 | |
CenterPoint Energy Houston Electric LLC, | |
General Ref. Mortgage, Series K2 | |
6.950% | | 03/15/33 | | | | | | | | | | | 300 | | | | 337,002 | |
Comision Federal de Electricidad (Mexico), | |
Gtd. Notes, 144A | |
4.688% | | 05/15/29 | | | | | | | | | | | 1,000 | | | | 879,875 | |
Connecticut Light & Power Co. (The), | |
First Mortgage, Series A | |
2.050% | | 07/01/31 | | | | | | | | | | | 2,290 | | | | 1,846,545 | |
Consolidated Edison Co. of New York, Inc., | |
Sr. Unsec’d. Notes, Series 09-C | |
5.500% | | 12/01/39 | | | | | | | | | | | 145 | | | | 141,958 | |
Duke Energy Carolinas LLC, | |
First Mortgage | |
6.050% | | 04/15/38 | | | | | | | | | | | 530 | | | | 559,404 | |
El Paso Electric Co., | |
Sr. Unsec’d. Notes | |
6.000% | | 05/15/35 | | | | | | | | | | | 845 | | | | 821,389 | |
Enel Finance International NV (Italy), | |
Gtd. Notes, 144A | |
2.250% | | 07/12/31 | | | | | | | | | | | 1,500 | | | | 1,093,082 | |
Engie Energia Chile SA (Chile), | |
Sr. Unsec’d. Notes, 144A | |
3.400% | | 01/28/30 | | | | | | | | | | | 400 | | | | 324,825 | |
Florida Power & Light Co., | |
First Mortgage | |
5.950% | | 10/01/33 | | | | | | | | | | | 380 | | | | 401,885 | |
Iberdrola International BV (Spain), | |
Gtd. Notes | |
6.750% | | 09/15/33 | | | | | | | | | | | 140 | | | | 145,995 | |
Indiana Michigan Power Co., | |
Sr. Unsec’d. Notes | |
3.850% | | 05/15/28(a) | | | | | | | | | | | 2,105 | | | | 1,984,101 | |
Israel Electric Corp. Ltd. (Israel), | |
Sr. Sec’d. Notes, 144A, GMTN | |
4.250% | | 08/14/28 | | | | | | | | | | | 575 | | | | 538,811 | |
Monongahela Power Co., | |
First Mortgage, 144A | |
4.100% | | 04/15/24 | | | | | | | | | | | 1,560 | | | | 1,533,653 | |
Northern States Power Co., | |
First Mortgage | |
3.600% | | 09/15/47 | | | | | | | | | | | 1,035 | | | | 800,802 | |
NRG Energy, Inc., | |
Gtd. Notes, 144A | |
3.625% | | 02/15/31 | | | | | | | | | | | 50 | | | | 38,257 | |
3.875% | | 02/15/32 | | | | | | | | | | | 150 | | | | 113,092 | |
Sr. Sec’d. Notes, 144A | |
2.000% | | 12/02/25 | | | | | | | | | | | 225 | | | | 200,514 | |
SEE NOTES TO FINANCIAL STATEMENTS.
A46
| | | | |
| | PSF PGIM 50/50 BALANCED PORTFOLIO (CONTINUED) | | |
SCHEDULE OF INVESTMENTS | | | | as of December 31, 2022 |
| | | | | | | | | | | | | | | | | | |
Interest Rate | | Maturity Date | | | | | Principal
Amount
(000)# | | | Value | |
| | | | | | | | | | | | | | | |
|
CORPORATE BONDS (continued) | |
Electric (cont’d.) | |
2.450% | | 12/02/27 | | | | | | | | | | | 970 | | | $ | 804,547 | |
Ohio Power Co., | |
Sr. Unsec’d. Notes | |
4.000% | | 06/01/49 | | | | | | | | | | | 465 | | | | 368,245 | |
PacifiCorp, | |
First Mortgage | |
5.350% | | 12/01/53 | | | | | | | | | | | 2,045 | | | | 2,045,703 | |
PECO Energy Co., | |
First Mortgage | |
2.800% | | 06/15/50 | | | | | | | | | | | 785 | | | | 518,221 | |
Public Service Electric & Gas Co., | |
First Mortgage, MTN | |
3.700% | | 05/01/28 | | | | | | | | | | | 850 | | | | 809,789 | |
4.900% | | 12/15/32 | | | | | | | | | | | 820 | | | | 821,749 | |
Sr. Sec’d. Notes, MTN | |
5.800% | | 05/01/37 | | | | | | | | | | | 515 | | | | 535,801 | |
Public Service Enterprise Group, Inc., | |
Sr. Unsec’d. Notes | |
1.600% | | 08/15/30 | | | | | | | | | | | 1,235 | | | | 959,452 | |
San Diego Gas & Electric Co., | |
First Mortgage | |
4.150% | | 05/15/48 | | | | | | | | | | | 1,010 | | | | 849,334 | |
Southern California Edison Co., | |
First Ref. Mortgage | |
4.000% | | 04/01/47 | | | | | | | | | | | 350 | | | | 274,811 | |
First Ref. Mortgage, Series C | |
3.600% | | 02/01/45 | | | | | | | | | | | 690 | | | | 496,681 | |
Vistra Operations Co. LLC, | |
Gtd. Notes, 144A | |
5.000% | | 07/31/27 | | | | | | | | | | | 495 | | | | 460,651 | |
Sr. Sec’d. Notes, 144A | |
3.550% | | 07/15/24 | | | | | | | | | | | 1,475 | | | | 1,415,477 | |
Xcel Energy, Inc., | |
Sr. Unsec’d. Notes | |
4.800% | | 09/15/41 | | | | | | | | | | | 480 | | | | 418,273 | |
| | | | | | | | | | | | | | | | | | |
| |
| | | | 25,245,813 | |
| | | | | | | | | | | | | | | | | | |
Engineering & Construction — 0.1% | |
AECOM, | |
Gtd. Notes | |
5.125% | | 03/15/27 | | | | | | | | | | | 600 | | | | 580,791 | |
Mexico City Airport Trust (Mexico), | |
Sr. Sec’d. Notes, 144A | |
5.500% | | 07/31/47 | | | | | | | | | | | 1,350 | | | | 1,039,500 | |
| | | | | | | | | | | | | | | | | | |
| |
| | | | 1,620,291 | |
| | | | | | | | | | | | | | | | | | |
Entertainment — 0.0% | |
Warnermedia Holdings, Inc., | |
Gtd. Notes, 144A | |
5.050% | | 03/15/42 | | | | | | | | | | | 450 | | | | 346,050 | |
5.141% | | 03/15/52 | | | | | | | | | | | 650 | | | | 477,285 | |
| | | | | | | | | | | | | | | | | | |
| |
| | | | 823,335 | |
| | | | | | | | | | | | | | | | | | |
Foods — 0.3% | |
JBS USA LUX SA/JBS USA Food Co./JBS USA Finance, Inc., | |
Gtd. Notes, 144A | |
5.125% | | 02/01/28 | | | | | | | | | | | 3,000 | | | | 2,845,672 | |
| | | | | | | | | | | | | | | | | | |
Interest Rate | | Maturity Date | | | | | Principal
Amount
(000)# | | | Value | |
| | | | | | | | | | | | | | | |
|
CORPORATE BONDS (continued) | |
Foods (cont’d.) | |
Kraft Heinz Foods Co., | |
Gtd. Notes | |
6.500% | | 02/09/40 | | | | | | | | | | | 1,135 | | | $ | 1,201,871 | |
Lamb Weston Holdings, Inc., | |
Gtd. Notes, 144A | |
4.125% | | 01/31/30 | | | | | | | | | | | 200 | | | | 176,962 | |
4.375% | | 01/31/32 | | | | | | | | | | | 600 | | | | 524,047 | |
Mars, Inc., | |
Sr. Unsec’d. Notes, 144A | |
2.375% | | 07/16/40 | | | | | | | | | | | 535 | | | | 362,983 | |
Pilgrim’s Pride Corp., | |
Gtd. Notes, 144A | |
5.875% | | 09/30/27 | | | | | | | | | | | 1,200 | | | | 1,175,926 | |
| | | | | | | | | | | | | | | | | | |
| |
| | | | 6,287,461 | |
| | | | | | | | | | | | | | | | | | |
Forest Products & Paper — 0.0% | |
Celulosa Arauco y Constitucion SA (Chile), | |
Sr. Unsec’d. Notes | |
4.500% | | 08/01/24 | | | | | | | | | | | 207 | | | | 203,222 | |
| | | | | | | | | | | | | | | | | | |
Gas — 0.1% | |
NiSource, Inc., | |
Sr. Unsec’d. Notes | |
1.700% | | 02/15/31 | | | | | | | | | | | 270 | | | | 205,629 | |
3.600% | | 05/01/30 | | | | | | | | | | | 1,600 | | | | 1,426,502 | |
Piedmont Natural Gas Co., Inc., | |
Sr. Unsec’d. Notes | |
3.500% | | 06/01/29 | | | | | | | | | | | 2,090 | | | | 1,919,791 | |
| | | | | | | | | | | | | | | | | | |
| |
| | | | 3,551,922 | |
| | | | | | | | | | | | | | | | | | |
Healthcare-Products — 0.1% | |
DH Europe Finance II Sarl, | |
Gtd. Notes | |
1.350% | | 09/18/39 | | | | | | | EUR | | | | 1,125 | | | | 813,930 | |
Medline Borrower LP, | |
Sr. Sec’d. Notes, 144A | |
3.875% | | 04/01/29 | | | | | | | | | | | 475 | | | | 382,830 | |
Medtronic Global Holdings SCA, | |
Gtd. Notes | |
2.250% | | 03/07/39 | | | | | | | EUR | | | | 300 | | | | 247,501 | |
| | | | | | | | | | | | | | | | | | |
| |
| | | | 1,444,261 | |
| | | | | | | | | | | | | | | | | | |
Healthcare-Services — 0.2% | |
Aetna, Inc., | |
Sr. Unsec’d. Notes | |
6.625% | | 06/15/36 | | | | | | | | | | | 480 | | | | 510,994 | |
Elevance Health, Inc., | |
Sr. Unsec’d. Notes | |
3.600% | | 03/15/51 | | | | | | | | | | | 885 | | | | 666,266 | |
4.625% | | 05/15/42 | | | | | | | | | | | 330 | | | | 300,179 | |
HCA, Inc., | |
Gtd. Notes | |
5.125% | | 06/15/39 | | | | | | | | | | | 665 | | | | 592,788 | |
Kaiser Foundation Hospitals, | |
Gtd. Notes | |
4.150% | | 05/01/47 | | | | | | | | | | | 670 | | | | 568,818 | |
SEE NOTES TO FINANCIAL STATEMENTS.
A47
| | | | |
| | PSF PGIM 50/50 BALANCED PORTFOLIO (CONTINUED) | | |
SCHEDULE OF INVESTMENTS | | | | as of December 31, 2022 |
| | | | | | | | | | | | | | | | | | |
Interest Rate | | Maturity Date | | | | | Principal
Amount
(000)# | | | Value | |
| | | | | | | | | | | | | | | |
|
CORPORATE BONDS (continued) | |
Healthcare-Services (cont’d.) | |
Tenet Healthcare Corp., | |
Sr. Sec’d. Notes, 144A | |
4.375% | | 01/15/30 | | | | | | | | | | | 425 | | | $ | 368,217 | |
6.125% | | 06/15/30 | | | | | | | | | | | 225 | | | | 214,293 | |
UnitedHealth Group, Inc., | |
Sr. Unsec’d. Notes | |
5.875% | | 02/15/53(a) | | | | | | | | | | | 965 | | | | 1,047,740 | |
6.050% | | 02/15/63 | | | | | | | | | | | 630 | | | | 693,723 | |
| | | | | | | | | | | | | | | | | | |
| |
| | | | 4,963,018 | |
| | | | | | | | | | | | | | | | | | |
Home Builders — 0.0% | |
KB Home, | |
Gtd. Notes | |
4.000% | | 06/15/31(a) | | | | | | | | | | | 400 | | | | 323,150 | |
Taylor Morrison Communities, Inc., | |
Gtd. Notes, 144A | |
5.875% | | 06/15/27 | | | | | | | | | | | 405 | | | | 389,748 | |
Taylor Morrison Communities, Inc./Taylor Morrison Holdings II, Inc., | |
Gtd. Notes, 144A | |
5.625% | | 03/01/24 | | | | | | | | | | | 600 | | | | 595,500 | |
| | | | | | | | | | | | | | | | | | |
| |
| | | | 1,308,398 | |
| | | | | | | | | | | | | | | | | | |
Housewares — 0.1% | |
Newell Brands, Inc., | |
Sr. Unsec’d. Notes | |
4.450% | | 04/01/26 | | | | | | | | | | | 2,010 | | | | 1,901,910 | |
| | | | | | | | | | | | | | | | | | |
Insurance — 0.2% | |
Liberty Mutual Group, Inc., | |
Gtd. Notes, 144A | |
3.951% | | 10/15/50 | | | | | | | | | | | 1,125 | | | | 792,356 | |
Lincoln National Corp., | |
Sr. Unsec’d. Notes | |
6.300% | | 10/09/37 | | | | | | | | | | | 701 | | | | 687,996 | |
Markel Corp., | |
Sr. Unsec’d. Notes | |
5.000% | | 03/30/43 | | | | | | | | | | | 165 | | | | 141,628 | |
New York Life Insurance Co., | |
Sub. Notes, 144A | |
6.750% | | 11/15/39 | | | | | | | | | | | 650 | | | | 723,795 | |
Principal Financial Group, Inc., | |
Gtd. Notes | |
4.625% | | 09/15/42 | | | | | | | | | | | 105 | | | | 87,791 | |
Teachers Insurance & Annuity Association of America, | |
Sub. Notes, 144A | |
4.270% | | 05/15/47 | | | | | | | | | | | 1,430 | | | | 1,181,754 | |
6.850% | | 12/16/39 | | | | | | | | | | | 122 | | | | 134,120 | |
| | | | | | | | | | | | | | | | | | |
| |
| | | | 3,749,440 | |
| | | | | | | | | | | | | | | | | | |
Internet — 0.0% | |
Meta Platforms, Inc., | |
Sr. Unsec’d. Notes | |
4.450% | | 08/15/52(a) | | | | | | | | | | | 530 | | | | 421,165 | |
| | | | | | | | | | | | | | | | | | |
Media — 0.4% | |
CCO Holdings LLC/CCO Holdings Capital Corp., | |
Sr. Unsec’d. Notes, 144A | |
4.000% | | 03/01/23(a) | | | | | | | | | | | 1,000 | | | | 996,770 | |
5.500% | | 05/01/26(a) | | | | | | | | | | | 500 | | | | 484,236 | |
| | | | | | | | | | | | | | | | | | |
Interest Rate | | Maturity Date | | | | | Principal
Amount
(000)# | | | Value | |
| | | | | | | | | | | | | | | |
|
CORPORATE BONDS (continued) | |
Media (cont’d.) | |
Charter Communications Operating LLC/Charter Communications Operating Capital, | |
Sr. Sec’d. Notes | |
3.900% | | 06/01/52 | | | | | | | | | | | 500 | | | $ | 315,361 | |
6.384% | | 10/23/35 | | | | | | | | | | | 1,695 | | | | 1,655,345 | |
6.484% | | 10/23/45 | | | | | | | | | | | 1,000 | | | | 906,256 | |
Cox Communications, Inc., | |
Sr. Unsec’d. Notes, 144A | |
2.600% | | 06/15/31 | | | | | | | | | | | 3,695 | | | | 2,939,740 | |
CSC Holdings LLC, | |
Gtd. Notes, 144A | |
4.500% | | 11/15/31 | | | | | | | | | | | 1,000 | | | | 695,000 | |
Discovery Communications LLC, | |
Gtd. Notes | |
4.000% | | 09/15/55 | | | | | | | | | | | 823 | | | | 495,822 | |
Paramount Global, | |
Sr. Unsec’d. Notes | |
5.250% | | 04/01/44 | | | | | | | | | | | 1,340 | | | | 1,032,510 | |
Time Warner Cable LLC, | |
Sr. Sec’d. Notes | |
5.500% | | 09/01/41 | | | | | | | | | | | 270 | | | | 225,502 | |
Walt Disney Co. (The), | |
Gtd. Notes | |
7.625% | | 11/30/28 | | | | | | | | | | | 515 | | | | 580,187 | |
| | | | | | | | | | | | | | | | | | |
| |
| | | | 10,326,729 | |
| | | | | | | | | | | | | | | | | | |
Miscellaneous Manufacturing — 0.1% | |
Amsted Industries, Inc., | |
Gtd. Notes, 144A | |
5.625% | | 07/01/27 | | | | | | | | | | | 800 | | | | 764,149 | |
Pentair Finance Sarl, | |
Gtd. Notes | |
4.500% | | 07/01/29 | | | | | | | | | | | 2,415 | | | | 2,234,933 | |
| | | | | | | | | | | | | | | | | | |
| |
| | | | 2,999,082 | |
| | | | | | | | | | | | | | | | | | |
Multi-National — 0.0% | |
Corp. Andina de Fomento (Supranational Bank), | |
Sr. Unsec’d. Notes | |
2.750% | | 01/06/23 | | | | | | | | | | | 385 | | | | 384,808 | |
| | | | | | | | | | | | | | | | | | |
Office/Business Equipment — 0.1% | |
CDW LLC/CDW Finance Corp., | |
Gtd. Notes | |
2.670% | | 12/01/26 | | | | | | | | | | | 1,270 | | | | 1,129,304 | |
5.500% | | 12/01/24 | | | | | | | | | | | 500 | | | | 498,198 | |
| | | | | | | | | | | | | | | | | | |
| |
| | | | 1,627,502 | |
| | | | | | | | | | | | | | | | | | |
Oil & Gas — 0.5% | |
Aker BP ASA (Norway), | |
Gtd. Notes, 144A | |
3.100% | | 07/15/31 | | | | | | | | | | | 530 | | | | 431,167 | |
Sr. Unsec’d. Notes, 144A | |
3.750% | | 01/15/30 | | | | | | | | | | | 2,222 | | | | 1,948,507 | |
Cenovus Energy, Inc. (Canada), | |
Sr. Unsec’d. Notes | |
5.400% | | 06/15/47 | | | | | | | | | | | 850 | | | | 767,605 | |
SEE NOTES TO FINANCIAL STATEMENTS.
A48
| | | | |
| | PSF PGIM 50/50 BALANCED PORTFOLIO (CONTINUED) | | |
SCHEDULE OF INVESTMENTS | | | | as of December 31, 2022 |
| | | | | | | | | | | | | | | | | | |
Interest Rate | | Maturity Date | | | | | Principal
Amount
(000)# | | | Value | |
| | | | | | | | | | | | | | | |
|
CORPORATE BONDS (continued) | |
Oil & Gas (cont’d.) | |
Continental Resources, Inc., | |
Gtd. Notes | |
4.500% | | 04/15/23(a) | | | | | | | | | | | 430 | | | $ | 428,490 | |
Devon Energy Corp., | |
Sr. Unsec’d. Notes | |
5.600% | | 07/15/41 | | | | | | | | | | | 225 | | | | 210,212 | |
Ecopetrol SA (Colombia), | |
Sr. Unsec’d. Notes | |
6.875% | | 04/29/30 | | | | | | | | | | | 440 | | | | 398,200 | |
Endeavor Energy Resources LP/EER Finance, Inc., | |
Sr. Unsec’d. Notes, 144A | |
5.750% | | 01/30/28 | | | | | | | | | | | 350 | | | | 335,131 | |
Energean Israel Finance Ltd. (Israel), | |
Sr. Sec’d. Notes, 144A | |
4.500% | | 03/30/24 | | | | | | | | | | | 390 | | | | 375,570 | |
4.875% | | 03/30/26 | | | | | | | | | | | 570 | | | | 523,082 | |
Hilcorp Energy I LP/Hilcorp Finance Co., | |
Sr. Unsec’d. Notes, 144A | |
6.000% | | 04/15/30 | | | | | | | | | | | 275 | | | | 246,100 | |
6.250% | | 04/15/32 | | | | | | | | | | | 325 | | | | 279,211 | |
KazMunayGas National Co. JSC (Kazakhstan), | |
Sr. Unsec’d. Notes, 144A | |
4.750% | | 04/24/25 | | | | | | | | | | | 400 | | | | 385,075 | |
Occidental Petroleum Corp., | |
Sr. Unsec’d. Notes | |
6.450% | | 09/15/36 | | | | | | | | | | | 1,040 | | | | 1,061,004 | |
Petroleos Mexicanos (Mexico), | |
Gtd. Notes | |
4.750% | | 02/26/29 | | | | | | | EUR | | | | 100 | | | | 83,682 | |
6.350% | | 02/12/48 | | | | | | | | | | | 458 | | | | 278,035 | |
6.490% | | 01/23/27 | | | | | | | | | | | 346 | | | | 315,898 | |
6.500% | | 03/13/27 | | | | | | | | | | | 130 | | | | 118,138 | |
Gtd. Notes, MTN | |
6.750% | | 09/21/47 | | | | | | | | | | | 471 | | | | 299,970 | |
6.875% | | 08/04/26(a) | | | | | | | | | | | 770 | | | | 731,885 | |
QatarEnergy Trading LLC (Qatar), | |
Sr. Unsec’d. Notes, 144A | |
1.375% | | 09/12/26 | | | | | | | | | | | 1,544 | | | | 1,364,800 | |
2.250% | | 07/12/31 | | | | | | | | | | | 545 | | | | 449,727 | |
| | | | | | | | | | | | | | | | | | |
| |
| | | | 11,031,489 | |
| | | | | | | | | | | | | | | | | | |
Packaging & Containers — 0.2% | |
Ball Corp., | |
Gtd. Notes | |
3.125% | | 09/15/31 | | | | | | | | | | | 300 | | | | 240,825 | |
Berry Global, Inc., | |
Sr. Sec’d. Notes | |
1.570% | | 01/15/26 | | | | | | | | | | | 3,570 | | | | 3,187,679 | |
Graphic Packaging International LLC, | |
Gtd. Notes | |
4.125% | | 08/15/24 | | | | | | | | | | | 450 | | | | 440,104 | |
| | | | | | | | | | | | | | | | | | |
| |
| | | | 3,868,608 | |
| | | | | | | | | | | | | | | | | | |
Pharmaceuticals — 0.5% | |
AbbVie, Inc., | |
Sr. Unsec’d. Notes | |
3.800% | | 03/15/25 | | | | | | | | | | | 950 | | | | 926,082 | |
| | | | | | | | | | | | | | | | | | |
Interest Rate | | Maturity Date | | | | | Principal
Amount
(000)# | | | Value | |
| | | | | | | | | | | | | | | |
|
CORPORATE BONDS (continued) | |
Pharmaceuticals (cont’d.) | |
4.250% | | 11/21/49 | | | | | | | | | | | 1,000 | | | $ | 840,567 | |
4.500% | | 05/14/35 | | | | | | | | | | | 1,595 | | | | 1,484,868 | |
4.550% | | 03/15/35 | | | | | | | | | | | 1,770 | | | | 1,654,648 | |
4.700% | | 05/14/45 | | | | | | | | | | | 855 | | | | 763,759 | |
Bayer US Finance II LLC (Germany), | |
Gtd. Notes, 144A | |
4.250% | | 12/15/25 | | | | | | | | | | | 1,150 | | | | 1,116,760 | |
Becton, Dickinson & Co., | |
Sr. Unsec’d. Notes | |
3.734% | | 12/15/24 | | | | | | | | | | | 102 | | | | 99,446 | |
Bristol-Myers Squibb Co., | |
Sr. Unsec’d. Notes | |
4.125% | | 06/15/39 | | | | | | | | | | | 280 | | | | 249,627 | |
Cigna Corp., | |
Gtd. Notes | |
4.375% | | 10/15/28 | | | | | | | | | | | 1,870 | | | | 1,803,845 | |
Sr. Unsec’d. Notes | |
3.200% | | 03/15/40 | | | | | | | | | | | 1,555 | | | | 1,176,287 | |
CVS Health Corp., | |
Sr. Unsec’d. Notes | |
5.125% | | 07/20/45 | | | | | | | | | | | 985 | | | | 897,510 | |
5.300% | | 12/05/43 | | | | | | | | | | | 185 | | | | 173,274 | |
Mylan, Inc., | |
Gtd. Notes | |
5.400% | | 11/29/43 | | | | | | | | | | | 590 | | | | 467,375 | |
Organon & Co./Organon Foreign Debt Co-Issuer BV, | |
Sr. Sec’d. Notes, 144A | |
4.125% | | 04/30/28 | | | | | | | | | | | 700 | | | | 619,793 | |
Viatris, Inc., | |
Gtd. Notes | |
3.850% | | 06/22/40 | | | | | | | | | | | 520 | | | | 348,485 | |
| | | | | | | | | | | | | | | | | | |
| |
| | | | 12,622,326 | |
| | | | | | | | | | | | | | | | | | |
Pipelines — 0.7% | |
Antero Midstream Partners LP/Antero Midstream Finance Corp., | |
Gtd. Notes, 144A | |
7.875% | | 05/15/26 | | | | | | | | | | | 525 | | | | 533,119 | |
DCP Midstream Operating LP, | |
Gtd. Notes | |
5.125% | | 05/15/29 | | | | | | | | | | | 2,600 | | | | 2,506,715 | |
Eastern Gas Transmission & Storage, Inc., | |
Sr. Unsec’d. Notes | |
4.600% | | 12/15/44 | | | | | | | | | | | 45 | | | | 36,972 | |
EIG Pearl Holdings Sarl (Saudi Arabia), | |
Sr. Sec’d. Notes, 144A | |
3.545% | | 08/31/36 | | | | | | | | | | | 1,060 | | | | 888,942 | |
Energy Transfer LP, | |
Sr. Unsec’d. Notes | |
4.950% | | 06/15/28 | | | | | | | | | | | 795 | | | | 767,890 | |
5.000% | | 05/15/50 | | | | | | | | | | | 990 | | | | 799,240 | |
6.125% | | 12/15/45 | | | | | | | | | | | 120 | | | | 111,277 | |
EQM Midstream Partners LP, | |
Sr. Unsec’d. Notes, 144A | |
7.500% | | 06/01/27 | | | | | | | | | | | 25 | | | | 24,492 | |
7.500% | | 06/01/30 | | | | | | | | | | | 25 | | | | 24,100 | |
SEE NOTES TO FINANCIAL STATEMENTS.
A49
| | | | |
| | PSF PGIM 50/50 BALANCED PORTFOLIO (CONTINUED) | | |
SCHEDULE OF INVESTMENTS | | | | as of December 31, 2022 |
| | | | | | | | | | | | | | | | | | |
Interest Rate | | Maturity Date | | | | | Principal
Amount
(000)# | | | Value | |
| | | | | | | | | | | | | | | |
|
CORPORATE BONDS (continued) | |
Pipelines (cont’d.) | |
Kinder Morgan, Inc., | |
Gtd. Notes | |
3.600% | | 02/15/51 | | | | | | | | | | | 1,575 | | | $ | 1,088,786 | |
MPLX LP, | |
Sr. Unsec’d. Notes | |
4.000% | | 02/15/25 | | | | | | | | | | | 1,140 | | | | 1,104,680 | |
4.875% | | 06/01/25 | | | | | | | | | | | 2,275 | | | | 2,248,785 | |
5.200% | | 03/01/47 | | | | | | | | | | | 25 | | | | 21,252 | |
5.500% | | 02/15/49 | | | | | | | | | | | 700 | | | | 619,195 | |
ONEOK Partners LP, | |
Gtd. Notes | |
6.650% | | 10/01/36 | | | | | | | | | | | 130 | | | | 130,529 | |
ONEOK, Inc., | |
Gtd. Notes | |
3.100% | | 03/15/30 | | | | | | | | | | | 3,495 | | | | 2,932,640 | |
4.500% | | 03/15/50 | | | | | | | | | | | 245 | | | | 183,815 | |
4.950% | | 07/13/47 | | | | | | | | | | | 640 | | | | 519,477 | |
Venture Global Calcasieu Pass LLC, | |
Sr. Sec’d. Notes, 144A | |
3.875% | | 08/15/29 | | | | | | | | | | | 80 | | | | 70,042 | |
4.125% | | 08/15/31 | | | | | | | | | | | 55 | | | | 46,888 | |
Western Midstream Operating LP, | |
Sr. Unsec’d. Notes | |
5.300% | | 03/01/48 | | | | | | | | | | | 80 | | | | 66,238 | |
Williams Cos., Inc. (The), | |
Sr. Unsec’d. Notes | |
4.900% | | 01/15/45 | | | | | | | | | | | 1,100 | | | | 935,542 | |
5.300% | | 08/15/52 | | | | | | | | | | | 210 | | | | 189,174 | |
| | | | | | | | | | | | | | | | | | |
| |
| | | | 15,849,790 | |
| | | | | | | | | | | | | | | | | | |
Real Estate Investment Trusts (REITs) — 0.2% | |
Corporate Office Properties LP, | |
Gtd. Notes | |
2.900% | | 12/01/33 | | | | | | | | | | | 945 | | | | 665,713 | |
GLP Capital LP/GLP Financing II, Inc., | |
Gtd. Notes | |
5.375% | | 04/15/26 | | | | | | | | | | | 725 | | | | 714,889 | |
Kimco Realty Corp., | |
Sr. Unsec’d. Notes | |
2.700% | | 10/01/30 | | | | | | | | | | | 2,420 | | | | 1,974,841 | |
MPT Operating Partnership LP/MPT Finance Corp., | |
Gtd. Notes | |
3.500% | | 03/15/31 | | | | | | | | | | | 625 | | | | 429,980 | |
5.000% | | 10/15/27(a) | | | | | | | | | | | 275 | | | | 231,413 | |
Realty Income Corp., | |
Sr. Unsec’d. Notes | |
3.250% | | 01/15/31(a) | | | | | | | | | | | 2,250 | | | | 1,951,295 | |
| | | | | | | | | | | | | | | | | | |
| |
| | | | 5,968,131 | |
| | | | | | | | | | | | | | | | | | |
Retail — 0.3% | |
1011778 BC ULC/New Red Finance, Inc. (Canada), | |
Sr. Sec’d. Notes, 144A | |
3.875% | | 01/15/28(a) | | | | | | | | | | | 500 | | | | 450,625 | |
AutoZone, Inc., | |
Sr. Unsec’d. Notes | |
3.750% | | 04/18/29 | | | | | | | | | | | 1,820 | | | | 1,685,461 | |
| | | | | | | | | | | | | | | | | | |
Interest Rate | | Maturity Date | | | | | Principal
Amount
(000)# | | | Value | |
| | | | | | | | | | | | | | | |
|
CORPORATE BONDS (continued) | |
Retail (cont’d.) | |
Dollar Tree, Inc., | |
Sr. Unsec’d. Notes | |
4.000% | | 05/15/25 | | | | | | | | | | | 3,395 | | | $ | 3,315,602 | |
Gap, Inc. (The), | |
Gtd. Notes, 144A | |
3.625% | | 10/01/29 | | | | | | | | | | | 200 | | | | 142,323 | |
3.875% | | 10/01/31(a) | | | | | | | | | | | 425 | | | | 299,830 | |
Sally Holdings LLC/Sally Capital, Inc., | |
Gtd. Notes | |
5.625% | | 12/01/25 | | | | | | | | | | | 1,020 | | | | 982,488 | |
| | | | | | | | | | | | | | | | | | |
| |
| | | | 6,876,329 | |
| | | | | | | | | | | | | | | | | | |
Semiconductors — 0.1% | |
Broadcom, Inc., | |
Sr. Unsec’d. Notes, 144A | |
3.187% | | 11/15/36 | | | | | | | | | | | 3,650 | | | | 2,634,349 | |
| | | | | | | | | | | | | | | | | | |
Software — 0.1% | |
ServiceNow, Inc., | |
Sr. Unsec’d. Notes | |
1.400% | | 09/01/30 | | | | | | | | | | | 1,425 | | | | 1,085,804 | |
Workday, Inc., | |
Sr. Unsec’d. Notes | |
3.800% | | 04/01/32(a) | | | | | | | | | | | 1,845 | | | | 1,628,240 | |
| | | | | | | | | | | | | | | | | | |
| |
| | | | 2,714,044 | |
| | | | | | | | | | | | | | | | | | |
Telecommunications — 0.6% | |
AT&T, Inc., | |
Sr. Unsec’d. Notes | |
2.550% | | 12/01/33 | | | | | | | | | | | 346 | | | | 266,074 | |
3.500% | | 09/15/53 | | | | | | | | | | | 2,817 | | | | 1,916,601 | |
3.650% | | 09/15/59 | | | | | | | | | | | 4 | | | | 2,708 | |
4.300% | | 02/15/30 | | | | | | | | | | | 490 | | | | 460,787 | |
4.500% | | 05/15/35 | | | | | | | | | | | 1,095 | | | | 995,920 | |
British Telecommunications PLC (United Kingdom), | |
Sr. Unsec’d. Notes | |
9.625% | | 12/15/30 | | | | | | | | | | | 350 | | | | 419,563 | |
Level 3 Financing, Inc., | |
Sr. Sec’d. Notes, 144A | |
3.400% | | 03/01/27 | | | | | | | | | | | 250 | | | | 211,797 | |
T-Mobile USA, Inc., | |
Gtd. Notes | |
2.550% | | 02/15/31 | | | | | | | | | | | 965 | | | | 786,404 | |
3.875% | | 04/15/30 | | | | | | | | | | | 5,500 | | | | 4,992,491 | |
Verizon Communications, Inc., | |
Sr. Unsec’d. Notes | |
2.550% | | 03/21/31 | | | | | | | | | | | 1,515 | | | | 1,246,841 | |
2.650% | | 11/20/40 | | | | | | | | | | | 1,095 | | | | 739,142 | |
4.016% | | 12/03/29 | | | | | | | | | | | 1,365 | | | | 1,277,439 | |
| | | | | | | | | | | | | | | | | | |
| |
| | | | 13,315,767 | |
| | | | | | | | | | | | | | | | | | |
Transportation — 0.1% | |
Burlington Northern Santa Fe LLC, | |
Sr. Unsec’d. Notes | |
6.700% | | 08/01/28 | | | | | | | | | | | 735 | | | | 774,839 | |
CSX Corp., | |
Sr. Unsec’d. Notes | |
6.150% | | 05/01/37 | | | | | | | | | | | 690 | | | | 736,375 | |
SEE NOTES TO FINANCIAL STATEMENTS.
A50
| | | | |
| | PSF PGIM 50/50 BALANCED PORTFOLIO (CONTINUED) | | |
SCHEDULE OF INVESTMENTS | | | | as of December 31, 2022 |
| | | | | | | | | | | | | | | | | | | | |
Interest Rate | | Maturity
Date | | | | | | | | | Principal
Amount
(000)# | | | Value | |
| | | | | | | | | | | | | | | | |
|
CORPORATE BONDS (continued) | |
Transportation (cont’d.) | |
Norfolk Southern Corp., | |
Sr. Unsec’d. Notes | |
5.590% | | | 05/17/25 | | | | | | | | | | | | 120 | | | $ | 120,984 | |
| | | | | | | | | | | | | | | | | | | | |
| |
| | | | 1,632,198 | |
| | | | | | | | | | | | | | | | | | | | |
TOTAL CORPORATE BONDS
(cost $287,289,569) | | | | 253,794,414 | |
| | | | | | | | | | | | | | | | | | | | |
|
MUNICIPAL BONDS — 0.4% | |
Alabama — 0.0% | |
Alabama Economic Settlement Authority, | |
Taxable, Revenue Bonds, Series B | |
4.263% | | | 09/15/32 | | | | | | | | | | | | 180 | | | | 166,736 | |
| | | | | | | | | | | | | | | | | | | | |
California — 0.2% | |
Bay Area Toll Authority, | |
Revenue Bonds, BABs, Series F2 | |
6.263% | | | 04/01/49 | | | | | | | | | | | | 1,305 | | | | 1,502,478 | |
Taxable, Revenue Bonds | |
2.574% | | | 04/01/31 | | | | | | | | | | | | 415 | | | | 362,366 | |
State of California, | |
General Obligation Unlimited, BABs | |
7.300% | | | 10/01/39 | | | | | | | | | | | | 1,250 | | | | 1,516,791 | |
General Obligation Unlimited, Taxable, BABs | |
7.500% | | | 04/01/34 | | | | | | | | | | | | 350 | | | | 424,637 | |
7.625% | | | 03/01/40 | | | | | | | | | | | | 205 | | | | 258,064 | |
| | | | | | | | | | | | | | | | | | | | |
| |
| | | | 4,064,336 | |
| | | | | | | | | | | | | | | | | | | | |
Colorado — 0.0% | |
Regional Transportation District Sales Tax Revenue, | |
Revenue Bonds, BABs, Series B | |
5.844% | | | 11/01/50 | | | | | | | | | | | | 565 | | | | 608,422 | |
| | | | | | | | | | | | | | | | | | | | |
Illinois — 0.0% | |
Chicago O’Hare International Airport, | |
Revenue Bonds, BABs, Series B | |
6.395% | | | 01/01/40 | | | | | | | | | | | | 970 | | | | 1,080,758 | |
| | | | | | | | | | | | | | | | | | | | |
New Jersey — 0.1% | |
New Jersey Turnpike Authority, | |
Taxable, Revenue Bonds, BABs, Series F | |
7.414% | | | 01/01/40 | | | | | | | | | | | | 1,000 | | | | 1,236,722 | |
| | | | | | | | | | | | | | | | | | | | |
New York — 0.1% | |
New York City Transitional Finance Authority Future Tax Secured Revenue, | |
Taxable, Revenue Bonds, BABs | |
5.767% | | | 08/01/36 | | | | | | | | | | | | 1,050 | | | | 1,085,385 | |
| | | | | | | | | | | | | | | | | | | | |
Ohio — 0.0% | |
Ohio State University (The), | |
Taxable, Revenue Bonds, BABs, Series C | |
4.910% | | | 06/01/40 | | | | | | | | | | | | 415 | | | | 419,612 | |
Ohio Water Development Authority Water Pollution Control Loan Fund, | |
Taxable, Revenue Bonds, BABs, Series B2 | |
4.879% | | | 12/01/34 | | | | | | | | | | | | 275 | | | | 275,582 | |
| | | | | | | | | | | | | | | | | | | | |
| |
| | | | 695,194 | |
| | | | | | | | | | | | | | | | | | | | |
Oregon — 0.0% | |
State of Oregon Department of Transportation, | |
Taxable, Revenue Bonds, BABs, Series A | |
5.834% | | | 11/15/34 | | | | | | | | | | | | 425 | | | | 455,219 | |
| | | | | | | | | | | | | | | | | | | | |
| | | | | | | | | | | | | | | | | | | | |
Interest Rate | | Maturity
Date | | | | | | | | | Principal
Amount
(000)# | | | Value | |
| | | | | | | | | | | | | | | | |
|
MUNICIPAL BONDS (continued) | |
Pennsylvania — 0.0% | |
Pennsylvania Turnpike Commission, | |
Revenue Bonds, BABs, Series B | |
5.511% | | | 12/01/45 | | | | | | | | | | | | 505 | | | $ | 507,792 | |
| | | | | | | | | | | | | | | | | | | | |
Virginia — 0.0% | |
University of Virginia, | |
Taxable, Revenue Bonds, Series C | |
4.179% | | | 09/01/2117 | | | | | | | | | | | | 355 | | | | 261,952 | |
| | | | | | | | | | | | | | | | | | | | |
| |
TOTAL MUNICIPAL BONDS
(cost $9,380,780) | | | | 10,162,516 | |
| | | | | | | | | | | | | | | | | | | | |
RESIDENTIAL MORTGAGE-BACKED SECURITIES — 1.6% | |
Alternative Loan Trust, | |
Series 2004-18CB, Class 3A1 | |
5.250% | | | 09/25/35 | | | | | | | | | | | | 10 | | | | 9,323 | |
Banc of America Mortgage Trust, | |
Series 2005-A, Class 2A1 | |
2.543%(cc) | | | 02/25/35 | | | | | | | | | | | | 41 | | | | 38,696 | |
Bellemeade Re Ltd., | |
Series 2021-02A, Class M1A, 144A, 30 Day Average SOFR + 1.200% (Cap N/A, Floor 1.200%) | |
5.128%(c) | | | 06/25/31 | | | | | | | | | | | | 1,400 | | | | 1,386,225 | |
Series 2021-03A, Class A2, 144A, 30 Day Average SOFR + 1.000%
(Cap N/A, Floor 1.000%) | |
4.928%(c) | | | 09/25/31 | | | | | | | | | | | | 1,500 | | | | 1,421,378 | |
Series 2021-03A, Class M1A, 144A, 30 Day Average SOFR + 1.000% (Cap N/A, Floor 1.000%) | |
4.928%(c) | | | 09/25/31 | | | | | | | | | | | | 944 | | | | 931,434 | |
Series 2022-01, Class M1A, 144A, 30 Day Average SOFR + 1.750% (Cap N/A, Floor 1.750%) | |
5.678%(c) | | | 01/26/32 | | | | | | | | | | | | 2,270 | | | | 2,239,529 | |
Chase Mortgage Finance Trust, | |
Series 2007-A01, Class 1A5 | |
3.492%(cc) | | | 02/25/37 | | | | | | | | | | | | 76 | | | | 72,134 | |
Credit Suisse Mortgage Trust, | |
Series 2018-RPL09, Class A, 144A | |
3.850%(cc) | | | 09/25/57 | | | | | | | | | | | | 516 | | | | 482,090 | |
Eagle Re Ltd., | |
Series 2021-02, Class M1A, 144A, 30 Day Average SOFR + 1.550% (Cap N/A, Floor 1.550%) | |
5.478%(c) | | | 04/25/34 | | | | | | | | | | | | 3,641 | | | | 3,619,504 | |
Fannie Mae REMIC, | |
Series 2014-73, Class CZ | |
3.000% | | | 11/25/44 | | | | | | | | | | | | 2,582 | | | | 2,245,929 | |
Series 2020-24, Class SP, IO, 1 Month LIBOR + 6.050% (Cap 6.050%, Floor 0.000%) | |
1.661%(c) | | | 04/25/50 | | | | | | | | | | | | 810 | | | | 91,244 | |
Series 2021-03, Class JI, IO | |
2.500% | | | 02/25/51 | | | | | | | | | | | | 2,387 | | | | 318,328 | |
Series 2022-51, Class PS, IO, 30 Day Average SOFR + 5.950% (Cap 5.950%, Floor 0.000%) | |
2.022%(c) | | | 08/25/52 | | | | | | | | | | | | 1,903 | | | | 129,701 | |
FHLMC Structured Agency Credit Risk Debt Notes, | |
Series 2020-HQA05, Class M2, 144A, 30 Day Average SOFR + 2.600% (Cap N/A, Floor 0.000%) | |
6.528%(c) | | | 11/25/50 | | | | | | | | | | | | 1,251 | | | | 1,248,646 | |
SEE NOTES TO FINANCIAL STATEMENTS.
A51
| | | | |
| | PSF PGIM 50/50 BALANCED PORTFOLIO (CONTINUED) | | |
SCHEDULE OF INVESTMENTS | | | | as of December 31, 2022 |
| | | | | | | | | | | | | | | | | | |
Interest Rate | | Maturity
Date | | | | | | | | Principal
Amount
(000)# | | | Value | |
| | | | | | | | | | | | | | | |
|
| RESIDENTIAL MORTGAGE-BACKED SECURITIES (continued) | |
FHLMC Structured Agency Credit Risk REMIC Trust, | |
Series 2020-HQA04, Class B1, 144A, 1 Month LIBOR + 5.250%
(Cap N/A, Floor 0.000%) | |
9.639%(c) | | 09/25/50 | | | | | | | | | | | 155 | | | $ | 158,293 | |
Series 2021-DNA03, Class M2, 144A, 30 Day Average SOFR + 2.100% (Cap N/A, Floor 0.000%) | |
6.028%(c) | | 10/25/33 | | | | | | | | | | | 2,005 | | | | 1,965,851 | |
Series 2021-DNA05, Class M2, 144A, 30 Day Average SOFR + 1.650% (Cap N/A, Floor 0.000%) | |
5.578%(c) | | 01/25/34 | | | | | | | | | | | 170 | | | | 167,989 | |
Series 2021-HQA03, Class M1, 144A, 30 Day Average SOFR + 0.850% (Cap N/A, Floor 0.000%) | |
4.778%(c) | | 09/25/41 | | | | | | | | | | | 4,287 | | | | 4,092,534 | |
Series 2022-DNA01, Class M1A, 144A, 30 Day Average SOFR + 1.000% (Cap N/A, Floor 0.000%) | |
4.928%(c) | | 01/25/42 | | | | | | | | | | | 1,126 | | | | 1,097,384 | |
Freddie Mac REMIC, | |
Series 4117, Class ZC | |
3.000% | | 10/15/42 | | | | | | | | | | | 2,269 | | | | 2,011,804 | |
Series 4535, Class PA | |
3.000% | | 03/15/44 | | | | | | | | | | | 371 | | | | 347,631 | |
Series 4680, Class GZ | |
3.500% | | 03/15/47 | | | | | | | | | | | 1,216 | | | | 1,054,079 | |
Series 5021, Class SB, IO, 30 Day Average SOFR + 3.550%
(Cap 3.550%, Floor 0.000%) | |
0.000%(c) | | 10/25/50 | | | | | | | | | | | 1,949 | | | | 66,170 | |
Series 5023, Class IO, IO | |
2.000% | | 10/25/50 | | | | | | | | | | | 911 | | | | 106,154 | |
Series 5222, Class SA, IO, 30 Day Average SOFR + 3.500%
(Cap 3.500%, Floor 0.000%) | |
0.000%(c) | | 05/25/52 | | | | | | | | | | | 312 | | | | 5,383 | |
Government National Mortgage Assoc., | |
Series 2019-69, Class KB | |
3.000% | | 06/20/49 | | | | | | | | | | | 2,400 | | | | 1,905,115 | |
Series 2021-165, Class ST, IO, 1 Month LIBOR + 3.360%
(Cap 0.020%, Floor 0.000%) | |
0.000%(c) | | 01/20/50 | | | | | | | | | | | 468 | | | | 154 | |
Series 2021-177, Class SB, IO, 30 Day Average SOFR + 3.200%
(Cap 3.200%, Floor 0.000%) | |
0.000%(c) | | 10/20/51 | | | | | | | | | | | 2,105 | | | | 33,307 | |
Series 2021-205, Class DS, IO, 30 Day Average SOFR + 3.200%
(Cap 3.200%, Floor 0.000%) | |
0.000%(c) | | 11/20/51 | | | | | | | | | | | 3,469 | | | | 54,972 | |
Series 2022-046, Class S, IO, 30 Day Average SOFR + 3.500%
(Cap 3.500%, Floor 0.000%) | |
0.000%(c) | | 03/20/52 | | | | | | | | | | | 833 | | | | 14,093 | |
Series 2022-051, Class SC, IO, 30 Day Average SOFR + 3.500%
(Cap 3.500%, Floor 0.000%) | |
0.000%(c) | | 03/20/52 | | | | | | | | | | | 3,832 | | | | 59,337 | |
Series 2022-066, Class SB, IO, 30 Day Average SOFR + 3.850%
(Cap 3.850%, Floor 0.000%) | |
0.024%(c) | | 04/20/52 | | | | | | | | | | | 1,300 | | | | 25,113 | |
Series 2022-068, Class SP, IO, 30 Day Average SOFR + 3.850%
(Cap 3.850%, Floor 0.000%) | |
0.024%(c) | | 04/20/52 | | | | | | | | | | | 1,010 | | | | 18,292 | |
| | | | | | | | | | | | | | | | | | |
Interest Rate | | Maturity
Date | | | | | | | | Principal
Amount
(000)# | | | Value | |
| | | | | | | | | | | | | | | |
|
| RESIDENTIAL MORTGAGE-BACKED SECURITIES (continued) | |
Series 2022-078, Class MS, IO, 30 Day Average SOFR + 3.600% (Cap 3.600%, Floor 0.000%) | |
0.000%(c) | | 04/20/52 | | | | | | | | | | | 3,331 | | | $ | 49,207 | |
Series 2022-078, Class SB, IO, 30 Day Average SOFR + 3.750% (Cap 3.750%, Floor 0.000%) | |
0.000%(c) | | 04/20/52 | | | | | | | | | | | 2,229 | | | | 40,057 | |
Series 2022-093, Class GS, IO, 30 Day Average SOFR + 3.650% (Cap 3.650%, Floor 0.000%) | |
0.000%(c) | | 05/20/52 | | | | | | | | | | | 742 | | | | 10,943 | |
Series 2022-126, Class CS, IO, 30 Day Average SOFR + 3.760% (Cap 3.760%, Floor 0.000%) | |
0.000%(c) | | 07/20/52 | | | | | | | | | | | 4,445 | | | | 47,686 | |
Series 2022-133, Class SA, IO, 30 Day Average SOFR + 3.950% (Cap 3.950%, Floor 0.000%) | |
0.124%(c) | | 07/20/52 | | | | | | | | | | | 1,630 | | | | 25,946 | |
Series 2022-148, Class DS, IO, 30 Day Average SOFR + 3.600% (Cap 3.600%, Floor 0.000%) | |
0.000%(c) | | 08/20/52 | | | | | | | | | | | 1,635 | | | | 20,966 | |
Home Re Ltd., | |
Series 2019-01, Class M1, 144A, 1 Month LIBOR + 1.650% (Cap N/A, Floor 0.000%) | |
6.039%(c) | | 05/25/29 | | | | | | | | | | | 116 | | | | 114,092 | |
Series 2021-02, Class M1A, 144A, 30 Day Average SOFR + 1.250% (Cap N/A, Floor 0.000%) | |
5.178%(c) | | 01/25/34 | | | | | | | | | | | 375 | | | | 374,024 | |
JPMorgan Mortgage Trust, | |
Series 2007-A01, Class 4A1 | |
3.939%(cc) | | 07/25/35 | | | | | | | | | | | 24 | | | | 23,459 | |
Legacy Mortgage Asset Trust, | |
Series 2021-GS01, Class A1, 144A | |
1.892% | | 10/25/66 | | | | | | | | | | | 240 | | | | 219,389 | |
MFA Trust, | |
Series 2021-RPL01, Class A1, 144A | |
1.131%(cc) | | 07/25/60 | | | | | | | | | | | 1,819 | | | | 1,592,362 | |
Mill City Mortgage Loan Trust, | |
Series 2017-03, Class A1, 144A | |
2.750%(cc) | | 01/25/61 | | | | | | | | | | | 288 | | | | 278,625 | |
New Residential Mortgage Loan Trust, | |
Series 2018-04A, Class A1S, 144A, 1 Month LIBOR + 0.750% (Cap N/A, Floor 0.750%) | |
5.139%(c) | | 01/25/48 | | | | | | | | | | | 167 | | | | 160,484 | |
Oaktown Re II Ltd., | |
Series 2018-01A, Class M1, 144A, 1 Month LIBOR + 1.550% (Cap N/A, Floor 0.000%) | |
5.939%(c) | | 07/25/28 | | | | | | | | | | | 103 | | | | 103,192 | |
Oaktown Re VII Ltd., | |
Series 2021-02, Class M1A, 144A, 30 Day Average SOFR + 1.600% (Cap N/A, Floor 1.600%) | |
5.528%(c) | | 04/25/34 | | | | | | | | | | | 2,700 | | | | 2,642,922 | |
PMT Credit Risk Transfer Trust, | |
Series 2021-01R, Class A, 144A, 1 Month LIBOR + 2.900% (Cap N/A, Floor 2.900%) | |
7.287%(c) | | 02/27/24 | | | | | | | | | | | 1,767 | | | | 1,687,629 | |
Seasoned Credit Risk Transfer Trust, | |
Series 2019-02, Class MA | |
3.500% | | 08/25/58 | | | | | | | | | | | 784 | | | | 738,931 | |
SEE NOTES TO FINANCIAL STATEMENTS.
A52
| | | | |
| | PSF PGIM 50/50 BALANCED PORTFOLIO (CONTINUED) | | |
SCHEDULE OF INVESTMENTS | | | | as of December 31, 2022 |
| | | | | | | | | | | | | | | | | | |
Interest Rate | | Maturity
Date | | | | | Principal
Amount
(000)# | | | Value | |
| | | | | | | | | | | | | | | |
|
| RESIDENTIAL MORTGAGE-BACKED SECURITIES (continued) | |
Structured Adjustable Rate Mortgage Loan Trust, | |
Series 2004-01, Class 4A3 | |
3.780%(cc) | | 02/25/34 | | | | | | | | | | | 65 | | | $ | 60,321 | |
TFS (Spain), | |
Series 2018-03, Class A1 | |
0.000%(s) | | 04/16/40^ | | | | | | | EUR | | | | — | (r) | | | 1,145 | |
Towd Point Mortgage Trust, | |
Series 2017-05, Class A1, 144A, 1 Month LIBOR + 0.600% (Cap N/A, Floor 0.000%) | |
3.773%(c) | | 02/25/57 | | | | | | | | | | | 455 | | | | 450,417 | |
Series 2020-04, Class A1, 144A | |
1.750% | | 10/25/60 | | | | | | | | | | | 586 | | | | 517,801 | |
| | | | | | | | | | | | | | | | | | |
TOTAL RESIDENTIAL MORTGAGE-BACKED SECURITIES
(cost $39,623,155) | | | | 36,577,414 | |
| | | | | | | | | | | | | | | | | | |
|
SOVEREIGN BONDS — 0.4% | |
Abu Dhabi Government International Bond (United Arab Emirates), | |
Sr. Unsec’d. Notes, 144A | |
3.125% | | 10/11/27 | | | | | | | | | | | 2,420 | | | | 2,310,344 | |
Bermuda Government International Bond (Bermuda), | |
Sr. Unsec’d. Notes, 144A | |
2.375% | | 08/20/30 | | | | | | | | | | | 465 | | | | 390,542 | |
Colombia Government International Bond (Colombia), | |
Sr. Unsec’d. Notes | |
4.500% | | 01/28/26 | | | | | | | | | | | 220 | | | | 206,498 | |
Export-Import Bank of India (India), | |
Sr. Unsec’d. Notes, 144A | |
3.875% | | 02/01/28 | | | | | | | | | | | 745 | | | | 689,497 | |
Finnvera OYJ (Finland), | |
Gov’t. Gtd. Notes, 144A, MTN | |
2.375% | | 06/04/25 | | | | | | | | | | | 400 | | | | 379,732 | |
Indonesia Government International Bond (Indonesia), | |
Sr. Unsec’d. Notes | |
1.450% | | 09/18/26 | | | | | | | EUR | | | | 1,510 | | | | 1,469,693 | |
3.375% | | 07/30/25 | | | | | | | EUR | | | | 1,200 | | | | 1,271,935 | |
Japan Bank for International Cooperation (Japan), | |
Gov’t. Gtd. Notes | |
3.375% | | 10/31/23 | | | | | | | | | | | 200 | | | | 197,489 | |
Japan Finance Organization for Municipalities (Japan), | |
Sr. Unsec’d. Notes, 144A, MTN | |
2.125% | | 10/25/23 | | | | | | | | | | | 1,000 | | | | 976,847 | |
3.000% | | 03/12/24 | | | | | | | | | | | 200 | | | | 195,528 | |
Panama Government International Bond (Panama), | |
Sr. Unsec’d. Notes | |
4.500% | | 04/16/50 | | | | | | | | | | | 340 | | | | 256,445 | |
Peruvian Government International Bond (Peru), | |
Sr. Unsec’d. Notes | |
2.783% | | 01/23/31 | | | | | | | | | | | 514 | | | | 424,950 | |
Qatar Government International Bond (Qatar), | |
Sr. Unsec’d. Notes, 144A | |
5.103% | | 04/23/48 | | | | | | | | | | | 665 | | | | 664,917 | |
Tokyo Metropolitan Government (Japan), | |
Sr. Unsec’d. Notes, 144A | |
3.250% | | 06/01/23 | | | | | | | | | | | 600 | | | | 594,944 | |
| | | | | | | | | | | | | | | | | | |
Interest Rate | | Maturity
Date | | | | | | | | Principal
Amount
(000)# | | | Value | |
| | | | | | | | | | | | | | | |
|
SOVEREIGN BONDS (continued) | |
Uruguay Government International Bond (Uruguay), | |
Sr. Unsec’d. Notes | |
5.100% | | 06/18/50 | | | | | | | | | | | 395 | | | $ | 389,470 | |
| | | | | | | | | | | | | | | | | | |
| |
TOTAL SOVEREIGN BONDS
(cost $11,060,974) | | | | 10,418,831 | |
| | | | | | | | | | | | | | | | | | |
|
U.S. GOVERNMENT AGENCY OBLIGATIONS — 12.3% | |
Federal Home Loan Bank | |
5.500% | | 07/15/36 | | | | | | | | | | | 850 | | | | 934,469 | |
Federal Home Loan Mortgage Corp. | |
1.500% | | 11/01/50 | | | | | | | | | | | 1,251 | | | | 966,863 | |
2.000% | | 01/01/32 | | | | | | | | | | | 376 | | | | 342,493 | |
2.000% | | 02/01/36 | | | | | | | | | | | 936 | | | | 834,769 | |
2.000% | | 06/01/40 | | | | | | | | | | | 744 | | | | 633,720 | |
2.000% | | 10/01/40 | | | | | | | | | | | 1,237 | | | | 1,053,534 | |
2.000% | | 09/01/50 | | | | | | | | | | | 2,835 | | | | 2,318,459 | |
2.000% | | 03/01/51 | | | | | | | | | | | 921 | | | | 752,201 | |
2.000% | | 07/01/51 | | | | | | | | | | | 2,701 | | | | 2,203,833 | |
2.000% | | 09/01/51 | | | | | | | | | | | 482 | | | | 395,341 | |
2.000% | | 10/01/51 | | | | | | | | | | | 488 | | | | 397,400 | |
2.500% | | 03/01/30 | | | | | | | | | | | 198 | | | | 185,507 | |
2.500% | | 03/01/51 | | | | | | | | | | | 675 | | | | 579,636 | |
2.500% | | 04/01/51 | | | | | | | | | | | 5,603 | | | | 4,759,092 | |
2.500% | | 05/01/51 | | | | | | | | | | | 2,550 | | | | 2,163,036 | |
2.500% | | 08/01/51 | | | | | | | | | | | 485 | | | | 412,059 | |
2.500% | | 08/01/51 | | | | | | | | | | | 2,649 | | | | 2,249,064 | |
2.500% | | 09/01/51 | | | | | | | | | | | 1,868 | | | | 1,585,583 | |
2.500% | | 09/01/51 | | | | | | | | | | | 4,509 | | | | 3,828,604 | |
2.500% | | 12/01/51 | | | | | | | | | | | 1,000 | | | | 846,723 | |
2.500% | | 12/01/51 | | | | | | | | | | | 2,895 | | | | 2,450,585 | |
3.000% | | 10/01/28 | | | | | | | | | | | 135 | | | | 129,916 | |
3.000% | | 06/01/29 | | | | | | | | | | | 299 | | | | 287,897 | |
3.000% | | 01/01/37 | | | | | | | | | | | 84 | | | | 78,121 | |
3.000% | | 06/01/42 | | | | | | | | | | | 139 | | | | 126,217 | |
3.000% | | 10/01/42 | | | | | | | | | | | 340 | | | | 309,542 | |
3.000% | | 01/01/43 | | | | | | | | | | | 320 | | | | 291,559 | |
3.000% | | 07/01/43 | | | | | | | | | | | 863 | | | | 785,874 | |
3.000% | | 11/01/49 | | | | | | | | | | | 1,142 | | | | 1,009,446 | |
3.000% | | 02/01/50 | | | | | | | | | | | 1,425 | | | | 1,260,530 | |
3.000% | | 05/01/50 | | | | | | | | | | | 296 | | | | 260,876 | |
3.000% | | 06/01/51 | | | | | | | | | | | 1,711 | | | | 1,506,627 | |
3.000% | | 01/01/52 | | | | | | | | | | | 1,000 | | | | 877,986 | |
3.000% | | 02/01/52 | | | | | | | | | | | 2,526 | | | | 2,230,910 | |
3.000% | | 02/01/52 | | | | | | | | | | | 3,882 | | | | 3,408,333 | |
3.000% | | 06/01/52 | | | | | | | | | | | 5,344 | | | | 4,692,813 | |
3.500% | | 06/01/42 | | | | | | | | | | | 146 | | | | 136,649 | |
3.500% | | 01/01/47 | | | | | | | | | | | 238 | | | | 221,173 | |
3.500% | | 02/01/47 | | | | | | | | | | | 401 | | | | 372,866 | |
3.500% | | 05/01/52 | | | | | | | | | | | 1,503 | | | | 1,367,134 | |
3.500% | | 06/01/52 | | | | | | | | | | | 2,993 | | | | 2,719,556 | |
4.000% | | 06/01/26 | | | | | | | | | | | 118 | | | | 114,809 | |
4.000% | | 09/01/26 | | | | | | | | | | | 43 | | | | 41,871 | |
4.000% | | 11/01/37 | | | | | | | | | | | 4,839 | | | | 4,722,359 | |
4.000% | | 03/01/38 | | | | | | | | | | | 166 | | | | 157,584 | |
4.000% | | 10/01/39 | | | | | | | | | | | 268 | | | | 257,605 | |
4.000% | | 09/01/40 | | | | | | | | | | | 323 | | | | 310,463 | |
4.000% | | 12/01/40 | | | | | | | | | | | 156 | | | | 149,810 | |
4.000% | | 10/01/41 | | | | | | | | | | | 132 | | | | 126,728 | |
SEE NOTES TO FINANCIAL STATEMENTS.
A53
| | | | |
| | PSF PGIM 50/50 BALANCED PORTFOLIO (CONTINUED) | | |
SCHEDULE OF INVESTMENTS | | | | as of December 31, 2022 |
| | | | | | | | | | | | | | | | | | | | |
Interest Rate | | Maturity
Date | | | | | | | | Principal
Amount
(000)# | | | Value | |
| | | | | | | | | | | | | | | |
| | | | | | | | | | | | | | | |
|
| U.S. GOVERNMENT AGENCY OBLIGATIONS (continued) | |
4.000% | | | 01/01/42 | | | | | | | | | | | | 48 | | | $ | 46,200 | |
4.000% | | | 04/01/52 | | | | | | | | | | | | 953 | | | | 901,528 | |
4.500% | | | 02/01/39 | | | | | | | | | | | | 37 | | | | 36,541 | |
4.500% | | | 09/01/39 | | | | | | | | | | | | 56 | | | | 55,613 | |
4.500% | | | 10/01/39 | | | | | | | | | | | | 486 | | | | 482,483 | |
4.500% | | | 12/01/39 | | | | | | | | | | | | 50 | | | | 49,801 | |
4.500% | | | 07/01/41 | | | | | | | | | | | | 64 | | | | 62,702 | |
4.500% | | | 07/01/41 | | | | | | | | | | | | 1,069 | | | | 1,060,931 | |
4.500% | | | 08/01/41 | | | | | | | | | | | | 103 | | | | 101,653 | |
4.500% | | | 08/01/41 | | | | | | | | | | | | 106 | | | | 103,137 | |
4.500% | | | 08/01/41 | | | | | | | | | | | | 169 | | | | 166,690 | |
4.500% | | | 10/01/41 | | | | | | | | | | | | 97 | | | | 95,171 | |
4.500% | | | 12/01/47 | | | | | | | | | | | | 92 | | | | 90,789 | |
4.500% | | | 08/01/48 | | | | | | | | | | | | 192 | | | | 188,211 | |
5.000% | | | 05/01/34 | | | | | | | | | | | | 12 | | | | 11,888 | |
5.000% | | | 05/01/34 | | | | | | | | | | | | 137 | | | | 139,904 | |
5.000% | | | 10/01/35 | | | | | | | | | | | | 3 | | | | 3,157 | |
5.000% | | | 07/01/37 | | | | | | | | | | | | 178 | | | | 182,401 | |
5.000% | | | 05/01/39 | | | | | | | | | | | | 27 | | | | 27,671 | |
5.000% | | | 10/01/52 | | | | | | | | | | | | 1,506 | | | | 1,485,417 | |
5.000% | | | 11/01/52 | | | | | | | | | | | | 990 | | | | 975,980 | |
5.500% | | | 12/01/33 | | | | | | | | | | | | 30 | | | | 30,414 | |
5.500% | | | 01/01/34 | | | | | | | | | | | | 28 | | | | 28,622 | |
5.500% | | | 06/01/34 | | | | | | | | | | | | 38 | | | | 38,132 | |
5.500% | | | 07/01/34 | | | | | | | | | | | | 88 | | | | 90,726 | |
5.500% | | | 05/01/37 | | | | | | | | | | | | 24 | | | | 25,186 | |
5.500% | | | 02/01/38 | | | | | | | | | | | | 186 | | | | 193,431 | |
5.500% | | | 05/01/38 | | | | | | | | | | | | 20 | | | | 21,071 | |
5.500% | | | 07/01/38 | | | | | | | | | | | | 50 | | | | 52,202 | |
6.000% | | | 03/01/32 | | | | | | | | | | | | 115 | | | | 116,926 | |
6.000% | | | 12/01/33 | | | | | | | | | | | | 22 | | | | 21,904 | |
6.000% | | | 11/01/36 | | | | | | | | | | | | 24 | | | | 24,650 | |
6.000% | | | 01/01/37 | | | | | | | | | | | | 17 | | | | 17,282 | |
6.000% | | | 05/01/37 | | | | | | | | | | | | 11 | | | | 11,176 | |
6.000% | | | 02/01/38 | | | | | | | | | | | | 2 | | | | 1,881 | |
6.000% | | | 08/01/39 | | | | | | | | | | | | 28 | | | | 29,346 | |
6.750% | | | 03/15/31 | | | | | | | | | | | | 550 | | | | 647,143 | |
7.000% | | | 05/01/31 | | | | | | | | | | | | 3 | | | | 2,739 | |
7.000% | | | 06/01/31 | | | | | | | | | | | | 11 | | | | 10,780 | |
7.000% | | | 08/01/31 | | | | | | | | | | | | 88 | | | | 90,191 | |
7.000% | | | 10/01/31 | | | | | | | | | | | | 5 | | | | 5,336 | |
Federal National Mortgage Assoc. | |
1.500% | | | 02/01/42 | | | | | | | | | | | | 480 | | | | 388,088 | |
1.500% | | | 11/01/50 | | | | | | | | | | | | 3,294 | | | | 2,545,265 | |
1.500% | | | 12/01/50 | | | | | | | | | | | | 3,463 | | | | 2,675,551 | |
2.000% | | | 08/01/31 | | | | | | | | | | | | 366 | | | | 332,521 | |
2.000% | | | 02/01/41 | | | | | | | | | | | | 1,574 | | | | 1,340,107 | |
2.000% | | | 05/01/41 | (k) | | | | | | | | | | | 3,469 | | | | 2,954,553 | |
2.000% | | | 08/01/50 | | | | | | | | | | | | 1,160 | | | | 950,372 | |
2.000% | | | 10/01/50 | | | | | | | | | | | | 6,559 | | | | 5,377,066 | |
2.000% | | | 11/01/50 | | | | | | | | | | | | 1,576 | | | | 1,289,113 | |
2.000% | | | 03/01/51 | | | | | | | | | | | | 3,178 | | | | 2,595,468 | |
2.000% | | | 05/01/51 | | | | | | | | | | | | 2,821 | | | | 2,302,516 | |
2.000% | | | 08/01/51 | | | | | | | | | | | | 987 | | | | 805,627 | |
2.000% | | | 10/01/51 | | | | | | | | | | | | 2,973 | | | | 2,424,169 | |
2.500% | | | 10/01/43 | | | | | | | | | | | | 337 | | | | 290,329 | |
2.500% | | | 12/01/46 | | | | | | | | | | | | 710 | | | | 612,442 | |
2.500% | | | 03/01/50 | | | | | | | | | | | | 692 | | | | 591,273 | |
| | | | | | | | | | | | | | | | | | | | |
Interest Rate | | Maturity
Date | | | | | | | | Principal
Amount
(000)# | | | Value | |
| | | | | | | | | | | | | | | |
|
| U.S. GOVERNMENT AGENCY OBLIGATIONS (continued) | |
2.500% | | | 08/01/50 | | | | | | | | | | | | 2,454 | | | $ | 2,087,867 | |
2.500% | | | 02/01/51 | | | | | | | | | | | | 1,336 | | | | 1,132,420 | |
2.500% | | | 02/01/51 | | | | | | | | | | | | 1,620 | | | | 1,373,434 | |
2.500% | | | 03/01/51 | | | | | | | | | | | | 1,625 | | | | 1,377,252 | |
2.500% | | | 04/01/51 | | | | | | | | | | | | 2,822 | | | | 2,397,611 | |
2.500% | | | 08/01/51 | | | | | | | | | | | | 958 | | | | 813,306 | |
2.500% | | | 08/01/51 | | | | | | | | | | | | 1,468 | | | | 1,246,423 | |
2.500% | | | 09/01/51 | | | | | | | | | | | | 1,012 | | | | 858,845 | |
2.500% | | | 10/01/51 | | | | | | | | | | | | 526 | | | | 445,982 | |
2.500% | | | 11/01/51 | | | | | | | | | | | | 2,441 | | | | 2,072,203 | |
2.500% | | | 12/01/51 | | | | | | | | | | | | 3,997 | | | | 3,407,153 | |
2.500% | | | 02/01/52 | | | | | | | | | | | | 482 | | | | 410,663 | |
2.500% | | | 02/01/52 | | | | | | | | | | | | 500 | | | | 423,464 | |
2.500% | | | 03/01/52 | | | | | | | | | | | | 499 | | | | 422,804 | |
2.500% | | | 03/01/52 | | | | | | | | | | | | 1,810 | | | | 1,535,930 | |
2.500% | | | 04/01/52 | | | | | | | | | | | | 186 | | | | 157,487 | |
2.500% | | | 05/01/52 | | | | | | | | | | | | 1,436 | | | | 1,224,029 | |
3.000% | | | TBA(tt) | | | | | | | | | | | | 3,000 | | | | 2,632,108 | |
3.000% | | | 02/01/27 | | | | | | | | | | | | 456 | | | | 440,809 | |
3.000% | | | 08/01/30 | | | | | | | | | | | | 434 | | | | 411,872 | |
3.000% | | | 11/01/36 | | | | | | | | | | | | 648 | | | | 601,002 | |
3.000% | | | 12/01/42 | | | | | | | | | | | | 581 | | | | 528,555 | |
3.000% | | | 03/01/43 | | | | | | | | | | | | 117 | | | | 106,596 | |
3.000% | | | 11/01/46 | | | | | | | | | | | | 417 | | | | 374,103 | |
3.000% | | | 01/01/47 | | | | | | | | | | | | 621 | | | | 554,160 | |
3.000% | | | 02/01/47 | | | | | | | | | | | | 660 | | | | 590,254 | |
3.000% | | | 03/01/47 | | | | | | | | | | | | 347 | | | | 310,125 | |
3.000% | | | 06/01/49 | | | | | | | | | | | | 15 | | | | 12,876 | |
3.000% | | | 12/01/49 | | | | | | | | | | | | 1,299 | | | | 1,149,472 | |
3.000% | | | 01/01/50 | | | | | | | | | | | | 482 | | | | 425,972 | |
3.000% | | | 02/01/50 | | | | | | | | | | | | 492 | | | | 434,882 | |
3.000% | | | 02/01/50 | | | | | | | | | | | | 2,671 | | | | 2,363,707 | |
3.000% | | | 03/01/50 | | | | | | | | | | | | 271 | | | | 239,237 | |
3.000% | | | 04/01/51 | | | | | | | | | | | | 121 | | | | 106,567 | |
3.000% | | | 05/01/51 | | | | | | | | | | | | 2,225 | | | | 1,962,050 | |
3.000% | | | 11/01/51 | | | | | | | | | | | | 114 | | | | 99,852 | |
3.000% | | | 02/01/52 | | | | | | | | | | | | 765 | | | | 671,712 | |
3.000% | | | 03/01/52 | | | | | | | | | | | | 951 | | | | 838,912 | |
3.000% | | | 04/01/52 | | | | | | | | | | | | 486 | | | | 427,132 | |
3.000% | | | 04/01/52 | | | | | | | | | | | | 975 | | | | 861,244 | |
3.000% | | | 04/01/52 | | | | | | | | | | | | 1,500 | | | | 1,316,275 | |
3.500% | | | 07/01/31 | | | | | | | | | | | | 345 | | | | 335,736 | |
3.500% | | | 02/01/33 | | | | | | | | | | | | 845 | | | | 816,789 | |
3.500% | | | 06/01/39 | | | | | | | | | | | | 258 | | | | 241,171 | |
3.500% | | | 01/01/42 | | | | | | | | | | | | 1,527 | | | | 1,428,921 | |
3.500% | | | 05/01/42 | | | | | | | | | | | | 777 | | | | 727,322 | |
3.500% | | | 07/01/42 | | | | | | | | | | | | 403 | | | | 377,021 | |
3.500% | | | 08/01/42 | | | | | | | | | | | | 153 | | | | 143,125 | |
3.500% | | | 08/01/42 | | | | | | | | | | | | 391 | | | | 366,343 | |
3.500% | | | 09/01/42 | | | | | | | | | | | | 222 | | | | 207,869 | |
3.500% | | | 09/01/42 | | | | | | | | | | | | 810 | | | | 758,086 | |
3.500% | | | 11/01/42 | | | | | | | | | | | | 110 | | | | 102,728 | |
3.500% | | | 03/01/43 | | | | | | | | | | | | 1,254 | | | | 1,173,553 | |
3.500% | | | 04/01/43 | | | | | | | | | | | | 242 | | | | 226,805 | |
3.500% | | | 04/01/43 | | | | | | | | | | | | 354 | | | | 330,784 | |
3.500% | | | 01/01/46 | | | | | | | | | | | | 632 | | | | 592,989 | |
3.500% | | | 07/01/46 | | | | | | | | | | | | 448 | | | | 415,940 | |
3.500% | | | 11/01/46 | | | | | | | | | | | | 522 | | | | 484,184 | |
SEE NOTES TO FINANCIAL STATEMENTS.
A54
| | | | |
| | PSF PGIM 50/50 BALANCED PORTFOLIO (CONTINUED) | | |
SCHEDULE OF INVESTMENTS | | | | as of December 31, 2022 |
| | | | | | | | | | | | | | | | | | | | |
Interest Rate | | Maturity
Date | | | | | | | | Principal
Amount
(000)# | | | Value | |
| | | | | | | | | | | | | | | |
|
U.S. GOVERNMENT AGENCY OBLIGATIONS (continued) | |
3.500% | | | 09/01/47 | | | | | | | | | | | | 271 | | | $ | 251,155 | |
3.500% | | | 01/01/48 | | | | | | | | | | | | 2,292 | | | | 2,125,716 | |
3.500% | | | 05/01/48 | | | | | | | | | | | | 463 | | | | 428,146 | |
3.500% | | | 06/01/48 | | | | | | | | | | | | 463 | | | | 428,781 | |
3.500% | | | 07/01/48 | | | | | | | | | | | | 276 | | | | 255,496 | |
3.500% | | | 03/01/49 | | | | | | | | | | | | 5,420 | | | | 5,022,388 | |
3.500% | | | 05/01/49 | | | | | | | | | | | | 402 | | | | 370,532 | |
3.500% | | | 06/01/49 | | | | | | | | | | | | 226 | | | | 209,800 | |
3.500% | | | 02/01/52 | | | | | | | | | | | | 2,946 | | | | 2,680,273 | |
3.500% | | | 03/01/52 | | | | | | | | | | | | 991 | | | | 908,028 | |
3.500% | | | 03/01/52 | | | | | | | | | | | | 1,910 | | | | 1,736,016 | |
3.500% | | | 06/01/52 | | | | | | | | | | | | 997 | | | | 905,819 | |
3.500% | | | 07/01/52 | | | | | | | | | | | | 6,939 | | | | 6,307,374 | |
4.000% | | | TBA | | | | | | | | | | | | 500 | | | | 487,323 | |
4.000% | | | 10/01/41 | | | | | | | | | | | | 1,001 | | | | 961,514 | |
4.000% | | | 09/01/44 | | | | | | | | | | | | 677 | | | | 648,250 | |
4.000% | | | 10/01/46 | | | | | | | | | | | | 251 | | | | 238,519 | |
4.000% | | | 02/01/47 | | | | | | | | | | | | 126 | | | | 119,990 | |
4.000% | | | 09/01/47 | | | | | | | | | | | | 426 | | | | 406,213 | |
4.000% | | | 11/01/47 | | | | | | | | | | | | 295 | | | | 282,245 | |
4.000% | | | 11/01/47 | | | | | | | | | | | | 594 | | | | 568,568 | |
4.000% | | | 03/01/49 | | | | | | | | | | | | 2,726 | | | | 2,599,495 | |
4.000% | | | 04/01/52 | | | | | | | | | | | | 488 | | | | 457,787 | |
4.000% | | | 05/01/52 | | | | | | | | | | | | 1,471 | | | | 1,380,315 | |
4.000% | | | 06/01/52 | | | | | | | | | | | | 966 | | | | 906,280 | |
4.500% | | | TBA | | | | | | | | | | | | 32,000 | | | | 30,792,202 | |
4.500% | | | 07/01/33 | | | | | | | | | | | | 21 | | | | 20,754 | |
4.500% | | | 08/01/33 | | | | | | | | | | | | 23 | | | | 22,846 | |
4.500% | | | 09/01/33 | | | | | | | | | | | | 51 | | | | 49,576 | |
4.500% | | | 10/01/33 | | | | | | | | | | | | 3 | | | | 2,637 | |
4.500% | | | 10/01/33 | | | | | | | | | | | | 19 | | | | 18,385 | |
4.500% | | | 10/01/33 | | | | | | | | | | | | 55 | | | | 54,585 | |
4.500% | | | 01/01/35 | | | | | | | | | | | | 1 | | | | 689 | |
4.500% | | | 07/01/39 | | | | | | | | | | | | 403 | | | | 398,454 | |
4.500% | | | 08/01/39 | | | | | | | | | | | | 558 | | | | 550,825 | |
4.500% | | | 03/01/41 | | | | | | | | | | | | 184 | | | | 182,145 | |
4.500% | | | 11/01/47 | | | | | | | | | | | | 967 | | | | 949,195 | |
4.500% | | | 01/01/49 | | | | | | | | | | | | 152 | | | | 148,734 | |
5.000% | | | TBA(tt) | | | | | | | | | | | | 2,000 | | | | 1,970,443 | |
5.000% | | | 03/01/34 | | | | | | | | | | | | 112 | | | | 113,949 | |
5.000% | | | 06/01/35 | | | | | | | | | | | | 40 | | | | 40,551 | |
5.000% | | | 07/01/35 | | | | | | | | | | | | 53 | | | | 54,183 | |
5.000% | | | 09/01/35 | | | | | | | | | | | | 44 | | | | 44,492 | |
5.000% | | | 11/01/35 | | | | | | | | | | | | 55 | | | | 56,627 | |
5.000% | | | 02/01/36 | | | | | | | | | | | | 49 | | | | 49,654 | |
5.000% | | | 05/01/36 | | | | | | | | | | | | 24 | | | | 24,809 | |
5.000% | | | 09/01/52 | | | | | | | | | | | | 494 | | | | 487,311 | |
5.500% | | | TBA(tt) | | | | | | | | | | | | 2,000 | | | | 2,004,933 | |
5.500% | | | 09/01/33 | | | | | | | | | | | | 95 | | | | 97,483 | |
5.500% | | | 10/01/33 | | | | | | | | | | | | 45 | | | | 45,740 | |
5.500% | | | 12/01/33 | | | | | | | | | | | | 27 | | | | 27,847 | |
5.500% | | | 01/01/34 | | | | | | | | | | | | 1 | | | | 594 | |
5.500% | | | 12/01/34 | | | | | | | | | | | | 93 | | | | 96,355 | |
5.500% | | | 10/01/35 | | | | | | | | | | | | 197 | | | | 198,522 | |
5.500% | | | 03/01/36 | | | | | | | | | | | | 44 | | | | 44,595 | |
5.500% | | | 05/01/36 | | | | | | | | | | | | 88 | | | | 90,269 | |
5.500% | | | 04/01/37 | | | | | | | | | | | | 44 | | | | 46,077 | |
6.000% | | | TBA(tt) | | | | | | | | | | | | 3,000 | | | | 3,044,268 | |
| | | | | | | | | | | | | | | | | | | | |
Interest Rate | | Maturity
Date | | | | | | | | Principal
Amount
(000)# | | | Value | |
| | | | | | | | | | | | | | | |
|
| U.S. GOVERNMENT AGENCY OBLIGATIONS (continued) | |
6.000% | | | 04/01/33 | | | | | | | | | | | | 7 | | | $ | 7,513 | |
6.000% | | | 06/01/33 | | | | | | | | | | | | 3 | | | | 2,777 | |
6.000% | | | 10/01/33 | | | | | | | | | | | | 173 | | | | 176,760 | |
6.000% | | | 11/01/33 | | | | | | | | | | | | 2 | | | | 1,987 | |
6.000% | | | 11/01/33 | | | | | | | | | | | | 8 | | | | 7,953 | |
6.000% | | | 11/01/33 | | | | | | | | | | | | 40 | | | | 40,318 | |
6.000% | | | 01/01/34 | | | | | | | | | | | | 180 | | | | 184,791 | |
6.000% | | | 02/01/34 | | | | | | | | | | | | 33 | | | | 34,161 | |
6.000% | | | 03/01/34 | | | | | | | | | | | | 17 | | | | 17,393 | |
6.000% | | | 03/01/34 | | | | | | | | | | | | 21 | | | | 21,354 | |
6.000% | | | 07/01/34 | | | | | | | | | | | | 119 | | | | 122,158 | |
6.000% | | | 08/01/34 | | | | | | | | | | | | 1 | | | | 516 | |
6.000% | | | 10/01/34 | | | | | | | | | | | | 2 | | | | 1,931 | |
6.000% | | | 11/01/34 | | | | | | | | | | | | 2 | | | | 2,240 | |
6.000% | | | 11/01/34 | | | | | | | | | | | | 7 | | | | 7,048 | |
6.000% | | | 01/01/35 | | | | | | | | | | | | 46 | | | | 47,137 | |
6.000% | | | 01/01/35 | | | | | | | | | | | | 87 | | | | 87,892 | |
6.000% | | | 02/01/35 | | | | | | | | | | | | 34 | | | | 34,564 | |
6.000% | | | 02/01/35 | | | | | | | | | | | | 114 | | | | 117,830 | |
6.000% | | | 03/01/35 | | | | | | | | | | | | 1 | | | | 882 | |
6.000% | | | 04/01/35 | | | | | | | | | | | | —(r | ) | | | 446 | |
6.000% | | | 07/01/36 | | | | | | | | | | | | 17 | | | | 17,707 | |
6.000% | | | 02/01/37 | | | | | | | | | | | | 36 | | | | 38,047 | |
6.000% | | | 05/01/37 | | | | | | | | | | | | 14 | | | | 14,215 | |
6.000% | | | 06/01/37 | | | | | | | | | | | | —(r | ) | | | 280 | |
6.000% | | | 08/01/37 | | | | | | | | | | | | 7 | | | | 6,960 | |
6.000% | | | 09/01/37 | | | | | | | | | | | | —(r | ) | | | 200 | |
6.000% | | | 10/01/37 | | | | | | | | | | | | 26 | | | | 27,075 | |
6.000% | | | 05/01/38 | | | | | | | | | | | | 31 | | | | 31,954 | |
6.000% | | | 06/01/38 | | | | | | | | | | | | 1 | | | | 740 | |
6.500% | | | 07/01/32 | | | | | | | | | | | | 26 | | | | 26,832 | |
6.500% | | | 09/01/32 | | | | | | | | | | | | 1 | | | | 1,306 | |
6.500% | | | 09/01/32 | | | | | | | | | | | | 34 | | | | 34,592 | |
6.500% | | | 09/01/32 | | | | | | | | | | | | 35 | | | | 35,762 | |
6.500% | | | 09/01/32 | | | | | | | | | | | | 44 | | | | 45,325 | |
6.500% | | | 04/01/33 | | | | | | | | | | | | 41 | | | | 42,255 | |
6.500% | | | 11/01/33 | | | | | | | | | | | | 18 | | | | 18,731 | |
6.500% | | | 01/01/34 | | | | | | | | | | | | 19 | | | | 19,266 | |
6.500% | | | 09/01/34 | | | | | | | | | | | | 41 | | | | 41,759 | |
6.500% | | | 09/01/36 | | | | | | | | | | | | 40 | | | | 42,533 | |
6.500% | | | 10/01/36 | | | | | | | | | | | | 11 | | | | 11,264 | |
6.500% | | | 01/01/37 | | | | | | | | | | | | 35 | | | | 36,100 | |
6.500% | | | 01/01/37 | | | | | | | | | | | | 53 | | | | 54,009 | |
6.625% | | | 11/15/30 | | | | | | | | | | | | 1,140 | | | | 1,329,773 | |
7.000% | | | 02/01/32 | | | | | | | | | | | | 9 | | | | 9,350 | |
7.000% | | | 05/01/32 | | | | | | | | | | | | 9 | | | | 9,232 | |
7.000% | | | 06/01/32 | | | | | | | | | | | | 9 | | | | 9,336 | |
7.000% | | | 07/01/32 | | | | | | | | | | | | 29 | | | | 29,841 | |
7.125% | | | 01/15/30(k | ) | | | | | | | | | | | 3,195 | | | | 3,775,528 | |
Government National Mortgage Assoc. | |
2.000% | | | 03/20/51 | | | | | | | | | | | | 782 | | | | 658,666 | |
2.000% | | | 07/20/51 | | | | | | | | | | | | 475 | | | | 398,178 | |
2.000% | | | 10/20/51 | | | | | | | | | | | | 686 | | | | 576,666 | |
2.500% | | | TBA | | | | | | | | | | | | 7,000 | | | | 6,064,506 | |
2.500% | | | 03/20/43 | | | | | | | | | | | | 135 | | | | 119,156 | |
2.500% | | | 12/20/46 | | | | | | | | | | | | 240 | | | | 211,452 | |
2.500% | | | 05/20/51 | | | | | | | | | | | | 399 | | | | 346,699 | |
2.500% | | | 08/20/51 | | | | | | | | | | | | 699 | | | | 606,874 | |
SEE NOTES TO FINANCIAL STATEMENTS.
A55
| | | | |
| | PSF PGIM 50/50 BALANCED PORTFOLIO (CONTINUED) | | |
SCHEDULE OF INVESTMENTS | | | | as of December 31, 2022 |
| | | | | | | | | | | | |
Interest Rate | | Maturity Date | | | | Principal
Amount
(000)# | | | Value | |
| | | | | | | | | | | |
|
U.S. GOVERNMENT AGENCY OBLIGATIONS (continued) | |
2.500% | | 11/20/51 | | | | | 455 | | | $ | 394,600 | |
2.500% | | 03/20/52 | | | | | 5,511 | | | | 4,776,399 | |
2.500% | | 05/20/52 | | | | | 5,000 | | | | 4,331,335 | |
3.000% | | TBA | | | | | 11,000 | | | | 9,791,999 | |
3.000% | | 12/20/44 | | | | | 89 | | | | 81,125 | |
3.000% | | 03/15/45 | | | | | 242 | | | | 216,496 | |
3.000% | | 11/20/45 | | | | | 274 | | | | 248,932 | |
3.000% | | 03/20/46 | | | | | 562 | | | | 510,323 | |
3.000% | | 07/20/46 | | | | | 1,421 | | | | 1,287,976 | |
3.000% | | 08/20/46 | | | | | 378 | | | | 341,464 | |
3.000% | | 10/20/46 | | | | | 329 | | | | 297,860 | |
3.000% | | 04/20/47 | | | | | 463 | | | | 417,235 | |
3.000% | | 12/20/49 | | | | | 157 | | | | 141,443 | |
3.000% | | 01/20/50 | | | | | 929 | | | | 835,069 | |
3.000% | | 06/20/51 | | | | | 679 | | | | 607,362 | |
3.000% | | 10/20/51 | | | | | 1,423 | | | | 1,271,467 | |
3.000% | | 12/20/51 | | | | | 2,791 | | | | 2,493,787 | |
3.000% | | 04/20/52 | | | | | 971 | | | | 865,545 | |
3.500% | | 12/20/42 | | | | | 540 | | | | 509,134 | |
3.500% | | 05/20/43 | | | | | 165 | | | | 155,533 | |
3.500% | | 04/20/45 | | | | | 474 | | | | 443,281 | |
3.500% | | 07/20/46 | | | | | 1,716 | | | | 1,600,521 | |
3.500% | | 07/20/48 | | | | | 1,333 | | | | 1,241,282 | |
3.500% | | 11/20/48 | | | | | 437 | | | | 406,260 | |
3.500% | | 06/20/49 | | | | | 1,643 | | | | 1,517,019 | |
3.500% | | 09/20/52 | | | | | 6,467 | | | | 5,942,517 | |
4.000% | | 06/15/40 | | | | | 31 | | | | 30,161 | |
4.000% | | 05/20/41 | | | | | 28 | | | | 26,583 | |
4.000% | | 12/20/42 | | | | | 307 | | | | 296,485 | |
4.000% | | 08/20/44 | | | | | 111 | | | | 106,944 | |
4.000% | | 11/20/45 | | | | | 212 | | | | 204,242 | |
4.000% | | 12/20/45 | | | | | 579 | | | | 558,549 | |
4.000% | | 09/20/47 | | | | | 1,584 | | | | 1,524,717 | |
4.000% | | 02/20/49 | | | | | 574 | | | | 549,046 | |
4.000% | | 01/20/50 | | | | | 226 | | | | 215,689 | |
4.500% | | 04/15/40 | | | | | 180 | | | | 178,786 | |
4.500% | | 01/20/41 | | | | | 209 | | | | 208,748 | |
4.500% | | 02/20/41 | | | | | 327 | | | | 325,949 | |
4.500% | | 03/20/41 | | | | | 164 | | | | 163,984 | |
4.500% | | 06/20/44 | | | | | 242 | | | | 244,196 | |
4.500% | | 09/20/46 | | | | | 198 | | | | 194,309 | |
4.500% | | 11/20/46 | | | | | 257 | | | | 258,368 | |
4.500% | | 03/20/47 | | | | | 139 | | | | 137,703 | |
4.500% | | 05/20/48 | | | | | 225 | | | | 221,219 | |
4.500% | | 08/20/48 | | | | | 398 | | | | 390,759 | |
5.000% | | TBA | | | | | 500 | | | | 495,365 | |
5.000% | | 10/20/37 | | | | | 59 | | | | 59,613 | |
5.000% | | 04/20/45 | | | | | 280 | | | | 284,281 | |
5.500% | | TBA | | | | | 3,500 | | | | 3,516,289 | |
5.500% | | 08/15/33 | | | | | 113 | | | | 114,938 | |
5.500% | | 08/15/33 | | | | | 149 | | | | 151,708 | |
5.500% | | 09/15/33 | | | | | 34 | | | | 34,284 | |
5.500% | | 12/15/33 | | | | | 8 | | | | 7,962 | |
5.500% | | 03/15/34 | | | | | 98 | | | | 99,748 | |
5.500% | | 12/15/34 | | | | | 183 | | | | 191,488 | |
5.500% | | 07/15/35 | | | | | 31 | | | | 31,932 | |
5.500% | | 04/15/36 | | | | | 27 | | | | 27,750 | |
5.500% | | 09/20/52 | | | | | 5,992 | | | | 6,033,910 | |
| | | | | | | | | | | | |
Interest
Rate | | Maturity
Date | | | | Principal
Amount
(000)# | | | Value | |
| | | | | | | | | | | |
|
U.S. GOVERNMENT AGENCY OBLIGATIONS (continued) | |
6.000% | | 04/15/33 | | | | | 4 | | | $ | 4,479 | |
6.000% | | 12/15/33 | | | | | 64 | | | | 65,739 | |
6.000% | | 01/15/34 | | | | | 18 | | | | 18,312 | |
6.000% | | 01/15/34 | | | | | 18 | | | | 18,689 | |
6.000% | | 01/15/34 | | | | | 34 | | | | 35,540 | |
6.000% | | 06/20/34 | | | | | 57 | | | | 59,977 | |
6.000% | | 07/15/34 | | | | | 42 | | | | 44,794 | |
6.500% | | 10/15/23 | | | | | —(r | ) | | | 89 | |
6.500% | | 12/15/23 | | | | | —(r | ) | | | 281 | |
6.500% | | 01/15/24 | | | | | —(r | ) | | | 91 | |
6.500% | | 01/15/24 | | | | | 1 | | | | 836 | |
6.500% | | 01/15/24 | | | | | 2 | | | | 1,943 | |
6.500% | | 01/15/24 | | | | | 2 | | | | 2,276 | |
6.500% | | 01/15/24 | | | | | 2 | | | | 2,428 | |
6.500% | | 01/15/24 | | | | | 7 | | | | 6,876 | |
6.500% | | 02/15/24 | | | | | —(r | ) | | | 234 | |
6.500% | | 02/15/24 | | | | | —(r | ) | | | 387 | |
6.500% | | 02/15/24 | | | | | 1 | | | | 1,017 | |
6.500% | | 02/15/24 | | | | | 1 | | | | 1,273 | |
6.500% | | 02/15/24 | | | | | 1 | | | | 1,331 | |
6.500% | | 03/15/24 | | | | | —(r | ) | | | 11 | |
6.500% | | 03/15/24 | | | | | —(r | ) | | | 259 | |
6.500% | | 04/15/24 | | | | | —(r | ) | | | 104 | |
6.500% | | 04/15/24 | | | | | —(r | ) | | | 403 | |
6.500% | | 04/15/24 | | | | | —(r | ) | | | 417 | |
6.500% | | 04/15/24 | | | | | 1 | | | | 540 | |
6.500% | | 04/15/24 | | | | | 2 | | | | 2,084 | |
6.500% | | 04/15/24 | | | | | 2 | | | | 2,084 | |
6.500% | | 05/15/24 | | | | | 1 | | | | 600 | |
6.500% | | 05/15/24 | | | | | 1 | | | | 1,029 | |
6.500% | | 05/15/24 | | | | | 2 | | | | 2,291 | |
6.500% | | 10/15/24 | | | | | 2 | | | | 2,085 | |
6.500% | | 11/15/28 | | | | | 2 | | | | 2,549 | |
6.500% | | 08/15/31 | | | | | 3 | | | | 2,863 | |
6.500% | | 12/15/31 | | | | | 5 | | | | 5,524 | |
6.500% | | 02/15/32 | | | | | 18 | | | | 18,026 | |
6.500% | | 06/15/32 | | | | | 10 | | | | 10,582 | |
6.500% | | 07/15/32 | | | | | 18 | | | | 18,467 | |
6.500% | | 08/15/32 | | | | | 3 | | | | 3,182 | |
6.500% | | 08/15/32 | | | | | 3 | | | | 3,549 | |
6.500% | | 08/15/32 | | | | | 6 | | | | 6,551 | |
6.500% | | 08/15/32 | | | | | 21 | | | | 21,775 | |
6.500% | | 08/15/32 | | | | | 102 | | | | 105,761 | |
6.500% | | 08/15/34 | | | | | 19 | | | | 19,522 | |
6.500% | | 06/15/35 | | | | | 18 | | | | 18,909 | |
6.500% | | 09/15/36 | | | | | 20 | | | | 20,817 | |
8.000% | | 01/15/24 | | | | | 1 | | | | 1,217 | |
Tennessee Valley Authority, Sr. Unsec’d. Notes | |
1.500% | | 09/15/31 | | | | | 200 | | | | 157,003 | |
7.125% | | 05/01/30 | | | | | 510 | | | | 595,169 | |
| | | | | | | | | | | | |
TOTAL U.S. GOVERNMENT AGENCY OBLIGATIONS
(cost $306,014,589) | | | | 287,552,610 | |
| | | | | | | | | | | | |
|
U.S. TREASURY OBLIGATIONS — 1.8% | |
U.S. Treasury Bonds | |
2.000% | | 11/15/41 | | | | | 15,220 | | | | 10,887,056 | |
2.250% | | 05/15/41(h) | | | | | 12,770 | | | | 9,601,444 | |
2.375% | | 02/15/42 | | | | | 12,375 | | | | 9,455,273 | |
SEE NOTES TO FINANCIAL STATEMENTS.
A56
| | | | |
| | PSF PGIM 50/50 BALANCED PORTFOLIO (CONTINUED) | | |
SCHEDULE OF INVESTMENTS | | | | as of December 31, 2022 |
| | | | | | | | | | | | |
Interest Rate | | Maturity Date | | | | Principal
Amount
(000)# | | | Value | |
| | | | | | | | | | | |
|
U.S. TREASURY OBLIGATIONS (continued) | |
2.500% | | 05/15/46 | | | | | 1,485 | | | $ | 1,112,590 | |
2.875% | | 05/15/52 | | | | | 3,105 | | | | 2,500,495 | |
3.000% | | 08/15/52 | | | | | 1,805 | | | | 1,496,458 | |
U.S. Treasury Notes | |
2.375% | | 03/31/29 | | | | | 705 | | | | 641,715 | |
U.S. Treasury Strips Coupon | |
1.760%(s) | | 08/15/40 | | | | | 830 | | | | 394,056 | |
2.000%(s) | | 08/15/39 | | | | | 360 | | | | 178,819 | |
2.378%(s) | | 11/15/43 | | | | | 3,600 | | | | 1,468,406 | |
2.941%(s) | | 11/15/41 | | | | | 7,520 | | | | 3,347,575 | |
| | | | | | | | | | | | |
TOTAL U.S. TREASURY OBLIGATIONS
(cost $52,249,052) | | | | 41,083,887 | |
| | | | | | | | | | | | |
TOTAL LONG-TERM INVESTMENTS
(cost $1,366,828,704) | | | | 2,110,928,048 | |
| | | | | | | | | | | | |
| | | | |
| | | | | | | Shares | | | | |
SHORT-TERM INVESTMENTS — 13.4% | |
AFFILIATED MUTUAL FUNDS — 13.3% | |
PGIM Core Ultra Short Bond Fund(wa) | | | | | 265,991,591 | | | | 265,991,591 | |
PGIM Institutional Money Market Fund
(cost $46,062,431; includes $45,874,955 of cash collateral for securities on loan)(b)(wa) | | | | | 46,168,616 | | | | 46,145,531 | |
| | | | | | | | | | | | |
TOTAL AFFILIATED MUTUAL FUNDS
(cost $312,054,022) | | | | 312,137,122 | |
| | | | | | | | | | | | |
| | | | |
Interest Rate | | Maturity Date | | | | Principal
Amount
(000)# | | | | |
| | | | | | | | | | | |
|
U.S. TREASURY OBLIGATION(k)(n) — 0.1% | |
U.S. Treasury Bills | |
4.275% | | 03/16/23 | | | | | 1,230 | | | | 1,219,565 | |
| | | | | | | | | | | | |
(cost $1,219,309) | |
TOTAL SHORT-TERM INVESTMENTS
(cost $313,273,331) | | | | 313,356,687 | |
| | | | | | | | | | | | |
TOTAL INVESTMENTS, BEFORE OPTIONS
WRITTEN—103.7%
(cost $1,680,102,035) | | | | 2,424,284,735 | |
| | | | | | | | | | | | |
|
OPTIONS WRITTEN*~ — (0.0)% | |
(premiums received $0) | | | | (149 | ) |
| | | | | | | | | | | | |
| |
TOTAL INVESTMENTS, NET OF OPTIONS
WRITTEN—103.7%
(cost $1,680,102,035) | | | | 2,424,284,586 | |
Liabilities in excess of other assets(z) — (3.7)% | | | | (85,967,481 | ) |
| | | | | | | | | | | | |
| |
NET ASSETS — 100.0% | | | $ | 2,338,317,105 | |
| | | | | | | | | | | | |
See the Glossary for a list of the abbreviation(s) used in the annual report.
| * | Non-income producing security. |
| # | Principal or notional amount is shown in U.S. dollars unless otherwise stated. |
| ~ | See tables subsequent to the Schedule of Investments for options detail. Excludes centrally cleared swaptions. |
| ^ | Indicates a Level 3 instrument. The aggregate value of Level 3 instruments is $905,736 and 0.0% of net assets. |
| (a) | All or a portion of security is on loan. The aggregate market value of such securities, including those sold and pending settlement, is $44,951,956; cash collateral of $45,874,955 (included in liabilities) was received with which the Portfolio purchased highly liquid short-term investments. In the event of significant appreciation in value of securities on loan on the last business day of the reporting period, the Portfolio may reflect a collateral value that is less than the market value of the loaned securities and such shortfall is remedied the following business day. |
| (b) | Represents security, or portion thereof, purchased with cash collateral received for securities on loan and includes dividend reinvestment. |
| (c) | Variable rate instrument. The interest rate shown reflects the rate in effect at December 31, 2022. |
| (cc) | Variable rate instrument. The rate shown is based on the latest available information as of December 31, 2022. Certain variable rate securities are not based on a published reference rate and spread but are determined by the issuer or agent and are based on current market conditions. These securities do not indicate a reference rate and spread in their description. |
| (ff) | Variable rate security. Security may be issued at a fixed coupon rate, which converts to a variable rate at a specified date. Rate shown is the rate in effect as of period end. |
| (h) | Represents security, or a portion thereof, segregated as collateral for OTC derivatives. |
| (k) | Represents security, or a portion thereof, segregated as collateral for centrally cleared/exchange-traded derivatives. |
| (n) | Rate shown reflects yield to maturity at purchased date. |
| (oo) | Perpetual security. Maturity date represents next call date. |
| (r) | Principal or notional amount is less than $500 par. |
| (s) | Represents zero coupon bond or principal only security. Rate represents yield to maturity at purchase date. |
| (tt) | All or partial principal amount represents “TBA” mortgage dollar rolls. The aggregate mortgage dollar roll principal amount of 10,000,000 is 0.4% of net assets. |
| (wa) | PGIM Investments LLC, the manager of the Portfolio, also serves as manager of the PGIM Core Ultra Short Bond Fund and PGIM Institutional Money Market Fund, if applicable. |
| (z) | Includes net unrealized appreciation/(depreciation) and/or market value of the below holdings which are excluded from the Schedule of Investments: |
SEE NOTES TO FINANCIAL STATEMENTS.
A57
| | | | |
| | PSF PGIM 50/50 BALANCED PORTFOLIO (CONTINUED) | | |
SCHEDULE OF INVESTMENTS | | | | as of December 31, 2022 |
Forward Commitment Contracts:
| | | | | | | | | | | | | | | | | | | | |
U.S. Government Agency Obligations | | Interest
Rate | | | Maturity
Date | | | Settlement
Date | | | Principal
Amount
(000)# | | | Value | |
Federal National Mortgage Assoc. | | | 2.500% | | | | TBA | | | | 01/12/23 | | | | (1,000 | ) | | $ | (846,514 | ) |
Federal National Mortgage Assoc. | | | 4.000% | | | | TBA | | | | 01/12/23 | | | | (1,000 | ) | | | (937,660 | ) |
| | | | | | | | | | | | | | | | | | | | |
TOTAL FORWARD COMMITMENT CONTRACTS
(proceeds receivable $1,810,703) | | | | | | | | | | | | | | | | | | $ | (1,784,174 | ) |
| | | | | | | | | | | | | | | | | | | | |
Options Written:
OTC Swaptions
| | | | | | | | | | | | | | | | | | | | | | | | | | | | | | | | |
Description | | Call/
Put | | | Counterparty | | | Expiration
Date | | | Strike | | | Receive | | | Pay | | | Notional
Amount
(000)# | | | Value | |
GS_21-PJA^ | | | Put | | | | GSI | | | | 06/17/24 | | | | 0.25% | | | | 0.25%(M) | | | | GS_21-PJA(M) | | | | 9,100 | | | $ | (149 | ) |
| | | | | | | | | | | | | | | | | | | | | | | | | | | | | | | | |
(premiums received $0) | | | | | | | | | | | | | | | | | | | | | | | | | | | | | | | | |
Options Purchased:
Centrally Cleared Swaptions
| | | | | | | | | | | | | | | | | | | | | | | | | | | | | | | | | | |
Description | | Call/
Put | | Expiration
Date | | Strike | | Receive | | Pay | | Notional
Amount
(000)# | | | Value at December 31, 2022 | | | Unrealized
Appreciation
(Depreciation) |
| | | | | | | | | | | | | | | | | | | | | | | | | | | | | | |
CDX.NA.IG.39.V1, 12/20/27 | | Put | | 01/18/23 | | 1.03% | | CDX.NA.IG.39.V1(Q) | | 1.00%(Q) | | | 10,800 | | | | | $ | 2,586 | | | | | | | | | | | $ | (50,334 | ) | | |
CDX.NA.IG.39.V1, 12/20/27 | | Put | | 02/15/23 | | 0.90% | | CDX.NA.IG.39.V1(Q) | | 1.00%(Q) | | | 9,270 | | | | | | 18,322 | | | | | | | | | | | | (16,318 | ) | | |
CDX.NA.IG.39.V1, 12/20/27 | | Put | | 03/15/23 | | 0.80% | | CDX.NA.IG.39.V1(Q) | | 1.00%(Q) | | | 12,950 | | | | | | 60,188 | | | | | | | | | | | | 19,524 | | | |
| | | | | | | | | | | | | | | | | | | | | | | | | | | | | | | | | | |
Total Centrally Cleared Swaptions (cost $128,223) | | | | | | | | | | $ | 81,096 | | | | | | | | | | | $ | (47,128 | ) | | |
| | | | | | | | | | | | | | | | | | | | | | | | | | | | | | | | | | |
Options Written:
Centrally Cleared Swaptions
| | | | | | | | | | | | | | | | | | | | | | | | | | | | | | | | |
Description | | Call/
Put | | Expiration
Date | | Strike | | Receive | | Pay | | Notional
Amount
(000)# | | | Value at December 31,
2022 | | | | Unrealized Appreciation (Depreciation) |
CDX.NA.IG.39.V1, 12/20/27 | | Call | | 01/18/23 | | 0.90% | | CDX.NA.IG.39.V1(Q) | | 1.00%(Q) | | | 10,800 | | | | | $ | (41,872 | ) | | | | | | | | $ | (19,192 | ) | | |
CDX.NA.IG.39.V1, 12/20/27 | | Call | | 02/15/23 | | 0.80% | | CDX.NA.IG.39.V1(Q) | | 1.00%(Q) | | | 9,270 | | | | | | (16,384 | ) | | | | | | | | | 3,854 | | | |
CDX.NA.IG.39.V1, 12/20/27 | | Call | | 03/15/23 | | 0.73% | | CDX.NA.IG.39.V1(Q) | | 1.00%(Q) | | | 12,950 | | | | | | (12,083 | ) | | | | | | | | | 15,112 | | | |
CDX.NA.IG.39.V1, 12/20/27 | | Put | | 01/18/23 | | 1.30% | | 1.00%(Q) | | CDX.NA.IG.39.V1(Q) | | | 10,800 | | | | | | (869 | ) | | | | | | | | | 24,511 | | | |
CDX.NA.IG.39.V1, 12/20/27 | | Put | | 02/15/23 | | 1.15% | | 1.00%(Q) | | CDX.NA.IG.39.V1(Q) | | | 9,270 | | | | | | (5,085 | ) | | | | | | | | | 8,664 | | | |
CDX.NA.IG.39.V1, 12/20/27 | | Put | | 03/15/23 | | 1.10% | | 1.00%(Q) | | CDX.NA.IG.39.V1(Q) | | | 12,950 | | | | | | (17,747 | ) | | | | | | | | | (6,092 | ) | | |
| | | | | | | | | | | | | | | | | | | | | | | | | | | | | | | | |
Total Centrally Cleared Swaptions (premiums received $120,897) | | | | | | | | $ | (94,040 | ) | | | | | | | | $ | 26,857 | | | |
| | | | | | | | | | | | | | | | | | | | | | | | | | | | | | | | |
Futures contracts outstanding at December 31, 2022:
| | | | | | | | | | | | | | | | | | |
Number of Contracts | | Type | | Expiration
Date | | | Current
Notional
Amount | | | Value / Unrealized Appreciation (Depreciation) |
Long Positions: | | | | | | | | | | | | | |
227 | | 2 Year U.S. Treasury Notes | | | Mar. 2023 | | | $ | 46,552,735 | | | | | $ | 45,949 | | | |
316 | | 5 Year U.S. Treasury Notes | | | Mar. 2023 | | | | 34,105,782 | | | | | | (369,614 | ) | | |
SEE NOTES TO FINANCIAL STATEMENTS.
A58
| | | | |
| | PSF PGIM 50/50 BALANCED PORTFOLIO (CONTINUED) | | |
SCHEDULE OF INVESTMENTS | | | | as of December 31, 2022 |
Futures contracts outstanding at December 31, 2022 (continued):
| | | | | | | | | | | | | | | | | | |
Number of Contracts | | Type | | Expiration
Date | | | Current
Notional
Amount | | | Value /
Unrealized
Appreciation
(Depreciation) |
| | | | | |
Long Positions (cont’d): | | | | | | | | | | | | | | | | |
342 | | 10 Year U.S. Treasury Notes | | | Mar. 2023 | | | | $38,405,533 | | | | | $ | (530,223 | ) | | |
86 | | 30 Year U.S. Ultra Treasury Bonds | | | Mar. 2023 | | | | 11,550,875 | | | | | | (212,003 | ) | | |
5 | | Mini MSCI EAFE Index | | | Mar. 2023 | | | | 487,350 | | | | | | (8,476 | ) | | |
86 | | S&P 500 E-Mini Index | | | Mar. 2023 | | | | 16,602,300 | | | | | | (464,197 | ) | | |
| | | | | | | | | | | | | | | | | | |
| | | | | | | | | | | | | | | (1,538,564 | ) | | |
| | | | | | | | | | | | | | | | | | |
| | | | | |
Short Positions: | | | | | | | | | | | | | | | | |
23 | | 5 Year Euro-Bobl | | | Mar. 2023 | | | | 2,849,805 | | | | | | 91,540 | | | |
11 | | 10 Year Euro-Bund | | | Mar. 2023 | | | | 1,565,244 | | | | | | 104,400 | | | |
25 | | 10 Year U.S. Ultra Treasury Notes | | | Mar. 2023 | | | | 2,957,031 | | | | | | 18,974 | | | |
412 | | 20 Year U.S. Treasury Bonds | | | Mar. 2023 | | | | 51,641,625 | | | | | | 295,718 | | | |
14 | | Euro Schatz Index | | | Mar. 2023 | | | | 1,579,856 | | | | | | 19,396 | | | |
| | | | | | | | | | | | | | | | | | |
| | | | | | | | | | | | | | | 530,028 | | | |
| | | | | | | | | | | | | | | | | | |
| | | | | | | | | | | | | | $ | (1,008,536 | ) | | |
| | | | | | | | | | | | | | | | | | |
Forward foreign currency exchange contracts outstanding at December 31, 2022:
| | | | | | | | | | | | | | | | | | | | | | | | | | | | | | | | | | | | |
Sale Contracts | | Counterparty | | | | Notional
Amount
(000) | | | Value at
Settlement
Date | | | Current
Value | | | Unrealized Appreciation | | Unrealized Depreciation |
OTC Forward Foreign Currency Exchange Contracts: | | | | | | | | | | | | | | | | | | | | | | | | | |
Canadian Dollar, | | | | | | | | | | | | | | | | | | | | | | | | | | | | | | | | | | | | |
Expiring 01/19/23 | | HSBC | | | | | CAD | | | | 429 | | | $ | 310,865 | | | $ | 316,887 | | | | | $ | — | | | | | | | $ | (6,022 | ) | | |
Euro, | | | | | | | | | | | | | | | | | | | | | | | | | | | | | | | | | | | | |
Expiring 01/12/23 | | BNP | | | | | EUR | | | | 15,430 | | | | 15,993,843 | | | | 16,532,202 | | | | | | — | | | | | | | | (538,359 | ) | | |
| | | | | | | | | | | | | | | | | | | | | | | | | | | | | | | | | | | | |
| | | | | | | | | | | | | | $ | 16,304,708 | | | $ | 16,849,089 | | | | | $ | — | | | | | | | $ | (544,381 | ) | | |
| | | | | | | | | | | | | | | | | | | | | | | | | | | | | | | | | | | | |
Credit default swap agreement outstanding at December 31, 2022:
| | | | | | | | | | | | | | | | | | | | | | | | | | | | | | | | |
Reference Entity/ Obligation | | Termination
Date | | | Fixed
Rate | | Notional
Amount
(000)#(3) | | | Implied
Credit
Spread at
December 31,
2022(4) | | Fair
Value | | | Upfront
Premiums
Paid
(Received) | | Unrealized
Appreciation
(Depreciation) | | Counterparty |
| | | | | | | | | | | | | | | | | | | | | | | | | | | | | |
OTC Credit Default Swap Agreement on asset-backed and/or mortgage-backed securities - Sell Protection(2)^: |
GS_21-PJA | | | 01/14/23 | | | 0.250%(M) | | | 5,100 | | | * | | $ | 1,733 | | | | | $(35) | | | | | | $ | 1,768 | | | | | GSI |
| | | | | | | | | | | | | | | | | | | | | | | | | | | | | | | | |
| | | | | | | | | | | | | | | | | | | | | | | | | | | | | | | | | | |
Reference Entity/ Obligation | | Termination
Date | | | Fixed
Rate | | | Notional
Amount
(000)#(3) | | | Fair
Value | | | Upfront
Premiums
Paid
(Received) | | Unrealized
Appreciation
(Depreciation) | | Counterparty |
| | | | | | | | | | | | | | | | | | | | | | | | | | | | | |
OTC Credit Default Swap Agreements on corporate and/or sovereign issues - Buy Protection(1): |
Credit Suisse Group AG | | | 06/20/26 | | | | 1.000%(Q) | | | | 2,000 | | | $ | 171,504 | | | | | $ | 115,683 | | | | | | | $ | 55,821 | | | | | BARC |
Credit Suisse Group AG | | | 06/20/26 | | | | 1.000%(Q) | | | | 2,000 | | | | 171,503 | | | | | | 112,839 | | | | | | | | 58,664 | | | | | BARC |
Credit Suisse Group AG | | | 06/20/26 | | | | 1.000%(Q) | | | | 2,000 | | | | 171,504 | | | | | | 126,934 | | | | | | | | 44,570 | | | | | BARC |
| | | | | | | | | | | | | | | | | | | | | | | | | | | | | | | | | | |
| | | | | | | | | | | | | | $ | 514,511 | | | | | $ | 355,456 | | | | | | | $ | 159,055 | | | | | |
| | | | | | | | | | | | | | | | | | | | | | | | | | | | | | | | | | |
SEE NOTES TO FINANCIAL STATEMENTS.
A59
| | | | |
| | PSF PGIM 50/50 BALANCED PORTFOLIO (CONTINUED) | | |
SCHEDULE OF INVESTMENTS | | | | as of December 31, 2022 |
Credit default swap agreement outstanding at December 31, 2022: (continued)
| | | | | | | | | | | | | | | | | | | | | | | | | | | | | | | | |
Reference Entity/ Obligation | | Termination
Date | | Fixed
Rate | | Notional
Amount
(000)#(3) | | | Value at
Trade Date | | Value at December 31, 2022 | | Unrealized Appreciation (Depreciation) |
| | | | | | | | | | | | | | | | | | | | | | | | | | | | | |
Centrally Cleared Credit Default Swap Agreement on credit indices - Buy Protection(1): | | | |
CDX.NA.IG.39.V1 | | 12/20/27 | | 1.000%(Q) | | | 22,520 | | | | | $ | (97,932) | | | | | | | $ | (186,992 | ) | | | | | | $ | (89,060 | ) | | |
| | | | | | | | | | | | | | | | | | | | | | | | | | | | | | | | |
The Portfolio entered into credit default swaps (“CDS”) to provide a measure of protection against defaults or to take an active long or short position with respect to the likelihood of a particular issuer’s default or the reference entity’s credit soundness. CDS contracts generally trade based on a spread which represents the cost a protection buyer has to pay the protection seller. The protection buyer is said to be short the credit as the value of the contract rises the more the credit deteriorates. The value of the CDS contract increases for the protection buyer if the spread increases.
| (1) | If the Portfolio is a buyer of protection, it pays the fixed rate. When a credit event occurs, as defined under the terms of that particular swap agreement, the Portfolio will either (i) receive from the seller of protection an amount equal to the notional amount of the swap and make delivery of the referenced obligation or underlying securities comprising the referenced index or (ii) receive a net settlement amount in the form of cash or securities equal to the notional amount of the swap less the recovery value of the referenced obligation or underlying securities comprising the referenced index. |
| (2) | If the Portfolio is a seller of protection, it receives the fixed rate. When a credit event occurs, as defined under the terms of that particular swap agreement, the Portfolio will either (i) pay to the buyer of protection an amount equal to the notional amount of the swap and take delivery of the referenced obligation or underlying securities comprising the referenced index or (ii) pay a net settlement amount in the form of cash or securities equal to the notional amount of the swap less the recovery value of the referenced obligation or underlying securities comprising the referenced index. |
| (3) | Notional amount represents the maximum potential amount the Portfolio could be required to pay as a seller of credit protection or receive as a buyer of credit protection if a credit event occurs as defined under the terms of that particular swap agreement. |
| (4) | Implied credit spreads, represented in absolute terms, utilized in determining the fair value of credit default swap agreements where the Portfolio is the seller of protection as of the reporting date serve as an indicator of the current status of the payment/ performance risk and represent the likelihood of risk of default for the credit derivative. The implied credit spread of a particular referenced entity reflects the cost of buying/selling protection and may include up-front payments required to be made to enter into the agreement. Wider credit spreads represent a deterioration of the referenced entity’s credit soundness and a greater likelihood of risk of default or other credit event occurring as defined under the terms of the agreement. |
| * | When an implied credit spread is not available, reference the fair value of credit default swap agreements on credit indices and asset-backed securities. Where the Portfolio is the seller of protection, it serves as an indicator of the current status of the payment/performance risk and represents the likelihood of an expected liability (or profit) for the credit derivative should the notional amount of the swap agreement be closed/sold as of the reporting date. Increasing fair value in absolute terms, when compared to the notional amount of the swap, represents a deterioration of the referenced entity’s credit soundness and a greater likelihood of risk of default or other credit event occurring as defined under the terms of the agreement. |
Total return swap agreements outstanding at December 31, 2022:
| | | | | | | | | | | | | | | | | | | | | | | | | | | | | | | | |
Reference Entity | | Financing Rate | | Counterparty | | Termination
Date | | Long (Short)
Notional
Amount
(000)#(1) | | Fair
Value | | Upfront
Premiums
Paid
(Received) | | Unrealized
Appreciation
(Depreciation)(2) |
| | | | | | | | | | | | | | | |
OTC Total Return Swap Agreements: | | | | | | | | | | | | | | | | | | | | | | | | | | | | | | |
Total Return Benchmark Bond Index(T) | | 1 Day USOIS -50bps(Q)/ 3.830% | | | | JPM | | | | | 03/20/23 | | | | | (4,897) | | | | $ | (329,975 | ) | | | $ | — | | | | | $(329,975) | |
U.S. Treasury Bond(T) | | 1 Day USOIS +9bps(T)/ 4.420% | | | | JPM | | | | | 01/18/23 | | | | | 6,655 | | | | | 39,220 | | | | | — | | | | | 39,220 | |
U.S. Treasury Bond(T) | | 1 Day USOIS +6bps(T)/ 4.390% | | | | GSI | | | | | 01/19/23 | | | | | 12,240 | | | | | 116,052 | | | | | — | | | | | 116,052 | |
U.S. Treasury Bond(T) | | 1 Day USOIS +10bps(T)/ 4.430% | | | | JPM | | | | | 01/23/23 | | | | | 11,775 | | | | | 331,454 | | | | | — | | | | | 331,454 | |
SEE NOTES TO FINANCIAL STATEMENTS.
A60
| | | | |
| | PSF PGIM 50/50 BALANCED PORTFOLIO (CONTINUED) | | |
SCHEDULE OF INVESTMENTS | | | | as of December 31, 2022 |
Total return swap agreements outstanding at December 31, 2022 (continued):
| | | | | | | | | | | | | | | | | | | | | | | | | | | | | | | | |
Reference Entity | | Financing Rate | | Counterparty | | Termination
Date | | Long (Short)
Notional
Amount
(000)#(1) | | Fair
Value | | Upfront
Premiums
Paid
(Received) | | Unrealized
Appreciation
(Depreciation)(2) |
| | | | | | | | | | | | | | | |
| | | | | | | | | | | | | | | |
OTC Total Return Swap Agreements (cont’d.): | | | | | | | | | | | | | | | | | | | | | | | | | | |
U.S. Treasury Bond(T) | | 1 Day USOIS +12bps(T)/ 4.450% | | | | JPM | | | | | 01/26/23 | | | | | 10,220 | | | | $ | 448,783 | | | | $ | — | | | | $ | 448,783 | |
U.S. Treasury Bond(T) | | 1 Day USOIS +6bps(T)/ 4.390% | | | | GSI | | | | | 01/27/23 | | | | | 16,755 | | | | | 348,063 | | | | | — | | | | | 348,063 | |
U.S. Treasury Bond(T) | | 1 Day USOIS +15bps(T)/ 4.480% | | | | BOA | | | | | 02/10/23 | | | | | 19,230 | | | | | 600,928 | | | | | — | | | | | 600,928 | |
U.S. Treasury Bond(T) | | 1 Day USOIS +13bps(T)/ 4.460% | | | | JPM | | | | | 02/23/23 | | | | | 13,010 | | | | | 14,571 | | | | | — | | | | | 14,571 | |
| | | | | | | | | | | | | | | | | | | | | | | | | | | | | | | | |
| | | | | | | |
| | | | | | | | | | | | | | | | | | | | $ | 1,569,096 | | | | $ | — | | | | $ | 1,569,096 | |
| | | | | | | | | | | | | | | | | | | | | | | | | | | | | | | | |
| (1) | On a long total return swap, the Portfolio receives payments for any positive return on the reference entity (makes payments for any negative return) and pays the financing rate. On a short total return swap, the Portfolio makes payments for any positive return on the reference entity (receives payments for any negative return) and receives the financing rate. |
| (2) | Upfront/recurring fees or commissions, as applicable, are included in the net unrealized appreciation (depreciation). |
Balances Reported in the Statement of Assets and Liabilities for OTC Swap Agreements:
| | | | | | | | |
| | | Premiums Paid | | Premiums Received | | Unrealized Appreciation | | Unrealized Depreciation |
| | | | |
OTC Swap Agreements | | $355,456 | | $(35) | | $2,059,894 | | $(329,975) |
Summary of Collateral for Centrally Cleared/Exchange-traded Derivatives:
Cash and securities segregated as collateral, including pending settlement for closed positions, to cover requirements for centrally cleared/exchange-traded derivatives are listed by broker as follows:
| | | | | | | | | | |
Broker | | Cash and/or Foreign Currency | | Securities Market Value |
CIGM | | | $ | — | | | | $ | 2,218,888 | |
GS | | | | — | | | | | 1,219,565 | |
| | | | | | | | | | |
Total | | | $ | — | | | | $ | 3,438,453 | |
| | | | | | | | | | |
Fair Value Measurements:
Various inputs are used in determining the value of the Portfolio’s investments. These inputs are summarized in the three broad levels listed below.
Level 1—unadjusted quoted prices generally in active markets for identical securities.
Level 2—quoted prices for similar securities, interest rates and yield curves, prepayment speeds, foreign currency exchange rates and other observable inputs.
Level 3—unobservable inputs for securities valued in accordance with Board approved fair valuation procedures.
The following is a summary of the inputs used as of December 31, 2022 in valuing such portfolio securities:
| | | | | | | | | | | | |
| | | Level 1 | | | Level 2 | | | Level 3 | |
Investments in Securities | | | | | | | | | | | | |
Assets | | | | | | | | | | | | |
Long-Term Investments | | | | | | | | | | | | |
Common Stocks | | $ | 1,114,034,287 | | | $ | 29,919,914 | | | $ | — | |
Exchange-Traded Funds | | | 13,562,811 | | | | — | | | | — | |
Preferred Stocks | | | 1,273,300 | | | | 166,065 | | | | — | |
Rights | | | — | | | | — | | | | — | |
SEE NOTES TO FINANCIAL STATEMENTS.
A61
| | | | |
| | PSF PGIM 50/50 BALANCED PORTFOLIO (CONTINUED) | | |
SCHEDULE OF INVESTMENTS | | | | as of December 31, 2022 |
| | | | | | | | | | | | | | | |
| | | Level 1 | | Level 2 | | Level 3 |
Investments in Securities (continued) | | | | | | | | | | | | | | | |
Assets (continued) | | | | | | | | | | | | | | | |
Long-Term Investments (continued) | | | | | | | | | | | | | | | |
Asset-Backed Securities | | | | | | | | | | | | | | | |
Automobiles | | | $ | — | | | | $ | 47,132,206 | | | | $ | — | |
Collateralized Loan Obligations | | | | — | | | | | 104,560,809 | | | | | — | |
Consumer Loans | | | | — | | | | | 6,448,851 | | | | | — | |
Equipment | | | | — | | | | | 5,400,019 | | | | | — | |
Other | | | | — | | | | | 2,870,782 | | | | | — | |
Residential Mortgage-Backed Securities | | | | — | | | | | 245,264 | | | | | 903,007 | |
Student Loans | | | | — | | | | | 7,442,363 | | | | | — | |
Corporate Bonds | | | | — | | | | | 253,794,414 | | | | | — | |
Commercial Mortgage-Backed Securities | | | | — | | | | | 137,378,698 | | | | | — | |
Municipal Bonds | | | | — | | | | | 10,162,516 | | | | | — | |
Residential Mortgage-Backed Securities | | | | — | | | | | 36,576,269 | | | | | 1,145 | |
Sovereign Bonds | | | | — | | | | | 10,418,831 | | | | | — | |
U.S. Government Agency Obligations | | | | — | | | | | 287,552,610 | | | | | — | |
U.S. Treasury Obligations | | | | — | | | | | 41,083,887 | | | | | — | |
Short-Term Investments | | | | | | | | | | | | | | | |
Affiliated Mutual Funds | | | | 312,137,122 | | | | | — | | | | | — | |
U.S. Treasury Obligation | | | | — | | | | | 1,219,565 | | | | | — | |
| | | | | | | | | | | | | | | |
Total | | | $ | 1,441,007,520 | | | | $ | 982,373,063 | | | | $ | 904,152 | |
| | | | | | | | | | | | | | | |
| | | |
Liabilities | | | | | | | | | | | | | | | |
Option Written | | | $ | — | | | | $ | — | | | | $ | (149 | ) |
| | | | | | | | | | | | | | | |
Other Financial Instruments* | | | | | | | | | | | | | | | |
Assets | | | | | | | | | | | | | | | |
Centrally Cleared Swaptions Purchased | | | $ | — | | | | $ | 19,524 | | | | $ | — | |
Centrally Cleared Swaptions Written | | | | — | | | | | 52,141 | | | | | — | |
Futures Contracts | | | | 575,977 | | | | | — | | | | | — | |
OTC Credit Default Swap Agreements | | | | — | | | | | 514,511 | | | | | 1,733 | |
OTC Total Return Swap Agreements | | | | — | | | | | 1,899,071 | | | | | — | |
| | | | | | | | | | | | | | | |
Total | | | $ | 575,977 | | | | $ | 2,485,247 | | | | $ | 1,733 | |
| | | | | | | | | | | | | | | |
Liabilities | | | | | | | | | | | | | | | |
Forward Commitment Contracts | | | $ | — | | | | $ | (1,784,174 | ) | | | $ | — | |
Centrally Cleared Swaptions Purchased | | | | — | | | | | (66,652 | ) | | | | — | |
Centrally Cleared Swaptions Written | | | | — | | | | | (25,284 | ) | | | | — | |
Futures Contracts | | | | (1,584,513 | ) | | | | — | | | | | — | |
OTC Forward Foreign Currency Exchange Contracts | | | | — | | | | | (544,381 | ) | | | | — | |
Centrally Cleared Credit Default Swap Agreement | | | | — | | | | | (89,060 | ) | | | | — | |
OTC Total Return Swap Agreement | | | | — | | | | | (329,975 | ) | | | | — | |
| | | | | | | | | | | | | | | |
Total | | | $ | (1,584,513 | ) | | | $ | (2,839,526 | ) | | | $ | — | |
| | | | | | | | | | | | | | | |
| * | Other financial instruments are derivative instruments, with the exception of forward commitment contracts and centrally cleared swaptions, and are not reflected in the Schedule of Investments. Centrally cleared swaptions, futures, forwards and centrally cleared swap contracts are recorded at net unrealized appreciation (depreciation) and OTC swap contracts are recorded at fair value. Forward commitment contracts are recorded at market value. |
Industry Classification:
The industry classification of investments and liabilities in excess of other assets shown as a percentage of net assets as of December 31, 2022 were as follows:
| | | | |
Affiliated Mutual Funds (2.0% represents investments purchased with collateral from securities on loan) | | | 13.3 | % |
U.S. Government Agency Obligations | | | 12.3 | |
Commercial Mortgage-Backed Securities | | | 5.9 | |
Banks | | | 5.0 | |
Collateralized Loan Obligations | | | 4.5 | |
| | | | |
Software | | | 4.1 | % |
Pharmaceuticals | | | 3.0 | |
Technology Hardware, Storage & Peripherals | | | 3.0 | |
Automobiles | | | 2.7 | |
Semiconductors & Semiconductor Equipment | | | 2.5 | |
Oil, Gas & Consumable Fuels | | | 2.4 | |
SEE NOTES TO FINANCIAL STATEMENTS.
A62
| | | | |
| | PSF PGIM 50/50 BALANCED PORTFOLIO (CONTINUED) | | |
SCHEDULE OF INVESTMENTS | | | | as of December 31, 2022 |
Industry Classification (continued):
| | | | |
IT Services | | | 2.2 | % |
Interactive Media & Services | | | 1.9 | |
U.S. Treasury Obligations | | | 1.9 | |
Health Care Providers & Services | | | 1.8 | |
Residential Mortgage-Backed Securities | | | 1.7 | |
Capital Markets | | | 1.6 | |
Insurance | | | 1.4 | |
Health Care Equipment & Supplies | | | 1.3 | |
Equity Real Estate Investment Trusts (REITs) | | | 1.3 | |
Biotechnology | | | 1.3 | |
Aerospace & Defense | | | 1.2 | |
Specialty Retail | | | 1.2 | |
Internet & Direct Marketing Retail | | | 1.2 | |
Diversified Financial Services | | | 1.1 | |
Electric | | | 1.1 | |
Chemicals | | | 1.0 | |
Electric Utilities | | | 1.0 | |
Beverages | | | 1.0 | |
Hotels, Restaurants & Leisure | | | 1.0 | |
Machinery | | | 0.9 | |
Life Sciences Tools & Services | | | 0.9 | |
Media | | | 0.8 | |
Household Products | | | 0.8 | |
Food & Staples Retailing | | | 0.8 | |
Pipelines | | | 0.7 | |
Entertainment | | | 0.6 | |
Food Products | | | 0.6 | |
Exchange-Traded Funds | | | 0.6 | |
Telecommunications | | | 0.6 | |
Industrial Conglomerates | | | 0.5 | |
Oil & Gas | | | 0.5 | |
Diversified Telecommunication Services | | | 0.5 | |
Multi-Utilities | | | 0.5 | |
Sovereign Bonds | | | 0.4 | |
Municipal Bonds | | | 0.4 | |
Communications Equipment | | | 0.4 | |
Road & Rail | | | 0.4 | |
Tobacco | | | 0.4 | |
Student Loans | | | 0.3 | |
Electronic Equipment, Instruments & Components | | | 0.3 | |
Auto Manufacturers | | | 0.3 | |
Retail | | | 0.3 | |
Air Freight & Logistics | | | 0.3 | |
Textiles, Apparel & Luxury Goods | | | 0.3 | |
Electrical Equipment | | | 0.3 | |
Metals & Mining | | | 0.3 | |
Consumer Loans | | | 0.3 | |
Foods | | | 0.3 | |
Real Estate Investment Trusts (REITs) | | | 0.2 | |
Consumer Finance | | | 0.2 | |
Airlines | | | 0.2 | |
Commercial Services & Supplies | | | 0.2 | |
Multiline Retail | | | 0.2 | |
Equipment | | | 0.2 | |
Building Products | | | 0.2 | |
Healthcare-Services | | | 0.2 | |
Energy Equipment & Services | | | 0.2 | |
Agriculture | | | 0.2 | |
| | | | |
Professional Services | | | 0.2 | % |
Packaging & Containers | | | 0.2 | |
Household Durables | | | 0.2 | |
Trading Companies & Distributors | | | 0.2 | |
Gas | | | 0.1 | |
Containers & Packaging | | | 0.1 | |
Miscellaneous Manufacturing | | | 0.1 | |
Wireless Telecommunication Services | | | 0.1 | |
Commercial Services | | | 0.1 | |
Other | | | 0.1 | |
Personal Products | | | 0.1 | |
Semiconductors | | | 0.1 | |
Housewares | | | 0.1 | |
Distributors | | | 0.1 | |
Transportation | | | 0.1 | |
Office/Business Equipment | | | 0.1 | |
Engineering & Construction | | | 0.1 | |
Construction Materials | | | 0.1 | |
Healthcare-Products | | | 0.1 | |
Auto Components | | | 0.1 | |
Construction & Engineering | | | 0.1 | |
Home Builders | | | 0.0 | * |
Real Estate Management & Development | | | 0.0 | * |
Water Utilities | | | 0.0 | * |
Independent Power & Renewable Electricity Producers | | | 0.0 | * |
Building Materials | | | 0.0 | * |
Gas Utilities | | | 0.0 | * |
Internet | | | 0.0 | * |
Apparel | | | 0.0 | * |
Multi-National | | | 0.0 | * |
Leisure Products | | | 0.0 | * |
Marine | | | 0.0 | * |
Forest Products & Paper | | | 0.0 | * |
Paper & Forest Products | | | 0.0 | * |
| | | | |
| | | 103.7 | |
Option Written | | | (0.0 | )* |
Liabilities in excess of other assets | | | (3.7 | ) |
| | | | |
| |
| | | 100.0 | % |
| | | | |
SEE NOTES TO FINANCIAL STATEMENTS.
A63
| | | | |
| | PSF PGIM 50/50 BALANCED PORTFOLIO (CONTINUED) | | |
SCHEDULE OF INVESTMENTS | | | | as of December 31, 2022 |
Effects of Derivative Instruments on the Financial Statements and Primary Underlying Risk Exposure:
The Portfolio invested in derivative instruments during the reporting period. The primary types of risk associated with these derivative instruments are credit contracts risk, equity contracts risk, foreign exchange contracts risk and interest rate contracts risk. See the Notes to Financial Statements for additional detail regarding these derivative instruments and their risks. The effect of such derivative instruments on the Portfolio’s financial position and financial performance as reflected in the Statement of Assets and Liabilities and Statement of Operations is presented in the summary below.
Fair values of derivative instruments as of December 31, 2022 as presented in the Statement of Assets and Liabilities:
| | | | | | | | | | | | | | |
| | | Asset Derivatives | | | Liability Derivatives | |
Derivatives not accounted for as hedging instruments, carried at fair value | | Statement of Assets and Liabilities Location | | | | Fair
Value | | | Statement of Assets and Liabilities Location | | Fair
Value | |
Credit contracts | | Due from/to broker-variation margin swaps and swaptions | | | | $ | 71,665 | * | | Due from/to broker-variation margin swaps and swaptions | | $ | 180,996 | * |
Credit contracts | | Premiums paid for OTC swap agreements | | | | | 355,456 | | | Premiums received for OTC swap agreements | | | 35 | |
Credit contracts | | — | | | | | — | | | Options written outstanding, at value | | | 149 | |
Credit contracts | | Unrealized appreciation on OTC swap agreements | | | | | 160,823 | | | — | | | — | |
Equity contracts | | — | | | | | — | | | Due from/to broker-variation margin futures | | | 472,673 | * |
Foreign exchange contracts | | — | | | | | — | | | Unrealized depreciation on OTC forward foreign currency exchange contracts | | | 544,381 | |
Interest rate contracts | | Due from/to broker-variation margin futures | | | | | 575,977 | * | | Due from/to broker-variation margin futures | | | 1,111,840 | * |
Interest rate contracts | | Unrealized appreciation on OTC swap agreements | | | | | 1,899,071 | | | Unrealized depreciation on OTC swap agreements | | | 329,975 | |
| | | | | | | | | | | | | | |
| | | | | | $ | 3,062,992 | | | | | $ | 2,640,049 | |
| | | | | | | | | | | | | | |
| * | Includes cumulative appreciation (depreciation) as reported in the schedule of open futures, centrally cleared swap contracts, and centrally cleared swaptions. Only unsettled variation margin receivable (payable) is reported within the Statement of Assets and Liabilities. |
The effects of derivative instruments on the Statement of Operations for the year ended December 31, 2022 are as follows:
| | | | | | | | | | | | | | | | | | | | | | | | | | | | |
Amount of Realized Gain (Loss) on Derivatives Recognized in Income | |
Derivatives not accounted for as hedging instruments, carried at fair value | | Options Purchased(1) | | | Options
Written | | | Futures | | | Forward
Currency
Exchange
Contracts | | | Swaps | |
Credit contracts | | | | | | $ | (375,543 | ) | | | | | | $ | 367,663 | | | $ | — | | | $ | — | | | $ | 151,586 | |
Equity contracts | | | | | | | — | | | | | | | | — | | | | (4,428,356 | ) | | | — | | | | — | |
Foreign exchange contracts | | | | | | | — | | | | | | | | — | | | | — | | | | 1,957,920 | | | | — | |
Interest rate contracts | | | | | | | — | | | | | | | | — | | | | (26,439,214 | ) | | | — | | | | (11,073,117 | ) |
| | | | | | | | | | | | | | | | | | | | | | | | | | | | |
Total | | | | | | $ | (375,543 | ) | | | | | | $ | 367,663 | | | $ | (30,867,570 | ) | | $ | 1,957,920 | | | $ | (10,921,531 | ) |
| | | | | | | | | | | | | | | | | | | | | | | | | | | | |
| (1) | Included in net realized gain (loss) on investment transactions in the Statement of Operations. |
| | | | | | | | | | | | | | | | | | | | | | | | | |
Change in Unrealized Appreciation (Depreciation) on Derivatives Recognized in Income |
Derivatives not accounted for as hedging instruments, carried at fair value | | Options Purchased(2) | | Options Written | | Futures | | Forward
Currency
Exchange
Contracts | | Swaps |
Credit contracts | | | $ | (13,841 | ) | | | $ | 43,689 | | | | $ | — | | | | $ | — | | | | $ | 66,906 | |
Equity contracts | | | | — | | | | | — | | | | | (831,783 | ) | | | | — | | | | | — | |
SEE NOTES TO FINANCIAL STATEMENTS.
A64
| | | | |
| | PSF PGIM 50/50 BALANCED PORTFOLIO (CONTINUED) | | |
SCHEDULE OF INVESTMENTS | | | | as of December 31, 2022 |
| | | | | | | | | | | | | | | | | | | | | | | | | | | | | | | | | | | | |
Change in Unrealized Appreciation (Depreciation) on Derivatives Recognized in Income | |
Derivatives not accounted for as hedging instruments, carried at fair value | | Options
Purchased(2) | | | Options
Written | | | Futures | | | Forward
Currency
Exchange
Contracts | | | Swaps | |
Foreign exchange contracts | | | | | | $ | — | | | | | | | | | | | $ | — | | | | | | | $ | — | | | $ | (301,006 | ) | | $ | — | |
Interest rate contracts | | | | | | | — | | | | | | | | | | | | — | | | | | | | | (1,844,659 | ) | | | — | | | | 3,643,684 | |
| | | | | | | | | | | | | | | | | | | | | | | | | | | | | | | | | | | | |
Total | | | | | | $ | (13,841 | ) | | | | | | | | | | $ | 43,689 | | | | | | | $ | (2,676,442 | ) | | $ | (301,006 | ) | | $ | 3,710,590 | |
| | | | | | | | | | | | | | | | | | | | | | | | | | | | | | | | | | | | |
| (2) | Included in net change in unrealized appreciation (depreciation) on investments in the Statement of Operations. |
For the year ended December 31, 2022, the Portfolio’s average volume of derivative activities is as follows:
| | | | |
| Derivative Contract Type | | Average Volume of Derivative Activities* |
Options Purchased (1) | | | $ 94,423 | |
Options Written (2) | | | 69,744,000 | |
Futures Contracts - Long Positions (2) | | | 187,124,962 | |
Futures Contracts - Short Positions (2) | | | 52,798,189 | |
Forward Foreign Currency Exchange Contracts - Purchased (3) | | | 10,577,331 | |
Forward Foreign Currency Exchange Contracts - Sold (3) | | | 30,184,543 | |
Credit Default Swap Agreements - Buy Protection (2) | | | 17,866,000 | |
Credit Default Swap Agreements - Sell Protection (2) | | | 8,830,224 | |
Total Return Swap Agreements (2) | | | 40,902,385 | |
Inflation Swap Agreements (2) | | | 5,735,000 | |
| * | Average volume is based on average quarter end balances as noted for the year ended December 31, 2022. |
| (2) | Notional Amount in USD. |
| (3) | Value at Settlement Date. |
Financial Instruments/Transactions—Summary of Offsetting and Netting Arrangements:
The Portfolio invested in OTC derivatives and entered into financial instruments/transactions during the reporting period that are either offset in accordance with current requirements or are subject to enforceable master netting arrangements or similar agreements that permit offsetting. The information about offsetting and related netting arrangements for OTC derivatives and financial instruments/transactions where the legal right to set-off exists is presented in the summary below.
Offsetting of financial instrument/transaction assets and liabilities:
| | | | | | |
| Description | | Gross Market Value of Recognized Assets/(Liabilities) | | Collateral Pledged/(Received)(2) | | Net Amount |
Securities on Loan | | $44,951,956 | | $(44,951,956) | | $— |
Offsetting of OTC derivative assets and liabilities:
| | | | | | | | | | | | | | | | | | | | | | | | | | | | | | | | | | | | | | | | | | | | | | | | | | | | | | | | | | | | |
Counterparty | | Gross Amounts of
Recognized
Assets(1) | | | Gross Amounts of
Recognized
Liabilities(1) | | | Net Amounts of Recognized Assets/(Liabilities) | | | Collateral Pledged/(Received)(2) | | | Net Amount | |
| | | | | | | | | | | | | | | | | | | | | | | | | | | | | | | | | | | | | | | | | | | | | | |
BARC | | | | | | $ | 514,511 | | | | | | | | | | | $ | — | | | | | | | | | | | $ | 514,511 | | | | | | | | | | | $ | (514,511 | ) | | | | | | | | | | $ | — | | | | | |
BNP | | | | | | | — | | | | | | | | | | | | (538,359 | ) | | | | | | | | | | | (538,359 | ) | | | | | | | | | | | 247,470 | | | | | | | | | | | | (290,889 | ) | | | | |
BOA | | | | | | | 600,928 | | | | | | | | | | | | — | | | | | | | | | | | | 600,928 | | | | | | | | | | | | (600,928 | ) | | | | | | | | | | | — | | | | | |
GSI | | | | | | | 465,883 | | | | | | | | | | | | (184 | ) | | | | | | | | | | | 465,699 | | | | | | | | | | | | (465,699 | ) | | | | | | | | | | | — | | | | | |
HSBC | | | | | | | — | | | | | | | | | | | | (6,022 | ) | | | | | | | | | | | (6,022 | ) | | | | | | | | | | | — | | | | | | | | | | | | (6,022 | ) | | | | |
JPM | | | | | | | 834,028 | | | | | | | | | | | | (329,975 | ) | | | | | | | | | | | 504,053 | | | | | | | | | | | | (504,053 | ) | | | | | | | | | | | — | | | | | |
| | | | | | | | | | | | | | | | | | | | | | | | | | | | | | | | | | | | | | | | | | | | | | | | | | | | | | | | | | | | |
| | | | | | $ | 2,415,350 | | | | | | | | | | | $ | (874,540 | ) | | | | | | | | | | $ | 1,540,810 | | | | | | | | | | | $ | (1,837,721 | ) | | | | | | | | | | $ | (296,911 | ) | | | | |
| | | | | | | | | | | | | | | | | | | | | | | | | | | | | | | | | | | | | | | | | | | | | | | | | | | | | | | | | | | | |
SEE NOTES TO FINANCIAL STATEMENTS.
A65
| | | | |
| | PSF PGIM 50/50 BALANCED PORTFOLIO (CONTINUED) | | |
SCHEDULE OF INVESTMENTS | | | | as of December 31, 2022 |
| (1) | Includes unrealized appreciation/(depreciation) on swaps and forwards, premiums paid/(received) on swap agreements and market value of purchased and written options, as represented on the Statement of Assets and Liabilities. |
| (2) | Collateral amount disclosed by the Portfolio is limited to the market value of financial instruments/transactions and the Portfolio’s OTC derivative exposure by counterparty. |
SEE NOTES TO FINANCIAL STATEMENTS.
A66
| | | | |
| | PSF PGIM 50/50 BALANCED PORTFOLIO (CONTINUED) | | |
STATEMENT OF ASSETS AND LIABILITIES
as of December 31, 2022
| | | | |
ASSETS | | | | |
Investments at value, including securities on loan of $44,951,956: | | | | |
Unaffiliated investments (cost $1,368,048,013) | | $ | 2,112,147,613 | |
Affiliated investments (cost $312,054,022) | | | 312,137,122 | |
Foreign currency, at value (cost $160,004) | | | 160,971 | |
Receivable for investments sold | | | 53,205,171 | |
Dividends and interest receivable | | | 6,949,746 | |
Unrealized appreciation on OTC swap agreements | | | 2,059,894 | |
Premiums paid for OTC swap agreements | | | 355,456 | |
Tax reclaim receivable | | | 331,598 | |
Receivable for Portfolio shares sold | | | 10,764 | |
Receivable from affiliate | | | 1,300 | |
Due from broker-variation margin swaps and swaptions | | | 536 | |
Prepaid expenses | | | 20,506 | |
| | | | |
Total Assets | | | 2,487,380,677 | |
| | | | |
LIABILITIES | | | | |
Payable for investments purchased | | | 97,757,242 | |
Payable to broker for collateral for securities on loan | | | 45,874,955 | |
Forward commitment contracts, at value (proceeds receivable $1,810,703) | | | 1,784,174 | |
Management fee payable | | | 1,111,586 | |
Accrued expenses and other liabilities | | | 1,074,132 | |
Unrealized depreciation on OTC forward foreign currency exchange contracts | | | 544,381 | |
Payable for Portfolio shares purchased | | | 398,337 | |
Unrealized depreciation on OTC swap agreements | | | 329,975 | |
Due to broker-variation margin futures | | | 113,385 | |
Payable to affiliate | | | 70,063 | |
Trustees’ fees payable | | | 1,629 | |
Distribution fee payable | | | 1,428 | |
Payable to custodian | | | 1,121 | |
Affiliated transfer agent fee payable | | | 980 | |
Options written outstanding, at value | | | 149 | |
Premiums received for OTC swap agreements | | | 35 | |
| | | | |
Total Liabilities | | | 149,063,572 | |
| | | | |
NET ASSETS | | $ | 2,338,317,105 | |
| | | | |
Net assets were comprised of: | | | | |
Partners’ Equity | | $ | 2,338,317,105 | |
| | | | |
Class I: | | | | |
Net asset value and redemption price per share, $2,331,607,006 / 68,905,541 outstanding shares of beneficial interest | | $ | 33.84 | |
| | | | |
Class III: | | | | |
Net asset value and redemption price per share, $6,710,099 / 199,138 outstanding shares of beneficial interest | | $ | 33.70 | |
| | | | |
STATEMENT OF OPERATIONS
Year Ended December 31, 2022
| | | | |
NET INVESTMENT INCOME (LOSS) | | | | |
INCOME | | | | |
Interest income (net of $498 foreign withholding tax) | | $ | 27,863,338 | |
Unaffiliated dividend income (net of $142,196 foreign withholding tax, of which $21,630 is reimbursable by an affiliate) | | | 21,037,885 | |
Affiliated dividend income | | | 6,119,960 | |
Income from securities lending, net (including affiliated income of $77,097) | | | 89,476 | |
| | | | |
Total income | | | 55,110,659 | |
| | | | |
EXPENSES | | | | |
Management fee | | | 13,850,406 | |
Distribution fee—Class III | | | 13,243 | |
Custodian and accounting fees | | | 254,630 | |
Shareholders’ reports | | | 51,609 | |
Audit fee | | | 49,500 | |
Trustees’ fees | | | 47,439 | |
Legal fees and expenses | | | 34,564 | |
Transfer agent’s fees and expenses (including affiliated expense of $5,882) | | | 10,682 | |
Miscellaneous | | | 76,919 | |
| | | | |
Total expenses | | | 14,388,992 | |
| | | | |
NET INVESTMENT INCOME (LOSS) | | | 40,721,667 | |
| | | | |
| REALIZED AND UNREALIZED GAIN (LOSS) ON INVESTMENT AND FOREIGN CURRENCY TRANSACTIONS | | | | |
Net realized gain (loss) on: | | | | |
Investment transactions (including affiliated of $16,548) | | | 77,442,062 | |
Futures transactions | | | (30,867,570 | ) |
Forward currency contract transactions | | | 1,957,920 | |
Options written transactions | | | 367,663 | |
Swap agreements transactions | | | (10,921,531 | ) |
Foreign currency transactions | | | (838,243 | ) |
| | | | |
| | | 37,140,301 | |
| | | | |
Net change in unrealized appreciation (depreciation) on: | | | | |
Investments (including affiliated of $5,262) | | | (498,076,675 | ) |
Futures | | | (2,676,442 | ) |
Forward currency contracts | | | (301,006 | ) |
Options written | | | 43,689 | |
Swap agreements | | | 3,710,590 | |
Foreign currencies | | | 32,131 | |
| | | | |
| | | (497,267,713 | ) |
| | | | |
NET GAIN (LOSS) ON INVESTMENT AND FOREIGN CURRENCY TRANSACTIONS | | | (460,127,412 | ) |
| | | | |
NET INCREASE (DECREASE) IN NET ASSETS RESULTING FROM OPERATIONS | | $ | (419,405,745 | ) |
| | | | |
STATEMENTS OF CHANGES IN NET ASSETS
| | | | | | | | | | | | | | | | | | | | | | | | |
| | | Year Ended
December 31, 2022 | | | Year Ended
December 31, 2021 | |
INCREASE (DECREASE) IN NET ASSETS | | | | | | | | | | | | | | | | | | | | | | | | |
OPERATIONS | | | | | | | | | | | | | | | | | | | | | | | | |
Net investment income (loss) | | | | | | $ | 40,721,667 | | | | | | | | | | | $ | 29,759,603 | | | | | |
Net realized gain (loss) on investment and foreign currency transactions | | | | | | | 37,140,301 | | | | | | | | | | | | 183,271,608 | | | | | |
Net change in unrealized appreciation (depreciation) on investments and foreign currencies | | | | | | | (497,267,713 | ) | | | | | | | | | | | 138,627,524 | | | | | |
| | | | | | | | | | | | | | | | | | | | | | | | |
NET INCREASE (DECREASE) IN NET ASSETS RESULTING FROM OPERATIONS | | | | | | | (419,405,745 | ) | | | | | | | | | | | 351,658,735 | | | | | |
| | | | | | | | | | | | | | | | | | | | | | | | |
PORTFOLIO SHARE TRANSACTIONS | | | | | | | | | | | | | | | | | | | | | | | | |
Portfolio shares sold | | | | | | | 21,707,452 | | | | | | | | | | | | 16,716,926 | | | | | |
Portfolio shares purchased | | | | | | | (163,027,170 | ) | | | | | | | | | | | (179,291,386 | ) | | | | |
| | | | | | | | | | | | | | | | | | | | | | | | |
NET INCREASE (DECREASE) IN NET ASSETS FROM PORTFOLIO SHARE TRANSACTIONS | | | | | | | (141,319,718 | ) | | | | | | | | | | | (162,574,460 | ) | | | | |
| | | | | | | | | | | | | | | | | | | | | | | | |
TOTAL INCREASE (DECREASE) | | | | | | | (560,725,463 | ) | | | | | | | | | | | 189,084,275 | | | | | |
NET ASSETS: | | | | | | | | | | | | | | | | | | | | | | | | |
Beginning of year | | | | | | | 2,899,042,568 | | | | | | | | | | | | 2,709,958,293 | | | | | |
| | | | | | | | | | | | | | | | | | | | | | | | |
End of year | | | | | | $ | 2,338,317,105 | | | | | | | | | | | $ | 2,899,042,568 | | | | | |
| | | | | | | | | | | | | | | | | | | | | | | | |
SEE NOTES TO FINANCIAL STATEMENTS.
A67
| | | | |
| | PSF PGIM 50/50 BALANCED PORTFOLIO (CONTINUED) | | |
FINANCIAL HIGHLIGHTS
| | | | | | | | | | | | | | | | | | | | | | |
Class I | | | | | | | | | | | | | | | | | | | | | | |
| | | | | Year Ended December 31, | |
| | | | | 2022 | | | 2021 | | | 2020 | | | 2019 | | | 2018 | |
Per Share Operating Performance(a): | | | | | | | | | | | | | | | | | | | | | | |
Net Asset Value, beginning of year | | | | $ | 39.67 | | | $ | 34.99 | | | $ | 31.40 | | | $ | 26.50 | | | $ | 27.17 | |
| | | | | | | | | | | | | | | | | | | | | | |
Income (Loss) From Investment Operations: | | | | | | | | | | | | | | | | | | | | | | |
Net investment income (loss) | | | | | 0.57 | | | | 0.40 | | | | 0.50 | | | | 0.59 | | | | 0.53 | |
Net realized and unrealized gain (loss) on investment and foreign currency transactions | | | | | (6.40 | ) | | | 4.28 | | | | 3.09 | | | | 4.31 | | | | (1.20 | ) |
| | | | | | | | | | | | | | | | | | | | | | |
Total from investment operations | | | | | (5.83 | ) | | | 4.68 | | | | 3.59 | | | | 4.90 | | | | (0.67 | ) |
| | | | | | | | | | | | | | | | | | | | | | |
Capital Contributions | | | | | — | | | | — | | | | — | | | | — | (b)(c) | | | — | (b)(c) |
| | | | | | | | | | | | | | | | | | | | | | |
Net Asset Value, end of year | | | | $ | 33.84 | | | $ | 39.67 | | | $ | 34.99 | | | $ | 31.40 | | | $ | 26.50 | |
| | | | | | | | | | | | | | | | | | | | | | |
Total Return(d) | | | | | (14.70 | )% | | | 13.38 | % | | | 11.43 | % | | | 18.49 | %(e) | | | (2.47 | )%(e) |
Ratios/Supplemental Data: | | | | | | | | | | | | | | | | | | | | | | |
Net assets, end of year (in millions) | | | | $ | 2,332 | | | $ | 2,896 | | | $ | 2,710 | | | $ | 2,597 | | | $ | 2,370 | |
Average net assets (in millions) | | | | $ | 2,513 | | | $ | 2,800 | | | $ | 2,540 | | | $ | 2,506 | | | $ | 2,535 | |
Ratios to average net assets(f): | | | | | | | | | | | | | | | | | | | | | | |
Expenses after waivers and/or expense reimbursement | | | | | 0.57 | % | | | 0.57 | % | | | 0.58 | % | | | 0.59 | % | | | 0.59 | % |
Expenses before waivers and/or expense reimbursement | | | | | 0.57 | % | | | 0.57 | % | | | 0.58 | % | | | 0.59 | % | | | 0.59 | % |
Net investment income (loss) | | | | | 1.62 | % | | | 1.06 | % | | | 1.58 | % | | | 2.02 | % | | | 1.94 | % |
Portfolio turnover rate(g)(h) | | | | | 96 | % | | | 69 | % | | | 75 | % | | | 90 | % | | | 101 | % |
| | | | | | | | | | | | | | | | | | | | | | | | | | |
Class III | | | | | | | | | | | | | | | | | | | | | | | | | | |
| | | | | Year Ended December 31, 2022 | | | April 26, 2021(i) through December 31, 2021 | |
Per Share Operating Performance(a): | | | | | | | | | | | | | | | | | | | | | | | | | | |
Net Asset Value, beginning of period | | | | | | | | $ | 39.60 | | | | | | | | | | | $ | 36.75 | | | | | |
| | | | | | | | | | | | | | | | | | | | | | | | | | |
Income (Loss) From Investment Operations: | | | | | | | | | | | | | | | | | | | | | | | | | | |
Net investment income (loss) | | | | | | | | | 0.52 | | | | | | | | | | | | 0.21 | | | | | |
Net realized and unrealized gain (loss) on investment and foreign currency transactions | | | | | | | | | (6.42 | ) | | | | | | | | | | | 2.64 | | | | | |
| | | | | | | | | | | | | | | | | | | | | | | | | | |
Total from investment operations | | | | | | | | | (5.90 | ) | | | | | | | | | | | 2.85 | | | | | |
| | | | | | | | | | | | | | | | | | | | | | | | | | |
Net Asset Value, end of period | | | | | | | | $ | 33.70 | | | | | | | | | | | $ | 39.60 | | | | | |
| | | | | | | | | | | | | | | | | | | | | | | | | | |
Total Return(d) | | | | | | | | | (14.90 | )% | | | | | | | | | | | 7.76 | % | | | | |
Ratios/Supplemental Data: | | | | | | | | | | | | | | | | | | | | | | | | | | |
Net assets, end of period (in millions) | | | | | | | | $ | 7 | | | | | | | | | | | $ | 3 | | | | | |
Average net assets (in millions) | | | | | | | | $ | 5 | | | | | | | | | | | $ | 1 | | | | | |
Ratios to average net assets(f): | | | | | | | | | | | | | | | | | | | | | | | | | | |
Expenses after waivers and/or expense reimbursement | | | | | | | | | 0.82 | % | | | | | | | | | | | 0.81 | %(j) | | | | |
Expenses before waivers and/or expense reimbursement | | | | | | | | | 0.82 | % | | | | | | | | | | | 0.81 | %(j) | | | | |
Net investment income (loss) | | | | | | | | | 1.48 | % | | | | | | | | | | | 0.76 | %(j) | | | | |
Portfolio turnover rate(g)(h) | | | | | | | | | 96 | % | | | | | | | | | | | 69 | % | | | | |
| (a) | Calculated based on average shares outstanding during the period. |
| (b) | Represents payment received by the Portfolio, from Prudential, in connection with excess foreign withholding tax withheld on dividends and interest from certain countries due to the Portfolio’s tax status as a partnership. |
| (c) | Amount rounds to zero. |
| (d) | Total return is calculated assuming a purchase of a share on the first day and a sale on the last day of each period reported and includes reinvestment of dividends and distributions, if any, and does not reflect the effect of insurance contract charges. Total return does not reflect expenses associated with the separate account such as administrative fees, account charges and surrender charges which, if reflected, would reduce the total returns for all periods shown. Performance figures may reflect fee waivers and/or expense reimbursements. In the absence of fee waivers and/or expense reimbursements, the total return would be lower. Past performance is no guarantee of future results. Total returns may reflect adjustments to conform to GAAP. Total returns for periods less than one full year are not annualized. |
| (e) | Total return for the year includes the impact of the capital contribution, which was not material to the total return. |
| (f) | Does not include expenses of the underlying funds in which the Portfolio invests. |
| (g) | The Portfolio accounts for mortgage dollar roll transactions, when applicable, as purchases and sales which, as a result, can increase its portfolio turnover rate. |
| (h) | The Portfolio’s portfolio turnover rate is calculated in accordance with regulatory requirements, without regard to transactions involving short-term investments, certain derivatives and in-kind transactions (if any). If such transactions were included, the Portfolio’s portfolio turnover rate may be higher. |
| (i) | Commencement of offering. |
| (j) | Annualized, with the exception of certain non-recurring expenses. |
SEE NOTES TO FINANCIAL STATEMENTS.
A68
| | | | |
| | PSF PGIM FLEXIBLE MANAGED PORTFOLIO | | |
SCHEDULE OF INVESTMENTS | | | | as of December 31, 2022 |
| | | | | | | | |
| | | Shares | | | Value | |
|
LONG-TERM INVESTMENTS — 95.1% | |
COMMON STOCKS — 59.7% | | | | | | | | |
Aerospace & Defense — 1.2% | | | | | | | | |
BAE Systems PLC (United Kingdom) | | | 9,579 | | | $ | 98,936 | |
General Dynamics Corp. | | | 60,700 | | | | 15,060,277 | |
Howmet Aerospace, Inc. | | | 202,900 | | | | 7,996,289 | |
Kongsberg Gruppen ASA (Norway) | | | 260 | | | | 11,066 | |
Lockheed Martin Corp. | | | 39,900 | | | | 19,410,951 | |
MTU Aero Engines AG (Germany) | | | 655 | | | | 140,914 | |
Textron, Inc. | | | 42,500 | | | | 3,009,000 | |
Thales SA (France) | | | 324 | | | | 41,397 | |
TransDigm Group, Inc. | | | 5,500 | | | | 3,463,075 | |
| | | | | | | | |
| | |
| | | | | | | 49,231,905 | |
| | | | | | | | |
Air Freight & Logistics — 0.3% | | | | | | | | |
FedEx Corp. | | | 64,600 | | | | 11,188,720 | |
| | | | | | | | |
Airlines — 0.2% | | | | | | | | |
Alaska Air Group, Inc.* | | | 188,500 | | | | 8,094,190 | |
Deutsche Lufthansa AG (Germany)* | | | 1,806 | | | | 14,887 | |
Qantas Airways Ltd. (Australia)* | | | 2,977 | | | | 12,050 | |
Singapore Airlines Ltd. (Singapore) | | | 4,200 | | | | 17,341 | |
United Airlines Holdings, Inc.* | | | 38,500 | | | | 1,451,450 | |
| | | | | | | | |
| | |
| | | | | | | 9,589,918 | |
| | | | | | | | |
Auto Components — 0.2% | | | | | | | | |
BorgWarner, Inc. | | | 181,400 | | | | 7,301,350 | |
| | | | | | | | |
Automobiles — 0.8% | | | | | | | | |
Bayerische Motoren Werke AG (Germany) | | | 671 | | | | 59,407 | |
Ferrari NV (Italy) | | | 375 | | | | 80,415 | |
General Motors Co. | | | 283,800 | | | | 9,547,032 | |
Honda Motor Co. Ltd. (Japan) | | | 4,800 | | | | 109,483 | |
Mazda Motor Corp. (Japan) | | | 1,700 | | | | 12,743 | |
Stellantis NV | | | 24,957 | | | | 354,648 | |
Subaru Corp. (Japan) | | | 17,200 | | | | 260,409 | |
Suzuki Motor Corp. (Japan) | | | 1,000 | | | | 32,027 | |
Tesla, Inc.* | | | 176,200 | | | | 21,704,316 | |
Toyota Motor Corp. (Japan) | | | 13,200 | | | | 180,082 | |
Volkswagen AG (Germany) | | | 88 | | | | 13,805 | |
| | | | | | | | |
| | |
| | | | | | | 32,354,367 | |
| | | | | | | | |
Banks — 2.3% | | | | | | | | |
ABN AMRO Bank NV (Netherlands), 144A, CVA | | | 6,436 | | | | 89,126 | |
ANZ Group Holdings Ltd. (Australia) | | | 12,387 | | | | 199,541 | |
Banco Santander SA (Spain) | | | 11,084 | | | | 33,142 | |
Bank Hapoalim BM (Israel) | | | 4,211 | | | | 37,916 | |
Bank Leumi Le-Israel BM (Israel) | | | 34,068 | | | | 283,746 | |
Bank of America Corp. | | | 436,900 | | | | 14,470,128 | |
Barclays PLC (United Kingdom) | | | 189,362 | | | | 360,320 | |
Citigroup, Inc. | | | 365,450 | | | | 16,529,303 | |
Citizens Financial Group, Inc. | | | 180,300 | | | | 7,098,411 | |
Commerzbank AG (Germany)* | | | 3,294 | | | | 30,798 | |
Commonwealth Bank of Australia (Australia) | | | 4,864 | | | | 337,828 | |
DBS Group Holdings Ltd. (Singapore) | | | 16,900 | | | | 427,766 | |
DNB Bank ASA (Norway) | | | 10,338 | | | | 204,177 | |
HSBC Holdings PLC (United Kingdom) | | | 16,723 | | | | 103,641 | |
ING Groep NV (Netherlands) | | | 28,695 | | | | 349,539 | |
| | | | | | | | |
| | | Shares | | | Value | |
|
COMMON STOCKS (continued) | |
Banks (cont’d.) | |
Israel Discount Bank Ltd. (Israel) (Class A Stock) | | | 3,668 | | | $ | 19,257 | |
JPMorgan Chase & Co. | | | 128,294 | | | | 17,204,225 | |
KBC Group NV (Belgium) | | | 390 | | | | 25,110 | |
Lloyds Banking Group PLC (United Kingdom) | | | 695,750 | | | | 379,681 | |
Mizrahi Tefahot Bank Ltd. (Israel) | | | 456 | | | | 14,718 | |
National Australia Bank Ltd. (Australia) | | | 1,368 | | | | 27,775 | |
NatWest Group PLC (United Kingdom) | | | 15,778 | | | | 50,320 | |
Nordea Bank Abp (Finland) | | | 10,332 | | | | 110,676 | |
Oversea-Chinese Banking Corp. Ltd. (Singapore) | | | 15,600 | | | | 141,898 | |
Signature Bank | | | 20,800 | | | | 2,396,576 | |
Skandinaviska Enskilda Banken AB (Sweden) (Class A Stock) | | | 4,686 | | | | 53,949 | |
Sumitomo Mitsui Financial Group, Inc. (Japan) | | | 3,700 | | | | 148,860 | |
Swedbank AB (Sweden) (Class A Stock) | | | 2,800 | | | | 47,625 | |
Truist Financial Corp. | | | 179,700 | | | | 7,732,491 | |
Wells Fargo & Co. | | | 532,100 | | | | 21,970,409 | |
| | | | | | | | |
| | |
| | | | | | | 90,878,952 | |
| | | | | | | | |
Beverages — 1.3% | | | | | | | | |
Coca-Cola Co. (The) | | | 252,700 | | | | 16,074,247 | |
Constellation Brands, Inc. (Class A Stock) | | | 18,400 | | | | 4,264,200 | |
Diageo PLC (United Kingdom) | | | 1,139 | | | | 49,856 | |
Heineken Holding NV (Netherlands) | | | 341 | | | | 26,336 | |
Heineken NV (Netherlands) | | | 755 | | | | 71,115 | |
PepsiCo, Inc. | | | 165,800 | | | | 29,953,428 | |
| | | | | | | | |
| | |
| | | | | | | 50,439,182 | |
| | | | | | | | |
Biotechnology — 1.3% | | | | | | | | |
AbbVie, Inc. | | | 103,500 | | | | 16,726,635 | |
Amgen, Inc. | | | 19,300 | | | | 5,068,952 | |
Gilead Sciences, Inc. | | | 120,550 | | | | 10,349,218 | |
Regeneron Pharmaceuticals, Inc.* | | | 4,900 | | | | 3,535,301 | |
Swedish Orphan Biovitrum AB (Sweden)* | | | 494 | | | | 10,224 | |
United Therapeutics Corp.* | | | 2,800 | | | | 778,652 | |
Vertex Pharmaceuticals, Inc.* | | | 56,100 | | | | 16,200,558 | |
| | | | | | | | |
| | |
| | | | | | | 52,669,540 | |
| | | | | | | | |
Building Products — 0.2% | | | | | | | | |
Assa Abloy AB (Sweden) (Class B Stock) | | | 2,997 | | | | 64,463 | |
Carrier Global Corp. | | | 99,500 | | | | 4,104,375 | |
Cie de Saint-Gobain (France) | | | 2,983 | | | | 145,931 | |
Johnson Controls International PLC | | | 11,100 | | | | 710,400 | |
Lixil Corp. (Japan) | | | 1,400 | | | | 21,107 | |
Nibe Industrier AB (Sweden) (Class B Stock) | | | 4,437 | | | | 41,414 | |
Trane Technologies PLC | | | 9,300 | | | | 1,563,237 | |
Xinyi Glass Holdings Ltd. (China) | | | 6,000 | | | | 11,085 | |
| | | | | | | | |
| | |
| | | | | | | 6,662,012 | |
| | | | | | | | |
SEE NOTES TO FINANCIAL STATEMENTS.
A69
| | | | |
| | PSF PGIM FLEXIBLE MANAGED PORTFOLIO (CONTINUED) | | |
SCHEDULE OF INVESTMENTS | | | | as of December 31, 2022 |
| | | | | | | | |
| | | Shares | | | Value | |
|
COMMON STOCKS (continued) | |
Capital Markets — 1.8% | | | | | | | | |
3i Group PLC (United Kingdom) | | | 15,710 | | | $ | 253,361 | |
Ameriprise Financial, Inc. | | | 6,800 | | | | 2,117,316 | |
Bank of New York Mellon Corp. (The) | | | 196,100 | | | | 8,926,472 | |
Carlyle Group, Inc. (The) | | | 33,600 | | | | 1,002,624 | |
Charles Schwab Corp. (The) | | | 199,600 | | | | 16,618,696 | |
CME Group, Inc. | | | 38,500 | | | | 6,474,160 | |
Deutsche Bank AG (Germany) | | | 29,925 | | | | 336,404 | |
Deutsche Boerse AG (Germany) | | | 568 | | | | 97,804 | |
Goldman Sachs Group, Inc. (The) | | | 37,400 | | | | 12,842,412 | |
Hargreaves Lansdown PLC (United Kingdom) | | | 1,106 | | | | 11,389 | |
Intercontinental Exchange, Inc. | | | 49,000 | | | | 5,026,910 | |
Invesco Ltd. | | | 133,000 | | | | 2,392,670 | |
Julius Baer Group Ltd. (Switzerland) | | | 1,020 | | | | 59,365 | |
Macquarie Group Ltd. (Australia) | | | 1,812 | | | | 204,554 | |
MarketAxess Holdings, Inc. | | | 9,200 | | | | 2,565,788 | |
Morgan Stanley | | | 40,000 | | | | 3,400,800 | |
MSCI, Inc. | | | 11,800 | | | | 5,489,006 | |
Nasdaq, Inc. | | | 48,100 | | | | 2,950,935 | |
Partners Group Holding AG (Switzerland) | | | 68 | | | | 60,213 | |
Schroders PLC (United Kingdom) | | | 2,394 | | | | 12,579 | |
Singapore Exchange Ltd. (Singapore) | | | 25,200 | | | | 168,509 | |
UBS Group AG (Switzerland) | | | 27,197 | | | | 505,490 | |
| | | | | | | | |
| | |
| | | | | | | 71,517,457 | |
| | | | | | | | |
Chemicals — 1.0% | | | | | | | | |
Air Products & Chemicals, Inc. | | | 2,300 | | | | 708,998 | |
Albemarle Corp. | | | 48,500 | | | | 10,517,710 | |
BASF SE (Germany) | | | 1,241 | | | | 61,105 | |
Celanese Corp. | | | 15,700 | | | | 1,605,168 | |
Clariant AG (Switzerland)* | | | 660 | | | | 10,482 | |
ICL Group Ltd. (Israel) | | | 2,068 | | | | 14,942 | |
Linde PLC (United Kingdom) | | | 36,300 | | | | 11,840,334 | |
LyondellBasell Industries NV (Class A Stock) | | | 105,300 | | | | 8,743,059 | |
Mitsubishi Chemical Group Corp. (Japan) | | | 3,800 | | | | 19,673 | |
Mosaic Co. (The) | | | 87,000 | | | | 3,816,690 | |
Nitto Denko Corp. (Japan) | | | 500 | | | | 28,797 | |
OCI NV (Netherlands) | | | 1,174 | | | | 41,973 | |
Sherwin-Williams Co. (The) | | | 4,900 | | | | 1,162,917 | |
Shin-Etsu Chemical Co. Ltd. (Japan) | | | 1,100 | | | | 134,324 | |
Solvay SA (Belgium) | | | 2,797 | | | | 282,794 | |
Tosoh Corp. (Japan) | | | 800 | | | | 9,513 | |
Yara International ASA (Brazil) | | | 6,343 | | | | 278,565 | |
| | | | | | | | |
| | |
| | | | | | | 39,277,044 | |
| | | | | | | | |
Commercial Services & Supplies — 0.2% | |
Rollins, Inc. | | | 18,600 | | | | 679,644 | |
Securitas AB (Sweden) (Class B Stock) | | | 1,439 | | | | 12,008 | |
Waste Management, Inc. | | | 42,500 | | | | 6,667,400 | |
| | | | | | | | |
| | |
| | | | | | | 7,359,052 | |
| | | | | | | | |
Communications Equipment — 0.6% | | | | | | | | |
Arista Networks, Inc.* | | | 42,200 | | | | 5,120,970 | |
Cisco Systems, Inc. | | | 433,100 | | | | 20,632,884 | |
| | | | | | | | |
| | | Shares | | | Value | |
|
COMMON STOCKS (continued) | |
Communications Equipment (cont’d.) | |
Nokia OYJ (Finland) | | | 15,940 | | | $ | 74,053 | |
| | | | | | | | |
| | |
| | | | | | | 25,827,907 | |
| | | | | | | | |
Construction & Engineering — 0.0% | |
Eiffage SA (France) | | | 250 | | | | 24,591 | |
Kajima Corp. (Japan) | | | 1,300 | | | | 15,128 | |
Valmont Industries, Inc. | | | 2,500 | | | | 826,675 | |
Vinci SA (France) | | | 4,289 | | | | 427,558 | |
| | | | | | | | |
| | |
| | | | | | | 1,293,952 | |
| | | | | | | | |
Construction Materials — 0.2% | |
Eagle Materials, Inc. | | | 60,700 | | | | 8,063,995 | |
HeidelbergCement AG (Germany) | | | 432 | | | | 24,479 | |
| | | | | | | | |
| | |
| | | | | | | 8,088,474 | |
| | | | | | | | |
Consumer Finance — 0.4% | |
American Express Co. | | | 44,800 | | | | 6,619,200 | |
Capital One Financial Corp. | | | 72,600 | | | | 6,748,896 | |
Synchrony Financial | | | 103,500 | | | | 3,401,010 | |
| | | | | | | | |
| | |
| | | | | | | 16,769,106 | |
| | | | | | | | |
Containers & Packaging — 0.3% | |
Berry Global Group, Inc. | | | 15,100 | | | | 912,493 | |
Westrock Co. | | | 284,900 | | | | 10,017,084 | |
| | | | | | | | |
| | |
| | | | | | | 10,929,577 | |
| | | | | | | | |
Distributors — 0.2% | | | | | | | | |
D’ieteren Group (Belgium) | | | 80 | | | | 15,353 | |
Genuine Parts Co. | | | 15,200 | | | | 2,637,352 | |
LKQ Corp. | | | 110,500 | | | | 5,901,805 | |
| | | | | | | | |
| | |
| | | | | | | 8,554,510 | |
| | | | | | | | |
Diversified Financial Services — 0.9% | |
Berkshire Hathaway, Inc. (Class B Stock)* | | | 119,450 | | | | 36,898,105 | |
Industrivarden AB (Sweden) (Class A Stock) | | | 380 | | | | 9,243 | |
Investor AB (Sweden) (Class A Stock) | | | 1,443 | | | | 26,846 | |
ORIX Corp. (Japan) | | | 8,400 | | | | 134,456 | |
| | | | | | | | |
| | |
| | | | | | | 37,068,650 | |
| | | | | | | | |
Diversified Telecommunication Services — 0.6% | |
AT&T, Inc. | | | 599,000 | | | | 11,027,590 | |
Bezeq The Israeli Telecommunication Corp. Ltd. (Israel) | | | 12,038 | | | | 20,651 | |
Deutsche Telekom AG (Germany) | | | 13,614 | | | | 270,872 | |
HKT Trust & HKT Ltd. (Hong Kong) | | | 11,000 | | | | 13,465 | |
Koninklijke KPN NV (Netherlands) | | | 9,590 | | | | 29,684 | |
Nippon Telegraph & Telephone Corp. (Japan) | | | 400 | | | | 11,408 | |
Spark New Zealand Ltd. (New Zealand) | | | 42,247 | | | | 144,644 | |
Telefonica Deutschland Holding AG (Germany) | | | 68,471 | | | | 168,166 | |
Telstra Group Ltd. (Australia) | | | 12,628 | | | | 34,152 | |
Verizon Communications, Inc. | | | 295,988 | | | | 11,661,927 | |
| | | | | | | | |
| | |
| | | | | | | 23,382,559 | |
| | | | | | | | |
SEE NOTES TO FINANCIAL STATEMENTS.
A70
| | | | |
| | PSF PGIM FLEXIBLE MANAGED PORTFOLIO (CONTINUED) | | |
SCHEDULE OF INVESTMENTS | | | | as of December 31, 2022 |
| | | | | | | | |
| | | Shares | | | Value | |
|
COMMON STOCKS (continued) | |
Electric Utilities — 1.2% | | | | | | | | |
CK Infrastructure Holdings Ltd. (Hong Kong) | | | 2,000 | | | $ | 10,436 | |
Duke Energy Corp. | | | 10,900 | | | | 1,122,591 | |
Edison International | | | 126,000 | | | | 8,016,120 | |
Endesa SA (Spain) | | | 3,866 | | | | 72,861 | |
Enel SpA (Italy) | | | 74,321 | | | | 399,709 | |
Entergy Corp. | | | 46,800 | | | | 5,265,000 | |
Exelon Corp. | | | 354,000 | | | | 15,303,420 | |
Fortum OYJ (Finland) | | | 1,144 | | | | 19,052 | |
Iberdrola SA (Spain) | | | 17,219 | | | | 201,006 | |
NextEra Energy, Inc. | | | 116,500 | | | | 9,739,400 | |
NRG Energy, Inc. | | | 187,900 | | | | 5,978,978 | |
Origin Energy Ltd. (Australia) | | | 5,275 | | | | 27,609 | |
Power Assets Holdings Ltd. (Hong Kong) | | | 4,500 | | | | 24,595 | |
SSE PLC (United Kingdom) | | | 14,458 | | | | 297,357 | |
Terna - Rete Elettrica Nazionale (Italy) | | | 4,240 | | | | 31,313 | |
| | | | | | | | |
| | |
| | | | | | | 46,509,447 | |
| | | | | | | | |
Electrical Equipment — 0.4% | | | | | | | | |
ABB Ltd. (Switzerland) | | | 4,604 | | | | 140,318 | |
Acuity Brands, Inc. | | | 5,800 | | | | 960,538 | |
AMETEK, Inc. | | | 11,900 | | | | 1,662,668 | |
Eaton Corp. PLC | | | 6,500 | | | | 1,020,175 | |
Emerson Electric Co. | | | 25,400 | | | | 2,439,924 | |
Fuji Electric Co. Ltd. (Japan) | | | 300 | | | | 11,322 | |
Hubbell, Inc. | | | 39,600 | | | | 9,293,328 | |
Prysmian SpA (Italy) | | | 775 | | | | 28,796 | |
| | | | | | | | |
| | |
| | | | | | | 15,557,069 | |
| | | | | | | | |
Electronic Equipment, Instruments & Components — 0.3% | |
Amphenol Corp. (Class A Stock) | | | 13,700 | | | | 1,043,118 | |
Corning, Inc. | | | 181,200 | | | | 5,787,528 | |
Halma PLC (United Kingdom) | | | 800 | | | | 19,052 | |
Hamamatsu Photonics KK (Japan) | | | 500 | | | | 23,864 | |
Hirose Electric Co. Ltd. (Japan) | | | 700 | | | | 87,795 | |
Keysight Technologies, Inc.* | | | 21,300 | | | | 3,643,791 | |
Venture Corp. Ltd. (Singapore) | | | 2,600 | | | | 33,140 | |
Yokogawa Electric Corp. (Japan) | | | 600 | | | | 9,522 | |
| | | | | | | | |
| | |
| | | | | | | 10,647,810 | |
| | | | | | | | |
Energy Equipment & Services — 0.4% | |
Halliburton Co. | | | 386,700 | | | | 15,216,645 | |
Schlumberger Ltd. | | | 20,000 | | | | 1,069,200 | |
| | | | | | | | |
| | |
| | | | | | | 16,285,845 | |
| | | | | | | | |
Entertainment — 0.9% | | | | | | | | |
Electronic Arts, Inc. | | | 61,500 | | | | 7,514,070 | |
Netflix, Inc.* | | | 39,900 | | | | 11,765,712 | |
Nintendo Co. Ltd. (Japan) | | | 3,300 | | | | 138,754 | |
Walt Disney Co. (The)* | | | 184,700 | | | | 16,046,736 | |
| | | | | | | | |
| | |
| | | | | | | 35,465,272 | |
| | | | | | | | |
Equity Real Estate Investment Trusts (REITs) — 1.4% | |
American Tower Corp. | | | 21,300 | | | | 4,512,618 | |
Americold Realty Trust, Inc.(a) | | | 110,400 | | | | 3,125,424 | |
AvalonBay Communities, Inc. | | | 11,500 | | | | 1,857,480 | |
Camden Property Trust | | | 6,400 | | | | 716,032 | |
| | | | | | | | |
| | | Shares | | | Value | |
|
COMMON STOCKS (continued) | |
Equity Real Estate Investment Trusts (REITs) (cont’d.) | |
Dexus (Australia) | | | 3,128 | | | $ | 16,422 | |
Equinix, Inc. | | | 12,200 | | | | 7,991,366 | |
Equity Residential | | | 19,000 | | | | 1,121,000 | |
GLP J-REIT (Japan) | | | 12 | | | | 13,820 | |
Goodman Group (Australia) | | | 19,591 | | | | 230,397 | |
Host Hotels & Resorts, Inc. | | | 235,700 | | | | 3,782,985 | |
Hudson Pacific Properties, Inc. | | | 98,700 | | | | 960,351 | |
Japan Real Estate Investment Corp. (Japan) | | | 3 | | | | 13,177 | |
Klepierre SA (France)* | | | 12,291 | | | | 283,684 | |
Nomura Real Estate Master Fund, Inc. (Japan) | | | 12 | | | | 14,867 | |
Park Hotels & Resorts, Inc. | | | 57,000 | | | | 672,030 | |
Public Storage | | | 39,700 | | | | 11,123,543 | |
SBA Communications Corp. | | | 18,600 | | | | 5,213,766 | |
Scentre Group (Australia) | | | 8,151 | | | | 15,866 | |
Simon Property Group, Inc. | | | 49,500 | | | | 5,815,260 | |
Stockland (Australia) | | | 7,056 | | | | 17,378 | |
Unibail-Rodamco-Westfield (France)* | | | 352 | | | | 18,401 | |
Ventas, Inc. | | | 173,100 | | | | 7,798,155 | |
Vicinity Ltd. (Australia) | | | 11,837 | | | | 15,984 | |
Warehouses De Pauw CVA (Belgium) | | | 456 | | | | 13,063 | |
Weyerhaeuser Co. | | | 67,200 | | | | 2,083,200 | |
| | | | | | | | |
| | |
| | | | | | | 57,426,269 | |
| | | | | | | | |
Food & Staples Retailing — 0.9% | | | | | | | | |
Albertson’s Cos., Inc. (Class A Stock)(a) | | | 180,800 | | | | 3,749,792 | |
Carrefour SA (France) | | | 1,718 | | | | 28,735 | |
Coles Group Ltd. (Australia) | | | 3,495 | | | | 39,618 | |
Costco Wholesale Corp. | | | 46,100 | | | | 21,044,650 | |
Endeavour Group Ltd. (Australia) | | | 3,910 | | | | 17,016 | |
J Sainsbury PLC (United Kingdom) | | | 4,128 | | | | 10,827 | |
Jeronimo Martins SGPS SA (Portugal) | | | 860 | | | | 18,607 | |
Kesko OYJ (Finland) (Class B Stock) | | | 3,410 | | | | 75,348 | |
Koninklijke Ahold Delhaize NV (Netherlands) | | | 13,373 | | | | 384,491 | |
Kroger Co. (The) | | | 70,100 | | | | 3,125,058 | |
Tesco PLC (United Kingdom) | | | 22,967 | | | | 61,893 | |
Walmart, Inc. | | | 55,300 | | | | 7,840,987 | |
Woolworths Group Ltd. (Australia) | | | 3,570 | | | | 81,522 | |
| | | | | | | | |
| | |
| | | | | | | 36,478,544 | |
| | | | | | | | |
Food Products — 0.9% | | | | | | | | |
Archer-Daniels-Midland Co. | | | 88,600 | | | | 8,226,510 | |
Mondelez International, Inc. (Class A Stock) | | | 133,100 | | | | 8,871,115 | |
Mowi ASA (Norway) | | | 1,258 | | | | 21,437 | |
Nestle SA | | | 7,192 | | | | 830,744 | |
Orkla ASA (Norway) | | | 10,287 | | | | 74,245 | |
Pilgrim’s Pride Corp.* | | | 166,600 | | | | 3,953,418 | |
Post Holdings, Inc.*(a) | | | 25,200 | | | | 2,274,552 | |
Tyson Foods, Inc. (Class A Stock) | | | 156,900 | | | | 9,767,025 | |
WH Group Ltd. (Hong Kong), 144A | | | 274,000 | | | | 159,807 | |
Wilmar International Ltd. (China) | | | 99,000 | | | | 308,422 | |
| | | | | | | | |
| | |
| | | | | | | 34,487,275 | |
| | | | | | | | |
SEE NOTES TO FINANCIAL STATEMENTS.
A71
| | | | |
| | PSF PGIM FLEXIBLE MANAGED PORTFOLIO (CONTINUED) | | |
SCHEDULE OF INVESTMENTS | | | | as of December 31, 2022 |
| | | | | | | | |
| | | Shares | | | Value | |
|
COMMON STOCKS (continued) | |
Gas Utilities — 0.1% | | | | | | | | |
Osaka Gas Co. Ltd. (Japan) | | | 1,100 | | | $ | 17,724 | |
Tokyo Gas Co. Ltd. (Japan) | | | 1,200 | | | | 23,496 | |
UGI Corp. | | | 111,900 | | | | 4,148,133 | |
| | | | | | | | |
| | |
| | | | | | | 4,189,353 | |
| | | | | | | | |
Health Care Equipment & Supplies — 1.6% | |
Abbott Laboratories | | | 164,000 | | | | 18,005,560 | |
Baxter International, Inc. | | | 45,400 | | | | 2,314,038 | |
Becton, Dickinson & Co. | | | 3,200 | | | | 813,760 | |
Cochlear Ltd. (Australia) | | | 192 | | | | 26,517 | |
Dexcom, Inc.* | | | 101,100 | | | | 11,448,564 | |
Medtronic PLC | | | 201,000 | | | | 15,621,720 | |
Olympus Corp. (Japan) | | | 12,000 | | | | 211,651 | |
STERIS PLC | | | 25,100 | | | | 4,635,719 | |
Straumann Holding AG (Switzerland) | | | 252 | | | | 28,897 | |
Stryker Corp. | | | 18,900 | | | | 4,620,861 | |
Zimmer Biomet Holdings, Inc. | | | 37,100 | | | | 4,730,250 | |
| | | | | | | | |
| | |
| | | | | | | 62,457,537 | |
| | | | | | | | |
Health Care Providers & Services — 2.3% | |
Cardinal Health, Inc. | | | 83,400 | | | | 6,410,958 | |
Cigna Corp. | | | 20,900 | | | | 6,925,006 | |
CVS Health Corp. | | | 176,800 | | | | 16,475,992 | |
Elevance Health, Inc. | | | 5,900 | | | | 3,026,523 | |
Fresenius SE & Co. KGaA (Germany) | | | 1,240 | | | | 34,636 | |
Humana, Inc. | | | 2,500 | | | | 1,280,475 | |
McKesson Corp. | | | 3,300 | | | | 1,237,896 | |
Molina Healthcare, Inc.* | | | 24,500 | | | | 8,090,390 | |
Sonic Healthcare Ltd. (Australia) | | | 13,629 | | | | 277,364 | |
UnitedHealth Group, Inc. | | | 88,600 | | | | 46,973,948 | |
| | | | | | | | |
| | |
| | | | | | | 90,733,188 | |
| | | | | | | | |
Hotels, Restaurants & Leisure — 1.3% | |
Aristocrat Leisure Ltd. (Australia) | | | 1,774 | | | | 36,555 | |
Booking Holdings, Inc.* | | | 1,000 | | | | 2,015,280 | |
Caesars Entertainment, Inc.* | | | 99,000 | | | | 4,118,400 | |
Chipotle Mexican Grill, Inc.* | | | 2,300 | | | | 3,191,227 | |
Compass Group PLC (United Kingdom) | | | 12,888 | | | | 297,610 | |
Evolution AB (Sweden), 144A | | | 1,217 | | | | 118,541 | |
Genting Singapore Ltd. (Singapore) | | | 18,200 | | | | 12,988 | |
Hilton Worldwide Holdings, Inc. | | | 27,200 | | | | 3,436,992 | |
InterContinental Hotels Group PLC (United Kingdom) | | | 528 | | | | 30,296 | |
La Francaise des Jeux SAEM (France), 144A | | | 6,652 | | | | 267,667 | |
Marriott International, Inc. (Class A Stock) | | | 86,600 | | | | 12,893,874 | |
McDonald’s Corp. | | | 16,800 | | | | 4,427,304 | |
Oriental Land Co. Ltd. (Japan) | | | 1,600 | | | | 232,839 | |
Sodexo SA (France) | | | 253 | | | | 24,207 | |
Starbucks Corp. | | | 195,200 | | | | 19,363,840 | |
Whitbread PLC (United Kingdom) | | | 364 | | | | 11,254 | |
| | | | | | | | |
| | |
| | | | | | | 50,478,874 | |
| | | | | | | | |
Household Durables — 0.1% | |
Lennar Corp. (Class A Stock) | | | 9,500 | | | | 859,750 | |
Mohawk Industries, Inc.* | | | 20,500 | | | | 2,095,510 | |
| | | | | | | | |
| | | Shares | | | Value | |
|
COMMON STOCKS (continued) | |
Household Durables (cont’d.) | | | | | | | | |
Open House Group Co. Ltd. (Japan) | | | 300 | | | $ | 10,923 | |
Sekisui Chemical Co. Ltd. (Japan) | | | 1,000 | | | | 13,938 | |
Sony Group Corp. (Japan) | | | 500 | | | | 38,111 | |
| | | | | | | | |
| | |
| | | | | | | 3,018,232 | |
| | | | | | | | |
Household Products — 1.1% | | | | | | | | |
Colgate-Palmolive Co. | | | 74,600 | | | | 5,877,734 | |
Henkel AG & Co. KGaA (Germany) | | | 279 | | | | 17,930 | |
Kimberly-Clark Corp. | | | 75,800 | | | | 10,289,850 | |
Procter & Gamble Co. (The) | | | 171,005 | | | | 25,917,518 | |
Reckitt Benckiser Group PLC (United Kingdom) | | | 3,776 | | | | 261,738 | |
| | | | | | | | |
| | |
| | | | | | | 42,364,770 | |
| | | | | | | | |
Independent Power & Renewable Electricity Producers — 0.1% | |
AES Corp. (The) | | | 140,900 | | | | 4,052,284 | |
Meridian Energy Ltd. (New Zealand) | | | 4,020 | | | | 13,371 | |
Vistra Corp. | | | 90,900 | | | | 2,108,880 | |
| | | | | | | | |
| | |
| | | | | | | 6,174,535 | |
| | | | | | | | |
Industrial Conglomerates — 0.7% | | | | | | | | |
3M Co. | | | 39,900 | | | | 4,784,808 | |
DCC PLC (United Kingdom) | | | 294 | | | | 14,456 | |
General Electric Co. | | | 9,400 | | | | 787,626 | |
Hitachi Ltd. (Japan) | | | 6,300 | | | | 316,993 | |
Honeywell International, Inc. | | | 99,200 | | | | 21,258,560 | |
Jardine Matheson Holdings Ltd. (Hong Kong) | | | 5,600 | | | | 284,877 | |
Lifco AB (Sweden) (Class B Stock) | | | 736 | | | | 12,319 | |
Smiths Group PLC (United Kingdom) | | | 10,385 | | | | 199,310 | |
| | | | | | | | |
| | |
| | | | | | | 27,658,949 | |
| | | | | | | | |
Insurance — 1.5% | | | | | | | | |
Ageas SA/NV (Belgium) | | | 513 | | | | 22,763 | |
AIA Group Ltd. (Hong Kong) | | | 8,000 | | | | 88,347 | |
American International Group, Inc. | | | 125,700 | | | | 7,949,268 | |
Aon PLC (Class A Stock) | | | 4,800 | | | | 1,440,672 | |
AXA SA (France) | | | 16,191 | | | | 451,009 | |
Chubb Ltd. | | | 80,200 | | | | 17,692,120 | |
Dai-ichi Life Holdings, Inc. (Japan) | | | 17,700 | | | | 399,726 | |
Gjensidige Forsikring ASA (Norway) | | | 624 | | | | 12,239 | |
Globe Life, Inc. | | | 7,900 | | | | 952,345 | |
Hartford Financial Services Group, Inc. (The) | | | 12,500 | | | | 947,875 | |
Japan Post Holdings Co. Ltd. (Japan) | | | 35,000 | | | | 294,489 | |
Japan Post Insurance Co. Ltd. (Japan) | | | 16,700 | | | | 293,705 | |
Legal & General Group PLC (United Kingdom) | | | 11,379 | | | | 34,116 | |
Marsh & McLennan Cos., Inc. | | | 61,200 | | | | 10,127,376 | |
MetLife, Inc. | | | 62,300 | | | | 4,508,651 | |
Muenchener Rueckversicherungs-Gesellschaft AG in Muenchen (Germany) | | | 63 | | | | 20,379 | |
NN Group NV (Netherlands) | | | 6,769 | | | | 276,799 | |
Poste Italiane SpA (Italy), 144A | | | 11,954 | | | | 116,629 | |
Progressive Corp. (The) | | | 77,700 | | | | 10,078,467 | |
Reinsurance Group of America, Inc. | | | 7,500 | | | | 1,065,675 | |
Sampo OYJ (Finland) (Class A Stock) | | | 1,501 | | | | 78,396 | |
SEE NOTES TO FINANCIAL STATEMENTS.
A72
| | | | |
| | PSF PGIM FLEXIBLE MANAGED PORTFOLIO (CONTINUED) | | |
SCHEDULE OF INVESTMENTS | | | | as of December 31, 2022 |
| | | | | | | | |
| | | Shares | | | Value | |
|
COMMON STOCKS (continued) | |
Insurance (cont’d.) | | | | | | | | |
Tokio Marine Holdings, Inc. (Japan) | | | 13,100 | | | $ | 279,847 | |
Unum Group | | | 47,700 | | | | 1,957,131 | |
Zurich Insurance Group AG (Switzerland) | | | 442 | | | | 211,310 | |
| | | | | | | | |
| | |
| | | | | | | 59,299,334 | |
| | | | | | | | |
Interactive Media & Services — 2.5% | | | | | | | | |
Alphabet, Inc. (Class A Stock)* | | | 413,200 | | | | 36,456,636 | |
Alphabet, Inc. (Class C Stock)* | | | 396,840 | | | | 35,211,613 | |
Meta Platforms, Inc. (Class A Stock)* | | | 220,150 | | | | 26,492,851 | |
Scout24 SE (Germany), 144A | | | 234 | | | | 11,778 | |
| | | | | | | | |
| | |
| | | | | | | 98,172,878 | |
| | | | | | | | |
Internet & Direct Marketing Retail — 1.3% | |
Amazon.com, Inc.* | | | 546,800 | | | | 45,931,200 | |
eBay, Inc.(a) | | | 159,900 | | | | 6,631,053 | |
| | | | | | | | |
| | |
| | | | | | | 52,562,253 | |
| | | | | | | | |
IT Services — 2.5% | | | | | | | | |
Accenture PLC (Class A Stock) | | | 32,250 | | | | 8,605,590 | |
Automatic Data Processing, Inc. | | | 72,200 | | | | 17,245,692 | |
Bechtle AG (Germany) | | | 242 | | | | 8,554 | |
Broadridge Financial Solutions, Inc. | | | 5,100 | | | | 684,063 | |
Capgemini SE (France) | | | 1,780 | | | | 297,574 | |
Cognizant Technology Solutions Corp. (Class A Stock) | | | 40,100 | | | | 2,293,319 | |
Computershare Ltd. | | | 4,836 | | | | 85,191 | |
DXC Technology Co.* | | | 39,600 | | | | 1,049,400 | |
Edenred (France) | | | 728 | | | | 39,622 | |
EPAM Systems, Inc.* | | | 5,600 | | | | 1,835,344 | |
Gartner, Inc.* | | | 9,700 | | | | 3,260,558 | |
International Business Machines Corp. | | | 42,400 | | | | 5,973,736 | |
Mastercard, Inc. (Class A Stock) | | | 68,300 | | | | 23,749,959 | |
NEC Corp. (Japan) | | | 800 | | | | 28,055 | |
NTT Data Corp. (Japan) | | | 1,800 | | | | 26,231 | |
Otsuka Corp. (Japan) | | | 6,500 | | | | 204,882 | |
PayPal Holdings, Inc.* | | | 22,800 | | | | 1,623,816 | |
SCSK Corp. (Japan) | | | 1,400 | | | | 21,192 | |
TIS, Inc. (Japan) | | | 700 | | | | 18,397 | |
VeriSign, Inc.* | | | 6,700 | | | | 1,376,448 | |
Visa, Inc. (Class A Stock)(a) | | | 155,400 | | | | 32,285,904 | |
| | | | | | | | |
| | |
| | | | | | | 100,713,527 | |
| | | | | | | | |
Leisure Products — 0.0% | | | | | | | | |
Bandai Namco Holdings, Inc. (Japan) | | | 700 | | | | 43,875 | |
Shimano, Inc. (Japan) | | | 300 | | | | 47,406 | |
| | | | | | | | |
| | |
| | | | | | | 91,281 | |
| | | | | | | | |
Life Sciences Tools & Services — 1.0% | |
Agilent Technologies, Inc. | | | 58,300 | | | | 8,724,595 | |
Danaher Corp. | | | 34,500 | | | | 9,156,990 | |
IQVIA Holdings, Inc.* | | | 39,600 | | | | 8,113,644 | |
Sotera Health Co.* | | | 492,700 | | | | 4,104,191 | |
Thermo Fisher Scientific, Inc. | | | 19,100 | | | | 10,518,179 | |
| | | | | | | | |
| | |
| | | | | | | 40,617,599 | |
| | | | | | | | |
Machinery — 1.1% | | | | | | | | |
AGCO Corp. | | | 5,900 | | | | 818,271 | |
| | | | | | | | |
| | | Shares | | | Value | |
|
COMMON STOCKS (continued) | |
Machinery (cont’d.) | | | | | | | | |
Alfa Laval AB (Sweden) | | | 870 | | | $ | 25,167 | |
ANDRITZ AG (Austria) | | | 1,481 | | | | 84,776 | |
Atlas Copco AB (Sweden) (Class A Stock) | | | 7,616 | | | | 90,237 | |
Atlas Copco AB (Sweden) (Class B Stock) | | | 4,168 | | | | 44,471 | |
Caterpillar, Inc. | | | 28,200 | | | | 6,755,592 | |
CNH Industrial NV (United Kingdom) | | | 3,021 | | | | 48,463 | |
Daimler Truck Holding AG (Germany)* | | | 1,305 | | | | 40,118 | |
Deere & Co. | | | 12,900 | | | | 5,531,004 | |
Epiroc AB (Sweden) (Class A Stock) | | | 1,968 | | | | 35,835 | |
Epiroc AB (Sweden) (Class B Stock) | | | 1,075 | | | | 17,294 | |
Esab Corp. | | | 60,300 | | | | 2,829,276 | |
Gates Industrial Corp. PLC* | | | 103,200 | | | | 1,177,512 | |
GEA Group AG (Germany) | | | 976 | | | | 39,692 | |
Hitachi Construction Machinery Co. Ltd. (Japan) | | | 12,400 | | | | 276,352 | |
Hoshizaki Corp. (Japan) | | | 400 | | | | 14,065 | |
IDEX Corp. | | | 30,600 | | | | 6,986,898 | |
Indutrade AB (Sweden) | | | 820 | | | | 16,629 | |
Komatsu Ltd. (Japan) | | | 13,800 | | | | 298,275 | |
PACCAR, Inc. | | | 133,800 | | | | 13,242,186 | |
Parker-Hannifin Corp. | | | 5,500 | | | | 1,600,500 | |
Rational AG (Germany) | | | 15 | | | | 8,907 | |
Sandvik AB (Sweden) | | | 3,185 | | | | 57,558 | |
Schindler Holding AG (Switzerland) | | | 55 | | | | 9,919 | |
Spirax-Sarco Engineering PLC (United Kingdom) | | | 222 | | | | 28,356 | |
Timken Co. (The) | | | 38,700 | | | | 2,734,929 | |
Volvo AB (Sweden) (Class A Stock) | | | 612 | | | | 11,620 | |
Volvo AB (Sweden) (Class B Stock) | | | 16,950 | | | | 306,178 | |
| | | | | | | | |
| | |
| | | | | | | 43,130,080 | |
| | | | | | | | |
Marine — 0.0% | | | | | | | | |
AP Moller - Maersk A/S (Denmark)
(Class A Stock) | | | 9 | | | | 19,835 | |
AP Moller - Maersk A/S (Denmark)
(Class B Stock) | | | 103 | | | | 230,577 | |
Kuehne + Nagel International AG (Switzerland) | | | 162 | | | | 37,662 | |
Nippon Yusen KK (Japan) | | | 1,500 | | | | 35,371 | |
SITC International Holdings Co. Ltd. (China) | | | 87,000 | | | | 192,830 | |
| | | | | | | | |
| | |
| | | | | | | 516,275 | |
| | | | | | | | |
Media — 0.4% | | | | | | | | |
Comcast Corp. (Class A Stock) | | | 379,700 | | | | 13,278,109 | |
Dentsu Group, Inc. (Japan) | | | 8,000 | | | | 250,965 | |
Fox Corp. (Class A Stock) | | | 27,800 | | | | 844,286 | |
Informa PLC (United Kingdom) | | | 4,560 | | | | 34,016 | |
Publicis Groupe SA (France) | | | 5,468 | | | | 349,309 | |
WPP PLC (United Kingdom) | | | 27,300 | | | | 269,724 | |
| | | | | | | | |
| | |
| | | | | | | 15,026,409 | |
| | | | | | | | |
Metals & Mining — 0.2% | | | | | | | | |
ArcelorMittal SA (Luxembourg) | | | 1,528 | | | | 40,312 | |
BHP Group Ltd. (Australia) | | | 15,916 | | | | 493,029 | |
BlueScope Steel Ltd. (Australia) | | | 23,757 | | | | 270,764 | |
SEE NOTES TO FINANCIAL STATEMENTS.
A73
| | | | |
| | PSF PGIM FLEXIBLE MANAGED PORTFOLIO (CONTINUED) | | |
SCHEDULE OF INVESTMENTS | | | | as of December 31, 2022 |
| | | | | | | | |
| | | Shares | | | Value | |
| |
COMMON STOCKS (continued) | | | | | |
Metals & Mining (cont’d.) | | | | | | | | |
Boliden AB (Sweden) | | | 814 | | | $ | 30,576 | |
Fortescue Metals Group Ltd. (Australia) | | | 25,375 | | | | 354,670 | |
Glencore PLC (Australia) | | | 29,055 | | | | 193,757 | |
Nippon Steel Corp. (Japan) | | | 17,700 | | | | 307,115 | |
Norsk Hydro ASA (Norway) | | | 3,960 | | | | 29,591 | |
Pilbara Minerals Ltd. (Australia)* | | | 7,479 | | | | 18,939 | |
Reliance Steel & Aluminum Co. | | | 3,600 | | | | 728,784 | |
Rio Tinto Ltd. (Australia) | | | 1,099 | | | | 86,739 | |
Rio Tinto PLC (Australia) | | | 3,301 | | | | 232,338 | |
South32 Ltd. (Australia) | | | 14,260 | | | | 39,096 | |
Steel Dynamics, Inc. | | | 35,300 | | | | 3,448,810 | |
Sumitomo Metal Mining Co. Ltd. (Japan) | | | 800 | | | | 28,111 | |
voestalpine AG (Austria) | | | 338 | | | | 8,953 | |
| | | | | | | | |
| | |
| | | | | | | 6,311,584 | |
| | | | | | | | |
Mortgage Real Estate Investment Trusts (REITs) — 0.0% | |
Rithm Capital Corp. | | | 218,800 | | | | 1,787,596 | |
| | | | | | | | |
Multiline Retail — 0.3% | | | | | | | | |
Dollar General Corp. | | | 47,100 | | | | 11,598,375 | |
Macy’s, Inc. | | | 63,800 | | | | 1,317,470 | |
Wesfarmers Ltd. (Australia) | | | 350 | | | | 10,916 | |
| | | | | | | | |
| | |
| | | | | | | 12,926,761 | |
| | | | | | | | |
Multi-Utilities — 0.4% | | | | | | | | |
Dominion Energy, Inc. | | | 55,200 | | | | 3,384,864 | |
DTE Energy Co. | | | 9,400 | | | | 1,104,782 | |
E.ON SE (Germany) | | | 33,405 | | | | 332,113 | |
Engie SA (France) | | | 22,305 | | | | 319,097 | |
NiSource, Inc. | | | 79,900 | | | | 2,190,858 | |
Sempra Energy | | | 59,600 | | | | 9,210,584 | |
| | | | | | | | |
| | |
| | | | | | | 16,542,298 | |
| | | | | | | | |
Oil, Gas & Consumable Fuels — 2.8% | | | | | |
BP PLC (United Kingdom) | | | 56,782 | | | | 327,629 | |
Cheniere Energy, Inc. | | | 7,300 | | | | 1,094,708 | |
Chevron Corp. | | | 162,400 | | | | 29,149,176 | |
ConocoPhillips | | | 177,800 | | | | 20,980,400 | |
Diamondback Energy, Inc. | | | 21,100 | | | | 2,886,058 | |
Eni SpA (Italy) | | | 24,129 | | | | 343,101 | |
Equinor ASA (Norway) | | | 10,546 | | | | 379,026 | |
Exxon Mobil Corp. | | | 301,200 | | | | 33,222,360 | |
Inpex Corp. (Japan) | | | 20,700 | | | | 222,430 | |
Marathon Petroleum Corp. | | | 47,100 | | | | 5,481,969 | |
New Fortress Energy, Inc.(a) | | | 23,300 | | | | 988,386 | |
ONEOK, Inc. | | | 25,100 | | | | 1,649,070 | |
Pioneer Natural Resources Co. | | | 18,800 | | | | 4,293,732 | |
Shell PLC (Netherlands) | | | 26,154 | | | | 737,303 | |
TotalEnergies SE (France) | | | 7,214 | | | | 452,846 | |
Valero Energy Corp. | | | 89,300 | | | | 11,328,598 | |
| | | | | | | | |
| | |
| | | | | | | 113,536,792 | |
| | | | | | | | |
Paper & Forest Products — 0.0% | | | | | | | | |
Oji Holdings Corp. (Japan) | | | 22,100 | | | | 89,262 | |
Stora Enso OYJ (Finland) (Class R Stock) | | | 1,700 | | | | 23,969 | |
| | | | | | | | |
| | |
| | | | | | | 113,231 | |
| | | | | | | | |
| | | | | | | | |
| | | Shares | | | Value | |
| |
COMMON STOCKS (continued) | | | | | |
Personal Products — 0.0% | | | | | | | | |
Haleon PLC* | | | 15,766 | | | $ | 62,380 | |
L’Oreal SA (France) | | | 695 | | | | 248,878 | |
Unilever PLC (United Kingdom) | | | 13,246 | | | | 668,762 | |
| | | | | | | | |
| | |
| | | | | | | 980,020 | |
| | | | | | | | |
Pharmaceuticals — 3.1% | | | | | | | | |
Astellas Pharma, Inc. (Japan) | | | 5,500 | | | | 83,631 | |
AstraZeneca PLC (United Kingdom) | | | 2,439 | | | | 330,044 | |
Bayer AG (Germany) | | | 5,617 | | | | 289,108 | |
Bristol-Myers Squibb Co. | | | 251,700 | | | | 18,109,815 | |
Chugai Pharmaceutical Co. Ltd. (Japan) | | | 2,000 | | | | 51,014 | |
Eli Lilly & Co. | | | 24,400 | | | | 8,926,496 | |
GSK PLC | | | 27,322 | | | | 472,213 | |
Ipsen SA (France) | | | 2,855 | | | | 307,086 | |
Jazz Pharmaceuticals PLC* | | | 14,200 | | | | 2,262,202 | |
Johnson & Johnson | | | 199,148 | | | | 35,179,494 | |
Kyowa Kirin Co. Ltd. (Japan) | | | 800 | | | | 18,323 | |
Merck & Co., Inc. | | | 273,900 | | | | 30,389,205 | |
Merck KGaA (Germany) | | | 725 | | | | 139,882 | |
Novartis AG (Switzerland) | | | 9,664 | | | | 874,567 | |
Novo Nordisk A/S (Denmark) (Class B Stock) | | | 4,909 | | | | 666,719 | |
Ono Pharmaceutical Co. Ltd. (Japan) | | | 2,300 | | | | 53,759 | |
Orion OYJ (Finland) (Class B Stock) | | | 323 | | | | 17,708 | |
Pfizer, Inc. | | | 473,600 | | | | 24,267,264 | |
Roche Holding AG | | | 2,631 | | | | 826,759 | |
Sanofi (France) | | | 6,691 | | | | 645,190 | |
Shionogi & Co. Ltd. (Japan) | | | 800 | | | | 39,914 | |
Takeda Pharmaceutical Co. Ltd. (Japan) | | | 200 | | | | 6,249 | |
| | | | | | | | |
| | |
| | | | | | | 123,956,642 | |
| | | | | | | | |
Professional Services — 0.3% | | | | | | | | |
CoStar Group, Inc.* | | | 126,600 | | | | 9,783,648 | |
Leidos Holdings, Inc. | | | 18,800 | | | | 1,977,572 | |
Randstad NV (Netherlands) | | | 359 | | | | 21,936 | |
RELX PLC (United Kingdom) | | | 5,829 | | | | 161,160 | |
Wolters Kluwer NV (Netherlands) | | | 3,063 | | | | 320,498 | |
| | | | | | | | |
| | |
| | | | | | | 12,264,814 | |
| | | | | | | | |
Real Estate Management & Development — 0.0% | | | | | |
Aroundtown SA (Germany) | | | 3,078 | | | | 7,170 | |
Capitaland Investment Ltd. (Singapore) | | | 7,800 | | | | 21,557 | |
CK Asset Holdings Ltd. (Hong Kong) | | | 6,000 | | | | 36,799 | |
Daito Trust Construction Co. Ltd. (Japan) | | | 200 | | | | 20,477 | |
New World Development Co. Ltd. (Hong Kong) | | | 5,000 | | | | 14,026 | |
Nomura Real Estate Holdings, Inc. (Japan) | | | 3,900 | | | | 83,393 | |
Opendoor Technologies, Inc.*(a) | | | 1,158,400 | | | | 1,343,744 | |
Sagax AB (Sweden) (Class B Stock) | | | 574 | | | | 13,041 | |
Sino Land Co. Ltd. (Hong Kong) | | | 12,000 | | | | 14,967 | |
Swire Pacific Ltd. (Hong Kong)
(Class A Stock) | | | 1,500 | | | | 13,149 | |
| | | | | | | | |
| | |
| | | | | | | 1,568,323 | |
| | | | | | | | |
SEE NOTES TO FINANCIAL STATEMENTS.
A74
| | | | |
| | PSF PGIM FLEXIBLE MANAGED PORTFOLIO (CONTINUED) | | |
SCHEDULE OF INVESTMENTS | | | | as of December 31, 2022 |
| | | | | | | | |
| | | Shares | | | Value | |
| |
COMMON STOCKS (continued) | | | | | |
Road & Rail — 0.4% | | | | | | | | |
CSX Corp. | | | 65,800 | | | $ | 2,038,484 | |
Ryder System, Inc. | | | 31,800 | | | | 2,657,526 | |
Union Pacific Corp. | | | 58,200 | | | | 12,051,474 | |
| | | | | | | | |
| | |
| | | | | | | 16,747,484 | |
| | | | | | | | |
Semiconductors & Semiconductor Equipment — 3.0% | |
Analog Devices, Inc. | | | 32,800 | | | | 5,380,184 | |
ASML Holding NV (Netherlands) | | | 659 | | | | 359,321 | |
Broadcom, Inc. | | | 51,600 | | | | 28,851,108 | |
Cirrus Logic, Inc.*(a) | | | 14,400 | | | | 1,072,512 | |
Disco Corp. (Japan) | | | 100 | | | | 28,502 | |
Enphase Energy, Inc.* | | | 47,600 | | | | 12,612,096 | |
Infineon Technologies AG (Germany) | | | 11,332 | | | | 344,401 | |
Intel Corp. | | | 708,550 | | | | 18,726,977 | |
KLA Corp. | | | 2,000 | | | | 754,060 | |
Microchip Technology, Inc. | | | 174,600 | | | | 12,265,650 | |
NVIDIA Corp. | | | 111,700 | | | | 16,323,838 | |
NXP Semiconductors NV (China) | | | 29,300 | | | | 4,630,279 | |
ON Semiconductor Corp.* | | | 25,600 | | | | 1,596,672 | |
QUALCOMM, Inc. | | | 154,100 | | | | 16,941,754 | |
Renesas Electronics Corp. (Japan)* | | | 11,700 | | | | 103,408 | |
STMicroelectronics NV (Singapore) | | | 2,000 | | | | 71,072 | |
SUMCO Corp. (Japan) | | | 18,500 | | | | 245,099 | |
| | | | | | | | |
| | |
| | | | | | | 120,306,933 | |
| | | | | | | | |
Software — 5.0% | | | | | | | | |
Adobe, Inc.* | | | 42,750 | | | | 14,386,658 | |
Autodesk, Inc.* | | | 3,900 | | | | 728,793 | |
Check Point Software Technologies Ltd. (Israel)* | | | 2,200 | | | | 277,552 | |
Dassault Systemes SE (France) | | | 2,743 | | | | 98,637 | |
Microsoft Corp. | | | 564,100 | | | | 135,282,462 | |
Nice Ltd. (Israel)* | | | 104 | | | | 20,007 | |
Oracle Corp. | | | 71,350 | | | | 5,832,149 | |
Paycom Software, Inc.* | | | 33,600 | | | | 10,426,416 | |
Roper Technologies, Inc. | | | 32,700 | | | | 14,129,343 | |
Sage Group PLC (The) (United Kingdom) | | | 3,008 | | | | 27,086 | |
SAP SE (Germany) | | | 330 | | | | 34,070 | |
ServiceNow, Inc.* | | | 18,200 | | | | 7,066,514 | |
Synopsys, Inc.* | | | 38,700 | | | | 12,356,523 | |
WiseTech Global Ltd. (Australia) | | | 1,020 | | | | 35,080 | |
| | | | | | | | |
| | |
| | | | | | | 200,701,290 | |
| | | | | | | | |
Specialty Retail — 1.4% | | | | | | | | |
Bath & Body Works, Inc. | | | 196,600 | | | | 8,284,724 | |
Fast Retailing Co. Ltd. (Japan) | | | 500 | | | | 304,267 | |
Home Depot, Inc. (The) | | | 61,500 | | | | 19,425,390 | |
Industria de Diseno Textil SA (Spain) | | | 14,035 | | | | 372,784 | |
JD Sports Fashion PLC (United Kingdom) | | | 209,959 | | | | 319,060 | |
Lowe’s Cos., Inc. | | | 44,000 | | | | 8,766,560 | |
O’Reilly Automotive, Inc.* | | | 6,900 | | | | 5,823,807 | |
Ross Stores, Inc. | | | 11,500 | | | | 1,334,805 | |
TJX Cos., Inc. (The) | | | 116,200 | | | | 9,249,520 | |
Ulta Beauty, Inc.* | | | 1,700 | | | | 797,419 | |
USS Co. Ltd. (Japan) | | | 700 | | | | 11,107 | |
| | | | | | | | |
| | |
| | | | | | | 54,689,443 | |
| | | | | | | | |
| | | | | | | | |
| | | Shares | | | Value | |
| |
COMMON STOCKS (continued) | | | | | |
Technology Hardware, Storage & Peripherals — 3.7% | |
Apple, Inc. | | | 1,044,100 | | | $ | 135,659,913 | |
Hewlett Packard Enterprise Co. | | | 279,800 | | | | 4,465,608 | |
Pure Storage, Inc. (Class A Stock)* | | | 241,200 | | | | 6,454,512 | |
Seiko Epson Corp. (Japan) | | | 17,700 | | | | 257,518 | |
| | | | | | | | |
| | |
| | | | | | | 146,837,551 | |
| | | | | | | | |
Textiles, Apparel & Luxury Goods — 0.3% | | | | | |
Burberry Group PLC (United Kingdom) | | | 1,180 | | | | 28,688 | |
Cie Financiere Richemont SA (Switzerland) (Class A Stock) | | | 3,470 | | | | 449,920 | |
Deckers Outdoor Corp.* | | | 10,900 | | | | 4,350,844 | |
Hermes International (France) | | | 109 | | | | 168,716 | |
LVMH Moet Hennessy Louis Vuitton SE (France) | | | 821 | | | | 597,436 | |
NIKE, Inc. (Class B Stock) | | | 16,100 | | | | 1,883,861 | |
PVH Corp. | | | 89,000 | | | | 6,282,510 | |
Swatch Group AG (The) (Switzerland) | | | 140 | | | | 7,280 | |
| | | | | | | | |
| | |
| | | | | | | 13,769,255 | |
| | | | | | | | |
Tobacco — 0.3% | | | | | | | | |
Altria Group, Inc. | | | 84,000 | | | | 3,839,640 | |
British American Tobacco PLC (United Kingdom) | | | 13,687 | | | | 541,432 | |
Imperial Brands PLC (United Kingdom) | | | 3,425 | | | | 85,321 | |
Japan Tobacco, Inc. (Japan) | | | 16,900 | | | | 340,708 | |
Philip Morris International, Inc. | | | 86,900 | | | | 8,795,149 | |
| | | | | | | | |
| | |
| | | | | | | 13,602,250 | |
| | | | | | | | |
Trading Companies & Distributors — 0.2% | | | | | |
AerCap Holdings NV (Ireland)* | | | 400 | | | | 23,328 | |
Ashtead Group PLC (United Kingdom) | | | 2,478 | | | | 140,762 | |
Brenntag SE (Germany) | | | 3,293 | | | | 210,011 | |
Bunzl PLC (United Kingdom) | | | 957 | | | | 31,840 | |
IMCD NV (Netherlands) | | | 165 | | | | 23,602 | |
ITOCHU Corp. (Japan) | | | 11,400 | | | | 357,649 | |
Marubeni Corp. (Japan) | | | 13,300 | | | | 152,364 | |
Mitsubishi Corp. (Japan) | | | 7,700 | | | | 249,979 | |
MonotaRO Co. Ltd. (Japan) | | | 800 | | | | 11,269 | |
Sumitomo Corp. (Japan) | | | 3,200 | | | | 53,194 | |
Toyota Tsusho Corp. (Japan) | | | 7,200 | | | | 264,847 | |
Univar Solutions, Inc.*(a) | | | 39,600 | | | | 1,259,280 | |
W.W. Grainger, Inc.(a) | | | 7,700 | | | | 4,283,125 | |
WESCO International, Inc.* | | | 10,400 | | | | 1,302,080 | |
| | | | | | | | |
| | |
| | | | | | | 8,363,330 | |
| | | | | | | | |
Water Utilities — 0.1% | | | | | | | | |
American Water Works Co., Inc.(a) | | | 39,000 | | | | 5,944,380 | |
| | | | | | | | |
Wireless Telecommunication Services — 0.2% | | | | | |
KDDI Corp. (Japan) | | | 4,600 | | | | 139,504 | |
T-Mobile US, Inc.* | | | 46,300 | | | | 6,482,000 | |
| | | | | | | | |
| | |
| | | | | | | 6,621,504 | |
| | | | | | | | |
TOTAL COMMON STOCKS
(cost $1,883,495,035) | | | | | | | 2,388,018,320 | |
| | | | | | | | |
| |
EXCHANGE-TRADED FUND — 0.0% | | | | | |
iShares MSCI EAFE ETF(a) | | | 2,688 | | | | 176,440 | |
| | | | | | | | |
(cost $147,366) | | | | | | | | |
SEE NOTES TO FINANCIAL STATEMENTS.
A75
| | | | |
| | PSF PGIM FLEXIBLE MANAGED PORTFOLIO (CONTINUED) | | |
SCHEDULE OF INVESTMENTS | | | | as of December 31, 2022 |
| | | | | | | | | | |
| | |
Shares | | |
Value | |
| |
PREFERRED STOCKS — 0.0% | | | | | |
Automobiles — 0.0% | | | | | | | | |
Bayerische Motoren Werke AG (Germany) (PRFC) | | | 151 | | | $ | 12,743 | |
Porsche Automobil Holding SE (Germany) (PRFC) | | | 3,802 | | | | 207,346 | |
Volkswagen AG (Germany) (PRFC) | | | 85 | | | | 10,544 | |
| | | | | | | | | | |
| | |
| | | | | | | 230,633 | |
| | | | | | | | | | |
Banks — 0.0% | | | | | | | | |
Citigroup Capital XIII, 10.785%(c),
3 Month LIBOR + 6.370%, Maturing 10/30/40(a) | | | 22,000 | | | | 624,800 | |
| | | | | | | | | | |
TOTAL PREFERRED STOCKS
(cost $817,282) | | | | | | | 855,433 | |
| | | | | | | | | | |
| | | | | | | | | | | | |
Interest Rate | | Maturity
Date | | | | Principal
Amount
(000)# | | | | |
| | | | | | | | | | | |
|
ASSET-BACKED SECURITIES — 6.8% | |
Automobiles — 1.8% | |
AmeriCredit Automobile Receivables Trust, | |
Series 2019-02, Class C | |
2.740% | | 04/18/25 | | | | | 1,682 | | | | 1,665,418 | |
Series 2019-03, Class C | |
2.320% | | 07/18/25 | | | | | 3,400 | | | | 3,339,022 | |
Series 2021-02, Class C | |
1.010% | | 01/19/27 | | | | | 1,300 | | | | 1,181,916 | |
Series 2021-03, Class C | |
1.410% | | 08/18/27 | | | | | 1,300 | | | | 1,170,524 | |
Avis Budget Rental Car Funding AESOP LLC, | |
Series 2019-02A, Class A, 144A | |
3.350% | | 09/22/25 | | | | | 3,000 | | | | 2,898,535 | |
Series 2019-03A, Class A, 144A | |
2.360% | | 03/20/26 | | | | | 4,000 | | | | 3,722,835 | |
Series 2020-01A, Class A, 144A | |
2.330% | | 08/20/26 | | | | | 1,800 | | | | 1,665,631 | |
Series 2021-01A, Class A, 144A | |
1.380% | | 08/20/27 | | | | | 3,500 | | | | 3,047,295 | |
Series 2021-02A, Class A, 144A | |
1.660% | | 02/20/28 | | | | | 3,700 | | | | 3,201,567 | |
Series 2022-01A, Class A, 144A | |
3.830% | | 08/21/28 | | | | | 4,200 | | | | 3,998,247 | |
CarMax Auto Owner Trust, | |
Series 2021-02, Class C | |
1.340% | | 02/16/27 | | | | | 1,100 | | | | 994,268 | |
Series 2021-04, Class C | |
1.380% | | 07/15/27 | | | | | 800 | | | | 703,733 | |
Ford Auto Securitization Trust (Canada), | |
Series 2020-AA, Class A3, 144A | |
1.153% | | 11/15/25 | | | | CAD | 3,600 | | | | 2,526,833 | |
Ford Credit Auto Owner Trust, | |
Series 2018-01, Class A, 144A | |
3.190% | | 07/15/31 | | | | | 2,500 | | | | 2,388,020 | |
Series 2019-01, Class A, 144A | |
3.520% | | 07/15/30 | | | | | 5,000 | | | | 4,902,221 | |
Series 2020-01, Class A, 144A | |
2.040% | | 08/15/31 | | | | | 3,600 | | | | 3,376,925 | |
| | | | | | | | | | | | |
Interest Rate | | Maturity
Date | | | | Principal
Amount
(000)# | | | Value | |
| | | | | | | | | |
|
ASSET-BACKED SECURITIES (continued) | |
Automobiles (cont’d.) | | | | | |
Series 2020-02, Class A, 144A | | | | | |
1.060% | | 04/15/33 | | | | | 1,300 | | | $ | 1,164,033 | |
Series 2021-02, Class B, 144A | | | | | |
1.910% | | 05/15/34 | | | | | 500 | | | | 429,688 | |
GM Financial Revolving Receivables Trust, | | | | | |
Series 2021-01, Class B, 144A | | | | | |
1.490% | | 06/12/34 | | | | | 200 | | | | 170,308 | |
Hertz Vehicle Financing III LP, | | | | | |
Series 2021-02A, Class A, 144A | | | | | |
1.680% | | 12/27/27 | | | | | 1,900 | | | | 1,653,675 | |
Hertz Vehicle Financing LLC, | | | | | |
Series 2021-01A, Class A, 144A | | | | | |
1.210% | | 12/26/25 | | | | | 2,100 | | | | 1,940,157 | |
Series 2022-02A, Class A, 144A | | | | | |
2.330% | | 06/26/28 | | | | | 4,700 | | | | 4,119,677 | |
OneMain Direct Auto Receivables Trust, | | | | | |
Series 2019-01A, Class A, 144A | | | | | |
3.630% | | 09/14/27 | | | | | 6,300 | | | | 6,046,553 | |
Series 2021-01A, Class B, 144A | | | | | |
1.260% | | 07/14/28 | | | | | 2,600 | | | | 2,262,796 | |
Santander Drive Auto Receivables Trust, | | | | | |
Series 2020-02, Class C | | | | | |
1.460% | | 09/15/25 | | | | | 188 | | | | 187,764 | |
Series 2020-03, Class C | | | | | |
1.120% | | 01/15/26 | | | | | 1,151 | | | | 1,140,672 | |
Series 2020-04, Class C | | | | | |
1.010% | | 01/15/26 | | | | | 1,004 | | | | 993,295 | |
Series 2021-02, Class C | | | | | |
0.900% | | 06/15/26 | | | | | 1,100 | | | | 1,070,065 | |
Series 2021-02, Class D | | | | | |
1.350% | | 07/15/27 | | | | | 2,300 | | | | 2,150,365 | |
Series 2021-03, Class C | | | | | |
0.950% | | 09/15/27 | | | | | 2,000 | | | | 1,923,688 | |
Series 2021-04, Class C | | | | | |
1.260% | | 02/16/27 | | | | | 2,700 | | | | 2,566,391 | |
Series 2022-01, Class C | | | | | |
2.560% | | 04/17/28 | | | | | 1,600 | | | | 1,528,550 | |
World Omni Select Auto Trust, | | | | | |
Series 2021-A, Class C | | | | | |
1.090% | | 11/15/27 | | | | | 600 | | | | 546,203 | |
| | | | | | | | | | | | |
| | | | |
| | | | | | | | | | | 70,676,870 | |
| | | | | | | | | | | | |
Collateralized Loan Obligations — 4.2% | | | | | |
Bain Capital Credit CLO Ltd. (Cayman Islands), | |
Series 2019-02A, Class AR, 144A, 3 Month LIBOR + 1.100% (Cap N/A, Floor 1.100%) | |
5.179%(c) | | 10/17/32 | | | | | 5,000 | | | | 4,906,602 | |
Balboa Bay Loan Funding Ltd. (Cayman Islands), | |
Series 2021-01A, Class A, 144A, 3 Month LIBOR + 1.200% (Cap N/A, Floor 1.200%) | |
5.443%(c) | | 07/20/34 | | | | | 3,750 | | | | 3,651,449 | |
Battalion CLO Ltd. (Cayman Islands), | | | | | |
Series 2016-10A, Class A1R2, 144A, 3 Month LIBOR + 1.170% (Cap N/A, Floor 1.170%) | |
5.495%(c) | | 01/25/35 | | | | | 700 | | | | 681,877 | |
SEE NOTES TO FINANCIAL STATEMENTS.
A76
| | | | |
| | PSF PGIM FLEXIBLE MANAGED PORTFOLIO (CONTINUED) | | |
SCHEDULE OF INVESTMENTS | | | | as of December 31, 2022 |
| | | | | | | | | | | | |
Interest Rate | | Maturity
Date | | | | Principal
Amount
(000)# | | | Value | |
| | | | | | | | | |
|
ASSET-BACKED SECURITIES (continued) | |
Collateralized Loan Obligations (cont’d.) | |
Benefit Street Partners CLO Ltd. (Cayman Islands), | |
Series 2013-IIA, Class A1R2, 144A, 3 Month LIBOR + 0.870% (Cap N/A, Floor 0.870%) | |
4.949%(c) | | 07/15/29 | | | | | 802 | | | $ | 794,593 | |
BNPP AM Euro CLO DAC (Ireland), | |
Series 2018-01A, Class AR, 144A, 3 Month EURIBOR + 0.600% (Cap N/A, Floor 0.600%) | |
1.978%(c) | | 04/15/31 | | | | EUR | 3,000 | | | | 3,108,690 | |
Canyon Capital CLO Ltd. (Cayman Islands), | |
Series 2017-01A, Class AR, 144A, 3 Month LIBOR + 1.000% (Cap N/A, Floor 1.000%) | |
5.079%(c) | | 07/15/30 | | | | | 2,984 | | | | 2,954,223 | |
Carlyle Euro CLO DAC (Ireland), | |
Series 2021-02A, Class A1, 144A, 3 Month EURIBOR + 0.990% (Cap N/A, Floor 0.990%) | |
2.368%(c) | | 10/15/35 | | | | EUR | 5,000 | | | | 5,114,109 | |
Carlyle Global Market Strategies CLO Ltd. (Cayman Islands), | |
Series 2015-05A, Class A1RR, 144A, 3 Month LIBOR + 1.080% (Cap N/A, Floor 1.080%) | |
5.323%(c) | | 01/20/32 | | | | | 9,750 | | | | 9,569,532 | |
CIFC Funding Ltd. (Cayman Islands), | |
Series 2014-05A, Class A1R2, 144A, 3 Month LIBOR + 1.200% (Cap N/A, Floor 1.200%) | |
5.279%(c) | | 10/17/31 | | | | | 9,750 | | | | 9,629,850 | |
Elevation CLO Ltd. (Cayman Islands), | |
Series 2017-06A, Class A1, 144A, 3 Month LIBOR + 1.280% (Cap N/A, Floor 1.280%) | |
5.359%(c) | | 07/15/29 | | | | | 415 | | | | 410,073 | |
Greenwood Park CLO Ltd. (Cayman Islands), | |
Series 2018-01A, Class A2, 144A, 3 Month LIBOR + 1.010% (Cap N/A, Floor 0.000%) | |
5.089%(c) | | 04/15/31 | | | | | 2,000 | | | | 1,973,774 | |
Greywolf CLO Ltd. (Cayman Islands), | |
Series 2018-01A, Class A1, 144A, 3 Month SOFR + 1.290% (Cap N/A, Floor 0.000%) | |
5.336%(c) | | 04/26/31 | | | | | 4,000 | | | | 3,922,140 | |
HPS Loan Management Ltd. (Cayman Islands), | |
Series 2015-06A, Class A1R, 144A, 3 Month LIBOR + 1.000% (Cap N/A, Floor 0.000%) | |
5.532%(c) | | 02/05/31 | | | | | 248 | | | | 245,499 | |
ICG US CLO Ltd. (Cayman Islands), | |
Series 2015-01A, Class A1R, 144A, 3 Month LIBOR + 1.140% (Cap N/A, Floor 1.140%) | |
5.367%(c) | | 10/19/28 | | | | | 6,762 | | | | 6,670,854 | |
Jamestown CLO Ltd. (Cayman Islands), | |
Series 2019-01A, Class A1, 144A, 3 Month LIBOR + 1.470% (Cap N/A, Floor 1.470%) | |
5.713%(c) | | 04/20/32 | | | | | 5,750 | | | | 5,677,118 | |
Series 2019-14A, Class A1AR, 144A, 3 Month LIBOR + 1.200% (Cap N/A, Floor 1.200%) | |
5.443%(c) | | 10/20/34 | | | | | 4,875 | | | | 4,731,409 | |
Jefferson Mill CLO Ltd. (Cayman Islands), | |
Series 2015-01A, Class AR, 144A, 3 Month LIBOR + 1.175% (Cap N/A, Floor 0.000%) | |
5.418%(c) | | 10/20/31 | | | | | 6,729 | | | | 6,556,862 | |
| | | | | | | | | | | | |
Interest Rate | | Maturity
Date | | | | Principal
Amount
(000)# | | | Value | |
| | | | | | | | | |
|
ASSET-BACKED SECURITIES (continued) | |
Collateralized Loan Obligations (cont’d.) | |
KKR Static CLO Ltd. (Cayman Islands), | |
Series 2022-02A, Class A1, 144A, 3 Month SOFR + 2.220% (Cap N/A, Floor 2.220%) | |
6.738%(c) | | 10/20/31 | | | | | 5,500 | | | $ | 5,498,245 | |
MidOcean Credit CLO (Cayman Islands), | |
Series 2014-03A, Class A1R, 144A, 3 Month LIBOR + 1.120% (Cap N/A, Floor 1.120%) | |
5.398%(c) | | 04/21/31 | | | | | 2,371 | | | | 2,325,755 | |
Northwoods Capital Ltd. (Cayman Islands), | |
Series 2017-15A, Class A1R, 144A, 3 Month LIBOR + 1.210% (Cap N/A, Floor 1.210%) | |
5.956%(c) | | 06/20/34 | | | | | 9,500 | | | | 9,193,408 | |
Series 2020-22A, Class AR, 144A, 3 Month SOFR + 1.450% (Cap N/A, Floor 1.450%) | |
5.854%(c) | | 09/01/31 | | | | | 5,750 | | | | 5,652,594 | |
Octagon Investment Partners 31 Ltd. (Cayman Islands), | |
Series 2017-01A, Class AR, 144A, 3 Month LIBOR + 1.050% (Cap N/A, Floor 1.050%) | |
5.293%(c) | | 07/20/30 | | | | | 3,500 | | | | 3,451,607 | |
OZLM Ltd. (Cayman Islands), | |
Series 2015-11A, Class A1R, 144A, 3 Month LIBOR + 1.250% (Cap N/A, Floor 0.000%) | |
5.665%(c) | | 10/30/30 | | | | | 1,484 | | | | 1,461,534 | |
Palmer Square CLO Ltd. (Cayman Islands), | |
Series 2014-01A, Class A1R2, 144A, 3 Month LIBOR + 1.130% (Cap N/A, Floor 1.130%) | |
5.209%(c) | | 01/17/31 | | | | | 1,500 | | | | 1,484,889 | |
Series 2018-02A, Class A1A, 144A, 3 Month LIBOR + 1.100% (Cap N/A, Floor 0.000%) | |
5.179%(c) | | 07/16/31 | | | | | 2,350 | | | | 2,318,764 | |
Palmer Square European CLO DAC (Ireland), | |
Series 2022-02A, Class A1, 144A, 3 Month EURIBOR + 2.200% (Cap N/A, Floor 2.200%) | |
4.184%(c) | | 01/15/36 | | | | EUR | 7,500 | | | | 8,012,591 | |
Park Avenue Institutional Advisers CLO Ltd. (Cayman Islands), | |
Series 2018-01A, Class A1AR, 144A, 3 Month LIBOR + 1.000% (Cap N/A, Floor 1.000%) | |
5.243%(c) | | 10/20/31 | | | | | 8,750 | | | | 8,524,065 | |
Regatta Funding Ltd. (Cayman Islands), | |
Series 2016-01A, Class A1R2, 144A, 3 Month LIBOR + 1.150% (Cap N/A, Floor 1.150%) | |
5.896%(c) | | 06/20/34 | | | | | 5,500 | | | | 5,380,460 | |
Romark CLO Ltd. (Cayman Islands), | |
Series 2018-02A, Class A1, 144A, 3 Month LIBOR + 1.175% (Cap N/A, Floor 1.175%) | |
5.533%(c) | | 07/25/31 | | | | | 1,000 | | | | 978,927 | |
Sound Point CLO Ltd. (Cayman Islands), | |
Series 2013-01A, Class A1R, 144A, 3 Month LIBOR + 1.070% (Cap N/A, Floor 1.070%) | |
5.397%(c) | | 01/26/31 | | | | | 4,250 | | | | 4,201,215 | |
TCW CLO Ltd. (Cayman Islands), | |
Series 2021-02A, Class AS, 144A, 3 Month LIBOR + 1.180% (Cap N/A, Floor 1.180%) | |
5.538%(c) | | 07/25/34 | | | | | 6,750 | | | | 6,570,858 | |
Telos CLO Ltd. (Cayman Islands), | |
Series 2013-04A, Class AR, 144A, 3 Month LIBOR + 1.240% (Cap N/A, Floor 0.000%) | |
5.319%(c) | | 01/17/30 | | | | | 2,126 | | | | 2,093,549 | |
SEE NOTES TO FINANCIAL STATEMENTS.
A77
| | | | |
| | PSF PGIM FLEXIBLE MANAGED PORTFOLIO (CONTINUED) | | |
SCHEDULE OF INVESTMENTS | | | | as of December 31, 2022 |
| | | | | | | | | | | | |
Interest Rate | | Maturity
Date | | | | Principal
Amount
(000)# | | | Value | |
| | | | | | | | | |
|
ASSET-BACKED SECURITIES (continued) | |
Collateralized Loan Obligations (cont’d.) | |
TICP CLO Ltd. (Cayman Islands), | |
Series 2018-03R, Class A, 144A, 3 Month LIBOR + 0.840% (Cap N/A, Floor 0.840%) | |
5.083%(c) | | 04/20/28 | | | | | 1,239 | | | $ | 1,233,231 | |
Toro European CLO DAC (Ireland), | |
Series 02A, Class ARR, 144A, 3 Month EURIBOR + 0.990% (Cap N/A, Floor 0.990%) | |
2.533%(c) | | 07/25/34 | | | | EUR | 4,500 | | | | 4,613,926 | |
Trimaran Cavu Ltd., | |
Series 2019-01A, Class A1, 144A, 3 Month LIBOR + 1.460% (Cap N/A, Floor 1.460%) | |
5.703%(c) | | 07/20/32 | | | | | 3,000 | | | | 2,938,283 | |
TSTAT Ltd. (Bermuda), | |
Series 2022-02A, Class A1, 144A | |
0.000%(cc) | | 01/20/31 | | | | | 8,750 | | | | 8,736,241 | |
Venture CLO Ltd. (Cayman Islands), | |
Series 2015-21A, Class AR, 144A, 3 Month LIBOR + 0.880% (Cap N/A, Floor 0.000%) | |
4.959%(c) | | 07/15/27 | | | | | 53 | | | | 52,905 | |
Wellfleet CLO Ltd., | |
Series 2017-03A, Class A1, 144A, 3 Month LIBOR + 1.150% (Cap N/A, Floor 1.150%) | |
5.229%(c) | | 01/17/31 | | | | | 2,750 | | | | 2,697,151 | |
Series 2018-01A, Class A, 144A, 3 Month LIBOR + 1.100% (Cap N/A, Floor 1.100%) | |
5.179%(c) | | 07/17/31 | | | | | 3,500 | | | | 3,426,792 | |
Series 2018-02A, Class A1, 144A, 3 Month LIBOR + 1.200% (Cap N/A, Floor 1.200%) | |
5.443%(c) | | 10/20/31 | | | | | 5,750 | | | | 5,592,771 | |
| | | | | | | | | | | | |
| |
| | | | 167,038,415 | |
| | | | | | | | | | | | |
Consumer Loans — 0.3% | |
Lendmark Funding Trust, | |
Series 2019-02A, Class A, 144A | |
2.780% | | 04/20/28 | | | | | 2,516 | | | | 2,441,629 | |
OneMain Financial Issuance Trust, | |
Series 2020-01A, Class A, 144A | |
3.840% | | 05/14/32 | | | | | 540 | | | | 536,169 | |
Series 2020-02A, Class A, 144A | |
1.750% | | 09/14/35 | | | | | 2,900 | | | | 2,533,354 | |
Series 2021-01A, Class A2, 144A, 30 Day Average SOFR + 0.760% (Cap N/A, Floor 0.000%) | |
4.567%(c) | | 06/16/36 | | | | | 2,800 | | | | 2,675,328 | |
Series 2022-02A, Class A, 144A | |
4.890% | | 10/14/34 | | | | | 2,050 | | | | 2,001,160 | |
Oportun Funding XIV LLC, | |
Series 2021-A, Class A, 144A | |
1.210% | | 03/08/28 | | | | | 1,300 | | | | 1,210,532 | |
| | | | | | | | | | | | |
| |
| | | | 11,398,172 | |
| | | | | | | | | | | | |
Equipment — 0.2% | |
MMAF Equipment Finance LLC, | |
Series 2017-B, Class A5, 144A | |
2.720% | | 06/15/40 | | | | | 2,619 | | | | 2,545,323 | |
Series 2018-A, Class A5, 144A | |
3.610% | | 03/10/42 | | | | | 800 | | | | 776,659 | |
Series 2019-A, Class A5, 144A | |
3.080% | | 11/12/41 | | | | | 2,500 | | | | 2,414,217 | |
| | | | | | | | | | | | |
Interest Rate | | Maturity
Date | | | | Principal
Amount
(000)# | | | Value | |
| | | | | | | | | |
|
ASSET-BACKED SECURITIES (continued) | |
Equipment (cont’d.) | |
Series 2019-B, Class A5, 144A | |
2.290% | | 11/12/41 | | | | | 2,400 | | | $ | 2,190,774 | |
| | | | | | | | | | | | |
| |
| | | | 7,926,973 | |
| | | | | | | | | | | | |
Other — 0.1% | |
Home Partners of America Trust, | |
Series 2021-03, Class A, 144A | |
2.200% | | 01/17/41 | | | | | 1,289 | | | | 1,084,934 | |
TH MSR Issuer Trust, | |
Series 2019-FT01, Class A, 144A, 1 Month LIBOR + 2.800% (Cap N/A, Floor 2.800%) | |
7.189%(c) | | 06/25/24 | | | | | 3,250 | | | | 3,040,823 | |
| | | | | | | | | | | | |
| |
| | | | 4,125,757 | |
| | | | | | | | | | | | |
Residential Mortgage-Backed Securities — 0.0% | |
Long Beach Mortgage Loan Trust, | |
Series 2004-02, Class M1, 1 Month LIBOR + 0.795% (Cap N/A, Floor 0.795%) | |
5.184%(c) | | 06/25/34 | | | | | 111 | | | | 105,649 | |
TFS (Spain), | |
Series 2018-03, Class A1 | |
0.000%(s) | | 04/16/40^ | | | | EUR | — | (r) | | | 1,595 | |
Series 2018-03, Class A1, 1 Month EURIBOR + 3.000% | |
4.686%(c) | | 04/16/23^ | | | | EUR | 1,239 | | | | 1,257,458 | |
| | | | | | | | | | | | |
| |
| | | | 1,364,702 | |
| | | | | | | | | | | | |
Student Loans — 0.2% | |
Commonbond Student Loan Trust, | |
Series 2017-BGS, Class A1, 144A | |
2.680% | | 09/25/42 | | | | | 722 | | | | 664,650 | |
Series 2018-AGS, Class A1, 144A | |
3.210% | | 02/25/44 | | | | | 527 | | | | 488,251 | |
Series 2018-CGS, Class A1, 144A | |
3.870% | | 02/25/46 | | | | | 153 | | | | 147,070 | |
Laurel Road Prime Student Loan Trust, | |
Series 2017-C, Class A2B, 144A | |
2.810% | | 11/25/42 | | | | | 113 | | | | 110,591 | |
Series 2018-B, Class A2FX, 144A | |
3.540% | | 05/26/43 | | | | | 219 | | | | 214,863 | |
Series 2019-A, Class A2FX, 144A | |
2.730% | | 10/25/48 | | | | | 268 | | | | 260,291 | |
Navient Private Education Refi Loan Trust, | |
Series 2018-A, Class A2, 144A | |
3.190% | | 02/18/42 | | | | | 245 | | | | 243,520 | |
Series 2018-CA, Class A2, 144A | |
3.520% | | 06/16/42 | | | | | 243 | | | | 238,074 | |
Series 2019-CA, Class A2, 144A | |
3.130% | | 02/15/68 | | | | | 839 | | | | 792,704 | |
Series 2020-BA, Class A2, 144A | |
2.120% | | 01/15/69 | | | | | 862 | | | | 782,266 | |
Pennsylvania Higher Education Assistance Agency, | |
Series 2021-01A, Class A, 144A, 1 Month LIBOR + 0.530% (Cap N/A, Floor 0.530%) | |
4.919%(c) | | 05/25/70 | | | | | 1,879 | | | | 1,828,974 | |
SoFi Professional Loan Program LLC, | |
Series 2019-A, Class A2FX, 144A | |
3.690% | | 06/15/48 | | | | | 694 | | | | 670,527 | |
SEE NOTES TO FINANCIAL STATEMENTS.
A78
| | | | |
| | PSF PGIM FLEXIBLE MANAGED PORTFOLIO (CONTINUED) | | |
SCHEDULE OF INVESTMENTS | | | | as of December 31, 2022 |
| | | | | | | | | | | | |
Interest Rate | | Maturity Date | | | | Principal
Amount
(000)# | | | Value | |
| | | | | | | | | | | |
|
| ASSET-BACKED SECURITIES (continued) | |
Student Loans (cont’d.) | | | | | |
Series 2019-B, Class A2FX, 144A | |
3.090% | | 08/17/48 | | | | | 843 | | | $ | 792,445 | |
Series 2019-C, Class A2FX, 144A | |
2.370% | | 11/16/48 | | | | | 1,277 | | | | 1,185,705 | |
SoFi Professional Loan Program Trust, | |
Series 2018-B, Class A2FX, 144A | |
3.340% | | 08/25/47 | | | | | 769 | | | | 744,938 | |
Series 2020-A, Class A2FX, 144A | |
2.540% | | 05/15/46 | | | | | 1,657 | | | | 1,499,162 | |
| | | | | | | | | | | | |
| | | | |
| | | | | | | | | | | 10,664,031 | |
| | | | | | | | | | | | |
TOTAL ASSET-BACKED SECURITIES
(cost $284,801,040) | | | | 273,194,920 | |
| | | | | | | | | | | | |
|
COMMERCIAL MORTGAGE-BACKED SECURITIES — 4.9% | |
Arbor Multifamily Mortgage Securities Trust, | |
Series 2021-MF03, Class A3, 144A | |
2.168% | | 10/15/54 | | | | | 8,000 | | | | 6,758,173 | |
Series 2021-MF03, Class ASB, 144A | |
2.378% | | 10/15/54 | | | | | 3,800 | | | | 3,221,855 | |
Assurant Commercial Mortgage Trust, | |
Series 2016-01A, Class AS, 144A | |
3.172% | | 05/15/49 | | | | | 4,000 | | | | 3,811,674 | |
BANK, | |
Series 2017-BNK04, Class A3 | |
3.362% | | 05/15/50 | | | | | 6,465 | | | | 5,997,078 | |
Series 2021-BN35, Class A3 | |
1.717% | | 06/15/64 | | | | | 4,900 | | | | 4,093,710 | |
Series 2021-BN35, Class ASB | |
2.067% | | 06/15/64 | | | | | 3,200 | | | | 2,698,236 | |
Barclays Commercial Mortgage Securities Trust, | |
Series 2018-C02, Class A4 | |
4.047% | | 12/15/51 | | | | | 5,400 | | | | 5,079,608 | |
Benchmark Mortgage Trust, | |
Series 2018-B03, Class A4 | |
3.761% | | 04/10/51 | | | | | 5,000 | | | | 4,675,742 | |
Series 2018-B08, Class A4 | |
3.963% | | 01/15/52 | | | | | 6,700 | | | | 6,345,254 | |
Series 2021-B24, Class A3 | |
2.010% | | 03/15/54 | | | | | 2,900 | | | | 2,484,167 | |
BXP Trust, | |
Series 2021-601L, Class A, 144A | |
2.618% | | 01/15/44 | | | | | 7,750 | | | | 5,793,669 | |
Cantor Commercial Real Estate Lending, | |
Series 2019-CF02, Class A3 | |
2.647% | | 11/15/52 | | | | | 8,000 | | | | 7,440,850 | |
Citigroup Commercial Mortgage Trust, | |
Series 2014-GC21, Class A4 | |
3.575% | | 05/10/47 | | | | | 831 | | | | 810,447 | |
Series 2014-GC23, Class A3 | |
3.356% | | 07/10/47 | | | | | 1,549 | | | | 1,493,230 | |
Series 2016-C01, Class A3 | |
2.944% | | 05/10/49 | | | | | 5,000 | | | | 4,625,487 | |
Series 2016-GC37, Class A3 | |
3.050% | | 04/10/49 | | | | | 3,560 | | | | 3,325,912 | |
Series 2017-P07, Class A3 | |
3.442% | | 04/14/50 | | | | | 5,116 | | | | 4,763,389 | |
| | | | | | | | | | | | |
Interest Rate | | Maturity Date | | | | Principal
Amount
(000)# | | | Value | |
| | | | | | | | | | | |
|
| COMMERCIAL MORTGAGE-BACKED SECURITIES (continued) | |
Commercial Mortgage Trust, | |
Series 2014-CR18, Class A4 | |
3.550% | | 07/15/47 | | | | | 2,325 | | | $ | 2,250,964 | |
Series 2014-CR20, Class A3 | |
3.326% | | 11/10/47 | | | | | 4,131 | | | | 3,937,943 | |
Series 2015-CR27, Class A3 | |
3.349% | | 10/10/48 | | | | | 5,914 | | | | 5,592,947 | |
CSAIL Commercial Mortgage Trust, | |
Series 2015-C04, Class A3 | |
3.544% | | 11/15/48 | | | | | 2,979 | | | | 2,829,344 | |
Series 2017-C08, Class A3 | |
3.127% | | 06/15/50 | | | | | 5,129 | | | | 4,605,736 | |
FHLMC Multifamily Structured Pass-Through Certificates, | |
Series K055, Class X1, IO | |
1.346%(cc) | | 03/25/26 | | | | | 12,902 | | | | 448,364 | |
GS Mortgage Securities Corp. Trust, | |
Series 2021-RENT, Class A, 144A, 1 Month LIBOR + 0.700% (Cap N/A, Floor 0.700%) | |
5.054%(c) | | 11/21/35 | | | | | 1,534 | | | | 1,427,198 | |
GS Mortgage Securities Trust, | |
Series 2015-GC28, Class A4 | |
3.136% | | 02/10/48 | | | | | 3,684 | | | | 3,529,279 | |
Series 2015-GC32, Class A3 | |
3.498% | | 07/10/48 | | | | | 5,265 | | | | 5,021,002 | |
Series 2016-GS03, Class A3 | |
2.592% | | 10/10/49 | | | | | 5,387 | | | | 4,891,060 | |
Series 2016-GS04, Class A3 | |
3.178% | | 11/10/49 | | | | | 5,219 | | | | 4,809,649 | |
Series 2020-GSA02, Class A4 | |
1.721% | | 12/12/53 | | | | | 6,000 | | | | 4,706,895 | |
Series 2021-GSA03, Class A4 | |
2.369% | | 12/15/54 | | | | | 5,800 | | | | 4,610,678 | |
JPMBB Commercial Mortgage Securities Trust, | |
Series 2014-C25, Class A4A1 | |
3.408% | | 11/15/47 | | | | | 676 | | | | 648,657 | |
Series 2015-C27, Class A3A1 | |
2.920% | | 02/15/48 | | | | | 4,774 | | | | 4,490,625 | |
MHC Commercial Mortgage Trust, | |
Series 2021-MHC, Class C, 144A, 1 Month LIBOR + 1.351% (Cap N/A, Floor 1.351%) | |
5.669%(c) | | 04/15/38 | | | | | 3,000 | | | | 2,867,436 | |
Morgan Stanley Capital I Trust, | |
Series 2016-BNK02, Class A3 | |
2.791% | | 11/15/49 | | | | | 3,000 | | | | 2,722,882 | |
Series 2016-UB11, Class A3 | |
2.531% | | 08/15/49 | | | | | 10,155 | | | | 9,129,480 | |
Series 2018-H04, Class A3 | |
4.043% | | 12/15/51 | | | | | 1,900 | | | | 1,786,266 | |
Series 2019-H07, Class A2 | |
2.492% | | 07/15/52 | | | | | 13,500 | | | | 12,834,981 | |
UBS Commercial Mortgage Trust, | |
Series 2017-C02, Class ASB | |
3.264% | | 08/15/50 | �� | | | | 3,246 | | | | 3,092,202 | |
Series 2017-C05, Class A4 | |
3.212% | | 11/15/50 | | | | | 6,750 | | | | 6,218,127 | |
Series 2018-C09, Class A3 | |
3.854% | | 03/15/51 | | | | | 2,500 | | | | 2,329,999 | |
SEE NOTES TO FINANCIAL STATEMENTS.
A79
| | | | |
| | PSF PGIM FLEXIBLE MANAGED PORTFOLIO (CONTINUED) | | |
SCHEDULE OF INVESTMENTS | | | | as of December 31, 2022 |
| | | | | | | | | | | | |
Interest Rate | | Maturity Date | | | | Principal
Amount
(000)# | | | Value | |
| | | | | | | | | | | |
|
| COMMERCIAL MORTGAGE-BACKED SECURITIES (continued) | |
Series 2018-C14, Class A3 | |
4.180% | | 12/15/51 | | | | | 3,829 | | | $ | 3,606,806 | |
Wells Fargo Commercial Mortgage Trust, | |
Series 2016-NXS06, Class A3 | |
2.642% | | 11/15/49 | | | | | 8,000 | | | | 7,353,926 | |
Series 2017-C38, Class A4 | |
3.190% | | 07/15/50 | | | | | 4,440 | | | | 4,062,524 | |
Series 2018-C48, Class A4 | |
4.037% | | 01/15/52 | | | | | 7,000 | | | | 6,595,366 | |
Series 2020-C58, Class A3 | |
1.810% | | 07/15/53 | | | | | 7,100 | | | | 5,644,324 | |
| | | | | | | | | | | | |
TOTAL COMMERCIAL MORTGAGE-BACKED SECURITIES
(cost $218,017,268) | | | | 195,463,141 | |
| | | | | | | | | | | | |
|
CORPORATE BONDS — 9.5% | |
Aerospace & Defense — 0.2% | |
Boeing Co. (The), | |
Sr. Unsec’d. Notes | |
2.196% | | 02/04/26 | | | | | 2,160 | | | | 1,963,271 | |
3.300% | | 03/01/35 | | | | | 2,900 | | | | 2,150,647 | |
3.900% | | 05/01/49 | | | | | 2,175 | | | | 1,533,117 | |
Embraer Netherlands Finance BV (Brazil), | |
Gtd. Notes | |
5.050% | | 06/15/25 | | | | | 906 | | | | 878,990 | |
Embraer Overseas Ltd. (Brazil), | |
Gtd. Notes, 144A | |
5.696% | | 09/16/23 | | | | | 950 | | | | 948,575 | |
Lockheed Martin Corp., | |
Sr. Unsec’d. Notes | |
5.700% | | 11/15/54 | | | | | 805 | | | | 853,692 | |
Raytheon Technologies Corp., | |
Sr. Unsec’d. Notes | |
4.125% | | 11/16/28 | | | | | 1,270 | | | | 1,217,078 | |
| | | | | | | | | | | | |
| | | | |
| | | | | | | | | | | 9,545,370 | |
| | | | | | | | | | | | |
Agriculture — 0.3% | |
Altria Group, Inc., | |
Gtd. Notes | |
3.400% | | 02/04/41 | | | | | 2,545 | | | | 1,688,778 | |
BAT Capital Corp. (United Kingdom), | |
Gtd. Notes | |
2.259% | | 03/25/28 | | | | | 5,140 | | | | 4,277,955 | |
3.557% | | 08/15/27 | | | | | 395 | | | | 359,682 | |
BAT International Finance PLC (United Kingdom), | |
Gtd. Notes | |
4.448% | | 03/16/28 | | | | | 1,500 | | | | 1,386,204 | |
Philip Morris International, Inc., | |
Sr. Unsec’d. Notes | |
5.625% | | 11/17/29(a) | | | | | 1,885 | | | | 1,919,777 | |
5.750% | | 11/17/32 | | | | | 780 | | | | 797,810 | |
Vector Group Ltd., | |
Sr. Sec’d. Notes, 144A | |
5.750% | | 02/01/29 | | | | | 1,250 | | | | 1,084,814 | |
| | | | | | | | | | | | |
| | | | |
| | | | | | | | | | | 11,515,020 | |
| | | | | | | | | | | | |
| | | | | | | | | | | | |
Interest Rate | | Maturity
Date | | | | Principal
Amount
(000)# | | | Value | |
| | | | | | | | | | | |
|
CORPORATE BONDS (continued) | |
Airlines — 0.1% | | | | | |
American Airlines 2015-1 Class A Pass-Through Trust, | |
Pass-Through Certificates | |
3.375% | | 11/01/28 | | | | | 2,040 | | | $ | 1,700,863 | |
Continental Airlines 2012-2 Class A Pass-Through Trust, | |
Pass-Through Certificates | |
4.000% | | 04/29/26 | | | | | 389 | | | | 371,323 | |
Southwest Airlines Co., | |
Sr. Unsec’d. Notes | |
5.125% | | 06/15/27 | | | | | 905 | | | | 894,697 | |
United Airlines, Inc., | |
Sr. Sec’d. Notes, 144A | |
4.375% | | 04/15/26 | | | | | 840 | | | | 782,355 | |
4.625% | | 04/15/29 | | | | | 165 | | | | 143,998 | |
| | | | | | | | | | | | |
| | | | |
| | | | | | | | | | | 3,893,236 | |
| | | | | | | | | | | | |
Apparel — 0.0% | |
Wolverine World Wide, Inc., | |
Gtd. Notes, 144A | |
4.000% | | 08/15/29 | | | | | 725 | | | | 548,974 | |
| | | | | | | | | | | | |
Auto Manufacturers — 0.3% | |
Daimler Trucks Finance North America LLC (Germany), | |
Gtd. Notes, 144A | |
1.625% | | 12/13/24 | | | | | 5,350 | | | | 4,975,276 | |
Ford Motor Co., | |
Sr. Unsec’d. Notes | |
5.291% | | 12/08/46 | | | | | 1,220 | | | | 938,179 | |
Ford Motor Credit Co. LLC, | |
Sr. Unsec’d. Notes | |
2.900% | | 02/16/28 | | | | | 200 | | | | 165,260 | |
General Motors Co., | |
Sr. Unsec’d. Notes | |
6.250% | | 10/02/43 | | | | | 980 | | | | 908,089 | |
6.600% | | 04/01/36 | | | | | 760 | | | | 745,324 | |
General Motors Financial Co., Inc., | |
Gtd. Notes | |
3.950% | | 04/13/24 | | | | | 2,800 | | | | 2,744,859 | |
| | | | | | | | | | | | |
| | | | |
| | | | | | | | | | | 10,476,987 | |
| | | | | | | | | | | | |
Banks — 2.8% | |
Banco Santander SA (Spain), | |
Sr. Unsec’d. Notes | |
1.849% | | 03/25/26 | | | | | 1,000 | | | | 884,245 | |
Sr. Unsec’d. Notes, 3 Month LIBOR + 1.120% | |
5.039%(c) | | 04/12/23 | | | | | 800 | | | | 799,373 | |
Bank of America Corp., | |
Jr. Sub. Notes, Series JJ | |
5.125%(ff) | | 06/20/24(a)(oo) | | | | | 1,665 | | | | 1,551,888 | |
Sr. Unsec’d. Notes, MTN | |
1.898%(ff) | | 07/23/31 | | | | | 2,600 | | | | 1,998,998 | |
2.496%(ff) | | 02/13/31 | | | | | 3,085 | | | | 2,506,273 | |
3.824%(ff) | | 01/20/28 | | | | | 955 | | | | 891,541 | |
4.271%(ff) | | 07/23/29 | | | | | 510 | | | | 476,371 | |
Sr. Unsec’d. Notes, Series N | |
1.658%(ff) | | 03/11/27(a) | | | | | 2,550 | | | | 2,253,377 | |
Sub. Notes, MTN | |
4.000% | | 01/22/25 | | | | | 2,000 | | | | 1,957,627 | |
4.450% | | 03/03/26 | | | | | 8,455 | | | | 8,283,658 | |
SEE NOTES TO FINANCIAL STATEMENTS.
A80
| | | | |
| | PSF PGIM FLEXIBLE MANAGED PORTFOLIO (CONTINUED) | | |
SCHEDULE OF INVESTMENTS | | | | as of December 31, 2022 |
| | | | | | | | | | | | |
Interest Rate | | Maturity Date | | | | Principal
Amount
(000)# | | | Value | |
| | | | | | | | | | | |
|
CORPORATE BONDS (continued) | |
Banks (cont’d.) | | | | | |
Bank of America NA, | |
Sub. Notes | |
6.000% | | 10/15/36 | | | | | 410 | | | $ | 420,355 | |
Barclays PLC (United Kingdom), | |
Sr. Unsec’d. Notes | |
3.650% | | 03/16/25 | | | | | 850 | | | | 815,854 | |
3.932%(ff) | | 05/07/25 | | | | | 585 | | | | 567,975 | |
Sr. Unsec’d. Notes, MTN | |
4.972%(ff) | | 05/16/29 | | | | | 3,825 | | | | 3,592,760 | |
BNP Paribas SA (France), | |
Sr. Unsec’d. Notes, 144A | |
1.323%(ff) | | 01/13/27 | | | | | 1,800 | | | | 1,569,596 | |
2.219%(ff) | | 06/09/26 | | | | | 680 | | | | 625,169 | |
2.591%(ff) | | 01/20/28 | | | | | 1,130 | | | | 994,414 | |
3.132%(ff) | | 01/20/33 | | | | | 1,505 | | | | 1,183,057 | |
Citigroup, Inc., | |
Jr. Sub. Notes, Series V | |
4.700%(ff) | | 01/30/25(oo) | | | | | 1,400 | | | | 1,165,767 | |
Sr. Unsec’d. Notes | |
2.561%(ff) | | 05/01/32 | | | | | 1,260 | | | | 994,922 | |
3.200% | | 10/21/26 | | | | | 1,870 | | | | 1,733,422 | |
3.700% | | 01/12/26 | | | | | 6,180 | | | | 5,946,306 | |
Sub. Notes | |
4.450% | | 09/29/27 | | | | | 5,965 | | | | 5,697,685 | |
4.750% | | 05/18/46 | | | | | 820 | | | | 678,354 | |
Credit Agricole SA (France), | |
Sr. Unsec’d. Notes, 144A | |
1.247%(ff) | | 01/26/27 | | | | | 1,495 | | | | 1,309,082 | |
Sr. Unsec’d. Notes, 144A, MTN | |
1.907%(ff) | | 06/16/26 | | | | | 1,160 | | | | 1,057,622 | |
Credit Suisse Group AG (Switzerland), | |
Sr. Unsec’d. Notes | |
4.550% | | 04/17/26 | | | | | 9,000 | | | | 7,950,766 | |
Sr. Unsec’d. Notes, 144A | |
2.193%(ff) | | 06/05/26 | | | | | 1,560 | | | | 1,326,564 | |
3.091%(ff) | | 05/14/32 | | | | | 885 | | | | 609,028 | |
4.282% | �� | 01/09/28 | | | | | 1,370 | | | | 1,130,939 | |
Deutsche Bank AG (Germany), | |
Sr. Unsec’d. Notes | |
2.129%(ff) | | 11/24/26 | | | | | 440 | | | | 387,893 | |
Discover Bank, | |
Sr. Unsec’d. Notes | |
4.250% | | 03/13/26 | | | | | 970 | | | | 927,790 | |
Goldman Sachs Group, Inc. (The), | |
Sr. Unsec’d. Notes | |
3.500% | | 01/23/25 | | | | | 4,100 | | | | 3,967,073 | |
3.750% | | 02/25/26 | | | | | 1,010 | | | | 973,369 | |
3.814%(ff) | | 04/23/29 | | | | | 540 | | | | 491,287 | |
3.850% | | 01/26/27 | | | | | 2,910 | | | | 2,770,734 | |
Sub. Notes | |
6.750% | | 10/01/37 | | | | | 104 | | | | 110,765 | |
JPMorgan Chase & Co., | |
Jr. Sub. Notes, Series HH | |
4.600%(ff) | | 02/01/25(oo) | | | | | 1,645 | | | | 1,460,640 | |
Jr. Sub. Notes, Series II | |
4.000%(ff) | | 04/01/25(a)(oo) | | | | | 1,045 | | | | 892,340 | |
| | | | | | | | | | | | |
Interest Rate | | Maturity Date | | | | Principal
Amount
(000)# | | | Value | |
| | | | | | | | | | | |
|
CORPORATE BONDS (continued) | |
Banks (cont’d.) | | | | | |
Sr. Unsec’d. Notes | |
3.782%(ff) | | 02/01/28 | | | | | 695 | | | $ | 650,072 | |
3.964%(ff) | | 11/15/48 | | | | | 3,250 | | | | 2,544,315 | |
4.005%(ff) | | 04/23/29 | | | | | 2,170 | | | | 2,010,122 | |
4.452%(ff) | | 12/05/29 | | | | | 3,350 | | | | 3,149,335 | |
Sub. Notes | |
3.875% | | 09/10/24(a) | | | | | 3,775 | | | | 3,692,651 | |
Morgan Stanley, | |
Sr. Unsec’d. Notes, GMTN | |
2.239%(ff) | | 07/21/32 | | | | | 630 | | | | 482,687 | |
3.772%(ff) | | 01/24/29 | | | | | 8,775 | | | | 8,031,274 | |
3.875% | | 01/27/26 | | | | | 675 | | | | 653,689 | |
4.431%(ff) | | 01/23/30 | | | | | 515 | | | | 480,791 | |
Sr. Unsec’d. Notes, MTN | |
3.591%(ff) | | 07/22/28 | | | | | 1,255 | | | | 1,153,527 | |
Sub. Notes, GMTN | |
4.350% | | 09/08/26 | | | | | 3,825 | | | | 3,717,825 | |
Societe Generale SA (France), | |
Sr. Unsec’d. Notes, 144A | |
1.488%(ff) | | 12/14/26 | | | | | 4,400 | | | | 3,830,401 | |
State Bank of India (India), | |
Sr. Unsec’d. Notes, 144A | |
4.375% | | 01/24/24 | | | | | 1,925 | | | | 1,897,087 | |
Texas Capital Bank NA, | |
Sr. Unsec’d. Notes, 144A, 3 Month LIBOR + 4.500% | |
9.254%(c) | | 09/30/24 | | | | | 2,670 | | | | 2,587,872 | |
Wells Fargo & Co., | |
Sr. Unsec’d. Notes, MTN | |
2.572%(ff) | | 02/11/31 | | | | | 4,175 | | | | 3,453,082 | |
| | | | | | | | | | | | |
| | | | |
| | | | | | | | | | | 111,289,609 | |
| | | | | | | | | | | | |
Beverages — 0.1% | |
Anheuser-Busch Cos. LLC/Anheuser-Busch InBev Worldwide, Inc. (Belgium), | |
Gtd. Notes | |
4.900% | | 02/01/46 | | | | | 620 | | | | 567,361 | |
Anheuser-Busch InBev Worldwide, Inc. (Belgium), | |
Gtd. Notes | |
4.600% | | 04/15/48 | | | | | 360 | | | | 316,895 | |
8.000% | | 11/15/39 | | | | | 1,285 | | | | 1,568,547 | |
8.200% | | 01/15/39 | | | | | 250 | | | | 310,738 | |
Constellation Brands, Inc., | |
Sr. Unsec’d. Notes | |
2.250% | | 08/01/31(a) | | | | | 1,015 | | | | 805,655 | |
Keurig Dr. Pepper, Inc., | |
Gtd. Notes | |
4.500% | | 04/15/52 | | | | | 2,291 | | | | 1,919,767 | |
| | | | | | | | | | | | |
| | | | |
| | | | | | | | | | | 5,488,963 | |
| | | | | | | | | | | | |
Biotechnology — 0.1% | |
Amgen, Inc., | |
Sr. Unsec’d. Notes | |
2.800% | | 08/15/41 | | | | | 4,050 | | | | 2,811,171 | |
| | | | | | | | | | | | |
Building Materials — 0.0% | |
Masonite International Corp., | |
Gtd. Notes, 144A | |
3.500% | | 02/15/30 | | | | | 550 | | | | 442,750 | |
SEE NOTES TO FINANCIAL STATEMENTS.
A81
| | | | |
| | PSF PGIM FLEXIBLE MANAGED PORTFOLIO (CONTINUED) | | |
SCHEDULE OF INVESTMENTS | | | | as of December 31, 2022 |
| | | | | | | | | | | | |
Interest Rate | | Maturity Date | | | | Principal
Amount
(000)# | | | Value | |
| | | | | | | | | | | |
|
CORPORATE BONDS (continued) | |
Building Materials (cont’d.) | | | | | |
Standard Industries, Inc., | |
Sr. Unsec’d. Notes, 144A | |
4.375% | | 07/15/30 | | | | | 760 | | | $ | 622,558 | |
4.750% | | 01/15/28 | | | | | 700 | | | | 629,921 | |
| | | | | | | | | | | | |
| | | | |
| | | | | | | | | | | 1,695,229 | |
| | | | | | | | | | | | |
Chemicals — 0.1% | |
Dow Chemical Co. (The), | |
Sr. Unsec’d. Notes | |
4.375% | | 11/15/42 | | | | | 95 | | | | 78,547 | |
6.900% | | 05/15/53 | | | | | 35 | | | | 38,180 | |
9.400% | | 05/15/39 | | | | | 155 | | | | 204,592 | |
NOVA Chemicals Corp. (Canada), | |
Sr. Unsec’d. Notes, 144A | |
4.875% | | 06/01/24 | | | | | 1,300 | | | | 1,256,125 | |
Sasol Financing USA LLC (South Africa), | |
Gtd. Notes | |
5.875% | | 03/27/24 | | | | | 700 | | | | 682,500 | |
6.500% | | 09/27/28 | | | | | 670 | | | | 607,355 | |
| | | | | | | | | | | | |
| | | | |
| | | | | | | | | | | 2,867,299 | |
| | | | | | | | | | | | |
Commercial Services — 0.1% | |
ERAC USA Finance LLC, | |
Gtd. Notes, 144A | |
4.200% | | 11/01/46 | | | | | 975 | | | | 759,960 | |
6.700% | | 06/01/34 | | | | | 420 | | | | 442,035 | |
7.000% | | 10/15/37 | | | | | 380 | | | | 414,028 | |
Massachusetts Institute of Technology, | |
Unsec’d. Notes | |
3.885% | | 07/01/2116 | | | | | 1,500 | | | | 1,087,083 | |
United Rentals North America, Inc., | |
Gtd. Notes | |
3.750% | | 01/15/32 | | | | | 325 | | | | 265,477 | |
4.875% | | 01/15/28(a) | | | | | 1,190 | | | | 1,127,538 | |
5.250% | | 01/15/30 | | | | | 385 | | | | 361,583 | |
University of Miami, | |
Sr. Unsec’d. Notes, Series 2022 | |
4.063% | | 04/01/52 | | | | | 1,170 | | | | 960,638 | |
| | | | | | | | | | | | |
| | | | |
| | | | | | | | | | | 5,418,342 | |
| | | | | | | | | | | | |
Diversified Financial Services — 0.2% | |
BOC Aviation USA Corp. (Singapore), | |
Gtd. Notes, 144A, MTN | |
1.625% | | 04/29/24 | | | | | 670 | | | | 636,143 | |
Cantor Fitzgerald LP, | |
Sr. Unsec’d. Notes, 144A | |
4.500% | | 04/14/27 | | | | | 4,985 | | | | 4,628,201 | |
CDP Financial, Inc. (Canada), | |
Gtd. Notes, 144A | |
3.150% | | 07/24/24 | | | | | 480 | | | | 467,863 | |
Nomura Holdings, Inc. (Japan), | |
Sr. Unsec’d. Notes | |
2.608% | | 07/14/31 | | | | | 2,055 | | | | 1,584,595 | |
OneMain Finance Corp., | |
Gtd. Notes | |
8.250% | | 10/01/23 | | | | | 1,600 | | | | 1,608,447 | |
| | | | | | | | | | | | |
Interest Rate | | Maturity Date | | | | Principal
Amount
(000)# | | | Value | |
| | | | | | | | | | | |
|
CORPORATE BONDS (continued) | |
Diversified Financial Services (cont’d.) | |
Private Export Funding Corp., | |
U.S. Gov’t. Gtd. Notes, Series NN | |
3.250% | | 06/15/25 | | | | | 330 | | | $ | 317,764 | |
| | | | | | | | | | | | |
| | | | |
| | | | | | | | | | | 9,243,013 | |
| | | | | | | | | | | | |
Electric — 0.9% | |
Abu Dhabi National Energy Co. PJSC (United Arab Emirates), | |
Sr. Unsec’d. Notes, 144A, MTN | |
2.000% | | 04/29/28 | | | | | 525 | | | | 465,216 | |
Alfa Desarrollo SpA (Chile), | |
Sr. Sec’d. Notes, 144A | |
4.550% | | 09/27/51 | | | | | 628 | | | | 477,055 | |
Baltimore Gas & Electric Co., | |
Sr. Unsec’d. Notes | |
6.350% | | 10/01/36 | | | | | 550 | | | | 587,572 | |
Berkshire Hathaway Energy Co., | |
Sr. Unsec’d. Notes | |
5.950% | | 05/15/37 | | | | | 305 | | | | 315,574 | |
Calpine Corp., | |
Sr. Sec’d. Notes, 144A | |
3.750% | | 03/01/31 | | | | | 2,000 | | | | 1,617,172 | |
CenterPoint Energy Houston Electric LLC, | |
General Ref. Mortgage, Series K2 | |
6.950% | | 03/15/33 | | | | | 590 | | | | 662,771 | |
Comision Federal de Electricidad (Mexico), | |
Gtd. Notes, 144A | |
4.688% | | 05/15/29 | | | | | 1,400 | | | | 1,231,825 | |
Commonwealth Edison Co., | |
First Mortgage, Series 123 | |
3.750% | | 08/15/47 | | | | | 1,610 | | | | 1,258,294 | |
Connecticut Light & Power Co. (The), | |
First Mortgage, Series A | |
2.050% | | 07/01/31 | | | | | 3,255 | | | | 2,624,674 | |
Consolidated Edison Co. of New York, Inc., | |
Sr. Unsec’d. Notes, Series 09-C | |
5.500% | | 12/01/39 | | | | | 220 | | | | 215,385 | |
Duke Energy Carolinas LLC, | |
First Mortgage | |
6.050% | | 04/15/38 | | | | | 550 | | | | 580,514 | |
First Ref. Mortgage | |
4.000% | | 09/30/42 | | | | | 570 | | | | 471,170 | |
El Paso Electric Co., | |
Sr. Unsec’d. Notes | |
6.000% | | 05/15/35 | | | | | 670 | | | | 651,279 | |
Enel Finance International NV (Italy), | |
Gtd. Notes, 144A | |
2.250% | | 07/12/31 | | | | | 2,140 | | | | 1,559,463 | |
Engie Energia Chile SA (Chile), | |
Sr. Unsec’d. Notes, 144A | |
3.400% | | 01/28/30 | | | | | 400 | | | | 324,825 | |
Florida Power & Light Co., | |
First Mortgage | |
5.950% | | 10/01/33 | | | | | 295 | | | | 311,989 | |
Iberdrola International BV (Spain), | |
Gtd. Notes | |
6.750% | | 09/15/33 | | | | | 145 | | | | 151,209 | |
SEE NOTES TO FINANCIAL STATEMENTS.
A82
| | | | |
| | PSF PGIM FLEXIBLE MANAGED PORTFOLIO (CONTINUED) | | |
SCHEDULE OF INVESTMENTS | | | | as of December 31, 2022 |
| | | | | | | | | | | | |
Interest Rate | | Maturity Date | | | | Principal
Amount
(000)# | | | Value | |
| | | | | | | | | | | |
|
CORPORATE BONDS (continued) | |
Electric (cont’d.) | | | | | |
Indiana Michigan Power Co., | |
Sr. Unsec’d. Notes | |
3.850% | | 05/15/28(a) | | | | | 2,910 | | | $ | 2,742,866 | |
Israel Electric Corp. Ltd. (Israel), | |
Sr. Sec’d. Notes, 144A, GMTN | |
4.250% | | 08/14/28 | | | | | 470 | | | | 440,419 | |
Monongahela Power Co., | |
First Mortgage, 144A | |
4.100% | | 04/15/24 | | | | | 2,170 | | | | 2,133,351 | |
Northern States Power Co., | |
First Mortgage | |
3.600% | | 09/15/47 | | | | | 1,580 | | | | 1,222,481 | |
NRG Energy, Inc., | |
Gtd. Notes, 144A | |
3.625% | | 02/15/31 | | | | | 75 | | | | 57,385 | |
3.875% | | 02/15/32 | | | | | 200 | | | | 150,789 | |
Sr. Sec’d. Notes, 144A | |
2.000% | | 12/02/25 | | | | | 320 | | | | 285,175 | |
2.450% | | 12/02/27 | | | | | 1,395 | | | | 1,157,054 | |
PacifiCorp, | |
First Mortgage | |
5.350% | | 12/01/53 | | | | | 3,010 | | | | 3,011,035 | |
PECO Energy Co., | |
First Mortgage | |
2.800% | | 06/15/50 | | | | | 1,110 | | | | 732,771 | |
Public Service Electric & Gas Co., | |
First Mortgage, MTN | |
2.050% | | 08/01/50 | | | | | 1,005 | | | | 561,599 | |
3.700% | | 05/01/28 | | | | | 1,280 | | | | 1,219,447 | |
4.900% | | 12/15/32 | | | | | 1,050 | | | | 1,052,240 | |
Sr. Sec’d. Notes, MTN | |
5.800% | | 05/01/37 | | | | | 535 | | | | 556,609 | |
Public Service Enterprise Group, Inc., | |
Sr. Unsec’d. Notes | |
1.600% | | 08/15/30 | | | | | 710 | | | | 551,588 | |
Puget Energy, Inc., | |
Sr. Sec’d. Notes | |
2.379% | | 06/15/28 | | | | | 1,115 | | | | 950,678 | |
San Diego Gas & Electric Co., | |
First Mortgage | |
4.150% | | 05/15/48 | | | | | 1,400 | | | | 1,177,295 | |
Southern California Edison Co., | |
First Ref. Mortgage | |
4.000% | | 04/01/47 | | | | | 580 | | | | 455,401 | |
First Ref. Mortgage, Series C | |
3.600% | | 02/01/45 | | | | | 860 | | | | 619,052 | |
Vistra Operations Co. LLC, | |
Gtd. Notes, 144A | |
5.000% | | 07/31/27 | | | | | 725 | | | | 674,691 | |
Sr. Sec’d. Notes, 144A | |
3.550% | | 07/15/24 | | | | | 2,135 | | | | 2,048,843 | |
Xcel Energy, Inc., | |
Sr. Unsec’d. Notes | |
4.800% | | 09/15/41 | | | | | 480 | | | | 418,273 | |
| | | | | | | | | | | | |
| | | | |
| | | | | | | | | | | 35,725,029 | |
| | | | | | | | | | | | |
| | | | | | | | | | | | |
Interest Rate | | Maturity Date | | | | Principal
Amount
(000)# | | | Value | |
| | | | | | | | | | | |
|
CORPORATE BONDS (continued) | |
Engineering & Construction — 0.0% | |
AECOM, | |
Gtd. Notes | |
5.125% | | 03/15/27(a) | | | | | 700 | | | $ | 677,589 | |
Mexico City Airport Trust (Mexico), | |
Sr. Sec’d. Notes, 144A | |
3.875% | | 04/30/28 | | | | | 500 | | | | 455,250 | |
5.500% | | 07/31/47 | | | | | 800 | | | | 616,000 | |
| | | | | | | | | | | | |
| |
| | | | 1,748,839 | |
| | | | | | | | | | | | |
Entertainment — 0.0% | |
Warnermedia Holdings, Inc., | |
Gtd. Notes, 144A | |
5.050% | | 03/15/42 | | | | | 865 | | | | 665,186 | |
5.141% | | 03/15/52 | | | | | 810 | | | | 594,770 | |
5.391% | | 03/15/62 | | | | | 405 | | | | 296,685 | |
| | | | | | | | | | | | |
| |
| | | | 1,556,641 | |
| | | | | | | | | | | | |
Foods — 0.2% | |
JBS USA LUX SA/JBS USA Food Co./JBS USA Finance, Inc., | |
Gtd. Notes, 144A | |
5.125% | | 02/01/28 | | | | | 2,000 | | | | 1,897,115 | |
Kraft Heinz Foods Co., | |
Gtd. Notes | |
6.500% | | 02/09/40 | | | | | 1,420 | | | | 1,503,662 | |
Lamb Weston Holdings, Inc., | |
Gtd. Notes, 144A | |
4.125% | | 01/31/30 | | | | | 300 | | | | 265,443 | |
4.375% | | 01/31/32 | | | | | 875 | | | | 764,235 | |
Mars, Inc., | |
Sr. Unsec’d. Notes, 144A | |
2.375% | | 07/16/40 | | | | | 660 | | | | 447,793 | |
Pilgrim’s Pride Corp., | |
Gtd. Notes, 144A | |
5.875% | | 09/30/27 | | | | | 1,625 | | | | 1,592,400 | |
| | | | | | | | | | | | |
| |
| | | | 6,470,648 | |
| | | | | | | | | | | | |
Gas — 0.1% | |
NiSource, Inc., | |
Sr. Unsec’d. Notes | |
1.700% | | 02/15/31 | | | | | 915 | | | | 696,854 | |
3.490% | | 05/15/27 | | | | | 1,415 | | | | 1,333,721 | |
3.600% | | 05/01/30 | | | | | 1,270 | | | | 1,132,286 | |
| | | | | | | | | | | | |
| |
| | | | 3,162,861 | |
| | | | | | | | | | | | |
Healthcare-Products — 0.1% | |
DH Europe Finance II Sarl, | |
Gtd. Notes | |
1.350% | | 09/18/39 | | | | EUR | 1,635 | | | | 1,182,911 | |
Medline Borrower LP, | |
Sr. Sec’d. Notes, 144A | |
3.875% | | 04/01/29 | | | | | 675 | | | | 544,022 | |
Medtronic Global Holdings SCA, | |
Gtd. Notes | |
1.625% | | 03/07/31 | | | | EUR | 100 | | | | 91,081 | |
2.250% | | 03/07/39 | | | | EUR | 400 | | | | 330,001 | |
| | | | | | | | | | | | |
| |
| | | | 2,148,015 | |
| | | | | | | | | | | | |
SEE NOTES TO FINANCIAL STATEMENTS.
A83
| | | | |
| | PSF PGIM FLEXIBLE MANAGED PORTFOLIO (CONTINUED) | | |
SCHEDULE OF INVESTMENTS | | | | as of December 31, 2022 |
| | | | | | | | | | | | |
Interest Rate | | Maturity Date | | | | Principal
Amount
(000)# | | | Value | |
| | | | | | | | | | | |
|
CORPORATE BONDS (continued) | |
Healthcare-Services — 0.2% | |
Aetna, Inc., | |
Sr. Unsec’d. Notes | |
6.625% | | 06/15/36 | | | | | 515 | | | $ | 548,254 | |
Elevance Health, Inc., | |
Sr. Unsec’d. Notes | |
4.625% | | 05/15/42 | | | | | 390 | | | | 354,757 | |
HCA, Inc., | |
Gtd. Notes | |
5.375% | | 02/01/25 | | | | | 305 | | | | 304,671 | |
Gtd. Notes, MTN | |
7.750% | | 07/15/36 | | | | | 450 | | | | 492,891 | |
Kaiser Foundation Hospitals, | |
Gtd. Notes | |
4.150% | | 05/01/47 | | | | | 940 | | | | 798,043 | |
Providence St. Joseph Health Obligated Group, | |
Unsec’d. Notes, Series 19A | |
2.532% | | 10/01/29 | | | | | 765 | | | | 643,616 | |
Tenet Healthcare Corp., | |
Sr. Sec’d. Notes, 144A | |
4.375% | | 01/15/30 | | | | | 625 | | | | 541,495 | |
6.125% | | 06/15/30 | | | | | 325 | | | | 309,535 | |
UnitedHealth Group, Inc., | |
Sr. Unsec’d. Notes | |
3.250% | | 05/15/51 | | | | | 1,000 | | | | 720,738 | |
5.875% | | 02/15/53(a) | | | | | 1,430 | | | | 1,552,610 | |
6.050% | | 02/15/63 | | | | | 915 | | | | 1,007,551 | |
| | | | | | | | | | | | |
| |
| | | | 7,274,161 | |
| | | | | | | | | | | | |
Home Builders — 0.0% | |
KB Home, | |
Gtd. Notes | |
4.000% | | 06/15/31(a) | | | | | 575 | | | | 464,528 | |
Taylor Morrison Communities, Inc., | |
Gtd. Notes, 144A | |
5.875% | | 06/15/27 | | | | | 525 | | | | 505,229 | |
Taylor Morrison Communities, Inc./Taylor Morrison Holdings II, Inc., | |
Gtd. Notes, 144A | |
5.625% | | 03/01/24 | | | | | 800 | | | | 794,000 | |
| | | | | | | | | | | | |
| |
| | | | 1,763,757 | |
| | | | | | | | | | | | |
Housewares — 0.0% | |
Newell Brands, Inc., | |
Sr. Unsec’d. Notes | |
4.450% | | 04/01/26 | | | | | 275 | | | | 260,212 | |
4.875% | | 06/01/25 | | | | | 1,420 | | | | 1,385,336 | |
| | | | | | | | | | | | |
| |
| | | | 1,645,548 | |
| | | | | | | | | | | | |
Insurance — 0.1% | |
Liberty Mutual Group, Inc., | |
Gtd. Notes, 144A | |
3.951% | | 10/15/50 | | | | | 1,215 | | | | 855,744 | |
Lincoln National Corp., | |
Sr. Unsec’d. Notes | |
6.300% | | 10/09/37 | | | | | 772 | | | | 757,679 | |
Markel Corp., | |
Sr. Unsec’d. Notes | |
4.150% | | 09/17/50 | | | | | 410 | | | | 313,216 | |
| | | | | | | | | | | | |
Interest Rate | | Maturity Date | | | | Principal
Amount
(000)# | | | Value | |
| | | | | | | | | | | |
|
CORPORATE BONDS (continued) | |
Insurance (cont’d.) | |
5.000% | | 03/30/43 | | | | | 200 | | | $ | 171,671 | |
New York Life Insurance Co., | |
Sub. Notes, 144A | |
6.750% | | 11/15/39 | | | | | 660 | | | | 734,930 | |
Principal Financial Group, Inc., | |
Gtd. Notes | |
4.625% | | 09/15/42 | | | | | 130 | | | | 108,694 | |
Teachers Insurance & Annuity Association of America, | |
Sub. Notes, 144A | |
4.270% | | 05/15/47 | | | | | 1,450 | | | | 1,198,282 | |
6.850% | | 12/16/39 | | | | | 124 | | | | 136,319 | |
| | | | | | | | | | | | |
| |
| | | | 4,276,535 | |
| | | | | | | | | | | | |
Media — 0.3% | |
CCO Holdings LLC/CCO Holdings Capital Corp., | |
Sr. Unsec’d. Notes, 144A | |
5.500% | | 05/01/26 | | | | | 750 | | | | 726,355 | |
Charter Communications Operating LLC/Charter Communications Operating Capital, | |
Sr. Sec’d. Notes | |
3.900% | | 06/01/52 | | | | | 580 | | | | 365,819 | |
5.375% | | 04/01/38 | | | | | 1,950 | | | | 1,638,548 | |
6.384% | | 10/23/35 | | | | | 875 | | | | 854,529 | |
6.484% | | 10/23/45 | | | | | 1,386 | | | | 1,256,071 | |
Comcast Corp., | |
Gtd. Notes | |
3.950% | | 10/15/25 | | | | | 225 | | | | 220,271 | |
Cox Communications, Inc., | |
Sr. Unsec’d. Notes, 144A | |
2.600% | | 06/15/31 | | | | | 5,275 | | | | 4,196,787 | |
CSC Holdings LLC, | |
Gtd. Notes, 144A | |
4.500% | | 11/15/31 | | | | | 1,400 | | | | 973,000 | |
Paramount Global, | |
Sr. Unsec’d. Notes | |
5.250% | | 04/01/44 | | | | | 1,450 | | | | 1,117,268 | |
Time Warner Cable LLC, | |
Sr. Sec’d. Notes | |
5.500% | | 09/01/41 | | | | | 360 | | | | 300,669 | |
| | | | | | | | | | | | |
| |
| | | | 11,649,317 | |
| | | | | | | | | | | | |
Mining — 0.1% | |
Freeport Indonesia PT (Indonesia), | |
Sr. Unsec’d. Notes, 144A, MTN | |
4.763% | | 04/14/27 | | | | | 215 | | | | 206,155 | |
Yamana Gold, Inc. (Canada), | |
Gtd. Notes | |
2.630% | | 08/15/31 | | | | | 3,050 | | | | 2,289,865 | |
| | | | | | | | | | | | |
| |
| | | | 2,496,020 | |
| | | | | | | | | | | | |
Miscellaneous Manufacturing — 0.0% | |
Amsted Industries, Inc., | |
Gtd. Notes, 144A | |
5.625% | | 07/01/27 | | | | | 1,200 | | | | 1,146,223 | |
| | | | | | | | | | | | |
SEE NOTES TO FINANCIAL STATEMENTS.
A84
| | | | |
| | PSF PGIM FLEXIBLE MANAGED PORTFOLIO (CONTINUED) | | |
SCHEDULE OF INVESTMENTS | | | | as of December 31, 2022 |
| | | | | | | | | | | | |
Interest Rate | | Maturity
Date | | | | Principal
Amount
(000)# | | | Value | |
| | | | | | | | | | | |
|
CORPORATE BONDS (continued) | |
Multi-National — 0.0% | |
Corp. Andina de Fomento (Supranational Bank), | |
Sr. Unsec’d. Notes | |
2.750% | | 01/06/23 | | | | | 315 | | | $ | 314,843 | |
| | | | | | | | | | | | |
Office/Business Equipment — 0.1% | |
CDW LLC/CDW Finance Corp., | |
Gtd. Notes | |
2.670% | | 12/01/26 | | | | | 1,810 | | | | 1,609,481 | |
5.500% | | 12/01/24 | | | | | 700 | | | | 697,477 | |
| | | | | | | | | | | | |
| |
| | | | 2,306,958 | |
| | | | | | | | | | | | |
Oil & Gas — 0.4% | |
Aker BP ASA (Norway), | |
Gtd. Notes, 144A | |
3.100% | | 07/15/31 | | | | | 755 | | | | 614,209 | |
Sr. Unsec’d. Notes, 144A | |
3.750% | | 01/15/30 | | | | | 3,250 | | | | 2,849,976 | |
Cenovus Energy, Inc. (Canada), | |
Sr. Unsec’d. Notes | |
5.400% | | 06/15/47 | | | | | 1,200 | | | | 1,083,678 | |
Devon Energy Corp., | |
Sr. Unsec’d. Notes | |
5.600% | | 07/15/41 | | | | | 300 | | | | 280,283 | |
Ecopetrol SA (Colombia), | |
Sr. Unsec’d. Notes | |
6.875% | | 04/29/30 | | | | | 637 | | | | 576,485 | |
Endeavor Energy Resources LP/EER Finance, Inc., | |
Sr. Unsec’d. Notes, 144A | |
5.750% | | 01/30/28 | | | | | 500 | | | | 478,759 | |
Energean Israel Finance Ltd. (Israel), | |
Sr. Sec’d. Notes, 144A | |
4.500% | | 03/30/24 | | | | | 570 | | | | 548,910 | |
4.875% | | 03/30/26 | | | | | 795 | | | | 729,562 | |
Hilcorp Energy I LP/Hilcorp Finance Co., | |
Sr. Unsec’d. Notes, 144A | |
6.000% | | 04/15/30 | | | | | 400 | | | | 357,964 | |
6.250% | | 04/15/32 | | | | | 500 | | | | 429,556 | |
KazMunayGas National Co. JSC (Kazakhstan), | |
Sr. Unsec’d. Notes, 144A | |
4.750% | | 04/24/25 | | | | | 550 | | | | 529,478 | |
Occidental Petroleum Corp., | |
Sr. Unsec’d. Notes | |
6.450% | | 09/15/36 | | | | | 1,155 | | | | 1,178,327 | |
Petroleos Mexicanos (Mexico), | |
Gtd. Notes | |
5.950% | | 01/28/31 | | | | | 2,146 | | | | 1,622,376 | |
6.490% | | 01/23/27 | | | | | 471 | | | | 430,023 | |
6.500% | | 03/13/27 | | | | | 330 | | | | 299,887 | |
Gtd. Notes, MTN | |
6.750% | | 09/21/47 | | | | | 313 | | | | 199,343 | |
6.875% | | 08/04/26(a) | | | | | 670 | | | | 636,835 | |
QatarEnergy Trading LLC (Qatar), | |
Sr. Unsec’d. Notes, 144A | |
1.375% | | 09/12/26 | | | | | 2,159 | | | | 1,908,421 | |
2.250% | | 07/12/31 | | | | | 820 | | | | 676,654 | |
| | | | | | | | | | | | |
| |
| | | | 15,430,726 | |
| | | | | | | | | | | | |
| | | | | | | | | | | | |
Interest Rate | | Maturity
Date | | | | Principal
Amount
(000)# | | | Value | |
| | | | | | | | | | | |
|
CORPORATE BONDS (continued) | |
Packaging & Containers — 0.1% | |
Ball Corp., | |
Gtd. Notes | |
3.125% | | 09/15/31(a) | | | | | 425 | | | $ | 341,168 | |
Berry Global, Inc., | |
Sr. Sec’d. Notes | |
1.570% | | 01/15/26 | | | | | 5,135 | | | | 4,585,078 | |
Graphic Packaging International LLC, | |
Gtd. Notes | |
4.125% | | 08/15/24 | | | | | 625 | | | | 611,256 | |
| | | | | | | | | | | | |
| |
| | | | 5,537,502 | |
| | | | | | | | | | | | |
Pharmaceuticals — 0.7% | |
AbbVie, Inc., | |
Sr. Unsec’d. Notes | |
3.800% | | 03/15/25 | | | | | 1,175 | | | | 1,145,417 | |
4.250% | | 11/21/49 | | | | | 1,750 | | | | 1,470,993 | |
4.500% | | 05/14/35 | | | | | 1,910 | | | | 1,778,118 | |
4.550% | | 03/15/35 | | | | | 2,190 | | | | 2,047,276 | |
4.700% | | 05/14/45 | | | | | 1,460 | | | | 1,304,196 | |
Bayer US Finance II LLC (Germany), | |
Gtd. Notes, 144A | |
4.250% | | 12/15/25 | | | | | 1,600 | | | | 1,553,753 | |
Becton, Dickinson & Co., | |
Sr. Unsec’d. Notes | |
3.734% | | 12/15/24 | | | | | 130 | | | | 126,745 | |
Bristol-Myers Squibb Co., | |
Sr. Unsec’d. Notes | |
4.125% | | 06/15/39 | | | | | 410 | | | | 365,526 | |
Cigna Corp., | |
Gtd. Notes | |
4.375% | | 10/15/28 | | | | | 9,285 | | | | 8,956,525 | |
CVS Health Corp., | |
Sr. Unsec’d. Notes | |
4.780% | | 03/25/38 | | | | | 3,810 | | | | 3,490,992 | |
5.300% | | 12/05/43 | | | | | 250 | | | | 234,155 | |
Mylan, Inc., | |
Gtd. Notes | |
5.200% | | 04/15/48 | | | | | 1,375 | | | | 1,029,500 | |
5.400% | | 11/29/43 | | | | | 845 | | | | 669,376 | |
Organon & Co./Organon Foreign Debt Co-Issuer BV, | |
Sr. Sec’d. Notes, 144A | |
4.125% | | 04/30/28 | | | | | 900 | | | | 796,877 | |
Viatris, Inc., | |
Gtd. Notes | |
3.850% | | 06/22/40 | | | | | 470 | | | | 314,976 | |
Wyeth LLC, | |
Gtd. Notes | |
6.450% | | 02/01/24 | | | | | 60 | | | | 60,957 | |
Zoetis, Inc., | |
Sr. Unsec’d. Notes | |
5.600% | | 11/16/32(a) | | | | | 2,658 | | | | 2,757,835 | |
| | | | | | | | | | | | |
| |
| | | | 28,103,217 | |
| | | | | | | | | | | | |
Pipelines — 0.7% | |
Antero Midstream Partners LP/Antero Midstream Finance Corp., | |
Gtd. Notes, 144A | |
5.750% | | 01/15/28 | | | | | 750 | | | | 698,919 | |
SEE NOTES TO FINANCIAL STATEMENTS.
A85
| | | | |
| | PSF PGIM FLEXIBLE MANAGED PORTFOLIO (CONTINUED) | | |
SCHEDULE OF INVESTMENTS | | | | as of December 31, 2022 |
| | | | | | | | | | | | |
Interest Rate | | Maturity
Date | | | | Principal
Amount
(000)# | | | Value | |
| | | | | | | | | | | |
|
CORPORATE BONDS (continued) | |
Pipelines (cont’d.) | |
Boardwalk Pipelines LP, | |
Gtd. Notes | |
3.400% | | 02/15/31 | | | | | 1,625 | | | $ | 1,360,441 | |
DCP Midstream Operating LP, | |
Gtd. Notes | |
5.125% | | 05/15/29 | | | | | 5,240 | | | | 5,051,994 | |
Eastern Gas Transmission & Storage, Inc., | |
Sr. Unsec’d. Notes | |
4.600% | | 12/15/44 | | | | | 65 | | | | 53,403 | |
EIG Pearl Holdings Sarl (Saudi Arabia), | |
Sr. Sec’d. Notes, 144A | |
3.545% | | 08/31/36 | | | | | 1,429 | | | | 1,198,395 | |
Energy Transfer LP, | |
Sr. Unsec’d. Notes | |
4.950% | | 06/15/28 | | | | | 1,115 | | | | 1,076,978 | |
5.000% | | 05/15/50 | | | | | 965 | | | | 779,057 | |
6.125% | | 12/15/45 | | | | | 180 | | | | 166,916 | |
6.250% | | 04/15/49 | | | | | 450 | | | | 420,249 | |
EQM Midstream Partners LP, | |
Sr. Unsec’d. Notes, 144A | |
7.500% | | 06/01/27 | | | | | 50 | | | | 48,984 | |
7.500% | | 06/01/30 | | | | | 50 | | | | 48,199 | |
Kinder Morgan, Inc., | |
Gtd. Notes | |
3.600% | | 02/15/51 | | | | | 2,260 | | | | 1,562,321 | |
MPLX LP, | |
Sr. Unsec’d. Notes | |
2.650% | | 08/15/30 | | | | | 595 | | | | 482,741 | |
4.000% | | 02/15/25 | | | | | 1,430 | | | | 1,385,696 | |
4.000% | | 03/15/28 | | | | | 1,385 | | | | 1,290,081 | |
4.875% | | 06/01/25 | | | | | 3,250 | | | | 3,212,549 | |
5.200% | | 03/01/47 | | | | | 40 | | | | 34,004 | |
5.500% | | 02/15/49 | | | | | 395 | | | | 349,403 | |
ONEOK Partners LP, | |
Gtd. Notes | |
6.650% | | 10/01/36 | | | | | 145 | | | | 145,591 | |
ONEOK, Inc., | |
Gtd. Notes | |
3.100% | | 03/15/30 | | | | | 5,205 | | | | 4,367,494 | |
4.500% | | 03/15/50 | | | | | 295 | | | | 221,328 | |
4.950% | | 07/13/47 | | | | | 935 | | | | 758,923 | |
Venture Global Calcasieu Pass LLC, | |
Sr. Sec’d. Notes, 144A | |
3.875% | | 08/15/29 | | | | | 115 | | | | 100,685 | |
4.125% | | 08/15/31 | | | | | 90 | | | | 76,726 | |
Western Midstream Operating LP, | |
Sr. Unsec’d. Notes | |
5.300% | | 03/01/48 | | | | | 125 | | | | 103,498 | |
Williams Cos., Inc. (The), | |
Sr. Unsec’d. Notes | |
4.900% | | 01/15/45 | | | | | 1,000 | | | | 850,493 | |
5.100% | | 09/15/45 | | | | | 500 | | | | 437,342 | |
5.300% | | 08/15/52 | | | | | 290 | | | | 261,240 | |
| | | | | | | | | | | | |
| |
| | | | 26,543,650 | |
| | | | | | | | | | | | |
| | | | | | | | | | | | |
Interest Rate | | Maturity
Date | | | | Principal
Amount
(000)# | | | Value | |
| | | | | | | | | | | |
|
CORPORATE BONDS (continued) | |
Real Estate Investment Trusts (REITs) — 0.3% | |
Alexandria Real Estate Equities, Inc., | |
Gtd. Notes | |
2.000% | | 05/18/32 | | | | | 1,815 | | | $ | 1,396,565 | |
Corporate Office Properties LP, | |
Gtd. Notes | |
2.900% | | 12/01/33 | | | | | 1,345 | | | | 947,495 | |
GLP Capital LP/GLP Financing II, Inc., | |
Gtd. Notes | |
5.375% | | 04/15/26 | | | | | 1,050 | | | | 1,035,357 | |
Kimco Realty Corp., | |
Sr. Unsec’d. Notes | |
2.700% | | 10/01/30 | | | | | 3,480 | | | | 2,839,853 | |
MPT Operating Partnership LP/MPT Finance Corp., | |
Gtd. Notes | |
3.500% | | 03/15/31 | | | | | 950 | | | | 653,570 | |
5.000% | | 10/15/27(a) | | | | | 400 | | | | 336,601 | |
Public Storage, | |
Sr. Unsec’d. Notes | |
2.250% | | 11/09/31 | | | | | 1,288 | | | | 1,038,640 | |
Realty Income Corp., | |
Sr. Unsec’d. Notes | |
3.250% | | 01/15/31 | | | | | 3,235 | | | | 2,805,529 | |
Sun Communities Operating LP, | |
Gtd. Notes | |
2.700% | | 07/15/31 | | | | | 3,000 | | | | 2,361,943 | |
| | | | | | | | | | | | |
| |
| | | | 13,415,553 | |
| | | | | | | | | | | | |
Retail — 0.2% | |
1011778 BC ULC/New Red Finance, Inc. (Canada), | |
Sr. Sec’d. Notes, 144A | |
3.875% | | 01/15/28(a) | | | | | 675 | | | | 608,344 | |
AutoZone, Inc., | |
Sr. Unsec’d. Notes | |
1.650% | | 01/15/31 | | | | | 770 | | | | 596,015 | |
Dollar Tree, Inc., | |
Sr. Unsec’d. Notes | |
4.000% | | 05/15/25 | | | | | 4,705 | | | | 4,594,965 | |
Gap, Inc. (The), | |
Gtd. Notes, 144A | |
3.625% | | 10/01/29 | | | | | 275 | | | | 195,695 | |
3.875% | | 10/01/31 | | | | | 275 | | | | 194,008 | |
Sally Holdings LLC/Sally Capital, Inc., | |
Gtd. Notes | |
5.625% | | 12/01/25 | | | | | 1,375 | | | | 1,324,432 | |
| | | | | | | | | | | | |
| |
| | | | 7,513,459 | |
| | | | | | | | | | | | |
Semiconductors — 0.1% | |
Broadcom, Inc., | |
Sr. Unsec’d. Notes, 144A | |
3.137% | | 11/15/35 | | | | | 320 | | | | 234,770 | |
3.187% | | 11/15/36 | | | | | 4,445 | | | | 3,208,131 | |
| | | | | | | | | | | | |
| |
| | | | 3,442,901 | |
| | | | | | | | | | | | |
Software — 0.1% | |
Microsoft Corp., | |
Sr. Unsec’d. Notes | |
2.525% | | 06/01/50 | | | | | 1,425 | | | | 949,631 | |
SEE NOTES TO FINANCIAL STATEMENTS.
A86
| | | | |
| | PSF PGIM FLEXIBLE MANAGED PORTFOLIO (CONTINUED) | | |
SCHEDULE OF INVESTMENTS | | | | as of December 31, 2022 |
| | | | | | | | | | | | |
Interest Rate | | Maturity Date | | | | Principal
Amount
(000)# | | | Value | |
| | | | | | | | | | | |
|
CORPORATE BONDS (continued) | |
Software (cont’d.) | |
ServiceNow, Inc., | |
Sr. Unsec’d. Notes | |
1.400% | | 09/01/30 | | | | | 2,055 | | | $ | 1,565,843 | |
| | | | | | | | | | | | |
| |
| | | | 2,515,474 | |
| | | | | | | | | | | | |
Telecommunications — 0.5% | |
AT&T, Inc., | |
Sr. Unsec’d. Notes | |
2.550% | | 12/01/33 | | | | | 576 | | | | 442,944 | |
3.500% | | 09/15/53 | | | | | 5,308 | | | | 3,611,401 | |
3.650% | | 09/15/59 | | | | | 160 | | | | 108,315 | |
4.300% | | 02/15/30 | | | | | 615 | | | | 578,335 | |
4.500% | | 05/15/35 | | | | | 545 | | | | 495,686 | |
Level 3 Financing, Inc., | |
Sr. Sec’d. Notes, 144A | |
3.400% | | 03/01/27 | | | | | 300 | | | | 254,156 | |
T-Mobile USA, Inc., | |
Gtd. Notes | |
2.550% | | 02/15/31 | | | | | 1,385 | | | | 1,128,673 | |
3.875% | | 04/15/30 | | | | | 8,000 | | | | 7,261,805 | |
Verizon Communications, Inc., | |
Sr. Unsec’d. Notes | |
2.550% | | 03/21/31 | | | | | 1,600 | | | | 1,316,796 | |
2.650% | | 11/20/40 | | | | | 1,575 | | | | 1,063,150 | |
4.016% | | 12/03/29 | | | | | 1,900 | | | | 1,778,120 | |
| | | | | | | | | | | | |
| |
| | | | 18,039,381 | |
| | | | | | | | | | | | |
Transportation — 0.0% | |
Burlington Northern Santa Fe LLC, | |
Sr. Unsec’d. Notes | |
6.700% | | 08/01/28 | | | | | 670 | | | | 706,316 | |
CSX Corp., | |
Sr. Unsec’d. Notes | |
6.150% | | 05/01/37 | | | | | 715 | | | | 763,055 | |
Norfolk Southern Corp., | |
Sr. Unsec’d. Notes | |
5.590% | | 05/17/25 | | | | | 100 | | | | 100,820 | |
| | | | | | | | | | | | |
| |
| | | | 1,570,191 | |
| | | | | | | | | | | | |
| |
TOTAL CORPORATE BONDS
(cost $427,200,239) | | | | 380,590,662 | |
| | | | | | | | | | | | |
|
MUNICIPAL BONDS — 0.3% | |
Alabama — 0.0% | |
Alabama Economic Settlement Authority, | |
Taxable, Revenue Bonds, Series B | |
4.263% | | 09/15/32 | | | | | 240 | | | | 222,315 | |
| | | | | | | | | | | | |
California — 0.2% | |
Bay Area Toll Authority, | |
Revenue Bonds, BABs, Series F2 | |
6.263% | | 04/01/49 | | | | | 1,325 | | | | 1,525,504 | |
Taxable, Revenue Bonds | |
2.574% | | 04/01/31 | | | | | 1,210 | | | | 1,056,538 | |
State of California, | |
General Obligation Unlimited, BABs | |
7.300% | | 10/01/39 | | | | | 1,270 | | | | 1,541,060 | |
| | | | | | | | | | | | |
Interest Rate | | Maturity Date | | | | Principal
Amount
(000)# | | | Value | |
| | | | | | | | | | | |
|
MUNICIPAL BONDS (continued) | |
California (cont’d.) | |
General Obligation Unlimited, Taxable, BABs | |
7.500% | | 04/01/34 | | | | | 475 | | | $ | 576,293 | |
7.625% | | 03/01/40 | | | | | 215 | | | | 270,652 | |
7.550% | | 04/01/39 | | | | | 245 | | | | 309,513 | |
| | | | | | | | | | | | |
| |
| | | | 5,279,560 | |
| | | | | | | | | | | | |
Colorado — 0.0% | |
Regional Transportation District Sales Tax Revenue, | |
Revenue Bonds, BABs, Series B | |
5.844% | | 11/01/50 | | | | | 680 | | | | 732,260 | |
| | | | | | | | | | | | |
Illinois — 0.0% | |
Chicago O’Hare International Airport, | |
Revenue Bonds, BABs, Series B | |
6.395% | | 01/01/40 | | | | | 1,030 | | | | 1,147,609 | |
| | | | | | | | | | | | |
New Jersey — 0.1% | |
New Jersey Turnpike Authority, | |
Taxable, Revenue Bonds, BABs, Series F | |
7.414% | | 01/01/40 | | | | | 1,070 | | | | 1,323,293 | |
| | | | | | | | | | | | |
New York — 0.0% | |
New York City Transitional Finance Authority Future Tax Secured Revenue, | |
Taxable, Revenue Bonds, BABs | |
5.767% | | 08/01/36 | | | | | 1,075 | | | | 1,111,228 | |
| | | | | | | | | | | | |
Ohio — 0.0% | |
Ohio State University (The), | |
Taxable, Revenue Bonds, BABs, Series C | |
4.910% | | 06/01/40 | | | | | 455 | | | | 460,056 | |
Ohio Water Development Authority Water Pollution Control Loan Fund, | |
Taxable, Revenue Bonds, BABs, Series B2 | |
4.879% | | 12/01/34 | | | | | 300 | | | | 300,635 | |
| | | | | | | | | | | | |
| |
| | | | 760,691 | |
| | | | | | | | | | | | |
Oregon — 0.0% | |
State of Oregon Department of Transportation, | |
Taxable, Revenue Bonds, BABs, Series A | |
5.834% | | 11/15/34 | | | | | 445 | | | | 476,641 | |
| | | | | | | | | | | | |
Pennsylvania — 0.0% | |
Pennsylvania Turnpike Commission, | |
Revenue Bonds, BABs, Series B | |
5.511% | | 12/01/45 | | | | | 550 | | | | 553,041 | |
| | | | | | | | | | | | |
Virginia — 0.0% | |
University of Virginia, | |
Taxable, Revenue Bonds, Series C | |
4.179% | | 09/01/2117 | | | | | 495 | | | | 365,257 | |
| | | | | | | | | | | | |
| |
TOTAL MUNICIPAL BONDS
(cost $11,203,847) | | | | 11,971,895 | |
| | | | | | | | | | | | |
|
RESIDENTIAL MORTGAGE-BACKED SECURITIES — 1.3% | |
Alternative Loan Trust, | |
Series 2004-18CB, Class 3A1 | |
5.250% | | 09/25/35 | | | | | 8 | | | | 7,360 | |
Banc of America Mortgage Trust, | |
Series 2005-A, Class 2A1 | |
2.543%(cc) | | 02/25/35 | | | | | 110 | | | | 104,737 | |
SEE NOTES TO FINANCIAL STATEMENTS.
A87
| | | | |
| | PSF PGIM FLEXIBLE MANAGED PORTFOLIO (CONTINUED) | | |
SCHEDULE OF INVESTMENTS | | | | as of December 31, 2022 |
| | | | | | | | | | | | |
Interest Rate | | Maturity
Date | | | | Principal
Amount
(000)# | | | Value | |
| | | | | | | | | | | |
|
| RESIDENTIAL MORTGAGE-BACKED SECURITIES (continued) | |
Bellemeade Re Ltd., | |
Series 2019-03A, Class M1B, 144A, 1 Month LIBOR + 1.600% (Cap N/A, Floor 1.600%) | |
5.989%(c) | | 07/25/29 | | | | | 156 | | | $ | 156,263 | |
Series 2021-02A, Class M1A, 144A, 30 Day Average SOFR + 1.200% (Cap N/A, Floor 1.200%) | |
5.128%(c) | | 06/25/31 | | | | | 1,998 | | | | 1,978,159 | |
Series 2021-03A, Class A2, 144A, 30 Day Average SOFR + 1.000% (Cap N/A, Floor 1.000%) | |
4.928%(c) | | 09/25/31 | | | | | 2,100 | | | | 1,989,929 | |
Series 2021-03A, Class M1A, 144A, 30 Day Average SOFR + 1.000% (Cap N/A, Floor 1.000%) | |
4.928%(c) | | 09/25/31 | | | | | 1,373 | | | | 1,354,813 | |
Series 2022-01, Class M1A, 144A, 30 Day Average SOFR + 1.750% (Cap N/A, Floor 1.750%) | |
5.678%(c) | | 01/26/32 | | | | | 3,260 | | | | 3,216,240 | |
Chase Mortgage Finance Trust, | |
Series 2007-A01, Class 1A5 | |
3.492%(cc) | | 02/25/37 | | | | | 78 | | | | 74,711 | |
Citigroup Mortgage Loan Trust, | |
Series 2022-A, Class A1, 144A | |
6.170% | | 09/25/62 | | | | | 680 | | | | 664,142 | |
Connecticut Avenue Securities Trust, | |
Series 2022-R01, Class 1M2, 144A, 30 Day Average SOFR + 1.900% (Cap N/A, Floor 0.000%) | |
5.828%(c) | | 12/25/41 | | | | | 1,760 | | | | 1,671,355 | |
Credit Suisse Mortgage Trust, | |
Series 2018-RPL09, Class A, 144A | |
3.850%(cc) | | 09/25/57 | | | | | 698 | | | | 651,575 | |
Eagle Re Ltd., | |
Series 2019-01, Class M1B, 144A, 1 Month LIBOR + 1.800% (Cap N/A, Floor 0.000%) | |
6.189%(c) | | 04/25/29 | | | | | 181 | | | | 176,661 | |
Series 2021-02, Class M1A, 144A, 30 Day Average SOFR + 1.550% (Cap N/A, Floor 1.550%) | |
5.478%(c) | | 04/25/34 | | | | | 5,177 | | | | 5,146,483 | |
Fannie Mae REMIC, | |
Series 2014-73, Class CZ | |
3.000% | | 11/25/44 | | | | | 1,549 | | | | 1,347,557 | |
Series 2020-24, Class SP, IO, 1 Month LIBOR + 6.050% (Cap 6.050%, Floor 0.000%) | |
1.661%(c) | | 04/25/50 | | | | | 1,156 | | | | 130,173 | |
Series 2020-45, Class ZC | |
2.000% | | 07/25/50 | | | | | 2,229 | | | | 1,488,183 | |
Series 2021-03, Class JI, IO | |
2.500% | | 02/25/51 | | | | | 3,183 | | | | 424,437 | |
Series 2022-51, Class PS, IO, 30 Day Average SOFR + 5.950% (Cap 5.950%, Floor 0.000%) | |
2.022%(c) | | 08/25/52 | | | | | 2,716 | | | | 185,136 | |
FHLMC Structured Agency Credit Risk Debt Notes, | |
Series 2020-HQA05, Class M2, 144A, 30 Day Average SOFR + 2.600% (Cap N/A, Floor 0.000%) | |
6.528%(c) | | 11/25/50 | | | | | 1,804 | | | | 1,799,958 | |
FHLMC Structured Agency Credit Risk REMIC Trust, | |
Series 2020-HQA04, Class B1, 144A, 1 Month LIBOR + 5.250% (Cap N/A, Floor 0.000%) | |
9.639%(c) | | 09/25/50 | | | | | 225 | | | | 229,781 | |
| | | | | | | | | | | | |
Interest Rate | | Maturity
Date | | | | Principal
Amount
(000)# | | | Value | |
| | | | | | | | | | | |
|
| RESIDENTIAL MORTGAGE-BACKED SECURITIES (continued) | |
Series 2021-DNA05, Class M2, 144A, 30 Day Average SOFR + 1.650% (Cap N/A, Floor 0.000%) | |
5.578%(c) | | 01/25/34 | | | | | 252 | | | $ | 247,984 | |
Series 2021-HQA03, Class M1, 144A, 30 Day Average SOFR + 0.850% (Cap N/A, Floor 0.000%) | |
4.778%(c) | | 09/25/41 | | | | | 6,153 | | | | 5,874,089 | |
Series 2022-DNA01, Class M1A, 144A, 30 Day Average SOFR + 1.000% (Cap N/A, Floor 0.000%) | |
4.928%(c) | | 01/25/42 | | | | | 1,428 | | | | 1,391,172 | |
Freddie Mac REMIC, | |
Series 4117, Class ZC | |
3.000% | | 10/15/42 | | | | | 2,589 | | | | 2,295,597 | |
Series 4535, Class PA | |
3.000% | | 03/15/44 | | | | | 536 | | | | 502,007 | |
Series 4680, Class GZ | |
3.500% | | 03/15/47 | | | | | 3,628 | | | | 3,146,427 | |
Series 5021, Class SB, IO, 30 Day Average SOFR + 3.550% (Cap 3.550%, Floor 0.000%) | |
0.000% | | 10/25/50 | | | | | 3,898 | | | | 132,340 | |
Series 5023, Class IO, IO | |
2.000% | | 10/25/50 | | | | | 911 | | | | 106,154 | |
Series 5222, Class SA, IO, 30 Day Average SOFR + 3.500% (Cap 3.500%, Floor 0.000%) | |
0.000%(c) | | 05/25/52 | | | | | 446 | | | | 7,684 | |
Government National Mortgage Assoc., | |
Series 2015-124, Class VZ | |
3.500% | | 09/20/45 | | | | | 2,577 | | | | 2,322,731 | |
Series 2019-69, Class KB | |
3.000% | | 06/20/49 | | | | | 3,423 | | | | 2,717,171 | |
Series 2021-165, Class ST, IO, 1 Month LIBOR + 3.360% (Cap 0.020%, Floor 0.000%) | |
0.000%(c) | | 01/20/50 | | | | | 667 | | | | 219 | |
Series 2021-177, Class SB, IO, 30 Day Average SOFR + 3.200% (Cap 3.200%, Floor 0.000%) | |
0.000%(c) | | 10/20/51 | | | | | 3,002 | | | | 47,517 | |
Series 2021-205, Class DS, IO, 30 Day Average SOFR + 3.200% (Cap 3.200%, Floor 0.000%) | |
0.000%(c) | | 11/20/51 | | | | | 4,856 | | | | 76,961 | |
Series 2022-046, Class S, IO, 30 Day Average SOFR + 3.500% (Cap 3.500%, Floor 0.000%) | |
0.000%(c) | | 03/20/52 | | | | | 1,249 | | | | 21,140 | |
Series 2022-051, Class SC, IO, 30 Day Average SOFR + 3.500% (Cap 3.500%, Floor 0.000%) | |
0.000%(c) | | 03/20/52 | | | | | 5,467 | | | | 84,654 | |
Series 2022-066, Class SB, IO, 30 Day Average SOFR + 3.850% (Cap 3.850%, Floor 0.000%) | |
0.024%(c) | | 04/20/52 | | | | | 1,854 | | | | 35,827 | |
Series 2022-068, Class SP, IO, 30 Day Average SOFR + 3.850% (Cap 3.850%, Floor 0.000%) | |
0.024%(c) | | 04/20/52 | | | | | 1,441 | | | | 26,096 | |
Series 2022-078, Class MS, IO, 30 Day Average SOFR + 3.600% (Cap 3.600%, Floor 0.000%) | |
0.000%(c) | | 04/20/52 | | | | | 4,752 | | | | 70,202 | |
Series 2022-078, Class SB, IO, 30 Day Average SOFR + 3.750% (Cap 3.750%, Floor 0.000%) | |
0.000%(c) | | 04/20/52 | | | | | 3,182 | | | | 57,178 | |
SEE NOTES TO FINANCIAL STATEMENTS.
A88
| | | | |
| | PSF PGIM FLEXIBLE MANAGED PORTFOLIO (CONTINUED) | | |
SCHEDULE OF INVESTMENTS | | | | as of December 31, 2022 |
| | | | | | | | | | | | |
Interest Rate | | Maturity Date | | | | Principal
Amount
(000)# | | | Value | |
| | | | | | | | | | | |
|
RESIDENTIAL MORTGAGE-BACKED SECURITIES (continued) | |
Series 2022-093, Class GS, IO, 30 Day Average SOFR + 3.650% (Cap 3.650%, Floor 0.000%) | |
0.000%(c) | | 05/20/52 | | | | | 1,058 | | | $ | 15,612 | |
Series 2022-126, Class CS, IO, 30 Day Average SOFR + 3.760% (Cap 3.760%, Floor 0.000%) | |
0.000%(c) | | 07/20/52 | | | | | 6,342 | | | | 68,031 | |
Series 2022-133, Class SA, IO, 30 Day Average SOFR + 3.950% (Cap 3.950%, Floor 0.000%) | |
0.124%(c) | | 07/20/52 | | | | | 2,327 | | | | 37,035 | |
Series 2022-148, Class DS, IO, 30 Day Average SOFR + 3.600% (Cap 3.600%, Floor 0.000%) | |
0.000%(c) | | 08/20/52 | | | | | 2,334 | | | | 29,927 | |
Home Re Ltd., | |
Series 2019-01, Class M1, 144A, 1 Month LIBOR + 1.650% (Cap N/A, Floor 0.000%) | |
6.039%(c) | | 05/25/29 | | | | | 168 | | | | 165,705 | |
Series 2021-02, Class M1A, 144A, 30 Day Average SOFR + 1.250% (Cap N/A, Floor 0.000%) | |
5.178%(c) | | 01/25/34 | | | | | 545 | | | | 543,319 | |
JPMorgan Mortgage Trust, | |
Series 2007-A01, Class 4A1 | |
3.939%(cc) | | 07/25/35 | | | | | 26 | | | | 25,319 | |
Legacy Mortgage Asset Trust, | |
Series 2021-GS01, Class A1, 144A | |
1.892% | | 10/25/66 | | | | | 344 | | | | 314,457 | |
MFA Trust, | |
Series 2021-RPL01, Class A1, 144A | |
1.131%(cc) | | 07/25/60 | | | | | 2,595 | | | | 2,271,660 | |
Mill City Mortgage Loan Trust, | |
Series 2017-03, Class A1, 144A | |
2.750%(cc) | | 01/25/61 | | | | | 401 | | | | 387,196 | |
New Residential Mortgage Loan Trust, | |
Series 2018-04A, Class A1S, 144A, 1 Month LIBOR + 0.750% (Cap N/A, Floor 0.750%) | |
5.139%(c) | | 01/25/48 | | | | | 263 | | | | 252,189 | |
Oaktown Re II Ltd., | |
Series 2018-01A, Class M1, 144A, 1 Month LIBOR + 1.550% (Cap N/A, Floor 0.000%) | |
5.939%(c) | | 07/25/28 | | | | | 136 | | | | 136,213 | |
Oaktown Re VII Ltd., | |
Series 2021-02, Class M1A, 144A, 30 Day Average SOFR + 1.600% (Cap N/A, Floor 1.600%) | |
5.528%(c) | | 04/25/34 | | | | | 1,300 | | | | 1,272,518 | |
PMT Credit Risk Transfer Trust, | |
Series 2021-01R, Class A, 144A, 1 Month LIBOR + 2.900% (Cap N/A, Floor 2.900%) | |
7.287%(c) | | 02/27/24 | | | | | 2,537 | | | | 2,423,262 | |
Seasoned Credit Risk Transfer Trust, | |
Series 2019-02, Class MA | |
3.500% | | 08/25/58 | | | | | 661 | | | | 623,473 | |
Structured Adjustable Rate Mortgage Loan Trust, | |
Series 2004-01, Class 4A3 | |
3.780%(cc) | | 02/25/34 | | | | | 52 | | | | 48,256 | |
Towd Point Mortgage Trust, | |
Series 2017-05, Class A1, 144A, 1 Month LIBOR + 0.600% (Cap N/A, Floor 0.000%) | |
3.773%(c) | | 02/25/57 | | | | | 647 | | | | 640,593 | |
| | | | | | | | | | | | |
Interest Rate | | Maturity Date | | | | Principal
Amount
(000)# | | | Value | |
| | | | | | | | | | | |
|
RESIDENTIAL MORTGAGE-BACKED SECURITIES (continued) | |
Series 2020-04, Class A1, 144A | |
1.750% | | 10/25/60 | | | | | 774 | | | $ | 683,599 | |
| | | | | | | | | | | | |
TOTAL RESIDENTIAL MORTGAGE-BACKED SECURITIES
(cost $56,575,414) | | | | 51,899,167 | |
| | | | | | | | | | | | |
|
SOVEREIGN BONDS — 0.4% | |
Abu Dhabi Government International Bond (United Arab Emirates), | |
Sr. Unsec’d. Notes, 144A | |
3.125% | | 10/11/27 | | | | | 3,350 | | | | 3,198,203 | |
Bermuda Government International Bond (Bermuda), | |
Sr. Unsec’d. Notes, 144A | |
2.375% | | 08/20/30 | | | | | 710 | | | | 596,311 | |
Colombia Government International Bond (Colombia), | |
Sr. Unsec’d. Notes | |
4.000% | | 02/26/24 | | | | | 175 | | | | 170,712 | |
Export-Import Bank of India (India), | |
Sr. Unsec’d. Notes, 144A | |
3.875% | | 02/01/28 | | | | | 1,040 | | | | 962,520 | |
Finnvera OYJ (Finland), | |
Gov’t. Gtd. Notes, 144A, MTN | |
2.375% | | 06/04/25 | | | | | 400 | | | | 379,732 | |
Indonesia Government International Bond (Indonesia), | |
Sr. Unsec’d. Notes | |
1.450% | | 09/18/26 | | | | EUR | 2,100 | | | | 2,043,944 | |
3.375% | | 07/30/25 | | | | EUR | 1,500 | | | | 1,589,919 | |
Japan Finance Organization for Municipalities (Japan), | |
Sr. Unsec’d. Notes, 144A, MTN | |
2.125% | | 10/25/23 | | | | | 1,400 | | | | 1,367,586 | |
3.000% | | 03/12/24 | | | | | 400 | | | | 391,057 | |
Panama Government International Bond (Panama), | |
Sr. Unsec’d. Notes | |
4.500% | | 04/16/50 | | | | | 475 | | | | 358,269 | |
Peruvian Government International Bond (Peru), | |
Sr. Unsec’d. Notes | |
2.783% | | 01/23/31 | | | | | 453 | | | | 374,518 | |
Qatar Government International Bond (Qatar), | |
Sr. Unsec’d. Notes, 144A | |
5.103% | | 04/23/48 | | | | | 915 | | | | 914,886 | |
Tokyo Metropolitan Government (Japan), | |
Sr. Unsec’d. Notes, 144A | |
3.250% | | 06/01/23 | | | | | 800 | | | | 793,258 | |
Uruguay Government International Bond (Uruguay), | |
Sr. Unsec’d. Notes | |
5.100% | | 06/18/50 | | | | | 545 | | | | 537,370 | |
| | | | | | | | | | | | |
| |
TOTAL SOVEREIGN BONDS
(cost $14,470,114) | | | | 13,678,285 | |
| | | | | | | | | | | | |
|
U.S. GOVERNMENT AGENCY OBLIGATIONS — 10.7% | |
Federal Home Loan Bank | |
5.500% | | 07/15/36(k) | | | | | 1,080 | | | | 1,187,326 | |
Federal Home Loan Mortgage Corp. | |
1.500% | | 11/01/50 | | | | | 1,680 | | | | 1,297,803 | |
2.000% | | 01/01/32 | | | | | 410 | | | | 372,980 | |
2.000% | | 02/01/36 | | | | | 1,404 | | | | 1,252,153 | |
2.000% | | 06/01/40 | | | | | 1,116 | | | | 950,337 | |
2.000% | | 10/01/40 | | | | | 1,649 | | | | 1,404,511 | |
SEE NOTES TO FINANCIAL STATEMENTS.
A89
| | | | |
| | PSF PGIM FLEXIBLE MANAGED PORTFOLIO (CONTINUED) | | |
SCHEDULE OF INVESTMENTS | | | | as of December 31, 2022 |
| | | | | | | | | | | | |
Interest Rate | | Maturity Date | | | | Principal
Amount
(000)# | | | Value | |
| | | | | | | | | | | |
|
U.S. GOVERNMENT AGENCY OBLIGATIONS(continued) | |
2.000% | | 09/01/50 | | | | | 3,266 | | | $ | 2,670,857 | |
2.000% | | 10/01/50 | | | | | 2,685 | | | | 2,195,500 | |
2.000% | | 03/01/51 | | | | | 1,275 | | | | 1,041,696 | |
2.000% | | 07/01/51 | | | | | 5,403 | | | | 4,407,667 | |
2.000% | | 09/01/51 | | | | | 482 | | | | 395,341 | |
2.500% | | 03/01/30 | | | | | 198 | | | | 185,507 | |
2.500% | | 10/01/32 | | | | | 448 | | | | 418,492 | |
2.500% | | 03/01/51 | | | | | 1,088 | | | | 933,858 | |
2.500% | | 04/01/51 | | | | | 8,205 | | | | 6,969,143 | |
2.500% | | 05/01/51 | | | | | 4,590 | | | | 3,893,464 | |
2.500% | | 08/01/51 | | | | | 485 | | | | 412,059 | |
2.500% | | 09/01/51 | | | | | 2,802 | | | | 2,378,374 | |
2.500% | | 10/01/51 | | | | | 3,974 | | | | 3,393,540 | |
2.500% | | 12/01/51 | | | | | 3,375 | | | | 2,857,145 | |
2.500% | | 04/01/52 | | | | | 4,000 | | | | 3,388,610 | |
2.500% | | 04/01/52 | | | | | 7,984 | | | | 6,771,144 | |
3.000% | | 10/01/28 | | | | | 135 | | | | 129,916 | |
3.000% | | 06/01/29 | | | | | 374 | | | | 359,872 | |
3.000% | | 03/01/32 | | | | | 448 | | | | 428,584 | |
3.000% | | 01/01/37 | | | | | 196 | | | | 182,282 | |
3.000% | | 01/01/43 | | | | | 427 | | | | 388,745 | |
3.000% | | 07/01/43 | | | | | 863 | | | | 785,874 | |
3.000% | | 01/01/47 | | | | | 2,138 | | | | 1,912,992 | |
3.000% | | 02/01/50 | | | | | 1,782 | | | | 1,575,515 | |
3.000% | | 06/01/51 | | | | | 642 | | | | 564,985 | |
3.000% | | 07/01/51 | | | | | 1,000 | | | | 884,733 | |
3.000% | | 11/01/51 | | | | | 1,000 | | | | 878,209 | |
3.000% | | 12/01/51 | | | | | 138 | | | | 121,568 | |
3.000% | | 12/01/51 | | | | | 1,000 | | | | 877,938 | |
3.000% | | 01/01/52 | | | | | 1,000 | | | | 877,900 | |
3.000% | | 02/01/52 | | | | | 505 | | | | 446,182 | |
3.000% | | 03/01/52 | | | | | 1,000 | | | | 877,519 | |
3.000% | | 03/01/52 | | | | | 2,501 | | | | 2,195,936 | |
3.000% | | 04/01/52 | | | | | 1,000 | | | | 877,429 | |
3.000% | | 04/01/52 | | | | | 2,506 | | | | 2,200,427 | |
3.000% | | 05/01/52 | | | | | 463 | | | | 406,275 | |
3.000% | | 05/01/52 | | | | | 1,000 | | | | 877,955 | |
3.000% | | 05/01/52 | | | | | 6,733 | | | | 5,911,351 | |
3.000% | | 06/01/52 | | | | | 4,412 | | | | 3,874,424 | |
3.000% | | 06/01/52 | | | | | 9,081 | | | | 7,973,783 | |
3.500% | | 03/01/42 | | | | | 203 | | | | 190,412 | |
3.500% | | 06/01/42 | | | | | 146 | | | | 136,649 | |
3.500% | | 01/01/47 | | | | | 356 | | | | 331,856 | |
3.500% | | 02/01/47 | | | | | 524 | | | | 487,008 | |
3.500% | | 04/01/52 | | | | | 2,965 | | | | 2,702,354 | |
3.500% | | 05/01/52 | | | | | 1,493 | | | | 1,357,807 | |
3.500% | | 05/01/52 | | | | | 2,004 | | | | 1,822,846 | |
3.500% | | 06/01/52 | | | | | 63 | | | | 57,054 | |
3.500% | | 06/01/52 | | | | | 2,993 | | | | 2,719,556 | |
3.500% | | 06/01/52 | | | | | 5,471 | | | | 4,974,150 | |
3.500% | | 07/01/52 | | | | | 64 | | | | 57,771 | |
3.500% | | 08/01/52 | | | | | 1,994 | | | | 1,811,907 | |
3.500% | | 09/01/52 | | | | | 3,494 | | | | 3,175,704 | |
3.500% | | 11/01/52 | | | | | 1,022 | | | | 928,961 | |
3.500% | | 11/01/52 | | | | | 4,209 | | | | 3,824,923 | |
4.000% | | 06/01/26 | | | | | 137 | | | | 133,944 | |
4.000% | | 09/01/26 | | | | | 72 | | | | 70,552 | |
4.000% | | 11/01/37 | | | | | 7,258 | | | | 7,083,539 | |
| | | | | | | | | | | | |
Interest Rate | | Maturity Date | | | | Principal
Amount
(000)# | | | Value | |
| | | | | | | | | | | |
|
U.S. GOVERNMENT AGENCY OBLIGATIONS(continued) | |
4.000% | | 10/01/39 | | | | | 357 | | | $ | 343,473 | |
4.000% | | 12/01/40 | | | | | 156 | | | | 149,810 | |
4.000% | | 10/01/41 | | | | | 132 | | | | 126,728 | |
4.000% | | 01/01/42 | | | | | 52 | | | | 49,816 | |
4.000% | | 10/01/45 | | | | | 167 | | | | 159,895 | |
4.000% | | 04/01/52 | | | | | 1,429 | | | | 1,352,293 | |
4.500% | | 09/01/39 | | | | | 112 | | | | 111,226 | |
4.500% | | 10/01/39 | | | | | 619 | | | | 614,069 | |
4.500% | | 12/01/39 | | | | | 201 | | | | 199,205 | |
4.500% | | 07/01/41 | | | | | 67 | | | | 65,786 | |
4.500% | | 07/01/41 | | | | | 1,122 | | | | 1,113,108 | |
4.500% | | 08/01/41 | | | | | 108 | | | | 106,653 | |
4.500% | | 08/01/41 | | | | | 111 | | | | 108,209 | |
4.500% | | 08/01/41 | | | | | 178 | | | | 174,888 | |
4.500% | | 10/01/41 | | | | | 97 | | | | 95,171 | |
4.500% | | 10/01/46 | | | | | 93 | | | | 91,737 | |
4.500% | | 12/01/47 | | | | | 435 | | | | 427,101 | |
5.000% | | 05/01/34 | | | | | 11 | | | | 10,862 | |
5.000% | | 05/01/34 | | | | | 109 | | | | 111,923 | |
5.000% | | 08/01/35 | | | | | 11 | | | | 11,449 | |
5.000% | | 09/01/35 | | | | | 25 | | | | 25,225 | |
5.000% | | 10/01/36 | | | | | 17 | | | | 17,773 | |
5.000% | | 05/01/37 | | | | | 10 | | | | 10,631 | |
5.000% | | 07/01/37 | | | | | 185 | | | | 189,624 | |
5.000% | | 09/01/38 | | | | | 25 | | | | 25,500 | |
5.000% | | 09/01/38 | | | | | 26 | | | | 26,859 | |
5.000% | | 09/01/38 | | | | | 30 | | | | 30,723 | |
5.000% | | 02/01/39 | | | | | 10 | | | | 10,206 | |
5.000% | | 06/01/39 | | | | | 30 | | | | 30,426 | |
5.000% | | 10/01/52 | | | | | 489 | | | | 482,679 | |
5.500% | | 02/01/34 | | | | | 27 | | | | 27,169 | |
5.500% | | 04/01/34 | | | | | 261 | | | | 263,599 | |
5.500% | | 06/01/34 | | | | | 45 | | | | 45,913 | |
5.500% | | 06/01/34 | | | | | 78 | | | | 78,707 | |
5.500% | | 05/01/37 | | | | | 24 | | | | 25,186 | |
5.500% | | 02/01/38 | | | | | 186 | | | | 193,431 | |
5.500% | | 05/01/38 | | | | | 34 | | | | 35,118 | |
5.500% | | 07/01/38 | | | | | 166 | | | | 172,268 | |
6.000% | | 03/01/32 | | | | | 115 | | | | 116,926 | |
6.000% | | 12/01/33 | | | | | 22 | | | | 21,904 | |
6.000% | | 07/01/36 | | | | | 2 | | | | 2,432 | |
6.000% | | 12/01/36 | | | | | 4 | | | | 4,277 | |
6.000% | | 05/01/37 | | | | | 6 | | | | 6,581 | |
6.000% | | 12/01/37 | | | | | 10 | | | | 9,684 | |
6.000% | | 01/01/38 | | | | | 3 | | | | 2,988 | |
6.000% | | 01/01/38 | | | | | 6 | | | | 5,841 | |
6.000% | | 01/01/38 | | | | | 112 | | | | 116,368 | |
6.000% | | 10/01/38 | | | | | 50 | | | | 52,109 | |
6.000% | | 08/01/39 | | | | | 20 | | | | 20,440 | |
6.750% | | 03/15/31 | | | | | 500 | | | | 588,312 | |
7.000% | | 01/01/31 | | | | | 11 | | | | 10,971 | |
7.000% | | 06/01/31 | | | | | 7 | | | | 7,045 | |
7.000% | | 09/01/31 | | | | | 2 | | | | 1,914 | |
7.000% | | 10/01/31 | | | | | 22 | | | | 22,924 | |
7.000% | | 10/01/32 | | | | | 25 | | | | 25,337 | |
Federal National Mortgage Assoc | |
1.500% | | 02/01/42 | | | | | 480 | | | | 388,088 | |
1.500% | | 10/01/50 | | | | | 398 | | | | 307,436 | |
SEE NOTES TO FINANCIAL STATEMENTS.
A90
| | | | |
| | PSF PGIM FLEXIBLE MANAGED PORTFOLIO (CONTINUED) | | |
SCHEDULE OF INVESTMENTS | | | | as of December 31, 2022 |
| | | | | | | | | | | | |
Interest Rate | | Maturity Date | | | | Principal
Amount
(000)# | | | Value | |
| | | | | | | | | | | |
|
U.S. GOVERNMENT AGENCY OBLIGATIONS(continued) | |
1.500% | | 11/01/50 | | | | | 4,267 | | | $ | 3,296,397 | |
1.500% | | 12/01/50 | | | | | 4,760 | | | | 3,677,261 | |
2.000% | | 08/01/31 | | | | | 609 | | | | 554,201 | |
2.000% | | 02/01/41 | | | | | 2,264 | | | | 1,928,148 | |
2.000% | | 05/01/41(k) | | | | | 5,048 | | | | 4,299,196 | |
2.000% | | 08/01/50 | | | | | 1,160 | | | | 950,372 | |
2.000% | | 10/01/50 | | | | | 11,823 | | | | 9,692,616 | |
2.000% | | 02/01/51(k) | | | | | 12,254 | | | | 10,001,751 | |
2.000% | | 03/01/51 | | | | | 1,651 | | | | 1,348,632 | |
2.000% | | 05/01/51 | | | | | 2,377 | | | | 1,940,545 | |
2.000% | | 08/01/51 | | | | | 1,988 | | | | 1,622,723 | |
2.000% | | 10/01/51 | | | | | 2,973 | | | | 2,424,169 | |
2.500% | | 10/01/43 | | | | | 505 | | | | 435,493 | |
2.500% | | 12/01/46 | | | | | 919 | | | | 792,572 | |
2.500% | | 03/01/50 | | | | | 692 | | | | 591,273 | |
2.500% | | 08/01/50 | | | | | 3,067 | | | | 2,609,982 | |
2.500% | | 12/01/50 | | | | | 305 | | | | 261,968 | |
2.500% | | 02/01/51 | | | | | 2,404 | | | | 2,038,356 | |
2.500% | | 02/01/51 | | | | | 2,915 | | | | 2,472,181 | |
2.500% | | 04/01/51 | | | | | 3,622 | | | | 3,076,526 | |
2.500% | | 08/01/51 | | | | | 958 | | | | 813,306 | |
2.500% | | 08/01/51 | | | | | 979 | | | | 830,948 | |
2.500% | | 09/01/51 | | | | | 3,035 | | | | 2,576,535 | |
2.500% | | 10/01/51 | | | | | 1,052 | | | | 891,965 | |
2.500% | | 11/01/51 | | | | | 4,882 | | | | 4,144,407 | |
2.500% | | 12/01/51 | | | | | 9,136 | | | | 7,787,777 | |
2.500% | | 02/01/52 | | | | | 482 | | | | 410,663 | |
2.500% | | 03/01/52 | | | | | 998 | | | | 845,608 | |
2.500% | | 04/01/52 | | | | | 3,981 | | | | 3,372,463 | |
2.500% | | 04/01/52 | | | | | 4,000 | | | | 3,387,973 | |
2.500% | | 05/01/52 | | | | | 957 | | | | 816,019 | |
3.000% | | 02/01/27 | | | | | 504 | | | | 487,694 | |
3.000% | | 08/01/30 | | | | | 434 | | | | 411,872 | |
3.000% | | 11/01/36 | | | | | 864 | | | | 801,336 | |
3.000% | | 12/01/42 | | | | | 476 | | | | 433,207 | |
3.000% | | 12/01/42 | | | | | 697 | | | | 634,266 | |
3.000% | | 03/01/43 | | | | | 117 | | | | 106,596 | |
3.000% | | 11/01/46 | | | | | 116 | | | | 104,040 | |
3.000% | | 01/01/47 | | | | | 932 | | | | 831,826 | |
3.000% | | 02/01/47 | | | | | 660 | | | | 590,254 | |
3.000% | | 03/01/47 | | | | | 520 | | | | 465,188 | |
3.000% | | 11/01/49 | | | | | 512 | | | | 452,208 | |
3.000% | | 12/01/49 | | | | | 318 | | | | 281,894 | |
3.000% | | 12/01/49 | | | | | 439 | | | | 388,040 | |
3.000% | | 01/01/50 | | | | | 482 | | | | 425,972 | |
3.000% | | 02/01/50 | | | | | 453 | | | | 402,045 | |
3.000% | | 02/01/50 | | | | | 492 | | | | 434,882 | |
3.000% | | 02/01/50 | | | | | 5,442 | | | | 4,814,789 | |
3.000% | | 03/01/50 | | | | | 379 | | | | 334,887 | |
3.000% | | 05/01/51 | | | | | 834 | | | | 735,769 | |
3.000% | | 02/01/52 | | | | | 3,349 | | | | 2,941,075 | |
3.000% | | 03/01/52 | | | | | 67 | | | | 58,728 | |
3.000% | | 03/01/52 | | | | | 500 | | | | 438,758 | |
3.000% | | 03/01/52 | | | | | 1,903 | | | | 1,677,825 | |
3.000% | | 04/01/52 | | | | | 54 | | | | 47,478 | |
3.000% | | 04/01/52 | | | | | 971 | | | | 854,264 | |
3.000% | | 04/01/52 | | | | | 1,000 | | | | 877,518 | |
3.000% | | 04/01/52 | | | | | 1,950 | | | | 1,722,487 | |
| | | | | | | | | | | | |
Interest Rate | | Maturity �� Date | | | | Principal
Amount
(000)# | | | Value | |
| | | | | | | | | | | |
|
U.S. GOVERNMENT AGENCY OBLIGATIONS(continued) | |
3.000% | | 05/01/52 | | | | | 1,000 | | | $ | 878,201 | |
3.000% | | 06/01/52 | | | | | 1,000 | | | | 878,009 | |
3.000% | | 06/01/52 | | | | | 1,000 | | | | 878,130 | |
3.000% | | 07/01/52 | | | | | 4,948 | | | | 4,342,864 | |
3.500% | | 07/01/31 | | | | | 345 | | | | 335,736 | |
3.500% | | 11/01/32 | | | | | 203 | | | | 196,422 | |
3.500% | | 02/01/33 | | | | | 418 | | | | 404,218 | |
3.500% | | 05/01/33 | | | | | 570 | | | | 547,765 | |
3.500% | | 06/01/39 | | | | | 322 | | | | 301,464 | |
3.500% | | 01/01/42 | | | | | 2,245 | | | | 2,101,354 | |
3.500% | | 05/01/42 | | | | | 1,088 | | | | 1,018,169 | |
3.500% | | 07/01/42 | | | | | 403 | | | | 377,021 | |
3.500% | | 08/01/42 | | | | | 153 | | | | 143,125 | |
3.500% | | 08/01/42 | | | | | 391 | | | | 366,343 | |
3.500% | | 09/01/42 | | | | | 445 | | | | 415,738 | |
3.500% | | 09/01/42 | | | | | 776 | | | | 725,913 | |
3.500% | | 11/01/42 | | | | | 220 | | | | 205,456 | |
3.500% | | 03/01/43 | | | | | 1,596 | | | | 1,493,613 | |
3.500% | | 04/01/43 | | | | | 242 | | | | 226,805 | |
3.500% | | 04/01/43 | | | | | 590 | | | | 551,306 | |
3.500% | | 07/01/43 | | | | | 111 | | | | 104,135 | |
3.500% | | 06/01/45 | | | | | 2,081 | | | | 1,935,559 | |
3.500% | | 07/01/46 | | | | | 278 | | | | 257,766 | |
3.500% | | 11/01/46 | | | | | 522 | | | | 484,184 | |
3.500% | | 09/01/47 | | | | | 494 | | | | 457,728 | |
3.500% | | 01/01/48 | | | | | 4,999 | | | | 4,635,645 | |
3.500% | | 05/01/48 | | | | | 463 | | | | 428,146 | |
3.500% | | 06/01/48 | | | | | 2,306 | | | | 2,138,485 | |
3.500% | | 02/01/52 | | | | | 5,891 | | | | 5,360,546 | |
3.500% | | 03/01/52 | | | | | 991 | | | | 908,028 | |
3.500% | | 04/01/52 | | | | | 26 | | | | 23,467 | |
3.500% | | 05/01/52 | | | | | 43 | | | | 38,616 | |
3.500% | | 06/01/52 | | | | | 25 | | | | 23,089 | |
3.500% | | 06/01/52 | | | | | 1,686 | | | | 1,536,713 | |
3.500% | | 06/01/52 | | | | | 3,489 | | | | 3,170,366 | |
3.500% | | 06/01/52 | | | | | 3,776 | | | | 3,434,225 | |
3.500% | | 07/01/52 | | | | | 498 | | | | 453,061 | |
3.500% | | 07/01/52 | | | | | 645 | | | | 586,986 | |
3.500% | | 07/01/52 | | | | | 9,914 | | | | 9,010,534 | |
3.500% | | 08/01/52 | | | | | 62 | | | | 56,201 | |
3.500% | | 08/01/52 | | | | | 1,501 | | | | 1,364,706 | |
3.500% | | 09/01/52 | | | | | 702 | | | | 638,300 | |
3.500% | | 10/01/52 | | | | | 143 | | | | 130,058 | |
3.500% | | 10/01/52 | | | | | 199 | | | | 180,691 | |
3.500% | | 10/01/52 | | | | | 226 | | | | 204,937 | |
3.500% | | 11/01/52 | | | | | 35 | | | | 32,106 | |
3.500% | | 12/01/52 | | | | | 529 | | | | 480,566 | |
4.000% | | TBA | | | | | 1,500 | | | | 1,461,969 | |
4.000% | | 12/01/36 | | | | | 404 | | | | 389,021 | |
4.000% | | 10/01/41 | | | | | 1,251 | | | | 1,201,892 | |
4.000% | | 07/01/44 | | | | | 472 | | | | 452,524 | |
4.000% | | 09/01/44 | | | | | 773 | | | | 740,857 | |
4.000% | | 10/01/46 | | | | | 397 | | | | 378,149 | |
4.000% | | 06/01/47 | | | | | 341 | | | | 326,000 | |
4.000% | | 09/01/47 | | | | | 127 | | | | 120,845 | |
4.000% | | 11/01/47 | | | | | 412 | | | | 394,858 | |
4.000% | | 11/01/47 | | | | | 529 | | | | 506,088 | |
4.000% | | 12/01/47 | | | | | 1,726 | | | | 1,651,275 | |
SEE NOTES TO FINANCIAL STATEMENTS.
A91
| | | | |
| | PSF PGIM FLEXIBLE MANAGED PORTFOLIO (CONTINUED) | | |
SCHEDULE OF INVESTMENTS | | | | as of December 31, 2022 |
| | | | | | | | | | | | |
Interest Rate | | Maturity Date | | | | Principal
Amount
(000)# | | | Value | |
| | | | | | | | | | | |
|
U.S. GOVERNMENT AGENCY OBLIGATIONS(continued) | |
4.000% | | 03/01/49 | | | | | 3,544 | | | $ | 3,379,343 | |
4.000% | | 05/01/52 | | | | | 985 | | | | 923,996 | |
4.000% | | 06/01/52 | | | | | 966 | | | | 906,280 | |
4.500% | | TBA | | | | | 22,500 | | | | 21,650,767 | |
4.500% | | 07/01/33 | | | | | 21 | | | | 20,754 | |
4.500% | | 08/01/33 | | | | | 7 | | | | 6,962 | |
4.500% | | 09/01/33 | | | | | 22 | | | | 21,381 | |
4.500% | | 10/01/33 | | | | | 55 | | | | 54,585 | |
4.500% | | 03/01/34 | | | | | 16 | | | | 15,588 | |
4.500% | | 01/01/35 | | | | | 1 | | | | 1,032 | |
4.500% | | 07/01/39 | | | | | 403 | | | | 398,454 | |
4.500% | | 08/01/39 | | | | | 279 | | | | 275,413 | |
4.500% | | 09/01/39 | | | | | 164 | | | | 162,053 | |
4.500% | | 12/01/39 | | | | | 2 | | | | 2,222 | |
4.500% | | 03/01/41 | | | | | 643 | | | | 637,506 | |
4.500% | | 07/01/42 | | | | | 62 | | | | 61,083 | |
4.500% | | 06/01/50 | | | | | 771 | | | | 747,960 | |
5.000% | | TBA(tt) | | | | | 3,500 | | | | 3,448,275 | |
5.000% | | 03/01/34 | | | | | 112 | | | | 113,949 | |
5.000% | | 04/01/35 | | | | | 264 | | | | 269,762 | |
5.000% | | 06/01/35 | | | | | 63 | | | | 64,415 | |
5.000% | | 07/01/35 | | | | | 64 | | | | 65,020 | |
5.000% | | 07/01/35 | | | | | 65 | | | | 66,871 | |
5.000% | | 09/01/35 | | | | | 48 | | | | 48,941 | |
5.000% | | 11/01/35 | | | | | 61 | | | | 62,290 | |
5.000% | | 02/01/36 | | | | | 35 | | | | 35,630 | |
5.000% | | 08/01/52 | | | | | 484 | | | | 477,493 | |
5.000% | | 09/01/52 | | | | | 494 | | | | 487,310 | |
5.500% | | TBA(tt) | | | | | 4,500 | | | | 4,511,100 | |
5.500% | | 02/01/33 | | | | | 48 | | | | 49,829 | |
5.500% | | 08/01/33 | | | | | 121 | | | | 123,825 | |
5.500% | | 10/01/33 | | | | | 30 | | | | 30,493 | |
5.500% | | 12/01/33 | | | | | 27 | | | | 27,847 | |
5.500% | | 12/01/34 | | | | | 75 | | | | 77,084 | |
5.500% | | 10/01/35 | | | | | 177 | | | | 178,670 | |
5.500% | | 03/01/36 | | | | | 44 | | | | 43,956 | |
5.500% | | 04/01/36 | | | | | 45 | | | | 45,662 | |
5.500% | | 01/01/37 | | | | | 35 | | | | 35,935 | |
5.500% | | 04/01/37 | | | | | 17 | | | | 17,532 | |
5.500% | | 05/01/37 | | | | | 105 | | | | 108,607 | |
5.500% | | 08/01/37 | | | | | 130 | | | | 134,711 | |
6.000% | | TBA(tt) | | | | | 5,500 | | | | 5,581,158 | |
6.000% | | 10/01/33 | | | | | 148 | | | | 151,508 | |
6.000% | | 11/01/33 | | | | | 12 | | | | 12,565 | |
6.000% | | 11/01/33 | | | | | 13 | | | | 12,790 | |
6.000% | | 01/01/34 | | | | | 157 | | | | 161,693 | |
6.000% | | 02/01/34 | | | | | 53 | | | | 54,753 | |
6.000% | | 03/01/34 | | | | | 1 | | | | 1,123 | |
6.000% | | 03/01/34 | | | | | 9 | | | | 9,067 | |
6.000% | | 03/01/34 | | | | | 11 | | | | 11,595 | |
6.000% | | 11/01/34 | | | | | 15 | | | | 14,940 | |
6.000% | | 01/01/35 | | | | | 26 | | | | 26,724 | |
6.000% | | 01/01/35 | | | | | 65 | | | | 65,919 | |
6.000% | | 02/01/35 | | | | | 2 | | | | 1,847 | |
6.000% | | 02/01/35 | | | | | 93 | | | | 94,881 | |
6.000% | | 02/01/35 | | | | | 99 | | | | 101,881 | |
6.000% | | 04/01/35 | | | | | 9 | | | | 9,216 | |
6.000% | | 05/01/36 | | | | | 14 | | | | 13,797 | |
| | | | | | | | | | | | |
Interest Rate | | Maturity Date | | | | Principal
Amount
(000)# | | | Value | |
| | | | | | | | | | | |
|
U.S. GOVERNMENT AGENCY OBLIGATIONS(continued) | |
6.000% | | 06/01/36 | | | | | 12 | | | $ | 12,417 | |
6.000% | | 02/01/37 | | | | | 36 | | | | 38,047 | |
6.000% | | 06/01/37 | | | | | 11 | | | | 11,156 | |
6.000% | | 05/01/38 | | | | | 89 | | | | 92,736 | |
6.500% | | 09/01/32 | | | | | 1 | | | | 871 | |
6.500% | | 09/01/32 | | | | | 11 | | | | 11,458 | |
6.500% | | 09/01/32 | | | | | 22 | | | | 22,777 | |
6.500% | | 09/01/32 | | | | | 22 | | | | 23,061 | |
6.500% | | 10/01/32 | | | | | 27 | | | | 27,702 | |
6.500% | | 04/01/33 | | | | | 27 | | | | 27,789 | |
6.500% | | 11/01/33 | | | | | 18 | | | | 18,731 | |
6.500% | | 01/01/34 | | | | | 19 | | | | 19,266 | |
6.500% | | 09/01/34 | | | | | 34 | | | | 34,623 | |
6.500% | | 09/01/36 | | | | | 89 | | | | 93,913 | |
6.500% | | 10/01/36 | | | | | 16 | | | | 16,164 | |
6.500% | | 01/01/37 | | | | | 35 | | | | 36,100 | |
6.500% | | 01/01/37 | | | | | 53 | | | | 54,009 | |
6.500% | | 09/01/37 | | | | | 9 | | | | 9,667 | |
6.625% | | 11/15/30(k) | | | | | 1,080 | | | | 1,259,785 | |
7.000% | | 02/01/32 | | | | | 9 | | | | 9,350 | |
7.000% | | 05/01/32 | | | | | 9 | | | | 9,232 | |
7.000% | | 06/01/32 | | | | | 7 | | | | 6,669 | |
7.000% | | 07/01/32 | | | | | 29 | | | | 29,841 | |
7.125% | | 01/15/30(k) | | | | | 3,600 | | | | 4,254,116 | |
Government National Mortgage Assoc. | |
2.000% | | 03/20/51 | | | | | 1,562 | | | | 1,316,664 | |
2.000% | | 07/20/51 | | | | | 475 | | | | 398,178 | |
2.000% | | 10/20/51 | | | | | 972 | | | | 816,944 | |
2.500% | | TBA | | | | | 11,500 | | | | 9,963,118 | |
2.500% | | 03/20/43 | | | | | 362 | | | | 319,077 | |
2.500% | | 12/20/46 | | | | | 330 | | | | 290,746 | |
2.500% | | 05/20/51 | | | | | 14,076 | | | | 12,238,063 | |
2.500% | | 08/20/51 | | | | | 1,049 | | | | 910,689 | |
2.500% | | 11/20/51 | | | | | 455 | | | | 394,600 | |
2.500% | | 12/20/51 | | | | | 5,064 | | | | 4,392,762 | |
3.000% | | TBA | | | | | 9,500 | | | | 8,456,727 | |
3.000% | | 03/15/45 | | | | | 303 | | | | 270,620 | |
3.000% | | 11/20/45 | | | | | 410 | | | | 373,320 | |
3.000% | | 03/20/46 | | | | | 2,435 | | | | 2,211,399 | |
3.000% | | 07/20/46 | | | | | 1,579 | | | | 1,430,665 | |
3.000% | | 10/20/46 | | | | | 527 | | | | 476,645 | |
3.000% | | 02/20/47 | | | | | 798 | | | | 718,111 | |
3.000% | | 12/20/49 | | | | | 157 | | | | 141,443 | |
3.000% | | 01/20/50 | | | | | 1,393 | | | | 1,252,604 | |
3.000% | | 06/20/51 | | | | | 370 | | | | 330,780 | |
3.000% | | 10/20/51 | | | | | 4,930 | | | | 4,405,428 | |
3.000% | | 11/20/51 | | | | | 930 | | | | 831,870 | |
3.000% | | 12/20/51 | | | | | 1,650 | | | | 1,473,952 | |
3.000% | | 04/20/52 | | | | | 971 | | | | 865,545 | |
3.000% | | 06/20/52 | | | | | 3,000 | | | | 2,671,287 | |
3.500% | | 12/20/42 | | | | | 811 | | | | 763,701 | |
3.500% | | 05/20/43 | | | | | 165 | | | | 155,533 | |
3.500% | | 03/20/45 | | | | | 506 | | | | 472,591 | |
3.500% | | 04/20/45 | | | | | 678 | | | | 633,259 | |
3.500% | | 07/20/46 | | | | | 2,340 | | | | 2,182,529 | |
3.500% | | 06/20/49 | | | | | 3,029 | | | | 2,796,302 | |
4.000% | | 06/15/40 | | | | | 64 | | | | 61,481 | |
4.000% | | 05/20/41 | | | | | 123 | | | | 119,231 | |
SEE NOTES TO FINANCIAL STATEMENTS.
A92
| | | | |
| | PSF PGIM FLEXIBLE MANAGED PORTFOLIO (CONTINUED) | | |
SCHEDULE OF INVESTMENTS | | | | as of December 31, 2022 |
| | | | | | | | | | | | |
Interest Rate | | Maturity Date | | | | Principal
Amount
(000)# | | | Value | |
| | | | | | | | | | | |
|
U.S. GOVERNMENT AGENCY OBLIGATIONS(continued) | |
4.000% | | 12/20/42 | | | | | 307 | | | $ | 296,485 | |
4.000% | | 08/20/44 | | | | | 111 | | | | 106,944 | |
4.000% | | 11/20/45 | | | | | 530 | | | | 510,605 | |
4.000% | | 12/20/45 | | | | | 579 | | | | 558,549 | |
4.000% | | 11/20/46 | | | | | 124 | | | | 118,834 | |
4.000% | | 09/20/47 | | | | | 1,614 | | | | 1,553,485 | |
4.000% | | 02/20/49 | | | | | 919 | | | | 879,017 | |
4.000% | | 01/20/50 | | | | | 903 | | | | 863,331 | |
4.500% | | 04/15/40 | | | | | 225 | | | | 223,483 | |
4.500% | | 01/20/41 | | | | | 569 | | | | 568,104 | |
4.500% | | 02/20/41 | | | | | 339 | | | | 338,321 | |
4.500% | | 06/20/44 | | | | | 363 | | | | 366,750 | |
4.500% | | 09/20/46 | | | | | 198 | | | | 194,309 | |
4.500% | | 11/20/46 | | | | | 342 | | | | 344,490 | |
4.500% | | 03/20/47 | | | | | 278 | | | | 275,405 | |
4.500% | | 05/20/48 | | | | | 280 | | | | 275,152 | |
4.500% | | 06/20/48 | | | | | 361 | | | | 354,990 | |
4.500% | | 08/20/48 | | | | | 1,207 | | | | 1,185,483 | |
5.000% | | TBA | | | | | 1,000 | | | | 990,729 | |
5.000% | | 10/20/37 | | | | | 77 | | | | 78,546 | |
5.000% | | 04/20/45 | | | | | 369 | | | | 375,561 | |
5.500% | | 11/15/32 | | | | | 30 | | | | 30,300 | |
5.500% | | 02/15/33 | | | | | 24 | | | | 25,675 | |
5.500% | | 08/15/33 | | | | | 46 | | | | 46,606 | |
5.500% | | 08/15/33 | | | | | 63 | | | | 63,744 | |
5.500% | | 09/15/33 | | | | | 34 | | | | 34,450 | |
5.500% | | 09/15/33 | | | | | 55 | | | | 56,961 | |
5.500% | | 10/15/33 | | | | | 40 | | | | 41,473 | |
5.500% | | 12/15/33 | | | | | 4 | | | | 3,981 | |
5.500% | | 04/15/34 | | | | | 145 | | | | 151,457 | |
5.500% | | 07/15/35 | | | | | 31 | | | | 31,932 | |
5.500% | | 02/15/36 | | | | | 83 | | | | 85,681 | |
5.500% | | 09/20/52 | | | | | 10,485 | | | | 10,559,343 | |
6.000% | | 02/15/33 | | | | | 2 | | | | 1,566 | |
6.000% | | 04/15/33 | | | | | 12 | | | | 12,235 | |
6.000% | | 09/15/33 | | | | | 9 | | | | 9,289 | |
6.000% | | 12/15/33 | | | | | 22 | | | | 22,996 | |
6.000% | | 12/15/33 | | | | | 64 | | | | 65,739 | |
6.000% | | 01/15/34 | | | | | 11 | | | | 11,294 | |
6.000% | | 01/15/34 | | | | | 18 | | | | 18,689 | |
6.000% | | 06/20/34 | | | | | 38 | | | | 39,985 | |
6.000% | | 07/15/34 | | | | | 85 | | | | 89,589 | |
6.000% | | 10/15/34 | | | | | 106 | | | | 109,851 | |
6.500% | | 10/15/23 | | | | | —(r | ) | | | 89 | |
6.500% | | 12/15/23 | | | | | —(r | ) | | | 281 | |
6.500% | | 01/15/24 | | | | | —(r | ) | | | 225 | |
6.500% | | 01/15/24 | | | | | 1 | | | | 624 | |
6.500% | | 01/15/24 | | | | | 1 | | | | 1,351 | |
6.500% | | 01/15/24 | | | | | 2 | | | | 1,943 | |
6.500% | | 01/15/24 | | | | | 7 | | | | 6,876 | |
6.500% | | 02/15/24 | | | | | —(r | ) | | | 45 | |
6.500% | | 02/15/24 | | | | | —(r | ) | | | 66 | |
6.500% | | 02/15/24 | | | | | —(r | ) | | | 246 | |
6.500% | | 02/15/24 | | | | | —(r | ) | | | 353 | |
6.500% | | 02/15/24 | | | | | —(r | ) | | | 489 | |
6.500% | | 02/15/24 | | | | | 1 | | | | 1,331 | |
6.500% | | 02/15/24 | | | | | 1 | | | | 1,491 | |
6.500% | | 02/15/24 | | | | | 2 | | | | 2,047 | |
| | | | | | | | | | | | |
Interest Rate | | Maturity Date | | | | Principal
Amount
(000)# | | | Value | |
| | | | | | | | | | | |
|
U.S. GOVERNMENT AGENCY OBLIGATIONS(continued) | |
6.500% | | 02/15/24 | | | | | 8 | | | $ | 8,018 | |
6.500% | | 04/15/24 | | | | | —(r | ) | | | 62 | |
6.500% | | 04/15/24 | | | | | —(r | ) | | | 272 | |
6.500% | | 04/15/24 | | | | | 1 | | | | 540 | |
6.500% | | 04/15/24 | | | | | 2 | | | | 2,084 | |
6.500% | | 05/15/24 | | | | | 1 | | | | 1,506 | |
6.500% | | 05/15/24 | | | | | 2 | | | | 2,496 | |
6.500% | | 10/15/24 | | | | | 2 | | | | 2,085 | |
6.500% | | 12/15/30 | | | | | 4 | | | | 4,478 | |
6.500% | | 01/15/32 | | | | | 13 | | | | 13,629 | |
6.500% | | 02/15/32 | | | | | 8 | | | | 8,247 | |
6.500% | | 07/15/32 | | | | | 19 | | | | 19,745 | |
6.500% | | 08/15/32 | | | | | 3 | | | | 3,379 | |
6.500% | | 08/15/32 | | | | | 7 | | | | 6,922 | |
6.500% | | 08/15/32 | | | | | 22 | | | | 23,124 | |
6.500% | | 08/15/32 | | | | | 108 | | | | 112,334 | |
6.500% | | 06/15/35 | | | | | 18 | | | | 18,522 | |
6.500% | | 07/15/35 | | | | | 6 | | | | 6,091 | |
8.000% | | 01/15/24 | | | | | 1 | | | | 1,217 | |
8.000% | | 04/15/25 | | | | | 1 | | | | 657 | |
Tennessee Valley Authority, Sr. Unsec’d. Notes | |
1.500% | | 09/15/31 | | | | | 625 | | | | 490,634 | |
| | | | | | | | | | | | |
| |
TOTAL U.S. GOVERNMENT AGENCY OBLI GATIONS
(cost $454,396,885) | | | | 427,900,103 | |
| | | | | | | | | | | | |
|
U.S. TREASURY OBLIGATIONS — 1.5% | |
U.S. Treasury Bonds | |
1.750% | | 08/15/41 | | | | | 9,990 | | | | 6,847,833 | |
2.000% | | 11/15/41(h) | | | | | 21,340 | | | | 15,264,769 | |
2.250% | | 05/15/41 | | | | | 5,895 | | | | 4,432,303 | |
2.375% | | 02/15/42(h) | | | | | 11,610 | | | | 8,870,766 | |
2.500% | | 05/15/46 | | | | | 8,190 | | | | 6,136,102 | |
2.875% | | 05/15/52 | | | | | 4,555 | | | | 3,668,198 | |
3.000% | | 08/15/52 | | | | | 2,645 | | | | 2,192,870 | |
U.S. Treasury Notes | |
3.125% | | 11/15/28 | | | | | 100 | | | | 95,344 | |
4.125% | | 11/15/32 | | | | | 1,505 | | | | 1,535,100 | |
U.S. Treasury Strips Coupon | |
2.000%(s) | | 08/15/39 | | | | | 3,780 | | | | 1,877,597 | |
2.228%(s) | | 05/15/28 | | | | | 718 | | | | 576,840 | |
2.365%(s) | | 08/15/44 | | | | | 3,095 | | | | 1,224,338 | |
2.395%(s) | | 11/15/43 | | | | | 1,156 | | | | 471,522 | |
2.955%(s) | | 11/15/41 | | | | | 10,800 | | | | 4,807,687 | |
| | | | | | | | | | | | |
| |
TOTAL U.S. TREASURY OBLIGATIONS
(cost $73,193,113) | | | | 58,001,269 | |
| | | | | | | | | | | | |
| |
TOTAL LONG-TERM INVESTMENTS
(cost $3,424,317,603) | | | | 3,801,749,635 | |
| | | | | | | | | | | | |
| | | |
| | | | | Shares | | | | |
SHORT-TERM INVESTMENTS — 7.5% | |
AFFILIATED MUTUAL FUNDS — 7.5% | |
PGIM Core Ultra Short Bond Fund(wa) | | | | | 237,823,701 | | | | 237,823,701 | |
SEE NOTES TO FINANCIAL STATEMENTS.
A93
| | | | |
| | PSF PGIM FLEXIBLE MANAGED PORTFOLIO (CONTINUED) | | |
SCHEDULE OF INVESTMENTS | | | | as of December 31, 2022 |
| | | | | | | | |
| | | Shares | | | Value | |
|
AFFILIATED MUTUAL FUNDS (continued) | |
PGIM Institutional Money Market Fund
(cost $59,857,449; includes $59,594,222 of cash collateral for securities on loan)(b)(wa) | | | 59,978,986 | | | $ | 59,948,997 | |
| | | | | | | | |
TOTAL AFFILIATED MUTUAL FUNDS | |
(cost $297,681,150) | | | | 297,772,698 | |
| | | | | | | | |
| | | | | | | | | | | | |
Interest Rate | | Maturity
Date | | | | Principal
Amount
(000)# | | | | |
| | | | | | | | | | | |
| | | | | | | | | | | |
|
U.S. TREASURY OBLIGATION(k)(n) — 0.0% | |
U.S. Treasury Bills | |
4.226% | | 03/16/23 | | | | | 140 | | | | 138,812 | |
| | | | | | | | | | | | |
(cost $138,798) | |
| |
TOTAL SHORT-TERM INVESTMENTS
(cost $297,819,948) | | | | 297,911,510 | |
| | | | | | | | | | | | |
| |
TOTAL INVESTMENTS, BEFORE OPTIONS WRITTEN—102.6%
(cost $3,722,137,551) | | | | 4,099,661,145 | |
| | | | | | | | | | | | |
|
OPTIONS WRITTEN*~ — (0.0)% | |
(premiums received $0) | | | | (220 | ) |
| | | | | | | | | | | | |
| |
TOTAL INVESTMENTS, NET OF OPTIONS WRITTEN—102.6%
(cost $3,722,137,551) | | | | 4,099,660,925 | |
Liabilities in excess of other assets(z) — (2.6)% | | | | (102,434,219 | ) |
| | | | | | | | | | | | |
| |
NET ASSETS — 100.0% | | | $ | 3,997,226,706 | |
| | | | | | | | | | | | |
See the Glossary for a list of the abbreviation(s) used in the annual report.
| * | Non-income producing security. |
| # | Principal or notional amount is shown in U.S. dollars unless otherwise stated. |
| ~ | See tables subsequent to the Schedule of Investments for options detail. Excludes centrally cleared swaptions. |
| ^ | Indicates a Level 3 instrument. The aggregate value of Level 3 instruments is $1,261,403 and 0.0% of net assets. |
| (a) | All or a portion of security is on loan. The aggregate market value of such securities, including those sold and pending settlement, is $57,818,391; cash collateral of $59,594,222 (included in liabilities) was received with which the Portfolio purchased highly liquid short-term investments. In the event of significant appreciation in value of securities on loan on the last business day of the reporting period, the Portfolio may reflect a collateral value that is less than the market value of the loaned securities and such shortfall is remedied the following business day. |
| (b) | Represents security, or portion thereof, purchased with cash collateral received for securities on loan and includes dividend reinvestment. |
| (c) | Variable rate instrument. The interest rate shown reflects the rate in effect at December 31, 2022. |
| (cc) | Variable rate instrument. The rate shown is based on the latest available information as of December 31, 2022. Certain variable rate securities are not based on a published reference rate and spread but are determined by the issuer or agent and are based on current market conditions. These securities do not indicate a reference rate and spread in their description. |
| (ff) | Variable rate security. Security may be issued at a fixed coupon rate, which converts to a variable rate at a specified date. Rate shown is the rate in effect as of period end. |
| (h) | Represents security, or a portion thereof, segregated as collateral for OTC derivatives. |
| (k) | Represents security, or a portion thereof, segregated as collateral for centrally cleared/exchange-traded derivatives. |
| (n) | Rate shown reflects yield to maturity at purchased date. |
| (oo) | Perpetual security. Maturity date represents next call date. |
| (r) | Principal or notional amount is less than $500 par. |
| (s) | Represents zero coupon bond or principal only security. Rate represents yield to maturity at purchase date. |
| (tt) | All or partial principal amount represents “TBA” mortgage dollar rolls. The aggregate mortgage dollar roll principal amount of 11,000,000 is 0.3% of net assets. |
| (wa) | PGIM Investments LLC, the manager of the Portfolio, also serves as manager of the PGIM Core Ultra Short Bond Fund and PGIM Institutional Money Market Fund, if applicable. |
| (z) | Includes net unrealized appreciation/(depreciation) and/or market value of the below holdings which are excluded from the Schedule of Investments: |
Forward Commitment Contracts:
| | | | | | | | | | | | | | | | | | | | |
U.S. Government Agency Obligations | | Interest
Rate | | | Maturity
Date | | | Settlement
Date | | | Principal
Amount
(000)# | | | Value | |
Federal National Mortgage Assoc. | | | 2.500% | | | | TBA | | | | 01/12/23 | | | | (11,500 | ) | | $ | (9,734,915 | ) |
Federal National Mortgage Assoc. | | | 3.000% | | | | TBA | | | | 01/12/23(tt) | | | | (2,500 | ) | | | (2,193,423 | ) |
Government National Mortgage Assoc. | | | 5.500% | | | | TBA | | | | 01/23/23 | | | | (3,000 | ) | | | (3,016,775 | ) |
| | | | | | | | | | | | | | | | | | | | |
TOTAL FORWARD COMMITMENT CONTRACTS
(proceeds receivable $15,107,188) | | | | | | | | | | | | | | | | | | $ | (14,945,113 | ) |
| | | | | | | | | | | | | | | | | | | | |
SEE NOTES TO FINANCIAL STATEMENTS.
A94
| | | | |
| | PSF PGIM FLEXIBLE MANAGED PORTFOLIO (CONTINUED) | | |
| | | | |
SCHEDULE OF INVESTMENTS | | | | as of December 31, 2022 |
Options Written:
OTC Swaptions
| | | | | | | | | | | | | | | | | | | | | | | | | | | | | | | | |
Description | | Call/
Put | | | Counterparty | | | Expiration
Date | | | Strike | | | Receive | | | Pay | | | Notional
Amount
(000)# | | | Value | |
GS_21-PJA^ | | | Put | | | | GSI | | | | 06/17/24 | | | | 0.25% | | | | 0.25%(M) | | | | GS_21-PJA(M) | | | | 13,500 | | | $ | (220 | ) |
(premiums received $0) | | | | | | | | | | | | | | | | | | | | | | | | | | | | | | | | |
Options Purchased:
Centrally Cleared Swaptions
| | | | | | | | | | | | | | | | | | | | | | | | | | | | | | | | | | | | | | | | | | |
Description | | Call/
Put | | | Expiration
Date | | Strike | | Receive | | Pay | | | Notional
Amount
(000)# | | | Value at
December 31,
2022 | | | Unrealized
Appreciation
(Depreciation) | |
CDX.NA.IG.39.V1, 12/20/27 | | | Put | | | 01/18/23 | | 1.03% | | CDX.NA.IG.39.V1(Q) | | | 1.00%(Q) | | | | 15,420 | | | | | | | $ | 3,692 | | | | | | | | | | | $ | (71,866 | ) | | | | |
CDX.NA.IG.39.V1, 12/20/27 | | | Put | | | 02/15/23 | | 0.90% | | CDX.NA.IG.39.V1(Q) | | | 1.00%(Q) | | | | 13,230 | | | | | | | | 26,148 | | | | | | | | | | | | (23,279 | ) | | | | |
CDX.NA.IG.39.V1, 12/20/27 | | | Put | | | 03/15/23 | | 0.80% | | CDX.NA.IG.39.V1(Q) | | | 1.00%(Q) | | | | 18,515 | | | | | | | | 86,052 | | | | | | | | | | | | 27,914 | | | | | |
| | | | | | | | | | | | | | | | | | | | | | | | | | | | | | | | | | | | | | | | | | |
Total Centrally Cleared Swaptions (cost $183,123) | | | | | | | | | | | | | | $ | 115,892 | | | | | | | | | | | $ | (67,231 | ) | | | | |
| | | | | | | | | | | | | | | | | | | | | | | | | | | | | | | | | | | | | | | | | | |
Options Written: Centrally Cleared Swaptions | |
Description | | Call/
Put | | | Expiration
Date | | Strike | | Receive | | Pay | | | Notional
Amount
(000)# | | | Value at
December 31,
2022 | | | Unrealized
Appreciation
(Depreciation) | |
CDX.NA.IG.39.V1, 12/20/27 | | | Call | | | 01/18/23 | | 0.90% | | CDX.NA.IG.39.V1(Q) | | | 1.00%(Q) | | | | 15,420 | | | | | | | $ | (59,783 | ) | | | | | | | | | | $ | (27,401 | ) | | | | |
CDX.NA.IG.39.V1, 12/20/27 | | | Call | | | 02/15/23 | | 0.80% | | CDX.NA.IG.39.V1(Q) | | | 1.00%(Q) | | | | 13,230 | | | | | | | | (23,383 | ) | | | | | | | | | | | 5,511 | | | | | |
CDX.NA.IG.39.V1, 12/20/27 | | | Call | | | 03/15/23 | | 0.73% | | CDX.NA.IG.39.V1(Q) | | | 1.00%(Q) | | | | 18,515 | | | | | | | | (17,275 | ) | | | | | | | | | | | 21,606 | | | | | |
CDX.NA.IG.39.V1, 12/20/27 | | | Put | | | 01/18/23 | | 1.30% | | 1.00%(Q) | | | CDX.NA.IG.39.V1(Q) | | | | 15,420 | | | | | | | | (1,241 | ) | | | | | | | | | | | 34,996 | | | | | |
CDX.NA.IG.39.V1, 12/20/27 | | | Put | | | 02/15/23 | | 1.15% | | 1.00%(Q) | | | CDX.NA.IG.39.V1(Q) | | | | 13,230 | | | | | | | | (7,257 | ) | | | | | | | | | | | 12,376 | | | | | |
CDX.NA.IG.39.V1, 12/20/27 | | | Put | | | 03/15/23 | | 1.10% | | 1.00%(Q) | | | CDX.NA.IG.39.V1(Q) | | | | 18,515 | | | | | | | | (25,373 | ) | | | | | | | | | | | (8,710 | ) | | | | |
| | | | | | | | | | | | | | | | | | | | | | | | | | | | | | | | | | | | | | | | | | |
Total Centrally Cleared Swaptions (premiums received $172,690) | | | | | | | | | | | | | | $ | (134,312 | ) | | | | | | | | | | $ | 38,378 | | | | | |
| | | | | | | | | | | | | | | | | | | | | | | | | | | | | | | | | | | | | | | | | | |
Futures contracts outstanding at December 31, 2022:
| | | | | | | | | | | | | | | | | | | | | | |
Number
of
Contracts | | Type | | Expiration
Date | | | Current
Notional
Amount | | | Value /
Unrealized
Appreciation
(Depreciation) | |
| Long Positions: | | | | | | | | | | | | | | | | | | | | |
363 | | 2 Year U.S. Treasury Notes | | | Mar. 2023 | | | $ | 74,443,360 | | | | | | | $ | 23,325 | | | | | |
397 | | 5 Year U.S. Treasury Notes | | | Mar. 2023 | | | | 42,848,087 | | | | | | | | (364,150 | ) | | | | |
683 | | 10 Year U.S. Treasury Notes | | | Mar. 2023 | | | | 76,698,769 | | | | | | | | (1,064,499 | ) | | | | |
40 | | 10 Year U.S. Ultra Treasury Notes | | | Mar. 2023 | | | | 4,731,250 | | | | | | | | (18,556 | ) | | | | |
103 | | 30 Year U.S. Ultra Treasury Bonds | | | Mar. 2023 | | | | 13,834,187 | | | | | | | | (561,451 | ) | | | | |
6 | | Mini MSCI EAFE Index | | | Mar. 2023 | | | | 584,820 | | | | | | | | (10,171 | ) | | | | |
6 | | S&P 500 E-Mini Index | | | Mar. 2023 | | | | 1,158,300 | | | | | | | | (32,386 | ) | | | | |
| | | | | | | | | | | | | | | | | | | | | | |
| | | | | | | | | | | | | | | | | (2,027,888 | ) | | | | |
| | | | | | | | | | | | | | | | | | | | | | |
| Short Positions: | | | | | | | | | | | | | | | | | | | | |
13 | | 5 Year Euro-Bobl | | | Mar. 2023 | | | | 1,610,759 | | | | | | | | 51,980 | | | | | |
16 | | 10 Year Euro-Bund | | | Mar. 2023 | | | | 2,276,719 | | | | | | | | 151,854 | | | | | |
484 | | 20 Year U.S. Treasury Bonds | | | Mar. 2023 | | | | 60,666,375 | | | | | | | | 397,922 | | | | | |
SEE NOTES TO FINANCIAL STATEMENTS.
A95
| | | | |
| | PSF PGIM FLEXIBLE MANAGED PORTFOLIO (CONTINUED) | | |
| | | | |
SCHEDULE OF INVESTMENTS | | | | as of December 31, 2022 |
Futures contracts outstanding at December 31, 2022 (continued):
| | | | | | | | | | | | | | | | | | | | | | |
Number of Contracts | | Type | | Expiration
Date | | | Current
Notional
Amount | | | Value / Unrealized Appreciation
(Depreciation) | |
| | | | | | | | | | | | | | | | | | |
Short Positions (cont’d): | | | | | | | | | | | | | | | | | | | | |
14 | | Euro Schatz Index | | | Mar. 2023 | | | $ | 1,579,856 | | | | | | | $ | 19,396 | | | | | |
| | | | | | | | | | | | | | | | | | | | | | |
| | | | | | | | | | | | | | | | | 621,152 | | | | | |
| | | | | | | | | | | | | | | | | | | | | | |
| | | | | | | | | | | | | | | | $ | (1,406,736 | ) | | | | |
| | | | | | | | | | | | | | | | | | | | | | |
Forward foreign currency exchange contracts outstanding at December 31, 2022:
| | | | | | | | | | | | | | | | | | | | | | | | | | | | | | | | | | | | | | |
Sale Contracts | | Counterparty | | Notional
Amount
(000) | | | Value at
Settlement
Date | | | Current
Value | | | Unrealized
Appreciation | | | Unrealized
Depreciation | |
OTC Forward Foreign Currency Exchange Contracts: | | | | | | | | | | | | | | | | | | | | | | | | | | | | | | | | | |
Canadian Dollar, | | | | | | | | | | | | | | | | | | | | | | | | | | | | | | | | | | | | | | |
Expiring 01/19/23 | | HSBC | | CAD | 4,286 | | | $ | 3,105,926 | | | $ | 3,166,090 | | | | | | | $ | — | | | | | | | | | | | $ | (60,164 | ) | | | | |
Euro, | | | | | | | | | | | | | | | | | | | | | | | | | | | | | | | | | | | | | | |
Expiring 01/12/23 | | BNP | | EUR | 19,901 | | | | 20,628,407 | | | | 21,322,768 | | | | | | | | — | | | | | | | | | | | | (694,361 | ) | | | | |
Expiring 01/12/23 | | SCB | | EUR | 7,102 | | | | 7,364,315 | | | | 7,609,321 | | | | | | | | — | | | | | | | | | | | | (245,006 | ) | | | | |
| | | | | | | | | | | | | | | | | | | | | | | | | | | | | | | | | | | | | | |
| | | | | | | | $ | 31,098,648 | | | $ | 32,098,179 | | | | | | | $ | — | | | | | | | | | | | $ | (999,531 | ) | | | | |
| | | | | | | | | | | | | | | | | | | | | | | | | | | | | | | | | | | | | | |
Credit default swap agreements outstanding at December 31, 2022:
| | | | | | | | | | | | | | | | | | | | | | | | | | | | | | | | | | | | | | | | |
Reference Entity/ Obligation | | Termination
Date | | Fixed
Rate | | Notional
Amount
(000)#(3) | | | Implied
Credit
Spread at
December 31,
2022(4) | | Fair
Value | | | Upfront
Premiums
Paid
(Received) | | | Unrealized
Appreciation
(Depreciation) | | | Counterparty |
| | | | | | | | | | | | | | | | | | | | | | | | | | | | | | | | | |
OTC Credit Default Swap Agreement on asset-backed and/or mortgage-backed securities - Sell Protection(2)^: |
GS_21-PJA | | 01/14/23 | | 0.250%(M) | | | 7,565 | | | * | | $ | 2,570 | | | | | | | $ | (53 | ) | | | | | | | | | | $ | 2,623 | | | | | | | GSI |
| | | | | | | | | | | | | | | | | | | | | | | | | | | | | | | | | | | | | | | | |
| | | | | | | | | | | | | | | | | | | | | | | | | | | | | | | | | | | | | | | | | | | | |
Reference Entity/ Obligation | | Termination
Date | | | Fixed
Rate | | | Notional
Amount
(000)#(3) | | | Fair
Value | | | Upfront
Premiums
Paid
(Received) | | | Unrealized
Appreciation
(Depreciation) | | | Counterparty | |
| | | | | | | | | | | | | | | | | | | | | | | | | | | | | | | | | | |
OTC Credit Default Swap Agreements on corporate and/or sovereign issues - Buy Protection(1): | |
Credit Suisse Group AG | | | 06/20/26 | | | | 1.000%(Q) | | | | 3,000 | | | $ | 257,255 | | | | | | | $ | 173,524 | | | | | | | | | | | $ | 83,731 | | | | | | | | BARC | |
Credit Suisse Group AG | | | 06/20/26 | | | | 1.000%(Q) | | | | 3,000 | | | | 257,255 | | | | | | | | 169,259 | | | | | | | | | | | | 87,996 | | | | | | | | BARC | |
Credit Suisse Group AG | | | 06/20/26 | | | | 1.000%(Q) | | | | 3,000 | | | | 257,255 | | | | | | | | 190,401 | | | | | | | | | | | | 66,854 | | | | | | | | BARC | |
| | | | | | | | | | | | | | | | | | | | | | | | | | | | | | | | | | | | | | | | | | | | |
| | | | | | | | | | | | | | $ | 771,765 | | | | | | | $ | 533,184 | | | | | | | | | | | $ | 238,581 | | | | | | | | | |
| | | | | | | | | | | | | | | | | | | | | | | | | | | | | | | | | | | | | | | | | | | | |
| | | | | | | | | | | | | | | | | | | | | | | | | | | | | | | | | | | | | | |
Reference Entity/ Obligation | | Termination
Date | | Fixed
Rate | | Notional
Amount
(000)#(3) | | Value at
Trade Date | | | Value at
December 31,
2022 | | | Unrealized
Appreciation
(Depreciation) | | | | |
| | | | | | | | | | | | | | | | | | | | | | | | | | | | | | | |
Centrally Cleared Credit Default Swap Agreement on credit indices - Buy Protection(1): | | | | | | | | | | | | | | | | | | | | | | | | | | | | | |
CDX.NA.IG.39.V1 | | 12/20/27 | | 1.000%(Q) | | 32,130 | | $ | (139,820 | ) | | | | | | $ | (266,788 | ) | | | | | | | | | | $ | (126,968 | ) | | | | | | | | |
| | | | | | | | | | | | | | | | | | | | | | | | | | | | | | | | | | | | | | |
The Portfolio entered into credit default swaps (“CDS”) to provide a measure of protection against defaults or to take an active long or short position with respect to the likelihood of a particular issuer’s default or the reference entity’s credit soundness. CDS contracts generally trade based on a spread which represents the cost a protection buyer has to pay the protection seller. The protection buyer is said to be short the credit as the value of the contract rises the more the credit deteriorates. The value of the CDS contract increases for the protection buyer if the spread increases.
| (1) | If the Portfolio is a buyer of protection, it pays the fixed rate. When a credit event occurs, as defined under the terms of that particular swap agreement, the Portfolio will either (i) receive from the seller of protection an amount equal to the notional amount of the swap and make delivery |
SEE NOTES TO FINANCIAL STATEMENTS.
A96
| | | | |
| | PSF PGIM FLEXIBLE MANAGED PORTFOLIO (CONTINUED) | | |
| | | | |
SCHEDULE OF INVESTMENTS | | | | as of December 31, 2022 |
| | of the referenced obligation or underlying securities comprising the referenced index or (ii) receive a net settlement amount in the form of cash or securities equal to the notional amount of the swap less the recovery value of the referenced obligation or underlying securities comprising the referenced index. |
| (2) | If the Portfolio is a seller of protection, it receives the fixed rate. When a credit event occurs, as defined under the terms of that particular swap agreement, the Portfolio will either (i) pay to the buyer of protection an amount equal to the notional amount of the swap and take delivery of the referenced obligation or underlying securities comprising the referenced index or (ii) pay a net settlement amount in the form of cash or securities equal to the notional amount of the swap less the recovery value of the referenced obligation or underlying securities comprising the referenced index. |
| (3) | Notional amount represents the maximum potential amount the Portfolio could be required to pay as a seller of credit protection or receive as a buyer of credit protection if a credit event occurs as defined under the terms of that particular swap agreement. |
| (4) | Implied credit spreads, represented in absolute terms, utilized in determining the fair value of credit default swap agreements where the Portfolio is the seller of protection as of the reporting date serve as an indicator of the current status of the payment/ performance risk and represent the likelihood of risk of default for the credit derivative. The implied credit spread of a particular referenced entity reflects the cost of buying/selling protection and may include up-front payments required to be made to enter into the agreement. Wider credit spreads represent a deterioration of the referenced entity’s credit soundness and a greater likelihood of risk of default or other credit event occurring as defined under the terms of the agreement. |
| * | When an implied credit spread is not available, reference the fair value of credit default swap agreements on credit indices and asset-backed securities. Where the Portfolio is the seller of protection, it serves as an indicator of the current status of the payment/performance risk and represents the likelihood of an expected liability (or profit) for the credit derivative should the notional amount of the swap agreement be closed/sold as of the reporting date. Increasing fair value in absolute terms, when compared to the notional amount of the swap, represents a deterioration of the referenced entity’s credit soundness and a greater likelihood of risk of default or other credit event occurring as defined under the terms of the agreement. |
Total return swap agreements outstanding at December 31, 2022:
| | | | | | | | | | | | | | | | | | | | | | | | | | | | | | | | | | | | | | | | | | | | | | | | | | | | | | | | | | |
Reference Entity | | Financing Rate | | Counterparty | | | Termination
Date | | | Long (Short)
Notional
Amount
(000)#(1) | | | Fair Value | | | Upfront Premiums Paid (Received) | | | Unrealized Appreciation (Depreciation)(2) | |
| | | | | | | | | | | | | | | | | | | | | | | | | | | | | | | | | | | | | | | | | | | | | |
OTC Total Return Swap Agreements: | | | | | | | | | | | | | | | | | | | | | | | | | | | | | | | | | | | | | | | | | | | | | | | | | | | | | |
Total Return Benchmark Bond Index(T) | | 1 Day USOIS-50bps(Q)/ 3.830% | | | JPM | | | | 03/20/23 | | | | | | | | (7,182 | ) | | | | | | | | | | $ | (483,966 | ) | | | | | | | | | | $ | — | | | | | | | | | | | $ | (483,966 | ) | | | | |
U.S. Treasury Bond(T) | | 1 Day USOIS +9bps(T)/ 4.420% | | | JPM | | | | 01/18/23 | | | | | | | | 9,385 | | | | | | | | | | | | 55,309 | | | | | | | | | | | | — | | | | | | | | | | | | 55,309 | | | | | |
U.S. Treasury Bond(T) | | 1 Day USOIS +6bps(T)/ 4.390% | | | GSI | | | | 01/19/23 | | | | | | | | 17,470 | | | | | | | | | | | | 165,639 | | | | | | | | | | | | — | | | | | | | | | | | | 165,639 | | | | | |
U.S. Treasury Bond(T) | | 1 Day USOIS +10bps(T)/ 4.430% | | | JPM | | | | 01/23/23 | | | | | | | | 16,725 | | | | | | | | | | | | 470,791 | | | | | | | | | | | | — | | | | | | | | | | | | 470,791 | | | | | |
U.S. Treasury Bond(T) | | 1 Day USOIS +12bps(T)/ 4.450% | | | JPM | | | | 01/26/23 | | | | | | | | 14,990 | | | | | | | | | | | | 658,245 | | | | | | | | | | | | — | | | | | | | | | | | | 658,245 | | | | | |
U.S. Treasury Bond(T) | | 1 Day USOIS +6bps(T)/ 4.390% | | | GSI | | | | 01/27/23 | | | | | | | | 24,575 | | | | | | | | | | | | 510,513 | | | | | | | | | | | | — | | | | | | | | | | | | 510,513 | | | | | |
U.S. Treasury Bond(T) | | 1 Day USOIS +15bps(T)/ 4.480% | | | BOA | | | | 02/10/23 | | | | | | | | 27,440 | | | | | | | | | | | | 857,486 | | | | | | | | | | | | — | | | | | | | | | | | | 857,486 | | | | | |
U.S. Treasury Bond(T) | | 1 Day USOIS +13bps(T)/ 4.460% | | | JPM | | | | 02/23/23 | | | | | | | | 18,765 | | | | | | | | | | | | 21,017 | | | | | | | | | | | | — | | | | | | | | | | | | 21,017 | | | | | |
| | | | | | | | | | | | | | | | | | | | | | | | | | | | | | | | | | | | | | | | | | | | | | | | | | | | | | | | | | |
| | | | | | | | | | | | | | | | | | | | | | | | | | | | $ | 2,255,034 | | | | | | | | | | | $ | — | | | | | | | | | | | $ | 2,255,034 | | | | | |
| | | | | | | | | | | | | | | | | | | | | | | | | | | | | | | | | | | | | | | | | | | | | | | | | | | | | | | | | | |
| (1) | On a long total return swap, the Portfolio receives payments for any positive return on the reference entity (makes payments for any negative return) and pays the financing rate. On a short total return swap, the Portfolio makes payments for any positive return on the reference entity (receives payments for any negative return) and receives the financing rate. |
SEE NOTES TO FINANCIAL STATEMENTS.
A97
| | | | |
| | PSF PGIM FLEXIBLE MANAGED PORTFOLIO (CONTINUED) | | |
| | | | |
SCHEDULE OF INVESTMENTS | | | | as of December 31, 2022 |
| (2) | Upfront/recurring fees or commissions, as applicable, are included in the net unrealized appreciation (depreciation). |
Balances Reported in the Statement of Assets and Liabilities for OTC Swap Agreements:
| | | | | | | | |
| | | Premiums Paid | | Premiums Received | | Unrealized
Appreciation | | Unrealized
Depreciation |
OTC Swap Agreements | | $533,184 | | $(53) | | $2,980,204 | | $(483,966) |
Summary of Collateral for Centrally Cleared/Exchange-traded Derivatives:
Cash and securities segregated as collateral, including pending settlement for closed positions, to cover requirements for centrally cleared/exchange-traded derivatives are listed by broker as follows:
| | | | | | | | | | | | | | | | | | | | | | | | | | | | | | |
Broker | | | | Cash and/or Foreign Currency | | | | | | Securities Market Value | |
CIGM | | | | | | | | $ | — | | | | | | | | | | | | | | | $ | 3,517,585 | | | | | |
GS | | | | | | | | | — | | | | | | | | | | | | | | | | 138,812 | | | | | |
| | | | | | | | | | | | | | | | | | | | | | | | | | | | | | |
Total | | | | | | | | $ | — | | | | | | | | | | | | | | | $ | 3,656,397 | | | | | |
| | | | | | | | | | | | | | | | | | | | | | | | | | | | | | |
Fair Value Measurements:
Various inputs are used in determining the value of the Portfolio’s investments. These inputs are summarized in the three broad levels listed below.
Level 1—unadjusted quoted prices generally in active markets for identical securities.
Level 2—quoted prices for similar securities, interest rates and yield curves, prepayment speeds, foreign currency exchange rates and other observable inputs.
Level 3—unobservable inputs for securities valued in accordance with Board approved fair valuation procedures.
The following is a summary of the inputs used as of December 31, 2022 in valuing such portfolio securities:
| | | | | | | | | | | | |
| | | Level 1 | | | Level 2 | | | Level 3 | |
Investments in Securities | | | | | | | | | | | | |
Assets | | | | | | | | | | | | |
Long-Term Investments | | | | | | | | | | | | |
Common Stocks | | $ | 2,346,957,544 | | | $ | 41,060,776 | | | $ | — | |
Exchange-Traded Fund | | | 176,440 | | | | — | | | | — | |
Preferred Stocks | | | 624,800 | | | | 230,633 | | | | — | |
Asset-Backed Securities | | | | | | | | | | | | |
Automobiles | | | — | | | | 70,676,870 | | | | — | |
Collateralized Loan Obligations | | | — | | | | 167,038,415 | | | | — | |
Consumer Loans | | | — | | | | 11,398,172 | | | | — | |
Equipment | | | — | | | | 7,926,973 | | | | — | |
Other | | | — | | | | 4,125,757 | | | | — | |
Residential Mortgage-Backed Securities | | | — | | | | 105,649 | | | | 1,259,053 | |
Student Loans | | | — | | | | 10,664,031 | | | | — | |
Commercial Mortgage-Backed Securities | | | — | | | | 195,463,141 | | | | — | |
Corporate Bonds | | | — | | | | 380,590,662 | | | | — | |
Municipal Bonds. | | | — | | | | 11,971,895 | | | | — | |
Residential Mortgage-Backed Securities | | | — | | | | 51,899,167 | | | | — | |
Sovereign Bonds | | | — | | | | 13,678,285 | | | | — | |
U.S. Government Agency Obligations | | | — | | | | 427,900,103 | | | | — | |
U.S. Treasury Obligations | | | — | | | | 58,001,269 | | | | — | |
Short-Term Investments | | | | | | | | | | | | |
Affiliated Mutual Funds | | | 297,772,698 | | | | — | | | | — | |
U.S. Treasury Obligation | | | — | | | | 138,812 | | | | — | |
| | | | | | | | | | | | |
Total | | $ | 2,645,531,482 | | | $ | 1,452,870,610 | | | $ | 1,259,053 | |
| | | | | | | | | | | | |
| | | |
Liabilities | | | | | | | | | | | | |
Option Written | | $ | — | | | $ | — | | | $ | (220 | ) |
| | | | | | | | | | | | |
| | | |
Other Financial Instruments* | | | | | | | | | | | | |
Assets | | | | | | | | | | | | |
Centrally Cleared Swaptions Purchased | | $ | — | | | $ | 27,914 | | | $ | — | |
SEE NOTES TO FINANCIAL STATEMENTS.
A98
| | | | |
| | PSF PGIM FLEXIBLE MANAGED PORTFOLIO (CONTINUED) | | |
| | | | |
SCHEDULE OF INVESTMENTS | | | | as of December 31, 2022 |
| | | | | | | | | | | | |
| | | Level 1 | | | Level 2 | | | Level 3 | |
| | | |
Other Financial Instruments* (continued) | | | | | | | | | | | | |
Assets (continued) | | | | | | | | | | | | |
Centrally Cleared Swaptions Written | | $ | — | | | $ | 74,489 | | | $ | — | |
Futures Contracts | | | 644,477 | | | | — | | | | — | |
OTC Credit Default Swap Agreements | | | — | | | | 771,765 | | | | 2,570 | |
OTC Total Return Swap Agreements | | | — | | | | 2,739,000 | | | | — | |
| | | | | | | | | | | | |
Total | | $ | 644,477 | | | $ | 3,613,168 | | | $ | 2,570 | |
| | | | | | | | | | | | |
| | | |
Liabilities | | | | | | | | | | | | |
Forward Commitment Contracts | | $ | — | | | $ | (14,945,113 | ) | | $ | — | |
Centrally Cleared Swaptions Purchased | | | — | | | | (95,145 | ) | | | — | |
Centrally Cleared Swaptions Written | | | — | | | | (36,111 | ) | | | — | |
Futures Contracts | | | (2,051,213 | ) | | | — | | | | — | |
OTC Forward Foreign Currency Exchange Contracts | | | — | | | | (999,531 | ) | | | — | |
Centrally Cleared Credit Default Swap Agreement | | | — | | | | (126,968 | ) | | | — | |
OTC Total Return Swap Agreement | | | — | | | | (483,966 | ) | | | — | |
| | | | | | | | | | | | |
Total | | $ | (2,051,213 | ) | | $ | (16,686,834 | ) | | $ | — | |
| | | | | | | | | | | | |
| * | Other financial instruments are derivative instruments, with the exception of forward commitment contracts and centrally cleared swaptions, and are not reflected in the Schedule of Investments. Centrally cleared swaptions, futures, forwards and centrally cleared swap contracts are recorded at net unrealized appreciation (depreciation) and OTC swap contracts are recorded at fair value. Forward commitment contracts are recorded at market value. |
Industry Classification:
The industry classification of investments and liabilities in excess of other assets shown as a percentage of net assets as of December 31, 2022 were as follows:
| | | | |
U.S. Government Agency Obligations | | | 10.7 | % |
Affiliated Mutual Funds (1.5% represents investments purchased with collateral from securities on loan) | | | 7.5 | |
Software | | | 5.1 | |
Banks | | | 5.1 | |
Commercial Mortgage-Backed Securities | | | 4.9 | |
Collateralized Loan Obligations | | | 4.2 | |
Pharmaceuticals | | | 3.8 | |
Technology Hardware, Storage & Peripherals | | | 3.7 | |
Semiconductors & Semiconductor Equipment | | | 3.0 | |
Oil, Gas & Consumable Fuels | | | 2.8 | |
Automobiles | | | 2.6 | |
IT Services | | | 2.5 | |
Interactive Media & Services | | | 2.5 | |
Health Care Providers & Services | | | 2.3 | |
Capital Markets | | | 1.8 | |
Insurance | | | 1.6 | |
Health Care Equipment & Supplies | | | 1.6 | |
U.S. Treasury Obligations | | | 1.5 | |
Aerospace & Defense | | | 1.4 | |
Equity Real Estate Investment Trusts (REITs) | | | 1.4 | |
Beverages | | | 1.4 | |
Biotechnology | | | 1.4 | |
Specialty Retail | | | 1.4 | |
Residential Mortgage-Backed Securities | | | 1.3 | |
Internet & Direct Marketing Retail | | | 1.3 | |
Hotels, Restaurants & Leisure | | | 1.3 | |
Electric Utilities | | | 1.2 | |
Diversified Financial Services | | | 1.1 | |
Machinery | | | 1.1 | |
Household Products | | | 1.1 | |
Chemicals | | | 1.1 | |
| | | | |
Life Sciences Tools & Services | | | 1.0 | % |
Entertainment | | | 0.9 | |
Food & Staples Retailing | | | 0.9 | |
Electric | | | 0.9 | |
Food Products | | | 0.9 | |
Industrial Conglomerates | | | 0.7 | |
Media | | | 0.7 | |
Pipelines | | | 0.7 | |
Communications Equipment | | | 0.6 | |
Diversified Telecommunication Services | | | 0.6 | |
Telecommunications | | | 0.5 | |
Consumer Finance | | | 0.4 | |
Road & Rail | | | 0.4 | |
Multi-Utilities | | | 0.4 | |
Energy Equipment & Services | | | 0.4 | |
Electrical Equipment | | | 0.4 | |
Oil & Gas | | | 0.4 | |
Sovereign Bonds | | | 0.4 | |
Textiles, Apparel & Luxury Goods | | | 0.3 | |
Tobacco | | | 0.3 | |
Airlines | | | 0.3 | |
Real Estate Investment Trusts (REITs) | | | 0.3 | |
Multiline Retail | | | 0.3 | |
Professional Services | | | 0.3 | |
Municipal Bonds | | | 0.3 | |
Agriculture | | | 0.3 | |
Consumer Loans | | | 0.3 | |
Air Freight & Logistics | | | 0.3 | |
Containers & Packaging | | | 0.3 | |
Electronic Equipment, Instruments & Components | | | 0.3 | |
Auto Manufacturers | | | 0.3 | |
Student Loans | | | 0.2 | |
SEE NOTES TO FINANCIAL STATEMENTS.
A99
| | | | |
| | PSF PGIM FLEXIBLE MANAGED PORTFOLIO (CONTINUED) | | |
| | | | |
SCHEDULE OF INVESTMENTS | | | | as of December 31, 2022 |
Industry Classification (continued):
| | | | |
Distributors | | | 0.2 | % |
Trading Companies & Distributors | | | 0.2 | |
Construction Materials | | | 0.2 | |
Equipment | | | 0.2 | |
Retail | | | 0.2 | |
Commercial Services & Supplies | | | 0.2 | |
Auto Components | | | 0.2 | |
Healthcare-Services | | | 0.2 | |
Building Products | | | 0.2 | |
Wireless Telecommunication Services | | | 0.2 | |
Foods | | | 0.2 | |
Metals & Mining | | | 0.2 | |
Independent Power & Renewable Electricity Producers | | | 0.1 | |
Water Utilities | | | 0.1 | |
Packaging & Containers | | | 0.1 | |
Commercial Services | | | 0.1 | |
Gas Utilities | | | 0.1 | |
Other | | | 0.1 | |
Semiconductors | | | 0.1 | |
Gas | | | 0.1 | |
Household Durables | | | 0.1 | |
Mining | | | 0.1 | |
Office/Business Equipment | | | 0.1 | |
Healthcare-Products | | | 0.1 | |
| | | | |
Mortgage Real Estate Investment Trusts (REITs) | | | 0.0 | *% |
Home Builders | | | 0.0 | * |
Engineering & Construction | | | 0.0 | * |
Building Materials | | | 0.0 | * |
Housewares | | | 0.0 | * |
Transportation | | | 0.0 | * |
Real Estate Management & Development | | | 0.0 | * |
Construction & Engineering | | | 0.0 | * |
Miscellaneous Manufacturing | | | 0.0 | * |
Personal Products | | | 0.0 | * |
Apparel | | | 0.0 | * |
Marine | | | 0.0 | * |
Multi-National | | | 0.0 | * |
Exchange-Traded Fund | | | 0.0 | * |
Paper & Forest Products | | | 0.0 | * |
Leisure Products | | | 0.0 | * |
| | | | |
| |
| | | 102.6 | |
Option Written | | | (0.0 | )* |
| |
Liabilities in excess of other assets | | | (2.6 | ) |
| | | | |
| |
| | | 100.0 | % |
| | | | |
* Less than +/- 0.05%
Effects of Derivative Instruments on the Financial Statements and Primary Underlying Risk Exposure:
The Portfolio invested in derivative instruments during the reporting period. The primary types of risk associated with these derivative instruments are credit contracts risk, equity contracts risk, foreign exchange contracts risk and interest rate contracts risk. See the Notes to Financial Statements for additional detail regarding these derivative instruments and their risks. The effect of such derivative instruments on the Portfolio’s financial position and financial performance as reflected in the Statement of Assets and Liabilities and Statement of Operations is presented in the summary below.
Fair values of derivative instruments as of December 31, 2022 as presented in the Statement of Assets and Liabilities:
| | | | | | | | | | | | | | | | | | | | | | |
| | | | | Asset Derivatives | | | Liability Derivatives | |
| | | | | | | | | |
| | | | | | | |
Derivatives not accounted for as hedging instruments, carried at fair value | | | | Statement of
Assets and
Liabilities Location | | | | | | Fair
Value | | | Statement of
Assets and
Liabilities Location | | | | Fair
Value | |
| | | | | | | |
Credit contracts | | | |
| Due from/to broker-variation
margin swaps and swaptions |
| | | | | | $ | 102,403 | * | | Due from/to broker-variation
margin swaps and swaptions | | | | $ | 258,224 | * |
Credit contracts | | | |
| Premiums paid for OTC
swap agreements |
| | | | | | | 533,184 | | | Premiums received for OTC swap
agreements | | | | | 53 | |
Credit contracts | | | | | — | | | | | | | | — | | | Options written outstanding, at
value | | | | | 220 | |
Credit contracts | | | |
| Unrealized appreciation on
OTC swap agreements |
| | | | | | | 241,204 | | | — | | | | | — | |
Equity contracts | | | | | — | | | | | | | | — | | | Due from/to broker-variation
margin futures | | | | | 42,557 | * |
Foreign exchange contracts | | | | | — | | | | | | | | — | | | Unrealized depreciation on OTC
forward foreign currency
exchange contracts | | | | | 999,531 | |
Interest rate contracts | | | |
| Due from/to broker-variation
margin futures |
| | | | | | | 644,477 | * | | Due from/to broker-variation
margin futures | | | | | 2,008,656 | * |
Interest rate contracts | | | |
| Unrealized appreciation on
OTC swap agreements |
| | | | | | | 2,739,000 | | | Unrealized depreciation on OTC
swap agreements | | | | | 483,966 | |
| | | | | | | | | | | | | | | | | | | | | | |
| | | | | | | |
| | | | | | | | | | | | $ | 4,260,268 | | | | | | | $ | 3,793,207 | |
| | | | | | | | | | | | | | | | | | | | | | |
SEE NOTES TO FINANCIAL STATEMENTS.
A100
| | | | |
| | PSF PGIM FLEXIBLE MANAGED PORTFOLIO (CONTINUED) | | |
| | | | |
SCHEDULE OF INVESTMENTS | | | | as of December 31, 2022 |
| * | Includes cumulative appreciation (depreciation) as reported in the schedule of open futures, centrally cleared swap contracts, and centrally cleared swaptions. Only unsettled variation margin receivable (payable) is reported within the Statement of Assets and Liabilities. |
The effects of derivative instruments on the Statement of Operations for the year ended December 31, 2022 are as follows:
| | | | | | | | | | | | | | | | | | | | | | | | | | | | | | | | | | | | |
Amount of Realized Gain (Loss) on Derivatives Recognized in Income | |
| | |
| | | | | |
Derivatives not accounted for as hedging instruments, carried at fair value | | Options
Purchased(1) | | | Options
Written | | | Futures | | | Forward
Currency
Exchange
Contracts | | | Swaps | |
| | | | | | | | | |
Credit contracts | | | | | | | $(535,941) | | | | | | | | | | | $ | 524,703 | | | | | | | $ | — | | | $ | — | | | $ | 217,400 | |
Equity contracts | | | | | | | — | | | | | | | | | | | | — | | | | | | | | (334,213 | ) | | | — | | | | — | |
Foreign exchange contracts | | | | | | | — | | | | | | | | | | | | — | | | | | | | | — | | | | 2,790,282 | | | | — | |
Interest rate contracts | | | | | | | — | | | | | | | | | | | | — | | | | | | | | (38,872,233 | ) | | | — | | | | (15,879,775 | ) |
| | | | | | | | | | | | | | | | | | | | | | | | | | | | | | | | | | | | |
Total | | | | | | | $(535,941) | | | | | | | | | | | $ | 524,703 | | | | | | | $ | (39,206,446 | ) | | $ | 2,790,282 | | | $ | (15,662,375 | ) |
| | | | | | | | | | | | | | | | | | | | | | | | | | | | | | | | | | | | |
| (1) | Included in net realized gain (loss) on investment transactions in the Statement of Operations. |
| | | | | | | | | | | | | | | | | | | | | | | | | | | | | | | | | | |
Change in Unrealized Appreciation (Depreciation) on Derivatives Recognized in Income | |
| | | | | |
Derivatives not accounted for as hedging instruments, carried at fair value | | Options
Purchased(2) | | | Options Written | | | Futures | | | Forward
Currency
Exchange
Contracts | | | Swaps | |
| | | | | | | | | |
Credit contracts | | | | $ | (19,747 | ) | | | | | | | | | | $ | 62,425 | | | | | | | $ | — | | | $ | — | | | $ | 107,031 | |
Equity contracts | | | | | — | | | | | | | | | | | | — | | | | | | | | (75,385 | ) | | | — | | | | — | |
Foreign exchange contracts | | | | | — | | | | | | | | | | | | — | | | | | | | | — | | | | (804,293 | ) | | | — | |
Interest rate contracts | | | | | — | | | | | | | | | | | | — | | | | | | | | (3,266,407 | ) | | | — | | | | 5,236,361 | |
| | | | | | | | | | | | | | | | | | | | | | | | | | | | | | | | | | |
Total | | | | $ | (19,747 | ) | | | | | | | | | | $ | 62,425 | | | | | | | $ | (3,341,792 | ) | | $ | (804,293 | ) | | $ | 5,343,392 | |
| | | | | | | | | | | | | | | | | | | | | | | | | | | | | | | | | | |
| (2) | Included in net change in unrealized appreciation (depreciation) on investments in the Statement of Operations. |
For the year ended December 31, 2022, the Portfolio’s average volume of derivative activities is as follows:
| | |
| Derivative Contract Type | | Average Volume of Derivative Activities* |
| |
Options Purchased (1) | | $ 134,778 |
| |
Options Written (2) | | 100,270,000 |
| |
Futures Contracts - Long Positions (2) | | 233,380,460 |
| |
Futures Contracts - Short Positions (2) | | 56,337,269 |
| |
Forward Foreign Currency Exchange Contracts - Purchased (3) | | 13,358,584 |
| |
Forward Foreign Currency Exchange Contracts - Sold (3) | | 41,074,999 |
| |
Credit Default Swap Agreements - Buy Protection (2) | | 25,580,000 |
| |
Credit Default Swap Agreements - Sell Protection (2) | | 13,098,540 |
| |
Total Return Swap Agreements (2) | | 58,782,442 |
| |
Inflation Swap Agreements (2) | | 8,243,000 |
| * | Average volume is based on average quarter end balances as noted for the year ended December 31, 2022. |
| (2) | Notional Amount in USD. |
| (3) | Value at Settlement Date. |
Financial Instruments/Transactions—Summary of Offsetting and Netting Arrangements:
The Portfolio invested in OTC derivatives and entered into financial instruments/transactions during the reporting period that are either offset in accordance with current requirements or are subject to enforceable master netting arrangements or similar agreements that permit offsetting. The information about offsetting and related netting arrangements for OTC derivatives and financial instruments/transactions where the legal right to set-off exists is presented in the summary below.
SEE NOTES TO FINANCIAL STATEMENTS.
A101
| | | | |
| | PSF PGIM FLEXIBLE MANAGED PORTFOLIO (CONTINUED) | | |
| | | | |
SCHEDULE OF INVESTMENTS | | | | as of December 31, 2022 |
| | | | | | |
| Offsetting of financial instrument/transaction assets and liabilities: |
| | | |
| Description | | Gross Market Value of Recognized Assets/(Liabilities) | | Collateral Pledged/(Received)(2) | | Net
Amount |
Securities on Loan | | $57,818,391 | | $(57,818,391) | | $— |
Offsetting of OTC derivative assets and liabilities:
| | | | | | | | | | | | | | | | | | | | | | | | | | | | | | | | | | | | | | | | | | | | | | | | | | | | | | | | | | |
Counterparty | | Gross Amounts of Recognized Assets(1) | | | Gross Amounts of
Recognized Liabilities(1) | | | Net Amounts of Recognized Assets/(Liabilities) | | | Collateral Pledged/(Received)(2) | | | Net Amount |
| | | | | | | | | | | | | | | |
BARC | | | | | | $ | 771,765 | | | | | | | | | | | $ | — | | | | | | | | | | | $ | 771,765 | | | | | | | | | | | $ | (771,765 | ) | | | | | | | | | | $ | — | | | |
BNP | | | | | | | — | | | | | | | | | | | | (694,361 | ) | | | | | | | | | | | (694,361 | ) | | | | | | | | | | | 612,829 | | | | | | | | | | | | (81,532 | ) | | |
BOA | | | | | | | 857,486 | | | | | | | | | | | | — | | | | | | | | | | | | 857,486 | | | | | | | | | | | | (857,486 | ) | | | | | | | | | | | — | | | |
GSI | | | | | | | 678,775 | | | | | | | | | | | | (273 | ) | | | | | | | | | | | 678,502 | | | | | | | | | | | | (678,502 | ) | | | | | | | | | | | — | | | |
HSBC | | | | | | | — | | | | | | | | | | | | (60,164 | ) | | | | | | | | | | | (60,164 | ) | | | | | | | | | | | — | | | | | | | | | | | | (60,164 | ) | | |
JPM | | | | | | | 1,205,362 | | | | | | | | | | | | (483,966 | ) | | | | | | | | | | | 721,396 | | | | | | | | | | | | (721,396 | ) | | | | | | | | | | | — | | | |
SCB | | | | | | | — | | | | | | | | | | | | (245,006 | ) | | | | | | | | | | | (245,006 | ) | | | | | | | | | | | — | | | | | | | | | | | | (245,006 | ) | | |
| | | | | | | | | | | | | | | | | | | | | | | | | | | | | | | | | | | | | | | | | | | | | | | | | | | | | | | | | | |
| | | | | | $ | 3,513,388 | | | | | | | | | | | $ | (1,483,770 | ) | | | | | | | | | | $ | 2,029,618 | | | | | | | | | | | $ | (2,416,320 | ) | | | | | | | | | | $ | (386,702 | ) | | |
| | | | | | | | | | | | | | | | | | | | | | | | | | | | | | | | | | | | | | | | | | | | | | | | | | | | | | | | | | |
| (1) | Includes unrealized appreciation/(depreciation) on swaps and forwards, premiums paid/(received) on swap agreements and market value of purchased and written options, as represented on the Statement of Assets and Liabilities. |
| (2) | Collateral amount disclosed by the Portfolio is limited to the market value of financial instruments/transactions and the Portfolio’s OTC derivative exposure by counterparty. |
SEE NOTES TO FINANCIAL STATEMENTS.
A102
| | | | |
| | PSF PGIM FLEXIBLE MANAGED PORTFOLIO (CONTINUED) | | |
STATEMENT OF ASSETS AND LIABILITIES
as of December 31, 2022
| | | | |
| |
ASSETS | | | | |
Investments at value, including securities on loan of $57,818,391: | | | | |
Unaffiliated investments (cost $3,424,456,401) | | $ | 3,801,888,447 | |
Affiliated investments (cost $297,681,150) | | | 297,772,698 | |
Foreign currency, at value (cost $314,997) | | | 317,840 | |
Receivable for investments sold | | | 72,934,912 | |
Dividends and interest receivable | | | 12,965,436 | |
Unrealized appreciation on OTC swap agreements | | | 2,980,204 | |
Tax reclaim receivable | | | 600,347 | |
Premiums paid for OTC swap agreements | | | 533,184 | |
Receivable for Portfolio shares sold | | | 208,759 | |
Receivable from affiliate | | | 1,956 | |
Due from broker-variation margin swaps and swaptions | | | 987 | |
Prepaid expenses and other assets | | | 548,112 | |
| | | | |
Total Assets | | | 4,190,752,882 | |
| | | | |
LIABILITIES | | | | |
Payable for investments purchased | | | 113,430,825 | |
Payable to broker for collateral for securities on loan | | | 59,594,222 | |
Forward commitment contracts, at value (proceeds receivable $15,107,188) | | | 14,945,113 | |
Management fee payable | | | 2,077,309 | |
Accrued expenses and other liabilities | | | 1,420,568 | |
Unrealized depreciation on OTC forward foreign currency exchange contracts | | | 999,531 | |
Unrealized depreciation on OTC swap agreements | | | 483,966 | |
Payable for Portfolio shares purchased | | | 312,680 | |
Due to broker-variation margin futures | | | 147,806 | |
Payable to affiliate | | | 109,518 | |
Trustees’ fees payable | | | 2,590 | |
Affiliated transfer agent fee payable | | | 980 | |
Distribution fee payable | | | 795 | |
Options written outstanding, at value | | | 220 | |
Premiums received for OTC swap agreements | | | 53 | |
| | | | |
Total Liabilities | | | 193,526,176 | |
| | | | |
NET ASSETS | | $ | 3,997,226,706 | |
| | | | |
Net assets were comprised of: | | | | |
Partners’ Equity | | $ | 3,997,226,706 | |
| | | | |
| |
Class I: | | | | |
Net asset value and redemption price per share, $3,993,540,470 / 106,060,061 outstanding shares of beneficial interest | | $ | 37.65 | |
| | | | |
| |
Class III: | | | | |
Net asset value and redemption price per share, $3,686,236 / 98,314 outstanding shares of beneficial interest | | $ | 37.49 | |
| | | | |
STATEMENT OF OPERATIONS
Year Ended December 31, 2022
| | | | |
NET INVESTMENT INCOME (LOSS) | | | | |
INCOME | | | | |
Unaffiliated dividend income (net of $198,374 foreign withholding tax, of which $28,259 is reimbursable by an affiliate) | | $ | 47,091,166 | |
Interest income | | | 40,132,107 | |
Affiliated dividend income | | | 6,847,036 | |
Income from securities lending, net (including affiliated income of $87,538) | | | 90,659 | |
| | | | |
Total income | | | 94,160,968 | |
| | | | |
EXPENSES | | | | |
Management fee | | | 26,029,490 | |
Distribution fee—Class III | | | 7,703 | |
Custodian and accounting fees | | | 349,545 | |
Trustees’ fees | | | 75,550 | |
Legal fees and expenses | | | 54,564 | |
Audit fee | | | 47,000 | |
Shareholders’ reports | | | 45,593 | |
Transfer agent’s fees and expenses (including affiliated expense of $5,882) | | | 10,682 | |
Miscellaneous | | | 106,806 | |
| | | | |
Total expenses | | | 26,726,933 | |
| | | | |
NET INVESTMENT INCOME (LOSS) | | | 67,434,035 | |
| | | | |
| REALIZED AND UNREALIZED GAIN (LOSS) ON INVESTMENT AND FOREIGN CURRENCY TRANSACTIONS | | | | |
Net realized gain (loss) on: | | | | |
Investment transactions (including affiliated of $7,556) | | | (10,963,545 | ) |
Futures transactions | | | (39,206,446 | ) |
Forward currency contract transactions | | | 2,790,282 | |
Options written transactions | | | 524,703 | |
Swap agreements transactions | | | (15,662,375 | ) |
Foreign currency transactions | | | (692,373 | ) |
| | | | |
| | | (63,209,754 | ) |
| | | | |
Net change in unrealized appreciation (depreciation) on: | | | | |
Investments (including affiliated of $23,713) | | | (722,293,126 | ) |
Futures | | | (3,341,792 | ) |
Forward currency contracts | | | (804,293 | ) |
Options written | | | 62,425 | |
Swap agreements | | | 5,343,392 | |
Foreign currencies | | | 79,337 | |
| | | | |
| | | (720,954,057 | ) |
| | | | |
NET GAIN (LOSS) ON INVESTMENT AND FOREIGN CURRENCY TRANSACTIONS | | | (784,163,811 | ) |
| | | | |
NET INCREASE (DECREASE) IN NET ASSETS RESULTING FROM OPERATIONS | | $ | (716,729,776 | ) |
| | | | |
STATEMENTS OF CHANGES IN NET ASSETS
| | | | | | | | | | | | | | | | | | | | | | | | |
| | | Year Ended
December 31, 2022 | | | Year Ended
December 31, 2021 | |
INCREASE (DECREASE) IN NET ASSETS | | | | | | | | | | | | | | | | | | | | | | | | |
OPERATIONS | | | | | | | | | | | | | | | | | | | | | | | | |
Net investment income (loss) | | | | | | $ | 67,434,035 | | | | | | | | | | | $ | 56,460,238 | | | | | |
Net realized gain (loss) on investment and foreign currency transactions | | | | | | | (63,209,754 | ) | | | | | | | | | | | 523,923,693 | | | | | |
Net change in unrealized appreciation (depreciation) on investments and foreign currencies | | | | | | | (720,954,057 | ) | | | | | | | | | | | 177,114,878 | | | | | |
| | | | | | | | | | | | | | | | | | | | | | | | |
NET INCREASE (DECREASE) IN NET ASSETS RESULTING FROM OPERATIONS | | | | | | | (716,729,776 | ) | | | | | | | | | | | 757,498,809 | | | | | |
| | | | | | | | | | | | | | | | | | | | | | | | |
PORTFOLIO SHARE TRANSACTIONS | | | | | | | | | | | | | | | | | | | | | | | | |
Portfolio shares sold | | | | | | | 7,218,379 | | | | | | | | | | | | 10,264,950 | | | | | |
Portfolio shares purchased | | | | | | | (263,033,768 | ) | | | | | | | | | | | (277,076,354 | ) | | | | |
| | | | | | | | | | | | | | | | | | | | | | | | |
NET INCREASE (DECREASE) IN NET ASSETS FROM PORTFOLIO SHARE TRANSACTIONS | | | | | | | (255,815,389 | ) | | | | | | | | | | | (266,811,404 | ) | | | | |
| | | | | | | | | | | | | | | | | | | | | | | | |
TOTAL INCREASE (DECREASE) | | | | | | | (972,545,165 | ) | | | | | | | | | | | 490,687,405 | | | | | |
NET ASSETS: | | | | | | | | | | | | | | | | | | | | | | | | |
Beginning of year | | | | | | | 4,969,771,871 | | | | | | | | | | | | 4,479,084,466 | | | | | |
| | | | | | | | | | | | | | | | | | | | | | | | |
End of year | | | | | | $ | 3,997,226,706 | | | | | | | | | | | $ | 4,969,771,871 | | | | | |
| | | | | | | | | | | | | | | | | | | | | | | | |
SEE NOTES TO FINANCIAL STATEMENTS.
A103
| | | | |
| | PSF PGIM FLEXIBLE MANAGED PORTFOLIO (CONTINUED) | | |
| | | | | | | | | | | | | | | | | | | | |
Class I | | | | | | | | | | | | | | | |
| | | Year Ended December 31, | |
| | | 2022 | | | 2021 | | | 2020 | | | 2019 | | | 2018 | |
Per Share Operating Performance(a): | | | | | | | | | | | | | | | | | | | | |
Net Asset Value, beginning of year | | $ | 44.14 | | | $ | 37.61 | | | $ | 34.32 | | | $ | 28.63 | | | $ | 29.88 | |
| | | | | | | | | | | | | | | | | | | | |
Income (Loss) From Investment Operations: | | | | | | | | | | | | | | | | | | | | |
Net investment income (loss) | | | 0.62 | | | | 0.49 | | | | 0.56 | | | | 0.61 | | | | 0.53 | |
Net realized and unrealized gain (loss) on investment and foreign currency transactions | | | (7.11 | ) | | | 6.04 | | | | 2.73 | | | | 5.08 | | | | (1.78 | ) |
| | | | | | | | | | | | | | | | | | | | |
Total from investment operations | | | (6.49 | ) | | | 6.53 | | | | 3.29 | | | | 5.69 | | | | (1.25 | ) |
| | | | | | | | | | | | | | | | | | | | |
Capital Contributions | | | — | | | | — | | | | — | | | | — | (b)(c) | | | — | (b)(c) |
| | | | | | | | | | | | | | | | | | | | |
Net Asset Value, end of year | | $ | 37.65 | | | $ | 44.14 | | | $ | 37.61 | | | $ | 34.32 | | | $ | 28.63 | |
| | | | | | | | | | | | | | | | | | | | |
Total Return(d) | | | (14.70 | )% | | | 17.36 | % | | | 9.59 | % | | | 19.87 | %(e) | | | (4.18 | )%(e) |
Ratios/Supplemental Data: | | | | | | | | | | | | | | | | | | | | |
Net assets, end of year (in millions) | | $ | 3,994 | | | $ | 4,968 | | | $ | 4,479 | | | $ | 4,328 | | | $ | 3,834 | |
Average net assets (in millions) | | $ | 4,335 | | | $ | 4,766 | | | $ | 4,171 | | | $ | 4,127 | | | $ | 4,157 | |
Ratios to average net assets(f): | | | | | | | | | | | | | | | | | | | | |
Expenses after waivers and/or expense reimbursement. | | | 0.62 | % | | | 0.61 | % | | | 0.62 | % | | | 0.63 | % | | | 0.63 | % |
Expenses before waivers and/or expense reimbursement | | | 0.62 | % | | | 0.61 | % | | | 0.62 | % | | | 0.63 | % | | | 0.63 | % |
Net investment income (loss) | | | 1.55 | % | | | 1.18 | % | | | 1.64 | % | | | 1.92 | % | | | 1.75 | % |
Portfolio turnover rate(g)(h) | | | 139 | % | | | 119 | % | | | 120 | % | | | 125 | % | | | 139 | % |
| | | | | | | | | | | | | | | | |
Class III | | | | | | | | | | | | | | |
| | | Year Ended December 31, 2022 | | April 26, 2021(i)
through December 31, 2021 |
Per Share Operating Performance(a): | | | | | | | | | | | | | | | | |
Net Asset Value, beginning of period | | | | $ | 44.06 | | | | | | | $ | 40.73 | | | |
| | | | | | | | | | | | | | | | |
Income (Loss) From Investment Operations: | | | | | | | | | | | | | | | | |
Net investment income (loss) | | | | | 0.55 | | | | | | | | 0.26 | | | |
Net realized and unrealized gain (loss) on investment and foreign currency transactions | | | | | (7.12 | ) | | | | | | | 3.07 | | | |
| | | | | | | | | | | | | | | | |
Total from investment operations | | | | | (6.57 | ) | | | | | | | 3.33 | | | |
| | | | | | | | | | | | | | | | |
Net Asset Value, end of period | | | | $ | 37.49 | | | | | | | $ | 44.06 | | | |
| | | | | | | | | | | | | | | | |
Total Return(d) | | | | | (14.91 | )% | | | | | | | 8.18 | % | | |
Ratios/Supplemental Data: | | | | | | | | | | | | | | | | |
Net assets, end of period (in millions) | | | | $ | 4 | | | | | | | $ | 2 | | | |
Average net assets (in millions) | | | | $ | 3 | | | | | | | $ | 1 | | | |
Ratios to average net assets(f): | | | | | | | | | | | | | | | | |
Expenses after waivers and/or expense reimbursement | | | | | 0.87 | % | | | | | | | 0.86 | %(j) | | |
Expenses before waivers and/or expense reimbursement | | | | | 0.87 | % | | | | | | | 0.86 | %(j) | | |
Net investment income (loss) | | | | | 1.39 | % | | | | | | | 0.86 | %(j) | | |
Portfolio turnover rate(g)(h) | | | | | 139 | % | | | | | | | 119 | % | | |
| (a) | Calculated based on average shares outstanding during the period. |
| (b) | Represents payment received by the Portfolio, from Prudential, in connection with excess foreign withholding tax withheld on dividends and interest from certain countries due to the Portfolio’s tax status as a partnership. |
| (c) | Amount rounds to zero. |
| (d) | Total return is calculated assuming a purchase of a share on the first day and a sale on the last day of each period reported and includes reinvestment of dividends and distributions, if any, and does not reflect the effect of insurance contract charges. Total return does not reflect expenses associated with the separate account such as administrative fees, account charges and surrender charges which, if reflected, would reduce the total returns for all periods shown. Performance figures may reflect fee waivers and/or expense reimbursements. In the absence of fee waivers and/or expense reimbursements, the total return would be lower. Past performance is no guarantee of future results. Total returns may reflect adjustments to conform to GAAP. Total returns for periods less than one full year are not annualized. |
| (e) | Total return for the year includes the impact of the capital contribution, which was not material to the total return. |
| (f) | Does not include expenses of the underlying funds in which the Portfolio invests. |
| (g) | The Portfolio accounts for mortgage dollar roll transactions, when applicable, as purchases and sales which, as a result, can increase its portfolio turnover rate. |
| (h) | The Portfolio’s portfolio turnover rate is calculated in accordance with regulatory requirements, without regard to transactions involving short-term investments, certain derivatives and in-kind transactions (if any). If such transactions were included, the Portfolio’s portfolio turnover rate may be higher. |
| (i) | Commencement of offering. |
| (j) | Annualized, with the exception of certain non-recurring expenses. |
SEE NOTES TO FINANCIAL STATEMENTS.
A104
| | | | |
| | PSF PGIM GOVERNMENT INCOME PORTFOLIO | | |
SCHEDULE OF INVESTMENTS | | | | as of December 31, 2022 |
| | | | | | | | | | | | |
Interest Rate | | Maturity
Date | | | | Principal
Amount
(000)# | | | Value | |
| | | | | | | | | | | |
LONG-TERM INVESTMENTS — 98.8% | |
ASSET-BACKED SECURITIES — 11.2% | |
Collateralized Loan Obligations | |
AGL Core CLO Ltd. (Cayman Islands), | |
Series 2019-02A, Class A1, 144A, 3 Month LIBOR + 1.390% (Cap N/A, Floor 1.390%) | |
5.633%(c) | | 04/20/32 | | | | | 1,000 | | | $ | 984,635 | |
Bain Capital Credit CLO Ltd. (Cayman Islands), | |
Series 2019-02A, Class AR, 144A, 3 Month LIBOR + 1.100% (Cap N/A, Floor 1.100%) | |
5.179%(c) | | 10/17/32 | | | | | 500 | | | | 490,660 | |
Balboa Bay Loan Funding Ltd. (Cayman Islands), | |
Series 2021-01A, Class A, 144A, 3 Month LIBOR + 1.200% (Cap N/A, Floor 1.200%) | |
5.443%(c) | | 07/20/34 | | | | | 3,000 | | | | 2,921,159 | |
Battalion CLO Ltd., | |
Series 2020-15A, Class A1, 144A, 3 Month LIBOR + 1.350% (Cap N/A, Floor 1.350%) | |
5.429%(c) | | 01/17/33 | | | | | 2,500 | | | | 2,447,739 | |
Jamestown CLO Ltd. (Cayman Islands), | |
Series 2019-14A, Class A1AR, 144A, 3 Month LIBOR + 1.200% (Cap N/A, Floor 1.200%) | |
5.443%(c) | | 10/20/34 | | | | | 500 | | | | 485,273 | |
OZLM Ltd. (Cayman Islands), | |
Series 2015-11A, Class A1R, 144A, 3 Month LIBOR + 1.250% (Cap N/A, Floor 0.000%) | |
5.665%(c) | | 10/30/30 | | | | | 3,709 | | | | 3,653,835 | |
Regatta Funding Ltd. (Cayman Islands), | |
Series 2016-01A, Class A1R2, 144A, 3 Month LIBOR + 1.150% (Cap N/A, Floor 1.150%) | |
5.896%(c) | | 06/20/34 | | | | | 3,250 | | | | 3,179,363 | |
TCW CLO Ltd. (Cayman Islands), | |
Series 2017-01A, Class A1RR, 144A, 3 Month LIBOR + 1.180% (Cap N/A, Floor 1.180%) | |
5.595%(c) | | 10/29/34 | | | | | 500 | | | | 485,527 | |
Trimaran Cavu Ltd., | |
Series 2019-01A, Class A1, 144A, 3 Month LIBOR + 1.460% (Cap N/A, Floor 1.460%) | |
5.703%(c) | | 07/20/32 | | | | | 2,500 | | | | 2,448,569 | |
Venture CLO Ltd. (Cayman Islands), | |
Series 2021-43A, Class A1, 144A, 3 Month LIBOR + 1.240% (Cap N/A, Floor 1.240%) | |
5.319%(c) | | 04/15/34 | | | | | 2,250 | | | | 2,175,143 | |
Wellfleet CLO Ltd. (Cayman Islands), | |
Series 2017-02A, Class A1R, 144A, 3 Month LIBOR + 1.060% (Cap N/A, Floor 0.000%) | |
5.303%(c) | | 10/20/29 | | | | | 914 | | | | 903,657 | |
Wind River CLO Ltd. (Cayman Islands), | |
Series 2016-01KRA, Class A1R2, 144A, 3 Month LIBOR + 1.210% (Cap N/A, Floor 1.210%) | |
5.289%(c) | | 10/15/34 | | | | | 500 | | | | 484,501 | |
| | | | | | | | | | | | |
| |
TOTAL ASSET-BACKED SECURITIES
(cost $21,002,248) | | | | 20,660,061 | |
| | | | | | | | | | | | |
| COMMERCIAL MORTGAGE-BACKED SECURITIES — 6.2% | |
Barclays Commercial Mortgage Securities Trust, | |
Series 2019-C04, Class A4 | |
2.661% | | 08/15/52 | | | | | 3,000 | | | | 2,615,726 | |
| | | | | | | | | | | | |
Interest Rate | | Maturity
Date | | | | Principal
Amount
(000)# | | | Value | |
| | | | | | | | | | | |
|
| COMMERCIAL MORTGAGE-BACKED SECURITIES (continued) | |
CD Mortgage Trust, | |
Series 2019-CD08, Class A3 | |
2.657% | | 08/15/57 | | | | | 4,000 | | | $ | 3,420,374 | |
Fannie Mae-Aces, | |
Series 2022-M03, Class A2 | |
1.707%(cc) | | 11/25/31 | | | | | 4,000 | | | | 3,147,124 | |
Series 2022-M13, Class A2 | |
2.593%(cc) | | 06/25/32 | | | | | 2,000 | | | | 1,688,731 | |
FHLMC Multifamily Structured Pass-Through Certificates, | |
Series K151, Class A3 | |
3.511% | | 04/25/30 | | | | | 400 | | | | 373,237 | |
Series K152, Class A2 | |
3.080% | | 01/25/31 | | | | | 140 | | | | 127,022 | |
| | | | | | | | | | | | |
| |
TOTAL COMMERCIAL MORTGAGE-BACKED SECURITIES
(cost $12,992,701) | | | | 11,372,214 | |
| | | | | | | | | | | | |
| CORPORATE BOND — 0.4% | |
Diversified Financial Services | |
Private Export Funding Corp., | |
U.S. Gov’t. Gtd. Notes, Series PP | |
1.400% | | 07/15/28 | | | | | 885 | | | | 749,081 | |
| | | | | | | | | | | | |
(cost $883,264) | |
| RESIDENTIAL MORTGAGE-BACKED SECURITIES — 0.1% | |
Government National Mortgage Assoc., | |
Series 2015-143, Class WA | |
4.000% | | 10/20/45 | | | | | 172 | | | | 167,307 | |
Merrill Lynch Mortgage Investors Trust, | |
Series 2003-E, Class A1, 1 Month LIBOR + 0.620% (Cap 11.750%, Floor 0.620%) | |
5.009%(c) | | 10/25/28 | | | | | 6 | | | | 5,564 | |
Structured Adjustable Rate Mortgage Loan Trust, | |
Series 2004-01, Class 4A3 | |
3.780%(cc) | | 02/25/34 | | | | | 30 | | | | 27,747 | |
| | | | | | | | | | | | |
| |
TOTAL RESIDENTIAL MORTGAGE-BACKED SECURITIES
(cost $215,555) | | | | 200,618 | |
| | | | | | | | | | | | |
|
| U.S. GOVERNMENT AGENCY OBLIGATIONS — 51.7% | |
Federal Farm Credit Bank | |
5.480% | | 06/27/42 | | | | | 500 | | | | 481,886 | |
Federal Home Loan Bank | |
4.250% | | 09/10/32 | | | | | 210 | | | | 204,998 | |
5.500% | | 07/15/36 | | | | | 1,000 | | | | 1,099,376 | |
Federal Home Loan Mortgage Corp. | |
1.500% | | 11/01/50 | | | | | 429 | | | | 331,589 | |
2.000% | | 01/01/32 | | | | | 120 | | | | 109,266 | |
2.000% | | 12/01/50 | | | | | 1,781 | | | | 1,455,303 | |
2.000% | | 05/01/51 | | | | | 472 | | | | 385,644 | |
2.500% | | 03/01/30 | | | | | 198 | | | | 185,507 | |
2.500% | | 11/01/46 | | | | | 257 | | | | 221,466 | |
2.500% | | 04/01/51 | | | | | 2,602 | | | | 2,210,051 | |
3.000% | | 06/01/29 | | | | | 150 | | | | 143,949 | |
3.000% | | 01/01/37 | | | | | 272 | | | | 252,591 | |
3.000% | | 06/01/45 | | | | | 146 | | | | 133,320 | |
3.000% | | 01/01/48 | | | | | 215 | | | | 191,227 | |
3.000% | | 10/01/49 | | | | | 74 | | | | 65,503 | |
SEE NOTES TO FINANCIAL STATEMENTS.
A105
| | | | |
| | PSF PGIM GOVERNMENT INCOME PORTFOLIO (CONTINUED) | | |
SCHEDULE OF INVESTMENTS | | | | as of December 31, 2022 |
| | | | | | | | | | | | |
Interest Rate | | Maturity
Date | | | | Principal
Amount
(000)# | | | Value | |
| | | | | | | | | | | |
|
U.S. GOVERNMENT AGENCY OBLIGATIONS (continued) | |
3.000% | | 04/01/52 | | | | | 494 | | | $ | 433,700 | |
3.000% | | 05/01/52 | | | | | 762 | | | | 668,961 | |
3.000% | | 06/01/52 | | | | | 486 | | | | 426,619 | |
3.500% | | 12/01/32 | | | | | 244 | | | | 235,850 | |
3.500% | | 07/01/42 | | | | | 236 | | | | 221,224 | |
3.500% | | 10/01/42 | | | | | 406 | | | | 380,063 | |
3.500% | | 08/01/43 | | | | | 455 | | | | 426,112 | |
3.500% | | 09/01/45 | | | | | 155 | | | | 143,869 | |
3.500% | | 10/01/45 | | | | | 137 | | | | 127,241 | |
3.500% | | 02/01/47 | | | | | 181 | | | | 167,790 | |
3.500% | | 07/01/47 | | | | | 275 | | | | 256,562 | |
3.500% | | 03/01/48 | | | | | 370 | | | | 343,003 | |
3.500% | | 02/01/52 | | | | | 998 | | | | 907,610 | |
3.500% | | 08/01/52 | | | | | 498 | | | | 452,754 | |
4.000% | | 06/01/26 | | | | | 12 | | | | 11,322 | |
4.000% | | 09/01/26 | | | | | 48 | | | | 47,035 | |
4.000% | | 11/01/37 | | | | | 596 | | | | 581,762 | |
4.000% | | 09/01/40 | | | | | 122 | | | | 117,538 | |
4.000% | | 12/01/40 | | | | | 135 | | | | 129,650 | |
4.000% | | 12/01/40 | | | | | 156 | | | | 149,810 | |
4.000% | | 11/01/43 | | | | | 297 | | | | 285,481 | |
4.000% | | 09/01/48 | | | | | 6 | | | | 5,788 | |
4.000% | | 05/01/52 | | | | | 492 | | | | 461,489 | |
4.500% | | 09/01/39 | | | | | 504 | | | | 500,517 | |
4.500% | | 08/01/48 | | | | | 135 | | | | 132,445 | |
5.000% | | 06/01/33 | | | | | 126 | | | | 128,784 | |
5.000% | | 05/01/34 | | | | | 76 | | | | 77,414 | |
5.000% | | 09/01/52 | | | | | 995 | | | | 980,891 | |
5.500% | | 05/01/37 | | | | | 24 | | | | 25,186 | |
5.500% | | 02/01/38 | | | | | 80 | | | | 82,899 | |
5.500% | | 05/01/38 | | | | | 34 | | | | 35,118 | |
5.500% | | 01/01/53 | | | | | 2,500 | | | | 2,506,660 | |
6.000% | | 09/01/34 | | | | | 41 | | | | 41,290 | |
6.000% | | 01/01/37 | | | | | 31 | | | | 31,904 | |
6.000% | | 09/01/38 | | | | | 23 | | | | 24,146 | |
6.000% | | 08/01/39 | | | | | 28 | | | | 29,346 | |
6.250% | | 07/15/32 | | | | | 2,275 | | | | 2,652,879 | |
6.500% | | 09/01/32 | | | | | 11 | | | | 11,621 | |
6.750% | | 03/15/31 | | | | | 210 | | | | 247,091 | |
Federal Home Loan Mortgage Corp., MTN | |
1.899%(s) | | 11/15/38 | | | | | 600 | | | | 284,016 | |
Federal National Mortgage Assoc. | |
0.875% | | 08/05/30 | | | | | 500 | | | | 397,276 | |
1.500% | | 11/01/50 | | | | | 1,324 | | | | 1,023,011 | |
1.500% | | 12/01/50 | | | | | 842 | | | | 650,851 | |
2.000% | | TBA | | | | | 1,500 | | | | 1,220,190 | |
2.000% | | 08/01/31 | | | | | 122 | | | | 110,840 | |
2.000% | | 05/01/36 | | | | | 791 | | | | 705,129 | |
2.000% | | 06/01/40 | | | | | 327 | | | | 278,315 | |
2.000% | | 07/01/40 | | | | | 349 | | | | 297,061 | |
2.000% | | 02/01/41 | | | | | 1,589 | | | | 1,353,038 | |
2.000% | | 05/01/41 | | | | | 1,901 | | | | 1,619,141 | |
2.000% | | 09/01/50 | | | | | 2,407 | | | | 1,969,609 | |
2.000% | | 10/01/50 | | | | | 1,556 | | | | 1,275,556 | |
2.000% | | 12/01/50 | | | | | 395 | | | | 322,814 | |
2.000% | | 02/01/51(k) | | | | | 3,522 | | | | 2,874,486 | |
2.000% | | 05/01/51 | | | | | 466 | | | | 380,641 | |
2.500% | | 06/01/28 | | | | | 663 | | | | 630,093 | |
| | | | | | | | | | | | |
Interest Rate | | Maturity
Date | | | | Principal
Amount
(000)# | | | Value | |
| | | | | | | | | | | |
|
U.S. GOVERNMENT AGENCY OBLIGATIONS (continued) | |
2.500% | | 05/01/41 | | | | | 1,001 | | | $ | 880,009 | |
2.500% | | 02/01/43 | | | | | 96 | | | | 82,349 | |
2.500% | | 12/01/46 | | | | | 334 | | | | 288,208 | |
2.500% | | 01/01/50 | | | | | 678 | | | | 579,559 | |
2.500% | | 03/01/50 | | | | | 212 | | | | 181,599 | |
2.500% | | 05/01/50 | | | | | 909 | | | | 777,339 | |
2.500% | | 08/01/50 | | | | | 2,101 | | | | 1,787,578 | |
2.500% | | 09/01/50 | | | | | 1,583 | | | | 1,370,300 | |
2.500% | | 10/01/50 | | | | | 2,361 | | | | 2,010,411 | |
2.500% | | 04/01/51 | | | | | 1,073 | | | | 921,355 | |
2.500% | | 04/01/51 | | | | | 1,594 | | | | 1,353,768 | |
2.500% | | 11/01/51 | | | | | 966 | | | | 820,040 | |
2.500% | | 04/01/52 | | | | | 474 | | | | 401,506 | |
2.500% | | 05/01/52 | | | | | 957 | | | | 816,019 | |
3.000% | | 02/01/31 | | | | | 276 | | | | 263,825 | |
3.000% | | 11/01/36 | | | | | 216 | | | | 200,334 | |
3.000% | | 03/01/43 | | | | | 361 | | | | 328,749 | |
3.000% | | 07/01/43 | | | | | 446 | | | | 405,682 | |
3.000% | | 07/01/43 | | | | | 594 | | | | 540,429 | |
3.000% | | 09/01/46 | | | | | 304 | | | | 271,518 | |
3.000% | | 11/01/46 | | | | | 141 | | | | 125,813 | |
3.000% | | 11/01/46 | | | | | 185 | | | | 165,801 | |
3.000% | | 11/01/46 | | | | | 784 | | | | 701,003 | |
3.000% | | 12/01/47 | | | | | 419 | | | | 378,603 | |
3.000% | | 02/01/50 | | | | | 174 | | | | 154,320 | |
3.000% | | 06/01/50 | | | | | 302 | | | | 266,486 | |
3.000% | | 11/01/51 | | | | | 936 | | | | 823,365 | |
3.000% | | 04/01/52 | | | | | 485 | | | | 425,516 | |
3.000% | | 04/01/52 | | | | | 485 | | | | 425,894 | |
3.000% | | 04/01/52 | | | | | 675 | | | | 592,305 | |
3.000% | | 04/01/52 | | | | | 962 | | | | 845,141 | |
3.000% | | 04/01/52 | | | | | 965 | | | | 847,699 | |
3.000% | | 04/01/52 | | | | | 973 | | | | 862,852 | |
3.500% | | TBA(tt) | | | | | 1,500 | | | | 1,362,454 | |
3.500% | | 07/01/31 | | | | | 345 | | | | 335,736 | |
3.500% | | 02/01/33 | | | | | 60 | | | | 58,418 | |
3.500% | | 06/01/39 | | | | | 129 | | | | 120,586 | |
3.500% | | 04/01/42 | | | | | 214 | | | | 199,979 | |
3.500% | | 06/01/42 | | | | | 321 | | | | 300,496 | |
3.500% | | 07/01/42 | | | | | 166 | | | | 155,800 | |
3.500% | | 07/01/42 | | | | | 403 | | | | 377,021 | |
3.500% | | 06/01/45 | | | | | 548 | | | | 509,263 | |
3.500% | | 07/01/46 | | | | | 177 | | | | 164,033 | |
3.500% | | 12/01/46 | | | | | 161 | | | | 149,368 | |
3.500% | | 12/01/46 | | | | | 402 | | | | 376,220 | |
3.500% | | 11/01/48 | | | | | 289 | | | | 267,573 | |
3.500% | | 09/01/51 | | | | | 499 | | | | 454,450 | |
4.000% | | 07/01/37 | | | | | 374 | | | | 364,844 | |
4.000% | | 09/01/40 | | | | | 511 | | | | 491,183 | |
4.000% | | 06/01/42 | | | | | 309 | | | | 296,591 | |
4.000% | | 09/01/44 | | | | | 193 | | | | 185,214 | |
4.000% | | 09/01/44 | | | | | 361 | | | | 345,536 | |
4.000% | | 04/01/45 | | | | | 180 | | | | 172,360 | |
4.000% | | 07/01/45 | | | | | 128 | | | | 122,463 | |
4.000% | | 10/01/45 | | | | | 220 | | | | 210,868 | |
4.000% | | 10/01/46 | | | | | 68 | | | | 64,761 | |
4.000% | | 02/01/47 | | | | | 63 | | | | 59,995 | |
4.000% | | 06/01/47 | | | | | 109 | | | | 104,320 | |
SEE NOTES TO FINANCIAL STATEMENTS.
A106
| | | | |
| | PSF PGIM GOVERNMENT INCOME PORTFOLIO (CONTINUED) | | |
SCHEDULE OF INVESTMENTS | | | | as of December 31, 2022 |
| | | | | | | | | | | | |
Interest Rate | | Maturity
Date | | | | Principal
Amount
(000)# | | | Value | |
| | | | | | | | | | | |
|
U.S. GOVERNMENT AGENCY OBLIGATIONS (continued) | |
4.000% | | 07/01/47 | | | | | 113 | | | $ | 108,293 | |
4.000% | | 10/01/47 | | | | | 354 | | | | 337,843 | |
4.000% | | 11/01/47 | | | | | 90 | | | | 85,611 | |
4.000% | | 11/01/47 | | | | | 122 | | | | 116,838 | |
4.000% | | 05/01/52 | | | | | 980 | | | | 920,018 | |
4.500% | | TBA | | | | | 250 | | | | 240,564 | |
4.500% | | 05/01/40 | | | | | 460 | | | | 451,810 | |
4.500% | | 04/01/42 | | | | | 305 | | | | 302,169 | |
5.000% | | 12/01/31 | | | | | 21 | | | | 20,800 | |
5.000% | | 03/01/34 | | | | | 149 | | | | 151,932 | |
5.000% | | 06/01/35 | | | | | 63 | | | | 64,415 | |
5.000% | | 07/01/35 | | | | | 32 | | | | 32,510 | |
5.000% | | 05/01/36 | | | | | 42 | | | | 42,644 | |
5.000% | | 07/01/52 | | | | | 485 | | | | 478,118 | |
5.500% | | 02/01/34 | | | | | 98 | | | | 101,439 | |
5.500% | | 09/01/34 | | | | | 113 | | | | 116,418 | |
5.500% | | 02/01/35 | | | | | 102 | | | | 103,244 | |
5.500% | | 06/01/35 | | | | | 31 | | | | 30,763 | |
5.500% | | 06/01/35 | | | | | 52 | | | | 52,563 | |
5.500% | | 09/01/35 | | | | | 30 | | | | 30,179 | |
5.500% | | 09/01/35 | | | | | 64 | | | | 64,146 | |
5.500% | | 10/01/35 | | | | | 105 | | | | 106,441 | |
5.500% | | 11/01/35 | | | | | 40 | | | | 40,575 | |
5.500% | | 11/01/35 | | | | | 54 | | | | 54,367 | |
5.500% | | 11/01/35 | | | | | 214 | | | | 221,814 | |
5.500% | | 11/01/52 | | | | | 500 | | | | 501,341 | |
5.500% | | 11/01/52 | | | | | 502 | | | | 503,132 | |
5.500% | | 01/01/53 | | | | | 500 | | | | 501,342 | |
6.000% | | 12/01/33 | | | | | 8 | | | | 8,584 | |
6.000% | | 02/01/34 | | | | | 53 | | | | 54,753 | |
6.000% | | 08/01/34 | | | | | —(r | ) | | | 192 | |
6.000% | | 11/01/34 | | | | | —(r | ) | | | 258 | |
6.000% | | 01/01/35 | | | | | 3 | | | | 3,247 | |
6.000% | | 01/01/36 | | | | | 52 | | | | 53,019 | |
6.000% | | 05/01/38 | | | | | 19 | | | | 20,261 | |
6.500% | | 07/01/32 | | | | | 95 | | | | 98,210 | |
6.500% | | 08/01/32 | | | | | 46 | | | | 47,085 | |
6.500% | | 10/01/32 | | | | | 104 | | | | 107,665 | |
6.500% | | 10/01/37 | | | | | 73 | | | | 76,395 | |
6.625% | | 11/15/30 | | | | | 3,000 | | | | 3,499,404 | |
7.000% | | 12/01/31 | | | | | 24 | | | | 24,143 | |
7.000% | | 01/01/36 | | | | | 12 | | | | 12,899 | |
8.000% | | 10/01/23 | | | | | —(r | ) | | | 10 | |
8.000% | | 09/01/24 | | | | | —(r | ) | | | 340 | |
8.000% | | 11/01/24 | | | | | —(r | ) | | | 445 | |
8.000% | | 01/01/26 | | | | | —(r | ) | | | 9 | |
9.000% | | 02/01/25 | | | | | 2 | | | | 2,034 | |
9.000% | | 04/01/25 | | | | | 1 | | | | 743 | |
Government National Mortgage Assoc. | |
2.000% | | 09/20/51 | | | | | 317 | | | | 266,584 | |
2.500% | | 12/20/46 | | | | | 90 | | | | 79,294 | |
2.500% | | 05/20/51 | | | | | 399 | | | | 346,699 | |
2.500% | | 08/20/51 | | | | | 1,500 | | | | 1,302,477 | |
3.000% | | TBA | | | | | 500 | | | | 445,091 | |
3.000% | | 03/15/45 | | | | | 363 | | | | 324,744 | |
3.000% | | 07/20/46 | | | | | 360 | | | | 325,980 | |
3.000% | | 09/20/46 | | | | | 388 | | | | 350,810 | |
3.000% | | 10/20/46 | | | | | 97 | | | | 88,143 | |
| | | | | | | | | | | | |
Interest Rate | | Maturity
Date | | | | Principal
Amount
(000)# | | | Value | |
| | | | | | | | | | | |
|
U.S. GOVERNMENT AGENCY OBLIGATIONS (continued) | |
3.000% | | 04/20/47 | | | | | 452 | | | $ | 407,301 | |
3.000% | | 12/20/48 | | | | | 287 | | | | 258,468 | |
3.000% | | 04/20/49 | | | | | 277 | | | | 249,686 | |
3.000% | | 07/20/49 | | | | | 72 | | | | 64,597 | |
3.000% | | 12/20/49 | | | | | 302 | | | | 271,516 | |
3.000% | | 09/20/51 | | | | | 1,051 | | | | 940,012 | |
3.500% | | TBA | | | | | 500 | | | | 459,308 | |
3.500% | | 01/20/43 | | | | | 431 | | | | 406,319 | |
3.500% | | 04/20/43 | | | | | 204 | | | | 192,313 | |
3.500% | | 03/20/45 | | | | | 253 | | | | 236,295 | |
3.500% | | 04/20/45 | | | | | 203 | | | | 189,724 | |
3.500% | | 04/20/46 | | | | | 340 | | | | 317,136 | |
3.500% | | 07/20/46 | | | | | 495 | | | | 461,279 | |
3.500% | | 07/20/48 | | | | | 410 | | | | 381,894 | |
3.500% | | 11/20/48 | | | | | 106 | | | | 98,847 | |
3.500% | | 01/20/49 | | | | | 188 | | | | 175,201 | |
3.500% | | 05/20/49 | | | | | 354 | | | | 328,863 | |
4.000% | | 06/15/40 | | | | | 65 | | | | 62,640 | |
4.000% | | 08/20/46 | | | | | 205 | | | | 196,692 | |
4.000% | | 11/20/46 | | | | | 124 | | | | 118,834 | |
4.000% | | 09/20/47 | | | | | 164 | | | | 158,225 | |
4.000% | | 06/20/48 | | | | | 252 | | | | 240,279 | |
4.000% | | 02/20/49 | | | | | 227 | | | | 217,444 | |
4.500% | | TBA(tt) | | | | | 500 | | | | 484,956 | |
4.500% | | 02/20/41 | | | | | 196 | | | | 195,570 | |
4.500% | | 03/20/41 | | | | | 167 | | | | 166,592 | |
4.500% | | 06/20/44 | | | | | 126 | | | | 126,927 | |
4.500% | | 09/20/46 | | | | | 148 | | | | 144,634 | |
4.500% | | 11/20/46 | | | | | 257 | | | | 258,368 | |
4.500% | | 01/20/47 | | | | | 33 | | | | 32,706 | |
4.500% | | 05/20/52 | | | | | 524 | | | | 509,426 | |
5.000% | | 07/15/33 | | | | | 63 | | | | 64,598 | |
5.000% | | 09/15/33 | | | | | 110 | | | | 112,898 | |
5.000% | | 04/15/34 | | | | | 67 | | | | 67,447 | |
5.000% | | 10/20/48 | | | | | 46 | | | | 46,580 | |
5.000% | | 08/20/52 | | | | | 997 | | | | 988,126 | |
5.500% | | 03/15/34 | | | | | 116 | | | | 121,360 | |
5.500% | | 03/15/36 | | | | | 32 | | | | 32,934 | |
6.500% | | 07/15/32 | | | | | 8 | | | | 8,097 | |
6.500% | | 08/15/32 | | | | | 1 | | | | 1,394 | |
6.500% | | 08/15/32 | | | | | 3 | | | | 2,843 | |
6.500% | | 08/15/32 | | | | | 9 | | | | 9,635 | |
6.500% | | 08/15/32 | | | | | 45 | | | | 46,207 | |
7.000% | | 06/15/23 | | | | | —(r | ) | | | 101 | |
7.000% | | 06/15/23 | | | | | —(r | ) | | | 194 | |
7.000% | | 06/15/23 | | | | | —(r | ) | | | 332 | |
7.000% | | 07/15/23 | | | | | —(r | ) | | | 15 | |
7.000% | | 07/15/23 | | | | | 2 | | | | 1,713 | |
7.000% | | 08/15/23 | | | | | —(r | ) | | | 42 | |
7.000% | | 08/15/23 | | | | | —(r | ) | | | 422 | |
7.000% | | 09/15/23 | | | | | —(r | ) | | | 228 | |
7.000% | | 10/15/23 | | | | | —(r | ) | | | 105 | |
7.000% | | 11/15/23 | | | | | —(r | ) | | | 325 | |
7.000% | | 11/15/23 | | | | | 1 | | | | 961 | |
7.000% | | 01/15/24 | | | | | 2 | | | | 1,867 | |
7.000% | | 05/15/24 | | | | | 2 | | | | 2,387 | |
7.000% | | 08/15/28 | | | | | 16 | | | | 16,779 | |
7.500% | | 12/15/25 | | | | | 13 | | | | 13,495 | |
SEE NOTES TO FINANCIAL STATEMENTS.
A107
| | | | |
| | PSF PGIM GOVERNMENT INCOME PORTFOLIO (CONTINUED) | | |
SCHEDULE OF INVESTMENTS | | | | as of December 31, 2022 |
| | | | | | | | | | | | |
Interest Rate | | Maturity
Date | | | | Principal
Amount
(000)# | | | Value | |
| | | | | | | | | | | |
|
U.S. GOVERNMENT AGENCY OBLIGATIONS (continued) | |
7.500% | | 02/15/26 | | | | | 3 | | | $ | 2,751 | |
8.500% | | 09/15/24 | | | | | 12 | | | | 12,457 | |
8.500% | | 04/15/25 | | | | | 1 | | | | 896 | |
Israel Government, USAID Bond, U.S. Gov’t. Gtd. Notes | |
5.500% | | 09/18/33 | | | | | 300 | | | | 324,990 | |
Resolution Funding Corp. Interest Strips, Bonds | |
2.895%(s) | | 01/15/30 | | | | | 350 | | | | 252,114 | |
3.555%(s) | | 04/15/30 | | | | | 675 | | | | 489,399 | |
Resolution Funding Corp. Principal Strips, Bonds | |
3.143%(s) | | 04/15/30 | | | | | 2,305 | | | | 1,667,521 | |
3.596%(s) | | 01/15/30 | | | | | 2,290 | | | | 1,677,775 | |
Tennessee Valley Authority, Sr. Unsec’d. Notes | |
0.750% | | 05/15/25 | | | | | 325 | | | | 297,704 | |
1.500% | | 09/15/31 | | | | | 500 | | | | 392,507 | |
2.875% | | 02/01/27 | | | | | 175 | | | | 166,422 | |
5.880% | | 04/01/36 | | | | | 230 | | | | 253,432 | |
6.750% | | 11/01/25 | | | | | 510 | | | | 541,598 | |
7.125% | | 05/01/30 | | | | | 530 | | | | 618,508 | |
| | | | | | | | | | | | |
| |
TOTAL U.S. GOVERNMENT AGENCY OBLIGATIONS
(cost $105,914,268) | | | | 95,410,132 | |
| | | | | | | | | | | | |
U.S. TREASURY OBLIGATIONS — 29.2% | |
U.S. Treasury Bonds | |
1.375% | | 11/15/40 | | | | | 6,870 | | | | 4,470,867 | |
2.000% | | 11/15/41 | | | | | 830 | | | | 593,709 | |
2.250% | | 05/15/41(k) | | | | | 25,835 | | | | 19,424,691 | |
2.375% | | 02/15/42 | | | | | 245 | | | | 187,195 | |
2.500% | | 02/15/46 | | | | | 710 | | | | 532,944 | |
2.500% | | 05/15/46 | | | | | 1,485 | | | | 1,112,590 | |
2.875% | | 05/15/43(k) | | | | | 1,515 | | | | 1,239,223 | |
3.000% | | 05/15/47 | | | | | 10,490 | | | | 8,618,191 | |
3.625% | | 08/15/43 | | | | | 125 | | | | 115,156 | |
3.750% | | 11/15/43 | | | | | 3,645 | | | | 3,421,174 | |
U.S. Treasury Notes | |
3.875% | | 11/30/27 | | | | | 280 | | | | 278,491 | |
4.125% | | 11/15/32 | | | | | 370 | | | | 377,400 | |
U.S. Treasury Strips Coupon | |
0.807%(s) | | 11/15/29 | | | | | 15 | | | | 11,335 | |
1.225%(s) | | 02/15/41 | | | | | 130 | | | | 60,145 | |
1.450%(s) | | 08/15/42 | | | | | 60 | | | | 25,718 | |
1.463%(s) | | 11/15/42 | | | | | 155 | | | | 65,621 | |
1.488%(s) | | 11/15/41 | | | | | 730 | | | | 324,964 | |
1.775%(s) | | 02/15/40 | | | | | 535 | | | | 260,269 | |
1.982%(s) | | 08/15/39 | | | | | 2,120 | | | | 1,053,044 | |
1.990%(s) | | 02/15/39 | | | | | 2,825 | | | | 1,436,336 | |
2.010%(s) | | 08/15/30 | | | | | 941 | | | | 690,863 | |
2.056%(s) | | 11/15/38 | | | | | 220 | | | | 113,120 | |
2.172%(s) | | 02/15/28 | | | | | 530 | | | | 430,107 | |
2.208%(s) | | 05/15/39 | | | | | 560 | | | | 281,094 | |
2.353%(s) | | 02/15/44 | | | | | 780 | | | | 314,529 | |
2.361%(s) | | 05/15/41 | | | | | 1,945 | | | | 887,862 | |
2.365%(s) | | 05/15/44 | | | | | 2,790 | | | | 1,111,859 | |
2.415%(s) | | 11/15/40 | | | | | 525 | | | | 246,012 | |
2.416%(s) | | 05/15/42 | | | | | 80 | | | | 34,612 | |
| | | | | | | | | | | | |
Interest Rate | | Maturity
Date | | | | Principal
Amount
(000)# | | | Value | |
| | | | | | | | | | | |
|
U.S. TREASURY OBLIGATIONS (continued) | |
2.434%(s) | | 11/15/45 | | | | | 345 | | | $ | 129,766 | |
2.436%(s) | | 02/15/46 | | | | | 390 | | | | 145,473 | |
2.443%(s) | | 08/15/44 | | | | | 210 | | | | 83,073 | |
2.452%(s) | | 08/15/43 | | | | | 1,145 | | | | 470,389 | |
2.486%(s) | | 02/15/45 | | | | | 200 | | | | 77,594 | |
2.506%(s) | | 11/15/43 | | | | | 4,315 | | | | 1,760,048 | |
2.513%(s) | | 08/15/41 | | | | | 2,740 | | | | 1,233,642 | |
2.857%(s) | | 05/15/31 | | | | | 33 | | | | 23,578 | |
3.176%(s) | | 08/15/40 | | | | | 800 | | | | 379,812 | |
3.979%(s) | | 02/15/42 | | | | | 3,945 | | | | 1,730,869 | |
| | | | | | | | | | | | |
| |
TOTAL U.S. TREASURY OBLIGATIONS
(cost $68,523,810) | | | | 53,753,365 | |
| | | | | | | | | | | | |
| |
TOTAL LONG-TERM INVESTMENTS
(cost $209,531,846) | | | | 182,145,471 | |
| | | | | | | | | | | | |
| | |
| | | Shares | | | | |
| SHORT-TERM INVESTMENT — 3.4% | |
AFFILIATED MUTUAL FUND | |
PGIM Core Ultra Short Bond Fund
(cost $6,302,149)(wa) | | | 6,302,149 | | | | 6,302,149 | |
| | | | | | | | | | | | |
| |
TOTAL INVESTMENTS—102.2%
(cost $215,833,995) | | | | 188,447,620 | |
Liabilities in excess of other assets(z) — (2.2)% | | | | (4,121,008 | ) |
| | | | | | | | | | | | |
| |
NET ASSETS — 100.0% | | | $ | 184,326,612 | |
| | | | | | | | | | | | |
See the Glossary for a list of the abbreviation(s) used in the annual report.
| # | Principal amount is shown in U.S. dollars unless otherwise stated. |
| (c) | Variable rate instrument. The interest rate shown reflects the rate in effect at December 31, 2022. |
| (cc) | Variable rate instrument. The rate shown is based on the latest available information as of December 31, 2022. Certain variable rate securities are not based on a published reference rate and spread but are determined by the issuer or agent and are based on current market conditions. These securities do not indicate a reference rate and spread in their description. |
| (k) | Represents security, or a portion thereof, segregated as collateral for centrally cleared/exchange-traded derivatives. |
| (r) | Principal or notional amount is less than $500 par. |
| (s) | Represents zero coupon bond or principal only security. Rate represents yield to maturity at purchase date. |
| (tt) | All or partial principal amount represents “TBA” mortgage dollar rolls. The aggregate mortgage dollar roll principal amount of 2,000,000 is 1.1% of net assets. |
| (wa) | PGIM Investments LLC, the manager of the Portfolio, also serves as manager of the PGIM Core Ultra Short Bond Fund and PGIM Institutional Money Market Fund, if applicable. |
| (z) | Includes net unrealized appreciation/(depreciation) and/or market value of the below holdings which are excluded from the Schedule of Investments: |
SEE NOTES TO FINANCIAL STATEMENTS.
A108
| | | | |
| | PSF PGIM GOVERNMENT INCOME PORTFOLIO (CONTINUED) | | |
| | | | |
SCHEDULE OF INVESTMENTS | | | | as of December 31, 2022 |
Forward Commitment Contract:
| | | | | | | | | | | | | | | | |
U.S. Government Agency Obligation | | Interest
Rate | | | Maturity
Date | | Settlement
Date | | Principal
Amount
(000)# | | | Value | |
| | | | | |
Federal National Mortgage Assoc.
(proceeds receivable $251,211) | | | 5.500% | | | TBA | | 01/12/23 | | | (250 | ) | | $ | (250,617 | ) |
| | | | | | | | | | | | | | | | |
Futures contracts outstanding at December 31, 2022:
| | | | | | | | | | | | | | | | | | | | | | |
Number of Contracts | | Type | | Expiration
Date | | | Current
Notional
Amount | | | Value /
Unrealized Appreciation (Depreciation) | |
| | | | | |
| Long Positions: | | | | | | | | | | | | | | | | | | | | |
141 | | 2 Year U.S. Treasury Notes | | | Mar. 2023 | | | $ | 28,916,016 | | | | | | | $ | 11,866 | | | | | |
256 | | 5 Year U.S. Treasury Notes | | | Mar. 2023 | | | | 27,630,001 | | | | | | | | (74,661 | ) | | | | |
421 | | 10 Year U.S. Treasury Notes | | | Mar. 2023 | | | | 47,276,986 | | | | | | | | (179,110 | ) | | | | |
9 | | 30 Year U.S. Ultra Treasury Bonds | | | Mar. 2023 | | | | 1,208,813 | | | | | | | | (67,513 | ) | | | | |
| | | | | | | | | | | | | | | | | | | | | | |
| | | | | | |
| | | | | | | | | | | | | | | | | (309,418 | ) | | | | |
| | | | | | | | | | | | | | | | | | | | | | |
Short Positions: | | | | | | | | | | | | | | | | | | | | |
217 | | 10 Year U.S. Ultra Treasury Notes | | | Mar. 2023 | | | | 25,667,031 | | | | | | | | 166,829 | | | | | |
448 | | 20 Year U.S. Treasury Bonds | | | Mar. 2023 | | | | 56,154,000 | | | | | | | | 201,975 | | | | | |
| | | | | | | | | | | | | | | | | | | | | | |
| | | | | | |
| | | | | | | | | | | | | | | | | 368,804 | | | | | |
| | | | | | | | | | | | | | | | | | | | | | |
| | | | | | |
| | | | | | | | | | | | | | | | $ | 59,386 | | | | | |
| | | | | | | | | | | | | | | | | | | | | | |
Summary of Collateral for Centrally Cleared/Exchange-traded Derivatives:
Cash and securities segregated as collateral, including pending settlement for closed positions, to cover requirements for centrally cleared/exchange-traded derivatives are listed by broker as follows:
| | | | | | | | | | | | | | | | | | | | | | | | |
| Broker | | Cash and/or Foreign Currency | | | Securities Market Value | |
| | | | | | |
| CIGM | | | | | | $ | — | | | | | | | | | | | $ | 2,057,424 | | | | | |
| | | | | | | | | | | | | | | | | | | | | | | | |
Fair Value Measurements:
Various inputs are used in determining the value of the Portfolio’s investments. These inputs are summarized in the three broad levels listed below.
Level 1—unadjusted quoted prices generally in active markets for identical securities.
Level 2—quoted prices for similar securities, interest rates and yield curves, prepayment speeds, foreign currency exchange rates and other observable inputs.
Level 3—unobservable inputs for securities valued in accordance with Board approved fair valuation procedures.
The following is a summary of the inputs used as of December 31, 2022 in valuing such portfolio securities:
| | | | | | | | | | | | | | | | | | | | |
| | | Level 1 | | | Level 2 | | | Level 3 | |
| | | | | |
Investments in Securities | | | | | | | | | | | | | | | | | | | | |
Assets | | | | | | | | | | | | | | | | | | | | |
Long-Term Investments | | | | | | | | | | | | | | | | | | | | |
Asset-Backed Securities | | | | | | | | | | | | | | | | | | | | |
Collateralized Loan Obligations | | $ | — | | | $ | 20,660,061 | | | | | | | $ | — | | | | | |
Commercial Mortgage-Backed Securities | | | — | | | | 11,372,214 | | | | | | | | — | | | | | |
Corporate Bond | | | — | | | | 749,081 | | | | | | | | — | | | | | |
Residential Mortgage-Backed Securities | | | — | | | | 200,618 | | | | | | | | — | | | | | |
U.S. Government Agency Obligations | | | — | | | | 95,410,132 | | | | | | | | — | | | | | |
U.S. Treasury Obligations | | | — | | | | 53,753,365 | | | | | | | | — | | | | | |
Short-Term Investment | | | | | | | | | | | | | | | | | | | | |
Affiliated Mutual Fund | | | 6,302,149 | | | | — | | | | | | | | — | | | | | |
| | | | | | | | | | | | | | | | | | | | |
| | | | | |
Total | | $ | 6,302,149 | | | $ | 182,145,471 | | | | | | | $ | — | | | | | |
| | | | | | | | | | | | |
SEE NOTES TO FINANCIAL STATEMENTS.
A109
| | | | |
| | PSF PGIM GOVERNMENT INCOME PORTFOLIO (CONTINUED) | | |
| | | | |
SCHEDULE OF INVESTMENTS | | | | as of December 31, 2022 |
| | | | | | | | | | | | | | |
| | | Level 1 | | | Level 2 | | | Level 3 |
| | | | | |
Other Financial Instruments* | | | | | | | | | | | | | | |
Assets | | | | | | | | | | | | | | |
Futures Contracts | | $ | 380,670 | | | $ | — | | | | | $— | | |
| | | | | | | | | | |
| | | | | |
Liabilities | | | | | | | | | | | | | | |
Forward Commitment Contract | | $ | — | | | $ | (250,617 | ) | | | | $— | | |
Futures Contracts | | | (321,284 | ) | | | — | | | | | — | | |
| | | | | | | | | | | | | | |
| | | | | |
Total | | $ | (321,284 | ) | | $ | (250,617 | ) | | | | $— | | |
| | | | | | | | | | |
| * | Other financial instruments are derivative instruments, with the exception of forward commitment contracts, and are not reflected in the Schedule of Investments. Futures, forwards and centrally cleared swap contracts are recorded at net unrealized appreciation (depreciation) and OTC swap contracts are recorded at fair value. Forward commitment contracts are recorded at market value. |
Industry Classification:
The industry classification of investments and liabilities in excess of other assets shown as a percentage of net assets as of December 31, 2022 were as follows:
| | | | |
U.S. Government Agency Obligations | | | 51.7 | % |
U.S. Treasury Obligations | | | 29.2 | |
Collateralized Loan Obligations | | | 11.2 | |
Commercial Mortgage-Backed Securities | | | 6.2 | |
Affiliated Mutual Fund | | | 3.4 | |
Diversified Financial Services | | | 0.4 | |
| | | | |
Residential Mortgage-Backed Securities | | | 0.1 | % |
| | | | |
| |
| | | 102.2 | |
Liabilities in excess of other assets | | | (2.2 | ) |
| | | | |
| |
| | | 100.0 | % |
| | | | |
Effects of Derivative Instruments on the Financial Statements and Primary Underlying Risk Exposure:
The Portfolio invested in derivative instruments during the reporting period. The primary type of risk associated with these derivative instrumentsis interest rate contracts risk. See the Notes to Financial Statements for additional detail regarding these derivative instruments and their risks. The effect of such derivative instruments on the Portfolio’s financial position and financial performance as reflected in the Statement of Assets and Liabilities and Statement of Operations is presented in the summary below.
Fair values of derivative instruments as of December 31, 2022 as presented in the Statement of Assets and Liabilities:
| | | | | | | | | | | | | | | | | | | | | | |
| | | | | Asset Derivatives | | | Liability Derivatives | |
| | | | | | | | |
| | | | | | | | |
Derivatives not accounted for as hedging instruments, carried at fair value | | | | Statement of
Assets and
Liabilities Location | | | | Fair
Value | | | | | | Statement of
Assets and
Liabilities Location | | | | Fair
Value | |
Interest rate contracts | | | | Due from/to broker-variation
margin futures | | | | $ | 380,670 | * | | | | | | Due from/to broker-variation
margin futures | | | | $ | 321,284 | * |
| | | | | | | | | | | | | | | | | | | | | | |
| * | Includes cumulative appreciation (depreciation) as reported in the schedule of open futures and centrally cleared swap contracts. Only unsettled variation margin receivable (payable) is reported within the Statement of Assets and Liabilities. |
The effects of derivative instruments on the Statement of Operations for the year ended December 31, 2022 are as follows:
| | | | | | | | |
Amount of Realized Gain (Loss) on Derivatives Recognized in Income | |
Derivatives not accounted for as hedging instruments, carried at fair value | | Futures | | | Swaps | |
| | |
Interest rate contracts | | $ | 2,889,540 | | | $ | (779,452 | ) |
| | | | | | | | |
| | | | |
|
Change in Unrealized Appreciation (Depreciation) on Derivatives Recognized in Income |
| | | | | | | | |
Derivatives not accounted for as hedging instruments, carried at fair value | | Futures | | | Swaps | |
| | |
Interest rate contracts | | $ | 400,503 | | | $ | 786,295 | |
| | | | | | | | |
SEE NOTES TO FINANCIAL STATEMENTS.
A110
| | | | |
| | PSF PGIM GOVERNMENT INCOME PORTFOLIO (CONTINUED) | | |
| | | | |
SCHEDULE OF INVESTMENTS | | | | as of December 31, 2022 |
For the year ended December 31, 2022, the Portfolio’s average volume of derivative activities is as follows:
| | | | |
| Derivative Contract Type | | Average Volume of Derivative Activities* | |
Futures Contracts - Long Positions (1) | | | $113,838,513 | |
Futures Contracts - Short Positions (1) | | | 87,943,910 | |
Inflation Swap Agreements (1) | | | 2,134,000 | |
| * | Average volume is based on average quarter end balances as noted for the year ended December 31, 2022. |
| (1) | Notional Amount in USD. |
SEE NOTES TO FINANCIAL STATEMENTS.
A111
| | | | |
| | PSF PGIM GOVERNMENT INCOME PORTFOLIO (CONTINUED) | | |
STATEMENT OF ASSETS AND LIABILITIES
as of December 31, 2022
| | | | |
| |
ASSETS | | | | |
Investments at value: | | | | |
Unaffiliated investments (cost $209,531,846) | | $ | 182,145,471 | |
Affiliated investments (cost $6,302,149) | | | 6,302,149 | |
Cash | | | 19,082 | |
Receivable for investments sold | | | 3,692,348 | |
Dividends and interest receivable | | | 780,573 | |
Receivable for Portfolio shares sold | | | 49 | |
Prepaid expenses and other assets | | | 3,367 | |
| | | | |
Total Assets | | | 192,943,039 | |
| | | | |
LIABILITIES | | | | |
Payable for investments purchased | | | 8,181,259 | |
Forward commitment contracts, at value (proceeds receivable $251,211) | | | 250,617 | |
Accrued expenses and other liabilities | | | 77,858 | |
Management fee payable | | | 63,748 | |
Due to broker-variation margin futures | | | 24,170 | |
Payable for Portfolio shares purchased | | | 16,778 | |
Affiliated transfer agent fee payable | | | 980 | |
Distribution fee payable | | | 606 | |
Trustees’ fees payable | | | 411 | |
| | | | |
Total Liabilities | | | 8,616,427 | |
| | | | |
NET ASSETS | | $ | 184,326,612 | |
| | | | |
Net assets were comprised of: | | | | |
Partners’ Equity | | $ | 184,326,612 | |
| | | | |
Class I: | | | | |
Net asset value and redemption price per share, $181,332,883 / 14,916,984 outstanding shares of beneficial interest | | $ | 12.16 | |
| | | | |
Class III: | | | | |
Net asset value and redemption price per share, $2,993,729 / 247,239 outstanding shares of beneficial interest | | $ | 12.11 | |
| | | | |
STATEMENT OF OPERATIONS
Year Ended December 31, 2022
| | | | |
NET INVESTMENT INCOME (LOSS) | | | | |
INCOME | | | | |
Interest income | | $ | 5,376,629 | |
Affiliated dividend income | | | 127,982 | |
Income from securities lending, net (including affiliated income of $802) | | | 914 | |
| | | | |
Total income | | | 5,505,525 | |
| | | | |
EXPENSES | | | | |
Management fee | | | 793,826 | |
Distribution fee—Class III | | | 4,122 | |
Custodian and accounting fees | | | 47,239 | |
Audit fee | | | 35,300 | |
Shareholders’ reports | | | 25,645 | |
Legal fees and expenses | | | 20,910 | |
Trustees’ fees | | | 11,601 | |
Transfer agent’s fees and expenses (including affiliated expense of $5,882) | | | 10,682 | |
Miscellaneous | | | 22,372 | |
| | | | |
Total expenses | | | 971,697 | |
| | | | |
NET INVESTMENT INCOME (LOSS) | | | 4,533,828 | |
| | | | |
| REALIZED AND UNREALIZED GAIN (LOSS) ON INVESTMENT TRANSACTIONS | | | | |
Net realized gain (loss) on: | | | | |
Investment transactions (including affiliated of $(2,904)) | | | (5,064,555 | ) |
Futures transactions | | | 2,889,540 | |
Swap agreements transactions | | | (779,452 | ) |
| | | | |
| | | (2,954,467 | ) |
| | | | |
Net change in unrealized appreciation (depreciation) on: | | | | |
Investments | | | (32,459,518 | ) |
Futures | | | 400,503 | |
Swap agreements | | | 786,295 | |
| | | | |
| | | (31,272,720 | ) |
| | | | |
NET GAIN (LOSS) ON INVESTMENT TRANSACTIONS | | | (34,227,187 | ) |
| | | | |
NET INCREASE (DECREASE) IN NET ASSETS RESULTING FROM OPERATIONS | | $ | (29,693,359 | ) |
| | | | |
| | | | | | | | | | | | | | | | | | | | | | | | |
STATEMENTS OF CHANGES IN NET ASSETS | | | | | | | | | | | | | | | | | | | | | | | | |
| | | Year Ended December 31, 2022 | | | Year Ended December 31, 2021 | |
INCREASE (DECREASE) IN NET ASSETS | | | | | | | | | | | | | | | | | | | | | | | | |
OPERATIONS | | | | | | | | | | | | | | | | | | | | | | | | |
Net investment income (loss) | | | | | | $ | 4,533,828 | | | | | | | | | | | $ | 3,127,986 | | | | | |
Net realized gain (loss) on investment transactions | | | | | | | (2,954,467 | ) | | | | | | | | | | | 1,187,150 | | | | | |
Net change in unrealized appreciation (depreciation) on investments | | | | | | | (31,272,720 | ) | | | | | | | | | | | (11,901,520 | ) | | | | |
| | | | | | | | | | | | | | | | | | | | | | | | |
NET INCREASE (DECREASE) IN NET ASSETS RESULTING FROM OPERATIONS | | | | | | | (29,693,359 | ) | | | | | | | | | | | (7,586,384 | ) | | | | |
| | | | | | | | | | | | | | | | | | | | | | | | |
PORTFOLIO SHARE TRANSACTIONS | | | | | | | | | | | | | | | | | | | | | | | | |
Portfolio shares sold | | | | | | | 11,747,354 | | | | | | | | | | | | 3,780,217 | | | | | |
Portfolio shares purchased | | | | | | | (21,104,441 | ) | | | | | | | | | | | (19,045,491 | ) | | | | |
| | | | | | | | | | | | | | | | | | | | | | | | |
NET INCREASE (DECREASE) IN NET ASSETS FROM PORTFOLIO SHARE TRANSACTIONS | | | | | | | (9,357,087 | ) | | | | | | | | | | | (15,265,274 | ) | | | | |
| | | | | | | | | | | | | | | | | | | | | | | | |
TOTAL INCREASE (DECREASE) | | | | | | | (39,050,446 | ) | | | | | | | | | | | (22,851,658 | ) | | | | |
NET ASSETS: | | | | | | | | | | | | | | | | | | | | | | | | |
Beginning of year | | | | | | | 223,377,058 | | | | | | | | | | | | 246,228,716 | | | | | |
| | | | | | | | | | | | | | | | | | | | | | | | |
End of year | | | | | | $ | 184,326,612 | | | | | | | | | | | $ | 223,377,058 | | | | | |
| | | | | | | | | | | | | | | | | | | | | | | | |
SEE NOTES TO FINANCIAL STATEMENTS.
A112
| | | | |
| | PSF PGIM GOVERNMENT INCOME PORTFOLIO (CONTINUED) | | |
FINANCIAL HIGHLIGHTS
| | | | | | | | | | | | | | | | | | | | |
Class I | | | | | | | | | | | | | | | |
| | | Year Ended December 31, | |
| | | 2022 | | | 2021 | | | 2020 | | | 2019 | | | 2018 | |
Per Share Operating Performance(a): | | | | | | | | | | | | | | | | | | | | |
Net Asset Value, beginning of year | | $ | 14.05 | | | $ | 14.51 | | | $ | 13.54 | | | $ | 12.70 | | | $ | 12.62 | |
| | | | | | | | | | | | | | | | | | | | |
Income (Loss) From Investment Operations: | | | | | | | | | | | | | | | | | | | | |
Net investment income (loss) | | | 0.29 | | | | 0.19 | | | | 0.23 | | | | 0.31 | | | | 0.28 | |
Net realized and unrealized gain (loss) on investment transactions | | | (2.18 | ) | | | (0.65 | ) | | | 0.74 | | | | 0.53 | | | | (0.20 | ) |
| | | | | | | | | | | | | | | | | | | | |
Total from investment operations | | | (1.89 | ) | | | (0.46 | ) | | | 0.97 | | | | 0.84 | | | | 0.08 | |
| | | | | | | | | | | | | | | | | | | | |
Capital Contributions | | | — | | | | — | | | | — | | | | — | | | | — | (b)(c) |
| | | | | | | | | | | | | | | | | | | | |
Net Asset Value, end of year | | $ | 12.16 | | | $ | 14.05 | | | $ | 14.51 | | | $ | 13.54 | | | $ | 12.70 | |
| | | | | | | | | | | | | | | | | | | | |
Total Return(d) | | | (13.45 | )% | | | (3.17 | )% | | | 7.16 | % | | | 6.61 | % | | | 0.63 | %(e) |
Ratios/Supplemental Data: | | | | | | | | | | | | | | | | | | | | |
Net assets, end of year (in millions) | | $ | 181.3 | | | $ | 223.1 | | | $ | 246.2 | | | $ | 238.6 | | | $ | 221.1 | |
Average net assets (in millions) | | $ | 196.8 | | | $ | 231.5 | | | $ | 246.6 | | | $ | 234.6 | | | $ | 230.5 | |
Ratios to average net assets(f): | | | | | | | | | | | | | | | | | | | | |
Expenses after waivers and/or expense reimbursement | | | 0.49 | % | | | 0.48 | % | | | 0.51 | % | | | 0.52 | % | | | 0.51 | % |
Expenses before waivers and/or expense reimbursement | | | 0.49 | % | | | 0.48 | % | | | 0.51 | % | | | 0.52 | % | | | 0.51 | % |
Net investment income (loss) | | | 2.28 | % | | | 1.35 | % | | | 1.58 | % | | | 2.34 | % | | | 2.28 | % |
Portfolio turnover rate(g)(h) | | | 177 | % | | | 222 | % | | | 150 | % | | | 269 | % | | | 284 | % |
| | | | | | | | | | | | | | | | | | | | |
Class III | | | | | | | | | | | | | | | | |
| | | Year Ended December 31, 2022 | | April 26, 2021(i) through December 31, 2021 | |
Per Share Operating Performance(a): | | | | | | | | | | | | | | | | | | | | |
Net Asset Value, beginning of period | | | | $ | 14.03 | | | | | | | | | $ | 14.17 | | | | | |
| | | | | | | | | | | | | | | | | | | | |
Income (Loss) From Investment Operations: | | | | | | | | | | | | | | | | | | | | |
Net investment income (loss) | | | | | 0.28 | | | | | | | | | | 0.11 | | | | | |
Net realized and unrealized gain (loss) on investment transactions | | | | | (2.20 | ) | | | | | | | | | (0.25 | ) | | | | |
| | | | | | | | | | | | | | | | | | | | |
Total from investment operations | | | | | (1.92 | ) | | | | | | | | | (0.14 | ) | | | | |
| | | | | | | | | | | | | | | | | | | | |
Net Asset Value, end of period | | | | $ | 12.11 | | | | | | | | | $ | 14.03 | | | | | |
| | | | | | | | | | | | | | | | | | | | |
Total Return(d) | | | | | (13.68 | )% | | | | | | | | | (0.99 | )% | | | | |
Ratios/Supplemental Data: | | | | | | | | | | | | | | | | | | | | |
Net assets, end of period (in millions) | | | | $ | 3.0 | | | | | | | | | $ | 0.3 | | | | | |
Average net assets (in millions) | | | | $ | 1.6 | | | | | | | | | $ | 0.2 | | | | | |
Ratios to average net assets(f): | | | | | | | | | | | | | | | | | | | | |
Expenses after waivers and/or expense reimbursement | | | | | 0.74 | % | | | | | | | | | 0.68 | %(j) | | | | |
Expenses before waivers and/or expense reimbursement | | | | | 0.74 | % | | | | | | | | | 0.68 | %(j) | | | | |
Net investment income (loss) | | | | | 2.26 | % | | | | | | | | | 1.09 | %(j) | | | | |
Portfolio turnover rate(g)(h) | | | | | 177 | % | | | | | | | | | 222 | % | | | | |
| (a) | Calculated based on average shares outstanding during the period. |
| (b) | Represents payment received by the Portfolio, from Prudential, in connection with excess foreign withholding tax withheld on dividends and interest from certain countries due to the Portfolio’s tax status as a partnership. |
| (c) | Amount rounds to zero. |
| (d) | Total return is calculated assuming a purchase of a share on the first day and a sale on the last day of each period reported and includes reinvestment of dividends and distributions, if any, and does not reflect the effect of insurance contract charges. Total return does not reflect expenses associated with the separate account such as administrative fees, account charges and surrender charges which, if reflected, would reduce the total returns for all periods shown. Performance figures may reflect fee waivers and/or expense reimbursements. In the absence of fee waivers and/or expense reimbursements, the total return would be lower. Past performance is no guarantee of future results. Total returns may reflect adjustments to conformto GAAP. Total returns for periods less than one full year are not annualized. |
| (e) | Total return for the year includes the impact of the capital contribution, which was not material to the total return. |
| (f) | Does not include expenses of the underlying funds in which the Portfolio invests. |
| (g) | The Portfolio accounts for mortgage dollar roll transactions, when applicable, as purchases and sales which, as a result, can increase its portfolio turnover rate. |
| (h) | The Portfolio’s portfolio turnover rate is calculated in accordance with regulatory requirements, without regard to transactions involving short-term investments, certain derivatives and in-kind transactions (if any). If such transactions were included, the Portfolio’s portfolio turnover rate may be higher. |
| (i) | Commencement of offering. |
| (j) | Annualized, with the exception of certain non-recurring expenses. |
SEE NOTES TO FINANCIAL STATEMENTS.
A113
| | | | |
| | PSF PGIM GOVERNMENT MONEY MARKET PORTFOLIO | | |
SCHEDULE OF INVESTMENTS | | | | as of December 31, 2022 |
| | | | | | | | | | | | |
Interest Rate | | Maturity Date | | | | Principal
Amount
(000)# | | | Value | |
| | | | | | | | | | | |
|
REPURCHASE AGREEMENTS — 32.1% | |
BOS | |
4.3%, dated 12/30/22, due 01/03/23 in the amount of $70,033,444 collateralized by GNMA (coupon rates 3.000%-5.500%, maturity dates 04/20/45-12/20/52) with the aggregate value, including accrued interest, of $71,400,001 | | | 70,000 | | | $ | 70,000,000 | |
CAG | |
4.3%, dated 12/30/22, due 01/03/23 in the amount of $8,420,021 collateralized by GNMA (coupon rate 2.000%, maturity date 01/20/51) with the aggregate value, including accrued interest, of $8,584,320 | | | 8,416 | | | | 8,416,000 | |
CIBC | |
4.3%, dated 12/15/22, due 02/02/23 in the amount of $20,117,056 collateralized by U.S. Treasury Securities (coupon rates 0.000%-4.435%, maturity dates 02/21/23-08/15/49) with the aggregate value, including accrued interest, of $20,446,301 | | | 20,000 | | | | 20,000,000 | |
GS | |
4.3%, dated 12/28/22, due 01/04/23 in the amount of $35,029,264 collateralized by FNMA (coupon rate 3.500%, maturity date 07/01/52) with the aggregate value, including accrued interest, of $35,700,000 | | | 35,000 | | | | 35,000,000 | |
ING | |
4.31%, dated 12/15/22, due 02/02/23 in the amount of $20,117,328 collateralized by FHLMC (coupon rates 2.387%-5.500%, maturity dates 03/01/38-11/01/52), FNMA (coupon rates 2.000%-5.500%, maturity dates 05/01/35-09/01/52) and GNMA (coupon rate 5.500%, maturity date 09/20/52) with the aggregate value, including accrued interest, of $20,400,001 | | | 20,000 | | | | 20,000,000 | |
4.31%, dated 12/15/22, due 02/03/23 in the amount of $20,119,722 collateralized by FHLMC (coupon rates 2.000%-8.000%, maturity dates 07/01/28-11/01/52) and FNMA (coupon rates 2.000%-5.500%, maturity dates 12/01/26-11/01/52) with the aggregate value, including accrued interest, of $20,400,000 | | | 20,000 | | | | 20,000,000 | |
| | | | | | | | | | | | |
Interest Rate | | Maturity Date | | | | Principal
Amount
(000)# | | | Value | |
| | | | | | | | | | | |
|
| REPURCHASE AGREEMENTS (continued) | |
NWS | |
4.28%, dated 12/28/22, due 01/04/23 in the amount of $20,016,644 collateralized by U.S. Treasury Securities (coupon rate 3.125%, maturity date 08/15/25) with the aggregate value, including accrued interest, of $20,417,039 | | | 20,000 | | | $ | 20,000,000 | |
SSB | |
4.3%, dated 12/30/22, due 01/03/23 in the amount of $40,019,111 collateralized by U.S. Treasury Securities (coupon rate 0.125%, maturity date 05/15/23) with the aggregate value, including accrued interest, of $40,806,455 | | | 40,000 | | | | 40,000,000 | |
TDM | |
4.3%, dated 12/30/22, due 01/03/23 in the amount of $70,033,444 collateralized by U.S. Treasury Securities (coupon rates 0.375%-2.875%, maturity dates 03/31/24-09/30/27) with the aggregate value, including accrued interest, of $71,400,024 | | | 70,000 | | | | 70,000,000 | |
| | | | | | | | | | | | |
TOTAL REPURCHASE AGREEMENTS
(cost $303,416,000) | | | | 303,416,000 | |
| | | | | | | | | | | | |
|
U.S. GOVERNMENT AGENCY OBLIGATIONS — 67.0% | |
Federal Farm Credit Bank, SOFR + 0.008% (Cap N/A, Floor 0.000%) | |
4.308%(c) | | 02/07/23 | | | | | 8,750 | | | | 8,749,889 | |
Federal Farm Credit Bank, SOFR + 0.015% (Cap N/A, Floor 0.000%) | |
4.315%(c) | | 05/02/23 | | | | | 10,000 | | | | 9,999,831 | |
Federal Farm Credit Bank, SOFR + 0.025% | |
4.325%(c) | | 10/27/23 | | | | | 11,450 | | | | 11,449,438 | |
Federal Farm Credit Bank, SOFR + 0.025% (Cap N/A, Floor 0.000%) | |
4.325%(c) | | 09/27/23 | | | | | 9,350 | | | | 9,349,651 | |
Federal Farm Credit Bank, SOFR + 0.035% (Cap N/A, Floor 0.000%) | |
4.335%(c) | | 05/12/23 | | | | | 10,500 | | | | 10,500,191 | |
Federal Farm Credit Bank, SOFR + 0.040% (Cap N/A, Floor 0.000%) | |
4.340%(c) | | 03/10/23 | | | | | 4,500 | | | | 4,500,105 | |
Federal Farm Credit Bank, SOFR + 0.050% (Cap N/A, Floor 0.000%) | |
4.350%(c) | | 11/09/23 | | | | | 2,825 | | | | 2,825,363 | |
Federal Farm Credit Bank, SOFR + 0.110% (Cap N/A, Floor 0.000%) | |
4.410%(c) | | 11/15/23 | | | | | 10,000 | | | | 10,000,000 | |
Federal Farm Credit Bank, SOFR + 0.120% (Cap N/A, Floor 0.000%) | |
4.420%(c) | | 09/14/23 | | | | | 6,800 | | | | 6,800,000 | |
Federal Home Loan Bank | |
4.011%(n) | | 01/06/23 | | | | | 12,000 | | | | 11,993,333 | |
4.111%(n) | | 01/27/23 | | | | | 22,000 | | | | 21,935,289 | |
4.210%(n) | | 02/06/23 | | | | | 13,000 | | | | 12,945,660 | |
4.229%(n) | | 02/08/23 | | | | | 17,500 | | | | 17,422,298 | |
4.260%(n) | | 02/15/23 | | | | | 13,500 | | | | 13,428,872 | |
4.289%(n) | | 02/17/23 | | | | | 34,000 | | | | 33,811,347 | |
4.400%(n) | | 02/22/23 | | | | | 17,500 | | | | 17,389,536 | |
4.417%(n) | | 03/01/23 | | | | | 16,750 | | | | 16,630,093 | |
4.480%(n) | | 03/15/23 | | | | | 17,000 | | | | 16,847,288 | |
4.495%(n) | | 03/22/23 | | | | | 17,500 | | | | 17,327,139 | |
SEE NOTES TO FINANCIAL STATEMENTS.
A114
| | | | |
| | PSF PGIM GOVERNMENT MONEY MARKET PORTFOLIO (CONTINUED) | | |
SCHEDULE OF INVESTMENTS | | | | as of December 31, 2022 |
| | | | | | | | | | | | |
Interest Rate | | Maturity Date | | | | Principal
Amount
(000)# | | | Value | |
| | | | | | | | | | | |
|
| U.S. GOVERNMENT AGENCY OBLIGATIONS (continued) | |
Federal Home Loan Bank, SOFR + 0.010% (Cap N/A, Floor 0.000%) | |
4.310%(c) | | 01/17/23 | | | | | 15,000 | | | $ | 14,999,912 | |
Federal Home Loan Bank, SOFR + 0.015% (Cap N/A, Floor 0.000%) | |
4.315%(c) | | 02/08/23 | | | | | 8,750 | | | | 8,749,931 | |
Federal Home Loan Bank, SOFR + 0.020% (Cap N/A, Floor 0.000%) | |
4.320%(c) | | 01/12/23 | | | | | 16,500 | | | | 16,500,000 | |
4.320%(c) | | 01/24/23 | | | | | 13,000 | | | | 13,000,000 | |
Federal Home Loan Bank, SOFR + 0.025% (Cap N/A, Floor 0.000%) | |
4.325%(c) | | 01/25/23 | | | | | 10,500 | | | | 10,500,032 | |
Federal Home Loan Bank, SOFR + 0.030% (Cap N/A, Floor 0.000%) | |
4.330%(c) | | 01/19/23 | | | | | 16,500 | | | | 16,500,000 | |
4.330%(c) | | 02/28/23 | | | | | 16,500 | | | | 16,500,000 | |
4.330%(c) | | 03/21/23 | | | | | 13,000 | | | | 13,000,000 | |
Federal Home Loan Bank, SOFR + 0.040% (Cap N/A, Floor 0.000%) | |
4.340%(c) | | 01/30/23 | | | | | 3,000 | | | | 2,999,999 | |
4.340%(c) | | 01/30/23 | | | | | 16,500 | | | | 16,500,000 | |
4.340%(c) | | 02/10/23 | | | | | 16,000 | | | | 16,000,000 | |
4.340%(c) | | 02/17/23 | | | | | 13,000 | | | | 13,000,000 | |
4.340%(c) | | 10/06/23 | | | | | 8,250 | | | | 8,250,000 | |
Federal Home Loan Bank, SOFR + 0.045% (Cap N/A, Floor 0.000%) | |
4.345%(c) | | 03/03/23 | | | | | 13,000 | | | | 13,000,000 | |
Federal Home Loan Bank, SOFR + 0.050% (Cap N/A, Floor 0.000%) | |
4.350%(c) | | 02/08/23 | | | | | 8,000 | | | | 8,000,000 | |
4.350%(c) | | 03/03/23 | | | | | 9,000 | | | | 9,000,000 | |
4.350%(c) | | 06/27/23 | | | | | 16,500 | | | | 16,500,000 | |
Federal Home Loan Bank, SOFR + 0.055% (Cap N/A, Floor 0.000%) | |
4.355%(c) | | 04/04/23 | | | | | 16,500 | | | | 16,500,000 | |
Federal Home Loan Bank, SOFR + 0.060% (Cap N/A, Floor 0.000%) | |
4.360%(c) | | 04/10/23 | | | | | 10,000 | | | | 10,000,000 | |
4.360%(c) | | 04/18/23 | | | | | 3,000 | | | | 3,000,000 | |
| | | | | | | | | | | | |
Interest Rate | | Maturity Date | | | | Principal
Amount
(000)# | | | Value | |
| | | | | | | | | | | |
|
| U.S. GOVERNMENT AGENCY OBLIGATIONS (continued) | |
4.360%(c) | | 05/01/23 | | | | | 17,000 | | | $ | 17,000,000 | |
4.360%(c) | | 06/06/23 | | | | | 16,000 | | | | 16,000,000 | |
4.360%(c) | | 07/03/23 | | | | | 13,000 | | | | 13,000,000 | |
Federal Home Loan Bank, SOFR + 0.065% (Cap N/A, Floor 0.000%) | |
4.365%(c) | | 05/08/23 | | | | | 16,000 | | | | 16,000,000 | |
Federal Home Loan Bank, SOFR + 0.070% (Cap N/A, Floor 0.000%) | |
4.370%(c) | | 04/03/23 | | | | | 12,000 | | | | 12,000,000 | |
4.370%(c) | | 05/17/23 | | | | | 11,500 | | | | 11,500,000 | |
4.370%(c) | | 12/14/23 | | | | | 8,400 | | | | 8,400,000 | |
Federal Home Loan Bank, SOFR + 0.090% (Cap N/A, Floor 0.000%) | |
4.390%(c) | | 05/23/23 | | | | | 10,000 | | | | 10,000,000 | |
4.390%(c) | | 08/15/23 | | | | | 12,000 | | | | 12,000,000 | |
4.390%(c) | | 08/16/23 | | | | | 5,000 | | | | 5,000,000 | |
Federal Home Loan Bank, SOFR + 0.100% (Cap N/A, Floor 0.000%) | |
4.400%(c) | | 09/21/23 | | | | | 16,500 | | | | 16,500,000 | |
| | | | | | | | | | | | |
| |
TOTAL U.S. GOVERNMENT AGENCY OBLIGATIONS
(cost $633,805,197) | | | | 633,805,197 | |
| | | | | | | | | | | | |
| |
TOTAL INVESTMENTS — 99.1%
(cost $937,221,197) | | | | 937,221,197 | |
| |
Other assets in excess of liabilities — 0.9% | | | | 8,089,530 | |
| | | | | | | | | | | | |
| |
NET ASSETS — 100.0% | | | $ | 945,310,727 | |
| | | | | | | | | | | | |
See the Glossary for a list of the abbreviation(s) used in the annual report.
| # | Principal amount is shown in U.S. dollars unless otherwise stated. |
| (c) | Variable rate instrument. The interest rate shown reflects the rate in effect at December 31, 2022. |
| (n) | Rate shown reflects yield to maturity at purchased date. |
Fair Value Measurements:
Various inputs are used in determining the value of the Portfolio’s investments. These inputs are summarized in the three broad levels listed below.
Level 1—unadjusted quoted prices generally in active markets for identical securities.
Level 2—quoted prices for similar securities, interest rates and yield curves, prepayment speeds, foreign currency exchange rates and other observable inputs.
Level 3—unobservable inputs for securities valued in accordance with Board approved fair valuation procedures.
The following is a summary of the inputs used as of December 31, 2022 in valuing such portfolio securities:
| | | | | | | | | | | | | | | | | | | | | | | | | | | | |
| | | Level 1 | | | Level 2 | | | Level 3 | |
Investments in Securities | | | | | | | | | | | | | | | | | | | | | | | | | | | | |
Assets | | | | | | | | | | | | | | | | | | | | | | | | | | | | |
Short-Term Investments | | | | | | | | | | | | | | | | | | | | | | | | | | | | |
Repurchase Agreements | | | | | | $ | — | | | | | | | $ | 303,416,000 | | | | | | | $ | — | | | | | |
U.S. Government Agency Obligations | | | | | | | — | | | | | | | | 633,805,197 | | | | | | | | — | | | | | |
| | | | | | | | | | | | | | | | | | | | | | | | | | | | |
| | | | | | | |
Total | | | | | | $ | — | | | | | | | $ | 937,221,197 | | | | | | | $ | — | | | | | |
| | | | | | | | | | | | |
Industry Classification:
The industry classification of investments and other assets in excess of liabilities shown as a percentage of net assets as of December 31, 2022 were as follows:
| | | | |
U.S. Government Agency Obligations | | | 67.0 | % |
SEE NOTES TO FINANCIAL STATEMENTS.
A115
| | | | |
| | PSF PGIM GOVERNMENT MONEY MARKET PORTFOLIO (CONTINUED) | | |
| | | | |
SCHEDULE OF INVESTMENTS | | | | as of December 31, 2022 |
| | | | |
Industry Classification (continued): | | | | |
| |
Repurchase Agreements | | | 32.1 | % |
| | | | |
| |
| | | 99.1 | |
Other assets in excess of liabilities | | | 0.9 | |
| | | | |
| |
| | | 100.0 | % |
| | | | |
Financial Instruments/Transactions—Summary of Offsetting and Netting Arrangements:
The Portfolio entered into financial instruments/transactions during the reporting period that are either offset in accordance with current requirements or are subject to enforceable master netting arrangements or similar agreements that permit offsetting. The information about offsetting and related netting arrangements for financial instruments/transactions where the legal right to set-off exists is presented in the summary below.
Offsetting of financial instrument/transaction assets and liabilities:
| | | | | | | | | | | | | | | | | | | | | | |
| Description | | Counterparty | | Gross Market Value of Recognized Assets/(Liabilities) | | | Collateral Pledged/(Received)(1) | | Net Amount |
Repurchase Agreements | | BOS | | | | | | $ | 70,000,000 | | | | | | | | $(70,000,000 | ) | | | $— | |
Repurchase Agreements | | CAG | | | | | | | 8,416,000 | | | | | | | | (8,416,000 | ) | | | — | |
Repurchase Agreements | | CIBC | | | | | | | 20,000,000 | | | | | | | | (20,000,000 | ) | | | — | |
Repurchase Agreements | | GS | | | | | | | 35,000,000 | | | | | | | | (35,000,000 | ) | | | — | |
Repurchase Agreements | | ING | | | | | | | 40,000,000 | | | | | | | | (40,000,000 | ) | | | — | |
Repurchase Agreements | | NWS | | | | | | | 20,000,000 | | | | | | | | (20,000,000 | ) | | | — | |
Repurchase Agreements | | SSB | | | | | | | 40,000,000 | | | | | | | | (40,000,000 | ) | | | — | |
Repurchase Agreements | | TDM | | | | | | | 70,000,000 | | | | | | | | (70,000,000 | ) | | | — | |
| | | | | | | | | | | | | | | | | | | | | | |
| | | | | | | | $ | 303,416,000 | | | | | | | | | | | | | |
| | | | | | | | | | | | | | | | | | | | | | |
| (1) | Collateral amount disclosed by the Portfolio is limited to the market value of financial instruments/transactions. |
SEE NOTES TO FINANCIAL STATEMENTS.
A116
| | | | |
| | PSF PGIM GOVERNMENT MONEY MARKET PORTFOLIO (CONTINUED) | | |
| | | | |
STATEMENT OF ASSETS AND LIABILITIES | |
|
as of December 31, 2022 | |
| |
ASSETS | | | | |
Investments, at value: | | $ | 633,805,197 | |
Repurchase Agreements (cost $303,416,000) | | | 303,416,000 | |
Cash | | | 56 | |
Receivable for investments sold | | | 8,500,000 | |
Interest receivable | | | 2,744,356 | |
Receivable for Portfolio shares sold | | | 29,805 | |
Prepaid expenses | | | 7,655 | |
| | | | |
Total Assets | | | 948,503,069 | |
| | | | |
LIABILITIES | | | | |
Payable for Portfolio shares purchased | | | 2,840,852 | |
Management fee payable | | | 239,670 | |
Accrued expenses and other liabilities | | | 79,729 | |
Distribution fee payable | | | 30,310 | |
Affiliated transfer agent fee payable | | | 980 | |
Trustees’ fees payable | | | 801 | |
| | | | |
Total Liabilities | | | 3,192,342 | |
| | | | |
NET ASSETS | | $ | 945,310,727 | |
| | | | |
Net assets were comprised of: | | | | |
Partners’ Equity | | $ | 945,310,727 | |
| | | | |
Class I: | | | | |
Net asset value and redemption price per share, $802,595,837 / 80,256,778 outstanding shares of beneficial interest | | $ | 10.00 | |
| | | | |
Class III: | | | | |
Net asset value and redemption price per share, $142,714,890 / 14,271,667 outstanding shares of beneficial interest | | $ | 10.00 | |
| | | | |
| | | | |
STATEMENT OF OPERATIONS | |
|
Year Ended December 31, 2022 | |
|
NET INVESTMENT INCOME (LOSS) | |
Interest income | | $ | 15,119,909 | |
| | | | |
EXPENSES | | | | |
Management fee | | | 2,751,606 | |
Distribution fee—Class III | | | 342,353 | |
Custodian and accounting fees | | | 93,688 | |
Shareholders’ reports | | | 39,197 | |
Audit fee | | | 25,100 | |
Legal fees and expenses | | | 25,093 | |
Trustees’ fees | | | 22,582 | |
Transfer agent’s fees and expenses (including affiliated expense of $5,882) | | | 10,682 | |
Miscellaneous | | | 23,628 | |
| | | | |
Total expenses | | | 3,333,929 | |
Less: Fee waivers and/or expense reimbursement | | | (503,442 | ) |
Less: Distribution fee waiver—Class III | | | (113,784 | ) |
| | | | |
Net expenses | | | 2,716,703 | |
| | | | |
NET INVESTMENT INCOME (LOSS) | | | 12,403,206 | |
| | | | |
REALIZED AND UNREALIZED GAIN (LOSS) ON INVESTMENT TRANSACTIONS | | | | |
Net realized gain (loss) on investment transactions | | | 3,259 | |
| | | | |
NET INCREASE (DECREASE) IN NET ASSETS RESULTING FROM OPERATIONS | | $ | 12,406,465 | |
| | | | |
STATEMENTS OF CHANGES IN NET ASSETS
| | | | | | | | | | | | | | | | | | | | | | | | |
| | | Year Ended December 31, 2022 | | | Year Ended December 31, 2021 | |
INCREASE (DECREASE) IN NET ASSETS | | | | | | | | | | | | | | | | | | | | | | | | |
OPERATIONS | | | | | | | | | | | | | | | | | | | | | | | | |
Net investment income (loss) | | | | | | $ | 12,403,206 | | | | | | | | | | | $ | — | | | | | |
Net realized gain (loss) on investment transactions | | | | | | | 3,259 | | | | | | | | | | | | 381,775 | | | | | |
| | | | | | | | | | | | | | | | | | | | | | | | |
NET INCREASE (DECREASE) IN NET ASSETS RESULTING FROM OPERATIONS | | | | | | | 12,406,465 | | | | | | | | | | | | 381,775 | | | | | |
| | | | | | | | | | | | | | | | | | | | | | | | |
DISTRIBUTIONS | | | | | | | | | | | | | | | | | | | | | | | | |
Class I | | | | | | | (10,727,306 | ) | | | | | | | | | | | (331,630 | ) | | | | |
Class III | | | | | | | (1,680,477 | ) | | | | | | | | | | | (50,145 | ) | | | | |
| | | | | | | | | | | | | | | | | | | | | | | | |
| | | | | | | (12,407,783 | ) | | | | | | | | | | | (381,775 | ) | | | | |
| | | | | | | | | | | | | | | | | | | | | | | | |
PORTFOLIO SHARE TRANSACTIONS | | | | | | | | | | | | | | | | | | | | | | | | |
Portfolio shares sold | | | | | | | 896,553,186 | | | | | | | | | | | | 1,118,916,318 | | | | | |
Portfolio shares issued in reinvestment of distributions | | | | | | | 12,407,783 | | | | | | | | | | | | 381,775 | | | | | |
Portfolio shares purchased | | | | | | | (832,486,578 | ) | | | | | | | | | | | (1,108,241,533 | ) | | | | |
| | | | | | | | | | | | | | | | | | | | | | | | |
NET INCREASE (DECREASE) IN NET ASSETS FROM PORTFOLIO SHARE TRANSACTIONS | | | | | | | 76,474,391 | | | | | | | | | | | | 11,056,560 | | | | | |
| | | | | | | | | | | | | | | | | | | | | | | | |
TOTAL INCREASE (DECREASE) | | | | | | | 76,473,073 | | | | | | | | | | | | 11,056,560 | | | | | |
NET ASSETS: | | | | | | | | | | | | | | | | | | | | | | | | |
Beginning of year | | | | | | | 868,837,654 | | | | | | | | | | | | 857,781,094 | | | | | |
| | | | | | | | | | | | | | | | | | | | | | | | |
End of year | | | | | | $ | 945,310,727 | | | | | | | | | | | $ | 868,837,654 | | | | | |
| | | | | | | | | | | | | | | | | | | | | | | | |
SEE NOTES TO FINANCIAL STATEMENTS.
A117
| | | | |
| | PSF PGIM GOVERNMENT MONEY MARKET PORTFOLIO (CONTINUED) | | |
FINANCIAL HIGHLIGHTS
| | | | | | | | | | | | | | | | | | | | |
| Class I | | | | | | | | | | | | | | | |
| | | Year Ended December 31, | |
| | | 2022 | | | 2021 | | | 2020 | | | 2019 | | | 2018 | |
Per Share Operating Performance(a): | | | | | | | | | | | | | | | | | | | | |
Net Asset Value, beginning of year | | $ | 10.00 | | | $ | 10.00 | | | $ | 10.00 | | | $ | 10.00 | | | $ | 10.00 | |
| | | | | | | | | | | | | | | | | | | | |
Income (Loss) From Investment Operations: | | | | | | | | | | | | | | | | | | | | |
Net investment income (loss) and realized gains (losses) | | | 0.14 | | | | — | (b) | | | 0.03 | | | | 0.19 | | | | 0.15 | |
Less Dividends and Distributions | | | (0.14 | ) | | | (— | )(b) | | | (0.03 | ) | | | (0.19 | ) | | | (0.15 | ) |
| | | | | | | | | | | | | | | | | | | | |
Net Asset Value, end of year | | $ | 10.00 | | | $ | 10.00 | | | $ | 10.00 | | | $ | 10.00 | | | $ | 10.00 | |
| | | | | | | | | | | | | | | | | | | | |
Total Return(c) | | | 1.39 | % | | | 0.04 | % | | | 0.30 | % | | | 1.92 | % | | | 1.53 | % |
Ratios/Supplemental Data: | | | | | | | | | | | | | | | | | | | | |
Net assets, end of year (in millions) | | $ | 803 | | | $ | 725 | | | $ | 792 | | | $ | 600 | | | $ | 536 | |
Average net assets (in millions) | | $ | 780 | | | $ | 748 | | | $ | 667 | | | $ | 563 | | | $ | 560 | |
Ratios to average net assets(d): | | | | | | | | | | | | | | | | | | | | |
Expenses after waivers and/or expense reimbursement | | | 0.27 | % | | | 0.06 | % | | | 0.21 | % | | | 0.35 | % | | | 0.35 | % |
Expenses before waivers and/or expense reimbursement | | | 0.32 | % | | | 0.32 | % | | | 0.34 | % | | | 0.35 | % | | | 0.35 | % |
Net investment income (loss) | | | 1.37 | % | | | — | % | | | 0.26 | % | | | 1.88 | % | | | 1.52 | % |
| | | | | | | | | | | | | | | |
| Class III | | | | | | |
| | | Year Ended December 31, | | May 18, 2020(e)
through December 31,
2020 |
| | | 2022 | | 2021 |
Per Share Operating Performance(a): | | | | | | | | | | | | | | | |
Net Asset Value, beginning of period | | | $ | 10.00 | | | | $ | 10.00 | | | | $ | 10.00 | |
| | | | | | | | | | | | | | | |
Income (Loss) From Investment Operations: | | | | | | | | | | | | | | | |
Net investment income (loss) and realized gains (losses) | | | | 0.12 | | | | | — | (b) | | | | — | (b) |
Less Dividends and Distributions: | | | | (0.12 | ) | | | | (— | )(b) | | | | (— | )(b) |
| | | | | | | | | | | | | | | |
Net Asset Value, end of period | | | $ | 10.00 | | | | $ | 10.00 | | | | $ | 10.00 | |
| | | | | | | | | | | | | | | |
Total Return(c) | | | | 1.22 | % | | | | 0.04 | % | | | | — | %(b) |
Ratios/Supplemental Data: | | | | | | | | | | | | | | | |
Net assets, end of period (in millions) | | | $ | 143 | | | | $ | 144 | | | | $ | 66 | |
Average net assets (in millions) | | | $ | 137 | | | | $ | 118 | | | | $ | 34 | |
Ratios to average net assets(d): | | | | | | | | | | | | | | | |
Expenses after waivers and/or expense reimbursement | | | | 0.44 | % | | | | 0.06 | % | | | | 0.13 | %(f) |
Expenses before waivers and/or expense reimbursement | | | | 0.58 | % | | | | 0.58 | % | | | | 0.58 | %(f) |
Net investment income (loss) | | | | 1.23 | % | | | | — | % | | | | — | %(b)(f) |
| (a) | Calculated based on average shares outstanding during the period. |
| (b) | Amount rounds to zero. |
| (c) | Total return is calculated assuming a purchase of a share on the first day and a sale on the last day of each period reported and includes reinvestment of dividends and distributions, if any, and does not reflect the effect of insurance contract charges. Total return does not reflect expenses associated with the separate account such as administrative fees, account charges and surrender charges which, if reflected, would reduce the total returns for all periods shown. Performance figures may reflect fee waivers and/or expense reimbursements. In the absence of fee waivers and/or expense reimbursements, the total return would be lower. Past performance is no guarantee of future results. Total returns may reflect adjustments to conform to GAAP. Total returns for periods less than one full year are not annualized. |
| (d) | Does not include expenses of the underlying funds in which the Portfolio invests. |
| (e) | Commencement of offering. |
SEE NOTES TO FINANCIAL STATEMENTS.
A118
| | | | |
| | PSF PGIM HIGH YIELD BOND PORTFOLIO | | |
| | | | |
SCHEDULE OF INVESTMENTS | | | | as of December 31, 2022 |
| | | | | | | | | | | | |
Interest
Rate | | Maturity Date | | | | Principal
Amount
(000)# | | | Value | |
| | | | | | | | | | | |
LONG-TERM INVESTMENTS — 94.1% | |
|
ASSET-BACKED SECURITIES — 6.1% | |
Collateralized Loan Obligations | |
BlueMountain CLO Ltd. (Cayman Islands), | |
Series 2018-22A, Class A1, 144A, 3 Month LIBOR + 1.080% (Cap N/A, Floor 0.000%) | |
5.159%(c) | | 07/15/31 | | | | | 2,500 | | | $ | 2,460,382 | |
Carlyle Global Market Strategies CLO Ltd. (Cayman Islands), | |
Series 2015-05A, Class A1RR, 144A, 3 Month LIBOR + 1.080% (Cap N/A, Floor 1.080%) | |
5.323%(c) | | 01/20/32 | | | | | 5,000 | | | | 4,907,452 | |
CIFC Funding Ltd. (Cayman Islands), | |
Series 2018-02A, Class A1, 144A, 3 Month LIBOR + 1.040% (Cap N/A, Floor 0.000%) | |
5.283%(c) | | 04/20/31 | | | | | 2,500 | | | | 2,458,578 | |
Guggenheim CLO STAT Ltd. (Cayman Islands), | |
Series 2022-01A, Class A1A, 144A, 3 Month SOFR + 2.590% (Cap N/A, Floor 2.590%) | |
6.709%(c) | | 10/25/31 | | | | | 4,750 | | | | 4,747,640 | |
KKR CLO Ltd. (Cayman Islands), | |
Series 11, Class AR, 144A, 3 Month LIBOR + 1.180% (Cap N/A, Floor 1.180%) | |
5.259%(c) | | 01/15/31 | | | | | 2,000 | | | | 1,981,422 | |
KKR Static CLO Ltd. (Cayman Islands), | |
Series 2022-02A, Class A1, 144A, 3 Month SOFR + 2.220% (Cap N/A, Floor 2.220%) | |
6.738%(c) | | 10/20/31 | | | | | 2,000 | | | | 1,999,362 | |
Race Point CLO Ltd. (Cayman Islands), | |
Series 2013-08A, Class AR2, 144A, 3 Month LIBOR + 1.040% (Cap N/A, Floor 1.040%) | |
5.715%(c) | | 02/20/30 | | | | | 4,213 | | | | 4,150,628 | |
Signal Peak CLO Ltd., | |
Series 2018-05A, Class A, 144A, 3 Month LIBOR + 1.110% (Cap N/A, Floor 1.110%) | |
5.468%(c) | | 04/25/31 | | | | | 4,800 | | | | 4,703,220 | |
TSTAT Ltd. (Bermuda), | |
Series 2022-02A, Class A1, 144A | |
0.000%(cc) | | 01/20/31 | | | | | 2,250 | | | | 2,246,462 | |
| | | | | | | | | | | | |
| |
TOTAL ASSET-BACKED SECURITIES
(cost $29,612,427) | | | | 29,655,146 | |
| | | | | | | | | | | | |
CONVERTIBLE BOND — 0.0% | |
Telecommunications | |
Digicel Group Holdings Ltd. (Jamaica), | |
Sub. Notes, 144A, Cash coupon 7.000% or PIK N/A (original cost $78,710; purchased 06/23/20 - 10/01/22)(f) | |
7.000% | | 01/17/23(oo) | | | | | 486 | | | | 43,741 | |
| | | | | | | | | | | | |
(cost $78,710) | |
CORPORATE BONDS — 77.3% | |
Advertising — 0.4% | |
CMG Media Corp., | |
Gtd. Notes, 144A | |
8.875% | | 12/15/27 | | | | | 2,450 | | | | 1,843,375 | |
| | | | | | | | | | | | |
Aerospace & Defense — 2.9% | |
Boeing Co. (The), | |
Sr. Unsec’d. Notes | |
5.805% | | 05/01/50 | | | | | 2,100 | | | | 1,953,841 | |
5.930% | | 05/01/60 | | | | | 725 | | | | 665,747 | |
| | | | | | | | | | | | |
Interest
Rate | | Maturity
Date | | | | Principal
Amount
(000)# | | | Value | |
| | | | | | | | | | | |
|
CORPORATE BONDS (continued) | |
Aerospace & Defense (cont’d.) | |
Bombardier, Inc. (Canada), | |
Sr. Unsec’d. Notes, 144A | |
6.000% | | 02/15/28 | | | | | 1,025 | | | $ | 948,514 | |
7.125% | | 06/15/26(a) | | | | | 1,150 | | | | 1,112,625 | |
7.500% | | 12/01/24 | | | | | 1,720 | | | | 1,717,907 | |
7.500% | | 03/15/25 | | | | | 1,074 | | | | 1,062,957 | |
7.875% | | 04/15/27(a) | | | | | 3,825 | | | | 3,717,441 | |
Spirit AeroSystems, Inc., | |
Sec’d. Notes, 144A | |
7.500% | | 04/15/25 | | | | | 725 | | | | 716,445 | |
TransDigm UK Holdings PLC, | |
Gtd. Notes | |
6.875% | | 05/15/26 | | | | | 600 | | | | 587,250 | |
TransDigm, Inc., | |
Gtd. Notes | |
4.625% | | 01/15/29(a) | | | | | 400 | | | | 351,471 | |
5.500% | | 11/15/27 | | | | | 775 | | | | 727,768 | |
Sr. Sec’d. Notes, 144A | |
6.250% | | 03/15/26(a) | | | | | 600 | | | | 592,994 | |
| | | | | | | | | | | | |
| |
| | | | 14,154,960 | |
| | | | | | | | | | | | |
| |
Agriculture — 0.3% | |
Vector Group Ltd., | |
Sr. Sec’d. Notes, 144A | |
5.750% | | 02/01/29 | | | | | 1,425 | | | | 1,236,688 | |
| | | | | | | | | | | | |
Airlines — 0.7% | |
American Airlines, Inc., | |
Sr. Sec’d. Notes, 144A | |
11.750% | | 07/15/25 | | | | | 800 | | | | 860,670 | |
American Airlines, Inc./AAdvantage Loyalty IP Ltd., | |
Sr. Sec’d. Notes, 144A | |
5.500% | | 04/20/26 | | | | | 125 | | | | 120,207 | |
5.750% | | 04/20/29 | | | | | 1,200 | | | | 1,093,320 | |
Hawaiian Brand Intellectual Property Ltd./HawaiianMiles Loyalty Ltd., | |
Sr. Sec’d. Notes, 144A | |
5.750% | | 01/20/26(a) | | | | | 425 | | | | 384,625 | |
United Airlines, Inc., | |
Sr. Sec’d. Notes, 144A | |
4.375% | | 04/15/26 | | | | | 640 | | | | 596,080 | |
4.625% | | 04/15/29 | | | | | 440 | | | | 383,994 | |
| | | | | | | | | | | | |
| |
| | | | 3,438,896 | |
| | | | | | | | | | | | |
Apparel — 0.3% | |
Kontoor Brands, Inc., | |
Gtd. Notes, 144A | |
4.125% | | 11/15/29 | | | | | 250 | | | | 201,202 | |
Wolverine World Wide, Inc., | |
Gtd. Notes, 144A | |
4.000% | | 08/15/29 | | | | | 1,650 | | | | 1,249,389 | |
| | | | | | | | | | | | |
| |
| | | | 1,450,591 | |
| | | | | | | | | | | | |
Auto Manufacturers — 1.4% | |
Allison Transmission, Inc., | |
Gtd. Notes, 144A | |
3.750% | | 01/30/31(a) | | | | | 275 | | | | 226,258 | |
SEE NOTES TO FINANCIAL STATEMENTS.
A119
| | | | |
| | PSF PGIM HIGH YIELD BOND PORTFOLIO (CONTINUED) | | |
| | | | |
SCHEDULE OF INVESTMENTS | | | | as of December 31, 2022 |
| | | | | | | | | | | | |
Interest
Rate | | Maturity Date | | | | Principal
Amount
(000)# | | | Value | |
| | | | | | | | | | | |
|
CORPORATE BONDS (continued) | |
Auto Manufacturers (cont’d.) | |
Ford Motor Co., | |
Sr. Unsec’d. Notes | |
4.750% | | 01/15/43 | | | | | 2,150 | | | $ | 1,555,500 | |
5.291% | | 12/08/46 | | | | | 3,575 | | | | 2,749,173 | |
7.400% | | 11/01/46 | | | | | 550 | | | | 540,231 | |
Ford Motor Credit Co. LLC, | |
Sr. Unsec’d. Notes | |
4.000% | | 11/13/30 | | | | | 375 | | | | 307,995 | |
Jaguar Land Rover Automotive PLC (United Kingdom), | |
Gtd. Notes, 144A | |
7.750% | | 10/15/25 | | | | | 750 | | | | 693,852 | |
PM General Purchaser LLC, | |
Sr. Sec’d. Notes, 144A | |
9.500% | | 10/01/28 | | | | | 1,150 | | | | 874,396 | |
| | | | | | | | | | | | |
| |
| | | | 6,947,405 | |
| | | | | | | | | | | | |
Auto Parts & Equipment — 1.0% | |
Adient Global Holdings Ltd., | |
Gtd. Notes, 144A | |
4.875% | | 08/15/26 | | | | | 2,175 | | | | 2,019,901 | |
American Axle & Manufacturing, Inc., | |
Gtd. Notes | |
6.250% | | 03/15/26(a) | | | | | 865 | | | | 811,934 | |
Dana Financing Luxembourg Sarl, | |
Gtd. Notes, 144A | |
5.750% | | 04/15/25 | | | | | 475 | | | | 466,094 | |
Dana, Inc., | |
Sr. Unsec’d. Notes | |
4.250% | | 09/01/30(a) | | | | | 475 | | | | 382,768 | |
4.500% | | 02/15/32(a) | | | | | 475 | | | | 383,491 | |
5.375% | | 11/15/27 | | | | | 175 | | | | 162,287 | |
5.625% | | 06/15/28(a) | | | | | 50 | | | | 45,486 | |
Titan International, Inc., | |
Sr. Sec’d. Notes | |
7.000% | | 04/30/28 | | | | | 625 | | | | 594,434 | |
| | | | | | | | | | | | |
| |
| | | | 4,866,395 | |
| | | | | | | | | | | | |
Banks — 0.3% | |
Citigroup, Inc., | |
Jr. Sub. Notes | |
3.875%(ff) | | 02/18/26(oo) | | | | | 600 | | | | 512,872 | |
Freedom Mortgage Corp., | |
Sr. Unsec’d. Notes, 144A | |
7.625% | | 05/01/26 | | | | | 350 | | | | 294,268 | |
Intesa Sanpaolo SpA (Italy), | |
Sub. Notes, 144A | |
4.198%(ff) | | 06/01/32 | | | | | 725 | | | | 537,088 | |
| | | | | | | | | | | | |
| |
| | | | 1,344,228 | |
| | | | | | | | | | | | |
Building Materials — 1.6% | |
Camelot Return Merger Sub, Inc., | |
Sr. Sec’d. Notes, 144A | |
8.750% | | 08/01/28 | | | | | 550 | | | | 504,503 | |
Cornerstone Building Brands, Inc., | |
Gtd. Notes, 144A | |
6.125% | | 01/15/29 | | | | | 975 | | | | 687,271 | |
| | | | | | | | | | | | |
Interest Rate | | Maturity
Date | | | | Principal
Amount
(000)# | | | Value | |
| | | | | | | | | | | |
|
CORPORATE BONDS (continued) | |
Building Materials (cont’d.) | |
Eco Material Technologies, Inc., | |
Sr. Sec’d. Notes, 144A | |
7.875% | | 01/31/27 | | | | | 525 | | | $ | 501,802 | |
Griffon Corp., | |
Gtd. Notes | |
5.750% | | 03/01/28 | | | | | 750 | | | | 685,861 | |
JELD-WEN, Inc., | |
Gtd. Notes, 144A | |
4.625% | | 12/15/25(a) | | | | | 350 | | | | 292,390 | |
Masonite International Corp., | |
Gtd. Notes, 144A | |
3.500% | | 02/15/30 | | | | | 275 | | | | 221,375 | |
5.375% | | 02/01/28(a) | | | | | 325 | | | | 299,991 | |
MIWD Holdco II LLC/MIWD Finance Corp., | |
Gtd. Notes, 144A | |
5.500% | | 02/01/30 | | | | | 750 | | | | 602,649 | |
Smyrna Ready Mix Concrete LLC, | |
Sr. Sec’d. Notes, 144A | |
6.000% | | 11/01/28 | | | | | 1,450 | | | | 1,296,646 | |
Standard Industries, Inc., | |
Sr. Unsec’d. Notes, 144A | |
3.375% | | 01/15/31 | | | | | 525 | | | | 396,944 | |
4.375% | | 07/15/30 | | | | | 1,050 | | | | 860,114 | |
4.750% | | 01/15/28 | | | | | 625 | | | | 562,430 | |
5.000% | | 02/15/27(a) | | | | | 690 | | | | 638,202 | |
| | | | | | | | | | | | |
| |
| | | | 7,550,178 | |
| | | | | | | | | | | | |
Chemicals — 2.4% | |
Ashland LLC, | |
Gtd. Notes | |
6.875% | | 05/15/43 | | | | | 1,705 | | | | 1,661,578 | |
ASP Unifrax Holdings, Inc., | |
Sr. Sec’d. Notes, 144A | |
5.250% | | 09/30/28 | | | | | 275 | | | | 221,455 | |
Sr. Unsec’d. Notes, 144A | |
7.500% | | 09/30/29(a) | | | | | 225 | | | | 142,952 | |
Chemours Co. (The), | |
Gtd. Notes | |
5.375% | | 05/15/27 | | | | | 305 | | | | 281,063 | |
Gtd. Notes, 144A | |
4.625% | | 11/15/29(a) | | | | | 620 | | | | 508,404 | |
5.750% | | 11/15/28(a) | | | | | 315 | | | | 282,844 | |
Cornerstone Chemical Co., | |
Sr. Sec’d. Notes, 144A (original cost $1,097,619; purchased 08/09/17 - 01/05/18)(f) | |
6.750% | | 08/15/24(a) | | | | | 1,110 | | | | 889,885 | |
Diamond BC BV, | |
Gtd. Notes, 144A | |
4.625% | | 10/01/29(a) | | | | | 580 | | | | 465,450 | |
Iris Holding, Inc., | |
Sr. Unsec’d. Notes, 144A | |
10.000% | | 12/15/28(a) | | | | | 950 | | | | 787,964 | |
NOVA Chemicals Corp. (Canada), | |
Sr. Unsec’d. Notes, 144A | |
5.250% | | 06/01/27(a) | | | | | 506 | | | | 452,666 | |
SEE NOTES TO FINANCIAL STATEMENTS.
A120
| | | | |
| | PSF PGIM HIGH YIELD BOND PORTFOLIO (CONTINUED) | | |
| | | | |
SCHEDULE OF INVESTMENTS | | | | as of December 31, 2022 |
| | | | | | | | | | | | |
Interest
Rate | | Maturity
Date | | | | Principal
Amount
(000)# | | | Value | |
| | | | | | | | | | | |
|
CORPORATE BONDS (continued) | |
Chemicals (cont’d.) | |
Olympus Water US Holding Corp., | |
Sr. Sec’d. Notes, 144A | |
4.250% | | 10/01/28 | | | | | 500 | | | $ | 409,679 | |
Rain CII Carbon LLC/CII Carbon Corp., | |
Sec’d. Notes, 144A | |
7.250% | | 04/01/25 | | | | | 1,370 | | | | 1,260,150 | |
SK Invictus Intermediate II Sarl (Luxembourg), | |
Sr. Sec’d. Notes, 144A | |
5.000% | | 10/30/29 | | | | | 740 | | | | 606,608 | |
SPCM SA (France), | |
Sr. Unsec’d. Notes, 144A | |
3.375% | | 03/15/30 | | | | | 425 | | | | 345,844 | |
TPC Group, Inc., | |
Sr. Sec’d. Notes, 144A | |
13.000% | | 12/16/27 | | | | | 651 | | | | 651,207 | |
Tronox, Inc., | |
Gtd. Notes, 144A | |
4.625% | | 03/15/29(a) | | | | | 1,395 | | | | 1,159,041 | |
Valvoline, Inc., | |
Gtd. Notes, 144A | |
4.250% | | 02/15/30(a) | | | | | 450 | | | | 439,065 | |
Sr. Unsec’d. Notes, 144A | |
3.625% | | 06/15/31(a) | | | | | 325 | | | | 266,577 | |
Venator Finance Sarl/Venator Materials LLC, | |
Gtd. Notes, 144A | |
5.750% | | 07/15/25 | | | | | 1,770 | | | | 589,853 | |
Sr. Sec’d. Notes, 144A | |
9.500% | | 07/01/25 | | | | | 500 | | | | 341,250 | |
WR Grace Holdings LLC, | |
Sr. Sec’d. Notes, 144A | |
5.625% | | 10/01/24 | | | | | 100 | | | | 98,820 | |
| | | | | | | | | | | | |
| |
| | | | 11,862,355 | |
| | | | | | | | | | | | |
Coal — 0.1% | |
Coronado Finance Pty Ltd. (Australia), | |
Sr. Sec’d. Notes, 144A | |
10.750% | | 05/15/26 | | | | | 323 | | | | 331,479 | |
| | | | | | | | | | | | |
Commercial Services — 4.0% | |
Adtalem Global Education, Inc., | |
Sr. Sec’d. Notes, 144A | |
5.500% | | 03/01/28 | | | | | 365 | | | | 334,549 | |
Allied Universal Holdco LLC/Allied Universal Finance Corp., | |
Sr. Sec’d. Notes, 144A | |
6.625% | | 07/15/26 | | | | | 985 | | | | 903,274 | |
Sr. Unsec’d. Notes, 144A | |
6.000% | | 06/01/29(a) | | | | | 1,625 | | | | 1,188,831 | |
9.750% | | 07/15/27 | | | | | 1,425 | | | | 1,250,833 | |
Allied Universal Holdco LLC/Allied Universal Finance Corp./Atlas Luxco 4 Sarl, | |
Sr. Sec’d. Notes, 144A | |
4.625% | | 06/01/28(a) | | | | | 1,260 | | | | 1,037,106 | |
4.625% | | 06/01/28(a) | | | | | 1,065 | | | | 862,650 | |
Alta Equipment Group, Inc., | |
Sec’d. Notes, 144A | |
5.625% | | 04/15/26 | | | | | 375 | | | | 339,712 | |
| | | | | | | | | | | | |
Interest
Rate | | Maturity
Date | | | | Principal
Amount
(000)# | | | Value | |
| | | | | | | | | | | |
|
CORPORATE BONDS (continued) | |
Commercial Services (cont’d.) | |
AMN Healthcare, Inc., | |
Gtd. Notes, 144A | |
4.000% | | 04/15/29 | | | | | 525 | | | $ | 452,314 | |
4.625% | | 10/01/27 | | | | | 225 | | | | 207,420 | |
APi Group DE, Inc., | |
Gtd. Notes, 144A | |
4.750% | | 10/15/29 | | | | | 250 | | | | 218,978 | |
Avis Budget Car Rental LLC/Avis Budget Finance, Inc., | |
Gtd. Notes, 144A | |
4.750% | | 04/01/28(a) | | | | | 550 | | | | 466,148 | |
5.750% | | 07/15/27(a) | | | | | 575 | | | | 523,494 | |
Brink’s Co. (The), | |
Gtd. Notes, 144A | |
5.500% | | 07/15/25 | | | | | 205 | | | | 201,279 | |
Gartner, Inc., | |
Gtd. Notes, 144A | |
3.625% | | 06/15/29 | | | | | 325 | | | | 284,891 | |
3.750% | | 10/01/30 | | | | | 225 | | | | 195,089 | |
Hertz Corp. (The), | |
Gtd. Notes, 144A | |
4.625% | | 12/01/26 | | | | | 225 | | | | 188,517 | |
5.000% | | 12/01/29 | | | | | 425 | | | | 322,341 | |
Metis Merger Sub LLC, | |
Sr. Unsec’d. Notes, 144A | |
6.500% | | 05/15/29 | | | | | 2,000 | | | | 1,691,205 | |
MPH Acquisition Holdings LLC, | |
Sr. Sec’d. Notes, 144A | |
5.500% | | 09/01/28 | | | | | 1,300 | | | | 1,014,556 | |
NESCO Holdings II, Inc., | |
Sec’d. Notes, 144A | |
5.500% | | 04/15/29 | | | | | 500 | | | | 440,874 | |
Service Corp. International, | |
Sr. Unsec’d. Notes | |
4.000% | | 05/15/31(a) | | | | | 750 | | | | 636,601 | |
United Rentals North America, Inc., | |
Gtd. Notes | |
3.750% | | 01/15/32 | | | | | 450 | | | | 367,584 | |
3.875% | | 02/15/31 | | | | | 175 | | | | 147,280 | |
4.000% | | 07/15/30 | | | | | 100 | | | | 85,594 | |
4.875% | | 01/15/28(a) | | | | | 3,500 | | | | 3,316,288 | |
Verscend Escrow Corp., | |
Sr. Unsec’d. Notes, 144A | |
9.750% | | 08/15/26 | | | | | 2,860 | | | | 2,801,544 | |
| | | | | | | | | | | | |
| |
| | | | 19,478,952 | |
| | | | | | | | | | | | |
Computers — 0.5% | |
CA Magnum Holdings (India), | |
Sr. Sec’d. Notes, 144A | |
5.375% | | 10/31/26 | | | | | 200 | | | | 181,026 | |
Condor Merger Sub, Inc., | |
Sr. Unsec’d. Notes, 144A | |
7.375% | | 02/15/30(a) | | | | | 610 | | | | 492,626 | |
NCR Corp., | |
Gtd. Notes, 144A | |
5.000% | | 10/01/28 | | | | | 325 | | | | 278,865 | |
5.125% | | 04/15/29(a) | | | | | 935 | | | | 781,935 | |
5.250% | | 10/01/30(a) | | | | | 680 | | | | 560,580 | |
SEE NOTES TO FINANCIAL STATEMENTS.
A121
| | | | |
| | PSF PGIM HIGH YIELD BOND PORTFOLIO (CONTINUED) | | |
| | | | |
SCHEDULE OF INVESTMENTS | | | | as of December 31, 2022 |
| | | | | | | | | | | | |
Interest
Rate | | Maturity
Date | | | | Principal
Amount
(000)# | | | Value | |
| | | | | | | | | | | |
|
CORPORATE BONDS (continued) | |
Computers (cont’d.) | |
Tempo Acquisition LLC/Tempo Acquisition Finance Corp., | |
Sr. Sec’d. Notes, 144A | |
5.750% | | 06/01/25 | | | | | 300 | | | $ | 300,965 | |
| | | | | | | | | | | | |
| |
| | | | 2,595,997 | |
| | | | | | | | | | | | |
Distribution/Wholesale — 0.4% | |
H&E Equipment Services, Inc., | |
Gtd. Notes, 144A | |
3.875% | | 12/15/28 | | | | | 2,100 | | | | 1,787,814 | |
| | | | | | | | | | | | |
Diversified Financial Services — 2.9% | |
Bread Financial Holdings, Inc., | |
Gtd. Notes, 144A | |
4.750% | | 12/15/24(a) | | | | | 800 | | | | 707,892 | |
goeasy Ltd. (Canada), | |
Gtd. Notes, 144A | |
4.375% | | 05/01/26(a) | | | | | 400 | | | | 352,000 | |
Home Point Capital, Inc., | |
Gtd. Notes, 144A | |
5.000% | | 02/01/26 | | | | | 375 | | | | 256,338 | |
Jefferies Finance LLC/JFIN Co-Issuer Corp., | |
Sr. Unsec’d. Notes, 144A | |
5.000% | | 08/15/28 | | | | | 1,675 | | | | 1,367,857 | |
LD Holdings Group LLC, | |
Gtd. Notes, 144A | |
6.125% | | 04/01/28 | | | | | 825 | | | | 492,514 | |
LFS Topco LLC, | |
Gtd. Notes, 144A | |
5.875% | | 10/15/26 | | | | | 850 | | | | 684,635 | |
LPL Holdings, Inc., | |
Gtd. Notes, 144A | |
4.000% | | 03/15/29 | | | | | 150 | | | | 130,529 | |
4.375% | | 05/15/31(a) | | | | | 500 | | | | 428,727 | |
Nationstar Mortgage Holdings, Inc., | |
Gtd. Notes, 144A | |
5.125% | | 12/15/30(a) | | | | | 1,700 | | | | 1,307,232 | |
5.500% | | 08/15/28 | | | | | 200 | | | | 163,630 | |
6.000% | | 01/15/27(a) | | | | | 310 | | | | 278,057 | |
Navient Corp., | |
Sr. Unsec’d. Notes | |
5.500% | | 03/15/29(a) | | | | | 700 | | | | 574,066 | |
OneMain Finance Corp., | |
Gtd. Notes | |
3.875% | | 09/15/28(a) | | | | | 325 | | | | 258,571 | |
4.000% | | 09/15/30(a) | | | | | 550 | | | | 411,115 | |
6.625% | | 01/15/28(a) | | | | | 950 | | | | 875,942 | |
6.875% | | 03/15/25 | | | | | 1,025 | | | | 985,383 | |
7.125% | | 03/15/26 | | | | | 2,550 | | | | 2,424,589 | |
PennyMac Financial Services, Inc., | |
Gtd. Notes, 144A | |
4.250% | | 02/15/29(a) | | | | | 425 | | | | 332,208 | |
5.375% | | 10/15/25 | | | | | 575 | | | | 520,971 | |
Rocket Mortgage LLC/Rocket Mortgage Co-Issuer, Inc., | |
Gtd. Notes, 144A | |
4.000% | | 10/15/33 | | | | | 750 | | | | 561,002 | |
VistaJet Malta Finance PLC/XO Management Holding, Inc. (Switzerland), | |
Sr. Unsec’d. Notes, 144A | |
6.375% | | 02/01/30(a) | | | | | 650 | | | | 519,594 | |
| | | | | | | | | | | | |
Interest
Rate | | Maturity
Date | | | | Principal
Amount
(000)# | | | Value | |
| | | | | | | | | | | |
|
CORPORATE BONDS (continued) | |
Diversified Financial Services (cont’d.) | |
7.875% | | 05/01/27(a) | | | | | 675 | | | $ | 609,187 | |
| | | | | | | | | | | | |
| |
| | | | 14,242,039 | |
| | | | | | | | | | | | |
Electric — 4.5% | |
Calpine Corp., | |
Sr. Unsec’d. Notes, 144A | |
4.625% | | 02/01/29(a) | | | | | 2,732 | | | | 2,354,200 | |
5.000% | | 02/01/31(a) | | | | | 1,925 | | | | 1,621,629 | |
5.125% | | 03/15/28(a) | | | | | 4,900 | | | | 4,386,125 | |
Keystone Power Pass-Through Holders LLC/Conemaugh Power Pass-Through Holders, | |
Sub. Notes, 144A, Cash coupon 13.000% or PIK N/A | |
13.000% | | 06/01/24 | | | | | 438 | | | | 261,430 | |
NRG Energy, Inc., | |
Gtd. Notes | |
5.750% | | 01/15/28(a) | | | | | 750 | | | | 704,610 | |
6.625% | | 01/15/27 | | | | | 442 | | | | 439,038 | |
Gtd. Notes, 144A | |
3.375% | | 02/15/29 | | | | | 275 | | | | 222,032 | |
3.625% | | 02/15/31(a) | | | | | 1,000 | | | | 765,129 | |
3.875% | | 02/15/32 | | | | | 1,075 | | | | 810,494 | |
5.250% | | 06/15/29(a) | | | | | 775 | | | | 684,708 | |
PG&E Corp., | |
Sr. Sec’d. Notes | |
5.000% | | 07/01/28(a) | | | | | 935 | | | | 855,594 | |
5.250% | | 07/01/30(a) | | | | | 2,355 | | | | 2,142,982 | |
Vistra Corp., | |
Jr. Sub. Notes, 144A | |
7.000%(ff) | | 12/15/26(oo) | | | | | 800 | | | | 729,290 | |
8.000%(ff) | | 10/15/26(oo) | | | | | 1,150 | | | | 1,099,748 | |
Vistra Operations Co. LLC, | |
Gtd. Notes, 144A | |
4.375% | | 05/01/29(a) | | | | | 925 | | | | 798,101 | |
5.000% | | 07/31/27 | | | | | 1,515 | | | | 1,409,872 | |
5.500% | | 09/01/26 | | | | | 1,350 | | | | 1,302,209 | |
5.625% | | 02/15/27(a) | | | | | 1,458 | | | | 1,392,432 | |
| | | | | | | | | | | | |
| |
| | | | 21,979,623 | |
| | | | | | | | | | | | |
Electrical Components & Equipment — 0.5% | |
Energizer Holdings, Inc., | |
Gtd. Notes, 144A | |
4.375% | | 03/31/29 | | | | | 800 | | | | 680,024 | |
4.750% | | 06/15/28 | | | | | 225 | | | | 195,817 | |
WESCO Distribution, Inc., | |
Gtd. Notes, 144A | |
7.125% | | 06/15/25 | | | | | 500 | | | | 506,840 | |
7.250% | | 06/15/28 | | | | | 835 | | | | 846,568 | |
| | | | | | | | | | | | |
| |
| | | | 2,229,249 | |
| | | | | | | | | | | | |
Electronics — 0.2% | |
Likewize Corp., | |
Sr. Sec’d. Notes, 144A | |
9.750% | | 10/15/25 | | | | | 1,060 | | | | 977,218 | |
| | | | | | | | | | | | |
Engineering & Construction — 0.3% | |
AECOM, | |
Gtd. Notes | |
5.125% | | 03/15/27 | | | | | 375 | | | | 362,994 | |
SEE NOTES TO FINANCIAL STATEMENTS.
A122
| | | | |
| | PSF PGIM HIGH YIELD BOND PORTFOLIO (CONTINUED) | | |
| | | | |
SCHEDULE OF INVESTMENTS | | | | as of December 31, 2022 |
| | | | | | | | | | | | |
Interest
Rate | | Maturity
Date | | | | Principal
Amount
(000)# | | | Value | |
| | | | | | | | | | | |
|
CORPORATE BONDS (continued) | |
Engineering & Construction (cont’d.) | |
Artera Services LLC, | |
Sr. Sec’d. Notes, 144A | |
9.033% | | 12/04/25 | | | | | 550 | | | $ | 458,991 | |
TopBuild Corp., | |
Gtd. Notes, 144A | |
3.625% | | 03/15/29 | | | | | 500 | | | | 413,966 | |
4.125% | | 02/15/32(a) | | | | | 325 | | | | 264,051 | |
| | | | | | | | | | | | |
| |
| | | | 1,500,002 | |
| |
Entertainment — 2.4% | | | | | | | | | | |
AMC Entertainment Holdings, Inc., | |
Sec’d. Notes, 144A, Cash coupon 10.000% or PIK 12.000% or Cash coupon 5.000% and PIK 6.000% | |
10.000% | | 06/15/26 | | | | | 492 | | | | 204,368 | |
Caesars Entertainment, Inc., | |
Sr. Sec’d. Notes, 144A | |
6.250% | | 07/01/25 | | | | | 1,130 | | | | 1,099,401 | |
Sr. Unsec’d. Notes, 144A | |
4.625% | | 10/15/29(a) | | | | | 575 | | | | 467,589 | |
CCM Merger, Inc., | |
Sr. Unsec’d. Notes, 144A | |
6.375% | | 05/01/26 | | | | | 450 | | | | 423,594 | |
Everi Holdings, Inc., | |
Gtd. Notes, 144A | |
5.000% | | 07/15/29 | | | | | 100 | | | | 86,180 | |
Golden Entertainment, Inc., | |
Sr. Unsec’d. Notes, 144A | |
7.625% | | 04/15/26(a) | | | | | 1,550 | | | | 1,528,452 | |
International Game Technology PLC, | |
Sr. Sec’d. Notes, 144A | |
4.125% | | 04/15/26 | | | | | 975 | | | | 909,773 | |
6.250% | | 01/15/27 | | | | | 450 | | | | 444,942 | |
Jacobs Entertainment, Inc., | |
Sr. Unsec’d. Notes, 144A | |
6.750% | | 02/15/29 | | | | | 425 | | | | 386,507 | |
Midwest Gaming Borrower LLC/Midwest Gaming Finance Corp., | |
Sr. Sec’d. Notes, 144A | |
4.875% | | 05/01/29 | | | | | 850 | | | | 726,299 | |
Motion Bondco DAC (United Kingdom), | |
Gtd. Notes, 144A | |
6.625% | | 11/15/27(a) | | | | | 850 | | | | 733,125 | |
Penn Entertainment, Inc., | |
Sr. Unsec’d. Notes, 144A | |
4.125% | | 07/01/29 | | | | | 750 | | | | 593,323 | |
5.625% | | 01/15/27(a) | | | | | 1,625 | | | | 1,472,107 | |
Premier Entertainment Sub LLC/Premier Entertainment Finance Corp., | |
Gtd. Notes, 144A | |
5.875% | | 09/01/31 | | | | | 1,200 | | | | 846,562 | |
Scientific Games Holdings LP/Scientific Games US FinCo, Inc., | |
Sr. Unsec’d. Notes, 144A | |
6.625% | | 03/01/30(a) | | | | | 800 | | | | 675,526 | |
Wynn Resorts Finance LLC/Wynn Resorts Capital Corp., | |
Gtd. Notes, 144A | |
5.125% | | 10/01/29 | | | | | 770 | | | | 660,344 | |
Sr. Unsec’d. Notes, 144A | |
7.750% | | 04/15/25(a) | | | | | 375 | | | | 373,365 | |
| | | | | | | | | | | | |
| |
| | | | 11,631,457 | |
| | | | | | | | | | | | |
| | | | | | | | | | | | |
Interest
Rate | | Maturity
Date | | | | Principal
Amount
(000)# | | | Value | |
| | | | | | | | | | | |
|
CORPORATE BONDS (continued) | |
Environmental Control — 0.2% | |
GFL Environmental, Inc. (Canada), | |
Gtd. Notes, 144A | |
4.000% | | 08/01/28(a) | | | | | 200 | | | $ | 171,000 | |
4.375% | | 08/15/29(a) | | | | | 825 | | | | 697,125 | |
| | | | | | | | | | | | |
| |
| | | | 868,125 | |
| | | | | | | | | | | | |
Foods — 2.7% | |
Albertson’s Cos., Inc./Safeway, Inc./New Albertson’s LP/Albertson’s LLC, | |
Gtd. Notes, 144A | |
3.500% | | 03/15/29 | | | | | 800 | | | | 670,831 | |
5.875% | | 02/15/28 | | | | | 125 | | | | 118,919 | |
B&G Foods, Inc., | |
Gtd. Notes | |
5.250% | | 04/01/25(a) | | | | | 625 | | | | 550,617 | |
5.250% | | 09/15/27 | | | | | 1,510 | | | | 1,158,652 | |
C&S Group Enterprises LLC, | |
Gtd. Notes, 144A | |
5.000% | | 12/15/28 | | | | | 625 | | | | 470,967 | |
Chobani LLC/Chobani Finance Corp., Inc., | |
Gtd. Notes, 144A | |
7.500% | | 04/15/25(a) | | | | | 375 | | | | 365,182 | |
Sr. Sec’d. Notes, 144A | |
4.625% | | 11/15/28 | | | | | 125 | | | | 110,329 | |
JBS USA LUX SA/JBS USA Food Co./JBS USA Finance, Inc., | |
Sr. Unsec’d. Notes, 144A | |
5.500% | | 01/15/30(a) | | | | | 950 | | | | 903,900 | |
Kraft Heinz Foods Co., | |
Gtd. Notes | |
4.375% | | 06/01/46 | | | | | 1,875 | | | | 1,531,577 | |
4.875% | | 10/01/49(a) | | | | | 750 | | | | 654,502 | |
5.000% | | 07/15/35 | | | | | 163 | | | | 156,314 | |
5.200% | | 07/15/45 | | | | | 250 | | | | 230,366 | |
5.500% | | 06/01/50(a) | | | | | 750 | | | | 719,669 | |
Lamb Weston Holdings, Inc., | |
Gtd. Notes, 144A | |
4.125% | | 01/31/30 | | | | | 400 | | | | 353,924 | |
4.375% | | 01/31/32(a) | | | | | 575 | | | | 502,212 | |
Pilgrim’s Pride Corp., | |
Gtd. Notes, 144A | |
3.500% | | 03/01/32 | | | | | 300 | | | | 234,497 | |
4.250% | | 04/15/31 | | | | | 650 | | | | 553,265 | |
5.875% | | 09/30/27(a) | | | | | 2,150 | | | | 2,106,868 | |
Post Holdings, Inc., | |
Gtd. Notes, 144A | |
4.625% | | 04/15/30(a) | | | | | 1,160 | | | | 1,000,776 | |
5.500% | | 12/15/29(a) | | | | | 425 | | | | 385,042 | |
Sr. Unsec’d. Notes, 144A | |
4.500% | | 09/15/31 | | | | | 425 | | | | 358,982 | |
| | | | | | | | | | | | |
| |
| | | | 13,137,391 | |
| | | | | | | | | | | | |
Gas — 0.6% | |
AmeriGas Partners LP/AmeriGas Finance Corp., | |
Sr. Unsec’d. Notes | |
5.500% | | 05/20/25 | | | | | 1,075 | | | | 1,032,872 | |
5.750% | | 05/20/27 | | | | | 1,050 | | | | 981,595 | |
5.875% | | 08/20/26(a) | | | | | 975 | | | | 927,783 | |
| |
| | | | 2,942,250 | |
| |
SEE NOTES TO FINANCIAL STATEMENTS.
A123
| | | | |
| | PSF PGIM HIGH YIELD BOND PORTFOLIO (CONTINUED) | | |
| | | | |
SCHEDULE OF INVESTMENTS | | | | as of December 31, 2022 |
| | | | | | | | | | | | |
Interest
Rate | | Maturity
Date | | | | Principal
Amount
(000)# | | | Value | |
| | | | | | | | | | | |
|
CORPORATE BONDS (continued) | |
Healthcare-Products — 0.7% | |
Medline Borrower LP, | |
Sr. Sec’d. Notes, 144A | |
3.875% | | 04/01/29 | | | | | 1,625 | | | $ | 1,309,683 | |
Sr. Unsec’d. Notes, 144A | |
5.250% | | 10/01/29(a) | | | | | 2,525 | | | | 2,006,818 | |
| | | | | | | | | | | | |
| |
| | | | 3,316,501 | |
| | | | | | | | | | | | |
Healthcare-Services — 3.6% | |
DaVita, Inc., | |
Gtd. Notes, 144A | |
3.750% | | 02/15/31 | | | | | 2,375 | | | | 1,771,328 | |
4.625% | | 06/01/30 | | | | | 1,800 | | | | 1,450,644 | |
HCA, Inc., | |
Gtd. Notes | |
7.050% | | 12/01/27 | | | | | 1,750 | | | | 1,820,946 | |
7.500% | | 11/06/33 | | | | | 650 | | | | 684,092 | |
Gtd. Notes, MTN | |
7.750% | | 07/15/36 | | | | | 400 | | | | 438,126 | |
Legacy LifePoint Health LLC, | |
Sr. Sec’d. Notes, 144A | |
4.375% | | 02/15/27 | | | | | 500 | | | | 423,210 | |
LifePoint Health, Inc., | |
Gtd. Notes, 144A | |
5.375% | | 01/15/29 | | | | | 2,850 | | | | 1,613,459 | |
Prime Healthcare Services, Inc., | |
Sr. Sec’d. Notes, 144A | |
7.250% | | 11/01/25(a) | | | | | 1,750 | | | | 1,481,098 | |
RegionalCare Hospital Partners Holdings, Inc./LifePoint Health, Inc., | |
Gtd. Notes, 144A | |
9.750% | | 12/01/26(a) | | | | | 2,025 | | | | 1,630,237 | |
Tenet Healthcare Corp., | |
Gtd. Notes, 144A | |
6.125% | | 10/01/28(a) | | | | | 1,250 | | | | 1,121,707 | |
Sr. Sec’d. Notes, 144A | |
4.250% | | 06/01/29(a) | | | | | 1,725 | | | | 1,493,523 | |
4.375% | | 01/15/30 | | | | | 1,425 | | | | 1,234,609 | |
6.125% | | 06/15/30 | | | | | 250 | | | | 238,103 | |
Sr. Unsec’d. Notes | |
6.875% | | 11/15/31 | | | | | 2,350 | | | | 2,123,218 | |
| | | | | | | | | | | | |
| |
| | | | 17,524,300 | |
| | | | | | | | | | | | |
Home Builders — 4.5% | |
Ashton Woods USA LLC/Ashton Woods Finance Co., | |
Sr. Unsec’d. Notes, 144A | |
4.625% | | 08/01/29 | | | | | 725 | | | | 590,681 | |
4.625% | | 04/01/30 | | | | | 700 | | | | 566,633 | |
Beazer Homes USA, Inc., | |
Gtd. Notes | |
5.875% | | 10/15/27 | | | | | 1,300 | | | | 1,146,462 | |
6.750% | | 03/15/25 | | | | | 850 | | | | 823,979 | |
7.250% | | 10/15/29(a) | | | | | 1,775 | | | | 1,588,384 | |
Brookfield Residential Properties, Inc./Brookfield Residential US LLC (Canada), | |
Gtd. Notes, 144A | |
4.875% | | 02/15/30 | | | | | 1,175 | | | | 907,688 | |
6.250% | | 09/15/27 | | | | | 625 | | | | 555,063 | |
| | | | | | | | | | | | |
Interest
Rate | | Maturity
Date | | | | Principal
Amount
(000)# | | | Value | |
| | | | | | | | | | | |
|
CORPORATE BONDS (continued) | |
Home Builders (cont’d.) | |
Sr. Unsec’d. Notes, 144A | |
5.000% | | 06/15/29(a) | | | | | 625 | | | $ | 493,750 | |
Century Communities, Inc., | |
Gtd. Notes | |
6.750% | | 06/01/27(a) | | | | | 325 | | | | 310,764 | |
Gtd. Notes, 144A | |
3.875% | | 08/15/29(a) | | | | | 625 | | | | 491,258 | |
Forestar Group, Inc., | |
Gtd. Notes, 144A | |
3.850% | | 05/15/26 | | | | | 350 | | | | 311,198 | |
5.000% | | 03/01/28(a) | | | | | 1,300 | | | | 1,121,736 | |
KB Home, | |
Gtd. Notes | |
4.000% | | 06/15/31(a) | | | | | 625 | | | | 504,921 | |
4.800% | | 11/15/29 | | | | | 1,500 | | | | 1,305,806 | |
7.250% | | 07/15/30 | | | | | 225 | | | | 218,507 | |
M/I Homes, Inc., | |
Gtd. Notes | |
3.950% | | 02/15/30 | | | | | 325 | | | | 264,524 | |
4.950% | | 02/01/28 | | | | | 625 | | | | 555,186 | |
Mattamy Group Corp. (Canada), | |
Sr. Unsec’d. Notes, 144A | |
4.625% | | 03/01/30(a) | | | | | 1,150 | | | | 934,375 | |
5.250% | | 12/15/27(a) | | | | | 1,000 | | | | 886,250 | |
Meritage Homes Corp., | |
Gtd. Notes | |
5.125% | | 06/06/27 | | | | | 525 | | | | 497,104 | |
6.000% | | 06/01/25 | | | | | 975 | | | | 968,089 | |
Shea Homes LP/Shea Homes Funding Corp., | |
Sr. Unsec’d. Notes | |
4.750% | | 02/15/28(a) | | | | | 1,175 | | | | 1,026,758 | |
4.750% | | 04/01/29 | | | | | 700 | | | | 590,047 | |
STL Holding Co. LLC, | |
Sr. Unsec’d. Notes, 144A | |
7.500% | | 02/15/26 | | | | | 1,075 | | | | 932,925 | |
Taylor Morrison Communities, Inc., | |
Gtd. Notes, 144A | |
5.875% | | 06/15/27(a) | | | | | 1,625 | | | | 1,563,805 | |
Sr. Unsec’d. Notes, 144A | |
5.125% | | 08/01/30 | | | | | 1,792 | | | | 1,559,247 | |
Tri Pointe Homes, Inc., | |
Gtd. Notes | |
5.700% | | 06/15/28(a) | | | | | 1,190 | | | | 1,083,730 | |
| | | | | | | | | | | | |
| |
| | | | 21,798,870 | |
| | | | | | | | | | | | |
Home Furnishings — 0.0% | |
Tempur Sealy International, Inc., | |
Gtd. Notes, 144A | |
4.000% | | 04/15/29 | | | | | 175 | | | | 146,937 | |
| | | | | | | | | | | | |
Household Products/Wares — 0.4% | |
ACCO Brands Corp., | |
Gtd. Notes, 144A | |
4.250% | | 03/15/29(a) | | | | | 1,250 | | | | 1,031,746 | |
Central Garden & Pet Co., | |
Gtd. Notes, 144A | |
4.125% | | 04/30/31 | | | | | 50 | | | | 41,429 | |
SEE NOTES TO FINANCIAL STATEMENTS.
A124
| | | | |
| | PSF PGIM HIGH YIELD BOND PORTFOLIO (CONTINUED) | | |
| | | | |
SCHEDULE OF INVESTMENTS | | | | as of December 31, 2022 |
| | | | | | | | | | | | |
Interest
Rate | | Maturity
Date | | | | Principal
Amount
(000)# | | | Value | |
| | | | | | | | | | | |
|
CORPORATE BONDS (continued) | |
Household Products/Wares (cont’d.) | |
Kronos Acquisition Holdings, Inc./KIK Custom Products, Inc. (Canada), | |
Gtd. Notes, 144A | |
7.000% | | 12/31/27(a) | | | | | 825 | | | $ | 676,500 | |
Sr. Sec’d. Notes, 144A | |
5.000% | | 12/31/26 | | | | | 150 | | | | 129,000 | |
| | | | | | | | | | | | |
| |
| | | | 1,878,675 | |
| | | | | | | | | | | | |
Housewares — 0.5% | |
Scotts Miracle-Gro Co. (The), | |
Gtd. Notes | |
4.000% | | 04/01/31 | | | | | 1,275 | | | | 979,076 | |
4.375% | | 02/01/32 | | | | | 275 | | | | 210,262 | |
4.500% | | 10/15/29 | | | | | 150 | | | | 121,509 | |
SWF Escrow Issuer Corp., | |
Sr. Unsec’d. Notes, 144A | |
6.500% | | 10/01/29 | | | | | 1,900 | | | | 1,101,809 | |
| | | | | | | | | | | | |
| |
| | | | 2,412,656 | |
| | | | | | | | | | | | |
Insurance — 0.1% | |
BroadStreet Partners, Inc., | |
Sr. Unsec’d. Notes, 144A | |
5.875% | | 04/15/29(a) | | | | | 675 | | | | 580,247 | |
| | | | | | | | | | | | |
Internet — 0.5% | |
Cablevision Lightpath LLC, | |
Sr. Sec’d. Notes, 144A | |
3.875% | | 09/15/27 | | | | | 475 | | | | 394,397 | |
Sr. Unsec’d. Notes, 144A | |
5.625% | | 09/15/28 | | | | | 820 | | | | 613,654 | |
Gen Digital, Inc., | |
Sr. Unsec’d. Notes, 144A | |
5.000% | | 04/15/25 | | | | | 875 | | | | 853,165 | |
Go Daddy Operating Co. LLC/GD Finance Co., Inc., | |
Gtd. Notes, 144A | |
3.500% | | 03/01/29 | | | | | 400 | | | | 337,439 | |
| | | | | | | | | | | | |
| |
| | | | 2,198,655 | |
| | | | | | | | | | | | |
Iron/Steel — 0.2% | |
Big River Steel LLC/BRS Finance Corp., | |
Sr. Sec’d. Notes, 144A | |
6.625% | | 01/31/29(a) | | | | | 863 | | | | 826,029 | |
Commercial Metals Co., | |
Sr. Unsec’d. Notes | |
4.125% | | 01/15/30 | | | | | 200 | | | | 176,238 | |
4.375% | | 03/15/32 | | | | | 225 | | | | 194,686 | |
| | | | | | | | | | | | |
| |
| | | | 1,196,953 | |
| | | | | | | | | | | | |
Leisure Time — 0.3% | |
Royal Caribbean Cruises Ltd., | |
Sr. Sec’d. Notes, 144A | |
8.250% | | 01/15/29(a) | | | | | 425 | | | | 426,062 | |
Sr. Unsec’d. Notes, 144A | |
5.500% | | 04/01/28 | | | | | 25 | | | | 19,882 | |
Viking Cruises Ltd., | |
Gtd. Notes, 144A | |
5.875% | | 09/15/27(a) | | | | | 250 | | | | 205,000 | |
| | | | | | | | | | | | |
Interest
Rate | | Maturity
Date | | | | Principal
Amount
(000)# | | | Value | |
| | | | | | | | | | | |
|
CORPORATE BONDS (continued) | |
Leisure Time (cont’d.) | |
Viking Ocean Cruises Ship VII Ltd., | |
Sr. Sec’d. Notes, 144A | |
5.625% | | 02/15/29 | | | | | 450 | | | $ | 362,250 | |
Vista Outdoor, Inc., | |
Gtd. Notes, 144A | |
4.500% | | 03/15/29 | | | | | 375 | | | | 276,232 | |
| | | | | | | | | | | | |
| |
| | | | 1,289,426 | |
| | | | | | | | | | | | |
Lodging — 1.4% | |
Hilton Domestic Operating Co., Inc., | |
Gtd. Notes, 144A | |
3.625% | | 02/15/32 | | | | | 925 | | | | 740,379 | |
4.000% | | 05/01/31 | | | | | 150 | | | | 126,336 | |
MGM Resorts International, | |
Gtd. Notes | |
4.625% | | 09/01/26(a) | | | | | 750 | | | | 686,940 | |
4.750% | | 10/15/28(a) | | | | | 1,575 | | | | 1,375,083 | |
5.500% | | 04/15/27(a) | | | | | 525 | | | | 487,977 | |
5.750% | | 06/15/25 | | | | | 25 | | | | 24,296 | |
6.750% | | 05/01/25(a) | | | | | 955 | | | | 962,561 | |
Sugarhouse HSP Gaming Prop Mezz LP/Sugarhouse HSP Gaming Finance Corp., | |
Sr. Sec’d. Notes, 144A | |
5.875% | | 05/15/25 | | | | | 350 | | | | 327,287 | |
Wynn Macau Ltd. (Macau), | |
Sr. Unsec’d. Notes, 144A | |
5.125% | | 12/15/29(a) | | | | | 675 | | | | 539,386 | |
5.625% | | 08/26/28 | | | | | 2,025 | | | | 1,710,902 | |
| | | | | | | | | | | | |
| |
| | | | 6,981,147 | |
| | | | | | | | | | | | |
Machinery-Construction & Mining — 0.1% | |
Terex Corp., | |
Gtd. Notes, 144A | |
5.000% | | 05/15/29 | | | | | 550 | | | | 494,209 | |
| | | | | | | | | | | | |
Machinery-Diversified — 0.6% | |
Chart Industries, Inc., | |
Gtd. Notes, 144A | |
9.500% | | 01/01/31 | | | | | 200 | | | | 205,117 | |
Sr. Sec’d. Notes, 144A | |
7.500% | | 01/01/30(a) | | | | | 500 | | | | 502,075 | |
GrafTech Finance, Inc., | |
Sr. Sec’d. Notes, 144A | |
4.625% | | 12/15/28 | | | | | 575 | | | | 474,724 | |
Maxim Crane Works Holdings Capital LLC, | |
Sec’d. Notes, 144A | |
10.125% | | 08/01/24 | | | | | 1,504 | | | | 1,455,580 | |
TK Elevator US Newco, Inc. (Germany), | |
Sr. Sec’d. Notes, 144A | |
5.250% | | 07/15/27 | | | | | 224 | | | | 197,680 | |
| | | | | | | | | | | | |
| |
| | | | 2,835,176 | |
| | | | | | | | | | | | |
Media — 6.3% | |
CCO Holdings LLC/CCO Holdings Capital Corp., | |
Sr. Unsec’d. Notes | |
4.500% | | 05/01/32(a) | | | | | 3,040 | | | | 2,419,844 | |
Sr. Unsec’d. Notes, 144A | |
4.000% | | 03/01/23 | | | | | 140 | | | | 139,548 | |
SEE NOTES TO FINANCIAL STATEMENTS.
A125
| | | | |
| | PSF PGIM HIGH YIELD BOND PORTFOLIO (CONTINUED) | | |
| | | | |
SCHEDULE OF INVESTMENTS | | | | as of December 31, 2022 |
| | | | | | | | | | | | |
Interest Rate | | Maturity Date | | | | Principal
Amount
(000)# | | | Value | |
| | | | | | | | | | | |
|
CORPORATE BONDS (continued) | |
Media (cont’d.) | |
4.250% | | 02/01/31 | | | | | 3,775 | | | $ | 3,030,854 | |
4.500% | | 06/01/33 | | | | | 315 | | | | 242,575 | |
4.750% | | 03/01/30(a) | | | | | 2,375 | | | | 2,051,259 | |
5.000% | | 02/01/28(a) | | | | | 930 | | | | 845,132 | |
CSC Holdings LLC, | |
Gtd. Notes, 144A | |
3.375% | | 02/15/31 | | | | | 1,190 | | | | 776,296 | |
4.125% | | 12/01/30 | | | | | 575 | | | | 405,853 | |
5.375% | | 02/01/28(a) | | | | | 890 | | | | 717,415 | |
5.500% | | 04/15/27 | | | | | 225 | | | | 189,351 | |
6.500% | | 02/01/29 | | | | | 400 | | | | 328,190 | |
Sr. Unsec’d. Notes, 144A | |
4.625% | | 12/01/30 | | | | | 3,275 | | | | 1,802,198 | |
5.000% | | 11/15/31 | | | | | 310 | | | | 173,251 | |
5.750% | | 01/15/30 | | | | | 2,725 | | | | 1,540,780 | |
7.500% | | 04/01/28 | | | | | 200 | | | | 135,538 | |
Diamond Sports Group LLC/Diamond Sports Finance Co., | |
Gtd. Notes, 144A (original cost $5,052,669; purchased 07/18/19 - 06/03/22)(f) | |
6.625% | | 08/15/27 | | | | | 6,605 | | | | 73,876 | |
Sec’d. Notes, 144A (original cost $2,812,977; purchased 07/18/19 - 08/30/22)(f) | |
5.375% | | 08/15/26 | | | | | 6,440 | | | | 766,739 | |
DISH DBS Corp., | |
Gtd. Notes | |
5.000% | | 03/15/23 | | | | | 285 | | | | 283,702 | |
5.125% | | 06/01/29 | | | | | 1,965 | | | | 1,267,644 | |
7.375% | | 07/01/28 | | | | | 950 | | | | 671,460 | |
7.750% | | 07/01/26(a) | | | | | 4,150 | | | | 3,349,075 | |
Gray Television, Inc., | |
Gtd. Notes, 144A | |
5.875% | | 07/15/26 | | | | | 1,335 | | | | 1,189,405 | |
iHeartCommunications, Inc., | |
Sr. Sec’d. Notes | |
6.375% | | 05/01/26(a) | | | | | 325 | | | | 298,950 | |
Midcontinent Communications/Midcontinent Finance Corp., | |
Gtd. Notes, 144A | |
5.375% | | 08/15/27 | | | | | 300 | | | | 273,321 | |
News Corp., | |
Sr. Unsec’d. Notes, 144A | |
3.875% | | 05/15/29 | | | | | 250 | | | | 216,626 | |
Nexstar Media, Inc., | |
Gtd. Notes, 144A | |
4.750% | | 11/01/28 | | | | | 135 | | | | 116,955 | |
5.625% | | 07/15/27(a) | | | | | 455 | | | | 417,893 | |
Radiate Holdco LLC/Radiate Finance, Inc., | |
Sr. Sec’d. Notes, 144A | |
4.500% | | 09/15/26 | | | | | 505 | | | | 371,146 | |
Sr. Unsec’d. Notes, 144A | |
6.500% | | 09/15/28 | | | | | 3,515 | | | | 1,473,185 | |
Sinclair Television Group, Inc., | |
Gtd. Notes, 144A (original cost $277,163; purchased 09/15/21)(f) | |
5.125% | | 02/15/27(a) | | | | | 285 | | | | 232,851 | |
TPC Holdings, Inc., | |
Sr. Unsec’d. Notes, 144A, Cash coupon N/A or PIK 17.000% | |
17.000% | | 06/18/28 | | | | | 400 | | | | 400,097 | |
| | | | | | | | | | | | |
Interest Rate | | Maturity Date | | | | Principal
Amount
(000)# | | | Value | |
| | | | | | | | | | | |
|
CORPORATE BONDS (continued) | |
Media (cont’d.) | |
Univision Communications, Inc., | |
Sr. Sec’d. Notes, 144A | |
4.500% | | 05/01/29 | | | | | 520 | | | $ | 434,608 | |
5.125% | | 02/15/25 | | | | | 1,760 | | | | 1,676,683 | |
6.625% | | 06/01/27 | | | | | 1,275 | | | | 1,231,380 | |
VZ Secured Financing BV (Netherlands), | |
Sr. Sec’d. Notes, 144A | |
5.000% | | 01/15/32 | | | | | 1,475 | | | | 1,185,531 | |
| | | | | | | | | | | | |
| |
| | | | 30,729,211 | |
| | | | | | | | | | | | |
Metal Fabricate/Hardware — 0.1% | |
Roller Bearing Co. of America, Inc., | |
Sr. Unsec’d. Notes, 144A | |
4.375% | | 10/15/29(a) | | | | | 475 | | | | 410,644 | |
| | | | | | | | | | | | |
Mining — 1.8% | |
Constellium SE, | |
Gtd. Notes, 144A | |
5.875% | | 02/15/26(a) | | | | | 925 | | | | 889,406 | |
Eldorado Gold Corp. (Turkey), | |
Sr. Unsec’d. Notes, 144A | |
6.250% | | 09/01/29(a) | | | | | 1,100 | | | | 965,594 | |
First Quantum Minerals Ltd. (Zambia), | |
Gtd. Notes, 144A | |
6.500% | | 03/01/24 | | | | | 710 | | | | 696,063 | |
6.875% | | 10/15/27 | | | | | 425 | | | | 396,392 | |
7.500% | | 04/01/25(a) | | | | | 2,075 | | | | 2,018,975 | |
FMG Resources August 2006 Pty Ltd. (Australia), | |
Sr. Unsec’d. Notes, 144A | |
6.125% | | 04/15/32 | | | | | 50 | | | | 46,515 | |
Hecla Mining Co., | |
Gtd. Notes | |
7.250% | | 02/15/28 | | | | | 575 | | | | 567,387 | |
Hudbay Minerals, Inc. (Canada), | |
Gtd. Notes, 144A | |
4.500% | | 04/01/26 | | | | | 300 | | | | 271,875 | |
6.125% | | 04/01/29(a) | | | | | 995 | | | | 902,963 | |
New Gold, Inc. (Canada), | |
Gtd. Notes, 144A | |
7.500% | | 07/15/27(a) | | | | | 1,350 | | | | 1,182,937 | |
Novelis Corp., | |
Gtd. Notes, 144A | |
3.875% | | 08/15/31 | | | | | 650 | | | | 531,880 | |
4.750% | | 01/30/30 | | | | | 50 | | | | 44,206 | |
| | | | | | | | | | | | |
| |
| | | | 8,514,193 | |
| | | | | | | | | | | | |
Miscellaneous Manufacturing — 0.2% | |
Amsted Industries, Inc., | |
Gtd. Notes, 144A | |
5.625% | | 07/01/27 | | | | | 425 | | | | 405,954 | |
Sr. Unsec’d. Notes, 144A | |
4.625% | | 05/15/30 | | | | | 570 | | | | 487,127 | |
| | | | | | | | | | | | |
| |
| | | | 893,081 | |
| | | | | | | | | | | | |
Oil & Gas — 6.6% | |
Aethon United BR LP/Aethon United Finance Corp., | |
Sr. Unsec’d. Notes, 144A | |
8.250% | | 02/15/26 | | | | | 725 | | | | 719,945 | |
SEE NOTES TO FINANCIAL STATEMENTS.
A126
| | | | |
| | PSF PGIM HIGH YIELD BOND PORTFOLIO (CONTINUED) | | |
| | | | |
SCHEDULE OF INVESTMENTS | | | | as of December 31, 2022 |
| | | | | | | | | | | | |
Interest Rate | | Maturity Date | | | | Principal
Amount
(000)# | | | Value | |
| | | | | | | | | | | |
|
CORPORATE BONDS (continued) | |
Oil & Gas (cont’d.) | |
Alta Mesa Holdings LP/Alta Mesa Finance Services Corp., | |
Gtd. Notes | |
7.875% | | 12/15/24^(d) | | | | | 5,200 | | | $ | 35,360 | |
Antero Resources Corp., | |
Gtd. Notes, 144A | |
5.375% | | 03/01/30(a) | | | | | 1,500 | | | | 1,390,349 | |
7.625% | | 02/01/29 | | | | | 328 | | | | 332,259 | |
Ascent Resources Utica Holdings LLC/ARU Finance Corp., | |
Gtd. Notes, 144A | |
7.000% | | 11/01/26 | | | | | 850 | | | | 827,548 | |
9.000% | | 11/01/27 | | | | | 676 | | | | 825,330 | |
Athabasca Oil Corp. (Canada), | |
Sec’d. Notes, 144A | |
9.750% | | 11/01/26 | | | | | 1,514 | | | | 1,610,668 | |
Chesapeake Energy Corp., | |
Gtd. Notes, 144A | |
5.500% | | 02/01/26 | | | | | 300 | | | | 289,576 | |
5.875% | | 02/01/29 | | | | | 1,050 | | | | 1,000,287 | |
6.750% | | 04/15/29(a) | | | | | 675 | | | | 657,297 | |
CITGO Petroleum Corp., | |
Sr. Sec’d. Notes, 144A | |
7.000% | | 06/15/25 | | | | | 1,525 | | | | 1,490,695 | |
CNX Resources Corp., | |
Gtd. Notes, 144A | |
7.250% | | 03/14/27 | | | | | 1,375 | | | | 1,370,790 | |
Comstock Resources, Inc., | |
Gtd. Notes, 144A | |
5.875% | | 01/15/30(a) | | | | | 450 | | | | 389,153 | |
6.750% | | 03/01/29 | | | | | 825 | | | | 744,847 | |
CrownRock LP/CrownRock Finance, Inc., | |
Sr. Unsec’d. Notes, 144A | |
5.000% | | 05/01/29 | | | | | 200 | | | | 179,280 | |
5.625% | | 10/15/25 | | | | | 350 | | | | 337,750 | |
Endeavor Energy Resources LP/EER Finance, Inc., | |
Sr. Unsec’d. Notes, 144A | |
5.750% | | 01/30/28 | | | | | 1,500 | | | | 1,436,278 | |
EQT Corp., | |
Sr. Unsec’d. Notes | |
5.000% | | 01/15/29 | | | | | 175 | | | | 164,445 | |
Hilcorp Energy I LP/Hilcorp Finance Co., | |
Sr. Unsec’d. Notes, 144A | |
5.750% | | 02/01/29 | | | | | 275 | | | | 245,731 | |
6.000% | | 04/15/30(a) | | | | | 1,100 | | | | 984,400 | |
6.000% | | 02/01/31 | | | | | 900 | | | | 763,986 | |
6.250% | | 11/01/28 | | | | | 1,050 | | | | 952,600 | |
6.250% | | 04/15/32 | | | | | 625 | | | | 536,945 | |
MEG Energy Corp. (Canada), | |
Gtd. Notes, 144A | |
5.875% | | 02/01/29(a) | | | | | 450 | | | | 423,247 | |
7.125% | | 02/01/27(a) | | | | | 1,352 | | | | 1,377,350 | |
Nabors Industries Ltd., | |
Gtd. Notes, 144A | |
7.250% | | 01/15/26 | | | | | 900 | | | | 848,646 | |
7.500% | | 01/15/28(a) | | | | | 1,250 | | | | 1,131,250 | |
Nabors Industries, Inc., | |
Gtd. Notes | |
5.750% | | 02/01/25(a) | | | | | 1,300 | | | | 1,238,539 | |
| | | | | | | | | | | | |
Interest Rate | | Maturity Date | | | | Principal
Amount
(000)# | | | Value | |
| | | | | | | | | | | |
|
CORPORATE BONDS (continued) | |
Oil & Gas (cont’d.) | |
Gtd. Notes, 144A | |
7.375% | | 05/15/27 | | | | | 50 | | | $ | 48,992 | |
Occidental Petroleum Corp., | |
Sr. Unsec’d. Notes | |
6.125% | | 01/01/31(a) | | | | | 400 | | | | 404,797 | |
6.625% | | 09/01/30 | | | | | 100 | | | | 103,329 | |
7.150% | | 05/15/28 | | | | | 275 | | | | 285,815 | |
7.875% | | 09/15/31 | | | | | 100 | | | | 110,376 | |
Parkland Corp. (Canada), | |
Gtd. Notes, 144A | |
4.500% | | 10/01/29(a) | | | | | 500 | | | | 416,250 | |
4.625% | | 05/01/30(a) | | | | | 1,275 | | | | 1,061,437 | |
Precision Drilling Corp. (Canada), | |
Gtd. Notes, 144A | |
6.875% | | 01/15/29 | | | | | 200 | | | | 185,000 | |
7.125% | | 01/15/26(a) | | | | | 1,225 | | | | 1,197,437 | |
Range Resources Corp., | |
Gtd. Notes | |
4.875% | | 05/15/25 | | | | | 1,075 | | | | 1,024,647 | |
Gtd. Notes, 144A | |
4.750% | | 02/15/30 | | | | | 225 | | | | 199,058 | |
Southwestern Energy Co., | |
Gtd. Notes | |
4.750% | | 02/01/32(a) | | | | | 1,075 | | | | 917,870 | |
5.375% | | 02/01/29 | | | | | 125 | | | | 115,778 | |
5.375% | | 03/15/30(a) | | | | | 1,525 | | | | 1,386,886 | |
Sunoco LP/Sunoco Finance Corp., | |
Gtd. Notes | |
4.500% | | 05/15/29 | | | | | 450 | | | | 393,603 | |
4.500% | | 04/30/30 | | | | | 1,175 | | | | 1,020,381 | |
5.875% | | 03/15/28 | | | | | 100 | | | | 94,805 | |
Transocean, Inc., | |
Gtd. Notes, 144A | |
7.250% | | 11/01/25 | | | | | 250 | | | | 221,250 | |
7.500% | | 01/15/26(a) | | | | | 650 | | | | 546,000 | |
8.000% | | 02/01/27 | | | | | 225 | | | | 182,644 | |
| | | | | | | | | | | | |
| |
| | | | 32,220,906 | |
| | | | | | | | | | | | |
Packaging & Containers — 1.4% | |
ARD Finance SA (Luxembourg), | |
Sr. Sec’d. Notes, 144A, Cash coupon 6.500% or PIK 7.250% | |
6.500% | | 06/30/27 | | | | | 1,107 | | | | 763,446 | |
Ardagh Packaging Finance PLC/Ardagh Holdings USA, Inc., | |
Sr. Sec’d. Notes, 144A | |
4.125% | | 08/15/26 | | | | | 375 | | | | 323,663 | |
Sr. Unsec’d. Notes, 144A | |
5.250% | | 08/15/27(a) | | | | | 425 | | | | 318,895 | |
Graham Packaging Co., Inc., | |
Gtd. Notes, 144A | |
7.125% | | 08/15/28(a) | | | | | 820 | | | | 685,419 | |
Graphic Packaging International LLC, | |
Gtd. Notes | |
4.125% | | 08/15/24 | | | | | 300 | | | | 293,403 | |
Intelligent Packaging Holdco Issuer LP (Canada), | |
Sr. Unsec’d. Notes, 144A, Cash coupon 9.000% or PIK 9.750% | |
9.000% | | 01/15/26 | | | | | 425 | | | | 293,250 | |
SEE NOTES TO FINANCIAL STATEMENTS.
A127
| | | | |
| | PSF PGIM HIGH YIELD BOND PORTFOLIO (CONTINUED) | | |
| | | | |
SCHEDULE OF INVESTMENTS | | | | as of December 31, 2022 |
| | | | | | | | | | | | |
Interest Rate | | Maturity
Date | | | | Principal
Amount
(000)# | | | Value | |
| | | | | | | | | | | |
|
CORPORATE BONDS (continued) | |
Packaging & Containers (cont’d.) | |
Intelligent Packaging Ltd. Finco, Inc./Intelligent Packaging Ltd. Co-Issuer LLC (Canada), | |
Sr. Sec’d. Notes, 144A | |
6.000% | | 09/15/28(a) | | | | | 960 | | | $ | 766,800 | |
LABL, Inc., | |
Sr. Sec’d. Notes, 144A | |
5.875% | | 11/01/28 | | | | | 525 | | | | 449,013 | |
6.750% | | 07/15/26 | | | | | 50 | | | | 47,462 | |
Sr. Unsec’d. Notes, 144A | |
8.250% | | 11/01/29 | | | | | 1,175 | | | | 937,451 | |
10.500% | | 07/15/27 | | | | | 150 | | | | 139,199 | |
OI European Group BV, | |
Gtd. Notes, 144A | |
4.750% | | 02/15/30(a) | | | | | 325 | | | | 284,781 | |
Owens-Brockway Glass Container, Inc., | |
Gtd. Notes, 144A | |
6.375% | | 08/15/25 | | | | | 200 | | | | 196,105 | |
6.625% | | 05/13/27 | | | | | 170 | | | | 165,460 | |
Pactiv Evergreen Group Issuer LLC/Pactiv Evergreen Group Issuer, Inc., | |
Sr. Sec’d. Notes, 144A | |
4.375% | | 10/15/28(a) | | | | | 500 | | | | 446,862 | |
Trident TPI Holdings, Inc., | |
Gtd. Notes, 144A | |
6.625% | | 11/01/25 | | | | | 350 | | | | 308,066 | |
9.250% | | 08/01/24 | | | | | 225 | | | | 214,028 | |
TriMas Corp., | |
Gtd. Notes, 144A | |
4.125% | | 04/15/29(a) | | | | | 325 | | | | 285,105 | |
| | | | | | | | | | | | |
| |
| | | | 6,918,408 | |
| | | | | | | | | | | | |
Pharmaceuticals — 2.4% | |
AdaptHealth LLC, | |
Gtd. Notes, 144A | |
4.625% | | 08/01/29 | | | | | 500 | | | | 419,100 | |
5.125% | | 03/01/30 | | | | | 750 | | | | 638,339 | |
6.125% | | 08/01/28 | | | | | 820 | | | | 758,172 | |
Bausch Health Cos., Inc., | |
Gtd. Notes, 144A | |
5.000% | | 01/30/28 | | | | | 1,550 | | | | 751,936 | |
5.000% | | 02/15/29 | | | | | 1,600 | | | | 768,000 | |
5.250% | | 01/30/30 | | | | | 1,300 | | | | 621,309 | |
5.250% | | 02/15/31 | | | | | 1,250 | | | | 602,825 | |
6.250% | | 02/15/29 | | | | | 6,510 | | | | 3,141,075 | |
7.000% | | 01/15/28 | | | | | 250 | | | | 121,250 | |
9.000% | | 12/15/25(a) | | | | | 500 | | | | 394,575 | |
Embecta Corp., | |
Sr. Sec’d. Notes, 144A | |
5.000% | | 02/15/30(a) | | | | | 1,175 | | | | 984,919 | |
6.750% | | 02/15/30 | | | | | 175 | | | | 157,913 | |
Jazz Securities DAC, | |
Sr. Sec’d. Notes, 144A | |
4.375% | | 01/15/29 | | | | | 350 | | | | 312,340 | |
Organon & Co./Organon Foreign Debt Co-Issuer BV, | |
Sr. Sec’d. Notes, 144A | |
4.125% | | 04/30/28 | | | | | 450 | | | | 398,439 | |
Sr. Unsec’d. Notes, 144A | |
5.125% | | 04/30/31 | | | | | 700 | | | | 606,357 | |
| | | | | | | | | | | | |
Interest Rate | | Maturity Date | | | | Principal
Amount
(000)# | | | Value | |
| | | | | | | | | | | |
|
CORPORATE BONDS (continued) | |
Pharmaceuticals (cont’d.) | |
P&L Development LLC/PLD Finance Corp., | |
Sr. Sec’d. Notes, 144A | |
7.750% | | 11/15/25 | | | | | 900 | | | $ | 724,701 | |
| | | | | | | | | | | | |
| |
| | | | 11,401,250 | |
| | | | | | | | | | | | |
Pipelines — 3.0% | |
Antero Midstream Partners LP/Antero Midstream Finance Corp., | |
Gtd. Notes, 144A | |
5.375% | | 06/15/29 | | | | | 750 | | | | 686,045 | |
5.750% | | 01/15/28(a) | | | | | 1,825 | | | | 1,700,703 | |
7.875% | | 05/15/26 | | | | | 200 | | | | 203,093 | |
Cheniere Energy Partners LP, | |
Gtd. Notes | |
4.000% | | 03/01/31(a) | | | | | 900 | | | | 770,879 | |
Cheniere Energy, Inc., | |
Sr. Unsec’d. Notes | |
4.625% | | 10/15/28(a) | | | | | 2,250 | | | | 2,040,381 | |
CNX Midstream Partners LP, | |
Gtd. Notes, 144A | |
4.750% | | 04/15/30 | | | | | 150 | | | | 123,821 | |
DCP Midstream Operating LP, | |
Gtd. Notes | |
5.625% | | 07/15/27 | | | | | 395 | | | | 392,440 | |
Gtd. Notes, 144A | |
6.450% | | 11/03/36 | | | | | 200 | | | | 197,137 | |
Energy Transfer LP, | |
Jr. Sub. Notes, Series G | |
7.125%(ff) | | 05/15/30(oo) | | | | | 625 | | | | 522,117 | |
EQM Midstream Partners LP, | |
Sr. Unsec’d. Notes | |
5.500% | | 07/15/28 | | | | | 50 | | | | 44,665 | |
Sr. Unsec’d. Notes, 144A | |
6.000% | | 07/01/25 | | | | | 101 | | | | 98,114 | |
6.500% | | 07/01/27 | | | | | 810 | | | | 774,398 | |
7.500% | | 06/01/27 | | | | | 175 | | | | 171,445 | |
7.500% | | 06/01/30 | | | | | 175 | | | | 168,698 | |
Global Partners LP/GLP Finance Corp., | |
Gtd. Notes | |
6.875% | | 01/15/29 | | | | | 400 | | | | 362,289 | |
7.000% | | 08/01/27(a) | | | | | 260 | | | | 248,128 | |
Rockies Express Pipeline LLC, | |
Sr. Unsec’d. Notes, 144A | |
6.875% | | 04/15/40(a) | | | | | 2,069 | | | | 1,737,730 | |
Tallgrass Energy Partners LP/Tallgrass Energy Finance Corp., | |
Gtd. Notes, 144A | |
5.500% | | 01/15/28 | | | | | 1,625 | | | | 1,444,131 | |
6.000% | | 12/31/30 | | | | | 975 | | | | 848,030 | |
6.000% | | 09/01/31 | | | | | 325 | | | | 279,907 | |
7.500% | | 10/01/25 | | | | | 175 | | | | 176,538 | |
Venture Global Calcasieu Pass LLC, | |
Sr. Sec’d. Notes, 144A | |
3.875% | | 08/15/29 | | | | | 440 | | | | 385,231 | |
4.125% | | 08/15/31 | | | | | 240 | | | | 204,602 | |
Western Midstream Operating LP, | |
Sr. Unsec’d. Notes | |
3.950% | | 06/01/25 | | | | | 275 | | | | 260,703 | |
4.300% | | 02/01/30 | | | | | 575 | | | | 503,657 | |
SEE NOTES TO FINANCIAL STATEMENTS.
A128
| | | | |
| | PSF PGIM HIGH YIELD BOND PORTFOLIO (CONTINUED) | | |
| | | | |
SCHEDULE OF INVESTMENTS | | | | as of December 31, 2022 |
| | | | | | | | | | | | |
Interest Rate | | Maturity Date | | | | Principal
Amount
(000)# | | | Value | |
| | | | | | | | | | | |
|
CORPORATE BONDS (continued) | |
Pipelines (cont’d.) | |
5.500% | | 08/15/48 | | | | | 300 | | | $ | 249,161 | |
| | | | | | | | | | | | |
| |
| | | | 14,594,043 | |
| | | | | | | | | | | | |
Real Estate — 1.5% | |
Five Point Operating Co. LP/Five Point Capital Corp., | |
Gtd. Notes, 144A | |
7.875% | | 11/15/25(a) | | | | | 1,925 | | | | 1,615,736 | |
Greystar Real Estate Partners LLC, | |
Sr. Sec’d. Notes, 144A | |
5.750% | | 12/01/25 | | | | | 1,825 | | | | 1,783,411 | |
Howard Hughes Corp. (The), | |
Gtd. Notes, 144A | |
4.125% | | 02/01/29(a) | | | | | 625 | | | | 522,825 | |
4.375% | | 02/01/31 | | | | | 700 | | | | 563,547 | |
5.375% | | 08/01/28 | | | | | 720 | | | | 648,267 | |
Hunt Cos., Inc., | |
Sr. Sec’d. Notes, 144A | |
5.250% | | 04/15/29 | | | | | 1,525 | | | | 1,288,401 | |
Realogy Group LLC/Realogy Co-Issuer Corp., | |
Gtd. Notes, 144A | |
5.250% | | 04/15/30 | | | | | 1,050 | | | | 765,642 | |
5.750% | | 01/15/29 | | | | | 200 | | | | 150,942 | |
| | | | | | | | | | | | |
| |
| | | | 7,338,771 | |
| | | | | | | | | | | | |
Real Estate Investment Trusts (REITs) — 2.5% | |
Diversified Healthcare Trust, | |
Gtd. Notes | |
4.375% | | 03/01/31 | | | | | 550 | | | | 350,491 | |
9.750% | | 06/15/25 | | | | | 1,112 | | | | 1,066,315 | |
Sr. Unsec’d. Notes | |
4.750% | | 05/01/24 | | | | | 50 | | | | 43,156 | |
4.750% | | 02/15/28 | | | | | 2,350 | | | | 1,335,655 | |
MPT Operating Partnership LP/MPT Finance Corp., | |
Gtd. Notes | |
3.500% | | 03/15/31 | | | | | 600 | | | | 412,781 | |
5.000% | | 10/15/27(a) | | | | | 825 | | | | 694,240 | |
Park Intermediate Holdings LLC/PK Domestic Property LLC/PK Finance Co-Issuer, | |
Sr. Sec’d. Notes, 144A | |
7.500% | | 06/01/25 | | | | | 1,435 | | | | 1,435,455 | |
Sabra Health Care LP, | |
Gtd. Notes | |
5.125% | | 08/15/26 | | | | | 300 | | | | 285,739 | |
SBA Communications Corp., | |
Sr. Unsec’d. Notes | |
3.125% | | 02/01/29(a) | | | | | 330 | | | | 274,811 | |
Uniti Group LP/Uniti Fiber Holdings, Inc./CSL Capital LLC, | |
Sr. Sec’d. Notes, 144A | |
7.875% | | 02/15/25 | | | | | 3,755 | | | | 3,644,423 | |
Uniti Group LP/Uniti Group Finance, Inc./CSL Capital LLC, | |
Sr. Sec’d. Notes, 144A | |
4.750% | | 04/15/28(a) | | | | | 445 | | | | 355,382 | |
VICI Properties LP/VICI Note Co., Inc., | |
Gtd. Notes, 144A | |
4.500% | | 01/15/28 | | | | | 1,175 | | | | 1,074,551 | |
4.625% | | 12/01/29 | | | | | 1,175 | | | | 1,069,143 | |
| | | | | | | | | | | | |
| |
| | | | 12,042,142 | |
| | | | | | | | | | | | |
| | | | | | | | | | | | |
Interest Rate | | Maturity Date | | | | Principal
Amount
(000)# | | | Value | |
| | | | | | | | | | | |
|
CORPORATE BONDS (continued) | |
Retail — 3.8% | |
1011778 BC ULC/New Red Finance, Inc. (Canada), | |
Sec’d. Notes, 144A | |
4.000% | | 10/15/30(a) | | | | | 2,050 | | | $ | 1,661,422 | |
Sr. Sec’d. Notes, 144A | |
3.875% | | 01/15/28 | | | | | 400 | | | | 360,500 | |
At Home Group, Inc., | |
Gtd. Notes, 144A | |
7.125% | | 07/15/29 | | | | | 1,600 | | | | 928,808 | |
Sr. Sec’d. Notes, 144A | |
4.875% | | 07/15/28 | | | | | 100 | | | | 70,657 | |
BCPE Ulysses Intermediate, Inc., | |
Sr. Unsec’d. Notes, 144A, Cash coupon 7.750% or PIK 8.500% | |
7.750% | | 04/01/27 | | | | | 150 | | | | 92,821 | |
Brinker International, Inc., | |
Gtd. Notes, 144A | |
5.000% | | 10/01/24 | | | | | 200 | | | | 192,878 | |
Sr. Unsec’d. Notes | |
3.875% | | 05/15/23 | | | | | 250 | | | | 247,695 | |
Carrols Restaurant Group, Inc., | |
Gtd. Notes, 144A | |
5.875% | | 07/01/29 | | | | | 500 | | | | 350,412 | |
eG Global Finance PLC (United Kingdom), | |
Sr. Sec’d. Notes, 144A | |
6.750% | | 02/07/25 | | | | | 250 | | | | 217,812 | |
8.500% | | 10/30/25 | | | | | 1,075 | | | | 1,000,825 | |
Ferrellgas LP/Ferrellgas Finance Corp., | |
Sr. Unsec’d. Notes, 144A (original cost $139,125; purchased 08/02/22 - 08/04/22)(f) | |
5.375% | | 04/01/26 | | | | | 150 | | | | 136,669 | |
Sr. Unsec’d. Notes, 144A (original cost $292,975; purchased 08/02/22 - 08/15/22)(f) | |
5.875% | | 04/01/29 | | | | | 330 | | | | 270,607 | |
Fertitta Entertainment LLC/Fertitta Entertainment Finance Co., Inc., | |
Gtd. Notes, 144A | |
6.750% | | 01/15/30(a) | | | | | 1,025 | | | | 827,419 | |
Sr. Sec’d. Notes, 144A | |
4.625% | | 01/15/29 | | | | | 425 | | | | 359,752 | |
Foundation Building Materials, Inc., | |
Gtd. Notes, 144A | |
6.000% | | 03/01/29 | | | | | 1,400 | | | | 1,051,322 | |
Gap, Inc. (The), | |
Gtd. Notes, 144A | |
3.625% | | 10/01/29 | | | | | 800 | | | | 569,294 | |
3.875% | | 10/01/31(a) | | | | | 1,000 | | | | 705,483 | |
LBM Acquisition LLC, | |
Gtd. Notes, 144A | |
6.250% | | 01/15/29 | | | | | 1,050 | | | | 680,986 | |
LCM Investments Holdings II LLC, | |
Sr. Unsec’d. Notes, 144A | |
4.875% | | 05/01/29 | | | | | 500 | | | | 403,858 | |
Park River Holdings, Inc., | |
Gtd. Notes, 144A | |
5.625% | | 02/01/29(a) | | | | | 1,620 | | | | 1,100,399 | |
Sr. Unsec’d. Notes, 144A | |
6.750% | | 08/01/29 | | | | | 225 | | | | 157,003 | |
SEE NOTES TO FINANCIAL STATEMENTS.
A129
| | | | |
| | PSF PGIM HIGH YIELD BOND PORTFOLIO (CONTINUED) | | |
| | | | |
SCHEDULE OF INVESTMENTS | | | | as of December 31, 2022 |
| | | | | | | | | | | | |
Interest Rate | | Maturity Date | | | | Principal
Amount
(000)# | | | Value | |
| | | | | | | | | | | |
|
CORPORATE BONDS (continued) | |
Retail (cont’d.) | |
Patrick Industries, Inc., | |
Gtd. Notes, 144A | |
4.750% | | 05/01/29(a) | | | | | 375 | | | $ | 314,491 | |
7.500% | | 10/15/27 | | | | | 575 | | | | 559,324 | |
Sally Holdings LLC/Sally Capital, Inc., | |
Gtd. Notes | |
5.625% | | 12/01/25 | | | | | 2,600 | | | | 2,504,381 | |
SRS Distribution, Inc., | |
Gtd. Notes, 144A | |
6.000% | | 12/01/29(a) | | | | | 1,000 | | | | 799,783 | |
Suburban Propane Partners LP/Suburban Energy Finance Corp., | |
Sr. Unsec’d. Notes | |
5.875% | | 03/01/27 | | | | | 275 | | | | 263,099 | |
Sr. Unsec’d. Notes, 144A | |
5.000% | | 06/01/31 | | | | | 1,100 | | | | 941,620 | |
Superior Plus LP/Superior General Partner, Inc. (Canada), | |
Gtd. Notes, 144A | |
4.500% | | 03/15/29(a) | | | | | 1,125 | | | | 960,469 | |
White Cap Buyer LLC, | |
Sr. Unsec’d. Notes, 144A | |
6.875% | | 10/15/28(a) | | | | | 625 | | | | 544,598 | |
| | | | | | | | | | | | |
| |
| | | | 18,274,387 | |
| | | | | | | | | | | | |
Software — 0.3% | |
Black Knight InfoServ LLC, | |
Gtd. Notes, 144A | |
3.625% | | 09/01/28 | | | | | 1,660 | | | | 1,447,515 | |
Dun & Bradstreet Corp. (The), | |
Gtd. Notes, 144A | |
5.000% | | 12/15/29 | | | | | 175 | | | | 150,799 | |
| | | | | | | | | | | | |
| |
| | | | 1,598,314 | |
| | | | | | | | | | | | |
Telecommunications — 3.7% | |
Altice France SA (France), | |
Sr. Sec’d. Notes, 144A | |
8.125% | | 02/01/27 | | | | | 950 | | | | 864,500 | |
Digicel Group Holdings Ltd. (Jamaica), | |
Sr. Unsec’d. Notes, 144A, Cash coupon 5.000% and PIK 3.000% (original cost $221,783; purchased 06/23/20 - 10/03/22)(f) | |
8.000% | | 04/01/25 | | | | | 682 | | | | 174,331 | |
Digicel International Finance Ltd./Digicel International Holdings Ltd. (Jamaica), | |
Gtd. Notes, 144A (original cost $1,162,720; purchased 05/22/20 - 08/30/22)(f) | |
8.000% | | 12/31/26 | | | | | 1,618 | | | | 709,994 | |
Gtd. Notes, 144A, Cash coupon 6.000% and PIK 7.000% (original cost $624,050; purchased 10/28/22 - 12/15/22)(f) | |
13.000% | | 12/31/25 | | | | | 931 | | | | 484,380 | |
Sr. Sec’d. Notes, 144A (original cost $1,040,000; purchased 03/07/19 - 07/20/20)(f) | |
8.750% | | 05/25/24 | | | | | 1,050 | | | | 899,588 | |
Sr. Sec’d. Notes, 144A (original cost $1,014,594; purchased 05/22/20 - 07/30/20)(f) | |
8.750% | | 05/25/24 | | | | | 1,058 | | | | 907,871 | |
| | | | | | | | | | | | |
Interest Rate | | Maturity Date | | | | Principal
Amount
(000)# | | | Value | |
| | | | | | | | | | | |
|
CORPORATE BONDS (continued) | |
Telecommunications (cont’d.) | |
Digicel Ltd. (Jamaica), | |
Gtd. Notes, 144A (original cost $4,459,150; purchased 09/26/17 - 11/21/22)(f) | |
6.750% | | 03/01/23 | | | | | 5,725 | | | $ | 2,175,500 | |
Iliad Holding SASU (France), | |
Sr. Sec’d. Notes, 144A | |
6.500% | | 10/15/26 | | | | | 675 | | | | 625,219 | |
7.000% | | 10/15/28 | | | | | 900 | | | | 815,715 | |
Intelsat Jackson Holdings SA (Luxembourg), | |
Gtd. Notes | |
5.500% | | 08/01/23^(d) | | | | | 1,595 | | | | 2 | |
Gtd. Notes, 144A | |
8.500% | | 10/15/24^(d) | | | | | 25 | | | | — | |
9.750% | | 07/15/25^(d) | | | | | 3,955 | | | | 4 | |
Sr. Sec’d. Notes, 144A | |
6.500% | | 03/15/30 | | | | | 2,355 | | | | 2,105,346 | |
Level 3 Financing, Inc., | |
Gtd. Notes, 144A | |
3.750% | | 07/15/29 | | | | | 145 | | | | 104,426 | |
4.250% | | 07/01/28(a) | | | | | 460 | | | | 362,378 | |
4.625% | | 09/15/27 | | | | | 210 | | | | 175,253 | |
Sr. Sec’d. Notes, 144A | |
3.400% | | 03/01/27(a) | | | | | 400 | | | | 338,875 | |
Lumen Technologies, Inc., | |
Sr. Unsec’d. Notes, Series P | |
7.600% | | 09/15/39 | | | | | 935 | | | | 637,168 | |
Northwestern Bell Telephone, | |
Sr. Unsec’d. Notes | |
7.750% | | 05/01/30 | | | | | 100 | | | | 96,395 | |
Sprint Capital Corp., | |
Gtd. Notes | |
6.875% | | 11/15/28 | | | | | 430 | | | | 447,176 | |
8.750% | | 03/15/32 | | | | | 731 | | | | 869,574 | |
Sprint LLC, | |
Gtd. Notes | |
7.625% | | 02/15/25(a) | | | | | 885 | | | | 916,356 | |
7.625% | | 03/01/26 | | | | | 500 | | | | 526,154 | |
7.875% | | 09/15/23 | | | | | 1,175 | | | | 1,192,545 | |
Viasat, Inc., | |
Sr. Unsec’d. Notes, 144A | |
5.625% | | 09/15/25(a) | | | | | 1,700 | | | | 1,586,720 | |
Zayo Group Holdings, Inc., | |
Sr. Sec’d. Notes, 144A | |
4.000% | | 03/01/27(a) | | | | | 510 | | | | 377,968 | |
Sr. Unsec’d. Notes, 144A | |
6.125% | | 03/01/28 | | | | | 960 | | | | 547,450 | |
| | | | | | | | | | | | |
| |
| | | | 17,940,888 | |
| | | | | | | | | | | | |
Transportation — 0.1% | |
XPO Escrow Sub LLC, | |
Gtd. Notes, 144A | |
7.500% | | 11/15/27(a) | | | | | 225 | | | | 227,032 | |
| | | | | | | | | | | | |
SEE NOTES TO FINANCIAL STATEMENTS.
A130
| | | | |
| | PSF PGIM HIGH YIELD BOND PORTFOLIO (CONTINUED) | | |
| | | | |
SCHEDULE OF INVESTMENTS | | | | as of December 31, 2022 |
| | | | | | | | | | | | |
Interest Rate | | Maturity Date | | | | Principal
Amount
(000)# | | | Value | |
| | | | | | | | | | | |
|
CORPORATE BONDS (continued) | |
Trucking & Leasing — 0.1% | |
Fortress Transportation & Infrastructure Investors LLC, | |
Sr. Unsec’d. Notes, 144A | |
5.500% | | 05/01/28(a) | | | | | 775 | | | $ | 660,564 | |
| | | | | | | | | | | | |
TOTAL CORPORATE BONDS
(cost $448,837,169) | | | | 374,814,253 | |
| | | | | | | | | | | | |
|
FLOATING RATE AND OTHER LOANS — 2.8% | |
Airlines — 0.3% | |
United Airlines, Inc., | |
Class B Term Loan, 3 Month LIBOR + 3.750% | |
8.108%(c) | | 04/21/28 | | | | | 1,224 | | | | 1,205,096 | |
| | | | | | | | | | | | |
Chemicals — 0.0% | |
Venator Materials LLC, | |
Initial Term Loan, 1 Month LIBOR + 3.000% | |
7.592%(c) | | 08/08/24 | | | | | 249 | | | | 178,903 | |
| | | | | | | | | | | | |
Electric — 0.1% | |
Heritage Power LLC, | |
Term Loan B, 3 Month LIBOR + 6.000% | |
10.415%(c) | | 07/30/26 | | | | | 1,864 | | | | 615,069 | |
| | | | | | | | | | | | |
Housewares — 0.1% | |
SWF Holdings I Corp., | |
Initial Term Loan, 3 Month LIBOR + 4.000% | |
8.753%(c) | | 10/06/28 | | | | | 784 | | | | 639,805 | |
| | | | | | | | | | | | |
Insurance — 0.2% | |
Asurion LLC, | |
New B-4 Term Loan, 1 Month LIBOR + 5.250% | |
9.634%(c) | | 01/20/29 | | | | | 1,290 | | | | 995,450 | |
| | | | | | | | | | | | |
Media — 0.2% | |
Diamond Sports Group LLC, | |
First Lien Term Loan, 1 Month SOFR + 8.100% | |
12.317%(c) | | 05/25/26^ | | | | | 957 | | | | 890,162 | |
Second Lien Term loan, 1 Month SOFR + 3.350% | |
7.567%(c) | | 08/24/26 | | | | | 2,226 | | | | 268,943 | |
| | | | | | | | | | | | |
| |
| | | | 1,159,105 | |
| | | | | | | | | | | | |
Oil & Gas — 0.3% | |
Ascent Resources Utica Holdings LLC, | |
Second Lien Term Loan, 3 Month LIBOR + 9.000% | |
12.941%(c) | | 11/01/25 | | | | | 1,385 | | | | 1,457,713 | |
| | | | | | | | | | | | |
Retail — 0.2% | |
EG America LLC (United Kingdom), | |
Project Becker Additional Facility, 3 Month LIBOR + 4.250% | |
8.980%(c) | | 03/31/26 | | | | | 316 | | | | 294,350 | |
Great Outdoors Group LLC, | |
Term B-2 Loan, 1 Month LIBOR + 3.750% | |
8.134%(c) | | 03/06/28 | | | | | 564 | | | | 541,129 | |
| |
| |
| | | | 835,479 | |
| | | | | | | | | | | | |
Software — 0.6% | |
Boxer Parent Co., Inc., | |
2021 Replacement Dollar Term Loan, 1 Month LIBOR + 3.750% | |
8.134%(c) | | 10/02/25 | | | | | 704 | | | | 672,293 | |
Second Lien Incremental Term Loan, 1 Month LIBOR + 5.500% | |
9.884%(c) | | 02/27/26 | | | | | 250 | | | | 228,125 | |
| | | | | | | | | | | | |
Interest Rate | | Maturity
Date | | | | Principal
Amount
(000)# | | | Value | |
| | | | | | | | | | | |
|
FLOATING RATE AND OTHER LOANS (continued) | |
Software (cont’d.) | |
Finastra USA, Inc., | |
Dollar Term Loan (Second Lien), 3 Month LIBOR + 7.250% | |
10.621%(c) | | 06/13/25 | | | | | 975 | | | $ | 723,666 | |
First Lien Dollar Term Loan, 6 Month LIBOR + 3.500% | |
6.871%(c) | | 06/13/24 | | | | | 178 | | | | 157,139 | |
Skillsoft Finance II, Inc., | |
Initial Term Loan, 1 Month SOFR + 5.364% | |
9.582%(c) | | 07/14/28 | | | | | 1,168 | | | | 969,320 | |
| | | | | | | | | | | | |
| |
| | | | 2,750,543 | |
| | | | | | | | | | | | |
Telecommunications — 0.8% | |
West Corp., | |
Incremental B1 Term Loan, 3 Month LIBOR + 3.500% | |
7.915%(c) | | 10/10/24 | | | | | 738 | | | | 675,349 | |
Initial Term B Loan, 3 Month LIBOR + 4.000% | |
8.415%(c) | | 10/10/24 | | | | | 2,219 | | | | 2,027,897 | |
Xplornet Communications, Inc. (Canada), | |
First Lien Refinancing Term Loan, 1 Month LIBOR + 4.000% | |
8.384%(c) | | 10/02/28 | | | | | 1,135 | | | | 869,603 | |
Initial Term Loan- Second Lien, 1 Month LIBOR + 7.000% | |
11.384%(c) | | 10/01/29^ | | | | | 565 | | | | 381,375 | |
| | | | | | | | | | | | |
| |
| | | | 3,954,224 | |
| | | | | | | | | | | | |
TOTAL FLOATING RATE AND OTHER LOANS
(cost $16,570,823) | | | | 13,791,387 | |
| | | | | | | | | | | | |
RESIDENTIAL MORTGAGE-BACKED SECURITIES — 0.0% | |
Adjustable Rate Mortgage Trust, | |
Series 2005-07, Class 1A1 | |
3.828%(cc) | | 10/25/35 | | | | | 4 | | | | 2,835 | |
Alternative Loan Trust, | |
Series 2005-43, Class 4A3 | |
3.173%(cc) | | 10/25/35 | | | | | 2 | | | | 1,291 | |
Series 2006-HY13, Class 4A1 | |
3.435%(cc) | | 02/25/37 | | | | | 2 | | | | 1,349 | |
Series 2006-OA09, Class 2A1A, 1 Month LIBOR + 0.210% (Cap N/A, Floor 0.210%) | |
4.563%(c) | | 07/20/46 | | | | | 2 | | | | 1,673 | |
American Home Mortgage Assets Trust, | |
Series 2006-04, Class 1A12, 1 Month LIBOR + 0.210% (Cap N/A, Floor 0.210%) | |
4.599%(c) | | 10/25/46 | | | | | 15 | | | | 8,028 | |
Banc of America Funding Trust, | |
Series 2006-B, Class 2A1 | |
3.221%(cc) | | 03/20/36 | | | | | 3 | | | | 2,667 | |
Citigroup Mortgage Loan Trust, | |
Series 2007-10, Class 22AA | |
3.871%(cc) | | 09/25/37 | | | | | 6 | | | | 5,549 | |
HarborView Mortgage Loan Trust, | |
Series 2006-05, Class 2A1A, 1 Month LIBOR + 0.360% (Cap N/A, Floor 0.360%) | |
4.699%(c) | | 07/19/46 | | | | | 4 | | | | 2,122 | |
IndyMac INDX Mortgage Loan Trust, | |
Series 2006-AR12, Class A1, 1 Month LIBOR + 0.380% (Cap N/A, Floor 0.380%) | |
4.769%(c) | | 09/25/46 | | | | | 3 | | | | 2,673 | |
SEE NOTES TO FINANCIAL STATEMENTS.
A131
| | | | |
| | PSF PGIM HIGH YIELD BOND PORTFOLIO (CONTINUED) | | |
| | | | |
SCHEDULE OF INVESTMENTS | | | | as of December 31, 2022 |
| | | | | | | | | | | | |
Interest Rate | | Maturity Date | | | | Principal
Amount
(000)# | | | Value | |
| | | | | | | | | | | |
|
| RESIDENTIAL MORTGAGE-BACKED SECURITIES (continued) | |
JPMorgan Mortgage Trust, | |
Series 2007-S03, Class 1A96 | |
6.000% | | 08/25/37 | | | | | 10 | | | $ | 5,381 | |
MASTR Adjustable Rate Mortgages Trust, | |
Series 2006-OA01, Class 1A1, 1 Month LIBOR + 0.210% (Cap N/A, Floor 0.210%) | |
4.599%(c) | | 04/25/46 | | | | | 2 | | | | 1,382 | |
Residential Accredit Loans Trust, | |
Series 2006-QA02, Class 3A1 | |
5.751%(cc) | | 02/25/36 | | | | | 9 | | | | 7,291 | |
Residential Asset Securitization Trust, | |
Series 2007-A05, Class 2A3 | |
6.000% | | 05/25/37 | | | | | 3 | | | | 1,473 | |
Washington Mutual Mortgage Pass-Through Certificates Trust, | |
Series 2007-HY01, Class 2A3 | |
3.093%(cc) | | 02/25/37 | | | | | 2 | | | | 1,391 | |
Series 2007-HY01, Class 4A1 | |
3.266%(cc) | | 02/25/37 | | | | | 2 | | | | 2,022 | |
| | | | | | | | | | | | |
TOTAL RESIDENTIAL MORTGAGE-BACKED SECURITIES
(cost $53,748) | | | | 47,127 | |
| | | | | | | | | | | | |
|
U.S. TREASURY OBLIGATIONS — 5.0% | |
U.S. Treasury Notes | |
2.750% | | 04/30/27(k) | | | | | 10,329 | | | | 9,789,955 | |
3.000% | | 07/31/24 | | | | | 9,849 | | | | 9,604,314 | |
3.875% | | 11/30/27 | | | | | 5,000 | | | | 4,973,047 | |
| | | | | | | | | | | | |
TOTAL U.S. TREASURY OBLIGATIONS
(cost $25,049,891) | | | | 24,367,316 | |
| | | | | | | | | | | | |
| | |
| | | Shares | | | | |
|
COMMON STOCKS — 2.2% | |
Chemicals — 0.2% | |
TPC Group, Inc.*^ | | | 49,934 | | | | 998,680 | |
| | | | | | | | | | | | |
Electric Utilities — 0.3% | |
GenOn Energy Holdings, Inc. (Class A Stock) (original cost $1,273,580; purchased 02/28/19)*^(f) | | | 11,836 | | | | 1,183,600 | |
Keycon Power Holdings LLC*^ | | | 2,150 | | | | 272,835 | |
| | | | | | | | | | | | |
| |
| | | | 1,456,435 | |
| | | | | | | | | | | | |
Gas Utilities — 0.6% | |
Ferrellgas Partners LP (Class B Stock)(original cost $3,601,855; purchased 01/30/17 - 04/08/20)^(f) | | | 13,116 | | | | 2,620,183 | |
| | | | | | | | | | | | |
Independent Power & Renewable Electricity Producers — 0.2% | |
Vistra Corp. | | | 44,042 | | | | 1,021,774 | |
| | | | | | | | | | | | |
Oil, Gas & Consumable Fuels — 0.6% | |
Chesapeake Energy Corp. | | | 32,875 | | | | 3,102,414 | |
| | | | | | | | | | | | |
Wireless Telecommunication Services — 0.3% | |
Intelsat Emergence SA (Luxembourg)* . 52,734 | | | | 1,276,163 | |
| | | | | | | | | | | | |
TOTAL COMMON STOCKS
(cost $6,438,115) | | | | 10,475,649 | |
| | | | | | | | | | | | |
| | | | | | | | |
| | | Shares | | | Value | |
| | | | | | | |
|
PREFERRED STOCKS — 0.7% | |
Capital Markets — 0.1% | | | | | | | | |
Goldman Sachs Group, Inc. (The), Series K, 6.375%(c), 3 Month LIBOR + 3.550%, Maturing 05/10/24(oo) | | | 11,850 | | | $ | 293,524 | |
| | | | | | | | |
Construction Materials — 0.0% | | | | | |
New Millennium Homes LLC, Maturing 01/01/49^ | | | 409 | | | | 2,045 | |
| | | | | | | | |
Gas Utilities — 0.6% | | | | | | | | |
Ferrellgas Escrow LLC, 8.956%, Maturing 03/30/31(original cost $2,850,000; purchased 03/29/21)^(f) | | | 2,850 | | | | 2,850,000 | |
| | | | | | | | |
Media — 0.0% | | | | | | | | |
Adelphia Communications Corp.^ | | | 700 | | | | 1 | |
| | | | | | | | |
TOTAL PREFERRED STOCKS
(cost $3,061,417) | | | | | | | 3,145,570 | |
| | | | | | | | |
| | |
| | | Units | | | | |
| | |
RIGHTS* — 0.0% | | | | | | | | |
Wireless Telecommunication Services | | | | | |
Intelsat Jackson Holdings SA, Series A, CVR (Luxembourg), expiring 12/05/25^ | | | 5,521 | | | | 52,619 | |
Intelsat Jackson Holdings SA, Series B, CVR (Luxembourg), expiring 12/05/25^ | | | 5,521 | | | | 10,929 | |
| | | | | | | | |
TOTAL RIGHTS
(cost $0) | | | | | | | 63,548 | |
| | | | | | | | |
TOTAL LONG-TERM INVESTMENTS
(cost $529,702,300) | | | | 456,403,737 | |
| | | | | | | | |
| | |
| | | Shares | | | | |
SHORT-TERM INVESTMENTS — 21.9% | |
AFFILIATED MUTUAL FUNDS | | | | | |
PGIM Core Ultra Short Bond Fund(wa) | | | 19,618,137 | | | | 19,618,137 | |
PGIM Institutional Money Market Fund (cost $86,296,209; includes $85,881,636 of cash collateral for securities on loan)(b)(wa) | | | 86,398,318 | | | | 86,355,118 | |
| | | | | | | | |
TOTAL SHORT-TERM INVESTMENTS
(cost $105,914,346) | | | | 105,973,255 | |
| | | | | | | | |
TOTAL INVESTMENTS—116.0%
(cost $635,616,646) | | | | 562,376,992 | |
Liabilities in excess of other assets(z) — (16.0)% | | | | (77,405,059 | ) |
| | | | | | | | |
| | |
NET ASSETS — 100.0% | | | | | | $ | 484,971,933 | |
| | | | | | | | |
See the Glossary for a list of the abbreviation(s) used in the annual report.
| * | Non-income producing security. |
| # | Principal or notional amount is shown in U.S. dollars unless otherwise stated. |
| ^ | Indicates a Level 3 instrument. The aggregate value of Level 3 instruments is $9,297,795 and 1.9% of net assets. |
SEE NOTES TO FINANCIAL STATEMENTS.
A132
| | | | |
| | PSF PGIM HIGH YIELD BOND PORTFOLIO (CONTINUED) | | |
| | | | |
SCHEDULE OF INVESTMENTS | | | | as of December 31, 2022 |
| (a) | All or a portion of security is on loan. The aggregate market value of such securities, including those sold and pending settlement, is $84,433,963; cash collateral of $85,881,636 (included in liabilities) was received with which the Portfolio purchased highly liquid short-term investments. In the event of significant appreciation in value of securities on loan on the last business day of the reporting period, the Portfolio may reflect a collateral value that is less than the market value of the loaned securities and such shortfall is remedied the following business day. |
| (b) | Represents security, or portion thereof, purchased with cash collateral received for securities on loan and includes dividend reinvestment. |
| (c) | Variable rate instrument. The interest rate shown reflects the rate in effect at December 31, 2022. |
| (cc) | Variable rate instrument. The rate shown is based on the latest available information as of December 31, 2022. Certain variable rate securities are not based on a published reference rate and spread but are determined by the issuer or agent and are based on current market conditions. These securities do not indicate a reference rate and spread in their description. |
| (d) | Represents issuer in default on interest payments and/or principal repayment. Non-income producing security. Such securities may be post-maturity. |
| (f) | Indicates a restricted security that is acquired in unregistered, private sales from the issuing company or from an affiliate of the issuer and is considered restricted as to disposition under federal securities law; the aggregate original cost of such securities is $25,998,970. The aggregate value of $14,419,815 is 3.0% of net assets. |
| (ff) | Variable rate security. Security may be issued at a fixed coupon rate, which converts to a variable rate at a specified date. Rate shown is the rate in effect as of period end. |
| (k) | Represents security, or a portion thereof, segregated as collateral for centrally cleared/exchange-traded derivatives. |
| (oo) | Perpetual security. Maturity date represents next call date. |
| (wa) | PGIM Investments LLC, the manager of the Portfolio, also serves as manager of the PGIM Core Ultra Short Bond Fund and PGIM Institutional Money Market Fund, if applicable. |
| (z) | Includes net unrealized appreciation/(depreciation) and/or market value of the below holdings which are excluded from the Schedule of Investments: |
Futures contracts outstanding at December 31, 2022:
| | | | | | | | | | | | | | | | | | | | | | |
Number of Contracts | | Type | | Expiration
Date | | | Current
Notional
Amount | | | Value /
Unrealized
Appreciation
(Depreciation) | |
| | | | | | | | | | | | | | | | | | |
Long Positions: | | | | | | | | | | | | | | | | | | | | |
67 | | 2 Year U.S. Treasury Notes | | | Mar. 2023 | | | $ | 13,740,234 | | | | | | | $ | 12,616 | | | | | |
205 | | 5 Year U.S. Treasury Notes | | | Mar. 2023 | | | | 22,125,586 | | | | | | | | (40,392 | ) | | | | |
309 | | 10 Year U.S. Treasury Notes | | | Mar. 2023 | | | | 34,699,736 | | | | | | | | (128,202 | ) | | | | |
| | | | | | | | | | | | | | | | | | | | | | |
| | | | | | | | | | | | | | | | | (155,978 | ) | | | | |
| | | | | | | | | | | | | | | | | | | | | | |
Short Positions: | | | | | | | | | | | | | | | | | | | | |
6 | | 20 Year U.S. Treasury Bonds | | | Mar. 2023 | | | | 752,063 | | | | | | | | 977 | | | | | |
21 | | 30 Year U.S. Ultra Treasury Bonds | | | Mar. 2023 | | | | 2,820,563 | | | | | | | | 29,665 | | | | | |
| | | | | | | | | | | | | | | | | | | | | | |
| | | | | | | | | | | | | | | | | 30,642 | | | | | |
| | | | | | | | | | | | | | | | | | | | | | |
| | | | | | | | | | | | | | | | $ | (125,336 | ) | | | | |
| | | | | | | | | | | | | | | | | | | | | | |
Credit default swap agreements outstanding at December 31, 2022:
| | | | | | | | | | | | | | | | | | | | | | | | | | | | | | | | | | |
Reference Entity/ Obligation | | Termination
Date | | | Fixed
Rate | | Notional
Amount
(000)#(3) | | | Value at Trade Date | | Value at December 31, 2022 | | Unrealized Appreciation (Depreciation) |
| | | | | | | |
Centrally Cleared Credit Default Swap Agreement on credit indices - Buy Protection(1): | | | | | | | | | | | | | | | | | | | |
CDX.NA.IG.39.V1 | | | 12/20/32 | | | 1.000%(Q) | | | 13,140 | | | | | $ | 303,548 | | | | | | | $ | 175,831 | | | | | | | $ | (127,717 | ) | | |
| | | | | | | | | | | | | | | | | | | | | | | | | | | | | | | | | | |
| | | | | | | | | | | | | | | | | | | | | | | | | | | | | | | | | | | | | | | | |
Reference Entity/ Obligation | | Termination
Date | | | Fixed
Rate | | | Notional
Amount
(000)#(3) | | | Implied Credit
Spread at
December 31,
2022(4) | | | Value at Trade Date | | Value at December 31, 2022 | | Unrealized Appreciation (Depreciation) |
| | | |
Centrally Cleared Credit Default Swap Agreements on credit indices - Sell Protection(2): | | | | | | | | |
CDX.NA.HY.38.V2 | | | 06/20/27 | | | | 5.000%(Q) | | | | 10,529 | | | | 4.426% | | | | | $ | (293,582 | ) | | | | | | $ | 235,138 | | | | | | | $ | 528,720 | | | |
CDX.NA.HY.39.V1 | | | 12/20/27 | | | | 5.000%(Q) | | | | 925 | | | | 4.849% | | | | | | 1,835 | | | | | | | | 6,929 | | | | | | | | 5,094 | | | |
| | | | | | | | | | | | | | | | | | | | | | | | | | | | | | | | | | | | | | | | |
| | | | | | | | | | | | | | | | | | | | $ | (291,747 | ) | | | | | | $ | 242,067 | | | | | | | $ | 533,814 | | | |
| | | | | | | | | | | | | | | | | | | | | | | | | | | | | | | | | | | | | | | | |
SEE NOTES TO FINANCIAL STATEMENTS.
A133
| | | | |
| | PSF PGIM HIGH YIELD BOND PORTFOLIO (CONTINUED) | | |
| | | | |
SCHEDULE OF INVESTMENTS | | | | as of December 31, 2022 |
Credit default swap agreements outstanding at December 31, 2022: (continued)
The Portfolio entered into credit default swaps (“CDS”) to provide a measure of protection against defaults or to take an active long or short position with respect to the likelihood of a particular issuer’s default or the reference entity’s credit soundness. CDS contracts generally trade based on a spread which represents the cost a protection buyer has to pay the protection seller. The protection buyer is said to be short the credit as the value of the contract rises the more the credit deteriorates. The value of the CDS contract increases for the protection buyer if the spread increases.
| (1) | If the Portfolio is a buyer of protection, it pays the fixed rate. When a credit event occurs, as defined under the terms of that particular swap agreement, the Portfolio will either (i) receive from the seller of protection an amount equal to the notional amount of the swap and make delivery of the referenced obligation or underlying securities comprising the referenced index or (ii) receive a net settlement amount in the form of cash or securities equal to the notional amount of the swap less the recovery value of the referenced obligation or underlying securities comprising the referenced index. |
| (2) | If the Portfolio is a seller of protection, it receives the fixed rate. When a credit event occurs, as defined under the terms of that particular swap agreement, the Portfolio will either (i) pay to the buyer of protection an amount equal to the notional amount of the swap and take delivery of the referenced obligation or underlying securities comprising the referenced index or (ii) pay a net settlement amount in the form of cash or securities equal to the notional amount of the swap less the recovery value of the referenced obligation or underlying securities comprising the referenced index. |
| (3) | Notional amount represents the maximum potential amount the Portfolio could be required to pay as a seller of credit protection or receive as a buyer of credit protection if a credit event occurs as defined under the terms of that particular swap agreement. |
| (4) | Implied credit spreads, represented in absolute terms, utilized in determining the fair value of credit default swap agreements where the Portfolio is the seller of protection as of the reporting date serve as an indicator of the current status of the payment/ performance risk and represent the likelihood of risk of default for the credit derivative. The implied credit spread of a particular referenced entity reflects the cost of buying/selling protection and may include up-front payments required to be made to enter into the agreement. Wider credit spreads represent a deterioration of the referenced entity’s credit soundness and a greater likelihood of risk of default or other credit event occurring as defined under the terms of the agreement. |
Summary of Collateral for Centrally Cleared/Exchange-traded Derivatives:
Cash and securities segregated as collateral, including pending settlement for closed positions, to cover requirements for centrally cleared/exchange-traded derivatives are listed by broker as follows:
| | | | | | | | | | | | | | | | | | | | |
Broker | | Cash and/or Foreign Currency | | | Securities Market Value | |
CIGM | | | | $ | 1,255,000 | | | | | | | | | $ | 956,343 | | | | | |
| | | | | | | | | | | | | | | | | | | | |
Fair Value Measurements:
Various inputs are used in determining the value of the Portfolio’s investments. These inputs are summarized in the three broad levels listed below.
Level 1—unadjusted quoted prices generally in active markets for identical securities.
Level 2—quoted prices for similar securities, interest rates and yield curves, prepayment speeds, foreign currency exchange rates and other observable inputs.
Level 3—unobservable inputs for securities valued in accordance with Board approved fair valuation procedures.
The following is a summary of the inputs used as of December 31, 2022 in valuing such portfolio securities:
| | | | | | | | | | | | |
| | | Level 1 | | | Level 2 | | | Level 3 | |
Investments in Securities | | | | | | | | | | | | |
Assets | | | | | | | | | | | | |
Long-Term Investments | | | | | | | | | | | | |
Asset-Backed Securities | | | | | | | | | | | | |
Collateralized Loan Obligations | | $ | — | | | $ | 29,655,146 | | | $ | — | |
Convertible Bond | | | — | | | | 43,741 | | | | — | |
Corporate Bonds | | | — | | | | 374,778,887 | | | | 35,366 | |
Floating Rate and other Loans | | | — | | | | 12,519,850 | | | | 1,271,537 | |
Residential Mortgage-Backed Securities | | | — | | | | 47,127 | | | | — | |
U.S. Treasury Obligations | | | — | | | | 24,367,316 | | | | — | |
Common Stocks | | | 4,124,188 | | | | 1,276,163 | | | | 5,075,298 | |
Preferred Stocks | | | 293,524 | | | | — | | | | 2,852,046 | |
Rights | | | — | | | | — | | | | 63,548 | |
SEE NOTES TO FINANCIAL STATEMENTS.
A134
| | | | |
| | PSF PGIM HIGH YIELD BOND PORTFOLIO (CONTINUED) | | |
| | | | |
SCHEDULE OF INVESTMENTS | | | | as of December 31, 2022 |
| | | | | | | | | | | | |
| | | Level 1 | | | Level 2 | | | Level 3 | |
Investments in Securities (continued) | | | | | | | | | | | | |
Assets (continued) | | | | | | | | | | | | |
Short-Term Investments | | | | | | | | | | | | |
Affiliated Mutual Funds | | $ | 105,973,255 | | | $ | — | | | $ | — | |
| | | | | | | | | | | | |
| | | |
Total | | $ | 110,390,967 | | | $ | 442,688,230 | | | $ | 9,297,795 | |
| | | | | | | | | | | | |
| | | |
Other Financial Instruments* | | | | | | | | | | | | |
Assets | | | | | | | | | | | | |
Futures Contracts | | $ | 43,258 | | | $ | — | | | $ | — | |
Centrally Cleared Credit Default Swap Agreements | | | — | | | | 533,814 | | | | — | |
| | | | | | | | | | | | |
Total | | $ | 43,258 | | | $ | 533,814 | | | $ | — | |
| | | | | | | | | | | | |
| | | |
Liabilities | | | | | | | | | | | | |
Futures Contracts | | $ | (168,594 | ) | | $ | — | | | $ | — | |
Centrally Cleared Credit Default Swap Agreement | | | — | | | | (127,717 | ) | | | — | |
| | | | | | | | | | | | |
Total | | $ | (168,594 | ) | | $ | (127,717 | ) | | $ | — | |
| | | | | | | | | | | | |
| * | Other financial instruments are derivative instruments not reflected in the Schedule of Investments. futures, forwards and centrally cleared swap contracts, which are recorded at the unrealized appreciation (depreciation) on the instrument, and OTC swap contracts which are recorded at fair value. |
The following is a reconciliation of assets in which unobservable inputs (Level 3) were used in determining fair value:
| | | | | | | | | | | | | | | | | | | | | | | | | | | | | | | | | | | | | | | | |
| | | Corporate Bonds | | Floating Rate and other Loans | | Common Stocks | | Preferred Stocks | | Rights | | | Warrants | |
Balance as of 12/31/21 | | | | $ | 35,610 | | | | | | | $ | 324,666 | | | | | | | $ | 1,960,190 | | | | | | | $ | 3,152,864 | | | | | $ | — | | | $ | 4,972 | |
Realized gain (loss) | | | | | (1 | ) | | | | | | | 1,230 | | | | | | | | 259,903 | | | | | | | | 10,500 | | | | | | — | | | | — | |
Change in unrealized appreciation (depreciation) | | | | | (436,055 | ) | | | | | | | (155,038 | ) | | | | | | | (88,530 | ) | | | | | | | (9,818 | ) | | | | | 63,548 | | | | (4,972 | ) |
Purchases/Exchanges/Issuances | | | | | — | | | | | | | | 1,160,045 | | | | | | | | 541,017 | | | | | | | | — | | | | | | — | | | | — | |
Sales/Paydowns | | | | | — | | | | | | | | (63,189 | ) | | | | | | | (1,945,122 | ) | | | | | | | (301,500 | ) | | | | | — | | | | — | |
Accrued discount/premium | | | | | 435,812 | | | | | | | | 3,823 | | | | | | | | — | | | | | | | | — | | | | | | — | | | | — | |
Transfers into Level 3* | | | | | — | | | | | | | | — | | | | | | | | 4,347,840 | | | | | | | | — | | | | | | — | | | | — | |
Transfers out of Level 3* | | | | | — | | | | | | | | — | | | | | | | | — | | | | | | | | — | | | | | | — | | | | — | |
| | | | | | | | | | | | | | | | | | | | | | | | | | | | | | | | | | | | | | | | |
Balance as of 12/31/22 | | | | $ | 35,366 | | | | | | | $ | 1,271,537 | | | | | | | $ | 5,075,298 | | | | | | | $ | 2,852,046 | | | | | $ | 63,548 | | | $ | — | |
| | | | | | | | | | | | | | | | | | | | | | | | | | | | | | | | | | | | | | | | |
| | | | | | | | | | | | | | |
Change in unrealized appreciation (depreciation)relating to securities still held at reporting periodend | | | | $ | (435,806 | ) | | | | | | $ | (149,890 | ) | | | | | | $ | (88,530 | ) | | | | | | $ | (9,818 | ) | | | | $ | 63,548 | | | $ | — | |
| | | | | | | | | | | | | | | | | | | | | | | | | | | | | | | | | | | | | | | | |
| * | It is the Portfolio’s policy to recognize transfers in and transfers out at the securities’ fair values as of the beginning of period. Securities transferred between Level 2 and Level 3 are due to changes in the method utilized in valuing the investments. Transfers from Level 2 to Level 3 are typically a result of a change from the use of methods used by independent pricing services (Level 2) to the use of a single broker quote or valuation technique which utilizes significant unobservable inputs due to an absence of current or reliable market quotations (Level 3). Transfers from Level 3 to Level 2 are a result of the availability of current and reliable market data provided by independent pricing services or other valuation techniques which utilize observable inputs. In accordance with the requirements of ASC 820, the amounts of transfers into and out of Level 3, if material, are disclosed in the Notes to the Schedule of Investments of the Portfolio. |
Level 3 securities as presented in the table above are being fair valued using pricing methodologies approved by the Board, which contain unobservable inputs as follows:
| | | | | | | | | | | | | | | | | | |
Level 3 Securities** | | Fair Value as of
December 31, 2022 | | | Valuation
Approach | | Valuation Methodology | | Unobservable Inputs |
Corporate Bonds | | | | | | $ | 6 | | | | | | | Market | | Contingent Value | | Contingent Value |
Corporate Bonds | | | | | | | 35,360 | | | | | | | Market | | Transaction Based | | Unadjusted Last Traded Price |
Common Stocks | | | | | | | 998,680 | | | | | | | Market | | Enterprise Value | | Implied Equity Value |
Common Stocks | | | | | | | 272,835 | | | | | | | Market | | Enterprise Value | | Discount Rate |
Common Stocks | | | | | | | 2,620,183 | | | | | | | Market | | Transaction Based/Broker Quote | | Allocation Rate |
Preferred Stocks | | | | | | | 2,045 | | | | | | | Market | | Discounted Cash Flow | | Discount Rate |
Preferred Stocks | | | | | | | 1 | | | | | | | Market | | Discounting | | Discount Rate |
Preferred Stocks | | | | | | | 2,850,000 | | | | | | | Market | | Transaction Based | | Unadjusted Purchase Price |
SEE NOTES TO FINANCIAL STATEMENTS.
A135
| | | | |
| | PSF PGIM HIGH YIELD BOND PORTFOLIO (CONTINUED) | | |
| | | | |
SCHEDULE OF INVESTMENTS | | | | as of December 31, 2022 |
| | | | | | | | | | | | | | | | | | |
Level 3 Securities** | | Fair Value as of
December 31, 2022 | | Valuation
Approach | | | Valuation
Methodology | | | Unobservable Inputs | |
| | | | | | |
Rights | | | | $ 63,548 | | | | | Market | | | | Contingent Value | | | | Contingent Value | |
| | | | | | | | | | | | | | | | | | |
| | | | $6,842,658 | | | | | | | | | | | | | | |
| | | | | | | | | | | | | | | | | | |
| ** | The table does not include Level 3 securities and/or derivatives that are valued by independent pricing vendors or brokers. As of December 31, 2022, the aggregate value of these securities and/or derivatives was $2,455,137. The unobservable inputs for these investments were not developed by the Portfolio and are not readily available (e.g. single broker quotes). |
Industry Classification:
The industry classification of investments and liabilities in excess of other assets shown as a percentage of net assets as of December 31, 2022 were as follows:
| | | | |
Affiliated Mutual Funds (17.7% represents investments purchased with collateral from securities on loan) | | | 21.9 | % |
Oil & Gas | | | 6.9 | |
Media | | | 6.5 | |
Collateralized Loan Obligations | | | 6.1 | |
U.S. Treasury Obligations | | | 5.0 | |
Electric | | | 4.6 | |
Telecommunications | | | 4.5 | |
Home Builders | | | 4.5 | |
Commercial Services | | | 4.0 | |
Retail | | | 4.0 | |
Healthcare-Services | | | 3.6 | |
Pipelines | | | 3.0 | |
Diversified Financial Services | | | 2.9 | |
Aerospace & Defense | | | 2.9 | |
Foods | | | 2.7 | |
Chemicals | | | 2.6 | |
Real Estate Investment Trusts (REITs) | | | 2.5 | |
Entertainment | | | 2.4 | |
Pharmaceuticals | | | 2.4 | |
Mining | | | 1.8 | |
Building Materials | | | 1.6 | |
Real Estate | | | 1.5 | |
Lodging | | | 1.4 | |
Auto Manufacturers | | | 1.4 | |
Packaging & Containers | | | 1.4 | |
Gas Utilities | | | 1.2 | |
Auto Parts & Equipment | | | 1.0 | |
Airlines | | | 1.0 | |
Software | | | 0.9 | |
Healthcare-Products | | | 0.7 | |
Oil, Gas & Consumable Fuels | | | 0.6 | |
Housewares | | | 0.6 | |
Gas | | | 0.6 | |
Machinery-Diversified | | | 0.6 | |
Computers | | | 0.5 | |
Electrical Components & Equipment | | | 0.5 | |
Internet | | | 0.5 | |
Household Products/Wares | | | 0.4 | |
Advertising | | | 0.4 | |
Distribution/Wholesale | | | 0.4 | |
Insurance | | | 0.3 | |
Engineering & Construction | | | 0.3 | |
Electric Utilities | | | 0.3 | |
Apparel | | | 0.3 | |
Banks | | | 0.3 | |
| | | | |
Wireless Telecommunication Services | | | 0.3 | % |
Leisure Time | | | 0.3 | |
Agriculture | | | 0.3 | |
Iron/Steel | | | 0.2 | |
Independent Power & Renewable Electricity Producers | | | 0.2 | |
Electronics | | | 0.2 | |
Miscellaneous Manufacturing | | | 0.2 | |
Environmental Control | | | 0.2 | |
Trucking & Leasing | | | 0.1 | |
Machinery-Construction & Mining | | | 0.1 | |
Metal Fabricate/Hardware | | | 0.1 | |
Coal | | | 0.1 | |
Capital Markets | | | 0.1 | |
Transportation | | | 0.1 | |
Home Furnishings | | | 0.0 | * |
Residential Mortgage-Backed Securities | | | 0.0 | * |
Construction Materials | | | 0.0 | * |
| | | | |
| |
| | | 116.0 | |
Liabilities in excess of other assets | | | (16.0 | ) |
| | | | |
| |
| | | 100.0 | % |
| | | | |
SEE NOTES TO FINANCIAL STATEMENTS.
A136
| | | | |
| | PSF PGIM HIGH YIELD BOND PORTFOLIO (CONTINUED) | | |
| | | | |
SCHEDULE OF INVESTMENTS | | | | as of December 31, 2022 |
Effects of Derivative Instruments on the Financial Statements and Primary Underlying Risk Exposure:
The Portfolio invested in derivative instruments during the reporting period. The primary types of risk associated with these derivative instruments are credit contracts risk and interest rate contracts risk. See the Notes to Financial Statements for additional detail regarding these derivative instruments and their risks. The effect of such derivative instruments on the Portfolio’s financial position and financial performance as reflected in the Statement of Assets and Liabilities and Statement of Operations is presented in the summary below.
Fair values of derivative instruments as of December 31, 2022 as presented in the Statement of Assets and Liabilities:
| | | | | | | | | | | | | | | | |
| | | Asset Derivatives | | Liability Derivatives | |
| | | | |
Derivatives not accounted for as hedging instruments, carried at fair value | | Statement of
Assets and
Liabilities Location | | | Fair Value | | Statement of Assets and Liabilities Location | | Fair
Value | |
| | | | | | |
Credit contracts | |
| Due from/to broker-variation
margin swaps |
| | | | $533,814* | | | | Due from/to broker-variation margin swaps | | $ | 127,717 | * |
Interest rate contracts | |
| Due from/to broker-variation
margin futures |
| | | | 43,258* | | | | Due from/to broker-variation margin futures | | | 168,594 | * |
| | | | | | | | | | | | | | | | |
| | | | | | |
| | | | | | | | $577,072 | | | | | | $ | 296,311 | |
| | | | | | | | | | | | | | | | |
| * | Includes cumulative appreciation (depreciation) as reported in the schedule of open futures and centrally cleared swap contracts. Only unsettled variation margin receivable (payable) is reported within the Statement of Assets and Liabilities. |
The effects of derivative instruments on the Statement of Operations for the year ended December 31, 2022 are as follows:
| | | | | | | | |
| Amount of Realized Gain (Loss) on Derivatives Recognized in Income | |
| |
Derivatives not accounted for as hedging instruments, carried at fair value | | Futures | | | Swaps | |
| | |
Credit contracts | | $ | — | | | $ | 1,797,526 | |
Interest rate contracts | | | (6,823,977 | ) | | | 100,769 | |
| | | | | | | | |
| | |
Total | | $ | (6,823,977 | ) | | $ | 1,898,295 | |
| | | | | | | | |
| | |
| Change in Unrealized Appreciation (Depreciation) on Derivatives Recognized in Income |
|
| | | | | | | | |
Derivatives not accounted for as hedging instruments, carried at fair value | | Futures | | | Swaps | |
| | |
Credit contracts | | $ | — | | | $ | 414,591 | |
Interest rate contracts | | | (325,086 | ) | | | — | |
| | | | | | | | |
| | |
Total | | $ | (325,086 | ) | | $ | 414,591 | |
| | | | | | | | |
For the year ended December 31, 2022, the Portfolio’s average volume of derivative activities is as follows:
| | |
| Derivative Contract Type | | Average Volume of Derivative Activities* |
| |
Futures Contracts - Long Positions (1) | | $74,018,436 |
| |
Futures Contracts - Short Positions (1) | | 3,371,457 |
| |
Credit Default Swap Agreements - Buy Protection (1) | | 14,873,000 |
| |
Credit Default Swap Agreements - Sell Protection (1) | | 8,376,890 |
| |
Total Return Swap Agreements (1) | | 500,000 |
| * | Average volume is based on average quarter end balances as noted for the year ended December 31, 2022. |
| (1) | Notional Amount in USD. |
SEE NOTES TO FINANCIAL STATEMENTS.
A137
| | | | |
| | PSF PGIM HIGH YIELD BOND PORTFOLIO (CONTINUED) | | |
| | | | |
SCHEDULE OF INVESTMENTS | | | | as of December 31, 2022 |
Financial Instruments/Transactions—Summary of Offsetting and Netting Arrangements:
The Portfolio entered into financial instruments/transactions during the reporting period that are either offset in accordance with current requirements or are subject to enforceable master netting arrangements or similar agreements that permit offsetting. The information about offsetting and related netting arrangements for financial instruments/transactions where the legal right to set-off exists is presented in the summary below.
Offsetting of financial instrument/transaction assets and liabilities:
| | | | | | | | |
| Description | | Gross Market
Value of
Recognized
Assets/(Liabilities) | | | | Collateral
Pledged/(Received)(1) | | Net
Amount |
| | | | |
Securities on Loan | | $84,433,963 | | | | $(84,433,963) | | $— |
| (1) | Collateral amount disclosed by the Portfolio is limited to the market value of financial instruments/transactions. |
SEE NOTES TO FINANCIAL STATEMENTS.
A138
| | | | |
| | PSF PGIM HIGH YIELD BOND PORTFOLIO (CONTINUED) | | |
STATEMENT OF ASSETS AND LIABILITIES
as of December 31, 2022
| | | | |
ASSETS | | | | |
Investments at value, including securities on loan of $84,433,963: | | | | |
Unaffiliated investments (cost $529,702,300) | | $ | 456,403,737 | |
Affiliated investments (cost $105,914,346) | | | 105,973,255 | |
Cash | | | 18,658 | |
Dividends and interest receivable | | | 8,270,205 | |
Deposit with broker for centrally cleared/exchange-traded derivatives | | | 1,255,000 | |
Receivable for Portfolio shares sold | | | 61,114 | |
Receivable for investments sold | | | 3,983 | |
Tax reclaim receivable | | | 305 | |
Prepaid expenses and other assets | | | 37,060 | |
| | | | |
Total Assets | | | 572,023,317 | |
| | | | |
LIABILITIES | | | | |
Payable to broker for collateral for securities on loan | | | 85,881,636 | |
Accrued expenses and other liabilities | | | 632,073 | |
Payable for investments purchased | | | 223,815 | |
Management fee payable | | | 213,242 | |
Due to broker-variation margin futures | | | 60,101 | |
Payable for Portfolio shares purchased | | | 34,299 | |
Due to broker-variation margin swaps | | | 2,424 | |
Distribution fee payable | | | 1,929 | |
Affiliated transfer agent fee payable | | | 980 | |
Trustees’ fees payable | | | 580 | |
Payable to affiliate | | | 305 | |
| | | | |
Total Liabilities | | | 87,051,384 | |
| | | | |
NET ASSETS | | $ | 484,971,933 | |
| | | | |
Net assets were comprised of: | | | | |
Partners’ Equity | | $ | 484,971,933 | |
| | | | |
Class I: | | | | |
Net asset value and redemption price per share, $475,712,007 / 80,299,934 outstanding shares of beneficial interest | | $ | 5.92 | |
| | | | |
Class III: | | | | |
Net asset value and redemption price per share, $9,259,926 / 1,569,365 outstanding shares of beneficial interest | | $ | 5.90 | |
| | | | |
STATEMENT OF OPERATIONS
Year Ended December 31, 2022
| | | | |
NET INVESTMENT INCOME (LOSS) | | | | |
INCOME | | | | |
Interest income (net of $7,233 foreign withholding tax) | | $ | 31,431,770 | |
Unaffiliated dividend income (net of $948 foreign withholding tax, all of which is reimbursable by an affiliate) | | | 980,061 | |
Affiliated dividend income. | | | 429,970 | |
Income from securities lending, net (including affiliated income of $227,644) | | | 277,548 | |
| | | | |
Total income | | | 33,119,349 | |
| | | | |
EXPENSES | | | | |
Management fee | | | 2,802,282 | |
Distribution fee—Class III | | | 19,804 | |
Custodian and accounting fees | | | 70,743 | |
Shareholders’ reports | | | 64,618 | |
Audit fee | | | 46,800 | |
Legal fees and expenses | | | 23,784 | |
Trustees’ fees | | | 16,430 | |
Transfer agent’s fees and expenses (including affiliated expense of $5,882) | | | 10,682 | |
Miscellaneous | | | 31,124 | |
| | | | |
Total expenses | | | 3,086,267 | |
Less: Fee waivers and/or expense reimbursement | | | (166,260 | ) |
| | | | |
Net expenses | | | 2,920,007 | |
| | | | |
NET INVESTMENT INCOME (LOSS) | | | 30,199,342 | |
| | | | |
| REALIZED AND UNREALIZED GAIN (LOSS) ON INVESTMENT TRANSACTIONS | | | | |
Net realized gain (loss) on: | | | | |
Investment transactions (including affiliated of $(10,212)) | | | 3,646,517 | |
Futures transactions | | | (6,823,977 | ) |
Swap agreements transactions | | | 1,898,295 | |
| | | | |
| | | (1,279,165 | ) |
| | | | |
Net change in unrealized appreciation (depreciation) on: | | | | |
Investments (including affiliated of $42,781) | | | (92,282,377 | ) |
Futures | | | (325,086 | ) |
Swap agreements | | | 414,591 | |
Unfunded loan commitments | | | (724 | ) |
| | | | |
| | | (92,193,596 | ) |
| | | | |
NET GAIN (LOSS) ON INVESTMENT TRANSACTIONS | | | (93,472,761 | ) |
| | | | |
NET INCREASE (DECREASE) IN NET ASSETS RESULTING FROM OPERATIONS | | $ | (63,273,419 | ) |
| | | | |
STATEMENTS OF CHANGES IN NET ASSETS
| | | | | | | | | | | | | | | | | | | | | | | | |
| | | Year Ended
December 31, 2022 | | | Year Ended
December 31, 2021 | |
INCREASE (DECREASE) IN NET ASSETS | | | | | | | | | | | | | | | | | | | | | | | | |
OPERATIONS | | | | | | | | | | | | | | | | | | | | | | | | |
Net investment income (loss) | | | | | | $ | 30,199,342 | | | | | | | | | | | $ | 28,155,051 | | | | | |
Net realized gain (loss) on investment transactions. | | | | | | | (1,279,165 | ) | | | | | | | | | | | 6,025,005 | | | | | |
Net change in unrealized appreciation (depreciation) on investments | | | | | | | (92,193,596 | ) | | | | | | | | | | | 7,730,935 | | | | | |
| | | | | | | | | | | | | | | | | | | | | | | | |
NET INCREASE (DECREASE) IN NET ASSETS RESULTING FROM OPERATIONS | | | | | | | (63,273,419 | ) | | | | | | | | | | | 41,910,991 | | | | | |
| | | | | | | | | | | | | | | | | | | | | | | | |
PORTFOLIO SHARE TRANSACTIONS | | | | | | | | | | | | | | | | | | | | | | | | |
Portfolio shares sold | | | | | | | 21,791,340 | | | | | | | | | | | | 34,073,944 | | | | | |
Portfolio shares purchased | | | | | | | (41,725,529 | ) | | | | | | | | | | | (37,040,105 | ) | | | | |
| | | | | | | | | | | | | | | | | | | | | | | | |
NET INCREASE (DECREASE) IN NET ASSETS FROM PORTFOLIO SHARE TRANSACTIONS | | | | | | | (19,934,189 | ) | | | | | | | | | | | (2,966,161 | ) | | | | |
| | | | | | | | | | | | | | | | | | | | | | | | |
TOTAL INCREASE (DECREASE) | | | | | | | (83,207,608 | ) | | | | | | | | | | | 38,944,830 | | | | | |
NET ASSETS: | | | | | | | | | | | | | | | | | | | | | | | | |
Beginning of year | | | | | | | 568,179,541 | | | | | | | | | | | | 529,234,711 | | | | | |
| | | | | | | | | | | | | | | | | | | | | | | | |
End of year. | | | | | | $ | 484,971,933 | | | | | | | | | | | $ | 568,179,541 | | | | | |
| | | | | | | | | | | | | | | | | | | | | | | | |
SEE NOTES TO FINANCIAL STATEMENTS.
A139
| | | | |
| | PSF PGIM HIGH YIELD BOND PORTFOLIO (CONTINUED) | | |
FINANCIAL HIGHLIGHTS
| | | | | | | | | | | | | | | | | | | | |
Class I | | | | | | | | | | | | | | | |
| | | Year Ended December 31, | |
| | | 2022 | | | 2021 | | | 2020 | | | 2019 | | | 2018 | |
Per Share Operating Performance(a): | | | | | | | | | | | | | | | | | | | | |
Net Asset Value, beginning of year | | $ | 6.67 | | | $ | 6.18 | | | $ | 5.77 | | | $ | 4.96 | | | $ | 5.17 | |
Income (Loss) From Investment Operations: | | | | | | | | | | | | | | | | | | | | |
Net investment income (loss) | | | 0.36 | | | | 0.33 | | | | 0.35 | | | | 0.34 | | | | 0.33 | |
Net realized and unrealized gain (loss) on investment and foreign currency transactions | | | (1.11 | ) | | | 0.16 | | | | 0.06 | | | | 0.47 | | | | (0.39 | ) |
| | | | | | | | | | | | | | | | | | | | |
Total from investment operations | | | (0.75 | ) | | | 0.49 | | | | 0.41 | | | | 0.81 | | | | (0.06 | ) |
| | | | | | | | | | | | | | | | | | | | |
Less Dividends and Distributions | | | — | | | | — | | | | — | | | | — | | | | (0.15 | ) |
Capital Contributions | | | — | | | | — | | | | — | | | | — | | | | — | (b)(c) |
| | | | | | | | | | | | | | | | | | | | |
Net Asset Value, end of year | | $ | 5.92 | | | $ | 6.67 | | | $ | 6.18 | | | $ | 5.77 | | | $ | 4.96 | |
| | | | | | | | | | | | | | | | | | | | |
Total Return(d) | | | (11.24 | )% | | | 7.93 | % | | | 7.11 | % | | | 16.33 | % | | | (1.26 | )%(e) |
Ratios/Supplemental Data: | | | | | | | | | | | | | | | | | | | | |
Net assets, end of year (in millions) | | $ | 476 | | | $ | 562 | | | $ | 529 | | | $ | 522 | | | $ | 474 | |
Average net assets (in millions) | | $ | 502 | | | $ | 550 | | | $ | 497 | | | $ | 507 | | | $ | 499 | |
Ratios to average net assets(f): | | | | | | | | | | | | | | | | | | | | |
Expenses after waivers and/or expense reimbursement | | | 0.57 | % | | | 0.57 | % | | | 0.57 | % | | | 0.57 | % | | | 0.57 | % |
Expenses before waivers and/or expense reimbursement | | | 0.60 | % | | | 0.59 | % | | | 0.61 | % | | | 0.62 | % | | | 0.62 | % |
Net investment income (loss) | | | 5.93 | % | | | 5.11 | % | | | 6.16 | % | | | 6.28 | % | | | 6.50 | % |
Portfolio turnover rate(g) | | | 33 | % | | | 48 | % | | | 61 | % | | | 58 | % | | | 47 | % |
| | | | | | | | | | | | | | | | |
Class III | | | | | | | | | | | | | | |
| | | Year Ended December 31, 2022 | | April 26, 2021(h)
through December 31, 2021 |
Per Share Operating Performance(a): | | | | | | | | | | | | | | | | |
Net Asset Value, beginning of period | | | | $ | 6.66 | | | | | | | $ | 6.41 | | | |
| | | | | | | | | | | | | | | | |
Income (Loss) From Investment Operations: | | | | | | | | | | | | | | | | |
Net investment income (loss) | | | | | 0.35 | | | | | | | | 0.22 | | | |
Net realized and unrealized gain (loss) on investment and foreign currency transactions | | | | | (1.11 | ) | | | | | | | 0.03 | | | |
| | | | | | | | | | | | | | | | |
Total from investment operations | | | | | (0.76 | ) | | | | | | | 0.25 | | | |
| | | | | | | | | | | | | | | | |
Net Asset Value, end of period | | | | $ | 5.90 | | | | | | | $ | 6.66 | | | |
| | | | | | | | | | | | | | | | |
Total Return(d) | | | | | (11.41 | )% | | | | | | | 3.90 | % | | |
Ratios/Supplemental Data: | | | | | | | | | | | | | | | | |
Net assets, end of period (in millions) | | | | $ | 9 | | | | | | | $ | 6 | | | |
Average net assets (in millions) | | | | $ | 8 | | | | | | | $ | 2 | | | |
Ratios to average net assets(f): | | | | | | | | | | | | | | | | |
Expenses after waivers and/or expense reimbursement | | | | | 0.82 | % | | | | | | | 0.80 | %(i) | | |
Expenses before waivers and/or expense reimbursement | | | | | 0.85 | % | | | | | | | 0.82 | %(i) | | |
Net investment income (loss) | | | | | 5.76 | % | | | | | | | 4.72 | %(i) | | |
Portfolio turnover rate(g) | | | | | 33 | % | | | | | | | 48 | % | | |
| (a) | Calculated based on average shares outstanding during the period. |
| (b) | Represents payment received by the Portfolio, from Prudential, in connection with excess foreign withholding tax withheld on dividends and interest from certain countries due to the Portfolio’s tax status as a partnership. |
| (c) | Amount rounds to zero. |
| (d) | Total return is calculated assuming a purchase of a share on the first day and a sale on the last day of each period reported and includes reinvestment of dividends and distributions, if any, and does not reflect the effect of insurance contract charges. Total return does not reflect expenses associated with the separate account such as administrative fees, account charges and surrender charges which, if reflected, would reduce the total returns for all periods shown. Performance figures may reflect fee waivers and/or expense reimbursements. In the absence of fee waivers and/or expense reimbursements, the total return would be lower. Past performance is no guarantee of future results. Total returns may reflect adjustments to conform to GAAP. Total returns for periods less than one full year are not annualized. |
| (e) | Total return for the year includes the impact of the capital contribution, which was not material to the total return. |
| (f) | Does not include expenses of the underlying funds in which the Portfolio invests. |
| (g) | The Portfolio’s portfolio turnover rate is calculated in accordance with regulatory requirements, without regard to transactions involving short-term investments, certain derivatives and in-kind transactions (if any). If such transactions were included, the Portfolio’s portfolio turnover rate may be higher. |
| (h) | Commencement of offering. |
| (i) | Annualized, with the exception of certain non-recurring expenses. |
SEE NOTES TO FINANCIAL STATEMENTS.
A140
| | | | |
| | PSF PGIM JENNISON BLEND PORTFOLIO | | |
| | | | |
SCHEDULE OF INVESTMENTS | | | | as of December 31, 2022 |
| | | | | | | | |
| | | Shares | | | Value | |
LONG-TERM INVESTMENTS — 98.1% | |
COMMON STOCKS — 97.8% | | | | | |
Aerospace & Defense — 2.7% | | | | | | | | |
Airbus SE (France) | | | 367,843 | | | $ | 43,737,453 | |
Northrop Grumman Corp. | | | 37,973 | | | | 20,718,449 | |
Raytheon Technologies Corp. | | | 541,886 | | | | 54,687,135 | |
| | | | | | | | |
| | |
| | | | | | | 119,143,037 | |
| | | | | | | | |
Automobiles — 1.8% | | | | | | | | |
General Motors Co. | | | 747,666 | | | | 25,151,484 | |
Tesla, Inc.* | | | 470,520 | | | | 57,958,654 | |
| | | | | | | | |
| | |
| | | | | | | 83,110,138 | |
| | | | | | | | |
Banks — 5.3% | | | | | | | | |
Bank of America Corp. | | | 1,868,960 | | | | 61,899,955 | |
JPMorgan Chase & Co. | | | 601,776 | | | | 80,698,162 | |
PNC Financial Services Group, Inc. (The) | | | 319,158 | | | | 50,407,814 | |
Truist Financial Corp. | | | 1,065,321 | | | | 45,840,763 | |
| | | | | | | | |
| | |
| | | | | | | 238,846,694 | |
| | | | | | | | |
Beverages — 1.0% | | | | | | | | |
PepsiCo, Inc. | | | 240,557 | | | | 43,459,028 | |
| | | | | | | | |
Biotechnology — 3.0% | | | | | | | | |
AbbVie, Inc. | | | 396,041 | | | | 64,004,186 | |
Amgen, Inc. | | | 142,078 | | | | 37,315,366 | |
Vertex Pharmaceuticals, Inc.* | | | 117,252 | | | | 33,860,032 | |
| | | | | | | | |
| | |
| | | | | | | 135,179,584 | |
| | | | | | | | |
Building Products — 1.3% | | | | | | | | |
Johnson Controls International PLC | | | 879,805 | | | | 56,307,520 | |
| | | | | | | | |
Capital Markets — 2.2% | | | | | | | | |
Blackstone, Inc. | | | 242,604 | | | | 17,998,791 | |
Goldman Sachs Group, Inc. (The) | | | 237,129 | | | | 81,425,356 | |
| | | | | | | | |
| | |
| | | | | | | 99,424,147 | |
| | | | | | | | |
Chemicals — 1.6% | | | | | | | | |
Linde PLC (United Kingdom) | | | 223,452 | | | | 72,885,573 | |
| | | | | | | | |
Communications Equipment — 0.7% | |
Cisco Systems, Inc. | | | 675,104 | | | | 32,161,955 | |
| | | | | | | | |
Consumer Finance — 0.6% | | | | | | | | |
SLM Corp. | | | 1,764,399 | | | | 29,289,023 | |
| | | | | | | | |
Containers & Packaging — 0.8% | | | | | |
Crown Holdings, Inc.(a) | | | 462,409 | | | | 38,014,644 | |
| | | | | | | | |
Electric Utilities — 0.9% | | | | | | | | |
NextEra Energy, Inc. | | | 500,838 | | | | 41,870,057 | |
| | | | | | | | |
Energy Equipment & Services — 0.8% | |
Schlumberger Ltd. | | | 674,923 | | | | 36,081,384 | |
| | | | | | | | |
Entertainment — 1.3% | | | | | | | | |
Netflix, Inc.* | | | 146,730 | | | | 43,267,743 | |
ROBLOX Corp. (Class A Stock)*(a) | | | 168,626 | | | | 4,799,096 | |
Spotify Technology SA* | | | 141,933 | | | | 11,205,610 | |
| | | | | | | | |
| | |
| | | | | | | 59,272,449 | |
| | | | | | | | |
Equity Real Estate Investment Trusts (REITs) — 0.6% | |
American Tower Corp. | | | 131,552 | | | | 27,870,607 | |
| | | | | | | | |
| | | | | | | | |
| | | Shares | | | Value | |
|
COMMON STOCKS (continued) | |
Food & Staples Retailing — 2.5% | | | | | |
Costco Wholesale Corp. | | | 120,690 | | | $ | 55,094,985 | |
Walmart, Inc. | | | 413,684 | | | | 58,656,254 | |
| | | | | | | | |
| | |
| | | | | | | 113,751,239 | |
| | | | | | | | |
Food Products — 0.9% | | | | | | | | |
Mondelez International, Inc. (Class A Stock) | | | 627,346 | | | | 41,812,611 | |
| | | | | | | | |
Health Care Equipment & Supplies — 1.5% | |
Abbott Laboratories | | | 240,408 | | | | 26,394,394 | |
Intuitive Surgical, Inc.* | | | 146,276 | | | | 38,814,337 | |
| | | | | | | | |
| | |
| | | | | | | 65,208,731 | |
| | | | | | | | |
Health Care Providers & Services — 2.8% | |
Centene Corp.* | | | 426,974 | | | | 35,016,138 | |
Cigna Corp. | | | 100,662 | | | | 33,353,347 | |
UnitedHealth Group, Inc. | | | 106,363 | | | | 56,391,535 | |
| | | | | | | | |
| | |
| | | | | | | 124,761,020 | |
| | | | | | | | |
Hotels, Restaurants & Leisure — 2.5% | |
Airbnb, Inc. (Class A Stock)* | | | 215,192 | | | | 18,398,916 | |
Chipotle Mexican Grill, Inc.* | | | 11,361 | | | | 15,763,274 | |
Marriott International, Inc. (Class A Stock) | | | 140,480 | | | | 20,916,067 | |
McDonald’s Corp. | | | 210,078 | | | | 55,361,855 | |
| | | | | | | | |
| | |
| | | | | | | 110,440,112 | |
| | | | | | | | |
Household Products — 1.4% | | | | | | | | |
Procter & Gamble Co. (The) | | | 411,176 | | | | 62,317,835 | |
| | | | | | | | |
Insurance — 3.8% | | | | | | | | |
Chubb Ltd. | | | 353,154 | | | | 77,905,773 | |
Marsh & McLennan Cos., Inc. | | | 287,534 | | | | 47,581,126 | |
MetLife, Inc. | | | 652,632 | | | | 47,230,978 | |
| | | | | | | | |
| | |
| | | | | | | 172,717,877 | |
| | | | | | | | |
Interactive Media & Services — 4.3% | | | | | |
Alphabet, Inc. (Class A Stock)* | | | 1,230,494 | | | | 108,566,486 | |
Alphabet, Inc. (Class C Stock)* | | | 622,780 | | | | 55,259,269 | |
Meta Platforms, Inc. (Class A Stock)* | | | 232,884 | | | | 28,025,261 | |
| | | | | | | | |
| | |
| | | | | | | 191,851,016 | |
| | | | | | | | |
Internet & Direct Marketing Retail — 3.7% | |
Amazon.com, Inc.* | | | 1,290,800 | | | | 108,427,200 | |
MercadoLibre, Inc. (Brazil)* | | | 67,721 | | | | 57,308,219 | |
| | | | | | | | |
| | |
| | | | | | | 165,735,419 | |
| | | | | | | | |
IT Services — 4.1% | | | | | | | | |
Adyen NV (Netherlands), 144A* | | | 17,681 | | | | 24,545,646 | |
Mastercard, Inc. (Class A Stock) | | | 166,657 | | | | 57,951,639 | |
Snowflake, Inc. (Class A Stock)* | | | 198,111 | | | | 28,436,853 | |
Visa, Inc. (Class A Stock)(a) | | | 354,557 | | | | 73,662,762 | |
| | | | | | | | |
| | |
| | | | | | | 184,596,900 | |
| | | | | | | | |
Life Sciences Tools & Services — 2.2% | |
Danaher Corp. | | | 327,664 | | | | 86,968,579 | |
Thermo Fisher Scientific, Inc. | | | 17,468 | | | | 9,619,453 | |
| | | | | | | | |
| | |
| | | | | | | 96,588,032 | |
| | | | | | | | |
SEE NOTES TO FINANCIAL STATEMENTS.
A141
| | | | |
| | PSF PGIM JENNISON BLEND PORTFOLIO (CONTINUED) | | |
SCHEDULE OF INVESTMENTS | | | | as of December 31, 2022 |
| | | | | | | | |
| | | Shares | | | Value | |
|
COMMON STOCKS (continued) | |
Machinery — 2.6% | | | | | | | | |
Deere & Co. | | | 96,034 | | | $ | 41,175,538 | |
Fortive Corp. | | | 571,242 | | | | 36,702,299 | |
Otis Worldwide Corp. | | | 488,427 | | | | 38,248,718 | |
| | | | | | | | |
| | |
| | | | | | | 116,126,555 | |
| | | | | | | | |
Media — 0.4% | | | | | | | | |
Trade Desk, Inc. (The) (Class A Stock)*(a) | | | 451,428 | | | | 20,237,517 | |
| | | | | | | | |
Multi-Utilities — 1.2% | | | | | | | | |
Ameren Corp. | | | 597,916 | | | | 53,166,691 | |
| | | | | | | | |
Oil, Gas & Consumable Fuels — 6.1% | |
ConocoPhillips | | | 2,307,824 | | | | 272,323,232 | |
| | | | | | | | |
Personal Products — 0.8% | | | | | | | | |
Estee Lauder Cos., Inc. (The) (Class A Stock) | | | 146,138 | | | | 36,258,299 | |
| | | | | | | | |
Pharmaceuticals — 8.5% | | | | | | | | |
AstraZeneca PLC (United Kingdom), ADR | | | 1,366,079 | | | | 92,620,156 | |
Bristol-Myers Squibb Co. | | | 1,144,933 | | | | 82,377,929 | |
Eli Lilly & Co. | | | 455,893 | | | | 166,783,895 | |
Novo Nordisk A/S (Denmark), ADR | | | 276,263 | | | | 37,389,435 | |
| | | | | | | | |
| | |
| | | | | | | 379,171,415 | |
| | | | | | | | |
Road & Rail — 1.6% | | | | | | | | |
Uber Technologies, Inc.* | | | 1,378,732 | | | | 34,096,042 | |
Union Pacific Corp. | | | 177,227 | | | | 36,698,395 | |
| | | | | | | | |
| | |
| | | | | | | 70,794,437 | |
| | | | | | | | |
Semiconductors & Semiconductor Equipment — 4.9% | |
Broadcom, Inc. | | | 87,264 | | | | 48,791,920 | |
Lam Research Corp. | | | 81,220 | | | | 34,136,766 | |
NVIDIA Corp. | | | 446,888 | | | | 65,308,212 | |
NXP Semiconductors NV (China) | | | 226,651 | | | | 35,817,658 | |
QUALCOMM, Inc. | | | 315,499 | | | | 34,685,960 | |
| | | | | | | | |
| | |
| | | | | | | 218,740,516 | |
| | | | | | | | |
Software — 7.9% | | | | | | | | |
Adobe, Inc.* | | | 173,626 | | | | 58,430,358 | |
Atlassian Corp. (Class A Stock)*(a) | | | 155,792 | | | | 20,047,314 | |
Crowdstrike Holdings, Inc. (Class A Stock)* | | | 119,063 | | | | 12,536,143 | |
Microsoft Corp. | | | 840,312 | | | | 201,523,624 | |
Salesforce, Inc.* | | | 481,400 | | | | 63,828,826 | |
| | | | | | | | |
| | |
| | | | | | | 356,366,265 | |
| | | | | | | | |
Specialty Retail — 1.3% | | | | | | | | |
Home Depot, Inc. (The) | | | 100,952 | | | | 31,886,698 | |
Lowe’s Cos., Inc. | | | 122,553 | | | | 24,417,460 | |
| | | | | | | | |
| | |
| | | | | | | 56,304,158 | |
| | | | | | | | |
Technology Hardware, Storage & Peripherals — 4.7% | |
Apple, Inc. | | | 1,617,509 | | | | 210,162,944 | |
| | | | | | | | |
| | | | | | | | |
| | | Shares | | | Value | |
| |
COMMON STOCKS (continued) | | | | | |
Textiles, Apparel & Luxury Goods — 2.6% | |
Lululemon Athletica, Inc.* | | | 95,147 | | | $ | 30,483,196 | |
LVMH Moet Hennessy Louis Vuitton SE (France) | | | 95,634 | | | | 69,592,219 | |
NIKE, Inc. (Class B Stock) | | | 142,756 | | | | 16,703,879 | |
| | | | | | | | |
| | |
| | | | | | | 116,779,294 | |
| | | | | | | | |
Wireless Telecommunication Services — 0.9% | |
T-Mobile US, Inc.* | | | 284,813 | | | | 39,873,820 | |
| | | | | | | | |
TOTAL COMMON STOCKS
(cost $2,881,817,899) | | | | | | | 4,389,001,775 | |
| | | | | | | | |
PREFERRED STOCK — 0.3% | |
Automobiles | | | | | | | | |
Dr. Ing. h.c. F. Porsche AG (Germany) (PRFC)* | | | 128,245 | | | | 12,941,658 | |
| | | | | | | | |
(cost $10,333,164) | | | | | | | | |
| |
TOTAL LONG-TERM INVESTMENTS
(cost $2,892,151,063) | | | | 4,401,943,433 | |
| | | | | | | | |
|
SHORT-TERM INVESTMENTS — 3.7% | |
AFFILIATED MUTUAL FUNDS | |
PGIM Core Ultra Short Bond Fund(wa) | | | 80,562,662 | | | | 80,562,662 | |
PGIM Institutional Money Market Fund
(cost $83,587,364; includes
$83,241,217 of cash collateral for securities on loan)(b)(wa) | | | 83,812,616 | | | | 83,770,710 | |
| | | | | | | | |
| |
TOTAL SHORT-TERM INVESTMENTS
(cost $164,150,026) | | | | 164,333,372 | |
| | | | | | | | |
| |
TOTAL INVESTMENTS—101.8%
(cost $3,056,301,089) | | | | 4,566,276,805 | |
Liabilities in excess of other assets — (1.8)% | | | | (80,895,193 | ) |
| | | | | | | | |
| | |
NET ASSETS — 100.0% | | | | | | $ | 4,485,381,612 | |
| | | | | | | | |
See the Glossary for a list of the abbreviation(s) used in the annual report.
| * | Non-income producing security. |
| (a) | All or a portion of security is on loan. The aggregate market value of such securities, including those sold and pending settlement, is $81,142,604; cash collateral of $83,241,217 (included in liabilities) was received with which the Portfolio purchased highly liquid short-term investments. In the event of significant appreciation in value of securities on loan on the last business day of the reporting period, the Portfolio may reflect a collateral value that is less than the market value of the loaned securities and such shortfall is remedied the following business day. |
| (b) | Represents security, or portion thereof, purchased with cash collateral received for securities on loan and includes dividend reinvestment. |
| (wa) | PGIM Investments LLC, the manager of the Portfolio, also serves as manager of the PGIM Core Ultra Short Bond Fund and PGIM Institutional Money Market Fund, if applicable. |
Fair Value Measurements:
Various inputs are used in determining the value of the Portfolio’s investments. These inputs are summarized in the three broad levels listed below.
Level 1—unadjusted quoted prices generally in active markets for identical securities.
SEE NOTES TO FINANCIAL STATEMENTS.
A142
| | | | |
| | PSF PGIM JENNISON BLEND PORTFOLIO (CONTINUED) | | |
| | | | |
SCHEDULE OF INVESTMENTS | | | | as of December 31, 2022 |
Level 2—quoted prices for similar securities, interest rates and yield curves, prepayment speeds, foreign currency exchange rates and other observable inputs.
Level 3—unobservable inputs for securities valued in accordance with Board approved fair valuation procedures.
The following is a summary of the inputs used as of December 31, 2022 in valuing such portfolio securities:
| | | | | | | | | | | | | | | | | | | | |
| | | Level 1 | | | Level 2 | | | Level 3 | |
| | | | | |
Investments in Securities | | | | | | | | | | | | | | | | | | | | |
Assets | | | | | | | | | | | | | | | | | | | | |
Long-Term Investments | | | | | | | | | | | | | | | | | | | | |
Common Stocks | | | | | | | | | | | | | | | | | | | | |
Aerospace & Defense | | $ | 75,405,584 | | | $ | 43,737,453 | | | | | | | $ | — | | | | | |
Automobiles | | | 83,110,138 | | | | — | | | | | | | | — | | | | | |
Banks | | | 238,846,694 | | | | — | | | | | | | | — | | | | | |
Beverages | | | 43,459,028 | | | | — | | | | | | | | — | | | | | |
Biotechnology | | | 135,179,584 | | | | — | | | | | | | | — | | | | | |
Building Products | | | 56,307,520 | | | | — | | | | | | | | — | | | | | |
Capital Markets | | | 99,424,147 | | | | — | | | | | | | | — | | | | | |
Chemicals | | | 72,885,573 | | | | — | | | | | | | | — | | | | | |
Communications Equipment | | | 32,161,955 | | | | — | | | | | | | | — | | | | | |
Consumer Finance | | | 29,289,023 | | | | — | | | | | | | | — | | | | | |
Containers & Packaging | | | 38,014,644 | | | | — | | | | | | | | — | | | | | |
Electric Utilities | | | 41,870,057 | | | | — | | | | | | | | — | | | | | |
Energy Equipment & Services | | | 36,081,384 | | | | — | | | | | | | | — | | | | | |
Entertainment | | | 59,272,449 | | | | — | | | | | | | | — | | | | | |
Equity Real Estate Investment Trusts (REITs) | | | 27,870,607 | | | | — | | | | | | | | — | | | | | |
Food & Staples Retailing | | | 113,751,239 | | | | — | | | | | | | | — | | | | | |
Food Products | | | 41,812,611 | | | | — | | | | | | | | — | | | | | |
Health Care Equipment & Supplies | | | 65,208,731 | | | | — | | | | | | | | — | | | | | |
Health Care Providers & Services | | | 124,761,020 | | | | — | | | | | | | | — | | | | | |
Hotels, Restaurants & Leisure | | | 110,440,112 | | | | — | | | | | | | | — | | | | | |
Household Products | | | 62,317,835 | | | | — | | | | | | | | — | | | | | |
Insurance | | | 172,717,877 | | | | — | | | | | | | | — | | | | | |
Interactive Media & Services | | | 191,851,016 | | | | — | | | | | | | | — | | | | | |
Internet & Direct Marketing Retail | | | 165,735,419 | | | | — | | | | | | | | — | | | | | |
IT Services | | | 160,051,254 | | | | 24,545,646 | | | | | | | | — | | | | | |
Life Sciences Tools & Services | | | 96,588,032 | | | | — | | | | | | | | — | | | | | |
Machinery | | | 116,126,555 | | | | — | | | | | | | | — | | | | | |
Media | | | 20,237,517 | | | | — | | | | | | | | — | | | | | |
Multi-Utilities | | | 53,166,691 | | | | — | | | | | | | | — | | | | | |
Oil, Gas & Consumable Fuels | | | 272,323,232 | | | | — | | | | | | | | — | | | | | |
Personal Products | | | 36,258,299 | | | | — | | | | | | | | — | | | | | |
Pharmaceuticals | | | 379,171,415 | | | | — | | | | | | | | — | | | | | |
Road & Rail | | | 70,794,437 | | | | — | | | | | | | | — | | | | | |
Semiconductors & Semiconductor Equipment | | | 218,740,516 | | | | — | | | | | | | | — | | | | | |
Software | | | 356,366,265 | | | | — | | | | | | | | — | | | | | |
Specialty Retail | | | 56,304,158 | | | | — | | | | | | | | — | | | | | |
Technology Hardware, Storage & Peripherals | | | 210,162,944 | | | | — | | | | | | | | — | | | | | |
Textiles, Apparel & Luxury Goods | | | 47,187,075 | | | | 69,592,219 | | | | | | | | — | | | | | |
Wireless Telecommunication Services | | | 39,873,820 | | | | — | | | | | | | | — | | | | | |
Preferred Stock | | | | | | | | | | | | | | | | | | | | |
Automobiles | | | — | | | | 12,941,658 | | | | | | | | — | | | | | |
Short-Term Investments | | | | | | | | | | | | | | | | | | | | |
Affiliated Mutual Funds | | | 164,333,372 | | | | — | | | | | | | | — | | | | | |
| | | | | | | | | | | | | | | | | | | | |
Total | | $ | 4,415,459,829 | | | $ | 150,816,976 | | | | | | | $ | — | | | | | |
| | | | | | | | | | | | |
SEE NOTES TO FINANCIAL STATEMENTS.
A143
| | | | |
| | PSF PGIM JENNISON BLEND PORTFOLIO (CONTINUED) | | |
| | | | |
SCHEDULE OF INVESTMENTS | | | | as of December 31, 2022 |
Industry Classification:
The industry classification of investments and liabilities in excess of other assets shown as a percentage of net assets as of December 31, 2022 were as follows:
| | | | |
Pharmaceuticals | | | 8.5 | % |
Software | | | 7.9 | |
Oil, Gas & Consumable Fuels | | | 6.1 | |
Banks | | | 5.3 | |
Semiconductors & Semiconductor Equipment | | | 4.9 | |
Technology Hardware, Storage & Peripherals | | | 4.7 | |
Interactive Media & Services | | | 4.3 | |
IT Services | | | 4.1 | |
Insurance | | | 3.8 | |
Internet & Direct Marketing Retail | | | 3.7 | |
Affiliated Mutual Funds (1.9% represents investments purchased with collateral from securities on loan) | | | 3.7 | |
Biotechnology | | | 3.0 | |
Health Care Providers & Services | | | 2.8 | |
Aerospace & Defense | | | 2.7 | |
Textiles, Apparel & Luxury Goods | | | 2.6 | |
Machinery | | | 2.6 | |
Food & Staples Retailing | | | 2.5 | |
Hotels, Restaurants & Leisure | | | 2.5 | |
Capital Markets | | | 2.2 | |
Life Sciences Tools & Services | | | 2.2 | |
Automobiles | | | 2.1 | |
Chemicals | | | 1.6 | |
| | | | |
Road & Rail | | | 1.6 | % |
Health Care Equipment & Supplies | | | 1.5 | |
Household Products | | | 1.4 | |
Entertainment | | | 1.3 | |
Building Products | | | 1.3 | |
Specialty Retail | | | 1.3 | |
Multi-Utilities | | | 1.2 | |
Beverages | | | 1.0 | |
Electric Utilities | | | 0.9 | |
Food Products | | | 0.9 | |
Wireless Telecommunication Services | | | 0.9 | |
Containers & Packaging | | | 0.8 | |
Personal Products | | | 0.8 | |
Energy Equipment & Services | | | 0.8 | |
Communications Equipment | | | 0.7 | |
Consumer Finance | | | 0.6 | |
Equity Real Estate Investment Trusts (REITs) | | | 0.6 | |
Media | | | 0.4 | |
| | | | |
| |
| | | 101.8 | |
Liabilities in excess of other assets | | | (1.8 | ) |
| | | | |
| |
| | | 100.0 | % |
| | | | |
Financial Instruments/Transactions—Summary of Offsetting and Netting Arrangements:
The Portfolio entered into financial instruments/transactions during the reporting period that are either offset in accordance with current requirements or are subject to enforceable master netting arrangements or similar agreements that permit offsetting. The information about offsetting and related netting arrangements for financial instruments/transactions where the legal right to set-off exists is presented in the summary below.
Offsetting of financial instrument/transaction assets and liabilities:
| | | | | | | | |
| Description | | Gross Market
Value of
Recognized
Assets/(Liabilities) | | | | Collateral
Pledged/(Received)(1) | | Net Amount |
Securities on Loan | | $81,142,604 | | | | $(81,142,604) | | $— |
| (1) | Collateral amount disclosed by the Portfolio is limited to the market value of financial instruments/transactions. |
SEE NOTES TO FINANCIAL STATEMENTS.
A144
| | | | |
| | PSF PGIM JENNISON BLEND PORTFOLIO (CONTINUED) | | |
STATEMENT OF ASSETS AND LIABILITIES
as of December 31, 2022
| | | | |
ASSETS | | | | |
Investments at value, including securities on loan of $81,142,604: | | | | |
Unaffiliated investments (cost $2,892,151,063) | | $ | 4,401,943,433 | |
Affiliated investments (cost $164,150,026) | | | 164,333,372 | |
Cash | | | 44 | |
Dividends receivable | | | 3,787,363 | |
Tax reclaim receivable | | | 1,228,280 | |
Receivable for Portfolio shares sold | | | 1,914 | |
Prepaid expenses and other assets | | | 502,012 | |
| | | | |
Total Assets | | | 4,571,796,418 | |
| | | | |
| |
LIABILITIES | | | | |
Payable to broker for collateral for securities on loan | | | 83,241,217 | |
Management fee payable | | | 1,756,969 | |
Payable for Portfolio shares purchased | | | 565,374 | |
Accrued expenses and other liabilities | | | 478,005 | |
Payable to affiliate | | | 368,468 | |
Trustees’ fees payable | | | 2,941 | |
Affiliated transfer agent fee payable | | | 980 | |
Distribution fee payable | | | 549 | |
Administration fee payable | | | 303 | |
| | | | |
Total Liabilities | | | 86,414,806 | |
| | | | |
| |
NET ASSETS | | $ | 4,485,381,612 | |
| | | | |
Net assets were comprised of: | | | | |
Partners’ Equity | | $ | 4,485,381,612 | |
| | | | |
| |
Class I: | | | | |
Net asset value and redemption price per share, $4,482,850,104 / 61,013,653 outstanding shares of beneficial interest | | $ | 73.47 | |
| | | | |
| |
Class II: | | | | |
Net asset value and redemption price per share, $1,627,558 / 22,812 outstanding shares of beneficial interest | | $ | 71.35 | |
| | | | |
| |
Class III: | | | | |
Net asset value and redemption price per share, $903,950 / 12,355 outstanding shares of beneficial interest | | $ | 73.16 | |
| | | | |
STATEMENT OF OPERATIONS
Year Ended December 31, 2022
| | | | |
NET INVESTMENT INCOME (LOSS) | | | | |
INCOME | | | | |
Unaffiliated dividend income (net of $449,871 foreign withholding tax, of which $17,374 is reimbursable by an affiliate) | | $ | 69,684,519 | |
Affiliated dividend income | | | 1,267,466 | |
Income from securities lending, net (including affiliated income of $151,316) | | | 151,573 | |
| | | | |
Total income | | | 71,103,558 | |
| | | | |
EXPENSES | | | | |
Management fee | | | 22,712,835 | |
Distribution fee—Class II | | | 4,559 | |
Distribution fee—Class III | | | 2,030 | |
Administration fee—Class II | | | 2,735 | |
Custodian and accounting fees | | | 271,110 | |
Trustees’ fees | | | 86,290 | |
Legal fees and expenses | | | 48,408 | |
Shareholders’ reports | | | 40,836 | |
Audit fee | | | 25,000 | |
Transfer agent’s fees and expenses (including affiliated expense of $5,882) | | | 10,682 | |
Miscellaneous | | | 121,818 | |
| | | | |
Total expenses | | | 23,326,303 | |
| | | | |
NET INVESTMENT INCOME (LOSS) | | | 47,777,255 | |
| | | | |
| REALIZED AND UNREALIZED GAIN (LOSS) ON INVESTMENT AND FOREIGN CURRENCY TRANSACTIONS | | | | |
Net realized gain (loss) on: | | | | |
Investment transactions (including affiliated of $74,496) | | | (13,197,016 | ) |
Foreign currency transactions | | | 27,906 | |
| | | | |
| | | (13,169,110 | ) |
| | | | |
Net change in unrealized appreciation (depreciation) on: | | | | |
Investments (including affiliated of $(35,063)) | | | (1,609,381,738 | ) |
Foreign currencies | | | (7,751 | ) |
| | | | |
| | | (1,609,389,489 | ) |
| | | | |
NET GAIN (LOSS) ON INVESTMENT AND FOREIGN CURRENCY TRANSACTIONS | | | (1,622,558,599 | ) |
| | | | |
NET INCREASE (DECREASE) IN NET ASSETS RESULTING FROM OPERATIONS | | $ | (1,574,781,344 | ) |
| | | | |
STATEMENTS OF CHANGES IN NET ASSETS
| | | | | | | | | | | | | | | | | | | | | | | | |
| | | Year Ended
December 31, 2022 | | | Year Ended
December 31, 2021 | |
INCREASE (DECREASE) IN NET ASSETS | | | | | | | | | | | | | | | | | | | | | | | | |
OPERATIONS | | | | | | | | | | | | | | | | | | | | | | | | |
Net investment income (loss) | | | | | | $ | 47,777,255 | | | | | | | | | | | $ | 27,094,027 | | | | | |
Net realized gain (loss) on investment and foreign currency transactions | | | | | | | (13,169,110 | ) | | | | | | | | | | | 458,080,561 | | | | | |
Net change in unrealized appreciation (depreciation) on investments and foreign currencies | | | | | | | (1,609,389,489 | ) | | | | | | | | | | | 633,394,382 | | | | | |
| | | | | | | | | | | | | | | | | | | | | | | | |
NET INCREASE (DECREASE) IN NET ASSETS RESULTING FROM OPERATIONS | | | | | | | (1,574,781,344 | ) | | | | | | | | | | | 1,118,568,970 | | | | | |
| | | | | | | | | | | | | | | | | | | | | | | | |
PORTFOLIO SHARE TRANSACTIONS | | | | | | | | | | | | | | | | | | | | | | | | |
Portfolio shares sold | | | | | | | 3,644,403 | | | | | | | | | | | | 8,893,934 | | | | | |
Portfolio shares purchased | | | | | | | (325,685,209 | ) | | | | | | | | | | | (419,616,091 | ) | | | | |
| | | | | | | | | | | | | | | | | | | | | | | | |
NET INCREASE (DECREASE) IN NET ASSETS FROM PORTFOLIO SHARE TRANSACTIONS | | | | | | | (322,040,806 | ) | | | | | | | | | | | (410,722,157 | ) | | | | |
| | | | | | | | | | | | | | | | | | | | | | | | |
TOTAL INCREASE (DECREASE) | | | | | | | (1,896,822,150 | ) | | | | | | | | | | | 707,846,813 | | | | | |
NET ASSETS: | | | | | | | | | | | | | | | | | | | | | | | | |
Beginning of year | | | | | | | 6,382,203,762 | | | | | | | | | | | | 5,674,356,949 | | | | | |
| | | | | | | | | | | | | | | | | | | | | | | | |
End of year | | | | | | $ | 4,485,381,612 | | | | | | | | | | | $ | 6,382,203,762 | | | | | |
| | | | | | | | | | | | | | | | | | | | | | | | |
SEE NOTES TO FINANCIAL STATEMENTS.
A145
| | | | |
| | PSF PGIM JENNISON BLEND PORTFOLIO (CONTINUED) | | |
FINANCIAL HIGHLIGHTS
| | | | | | | | | | | | | | | | | | | | |
Class I | | | |
| | | Year Ended December 31, | |
| | | 2022 | | | 2021 | | | 2020 | | | 2019 | | | 2018 | |
Per Share Operating Performance(a): | | | | | | | | | | | | | | | | | | | | |
Net Asset Value, beginning of year | | $ | 98.09 | | | $ | 81.50 | | | $ | 63.18 | | | $ | 49.02 | | | $ | 51.52 | |
| | | | | | | | | | | | | | | | | | | | |
Income (Loss) From Investment Operations: | | | | | | | | | | | | | | | | | | | | |
Net investment income (loss) | | | 0.76 | | | | 0.40 | | | | 0.53 | | | | 0.66 | | | | 0.53 | |
Net realized and unrealized gain (loss) on investment and foreign currency transactions | | | (25.38 | ) | | | 16.19 | | | | 17.79 | | | | 13.50 | | | | (3.07 | ) |
| | | | | | | | | | | | | | | | | | | | |
Total from investment operations | | | (24.62 | ) | | | 16.59 | | | | 18.32 | | | | 14.16 | | | | (2.54 | ) |
| | | | | | | | | | | | | | | | | | | | |
Capital Contributions | | | — | | | | — | | | | — | | | | — | (b)(c) | | | 0.04 | (b) |
| | | | | | | | | | | | | | | | | | | | |
Net Asset Value, end of year | | $ | 73.47 | | | $ | 98.09 | | | $ | 81.50 | | | $ | 63.18 | | | $ | 49.02 | |
| | | | | | | | | | | | | | | | | | | | |
Total Return(d) | | | (25.10 | )% | | | 20.36 | % | | | 29.00 | % | | | 28.89 | %(e) | | | (4.85 | )%(f) |
Ratios/Supplemental Data: | | | | | | | | | | | | | | | | | | | | |
Net assets, end of year (in millions) | | $ | 4,482.9 | | | $ | 6,379.2 | | | $ | 5,672.4 | | | $ | 4,711.0 | | | $ | 3,919.6 | |
Average net assets (in millions) | | $ | 5,044.7 | | | $ | 6,084.1 | | | $ | 4,776.8 | | | $ | 4,406.8 | | | $ | 4,497.1 | |
Ratios to average net assets(g): | | | | | | | | | | | | | | | | | | | | |
Expenses after waivers and/or expense reimbursement | | | 0.46 | % | | | 0.46 | % | | | 0.47 | % | | | 0.47 | % | | | 0.47 | % |
Expenses before waivers and/or expense reimbursement | | | 0.46 | % | | | 0.46 | % | | | 0.47 | % | | | 0.47 | % | | | 0.47 | % |
Net investment income (loss) | | | 0.95 | % | | | 0.45 | % | | | 0.80 | % | | | 1.16 | % | | | 0.98 | % |
Portfolio turnover rate(h) | | | 22 | % | | | 29 | % | | | 62 | % | | | 43 | % | | | 37 | % |
| | | | | | | | | | | | | | | | | | | | |
Class II | | | |
| | | Year Ended December 31, | |
| | | 2022 | | | 2021 | | | 2020 | | | 2019 | | | 2018 | |
Per Share Operating Performance(a): | | | | | | | | | | | | | | | | | | | | |
Net Asset Value, beginning of year | | $ | 95.64 | | | $ | 79.78 | | | $ | 62.09 | | | $ | 48.37 | | | $ | 51.04 | |
| | | | | | | | | | | | | | | | | | | | |
Income (Loss) From Investment Operations: | | | | | | | | | | | | | | | | | | | | |
Net investment income (loss) | | | 0.43 | | | | 0.04 | | | | 0.26 | | | | 0.43 | | | | 0.32 | |
Net realized and unrealized gain (loss) on investment and foreign currency transactions | | | (24.72 | ) | | | 15.82 | | | | 17.43 | | | | 13.29 | | | | (3.03 | ) |
| | | | | | | | | | | | | | | | | | | | |
Total from investment operations | | | (24.29 | ) | | | 15.86 | | | | 17.69 | | | | 13.72 | | | | (2.71 | ) |
| | | | | | | | | | | | | | | | | | | | |
Capital Contributions | | | — | | | | — | | | | — | | | | — | (b)(c) | | | 0.04 | (b) |
| | | | | | | | | | | | | | | | | | | | |
Net Asset Value, end of year | | $ | 71.35 | | | $ | 95.64 | | | $ | 79.78 | | | $ | 62.09 | | | $ | 48.37 | |
| | | | | | | | | | | | | | | | | | | | |
Total Return(d) | | | (25.40 | )% | | | 19.88 | % | | | 28.49 | % | | | 28.36 | %(e) | | | (5.23 | )%(f) |
Ratios/Supplemental Data: | | | | | | | | | | | | | | | | | | | | |
Net assets, end of year (in millions) | | $ | 1.6 | | | $ | 2.3 | | | $ | 2.0 | | | $ | 1.7 | | | $ | 1.5 | |
Average net assets (in millions) | | $ | 1.8 | | | $ | 2.2 | | | $ | 1.7 | | | $ | 1.6 | | | $ | 1.8 | |
Ratios to average net assets(g): | | | | | | | | | | | | | | | | | | | | |
Expenses after waivers and/or expense reimbursement | | | 0.86 | % | | | 0.86 | % | | | 0.87 | % | | | 0.87 | % | | | 0.87 | % |
Expenses before waivers and/or expense reimbursement | | | 0.86 | % | | | 0.86 | % | | | 0.87 | % | | | 0.87 | % | | | 0.87 | % |
Net investment income (loss) | | | 0.55 | % | | | 0.04 | % | | | 0.40 | % | | | 0.76 | % | | | 0.59 | % |
Portfolio turnover rate(h) | | | 22 | % | | | 29 | % | | | 62 | % | | | 43 | % | | | 37 | % |
SEE NOTES TO FINANCIAL STATEMENTS.
A146
| | | | |
| | PSF PGIM JENNISON BLEND PORTFOLIO (CONTINUED) | | |
FINANCIAL HIGHLIGHTS
| | | | | | | | | | | | | | | | |
Class III | | |
| | | Year Ended December 31, 2022 | | April 26, 2021(i) through December 31, 2021 |
Per Share Operating Performance(a): | | | | | | | | | | | | | | | | |
Net Asset Value, beginning of period | | | | $ | 97.92 | | | | | | | $ | 87.74 | | | |
| | | | | | | | | | | | | | | | |
Income (Loss) From Investment Operations: | | | | | | | | | | | | | | | | |
Net investment income (loss) | | | | | 0.58 | | | | | | | | 0.12 | | | |
Net realized and unrealized gain (loss) on investment and foreign currency transactions. | | | | | (25.34 | ) | | | | | | | 10.06 | | | |
| | | | | | | | | | | | | | | | |
Total from investment operations | | | | | (24.76 | ) | | | | | | | 10.18 | | | |
| | | | | | | | | | | | | | | | |
Net Asset Value, end of period | | | | $ | 73.16 | | | | | | | $ | 97.92 | | | |
| | | | | | | | | | | | | | | | |
Total Return(d) | | | | | (25.29 | )% | | | | | | | 11.60 | % | | |
Ratios/Supplemental Data: | | | | | | | | | | | | | | | | |
Net assets, end of period (in millions) | | | | $ | 0.9 | | | | | | | $ | 0.6 | | | |
Average net assets (in millions) | | | | $ | 0.8 | | | | | | | $ | 0.2 | | | |
Ratios to average net assets(g): | | | | | | | | | | | | | | | | |
Expenses after waivers and/or expense reimbursement | | | | | 0.71 | % | | | | | | | 0.70 | %(j) | | |
Expenses before waivers and/or expense reimbursement | | | | | 0.71 | % | | | | | | | 0.70 | %(j) | | |
Net investment income (loss) | | | | | 0.74 | % | | | | | | | 0.18 | %(j) | | |
Portfolio turnover rate(h) | | | | | 22 | % | | | | | | | 29 | % | | |
| (a) | Calculated based on average shares outstanding during the period. |
| (b) | Represents payment received by the Portfolio, from Prudential, in connection with the failure to timely compensate the Portfolio for the excess foreign withholding tax withheld on dividends and interest from certain countries due to the Portfolio’s tax status as a partnership. |
| (c) | Amount rounds to zero. |
| (d) | Total return is calculated assuming a purchase of a share on the first day and a sale on the last day of each period reported and includes reinvestment of dividends and distributions, if any, and does not reflect the effect of insurance contract charges. Total return does not reflect expenses associated with the separate account such as administrative fees, account charges and surrender charges which, if reflected, would reduce the total returns for all periods shown. Performance figures may reflect fee waivers and/or expense reimbursements. In the absence of fee waivers and/or expense reimbursements, the total return would be lower. Past performance is no guarantee of future results. Total returns may reflect adjustments to conform to GAAP. Total returns for periods less than one full year are not annualized. |
| (e) | Total return for the year includes the impact of the capital contribution, which was not material to the total return. |
| (f) | Total return for the year includes the impact of the capital contribution. Excluding the capital contribution, the total return would have been (4.93)% and (5.31)% for Class I and Class II, respectively. |
| (g) | Does not include expenses of the underlying funds in which the Portfolio invests. |
| (h) | The Portfolio’s portfolio turnover rate is calculated in accordance with regulatory requirements, without regard to transactions involving short-term investments, certain derivatives and in-kind transactions (if any). If such transactions were included, the Portfolio’s portfolio turnover rate may be higher. |
| (i) | Commencement of offering. |
| (j) | Annualized, with the exception of certain non-recurring expenses. |
SEE NOTES TO FINANCIAL STATEMENTS.
A147
| | | | |
| | PSF PGIM JENNISON FOCUSED BLEND PORTFOLIO | | |
SCHEDULE OF INVESTMENTS | | | | as of December 31, 2022 |
| | | | | | | | |
| | | Shares | | | Value | |
LONG-TERM INVESTMENTS — 95.7% | |
COMMON STOCKS — 95.4% | |
Aerospace & Defense — 2.8% | |
Airbus SE (France) | | | 25,852 | | | $ | 3,073,868 | |
Raytheon Technologies Corp. | | | 13,196 | | | | 1,331,740 | |
| | | | | | | | |
| | |
| | | | | | | 4,405,608 | |
| | | | | | | | |
Automobiles — 2.1% | | | | | | | | |
General Motors Co. | | | 36,410 | | | | 1,224,833 | |
Tesla, Inc.* | | | 16,945 | | | | 2,087,285 | |
| | | | | | | | |
| | |
| | | | | | | 3,312,118 | |
| | | | | | | | |
Banks — 5.7% | | | | | | | | |
Bank of America Corp. | | | 70,676 | | | | 2,340,789 | |
JPMorgan Chase & Co. | | | 21,758 | | | | 2,917,748 | |
PNC Financial Services Group, Inc. (The) | | | 12,471 | | | | 1,969,669 | |
Truist Financial Corp. | | | 42,958 | | | | 1,848,483 | |
| | | | | | | | |
| | |
| | | | | | | 9,076,689 | |
| | | | | | | | |
Biotechnology — 3.0% | | | | | | | | |
AbbVie, Inc. | | | 18,714 | | | | 3,024,369 | |
Vertex Pharmaceuticals, Inc.* | | | 6,010 | | | | 1,735,568 | |
| | | | | | | | |
| | |
| | | | | | | 4,759,937 | |
| | | | | | | | |
Building Products — 1.8% | |
Johnson Controls International PLC | | | 46,042 | | | | 2,946,688 | |
| | | | | | | | |
Capital Markets — 2.0% | | | | | |
Blackstone, Inc. | | | 8,603 | | | | 638,257 | |
Goldman Sachs Group, Inc. (The) | | | 7,471 | | | | 2,565,392 | |
| | | | | | | | |
| | |
| | | | | | | 3,203,649 | |
| | | | | | | | |
Chemicals — 1.7% | | | | | | | | |
Linde PLC (United Kingdom) | | | 8,387 | | | | 2,735,672 | |
| | | | | | | | |
Containers & Packaging — 1.0% | | | | | |
Crown Holdings, Inc. | | | 19,724 | | | | 1,621,510 | |
| | | | | | | | |
Electric Utilities — 1.3% | | | | | | | | |
NextEra Energy, Inc. | | | 24,335 | | | | 2,034,406 | |
| | | | | | | | |
Entertainment — 1.1% | | | | | | | | |
Netflix, Inc.* | | | 5,719 | | | | 1,686,419 | |
| | | | | | | | |
Equity Real Estate Investment Trusts (REITs) — 0.9% | |
SBA Communications Corp. | | | 4,920 | | | | 1,379,125 | |
| | | | | | | | |
Food & Staples Retailing — 4.0% | |
Costco Wholesale Corp. | | | 5,340 | | | | 2,437,710 | |
Walmart, Inc. | | | 27,385 | | | | 3,882,919 | |
| | | | | | | | |
| | |
| | | | | | | 6,320,629 | |
| | | | | | | | |
Health Care Equipment & Supplies — 0.9% | |
Dexcom, Inc.* | | | 12,144 | | | | 1,375,187 | |
| | | | | | | | |
Health Care Providers & Services — 2.6% | |
Centene Corp.* | | | 15,230 | | | | 1,249,012 | |
UnitedHealth Group, Inc. | | | 5,623 | | | | 2,981,202 | |
| | | | | | | | |
| | |
| | | | | | | 4,230,214 | |
| | | | | | | | |
Hotels, Restaurants & Leisure — 2.0% | |
Airbnb, Inc. (Class A Stock)* | | | 7,540 | | | | 644,670 | |
| | | | | | | | |
| | | Shares | | | Value | |
|
COMMON STOCKS (continued) | |
Hotels, Restaurants & Leisure (cont’d.) | |
McDonald’s Corp. | | | 9,748 | | | $ | 2,568,890 | |
| | | | | | | | |
| | |
| | | | | | | 3,213,560 | |
| | | | | | | | |
Insurance — 4.5% | |
Chubb Ltd. | | | 18,685 | | | | 4,121,911 | |
MetLife, Inc. | | | 43,009 | | | | 3,112,561 | |
| | | | | | | | |
| | |
| | | | | | | 7,234,472 | |
| | | | | | | | |
Interactive Media & Services — 4.0% | |
Alphabet, Inc. (Class A Stock)* | | | 49,345 | | | | 4,353,710 | |
Alphabet, Inc. (Class C Stock)* | | | 19,758 | | | | 1,753,127 | |
ZoomInfo Technologies, Inc.* | | | 9,193 | | | | 276,801 | |
| | | | | | | | |
| | |
| | | | | | | 6,383,638 | |
| | | | | | | | |
Internet & Direct Marketing Retail — 3.7% | |
Amazon.com, Inc.* | | | 45,075 | | | | 3,786,300 | |
MercadoLibre, Inc. (Brazil)* | | | 2,564 | | | | 2,169,759 | |
| | | | | | | | |
| | |
| | | | | | | 5,956,059 | |
| | | | | | | | |
IT Services — 2.9% | | | | | | | | |
Adyen NV (Netherlands), 144A* | | | 525 | | | | 728,831 | |
Mastercard, Inc. (Class A Stock) | | | 9,702 | | | | 3,373,676 | |
Snowflake, Inc. (Class A Stock)* | | | 4,077 | | | | 585,213 | |
| | | | | | | | |
| | |
| | | | | | | 4,687,720 | |
| | | | | | | | |
Life Sciences Tools & Services — 2.4% | |
Danaher Corp. | | | 12,335 | | | | 3,273,956 | |
Lonza Group AG (Switzerland) | | | 1,130 | | | | 554,689 | |
| | | | | | | | |
| | |
| | | | | | | 3,828,645 | |
| | | | | | | | |
Machinery — 1.0% | | | | | | | | |
Deere & Co. | | | 3,714 | | | | 1,592,415 | |
| | | | | | | | |
Multi-Utilities — 1.6% | | | | | | | | |
Ameren Corp. | | | 27,986 | | | | 2,488,515 | |
| | | | | | | | |
Oil, Gas & Consumable Fuels — 6.0% | |
ConocoPhillips | | | 80,863 | | | | 9,541,834 | |
| | | | | | | | |
Personal Products — 1.0% | |
Estee Lauder Cos., Inc. (The) (Class A Stock) | | | 3,574 | | | | 886,745 | |
L’Oreal SA (France) | | | 2,159 | | | | 773,133 | |
| | | | | | | | |
| | |
| | | | | | | 1,659,878 | |
| | | | | | | | |
Pharmaceuticals — 11.7% | | | | | | | | |
AstraZeneca PLC (United Kingdom), ADR | | | 57,732 | | | | 3,914,229 | |
Bristol-Myers Squibb Co. | | | 40,728 | | | | 2,930,380 | |
Eli Lilly & Co. | | | 23,706 | | | | 8,672,603 | |
Novo Nordisk A/S (Denmark), ADR | | | 23,662 | | | | 3,202,415 | |
| | | | | | | | |
| | |
| | | | | | | 18,719,627 | |
| | | | | | | | |
Road & Rail — 1.9% | | | | | | | | |
Union Pacific Corp. | | | 14,498 | | | | 3,002,101 | |
| | | | | | | | |
Semiconductors & Semiconductor Equipment — 7.2% | |
ASML Holding NV (Netherlands) | | | 3,808 | | | | 2,080,691 | |
Broadcom, Inc. | | | 3,148 | | | | 1,760,141 | |
Lam Research Corp. | | | 3,851 | | | | 1,618,575 | |
NVIDIA Corp. | | | 20,864 | | | | 3,049,065 | |
SEE NOTES TO FINANCIAL STATEMENTS.
A148
| | | | |
| | PSF PGIM JENNISON FOCUSED BLEND PORTFOLIO (CONTINUED) | | |
SCHEDULE OF INVESTMENTS | | | | as of December 31, 2022 |
| | | | | | | | |
| | | Shares | | | Value | |
|
COMMON STOCKS (continued) | |
Semiconductors & Semiconductor Equipment (cont’d.) | |
NXP Semiconductors NV (China) | | | 9,603 | | | $ | 1,517,562 | |
QUALCOMM, Inc. | | | 13,307 | | | | 1,462,972 | |
| | | | | | | | |
| | |
| | | | | | | 11,489,006 | |
| | | | | | | | |
Software — 6.5% | | | | | | | | |
Cadence Design Systems, Inc.* | | | 4,284 | | | | 688,182 | |
Crowdstrike Holdings, Inc. (Class A Stock)* | | | 3,824 | | | | 402,629 | |
Microsoft Corp. | | | 32,796 | | | | 7,865,137 | |
Palo Alto Networks, Inc.* | | | 2,298 | | | | 320,663 | |
Salesforce, Inc.* | | | 8,051 | | | | 1,067,482 | |
| | | | | | | | |
| | |
| | | | | | | 10,344,093 | |
| | | | | | | | |
Technology Hardware, Storage & Peripherals — 2.8% | |
Apple, Inc. | | | 34,161 | | | | 4,438,539 | |
| | | | | | | | |
Textiles, Apparel & Luxury Goods — 4.1% | |
Lululemon Athletica, Inc.* | | | 6,025 | | | | 1,930,290 | |
LVMH Moet Hennessy Louis Vuitton SE (France) | | | 5,046 | | | | 3,671,940 | |
NIKE, Inc. (Class B Stock) | | | 8,403 | | | | 983,235 | |
| | | | | | | | |
| | |
| | | | | | | 6,585,465 | |
| | | | | | | | |
Wireless Telecommunication Services — 1.2% | |
T-Mobile US, Inc.* | | | 13,577 | | | | 1,900,780 | |
| | | | | | | | |
TOTAL COMMON STOCKS
(cost $124,203,268) | | | | | | | 152,154,198 | |
| | | | | | | | |
| | | | | | | | |
| | | Shares | | | Value | |
|
PREFERRED STOCK — 0.3% | |
Automobiles | | | | | | | | |
Dr. Ing. h.c. F. Porsche AG (Germany) (PRFC)* | | | 4,517 | | | $ | 455,827 | |
| | | | | | | | |
(cost $363,951) | | | | | | | | |
TOTAL LONG-TERM INVESTMENTS
(cost $124,567,219) | | | | 152,610,025 | |
| | | | | | | | |
|
SHORT-TERM INVESTMENT — 4.4% | |
AFFILIATED MUTUAL FUND | |
PGIM Core Ultra Short Bond Fund
(cost $6,980,217)(wa) | | | 6,980,217 | | | | 6,980,217 | |
| | | | | | | | |
TOTAL INVESTMENTS—100.1%
(cost $131,547,436) | | | | 159,590,242 | |
Liabilities in excess of other assets — (0.1)% | | | | (198,627 | ) |
| | | | | | | | |
| | |
NET ASSETS — 100.0% | | | | | | $ | 159,391,615 | |
| | | | | | | | |
See the Glossary for a list of the abbreviation(s) used in the annual report.
| * | Non-income producing security. |
| (wa) | PGIM Investments LLC, the manager of the Portfolio, also serves as manager of the PGIM Core Ultra Short Bond Fund and PGIM Institutional Money Market Fund, if applicable. |
Fair Value Measurements:
Various inputs are used in determining the value of the Portfolio’s investments. These inputs are summarized in the three broad levels listed below.
Level 1—unadjusted quoted prices generally in active markets for identical securities.
Level 2—quoted prices for similar securities, interest rates and yield curves, prepayment speeds, foreign currency exchange rates and other observable inputs.
Level 3—unobservable inputs for securities valued in accordance with Board approved fair valuation procedures.
The following is a summary of the inputs used as of December 31, 2022 in valuing such portfolio securities:
| | | | | | | | | | | | | | | | |
| | | Level 1 | | | Level 2 | | | Level 3 |
Investments in Securities | | | | | | | | | | | | | | | | |
Assets | | | | | | | | | | | | | | | | |
Long-Term Investments | | | | | | | | | | | | | | | | |
Common Stocks | | | | | | | | | | | | | | | | |
Aerospace & Defense | | $ | 1,331,740 | | | $ | 3,073,868 | | | | | $ | — | | | |
Automobiles | | | 3,312,118 | | | | — | | | | | | — | | | |
Banks | | | 9,076,689 | | | | — | | | | | | — | | | |
Biotechnology | | | 4,759,937 | | | | — | | | | | | — | | | |
Building Products | | | 2,946,688 | | | | — | | | | | | — | | | |
Capital Markets | | | 3,203,649 | | | | — | | | | | | — | | | |
Chemicals | | | 2,735,672 | | | | — | | | | | | — | | | |
Containers & Packaging. | | | 1,621,510 | | | | — | | | | | | — | | | |
Electric Utilities | | | 2,034,406 | | | | — | | | | | | — | | | |
Entertainment | | | 1,686,419 | | | | — | | | | | | — | | | |
Equity Real Estate Investment Trusts (REITs) | | | 1,379,125 | | | | — | | | | | | — | | | |
Food & Staples Retailing | | | 6,320,629 | | | | — | | | | | | — | | | |
Health Care Equipment & Supplies | | | 1,375,187 | | | | — | | | | | | — | | | |
Health Care Providers & Services | | | 4,230,214 | | | | — | | | | | | — | | | |
SEE NOTES TO FINANCIAL STATEMENTS.
A149
| | | | |
| | PSF PGIM JENNISON FOCUSED BLEND PORTFOLIO (CONTINUED) | | |
SCHEDULE OF INVESTMENTS | | | | as of December 31, 2022 |
| | | | | | | | | | |
| | | Level 1 | | | Level 2 | | | Level 3 |
Investments in Securities (continued) | | | | | | | | | | |
Assets (continued) | | | | | | | | | | |
Long-Term Investments (continued) | | | | | | | | | | |
Common Stocks (continued) | | | | | | | | | | |
Hotels, Restaurants & Leisure | | $ | 3,213,560 | | | $ | — | | | $— |
Insurance | | | 7,234,472 | | | | — | | | — |
Interactive Media & Services | | | 6,383,638 | | | | — | | | — |
Internet & Direct Marketing Retail | | | 5,956,059 | | | | — | | | — |
IT Services | | | 3,958,889 | | | | 728,831 | | | — |
Life Sciences Tools & Services | | | 3,273,956 | | | | 554,689 | | | — |
Machinery | | | 1,592,415 | | | | — | | | — |
Multi-Utilities | | | 2,488,515 | | | | — | | | — |
Oil, Gas & Consumable Fuels | | | 9,541,834 | | | | — | | | — |
Personal Products | | | 886,745 | | | | 773,133 | | | — |
Pharmaceuticals | | | 18,719,627 | | | | — | | | — |
Road & Rail | | | 3,002,101 | | | | — | | | — |
Semiconductors & Semiconductor Equipment | | | 11,489,006 | | | | — | | | — |
Software | | | 10,344,093 | | | | — | | | — |
Technology Hardware, Storage & Peripherals | | | 4,438,539 | | | | — | | | — |
Textiles, Apparel & Luxury Goods | | | 2,913,525 | | | | 3,671,940 | | | — |
Wireless Telecommunication Services | | | 1,900,780 | | | | — | | | — |
Preferred Stock | | | | | | | | | | |
Automobiles | | | — | | | | 455,827 | | | — |
Short-Term Investment | | | | | | | | | | |
Affiliated Mutual Fund | | | 6,980,217 | | | | — | | | — |
| | | | | | | | | | |
| | | |
Total | | $ | 150,331,954 | | | $ | 9,258,288 | | | $— |
| | | | | | | | | | |
Industry Classification:
The industry classification of investments and liabilities in excess of other assets shown as a percentage of net assets as of December 31, 2022 were as follows:
| | | | |
Pharmaceuticals | | | 11.7 | % |
Semiconductors & Semiconductor Equipment | | | 7.2 | |
Software | | | 6.5 | |
Oil, Gas & Consumable Fuels | | | 6.0 | |
Banks | | | 5.7 | |
Insurance | | | 4.5 | |
Affiliated Mutual Funds | | | 4.4 | |
Textiles, Apparel & Luxury Goods | | | 4.1 | |
Interactive Media & Services | | | 4.0 | |
Food & Staples Retailing | | | 4.0 | |
Internet & Direct Marketing Retail | | | 3.7 | |
Biotechnology | | | 3.0 | |
IT Services | | | 2.9 | |
Technology Hardware, Storage & Peripherals | | | 2.8 | |
Aerospace & Defense | | | 2.8 | |
Health Care Providers & Services | | | 2.6 | |
Life Sciences Tools & Services | | | 2.4 | |
Automobiles | | | 2.4 | |
Hotels, Restaurants & Leisure | | | 2.0 | |
| | | | |
Capital Markets | | | 2.0 | % |
Road & Rail | | | 1.9 | |
Building Products | | | 1.8 | |
Chemicals | | | 1.7 | |
Multi-Utilities | | | 1.6 | |
Electric Utilities | | | 1.3 | |
Wireless Telecommunication Services | | | 1.2 | |
Entertainment | | | 1.1 | |
Personal Products | | | 1.0 | |
Containers & Packaging | | | 1.0 | |
Machinery | | | 1.0 | |
Equity Real Estate Investment Trusts (REITs) | | | 0.9 | |
Health Care Equipment & Supplies | | | 0.9 | |
| | | | |
| | | 100.1 | |
| | | | |
Liabilities in excess of other assets | | | (0.1 | ) |
| | | | |
| | | 100.0 | % |
SEE NOTES TO FINANCIAL STATEMENTS.
A150
| | | | |
| | PSF PGIM JENNISON FOCUSED BLEND PORTFOLIO (CONTINUED) | | |
| | | | |
| | | | |
STATEMENT OF ASSETS AND LIABILITIES | | | | |
| |
as of December 31, 2022 | | | | |
| |
ASSETS | | | | |
Investments at value: | | | | |
Unaffiliated investments (cost $124,567,219) | | $ | 152,610,025 | |
Affiliated investments (cost $6,980,217) | | | 6,980,217 | |
Dividends receivable | | | 124,823 | |
Tax reclaim receivable | | | 55,713 | |
Receivable for Portfolio shares sold | | | 7,004 | |
Prepaid expenses | | | 1,810 | |
| | | | |
Total Assets | | | 159,779,592 | |
| | | | |
LIABILITIES | | | | |
Payable for Portfolio shares purchased | | | 164,873 | |
Management fee payable | | | 104,301 | |
Audit fee payable | | | 24,599 | |
Accrued expenses and other liabilities | | | 23,077 | |
Custodian and accounting fees payable | | | 22,644 | |
Distribution fee payable | | | 19,587 | |
Payable to affiliate | | | 15,818 | |
Administration fee payable | | | 11,698 | |
Affiliated transfer agent fee payable | | | 980 | |
Trustees’ fees payable | | | 400 | |
| | | | |
Total Liabilities | | | 387,977 | |
| | | | |
NET ASSETS | | $ | 159,391,615 | |
| | | | |
Net assets were comprised of: | | | | |
Partners’ Equity | | $ | 159,391,615 | |
| | | | |
Class I: | | | | |
Net asset value and redemption price per share, $70,062,720 / 1,620,993 outstanding shares of beneficial interest | | $ | 43.22 | |
| | | | |
Class II: | | | | |
Net asset value and redemption price per share, $88,896,007 / 2,190,331 outstanding shares of beneficial interest | | $ | 40.59 | |
| | | | |
Class III: | | | | |
Net asset value and redemption price per share, $432,888 / 10,057 outstanding shares of beneficial interest | | $ | 43.04 | |
| | | | |
| | | | |
STATEMENT OF OPERATIONS | | | | |
| |
Year Ended December 31, 2022 | | | | |
| |
NET INVESTMENT INCOME (LOSS) | | | | |
INCOME | | | | |
Unaffiliated dividend income (net of $35,281 foreign withholding tax, of which $1,021 is reimbursable by an affiliate) | | $ | 2,423,615 | |
Affiliated dividend income. | | | 121,731 | |
Income from securities lending, net (including affiliated income of $2,990) | | | 3,551 | |
| | | | |
Total income | | | 2,548,897 | |
| | | | |
EXPENSES | | | | |
Management fee | | | 1,342,293 | |
Distribution fee—Class II | | | 253,238 | |
Distribution fee—Class III | | | 989 | |
Administration fee—Class II | | | 151,943 | |
Custodian and accounting fees | | | 68,325 | |
Shareholders’ reports | | | 45,259 | |
Audit fee | | | 24,600 | |
Legal fees and expenses | | | 22,091 | |
Trustees’ fees | | | 11,360 | |
Transfer agent’s fees and expenses (including affiliated expense of $5,882) | | | 10,682 | |
Miscellaneous | | | 20,949 | |
| | | | |
Total expenses | | | 1,951,729 | |
| | | | |
NET INVESTMENT INCOME (LOSS) | | | 597,168 | |
| | | | |
| REALIZED AND UNREALIZED GAIN (LOSS) ON INVESTMENT AND FOREIGN CURRENCY TRANSACTIONS | | | | |
Net realized gain (loss) on: | | | | |
Investment transactions (including affiliated of $(175)) | | | (10,138,823 | ) |
Foreign currency transactions | | | (2,218 | ) |
| | | | |
| | | (10,141,041 | ) |
| | | | |
Net change in unrealized appreciation (depreciation)on: | | | | |
Investments (including affiliated of $(8)) | | | (48,670,891 | ) |
| | | | |
Foreign currencies | | | (216 | ) |
| | | | |
| | | (48,671,107 | ) |
| | | | |
NET GAIN (LOSS) ON INVESTMENT AND FOREIGN CURRENCY TRANSACTIONS | | | (58,812,148 | ) |
| | | | |
NET INCREASE (DECREASE) IN NET ASSETS RESULTING FROM OPERATIONS | | $ | (58,214,980 | ) |
| | | | |
STATEMENTS OF CHANGES IN NET ASSETS
| | | | | | | | | | | | | | | | | | | | | | | | |
| | | Year Ended December 31, 2022 | | | Year Ended December 31, 2021 | |
INCREASE (DECREASE) IN NET ASSETS | | | | | | | | | | | | | | | | | | | | | | | | |
OPERATIONS | | | | | | | | | | | | | | | | | | | | | | | | |
Net investment income (loss) | | | | | | $ | 597,168 | | | | | | | | | | | $ | (445,264 | ) | | | | |
Net realized gain (loss) on investment and foreign currency transactions | | | | | | | (10,141,041 | ) | | | | | | | | | | | 41,312,210 | | | | | |
Net change in unrealized appreciation (depreciation) on investments and foreign currencies | | | | | | | (48,671,107 | ) | | | | | | | | | | | (6,561,836 | ) | | | | |
| | | | | | | | | | | | | | | | | | | | | | | | |
NET INCREASE (DECREASE) IN NET ASSETS RESULTING FROM OPERATIONS | | | | | | | (58,214,980 | ) | | | | | | | | | | | 34,305,110 | | | | | |
| | | | | | | | | | | | | | | | | | | | | | | | |
PORTFOLIO SHARE TRANSACTIONS | | | | | | | | | | | | | | | | | | | | | | | | |
Portfolio shares sold | | | | | | | 10,266,806 | | | | | | | | | | | | 11,647,926 | | | | | |
Portfolio shares purchased | | | | | | | (20,364,529 | ) | | | | | | | | | | | (35,699,218 | ) | | | | |
| | | | | | | | | | | | | | | | | | | | | | | | |
NET INCREASE (DECREASE) IN NET ASSETS FROM PORTFOLIO SHARE TRANSACTIONS | | | | | | | (10,097,723 | ) | | | | | | | | | | | (24,051,292 | ) | | | | |
| | | | | | | | | | | | | | | | | | | | | | | | |
TOTAL INCREASE (DECREASE) | | | | | | | (68,312,703 | ) | | | | | | | | | | | 10,253,818 | | | | | |
NET ASSETS: | | | | | | | | | | | | | | | | | | | | | | | | |
Beginning of year | | | | | | | 227,704,318 | | | | | | | | | | | | 217,450,500 | | | | | |
| | | | | | | | | | | | | | | | | | | | | | | | |
End of year. | | | | | | $ | 159,391,615 | | | | | | | | | | | $ | 227,704,318 | | | | | |
| | | | | | | | | | | | | | | | | | | | | | | | |
SEE NOTES TO FINANCIAL STATEMENTS.
A151
| | | | |
| | PSF PGIM JENNISON FOCUSED BLEND PORTFOLIO (CONTINUED) | | |
FINANCIAL HIGHLIGHTS | | | | |
| | | | | | | | | | | | | | | | | | | | |
Class I | | | | | | | | | | | | | | | |
| | | Year Ended December 31, | |
| | | 2022 | | | 2021 | | | 2020 | | | 2019 | | | 2018 | |
Per Share Operating Performance(a): | | | | | | | | | | | | | | | | | | | | |
Net Asset Value, beginning of year | | $ | 58.22 | | | $ | 49.83 | | | $ | 38.06 | | | $ | 29.52 | | | $ | 31.19 | |
| | | | | | | | | | | | | | | | | | | | |
Income (Loss) From Investment Operations: | | | | | | | | | | | | | | | | | | | | |
Net investment income (loss) | | | 0.26 | | | | 0.02 | (b) | | | 0.16 | | | | 0.23 | | | | 0.26 | |
Net realized and unrealized gain (loss) on investment and foreign currency transactions. | | | (15.26 | ) | | | 8.37 | | | | 11.61 | | | | 8.31 | | | | (1.95 | ) |
| | | | | | | | | | | | | | | | | | | | |
Total from investment operations | | | (15.00 | ) | | | 8.39 | | | | 11.77 | | | | 8.54 | | | | (1.69 | ) |
| | | | | | | | | | | | | | | | | | | | |
Capital Contributions | | | — | | | | — | | | | — | | | | — | | | | 0.02 | (d) |
| | | | | | | | | | | | | | | | | | | | |
Net Asset Value, end of year | | $ | 43.22 | | | $ | 58.22 | | | $ | 49.83 | | | $ | 38.06 | | | $ | 29.52 | |
| | | | | | | | | | | | | | | | | | | | |
Total Return(e) | | | (25.76 | )% | | | 16.84 | % | | | 30.92 | % | | | 28.93 | % | | | (5.35 | )%(f) |
Ratios/Supplemental Data: | | | | | | | | | | | | | | | | | | | | |
Net assets, end of year (in millions) | | $ | 70.1 | | | $ | 97.2 | | | $ | 86.7 | | | $ | 71.7 | | | $ | 59.0 | |
Average net assets (in millions) | | $ | 77.3 | | | $ | 93.3 | | | $ | 73.4 | | | $ | 66.3 | | | $ | 68.9 | |
Ratios to average net assets(g): | | | | | | | | | | | | | | | | | | | | |
Expenses after waivers and/or expense reimbursement | | | 0.86 | % | | | 0.84 | % | | | 0.86 | % | | | 0.87 | % | | | 0.82 | % |
Expenses before waivers and/or expense reimbursement | | | 0.86 | % | | | 0.84 | % | | | 0.86 | % | | | 0.87 | % | | | 0.84 | % |
Net investment income (loss) | | | 0.56 | % | | | 0.04 | % | | | 0.39 | % | | | 0.66 | % | | | 0.80 | % |
Portfolio turnover rate(h) | | | 44 | % | | | 66 | % | | | 82 | % | | | 61 | % | | | 42 | % |
| | | | | | | | | | | | | | | | | | | | |
Class II | | | | | | | | | | | | | | | |
| | | Year Ended December 31, | |
| | | 2022 | | | 2021 | | | 2020 | | | 2019 | | | 2018 | |
Per Share Operating Performance(a): | | | | | | | | | | | | | | | | | | | | |
Net Asset Value, beginning of year | | $ | 54.88 | | | $ | 47.17 | | | $ | 36.17 | | | $ | 28.17 | | | $ | 29.88 | |
| | | | | | | | | | | | | | | | | | | | |
Income (Loss) From Investment Operations: | | | | | | | | | | | | | | | | | | | | |
Net investment income (loss) | | | 0.07 | | | | (0.19 | ) | | | — | (c) | | | 0.09 | | | | 0.13 | |
Net realized and unrealized gain (loss) on investment and foreign currency transactions | | | (14.36 | ) | | | 7.90 | | | | 11.00 | | | | 7.91 | | | | (1.86 | ) |
| | | | | | | | | | | | | | | | | | | | |
Total from investment operations | | | (14.29 | ) | | | 7.71 | | | | 11.00 | | | | 8.00 | | | | (1.73 | ) |
| | | | | | | | | | | | | | | | | | | | |
Capital Contributions | | | — | | | | — | | | | — | | | | — | | | | 0.02 | (d) |
| | | | | | | | | | | | | | | | | | | | |
Net Asset Value, end of year | | $ | 40.59 | | | $ | 54.88 | | | $ | 47.17 | | | $ | 36.17 | | | $ | 28.17 | |
| | | | | | | | | | | | | | | | | | | | |
Total Return(e) | | | (26.04 | )% | | | 16.35 | % | | | 30.41 | % | | | 28.40 | % | | | (5.72 | )%(f) |
Ratios/Supplemental Data: | | | | | | | | | | | | | | | | | | | | |
Net assets, end of year (in millions) | | $ | 88.9 | | | $ | 130.1 | | | $ | 130.8 | | | $ | 121.4 | | | $ | 118.6 | |
Average net assets (in millions) | | $ | 101.3 | | | $ | 131.9 | | | $ | 117.4 | | | $ | 118.1 | | | $ | 147.4 | |
Ratios to average net assets(g): | | | | | | | | | | | | | | | | | | | | |
Expenses after waivers and/or expense reimbursement | | | 1.26 | % | | | 1.24 | % | | | 1.26 | % | | | 1.27 | % | | | 1.22 | % |
Expenses before waivers and/or expense reimbursement | | | 1.26 | % | | | 1.24 | % | | | 1.26 | % | | | 1.27 | % | | | 1.24 | % |
Net investment income (loss) | | | 0.16 | % | | | (0.36 | )% | | | — | %(c) | | | 0.26 | % | | | 0.40 | % |
Portfolio turnover rate(h) | | | 44 | % | | | 66 | % | | | 82 | % | | | 61 | % | | | 42 | % |
SEE NOTES TO FINANCIAL STATEMENTS.
A152
| | | | |
| | PSF PGIM JENNISON FOCUSED BLEND PORTFOLIO (CONTINUED) | | |
FINANCIAL HIGHLIGHTS | | | | |
| | | | | | | | | | | | | | | | | | | | | | | | |
Class III | | | | | | | | | | | | | | | | | | |
| | | Year Ended December 31, 2022 | | | April 26, 2021(i) through December 31, 2021 | |
Per Share Operating Performance(a): | | | | | | | | | | | | | | | | | | | | | | | | |
Net Asset Value, beginning of period | | | | | | $ | 58.12 | | | | | | | | | | | $ | 54.19 | | | | | |
| | | | | | | | | | | | | | | | | | | | | | | | |
Income (Loss) From Investment Operations: | | | | | | | | | | | | | | | | | | | | | | | | |
Net investment income (loss) | | | | | | | 0.16 | | | | | | | | | | | | (0.11 | ) | | | | |
Net realized and unrealized gain (loss) on investment and foreign currency transactions | | | | | | | (15.24 | ) | | | | | | | | | | | 4.04 | | | | | |
| | | | | | | | | | | | | | | | | | | | | | | | |
Total from investment operations | | | | | | | (15.08 | ) | | | | | | | | | | | 3.93 | | | | | |
| | | | | | | | | | | | | | | | | | | | | | | | |
Net Asset Value, end of period | | | | | | $ | 43.04 | | | | | | | | | | | $ | 58.12 | | | | | |
| | | | | | | | | | | | | | | | | | | | | | | | |
Total Return(e) | | | | | | | (25.95 | )% | | | | | | | | | | | 7.25 | % | | | | |
Ratios/Supplemental Data: | | | | | | | | | | | | | | | | | | | | | | | | |
Net assets, end of period (in millions) | | | | | | $ | 0.4 | | | | | | | | | | | $ | 0.4 | | | | | |
Average net assets (in millions) | | | | | | $ | 0.4 | | | | | | | | | | | $ | 0.2 | | | | | |
Ratios to average net assets(g): | | | | | | | | | | | | | | | | | | | | | | | | |
Expenses after waivers and/or expense reimbursement | | | | | | | 1.12 | % | | | | | | | | | | | 1.09 | %(j) | | | | |
Expenses before waivers and/or expense reimbursement | | | | | | | 1.12 | % | | | | | | | | | | | 1.09 | %(j) | | | | |
Net investment income (loss) | | | | | | | 0.34 | % | | | | | | | | | | | (0.27 | )%(j) | | | | |
Portfolio turnover rate(h) | | | | | | | 44 | % | | | | | | | | | | | 66 | % | | | | |
| (a) | Calculated based on average shares outstanding during the period. |
| (b) | The per share amount of net investment income (loss) does not directly correlate to the amounts reported in the Statement of Operations due to class specific expenses. |
| (c) | Amount rounds to zero. |
| (d) | Represents payment received by the Portfolio, from Prudential, in connection with excess foreign withholding tax withheld on dividends and interest from certain countries due to the Portfolio’s tax status as a partnership. |
| (e) | Total return is calculated assuming a purchase of a share on the first day and a sale on the last day of each period reported and includes reinvestment of dividends and distributions, if any, and does not reflect the effect of insurance contract charges. Total return does not reflect expenses associated with the separate account such as administrative fees, account charges and surrender charges which, if reflected, would reduce the total returns for all periods shown. Performance figures may reflect fee waivers and/or expense reimbursements. In the absence of fee waivers and/or expense reimbursements, the total return would be lower. Past performance is no guarantee of future results. Total returns may reflect adjustments to conform to GAAP. Total returns for periods less than one full year are not annualized. |
| (f) | Total return for the year includes the impact of the capital contribution. Excluding the capital contribution, the total return would have been (5.41)% and (5.79)% for Class I and Class II, respectively. |
| (g) | Does not include expenses of the underlying funds in which the Portfolio invests. |
| (h) | The Portfolio’s portfolio turnover rate is calculated in accordance with regulatory requirements, without regard to transactions involving short-term investments, certain derivatives and in-kind transactions (if any). If such transactions were included, the Portfolio’s portfolio turnover rate may be higher. |
| (i) | Commencement of offering. |
| (j) | Annualized, with the exception of certain non-recurring expenses. |
SEE NOTES TO FINANCIAL STATEMENTS.
A153
| | | | |
| | PSF PGIM JENNISON GROWTH PORTFOLIO | | |
SCHEDULE OF INVESTMENTS | | | | as of December 31, 2022 |
| | | | | | | | |
| | | Shares | | | Value | |
|
LONG-TERM INVESTMENTS — 99.3% | |
COMMON STOCKS — 98.7% | |
Aerospace & Defense — 0.8% | | | | | | | | |
Northrop Grumman Corp. | | | 32,042 | | | $ | 17,482,436 | |
| | | | | | | | |
Automobiles — 3.0% | | | | | | | | |
Tesla, Inc.* | | | 522,251 | | | | 64,330,878 | |
| | | | | | | | |
Biotechnology — 1.5% | | | | | | | | |
Vertex Pharmaceuticals, Inc.* | | | 112,744 | | | | 32,558,212 | |
| | | | | | | | |
Capital Markets — 3.6% | | | | | | | | |
Goldman Sachs Group, Inc. (The) | | | 92,608 | | | | 31,799,735 | |
KKR & Co., Inc. | | | 249,419 | | | | 11,578,030 | |
S&P Global, Inc. | | | 99,784 | | | | 33,421,653 | |
| | | | | | | | |
| | | | | | | 76,799,418 | |
| | | | | | | | |
Energy Equipment & Services — 2.2% | |
Schlumberger Ltd. | | | 907,410 | | | | 48,510,139 | |
| | | | | | | | |
Entertainment — 2.1% | | | | | | | | |
Netflix, Inc.* | | | 124,974 | | | | 36,852,333 | |
ROBLOX Corp. (Class A
Stock)*(a) | | | 293,104 | | | | 8,341,740 | |
| | | | | | | | |
| | | | | | | 45,194,073 | |
| | | | | | | | |
Equity Real Estate Investment Trusts (REITs) — 1.7% | |
American Tower Corp. | | | 170,178 | | | | 36,053,911 | |
| | | | | | | | |
Food & Staples Retailing — 2.3% | |
Costco Wholesale Corp. | | | 109,783 | | | | 50,115,939 | |
| | | | | | | | |
Health Care Equipment & Supplies — 3.1% | |
Abbott Laboratories | | | 115,169 | | | | 12,644,405 | |
Dexcom, Inc.*(a) | | | 212,357 | | | | 24,047,307 | |
Intuitive Surgical, Inc.* | | | 113,607 | | | | 30,145,617 | |
| | | | | | | | |
| | | | | | | 66,837,329 | |
| | | | | | | | |
Health Care Providers & Services — 2.7% | |
UnitedHealth Group, Inc. | | | 109,597 | | | | 58,106,137 | |
| | | | | | | | |
Hotels, Restaurants & Leisure — 3.8% | |
Airbnb, Inc. (Class A Stock)* | | | 207,187 | | | | 17,714,488 | |
Chipotle Mexican Grill, Inc.* | | | 11,675 | | | | 16,198,946 | |
Marriott International, Inc. (Class A Stock) | | | 183,886 | | | | 27,378,787 | |
McDonald’s Corp. | | | 74,806 | | | | 19,713,625 | |
| | | | | | | | |
| | | | | | | 81,005,846 | |
| | | | | | | | |
Interactive Media & Services — 6.7% | |
Alphabet, Inc. (Class A Stock)* | | | 705,890 | | | | 62,280,675 | |
Alphabet, Inc. (Class C Stock)* | | | 703,013 | | | | 62,378,343 | |
Meta Platforms, Inc. (Class A Stock)* | | | 88,005 | | | | 10,590,522 | |
ZoomInfo Technologies, Inc.* | | | 297,536 | | | | 8,958,809 | |
| | | | | | | | |
| | | | | | | 144,208,349 | |
| | | | | | | | |
Internet & Direct Marketing Retail — 6.3% | |
Amazon.com, Inc.* | | | 1,248,888 | | | | 104,906,592 | |
MercadoLibre, Inc. (Brazil)* | | | 37,468 | | | | 31,706,920 | |
| | | | | | | | |
| | | | | | | 136,613,512 | |
| | | | | | | | |
IT Services — 9.4% | | | | | | | | |
Adyen NV (Netherlands), 144A* | | | 19,640 | | | | 27,265,228 | |
Mastercard, Inc. (Class A Stock) | | | 196,852 | | | | 68,451,346 | |
Snowflake, Inc. (Class A Stock)* | | | 182,469 | | | | 26,191,600 | |
| | | | | | | | |
| | | Shares | | | Value | |
|
COMMON STOCKS (continued) | |
IT Services (cont’d.) | | | | | | | | |
Visa, Inc. (Class A Stock)(a) | | | 386,316 | | | $ | 80,261,012 | |
| | | | | | | | |
| | | | | | | 202,169,186 | |
| | | | | | | | |
Life Sciences Tools & Services — 2.1% | |
Danaher Corp. | | | 133,755 | | | | 35,501,252 | |
Thermo Fisher Scientific, Inc. | | | 19,576 | | | | 10,780,308 | |
| | | | | | | | |
| | | | | | | 46,281,560 | |
| | | | | | | | |
Media — 0.7% | | | | | | | | |
Trade Desk, Inc. (The) (Class A Stock)* | | | 347,144 | | | | 15,562,465 | |
| | | | | | | | |
Personal Products — 1.4% | |
Estee Lauder Cos., Inc. (The) (Class A Stock) | | | 122,916 | | | | 30,496,689 | |
| | | | | | | | |
Pharmaceuticals — 5.8% | | | | | | | | |
Eli Lilly & Co. | | | 232,203 | | | | 84,949,146 | |
Novo Nordisk A/S (Denmark), ADR | | | 299,186 | | | | 40,491,833 | |
| | | | | �� | | | |
| | | | | | | 125,440,979 | |
| | | | | | | | |
Road & Rail — 1.6% | | | | | | | | |
Uber Technologies, Inc.* | | | 1,404,907 | | | | 34,743,350 | |
| | | | | | | | |
Semiconductors & Semiconductor Equipment — 8.3% | |
ASML Holding NV (Netherlands) | | | 54,230 | | | | 29,631,272 | |
Broadcom, Inc. | | | 90,791 | | | | 50,763,972 | |
NVIDIA Corp. | | | 680,405 | | | | 99,434,387 | |
| | | | | | | | |
| | | | | | | 179,829,631 | |
| | | | | | | | |
Software — 10.8% | | | | | | | | |
Adobe, Inc.* | | | 101,450 | | | | 34,140,968 | |
Atlassian Corp. (Class A
Stock)*(a) | | | 147,197 | | | | 18,941,310 | |
Crowdstrike Holdings, Inc. (Class A Stock)* | | | 148,392 | | | | 15,624,194 | |
HubSpot, Inc.* | | | 24,278 | | | | 7,019,498 | |
Microsoft Corp. | | | 560,805 | | | | 134,492,255 | |
Salesforce, Inc.* | | | 172,246 | | | | 22,838,097 | |
| | | | | | | | |
| | | | | | | 233,056,322 | |
| | | | | | | | |
Specialty Retail — 5.2% | | | | | | | | |
Home Depot, Inc. (The) | | | 125,444 | | | | 39,622,742 | |
O’Reilly Automotive, Inc.* | | | 32,466 | | | | 27,402,278 | |
TJX Cos., Inc. (The) | | | 447,988 | | | | 35,659,845 | |
Ulta Beauty, Inc.* | | | 19,501 | | | | 9,147,334 | |
| | | | | | | | |
| | | | | | | 111,832,199 | |
| | | | | | | | |
Technology Hardware, Storage & Peripherals — 6.3% | |
Apple, Inc. | | | 1,052,203 | | | | 136,712,736 | |
| | | | | | | | |
Textiles, Apparel & Luxury Goods — 5.9% | |
Lululemon Athletica, Inc.* | | | 120,886 | | | | 38,729,457 | |
LVMH Moet Hennessy Louis Vuitton SE (France) | | | 89,705 | | | | 65,277,725 | |
NIKE, Inc. (Class B Stock) | | | 207,520 | | | | 24,281,915 | |
| | | | | | | | |
| | | | | | | 128,289,097 | |
| | | | | | | | |
Wireless Telecommunication Services — 1.4% | |
T-Mobile US, Inc.* | | | 209,597 | | | | 29,343,580 | |
| | | | | | | | |
TOTAL COMMON STOCKS
(cost $1,282,101,628) | | | | | | | 2,131,573,973 | |
| | | | | | | | |
SEE NOTES TO FINANCIAL STATEMENTS.
A154
| | | | |
| | PSF PGIM JENNISON GROWTH PORTFOLIO (CONTINUED) | | |
SCHEDULE OF INVESTMENTS | | | | as of December 31, 2022 |
| | | | | | | | |
| | | Shares | | | Value | |
|
PREFERRED STOCK — 0.6% | |
Automobiles | | | | | | | | |
Dr. Ing. h.c. F. Porsche AG (Germany) (PRFC)* | | | 139,591 | | | $ | 14,086,623 | |
(cost $11,247,353) | | | | | | | | |
| | |
TOTAL LONG-TERM INVESTMENTS (cost $1,293,348,981) | | | | | | | 2,145,660,596 | |
| | | | | | | | |
| |
SHORT-TERM INVESTMENTS — 5.0% | | | | | |
AFFILIATED MUTUAL FUNDS | | | | | |
PGIM Core Ultra Short Bond Fund(wa) | | | 14,461,468 | | | | 14,461,468 | |
PGIM Institutional Money Market Fund (cost $92,451,626; includes $92,046,669 of cash collateral for securities on loan)(b)(wa) | | | 92,645,270 | | | | 92,598,947 | |
| | | | | | | | |
| | |
TOTAL SHORT-TERM INVESTMENTS
(cost $106,913,094) | | | | | | | 107,060,415 | |
| | | | | | | | |
| | |
TOTAL INVESTMENTS—104.3%
(cost $1,400,262,075) | | | | | | | 2,252,721,011 | |
| |
Liabilities in excess of other assets — (4.3)% | | | | (92,731,604 | ) |
| | | | | | | | |
| | |
NET ASSETS — 100.0% | | | | | | $ | 2,159,989,407 | |
| | | | | | | | |
See the Glossary for a list of the abbreviation(s) used in the annual report.
| * | Non-income producing security. |
| (a) | All or a portion of security is on loan. The aggregate market value of such securities, including those sold and pending settlement, is $90,271,082; cash collateral of $92,046,669 (included in liabilities) was received with which the Portfolio purchased highly liquid short-term investments. In the event of significant appreciation in value of securities on loan on the last business day of the reporting period, the Portfolio may reflect a collateral value that is less than the market value of the loaned securities and such shortfall is remedied the following business day. |
| (b) | Represents security, or portion thereof, purchased with cash collateral received for securities on loan and includes dividend reinvestment. |
| (wa) | PGIM Investments LLC, the manager of the Portfolio, also serves as manager of the PGIM Core Ultra Short Bond Fund and PGIM Institutional Money Market Fund, if applicable. |
Fair Value Measurements:
Various inputs are used in determining the value of the Portfolio’s investments. These inputs are summarized in the three broad levels listed below.
Level 1—unadjusted quoted prices generally in active markets for identical securities.
Level 2—quoted prices for similar securities, interest rates and yield curves, prepayment speeds, foreign currency exchange rates and other observable inputs.
Level 3—unobservable inputs for securities valued in accordance with Board approved fair valuation procedures.
The following is a summary of the inputs used as of December 31, 2022 in valuing such portfolio securities:
| | | | | | | | | | | | |
| | | Level 1 | | | Level 2 | | | Level 3 | |
Investments in Securities | | | | | | | | | | | | |
Assets | | | | | | | | | | | | |
Long-Term Investments | | | | | | | | | | | | |
Common Stocks | | | | | | | | | | | | |
Aerospace & Defense | | $ | 17,482,436 | | | $ | — | | | $ | — | |
Automobiles | | | 64,330,878 | | | | — | | | | — | |
Biotechnology | | | 32,558,212 | | | | — | | | | — | |
Capital Markets | | | 76,799,418 | | | | — | | | | — | |
Energy Equipment & Services | | | 48,510,139 | | | | — | | | | — | |
Entertainment | | | 45,194,073 | | | | — | | | | — | |
Equity Real Estate Investment Trusts (REITs) | | | 36,053,911 | | | | — | | | | — | |
Food & Staples Retailing | | | 50,115,939 | | | | — | | | | — | |
Health Care Equipment & Supplies | | | 66,837,329 | | | | — | | | | — | |
Health Care Providers & Services | | | 58,106,137 | | | | — | | | | — | |
Hotels, Restaurants & Leisure | | | 81,005,846 | | | | — | | | | — | |
Interactive Media & Services | | | 144,208,349 | | | | — | | | | — | |
Internet & Direct Marketing Retail | | | 136,613,512 | | | | — | | | | — | |
IT Services | | | 174,903,958 | | | | 27,265,228 | | | | — | |
Life Sciences Tools & Services | | | 46,281,560 | | | | — | | | | — | |
Media | | | 15,562,465 | | | | — | | | | — | |
Personal Products | | | 30,496,689 | | | | — | | | | — | |
Pharmaceuticals | | | 125,440,979 | | | | — | | | | — | |
SEE NOTES TO FINANCIAL STATEMENTS.
A155
| | | | |
| | PSF PGIM JENNISON GROWTH PORTFOLIO (CONTINUED) | | |
SCHEDULE OF INVESTMENTS | | | | as of December 31, 2022 |
| | | | | | | | | | | | | | | | | | | | |
| | | Level 1 | | | Level 2 | | | Level 3 | |
| | | | | |
Investments in Securities (continued) | | | | | | | | | | | | | | | | | | | | |
Assets (continued) | | | | | | | | | | | | | | | | | | | | |
Long-Term Investments (continued) | | | | | | | | | | | | | | | | | | | | |
Common Stocks (continued) | | | | | | | | | | | | | | | | | | | | |
Road & Rail | | $ | 34,743,350 | | | $ | — | | | | | | | $ | — | | | | | |
Semiconductors & Semiconductor Equipment | | | 179,829,631 | | | | — | | | | | | | | — | | | | | |
Software | | | 233,056,322 | | | | — | | | | | | | | — | | | | | |
Specialty Retail | | | 111,832,199 | | | | — | | | | | | | | — | | | | | |
Technology Hardware, Storage & Peripherals | | | 136,712,736 | | | | — | | | | | | | | — | | | | | |
Textiles, Apparel & Luxury Goods | | | 63,011,372 | | | | 65,277,725 | | | | | | | | — | | | | | |
Wireless Telecommunication Services | | | 29,343,580 | | | | — | | | | | | | | — | | | | | |
Preferred Stock | | | | | | | | | | | | | | | | | | | | |
Automobiles | | | — | | | | 14,086,623 | | | | | | | | — | | | | | |
Short-Term Investments | | | | | | | | | | | | | | | | | | | | |
Affiliated Mutual Funds | | | 107,060,415 | | | | — | | | | | | | | — | | | | | |
| | | | | | | | | | | | | | | | | | | | |
| | | | | |
Total | | $ | 2,146,091,435 | | | $ | 106,629,576 | | | | | | | $ | — | | | | | |
| | | | | | | | | | | | |
Industry Classification:
The industry classification of investments and liabilities in excess of other assets shown as a percentage of net assets as of December 31, 2022 were as follows:
| | | | |
Software | | | 10.8 | % |
IT Services | | | 9.4 | |
Semiconductors & Semiconductor Equipment | | | 8.3 | |
Interactive Media & Services | | | 6.7 | |
Technology Hardware, Storage & Peripherals | | | 6.3 | |
Internet & Direct Marketing Retail | | | 6.3 | |
Textiles, Apparel & Luxury Goods | | | 5.9 | |
Pharmaceuticals | | | 5.8 | |
Specialty Retail | | | 5.2 | |
Affiliated Mutual Funds (4.3% represents investments purchased with collateral from securities on loan) | | | 5.0 | |
Hotels, Restaurants & Leisure | | | 3.8 | |
Automobiles | | | 3.6 | |
Capital Markets | | | 3.6 | |
Health Care Equipment & Supplies | | | 3.1 | |
Health Care Providers & Services | | | 2.7 | |
| | | | |
Food & Staples Retailing | | | 2.3 | % |
Energy Equipment & Services | | | 2.2 | |
Life Sciences Tools & Services | | | 2.1 | |
Entertainment | | | 2.1 | |
Equity Real Estate Investment Trusts (REITs) | | | 1.7 | |
Road & Rail | | | 1.6 | |
Biotechnology | | | 1.5 | |
Personal Products | | | 1.4 | |
Wireless Telecommunication Services | | | 1.4 | |
Aerospace & Defense | | | 0.8 | |
Media | | | 0.7 | |
| | | | |
| |
| | | 104.3 | |
Liabilities in excess of other assets | | | (4.3 | ) |
| | | | |
| |
| | | 100.0 | % |
| | | | |
Financial Instruments/Transactions—Summary of Offsetting and Netting Arrangements:
The Portfolio entered into financial instruments/transactions during the reporting period that are either offset in accordance with current requirements or are subject to enforceable master netting arrangements or similar agreements that permit offsetting. The information about offsetting and related netting arrangements for financial instruments/transactions where the legal right to set-off exists is presented in the summary below.
Offsetting of financial instrument/transaction assets and liabilities:
| | | | | | | | |
| Description | | Gross Market
Value of
Recognized
Assets/(Liabilities) | | | | Collateral
Pledged/(Received)(1) | | Net
Amount |
Securities on Loan | | $90,271,082 | | | | $(90,271,082) | | $— |
(1) Collateral amount disclosed by the Portfolio is limited to the market value of financial instruments/transactions.
SEE NOTES TO FINANCIAL STATEMENTS.
A156
| | | | |
| | PSF PGIM JENNISON GROWTH PORTFOLIO (CONTINUED) | | |
| | | | |
STATEMENT OF ASSETS AND LIABILITIES
as of December 31, 2022
| | | | |
ASSETS | | | | |
Investments at value, including securities on loan of $90,271,082: | | | | |
Unaffiliated investments (cost $1,293,348,981) | | $ | 2,145,660,596 | |
Affiliated investments (cost $106,913,094) | | | 107,060,415 | |
Dividends receivable | | | 461,601 | |
Receivable for investments sold | | | 422,336 | |
Tax reclaim receivable | | | 295,790 | |
Receivable for Portfolio shares sold | | | 90,119 | |
Prepaid expenses and other assets | | | 84,058 | |
| | | | |
Total Assets | | | 2,254,074,915 | |
| | | | |
| |
LIABILITIES | | | | |
Payable to broker for collateral for securities on loan | | | 92,046,669 | |
Management fee payable | | | 1,141,875 | |
Accrued expenses and other liabilities | | | 497,691 | |
Payable to affiliate | | | 268,202 | |
Payable for Portfolio shares purchased | | | 97,151 | |
Payable to custodian | | | 14,745 | |
Distribution fee payable | | | 10,829 | |
Administration fee payable | | | 5,767 | |
Trustees’ fees payable | | | 1,599 | |
Affiliated transfer agent fee payable | | | 980 | |
| | | | |
Total Liabilities | | | 94,085,508 | |
| | | | |
| |
NET ASSETS | | $ | 2,159,989,407 | |
| | | | |
Net assets were comprised of: | | | | |
Partners’ Equity | | $ | 2,159,989,407 | |
| | | | |
| |
Class I: | | | | |
Net asset value and redemption price per share, $2,110,944,768 / 22,873,226 outstanding shares of beneficial interest | | $ | 92.29 | |
| | | | |
| |
Class II: | | | | |
Net asset value and redemption price per share, $42,667,045 / 490,004 outstanding shares of beneficial interest | | $ | 87.07 | |
| | | | |
| |
Class III: | | | | |
Net asset value and redemption price per share, $6,377,594 / 69,400 outstanding shares of beneficial interest | | $ | 91.90 | |
| | | | |
STATEMENT OF OPERATIONS
Year Ended December 31, 2022
| | | | |
NET INVESTMENT INCOME (LOSS) | | | | |
INCOME | | | | |
Unaffiliated dividend income (net of $479,046 foreign withholding tax, of which $123,435 is reimbursable by an affiliate) | | $ | 14,982,659 | |
Affiliated dividend income | | | 511,768 | |
Income from securities lending, net (including affiliated income of $157,970) | | | 158,154 | |
| | | | |
Total income | | | 15,652,581 | |
| | | | |
EXPENSES | | | | |
Management fee | | | 15,589,309 | |
Distribution fee—Class II | | | 137,590 | |
Distribution fee—Class III | | | 14,437 | |
Administration fee—Class II | | | 82,554 | |
Custodian and accounting fees | | | 160,607 | |
Shareholders’ reports | | | 48,954 | |
Trustees’ fees | | | 48,010 | |
Legal fees and expenses | | | 34,818 | |
Audit fee | | | 24,000 | |
Transfer agent’s fees and expenses (including affiliated expense of $5,882) | | | 10,682 | |
Miscellaneous | | | 68,212 | |
| | | | |
Total expenses | | | 16,219,173 | |
| | | | |
NET INVESTMENT INCOME (LOSS) | | | (566,592 | ) |
| | | | |
| REALIZED AND UNREALIZED GAIN (LOSS) ON INVESTMENT AND FOREIGN CURRENCY TRANSACTIONS | | | | |
Net realized gain (loss) on: | | | | |
Investment transactions (including affiliated of $52,299) | | | 8,051,679 | |
Foreign currency transactions | | | (24,151 | ) |
| | | | |
| | | 8,027,528 | |
| | | | |
Net change in unrealized appreciation (depreciation) on: | | | | |
Investments (including affiliated of $26,651) | | | (1,356,765,436 | ) |
Foreign currencies | | | (965 | ) |
| | | | |
| | | (1,356,766,401 | ) |
| | | | |
NET GAIN (LOSS) ON INVESTMENT AND FOREIGN CURRENCY TRANSACTIONS | | | (1,348,738,873 | ) |
| | | | |
NET INCREASE (DECREASE) IN NET ASSETS RESULTING FROM OPERATIONS | | $ | (1,349,305,465 | ) |
| | | | |
STATEMENTS OF CHANGES IN NET ASSETS
| | | | | | | | | | | | | | | | | | | | | | | | |
| | | Year Ended
December 31, 2022 | | | Year Ended
December 31, 2021 | |
| | | | | | |
INCREASE (DECREASE) IN NET ASSETS | | | | | | | | | | | | | | | | | | | | | | | | |
OPERATIONS | | | | | | | | | | | | | | | | | | | | | | | | |
Net investment income (loss) | | | | | | $ | (566,592 | ) | | | | | | | | | | $ | (11,677,744 | ) | | | | |
Net realized gain (loss) on investment and foreign currency transactions | | | | | | | 8,027,528 | | | | | | | | | | | | 364,529,600 | | | | | |
Net change in unrealized appreciation (depreciation) on investments and foreign currencies | | | | | | | (1,356,766,401 | ) | | | | | | | | | | | 165,052,749 | | | | | |
| | | | | | | | | | | | | | | | | | | | | | | | |
NET INCREASE (DECREASE) IN NET ASSETS RESULTING FROM OPERATIONS | | | | | | | (1,349,305,465 | ) | | | | | | | | | | | 517,904,605 | | | | | |
| | | | | | | | | | | | | | | | | | | | | | | | |
PORTFOLIO SHARE TRANSACTIONS | | | | | | | | | | | | | | | | | | | | | | | | |
Portfolio shares sold | | | | | | | 43,664,186 | | | | | | | | | | | | 67,317,387 | | | | | |
Portfolio shares purchased | | | | | | | (187,156,630 | ) | | | | | | | | | | | (280,555,896 | ) | | | | |
| | | | | | | | | | | | | | | | | | | | | | | | |
NET INCREASE (DECREASE) IN NET ASSETS FROM PORTFOLIO SHARE TRANSACTIONS | | | | | | | (143,492,444 | ) | | | | | | | | | | | (213,238,509 | ) | | | | |
| | | | | | | | | | | | | | | | | | | | | | | | |
TOTAL INCREASE (DECREASE) | | | | | | | (1,492,797,909 | ) | | | | | | | | | | | 304,666,096 | | | | | |
NET ASSETS: | | | | | | | | | | | | | | | | | | | | | | | | |
Beginning of year | | | | | | | 3,652,787,316 | | | | | | | | | | | | 3,348,121,220 | | | | | |
| | | | | | | | | | | | | | | | | | | | | | | | |
End of year | | | | | | $ | 2,159,989,407 | | | | | | | | | | | $ | 3,652,787,316 | | | | | |
| | | | | | | | | | | | | | | | | | | | | | | | |
SEE NOTES TO FINANCIAL STATEMENTS.
A157
| | | | |
| | PSF PGIM JENNISON GROWTH PORTFOLIO (CONTINUED) | | |
FINANCIAL HIGHLIGHTS | | | | |
| | | | | | | | | | | | | | | | | | | | |
Class I | | | | | | | | | | | | | | | |
| | | Year Ended December 31, | |
| | | 2022 | | | 2021 | | | 2020 | | | 2019 | | | 2018 | |
Per Share Operating Performance(a): | | | | | | | | | | | | | | | | | | | | |
Net Asset Value, beginning of year | | $ | 147.90 | | | $ | 127.49 | | | $ | 81.62 | | | $ | 61.21 | | | $ | 61.69 | |
| | | | | | | | | | | | | | | | | | | | |
Income (Loss) From Investment Operations: | | | | | | | | | | | | | | | | | | | | |
Net investment income (loss) | | | (0.01 | ) | | | (0.45 | ) | | | (0.13 | ) | | | 0.09 | | | | 0.13 | |
| Net realized and unrealized gain (loss) on investment and foreign currency transactions | | | (55.60 | ) | | | 20.86 | | | | 46.00 | | | | 20.32 | | | | (0.61 | ) |
| | | | | | | | | | | | | | | | | | | | |
Total from investment operations | | | (55.61 | ) | | | 20.41 | | | | 45.87 | | | | 20.41 | | | | (0.48 | ) |
| | | | | | | | | | | | | | | | | | | | |
Capital Contributions | | | — | | | | — | | | | — | | | | — | (b)(c) | | | — | (b)(c) |
| | | | | | | | | | | | | | | | | | | | |
Net Asset Value, end of year | | $ | 92.29 | | | $ | 147.90 | | | $ | 127.49 | | | $ | 81.62 | | | $ | 61.21 | |
| | | | | | | | | | | | | | | | | | | | |
Total Return(d) | | | (37.60 | )% | | | 16.01 | % | | | 56.20 | % | | | 33.34 | %(e) | | | (0.78 | )%(e) |
Ratios/Supplemental Data: | | | | | | | | | | | | | | | | | | | | |
Net assets, end of year (in millions) | | $ | 2,111 | | | $ | 3,566 | | | $ | 3,260 | | | $ | 2,242 | | | $ | 1,803 | |
Average net assets (in millions) | | $ | 2,537 | | | $ | 3,435 | | | $ | 2,606 | | | $ | 2,073 | | | $ | 2,052 | |
Ratios to average net assets(f): | | | | | | | | | | | | | | | | | | | | |
Expenses after waivers and/or expense reimbursement | | | 0.62 | % | | | 0.61 | % | | | 0.62 | % | | | 0.62 | % | | | 0.62 | % |
Expenses before waivers and/or expense reimbursement | | | 0.62 | % | | | 0.61 | % | | | 0.62 | % | | | 0.62 | % | | | 0.62 | % |
Net investment income (loss) | | | (0.01 | )% | | | (0.32 | )% | | | (0.13 | )% | | | 0.13 | % | | | 0.19 | % |
Portfolio turnover rate(g) | | | 32 | % | | | 40 | % | | | 56 | % | | | 41 | % | | | 38 | % |
| | | | | |
Class II | | | | | | | | | | | | | | | |
| | | Year Ended December 31, | |
| | | 2022 | | | 2021 | | | 2020 | | | 2019 | | | 2018 | |
Per Share Operating Performance(a): | | | | | | | | | | | | | | | | | | | | |
Net Asset Value, beginning of year | | $ | 140.11 | | | $ | 121.26 | | | $ | 77.94 | | | $ | 58.68 | | | $ | 59.38 | |
| | | | | | | | | | | | | | | | | | | | |
Income (Loss) From Investment Operations: | | | | | | | | | | | | | | | | | | | | |
Net investment income (loss) | | | (0.43 | ) | | | (0.95 | ) | | | (0.49 | ) | | | (0.19 | ) | | | (0.14 | ) |
| Net realized and unrealized gain (loss) on investment and foreign currency transactions | | | (52.61 | ) | | | 19.80 | | | | 43.81 | | | | 19.45 | | | | (0.56 | ) |
| | | | | | | | | | | | | | | | | | | | |
Total from investment operations | | | (53.04 | ) | | | 18.85 | | | | 43.32 | | | | 19.26 | | | | (0.70 | ) |
| | | | | | | | | | | | | | | | | | | | |
Capital Contributions | | | — | | | | — | | | | — | | | | — | (b)(c) | | | — | (b)(c) |
| | | | | | | | | | | | | | | | | | | | |
Net Asset Value, end of year | | $ | 87.07 | | | $ | 140.11 | | | $ | 121.26 | | | $ | 77.94 | | | $ | 58.68 | |
| | | | | | | | | | | | | | | | | | | | |
Total Return(d) | | | (37.85 | )% | | | 15.55 | % | | | 55.57 | % | | | 32.82 | %(e) | | | (1.18 | )%(e) |
Ratios/Supplemental Data: | | | | | | | | | | | | | | | | | | | | |
Net assets, end of year (in millions) | | $ | 43 | | | $ | 82 | | | $ | 88 | | | $ | 66 | | | $ | 61 | |
Average net assets (in millions) | | $ | 55 | | | $ | 85 | | | $ | 72 | | | $ | 64 | | | $ | 70 | |
Ratios to average net assets(f): | | | | | | | | | | | | | | | | | | | | |
Expenses after waivers and/or expense reimbursement | | | 1.02 | % | | | 1.01 | % | | | 1.02 | % | | | 1.02 | % | | | 1.02 | % |
Expenses before waivers and/or expense reimbursement | | | 1.02 | % | | | 1.01 | % | | | 1.02 | % | | | 1.02 | % | | | 1.02 | % |
Net investment income (loss) | | | (0.42 | )% | | | (0.72 | )% | | | (0.53 | )% | | | (0.27 | )% | | | (0.22 | )% |
Portfolio turnover rate(g) | | | 32 | % | | | 40 | % | | | 56 | % | | | 41 | % | | | 38 | % |
SEE NOTES TO FINANCIAL STATEMENTS.
A158
| | | | |
| | PSF PGIM JENNISON GROWTH PORTFOLIO (CONTINUED) | | |
FINANCIAL HIGHLIGHTS | | | | |
| | | | | | | | | | | | | | | | |
Class III | | | | | | | | | | | | | | |
| | | Year Ended December 31,
2022 | | April 26, 2021(h)
through December 31, 2021 |
| | | | | | |
Per Share Operating Performance(a): | | | | | | | | | | | | | | | | |
Net Asset Value, beginning of period | | | | $ | 147.64 | | | | | | | $ | 132.99 | | | |
| | | | | | | | | | | | | | | | |
| | | | | | |
Income (Loss) From Investment Operations: | | | | | | | | | | | | | | | | |
Net investment income (loss) | | | | | (0.24 | ) | | | | | | | (0.59 | ) | | |
Net realized and unrealized gain (loss) on investment and foreign currency transactions | | | | | (55.50 | ) | | | | | | | 15.24 | | | |
| | | | | | | | | | | | | | | | |
Total from investment operations | | | | | (55.74 | ) | | | | | | | 14.65 | | | |
| | | | | | | | | | | | | | | | |
Net Asset Value, end of period | | | | $ | 91.90 | | | | | | | $ | 147.64 | | | |
| | | | | | | | | | | | | | | | |
| | | | | | |
Total Return(d) | | | | | (37.75 | )% | | | | | | | 11.02 | % | | |
Ratios/Supplemental Data: | | | | | | | | | | | | | | | | |
Net assets, end of period (in millions) | | | | $ | 6 | | | | | | | $ | 5 | | | |
Average net assets (in millions) | | | | $ | 6 | | | | | | | $ | 2 | | | |
Ratios to average net assets(f): | | | | | | | | | | | | | | | | |
Expenses after waivers and/or expense reimbursement | | | | | 0.86 | % | | | | | | | 0.86 | %(i) | | |
Expenses before waivers and/or expense reimbursement | | | | | 0.86 | % | | | | | | | 0.86 | %(i) | | |
Net investment income (loss) | | | | | (0.23 | )% | | | | | | | (0.58 | )%(i) | | |
Portfolio turnover rate(g) | | | | | 32 | % | | | | | | | 40 | % | | |
| (a) | Calculated based on average shares outstanding during the period. |
| (b) | Represents payment received by the Portfolio, from Prudential, in connection with excess foreign withholding tax withheld on dividends and interest from certain countries due to the Portfolio’s tax status as a partnership. |
| (c) | Amount rounds to zero. |
| (d) | Total return is calculated assuming a purchase of a share on the first day and a sale on the last day of each period reported and includes reinvestment of dividends and distributions, if any, and does not reflect the effect of insurance contract charges. Total return does not reflect expenses associated with the separate account such as administrative fees, account charges and surrender charges which, if reflected, would reduce the total returns for all periods shown. Performance figures may reflect fee waivers and/or expense reimbursements. In the absence of fee waivers and/or expense reimbursements, the total return would be lower. Past performance is no guarantee of future results. Total returns may reflect adjustments to conform to GAAP. Total returns for periods less than one full year are not annualized. |
| (e) | Total return for the year includes the impact of the capital contribution, which was not material to the total return. |
| (f) | Does not include expenses of the underlying funds in which the Portfolio invests. |
| (g) | The Portfolio’s portfolio turnover rate is calculated in accordance with regulatory requirements, without regard to transactions involving short-term investments, certain derivatives and in-kind transactions (if any). If such transactions were included, the Portfolio’s portfolio turnover rate may be higher. |
| (h) | Commencement of offering. |
| (i) | Annualized, with the exception of certain non-recurring expenses. |
SEE NOTES TO FINANCIAL STATEMENTS.
A159
| | | | |
| | PSF PGIM JENNISON VALUE PORTFOLIO | | |
SCHEDULE OF INVESTMENTS | | | | as of December 31, 2022 |
| | | | | | | | |
| | | Shares | | | Value | |
LONG-TERM INVESTMENTS — 97.6% | |
COMMON STOCKS | | | | | | | | |
Aerospace & Defense — 3.4% | | | | | | | | |
Airbus SE (France) | | | 147,946 | | | $ | 17,591,150 | |
Raytheon Technologies Corp. | | | 309,453 | | | | 31,229,997 | |
| | | | | | | | |
| | |
| | | | | | | 48,821,147 | |
| | | | | | | | |
Airlines — 1.2% | | | | | | | | |
Delta Air Lines, Inc.* | | | 525,025 | | | | 17,252,322 | |
| | | | | | | | |
Automobiles — 1.0% | | | | | | | | |
General Motors Co. | | | 423,421 | | | | 14,243,883 | |
| | | | | | | | |
Banks — 9.1% | | | | | | | | |
Bank of America Corp. | | | 977,073 | | | | 32,360,658 | |
JPMorgan Chase & Co. | | | 329,579 | | | | 44,196,544 | |
PNC Financial Services Group, Inc. (The) | | | 179,071 | | | | 28,282,473 | |
Truist Financial Corp. | | | 597,725 | | | | 25,720,107 | |
| | | | | | | | |
| | |
| | | | | | | 130,559,782 | |
| | | | | | | | |
Beverages — 1.8% | | | | | | | | |
PepsiCo, Inc. | | | 146,142 | | | | 26,402,014 | |
| | | | | | | | |
Biotechnology — 4.0% | | | | | | | | |
AbbVie, Inc. | | | 226,238 | | | | 36,562,323 | |
Amgen, Inc. | | | 81,264 | | | | 21,343,177 | |
| | | | | | | | |
| | |
| | | | | | | 57,905,500 | |
| | | | | | | | |
Building Products — 1.7% | | | | | | | | |
Johnson Controls International PLC | | | 373,025 | | | | 23,873,600 | |
| | | | | | | | |
Capital Markets — 2.9% | | | | | | | | |
Blackstone, Inc. | | | 136,055 | | | | 10,093,920 | |
Goldman Sachs Group, Inc. (The) | | | 93,792 | | | | 32,206,297 | |
| | | | | | | | |
| | |
| | | | | | | 42,300,217 | |
| | | | | | | | |
Chemicals — 3.4% | | | | | | | | |
DuPont de Nemours, Inc.(a) | | | 240,008 | | | | 16,471,749 | |
Linde PLC (United Kingdom)(a) | | | 101,057 | | | | 32,962,772 | |
| | | | | | | | |
| | |
| | | | | | | 49,434,521 | |
| | | | | | | | |
Communications Equipment — 1.3% | | | | | |
Cisco Systems, Inc. | | | 391,360 | | | | 18,644,390 | |
| | | | | | | | |
Consumer Finance — 1.2% | | | | | | | | |
SLM Corp. | | | 997,302 | | | | 16,555,213 | |
| | | | | | | | |
Containers & Packaging — 1.2% | | | | | |
Crown Holdings, Inc.(a) | | | 208,354 | | | | 17,128,782 | |
| | | | | | | | |
Electric Utilities — 1.6% | | | | | | | | |
NextEra Energy, Inc. | | | 282,433 | | | | 23,611,399 | |
| | | | | | | | |
Equity Real Estate Investment Trusts (REITs) — 1.4% | |
Alexandria Real Estate Equities, Inc. | | | 140,231 | | | | 20,427,450 | |
| | | | | | | | |
Food & Staples Retailing — 2.1% | |
Walmart, Inc. | | | 209,550 | | | | 29,712,095 | |
| | | | | | | | |
Food Products — 1.3% | | | | | | | | |
Mondelez International, Inc. (Class A Stock) | | | 283,323 | | | | 18,883,478 | |
| | | | | | | | |
Health Care Equipment & Supplies — 1.6% | |
Abbott Laboratories | | | 212,100 | | | | 23,286,459 | |
| | | | | | | | |
Health Care Providers & Services — 2.7% | | | | | |
Centene Corp.* | | | 241,559 | | | | 19,810,253 | |
| | | | | | | | |
| | | Shares | | | Value | |
|
COMMON STOCKS (continued) | |
Health Care Providers & Services (cont’d.) | |
Cigna Corp. | | | 57,005 | | | $ | 18,888,037 | |
| | | | | | | | |
| | |
| | | | | | | 38,698,290 | |
| | | | | | | | |
Hotels, Restaurants & Leisure — 2.1% | | | | | |
McDonald’s Corp. | | | 116,945 | | | | 30,818,516 | |
| | | | | | | | |
Household Products — 2.2% | | | | | | | | |
Procter & Gamble Co. (The) | | | 210,840 | | | | 31,954,910 | |
| | | | | | | | |
Insurance — 7.1% | | | | | | | | |
Chubb Ltd. | | | 196,379 | | | | 43,321,207 | |
Marsh & McLennan Cos., Inc. | | | 107,969 | | | | 17,866,710 | |
MetLife, Inc. | | | 344,118 | | | | 24,903,820 | |
RenaissanceRe Holdings Ltd. (Bermuda) | | | 87,642 | | | | 16,146,286 | |
| | | | | | | | |
| | |
| | | | | | | 102,238,023 | |
| | | | | | | | |
Interactive Media & Services — 2.6% | | | | | |
Alphabet, Inc. (Class A Stock)* | | | 301,853 | | | | 26,632,490 | |
Meta Platforms, Inc. (Class A Stock)* | | | 86,405 | | | | 10,397,978 | |
| | | | | | | | |
| | |
| | | | | | | 37,030,468 | |
| | | | | | | | |
Life Sciences Tools & Services — 1.5% | |
Danaher Corp. | | | 83,863 | | | | 22,258,918 | |
| | | | | | | | |
Machinery — 4.4% | | | | | | | | |
Deere & Co. | | | 54,290 | | | | 23,277,380 | |
Fortive Corp. | | | 291,081 | | | | 18,701,954 | |
Otis Worldwide Corp. | | | 276,238 | | | | 21,632,198 | |
| | | | | | | | |
| | |
| | | | | | | 63,611,532 | |
| | | | | | | | |
Multi-Utilities — 3.2% | | | | | | | | |
Ameren Corp.(a) | | | 318,868 | | | | 28,353,743 | |
CenterPoint Energy, Inc. | | | 613,603 | | | | 18,401,954 | |
| | | | | | | | |
| | |
| | | | | | | 46,755,697 | |
| | | | | | | | |
Oil, Gas & Consumable Fuels — 10.7% | |
Chevron Corp. | | | 302,400 | | | | 54,277,775 | |
ConocoPhillips | | | 333,395 | | | | 39,340,610 | |
Hess Corp. | | | 214,303 | | | | 30,392,451 | |
Williams Cos., Inc. (The) | | | 940,282 | | | | 30,935,278 | |
| | | | | | | | |
| | |
| | | | | | | 154,946,114 | |
| | | | | | | | |
Pharmaceuticals — 8.7% | | | | | | | | |
AstraZeneca PLC (United Kingdom), ADR | | | 440,034 | | | | 29,834,305 | |
Bristol-Myers Squibb Co. | | | 639,318 | | | | 45,998,930 | |
Eli Lilly & Co. | | | 133,855 | | | | 48,969,514 | |
| | | | | | | | |
| | |
| | | | | | | 124,802,749 | |
| | | | | | | | |
Road & Rail — 1.2% | | | | | | | | |
Union Pacific Corp. | | | 83,491 | | | | 17,288,481 | |
| | | | | | | | |
Semiconductors & Semiconductor Equipment — 4.8% | |
Broadcom, Inc. | | | 39,055 | | | | 21,836,822 | |
Lam Research Corp. | | | 35,157 | | | | 14,776,487 | |
NXP Semiconductors NV (China) | | | 97,752 | | | | 15,447,749 | |
QUALCOMM, Inc. | | | 153,609 | | | | 16,887,773 | |
| | | | | | | | |
| | |
| | | | | | | 68,948,831 | |
| | | | | | | | |
SEE NOTES TO FINANCIAL STATEMENTS.
A160
| | | | |
| | PSF PGIM JENNISON VALUE PORTFOLIO (CONTINUED) | | |
SCHEDULE OF INVESTMENTS | | | | as of December 31, 2022 |
| | | | | | | | |
| | | Shares | | | Value | |
|
COMMON STOCKS (continued) | |
Software — 2.9% | | | | | | | | |
Microsoft Corp. | | | 103,199 | | | $ | 24,749,184 | |
Salesforce, Inc.* | | | 127,644 | | | | 16,924,318 | |
| | | | | | | | |
| | |
| | | | | | | 41,673,502 | |
| | | | | | | | |
Specialty Retail — 1.0% | | | | | | | | |
Lowe’s Cos., Inc. | | | 68,922 | | | | 13,732,019 | |
| | | | | | | | |
Technology Hardware, Storage & Peripherals — 1.5% | |
Apple, Inc. | | | 168,169 | | | | 21,850,198 | |
| | | | | | | | |
Wireless Telecommunication Services — 0.8% | |
T-Mobile US, Inc.* | | | 86,762 | | | | 12,146,680 | |
| | | | | | | | |
TOTAL LONG-TERM INVESTMENTS
(cost $924,976,428) | | | | 1,407,797,180 | |
| | | | | | | | |
|
SHORT-TERM INVESTMENTS — 5.3% | |
AFFILIATED MUTUAL FUNDS | | | | | | | | |
PGIM Core Ultra Short Bond Fund(wa) | | | 34,188,675 | | | | 34,188,675 | |
PGIM Institutional Money Market Fund (cost $42,875,832; includes $42,719,027 of cash collateral for securities on loan)(b)(wa) | | | 42,910,858 | | | | 42,889,403 | |
| | | | | | | | |
TOTAL SHORT-TERM INVESTMENTS
(cost $77,064,507) | | | | 77,078,078 | |
| | | | | | | | |
TOTAL INVESTMENTS—102.9%
(cost $1,002,040,935) | | | | | | | 1,484,875,258 | |
Liabilities in excess of other assets — (2.9)% | | | | (41,673,521 | ) |
| | | | | | | | |
| | |
NET ASSETS — 100.0% | | | | | | $ | 1,443,201,737 | |
| | | | | | | | |
See the Glossary for a list of the abbreviation(s) used in the annual report.
| * | Non-income producing security. |
| (a) | All or a portion of security is on loan. The aggregate market value of such securities, including those sold and pending settlement, is $41,463,559; cash collateral of $42,719,027 (included in liabilities) was received with which the Portfolio purchased highly liquid short-term investments. In the event of significant appreciation in value of securities on loan on the last business day of the reporting period, the Portfolio may reflect a collateral value that is less than the market value of the loaned securities and such shortfall is remedied the following business day. |
| (b) | Represents security, or portion thereof, purchased with cash collateral received for securities on loan and includes dividend reinvestment. |
| (wa) | PGIM Investments LLC, the manager of the Portfolio, also serves as manager of the PGIM Core Ultra Short Bond Fund and PGIM Institutional Money Market Fund, if applicable. |
Fair Value Measurements:
Various inputs are used in determining the value of the Portfolio’s investments. These inputs are summarized in the three broad levels listed below.
Level 1—unadjusted quoted prices generally in active markets for identical securities.
Level 2—quoted prices for similar securities, interest rates and yield curves, prepayment speeds, foreign currency exchange rates and other observable inputs.
Level 3—unobservable inputs for securities valued in accordance with Board approved fair valuation procedures.
The following is a summary of the inputs used as of December 31, 2022 in valuing such portfolio securities:
| | | | | | | | | | | | |
| | | Level 1 | | | Level 2 | | | Level 3 | |
Investments in Securities | | | | | | | | | | | | |
Assets | | | | | | | | | | | | |
Long-Term Investments | | | | | | | | | | | | |
Common Stocks | | | | | | | | | | | | |
Aerospace & Defense | | $ | 31,229,997 | | | $ | 17,591,150 | | | | $— | |
Airlines | | | 17,252,322 | | | | — | | | | — | |
Automobiles | | | 14,243,883 | | | | — | | | | — | |
Banks | | | 130,559,782 | | | | — | | | | — | |
Beverages | | | 26,402,014 | | | | — | | | | — | |
Biotechnology | | | 57,905,500 | | | | — | | | | — | |
Building Products | | | 23,873,600 | | | | — | | | | — | |
Capital Markets | | | 42,300,217 | | | | — | | | | — | |
Chemicals | | | 49,434,521 | | | | — | | | | — | |
Communications Equipment | | | 18,644,390 | | | | — | | | | — | |
Consumer Finance | | | 16,555,213 | | | | — | | | | — | |
SEE NOTES TO FINANCIAL STATEMENTS.
A161
| | | | |
| | PSF PGIM JENNISON VALUE PORTFOLIO (CONTINUED) | | |
SCHEDULE OF INVESTMENTS | | | | as of December 31, 2022 |
| | | | | | | | | | | | |
| | | Level 1 | | | Level 2 | | | Level 3 | |
Investments in Securities (continued) | | | | | | | | | | | | |
Assets (continued) | | | | | | | | | | | | |
Long-Term Investments (continued) | | | | | | | | | | | | |
Common Stocks (continued) | | | | | | | | | | | | |
Containers & Packaging | | $ | 17,128,782 | | | $ | — | | | | $— | |
Electric Utilities | | | 23,611,399 | | | | — | | | | — | |
Equity Real Estate Investment Trusts (REITs) | | | 20,427,450 | | | | — | | | | — | |
Food & Staples Retailing | | | 29,712,095 | | | | — | | | | — | |
Food Products | | | 18,883,478 | | | | — | | | | — | |
Health Care Equipment & Supplies | | | 23,286,459 | | | | — | | | | — | |
Health Care Providers & Services | | | 38,698,290 | | | | — | | | | — | |
Hotels, Restaurants & Leisure | | | 30,818,516 | | | | — | | | | — | |
Household Products | | | 31,954,910 | | | | — | | | | — | |
Insurance | | | 102,238,023 | | | | — | | | | — | |
Interactive Media & Services | | | 37,030,468 | | | | — | | | | — | |
Life Sciences Tools & Services | | | 22,258,918 | | | | — | | | | — | |
Machinery | | | 63,611,532 | | | | — | | | | — | |
Multi-Utilities | | | 46,755,697 | | | | — | | | | — | |
Oil, Gas & Consumable Fuels | | | 154,946,114 | | | | — | | | | — | |
Pharmaceuticals | | | 124,802,749 | | | | — | | | | — | |
Road & Rail | | | 17,288,481 | | | | — | | | | — | |
Semiconductors & Semiconductor Equipment | | | 68,948,831 | | | | — | | | | — | |
Software | | | 41,673,502 | | | | — | | | | — | |
Specialty Retail | | | 13,732,019 | | | | — | | | | — | |
Technology Hardware, Storage & Peripherals | | | 21,850,198 | | | | — | | | | — | |
Wireless Telecommunication Services | | | 12,146,680 | | | | — | | | | — | |
Short-Term Investments | | | | | | | | | | | | |
Affiliated Mutual Funds | | | 77,078,078 | | | | — | | | | — | |
| | | | | | | | | | | | |
| | | |
Total | | $ | 1,467,284,108 | | | $ | 17,591,150 | | | | $— | |
| | | | | | | | | | | | |
Industry Classification:
The industry classification of investments and liabilities in excess of other assets shown as a percentage of net assets as of December 31, 2022 were as follows:
| | | | |
Oil, Gas & Consumable Fuels | | | 10.7 | % |
Banks | | | 9.1 | |
Pharmaceuticals | | | 8.7 | |
Insurance | | | 7.1 | |
Affiliated Mutual Funds (3.0% represents investments purchased with collateral from securities on loan) | | | 5.3 | |
Semiconductors & Semiconductor Equipment | | | 4.8 | |
Machinery | | | 4.4 | |
Biotechnology | | | 4.0 | |
Chemicals | | | 3.4 | |
Aerospace & Defense | | | 3.4 | |
Multi-Utilities | | | 3.2 | |
Capital Markets | | | 2.9 | |
Software | | | 2.9 | |
Health Care Providers & Services | | | 2.7 | |
Interactive Media & Services | | | 2.6 | |
Household Products | | | 2.2 | |
Hotels, Restaurants & Leisure | | | 2.1 | |
Food & Staples Retailing | | | 2.1 | |
Beverages | | | 1.8 | |
| | | | |
Building Products | | | 1.7 | % |
Electric Utilities | | | 1.6 | |
Health Care Equipment & Supplies | | | 1.6 | |
Life Sciences Tools & Services | | | 1.5 | |
Technology Hardware, Storage & Peripherals | | | 1.5 | |
Equity Real Estate Investment Trusts (REITs) | | | 1.4 | |
Food Products | | | 1.3 | |
Communications Equipment | | | 1.3 | |
Road & Rail | | | 1.2 | |
Airlines | | | 1.2 | |
Containers & Packaging | | | 1.2 | |
Consumer Finance | | | 1.2 | |
Automobiles | | | 1.0 | |
Specialty Retail | | | 1.0 | |
Wireless Telecommunication Services | | | 0.8 | |
| | | | |
| |
| | | 102.9 | |
Liabilities in excess of other assets | | | (2.9 | ) |
| | | | |
| |
| | | 100.0 | % |
| | | | |
SEE NOTES TO FINANCIAL STATEMENTS.
A162
| | | | |
| | PSF PGIM JENNISON VALUE PORTFOLIO (CONTINUED) | | |
SCHEDULE OF INVESTMENTS | | | | as of December 31, 2022 |
Financial Instruments/Transactions—Summary of Offsetting and Netting Arrangements:
The Portfolio entered into financial instruments/transactions during the reporting period that are either offset in accordance with current requirements or are subject to enforceable master netting arrangements or similar agreements that permit offsetting. The information about offsetting and related netting arrangements for financial instruments/transactions where the legal right to set-off exists is presented in the summary below.
Offsetting of financial instrument/transaction assets and liabilities:
| | | | | | | | |
| Description | | Gross Market Value of Recognized Assets/(Liabilities) | | | | Collateral
Pledged/(Received)(1) | | Net Amount |
| | | | |
Securities on Loan | | $41,463,559 | | | | $(41,463,559) | | $— |
(1) Collateral amount disclosed by the Portfolio is limited to the market value of financial instruments/transactions.
SEE NOTES TO FINANCIAL STATEMENTS.
A163
| | | | |
| | PSF PGIM JENNISON VALUE PORTFOLIO (CONTINUED) | | |
| | | | |
STATEMENT OF ASSETS AND LIABILITIES
as of December 31, 2022
| | | | |
ASSETS | | | | |
Investments at value, including securities on loan of $41,463,559: | | | | |
Unaffiliated investments (cost $924,976,428) | | $ | 1,407,797,180 | |
Affiliated investments (cost $77,064,507) | | | 77,078,078 | |
Cash | | | 49 | |
Dividends receivable | | | 1,306,941 | |
Tax reclaim receivable | | | 742,700 | |
Receivable for Portfolio shares sold | | | 41,631 | |
Prepaid expenses and other assets | | | 194,537 | |
| | | | |
Total Assets | | | 1,487,161,116 | |
| | | | |
LIABILITIES | | | | |
Payable to broker for collateral for securities on loan | | | 42,719,027 | |
Management fee payable | | | 496,787 | |
Payable to affiliate | | | 335,164 | |
Accrued expenses and other liabilities | | | 231,150 | |
Payable for Portfolio shares purchased | | | 171,433 | |
Distribution fee payable | | | 2,513 | |
Administration fee payable | | | 1,186 | |
Trustees’ fees payable | | | 1,139 | |
Affiliated transfer agent fee payable | | | 980 | |
| | | | |
Total Liabilities | | | 43,959,379 | |
| | | | |
NET ASSETS | | $ | 1,443,201,737 | |
| | | | |
Net assets were comprised of: | | | | |
Partners’ Equity | | $ | 1,443,201,737 | |
| | | | |
Class I: | | | | |
Net asset value and redemption price per share, $1,431,454,265 / 32,622,912 outstanding shares of beneficial interest | | $ | 43.88 | |
| | | | |
Class II: | | | | |
Net asset value and redemption price per share, $9,160,836 / 215,761 outstanding shares of beneficial interest. | | $ | 42.46 | |
| | | | |
Class III: | | | | |
Net asset value and redemption price per share, $2,586,636 / 59,196 outstanding shares of beneficial interest | | $ | 43.70 | |
| | | | |
STATEMENT OF OPERATIONS
Year Ended December 31, 2022
| | | | |
NET INVESTMENT INCOME (LOSS) | | | | |
INCOME | | | | |
Unaffiliated dividend income (net of $96,287 foreign withholding tax, of which $11,457 is reimbursable by an affiliate) | | $ | 30,468,432 | |
Affiliated dividend income | | | 746,371 | |
Affiliated income from securities lending, net | | | 48,671 | |
| | | | |
Total income | | | 31,263,474 | |
| | | | |
EXPENSES | | | | |
Management fee | | | 5,962,257 | |
Distribution fee—Class II | | | 23,813 | |
Distribution fee—Class III | | | 4,224 | |
Administration fee—Class II | | | 14,287 | |
Custodian and accounting fees | | | 100,221 | |
Shareholders’ reports | | | 45,097 | |
Trustees’ fees | | | 31,879 | |
Legal fees and expenses | | | 29,029 | |
Audit fee | | | 24,000 | |
Transfer agent’s fees and expenses (including affiliated expense of $5,882) | | | 10,682 | |
Miscellaneous | | | 41,056 | |
| | | | |
Total expenses | | | 6,286,545 | |
| | | | |
NET INVESTMENT INCOME (LOSS) | | | 24,976,929 | |
| | | | |
| REALIZED AND UNREALIZED GAIN (LOSS) ON INVESTMENT AND FOREIGN CURRENCY TRANSACTIONS | | | | |
Net realized gain (loss) on: | | | | |
Investment transactions (including affiliated of $12,609) | | | 77,622,600 | |
Foreign currency transactions | | | (402 | ) |
| | | | |
| | | 77,622,198 | |
| | | | |
Net change in unrealized appreciation (depreciation) on: | | | | |
Investments (including affiliated of $5,545) | | | (232,639,190 | ) |
| | | | |
NET GAIN (LOSS) ON INVESTMENT AND FOREIGN CURRENCY TRANSACTIONS | | | (155,016,992 | ) |
| | | | |
NET INCREASE (DECREASE) IN NET ASSETS RESULTING FROM OPERATIONS | | $ | (130,040,063 | ) |
| | | | |
STATEMENTS OF CHANGES IN NET ASSETS
| | | | | | | | | | | | | | | | | | | | | | | | |
| | | Year Ended | | | Year Ended | |
| | | December 31, 2022 | | | December 31, 2021 | |
INCREASE (DECREASE) IN NET ASSETS | | | | | | | | | | | | | | | | | | | | | | | | |
OPERATIONS | | | | | | | | | | | | | | | | | | | | | | | | |
Net investment income (loss) | | | | | | $ | 24,976,929 | | | | | | | | | | | $ | 21,706,648 | | | | | |
Net realized gain (loss) on investment and foreign currency transactions | | | | | | | 77,622,198 | | | | | | | | | | | | 113,558,071 | | | | | |
Net change in unrealized appreciation (depreciation) on investments | | | | | | | (232,639,190 | ) | | | | | | | | | | | 238,270,819 | | | | | |
| | | | | | | | | | | | | | | | | | | | | | | | |
NET INCREASE (DECREASE) IN NET ASSETS RESULTING FROM OPERATIONS | | | | | | | (130,040,063 | ) | | | | | | | | | | | 373,535,538 | | | | | |
| | | | | | | | | | | | | | | | | | | | | | | | |
PORTFOLIO SHARE TRANSACTIONS | | | | | | | | | | | | | | | | | | | | | | | | |
Portfolio shares sold | | | | | | | 20,960,956 | | | | | | | | | | | | 16,872,668 | | | | | |
Portfolio shares purchased | | | | | | | (105,411,031 | ) | | | | | | | | | | | (112,907,503 | ) | | | | |
| | | | | | | | | | | | | | | | | | | | | | | | |
NET INCREASE (DECREASE) IN NET ASSETS FROM PORTFOLIO SHARE TRANSACTIONS | | | | | | | (84,450,075 | ) | | | | | | | | | | | (96,034,835 | ) | | | | |
| | | | | | | | | | | | | | | | | | | | | | | | |
TOTAL INCREASE (DECREASE) | | | | | | | (214,490,138 | ) | | | | | | | | | | | 277,500,703 | | | | | |
NET ASSETS: | | | | | | | | | | | | | | | | | | | | | | | | |
Beginning of year | | | | | | | 1,657,691,875 | | | | | | | | | | | | 1,380,191,172 | | | | | |
| | | | | | | | | | | | | | | | | | | | | | | | |
End of year | | | | | | $ | 1,443,201,737 | | | | | | | | | | | $ | 1,657,691,875 | | | | | |
| | | | | | | | | | | | | | | | | | | | | | | | |
SEE NOTES TO FINANCIAL STATEMENTS.
A164
| | | | |
| | PSF PGIM JENNISON VALUE PORTFOLIO (CONTINUED) | | |
| | | | |
FINANCIAL HIGHLIGHTS
| | | | | | | | | | | | | | | | | | | | |
Class I | | | | | | | | | | | | | | | |
| | | Year Ended December 31, | |
| | | 2022 | | | 2021 | | | 2020 | | | 2019 | | | 2018 | |
Per Share Operating Performance(a): | | | | | | | | | | | | | | | | | | | | |
Net Asset Value, beginning of year | | $ | 47.64 | | | $ | 37.28 | | | $ | 35.99 | | | $ | 28.55 | | | $ | 31.68 | |
| | | | | | | | | | | | �� | | | | | | | | |
Income (Loss) From Investment Operations: | | | | | | | | | | | | | | | | | | | | |
Net investment income (loss) | | | 0.74 | | | | 0.61 | | | | 0.66 | | | | 0.67 | | | | 0.56 | |
Net realized and unrealized gain (loss) on investment and foreign currency transactions | | | (4.50 | ) | | | 9.75 | | | | 0.63 | | | | 6.77 | | | | (3.71 | ) |
| | | | | | | | | | | | | | | | | | | | |
Total from investment operations | | | (3.76 | ) | | | 10.36 | | | | 1.29 | | | | 7.44 | | | | (3.15 | ) |
| | | | | | | | | | | | | �� | | | | | | | |
Capital Contributions | | | — | | | | — | | | | — | | | | — | (b)(c) | | | 0.02 | (b) |
| | | | | | | | | | | | | | | | | | | | |
Net Asset Value, end of year | | $ | 43.88 | | | $ | 47.64 | | | $ | 37.28 | | | $ | 35.99 | | | $ | 28.55 | |
| | | | | | | | | | | | | | | | | | | | |
Total Return(d) | | | (7.89 | )% | | | 27.79 | % | | | 3.58 | % | | | 26.06 | %(e) | | | (9.88 | )%(f) |
Ratios/Supplemental Data: | | | | | | | | | | | | | | | | | | | | |
Net assets, end of year (in millions) | | $ | 1,431.5 | | | $ | 1,646.0 | | | $ | 1,371.2 | | | $ | 1,429.9 | | | $ | 1,226.4 | |
Average net assets (in millions) | | $ | 1,479.3 | | | $ | 1,543.8 | | | $ | 1,236.8 | | | $ | 1,354.1 | | | $ | 1,416.6 | |
Ratios to average net assets(g): | | | | | | | | | | | | | | | | | | | | |
Expenses after waivers and/or expense reimbursement | | | 0.42 | % | | | 0.42 | % | | | 0.43 | % | | | 0.43 | % | | | 0.43 | % |
Expenses before waivers and/or expense reimbursement | | | 0.42 | % | | | 0.42 | % | | | 0.43 | % | | | 0.43 | % | | | 0.43 | % |
Net investment income (loss) | | | 1.68 | % | | | 1.40 | % | | | 2.03 | % | | | 2.04 | % | | | 1.76 | % |
Portfolio turnover rate(h) | | | 23 | % | | | 17 | % | | | 32 | % | | | 25 | % | | | 23 | % |
| | | | | |
Class II | | | | | | | | | | | | | | | |
| | | Year Ended December 31, | |
| | | 2022 | | | 2021 | | | 2020 | | | 2019 | | | 2018 | |
Per Share Operating Performance(a): | | | | | | | | | | | | | | | | | | | | |
Net Asset Value, beginning of year | | $ | 46.28 | | | $ | 36.36 | | | $ | 35.25 | | | $ | 28.07 | | | $ | 31.27 | |
| | | | | | | | | | | | | | | | | | | | |
Income (Loss) From Investment Operations: | | | | | | | | | | | | | | | | | | | | |
Net investment income (loss) | | | 0.55 | | | | 0.42 | | | | 0.51 | | | | 0.53 | | | | 0.42 | |
Net realized and unrealized gain (loss) on investment and foreign currency transactions | | | (4.37 | ) | | | 9.50 | | | | 0.60 | | | | 6.65 | | | | (3.64 | ) |
| | | | | | | | | | | | | | | | | | | | |
Total from investment operations | | | (3.82 | ) | | | 9.92 | | | | 1.11 | | | | 7.18 | | | | (3.22 | ) |
| | | | | | | | | | | | | | | | | | | | |
Capital Contributions | | | — | | | | — | | | | — | | | | — | (b)(c) | | | 0.02 | (b) |
| | | | | | | | | | | | | | | | | | | | |
Net Asset Value, end of year | | $ | 42.46 | | | $ | 46.28 | | | $ | 36.36 | | | $ | 35.25 | | | $ | 28.07 | |
| | | | | | | | | | | | | | | | | | | | |
Total Return(d) | | | (8.25 | )% | | | 27.28 | % | | | 3.15 | % | | | 25.58 | %(e) | | | (10.23 | )%(f) |
Ratios/Supplemental Data: | | | | | | | | | | | | | | | | | | | | |
Net assets, end of year (in millions) | | $ | 9.2 | | | $ | 10.7 | | | $ | 9.0 | | | $ | 8.7 | | | $ | 6.1 | |
Average net assets (in millions) | | $ | 9.5 | | | $ | 10.1 | | | $ | 7.9 | | | $ | 7.4 | | | $ | 7.2 | |
Ratios to average net assets(g): | | | | | | | | | | | | | | | | | | | | |
Expenses after waivers and/or expense reimbursement | | | 0.82 | % | | | 0.82 | % | | | 0.83 | % | | | 0.83 | % | | | 0.83 | % |
Expenses before waivers and/or expense reimbursement | | | 0.82 | % | | | 0.82 | % | | | 0.83 | % | | | 0.83 | % | | | 0.83 | % |
Net investment income (loss) | | | 1.28 | % | | | 1.00 | % | | | 1.62 | % | | | 1.63 | % | | | 1.36 | % |
Portfolio turnover rate(h) | | | 23 | % | | | 17 | % | | | 32 | % | | | 25 | % | | | 23 | % |
SEE NOTES TO FINANCIAL STATEMENTS.
A165
| | | | |
| | PSF PGIM JENNISON VALUE PORTFOLIO (CONTINUED) | | |
| | | | |
FINANCIAL HIGHLIGHTS
| | | | | | | | | | | | | | | | |
Class III | | | | | | | | | | | | | | |
| | | Year Ended December 31, 2022 | | April 26, 2021(i) through December 31, 2021 |
Per Share Operating Performance(a): | | | | | | | | | | | | | | | | |
Net Asset Value, beginning of period | | | | $ | 47.56 | | | | | | | $ | 42.77 | | | |
| | | | | | | | | | | | | | | | |
Income (Loss) From Investment Operations: | | | | | | | | | | | | | | | | |
Net investment income (loss) | | | | | 0.62 | | | | | | | | 0.29 | | | |
Net realized and unrealized gain (loss) on investment and foreign currency transactions | | | | | (4.48 | ) | | | | | | | 4.50 | | | |
| | | | | | | | | | | | | | | | |
Total from investment operations | | | | | (3.86 | ) | | | | | | | 4.79 | | | |
| | | | | | | | | | | | | | | | |
Net Asset Value, end of period | | | �� | $ | 43.70 | | | | | | | $ | 47.56 | | | |
| | | | | | | | | | | | | | | | |
Total Return(d) | | | | | (8.12 | )% | | | | | | | 11.20 | % | | |
Ratios/Supplemental Data: | | | | | | | | | | | | | | | | |
Net assets, end of period (in millions) | | | | $ | 2.6 | | | | | | | $ | 1.0 | | | |
Average net assets (in millions) | | | | $ | 1.7 | | | | | | | $ | 0.4 | | | |
Ratios to average net assets(g): | | | | | | | | | | | | | | | | |
Expenses after waivers and/or expense reimbursement | | | | | 0.67 | % | | | | | | | 0.66 | %(j) | | |
Expenses before waivers and/or expense reimbursement | | | | | 0.67 | % | | | | | | | 0.66 | %(j) | | |
Net investment income (loss) | | | | | 1.41 | % | | | | | | | 0.92 | %(j) | | |
Portfolio turnover rate(h) | | | | | 23 | % | | | | | | | 17 | % | | |
| (a) | Calculated based on average shares outstanding during the period. |
| (b) | Represents payment received by the Portfolio, from Prudential, in connection with excess foreign withholding tax withheld on dividends and interest from certain countries due to the Portfolio’s tax status as a partnership. |
| (c) | Amount rounds to zero. |
| (d) | Total return is calculated assuming a purchase of a share on the first day and a sale on the last day of each period reported and includes reinvestment of dividends and distributions, if any, and does not reflect the effect of insurance contract charges. Total return does not reflect expenses associated with the separate account such as administrative fees, account charges and surrender charges which, if reflected, would reduce the total returns for all periods shown. Performance figures may reflect fee waivers and/or expense reimbursements. In the absence of fee waivers and/or expense reimbursements, the total return would be lower. Past performance is no guarantee of future results. Total returns may reflect adjustments to conform to GAAP. Total returns for periods less than one full year are not annualized. |
| (e) | Total return for the year includes the impact of the capital contribution, which was not material to the total return. |
| (f) | Total return for the year includes the impact of the capital contribution. Excluding the capital contribution, the total return would have been (9.94)% and (10.29)% for Class I and Class II, respectively. |
| (g) | Does not include expenses of the underlying funds in which the Portfolio invests. |
| (h) | The Portfolio’s portfolio turnover rate is calculated in accordance with regulatory requirements, without regard to transactions involving short-term investments, certain derivatives and in-kind transactions (if any). If such transactions were included, the Portfolio’s portfolio turnover rate may be higher. |
| (i) | Commencement of offering. |
| (j) | Annualized, with the exception of certain non-recurring expenses. |
SEE NOTES TO FINANCIAL STATEMENTS.
A166
| | | | |
| | PSF PGIM TOTAL RETURN BOND PORTFOLIO | | |
SCHEDULE OF INVESTMENTS | | | | as of December 31, 2022 |
| | | | | | | | | | | | |
Interest Rate | | Maturity Date | | | | Principal
Amount
(000)# | | | Value | |
| | | | | | | | | | | |
LONG-TERM INVESTMENTS — 107.3% | |
ASSET-BACKED SECURITIES — 23.0% | |
Automobiles — 1.2% | |
AmeriCredit Automobile Receivables Trust, | |
Series 2020-02, Class D | |
2.130% | | 03/18/26 | | | | | 300 | | | $ | 280,814 | |
Avis Budget Rental Car Funding AESOP LLC, | |
Series 2020-02A, Class A, 144A | |
2.020% | | 02/20/27 | | | | | 600 | | | | 543,738 | |
Exeter Automobile Receivables Trust, | |
Series 2020-03A, Class C | |
1.320% | | 07/15/25 | | | | | 154 | | | | 152,670 | |
Series 2020-03A, Class D | |
1.730% | | 07/15/26 | | | | | 200 | | | | 192,683 | |
Series 2021-02A, Class C | |
0.980% | | 06/15/26 | | | | | 10 | | | | 9,610 | |
Series 2021-02A, Class D | |
1.400% | | 04/15/27 | | | | | 20 | | | | 18,273 | |
Series 2022-01A, Class E, 144A | |
5.020% | | 10/15/29 | | | | | 1,300 | | | | 1,084,347 | |
GM Financial Automobile Leasing Trust, | |
Series 2020-02, Class C | |
2.560% | | 07/22/24 | | | | | 1 | | | | 998 | |
Hertz Vehicle Financing III LLC, | |
Series 2022-01A, Class C, 144A | |
2.630% | | 06/25/26 | | | | | 200 | | | | 177,479 | |
Hertz Vehicle Financing III LP, | |
Series 2021-02A, Class A, 144A | |
1.680% | | 12/27/27 | | | | | 2,300 | | | | 2,001,817 | |
Series 2021-02A, Class B, 144A | |
2.120% | | 12/27/27 | | | | | 200 | | | | 171,388 | |
Hertz Vehicle Financing LLC, | |
Series 2021-01A, Class C, 144A | |
2.050% | | 12/26/25 | | | | | 100 | | | | 90,080 | |
Series 2022-02A, Class B, 144A | |
2.650% | | 06/26/28 | | | | | 400 | | | | 342,792 | |
JPMorgan Chase Bank, NA, | |
Series 2020-01, Class R, 144A | |
33.784% | | 01/25/28 | | | | | 732 | | | | 840,815 | |
Series 2020-02, Class D, 144A | |
1.487% | | 02/25/28 | | | | | 282 | | | | 275,326 | |
OneMain Direct Auto Receivables Trust, | |
Series 2019-01A, Class A, 144A | |
3.630% | | 09/14/27 | | | | | 3,500 | | | | 3,359,196 | |
Series 2019-01A, Class B, 144A | |
3.950% | | 11/14/28 | | | | | 800 | | | | 740,960 | |
Santander Bank Auto Credit-Linked Notes, | |
Series 2022-A, Class C, 144A | |
7.375% | | 05/15/32 | | | | | 567 | | | | 553,924 | |
Series 2022-C, Class E, 144A | |
11.366% | | 12/15/32 | | | | | 300 | | | | 300,041 | |
Santander Drive Auto Receivables Trust, | |
Series 2020-02, Class D | |
2.220% | | 09/15/26 | | | | | 400 | | | | 389,589 | |
Series 2020-03, Class D | |
1.640% | | 11/16/26 | | | | | 1,400 | | | | 1,342,200 | |
| | | | | | | | | | | | |
| |
| | | | 12,868,740 | |
| | | | | | | | | | | | |
| | | | | | | | | | | | |
Interest Rate | | Maturity Date | | | | Principal
Amount
(000)# | | | Value | |
| | | | | | | | | | | |
ASSET-BACKED SECURITIES (continued) | |
Collateralized Debt Obligations — 0.4% | |
Arbor Realty Commercial Real Estate Notes Ltd. (Cayman Islands), | |
Series 2022-FL01, Class A, 144A, 30 Day Average SOFR + 1.450% (Cap N/A, Floor 1.450%) | |
5.257%(c) | | 01/15/37 | | | | | 3,000 | | | $ | 2,917,884 | |
MF1 Ltd. (Cayman Islands), | |
Series 2022-FL08, Class A, 144A, 30 Day Average SOFR + 1.350% (Cap N/A, Floor 1.350%) | |
5.176%(c) | | 02/19/37 | | | | | 1,550 | | | | 1,490,304 | |
| | | | | | | | | | | | |
| |
| | | | 4,408,188 | |
| | | | | | | | | | | | |
Collateralized Loan Obligations — 19.5% | |
AlbaCore Euro CLO DAC (Ireland), | |
Series 04A, Class B1, 144A, 3 Month EURIBOR + 2.600% (Cap N/A, Floor 2.600%) | |
2.600%(c) | | 07/15/35 | | | | EUR | 5,500 | | | | 5,681,969 | |
Ares European CLO DAC (Ireland), | |
Series 11A, Class A1R, 144A, 3 Month EURIBOR + 0.770% (Cap N/A, Floor 0.770%) | |
2.148%(c) | | 04/15/32 | | | | EUR | 10,000 | | | | 10,398,316 | |
Atlas Static Senior Loan Fund Ltd. (Cayman Islands), | |
Series 2022-01A, Class A, 144A, 3 Month SOFR + 2.600% (Cap N/A, Floor 2.600%) | |
5.100%(c) | | 07/15/30 | | | | | 4,750 | | | | 4,731,998 | |
Bain Capital Credit CLO Ltd. (Cayman Islands), | |
Series 2019-02A, Class AR, 144A, 3 Month LIBOR + 1.100% (Cap N/A, Floor 1.100%) | |
5.179%(c) | | 10/17/32 | | | | | 3,500 | | | | 3,434,622 | |
Battalion CLO Ltd., | |
Series 2018-12A, Class A1, 144A, 3 Month LIBOR + 1.070% (Cap N/A, Floor 1.070%) | |
5.720%(c) | | 05/17/31 | | | | | 3,000 | | | | 2,937,953 | |
Carlyle Euro CLO DAC (Ireland), | |
Series 2021-02A, Class A1, 144A, 3 Month EURIBOR + 0.990% (Cap N/A, Floor 0.990%) | |
2.368%(c) | | 10/15/35 | | | | EUR | 6,500 | | | | 6,648,341 | |
Series 2021-02A, Class A2B, 144A | |
2.100% | | 10/15/35 | | | | EUR | 6,250 | | | | 5,270,316 | |
Carlyle Global Market Strategies Euro CLO Ltd. (Ireland), | |
Series 2014-02A, Class AR1, 144A, 3 Month EURIBOR + 0.750% (Cap N/A, Floor 0.750%) | |
2.548%(c) | | 11/15/31 | | | | EUR | 10,000 | | | | 10,343,674 | |
Carlyle US CLO Ltd. (Cayman Islands), | |
Series 2017-04A, Class A1, 144A, 3 Month LIBOR + 1.180% (Cap N/A, Floor 1.180%) | |
5.259%(c) | | 01/15/30 | | | | | 4,000 | | | | 3,942,141 | |
CIFC Funding Ltd. (Cayman Islands), | |
Series 2013-03RA, Class A1, 144A, 3 Month LIBOR + 0.980% (Cap N/A, Floor 0.980%) | |
5.305%(c) | | 04/24/31 | | | | | 1,500 | | | | 1,474,852 | |
Series 2015-01A, Class ARR, 144A, 3 Month LIBOR + 1.110% (Cap N/A, Floor 1.110%) | |
5.435%(c) | | 01/22/31 | | | | | 3,750 | | | | 3,701,222 | |
Elevation CLO Ltd. (Cayman Islands), | |
Series 2014-02A, Class A1R, 144A, 3 Month SOFR + 1.492% (Cap N/A, Floor 0.000%) | |
5.355%(c) | | 10/15/29 | | | | | 6,302 | | | | 6,258,440 | |
SEE NOTES TO FINANCIAL STATEMENTS.
A167
| | | | |
| | PSF PGIM TOTAL RETURN BOND PORTFOLIO (CONTINUED) | | |
SCHEDULE OF INVESTMENTS | | | | as of December 31, 2022 |
| | | | | | | | | | | | |
Interest Rate | | Maturity Date | | | | Principal
Amount
(000)# | | | Value | |
| | | | | | | | | | | |
|
ASSET-BACKED SECURITIES (continued) | |
Collateralized Loan Obligations (cont’d.) | |
Series 2017-06A, Class A1, 144A, 3 Month LIBOR + 1.280% (Cap N/A, Floor 1.280%) | |
5.359%(c) | | 07/15/29 | | | | | 207 | | | $ | 205,037 | |
Generate CLO Ltd. (Cayman Islands), | |
Series 02A, Class AR, 144A, 3 Month LIBOR + 1.150% (Cap N/A, Floor 1.150%) | |
5.475%(c) | | 01/22/31 | | | | | 2,000 | | | | 1,975,359 | |
Greenwood Park CLO Ltd. (Cayman Islands), | |
Series 2018-01A, Class A2, 144A, 3 Month LIBOR + 1.010% (Cap N/A, Floor 0.000%) | |
5.089%(c) | | 04/15/31 | | | | | 6,000 | | | | 5,921,321 | |
Greywolf CLO Ltd. (Cayman Islands), | |
Series 2018-01A, Class A1, 144A, 3 Month SOFR + 1.290% (Cap N/A, Floor 0.000%) | |
5.336%(c) | | 04/26/31 | | | | | 3,500 | | | | 3,431,873 | |
Hayfin Emerald CLO DAC (Ireland), | |
Series 05A, Class A, 144A, 3 Month EURIBOR + 1.100% (Cap N/A, Floor 1.100%) | |
2.895%(c) | | 11/17/32 | | | | EUR | 10,500 | | | | 11,016,308 | |
HPS Loan Management Ltd. (Cayman Islands), | |
Series 2015-06A, Class A1R, 144A, 3 Month LIBOR + 1.000% (Cap N/A, Floor 0.000%) | |
5.532%(c) | | 02/05/31 | | | | | 3,973 | | | | 3,927,977 | |
ICG US CLO Ltd. (Cayman Islands), | |
Series 2014-03A, Class A1RR, 144A, 3 Month LIBOR + 1.030% (Cap N/A, Floor 0.000%) | |
5.388%(c) | | 04/25/31 | | | | | 2,494 | | | | 2,463,738 | |
Jamestown CLO Ltd. (Cayman Islands), | |
Series 2019-14A, Class A1AR, 144A, 3 Month LIBOR + 1.200% (Cap N/A, Floor 1.200%) | |
5.443%(c) | | 10/20/34 | | | | | 6,625 | | | | 6,429,863 | |
Series 2019-14A, Class A2R, 144A, 3 Month LIBOR + 1.750% (Cap N/A, Floor 1.750%) | |
5.993%(c) | | 10/20/34 | | | | | 6,750 | | | | 6,442,134 | |
Madison Park Funding Ltd. (Cayman Islands), | |
Series 12A, Class AR, 144A, 3 Month LIBOR + 0.830% (Cap N/A, Floor 0.000%) | |
5.155%(c) | | 04/22/27 | | | | | 6,901 | | | | 6,812,817 | |
Series 2019-34A, Class AR, 144A, 3 Month LIBOR + 1.120% (Cap N/A, Floor 1.120%) | |
5.478%(c) | | 04/25/32 | | | | | 2,000 | | | | 1,967,092 | |
MidOcean Credit CLO (Cayman Islands), | |
Series 2014-03A, Class A1R, 144A, 3 Month LIBOR + 1.120% (Cap N/A, Floor 1.120%) | |
5.398%(c) | | 04/21/31 | | | | | 9,635 | | | | 9,448,379 | |
Mountain View CLO Ltd. (Cayman Islands), | |
Series 2015-09A, Class A1R, 144A, 3 Month LIBOR + 1.120% (Cap N/A, Floor 0.000%) | |
5.199%(c) | | 07/15/31 | | | | | 6,000 | | | | 5,880,209 | |
OCP CLO Ltd. (Cayman Islands), | |
Series 2020-18A, Class AR, 144A, 3 Month LIBOR + 1.090% (Cap N/A, Floor 1.090%) | |
5.333%(c) | | 07/20/32 | | | | | 5,000 | | | | 4,892,743 | |
OZLM Ltd. (Cayman Islands), | |
Series 2015-11A, Class A1R, 144A, 3 Month LIBOR + 1.250% (Cap N/A, Floor 0.000%) | |
5.665%(c) | | 10/30/30 | | | | | 1,236 | | | | 1,217,945 | |
| | | | | | | | | | | | |
Interest Rate | | Maturity Date | | | | Principal
Amount
(000)# | | | Value | |
| | | | | | | | | | | |
|
ASSET-BACKED SECURITIES (continued) | |
Collateralized Loan Obligations (cont’d.) | |
Park Avenue Institutional Advisers CLO Ltd. (Cayman Islands), | |
Series 2019-02A, Class A1R, 144A, 3 Month LIBOR + 1.180% (Cap N/A, Floor 1.180%) | |
5.259%(c) | | 10/15/34 | | | | | 7,000 | | | $ | 6,769,609 | |
Romark WM-R Ltd. (Cayman Islands), | |
Series 2018-01A, Class A1, 144A, 3 Month LIBOR + 1.030% (Cap N/A, Floor 0.000%) | |
5.273%(c) | | 04/20/31 | | | | | 3,958 | | | | 3,885,240 | |
Shackleton CLO Ltd. (Cayman Islands), | |
Series 2014-05RA, Class A, 144A, 3 Month LIBOR + 1.100% (Cap N/A, Floor 0.000%) | |
5.632%(c) | | 05/07/31 | | | | | 4,955 | | | | 4,838,558 | |
Signal Peak CLO Ltd., | |
Series 2018-05A, Class A, 144A, 3 Month LIBOR + 1.110% (Cap N/A, Floor 1.110%) | |
5.468%(c) | | 04/25/31 | | | | | 5,750 | | | | 5,634,066 | |
Sixth Street CLO Ltd. (Cayman Islands), | |
Series 2020-16A, Class A1A, 144A, 3 Month LIBOR + 1.320% (Cap N/A, Floor 1.320%) | |
5.563%(c) | | 10/20/32 | | | | | 12,500 | | | | 12,398,315 | |
Sound Point CLO Ltd. (Cayman Islands), | |
Series 2013-01A, Class A1R, 144A, 3 Month LIBOR + 1.070% (Cap N/A, Floor 1.070%) | |
5.397%(c) | | 01/26/31 | | | | | 3,500 | | | | 3,459,824 | |
TCW CLO Ltd. (Cayman Islands), | |
Series 2017-01A, Class A1RR, 144A, 3 Month LIBOR + 1.180% (Cap N/A, Floor 1.180%) | |
5.595%(c) | | 10/29/34 | | | | | 3,000 | | | | 2,913,163 | |
Series 2017-01A, Class BRR, 144A, 3 Month LIBOR + 1.700% (Cap N/A, Floor 1.700%) | |
6.115%(c) | | 10/29/34 | | | | | 4,000 | | | | 3,810,356 | |
Telos CLO Ltd. (Cayman Islands), | |
Series 2013-04A, Class AR, 144A, 3 Month LIBOR + 1.240% (Cap N/A, Floor 0.000%) | |
5.319%(c) | | 01/17/30 | | | | | 2,977 | | | | 2,930,968 | |
TICP CLO Ltd. (Cayman Islands), | |
Series 2017-09A, Class A, 144A, 3 Month LIBOR + 1.140% (Cap N/A, Floor 1.140%) | |
5.383%(c) | | 01/20/31 | | | | | 3,000 | | | | 2,967,305 | |
Toro European CLO DAC (Ireland), | |
Series 03A, Class ARR, 144A, 3 Month EURIBOR + 0.990% (Cap N/A, Floor 0.990%) | |
2.368%(c) | | 07/15/34 | | | | EUR | 8,000 | | | | 8,218,638 | |
Trinitas Euro CLO DAC (Ireland), | |
Series 02A, Class CR, 144A, 3 Month EURIBOR + 3.750% (Cap N/A, Floor 3.750%) | |
5.128%(c) | | 04/15/35 | | | | EUR | 4,500 | | | | 4,664,080 | |
Voya CLO Ltd. (Cayman Islands), | |
Series 2013-02A, Class A1R, 144A, 3 Month SOFR + 1.232% (Cap N/A, Floor 0.970%) | |
5.292%(c) | | 04/25/31 | | | | | 3,000 | | | | 2,952,942 | |
Wellfleet CLO Ltd., | |
Series 2017-03A, Class A1, 144A, 3 Month LIBOR + 1.150% (Cap N/A, Floor 1.150%) | |
5.229%(c) | | 01/17/31 | | | | | 6,500 | | | | 6,375,085 | |
Series 2018-02A, Class A1, 144A, 3 Month LIBOR + 1.200% (Cap N/A, Floor 1.200%) | |
5.443%(c) | | 10/20/31 | | | | | 2,750 | | | | 2,674,804 | |
SEE NOTES TO FINANCIAL STATEMENTS.
A168
| | | | |
| | PSF PGIM TOTAL RETURN BOND PORTFOLIO (CONTINUED) | | |
SCHEDULE OF INVESTMENTS | | | | as of December 31, 2022 |
| | | | | | | | | | | | |
Interest Rate | | Maturity Date | | | | Principal
Amount
(000)# | | | Value | |
| | | | | | | | | | | |
|
ASSET-BACKED SECURITIES (continued) | |
Collateralized Loan Obligations (cont’d.) | |
Wind River CLO Ltd. (Cayman Islands), | |
Series 2016-01KRA, Class A1R2, 144A, 3 Month LIBOR + 1.210% (Cap N/A, Floor 1.210%) | |
5.289%(c) | | 10/15/34 | | | | | 1,750 | | | $ | 1,695,754 | |
| | | | | | | | | | | | |
| |
| | | | 213,045,346 | |
| | | | | | | | | | | | |
Consumer Loans — 0.7% | |
Fairstone Financial Issuance Trust (Canada), | |
Series 2020-01A, Class A, 144A | |
2.509% | | 10/20/39 | | | | CAD | 400 | | | | 277,805 | |
Lending Funding Trust, | |
Series 2020-02A, Class A, 144A | |
2.320% | | 04/21/31 | | | | | 300 | | | | 261,016 | |
Lendmark Funding Trust, | |
Series 2019-02A, Class A, 144A | |
2.780% | | 04/20/28 | | | | | 762 | | | | 739,888 | |
Series 2021-01A, Class B, 144A | |
2.470% | | 11/20/31 | | | | | 100 | | | | 81,001 | |
Mariner Finance Issuance Trust, | |
Series 2019-AA, Class A, 144A | |
2.960% | | 07/20/32 | | | | | 380 | | | | 374,946 | |
Series 2020-AA, Class A, 144A | |
2.190% | | 08/21/34 | | | | | 500 | | | | 475,846 | |
OneMain Financial Issuance Trust, | |
Series 2020-01A, Class A, 144A | |
3.840% | | 05/14/32 | | | | | 450 | | | | 446,807 | |
Series 2020-02A, Class A, 144A | |
1.750% | | 09/14/35 | | | | | 1,500 | | | | 1,310,356 | |
Oportun Funding XIII LLC, | |
Series 2019-A, Class A, 144A | |
3.080% | | 08/08/25 | | | | | 1,011 | | | | 998,455 | |
Series 2019-A, Class D, 144A | |
6.220% | | 08/08/25 | | | | | 1,300 | | | | 1,168,587 | |
Oportun Funding XIV LLC, | |
Series 2021-A, Class B, 144A | |
1.760% | | 03/08/28 | | | | | 300 | | | | 277,851 | |
Regional Management Issuance Trust, | |
Series 2022-01, Class A, 144A | |
3.070% | | 03/15/32 | | | | | 1,200 | | | | 1,094,671 | |
| | | | | | | | | | | | |
| |
| | | | 7,507,229 | |
| | | | | | | | | | | | |
Credit Cards — 0.2% | |
Newday Funding Master Issuer PLC (United Kingdom), | |
Series 2021-01A, Class A1, 144A, SONIA + 0.970% (Cap N/A, Floor 0.000%) | |
4.293%(c) | | 03/15/29 | | | | GBP | 300 | | | | 358,791 | |
Series 2021-02A, Class A1, 144A, SONIA + 0.800% (Cap N/A, Floor 0.000%) | |
4.123%(c) | | 07/15/29 | | | | GBP | 300 | | | | 356,702 | |
Newday Partnership Funding PLC (United Kingdom), | |
Series 2020-01A, Class A3, 144A, 1 Month SONIA + 1.400% (Cap N/A, Floor 0.000%) | |
4.331%(c) | | 11/15/28 | | | | GBP | 1,625 | | | | 1,949,111 | |
| | | | | | | | | | | | |
| |
| | | | 2,664,604 | |
| | | | | | | | | | | | |
| | | | | | | | | | | | |
Interest Rate | | Maturity Date | | | | Principal
Amount
(000)# | | | Value | |
| | | | | | | | | | | |
|
ASSET-BACKED SECURITIES (continued) | |
Home Equity Loans — 0.0% | |
Floating Rate Mortgage Pass-Through Certificates, | |
Series 2001-02, Class M3, 1 Month LIBOR + 2.925% (Cap N/A, Floor 2.925%) | |
7.314%(c) | | 10/25/31 | | | | | 169 | | | $ | 155,656 | |
Merrill Lynch Mortgage Investors Trust, | |
Series 2004-HE02, Class M1, 1 Month LIBOR + 1.200% (Cap N/A, Floor 1.200%) | |
5.589%(c) | | 08/25/35 | | | | | 62 | | | | 60,080 | |
Morgan Stanley ABS Capital I, Inc. Trust, | |
Series 2003-HE03, Class M1, 1 Month LIBOR + 1.020% (Cap N/A, Floor 1.020%) | |
5.409%(c) | | 10/25/33 | | | | | 89 | | | | 87,316 | |
| | | | | | | | | | | | |
| |
| | | | 303,052 | |
| | | | | | | | | | | | |
Other — 0.2% | |
PNMAC FMSR Issuer Trust, | |
Series 2018-FT01, Class A, 144A, 1 Month LIBOR + 2.350% (Cap N/A, Floor 0.000%) | |
6.739%(c) | | 04/25/23 | | | | | 220 | | | | 206,618 | |
TH MSR Issuer Trust, | |
Series 2019-FT01, Class A, 144A, 1 Month LIBOR + 2.800% (Cap N/A, Floor 2.800%) | |
7.189%(c) | | 06/25/24 | | | | | 2,250 | | | | 2,105,185 | |
| | | | | | | | | | | | |
| |
| | | | 2,311,803 | |
| | | | | | | | | | | | |
|
Residential Mortgage-Backed Securities — 0.4% | |
Argent Securities, Inc., Asset-Backed Pass-Through Certificates, | |
Series 2004-W010, Class A2, 1 Month LIBOR + 0.780% (Cap N/A, Floor 0.780%) | |
3.766%(c) | | 10/25/34 | | | | | 506 | | | | 484,570 | |
LSF11 Boson Investments Sarl Compartment 2 (Spain), | |
Series 2021-NPLA, Class A1, 144A, 3 Month EURIBOR + 2.000% (Cap N/A, Floor 2.000%) | |
3.898%(c) | | 11/25/60 | | | | EUR | 828 | | | | 843,447 | |
Merrill Lynch Mortgage Investors Trust, | |
Series 2004-OPT01, Class A1A, 1 Month LIBOR + 0.520% (Cap N/A, Floor 0.520%) | |
4.909%(c) | | 06/25/35 | | | | | 54 | | | | 54,036 | |
Rathlin Residential DAC (Ireland), | |
Series 2021-01A, Class A, 144A, 1 Month EURIBOR + 2.000% (Cap N/A, Floor 0.000%) | |
3.895%(c) | | 09/27/75 | | | | EUR | 1,278 | | | | 1,309,086 | |
TFS (Spain), | |
Series 2018-03, Class A1, 1 Month EURIBOR + 3.000% | |
4.686%(c) | | 04/16/23^ | | | | EUR | 1,830 | | | | 1,856,650 | |
| | | | | | | | | | | | |
| |
| | | | 4,547,789 | |
| | | | | | | | | | | | |
Student Loans — 0.4% | |
Laurel Road Prime Student Loan Trust, | |
Series 2018-A, Class A, 144A | |
0.000% | | 02/25/43 | | | | | 2,980 | | | | 696,192 | |
Series 2018-C, Class A, 144A | |
0.000%(cc) | | 08/25/43 | | | | | 779 | | | | 722,594 | |
Series 2018-D, Class A, 144A | |
0.000%(cc) | | 11/25/43 | | | | | 794 | | | | 744,547 | |
Series 2 019-A, Class R, 144A | |
0.000% | | 10/25/48 | | | | | 1,393 | | | | 297,466 | |
SEE NOTES TO FINANCIAL STATEMENTS.
A169
| | | | |
| | PSF PGIM TOTAL RETURN BOND PORTFOLIO (CONTINUED) | | |
SCHEDULE OF INVESTMENTS | | | | as of December 31, 2022 |
| | | | | | | | | | | | |
Interest Rate | | Maturity Date | | | | Principal
Amount
(000)# | | | Value | |
| | | | | | | | | | | |
|
ASSET-BACKED SECURITIES (continued) | |
Student Loans (cont’d.) | |
Navient Private Education Refi Loan Trust, | |
Series 2020-DA, Class A, 144A | |
1.690% | | 05/15/69 | | | | | 33 | | | $ | 29,315 | |
SoFi RR Funding II Trust, | |
Series 2019-01, Class A, 144A, 1 Month LIBOR + 2.250% (Cap N/A, Floor 1.250%) | |
6.639%(c) | | 11/29/24 | | | | | 219 | | | | 218,550 | |
SoFi RR Funding III Trust, | |
Series 2020-01, Class A, 144A, 1 Month LIBOR + 2.250% (Cap N/A, Floor 1.250%) | |
6.639%(c) | | 11/29/24 | | | | | 1,116 | | | | 1,115,833 | |
| | | | | | | | | | | | |
| |
| | | | 3,824,497 | |
| | | | | | | | | | | | |
TOTAL ASSET-BACKED SECURITIES
(cost $266,169,181) | | | | 251,481,248 | |
| | | | | | | | | | | | |
COMMERCIAL MORTGAGE-BACKED SECURITIES — 13.0% | |
BANK, | |
Series 2017-BNK05, Class A4 | |
3.131% | | 06/15/60 | | | | | 4,400 | | | | 4,022,890 | |
Series 2017-BNK06, Class A4 | |
3.254% | | 07/15/60 | | | | | 920 | | | | 850,942 | |
Series 2017-BNK08, Class A3 | |
3.229% | | 11/15/50 | | | | | 1,333 | | | | 1,216,259 | |
Series 2019-BN18, Class A3 | |
3.325% | | 05/15/62 | | | | | 1,500 | | | | 1,346,169 | |
Series 2020-BN29, Class A3 | |
1.742% | | 11/15/53 | | | | | 1,000 | | | | 783,468 | |
Bank of America Merrill Lynch Commercial Mortgage Trust, | |
Series 2016-UB10, Class A3 | |
2.903% | | 07/15/49 | | | | | 989 | | | | 914,416 | |
Barclays Commercial Mortgage Securities Trust, | |
Series 2016-ETC, Class A, 144A | |
2.937% | | 08/14/36 | | | | | 1,170 | | | | 1,018,489 | |
Series 2016-ETC, Class B, 144A | |
3.189% | | 08/14/36 | | | | | 510 | | | | 433,550 | |
Series 2016-ETC, Class C, 144A | |
3.391% | | 08/14/36 | | | | | 430 | | | | 353,812 | |
Series 2016-ETC, Class D, 144A | |
3.609%(cc) | | 08/14/36 | | | | | 1,560 | | | | 1,239,131 | |
Benchmark Mortgage Trust, | |
Series 2019-B09, Class A4 | |
3.751% | | 03/15/52 | | | | | 3,400 | | | | 3,146,348 | |
Series 2020-B18, Class A4 | |
1.672% | | 07/15/53 | | | | | 2,900 | | | | 2,315,228 | |
Series 2020-B21, Class A4 | |
1.704% | | 12/17/53 | | | | | 1,000 | | | | 795,283 | |
BX Commercial Mortgage Trust, | |
Series 2019-XL, Class F, 144A, 1 Month SOFR + 2.114% (Cap N/A, Floor 2.114%) | |
6.450%(c) | | 10/15/36 | | | | | 2,125 | | | | 2,044,744 | |
Series 2019-XL, Class G, 144A, 1 Month SOFR + 2.414% (Cap N/A, Floor 2.414%) | |
6.750%(c) | | 10/15/36 | | | | | 1,360 | | | | 1,301,790 | |
| | | | | | | | | | | | |
Interest Rate | | Maturity Date | | | | Principal
Amount
(000)# | | | Value | |
| | | | | | | | | | | |
|
COMMERCIAL MORTGAGE-BACKED SECURITIES (continued) | |
Series 2019-XL, Class J, 144A, 1 Month SOFR + 2.764% (Cap N/A, Floor 2.764%) | |
7.100%(c) | | 10/15/36 | | | | | 2,975 | | | $ | 2,834,206 | |
Series 2021-ACNT, Class E, 144A, 1 Month LIBOR + 2.197% (Cap N/A, Floor 2.197%) | |
6.515%(c) | | 11/15/38 | | | | | 3,350 | | | | 3,156,785 | |
BX Trust, | |
Series 2022-LBA06, Class E, 144A, 1 Month SOFR + 2.700% (Cap N/A, Floor 2.700%) | |
7.036%(c) | | 01/15/39 | | | | | 5,000 | | | | 4,549,004 | |
Cantor Commercial Real Estate Lending, | |
Series 2019-CF02, Class A3 | |
2.647% | | 11/15/52 | | | | | 7,700 | | | | 7,161,818 | |
CD Mortgage Trust, | |
Series 2017-CD05, Class A3 | |
3.171% | | 08/15/50 | | | | | 3,500 | | | | 3,182,931 | |
CFK Trust, | |
Series 2020-MF02, Class A, 144A | |
2.387% | | 03/15/39 | | | | | 6,550 | | | | 5,639,672 | |
CityLine Commercial Mortgage Trust, | |
Series 2016-CLNE, Class B, 144A | |
2.778%(cc) | | 11/10/31 | | | | | 2,400 | | | | 2,293,750 | |
Series 2016-CLNE, Class C, 144A | |
2.778%(cc) | | 11/10/31 | | | | | 900 | | | | 853,509 | |
Cold Storage Trust, | |
Series 2020-ICE05, Class E, 144A, 1 Month LIBOR + 2.766% (Cap N/A, Floor 2.833%) | |
7.083%(c) | | 11/15/37 | | | | | 1,327 | | | | 1,272,065 | |
Commercial Mortgage Trust, | |
Series 2014-UBS04, Class A4 | |
3.420% | | 08/10/47 | | | | | 3,200 | | | | 3,094,483 | |
Series 2015-DC01, Class A4 | |
3.078% | | 02/10/48 | | | | | 5,000 | | | | 4,807,148 | |
Series 2016-COR01, Class A3 | |
2.826% | | 10/10/49 | | | | | 2,474 | | | | 2,284,196 | |
Series 2017-COR02, Class A2 | |
3.239% | | 09/10/50 | | | | | 3,829 | | | | 3,502,419 | |
Credit Suisse Mortgage Capital Certificates, | |
Series 2019-ICE04, Class E, 144A, 1 Month LIBOR + 2.150% (Cap N/A, Floor 2.150%) | |
6.468%(c) | | 05/15/36 | | | | | 2,600 | | | | 2,514,700 | |
CSAIL Commercial Mortgage Trust, | |
Series 2019-C16, Class A2 | |
3.067% | | 06/15/52 | | | | | 1,200 | | | | 1,048,836 | |
DBGS Mortgage Trust, | |
Series 2018-BIOD, Class G, 144A, 1 Month LIBOR + 2.500% (Cap N/A, Floor 2.500%) | |
6.736%(c) | | 05/15/35 | | | | | 2,990 | | | | 2,799,563 | |
DBWF Mortgage Trust, | |
Series 2016-85T, Class D, 144A | |
3.808%(cc) | | 12/10/36 | | | | | 1,400 | | | | 1,142,536 | |
Deutsche Bank Commercial Mortgage Trust, | |
Series 2017-C06, Class A4 | |
3.071% | | 06/10/50 | | | | | 2,800 | | | | 2,572,701 | |
Eleven Madison Mortgage Trust, | |
Series 2015-11MD, Class C, 144A | |
3.555%(cc) | | 09/10/35 | | | | | 3,000 | | | | 2,669,155 | |
SEE NOTES TO FINANCIAL STATEMENTS.
A170
| | | | |
| | PSF PGIM TOTAL RETURN BOND PORTFOLIO (CONTINUED) | | |
SCHEDULE OF INVESTMENTS | | | | as of December 31, 2022 |
| | | | | | | | | | | | |
Interest Rate | | Maturity Date | | | | Principal
Amount
(000)# | | | Value | |
| | | | | | | | | | | |
|
| COMMERCIAL MORTGAGE-BACKED SECURITIES (continued) | |
FHLMC Multifamily Structured Pass-Through Certificates, | |
Series K044, Class X1, IO | |
0.739%(cc) | | 01/25/25 | | | | | 62,168 | | | $ | 764,110 | |
Series K053, Class X1, IO | |
0.877%(cc) | | 12/25/25 | | | | | 85,055 | | | | 1,767,963 | |
Series K055, Class X1, IO | |
1.346%(cc) | | 03/25/26 | | | | | 12,905 | | | | 448,444 | |
Series KG03, Class X1, IO | |
1.379%(cc) | | 06/25/30 | | | | | 29,271 | | | | 2,253,870 | |
GS Mortgage Securities Trust, | |
Series 2015-GC30, Class A3 | |
3.119% | | 05/10/50 | | | | | 2,849 | | | | 2,699,587 | |
Series 2017-GS06, Class A2 | |
3.164% | | 05/10/50 | | | | | 3,249 | | | | 2,971,278 | |
Series 2019-GC38, Class A3 | |
3.703% | | 02/10/52 | | | | | 5,800 | | | | 5,301,482 | |
IMT Trust, | |
Series 2017-APTS, Class AFX, 144A | |
3.478% | | 06/15/34 | | | | | 310 | | | | 295,529 | |
JPMDB Commercial Mortgage Securities Trust, | |
Series 2016-C02, Class A3A | |
2.881% | | 06/15/49 | | | | | 1,070 | | | | 995,575 | |
Series 2017-C05, Class A4 | |
3.414% | | 03/15/50 | | | | | 1,423 | | | | 1,326,807 | |
Series 2017-C07, Class A4 | |
3.147% | | 10/15/50 | | | | | 3,600 | | | | 3,283,695 | |
JPMorgan Chase Commercial Mortgage Securities Trust, | |
Series 2016-JP02, Class A3 | |
2.559% | | 08/15/49 | | | | | 1,639 | | | | 1,498,159 | |
Series 2018-AON, Class E, 144A | |
4.613%(cc) | | 07/05/31 | | | | | 5,875 | | | | 4,903,496 | |
Morgan Stanley Bank of America Merrill Lynch Trust, | |
Series 2013-C10, Class A3 | |
3.955%(cc) | | 07/15/46 | | | | | 1,212 | | | | 1,203,786 | |
Morgan Stanley Capital I Trust, | |
Series 2017-H01, Class A4 | |
3.259% | | 06/15/50 | | | | | 2,750 | | | | 2,536,818 | |
Series 2017-HR02, Class A3 | |
3.330% | | 12/15/50 | | | | | 5,453 | | | | 4,980,582 | |
Series 2019-L03, Class A3 | |
2.874% | | 11/15/52 | | | | | 1,200 | | | | 1,028,980 | |
Series 2019-MEAD, Class E, 144A | |
3.177%(cc) | | 11/10/36 | | | | | 575 | | | | 477,901 | |
Shops at Crystals Trust, | |
Series 2016-CSTL, Class A, 144A | |
3.126% | | 07/05/36 | | | | | 140 | | | | 121,450 | |
UBS Commercial Mortgage Trust, | |
Series 2017-C02, Class A3 | |
3.225% | | 08/15/50 | | | | | 1,887 | | | | 1,721,442 | |
Series 2017-C07, Class A3 | |
3.418% | | 12/15/50 | | | | | 5,200 | | | | 4,823,051 | |
Series 2018-C10, Class A3 | |
4.048% | | 05/15/51 | | | | | 2,200 | | | | 2,056,199 | |
Series 2019-C17, Class A3 | |
2.669% | | 10/15/52 | | | | | 2,000 | | | | 1,702,877 | |
| | | | | | | | | | | | |
Interest Rate | | Maturity Date | | | | Principal
Amount
(000)# | | | Value | |
| | | | | | | | | | | |
|
| COMMERCIAL MORTGAGE-BACKED SECURITIES (continued) | |
Wells Fargo Commercial Mortgage Trust, | |
Series 2014-LC16, Class A4 | |
3.548% | | 08/15/50 | | | | | 2,777 | | | $ | 2,703,450 | |
Series 2016-C32, Class A3 | |
3.294% | | 01/15/59 | | | | | 1,998 | | | | 1,878,042 | |
Series 2016-C34, Class A3 | |
2.834% | | 06/15/49 | | | | | 2,500 | | | | 2,355,257 | |
Series 2016-C35, Class A3 | |
2.674% | | 07/15/48 | | | | | 4,451 | | | | 4,070,514 | |
Series 2017-C40, Class A3 | |
3.317% | | 10/15/50 | | | | | 1,370 | | | | 1,258,552 | |
Series 2019-C54, Class A3 | |
2.892% | | 12/15/52 | | | | | 1,200 | | | | 1,034,727 | |
| | | | | | | | | | | | |
| |
TOTAL COMMERCIAL MORTGAGE-BACKED SECURITIES
(cost $155,821,646) | | | | 141,625,619 | |
| | | | | | | | | | | | |
|
CORPORATE BONDS — 34.2% | |
Aerospace & Defense — 0.9% | |
BAE Systems PLC (United Kingdom), | |
Sr. Unsec’d. Notes, 144A | |
1.900% | | 02/15/31 | | | | | 2,770 | | | | 2,145,190 | |
3.400% | | 04/15/30 | | | | | 385 | | | | 337,960 | |
Boeing Co. (The), | |
Sr. Unsec’d. Notes | |
1.875% | | 06/15/23 | | | | | 10 | | | | 9,832 | |
1.950% | | 02/01/24 | | | | | 20 | | | | 19,253 | |
2.196% | | 02/04/26 | | | | | 180 | | | | 163,606 | |
2.750% | | 02/01/26 | | | | | 90 | | | | 83,575 | |
2.850% | | 10/30/24 | | | | | 30 | | | | 28,713 | |
2.950% | | 02/01/30 | | | | | 5 | | | | 4,232 | |
3.900% | | 05/01/49 | | | | | 50 | | | | 35,244 | |
3.950% | | 08/01/59 | | | | | 1,450 | | | | 973,318 | |
4.508% | | 05/01/23 | | | | | 20 | | | | 19,934 | |
5.150% | | 05/01/30 | | | | | 25 | | | | 24,382 | |
5.930% | | 05/01/60 | | | | | 48 | | | | 44,077 | |
6.875% | | 03/15/39 | | | | | 20 | | | | 21,088 | |
7.950% | | 08/15/24 | | | | | 50 | | | | 51,022 | |
Bombardier, Inc. (Canada), | |
Sr. Unsec’d. Notes, 144A | |
7.500% | | 12/01/24 | | | | | 1,280 | | | | 1,278,442 | |
7.500% | | 03/15/25 | | | | | 1,321 | | | | 1,307,418 | |
7.875% | | 04/15/27(a) | | | | | 2,575 | | | | 2,502,591 | |
General Dynamics Corp., | |
Gtd. Notes | |
1.150% | | 06/01/26 | | | | | 20 | | | | 17,784 | |
3.250% | | 04/01/25 | | | | | 10 | | | | 9,696 | |
3.500% | | 04/01/27 | | | | | 30 | | | | 28,712 | |
4.250% | | 04/01/40 | | | | | 5 | | | | 4,565 | |
L3 Technologies, Inc., | |
Gtd. Notes | |
3.850% | | 06/15/23 | | | | | 25 | | | | 24,771 | |
L3Harris Technologies, Inc., | |
Sr. Unsec’d. Notes | |
2.900% | | 12/15/29 | | | | | 40 | | | | 34,202 | |
4.400% | | 06/15/28 | | | | | 37 | | | | 35,596 | |
4.400% | | 06/15/28 | | | | | 15 | | | | 14,487 | |
SEE NOTES TO FINANCIAL STATEMENTS.
A171
| | | | |
| | PSF PGIM TOTAL RETURN BOND PORTFOLIO (CONTINUED) | | |
SCHEDULE OF INVESTMENTS | | | | as of December 31, 2022 |
| | | | | | | | | | | | |
Interest Rate | | Maturity Date | | | | Principal
Amount
(000)# | | | Value | |
| | | | | | | | | | | |
|
CORPORATE BONDS (continued) | |
Aerospace & Defense (cont’d.) | |
Lockheed Martin Corp., | |
Sr. Unsec’d. Notes | |
2.800% | | 06/15/50 | | | | | 10 | | | $ | 6,778 | |
4.500% | | 05/15/36 | | | | | 30 | | | | 28,580 | |
Northrop Grumman Corp., | |
Sr. Unsec’d. Notes | |
2.930% | | 01/15/25 | | | | | 30 | | | | 28,791 | |
3.250% | | 01/15/28 | | | | | 40 | | | | 36,994 | |
5.250% | | 05/01/50 | | | | | 10 | | | | 9,891 | |
Raytheon Technologies Corp., | |
Sr. Unsec’d. Notes | |
3.500% | | 03/15/27 | | | | | 5 | | | | 4,764 | |
4.875% | | 10/15/40 | | | | | 15 | | | | 13,999 | |
| | | | | | | | | | | | |
| |
| | | | 9,349,487 | |
| | | | | | | | | | | | |
Agriculture — 0.3% | |
Altria Group, Inc., | |
Gtd. Notes | |
2.450% | | 02/04/32 | | | | | 60 | | | | 45,250 | |
2.625% | | 09/16/26 | | | | | 35 | | | | 32,054 | |
3.400% | | 02/04/41 | | | | | 50 | | | | 33,178 | |
3.700% | | 02/04/51 | | | | | 100 | | | | 63,167 | |
3.875% | | 09/16/46 | | | | | 10 | | | | 6,674 | |
4.000% | | 02/04/61 | | | | | 5 | | | | 3,259 | |
4.400% | | 02/14/26 | | | | | 43 | | | | 42,150 | |
4.800% | | 02/14/29 | | | | | 11 | | | | 10,547 | |
5.950% | | 02/14/49 | | | | | 30 | | | | 26,734 | |
BAT Capital Corp. (United Kingdom), | |
Gtd. Notes | |
2.259% | | 03/25/28(a) | | | | | 1,570 | | | | 1,306,691 | |
2.726% | | 03/25/31 | | | | | 10 | | | | 7,799 | |
3.462% | | 09/06/29 | | | | | 10 | | | | 8,553 | |
3.557% | | 08/15/27 | | | | | 1,500 | | | | 1,365,880 | |
4.540% | | 08/15/47 | | | | | 20 | | | | 14,216 | |
BAT International Finance PLC (United Kingdom), | |
Gtd. Notes | |
1.668% | | 03/25/26 | | | | | 145 | | | | 128,448 | |
Gtd. Notes, 144A | |
3.950% | | 06/15/25 | | | | | 150 | | | | 144,032 | |
Cargill, Inc., | |
Sr. Unsec’d. Notes, 144A | |
0.750% | | 02/02/26 | | | | | 40 | | | | 35,268 | |
Philip Morris International, Inc., | |
Sr. Unsec’d. Notes | |
0.875% | | 05/01/26 | | | | | 30 | | | | 26,365 | |
1.500% | | 05/01/25 | | | | | 15 | | | | 13,876 | |
5.000% | | 11/17/25 | | | | | 10 | | | | 10,051 | |
Reynolds American, Inc. (United Kingdom), | |
Gtd. Notes | |
4.450% | | 06/12/25 | | | | | 20 | | | | 19,572 | |
| | | | | | | | | | | | |
| |
| | | | 3,343,764 | |
| | | | | | | | | | | | |
Airlines — 0.5% | |
Air Canada (Canada), | |
Sr. Sec’d. Notes, 144A | |
3.875% | | 08/15/26 | | | | | 50 | | | | 44,235 | |
| | | | | | | | | | | | |
Interest Rate | | Maturity Date | | | | Principal
Amount
(000)# | | | Value | |
| | | | | | | | | | | |
|
CORPORATE BONDS (continued) | |
Airlines (cont’d.) | |
American Airlines 2016-1 Class AA Pass-Through Trust, | |
Pass-Through Certificates | |
3.575% | | 07/15/29 | | | | | 1,382 | | | $ | 1,233,904 | |
American Airlines 2017-2 Class AA Pass-Through Trust, | |
Pass-Through Certificates | |
3.350% | | 04/15/31 | | | | | 38 | | | | 32,652 | |
Delta Air Lines, Inc., | |
Sr. Unsec’d. Notes | |
3.750% | | 10/28/29 | | | | | 10 | | | | 8,412 | |
3.800% | | 04/19/23 | | | | | 11 | | | | 10,908 | |
Delta Air Lines, Inc./SkyMiles IP Ltd., | |
Sr. Sec’d. Notes, 144A | |
4.500% | | 10/20/25 | | | | | 15 | | | | 14,629 | |
4.750% | | 10/20/28 | | | | | 75 | | | | 70,591 | |
Mileage Plus Holdings LLC/Mileage Plus Intellectual Property Assets Ltd., | |
Sr. Sec’d. Notes, 144A | |
6.500% | | 06/20/27 | | | | | 27 | | | | 26,903 | |
Southwest Airlines Co., | |
Sr. Unsec’d. Notes | |
5.125% | | 06/15/27 | | | | | 3,355 | | | | 3,316,805 | |
United Airlines 2019-1 Class AA Pass-Through Trust, | |
Pass-Through Certificates | |
4.150% | | 02/25/33 | | | | | 43 | | | | 37,615 | |
United Airlines 2019-2 Class AA Pass-Through Trust, | |
Pass-Through Certificates | |
2.700% | | 11/01/33 | | | | | 53 | | | | 42,711 | |
United Airlines 2020-1 Class A Pass-Through Trust, | |
Pass-Through Certificates | |
5.875% | | 04/15/29 | | | | | 103 | | | | 101,212 | |
United Airlines 2020-1 Class B Pass-Through Trust, | |
Pass-Through Certificates | |
4.875% | | 07/15/27 | | | | | 19 | | | | 18,124 | |
United Airlines, Inc., | |
Sr. Sec’d. Notes, 144A | |
4.375% | | 04/15/26 | | | | | 825 | | | | 768,384 | |
4.625% | | 04/15/29 | | | | | 195 | | | | 170,179 | |
| | | | | | | | | | | | |
| |
| | | | 5,897,264 | |
| | | | | | | | | | | | |
Auto Manufacturers — 0.8% | |
BMW US Capital LLC (Germany), | |
Gtd. Notes, 144A | |
0.800% | | 04/01/24 | | | | | 40 | | | | 37,934 | |
Ford Motor Co., | |
Sr. Unsec’d. Notes | |
3.250% | | 02/12/32 | | | | | 10 | | | | 7,524 | |
4.346% | | 12/08/26 | | | | | 20 | | | | 18,953 | |
4.750% | | 01/15/43 | | | | | 1,125 | | | | 813,925 | |
5.291% | | 12/08/46 | | | | | 290 | | | | 223,010 | |
Ford Motor Credit Co. LLC, | |
Sr. Unsec’d. Notes | |
2.900% | | 02/16/28 | | | | | 275 | | | | 227,232 | |
General Motors Co., | |
Sr. Unsec’d. Notes | |
4.000% | | 04/01/25 | | | | | 17 | | | | 16,604 | |
4.875% | | 10/02/23 | | | | | 1,350 | | | | 1,348,728 | |
5.000% | | 04/01/35 | | | | | 1,365 | | | | 1,174,728 | |
5.150% | | 04/01/38 | | | | | 1,000 | | | | 866,016 | |
SEE NOTES TO FINANCIAL STATEMENTS.
A172
| | | | |
| | PSF PGIM TOTAL RETURN BOND PORTFOLIO (CONTINUED) | | |
SCHEDULE OF INVESTMENTS | | | | as of December 31, 2022 |
| | | | | | | | | | | | |
Interest Rate | | Maturity Date | | | | Principal
Amount
(000)# | | | Value | |
| | | | | | | | | | | |
|
CORPORATE BONDS (continued) | |
Auto Manufacturers (cont’d.) | |
5.200% | | 04/01/45 | | | | | 10 | | | $ | 8,177 | |
6.125% | | 10/01/25 | | | | | 40 | | | | 40,778 | |
6.250% | | 10/02/43 | | | | | 1,455 | | | | 1,348,234 | |
6.600% | | 04/01/36 | | | | | 285 | | | | 279,497 | |
General Motors Financial Co., Inc., | |
Gtd. Notes | |
3.250% | | 01/05/23 | | | | | 85 | | | | 85,000 | |
3.700% | | 05/09/23 | | | | | 20 | | | | 19,886 | |
4.250% | | 05/15/23 | | | | | 50 | | | | 49,827 | |
4.300% | | 07/13/25 | | | | | 70 | | | | 67,910 | |
Jr. Sub. Notes, Series C | |
5.700%(ff) | | 09/30/30(oo) | | | | | 5 | | | | 4,240 | |
Sr. Unsec’d. Notes | |
2.350% | | 01/08/31 | | | | | 20 | | | | 15,106 | |
2.400% | | 04/10/28 | | | | | 1,065 | | | | 898,771 | |
2.700% | | 08/20/27 | | | | | 38 | | | | 33,184 | |
3.100% | | 01/12/32(a) | | | | | 45 | | | | 35,347 | |
5.100% | | 01/17/24 | | | | | 45 | | | | 44,870 | |
Hyundai Capital America, | |
Sr. Unsec’d. Notes, 144A | |
1.000% | | 09/17/24 | | | | | 30 | | | | 27,732 | |
1.800% | | 10/15/25 | | | | | 40 | | | | 36,022 | |
2.375% | | 10/15/27 | | | | | 15 | | | | 12,828 | |
2.650% | | 02/10/25 | | | | | 15 | | | | 14,097 | |
3.400% | | 06/20/24 | | | | | 40 | | | | 38,695 | |
Sr. Unsec’d. Notes, 144A, MTN | |
0.800% | | 01/08/24 | | | | | 60 | | | | 57,131 | |
1.800% | | 01/10/28 | | | | | 15 | | | | 12,288 | |
Mercedes-Benz Finance North America LLC (Germany), | |
Gtd. Notes, 144A | |
1.450% | | 03/02/26 | | | | | 150 | | | | 134,226 | |
Nissan Motor Acceptance Co. LLC, | |
Sr. Unsec’d. Notes, 144A | |
1.050% | | 03/08/24 | | | | | 90 | | | | 84,326 | |
Sr. Unsec’d. Notes, 144A, MTN | |
1.850% | | 09/16/26 | | | | | 54 | | | | 45,160 | |
Toyota Motor Credit Corp., | |
Sr. Unsec’d. Notes, MTN | |
1.150% | | 08/13/27 | | | | | 25 | | | | 21,314 | |
1.900% | | 04/06/28 | | | | | 50 | | | | 43,533 | |
2.150% | | 02/13/30 | | | | | 10 | | | | 8,420 | |
Sr. Unsec’d. Notes, MTN, SOFR Index + 0.330% | |
4.055%(c) | | 01/11/24 | | | | | 100 | | | | 99,549 | |
| | | | | | | | | | | | |
| |
| | | | 8,300,802 | |
| | | | | | | | | | | | |
Auto Parts & Equipment — 0.2% | |
American Axle & Manufacturing, Inc., | |
Gtd. Notes | |
6.500% | | 04/01/27(a) | | | | | 645 | | | | 584,779 | |
Aptiv PLC/Aptiv Corp., | |
Gtd. Notes | |
4.150% | | 05/01/52 | | | | | 20 | | | | 14,483 | |
BorgWarner, Inc., | |
Sr. Unsec’d. Notes, 144A | |
5.000% | | 10/01/25 | | | | | 60 | | | | 58,951 | |
| | | | | | | | | | | | |
Interest Rate | | Maturity Date | | | | Principal
Amount
(000)# | | | Value | |
| | | | | | | | | | | |
|
CORPORATE BONDS (continued) | |
Auto Parts & Equipment (cont’d.) | |
Dana Financing Luxembourg Sarl, | |
Gtd. Notes, 144A | |
5.750% | | 04/15/25 | | | | | 875 | | | $ | 858,594 | |
Dana, Inc., | |
Sr. Unsec’d. Notes | |
5.375% | | 11/15/27 | | | | | 350 | | | | 324,574 | |
| | | | | | | | | | | | |
| |
| | | | 1,841,381 | |
| | | | | | | | | | | | |
Banks — 9.8% | |
Banco Santander SA (Spain), | |
Sr. Unsec’d. Notes | |
1.849% | | 03/25/26 | | | | | 600 | | | | 530,547 | |
Sr. Unsec’d. Notes, 3 Month LIBOR + 1.120% | |
5.039%(c) | | 04/12/23 | | | | | 400 | | | | 399,687 | |
Sub. Notes | |
2.749% | | 12/03/30 | | | | | 1,000 | | | | 757,994 | |
Bank of America Corp., | |
Jr. Sub. Notes, Series JJ | |
5.125%(ff) | | 06/20/24(a)(oo) | | | | | 1,655 | | | | 1,542,568 | |
Sr. Unsec’d. Notes | |
1.734%(ff) | | 07/22/27 | | | | | 45 | | | | 39,444 | |
2.299%(ff) | | 07/21/32 | | | | | 20 | | | | 15,397 | |
2.572%(ff) | | 10/20/32 | | | | | 10 | | | | 7,845 | |
2.687%(ff) | | 04/22/32 | | | | | 2,565 | | | | 2,052,185 | |
3.419%(ff) | | 12/20/28 | | | | | 10 | | | | 9,070 | |
Sr. Unsec’d. Notes, GMTN | |
3.593%(ff) | | 07/21/28(a) | | | | | 740 | | | | 681,516 | |
Sr. Unsec’d. Notes, MTN | |
1.898%(ff) | | 07/23/31 | | | | | 50 | | | | 38,442 | |
1.922%(ff) | | 10/24/31 | | | | | 20 | | | | 15,266 | |
2.496%(ff) | | 02/13/31 | | | | | 92 | | | | 74,741 | |
2.676%(ff) | | 06/19/41 | | | | | 20 | | | | 13,512 | |
3.093%(ff) | | 10/01/25 | | | | | 50 | | | | 47,903 | |
3.824%(ff) | | 01/20/28 | | | | | 3,410 | | | | 3,183,407 | |
3.974%(ff) | | 02/07/30 | | | | | 685 | | | | 622,238 | |
4.078%(ff) | | 04/23/40 | | | | | 2,340 | | | | 1,945,680 | |
4.271%(ff) | | 07/23/29 | | | | | 945 | | | | 882,687 | |
4.330%(ff) | | 03/15/50 | | | | | 20 | | | | 16,450 | |
Sr. Unsec’d. Notes, Series N | |
2.651%(ff) | | 03/11/32 | | | | | 5,020 | | | | 4,019,215 | |
Sub. Notes | |
2.482%(ff) | | 09/21/36 | | | | | 10 | | | | 7,372 | |
Sub. Notes, MTN | |
4.000% | | 01/22/25 | | | | | 1,122 | | | | 1,098,229 | |
4.450% | | 03/03/26 | | | | | 1,735 | | | | 1,699,840 | |
Sub. Notes, Series L, MTN | |
3.950% | | 04/21/25 | | | | | 90 | | | | 87,676 | |
4.183% | | 11/25/27 | | | | | 50 | | | | 47,489 | |
Bank of New York Mellon Corp. (The), | |
Jr. Sub. Notes, Series H | |
3.700%(ff) | | 03/20/26(oo) | | | | | 15 | | | | 13,433 | |
Barclays PLC (United Kingdom), | |
Sr. Unsec’d. Notes | |
3.650% | | 03/16/25 | | | | | 700 | | | | 671,880 | |
3.932%(ff) | | 05/07/25 | | | | | 480 | | | | 466,031 | |
Sr. Unsec’d. Notes, MTN | |
4.972%(ff) | | 05/16/29 | | | | | 475 | | | | 446,160 | |
SEE NOTES TO FINANCIAL STATEMENTS.
A173
| | | | |
| | PSF PGIM TOTAL RETURN BOND PORTFOLIO (CONTINUED) | | |
SCHEDULE OF INVESTMENTS | | | | as of December 31, 2022 |
| | | | | | | | | | | | |
Interest Rate | | Maturity Date | | | | Principal
Amount
(000)# | | | Value | |
| | | | | | | | | | | |
|
CORPORATE BONDS (continued) | |
Banks (cont’d.) | |
Sub. Notes | |
4.836% | | 05/09/28 | | | | | 720 | | | $ | 662,854 | |
BNP Paribas SA (France), | |
Sr. Unsec’d. Notes, 144A | |
1.323%(ff) | | 01/13/27 | | | | | 710 | | | | 619,118 | |
1.904%(ff) | | 09/30/28 | | | | | 2,200 | | | | 1,836,088 | |
2.871%(ff) | | 04/19/32 | | | | | 1,815 | | | | 1,421,374 | |
BPCE SA (France), | |
Sr. Unsec’d. Notes, 144A, MTN | |
3.500% | | 10/23/27 | | | | | 300 | | | | 269,272 | |
Sub. Notes, 144A, MTN | |
4.500% | | 03/15/25 | | | | | 1,120 | | | | 1,076,835 | |
4.875% | | 04/01/26(a) | | | | | 380 | | | | 360,750 | |
Citigroup, Inc., | |
Jr. Sub. Notes | |
3.875%(ff) | | 02/18/26(oo) | | | | | 1,880 | | | | 1,606,999 | |
Jr. Sub. Notes, Series V | |
4.700%(ff) | | 01/30/25(oo) | | | | | 1,445 | | | | 1,203,238 | |
Jr. Sub. Notes, Series W | |
4.000%(ff) | | 12/10/25(oo) | | | | | 890 | | | | 776,322 | |
Jr. Sub. Notes, Series Y | |
4.150%(ff) | | 11/15/26(oo) | | | | | 25 | | | | 20,578 | |
Sr. Unsec’d. Notes | |
2.520%(ff) | | 11/03/32 | | | | | 10 | | | | 7,764 | |
2.561%(ff) | | 05/01/32 | | | | | 875 | | | | 690,918 | |
2.572%(ff) | | 06/03/31 | | | | | 70 | | | | 56,620 | |
2.666%(ff) | | 01/29/31(a) | | | | | 1,225 | | | | 1,005,025 | |
2.976%(ff) | | 11/05/30 | | | | | 20 | | | | 16,811 | |
3.200% | | 10/21/26 | | | | | 3,255 | | | | 3,017,267 | |
3.668%(ff) | | 07/24/28 | | | | | 30 | | | | 27,553 | |
3.785%(ff) | | 03/17/33 | | | | | 1,160 | | | | 994,879 | |
3.887%(ff) | | 01/10/28 | | | | | 1,725 | | | | 1,612,225 | |
4.075%(ff) | | 04/23/29 | | | | | 40 | | | | 36,888 | |
Sub. Notes | |
4.300% | | 11/20/26 | | | | | 110 | | | | 106,167 | |
4.450% | | 09/29/27 | | | | | 2,735 | | | | 2,612,434 | |
Credit Suisse Group AG (Switzerland), | |
Sr. Unsec’d. Notes, 144A | |
3.091%(ff) | | 05/14/32 | | | | | 1,695 | | | | 1,166,443 | |
6.537%(ff) | | 08/12/33(a) | | | | | 1,310 | | | | 1,148,380 | |
Deutsche Bank AG (Germany), | |
Sr. Unsec’d. Notes, EMTN | |
1.750%(ff) | | 11/19/30 | | | | EUR | 100 | | | | 83,795 | |
Sr. Unsec’d. Notes, MTN | |
3.700% | | 05/30/24 | | | | | 159 | | | | 156,206 | |
Sub. Notes | |
3.742%(ff) | | 01/07/33 | | | | | 2,415 | | | | 1,717,990 | |
Discover Bank, | |
Sr. Unsec’d. Notes | |
3.450% | | 07/27/26 | | | | | 280 | | | | 257,904 | |
4.250% | | 03/13/26 | | | | | 1,150 | | | | 1,099,957 | |
Goldman Sachs Group, Inc. (The), | |
Jr. Sub. Notes, Series U | |
3.650%(ff) | | 08/10/26(oo) | | | | | 950 | | | | 769,236 | |
Sr. Unsec’d. Notes | |
1.948%(ff) | | 10/21/27 | | | | | 50 | | | | 43,636 | |
1.992%(ff) | | 01/27/32 | | | | | 20 | | | | 15,225 | |
| | | | | | | | | | | | |
Interest Rate | | Maturity
Date | | | | Principal
Amount
(000)# | | | Value | |
| | | | | | | | | | | |
|
CORPORATE BONDS (continued) | |
Banks (cont’d.) | |
2.383%(ff) | | 07/21/32 | | | | | 1,480 | | | $ | 1,147,288 | |
2.600% | | 02/07/30 | | | | | 35 | | | | 29,216 | |
2.615%(ff) | | 04/22/32 | | | | | 4,715 | | | | 3,757,463 | |
2.650%(ff) | | 10/21/32 | | | | | 10 | | | | 7,893 | |
2.908%(ff) | | 07/21/42 | | | | | 25 | | | | 17,044 | |
3.272%(ff) | | 09/29/25(a) | | | | | 4,063 | | | | 3,907,198 | |
3.436%(ff) | | 02/24/43 | | | | | 35 | | | | 25,791 | |
3.500% | | 01/23/25 | | | | | 20 | | | | 19,352 | |
3.691%(ff) | | 06/05/28 | | | | | 50 | | | | 46,448 | |
3.750% | | 02/25/26 | | | | | 125 | | | | 120,466 | |
3.814%(ff) | | 04/23/29 | | | | | 1,080 | | | | 982,574 | |
3.850% | | 01/26/27 | | | | | 1,765 | | | | 1,680,531 | |
Sr. Unsec’d. Notes, GMTN, 3 Month LIBOR + 1.750% | |
6.124%(c) | | 10/28/27 | | | | | 21 | | | | 21,321 | |
Sr. Unsec’d. Notes, Series VAR | |
1.093%(ff) | | 12/09/26 | | | | | 85 | | | | 75,042 | |
Sub. Notes | |
5.150% | | 05/22/45 | | | | | 20 | | | | 18,089 | |
JPMorgan Chase & Co., | |
Jr. Sub. Notes, Series FF | |
5.000%(ff) | | 08/01/24(oo) | | | | | 1,025 | | | | 942,011 | |
Jr. Sub. Notes, Series HH | |
4.600%(ff) | | 02/01/25(oo) | | | | | 1,940 | | | | 1,722,578 | |
Jr. Sub. Notes, Series II | |
4.000%(ff) | | 04/01/25(a)(oo) | | | | | 1,350 | | | | 1,152,783 | |
Jr. Sub. Notes, Series KK | |
3.650%(ff) | | 06/01/26(a)(oo) | | | | | 1,860 | | | | 1,583,682 | |
Sr. Unsec’d. Notes | |
0.563%(ff) | | 02/16/25 | | | | | 20 | | | | 18,865 | |
1.045%(ff) | | 11/19/26 | | | | | 20 | | | | 17,659 | |
1.578%(ff) | | 04/22/27 | | | | | 785 | | | | 690,916 | |
1.953%(ff) | | 02/04/32 | | | | | 130 | | | | 99,511 | |
2.301%(ff) | | 10/15/25 | | | | | 5 | | | | 4,707 | |
2.525%(ff) | | 11/19/41 | | | | | 2,330 | | | | 1,529,064 | |
2.545%(ff) | | 11/08/32 | | | | | 1,135 | | | | 896,903 | |
2.580%(ff) | | 04/22/32 | | | | | 1,775 | | | | 1,420,071 | |
2.947%(ff) | | 02/24/28 | | | | | 905 | | | | 819,217 | |
2.950% | | 10/01/26(a) | | | | | 1,285 | | | | 1,198,751 | |
3.782%(ff) | | 02/01/28 | | | | | 1,235 | | | | 1,155,164 | |
3.897%(ff) | | 01/23/49 | | | | | 10 | | | | 7,707 | |
3.960%(ff) | | 01/29/27(a) | | | | | 930 | | | | 887,801 | |
3.964%(ff) | | 11/15/48 | | | | | 985 | | | | 771,123 | |
4.005%(ff) | | 04/23/29 | | | | | 1,200 | | | | 1,111,588 | |
4.203%(ff) | | 07/23/29 | | | | | 50 | | | | 46,572 | |
4.323%(ff) | | 04/26/28 | | | | | 695 | | | | 662,551 | |
4.452%(ff) | | 12/05/29 | | | | | 17 | | | | 15,982 | |
Sub. Notes | |
2.956%(ff) | | 05/13/31 | | | | | 155 | | | | 127,618 | |
4.125% | | 12/15/26 | | | | | 40 | | | | 38,681 | |
4.250% | | 10/01/27(a) | | | | | 420 | | | | 404,024 | |
Mitsubishi UFJ Financial Group, Inc. (Japan), | |
Sr. Unsec’d. Notes | |
3.407% | | 03/07/24 | | | | | 45 | | | | 44,041 | |
Morgan Stanley, | |
Sr. Unsec’d. Notes | |
3.217%(ff) | | 04/22/42 | | | | | 10 | | | | 7,388 | |
SEE NOTES TO FINANCIAL STATEMENTS.
A174
| | | | |
| | PSF PGIM TOTAL RETURN BOND PORTFOLIO (CONTINUED) | | |
SCHEDULE OF INVESTMENTS | | | | as of December 31, 2022 |
| | | | | | | | | | | | |
Interest Rate | | Maturity
Date | | | | Principal
Amount
(000)# | | | Value | |
| | | | | | | | | | | |
|
CORPORATE BONDS (continued) | |
Banks (cont’d.) | |
Sr. Unsec’d. Notes, GMTN | |
1.512%(ff) | | 07/20/27 | | | | | 15 | | | $ | 13,027 | |
2.239%(ff) | | 07/21/32 | | | | | 4,303 | | | | 3,296,833 | |
2.699%(ff) | | 01/22/31 | | | | | 35 | | | | 28,965 | |
3.772%(ff) | | 01/24/29 | | | | | 2,010 | | | | 1,839,642 | |
4.431%(ff) | | 01/23/30 | | | | | 1,340 | | | | 1,250,990 | |
Sr. Unsec’d. Notes, MTN | |
0.529%(ff) | | 01/25/24 | | | | | 20 | | | | 19,877 | |
1.794%(ff) | | 02/13/32 | | | | | 1,015 | | | | 760,793 | |
1.928%(ff) | | 04/28/32 | | | | | 193 | | | | 145,819 | |
2.511%(ff) | | 10/20/32 | | | | | 1,590 | | | | 1,242,722 | |
2.943%(ff) | | 01/21/33 | | | | | 1,470 | | | | 1,192,227 | |
3.125% | | 07/27/26 | | | | | 2,725 | | | | 2,542,102 | |
Sub. Notes | |
2.484%(ff) | | 09/16/36 | | | | | 20 | | | | 14,589 | |
Sub. Notes, GMTN | |
4.350% | | 09/08/26 | | | | | 756 | | | | 734,817 | |
NatWest Group PLC (United Kingdom), | |
Sr. Unsec’d. Notes | |
2.359%(ff) | | 05/22/24 | | | | | 200 | | | | 197,200 | |
PNC Financial Services Group, Inc. (The), | |
Sr. Unsec’d. Notes | |
2.200% | | 11/01/24 | | | | | 21 | | | | 20,068 | |
Societe Generale SA (France), | |
Sr. Unsec’d. Notes, 144A | |
2.797%(ff) | | 01/19/28 | | | | | 2,210 | | | | 1,929,291 | |
2.889%(ff) | | 06/09/32 | | | | | 250 | | | | 190,939 | |
3.337%(ff) | | 01/21/33 | | | | | 1,330 | | | | 1,047,553 | |
Standard Chartered PLC (United Kingdom), | |
Sr. Unsec’d. Notes, 144A | |
2.819%(ff) | | 01/30/26 | | | | | 25 | | | | 23,281 | |
State Street Corp., | |
Sub. Notes | |
2.200% | | 03/03/31 | | | | | 4,130 | | | | 3,301,573 | |
Sumitomo Mitsui Financial Group, Inc. (Japan), | |
Sr. Unsec’d. Notes | |
3.364% | | 07/12/27 | | | | | 50 | | | | 45,991 | |
Sr. Unsec’d. Notes, 3 Month LIBOR + 0.740% | |
4.819%(c) | | 01/17/23 | | | | | 22 | | | | 21,998 | |
Sr. Unsec’d. Notes, 3 Month LIBOR + 0.860% | |
5.087%(c) | | 07/19/23 | | | | | 20 | | | | 20,015 | |
Texas Capital Bank NA, | |
Sr. Unsec’d. Notes, 144A, 3 Month LIBOR + 4.500% | |
9.254%(c) | | 09/30/24 | | | | | 3,340 | | | | 3,237,263 | |
U.S. Bancorp, | |
Jr. Sub. Notes | |
3.700%(ff) | | 01/15/27(oo) | | | | | 30 | | | | 24,685 | |
Jr. Sub. Notes, Series J | |
5.300%(ff) | | 04/15/27(oo) | | | | | 25 | | | | 21,788 | |
UniCredit SpA (Italy), | |
Sr. Unsec’d. Notes, 144A | |
2.569%(ff) | | 09/22/26 | | | | | 685 | | | | 607,255 | |
3.127%(ff) | | 06/03/32 | | | | | 1,225 | | | | 925,483 | |
Wells Fargo & Co., | |
Sr. Unsec’d. Notes | |
3.068%(ff) | | 04/30/41 | | | | | 2,690 | | | | 1,923,047 | |
| | | | | | | | | | | | |
Interest Rate | | Maturity
Date | | | | Principal
Amount
(000)# | | | Value | |
| | | | | | | | | | | |
|
CORPORATE BONDS (continued) | |
Banks (cont’d.) | |
Sr. Unsec’d. Notes, MTN | |
2.393%(ff) | | 06/02/28 | | | | | 60 | | | $ | 52,915 | |
2.572%(ff) | | 02/11/31 | | | | | 3,525 | | | | 2,915,476 | |
5.013%(ff) | | 04/04/51 | | | | | 20 | | | | 17,790 | |
Sub. Notes, MTN | |
4.100% | | 06/03/26 | | | | | 20 | | | | 19,324 | |
| | | | | | | | | | | | |
| |
| | | | 106,788,667 | |
| | | | | | | | | | | | |
Beverages — 0.3% | |
Anheuser-Busch Cos. LLC/Anheuser-Busch InBev Worldwide, Inc. (Belgium), | |
Gtd. Notes | |
4.700% | | 02/01/36 | | | | | 31 | | | | 29,226 | |
4.900% | | 02/01/46 | | | | | 1,947 | | | | 1,781,698 | |
Anheuser-Busch InBev Worldwide, Inc. (Belgium), | |
Gtd. Notes | |
3.500% | | 06/01/30 | | | | | 30 | | | | 27,285 | |
4.600% | | 04/15/48 | | | | | 8 | | | | 7,042 | |
4.750% | | 01/23/29 | | | | | 118 | | | | 116,563 | |
5.550% | | 01/23/49 | | | | | 1,465 | | | | 1,460,076 | |
Coca-Cola Co. (The), | |
Sr. Unsec’d. Notes | |
1.375% | | 03/15/31 | | | | | 10 | | | | 7,825 | |
1.650% | | 06/01/30 | | | | | 10 | | | | 8,165 | |
Constellation Brands, Inc., | |
Sr. Unsec’d. Notes | |
2.875% | | 05/01/30 | | | | | 70 | | | | 59,496 | |
PepsiCo, Inc., | |
Sr. Unsec’d. Notes | |
2.875% | | 10/15/49 | | | | | 15 | | | | 10,797 | |
| | | | | | | | | | | | |
| |
| | | | 3,508,173 | |
| | | | | | | | | | | | |
Biotechnology — 0.0% | |
Amgen, Inc., | |
Sr. Unsec’d. Notes | |
2.000% | | 01/15/32 | | | | | 10 | | | | 7,796 | |
2.250% | | 08/19/23 | | | | | 30 | | | | 29,453 | |
2.770% | | 09/01/53 | | | | | 19 | | | | 11,478 | |
3.150% | | 02/21/40 | | | | | 20 | | | | 14,769 | |
5.150% | | 11/15/41 | | | | | 16 | | | | 14,897 | |
Baxalta, Inc., | |
Gtd. Notes | |
4.000% | | 06/23/25 | | | | | 75 | | | | 73,055 | |
Gilead Sciences, Inc., | |
Sr. Unsec’d. Notes | |
2.800% | | 10/01/50 | | | | | 10 | | | | 6,472 | |
2.950% | | 03/01/27 | | | | | 7 | | | | 6,520 | |
4.750% | | 03/01/46 | | | | | 10 | | | | 9,041 | |
| | | | | | | | | | | | |
| |
| | | | 173,481 | |
| | | | | | | | | | | | |
Building Materials — 0.2% | |
Carrier Global Corp., | |
Sr. Unsec’d. Notes | |
2.242% | | 02/15/25 | | | | | 5 | | | | 4,715 | |
2.493% | | 02/15/27 | | | | | 5 | | | | 4,510 | |
2.722% | | 02/15/30 | | | | | 45 | | | | 37,923 | |
SEE NOTES TO FINANCIAL STATEMENTS.
A175
| | | | |
| | PSF PGIM TOTAL RETURN BOND PORTFOLIO (CONTINUED) | | |
SCHEDULE OF INVESTMENTS | | | | as of December 31, 2022 |
| | | | | | | | | | | | |
Interest Rate | | Maturity
Date | | | | Principal
Amount
(000)# | | | Value | |
| | | | | | | | | | | |
|
CORPORATE BONDS (continued) | |
Building Materials (cont’d.) | |
Johnson Controls International PLC/Tyco Fire & Security Finance SCA, | |
Sr. Unsec’d. Notes | |
1.750% | | 09/15/30 | | | | | 20 | | | $ | 15,961 | |
Martin Marietta Materials, Inc., | |
Sr. Unsec’d. Notes | |
2.400% | | 07/15/31 | | | | | 15 | | | | 11,988 | |
Masonite International Corp., | |
Gtd. Notes, 144A | |
5.375% | | 02/01/28(a) | | | | | 475 | | | | 438,449 | |
Owens Corning, | |
Sr. Unsec’d. Notes | |
3.950% | | 08/15/29 | | | | | 40 | | | | 36,252 | |
4.300% | | 07/15/47 | | | | | 20 | | | | 15,562 | |
Smyrna Ready Mix Concrete LLC, | |
Sr. Sec’d. Notes, 144A | |
6.000% | | 11/01/28 | | | | | 1,275 | | | | 1,140,154 | |
Vulcan Materials Co., | |
Sr. Unsec’d. Notes | |
3.500% | | 06/01/30 | | | | | 15 | | | | 13,223 | |
| | | | | | | | | | | | |
| |
| | | | 1,718,737 | |
| | | | | | | | | | | | |
Chemicals — 0.7% | |
Ashland LLC, | |
Gtd. Notes | |
6.875% | | 05/15/43 | | | | | 1,400 | | | | 1,364,346 | |
Ashland Services BV, | |
Gtd. Notes | |
2.000% | | 01/30/28 | | | | EUR | 1,600 | | | | 1,453,551 | |
CF Industries, Inc., | |
Gtd. Notes | |
4.950% | | 06/01/43 | | | | | 675 | | | | 576,103 | |
Dow Chemical Co. (The), | |
Sr. Unsec’d. Notes | |
3.600% | | 11/15/50 | | | | | 5 | | | | 3,604 | |
6.900% | | 05/15/53 | | | | | 25 | | | | 27,272 | |
LYB International Finance III LLC, | |
Gtd. Notes | |
1.250% | | 10/01/25 | | | | | 35 | | | | 31,288 | |
3.375% | | 10/01/40 | | | | | 60 | | | | 42,613 | |
4.200% | | 10/15/49 | | | | | 5 | | | | 3,740 | |
Mosaic Co. (The), | |
Sr. Unsec’d. Notes | |
5.625% | | 11/15/43 | | | | | 155 | | | | 144,862 | |
NOVA Chemicals Corp. (Canada), | |
Sr. Unsec’d. Notes, 144A | |
4.875% | | 06/01/24 | | | | | 1,150 | | | | 1,111,187 | |
Nutrien Ltd. (Canada), | |
Sr. Unsec’d. Notes | |
4.900% | | 06/01/43 | | | | | 870 | | | | 771,847 | |
5.250% | | 01/15/45 | | | | | 305 | | | | 280,232 | |
Sasol Financing USA LLC (South Africa), | |
Gtd. Notes | |
4.375% | | 09/18/26(a) | | | | | 460 | | | | 407,582 | |
5.875% | | 03/27/24 | | | | | 375 | | | | 365,625 | |
Sherwin-Williams Co. (The), | |
Sr. Unsec’d. Notes | |
2.300% | | 05/15/30 | | | | | 20 | | | | 16,433 | |
| | | | | | | | | | | | |
Interest
Rate | | Maturity
Date | | | | Principal
Amount
(000)# | | | Value | |
| | | | | | | | | | | |
|
CORPORATE BONDS (continued) | |
Chemicals (cont’d.) | |
3.125% | | 06/01/24 | | | | | 14 | | | $ | 13,604 | |
3.450% | | 08/01/25 | | | | | 449 | | | | 431,923 | |
TPC Group, Inc., | |
Sr. Sec’d. Notes, 144A | |
13.000% | | 12/16/27 | | | | | 194 | | | | 194,056 | |
Yara International ASA (Brazil), | |
Sr. Unsec’d. Notes, 144A | |
4.750% | | 06/01/28 | | | | | 40 | | | | 36,868 | |
| | | | | | | | | | | | |
| |
| | | | 7,276,736 | |
| | | | | | | | | | | | |
Commercial Services — 0.7% | |
Allied Universal Holdco LLC/Allied Universal Finance Corp./Atlas Luxco 4 Sarl, | |
Sr. Sec’d. Notes, 144A | |
4.625% | | 06/01/28 | | | | | 1,300 | | | | 1,053,000 | |
ERAC USA Finance LLC, | |
Gtd. Notes, 144A | |
4.200% | | 11/01/46 | | | | | 50 | | | | 38,972 | |
6.700% | | 06/01/34 | | | | | 920 | | | | 968,268 | |
7.000% | | 10/15/37 | | | | | 770 | | | | 838,951 | |
Gartner, Inc., | |
Gtd. Notes, 144A | |
4.500% | | 07/01/28 | | | | | 230 | | | | 214,626 | |
Global Payments, Inc., | |
Sr. Unsec’d. Notes | |
1.200% | | 03/01/26 | | | | | 145 | | | | 126,405 | |
2.650% | | 02/15/25 | | | | | 40 | | | | 37,664 | |
3.200% | | 08/15/29 | | | | | 30 | | | | 25,608 | |
Nexi SpA (Italy), | |
Sr. Unsec’d. Notes | |
2.125% | | 04/30/29 | | | | EUR | 2,640 | | | | 2,284,248 | |
S&P Global, Inc., | |
Gtd. Notes, 144A | |
4.250% | | 05/01/29 | | | | | 60 | | | | 57,260 | |
United Rentals North America, Inc., | |
Gtd. Notes | |
3.750% | | 01/15/32 | | | | | 50 | | | | 40,843 | |
3.875% | | 02/15/31(a) | | | | | 392 | | | | 329,907 | |
4.875% | | 01/15/28(a) | | | | | 1,325 | | | | 1,255,452 | |
5.250% | | 01/15/30 | | | | | 525 | | | | 493,068 | |
| | | | | | | | | | | | |
| |
| | | | 7,764,272 | |
| | | | | | | | | | | | |
Computers — 0.1% | |
Apple, Inc., | |
Sr. Unsec’d. Notes | |
0.700% | | 02/08/26 | | | | | 40 | | | | 35,545 | |
1.200% | | 02/08/28 | | | | | 100 | | | | 84,902 | |
1.400% | | 08/05/28 | | | | | 29 | | | | 24,573 | |
1.650% | | 02/08/31 | | | | | 55 | | | | 44,272 | |
2.375% | | 02/08/41 | | | | | 40 | | | | 28,303 | |
2.650% | | 05/11/50 | | | | | 15 | | | | 9,975 | |
2.650% | | 02/08/51 | | | | | 15 | | | | 10,010 | |
2.700% | | 08/05/51 | | | | | 5 | | | | 3,339 | |
2.800% | | 02/08/61 | | | | | 100 | | | | 64,165 | |
2.950% | | 09/11/49 | | | | | 25 | | | | 17,852 | |
3.350% | | 02/09/27 | | | | | 70 | | | | 67,010 | |
3.850% | | 08/04/46 | | | | | 15 | | | | 12,773 | |
SEE NOTES TO FINANCIAL STATEMENTS.
A176
| | | | |
| | PSF PGIM TOTAL RETURN BOND PORTFOLIO (CONTINUED) | | |
SCHEDULE OF INVESTMENTS | | | | as of December 31, 2022 |
| | | | | | | | | | | | |
Interest Rate | | Maturity Date | | | | Principal
Amount
(000)# | | | Value | |
| | | | | | | | | | | |
|
CORPORATE BONDS (continued) | |
Computers (cont’d.) | |
Genpact Luxembourg Sarl, | |
Gtd. Notes | |
3.375% | | 12/01/24 | | | | | 90 | | | $ | 86,020 | |
HP, Inc., | |
Sr. Unsec’d. Notes | |
1.450% | | 06/17/26 | | | | | 100 | | | | 87,684 | |
NetApp, Inc., | |
Sr. Unsec’d. Notes | |
3.300% | | 09/29/24 | | | | | 40 | | | | 38,724 | |
Seagate HDD Cayman, | |
Gtd. Notes | |
4.875% | | 06/01/27 | | | | | 40 | | | | 37,388 | |
| | | | | | | | | | | | |
| |
| | | | 652,535 | |
| | | | | | | | | | | | |
Diversified Financial Services — 0.5% | |
AerCap Ireland Capital DAC/AerCap Global Aviation Trust (Ireland), | |
Gtd. Notes | |
3.000% | | 10/29/28 | | | | | 150 | | | | 125,628 | |
3.400% | | 10/29/33 | | | | | 150 | | | | 113,912 | |
Air Lease Corp., | |
Sr. Unsec’d. Notes | |
1.875% | | 08/15/26 | | | | | 56 | | | | 48,747 | |
3.375% | | 07/01/25 | | | | | 15 | | | | 14,146 | |
Sr. Unsec’d. Notes, MTN | |
2.300% | | 02/01/25 | | | | | 20 | | | | 18,646 | |
2.875% | | 01/15/26 | | | | | 15 | | | | 13,889 | |
4.250% | | 02/01/24 | | | | | 10 | | | | 9,827 | |
Ally Financial, Inc., | |
Sub. Notes | |
5.750% | | 11/20/25 | | | | | 25 | | | | 24,255 | |
American Express Co., | |
Jr. Sub. Notes | |
3.550%(ff) | | 09/15/26(oo) | | | | | 10 | | | | 8,225 | |
Avolon Holdings Funding Ltd. (Ireland), | |
Gtd. Notes, 144A | |
2.528% | | 11/18/27 | | | | | 23 | | | | 18,505 | |
2.875% | | 02/15/25 | | | | | 10 | | | | 9,190 | |
3.950% | | 07/01/24 | | | | | 10 | | | | 9,571 | |
Sr. Unsec’d. Notes, 144A | |
2.750% | | 02/21/28 | | | | | 30 | | | | 24,061 | |
Blackstone Private Credit Fund, | |
Sr. Sec’d. Notes | |
5.610% | | 05/03/27^ | | | | | 1,100 | | | | 1,012,436 | |
Cantor Fitzgerald LP, | |
Sr. Unsec’d. Notes, 144A | |
4.875% | | 05/01/24 | | | | | 50 | | | | 49,050 | |
Capital One Financial Corp., | |
Sr. Unsec’d. Notes | |
3.800% | | 01/31/28 | | | | | 5 | | | | 4,684 | |
Sub. Notes | |
2.359%(ff) | | 07/29/32 | | | | | 45 | | | | 32,409 | |
Charles Schwab Corp. (The), | |
Jr. Sub. Notes, Series H | |
4.000%(ff) | | 12/01/30(oo) | | | | | 20 | | | | 15,902 | |
Jr. Sub. Notes, Series I | |
4.000%(ff) | | 06/01/26(oo) | | | | | 35 | | | | 30,350 | |
| | | | | | | | | | | | |
Interest Rate | | Maturity Date | | | | Principal
Amount
(000)# | | | Value | |
| | | | | | | | | | | |
|
CORPORATE BONDS (continued) | |
Diversified Financial Services (cont’d.) | |
Credit Acceptance Corp., | |
Gtd. Notes, 144A | |
5.125% | | 12/31/24 | | | | | 15 | | | $ | 14,147 | |
GTP Acquisition Partners I LLC, | |
Sr. Sec’d. Notes, 144A | |
3.482% | | 06/15/50 | | | | | 100 | | | | 93,153 | |
Intercontinental Exchange, Inc., | |
Sr. Unsec’d. Notes | |
2.100% | | 06/15/30 | | | | | 50 | | | | 40,804 | |
3.000% | | 06/15/50 | | | | | 35 | | | | 23,423 | |
Jefferies Financial Group, Inc., | |
Sr. Unsec’d. Notes | |
6.500% | | 01/20/43 | | | | | 555 | | | | 541,948 | |
Mastercard, Inc., | |
Sr. Unsec’d. Notes | |
1.900% | | 03/15/31 | | | | | 15 | | | | 12,182 | |
3.300% | | 03/26/27 | | | | | 10 | | | | 9,530 | |
3.850% | | 03/26/50 | | | | | 20 | | | | 16,772 | |
Nationstar Mortgage Holdings, Inc., | |
Gtd. Notes, 144A | |
5.500% | | 08/15/28 | | | | | 880 | | | | 719,970 | |
6.000% | | 01/15/27 | | | | | 275 | | | | 246,663 | |
Nomura Holdings, Inc. (Japan), | |
Sr. Unsec’d. Notes | |
2.608% | | 07/14/31 | | | | | 515 | | | | 397,113 | |
OneMain Finance Corp., | |
Gtd. Notes | |
3.875% | | 09/15/28 | | | | | 575 | | | | 457,471 | |
5.375% | | 11/15/29(a) | | | | | 550 | | | | 450,582 | |
Power Finance Corp. Ltd. (India), | |
Sr. Unsec’d. Notes, 144A, MTN | |
6.150% | | 12/06/28 | | | | | 400 | | | | 405,976 | |
Rocket Mortgage LLC/Rocket Mortgage Co-Issuer, Inc., | |
Gtd. Notes, 144A | |
2.875% | | 10/15/26 | | | | | 10 | | | | 8,609 | |
Synchrony Financial, | |
Sr. Unsec’d. Notes | |
3.950% | | 12/01/27 | | | | | 40 | | | | 35,707 | |
Visa, Inc., | |
Sr. Unsec’d. Notes | |
1.100% | | 02/15/31 | | | | | 10 | | | | 7,691 | |
2.050% | | 04/15/30 | | | | | 10 | | | | 8,474 | |
4.300% | | 12/14/45 | | | | | 20 | | | | 18,282 | |
| | | | | | | | | | | | |
| |
| | | | 5,091,930 | |
| | | | | | | | | | | | |
Electric — 2.9% | |
Abu Dhabi National Energy Co. PJSC (United Arab Emirates), | |
Sr. Unsec’d. Notes, 144A | |
3.625% | | 01/12/23 | | | | | 200 | | | | 199,400 | |
AEP Transmission Co. LLC, | |
Sr. Unsec’d. Notes | |
3.750% | | 12/01/47 | | | | | 100 | | | | 77,664 | |
AES Corp. (The), | |
Sr. Unsec’d. Notes | |
1.375% | | 01/15/26 | | | | | 35 | | | | 31,186 | |
2.450% | | 01/15/31 | | | | | 15 | | | | 11,890 | |
SEE NOTES TO FINANCIAL STATEMENTS.
A177
| | | | |
| | PSF PGIM TOTAL RETURN BOND PORTFOLIO (CONTINUED) | | |
SCHEDULE OF INVESTMENTS | | | | as of December 31, 2022 |
| | | | | | | | | | | | |
Interest Rate | | Maturity Date | | | | Principal
Amount
(000)# | | | Value | |
| | | | | | | | | | | |
|
CORPORATE BONDS (continued) | |
Electric (cont’d.) | |
Sr. Unsec’d. Notes, 144A | |
3.300% | | 07/15/25 | | | | | 45 | | | $ | 42,572 | |
3.950% | | 07/15/30 | | | | | 5 | | | | 4,408 | |
Alliant Energy Finance LLC, | |
Gtd. Notes, 144A | |
3.750% | | 06/15/23 | | | | | 10 | | | | 9,921 | |
Ameren Illinois Co., | |
First Mortgage | |
4.500% | | 03/15/49 | | | | | 40 | | | | 36,870 | |
American Electric Power Co., Inc., | |
Sr. Unsec’d. Notes, Series J | |
4.300% | | 12/01/28 | | | | | 45 | | | | 42,982 | |
American Transmission Systems, Inc., | |
Sr. Unsec’d. Notes, 144A | |
2.650% | | 01/15/32 | | | | | 10 | | | | 8,224 | |
Arizona Public Service Co., | |
Sr. Unsec’d. Notes | |
2.200% | | 12/15/31 | | | | | 25 | | | | 19,073 | |
Atlantic City Electric Co., | |
First Mortgage | |
2.300% | | 03/15/31 | | | | | 25 | | | | 20,299 | |
Avangrid, Inc., | |
Sr. Unsec’d. Notes | |
3.800% | | 06/01/29 | | | | | 10 | | | | 9,085 | |
Baltimore Gas & Electric Co., | |
Sr. Unsec’d. Notes | |
2.250% | | 06/15/31 | | | | | 5 | | | | 4,056 | |
3.350% | | 07/01/23 | | | | | 550 | | | | 545,023 | |
Berkshire Hathaway Energy Co., | |
Sr. Unsec’d. Notes | |
4.050% | | 04/15/25 | | | | | 35 | | | | 34,497 | |
4.250% | | 10/15/50 | | | | | 20 | | | | 16,673 | |
Calpine Corp., | |
Sr. Unsec’d. Notes, 144A | |
4.625% | | 02/01/29 | | | | | 600 | | | | 517,028 | |
5.000% | | 02/01/31 | | | | | 750 | | | | 631,803 | |
5.125% | | 03/15/28 | | | | | 1,700 | | | | 1,521,717 | |
CenterPoint Energy, Inc., | |
Sr. Unsec’d. Notes | |
2.950% | | 03/01/30 | | | | | 36 | | | | 30,946 | |
CMS Energy Corp., | |
Sr. Unsec’d. Notes | |
3.000% | | 05/15/26 | | | | | 20 | | | | 18,635 | |
Comision Federal de Electricidad (Mexico), | |
Gtd. Notes, 144A | |
4.688% | | 05/15/29 | | | | | 1,325 | | | | 1,165,834 | |
Consolidated Edison Co. of New York, Inc., | |
Sr. Unsec’d. Notes | |
4.500% | | 12/01/45 | | | | | 10 | | | | 8,559 | |
Sr. Unsec’d. Notes, Series C | |
3.000% | | 12/01/60 | | | | | 20 | | | | 12,521 | |
4.300% | | 12/01/56 | | | | | 235 | | | | 190,170 | |
Constellation Energy Generation LLC, | |
Sr. Unsec’d. Notes | |
3.250% | | 06/01/25 | | | | | 20 | | | | 19,153 | |
| | | | | | | | | | | | |
Interest Rate | | Maturity Date | | | | Principal
Amount
(000)# | | | Value | |
| | | | | | | | | | | |
|
CORPORATE BONDS (continued) | |
Electric (cont’d.) | |
Consumers Energy Co., | |
First Mortgage | |
2.500% | | 05/01/60 | | | | | 5 | | | $ | 2,841 | |
Dominion Energy South Carolina, Inc., | |
First Mortgage | |
4.600% | | 06/15/43 | | | | | 2,025 | | | | 1,804,831 | |
Dominion Energy, Inc., | |
Jr. Sub. Notes | |
3.071% | | 08/15/24 | | | | | 5 | | | | 4,818 | |
Sr. Unsec’d. Notes | |
3.900% | | 10/01/25 | | | | | 15 | | | | 14,621 | |
Sr. Unsec’d. Notes, Series C | |
3.375% | | 04/01/30 | | | | | 10 | | | | 8,810 | |
DPL, Inc., | |
Sr. Unsec’d. Notes | |
4.125% | | 07/01/25 | | | | | 10 | | | | 9,435 | |
DTE Electric Co., | |
First Mortgage, Series C | |
2.625% | | 03/01/31 | | | | | 10 | | | | 8,484 | |
Duke Energy Carolinas LLC, | |
First Mortgage | |
3.950% | | 11/15/28 | | | | | 40 | | | | 38,419 | |
Duke Energy Corp., | |
Sr. Unsec’d. Notes | |
2.450% | | 06/01/30 | | | | | 5 | | | | 4,116 | |
Duke Energy Florida LLC, | |
First Mortgage | |
1.750% | | 06/15/30 | | | | | 50 | | | | 39,840 | |
2.500% | | 12/01/29 | | | | | 75 | | | | 64,207 | |
3.850% | | 11/15/42 | | | | | 25 | | | | 20,103 | |
Duke Energy Indiana LLC, | |
First Mortgage | |
2.750% | | 04/01/50 | | | | | 10 | | | | 6,306 | |
Duke Energy Ohio, Inc., | |
First Mortgage | |
2.125% | | 06/01/30 | | | | | 30 | | | | 24,540 | |
Duke Energy Progress LLC, | |
First Mortgage | |
3.450% | | 03/15/29 | | | | | 45 | | | | 41,442 | |
Edison International, | |
Jr. Sub. Notes, Series A | |
5.375%(ff) | | 03/15/26(oo) | | | | | 10 | | | | 8,202 | |
Jr. Sub. Notes, Series B | |
5.000%(ff) | | 12/15/26(oo) | | | | | 20 | | | | 16,730 | |
Sr. Unsec’d. Notes | |
3.550% | | 11/15/24 | | | | | 85 | | | | 82,086 | |
4.950% | | 04/15/25 | | | | | 5 | | | | 4,937 | |
El Paso Electric Co., | |
Sr. Unsec’d. Notes | |
6.000% | | 05/15/35 | | | | | 2,325 | | | | 2,260,034 | |
Emera US Finance LP (Canada), | |
Gtd. Notes | |
0.833% | | 06/15/24 | | | | | 20 | | | | 18,714 | |
3.550% | | 06/15/26 | | | | | 20 | | | | 18,782 | |
Entergy Corp., | |
Sr. Unsec’d. Notes | |
0.900% | | 09/15/25 | | | | | 10 | | | | 8,911 | |
SEE NOTES TO FINANCIAL STATEMENTS.
A178
| | | | |
| | PSF PGIM TOTAL RETURN BOND PORTFOLIO (CONTINUED) | | |
SCHEDULE OF INVESTMENTS | | | | as of December 31, 2022 |
| | | | | | | | | | | | |
Interest Rate | | Maturity Date | | | | Principal
Amount
(000)# | | | Value | |
| | | | | | | | | | | |
|
CORPORATE BONDS (continued) | |
Electric (cont’d.) | |
2.400% | | 06/15/31 | | | | | 48 | | | $ | 38,048 | |
2.800% | | 06/15/30 | | | | | 10 | | | | 8,417 | |
Entergy Louisiana LLC, | |
First Mortgage | |
2.350% | | 06/15/32 | | | | | 120 | | | | 95,489 | |
Entergy Texas, Inc., | |
First Mortgage | |
3.550% | | 09/30/49 | | | | | 25 | | | | 18,075 | |
Eskom Holdings SOC Ltd. (South Africa), | |
Sr. Unsec’d. Notes, 144A | |
7.125% | | 02/11/25 | | | | | 390 | | | | 353,876 | |
Eversource Energy, | |
Sr. Unsec’d. Notes, Series M | |
3.300% | | 01/15/28 | | | | | 40 | | | | 36,897 | |
Sr. Unsec’d. Notes, Series U | |
1.400% | | 08/15/26 | | | | | 20 | | | | 17,574 | |
Exelon Corp., | |
Sr. Unsec’d. Notes | |
3.400% | | 04/15/26 | | | | | 5 | | | | 4,752 | |
3.950% | | 06/15/25 | | | | | 35 | | | | 34,185 | |
4.050% | | 04/15/30 | | | | | 25 | | | | 23,284 | |
FirstEnergy Corp., | |
Sr. Unsec’d. Notes, Series C | |
5.350% | | 07/15/47(cc) | | | | | 4 | | | | 3,575 | |
FirstEnergy Transmission LLC, | |
Sr. Unsec’d. Notes, 144A | |
4.350% | | 01/15/25(a) | | | | | 3,771 | | | | 3,666,549 | |
5.450% | | 07/15/44 | | | | | 280 | | | | 260,279 | |
Florida Power & Light Co., | |
First Mortgage | |
2.875% | | 12/04/51 | | | | | 5 | | | | 3,405 | |
3.150% | | 10/01/49 | | | | | 36 | | | | 26,151 | |
Georgia Power Co., | |
Sr. Unsec’d. Notes, Series B | |
2.650% | | 09/15/29 | | | | | 95 | | | | 81,000 | |
Iberdrola International BV (Spain), | |
Gtd. Notes | |
6.750% | | 09/15/33 | | | | | 1,150 | | | | 1,199,242 | |
Interstate Power & Light Co., | |
Sr. Unsec’d. Notes | |
3.250% | | 12/01/24 | | | | | 20 | | | | 19,321 | |
3.600% | | 04/01/29 | | | | | 50 | | | | 45,541 | |
Israel Electric Corp. Ltd. (Israel), | |
Sr. Sec’d. Notes, 144A, GMTN | |
4.250% | | 08/14/28 | | | | | 680 | | | | 637,202 | |
Jersey Central Power & Light Co., | |
Sr. Unsec’d. Notes, 144A | |
4.700% | | 04/01/24 | | | | | 50 | | | | 49,315 | |
Kentucky Utilities Co., | |
First Mortgage | |
4.375% | | 10/01/45 | | | | | 3,050 | | | | 2,581,062 | |
MidAmerican Energy Co., | |
First Mortgage | |
3.150% | | 04/15/50 | | | | | 5 | | | | 3,552 | |
3.650% | | 04/15/29 | | | | | 20 | | | | 18,754 | |
3.650% | | 08/01/48 | | | | | 20 | | | | 15,731 | |
| | | | | | | | | | | | |
Interest Rate | | Maturity Date | | | | Principal
Amount
(000)# | | | Value | |
| | | | | | | | | | | |
|
CORPORATE BONDS (continued) | |
Electric (cont’d.) | |
Narragansett Electric Co. (The), | |
Sr. Unsec’d. Notes, 144A | |
3.395% | | 04/09/30(a) | | | | | 1,050 | | | $ | 937,139 | |
NextEra Energy Capital Holdings, Inc., | |
Gtd. Notes | |
1.900% | | 06/15/28 | | | | | 15 | | | | 12,837 | |
2.250% | | 06/01/30 | | | | | 20 | | | | 16,462 | |
2.440% | | 01/15/32 | | | | | 11 | | | | 8,865 | |
3.000% | | 01/15/52 | | | | | 58 | | | | 38,400 | |
Northern States Power Co., | |
First Mortgage | |
2.250% | | 04/01/31 | | | | | 10 | | | | 8,292 | |
2.600% | | 06/01/51 | | | | | 5 | | | | 3,203 | |
3.600% | | 09/15/47 | | | | | 10 | | | | 7,737 | |
NRG Energy, Inc., | |
Gtd. Notes, 144A | |
3.625% | | 02/15/31 | | | | | 100 | | | | 76,513 | |
3.875% | | 02/15/32 | | | | | 325 | | | | 245,033 | |
5.250% | | 06/15/29 | | | | | 375 | | | | 331,310 | |
Sr. Sec’d. Notes, 144A | |
2.000% | | 12/02/25 | | | | | 285 | | | | 253,984 | |
2.450% | | 12/02/27 | | | | | 1,245 | | | | 1,032,640 | |
3.750% | | 06/15/24 | | | | | 50 | | | | 48,152 | |
Ohio Power Co., | |
Sr. Unsec’d. Notes, Series P | |
2.600% | | 04/01/30 | | | | | 25 | | | | 21,217 | |
Sr. Unsec’d. Notes, Series Q | |
1.625% | | 01/15/31 | | | | | 5 | | | | 3,874 | |
Sr. Unsec’d. Notes, Series R | |
2.900% | | 10/01/51 | | | | | 5 | | | | 3,270 | |
Oncor Electric Delivery Co. LLC, | |
Sr. Sec’d. Notes | |
3.700% | | 11/15/28 | | | | | 40 | | | | 37,743 | |
3.800% | | 06/01/49 | | | | | 6 | | | | 4,857 | |
Pacific Gas & Electric Co., | |
First Mortgage | |
2.100% | | 08/01/27 | | | | | 10 | | | | 8,562 | |
3.250% | | 06/15/23 | | | | | 25 | | | | 24,708 | |
3.450% | | 07/01/25 | | | | | 13 | | | | 12,332 | |
3.750% | | 08/15/42 | | | | | 50 | | | | 33,355 | |
3.850% | | 11/15/23 | | | | | 40 | | | | 39,476 | |
4.000% | | 12/01/46 | | | | | 15 | | | | 10,170 | |
4.450% | | 04/15/42 | | | | | 5 | | | | 3,734 | |
4.550% | | 07/01/30 | | | | | 1,748 | | | | 1,584,573 | |
4.950% | | 07/01/50 | | | | | 69 | | | | 54,058 | |
PacifiCorp, | |
First Mortgage | |
3.300% | | 03/15/51 | | | | | 390 | | | | 281,140 | |
PECO Energy Co., | |
First Mortgage | |
2.800% | | 06/15/50 | | | | | 25 | | | | 16,504 | |
Perusahaan Listrik Negara PT (Indonesia), | |
Sr. Unsec’d. Notes, 144A | |
1.875% | | 11/05/31 | | | | EUR | 324 | | | | 247,178 | |
PG&E Energy Recovery Funding LLC, | |
Sr. Sec’d. Notes, Series A-3 | |
2.822% | | 07/15/48 | | | | | 20 | | | | 14,141 | |
SEE NOTES TO FINANCIAL STATEMENTS.
A179
| | | | |
| | PSF PGIM TOTAL RETURN BOND PORTFOLIO (CONTINUED) | | |
SCHEDULE OF INVESTMENTS | | | | as of December 31, 2022 |
| | | | | | | | | | | | |
Interest Rate | | Maturity Date | | | | Principal
Amount
(000)# | | | Value | |
| | | | | | | | | | | |
|
CORPORATE BONDS (continued) | |
Electric (cont’d.) | |
Progress Energy, Inc., | |
Sr. Unsec’d. Notes | |
7.000% | | 10/30/31 | | | | | 90 | | | $ | 98,103 | |
Public Service Co. of Colorado, | |
First Mortgage, Series 34 | |
3.200% | | 03/01/50 | | | | | 5 | | | | 3,584 | |
Public Service Electric & Gas Co., | |
First Mortgage, MTN | |
2.050% | | 08/01/50 | | | | | 45 | | | | 25,146 | |
Public Service Enterprise Group, Inc., | |
Sr. Unsec’d. Notes | |
1.600% | | 08/15/30 | | | | | 35 | | | | 27,191 | |
Rochester Gas & Electric Corp., | |
First Mortgage, 144A | |
3.100% | | 06/01/27 | | | | | 45 | | | | 41,325 | |
San Diego Gas & Electric Co., | |
First Mortgage | |
4.150% | | 05/15/48 | | | | | 20 | | | | 16,818 | |
5.350% | | 05/15/35 | | | | | 40 | | | | 38,885 | |
First Mortgage, Series WWW | |
2.950% | | 08/15/51 | | | | | 5 | | | | 3,399 | |
Sr. Sec’d. Notes, Series VVV | |
1.700% | | 10/01/30 | | | | | 10 | | | | 7,925 | |
Sempra Energy, | |
Sr. Unsec’d. Notes | |
3.400% | | 02/01/28 | | | | | 35 | | | | 32,522 | |
4.000% | | 02/01/48 | | | | | 5 | | | | 3,931 | |
Sierra Pacific Power Co., | |
General Ref. Mortgage | |
2.600% | | 05/01/26 | | | | | 20 | | | | 18,548 | |
Southern California Edison Co., | |
First Mortgage | |
1.100% | | 04/01/24 | | | | | 135 | | | | 128,350 | |
2.250% | | 06/01/30 | | | | | 35 | | | | 28,877 | |
2.850% | | 08/01/29 | | | | | 40 | | | | 34,768 | |
3.650% | | 02/01/50 | | | | | 25 | | | | 18,376 | |
First Mortgage, SOFR Index + 0.640% | |
4.963%(c) | | 04/03/23 | | | | | 40 | | | | 39,962 | |
First Mortgage, Series 20A | |
2.950% | | 02/01/51 | | | | | 5 | | | | 3,205 | |
First Mortgage, Series A | |
4.200% | | 03/01/29 | | | | | 20 | | | | 19,026 | |
First Mortgage, Series G | |
2.500% | | 06/01/31 | | | | | 10 | | | | 8,241 | |
First Mortgage, Series H | |
3.650% | | 06/01/51 | | | | | 5 | | | | 3,671 | |
First Ref. Mortgage | |
5.500% | | 03/15/40 | | | | | 10 | | | | 9,676 | |
First Ref. Mortgage, Series C | |
4.125% | | 03/01/48 | | | | | 50 | | | | 39,945 | |
Southwestern Public Service Co., | |
First Mortgage | |
3.750% | | 06/15/49 | | | | | 30 | | | | 22,967 | |
Tampa Electric Co., | |
Sr. Unsec’d. Notes | |
3.450% | | 03/15/51 | | | | | 40 | | | | 28,122 | |
| | | | | | | | | | | | |
Interest Rate | | Maturity Date | | | | Principal
Amount
(000)# | | | Value | |
| | | | | | | | | | | |
|
CORPORATE BONDS (continued) | |
Electric (cont’d.) | |
Toledo Edison Co. (The), | |
First Mortgage, 144A | |
2.650% | | 05/01/28 | | | | | 10 | | | $ | 8,683 | |
Trans-Allegheny Interstate Line Co., | |
Sr. Unsec’d. Notes, 144A | |
3.850% | | 06/01/25 | | | | | 100 | | | | 96,691 | |
Tucson Electric Power Co., | |
Sr. Unsec’d. Notes | |
4.000% | | 06/15/50 | | | | | 1,500 | | | | 1,140,260 | |
Virginia Electric & Power Co., | |
Sr. Unsec’d. Notes | |
4.450% | | 02/15/44 | | | | | 15 | | | | 12,860 | |
Vistra Corp., | |
Jr. Sub. Notes, 144A | |
7.000%(ff) | | 12/15/26(oo) | | | | | 625 | | | | 569,758 | |
8.000%(ff) | | 10/15/26(oo) | | | | | 2,075 | | | | 1,984,329 | |
Vistra Operations Co. LLC, | |
Gtd. Notes, 144A | |
5.000% | | 07/31/27 | | | | | 450 | | | | 418,774 | |
5.625% | | 02/15/27(a) | | | | | 600 | | | | 573,017 | |
Sr. Sec’d. Notes, 144A | |
3.550% | | 07/15/24 | | | | | 130 | | | | 124,754 | |
3.700% | | 01/30/27 | | | | | 2,000 | | | | 1,820,512 | |
| | | | | | | | | | | | |
| |
| | | | 31,856,334 | |
| | | | | | | | | | | | |
Electrical Components & Equipment — 0.1% | |
WESCO Distribution, Inc., | |
Gtd. Notes, 144A | |
7.125% | | 06/15/25 | | | | | 575 | | | | 582,866 | |
7.250% | | 06/15/28 | | | | | 550 | | | | 557,620 | |
| | | | | | | | | | | | |
| |
| | | | 1,140,486 | |
| | | | | | | | | | | | |
Electronics — 0.1% | |
Agilent Technologies, Inc., | |
Sr. Unsec’d. Notes | |
2.300% | | 03/12/31 | | | | | 45 | | | | 36,413 | |
Honeywell International, Inc., | |
Sr. Unsec’d. Notes | |
1.100% | | 03/01/27 | | | | | 20 | | | | 17,432 | |
1.950% | | 06/01/30 | | | | | 30 | | | | 24,816 | |
Sensata Technologies BV, | |
Gtd. Notes, 144A | |
5.000% | | 10/01/25 | | | | | 1,000 | | | | 977,500 | |
TD SYNNEX Corp., | |
Sr. Unsec’d. Notes | |
1.250% | | 08/09/24 | | | | | 30 | | | | 27,847 | |
Sr. Unsec’d. Notes, Sr. Unsec’d. Notes | |
2.650% | | 08/09/31 | | | | | 25 | | | | 18,906 | |
| | | | | | | | | | | | |
| |
| | | | 1,102,914 | |
| | | | | | | | | | | | |
Engineering & Construction — 0.4% | |
Cellnex Telecom SA (Spain), | |
Sr. Unsec’d. Notes, EMTN | |
1.750% | | 10/23/30 | | | | EUR | 2,800 | | | | 2,317,829 | |
GMR Hyderabad International Airport Ltd. (India), | |
Sr. Sec’d. Notes, 144A | |
4.250% | | 10/27/27(a) | | | | | 345 | | | | 296,873 | |
SEE NOTES TO FINANCIAL STATEMENTS.
A180
| | | | |
| | PSF PGIM TOTAL RETURN BOND PORTFOLIO (CONTINUED) | | |
SCHEDULE OF INVESTMENTS | | | | as of December 31, 2022 |
| | | | | | | | | | | | |
Interest Rate | | Maturity Date | | | | Principal
Amount
(000)# | | | Value | |
| | | | | | | | | | | |
|
CORPORATE BONDS (continued) | |
Engineering & Construction (cont’d.) | |
Mexico City Airport Trust (Mexico), | |
Sr. Sec’d. Notes, 144A | |
4.250% | | 10/31/26 | | | | | 605 | | | $ | 574,485 | |
5.500% | | 07/31/47 | | | | | 1,690 | | | | 1,301,300 | |
| | | | | | | | | | | | |
| |
| | | | 4,490,487 | |
| | | | | | | | | | | | |
Entertainment — 0.4% | |
AMC Entertainment Holdings, Inc., | |
Sec’d. Notes, 144A, Cash coupon 10.000% or PIK 12.000% or Cash coupon 5.000% and PIK 6.000% | |
10.000% | | 06/15/26 | | | | | 366 | | | | 151,971 | |
Caesars Entertainment, Inc., | |
Sr. Sec’d. Notes, 144A | |
6.250% | | 07/01/25 | | | | | 860 | | | | 836,712 | |
Golden Entertainment, Inc., | |
Sr. Unsec’d. Notes, 144A | |
7.625% | | 04/15/26 | | | | | 875 | | | | 862,836 | |
Penn Entertainment, Inc., | |
Sr. Unsec’d. Notes, 144A | |
5.625% | | 01/15/27 | | | | | 800 | | | | 724,729 | |
Warnermedia Holdings, Inc., | |
Gtd. Notes, 144A | |
3.528% | | 03/15/24 | | | | | 20 | | | | 19,380 | |
5.050% | | 03/15/42 | | | | | 1,065 | | | | 818,986 | |
5.141% | | 03/15/52 | | | | | 1,015 | | | | 745,299 | |
5.391% | | 03/15/62 | | | | | 485 | | | | 355,290 | |
| | | | | | | | | | | | |
| |
| | | | 4,515,203 | |
| | | | | | | | | | | | |
Environmental Control — 0.0% | |
Republic Services, Inc., | |
Sr. Unsec’d. Notes | |
0.875% | | 11/15/25 | | | | | 10 | | | | 8,919 | |
2.500% | | 08/15/24 | | | | | 30 | | | | 28,756 | |
3.950% | | 05/15/28 | | | | | 20 | | | | 19,041 | |
Waste Connections, Inc., | |
Sr. Unsec’d. Notes | |
3.500% | | 05/01/29 | | | | | 35 | | | | 32,030 | |
Waste Management, Inc., | |
Gtd. Notes | |
2.400% | | 05/15/23 | | | | | 30 | | | | 29,709 | |
| | | | | | | | | | | | |
| |
| | | | 118,455 | |
| | | | | | | | | | | | |
Foods — 0.9% | |
Bellis Acquisition Co. PLC (United Kingdom), | |
Sr. Sec’d. Notes, 144A | |
3.250% | | 02/16/26 | | | | GBP | 3,100 | | | | 3,038,475 | |
Bellis Finco PLC (United Kingdom), | |
Sr. Unsec’d. Notes, 144A | |
4.000% | | 02/16/27 | | | | GBP | 1,600 | | | | 1,407,373 | |
Campbell Soup Co., | |
Sr. Unsec’d. Notes | |
3.950% | | 03/15/25 | | | | | 45 | | | | 43,960 | |
4.800% | | 03/15/48 | | | | | 55 | | | | 48,899 | |
General Mills, Inc., | |
Sr. Unsec’d. Notes | |
2.250% | | 10/14/31 | | | | | 5 | | | | 4,010 | |
| | | | | | | | | | | | |
Interest Rate | | Maturity
Date | | | | Principal
Amount
(000)# | | | Value | |
| | �� | | | | | | | | | |
|
CORPORATE BONDS (continued) | |
Foods (cont’d.) | |
Hershey Co. (The), | |
Sr. Unsec’d. Notes | |
1.700% | | 06/01/30 | | | | | 10 | | | $ | 8,018 | |
Kraft Heinz Foods Co., | |
Gtd. Notes | |
4.625% | | 10/01/39 | | | | | 645 | | | | 566,240 | |
5.000% | | 06/04/42(a) | | | | | 1,475 | | | | 1,332,471 | |
Market Bidco Finco PLC (United Kingdom), | |
Sr. Sec’d. Notes, 144A | |
5.500% | | 11/04/27 | | | | GBP | 2,500 | | | | 2,295,796 | |
Mars, Inc., | |
Gtd. Notes, 144A | |
3.875% | | 04/01/39 | | | | | 440 | | | | 372,365 | |
3.950% | | 04/01/49 | | | | | 25 | | | | 20,585 | |
4.125% | | 04/01/54 | | | | | 415 | | | | 334,424 | |
Sr. Unsec’d. Notes, 144A | |
2.375% | | 07/16/40 | | | | | 10 | | | | 6,785 | |
Mondelez International, Inc., | |
Sr. Unsec’d. Notes | |
1.500% | | 02/04/31 | | | | | 30 | | | | 23,072 | |
Smithfield Foods, Inc., | |
Sr. Unsec’d. Notes, 144A | |
3.000% | | 10/15/30 | | | | | 10 | | | | 7,611 | |
Tyson Foods, Inc., | |
Sr. Unsec’d. Notes | |
5.100% | | 09/28/48 | | | | | 15 | | | | 13,916 | |
| | | | | | | | | | | | |
| |
| | | | 9,524,000 | |
| | | | | | | | | | | | |
Forest Products & Paper — 0.0% | |
Georgia-Pacific LLC, | |
Sr. Unsec’d. Notes, 144A | |
0.950% | | 05/15/26 | | | | | 40 | | | | 35,112 | |
Suzano Austria GmbH (Brazil), | |
Gtd. Notes, Series DM3N | |
3.125% | | 01/15/32 | | | | | 10 | | | | 7,787 | |
| | | | | | | | | | | | |
| |
| | | | 42,899 | |
| | | | | | | | | | | | |
Gas — 0.2% | |
AmeriGas Partners LP/AmeriGas Finance Corp., | |
Sr. Unsec’d. Notes | |
5.875% | | 08/20/26 | | | | | 1,100 | | | | 1,046,729 | |
Atmos Energy Corp., | |
Sr. Unsec’d. Notes | |
1.500% | | 01/15/31 | | | | | 55 | | | | 42,841 | |
2.625% | | 09/15/29 | | | | | 15 | | | | 13,028 | |
2.850% | | 02/15/52 | | | | | 5 | | | | 3,260 | |
CenterPoint Energy Resources Corp., | |
Sr. Unsec’d. Notes | |
0.700% | | 03/02/23 | | | | | 105 | | | | 104,250 | |
1.750% | | 10/01/30 | | | | | 10 | | | | 7,925 | |
NiSource, Inc., | |
Sr. Unsec’d. Notes | |
0.950% | | 08/15/25 | | | | | 75 | | | | 67,649 | |
1.700% | | 02/15/31 | | | | | 120 | | | | 91,391 | |
3.600% | | 05/01/30 | | | | | 36 | | | | 32,096 | |
4.800% | | 02/15/44 | | | | | 300 | | | | 264,878 | |
SEE NOTES TO FINANCIAL STATEMENTS.
A181
| | | | |
| | PSF PGIM TOTAL RETURN BOND PORTFOLIO (CONTINUED) | | |
SCHEDULE OF INVESTMENTS | | | | as of December 31, 2022 |
| | | | | | | | | | | | |
Interest Rate | | Maturity Date | | | | Principal
Amount
(000)# | | | Value | |
| | | | | | | | | | | |
|
CORPORATE BONDS (continued) | |
Gas (cont’d.) | |
Piedmont Natural Gas Co., Inc., | |
Sr. Unsec’d. Notes | |
4.100% | | 09/18/34 | | | | | 20 | | | $ | 17,092 | |
Southern California Gas Co., | |
First Mortgage, Series WW | |
3.950% | | 02/15/50 | | | | | 45 | | | | 35,028 | |
Southern Co. Gas Capital Corp., | |
Gtd. Notes | |
4.400% | | 06/01/43 | | | | | 1,050 | | | | 862,119 | |
| | | | | | | | | | | | |
| |
| | | | 2,588,286 | |
| | | | | | | | | | | | |
Healthcare-Products — 0.3% | |
Abbott Laboratories, | |
Sr. Unsec’d. Notes | |
4.750% | | 11/30/36 | | | | | 10 | | | | 9,904 | |
DH Europe Finance II Sarl, | |
Gtd. Notes | |
1.350% | | 09/18/39 | | | | EUR | 1,275 | | | | 922,453 | |
Medline Borrower LP, | |
Sr. Sec’d. Notes, 144A | |
3.875% | | 04/01/29 | | | | | 325 | | | | 261,937 | |
Sr. Unsec’d. Notes, 144A | |
5.250% | | 10/01/29(a) | | | | | 225 | | | | 178,825 | |
Medtronic Global Holdings SCA, | |
Gtd. Notes | |
1.375% | | 10/15/40 | | | | EUR | 540 | | | | 372,496 | |
1.625% | | 10/15/50 | | | | EUR | 495 | | | | 312,490 | |
2.250% | | 03/07/39 | | | | EUR | 300 | | | | 247,501 | |
Stryker Corp., | |
Sr. Unsec’d. Notes | |
2.125% | | 11/30/27 | | | | EUR | 510 | | | | 507,915 | |
3.650% | | 03/07/28 | | | | | 30 | | | | 28,497 | |
Thermo Fisher Scientific, Inc., | |
Sr. Unsec’d. Notes, EMTN | |
1.500% | | 10/01/39 | | | | EUR | 600 | | | | 433,025 | |
1.875% | | 10/01/49 | | | | EUR | 425 | | | | 287,053 | |
| | | | | | | | | | | | |
| |
| | | | 3,562,096 | |
| | | | | | | | | | | | |
Healthcare-Services — 0.7% | |
Adventist Health System/West, | |
Bonds | |
2.952% | | 03/01/29 | | | | | 10 | | | | 8,507 | |
Advocate Health & Hospitals Corp., | |
Sr. Unsec’d. Notes | |
3.387% | | 10/15/49 | | | | | 20 | | | | 14,339 | |
Aetna, Inc., | |
Sr. Unsec’d. Notes | |
2.800% | | 06/15/23 | | | | | 20 | | | | 19,794 | |
3.875% | | 08/15/47 | | | | | 3 | | | | 2,318 | |
6.750% | | 12/15/37 | | | | | 1,900 | | | | 2,029,640 | |
AHS Hospital Corp., | |
Sr. Unsec’d. Notes, Series 2021 | |
2.780% | | 07/01/51 | | | | | 10 | | | | 6,167 | |
Ascension Health, | |
Sr. Unsec’d. Notes, Series B | |
3.106% | | 11/15/39 | | | | | 20 | | | | 15,277 | |
| | | | | | | | | | | | |
Interest Rate | | Maturity Date | | | | Principal
Amount
(000)# | | | Value | |
| | | | | | | | | | | |
|
CORPORATE BONDS (continued) | |
Healthcare-Services (cont’d.) | |
Baylor Scott & White Holdings, | |
Unsec’d. Notes, Series 2021 | |
2.839% | | 11/15/50 | | | | | 10 | | | $ | 6,598 | |
Bon Secours Mercy Health, Inc., | |
Sec’d. Notes, Series 20-2 | |
2.095% | | 06/01/31 | | | | | 10 | | | | 7,762 | |
City of Hope, | |
Sr. Sec’d. Notes, Series 2013 | |
5.623% | | 11/15/43 | | | | | 20 | | | | 19,709 | |
CommonSpirit Health, | |
Sr. Sec’d. Notes | |
1.547% | | 10/01/25 | | | | | 35 | | | | 31,498 | |
2.782% | | 10/01/30 | | | | | 5 | | | | 4,112 | |
3.910% | | 10/01/50 | | | | | 5 | | | | 3,698 | |
4.187% | | 10/01/49 | | | | | 30 | | | | 23,300 | |
Duke University Health System, Inc., | |
Sr. Unsec’d. Notes, Series 2017 | |
3.920% | | 06/01/47 | | | | | 25 | | | | 20,179 | |
Elevance Health, Inc., | |
Sr. Unsec’d. Notes | |
2.375% | | 01/15/25 | | | | | 15 | | | | 14,240 | |
4.650% | | 01/15/43 | | | | | 385 | | | | 348,610 | |
HCA, Inc., | |
Gtd. Notes | |
5.375% | | 02/01/25 | | | | | 940 | | | | 938,987 | |
7.500% | | 11/06/33 | | | | | 500 | | | | 526,224 | |
Gtd. Notes, MTN | |
7.750% | | 07/15/36 | | | | | 500 | | | | 547,657 | |
Kaiser Foundation Hospitals, | |
Unsec’d. Notes, Series 2021 | |
3.002% | | 06/01/51 | | | | | 10 | | | | 6,800 | |
Laboratory Corp. of America Holdings, | |
Sr. Unsec’d. Notes | |
2.950% | | 12/01/29 | | | | | 25 | | | | 21,497 | |
3.600% | | 02/01/25(a) | | | | | 675 | | | | 653,505 | |
Mount Sinai Hospitals Group, Inc., | |
Sec’d. Notes, Series 2017 | |
3.981% | | 07/01/48 | | | | | 2 | | | | 1,614 | |
Sec’d. Notes, Series 2019 | |
3.737% | | 07/01/49 | | | | | 29 | | | | 21,574 | |
Unsec’d. Notes, Series 2020 | |
3.391% | | 07/01/50 | | | | | 10 | | | | 6,750 | |
Northwell Healthcare, Inc., | |
Sec’d. Notes | |
3.809% | | 11/01/49 | | | | | 10 | | | | 7,147 | |
Orlando Health Obligated Group, | |
Unsec’d. Notes | |
4.089% | | 10/01/48 | | | | | 25 | | | | 19,736 | |
PeaceHealth Obligated Group, | |
Sr. Unsec’d. Notes, Series 2020 | |
1.375% | | 11/15/25 | | | | | 10 | | | | 8,958 | |
Piedmont Healthcare, Inc., | |
Sec’d. Notes, Series 2032 | |
2.044% | | 01/01/32 | | | | | 10 | | | | 7,686 | |
Providence St. Joseph Health Obligated Group, | |
Unsec’d. Notes, Series 19A | |
2.532% | | 10/01/29 | | | | | 50 | | | | 42,066 | |
SEE NOTES TO FINANCIAL STATEMENTS.
A182
| | | | |
| | PSF PGIM TOTAL RETURN BOND PORTFOLIO (CONTINUED) | | |
SCHEDULE OF INVESTMENTS | | | | as of December 31, 2022 |
| | | | | | | | | | | | |
Interest Rate | | Maturity Date | | | | Principal
Amount
(000)# | | | Value | |
| | | | | | | | | | | |
|
CORPORATE BONDS (continued) | |
Healthcare-Services (cont’d.) | |
Quest Diagnostics, Inc., | |
Sr. Unsec’d. Notes | |
2.950% | | 06/30/30 | | | | | 50 | | | $ | 43,229 | |
Sutter Health, | |
Unsec’d. Notes, Series 20A | |
2.294% | | 08/15/30 | | | | | 6 | | | | 4,845 | |
3.361% | | 08/15/50 | | | | | 4 | | | | 2,784 | |
Tenet Healthcare Corp., | |
Gtd. Notes, 144A | |
6.125% | | 10/01/28(a) | | | | | 200 | | | | 179,473 | |
Sr. Sec’d. Notes, 144A | |
4.625% | | 06/15/28 | | | | | 285 | | | | 255,445 | |
4.875% | | 01/01/26 | | | | | 450 | | | | 428,727 | |
5.125% | | 11/01/27(a) | | | | | 550 | | | | 513,224 | |
Trinity Health Corp., | |
Sr. Unsec’d. Notes, Series 2019 | |
3.434% | | 12/01/48 | | | | | 30 | | | | 22,837 | |
UnitedHealth Group, Inc., | |
Sr. Unsec’d. Notes | |
2.900% | | 05/15/50 | | | | | 20 | | | | 13,631 | |
3.050% | | 05/15/41 | | | | | 895 | | | | 674,314 | |
3.250% | | 05/15/51 | | | | | 5 | | | | 3,604 | |
3.500% | | 08/15/39 | | | | | 25 | | | | 20,502 | |
3.950% | | 10/15/42 | | | | | 220 | | | | 186,265 | |
4.450% | | 12/15/48 | | | | | 10 | | | | 8,917 | |
Universal Health Services, Inc., | |
Sr. Sec’d. Notes, 144A | |
2.650% | | 10/15/30 | | | | | 25 | | | | 19,876 | |
| | | | | | | | | | | | |
| |
| | | | 7,763,622 | |
| | | | | | | | | | | | |
Home Builders — 0.1% | |
D.R. Horton, Inc., | |
Gtd. Notes | |
2.500% | | 10/15/24 | | | | | 45 | | | | 42,820 | |
Taylor Morrison Communities, Inc., | |
Gtd. Notes, 144A | |
5.875% | | 06/15/27 | | | | | 875 | | | | 842,049 | |
Sr. Unsec’d. Notes, 144A | |
5.125% | | 08/01/30 | | | | | 45 | | | | 39,155 | |
| | | | | | | | | | | | |
| |
| | | | 924,024 | |
| | | | | | | | | | | | |
Housewares — 0.1% | |
Newell Brands, Inc., | |
Sr. Unsec’d. Notes | |
4.875% | | 06/01/25 | | | | | 670 | | | | 653,645 | |
| | | | | | | | | | | | |
Insurance — 0.6% | |
Allianz SE (Germany), | |
Jr. Sub. Notes, 144A | |
3.500%(ff) | | 11/17/25(oo) | | | | | 200 | | | | 168,500 | |
American International Group, Inc., | |
Sr. Unsec’d. Notes | |
4.800% | | 07/10/45 | | | | | 3 | | | | 2,683 | |
Everest Reinsurance Holdings, Inc., | |
Sr. Unsec’d. Notes | |
3.500% | | 10/15/50 | | | | | 20 | | | | 13,430 | |
| | | | | | | | | | | | |
Interest Rate | | Maturity
Date | | | | Principal
Amount
(000)# | | | Value | |
| | | | | | | | | | | |
|
CORPORATE BONDS (continued) | |
Insurance (cont’d.) | |
Great-West Lifeco US Finance 2020 LP (Canada), | |
Gtd. Notes, 144A | |
0.904% | | 08/12/25 | | | | | 25 | | | $ | 22,257 | |
Liberty Mutual Finance Europe DAC, | |
Gtd. Notes, 144A | |
1.750% | | 03/27/24 | | | | EUR | 800 | | | | 833,147 | |
Liberty Mutual Group, Inc., | |
Gtd. Notes, 144A | |
3.951% | | 10/15/50 | | | | | 1,030 | | | | 725,446 | |
Lincoln National Corp., | |
Sr. Unsec’d. Notes | |
7.000% | | 06/15/40 | | | | | 405 | | | | 419,298 | |
Markel Corp., | |
Sr. Unsec’d. Notes | |
5.000% | | 03/30/43 | | | | | 350 | | | | 300,424 | |
Marsh & McLennan Cos., Inc., | |
Sr. Unsec’d. Notes | |
2.250% | | 11/15/30 | | | | | 5 | | | | 4,090 | |
2.375% | | 12/15/31 | | | | | 15 | | | | 12,139 | |
New York Life Insurance Co., | |
Sub. Notes, 144A | |
3.750% | | 05/15/50 | | | | | 25 | | | | 19,131 | |
Principal Financial Group, Inc., | |
Gtd. Notes | |
4.625% | | 09/15/42 | | | | | 150 | | | | 125,416 | |
Protective Life Corp., | |
Sr. Unsec’d. Notes, 144A | |
3.400% | | 01/15/30 | | | | | 15 | | | | 13,032 | |
Sompo International Holdings Ltd. (Bermuda), | |
Sr. Unsec’d. Notes | |
7.000% | | 07/15/34 | | | | | 1,350 | | | | 1,452,419 | |
Teachers Insurance & Annuity Association of America, | |
Sub. Notes, 144A | |
3.300% | | 05/15/50 | | | | | 10 | | | | 7,017 | |
4.270% | | 05/15/47 | | | | | 2,310 | | | | 1,908,987 | |
6.850% | | 12/16/39 | | | | | 196 | | | | 215,472 | |
W.R. Berkley Corp., | |
Sr. Unsec’d. Notes | |
4.000% | | 05/12/50 | | | | | 15 | | | | 11,427 | |
| | | | | | | | | | | | |
| |
| | | | 6,254,315 | |
| | | | | | | | | | | | |
Internet — 0.0% | |
Alibaba Group Holding Ltd. (China), | |
Sr. Unsec’d. Notes | |
2.125% | | 02/09/31 | | | | | 200 | | | | 157,752 | |
Alphabet, Inc., | |
Sr. Unsec’d. Notes | |
1.100% | | 08/15/30 | | | | | 20 | | | | 15,703 | |
1.900% | | 08/15/40 | | | | | 15 | | | | 9,943 | |
2.050% | | 08/15/50 | | | | | 5 | | | | 2,967 | |
Amazon.com, Inc., | |
Sr. Unsec’d. Notes | |
1.000% | | 05/12/26 | | | | | 100 | | | | 88,641 | |
1.200% | | 06/03/27 | | | | | 20 | | | | 17,334 | |
2.100% | | 05/12/31 | | | | | 30 | | | | 24,553 | |
2.500% | | 06/03/50 | | | | | 25 | | | | 15,863 | |
2.700% | | 06/03/60 | | | | | 5 | | | | 3,043 | |
SEE NOTES TO FINANCIAL STATEMENTS.
A183
| | | | |
| | PSF PGIM TOTAL RETURN BOND PORTFOLIO (CONTINUED) | | |
SCHEDULE OF INVESTMENTS | | | | as of December 31, 2022 |
| | | | | | | | | | | | |
Interest Rate | | Maturity Date | | | | Principal
Amount
(000)# | | | Value | |
| | | | | | | | | | | |
|
CORPORATE BONDS (continued) | |
Internet (cont’d.) | | | | | |
3.100% | | 05/12/51 | | | | | 25 | | | $ | 17,914 | |
3.150% | | 08/22/27 | | | | | 45 | | | | 42,368 | |
3.250% | | 05/12/61 | | | | | 10 | | | | 6,954 | |
3.875% | | 08/22/37 | | | | | 50 | | | | 44,348 | |
Arches Buyer, Inc., | |
Sr. Sec’d. Notes, 144A | |
4.250% | | 06/01/28 | | | | | 25 | | | | 19,608 | |
Expedia Group, Inc., | |
Gtd. Notes | |
2.950% | | 03/15/31 | | | | | 2 | | | | 1,610 | |
3.250% | | 02/15/30 | | | | | 35 | | | | 29,704 | |
Gtd. Notes, 144A | |
6.250% | | 05/01/25 | | | | | 3 | | | | 3,022 | |
Netflix, Inc., | |
Sr. Unsec’d. Notes | |
4.375% | | 11/15/26 | | | | | 18 | | | | 17,567 | |
5.750% | | 03/01/24 | | | | | 5 | | | | 5,043 | |
| | | | | | | | | | | | |
| | | | |
| | | | | | | | | | | 523,937 | |
| | | | | | | | | | | | |
Investment Companies — 0.0% | | | | | |
Blackstone Private Credit Fund, | |
Sr. Unsec’d. Notes | |
3.250% | | 03/15/27 | | | | | 20 | | | | 16,855 | |
| | | | | | | | | | | | |
Iron/Steel — 0.0% | | | | | |
ArcelorMittal SA (Luxembourg), | |
Sr. Unsec’d. Notes | |
3.600% | | 07/16/24 | | | | | 50 | | | | 48,566 | |
Nucor Corp., | |
Sr. Unsec’d. Notes | |
2.000% | | 06/01/25 | | | | | 5 | | | | 4,657 | |
Steel Dynamics, Inc., | |
Sr. Unsec’d. Notes | |
2.400% | | 06/15/25 | | | | | 5 | | | | 4,684 | |
3.250% | | 01/15/31 | | | | | 20 | | | | 17,123 | |
3.250% | | 10/15/50 | | | | | 5 | | | | 3,252 | |
3.450% | | 04/15/30 | | | | | 5 | | | | 4,401 | |
Vale Overseas Ltd. (Brazil), | |
Gtd. Notes | |
6.250% | | 08/10/26 | | | | | 50 | | | | 51,603 | |
| | | | | | | | | | | | |
| | | | |
| | | | | | | | | | | 134,286 | |
| | | | | | | | | | | | |
Lodging — 0.3% | | | | | |
Las Vegas Sands Corp., | |
Sr. Unsec’d. Notes | |
2.900% | | 06/25/25 | | | | | 40 | | | | 36,950 | |
3.200% | | 08/08/24 | | | | | 105 | | | | 99,242 | |
3.500% | | 08/18/26 | | | | | 30 | | | | 27,118 | |
Marriott International, Inc., | |
Sr. Unsec’d. Notes | |
3.125% | | 02/15/23 | | | | | 5 | | | | 4,986 | |
3.600% | | 04/15/24 | | | | | 30 | | | | 29,363 | |
3.750% | | 10/01/25 | | | | | 5 | | | | 4,795 | |
Sr. Unsec’d. Notes, Series EE | |
5.750% | | 05/01/25 | | | | | 59 | | | | 59,624 | |
Sr. Unsec’d. Notes, Series GG | |
3.500% | | 10/15/32(a) | | | | | 1,825 | | | | 1,516,975 | |
| | | | | | | | | | | | |
Interest Rate | | Maturity Date | | | | Principal
Amount
(000)# | | | Value | |
| | | | | | | | | | | |
|
CORPORATE BONDS (continued) | |
Lodging (cont’d.) | | | | | |
MGM Resorts International, | |
Gtd. Notes | |
4.750% | | 10/15/28 | | | | | 950 | | | $ | 829,415 | |
Sands China Ltd. (Macau), | |
Sr. Unsec’d. Notes | |
5.625% | | 08/08/25 | | | | | 400 | | | | 384,000 | |
| | | | | | | | | | | | |
| | | | |
| | | | | | | | | | | 2,992,468 | |
| | | | | | | | | | | | |
Machinery-Construction & Mining — 0.0% | |
Caterpillar Financial Services Corp., | |
Sr. Unsec’d. Notes, MTN | |
0.800% | | 11/13/25 | | | | | 10 | | | | 8,986 | |
1.100% | | 09/14/27 | | | | | 10 | | | | 8,549 | |
Caterpillar, Inc., | |
Sr. Unsec’d. Notes | |
2.600% | | 04/09/30 | | | | | 10 | | | | 8,725 | |
3.250% | | 04/09/50 | | | | | 10 | | | | 7,643 | |
| | | | | | | | | | | | |
| | | | |
| | | | | | | | | | | 33,903 | |
| | | | | | | | | | | | |
Machinery-Diversified — 0.0% | |
Chart Industries, Inc., | |
Sr. Sec’d. Notes, 144A | |
7.500% | | 01/01/30 | | | | | 175 | | | | 175,726 | |
Deere & Co., | |
Sr. Unsec’d. Notes | |
3.100% | | 04/15/30 | | | | | 10 | | | | 8,965 | |
3.750% | | 04/15/50 | | | | | 10 | | | | 8,477 | |
Westinghouse Air Brake Technologies Corp., | |
Gtd. Notes | |
4.400% | | 03/15/24 | | | | | 35 | | | | 34,427 | |
4.950% | | 09/15/28 | | | | | 30 | | | | 28,835 | |
| | | | | | | | | | | | |
| | | | |
| | | | | | | | | | | 256,430 | |
| | | | | | | | | | | | |
Media — 1.7% | |
CCO Holdings LLC/CCO Holdings Capital Corp., | |
Sr. Unsec’d. Notes | |
4.500% | | 05/01/32 | | | | | 450 | | | | 358,201 | |
Sr. Unsec’d. Notes, 144A | |
4.500% | | 08/15/30 | | | | | 5 | | | | 4,140 | |
4.750% | | 03/01/30 | | | | | 8 | | | | 6,909 | |
5.375% | | 06/01/29(a) | | | | | 800 | | | | 723,140 | |
5.500% | | 05/01/26(a) | | | | | 1,650 | | | | 1,597,981 | |
Charter Communications Operating LLC/Charter Communications Operating Capital, | |
Sr. Sec’d. Notes | |
2.250% | | 01/15/29 | | | | | 10 | | | | 8,038 | |
2.800% | | 04/01/31 | | | | | 100 | | | | 77,750 | |
3.500% | | 06/01/41 | | | | | 45 | | | | 29,593 | |
3.500% | | 03/01/42 | | | | | 50 | | | | 32,305 | |
3.950% | | 06/30/62 | | | | | 10 | | | | 5,908 | |
4.200% | | 03/15/28 | | | | | 30 | | | | 27,560 | |
4.500% | | 02/01/24 | | | | | 30 | | | | 29,638 | |
4.908% | | 07/23/25 | | | | | 65 | | | | 63,746 | |
5.050% | | 03/30/29 | | | | | 85 | | | | 79,924 | |
5.375% | | 05/01/47 | | | | | 20 | | | | 15,759 | |
5.750% | | 04/01/48 | | | | | 20 | | | | 16,448 | |
6.384% | | 10/23/35 | | | | | 2,487 | | | | 2,428,815 | |
SEE NOTES TO FINANCIAL STATEMENTS.
A184
| | | | |
| | PSF PGIM TOTAL RETURN BOND PORTFOLIO (CONTINUED) | | |
SCHEDULE OF INVESTMENTS | | | | as of December 31, 2022 |
| | | | | | | | | | | | |
Interest Rate | | Maturity Date | | | | Principal
Amount
(000)# | | | Value | |
| | | | | | | | | | | |
|
CORPORATE BONDS (continued) | |
Media (cont’d.) | | | | | |
6.484% | | 10/23/45 | | | | | 1,140 | | | $ | 1,033,132 | |
Comcast Corp., | |
Gtd. Notes | |
2.350% | | 01/15/27 | | | | | 30 | | | | 27,301 | |
2.650% | | 02/01/30 | | | | | 10 | | | | 8,634 | |
2.650% | | 08/15/62 | | | | | 17 | | | | 9,698 | |
2.937% | | 11/01/56 | | | | | 26 | | | | 16,308 | |
3.150% | | 02/15/28 | | | | | 80 | | | | 73,932 | |
3.250% | | 11/01/39 | | | | | 35 | | | | 27,321 | |
3.900% | | 03/01/38 | | | | | 25 | | | | 21,674 | |
3.999% | | 11/01/49 | | | | | 85 | | | | 67,707 | |
4.000% | | 03/01/48 | | | | | 40 | | | | 32,207 | |
4.150% | | 10/15/28 | | | | | 50 | | | | 48,057 | |
Cox Communications, Inc., | |
Gtd. Notes, 144A | |
2.950% | | 10/01/50 | | | | | 60 | | | | 35,988 | |
Sr. Unsec’d. Notes, 144A | |
3.150% | | 08/15/24 | | | | | 965 | | | | 929,039 | |
3.500% | | 08/15/27 | | | | | 65 | | | | 60,280 | |
CSC Holdings LLC, | |
Gtd. Notes, 144A | |
3.375% | | 02/15/31 | | | | | 1,000 | | | | 652,349 | |
5.500% | | 04/15/27(a) | | | | | 650 | | | | 547,013 | |
Sr. Unsec’d. Notes, 144A | |
4.625% | | 12/01/30 | | | | | 1,000 | | | | 550,289 | |
Diamond Sports Group LLC/Diamond Sports Finance Co., | |
Gtd. Notes, 144A (original cost $401,250; purchased 07/18/19 - 09/21/20)(f) | |
6.625% | | 08/15/27 | | | | | 520 | | | | 5,816 | |
Sec’d. Notes, 144A (original cost $1,322,435; purchased 07/18/19 - 08/30/22)(f) | |
5.375% | | 08/15/26 | | | | | 3,180 | | | | 378,607 | |
Discovery Communications LLC, | |
Gtd. Notes | |
5.300% | | 05/15/49 | | | | | 275 | | | | 208,438 | |
DISH DBS Corp., | |
Gtd. Notes | |
5.000% | | 03/15/23 | | | | | 1,100 | | | | 1,094,990 | |
7.375% | | 07/01/28 | | | | | 400 | | | | 282,720 | |
Fox Corp., | |
Sr. Unsec’d. Notes | |
3.050% | | 04/07/25 | | | | | 5 | | | | 4,785 | |
4.030% | | 01/25/24 | | | | | 30 | | | | 29,641 | |
NBCUniversal Media LLC, | |
Gtd. Notes | |
4.450% | | 01/15/43 | | | | | 10 | | | | 8,772 | |
Sirius XM Radio, Inc., | |
Gtd. Notes, 144A | |
3.125% | | 09/01/26 | | | | | 15 | | | | 13,318 | |
4.000% | | 07/15/28 | | | | | 15 | | | | 13,022 | |
TCI Communications, Inc., | |
Sr. Unsec’d. Notes | |
7.875% | | 02/15/26 | | | | | 750 | | | | 812,264 | |
Time Warner Cable LLC, | |
Sr. Sec’d. Notes | |
6.550% | | 05/01/37 | | | | | 40 | | | | 37,932 | |
| | | | | | | | | | | | |
Interest Rate | | Maturity Date | | | | Principal
Amount
(000)# | | | Value | |
| | | | | | | | | | | |
|
CORPORATE BONDS (continued) | |
Media (cont’d.) | |
TPC Holdings, Inc., | |
Sr. Unsec’d. Notes, 144A, Cash coupon N/A or PIK 17.000% | |
17.000% | | 06/18/28 | | | | | 119 | | | $ | 119,235 | |
TWDC Enterprises 18 Corp., | |
Gtd. Notes, MTN | |
1.850% | | 07/30/26 | | | | | 30 | | | | 27,136 | |
Univision Communications, Inc., | |
Sr. Sec’d. Notes, 144A | |
5.125% | | 02/15/25 | | | | | 1,175 | | | | 1,119,376 | |
6.625% | | 06/01/27 | | | | | 975 | | | | 941,644 | |
Virgin Media Secured Finance PLC (United Kingdom), | |
Sr. Sec’d. Notes | |
4.125% | | 08/15/30 | | | | GBP | 900 | | | | 828,258 | |
4.250% | | 01/15/30 | | | | GBP | 800 | | | | 749,631 | |
Walt Disney Co. (The), | |
Gtd. Notes | |
3.800% | | 03/22/30 | | | | | 85 | | | | 79,108 | |
6.400% | | 12/15/35 | | | | | 31 | | | | 33,914 | |
7.625% | | 11/30/28 | | | | | 500 | | | | 563,288 | |
Ziggo BV (Netherlands), | |
Sr. Sec’d. Notes | |
2.875% | | 01/15/30 | | | | EUR | 1,910 | | | | 1,634,818 | |
| | | | | | | | | | | | |
| | | | |
| | | | | | | | | | | 18,633,497 | |
| | | | | | | | | | | | |
Mining — 0.2% | |
Barrick North America Finance LLC (Canada), | |
Gtd. Notes | |
5.700% | | 05/30/41 | | | | | 10 | | | | 10,058 | |
5.750% | | 05/01/43 | | | | | 420 | | | | 424,797 | |
BHP Billiton Finance USA Ltd. (Australia), | |
Gtd. Notes | |
6.420% | | 03/01/26 | | | | | 120 | | | | 125,325 | |
First Quantum Minerals Ltd. (Zambia), | |
Gtd. Notes, 144A | |
6.500% | | 03/01/24 | | | | | 525 | | | | 514,694 | |
FMG Resources August 2006 Pty Ltd. (Australia), | |
Gtd. Notes, 144A | |
4.375% | | 04/01/31 | | | | | 25 | | | | 20,781 | |
Freeport Indonesia PT (Indonesia), | |
Sr. Unsec’d. Notes, 144A, MTN | |
5.315% | | 04/14/32 | | | | | 450 | | | | 412,924 | |
Freeport-McMoRan, Inc., | |
Gtd. Notes | |
3.875% | | 03/15/23 | | | | | 20 | | | | 19,959 | |
5.450% | | 03/15/43 | | | | | 20 | | | | 18,025 | |
Glencore Canada Corp. (Switzerland), | |
Gtd. Notes | |
6.200% | | 06/15/35 | | | | | 50 | | | | 48,052 | |
Glencore Funding LLC (Australia), | |
Gtd. Notes, 144A | |
2.625% | | 09/23/31 | | | | | 25 | | | | 19,930 | |
3.875% | | 04/27/51 | | | | | 25 | | | | 18,076 | |
4.125% | | 03/12/24 | | | | | 15 | | | | 14,742 | |
Kinross Gold Corp. (Canada), | |
Gtd. Notes | |
4.500% | | 07/15/27 | | | | | 25 | | | | 23,660 | |
5.950% | | 03/15/24 | | | | | 50 | | | | 50,061 | |
SEE NOTES TO FINANCIAL STATEMENTS.
A185
| | | | |
| | PSF PGIM TOTAL RETURN BOND PORTFOLIO (CONTINUED) | | |
SCHEDULE OF INVESTMENTS | | | | as of December 31, 2022 |
| | | | | | | | | | | | |
Interest Rate | | Maturity Date | | | | Principal
Amount
(000)# | | | Value | |
| | | | | | | | | | | |
|
CORPORATE BONDS (continued) | |
Mining (cont’d.) | | | | | |
Newmont Corp., | |
Gtd. Notes | |
2.250% | | 10/01/30 | | | | | 5 | | | $ | 4,019 | |
2.800% | | 10/01/29 | | | | | 30 | | | | 25,566 | |
Southern Copper Corp. (Mexico), | |
Sr. Unsec’d. Notes | |
3.875% | | 04/23/25 | | | | | 50 | | | | 48,551 | |
Teck Resources Ltd. (Canada), | |
Sr. Unsec’d. Notes | |
3.900% | | 07/15/30 | | | | | 30 | | | | 26,978 | |
Yamana Gold, Inc. (Canada), | |
Gtd. Notes | |
4.625% | | 12/15/27 | | | | | 45 | | | | 41,793 | |
| | | | | | | | | | | | |
| | | | |
| | | | | | | | | | | 1,867,991 | |
| | | | | | | | | | | | |
Miscellaneous Manufacturing — 0.0% | |
Carlisle Cos., Inc., | |
Sr. Unsec’d. Notes | |
2.200% | | 03/01/32 | | | | | 15 | | | | 11,404 | |
General Electric Co., | |
Sr. Unsec’d. Notes, MTN, 3 Month LIBOR + 0.380% | |
4.912%(c) | | 05/05/26 | | | | | 95 | | | | 91,290 | |
Hillenbrand, Inc., | | | | | |
Gtd. Notes | |
5.000% | | 09/15/26 | | | | | 100 | | | | 96,453 | |
Pentair Finance Sarl, | |
Gtd. Notes | |
4.500% | | 07/01/29 | | | | | 50 | | | | 46,272 | |
Teledyne Technologies, Inc., | |
Gtd. Notes | |
2.750% | | 04/01/31 | | | | | 60 | | | | 49,151 | |
Textron, Inc., | |
Sr. Unsec’d. Notes | |
2.450% | | 03/15/31 | | | | | 64 | | | | 51,263 | |
| | | | | | | | | | | | |
| | | | |
| | | | | | | | | | | 345,833 | |
| | | | | | | | | | | | |
Multi-National — 0.1% | |
Inter-American Development Bank (Supranational Bank), | |
Unsec’d. Notes | | | | | |
6.950% | | 08/01/26 | | | | | 1,500 | | | | 1,620,352 | |
| | | | | | | | | | | | |
Office/Business Equipment — 0.0% | |
CDW LLC/CDW Finance Corp., | |
Gtd. Notes | |
2.670% | | 12/01/26 | | | | | 20 | | | | 17,784 | |
3.276% | | 12/01/28 | | | | | 25 | | | | 21,453 | |
5.500% | | 12/01/24 | | | | | 14 | | | | 13,950 | |
| | | | | | | | | | | | |
| | | | |
| | | | | | | | | | | 53,187 | |
| | | | | | | | | | | | |
Oil & Gas — 2.2% | |
Aker BP ASA (Norway), | |
Gtd. Notes, 144A | |
3.100% | | 07/15/31 | | | | | 705 | | | | 573,533 | |
Ascent Resources Utica Holdings LLC/ARU Finance Corp., | |
Gtd. Notes, 144A | |
7.000% | | 11/01/26 | | | | | 350 | | | | 340,755 | |
9.000% | | 11/01/27 | | | | | 179 | | | | 218,542 | |
| | | | | | | | | | | | |
Interest Rate | | Maturity Date | | | | Principal
Amount
(000)# | | | Value | |
| | | | | | | | | | | |
|
CORPORATE BONDS (continued) | |
Oil & Gas (cont’d.) | |
Sr. Unsec’d. Notes, 144A | |
8.250% | | 12/31/28 | | | | | 450 | | | $ | 441,623 | |
BP Capital Markets America, Inc., | |
Gtd. Notes | |
1.749% | | 08/10/30 | | | | | 10 | | | | 7,978 | |
2.772% | | 11/10/50 | | | | | 145 | | | | 92,644 | |
2.939% | | 06/04/51 | | | | | 1,845 | | | | 1,218,119 | |
3.000% | | 02/24/50 | | | | | 60 | | | | 40,704 | |
3.060% | | 06/17/41 | | | | | 7 | | | | 5,220 | |
3.379% | | 02/08/61 | | | | | 5 | | | | 3,457 | |
4.234% | | 11/06/28 | | | | | 50 | | | | 48,414 | |
Canadian Natural Resources Ltd. (Canada), | |
Sr. Unsec’d. Notes | |
2.950% | | 07/15/30 | | | | | 10 | | | | 8,420 | |
Cenovus Energy, Inc. (Canada), | |
Sr. Unsec’d. Notes | |
3.750% | | 02/15/52 | | | | | 340 | | | | 238,772 | |
5.250% | | 06/15/37 | | | | | 30 | | | | 27,398 | |
5.400% | | 06/15/47 | | | | | 1,030 | | | | 930,157 | |
Chevron Corp., | |
Sr. Unsec’d. Notes | |
2.954% | | 05/16/26 | | | | | 20 | | | | 18,979 | |
3.078% | | 05/11/50 | | | | | 10 | | | | 7,273 | |
Chevron USA, Inc., | |
Gtd. Notes | |
1.018% | | 08/12/27 | | | | | 10 | | | | 8,579 | |
2.343% | | 08/12/50 | | | | | 10 | | | | 6,262 | |
3.850% | | 01/15/28 | | | | | 10 | | | | 9,656 | |
3.900% | | 11/15/24 | | | | | 50 | | | | 49,157 | |
Cimarex Energy Co., | |
Sr. Unsec’d. Notes | |
4.375% | | 03/15/29 | | | | | 10 | | | | 7,748 | |
CITGO Petroleum Corp., | |
Sr. Sec’d. Notes, 144A | |
7.000% | | 06/15/25 | | | | | 800 | | | | 782,004 | |
Continental Resources, Inc., | |
Gtd. Notes | |
3.800% | | 06/01/24 | | | | | 10 | | | | 9,723 | |
4.500% | | 04/15/23 | | | | | 5 | | | | 4,982 | |
Gtd. Notes, 144A | |
2.268% | | 11/15/26 | | | | | 10 | | | | 8,672 | |
Devon Energy Corp., | |
Sr. Unsec’d. Notes | |
4.500% | | 01/15/30 | | | | | 6 | | | | 5,598 | |
4.750% | | 05/15/42 | | | | | 6 | | | | 5,093 | |
5.250% | | 09/15/24 | | | | | 2 | | | | 2,000 | |
5.250% | | 10/15/27 | | | | | 15 | | | | 14,900 | |
5.600% | | 07/15/41 | | | | | 870 | | | | 812,820 | |
5.850% | | 12/15/25 | | | | | 30 | | | | 30,574 | |
Devon OEI Operating LLC, | |
Sr. Unsec’d. Notes | |
7.500% | | 09/15/27 | | | | | 20 | | | | 21,635 | |
Diamondback Energy, Inc., | |
Gtd. Notes | |
3.125% | | 03/24/31 | | | | | 25 | | | | 20,722 | |
3.250% | | 12/01/26 | | | | | 20 | | | | 18,632 | |
SEE NOTES TO FINANCIAL STATEMENTS.
A186
| | | | |
| | PSF PGIM TOTAL RETURN BOND PORTFOLIO (CONTINUED) | | |
SCHEDULE OF INVESTMENTS | | | | as of December 31, 2022 |
| | | | | | | | | | | | |
Interest Rate | | Maturity Date | | | | Principal
Amount
(000)# | | | Value | |
| | | | | | | | | | | |
| |
CORPORATE BONDS (continued) | | | | | |
Oil & Gas (cont’d.) | | | | | |
Ecopetrol SA (Colombia), | |
Sr. Unsec’d. Notes | |
5.875% | | 09/18/23 | | | | | 1,195 | | | $ | 1,185,440 | |
6.875% | | 04/29/30 | | | | | 497 | | | | 449,785 | |
Endeavor Energy Resources LP/EER Finance, Inc., | |
Sr. Unsec’d. Notes, 144A | |
5.750% | | 01/30/28 | | | | | 1,300 | | | | 1,244,774 | |
Energean Israel Finance Ltd. (Israel), | |
Sr. Sec’d. Notes, 144A | |
4.500% | | 03/30/24 | | | | | 500 | | | | 481,500 | |
4.875% | | 03/30/26 | | | | | 547 | | | | 501,975 | |
5.375% | | 03/30/28 | | | | | 890 | | | | 793,101 | |
EOG Resources, Inc., | |
Sr. Unsec’d. Notes | |
4.375% | | 04/15/30 | | | | | 15 | | | | 14,520 | |
EQT Corp., | |
Sr. Unsec’d. Notes, 144A | |
3.125% | | 05/15/26 | | | | | 10 | | | | 9,207 | |
Equinor ASA (Norway), | |
Gtd. Notes | |
1.750% | | 01/22/26 | | | | | 10 | | | | 9,140 | |
Exxon Mobil Corp., | |
Sr. Unsec’d. Notes | |
2.992% | | 03/19/25 | | | | | 15 | | | | 14,459 | |
3.452% | | 04/15/51 | | | | | 25 | | | | 18,950 | |
3.482% | | 03/19/30 | | | | | 10 | | | | 9,316 | |
Helmerich & Payne, Inc., | |
Sr. Unsec’d. Notes | |
2.900% | | 09/29/31 | | | | | 25 | | | | 20,241 | |
Hess Corp., | |
Sr. Unsec’d. Notes | |
4.300% | | 04/01/27 | | | | | 45 | | | | 43,067 | |
5.600% | | 02/15/41 | | | | | 15 | | | | 14,203 | |
7.300% | | 08/15/31 | | | | | 5 | | | | 5,435 | |
KazMunayGas National Co. JSC (Kazakhstan), | |
Sr. Unsec’d. Notes, 144A | |
4.750% | | 04/24/25 | | | | | 1,160 | | | | 1,116,717 | |
4.750% | | 04/19/27 | | | | | 200 | | | | 182,725 | |
Marathon Petroleum Corp., | |
Sr. Unsec’d. Notes | |
5.125% | | 12/15/26 | | | | | 50 | | | | 49,804 | |
MEG Energy Corp. (Canada), | |
Gtd. Notes, 144A | |
7.125% | | 02/01/27(a) | | | | | 425 | | | | 432,969 | |
Occidental Petroleum Corp., | |
Sr. Unsec’d. Notes | |
6.450% | | 09/15/36 | | | | | 945 | | | | 964,085 | |
Petrobras Global Finance BV (Brazil), | |
Gtd. Notes | |
6.250% | | 03/17/24 | | | | | 30 | | | | 30,090 | |
6.625% | | 01/16/34 | | | | GBP | 680 | | | | 711,515 | |
Petroleos Mexicanos (Mexico), | |
Gtd. Notes | |
4.750% | | 02/26/29 | | | | EUR | 394 | | | | 329,709 | |
5.350% | | 02/12/28 | | | | | 157 | | | | 132,037 | |
5.950% | | 01/28/31 | | | | | 20 | | | | 15,120 | |
6.490% | | 01/23/27 | | | | | 1,550 | | | | 1,415,150 | |
| | | | | | | | | | | | |
Interest Rate | | Maturity Date | | | | Principal
Amount
(000)# | | | Value | |
| | | | | | | | | | | |
| |
CORPORATE BONDS (continued) | | | | | |
Oil & Gas (cont’d.) | |
6.500% | | 03/13/27 | | | | | 1,753 | | | $ | 1,593,039 | |
6.500% | | 01/23/29(a) | | | | | 700 | | | | 597,702 | |
6.700% | | 02/16/32 | | | | | 16 | | | | 12,540 | |
6.840% | | 01/23/30 | | | | | 306 | | | | 253,062 | |
Gtd. Notes, EMTN | |
3.750% | | 02/21/24 | | | | EUR | 400 | | | | 418,760 | |
4.875% | | 02/21/28 | | | | EUR | 1,530 | | | | 1,337,152 | |
Phillips 66, | |
Gtd. Notes | |
1.300% | | 02/15/26 | | | | | 22 | | | | 19,669 | |
2.150% | | 12/15/30 | | | | | 53 | | | | 42,386 | |
Phillips 66 Co., | |
Gtd. Notes, 144A | |
2.450% | | 12/15/24 | | | | | 50 | | | | 47,038 | |
4.680% | | 02/15/45 | | | | | 1,900 | | | | 1,652,273 | |
Pioneer Natural Resources Co., | |
Sr. Unsec’d. Notes | |
0.550% | | 05/15/23 | | | | | 55 | | | | 54,089 | |
1.125% | | 01/15/26 | | | | | 25 | | | | 22,278 | |
1.900% | | 08/15/30 | | | | | 795 | | | | 623,824 | |
2.150% | | 01/15/31 | | | | | 5 | | | | 3,966 | |
QatarEnergy Trading LLC (Qatar), | |
Sr. Unsec’d. Notes, 144A | |
1.375% | | 09/12/26 | | | | | 200 | | | | 176,788 | |
3.125% | | 07/12/41 | | | | | 640 | | | | 489,320 | |
Shell International Finance BV (Netherlands), | |
Gtd. Notes | |
3.250% | | 04/06/50 | | | | | 10 | | | | 7,276 | |
4.000% | | 05/10/46 | | | | | 20 | | | | 16,509 | |
TotalEnergies Capital International SA (France), | |
Gtd. Notes | |
3.127% | | 05/29/50 | | | | | 4 | | | | 2,837 | |
Transocean, Inc., | |
Gtd. Notes, 144A | |
8.000% | | 02/01/27 | | | | | 125 | | | | 101,469 | |
Valero Energy Corp., | |
Sr. Unsec’d. Notes | |
2.150% | | 09/15/27(a) | | | | | 845 | | | | 741,278 | |
| | | | | | | | | | | | |
| | | | |
| | | | | | | | | | | 24,449,034 | |
| | | | | | | | | | | | |
Oil & Gas Services — 0.0% | |
Cameron International Corp., | |
Gtd. Notes | |
7.000% | | 07/15/38 | | | | | 450 | | | | 442,831 | |
Halliburton Co., | |
Sr. Unsec’d. Notes | |
2.920% | | 03/01/30 | | | | | 6 | | | | 5,153 | |
3.800% | | 11/15/25 | | | | | 8 | | | | 7,780 | |
| | | | | | | | | | | | |
| | | | |
| | | | | | | | | | | 455,764 | |
| | | | | | | | | | | | |
Packaging & Containers — 0.1% | |
Amcor Flexibles North America, Inc., | |
Gtd. Notes | |
2.630% | | 06/19/30 | | | | | 55 | | | | 44,651 | |
Berry Global, Inc., | |
Sr. Sec’d. Notes | |
1.570% | | 01/15/26 | | | | | 90 | | | | 80,362 | |
SEE NOTES TO FINANCIAL STATEMENTS.
A187
| | | | |
| | PSF PGIM TOTAL RETURN BOND PORTFOLIO (CONTINUED) | | |
SCHEDULE OF INVESTMENTS | | | | as of December 31, 2022 |
| | | | | | | | | | | | |
Interest Rate | | Maturity Date | | | | Principal
Amount
(000)# | | | Value | |
| | | | | | | | | | | |
|
CORPORATE BONDS (continued) | |
Packaging & Containers (cont’d.) | | | | | |
Sr. Sec’d. Notes, 144A | |
4.875% | | 07/15/26 | | | | | 20 | | | $ | 19,315 | |
Graphic Packaging International LLC, | |
Gtd. Notes | |
4.125% | | 08/15/24 | | | | | 575 | | | | 562,355 | |
Sr. Sec’d. Notes, 144A | |
1.512% | | 04/15/26 | | | | | 30 | | | | 26,200 | |
WRKCo, Inc., | |
Gtd. Notes | |
3.000% | | 06/15/33 | | | | | 5 | | | | 3,990 | |
3.900% | | 06/01/28 | | | | | 16 | | | | 14,755 | |
4.650% | | 03/15/26 | | | | | 25 | | | | 24,606 | |
4.900% | | 03/15/29 | | | | | 15 | | | | 14,437 | |
| | | | | | | | | | | | |
| | | | |
| | | | | | | | | | | 790,671 | |
| | | | | | | | | | | | |
Pharmaceuticals — 2.2% | | | | | |
AbbVie, Inc., | |
Sr. Unsec’d. Notes | |
2.950% | | 11/21/26 | | | | | 300 | | | | 279,555 | |
3.200% | | 11/21/29 | | | | | 59 | | | | 53,196 | |
3.800% | | 03/15/25 | | | | | 1,040 | | | | 1,013,816 | |
4.050% | | 11/21/39 | | | | | 5,170 | | | | 4,427,689 | |
4.250% | | 11/14/28 | | | | | 50 | | | | 48,346 | |
4.300% | | 05/14/36 | | | | | 10 | | | | 9,040 | |
4.500% | | 05/14/35 | | | | | 1,715 | | | | 1,596,582 | |
4.550% | | 03/15/35 | | | | | 2,040 | | | | 1,907,052 | |
4.875% | | 11/14/48 | | | | | 35 | | | | 32,229 | |
Astrazeneca Finance LLC (United Kingdom), | |
Gtd. Notes | |
2.250% | | 05/28/31 | | | | | 8 | | | | 6,640 | |
AstraZeneca PLC (United Kingdom), | |
Sr. Unsec’d. Notes | |
0.700% | | 04/08/26 | | | | | 45 | | | | 39,648 | |
Bausch Health Americas, Inc., | |
Gtd. Notes, 144A | |
8.500% | | 01/31/27 | | | | | 320 | | | | 168,019 | |
Bausch Health Cos., Inc., | |
Gtd. Notes, 144A | |
5.000% | | 01/30/28 | | | | | 430 | | | | 208,602 | |
5.000% | | 02/15/29 | | | | | 250 | | | | 120,000 | |
5.250% | | 01/30/30 | | | | | 325 | | | | 155,327 | |
5.250% | | 02/15/31 | | | | | 225 | | | | 108,508 | |
6.250% | | 02/15/29 | | | | | 1,150 | | | | 554,875 | |
Becton, Dickinson & Co., | |
Sr. Unsec’d. Notes | |
1.957% | | 02/11/31 | | | | | 20 | | | | 15,802 | |
3.700% | | 06/06/27 | | | | | 136 | | | | 128,650 | |
3.794% | | 05/20/50 | | | | | 27 | | | | 20,761 | |
4.685% | | 12/15/44 | | | | | 9 | | | | 8,009 | |
Bristol-Myers Squibb Co., | |
Sr. Unsec’d. Notes | |
2.350% | | 11/13/40 | | | | | 10 | | | | 6,864 | |
4.125% | | 06/15/39 | | | | | 470 | | | | 419,017 | |
Cigna Corp., | |
Gtd. Notes | |
3.250% | | 04/15/25 | | | | | 20 | | | | 19,264 | |
3.875% | | 10/15/47 | | | | | 20 | | | | 15,437 | |
| | | | | | | | | | | | |
Interest Rate | | Maturity Date | | | | Principal
Amount
(000)# | | | Value | |
| | | | | | | | | | | |
|
CORPORATE BONDS (continued) | |
Pharmaceuticals (cont’d.) | | | | | |
4.125% | | 11/15/25 | | | | | 45 | | | $ | 44,003 | |
4.375% | | 10/15/28 | | | | | 1,390 | | | | 1,340,826 | |
4.500% | | 02/25/26 | | | | | 3,690 | | | | 3,636,503 | |
Sr. Unsec’d. Notes | |
2.400% | | 03/15/30 | | | | | 140 | | | | 117,313 | |
3.200% | | 03/15/40 | | | | | 460 | | | | 347,969 | |
CVS Health Corp., | |
Sr. Unsec’d. Notes | |
1.750% | | 08/21/30 | | | | | 60 | | | | 47,165 | |
2.125% | | 09/15/31 | | | | | 40 | | | | 31,700 | |
2.625% | | 08/15/24 | | | | | 100 | | | | 96,010 | |
2.700% | | 08/21/40 | | | | | 480 | | | | 328,813 | |
3.000% | | 08/15/26 | | | | | 12 | | | | 11,207 | |
3.625% | | 04/01/27 | | | | | 50 | | | | 47,456 | |
3.750% | | 04/01/30 | | | | | 110 | | | | 99,831 | |
4.300% | | 03/25/28 | | | | | 98 | | | | 94,791 | |
4.780% | | 03/25/38 | | | | | 290 | | | | 265,718 | |
Johnson & Johnson, | |
Sr. Unsec’d. Notes | |
2.100% | | 09/01/40 | | | | | 10 | | | | 6,868 | |
Merck & Co., Inc., | |
Sr. Unsec’d. Notes | |
1.450% | | 06/24/30 | | | | | 25 | | | | 19,949 | |
2.350% | | 06/24/40 | | | | | 10 | | | | 6,977 | |
2.750% | | 12/10/51 | | | | | 15 | | | | 10,096 | |
Mylan, Inc., | |
Gtd. Notes | |
5.200% | | 04/15/48 | | | | | 890 | | | | 666,367 | |
Novartis Capital Corp. (Switzerland), | |
Gtd. Notes | |
2.750% | | 08/14/50 | | | | | 10 | | | | 6,958 | |
Pfizer, Inc., | |
Sr. Unsec’d. Notes | |
3.000% | | 12/15/26 | | | | | 20 | | | | 18,958 | |
Shire Acquisitions Investments Ireland DAC, | |
Gtd. Notes | |
2.875% | | 09/23/23 | | | | | 16 | | | | 15,724 | |
3.200% | | 09/23/26 | | | | | 3,785 | | | | 3,549,562 | |
Takeda Pharmaceutical Co. Ltd. (Japan), | |
Sr. Unsec’d. Notes | |
3.025% | | 07/09/40 | | | | | 525 | | | | 385,505 | |
Utah Acquisition Sub, Inc., | |
Gtd. Notes | |
3.950% | | 06/15/26 | | | | | 30 | | | | 28,038 | |
5.250% | | 06/15/46 | | | | | 185 | | | | 140,178 | |
Viatris, Inc., | |
Gtd. Notes | |
3.850% | | 06/22/40 | | | | | 5 | | | | 3,351 | |
4.000% | | 06/22/50 | | | | | 1,292 | | | | 800,329 | |
Zoetis, Inc., | |
Sr. Unsec’d. Notes | |
3.900% | | 08/20/28 | | | | | 30 | | | | 28,521 | |
| | | | | | | | | | | | |
| | | | |
| | | | | | | | | | | 23,559,614 | |
| | | | | | | | | | | | |
SEE NOTES TO FINANCIAL STATEMENTS.
A188
| | | | |
| | PSF PGIM TOTAL RETURN BOND PORTFOLIO (CONTINUED) | | |
SCHEDULE OF INVESTMENTS | | | | as of December 31, 2022 |
| | | | | | | | | | | | |
Interest Rate | | Maturity
Date | | | | Principal
Amount
(000)# | | | Value | |
| | | | | | | | | | | |
|
CORPORATE BONDS (continued) | |
Pipelines — 1.8% | |
Boardwalk Pipelines LP, | |
Gtd. Notes | |
3.400% | | 02/15/31 | | | | | 1,805 | | | $ | 1,511,136 | |
4.450% | | 07/15/27 | | | | | 60 | | | | 57,026 | |
Cameron LNG LLC, | |
Sr. Sec’d. Notes, 144A | |
2.902% | | 07/15/31 | | | | | 10 | | | | 8,436 | |
3.302% | | 01/15/35 | | | | | 45 | | | | 36,578 | |
3.701% | | 01/15/39 | | | | | 10 | | | | 7,916 | |
Cheniere Energy Partners LP, | |
Gtd. Notes | |
3.250% | | 01/31/32 | | | | | 15 | | | | 11,948 | |
DCP Midstream Operating LP, | |
Gtd. Notes | |
3.250% | | 02/15/32 | | | | | 18 | | | | 14,822 | |
Energy Transfer LP, | |
Jr. Sub. Notes, Series B | |
6.625%(ff) | | 02/15/28(oo) | | | | | 10 | | | | 7,318 | |
Jr. Sub. Notes, Series G | |
7.125%(ff) | | 05/15/30(oo) | | | | | 895 | | | | 747,671 | |
Jr. Sub. Notes, Series H | |
6.500%(ff) | | 11/15/26(a)(oo) | | | | | 1,365 | | | | 1,185,602 | |
Sr. Unsec’d. Notes | |
2.900% | | 05/15/25 | | | | | 5 | | | | 4,711 | |
3.600% | | 02/01/23 | | | | | 13 | | | | 12,972 | |
3.750% | | 05/15/30 | | | | | 60 | | | | 52,894 | |
4.050% | | 03/15/25 | | | | | 50 | | | | 48,449 | |
4.200% | | 04/15/27 | | | | | 120 | | | | 113,258 | |
4.250% | | 04/01/24 | | | | | 5 | | | | 4,909 | |
4.900% | | 02/01/24 | | | | | 10 | | | | 9,877 | |
4.950% | | 06/15/28 | | | | | 20 | | | | 19,318 | |
5.000% | | 05/15/50 | | | | | 293 | | | | 236,543 | |
5.150% | | 03/15/45 | | | | | 55 | | | | 45,660 | |
5.250% | | 04/15/29 | | | | | 25 | | | | 24,238 | |
5.300% | | 04/15/47 | | | | | 120 | | | | 100,395 | |
5.400% | | 10/01/47 | | | | | 60 | | | | 51,068 | |
5.500% | | 06/01/27 | | | | | 50 | | | | 49,694 | |
6.125% | | 12/15/45 | | | | | 90 | | | | 83,458 | |
6.250% | | 04/15/49 | | | | | 1,470 | | | | 1,372,814 | |
6.500% | | 02/01/42 | | | | | 5 | | | | 4,940 | |
Sr. Unsec’d. Notes, Series 05Y | |
4.200% | | 09/15/23 | | | | | 17 | | | | 16,855 | |
Sr. Unsec’d. Notes, Series 20Y | |
5.800% | | 06/15/38 | | | | | 20 | | | | 18,375 | |
Enterprise Products Operating LLC, | |
Gtd. Notes | |
2.800% | | 01/31/30 | | | | | 5 | | | | 4,260 | |
3.125% | | 07/31/29 | | | | | 30 | | | | 26,411 | |
3.300% | | 02/15/53 | | | | | 15 | | | | 10,017 | |
3.700% | | 01/31/51 | | | | | 130 | | | | 94,547 | |
3.950% | | 01/31/60 | | | | | 800 | | | | 581,745 | |
4.150% | | 10/16/28 | | | | | 30 | | | | 28,406 | |
4.250% | | 02/15/48 | | | | | 45 | | | | 36,287 | |
4.800% | | 02/01/49 | | | | | 30 | | | | 25,920 | |
4.850% | | 03/15/44 | | | | | 25 | | | | 21,956 | |
4.900% | | 05/15/46 | | | | | 2,115 | | | | 1,853,170 | |
| | | | | | | | | | | | |
Interest Rate | | Maturity
Date | | | | Principal
Amount
(000)# | | | Value | |
| | | | | | | | | | | |
|
CORPORATE BONDS (continued) | |
Pipelines (cont’d.) | |
Gtd. Notes, Series D | |
6.875% | | 03/01/33 | | | | | 10 | | | $ | 10,928 | |
Fermaca Enterprises S de RL de CV (Mexico), | |
Sr. Sec’d. Notes, 144A | |
6.375% | | 03/30/38 | | | | | 341 | | | | 319,955 | |
Florida Gas Transmission Co. LLC, | |
Sr. Unsec’d. Notes, 144A | |
2.300% | | 10/01/31 | | | | | 30 | | | | 23,007 | |
Kinder Morgan Energy Partners LP, | |
Gtd. Notes | |
4.300% | | 05/01/24 | | | | | 30 | | | | 29,618 | |
4.700% | | 11/01/42 | | | | | 5 | | | | 4,142 | |
5.400% | | 09/01/44 | | | | | 13 | | | | 11,685 | |
7.300% | | 08/15/33 | | | | | 10 | | | | 10,818 | |
Kinder Morgan, Inc., | |
Gtd. Notes | |
1.750% | | 11/15/26 | | | | | 30 | | | | 26,471 | |
3.250% | | 08/01/50 | | | | | 782 | | | | 507,115 | |
3.600% | | 02/15/51 | | | | | 1,178 | | | | 814,343 | |
4.300% | | 06/01/25 | | | | | 30 | | | | 29,450 | |
5.300% | | 12/01/34 | | | | | 23 | | | | 21,529 | |
Gtd. Notes, 144A | |
5.625% | | 11/15/23 | | | | | 37 | | | | 37,004 | |
Magellan Midstream Partners LP, | |
Sr. Unsec’d. Notes | |
4.200% | | 03/15/45 | | | | | 1,000 | | | | 715,408 | |
MPLX LP, | |
Sr. Unsec’d. Notes | |
1.750% | | 03/01/26 | | | | | 85 | | | | 75,878 | |
2.650% | | 08/15/30 | | | | | 30 | | | | 24,340 | |
4.000% | | 02/15/25 | | | | | 55 | | | | 53,296 | |
4.125% | | 03/01/27 | | | | | 50 | | | | 47,333 | |
4.500% | | 04/15/38 | | | | | 970 | | | | 815,269 | |
4.800% | | 02/15/29 | | | | | 40 | | | | 38,259 | |
4.875% | | 06/01/25 | | | | | 10 | | | | 9,885 | |
4.950% | | 03/14/52 | | | | | 15 | | | | 12,317 | |
5.200% | | 03/01/47 | | | | | 115 | | | | 97,761 | |
5.500% | | 02/15/49 | | | | | 40 | | | | 35,383 | |
NGPL PipeCo LLC, | |
Sr. Unsec’d. Notes, 144A | |
4.875% | | 08/15/27 | | | | | 255 | | | | 242,921 | |
Northern Natural Gas Co., | |
Sr. Unsec’d. Notes, 144A | |
3.400% | | 10/16/51 | | | | | 5 | | | | 3,393 | |
Northwest Pipeline LLC, | |
Sr. Unsec’d. Notes | |
7.125% | | 12/01/25 | | | | | 40 | | | | 41,414 | |
ONEOK Partners LP, | |
Gtd. Notes | |
5.000% | | 09/15/23 | | | | | 30 | | | | 29,901 | |
6.850% | | 10/15/37 | | | | | 1,250 | | | | 1,266,142 | |
ONEOK, Inc., | |
Gtd. Notes | |
2.200% | | 09/15/25 | | | | | 50 | | | | 45,918 | |
3.100% | | 03/15/30 | | | | | 75 | | | | 62,932 | |
4.350% | | 03/15/29 | | | | | 100 | | | | 92,730 | |
4.500% | | 03/15/50 | | | | | 2,685 | | | | 2,014,459 | |
SEE NOTES TO FINANCIAL STATEMENTS.
A189
| | | | |
| | PSF PGIM TOTAL RETURN BOND PORTFOLIO (CONTINUED) | | |
SCHEDULE OF INVESTMENTS | | | | as of December 31, 2022 |
| | | | | | | | | | | | |
Interest Rate | | Maturity
Date | | | | Principal
Amount
(000)# | | | Value | |
| | | | | | | | | | | |
|
CORPORATE BONDS (continued) | |
Pipelines (cont’d.) | |
4.950% | | 07/13/47 | | | | | 450 | | | $ | 365,257 | |
Plains All American Pipeline LP/PAA Finance Corp., | |
Sr. Unsec’d. Notes | |
3.550% | | 12/15/29 | | | | | 20 | | | | 17,382 | |
3.850% | | 10/15/23 | | | | | 40 | | | | 39,438 | |
4.650% | | 10/15/25 | | | | | 10 | | | | 9,792 | |
Rockies Express Pipeline LLC, | |
Sr. Unsec’d. Notes, 144A | |
3.600% | | 05/15/25 | | | | | 75 | | | | 70,789 | |
Southern Natural Gas Co. LLC, | |
Sr. Unsec’d. Notes | |
8.000% | | 03/01/32 | | | | | 10 | | | | 10,978 | |
Tallgrass Energy Partners LP/Tallgrass Energy Finance Corp., | |
Gtd. Notes, 144A | |
7.500% | | 10/01/25 | | | | | 1,150 | | | | 1,160,109 | |
Targa Resources Partners LP/Targa Resources Partners Finance Corp., | |
Gtd. Notes | |
5.500% | | 03/01/30 | | | | | 15 | | | | 14,135 | |
Tennessee Gas Pipeline Co. LLC, | |
Gtd. Notes | |
7.000% | | 03/15/27 | | | | | 10 | | | | 10,588 | |
7.000% | | 10/15/28 | | | | | 10 | | | | 10,675 | |
Gtd. Notes, 144A | |
2.900% | | 03/01/30 | | | | | 10 | | | | 8,383 | |
Transcontinental Gas Pipe Line Co. LLC, | |
Sr. Unsec’d. Notes | |
3.250% | | 05/15/30 | | | | | 80 | | | | 69,494 | |
Venture Global Calcasieu Pass LLC, | |
Sr. Sec’d. Notes, 144A | |
3.875% | | 08/15/29 | | | | | 115 | | | | 100,685 | |
4.125% | | 08/15/31 | | | | | 80 | | | | 68,201 | |
Western Midstream Operating LP, | |
Sr. Unsec’d. Notes | |
5.450% | | 04/01/44 | | | | | 575 | | | | 480,252 | |
5.500% | | 02/01/50 | | | | | 5 | | | | 4,134 | |
Williams Cos., Inc. (The), | |
Sr. Unsec’d. Notes | |
2.600% | | 03/15/31 | | | | | 30 | | | | 24,342 | |
3.750% | | 06/15/27 | | | | | 25 | | | | 23,564 | |
4.000% | | 09/15/25 | | | | | 60 | | | | 58,301 | |
4.900% | | 01/15/45 | | | | | 1,200 | | | | 1,020,592 | |
5.300% | | 08/15/52 | | | | | 30 | | | | 27,025 | |
8.750% | | 03/15/32 | | | | | 10 | | | | 11,875 | |
| | | | | | | | | | | | |
| |
| | | | 19,718,595 | |
| | | | | | | | | | | | |
Real Estate — 0.1% | |
Greystar Real Estate Partners LLC, | |
Sr. Sec’d. Notes, 144A | |
5.750% | | 12/01/25 | | | | | 1,200 | | | | 1,172,654 | |
| | | | | | | | | | | | |
Real Estate Investment Trusts (REITs) — 0.7% | |
Alexandria Real Estate Equities, Inc., | |
Gtd. Notes | |
1.875% | | 02/01/33 | | | | | 5 | | | | 3,725 | |
2.000% | | 05/18/32 | | | | | 5 | | | | 3,847 | |
3.800% | | 04/15/26 | | | | | 25 | | | | 24,200 | |
| | | | | | | | | | | | |
Interest Rate | | Maturity
Date | | | | Principal
Amount
(000)# | | | Value | |
| | | | | | | | | | | |
|
CORPORATE BONDS (continued) | |
Real Estate Investment Trusts (REITs) (cont’d.) | |
American Tower Corp., | |
Sr. Unsec’d. Notes | |
1.300% | | 09/15/25 | | | | | 25 | | | $ | 22,567 | |
1.600% | | 04/15/26 | | | | | 50 | | | | 44,466 | |
2.700% | | 04/15/31 | | | | | 90 | | | | 73,200 | |
3.600% | | 01/15/28 | | | | | 17 | | | | 15,640 | |
4.000% | | 06/01/25 | | | | | 75 | | | | 73,022 | |
4.400% | | 02/15/26 | | | | | 25 | | | | 24,380 | |
Brixmor Operating Partnership LP, | |
Sr. Unsec’d. Notes | |
3.900% | | 03/15/27 | | | | | 35 | | | | 32,275 | |
4.050% | | 07/01/30 | | | | | 1,145 | | | | 1,006,397 | |
Camden Property Trust, | |
Sr. Unsec’d. Notes | |
2.800% | | 05/15/30 | | | | | 5 | | | | 4,306 | |
Crown Castle, Inc., | |
Sr. Unsec’d. Notes | |
1.350% | | 07/15/25 | | | | | 25 | | | | 22,730 | |
2.250% | | 01/15/31 | | | | | 75 | | | | 59,976 | |
2.500% | | 07/15/31 | | | | | 35 | | | | 28,189 | |
3.300% | | 07/01/30 | | | | | 30 | | | | 26,209 | |
4.000% | | 03/01/27 | | | | | 10 | | | | 9,523 | |
5.200% | | 02/15/49 | | | | | 10 | | | | 8,987 | |
Diversified Healthcare Trust, | |
Gtd. Notes | |
9.750% | | 06/15/25 | | | �� | | 500 | | | | 479,458 | |
Essex Portfolio LP, | |
Gtd. Notes | |
1.650% | | 01/15/31 | | | | | 25 | | | | 18,620 | |
Global Net Lease, Inc./Global Net Lease Operating Partnership LP, | |
Gtd. Notes, 144A | |
3.750% | | 12/15/27 | | | | | 20 | | | | 16,841 | |
GLP Capital LP/GLP Financing II, Inc., | |
Gtd. Notes | |
3.350% | | 09/01/24 | | | | | 70 | | | | 67,028 | |
4.000% | | 01/15/30 | | | | | 50 | | | | 43,746 | |
4.000% | | 01/15/31 | | | | | 10 | | | | 8,505 | |
5.375% | | 11/01/23 | | | | | 50 | | | | 49,836 | |
5.750% | | 06/01/28 | | | | | 50 | | | | 49,236 | |
Healthpeak Properties, Inc., | |
Sr. Unsec’d. Notes | |
1.350% | | 02/01/27 | | | | | 15 | | | | 13,017 | |
Host Hotels & Resorts LP, | |
Sr. Unsec’d. Notes, Series E | |
4.000% | | 06/15/25 | | | | | 40 | | | | 38,448 | |
Kimco Realty Corp., | |
Sr. Unsec’d. Notes | |
2.250% | | 12/01/31 | | | | | 20 | | | | 15,328 | |
MPT Operating Partnership LP/MPT Finance Corp., | |
Gtd. Notes | |
0.993% | | 10/15/26 | | | | EUR | 675 | | | | 546,657 | |
3.500% | | 03/15/31 | | | | | 925 | | | | 636,371 | |
Necessity Retail REIT, Inc. (The)/American Finance Operating Partner LP, | |
Gtd. Notes, 144A | |
4.500% | | 09/30/28 | | | | | 10 | | | | 7,350 | |
SEE NOTES TO FINANCIAL STATEMENTS.
A190
| | | | |
| | PSF PGIM TOTAL RETURN BOND PORTFOLIO (CONTINUED) | | |
SCHEDULE OF INVESTMENTS | | | | as of December 31, 2022 |
| | | | | | | | | | | | |
Interest Rate | | Maturity
Date | | | | Principal
Amount
(000)# | | | Value | |
| | | | | | | | | | | |
|
CORPORATE BONDS (continued) | |
Real Estate Investment Trusts (REITs) (cont’d.) | |
Prologis LP, | |
Sr. Unsec’d. Notes | |
1.250% | | 10/15/30 | | | | | 10 | | | $ | 7,591 | |
1.750% | | 02/01/31 | | | | | 25 | | | | 19,686 | |
Realty Income Corp., | |
Sr. Unsec’d. Notes | |
1.800% | | 03/15/33 | | | | | 15 | | | | 10,791 | |
2.200% | | 06/15/28 | | | | | 5 | | | | 4,287 | |
2.850% | | 12/15/32 | | | | | 530 | | | | 430,504 | |
3.950% | | 08/15/27 | | | | | 91 | | | | 86,962 | |
4.875% | | 06/01/26 | | | | | 50 | | | | 49,766 | |
Simon Property Group LP, | |
Sr. Unsec’d. Notes | |
2.450% | | 09/13/29 | | | | | 40 | | | | 33,437 | |
3.250% | | 11/30/26 | | | | | 20 | | | | 18,716 | |
Spirit Realty LP, | |
Gtd. Notes | |
2.100% | | 03/15/28 | | | | | 15 | | | | 12,224 | |
2.700% | | 02/15/32 | | | | | 2,190 | | | | 1,623,846 | |
Uniti Group LP/Uniti Fiber Holdings, Inc./CSL Capital LLC, | |
Sr. Sec’d. Notes, 144A | |
7.875% | | 02/15/25 | | | | | 550 | | | | 533,804 | |
Ventas Realty LP, | |
Gtd. Notes | |
3.000% | | 01/15/30 | | | | | 5 | | | | 4,214 | |
VICI Properties LP/VICI Note Co., Inc., | |
Gtd. Notes, 144A | |
3.500% | | 02/15/25 | | | | | 25 | | | | 23,647 | |
4.625% | | 06/15/25 | | | | | 405 | | | | 388,323 | |
Welltower, Inc., | |
Sr. Unsec’d. Notes | |
2.050% | | 01/15/29 | | | | | 15 | | | | 12,186 | |
2.700% | | 02/15/27 | | | | | 25 | | | | 22,520 | |
2.800% | | 06/01/31 | | | | | 35 | | | | 27,883 | |
Weyerhaeuser Co., | |
Sr. Unsec’d. Notes | |
7.375% | | 03/15/32 | | | | | 6 | | | | 6,646 | |
WP Carey, Inc., | |
Sr. Unsec’d. Notes | |
2.250% | | 04/01/33 | | | | | 1,930 | | | | 1,431,336 | |
| | | | | | | | | | | | |
| |
| | | | 8,222,449 | |
| | | | | | | | | | | | |
Retail — 0.6% | |
1011778 BC ULC/New Red Finance, Inc. (Canada), | |
Sec’d. Notes, 144A | |
4.000% | | 10/15/30(a) | | | | | 1,500 | | | | 1,215,675 | |
7-Eleven, Inc., | |
Sr. Unsec’d. Notes, 144A | |
0.950% | | 02/10/26 | | | | | 79 | | | | 69,120 | |
Alimentation Couche-Tard, Inc. (Canada), | |
Sr. Unsec’d. Notes, 144A | |
3.800% | | 01/25/50 | | | | | 20 | | | | 14,183 | |
At Home Group, Inc., | |
Sr. Sec’d. Notes, 144A | |
4.875% | | 07/15/28 | | | | | 275 | | | | 194,307 | |
| | | | | | | | | | | | |
Interest Rate | | Maturity Date | | | | Principal
Amount
(000)# | | | Value | |
| | | | | | | | | | | |
|
CORPORATE BONDS (continued) | |
Retail (cont’d.) | |
AutoNation, Inc., | |
Sr. Unsec’d. Notes | |
4.750% | | 06/01/30 | | | | | 25 | | | $ | 22,371 | |
Dollar Tree, Inc., | |
Sr. Unsec’d. Notes | |
2.650% | | 12/01/31(a) | | | | | 1,340 | | | | 1,081,026 | |
eG Global Finance PLC (United Kingdom), | |
Sr. Sec’d. Notes | |
6.250% | | 10/30/25 | | | | EUR | 1,600 | | | | 1,496,819 | |
Home Depot, Inc. (The), | |
Sr. Unsec’d. Notes | |
2.950% | | 06/15/29 | | | | | 49 | | | | 44,340 | |
3.350% | | 04/15/50 | | | | | 5 | | | | 3,726 | |
3.900% | | 12/06/28 | | | | | 10 | | | | 9,635 | |
4.875% | | 02/15/44 | | | | | 10 | | | | 9,592 | |
Lowe’s Cos., Inc., | |
Sr. Unsec’d. Notes | |
1.300% | | 04/15/28 | | | | | 65 | | | | 53,981 | |
1.700% | | 09/15/28 | | | | | 20 | | | | 16,799 | |
1.700% | | 10/15/30 | | | | | 10 | | | | 7,811 | |
2.800% | | 09/15/41 | | | | | 25 | | | | 17,018 | |
3.650% | | 04/05/29 | | | | | 30 | | | | 27,674 | |
3.700% | | 04/15/46 | | | | | 15 | | | | 11,148 | |
McDonald’s Corp., | |
Sr. Unsec’d. Notes, MTN | |
3.800% | | 04/01/28 | | | | | 30 | | | | 28,701 | |
Nordstrom, Inc., | |
Sr. Unsec’d. Notes | |
2.300% | | 04/08/24 | | | | | 20 | | | | 18,737 | |
O’Reilly Automotive, Inc., | |
Sr. Unsec’d. Notes | |
1.750% | | 03/15/31 | | | | | 2,155 | | | | 1,666,870 | |
QVC, Inc., | |
Sr. Sec’d. Notes | |
4.450% | | 02/15/25 | | | | | 40 | | | | 32,702 | |
Ross Stores, Inc., | |
Sr. Unsec’d. Notes | |
4.600% | | 04/15/25 | | | | | 50 | | | | 49,623 | |
4.700% | | 04/15/27 | | | | | 2 | | | | 1,968 | |
Sally Holdings LLC/Sally Capital, Inc., | |
Gtd. Notes | |
5.625% | | 12/01/25 | | | | | 454 | | | | 437,303 | |
Tractor Supply Co., | |
Sr. Unsec’d. Notes | |
1.750% | | 11/01/30 | | | | | 55 | | | | 42,250 | |
Walmart, Inc., | |
Sr. Unsec’d. Notes | |
1.800% | | 09/22/31 | | | | | 10 | | | | 8,154 | |
2.375% | | 09/24/29 | | | | | 2 | | | | 1,753 | |
2.500% | | 09/22/41 | | | | | 15 | | | | 10,954 | |
4.500% | | 09/09/52 | | | | | 10 | | | | 9,542 | |
| | | | | | | | | | | | |
| |
| | | | 6,603,782 | |
| | | | | | | | | | | | |
Semiconductors — 0.4% | |
Analog Devices, Inc., | |
Sr. Unsec’d. Notes | |
2.800% | | 10/01/41 | | | | | 5 | | | | 3,679 | |
SEE NOTES TO FINANCIAL STATEMENTS.
A191
| | | | |
| | PSF PGIM TOTAL RETURN BOND PORTFOLIO (CONTINUED) | | |
SCHEDULE OF INVESTMENTS | | | | as of December 31, 2022 |
| | | | | | | | | | | | |
Interest Rate | | Maturity
Date | | | | Principal
Amount
(000)# | | | Value | |
| | | | | | | | | | | |
|
CORPORATE BONDS (continued) | |
Semiconductors (cont’d.) | |
2.950% | | 04/01/25 | | | | | 5 | | | $ | 4,802 | |
2.950% | | 10/01/51 | | | | | 30 | | | | 20,290 | |
Broadcom Corp./Broadcom Cayman Finance Ltd., | |
Gtd. Notes | |
3.875% | | 01/15/27 | | | | | 80 | | | | 75,621 | |
Broadcom, Inc., | |
Gtd. Notes | |
4.150% | | 11/15/30 | | | | | 9 | | | | 8,063 | |
Gtd. Notes, 144A | |
2.450% | | 02/15/31 | | | | | 30 | | | | 23,619 | |
Sr. Unsec’d. Notes, 144A | |
3.137% | | 11/15/35 | | | | | 3,006 | | | | 2,205,371 | |
3.419% | | 04/15/33 | | | | | 1,442 | | | | 1,157,467 | |
3.469% | | 04/15/34 | | | | | 50 | | | | 39,642 | |
4.926% | | 05/15/37 | | | | | 100 | | | | 87,403 | |
Intel Corp., | |
Sr. Unsec’d. Notes | |
2.800% | | 08/12/41 | | | | | 5 | | | | 3,485 | |
3.050% | | 08/12/51 | | | | | 15 | | | | 9,749 | |
3.100% | | 02/15/60 | | | | | 10 | | | | 6,237 | |
3.900% | | 03/25/30 | | | | | 20 | | | | 18,765 | |
KLA Corp., | |
Sr. Unsec’d. Notes | |
4.100% | | 03/15/29 | | | | | 50 | | | | 48,380 | |
5.000% | | 03/15/49 | | | | | 50 | | | | 46,767 | |
Lam Research Corp., | |
Sr. Unsec’d. Notes | |
1.900% | | 06/15/30 | | | | | 25 | | | | 20,336 | |
Microchip Technology, Inc., | |
Sr. Unsec’d. Notes | |
0.972% | | 02/15/24 | | | | | 65 | | | | 61,796 | |
NVIDIA Corp., | |
Sr. Unsec’d. Notes | |
1.550% | | 06/15/28 | | | | | 30 | | | | 25,647 | |
3.500% | | 04/01/40 | | | | | 10 | | | | 8,102 | |
NXP BV/NXP Funding LLC (China), | |
Gtd. Notes | |
4.875% | | 03/01/24 | | | | | 75 | | | | 74,334 | |
NXP BV/NXP Funding LLC/NXP USA, Inc. (China), | |
Gtd. Notes | |
2.500% | | 05/11/31 | | | | | 65 | | | | 51,179 | |
2.650% | | 02/15/32 | | | | | 35 | | | | 27,230 | |
3.400% | | 05/01/30 | | | | | 40 | | | | 34,383 | |
4.300% | | 06/18/29 | | | | | 110 | | | | 101,922 | |
Texas Instruments, Inc., | |
Sr. Unsec’d. Notes | |
2.700% | | 09/15/51 | | | | | 5 | | | | 3,469 | |
2.900% | | 11/03/27 | | | | | 10 | | | | 9,314 | |
| | | | | | | | | | | | |
| |
| | | | 4,177,052 | |
| | | | | | | | | | | | |
Shipbuilding — 0.0% | |
Huntington Ingalls Industries, Inc., | |
Gtd. Notes | |
4.200% | | 05/01/30 | | | | | 20 | | | | 18,114 | |
| | | | | | | | | | | | |
| | | | | | | | | | | | |
Interest Rate | | Maturity
Date | | | | Principal
Amount
(000)# | | | Value | |
| | | | | | | | | | | |
|
CORPORATE BONDS (continued) | |
Software — 0.2% | |
Adobe, Inc., | |
Sr. Unsec’d. Notes | |
2.150% | | 02/01/27 | | | | | 20 | | | $ | 18,224 | |
Autodesk, Inc., | |
Sr. Unsec’d. Notes | |
2.400% | | 12/15/31 | | | | | 30 | | | | 24,060 | |
Boxer Parent Co., Inc., | |
Sec’d. Notes, 144A | |
9.125% | | 03/01/26 | | | | | 850 | | | | 803,364 | |
Electronic Arts, Inc., | |
Sr. Unsec’d. Notes | |
1.850% | | 02/15/31 | | | | | 65 | | | | 51,146 | |
Fidelity National Information Services, Inc., | |
Sr. Unsec’d. Notes | |
3.100% | | 03/01/41 | | | | | 10 | | | | 6,925 | |
Fiserv, Inc., | |
Sr. Unsec’d. Notes | |
2.250% | | 06/01/27 | | | | | 21 | | | | 18,751 | |
2.750% | | 07/01/24 | | | | | 50 | | | | 48,226 | |
3.500% | | 07/01/29 | | | | | 40 | | | | 36,045 | |
3.800% | | 10/01/23 | | | | | 15 | | | | 14,845 | |
4.200% | | 10/01/28 | | | | | 40 | | | | 37,860 | |
Microsoft Corp., | |
Sr. Unsec’d. Notes | |
2.400% | | 08/08/26 | | | | | 10 | | | | 9,329 | |
2.525% | | 06/01/50 | | | | | 1,842 | | | | 1,227,523 | |
2.921% | | 03/17/52 | | | | | 89 | | | | 63,411 | |
Oracle Corp., | |
Sr. Unsec’d. Notes | |
1.650% | | 03/25/26 | | | | | 80 | | | | 71,694 | |
2.650% | | 07/15/26 | | | | | 50 | | | | 45,976 | |
2.950% | | 04/01/30 | | | | | 100 | | | | 85,360 | |
3.600% | | 04/01/50 | | | | | 31 | | | | 21,149 | |
3.650% | | 03/25/41 | | | | | 10 | | | | 7,393 | |
3.850% | | 04/01/60 | | | | | 5 | | | | 3,345 | |
3.950% | | 03/25/51 | | | | | 5 | | | | 3,602 | |
4.000% | | 11/15/47 | | | | | 25 | | | | 18,353 | |
Salesforce, Inc., | |
Sr. Unsec’d. Notes | |
1.500% | | 07/15/28 | | | | | 10 | | | | 8,544 | |
VMware, Inc., | |
Sr. Unsec’d. Notes | |
1.800% | | 08/15/28 | | | | | 10 | | | | 8,164 | |
2.200% | | 08/15/31 | | | | | 30 | | | | 22,745 | |
3.900% | | 08/21/27 | | | | | 35 | | | | 32,663 | |
4.700% | | 05/15/30 | | | | | 43 | | | | 40,004 | |
| | | | | | | | | | | | |
| |
| | | | 2,728,701 | |
| | | | | | | | | | | | |
Telecommunications — 1.7% | |
AT&T, Inc., | |
Sr. Unsec’d. Notes | |
1.700% | | 03/25/26 | | | | | 200 | | | | 180,514 | |
2.250% | | 02/01/32 | | | | | 45 | | | | 35,284 | |
2.300% | | 06/01/27 | | | | | 75 | | | | 66,835 | |
2.550% | | 12/01/33 | | | | | 347 | | | | 266,843 | |
2.750% | | 06/01/31 | | | | | 110 | | | | 91,339 | |
3.500% | | 09/15/53 | | | | | 2,881 | | | | 1,960,144 | |
SEE NOTES TO FINANCIAL STATEMENTS.
A192
| | | | |
| | PSF PGIM TOTAL RETURN BOND PORTFOLIO (CONTINUED) | | |
SCHEDULE OF INVESTMENTS | | | | as of December 31, 2022 |
| | | | | | | | | | | | |
Interest Rate | | Maturity
Date | | | | Principal
Amount
(000)# | | | Value | |
| | | | | | | | | | | |
|
CORPORATE BONDS (continued) | |
Telecommunications (cont’d.) | |
3.550% | | 09/15/55 | | | | | 972 | | | $ | 656,507 | |
3.650% | | 09/15/59 | | | | | 180 | | | | 121,854 | |
3.800% | | 12/01/57 | | | | | 13 | | | | 9,010 | |
4.250% | | 03/01/27 | | | | | 10 | | | | 9,734 | |
4.300% | | 02/15/30 | | | | | 545 | | | | 512,508 | |
4.350% | | 03/01/29 | | | | | 45 | | | | 42,826 | |
4.500% | | 05/15/35 | | | | | 900 | | | | 818,565 | |
4.500% | | 03/09/48 | | | | | 10 | | | | 8,139 | |
6.950% | | 01/15/28 | | | | | 10 | | | | 10,519 | |
Deutsche Telekom International Finance BV (Germany), | |
Gtd. Notes | |
8.750% | | 06/15/30 | | | | | 10 | | | | 11,786 | |
Digicel International Finance Ltd./Digicel International Holdings Ltd. (Jamaica), | |
Gtd. Notes, 144A, Cash coupon 6.000% and PIK 7.000% (original cost $556,233; purchased 06/29/21 - 12/15/22)(f) | |
13.000% | | 12/31/25(a) | | | | | 554 | | | | 288,266 | |
Sr. Sec’d. Notes, 144A (original cost $202,500; purchased 07/28/20)(f) | |
8.750% | | 05/25/24 | | | | | 200 | | | | 171,350 | |
Sr. Sec’d. Notes, 144A (original cost $1,009,327; purchased 07/27/20)(f) | |
8.750% | | 05/25/24 | | | | | 997 | | | | 855,311 | |
Digicel Ltd. (Jamaica), | |
Gtd. Notes, 144A (original cost $301,250; purchased 09/11/20 )(f) | |
6.750% | | 03/01/23 | | | | | 500 | | | | 190,000 | |
Level 3 Financing, Inc., | |
Gtd. Notes, 144A | |
3.625% | | 01/15/29 | | | | | 40 | | | | 29,264 | |
Lumen Technologies, Inc., | |
Sr. Unsec’d. Notes, Series P | |
7.600% | | 09/15/39 | | | | | 550 | | | | 374,805 | |
Motorola Solutions, Inc., | |
Sr. Unsec’d. Notes | |
2.300% | | 11/15/30 | | | | | 49 | | | | 38,446 | |
4.600% | | 05/23/29 | | | | | 60 | | | | 56,990 | |
Sprint LLC, | |
Gtd. Notes | |
7.625% | | 02/15/25 | | | | | 2,502 | | | | 2,590,648 | |
7.625% | | 03/01/26 | | | | | 100 | | | | 105,231 | |
7.875% | | 09/15/23 | | | | | 2,000 | | | | 2,029,863 | |
T-Mobile USA, Inc., | |
Gtd. Notes | |
2.250% | | 02/15/26 | | | | | 45 | | | | 40,983 | |
2.250% | | 11/15/31 | | | | | 100 | | | | 78,640 | |
2.550% | | 02/15/31 | | | | | 10 | | | | 8,149 | |
2.625% | | 02/15/29 | | | | | 10 | | | | 8,488 | |
3.300% | | 02/15/51 | | | | | 5 | | | | 3,333 | |
3.750% | | 04/15/27 | | | | | 125 | | | | 117,856 | |
3.875% | | 04/15/30 | | | | | 137 | | | | 124,358 | |
4.375% | | 04/15/40 | | | | | 435 | | | | 373,216 | |
4.500% | | 04/15/50 | | | | | 3,140 | | | | 2,592,695 | |
Verizon Communications, Inc., | |
Sr. Unsec’d. Notes | |
1.500% | | 09/18/30 | | | | | 75 | | | | 58,345 | |
1.680% | | 10/30/30 | | | | | 32 | | | | 24,870 | |
1.750% | | 01/20/31 | | | | | 55 | | | | 42,602 | |
2.100% | | 03/22/28 | | | | | 230 | | | | 199,523 | |
2.355% | | 03/15/32 | | | | | 110 | | | | 87,235 | |
| | | | | | | | | | | | |
Interest Rate | | Maturity
Date | | | | Principal
Amount
(000)# | | | Value | |
| | | | | | | | | | | |
|
CORPORATE BONDS (continued) | |
Telecommunications (cont’d.) | |
2.550% | | 03/21/31 | | | | | 80 | | | $ | 65,840 | |
2.650% | | 11/20/40 | | | | | 3,440 | | | | 2,322,054 | |
2.850% | | 09/03/41 | | | | | 10 | | | | 6,920 | |
2.875% | | 11/20/50 | | | | | 10 | | | | 6,307 | |
3.150% | | 03/22/30 | | | | | 35 | | | | 30,835 | |
3.400% | | 03/22/41 | | | | | 1,185 | | | | 892,372 | |
3.550% | | 03/22/51 | | | | | 90 | | | | 64,427 | |
4.016% | | 12/03/29 | | | | | 140 | | | | 131,019 | |
4.329% | | 09/21/28 | | | | | 115 | | | | 110,697 | |
Vodafone Group PLC (United Kingdom), | |
Sr. Unsec’d. Notes | |
3.750% | | 01/16/24 | | | | | 20 | | | | 19,748 | |
| | | | | | | | | | | | |
| |
| | | | 18,943,093 | |
| | | | | | | | | | | | |
Transportation — 0.1% | |
Burlington Northern Santa Fe LLC, | |
Sr. Unsec’d. Notes | |
3.050% | | 02/15/51 | | | | | 5 | | | | 3,474 | |
3.550% | | 02/15/50 | | | | | 5 | | | | 3,849 | |
4.900% | | 04/01/44 | | | | | 10 | | | | 9,465 | |
CSX Corp., | |
Sr. Unsec’d. Notes | |
3.250% | | 06/01/27 | | | | | 10 | | | | 9,368 | |
3.800% | | 03/01/28 | | | | | 16 | | | | 15,258 | |
FedEx Corp., | |
Gtd. Notes | |
3.100% | | 08/05/29 | | | | | 10 | | | | 8,789 | |
4.250% | | 05/15/30 | | | | | 20 | | | | 18,855 | |
Indian Railway Finance Corp. Ltd. (India), | |
Sr. Unsec’d. Notes, 144A, MTN | |
3.570% | | 01/21/32 | | | | | 480 | | | | 410,923 | |
Kansas City Southern, | |
Gtd. Notes | |
3.500% | | 05/01/50 | | | | | 25 | | | | 17,844 | |
Lima Metro Line 2 Finance Ltd. (Peru), | |
Sr. Sec’d. Notes | |
5.875% | | 07/05/34 | | | | | 95 | | | | 91,652 | |
Norfolk Southern Corp., | |
Sr. Unsec’d. Notes | |
2.900% | | 06/15/26 | | | | | 14 | | | | 13,114 | |
3.800% | | 08/01/28 | | | | | 54 | | | | 51,449 | |
Union Pacific Corp., | |
Sr. Unsec’d. Notes | |
3.750% | | 03/15/24 | | | | | 20 | | | | 19,665 | |
3.799% | | 10/01/51 | | | | | 9 | | | | 7,208 | |
3.950% | | 08/15/59 | | | | | 35 | | | | 27,506 | |
| | | | | | | | | | | | |
| |
| | | | 708,419 | |
| | | | | | | | | | | | |
Trucking & Leasing — 0.0% | |
Penske Truck Leasing Co. LP/PTL Finance Corp., | |
Sr. Unsec’d. Notes, 144A | |
1.200% | | 11/15/25 | | | | | 20 | | | | 17,601 | |
1.700% | | 06/15/26 | | | | | 30 | | | | 26,201 | |
2.700% | | 11/01/24 | | | | | 20 | | | | 18,877 | |
4.000% | | 07/15/25 | | | | | 25 | | | | 23,918 | |
SEE NOTES TO FINANCIAL STATEMENTS.
A193
| | | | |
| | PSF PGIM TOTAL RETURN BOND PORTFOLIO (CONTINUED) | | |
SCHEDULE OF INVESTMENTS | | | | as of December 31, 2022 |
| | | | | | | | | | | | |
Interest Rate | | Maturity Date | | | | Principal
Amount
(000)# | | | Value | |
| | | | | | | | | | | |
|
CORPORATE BONDS (continued) | |
Trucking & Leasing (cont’d.) | | | | | |
4.125% | | 08/01/23 | | | | | 5 | | | $ | 4,956 | |
| | | | | | | | | | | | |
| | | | |
| | | | | | | | | | | 91,553 | |
| | | | | | | | | | | | |
| |
TOTAL CORPORATE BONDS
(cost $441,730,664) | | | | 374,362,229 | |
| | | | | | | | | | | | |
|
FLOATING RATE AND OTHER LOANS — 1.1% | |
Airlines — 0.1% | |
United Airlines, Inc., | | | | | | | | | | |
Class B Term Loan, 3 Month LIBOR + 3.750% | | | | | |
8.108%(c) | | 04/21/28 | | | | | 679 | | | | 667,815 | |
| | | | | | | | | | | | |
Commercial Services — 0.0% | |
Adtalem Global Education, Inc., | | | | | | | | |
Term B Loan, 1 Month LIBOR + 4.000% | | | | | |
8.389%(c) | | 08/12/28 | | | | | 225 | | | | 222,762 | |
| | | | | | | | | | | | |
Computers — 0.2% | |
McAfee Corp., | | | | | | | | | | | | |
Tranche B-1 Term Loan, 1 Month SOFR + 3.750% | | | | | |
7.974%(c) | | 03/01/29 | | | | | 1,343 | | | | 1,247,544 | |
Peraton Corp., | |
First Lien Term B Loan, 1 Month LIBOR + 3.750% | |
8.134%(c) | | 02/01/28 | | | | | 748 | | | | 729,019 | |
| | | | | | | | | | | | |
| | | | |
| | | | | | | | | | | 1,976,563 | |
| | | | | | | | | | | | |
Insurance — 0.1% | |
Asurion LLC, | | | | | | | | | | | | |
New B-7 Term Loan, 1 Month LIBOR + 3.000% | |
7.384%(c) | | 11/03/24 | | | | | 460 | | | | 446,165 | |
New B-9 Term Loan, 1 Month LIBOR + 3.250% | | | | | |
7.634%(c) | | 07/31/27 | | | | | 344 | | | | 299,687 | |
| | | | | | | | | | | | |
| | | | |
| | | | | | | | | | | 745,852 | |
| | | | | | | | | | | | |
Media — 0.1% | | | | | |
CSC Holdings LLC, | |
2017 Refinancing Term Loan, 1 Month LIBOR + 2.250% | |
6.575%(c) | | 07/17/25 | | | | | 186 | | | | 175,303 | |
September 2019 Term Loan, 1 Month LIBOR + 2.500% | |
6.818%(c) | | 04/15/27 | | | | | 766 | | | | 681,929 | |
Diamond Sports Group LLC, | |
First Lien Term Loan, 1 Month SOFR + 8.100% | |
12.317%(c) | | 05/25/26^ | | | | | 145 | | | | 134,975 | |
Second Lien Term loan, 1 Month SOFR + 3.350% | |
7.567%(c) | | 08/24/26 | | | | | 1,959 | | | | 236,690 | |
iHeartCommunications, Inc., | |
New Term Loan, 1 Month LIBOR + 3.000% | |
7.384%(c) | | 05/01/26 | | | | | 313 | | | | 286,038 | |
| | | | | | | | | | | | |
| | | | |
| | | | | | | | | | | 1,514,935 | |
| | | | | | | | | | | | |
Metal Fabricate/Hardware — 0.1% | |
Tank Holding Corp., | |
Term Loan, 1 Month SOFR + 5.850% | |
10.173%(c) | | 03/31/28 | | | | | 1,418 | | | | 1,339,892 | |
| | | | | | | | | | | | |
Oil & Gas — 0.0% | |
Ascent Resources Utica Holdings LLC, | |
Second Lien Term Loan, 3 Month LIBOR + 9.000% | |
12.941%(c) | | 11/01/25 | | | | | 388 | | | | 408,370 | |
| | | | | | | | | | | | |
| | | | | | | | | | | | |
Interest Rate | | Maturity Date | | | | Principal
Amount
(000)# | | | Value | |
| | | | | | | | | | | |
|
FLOATING RATE AND OTHER LOANS (continued) | |
Real Estate Investment Trusts (REITs) — 0.1% | |
Blackstone Mortgage Trust, Inc., | |
Term Loan, 1 Month LIBOR + 2.250% | |
6.634%(c) | | 04/23/26 | | | | | 490 | | | $ | 477,014 | |
| | | | | | | | | | | | |
Retail — 0.3% | |
EG Group Ltd. (United Kingdom), | |
Additional Second Lien Loan Facility, 6 Month EURIBOR + 7.000% | |
9.752%(c) | | 04/30/27 | | | | EUR | 3,500 | | | | 3,193,955 | |
| | | | | | | | | | | | |
Telecommunications — 0.1% | |
CenturyLink, Inc., | |
Term B Loan, 1 Month LIBOR + 2.250% | |
6.634%(c) | | 03/15/27 | | | | | 396 | | | | 375,001 | |
Digicel International Finance Ltd. (Saint Lucia), | |
First Lien Initial Term B Loan, 1 Month LIBOR + 3.250% | |
7.634%(c) | | 05/27/24 | | | | | 1,375 | | | | 1,148,256 | |
| | | | | | | | | | | | |
| | | | |
| | | | | | | | | | | 1,523,257 | |
| | | | | | | | | | | | |
| |
TOTAL FLOATING RATE AND OTHER LOANS
(cost $13,956,280) | | | | 12,070,415 | |
| | | | | | | | | | | | |
|
MUNICIPAL BONDS — 1.3% | |
Arizona — 0.0% | |
Salt River Project Agricultural Improvement & Power District, | |
Revenue Bonds, BABs | |
4.839% | | 01/01/41 | | | | | 30 | | | | 29,260 | |
| | | | | | | | | | | | |
|
California — 0.4% | |
Bay Area Toll Authority, | |
Taxable, Revenue Bonds, BABs, Series S3 | |
6.907% | | 10/01/50 | | | | | 1,125 | | | | 1,377,504 | |
State of California, | |
General Obligation Unlimited, BABs | |
7.300% | | 10/01/39 | | | | | 1,550 | | | | 1,880,821 | |
General Obligation Unlimited, Taxable, BABs | |
7.625% | | 03/01/40 | | | | | 725 | | | | 912,665 | |
| | | | | | | | | | | | |
| | | | |
| | | | | | | | | | | 4,170,990 | |
| | | | | | | | | | | | |
Colorado — 0.1% | |
Colorado Health Facilities Authority, | |
Taxable, Revenue Bonds, Series B | |
2.800% | | 12/01/26 | | | | | 5 | | | | 4,588 | |
Regional Transportation District Sales Tax Revenue, | |
Revenue Bonds, BABs, Series B | |
5.844% | | 11/01/50 | | | | | 770 | | | | 829,177 | |
| | | | | | | | | | | | |
| | | | |
| | | | | | | | | | | 833,765 | |
| | | | | | | | | | | | |
Illinois — 0.1% | |
Chicago O’Hare International Airport, | |
Revenue Bonds, BABs, Series B | |
6.395% | | 01/01/40 | | | | | 1,380 | | | | 1,537,573 | |
State of Illinois, | |
General Obligation Unlimited, Taxable, Series A | |
3.140% | | 10/01/24 | | | | | 35 | | | | 33,580 | |
| | | | | | | | | | | | |
| | | | |
| | | | | | | | | | | 1,571,153 | |
| | | | | | | | | | | | |
Missouri — 0.0% | |
Health & Educational Facilities Authority of the State of Missouri, | |
Taxable, Revenue Bonds, Series A | |
3.652% | | 08/15/57 | | | | | 20 | | | | 15,108 | |
| | | | | | | | | | | | |
SEE NOTES TO FINANCIAL STATEMENTS.
A194
| | | | |
| | PSF PGIM TOTAL RETURN BOND PORTFOLIO (CONTINUED) | | |
SCHEDULE OF INVESTMENTS | | | | as of December 31, 2022 |
| | | | | | | | | | | | |
Interest Rate | | Maturity Date | | | | Principal
Amount
(000)# | | | Value | |
| | | | | | | | | | | |
| |
MUNICIPAL BONDS (continued) | | | | | |
New Jersey — 0.4% | | | | | |
New Jersey Turnpike Authority, | |
Taxable, Revenue Bonds, BABs, Series A | |
7.102% | | 01/01/41 | | | | | 1,175 | | | $ | 1,412,097 | |
Taxable, Revenue Bonds, BABs, Series F | |
7.414% | | 01/01/40 | | | | | 2,050 | | | | 2,535,281 | |
| | | | | | | | | | | | |
| | | | |
| | | | | | | | | | | 3,947,378 | |
| | | | | | | | | | | | |
New York — 0.0% | |
New York State Urban Development Corp., | |
Taxable, Revenue Bonds, Series B | |
2.590% | | 03/15/35 | | | | | 20 | | | | 15,103 | |
Port Authority of New York & New Jersey, | |
Revenue Bonds | |
6.040% | | 12/01/29 | | | | | 25 | | | | 26,252 | |
| | | | | | | | | | | | |
| | | | |
| | | | | | | | | | | 41,355 | |
| | | | | | | | | | | | |
Ohio — 0.1% | |
Ohio State University (The), | |
Taxable, Revenue Bonds, BABs, Series C | |
4.910% | | 06/01/40 | | | | | 695 | | | | 702,724 | |
| | | | | | | | | | | | |
|
Oregon — 0.0% | |
State of Oregon Department of Transportation, | |
Taxable, Revenue Bonds, BABs, Series A | |
5.834% | | 11/15/34 | | | | | 615 | | | | 658,728 | |
| | | | | | | | | | | | |
|
Pennsylvania — 0.1% | |
Pennsylvania Turnpike Commission, | |
Revenue Bonds, BABs, Series B | |
5.511% | | 12/01/45 | | | | | 825 | | | | 829,562 | |
| | | | | | | | | | | | |
|
Puerto Rico — 0.1% | |
Puerto Rico Sales Tax Financing Corp. Sales Tax Revenue, | |
Revenue Bonds, Series A-1 | |
5.000% | | 07/01/58 | | | | | 1,710 | | | | 1,546,925 | |
| | | | | | | | | | | | |
|
Texas — 0.0% | |
Grand Parkway Transportation Corp., | |
Taxable, Revenue Bonds, Series B | |
3.236% | | 10/01/52 | | | | | 20 | | | | 14,298 | |
Texas Private Activity Bond Surface Transportation Corp., | |
Taxable, Revenue Bonds, Series B | |
3.922% | | 12/31/49 | | | | | 450 | | | | 336,111 | |
| | | | | | | | | | | | |
| | | | |
| | | | | | | | | | | 350,409 | |
| | | | | | | | | | | | |
| |
TOTAL MUNICIPAL BONDS
(cost $13,269,333) | | | | 14,697,357 | |
| | | | | | | | | | | | |
|
RESIDENTIAL MORTGAGE-BACKED SECURITIES — 4.0% | |
Alternative Loan Trust, | |
Series 2004-18CB, Class 3A1 | |
5.250% | | 09/25/35 | | | | | 12 | | | | 11,531 | |
Bellemeade Re Ltd., | |
Series 2018-03A, Class M1B, 144A, 1 Month LIBOR + 1.850% (Cap N/A, Floor 1.850%) | |
6.239%(c) | | 10/25/28 | | | | | 87 | | | | 86,718 | |
Series 2020-02A, Class M1C, 144A, 1 Month LIBOR + 4.000% (Cap N/A, Floor 4.000%) | |
8.387%(c) | | 08/26/30 | | | | | 5 | | | | 4,783 | |
| | | | | | | | | | | | |
Interest Rate | | Maturity
Date | | | | Principal
Amount
(000)# | | | Value | |
| | | | | | | | | | | |
|
| RESIDENTIAL MORTGAGE-BACKED SECURITIES (continued) | |
Series 2020-03A, Class M1C, 144A, 1 Month LIBOR + 3.700% (Cap N/A, Floor 3.700%) | |
8.089%(c) | | 10/25/30 | | | | | 263 | | | $ | 264,843 | |
Series 2021-03A, Class M1B, 144A, 30 Day Average SOFR + 1.400% (Cap N/A, Floor 1.400%) | |
5.328%(c) | | 09/25/31 | | | | | 200 | | | | 189,403 | |
Series 2022-01, Class M1B, 144A, 30 Day Average SOFR + 2.150% (Cap N/A, Floor 2.150%) | |
6.078%(c) | | 01/26/32 | | | | | 490 | | | | 466,574 | |
Series 2022-01, Class M1C, 144A, 30 Day Average SOFR + 3.700% (Cap N/A, Floor 3.700%) | |
7.628%(c) | | 01/26/32 | | | | | 1,240 | | | | 1,035,521 | |
BVRT Financing Trust, | |
Series 2021-04, Class F, 144A, 1 Month SOFR + 2.000% | |
5.807%(c) | | 09/12/26^ | | | | | 1,511 | | | | 1,503,486 | |
Citigroup Mortgage Loan Trust, | |
Series 2011-12, Class 3A2, 144A | |
3.632%(cc) | | 09/25/47 | | | | | 258 | | | | 226,100 | |
Connecticut Avenue Securities Trust, | |
Series 2018-R07, Class 1B1, 144A, 1 Month LIBOR + 4.350% (Cap N/A, Floor 0.000%) | |
8.739%(c) | | 04/25/31 | | | | | 370 | | | | 375,964 | |
Series 2019-R07, Class 1M2, 144A, 1 Month LIBOR + 2.100% (Cap N/A, Floor 0.000%) | |
6.489%(c) | | 10/25/39 | | | | | 56 | | | | 55,425 | |
Series 2022-R04, Class 1B1, 144A, 30 Day Average SOFR + 5.250% (Cap N/A, Floor 0.000%) | |
9.178%(c) | | 03/25/42 | | | | | 260 | | | | 260,001 | |
Credit Suisse Mortgage Trust, | |
Series 2020-RPL05, Class A1, 144A | |
3.023%(cc) | | 08/25/60 | | | | | 337 | | | | 322,095 | |
Eagle Re Ltd., | |
Series 2018-01, Class M1, 144A, 1 Month LIBOR + 1.700% (Cap N/A, Floor 1.700%) | |
6.089%(c) | | 11/25/28 | | | | | 585 | | | | 583,101 | |
Series 2019-01, Class M1B, 144A, 1 Month LIBOR + 1.800% (Cap N/A, Floor 0.000%) | |
6.189%(c) | | 04/25/29 | | | | | 180 | | | | 176,662 | |
Series 2021-01, Class M1B, 144A, 30 Day Average SOFR + 2.150% (Cap N/A, Floor 2.150%) | |
6.078%(c) | | 10/25/33 | | | | | 334 | | | | 333,481 | |
Series 2021-01, Class M1C, 144A, 30 Day Average SOFR + 2.700% (Cap N/A, Floor 2.700%) | |
6.628%(c) | | 10/25/33 | | | | | 940 | | | | 931,016 | |
Series 2021-02, Class M1C, 144A, 30 Day Average SOFR + 3.450% (Cap N/A, Floor 3.450%) | |
7.378%(c) | | 04/25/34 | | | | | 910 | | | | 893,935 | |
Fannie Mae REMIC, | |
Series 2011-116, Class ZA | |
3.500% | | 11/25/41 | | | | | 1,775 | | | | 1,625,949 | |
Series 2012-34, Class EB | |
4.000% | | 04/25/42 | | | | | 1,575 | | | | 1,464,071 | |
FHLMC Structured Agency Credit Risk Debt Notes, | |
Series 2020-HQA05, Class B1, 144A, 30 Day Average SOFR + 4.000% (Cap N/A, Floor 0.000%) | |
7.928%(c) | | 11/25/50 | | | | | 900 | | | | 859,501 | |
SEE NOTES TO FINANCIAL STATEMENTS.
A195
| | | | |
| | PSF PGIM TOTAL RETURN BOND PORTFOLIO (CONTINUED) | | |
SCHEDULE OF INVESTMENTS | | | | as of December 31, 2022 |
| | | | | | | | | | | | |
Interest Rate | | Maturity Date | | | | Principal
Amount
(000)# | | | Value | |
| | | | | | | | | | | |
|
| RESIDENTIAL MORTGAGE-BACKED SECURITIES (continued) | |
Series 2020-HQA05, Class M2, 144A, 30 Day Average SOFR + 2.600% (Cap N/A, Floor 0.000%) | |
6.528%(c) | | 11/25/50 | | | | | 2,607 | | | $ | 2,601,595 | |
Series 2021-DNA02, Class B1, 144A, 30 Day Average SOFR + 3.400% (Cap N/A, Floor 0.000%) | |
7.328%(c) | | 08/25/33 | | | | | 3,335 | | | | 3,080,139 | |
FHLMC Structured Agency Credit Risk REMIC Trust, | |
Series 2020-DNA02, Class M2, 144A, 1 Month LIBOR + 1.850% (Cap N/A, Floor 0.000%) | |
6.239%(c) | | 02/25/50 | | | | | 524 | | | | 522,527 | |
Series 2020-DNA03, Class B1, 144A, 1 Month LIBOR + 5.100% (Cap N/A, Floor 0.000%) | |
9.489%(c) | | 06/25/50 | | | | | 163 | | | | 170,270 | |
Series 2020-DNA04, Class B1, 144A, 1 Month LIBOR + 6.000% (Cap N/A, Floor 0.000%) | |
10.389%(c) | | 08/25/50 | | | | | 1,529 | | | | 1,625,215 | |
Series 2020-DNA05, Class B1, 144A, 30 Day Average SOFR + 4.800% (Cap N/A, Floor 0.000%) | |
8.728%(c) | | 10/25/50 | | | | | 670 | | | | 686,006 | |
Series 2020-DNA05, Class M2, 144A, 30 Day Average SOFR + 2.800% (Cap N/A, Floor 0.000%) | |
6.728%(c) | | 10/25/50 | | | | | 197 | | | | 198,570 | |
Series 2020-HQA02, Class M2, 144A, 1 Month LIBOR + 3.100% (Cap N/A, Floor 0.000%) | |
7.489%(c) | | 03/25/50 | | | | | 37 | | | | 37,941 | |
Series 2020-HQA04, Class B1, 144A, 1 Month LIBOR + 5.250% (Cap N/A, Floor 0.000%) | |
9.639%(c) | | 09/25/50 | | | | | 320 | | | | 326,799 | |
Series 2020-HQA04, Class M2, 144A, 1 Month LIBOR + 3.150% (Cap N/A, Floor 0.000%) | |
7.539%(c) | | 09/25/50 | | | | | 2 | | | | 1,881 | |
Series 2021-DNA01, Class B1, 144A, 30 Day Average SOFR + 2.650% (Cap N/A, Floor 0.000%) | |
6.578%(c) | | 01/25/51 | | | | | 200 | | | | 179,832 | |
Series 2021-DNA05, Class B1, 144A, 30 Day Average SOFR + 3.050% (Cap N/A, Floor 0.000%) | |
6.978%(c) | | 01/25/34 | | | | | 590 | | | | 538,829 | |
Series 2021-DNA05, Class M2, 144A, 30 Day Average SOFR + 1.650% (Cap N/A, Floor 0.000%) | |
5.578%(c) | | 01/25/34 | | | | | 316 | | | | 311,980 | |
Series 2021-DNA07, Class B1, 144A, 30 Day Average SOFR + 3.650% (Cap N/A, Floor 0.000%) | |
7.578%(c) | | 11/25/41 | | | | | 155 | | | | 143,962 | |
Series 2021-DNA07, Class M2, 144A, 30 Day Average SOFR + 1.800% (Cap N/A, Floor 0.000%) | |
5.728%(c) | | 11/25/41 | | | | | 100 | | | | 93,918 | |
Series 2021-HQA01, Class B1, 144A, 30 Day Average SOFR + 3.000% (Cap N/A, Floor 0.000%) | |
6.928%(c) | | 08/25/33 | | | | | 160 | | | | 135,193 | |
Series 2021-HQA01, Class M2, 144A, 30 Day Average SOFR + 2.250% (Cap N/A, Floor 0.000%) | |
6.178%(c) | | 08/25/33 | | | | | 4,200 | | | | 3,955,696 | |
Series 2021-HQA03, Class B1, 144A, 30 Day Average SOFR + 3.350% (Cap N/A, Floor 0.000%) | |
7.278%(c) | | 09/25/41 | | | | | 540 | | | | 461,224 | |
| | | | | | | | | | | | |
Interest Rate | | Maturity Date | | | | Principal
Amount
(000)# | | | Value | |
| | | | | | | | | | | |
|
| RESIDENTIAL MORTGAGE-BACKED SECURITIES (continued) | |
Series 2021-HQA03, Class M2, 144A, 30 Day Average SOFR + 2.100% (Cap N/A, Floor 0.000%) | |
6.028%(c) | | 09/25/41 | | | | | 1,020 | | | $ | 897,830 | |
Series 2021-HQA04, Class M2, 144A, 30 Day Average SOFR + 2.350% (Cap N/A, Floor 0.000%) | |
|
6.278%(c) | | 12/25/41 | | | | | 800 | | | | 706,003 | |
Freddie Mac REMIC, | |
Series 4289, Class WZ | |
3.000% | | 01/15/44 | | | | | 743 | | | | 672,971 | |
Series 4768, Class GA | |
3.500% | | 09/15/45 | | | | | 515 | | | | 493,431 | |
Series 4939, Class KT | |
3.000% | | 07/15/48 | | | | | 459 | | | | 409,758 | |
GCAT Asset-Backed Notes, | |
Series 2021-01, Class A1, 144A | |
2.487% | | 11/25/49 | | | | | 2,865 | | | | 2,648,941 | |
Home Re Ltd., | | | | | | | | | | | | |
Series 2019-01, Class M1, 144A, 1 Month LIBOR + 1.650% (Cap N/A, Floor 0.000%) | |
6.039%(c) | | 05/25/29 | | | | | 179 | | | | 176,571 | |
Series 2020-01, Class M1C, 144A, 1 Month LIBOR + 4.150% (Cap N/A, Floor 4.150%) | |
8.539%(c) | | 10/25/30 | | | | | 75 | | | | 74,679 | |
Series 2021-02, Class M1B, 144A, 30 Day Average SOFR + 1.600% (Cap N/A, Floor 0.000%) | |
5.528%(c) | | 01/25/34 | | | | | 530 | | | | 517,189 | |
Series 2021-02, Class M1C, 144A, 30 Day Average SOFR + 2.800% (Cap N/A, Floor 0.000%) | |
6.728%(c) | | 01/25/34 | | | | | 815 | | | | 754,781 | |
Legacy Mortgage Asset Trust, | |
Series 2020-GS01, Class A1, 144A | |
2.882% | | 10/25/59 | | | | | 944 | | | | 936,725 | |
Series 2020-SL01, Class A, 144A | |
2.734% | | 01/25/60 | | | | | 303 | | | | 295,449 | |
New Residential Mortgage Loan Trust, | |
Series 2018-04A, Class A1S, 144A, 1 Month LIBOR + 0.750% (Cap N/A, Floor 0.750%) | |
5.139%(c) | | 01/25/48 | | | | | 430 | | | | 412,673 | |
Oaktown Re II Ltd., | |
Series 2018-01A, Class M1, 144A, 1 Month LIBOR + 1.550% (Cap N/A, Floor 0.000%) | |
5.939%(c) | | 07/25/28 | | | | | 103 | | | | 103,192 | |
Oaktown Re V Ltd., | |
Series 2020-02A, Class M1B, 144A, 1 Month LIBOR + 3.600% (Cap N/A, Floor 3.600%) | |
7.989%(c) | | 10/25/30 | | | | | 20 | | | | 20,130 | |
Oaktown Re VII Ltd., | |
Series 2021-02, Class M1B, 144A, 30 Day Average SOFR + 2.900% (Cap N/A, Floor 2.900%) | |
6.828%(c) | | 04/25/34 | | | | | 900 | | | | 799,885 | |
PNMAC GMSR Issuer Trust, | | | | | | | | |
Series 2018-GT01, Class A, 144A, 1 Month LIBOR + 2.850% (Cap N/A, Floor 2.850%) | |
7.239%(c) | | 02/25/23 | | | | | 1,280 | | | | 1,250,995 | |
Series 2018-GT02, Class A, 144A, 1 Month LIBOR + 2.650% (Cap N/A, Floor 0.000%) | |
7.039%(c) | | 08/25/25 | | | | | 1,200 | | | | 1,177,820 | |
SEE NOTES TO FINANCIAL STATEMENTS.
A196
| | | | |
| | PSF PGIM TOTAL RETURN BOND PORTFOLIO (CONTINUED) | | |
SCHEDULE OF INVESTMENTS | | | | as of December 31, 2022 |
| | | | | | | | | | | | |
Interest Rate | | Maturity
Date | | | | Principal
Amount
(000)# | | | Value | |
| | | | | | | | | | | |
|
| RESIDENTIAL MORTGAGE-BACKED SECURITIES (continued) | |
Radnor Re Ltd., | |
Series 2018-01, Class M2, 144A, 1 Month LIBOR + 2.700% (Cap N/A, Floor 0.000%) | |
7.089%(c) | | 03/25/28 | | | | | 918 | | | $ | 918,386 | |
Series 2020-01, Class M1A, 144A, 1 Month LIBOR + 0.950% (Cap N/A, Floor 0.950%) | |
5.339%(c) | | 01/25/30 | | | | | 90 | | | | 89,385 | |
Series 2020-01, Class M1B, 144A, 1 Month LIBOR + 1.450% (Cap N/A, Floor 1.450%) | |
5.839%(c) | | 01/25/30 | | | | | 1,500 | | | | 1,487,013 | |
Series 2021-02, Class M1A, 144A, 30 Day Average SOFR + 1.850% (Cap N/A, Floor 1.850%) | |
5.778%(c) | | 11/25/31 | | | | | 612 | | | | 597,591 | |
Series 2021-02, Class M1B, 144A, 30 Day Average SOFR + 3.700% (Cap N/A, Floor 3.700%) | |
7.628%(c) | | 11/25/31 | | | | | 900 | | | | 850,151 | |
Structured Adjustable Rate Mortgage Loan Trust, | |
Series 2004-01, Class 4A3 | |
3.780%(cc) | | 02/25/34 | | | | | 180 | | | | 168,898 | |
Series 2004-18, Class 3A1 | |
4.361%(cc) | | 12/25/34 | | | | | 1,135 | | | | 1,042,441 | |
TFS (Spain), | |
Series 2018-03 | |
0.000%(s) | | 04/16/40^ | | | | EUR | — | (r) | | | 2,355 | |
| | | | | | | | | | | | |
| |
TOTAL RESIDENTIAL MORTGAGE-BACKED SECURITIES
(cost $46,564,941) | | | | 44,246,980 | |
| | | | | | | | | | | | |
|
SOVEREIGN BONDS — 2.6% | |
1MDB Global Investments Ltd. (Malaysia), | |
Sr. Unsec’d. Notes | |
4.400% | | 03/09/23 | | | | | 2,000 | | | | 1,954,125 | |
Bermuda Government International Bond (Bermuda), | |
Sr. Unsec’d. Notes, 144A | |
2.375% | | 08/20/30 | | | | | 570 | | | | 478,729 | |
Brazil Minas SPE via State of Minas Gerais (Brazil), | |
Gov’t. Gtd. Notes | |
5.333% | | 02/15/28 | | | | | 963 | | | | 931,883 | |
Colombia Government International Bond (Colombia), | |
Sr. Unsec’d. Notes | |
4.500% | | 01/28/26 | | | | | 250 | | | | 234,656 | |
Dominican Republic International Bond (Dominican Republic), | |
Sr. Unsec’d. Notes, 144A | |
5.500% | | 02/22/29 | | | | | 1,180 | | | | 1,080,659 | |
6.000% | | 07/19/28 | | | | | 575 | | | | 551,209 | |
Egypt Government International Bond (Egypt), | |
Sr. Unsec’d. Notes, 144A, MTN | |
4.750% | | 04/16/26 | | | | EUR | 300 | | | | 264,936 | |
Hellenic Republic Government International Bond (Greece), | |
Sr. Unsec’d. Notes | |
5.200% | | 07/17/34 | | | | EUR | 1,500 | | | | 1,606,093 | |
Hungary Government International Bond (Hungary), | |
Sr. Unsec’d. Notes | |
5.375% | | 03/25/24 | | | | | 290 | | | | 289,329 | |
Indonesia Government International Bond (Indonesia), | |
Sr. Unsec’d. Notes | |
1.100% | | 03/12/33 | | | | EUR | 410 | | | | 318,690 | |
| | | | | | | | | | | | |
Interest Rate | | Maturity Date | | | | Principal
Amount
(000)# | | | Value | |
| | | | | | | | | | | |
| |
SOVEREIGN BONDS (continued) | | | | | |
1.450% | | 09/18/26 | | | | EUR | 375 | | | $ | 364,990 | |
3.375% | | 07/30/25 | | | | EUR | 3,125 | | | | 3,312,332 | |
Sr. Unsec’d. Notes, EMTN | |
3.750% | | 06/14/28 | | | | EUR | 1,250 | | | | 1,294,826 | |
Japan Bank for International Cooperation (Japan), | |
Gov’t. Gtd. Notes, Series DTC | |
2.500% | | 05/23/24 | | | | | 1,000 | | | | 968,282 | |
Japan Finance Organization for Municipalities (Japan), | |
Sr. Unsec’d. Notes, 144A | |
3.375% | | 09/27/23 | | | | | 600 | | | | 591,477 | |
Sr. Unsec’d. Notes, 144A, MTN | |
1.750% | | 09/05/24 | | | | | 600 | | | | 569,617 | |
3.000% | | 03/12/24 | | | | | 600 | | | | 586,585 | |
Peruvian Government International Bond (Peru), | |
Sr. Unsec’d. Notes | |
2.783% | | 01/23/31 | | | | | 10 | | | | 8,268 | |
Qatar Government International Bond (Qatar), | |
Sr. Unsec’d. Notes, 144A | |
5.103% | | 04/23/48 | | | | | 780 | | | | 779,902 | |
Republic of Italy Government International Bond (Italy), | |
Sr. Unsec’d. Notes | |
2.875% | | 10/17/29 | | | | | 200 | | | | 166,110 | |
Sr. Unsec’d. Notes, EMTN | |
6.000% | | 08/04/28 | | | | GBP | 1,995 | | | | 2,415,352 | |
Sr. Unsec’d. Notes, MTN | |
5.375% | | 06/15/33 | | | | | 4,730 | | | | 4,511,617 | |
Romanian Government International Bond (Romania), | |
Sr. Unsec’d. Notes, 144A, MTN | |
3.875% | | 10/29/35 | | | | EUR | 278 | | | | 218,874 | |
Sr. Unsec’d. Notes, EMTN | |
3.875% | | 10/29/35 | | | | EUR | 398 | | | | 313,352 | |
Serbia International Bond (Serbia), | |
Sr. Unsec’d. Notes | |
1.500% | | 06/26/29 | | | | EUR | 1,443 | | | | 1,101,825 | |
3.125% | | 05/15/27 | | | | EUR | 2,264 | | | | 2,078,605 | |
Sr. Unsec’d. Notes, 144A | |
1.650% | | 03/03/33 | | | | EUR | 353 | | | | 228,563 | |
Ukraine Government International Bond (Ukraine), | |
Sr. Unsec’d. Notes | |
7.750% | | 09/01/24(d) | | | | | 920 | | | | 223,560 | |
8.994% | | 02/01/26(d) | | | | | 200 | | | | 43,913 | |
Sr. Unsec’d. Notes, 144A | |
4.375% | | 01/27/32(d) | | | | EUR | 1,090 | | | | 205,647 | |
7.750% | | 09/01/24(d) | | | | | 930 | | | | 225,990 | |
8.994% | | 02/01/26(d) | | | | | 200 | | | | 43,913 | |
9.750% | | 11/01/30(d) | | | | | 400 | | | | 85,950 | |
Uruguay Government International Bond (Uruguay), | |
Sr. Unsec’d. Notes | |
4.975% | | 04/20/55(a) | | | | | 500 | | | | 481,250 | |
| | | | | | | | | | | | |
| |
TOTAL SOVEREIGN BONDS
(cost $35,528,961) | | | | 28,531,109 | |
| | | | | | | | | | | | |
|
U.S. GOVERNMENT AGENCY OBLIGATIONS — 19.7% | |
Federal Home Loan Mortgage Corp. | |
3.500% | | 02/01/47 | | | | | 761 | | | | 711,264 | |
5.500% | | 10/01/33 | | | | | 359 | | | | 369,925 | |
5.500% | | 06/01/34 | | | | | 3 | | | | 2,791 | |
6.000% | | 11/01/33 | | | | | 30 | | | | 30,486 | |
SEE NOTES TO FINANCIAL STATEMENTS.
A197
| | | | |
| | PSF PGIM TOTAL RETURN BOND PORTFOLIO (CONTINUED) | | |
SCHEDULE OF INVESTMENTS | | | | as of December 31, 2022 |
| | | | | | | | | | | | |
Interest Rate | | Maturity
Date | | | | Principal
Amount
(000)# | | | Value | |
| | | | | | | | | | | |
|
| U.S. GOVERNMENT AGENCY OBLIGATIONS (continued) | |
6.000% | | 05/01/34 | | | | | 42 | | | $ | 42,304 | |
6.000% | | 06/01/34 | | | | | 66 | | | | 67,046 | |
6.250% | | 07/15/32(k)(kk) | | | | | 720 | | | | 839,592 | |
6.500% | | 07/01/32 | | | | | 4 | | | | 4,559 | |
6.500% | | 07/01/32 | | | | | 9 | | | | 9,357 | |
6.500% | | 08/01/32 | | | | | 20 | | | | 20,468 | |
6.500% | | 08/01/32 | | | | | 20 | | | | 21,124 | |
6.500% | | 08/01/32 | | | | | 22 | | | | 22,144 | |
6.500% | | 09/01/32 | | | | | 24 | | | | 24,178 | |
6.500% | | 09/01/32 | | | | | 69 | | | | 70,854 | |
6.750% | | 03/15/31(k) | | | | | 600 | | | | 705,975 | |
Federal National Mortgage Assoc. | |
2.000% | | TBA(tt) | | | | | 6,500 | | | | 5,287,492 | |
2.500% | | TBA | | | | | 7,000 | | | | 5,930,796 | |
2.500% | | TBA(tt) | | | | | 28,500 | | | | 24,125,658 | |
3.000% | | TBA(tt) | | | | | 32,000 | | | | 28,075,816 | |
3.500% | | TBA(tt) | | | | | 51,000 | | | | 46,323,439 | |
4.500% | | 08/01/40 | | | | | 877 | | | | 869,854 | |
5.000% | | TBA(tt) | | | | | 17,500 | | | | 17,241,375 | |
5.500% | | TBA(tt) | | | | | 43,000 | | | | 43,106,064 | |
5.500% | | 02/01/33 | | | | | 5 | | | | 5,296 | |
5.500% | | 02/01/33 | | | | | 8 | | | | 7,925 | |
5.500% | | 03/01/33 | | | | | 11 | | | | 11,406 | |
5.500% | | 03/01/33 | | | | | 21 | | | | 21,552 | |
5.500% | | 03/01/33 | | | | | 22 | | | | 22,634 | |
5.500% | | 04/01/33 | | | | | 3 | | | | 2,818 | |
5.500% | | 04/01/33 | | | | | 13 | | | | 13,457 | |
5.500% | | 04/01/33 | | | | | 17 | | | | 17,593 | |
5.500% | | 04/01/33 | | | | | 17 | | | | 17,637 | |
5.500% | | 07/01/33 | | | | | 14 | | | | 13,675 | |
5.500% | | 07/01/33 | | | | | 16 | | | | 16,792 | |
5.500% | | 08/01/33 | | | | | 13 | | | | 13,456 | |
5.500% | | 02/01/34 | | | | | 15 | | | | 15,227 | |
5.500% | | 04/01/34 | | | | | 13 | | | | 13,286 | |
5.500% | | 06/01/34 | | | | | 17 | | | | 16,691 | |
6.000% | | 10/01/33 | | | | | 1 | | | | 1,512 | |
6.000% | | 10/01/33 | | | | | 161 | | | | 164,553 | |
6.000% | | 03/01/34 | | | | | 23 | | | | 23,190 | |
6.000% | | 02/01/35 | | | | | 94 | | | | 96,849 | |
6.000% | | 11/01/36 | | | | | 27 | | | | 28,376 | |
6.500% | | 08/01/32 | | | | | 67 | | | | 69,268 | |
6.500% | | 09/01/32 | | | | | 56 | | | | 57,653 | |
6.500% | | 09/01/32 | | | | | 91 | | | | 95,059 | |
6.500% | | 10/01/32 | | | | | 38 | | | | 38,496 | |
6.500% | | 04/01/33 | | | | | 69 | | | | 71,467 | |
6.500% | | 11/01/33 | | | | | 3 | | | | 2,732 | |
6.625% | | 11/15/30(k) | | | | | 830 | | | | 968,168 | |
7.000% | | 05/01/32 | | | | | 47 | | | | 47,037 | |
7.000% | | 06/01/32 | | | | | 4 | | | | 3,757 | |
7.125% | | 01/15/30(k) | | | | | 785 | | | | 927,634 | |
Government National Mortgage Assoc. | |
3.000% | | TBA | | | | | 13,000 | | | | 11,572,363 | |
3.500% | | TBA | | | | | 15,500 | | | | 14,238,536 | |
3.500% | | 01/20/48 | | | | | 110 | | | | 102,970 | |
4.000% | | 02/20/49 | | | | | 227 | | | | 217,444 | |
4.500% | | TBA(tt) | | | | | 11,000 | | | | 10,669,038 | |
5.500% | | TBA | | | | | 1,000 | | | | 1,004,654 | |
5.500% | | 01/15/33 | | | | | 31 | | | | 32,966 | |
| | | | | | | | | | | | |
Interest Rate | | Maturity Date | | | | Principal
Amount
(000)# | | | Value | |
| | | | | | | | | | | |
|
| U.S. GOVERNMENT AGENCY OBLIGATIONS (continued) | |
5.500% | | 02/15/33 | | | | | 16 | | | $ | 16,938 | |
5.500% | | 05/15/33 | | | | | 49 | | | | 49,416 | |
5.500% | | 05/15/33 | | | | | 134 | | | | 135,843 | |
5.500% | | 06/15/33 | | | | | 148 | | | | 151,494 | |
5.500% | | 09/15/33 | | | | | 21 | | | | 21,746 | |
5.500% | | 07/15/35 | | | | | 31 | | | | 31,932 | |
6.000% | | 12/15/32 | | | | | 64 | | | | 67,151 | |
6.000% | | 11/15/33 | | | | | 25 | | | | 25,973 | |
6.000% | | 01/15/34 | | | | | 6 | | | | 6,371 | |
6.000% | | 06/20/34 | | | | | 170 | | | | 179,933 | |
6.000% | | 11/15/34 | | | | | 230 | | | | 240,162 | |
6.500% | | 09/15/32 | | | | | 29 | | | | 30,243 | |
6.500% | | 09/15/32 | | | | | 81 | | | | 83,787 | |
6.500% | | 09/15/32 | | | | | 119 | | | | 122,419 | |
6.500% | | 11/15/33 | | | | | 67 | | | | 68,872 | |
| | | | | | | | | | | | |
| |
TOTAL U.S. GOVERNMENT AGENCY OBLIGATIONS
(cost $217,601,623) | | | | 215,778,008 | |
| | | | | | | | | | | | |
|
U.S. TREASURY OBLIGATIONS — 7.9% | |
U.S. Treasury Bonds | |
1.125% | | 05/15/40 | | | | | 30 | | | | 18,806 | |
1.750% | | 08/15/41 | | | | | 5,286 | | | | 3,623,388 | |
1.875% | | 02/15/41 | | | | | 138 | | | | 97,281 | |
2.000% | | 11/15/41 | | | | | 2,719 | | | | 1,944,935 | |
2.250% | | 05/15/41(h)(kk) | | | | | 65,845 | | | | 49,507,209 | |
2.375% | | 02/15/42 | | | | | 1,255 | | | | 958,898 | |
2.500% | | 02/15/46(k) | | | | | 1,580 | | | | 1,185,988 | |
2.500% | | 05/15/46 | | | | | 965 | | | | 722,996 | |
2.875% | | 05/15/52 | | | | | 2,565 | | | | 2,065,627 | |
3.000% | | 05/15/45(k) | | | | | 4,065 | | | | 3,358,071 | |
3.000% | | 02/15/48(a) | | | | | 4,410 | | | | 3,632,738 | |
3.000% | | 08/15/52 | | | | | 2,190 | | | | 1,815,647 | |
3.125% | | 02/15/43(k) | | | | | 2,460 | | | | 2,100,994 | |
3.375% | | 08/15/42 | | | | | 5,210 | | | | 4,658,880 | |
U.S. Treasury Notes | |
2.375% | | 03/31/29(k) | | | | | 615 | | | | 559,794 | |
4.125% | | 11/15/32 | | | | | 375 | | | | 382,500 | |
U.S. Treasury Strips Coupon | |
1.467%(s) | | 11/15/41 | | | | | 500 | | | | 222,578 | |
2.056%(s) | | 11/15/38 | | | | | 130 | | | | 66,843 | |
2.208%(s) | | 05/15/39 | | | | | 1,575 | | | | 790,576 | |
2.335%(s) | | 08/15/44 | | | | | 2,500 | | | | 988,965 | |
2.364%(s) | | 05/15/45 | | | | | 3,420 | | | | 1,313,227 | |
2.377%(s) | | 08/15/45 | | | | | 1,250 | | | | 475,391 | |
2.387%(s) | | 05/15/43 | | | | | 4,015 | | | | 1,664,500 | |
2.395%(s) | | 11/15/43 | | | | | 619 | | | | 252,484 | |
2.423%(s) | | 11/15/40 | | | | | 430 | | | | 201,495 | |
2.423%(s) | | 05/15/44(k) | | | | | 7,225 | | | | 2,879,275 | |
3.143%(s) | | 08/15/41 | | | | | 1,350 | | | | 607,816 | |
3.176%(s) | | 08/15/40 | | | | | 120 | | | | 56,972 | |
| | | | | | | | | | | | |
| |
TOTAL U.S. TREASURY OBLIGATIONS
(cost $115,304,755) | | | | 86,153,874 | |
| | | | | | | | | | | | |
| | | | |
| | | | | | | Shares | | | | |
|
COMMON STOCKS — 0.3% | |
Chemicals — 0.0% | |
TPC Group, Inc.*^ | | | | | 14,880 | | | | 297,600 | |
| | | | | | | | | | | |
SEE NOTES TO FINANCIAL STATEMENTS.
A198
| | | | |
| | PSF PGIM TOTAL RETURN BOND PORTFOLIO (CONTINUED) | | |
SCHEDULE OF INVESTMENTS | | | | as of December 31, 2022 |
| | | | | | | | |
| | | Shares | | | Value | |
| |
COMMON STOCKS (continued) | | | | | |
Gas Utilities — 0.1% | | | | | | | | |
Ferrellgas Partners LP (Class B Stock)(original cost $1,543,888; purchased 10/25/19)^(f) | | | 5,622 | | | $ | 1,123,107 | |
| | | | | | | | |
Oil, Gas & Consumable Fuels — 0.2% | | | | | |
Chesapeake Energy Corp. | | | 16,284 | | | | 1,536,721 | |
| | | | | | | | |
| | |
TOTAL COMMON STOCKS
(cost $1,356,824) | | | | | | | 2,957,428 | |
| | | | | | | | |
| |
PREFERRED STOCKS — 0.2% | | | | | |
Banks — 0.1% | | | | | | | | |
Citigroup Capital XIII, 10.785%(c), 3 Month LIBOR + 6.370%, Maturing 10/30/40 | | | 45,000 | | | | 1,278,000 | |
| | | | | | | | |
Capital Markets — 0.1% | | | | | | | | |
State Street Corp., 5.350%(c), 3 Month LIBOR + 3.709%, Series G, Maturing 03/15/26(oo) | | | 35,000 | | | | 822,850 | |
| | | | | | | | |
| | |
TOTAL PREFERRED STOCKS
(cost $2,000,000) | | | | | | | 2,100,850 | |
| | | | | | | | |
| |
TOTAL LONG-TERM INVESTMENTS
(cost $1,309,304,208) | | | | 1,174,005,117 | |
| | | | | | | | |
| |
SHORT-TERM INVESTMENTS — 13.4% | | | | | |
AFFILIATED MUTUAL FUNDS | | | | | |
PGIM Core Ultra Short Bond Fund(wa) | | | 126,191,991 | | | | 126,191,991 | |
PGIM Institutional Money Market Fund (cost $19,589,896; includes $19,505,025 of cash collateral for securities on
loan)(b)(wa) | | | 19,618,570 | | | | 19,608,761 | |
| | | | | | | | |
| |
TOTAL SHORT-TERM INVESTMENTS
(cost $145,781,887) | | | | 145,800,752 | |
| | | | | | | | |
| |
TOTAL INVESTMENTS, BEFORE OPTIONS WRITTEN—120.7%
(cost $1,455,086,095) | | | | 1,319,805,869 | |
| | | | | | | | |
| |
OPTIONS WRITTEN*~ — (0.0)% | | | | | |
(premiums received $6,696) | | | | | | | (283 | ) |
| | | | | | | | |
| |
TOTAL INVESTMENTS, NET OF OPTIONS WRITTEN—120.7%
(cost $1,455,079,399) | | | | 1,319,805,586 | |
Liabilities in excess of other assets(z) — (20.7)% | | | | (225,952,353 | ) |
| | | | | | | | |
| | |
NET ASSETS — 100.0% | | | | | | $ | 1,093,853,233 | |
| | | | | | | | |
See the Glossary for a list of the abbreviation(s) used in the annual report.
| * | Non-income producing security. |
| # | Principal or notional amount is shown in U.S. dollars unless otherwise stated. |
| ~ | See tables subsequent to the Schedule of Investments for options detail. Excludes centrally cleared swaptions. |
| ^ | Indicates a Level 3 instrument. The aggregate value of Level 3 instruments is $5,933,236 and 0.5% of net assets. |
| (a) | All or a portion of security is on loan. The aggregate market value of such securities, including those sold and pending settlement, is $19,155,254; cash collateral of $19,505,025 (included in liabilities) was received with which the Portfolio purchased highly liquid short-term investments. In the event of significant appreciation in value of securities on loan on the last business day of the reporting period, the Portfolio may reflect a collateral value that is less than the market value of the loaned securities and such shortfall is remedied the following business day. |
| (b) | Represents security, or portion thereof, purchased with cash collateral received for securities on loan and includes dividend reinvestment. |
| (c) | Variable rate instrument. The interest rate shown reflects the rate in effect at December 31, 2022. |
| (cc) | Variable rate instrument. The rate shown is based on the latest available information as of December 31, 2022. Certain variable rate securities are not based on a published reference rate and spread but are determined by the issuer or agent and are based on current market conditions. These securities do not indicate a reference rate and spread in their description. |
| (d) | Represents issuer in default on interest payments and/or principal repayment. Non-income producing security. Such securities may be post-maturity. |
| (f) | Indicates a restricted security that is acquired in unregistered, private sales from the issuing company or from an affiliate of the issuer and is considered restricted as to disposition under federal securities law; the aggregate original cost of such securities is $5,336,883. The aggregate value of $3,012,457 is 0.3% of net assets. |
| (ff) | Variable rate security. Security may be issued at a fixed coupon rate, which converts to a variable rate at a specified date. Rate shown is the rate in effect as of period end. |
| (h) | Represents security, or a portion thereof, segregated as collateral for OTC derivatives. |
| (k) | Represents security, or a portion thereof, segregated as collateral for centrally cleared/exchange-traded derivatives. |
| (kk) | Represents security, or a portion thereof, segregated as collateral for TBA securities. |
| (oo) | Perpetual security. Maturity date represents next call date. |
| (r) | Principal or notional amount is less than $500 par. |
| (s) | Represents zero coupon bond or principal only security. Rate represents yield to maturity at purchase date. |
| (tt) | All or partial principal amount represents “TBA” mortgage dollar rolls. The aggregate mortgage dollar roll principal amount of 189,500,000 is 17.3% of net assets. |
| (wa) | PGIM Investments LLC, the manager of the Portfolio, also serves as manager of the PGIM Core Ultra Short Bond Fund and PGIM Institutional Money Market Fund, if applicable. |
| (z) | Includes net unrealized appreciation/(depreciation) and/or market value of the below holdings which are excluded from the Schedule of Investments: |
SEE NOTES TO FINANCIAL STATEMENTS.
A199
| | | | |
| | PSF PGIM TOTAL RETURN BOND PORTFOLIO (CONTINUED) | | |
SCHEDULE OF INVESTMENTS | | | | as of December 31, 2022 |
Options Written:
OTC Swaptions
| | | | | | | | | | | | | | | | | | | | | | | | | | |
Description | | Call/
Put | | Counterparty | | Expiration
Date | | Strike | | | Receive | | | Pay | | | Notional
Amount
(000)# | | | Value | |
CDX.NA.IG.38.V1,
06/20/27 | | Put | | GSI | | 01/18/23 | | | 3.00% | | | | 1.00%(Q) | | | | CDX.NA.IG.38.V1(Q) | | | | 11,160 | | | $ | (37 | ) |
GS_21-PJA†† ^ | | Put | | GSI | | 06/17/24 | | | 0.25% | | | | 0.25%(M) | | | | GS_21-PJA(M) | | | | 15,090 | | | | (246 | ) |
| | | | | | | | | | | | | | | | | | | | | | | | | | |
Total Options Written (premiums received $6,696) | | | | | | | | | | | | | | | | | | $ | (283 | ) |
| | | | | | | | | | | | | | | | | | | | | | | | | | |
†† The value of the contract, GS_21-PJA is derived from the aggregate credit performance of a pool of senior prime jumbo mortgages. The pool of prime jumbo mortgages is reset monthly.
Options Purchased:
Centrally Cleared Swaptions
| | | | | | | | | | | | | | | | | | | | | | | | | | | | | | | | | | | | |
Description | | Call/
Put | | Expiration
Date | | Strike | | | Receive | | Pay | | Notional
Amount
(000)# | | | Value at December 31,
2022 | | Unrealized Appreciation
(Depreciation) | |
CDX.NA.HY.39.V1, 12/20/27 | | Put | | 02/15/23 | | $ | 99.50 | | | CDX.NA.HY.39.V1(Q) | | 5.00%(Q) | | | 2,770 | | | | | $ | 33,755 | | | | | | | | | $ | (17,490 | ) | | | | |
CDX.NA.IG.39.V1, 12/20/27 | | Put | | 01/18/23 | | | 1.00% | | | CDX.NA.IG.39.V1(Q) | | 1.00%(Q) | | | 14,010 | | | | | | 4,064 | | | | | | | | | | (64,024 | ) | | | | |
CDX.NA.IG.39.V1, 12/20/27 | | Put | | 01/18/23 | | | 1.03% | | | CDX.NA.IG.39.V1(Q) | | 1.00%(Q) | | | 13,250 | | | | | | 3,173 | | | | | | | | | | (61,752 | ) | | | | |
CDX.NA.IG.39.V1, 12/20/27 | | Put | | 01/18/23 | | | 1.08% | | | CDX.NA.IG.39.V1(Q) | | 1.00%(Q) | | | 13,130 | | | | | | 2,292 | | | | | | | | | | (74,729 | ) | | | | |
CDX.NA.IG.39.V1, 12/20/27 | | Put | | 01/18/23 | | | 1.10% | | | CDX.NA.IG.39.V1(Q) | | 1.00%(Q) | | | 13,130 | | | | | | 2,016 | | | | | | | | | | (71,512 | ) | | | | |
CDX.NA.IG.39.V1, 12/20/27 | | Put | | 02/15/23 | | | 0.88% | | | CDX.NA.IG.39.V1(Q) | | 1.00%(Q) | | | 13,850 | | | | | | 31,772 | | | | | | | | | | (9,640 | ) | | | | |
CDX.NA.IG.39.V1, 12/20/27 | | Put | | 02/15/23 | | | 0.90% | | | CDX.NA.IG.39.V1(Q) | | 1.00%(Q) | | | 25,440 | | | | | | 50,281 | | | | | | | | | | (38,863 | ) | | | | |
CDX.NA.IG.39.V1, 12/20/27 | | Put | | 02/15/23 | | | 0.93% | | | CDX.NA.IG.39.V1(Q) | | 1.00%(Q) | | | 13,640 | | | | | | 23,291 | | | | | | | | | | (27,177 | ) | | | | |
CDX.NA.IG.39.V1, 12/20/27 | | Put | | 03/15/23 | | | 0.80% | | | CDX.NA.IG.39.V1(Q) | | 1.00%(Q) | | | 15,450 | | | | | | 71,806 | | | | | | | | | | 23,293 | | | | | |
CDX.NA.IG.39.V1, 12/20/27 | | Put | | 03/15/23 | | | 0.83% | | | CDX.NA.IG.39.V1(Q) | | 1.00%(Q) | | | 16,560 | | | | | | 68,788 | | | | | | | | | | 15,548 | | | | | |
CDX.NA.IG.39.V1, 12/20/27 | | Put | | 03/15/23 | | | 0.88% | | | CDX.NA.IG.39.V1(Q) | | 1.00%(Q) | | | 16,560 | | | | | | 55,206 | | | | | | | | | | 1,949 | | | | | |
CDX.NA.IG.39.V1, 12/20/27 | | Put | | 03/15/23 | | | 0.90% | | | CDX.NA.IG.39.V1(Q) | | 1.00%(Q) | | | 16,980 | | | | | | 50,850 | | | | | | | | | | (14,523 | ) | | | | |
| | | | | | | | | | | | | | | | | | | | | | | | | | | | | | | | | | | | |
| | | | | | | | |
Total Centrally Cleared Swaptions (cost $736,214) | | | | | | | | | | $ | 397,294 | | | | | | | | | $ | (338,920 | ) | | | | |
| | | | | | | | | | | | | | | | | | | | | | | | | | | | | | | | | | | | |
Options Written: Centrally Cleared Swaptions | |
Description | | Call/
Put | | Expiration
Date | | Strike | | | Receive | | Pay | | Notional
Amount
(000)# | | | Value at December 31, 2022 | | Unrealized
Appreciation (Depreciation) | |
CDX.NA.HY.39.V1, 12/20/27 | | Call | | 02/15/23 | | $ | 101.50 | | | CDX.NA.HY.39.V1(Q) | | 5.00%(Q) | | | 2,770 | | | | | $ | (17,428 | ) | | | | | | | | $ | 8,887 | | | | | |
CDX.NA.IG.39.V1, 12/20/27 | | Call | | 01/18/23 | | | 0.90% | | | CDX.NA.IG.39.V1(Q) | | 1.00%(Q) | | | 13,250 | | | | | | (51,370 | ) | | | | | | | | | (23,545 | ) | | | | |
CDX.NA.IG.39.V1, 12/20/27 | | Call | | 01/18/23 | | | 0.93% | | | CDX.NA.IG.39.V1(Q) | | 1.00%(Q) | | | 14,010 | | | | | | (66,959 | ) | | | | | | | | | (27,731 | ) | | | | |
CDX.NA.IG.39.V1, 12/20/27 | | Call | | 01/18/23 | | | 0.95% | | | CDX.NA.IG.39.V1(Q) | | 1.00%(Q) | | | 26,260 | | | | | | (150,433 | ) | | | | | | | | | (82,367 | ) | | | | |
CDX.NA.IG.39.V1, 12/20/27 | | Call | | 02/15/23 | | | 0.78% | | | CDX.NA.IG.39.V1(Q) | | 1.00%(Q) | | | 13,850 | | | | | | (17,900 | ) | | | | | | | | | 5,299 | | | | | |
SEE NOTES TO FINANCIAL STATEMENTS.
A200
| | | | |
| | PSF PGIM TOTAL RETURN BOND PORTFOLIO (CONTINUED) | | |
SCHEDULE OF INVESTMENTS | | | | as of December 31, 2022 |
Options Written (continued):
Centrally Cleared Swaptions
| | | | | | | | | | | | | | | | | | | | | | | | | | | | | | | | |
Description | | Call/
Put | | Expiration
Date | | Strike | | | Receive | | Pay | | Notional
Amount
(000)# | | | Value at December 31, 2022 | | Unrealized
Appreciation (Depreciation) |
CDX.NA.IG.39.V1, 12/20/27 | | Call | | 02/15/23 | | | 0.80% | | | CDX.NA.IG.39.V1(Q) | | 1.00%(Q) | | | 25,440 | | | | | $ | (44,964 | ) | | | | | | $ | 10,818 | | | |
CDX.NA.IG.39.V1, 12/20/27 | | Call | | 02/15/23 | | | 0.83% | | | CDX.NA.IG.39.V1(Q) | | 1.00%(Q) | | | 13,640 | | | | | | (31,682 | ) | | | | | | | 99 | | | |
CDX.NA.IG.39.V1, 12/20/27 | | Call | | 03/15/23 | | | 0.73% | | | CDX.NA.IG.39.V1(Q) | | 1.00%(Q) | | | 15,450 | | | | | | (14,415 | ) | | | | | | | 18,030 | | | |
CDX.NA.IG.39.V1, 12/20/27 | | Call | | 03/15/23 | | | 0.75% | | | CDX.NA.IG.39.V1(Q) | | 1.00%(Q) | | | 16,560 | | | | | | (21,216 | ) | | | | | | | 14,603 | | | |
CDX.NA.IG.39.V1, 12/20/27 | | Call | | 03/15/23 | | | 0.78% | | | CDX.NA.IG.39.V1(Q) | | 1.00%(Q) | | | 16,560 | | | | | | (28,196 | ) | | | | | | | 8,765 | | | |
CDX.NA.IG.39.V1, 12/20/27 | | Call | | 03/15/23 | | | 0.83% | | | CDX.NA.IG.39.V1(Q) | | 1.00%(Q) | | | 16,980 | | | | | | (46,615 | ) | | | | | | | (1,788 | ) | | |
CDX.NA.HY.39.V1, 12/20/27 | | Put | | 01/18/23 | | $ | 90.00 | | | 5.00%(Q) | | CDX.NA.HY.39.V1(Q) | | | 3,700 | | | | | | (1,898 | ) | | | | | | | 64,950 | | | |
CDX.NA.HY.39.V1, 12/20/27 | | Put | | 02/15/23 | | $ | 95.00 | | | 5.00%(Q) | | CDX.NA.HY.39.V1(Q) | | | 2,770 | | | | | | (10,201 | ) | | | | | | | 10,990 | | | |
CDX.NA.IG.39.V1, 12/20/27 | | Put | | 01/18/23 | | | 1.30% | | | 1.00%(Q) | | CDX.NA.IG.39.V1(Q) | | | 13,250 | | | | | | (1,066 | ) | | | | | | | 30,071 | | | |
CDX.NA.IG.39.V1, 12/20/27 | | Put | | 01/18/23 | | | 1.33% | | | 1.00%(Q) | | CDX.NA.IG.39.V1(Q) | | | 14,010 | | | | | | (1,063 | ) | | | | | | | 26,257 | | | |
CDX.NA.IG.39.V1, 12/20/27 | | Put | | 01/18/23 | | | 1.35% | | | 1.00%(Q) | | CDX.NA.IG.39.V1(Q) | | | 13,130 | | | | | | (940 | ) | | | | | | | 38,896 | | | |
CDX.NA.IG.39.V1, 12/20/27 | | Put | | 01/18/23 | | | 1.40% | | | 1.00%(Q) | | CDX.NA.IG.39.V1(Q) | | | 13,130 | | | | | | (842 | ) | | | | | | | 32,640 | | | |
CDX.NA.IG.39.V1, 12/20/27 | | Put | | 02/15/23 | | | 1.10% | | | 1.00%(Q) | | CDX.NA.IG.39.V1(Q) | | | 13,850 | | | | | | (9,480 | ) | | | | | | | 5,616 | | | |
CDX.NA.IG.39.V1, 12/20/27 | | Put | | 02/15/23 | | | 1.15% | | | 1.00%(Q) | | CDX.NA.IG.39.V1(Q) | | | 25,440 | | | | | | (13,955 | ) | | | | | | | 20,903 | | | |
CDX.NA.IG.39.V1, 12/20/27 | | Put | | 02/15/23 | | | 1.18% | | | 1.00%(Q) | | CDX.NA.IG.39.V1(Q) | | | 13,640 | | | | | | (6,742 | ) | | | | | | | 13,581 | | | |
CDX.NA.IG.39.V1, 12/20/27 | | Put | | 03/15/23 | | | 1.10% | | | 1.00%(Q) | | CDX.NA.IG.39.V1(Q) | | | 15,450 | | | | | | (21,173 | ) | | | | | | | (7,268 | ) | | |
CDX.NA.IG.39.V1, 12/20/27 | | Put | | 03/15/23 | | | 1.13% | | | 1.00%(Q) | | CDX.NA.IG.39.V1(Q) | | | 16,560 | | | | | | (20,784 | ) | | | | | | | (5,217 | ) | | |
CDX.NA.IG.39.V1, 12/20/27 | | Put | | 03/15/23 | | | 1.18% | | | 1.00%(Q) | | CDX.NA.IG.39.V1(Q) | | | 16,560 | | | | | | (17,533 | ) | | | | | | | 832 | | | |
CDX.NA.IG.39.V1, 12/20/27 | | Put | | 03/15/23 | | | 1.20% | | | 1.00%(Q) | | CDX.NA.IG.39.V1(Q) | | | 16,980 | | | | | | (16,564 | ) | | | | | | | 6,359 | | | |
| | | | | | | | | | | | | | | | | | | | | | | | | | | | | | | | |
| | | | | | | |
Total Centrally Cleared Swaptions (premiums received $783,099) | | | | | | | | $ | (613,419 | ) | | | | | | $ | 169,680 | | | |
| | | | | | | | | | | | | | | | | | | | | | | | | | | | | | | | |
Futures contracts outstanding at December 31, 2022:
| | | | | | | | | | | | | | | | |
Number of Contracts | | Type | | Expiration
Date | | Current
Notional
Amount | | | Value /
Unrealized
Appreciation
(Depreciation) |
Long Positions: | | | | | | | | | |
677 | | 2 Year U.S. Treasury Notes | | Mar. 2023 | | $ | 138,837,891 | | | | | $ | (17,430 | ) | | |
705 | | 5 Year U.S. Treasury Notes | | Mar. 2023 | | | 76,090,431 | | | | | | (161,652 | ) | | |
845 | | 10 Year U.S. Treasury Notes | | Mar. 2023 | | | 94,890,864 | | | | | | (663,116 | ) | | |
235 | | 10 Year U.S. Ultra Treasury Notes | | Mar. 2023 | | | 27,796,094 | | | | | | (113,427 | ) | | |
12 | | 30 Year U.S. Ultra Treasury Bonds | | Mar. 2023 | | | 1,611,750 | | | | | | (45,786 | ) | | |
| | | | | | | | | | | | | | | | |
| | | | | | | | | | | | | (1,001,411 | ) | | |
| | | | | | | | | | | | | | | | |
| | | | | |
Short Positions: | | | | | | | | | | | | | | |
86 | | 5 Year Euro-Bobl | | Mar. 2023 | | | 10,655,795 | | | | | | 342,240 | | | |
100 | | 10 Year Euro-Bund | | Mar. 2023 | | | 14,229,492 | | | | | | 949,089 | | | |
SEE NOTES TO FINANCIAL STATEMENTS.
A201
| | | | |
| | PSF PGIM TOTAL RETURN BOND PORTFOLIO (CONTINUED) | | |
SCHEDULE OF INVESTMENTS | | | | as of December 31, 2022 |
Futures contracts outstanding at December 31, 2022 (continued):
| | | | | | | | | | | | | | | | | | |
Number of Contracts | | Type | | Expiration
Date | | | Current
Notional
Amount | | | Value /
Unrealized
Appreciation
(Depreciation) |
Short Positions (cont’d): | | | | | | | | | | | | | | | | |
438 | | 20 Year U.S. Treasury Bonds | | | Mar. 2023 | | | $ | 54,900,563 | | | | | $ | 343,035 | | | |
43 | | Euro Schatz Index | | | Mar. 2023 | | | | 4,852,414 | | | | | | 59,574 | | | |
| | | | | | | | | | | | | | | | | | |
| | | | | | | | | | | | | | | 1,693,938 | | | |
| | | | | | | | | | | | | | | | | | |
| | | | | | | | | | | | | | $ | 692,527 | | | |
| | | | | | | | | | | | | | | | | | |
Forward foreign currency exchange contracts outstanding at December 31, 2022:
| | | | | | | | | | | | | | | | | | | | | | | | | | | | | | | | | | | | | | | | | | |
Purchase Contracts | | Counterparty | | Notional
Amount
(000) | | | Value at
Settlement
Date | | | Current
Value | | | Unrealized
Appreciation | | | Unrealized
Depreciation |
OTC Forward Foreign Currency Exchange Contracts: | | | | | | | | | | | | | | | | | | | | | | | | | | | | | | | | | | | | | |
Mexican Peso, | | | | | | | | | | | | | | | | | | | | | | | | | | | | | | | | | | | | | | | | | | |
Expiring 03/15/23 | | CITI | | MXN | 15,980 | | | | | | | $ | 818,904 | | | | | | | $ | 808,827 | | | | | | | $ | — | | | | | | | | | $ | (10,077 | ) | | |
| | | | | | | | | | | | | | | | | | | | | | | | | | | | | | | | | | | | | | | | | | |
| | | | | | | | | | | | | | | | | | | | | | | | | | | | | | | | | | |
Sale Contracts | | Counterparty | | Notional
Amount
(000) | | | Value at
Settlement
Date | | | Current
Value | | | Unrealized
Appreciation | | Unrealized
Depreciation | |
OTC Forward Foreign Currency Exchange Contracts: | | | | | | | | | | | | | | | | | | | | | | | | | | | | | |
British Pound, | | | | | | | | | | | | | | | | | | | | | | | | | | | | | | | | | | |
Expiring 01/12/23 | | MSI | | GBP | 12,897 | | | $ | 15,434,038 | | | $ | 15,596,781 | | | | | $ | — | | | | | | | | | $ | (162,743 | ) | | | | |
Euro, | | | | | | | | | | | | | | | | | | | | | | | | | | | | | | | | | | |
Expiring 01/12/23 | | BNP | | EUR | 94,198 | | | | 97,640,420 | | | | 100,927,037 | | | | | | — | | | | | | | | | | (3,286,617 | ) | | | | |
Expiring 01/12/23 | | TD | | EUR | 655 | | | | 689,748 | | | | 701,562 | | | | | | — | | | | | | | | | | (11,814 | ) | | | | |
South African Rand, | | | | | | | | | | | | | | | | | | | | | | | | | | | | | | | | | | |
Expiring 03/15/23 | | MSI | | ZAR | 11,532 | | | | 653,620 | | | | 674,353 | | | | | | — | | | | | | | | | | (20,733 | ) | | | | |
| | | | | | | | | | | | | | | | | | | | | | | | | | | | | | | | | | |
| | | | | | | | $ | 114,417,826 | | | $ | 117,899,733 | | | | | | — | | | | | | | | | | (3,481,907 | ) | | | | |
| | | | | | | | | | | | | | | | | | | | | | | | | | | | | | | | | | |
| | | | | | | | | | | | | | | | | | $ | — | | | | | | | | | $ | (3,491,984 | ) | | | | |
| | | | | | | | | | | | | | | | | | | | | | | | | | | | | | | | | | |
Credit default swap agreements outstanding at December 31, 2022:
| | | | | | | | | | | | | | | | | | | | | | | | | | | | | | | | | | | | | | | | | | | | |
Reference Entity/ Obligation | | Termination
Date | | | Fixed
Rate | | | Notional
Amount
(000)#(3) | | | Implied
Credit
Spread at
December 31,
2022(4) | | Fair
Value | | | Upfront
Premiums
Paid
(Received) | | | Unrealized
Appreciation
(Depreciation) | | | Counterparty |
| | | | | | | | | | | | | | | | | | | | | | | | | | | | | | | | | | | |
OTC Credit Default Swap Agreement on asset-backed and/or mortgage-backed securities - Sell Protection(2)^: |
GS_21-PJA | | | 01/14/23 | | | | 0.250%(M) | | | | 8,456 | | | * | | $ | 2,873 | | | | | | | $ | (59 | ) | | | | | | | | | | $ | 2,932 | | | | | | | GSI |
| | | | | | | | | | | | | | | | | | | | | | | | | | | | | | | | | | | | | | | | | | | | |
| | | | | | | | | | | | | | | | | | | | | | | | | | | | | | | | | | | | | | |
Reference Entity/ Obligation | | Termination
Date | | | Fixed
Rate | | | Notional
Amount
(000)#(3) | | | Fair
Value | | | Upfront
Premiums
Paid
(Received) | | Unrealized
Appreciation
(Depreciation) | | | Counterparty |
| | | | | | | | | | | | | | | | | | | | | | | | | | | | | | | |
OTC Credit Default Swap Agreements on corporate and/or sovereign issues - Buy Protection(1): |
United Mexican States | | | 06/20/23 | | | | 1.000%(Q) | | | | 665 | | | $ | (2,292 | ) | | | | $ | 455 | | | | | | | | | $ | (2,747 | ) | | | | | | CITI |
United Mexican States | | | 06/20/23 | | | | 1.000%(Q) | | | | 655 | | | | (2,258 | ) | | | | | 1,136 | | | | | | | | | | (3,394 | ) | | | | | | CITI |
United Mexican States | | | 06/20/23 | | | | 1.000%(Q) | | | | 220 | | | | (759 | ) | | | | | 427 | | | | | | | | | | (1,186 | ) | | | | | | CITI |
United Mexican States | | | 06/20/23 | | | | 1.000%(Q) | | | | 220 | | | | (759 | ) | | | | | 392 | | | | | | | | | | (1,151 | ) | | | | | | CITI |
United Mexican States | | | 06/20/23 | | | | 1.000%(Q) | | | | 215 | | | | (741 | ) | | | | | 138 | | | | | | | | | | (879 | ) | | | | | | CITI |
United Mexican States | | | 06/20/23 | | | | 1.000%(Q) | | | | 115 | | | | (396 | ) | | | | | 79 | | | | | | | | | | (475 | ) | | | | | | CITI |
United Mexican States | | | 12/20/24 | | | | 1.000%(Q) | | | | 160 | | | | (1,140 | ) | | | | | 444 | | | | | | | | | | (1,584 | ) | | | | | | CITI |
SEE NOTES TO FINANCIAL STATEMENTS.
A202
| | | | |
| | PSF PGIM TOTAL RETURN BOND PORTFOLIO (CONTINUED) | | |
SCHEDULE OF INVESTMENTS | | | | as of December 31, 2022 |
Credit default swap agreements outstanding at December 31, 2022: (continued)
| | | | | | | | | | | | | | | | | | | | | | | | | | | | | | | | | | | | | | | | |
Reference Entity/ Obligation | | Termination
Date | | | Fixed
Rate | | | Notional
Amount
(000)#(3) | | | Fair
Value | | | Upfront
Premiums
Paid
(Received) | | | Unrealized Appreciation (Depreciation) | | Counterparty | |
| | | | | | | | | | | | | | | | | | | | | | | | | | | | | | | | |
OTC Credit Default Swap Agreements on corporate and/or sovereign issues - Buy Protection(1)(cont’d.): | |
United Mexican States | | | 12/20/24 | | | | 1.000%(Q) | | | | 130 | | | $ | (926 | ) | | | | | | $ | 432 | | | | | | | | | $ | (1,358 | ) | | | | | CITI | |
| | | | | | | | | | | | | | | | | | | | | | | | | | | | | | | | | | | | | | | | |
| | | | | | | | | | | | | | $ | (9,271 | ) | | | | | | $ | 3,503 | | | | | | | | | $ | (12,774 | ) | | | | | | |
| | | | | | | | | | | | | | | | | | | | | | | | | | | | | | | | | | | | | | | | |
| | | | | | | | | | | | | | | | | | | | | | | | | | | | | | | | | | | | | | | | | | | | | | | | |
| | | | | | | | | | | | Implied | | | | | | | | | | | | | | | | | | | |
| | | | | | | | | | | | Credit | | | | | | Upfront | | | | | | | |
| | | | | | | | | Notional | | | Spread at | | | | | | Premiums | | | Unrealized | | | | |
| Reference Entity/ | | Termination | | | Fixed | | | Amount | | | December 31, | | | Fair | | | Paid | | | Appreciation | | | | |
Obligation | | Date | | | Rate | | | (000)#(3) | | | 2022(4) | | | Value | | | (Received) | | | (Depreciation) | | | Counterparty | |
| | | | | | | | | | | | | | | | | | | | | | | | | | | | | | | | | | | | | |
OTC Credit Default Swap Agreements on corporate and/or sovereign issues - Sell Protection(2): | | | | | | | | | | | | | |
International Bank for Reconstruction & Development | | | 06/20/23 | | | | 0.250%(Q) | | | | 10,710 | | | | 0.149% | | | $ | 5,952 | | | | | | | $ | 4,976 | | | | | | | | | | | $ | 976 | | | | | | | | BOA | |
Petroleos Mexicanos | | | 06/20/23 | | | | 1.000%(Q) | | | | 2,205 | | | | 2.539% | | | | (15,073 | ) | | | | | | | (6,928 | ) | | | | | | | | | | | (8,145 | ) | | | | | | | CSI | |
Petroleos Mexicanos | | | 06/20/23 | | | | 1.000%(Q) | | | | 550 | | | | 2.539% | | | | (3,760 | ) | | | | | | | (3,346 | ) | | | | | | | | | | | (414 | ) | | | | | | | CITI | |
Petroleos Mexicanos | | | 06/20/23 | | | | 1.000%(Q) | | | | 545 | | | | 2.539% | | | | (3,726 | ) | | | | | | | (3,980 | ) | | | | | | | | | | | 254 | | | | | | | | CITI | |
Petroleos Mexicanos | | | 06/20/23 | | | | 1.000%(Q) | | | | 185 | | | | 2.539% | | | | (1,264 | ) | | | | | | | (1,384 | ) | | | | | | | | | | | 120 | | | | | | | | CITI | |
Petroleos Mexicanos | | | 06/20/23 | | | | 1.000%(Q) | | | | 185 | | | | 2.539% | | | | (1,264 | ) | | | | | | | (1,359 | ) | | | | | | | | | | | 95 | | | | | | | | CITI | |
Petroleos Mexicanos | | | 06/20/23 | | | | 1.000%(Q) | | | | 180 | | | | 2.539% | | | | (1,230 | ) | | | | | | | (1,100 | ) | | | | | | | | | | | (130 | ) | | | | | | | CITI | |
Petroleos Mexicanos | | | 06/20/23 | | | | 1.000%(Q) | | | | 90 | | | | 2.539% | | | | (615 | ) | | | | | | | (547 | ) | | | | | | | | | | | (68 | ) | | | | | | | CITI | |
Petroleos Mexicanos | | | 12/20/24 | | | | 1.000%(Q) | | | | 160 | | | | 4.065% | | | | (8,860 | ) | | | | | | | (5,947 | ) | | | | | | | | | | | (2,913 | ) | | | | | | | CITI | |
Petroleos Mexicanos | | | 12/20/24 | | | | 1.000%(Q) | | | | 130 | | | | 4.065% | | | | (7,199 | ) | | | | | | | (4,889 | ) | | | | | | | | | | | (2,310 | ) | | | | | | | CITI | |
| | | | | | | | | | | | | | | | | | | | | | | | | | | | | | | | | | | | | | | | | | | | | | | | |
| | | | | | | | | | | | | | | | | | $ | (37,039 | ) | | | | | | $ | (24,504 | ) | | | | | | | | | | $ | (12,535 | ) | | | | | | | | |
| | | | | | | | | | | | | | | | | | | | | | | | | | | | | | | | | | | | | | | | | | | | | | | | |
| | | | | | | | | | | | | | | | | | | | | | | | | | | | | | | | | | | | | | | | | | | | |
Reference Entity/ Obligation | | Termination
Date | | | Fixed
Rate | | | Notional
Amount
(000)#(3) | | | Value at
Trade Date | | | Value at
December 31,
2022 | | | Unrealized
Appreciation
(Depreciation) | |
| | | | | | | | | | | | | | | | | | | | | | | | | | | | | | | | | | |
Centrally Cleared Credit Default Swap Agreements on credit indices - Buy Protection(1): | | | | | | | | | | | | | | | | | | | | | | | | | |
CDX.NA.IG.38.V1 | | | 06/20/27 | | | | 1.000%(Q) | | | | 13,510 | | | | | | | $ | (94,926 | ) | | | | | | $ | (146,238 | ) | | | | | | | | | | $ | (51,312 | ) | | | | |
CDX.NA.IG.39.V1 | | | 12/20/27 | | | | 1.000%(Q) | | | | 64,800 | | | | | | | | (340,378 | ) | | | | | | | (538,061 | ) | | | | | | | | | | | (197,683 | ) | | | | |
| | | | | | | | | | | | | | | | | | | | | | | | | | | | | | | | | | | | | | | | | | | | |
| | | | | | | | | | | | | | | | | | $ | (435,304 | ) | | | | | | $ | (684,299 | ) | | | | | | | | | | $ | (248,995 | ) | | | | |
| | | | | | | | | | | | | | | | | | | | | | | | | | | | | | | | | | | | | | | | | | | | |
The Portfolio entered into credit default swaps (“CDS”) to provide a measure of protection against defaults or to take an active long or short position with respect to the likelihood of a particular issuer’s default or the reference entity’s credit soundness. CDS contracts generally trade based on a spread which represents the cost a protection buyer has to pay the protection seller. The protection buyer is said to be short the credit as the value of the contract rises the more the credit deteriorates. The value of the CDS contract increases for the protection buyer if the spread increases.
| (1) | If the Portfolio is a buyer of protection, it pays the fixed rate. When a credit event occurs, as defined under the terms of that particular swap agreement, the Portfolio will either (i) receive from the seller of protection an amount equal to the notional amount of the swap and make delivery of the referenced obligation or underlying securities comprising the referenced index or (ii) receive a net settlement amount in the form of cash or securities equal to the notional amount of the swap less the recovery value of the referenced obligation or underlying securities comprising the referenced index. |
| (2) | If the Portfolio is a seller of protection, it receives the fixed rate. When a credit event occurs, as defined under the terms of that particular swap agreement, the Portfolio will either (i) pay to the buyer of protection an amount equal to the notional amount of the swap and take delivery of the referenced obligation or underlying securities comprising the referenced index or (ii) pay a net settlement amount in the form of cash or securities equal to the notional amount of the swap less the recovery value of the referenced obligation or underlying securities comprising the referenced index. |
| (3) | Notional amount represents the maximum potential amount the Portfolio could be required to pay as a seller of credit protection or receive as a buyer of credit protection if a credit event occurs as defined under the terms of that particular swap agreement. |
| (4) | Implied credit spreads, represented in absolute terms, utilized in determining the fair value of credit default swap agreements where the Portfolio is the seller of protection as of the reporting date serve as an indicator of the current status of the payment/ performance risk and represent the |
SEE NOTES TO FINANCIAL STATEMENTS.
A203
| | | | |
| | PSF PGIM TOTAL RETURN BOND PORTFOLIO (CONTINUED) | | |
SCHEDULE OF INVESTMENTS | | | | as of December 31, 2022 |
| | likelihood of risk of default for the credit derivative. The implied credit spread of a particular referenced entity reflects the cost of buying/selling protection and may include up-front payments required to be made to enter into the agreement. Wider credit spreads represent a deterioration of the referenced entity’s credit soundness and a greater likelihood of risk of default or other credit event occurring as defined under the terms of the agreement. |
| * | When an implied credit spread is not available, reference the fair value of credit default swap agreements on credit indices and asset-backed securities. Where the Portfolio is the seller of protection, it serves as an indicator of the current status of the payment/performance risk and represents the likelihood of an expected liability (or profit) for the credit derivative should the notional amount of the swap agreement be closed/sold as of the reporting date. Increasing fair value in absolute terms, when compared to the notional amount of the swap, represents a deterioration of the referenced entity’s credit soundness and a greater likelihood of risk of default or other credit event occurring as defined under the terms of the agreement. |
Interest rate swap agreements outstanding at December 31, 2022:
| | | | | | | | | | | | | | | | | | | | | | | | | | | | | | | | | | |
Notional Amount (000)# | | Termination Date | | Fixed Rate | | Floating Rate | | Value at
Trade Date | | | Value at December 31, 2022 | | | Unrealized Appreciation (Depreciation) | |
| | | | | | | | | | | | | | | | | | | | | | | | | | | | |
Centrally Cleared Interest Rate Swap Agreements: | | | | | | | | |
GBP 635 | | 05/08/23 | | 0.950%(A) | | 1 Day SONIA(1)(A)/ 3.428% | | $ | (14,468 | ) | | | | | | $ | 20,400 | | | | | | | | | | | $ | 34,868 | | | | | |
GBP 3,946 | | 05/08/26 | | 1.000%(A) | | 1 Day SONIA(1)(A)/ 3.428% | | | (184,608 | ) | | | | | | | 507,332 | | | | | | | | | | | | 691,940 | | | | | |
GBP 2,920 | | 05/08/27 | | 1.050%(A) | | 1 Day SONIA(1)(A)/ 3.428% | | | 150,731 | | | | | | | | 448,520 | | | | | | | | | | | | 297,789 | | | | | |
GBP 977 | | 10/22/28 | | 0.680%(A) | | 1 Day SONIA(1)(A)/ 3.428% | | | — | | | | | | | | 204,287 | | | | | | | | | | | | 204,287 | | | | | |
GBP 2,100 | | 05/08/30 | | 1.100%(A) | | 1 Day SONIA(1)(A)/ 3.428% | | | (145,549 | ) | | | | | | | 452,624 | | | | | | | | | | | | 598,173 | | | | | |
GBP 767 | | 05/08/31 | | 1.150%(A) | | 1 Day SONIA(2)(A)/ 3.428% | | | 41,383 | | | | | | | | (176,837 | ) | | | | | | | | | | | (218,220 | ) | | | | |
GBP 740 | | 05/08/32 | | 1.150%(A) | | 1 Day SONIA(1)(A)/ 3.428% | | | 52,659 | | | | | | | | 193,674 | | | | | | | | | | | | 141,015 | | | | | |
GBP 230 | | 05/08/34 | | 1.200%(A) | | 1 Day SONIA(1)(A)/ 3.428% | | | (9,088 | ) | | | | | | | 64,637 | | | | | | | | | | | | 73,725 | | | | | |
| | | | | | | | | | | | | | | | | | | | | | | | | | | | | | | | | | |
| | | | | | | | $ | (108,940 | ) | | | | | | $ | 1,714,637 | | | | | | | | | | | $ | 1,823,577 | | | | | |
| | | | | | | | | | | | | | | | | | | | | | | | | | | | | | | | | | |
| (1) | The Portfolio pays the fixed rate and receives the floating rate. |
| (2) | The Portfolio pays the floating rate and receives the fixed rate. |
Total return swap agreements outstanding at December 31, 2022:
| | | | | | | | | | | | | | | | | | | | | | | | | | | | | | | | | | | | | | |
Reference Entity | | Financing
Rate | | Counterparty | | Termination
Date | | Long (Short)
Notional
Amount
(000)#(1) | | Fair
Value | | | Upfront
Premiums
Paid
(Received) | | | Unrealized
Appreciation
(Depreciation)(2) | |
| | | | | | | | | | | | | | | | | | | | | | | | | | | | | | |
OTC Total Return Swap Agreements: | | | | | |
Total Return Benchmark Bond Index(T)†† | | 1 Day USOIS -50
bps(T)/ 3.830% | | GSI | | 01/27/23 | | | (18,548 | ) | | $ | (1,358,015 | ) | | | | | | $ | — | | | | | | | | | | | $ | (1,358,015 | ) | | | | |
U.S. Treasury Bond(T) | | 1 Day USOIS +9
bps(T)/ 4.420% | | JPM | | 01/18/23 | | | 8,530 | | | | 50,270 | | | | | | | | — | | | | | | | | | | | | 50,270 | | | | | |
U.S. Treasury Bond(T) | | 1 Day USOIS +6
bps(T)/ 4.390% | | GSI | | 01/19/23 | | | 15,820 | | | | 149,995 | | | | | | | | — | | | | | | | | | | | | 149,995 | | | | | |
U.S. Treasury Bond(T) | | 1 Day USOIS
+10 bps(T)/
4.430% | | JPM | | 01/23/23 | | | 15,190 | | | | 427,583 | | | | | | | | — | | | | | | | | | | | | 427,583 | | | | | |
U.S. Treasury Bond(T) | | 1 Day USOIS
+12 bps(T)/
4.450% | | JPM | | 01/26/23 | | | 12,265 | | | | 538,584 | | | | | | | | — | | | | | | | | | | | | 538,584 | | | | | |
U.S. Treasury Bond(T) | | 1 Day USOIS +7
bps(T)/ 4.400% | | GSI | | 01/31/23 | | | 17,905 | | | | 292,415 | | | | | | | | — | | | | | | | | | | | | 292,415 | | | | | |
| | | | | | | | | | | | | | | | | | | | | | | | | | | | | | | | | | | | | | |
| | | | | | | | | | | |
| | | | | | | | | | | | $ | 100,832 | | | | | | | $ | — | | | | | | | | | | | $ | 100,832 | | | | | |
| | | | | | | | | | | | | | | | | | | | | | | | | | | | | | | | | | | | | | |
| (1) | On a long total return swap, the Portfolio receives payments for any positive return on the reference entity (makes payments for any negative return) and pays the financing rate. On a short total return swap, the Portfolio makes payments for any positive return on the reference entity (receives payments for any negative return) and receives the financing rate. |
| (2) | Upfront/recurring fees or commissions, as applicable, are included in the net unrealized appreciation (depreciation). |
| †† | See the table below for the swap constituents. To the extent that any swap is composed of greater than 50 constituents, the Portfolio is only required to disclose the top 50. |
The following table represents the individual positions and related values of underlying securities of Total Return Benchmark Bond Index total return swap with GSI, as of December 31, 2022, termination date 01/27/2023:
SEE NOTES TO FINANCIAL STATEMENTS.
A204
| | | | |
| | PSF PGIM TOTAL RETURN BOND PORTFOLIO (CONTINUED) | | |
SCHEDULE OF INVESTMENTS | | | | as of December 31, 2022 |
Corporate Bond
| | | | | | | | | | | | |
Reference Entity | | Shares | | | Market
Value | | | % of Total
Index Value | |
| | | |
Bank of America Corp. | | | 40,319,400 | | | $ | 30,039,305 | | | | 7.02% | |
Wells Fargo & Co. | | | 34,230,900 | | | | 24,737,948 | | | | 5.78% | |
Morgan Stanley | | | 27,871,800 | | | | 20,830,849 | | | | 4.87% | |
Goldman Sachs Group, Inc. | | | 28,954,200 | | | | 20,211,399 | | | | 4.72% | |
Citigroup. Inc. | | | 26,654,100 | | | | 18,734,458 | | | | 4.38% | |
AT&T, Inc. | | | 24,354,000 | | | | 16,861,807 | | | | 3.94% | |
Verizon Communications, Inc. | | | 20,024,400 | | | | 14,632,586 | | | | 3.42% | |
Anheuser-Busch InBev Worldwide, Inc. | | | 15,694,800 | | | | 13,907,869 | | | | 3.25% | |
Comcast Corp. | | | 19,889,100 | | | | 12,969,811 | | | | 3.03% | |
Oracle Corp. | | | 15,559,500 | | | | 11,413,164 | | | | 2.67% | |
Apple, Inc. | | | 16,236,000 | | | | 10,993,891 | | | | 2.57% | |
AbbVie, Inc. | | | 10,282,800 | | | | 8,737,251 | | | | 2.04% | |
Microsoft Corp. | | | 10,553,400 | | | | 7,608,503 | | | | 1.78% | |
CVS Health Corp. | | | 9,200,400 | | | | 7,502,724 | | | | 1.75% | |
Amazon.com, Inc. | | | 10,147,500 | | | | 7,355,557 | | | | 1.72% | |
UnitedHealth Group, Inc. | | | 8,523,900 | | | | 6,209,008 | | | | 1.45% | |
Visa, Inc. | | | 9,335,700 | | | | 5,611,271 | | | | 1.31% | |
The Walt Disney Co. | | | 6,494,400 | | | | 5,140,287 | | | | 1.20% | |
Shell International Finance BV | | | 6,900,300 | | | | 5,077,313 | | | | 1.19% | |
Intel Corp. | | | 7,441,500 | | | | 4,949,124 | | | | 1.16% | |
Home Depot, Inc. | | | 7,982,700 | | | | 4,902,022 | | | | 1.15% | |
T-Mobile USA, Inc. | | | 7,035,600 | | | | 4,848,033 | | | | 1.13% | |
ExxonMobil Corp. | | | 6,223,800 | | | | 4,755,295 | | | | 1.11% | |
Broadcom, Inc. | | | 6,629,700 | | | | 4,739,932 | | | | 1.11% | |
Pfizer, Inc. | | | 6,494,400 | | | | 4,455,592 | | | | 1.04% | |
Amgen, Inc. | | | 6,765,000 | | | | 4,454,127 | | | | 1.04% | |
Telefonica Emisiones, S.A.U. | | | 5,412,000 | | | | 4,272,560 | | | | 1.00% | |
Bristol-Myers Squibb Co. | | | 6,494,400 | | | | 4,134,475 | | | | 0.97% | |
General Motors Co. | | | 4,870,800 | | | | 4,080,940 | | | | 0.95% | |
Cigna Corp. | | | 5,547,300 | | | | 4,039,965 | | | | 0.94% | |
Raytheon Tech Corp. | | | 5,682,600 | | | | 3,772,825 | | | | 0.88% | |
Intercontinental Exchange, Inc. | | | 5,547,300 | | | | 3,742,322 | | | | 0.87% | |
Pacific Gas & Electric Co. | | | 4,600,200 | | | | 3,728,814 | | | | 0.87% | |
PepsiCo, Inc. | | | 4,464,900 | | | | 3,727,487 | | | | 0.87% | |
B.A.T. Capital Corp. | | | 5,547,300 | | | | 3,720,528 | | | | 0.87% | |
Enterprise Products Operating LLC | | | 5,412,000 | | | | 3,692,945 | | | | 0.86% | |
Altria Group, Inc. | | | 5,412,000 | | | | 3,519,945 | | | | 0.82% | |
Gilead Sciences, Inc. | | | 5,276,700 | | | | 3,467,765 | | | | 0.81% | |
Johnson & Johnson | | | 5,276,700 | | | | 3,349,801 | | | | 0.78% | |
Vodafone Group PLC | | | 4,194,300 | | | | 3,304,539 | | | | 0.77% | |
McDonald’s Corp. | | | 3,788,400 | | | | 3,220,802 | | | | 0.75% | |
Coca-Cola Co. | | | 4,194,300 | | | | 3,125,321 | | | | 0.73% | |
BP Capital Markets America, Inc. | | | 4,194,300 | | | | 2,963,999 | | | | 0.69% | |
Anthem, Inc. | | | 3,788,400 | | | | 2,904,481 | | | | 0.68% | |
FedEx Corp. | | | 3,111,900 | | | | 2,888,303 | | | | 0.67% | |
American International Group, Inc. | | | 3,111,900 | | | | 2,662,823 | | | | 0.62% | |
Simon Property Group, Inc. | | | 3,382,500 | | | | 2,553,885 | | | | 0.60% | |
Berkshire Hathaway Finance Corp. | | | 3,923,700 | | | | 2,541,822 | | | | 0.59% | |
Union Pacific Corp. | | | 3,653,100 | | | | 2,523,998 | | | | 0.59% | |
International Business Machines Corp. | | | 3,788,400 | | | | 2,493,811 | | | | 0.58% | |
| | | | | | | | | | | | |
| | | |
| | | | | | $ | 362,113,282 | | | | | |
| | | | | | | | | | | | |
Balances Reported in the Statement of Assets and Liabilities for OTC Swap Agreements:
| | | | | | | | |
| | | Premiums Paid | | Premiums Received | | Unrealized Appreciation | | Unrealized Depreciation |
OTC Swap Agreements | | $8,479 | | $(29,539) | | $1,463,224 | | $(1,384,769) |
SEE NOTES TO FINANCIAL STATEMENTS.
A205
| | | | |
| | PSF PGIM TOTAL RETURN BOND PORTFOLIO (CONTINUED) | | |
SCHEDULE OF INVESTMENTS | | | | as of December 31, 2022 |
Summary of Collateral for Centrally Cleared/Exchange-traded Derivatives:
Cash and securities segregated as collateral, including pending settlement for closed positions, to cover requirements for centrally cleared/exchange-traded derivatives are listed by broker as follows:
| | | | | | | | | | |
Broker | | Cash and/or Foreign Currency | | Securities Market Value |
| | |
CIGM | | | $ | — | | | | $ | 8,589,838 | |
| | | | | | | | | | |
Fair Value Measurements:
Various inputs are used in determining the value of the Portfolio’s investments. These inputs are summarized in the three broad levels listed below.
Level 1—unadjusted quoted prices generally in active markets for identical securities.
Level 2—quoted prices for similar securities, interest rates and yield curves, prepayment speeds, foreign currency exchange rates and other observable inputs.
Level 3—unobservable inputs for securities valued in accordance with Board approved fair valuation procedures.
The following is a summary of the inputs used as of December 31, 2022 in valuing such portfolio securities:
| | | | | | | | | | | | |
| | | Level 1 | | | Level 2 | | | Level 3 | |
Investments in Securities | | | | | | | | | | | | |
Assets | | | | | | | | | | | | |
Long-Term Investments | | | | | | | | | | | | |
Asset-Backed Securities | | | | | | | | | | | | |
Automobiles | | $ | — | | | $ | 12,868,740 | | | $ | — | |
Collateralized Debt Obligations | | | — | | | | 4,408,188 | | | | — | |
Collateralized Loan Obligations | | | — | | | | 213,045,346 | | | | — | |
Consumer Loans | | | — | | | | 7,507,229 | | | | — | |
Credit Cards | | | — | | | | 2,664,604 | | | | — | |
Home Equity Loans | | | — | | | | 303,052 | | | | — | |
Other | | | — | | | | 2,311,803 | | | | — | |
Residential Mortgage-Backed Securities | | | — | | | | 2,691,139 | | | | 1,856,650 | |
Student Loans | | | — | | | | 3,824,497 | | | | — | |
Commercial Mortgage-Backed Securities | | | — | | | | 141,625,619 | | | | — | |
Corporate Bonds | | | — | | | | 373,349,793 | | | | 1,012,436 | |
Floating Rate and other Loans | | | — | | | | 11,935,440 | | | | 134,975 | |
Municipal Bonds | | | — | | | | 14,697,357 | | | | — | |
Residential Mortgage-Backed Securities | | | — | | | | 42,741,139 | | | | 1,505,841 | |
Sovereign Bonds | | | — | | | | 28,531,109 | | | | — | |
U.S. Government Agency Obligations | | | — | | | | 215,778,008 | | | | — | |
U.S. Treasury Obligations | | | — | | | | 86,153,874 | | | | — | |
Common Stocks | | | 1,536,721 | | | | — | | | | 1,420,707 | |
Preferred Stocks | | | 2,100,850 | | | | — | | | | — | |
Short-Term Investments | | | | | | | | | | | | |
Affiliated Mutual Funds | | | 145,800,752 | | | | — | | | | — | |
| | | | | | | | | | | | |
| | | |
Total | | $ | 149,438,323 | | | $ | 1,164,436,937 | | | $ | 5,930,609 | |
| | | | | | | | | | | | |
Liabilities | | | | | | | | | | | | |
Options Written | | $ | — | | | $ | (37 | ) | | $ | (246 | ) |
| | | | | | | | | | | | |
| | | |
Other Financial Instruments* | | | | | | | | | | | | |
Assets | | | | | | | | | | | | |
Centrally Cleared Swaptions Purchased | | $ | — | | | $ | 40,790 | | | $ | — | |
Centrally Cleared Swaptions Written | | | — | | | | 317,596 | | | | — | |
Futures Contracts | | | 1,693,938 | | | | — | | | | — | |
OTC Credit Default Swap Agreements | | | — | | | | 5,952 | | | | 2,873 | |
Centrally Cleared Interest Rate Swap Agreements | | | — | | | | 2,041,797 | | | | — | |
OTC Total Return Swap Agreements | | | — | | | | 1,458,847 | | | | — | |
| | | | | | | | | | | | |
| | | |
Total | | $ | 1,693,938 | | | $ | 3,864,982 | | | $ | 2,873 | |
| | | | | | | | | | | | |
| | | |
Liabilities | | | | | | | | | | | | |
Centrally Cleared Swaptions Purchased | | $ | — | | �� | $ | (379,710 | ) | | $ | — | |
Centrally Cleared Swaptions Written | | | — | | | | (147,916 | ) | | | — | |
SEE NOTES TO FINANCIAL STATEMENTS.
A206
| | | | |
| | PSF PGIM TOTAL RETURN BOND PORTFOLIO (CONTINUED) | | |
SCHEDULE OF INVESTMENTS | | | | as of December 31, 2022 |
| | | | | | | | | | | | |
| | | Level 1 | | | Level 2 | | | Level 3 | |
Other Financial Instruments* (continued) | | | | | | | | | | | | |
Liabilities (continued) | | | | | | | | | | | | |
Futures Contracts | | $ | (1,001,411 | ) | | $ | — | | | $ | — | |
OTC Forward Foreign Currency Exchange Contracts | | | — | | | | (3,491,984 | ) | | | — | |
Centrally Cleared Credit Default Swap Agreements | | | — | | | | (248,995 | ) | | | — | |
OTC Credit Default Swap Agreements | | | — | | | | (52,262 | ) | | | — | |
Centrally Cleared Interest Rate Swap Agreement | | | — | | | | (218,220 | ) | | | — | |
OTC Total Return Swap Agreement | | | — | | | | (1,358,015 | ) | | | — | |
| | | | | | | | | | | | |
| | | |
Total | | $ | (1,001,411 | ) | | $ | (5,897,102 | ) | | $ | — | |
| | | | | | | | | | | | |
| * | Other financial instruments are derivative instruments, with the exception of centrally cleared swaptions, and are not reflected in the Schedule of Investments. Centrally cleared swaptions, futures, forwards and centrally cleared swap contracts, which are recorded at the unrealized appreciation (depreciation) on the instrument, and OTC swap contracts which are recorded at fair value. |
Industry Classification:
The industry classification of investments and liabilities in excess of other assets shown as a percentage of net assets as of December 31, 2022 were as follows:
| | | | |
U.S. Government Agency Obligations | | | 19.7 | % |
Collateralized Loan Obligations | | | 19.5 | |
Affiliated Mutual Funds (1.8% represents investments purchased with collateral from securities on loan) | | | 13.4 | |
Commercial Mortgage-Backed Securities | | | 13.0 | |
Banks | | | 9.9 | |
U.S. Treasury Obligations | | | 7.9 | |
Residential Mortgage-Backed Securities | | | 4.4 | |
Electric | | | 2.9 | |
Sovereign Bonds | | | 2.6 | |
Oil & Gas | | | 2.2 | |
Pharmaceuticals | | | 2.2 | |
Telecommunications | | | 1.8 | |
Media | | | 1.8 | |
Pipelines | | | 1.8 | |
Municipal Bonds | | | 1.3 | |
Automobiles | | | 1.2 | |
Retail | | | 0.9 | |
Foods | | | 0.9 | |
Aerospace & Defense | | | 0.9 | |
Real Estate Investment Trusts (REITs) | | | 0.8 | |
Auto Manufacturers | | | 0.8 | |
Commercial Services | | | 0.7 | |
Healthcare-Services | | | 0.7 | |
Chemicals | | | 0.7 | |
Consumer Loans | | | 0.7 | |
Insurance | | | 0.7 | |
Airlines | | | 0.6 | |
Diversified Financial Services | | | 0.5 | |
Entertainment | | | 0.4 | |
Engineering & Construction | | | 0.4 | |
Collateralized Debt Obligations | | | 0.4 | |
Semiconductors | | | 0.4 | |
Student Loans | | | 0.4 | |
Healthcare-Products | | | 0.3 | |
Beverages | | | 0.3 | |
Agriculture | | | 0.3 | |
Lodging | | | 0.3 | |
Computers | | | 0.3 | |
Software | | | 0.2 | |
| | | | |
Credit Cards | | | 0.2 | % |
Gas | | | 0.2 | |
Other | | | 0.2 | |
Mining | | | 0.2 | |
Auto Parts & Equipment | | | 0.2 | |
Building Materials | | | 0.2 | |
Oil, Gas & Consumable Fuels | | | 0.2 | |
Multi-National | | | 0.1 | |
Metal Fabricate/Hardware | | | 0.1 | |
Real Estate | | | 0.1 | |
Electrical Components & Equipment | | | 0.1 | |
Gas Utilities | | | 0.1 | |
Electronics | | | 0.1 | |
Home Builders | | | 0.1 | |
Capital Markets | | | 0.1 | |
Packaging & Containers | | | 0.1 | |
Transportation | | | 0.1 | |
Housewares | | | 0.1 | |
Internet | | | 0.0 | * |
Oil & Gas Services | | | 0.0 | * |
Miscellaneous Manufacturing | | | 0.0 | * |
Home Equity Loans | | | 0.0 | * |
Machinery-Diversified | | | 0.0 | * |
Biotechnology | | | 0.0 | * |
Iron/Steel | | | 0.0 | * |
Environmental Control | | | 0.0 | * |
Trucking & Leasing | | | 0.0 | * |
Office/Business Equipment | | | 0.0 | * |
Forest Products & Paper | | | 0.0 | * |
Machinery-Construction & Mining | | | 0.0 | * |
Shipbuilding | | | 0.0 | * |
Investment Companies | | | 0.0 | * |
| | | | |
| |
| | | 120.7 | |
Options Written | | | (0.0 | )* |
Liabilities in excess of other assets | | | (20.7 | ) |
| | | | |
| |
| | | 100.0 | % |
| | | | |
SEE NOTES TO FINANCIAL STATEMENTS.
A207
| | | | |
| | PSF PGIM TOTAL RETURN BOND PORTFOLIO (CONTINUED) | | |
SCHEDULE OF INVESTMENTS | | | | as of December 31, 2022 |
Effects of Derivative Instruments on the Financial Statements and Primary Underlying Risk Exposure:
The Portfolio invested in derivative instruments during the reporting period. The primary types of risk associated with these derivative instruments are credit contracts risk, foreign exchange contracts risk and interest rate contracts risk. See the Notes to Financial Statements for additional detail regarding these derivative instruments and their risks. The effect of such derivative instruments on the Portfolio’s financial position and financial performance as reflected in the Statement of Assets and Liabilities and Statement of Operations is presented in the summary below.
Fair values of derivative instruments as of December 31, 2022 as presented in the Statement of Assets and Liabilities:
| | | | | | | | | | | | |
| | | Asset Derivatives | | | Liability Derivatives | |
| | | | | | |
Derivatives not accounted for as hedging instruments, carried at fair value | | Statement of Assets and Liabilities Location | | Fair
Value | | | Statement of Assets and Liabilities Location | | Fair
Value | |
| | | | |
Credit contracts | | Due from/to broker-variation margin swaps and swaptions | | $ | 358,386* | | | Due from/to broker-variation margin swaps and swaptions | | $ | 776,621* | |
Credit contracts | | Premiums paid for OTC swap agreements | | | 8,479 | | | Premiums received for OTC swap agreements | | | 29,539 | |
Credit contracts | | — | | | — | | | Options written outstanding, at value | | | 283 | |
Credit contracts | | Unrealized appreciation on OTC swap agreements | | | 4,377 | | | Unrealized depreciation on OTC swap agreements | | | 26,754 | |
Foreign exchange contracts | | — | | | — | | | Unrealized depreciation on OTC forward foreign currency exchange contracts | | | 3,491,984 | |
Interest rate contracts | | Due from/to broker-variation margin futures | | | 1,693,938 | * | | Due from/to broker-variation margin futures | | | 1,001,411 | * |
Interest rate contracts | | Due from/to broker-variation margin swaps and swaptions | | | 2,041,797 | * | | Due from/to broker-variation margin swaps and swaptions | | | 218,220 | * |
Interest rate contracts | | Unrealized appreciation on OTC swap agreements | | | 1,458,847 | | | Unrealized depreciation on OTC swap agreements | | | 1,358,015 | |
| | | | | | | | | | | | |
| | | | |
| | | | $ | 5,565,824 | | | | | $ | 6,902,827 | |
| | | | | | | | | | | | |
| * | Includes cumulative appreciation (depreciation) as reported in the schedule of open futures, centrally cleared swap contracts, and centrally cleared swaptions. Only unsettled variation margin receivable (payable) is reported within the Statement of Assets and Liabilities. |
The effects of derivative instruments on the Statement of Operations for the year ended December 31, 2022 are as follows:
| | | | | | | | | | | | | | | | | | | | | | | | | |
Amount of Realized Gain (Loss) on Derivatives Recognized in Income |
| | | | | |
Derivatives not accounted for as hedging instruments, carried at fair value | | Options Purchased(1) | | Options
Written | | Futures | | Forward
Currency
Exchange
Contracts | | Swaps |
Credit contracts | | | $ | (2,060,800 | ) | | | $ | 2,354,490 | | | | $ | — | | | | $ | — | | | | $ | 771,055 | |
Foreign exchange contracts | | | | — | | | | | — | | | | | — | | | | | 13,279,825 | | | | | — | |
Interest rate contracts | | | | — | | | | | — | | | | | (46,390,438 | ) | | | | — | | | | | (14,406,105 | ) |
| | | | | | | | | | | | | | | | | | | | | | | | | |
| | | | | |
Total | | | $ | (2,060,800 | ) | | | $ | 2,354,490 | | | | $ | (46,390,438 | ) | | | $ | 13,279,825 | | | | $ | (13,635,050 | ) |
| | | | | | | | | | | | | | | | | | | | | | | | | |
| (1) | Included in net realized gain (loss) on investment transactions in the Statement of Operations. |
| | | | | | | | | | | | | | | | | | | | | | | | | |
Change in Unrealized Appreciation (Depreciation) on Derivatives Recognized in Income |
| | | | | |
Derivatives not accounted for as hedging instruments, carried at fair value | | Options Purchased(2) | | Options
Written | | Futures | | Forward
Currency
Exchange
Contracts | | Swaps |
Credit contracts | | | $ | (149,287 | ) | | | $ | 152,174 | | | | $ | — | | | | $ | — | | | | $ | (272,221 | ) |
Foreign exchange contracts | | | | — | | | | | — | | | | | — | | | | | (2,101,291 | ) | | | | — | |
Interest rate contracts | | | | — | | | | | — | | | | | (2,417,976 | ) | | | | — | | | | | 10,968,506 | |
| | | | | | | | | | | | | | | | | | | | | | | | | |
| | | | | |
Total | | | $ | (149,287 | ) | | | $ | 152,174 | | | | $ | (2,417,976 | ) | | | $ | (2,101,291 | ) | | | $ | 10,696,285 | |
| | | | | | | | | | | | | | | | | | | | | | | | | |
SEE NOTES TO FINANCIAL STATEMENTS.
A208
| | | | |
| | PSF PGIM TOTAL RETURN BOND PORTFOLIO (CONTINUED) | | |
SCHEDULE OF INVESTMENTS | | | | as of December 31, 2022 |
| (2) | Included in net change in unrealized appreciation (depreciation) on investments in the Statement of Operations. |
For the year ended December 31, 2022, the Portfolio’s average volume of derivative activities is as follows:
| | | | | | | | | | | | |
| Derivative Contract Type | | Average Volume of Derivative Activities* | |
Options Purchased (1) | | | | | | $ | 533,940 | | | | | |
Options Written (2) | | | | | | | 345,174,824 | | | | | |
Futures Contracts - Long Positions (2) | | | | | | | 384,237,162 | | | | | |
Futures Contracts - Short Positions (2) | | | | | | | 214,542,488 | | | | | |
Forward Foreign Currency Exchange Contracts - Purchased (3) | | | | | | | 77,148,798 | | | | | |
Forward Foreign Currency Exchange Contracts - Sold (3) | | | | | | | 196,819,933 | | | | | |
Interest Rate Swap Agreements (2) | | | | | | | 32,735,543 | | | | | |
Credit Default Swap Agreements - Buy Protection (2) | | | | | | | 74,012,128 | | | | | |
Credit Default Swap Agreements - Sell Protection (2) | | | | | | | 24,253,397 | | | | | |
Total Return Swap Agreements (2) | | | | | | | 20,079,104 | | | | | |
Inflation Swap Agreements (2) | | | | | | | 3,636,000 | | | | | |
| * | Average volume is based on average quarter end balances as noted for the year ended December 31, 2022. |
| (2) | Notional Amount in USD. |
| (3) | Value at Settlement Date. |
Financial Instruments/Transactions—Summary of Offsetting and Netting Arrangements:
The Portfolio invested in OTC derivatives and entered into financial instruments/transactions during the reporting period that are either offset in accordance with current requirements or are subject to enforceable master netting arrangements or similar agreements that permit offsetting. The information about offsetting and related netting arrangements for OTC derivatives and financial instruments/transactions where the legal right to set-off exists is presented in the summary below.
Offsetting of financial instrument/transaction assets and liabilities:
| | | | | | |
| Description | | Gross Market Value of Recognized Assets/(Liabilities) | | Collateral Pledged/(Received)(2) | | Net Amount |
Securities on Loan | | $19,155,254 | | $(19,155,254) | | $— |
Offsetting of OTC derivative assets and liabilities:
| | | | | | | | | | | | | | | | | | | | | | | | | | | | | | | | | | | | | | | | | | | | | | | | | | | | | | | | | | | | |
Counterparty | | Gross Amounts of Recognized Assets(1) | | | Gross Amounts of Recognized Liabilities(1) | | | Net Amounts of Recognized Assets/(Liabilities) | | | Collateral Pledged/(Received)(2) | | | Net Amount | |
BNP | | | | | | $ | — | | | | | | | | | | | $ | (3,286,617 | ) | | | | | | | | | | $ | (3,286,617 | ) | | | | | | | | | | $ | 3,050,100 | | | | | | | | | | | $ | (236,517 | ) | | | | |
BOA | | | | | | | 5,952 | | | | | | | | | | | | — | | | | | | | | | | | | 5,952 | | | | | | | | | | | | — | | | | | | | | | | | | 5,952 | | | | | |
CITI | | | | | | | 3,972 | | | | | | | | | | | | (51,238 | ) | | | | | | | | | | | (47,266 | ) | | | | | | | | | | | — | | | | | | | | | | | | (47,266 | ) | | | | |
CSI | | | | | | | — | | | | | | | | | | | | (15,073 | ) | | | | | | | | | | | (15,073 | ) | | | | | | | | | | | 15,073 | | | | | | | | | | | | — | | | | | |
GSI | | | | | | | 445,342 | | | | | | | | | | | | (1,358,357 | ) | | | | | | | | | | | (913,015 | ) | | | | | | | | | | | 706,731 | | | | | | | | | | | | (206,284 | ) | | | | |
JPM | | | | | | | 1,016,437 | | | | | | | | | | | | — | | | | | | | | | | | | 1,016,437 | | | | | | | | | | | | (1,016,437 | ) | | | | | | | | | | | — | | | | | |
MSI | | | | | | | — | | | | | | | | | | | | (183,476 | ) | | | | | | | | | | | (183,476 | ) | | | | | | | | | | | 183,476 | | | | | | | | | | | | — | | | | | |
TD | | | | | | | — | | | | | | | | | | | | (11,814 | ) | | | | | | | | | | | (11,814 | ) | | | | | | | | | | | — | | | | | | | | | | | | (11,814 | ) | | | | |
| | | | | | | | | | | | | | | | | | | | | | | | | | | | | | | | | | | | | | | | | | | | | | | | | | | | | | | | | | | | |
| | | | | | $ | 1,471,703 | | | | | | | | | | | $ | (4,906,575 | ) | | | | | | | | | | $ | (3,434,872 | ) | | | | | | | | | | $ | 2,938,943 | | | | | | | | | | | $ | (495,929 | ) | | | | |
| | | | | | | | | | | | | | | | | | | | | | | | | | | | | | | | | | | | | | | | | | | | | | | | | | | | | | | | | | | | |
| (1) | Includes unrealized appreciation/(depreciation) on swaps and forwards, premiums paid/(received) on swap agreements and market value of purchased and written options, as represented on the Statement of Assets and Liabilities. |
| (2) | Collateral amount disclosed by the Portfolio is limited to the market value of financial instruments/transactions and the Portfolio’s OTC derivative exposure by counterparty. |
SEE NOTES TO FINANCIAL STATEMENTS.
A209
| | | | |
| | PSF PGIM TOTAL RETURN BOND PORTFOLIO (CONTINUED) | | |
STATEMENT OF ASSETS AND LIABILITIES
as of December 31, 2022
| | | | |
| | | | |
ASSETS | | | | |
Investments at value, including securities on loan of $19,155,254: | | | | |
Unaffiliated investments (cost $1,309,304,208) | | $ | 1,174,005,117 | |
Affiliated investments (cost $145,781,887) | | | 145,800,752 | |
Foreign currency, at value (cost $2,719,003) | | | 2,804,008 | |
Cash | | | 240,076 | |
Receivable for investments sold | | | 58,959,785 | |
Dividends and interest receivable | | | 9,328,573 | |
Unrealized appreciation on OTC swap agreements | | | 1,463,224 | |
Receivable for Portfolio shares sold | | | 579,201 | |
Due from broker-variation margin swaps and swaptions | | | 25,893 | |
Premiums paid for OTC swap agreements | | | 8,479 | |
Prepaid expenses and other assets | | | 183,191 | |
| | | | |
Total Assets | | | 1,393,398,299 | |
| | | | |
LIABILITIES | | | | |
Payable for investments purchased | | | 266,673,450 | |
Payable to broker for collateral for securities on loan | | | 19,505,025 | |
Due to Custodian | | | 7,680,921 | |
Unrealized depreciation on OTC forward foreign currency exchange contracts | | | 3,491,984 | |
Unrealized depreciation on OTC swap agreements | | | 1,384,769 | |
Management fee payable | | | 376,689 | |
Accrued expenses and other liabilities | | | 291,263 | |
Payable for Portfolio shares purchased | | | 62,862 | |
Due to broker-variation margin futures | | | 44,442 | |
Premiums received for OTC swap agreements | | | 29,539 | |
Distribution fee payable | | | 1,959 | |
Affiliated transfer agent fee payable | | | 980 | |
Trustees’ fees payable | | | 900 | |
Options written outstanding, at value (premiums received $6,696) | | | 283 | |
| | | | |
Total Liabilities | | | 299,545,066 | |
| | | | |
NET ASSETS | | $ | 1,093,853,233 | |
| | | | |
Net assets were comprised of: | | | | |
Partners’ Equity | | $ | 1,093,853,233 | |
| | | | |
Class I: | | | | |
Net asset value and redemption price per share, $1,084,574,917 / 81,333,140 outstanding shares of beneficial interest | | $ | 13.33 | |
| | | | |
Class III: | | | | |
Net asset value and redemption price per share, $9,278,316 / 698,669 outstanding shares of beneficial interest | | $ | 13.28 | |
| | | | |
STATEMENT OF OPERATIONS
Year Ended December 31, 2022
| | | | |
NET INVESTMENT INCOME (LOSS) | | | | |
INCOME | | | | |
Interest income | | $ | 40,425,523 | |
Affiliated dividend income | | | 1,623,023 | |
Unaffiliated dividend income | | | 622,499 | |
Income from securities lending, net (including affiliated income of $65,983) | | | 71,673 | |
| | | | |
Total income | | | 42,742,718 | |
| | | | |
EXPENSES | | | | |
Management fee | | | 4,649,183 | |
Distribution fee—Class III | | | 19,346 | |
Custodian and accounting fees | | | 107,795 | |
Audit fee | | | 90,000 | |
Shareholders’ reports | | | 58,195 | |
Legal fees and expenses | | | 26,534 | |
Trustees’ fees | | | 26,300 | |
Transfer agent’s fees and expenses (including affiliated expense of $8,140) | | | 10,865 | |
Miscellaneous | | | 46,027 | |
| | | | |
Total expenses | | | 5,034,245 | |
| | | | |
NET INVESTMENT INCOME (LOSS) | | | 37,708,473 | |
| | | | |
| REALIZED AND UNREALIZED GAIN (LOSS) ON INVESTMENT AND FOREIGN CURRENCY | | | | |
TRANSACTIONS | | | | |
Net realized gain (loss) on: | | | | |
Investment transactions (including affiliated of $(4,495)) | | | (15,991,452 | ) |
Futures transactions | | | (46,390,438 | ) |
Forward currency contract transactions | | | 13,279,825 | |
Options written transactions | | | 2,354,490 | |
Swap agreements transactions | | | (13,635,050 | ) |
Foreign currency transactions | | | (2,126,155 | ) |
| | | | |
| | | (62,508,780 | ) |
| | | | |
Net change in unrealized appreciation (depreciation) on: | | | | |
Investments (including affiliated of $7,911) | | | (176,777,198 | ) |
Futures | | | (2,417,976 | ) |
Forward currency contracts | | | (2,101,291 | ) |
Options written | | | 152,174 | |
Swap agreements | | | 10,696,285 | |
Foreign currencies | | | 778,131 | |
| | | | |
| | | (169,669,875 | ) |
| | | | |
NET GAIN (LOSS) ON INVESTMENT AND FOREIGN CURRENCY TRANSACTIONS | | | (232,178,655 | ) |
| | | | |
NET INCREASE (DECREASE) IN NET ASSETS RESULTING FROM OPERATIONS | | $ | (194,470,182 | ) |
| | | | |
STATEMENTS OF CHANGES IN NET ASSETS
| | | | | | | | | | |
| | | Year Ended
December 31, 2022 | | Year Ended
December 31, 2021 |
INCREASE (DECREASE) IN NET ASSETS | | | | | | | | | | |
OPERATIONS | | | | | | | | | | |
Net investment income (loss) | | | $ | 37,708,473 | | | | $ | 32,937,027 | |
Net realized gain (loss) on investment and foreign currency transactions | | | | (62,508,780 | ) | | | | 2,301,462 | |
Net change in unrealized appreciation (depreciation) on investments and foreign currencies | | | | (169,669,875 | ) | | | | (44,183,411 | ) |
| | | | | | | | | | |
NET INCREASE (DECREASE) IN NET ASSETS RESULTING FROM OPERATIONS | | | | (194,470,182 | ) | | | | (8,944,922 | ) |
| | | | | | | | | | |
PORTFOLIO SHARE TRANSACTIONS | | | | | | | | | | |
Portfolio shares sold | | | | 45,246,239 | | | | | 111,700,386 | |
Net asset value of shares issued in merger | | | | 46,303,369 | | | | | — | |
Portfolio shares purchased | | | | (106,286,659 | ) | | | | (92,303,055 | ) |
| | | | | | | | | | |
NET INCREASE (DECREASE) IN NET ASSETS FROM PORTFOLIO SHARE TRANSACTIONS | | | | (14,737,051 | ) | | | | 19,397,331 | |
| | | | | | | | | | |
TOTAL INCREASE (DECREASE) | | | | (209,207,233 | ) | | | | 10,452,409 | |
NET ASSETS: | | | | | | | | | | |
Beginning of year | | | | 1,303,060,466 | | | | | 1,292,608,057 | |
| | | | | | | | | | |
End of year | | | $ | 1,093,853,233 | | | | $ | 1,303,060,466 | |
| | | | | | | | | | |
SEE NOTES TO FINANCIAL STATEMENTS.
A210
| | | | |
| | PSF PGIM TOTAL RETURN BOND PORTFOLIO (CONTINUED) | | |
FINANCIAL HIGHLIGHTS
| | | | | | | | | | | | | | | | | | | | |
Class I | | | | | | | | | | | | | | | |
| | | Year Ended December 31, | |
| | | 2022 | | | 2021 | | | 2020 | | | 2019 | | | 2018 | |
Per Share Operating Performance(a): | | | | | | | | | | | | | | | | | | | | |
Net Asset Value, beginning of year | | $ | 15.66 | | | $ | 15.78 | | | $ | 14.55 | | | $ | 13.12 | | | $ | 13.14 | |
| | | | | | | | | | | | | | | | | | | | |
Income (Loss) From Investment Operations: | | | | | | | | | | | | | | | | | | | | |
Net investment income (loss) | | | 0.45 | | | | 0.40 | | | | 0.45 | | | | 0.49 | | | | 0.45 | |
Net realized and unrealized gain (loss) on investment and foreign currency transactions | | | (2.78 | ) | | | (0.52 | ) | | | 0.78 | | | | 0.94 | | | | (0.48 | ) |
| | | | | | | | | | | | | | | | | | | | |
Total from investment operations | | | (2.33 | ) | | | (0.12 | ) | | | 1.23 | | | | 1.43 | | | | (0.03 | ) |
| | | | | | | | | | | | | | | | | | | | |
Capital Contributions | | | — | | | | — | | | | — | | | | — | | | | 0.01 | (b) |
| | | | | | | | | | | | | | | | | | | | |
Net Asset Value, end of year | | $ | 13.33 | | | $ | 15.66 | | | $ | 15.78 | | | $ | 14.55 | | | $ | 13.12 | |
| | | | | | | | | | | | | | | | | | | | |
Total Return(c) | | | (14.81 | )% | | | (0.76 | )% | | | 8.45 | % | | | 10.90 | % | | | (0.15 | )%(d) |
Ratios/Supplemental Data: | | | | | | | | | | | | | | | | | | | | |
Net assets, end of year (in millions) | | $ | 1,085 | | | $ | 1,298 | | | $ | 1,293 | | | $ | 1,190 | | | $ | 1,123 | |
Average net assets (in millions) | | $ | 1,155 | | | $ | 1,292 | | | $ | 1,235 | | | $ | 1,166 | | | $ | 1,132 | |
Ratios to average net assets(e): | | | | | | | | | | | | | | | | | | | | |
Expenses after waivers and/or expense reimbursement | | | 0.43 | % | | | 0.42 | % | | | 0.43 | % | | | 0.44 | % | | | 0.44 | % |
Expenses before waivers and/or expense reimbursement | | | 0.43 | % | | | 0.42 | % | | | 0.43 | % | | | 0.44 | % | | | 0.44 | % |
Net investment income (loss) | | | 3.25 | % | | | 2.55 | % | | | 2.99 | % | | | 3.53 | % | | | 3.44 | % |
Portfolio turnover rate(f) | | | 182 | % | | | 49 | % | | | 35 | % | | | 48 | % | | | 51 | % |
| | | | | | | | | | | | | | | | | | | | | | | | | | |
Class III | | | | | | | | | | | | | | | | | | | | |
| | | | | Year Ended December 31, | | | April 26, 2021(g) through December 31, | |
| | | | | 2022 | | | 2021 | |
Per Share Operating Performance(a): | | | | | | | | | | | | | | | | | | | | | | | | | | |
Net Asset Value, beginning of period | | | | | | | | $ | 15.64 | | | | | | | | | | | $ | 15.35 | | | | | |
| | | | | | | | | | | | | | | | | | | | | | | | | | |
Income (Loss) From Investment Operations: | | | | | | | | | | | | | | | | | | | | | | | | | | |
Net investment income (loss) | | | | | | | | | 0.43 | | | | | | | | | | | | 0.24 | | | | | |
Net realized and unrealized gain (loss) on investment and foreign currency transactions | | | | | | | | | (2.79 | ) | | | | | | | | | | | 0.05 | (h) | | | | |
| | | | | | | | | | | | | | | | | | | | | | | | | | |
Total from investment operations | | | | | | | | | (2.36 | ) | | | | | | | | | | | 0.29 | | | | | |
| | | | | | | | | | | | | | | | | | | | | | | | | | |
Net Asset Value, end of period | | | | | | | | $ | 13.28 | | | | | | | | | | | $ | 15.64 | | | | | |
| | | | | | | | | | | | | | | | | | | | | | | | | | |
Total Return(c) | | | | | | | | | (15.09 | )% | | | | | | | | | | | 1.89 | % | | | | |
Ratios/Supplemental Data: | | | | | | | | | | | | | | | | | | | | | | | | | | |
Net assets, end of period (in millions) | | | | | | | | $ | 9 | | | | | | | | | | | $ | 5 | | | | | |
Average net assets (in millions) | | | | | | | | $ | 8 | | | | | | | | | | | $ | 2 | | | | | |
Ratios to average net assets(e): | | | | | | | | | | | | | | | | | | | | | | | | | | |
Expenses after waivers and/or expense reimbursement | | | | | | | | | 0.68 | % | | | | | | | | | | | 0.66 | %(i) | | | | |
Expenses before waivers and/or expense reimbursement | | | | | | | | | 0.68 | % | | | | | | | | | | | 0.66 | %(i) | | | | |
Net investment income (loss) | | | | | | | | | 3.08 | % | | | | | | | | | | | 2.24 | %(i) | | | | |
Portfolio turnover rate(f) | | | | | | | | | 182 | % | | | | | | | | | | | 49 | % | | | | |
| (a) | Calculated based on average shares outstanding during the period. |
| (b) | Represents payment received by the Portfolio, from Prudential, in connection with excess foreign withholding tax withheld on dividends and interest from certain countries due to the Portfolio’s tax status as a partnership. |
| (c) | Total return is calculated assuming a purchase of a share on the first day and a sale on the last day of each period reported and includes reinvestment of dividends and distributions, if any, and does not reflect the effect of insurance contract charges. Total return does not reflect expenses associated with the separate account such as administrative fees, account charges and surrender charges which, if reflected, would reduce the total returns for all periods shown. Performance figures may reflect fee waivers and/or expense reimbursements. In the absence of fee waivers and/or expense reimbursements, the total return would be lower. Past performance is no guarantee of future results. Total returns may reflect adjustments to conform to GAAP. Total returns for periods less than one full year are not annualized. |
| (d) | Total return for the year includes the impact of the capital contribution. Excluding the capital contribution, the total return would have been (0.23)%. |
| (e) | Does not include expenses of the underlying funds in which the Portfolio invests. |
| (f) | The Portfolio’s portfolio turnover rate is calculated in accordance with regulatory requirements, without regard to transactions involving short-term investments, certain derivatives and in-kind transactions (if any). If such transactions were included, the Portfolio’s portfolio turnover rate may be higher. |
| (g) | Commencement of offering. |
| (h) | The per share amount of realized and unrealized gain (loss) on investments does not directly correlate to the amounts reported in the Statement of Operations due to the timing of portfolio share transactions in relation to fluctuating market values. |
| (i) | Annualized, with the exception of certain non-recurring expenses. |
SEE NOTES TO FINANCIAL STATEMENTS.
A211
| | | | |
| | PSF SMALL-CAP STOCK INDEX PORTFOLIO | | |
SCHEDULE OF INVESTMENTS | | | | as of December 31, 2022 |
| | | | | | | | |
| | | Shares | | | Value | |
LONG-TERM INVESTMENTS — 99.1% | |
COMMON STOCKS — 97.8% | |
Aerospace & Defense — 1.4% | |
AAR Corp.*(a) | | | 30,411 | | | $ | 1,365,454 | |
Aerojet Rocketdyne Holdings, Inc.* | | | 69,095 | | | | 3,864,483 | |
AeroVironment, Inc.*(a) | | | 22,794 | | | | 1,952,534 | |
Kaman Corp.(a) | | | 25,542 | | | | 569,587 | |
Moog, Inc. (Class A Stock) | | | 26,414 | | | | 2,318,093 | |
National Presto Industries, Inc. | | | 4,619 | | | | 316,217 | |
Park Aerospace Corp. | | | 18,044 | | | | 241,970 | |
Triumph Group, Inc.* | | | 59,310 | | | | 623,941 | |
| | | | | | | | |
| | |
| | | | | | | 11,252,279 | |
| | | | | | | | |
Air Freight & Logistics — 0.9% | |
Atlas Air Worldwide Holdings, Inc.* | | | 24,320 | | | | 2,451,456 | |
Forward Air Corp. | | | 24,266 | | | | 2,545,261 | |
Hub Group, Inc. (Class A Stock)* | | | 29,820 | | | | 2,370,392 | |
| | | | | | | | |
| | |
| | | | | | | 7,367,109 | |
| | | | | | | | |
Airlines — 0.3% | | | | | | | | |
Allegiant Travel Co.*(a) | | | 14,254 | | | | 969,129 | |
Hawaiian Holdings, Inc.*(a) | | | 47,240 | | | | 484,682 | |
SkyWest, Inc.* | | | 46,160 | | | | 762,102 | |
Sun Country Airlines Holdings,
Inc.*(a) | | | 29,700 | | | | 471,042 | |
| | | | | | | | |
| | |
| | | | | | | 2,686,955 | |
| | | | | | | | |
Auto Components — 1.2% | |
American Axle & Manufacturing Holdings, Inc.* | | | 104,580 | | | | 817,816 | |
Dorman Products, Inc.* | | | 25,790 | | | | 2,085,637 | |
Gentherm, Inc.*(a) | | | 30,300 | | | | 1,978,287 | |
LCI Industries(a) | | | 23,279 | | | | 2,152,144 | |
Motorcar Parts of America, Inc.* | | | 17,640 | | | | 209,210 | |
Patrick Industries, Inc.(a) | | | 19,660 | | | | 1,191,396 | |
Standard Motor Products, Inc. | | | 17,169 | | | | 597,481 | |
XPEL, Inc.*(a) | | | 17,950 | | | | 1,078,077 | |
| | | | | | | | |
| | |
| | | | | | | 10,110,048 | |
| | | | | | | | |
Automobiles — 0.2% | | | | | | | | |
Winnebago Industries, Inc.(a) | | | 27,821 | | | | 1,466,167 | |
| | | | | | | | |
Banks — 10.4% | | | | | | | | |
Ameris Bancorp | | | 59,510 | | | | 2,805,301 | |
Banc of California, Inc. | | | 51,080 | | | | 813,704 | |
BancFirst Corp. | | | 15,970 | | | | 1,408,235 | |
Bancorp, Inc. (The)* | | | 51,110 | | | | 1,450,502 | |
BankUnited, Inc.(a) | | | 70,520 | | | | 2,395,564 | |
Banner Corp. | | | 31,220 | | | | 1,973,104 | |
Berkshire Hills Bancorp, Inc.(a) | | | 41,080 | | | | 1,228,292 | |
Brookline Bancorp, Inc. | | | 70,122 | | | | 992,226 | |
Central Pacific Financial Corp. | | | 24,850 | | | | 503,958 | |
City Holding Co.(a) | | | 13,564 | | | | 1,262,673 | |
Columbia Banking System, Inc.(a) | | | 71,768 | | | | 2,162,370 | |
Community Bank System, Inc.(a) | | | 49,116 | | | | 3,091,852 | |
Customers Bancorp, Inc.*(a) | | | 27,870 | | | | 789,836 | |
CVB Financial Corp.(a) | | | 119,940 | | | | 3,088,455 | |
Dime Community Bancshares, Inc. | | | 29,568 | | | | 941,149 | |
Eagle Bancorp, Inc. | | | 29,210 | | | | 1,287,285 | |
FB Financial Corp. | | | 32,140 | | | | 1,161,540 | |
First Bancorp(a) | | | 32,610 | | | | 1,397,012 | |
First BanCorp. (Puerto Rico)(a) | | | 168,502 | | | | 2,143,345 | |
| | | | | | | | |
| | | Shares | | | Value | |
COMMON STOCKS (continued) | |
Banks (cont’d.) | | | | | | | | |
First Commonwealth Financial
Corp.(a) | | | 85,230 | | | $ | 1,190,663 | |
First Financial Bancorp | | | 86,553 | | | | 2,097,179 | |
First Hawaiian, Inc.(a) | | | 116,540 | | | | 3,034,702 | |
Hanmi Financial Corp.(a) | | | 27,826 | | | | 688,694 | |
Heritage Financial Corp. | | | 32,020 | | | | 981,093 | |
Hilltop Holdings, Inc. | | | 41,870 | | | | 1,256,519 | |
HomeStreet, Inc. | | | 16,350 | | | | 450,933 | |
Hope Bancorp, Inc. | | | 109,034 | | | | 1,396,726 | |
Independent Bank Corp.(a) | | | 41,646 | | | | 3,516,172 | |
Independent Bank Group, Inc.(a) | | | 32,350 | | | | 1,943,588 | |
Lakeland Financial Corp. | | | 23,140 | | | | 1,688,526 | |
National Bank Holdings Corp. (Class A Stock) | | | 34,410 | | | | 1,447,629 | |
NBT Bancorp, Inc. | | | 39,120 | | | | 1,698,590 | |
Northwest Bancshares, Inc.(a) | | | 115,930 | | | | 1,620,701 | |
OFG Bancorp (Puerto Rico) | | | 43,420 | | | | 1,196,655 | |
Pacific Premier Bancorp, Inc.(a) | | | 86,705 | | | | 2,736,410 | |
Park National Corp. | | | 13,210 | | | | 1,859,307 | |
Pathward Financial, Inc. | | | 26,270 | | | | 1,130,923 | |
Preferred Bank | | | 12,030 | | | | 897,679 | |
Renasant Corp. | | | 51,080 | | | | 1,920,097 | |
S&T Bancorp, Inc.(a) | | | 35,623 | | | | 1,217,594 | |
Seacoast Banking Corp. of Florida(a) | | | 64,910 | | | | 2,024,543 | |
ServisFirst Bancshares, Inc.(a) | | | 44,640 | | | | 3,076,142 | |
Simmons First National Corp. (Class A Stock)(a) | | | 115,906 | | | | 2,501,251 | |
Southside Bancshares, Inc.(a) | | | 27,816 | | | | 1,001,098 | |
Stellar Bancorp, Inc.(a) | | | 40,550 | | | | 1,194,603 | |
Tompkins Financial Corp. | | | 11,494 | | | | 891,705 | |
Triumph Financial, Inc.*(a) | | | 20,650 | | | | 1,009,166 | |
Trustmark Corp.(a) | | | 55,630 | | | | 1,942,043 | |
United Community Banks, Inc.(a) | | | 96,887 | | | | 3,274,781 | |
Veritex Holdings, Inc. | | | 49,290 | | | | 1,384,063 | |
Westamerica BanCorp. | | | 24,570 | | | | 1,449,876 | |
| | | | | | | | |
| | |
| | | | | | | 84,616,054 | |
| | | | | | | | |
Beverages — 0.3% | | | | | | | | |
MGP Ingredients, Inc.(a) | | | 14,050 | | | | 1,494,639 | |
National Beverage Corp.*(a) | | | 21,310 | | | | 991,554 | |
| | | | | | | | |
| | |
| | | | | | | 2,486,193 | |
| | | | | | | | |
Biotechnology — 2.5% | | | | | | | | |
Anika Therapeutics, Inc.*(a) | | | 13,420 | | | | 397,232 | |
Arcus Biosciences, Inc.* | | | 47,600 | | | | 984,368 | |
Avid Bioservices, Inc.*(a) | | | 56,950 | | | | 784,201 | |
Catalyst Pharmaceuticals, Inc.*(a) | | | 87,400 | | | | 1,625,640 | |
Coherus Biosciences, Inc.*(a) | | | 59,390 | | | | 470,369 | |
Cytokinetics, Inc.*(a) | | | 86,380 | | | | 3,957,932 | |
Dynavax Technologies Corp.*(a) | | | 108,350 | | | | 1,152,844 | |
Eagle Pharmaceuticals, Inc.* | | | 9,500 | | | | 277,685 | |
Emergent BioSolutions, Inc.*(a) | | | 40,850 | | | | 482,438 | |
Enanta Pharmaceuticals, Inc.* | | | 17,840 | | | | 829,917 | |
Ironwood Pharmaceuticals, Inc.*(a) | | | 121,800 | | | | 1,509,102 | |
iTeos Therapeutics, Inc.* | | | 22,400 | | | | 437,472 | |
Myriad Genetics, Inc.* | | | 73,940 | | | | 1,072,869 | |
OmniAb, Inc. ($ 12.50 Earnout
Shares)*(a)^ | | | 5,597 | | | | 1 | |
OmniAb, Inc. ($ 15 Earnout
Shares)*(a)^ | | | 5,597 | | | | 1 | |
SEE NOTES TO FINANCIAL STATEMENTS.
A212
| | | | |
| | PSF SMALL-CAP STOCK INDEX PORTFOLIO (CONTINUED) | | |
SCHEDULE OF INVESTMENTS | | | | as of December 31, 2022 |
| | | | | | | | |
| | | Shares | | | Value | |
COMMON STOCKS (continued) | |
Biotechnology (cont’d.) | | | | | | | | |
Organogenesis Holdings, Inc.*(a) | | | 65,100 | | | $ | 175,119 | |
REGENXBIO, Inc.* | | | 34,360 | | | | 779,285 | |
uniQure NV (Netherlands)* | | | 37,590 | | | | 852,165 | |
Vanda Pharmaceuticals, Inc.* | | | 51,650 | | | | 381,694 | |
Vericel Corp.*(a) | | | 43,100 | | | | 1,135,254 | |
Vir Biotechnology, Inc.* | | | 69,250 | | | | 1,752,717 | |
Xencor, Inc.*(a) | | | 54,700 | | | | 1,424,388 | |
| | | | | | | | |
| | |
| | | | | | | 20,482,693 | |
| | | | | | | | |
Building Products — 2.1% | | | | | | | | |
AAON, Inc. | | | 38,349 | | | | 2,888,447 | |
American Woodmark Corp.* | | | 15,160 | | | | 740,718 | |
Apogee Enterprises, Inc. | | | 20,298 | | | | 902,449 | |
Gibraltar Industries, Inc.*(a) | | | 28,258 | | | | 1,296,477 | |
Griffon Corp. | | | 43,219 | | | | 1,546,808 | |
Insteel Industries, Inc.(a) | | | 17,790 | | | | 489,581 | |
Masterbrand, Inc.* | | | 118,000 | | | | 890,900 | |
PGT Innovations, Inc.* | | | 54,750 | | | | 983,310 | |
Quanex Building Products Corp. | | | 30,208 | | | | 715,325 | |
Resideo Technologies, Inc.* | | | 133,110 | | | | 2,189,659 | |
UFP Industries, Inc.(a) | | | 56,252 | | | | 4,457,971 | |
| | | | | | | | |
| | |
| | | | | | | 17,101,645 | |
| | | | | | | | |
Capital Markets — 1.0% | | | | | | | | |
B. Riley Financial, Inc.(a) | | | 14,600 | | | | 499,320 | |
Blucora, Inc.*(a) | | | 43,712 | | | | 1,115,967 | |
Brightsphere Investment Group,
Inc.(a) | | | 29,710 | | | | 611,432 | |
Donnelley Financial Solutions,
Inc.*(a) | | | 22,847 | | | | 883,037 | |
Piper Sandler Cos.(a) | | | 12,895 | | | | 1,678,800 | |
StoneX Group, Inc.* | | | 15,760 | | | | 1,501,928 | |
Virtus Investment Partners, Inc. | | | 6,200 | | | | 1,186,928 | |
WisdomTree, Inc.(a) | | | 101,970 | | | | 555,736 | |
| | | | | | | | |
| | | | | | | 8,033,148 | |
| | | | | | | | |
Chemicals — 2.9% | | | | | | | | |
AdvanSix, Inc. | | | 25,160 | | | | 956,583 | |
American Vanguard Corp.(a) | | | 25,368 | | | | 550,739 | |
Balchem Corp. | | | 29,333 | | | | 3,581,853 | |
FutureFuel Corp. | | | 23,560 | | | | 191,543 | |
Hawkins, Inc. | | | 17,280 | | | | 667,008 | |
HB Fuller Co. | | | 48,658 | | | | 3,484,886 | |
Innospec, Inc. | | | 22,600 | | | | 2,324,636 | |
Koppers Holdings, Inc. | | | 19,070 | | | | 537,774 | |
Livent Corp.*(a) | | | 163,730 | | | | 3,253,315 | |
Mativ Holdings, Inc.(a) | | | 50,127 | | | | 1,047,655 | |
Minerals Technologies, Inc. | | | 29,600 | | | | 1,797,312 | |
Quaker Chemical Corp.(a) | | | 12,438 | | | | 2,075,902 | |
Rayonier Advanced Materials,
Inc.*(a) | | | 58,370 | | | | 560,352 | |
Stepan Co. | | | 19,270 | | | | 2,051,484 | |
Tredegar Corp.(a) | | | 23,145 | | | | 236,542 | |
Trinseo PLC(a) | | | 31,930 | | | | 725,130 | |
| | | | | | | | |
| | |
| | | | | | | 24,042,714 | |
| | | | | | | | |
Commercial Services & Supplies — 2.2% | |
ABM Industries, Inc.(a) | | | 60,373 | | | | 2,681,769 | |
Brady Corp. (Class A Stock) | | | 42,342 | | | | 1,994,308 | |
CoreCivic, Inc.* | | | 104,950 | | | | 1,213,222 | |
Deluxe Corp. | | | 39,390 | | | | 668,842 | |
| | | | | | | | |
| | | Shares | | | Value | |
COMMON STOCKS (continued) | |
Commercial Services & Supplies (cont’d.) | |
GEO Group, Inc. (The)*(a) | | | 113,320 | | | $ | 1,240,854 | |
Harsco Corp.* | | | 72,520 | | | | 456,151 | |
Healthcare Services Group, Inc.(a) | | | 67,620 | | | | 811,440 | |
HNI Corp. | | | 37,761 | | | | 1,073,545 | |
Interface, Inc. | | | 53,092 | | | | 524,018 | |
KAR Auction Services, Inc.*(a) | | | 99,400 | | | | 1,297,170 | |
Matthews International Corp. (Class A Stock) | | | 27,930 | | | | 850,189 | |
MillerKnoll, Inc.(a) | | | 68,950 | | | | 1,448,640 | |
Pitney Bowes, Inc. | | | 147,720 | | | | 561,336 | |
UniFirst Corp. | | | 13,760 | | | | 2,655,542 | |
Viad Corp.* | | | 18,967 | | | | 462,605 | |
| | | | | | | | |
| | |
| | | | | | | 17,939,631 | |
| | | | | | | | |
Communications Equipment — 1.4% | |
ADTRAN Holdings, Inc.(a) | | | 64,480 | | | | 1,211,579 | |
Clearfield, Inc.* | | | 10,430 | | | | 981,880 | |
Comtech Telecommunications Corp. | | | 25,349 | | | | 307,737 | |
Digi International, Inc.*(a) | | | 32,184 | | | | 1,176,325 | |
Extreme Networks, Inc.* | | | 119,890 | | | | 2,195,186 | |
Harmonic, Inc.*(a) | �� | | 96,224 | | | | 1,260,535 | |
NETGEAR, Inc.* | | | 26,466 | | | | 479,299 | |
NetScout Systems, Inc.*(a) | | | 62,550 | | | | 2,033,501 | |
Viavi Solutions, Inc.* | | | 206,630 | | | | 2,171,681 | |
| | | | | | | | |
| | |
| | | | | | | 11,817,723 | |
| | | | | | | | |
Construction & Engineering — 1.1% | |
Arcosa, Inc. | | | 44,130 | | | | 2,398,024 | |
Comfort Systems USA, Inc. | | | 32,644 | | | | 3,756,672 | |
Granite Construction, Inc.(a) | | | 39,930 | | | | 1,400,345 | |
MYR Group, Inc.* | | | 15,150 | | | | 1,394,860 | |
| | | | | | | | |
| | |
| | | | | | | 8,949,901 | |
| | | | | | | | |
Consumer Finance — 0.9% | |
Bread Financial Holdings, Inc.(a) | | | 45,500 | | | | 1,713,530 | |
Encore Capital Group, Inc.*(a) | | | 21,340 | | | | 1,023,039 | |
Enova International, Inc.* | | | 28,729 | | | | 1,102,332 | |
EZCORP, Inc. (Class A Stock)*(a) | | | 49,311 | | | | 401,885 | |
Green Dot Corp. (Class A Stock)* | | | 42,700 | | | | 675,514 | |
LendingTree, Inc.*(a) | | | 10,000 | | | | 213,300 | |
PRA Group, Inc.* | | | 35,587 | | | | 1,202,129 | |
PROG Holdings, Inc.*(a) | | | 45,650 | | | | 771,028 | |
World Acceptance Corp.*(a) | | | 3,002 | | | | 197,952 | |
| | | | | | | | |
| | |
| | | | | | | 7,300,709 | |
| | | | | | | | |
Containers & Packaging — 0.4% | |
Myers Industries, Inc. | | | 33,310 | | | | 740,481 | |
O-I Glass, Inc.* | | | 141,600 | | | | 2,346,312 | |
| | | | | | | | |
| | |
| | | | | | | 3,086,793 | |
| | | | | | | | |
Diversified Consumer Services — 0.9% | |
Adtalem Global Education, Inc.* | | | 41,450 | | | | 1,471,475 | |
Frontdoor, Inc.* | | | 74,400 | | | | 1,547,520 | |
Mister Car Wash, Inc.* | | | 72,600 | | | | 670,098 | |
Perdoceo Education Corp.* | | | 61,320 | | | | 852,348 | |
Strategic Education, Inc. | | | 20,310 | | | | 1,590,679 | |
Stride, Inc.*(a) | | | 37,300 | | | | 1,166,744 | |
SEE NOTES TO FINANCIAL STATEMENTS.
A213
| | | | |
| | PSF SMALL-CAP STOCK INDEX PORTFOLIO (CONTINUED) | | |
SCHEDULE OF INVESTMENTS | | | | as of December 31, 2022 |
| | | | | | | | |
| | | Shares | | | Value | |
COMMON STOCKS (continued) | |
Diversified Consumer Services (cont’d.) | |
WW International, Inc.*(a) | | | 49,790 | | | $ | 192,190 | |
| | | | | | | | |
| | |
| | | | | | | 7,491,054 | |
| | | | | | | | |
Diversified Telecommunication Services — 0.4% | |
ATN International, Inc.(a) | | | 9,850 | | | | 446,303 | |
Cogent Communications Holdings, Inc.(a) | | | 39,000 | | | | 2,226,120 | |
Consolidated Communications Holdings, Inc.* | | | 67,720 | | | | 242,438 | |
| | | | | | | | |
| | |
| | | | | | | 2,914,861 | |
| | | | | | | | |
Electrical Equipment — 0.4% | |
AZZ, Inc. | | | 22,672 | | | | 911,414 | |
Encore Wire Corp.(a) | | | 16,741 | | | | 2,302,892 | |
Powell Industries, Inc. | | | 8,292 | | | | 291,713 | |
| | | | | | | | |
| | |
| | | | | | | 3,506,019 | |
| | | | | | | | |
Electronic Equipment, Instruments & Components — 4.1% | |
Advanced Energy Industries, Inc. | | | 34,107 | | | | 2,925,698 | |
Arlo Technologies, Inc.* | | | 80,554 | | | | 282,745 | |
Badger Meter, Inc.(a) | | | 26,714 | | | | 2,912,627 | |
Benchmark Electronics, Inc. | | | 32,100 | | | | 856,749 | |
CTS Corp.(a) | | | 29,104 | | | | 1,147,280 | |
ePlus, Inc.* | | | 24,570 | | | | 1,087,960 | |
Fabrinet (Thailand)* | | | 33,400 | | | | 4,282,548 | |
FARO Technologies, Inc.* | | | 17,114 | | | | 503,323 | |
Insight Enterprises, Inc.*(a) | | | 27,635 | | | | 2,770,961 | |
Itron, Inc.*(a) | | | 41,220 | | | | 2,087,793 | |
Knowles Corp.*(a) | | | 83,020 | | | | 1,363,188 | |
Methode Electronics, Inc. | | | 33,386 | | | | 1,481,337 | |
OSI Systems, Inc.* | | | 14,290 | | | | 1,136,341 | |
PC Connection, Inc. | | | 10,290 | | | | 482,601 | |
Plexus Corp.* | | | 25,260 | | | | 2,600,012 | |
Rogers Corp.* | | | 17,171 | | | | 2,049,187 | |
Sanmina Corp.* | | | 52,430 | | | | 3,003,715 | |
ScanSource, Inc.* | | | 23,043 | | | | 673,316 | |
TTM Technologies, Inc.* | | | 93,289 | | | | 1,406,798 | |
| | | | | | | | |
| | |
| | | | | | | 33,054,179 | |
| | | | | | | | |
Energy Equipment & Services — 2.3% | |
Archrock, Inc.(a) | | | 122,150 | | | | 1,096,907 | |
Bristow Group, Inc.* | | | 21,507 | | | | 583,485 | |
Core Laboratories NV(a) | | | 42,310 | | | | 857,624 | |
DMC Global, Inc.* | | | 17,090 | | | | 332,230 | |
Dril-Quip, Inc.*(a) | | | 30,950 | | | | 840,912 | |
Helix Energy Solutions Group,
Inc.*(a) | | | 130,270 | | | | 961,393 | |
Helmerich & Payne, Inc. | | | 96,190 | | | | 4,768,138 | |
Nabors Industries Ltd.*(a) | | | 8,166 | | | | 1,264,668 | |
Oceaneering International, Inc.* | | | 91,490 | | | | 1,600,160 | |
Oil States International, Inc.* | | | 58,870 | | | | 439,170 | |
Patterson-UTI Energy, Inc.(a) | | | 197,900 | | | | 3,332,636 | |
ProPetro Holding Corp.*(a) | | | 87,830 | | | | 910,797 | |
RPC, Inc.(a) | | | 75,970 | | | | 675,373 | |
U.S. Silica Holdings, Inc.* | | | 69,090 | | | | 863,625 | |
| | | | | | | | |
| | |
| | | | | | | 18,527,118 | |
| | | | | | | | |
Entertainment — 0.1% | |
Cinemark Holdings, Inc.*(a) | | | 97,830 | | | | 847,208 | |
| | | | | | | | |
| | | Shares | | | Value | |
COMMON STOCKS (continued) | |
Entertainment (cont’d.) | | | | | | | | |
Marcus Corp. (The)(a) | | | 22,468 | | | $ | 323,314 | |
| | | | | | | | |
| | |
| | | | | | | 1,170,522 | |
| | | | | | | | |
Equity Real Estate Investment Trusts (REITs) — 7.1% | |
Acadia Realty Trust | | | 86,655 | | | | 1,243,499 | |
Agree Realty Corp.(a) | | | 80,180 | | | | 5,687,167 | |
Alexander & Baldwin, Inc. | | | 66,230 | | | | 1,240,488 | |
American Assets Trust, Inc.(a) | | | 47,530 | | | | 1,259,545 | |
Armada Hoffler Properties, Inc. | | | 61,820 | | | | 710,930 | |
Brandywine Realty Trust | | | 156,580 | | | | 962,967 | |
CareTrust REIT, Inc. | | | 88,575 | | | | 1,645,723 | |
Centerspace(a) | | | 13,730 | | | | 805,539 | |
Chatham Lodging Trust | | | 44,520 | | | | 546,260 | |
Community Healthcare Trust, Inc. | | | 21,500 | | | | 769,700 | |
DiamondRock Hospitality Co.(a) | | | 191,110 | | | | 1,565,191 | |
Easterly Government Properties,
Inc.(a) | | | 82,840 | | | | 1,182,127 | |
Elme Communities(a) | | | 79,870 | | | | 1,421,686 | |
Essential Properties Realty Trust, Inc. | | | 129,880 | | | | 3,048,284 | |
Four Corners Property Trust, Inc.(a) | | | 75,429 | | | | 1,955,874 | |
Franklin Street Properties Corp. | | | 84,622 | | | | 231,018 | |
Getty Realty Corp.(a) | | | 38,814 | | | | 1,313,854 | |
Global Net Lease, Inc.(a) | | | 94,760 | | | | 1,191,133 | |
Hersha Hospitality Trust (Class A Stock)(a) | | | 30,240 | | | | 257,645 | |
Hudson Pacific Properties, Inc. | | | 117,050 | | | | 1,138,897 | |
Industrial Logistics Properties Trust | | | 60,690 | | | | 198,456 | |
Innovative Industrial Properties,
Inc.(a) | | | 25,530 | | | | 2,587,465 | |
iStar, Inc. | | | 78,650 | | | | 600,100 | |
LTC Properties, Inc.(a) | | | 36,956 | | | | 1,313,047 | |
LXP Industrial Trust | | | 251,656 | | | | 2,521,593 | |
NexPoint Residential Trust, Inc. | | | 20,750 | | | | 903,040 | |
Office Properties Income Trust | | | 44,310 | | | | 591,539 | |
Orion Office REIT, Inc.(a) | | | 51,700 | | | | 441,518 | |
Outfront Media, Inc.(a) | | | 133,350 | | | | 2,210,943 | |
Retail Opportunity Investments Corp. | | | 113,690 | | | | 1,708,761 | |
RPT Realty | | | 77,800 | | | | 781,112 | |
Safehold, Inc.(a) | | | 22,040 | | | | 630,785 | |
Saul Centers, Inc. | | | 11,760 | | | | 478,397 | |
Service Properties Trust(a) | | | 151,040 | | | | 1,101,082 | |
SITE Centers Corp.(a) | | | 168,740 | | | | 2,304,988 | |
Summit Hotel Properties, Inc.(a) | | | 97,560 | | | | 704,383 | |
Sunstone Hotel Investors, Inc.(a) | | | 192,050 | | | | 1,855,203 | |
Tanger Factory Outlet Centers, Inc.(a) | | | 95,250 | | | | 1,708,785 | |
Uniti Group, Inc.(a) | | | 216,510 | | | | 1,197,300 | |
Universal Health Realty Income Trust(a) | | | 11,580 | | | | 552,713 | |
Urban Edge Properties(a) | | | 107,200 | | | | 1,510,448 | |
Urstadt Biddle Properties, Inc.
(Class A Stock)(a) | | | 27,240 | | | | 516,198 | |
Veris Residential, Inc.* | | | 72,320 | | | | 1,152,058 | |
Whitestone REIT | | | 42,350 | | | | 408,254 | |
Xenia Hotels & Resorts, Inc.(a) | | | 103,930 | | | | 1,369,797 | |
| | | | | | | | |
| | |
| | | | | | | 57,525,492 | |
| | | | | | | | |
Food & Staples Retailing — 0.8% | | | | | | | | |
Andersons, Inc. (The) | | | 28,404 | | | | 993,856 | |
Chefs’ Warehouse, Inc. (The)*(a) | | | 31,060 | | | | 1,033,677 | |
PriceSmart, Inc. | | | 22,860 | | | | 1,389,431 | |
SEE NOTES TO FINANCIAL STATEMENTS.
A214
| | | | |
| | PSF SMALL-CAP STOCK INDEX PORTFOLIO (CONTINUED) | | |
SCHEDULE OF INVESTMENTS | | | | as of December 31, 2022 |
| | | | | | | | |
| | | Shares | | | Value | |
COMMON STOCKS (continued) | |
Food & Staples Retailing (cont’d.) | |
SpartanNash Co.(a) | | | 32,176 | | | $ | 973,002 | |
United Natural Foods, Inc.*(a) | | | 53,230 | | | | 2,060,533 | |
| | | | | | | | |
| | |
| | | | | | | 6,450,499 | |
| | | | | | | | |
Food Products — 2.1% | |
B&G Foods, Inc.(a) | | | 65,430 | | | | 729,545 | |
Calavo Growers, Inc.(a) | | | 16,200 | | | | 476,280 | |
Cal-Maine Foods, Inc. | | | 34,720 | | | | 1,890,504 | |
Fresh Del Monte Produce, Inc. | | | 27,950 | | | | 732,010 | |
Hain Celestial Group, Inc. (The)* | | | 81,500 | | | | 1,318,670 | |
Hostess Brands, Inc.*(a) | | | 122,200 | | | | 2,742,168 | |
J & J Snack Foods Corp.(a) | | | 13,658 | | | | 2,044,739 | |
John B. Sanfilippo & Son, Inc. | | | 8,130 | | | | 661,132 | |
Seneca Foods Corp. (Class A Stock)* | | | 4,840 | | | | 294,998 | |
Simply Good Foods Co. (The)*(a) | | | 76,810 | | | | 2,921,084 | |
Tootsie Roll Industries, Inc.(a) | | | 16,189 | | | | 689,166 | |
TreeHouse Foods, Inc.* | | | 46,150 | | | | 2,278,887 | |
| | | | | | | | |
| | |
| | | | | | | 16,779,183 | |
| | | | | | | | |
Gas Utilities — 0.9% | |
Chesapeake Utilities Corp.(a) | | | 16,190 | | | | 1,913,334 | |
Northwest Natural Holding Co. | | | 31,985 | | | | 1,522,166 | |
South Jersey Industries, Inc.(a) | | | 111,614 | | | | 3,965,646 | |
| | | | | | | | |
| | |
| | | | | | | 7,401,146 | |
| | | | | | | | |
Health Care Equipment & Supplies — 2.8% | |
AngioDynamics, Inc.* | | | 35,870 | | | | 493,930 | |
Artivion, Inc.*(a) | | | 36,783 | | | | 445,810 | |
Avanos Medical, Inc.* | | | 42,410 | | | | 1,147,614 | |
Cardiovascular Systems, Inc.* | | | 38,200 | | | | 520,284 | |
CONMED Corp.(a) | | | 27,799 | | | | 2,464,103 | |
Cutera, Inc.*(a) | | | 16,310 | | | | 721,228 | |
Embecta Corp.(a) | | | 52,800 | | | | 1,335,312 | |
Glaukos Corp.* | | | 43,530 | | | | 1,901,390 | |
Heska Corp.*(a) | | | 9,260 | | | | 575,602 | |
Inogen, Inc.* | | | 21,080 | | | | 415,487 | |
Integer Holdings Corp.* | | | 30,254 | | | | 2,071,189 | |
LeMaitre Vascular, Inc. | | | 17,680 | | | | 813,634 | |
Meridian Bioscience, Inc.* | | | 39,925 | | | | 1,325,909 | |
Merit Medical Systems, Inc.*(a) | | | 51,958 | | | | 3,669,274 | |
Mesa Laboratories, Inc.(a) | | | 4,600 | | | | 764,566 | |
NuVasive, Inc.* | | | 47,550 | | | | 1,960,962 | |
OraSure Technologies, Inc.* | | | 66,900 | | | | 322,458 | |
Orthofix Medical, Inc.* | | | 18,330 | | | | 376,315 | |
Surmodics, Inc.* | | | 12,782 | | | | 436,122 | |
Varex Imaging Corp.* | | | 36,430 | | | | 739,529 | |
Zimvie, Inc.* | | | 19,200 | | | | 179,328 | |
Zynex, Inc.(a) | | | 19,820 | | | | 275,696 | |
| | | | | | | | |
| | |
| | | | | | | 22,955,742 | |
| | | | | | | | |
Health Care Providers & Services — 3.1% | |
AdaptHealth Corp.*(a) | | | 70,100 | | | | 1,347,322 | |
Addus HomeCare Corp.*(a) | | | 14,730 | | | | 1,465,488 | |
Agiliti, Inc.*(a) | | | 30,400 | | | | 495,824 | |
AMN Healthcare Services, Inc.* | | | 39,559 | | | | 4,067,456 | |
Apollo Medical Holdings, Inc.*(a) | | | 36,260 | | | | 1,072,933 | |
Community Health Systems, Inc.* | | | 114,380 | | | | 494,122 | |
CorVel Corp.* | | | 8,350 | | | | 1,213,505 | |
| | | | | | | | |
| | | Shares | | | Value | |
COMMON STOCKS (continued) | |
Health Care Providers & Services (cont’d.) | |
Cross Country Healthcare, Inc.*(a) | | | 32,343 | | | $ | 859,354 | |
Enhabit, Inc.*(a) | | | 45,300 | | | | 596,148 | |
Ensign Group, Inc. (The) | | | 50,660 | | | | 4,792,943 | |
Fulgent Genetics, Inc.*(a) | | | 17,980 | | | | 535,444 | |
Joint Corp. (The)*(a) | | | 13,510 | | | | 188,870 | |
ModivCare, Inc.*(a) | | | 11,650 | | | | 1,045,354 | |
Owens & Minor, Inc.*(a) | | | 69,580 | | | | 1,358,897 | |
Pediatrix Medical Group, Inc.* | | | 74,780 | | | | 1,111,231 | |
Pennant Group, Inc. (The)* | | | 25,845 | | | | 283,778 | |
RadNet, Inc.* | | | 44,500 | | | | 837,935 | |
Select Medical Holdings Corp. | | | 95,090 | | | | 2,361,085 | |
U.S. Physical Therapy, Inc. | | | 11,890 | | | | 963,447 | |
| | | | | | | | |
| | |
| | | | | | | 25,091,136 | |
| | | | | | | | |
Health Care Technology — 0.5% | |
Allscripts Healthcare Solutions, Inc.* | | | 99,740 | | | | 1,759,414 | |
Computer Programs & Systems, Inc.* | | | 12,966 | | | | 352,934 | |
HealthStream, Inc.* | | | 22,030 | | | | 547,225 | |
NextGen Healthcare, Inc.* | | | 49,964 | | | | 938,324 | |
OptimizeRx Corp.* | | | 15,650 | | | | 262,920 | |
Simulations Plus, Inc. | | | 14,670 | | | | 536,482 | |
| | | | | | | | |
| | |
| | | | | | | 4,397,299 | |
| | | | | | | | |
Hotels, Restaurants & Leisure — 1.7% | |
BJ’s Restaurants, Inc.* | | | 21,332 | | | | 562,738 | |
Bloomin’ Brands, Inc. | | | 80,130 | | | | 1,612,216 | |
Brinker International, Inc.*(a) | | | 40,160 | | | | 1,281,506 | |
Cheesecake Factory, Inc. (The)(a) | | | 43,650 | | | | 1,384,142 | |
Chuy’s Holdings, Inc.*(a) | | | 16,410 | | | | 464,403 | |
Dave & Buster’s Entertainment, Inc.* | | | 38,300 | | | | 1,357,352 | |
Dine Brands Global, Inc.(a) | | | 14,315 | | | | 924,749 | |
El Pollo Loco Holdings, Inc.(a) | | | 17,890 | | | | 178,184 | |
Golden Entertainment, Inc.* | | | 20,050 | | | | 749,870 | |
Jack in the Box, Inc.(a) | | | 19,200 | | | | 1,310,016 | |
Monarch Casino & Resort, Inc.* | | | 12,171 | | | | 935,828 | |
Ruth’s Hospitality Group, Inc.(a) | | | 27,668 | | | | 428,301 | |
Shake Shack, Inc. (Class A Stock)* | | | 34,130 | | | | 1,417,419 | |
Six Flags Entertainment Corp.* | | | 67,550 | | | | 1,570,537 | |
| | | | | | | | |
| | |
| | | | | | | 14,177,261 | |
| | | | | | | | |
Household Durables — 2.4% | |
Cavco Industries, Inc.* | | | 7,560 | | | | 1,710,450 | |
Century Communities, Inc. | | | 25,810 | | | | 1,290,758 | |
Ethan Allen Interiors, Inc.(a) | | | 20,979 | | | | 554,265 | |
Green Brick Partners, Inc.* | | | 24,800 | | | | 600,904 | |
Installed Building Products, Inc.(a) | | | 21,480 | | | | 1,838,688 | |
iRobot Corp.*(a) | | | 24,850 | | | | 1,196,031 | |
La-Z-Boy, Inc.(a) | | | 39,271 | | | | 896,164 | |
LGI Homes, Inc.*(a) | | | 18,710 | | | | 1,732,546 | |
M/I Homes, Inc.* | | | 25,050 | | | | 1,156,809 | |
MDC Holdings, Inc. | | | 52,022 | | | | 1,643,895 | |
Meritage Homes Corp.* | | | 33,367 | | | | 3,076,437 | |
Sonos, Inc.*(a) | | | 116,150 | | | | 1,962,935 | |
Tri Pointe Homes, Inc.* | | | 92,100 | | | | 1,712,139 | |
Universal Electronics, Inc.* | | | 11,064 | | | | 230,242 | |
| | | | | | | | |
| | |
| | | | | | | 19,602,263 | |
| | | | | | | | |
SEE NOTES TO FINANCIAL STATEMENTS.
A215
| | | | |
| | PSF SMALL-CAP STOCK INDEX PORTFOLIO (CONTINUED) | | |
SCHEDULE OF INVESTMENTS | | | | as of December 31, 2022 |
| | | | | | | | |
| | | Shares | | | Value | |
COMMON STOCKS (continued) | |
Household Products — 0.4% | |
Central Garden & Pet Co.* | | | 8,940 | | | $ | 334,803 | |
Central Garden & Pet Co. (Class A Stock)* | | | 37,828 | | | | 1,354,242 | |
WD-40 Co.(a) | | | 12,399 | | | | 1,998,843 | |
| | | | | | | | |
| | |
| | | | | | | 3,687,888 | |
| | | | | | | | |
Insurance — 2.6% | | | | | | | | |
Ambac Financial Group, Inc.* | | | 41,050 | | | | 715,912 | |
American Equity Investment Life Holding Co.(a) | | | 63,360 | | | | 2,890,483 | |
AMERISAFE, Inc. | | | 17,494 | | | | 909,163 | |
Assured Guaranty Ltd.(a) | | | 54,810 | | | | 3,412,471 | |
Employers Holdings, Inc. | | | 24,825 | | | | 1,070,702 | |
Genworth Financial, Inc. (Class A Stock)* | | | 453,110 | | | | 2,396,952 | |
HCI Group, Inc.(a) | | | 6,380 | | | | 252,584 | |
Horace Mann Educators Corp. | | | 37,360 | | | | 1,396,143 | |
James River Group Holdings Ltd. | | | 34,160 | | | | 714,286 | |
Mercury General Corp. | | | 24,250 | | | | 829,350 | |
Palomar Holdings, Inc.* | | | 23,100 | | | | 1,043,196 | |
ProAssurance Corp. | | | 49,226 | | | | 859,978 | |
Safety Insurance Group, Inc.(a) | | | 13,470 | | | | 1,134,982 | |
SiriusPoint Ltd. (Bermuda)* | | | 77,550 | | | | 457,545 | |
Stewart Information Services
Corp.(a) | | | 24,742 | | | | 1,057,226 | |
Trupanion, Inc.*(a) | | | 32,100 | | | | 1,525,713 | |
United Fire Group, Inc.(a) | | | 19,901 | | | | 544,492 | |
Universal Insurance Holdings, Inc. | | | 25,080 | | | | 265,597 | |
| | | | | | | | |
| | |
| | | | | | | 21,476,775 | |
| | | | | | | | |
Interactive Media & Services — 0.5% | |
Cars.com, Inc.*(a) | | | 56,550 | | | | 778,694 | |
QuinStreet, Inc.* | | | 46,000 | | | | 660,100 | |
Shutterstock, Inc.(a) | | | 21,900 | | | | 1,154,568 | |
Yelp, Inc.*(a) | | | 63,600 | | | | 1,738,824 | |
| | | | | | | | |
| | |
| | | | | | | 4,332,186 | |
| | | | | | | | |
Internet & Direct Marketing Retail — 0.1% | |
Liquidity Services, Inc.* | | | 24,750 | | | | 347,985 | |
PetMed Express, Inc.(a) | | | 19,441 | | | | 344,106 | |
| | | | | | | | |
| | |
| | | | | | | 692,091 | |
| | | | | | | | |
IT Services — 1.2% | |
CSG Systems International, Inc. | | | 27,654 | | | | 1,581,809 | |
EVERTEC, Inc. (Puerto Rico) | | | 59,490 | | | | 1,926,286 | |
Payoneer Global, Inc.* | | | 181,650 | | | | 993,625 | |
Perficient, Inc.* | | | 31,614 | | | | 2,207,606 | |
Sabre Corp.*(a) | | | 299,750 | | | | 1,852,455 | |
TTEC Holdings, Inc. | | | 17,307 | | | | 763,758 | |
Unisys Corp.* | | | 62,450 | | | | 319,120 | |
| | | | | | | | |
| | |
| | | | | | | 9,644,659 | |
| | | | | | | | |
Leisure Products — 0.3% | |
Sturm Ruger & Co., Inc.(a) | | | 16,167 | | | | 818,374 | |
Vista Outdoor, Inc.*(a) | | | 51,650 | | | | 1,258,710 | |
| | | | | | | | |
| | |
| | | | | | | 2,077,084 | |
| | | | | | | | |
Life Sciences Tools & Services — 0.2% | |
BioLife Solutions, Inc.*(a) | | | 31,380 | | | | 571,116 | |
| | | | | | | | |
| | | Shares | | | Value | |
COMMON STOCKS (continued) | |
Life Sciences Tools & Services (cont’d.) | |
NeoGenomics, Inc.* | | | 115,260 | | | $ | 1,065,002 | |
| | | | | | | | |
| | |
| | | | | | | 1,636,118 | |
| | | | | | | | |
Machinery — 4.8% | |
3D Systems Corp.*(a) | | | 120,010 | | | | 888,074 | |
Alamo Group, Inc. | | | 9,390 | | | | 1,329,624 | |
Albany International Corp. (Class A Stock) | | | 28,364 | | | | 2,796,407 | |
Astec Industries, Inc. | | | 20,720 | | | | 842,475 | |
Barnes Group, Inc. | | | 46,146 | | | | 1,885,064 | |
CIRCOR International, Inc.* | | | 18,588 | | | | 445,368 | |
Enerpac Tool Group Corp. | | | 51,884 | | | | 1,320,448 | |
EnPro Industries, Inc. | | | 18,988 | | | | 2,063,806 | |
ESCO Technologies, Inc. | | | 23,611 | | | | 2,066,907 | |
Federal Signal Corp. | | | 55,350 | | | | 2,572,115 | |
Franklin Electric Co., Inc.(a) | | | 35,590 | | | | 2,838,302 | |
Greenbrier Cos., Inc. (The)(a) | | | 30,010 | | | | 1,006,235 | |
Hillenbrand, Inc. | | | 63,478 | | | | 2,708,606 | |
John Bean Technologies Corp. | | | 29,077 | | | | 2,655,602 | |
Lindsay Corp.(a) | | | 10,019 | | | | 1,631,594 | |
Mueller Industries, Inc. | | | 51,888 | | | | 3,061,392 | |
Proto Labs, Inc.* | | | 24,720 | | | | 631,102 | |
SPX Technologies, Inc.* | | | 41,250 | | | | 2,708,063 | |
Standex International Corp.(a) | | | 10,950 | | | | 1,121,390 | |
Tennant Co.(a) | | | 17,040 | | | | 1,049,153 | |
Titan International, Inc.*(a) | | | 46,450 | | | | 711,614 | |
Trinity Industries, Inc.(a) | | | 74,300 | | | | 2,197,051 | |
Wabash National Corp.(a) | | | 43,750 | | | | 988,750 | |
| | | | | | | | |
| | |
| | | | | | | 39,519,142 | |
| | | | | | | | |
Marine — 0.3% | |
Matson, Inc.(a) | | | 34,480 | | | | 2,155,345 | |
| | | | | | | | |
Media — 0.5% | |
AMC Networks, Inc. (Class A Stock)* | | | 25,780 | | | | 403,973 | |
EW Scripps Co. (The) (Class A
Stock)*(a) | | | 52,921 | | | | 698,028 | |
Gannett Co., Inc.* | | | 133,370 | | | | 270,741 | |
Scholastic Corp. | | | 27,140 | | | | 1,070,944 | |
TechTarget, Inc.*(a) | | | 24,630 | | | | 1,085,198 | |
Thryv Holdings, Inc.*(a) | | | 28,000 | | | | 532,000 | |
| | | | | | | | |
| | |
| | | | | | | 4,060,884 | |
| | | | | | | | |
Metals & Mining — 1.9% | |
Arconic Corp.* | | | 92,650 | | | | 1,960,474 | |
ATI, Inc.*(a) | | | 118,120 | | | | 3,527,063 | |
Carpenter Technology Corp. | | | 44,230 | | | | 1,633,856 | |
Century Aluminum Co.*(a) | | | 46,693 | | | | 381,949 | |
Compass Minerals International,
Inc.(a) | | | 31,050 | | | | 1,273,050 | |
Haynes International, Inc. | | | 11,350 | | | | 518,582 | |
Kaiser Aluminum Corp. | | | 14,600 | | | | 1,109,016 | |
Materion Corp.(a) | | | 18,718 | | | | 1,638,012 | |
Olympic Steel, Inc. | | | 8,718 | | | | 292,751 | |
SunCoke Energy, Inc. | | | 76,630 | | | | 661,317 | |
TimkenSteel Corp.* | | | 36,130 | | | | 656,482 | |
Warrior Met Coal, Inc. | | | 47,130 | | | | 1,632,583 | |
| | | | | | | | |
| | |
| | | | | | | 15,285,135 | |
| | | | | | | | |
SEE NOTES TO FINANCIAL STATEMENTS.
A216
| | | | |
| | PSF SMALL-CAP STOCK INDEX PORTFOLIO (CONTINUED) | | |
SCHEDULE OF INVESTMENTS | | | | as of December 31, 2022 |
| | | | | | | | |
| | | Shares | | | Value | |
COMMON STOCKS (continued) | |
Mortgage Real Estate Investment Trusts (REITs) — 1.2% | |
Apollo Commercial Real Estate Finance, Inc.(a) | | | 118,060 | | | $ | 1,270,326 | |
ARMOUR Residential REIT, Inc.(a) | | | 120,580 | | | | 678,865 | |
Ellington Financial, Inc.(a) | | | 52,582 | | | | 650,439 | |
Franklin BSP Realty Trust, Inc.(a) | | | 75,276 | | | | 971,061 | |
Granite Point Mortgage Trust,
Inc.(a) | | | 48,190 | | | | 258,298 | |
Invesco Mortgage Capital, Inc.(a) | | | 32,236 | | | | 410,364 | |
KKR Real Estate Finance Trust,
Inc.(a) | | | 52,350 | | | | 730,806 | |
New York Mortgage Trust, Inc.(a) | | | 338,680 | | | | 867,021 | |
PennyMac Mortgage Investment Trust(a) | | | 81,170 | | | | 1,005,696 | |
Ready Capital Corp.(a) | | | 89,773 | | | | 1,000,071 | |
Redwood Trust, Inc.(a) | | | 103,440 | | | | 699,255 | |
Two Harbors Investment Corp.(a) | | | 78,812 | | | | 1,242,865 | |
| | | | | | | | |
| | |
| | | | | | | 9,785,067 | |
| | | | | | | | |
Multiline Retail — 0.0% | | | | | | | | |
Big Lots, Inc.(a) | | | 26,510 | | | | 389,697 | |
| | | | | | | | |
Multi-Utilities — 0.5% | | | | | | | | |
Avista Corp. | | | 67,333 | | | | 2,985,545 | |
Unitil Corp. | | | 14,650 | | | | 752,424 | |
| | | | | | | | |
| | |
| | | | | | | 3,737,969 | |
| | | | | | | | |
Oil, Gas & Consumable Fuels — 2.2% | |
Callon Petroleum Co.*(a) | | | 46,680 | | | | 1,731,361 | |
Civitas Resources, Inc.(a) | | | 47,460 | | | | 2,749,358 | |
CONSOL Energy, Inc.(a) | | | 29,930 | | | | 1,945,450 | |
Dorian LPG Ltd. | | | 29,190 | | | | 553,151 | |
Green Plains, Inc.*(a) | | | 54,110 | | | | 1,650,355 | |
Laredo Petroleum, Inc.*(a) | | | 15,322 | | | | 787,857 | |
Par Pacific Holdings, Inc.* | | | 50,630 | | | | 1,177,147 | |
Ranger Oil Corp. (Class A Stock)(a) | | | 17,430 | | | | 704,695 | |
REX American Resources Corp.* | | | 14,180 | | | | 451,775 | |
SM Energy Co. | | | 112,100 | | | | 3,904,443 | |
Talos Energy, Inc.* | | | 59,530 | | | | 1,123,926 | |
World Fuel Services Corp. | | | 56,520 | | | | 1,544,692 | |
| | | | | | | | |
| | |
| | | | | | | 18,324,210 | |
| | | | | | | | |
Paper & Forest Products — 0.3% | | | | | | | | |
Clearwater Paper Corp.*(a) | | | 15,250 | | | | 576,602 | |
Mercer International, Inc.
(Germany)(a) | | | 36,820 | | | | 428,585 | |
Sylvamo Corp. | | | 30,200 | | | | 1,467,418 | |
| | | | | | | | |
| | |
| | | | | | | 2,472,605 | |
| | | | | | | | |
Personal Products — 1.2% | | | | | | | | |
Edgewell Personal Care Co. | | | 47,290 | | | | 1,822,557 | |
elf Beauty, Inc.* | | | 45,890 | | | | 2,537,717 | |
Inter Parfums, Inc.(a) | | | 16,340 | | | | 1,577,137 | |
Medifast, Inc. | | | 9,970 | | | | 1,150,039 | |
Nu Skin Enterprises, Inc. (Class A Stock) | | | 45,100 | | | | 1,901,416 | |
USANA Health Sciences, Inc.*(a) | | | 10,140 | | | | 539,448 | |
| | | | | | | | |
| | |
| | | | | | | 9,528,314 | |
| | | | | | | | |
Pharmaceuticals — 1.8% | | | | | | | | |
Amphastar Pharmaceuticals,
Inc.*(a) | | | 34,400 | | | | 963,888 | |
ANI Pharmaceuticals, Inc.* | | | 11,210 | | | | 450,978 | |
Cara Therapeutics, Inc.* | | | 41,563 | | | | 446,387 | |
| | | | | | | | |
| | | Shares | | | Value | |
COMMON STOCKS (continued) | |
Pharmaceuticals (cont’d.) | |
Collegium Pharmaceutical, Inc.* | | | 30,650 | | | $ | 711,080 | |
Corcept Therapeutics, Inc.*(a) | | | 87,600 | | | | 1,779,156 | |
Harmony Biosciences Holdings, Inc.* | | | 27,050 | | | | 1,490,455 | |
Innoviva, Inc.*(a) | | | 57,310 | | | | 759,357 | |
Ligand Pharmaceuticals, Inc.* | | | 14,660 | | | | 979,288 | |
Nektar Therapeutics* | | | 171,550 | | | | 387,703 | |
Pacira BioSciences, Inc.* | | | 41,880 | | | | 1,616,987 | |
Phibro Animal Health Corp. (Class A Stock) | | | 18,800 | | | | 252,108 | |
Prestige Consumer Healthcare, Inc.* | | | 45,200 | | | | 2,829,520 | |
Supernus Pharmaceuticals, Inc.*(a) | | | 49,280 | | | | 1,757,818 | |
| | | | | | | | |
| | |
| | | | | | | 14,424,725 | |
| | | | | | | | |
Professional Services — 1.4% | | | | | | | | |
Exponent, Inc. | | | 46,220 | | | | 4,579,940 | |
Forrester Research, Inc.* | | | 10,232 | | | | 365,896 | |
Heidrick & Struggles International, Inc. | | | 18,154 | | | | 507,768 | |
Kelly Services, Inc. (Class A Stock) | | | 31,569 | | | | 533,516 | |
Korn Ferry | | | 48,710 | | | | 2,465,700 | |
NV5 Global, Inc.*(a) | | | 11,360 | | | | 1,503,155 | |
Resources Connection, Inc. | | | 29,270 | | | | 537,983 | |
TrueBlue, Inc.* | | | 30,078 | | | | 588,927 | |
| | | | | | | | |
| | |
| | | | | | | 11,082,885 | |
| | | | | | | | |
Real Estate Management & Development — 0.6% | |
Anywhere Real Estate, Inc.* | | | 99,940 | | | | 638,617 | |
Cushman & Wakefield PLC*(a) | | | 148,450 | | | | 1,849,687 | |
Douglas Elliman, Inc. | | | 62,126 | | | | 252,853 | |
Marcus & Millichap, Inc.(a) | | | 22,640 | | | | 779,948 | |
RE/MAX Holdings, Inc. (Class A Stock) | | | 16,660 | | | | 310,542 | |
St. Joe Co. (The)(a) | | | 30,870 | | | | 1,193,125 | |
| | | | | | | | |
| | |
| | | | | | | 5,024,772 | |
| | | | | | | | |
Road & Rail — 0.4% | | | | | | | | |
ArcBest Corp.(a) | | | 22,265 | | | | 1,559,441 | |
Heartland Express, Inc.(a) | | | 42,498 | | | | 651,919 | |
Marten Transport Ltd. | | | 52,555 | | | | 1,039,538 | |
| | | | | | | | |
| | |
| | | | | | | 3,250,898 | |
| | | | | | | | |
Semiconductors & Semiconductor Equipment — 3.4% | |
Alpha & Omega Semiconductor
Ltd.*(a) | | | 20,250 | | | | 578,543 | |
Axcelis Technologies, Inc.* | | | 29,990 | | | | 2,380,006 | |
CEVA, Inc.* | | | 21,150 | | | | 541,017 | |
Cohu, Inc.*(a) | | | 43,467 | | | | 1,393,117 | |
Diodes, Inc.* | | | 41,510 | | | | 3,160,571 | |
FormFactor, Inc.*(a) | | | 70,280 | | | | 1,562,324 | |
Ichor Holdings Ltd.*(a) | | | 26,270 | | | | 704,561 | |
Kulicke & Soffa Industries, Inc. (Singapore)(a) | | | 53,072 | | | | 2,348,967 | |
MaxLinear, Inc.* | | | 65,980 | | | | 2,240,021 | |
Onto Innovation, Inc.*(a) | | | 45,207 | | | | 3,078,145 | |
PDF Solutions, Inc.* | | | 26,940 | | | | 768,329 | |
Photronics, Inc.* | | | 56,320 | | | | 947,866 | |
Rambus, Inc.*(a) | | | 98,090 | | | | 3,513,584 | |
Semtech Corp.* | | | 57,950 | | | | 1,662,585 | |
SMART Global Holdings, Inc.*(a) | | | 44,350 | | | | 659,928 | |
Ultra Clean Holdings, Inc.* | | | 41,510 | | | | 1,376,057 | |
SEE NOTES TO FINANCIAL STATEMENTS.
A217
| | | | |
| | PSF SMALL-CAP STOCK INDEX PORTFOLIO (CONTINUED) | | |
SCHEDULE OF INVESTMENTS | | | | as of December 31, 2022 |
| | | | | | | | |
| | | Shares | | | Value | |
COMMON STOCKS (continued) | |
Semiconductors & Semiconductor Equipment (cont’d.) | |
Veeco Instruments, Inc.*(a) | | | 46,923 | | | $ | 871,829 | |
| | | | | | | | |
| | |
| | | | | | | 27,787,450 | |
| | | | | | | | |
Software — 2.4% | |
8x8, Inc.*(a) | | | 101,920 | | | | 440,294 | |
A10 Networks, Inc.(a) | | | 58,300 | | | | 969,529 | |
Adeia, Inc. | | | 95,965 | | | | 909,748 | |
Agilysys, Inc.* | | | 18,142 | | | | 1,435,758 | |
Alarm.com Holdings, Inc.* | | | 45,560 | | | | 2,254,309 | |
Cerence, Inc.*(a) | | | 35,950 | | | | 666,153 | |
Consensus Cloud Solutions, Inc.*(a) | | | 16,150 | | | | 868,224 | |
Digital Turbine, Inc.* | | | 82,250 | | | | 1,253,490 | |
Ebix, Inc.(a) | | | 21,627 | | | | 431,675 | |
InterDigital, Inc.(a) | | | 27,070 | | | | 1,339,424 | |
LivePerson, Inc.*(a) | | | 64,210 | | | | 651,089 | |
LiveRamp Holdings, Inc.* | | | 60,650 | | | | 1,421,636 | |
OneSpan, Inc.* | | | 32,450 | | | | 363,116 | |
Progress Software Corp. | | | 39,317 | | | | 1,983,543 | |
SPS Commerce, Inc.*(a) | | | 32,900 | | | | 4,225,347 | |
Xperi, Inc.* | | | 38,386 | | | | 330,503 | |
| | | | | | | | |
| | |
| | | | | | | 19,543,838 | |
| | | | | | | | |
Specialty Retail — 4.6% | |
Aaron’s Co., Inc. (The) | | | 28,090 | | | | 335,676 | |
Abercrombie & Fitch Co. (Class A Stock)* | | | 45,150 | | | | 1,034,387 | |
Academy Sports & Outdoors, Inc.(a) | | | 72,800 | | | | 3,824,912 | |
American Eagle Outfitters, Inc.(a) | | | 159,000 | | | | 2,219,640 | |
America’s Car-Mart, Inc.*(a) | | | 5,280 | | | | 381,533 | |
Asbury Automotive Group, Inc.*(a) | | | 20,200 | | | | 3,620,850 | |
Bed Bath & Beyond, Inc.*(a) | | | 69,980 | | | | 175,650 | |
Boot Barn Holdings, Inc.* | | | 27,280 | | | | 1,705,546 | |
Buckle, Inc. (The) | | | 27,049 | | | | 1,226,672 | |
Caleres, Inc.(a) | | | 33,264 | | | | 741,122 | |
Chico’s FAS, Inc.*(a) | | | 114,200 | | | | 561,864 | |
Children’s Place, Inc. (The)*(a) | | | 11,865 | | | | 432,123 | |
Designer Brands, Inc. (Class A
Stock)(a) | | | 46,400 | | | | 453,792 | |
Genesco, Inc.* | | | 11,402 | | | | 524,720 | |
Group 1 Automotive, Inc. | | | 13,304 | | | | 2,399,642 | |
Guess?, Inc.(a) | | | 27,800 | | | | 575,182 | |
Haverty Furniture Cos., Inc.(a) | | | 12,051 | | | | 360,325 | |
Hibbett, Inc.(a) | | | 11,696 | | | | 797,901 | |
Leslie’s, Inc.*(a) | | | 135,300 | | | | 1,652,013 | |
MarineMax, Inc.*(a) | | | 19,662 | | | | 613,848 | |
Monro, Inc.(a) | | | 28,782 | | | | 1,300,946 | |
National Vision Holdings, Inc.*(a) | | | 72,000 | | | | 2,790,720 | |
ODP Corp. (The)* | | | 36,785 | | | | 1,675,189 | |
Rent-A-Center, Inc.(a) | | | 45,720 | | | | 1,030,986 | |
Sally Beauty Holdings, Inc.*(a) | | | 97,670 | | | | 1,222,828 | |
Shoe Carnival, Inc.(a) | | | 15,640 | | | | 373,952 | |
Signet Jewelers Ltd.(a) | | | 42,190 | | | | 2,868,920 | |
Sleep Number Corp.*(a) | | | 20,090 | | | | 521,938 | |
Sonic Automotive, Inc. (Class A Stock)(a) | | | 15,227 | | | | 750,234 | |
Urban Outfitters, Inc.*(a) | | | 54,700 | | | | 1,304,595 | |
Zumiez, Inc.*(a) | | | 14,320 | | | | 311,317 | |
| | | | | | | | |
| | |
| | | | | | | 37,789,023 | |
| | | | | | | | |
| | | | | | | | |
| | | Shares | | | Value | |
COMMON STOCKS (continued) | |
Technology Hardware, Storage & Peripherals — 0.2% | |
Avid Technology, Inc.*(a) | | | 30,300 | | | $ | 805,677 | |
Corsair Gaming, Inc.*(a) | | | 35,300 | | | | 479,021 | |
| | | | | | | | |
| | |
| | | | | | | 1,284,698 | |
| | | | | | | | |
Textiles, Apparel & Luxury Goods — 0.9% | |
G-III Apparel Group Ltd.* | | | 39,010 | | | | 534,827 | |
Kontoor Brands, Inc.(a) | | | 45,050 | | | | 1,801,550 | |
Movado Group, Inc.(a) | | | 14,517 | | | | 468,173 | |
Oxford Industries, Inc.(a) | | | 13,666 | | | | 1,273,398 | |
Steven Madden Ltd. | | | 66,825 | | | | 2,135,727 | |
Wolverine World Wide, Inc. | | | 71,894 | | | | 785,801 | |
| | | | | | | | |
| | |
| | | | | | | 6,999,476 | |
| | | | | | | | |
Thrifts & Mortgage Finance — 1.8% | |
Axos Financial, Inc.* | | | 48,710 | | | | 1,861,696 | |
Capitol Federal Financial, Inc. | | | 117,890 | | | | 1,019,749 | |
Mr. Cooper Group, Inc.* | | | 64,380 | | | | 2,583,569 | |
NMI Holdings, Inc. (Class A Stock)* | | | 76,310 | | | | 1,594,879 | |
Northfield Bancorp, Inc. | | | 38,360 | | | | 603,403 | |
Provident Financial Services, Inc.(a) | | | 68,690 | | | | 1,467,218 | |
TrustCo Bank Corp. | | | 17,427 | | | | 655,081 | |
Walker & Dunlop, Inc. | | | 28,010 | | | | 2,198,225 | |
WSFS Financial Corp.(a) | | | 56,210 | | | | 2,548,561 | |
| | | | | | | | |
| | |
| | | | | | | 14,532,381 | |
| | | | | | | | |
Tobacco — 0.3% | |
Universal Corp. | | | 22,450 | | | | 1,185,584 | |
Vector Group Ltd. | | | 120,102 | | | | 1,424,410 | |
| | | | | | | | |
| | |
| | | | | | | 2,609,994 | |
| | | | | | | | |
Trading Companies & Distributors — 1.5% | |
Applied Industrial Technologies, Inc. | | | 35,208 | | | | 4,437,264 | |
Boise Cascade Co.(a) | | | 36,010 | | | | 2,472,807 | |
DXP Enterprises, Inc.* | | | 14,400 | | | | 396,720 | |
GMS, Inc.* | | | 38,720 | | | | 1,928,256 | |
NOW, Inc.* | | | 100,800 | | | | 1,280,160 | |
Veritiv Corp.(a) | | | 12,310 | | | | 1,498,250 | |
| | | | | | | | |
| | |
| | | | | | | 12,013,457 | |
| | | | | | | | |
Water Utilities — 1.2% | |
American States Water Co.(a) | | | 33,942 | | | | 3,141,332 | |
California Water Service Group(a) | | | 49,960 | | | | 3,029,574 | |
Middlesex Water Co. | | | 16,100 | | | | 1,266,587 | |
SJW Group(a) | | | 24,350 | | | | 1,976,977 | |
| | | | | | | | |
| | |
| | | | | | | 9,414,470 | |
| | | | | | | | |
Wireless Telecommunication Services — 0.3% | |
Gogo, Inc.*(a) | | | 59,250 | | | | 874,530 | |
Shenandoah Telecommunications Co. | | | 45,710 | | | | 725,875 | |
Telephone & Data Systems, Inc.(a) | | | 91,100 | | | | 955,639 | |
| | | | | | | | |
| | |
| | | | | | | 2,556,044 | |
| | | | | | | | |
| | |
TOTAL COMMON STOCKS
(cost $578,348,980) | | | | | | | 796,902,816 | |
| | | | | | | | |
SEE NOTES TO FINANCIAL STATEMENTS.
A218
| | | | |
| | PSF SMALL-CAP STOCK INDEX PORTFOLIO (CONTINUED) | | |
SCHEDULE OF INVESTMENTS | | | | as of December 31, 2022 |
| | | | | | | | | | | | | | |
| | | | | | | | | Shares | | | Value | |
EXCHANGE-TRADED FUND — 1.3% | | | | | |
iShares Core S&P Small-Cap ETF(a) | | | 109,120 | | | $ | 10,327,117 | |
| | | | | | | | | | | | | | |
(cost $9,637,111) | | | | | | | | |
| |
TOTAL LONG-TERM INVESTMENTS
(cost $587,986,091) | | | | 807,229,933 | |
| | | | | | | | | | | | | | |
| |
SHORT-TERM INVESTMENTS — 32.4% | | | | | |
| |
AFFILIATED MUTUAL FUNDS — 32.3% | | | | | |
PGIM Core Ultra Short Bond Fund(wa) | | | 5,468,150 | | | | 5,468,150 | |
PGIM Institutional Money Market Fund (cost $257,173,354; includes $256,232,608 of cash collateral for securities on loan)(b)(wa) | | | 257,559,365 | | | | 257,430,585 | |
| | | | | | | | | | | | | | |
| |
TOTAL AFFILIATED MUTUAL FUNDS
(cost $262,641,504) | | | | 262,898,735 | |
| | | | | | | | | | | | | | |
| | | | | |
Interest
Rate | | Maturity Date | | | | | | Principal
Amount
(000)# | | | | |
| | | | | | | | | | | | | |
U.S. TREASURY OBLIGATION(k)(n) — 0.1% | |
U.S. Treasury Bills | | | | | | | | | | |
4.271% | | 03/16/23 | | | | | | | 700 | | | | 694,062 | |
| | | | | | | | | | | | | | |
(cost $693,921) | | | | | | | | | | |
| |
TOTAL SHORT-TERM INVESTMENTS
(cost $263,335,425) | | | | 263,592,797 | |
| | | | | | | | | | | | | | |
| |
TOTAL INVESTMENTS—131.5%
(cost $851,321,516) | | | | 1,070,822,730 | |
Liabilities in excess of other assets(z) — (31.5)% | | | | (256,330,449 | ) |
| | | | | | | | | | | | | | |
| |
NET ASSETS — 100.0% | | | $ | 814,492,281 | |
| | | | | | | | | | | | | | |
See the Glossary for a list of the abbreviation(s) used in the annual report.
| * | Non-income producing security. |
| # | Principal amount is shown in U.S. dollars unless otherwise stated. |
| ^ | Indicates a Level 3 instrument. The aggregate value of Level 3 instruments is $2 and 0.0% of net assets. |
| (a) | All or a portion of security is on loan. The aggregate market value of such securities, including those sold and pending settlement, is $250,054,040; cash collateral of $256,232,608 (included in liabilities) was received with which the Portfolio purchased highly liquid short-term investments. In the event of significant appreciation in value of securities on loan on the last business day of the reporting period, the Portfolio may reflect a collateral value that is less than the market value of the loaned securities and such shortfall is remedied the following business day. |
| (b) | Represents security, or portion thereof, purchased with cash collateral received for securities on loan and includes dividend reinvestment. |
| (k) | Represents security, or a portion thereof, segregated as collateral for centrally cleared/exchange-traded derivatives. |
| (n) | Rate shown reflects yield to maturity at purchased date. |
| (wa) | PGIM Investments LLC, the manager of the Portfolio, also serves as manager of the PGIM Core Ultra Short Bond Fund and PGIM Institutional Money Market Fund, if applicable. |
| (z) | Includes net unrealized appreciation/(depreciation) and/or market value of the below holdings which are excluded from the Schedule of Investments: |
Futures contracts outstanding at December 31, 2022:
| | | | | | | | | | | | | | | | | | | | | | | | | | |
Number of Contracts | | | | Type | | | | Expiration
Date | | | Current
Notional
Amount | | | Value /
Unrealized
Appreciation
(Depreciation) | |
Long Position: | | | | | | | | | | | | | | | | | | | | | | |
76 | | | | Russell 2000 E-Mini Index | | | | | Mar. 2023 | | | $ | 6,729,420 | | | | | | | $ | (145,234 | ) | | | | |
| | | | | | | | | | | | | | | | | | | | | | | | | | |
Summary of Collateral for Centrally Cleared/Exchange-traded Derivatives:
Cash and securities segregated as collateral, including pending settlement for closed positions, to cover requirements for centrally cleared/exchange-traded derivatives are listed by broker as follows:
| | | | | | | | | | | | | | | | | | | | | | | | |
Broker | | Cash and/or Foreign Currency | | | Securities Market Value | |
UBS | | | | | | $ | — | | | | | | | | | | | $ | 694,062 | | | | | |
| | | | | | | | | | | | | | | | | | | | | | | | |
Fair Value Measurements:
Various inputs are used in determining the value of the Portfolio’s investments. These inputs are summarized in the three broad levels listed below.
Level 1—unadjusted quoted prices generally in active markets for identical securities.
Level 2—quoted prices for similar securities, interest rates and yield curves, prepayment speeds, foreign currency exchange rates and other observable inputs.
SEE NOTES TO FINANCIAL STATEMENTS.
A219
| | | | |
| | PSF SMALL-CAP STOCK INDEX PORTFOLIO (CONTINUED) | | |
SCHEDULE OF INVESTMENTS | | | | as of December 31, 2022 |
Level 3—unobservable inputs for securities valued in accordance with Board approved fair valuation procedures.
The following is a summary of the inputs used as of December 31, 2022 in valuing such portfolio securities:
| | | | | | | | | | | | | | | | | | | | |
| | | Level 1 | | | Level 2 | | | Level 3 | |
| | | | | | | | | | | | | | | | |
Investments in Securities | | | | | | | | | | | | | | | | | | | | |
Assets | | | | | | | | | | | | | | | | | | | | |
Long-Term Investments | | | | | | | | | | | | | | | | | | | | |
Common Stocks | | | | | | | | | | | | | | | | | | | | |
Aerospace & Defense | | $ | 11,252,279 | | | $ | — | | | | | | | $ | — | | | | | |
Air Freight & Logistics | | | 7,367,109 | | | | — | | | | | | | | — | | | | | |
Airlines | | | 2,686,955 | | | | — | | | | | | | | — | | | | | |
Auto Components | | | 10,110,048 | | | | — | | | | | | | | — | | | | | |
Automobiles | | | 1,466,167 | | | | — | | | | | | | | — | | | | | |
Banks | | | 84,616,054 | | | | — | | | | | | | | — | | | | | |
Beverages | | | 2,486,193 | | | | — | | | | | | | | — | | | | | |
Biotechnology | | | 20,482,691 | | | | — | | | | | | | | 2 | | | | | |
Building Products | | | 17,101,645 | | | | — | | | | | | | | — | | | | | |
Capital Markets | | | 8,033,148 | | | | — | | | | | | | | — | | | | | |
Chemicals | | | 24,042,714 | | | | — | | | | | | | | — | | | | | |
Commercial Services & Supplies | | | 17,939,631 | | | | — | | | | | | | | — | | | | | |
Communications Equipment | | | 11,817,723 | | | | — | | | | | | | | — | | | | | |
Construction & Engineering | | | 8,949,901 | | | | — | | | | | | | | — | | | | | |
Consumer Finance | | | 7,300,709 | | | | — | | | | | | | | — | | | | | |
Containers & Packaging | | | 3,086,793 | | | | — | | | | | | | | — | | | | | |
Diversified Consumer Services | | | 7,491,054 | | | | — | | | | | | | | — | | | | | |
Diversified Telecommunication Services | | | 2,914,861 | | | | — | | | | | | | | — | | | | | |
Electrical Equipment | | | 3,506,019 | | | | — | | | | | | | | — | | | | | |
Electronic Equipment, Instruments & Components | | | 33,054,179 | | | | — | | | | | | | | — | | | | | |
Energy Equipment & Services | | | 18,527,118 | | | | — | | | | | | | | — | | | | | |
Entertainment | | | 1,170,522 | | | | — | | | | | | | | — | | | | | |
Equity Real Estate Investment Trusts (REITs) | | | 57,525,492 | | | | — | | | | | | | | — | | | | | |
Food & Staples Retailing | | | 6,450,499 | | | | — | | | | | | | | — | | | | | |
Food Products | | | 16,779,183 | | | | — | | | | | | | | — | | | | | |
Gas Utilities | | | 7,401,146 | | | | — | | | | | | | | — | | | | | |
Health Care Equipment & Supplies | | | 22,955,742 | | | | — | | | | | | | | — | | | | | |
Health Care Providers & Services | | | 25,091,136 | | | | — | | | | | | | | — | | | | | |
Health Care Technology | | | 4,397,299 | | | | — | | | | | | | | — | | | | | |
Hotels, Restaurants & Leisure | | | 14,177,261 | | | | — | | | | | | | | — | | | | | |
Household Durables | | | 19,602,263 | | | | — | | | | | | | | — | | | | | |
Household Products | | | 3,687,888 | | | | — | | | | | | | | — | | | | | |
Insurance | | | 21,476,775 | | | | — | | | | | | | | — | | | | | |
Interactive Media & Services | | | 4,332,186 | | | | — | | | | | | | | — | | | | | |
Internet & Direct Marketing Retail | | | 692,091 | | | | — | | | | | | | | — | | | | | |
IT Services | | | 9,644,659 | | | | — | | | | | | | | — | | | | | |
Leisure Products | | | 2,077,084 | | | | — | | | | | | | | — | | | | | |
Life Sciences Tools & Services | | | 1,636,118 | | | | — | | | | | | | | — | | | | | |
Machinery | | | 39,519,142 | | | | — | | | | | | | | — | | | | | |
Marine | | | 2,155,345 | | | | — | | | | | | | | — | | | | | |
Media | | | 4,060,884 | | | | — | | | | | | | | — | | | | | |
Metals & Mining | | | 15,285,135 | | | | — | | | | | | | | — | | | | | |
Mortgage Real Estate Investment Trusts (REITs) | | | 9,785,067 | | | | — | | | | | | | | — | | | | | |
Multiline Retail | | | 389,697 | | | | — | | | | | | | | — | | | | | |
Multi-Utilities | | | 3,737,969 | | | | — | | | | | | | | — | | | | | |
Oil, Gas & Consumable Fuels | | | 18,324,210 | | | | — | | | | | | | | — | | | | | |
Paper & Forest Products | | | 2,472,605 | | | | — | | | | | | | | — | | | | | |
Personal Products | | | 9,528,314 | | | | — | | | | | | | | — | | | | | |
Pharmaceuticals | | | 14,424,725 | | | | — | | | | | | | | — | | | | | |
Professional Services | | | 11,082,885 | | | | — | | | | | | | | — | | | | | |
Real Estate Management & Development | | | 5,024,772 | | | | — | | | | | | | | — | | | | | |
Road & Rail | | | 3,250,898 | | | | — | | | | | | | | — | | | | | |
Semiconductors & Semiconductor Equipment | | | 27,787,450 | | | | — | | | | | | | | — | | | | | |
Software | | | 19,543,838 | | | | — | | | | | | | | — | | | | | |
Specialty Retail | | | 37,789,023 | | | | — | | | | | | | | — | | | | | |
SEE NOTES TO FINANCIAL STATEMENTS.
A220
| | | | |
| | PSF SMALL-CAP STOCK INDEX PORTFOLIO (CONTINUED) | | |
SCHEDULE OF INVESTMENTS | | | | as of December 31, 2022 |
| | | | | | | | | | | | |
| | | Level 1 | | | Level 2 | | | Level 3 |
Investments in Securities (continued) | | | | | | | | | | | | |
Assets (continued) | | | | | | | | | | | | |
Long-Term Investments (continued) | | | | | | | | | | | | |
Common Stocks (continued) | | | | | | | | | | | | |
Technology Hardware, Storage & Peripherals | | $ | 1,284,698 | | | $ | — | | | | $— | |
Textiles, Apparel & Luxury Goods | | | 6,999,476 | | | | — | | | | — | |
Thrifts & Mortgage Finance | | | 14,532,381 | | | | — | | | | — | |
Tobacco | | | 2,609,994 | | | | — | | | | — | |
Trading Companies & Distributors | | | 12,013,457 | | | | — | | | | — | |
Water Utilities | | | 9,414,470 | | | | — | | | | — | |
Wireless Telecommunication Services | | | 2,556,044 | | | | — | | | | — | |
Exchange-Traded Fund | | | 10,327,117 | | | | — | | | | — | |
Short-Term Investments | | | | | | | | | | | | |
Affiliated Mutual Funds | | | 262,898,735 | | | | — | | | | — | |
U.S. Treasury Obligation | | | — | | | | 694,062 | | | | — | |
| | | | | | | | | | | | |
| | | |
Total | | $ | 1,070,128,666 | | | $ | 694,062 | | | | $ 2 | |
| | | | | | | | | | | | |
| | | |
Other Financial Instruments* | | | | | | | | | | | | |
Liabilities | | | | | | | | | | | | |
Futures Contracts | | $ | (145,234 | ) | | $ | — | | | | $— | |
| | | | | | | | | | | | |
| * | Other financial instruments are derivative instruments not reflected in the Schedule of Investments. futures, forwards and centrally cleared swap contracts, which are recorded at the unrealized appreciation (depreciation) on the instrument, and OTC swap contracts which are recorded at fair value. |
Industry Classification:
The industry classification of investments and liabilities in excess of other assets shown as a percentage of net assets as of December 31, 2022 were as follows:
| | | | |
Affiliated Mutual Funds (31.5% represents investments purchased with collateral from securities on loan) | | | 32.3 | % |
Banks | | | 10.4 | |
Equity Real Estate Investment Trusts (REITs) | | | 7.1 | |
Machinery | | | 4.8 | |
Specialty Retail | | | 4.6 | |
Electronic Equipment, Instruments & Components | | | 4.1 | |
Semiconductors & Semiconductor Equipment | | | 3.4 | |
Health Care Providers & Services | | | 3.1 | |
Chemicals | | | 2.9 | |
Health Care Equipment & Supplies | | | 2.8 | |
Insurance | | | 2.6 | |
Biotechnology | | | 2.5 | |
Household Durables | | | 2.4 | |
Software | | | 2.4 | |
Energy Equipment & Services | | | 2.3 | |
Oil, Gas & Consumable Fuels | | | 2.2 | |
Commercial Services & Supplies | | | 2.2 | |
Building Products | | | 2.1 | |
Food Products | | | 2.1 | |
Metals & Mining | | | 1.9 | |
Thrifts & Mortgage Finance | | | 1.8 | |
Pharmaceuticals | | | 1.8 | |
Hotels, Restaurants & Leisure | | | 1.7 | |
Trading Companies & Distributors | | | 1.5 | |
Communications Equipment | | | 1.4 | |
Aerospace & Defense | | | 1.4 | |
Professional Services | | | 1.4 | |
Exchange-Traded Fund | | | 1.3 | |
Auto Components | | | 1.2 | |
Mortgage Real Estate Investment Trusts (REITs) | | | 1.2 | |
| | | | |
IT Services | | | 1.2 | % |
Personal Products | | | 1.2 | |
Water Utilities | | | 1.2 | |
Construction & Engineering | | | 1.1 | |
Capital Markets | | | 1.0 | |
Diversified Consumer Services | | | 0.9 | |
Gas Utilities | | | 0.9 | |
Air Freight & Logistics | | | 0.9 | |
Consumer Finance | | | 0.9 | |
Textiles, Apparel & Luxury Goods | | | 0.9 | |
Food & Staples Retailing | | | 0.8 | |
Real Estate Management & Development | | | 0.6 | |
Health Care Technology | | | 0.5 | |
Interactive Media & Services | | | 0.5 | |
Media | | | 0.5 | |
Multi-Utilities | | | 0.5 | |
Household Products | | | 0.4 | |
Electrical Equipment | | | 0.4 | |
Road & Rail | | | 0.4 | |
Containers & Packaging | | | 0.4 | |
Diversified Telecommunication Services | | | 0.4 | |
Airlines | | | 0.3 | |
Tobacco | | | 0.3 | |
Wireless Telecommunication Services | | | 0.3 | |
Beverages | | | 0.3 | |
Paper & Forest Products | | | 0.3 | |
Marine | | | 0.3 | |
Leisure Products | | | 0.3 | |
Life Sciences Tools & Services | | | 0.2 | |
Automobiles | | | 0.2 | |
Technology Hardware, Storage & Peripherals | | | 0.2 | |
SEE NOTES TO FINANCIAL STATEMENTS.
A221
| | | | |
| | PSF SMALL-CAP STOCK INDEX PORTFOLIO (CONTINUED) | | |
SCHEDULE OF INVESTMENTS | | | | as of December 31, 2022 |
| | | | |
| Industry Classification (continued): | | | | |
| |
Entertainment | | | 0.1 | % |
U.S. Treasury Obligation | | | 0.1 | |
Internet & Direct Marketing Retail | | | 0.1 | |
Multiline Retail | | | 0.0 | * |
| | | | |
| |
| | | 131.5 | |
Liabilities in excess of other assets | | | (31.5 | ) |
| | | | |
| |
| | | 100.0 | % |
| | | | |
Effects of Derivative Instruments on the Financial Statements and Primary Underlying Risk Exposure:
The Portfolio invested in derivative instruments during the reporting period. The primary type of risk associated with these derivative instruments is equity contracts risk. See the Notes to Financial Statements for additional detail regarding these derivative instruments and their risks. The effect of such derivative instruments on the Portfolio’s financial position and financial performance as reflected in the Statement of Assets and Liabilities and Statement of Operations is presented in the summary below.
Fair values of derivative instruments as of December 31, 2022 as presented in the Statement of Assets and Liabilities:
| | | | | | | | | | |
| | | Asset Derivatives | | Liability Derivatives | |
| | | | |
Derivatives not accounted for as hedging instruments, carried at fair value | | Statement of
Assets and
Liabilities Location | | Fair
Value | | Statement of Assets and Liabilities Location | | Fair
Value | |
| | | | |
Equity contracts | | — | | $— | | Due from/to broker-variation margin futures | | $ | 145,234 | * |
| | | | | | | | | | |
| * | Includes cumulative appreciation (depreciation) as reported in the schedule of open futures and centrally cleared swap contracts. Only unsettled variation margin receivable (payable) is reported within the Statement of Assets and Liabilities. |
The effects of derivative instruments on the Statement of Operations for the year ended December 31, 2022 are as follows:
Amount of Realized Gain (Loss) on Derivatives Recognized in Income
| | | | | | |
| |
| | |
Derivatives not accounted for as hedging instruments, carried at fair value | | | | Futures | |
| | |
Equity contracts | | | | $ | (825,169 | ) |
| | | | | | |
Change in Unrealized Appreciation (Depreciation) on Derivatives Recognized in Income
| | | | | | |
| |
| | |
Derivatives not accounted for as hedging instruments, carried at fair value | | | | Futures | |
| | |
Equity contracts | | | | $ | (220,810 | ) |
| | | | | | |
For the year ended December 31, 2022, the Portfolio’s average volume of derivative activities is as follows:
| | |
| Derivative Contract Type | | Average Volume of Derivative Activities* |
|
Futures Contracts - Long Positions (1) | | $6,384,178 |
|
| * | Average volume is based on average quarter end balances as noted for the year ended December 31, 2022. |
| (1) | Notional Amount in USD. |
SEE NOTES TO FINANCIAL STATEMENTS.
A222
| | | | |
| | PSF SMALL-CAP STOCK INDEX PORTFOLIO (CONTINUED) | | |
SCHEDULE OF INVESTMENTS | | | | as of December 31, 2022 |
Financial Instruments/Transactions—Summary of Offsetting and Netting Arrangements:
The Portfolio entered into financial instruments/transactions during the reporting period that are either offset in accordance with current requirements or are subject to enforceable master netting arrangements or similar agreements that permit offsetting. The information about offsetting and related netting arrangements for financial instruments/transactions where the legal right to set-off exists is presented in the summary below.
Offsetting of financial instrument/transaction assets and liabilities:
| | | | | | |
| Description | | Gross Market Value of Recognized Assets/(Liabilities) | | Collateral
Pledged/(Received)(1) | | Net
Amount |
Securities on Loan | | $250,054,040 | | $(250,054,040) | | $— |
| (1) | Collateral amount disclosed by the Portfolio is limited to the market value of financial instruments/transactions. |
SEE NOTES TO FINANCIAL STATEMENTS.
A223
| | | | |
| | PSF SMALL-CAP STOCK INDEX PORTFOLIO (CONTINUED) | | |
| | |
STATEMENT OF ASSETS AND LIABILITIES |
|
as of December 31, 2022 |
| | | | |
| | | | |
ASSETS | | | | |
Investments at value, including securities on loan of $250,054,040: | | | | |
Unaffiliated investments (cost $588,680,012) | | $ | 807,923,995 | |
Affiliated investments (cost $262,641,504) | | | 262,898,735 | |
Dividends and interest receivable | | | 1,056,490 | |
Receivable for investments sold | | | 546,087 | |
Receivable for Portfolio shares sold | | | 58,944 | |
Prepaid expenses and other assets | | | 13,921 | |
| | | | |
Total Assets | | | 1,072,498,172 | |
| | | | |
LIABILITIES | | | | |
Payable to broker for collateral for securities on loan | | | 256,232,608 | |
Accrued expenses and other liabilities | | | 1,162,736 | |
Management fee payable | | | 247,942 | |
Payable for investments purchased | | | 174,483 | |
Payable for Portfolio shares purchased | | | 162,076 | |
Due to broker-variation margin futures | | | 22,386 | |
Distribution fee payable | | | 1,890 | |
Affiliated transfer agent fee payable | | | 980 | |
Trustees’ fees payable | | | 790 | |
| | | | |
Total Liabilities | | | 258,005,891 | |
| | | | |
NET ASSETS | | $ | 814,492,281 | |
| | | | |
Net assets were comprised of: Partners’ Equity | | $ | 814,492,281 | |
| | | | |
Class I: | | | | |
Net asset value and redemption price per share, $805,629,768 / 15,965,140 outstanding shares of beneficial interest | | $ | 50.46 | |
| | | | |
Class III: | | | | |
Net asset value and redemption price per share, $8,862,513 / 176,364 outstanding shares of beneficial interest | | $ | 50.25 | |
| | | | |
| | |
STATEMENT OF OPERATIONS |
|
Year Ended December 31, 2022 |
| | | | |
NET INVESTMENT INCOME (LOSS) | | | | |
INCOME | | | | |
Unaffiliated dividend income (net of $9,814 foreign withholding tax, of which $50 is reimbursable by an affiliate) | | $ | 12,572,358 | |
Income from securities lending, net (including affiliated income of $379,213) | | | 403,951 | |
Affiliated dividend income | | | 127,213 | |
Interest income | | | 7,985 | |
| | | | |
Total income | | | 13,111,507 | |
| | | | |
EXPENSES | | | | |
Management fee | | | 3,073,687 | |
Distribution fee—Class III | | | 19,904 | |
Custodian and accounting fees | | | 90,548 | |
Shareholders’ reports | | | 44,955 | |
Legal fees and expenses | | | 25,775 | |
Audit fee | | | 24,600 | |
Trustees’ fees | | | 22,161 | |
Transfer agent’s fees and expenses (including affiliated expense of $5,882) | | | 10,682 | |
Miscellaneous | | | 31,298 | |
| | | | |
Total expenses | | | 3,343,610 | |
| | | | |
NET INVESTMENT INCOME (LOSS) | | | 9,767,897 | |
| | | | |
REALIZED AND UNREALIZED GAIN (LOSS) ON INVESTMENT TRANSACTIONS | | | | |
Net realized gain (loss) on: | | | | |
Investment transactions (including affiliated of $(25,832)) | | | 48,392,214 | |
Futures transactions | | | (825,169 | ) |
| | | | |
| | | 47,567,045 | |
| | | | |
Net change in unrealized appreciation (depreciation) on: | | | | |
Investments (including affiliated of $92,226) | | | (223,530,059 | ) |
Futures | | | (220,810 | ) |
| | | | |
| | | (223,750,869 | ) |
| | | | |
NET GAIN (LOSS) ON INVESTMENT TRANSACTIONS | | | (176,183,824 | ) |
| | | | |
NET INCREASE (DECREASE) IN NET ASSETS RESULTING FROM OPERATIONS | | $ | (166,415,927 | ) |
| | | | |
STATEMENTS OF CHANGES IN NET ASSETS
| | | | | | | | | | | | | | | | | | | | | | | | |
| | | Year Ended
December 31, 2022 | | | Year Ended
December 31, 2021 | |
INCREASE (DECREASE) IN NET ASSETS | | | | | | | | | | | | | | | | | | | | | | | | |
OPERATIONS | | | | | | | | | | | | | | | | | | | | | | | | |
Net investment income (loss) | | | | | | $ | 9,767,897 | | | | | | | | | | | $ | 8,901,819 | | | | | |
Net realized gain (loss) on investment transactions | | | | | | | 47,567,045 | | | | | | | | | | | | 91,316,752 | | | | | |
Net change in unrealized appreciation (depreciation) on investments | | | | | | | (223,750,869 | ) | | | | | | | | | | | 122,798,716 | | | | | |
| | | | | | | | | | | | | | | | | | | | | | | | |
NET INCREASE (DECREASE) IN NET ASSETS RESULTING FROM OPERATIONS | | | | | | | (166,415,927 | ) | | | | | | | | | | | 223,017,287 | | | | | |
| | | | | | | | | | | | | | | | | | | | | | | | |
PORTFOLIO SHARE TRANSACTIONS | | | | | | | | | | | | | | | | | | | | | | | | |
Portfolio shares sold | | | | | | | 13,966,519 | | | | | | | | | | | | 24,869,098 | | | | | |
Portfolio shares purchased | | | | | | | (63,514,847 | ) | | | | | | | | | | | (75,416,063 | ) | | | | |
| | | | | | | | | | | | | | | | | | | | | | | | |
NET INCREASE (DECREASE) IN NET ASSETS FROM PORTFOLIO SHARE TRANSACTIONS | | | | | | | (49,548,328 | ) | | | | | | | | | | | (50,546,965 | ) | | | | |
| | | | | | | | | | | | | | | | | | | | | | | | |
TOTAL INCREASE (DECREASE) | | | | | | | (215,964,255 | ) | | | | | | | | | | | 172,470,322 | | | | | |
NET ASSETS: | | | | | | | | | | | | | | | | | | | | | | | | |
Beginning of year | | | | | | | 1,030,456,536 | | | | | | | | | | | | 857,986,214 | | | | | |
| | | | | | | | | | | | | | | | | | | | | | | | |
End of year | | | | | | $ | 814,492,281 | | | | | | | | | | | $ | 1,030,456,536 | | | | | |
| | | | | | | | | | | | | | | | | | | | | | | | |
SEE NOTES TO FINANCIAL STATEMENTS.
A224
| | | | |
| | PSF SMALL-CAP STOCK INDEX PORTFOLIO (CONTINUED) | | |
FINANCIAL HIGHLIGHTS | | | | |
| | | | | | | | | | | | | | | | | | | | |
Class I | | | | | | | | | | | | | | | |
| | | Year Ended December 31, | |
| | | 2022 | | | 2021 | | | 2020 | | | 2019 | | | 2018 | |
Per Share Operating Performance(a): | | | | | | | | | | | | | | | | | | | | |
Net Asset Value, beginning of year | | $ | 60.34 | | | $ | 47.76 | | | $ | 43.03 | | | $ | 35.15 | | | $ | 38.51 | |
| | | | | | | | | | | | | | | | | | | | |
Income (Loss) From Investment Operations: | | | | | | | | | | | | | | | | | | | | |
Net investment income (loss) | | | 0.59 | | | | 0.51 | | | | 0.40 | | | | 0.46 | | | | 0.40 | |
Net realized and unrealized gain (loss) on investment transactions | | | (10.47 | ) | | | 12.07 | | | | 4.33 | | | | 7.42 | | | | (3.76 | ) |
| | | | | | | | | | | | | | | | | | | | |
Total from investment operations | | | (9.88 | ) | | | 12.58 | | | | 4.73 | | | | 7.88 | | | | (3.36 | ) |
| | | | | | | | | | | | | | | | | | | | |
Capital Contributions | | | — | | | | — | | | | — | | | | — | | | | — | (b)(c) |
| | | | | | | | | | | | | | | | | | | | |
Net Asset Value, end of year | | $ | 50.46 | | | $ | 60.34 | | | $ | 47.76 | | | $ | 43.03 | | | $ | 35.15 | |
| | | | | | | | | | | | | | | | | | | | |
Total Return(d) | | | (16.37 | )% | | | 26.34 | % | | | 10.99 | % | | | 22.42 | %�� | | | (8.73 | )%(e) |
Ratios/Supplemental Data: | | | | | | | | | | | | | | | | | | | | |
Net assets, end of year (in millions) | | $ | 806 | | | $ | 1,024 | | | $ | 858 | | | $ | 834 | | | $ | 729 | |
Average net assets (in millions) | | $ | 870 | | | $ | 1,002 | | | $ | 701 | | | $ | 794 | | | $ | 871 | |
Ratios to average net assets(f): | | | | | | | | | | | | | | | | | | | | |
Expenses after waivers and/or expense reimbursement | | | 0.38 | % | | | 0.38 | % | | | 0.40 | % | | | 0.39 | % | | | 0.39 | % |
Expenses before waivers and/or expense reimbursement | | | 0.38 | % | | | 0.38 | % | | | 0.40 | % | | | 0.39 | % | | | 0.39 | % |
Net investment income (loss) | | | 1.11 | % | | | 0.89 | % | | | 1.07 | % | | | 1.15 | % | | | 0.98 | % |
Portfolio turnover rate(g) | | | 17 | % | | | 18 | % | | | 18 | % | | | 19 | % | | | 18 | % |
| | | | | | | | | | | | | | | | | | | | | | | | | | | | |
Class III | | | | | | | | | | | | | | | | | | | | | |
| | | Year Ended December 31,
2022 | | | | | | April 26, 2021(h)
through December 31,
2021 | |
Per Share Operating Performance(a): | | | | | | | | | | | | | | | | | | | | | | | | | | | | |
Net Asset Value, beginning of period | | | | | | $ | 60.24 | | | | | | | | | | | | | | | $ | 57.73 | | | | | |
| | | | | | | | | | | | | | | | | | | | | | | | | | | | |
Income (Loss) From Investment Operations: | | | | | | | | | | | | | | | | | | | | | | | | | | | | |
Net investment income (loss) | | | | | | | 0.47 | | | | | | | | | | | | | | | | 0.31 | | | | | |
Net realized and unrealized gain (loss) on investment transactions | | | | | | | (10.46 | ) | | | | | | | | | | | | | | | 2.20 | | | | | |
| | | | | | | | | | | | | | | | | | | | | | | | | | | | |
Total from investment operations | | | | | | | (9.99 | ) | | | | | | | | | | | | | | | 2.51 | | | | | |
| | | | | | | | | | | | | | | | | | | | | | | | | | | | |
Net Asset Value, end of period | | | | | | $ | 50.25 | | | | | | | | | | | | | | | $ | 60.24 | | | | | |
| | | | | | | | | | | | | | | | | | | | | | | | | | | | |
Total Return(d) | | | | | | | (16.58 | )% | | | | | | | | | | | | | | | 4.35 | % | | | | |
Ratios/Supplemental Data: | | | | | | | | | | | | | | | | | | | | | | | | | | | | |
Net assets, end of period (in millions) | | | | | | $ | 9 | | | | | | | | | | | | | | | $ | 6 | | | | | |
Average net assets (in millions) | | | | | | $ | 8 | | | | | | | | | | | | | | | $ | 3 | | | | | |
Ratios to average net assets(f): | | | | | | | | | | | | | | | | | | | | | | | | | | | | |
Expenses after waivers and/or expense reimbursement | | | | | | | 0.63 | % | | | | | | | | | | | | | | | 0.62 | %(i) | | | | |
Expenses before waivers and/or expense reimbursement | | | | | | | 0.63 | % | | | | | | | | | | | | | | | 0.62 | %(i) | | | | |
Net investment income (loss) | | | | | | | 0.90 | % | | | | | | | | | | | | | | | 0.76 | %(i) | | | | |
Portfolio turnover rate(g) | | | | | | | 17 | % | | | | | | | | | | | | | | | 18 | % | | | | |
| (a) | Calculated based on average shares outstanding during the period. |
| (b) | Represents payment received by the Portfolio, from Prudential, in connection with excess foreign withholding tax withheld on dividends and interest from certain countries due to the Portfolio’s tax status as a partnership. |
| (c) | Amount rounds to zero. |
| (d) | Total return is calculated assuming a purchase of a share on the first day and a sale on the last day of each period reported and includes reinvestment of dividends and distributions, if any, and does not reflect the effect of insurance contract charges. Total return does not reflect expenses associated with the separate account such as administrative fees, account charges and surrender charges which, if reflected, would reduce the total returns for all periods shown. Performance figures may reflect fee waivers and/or expense reimbursements. In the absence of fee waivers and/or expense reimbursements, the total return would be lower. Past performance is no guarantee of future results. Total returns may reflect adjustments to conform to GAAP. Total returns for periods less than one full year are not annualized. |
| (e) | Total return for the year includes the impact of the capital contribution, which was not material to the total return. |
| (f) | Does not include expenses of the underlying funds in which the Portfolio invests. |
| (g) | The Portfolio’s portfolio turnover rate is calculated in accordance with regulatory requirements, without regard to transactions involving short-term investments, certain derivatives and in-kind transactions (if any). If such transactions were included, the Portfolio’s portfolio turnover rate may be higher. |
| (h) | Commencement of offering. |
| (i) | Annualized, with the exception of certain non-recurring expenses. |
SEE NOTES TO FINANCIAL STATEMENTS.
A225
| | | | |
| | PSF SMALL-CAP VALUE PORTFOLIO | | |
SCHEDULE OF INVESTMENTS | | | | as of December 31, 2022 |
| | | | | | | | |
| | | Shares | | | Value | |
LONG-TERM INVESTMENTS — 98.2% | |
COMMON STOCKS — 96.7% | |
Aerospace & Defense — 2.0% | | | | | | | | |
AAR Corp.* | | | 28,498 | | | $ | 1,279,560 | |
Aerojet Rocketdyne Holdings, Inc.* | | | 27,323 | | | | 1,528,176 | |
Ducommun, Inc.* | | | 21,953 | | | | 1,096,772 | |
Maxar Technologies, Inc. | | | 32,518 | | | | 1,682,481 | |
| | | | | | | | |
| | |
| | | | | | | 5,586,989 | |
| | | | | | | | |
Airlines — 0.3% | | | | | | | | |
Spirit Airlines, Inc.* | | | 42,933 | | | | 836,335 | |
| | | | | | | | |
Auto Components — 0.8% | | | | | | | | |
Adient PLC* | | | 43,809 | | | | 1,519,734 | |
American Axle & Manufacturing Holdings, Inc.* | | | 92,632 | | | | 724,382 | |
| | | | | | | | |
| | |
| | | | | | | 2,244,116 | |
| | | | | | | | |
Banks — 18.6% | | | | | | | | |
Amalgamated Financial Corp. | | | 14,912 | | | | 343,572 | |
Ameris Bancorp | | | 39,199 | | | | 1,847,841 | |
Associated Banc-Corp. | | | 87,892 | | | | 2,029,426 | |
Atlantic Union Bankshares Corp. | | | 45,375 | | | | 1,594,477 | |
Banner Corp. | | | 36,218 | | | | 2,288,978 | |
Berkshire Hills Bancorp, Inc. | | | 21,579 | | | | 645,212 | |
Brookline Bancorp, Inc. | | | 60,378 | | | | 854,349 | |
Cadence Bank(a) | | | 17,675 | | | | 435,866 | |
Community Bank System, Inc. | | | 21,327 | | | | 1,342,535 | |
ConnectOne Bancorp, Inc. | | | 52,220 | | | | 1,264,246 | |
CVB Financial Corp. | | | 77,167 | | | | 1,987,050 | |
Eastern Bankshares, Inc. | | | 112,992 | | | | 1,949,112 | |
FB Financial Corp. | | | 35,202 | | | | 1,272,200 | |
First Financial Bankshares,
Inc.(a) | | | 31,310 | | | | 1,077,064 | |
First Merchants Corp. | | | 44,188 | | | | 1,816,569 | |
German American Bancorp, Inc. | | | 23,765 | | | | 886,435 | |
Glacier Bancorp, Inc. | | | 27,969 | | | | 1,382,228 | |
Hancock Whitney Corp. | | | 62,155 | | | | 3,007,680 | |
Heritage Financial Corp. | | | 36,383 | | | | 1,114,775 | |
Home BancShares, Inc.(a) | | | 69,723 | | | | 1,588,987 | |
Independent Bank Corp. | | | 27,508 | | | | 2,322,500 | |
Independent Bank Group, Inc. | | | 17,933 | | | | 1,077,415 | |
Lakeland Financial Corp. | | | 25,567 | | | | 1,865,624 | |
NBT Bancorp, Inc. | | | 18,810 | | | | 816,730 | |
OceanFirst Financial Corp. | | | 63,837 | | | | 1,356,536 | |
Origin Bancorp, Inc. | | | 20,567 | | | | 754,809 | |
Pacific Premier Bancorp, Inc. | | | 65,216 | | | | 2,058,217 | |
Pinnacle Financial Partners, Inc. | | | 17,910 | | | | 1,314,594 | |
Renasant Corp. | | | 49,902 | | | | 1,875,816 | |
SouthState Corp. | | | 28,727 | | | | 2,193,594 | |
Towne Bank | | | 40,889 | | | | 1,261,017 | |
TriCo Bancshares | | | 32,126 | | | | 1,638,105 | |
United Community Banks, Inc. | | | 76,588 | | | | 2,588,674 | |
Washington Federal, Inc. | | | 65,040 | | | | 2,182,092 | |
| | | | | | | | |
| | |
| | | | | | | 52,034,325 | |
| | | | | | | | |
Beverages — 0.9% | | | | | | | | |
Primo Water Corp. | | | 159,381 | | | | 2,476,781 | |
| | | | | | | | |
Biotechnology — 4.3% | | | | | | | | |
2seventy bio, Inc.* | | | 27,622 | | | | 258,818 | |
Agios Pharmaceuticals,
Inc.*(a) | | | 38,780 | | | | 1,088,942 | |
Alkermes PLC* | | | 32,706 | | | | 854,608 | |
| | | | | | | | |
| | | Shares | | | Value | |
COMMON STOCKS (continued) | |
Biotechnology (cont’d.) | | | | | | | | |
Allogene Therapeutics,
Inc.*(a) | | | 24,523 | | | $ | 154,250 | |
Apellis Pharmaceuticals, Inc.* | | | 13,516 | | | | 698,912 | |
Arcus Biosciences, Inc.*(a) | | | 19,748 | | | | 408,389 | |
Avidity Biosciences, Inc.*(a) | | | 28,970 | | | | 642,844 | |
Beam Therapeutics, Inc.*(a) | | | 11,654 | | | | 455,788 | |
Cytokinetics, Inc.* | | | 15,427 | | | | 706,865 | |
Intellia Therapeutics, Inc.*(a) | | | 8,078 | | | | 281,841 | |
Iovance Biotherapeutics, Inc.* | | | 60,530 | | | | 386,787 | |
Kura Oncology, Inc.* | | | 33,392 | | | | 414,395 | |
Mersana Therapeutics, Inc.* | | | 77,992 | | | | 457,033 | |
Myriad Genetics, Inc.* | | | 44,530 | | | | 646,130 | |
REGENXBIO, Inc.* | | | 21,025 | | | | 476,847 | |
Relay Therapeutics, Inc.*(a) | | | 43,225 | | | | 645,782 | |
REVOLUTION Medicines,
Inc.*(a) | | | 33,966 | | | | 809,070 | |
Sage Therapeutics, Inc.* | | | 30,217 | | | | 1,152,476 | |
Veracyte, Inc.* | | | 33,164 | | | | 786,982 | |
Xencor, Inc.* | | | 25,816 | | | | 672,249 | |
| | | | | | | | |
| | |
| | | | | | | 11,999,008 | |
| | | | | | | | |
Building Products — 0.5% | |
Resideo Technologies, Inc.* | | | 83,045 | | | | 1,366,090 | |
| | | | | | | | |
Capital Markets — 1.0% | |
P10, Inc. (Class A Stock)(a) | | | 46,709 | | | | 498,385 | |
Piper Sandler Cos.(a) | | | 7,319 | | | | 952,860 | |
PJT Partners, Inc. (Class A Stock) | | | 10,216 | | | | 752,817 | |
Stifel Financial Corp. | | | 11,856 | | | | 692,035 | |
| | | | | | | | |
| | |
| | | | | | | 2,896,097 | |
| | | | | | | | |
Chemicals — 1.8% | | | | | | | | |
Ashland, Inc. | | | 16,681 | | | | 1,793,708 | |
Avient Corp. | | | 65,828 | | | | 2,222,353 | |
HB Fuller Co. | | | 16,477 | | | | 1,180,083 | |
| | | | | | | | |
| | |
| | | | | | | 5,196,144 | |
| | | | | | | | |
Commercial Services & Supplies — 1.7% | |
ABM Industries, Inc. | | | 63,065 | | | | 2,801,347 | |
Deluxe Corp. | | | 31,562 | | | | 535,923 | |
UniFirst Corp. | | | 6,860 | | | | 1,323,911 | |
| | | | | | | | |
| | |
| | | | | | | 4,661,181 | |
| | | | | | | | |
Communications Equipment — 0.3% | |
Viavi Solutions, Inc.* | | | 78,321 | | | | 823,154 | |
| | | | | | | | |
Construction & Engineering — 1.6% | |
Arcosa, Inc. | | | 35,824 | | | | 1,946,676 | |
Dycom Industries, Inc.* | | | 6,427 | | | | 601,567 | |
MasTec, Inc.* | | | 23,039 | | | | 1,965,918 | |
| | | | | | | | |
| | |
| | | | | | | 4,514,161 | |
| | | | | | | | |
Construction Materials — 0.6% | |
Summit Materials, Inc.
(Class A Stock)* | | | 58,949 | | | | 1,673,562 | |
| | | | | | | | |
Consumer Finance — 0.5% | |
FirstCash Holdings, Inc. | | | 12,851 | | | | 1,116,880 | |
LendingClub Corp.* | | | 30,010 | | | | 264,088 | |
| | | | | | | | |
| | |
| | | | | | | 1,380,968 | |
| | | | | | | | |
Containers & Packaging — 0.2% | |
TriMas Corp. | | | 20,723 | | | | 574,856 | |
| | | | | | | | |
SEE NOTES TO FINANCIAL STATEMENTS.
A226
| | | | |
| | PSF SMALL-CAP VALUE PORTFOLIO (CONTINUED) | | |
SCHEDULE OF INVESTMENTS | | | | as of December 31, 2022 |
| | | | | | | | |
| | | Shares | | | Value | |
COMMON STOCKS (continued) | |
Diversified Consumer Services — 0.5% | |
Adtalem Global Education, Inc.* | | | 40,016 | | | $ | 1,420,568 | |
| | | | | | | | |
Diversified Financial Services — 0.1% | |
Alerus Financial Corp. | | | 8,537 | | | | 199,339 | |
| | | | | | | | |
Diversified Telecommunication Services — 0.5% | |
Iridium Communications, Inc.* | | | 28,400 | | | | 1,459,760 | |
| | | | | | | | |
Electric Utilities — 2.4% | | | | | | | | |
ALLETE, Inc. | | | 36,255 | | | | 2,338,810 | |
IDACORP, Inc. | | | 20,721 | | | | 2,234,760 | |
MGE Energy, Inc. | | | 29,538 | | | | 2,079,475 | |
| | | | | | | | |
| | |
| | | | | | | 6,653,045 | |
| | | | | | | | |
Electronic Equipment, Instruments & Components — 2.7% | |
CTS Corp.(a) | | | 19,996 | | | | 788,242 | |
FARO Technologies, Inc.* | | | 32,560 | | | | 957,590 | |
Itron, Inc.* | | | 21,400 | | | | 1,083,910 | |
Knowles Corp.* | | | 88,759 | | | | 1,457,423 | |
Rogers Corp.* | | | 3,030 | | | | 361,600 | |
Sanmina Corp.* | | | 27,557 | | | | 1,578,740 | |
TTM Technologies, Inc.* | | | 88,008 | | | | 1,327,161 | |
| | | | | | | | |
| | |
| | | | | | | 7,554,666 | |
| | | | | | | | |
Energy Equipment & Services — 1.7% | |
Helmerich & Payne, Inc. | | | 40,962 | | | | 2,030,486 | |
NexTier Oilfield Solutions, Inc.* | | | 151,024 | | | | 1,395,462 | |
Patterson-UTI Energy, Inc. | | | 75,259 | | | | 1,267,362 | |
| | | | | | | | |
| | |
| | | | | | | 4,693,310 | |
| | | | | | | | |
Equity Real Estate Investment Trusts (REITs) — 8.5% | |
Acadia Realty Trust | | | 159,190 | | | | 2,284,376 | |
Agree Realty Corp.(a) | | | 29,945 | | | | 2,123,999 | |
Hudson Pacific Properties, Inc. | | | 110,533 | | | | 1,075,486 | |
Pebblebrook Hotel Trust(a) | | | 117,801 | | | | 1,577,355 | |
Physicians Realty Trust(a) | | | 253,144 | | | | 3,662,994 | |
RLJ Lodging Trust | | | 221,299 | | | | 2,343,556 | |
Ryman Hospitality Properties, Inc. | | | 30,593 | | | | 2,501,896 | |
SITE Centers Corp.(a) | | | 176,004 | | | | 2,404,215 | |
STAG Industrial, Inc.(a) | | | 96,238 | | | | 3,109,450 | |
Terreno Realty Corp. | | | 48,805 | | | | 2,775,540 | |
| | | | | | | | |
| | |
| | | | | | | 23,858,867 | |
| | | | | | | | |
Food & Staples Retailing — 0.7% | |
SpartanNash Co. | | | 21,466 | | | | 649,132 | |
United Natural Foods, Inc.* | | | 33,856 | | | | 1,310,566 | |
| | | | | | | | |
| | |
| | | | | | | 1,959,698 | |
| | | | | | | | |
Food Products — 2.0% | | | | | | | | |
Hostess Brands, Inc.*(a) | | | 115,806 | | | | 2,598,687 | |
Simply Good Foods Co. (The)* | | | 22,941 | | | | 872,446 | |
TreeHouse Foods, Inc.* | | | 23,192 | | | | 1,145,221 | |
Utz Brands, Inc.(a) | | | 67,606 | | | | 1,072,231 | |
| | | | | | | | |
| | |
| | | | | | | 5,688,585 | |
| | | | | | | | |
Gas Utilities — 1.5% | | | | | | | | |
Chesapeake Utilities Corp. | | | 12,031 | | | | 1,421,823 | |
ONE Gas, Inc. | | | 30,064 | | | | 2,276,446 | |
Southwest Gas Holdings, Inc. | | | 9,286 | | | | 574,618 | |
| | | | | | | | |
| | |
| | | | | | | 4,272,887 | |
| | | | | | | | |
| | | | | | | | |
| | | Shares | | | Value | |
COMMON STOCKS (continued) | |
Health Care Equipment & Supplies — 2.6% | |
Avanos Medical, Inc.* | | | 51,307 | | | $ | 1,388,368 | |
CONMED Corp. | | | 7,804 | | | | 691,747 | |
Enovis Corp.* | | | 26,266 | | | | 1,405,756 | |
LivaNova PLC* | | | 19,763 | | | | 1,097,637 | |
NuVasive, Inc.* | | | 28,322 | | | | 1,167,999 | |
QuidelOrtho Corp.* | | | 17,006 | | | | 1,456,904 | |
| | | | | | | | |
| | |
| | | | | | | 7,208,411 | |
| | | | | | | | |
Health Care Providers & Services — 0.6% | |
Acadia Healthcare Co., Inc.* | | | 16,101 | | | | 1,325,434 | |
Owens & Minor, Inc.* | | | 20,315 | | | | 396,752 | |
| | | | | | | | |
| | |
| | | | | | | 1,722,186 | |
| | | | | | | | |
Health Care Technology — 0.8% | |
Allscripts Healthcare Solutions, Inc.* | | | 95,114 | | | | 1,677,811 | |
Health Catalyst, Inc.* | | | 44,499 | | | | 473,024 | |
| | | | | | | | |
| | |
| | | | | | | 2,150,835 | |
| | | | | | | | |
Hotels, Restaurants & Leisure — 2.4% | |
Boyd Gaming Corp. | | | 20,333 | | | | 1,108,758 | |
International Game Technology PLC | | | 75,129 | | | | 1,703,926 | |
Krispy Kreme, Inc.(a) | | | 47,331 | | | | 488,456 | |
Red Rock Resorts, Inc. (Class A Stock)(a) | | | 22,845 | | | | 914,028 | |
SeaWorld Entertainment, Inc.* | | | 24,458 | | | | 1,308,748 | |
Travel + Leisure Co. | | | 30,737 | | | | 1,118,827 | |
| | | | | | | | |
| | |
| | | | | | | 6,642,743 | |
| | | | | | | | |
Household Durables — 1.5% | |
Century Communities, Inc. | | | 21,715 | | | | 1,085,967 | |
Installed Building Products, Inc. | | | 8,610 | | | | 737,016 | |
Meritage Homes Corp.* | | | 25,139 | | | | 2,317,816 | |
| | | | | | | | |
| | |
| | | | | | | 4,140,799 | |
| | | | | | | | |
Independent Power & Renewable Electricity Producers — 0.4% | |
NextEra Energy Partners LP(a) | | | 18,200 | | | | 1,275,638 | |
| | | | | | | | |
Insurance — 2.8% | | | | | | | | |
AMERISAFE, Inc. | | | 13,130 | | | | 682,366 | |
CNO Financial Group, Inc. | | | 50,632 | | | | 1,156,941 | |
Enstar Group Ltd.* | | | 6,419 | | | | 1,483,046 | |
Hanover Insurance Group, Inc. (The) | | | 5,732 | | | | 774,565 | |
RLI Corp. | | | 6,356 | | | | 834,352 | |
Selective Insurance Group,
Inc.(a) | | | 32,027 | | | | 2,837,913 | |
| | | | | | | | |
| | |
| | | | | | | 7,769,183 | |
| | | | | | | | |
Interactive Media & Services — 0.3% | |
Bumble, Inc. (Class A Stock)* | | | 39,252 | | | | 826,255 | |
| | | | | | | | |
Leisure Products — 0.4% | |
Topgolf Callaway Brands Corp.* | | | 63,166 | | | | 1,247,529 | |
| | | | | | | | |
Life Sciences Tools & Services — 0.6% | |
NeoGenomics, Inc.* | | | 116,794 | | | | 1,079,176 | |
Pacific Biosciences of California, Inc.*(a) | | | 76,338 | | | | 624,445 | |
| | | | | | | | |
| | |
| | | | | | | 1,703,621 | |
| | | | | | | | |
Machinery — 4.6% | | | | | | | | |
Astec Industries, Inc. | | | 21,924 | | | | 891,430 | |
SEE NOTES TO FINANCIAL STATEMENTS.
A227
| | | | |
| | PSF SMALL-CAP VALUE PORTFOLIO (CONTINUED) | | |
SCHEDULE OF INVESTMENTS | | | | as of December 31, 2022 |
| | | | | | | | |
| | | Shares | | | Value | |
COMMON STOCKS (continued) | |
Machinery (cont’d.) | | | | | | | | |
Columbus McKinnon Corp. | | | 44,499 | | | $ | 1,444,882 | |
EnPro Industries, Inc. | | | 19,769 | | | | 2,148,692 | |
ESCO Technologies, Inc. | | | 22,119 | | | | 1,936,297 | |
Federal Signal Corp. | | | 49,374 | | | | 2,294,410 | |
SPX Technologies, Inc.* | | | 24,037 | | | | 1,578,029 | |
Standex International Corp. | | | 7,387 | | | | 756,503 | |
Terex Corp. | | | 46,376 | | | | 1,981,183 | |
| | | | | | | | |
| | |
| | | | | | | 13,031,426 | |
| | | | | | | | |
Media — 1.8% | | | | | | | | |
Entravision Communications Corp. (Class A Stock) | | | 122,877 | | | | 589,810 | |
iHeartMedia, Inc. (Class A Stock)* | | | 34,778 | | | | 213,189 | |
John Wiley & Sons, Inc. (Class A Stock) | | | 30,419 | | | | 1,218,585 | |
Nexstar Media Group, Inc. | | | 7,465 | | | | 1,306,599 | |
TEGNA, Inc. | | | 79,216 | | | | 1,678,587 | |
| | | | | | | | |
| | |
| | | | | | | 5,006,770 | |
| | | | | | | | |
Metals & Mining — 2.1% | | | | | | | | |
ATI, Inc.* | | | 50,220 | | | | 1,499,569 | |
Carpenter Technology Corp. | | | 33,445 | | | | 1,235,458 | |
Commercial Metals Co. | | | 34,945 | | | | 1,687,844 | |
Constellium SE* | | | 66,366 | | | | 785,110 | |
Hecla Mining Co. | | | 115,775 | | | | 643,709 | |
| | | | | | | | |
| | |
| | | | | | | 5,851,690 | |
| | | | | | | | |
Mortgage Real Estate Investment Trusts (REITs) — 1.3% | |
KKR Real Estate Finance Trust, Inc.(a) | | | 86,886 | | | | 1,212,929 | |
PennyMac Mortgage Investment Trust(a) | | | 140,182 | | | | 1,736,855 | |
TPG RE Finance Trust, Inc.(a) | | | 113,819 | | | | 772,831 | |
| | | | | | | | |
| | |
| | | | | | | 3,722,615 | |
| | | | | | | | |
Multiline Retail — 0.3% | | | | | | | | |
Macy’s, Inc. | | | 39,242 | | | | 810,347 | |
| | | | | | | | |
|
Oil, Gas & Consumable Fuels — 3.9% | |
Callon Petroleum Co.* | | | 9,080 | | | | 336,777 | |
DHT Holdings, Inc. | | | 119,231 | | | | 1,058,771 | |
Equitrans Midstream Corp. | | | 117,098 | | | | 784,557 | |
Golar LNG Ltd. (Cameroon)* | | | 49,859 | | | | 1,136,287 | |
Green Plains, Inc.*(a) | | | 27,445 | | | | 837,072 | |
Murphy Oil Corp. | | | 42,413 | | | | 1,824,183 | |
PBF Energy, Inc. (Class A Stock) | | | 18,040 | | | | 735,671 | |
Peabody Energy Corp.*(a) | | | 22,851 | | | | 603,723 | |
Scorpio Tankers, Inc. (Monaco) | | | 34,541 | | | | 1,857,270 | |
Sitio Royalties Corp. (Class A Stock) | | | 16,713 | | | | 482,167 | |
SM Energy Co. | | | 33,178 | | | | 1,155,590 | |
| | | | | | | | |
| | |
| | | | | | | 10,812,068 | |
| | | | | | | | |
Personal Products — 0.3% | | | | | | | | |
BellRing Brands, Inc.*(a) | | | 33,453 | | | | 857,735 | |
| | | | | | | | |
| | |
Professional Services — 2.8% | | | | | | | | |
Alight, Inc. (Class A Stock)* | | | 100,367 | | | | 839,068 | |
ASGN, Inc.* | | | 21,152 | | | | 1,723,465 | |
First Advantage Corp.* | | | 67,295 | | | | 874,835 | |
ICF International, Inc. | | | 13,331 | | | | 1,320,436 | |
| | | | | | | | |
| | | Shares | | | Value | |
COMMON STOCKS (continued) | |
Professional Services (cont’d.) | | | | | | | | |
KBR, Inc. | | | 58,090 | | | $ | 3,067,152 | |
| | | | | | | | |
| | |
| | | | | | | 7,824,956 | |
| | | | | | | | |
Real Estate Management & Development — 0.6% | |
Kennedy-Wilson Holdings, Inc. | | | 105,396 | | | | 1,657,879 | |
| | | | | | | | |
|
Road & Rail — 0.7% | |
ArcBest Corp. | | | 10,138 | | | | 710,066 | |
Saia, Inc.* | | | 5,650 | | | | 1,184,692 | |
| | | | | | | | |
| | |
| | | | | | | 1,894,758 | |
| | | | | | | | |
Semiconductors & Semiconductor Equipment — 1.2% | |
Cohu, Inc.* | | | 54,035 | | | | 1,731,822 | |
MACOM Technology Solutions Holdings, Inc.* | | | 19,945 | | | | 1,256,136 | |
Onto Innovation, Inc.* | | | 3,760 | | | | 256,018 | |
| | | | | | | | |
| | |
| | | | | | | 3,243,976 | |
| | | | | | | | |
Software — 1.9% | | | | | | | | |
Domo, Inc. (Class B Stock)* | | | 19,815 | | | | 282,166 | |
JFrog Ltd. (Israel)*(a) | | | 61,090 | | | | 1,303,050 | |
LiveRamp Holdings, Inc.* | | | 41,266 | | | | 967,275 | |
Smartsheet, Inc. (Class A Stock)* | | | 17,286 | | | | 680,377 | |
Tenable Holdings, Inc.* | | | 33,504 | | | | 1,278,177 | |
Verint Systems, Inc.* | | | 23,172 | | | | 840,680 | |
| | | | | | | | |
| | |
| | | | | | | 5,351,725 | |
| | | | | | | | |
Specialty Retail — 2.8% | | | | | | | | |
Academy Sports & Outdoors,
Inc.(a) | | | 46,474 | | | | 2,441,744 | |
American Eagle Outfitters, Inc.(a) | | | 31,163 | | | | 435,035 | |
Asbury Automotive Group,
Inc.*(a) | | | 7,172 | | | | 1,285,581 | |
Foot Locker, Inc. | | | 34,778 | | | | 1,314,261 | |
Group 1 Automotive, Inc. | | | 11,350 | | | | 2,047,200 | |
Signet Jewelers Ltd.(a) | | | 4,624 | | | | 314,432 | |
| | | | | | | | |
| | |
| | | | | | | 7,838,253 | |
| | | | | | | | |
Technology Hardware, Storage & Peripherals — 0.2% | |
Xerox Holdings Corp.(a) | | | 30,935 | | | | 451,651 | |
| | | | | | | | |
|
Textiles, Apparel & Luxury Goods — 1.3% | |
Capri Holdings Ltd.* | | | 31,990 | | | | 1,833,667 | |
Carter’s, Inc.(a) | | | 11,583 | | | | 864,207 | |
Deckers Outdoor Corp.* | | | 2,443 | | | | 975,148 | |
| | | | | | | | |
| | |
| | | | | | | 3,673,022 | |
| | | | | | | | |
Thrifts & Mortgage Finance — 1.4% | |
MGIC Investment Corp. | | | 146,985 | | | | 1,910,805 | |
NMI Holdings, Inc. (Class A Stock)* | | | 48,514 | | | | 1,013,943 | |
Walker & Dunlop, Inc. | | | 11,801 | | | | 926,142 | |
| | | | | | | | |
| | |
| | | | | | | 3,850,890 | |
| | | | | | | | |
Trading Companies & Distributors — 0.9% | |
Beacon Roofing Supply, Inc.* | | | 25,232 | | | | 1,331,997 | |
Herc Holdings, Inc. | | | 9,713 | | | | 1,277,940 | |
| | | | | | | | |
| | |
| | | | | | | 2,609,937 | |
| | | | | | | | |
Water Utilities — 0.4% | | | | | | | | |
SJW Group | | | 15,344 | | | | 1,245,779 | |
| | | | | | | | |
SEE NOTES TO FINANCIAL STATEMENTS.
A228
| | | | |
| | PSF SMALL-CAP VALUE PORTFOLIO (CONTINUED) | | |
SCHEDULE OF INVESTMENTS | | | | as of December 31, 2022 |
| | | | | | | | |
| | | Shares | | | Value | |
COMMON STOCKS (continued) | | | | | |
Wireless Telecommunication Services — 0.1% | |
Telephone & Data Systems, Inc.(a) | | | 28,491 | | | $ | 298,871 | |
| | | | | | | | |
| | |
TOTAL COMMON STOCKS
(cost $249,199,508) | | | | | | | 270,746,040 | |
| | | | | | | | |
| |
EXCHANGE-TRADED FUND — 1.5% | | | | | |
iShares Russell 2000 Value ETF(a) | | | 29,861 | | | | 4,140,825 | |
| | | | | | | | |
(cost $4,235,498) | | | | | | | | |
| |
TOTAL LONG-TERM INVESTMENTS
(cost $253,435,006) | | | | 274,886,865 | |
| | | | | | | | |
|
SHORT-TERM INVESTMENTS — 14.5% | |
| |
AFFILIATED MUTUAL FUNDS | | | | | |
PGIM Core Ultra Short Bond Fund(wa) | | | 5,051,958 | | | | 5,051,958 | |
PGIM Institutional Money Market Fund (cost $35,690,057; includes $35,568,192 of cash collateral for securities on loan)(b)(wa) | | | 35,726,128 | | | | 35,708,265 | |
| | | | | | | | |
| |
TOTAL SHORT-TERM INVESTMENTS
(cost $40,742,015) | | | | 40,760,223 | |
| | | | | | | | |
| | |
TOTAL INVESTMENTS—112.7%
(cost $294,177,021) | | | | | | | 315,647,088 | |
Liabilities in excess of other assets — (12.7)% | | | | (35,690,291 | ) |
| | | | | | | | |
| | |
NET ASSETS — 100.0% | | | | | | $ | 279,956,797 | |
| | | | | | | | |
See the Glossary for a list of the abbreviation(s) used in the annual report.
| * | Non-income producing security. |
| (a) | All or a portion of security is on loan. The aggregate market value of such securities, including those sold and pending settlement, is $34,719,610; cash collateral of $35,568,192 (included in liabilities) was received with which the Portfolio purchased highly liquid short-term investments. In the event of significant appreciation in value of securities on loan on the last business day of the reporting period, the Portfolio may reflect a collateral value that is less than the market value of the loaned securities and such shortfall is remedied the following business day. |
| (b) | Represents security, or portion thereof, purchased with cash collateral received for securities on loan and includes dividend reinvestment. |
| (wa) | PGIM Investments LLC, the manager of the Portfolio, also serves as manager of the PGIM Core Ultra Short Bond Fund and PGIM Institutional Money Market Fund, if applicable. |
Fair Value Measurements:
Various inputs are used in determining the value of the Portfolio’s investments. These inputs are summarized in the three broad levels listed below.
Level 1—unadjusted quoted prices generally in active markets for identical securities.
Level 2—quoted prices for similar securities, interest rates and yield curves, prepayment speeds, foreign currency exchange rates and other observable inputs.
Level 3—unobservable inputs for securities valued in accordance with Board approved fair valuation procedures.
The following is a summary of the inputs used as of December 31, 2022 in valuing such portfolio securities:
| | | | | | | | | | | | |
| | | Level 1 | | | Level 2 | | | Level 3 | |
Investments in Securities | | | | | | | | | | | | |
Assets | | | | | | | | | | | | |
Long-Term Investments | | | | | | | | | | | | |
Common Stocks | | | | | | | | | | | | |
Aerospace & Defense | | $ | 5,586,989 | | | | $— | | | | $— | |
Airlines | | | 836,335 | | | | — | | | | — | |
Auto Components | | | 2,244,116 | | | | — | | | | — | |
Banks | | | 52,034,325 | | | | — | | | | — | |
Beverages | | | 2,476,781 | | | | — | | | | — | |
Biotechnology | | | 11,999,008 | | | | — | | | | — | |
Building Products | | | 1,366,090 | | | | — | | | | — | |
Capital Markets | | | 2,896,097 | | | | — | | | | — | |
Chemicals | | | 5,196,144 | | | | — | | | | — | |
Commercial Services & Supplies | | | 4,661,181 | | | | — | | | | — | |
Communications Equipment | | | 823,154 | | | | — | | | | — | |
Construction & Engineering | | | 4,514,161 | | | | — | | | | — | |
Construction Materials | | | 1,673,562 | | | | — | | | | — | |
Consumer Finance | | | 1,380,968 | | | | — | | | | — | |
Containers & Packaging | | | 574,856 | | | | — | | | | — | |
SEE NOTES TO FINANCIAL STATEMENTS.
A229
| | | | |
| | PSF SMALL-CAP VALUE PORTFOLIO (CONTINUED) | | |
SCHEDULE OF INVESTMENTS | | | | as of December 31, 2022 |
| | | | | | | | | | | | |
| | | Level 1 | | | Level 2 | | | Level 3 | |
Investments in Securities (continued) | | | | | | | | | | | | |
Assets (continued) | | | | | | | | | | | | |
Long-Term Investments (continued) | | | | | | | | | | | | |
Common Stocks (continued) | | | | | | | | | | | | |
Diversified Consumer Services | | $ | 1,420,568 | | | | $— | | | | $— | |
Diversified Financial Services | | | 199,339 | | | | — | | | | — | |
Diversified Telecommunication Services | | | 1,459,760 | | | | — | | | | — | |
Electric Utilities | | | 6,653,045 | | | | — | | | | — | |
Electronic Equipment, Instruments & Components | | | 7,554,666 | | | | — | | | | — | |
Energy Equipment & Services | | | 4,693,310 | | | | — | | | | — | |
Equity Real Estate Investment Trusts (REITs) | | | 23,858,867 | | | | — | | | | — | |
Food & Staples Retailing | | | 1,959,698 | | | | — | | | | — | |
Food Products | | | 5,688,585 | | | | — | | | | — | |
Gas Utilities | | | 4,272,887 | | | | — | | | | — | |
Health Care Equipment & Supplies | | | 7,208,411 | | | | — | | | | — | |
Health Care Providers & Services | | | 1,722,186 | | | | — | | | | — | |
Health Care Technology | | | 2,150,835 | | | | — | | | | — | |
Hotels, Restaurants & Leisure | | | 6,642,743 | | | | — | | | | — | |
Household Durables | | | 4,140,799 | | | | — | | | | — | |
Independent Power & Renewable Electricity Producers | | | 1,275,638 | | | | — | | | | — | |
Insurance | | | 7,769,183 | | | | — | | | | — | |
Interactive Media & Services | | | 826,255 | | | | — | | | | — | |
Leisure Products | | | 1,247,529 | | | | — | | | | — | |
Life Sciences Tools & Services | | | 1,703,621 | | | | — | | | | — | |
Machinery | | | 13,031,426 | | | | — | | | | — | |
Media | | | 5,006,770 | | | | — | | | | — | |
Metals & Mining | | | 5,851,690 | | | | — | | | | — | |
Mortgage Real Estate Investment Trusts (REITs) | | | 3,722,615 | | | | — | | | | — | |
Multiline Retail | | | 810,347 | | | | — | | | | — | |
Oil, Gas & Consumable Fuels | | | 10,812,068 | | | | — | | | | — | |
Personal Products | | | 857,735 | | | | — | | | | — | |
Professional Services | | | 7,824,956 | | | | — | | | | — | |
Real Estate Management & Development | | | 1,657,879 | | | | — | | | | — | |
Road & Rail | | | 1,894,758 | | | | — | | | | — | |
Semiconductors & Semiconductor Equipment | | | 3,243,976 | | | | — | | | | — | |
Software | | | 5,351,725 | | | | — | | | | — | |
Specialty Retail | | | 7,838,253 | | | | — | | | | — | |
Technology Hardware, Storage & Peripherals | | | 451,651 | | | | — | | | | — | |
Textiles, Apparel & Luxury Goods | | | 3,673,022 | | | | — | | | | — | |
Thrifts & Mortgage Finance | | | 3,850,890 | | | | — | | | | — | |
Trading Companies & Distributors | | | 2,609,937 | | | | — | | | | — | |
Water Utilities | | | 1,245,779 | | | | — | | | | — | |
Wireless Telecommunication Services | | | 298,871 | | | | — | | | | — | |
Exchange-Traded Fund | | | 4,140,825 | | | | — | | | | — | |
Short-Term Investments | | | | | | | | | | | | |
Affiliated Mutual Funds | | | 40,760,223 | | | | — | | | | — | |
| | | | | | | | | | | | |
Total | | $ | 315,647,088 | | | | $— | | | | $— | |
| | | | | | | | | | | | |
SEE NOTES TO FINANCIAL STATEMENTS.
A230
| | | | |
| | PSF SMALL-CAP VALUE PORTFOLIO (CONTINUED) | | |
SCHEDULE OF INVESTMENTS | | | | as of December 31, 2022 |
Industry Classification:
The industry classification of investments and liabilities in excess of other assets shown as a percentage of net assets as of December 31, 2022 were as follows:
| | | | |
Banks | | | 18.6 | % |
Affiliated Mutual Funds (12.7% represents investments purchased with collateral from securities on loan) | | | 14.5 | |
Equity Real Estate Investment Trusts (REITs) | | | 8.5 | |
Machinery | | | 4.6 | |
Biotechnology | | | 4.3 | |
Oil, Gas & Consumable Fuels | | | 3.9 | |
Specialty Retail | | | 2.8 | |
Professional Services | | | 2.8 | |
Insurance | | | 2.8 | |
Electronic Equipment, Instruments & Components | | | 2.7 | |
Health Care Equipment & Supplies | | | 2.6 | |
Electric Utilities | | | 2.4 | |
Hotels, Restaurants & Leisure | | | 2.4 | |
Metals & Mining | | | 2.1 | |
Food Products | | | 2.0 | |
Aerospace & Defense | | | 2.0 | |
Software | | | 1.9 | |
Chemicals | | | 1.8 | |
Media | | | 1.8 | |
Energy Equipment & Services | | | 1.7 | |
Commercial Services & Supplies | | | 1.7 | |
Construction & Engineering | | | 1.6 | |
Gas Utilities | | | 1.5 | |
Household Durables | | | 1.5 | |
Exchange-Traded Fund | | | 1.5 | |
Thrifts & Mortgage Finance | | | 1.4 | |
Mortgage Real Estate Investment Trusts (REITs) | | | 1.3 | |
Textiles, Apparel & Luxury Goods | | | 1.3 | |
Semiconductors & Semiconductor Equipment | | | 1.2 | |
Capital Markets | | | 1.0 | |
| | | | |
Trading Companies & Distributors | | | 0.9 | % |
Beverages | | | 0.9 | |
Auto Components | | | 0.8 | |
Health Care Technology | | | 0.8 | |
Food & Staples Retailing | | | 0.7 | |
Road & Rail | | | 0.7 | |
Health Care Providers & Services | | | 0.6 | |
Life Sciences Tools & Services | | | 0.6 | |
Construction Materials | | | 0.6 | |
Real Estate Management & Development | | | 0.6 | |
Diversified Telecommunication Services | | | 0.5 | |
Diversified Consumer Services | | | 0.5 | |
Consumer Finance | | | 0.5 | |
Building Products | | | 0.5 | |
Independent Power & Renewable Electricity Producers | | | 0.4 | |
Leisure Products | | | 0.4 | |
Water Utilities | | | 0.4 | |
Personal Products | | | 0.3 | |
Airlines | | | 0.3 | |
Interactive Media & Services | | | 0.3 | |
Communications Equipment | | | 0.3 | |
Multiline Retail | | | 0.3 | |
Containers & Packaging | | | 0.2 | |
Technology Hardware, Storage & Peripherals | | | 0.2 | |
Wireless Telecommunication Services | | | 0.1 | |
Diversified Financial Services | | | 0.1 | |
| | | | |
| | | 112.7 | |
Liabilities in excess of other assets | | | (12.7 | ) |
| | | | |
| |
| | | 100.0 | % |
| | | | |
Financial Instruments/Transactions—Summary of Offsetting and Netting Arrangements:
The Portfolio entered into financial instruments/transactions during the reporting period that are either offset in accordance with current requirements or are subject to enforceable master netting arrangements or similar agreements that permit offsetting. The information about offsetting and related netting arrangements for financial instruments/transactions where the legal right to set-off exists is presented in the summary below.
Offsetting of financial instrument/transaction assets and liabilities:
| | | | | | |
| Description | | Gross Market Value of Recognized Assets/(Liabilities) | | Collateral Pledged/(Received)(1) | | Net
Amount |
Securities on Loan | | $34,719,610 | | $(34,719,610) | | $— |
| (1) | Collateral amount disclosed by the Portfolio is limited to the market value of financial instruments/transactions. |
SEE NOTES TO FINANCIAL STATEMENTS.
A231
| | | | |
| | PSF SMALL-CAP VALUE PORTFOLIO (CONTINUED) | | |
STATEMENT OF ASSETS AND LIABILITIES
as of December 31, 2022
| | | | |
ASSETS | | | | |
Investments at value, including securities on loan of $34,719,610: | | | | |
Unaffiliated investments (cost $253,435,006) | | $ | 274,886,865 | |
Affiliated investments (cost $40,742,015) | | | 40,760,223 | |
Dividends receivable | | | 425,481 | |
Receivable for Portfolio shares sold | | | 68,269 | |
Receivable for investments sold | | | 50,310 | |
Tax reclaim receivable | | | 7,407 | |
Prepaid expenses and other assets | | | 5,238 | |
| | | | |
Total Assets | | | 316,203,793 | |
| | | | |
LIABILITIES | | | | |
Payable to broker for collateral for securities on loan | | | 35,568,192 | |
Management fee payable | | | 217,666 | |
Payable for Portfolio shares purchased | | | 212,941 | |
Accrued expenses and other liabilities | | | 204,869 | |
Payable for investments purchased | | | 34,472 | |
Payable to affiliate | | | 7,407 | |
Affiliated transfer agent fee payable | | | 980 | |
Trustees’ fees payable | | | 469 | |
| | | | |
Total Liabilities | | | 36,246,996 | |
| | | | |
NET ASSETS | | $ | 279,956,797 | |
| | | | |
Net assets were comprised of: | | | | |
Partners’ Equity | | $ | 279,956,797 | |
| | | | |
Net asset value and redemption price per share, $279,956,797 / 9,136,373 outstanding shares of beneficial interest | | $ | 30.64 | |
| | | | |
STATEMENT OF OPERATIONS
Year Ended December 31, 2022
| | | | |
NET INVESTMENT INCOME (LOSS) | | | | |
INCOME | | | | |
Unaffiliated dividend income (net of $7,110 foreign withholding tax, of which $484 is reimbursable by an affiliate) | | $ | 4,861,058 | |
Affiliated dividend income | | | 75,491 | |
Income from securities lending, net (including affiliated income of $51,696) | | | 60,060 | |
| | | | |
Total income | | | 4,996,609 | |
| | | | |
EXPENSES | | | | |
Management fee | | | 2,607,711 | |
Custodian and accounting fees | | | 63,851 | |
Shareholders’ reports | | | 44,792 | |
Audit fee | | | 25,100 | |
Legal fees and expenses | | | 20,769 | |
Trustees’ fees | | | 12,829 | |
Transfer agent’s fees and expenses (including affiliated expense of $5,882) | | | 10,682 | |
Miscellaneous | | | 20,729 | |
| | | | |
Total expenses | | | 2,806,463 | |
| | | | |
NET INVESTMENT INCOME (LOSS) | | | 2,190,146 | |
| | | | |
| REALIZED AND UNREALIZED GAIN (LOSS) ON INVESTMENT TRANSACTIONS | | | | |
Net realized gain (loss) on investment transactions (including affiliated of $(5,447)) | | | (1,333,309 | ) |
| | | | |
Net change in unrealized appreciation (depreciation) on: | | | | |
Investments (including affiliated of $13,314) | | | (47,940,525 | ) |
| | | | |
| NET GAIN (LOSS) ON INVESTMENT TRANSACTIONS | | | (49,273,834 | ) |
| | | | |
NET INCREASE (DECREASE) IN NET ASSETS RESULTING FROM OPERATIONS | | $ | (47,083,688 | ) |
| | | | |
STATEMENTS OF CHANGES IN NET ASSETS
| | | | | | | | | | | | | | | | | | | | | | | | |
| | | Year Ended
December 31, 2022 | | | Year Ended
December 31, 2021 | |
INCREASE (DECREASE) IN NET ASSETS | | | | | | | | | | | | | | | | | | | | | | | | |
OPERATIONS | | | | | | | | | | | | | | | | | | | | | | | | |
Net investment income (loss) | | | | | | $ | 2,190,146 | | | | | | | | | | | $ | 496,790 | | | | | |
Net realized gain (loss) on investment transactions | | | | | | | (1,333,309 | ) | | | | | | | | | | | 55,333,818 | | | | | |
Net change in unrealized appreciation (depreciation) on investments | | | | | | | (47,940,525 | ) | | | | | | | | | | | 9,827,069 | | | | | |
| | | | | | | | | | | | | | | | | | | | | | | | |
NET INCREASE (DECREASE) IN NET ASSETS RESULTING FROM OPERATIONS | | | | | | | (47,083,688 | ) | | | | | | | | | | | 65,657,677 | | | | | |
| | | | | | | | | | | | | | | | | | | | | | | | |
PORTFOLIO SHARE TRANSACTIONS | | | | | | | | | | | | | | | | | | | | | | | | |
Portfolio shares sold [690,624 and 1,189,991 shares, respectively] | | | | | | | 22,194,653 | | | | | | | | | | | | 39,680,214 | | | | | |
Portfolio shares purchased [505,334 and 847,439 shares, respectively] | | | | | | | (16,507,069 | ) | | | | | | | | | | | (28,411,729 | ) | | | | |
| | | | | | | | | | | | | | | | | | | | | | | | |
NET INCREASE (DECREASE) IN NET ASSETS FROM PORTFOLIO SHARE TRANSACTIONS | | | | | | | 5,687,584 | | | | | | | | | | | | 11,268,485 | | | | | |
| | | | | | | | | | | | | | | | | | | | | | | | |
TOTAL INCREASE (DECREASE) | | | | | | | (41,396,104 | ) | | | | | | | | | | | 76,926,162 | | | | | |
NET ASSETS: | | | | | | | | | | | | | | | | | | | | | | | | |
Beginning of year | | | | | | | 321,352,901 | | | | | | | | | | | | 244,426,739 | | | | | |
| | | | | | | | | | | | | | | | | | | | | | | | |
End of year | | | | | | $ | 279,956,797 | | | | | | | | | | | $ | 321,352,901 | | | | | |
| | | | | | | | | | | | | | | | | | | | | | | | |
SEE NOTES TO FINANCIAL STATEMENTS.
A232
| | | | |
| | PSF SMALL-CAP VALUE PORTFOLIO (CONTINUED) | | |
FINANCIAL HIGHLIGHTS
| | | | | | | | | | | | | | | | | | | | |
| | | Year Ended December 31, | |
| | | 2022 | | | 2021 | | | 2020 | | | 2019 | | | 2018 | |
Per Share Operating Performance(a): | | | | | | | | | | | | | | | | | | | | |
Net Asset Value, beginning of year | | $ | 35.90 | | | $ | 28.39 | | | $ | 27.86 | | | $ | 22.69 | | | $ | 26.32 | |
| | | | | | | | | | | | | | | | | | | | |
Income (Loss) From Investment Operations: | | | | | | | | | | | | | | | | | | | | |
Net investment income (loss) | | | 0.24 | | | | 0.06 | | | | 0.14 | | | | 0.20 | | | | 0.13 | |
Net realized and unrealized gain (loss) on investment and foreign currency transactions | | | (5.50 | ) | | | 7.45 | | | | 0.39 | | | | 4.97 | | | | (3.76 | ) |
| | | | | | | | | | | | | | | | | | | | |
Total from investment operations | | | (5.26 | ) | | | 7.51 | | | | 0.53 | | | | 5.17 | | | | (3.63 | ) |
| | | | | | | | | | | | | | | | | | | | |
Capital Contributions | | | — | | | | — | | | | — | | | | — | | | | — | (b)(c) |
| | | | | | | | | | | | | | | | | | | | |
Net Asset Value, end of year | | $ | 30.64 | | | $ | 35.90 | | | $ | 28.39 | | | $ | 27.86 | | | $ | 22.69 | |
| | | | | | | | | | | | | | | | | | | | |
Total Return(d) | | | (14.65 | )% | | | 26.45 | % | | | 1.90 | % | | | 22.79 | % | | | (13.79 | )%(e) |
Ratios/Supplemental Data: | | | | | | | | | | | | | | | | | | | | |
Net assets, end of year (in millions) | | $ | 280 | | | $ | 321 | | | $ | 244 | | | $ | 221 | | | $ | 180 | |
Average net assets (in millions) | | $ | 290 | | | $ | 295 | | | $ | 188 | | | $ | 207 | | | $ | 211 | |
Ratios to average net assets(f): | | | | | | | | | | | | | | | | | | | | |
Expenses after waivers and/or expense reimbursement | | | 0.97 | % | | | 0.96 | % | | | 1.03 | % | | | 1.01 | % | | | 0.99 | % |
Expenses before waivers and/or expense reimbursement | | | 0.97 | % | | | 0.96 | % | | | 1.03 | % | | | 1.02 | % | | | 1.00 | % |
Net investment income (loss) | | | 0.76 | % | | | 0.17 | % | | | 0.61 | % | | | 0.76 | % | | | 0.48 | % |
Portfolio turnover rate(g) | | | 57 | % | | | 71 | % | | | 69 | % | | | 56 | % | | | 58 | % |
| (a) | Calculated based on average shares outstanding during the year. |
| (b) | Represents payment received by the Portfolio, from Prudential, in connection with excess foreign withholding tax withheld on dividends and interest from certain countries due to the Portfolio’s tax status as a partnership. |
| (c) | Amount rounds to zero. |
| (d) | Total return is calculated assuming a purchase of a share on the first day and a sale on the last day of each year reported and includes reinvestment of dividends and distributions, if any, and does not reflect the effect of insurance contract charges. Total return does not reflect expenses associated with the separate account such as administrative fees, account charges and surrender charges which, if reflected, would reduce the total returns for all years shown. Performance figures may reflect fee waivers and/or expense reimbursements. In the absence of fee waivers and/or expense reimbursements, the total return would be lower. Past performance is no guarantee of future results. Total returns may reflect adjustments to conform to GAAP. |
| (e) | Total return for the year includes the impact of the capital contribution, which was not material to the total return. |
| (f) | Does not include expenses of the underlying funds in which the Portfolio invests. |
| (g) | The Portfolio’s portfolio turnover rate is calculated in accordance with regulatory requirements, without regard to transactions involving short-term investments, certain derivatives and in-kind transactions (if any). If such transactions were included, the Portfolio’s portfolio turnover rate may be higher. |
SEE NOTES TO FINANCIAL STATEMENTS.
A233
| | | | |
| | PSF STOCK INDEX PORTFOLIO | | |
SCHEDULE OF INVESTMENTS | | | | as of December 31, 2022 |
| | | | | | | | |
| | | Shares | | | Value | |
|
LONG-TERM INVESTMENTS — 97.9% | |
|
COMMON STOCKS — 96.8% | |
Aerospace & Defense — 1.8% | | | | | | | | |
Boeing Co. (The)* | | | 99,736 | | | $ | 18,998,711 | |
General Dynamics Corp. | | | 39,960 | | | | 9,914,476 | |
Howmet Aerospace, Inc. | | | 65,392 | | | | 2,577,099 | |
Huntington Ingalls Industries, Inc. | | | 7,200 | | | | 1,660,896 | |
L3Harris Technologies, Inc. | | | 33,980 | | | | 7,074,976 | |
Lockheed Martin Corp. | | | 41,508 | | | | 20,193,227 | |
Northrop Grumman Corp. | | | 25,766 | | | | 14,058,187 | |
Raytheon Technologies Corp. | | | 261,648 | | | | 26,405,516 | |
Textron, Inc. | | | 37,150 | | | | 2,630,220 | |
TransDigm Group, Inc. | | | 9,150 | | | | 5,761,297 | |
| | | | | | | | |
| | |
| | | | | | | 109,274,605 | |
| | | | | | | | |
Air Freight & Logistics — 0.6% | | | | | | | | |
C.H. Robinson Worldwide, Inc.(a) | | | 21,000 | | | | 1,922,760 | |
Expeditors International of Washington, Inc. | | | 28,300 | | | | 2,940,936 | |
FedEx Corp. | | | 42,640 | | | | 7,385,248 | |
United Parcel Service, Inc. (Class B Stock) | | | 129,900 | | | | 22,581,816 | |
| | | | | | | | |
| | |
| | | | | | | 34,830,760 | |
| | | | | | | | |
Airlines — 0.2% | | | | | | | | |
Alaska Air Group, Inc.* | | | 21,900 | | | | 940,386 | |
American Airlines Group, Inc.*(a) | | | 114,700 | | | | 1,458,984 | |
Delta Air Lines, Inc.* | | | 113,200 | | | | 3,719,752 | |
Southwest Airlines Co.* | | | 104,837 | | | | 3,529,862 | |
United Airlines Holdings, Inc.* | | | 57,700 | | | | 2,175,290 | |
| | | | | | | | |
| | |
| | | | | | | 11,824,274 | |
| | | | | | | | |
Auto Components — 0.1% | | | | | | | | |
Aptiv PLC* | | | 47,900 | | | | 4,460,927 | |
BorgWarner, Inc. | | | 41,600 | | | | 1,674,400 | |
| | | | | | | | |
| | |
| | | | | | | 6,135,327 | |
| | | | | | | | |
Automobiles — 1.3% | | | | | | | | |
Ford Motor Co. | | | 702,659 | | | | 8,171,924 | |
General Motors Co. | | | 252,800 | | | | 8,504,192 | |
Tesla, Inc.* | | | 477,550 | | | | 58,824,609 | |
| | | | | | | | |
| | |
| | | | | | | 75,500,725 | |
| | | | | | | | |
Banks — 3.7% | | | | | | | | |
Bank of America Corp. | | | 1,241,732 | | | | 41,126,164 | |
Citigroup, Inc. | | | 344,622 | | | | 15,587,253 | |
Citizens Financial Group, Inc. | | | 87,900 | | | | 3,460,623 | |
Comerica, Inc. | | | 23,250 | | | | 1,554,263 | |
Fifth Third Bancorp(a) | | | 122,149 | | | | 4,007,709 | |
First Republic Bank | | | 32,600 | | | | 3,973,614 | |
Huntington Bancshares, Inc.(a) | | | 254,675 | | | | 3,590,917 | |
JPMorgan Chase & Co. | | | 521,895 | | | | 69,986,119 | |
KeyCorp. | | | 165,100 | | | | 2,876,042 | |
M&T Bank Corp. | | | 30,761 | | | | 4,462,191 | |
PNC Financial Services Group, Inc. (The) | | | 71,743 | | | | 11,331,089 | |
Regions Financial Corp. | | | 166,412 | | | | 3,587,843 | |
Signature Bank | | | 11,100 | | | | 1,278,942 | |
SVB Financial Group* | | | 10,490 | | | | 2,414,169 | |
Truist Financial Corp. | | | 236,126 | | | | 10,160,502 | |
| | | | | | | | |
| | | Shares | | | Value | |
|
COMMON STOCKS (continued) | |
Banks (cont’d.) | | | | | | | | |
U.S. Bancorp | | | 240,581 | | | $ | 10,491,737 | |
Wells Fargo & Co. | | | 677,976 | | | | 27,993,629 | |
Zions Bancorp NA | | | 26,700 | | | | 1,312,572 | |
| | | | | | | | |
| | |
| | | | | | | 219,195,378 | |
| | | | | | | | |
Beverages — 1.9% | | | | | | | | |
Brown-Forman Corp. (Class B Stock) | | | 32,525 | | | | 2,136,242 | |
Coca-Cola Co. (The) | | | 688,950 | | | | 43,824,110 | |
Constellation Brands, Inc. (Class A Stock) | | | 28,900 | | | | 6,697,575 | |
Keurig Dr. Pepper, Inc. | | | 150,300 | | | | 5,359,698 | |
Molson Coors Beverage Co. (Class B Stock)(a) | | | 33,400 | | | | 1,720,768 | |
Monster Beverage Corp.* | | | 68,100 | | | | 6,914,193 | |
PepsiCo, Inc. | | | 244,544 | | | | 44,179,319 | |
| | | | | | | | |
| | |
| | | | | | | 110,831,905 | |
| | | | | | | | |
Biotechnology — 2.4% | | | | | | | | |
AbbVie, Inc. | | | 313,189 | | | | 50,614,474 | |
Amgen, Inc. | | | 94,894 | | | | 24,922,960 | |
Biogen, Inc.* | | | 25,655 | | | | 7,104,383 | |
Gilead Sciences, Inc. | | | 223,200 | | | | 19,161,720 | |
Incyte Corp.* | | | 32,700 | | | | 2,626,464 | |
Moderna, Inc.* | | | 58,800 | | | | 10,561,656 | |
Regeneron Pharmaceuticals, Inc.* | | | 19,050 | | | | 13,744,384 | |
Vertex Pharmaceuticals, Inc.* | | | 45,660 | | | | 13,185,695 | |
| | | | | | | | |
| | |
| | | | | | | 141,921,736 | |
| | | | | | | | |
Building Products — 0.4% | | | | | | | | |
A.O. Smith Corp.(a) | | | 22,700 | | | | 1,299,348 | |
Allegion PLC | | | 15,833 | | | | 1,666,581 | |
Carrier Global Corp. | | | 148,867 | | | | 6,140,764 | |
Johnson Controls International PLC | | | 122,615 | | | | 7,847,360 | |
Masco Corp.(a) | | | 39,930 | | | | 1,863,533 | |
Trane Technologies PLC | | | 41,000 | | | | 6,891,690 | |
| | | | | | | | |
| | |
| | | | | | | 25,709,276 | |
| | | | | | | | |
Capital Markets — 3.0% | | | | | | | | |
Ameriprise Financial, Inc. | | | 18,950 | | | | 5,900,461 | |
Bank of New York Mellon Corp. (The) | | | 130,949 | | | | 5,960,798 | |
BlackRock, Inc. | | | 26,740 | | | | 18,948,766 | |
Cboe Global Markets, Inc. | | | 18,800 | | | | 2,358,836 | |
Charles Schwab Corp. (The) | | | 271,400 | | | | 22,596,764 | |
CME Group, Inc. | | | 64,060 | | | | 10,772,330 | |
FactSet Research Systems, Inc. | | | 6,700 | | | | 2,688,107 | |
Franklin Resources, Inc.(a) | | | 50,300 | | | | 1,326,914 | |
Goldman Sachs Group, Inc. (The) | | | 60,270 | | | | 20,695,513 | |
Intercontinental Exchange, Inc. | | | 99,390 | | | | 10,196,420 | |
Invesco Ltd. | | | 80,500 | | | | 1,448,195 | |
MarketAxess Holdings, Inc. | | | 6,800 | | | | 1,896,452 | |
Moody’s Corp.(a) | | | 27,970 | | | | 7,793,001 | |
Morgan Stanley | | | 234,578 | | | | 19,943,822 | |
MSCI, Inc. | | | 14,380 | | | | 6,689,145 | |
Nasdaq, Inc. | | | 60,000 | | | | 3,681,000 | |
Northern Trust Corp. | | | 36,900 | | | | 3,265,281 | |
Raymond James Financial, Inc.(a) | | | 34,550 | | | | 3,691,668 | |
S&P Global, Inc. | | | 59,246 | | | | 19,843,855 | |
State Street Corp. | | | 65,275 | | | | 5,063,382 | |
SEE NOTES TO FINANCIAL STATEMENTS.
A234
| | | | |
| | PSF STOCK INDEX PORTFOLIO (CONTINUED) | | |
SCHEDULE OF INVESTMENTS | | | | as of December 31, 2022 |
| | | | | | | | |
| | | Shares | | | Value | |
|
COMMON STOCKS (continued) | |
Capital Markets (cont’d.) | | | | | | | | |
T. Rowe Price Group, Inc.(a) | | | 39,900 | | | $ | 4,351,494 | |
| | | | | | | | |
| | |
| | | | | | | 179,112,204 | |
| | | | | | | | |
Chemicals — 1.8% | | | | | | | | |
Air Products & Chemicals, Inc. | | | 39,450 | | | | 12,160,857 | |
Albemarle Corp. | | | 20,900 | | | | 4,532,374 | |
Celanese Corp. | | | 17,600 | | | | 1,799,424 | |
CF Industries Holdings, Inc. | | | 35,300 | | | | 3,007,560 | |
Corteva, Inc. | | | 127,556 | | | | 7,497,742 | |
Dow, Inc. | | | 125,222 | | | | 6,309,936 | |
DuPont de Nemours, Inc.(a) | | | 88,656 | | | | 6,084,461 | |
Eastman Chemical Co. | | | 21,700 | | | | 1,767,248 | |
Ecolab, Inc. | | | 43,900 | | | | 6,390,084 | |
FMC Corp. | | | 22,250 | | | | 2,776,800 | |
International Flavors & Fragrances, Inc.(a) | | | 45,240 | | | | 4,742,962 | |
Linde PLC (United Kingdom)(a) | | | 88,000 | | | | 28,703,840 | |
LyondellBasell Industries NV (Class A Stock)(a) | | | 45,000 | | | | 3,736,350 | |
Mosaic Co. (The) | | | 61,100 | | | | 2,680,457 | |
PPG Industries, Inc.(a) | | | 41,700 | | | | 5,243,358 | |
Sherwin-Williams Co. (The) | | | 41,900 | | | | 9,944,127 | |
| | | | | | | | |
| | |
| | | | | | | 107,377,580 | |
| | | | | | | | |
Commercial Services & Supplies — 0.5% | |
Cintas Corp. | | | 15,300 | | | | 6,909,786 | |
Copart, Inc.* | | | 76,300 | | | | 4,645,907 | |
Republic Services, Inc. | | | 36,335 | | | | 4,686,852 | |
Rollins, Inc. | | | 41,025 | | | | 1,499,054 | |
Waste Management, Inc. | | | 66,530 | | | | 10,437,226 | |
| | | | | | | | |
| | |
| | | | | | | 28,178,825 | |
| | | | | | | | |
Communications Equipment — 0.9% | |
Arista Networks, Inc.* | | | 44,100 | | | | 5,351,535 | |
Cisco Systems, Inc. | | | 730,475 | | | | 34,799,829 | |
F5, Inc.* | | | 10,650 | | | | 1,528,382 | |
Juniper Networks, Inc. | | | 57,400 | | | | 1,834,504 | |
Motorola Solutions, Inc. | | | 29,727 | | | | 7,660,945 | |
| | | | | | | | |
| | |
| | | | | | | 51,175,195 | |
| | | | | | | | |
Construction & Engineering — 0.1% | |
Quanta Services, Inc.(a) | | | 25,400 | | | | 3,619,500 | |
| | | | | | | | |
Construction Materials — 0.1% | |
Martin Marietta Materials, Inc. | | | 11,200 | | | | 3,785,264 | |
Vulcan Materials Co. | | | 23,700 | | | | 4,150,107 | |
| | | | | | | | |
| | |
| | | | | | | 7,935,371 | |
| | | | | | | | |
Consumer Finance — 0.5% | | | | | | | | |
American Express Co. | | | 106,150 | | | | 15,683,663 | |
Capital One Financial Corp. | | | 67,969 | | | | 6,318,398 | |
Discover Financial Services | | | 48,305 | | | | 4,725,678 | |
Synchrony Financial | | | 80,230 | | | | 2,636,358 | |
| | | | | | | | |
| | |
| | | | | | | 29,364,097 | |
| | | | | | | | |
Containers & Packaging — 0.3% | |
Amcor PLC(a) | | | 266,300 | | | | 3,171,633 | |
Avery Dennison Corp. | | | 14,600 | | | | 2,642,600 | |
Ball Corp.(a) | | | 55,600 | | | | 2,843,384 | |
| | | | | | | | |
| | | Shares | | | Value | |
|
COMMON STOCKS (continued) | |
Containers & Packaging (cont’d.) | |
International Paper Co.(a) | | | 64,067 | | | $ | 2,218,640 | |
Packaging Corp. of America | | | 16,700 | | | | 2,136,097 | |
Sealed Air Corp. | | | 26,020 | | | | 1,297,878 | |
Westrock Co. | | | 44,961 | | | | 1,580,829 | |
| | | | | | | | |
| | |
| | | | | | | 15,891,061 | |
| | | | | | | | |
Distributors — 0.1% | | | | | | | | |
Genuine Parts Co. | | | 25,125 | | | | 4,359,439 | |
LKQ Corp. | | | 45,900 | | | | 2,451,519 | |
Pool Corp. | | | 7,120 | | | | 2,152,589 | |
| | | | | | | | |
| | |
| | | | | | | 8,963,547 | |
| | | | | | | | |
Diversified Financial Services — 1.7% | | | | | | | | |
Berkshire Hathaway, Inc. (Class B Stock)* | | | 320,610 | | | | 99,036,429 | |
| | | | | | | | |
Diversified Telecommunication Services — 0.9% | |
AT&T, Inc. | | | 1,267,971 | | | | 23,343,346 | |
Lumen Technologies, Inc.(a) | | | 168,643 | | | | 880,317 | |
Verizon Communications, Inc. | | | 747,188 | | | | 29,439,207 | |
| | | | | | | | |
| | |
| | | | | | | 53,662,870 | |
| | | | | | | | |
Electric Utilities — 2.0% | | | | | | | | |
Alliant Energy Corp. | | | 44,300 | | | | 2,445,803 | |
American Electric Power Co., Inc.(a) | | | 91,440 | | | | 8,682,228 | |
Constellation Energy Corp. | | | 58,224 | | | | 5,019,491 | |
Duke Energy Corp. | | | 137,048 | | | | 14,114,574 | |
Edison International | | | 68,000 | | | | 4,326,160 | |
Entergy Corp. | | | 36,200 | | | | 4,072,500 | |
Evergy, Inc. | | | 40,900 | | | | 2,573,837 | |
Eversource Energy | | | 62,000 | | | | 5,198,080 | |
Exelon Corp. | | | 176,773 | | | | 7,641,897 | |
FirstEnergy Corp. | | | 96,080 | | | | 4,029,595 | |
NextEra Energy, Inc. | | | 353,600 | | | | 29,560,960 | |
NRG Energy, Inc. | | | 41,900 | | | | 1,333,258 | |
PG&E Corp.* | | | 285,000 | | | | 4,634,100 | |
Pinnacle West Capital Corp. | | | 20,200 | | | | 1,536,008 | |
PPL Corp. | | | 129,900 | | | | 3,795,678 | |
Southern Co. (The) | | | 193,700 | | | | 13,832,117 | |
Xcel Energy, Inc. | | | 97,395 | | | | 6,828,363 | |
| | | | | | | | |
| | |
| | | | | | | 119,624,649 | |
| | | | | | | | |
Electrical Equipment — 0.6% | | | | | | | | |
AMETEK, Inc. | | | 40,800 | | | | 5,700,576 | |
Eaton Corp. PLC | | | 70,811 | | | | 11,113,787 | |
Emerson Electric Co. | | | 104,900 | | | | 10,076,694 | |
Generac Holdings, Inc.*(a) | | | 11,300 | | | | 1,137,458 | |
Rockwell Automation, Inc.(a) | | | 20,420 | | | | 5,259,579 | |
| | | | | | | | |
| | |
| | | | | | | 33,288,094 | |
| | | | | | | | |
Electronic Equipment, Instruments & Components — 0.6% | |
Amphenol Corp. (Class A Stock) | | | 105,900 | | | | 8,063,226 | |
CDW Corp. | | | 24,000 | | | | 4,285,920 | |
Corning, Inc. | | | 134,700 | | | | 4,302,318 | |
Keysight Technologies, Inc.* | | | 31,800 | | | | 5,440,026 | |
TE Connectivity Ltd. (Switzerland) | | | 56,900 | | | | 6,532,120 | |
Teledyne Technologies, Inc.* | | | 8,279 | | | | 3,310,855 | |
Trimble, Inc.* | | | 43,900 | | | | 2,219,584 | |
SEE NOTES TO FINANCIAL STATEMENTS.
A235
| | | | |
| | PSF STOCK INDEX PORTFOLIO (CONTINUED) | | |
SCHEDULE OF INVESTMENTS | | | | as of December 31, 2022 |
| | | | | | | | |
| | | Shares | | | Value | |
|
COMMON STOCKS (continued) | |
Electronic Equipment, Instruments & Components (cont’d.) | |
Zebra Technologies Corp. (Class A Stock)* | | | 9,180 | | | $ | 2,353,844 | |
| | | | | | | | |
| | |
| | | | | | | 36,507,893 | |
| | | | | | | | |
Energy Equipment & Services — 0.4% | |
Baker Hughes Co.(a) | | | 179,048 | | | | 5,287,287 | |
Halliburton Co. | | | 161,600 | | | | 6,358,960 | |
Schlumberger Ltd. | | | 252,298 | | | | 13,487,851 | |
| | | | | | | | |
| | |
| | | | | | | 25,134,098 | |
| | | | | | | | |
Entertainment — 1.3% | | | | | | | | |
Activision Blizzard, Inc. | | | 126,800 | | | | 9,706,540 | |
Electronic Arts, Inc. | | | 46,700 | | | | 5,705,806 | |
Live Nation Entertainment, Inc.* | | | 25,100 | | | | 1,750,474 | |
Netflix, Inc.* | | | 79,190 | | | | 23,351,547 | |
Take-Two Interactive Software, Inc.* | | | 27,950 | | | | 2,910,434 | |
Walt Disney Co. (The)* | | | 324,322 | | | | 28,177,095 | |
Warner Bros Discovery, Inc.* | | | 391,008 | | | | 3,706,756 | |
| | | | | | | | |
| | |
| | | | | | | 75,308,652 | |
| | | | | | | | |
Equity Real Estate Investment Trusts (REITs) — 2.5% | |
Alexandria Real Estate Equities, Inc. | | | 26,580 | | | | 3,871,909 | |
American Tower Corp. | | | 82,900 | | | | 17,563,194 | |
AvalonBay Communities, Inc. | | | 24,968 | | | | 4,032,831 | |
Boston Properties, Inc.(a) | | | 25,100 | | | | 1,696,258 | |
Camden Property Trust | | | 18,800 | | | | 2,103,344 | |
Crown Castle, Inc. | | | 77,050 | | | | 10,451,062 | |
Digital Realty Trust, Inc. | | | 50,900 | | | | 5,103,743 | |
Equinix, Inc. | | | 16,475 | | | | 10,791,619 | |
Equity Residential | | | 60,400 | | | | 3,563,600 | |
Essex Property Trust, Inc. | | | 11,670 | | | | 2,473,106 | |
Extra Space Storage, Inc. | | | 23,900 | | | | 3,517,602 | |
Federal Realty Investment Trust | | | 13,000 | | | | 1,313,520 | |
Healthpeak Properties, Inc. | | | 95,700 | | | | 2,399,199 | |
Host Hotels & Resorts, Inc. | | | 127,226 | | | | 2,041,977 | |
Invitation Homes, Inc.(a) | | | 102,700 | | | | 3,044,028 | |
Iron Mountain, Inc.(a) | | | 51,530 | | | | 2,568,771 | |
Kimco Realty Corp. | | | 110,100 | | | | 2,331,918 | |
Mid-America Apartment Communities, Inc. | | | 20,600 | | | | 3,233,994 | |
Prologis, Inc. | | | 164,280 | | | | 18,519,285 | |
Public Storage | | | 28,150 | | | | 7,887,349 | |
Realty Income Corp.(a) | | | 111,600 | | | | 7,078,788 | |
Regency Centers Corp. | | | 27,400 | | | | 1,712,500 | |
SBA Communications Corp. | | | 19,130 | | | | 5,362,330 | |
Simon Property Group, Inc. | | | 58,011 | | | | 6,815,132 | |
UDR, Inc. | | | 54,100 | | | | 2,095,293 | |
Ventas, Inc. | | | 70,604 | | | | 3,180,710 | |
VICI Properties, Inc.(a) | | | 170,600 | | | | 5,527,440 | |
Vornado Realty Trust(a) | | | 28,057 | | | | 583,866 | |
Welltower, Inc. | | | 84,100 | | | | 5,512,755 | |
Weyerhaeuser Co. | | | 131,430 | | | | 4,074,330 | |
| | | | | | | | |
| | |
| | | | | | | 150,451,453 | |
| | | | | | | | |
Food & Staples Retailing — 1.5% | |
Costco Wholesale Corp. | | | 78,752 | | | | 35,950,288 | |
Kroger Co. (The) | | | 115,800 | | | | 5,162,364 | |
Sysco Corp.(a) | | | 89,900 | | | | 6,872,855 | |
| | | | | | | | |
| | | Shares | | | Value | |
|
COMMON STOCKS (continued) | |
Food & Staples Retailing (cont’d.) | | | | | | | | |
Walgreens Boots Alliance, Inc.(a) | | | 127,700 | | | $ | 4,770,872 | |
Walmart, Inc. | | | 252,500 | | | | 35,801,975 | |
| | | | | | | | |
| | |
| | | | | | | 88,558,354 | |
| | | | | | | | |
Food Products — 1.2% | | | | | | | | |
Archer-Daniels-Midland Co. | | | 97,738 | | | | 9,074,974 | |
Campbell Soup Co.(a) | | | 35,800 | | | | 2,031,650 | |
Conagra Brands, Inc. | | | 85,000 | | | | 3,289,500 | |
General Mills, Inc.(a) | | | 105,400 | | | | 8,837,790 | |
Hershey Co. (The) | | | 26,200 | | | | 6,067,134 | |
Hormel Foods Corp. | | | 51,200 | | | | 2,332,160 | |
J.M. Smucker Co. (The) | | | 19,000 | | | | 3,010,740 | |
Kellogg Co.(a) | | | 45,150 | | | | 3,216,486 | |
Kraft Heinz Co. (The) | | | 140,937 | | | | 5,737,545 | |
Lamb Weston Holdings, Inc. | | | 25,700 | | | | 2,296,552 | |
McCormick & Co., Inc.(a) | | | 44,400 | | | | 3,680,316 | |
Mondelez International, Inc. (Class A Stock) | | | 242,511 | | | | 16,163,358 | |
Tyson Foods, Inc. (Class A Stock) | | | 51,600 | | | | 3,212,100 | |
| | | | | | | | |
| | |
| | | | | | | 68,950,305 | |
| | | | | | | | |
Gas Utilities — 0.0% | | | | | | | | |
Atmos Energy Corp. | | | 24,900 | | | | 2,790,543 | |
| | | | | | | | |
Health Care Equipment & Supplies — 2.7% | |
Abbott Laboratories | | | 310,225 | | | | 34,059,603 | |
Align Technology, Inc.* | | | 12,820 | | | | 2,703,738 | |
Baxter International, Inc. | | | 89,700 | | | | 4,572,009 | |
Becton, Dickinson & Co. | | | 50,799 | | | | 12,918,186 | |
Boston Scientific Corp.* | | | 254,849 | | | | 11,791,863 | |
Cooper Cos., Inc. (The) | | | 8,780 | | | | 2,903,283 | |
DENTSPLY SIRONA, Inc. | | | 38,200 | | | | 1,216,288 | |
Dexcom, Inc.* | | | 68,720 | | | | 7,781,853 | |
Edwards Lifesciences Corp.* | | | 109,950 | | | | 8,203,369 | |
Hologic, Inc.* | | | 44,250 | | | | 3,310,342 | |
IDEXX Laboratories, Inc.* | | | 14,880 | | | | 6,070,445 | |
Intuitive Surgical, Inc.* | | | 62,880 | | | | 16,685,208 | |
Medtronic PLC | | | 236,528 | | | | 18,382,956 | |
ResMed, Inc. | | | 26,100 | | | | 5,432,193 | |
STERIS PLC | | | 17,700 | | | | 3,269,013 | |
Stryker Corp. | | | 59,970 | | | | 14,662,065 | |
Teleflex, Inc. | | | 8,350 | | | | 2,084,411 | |
Zimmer Biomet Holdings, Inc. | | | 37,386 | | | | 4,766,715 | |
| | | | | | | | |
| | |
| | | | | | | 160,813,540 | |
| | | | | | | | |
Health Care Providers & Services — 3.6% | |
AmerisourceBergen Corp. | | | 28,900 | | | | 4,789,019 | |
Cardinal Health, Inc.(a) | | | 46,675 | | | | 3,587,907 | |
Centene Corp.* | | | 101,168 | | | | 8,296,788 | |
Cigna Corp. | | | 54,432 | | | | 18,035,499 | |
CVS Health Corp. | | | 233,799 | | | | 21,787,729 | |
DaVita, Inc.* | | | 9,900 | | | | 739,233 | |
Elevance Health, Inc. | | | 42,500 | | | | 21,801,225 | |
HCA Healthcare, Inc. | | | 37,700 | | | | 9,046,492 | |
Henry Schein, Inc.*(a) | | | 24,300 | | | | 1,940,841 | |
Humana, Inc. | | | 22,530 | | | | 11,539,641 | |
Laboratory Corp. of America Holdings | | | 15,800 | | | | 3,720,584 | |
McKesson Corp. | | | 25,207 | | | | 9,455,650 | |
Molina Healthcare, Inc.* | | | 10,300 | | | | 3,401,266 | |
SEE NOTES TO FINANCIAL STATEMENTS.
A236
| | | | |
| | PSF STOCK INDEX PORTFOLIO (CONTINUED) | | |
SCHEDULE OF INVESTMENTS | | | | as of December 31, 2022 |
| | | | | | | | |
| | | Shares | | | Value | |
|
COMMON STOCKS (continued) | |
Health Care Providers & Services (cont’d.) | |
Quest Diagnostics, Inc.(a) | | | 20,300 | | | $ | 3,175,732 | |
UnitedHealth Group, Inc. | | | 166,230 | | | | 88,131,821 | |
Universal Health Services, Inc. (Class B Stock) | | | 11,400 | | | | 1,606,146 | |
| | | | | | | | |
| | |
| | | | | | | 211,055,573 | |
| | | | | | | | |
Hotels, Restaurants & Leisure — 1.9% | |
Booking Holdings, Inc.* | | | 6,900 | | | | 13,905,432 | |
Caesars Entertainment, Inc.* | | | 37,600 | | | | 1,564,160 | |
Carnival Corp.*(a) | | | 178,200 | | | | 1,436,292 | |
Chipotle Mexican Grill, Inc.* | | | 4,915 | | | | 6,819,513 | |
Darden Restaurants, Inc. | | | 21,900 | | | | 3,029,427 | |
Domino’s Pizza, Inc. | | | 6,400 | | | | 2,216,960 | |
Expedia Group, Inc.* | | | 26,700 | | | | 2,338,920 | |
Hilton Worldwide Holdings, Inc. | | | 48,100 | | | | 6,077,916 | |
Las Vegas Sands Corp.*(a) | | | 58,100 | | | | 2,792,867 | |
Marriott International, Inc. (Class A Stock) | | | 47,873 | | | | 7,127,811 | |
McDonald’s Corp. | | | 130,360 | | | | 34,353,771 | |
MGM Resorts International | | | 57,700 | | | | 1,934,681 | |
Norwegian Cruise Line Holdings
Ltd.*(a) | | | 72,700 | | | | 889,848 | |
Royal Caribbean Cruises Ltd.*(a) | | | 39,200 | | | | 1,937,656 | |
Starbucks Corp. | | | 204,200 | | | | 20,256,640 | |
Wynn Resorts Ltd.*(a) | | | 18,400 | | | | 1,517,448 | |
Yum! Brands, Inc. | | | 50,400 | | | | 6,455,232 | |
| | | | | | | | |
| | |
| | | | | | | 114,654,574 | |
| | | | | | | | |
Household Durables — 0.3% | | | | | | | | |
D.R. Horton, Inc.(a) | | | 56,000 | | | | 4,991,840 | |
Garmin Ltd. | | | 27,100 | | | | 2,501,059 | |
Lennar Corp. (Class A Stock) | | | 45,100 | | | | 4,081,550 | |
Mohawk Industries, Inc.* | | | 9,500 | | | | 971,090 | |
Newell Brands, Inc.(a) | | | 65,749 | | | | 859,997 | |
NVR, Inc.* | | | 530 | | | | 2,444,667 | |
PulteGroup, Inc. | | | 40,585 | | | | 1,847,835 | |
Whirlpool Corp.(a) | | | 9,667 | | | | 1,367,494 | |
| | | | | | | | |
| | |
| | | | | | | 19,065,532 | |
| | | | | | | | |
Household Products — 1.5% | | | | | | | | |
Church & Dwight Co., Inc.(a) | | | 43,400 | | | | 3,498,474 | |
Clorox Co. (The)(a) | | | 22,000 | | | | 3,087,260 | |
Colgate-Palmolive Co. | | | 148,100 | | | | 11,668,799 | |
Kimberly-Clark Corp. | | | 60,038 | | | | 8,150,158 | |
Procter & Gamble Co. (The) | | | 423,176 | | | | 64,136,555 | |
| | | | | | | | |
| | |
| | | | | | | 90,541,246 | |
| | | | | | | | |
Independent Power & Renewable Electricity Producers — 0.1% | |
AES Corp. (The) | | | 118,000 | | | | 3,393,680 | |
| | | | | | | | |
Industrial Conglomerates — 0.9% | | | | | | | | |
3M Co. | | | 98,390 | | | | 11,798,929 | |
General Electric Co. | | | 194,455 | | | | 16,293,384 | |
Honeywell International, Inc. | | | 119,650 | | | | 25,640,995 | |
| | | | | | | | |
| | |
| | | | | | | 53,733,308 | |
| | | | | | | | |
Insurance — 2.4% | | | | | | | | |
Aflac, Inc. | | | 101,800 | | | | 7,323,492 | |
Allstate Corp. (The) | | | 47,228 | | | | 6,404,117 | |
| | | | | | | | |
| | | Shares | | | Value | |
|
COMMON STOCKS (continued) | |
Insurance (cont’d.) | | | | | | | | |
American International Group, Inc. | | | 132,229 | | | $ | 8,362,162 | |
Aon PLC (Class A Stock) | | | 36,825 | | | | 11,052,655 | |
Arch Capital Group Ltd.*(a) | | | 65,400 | | | | 4,105,812 | |
Arthur J. Gallagher & Co. | | | 37,550 | | | | 7,079,677 | |
Assurant, Inc. | | | 9,600 | | | | 1,200,576 | |
Brown & Brown, Inc. | | | 41,400 | | | | 2,358,558 | |
Chubb Ltd. | | | 74,130 | | | | 16,353,078 | |
Cincinnati Financial Corp.(a) | | | 28,128 | | | | 2,880,026 | |
Everest Re Group Ltd. | | | 7,100 | | | | 2,352,017 | |
Globe Life, Inc. | | | 16,175 | | | | 1,949,896 | |
Hartford Financial Services Group, Inc. (The) | | | 57,200 | | | | 4,337,476 | |
Lincoln National Corp.(a) | | | 27,463 | | | | 843,663 | |
Loews Corp. | | | 35,426 | | | | 2,066,399 | |
Marsh & McLennan Cos., Inc. | | | 88,500 | | | | 14,644,980 | |
MetLife, Inc. | | | 117,280 | | | | 8,487,554 | |
Principal Financial Group, Inc. | | | 40,500 | | | | 3,398,760 | |
Progressive Corp. (The) | | | 103,700 | | | | 13,450,927 | |
Prudential Financial, Inc.(a) | | | 65,800 | | | | 6,544,468 | |
Travelers Cos., Inc. (The) | | | 41,948 | | | | 7,864,830 | |
W.R. Berkley Corp. | | | 36,100 | | | | 2,619,777 | |
Willis Towers Watson PLC(a) | | | 19,300 | | | | 4,720,394 | |
| | | | | | | | |
| | |
| | | | | | | 140,401,294 | |
| | | | | | | | |
Interactive Media & Services — 3.9% | |
Alphabet, Inc. (Class A Stock)* | | | 1,062,780 | | | | 93,769,079 | |
Alphabet, Inc. (Class C Stock)* | | | 942,000 | | | | 83,583,660 | |
Match Group, Inc.* | | | 50,400 | | | | 2,091,096 | |
Meta Platforms, Inc. (Class A Stock)* | | | 400,120 | | | | 48,150,441 | |
| | | | | | | | |
| | |
| | | | | | | 227,594,276 | |
| | | | | | | | |
Internet & Direct Marketing Retail — 2.4% | |
Amazon.com, Inc.* | | | 1,579,000 | | | | 132,636,000 | |
eBay, Inc.(a) | | | 97,200 | | | | 4,030,884 | |
Etsy, Inc.*(a) | | | 22,600 | | | | 2,707,028 | |
| | | | | | | | |
| | |
| | | | | | | 139,373,912 | |
| | | | | | | | |
IT Services — 4.3% | | | | | | | | |
Accenture PLC (Class A Stock) | | | 112,150 | | | | 29,926,106 | |
Akamai Technologies, Inc.*(a) | | | 28,000 | | | | 2,360,400 | |
Automatic Data Processing, Inc. | | | 73,810 | | | | 17,630,257 | |
Broadridge Financial Solutions, Inc. | | | 21,000 | | | | 2,816,730 | |
Cognizant Technology Solutions Corp. (Class A Stock) | | | 91,600 | | | | 5,238,604 | |
DXC Technology Co.* | | | 40,650 | | | | 1,077,225 | |
EPAM Systems, Inc.* | | | 10,140 | | | | 3,323,284 | |
Fidelity National Information Services, Inc. | | | 105,600 | | | | 7,164,960 | |
Fiserv, Inc.* | | | 113,200 | | | | 11,441,124 | |
FleetCor Technologies, Inc.* | | | 13,300 | | | | 2,442,944 | |
Gartner, Inc.* | | | 14,050 | | | | 4,722,767 | |
Global Payments, Inc. | | | 48,113 | | | | 4,778,583 | |
International Business Machines
Corp.(a) | | | 160,925 | | | | 22,672,723 | |
Jack Henry & Associates, Inc. | | | 12,950 | | | | 2,273,502 | |
Mastercard, Inc. (Class A Stock) | | | 151,150 | | | | 52,559,389 | |
Paychex, Inc. | | | 57,050 | | | | 6,592,698 | |
PayPal Holdings, Inc.* | | | 202,800 | | | | 14,443,416 | |
SEE NOTES TO FINANCIAL STATEMENTS.
A237
| | | | |
| | PSF STOCK INDEX PORTFOLIO (CONTINUED) | | |
SCHEDULE OF INVESTMENTS | | | | as of December 31, 2022 |
| | | | | | | | |
| | | Shares | | | Value | |
|
COMMON STOCKS (continued) | |
IT Services (cont’d.) | | | | | | | | |
VeriSign, Inc.* | | | 16,500 | | | $ | 3,389,760 | |
Visa, Inc. (Class A Stock)(a) | | | 290,900 | | | | 60,437,384 | |
| | | | | | | | |
| | |
| | | | | | | 255,291,856 | |
| | | | | | | | |
Leisure Products — 0.0% | | | | | | | | |
Hasbro, Inc. | | | 22,950 | | | | 1,400,179 | |
| | | | | | | | |
Life Sciences Tools & Services — 1.9% | |
Agilent Technologies, Inc. | | | 52,782 | | | | 7,898,826 | |
Bio-Rad Laboratories, Inc. (Class A Stock)* | | | 3,860 | | | | 1,623,091 | |
Bio-Techne Corp. | | | 28,120 | | | | 2,330,586 | |
Charles River Laboratories International, Inc.* | | | 9,100 | | | | 1,982,890 | |
Danaher Corp. | | | 116,600 | | | | 30,947,972 | |
Illumina, Inc.* | | | 28,010 | | | | 5,663,622 | |
IQVIA Holdings, Inc.* | | | 33,000 | | | | 6,761,370 | |
Mettler-Toledo International, Inc.* | | | 3,970 | | | | 5,738,437 | |
PerkinElmer, Inc. | | | 22,300 | | | | 3,126,906 | |
Thermo Fisher Scientific, Inc. | | | 69,780 | | | | 38,427,148 | |
Waters Corp.* | | | 10,550 | | | | 3,614,219 | |
West Pharmaceutical Services, Inc. | | | 13,200 | | | | 3,106,620 | |
| | | | | | | | |
| | |
| | | | | | | 111,221,687 | |
| | | | | | | | |
Machinery — 1.8% | | | | | | | | |
Caterpillar, Inc. | | | 92,650 | | | | 22,195,234 | |
Cummins, Inc.(a) | | | 25,050 | | | | 6,069,364 | |
Deere & Co. | | | 48,850 | | | | 20,944,926 | |
Dover Corp. | | | 25,000 | | | | 3,385,250 | |
Fortive Corp. | | | 63,500 | | | | 4,079,875 | |
IDEX Corp.(a) | | | 13,500 | | | | 3,082,455 | |
Illinois Tool Works, Inc. | | | 49,775 | | | | 10,965,432 | |
Ingersoll Rand, Inc. | | | 72,037 | | | | 3,763,933 | |
Nordson Corp. | | | 9,600 | | | | 2,282,112 | |
Otis Worldwide Corp. | | | 74,583 | | | | 5,840,595 | |
PACCAR, Inc. | | | 61,928 | | | | 6,129,014 | |
Parker-Hannifin Corp. | | | 22,887 | | | | 6,660,117 | |
Pentair PLC | | | 28,907 | | | | 1,300,237 | |
Snap-on, Inc.(a) | | | 9,550 | | | | 2,182,080 | |
Stanley Black & Decker, Inc. | | | 26,135 | | | | 1,963,261 | |
Westinghouse Air Brake Technologies Corp. | | | 32,212 | | | | 3,215,080 | |
Xylem, Inc. | | | 32,000 | | | | 3,538,240 | |
| | | | | | | | |
| | |
| | | | | | | 107,597,205 | |
| | | | | | | | |
Media — 0.8% | | | | | | | | |
Charter Communications, Inc. (Class A Stock)*(a) | | | 19,150 | | | | 6,493,765 | |
Comcast Corp. (Class A Stock) | | | 767,492 | | | | 26,839,195 | |
DISH Network Corp. (Class A
Stock)*(a) | | | 43,175 | | | | 606,177 | |
Fox Corp. (Class A Stock) | | | 54,266 | | | | 1,648,059 | |
Fox Corp. (Class B Stock) | | | 25,766 | | | | 733,043 | |
Interpublic Group of Cos., Inc.
(The)(a) | | | 69,162 | | | | 2,303,786 | |
News Corp. (Class A Stock) | | | 67,925 | | | | 1,236,235 | |
News Corp. (Class B Stock) | | | 21,400 | | | | 394,616 | |
Omnicom Group, Inc.(a) | | | 36,700 | | | | 2,993,619 | |
| | | | | | | | |
| | | Shares | | | Value | |
|
COMMON STOCKS (continued) | |
Media (cont’d.) | | | | | | | | |
Paramount Global (Class B Stock)(a) | | | 89,366 | | | $ | 1,508,498 | |
| | | | | | | | |
| | |
| | | | | | | 44,756,993 | |
| | | | | | | | |
Metals & Mining — 0.4% | | | | | | | | |
Freeport-McMoRan, Inc.(a) | | | 254,312 | | | | 9,663,856 | |
Newmont Corp. | | | 141,203 | | | | 6,664,782 | |
Nucor Corp.(a) | | | 45,700 | | | | 6,023,717 | |
Steel Dynamics, Inc. | | | 29,600 | | | | 2,891,920 | |
| | | | | | | | |
| | |
| | | | | | | 25,244,275 | |
| | | | | | | | |
Multiline Retail — 0.5% | | | | | | | | |
Dollar General Corp. | | | 40,100 | | | | 9,874,625 | |
Dollar Tree, Inc.* | | | 37,347 | | | | 5,282,359 | |
Target Corp. | | | 82,068 | | | | 12,231,415 | |
| | | | | | | | |
| | |
| | | | | | | 27,388,399 | |
| | | | | | | | |
Multi-Utilities — 0.9% | | | | | | | | |
Ameren Corp. | | | 45,700 | | | | 4,063,644 | |
CenterPoint Energy, Inc. | | | 111,210 | | | | 3,335,188 | |
CMS Energy Corp. | | | 51,700 | | | | 3,274,161 | |
Consolidated Edison, Inc. | | | 63,200 | | | | 6,023,592 | |
Dominion Energy, Inc. | | | 148,240 | | | | 9,090,077 | |
DTE Energy Co. | | | 34,500 | | | | 4,054,785 | |
NiSource, Inc. | | | 71,650 | | | | 1,964,643 | |
Public Service Enterprise Group, Inc. | | | 88,600 | | | | 5,428,522 | |
Sempra Energy | | | 55,954 | | | | 8,647,131 | |
WEC Energy Group, Inc. | | | 56,176 | | | | 5,267,062 | |
| | | | | | | | |
| | |
| | | | | | | 51,148,805 | |
| | | | | | | | |
Oil, Gas & Consumable Fuels — 4.6% | |
APA Corp. | | | 57,750 | | | | 2,695,770 | |
Chevron Corp. | | | 316,559 | | | | 56,819,175 | |
ConocoPhillips | | | 221,661 | | | | 26,155,998 | |
Coterra Energy, Inc.(a) | | | 140,800 | | | | 3,459,456 | |
Devon Energy Corp. | | | 115,900 | | | | 7,129,009 | |
Diamondback Energy, Inc. | | | 31,500 | | | | 4,308,570 | |
EOG Resources, Inc. | | | 104,500 | | | | 13,534,840 | |
EQT Corp.(a) | | | 65,500 | | | | 2,215,865 | |
Exxon Mobil Corp. | | | 732,704 | | | | 80,817,251 | |
Hess Corp. | | | 49,375 | | | | 7,002,362 | |
Kinder Morgan, Inc. | | | 350,843 | | | | 6,343,241 | |
Marathon Oil Corp. | | | 112,994 | | | | 3,058,748 | |
Marathon Petroleum Corp. | | | 83,387 | | | | 9,705,413 | |
Occidental Petroleum Corp.(a) | | | 129,428 | | | | 8,152,670 | |
ONEOK, Inc. | | | 79,540 | | | | 5,225,778 | |
Phillips 66 | | | 84,064 | | | | 8,749,381 | |
Pioneer Natural Resources Co. | | | 42,400 | | | | 9,683,736 | |
Targa Resources Corp. | | | 40,100 | | | | 2,947,350 | |
Valero Energy Corp. | | | 68,600 | | | | 8,702,596 | |
Williams Cos., Inc. (The) | | | 216,700 | | | | 7,129,430 | |
| | | | | | | | |
| | |
| | | | | | | 273,836,639 | |
| | | | | | | | |
Personal Products — 0.2% | | | | | | | | |
Estee Lauder Cos., Inc. (The) (Class A Stock) | | | 41,200 | | | | 10,222,132 | |
| | | | | | | | |
Pharmaceuticals — 4.7% | | | | | | | | |
Bristol-Myers Squibb Co. | | | 378,390 | | | | 27,225,160 | |
Catalent, Inc.* | | | 31,800 | | | | 1,431,318 | |
SEE NOTES TO FINANCIAL STATEMENTS.
A238
| | | | |
| | PSF STOCK INDEX PORTFOLIO (CONTINUED) | | |
SCHEDULE OF INVESTMENTS | | | | as of December 31, 2022 |
| | | | | | | | |
| | | Shares | | | Value | |
|
COMMON STOCKS (continued) | |
Pharmaceuticals (cont’d.) | | | | | | | | |
Eli Lilly & Co. | | | 140,300 | | | $ | 51,327,352 | |
Johnson & Johnson | | | 465,646 | | | | 82,256,366 | |
Merck & Co., Inc. | | | 451,103 | | | | 50,049,878 | |
Organon & Co. | | | 44,790 | | | | 1,250,985 | |
Pfizer, Inc. | | | 998,623 | | | | 51,169,443 | |
Viatris, Inc. | | | 213,994 | | | | 2,381,753 | |
Zoetis, Inc. | | | 83,000 | | | | 12,163,650 | |
| | | | | | | | |
| | |
| | | | | | | 279,255,905 | |
| | | | | | | | |
Professional Services — 0.4% | | | | | | | | |
CoStar Group, Inc.* | | | 72,400 | | | | 5,595,072 | |
Equifax, Inc. | | | 21,850 | | | | 4,246,766 | |
Jacobs Solutions, Inc. | | | 22,800 | | | | 2,737,596 | |
Leidos Holdings, Inc. | | | 24,350 | | | | 2,561,376 | |
Robert Half International, Inc.(a) | | | 19,500 | | | | 1,439,685 | |
Verisk Analytics, Inc. | | | 27,900 | | | | 4,922,118 | |
| | | | | | | | |
| | |
| | | | | | | 21,502,613 | |
| | | | | | | | |
Real Estate Management & Development — 0.1% | |
CBRE Group, Inc. (Class A Stock)* | | | 56,200 | | | | 4,325,152 | |
| | | | | | | | |
Road & Rail — 0.9% | | | | | | | | |
CSX Corp. | | | 374,016 | | | | 11,587,016 | |
J.B. Hunt Transport Services, Inc. | | | 14,800 | | | | 2,580,528 | |
Norfolk Southern Corp. | | | 41,200 | | | | 10,152,504 | |
Old Dominion Freight Line, Inc. | | | 16,100 | | | | 4,568,858 | |
Union Pacific Corp. | | | 109,450 | | | | 22,663,811 | |
| | | | | | | | |
| | |
| | | | | | | 51,552,717 | |
| | | | | | | | |
Semiconductors & Semiconductor Equipment — 4.9% | |
Advanced Micro Devices, Inc.* | | | 286,895 | | | | 18,582,189 | |
Analog Devices, Inc. | | | 91,494 | | | | 15,007,761 | |
Applied Materials, Inc. | | | 153,100 | | | | 14,908,878 | |
Broadcom, Inc. | | | 72,050 | | | | 40,285,317 | |
Enphase Energy, Inc.* | | | 24,200 | | | | 6,412,032 | |
First Solar, Inc.* | | | 17,700 | | | | 2,651,283 | |
Intel Corp. | | | 734,200 | | | | 19,404,906 | |
KLA Corp. | | | 25,200 | | | | 9,501,156 | |
Lam Research Corp. | | | 24,300 | | | | 10,213,290 | |
Microchip Technology, Inc. | | | 98,200 | | | | 6,898,550 | |
Micron Technology, Inc.(a) | | | 193,400 | | | | 9,666,132 | |
Monolithic Power Systems, Inc. | | | 7,900 | | | | 2,793,519 | |
NVIDIA Corp. | | | 443,010 | | | | 64,741,481 | |
NXP Semiconductors NV (China) | | | 46,100 | | | | 7,285,183 | |
ON Semiconductor Corp.*(a) | | | 76,700 | | | | 4,783,779 | |
Qorvo, Inc.* | | | 18,286 | | | | 1,657,443 | |
QUALCOMM, Inc. | | | 199,450 | | | | 21,927,533 | |
Skyworks Solutions, Inc. | | | 28,600 | | | | 2,606,318 | |
SolarEdge Technologies, Inc.*(a) | | | 9,900 | | | | 2,804,373 | |
Teradyne, Inc. | | | 27,700 | | | | 2,419,595 | |
Texas Instruments, Inc. | | | 161,700 | | | | 26,716,074 | |
| | | | | | | | |
| | |
| | | | | | | 291,266,792 | |
| | | | | | | | |
Software — 8.1% | | | | | | | | |
Adobe, Inc.* | | | 82,695 | | | | 27,829,348 | |
ANSYS, Inc.* | | | 15,400 | | | | 3,720,486 | |
Autodesk, Inc.* | | | 38,570 | | | | 7,207,576 | |
Cadence Design Systems, Inc.* | | | 48,800 | | | | 7,839,232 | |
Ceridian HCM Holding, Inc.* | | | 27,100 | | | | 1,738,465 | |
| | | | | | | | |
| | | Shares | | | Value | |
|
COMMON STOCKS (continued) | |
Software (cont’d.) | | | | | | | | |
Fortinet, Inc.* | | | 115,800 | | | $ | 5,661,462 | |
Gen Digital, Inc. | | | 103,211 | | | | 2,211,812 | |
Intuit, Inc. | | | 50,060 | | | | 19,484,353 | |
Microsoft Corp. | | | 1,326,380 | | | | 318,092,452 | |
Oracle Corp. | | | 273,395 | | | | 22,347,307 | |
Paycom Software, Inc.* | | | 8,600 | | | | 2,668,666 | |
PTC, Inc.* | | | 18,600 | | | | 2,232,744 | |
Roper Technologies, Inc. | | | 18,900 | | | | 8,166,501 | |
Salesforce, Inc.* | | | 177,900 | | | | 23,587,761 | |
ServiceNow, Inc.* | | | 35,990 | | | | 13,973,837 | |
Synopsys, Inc.* | | | 27,200 | | | | 8,684,688 | |
Tyler Technologies, Inc.* | | | 7,380 | | | | 2,379,386 | |
| | | | | | | | |
| | |
| | | | | | | 477,826,076 | |
| | | | | | | | |
Specialty Retail — 2.3% | | | | | | | | |
Advance Auto Parts, Inc. | | | 10,860 | | | | 1,596,746 | |
AutoZone, Inc.* | | | 3,380 | | | | 8,335,688 | |
Bath & Body Works, Inc. | | | 40,396 | | | | 1,702,288 | |
Best Buy Co., Inc.(a) | | | 35,725 | | | | 2,865,502 | |
CarMax, Inc.*(a) | | | 28,500 | | | | 1,735,365 | |
Home Depot, Inc. (The) | | | 182,069 | | | | 57,508,314 | |
Lowe’s Cos., Inc. | | | 110,475 | | | | 22,011,039 | |
O’Reilly Automotive, Inc.* | | | 11,140 | | | | 9,402,494 | |
Ross Stores, Inc. | | | 61,700 | | | | 7,161,519 | |
TJX Cos., Inc. (The) | | | 207,700 | | | | 16,532,920 | |
Tractor Supply Co. | | | 19,800 | | | | 4,454,406 | |
Ulta Beauty, Inc.* | | | 9,070 | | | | 4,254,465 | |
| | | | | | | | |
| | |
| | | | | | | 137,560,746 | |
| | | | | | | | |
Technology Hardware, Storage & Peripherals — 6.1% | |
Apple, Inc. | | | 2,660,720 | | | | 345,707,350 | |
Hewlett Packard Enterprise Co. | | | 228,166 | | | | 3,641,529 | |
HP, Inc. | | | 157,466 | | | | 4,231,111 | |
NetApp, Inc. | | | 39,100 | | | | 2,348,346 | |
Seagate Technology Holdings PLC(a) | | | 34,150 | | | | 1,796,632 | |
Western Digital Corp.* | | | 56,568 | | | | 1,784,720 | |
| | | | | | | | |
| | |
| | | | | | | 359,509,688 | |
| | | | | | | | |
Textiles, Apparel & Luxury Goods — 0.5% | |
NIKE, Inc. (Class B Stock) | | | 224,100 | | | | 26,221,941 | |
Ralph Lauren Corp.(a) | | | 7,600 | | | | 803,092 | |
Tapestry, Inc. | | | 42,900 | | | | 1,633,632 | |
VF Corp.(a) | | | 58,444 | | | | 1,613,639 | |
| | | | | | | | |
| | |
| | | | | | | 30,272,304 | |
| | | | | | | | |
Tobacco — 0.7% | | | | | | | | |
Altria Group, Inc. | | | 318,600 | | | | 14,563,206 | |
Philip Morris International, Inc. | | | 275,800 | | | | 27,913,718 | |
| | | | | | | | |
| | |
| | | | | | | 42,476,924 | |
| | | | | | | | |
Trading Companies & Distributors — 0.2% | |
Fastenal Co.(a) | | | 101,700 | | | | 4,812,444 | |
United Rentals, Inc.*(a) | | | 12,440 | | | | 4,421,425 | |
W.W. Grainger, Inc.(a) | | | 8,020 | | | | 4,461,125 | |
| | | | | | | | |
| | |
| | | | | | | 13,694,994 | |
| | | | | | | | |
Water Utilities — 0.1% | | | | | | | | |
American Water Works Co., Inc.(a) | | | 32,350 | | | | 4,930,787 | |
| | | | | | | | |
SEE NOTES TO FINANCIAL STATEMENTS.
A239
| | | | |
| | PSF STOCK INDEX PORTFOLIO (CONTINUED) | | |
SCHEDULE OF INVESTMENTS | | | | as of December 31, 2022 |
| | | | | | | | |
| | | Shares | | | Value | |
| |
COMMON STOCKS (continued) | | | | | |
Wireless Telecommunication Services — 0.3% | |
T-Mobile US, Inc.* | | | 106,500 | | | $ | 14,910,000 | |
| | | | | | | | |
TOTAL COMMON STOCKS
(cost $1,638,254,471) | | | | | | | 5,717,974,509 | |
| | | | | | | | |
|
EXCHANGE-TRADED FUNDS — 1.1% | |
iShares Core S&P 500 ETF | | | 126,000 | | | | 48,410,460 | |
SPDR S&P 500 ETF Trust(a) | | | 34,400 | | | | 13,155,592 | |
| | | | | | | | |
TOTAL EXCHANGE-TRADED FUNDS
(cost $55,628,325) | | | | 61,566,052 | |
| | | | | | | | |
| | |
| | | Units | | | | |
RIGHTS* — 0.0% | | | | | | | | |
Health Care Equipment & Supplies | |
ABIOMED, Inc., expiring 12/31/23^ | | | 8,200 | | | | 1 | |
| | | | | | | | |
(cost $0) | | | | | | | | |
| |
TOTAL LONG-TERM INVESTMENTS
(cost $1,693,882,796) | | | | 5,779,540,562 | |
| | | | | | | | |
| | |
| | | Shares | | | | |
SHORT-TERM INVESTMENTS — 7.1% | |
AFFILIATED MUTUAL FUNDS — 7.0% | |
PGIM Core Ultra Short Bond
Fund(wa) | | | 112,606,360 | | | | 112,606,360 | |
PGIM Institutional Money Market Fund (cost $298,740,945; includes $297,570,971 of cash collateral for securities on
loan)(b)(wa) | | | 299,157,683 | | | | 299,008,104 | |
| | | | | | | | |
| |
TOTAL AFFILIATED MUTUAL FUNDS
(cost $411,347,305) | | | | 411,614,464 | |
| | | | | | | | |
| | | | | | | | | | | | |
Interest Rate | | Maturity Date | | | | Principal
Amount
(000)# | | | | |
| | | | | | | | | | | |
|
U.S. TREASURY OBLIGATION(k)(n) — 0.1% | |
U.S. Treasury Bills | |
4.271% | | 03/16/23 | | | | | 8,400 | | | | 8,328,739 | |
| | | | | | | | | | | | |
(cost $8,327,048) | |
| |
TOTAL SHORT-TERM INVESTMENTS
(cost $419,674,353) | | | | 419,943,203 | |
| | | | | | | | | | | | |
| |
TOTAL INVESTMENTS—105.0%
(cost $2,113,557,149) | | | | 6,199,483,765 | |
Liabilities in excess of other assets(z) — (5.0)% | | | | (294,542,862 | ) |
| | | | | | | | | | | | |
| |
NET ASSETS — 100.0% | | | $ | 5,904,940,903 | |
| | | | | | | | | | | | |
See the Glossary for a list of the abbreviation(s) used in the annual report.
| * | Non-income producing security. |
| # | Principal amount is shown in U.S. dollars unless otherwise stated. |
| ^ | Indicates a Level 3 instrument. The aggregate value of Level 3 instruments is $1 and 0.0% of net assets. |
| (a) | All or a portion of security is on loan. The aggregate market value of such securities, including those sold and pending settlement, is $289,986,377; cash collateral of $297,570,971 (included in liabilities) was received with which the Portfolio purchased highly liquid short-term investments. In the event of significant appreciation in value of securities on loan on the last business day of the reporting period, the Portfolio may reflect a collateral value that is less than the market value of the loaned securities and such shortfall is remedied the following business day. |
| (b) | Represents security, or portion thereof, purchased with cash collateral received for securities on loan and includes dividend reinvestment. |
| (k) | Represents security, or a portion thereof, segregated as collateral for centrally cleared/exchange-traded derivatives. |
| (n) | Rate shown is the effective yield at purchase date. |
| (wa) | PGIM Investments LLC, the manager of the Portfolio, also serves as manager of the PGIM Core Ultra Short Bond Fund and PGIM Institutional Money Market Fund, if applicable. |
| (z) | Includes net unrealized appreciation/(depreciation) and/or market value of the below holdings which are excluded from the Schedule of Investments: |
Futures contracts outstanding at December 31, 2022:
| | | | | | | | | | | | | | | | | | |
Number of Contracts | | Type | | Expiration
Date | | | Current
Notional
Amount | | | Value / Unrealized Appreciation (Depreciation) |
Long Position: | | | | | | | | | | | | | | | | |
624 | | S&P 500 E-Mini Index | | | Mar. 2023 | | | $ | 120,463,200 | | | | | $ | (3,250,719 | ) | | |
| | | | | | | | | | | | | | | | | | |
SEE NOTES TO FINANCIAL STATEMENTS.
A240
| | | | |
| | PSF STOCK INDEX PORTFOLIO (CONTINUED) | | |
SCHEDULE OF INVESTMENTS | | | | as of December 31, 2022 |
Summary of Collateral for Centrally Cleared/Exchange-traded Derivatives:
Cash and securities segregated as collateral, including pending settlement for closed positions, to cover requirements for centrally cleared/exchange-traded derivatives are listed by broker as follows:
| | | | | | | | | | |
Broker | | Cash and/or Foreign Currency | | Securities Market Value |
| | |
UBS | | | $ | — | | | | $ | 8,328,739 | |
| | | | | | | | | | |
Fair Value Measurements:
Various inputs are used in determining the value of the Portfolio’s investments. These inputs are summarized in the three broad levels listed below.
Level 1—unadjusted quoted prices generally in active markets for identical securities.
Level 2—quoted prices for similar securities, interest rates and yield curves, prepayment speeds, foreign currency exchange rates and other observable inputs.
Level 3—unobservable inputs for securities valued in accordance with Board approved fair valuation procedures.
The following is a summary of the inputs used as of December 31, 2022 in valuing such portfolio securities:
| | | | | | | | | | | | |
| | | Level 1 | | | Level 2 | | | Level 3 | |
Investments in Securities | | | | | | | | | | | | |
Assets | | | | | | | | | | | | |
Long-Term Investments | | | | | | | | | | | | |
Common Stocks | | | | | | | | | | | | |
Aerospace & Defense | | $ | 109,274,605 | | | $ | — | | | | $— | |
Air Freight & Logistics | | | 34,830,760 | | | | — | | | | — | |
Airlines | | | 11,824,274 | | | | — | | | | — | |
Auto Components | | | 6,135,327 | | | | — | | | | — | |
Automobiles | | | 75,500,725 | | | | — | | | | — | |
Banks | | | 219,195,378 | | | | — | | | | — | |
Beverages | | | 110,831,905 | | | | — | | | | — | |
Biotechnology | | | 141,921,736 | | | | — | | | | — | |
Building Products | | | 25,709,276 | | | | — | | | | — | |
Capital Markets | | | 179,112,204 | | | | — | | | | — | |
Chemicals | | | 107,377,580 | | | | — | | | | — | |
Commercial Services & Supplies | | | 28,178,825 | | | | — | | | | — | |
Communications Equipment | | | 51,175,195 | | | | — | | | | — | |
Construction & Engineering | | | 3,619,500 | | | | — | | | | — | |
Construction Materials | | | 7,935,371 | | | | — | | | | — | |
Consumer Finance | | | 29,364,097 | | | | — | | | | — | |
Containers & Packaging | | | 15,891,061 | | | | — | | | | — | |
Distributors | | | 8,963,547 | | | | — | | | | — | |
Diversified Financial Services | | | 99,036,429 | | | | — | | | | — | |
Diversified Telecommunication Services | | | 53,662,870 | | | | — | | | | — | |
Electric Utilities | | | 119,624,649 | | | | — | | | | — | |
Electrical Equipment | | | 33,288,094 | | | | — | | | | — | |
Electronic Equipment, Instruments & Components | | | 36,507,893 | | | | — | | | | — | |
Energy Equipment & Services | | | 25,134,098 | | | | — | | | | — | |
Entertainment | | | 75,308,652 | | | | — | | | | — | |
Equity Real Estate Investment Trusts (REITs) | | | 150,451,453 | | | | — | | | | — | |
Food & Staples Retailing | | | 88,558,354 | | | | — | | | | — | |
Food Products | | | 68,950,305 | | | | — | | | | — | |
Gas Utilities | | | 2,790,543 | | | | — | | | | — | |
Health Care Equipment & Supplies | | | 160,813,540 | | | | — | | | | — | |
Health Care Providers & Services | | | 211,055,573 | | | | — | | | | — | |
Hotels, Restaurants & Leisure | | | 114,654,574 | | | | — | | | | — | |
Household Durables | | | 19,065,532 | | | | — | | | | — | |
Household Products | | | 90,541,246 | | | | — | | | | — | |
Independent Power & Renewable Electricity Producers | | | 3,393,680 | | | | — | | | | — | |
Industrial Conglomerates | | | 53,733,308 | | | | — | | | | — | |
Insurance | | | 140,401,294 | | | | — | | | | — | |
Interactive Media & Services | | | 227,594,276 | | | | — | | | | — | |
Internet & Direct Marketing Retail | | | 139,373,912 | | | | — | | | | — | |
SEE NOTES TO FINANCIAL STATEMENTS.
A241
| | | | |
| | PSF STOCK INDEX PORTFOLIO (CONTINUED) | | |
SCHEDULE OF INVESTMENTS | | | | as of December 31, 2022 |
| | | | | | | | | | | | |
| | | Level 1 | | | Level 2 | | | Level 3 | |
Investments in Securities (continued) | | | | | | | | | | | | |
Assets (continued) | | | | | | | | | | | | |
Long-Term Investments (continued) | | | | | | | | | | | | |
Common Stocks (continued) | | | | | | | | | | | | |
IT Services | | $ | 255,291,856 | | | $ | — | | | | $— | |
Leisure Products | | | 1,400,179 | | | | — | | | | — | |
Life Sciences Tools & Services | | | 111,221,687 | | | | — | | | | — | |
Machinery | | | 107,597,205 | | | | — | | | | — | |
Media | | | 44,756,993 | | | | — | | | | — | |
Metals & Mining | | | 25,244,275 | | | | — | | | | — | |
Multiline Retail | | | 27,388,399 | | | | — | | | | — | |
Multi-Utilities | | | 51,148,805 | | | | — | | | | — | |
Oil, Gas & Consumable Fuels | | | 273,836,639 | | | | — | | | | — | |
Personal Products | | | 10,222,132 | | | | — | | | | — | |
Pharmaceuticals | | | 279,255,905 | | | | — | | | | — | |
Professional Services | | | 21,502,613 | | | | — | | | | — | |
Real Estate Management & Development | | | 4,325,152 | | | | — | | | | — | |
Road & Rail | | | 51,552,717 | | | | — | | | | — | |
Semiconductors & Semiconductor Equipment | | | 291,266,792 | | | | — | | | | — | |
Software | | | 477,826,076 | | | | — | | | | — | |
Specialty Retail | | | 137,560,746 | | | | — | | | | — | |
Technology Hardware, Storage & Peripherals | | | 359,509,688 | | | | — | | | | — | |
Textiles, Apparel & Luxury Goods | | | 30,272,304 | | | | — | | | | — | |
Tobacco | | | 42,476,924 | | | | — | | | | — | |
Trading Companies & Distributors | | | 13,694,994 | | | | — | | | | — | |
Water Utilities | | | 4,930,787 | | | | — | | | | — | |
Wireless Telecommunication Services | | | 14,910,000 | | | | — | | | | — | |
Exchange-Traded Funds | | | 61,566,052 | | | | — | | | | — | |
Rights | | | | | | | | | | | | |
Health Care Equipment & Supplies | | | — | | | | — | | | | 1 | |
Short-Term Investments | | | | | | | | | | | | |
Affiliated Mutual Funds | | | 411,614,464 | | | | — | | | | — | |
U.S. Treasury Obligation | | | — | | | | 8,328,739 | | | | — | |
| | | | | | | | | | | | |
Total | | $ | 6,191,155,025 | | | $ | 8,328,739 | | | | $ 1 | |
| | | | | | | | | | | | |
| | | |
Other Financial Instruments* | | | | | | | | | | | | |
Liabilities | | | | | | | | | | | | |
Futures Contracts | | $ | (3,250,719 | ) | | $ | — | | | | $— | |
| | | | | | | | | | | | |
| * | Other financial instruments are derivative instruments not reflected in the Schedule of Investments, such as futures, forwards and centrally cleared swap contracts, which are recorded at the unrealized appreciation (depreciation) on the instrument, and OTC swap contracts which are recorded at fair value. |
Industry Classification:
The industry classification of investments and liabilities in excess of other assets shown as a percentage of net assets as of December 31, 2022 were as follows:
| | | | |
Software | | | 8.1 | % |
Affiliated Mutual Funds (5.0% represents investments purchased with collateral from securities on loan) | | | 7.0 | |
Technology Hardware, Storage & Peripherals | | | 6.1 | |
Semiconductors & Semiconductor Equipment | | | 4.9 | |
Pharmaceuticals | | | 4.7 | |
Oil, Gas & Consumable Fuels | | | 4.6 | |
IT Services | | | 4.3 | |
Interactive Media & Services | | | 3.9 | |
Banks | | | 3.7 | |
Health Care Providers & Services | | | 3.6 | |
Capital Markets | | | 3.0 | |
Health Care Equipment & Supplies | | | 2.7 | |
Equity Real Estate Investment Trusts (REITs) | | | 2.5 | |
| | | | |
Biotechnology | | | 2.4 | % |
Insurance | | | 2.4 | |
Internet & Direct Marketing Retail | | | 2.4 | |
Specialty Retail | | | 2.3 | |
Electric Utilities | | | 2.0 | |
Hotels, Restaurants & Leisure | | | 1.9 | |
Life Sciences Tools & Services | | | 1.9 | |
Beverages | | | 1.9 | |
Aerospace & Defense | | | 1.8 | |
Machinery | | | 1.8 | |
Chemicals | | | 1.8 | |
Diversified Financial Services | | | 1.7 | |
Household Products | | | 1.5 | |
Food & Staples Retailing | | | 1.5 | |
SEE NOTES TO FINANCIAL STATEMENTS.
A242
| | | | |
| | PSF STOCK INDEX PORTFOLIO (CONTINUED) | | |
SCHEDULE OF INVESTMENTS | | | | as of December 31, 2022 |
Industry Classification (continued):
| | | | |
Automobiles | | | 1.3 | % |
Entertainment | | | 1.3 | |
Food Products | | | 1.2 | |
Exchange-Traded Funds | | | 1.1 | |
Industrial Conglomerates | | | 0.9 | |
Diversified Telecommunication Services | | | 0.9 | |
Road & Rail | | | 0.9 | |
Communications Equipment | | | 0.9 | |
Multi-Utilities | | | 0.9 | |
Media | | | 0.8 | |
Tobacco | | | 0.7 | |
Electronic Equipment, Instruments & Components | | | 0.6 | |
Air Freight & Logistics | | | 0.6 | |
Electrical Equipment | | | 0.6 | |
Textiles, Apparel & Luxury Goods | | | 0.5 | |
Consumer Finance | | | 0.5 | |
Commercial Services & Supplies | | | 0.5 | |
Multiline Retail | | | 0.5 | |
Building Products | | | 0.4 | |
Metals & Mining | | | 0.4 | |
Energy Equipment & Services | | | 0.4 | |
Professional Services | | | 0.4 | |
| | | | |
Household Durables | | | 0.3 | % |
Containers & Packaging | | | 0.3 | |
Wireless Telecommunication Services | | | 0.3 | |
Trading Companies & Distributors | | | 0.2 | |
Airlines | | | 0.2 | |
Personal Products | | | 0.2 | |
Distributors | | | 0.1 | |
U.S. Treasury Obligation | | | 0.1 | |
Construction Materials | | | 0.1 | |
Auto Components | | | 0.1 | |
Water Utilities | | | 0.1 | |
Real Estate Management & Development | | | 0.1 | |
Construction & Engineering | | | 0.1 | |
Independent Power & Renewable Electricity Producers | | | 0.1 | |
Gas Utilities | | | 0.0 | * |
Leisure Products | | | 0.0 | * |
| | | | |
| |
| | | 105.0 | |
Liabilities in excess of other assets | | | (5.0 | ) |
| | | | |
| |
| | | 100.0 | % |
| | | | |
Effects of Derivative Instruments on the Financial Statements and Primary Underlying Risk Exposure:
The Portfolio invested in derivative instruments during the reporting period. The primary type of risk associated with these derivative instruments is equity contracts risk. See the Notes to Financial Statements for additional detail regarding these derivative instruments and their risks. The effect of such derivative instruments on the Portfolio’s financial position and financial performance as reflected in the Statement of Assets and Liabilities and Statement of Operations is presented in the summary below.
Fair values of derivative instruments as of December 31, 2022 as presented in the Statement of Assets and Liabilities:
| | | | | | | | | | | | | | | | | | |
| | | | | Asset Derivatives | | Liability Derivatives | |
| | | | | | | | |
Derivatives not accounted for as hedging instruments, carried at fair value | | | | Statement of Assets and Liabilities Location | | | | Fair
Value | | | | Statement of Assets and Liabilities Location | | | | Fair
Value | |
Equity contracts | | | | — | | | | $— | | | | Due from/to broker-variation margin futures | | | | $ | 3,250,719 | * |
| | | | | | | | | | | | | | | | | | |
| * | Includes cumulative appreciation (depreciation) as reported in the schedule of open futures and centrally cleared swap contracts. Only unsettled variation margin receivable (payable) is reported within the Statement of Assets and Liabilities. |
The effects of derivative instruments on the Statement of Operations for the year ended December 31, 2022 are as follows:
|
Amount of Realized Gain (Loss) on Derivatives Recognized in Income |
| | | | | | |
| | |
Derivatives not accounted for as hedging instruments, carried at fair value | | | | Futures | |
| | |
Equity contracts | | | | $ | (23,176,239 | ) |
| | | | | | |
|
Change in Unrealized Appreciation (Depreciation) on Derivatives Recognized in Income |
| | | | | | |
Derivatives not accounted for as hedging instruments, carried at fair value | | | | Futures | |
| | |
Equity contracts | | | | $ | (5,075,629 | ) |
| | | | | | |
SEE NOTES TO FINANCIAL STATEMENTS.
A243
| | | | |
| | PSF STOCK INDEX PORTFOLIO (CONTINUED) | | |
SCHEDULE OF INVESTMENTS | | | | as of December 31, 2022 |
For the year ended December 31, 2022, the Portfolio’s average volume of derivative activities is as follows:
| | |
| Derivative Contract Type | | Average Volume of Derivative Activities* |
Futures Contracts - Long Positions (1) | | $124,876,265 |
| * | Average volume is based on average quarter end balances as noted for the year ended December 31, 2022. |
| (1) | Notional Amount in USD. |
Financial Instruments/Transactions—Summary of Offsetting and Netting Arrangements:
The Portfolio entered into financial instruments/transactions during the reporting period that are either offset in accordance with current requirements or are subject to enforceable master netting arrangements or similar agreements that permit offsetting. The information about offsetting and related netting arrangements for financial instruments/transactions where the legal right to set-off exists is presented in the summary below.
Offsetting of financial instrument/transaction assets and liabilities:
| | | | | | | | |
| Description | | Gross Market Value of Recognized
Assets/(Liabilities) | | | | Collateral Pledged/(Received)(1) | | Net Amount |
Securities on Loan | | $289,986,377 | | | | $(289,986,377) | | $— |
| (1) | Collateral amount disclosed by the Portfolio is limited to the market value of financial instruments/transactions. |
SEE NOTES TO FINANCIAL STATEMENTS.
A244
| | | | |
| | PSF STOCK INDEX PORTFOLIO (CONTINUED) | | |
STATEMENT OF ASSETS AND LIABILITIES
as of December 31, 2022
| | | | |
ASSETS | | | | |
Investments at value, including securities on loan of $289,986,377: | | | | |
Unaffiliated investments (cost $1,702,209,844) | | $ | 5,787,869,301 | |
Affiliated investments (cost $411,347,305) | | | 411,614,464 | |
Cash | | | 35 | |
Dividends receivable | | | 5,028,057 | |
Receivable for Portfolio shares sold | | | 1,038,377 | |
Tax reclaim receivable | | | 597,585 | |
Prepaid expenses | | | 663,872 | |
| | | | |
Total Assets | | | 6,206,811,691 | |
| | | | |
LIABILITIES | | | | |
Payable to broker for collateral for securities on loan | | | 297,570,971 | |
Management fee payable | | | 1,448,989 | |
Accrued expenses and other liabilities | | | 1,273,427 | |
Payable for investments purchased | | | 762,856 | |
Payable for Portfolio shares purchased | | | 469,078 | |
Due to broker-variation margin futures | | | 335,400 | |
Distribution fee payable | | | 5,347 | |
Trustees’ fees payable | | | 3,740 | |
Affiliated transfer agent fee payable | | | 980 | |
| | | | |
Total Liabilities | | | 301,870,788 | |
| | | | |
NET ASSETS | | $ | 5,904,940,903 | |
| | | | |
Net assets were comprised of: | | | | |
Partners’ Equity | | $ | 5,904,940,903 | |
| | | | |
Class I: | | | | |
Net asset value and redemption price per share, $5,880,114,251 / 64,031,621 outstanding shares of beneficial interest | | $ | 91.83 | |
| | | | |
Class III: | | | | |
Net asset value and redemption price per share, $24,826,652 / 271,485 outstanding shares of beneficial interest | | $ | 91.45 | |
| | | | |
STATEMENT OF OPERATIONS
Year Ended December 31, 2022
| | | | |
NET INVESTMENT INCOME (LOSS) | | | | |
INCOME | | | | |
Unaffiliated dividend income
(net of $9,170 foreign withholding tax) | | $ | 98,609,623 | |
Affiliated dividend income | | | 1,987,699 | |
Income from securities lending, net (including affiliated income of $485,564) | | | 540,369 | |
Interest income | | | 80,081 | |
| | | | |
Total income | | | 101,217,772 | |
| | | | |
EXPENSES | | | | |
Management fee | | | 17,684,332 | |
Distribution fee—Class III | | | 53,341 | |
Custodian and accounting fees | | | 326,358 | |
Trustees’ fees | | | 106,160 | |
Legal fees and expenses | | | 55,678 | |
Shareholders’ reports | | | 52,374 | |
Audit fee | | | 30,300 | |
Transfer agent’s fees and expenses (including affiliated expense of $5,882) | | | 10,682 | |
Miscellaneous | | | 115,093 | |
| | | | |
Total expenses | | | 18,434,318 | |
| | | | |
NET INVESTMENT INCOME (LOSS) | | | 82,783,454 | |
| | | | |
| REALIZED AND UNREALIZED GAIN (LOSS) ON INVESTMENT TRANSACTIONS | | | | |
Net realized gain (loss) on: | | | | |
Investment transactions (including affiliated of $(14,541)) | | | 35,423,247 | |
Futures transactions | | | (23,176,239 | ) |
| | | | |
| | | 12,247,008 | |
| | | | |
Net change in unrealized appreciation (depreciation) on: | | | | |
Investments (including affiliated of $129,763) | | | (1,418,658,293 | ) |
Futures | | | (5,075,629 | ) |
| | | | |
| | | (1,423,733,922 | ) |
| | | | |
NET GAIN (LOSS) ON INVESTMENT TRANSACTIONS | | | (1,411,486,914 | ) |
| | | | |
NET INCREASE (DECREASE) IN NET ASSETS RESULTING FROM OPERATIONS | | $ | (1,328,703,460 | ) |
| | | | |
STATEMENTS OF CHANGES IN NET ASSETS
| | | | | | | | | | | | | | | | | | | | | | | | |
| | | Year Ended
December 31, 2022 | | | Year Ended
December 31, 2021 | |
INCREASE (DECREASE) IN NET ASSETS | | | | | | | | | | | | | | | | | | | | | | | | |
OPERATIONS | | | | | | | | | | | | | | | | | | | | | | | | |
Net investment income (loss) | | | | | | $ | 82,783,454 | | | | | | | | | | | $ | 67,998,064 | | | | | |
Net realized gain (loss) on investment transactions | | | | | | | 12,247,008 | | | | | | | | | | | | 80,159,789 | | | | | |
Net change in unrealized appreciation (depreciation) on investments | | | | | | | (1,423,733,922 | ) | | | | | | | | | | | 1,443,977,584 | | | | | |
| | | | | | | | | | | | | | | | | | | | | | | | |
NET INCREASE (DECREASE) IN NET ASSETS RESULTING FROM OPERATIONS | | | | | | | (1,328,703,460 | ) | | | | | | | | | | | 1,592,135,437 | | | | | |
| | | | | | | | | | | | | | | | | | | | | | | | |
PORTFOLIO SHARE TRANSACTIONS | | | | | | | | | | | | | | | | | | | | | | | | |
Portfolio shares sold | | | | | | | 236,760,993 | | | | | | | | | | | | 325,130,065 | | | | | |
Portfolio shares purchased | | | | | | | (264,281,273 | ) | | | | | | | | | | | (276,298,925 | ) | | | | |
| | | | | | | | | | | | | | | | | | | | | | | | |
NET INCREASE (DECREASE) IN NET ASSETS FROM PORTFOLIO SHARE TRANSACTIONS | | | | | | | (27,520,280 | ) | | | | | | | | | | | 48,831,140 | | | | | |
| | | | | | | | | | | | | | | | | | | | | | | | |
TOTAL INCREASE (DECREASE) | | | | | | | (1,356,223,740 | ) | | | | | | | | | | | 1,640,966,577 | | | | | |
NET ASSETS: | | | | | | | | | | | | | | | | | | | | | | | | |
Beginning of year | | | | | | | 7,261,164,643 | | | | | | | | | | | | 5,620,198,066 | | | | | |
| | | | | | | | | | | | | | | | | | | | | | | | |
End of year | | | | | | $ | 5,904,940,903 | | | | | | | | | | | $ | 7,261,164,643 | | | | | |
| | | | | | | | | | | | | | | | | | | | | | | | |
SEE NOTES TO FINANCIAL STATEMENTS.
A245
| | | | |
| | PSF STOCK INDEX PORTFOLIO (CONTINUED) | | |
FINANCIAL HIGHLIGHTS | | | | |
| | | | | | | | | | | | | | | | | | | | |
| Class I | | | | | | | | | | | | | | | |
| | | Year Ended December 31, | |
| | | 2022 | | | 2021 | | | 2020 | | | 2019 | | | 2018 | |
Per Share Operating Performance(a): | | | | | | | | | | | | | | | | | | | | |
Net Asset Value, beginning of year | | $ | 112.45 | | | $ | 87.66 | | | $ | 74.24 | | | $ | 56.64 | | | $ | 59.38 | |
| | | | | | | | | | | | | | | | | | | | |
Income (Loss) From Investment Operations: | | | | | | | | | | | | | | | | | | | | |
Net investment income (loss) | | | 1.29 | | | | 1.06 | | | | 1.12 | | | | 1.12 | | | | 1.00 | |
Net realized and unrealized gain (loss) on investment transactions | | | (21.91 | ) | | | 23.73 | | | | 12.30 | | | | 16.48 | | | | (3.74 | ) |
| | | | | | | | | | | | | | | | | | | | |
Total from investment operations | | | (20.62 | ) | | | 24.79 | | | | 13.42 | | | | 17.60 | | | | (2.74 | ) |
| | | | | | | | | | | | | | | | | | | | |
Net Asset Value, end of year | | $ | 91.83 | | | $ | 112.45 | | | $ | 87.66 | | | $ | 74.24 | | | $ | 56.64 | |
| | | | | | | | | | | | | | | | | | | | |
Total Return(b) | | | (18.34 | )% | | | 28.28 | % | | | 18.08 | % | | | 31.07 | % | | | (4.61 | )% |
Ratios/Supplemental Data: | | | | | | | | | | | | | | | | | | | | |
Net assets, end of year (in millions) | | $ | 5,880 | | | $ | 7,244 | | | $ | 5,620 | | | $ | 4,757 | | | $ | 3,672 | |
Average net assets (in millions) | | $ | 6,252 | | | $ | 6,427 | | | $ | 4,802 | | | $ | 4,298 | | | $ | 4,051 | |
Ratios to average net assets(c): | | | | | | | | | | | | | | | | | | | | |
Expenses after waivers and/or expense reimbursement | | | 0.29 | % | | | 0.29 | % | | | 0.31 | % | | | 0.31 | % | | | 0.31 | % |
Expenses before waivers and/or expense reimbursement | | | 0.29 | % | | | 0.29 | % | | | 0.31 | % | | | 0.31 | % | | | 0.31 | % |
Net investment income (loss) | | | 1.32 | % | | | 1.06 | % | | | 1.50 | % | | | 1.69 | % | | | 1.63 | % |
Portfolio turnover rate(d) | | �� | 3 | % | | | 2 | % | | | 4 | % | | | 3 | % | | | 4 | % |
| | | | | | | | | | | | | | | | | | | | | | | | |
| Class III | | | | | | | | | | | | | | | | | | |
| | | Year Ended December 31,
2022 | | | April 26, 2021(e)
through December 31,
2021 | |
Per Share Operating Performance(a): | | | | | | | | | | | | | | | | | | | | | | | | |
Net Asset Value, beginning of period | | | | | | $ | 112.26 | | | | | | | | | | | $ | 97.90 | | | | | |
| | | | | | | | | | | | | | | | | | | | | | | | |
Income (Loss) From Investment Operations: | | | | | | | | | | | | | | | | | | | | | | | | |
Net investment income (loss) | | | | | | | 1.06 | | | | | | | | | | | | 0.54 | | | | | |
Net realized and unrealized gain (loss) on investment transactions | | | | | | | (21.87 | ) | | | | | | | | | | | 13.82 | | | | | |
| | | | | | | | | | | | | | | | | | | | | | | | |
Total from investment operations | | | | | | | (20.81 | ) | | | | | | | | | | | 14.36 | | | | | |
| | | | | | | | | | | | | | | | | | | | | | | | |
Net Asset Value, end of period | | | | | | $ | 91.45 | | | | | | | | | | | $ | 112.26 | | | | | |
| | | | | | | | | | | | | | | | | | | | | | | | |
Total Return(b) | | | | | | | (18.54 | )% | | | | | | | | | | | 14.67 | % | | | | |
Ratios/Supplemental Data: | | | | | | | | | | | | | | | | | | | | | | | | |
Net assets, end of period (in millions) | | | | | | $ | 25 | | | | | | | | | | | $ | 17 | | | | | |
Average net assets (in millions) | | | | | | $ | 21 | | | | | | | | | | | $ | 7 | | | | | |
Ratios to average net assets(c): | | | | | | | | | | | | | | | | | | | | | | | | |
Expenses after waivers and/or expense reimbursement | | | | | | | 0.54 | % | | | | | | | | | | | 0.54 | %(f) | | | | |
Expenses before waivers and/or expense reimbursement | | | | | | | 0.54 | % | | | | | | | | | | | 0.54 | %(f) | | | | |
Net investment income (loss) | | | | | | | 1.09 | % | | | | | | | | | | | 0.74 | %(f) | | | | |
Portfolio turnover rate(d) | | | | | | | 3 | % | | | | | | | | | | | 2 | % | | | | |
| (a) | Calculated based on average shares outstanding during the period. |
| (b) | Total return is calculated assuming a purchase of a share on the first day and a sale on the last day of each period reported and includes reinvestment of dividends and distributions, if any, and does not reflect the effect of insurance contract charges. Total return does not reflect expenses associated with the separate account such as administrative fees, account charges and surrender charges which, if reflected, would reduce the total returns for all periods shown. Performance figures may reflect fee waivers and/or expense reimbursements. In the absence of fee waivers and/or expense reimbursements, the total return would be lower. Past performance is no guarantee of future results. Total returns may reflect adjustments to conform to GAAP. Total returns for periods less than one full year are not annualized. |
| (c) | Does not include expenses of the underlying funds in which the Portfolio invests. |
| (d) | The Portfolio’s portfolio turnover rate is calculated in accordance with regulatory requirements, without regard to transactions involving short-term investments, certain derivatives and in-kind transactions (if any). If such transactions were included, the Portfolio’s portfolio turnover rate may be higher. |
| (e) | Commencement of offering. |
| (f) | Annualized, with the exception of certain non-recurring expenses. |
SEE NOTES TO FINANCIAL STATEMENTS.
A246
NOTES TO FINANCIAL STATEMENTS OF
THE PRUDENTIAL SERIES FUND
1. Organization
The Prudential Series Fund (“Series Fund”), a Delaware statutory trust, is registered under the Investment Company Act of 1940, as amended (“1940 Act”), as an open-end management investment company. The Series Fund is currently composed of 17 Portfolios (each, a “Portfolio” and collectively, the “Portfolios”). The information presented in these financial statements pertains to the 17 Portfolios listed below together with their investment objectives. Each Portfolio is a diversified portfolio for purposes of the 1940 Act.
The Portfolios have the following investment objective(s):
| | |
| | |
| Portfolio | | Investment Objective(s) |
PSF Global Portfolio | | Long-term growth of capital. |
PSF International Growth Portfolio | | Long-term growth of capital. |
PSF Mid-Cap Growth Portfolio | | Long-term capital appreciation. |
PSF Natural Resources Portfolio | | Long-term growth of capital. |
PSF PGIM 50/50 Balanced Portfolio | | Total investment return consistent with a conservatively managed diversified portfolio. |
PSF PGIM Flexible Managed Portfolio | | Total return consistent with an aggressively managed diversified portfolio. |
PSF PGIM Government Income Portfolio | | High level of income over the long-term consistent with the preservation of capital. |
PSF PGIM Government Money Market Portfolio | | Maximum current income consistent with the stability of capital and maintenance of liquidity. |
PSF PGIM High Yield Bond Portfolio | | High total return. |
PSF PGIM Jennison Blend Portfolio | | Long-term growth of capital. |
PSF PGIM Jennison Focused Blend Portfolio | | Long-term growth of capital. |
PSF PGIM Jennison Growth Portfolio | | Long-term growth of capital. |
PSF PGIM Jennison Value Portfolio | | Capital appreciation. |
B1
| | |
| | |
| Portfolio | | Investment Objective(s) |
PSF PGIM Total Return Bond Portfolio | | High level of income over a longer term while providing reasonable safety of capital. |
PSF Small-Cap Stock Index Portfolio | | Long-term growth of capital. |
PSF Small-Cap Value Portfolio | | Long-term growth of capital. |
PSF Stock Index Portfolio | | Achieve investment results that generally correspond to the performance of publicly traded common stocks. |
2. Accounting Policies
The Series Fund follows the investment company accounting and reporting guidance of the Financial Accounting Standards Board (“FASB”) Accounting Standard Codification (“ASC”) Topic 946 Financial Services — Investment Companies.The following is a summary of significant accounting policies followed by the Series Fund in the preparation of its financial statements. The policies conform to U.S. generally accepted accounting principles (“GAAP”). The Series Fund and the Portfolios consistently follow such policies in the preparation of their financial statements.
Securities Valuation: Each Portfolio holds securities and other assets and liabilities that are fair valued as of the close of each day (generally, 4:00 PM Eastern time) the New York Stock Exchange (“NYSE”) is open for trading. As described in further detail below, the Portfolios’ investments are valued daily based on a number of factors, including the type of investment and whether market quotations are readily available. The Series Fund’s Board of Trustees (the “Board”) has approved the Portfolios’ valuation policies and procedures for security valuation and designated to PGIM Investments LLC (“PGIM Investments” or the “Manager”) as the Valuation Designee pursuant to SEC Rule 2a-5(b) to perform the fair value determination relating to all Portfolio investments. Pursuant to the Board’s oversight, the Valuation Designee has established a Valuation Committee to perform the duties and responsibilities as valuation designee under SEC Rule 2a-5. The valuation procedures permit a Portfolio to utilize independent pricing vendor services, quotations from market makers, and alternative valuation methods when market quotations are either not readily available or not deemed representative of fair value. Fair value is the price that would be received to sell an asset or paid to transfer a liability in an orderly transaction between market participants on the measurement date.
For the fiscal reporting year-end, securities and other assets and liabilities were fair valued at the close of the last U.S. business day. Trading in certain foreign securities may occur when the NYSE is closed (including weekends and holidays). Because such foreign securities trade in markets that are open on weekends and U.S. holidays, the values of some of the Portfolios’ foreign investments may change on days when investors cannot purchase or redeem Portfolio shares.
Various inputs determine how the Portfolios’ investments are valued, all of which are categorized according to the three broad levels (Level 1, 2, or 3) detailed in the Schedule of Investments and referred to herein as the “fair value hierarchy” in accordance with FASB ASC Topic 820 - Fair Value Measurement.
Common or preferred stocks, exchange-traded funds and derivative instruments, if applicable, that are traded on a national securities exchange are valued at the last sale price as of the close of trading on the applicable exchange where the security principally trades. Securities traded via NASDAQ are valued at the NASDAQ official closing price. To the extent these securities are valued at the last sale price or NASDAQ official closing price, they are classified as Level 1 in the fair value hierarchy. In the event that no sale or official closing price on valuation date exists, these securities are generally valued at the mean between the last reported bid and ask prices, or at the last bid price in the absence of an ask price. These securities are classified as Level 2 in the fair value hierarchy.
Foreign equities traded on foreign securities exchanges are generally valued using pricing vendor services that provide model prices derived using adjustment factors based on information such as local closing price, relevant general and sector indices, currency fluctuations, depositary receipts, and futures, as applicable. Securities valued using such model prices are classified as Level 2 in the fair value hierarchy. The models generate an evaluated adjustment factor for each security, which is applied to the local closing price to adjust it for post closing market movements up to the time each Portfolio is valued.
B2
Utilizing that evaluated adjustment factor, the vendor provides an evaluated price for each security. If the vendor does not provide an evaluated price, securities are valued in accordance with exchange-traded common and preferred stock valuation policies discussed above.
Investments in open-end funds (other than exchange-traded funds) are valued at their net asset values as of the close of the NYSE on the date of valuation. These securities are classified as Level 1 in the fair value hierarchy since they may be purchased or sold at their net asset values on the date of valuation.
Fixed income securities traded in the OTC market are generally classified as Level 2 in the fair value hierarchy. Such fixed income securities are typically valued using the market approach which generally involves obtaining data from an approved independent third-party vendor source. The Portfolios utilize the market approach as the primary method to value securities when market prices of identical or comparable instruments are available. The third-party vendors’ valuation techniques used to derive the evaluated bid price are based on evaluating observable inputs, including but not limited to, yield curves, yield spreads, credit ratings, deal terms, tranche level attributes, default rates, cash flows, prepayment speeds, broker/dealer quotations and reported trades. Certain Level 3 securities are also valued using the market approach when obtaining a single broker quote or when utilizing transaction prices for identical securities that have been used in excess of five business days. During the reporting period, there were no changes to report with respect to the valuation approach and/or valuation techniques discussed above.
The Government Money Market Portfolio values all of its securities of sufficient credit quality at amortized cost, which approximates fair value. The amortized cost method involves valuing a security at its cost on the date of purchase and thereafter assuming a constant amortization to maturity of the difference between the principal amount due at maturity and cost. These securities are categorized as Level 2 of the fair value hierarchy.
Floating rate and other loans are generally valued at prices provided by approved independent pricing vendors. The pricing vendors utilize broker/dealer quotations and provide prices based on the average of such quotations. Floating rate and other loans valued using such vendor prices are generally classified as Level 2 in the fair value hierarchy. Floating rate and other loans valued based on a single broker quote or at the original transaction price in excess of five business days are classified as Level 3 in the fair value hierarchy.
OTC and centrally cleared derivative instruments are generally classified as Level 2 in the fair value hierarchy. Such derivative instruments are typically valued using the market approach and/or income approach which generally involves obtaining data from an approved independent third-party vendor source. The Portfolios utilize the market approach when quoted prices in broker-dealer markets are available but also include consideration of alternative valuation approaches, including the income approach. In the absence of reliable market quotations, the income approach is typically utilized for purposes of valuing derivatives such as interest rate swaps based on a discounted cash flow analysis whereby the value of the instrument is equal to the present value of its future cash inflows or outflows. Such analysis includes projecting future cash flows and determining the discount rate (including the present value factors that affect the discount rate) used to discount the future cash flows. In addition, the third-party vendors’ valuation techniques used to derive the evaluated derivative price is based on evaluating observable inputs, including but not limited to, underlying asset prices, indices, spreads, interest rates and exchange rates. Certain derivatives may be classified as Level 3 when valued using the market approach by obtaining a single broker quote or when utilizing unobservable inputs in the income approach. During the reporting period, there were no changes to report with respect to the valuation approach and/or valuation techniques discussed above.
Securities and other assets that cannot be priced according to the methods described above are valued based on policies and procedures approved by the Board. In the event that unobservable inputs are used when determining such valuations, the securities will be classified as Level 3 in the fair value hierarchy. Altering one or more unobservable inputs may result in a significant change to a Level 3 security’s fair value measurement.
When determining the fair value of securities, some of the factors influencing the valuation include: the nature of any restrictions on disposition of the securities; assessment of the general liquidity of the securities; the issuer’s financial condition and the markets in which it does business; the cost of the investment; the size of the holding and the capitalization of the issuer; the prices of any recent transactions or bids/offers for such securities or any comparable securities; any available analyst media or other reports or information deemed reliable by the Valuation Designee regarding the issuer or the markets or industry in which it operates. Using fair value to price securities may result in a value that is different from a security’s most recent closing price and from the price used by other unaffiliated mutual funds to calculate their net asset values.
Foreign Currency Translation: The books and records of the Portfolios are maintained in U.S. dollars. Foreign currency amounts are translated into U.S. dollars on the following basis:
B3
(i) market value of investment securities, other assets and liabilities — at the exchange rate as of the valuation date;
(ii) purchases and sales of investment securities, income and expenses — at the rates of exchange prevailing on the respective dates of such transactions.
Although the net assets of the Portfolios are presented at the foreign exchange rates and market values at the close of the period, the Portfolios do not generally isolate that portion of the results of operations arising as a result of changes in the foreign exchange rates from the fluctuations arising from changes in the market prices of long-term portfolio securities held at the end of the period. Similarly, the Portfolios do not isolate the effect of changes in foreign exchange rates from the fluctuations arising from changes in the market prices of long-term portfolio securities sold during the period. Accordingly, holding period unrealized and realized foreign currency gains (losses) are included in the reported net change in unrealized appreciation (depreciation) on investments and net realized gains (losses) on investment transactions on the Statements of Operations. Notwithstanding the above, the Portfolios do isolate the effect of fluctuations in foreign currency exchange rates when determining the gain (loss) upon the sale or maturity of foreign currency denominated debt obligations; such amounts are included in net realized gains (losses) on foreign currency transactions.
Additionally, net realized gains (losses) on foreign currency transactions represent net foreign exchange gains (losses) from the disposition of holdings of foreign currencies, currency gains (losses) realized between the trade and settlement dates on investment transactions, and the difference between the amounts of interest, dividends and foreign withholding taxes recorded on the Portfolios’ books and the U.S. dollar equivalent amounts actually received or paid. Net unrealized currency gains (losses) arise from valuing foreign currency denominated assets and liabilities (other than investments) at period end exchange rates.
Forward and Cross Currency Contracts: A forward currency contract is a commitment to purchase or sell a foreign currency at a future date at a negotiated forward rate. Certain Portfolios entered into forward currency contracts, as defined in the prospectus, in order to hedge their exposure to changes in foreign currency exchange rates on their foreign portfolio holdings or on specific receivables and payables denominated in a foreign currency and to gain exposures to certain currencies. The contracts are valued daily at current forward exchange rates and any unrealized gain (loss) is included in net unrealized appreciation or depreciation on forward and cross currency contracts. Gain (loss) is realized on the settlement date of the contract equal to the difference between the settlement value of the original and negotiated forward contracts. This gain (loss), if any, is included in net realized gain (loss) on forward and cross currency contract transactions. Risks may arise upon entering into these contracts from the potential inability of the counterparties to meet the terms of their contracts. Forward currency contracts involve risks from currency exchange rate and credit risk in excess of the amounts reflected on the Statement of Assets and Liabilities. The Portfolios’ maximum risk of loss from counterparty credit risk is the net value of the cash flows to be received from the counterparty at the end of the contract’s life.Across currency contract is a forward contract where a specified amount of one foreign currency will be exchanged for a specified amount of another foreign currency.
Options: Certain Portfolios purchased and/or wrote options in order to hedge against adverse market movements or fluctuations in value caused by changes in prevailing interest rates, value of equities or foreign currency exchange rates with respect to securities or financial instruments which the Portfolio currently owns or intends to purchase. The Portfolios may also use options to gain additional market exposure. The Portfolios’ principal reason for writing options is to realize, through receipt of premiums, a greater current return than would be realized on the underlying security alone. When the Portfolio purchases an option, it pays a premium and an amount equal to that premium is recorded as an asset. When the Portfolio writes an option, it receives a premium and an amount equal to that premium is recorded as a liability. The asset or liability is adjusted daily to reflect the current market value of the option. If an option expires unexercised, the Portfolio realizes a gain (loss) to the extent of the premium received or paid. If an option is exercised, the premium received or paid is recorded as an adjustment to the proceeds from the sale or the cost of the purchase in determining whether the Portfolio has realized a gain (loss). The difference between the premium and the amount received or paid at the closing of a purchase or sale transaction is also treated as a realized gain (loss). Gain (loss) on purchased options is included in net realized gain (loss) on investment transactions. Gain (loss) on written options is presented separately as net realized gain (loss) on options written transactions.
The Portfolio, as writer of an option, may have no control over whether the underlying securities or financial instruments may be sold (called) or purchased (put). As a result, the Portfolio bears the market risk of an unfavorable change in the price of the security or financial instrument underlying the written option. The Portfolio, as purchaser of an OTC option, bears the risk of the potential inability of the counterparties to meet the terms of their contracts. With exchange-traded options contracts, there is minimal counterparty credit risk to the Portfolio since the exchanges’ clearinghouse acts as counterparty to all exchange-traded options and guarantees the options contracts against default.
When a Portfolio writes an option on a swap, an amount equal to any premium received by the Portfolio is recorded as a liability and is subsequently adjusted to the current market value of the written option on the swap. If a call option on a swap
B4
is exercised, the Portfolio becomes obligated to pay a fixed interest rate (noted as the strike price) and receive a variable interest rate on a notional amount. If a put option on a swap is exercised, the Portfolio becomes obligated to pay a variable interest rate and receive a fixed interest rate (noted as the strike price) on a notional amount. Premiums received from writing options on swaps that expire or are exercised are treated as realized gains upon the expiration or exercise of such options on swaps. The risk associated with writing put and call options on swaps is that the Portfolio will be obligated to be party to a swap agreement if an option on a swap is exercised. Certain Portfolios entered into options on swaps that are executed through a central clearing facility, such as a registered exchange. Such options pay or receive an amount known as “variation margin”, based on daily changes in the valuation of the contract. The daily variation margin, rather than the contract market value, is recorded for financial statement purposes on the Statement of Assets and Liabilities.
Financial Futures Contracts: A financial futures contract is an agreement to purchase (long) or sell (short) an agreed amount of securities at a set price for delivery on a future date. Upon entering into a financial futures contract, the Portfolios are required to pledge to the broker an amount of cash and/or other assets equal to a certain percentage of the contract amount. This amount is known as the “initial margin.” Subsequent payments, known as “variation margin,” are made or received by the Portfolios each day, depending on the daily fluctuations in the value of the underlying security. Such variation margin is recorded for financial statement purposes on a daily basis as unrealized gain (loss). When the contract expires or is closed, the gain (loss) is realized and is presented in the Statement of Operations as net realized gain (loss) on futures transactions.
Certain Portfolios invested in financial futures contracts in order to hedge their existing portfolio securities, or securities the Portfolios intend to purchase, against fluctuations in value caused by changes in prevailing interest rates. Should interest rates move unexpectedly, the Portfolios may not achieve the anticipated benefits of the financial futures contracts and may realize a loss. The use of futures transactions involves the risk of imperfect correlation in movements in the price of futures contracts, interest rates and the underlying hedged assets. Since futures contracts are exchange-traded, there is minimal counterparty credit risk to the Portfolios since the exchanges’ clearinghouse acts as counterparty to all exchange-traded futures and guarantees the futures contracts against default.
Swap Agreements: Certain Portfolios entered into certain types of swap agreements detailed in the disclosures below. A swap agreement is an agreement to exchange the return generated by one instrument for the return generated by another instrument. Swap agreements are negotiated in the OTC market and may be executed either directly with a counterparty (“OTC-traded”) or through a central clearing facility, such as a registered exchange. Swap agreements are valued daily at current market value and any change in value is included in the net unrealized appreciation or depreciation on swap agreements. Centrally cleared swaps pay or receive an amount known as “variation margin”, based on daily changes in the valuation of the swap contract. For OTC-traded, upfront premiums paid and received are shown as swap premiums paid and swap premiums received in the Statement of Assets and Liabilities. Risk of loss may exceed amounts recognized on the Statement of Assets and Liabilities. Swap agreements outstanding at period end, if any, are listed on the Schedule of Investments.
Interest Rate Swaps: Interest rate swaps represent an agreement between counterparties to exchange cash flows based on the difference between two interest rates, applied to a notional principal amount for a specified period. Certain Portfolios are subject to interest rate risk exposure in the normal course of pursuing their investment objective. Certain Portfolios used interest rate swaps to maintain their ability to generate steady cash flow by receiving a stream of fixed rate payments or to increase exposure to prevailing market rates by receiving floating rate payments. The Portfolios’ maximum risk of loss from counterparty credit risk is the discounted net present value of the cash flows to be received from the counterparty over the contract’s remaining life.
Inflation Swaps: Certain Portfolios entered into inflation swap agreements to protect against fluctuations in inflation rates. Inflation swaps are characterized by one party paying a fixed rate in exchange for a floating rate that is derived from an inflation index, such as the Consumer Price Index or UK Retail Price Index. Inflation swaps subject the Portfolios to interest rate risk.
Credit Default Swaps (“CDS”): CDS involve one party (the protection buyer) making a stream of payments to another party (the protection seller) in exchange for the right to receive a specified payment in the event of a default or as a result of a default (collectively a “credit event”) for the referenced entity (typically corporate issues or sovereign issues of an emerging country) on its obligation; or in the event of a write-down, principal shortfall, interest shortfall or default of all or part of the referenced entities comprising a credit index.
Certain Portfolios are subject to credit risk in the normal course of pursuing their investment objectives, and as such, have entered into CDS contracts to provide a measure of protection against defaults or to take an active long or short position with respect to the likelihood of a particular issuer’s default or the reference entity’s credit soundness. CDS contracts generally trade based on a spread which represents the cost a protection buyer has to pay the protection seller. The protection buyer is said to be short the credit as the value of the contract rises the more the credit deteriorates. The value of the CDS contract
B5
increases for the protection buyer if the spread increases. A Portfolio’s maximum risk of loss from counterparty credit risk for purchased CDS is the inability of the counterparty to honor the contract up to the notional value due to a credit event.
As a seller of protection on credit default swap agreements, the Portfolio generally receives an agreed upon payment from the buyer of protection throughout the term of the swap, provided no credit event occurs. As the seller, the Portfolio effectively increases its investment risk because, in addition to its total net assets, the Portfolio may be subject to investment exposure on the notional amount of the swap.
The maximum amount of the payment that the Portfolio, as a seller of protection, could be required to make under a credit default swap agreement would be equal to the notional amount of the underlying security or index contract as a result of a credit event. This potential amount will be partially offset by any recovery values of the respective referenced obligations, or net amounts received from the settlement of buy protection credit default swap agreements which the Portfolio entered into for the same referenced entity or index. As a buyer of protection, the Portfolio generally receives an amount up to the notional value of the swap if a credit event occurs.
Implied credit spreads, represented in absolute terms, utilized in determining the market value of credit default swap agreements where the Portfolio is the seller of protection as of period end are disclosed in the footnotes to the Schedule of Investments, if applicable. These spreads serve as indicators of the current status of the payment/performance risk and represent the likelihood of default risk for the credit derivative. The implied credit spread of a particular referenced entity reflects the cost of buying/selling protection and may include upfront payments required to enter into the agreement. Wider credit spreads and increased market value in absolute terms, when compared to the notional amount of the swap, represent a deterioration of the referenced entity’s credit soundness and a greater likelihood of risk of default or other credit event occurring as defined under the terms of the agreement.
Total Return Swaps: In a total return swap, one party receives payments based on the market value of the security or the commodity involved, or total return of a specific referenced asset, such as an equity, index or bond, and in return pays a defined amount. Certain Portfolios are subject to risk exposures associated with the referenced asset in the normal course of pursuing their investment objectives. Certain Portfolios entered into total return swaps to manage their exposure to a security or an index. The Portfolios’ maximum risk of loss from counterparty credit risk is the change in the value of the security, in favor of the Portfolio, from the point of entering into the contract.
Floating Rate and other Loans: Certain Portfolios invested in floating rate and other loans. Floating rate and other loans include loans that are privately negotiated between a corporate borrower and one or more financial institutions, including, but not limited to, term loans, revolvers, and other instruments issued in the floating rate and other loans market. The Portfolios acquire interests in loans directly (by way of assignment from the selling institution) and/or indirectly (by way of the purchase of a participation interest from the selling institution). Under a floating rate and other loans assignment, the Portfolios generally will succeed to all the rights and obligations of an assigning lending institution and become a lender under the loan agreement with the relevant borrower in connection with that loan. Under a floating rate and other loans participation, the Portfolios generally will have a contractual relationship only with the lender, not with the relevant borrower. As a result, the Portfolios generally will have the right to receive payments of principal, interest, and any fees to which they are entitled only from the lender selling the participation and only upon receipt by the lender of the payments from the relevant borrower. The Portfolios may not directly benefit from the collateral supporting the debt obligation in which they have purchased the participation. As a result, the Portfolios will assume the credit risk of both the borrower and the institution selling the participation to the Portfolios.
Repurchase Agreements: Certain Portfolios entered into repurchase agreements. In connection with transactions in repurchase agreements with United States financial institutions, it is each Portfolio’s policy that its custodian or designated subcustodians under triparty repurchase agreements, as the case may be, take possession of the underlying collateral securities, the value of which exceeds the principal amount of the repurchase transactions, including accrued interest. To the extent that any repurchase transaction exceeds one business day, the value of the collateral is marked-to-market on a daily basis to ensure the adequacy of the collateral. If the seller defaults and the value of the collateral declines or, if bankruptcy proceedings are commenced with respect to the seller of the security, realization of the collateral by the Portfolio may be delayed or limited.
Mortgage-Backed and Asset-Backed Securities: Mortgage-backed securities are pass-through securities, meaning that principal and interest payments made by the borrower on the underlying mortgages are passed through to the Portfolio. Asset-backed securities directly or indirectly represent a participation interest in, or are secured by and payable from, a stream of payments generated by particular assets such as motor vehicle or credit card receivables. Asset-backed securities may be classified as pass-through certificates or collateralized obligations, such as collateralized bond obligations, collateralized loan obligations and other similarly structured securities. The value of mortgage-backed and asset-backed
B6
securities varies with changes in interest rates and may be affected by changes in credit quality or value of the mortgage loans or other assets that support the securities.
Stripped mortgage-backed securities are usually structured with two classes that receive different proportions of the interest (“IO”) and principal (“PO”) distributions on a pool of mortgage assets. Payments received for IOs are included in interest income on the Statements of Operations. Because no principal will be received at the maturity of an IO, adjustments are made to the cost of the security on a monthly basis until maturity. These adjustments are included in interest income on the Statements of Operations. Payments received for POs are treated as reductions to the cost and par value of the securities.
Master Netting Arrangements: The Series Fund, on behalf of certain Portfolios, is subject to various Master Agreements, or netting arrangements, with select counterparties. These are agreements which a subadviser may have negotiated and entered into on behalf of all or a portion of a Portfolio. For multi-sleeve Portfolios, different subadvisers who manage their respective sleeve, may enter into such agreements with the same counterparty and are disclosed separately for each sleeve when presenting information about offsetting and related netting arrangements for OTC derivatives. A master netting arrangement between the Portfolio and the counterparty permits the Portfolio to offset amounts payable by the Portfolio to the same counterparty against amounts to be received; and by the receipt of collateral from the counterparty by the Portfolios to cover the Portfolios’ exposure to the counterparty. However, there is no assurance that such mitigating factors are easily enforceable. In addition to master netting arrangements, the right to set-off exists when all the conditions are met such that each of the parties owes the other determinable amounts, the reporting party has the right to set-off the amount owed with the amount owed by the other party, the reporting party intends to set-off and the right of set-off is enforceable by law.
The Series Fund, on behalf of certain Portfolios, is a party to International Swaps and Derivatives Association, Inc. (“ISDA”) Master Agreements with certain counterparties that govern OTC derivative and foreign exchange contracts entered into from time to time. The Master Agreements may contain provisions regarding, among other things, the parties’ general obligations, representations, agreements, collateral requirements, events of default and early termination. With respect to certain counterparties, in accordance with the terms of the Master Agreements, collateral posted to the Portfolio is held in a segregated account by the Portfolio’s custodian and with respect to those amounts which can be sold or re-pledged, are presented in the Schedule of Investments. Collateral pledged by the Portfolio is segregated by the Portfolio’s custodian and identified in the Schedule of Investments. Collateral can be in the form of cash or debt securities issued by the U.S. Government or related agencies or other securities as agreed to by the Portfolio and the applicable counterparty. Collateral requirements are determined based on the Portfolio’s net position with each counterparty. Termination events applicable to the Portfolio may occur upon a decline in the Portfolio’s net assets below a specified threshold over a certain period of time. Termination events applicable to counterparties may occur upon a decline in the counterparty’s long-term and short-term credit ratings below a specified level. In each case, upon occurrence, the other party may elect to terminate early and cause settlement of all derivative and foreign exchange contracts outstanding, including the payment of any losses and costs resulting from such early termination, as reasonably determined by the terminating party. Any decision by one or more of the Portfolio’s counterparties to elect early termination could impact the Portfolio’s future derivative activity.
In addition to each instrument’s primary underlying risk exposure (e.g. interest rate, credit, equity or foreign exchange, etc.), swap agreements involve, to varying degrees, elements of credit, market and documentation risk. Such risks involve the possibility that no liquid market for these agreements will exist, the counterparty to the agreement may default on its obligation to perform or disagree on the contractual terms of the agreement, and changes in net interest rates will be unfavorable. In connection with these agreements, securities in a portfolio may be identified or received as collateral from the counterparty in accordance with the terms of the respective swap agreements to provide or receive assets of value and to serve as recourse in the event of default or bankruptcy/ insolvency of either party. Such OTC derivative agreements include conditions which, when materialized, give the counterparty the right to cause an early termination of the transactions under those agreements. Any election by the counterparty for early termination of the contract(s) may impact the amounts reported on financial statements.
Short sales and OTC contracts, including forward foreign currency exchange contracts, swaps, forward rate agreements and written options involve elements of both market and credit risk in excess of the amounts reflected on the Statement of Assets and Liabilities, if applicable. Such risks may be mitigated by engaging in master netting arrangements.
Warrants and Rights: Certain Portfolios held warrants and rights acquired either through a direct purchase or pursuant to corporate actions. Warrants and rights entitle the holder to buy a proportionate amount of common stock, or such other security that the issuer may specify, at a specific price and time through the expiration dates. Such warrants and rights are held as long positions by the Portfolios until exercised, sold or expired. Warrants and rights are valued at fair value in accordance with the Board approved fair valuation procedures.
B7
Payment-In-Kind: Certain fixed income Portfolios invested in the open market or received pursuant to debt restructuring, securities that pay-in-kind (PIK) the interest due on such debt instruments. The PIK interest, computed at the contractual rate specified, is added to the existing principal balance of the debt when issued bonds have same terms as the bond or recorded as a separate bond when terms are different from the existing debt, and is recorded as interest income.
Delayed-Delivery Transactions: Certain Portfolios purchased or sold securities on a when-issued or delayed-delivery and forward commitment basis. These transactions involve a commitment by the Portfolio to purchase or sell securities for a predetermined price or yield, with payment and delivery taking place beyond the customary settlement period. When delayed-delivery purchases are outstanding, the Portfolio will set aside and maintain an amount of liquid assets sufficient to meet the purchase price in a segregated account until the settlement date. When purchasing a security on a delayed-delivery basis, the Portfolio assumes the rights and risks of ownership of the security, including the risk of price and yield fluctuations, and takes such fluctuations into account when determining its net asset value. The Portfolio may dispose of or renegotiate a delayed-delivery transaction subsequent to establishment, and may sell when-issued securities before they are delivered, which may result in a realized gain (loss). When selling a security on a delayed-delivery basis, the Portfolio forfeits its eligibility to realize future gains (losses) with respect to the security.
Securities Lending: Certain Portfolios lend their portfolio securities to banks and broker-dealers. The loans are secured by collateral at least equal to the market value of the securities loaned. Collateral pledged by each borrower is invested in an affiliated money market fund and is marked to market daily, based on the previous day’s market value, such that the value of the collateral exceeds the value of the loaned securities. In the event of significant appreciation in value of securities on loan on the last business day of the reporting period, the financial statements may reflect a collateral value that is less than the market value of the loaned securities. Such shortfall is remedied as described above. Loans are subject to termination at the option of the borrower or the Portfolio. Upon termination of the loan, the borrower will return to the Portfolio securities identical to the loaned securities. The remaining open loans of the securities lending transactions are considered overnight and continuous. Should the borrower of the securities fail financially, the Portfolio has the right to repurchase the securities in the open market using the collateral.
The Portfolio recognizes income, net of any rebate and securities lending agent fees, for lending its securities in the form of fees or interest on the investment of any cash received as collateral. The borrower receives all interest and dividends from the securities loaned and such payments are passed back to the lender in amounts equivalent thereto, which are reflected in interest income or unaffiliated dividend income based on the nature of the payment on the Statement of Operations. The Portfolio also continues to recognize any unrealized gain (loss) in the market price of the securities loaned and on the change in the value of the collateral invested that may occur during the term of the loan. In addition, realized gain (loss) is recognized on changes in the value of the collateral invested upon liquidation of the collateral. Net earnings from securities lending are disclosed in the Statement of Operations.
Mortgage Dollar Rolls: Certain Portfolios entered into mortgage dollar rolls in which the Portfolios sell mortgage securities for delivery in the current month, realizing a gain (loss), and simultaneously enter into contracts to repurchase somewhat similar (same type, coupon and maturity) securities on a specified future date. During the roll period, the Portfolios forgo principal and interest paid on the securities. The Portfolios are compensated by the interest earned on the cash proceeds of the initial sale and by the lower repurchase price at the future date. The difference between the sale proceeds and the lower repurchase price is recorded as a realized gain on investment transactions. The Portfolios maintain a segregated account, the dollar value of which is at least equal to its obligations, with respect to dollar rolls. The Portfolios are subject to the risk that the market value of the securities the Portfolios are obligated to repurchase under the agreement may decline below the repurchase price.
Equity and Mortgage Real Estate Investment Trusts (collectively REITs): Certain Portfolios invested in REITs, which report information on the source of their distributions annually. Based on current and historical information, a portion of distributions received from REITs during the period is estimated to be dividend income, capital gain or return of capital and recorded accordingly. When material, these estimates are adjusted periodically when the actual source of distributions is disclosed by the REITs.
Securities Transactions and Net Investment Income: Securities transactions are recorded on the trade date. Realized gains (losses) from investment and currency transactions are calculated on the specific identification method. Dividend income is recorded on the ex-date, or for certain foreign securities, when the Portfolios become aware of such dividends. Interest income, including amortization of premium and accretion of discount on debt securities, as required, is recorded on the accrual basis. Expenses are recorded on an accrual basis, which may require the use of certain estimates by management that may differ from actual. For Portfolios with multiple classes of shares, net investment income or loss (other than administration and distribution fees which are charged directly to the respective class) and unrealized and realized gains (losses) are allocated daily to each class of shares based upon the relative proportion of adjusted net assets of each class
B8
at the beginning of the day.
Taxes: For federal income tax purposes, each Portfolio is treated as a separate taxpaying entity. Each Portfolio is treated as a partnership for tax purposes. No provision has been made in the financial statements for U.S. federal, state, or local taxes, as any tax liability arising from operations of the Portfolios is the responsibility of the Portfolio’s shareholders (participating insurance companies). Each Portfolio is not generally subject to entity-level taxation. Shareholders of each Portfolio are subject to taxes on their distributive share of partnership items. Withholding taxes on foreign dividends, interest and capital gains are accrued in accordance with each Portfolio’s understanding of the applicable country’s tax rules and regulations. Such taxes are accrued net of reclaimable amounts, at the time the related income/gain is recorded taking into account any agreements in place with Prudential Financial, Inc. (“Prudential”) as referenced below. Each Portfolio generally attempts to manage its diversification in a manner that supports the diversification requirements of the underlying separate accounts.
Distributions: Distributions, if any, from each Portfolio are made in cash and automatically reinvested in additional shares of the Portfolio. The Government Money Market Portfolio declares and reinvests distributions, if any, daily. Distributions are recorded on the ex-date.
Estimates: The preparation of financial statements requires management to make estimates and assumptions that affect the reported amounts and disclosures in the financial statements. Actual results could differ from those estimates.
3. Agreements
The Series Fund, on behalf of the Portfolios, has entered into manager agreements with the Manager which provide that the Manager will furnish each Portfolio with investment advice, investment management and administrative services. The Manager has engaged the firms referenced in the below table as subadvisers for their respective Portfolios. Subadvisory fees are paid by the Manager out of the management fee that it receives from the Portfolios.
| | |
| | |
| Portfolio | | Subadviser(s) |
PSF Global Portfolio | | LSV Asset Management (“LSV”); PGIM Quantitative Solutions LLC (“PGIM Quantitative Solutions”) (a wholly-owned subsidiary of PGIM, Inc.); T. Rowe Price Associates, Inc. (“T. Rowe”) & William Blair & Co. LLC (“William Blair”); Effective April 23, 2022, Massachusetts Financial Services, Inc. (“MFS”); Until April 22, 2022, Brown Advisory LLC (“Brown”) |
PSF International Growth Portfolio | | Jennison Associates LLC (“Jennison”) (a wholly-owned subsidiary of PGIM, Inc.); Neuberger Berman Investment Advisors, LLC (“Neuberger Berman”) & William Blair |
PSF Mid-Cap Growth Portfolio | | J.P. Morgan Investment Management, Inc. (“J.P. Morgan”) |
PSF Natural Resources Portfolio | | Until June 30, 2022, Allianz Global Investors U.S. LLC (“Allianz”); Effective June 15, 2022, T. Rowe |
PSF PGIM 50/50 Balanced Portfolio | | PGIM Fixed Income (“PFI”) (a business unit of PGIM, Inc.); PGIM Limited & PGIM Quantitative Solutions |
PSF PGIM Flexible Managed Portfolio | | PFI; PGIM Limited & PGIM Quantitative Solutions |
PSF PGIM Government Income Portfolio | | PFI |
PSF PGIM Government Money Market Portfolio | | PFI |
PSF PGIM High Yield Bond Portfolio | | PFI & PGIM Limited |
PSF PGIM Jennison Blend Portfolio | | Jennison |
PSF PGIM Jennison Focused Blend Portfolio | | Jennison |
PSF PGIM Jennison Growth Portfolio | | Jennison |
PSF PGIM Jennison Value Portfolio | | Jennison |
PSF PGIM Total Return Bond Portfolio | | PFI & PGIM Limited |
PSF Small-Cap Stock Index Portfolio | | PGIM Quantitative Solutions |
PSF Small-Cap Value Portfolio | | Goldman Sachs Asset Management, L.P. |
PSF Stock Index Portfolio | | PGIM Quantitative Solutions |
The management fee paid to the Manager is accrued daily and payable monthly, using the value of each Portfolio’s average
B9
daily net assets, at the respective annual rates specified below.
| | | | | | |
| Portfolio | | Management Fee | | Effective Management Fee, Net of Waiver, if Applicable |
| | |
PSF Global Portfolio | | 0.75% | | | 0.71 | %* |
| | |
PSF International Growth Portfolio | | 0.85 | | | 0.64 | ** |
| | |
PSF Mid-Cap Growth Portfolio | | 0.60 | | | 0.60 | *** |
| | |
PSF Natural Resources Portfolio | | 0.45 | | | 0.44 | **** |
| | |
PSF PGIM 50/50 Balanced Portfolio | | 0.55 | | | 0.55 | |
| | |
PSF PGIM Flexible Managed Portfolio | | 0.60 | | | 0.60 | |
| | |
PSF PGIM Government Income Portfolio | | 0.40 | | | 0.40 | |
| | |
PSF PGIM Government Money Market Portfolio | | 0.30 | | | 0.25 | ***** |
| | |
PSF PGIM High Yield Bond Portfolio | | 0.55 | | | 0.52 | ****** |
| | |
PSF PGIM Jennison Blend Portfolio | | 0.45 | | | 0.45 | |
| | |
PSF PGIM Jennison Focused Blend Portfolio | | 0.75 | | | 0.75 | |
| | |
PSF PGIM Jennison Growth Portfolio | | 0.60 | | | 0.60 | |
| | |
PSF PGIM Jennison Value Portfolio | | 0.40 | | | 0.40 | |
| | |
PSF PGIM Total Return Bond Portfolio | | 0.40 | | | 0.40 | |
| | |
PSF Small-Cap Stock Index Portfolio | | 0.35 | | | 0.35 | |
| | |
PSF Small-Cap Value Portfolio | | 0.90 | | | 0.90 | ******* |
| | |
PSF Stock Index Portfolio | | 0.30% up to $ 4 billion | | | | |
| | |
| | | 0.25% over $ 4 billion | | | 0.28 | |
| * | The Manager has contractually agreed, through June 30, 2022, to waive a portion of its management fee equal to an annual rate of 0.0363% of the average daily net assets of the Portfolio. Effective April 23, 2022, the Manager has contractually agreed to waive an additional 0.012% of its investment management fee through June 30, 2023. Effective July 1, 2022, the Manager has contractually agreed to waive 0.0345% of its investment management fee through June 30, 2023. |
| ** | The Manager has contractually agreed, through June 30, 2023, to waive a portion of its management fee equal to an annual rate of 0.019% of the average daily net assets of the Portfolio. The Manager has also contractually agreed through June 30, 2023 to limit the net annual operating expenses (exclusive of distribution and service (12b-1) fees, administrative fees, taxes (such as income and foreign withholdings taxes, stamp duty and deferred tax expenses), interest, underlying funds, brokerage, extraordinary and certain other expenses such as dividend, broker charges and interest expense on short sales) of each class of shares of the Portfolio to 1.01% of the Portfolio’s average daily net assets. Where applicable, the Manager agrees to waive management fees or shared operating expenses on any share class to the same extent that it waives such expenses on any other share class. Expenses waived/reimbursed by the Manager in accordance with this agreement for the purpose of preventing the expenses from exceeding a certain expense ratio limit may be recouped by the Manager within the same fiscal year during which such waiver/reimbursement is made if such recoupment can be realized without exceeding the expense limit in effect at the time of the recoupment for that fiscal year. |
| *** | Effective December 3, 2022, the Manager has contractually agreed to waive 0.013% of its investment management fee through June 30, 2024. |
| **** | The Manager has contractually agreed, through June 30, 2023, to waive a portion of its management fee equal to an annual rate of 0.008% of the average daily net assets of the Portfolio. |
| ***** | The Manager has voluntarily agreed to limit the management fee of the Government Money Market Portfolio such that the 1-day yield of the Portfolio, excluding realized gain (loss) on investment transactions, does not fall below 0.00%. The waiver/reimbursement is voluntary and may be modified or terminated by the Manager at any time without notice. During the year ended December 31, 2022, the Manager has reimbursed the Portfolio as a result of this voluntary agreement in the amount of $503,441, 0.05% of the Government Money Market Portfolio’s average daily net assets. |
| ****** | The Manager has contractually agreed through June 30, 2023 to limit the net annual operating expenses (exclusive of distribution and service (12b-1) fees, administrative fees, taxes (such as income and foreign withholdings taxes, stamp duty and deferred tax expenses), interest, acquired fund fees and expenses, brokerage, extraordinary and certain other expenses such as dividend, broker charges and interest expense on short sales) of the Portfolio to 0.57% of the Portfolio’s average daily net assets. Where applicable, the Manager agrees to waive management fees or shared operating expenses on any share class to the same extent that it waives such expenses on any other share class. Expenses waived/reimbursed by the Manager in accordance with this agreement for the purpose of preventing the expenses from exceeding a certain expense ratio limit may be recouped by the Manager within the same fiscal year during which such waiver/reimbursement is made if such recoupment can be realized without exceeding the expense limit in effect at the time of the recoupment for that fiscal year. |
| ******* | The Manager has contractually agreed through June 30, 2023 to limit the net annual operating expenses (exclusive of distribution and service (12b-1) fees, administrative fees, taxes (such as income and foreign withholdings taxes, stamp duty and deferred tax expenses), interest, acquired fund fees and expenses, brokerage, extraordinary and certain other expenses such as dividend, broker charges and interest expense on short sales) of the Portfolio to 0.97% of the Portfolio’s average daily net assets. Where applicable, the Manager agrees to waive management fees or shared operating expenses on any share class to the same extent that it waives such expenses on any other share class. Expenses waived/reimbursed by the Manager in accordance with this agreement for the purpose of preventing the expenses from exceeding a certain expense ratio limit may be recouped by the Manager within the same fiscal year during which such waiver/reimbursement is made if such recoupment can be realized without exceeding the expense limit in effect at the time of the recoupment for that fiscal year. |
B10
The Series Fund, on behalf of the Portfolios, has a distribution agreement, pursuant to Rule 12b-1 under the 1940 Act, with Prudential Investment Management Services LLC (“PIMS”), which acts as the distributor of the Class I, Class II and Class III shares of the Portfolios. The Portfolios compensate PIMS for distributing and servicing the Portfolios’ Class II and Class III shares pursuant to a plan of distribution (the “Class II Plan” and “Class III Plan”, together, the Plans), regardless of expenses actually incurred by PIMS. The distribution fees are accrued daily and payable monthly. No distribution or service fees are paid to PIMS as distributor of the Class I shares of the Portfolios. Pursuant to the Plans, the Class II and Class III shares of each Portfolio compensate PIMS for distribution-related activities at an annual rate of 0.25% of the average daily net assets of the Class II and Class III shares. In order to support the Portfolio’s income yield, PIMS has voluntarily undertaken to waive the distribution and service (12b-1) fees of the Government Money Market Portfolio Class III shares, respectively, such that the 1-day income yield (excluding capital gain (loss)) does not fall below 0.00%.
The Series Fund has an administration agreement with the Manager, which acts as the administrator of the Class II shares of the Portfolios. The administration fee paid to the Manager is accrued daily and payable monthly, at the annual rate of 0.15% of the average daily net assets of the Class II shares.
The Series Fund, on behalf of the Portfolios, has entered into brokerage commission recapture agreements with certain registered broker-dealers. Under the brokerage commission recapture program, a portion of the commission is returned to the Portfolio on whose behalf the trades were made. Commission recapture is paid solely to those Portfolios generating the applicable trades. Such amounts are included within realized gain (loss) on investment transactions presented in the Statement of Operations. For the year ended December 31, 2022, brokerage commission recaptured under these agreements was as follows:
| | | | |
| | |
| Portfolio | | Amount | |
PSF Global Portfolio | | $ | 27,741 | |
PSF International Growth Portfolio | | | 4,402 | |
PSF Mid-Cap Growth Portfolio | | | 6,324 | |
PSF PGIM Jennison Blend Portfolio | | | 66,041 | |
PSF PGIM Jennison Focused Blend Portfolio | | | 2,523 | |
PSF PGIM Jennison Growth Portfolio | | | 51,710 | |
PSF PGIM Jennison Value Portfolio | | | 21,875 | |
PIMS, PGIM Investments, PGIM, Inc., PGIM Limited, PGIM Quantitative Solutions and Jennison are indirect, wholly-owned subsidiaries of Prudential.
4. Other Transactions with Affiliates
a.) Related Parties
Prudential Mutual Fund Services LLC (“PMFS”), an affiliate of PGIM Investments and an indirect, wholly-owned subsidiary of Prudential, serves as the transfer agent and shareholder servicing agent of the Portfolios. The transfer agent’s fees and expenses in the Statement of Operations include certain out-of-pocket expenses paid to non-affiliates, where applicable.
The Portfolios may invest their overnight sweep cash in the PGIM Core Ultra Short Bond Fund (the “Core Fund”) and their securities lending cash collateral in the PGIM Institutional Money Market Fund (the “Money Market Fund”), each a series of Prudential Investment Portfolios 2, registered under the 1940 Act and managed by PGIM Investments. The Portfolios may also invest in the PGIM Core Short-Term Bond Fund, pursuant to an exemptive order received from the Securities Exchange Commission (“SEC”), a series of Prudential Investment Portfolios 2 (together with PGIM Core Ultra Short Bond Fund, the “Core Funds”) registered under the 1940 Act and managed by PGIM Investments. PGIM Investments and/or its affiliates are paid fees or reimbursed for providing their services to the Core Fund and the Money Market Fund. In addition to the realized and unrealized gains on investments in the Core Funds and Money Market Fund, earnings from such investments are disclosed on the Statement of Operations as “Affiliated dividend income” and “Income from securities lending, net”, respectively. Effective January 2022, certain Portfolios changed their overnight cash sweep vehicle from the Core Fund to an unaffiliated money market fund.
Certain Portfolios may enter into certain securities purchase or sale transactions under Board approved Rule 17a-7 procedures. Rule 17a-7 is an exemptive rule under the 1940 Act, that subject to certain conditions, permits purchase and sale transactions among affiliated investment companies, or between an investment company and a person that is affiliated solely by reason of having a common (or affiliated) investment adviser, common directors/trustees, and/or common officers.
For the year ended December 31, 2022, the Portfolios’ purchase and sales transactions under Rule 17a-7 and realized gain
B11
(loss) as a result of 17a-7 sales transactions were as follows:
| | | | | | |
| | | | |
| Portfolio | | Purchases | | Sales | | Realized
Gain (Loss) |
PSF Global Portfolio | | $418,113 | | $— | | $— |
b.) Foreign Withholding Tax Reclaims
The Portfolios are considered partnerships for tax purposes rather than regulated investment companies (RICs). As a result of their partnership status, the Portfolios are subject to higher foreign withholding tax rates on dividend and interest income in certain foreign jurisdictions and/or are subject to delays in repayment of taxes withheld by certain foreign jurisdictions (collectively, “excess withholding tax”).
Prudential instituted a process in consultation with the Series Fund’s independent trustees to reimburse the affected Portfolios for any excess withholding tax on the first business day following the pay-date of the applicable dividend or interest income event regardless of whether the excess withholding tax is due to timing differences (i.e., jurisdictions in which the Portfolio was subject to a higher withholding tax rate due to its tax status which is reclaimable) or permanent detriments (i.e., jurisdictions in which the Portfolio was subject to a higher withholding tax rate due to its tax status which is not reclaimable) resulting from the Portfolios’ partnership tax status.
In cases in which the excess withholding tax is due to timing differences and is reclaimable from the foreign jurisdiction, the affected Portfolios have the ability to recover the excess withholding tax withheld by filing a reclaim with the relevant foreign tax authority. To avoid a Portfolio receiving and retaining a duplicate payment for the same excess withholding tax, payments received by an applicable Portfolio from a foreign tax authority for reclaims for which a Portfolio previously received reimbursement from Prudential will be payable to Prudential. Pending tax reclaim amounts due to Prudential for excess withholding tax which Prudential previously paid to the Portfolios are reported as “Payable to affiliate” on the “Statement of Assets and Liabilities” and any amounts accrued but not yet reimbursed by Prudential for excess withholding tax is recorded as “Receivable from affiliate” on the Statement of Assets and Liabilities. The full amount of tax reclaims due to a Portfolio, inclusive of timing differences and routine tax reclaims for foreign jurisdictions where the Portfolios do not incur an excess withholding tax is included as “Tax reclaim receivable” on the “Statement of Assets and Liabilities.” To the extent that there are costs associated with the filing of any reclaim attributable to excess withholding tax, those costs are borne by Prudential.
The following amounts have been paid by Prudential for excess withholding taxes related to permanent tax detriments as described above for certain countries due to the Portfolios’ status as partnerships for tax purposes.
| | | | |
| | |
| Portfolio | | 2022 Payments |
| |
PSF Global Portfolio | | | $183,783 | |
PSF International Growth Portfolio | | | 19,107 | |
PSF Natural Resources Portfolio | | | 23,953 | |
PSF PGIM 50/50 Balanced Portfolio | | | 21,630 | |
PSF PGIM Flexible Managed Portfolio | | | 28,259 | |
PSF PGIM High Yield Bond Portfolio | | | 948 | |
PSF PGIM Jennison Blend Portfolio | | | 17,374 | |
PSF PGIM Jennison Focused Blend Portfolio | | | 1,021 | |
PSF PGIM Jennison Growth Portfolio | | | 123,435 | |
PSF PGIM Jennison Value Portfolio | | | 11,457 | |
PSF Small-Cap Stock Index Portfolio | | | 50 | |
PSF Small-Cap Value Portfolio | | | 484 | |
The following amounts have been paid by Prudential for excess withholding taxes related to timing differences as described above for certain countries due to the Portfolios’ status as partnerships for tax purposes.
| | | | |
| | |
| Portfolio | | 2022 Payments |
PSF Global Portfolio | | | $227,965 | |
PSF International Growth Portfolio | | | 25,292 | |
PSF Natural Resources Portfolio | | | 385,100 | |
PSF PGIM 50/50 Balanced Portfolio | | | 14,710 | |
PSF PGIM Flexible Managed Portfolio | | | 19,572 | |
PSF PGIM Jennison Blend Portfolio | | | 103,367 | |
B12
| | | | |
| | |
| Portfolio | | 2022 Payments |
PSF PGIM Jennison Focused Blend Portfolio | | | $ 5,236 | |
PSF PGIM Jennison Growth Portfolio | | | 97,241 | |
PSF Small-Cap Value Portfolio | | | 2,986 | |
5. Portfolio Securities
The aggregate cost of purchases and proceeds from sales of portfolio securities (excluding short-term investments and U.S. Government securities) for the year ended December 31, 2022, were as follows:
| | | | | | | | |
| | | |
| Portfolio | | Cost of Purchases | | | Proceeds from Sales | |
PSF Global Portfolio | | $ | 645,396,136 | | | $ | 675,884,028 | |
PSF International Growth Portfolio | | | 40,845,930 | | | | 46,704,236 | |
PSF Mid-Cap Growth Portfolio | | | 140,427,196 | | | | 145,911,010 | |
PSF Natural Resources Portfolio | | | 552,799,713 | | | | 548,294,431 | |
PSF PGIM 50/50 Balanced Portfolio | | | 2,054,660,129 | | | | 2,088,413,889 | |
PSF PGIM Flexible Managed Portfolio | | | 5,475,563,822 | | | | 5,669,795,161 | |
PSF PGIM Government Income Portfolio | | | 241,145,642 | | | | 225,217,474 | |
PSF PGIM Government Money Market Portfolio | | | — | | | | — | |
PSF PGIM High Yield Bond Portfolio | | | 124,213,348 | | | | 135,781,766 | |
PSF PGIM Jennison Blend Portfolio | | | 1,087,549,582 | | | | 1,347,018,010 | |
PSF PGIM Jennison Focused Blend Portfolio | | | 77,762,332 | | | | 91,926,264 | |
PSF PGIM Jennison Growth Portfolio | | | 837,476,383 | | | | 981,189,081 | |
PSF PGIM Jennison Value Portfolio | | | 330,313,694 | | | | 377,838,575 | |
PSF PGIM Total Return Bond Portfolio | | | 2,164,002,984 | | | | 2,108,649,804 | |
PSF Small-Cap Stock Index Portfolio | | | 149,637,373 | | | | 191,746,135 | |
PSF Small-Cap Value Portfolio | | | 171,064,497 | | | | 161,934,892 | |
PSF Stock Index Portfolio | | | 237,266,448 | | | | 178,665,288 | |
A summary of the cost of purchases and proceeds from sales of shares of affiliated mutual funds for the year ended December 31, 2022, is presented as follows:
PSF Global Portfolio
| | | | | | | | | | | | | | | | | | | | | | | | | | | | |
| | | | | | | | |
Value,
Beginning
of Year | | Cost of
Purchases | | | Proceeds
from Sales | | | Change in
Unrealized
Gain
(Loss) | | | Realized
Gain
(Loss) | | | Value, End of Year | | | Shares,
End of Year | | | Income | |
Short-Term Investments - Affiliated Mutual Funds: | | | | | | | | | | | | | | | | | |
| | | | | | |
PGIM Core Ultra Short Bond Fund(1)(wa) | | | | | | | | | | | | | | | | | | | | | |
| | | | | | | | |
| $33,642,687 | | | $183,409,545 | | | | $196,229,395 | | | | $ — | | | | $ — | | | | $20,822,837 | | | | 20,822,837 | | | | $333,216 | |
| | | | | | |
PGIM Institutional Money Market Fund(1)(b)(wa) | | | | | | | | | | | | | | | | | | | | | |
| | | | | | | |
| 17,773,029 | | | 424,263,596 | | | | 395,546,798 | | | | 15,218 | | | | 6,949 | | | | 46,511,994 | | | | 46,535,263 | | | | 74,071 | (2) |
| $51,415,716 | | | $607,673,141 | | | | $591,776,193 | | | | $15,218 | | | | $6,949 | | | | $67,334,831 | | | | | | | | $407,287 | |
PSF International Growth Portfolio
| | | | | | | | | | | | | | | | | | | | | | | | |
| | | | | | | | |
Value,
Beginning
of Year | | Cost of
Purchases | | Proceeds
from Sales | | Change in
Unrealized
Gain
(Loss) | | | Realized
Gain
(Loss) | | | Value,
End of Year | | | Shares,
End of Year | | | Income | |
Short-Term Investments - Affiliated Mutual Funds: | | | | | | | | | | | | | | | | | |
| | | | | |
PGIM Core Ultra Short Bond Fund(1)(wa) | | | | | | | | | | | | | | | | | | | | |
| $ 602,494 | | $17,987,148 | | $17,791,842 | | | $ — | | | | $ — | | | | $ 797,800 | | | | 797,800 | | | | $24,644 | |
B13
| | | | | | | | | | | | | | | | |
| | | | | | | | |
Value,
Beginning
of Year | | Cost of
Purchases | | Proceeds
from Sales | | Change in
Unrealized
Gain
(Loss) | | Realized
Gain
(Loss) | | Value,
End of Year | | Shares,
End of Year | | Income | |
|
PGIM Institutional Money Market Fund(1)(b)(wa) | |
| | | | | | | |
| $1,369,078 | | $30,400,011 | | $28,489,476 | | $1,272 | | $(162) | | $3,280,723 | | 3,282,365 | | | $ 3,705 | (2) |
| $1,971,572 | | $48,387,159 | | $46,281,318 | | $1,272 | | $(162) | | $4,078,523 | | | | | $28,349 | |
PSF Mid-Cap Growth Portfolio
| | | | | | | | | | | | | | | | | | | | | | | | | | | | |
| | | | | | | | |
Value,
Beginning
of Year | | Cost of
Purchases | | | Proceeds
from Sales | | | Change in
Unrealized
Gain
(Loss) | | | Realized
Gain
(Loss) | | | Value, End of Year | | | Shares,
End of Year | | | Income | |
|
Short-Term Investments - Affiliated Mutual Funds: | |
| | | | |
PGIM Core Ultra Short Bond Fund(1)(wa) | | | | | | | | | | | | | | | | | |
| $ 6,531,135 | | $ | 64,410,103 | | | $ | 62,600,718 | | | | $ — | | | | $ — | | | | $ 8,340,520 | | | | 8,340,520 | | | | $176,715 | |
| | | | |
PGIM Institutional Money Market Fund(1)(b)(wa) | | | | | | | | | | | | | | | | | |
| 30,996,082 | | | 457,228,550 | | | | 443,076,595 | | | | 12,950 | | | | 7,708 | | | | 45,168,695 | | | | 45,191,291 | | | | 77,485 | (2) |
| $37,527,217 | | | $521,638,653 | | | $ | 505,677,313 | | | | $12,950 | | | | $7,708 | | | | $53,509,215 | | | | | | | | $254,200 | |
PSF Natural Resources Portfolio
| | | | | | | | | | | | | | | | | | | | | | | | | | | | |
| | | | | | | | |
Value,
Beginning
of Year | | Cost of
Purchases | | | Proceeds
from Sales | | | Change in
Unrealized
Gain
(Loss) | | | Realized
Gain
(Loss) | | | Value,
End of Year | | | Shares,
End of Year | | | Income | |
|
Short-Term Investments - Affiliated Mutual Funds: | |
| | | | |
PGIM Core Ultra Short Bond Fund(1)(wa) | | | | | | | | | | | | | | | | | |
| $ 2,305,472 | | | $173,006,291 | | | | $166,783,149 | | | | $ — | | | | $ — | | | | $8,528,614 | | | | 8,528,614 | | | $ | 120,340 | |
| | | | |
PGIM Institutional Money Market Fund(1)(b)(wa) | | | | | | | | | | | | | | | | | |
| 23,385,947 | | | 181,008,673 | | | | 204,393,369 | | | | (18,740 | ) | | | 17,489 | | | | — | | | | — | | | | 17,334 | (2) |
| $25,691,419 | | | $354,014,964 | | | | $371,176,518 | | | | $(18,740 | ) | | | $17,489 | | | | $8,528,614 | | | | | | | $ | 137,674 | |
PSF PGIM 50/50 Balanced Portfolio
| | | | | | | | | | | | | | | | | | | | | | | | | | | | |
| | | | | | | | |
Value,
Beginning of Year | | Cost of
Purchases | | | Proceeds
from Sales | | | Change in
Unrealized
Gain
(Loss) | | | Realized
Gain
(Loss) | | | Value, End of Year | | | Shares,
End of Year | | | Income | |
|
Short-Term Investments - Affiliated Mutual Funds: | |
| | | | |
PGIM Core Ultra Short Bond Fund(1)(wa) | | | | | | | | | | | | | | | | | |
| $363,398,511 | | | $452,246,254 | | | | $549,653,174 | | | | $ — | | | | $ — | | | | $265,991,591 | | | | 265,991,591 | | | $ | 6,119,960 | |
| | | | |
PGIM Institutional Money Market Fund(1)(b)(wa) | | | | | | | | | | | | | | | | | |
| 35,533,049 | | | 365,343,978 | | | | 354,753,306 | | | | 5,262 | | | | 16,548 | | | | 46,145,531 | | | | 46,168,616 | | | | 77,097 | (2) |
| $398,931,560 | | | $817,590,232 | | | | $904,406,480 | | | | $5,262 | | | | $16,548 | | | | $312,137,122 | | | | | | | $ | 6,197,057 | |
PSF PGIM Flexible Managed Portfolio
| | | | | | | | | | | | | | | | | | | | | | | | | | | | |
| | | | | | | | |
Value,
Beginning of Year | | Cost of
Purchases | | | Proceeds
from Sales | | | Change in
Unrealized
Gain
(Loss) | | | Realized
Gain
(Loss) | | | Value, End of Year | | | Shares,
End of Year | | | Income | |
| | |
| Short-Term Investments - Affiliated Mutual Funds: | | | | | | | | | |
| | |
| PGIM Core Ultra Short Bond Fund(1)(wa) | | | | | | | | | |
| | | | | | | |
| $303,840,636 | | | $ 923,263,159 | | | | $ 989,280,094 | | | | $ — | | | | $ — | | | | $237,823,701 | | | | 237,823,701 | | | | $6,847,036 | |
B14
| | | | | | | | | | | | | | | | | | | | | | | | | | | | |
| | | | | | | | |
Value,
Beginning of Year | | Cost of
Purchases | | | Proceeds from Sales | | | Change in
Unrealized
Gain
(Loss) | | | Realized
Gain
(Loss) | | | Value, End of Year | | | Shares,
End of Year | | | Income | |
|
PGIM Institutional Money Market Fund(1)(b)(wa) | |
| | | | | | | |
| $ 45,515,856 | | | $ 516,567,118 | | | | $ 502,165,246 | | | | $23,713 | | | | $7,556 | | | | $ 59,948,997 | | | | 59,978,986 | | | | $ 87,538 | (2) |
| $349,356,492 | | | $1,439,830,277 | | | | $1,491,445,340 | | | | $23,713 | | | | $7,556 | | | | $297,772,698 | | | | | | | | $6,934,574 | |
PSF PGIM Government Income Portfolio
| | | | | | | | | | | | | | | | | | | | | | | | | | | | |
| | | | | | | | |
Value,
Beginning
of Year | | Cost of
Purchases | | | Proceeds
from Sales | | | Change in
Unrealized
Gain
(Loss) | | | Realized
Gain
(Loss) | | | Value,
End of Year | | | Shares,
End of Year | | | Income | |
Short-Term Investments - Affiliated Mutual Funds: | |
| | | | | |
PGIM Core Ultra Short Bond Fund(1)(wa) | | | | | | | | | | | | | | | | | | | | | |
| $7,919,849 | | | $83,451,125 | | | | $85,068,825 | | | | $— | | | | $ — | | | | $6,302,149 | | | | 6,302,149 | | | | $127,982 | |
| | | | | |
PGIM Institutional Money Market Fund(1)(b)(wa) | | | | | | | | | | | | | | | | | | | | | |
| — | | | 14,449,266 | | | | 14,446,362 | | | | — | | | | (2,904 | ) | | | — | | | | — | | | | 802 | (2) |
| $7,919,849 | | | $97,900,391 | | | | $99,515,187 | | | | $— | | | | $(2,904 | ) | | | $6,302,149 | | | | | | | | $128,784 | |
PSF PGIM High Yield Bond Portfolio
| | | | | | | | | | | | | | | | | | | | | | | | | | | | |
| | | | | | | | |
Value,
Beginning of Year | | Cost of
Purchases | | | Proceeds
from Sales | | | Change in
Unrealized
Gain
(Loss) | | | Realized
Gain
(Loss) | | | Value, End of Year | | | Shares,
End of Year | | | Income | |
Short-Term Investments - Affiliated Mutual Funds: | |
| | | | | |
PGIM Core Ultra Short Bond Fund(1)(wa) | | | | | | | | | | | | | | | | | | | | | |
| $ 30,025,859 | | | $124,391,408 | | | | $134,799,130 | | | | $ — | | | | $ — | | | | $ 19,618,137 | | | | 19,618,137 | | | | $429,970 | |
| | | | | |
PGIM Institutional Money Market Fund(1)(b)(wa) | | | | | | | | | | | | | | | | | | | | | |
| 172,978,975 | | | 403,634,502 | | | | 490,290,928 | | | | 42,781 | | | | (10,212 | ) | | | 86,355,118 | | | | 86,398,318 | | | | 227,644 | (2) |
| $203,004,834 | | | $528,025,910 | | | | $625,090,058 | | | | $42,781 | | | | $(10,212 | ) | | | $105,973,255 | | | | | | | | $657,614 | |
PSF PGIM Jennison Blend Portfolio
| | | | | | | | | | | | | | | | | | | | | | | | | | | | |
| | | | | | | | |
Value,
Beginning of Year | | Cost of
Purchases | | | Proceeds
from Sales | | | Change in
Unrealized
Gain
(Loss) | | | Realized
Gain
(Loss) | | | Value, End of Year | | | Shares,
End of Year | | | Income | |
Short-Term Investments - Affiliated Mutual Funds: | |
| | | | | |
PGIM Core Ultra Short Bond Fund(1)(wa) | | | | | | | | | | | | | | | | | | | | | |
| $ 96,848,898 | | | $ 621,325,549 | | | | $ 637,611,785 | | | | $ — | | | | $ — | | | | $ 80,562,662 | | | | 80,562,662 | | | | $1,267,466 | |
| | | | | |
PGIM Institutional Money Market Fund(1)(b)(wa) | | | | | | | | | | | | | | | | | | | | | |
| 124,217,579 | | | 1,187,900,869 | | | | 1,228,387,171 | | | | (35,063 | ) | | | 74,496 | | | | 83,770,710 | | | | 83,812,616 | | | | 151,316 | (2) |
| $221,066,477 | | | $1,809,226,418 | | | | $1,865,998,956 | | | | $(35,063 | ) | | | $74,496 | | | | $164,333,372 | | | | | | | | $1,418,782 | |
PSF PGIM Jennison Focused Blend Portfolio
| | | | | | | | | | | | | | | | | | |
| | | | | | | | |
Value,
Beginning
of Year | | Cost of
Purchases | | Proceeds
from Sales | | Change in
Unrealized
Gain
(Loss) | | Realized
Gain
(Loss) | | Value,
End of Year | | | Shares,
End of Year | | | Income |
Short-Term Investments - Affiliated Mutual Funds: |
| | | |
PGIM Core Ultra Short Bond Fund(1)(wa) | | | | | | | | | | |
| $3,266,051 | | $48,508,291 | | $44,794,125 | | $— | | $ — | | | $6,980,217 | | | | 6,980,217 | | | $121,731 |
B15
| | | | | | | | | | | | | | | | | | | | |
| | | | | | | | |
Value,
Beginning
of Year | | Cost of
Purchases | | Proceeds
from Sales | | Change in
Unrealized
Gain
(Loss) | | Realized
Gain
(Loss) | | Value,
End of Year | | | Shares,
End of Year | | | Income | |
|
PGIM Institutional Money Market Fund(1)(b)(wa) | |
| | | | | | | |
| $3,667,845 | | $50,151,146 | | $53,818,808 | | $(8) | | $(175) | | | $ — | | | | — | | | $ | 2,990 | (2) |
| $6,933,896 | | $98,659,437 | | $98,612,933 | | $(8) | | $(175) | | | $6,980,217 | | | | | | | $ | 124,721 | |
PSF PGIM Jennison Growth Portfolio
| | | | | | | | | | | | | | | | | | | | | | | | | | | | |
| | | | | | | | |
Value,
Beginning
of Year | | Cost of
Purchases | | | Proceeds
from Sales | | | Change in
Unrealized
Gain
(Loss) | | | Realized
Gain
(Loss) | | | Value, End of Year | | | Shares,
End of Year | | | Income | |
Short-Term Investments - Affiliated Mutual Funds: | |
| | | | | |
PGIM Core Ultra Short Bond Fund(1)(wa) | | | | | | | | | | | | | | | | | | | | | |
| $16,926,102 | | | $ 478,715,090 | | | | $ 481,179,724 | | | | $ — | | | | $ — | | | | $ 14,461,468 | | | | 14,461,468 | | | $ | 511,768 | |
| | | | | |
PGIM Institutional Money Market Fund(1)(b)(wa) | | | | | | | | | | | | | | | | | | | | | |
| 64,603,383 | | | 1,138,500,738 | | | | 1,110,584,124 | | | | 26,651 | | | | 52,299 | | | | 92,598,947 | | | | 92,645,270 | | | | 157,970 | (2) |
| $81,529,485 | | | $1,617,215,828 | | | | $1,591,763,848 | | | | $26,651 | | | | $52,299 | | | | $107,060,415 | | | | | | | | $669,738 | |
PSF PGIM Jennison Value Portfolio
| | | | | | | | | | | | | | | | | | | | | | | | | | | | |
| | | | | | | | |
Value,
Beginning
of Year | | Cost of
Purchases | | | Proceeds
from Sales | | | Change in
Unrealized
Gain
(Loss) | | | Realized
Gain
(Loss) | | | Value, End of Year | | | Shares,
End of Year | | | Income | |
Short-Term Investments - Affiliated Mutual Funds: | |
| | | | | |
PGIM Core Ultra Short Bond Fund(1)(wa) | | | | | | | | | | | | | | | | | | | | | |
| $45,402,605 | | | $205,198,368 | | | | $216,412,298 | | | | $ — | | | | $ — | | | | $34,188,675 | | | | 34,188,675 | | | | $746,371 | |
| | | | | |
PGIM Institutional Money Market Fund(1)(b)(wa) | | | | | | | | | | | | | | | | | | | | | |
| 16,694,933 | | | 617,892,484 | | | | 591,716,168 | | | | 5,545 | | | | 12,609 | | | | 42,889,403 | | | | 42,910,858 | | | | 48,671 | (2) |
| $62,097,538 | | | $823,090,852 | | | | $808,128,466 | | | | $5,545 | | | | $12,609 | | | | $77,078,078 | | | | | | | | $795,042 | |
PSF PGIM Total Return Bond Portfolio
| | | | | | | | | | | | | | | | | | | | | | | | | | | | |
| | | | | | | | |
Value,
Beginning
of Year | | Cost of
Purchases | | | Proceeds
from Sales | | | Change in
Unrealized
Gain
(Loss) | | | Realized
Gain
(Loss) | | | Value, End of Year | | | Shares,
End of Year | | | Income | |
Short-Term Investments - Affiliated Mutual Funds: | |
| | | | | |
PGIM Core Ultra Short Bond Fund(1)(wa) | | | | | | | | | | | | | | | | | | | | | |
| $10,819,602 | | | $315,484,944 | | | | $200,112,555 | | | | $ — | | | | $ — | | | | $126,191,991 | | | | 126,191,991 | | | | $1,623,023 | |
| | | | | |
PGIM Institutional Money Market Fund(1)(b)(wa) | | | | | | | | | | | | | | | | | | | | | |
| 38,615,550 | | | 150,073,158 | | | | 169,083,363 | | | | 7,911 | | | | (4,495 | ) | | | 19,608,761 | | | | 19,618,570 | | | | 65,983 | (2) |
| $49,435,152 | | | $465,558,102 | | | | $369,195,918 | | | | $7,911 | | | | $(4,495 | ) | | | $145,800,752 | | | | | | | | $1,689,006 | |
PSF Small-Cap Stock Index Portfolio
| | | | | | | | | | | | | | | | | | |
| | | | | | | | |
Value,
Beginning
of Year | | Cost of
Purchases | | Proceeds
from Sales | | Change in
Unrealized
Gain
(Loss) | | Realized
Gain
(Loss) | | Value,
End of Year | | Shares,
End of Year | | | Income | |
| Short-Term Investments - Affiliated Mutual Funds: | | | | | | | | |
| | |
| PGIM Core Ultra Short Bond Fund(1)(wa) | | | | | | | | |
| | | | | | | |
| $ 3,755,340 | | $ 73,019,581 | | $ 71,306,771 | | $ — | | $ — | | $ 5,468,150 | | | 5,468,150 | | | | $127,213 | |
B16
| | | | | | | | | | | | | | | | | | |
| | | | | | | | |
Value,
Beginning of Year | | Cost of
Purchases | | Proceeds
from Sales | | Change in
Unrealized
Gain
(Loss) | | Realized
Gain
(Loss) | | Value, End of Year | | Shares,
End of Year | | | Income | |
| | |
PGIM Institutional Money Market Fund(1)(b)(wa) | | | | | | | | |
| $197,893,603 | | $ 944,188,629 | | $884,718,041 | | $92,226 | | $(25,832) | | $257,430,585 | | | 257,559,365 | | | | $379,213 | (2) |
| | | | | | | | |
| $201,648,943 | | $1,017,208,210 | | $956,024,812 | | $92,226 | | $(25,832) | | $262,898,735 | | | | | | | $506,426 | |
PSF Small-Cap Value Portfolio
| | | | | | | | | | | | | | | | | | | | | | | | | | |
| | | | | | | | |
Value,
Beginning
of Year | | Cost of
Purchases | | | Proceeds
from Sales | | | Change in
Unrealized
Gain
(Loss) | | | Realized
Gain
(Loss) | | Value, End of Year | | | Shares,
End of Year | | | Income | |
|
Short-Term Investments - Affiliated Mutual Funds: | |
| | | | |
PGIM Core Ultra Short Bond Fund(1)(wa) | | | | | | | | | | | | | | | |
| $ 5,648,018 | | | $ 41,847,007 | | | | $ 42,443,067 | | | | $ — | | | $ — | | | $5,051,958 | | | | 5,051,958 | | | | $ 75,491 | |
| | | | |
PGIM Institutional Money Market Fund(1)(b)(wa) | | | | | | | | | | | | | | | |
| 27,649,997 | | | 212,121,504 | | | | 204,071,103 | | | | 13,314 | | | (5,447) | | | 35,708,265 | | | | 35,726,128 | | | | 51,696 | (2) |
| $33,298,015 | | | $253,968,511 | | | | $246,514,170 | | | | $13,314 | | | $(5,447) | | | $40,760,223 | | | | | | | | $127,187 | |
PSF Stock Index Portfolio
| | | | | | | | | | | | | | | | | | | | | | | | | | | | |
| | | | | | | | |
Value,
Beginning of Year | | Cost of
Purchases | | | Proceeds
from Sales | | | Change in
Unrealized
Gain
(Loss) | | | Realized
Gain
(Loss) | | | Value, End of Year | | | Shares,
End of Year | | | Income | |
|
Short-Term Investments - Affiliated Mutual Funds: | |
| | | | |
PGIM Core Ultra Short Bond Fund(1)(wa) | | | | | | | | | | | | | | | | | |
| $144,567,480 | | | $ 248,377,640 | | | | $ 280,338,760 | | | | $ — | | | | $ — | | | | $112,606,360 | | | | 112,606,360 | | | | $1,987,699 | |
| | | | |
PGIM Institutional Money Market Fund(1)(b)(wa) | | | | | | | | | | | | | | | | | |
| 255,115,214 | | | 3,225,521,344 | | | | 3,181,743,676 | | | | 129,763 | | | | (14,541 | ) | | | 299,008,104 | | | | 299,157,683 | | | | 485,564 | (2) |
| $399,682,694 | | | $3,473,898,984 | | | | $3,462,082,436 | | | | $129,763 | | | | $(14,541 | ) | | | $411,614,464 | | | | | | | | $2,473,263 | |
| (1) | The Fund did not have any capital gain distributions during the reporting period. |
| (2) | The amount, or a portion thereof, represents the affiliated securities lending income shown on the Statement of Operations. |
| (b) | Represents security, or portion thereof, purchased with cash collateral received for securities on loan and includes dividend reinvestment. |
| (wa) | PGIM Investments LLC, the manager of the Portfolio, also serves as manager of the PGIM Core Ultra Short Bond Fund and PGIM Institutional Money Market Fund, if applicable. |
6. Tax Information
All Portfolios are treated as partnerships for federal income tax purposes. The character of the cash distributions, if any, made by the partnerships is generally classified as nontaxable return of capital distributions. After each fiscal year each shareholder of record will receive information regarding their distributive allocable share of the partnership’s income, gains, losses and deductions.
With respect to the Portfolios, book cost of assets differs from tax cost of assets as a result of each Portfolio’s adoption of a mark-to-market method of accounting for tax purposes. Under this method, tax cost of assets will approximate fair market value.
The Manager has analyzed the Portfolios’ tax positions taken on federal, state and local income tax returns for all open tax years and has concluded that no provision for income tax is required in the Portfolios’ financial statements for the current reporting period. Since tax authorities can examine previously filed tax returns, the Portfolios’ U.S. federal and state tax returns for each of the four fiscal years up to the most recent fiscal year ended December 31, 2022 are subject to such review.
B17
7. Borrowings
The Series Fund, on behalf of the Portfolios, (excluding the PSF PGIM Government Money Market Portfolio), along with other affiliated registered investment companies (the “Participating Funds”), is a party to a Syndicated Credit Agreement (“SCA”) with a group of banks. The purpose of the SCA is to provide an alternative source of temporary funding for capital share redemptions. The table below provides details of the current SCA in effect at the reporting period-end as well as the prior SCA.
| | | | |
| | | Current SCA | | Prior SCA |
Term of Commitment | | 9/30/2022 - 9/28/2023 | | 10/1/2021 – 9/29/2022 |
Total Commitment | | $ 1,200,000,000 | | $ 1,200,000,000 |
Annualized Commitment Fee on the
Unused Portion of the SCA | | 0.15% | | 0.15% |
Annualized Interest Rate on Borrowings | | 1.00% plus the higher of (1) the effective federal funds rate, (2) the daily SOFR rate plus 0.10% or (3) zero percent | | 1.20% plus the higher of (1) the effective federal funds rate, (2) the one-month LIBOR rate or (3) zero percent |
Certain affiliated registered investment companies that are parties to the SCA include portfolios that are subject to a predetermined mathematical formula used to manage certain benefit guarantees offered under variable annuity contracts. The formula may result in large scale asset flows into and out of these portfolios. Consequently, these portfolios may be more likely to utilize the SCA for purposes of funding redemptions. It may be possible for those portfolios to fully exhaust the committed amount of the SCA, thereby requiring the Manager to allocate available funding per a Board-approved methodology designed to treat the Participating Funds in the SCA equitably.
The following Portfolios utilized the SCA during the year ended December 31, 2022.The average balance outstanding is for the number of days the Portfolios utilized the credit facility.
| | | | | | | | | | | | | | | | | | | | |
| Portfolio | | Average
Balance
Outstanding | | Weighted
Average
Interest Rates | | Number of Days
Outstanding | | Maximum
Balance
Outstanding | | Balance
Outstanding at
December 31, 2022 |
PSF International Growth Portfolio | | $ | 467,300 | | | | 1.50 | % | | | 10 | | | | $1,258,000 | | | | $— | |
PSF Mid-Cap Growth Portfolio | | | 2,037,000 | | | | 1.32 | | | | 1 | | | | 2,037,000 | | | | — | |
PSF PGIM Jennison Growth Portfolio | | | 1,895,000 | | | | 1.31 | | | | 3 | | | | 1,895,000 | | | | — | |
8. Capital and Ownership
The Agreement and Declaration of Trust permits the Trust’s Board of Trustees to issue multiple classes of shares, and within each class, an unlimited number of shares of beneficial interest of the Portfolios. The Portfolios offer Class I shares and certain Portfolios offer Class II and/or Class III shares. All share classes are not subject to any sales charge or redemption charge and are sold at the net asset value of the Portfolio. Class I and Class III shares are sold only to certain separate accounts of Prudential to fund benefits under certain variable life insurance and variable annuity contracts (“contracts”). Class II shares are sold only to separate accounts of non-Prudential insurance companies as investment options under certain contracts. Class I shares are also offered to separate accounts of non-affiliated insurers for which Prudential or its affiliates administer and/or reinsure the variable life insurance or variable annuity contracts issued in connection with the separate accounts. The separate accounts invest in shares of the Portfolios through subaccounts that correspond to the Portfolios. The separate accounts will redeem shares of the Portfolios to the extent necessary to provide benefits under the contracts or for such other purposes as may be consistent with the contracts.
As of December 31, 2022, the following number of shares of the Portfolios were owned of record directly or by other Portfolios as part of their investments by insurance affiliates of Prudential.
| | | | | | | | |
| Portfolio | | Number of Shares | | Percentage of
Outstanding Shares |
PSF Global Portfolio–Class I | | | 25,723,941 | | | | 100.0 | % |
PSF Global Portfolio–Class III | | | 13,643 | | | | 100.0 | |
PSF International Growth Portfolio–Class I | | | 7,013,461 | | | | 96.3 | |
B18
| | | | | | | | |
| Portfolio | | Number of Shares | | Percentage of
Outstanding Shares |
PSF Mid-Cap Growth Portfolio–Class I | | | 13,738,534 | | | | 100.0 | % |
PSF Mid-Cap Growth Portfolio–Class III | | | 49,098 | | | | 100.0 | |
PSF Natural Resources Portfolio–Class I | | | 11,895,660 | | | | 100.0 | |
PSF Natural Resources Portfolio–Class III | | | 145,629 | | | | 100.0 | |
PSF PGIM 50/50 Balanced Portfolio–Class I | | | 68,905,541 | | | | 100.0 | |
PSF PGIM 50/50 Balanced Portfolio–Class III | | | 199,138 | | | | 100.0 | |
PSF PGIM Flexible Managed Portfolio–Class I | | | 106,060,061 | | | | 100.0 | |
PSF PGIM Flexible Managed Portfolio–Class III | | | 98,314 | | | | 100.0 | |
PSF PGIM Government Income Portfolio–Class I | | | 14,916,984 | | | | 100.0 | |
PSF PGIM Government Income Portfolio–Class III | | | 247,239 | | | | 100.0 | |
PSF PGIM Government Money Market Portfolio–Class I | | | 80,131,515 | | | | 99.8 | |
PSF PGIM Government Money Market Portfolio–Class III | | | 11,837,499 | | | | 82.9 | |
PSF PGIM High Yield Bond Portfolio–Class I | | | 80,299,934 | | | | 100.0 | |
PSF PGIM High Yield Bond Portfolio–Class III | | | 1,569,365 | | | | 100.0 | |
PSF PGIM Jennison Blend Portfolio–Class I | | | 61,013,653 | | | | 100.0 | |
PSF PGIM Jennison Blend Portfolio–Class III | | | 12,355 | | | | 100.0 | |
PSF PGIM Jennison Focused Blend Portfolio–Class I | | | 1,620,993 | | | | 100.0 | |
PSF PGIM Jennison Focused Blend Portfolio–Class III | | | 10,057 | | | | 100.0 | |
PSF PGIM Jennison Growth Portfolio–Class I | | | 22,873,226 | | | | 100.0 | |
PSF PGIM Jennison Growth Portfolio–Class III | | | 69,400 | | | | 100.0 | |
PSF PGIM Jennison Value Portfolio–Class I | | | 32,622,912 | | | | 100.0 | |
PSF PGIM Jennison Value Portfolio–Class III | | | 59,196 | | | | 100.0 | |
PSF PGIM Total Return Bond Portfolio–Class I | | | 80,501,397 | | | | 99.0 | |
PSF PGIM Total Return Bond Portfolio–Class III | | | 698,669 | | | | 100.0 | |
PSF Small-Cap Stock Index Portfolio–Class I | | | 15,965,140 | | | | 100.0 | |
PSF Small-Cap Stock Index Portfolio–Class III | | | 176,364 | | | | 100.0 | |
PSF Small-Cap Value Portfolio–Composite | | | 9,136,373 | | | | 100.0 | |
PSF Stock Index Portfolio–Class I | | | 64,031,621 | | | | 100.0 | |
PSF Stock Index Portfolio–Class III | | | 271,485 | | | | 100.0 | |
The following number of shareholders of record, each holding greater than 5% of the Portfolio, held the following percentage of outstanding shares, on behalf of multiple beneficial owners:
| | | | | | |
| Portfolio | | Number of Shareholders | | Percentage of Outstanding Shares |
Affiliated: | | | | | | |
PSF Global Portfolio | | 2 | | | 97.5 | % |
PSF International Growth Portfolio | | 2 | | | 95.0 | |
PSF Mid-Cap Growth Portfolio | | 2 | | | 99.5 | |
PSF Natural Resources Portfolio | | 2 | | | 90.9 | |
PSF PGIM 50/50 Balanced Portfolio | | 3 | | | 100.0 | |
PSF PGIM Flexible Managed Portfolio | | 3 | | | 100.0 | |
PSF PGIM Government Income Portfolio | | 2 | | | 97.6 | |
PSF PGIM Government Money Market Portfolio | | 3 | | | 97.4 | |
PSF PGIM High Yield Bond Portfolio | | 3 | | | 100.0 | |
PSF PGIM Jennison Blend Portfolio | | 3 | | | 99.9 | |
PSF PGIM Jennison Focused Blend Portfolio | | 1 | | | 38.1 | |
PSF PGIM Jennison Growth Portfolio | | 2 | | | 93.4 | |
PSF PGIM Jennison Value Portfolio | | 2 | | | 94.9 | |
PSF PGIM Total Return Bond Portfolio | | 3 | | | 99.0 | |
PSF Small-Cap Stock Index Portfolio | | 2 | | | 96.2 | |
PSF Small-Cap Value Portfolio | | 2 | | | 99.6 | |
B19
| | | | | | | | | | | | | | | | | | | | | | | | |
| Portfolio | | Number of Shareholders | | | Percentage of Outstanding Shares | |
Affiliated: | | | | | | | | | | | | | | | | | | | | | | | | |
PSF Stock Index Portfolio | | | | | | | 3 | | | | | | | | | | | | 100.0 | % | | | | |
Unaffiliated: | | | | | | | | | | | | | | | | | | | | | | | | |
PSF Global Portfolio | | | | | | | — | | | | | | | | | | | | — | | | | | |
PSF International Growth Portfolio | | | | | | | — | | | | | | | | | | | | — | | | | | |
PSF Mid-Cap Growth Portfolio | | | | | | | — | | | | | | | | | | | | — | | | | | |
PSF Natural Resources Portfolio | | | | | | | — | | | | | | | | | | | | — | | | | | |
PSF PGIM 50/50 Balanced Portfolio | | | | | | | — | | | | | | | | | | | | — | | | | | |
PSF PGIM Flexible Managed Portfolio | | | | | | | — | | | | | | | | | | | | — | | | | | |
PSF PGIM Government Income Portfolio | | | | | | | — | | | | | | | | | | | | — | | | | | |
PSF PGIM Government Money Market Portfolio | | | | | | | — | | | | | | | | | | | | — | | | | | |
PSF PGIM High Yield Bond Portfolio | | | | | | | — | | | | | | | | | | | | — | | | | | |
PSF PGIM Jennison Blend Portfolio | | | | | | | — | | | | | | | | | | | | — | | | | | |
PSF PGIM Jennison Focused Blend Portfolio | | | | | | | 2 | | | | | | | | | | | | 51.9 | | | | | |
PSF PGIM Jennison Growth Portfolio | | | | | | | — | | | | | | | | | | | | — | | | | | |
PSF PGIM Jennison Value Portfolio | | | | | | | — | | | | | | | | | | | | — | | | | | |
PSF PGIM Total Return Bond Portfolio | | | | | | | — | | | | | | | | | | | | — | | | | | |
PSF Small-Cap Stock Index Portfolio | | | | | | | — | | | | | | | | | | | | — | | | | | |
PSF Small-Cap Value Portfolio | | | | | | | — | | | | | | | | | | | | — | | | | | |
PSF Stock Index Portfolio | | | | | | | — | | | | | | | | | | | | — | | | | | |
Transactions in shares of beneficial interest of the Portfolios were as follows:
PSF Global Portfolio
| | | | | | | | |
| | | |
| Share Class | | Shares | | | Amount | |
| | |
Class I: | | | | | | | | |
Year ended December 31, 2022: | | | | | | | | |
Portfolio shares sold | | | 336,385 | | | $ | 16,450,500 | |
Portfolio shares purchased | | | (1,339,154 | ) | | | (65,018,053 | ) |
Net increase (decrease) in shares outstanding | | | (1,002,769 | ) | | $ | (48,567,553 | ) |
| | |
Year ended December 31, 2021: | | | | | | | | |
Portfolio shares sold | | | 331,454 | | | $ | 17,649,681 | |
Portfolio shares purchased | | | (2,257,822 | ) | | | (119,301,279 | ) |
Net increase (decrease) in shares outstanding | | | (1,926,368 | ) | | $ | (101,651,598 | ) |
| | |
Class III: | | | | | | | | |
| | |
Year ended December 31, 2022: | | | | | | | | |
Portfolio shares sold | | | 11,248 | | | $ | 580,484 | |
Portfolio shares purchased | | | (902 | ) | | | (44,856 | ) |
Net increase (decrease) in shares outstanding | | | 10,346 | | | $ | 535,628 | |
| | |
Period ended December 31, 2021*: | | | | | | | | |
Portfolio shares sold | | | 3,343 | | | $ | 183,467 | |
Portfolio shares purchased | | | (46 | ) | | | (2,584 | ) |
Net increase (decrease) in shares outstanding | | | 3,297 | | | $ | 180,883 | |
| * | Commencement of offering was April 26, 2021. |
B20
PSF International Growth Portfolio
| | | | | | | | |
| | | |
| Share Class | | Shares | | | Amount | |
| | |
Class I: | | | | | | | | |
Year ended December 31, 2022: | | | | | | | | |
Portfolio shares sold | | | 547,734 | | | $ | 5,694,785 | |
Portfolio shares purchased | | | (1,101,565 | ) | | | (11,939,916 | ) |
Net increase (decrease) in shares outstanding | | | (553,831 | ) | | $ | (6,245,131 | ) |
| | |
Year ended December 31, 2021: | | | | | | | | |
Portfolio shares sold | | | 359,564 | | | $ | 4,743,560 | |
Portfolio shares purchased | | | (940,090 | ) | | | (12,606,473 | ) |
Net increase (decrease) in shares outstanding | | | (580,526 | ) | | $ | (7,862,913 | ) |
| | |
Class II: | | | | | | | | |
| | |
Year ended December 31, 2022: | | | | | | | | |
Portfolio shares purchased | | | (2,879 | ) | | $ | (29,055 | ) |
Net increase (decrease) in shares outstanding | | | (2,879 | ) | | $ | (29,055 | ) |
| | |
Year ended December 31, 2021: | | | | | | | | |
Portfolio shares sold | | | 2,361 | | | $ | 28,072 | |
Portfolio shares purchased | | | (3,040 | ) | | | (36,623 | ) |
Net increase (decrease) in shares outstanding | | | (679 | ) | | $ | (8,551 | ) |
PSF Mid-Cap Growth Portfolio
| | | | | | | | |
| | | |
| Share Class | | Shares | | | Amount | |
| | |
Class I: | | | | | | | | |
Year ended December 31, 2022: | | | | | | | | |
Portfolio shares sold | | | 842,234 | | | $ | 20,283,654 | |
Portfolio shares purchased | | | (962,246 | ) | | | (23,740,002 | ) |
Net increase (decrease) in shares outstanding | | | (120,012 | ) | | $ | (3,456,348 | ) |
| | |
Year ended December 31, 2021: | | | | | | | | |
Portfolio shares sold | | | 1,190,070 | | | $ | 35,467,558 | |
Portfolio shares purchased | | | (1,135,400 | ) | | | (33,097,114 | ) |
Net increase (decrease) in shares outstanding | | | 54,670 | | | $ | 2,370,444 | |
| | |
Class II: | | | | | | | | |
| | |
Year ended December 31, 2022: | | | | | | | | |
Portfolio shares sold | | | 457 | | | $ | 10,048 | |
Portfolio shares purchased | | | (2,296 | ) | | | (48,135 | ) |
Net increase (decrease) in shares outstanding | | | (1,839 | ) | | $ | (38,087 | ) |
| | |
Year ended December 31, 2021: | | | | | | | | |
Portfolio shares sold | | | 677 | | | $ | 18,164 | |
Portfolio shares purchased | | | (3,764 | ) | | | (102,738 | ) |
Net increase (decrease) in shares outstanding | | | (3,087 | ) | | $ | (84,574 | ) |
B21
| | | | | | | | |
| | | |
| Share Class | | Shares | | | Amount | |
| | |
Class III: | | | | | | | | |
Year ended December 31, 2022: | | | | | | | | |
Portfolio shares sold | | | 29,114 | | | $ | 715,921 | |
Portfolio shares purchased | | | (5,483 | ) | | | (132,923 | ) |
Net increase (decrease) in shares outstanding | | | 23,631 | | | $ | 582,998 | |
| | |
Period ended December 31, 2021*: | | | | | | | | |
Portfolio shares sold | | | 29,340 | | | $ | 895,852 | |
Portfolio shares purchased | | | (3,873 | ) | | | (119,380 | ) |
Net increase (decrease) in shares outstanding | | | 25,467 | | | $ | 776,472 | |
| * | Commencement of offering was April 26, 2021. |
PSF Natural Resources Portfolio
| | | | | | | | |
| | | |
| Share Class | | Shares | | | Amount | |
| | |
Class I: | | | | | | | | |
Year ended December 31, 2022: | | | | | | | | |
Portfolio shares sold | | | 568,317 | | | $ | 22,147,964 | |
Portfolio shares purchased | | | (892,233 | ) | | | (35,110,214 | ) |
Net increase (decrease) in shares outstanding | | | (323,916 | ) | | $ | (12,962,250 | ) |
| | |
Year ended December 31, 2021: | | | | | | | | |
Portfolio shares sold | | | 219,073 | | | $ | 7,070,025 | |
Portfolio shares purchased | | | (872,875 | ) | | | (27,855,013 | ) |
Net increase (decrease) in shares outstanding | | | (653,802 | ) | | $ | (20,784,988 | ) |
| | |
Class II: | | | | | | | | |
Year ended December 31, 2022: | | | | | | | | |
Portfolio shares sold | | | 420,816 | | | $ | 15,496,428 | |
Portfolio shares purchased | | | (350,180 | ) | | | (13,067,241 | ) |
Net increase (decrease) in shares outstanding | | | 70,636 | | | $ | 2,429,187 | |
| | |
Year ended December 31, 2021: | | | | | | | | |
Portfolio shares sold | | | 499,553 | | | $ | 16,209,593 | |
Portfolio shares purchased | | | (956,397 | ) | | | (28,344,054 | ) |
Net increase (decrease) in shares outstanding | | | (456,844 | ) | | $ | (12,134,461 | ) |
| | |
Class III: | | | | | | | | |
Year ended December 31, 2022: | | | | | | | | |
Portfolio shares sold | | | 156,046 | | | $ | 6,124,088 | |
Portfolio shares purchased | | | (39,030 | ) | | | (1,473,471 | ) |
Net increase (decrease) in shares outstanding | | | 117,016 | | | $ | 4,650,617 | |
| | |
Period ended December 31, 2021*: | | | | | | | | |
Portfolio shares sold | | | 30,066 | | | $ | 1,009,154 | |
Portfolio shares purchased | | | (1,453 | ) | | | (48,949 | ) |
Net increase (decrease) in shares outstanding | | | 28,613 | | | $ | 960,205 | |
| * | Commencement of offering was April 26, 2021. |
B22
PSF PGIM 50/50 Balanced Portfolio
| | | | | | | | |
| | | |
| Share Class | | Shares | | | Amount | |
| | |
Class I: | | | | | | | | |
Year ended December 31, 2022: | | | | | | | | |
Portfolio shares sold | | | 445,937 | | | $ | 15,943,792 | |
Portfolio shares purchased | | | (4,558,075 | ) | | | (162,015,739 | ) |
Net increase (decrease) in shares outstanding | | | (4,112,138 | ) | | $ | (146,071,947 | ) |
| | |
Year ended December 31, 2021: | | | | | | | | |
Portfolio shares sold | | | 382,552 | | | $ | 14,110,839 | |
Portfolio shares purchased | | | (4,825,082 | ) | | | (179,267,581 | ) |
Net increase (decrease) in shares outstanding | | | (4,442,530 | ) | | $ | (165,156,742 | ) |
| | |
Class III: | | | | | | | | |
Year ended December 31, 2022: | | | | | | | | |
Portfolio shares sold | | | 161,137 | | | $ | 5,763,660 | |
Portfolio shares purchased | | | (29,273 | ) | | | (1,011,431 | ) |
Net increase (decrease) in shares outstanding | | | 131,864 | | | $ | 4,752,229 | |
| | |
Period ended December 31, 2021*: | | | | | | | | |
Portfolio shares sold | | | 67,888 | | | $ | 2,606,087 | |
Portfolio shares purchased | | | (614 | ) | | | (23,805 | ) |
Net increase (decrease) in shares outstanding | | | 67,274 | | | $ | 2,582,282 | |
| * | Commencement of offering was April 26, 2021. |
PSF PGIM Flexible Managed Portfolio
| | | | | | | | |
| | | |
| Share Class | | Shares | | | Amount | |
| | |
Class I: | | | | | | | | |
Year ended December 31, 2022: | | | | | | | | |
Portfolio shares sold | | | 123,754 | | | $ | 4,832,257 | |
Portfolio shares purchased | | | (6,614,469 | ) | | | (262,771,618 | ) |
Net increase (decrease) in shares outstanding | | | (6,490,715 | ) | | $ | (257,939,361 | ) |
| | |
Year ended December 31, 2021: | | | | | | | | |
Portfolio shares sold | | | 205,431 | | | $ | 8,283,511 | |
Portfolio shares purchased | | | (6,737,839 | ) | | | (277,035,778 | ) |
Net increase (decrease) in shares outstanding | | | (6,532,408 | ) | | $ | (268,752,267 | ) |
| | |
Class III: | | | | | | | | |
Year ended December 31, 2022: | | | | | | | | |
Portfolio shares sold | | | 59,627 | | | $ | 2,386,122 | |
Portfolio shares purchased | | | (6,888 | ) | | | (262,150 | ) |
Net increase (decrease) in shares outstanding | | | 52,739 | | | $ | 2,123,972 | |
| | |
Period ended December 31, 2021*: | | | | | | | | |
Portfolio shares sold | | | 46,517 | | | $ | 1,981,439 | |
Portfolio shares purchased | | | (942 | ) | | | (40,576 | ) |
Net increase (decrease) in shares outstanding | | | 45,575 | | | $ | 1,940,863 | |
| * | Commencement of offering was April 26, 2021. |
B23
PSF PGIM Government Income Portfolio
| | | | | | | | |
| | | |
| Share Class | | Shares | | | Amount | |
| | |
Class I: | | | | | | | | |
Year ended December 31, 2022: | | | | | | | | |
Portfolio shares sold | | | 600,611 | | | $ | 7,713,914 | |
Portfolio shares purchased | | | (1,559,673 | ) | | | (19,917,289 | ) |
Net increase (decrease) in shares outstanding | | | (959,062 | ) | | $ | (12,203,375 | ) |
| | |
Year ended December 31, 2021: | | | | | | | | |
Portfolio shares sold | | | 241,234 | | | $ | 3,421,573 | |
Portfolio shares purchased | | | (1,340,149 | ) | | | (19,017,186 | ) |
Net increase (decrease) in shares outstanding | | | (1,098,915 | ) | | $ | (15,595,613 | ) |
| | |
Class III: | | | | | | | | |
Year ended December 31, 2022: | | | | | | | | |
Portfolio shares sold | | | 318,123 | | | $ | 4,033,440 | |
Portfolio shares purchased | | | (94,133 | ) | | | (1,187,152 | ) |
Net increase (decrease) in shares outstanding | | | 223,990 | | | $ | 2,846,288 | |
| | |
Period ended December 31, 2021*: | | | | | | | | |
Portfolio shares sold | | | 25,257 | | | $ | 358,644 | |
Portfolio shares purchased | | | (2,008 | ) | | | (28,305 | ) |
Net increase (decrease) in shares outstanding | | | 23,249 | | | $ | 330,339 | |
| * | Commencement of offering was April 26, 2021. |
PSF PGIM Government Money Market Portfolio
| | | | | | | | |
| | | |
| Share Class | | Shares | | | Amount | |
| | |
Class I: | | | | | | | | |
Year ended December 31, 2022: | | | | | | | | |
Portfolio shares sold | | | 66,612,704 | | | $ | 666,127,047 | |
Shares issued in reinvestment of dividends and distributions | | | 1,072,731 | | | | 10,727,306 | |
Portfolio shares purchased | | | (59,910,156 | ) | | | (599,101,563 | ) |
Net increase (decrease) in shares outstanding | | | 7,775,279 | | | $ | 77,752,790 | |
| | |
Year ended December 31, 2021: | | | | | | | | |
Portfolio shares sold | | | 81,112,748 | | | $ | 811,127,478 | |
Shares issued in reinvestment of dividends and distributions | | | 33,163 | | | | 331,630 | |
Portfolio shares purchased | | | (87,878,545 | ) | | | (878,785,449 | ) |
Net increase (decrease) in shares outstanding | | | (6,732,634 | ) | | $ | (67,326,341 | ) |
| | |
Class III: | | | | | | | | |
Year ended December 31, 2022: | | | | | | | | |
Portfolio shares sold | | | 23,042,614 | | | $ | 230,426,139 | |
Shares issued in reinvestment of dividends and distributions | | | 168,048 | | | | 1,680,477 | |
Portfolio shares purchased | | | (23,338,502 | ) | | | (233,385,015 | ) |
Net increase (decrease) in shares outstanding | | | (127,840 | ) | | $ | (1,278,399 | ) |
B24
| | | | | | | | |
| | | |
| Share Class | | Shares | | | Amount | |
| | |
Year ended December 31, 2021: | | | | | | | | |
Portfolio shares sold | | | 30,778,884 | | | $ | 307,788,840 | |
Shares issued in reinvestment of dividends and distributions | | | 5,015 | | | | 50,145 | |
Portfolio shares purchased | | | (22,945,609 | ) | | | (229,456,084 | ) |
Net increase (decrease) in shares outstanding | | | 7,838,290 | | | $ | 78,382,901 | |
PSF PGIM High Yield Bond Portfolio
| | | | | | | | |
| | | |
| Share Class | | Shares | | | Amount | |
| | |
Class I: | | | | | | | | |
Year ended December 31, 2022: | | | | | | | | |
Portfolio shares sold | | | 2,625,359 | | | $ | 16,126,731 | |
Portfolio shares purchased | | | (6,601,912 | ) | | | (40,503,979 | ) |
Net increase (decrease) in shares outstanding | | | (3,976,553 | ) | | $ | (24,377,248 | ) |
| | |
Year ended December 31, 2021: | | | | | | | | |
Portfolio shares sold | | | 4,381,297 | | | $ | 28,424,104 | |
Portfolio shares purchased | | | (5,718,074 | ) | | | (37,023,011 | ) |
Net increase (decrease) in shares outstanding | | | (1,336,777 | ) | | $ | (8,598,907 | ) |
| | |
Class III: | | | | | | | | |
Year ended December 31, 2022: | | | | | | | | |
Portfolio shares sold | | | 915,127 | | | $ | 5,664,609 | |
Portfolio shares purchased | | | (202,935 | ) | | | (1,221,550 | ) |
Net increase (decrease) in shares outstanding | | | 712,192 | | | $ | 4,443,059 | |
| | |
Period ended December 31, 2021*: | | | | | | | | |
Portfolio shares sold | | | 859,765 | | | $ | 5,649,840 | |
Portfolio shares purchased | | | (2,592 | ) | | | (17,094 | ) |
Net increase (decrease) in shares outstanding | | | 857,173 | | | $ | 5,632,746 | |
| * | Commencement of offering was April 26, 2021. |
PSF PGIM Jennison Blend Portfolio
| | | | | | | | |
| | | |
| Share Class | | Shares | | | Amount | |
| | |
Class I: | | | | | | | | |
Year ended December 31, 2022: | | | | | | | | |
Portfolio shares sold | | | 38,022 | | | $ | 3,051,537 | |
Portfolio shares purchased | | | (4,057,480 | ) | | | (325,457,261 | ) |
Net increase (decrease) in shares outstanding | | | (4,019,458 | ) | | $ | (322,405,724 | ) |
| | |
Year ended December 31, 2021: | | | | | | | | |
Portfolio shares sold | | | 90,980 | | | $ | 8,234,342 | |
Portfolio shares purchased | | | (4,653,123 | ) | | | (419,514,499 | ) |
Net increase (decrease) in shares outstanding | | | (4,562,143 | ) | | $ | (411,280,157 | ) |
B25
| | | | | | | | |
| | | |
| Share Class | | Shares | | | Amount | |
| | |
Class II: | | | | | | | | |
Year ended December 31, 2022: | | | | | | | | |
Portfolio shares sold | | | 1 | | | $ | 33 | |
Portfolio shares purchased | | | (1,559 | ) | | | (129,611 | ) |
Net increase (decrease) in shares outstanding | | | (1,558 | ) | | $ | (129,578 | ) |
| | |
Year ended December 31, 2021: | | | | | | | | |
Portfolio shares sold | | | 61 | | | $ | 5,684 | |
Portfolio shares purchased | | | (789 | ) | | | (70,000 | ) |
Net increase (decrease) in shares outstanding | | | (728 | ) | | $ | (64,316 | ) |
| | |
Class III: | | | | | | | | |
Year ended December 31, 2022: | | | | | | | | |
Portfolio shares sold | | | 7,025 | | | $ | 592,833 | |
Portfolio shares purchased | | | (1,204 | ) | | | (98,337 | ) |
Net increase (decrease) in shares outstanding | | | 5,821 | | | $ | 494,496 | |
| | |
Period ended December 31, 2021*: | | | | | | | | |
Portfolio shares sold | | | 6,859 | | | $ | 653,908 | |
Portfolio shares purchased | | | (325 | ) | | | (31,592 | ) |
Net increase (decrease) in shares outstanding | | | 6,534 | | | $ | 622,316 | |
| * | Commencement of offering was April 26, 2021. |
PSF PGIM Jennison Focused Blend Portfolio
| | | | | | | | |
| | | |
| Share Class | | Shares | | | Amount | |
| | |
Class I: | | | | | | | | |
Year ended December 31, 2022: | | | | | | | | |
Portfolio shares sold | | | 96,263 | | | $ | 4,493,379 | |
Portfolio shares purchased | | | (144,556 | ) | | | (6,708,668 | ) |
Net increase (decrease) in shares outstanding | | | (48,293 | ) | | $ | (2,215,289 | ) |
| | |
Year ended December 31, 2021: | | | | | | | | |
Portfolio shares sold | | | 112,213 | | | $ | 6,197,482 | |
Portfolio shares purchased | | | (182,627 | ) | | | (9,978,651 | ) |
Net increase (decrease) in shares outstanding | | | (70,414 | ) | | $ | (3,781,169 | ) |
| | |
Class II: | | | | | | | | |
Year ended December 31, 2022: | | | | | | | | |
Portfolio shares sold | | | 125,490 | | | $ | 5,587,731 | |
Portfolio shares purchased | | | (305,760 | ) | | | (13,595,808 | ) |
Net increase (decrease) in shares outstanding | | | (180,270 | ) | | $ | (8,008,077 | ) |
| | |
Year ended December 31, 2021: | | | | | | | | |
Portfolio shares sold | | | 100,289 | | | $ | 5,001,130 | |
Portfolio shares purchased | | | (501,661 | ) | | | (25,677,194 | ) |
Net increase (decrease) in shares outstanding | | | (401,372 | ) | | $ | (20,676,064 | ) |
B26
| | | | | | | | |
| | | |
| Share Class | | Shares | | | Amount | |
| | |
Class III: | | | | | | | | |
Year ended December 31, 2022: | | | | | | | | |
Portfolio shares sold | | | 4,040 | | | $ | 185,696 | |
Portfolio shares purchased | | | (1,190 | ) | | | (60,053 | ) |
Net increase (decrease) in shares outstanding | | | 2,850 | | | $ | 125,643 | |
| | |
Period ended December 31, 2021*: | | | | | | | | |
Portfolio shares sold | | | 7,937 | | | $ | 449,314 | |
Portfolio shares purchased | | | (730 | ) | | | (43,373 | ) |
Net increase (decrease) in shares outstanding | | | 7,207 | | | $ | 405,941 | |
| * | Commencement of offering was April 26, 2021. |
PSF PGIM Jennison Growth Portfolio
| | | | | | | | |
| | | |
| Share Class | | Shares | | | Amount | |
| | |
Class I: | | | | | | | | |
Year ended December 31, 2022: | | | | | | | | |
Portfolio shares sold | | | 313,611 | | | $ | 33,566,860 | |
Portfolio shares purchased | | | (1,553,298 | ) | | | (171,481,409 | ) |
Net increase (decrease) in shares outstanding | | | (1,239,687 | ) | | $ | (137,914,549 | ) |
| | |
Year ended December 31, 2021: | | | | | | | | |
Portfolio shares sold | | | 371,490 | | | $ | 51,653,348 | |
Portfolio shares purchased | | | (1,829,415 | ) | | | (250,644,681 | ) |
Net increase (decrease) in shares outstanding | | | (1,457,925 | ) | | $ | (198,991,333 | ) |
| | |
Class II: | | | | | | | | |
Year ended December 31, 2022: | | | | | | | | |
Portfolio shares sold | | | 52,361 | | | $ | 5,487,355 | |
Portfolio shares purchased | | | (145,570 | ) | | | (15,190,161 | ) |
Net increase (decrease) in shares outstanding | | | (93,209 | ) | | $ | (9,702,806 | ) |
| | |
Year ended December 31, 2021: | | | | | | | | |
Portfolio shares sold | | | 85,254 | | | $ | 10,983,966 | |
Portfolio shares purchased | | | (228,495 | ) | | | (29,813,406 | ) |
Net increase (decrease) in shares outstanding | | | (143,241 | ) | | $ | (18,829,440 | ) |
| | |
Class III: | | | | | | | | |
Year ended December 31, 2022: | | | | | | | | |
Portfolio shares sold | | | 41,890 | | | $ | 4,609,971 | |
Portfolio shares purchased | | | (4,523 | ) | | | (485,060 | ) |
Net increase (decrease) in shares outstanding | | | 37,367 | | | $ | 4,124,911 | |
| | |
Period ended December 31, 2021*: | | | | | | | | |
Portfolio shares sold | | | 32,717 | | | $ | 4,680,073 | |
Portfolio shares purchased | | | (684 | ) | | | (97,809 | ) |
Net increase (decrease) in shares outstanding | | | 32,033 | | | $ | 4,582,264 | |
| * | Commencement of offering was April 26, 2021. |
B27
PSF PGIM Jennison Value Portfolio
| | | | | | | | |
| | | |
| Share Class | | Shares | | | Amount | |
| | |
Class I: | | | | | | | | |
Year ended December 31, 2022: | | | | | | | | |
Portfolio shares sold | | | 429,538 | | | $ | 18,850,313 | |
Portfolio shares purchased | | | (2,358,254 | ) | | | (104,294,464 | ) |
Net increase (decrease) in shares outstanding | | | (1,928,716 | ) | | $ | (85,444,151 | ) |
| | |
Year ended December 31, 2021: | | | | | | | | |
Portfolio shares sold | | | 360,683 | | | $ | 15,523,453 | |
Portfolio shares purchased | | | (2,588,306 | ) | | | (111,797,897 | ) |
Net increase (decrease) in shares outstanding | | | (2,227,623 | ) | | $ | (96,274,444 | ) |
| | |
Class II: | | | | | | | | |
Year ended December 31, 2022: | | | | | | | | |
Portfolio shares sold | | | 5,398 | | | $ | 216,746 | |
Portfolio shares purchased | | | (20,379 | ) | | | (871,866 | ) |
Net increase (decrease) in shares outstanding | | | (14,981 | ) | | $ | (655,120 | ) |
| | |
Year ended December 31, 2021: | | | | | | | | |
Portfolio shares sold | | | 8,558 | | | $ | 364,878 | |
Portfolio shares purchased | | | (25,793 | ) | | | (1,096,740 | ) |
Net increase (decrease) in shares outstanding | | | (17,235 | ) | | $ | (731,862 | ) |
| | |
Class III: | | | | | | | | |
Year ended December 31, 2022: | | | | | | | | |
Portfolio shares sold | | | 43,368 | | | $ | 1,893,897 | |
Portfolio shares purchased | | | (5,629 | ) | | | (244,701 | ) |
Net increase (decrease) in shares outstanding | | | 37,739 | | | $ | 1,649,196 | |
| | |
Period ended December 31, 2021*: | | | | | | | | |
Portfolio shares sold | | | 21,731 | | | $ | 984,337 | |
Portfolio shares purchased | | | (274 | ) | | | (12,866 | ) |
Net increase (decrease) in shares outstanding | | | 21,457 | | | $ | 971,471 | |
| * | Commencement of offering was April 26, 2021. |
PSF PGIM Total Return Bond Portfolio
| | | | | | | | |
| | | |
| Share Class | | Shares | | | Amount | |
| | |
Class I: | | | | | | | | |
Year ended December 31, 2022: | | | | | | | | |
Portfolio shares sold | | | 2,801,953 | | | $ | 39,029,329 | |
Shares issued in merger | | | 3,070,515 | | | | 46,303,369 | |
Portfolio shares purchased | | | (7,389,182 | ) | | | (105,005,255 | ) |
Net increase (decrease) in shares outstanding | | | (1,516,714 | ) | | $ | (19,672,557 | ) |
| | |
Year ended December 31, 2021: | | | | | | | | |
Portfolio shares sold | | | 6,877,466 | | | $ | 106,051,566 | |
Portfolio shares purchased | | | (5,936,458 | ) | | | (92,126,262 | ) |
Net increase (decrease) in shares outstanding | | | 941,008 | | | $ | 13,925,304 | |
B28
| | | | | | | | |
| | | |
| Share Class | | Shares | | | Amount | |
| | |
Class III: | | | | | | | | |
Year ended December 31, 2022: | | | | | | | | |
Portfolio shares sold | | | 437,500 | | | $ | 6,216,910 | |
Portfolio shares purchased | | | (89,681 | ) | | | (1,281,404 | ) |
Net increase (decrease) in shares outstanding | | | 347,819 | | | $ | 4,935,506 | |
| | |
Period ended December 31, 2021*: | | | | | | | | |
Portfolio shares sold | | | 362,146 | | | $ | 5,648,820 | |
Portfolio shares purchased | | | (11,296 | ) | | | (176,793 | ) |
Net increase (decrease) in shares outstanding | | | 350,850 | | | $ | 5,472,027 | |
| * | Commencement of offering was April 26, 2021. |
PSF Small-Cap Stock Index Portfolio
| | | | | | | | |
| | | |
| Share Class | | Shares | | | Amount | |
| | |
Class I: | | | | | | | | |
Year ended December 31, 2022: | | | | | | | | |
Portfolio shares sold | | | 177,588 | | | $ | 9,396,593 | |
Portfolio shares purchased | | | (1,189,080 | ) | | | (62,957,116 | ) |
Net increase (decrease) in shares outstanding | | | (1,011,492 | ) | | $ | (53,560,523 | ) |
| | |
Year ended December 31, 2021: | | | | | | | | |
Portfolio shares sold | | | 333,605 | | | $ | 18,823,948 | |
Portfolio shares purchased | | | (1,322,121 | ) | | | (75,335,373 | ) |
Net increase (decrease) in shares outstanding | | | (988,516 | ) | | $ | (56,511,425 | ) |
| | |
Class III: | | | | | | | | |
Year ended December 31, 2022: | | | | | | | | |
Portfolio shares sold | | | 85,002 | | | $ | 4,569,926 | |
Portfolio shares purchased | | | (10,558 | ) | | | (557,731 | ) |
Net increase (decrease) in shares outstanding | | | 74,444 | | | $ | 4,012,195 | |
| | |
Period ended December 31, 2021*: | | | | | | | | |
Portfolio shares sold | | | 103,297 | | | $ | 6,045,150 | |
Portfolio shares purchased | | | (1,377 | ) | | | (80,690 | ) |
Net increase (decrease) in shares outstanding | | | 101,920 | | | $ | 5,964,460 | |
| * | Commencement of offering was April 26, 2021. |
PSF Stock Index Portfolio
| | | | | | | | |
| | | |
| Share Class | | Shares | | | Amount | |
| | |
Class I: | | | | | | | | |
Year ended December 31, 2022: | | | | | | | | |
Portfolio shares sold | | | 2,300,141 | | | $ | 223,761,311 | |
Portfolio shares purchased | | | (2,691,850 | ) | | | (263,312,022 | ) |
Net increase (decrease) in shares outstanding | | | (391,709 | ) | | $ | (39,550,711 | ) |
B29
| | | | | | | | |
| | | |
| Share Class | | Shares | | | Amount | |
| | |
Year ended December 31, 2021: | | | | | | | | |
Portfolio shares sold | | | 3,091,067 | | | $ | 309,426,880 | |
Portfolio shares purchased | | | (2,782,213 | ) | | | (276,133,548 | ) |
Net increase (decrease) in shares outstanding | | | 308,854 | | | $ | 33,293,332 | |
| | |
Class III: | | | | | | | | |
Year ended December 31, 2022: | | | | | | | | |
Portfolio shares sold | | | 132,110 | | | $ | 12,999,682 | |
Portfolio shares purchased | | | (9,996 | ) | | | (969,251 | ) |
Net increase (decrease) in shares outstanding | | | 122,114 | | | $ | 12,030,431 | |
| | |
Period ended December 31, 2021*: | | | | | | | | |
Portfolio shares sold | | | 150,911 | | | $ | 15,703,185 | |
Portfolio shares purchased | | | (1,540 | ) | | | (165,377 | ) |
Net increase (decrease) in shares outstanding | | | 149,371 | | | $ | 15,537,808 | |
| * | Commencement of offering was April 26, 2021. |
9. Risks of Investing in the Portfolios
Each Portfolio’s risks include, but are not limited to, some or all of the risks discussed below. For further information on the risks applicable to any given Portfolio, please refer to the Prospectus and Statement of Additional Information of that Portfolio.
| | | | | | | | | | | | |
| | | | | | | |
| Risks | | PSF Global Portfolio | | PSF International Growth Portfolio | | PSF Mid-Cap Growth Portfolio | | PSF Natural Resources Portfolio | | PSF PGIM 50/50 Balanced Portfolio | | PSF PGIM Flexible Managed Portfolio |
Adjustable and Floating-Rate Securities | | – | | – | | – | | – | | – | | – |
Asset-Backed and/or Mortgage-Backed Securities | | – | | – | | – | | – | | X | | X |
Asset Transfer Program | | – | | X | | – | | – | | – | | – |
Bank Loan Investments | | – | | – | | – | | – | | – | | – |
Blend Style | | – | | – | | – | | – | | X | | X |
Commodity | | – | | – | | – | | X | | – | | – |
Covenant-Lite | | – | | – | | – | | – | | – | | – |
Credit | | – | | – | | – | | – | | – | | – |
Derivatives | | X | | X | | X | | X | | X | | X |
Economic and Market Events | | X | | X | | X | | X | | X | | X |
Emerging Markets | | – | | X | | – | | X | | – | | – |
Equity and Equity-Related Securities | | – | | – | | – | | – | | – | | – |
Equity Securities | | X | | X | | X | | X | | X | | X |
Exchange-Traded Funds (ETF) | | – | | X | | – | | X | | – | | – |
Expense | | X | | X | | X | | X | | – | | X |
Fixed Income Securities | | – | | – | | – | | – | | X | | X |
Focus | | X | | – | | – | | X | | – | | – |
Foreign Investment | | X | | X | | – | | X | | X | | X |
High Yield | | – | | – | | – | | – | | X | | X |
Index Tracking | | – | | – | | – | | – | | X | | X |
Interest Rate | | – | | – | | – | | – | | – | | – |
Investment Style | | X | | X | | X | | – | | – | | – |
B30
| | | | | | | | | | | | |
| Risks | | PSF Global Portfolio | | PSF International Growth Portfolio | | PSF Mid-Cap Growth Portfolio | | PSF Natural Resources Portfolio | | PSF PGIM 50/50 Balanced Portfolio | | PSF PGIM Flexible Managed Portfolio |
Large Company | | – | | – | | – | | – | | – | | – |
Leverage | | – | | – | | X | | – | | – | | – |
Liquidity and Valuation | | X | | X | | X | | X | | X | | X |
Market and Management | | X | | X | | X | | X | | X | | X |
Market Capitalization | | – | | – | | – | | – | | – | | – |
Mid-Sized Company | | – | | – | | X | | – | | – | | – |
Participation Notes (P-Notes) | | – | | X | | – | | – | | – | | – |
Portfolio Turnover | | – | | – | | – | | X | | X | | X |
Prepayment or Call | | – | | – | | – | | – | | – | | – |
Quantitative Model | | X | | – | | – | | – | | – | | X |
Real Estate | | – | | X | | – | | – | | – | | – |
Regulatory | | X | | X | | X | | X | | X | | X |
Small-Sized Company | | – | | – | | – | | X | | – | | – |
US Government Securities | | – | | – | | – | | – | | – | | X |
Yield | | – | | – | | – | | – | | – | | – |
| | | | | | | | | | | | |
| Risks | | PSF PGIM Government Income Portfolio | | PSF PGIM Government
Money Market Portfolio | | PSF PGIM High Yield Bond Portfolio | | PSF PGIM Jennison Blend Portfolio | | PSF PGIM Jennison Focused Blend Portfolio | | PSF PGIM Jennison Growth Portfolio |
Adjustable and Floating-Rate Securities | | – | | X | | – | | – | | – | | – |
Asset-Backed and/or Mortgage-Backed Securities | | X | | – | | – | | – | | – | | – |
Asset Transfer Program | | – | | – | | – | | – | | – | | – |
Bank Loan Investments | | – | | – | | X | | – | | – | | – |
Blend Style | | – | | – | | – | | X | | X | | – |
Commodity | | – | | – | | – | | – | | – | | – |
Covenant-Lite | | – | | – | | X | | – | | – | | – |
Credit | | – | | X | | – | | – | | – | | – |
Derivatives | | X | | – | | X | | – | | – | | – |
Economic and Market Events | | X | | X | | X | | X | | X | | X |
Emerging Markets | | – | | – | | X | | – | | – | | – |
Equity and Equity-Related Securities | | – | | – | | X | | – | | – | | – |
Equity Securities | | – | | – | | – | | X | | X | | X |
Exchange-Traded Funds (ETF) | | – | | – | | – | | – | | – | | – |
Expense | | X | | X | | X | | X | | X | | X |
Fixed Income Securities | | X | | X | | X | | – | | – | | – |
Focus | | – | | – | | – | | – | | X | | – |
Foreign Investment | | – | | – | | X | | X | | – | | X |
High Yield | | – | | – | | X | | – | | – | | – |
Index Tracking | | – | | – | | – | | – | | – | | – |
Interest Rate | | – | | X | | – | | – | | – | | – |
Investment Style | | – | | – | | – | | – | | – | | X |
Large Company | | – | | – | | – | | – | | – | | – |
Leverage | | – | | – | | – | | – | | – | | – |
B31
| | | | | | | | | | | | | | | | | | | | | | | | | | | | | | |
| Risks | | PSF PGIM Government Income Portfolio | | PSF PGIM Government Money Market Portfolio | | PSF PGIM High Yield Bond Portfolio | | PSF PGIM Jennison Blend Portfolio | | PSF PGIM Jennison Focused Blend Portfolio | | PSF PGIM Jennison Growth Portfolio |
Liquidity and Valuation | | X | | – | | X | | – | | – | | X |
Market and Management | | X | | X | | X | | X | | X | | X |
Market Capitalization | | – | | – | | – | | X | | – | | X |
Mid-Sized Company | | – | | – | | – | | – | | – | | – |
Participation Notes (P-Notes) | | – | | – | | – | | – | | – | | – |
Portfolio Turnover | | X | | – | | – | | – | | – | | – |
Prepayment or Call | | – | | X | | – | | – | | – | | – |
Quantitative Model | | – | | – | | – | | – | | – | | – |
Real Estate | | – | | – | | – | | X | | X | | – |
Regulatory | | X | | X | | X | | X | | X | | X |
Small-Sized Company | | – | | – | | – | | – | | – | | – |
US Government Securities | | X | | – | | – | | – | | – | | – |
Yield | | – | | X | | – | | – | | – | | – |
| | | | | | | | | | | | |
| Risks | | | | PSF PGIM Jennison Value Portfolio | | PSF PGIM Total Return Bond Portfolio | | PSF Small- Cap Stock Index Portfolio | | PSF Small- Cap Value Portfolio | | PSF PGIM Stock Index Portfolio |
Adjustable and Floating-Rate Securities | | – | | – | | – | | – | | – |
Asset-Backed and/or Mortgage-Backed Securities | | – | | X | | – | | – | | – |
Asset Transfer Program | | | | – | | – | | – | | – | | – |
Bank Loan Investments | | | | – | | X | | – | | – | | – |
Blend Style | | | | – | | – | | – | | – | | – |
Commodity | | | | – | | – | | – | | – | | – |
Covenant-Lite | | | | – | | X | | – | | – | | – |
Credit | | | | – | | – | | – | | – | | – |
Derivatives | | | | – | | X | | X | | X | | X |
Economic and Market Events | | | | X | | X | | X | | X | | X |
Emerging Markets | | | | – | | – | | – | | X | | – |
Equity and Equity-Related Securities | | | | – | | – | | – | | – | | – |
Equity Securities | | | | X | | – | | X | | X | | X |
Exchange-Traded Funds (ETF) | | | | – | | – | | – | | – | | – |
Expense | | | | X | | X | | X | | X | | X |
Fixed Income Securities | | | | – | | – | | – | | – | | – |
Focus | | | | – | | X | | – | | – | | – |
Foreign Investment | | | | X | | X | | – | | X | | – |
High Yield | | | | – | | X | | – | | – | | – |
Index Tracking | | | | – | | – | | X | | – | | X |
Interest Rate | | | | – | | – | | – | | – | | – |
Investment Style | | | | X | | – | | – | | X | | – |
Large Company | | | | X | | – | | – | | – | | X |
Leverage | | | | – | | – | | – | | – | | – |
Liquidity and Valuation | | | | – | | X | | X | | X | | X |
Market and Management | | | | X | | X | | X | | X | | X |
Market Capitalization | | | | – | | – | | – | | – | | – |
B32
| | | | | | | | | | | | | | | | | | | | | | | | | | | | | | |
| Risks | | | | PSF PGIM Jennison Value Portfolio | | PSF PGIM Total Return Bond Portfolio | | PSF Small- Cap Stock Index Portfolio | | PSF Small- Cap Value Portfolio | | PSF PGIM Stock Index Portfolio |
Mid-Sized Company | | | | – | | – | | – | | X | | – |
Participation Notes (P-Notes) | | | | – | | – | | – | | – | | – |
Portfolio Turnover | | | | – | | – | | – | | – | | – |
Prepayment or Call | | | | – | | – | | – | | – | | – |
Quantitative Model | | | | – | | – | | – | | – | | – |
Real Estate | | | | X | | – | | – | | X | | – |
Regulatory | | | | X | | X | | X | | X | | X |
Small-Sized Company | | | | – | | – | | X | | X | | – |
US Government Securities | | | | – | | – | | – | | – | | – |
Yield | | | | – | | – | | – | | – | | – |
Adjustable and Floating-Rate Securities Risk: The value of adjustable and floating-rate securities may lag behind the value of fixed-rate securities when interest rates change. Variable and floating-rate bonds are subject to credit risk, market risk and interest rate risk. In addition, the absence of an active market for these securities could make it difficult for the Portfolio to dispose of them if the issuer defaults.
Asset-Backed and/or Mortgage-Backed Securities Risk: Asset-backed and mortgage-backed securities are fixed income securities that represent an interest in an underlying pool of assets, such as credit card receivables or, in the case of mortgage-backed securities, mortgage loans. Like fixed income securities, asset-backed and mortgage-backed securities are subject to interest rate risk, liquidity risk, and credit risk, which may be heightened in connection with investments in loans to “subprime” borrowers. Certain asset-backed and mortgage-backed securities are subject to the risk that those obligations will be repaid sooner than expected or later than expected, either of which may result in lower-than-expected returns. Mortgage-backed securities, because they are backed by mortgage loans, are also subject to risks related to real estate, and securities backed by private-issued mortgages may experience higher rates of default on the underlying mortgages than securities backed by government-issued mortgages.
Asset Transfer Program Risk: Predetermined, nondiscretionary mathematical formulas used by the participating insurance companies to manage the guarantees offered in connection with certain benefit programs under the Contracts may result in systematic transfers of assets among the investment options under the Contracts, including the Portfolio. These formulas may result in large-scale asset flows into and out of the Portfolio, which could adversely affect the Portfolio, including its risk profile, expenses and performance. For example, the asset flows may adversely affect performance by requiring the Portfolio to purchase or sell securities at inopportune times, by otherwise limiting the subadviser’s ability to fully implement the Portfolio’s investment strategies, or by requiring the Portfolio to hold a larger portion of its assets in highly liquid securities than it otherwise would hold. The asset flows may also result in high turnover, low asset levels and high operating expense ratios for the Portfolio. The asset flows could remove all or substantially all of the assets of the Portfolio. The efficient operation of the asset flows depends on active and liquid markets. If market liquidity is strained, the asset flows may not operate as intended which in turn could adversely affect performance.
Bank Loan Investments Risk: The Portfolio’s ability to receive payments of principal and interest and other amounts in connection with loans (whether through participations, assignments, or otherwise) will depend primarily on the financial condition of the borrower. The failure by the Portfolio to receive scheduled interest or principal payments on a loan because of a default, bankruptcy, or any other reason would adversely affect the income of the Portfolio and would likely reduce the value of its assets. Even with loans secured by collateral, there is the risk that the value of the collateral may decline, may be insufficient to meet the obligations of the borrower, or be difficult to liquidate. In the event of a default, the Portfolio may have difficulty collecting on any collateral and would not have the ability to collect on any collateral for an uncollateralized loan. Further, the Portfolio’s access to collateral, if any, may be limited by bankruptcy laws. In addition, loan participations generally are subject to restrictions on transfer, and only limited opportunities may exist to sell loan participations in secondary markets. As a result, it may be difficult for the Portfolio to value loans or sell loans at an acceptable price when it wants to sell them. Loans trade in an over-the-counter market, and confirmation and settlement, which are effected through standardized procedures and documentation, may have an impact on the length and timing of completing trades. To the extent the Portfolio invests in loans of non-U.S. issuers, the risks of investing in non-U.S. issuers are applicable. Loans may not be considered to be “securities” and as a result may not benefit from the protections of the federal securities laws,
B33
including anti-fraud protections and those with respect to the use of material non-public information, so that purchasers, such as the Portfolio, may not have the benefit of these protections.
Blend Style Risk: The Portfolio’s blend investment style may subject the Portfolio to risks of both value and growth investing. The portion of the Portfolio’s portfolio that makes investments pursuant to a growth strategy may be subject to above-average fluctuations as a result of seeking high-quality stocks with good future growth prospects. The portion of the Portfolio’s portfolio that makes investments pursuant to a value strategy may be subject to the risk that the market may not recognize a security’s intrinsic value for long periods of time or that a stock judged to be undervalued may actually be appropriately priced. Growth and value stocks have historically produced similar long-term results, though each category has periods when it outperforms the other. Issuers of value stocks may have experienced adverse business developments or may be subject to special risks that have caused the stock to be out of favor. If the Portfolio’s assessment of market conditions or a company’s value is inaccurate, the Portfolio could suffer losses or produce poor performance relative to other funds. Historically, growth stocks have performed best during later stages of economic expansion and value stocks have performed best during periods of economic recovery. Therefore, both styles may over time go in and out of favor with the markets. At times when a style is out of favor, that portion of the portfolio may lag the other portion of the portfolio, which may cause the overall Portfolio to underperform the market in general, its benchmark have a notable impact on settlement performance and other mutual funds.
Commodity Risk: The value of a commodity-linked investment is affected by, among other things, overall market movements, factors affecting a particular industry or commodity, and changes in interest and exchange rates and may be more volatile than traditional equity and debt securities.
Covenant-Lite Risk: Some of the loans or debt obligations in which the Portfolio may invest or get exposure to may be “covenant-lite,” which means the loans or obligations contain fewer financial maintenance covenants than other loans or obligations (in some cases, none) and do not include terms that allow the lender to monitor the borrower’s performance and declare a default if certain criteria are breached. An investment by the Portfolio in a covenant-lite loan may potentially hinder the ability to reprice credit risk associated with the issuer and reduce the ability to restructure a problematic loan and mitigate potential loss. The Portfolio may also experience difficulty, expenses or delays in enforcing its rights on its holdings of covenant-lite loans or obligations. As a result of these risks, the Portfolio’s exposure to losses may be increased, which could result in an adverse impact on the Portfolio’s net income and net asset value.
Credit Risk: This is the risk that the issuer, the guarantor or the insurer of a fixed income security, or the counterparty to a contract, may be unable or unwilling to make timely principal and interest payments, or to otherwise honor its obligations. Additionally, fixed income securities could lose value due to a loss of confidence in the ability of the issuer, guarantor, insurer or counterparty to pay back debt. The lower the credit quality of a bond, the more sensitive it is to credit risk.
Derivatives Risk: A derivative is a financial contract, the value of which depends upon, or is derived from, the value of one or more underlying investments, such as an asset, reference rate, or index. The use of derivatives is a highly specialized activity that involves a variety of risks in addition to and greater than those associated with investing directly in securities, including the risk that: the party on the other side of a derivative transaction will be unable to honor its financial obligation; leverage created by investing in derivatives may result in losses to the Portfolio; derivatives may be difficult or impossible for the Portfolio to buy or sell at an opportune time or price, and may be difficult to terminate or otherwise offset; derivatives used for hedging may reduce or magnify losses but also may reduce or eliminate gains; and the price of commodity-linked derivatives may be more volatile than the prices of traditional equity and debt securities. The Portfolio is subject to a derivatives risk management program, which may limit the ability of the Portfolio to invest in derivatives.
Economic and Market Events Risk: Events in the US and global financial markets, including actions taken by the U.S. Federal Reserve or foreign central banks to stimulate or stabilize economic growth, may at times result in periods of unusually high volatility in a market or a segment of a market, which could negatively impact performance. Reduced liquidity in credit and fixed income markets could adversely affect issuers worldwide. In addition, it remains uncertain that governmental entities will intervene in response to market disturbances, and the effect of any such future intervention cannot be predicted.
Emerging Markets Risk: The risks of non-US investments are greater for investments in or exposed to emerging markets. Emerging market countries typically have economic, political and social systems that are less developed, and can be expected to be less stable, than those of more developed countries. As a result, there could be less information available about issuers in emerging market countries, which could negatively affect the ability of the Manager or a Portfolio’s Subadviser(s) to evaluate local companies or their potential impact on a Portfolio’s performance. For example, the economies of such countries can be subject to currency devaluations and rapid and unpredictable (and in some cases, extremely high) rates of inflation or deflation. Low trading volumes may result in a lack of liquidity, price volatility and valuation difficulties. Regulatory regimes outside of the US may not require or enforce corporate governance standards comparable
B34
to that of the US, which may result in less protections for investors in such issuers and make such issuers more susceptible to actions not in the best interest of the issuer or its investors. Emerging market countries may have policies that restrict investments by foreign investors, or that prevent foreign investors from withdrawing their money at will, which may make it difficult for a Portfolio to invest in such countries or increase the administrative costs of such investments. Countries with emerging markets can be found in regions such as Asia, Latin America, Eastern Europe and Africa. A Portfolio may invest in some emerging markets through trading structures or protocols that subject it to risks such as those associated with decreased liquidity, custody of assets, different settlement and clearance procedures and asserting legal title under a developing legal and regulatory regime to a greater degree than in developed markets or even in other emerging markets.
Equity and Equity-Related Securities Risk: From time to time, the Fund may purchase or hold equity or equity-related securities incidental to the purchase or ownership of fixed income instruments or in connection with a reorganization of a borrower. These include common stock, preferred stock or securities that may be converted into or exchanged for common stock—known as convertible securities—like rights and warrants.
Equity Securities Risk: The value of a particular stock or equity-related security held by the Portfolio could fluctuate, perhaps greatly, in response to a number of factors, such as changes in the issuer’s financial condition or the value of the equity markets or a sector of those markets. Such events may result in losses to the Portfolio. In addition, due to decreases in liquidity, the Portfolio may be unable to sell its securities holdings within a reasonable time at the price it values the security or at any price.
Exchange-Traded Funds (ETF) Risk: An investment in an ETF generally presents the same primary risks as an investment in a mutual fund that has the same investment objective, strategies and policies. In addition, the market price of an ETF’s shares may trade above or below its net asset value and there may not be an active trading market for an ETF’s shares. The Portfolio could lose money investing in an ETF if the prices of the securities owned by the ETF go down.
Expense Risk: The actual cost of investing in the Portfolio may be higher than the expenses shown in the “Annual Portfolio Operating Expenses” table in the Portfolio’s prospectus for a variety of reasons, including, for example, if the Portfolio’s average net assets decrease.
Fixed Income Securities Risk: Investment in fixed income securities involves a variety of risks, including that: an issuer or guarantor of a security will be unable or unwilling to pay obligations when due; due to decreases in liquidity, the Portfolio may be unable to sell its securities holdings within a reasonable time at the price it values the security or at any price; and the Portfolio’s investment may decrease in value when interest rates rise. Volatility in interest rates and in fixed income markets may increase the risk that the Portfolio’s investment in fixed income securities will go down in value. Risks associated with changing interest rates are currently heightened because any increase or decrease may be sudden and significant, with unpredictable effects on the markets and the Portfolio’s investments. Changes in interest rates may also affect the liquidity of the Portfolio’s investments in fixed income securities.
Focus Risk: The Portfolio focuses or may focus its investments in particular countries, regions, industries, sectors, markets, or types of investments and may accumulate large positions in such areas. As a result, the Portfolio’s performance may be more sensitive to a small group of related holdings and adverse developments in such areas than a portfolio more broadly invested, although the increasing interconnectivity between economies and financial markets throughout the world increases the likelihood that events or conditions in one country or region will adversely impact markets or issuers in other countries or regions.
Foreign Investment Risk: Investments in foreign securities generally involve more risk than investments in securities of US issuers, including: changes in currency exchange rates may affect the value of foreign securities held by the Portfolio; foreign markets generally are more volatile than, and generally are not subject to regulatory requirements comparable to, US markets; foreign financial reporting standards usually differ from those in the US; foreign exchanges are often less liquid than US markets; political or social developments may adversely affect the value of foreign securities; foreign holdings may be subject to special taxation and limitations on repatriating investment proceeds; and certain events in foreign markets may adversely affect foreign and domestic issuers, including, among others, military conflict, geopolitical developments, interruptions in the global supply chain, natural disasters, and outbreaks of infectious diseases.
High Yield Risk: Investments in fixed income securities rated below investment grade and unrated securities of similar credit quality (i.e., high yield securities or junk bonds) may be more sensitive to interest rate, credit, call, and liquidity risks than investments in investment grade securities, and have predominantly speculative characteristics.
Index Tracking Risk: The Portfolio’s ability to track the performance and/or holdings and weightings of an index with a high degree of correlation may be affected by, among other things, transaction costs and shareholder purchases and redemptions.
B35
Interest Rate Risk: The value of your investment may go down when interest rates rise. A rise in interest rates tends to have a greater impact on the prices of longer term or duration securities. When interest rates fall, the issuers of debt obligations may prepay principal more quickly than expected, and the Portfolio may be required to reinvest the proceeds at a lower interest rate. This is referred to as “prepayment risk.” When interest rates rise, debt obligations may be repaid more slowly than expected, and the value of the Portfolio’s holdings may fall sharply. This is referred to as “extension risk.”
Investment Style Risk: Securities held by the Portfolio as a result of a particular investment style, such as growth or value, tend to perform differently (i.e., better or worse than other segments of, or the overall, stock market) depending on market and economic conditions and investor sentiment. At times when the investment style is out of favor, the Portfolio may underperform other funds that invest in similar asset classes but use different investment styles.
Large Company Risk: Large-capitalization stocks as a group could fall out of favor with the market, causing the Portfolio to underperform investments that focus on small- or medium-capitalization stocks. Larger, more established companies may be slow to respond to challenges and may grow more slowly than smaller companies.
Leverage Risk: Using leverage, the investment of borrowed cash, may amplify the Portfolio’s gains and losses and cause the Portfolio to be more volatile and riskier than if it had not been leveraged.
Liquidity and Valuation Risk: The Portfolio may hold one or more securities for which there are no or few buyers and sellers or the securities are subject to limitations on transfer. The Portfolio may be unable to sell those portfolio holdings at the desired time or price, and may have difficulty determining the value of such securities for the purpose of determining the Portfolio’s net asset value. In such cases, investments owned by the Portfolio may be valued at fair value pursuant to policies and procedures adopted and implemented by the Manager. No assurance can be given that the fair value prices accurately reflect the value of the security. The Portfolio is subject to a liquidity risk management program, which limits the ability of the Portfolio to invest in illiquid investments.
Market and Management Risk: Markets in which the Portfolio invests may experience volatility and go down in value, and possibly sharply and unpredictably. Investment techniques, risk analyses, and investment strategies, which may include quantitative models or methods, used by a subadviser in making investment decisions for the Portfolio are subject to human error and may not produce the intended or desired results. The value of the Portfolio’s investments may be negatively affected by the occurrence of domestic or global events, including war, terrorism, environmental disasters, natural disasters, or events, political or civil instability, and public health emergencies, among others. Such events may reduce consumer demand or economic output, result in market closures, travel restrictions or quarantines, and significantly adversely impact the economy. There is no guarantee that the investment objective of the Portfolio will be achieved.
Market Capitalization Risk: Investing in issuers within the same market capitalization category carries the risk that the category may be out of favor due to current market conditions or investor sentiment. Because the Portfolio may invest a portion of its assets in securities issued by small-cap companies, it is likely to be more volatile than a portfolio that focuses on securities issued by larger companies. Small-sized companies often have less experienced management, narrower product lines, more limited financial resources, and less publicly available information than larger companies. In addition, smaller companies are typically more sensitive to changes in overall economic conditions and their securities may be difficult to trade.
Mid-Sized Company Risk: The shares of mid-sized companies tend to trade less frequently than those of larger, more established companies, which can have an adverse effect on the pricing and volatility of these securities and on the Portfolio’s ability to sell the securities.
Participation Notes (P-Notes) Risk: The Portfolio may gain exposure to securities traded in foreign markets through P-notes. In addition to risks similar to those associated with a direct investment in the underlying security, such as foreign investment risk, the holder of a P-note is not entitled to the same rights as an underlying security’s direct owner and P-notes are considered general unsecured contractual obligations and are subject to counterparty credit risks.
Portfolio Turnover Risk: A subadviser may engage in active trading on behalf of the Portfolio—that is, frequent trading of the Portfolio’s securities—in order to take advantage of new investment opportunities or yield differentials. The Portfolio’s turnover rate may be higher than that of other mutual funds. Portfolio turnover generally involves some expense to the Portfolio, including brokerage commissions or dealer mark-ups and other transaction costs on the sale of securities and reinvestment in other securities.
Prepayment or Call Risk: Prepayment or call risk is the risk that issuers will prepay fixed-rate obligations held by the Portfolio when interest rates fall, forcing a Portfolio to reinvest in obligations with lower interest rates than the original obligations. Mortgage-related securities and asset-backed securities are particularly subject to prepayment risk.
B36
Quantitative Model Risk: The Portfolio and certain Underlying Portfolios, if applicable, may use quantitative models as part of their investment process. Securities or other investments selected using quantitative methods may perform differently from the market as a whole or from their expected performance for many reasons, including factors used in building the quantitative analytical framework, the weights placed on each factor, and changing sources of market returns. There can be no assurance that these methodologies will produce the desired results or enable the Portfolio to achieve its objective. A given model may be more effective with certain instruments or strategies than others, and there can be no assurance that any model can identify and incorporate all factors that will affect an investment’s price or performance.
Real Estate Risk: Investments in real estate investment trusts (REITs) and real estate-linked derivative instruments are subject to risks similar to those associated with direct ownership of real estate. Poor performance by the manager of the REIT and adverse changes to or inability to qualify with favorable tax laws will adversely affect the Portfolio. In addition, some REITs have limited diversification because they invest in a limited number of properties, a narrow geographic area, or a single type of property.
Regulatory Risk: The Portfolio is subject to a variety of laws and regulations which govern its operations. The Portfolio is subject to regulation by the SEC, and depending on the Portfolio, the Commodity Futures Trading Commission. Similarly, the businesses and other issuers of the securities and other instruments in which the Portfolio invests are also subject to considerable regulation. Changes in laws and regulations may materially impact the Portfolio, a security, business, sector or market.
Small-Sized Company Risk: Securities of small sized companies tend to be less liquid than those of larger, more established companies, which can have an adverse effect on the price of these securities and on the Portfolio’s ability to sell these securities. The market price of such investments also may rise more in response to buying demand and fall more in response to selling pressure and be more volatile than investments in larger companies.
US Government Securities Risk: US Government securities may be adversely affected by changes in interest rates, a default by, or decline in the credit quality of, the US Government, and may not be backed by the full faith and credit of the US Government.
Yield Risk: The amount of income received by a Portfolio will go up or down depending on day-to-day variations in short-term interest rates, and when interest rates are very low, the Portfolio’s expenses could absorb all or a significant portion of the Portfolio’s income. If interest rates increase, the Portfolio’s yield may not increase proportionately. For example, the Portfolio’s investment manager may discontinue any temporary voluntary fee limitation.
10. Reorganization
On September 20-22, 2021, the Board approved Agreements and Plans of Reorganization (the “Plans”) which provided for the transfer of all the assets of AST BlackRock Corporate Bond Portfolio (“BlackRock Corporate Bond”), AST PIMCO Corporate Bond Portfolio (“PIMCO Corporate Bond”), AST Prudential Corporate Bond Portfolio (“Prudential Corporate Bond”), AST T. Rowe Price Corporate Bond Portfolio (“T. Rowe Price Corporate Bond”) and AST Western Asset Corporate Bond Portfolio (“Western Asset Corporate Bond”) (Merged Portfolios) for shares of PSF PGIM Total Return Bond Portfolio (the “Acquiring Portfolio”) and the assumption of the liabilities of the Merged Portfolios, respectively. Shareholders approved the Plan at a meeting on January 10, 2022 and the reorganization took place at the close of business on February 11, 2022.
On the reorganization date, the Merged Portfolios had the following total investment cost and value, representing the principal assets acquired by the Acquiring Portfolio:
| | | | | | | | |
| Merged Portfolios | | Total Investment Value | | Total Investment Cost |
BlackRock Corporate Bond | | | $ 9,114,989 | | | | $ 9,460,005 | |
PIMCO Corporate Bond | | | 9,915,524 | | | | 10,205,114 | |
Prudential Corporate Bond | | | 11,176,973 | | | | 11,586,726 | |
T. Rowe Price Corporate Bond | | | 7,744,789 | | | | 8,003,316 | |
Western Asset Corporate Bond | | | 8,362,026 | | | | 8,622,368 | |
The purpose of the transaction was to combine six portfolios with substantially similar investment objectives, policies and strategies.
B37
The acquisition was accomplished by a tax-free exchange of the following shares on February 11, 2022:
| | | | | | | | | | |
| Merged Portfolios | | | | | | | Shares | |
BlackRock Corporate Bond | | | | | | | | | 852,717 | |
PIMCO Corporate Bond | | | | | | | | | 928,846 | |
Prudential Corporate Bond | | | | | | | | | 1,080,646 | |
T. Rowe Price Corporate Bond | | | | | | | | | 759,459 | |
Western Asset Corporate Bond | | | | | | | | | 816,235 | |
| Acquiring Portfolio | | Shares | | | Class | | Value | |
PSF PGIM Total Return Bond | | | 3,070,515 | | | I | | $ | 46,303,369 | |
For financial reporting purposes, assets received and shares issued by the Acquiring Portfolio were recorded at fair value; however, the cost basis of the investments received from the Merged Portfolios were carried forward to reflect the tax-free status of the acquisition.
The net assets and net unrealized depreciation immediately before the acquisition were as follows:
| | | | | | | | |
| Merged Portfolios | | Unrealized
(Depreciation)
on Investments | | Net Assets | |
BlackRock Corporate Bond | | | $(345,016 | ) | | | $ 9,021,658 | |
PIMCO Corporate Bond | | | (289,590 | ) | | | 9,673,003 | |
Prudential Corporate Bond | | | (409,753 | ) | | | 11,257,526 | |
T. Rowe Price Corporate Bond | | | (258,527 | ) | | | 7,896,705 | |
Western Asset Corporate Bond | | | (260,342 | ) | | | 8,454,477 | |
| Acquiring Portfolio | | Class | | Net Assets | |
PSF PGIM Total Return Bond | | | I | | | $ | 1,244,085,296 | |
| | | | III | | | | 6,070,733 | |
Assuming the acquisition had been completed on January 1, 2022, the Acquiring Portfolio’s unaudited pro forma results of operations for the year ended December 31, 2022 would have been as follows:
| | | | | | |
| Acquiring Portfolio | | Net investment income (loss) (a) | | Net realized and
unrealized gain (loss) on investments (b) | | Net increase (decrease) in net assets resulting
from operations |
PSF PGIM Total Return Bond | | $37,808,164 | | $(234,204,538) | | $(196,396,374) |
| (a) | Net investment income as reported in the Statement of Operations (Year ended December 31, 2022) of the Acquiring Portfolio, plus net investment income from the Merged Portfolios pre-merger as follows: BlackRock Corporate Bond $17,574, PIMCO Corporate Bond $20,230, Prudential Corporate Bond $25,681, T. Rowe Price Corporate Bond $17,718 and Western Asset Corporate Bond $18,488. |
| (b) | Net realized and unrealized gain on investments as reported in the Statement of Operations (Year ended December 31, 2022) of the Acquiring Portfolio, plus net realized and unrealized gain (loss) on investments from the Merged Portfolios pre-merger as follows: BlackRock Corporate Bond $(393,915), PIMCO Corporate Bond $(381,290), Prudential Corporate Bond $(526,669), T. Rowe Price Corporate Bond $(349,114) and Western Asset Corporate Bond $(374,895). |
Since both the Merged Portfolios and the Acquiring Portfolio sold and redeemed shares throughout the period, it is not practicable to provide pro-forma information on a per-share basis.
Since the combined investment portfolios have been managed as a single integrated portfolio since the acquisition was completed, it is also not practicable to separate the amounts of revenue and earnings of the Merged Portfolios that have been included in the Acquiring Portfolio’s Statement of Operations since February 11, 2022.
11. Subsequent Events
On September 19-20, 2022, the Board of the Advanced Series Trust and the Prudential Series Fund approved the reorganization (the “Reorganization”) of AST International Value Portfolio, AST J.P. Morgan International Equity Portfolio, AST QMA International Core Equity Portfolio and PSF International Growth Portfolio (the “Target Portfolios”) into AST International Growth Portfolio (the “Acquiring Portfolio”). The shareholders of the Target Portfolios approved the
B38
reorganization at a meeting on February 8, 2023. It is expected that the Reorganization will be completed on or around March 10, 2023. Upon completion of the Reorganization, the AST International Growth Portfolio’s name will be changed to the AST International Equity Portfolio.
On September 19-20, 2022, the Board of the Advanced Series Trust and the Prudential Series Fund approved the reorganization (the “Reorganization”) of AST T. Rowe Price Diversified Real Growth Portfolio and AST Prudential Flexible Multi-Strategy Portfolio (the “Target Portfolios”) into PSF PGIM Flexible Managed Portfolio (the “Acquiring Portfolio”). The shareholders of the Target Portfolios approved the reorganization at a meeting on January 24, 2023. It is expected that the Reorganization will be completed on or around February 24, 2023.
B39
REPORT OF INDEPENDENT REGISTERED PUBLIC ACCOUNTING FIRM
To the Board of Trustees of Prudential Series Fund and Shareholders of PSF Global Portfolio, PSF International Growth Portfolio, PSF Mid-Cap Growth Portfolio, PSF Natural Resources Portfolio, PSF PGIM 50/50 Balanced Portfolio, PSF PGIM Flexible Managed Portfolio, PSF PGIM Government Income Portfolio, PSF PGIM Government Money Market Portfolio, PSF PGIM High Yield Bond Portfolio, PSF PGIM Jennison Blend Portfolio, PSF PGIM Jennison Focused Blend Portfolio, PSF PGIM Jennison Growth Portfolio, PSF PGIM Jennison Value Portfolio, PSF PGIM Total Return Bond Portfolio, PSF Small-Cap Stock Index Portfolio, PSF Small-Cap Value Portfolio and PSF Stock Index Portfolio
Opinions on the Financial Statements
We have audited the accompanying statements of assets and liabilities, including the schedules of investments, of PSF Global Portfolio, PSF International Growth Portfolio, PSF Mid-Cap Growth Portfolio, PSF Natural Resources Portfolio, PSF PGIM 50/50 Balanced Portfolio, PSF PGIM Flexible Managed Portfolio, PSF PGIM Government Income Portfolio, PSF PGIM Government Money Market Portfolio, PSF PGIM High Yield Bond Portfolio, PSF PGIM Jennison Blend Portfolio, PSF PGIM Jennison Focused Blend Portfolio, PSF PGIM Jennison Growth Portfolio, PSF PGIM Jennison Value Portfolio, PSF PGIM Total Return Bond Portfolio, PSF Small-Cap Stock Index Portfolio, PSF Small-Cap Value Portfolio and PSF Stock Index Portfolio (constituting Prudential Series Fund, hereafter collectively referred to as the “Portfolios”) as of December 31, 2022, the related statements of operations for the year ended December 31, 2022, the statements of changes in net assets for each of the two years in the period ended December 31, 2022, including the related notes, and the financial highlights for each of the periods indicated therein ended on or subsequent to December 31, 2020 (collectively referred to as the “financial statements”). In our opinion, the financial statements present fairly, in all material respects, the financial position of each of the Portfolios as of December 31, 2022, the results of each of their operations for the year then ended, and the changes in each of their net assets for each of the two years in the period ended December 31, 2022 and each of the financial highlights for each of the periods indicated therein ended on or subsequent to December 31, 2020 in conformity with accounting principles generally accepted in the United States of America.
The financial statements of PSF Global Portfolio, PSF International Growth Portfolio, PSF Mid-Cap Growth Portfolio, PSF Natural Resources Portfolio, PSF PGIM 50/50 Balanced Portfolio, PSF PGIM Flexible Managed Portfolio, PSF PGIM Government Income Portfolio, PSF PGIM Government Money Market Portfolio, PSF PGIM High Yield Bond Portfolio, PSF PGIM Jennison Blend Portfolio, PSF PGIM Jennison Growth Portfolio, PSF PGIM Jennison Value Portfolio, PSF PGIM Total Return Bond Portfolio, PSF Small-Cap Stock Index Portfolio, PSF Small-Cap Value Portfolio and PSF Stock Index Portfolio as of and for the year ended December 31, 2019 and the financial highlights for each of the periods ended on or prior to December 31, 2019 (not presented herein, other than the financial highlights) were audited by other auditors whose reports dated February 14, 2020 expressed unqualified opinions on those financial statements and financial highlights.
The financial statements of PSF PGIM Jennison Focused Blend Portfolio as of and for the year ended December 31, 2019 and the financial highlights for each of the periods ended on or prior to December 31, 2019 (not presented herein, other than the financial highlights) were audited by other auditors whose report dated February 12, 2020 expressed an unqualified opinion on those financial statements and financial highlights.
Basis for Opinions
These financial statements are the responsibility of the Portfolios’ management. Our responsibility is to express an opinion on the Portfolios’ financial statements based on our audits. We are a public accounting firm registered with the Public Company Accounting Oversight Board (United States) (PCAOB) and are required to be independent with respect to the Portfolios in accordance with the U.S. federal securities laws and the applicable rules and regulations of the Securities and Exchange Commission and the PCAOB.
We conducted our audits of these financial statements in accordance with the standards of the PCAOB. Those standards require that we plan and perform the audit to obtain reasonable assurance about whether the financial statements are free of material misstatement, whether due to error or fraud.
Our audits included performing procedures to assess the risks of material misstatement of the financial statements, whether due to error or fraud, and performing procedures that respond to those risks. Such procedures included examining, on a test basis, evidence regarding the amounts and disclosures in the financial statements. Our audits also included evaluating the accounting principles used and significant estimates made by management, as well as evaluating the overall presentation of the financial statements. Our procedures included confirmation of securities owned as of December 31, 2022 by correspondence with the custodian, transfer agent and brokers; when replies were not received from brokers, we performed other auditing procedures. We believe that our audits provide a reasonable basis for our opinions.
/s/PricewaterhouseCoopers LLP
New York, New York
February 17, 2023
We have served as the auditor of one or more investment companies in the Prudential Insurance Portfolios complex since 2020.
C1
INFORMATION ABOUT BOARD MEMBERS AND OFFICERS
Information about the Trustees (or “Board Members”) and the officers of the Trust is set forth below. Trustees who are not deemed to be “interested persons” of the Trust, as defined in the 1940 Act, are referred to as “Independent Board Members.” Trustees who are deemed to be “interested persons” of the Trust are referred to as “Interested Board Members.” The Trustees oversee the operations of the Trust and appoint officers who are responsible for day-to-day business decisions based on policies set by the Board.
| | | | | | |
| |
Independent Board Members |
Name Year of Birth No. of Portfolios Overseen | | Principal Occupation(s) During Past Five Years | | Other Directorships Held | | Length of Board Service |
Susan Davenport Austin 1967 No. of Portfolios Overseen: 76 | | Chief Financial Officer of Grace Church School (Since September 2019); President, Candide Business Advisors, Inc. (Since 2011); formerly Senior Managing Director of Brock Capital (2014-2019); formerly Vice Chairman (2013 -2017), Senior Vice President and Chief Financial Officer (2007-2012) and Vice President of Strategic Planning and Treasurer (2002-2007) of Sheridan Broadcasting Corporation; formerly President of Sheridan Gospel Network (2004-2014). | | Director of NextEra Energy Partners, LP (NYSE: NEP) (Since February 2015); Member of the Board of Directors, Hubbard Radio, LLC (Since 2011); formerly Chairman (2011-2014), formerly Presiding Director (2014-2017) and currently a Member (2007-present) of the Board of Directors, Broadcast Music, Inc.; formerly Member of the Board of Directors, The MacDowell Colony (2010 - 2021). | | Since February 2011 |
Sherry S. Barrat 1949 No. of Portfolios Overseen: 76 | | Formerly Vice Chairman of Northern Trust Corporation (financial services and banking institution) (2011–June 2012); formerly President, Personal Financial Services, Northern Trust Corporation (2006-2010); formerly Chairman & CEO, Western US Region, Northern Trust Corporation (1999-2005); formerly President & CEO, Palm Beach/Martin County Region, Northern Trust. | | Lead Director of NextEra Energy, Inc. (NYSE: NEE) (since May 2020); Director of NextEra Energy, Inc. (since 1998); Director of Arthur J. Gallagher & Company (Since July 2013). | | Since January 2013 |
Jessica M. Bibliowicz 1959 No. of Portfolios Overseen: 76 | | Chairman of the Board of Fellows of Weill Cornell Medicine (since 2014); Director of Apollo Global Management, Inc. (since 2022); formerly Chief Executive Officer (1999-2013) of National Financial Partners (independent distributor of financial services products). | | Formerly Director of the Asia-Pacific Fund, Inc. (2006-2019); formerly Director of Sotheby’s (2014-2019) auction house and art-related finance. | | Since September 2014 |
Kay Ryan Booth 1950 No. of Portfolios Overseen: 76 | | Trinity Investors (Since September 2014); formerly, Managing Director of Cappello Waterfield & Co. LLC (2011-2014); formerly Vice Chair, Global Research, J.P. Morgan (financial services and investment banking institution) (June 2008 – January 2009); formerly Global Director of Equity Research, Bear Stearns & Co., Inc. (financial services and investment banking institution) (1995-2008); formerly Associate Director of Equity Research, Bear Stearns & Co., Inc. (1987-1995). | | None. | | Since January 2013 |
Stephen M. Chipman 1961 No. of Portfolios Overseen: 76 | | Formerly Group Managing Director, International Expansion and Regional Managing Director, Americas of Vistra (June 2018 – June 2019); formerly Chief Executive Officer and Director of Radius (2016-2018); formerly Senior Vice Chairman (January 2015-October 2015) and Chief Executive Officer (January 2010-December 2014) of Grant Thornton LLP. | | Chairman of the Board of Auxadi Holdco, S.L. (Since February 2022); Non-Executive Director of Auxadi Holdco, S.L (Since November 2020); Non-Executive Director of Stout (Since January 2020); formerly Non-Executive Director of Clyde & Co. (January 2020 – June 2021); Formerly Non-Executive Chairman (September 2019 – January 2021) of Litera Microsystems. | | Since January 2018 |
Robert F. Gunia 1946 No. of Portfolios Overseen: 76 | | Director of ICI Mutual Insurance Company (June 2020 - present; June 2016-June 2019); formerly Chief Administrative Officer (September 1999-September 2009) and Executive Vice President (December 1996-September 2009) of PGIM Investments LLC; formerly Executive Vice President (March 1999-September 2009) and Treasurer (May 2000-September 2009) of Prudential Mutual Fund Services LLC; formerly President (April 1999-December 2008) and Executive Vice President and Chief Operating Officer (December 2008-December 2009) of Prudential Investment Management Services LLC; formerly Chief Administrative Officer, Executive Vice President and Director (May 2003-September 2009) of AST Investment Services, Inc. | | Formerly Director (1989-2019) of The Asia Pacific Fund, Inc. | | Since July 2003 |
D1
| | | | | | |
|
Independent Board Members |
Name Year of Birth No. of Portfolios Overseen | | Principal Occupation(s) During Past Five Years | | Other Directorships Held | | Length of Board Service |
Thomas M. O’Brien 1950 No. of Portfolios Overseen: 76 | | Chairman, Chief Executive Officer and President of Sterling Bancorp (Since June 2020); Chairman, Chief Executive Officer and President of Sterling Bank and Trust, F.S.B.; formerly Vice Chairman of Emigrant Bank and President of its Naples Commercial Finance Division (October 2018–March 2020); formerly Director, President and CEO Sun Bancorp, Inc. N.A. (NASDAQ: SNBC) and Sun National Bank (July 2014-February 2018); formerly Consultant, Valley National Bancorp, Inc. and Valley National Bank (January 2012-June 2012); formerly President and COO (November 2006-April 2017) and CEO (April 2007-December 2011) of State Bancorp, Inc. and State Bank; formerly Vice Chairman (January 1997-April 2000) of North Fork Bank; formerly President and Chief Executive Officer (December 1984-December 1996) of North Side Savings Bank; formerly President and Chief Executive Officer (May 2000-June 2006) Atlantic Bank of New York. | | Formerly Director, Sun Bancorp, Inc. N.A. (NASDAQ: SNBC) and Sun National Bank (July 2014-February 2018); formerly Director, BankUnited, Inc. and BankUnited N.A. (NYSE: BKU) (May 2012-April 2014); formerly Director (April 2008-January 2012) of Federal Home Loan Bank of New York; formerly Director (December 1996-May 2000) of North Fork Bancorporation, Inc.; formerly Director (May 2000-April 2006) of Atlantic Bank of New York; Director (November 2006 – January 2012) of State Bancorp, Inc. (NASDAQ: STBC) and State Bank of Long Island. | | Since July 2003 |
| | | | | | |
| |
Interested Board Member | | |
Timothy S. Cronin 1965 Number of Portfolios Overseen: 76 | | Vice President of Prudential Annuities (Since May 2003); Senior Vice President of PGIM Investments LLC (Since May 2009); Chief Investment Officer and Strategist of Prudential Annuities (Since January 2004); Director of Investment & Research Strategy (Since February 1998); President of AST Investment Services, Inc. (Since March 2006). | | None. | | Since October 2009 |
| | | | |
| |
Officers(a) |
Name Year of Birth Position | | Principal Occupation(s) During the Past Five Years | | Length of Service as Officer |
Ken Allen 1969 Vice President | | Vice President of Investment Management (since December 2009). | | Since June 2019 |
Claudia DiGiacomo 1974 Chief Legal Officer and Assistant Secretary | | Chief Legal Officer (since September 2022) of the PGIM Private Credit Fund; Chief Legal Officer (since July 2022) of the PGIM Private Real Estate Fund, Inc.; Chief Legal Officer, Executive Vice President and Secretary of PGIM Investments LLC (since August 2020); Chief Legal Officer of Prudential Mutual Fund Services LLC (since August 2020); Chief Legal Officer of PIFM Holdco, LLC (since August 2020); Vice President and Corporate Counsel (since January 2005) of Prudential; and Corporate Counsel of AST Investment Services, Inc. (since August 2020); formerly Vice President and Assistant Secretary of PGIM Investments LLC (2005-2020); formerly Associate at Sidley Austin Brown & Wood LLP (1999-2004). | | Since December 2005 |
Andrew R. French 1962 Secretary | | Vice President (since December 2018) of PGIM Investments LLC; Secretary (since September 2022) of the PGIM Private Credit Fund; Secretary (since March 2022) of the PGIM Private Real Estate Fund, Inc.; formerly Vice President and Corporate Counsel (2010-2018) of Prudential; formerly Director and Corporate Counsel (2006-2010) of Prudential; Vice President and Assistant Secretary (since January 2007) of PGIM Investments LLC; Vice President and Assistant Secretary (since January 2007) of Prudential Mutual Fund Services LLC. | | Since October 2006 |
Melissa Gonzalez 1980 Assistant Secretary | | Vice President and Corporate Counsel (since September 2018) of Prudential; Vice President and Assistant Secretary (since August 2020) of PGIM Investments LLC; Assistant Secretary (since September 2022) of the PGIM Private Credit Fund; Assistant Secretary (since March 2022) of the PGIM Private Real Estate Fund, Inc.; formerly Director and Corporate Counsel (March 2014-September 2018) of Prudential. | | Since March 2019 |
Patrick E. McGuinness 1986 Assistant Secretary | | Vice President and Assistant Secretary (since August 2020) of PGIM Investments LLC; Director and Corporate Counsel (since February 2017) of Prudential; Assistant Secretary (since September 2022) of the PGIM Private Credit Fund; Assistant Secretary (since March 2022) of the PGIM Private Real Estate Fund, Inc. | | Since June 2020 |
Debra Rubano 1975 Assistant Secretary | | Vice President and Corporate Counsel (since November 2020) of Prudential; Assistant Secretary (since September 2022) of the PGIM Private Credit Fund; Assistant Secretary (since March 2022) of the PGIM Private Real Estate Fund, Inc; formerly Director and Senior Counsel of Allianz Global Investors U.S. Holdings LLC (2010-2020) and Assistant Secretary of numerous funds in the Allianz fund complex (2015-2020). | | Since March 2021 |
D2
| | | | |
| | | |
Officers(a) | | | | |
Name Year of Birth Position | | Principal Occupation(s) During the Past Five Years | | Length of Service as Officer |
Isabelle Sajous 1976 Chief Compliance Officer | | Chief Compliance Officer (since April 2022) of PGIM Investments LLC, the PGIM Funds, Target Funds, PGIM ETF Trust, PGIM Global High Yield Fund, Inc., PGIM High Yield Bond Fund, Inc., PGIM Short Duration High Yield Opportunities Fund, Advanced Series Trust, The Prudential Series Fund and Prudential’s Gibraltar Fund, Inc.; Chief Compliance Officer (since September 2022) of the PGIM Private Credit Fund; Chief Compliance Officer (since March 2022) of the PGIM Private Real Estate Fund, Inc.; Vice President, Compliance of PGIM Investments LLC (since December 2020); formerly Director, Compliance (July 2018-December 2020) of Credit Suisse Asset Management LLC; and Vice President, Associate General Counsel & Deputy Chief Compliance Officer of Cramer Rosenthal McGlynn, LLC (August 2014-July 2018). | | Since April 2022 |
Kelly Florio 1978 Anti-Money Laundering Compliance Officer | | Vice President, Corporate Compliance, Global Compliance Programs and Compliance Risk Management (since December 2021) of Prudential; formerly, Head of Fraud Risk Management (October 2019-December 2021) at New York Life Insurance Company; formerly, Head of Key Risk Area Operations (November 2018-October 2019), Director of the US Anti-Money Laundering Compliance Unit (2009-2018) and Bank Loss Prevention Associate (2006 -2009) at MetLife. | | Since June 2022 |
Christian J. Kelly 1975 Treasurer and Principal Financial and Accounting Officer | | Vice President, Head of Fund Administration of PGIM Investments LLC (since November 2018); Principal Financial Officer (since September 2022) of the PGIM Private Credit Fund; Principal Financial Officer (since March 2022) of the PGIM Private Real Estate Fund, Inc.; formerly, Treasurer and Principal Accounting Officer (March 2022- July 2022) of the PGIM Private Real Estate Fund, Inc.; formerly Director of Fund Administration of Lord Abbett & Co. LLC (2009-2018), Treasurer and Principal Accounting Officer of the Lord Abbett Family of Funds (2017-2018); Director of Accounting, Avenue Capital Group (2008-2009); Senior Manager, Investment Management Practice of Deloitte & Touche LLP (1998-2007). | | Since January 2019 |
Lana Lomuti 1967 Assistant Treasurer | | Vice President (since 2007) within PGIM Investments Fund Administration; formerly Assistant Treasurer (December 2007-February 2014) of The Greater China Fund, Inc.; formerly Director (2005-2007) within PGIM Investments Fund Administration. | | Since April 2014 |
Russ Shupak 1973 Assistant Treasurer | | Vice President (since 2017) within PGIM Investments Fund Administration; Treasurer and Principal Accounting Officer (since July 2022) of the PGIM Private Real Estate Fund, Inc.; Assistant Treasurer (since September 2022) of the PGIM Private Credit Fund; formerly Assistant Treasurer (March 2022 – July 2022) of the PGIM Private Real Estate Fund, Inc.; formerly Director (2013-2017) within PGIM Investments Fund Administration. | | Since October 2019 |
Deborah Conway 1969 Assistant Treasurer | | Vice President (since 2017) within PGIM Investments Fund Administration; Assistant Treasurer (since September 2022) of the PGIM Private Credit Fund; Assistant Treasurer (since March 2022) of the PGIM Private Real Estate Fund, Inc.; formerly Director (2007-2017) within PGIM Investments Fund Administration. | | Since October 2019 |
Elyse M. McLaughlin 1974 Assistant Treasurer | | Vice President (since 2017) within PGIM Investments Fund Administration; Treasurer and Principal Accounting Officer (since September 2022) of the PGIM Private Credit Fund; Assistant Treasurer (since March 2022) of the PGIM Private Real Estate Fund, Inc.; formerly Director (2011-2017) within PGIM Investments Fund Administration. | | Since October 2019 |
Alina Srodecka, CPA 1966 Assistant Treasurer | | Vice President of Tax at Prudential Financial, Inc. (Since August 2007); formerly Director of Tax at MetLife (January 2003 – May 2006); formerly Tax Manager at Deloitte & Touché (October 1997 – January 2003); formerly Staff Accountant at Marsh & McLennan (May 1994 – May 1997). | | Since June 2017 |
(a) Excludes Mr. Cronin, an Interested Board Member who also serves as President and Principal Executive Officer.
Explanatory Notes to Tables:
Board Members are deemed to be “Interested,” as defined in the 1940 Act, by reason of their affiliation with PGIM Investments and/or an affiliate of PGIM Investments. Timothy S. Cronin is an Interested Board Member because he is employed by an affiliate of the Manager.
Unless otherwise noted, the address of all Board Members and Officers is c/o PGIM Investments LLC, 655 Broad Street, Newark, New Jersey 07102.
There is no set term of office for Board Members or Officers. The Independent Board Members have adopted a retirement policy, which calls for the retirement of Board Members on December 31 of the year in which they reach the age of 78, provided that the Board may extend the retirement age on a year-by-year basis for a Board Member.
As used in the Officer’s table, “Prudential” means The Prudential Insurance Company of America
“Other Directorships Held” includes all directorships of companies required to register or file reports with the SEC under the 1934 Act (that is, “public companies”) or other investment companies registered under the 1940 Act.
“No. of Portfolios Overseen” includes all investment companies managed by PGIM Investments and/or ASTIS that are overseen by the Board Member. The investment companies for which PGIM Investments and/or ASTIS serves as Manager include PGIM Mutual Funds, Target Funds, The Prudential Variable Contract Accounts, PGIM ETF Trust, PGIM Private Real Estate Fund, Inc., PGIM Private Credit Fund, PGIM High Yield Bond Fund, Inc., PGIM Global High Yield Fund, Inc., PGIM Short Duration High Yield Opportunities Fund, The Prudential Series Fund, Prudential’s Gibraltar Fund, Inc. and the Advanced Series Trust.
D3
The prospectuses for the Prudential Series Fund portfolios and the applicable variable annuity or variable life prospectuses contain information on the investment objectives, risks, charges, and expenses of the portfolios and on the contracts and should be read carefully.
A description of the policies and procedures that the Fund used to determine how to vote proxies relating to portfolio securities and information regarding how the Fund voted proxies relating to portfolio securities during the most recent 12-month period ended June 30 is available without charge upon request by calling the appropriate phone number listed below and on the website of the Securities and Exchange Commission (the Commission) at www.sec.gov. Additionally, this information is available on the Fund’s website at www.prudential.com/variableinsuranceportfolios.
The Fund files with the Commission a complete listing of portfolio holdings as of its first and third calendar quarter-end on Form N-PORT. Form N-PORT is available on the Commission’s website at www.sec.gov or call (800) SEC-0330. Additionally, the Fund makes a complete listing of portfolio holdings as of its first and third calendar quarter-end available on its website listed above.
The Fund’s Statement of Additional Information contains additional information about the Fund’s Trustees and is available without charge upon request by calling the appropriate phone number listed below.
To contact your client services representative, please call the phone number listed below.
Owners of Individual Annuity contracts should call (888) 778-2888.
Owners of Individual Life Insurance contracts should call (800) 778-2255.
Owners of Group Variable Universal Life Insurance contracts should call (800) 562-9874.
Owners of Group Variable Universal Life Insurance contracts through AICPA should call (800) 223-7473.
Annuity and life insurance contracts contain exclusions, limitations, reductions of benefits, and terms for keeping them in force. Your licensed financial professional can provide you with costs and complete details. Contract guarantees are based on the claims-paying ability of the issuing company.

The Prudential Insurance Company of America
751 Broad Street
Newark, NJ 07102-3714
Every year we will send you an updated summary prospectus. We will also send you, or make available to you pursuant to Rule 30e-3 under the Investment Company Act of 1940, an annual report and a semi-annual report, which contain important financial information about the Portfolios.
To reduce Portfolio expenses, we may send or make available one annual shareholder report, one semi-annual shareholder report and one summary prospectus per household (householding), unless you instruct us or the relevant participating insurance company otherwise.
Householding is not yet available on all products. You should be aware that by calling (800) 778-2255, you can revoke, or “opt out,” of householding at any time, which may increase the volume of mail you will receive.
©2023 Prudential Financial, Inc. and its related entities. PGIM Investments, the Prudential logo, and the Rock symbol are service marks of Prudential Financial, Inc. and its related entities, registered in many jurisdictions worldwide.
PSF-AR-A
Item 2 – Code of Ethics — See Exhibit (a)
As of the end of the period covered by this report, the registrant has adopted a code of ethics (the “Section 406 Standards for Investment Companies – Ethical Standards for Principal Executive and Financial Officers”) that applies to the registrant’s Principal Executive Officer and Principal Financial Officer; the registrant’s Principal Financial Officer also serves as the Principal Accounting Officer.
The registrant hereby undertakes to provide any person, without charge, upon request, a copy of the code of ethics. To request a copy of the code of ethics, contact the registrant 800-225-1852, and ask for a copy of the Section 406 Standards for Investment Companies - Ethical Standards for Principal Executive and Financial Officers.
Item 3 – Audit Committee Financial Expert –
The registrant’s Board has determined that Mr. Stephen Chipman, member of the Board’s Audit Committee is an “audit committee financial expert,” and that he is “independent,” for purposes of this item.
Item 4 – Principal Accountant Fees and Services –
(a) Audit Fees
For the fiscal years ended December 31, 2022 and December 31, 2021, PricewaterhouseCoopers LLP (“PwC”), the Registrant’s principal accountant, billed the Registrant $585,100 and $550,500, respectively, for professional services rendered for the audit of the Registrant’s annual financial statements or services that are normally provided in connection with statutory and regulatory filings.
(b) Audit-Related Fees
For the fiscal years ended December 31, 2022 and December 31, 2021, fees of $12,143 and $10,625 were billed to the Registrant for services rendered by PwC in connection with matters relating to foreign reclaims attestation paid by Prudential Financial, Inc. and/or its affiliates.
(c) All Other Fees
For the fiscal years ended December 31, 2022 and December 31, 2021: none.
(d) (1) Audit Committee Pre-Approval Policies and Procedures
THE PGIM MUTUAL FUNDS
AUDIT COMMITTEE POLICY
on
Pre-Approval of Services Provided by the Independent
Accountants
The Audit Committee of each PGIM Mutual Fund is charged with the responsibility to monitor the independence of the Fund’s independent accountants. As part of this responsibility, the Audit Committee must pre-approve the independent accounting firm’s engagement to render audit and/or permissible non-audit services, as required by law. In evaluating a proposed engagement of the independent accountants, the Audit Committee will assess the effect that the engagement might reasonably be expected to have on the accountant’s independence. The Committee’s evaluation will be based on:
| | • | | a review of the nature of the professional services expected to be provided, |
| | • | | a review of the safeguards put into place by the accounting firm to safeguard independence, and |
| | • | | periodic meetings with the accounting firm. |
Policy for Audit and Non-Audit Services Provided to the Funds
On an annual basis, the scope of audits for each Fund, audit fees and expenses, and audit-related and non-audit services (and fees proposed in respect thereof) proposed to be performed by the Fund’s independent accountants will be presented by the Treasurer and the independent accountants to the Audit Committee for review and, as appropriate, approval prior to the initiation of such services.
Such presentation shall be accompanied by confirmation by both the Treasurer and the independent accountants that the proposed non-audit services will not adversely affect the independence of the independent accountants. Such proposed non-audit services shall be described in sufficient detail to enable the Audit Committee to assess the appropriateness of such services and fees, and the compatibility of the provision of such services with the auditor’s independence. The Committee shall receive periodic reports on the progress of the audit and other services which are approved by the Committee or by the Committee Chair pursuant to authority delegated in this Policy.
The categories of services enumerated under “Audit Services”, “Audit-related Services”, and “Tax Services” are intended to provide guidance to the Treasurer and the independent accountants as to those categories of services which the Committee believes are generally consistent with the independence of the independent accountants and which the Committee (or the Committee Chair) would expect upon the presentation of specific proposals to pre-approve. The enumerated categories are not intended as an exclusive list of audit, audit-related or tax services, which the Committee (or the Committee Chair) would consider for pre-approval.
Audit Services
The following categories of audit services are considered to be consistent with the role of the Fund’s independent accountants:
| | • | | Annual Fund financial statement audits |
| | • | | Seed audits (related to new product filings, as required) |
| | • | | SEC and regulatory filings and consents |
Audit-related Services
The following categories of audit-related services are considered to be consistent with the role of the Fund’s independent accountants:
| | • | | Accounting consultations |
| | • | | Fund merger support services |
| | • | | Agreed Upon Procedure Reports |
| | • | | Other Internal Control Reports |
Individual audit-related services that fall within one of these categories (except for fund merger support services) and are not presented to the Audit Committee as part of the annual pre-approval process are subject to an authorized pre-approval by the Audit Committee so long as the estimated fee for those services does not exceed $30,000. Any services provided under such pre-approval will be reported to the Audit Committee at its next regular meeting. Should the amount of such services exceed $30,000 any additional fees will be subject to pre-approval by the Committee Chair (or any other Committee member on whom this responsibility has been delegated). Fees related to fund merger support services are subject to a separate authorized
pre-approval by the Audit Committee with fees determined on a per occurrence and merger complexity basis.
Tax Services
The following categories of tax services are considered to be consistent with the role of the Fund’s independent accountants:
| | • | | Tax compliance services related to the filing or amendment of the following: |
| | • | | Federal, state and local income tax compliance; and, |
| | • | | Sales and use tax compliance |
| | • | | Timely RIC qualification reviews |
| | • | | Tax distribution analysis and planning |
| | • | | Tax authority examination services |
| | • | | Tax appeals support services |
| | • | | Accounting methods studies |
| | • | | Fund merger support services |
| | • | | Tax consulting services and related projects |
Individual tax services that fall within one of these categories and are not presented to the Audit Committee as part of the annual pre-approval process are subject to an authorized pre-approval by the Audit Committee so long as the estimated fee for those services does not exceed $30,000. Any services provided under such pre-approval will be reported to the Audit Committee at its next regular meeting. Should the amount of such services exceed $30,000 any additional fees will be subject to pre-approval by the Committee Chair (or any other Committee member on whom this responsibility has been delegated).
Other Non-Audit Services
Certain non-audit services that the independent accountants are legally permitted to render will be subject to pre-approval by the Committee or by one or more Committee members to whom the Committee has delegated this authority and who will report to the full Committee any pre-approval decisions made pursuant to this Policy. Non-audit services presented for pre-approval pursuant to this paragraph will be accompanied by a confirmation from both the Treasurer and the independent accountants that the proposed services will not adversely affect the independence of the independent accountants.
Proscribed Services
The Fund’s independent accountants will not render services in the following categories of non-audit services:
| | • | | Bookkeeping or other services related to the accounting records or financial statements of the Fund |
| | • | | Financial information systems design and implementation |
| | • | | Appraisal or valuation services, fairness opinions, or contribution-in-kind reports |
| | • | | Internal audit outsourcing services |
| | • | | Management functions or human resources |
| | • | | Broker or dealer, investment adviser, or investment banking services |
| | • | | Legal services and expert services unrelated to the audit |
| | • | | Any other service that the Public Company Accounting Oversight Board determines, by regulation, is impermissible. |
Pre-approval of Non-Audit Services Provided to Other Entities Within the PGIM Fund Complex
Certain non-audit services provided to PGIM Investments LLC or any of its affiliates that also provide ongoing services to the PGIM Mutual Funds will be subject to pre-approval by the Audit Committee. The only non-audit services provided to these entities that will require pre-approval are those related directly to the operations and financial reporting of the Funds.
Individual projects that are not presented to the Audit Committee as part of the annual pre-approval process will be subject to pre-approval by the Committee Chair (or any other Committee member on whom this responsibility has been delegated) so long as the estimated fee for those services does not exceed $30,000. Services presented for pre-approval pursuant to this paragraph will be accompanied by a confirmation from both the Treasurer and the independent accountants that the proposed services will not adversely affect the independence of the independent accountants.
Although the Audit Committee will not pre-approve all services provided to PGIM Investments LLC and its affiliates, the Committee will receive an annual report from the Fund’s independent accounting firm showing the aggregate fees for all services provided to PGIM Investments and its affiliates.
(e) (2) Percentage of services described in each of paragraphs (b) through (d) of this Item that were approved by the audit committee pursuant to paragraph (c)(7)(i)(C) of Rule 2-01 of Regulation S-X –
| | | | |
| | Fiscal Year Ended December 31, 2022 | | Fiscal Year Ended December 31, 2021 |
| 4(b) | | 0% | | 0% |
| 4(c) | | Not applicable. | | Not applicable. |
| 4(d) | | Not applicable. | | Not applicable. |
(f) Percentage of hours expended attributable to work performed by other than full time employees of principal accountant if greater than 50%.
The percentage of hours expended on the principal accountant’s engagement to audit the registrant’s financial statements for the most recent fiscal year that were attributed to work performed by persons other than the principal accountant’s full-time, permanent employees was 0%.
(g) Non-Audit Fees
The aggregate non-audit fees billed by the Registrant’s principal accountant for services rendered to the registrant’s investment adviser and any entity controlling, controlled by, or under common control with the investment adviser that provides ongoing services to the registrant for the fiscal years ended December 31, 2022 and December 31, 2021 was $0 and $0, respectively.
(h) Principal Accountant’s Independence
Not applicable as the Registrant’s principal accountant has not provided non-audit services to the registrant’s investment adviser and any entity controlling, controlled by, or under common control with the investment adviser that provides ongoing services to the registrant that were not pre-approved pursuant to Rule 2-01(c)(7)(ii) of Regulation S-X.
(i) Not applicable.
(j) Not applicable.
Item 5 – Audit Committee of Listed Registrants – Not applicable.
Item 6 – Schedule of Investments – The schedule is included as part of the report to shareholders filed under Item 1 of this Form.
Item 7 – Disclosure of Proxy Voting Policies and Procedures for Closed-End Management Investment Companies – Not applicable.
| Item 8 – | Portfolio Managers of Closed-End Management Investment Companies – Not applicable. |
| Item 9 – | Purchases of Equity Securities by Closed-End Management Investment Company and Affiliated Purchasers – Not applicable. |
| Item 10 – | Submission of Matters to a Vote of Security Holders – There have been no material changes to these procedures. |
| Item 11 – | Controls and Procedures |
| | (a) | It is the conclusion of the registrant’s principal executive officer and principal financial officer that the effectiveness of the registrant’s current disclosure controls and procedures (such disclosure controls and procedures having been evaluated within 90 days of the date of this filing) provide reasonable assurance that the information required to be disclosed by the registrant has been recorded, processed, summarized and reported within the time period specified in the Commission’s rules and forms and that the information required to be disclosed by the registrant has been accumulated and communicated to the registrant’s principal executive officer and principal financial officer in order to allow timely decisions regarding required disclosure. |
| | (b) | There has been no significant change in the registrant’s internal control over financial reporting (as defined in Rule 30a-3(d) under the Act (17 CFR 270.30a-3(d)) that occurred during the period covered by this report that has materially affected, or is reasonably likely to materially affect, the registrant’s internal control over financial reporting. |
Item 12 – Controls and Procedures - Disclosure of Securities Lending Activities for Closed-End Management Investment Companies – Not applicable.
(a)(1) Code of Ethics – Attached hereto as Exhibit EX-99.CODE-ETH.
(a)(2) Certifications pursuant to Section 302 of the Sarbanes-Oxley Act – Attached hereto as Exhibit EX-99.CERT.
(a)(2)(1) Any written solicitation to purchase securities under Rule 23c-1 – Not applicable.
(a)(2)(2) Change in the registrant’s independent public accountant – Not applicable.
(b) Certifications pursuant to Section 906 of the Sarbanes-Oxley Act – Attached hereto as Exhibit EX-99.906CERT.
SIGNATURES
Pursuant to the requirements of the Securities Exchange Act of 1934 and the Investment Company Act of 1940, the registrant has duly caused this report to be signed on its behalf by the undersigned, thereunto duly authorized.
| | |
| Registrant: | | The Prudential Series Fund |
| |
| By: | | /s/ Andrew R. French |
| | Andrew R. French |
| | Secretary |
| |
| Date: | | February 17, 2023 |
|
| Pursuant to the requirements of the Securities Exchange Act of 1934 and the Investment Company Act of 1940, this report has been signed below by the following persons on behalf of the registrant and in the capacities and on the dates indicated. |
| |
| By: | | /s/ Timothy S. Cronin |
| | Timothy S. Cronin |
| | President and Principal Executive Officer |
| |
| Date: | | February 17, 2023 |
| |
| By: | | /s/ Christian J. Kelly |
| | Christian J. Kelly |
| | Treasurer and Principal Financial and Accounting Officer |
| |
| Date: | | February 17, 2023 |