0000711175 cik0000711175:C000005728Member cik0000711175:SpecialtyRetailMember 2024-12-31
UNITED STATES
SECURITIES AND EXCHANGE COMMISSION
Washington, D.C. 20549
CERTIFIED SHAREHOLDER REPORT OF REGISTERED MANAGEMENT INVESTMENT COMPANIES
| | |
| Investment Company Act file number: | | 811-03623 |
| |
| Exact name of registrant as specified in charter: | | The Prudential Series Fund |
| |
| Address of principal executive offices: | | 655 Broad Street, 6 th Floor |
| | Newark, New Jersey 07102 |
| |
| Name and address of agent for service: | | Andrew R. French |
| | 655 Broad Street, 6 th Floor |
| | Newark, New Jersey 07102 |
| |
| Registrant’s telephone number, including area code: | | |
| |
| Date of fiscal year end: | | 12/31/2024 |
| |
| Date of reporting period: | | 12/31/2024 |
Item 1 – Reports to Stockholders
(a) Report transmitted to stockholders pursuant to Rule
30e-1
under the Act (17 CFR
270.30e-1).
The Prudential Series Fund
ANNUAL SHAREHOLDER REPORT – DECEMBER 31, 2024
This annual shareholder report contains important information about the Class I shares of PSF Global Portfolio (the “Portfolio”) for the period of
January 1, 2024 to December 31, 2024.
You can find additional information about the Portfolio at
www.prudential.com/variableinsuranceportfolios
. You can also request this
information by contacting us at (800) 346-3778.
This report describes changes to the Portfolio that occurred during the reporting period.
WHAT WERE THE
P
ORTFOLIO COSTS FOR THE LAST YEAR?
(Based on a hypothetical $10,000 investment)
| Costs of a $10,000 investment | Costs paid as a percentage of a $10,000 investment |
PSF Global Portfolio—Class I | | |
The table does not include charges charged under your variable annuity contract or variable life insurance policies (each, a Contract). Because Contract charges are not included, the
total fees and expenses that you will incur will be higher than the fees and expenses set forth in the table. See your Contract prospectus for more information about Contract charges.
WHAT AFFECTED THE PORTFOLIO’S PERFORMANCE DURING THE REPORTING PERIOD?
■
US equities registered impressive returns in 2024, with the S&P 500 Index gaining 25% against the backdrop of robust economic growth,
disinflation progress, and US Federal Reserve interest rate cuts. It was the second straight year of 20% returns for the S&P 500 Index, the first
time that has occurred since 1999. Mega-cap growth stocks drove the S&P 500 Index’s outsized returns, underpinned by ongoing optimism
over the earnings potential of artificial intelligence.
■
International equities, as measured by the MSCI EAFE Index, delivered a modest gain of 3.82% in 2024, underperforming US equities by a
rather wide margin. Slowing economic momentum contributed to low-single-digit equity returns in Europe, while an end to deflation and
corporate governance reforms led to more impressive gains in Japan. Emerging market equities were up 7.5% despite economic struggles in
China, which were offset by optimism over the potential policy response such as monetary easing.
■
Top-level allocation between segments positively contributed to the Portfolio’s performance relative the MSCI World Index during the period. A
small overweight allocation to US large-cap growth was the main positive driver of Portfolio performance. A small underweight allocation to
international growth was also a positive, as it lagged both the international and growth segments.
■
Exposure to US value stocks was a drag on performance relative to US growth stocks in the domestic space but outperformed both
international growth and value stocks. Subadvisor performance struggled throughout the period. For the Portfolio’s domestic equity
subadvisors, the dominance of the “Magnificent Seven” mega-cap technology stocks detracted from performance, as subadvisers maintained
consistently underweight allocations to these stocks. The Portfolio’s international equity subadvisors struggled due to underweight allocations in
China, as well as underweight allocations to high-growth names within the growth style. Stock selection detracted from relative performance
across subadvisors.
HOW HAS THE PORTFOLIO PERFORMED OVER THE PAST 10 YEARS?
The Portfolio's past performance is not a good predictor of the Portfolio's future performance.
The returns do not reflect the deduction
of applicable taxes, if any, that a shareholder would pay on Portfolio distributions or redemption of Portfolio shares.
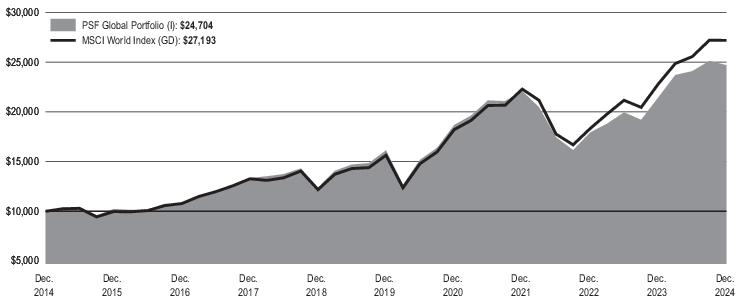
The line graph reflects a hypothetical $10,000 investment in Class I shares and assumes that all recurring fees (including management fees) were
deducted and dividends and distributions were reinvested. Without waiver of fees and/or expense reimbursements, if any, the returns would have
been lower. The returns shown in the chart and table do not include Contract charges. If Contract charges were included, the returns shown would
have been lower than those shown. Consult your Contract prospectus for information about Contract charges. Performance for other share
classes will vary.
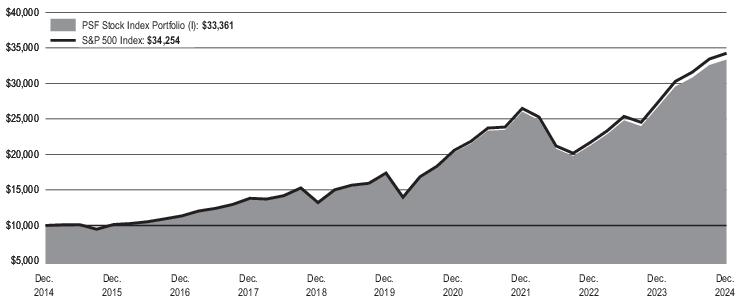
Cumulative Performance: December 31, 2014 to December 31, 2024 Initial Investment of $10,000 |
Average Annual Total Returns as of December 31, 2024 |
| | | |
| Portfolio | | | |
| MSCI World Index (GD) | | | |
WHAT ARE SOME KEY PORTFOLIO STATISTICS
AS
OF 12/31/2024?
| |
Number of portfolio holdings | |
Total advisory fees paid for the year | |
Portfolio turnover rate for the year | |
WHAT ARE SOME CHARACTERISTICS OF THE PORTFOLIO’S HOLDINGS AS OF 12/31/2024?
| |
| |
Semiconductors & Semiconductor Equipment | |
| |
Affiliated Mutual Fund - Short-Term Investment (4.1% represents investments purchased with collateral from securities on loan) | |
Interactive Media & Services | |
| |
| |
Oil, Gas & Consumable Fuels | |
| |
| |
| |
| |
Health Care Equipment & Supplies | |
Technology Hardware, Storage & Peripherals | |
| |
| |
Hotels, Restaurants & Leisure | |
| |
| |
Health Care Providers & Services | |
| |
| |
Life Sciences Tools & Services | |
Electronic Equipment, Instruments & Components | |
| |
| |
| |
| |
| |
| |
| |
| |
Consumer Staples Distribution & Retail | |
| |
| |
| |
| |
| |
| |
| |
| |
| |
| |
| |
Textiles, Apparel & Luxury Goods | |
| |
| |
Liabilities in excess of other assets | |
| |
* Consists of Industries that each make up less than 0.5% of the Fund's net assets
WERE THERE ANY SIGNIFICANT CHANGES TO THE PORTFOLIO THIS YEAR?
The following is a summary of certain changes to the Portfolio since January 1, 2024.
■
Effective April 4, 2024, the Manager agreed to voluntarily waive 0.04% of its investment management fee through April 9, 2024.
For more complete information, you should review the Portfolio’s current prospectus and any applicable supplements and the Portfolio’s next
prospectus, which we expect to be available by May 1, 2025 at
www.prudential.com/variableinsuranceportfolios
or by request at
(800) 346-3778.
You can find additional information at
www.prudential.com/variableinsuranceportfolios
, including the Portfolio’s prospectus, financial
information, portfolio holdings, and proxy voting information. You can also request this information by contacting us at (800) 346-3778.
The Prudential Series Fund
ANNUAL SHAREHOLDER REPORT – DECEMBER 31, 2024
This annual shareholder report contains important information about the Class III shares of PSF Global Portfolio (the “Portfolio”) for the period of
January 1, 2024 to December 31, 2024.
You can find additional information about the Portfolio at
www.prudential.com/variableinsuranceportfolios
. You can also request this
information by contacting us at (800) 346-3778.
This report describes changes to the Portfolio that occurred during the reporting period.
WHAT WERE THE PORTFOLIO COSTS FOR THE LAST YEAR?
(Based on a hypothetical $10,000 investment)
| Costs of a $10,000 investment | Costs paid as a percentage of a $10,000 investment |
PSF Global Portfolio—Class III | | |
The table does not include charges charged under your variable annuity contract or variable life insurance policies (each, a Contract). Because Contract charges are not included, the
total fees and expenses that you will incur will be higher than the fees and expenses set forth in the table. See your Contract prospectus for more information about Contract charges.
WHAT AFFECTED THE PORTFOLIO’S PERFORMANCE DURING THE REPORTING PERIOD?
■
US equities registered impressive returns in 2024, with the S&P 500 Index gaining 25% against the backdrop of robust economic growth,
disinflation progress, and US Federal Reserve interest rate cuts. It was the second straight year of 20% returns for the S&P 500 Index, the first
time that has occurred since 1999. Mega-cap growth stocks drove the S&P 500 Index’s outsized returns, underpinned by ongoing optimism
over the earnings potential of artificial intelligence.
■
International equities, as measured by the MSCI EAFE Index, delivered a modest gain of 3.82% in 2024, underperforming US equities by a
rather wide margin. Slowing economic momentum contributed to low-single-digit equity returns in Europe, while an end to deflation and
corporate governance reforms led to more impressive gains in Japan. Emerging market equities were up 7.5% despite economic struggles in
China, which were offset by optimism over the potential policy response such as monetary easing.
■
Top-level allocation between segments positively contributed to the Portfolio’s performance relative the MSCI World Index during the period. A
small overweight allocation to US large-cap growth was the main positive driver of Portfolio performance. A small underweight allocation to
international growth was also a positive, as it lagged both the international and growth segments.
■
Exposure to US value stocks was a drag on performance relative to US growth stocks in the domestic space but outperformed both
international growth and value stocks. Subadvisor performance struggled throughout the period. For the Portfolio’s domestic equity
subadvisors, the dominance of the “Magnificent Seven” mega-cap technology stocks detracted from performance, as subadvisers maintained
consistently underweight allocations to these stocks. The Portfolio’s international equity subadvisors struggled due to underweight allocations in
China, as well as underweight allocations to high-growth names within the growth style. Stock selection detracted from relative performance
across subadvisors.
HOW HAS THE PORTFOLIO PERFORMED SINCE INCEPTION?
The Portfolio's past performance is not a good predictor of the Portfolio's future performance.
The returns do not reflect the deduction
of applicable taxes, if any, that a shareholder would pay on Portfolio distributions or redemption of Portfolio shares.
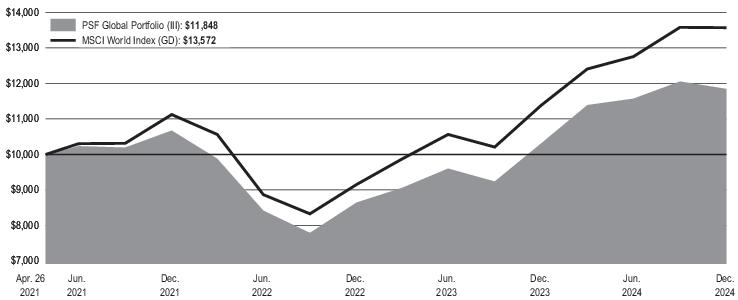
The line graph reflects a hypothetical $10,000 investment in Class III shares and assumes that all recurring fees (including management fees)
were deducted and dividends and distributions were reinvested. Without waiver of fees and/or expense reimbursements, if any, the returns would
have been lower. The returns shown in the chart and table do not include Contract charges. If Contract charges were included, the returns shown
would have been lower than those shown. Consult your Contract prospectus for information about Contract charges. Performance for other share
classes will vary.
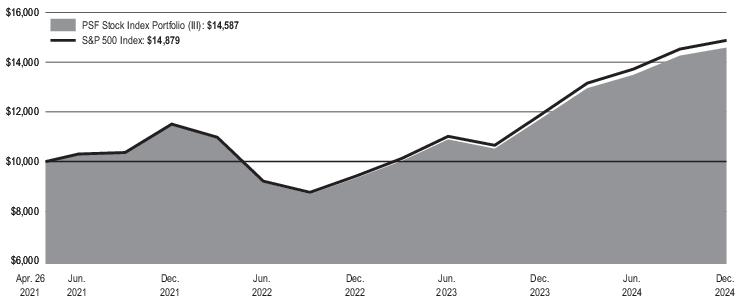
Cumulative Performance: April 26, 2021 to December 31, 2024 Initial Investment of $10,000 |
Average Annual Total Returns as of December 31, 2024 |
| | |
| Portfolio | | |
| MSCI World Index (GD) | | |
Portfolio Inception: 04/26/2021.
Since Inception returns are provided because the Portfolio has less than 10 fiscal years of returns. Since Inception returns for the Indexes are
measured from the closest month-end to the Portfolio’s inception date.
WHAT ARE SOME KEY PORTFOLIO STATISTICS
AS
OF 12/31/2024?
| |
Number of portfolio holdings | |
Total advisory fees paid for the year | |
Portfolio turnover rate for the year | |
WHAT ARE SOME CHARACTERISTICS OF THE PORTFOLIO’S HOLDINGS AS OF 12/31/2024?
| |
| |
Semiconductors & Semiconductor Equipment | |
| |
Affiliated Mutual Fund - Short-Term Investment (4.1% represents investments purchased with collateral from securities on loan) | |
Interactive Media & Services | |
| |
| |
Oil, Gas & Consumable Fuels | |
| |
| |
| |
| |
Health Care Equipment & Supplies | |
Technology Hardware, Storage & Peripherals | |
| |
| |
Hotels, Restaurants & Leisure | |
| |
| |
Health Care Providers & Services | |
| |
| |
Life Sciences Tools & Services | |
Electronic Equipment, Instruments & Components | |
| |
| |
| |
| |
| |
| |
| |
| |
Consumer Staples Distribution & Retail | |
| |
| |
| |
| |
| |
| |
| |
| |
| |
| |
| |
Textiles, Apparel & Luxury Goods | |
| |
| |
Liabilities in excess of other assets | |
| |
* Consists of Industries that each make up less than 0.5% of the Fund's net assets
WERE THERE ANY SIGNIFICANT CHANGES TO THE PORTFOLIO THIS YEAR?
The following is a summary of certain changes to the Portfolio since January 1, 2024.
■
Effective April 4, 2024, the Manager agreed to voluntarily waive 0.04% of its investment management fee through April 9, 2024.
For more complete information, you should review the Portfolio’s current prospectus and any applicable supplements and the Portfolio’s next
prospectus, which we expect to be available by May 1, 2025 at
www.prudential.com/variableinsuranceportfolios
or by request at
(800) 346-3778.
You can find additional information at
www.prudential.com/variableinsuranceportfolios
, including the Portfolio’s prospectus, financial
information, portfolio holdings, and proxy voting information. You can also request this information by contacting us at (800) 346-3778.
The Prudential Series Fund
PSF Mid-Cap Growth Portfolio
ANNUAL SHAREHOLDER REPORT – DECEMBER 31, 2024
This annual shareholder report contains important information about the Class I shares of PSF Mid-Cap Growth Portfolio (the “Portfolio”) for the
period of January 1, 2024 to December 31, 2024.
You can find additional information about the Portfolio at
www.prudential.com/variableinsuranceportfolios
. You can also request this
information by contacting us at (800) 346-3778.
This report describes changes to the Portfolio that occurred during the reporting period.
WHAT WERE THE PORTFOLIO COSTS FOR THE LAST YEAR?
(Based on a hypothetical $10,000 investment)
| Costs of a $10,000 investment | Costs paid as a percentage of a $10,000 investment |
PSF Mid-Cap Growth Portfolio—Class I | | |
The table does not include charges charged under your variable annuity contract or variable life insurance policies (each, a Contract). Because Contract charges are not included, the
total fees and expenses that you will incur will be higher than the fees and expenses set forth in the table. See your Contract prospectus for more information about Contract charges.
WHAT AFFECTED THE PORTFOLIO’S PERFORMANCE DURING THE REPORTING PERIOD?
■
In the year ended December 31, 2024, the S&P 500 Index achieved its second consecutive year of returns exceeding 20.0%, marking the S&P
500 Index’s best back-to-back performance since 1997-1998. While there were short periods where market breadth appeared to broaden, a
narrow subset of mega-cap stocks led the way during the reporting period, much like they did in 2023.
■
While large-cap equities led returns across the market spectrum, growth equities as a style continued to outperform value equities, with the
Russell Midcap Growth Index and Russell Midcap Value Index returning 22.10% and 13.07%, respectively, during the year. Within the Russell
Midcap Growth Index, the utilities and technology sectors led returns while the telecommunications and health care sectors lagged.
■
The Portfolio underperformed the Russell Midcap Growth Index during the year. As concentration within the Index became historically high, the
Portfolio’s underexposure to large benchmark names detracted from its relative performance. Seven of the top-10-performing securities in the
Russell Midcap Growth Index were unowned or underweight in the Portfolio for most of the reporting period. Stock selection in the technology
and industrials sectors was the top detractor from Portfolio performance, with underweight positions in
. and
representing the most significant detraction from Portfolio performance on an individual stock basis.
■
Conversely, stock selection within the financials and telecommunications sectors contributed positively to the Portfolio’s performance relative to
the Russell Midcap Growth Index, with overweight positions in
and
leading the way.
■
The portfolio managers aimed to strategically position the Portfolio to capitalize on a potential broadening of benchmark leadership with
exposure across enduring growth franchises and areas with lower expectations, such as certain segments of consumer, housing, and software.
HOW HAS THE PORTFOLIO PERFORMED OVER THE PAST 10 YEARS?
The Portfolio's past performance is not a good predictor of the Portfolio's future performance.
The returns do not reflect the deduction
of applicable taxes, if any, that a shareholder would pay on Portfolio distributions or redemption of Portfolio shares.
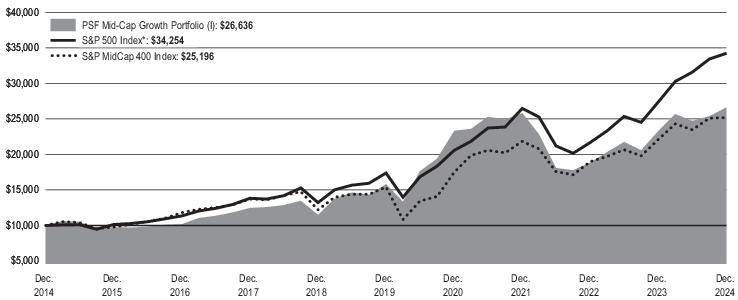
The line graph reflects a hypothetical $10,000 investment in Class I shares and assumes that all recurring fees (including management fees) were
deducted and dividends and distributions were reinvested. Without waiver of
fees and/or expense reimbursements,
if any, the returns would have
been lower. The returns shown in the chart and table do not include Contract charges. If Contract charges were included, the returns shown would
have been lower than those shown. Consult your Contract prospectus for information about Contract charges. Performance for other share
classes will vary.
Cumulative Performance: December 31, 2014 to December 31, 2024 Initial Investment of $10,000 |
Average Annual Total Returns as of December 31, 2024 |
| | | |
| Portfolio | | | |
| | | |
| Russell Midcap Growth Index | | | |
| S&P MidCap 400 Index | | | |
*The Portfolio has added this broad-based index in response to new regulatory requirements.
WHAT ARE SOME KEY PORTFOLIO STATISTICS AS OF 12/31/2024?
| |
Number of portfolio holdings | |
Total advisory fees paid for the year | |
Portfolio turnover rate for the year | |
WHAT ARE SOME CHARACTERISTICS OF THE PORTFOLIO’S
HOLDINGS AS OF 12/31/2024
?
| |
Affiliated Mutual Fund - Short-Term Investment (17.6% represents investments purchased with collateral from securities on loan) | |
| |
| |
Hotels, Restaurants & Leisure | |
Semiconductors & Semiconductor Equipment | |
| |
| |
| |
| |
| |
| |
Life Sciences Tools & Services | |
| |
Oil, Gas & Consumable Fuels | |
Health Care Equipment & Supplies | |
Construction & Engineering | |
| |
| |
Commercial Services & Supplies | |
Electronic Equipment, Instruments & Components | |
| |
| |
| |
| |
Consumer Staples Distribution & Retail | |
Diversified Consumer Services | |
| |
| |
Health Care Providers & Services | |
Energy Equipment & Services | |
| |
Independent Power & Renewable Electricity | |
| |
| |
| |
| |
| |
Textiles, Apparel & Luxury Goods | |
Trading Companies & Distributors | |
| |
| |
| |
| |
Liabilities in excess of other assets | |
| |
* Consists of Industries that each make up less than 0.5% of the Fund's net assets
WERE THERE ANY SIGNIFICANT CHANGES TO THE PORTFOLIO THIS YEAR?
The following is a summary of certain changes to the Portfolio since January 1, 2024.
■
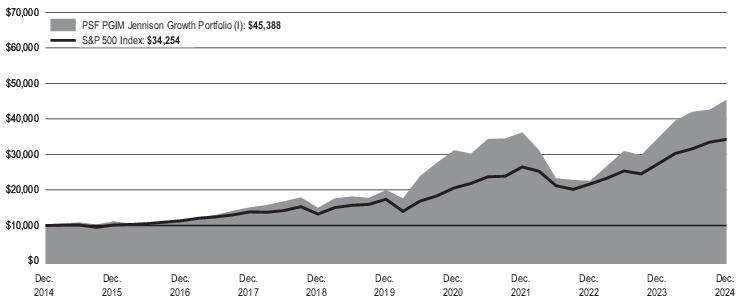
On November 20, 2024, the Board of Trustees of The Prudential Series Fund (the “Trust”) approved the reorganization (the “Reorganization”)
of PSF Mid-Cap Growth Portfolio (the “Target Portfolio”) into the PSF PGIM Jennison Growth Portfolio (the “Acquiring Portfolio”), each a series
of the Trust. The Reorganization is subject to approval by the shareholders of the Target Portfolio. A special meeting of the Target Portfolio’s
shareholders to vote on the proposed Reorganization will be held on or about March 25, 2025. If approved by shareholders of the Target
Portfolio, it is expected that the Reorganization will be completed on or about April 14, 2025.
For more complete information, you should review the Portfolio’s current prospectus and any applicable supplements and the Portfolio’s next
prospectus, which we expect to be available by May 1, 2025 at
www.prudential.com/variableinsuranceportfolios
or by request at
(800) 346-3778.
You can find additional information at
www.prudential.com/variableinsuranceportfolios
, including the Portfolio’s prospectus, financial
information, portfolio holdings, and proxy voting information. You can also request this information by contacting us at (800) 346-3778.
The Prudential Series Fund
PSF Mid-Cap Growth Portfolio
ANNUAL SHAREHOLDER REPORT – DECEMBER 31, 2024
This annual shareholder report contains important information about the Class II shares of PSF Mid-Cap Growth Portfolio (the “Portfolio”) for the
period of January 1, 2024 to December 31, 2024.
You can find additional information about the Portfolio at
www.prudential.com/variableinsuranceportfolios
. You can also request this
information by contacting us at (800) 346-3778.
This report describes changes to the Portfolio that occurred during the reporting period.
WHAT WERE THE PORTFOLIO COSTS FOR THE LAST YEAR?
(Based on a hypothetical $10,000 investment)
| Costs of a $10,000 investment | Costs paid as a percentage of a $10,000 investment |
PSF Mid-Cap Growth Portfolio—Class II | | |
The table does not include charges charged under your variable annuity contract or variable life insurance policies (each, a Contract). Because Contract charges are not included, the
total fees and expenses that you will incur will be higher than the fees and expenses set forth in the table. See your Contract prospectus for more information about Contract charges.
WHAT AFFECTED THE PORTFOLIO’S PERFORMANCE DURING THE REPORTING PERIOD?
■
In the year ended December 31, 2024, the S&P 500 Index achieved its second consecutive year of returns exceeding 20.0%, marking the S&P
500 Index’s best back-to-back performance since 1997-1998. While there were short periods where market breadth appeared to broaden, a
narrow subset of mega-cap stocks led the way during the reporting period, much like they did in 2023.
■
While large-cap equities led returns across the market spectrum, growth equities as a style continued to outperform value equities, with the
Russell Midcap Growth Index and Russell Midcap Value Index returning 22.10% and 13.07%, respectively, during the year. Within the Russell
Midcap Growth Index, the utilities and technology sectors led returns while the telecommunications and health care sectors lagged.
■
The Portfolio underperformed the Russell Midcap Growth Index during the year. As concentration within the Index became historically high, the
Portfolio’s underexposure to large benchmark names detracted from its relative performance. Seven of the top-10-performing securities in the
Russell Midcap Growth Index were unowned or underweight in the Portfolio for most of the reporting period. Stock selection in the technology
and industrials sectors was the top detractor from Portfolio performance, with underweight positions in
. and
representing the most significant detraction from Portfolio performance on an individual stock basis.
■
Conversely, stock selection within the financials and telecommunications sectors contributed positively to the Portfolio’s performance relative to
the Russell Midcap Growth Index, with overweight positions in
and
leading the way.
■
The portfolio managers aimed to strategically position the Portfolio to capitalize on a potential broadening of benchmark leadership with
exposure across enduring growth franchises and areas with lower expectations, such as certain segments of consumer, housing, and software.
HOW HAS THE PORTFOLIO PERFORMED OVER THE PAST 10 YEARS?
The Portfolio's past performance is not a good predictor of the Portfolio's future performance.
The returns do not reflect the deduction
of applicable taxes, if any, that a shareholder would pay on Portfolio distributions or redemption of Portfolio shares.
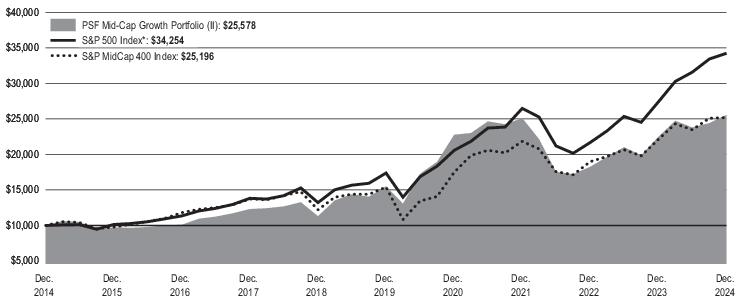
The line graph reflects a hypothetical $10,000 investment in Class II shares and assumes that all recurring fees (including management fees)
were deducted and dividends and distributions were reinvested. Without waiver of fees and/or ex
pense reimbursement
s, if any, the returns would
have been lower. The returns shown in the chart and table do not include Contract charges. If Contract charges were included, the returns shown
would have been lower than those shown. Consult your Contract prospectus for information about Contract charges. Performance for other share
classes will vary.
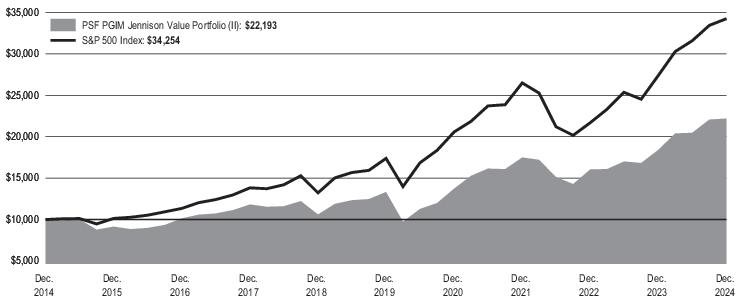
Cumulative Performance: December 31, 2014 to December 31, 2024 Initial Investment of $10,000 |
Average Annual Total Returns as of December 31, 2024 |
| | | |
| Portfolio | | | |
| | | |
| Russell Midcap Growth Index | | | |
| S&P MidCap 400 Index | | | |
*The Portfolio has added this broad-based index in response to new regulatory requirements.
WHAT ARE SOME KEY PORTFOLIO STATISTICS AS OF 12/31/2024?
| |
Number of portfolio holdings | |
Total advisory fees paid for the year | |
Portfolio turnover rate for the year | |
WHAT ARE SOME CHARACTERISTICS OF THE PORTFOLIO’S HOLDINGS AS OF 12/31/2024?
| |
Affiliated Mutual Fund - Short-Term Investment (17.6% represents investments purchased with collateral from securities on loan) | |
| |
| |
Hotels, Restaurants & Leisure | |
Semiconductors & Semiconductor Equipment | |
| |
| |
| |
| |
| |
| |
Life Sciences Tools & Services | |
| |
Oil, Gas & Consumable Fuels | |
Health Care Equipment & Supplies | |
Construction & Engineering | |
| |
| |
Commercial Services & Supplies | |
Electronic Equipment, Instruments & Components | |
| |
| |
| |
| |
Consumer Staples Distribution & Retail | |
Diversified Consumer Services | |
| |
| |
Health Care Providers & Services | |
Energy Equipment & Services | |
| |
Independent Power & Renewable Electricity | |
| |
| |
| |
| |
| |
Textiles, Apparel & Luxury Goods | |
Trading Companies & Distributors | |
| |
| |
| |
| |
Liabilities in excess of other assets | |
| |
* Consists of Industries that each make up less than 0.5% of the Fund's net assets
WERE THERE ANY SIGNIFICANT CHANGES TO THE PORTFOLIO THIS YEAR?
The following is a summary of certain changes to the Portfolio since January 1, 2024.
■
On November 20, 2024, the Board of Trustees of The Prudential Series Fund (the “Trust”) approved the reorganization (the “Reorganization”)
of PSF Mid-Cap Growth Portfolio (the “Target Portfolio”) into the PSF PGIM Jennison Growth Portfolio (the “Acquiring Portfolio”), each a series
of the Trust. The Reorganization is subject to approval by the shareholders of the Target Portfolio. A special meeting of the Target Portfolio’s
shareholders to vote on the proposed Reorganization will be held on or about March 25, 2025. If approved by shareholders of the Target
Portfolio, it is expected that the Reorganization will be completed on or about April 14, 2025.
For more complete information, you should review the Portfolio’s current prospectus and any applicable supplements and the Portfolio’s next
prospectus, which we expect to be available by May 1, 2025 at
www.prudential.com/variableinsuranceportfolios
or by request at
(800) 346-3778.
You can find additional information at
www.prudential.com/variableinsuranceportfolios
, including the Portfolio’s prospectus, financial
information, portfolio holdings, and proxy voting information. You can also request this information by contacting us at (800) 346-3778.
The Prudential Series Fund
PSF Mid-Cap Growth Portfolio
ANNUAL SHAREHOLDER REPORT – DECEMBER 31, 2024
This annual shareholder report contains important information about the Class III shares of PSF Mid-Cap Growth Portfolio (the “Portfolio”) for the
period of January 1, 2024 to December 31, 2024.
You can find additional information about the Portfolio at
www.prudential.com/variableinsuranceportfolios
. You can also request this
information by contacting us at (800) 346-3778.
This report describes changes to the Portfolio that occurred during the reporting period.
WHAT WERE THE PORTFOLIO COSTS FOR THE LAST YEAR?
(Based on a hypothetical $10,000 investment)
| Costs of a $10,000 investment | Costs paid as a percentage of a $10,000 investment |
PSF Mid-Cap Growth Portfolio—Class III | | |
The table does not include charges charged under your variable annuity contract or variable life insurance policies (each, a Contract). Because Contract charges are not included, the
total fees and expenses that you will incur will be higher than the fees and expenses set forth in the table. See your Contract prospectus for more information about Contract charges.
WHAT AFFECTED THE PORTFOLIO’S PERFORMANCE DURING THE REPORTING PERIOD?
■
In the year ended December 31, 2024, the S&P 500 Index achieved its second consecutive year of returns exceeding 20.0%, marking the S&P
500 Index’s best back-to-back performance since 1997-1998. While there were short periods where market breadth appeared to broaden, a
narrow subset of mega-cap stocks led the way during the reporting period, much like they did in 2023.
■
While large-cap equities led returns across the market spectrum, growth equities as a style continued to outperform value equities, with the
Russell Midcap Growth Index and Russell Midcap Value Index returning 22.10% and 13.07%, respectively, during the year. Within the Russell
Midcap Growth Index, the utilities and technology sectors led returns while the telecommunications and health care sectors lagged.
■
The Portfolio underperformed the Russell Midcap Growth Index during the year. As concentration within the Index became historically high, the
Portfolio’s underexposure to large benchmark names detracted from its relative performance. Seven of the top-10-performing securities in the
Russell Midcap Growth Index were unowned or underweight in the Portfolio for most of the reporting period. Stock selection in the technology
and industrials sectors was the top detractor from Portfolio performance, with underweight positions in
. and
representing the most significant detraction from Portfolio performance on an individual stock basis.
■
Conversely, stock selection within the financials and telecommunications sectors contributed positively to the Portfolio’s performance relative to
the Russell Midcap Growth Index, with overweight positions in
and
leading the way.
■
The portfolio managers aimed to strategically position the Portfolio to capitalize on a potential broadening of benchmark leadership with
exposure across enduring growth franchises and areas with lower expectations, such as certain segments of consumer, housing, and software.
HOW HAS THE PORTFOLIO PERFORMED SINCE INCEPTION?
The Portfolio's past performance is not a good predictor of the Portfolio's future performance.
The returns do not reflect the deduction
of applicable taxes, if any, that a shareholder would pay on Portfolio distributions or redemption of Portfolio shares.
The line graph reflects a hypothetical $10,000 investment in Class III shares and assumes that all recurring fees (including management fees)
were deducted and dividends and distributions were reinvested. Without waiver of fees and/or expense reimbursements, if any, the returns would
have been lower. The returns shown in the chart and table do not include Contract charges. If Contract charges were included, the returns shown
would have been lower than those shown. Consult your Contract prospectus for information about Contract charges. Performance for other share
classes will vary.
Cumulative Performance: April 26, 2021 to December 31, 2024 Initial Investment of $10,000 |
Average Annual Total Returns as of December 31, 2024 |
| | |
| Portfolio | | |
| | |
| Russell Midcap Growth Index | | |
| S&P MidCap 400 Index | | |
Portfolio Inception: 04/26/2021.
Since Inception returns are provided because the
Portfolio has less than
10 fiscal years of returns. Since Inception returns for the Indexes are
measured from the closest month-end to the Portfolio’s inception date.
*The Portfolio has added this broad-based index in response to new regulatory requirements.
WHAT ARE SOME KEY PORTFOLIO STATISTICS AS OF 12/31/2024?
| |
Number of portfolio holdings | |
Total advisory fees paid for the year | |
Portfolio turnover rate for the year | |
WHAT ARE SOME CHARACTERISTICS OF THE PORTFOLIO’S HOLDINGS AS OF 12/31/2024?
| |
Affiliated Mutual Fund - Short-Term Investment (17.6% represents investments purchased with collateral from securities on loan) | |
| |
| |
Hotels, Restaurants & Leisure | |
Semiconductors & Semiconductor Equipment | |
| |
| |
| |
| |
| |
| |
Life Sciences Tools & Services | |
| |
Oil, Gas & Consumable Fuels | |
Health Care Equipment & Supplies | |
Construction & Engineering | |
| |
| |
Commercial Services & Supplies | |
Electronic Equipment, Instruments & Components | |
| |
| |
| |
| |
Consumer Staples Distribution & Retail | |
Diversified Consumer Services | |
| |
| |
Health Care Providers & Services | |
Energy Equipment & Services | |
| |
Independent Power & Renewable Electricity | |
| |
| |
| |
| |
| |
Textiles, Apparel & Luxury Goods | |
Trading Companies & Distributors | |
| |
| |
| |
| |
Liabilities in excess of other assets | |
| |
* Consists of Industries that each make up less than 0.5% of the Fund's net assets
WERE THERE ANY SIGNIFICANT CHANGES TO THE PORTFOLIO THIS YEAR?
The following is a summary of certain changes to the Portfolio since January 1, 2024.
■
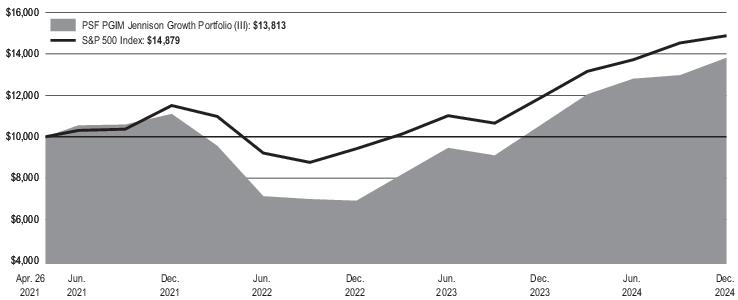
On November 20, 2024, the Board of Trustees of The Prudential Series Fund (the “Trust”) approved the reorganization (the “Reorganization”)
of PSF Mid-Cap Growth Portfolio (the “Target Portfolio”) into the PSF PGIM Jennison Growth Portfolio (the “Acquiring Portfolio”), each a series
of the Trust. The Reorganization is subject to approval by the shareholders of the Target Portfolio. A special meeting of the Target Portfolio’s
shareholders to vote on the proposed Reorganization will be held on or about March 25, 2025. If approved by shareholders of the Target
Portfolio, it is expected that the Reorganization will be completed on or about April 14, 2025.
For more complete information, you should review the Portfolio’s current prospectus and any applicable supplements and the Portfolio’s next
prospectus, which we expect to be available by May 1, 2025 at
www.prudential.com/variableinsuranceportfolios
or by request at
(800) 346-3778.
You can find additional information at
www.prudential.com/variableinsuranceportfolios
, including the Portfolio’s prospectus, financial
information, portfolio holdings, and proxy voting information. You can also request this information by contacting us at (800) 346-3778.
The Prudential Series Fund
PSF Natural Resources Portfolio
ANNUAL SHAREHOLDER REPORT – DECEMBER 31, 2024
This annual shareholder report contains important information about the Class I shares of PSF Natural Resources Portfolio (the “Portfolio”) for the
period of January 1, 2024 to December 31, 2024.
You can find additional information about the Portfolio at
www.prudential.com/variableinsuranceportfolios
. You can also request this
information by contacting us at (800) 346-3778.
This report describes changes to the Portfolio that occurred during the reporting period.
WHAT WERE THE PORTFOLIO COSTS FOR THE LAST YEAR?
(Based on a hypothetical $10,000 investment)
| Costs of a $10,000 investment | Costs paid as a percentage of a $10,000 investment |
PSF Natural Resources Portfolio—Class I | | |
The table does not include charges charged under your variable annuity contract or variable life insurance policies (each, a Contract). Because Contract charges are not included, the
total fees and expenses that you will incur will be higher than the fees and expenses set forth in the table. See your Contract prospectus for more information about Contract charges.
WHAT AFFECTED THE PORTFOLIO’S PERFORMANCE DURING THE REPORTING PERIOD?
■
Natural resources equities had strong results during the reporting period. While oil prices finished lower due to concerns over reduced demand,
particularly in China, natural gas prices rose. Gold prices reached all-time highs in October 2024 due to safe-haven demand, while base metals
prices were mixed.
■
Stock selection in the electrical components and equipment sector, where holdings benefited from increased demand given the critical ties
between artificial intelligence and electrification, and in the paper and forest products sector, where Portfolio holdings benefited from favorable
housing sentiment, contributed positively to performance relative to the Custom Blended Index (the Index) during the period. Stock selection in
precious metals and minerals sector also contributed positively.
■
Stock selection in the commodity chemicals sector and an underweight allocation to the oil and gas storage and transportation sector detracted
the most from performance during the reporting period.
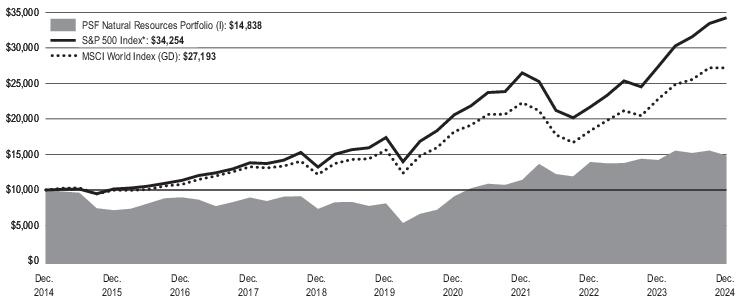
HOW HAS THE PORTFOLIO PERFORMED OVER THE PAST 10 YEARS?
The Portfolio's past performance is not a good predictor of the Portfolio's future performance
.
The returns do not reflect the deduction
of applicable taxes, if any, that a shareholder would pay on Portfolio distributions or redemption of Portfolio shares.
The line graph reflects a hypothetical $10,000 investment in Class I shares and assumes that all recurring fees (including management fees) were
deducted and dividends and distributions were reinvested. Without waiver of fees and/or expense reimbursements, if any, the returns would have
been lower. The returns shown in the chart and table do not include Contract charges. If Contract charges were included, the returns shown would
have been lower than those shown. Consult your Contract prospectus for information about Contract charges. Performance for other share
classes will vary.
Cumulative Performance: December 31, 2014 to December 31, 2024 Initial Investment of $10,000 |
Average Annual Total Returns as of December 31, 2024 |
| | | |
| | | |
| | | |
Lipper Global Natural Resources Funds Index | | | |
| | | |
*The Portfolio has added this broad-based index in response to new regulatory requirements.
WHAT ARE SOME KEY PORTFOLIO STATISTICS AS OF 12/31/2024?
| |
Number of portfolio holdings | |
Total advisory fees paid for the year | |
Portfolio turnover rate for the year | |
WHAT ARE SOME CHARACTERISTICS OF THE PORTFOLIO’S HOLDINGS AS OF 12/31/2024?
| |
United States (13.2% represents investments purchased with collateral from securities on loan) | |
| |
| |
| |
| |
| |
| |
| |
| |
| |
| |
Liabilities in excess of other assets | |
| |
WERE THERE ANY SIGNIFICANT CHANGES TO THE PORTFOLIO THIS YEAR?
The following is a summary of certain changes to the Portfolio since January 1, 2024.
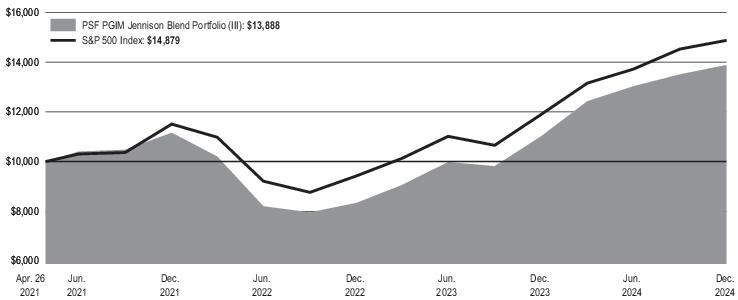
■
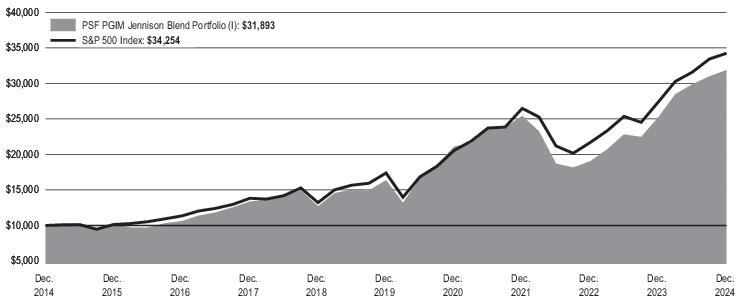
On November 20, 2024, the Board of Trustees of The Prudential Series Fund (the “Trust”) approved the reorganization (the “Reorganization”)
of PSF Natural Resources Portfolio (the “Target Portfolio”) into the PSF PGIM Jennison Blend Portfolio (the “Acquiring Portfolio”), each a series
of the Trust. The Reorganization is subject to approval by the shareholders of the Target Portfolio. A special meeting of the Target Portfolio’s
shareholders to vote on the proposed Reorganization will be held on March 25, 2025. If approved by shareholders of the Target Portfolio, it is
expected that the Reorganization will be completed on or about April 14, 2025.
For more complete information, you should review the Portfolio’s current prospectus and any applicable supplements and the Portfolio’s next
prospectus, which we expect to be available by May 1, 2025 at
www.prudential.com/variableinsuranceportfolios
or by request at
(800) 346-3778.
You can find additional information at
www.prudential.com/variableinsuranceportfolios
, including the Portfolio’s prospectus, financial
information, portfolio holdings, and proxy voting information. You can also request this information by contacting us at (800) 346-3778.
The Prudential Series Fund
PSF Natural Resources Portfolio
ANNUAL SHAREHOLDER REPORT – DECEMBER 31, 2024
This annual shareholder report contains important information about the Class II shares of PSF Natural Resources Portfolio (the “Portfolio”) for
the period of January 1, 2024 to December 31, 2024.
You can find additional information about the Portfolio at
www.prudential.com/variableinsuranceportfolios
. You can also request this
information by contacting us at (800) 346-3778.
This report describes changes to the Portfolio that occurred during the reporting period.
WHAT WERE THE PORTFOLIO COSTS FOR THE LAST YEAR?
(Based on a hypothetical $10,000 investment)
| Costs of a $10,000 investment | Costs paid as a percentage of a $10,000 investment |
PSF Natural Resources Portfolio—Class II | | |
The table does not include charges charged under your variable annuity contract or variable life insurance policies (each, a Contract). Because Contract charges are not included, the
total fees and expenses that you will incur will be higher than the fees and expenses set forth in the table. See your Contract prospectus for more information about Contract charges.
WHAT AFFECTED THE PORTFOLIO’S PERFORMANCE DURING THE REPORTING PERIOD?
■
Natural resources equities had strong results during the reporting period. While oil prices finished lower due to concerns over reduced demand,
particularly in China, natural gas prices rose. Gold prices reached all-time highs in October 2024 due to safe-haven demand, while base metals
prices were mixed.
■
Stock selection in the electrical components and equipment sector, where holdings benefited from increased demand given the critical ties
between artificial intelligence and electrification, and in the paper and forest products sector, where Portfolio holdings benefited from favorable
housing sentiment, contributed positively to performance relative to the Custom Blended Index (the Index) during the period. Stock selection in
precious metals and minerals sector also contributed positively.
■
Stock selection in the commodity chemicals sector and an underweight allocation to the oil and gas storage and transportation sector detracted
the most from performance during the reporting period.
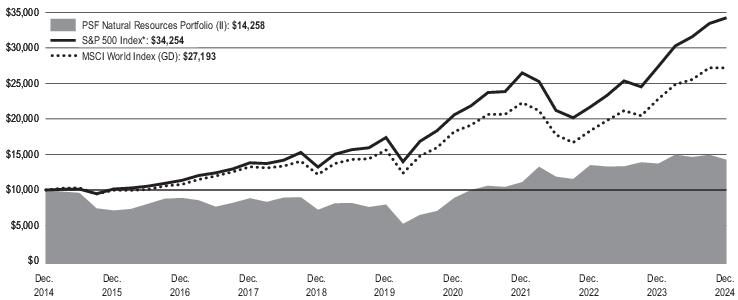
HOW HAS THE PORTFOLIO PERFORMED OVER THE PAST 10 YEARS?
The Portfolio's past performance is not a good predictor of the Portfolio's future performance
.
The returns do not reflect the deduction
of applicable taxes, if any, that a shareholder would pay on Portfolio distributions or redemption of Portfolio shares.
The line graph reflects a hypothetical $10,000 investment in Class II shares and assumes that all recurring fees (including management fees)
were deducted and dividends and distributions were reinvested. Without waiver of fees and/or expense reimbursements, if any, the returns would
have been lower. The returns shown in the chart and table do not include Contract charges. If Contract charges
were included
, the returns shown
would have been lower than those shown. Consult your Contract prospectus for information about Contract charges. Performance for other share
classes will vary.
Cumulative Performance: December 31, 2014 to December 31, 2024 Initial Investment of $10,000 |
Average Annual Total Returns as of December 31, 2024 |
| | | |
| | | |
| | | |
Lipper Global Natural Resources Funds Index | | | |
| | | |
*The Portfolio has added this broad-based index in response to new regulatory requirements.
WHAT ARE SOME KEY PORTFOLIO STATISTICS AS OF 12/31/2024?
| |
Number of portfolio holdings | |
Total advisory fees paid for the year | |
Portfolio turnover rate for the year | |
WHAT ARE SOME CHARACTERISTICS OF THE
PORTFOLIO’S HOLDINGS
AS OF 12/31/2024?
| |
United States (13.2% represents investments purchased with collateral from securities on loan) | |
| |
| |
| |
| |
| |
| |
| |
| |
| |
| |
Liabilities in excess of other assets | |
| |
WERE THERE ANY SIGNIFICANT CHANGES TO THE PORTFOLIO THIS YEAR?
The following is a summary of certain changes to the Portfolio since January 1, 2024.
■
On November 20, 2024, the Board of Trustees of The Prudential Series Fund (the “Trust”) approved the reorganization (the “Reorganization”)
of PSF Natural Resources Portfolio (the “Target Portfolio”) into the PSF PGIM Jennison Blend Portfolio (the “Acquiring Portfolio”), each a series
of the Trust. The Reorganization is subject to approval by the shareholders of the Target Portfolio. A special meeting of the Target Portfolio’s
shareholders to vote on the proposed Reorganization will be held on March 25, 2025. If approved by shareholders of the Target Portfolio, it is
expected that the Reorganization will be completed on or about April 14, 2025.
For more complete information, you should review the Portfolio’s current prospectus and any applicable supplements and the Portfolio’s next
prospectus, which we expect to be available by May 1, 2025 at
www.prudential.com/variableinsuranceportfolios
or by request at
(800) 346-3778.
You can find additional information at
www.prudential.com/variableinsuranceportfolios
, including the Portfolio’s prospectus, financial
information, portfolio holdings, and proxy voting information. You can also request this information by contacting us at (800) 346-3778.
The Prudential Series Fund
PSF Natural Resources Portfolio
ANNUAL SHAREHOLDER REPORT – DECEMBER 31, 2024
This annual shareholder report contains important information about the Class III shares of PSF Natural Resources Portfolio (the “Portfolio”) for
the period of January 1, 2024 to December 31, 2024.
You can find additional information about the Portfolio at
www.prudential.com/variableinsuranceportfolios
. You can also request this
information by contacting us at (800) 346-3778.
This report describes changes to the Portfolio that occurred during the reporting period.
WHAT WERE THE PORTFOLIO COSTS FOR THE LAST YEAR?
(Based on a hypothetical $10,000 investment)
| Costs of a $10,000 investment | Costs paid as a percentage of a $10,000 investment |
PSF Natural Resources Portfolio—Class III | | |
The table does not include charges charged under your variable annuity contract or variable life insurance policies (each, a Contract). Because Contract charges are not included, the
total fees and expenses that you will incur will be higher than the fees and expenses set forth in the table. See your Contract prospectus for more information about Contract charges.
WHAT AFFECTED THE PORTFOLIO’S PERFORMANCE DURING THE REPORTING PERIOD?
■
Natural resources equities had strong results during the reporting period. While oil prices finished lower due to concerns over reduced demand,
particularly in China, natural gas prices rose. Gold prices reached all-time highs in October 2024 due to safe-haven demand, while base metals
prices were mixed.
■
Stock selection in the electrical components and equipment sector, where holdings benefited from increased demand given the critical ties
between artificial intelligence and electrification, and in the paper and forest products sector, where Portfolio holdings benefited from favorable
housing sentiment, contributed positively to performance relative to the Custom Blended Index (the Index) during the period. Stock selection in
precious metals and minerals sector also contributed positively.
■
Stock selection in the commodity chemicals sector and an underweight allocation to the oil and gas storage and transportation sector detracted
the most from performance during the reporting period.
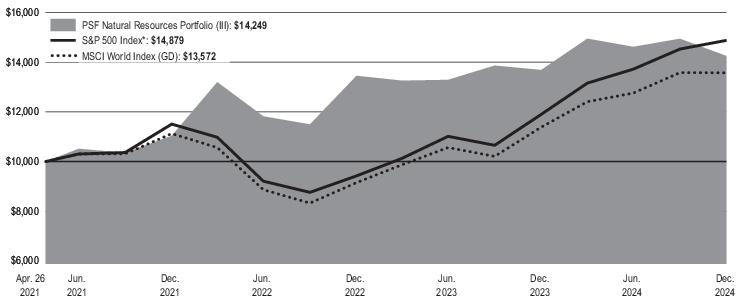
HOW HAS THE PORTFOLIO PERFORMED SINCE INCEPTION?
The Portfolio's past performance is not a good predictor of the Portfolio's future performance.
The returns do not reflect the deduction
of applicable taxes, if any, that a shareholder would pay on Portfolio distributions or redemption of Portfolio shares.
The line graph reflects a hypothetical $10,000 investment in Class III shares and assumes that all recurring fees (including management fees)
were deducted and dividends and distributions were reinvested. Without waiver of fees and/or expense reimbursements, if any, the returns would
have been lower. The returns shown in the chart and table do not include Contract charges. If Contract charges were included, the returns shown
would have been lower than those shown. Consult your Contract prospectus for information about Contract charges. Performance for other share
classes will vary.
Cumulative Performance: April 26, 2021 to December 31, 2024 Initial Investment of $10,000 |
Average Annual Total Returns as of December 31, 2024 |
| | |
| | |
| | |
Lipper Global Natural Resources Funds Index | | |
| | |
Portfolio Inception: 04/26/2021.
Since Inception returns are provided because the Portfolio has less than 10 fiscal years of returns. Since Inception returns for the Indexes are
measured from the closest month-end to the Portfolio’s inception date.
*The Portfolio has added this broad-based index in response to new regulatory requirements.
WHAT ARE SOME KEY PORTFOLIO STATISTICS AS OF 12/31/2024?
| |
Number of portfolio holdings | |
Total advisory fees paid for the year | |
Portfolio turnover rate for the year | |
WHAT ARE SOME CHARACTERISTICS OF THE PORTFOLIO’S HOLDINGS AS OF 12/31/2024?
| |
United States (13.2% represents investments purchased with collateral from securities on loan) | |
| |
| |
| |
| |
| |
| |
| |
| |
| |
| |
Liabilities in excess of other assets | |
| |
WERE THERE ANY SIGNIFICANT CHANGES TO THE
PORTFOLIO THIS YEAR
?
The following is a summary of certain changes to the Portfolio since January 1, 2024.
■
On November 20, 2024, the Board of Trustees of The Prudential Series Fund (the “Trust”) approved the reorganization (the “Reorganization”)
of PSF Natural Resources Portfolio (the “Target Portfolio”) into the PSF PGIM Jennison Blend Portfolio (the “Acquiring Portfolio”), each a series
of the Trust. The Reorganization is subject to approval by the shareholders of the Target Portfolio. A special meeting of the Target Portfolio’s
shareholders to vote on the proposed Reorganization will be held on March 25, 2025. If approved by shareholders of the Target Portfolio, it is
expected that the Reorganization will be completed on or about April 14, 2025.
For more complete information, you should review the Portfolio’s current prospectus and any applicable supplements and the Portfolio’s next
prospectus, which we expect to be available by May 1, 2025 at
www.prudential.com/variableinsuranceportfolios
or by request at
(800) 346-3778.
You can find additional information at
www.prudential.com/variableinsuranceportfolios
, including the Portfolio’s prospectus, financial
information, portfolio holdings, and proxy voting information. You can also request this information by contacting us at (800) 346-3778.
The Prudential Series Fund
PSF PGIM 50/50 Balanced Portfolio
ANNUAL SHAREHOLDER REPORT – DECEMBER 31, 2024
This annual shareholder report contains important information about the Class I shares of PSF PGIM 50/50 Balanced Portfolio (the “Portfolio”) for
the period of January 1, 2024 to December 31, 2024.
You can find additional information about the Portfolio at
www.prudential.com/variableinsuranceportfolios
. You can also request this
information by contacting us at (800) 346-3778.
WHAT WERE THE PORTFOLIO COSTS FOR THE LAST YEAR?
(Based on a hypothetical $10,000 investment)
| Costs of a $10,000 investment | Costs paid as a percentage of a $10,000 investment |
PSF PGIM 50/50 Balanced Portfolio—Class I | | |
The table does not include charges charged under your variable annuity contract or variable life insurance policies (each, a Contract). Because Contract charges are not included, the
total fees and expenses that you will incur will be higher than the fees and expenses set forth in the table. See your Contract prospectus for more information about Contract charges.
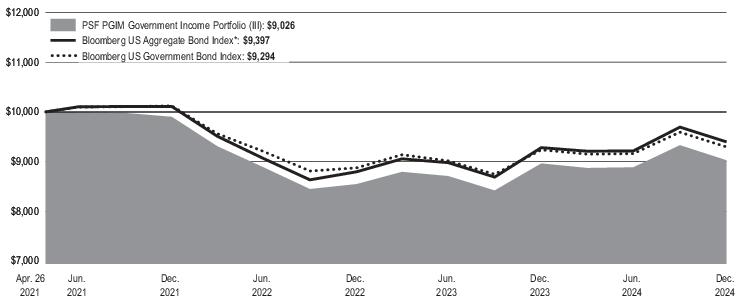
WHAT AFFECTED THE PORTFOLIO’S PERFORMANCE DURING THE REPORTING PERIOD?
■
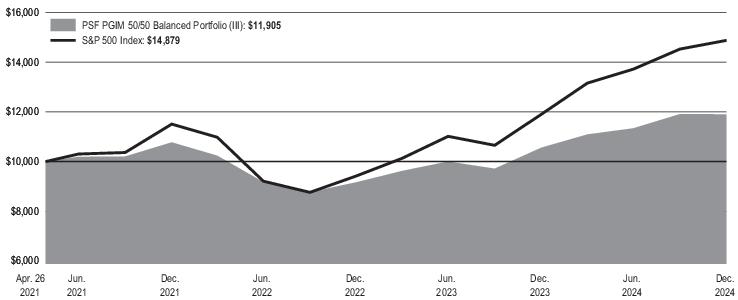
US stocks had a volatile end to 2024 but ultimately saw positive performance and finished the reporting period with strong gains. While the
Bloomberg US Aggregate Bond Index experienced late-term volatility, it still closed the year ended December 31, 2024 with positive
total returns.
■
The Portfolio’s overweight allocation to equities positively contributed to the Portfolio’s performance relative to its Custom Blended Index during
the reporting period. The Portfolio increased its equity exposure in the first quarter of 2024 and retained the overweight allocation over the year,
while also reducing its exposure to fixed income. The underweight allocation to fixed income was a steady contributor to performance,
notwithstanding a temporary pullback in equities during the summer.
■
The Portfolio’s off-benchmark position in international equities was generally flat for most of the reporting period before turning negative in the
final months of 2024. Non-US stocks underperformed US equities in the run-up to, and following, the US presidential election.
■
The Portfolio held a very modest position in S&P 500 Index futures, which provided flexibility to manage the equity exposure and had a slightly
positive impact on performance.
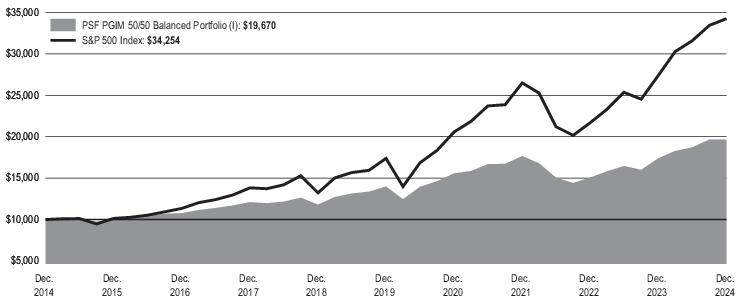
HOW HAS THE PORTFOLIO PERFORMED OVER THE PAST 10 YEARS?
The Portfolio's past performance is not a good predictor of the Portfolio's future performance.
The returns do not reflect the deduction
of applicable taxes, if any, that a shareholder would pay on Portfolio distributions or redemption of Portfolio shares.
The line graph reflects a hypothetical $10,000 investment in Class I shares and assumes that all recurring fees (including management fees) were
deducted and dividends and distributions were reinvested. Without waiver of fees and/or expense reimbursements, if any, the returns would have
been lower. The returns shown in the chart and table do not include Contract charges. If Contract charges were included, the returns shown would
have been lower than those shown. Consult your Contract prospectus for information about Contract charges. Performance for other share
classes will vary.
Cumulative Performance: December 31, 2014 to December 31, 2024 Initial Investment of $10,000 |
Average Annual Total Returns as of December 31, 2024 |
| | | |
| | | |
| | | |
| | | |
*The Portfolio’s Custom Blended Index is a model portfolio consisting of the S&P 500 Index (50%), Bloomberg US Aggregate Bond Index (40%), and FTSE 3-Month US Treasury Bill
Index (10%).
WHAT ARE SOME KEY
PORTFOLIO
STATISTICS
AS OF 12/31/2024?
| |
Number of portfolio holdings | |
Total advisory fees paid for the year | |
Portfolio turnover rate for the year | |
WHAT ARE SOME CHARACTERISTICS OF THE PORTFOLIO’S HOLDINGS AS OF 12/31/2024?
| |
Affiliated Mutual Fund - Short-Term Investment (1.4% represents investments purchased with collateral from securities on loan) | |
U.S. Government Agency Obligations | |
Semiconductors & Semiconductor Equipment | |
Collateralized Loan Obligations | |
Commercial Mortgage-Backed Securities | |
| |
| |
Technology Hardware, Storage & Peripherals | |
Interactive Media & Services | |
| |
| |
| |
| |
| |
U.S. Treasury Obligations | |
Oil, Gas & Consumable Fuels | |
| |
| |
Health Care Equipment & Supplies | |
| |
Health Care Providers & Services | |
Consumer Staples Distribution & Retail | |
Hotels, Restaurants & Leisure | |
| |
| |
Residential Mortgage-Backed Securities | |
| |
| |
| |
| |
| |
| |
| |
| |
| |
| |
| |
Real Estate Investment Trusts (REITs) | |
Life Sciences Tools & Services | |
| |
| |
| |
| |
| |
| |
Liabilities in excess of other assets | |
| |
* Consists of Industries that each make up less than 0.5% of the Fund's net assets
You can find additional information at
www.prudential.com/variableinsuranceportfolios
, including the Portfolio’s prospectus, financial
information, portfolio holdings, and proxy voting information. You can also request this information by contacting us at (800) 346-3778.
The Prudential Series Fund
PSF PGIM 50/50 Balanced Portfolio
ANNUAL SHAREHOLDER REPORT – DECEMBER 31, 2024
This annual shareholder report contains important information about the Class III shares of PSF PGIM 50/50 Balanced Portfolio (the “Portfolio”)
for the period of January 1, 2024 to December 31, 2024.
You can find additional information about the Portfolio at
www.prudential.com/variableinsuranceportfolios
. You can also request this
information by contacting us at (800) 346-3778.
WHAT WERE THE PORTFOLIO COSTS FOR THE LAST YEAR?
(Based on a hypothetical $10,000 investment)
| Costs of a $10,000 investment | Costs paid as a percentage of a $10,000 investment |
PSF PGIM 50/50 Balanced Portfolio—Class III | | |
The table does not include charges charged under your variable annuity contract or variable life insurance policies (each, a Contract). Because Contract charges are not included, the
total fees and expenses that you will incur will be higher than the fees and expenses set forth in the table. See your Contract prospectus for more information about Contract charges.
WHAT AFFECTED THE PORTFOLIO’S PERFORMANCE DURING THE REPORTING PERIOD?
■
US stocks had a volatile end to 2024 but ultimately saw positive performance and finished the reporting period with strong gains. While the
Bloomberg US Aggregate Bond Index experienced late-term volatility, it still closed the year ended December 31, 2024 with positive
total returns.
■
The Portfolio’s overweight allocation to equities positively contributed to the Portfolio’s performance relative to its Custom Blended Index during
the reporting period. The Portfolio increased its equity exposure in the first quarter of 2024 and retained the overweight allocation over the year,
while also reducing its exposure to fixed income. The underweight allocation to fixed income was a steady contributor to performance,
notwithstanding a temporary pullback in equities during the summer.
■
The Portfolio’s off-benchmark position in international equities was generally flat for most of the reporting period before turning negative in the
final months of 2024. Non-US stocks underperformed US equities in the run-up to, and following, the US presidential election.
■
The Portfolio held a very modest position in S&P 500 Index futures, which provided flexibility to manage the equity exposure and had a slightly
positive impact on performance.
HOW HAS THE PORTFOLIO PERFORMED SINCE INCEPTION?
The Portfolio's past performance is not a good predictor of the Portfolio's future performance.
The returns do not reflect the deduction
of applicable taxes, if any, that a shareholder would pay on Portfolio distributions or redemption of Portfolio shares.
The line graph reflects a hypothetical $10,000 investment in Class III shares and assumes that all recurring fees (including management fees)
were deducted and dividends and distributions were reinvested. Without waiver of fees and/or expense reimbursements, if any, the returns would
have been lower. The returns shown in the chart and table do not include Contract charges. If Contract charges were included, the returns shown
would have been lower than those shown. Consult your Contract prospectus for information about Contract charges. Performance for other share
classes will vary.
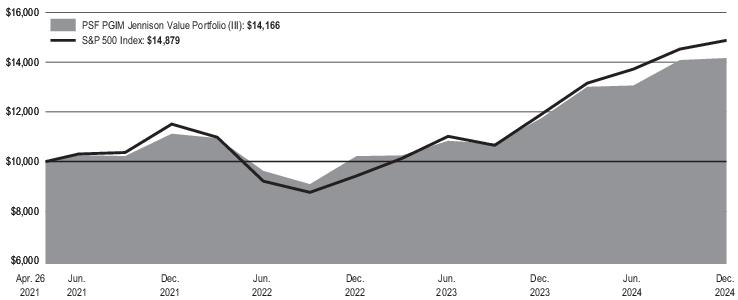
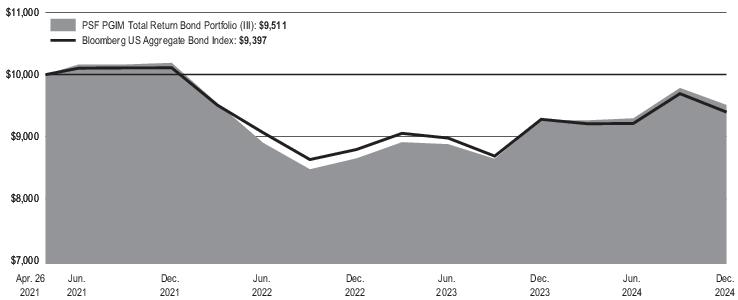
Cumulative Performance: April 26, 2021 to December 31, 2024 Initial Investment of $10,000 |
Average Annual Total Returns as of December 31, 2024 |
| | |
| | |
| | |
| | |
Portfolio Inception: 04/26/2021.
Since Inception returns are provided because the Portfolio has less than 10 fiscal years of returns. Since Inception returns for the Indexes are
measured from the closest month-end to the Portfolio’s inception date.
*The Portfolio’s Custom Blended Index is a model portfolio consisting of the S&P 500 Index (50%), Bloomberg US Aggregate Bond Index (40%), and FTSE 3-Month US Treasury Bill
Index (10%).
WHAT ARE SOME KEY PORTFOLIO STATISTICS AS OF 12/31/2024?
| |
Number of portfolio holdings | |
Total advisory fees paid for the year | |
Portfolio turnover rate for the year | |
WHAT ARE SOME CHARACTERISTICS OF THE PORTFOLIO’S HOLDINGS AS OF 12/31/2024?
| |
Affiliated Mutual Fund - Short-Term Investment (1.4% represents investments purchased with collateral from securities on loan) | |
U.S. Government Agency Obligations | |
Semiconductors & Semiconductor Equipment | |
Collateralized Loan Obligations | |
Commercial Mortgage-Backed Securities | |
| |
| |
Technology Hardware, Storage & Peripherals | |
Interactive Media & Services | |
| |
| |
| |
| |
| |
U.S. Treasury Obligations | |
Oil, Gas & Consumable Fuels | |
| |
| |
Health Care Equipment & Supplies | |
| |
Health Care Providers & Services | |
Consumer Staples Distribution & Retail | |
Hotels, Restaurants & Leisure | |
| |
| |
Residential Mortgage-Backed Securities | |
| |
| |
| |
| |
| |
| |
| |
| |
| |
| |
| |
Real Estate Investment Trusts (REITs) | |
Life Sciences Tools & Services | |
| |
| |
| |
| |
| |
| |
Liabilities in excess of other assets | |
| |
* Consists of Industries that each make up less than 0.5% of the Fund's net assets
You can find additional information at
www.prudential.com/variableinsuranceportfolios
, including the Portfolio’s prospectus, financial
information, portfolio holdings, and proxy voting information. You can also request this information by contacting us at (800) 346-3778.
The Prudential Series Fund
PSF PGIM Flexible Managed Portfolio
ANNUAL SHAREHOLDER REPORT – DECEMBER 31, 2024
This annual shareholder report contains important information about the Class I shares of PSF PGIM Flexible Managed Portfolio (the “Portfolio”)
for the period of January 1, 2024 to December 31, 2024.
You can find additional information about the Portfolio at
www.prudential.com/variableinsuranceportfolios
. You can also request this
information by contacting us at (800) 346-3778.
This report describes changes to the Portfolio that occurred during the reporting period.
WHAT WERE THE PORTFOLIO COSTS FOR THE LAST YEAR?
(Based on a hypothetical $10,000 investment)
| Costs of a $10,000 investment | Costs paid as a percentage of a $10,000 investment |
PSF PGIM Flexible Managed Portfolio—Class I | | |
The table does not include charges charged under your variable annuity contract or variable life insurance policies (each, a Contract). Because Contract charges are not included, the
total fees and expenses that you will incur will be higher than the fees and expenses set forth in the table. See your Contract prospectus for more information about Contract charges.
WHAT AFFECTED THE PORTFOLIO’S PERFORMANCE DURING THE REPORTING PERIOD?
■
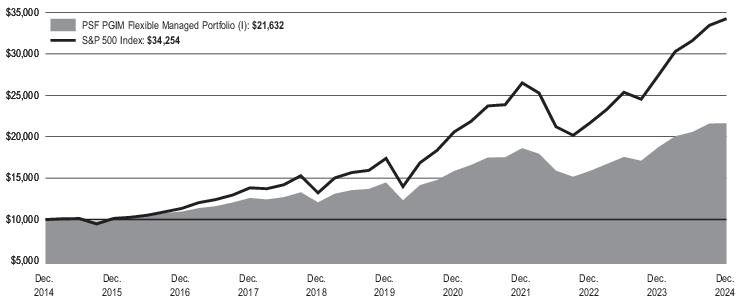
US stocks had a volatile end to 2024 but ultimately finished the reporting period with strong gains. While the Bloomberg US Aggregate Bond
Index experienced late-term volatility, it still closed the year ended December 31, 2024 with positive total returns.
■
The Portfolio’s overweight allocation to equities positively contributed to the Portfolio’s performance relative to its Custom Blended Index during
the reporting period. The Portfolio increased its equity exposure in the first quarter of 2024 and retained the overweight allocation over the year,
while also reducing its exposure to fixed income. The underweight allocation in fixed income was a steady contributor to performance,
notwithstanding a temporary pullback in equities during the summer.
■
An off-benchmark position in international equities was generally flat for most of the reporting period before turning negative in the final months
of 2024. Non-US stocks underperformed US equities in the run-up to, and following, the US presidential election.
■
The Portfolio held a very modest position in S&P 500 Index futures, which provided flexibility to manage the equity exposure and had a slightly
positive impact on performance.
HOW HAS THE PORTFOLIO PERFORMED OVER THE PAST 10 YEARS?
The Portfolio's past performance is not a good predictor of the Portfolio's future performance.
The returns do not reflect the deduction
of applicable taxes, if any, that a shareholder would pay on Portfolio distributions or redemption of Portfolio shares.
The line graph reflects a hypothetical $10,000 investment in Class I shares and assumes that all recurring fees (including management fees) were
deducted and dividends and distributions were reinvested. Without waiver of fees and/or expense reimbursements, if any, the returns would have
been lower. The returns shown in the chart and table do not include Contract charges. If Contract charges were included, the returns shown would
have been lower than those shown. Consult your Contract prospectus for information about Contract charges. Performance for other share
classes will vary.
Cumulative Performance: December 31, 2014 to December 31, 2024 Initial Investment of $10,000 |
Average Annual Total Returns as of December 31, 2024 |
| | | |
| | | |
| | | |
| | | |
*The Portfolio’s Custom Blended Index is a model portfolio consisting of the S&P 500 Index (60%), Bloomberg US Aggregate Bond Index (35%), and FTSE 3-Month US Treasury Bill
Index (5%).
WHAT ARE SOME KEY PORTFOLIO STATISTICS AS OF 12/31/2024?
| |
Number of portfolio holdings | |
Total advisory fees paid for the year | |
Portfolio turnover rate for the year | |
WHAT ARE SOME CHARACTERISTICS OF THE PORTFOLIO’S HOLDINGS AS OF 12/31/2024?
| |
U.S. Government Agency Obligations | |
Affiliated Mutual Fund - Short-Term Investment (1.9% represents investments purchased with collateral from securities on loan) | |
Semiconductors & Semiconductor Equipment | |
| |
| |
Commercial Mortgage-Backed Securities | |
Technology Hardware, Storage & Peripherals | |
Collateralized Loan Obligations | |
Interactive Media & Services | |
| |
| |
| |
| |
| |
Oil, Gas & Consumable Fuels | |
Health Care Equipment & Supplies | |
| |
| |
Consumer Staples Distribution & Retail | |
Health Care Providers & Services | |
Hotels, Restaurants & Leisure | |
| |
| |
| |
| |
| |
| |
| |
U.S. Treasury Obligations | |
| |
| |
Life Sciences Tools & Services | |
Residential Mortgage-Backed Securities | |
| |
| |
| |
| |
| |
| |
| |
| |
| |
| |
Real Estate Investment Trusts (REITs) | |
| |
| |
| |
| |
Liabilities in excess of other assets | |
| |
* Consists of Industries that each make up less than 0.5% of the Fund's net assets
WERE THERE ANY SIGNIFICANT CHANGES TO THE PORTFOLIO THIS YEAR?
The following is a summary of certain changes to the Portfolio since January 1, 2024.
■
The Manager has agreed to contractually limit expenses to 0.61% through June 30, 2024 and; effective July 1, 2024, contractually limit
expenses to 0.62% through June 30, 2025.
For more complete information, you should review the Portfolio’s current prospectus and any applicable supplements and the Portfolio’s next
prospectus, which we expect to be available by May 1, 2025 at
www.prudential.com/variableinsuranceportfolios
or by request at
(800) 346-3778.
You can find additional information at
www.prudential.com/variableinsuranceportfolios
, including the Portfolio’s prospectus, financial
information, portfolio holdings, and proxy voting information. You can also request this information by contacting us at (800) 346-3778.
The Prudential Series Fund
PSF PGIM Flexible Managed Portfolio
ANNUAL SHAREHOLDER REPORT – DECEMBER 31, 2024
This annual shareholder report contains important information about the Class III shares of PSF PGIM Flexible Managed Portfolio (the “Portfolio”)
for the period of January 1, 2024 to December 31, 2024.
You can find additional information about the Portfolio at
www.prudential.com/variableinsuranceportfolios
. You can also request this
information by contacting us at (800) 346-3778.
This report describes changes to the Portfolio that occurred during the reporting period.
WHAT WERE THE PORTFOLIO COSTS FOR THE LAST YEAR?
(Based on a hypothetical $10,000 investment)
| Costs of a $10,000 investment | Costs paid as a percentage of a $10,000 investment |
PSF PGIM Flexible Managed Portfolio—Class III | | |
The table does not include charges charged under your variable annuity contract or variable life insurance policies (each, a Contract). Because Contract charges are not included, the
total fees and expenses that you will incur will be higher than the fees and expenses set forth in the table. See your Contract prospectus for more information about Contract charges.
WHAT AFFECTED THE PORTFOLIO’S PERFORMANCE DURING THE REPORTING PERIOD?
■
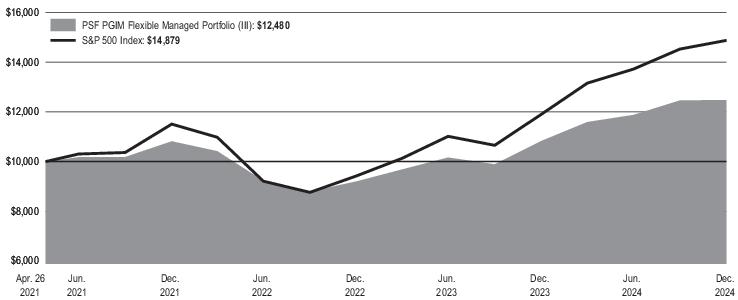
US stocks had a volatile end to 2024 but ultimately finished the reporting period with strong gains. While the Bloomberg US Aggregate Bond
Index experienced late-term volatility, it still closed the year ended December 31, 2024 with positive total returns.
■
The Portfolio’s overweight allocation to equities positively contributed to the Portfolio’s performance relative to its Custom Blended Index during
the reporting period. The Portfolio increased its equity exposure in the first quarter of 2024 and retained the overweight allocation over the year,
while also reducing its exposure to fixed income. The underweight allocation in fixed income was a steady contributor to performance,
notwithstanding a temporary pullback in equities during the summer.
■
An off-benchmark position in international equities was generally flat for most of the reporting period before turning negative in the final months
of 2024. Non-US stocks underperformed US equities in the run-up to, and following, the US presidential election.
■
The Portfolio held a very modest position in S&P 500 Index futures, which provided flexibility to manage the equity exposure and had a slightly
positive impact on performance.
HOW HAS THE PORTFOLIO PERFORMED SINCE INCEPTION?
The Portfolio's past performance is not a good predictor of the Portfolio's future performance.
The returns do not reflect the deduction
of applicable taxes, if any, that a shareholder would pay on Portfolio distributions or redemption of Portfolio shares.
The line graph reflects a hypothetical $10,000 investment in Class III shares and assumes that all recurring fees (including management fees)
were deducted and dividends and distributions were reinvested. Without waiver of fees and/or expense reimbursements, if any, the returns would
have been lower. The returns shown in the chart and table do not include Contract charges. If Contract charges were included, the returns shown
would have been lower than those shown. Consult your Contract prospectus for information about Contract charges. Performance for other share
classes will vary.
Cumulative Performance: April 26, 2021 to December 31, 2024 Initial Investment of $10,000 |
Average Annual Total Returns as of December 31, 2024 |
| | |
| | |
| | |
| | |
Portfolio Inception: 04/26/2021.
Since Inception returns are provided because the Portfolio has less than 10 fiscal years of returns. Since Inception returns for the Indexes are
measured from the closest month-end to the Portfolio’s inception date.
*The Portfolio’s Custom Blended Index is a model portfolio consisting of the S&P 500 Index (60%), Bloomberg US Aggregate Bond Index (35%), and FTSE 3-Month US Treasury Bill
Index (5%).
WHAT ARE SOME KEY PORTFOLIO STATISTICS
AS
OF 12/31/2024?
| |
Number of portfolio holdings | |
Total advisory fees paid for the year | |
Portfolio turnover rate for the year | |
WHAT ARE SOME CHARACTERISTICS OF THE PORTFOLIO’S HOLDINGS AS OF 12/31/2024?
| |
U.S. Government Agency Obligations | |
Affiliated Mutual Fund - Short-Term Investment (1.9% represents investments purchased with collateral from securities on loan) | |
Semiconductors & Semiconductor Equipment | |
| |
| |
Commercial Mortgage-Backed Securities | |
Technology Hardware, Storage & Peripherals | |
Collateralized Loan Obligations | |
Interactive Media & Services | |
| |
| |
| |
| |
| |
Oil, Gas & Consumable Fuels | |
Health Care Equipment & Supplies | |
| |
| |
Consumer Staples Distribution & Retail | |
Health Care Providers & Services | |
Hotels, Restaurants & Leisure | |
| |
| |
| |
| |
| |
| |
| |
U.S. Treasury Obligations | |
| |
| |
Life Sciences Tools & Services | |
Residential Mortgage-Backed Securities | |
| |
| |
| |
| |
| |
| |
| |
| |
| |
| |
Real Estate Investment Trusts (REITs) | |
| |
| |
| |
| |
Liabilities in excess of other assets | |
| |
* Consists of Industries that each make up less than 0.5% of the Fund's net assets
WERE THERE ANY SIGNIFICANT CHANGES TO THE PORTFOLIO THIS YEAR?
The following is a summary of certain changes to the Portfolio since January 1, 2024.
■
The Manager has agreed to contractually limit expenses to 0.61% through June 30, 2024 and; effective July 1, 2024, contractually limit
expenses to 0.62% through June 30, 2025.
For more complete information, you should review the Portfolio’s current prospectus and any applicable supplements and the Portfolio’s next
prospectus, which we expect to be available by May 1, 2025 at
www.prudential.com/variableinsuranceportfolios
or by request at
(800) 346-3778.
You can find additional information at
www.prudential.com/variableinsuranceportfolios
, including the Portfolio’s prospectus, financial
information, portfolio holdings, and proxy voting information. You can also request this information by contacting us at (800) 346-3778.
The Prudential Series Fund
PSF PGIM Government Income Portfolio
ANNUAL SHAREHOLDER REPORT – DECEMBER 31, 2024
This annual shareholder report contains important information about the Class I shares of PSF PGIM Government Income Portfolio (the
“Portfolio”) for the period of January 1, 2024 to December 31, 2024.
You can find additional information about the Portfolio at
www.prudential.com/variableinsuranceportfolios
. You can also request this
information by contacting us at (800) 346-3778.
This report describes changes to the Portfolio that occurred during the reporting period.
WHAT WERE THE PORTFOLIO COSTS FOR THE LAST YEAR?
(Based on a hypothetical $10,000 investment)
| Costs of a $10,000 investment | Costs paid as a percentage of a $10,000 investment |
PSF PGIM Government Income Portfolio—Class I | | |
The table does not include charges charged under your variable annuity contract or variable life insurance policies (each, a Contract). Because Contract charges are not included, the
total fees and expenses that you will incur will be higher than the fees and expenses set forth in the table. See your Contract prospectus for more information about Contract charges.
WHAT AFFECTED THE PORTFOLIO’S PERFORMANCE DURING THE REPORTING PERIOD?
■
During the reporting period, market expectations for both the timing and number of interest rate cuts fluctuated significantly as inflation slowed
and employment data showed some signs of softening. The US Federal Reserve's easing cycle began in September of 2024 with a 50-basis
points (bps) (one basis point equals 0.01%) rate cut followed by two separate 25-bps cuts. These rate cuts came after a re-steepening of the
US Treasury curve and greater market volatility due to election and fiscal uncertainty. As demand for yield remained robust, credit spreads
largely tightened, and performance across fixed income sectors was positive.
■
Security selection and sector allocation were the main drivers of the Portfolio’s outperformance versus the Bloomberg US Government Bond
Index during the reporting period. Overweight allocations to, and security selection in, the collateralized loan obligations AAA rated and
non-agency AAA rated sectors, along with security selection in US Treasuries, were the largest contributors.
■
Duration (duration measures the sensitivity of the price—the value of principal—of a bond to a change in interest rates) and yield curve
positioning (a yield curve is a line graph that illustrates the relationship between the yields and maturities of fixed income securities. It is
created by plotting the yields of different maturities for the same type of bonds) detracted from the Portfolio’s performance during the reporting
period. An overweight allocation to mortgage-backed securities also detracted from performance.
■
During the reporting period, the Portfolio used interest rate swaps to help manage duration and yield curve exposure, which had a negligible
impact on performance. The Portfolio used futures to manage interest rate risk, which we believe is a more efficient way of managing interest
rate risk than through the purchases and sales of bonds. The use of futures detracted from performance.
HOW HAS THE PORTFOLIO PERFORMED OVER THE PAST 10 YEARS?
The Portfolio's past performance is not a good predictor of the Portfolio's future performance.
The returns do not reflect the deduction
of applicable taxes, if any, that a shareholder would pay on Portfolio distributions or redemption of Portfolio shares.
The line graph reflects a hypothetical $10,000 investment in Class I shares and assumes that all recurring fees (including management fees) were
deducted and dividends and distributions were reinvested. Without waiver of fees and/or expense reimbursements, if any, the returns would have
been lower. The returns shown in the chart and table do not include Contract charges. If Contract charges were included, the returns shown would
have been lower than those shown. Consult your Contract prospectus for information about Contract charges. Performance for other share
classes will vary.
Cumulative Performance: December 31, 2014 to December 31, 2024 Initial Investment of $10,000 |
Average Annual Total Returns as of December 31, 2024 |
| | | |
| Portfolio | | | |
Bloomberg US Aggregate Bond Index* | | | |
| Bloomberg US Government Bond Index | | | |
*The Portfolio has added this broad-based index in response to new regulatory
requirements
.
WHAT ARE SOME KEY PORTFOLIO STATISTICS
AS
OF 12/31/2024?
| |
Number of portfolio holdings | |
Total advisory fees paid for the year | |
Portfolio turnover rate for the year | |
WHAT ARE SOME CHARACTERISTICS OF THE PORTFOLIO’S HOLDINGS AS OF 12/31/2024?
Credit quality ratings shown above reflect the middle rating assigned by a nationally recognized statistical rating organization (NRSRO) such as Moody’s Investor Service, Inc.
(Moody’s), S&P Global Ratings (S&P), or Fitch, Inc. (Fitch) if ratings differ. Where applicable, ratings are converted to the comparable S&P/Fitch rating category to illustrate credit
rating breakdowns. These NRSROs are independent and are widely used. The Not Rated (NR) category consists of securities that have not been rated by a NRSRO. Unrated
investments do not necessarily indicate low credit quality. The ratings category may include derivative instruments that could have a negative value. Credit quality ratings are subject
to change.
WERE THERE ANY SIGNIFICANT CHANGES TO THE PORTFOLIO THIS YEAR?
The following is a summary of certain changes to the Portfolio since January 1, 2024.
■
On November 20, 2024, the Board of Trustees of The Prudential Series Fund (the “Trust”) approved the reorganization (the “Reorganization”)
of PSF PGIM Government Income Portfolio (the “Target Portfolio”) into the PSF PGIM Total Return Bond Portfolio (the “Acquiring Portfolio”),
each a series of the Trust. The Reorganization is subject to approval by the shareholders of the Target Portfolio. A special meeting of the
Target Portfolio’s shareholders to vote on the proposed Reorganization will be held on or about March 25, 2025. If approved by shareholders of
the Target Portfolio, it is expected that the Reorganization will be completed on or about April 28, 2025.
For more complete information, you should review the Portfolio’s current prospectus and any applicable supplements and the Portfolio’s next
prospectus, which we expect to be available by May 1, 2025 at
www.prudential.com/variableinsuranceportfolios
or by request at
(800) 346-3778.
You can find additional information at
www.prudential.com/variableinsuranceportfolios
, including the Portfolio’s prospectus, financial
information, portfolio holdings, and proxy voting information. You can also request this information by contacting us at (800) 346-3778.
The Prudential Series Fund
PSF PGIM Government Income Portfolio
ANNUAL SHAREHOLDER REPORT – DECEMBER 31, 2024
This annual shareholder report contains important information about the Class III shares of PSF PGIM Government Income Portfolio (the
“Portfolio”) for the period of January 1, 2024 to December 31, 2024.
You can find additional information about the Portfolio at
www.prudential.com/variableinsuranceportfolios
. You can also request this
information by contacting us at (800) 346-3778.
This report describes changes to the Portfolio that occurred during the reporting period.
WHAT WERE THE PORTFOLIO COSTS FOR THE LAST YEAR?
(Based on a hypothetical $10,000 investment)
| Costs of a $10,000 investment | Costs paid as a percentage of a $10,000 investment |
PSF PGIM Government Income Portfolio—Class III | | |
The table does not include charges charged under your variable annuity contract or variable life insurance policies (each, a Contract). Because Contract charges are not included, the
total fees and expenses that you will incur will be higher than the fees and expenses set forth in the table. See your Contract prospectus for more information about Contract charges.
WHAT AFFECTED THE PORTFOLIO’S PERFORMANCE DURING THE REPORTING PERIOD?
■
During the reporting period, market expectations for both the timing and number of interest rate cuts fluctuated significantly as inflation slowed
and employment data showed some signs of softening. The US Federal Reserve's easing cycle began in September of 2024 with a 50-basis
points (bps) (one basis point equals 0.01%) rate cut followed by two separate 25-bps cuts. These rate cuts came after a re-steepening of the
US Treasury curve and greater market volatility due to election and fiscal uncertainty. As demand for yield remained robust, credit spreads
largely tightened, and performance across fixed income sectors was positive.
■
Security selection and sector allocation were the main drivers of the Portfolio’s outperformance versus the Bloomberg US Government Bond
Index during the reporting period. Overweight allocations to, and security selection in, the collateralized loan obligations AAA rated and
non-agency AAA rated sectors, along with security selection in US Treasuries, were the largest contributors.
■
Duration (duration measures the sensitivity of the price—the value of principal—of a bond to a change in interest rates) and yield curve
positioning (a yield curve is a line graph that illustrates the relationship between the yields and maturities of fixed income securities. It is
created by plotting the yields of different
maturities
for the same type of bonds) detracted from the Portfolio’s performance during the reporting
period. An overweight allocation to mortgage-backed securities also detracted from performance.
■
During the reporting period, the Portfolio used interest rate swaps to help manage duration and yield curve exposure, which had a negligible
impact on performance. The Portfolio used futures to manage interest rate risk, which we believe is a more efficient way of managing interest
rate risk than through the purchases and sales of bonds. The use of futures detracted from performance.
HOW HAS THE PORTFOLIO PERFORMED SINCE INCEPTION?
The Portfolio's past performance is not a good predictor of the Portfolio's future performance.
The returns do not reflect the deduction
of applicable taxes, if any, that a shareholder would pay on Portfolio distributions or redemption of Portfolio shares.
The line graph reflects a hypothetical $10,000 investment in Class III shares and assumes that all recurring fees (including management fees)
were deducted and dividends and distributions were reinvested. Without waiver of fees and/or expense reimbursements, if any, the returns would
have been lower. The returns shown in the chart and table do not include Contract charges. If Contract charges were included, the returns shown
would have been lower than those shown. Consult your Contract prospectus for information about Contract charges. Performance for other share
classes will vary.
Cumulative Performance: April 26, 2021 to December 31, 2024 Initial Investment of $10,000 |
Average Annual Total Returns as of December 31, 2024 |
| | |
| Portfolio | | |
Bloomberg US Aggregate Bond Index* | | |
| Bloomberg US Government Bond Index | | |
Portfolio Inception: 04/26/2021.
Since Inception returns are provided because the Portfolio has less than 10 fiscal years of returns. Since Inception returns for the Indexes are
measured from the closest month-end to the Portfolio’s inception date.
*The Portfolio has added this broad-based index in response to new regulatory
requirements
.
WHAT ARE SOME KEY PORTFOLIO STATISTICS AS OF 12/31/2024?
| |
Number of portfolio holdings | |
Total advisory fees paid for the year | |
Portfolio turnover rate for the year | |
WHAT ARE SOME CHARACTERISTICS OF THE PORTFOLIO’S HOLDINGS AS OF 12/31/2024?
Credit quality ratings shown above reflect the middle rating assigned by a nationally recognized statistical rating organization (NRSRO) such as Moody’s Investor Service, Inc.
(Moody’s), S&P Global Ratings (S&P), or Fitch, Inc. (Fitch) if ratings differ. Where applicable, ratings are converted to the comparable S&P/Fitch rating category to illustrate credit
rating breakdowns. These NRSROs are independent and are widely used. The Not Rated (NR) category consists of securities that have not been rated by a NRSRO. Unrated
investments do not necessarily indicate low credit quality. The ratings category may include derivative instruments that could have a negative value. Credit quality ratings are subject
to change.
WERE THERE ANY SIGNIFICANT CHANGES TO THE PORTFOLIO THIS YEAR?
The following is a summary of certain changes to the Portfolio since January 1, 2024.
■
On November 20, 2024, the Board of Trustees of The Prudential Series Fund (the “Trust”) approved the reorganization (the “Reorganization”)
of PSF PGIM Government Income Portfolio (the “Target Portfolio”) into the PSF PGIM Total Return Bond Portfolio (the “Acquiring Portfolio”),
each a series of the Trust. The Reorganization is subject to approval by the shareholders of the Target Portfolio. A special meeting of the
Target Portfolio’s shareholders to vote on the proposed Reorganization will be held on or about March 25, 2025. If approved by shareholders of
the Target Portfolio, it is expected that the Reorganization will be completed on or about April 28, 2025.
For more complete information, you should review the Portfolio’s current prospectus and any applicable supplements and the Portfolio’s next
prospectus, which we expect to be available by May 1, 2025 at
www.prudential.com/variableinsuranceportfolios
or by request at
(800) 346-3778.
You can find additional information at
www.prudential.com/variableinsuranceportfolios
, including the Portfolio’s prospectus, financial
information, portfolio holdings, and proxy voting information. You can also request this information by contacting us at (800) 346-3778.
The Prudential Series Fund
PSF PGIM Government Money
Market Portfolio
ANNUAL SHAREHOLDER REPORT – DECEMBER 31, 2024
This annual shareholder report contains important information about the Class I shares of PSF PGIM Government Money Market Portfolio (the
“Portfolio”) for the period of January 1, 2024 to December 31, 2024.
You can find additional information about the Portfolio at
www.prudential.com/variableinsuranceportfolios
. You can also request this
information by contacting us at (800) 346-3778.
WHAT WERE THE PORTFOLIO COSTS FOR THE LAST YEAR?
(Based on a hypothetical $10,000 investment)
| Costs of a $10,000 investment | Costs paid as a percentage of a $10,000 investment |
PSF PGIM Government Money Market Portfolio— | | |
The table does not include charges charged under your variable annuity contract or variable life insurance policies (each, a Contract). Because Contract charges are not included, the
total fees and expenses that you will incur will be higher than the fees and expenses set forth in the table. See your Contract prospectus for more information about Contract charges.
WHAT ARE SOME KEY PORTFOLIO STATISTICS AS OF 12/31/2024?
| |
Number of portfolio holdings | |
Total advisory fees paid for the year | |
WHAT ARE SOME CHARACTERISTICS OF THE PORTFOLIO’S HOLDINGS AS OF 12/31/2024?
| |
| |
U.S. Government Agency Obligations | |
U.S. Treasury Obligations | |
| |
Liabilities in excess of other assets | |
| |
You can find additional information at
www.prudential.com/variableinsuranceportfolios
, including the Portfolio’s prospectus, financial
information, portfolio holdings, and proxy voting information. You can also request this information by contacting us at (800) 346-3778.
The Prudential Series Fund
PSF PGIM Government Money
Market Portfolio
ANNUAL SHAREHOLDER REPORT – DECEMBER 31, 2024
This annual shareholder report contains important information about the Class III shares of PSF PGIM Government Money Market Portfolio (the
“Portfolio”) for the period of January 1, 2024 to December 31, 2024.
You can find additional information about the Portfolio at
www.prudential.com/variableinsuranceportfolios
. You can also request this
information by contacting us at (800) 346-3778.
WHAT WERE THE PORTFOLIO COSTS FOR THE LAST YEAR?
(Based on a hypothetical $10,000 investment)
| Costs of a $10,000 investment | Costs paid as a percentage of a $10,000 investment |
PSF PGIM Government Money Market Portfolio— | | |
The table does not include charges charged under your variable annuity contract or variable life insurance policies (each, a Contract). Because Contract charges are not included, the
total fees and expenses that you will incur will be higher than the fees and expenses set forth in the table. See your Contract prospectus for more information about Contract charges.
WHAT ARE SOME KEY PORTFOLIO STATISTICS AS OF 12/31/2024?
| |
Number of portfolio holdings | |
Total advisory fees paid for the year | |
WHAT ARE SOME CHARACTERISTICS OF THE PORTFOLIO’S HOLDINGS AS OF 12/31/2024?
| |
| |
U.S. Government Agency Obligations | |
U.S. Treasury Obligations | |
| |
Liabilities in excess of other assets | |
| |
You can find additional information at
www.prudential.com/variableinsuranceportfolios
, including the Portfolio’s prospectus, financial
information, portfolio holdings, and proxy voting information. You can also request this information by contacting us at (800) 346-3778.
The Prudential Series Fund
PSF PGIM High Yield Bond Portfolio
ANNUAL SHAREHOLDER REPORT – DECEMBER 31, 2024
This annual shareholder report contains important information about the Class I shares of PSF PGIM High Yield Bond Portfolio (the “Portfolio”) for
the period of January 1, 2024 to December 31, 2024.
You can find additional information about the Portfolio at
www.prudential.com/variableinsuranceportfolios
. You can also request this
information by contacting us at (800) 346-3778.
WHAT WERE THE PORTFOLIO COSTS FOR THE LAST YEAR?
(Based on a hypothetical $10,000 investment)
| Costs of a $10,000 investment | Costs paid as a percentage of a $10,000 investment |
PSF PGIM High Yield Bond Portfolio—Class I | | |
The table does not include charges charged under your variable annuity contract or variable life insurance policies (each, a Contract). Because Contract charges are not included, the
total fees and expenses that you will incur will be higher than the fees and expenses set forth in the table. See your Contract prospectus for more information about Contract charges.
WHAT AFFECTED THE PORTFOLIO’S PERFORMANCE DURING THE REPORTING PERIOD?
■
US high yield bonds posted strong total returns over the reporting period amid resilient economic growth, stable corporate earnings, and light
net new supply compared with inflows of approximately $16 billion into high yield bond mutual funds and exchange-traded funds. Lower-quality
bonds generally outperformed higher-quality bonds, with CCC-rated bonds outperforming both BB-rated and B-rated bonds.
■
During the reporting period, security selection in the electric utilities, healthcare and pharmaceuticals, and cable and satellite sectors
contributed to returns relative to the Bloomberg US Corporate High Yield 1% Issuer Capped Index. An overweight allocation to, and security
selection in, the emerging markets high yield bond sector also contributed positively to the Portfolio’s performance.
■
An underweight allocation to the US high yield bond market detracted from performance, as did security selection in the media and
entertainment, chemicals, and midstream energy sectors.
■
During the reporting period, the Portfolio used US Treasury futures and total return swaps to manage interest rate risk, which we believe is a
more efficient way of managing interest rate risk than through the purchase and sale of bonds. The impact of futures and swaps detracted from
performance. The Portfolio also used credit derivatives in the form of the Credit Default Swap Index (CDX) and credit default swaps to manage
the overall risk profile of the Portfolio, which had a positive impact on performance.
HOW HAS THE PORTFOLIO PERFORMED OVER THE PAST 10 YEARS?
The Portfolio's past performance is not a good predictor of the Portfolio's future performance.
The returns do not reflect the deduction
of applicable taxes, if any, that a shareholder would pay on Portfolio distributions or redemption of Portfolio shares.
The line graph reflects a hypothetical $10,000 investment in Class I shares and assumes that all recurring fees (including management fees) were
deducted and dividends and distributions were reinvested. Without waiver of fees and/or expense reimbursements, if any, the returns would have
been lower. The returns shown in the chart and table do not include Contract charges. If Contract charges were included, the returns shown would
have been lower than those shown. Consult your Contract prospectus for information about Contract charges. Performance for other share
classes will vary.
Cumulative Performance: December 31, 2014 to December 31, 2024 Initial Investment of $10,000 |
Average Annual Total Returns as of December 31, 2024 |
| | | |
| | | |
Bloomberg US Aggregate Bond Index* | | | |
Bloomberg US Corporate High Yield 1% Issuer Capped Index | | | |
*The Portfolio has added this broad-based index in response to new regulatory requirements.
WHAT ARE SOME KEY PORTFOLIO STATISTICS AS OF 12/31/2024?
| |
Number of portfolio holdings | |
Total advisory fees paid for the year | |
Portfolio turnover rate for the year | |
WHAT ARE SOME CHARACTERISTICS OF THE PORTFOLIO’S HOLDINGS AS OF 12/31/2024?
Credit quality ratings shown above reflect the middle rating assigned by a nationally recognized statistical rating organization (NRSRO) such as Moody’s Investor Service, Inc.
(Moody’s), S&P Global Ratings (S&P), or Fitch, Inc. (Fitch) if ratings differ. Where applicable, ratings are converted to the comparable S&P/Fitch rating category to illustrate credit
rating breakdowns. These NRSROs are independent and are widely used. The Not Rated (NR) category consists of securities that have not been rated by a NRSRO. Unrated
investments do not necessarily indicate low credit quality. The ratings category may include derivative instruments that could have a negative value. Credit quality ratings are subject
to change.
You can find additional information at
www.prudential.com/variableinsuranceportfolios
, including the Portfolio’s prospectus, financial
information, portfolio holdings, and proxy voting information. You can also request this information by contacting us at (800) 346-3778.
The Prudential Series Fund
PSF PGIM High Yield Bond Portfolio
ANNUAL SHAREHOLDER REPORT – DECEMBER 31, 2024
This annual shareholder report contains important information about the Class III shares of PSF PGIM High Yield Bond Portfolio (the “Portfolio”)
for the period of January 1, 2024 to December 31, 2024.
You can find additional information about the Portfolio at
www.prudential.com/variableinsuranceportfolios
. You can also request this
information by contacting us at (800) 346-3778.
WHAT WERE THE PORTFOLIO COSTS FOR THE LAST YEAR?
(Based on a hypothetical $10,000 investment)
| Costs of a $10,000 investment | Costs paid as a percentage of a $10,000 investment |
PSF PGIM High Yield Bond Portfolio—Class III | | |
The table does not include charges charged under your variable annuity contract or variable life insurance policies (each, a Contract). Because Contract charges are not included, the
total fees and expenses that you will incur will be higher than the fees and expenses set forth in the table. See your Contract prospectus for more information about Contract charges.
WHAT AFFECTED THE PORTFOLIO’S PERFORMANCE DURING THE REPORTING PERIOD?
■
US high yield bonds posted strong total returns over the reporting period amid resilient economic growth, stable corporate earnings, and light
net new supply compared with inflows of approximately $16 billion into high yield bond mutual funds and exchange-traded funds. Lower-quality
bonds generally outperformed higher-quality bonds, with CCC-rated bonds outperforming both BB-rated and B-rated bonds.
■
During the reporting period, security selection in the electric utilities, healthcare and pharmaceuticals, and cable and satellite sectors
contributed to returns relative to the Bloomberg US Corporate High Yield 1% Issuer Capped Index. An overweight allocation to, and security
selection in, the emerging markets high yield bond sector also contributed positively to the Portfolio’s performance.
■
An underweight allocation to the US high yield bond market detracted from performance, as did security selection in the media and
entertainment, chemicals, and midstream energy sectors.
■
During the reporting period, the Portfolio used US Treasury futures and total return swaps to manage interest rate risk, which we believe is a
more efficient way of managing interest rate risk than through the purchase and sale of bonds. The impact of futures and swaps detracted from
performance. The Portfolio also used credit derivatives in the form of the Credit Default Swap Index (CDX) and credit default swaps to manage
the overall risk profile of the Portfolio, which had a positive impact on performance.
HOW HAS THE PORTFOLIO PERFORMED SINCE INCEPTION?
The Portfolio's past performance is not a good predictor of the Portfolio's future performance.
The returns do not reflect the deduction
of applicable taxes, if any, that a shareholder would pay on Portfolio distributions or redemption of Portfolio shares.
The line graph reflects a hypothetical $10,000 investment in Class III shares and assumes that all recurring fees (including management fees)
were deducted and dividends and distributions were reinvested. Without waiver of fees and/or expense reimbursements, if any, the returns would
have been lower. The returns shown in the chart and table do not include Contract charges. If Contract charges were included, the returns shown
would have been lower than those shown. Consult your Contract prospectus for information about Contract charges. Performance for other share
classes will vary.
Cumulative Performance: April 26, 2021 to December 31, 2024 Initial Investment of $10,000 |
Average Annual Total Returns as of December 31, 2024 |
| | |
| | |
Bloomberg US Aggregate Bond Index* | | |
Bloomberg US Corporate High Yield 1% Issuer Capped Index | | |
Portfolio Inception: 04/26/2021.
Since Inception returns are provided because the Portfolio has less than 10 fiscal years of returns. Since Inception returns for the Indexes are
measured from the closest month-end to the Portfolio’s inception date.
*The Portfolio has added this broad-based index in response to new regulatory requirements.
WHAT ARE SOME KEY PORTFOLIO STATISTICS AS OF 12/31/2024?
| |
Number of portfolio holdings | |
Total advisory fees paid for the year | |
Portfolio turnover rate for the year | |
WHAT ARE SOME CHARACTERISTICS OF THE PORTFOLIO’S HOLDINGS AS OF 12/31/2024?
Credit quality ratings shown above reflect the middle rating assigned by a nationally recognized statistical rating organization (NRSRO) such as Moody’s Investor Service, Inc.
(Moody’s), S&P Global Ratings (S&P), or Fitch, Inc. (Fitch) if ratings differ. Where applicable, ratings are converted to the comparable S&P/Fitch rating category to illustrate credit
rating breakdowns. These NRSROs are independent and are widely used. The Not Rated (NR) category consists of securities that have not been rated by a NRSRO. Unrated
investments do not necessarily indicate low credit quality. The ratings category may include derivative instruments that could have a negative value. Credit quality ratings are subject
to change.
You can find additional information at
www.prudential.com/variableinsuranceportfolios
, including the Portfolio’s prospectus, financial
information, portfolio holdings, and proxy voting information. You can also request this information by contacting us at (800) 346-3778.
The Prudential Series Fund
PSF PGIM Jennison Blend Portfolio
ANNUAL SHAREHOLDER REPORT – DECEMBER 31, 2024
This annual shareholder report contains important information about the Class I shares of PSF PGIM Jennison Blend Portfolio (the “Portfolio”) for
the period of January 1, 2024 to December 31, 2024.
You can find additional information about the Portfolio at
www.prudential.com/variableinsuranceportfolios
. You can also request this
information by contacting us at (800) 346-3778.
This report describes changes to the Portfolio that occurred during the reporting period.
WHAT WERE THE PORTFOLIO COSTS FOR THE LAST YEAR?
(Based on a hypothetical $10,000 investment)
| Costs of a $10,000 investment | Costs paid as a percentage of a $10,000 investment |
PSF PGIM Jennison Blend Portfolio—Class I | | |
The table does not include charges charged under your variable annuity contract or variable life insurance policies (each, a Contract). Because Contract charges are not included, the
total fees and expenses that you will incur will be higher than the fees and expenses set forth in the table. See your Contract prospectus for more information about Contract charges.
WHAT AFFECTED THE PORTFOLIO’S PERFORMANCE DURING THE REPORTING PERIOD?
■
Equity market prices increased over the reporting period, ending the year at near-record levels, as investors reacted positively to the slowing
pace of inflation and sustained economic growth. The US Federal Reserve lowered the federal funds rate at each of its last three meetings in
2024, reducing the effective level of the funds rate from 5.3% to 4.3%. Equities—especially in cyclical and interest-rate-sensitive sectors of the
market—responded favorably to the moves, along with the perceived pro-business stance of the incoming administration and steady growth in
economic conditions during the reporting period. The year ended December 31, 2024 saw a repeat of the major equity market themes that
have persisted since the end of the global financial crisis (2007-2009) with growth outperforming value, large caps outperforming small caps,
and US securities outperforming non-US securities.
■
The Portfolio outperformed its benchmark, the Russell 1000 Value Index, over the reporting period. Security selection within the communication
services (primarily entertainment holdings), utilities (driven by independent power and renewable electricity producers), and energy (led by oil,
gas, and consumable fuels sectors), along with an underweight to health care, all contributed to the Portfolio’s outperformance of its
benchmark. On an absolute performance basis, positions within information technology (especially semiconductors and semiconductor
equipment and hardware, storage, and peripherals) were the primary drivers of performance.
■
Conversely, the Portfolio’s security selection in consumer discretionary (led by broadline retail), financials (especially banks), and industrials
(primarily electrical equipment) detracted the most from relative results during the reporting period.
HOW HAS THE PORTFOLIO PERFORMED OVER THE PAST 10 YEARS?
The Portfolio's past performance is not a good predictor of the Portfolio's future performance.
The returns do not reflect the deduction
of applicable taxes, if any, that a shareholder would pay on Portfolio distributions or redemption of Portfolio shares.
The line graph reflects a hypothetical $10,000 investment in Class I shares and assumes that all recurring fees (including management fees) were
deducted and dividends and distributions were reinvested. Without waiver of fees and/or expense reimbursements, if any, the returns would have
been lower. The returns shown in the chart and table do not include Contract charges. If Contract charges were included, the returns shown would
have been lower than those shown. Consult your Contract prospectus for information about Contract charges. Performance for other share
classes will vary.
Cumulative Performance: December 31, 2014 to December 31, 2024 Initial Investment of $10,000 |
Average Annual Total Returns as of December 31, 2024 |
| | | |
| | | |
| | | |
| | | |
WHAT ARE SOME KEY PORTFOLIO STATISTICS AS OF 12/31/2024?
| |
Number of portfolio holdings | |
Total advisory fees paid for the year | |
Portfolio turnover rate for the year | |
WHAT ARE SOME CHARACTERISTICS OF THE PORTFOLIO’S HOLDINGS AS OF 12/31/2024?
| |
Semiconductors & Semiconductor Equipment | |
| |
Technology Hardware, Storage & Peripherals | |
Interactive Media & Services | |
| |
| |
| |
Affiliated Mutual Fund - Short-Term Investment (3.4% represents investments purchased with collateral from securities on loan) | |
| |
Oil, Gas & Consumable Fuels | |
| |
Health Care Equipment & Supplies | |
| |
| |
Consumer Staples Distribution & Retail | |
| |
| |
| |
| |
| |
| |
| |
Hotels, Restaurants & Leisure | |
| |
| |
Diversified Telecommunication Services | |
| |
| |
Health Care Providers & Services | |
| |
| |
Construction & Engineering | |
| |
| |
| |
| |
Independent Power & Renewable Electricity | |
Commercial Services & Supplies | |
Textiles, Apparel & Luxury Goods | |
Real Estate Management & Development | |
| |
| |
| |
| |
Liabilities in excess of other assets | |
| |
* Consists of Industries that each make up less than 0.5% of the Fund's net assets
WERE THERE ANY SIGNIFICANT CHANGES TO THE PORTFOLIO THIS YEAR?
The following is a summary of certain changes to the Portfolio since January 1, 2024.
■
On November 20, 2024, the Board of Trustees of The Prudential Series Fund (the “Trust”) approved the reorganization (the “Reorganization”)
of PSF Natural Resources Portfolio (the “Target Portfolio”) into the PSF PGIM Jennison Blend Portfolio (the “Acquiring Portfolio”), each a series
of the Trust. The Reorganization is subject to approval by the shareholders of the Target Portfolio. A special meeting of the Target Portfolio’s
shareholders to vote on the proposed Reorganization will be held on March 25, 2025. If approved by shareholders of the Target Portfolio, it is
expected that the Reorganization will be completed on or about April 14, 2025.
For more complete information, you should review the Portfolio’s current prospectus and any applicable supplements and the Portfolio’s next
prospectus, which we expect to be available by May 1, 2025 at
www.prudential.com/variableinsuranceportfolios
or by request at
(800) 346-3778.
You can find additional information at
www.prudential.com/variableinsuranceportfolios
, including the Portfolio’s prospectus, financial
information, portfolio holdings, and proxy voting information. You can also request this information by contacting us at (800) 346-3778.
The Prudential Series Fund
PSF PGIM Jennison Blend Portfolio
ANNUAL SHAREHOLDER REPORT – DECEMBER 31, 2024
This annual shareholder report contains important information about the Class II shares of PSF PGIM Jennison Blend Portfolio (the “Portfolio”) for
the period of January 1, 2024 to December 31, 2024.
You can find additional information about the Portfolio at
www.prudential.com/variableinsuranceportfolios
. You can also request this
information by contacting us at (800) 346-3778.
This report describes changes to the Portfolio that occurred during the reporting period.
WHAT WERE THE PORTFOLIO COSTS FOR THE LAST YEAR?
(Based on a hypothetical $10,000 investment)
| Costs of a $10,000 investment | Costs paid as a percentage of a $10,000 investment |
PSF PGIM Jennison Blend Portfolio—Class II | | |
The table does not include charges charged under your variable annuity contract or variable life insurance policies (each, a Contract). Because Contract charges are not included, the
total fees and expenses that you will incur will be higher than the fees and expenses set forth in the table. See your Contract prospectus for more information about Contract charges.
WHAT AFFECTED THE PORTFOLIO’S PERFORMANCE DURING THE REPORTING PERIOD?
■
Equity market prices increased over the reporting period, ending the year at near-record levels, as investors reacted positively to the slowing
pace of inflation and sustained economic growth. The US Federal Reserve lowered the federal funds rate at each of its last three meetings in
2024, reducing the effective level of the funds rate from 5.3% to 4.3%. Equities—especially in cyclical and interest-rate-sensitive sectors of the
market—responded favorably to the moves, along with the perceived pro-business stance of the incoming administration and steady growth in
economic conditions during the reporting period. The year ended December 31, 2024 saw a repeat of the major equity market themes that
have persisted since the end of the global financial crisis (2007-2009) with growth outperforming value, large caps outperforming small caps,
and US securities outperforming non-US securities.
■
The Portfolio outperformed its benchmark, the Russell 1000 Value Index, over the reporting period. Security selection within the communication
services (primarily entertainment holdings), utilities (driven by independent power and renewable electricity producers), and energy (led by oil,
gas, and consumable fuels sectors), along with an underweight to health care, all contributed to the Portfolio’s outperformance of its
benchmark. On an absolute performance basis, positions within information technology (especially semiconductors and semiconductor
equipment and hardware, storage, and peripherals) were the primary drivers of performance.
■
Conversely, the Portfolio’s security selection in consumer discretionary (led by broadline retail), financials (especially banks), and industrials
(primarily electrical equipment) detracted the most from relative results during the reporting period.
HOW HAS THE PORTFOLIO PERFORMED OVER THE PAST 10 YEARS?
The Portfolio's past performance is not a good predictor of the Portfolio's future performance.
The returns do not reflect the deduction
of applicable taxes, if any, that a shareholder would pay on Portfolio distributions or redemption of Portfolio shares.
The line graph reflects a hypothetical $10,000 investment in Class II shares and assumes that all recurring fees (including management fees)
were deducted and dividends and distributions were reinvested. Without waiver of fees and/or expense reimbursements, if any, the returns would
have been lower. The returns shown in the chart and table do not include Contract charges. If Contract charges were included, the returns shown
would have been lower than those shown. Consult your Contract prospectus for information about Contract charges. Performance for other share
classes will vary.
Cumulative Performance: December 31, 2014 to December 31, 2024 Initial Investment of $10,000 |
Average Annual Total Returns as of December 31, 2024 |
| | | |
| | | |
| | | |
| | | |
WHAT ARE SOME KEY PORTFOLIO STATISTICS AS OF 12/31/2024?
| |
Number of portfolio holdings | |
Total advisory fees paid for the year | |
Portfolio turnover rate for the year | |
WHAT ARE SOME CHARACTERISTICS OF THE PORTFOLIO’S HOLDINGS AS OF 12/31/2024?
| |
Semiconductors & Semiconductor Equipment | |
| |
Technology Hardware, Storage & Peripherals | |
Interactive Media & Services | |
| |
| |
| |
Affiliated Mutual Fund - Short-Term Investment (3.4% represents investments purchased with collateral from securities on loan) | |
| |
Oil, Gas & Consumable Fuels | |
| |
Health Care Equipment & Supplies | |
| |
| |
Consumer Staples Distribution & Retail | |
| |
| |
| |
| |
| |
| |
| |
Hotels, Restaurants & Leisure | |
| |
| |
Diversified Telecommunication Services | |
| |
| |
Health Care Providers & Services | |
| |
| |
Construction & Engineering | |
| |
| |
| |
| |
Independent Power & Renewable Electricity | |
Commercial Services & Supplies | |
Textiles, Apparel & Luxury Goods | |
Real Estate Management & Development | |
| |
| |
| |
| |
Liabilities in excess of other assets | |
| |
* Consists of Industries that each make up less than 0.5% of the Fund's net assets
WERE THERE ANY SIGNIFICANT CHANGES TO THE PORTFOLIO THIS YEAR?
The following is a summary of certain changes to the Portfolio since January 1, 2024.
■
On November 20, 2024, the Board of Trustees of The Prudential Series Fund (the “Trust”) approved the reorganization (the “Reorganization”)
of PSF Natural Resources Portfolio (the “Target Portfolio”) into the PSF PGIM Jennison Blend Portfolio (the “Acquiring Portfolio”), each a series
of the Trust. The Reorganization is subject to approval by the shareholders of the Target Portfolio. A special meeting of the Target Portfolio’s
shareholders to vote on the proposed Reorganization will be held on March 25, 2025. If approved by shareholders of the Target Portfolio, it is
expected that the Reorganization will be completed on or about April 14, 2025.
For more complete information, you should review the Portfolio’s current prospectus and any applicable supplements and the Portfolio’s next
prospectus, which we expect to be available by May 1, 2025 at
www.prudential.com/variableinsuranceportfolios
or by request at
(800) 346-3778
.
You can find additional information at
www.prudential.com/variableinsuranceportfolios
, including the Portfolio’s prospectus, financial
information, portfolio holdings, and proxy voting information. You can also request this information by contacting us at (800) 346-3778.
The Prudential Series Fund
PSF PGIM Jennison Blend Portfolio
ANNUAL SHAREHOLDER REPORT – DECEMBER 31, 2024
This annual shareholder report contains important information about the Class III shares of PSF PGIM Jennison Blend Portfolio (the “Portfolio”)
for the period of January 1, 2024 to December 31, 2024.
You can find additional information about the Portfolio at
www.prudential.com/variableinsuranceportfolios
. You can also request this
information by contacting us at (800) 346-3778.
This report describes changes to the Portfolio that occurred during the reporting period.
WHAT WERE THE PORTFOLIO COSTS FOR THE LAST YEAR?
(Based on a hypothetical $10,000 investment)
| Costs of a $10,000 investment | Costs paid as a percentage of a $10,000 investment |
PSF PGIM Jennison Blend Portfolio—Class III | | |
The table does not include charges charged under your variable annuity contract or variable life insurance policies (each, a Contract). Because Contract charges are not included, the
total fees and expenses that you will incur will be higher than the fees and expenses set forth in the table. See your Contract prospectus for more information about Contract charges.
WHAT AFFECTED THE PORTFOLIO’S PERFORMANCE DURING THE REPORTING PERIOD?
■
Equity market prices increased over the reporting period, ending the year at near-record levels, as investors reacted positively to the slowing
pace of inflation and sustained economic growth. The US Federal Reserve lowered the federal funds rate at each of its last three meetings in
2024, reducing the effective level of the funds rate from 5.3% to 4.3%. Equities—especially in cyclical and interest-rate-sensitive sectors of the
market—responded favorably to the moves, along with the perceived pro-business stance of the incoming administration and steady growth in
economic conditions during the reporting period. The year ended December 31, 2024 saw a repeat of the major equity market themes that
have persisted since the end of the global financial crisis (2007-2009) with growth outperforming value, large caps outperforming small caps,
and US securities outperforming non-US securities.
■
The Portfolio outperformed its benchmark, the Russell 1000 Value Index, over the reporting period. Security selection within the communication
services (primarily entertainment holdings), utilities (driven by independent power and renewable electricity producers), and energy (led by oil,
gas, and consumable fuels sectors), along with an underweight to health care, all contributed to the Portfolio’s outperformance of its
benchmark. On an absolute performance basis, positions within information technology (especially semiconductors and semiconductor
equipment and hardware, storage, and peripherals) were the primary drivers of performance.
■
Conversely, the Portfolio’s security selection in consumer discretionary (led by broadline retail), financials (especially banks), and industrials
(primarily electrical equipment) detracted the most from relative results during the reporting period.
HOW HAS THE PORTFOLIO PERFORMED SINCE INCEPTION?
The Portfolio's past performance is not a good predictor of the Portfolio's future performance.
The returns do not reflect the deduction
of applicable taxes, if any, that a shareholder would pay on Portfolio distributions or redemption of Portfolio shares.
The line graph reflects a hypothetical $10,000 investment in Class III shares and assumes that all recurring fees (including management fees)
were deducted and dividends and distributions were reinvested. Without waiver of fees and/or expense reimbursements, if any, the returns would
have been lower. The returns shown in the chart and table do not include Contract charges. If Contract charges were included, the returns shown
would have been lower than those shown. Consult your Contract prospectus for information about Contract charges. Performance for other share
classes will vary.
Cumulative Performance: April 26, 2021 to December 31, 2024 Initial Investment of $10,000 |
Average Annual Total Returns as of December 31, 2024 |
| | |
| | |
| | |
| | |
Portfolio Inception: 04/26/2021.
Since Inception returns are provided because the Portfolio has less than 10 fiscal years of returns. Since Inception returns for the Indexes are
measured from the closest month-end to the Portfolio’s inception date.
WHAT ARE SOME KEY PORTFOLIO STATISTICS AS OF 12/31/2024?
| |
Number of portfolio holdings | |
Total advisory fees paid for the year | |
Portfolio turnover rate for the year | |
WHAT
ARE
SOME CHARACTERISTICS OF THE PORTFOLIO’S HOLDINGS AS OF 12/31/2024?
| |
Semiconductors & Semiconductor Equipment | |
| |
Technology Hardware, Storage & Peripherals | |
Interactive Media & Services | |
| |
| |
| |
Affiliated Mutual Fund - Short-Term Investment (3.4% represents investments purchased with collateral from securities on loan) | |
| |
Oil, Gas & Consumable Fuels | |
| |
Health Care Equipment & Supplies | |
| |
| |
Consumer Staples Distribution & Retail | |
| |
| |
| |
| |
| |
| |
| |
Hotels, Restaurants & Leisure | |
| |
| |
Diversified Telecommunication Services | |
| |
| |
Health Care Providers & Services | |
| |
| |
Construction & Engineering | |
| |
| |
| |
| |
Independent Power & Renewable Electricity | |
Commercial Services & Supplies | |
Textiles, Apparel & Luxury Goods | |
Real Estate Management & Development | |
| |
| |
| |
| |
Liabilities in excess of other assets | |
| |
* Consists of Industries that each make up less than 0.5% of the Fund's net assets
WERE THERE ANY SIGNIFICANT CHANGES TO THE PORTFOLIO THIS YEAR?
The following is a summary of certain changes to the Portfolio since January 1, 2024.
■
On November 20, 2024, the Board of Trustees of The Prudential Series Fund (the “Trust”) approved the reorganization (the “Reorganization”)
of PSF Natural Resources Portfolio (the “Target Portfolio”) into the PSF PGIM Jennison Blend Portfolio (the “Acquiring Portfolio”), each a series
of the Trust. The Reorganization is subject to approval by the shareholders of the Target Portfolio. A special meeting of the Target Portfolio’s
shareholders to vote on the proposed Reorganization will be held on March 25, 2025. If approved by shareholders of the Target Portfolio, it is
expected that the Reorganization will be completed on or about April 14, 2025.
For more complete information, you should review the Portfolio’s current prospectus and any applicable supplements and the Portfolio’s next
prospectus, which we expect to be available by May 1, 2025 at
www.prudential.com/variableinsuranceportfolios
or by request at
(800) 346-3778.
You can find additional information at
www.prudential.com/variableinsuranceportfolios
, including the Portfolio’s prospectus, financial
information, portfolio holdings, and proxy voting information. You can also request this information by contacting us at (800) 346-3778.
The Prudential Series Fund
PSF PGIM Jennison Growth Portfolio
ANNUAL SHAREHOLDER REPORT – DECEMBER 31, 2024
This annual shareholder report contains important information about the Class I shares of PSF PGIM Jennison Growth Portfolio (the “Portfolio”)
for the period of January 1, 2024 to December 31, 2024.
You can find additional information about the Portfolio at
www.prudential.com/variableinsuranceportfolios
. You can also request this
information by contacting us at (800) 346-3778.
This report describes changes to the Portfolio that occurred during the reporting period.
WHAT WERE THE PORTFOLIO COSTS FOR THE LAST YEAR?
(Based on a hypothetical $10,000 investment)
| Costs of a $10,000 investment | Costs paid as a percentage of a $10,000 investment |
PSF PGIM Jennison Growth Portfolio—Class I | | |
The table does not include charges charged under your variable annuity contract or variable life insurance policies (each, a Contract). Because Contract charges are not included, the
total fees and expenses that you will incur will be higher than the fees and expenses set forth in the table. See your Contract prospectus for more information about Contract charges.
WHAT AFFECTED THE PORTFOLIO’S PERFORMANCE DURING THE REPORTING PERIOD?
■
Positive investor reactions to a slowing pace of inflation and sustained economic growth led to increased capital asset prices over the reporting
period, with equities ending the year at near-record levels. The US Federal Reserve lowered the federal funds interest rate at each of its last
three meetings, bringing the effective level down from 5.3% at the start of the year to 4.3% as of December 31, 2024. Equities responded
favorably to the moves, especially in interest-rate-sensitive sectors. The strength of corporate profits overall has been an important contributor
to performance amidst the sustained growth of the US economy. Employment has remained at healthy levels throughout the period, although
there have been signs of weakening in the past six months. While the rate of inflation declined during the reporting period, this trend has
flattened out in recent months.
■
The Portfolio’s positions within the information technology sector (especially semiconductors and semiconductor equipment) added the most to
the Portfolio’s strong absolute performance during the reporting period. Relative to the Russell 1000 Growth Index (the Index), security
selection within the health care (led by health care equipment and supplies), communication services (especially entertainment), and consumer
staples (distribution and retail and personal care products) sectors was the largest contributor to the Portfolio’s performance.
■
While the Portfolio had strong absolute performance for 2024, relative results fell short of the Index for the period. Compared to the Index, the
Portfolio’s stock selection within the consumer discretionary (led by broadline retail and textiles, apparel, and luxury goods) and industrials
(driven by aerospace and defense) sectors detracted from relative performance.
HOW HAS THE PORTFOLIO PERFORMED OVER THE PAST 10 YEARS?
The Portfolio's past performance is not a good predictor of the Portfolio's future performance.
The returns do not reflect the deduction
of applicable taxes, if any, that a shareholder would pay on Portfolio distributions or redemption of Portfolio shares.
The line graph reflects a hypothetical $10,000 investment in Class I shares and assumes that all recurring fees (including management fees) were
deducted and dividends and distributions were reinvested. Without waiver of fees and/or expense reimbursements, if any, the returns would have
been lower. The returns shown in the chart and table do not include Contract charges. If Contract charges were included, the returns shown would
have been lower than those shown. Consult your Contract prospectus for information about Contract charges. Performance for other share
classes will vary.
Cumulative Performance: December 31, 2014 to December 31, 2024 Initial Investment of $10,000 |
Average Annual Total Returns as of December 31, 2024 |
| | | |
| | | |
| | | |
Russell 1000 Growth Index | | | |
WHAT ARE SOME KEY PORTFOLIO STATISTICS AS OF 12/31/2024?
| |
Number of portfolio holdings | |
Total advisory fees paid for the year | |
Portfolio turnover rate for the year | |
WHAT ARE SOME CHARACTERISTICS OF THE PORTFOLIO’S HOLDINGS AS OF 12/31/2024?
| |
Semiconductors & Semiconductor Equipment | |
| |
| |
Interactive Media & Services | |
| |
Technology Hardware, Storage & Peripherals | |
| |
| |
Consumer Staples Distribution & Retail | |
| |
| |
Hotels, Restaurants & Leisure | |
| |
Health Care Equipment & Supplies | |
Affiliated Mutual Fund - Short-Term Investment (0.6% represents investments purchased with collateral from securities on loan) | |
| |
| |
| |
| |
| |
| |
| |
Textiles, Apparel & Luxury Goods | |
| |
| |
Liabilities in excess of other assets | |
| |
WERE THERE ANY SIGNIFICANT CHANGES TO THE PORTFOLIO THIS YEAR?
The following is a summary of certain changes to the Portfolio since January 1, 2024.
■
On November 20, 2024, the Board of Trustees of The Prudential Series Fund (the “Trust”) approved the reorganization (the “Reorganization”)
of PSF Mid-Cap Growth Portfolio (the “Target Portfolio”) into the PSF PGIM Jennison Growth Portfolio (the “Acquiring Portfolio”), each a series
of the Trust. The Reorganization is subject to approval by the shareholders of the Target Portfolio. A special meeting of the Target Portfolio’s
shareholders to vote on the proposed Reorganization will be held on or about March 25, 2025. If approved by shareholders of the Target
Portfolio, it is expected that the Reorganization will be completed on or about April 14, 2025.
For more complete information, you should review the Portfolio’s current prospectus and any applicable supplements and the Portfolio’s next
prospectus, which we expect to be available by May 1, 2025 at
www.prudential.com/variableinsuranceportfolios
or by request at
(800) 346-3778.
You can find additional information at
www.prudential.com/variableinsuranceportfolios
, including the Portfolio’s prospectus, financial
information, portfolio holdings, and proxy voting information. You can also request this information by contacting us at (800) 346-3778.
The Prudential Series Fund
PSF PGIM Jennison Growth Portfolio
ANNUAL SHAREHOLDER REPORT – DECEMBER 31, 2024
This annual shareholder report contains important information about the Class II shares of PSF PGIM Jennison Growth Portfolio (the “Portfolio”)
for the period of January 1, 2024 to December 31, 2024.
You can find additional information about the Portfolio at
www.prudential.com/variableinsuranceportfolios
. You can also request this
information by contacting us at (800) 346-3778.
This report describes changes to the Portfolio that occurred during the reporting period.
WHAT WERE THE PORTFOLIO COSTS FOR THE LAST YEAR?
(Based on a hypothetical $10,000 investment)
| Costs of a $10,000 investment | Costs paid as a percentage of a $10,000 investment |
PSF PGIM Jennison Growth Portfolio—Class II | | |
The table does not include charges charged under your variable annuity contract or variable life insurance policies (each, a Contract). Because Contract charges are not included, the
total fees and expenses that you will incur will be higher than the fees and expenses set forth in the table. See your Contract prospectus for more information about Contract charges.
WHAT AFFECTED THE PORTFOLIO’S PERFORMANCE DURING THE REPORTING PERIOD?
■
Positive investor reactions to a slowing pace of inflation and sustained economic growth led to increased capital asset prices over the reporting
period, with equities ending the year at near-record levels. The US Federal Reserve lowered the federal funds interest rate at each of its last
three meetings, bringing the effective level down from 5.3% at the start of the year to 4.3% as of December 31, 2024. Equities responded
favorably to the moves, especially in interest-rate-sensitive sectors. The strength of corporate profits overall has been an important contributor
to performance amidst the sustained growth of the US economy. Employment has remained at healthy levels throughout the period, although
there have been signs of weakening in the past six months. While the rate of inflation declined during the reporting period, this trend has
flattened out in recent months.
■
The Portfolio’s positions within the information technology sector (especially semiconductors and semiconductor equipment) added the most to
the Portfolio’s strong absolute performance during the reporting period. Relative to the Russell 1000 Growth Index (the Index), security
selection within the health care (led by health care equipment and supplies), communication services (especially entertainment), and consumer
staples (distribution and retail and personal care products) sectors was the largest contributor to the Portfolio’s performance.
■
While the Portfolio had strong absolute performance for 2024, relative results fell short of the Index for the period. Compared to the Index, the
Portfolio’s stock selection within the consumer discretionary (led by broadline retail and textiles, apparel, and luxury goods) and industrials
(driven by aerospace and defense) sectors detracted from relative performance.
HOW HAS THE PORTFOLIO PERFORMED OVER THE PAST 10 YEARS?
The Portfolio's past performance is not a good predictor of the Portfolio's future performance.
The returns do not reflect the deduction
of applicable taxes, if any, that a shareholder would pay on Portfolio distributions or redemption of Portfolio shares.
The line graph reflects a hypothetical $10,000 investment in Class II shares and assumes that all recurring fees (including management fees)
were deducted and dividends and distributions were reinvested. Without waiver of fees and/or expense reimbursements, if any, the returns would
have been lower. The returns shown in the chart and table do not include Contract charges. If Contract charges were included, the returns shown
would have been lower than those shown. Consult your Contract prospectus for information about Contract charges. Performance for other share
classes will vary.
Cumulative Performance: December 31, 2014 to December 31, 2024 Initial Investment of $10,000 |
Average Annual Total Returns as of December 31, 2024 |
| | | |
| | | |
| | | |
Russell 1000 Growth Index | | | |
WHAT ARE
SOME
KEY PORTFOLIO STATISTICS AS OF 12/31/2024?
| |
Number of portfolio holdings | |
Total advisory fees paid for the year | |
Portfolio turnover rate for the year | |
WHAT ARE SOME CHARACTERISTICS OF THE PORTFOLIO’S HOLDINGS AS OF 12/31/2024?
| |
Semiconductors & Semiconductor Equipment | |
| |
| |
Interactive Media & Services | |
| |
Technology Hardware, Storage & Peripherals | |
| |
| |
Consumer Staples Distribution & Retail | |
| |
| |
Hotels, Restaurants & Leisure | |
| |
Health Care Equipment & Supplies | |
Affiliated Mutual Fund - Short-Term Investment (0.6% represents investments purchased with collateral from securities on loan) | |
| |
| |
| |
| |
| |
| |
| |
Textiles, Apparel & Luxury Goods | |
| |
| |
Liabilities in excess of other assets | |
| |
WERE THERE ANY SIGNIFICANT CHANGES TO THE PORTFOLIO THIS YEAR?
The following is a summary of certain changes to the Portfolio since January 1, 2024.
■
On November 20, 2024, the Board of Trustees of The Prudential Series Fund (the “Trust”) approved the reorganization (the “Reorganization”)
of PSF Mid-Cap Growth Portfolio (the “Target Portfolio”) into the PSF PGIM Jennison Growth Portfolio (the “Acquiring Portfolio”), each a series
of the Trust. The Reorganization is subject to approval by the shareholders of the Target Portfolio. A special meeting of the Target Portfolio’s
shareholders to vote on the proposed Reorganization will be held on or about March 25, 2025. If approved by shareholders of the Target
Portfolio, it is expected that the Reorganization will be completed on or about April 14, 2025.
For more complete information, you should review the Portfolio’s current prospectus and any applicable supplements and the Portfolio’s next
prospectus, which we expect to be available by May 1, 2025 at
www.prudential.com/variableinsuranceportfolios
or by request at
(800) 346-3778.
You can find additional information at
www.prudential.com/variableinsuranceportfolios
, including the Portfolio’s prospectus, financial
information, portfolio holdings, and proxy voting information. You can also request this information by contacting us at (800) 346-3778.
The Prudential Series Fund
PSF PGIM Jennison Growth Portfolio
ANNUAL SHAREHOLDER REPORT – DECEMBER 31, 2024
This annual shareholder report contains important information about the Class III shares of PSF PGIM Jennison Growth Portfolio (the “Portfolio”)
for the period of January 1, 2024 to December 31, 2024.
You can find additional information about the Portfolio at
www.prudential.com/variableinsuranceportfolios
. You can also request this
information by contacting us at (800) 346-3778.
This report describes changes to the Portfolio that occurred during the reporting period.
WHAT WERE THE PORTFOLIO COSTS FOR THE LAST YEAR?
(Based on a hypothetical $10,000 investment)
| Costs of a $10,000 investment | Costs paid as a percentage of a $10,000 investment |
PSF PGIM Jennison Growth Portfolio—Class III | | |
The table does not include charges charged under your variable annuity contract or variable life insurance policies (each, a Contract). Because Contract charges are not included, the
total fees and expenses that you will incur will be higher than the fees and expenses set forth in the table. See your Contract prospectus for more information about Contract charges.
WHAT AFFECTED THE PORTFOLIO’S PERFORMANCE DURING THE REPORTING PERIOD?
■
Positive investor reactions to a slowing pace of inflation and sustained economic growth led to increased capital asset prices over the reporting
period, with equities ending the year at near-record levels. The US Federal Reserve lowered the federal funds interest rate at each of its last
three meetings, bringing the effective level down from 5.3% at the start of the year to 4.3% as of December 31, 2024. Equities responded
favorably to the moves, especially in interest-rate-sensitive sectors. The strength of corporate profits overall has been an important contributor
to performance amidst the sustained growth of the US economy. Employment has remained at healthy levels throughout the period, although
there have been signs of weakening in the past six months. While the rate of inflation declined during the reporting period, this trend has
flattened out in recent months.
■
The Portfolio’s positions within the information technology sector (especially semiconductors and semiconductor equipment) added the most to
the Portfolio’s strong absolute performance during the reporting period. Relative to the Russell 1000 Growth Index (the Index), security
selection within the health care (led by health care equipment and supplies), communication services (especially entertainment), and consumer
staples (distribution and retail and personal care products) sectors was the largest contributor to the Portfolio’s performance.
■
While the Portfolio had strong absolute performance for 2024, relative results fell short of the Index for the period. Compared to the Index, the
Portfolio’s stock selection within the consumer discretionary (led by broadline retail and textiles, apparel, and luxury goods) and industrials
(driven by aerospace and defense) sectors detracted from relative performance.
HOW HAS THE PORTFOLIO PERFORMED SINCE INCEPTION?
The Portfolio's past performance is not a good predictor of the Portfolio's future performance.
The returns do not reflect the deduction
of applicable taxes, if any, that a shareholder would pay on Portfolio distributions or redemption of Portfolio shares.
The line graph reflects a hypothetical $10,000 investment in Class III shares and assumes that all recurring fees (including management fees)
were deducted and dividends and distributions were reinvested. Without waiver of fees and/or expense reimbursements, if any, the returns would
have been lower. The returns shown in the chart and table do not include Contract charges. If Contract charges were included, the returns shown
would have been lower than those shown. Consult your Contract prospectus for information about Contract charges. Performance for other share
classes will vary.
Cumulative Performance: April 26, 2021 to December 31, 2024 Initial Investment of $10,000 |
Average Annual Total Returns as of December 31, 2024 |
| | |
| | |
| | |
Russell 1000 Growth Index | | |
Portfolio Inception: 04/26/2021.
Since Inception returns are provided because the Portfolio has less than 10 fiscal years of returns. Since Inception returns for the Indexes are
measured from the closest month-end to the Portfolio’s inception date.
WHAT ARE SOME KEY PORTFOLIO STATISTICS AS OF 12/31/2024?
| |
Number of portfolio holdings | |
Total advisory fees paid for the year | |
Portfolio turnover rate for the year | |
WHAT ARE SOME CHARACTERISTICS OF THE PORTFOLIO’S HOLDINGS AS OF 12/31/2024?
| |
Semiconductors & Semiconductor Equipment | |
| |
| |
Interactive Media & Services | |
| |
Technology Hardware, Storage & Peripherals | |
| |
| |
Consumer Staples Distribution & Retail | |
| |
| |
Hotels, Restaurants & Leisure | |
| |
Health Care Equipment & Supplies | |
Affiliated Mutual Fund - Short-Term Investment (0.6% represents investments purchased with collateral from securities on loan) | |
| |
| |
| |
| |
| |
| |
| |
Textiles, Apparel & Luxury Goods | |
| |
| |
Liabilities in excess of other assets | |
| |
WERE THERE ANY SIGNIFICANT CHANGES TO THE PORTFOLIO THIS YEAR?
The following is a summary of certain changes to the Portfolio since January 1, 2024.
■
On November 20, 2024, the Board of Trustees of The Prudential Series Fund (the “Trust”) approved the reorganization (the “Reorganization”)
of PSF Mid-Cap Growth Portfolio (the “Target Portfolio”) into the PSF PGIM Jennison Growth Portfolio (the “Acquiring Portfolio”), each a series
of the Trust. The Reorganization is subject to approval by the shareholders of the Target Portfolio. A special meeting of the Target Portfolio’s
shareholders to vote on the proposed Reorganization will be held on or about March 25, 2025. If approved by shareholders of the Target
Portfolio, it is expected that the Reorganization will be completed on or about April 14, 2025.
For more complete information, you should review the Portfolio’s current prospectus and any applicable supplements and the Portfolio’s next
prospectus, which we expect to be available by May 1, 2025 at
www.prudential.com/variableinsuranceportfolios
or by request at
(800) 346-3778.
You can find additional information at
www.prudential.com/variableinsuranceportfolios
, including the Portfolio’s prospectus, financial
information, portfolio holdings, and proxy voting information. You can also request this information by contacting us at (800) 346-3778.
The Prudential Series Fund
PSF PGIM Jennison Value Portfolio
ANNUAL SHAREHOLDER REPORT – DECEMBER 31, 2024
This annual shareholder report contains important information about the Class I shares of PSF PGIM Jennison Value Portfolio (the “Portfolio”) for
the period of January 1, 2024 to December 31, 2024.
You can find additional information about the Portfolio at
www.prudential.com/variableinsuranceportfolios
. You can also request this
information by contacting us at (800) 346-3778.
WHAT WERE THE PORTFOLIO COSTS FOR THE LAST YEAR?
(Based on a hypothetical $10,000 investment)
| Costs of a $10,000 investment | Costs paid as a percentage of a $10,000 investment |
PSF PGIM Jennison Value Portfolio—Class I | | |
The table does not include charges charged under your variable annuity contract or variable life insurance policies (each, a Contract). Because Contract charges are not included, the
total fees and expenses that you will incur will be higher than the fees and expenses set forth in the table. See your Contract prospectus for more information about Contract charges.
WHAT AFFECTED THE PORTFOLIO’S PERFORMANCE DURING THE REPORTING PERIOD?
■
Equity market prices increased over the reporting period, ending the year at near-record levels, as investors reacted positively to the slowing
pace of inflation and sustained economic growth. The US Federal Reserve lowered the federal funds rate at each of its last three meetings in
2024, reducing the effective level of the funds rate from 5.3% to 4.3%. Equities—especially in cyclical and interest-rate-sensitive sectors of the
market—responded favorably to the moves, along with the perceived pro-business stance of the incoming administration and steady growth in
economic conditions during the reporting period. The year ended December 31, 2024 saw a repeat of the major equity market themes that
have persisted since the end of the global financial crisis (2007-2009), with growth outperforming value, large cap outperforming small cap, and
US securities outperforming non-US securities.
■
The Portfolio significantly outperformed its benchmark, the Russell 1000 Value Index (the Index), over the reporting period. Security selection
within information technology (especially semiconductors and semiconductor equipment and hardware, storage, and peripherals), health care
(led by pharmaceuticals), communication services (primarily positions in interactive media and services), energy (oil and gas), and financials
(banks) were the main contributors to the Portfolio’s solid absolute performance and its relative outperformance of the Index during the
reporting period.
■
Conversely, the Portfolio’s security selection within real estate (primarily health care-related real estate investment trusts) and consumer
discretionary (led by hotels, restaurants and leisure, and automobile components), along with an overweight to energy relative to its benchmark,
detracted the most from relative results during the reporting period.
HOW HAS THE PORTFOLIO PERFORMED OVER THE PAST 10 YEARS?
The Portfolio's past performance is not a good predictor of the Portfolio's future performance.
The returns do not reflect the deduction
of applicable taxes, if any, that a shareholder would pay on Portfolio distributions or redemption of Portfolio shares.
The line graph reflects a hypothetical $10,000 investment in Class I shares and assumes that all recurring fees (including management fees) were
deducted and dividends and distributions were reinvested. Without waiver of fees and/or expense reimbursements, if any, the returns would have
been lower. The returns shown in the chart and table do not include Contract charges. If Contract charges were included, the returns shown would
have been lower than those shown. Consult your Contract prospectus for information about Contract charges. Performance for other share
classes will vary.
Cumulative Performance: December 31, 2014 to December 31, 2024 Initial Investment of $10,000 |
Average Annual Total Returns as of December 31, 2024 |
| | | |
| | | |
| | | |
| | | |
WHAT
ARE
SOME KEY PORTFOLIO STATISTICS AS OF 12/31/2024?
| |
Number of portfolio holdings | |
Total advisory fees paid for the year | |
Portfolio turnover rate for the year | |
WHAT
ARE
SOME CHARACTERISTICS OF THE PORTFOLIO’S HOLDINGS AS OF 12/31/2024?
| |
| |
Oil, Gas & Consumable Fuels | |
Affiliated Mutual Fund - Short-Term Investment (5.6% represents investments purchased with collateral from securities on loan) | |
| |
| |
| |
| |
| |
| |
Consumer Staples Distribution & Retail | |
| |
| |
Interactive Media & Services | |
Technology Hardware, Storage & Peripherals | |
| |
Semiconductors & Semiconductor Equipment | |
| |
| |
| |
| |
| |
| |
Hotels, Restaurants & Leisure | |
| |
| |
| |
| |
| |
Health Care Equipment & Supplies | |
| |
| |
| |
Health Care Providers & Services | |
| |
| |
| |
Liabilities in excess of other assets | |
| |
You can find additional information at
www.prudential.com/variableinsuranceportfolios
, including the Portfolio’s prospectus, financial
information, portfolio holdings, and proxy voting information. You can also request this information by contacting us at (800) 346-3778.
The Prudential Series Fund
PSF PGIM Jennison Value Portfolio
ANNUAL SHAREHOLDER REPORT – DECEMBER 31, 2024
This annual shareholder report contains important information about the Class II shares of PSF PGIM Jennison Value Portfolio (the “Portfolio”) for
the period of January 1, 2024 to December 31, 2024.
You can find additional information about the Portfolio at
www.prudential.com/variableinsuranceportfolios
. You can also request this
information by contacting us at (800) 346-3778.
WHAT WERE THE PORTFOLIO COSTS FOR THE LAST YEAR?
(Based on a hypothetical $10,000 investment)
| Costs of a $10,000 investment | Costs paid as a percentage of a $10,000 investment |
PSF PGIM Jennison Value Portfolio—Class II | | |
The table does not include charges charged under your variable annuity contract or variable life insurance policies (each, a Contract). Because Contract charges are not included, the
total fees and expenses that you will incur will be higher than the fees and expenses set forth in the table. See your Contract prospectus for more information about Contract charges.
WHAT AFFECTED THE PORTFOLIO’S PERFORMANCE DURING THE REPORTING PERIOD?
■
Equity market prices increased over the reporting period, ending the year at near-record levels, as investors reacted positively to the slowing
pace of inflation and sustained economic growth. The US Federal Reserve lowered the federal funds rate at each of its last three meetings in
2024, reducing the effective level of the funds rate from 5.3% to 4.3%. Equities—especially in cyclical and interest-rate-sensitive sectors of the
market—responded favorably to the moves, along with the perceived pro-business stance of the incoming administration and steady growth in
economic conditions during the reporting period. The year ended December 31, 2024 saw a repeat of the major equity market themes that
have persisted since the end of the global financial crisis (2007-2009), with growth outperforming value, large cap outperforming small cap, and
US securities outperforming non-US securities.
■
The Portfolio significantly outperformed its benchmark, the Russell 1000 Value Index (the Index), over the reporting period. Security selection
within information technology (especially semiconductors and semiconductor equipment and hardware, storage, and peripherals), health care
(led by pharmaceuticals), communication services (primarily positions in interactive media and services), energy (oil and gas), and financials
(banks) were the main contributors to the Portfolio’s solid absolute performance and its relative outperformance of the Index during the
reporting period.
■
Conversely, the Portfolio’s security selection within real estate (primarily health care-related real estate investment trusts) and consumer
discretionary (led by hotels, restaurants and leisure, and automobile components), along with an overweight to energy relative to its benchmark,
detracted the most from relative results during the reporting period.
HOW HAS THE PORTFOLIO PERFORMED OVER THE PAST 10 YEARS?
The Portfolio's past performance is not a good predictor of the Portfolio's future performance.
The returns do not reflect the deduction
of applicable taxes, if any, that a shareholder would pay on Portfolio distributions or redemption of Portfolio shares.
The line graph reflects a hypothetical $10,000 investment in Class II shares and assumes that all recurring fees (including management fees)
were deducted and dividends and distributions were reinvested. Without waiver of fees and/or expense reimbursements, if any, the returns would
have been lower. The returns shown in the chart and table do not include Contract charges. If Contract charges were included, the returns shown
would have been lower than those shown. Consult your Contract prospectus for information about Contract charges. Performance for other share
classes will vary.
Cumulative Performance: December 31, 2014 to December 31, 2024 Initial Investment of $10,000 |
Average Annual Total Returns as of December 31, 2024 |
| | | |
| | | |
| | | |
| | | |
WHAT
ARE
SOME KEY PORTFOLIO STATISTICS AS OF 12/31/2024?
| |
Number of portfolio holdings | |
Total advisory fees paid for the year | |
Portfolio turnover rate for the year | |
WHAT ARE SOME CHARACTERISTICS OF THE PORTFOLIO’S HOLDINGS AS OF 12/31/2024?
| |
| |
Oil, Gas & Consumable Fuels | |
Affiliated Mutual Fund - Short-Term Investment (5.6% represents investments purchased with collateral from securities on loan) | |
| |
| |
| |
| |
| |
| |
Consumer Staples Distribution & Retail | |
| |
| |
Interactive Media & Services | |
Technology Hardware, Storage & Peripherals | |
| |
Semiconductors & Semiconductor Equipment | |
| |
| |
| |
| |
| |
| |
Hotels, Restaurants & Leisure | |
| |
| |
| |
| |
| |
Health Care Equipment & Supplies | |
| |
| |
| |
Health Care Providers & Services | |
| |
| |
| |
Liabilities in excess of other assets | |
| |
You can find additional information at
www.prudential.com/variableinsuranceportfolios
, including the Portfolio’s prospectus, financial
information, portfolio holdings, and proxy voting information. You can also request this information by contacting us at (800) 346-3778.
The Prudential Series Fund
PSF PGIM Jennison Value Portfolio
ANNUAL SHAREHOLDER REPORT – DECEMBER 31, 2024
This annual shareholder report contains important information about the Class III shares of PSF PGIM Jennison Value Portfolio (the “Portfolio”)
for the period of January 1, 2024 to December 31, 2024.
You can find additional information about the Portfolio at
www.prudential.com/variableinsuranceportfolios
. You can also request this
information by contacting us at (800) 346-3778.
WHAT WERE THE PORTFOLIO COSTS FOR THE LAST YEAR?
(Based on a hypothetical $10,000 investment)
| Costs of a $10,000 investment | Costs paid as a percentage of a $10,000 investment |
PSF PGIM Jennison Value Portfolio—Class III | | |
The table does not include charges charged under your variable annuity contract or variable life insurance policies (each, a Contract). Because Contract charges are not included, the
total fees and expenses that you will incur will be higher than the fees and expenses set forth in the table. See your Contract prospectus for more information about Contract charges.
WHAT AFFECTED THE PORTFOLIO’S PERFORMANCE DURING THE REPORTING PERIOD?
■
Equity market prices increased over the reporting period, ending the year at near-record levels, as investors reacted positively to the slowing
pace of inflation and sustained economic growth. The US Federal Reserve lowered the federal funds rate at each of its last three meetings in
2024, reducing the effective level of the funds rate from 5.3% to 4.3%. Equities—especially in cyclical and interest-rate-sensitive sectors of the
market—responded favorably to the moves, along with the perceived pro-business stance of the incoming administration and steady growth in
economic conditions during the reporting period. The year ended December 31, 2024 saw a repeat of the major equity market themes that
have persisted since the end of the global financial crisis (2007-2009), with growth outperforming value, large cap outperforming small cap, and
US securities outperforming non-US securities.
■
The Portfolio significantly outperformed its benchmark, the Russell 1000 Value Index (the Index), over the reporting period. Security selection
within information technology (especially semiconductors and semiconductor equipment and hardware, storage, and peripherals), health care
(led by pharmaceuticals), communication services (primarily positions in interactive media and services), energy (oil and gas), and financials
(banks) were the main contributors to the Portfolio’s solid absolute performance and its relative outperformance of the Index during the
reporting period.
■
Conversely, the Portfolio’s security selection within real estate (primarily health care-related real estate investment trusts) and consumer
discretionary (led by hotels, restaurants and leisure, and automobile components), along with an overweight to energy relative to its benchmark,
detracted the most from relative results during the reporting period.
HOW HAS THE PORTFOLIO PERFORMED SINCE INCEPTION?
The Portfolio's past performance is not a good predictor of the Portfolio's future performance.
The returns do not reflect the deduction
of applicable taxes, if any, that a shareholder would pay on Portfolio distributions or redemption of Portfolio shares.
The line graph reflects a hypothetical $10,000 investment in Class III shares and assumes that all recurring fees (including management fees)
were deducted and dividends and distributions were reinvested. Without waiver of fees and/or expense reimbursements, if any, the returns would
have been lower. The returns shown in the chart and table do not include Contract charges. If Contract charges were included, the returns shown
would have been lower than those shown. Consult your Contract prospectus for information about Contract charges. Performance for other share
classes will vary.
Cumulative Performance: April 26, 2021 to December 31, 2024 Initial Investment of $10,000 |
Average Annual Total Returns as of December 31, 2024 |
| | |
| | |
| | |
| | |
Portfolio Inception: 04/26/2021.
Since Inception returns are provided because the Portfolio has less than 10 fiscal years of returns. Since Inception returns for the Indexes are
measured from the closest month-end to the Portfolio’s inception date.
WHAT ARE SOME KEY PORTFOLIO STATISTICS AS OF 12/31/2024?
| |
Number of portfolio holdings | |
Total advisory fees paid for the year | |
Portfolio turnover rate for the year | |
WHAT ARE SOME CHARACTERISTICS OF THE PORTFOLIO’S HOLDINGS AS OF 12/31/2024?
| |
| |
Oil, Gas & Consumable Fuels | |
Affiliated Mutual Fund - Short-Term Investment (5.6% represents investments purchased with collateral from securities on loan) | |
| |
| |
| |
| |
| |
| |
Consumer Staples Distribution & Retail | |
| |
| |
Interactive Media & Services | |
Technology Hardware, Storage & Peripherals | |
| |
Semiconductors & Semiconductor Equipment | |
| |
| |
| |
| |
| |
| |
Hotels, Restaurants & Leisure | |
| |
| |
| |
| |
| |
Health Care Equipment & Supplies | |
| |
| |
| |
Health Care Providers & Services | |
| |
| |
| |
Liabilities in excess of other assets | |
| |
You can find additional information at
www.prudential.com/variableinsuranceportfolios
, including the Portfolio’s prospectus, financial
information, portfolio holdings, and proxy voting information. You can also request this information by contacting us at (800) 346-3778.
The Prudential Series Fund
PSF PGIM Total Return Bond Portfolio
ANNUAL SHAREHOLDER REPORT – DECEMBER 31, 2024
This annual shareholder report contains important information about the Class I shares of PSF PGIM Total Return Bond Portfolio (the “Portfolio”)
for the period of January 1, 2024 to December 31, 2024.
You can find additional information about the Portfolio at
www.prudential.com/variableinsuranceportfolios
. You can also request this
information by contacting us at (800) 346-3778.
This report describes changes to the Portfolio that occurred during the reporting period.
WHAT WERE THE PORTFOLIO COSTS FOR THE LAST YEAR?
(Based on a hypothetical $10,000 investment)
| Costs of a $10,000 investment | Costs paid as a percentage of a $10,000 investment |
PSF PGIM Total Return Bond Portfolio—Class I | | |
The table does not include charges charged under your variable annuity contract or variable life insurance policies (each, a Contract). Because Contract charges are not included, the
total fees and expenses that you will incur will be higher than the fees and expenses set forth in the table. See your Contract prospectus for more information about Contract charges.
WHAT AFFECTED THE PORTFOLIO’S PERFORMANCE DURING THE REPORTING PERIOD?
■
During the reporting period, market expectations for both the timing and number of interest rate cuts fluctuated significantly as inflation slowed
and employment data showed some signs of softening. The US Federal Reserve's easing cycle began in September of 2024 with a 50-basis
points (bps) (one basis point equals 0.01%) rate cut followed by two separate 25-bps cuts. These rate cuts came after a re-steepening of the
US Treasury curve and greater market volatility due to election and fiscal uncertainty. As demand for yield remained robust, credit spreads
largely tightened and performance across fixed income sectors was positive.
■
Security selection and sector allocation were the main drivers of the Portfolio’s outperformance versus the Bloomberg US Aggregate Bond
Index during the reporting period. Overweight allocations to, and security selection in, the collateralized loan obligations AAA rated, non-agency
collateralized mortgage-backed securities (CMBS) AAA rated, US investment grade corporate bond, and non-agency CMBS AA-and-below
sectors contributed the most to performance. Security selection in US high yield bonds and an overweight allocation to emerging markets high
yield bonds also contributed significantly to performance.
■
Duration (duration measures the sensitivity of the price—the value of principal—of a bond to a change in interest rates) and yield curve
positioning (a yield curve is a line graph that illustrates the relationship between the yields and maturities of fixed income securities and is
created by plotting the yields of different maturities for the same type of bonds) detracted from the Portfolio’s performance during the reporting
period. Selection in US Treasuries also detracted from performance.
■
During the reporting period, the Portfolio used total return and interest rate swaps to help manage duration and yield curve exposure. In
aggregate, the use of these swaps had a negative impact on performance. In addition, the Portfolio used futures to manage interest rate risk,
which we believe is a more efficient way of managing interest rate risk than through the purchase and sale of bonds. The use of futures had a
negative impact on performance. The Portfolio also used credit derivatives in the form of the Credit Default Swap Index to manage credit risk,
which detracted from performance.
HOW HAS THE PORTFOLIO PERFORMED OVER THE PAST 10 YEARS?
The Portfolio's past performance is not a good predictor of the Portfolio's future performance.
The returns do not reflect the deduction
of applicable taxes, if any, that a shareholder would pay on Portfolio distributions or redemption of Portfolio shares.
The line graph reflects a hypothetical $10,000 investment in Class I shares and assumes that all recurring fees (including management fees) were
deducted and dividends and distributions were reinvested. Without waiver of fees and/or expense reimbursements, if any, the returns would have
been lower. The returns shown in the chart and table do not include Contract charges. If Contract charges were included, the returns shown would
have been lower than those shown. Consult your Contract prospectus for information about Contract charges. Performance for other share
classes will vary.
Cumulative Performance: December 31, 2014 to December 31, 2024 Initial Investment of $10,000 |
Average Annual Total Returns as of December 31, 2024 |
| | | |
| Portfolio | | | |
| Bloomberg US Aggregate Bond Index | | | |
WHAT ARE SOME KEY PORTFOLIO STATISTICS AS OF 12/31/2024?
| |
Number of portfolio holdings | |
Total advisory fees paid for the year | |
Portfolio turnover rate for the year | |
WHAT ARE SOME CHARACTERISTICS OF THE PORTFOLIO’S HOLDINGS AS OF 12/31/2024?
Credit quality ratings shown above reflect the middle rating assigned by a nationally recognized statistical rating organization (NRSRO) such as Moody’s Investor Service, Inc.
(Moody’s), S&P Global Ratings (S&P), or Fitch, Inc. (Fitch) if ratings differ. Where applicable, ratings are converted to the comparable S&P/Fitch rating category to illustrate credit
rating breakdowns. These NRSROs are independent and are widely used. The Not Rated (NR) category consists of securities that have not been rated by a NRSRO. Unrated
investments do not necessarily
indicate low credit quality. The ratings category may include derivative
instruments
that could have a negative value. Credit quality ratings are subject
to change.
WERE THERE ANY SIGNIFICANT CHANGES TO THE PORTFOLIO THIS YEAR?
The following is a summary of certain changes to the Portfolio since January 1, 2024.
■
On November 20, 2024, the Board of Trustees of The Prudential Series Fund (the “Trust”) approved the reorganization (the “Reorganization”)
of PSF PGIM Government Income Portfolio (the “Target Portfolio”) into the PSF PGIM Total Return Bond Portfolio (the “Acquiring Portfolio”),
each a series of the Trust. The Reorganization is subject to approval by the shareholders of the Target Portfolio. A special meeting of the
Target Portfolio’s shareholders to vote on the proposed Reorganization
will
be held on or about March 25, 2025. If approved by shareholders of
the Target Portfolio, it is expected that the Reorganization will be completed on or about April 28, 2025.
For more complete information, you should review the Portfolio’s current prospectus and any applicable supplements and the Portfolio’s next
prospectus, which we expect to be available by May 1, 2025 at
www.prudential.com/variableinsuranceportfolios
or by request at
(800) 346-3778.
You can find additional information at
www.prudential.com/variableinsuranceportfolios
, including the Portfolio’s prospectus, financial
information, portfolio holdings, and proxy voting information. You can also request this information by contacting us at (800) 346-3778.
The Prudential Series Fund
PSF PGIM Total Return Bond Portfolio
ANNUAL SHAREHOLDER REPORT – DECEMBER 31, 2024
This annual shareholder report contains important information about the Class III shares of PSF PGIM Total Return Bond Portfolio (the “Portfolio”)
for the period of January 1, 2024 to December 31, 2024.
You can find additional information about the Portfolio at
www.prudential.com/variableinsuranceportfolios
. You can also request this
information by contacting us at (800) 346-3778.
This report describes changes to the Portfolio that occurred during the reporting period.
WHAT WERE THE PORTFOLIO COSTS FOR THE LAST YEAR?
(Based on a hypothetical $10,000 investment)
| Costs of a $10,000 investment | Costs paid as a percentage of a $10,000 investment |
PSF PGIM Total Return Bond Portfolio—Class III | | |
The table does not include charges charged under your variable annuity contract or variable life insurance policies (each, a Contract). Because Contract charges are not included, the
total fees and expenses that you will incur will be higher than the fees and expenses set forth in the table. See your Contract prospectus for more information about Contract charges.
WHAT AFFECTED THE PORTFOLIO’S PERFORMANCE DURING THE REPORTING PERIOD?
■
During the reporting period, market expectations for both the timing and number of interest rate cuts fluctuated significantly as inflation slowed
and employment data showed some signs of softening. The US Federal Reserve's easing cycle began in September of 2024 with a 50-basis
points (bps) (one basis point equals 0.01%) rate cut followed by two separate 25-bps cuts. These rate cuts came after a re-steepening of the
US Treasury curve and greater market volatility due to election and fiscal uncertainty. As demand for yield remained robust, credit spreads
largely tightened and performance across fixed income sectors was positive.
■
Security selection and sector allocation were the main drivers of the Portfolio’s outperformance versus the Bloomberg US Aggregate Bond
Index during the reporting period. Overweight allocations to, and security selection in, the collateralized loan obligations AAA rated, non-agency
collateralized mortgage-backed securities (CMBS) AAA rated, US investment grade corporate bond, and non-agency CMBS AA-and-below
sectors contributed the most to performance. Security selection in US high yield bonds and an overweight allocation to emerging markets high
yield bonds also contributed significantly to performance.
■
Duration (duration measures the sensitivity of the price—the value of principal—of a bond to a change in interest rates) and yield curve
positioning (a yield curve is a line graph that illustrates the relationship between the yields and maturities of fixed income securities and is
created by plotting the yields of different maturities for the same type of bonds) detracted from the Portfolio’s performance during the reporting
period. Selection in US Treasuries also detracted from performance.
■
During the reporting period, the Portfolio used total return and interest rate swaps to help manage duration and yield curve exposure. In
aggregate, the use of these swaps had a negative impact on performance. In addition, the Portfolio used futures to manage interest rate risk,
which we believe is a more efficient way of managing interest rate risk than through the purchase and sale of bonds. The use of futures had a
negative impact on performance. The Portfolio also used credit derivatives in the form of the Credit Default Swap Index to manage credit risk,
which detracted from performance.
HOW HAS THE PORTFOLIO PERFORMED SINCE INCEPTION?
The Portfolio's past performance is not a good predictor of the Portfolio's future performance.
The returns do not reflect the deduction
of applicable taxes, if any, that a shareholder would pay on Portfolio distributions or redemption of Portfolio shares.
The line graph reflects a hypothetical $10,000 investment in Class III shares and assumes that all recurring fees (including management fees)
were deducted and dividends and distributions were reinvested. Without waiver of fees and/or expense reimbursements, if any, the returns would
have been lower. The returns shown in the chart and table do not include Contract charges. If Contract charges were included, the returns shown
would have been lower than those shown. Consult your Contract prospectus for information about Contract charges. Performance for other share
classes will vary.
Cumulative Performance: April 26, 2021 to December 31, 2024 Initial Investment of $10,000 |
Average Annual Total Returns as of December 31, 2024 |
| | |
| Portfolio | | |
| Bloomberg US Aggregate Bond Index | | |
Portfolio Inception: 04/26/2021.
Since Inception returns are provided because the Portfolio has less than 10 fiscal years of returns. Since Inception returns for the Indexes are
measured from the closest month-end to the Portfolio’s inception date.
WHAT ARE SOME KEY PORTFOLIO STATISTICS AS OF 12/31/2024?
| |
Number of portfolio holdings | |
Total advisory fees paid for the year | |
Portfolio turnover rate for the year | |
WHAT ARE SOME CHARACTERISTICS OF THE PORTFOLIO’S HOLDINGS AS OF 12/31/2024?
Credit quality ratings shown above reflect the middle rating assigned by a nationally recognized statistical rating organization (NRSRO) such as Moody’s Investor Service, Inc.
(Moody’s), S&P Global Ratings (S&P), or Fitch, Inc. (Fitch) if ratings differ. Where applicable, ratings are converted to the comparable S&P/Fitch rating category to illustrate credit
rating breakdowns. These NRSROs are independent and are widely used. The Not Rated (NR) category consists of securities that have not been rated by a NRSRO. Unrated
investments do not necessarily indicate low credit quality. The ratings category may include derivative instruments that could have a negative value. Credit quality ratings are subject
to change.
WERE THERE ANY SIGNIFICANT CHANGES TO THE PORTFOLIO THIS YEAR?
The following is a summary of certain changes to the Portfolio since January 1, 2024.
■
On November 20, 2024, the Board of Trustees of The Prudential Series Fund (the “Trust”) approved the reorganization (the “Reorganization”)
of PSF PGIM Government Income Portfolio (the “Target Portfolio”) into the PSF PGIM Total Return Bond Portfolio (the “Acquiring Portfolio”),
each a series of the Trust. The Reorganization is subject to approval by the shareholders of the Target Portfolio. A special meeting of the
Target Portfolio’s shareholders to vote on the proposed Reorganization will be held on or about March 25, 2025. If approved by shareholders of
the Target Portfolio, it is expected that the Reorganization will be completed on or about April 28, 2025.
For more complete information, you should review the Portfolio’s current prospectus and any applicable supplements and the Portfolio’s next
prospectus, which we expect to be available by May 1, 2025 at
www.prudential.com/variableinsuranceportfolios
or by request at
(800) 346-3778.
You can find additional information at
www.prudential.com/variableinsuranceportfolios
, including the Portfolio’s prospectus, financial
information, portfolio holdings, and proxy voting information. You can also request this information by contacting us at (800) 346-3778.
The Prudential Series Fund
PSF Small-Cap Stock Index Portfolio
ANNUAL SHAREHOLDER REPORT – DECEMBER 31, 2024
This annual shareholder report contains important information about the Class I shares of PSF Small-Cap Stock Index Portfolio (the “Portfolio”)
for the period of January 1, 2024 to December 31, 2024.
You can find additional information about the Portfolio at
www.prudential.com/variableinsuranceportfolios
. You can also request this
information by contacting us at (800) 346-3778.
WHAT WERE THE PORTFOLIO COSTS FOR THE LAST YEAR?
(Based on a hypothetical $10,000 investment)
| Costs of a $10,000 investment | Costs paid as a percentage of a $10,000 investment |
PSF Small-Cap Stock Index Portfolio—Class I | | |
The table does not include charges charged under your variable annuity contract or variable life insurance policies (each, a Contract). Because Contract charges are not included, the
total fees and expenses that you will incur will be higher than the fees and expenses set forth in the table. See your Contract prospectus for more information about Contract charges.
WHAT AFFECTED THE PORTFOLIO’S PERFORMANCE DURING THE REPORTING PERIOD?
■
The reporting period started off strong for domestic equity markets. Anticipation of US Federal Reserve (Fed) interest rate cuts, slowing
inflation, and the excitement of artificial intelligence resulted in strong returns in the first quarter of 2024, especially for large-cap stocks.
■
The second quarter of the reporting period started off weak due to renewed inflation concerns and tensions in the Middle East. Performance
for mega-cap stocks rebounded as Fed Chair Powell eased concerns about further interest rate tightening. Interest rates held steady during the
second quarter, and the market reduced its expectations for further interest rate cuts in 2024. Large-cap stocks finished higher than small-cap
stocks during the second quarter, as smaller companies were more affected by the reduced outlook for interest rate cuts.
■
Fed policy again dominated headlines and acted as the main catalyst for equity returns in the third quarter of the reporting period. The Fed
lowered interest rates by 50 basis points (bps), matching investor expectations. While all segments of the domestic equity market responded
positively, smaller companies were the standout.
■
Equity performance was mixed in the final quarter of 2024. Equities experienced a post-election bump early in the quarter, but hawkish
comments from the Fed led to a domestic equity market pullback ending with small gains in the large-cap segment. Small caps were slightly
negative. For the year ended December 31, 2024, the S&P 500 Index returned 25.02% while the S&P 600 Index was up 8.70%.
■
The Portfolio used stock index futures to equitize cash and enhance portfolio liquidity, which had a negligible effect on performance.
HOW HAS THE PORTFOLIO PERFORMED OVER THE PAST 10 YEARS?
The Portfolio's past performance is not a good predictor of the Portfolio's future performance.
The returns do not reflect the deduction
of applicable taxes, if any, that a shareholder would pay on Portfolio distributions or redemption of Portfolio shares.
The line graph reflects a hypothetical $10,000 investment in Class I shares and assumes that all recurring fees (including management fees) were
deducted and dividends and distributions were reinvested. Without waiver of fees and/or expense reimbursements, if any, the returns would have
been lower. The returns shown in the chart and table do not include Contract charges. If Contract charges were included, the returns shown would
have been lower than those shown. Consult your Contract prospectus for information about Contract charges. Performance for other share
classes will vary.
Cumulative Performance: December 31, 2014 to December 31, 2024 Initial Investment of $10,000 |
Average Annual Total Returns as of December 31, 2024 |
| | | |
| Portfolio | | | |
| | | |
| S&P SmallCap 600 Index | | | |
*The Portfolio has added this broad-based index in response to new regulatory requirements.
WHAT ARE SOME KEY PORTFOLIO STATISTICS AS OF 12/31/2024?
| |
Number of portfolio holdings | |
Total advisory fees paid for the year | |
Portfolio turnover rate for the year | |
WHAT ARE SOME CHARACTERISTICS OF THE PORTFOLIO’S HOLDINGS AS OF 12/31/2024?
| |
Affiliated Mutual Fund - Short-Term Investment (23.2% represents investments purchased with collateral from securities on loan) | |
| |
| |
| |
| |
Health Care Equipment & Supplies | |
Electronic Equipment, Instruments & Components | |
Semiconductors & Semiconductor Equipment | |
| |
| |
Health Care Providers & Services | |
| |
Oil, Gas & Consumable Fuels | |
| |
| |
Commercial Services & Supplies | |
| |
Hotels, Restaurants & Leisure | |
Energy Equipment & Services | |
| |
| |
| |
Textiles, Apparel & Luxury Goods | |
| |
| |
Construction & Engineering | |
| |
Trading Companies & Distributors | |
Diversified Consumer Services | |
| |
| |
| |
| |
Interactive Media & Services | |
Mortgage Real Estate Investment Trusts (REITs) | |
| |
| |
| |
| |
| |
| |
| |
| |
Unaffiliated Exchange-Traded Funds | |
| |
Diversified Telecommunication Services | |
Consumer Staples Distribution & Retail | |
| |
| |
Real Estate Management & Development | |
| |
| |
| |
| |
| |
| |
| |
Life Sciences Tools & Services | |
| |
| |
Liabilities in excess of other assets | |
| |
* Consists of Industries that each make up less than 0.5% of the Fund's net assets
You can find additional information at
www.prudential.com/variableinsuranceportfolios
, including the Portfolio’s prospectus, financial
information, portfolio holdings, and proxy voting information. You can also request this information by contacting us at (800) 346-3778.
The Prudential Series Fund
PSF Small-Cap Stock Index Portfolio
ANNUAL SHAREHOLDER REPORT – DECEMBER 31, 2024
This annual shareholder report contains important information about the Class III shares of PSF Small-Cap Stock Index Portfolio (the “Portfolio”)
for the period of January 1, 2024 to December 31, 2024.
You can find additional information about the Portfolio at
www.prudential.com/variableinsuranceportfolios
. You can also request this
information by contacting us at (800) 346-3778.
WHAT WERE THE PORTFOLIO COSTS FOR THE LAST YEAR?
(Based on a hypothetical $10,000 investment)
| Costs of a $10,000 investment | Costs paid as a percentage of a $10,000 investment |
PSF Small-Cap Stock Index Portfolio—Class III | | |
The table does not include charges charged under your variable annuity contract or variable life insurance policies (each, a Contract). Because Contract charges are not included, the
total fees and expenses that you will incur will be higher than the fees and expenses set forth in the table. See your Contract prospectus for more information about Contract charges.
WHAT AFFECTED THE PORTFOLIO’S PERFORMANCE DURING THE REPORTING PERIOD?
■
The reporting period started off strong for domestic equity markets. Anticipation of US Federal Reserve (Fed) interest rate cuts, slowing
inflation, and the excitement of artificial intelligence resulted in strong returns in the first quarter of 2024, especially for large-cap stocks.
■
The second quarter of the reporting period started off weak due to renewed inflation concerns and tensions in the Middle East. Performance
for mega-cap stocks rebounded as Fed Chair Powell eased concerns about further interest rate tightening. Interest rates held steady during the
second quarter, and the market reduced its expectations for further interest rate cuts in 2024. Large-cap stocks finished higher than small-cap
stocks during the second quarter, as smaller companies were more affected by the reduced outlook for interest rate cuts.
■
Fed policy again dominated headlines and acted as the main catalyst for equity returns in the third quarter of the reporting period. The Fed
lowered interest rates by 50 basis points (bps), matching investor expectations. While all segments of the domestic equity market responded
positively, smaller companies were the standout.
■
Equity performance was mixed in the final quarter of 2024. Equities experienced a post-election bump early in the quarter, but hawkish
comments from the Fed led to a domestic equity market pullback ending with small gains in the large-cap segment. Small caps were slightly
negative. For the year ended December 31, 2024, the S&P 500 Index returned 25.02% while the S&P 600 Index was up 8.70%.
■
The Portfolio used stock index futures to equitize cash and enhance portfolio liquidity, which had a negligible effect on performance.
HOW HAS THE PORTFOLIO PERFORMED SINCE INCEPTION?
The Portfolio's past performance is not a good predictor of the Portfolio's future performance.
The returns do not reflect the deduction
of applicable taxes, if any, that a shareholder would pay on Portfolio distributions or redemption of Portfolio shares.
The line graph reflects a hypothetical $10,000 investment in Class III shares and assumes that all recurring fees (including management fees)
were deducted and dividends and distributions were reinvested. Without waiver of fees and/or expense reimbursements, if any, the returns would
have been lower. The returns shown in the chart and table do not include Contract charges. If Contract charges were included, the returns shown
would have been lower than those shown. Consult your Contract prospectus for information about Contract charges. Performance for other share
classes will vary.
Cumulative Performance: April 26, 2021 to December 31, 2024 Initial Investment of $10,000 |
Average Annual Total Returns as of December 31, 2024 |
| | |
| Portfolio | | |
| | |
| S&P SmallCap 600 Index | | |
Portfolio Inception: 04/26/2021.
Since Inception returns are provided because the Portfolio has less than 10 fiscal years of returns. Since Inception returns for the Indexes are
measured from the closest month-end to the Portfolio’s inception date.
*The Portfolio has added this broad-based index in response to new regulatory requirements.
WHAT ARE SOME KEY PORTFOLIO STATISTICS AS OF 12/31/2024?
| |
Number of portfolio holdings | |
Total advisory fees paid for the year | |
Portfolio turnover rate for the year | |
WHAT ARE SOME CHARACTERISTICS OF THE PORTFOLIO’S HOLDINGS AS OF 12/31/2024?
| |
Affiliated Mutual Fund - Short-Term Investment (23.2% represents investments purchased with collateral from securities on loan) | |
| |
| |
| |
| |
Health Care Equipment & Supplies | |
Electronic Equipment, Instruments & Components | |
Semiconductors & Semiconductor Equipment | |
| |
| |
Health Care Providers & Services | |
| |
Oil, Gas & Consumable Fuels | |
| |
| |
Commercial Services & Supplies | |
| |
Hotels, Restaurants & Leisure | |
Energy Equipment & Services | |
| |
| |
| |
Textiles, Apparel & Luxury Goods | |
| |
| |
Construction & Engineering | |
| |
Trading Companies & Distributors | |
Diversified Consumer Services | |
| |
| |
| |
| |
Interactive Media & Services | |
Mortgage Real Estate Investment Trusts (REITs) | |
| |
| |
| |
| |
| |
| |
| |
| |
Unaffiliated Exchange-Traded Funds | |
| |
Diversified Telecommunication Services | |
Consumer Staples Distribution & Retail | |
| |
| |
Real Estate Management & Development | |
| |
| |
| |
| |
| |
| |
| |
Life Sciences Tools & Services | |
| |
| |
Liabilities in excess of other assets | |
| |
* Consists of Industries that each make up less than 0.5% of the Fund's net assets
You can find additional information at
www.prudential.com/variableinsuranceportfolios
, including the Portfolio’s prospectus, financial
information, portfolio holdings, and proxy voting information. You can also request this information by contacting us at (800) 346-3778.
The Prudential Series Fund
PSF Stock Index Portfolio
ANNUAL SHAREHOLDER REPORT – DECEMBER 31, 2024
This annual shareholder report contains important information about the Class I shares of PSF Stock Index Portfolio (the “Portfolio”) for the period
of January 1, 2024 to December 31, 2024.
You can find additional information about the Portfolio at
www.prudential.com/variableinsuranceportfolios
. You can also request this
information by contacting us at (800) 346-3778.
This report describes changes to the Portfolio that occurred during the reporting period.
WHAT WERE THE PORTFOLIO COSTS FOR THE LAST YEAR?
(Based on a hypothetical $10,000 investment)
| Costs of a $10,000 investment | Costs paid as a percentage of a $10,000 investment |
PSF Stock Index Portfolio—Class I | | |
The table does not include charges charged under your variable annuity contract or variable life insurance policies (each, a Contract). Because Contract charges are not included, the
total fees and expenses that you will incur will be higher than the fees and expenses set forth in the table. See your Contract prospectus for more information about Contract charges.
WHAT AFFECTED THE PORTFOLIO’S PERFORMANCE DURING THE REPORTING PERIOD?
■
The reporting period started off strong for domestic equity markets. Anticipation of US Federal Reserve (Fed) interest rate cuts, slowing
inflation, and the excitement of artificial intelligence resulted in strong returns in the first quarter of 2024, especially for large-cap stocks.
■
The second quarter of the reporting period started off weak due to renewed inflation concerns and tensions in the Middle East. Performance
for mega-cap stocks rebounded as Fed Chair Powell eased concerns about further interest rate tightening. Interest rates held steady during the
second quarter, and the market reduced its expectations for further interest rate cuts in 2024. Large-cap stocks finished higher than small-cap
stocks during the second quarter, as smaller companies were more affected by the reduced outlook for interest rate cuts.
■
Fed policy again dominated headlines and acted as the main catalyst for equity returns in the third quarter of the reporting period. The Fed
lowered interest rates by 50 basis points (bps), matching investor expectations. While all segments of the domestic equity market responded
positively, smaller companies were the standout.
■
Equity performance was mixed in the final quarter of 2024. Equities experienced a post-election bump early in the quarter, but hawkish
comments from the Fed led to a domestic equity market pullback ending with small gains in the large-cap segment. Small caps were slightly
negative. For the year ended December 31, 2024, the S&P 500 Index returned 25.02% while the S&P 600 Index was up 8.70%.
■
The Portfolio used stock index futures to equitize cash and enhance portfolio liquidity, which had a negligible effect on performance.
HOW HAS THE PORTFOLIO PERFORMED OVER THE PAST 10 YEARS?
The Portfolio's past performance is not a good predictor of the Portfolio's future performance.
The returns do not reflect the deduction
of applicable taxes, if any, that a shareholder would pay on Portfolio distributions or redemption of Portfolio shares.
The line graph reflects a hypothetical $10,000 investment in Class I shares and assumes that all recurring fees (including management fees) were
deducted and dividends and distributions were reinvested. Without waiver of fees and/or expense reimbursements, if any, the returns would have
been lower. The returns shown in the chart and table do not include Contract charges. If Contract charges were included, the returns shown would
have been lower than those shown. Consult your Contract prospectus for information about Contract charges. Performance for other share
classes will vary.
Cumulative Performance: December 31, 2014 to December 31, 2024 Initial Investment of $10,000 |
Average Annual Total Returns as of December 31, 2024 |
| | | |
| Portfolio | | | |
| S&P 500 Index | | | |
WHAT ARE SOME KEY PORTFOLIO STATISTICS AS OF 12/31/2024?
| |
Number of portfolio holdings | |
Total advisory fees paid for the year | |
Portfolio turnover rate for the year | |
WHAT ARE SOME CHARACTERISTICS OF THE PORTFOLIO’S HOLDINGS AS OF 12/31/2024?
| |
Semiconductors & Semiconductor Equipment | |
| |
Technology Hardware, Storage & Peripherals | |
Interactive Media & Services | |
Affiliated Mutual Fund - Short-Term Investment (3.8% represents investments purchased with collateral from securities on loan) | |
| |
| |
| |
| |
| |
Oil, Gas & Consumable Fuels | |
| |
Health Care Equipment & Supplies | |
| |
Health Care Providers & Services | |
Consumer Staples Distribution & Retail | |
Hotels, Restaurants & Leisure | |
| |
| |
| |
| |
Unaffiliated Exchange-Traded Funds | |
| |
| |
| |
| |
| |
| |
| |
Life Sciences Tools & Services | |
| |
| |
| |
| |
Diversified Telecommunication Services | |
| |
| |
| |
| |
Electronic Equipment, Instruments & Components | |
| |
Commercial Services & Supplies | |
| |
| |
| |
| |
Liabilities in excess of other assets | |
| |
* Consists of Industries that each make up less than 0.5% of the Fund's net assets
WERE THERE ANY SIGNIFICANT CHANGES TO THE PORTFOLIO THIS YEAR?
The following is a summary of certain changes to the Portfolio since January 1, 2024.
■
Effective July 1, 2024, the Manager has agreed to voluntarily waive 0.03% of its investment management fee.
For more complete information, you should review the Portfolio’s current prospectus and any applicable supplements and the Portfolio’s next
prospectus, which we expect to be available by May 1, 2025 at
www.prudential.com/variableinsuranceportfolios
or by request at
(800) 346-3778.
You can find additional information at
www.prudential.com/variableinsuranceportfolios
, including the Portfolio’s prospectus, financial
information, portfolio holdings, and proxy voting information. You can also request this information by contacting us at (800) 346-3778.
The Prudential Series Fund
PSF Stock Index Portfolio
ANNUAL SHAREHOLDER REPORT – DECEMBER 31, 2024
This annual shareholder report contains important information about the Class III shares of PSF Stock Index Portfolio (the “Portfolio”) for the
period of January 1, 2024 to December 31, 2024.
You can find additional information about the Portfolio at
www.prudential.com/variableinsuranceportfolios
. You can also request this
information by contacting us at (800) 346-3778.
This report describes changes to the Portfolio that occurred during the reporting period.
WHAT WERE THE PORTFOLIO COSTS FOR THE LAST YEAR?
(Based on a hypothetical $10,000 investment)
| Costs of a $10,000 investment | Costs paid as a percentage of a $10,000 investment |
PSF Stock Index Portfolio—Class III | | |
The table does not include charges charged under your variable annuity contract or variable life insurance policies (each, a Contract). Because Contract charges are not included, the
total fees and expenses that you will incur will be higher than the fees and expenses set forth in the table. See your Contract prospectus for more information about Contract charges.
WHAT
AFFECTED
THE PORTFOLIO’S PERFORMANCE DURING THE REPORTING PERIOD?
■
The reporting period started off strong for domestic equity markets. Anticipation of US Federal Reserve (Fed) interest rate cuts, slowing
inflation, and the excitement of artificial intelligence resulted in strong returns in the first quarter of 2024, especially for large-cap stocks.
■
The second quarter of the reporting period started off weak due to renewed inflation concerns and tensions in the Middle East. Performance
for mega-cap stocks rebounded as Fed Chair Powell eased concerns about further interest rate tightening. Interest rates held steady during the
second quarter, and the market reduced its expectations for further interest rate cuts in 2024. Large-cap stocks finished higher than small-cap
stocks during the second quarter, as smaller companies were more affected by the reduced outlook for interest rate cuts.
■
Fed policy again dominated headlines and acted as the main catalyst for equity returns in the third quarter of the reporting period. The Fed
lowered interest rates by 50 basis points (bps), matching investor expectations. While all segments of the domestic equity market responded
positively, smaller companies were the standout.
■
Equity performance was mixed in the final quarter of 2024. Equities experienced a post-election bump early in the quarter, but hawkish
comments from the Fed led to a domestic equity market pullback ending with small gains in the large-cap segment. Small caps were slightly
negative. For the year ended December 31, 2024, the S&P 500 Index returned 25.02% while the S&P 600 Index was up 8.70%.
■
The Portfolio used stock index futures to equitize cash and enhance portfolio liquidity, which had a negligible effect on performance.
HOW HAS THE PORTFOLIO PERFORMED SINCE INCEPTION?
The Portfolio's past performance is not a good predictor of the Portfolio's future performance.
The returns do not reflect the deduction
of applicable taxes, if any, that a shareholder would pay on Portfolio distributions or redemption of Portfolio shares.
The line graph reflects a hypothetical $10,000 investment in Class III shares and assumes that all recurring fees (including management fees)
were deducted and dividends and distributions were reinvested. Without waiver of fees and/or expense reimbursements, if any, the returns would
have been lower. The returns shown in the chart and table do not include Contract charges. If Contract charges were included, the returns shown
would have been lower than those shown. Consult your Contract prospectus for information about Contract charges. Performance for other share
classes will vary.
Cumulative Performance: April 26, 2021 to December 31, 2024 Initial Investment of $10,000 |
Average Annual Total Returns as of December 31, 2024 |
| | |
| | |
| | |
Portfolio Inception: 04/26/2021.
Since Inception returns are provided because the Portfolio has less than 10 fiscal years of returns. Since Inception returns for the Indexes are
measured from the closest month-end to the Portfolio’s inception date.
WHAT ARE SOME KEY PORTFOLIO STATISTICS AS OF 12/31/2024?
| |
Number of portfolio holdings | |
Total advisory fees paid for the year | |
Portfolio turnover rate for the year | |
WHAT ARE SOME CHARACTERISTICS OF THE PORTFOLIO’S HOLDINGS AS OF 12/31/2024?
| |
Semiconductors & Semiconductor Equipment | |
| |
Technology Hardware, Storage & Peripherals | |
Interactive Media & Services | |
Affiliated Mutual Fund - Short-Term Investment (3.8% represents investments purchased with collateral from securities on loan) | |
| |
| |
| |
| |
| |
Oil, Gas & Consumable Fuels | |
| |
Health Care Equipment & Supplies | |
| |
Health Care Providers & Services | |
Consumer Staples Distribution & Retail | |
Hotels, Restaurants & Leisure | |
| |
| |
| |
| |
Unaffiliated Exchange-Traded Funds | |
| |
| |
| |
| |
| |
| |
| |
Life Sciences Tools & Services | |
| |
| |
| |
| |
Diversified Telecommunication Services | |
| |
| |
| |
| |
Electronic Equipment, Instruments & Components | |
| |
Commercial Services & Supplies | |
| |
| |
| |
| |
Liabilities in excess of other assets | |
| |
* Consists of Industries that each make up less than 0.5% of the Fund's net assets
WERE THERE ANY SIGNIFICANT CHANGES TO THE PORTFOLIO THIS YEAR?
The following is a summary of certain changes to the Portfolio since January 1, 2024.
■
Effective July 1, 2024, the Manager has agreed to voluntarily waive 0.03% of its investment management fee.
For more complete information, you should review the Portfolio’s current prospectus and any applicable supplements and the Portfolio’s next
prospectus, which we expect to be available by May 1, 2025 at
www.prudential.com/variableinsuranceportfolios
or by request at
(800) 346-3778.
You can find additional information at
www.prudential.com/variableinsuranceportfolios
, including the Portfolio’s prospectus, financial
information, portfolio holdings, and proxy voting information. You can also request this information by contacting us at (800) 346-3778.
| | (b) | Copy of each notice transmitted to stockholders in reliance on Rule 30e-3 under the Act (17 CFR 270.30e-3) that contains disclosures specified by paragraph (c)(3) of that rule – Not applicable. |
Item 2 – Code of Ethics – See Exhibit (a)(1) of Item 19
As of the end of the period covered by this report, the registrant has adopted a code of ethics (the “Section 406 Standards for Investment Companies – Ethical Standards for Principal Executive and Financial Officers”) that applies to the registrant’s Principal Executive Officer, Principal Financial Officer and Principal Accounting Officer.
The registrant hereby undertakes to provide any person, without charge, upon request, a copy of the code of ethics. To request a copy of the code of ethics, contact the registrant 800-225-1852, and ask for a copy of the Section 406 Standards for Investment Companies - Ethical Standards for Principal Executive and Financial Officers.
Item 3 – Audit Committee Financial Expert –
The registrant’s Board has determined that Mr. Stephen Chipman, member of the Board’s Audit Committee is an “audit committee financial expert,” and that he is “independent,” for purposes of this item.
Item 4 – Principal Accountant Fees and Services –
For the fiscal years ended December 31, 2024 and December 31, 2023, PricewaterhouseCoopers LLP (“PwC”), the Registrant’s principal accountant, billed the Registrant $662,956 and $628,050, respectively, for professional services rendered for the audit of the Registrant’s annual financial statements or services that are normally provided in connection with statutory and regulatory filings.
For the fiscal years ended December 31, 2024 and December 31, 2023, fees of $0 and $12,833 were billed to the Registrant for services rendered by PwC in connection with matters relating to foreign reclaims attestation paid by Prudential Financial, Inc. and/or its affiliates.
For the fiscal years ended December 31, 2024 and December 31, 2023, fees of $0 and $43,000 were billed to the Registrant for the services rendered by PwC in connection with N-14 filings and merger support services.
For the fiscal years ended December 31, 2024 and December 31, 2023: none.
For the fiscal years ended December 31, 2024 and December 31, 2023: none.
| | (e) | (1) Audit Committee Pre-Approval Policies and Procedures |
THE PGIM MUTUAL FUNDS
AUDIT COMMITTEE POLICY
on
Pre-Approval of Services Provided by the Independent
Accountants
The Audit Committee of each PGIM Mutual Fund is charged with the responsibility to monitor the independence of the Fund’s independent accountants. As part of this responsibility, the Audit Committee must pre-approve the independent accounting firm’s engagement to render audit and/or permissible non-audit services, as required by law. In evaluating a proposed engagement of the independent accountants, the Audit Committee will assess the effect that the engagement might reasonably be expected to have on the accountant’s independence. The Committee’s evaluation will be based on:
| | • | | a review of the nature of the professional services expected to be provided, |
| | • | | a review of the safeguards put into place by the accounting firm to safeguard independence, and |
| | • | | periodic meetings with the accounting firm. |
Policy for Audit and Non-Audit Services Provided to the Funds
On an annual basis, the scope of audits for each Fund, audit fees and expenses, and audit-related and non-audit services (and fees proposed in respect thereof) proposed to be performed by the Fund’s independent accountants will be presented by the Treasurer and the independent accountants to the Audit Committee for review and, as appropriate, approval prior to the initiation of such services.
Such presentation shall be accompanied by confirmation by both the Treasurer and the independent accountants that the proposed non-audit services will not adversely affect the independence of the independent accountants. Such proposed non-audit services shall be described in sufficient detail to enable the Audit Committee to assess the appropriateness of such services and fees, and the compatibility of the provision of such services with the auditor’s independence. The Committee shall receive periodic reports on the progress of the audit and other services which are approved by the Committee or by the Committee Chair pursuant to authority delegated in this Policy.
The categories of services enumerated under “Audit Services”, “Audit-related Services”, and “Tax Services” are intended to provide guidance to the Treasurer and the independent accountants as to those categories of services which the Committee believes are generally consistent with the independence of the independent accountants and which the Committee (or the Committee Chair) would expect upon the presentation of specific proposals to pre-approve. The enumerated categories are not intended as an exclusive list of audit, audit-related or tax services, which the Committee (or the Committee Chair) would consider for pre-approval.
Audit Services
The following categories of audit services are considered to be consistent with the role of the Fund’s independent accountants:
| | • | | Annual Fund financial statement audits |
| | • | | Seed audits (related to new product filings, as required) |
| | • | | SEC and regulatory filings and consents |
Audit-related Services
The following categories of audit-related services are considered to be consistent with the role of the Fund’s independent accountants:
| | • | | Accounting consultations |
| | • | | Fund merger support services |
| | • | | Agreed Upon Procedure Reports |
| | • | | Other Internal Control Reports |
Individual audit-related services that fall within one of these categories (except for fund merger support services) and are not presented to the Audit Committee as part of the annual pre-approval process are subject to an authorized pre-approval by the Audit Committee so long as the estimated fee for those services does not exceed $30,000. Any services provided under such pre-approval will be reported to the Audit Committee at its next regular meeting. Should the amount of such services exceed $30,000 any additional fees will be subject to pre-approval by the Committee Chair (or any other Committee member on whom this responsibility has been delegated). Fees related to fund merger support services are subject to a separate authorized pre-approval by the Audit Committee with fees determined on a per occurrence and merger complexity basis.
Tax Services
The following categories of tax services are considered to be consistent with the role of the Fund’s independent accountants:
| | • | | Tax compliance services related to the filing or amendment of the following: |
| | • | | Federal, state and local income tax compliance; and, |
| | • | | Sales and use tax compliance |
| | • | | Timely RIC qualification reviews |
| | • | | Tax distribution analysis and planning |
| | • | | Tax authority examination services |
| | • | | Tax appeals support services |
| | • | | Accounting methods studies |
| | • | | Fund merger support services |
| | • | | Tax consulting services and related project |
Individual tax services that fall within one of these categories and are not presented to the Audit Committee as part of the annual pre-approval process are subject to an authorized pre-approval by the Audit Committee so long as the estimated fee for those services does not exceed $30,000. Any services provided under such pre-approval will be reported to the Audit Committee at its next regular meeting. Should the amount of such services exceed $30,000 any additional fees will be subject to pre-approval by the Committee Chair (or any other Committee member on whom this responsibility has been delegated).
Other Non-Audit Services
Certain non-audit services that the independent accountants are legally permitted to render will be subject to pre-approval by the Committee or by one or more Committee members to whom the Committee has delegated this authority and who will report to the full Committee any pre-approval decisions made pursuant to this Policy. Non-audit services presented for pre-approval pursuant to this paragraph will be accompanied by a confirmation from both the Treasurer and the independent accountants that the proposed services will not adversely affect the independence of the independent accountants.
Proscribed Services
The Fund’s independent accountants will not render services in the following categories of non-audit services:
| | • | | Bookkeeping or other services related to the accounting records or financial statements of the Fund |
| | • | | Financial information systems design and implementation |
| | • | | Appraisal or valuation services, fairness opinions, or contribution-in-kind reports |
| | • | | Internal audit outsourcing services |
| | • | | Management functions or human resources |
| | • | | Broker or dealer, investment adviser, or investment banking services |
| | • | | Legal services and expert services unrelated to the audit |
| | • | | Any other service that the Public Company Accounting Oversight Board determines, by regulation, is impermissible. |
Pre-approval of Non-Audit Services Provided to Other Entities Within the PGIM Fund Complex
Certain non-audit services provided to PGIM Investments LLC or any of its affiliates that also provide ongoing services to the PGIM Mutual Funds will be subject to pre-approval by the Audit Committee. The only non-audit services provided to these entities that will require pre-approval are those related directly to the operations and financial reporting of the Funds. Individual projects that are not presented to the Audit Committee as part of the annual pre-approval process will be subject to pre-approval by the Committee Chair (or any other Committee member on whom this responsibility has been delegated) so long as the estimated fee for those services does not exceed $30,000. Services presented for pre-approval pursuant to this paragraph will be accompanied by a confirmation from both the Treasurer and the independent accountants that the proposed services will not adversely affect the independence of the independent accountants.
Although the Audit Committee will not pre-approve all services provided to PGIM Investments LLC and its affiliates, the Committee will receive an annual report from the Fund’s independent accounting firm showing the aggregate fees for all services provided to PGIM Investments and its affiliates.
(e) (2) Percentage of services described in each of paragraphs (b) through (d) of this Item that were approved by the audit committee pursuant to paragraph (c)(7)(i)(C) of Rule 2-01 of Regulation S-X –
| | | | |
| | | Fiscal Year Ended December 31, 2024 | | Fiscal Year Ended December 31, 2023 |
| 4(b) | | Not applicable. | | 0% |
| 4(c) | | Not applicable. | | Not applicable. |
| 4(d) | | Not applicable. | | Not applicable. |
(f) Percentage of hours expended attributable to work performed by other than full time employees of principal accountant if greater than 50%.
The percentage of hours expended on the principal accountant’s engagement to audit the registrant’s financial statements for the most recent fiscal year that were attributed to work performed by persons other than the principal accountant’s full-time, permanent employees was 0%.
(g) Non-Audit Fees
The aggregate non-audit fees billed by the Registrant’s principal accountant for services rendered to the registrant’s investment adviser and any entity controlling, controlled by, or under common control with the investment adviser that provides ongoing services to the registrant for the fiscal years ended December 31, 2024 and December 31, 2023 was $0 and $0, respectively.
(h) Principal Accountant’s Independence
Not applicable as the Registrant’s principal accountant has not provided non-audit services to the registrant’s investment adviser and any entity controlling, controlled by, or under common control with the investment adviser that provides ongoing services to the registrant that were not pre-approved pursuant to Rule 2-01(c)(7)(ii) of Regulation S-X.
(i) Not applicable.
(j) Not applicable.
Item 5 – Audit Committee of Listed Registrants – Not applicable.
Item 6 – Investments – The registrant’s Schedule of Investments is included in the financial statements filed under Item 7 of this Form.
Items 7 – 11 (Refer to Report below)
The Prudential Series Fund
FINANCIAL STATEMENTS AND OTHER INFORMATION
December 31, 2024
| | |
 | | PSF Global Portfolio PSF Mid-Cap Growth Portfolio PSF Natural Resources Portfolio PSF PGIM 50/50 Balanced Portfolio PSF PGIM Flexible Managed Portfolio PSF PGIM Government Income Portfolio PSF PGIM Government Money Market Portfolio PSF PGIM High Yield Bond Portfolio PSF PGIM Jennison Blend Portfolio PSF PGIM Jennison Growth Portfolio PSF PGIM Jennison Value Portfolio PSF PGIM Total Return Bond Portfolio PSF Small-Cap Stock Index Portfolio PSF Stock Index Portfolio |

| | | | |
Prudential Series Table of Contents | | Financial Statements and Other Information | | December 31, 2024 |
| | | | |
| ∎ | | FORM N-CSR ITEM 7 - FINANCIAL STATEMENTS AND FINANCIAL HIGHLIGHTS FOR OPEN-END MANAGEMENT INVESTMENT COMPANIES |
This report may include financial information pertaining to certain portfolios that are not available through the variable life insurance policy or variable annuity contract that you have chosen. Please refer to your variable life insurance or variable annuity prospectus to determine which portfolios are available to you.
The following abbreviations are used in the Portfolios’ descriptions:
| | |
BRL | | Brazilian Real |
CAD | | Canadian Dollar |
CLP | | Chilean Peso |
CNH | | Chinese Renminbi |
COP | | Colombian Peso |
CZK | | Czech Koruna |
EUR | | Euro |
GBP | | British Pound |
HUF | | Hungarian Forint |
IDR | | Indonesian Rupiah |
INR | | Indian Rupee |
KRW | | South Korean Won |
MXN | | Mexican Peso |
PEN | | Peruvian Nuevo Sol |
PHP | | Philippine Peso |
PLN | | Polish Zloty |
SGD | | Singapore Dollar |
THB | | Thai Baht |
TRY | | Turkish Lira |
TWD | | New Taiwanese Dollar |
USD | | US Dollar |
ZAR | | South African Rand |
144A — Security was purchased pursuant to Rule 144A under the Securities Act of 1933 and, pursuant to the requirements of Rule 144A, may not be resold except to qualified institutional buyers.
A — Annual payment frequency for swaps
Aces — Alternative Credit Enhancements Securities
ADR — American Depositary Receipt
BABs — Build America Bonds
BARC — Barclays Bank PLC
BMO — BMO Capital Markets
BNP — BNP Paribas S.A.
BOA — Bank of America, N.A.
CDX — Credit Derivative Index
CGM — Citigroup Global Markets, Inc.
CITI — Citibank, N.A.
CLO — Collateralized Loan Obligation
CMS — Constant Maturity Swap
CVA — Certificate Van Aandelen (Bearer)
CVR — Contingent Value Rights
DAC — Designated Activity Company
DB — Deutsche Bank AG
DIP — Debtor-In-Possession
EAFE — Europe, Australasia, Far East
EMTN — Euro Medium Term Note
ETF — Exchange-Traded Fund
EURIBOR — Euro Interbank Offered Rate
FHLMC — Federal Home Loan Mortgage Corporation
FNMA — Federal National Mortgage Association
GMTN — Global Medium Term Note
GNMA — Government National Mortgage Association
GS — Goldman Sachs & Co. LLC
GSI — Goldman Sachs International
HSBC — HSBC Bank PLC
iBoxx — Bond Market Indices
IO — Interest Only (Principal amount represents notional)
JPM — JPMorgan Chase Bank N.A.
LP — Limited Partnership
M — Monthly payment frequency for swaps
MASTR — Morgan Stanley Structured Asset Security
MSCI — Morgan Stanley Capital International
MSI — Morgan Stanley & Co International PLC
MTN — Medium Term Note
N/A — Not Applicable
OTC — Over-the-counter
PIK — Payment-in-Kind
PJSC — Public Joint-Stock Company
PO — Principal Only
PRFC — Preference Shares
Q — Quarterly payment frequency for swaps
REITs — Real Estate Investment Trust
REMIC — Real Estate Mortgage Investment Conduit
S&P — Standard & Poor’s
SCB — Standard Chartered Bank
SOFR — Secured Overnight Financing Rate
SONIA — Sterling Overnight Index Average
SSB — State Street Bank & Trust Company
STRIPs — Separate Trading of Registered Interest and Principal of Securities
T — Swap payment upon termination
TBA — To Be Announced
TD — The Toronto-Dominion Bank
UAG — UBS AG
UBS — UBS Securities LLC
USOIS — United States Overnight Index Swap
XAMS — Amsterdam Stock Exchange
XNGS — NASDAQ Global Select Exchange
SEE NOTES TO FINANCIAL STATEMENTS.
A1
| | | | |
| | PSF GLOBAL PORTFOLIO | | |
SCHEDULE OF INVESTMENTS | | | | as of December 31, 2024 |
| | | | | | | | |
| | | Shares | | | Value | |
LONG-TERM INVESTMENTS — 98.6% | |
COMMON STOCKS | | | | | | | | |
Australia — 1.0% | | | | | | | | |
AGL Energy Ltd. | | | 58,700 | | | $ | 409,320 | |
ANZ Group Holdings Ltd. | | | 29,400 | | | | 518,022 | |
Aristocrat Leisure Ltd. | | | 33,467 | | | | 1,413,330 | |
Bank of Queensland Ltd. | | | 119,900 | | | | 496,455 | |
Elders Ltd. | | | 80,100 | | | | 354,244 | |
Harvey Norman Holdings Ltd. | | | 104,100 | | | | 300,153 | |
JB Hi-Fi Ltd. | | | 5,650 | | | | 323,242 | |
Metcash Ltd. | | | 137,400 | | | | 263,123 | |
New Hope Corp. Ltd. | | | 162,800 | | | | 499,558 | |
Perenti Ltd. | | | 432,300 | | | | 372,886 | |
Perseus Mining Ltd. | | | 188,400 | | | | 298,402 | |
Pro Medicus Ltd. | | | 3,822 | | | | 590,394 | |
Qantas Airways Ltd.* | | | 127,000 | | | | 703,063 | |
QBE Insurance Group Ltd. | | | 59,500 | | | | 706,614 | |
Rio Tinto Ltd. | | | 14,620 | | | | 1,060,139 | |
Stockland, REIT | | | 42,761 | | | | 126,831 | |
Super Retail Group Ltd. | | | 67,500 | | | | 632,246 | |
| | | | | | | | |
| | |
| | | | | | | 9,068,022 | |
| | | | | | | | |
Austria — 0.2% | | | | | | | | |
BAWAG Group AG, 144A* | | | 9,600 | | | | 808,659 | |
OMV AG | | | 12,600 | | | | 488,649 | |
Wienerberger AG | | | 13,800 | | | | 382,460 | |
| | | | | | | | |
| | |
| | | | | | | 1,679,768 | |
| | | | | | | | |
Belgium — 0.2% | | | | | | | | |
Bekaert SA | | | 9,800 | | | | 339,657 | |
Colruyt Group NV | | | 5,552 | | | | 208,920 | |
UCB SA | | | 6,504 | | | | 1,294,711 | |
| | | | | | | | |
| | |
| | | | | | | 1,843,288 | |
| | | | | | | | |
Brazil — 0.2% | | | | | | | | |
MercadoLibre, Inc.* | | | 1,078 | | | | 1,833,074 | |
Yara International ASA | | | 13,700 | | | | 362,664 | |
| | | | | | | | |
| | |
| | | | | | | 2,195,738 | |
| | | | | | | | |
Canada — 1.6% | | | | | | | | |
Brookfield Asset Management Ltd. (Class A Stock)(a) | | | 31,218 | | | | 1,691,703 | |
Constellation Software, Inc. | | | 789 | | | | 2,439,761 | |
Dollarama, Inc. | | | 20,636 | | | | 2,013,856 | |
Intact Financial Corp. | | | 12,670 | | | | 2,306,946 | |
Shopify, Inc. (Class A Stock)* | | | 31,164 | | | | 3,313,668 | |
Suncor Energy, Inc. | | | 86,929 | | | | 3,101,627 | |
| | | | | | | | |
| | |
| | | | | | | 14,867,561 | |
| | | | | | | | |
China — 0.8% | | | | | | | | |
ANTA Sports Products Ltd. | | | 107,600 | | | | 1,062,690 | |
Kingboard Holdings Ltd. | | | 216,000 | | | | 517,155 | |
Prosus NV* | | | 4,300 | | | | 170,912 | |
Tencent Holdings Ltd. | | | 29,200 | | | | 1,558,487 | |
Trip.com Group Ltd.* | | | 31,100 | | | | 2,140,313 | |
Yum China Holdings, Inc. | | | 29,585 | | | | 1,425,109 | |
| | | | | | | | |
| | |
| | | | | | | 6,874,666 | |
| | | | | | | | |
Denmark — 0.7% | | | | | | | | |
Carlsberg A/S (Class B Stock) | | | 1,600 | | | | 153,668 | |
| | | | | | | | |
| | | Shares | | | Value | |
COMMON STOCKS (continued) | | | | | | | | |
Denmark (cont’d.) | | | | | | | | |
D/S Norden A/S | | | 11,300 | | | $ | 335,627 | |
Danske Bank A/S | | | 44,800 | | | | 1,270,200 | |
DSV A/S | | | 7,664 | | | | 1,632,169 | |
Jyske Bank A/S | | | 9,500 | | | | 674,749 | |
Novo Nordisk A/S (Class B Stock) | | | 15,702 | | | | 1,354,797 | |
Spar Nord Bank A/S | | | 33,300 | | | | 953,154 | |
| | | | | | | | |
| | |
| | | | | | | 6,374,364 | |
| | | | | | | | |
Finland — 0.2% | | | | | | | | |
Cargotec OYJ (Class B Stock) | | | 7,200 | | | | 381,573 | |
Kalmar OYJ (Class B Stock)* | | | 7,200 | | | | 237,497 | |
Nokia OYJ | | | 134,300 | | | | 594,065 | |
Nordea Bank Abp | | | 42,700 | | | | 465,137 | |
Valmet OYJ | | | 14,900 | | | | 361,161 | |
| | | | | | | | |
| | |
| | | | | | | 2,039,433 | |
| | | | | | | | |
France — 2.4% | | | | | | | | |
Airbus SE | | | 7,738 | | | | 1,239,094 | |
AXA SA | | | 17,100 | | | | 608,583 | |
BNP Paribas SA | | | 15,000 | | | | 920,952 | |
Bouygues SA | | | 19,500 | | | | 577,407 | |
Carrefour SA | | | 28,100 | | | | 399,942 | |
Cie de Saint-Gobain SA | | | 8,400 | | | | 746,438 | |
Cie Generale des Etablissements Michelin SCA | | | 13,000 | | | | 427,771 | |
Coface SA | | | 31,700 | | | | 472,407 | |
Credit Agricole SA | | | 32,700 | | | | 449,937 | |
Euroapi SA* | | | 1 | | | | 3 | |
Ipsen SA | | | 3,700 | | | | 424,097 | |
LVMH Moet Hennessy Louis Vuitton SE | | | 3,864 | | | | 2,541,713 | |
Orange SA | | | 50,900 | | | | 507,871 | |
Rexel SA | | | 23,700 | | | | 603,628 | |
Rubis SCA | | | 22,100 | | | | 545,589 | |
Safran SA | | | 6,959 | | | | 1,524,770 | |
Societe BIC SA | | | 7,200 | | | | 475,443 | |
Societe Generale SA | | | 18,200 | | | | 510,792 | |
Sopra Steria Group | | | 3,200 | | | | 567,237 | |
Thales SA | | | 10,836 | | | | 1,556,000 | |
TotalEnergies SE | | | 70,995 | | | | 3,955,478 | |
TotalEnergies SE, ADR(a) | | | 49,028 | | | | 2,672,026 | |
Verallia SA, 144A | | | 12,200 | | | | 306,400 | |
| | | | | | | | |
| | |
| | | | | | | 22,033,578 | |
| | | | | | | | |
Germany — 1.7% | | | | | | | | |
Allianz SE | | | 2,700 | | | | 829,881 | |
Bayer AG | | | 16,000 | | | | 319,599 | |
Bayerische Motoren Werke AG | | | 13,300 | | | | 1,087,806 | |
Bilfinger SE | | | 10,700 | | | | 512,193 | |
Daimler Truck Holding AG | | | 14,900 | | | | 570,701 | |
Deutsche Bank AG | | | 38,800 | | | | 669,568 | |
Deutsche Post AG | | | 15,900 | | | | 561,308 | |
Deutz AG | | | 91,200 | | | | 382,424 | |
Fresenius SE & Co. KGaA* | | | 18,600 | | | | 645,624 | |
Heidelberg Materials AG | | | 3,200 | | | | 395,402 | |
HUGO BOSS AG | | | 1,100 | | | | 50,547 | |
Infineon Technologies AG | | | 9,100 | | | | 297,040 | |
Mercedes-Benz Group AG | | | 20,800 | | | | 1,159,637 | |
SEE NOTES TO FINANCIAL STATEMENTS.
A2
| | | | |
| | PSF GLOBAL PORTFOLIO (CONTINUED) | | |
SCHEDULE OF INVESTMENTS | | | | as of December 31, 2024 |
| | | | | | | | |
| | | Shares | | | Value | |
COMMON STOCKS (continued) | |
Germany (cont’d.) | | | | | | | | |
Muenchener Rueckversicherungs-Gesellschaft AG in Muenchen | | | 920 | | | $ | 465,074 | |
SAP SE | | | 12,372 | | | | 3,043,194 | |
Siemens AG | | | 14,068 | | | | 2,743,186 | |
Suedzucker AG | | | 26,100 | | | | 280,631 | |
Symrise AG | | | 9,438 | | | | 1,006,777 | |
Traton SE | | | 3,800 | | | | 109,424 | |
United Internet AG | | | 18,800 | | | | 305,618 | |
Volkswagen AG | | | 5,800 | | | | 552,307 | |
| | | | | | | | |
| | |
| | | | | | | 15,987,941 | |
| | | | | | | | |
Hong Kong — 0.6% | | | | | | | | |
AIA Group Ltd. | | | 214,600 | | | | 1,541,442 | |
PAX Global Technology Ltd. | | | 615,000 | | | | 424,381 | |
Swire Pacific Ltd. (Class A Stock) | | | 45,500 | | | | 411,483 | |
Techtronic Industries Co. Ltd. | | | 82,000 | | | | 1,077,968 | |
Tongda Group Holdings Ltd.* | | | 8,180,000 | | | | 84,513 | |
WH Group Ltd., 144A | | | 1,291,500 | | | | 995,275 | |
Yue Yuen Industrial Holdings Ltd. | | | 296,500 | | | | 660,486 | |
| | | | | | | | |
| | |
| | | | | | | 5,195,548 | |
| | | | | | | | |
India — 0.4% | | | | | | | | |
HDFC Bank Ltd., ADR(a) | | | 33,469 | | | | 2,137,330 | |
ICICI Bank Ltd., ADR(a) | | | 58,631 | | | | 1,750,722 | |
| | | | | | | | |
| | |
| | | | | | | 3,888,052 | |
| | | | | | | | |
Indonesia — 0.1% | | | | | | | | |
First Resources Ltd. | | | 457,100 | | | | 498,836 | |
| | | | | | | | |
Ireland — 0.7% | | | | | | | | |
Accenture PLC (Class A Stock) | | | 12,291 | | | | 4,323,851 | |
Dalata Hotel Group PLC | | | 86,000 | | | | 415,967 | |
Kingspan Group PLC | | | 17,183 | | | | 1,249,161 | |
| | | | | | | | |
| | |
| | | | | | | 5,988,979 | |
| | | | | | | | |
Israel — 0.1% | | | | | | | | |
Oil Refineries Ltd. | | | 1,536,500 | | | | 397,058 | |
Teva Pharmaceutical Industries Ltd.* | | | 27,400 | | | | 606,335 | |
| | | | | | | | |
| | |
| | | | | | | 1,003,393 | |
| | | | | | | | |
Italy — 0.7% | | | | | | | | |
A2A SpA | | | 279,600 | | | | 620,806 | |
Coca-Cola HBC AG* | | | 27,800 | | | | 949,702 | |
Ferrari NV(a) | | | 4,577 | | | | 1,944,493 | |
Leonardo SpA | | | 29,600 | | | | 796,353 | |
Mediobanca Banca di Credito Finanziario SpA | | | 33,200 | | | | 484,851 | |
Piaggio & C SpA | | | 135,000 | | | | 304,693 | |
Pirelli & C SpA, 144A | | | 79,700 | | | | 452,078 | |
Prysmian SpA | | | 16,684 | | | | 1,067,716 | |
Ryanair Holdings PLC | | | 3,000 | | | | 59,100 | |
| | | | | | | | |
| | |
| | | | | | | 6,679,792 | |
| | | | | | | | |
Japan — 4.9% | | | | | | | | |
Advantest Corp. | | | 25,400 | | | | 1,444,215 | |
AGC, Inc. | | | 2,800 | | | | 81,791 | |
Bell System24 Holdings, Inc. | | | 37,700 | | | | 307,093 | |
BIPROGY, Inc. | | | 8,600 | | | | 258,017 | |
| | | | | | | | |
| | | Shares | | | Value | |
COMMON STOCKS (continued) | | | | | | | | |
Japan (cont’d.) | | | | | | | | |
Brother Industries Ltd. | | | 26,800 | | | $ | 453,350 | |
Central Glass Co. Ltd. | | | 22,900 | | | | 480,273 | |
Chugai Pharmaceutical Co. Ltd. | | | 42,200 | | | | 1,860,224 | |
Citizen Watch Co. Ltd. | | | 72,300 | | | | 424,802 | |
Credit Saison Co. Ltd. | | | 25,000 | | | | 582,158 | |
Dai-ichi Life Holdings, Inc. | | | 16,200 | | | | 431,671 | |
Daiichi Sankyo Co. Ltd. | | | 61,740 | | | | 1,689,407 | |
Daiwa House Industry Co. Ltd. | | | 11,400 | | | | 349,993 | |
DCM Holdings Co. Ltd. | | | 26,100 | | | | 236,261 | |
Ferrotec Holdings Corp. | | | 21,700 | | | | 350,968 | |
Fuji Corp. | | | 8,300 | | | | 125,445 | |
Fuyo General Lease Co. Ltd. | | | 5,500 | | | | 406,305 | |
Hanwa Co. Ltd. | | | 11,300 | | | | 354,576 | |
Honda Motor Co. Ltd. | | | 113,300 | | | | 1,078,708 | |
Hoya Corp. | | | 13,800 | | | | 1,712,667 | |
Isuzu Motors Ltd. | | | 43,600 | | | | 593,108 | |
ITOCHU Corp. | | | 23,700 | | | | 1,165,433 | |
Itoham Yonekyu Holdings, Inc. | | | 17,460 | | | | 437,688 | |
Iyogin Holdings, Inc. | | | 54,000 | | | | 522,001 | |
Japan Lifeline Co. Ltd. | | | 64,700 | | | | 564,471 | |
JVCKenwood Corp. | | | 60,000 | | | | 660,739 | |
Kamigumi Co. Ltd. | | | 18,200 | | | | 394,814 | |
Kanematsu Corp. | | | 33,800 | | | | 560,755 | |
KDDI Corp. | | | 8,000 | | | | 254,805 | |
Keiyo Bank Ltd. (The) | | | 76,500 | | | | 380,055 | |
Keyence Corp. | | | 4,300 | | | | 1,747,828 | |
Komatsu Ltd. | | | 16,900 | | | | 460,396 | |
Komeri Co. Ltd. | | | 21,500 | | | | 448,645 | |
Lintec Corp. | | | 24,600 | | | | 473,269 | |
Macnica Holdings, Inc. | | | 30,000 | | | | 345,828 | |
Marubeni Corp. | | | 42,500 | | | | 637,865 | |
Mitsubishi Gas Chemical Co., Inc. | | | 26,000 | | | | 461,176 | |
Mitsubishi HC Capital, Inc. | | | 99,400 | | | | 655,069 | |
Mitsubishi UFJ Financial Group, Inc. | | | 69,500 | | | | 811,392 | |
Mitsui & Co. Ltd. | | | 16,500 | | | | 342,196 | |
Mitsui Chemicals, Inc. | | | 17,500 | | | | 382,015 | |
Mitsui-Soko Holdings Co. Ltd. | | | 7,100 | | | | 333,447 | |
Mizuho Financial Group, Inc. | | | 29,600 | | | | 722,611 | |
NGK Insulators Ltd. | | | 33,400 | | | | 421,721 | |
NHK Spring Co. Ltd. | | | 39,700 | | | | 496,777 | |
Nippon Express Holdings, Inc. | | | 27,900 | | | | 423,022 | |
Nippon Shinyaku Co. Ltd. | | | 19,200 | | | | 485,126 | |
Nippon Telegraph & Telephone Corp. | | | 438,200 | | | | 437,702 | |
Nishi-Nippon Financial Holdings, Inc. | | | 41,000 | | | | 523,880 | |
Nomura Holdings, Inc. | | | 81,100 | | | | 470,529 | |
Nomura Real Estate Holdings, Inc. | | | 13,300 | | | | 328,216 | |
Ono Pharmaceutical Co. Ltd. | | | 31,700 | | | | 330,044 | |
ORIX Corp. | | | 31,900 | | | | 685,336 | |
Recruit Holdings Co. Ltd. | | | 24,800 | | | | 1,723,796 | |
Sankyu, Inc. | | | 14,700 | | | | 507,679 | |
Santen Pharmaceutical Co. Ltd. | | | 31,000 | | | | 317,411 | |
SCREEN Holdings Co. Ltd. | | | 1,100 | | | | 64,941 | |
Seiko Epson Corp. | | | 28,200 | | | | 508,813 | |
Seino Holdings Co. Ltd. | | | 7,800 | | | | 117,451 | |
Shin-Etsu Chemical Co. Ltd. | | | 38,100 | | | | 1,254,905 | |
Shionogi & Co. Ltd. | | | 30,000 | | | | 420,755 | |
SKY Perfect JSAT Holdings, Inc. | | | 75,500 | | | | 430,769 | |
Sojitz Corp. | | | 23,400 | | | | 476,889 | |
Sumitomo Heavy Industries Ltd. | | | 16,200 | | | | 330,681 | |
SEE NOTES TO FINANCIAL STATEMENTS.
A3
| | | | |
| | PSF GLOBAL PORTFOLIO (CONTINUED) | | |
SCHEDULE OF INVESTMENTS | | | | as of December 31, 2024 |
| | | | | | | | |
| | | Shares | | | Value | |
COMMON STOCKS (continued) | | | | | | | | |
Japan (cont’d.) | | | | | | | | |
Sumitomo Mitsui Financial Group, Inc. | | | 97,700 | | | $ | 2,344,824 | |
Toagosei Co. Ltd. | | | 47,600 | | | | 455,293 | |
Tokio Marine Holdings, Inc. | | | 60,000 | | | | 2,153,288 | |
Tokuyama Corp. | | | 26,500 | | | | 439,481 | |
Tokyo Electron Ltd. | | | 8,200 | | | | 1,232,619 | |
Toyota Motor Corp. | | | 5,200 | | | | 101,531 | |
Transcosmos, Inc. | | | 24,400 | | | | 516,573 | |
Tsubakimoto Chain Co. | | | 45,300 | | | | 557,202 | |
YAMABIKO Corp. | | | 33,300 | | | | 532,269 | |
Yokohama Rubber Co. Ltd. (The) | | | 19,700 | | | | 421,556 | |
| | | | | | | | |
| | |
| | | | | | | 45,494,609 | |
| | | | | | | | |
Netherlands — 1.2% | | | | | | | | |
ABN AMRO Bank NV, 144A, CVA | | | 51,300 | | | | 791,640 | |
Aegon Ltd. | | | 215,700 | | | | 1,283,568 | |
ASM International NV | | | 2,069 | | | | 1,196,266 | |
ASML Holding NV (XAMS) | | | 2,277 | | | | 1,594,890 | |
ASML Holding NV (XNGS) | | | 4,251 | | | | 2,946,283 | |
ASR Nederland NV | | | 10,200 | | | | 485,132 | |
ING Groep NV | | | 48,100 | | | | 753,803 | |
Koninklijke Ahold Delhaize NV | | | 40,600 | | | | 1,326,786 | |
NN Group NV | | | 13,500 | | | | 588,716 | |
| | | | | | | | |
| | |
| | | | | | | 10,967,084 | |
| | | | | | | | |
New Zealand — 0.0% | | | | | | | | |
Air New Zealand Ltd. | | | 887,700 | | | | 298,001 | |
| | | | | | | | |
Norway — 0.1% | | | | | | | | |
DNB Bank ASA | | | 24,500 | | | | 489,129 | |
Equinor ASA | | | 17,800 | | | | 422,199 | |
Mowi ASA | | | 20,100 | | | | 344,479 | |
| | | | | | | | |
| | |
| | | | | | | 1,255,807 | |
| | | | | | | | |
Singapore — 0.1% | | | | | | | | |
DBS Group Holdings Ltd. | | | 20,460 | | | | 655,650 | |
Jardine Cycle & Carriage Ltd. | | | 27,700 | | | | 574,732 | |
| | | | | | | | |
| | |
| | | | | | | 1,230,382 | |
| | | | | | | | |
South Africa — 0.0% | | | | | | | | |
Anglo American PLC | | | 11,100 | | | | 328,196 | |
| | | | | | | | |
South Korea — 0.4% | | | | | | | | |
Samsung Electronics Co. Ltd. | | | 59,616 | | | | 2,127,505 | |
SK Hynix, Inc. | | | 9,234 | | | | 1,058,127 | |
| | | | | | | | |
| | |
| | | | | | | 3,185,632 | |
| | | | | | | | |
Spain — 0.8% | | | | | | | | |
Amadeus IT Group SA | | | 29,544 | | | | 2,085,341 | |
Banco Santander SA | | | 212,800 | | | | 984,466 | |
Industria de Diseno Textil SA | | | 49,463 | | | | 2,533,691 | |
Mapfre SA | | | 195,300 | | | | 495,125 | |
Repsol SA | | | 83,000 | | | | 1,009,941 | |
Telefonica SA(a) | | | 20,146 | | | | 82,213 | |
| | | | | | | | |
| | |
| | | | | | | 7,190,777 | |
| | | | | | | | |
Sweden — 0.6% | | | | | | | | |
Atlas Copco AB (Class A Stock) | | | 118,076 | | | | 1,802,035 | |
Boliden AB | | | 16,700 | | | | 469,853 | |
Securitas AB (Class B Stock) | | | 46,900 | | | | 579,869 | |
SKF AB (Class B Stock) | | | 30,900 | | | | 579,978 | |
| | | | | | | | |
| | | Shares | | | Value | |
COMMON STOCKS (continued) | | | | | | | | |
Sweden (cont’d.) | | | | | | | | |
Swedbank AB (Class A Stock) | | | 27,700 | | | $ | 546,963 | |
Telefonaktiebolaget LM Ericsson
(Class B Stock) | | | 90,600 | | | | 733,720 | |
Volvo AB (Class B Stock) | | | 46,900 | | | | 1,139,772 | |
| | | | | | | | |
| | |
| | | | | | | 5,852,190 | |
| | | | | | | | |
Switzerland — 2.1% | | | | | | | | |
ABB Ltd. | | | 31,532 | | | | 1,702,681 | |
Adecco Group AG | | | 12,600 | | | | 311,254 | |
Bucher Industries AG | | | 822 | | | | 295,760 | |
EFG International AG* | | | 38,600 | | | | 560,947 | |
Forbo Holding AG | | | 300 | | | | 249,454 | |
Julius Baer Group Ltd. | | | 8,600 | | | | 557,894 | |
Lonza Group AG | | | 3,297 | | | | 1,946,017 | |
Novartis AG | | | 31,000 | | | | 3,018,076 | |
Partners Group Holding AG | | | 1,311 | | | | 1,780,722 | |
Sandoz Group AG | | | 66,695 | | | | 2,734,002 | |
Sika AG | | | 6,443 | | | | 1,537,346 | |
TE Connectivity PLC | | | 24,238 | | | | 3,465,307 | |
UBS Group AG | | | 24,060 | | | | 736,639 | |
| | | | | | | | |
| | |
| | | | | | | 18,896,099 | |
| | | | | | | | |
Taiwan — 1.2% | | | | | | | | |
MediaTek, Inc. | | | 62,000 | | | | 2,665,364 | |
Taiwan Semiconductor Manufacturing Co. Ltd. | | | 154,850 | | | | 5,032,633 | |
Taiwan Semiconductor Manufacturing Co. Ltd., ADR | | | 17,525 | | | | 3,461,012 | |
| | | | | | | | |
| | |
| | | | | | | 11,159,009 | |
| | | | | | | | |
United Kingdom — 3.2% | | | | | | | | |
3i Group PLC | | | 70,004 | | | | 3,116,105 | |
Associated British Foods PLC | | | 15,900 | | | | 405,583 | |
AstraZeneca PLC | | | 9,872 | | | | 1,287,108 | |
AstraZeneca PLC, ADR | | | 29,061 | | | | 1,904,077 | |
Aviva PLC | | | 79,600 | | | | 466,544 | |
BAE Systems PLC | | | 168,459 | | | | 2,416,592 | |
British American Tobacco PLC | | | 16,600 | | | | 599,007 | |
BT Group PLC | | | 375,900 | | | | 677,554 | |
Centrica PLC | | | 80,443 | | | | 134,209 | |
Chemring Group PLC | | | 25,300 | | | | 103,850 | |
CK Hutchison Holdings Ltd. | | | 100,000 | | | | 531,644 | |
Compass Group PLC | | | 71,266 | | | | 2,371,265 | |
Flutter Entertainment PLC* | | | 4,419 | | | | 1,142,091 | |
Halma PLC | | | 40,900 | | | | 1,372,152 | |
HSBC Holdings PLC | | | 62,400 | | | | 612,962 | |
Imperial Brands PLC | | | 31,300 | | | | 1,000,939 | |
International Consolidated Airlines Group SA | | | 206,200 | | | | 776,794 | |
Investec PLC | | | 98,400 | | | | 668,905 | |
J Sainsbury PLC | | | 169,600 | | | | 579,546 | |
Keller Group PLC | | | 37,300 | | | | 674,093 | |
Kingfisher PLC | | | 189,600 | | | | 589,345 | |
Lloyds Banking Group PLC | | | 751,500 | | | | 513,221 | |
London Stock Exchange Group PLC | | | 17,895 | | | | 2,525,968 | |
Marks & Spencer Group PLC | | | 147,600 | | | | 691,240 | |
Paragon Banking Group PLC | | | 58,100 | | | | 540,553 | |
Premier Foods PLC | | | 148,800 | | | | 349,316 | |
SEE NOTES TO FINANCIAL STATEMENTS.
A4
| | | | |
| | PSF GLOBAL PORTFOLIO (CONTINUED) | | |
SCHEDULE OF INVESTMENTS | | | | as of December 31, 2024 |
| | | | | | | | |
| | | Shares | | | Value | |
COMMON STOCKS (continued) | | | | | | | | |
United Kingdom (cont’d.) | | | | | | | | |
Reckitt Benckiser Group PLC | | | 200 | | | $ | 12,106 | |
RELX PLC | | | 44,188 | | | | 2,002,113 | |
Tesco PLC | | | 233,600 | | | | 1,074,409 | |
TORM PLC (Class A Stock) | | | 11,900 | | | | 229,894 | |
Zigup PLC | | | 103,600 | | | | 415,482 | |
| | | | | | | | |
| | |
| | | | | | | 29,784,667 | |
| | | | | | | | |
United States — 72.4% | | | | | | | | |
Adobe, Inc.* | | | 1,800 | | | | 800,424 | |
AGCO Corp.(a) | | | 32,388 | | | | 3,027,630 | |
Alphabet, Inc. (Class A Stock) | | | 107,452 | | | | 20,340,664 | |
Amazon.com, Inc.* | | | 102,231 | | | | 22,428,459 | |
Ameren Corp. | | | 61,706 | | | | 5,500,473 | |
American International Group, Inc. | | | 58,098 | | | | 4,229,534 | |
AMETEK, Inc. | | | 1,463 | | | | 263,720 | |
Amphenol Corp. (Class A Stock) | | | 75,489 | | | | 5,242,711 | |
Apollo Global Management, Inc. | | | 15,079 | | | | 2,490,448 | |
Apple, Inc. | | | 85,263 | | | | 21,351,560 | |
Ares Management Corp. (Class A Stock)(a) | | | 18,625 | | | | 3,297,184 | |
Arthur J. Gallagher & Co. | | | 8,996 | | | | 2,553,515 | |
Atlassian Corp. (Class A Stock)* | | | 11,946 | | | | 2,907,417 | |
Autodesk, Inc.* | | | 15,926 | | | | 4,707,248 | |
AvalonBay Communities, Inc., REIT(a) | | | 25,693 | | | | 5,651,689 | |
Bank of America Corp. | | | 182,831 | | | | 8,035,422 | |
Baxter International, Inc. | | | 94,566 | | | | 2,757,545 | |
Becton, Dickinson & Co.(a) | | | 27,014 | | | | 6,128,666 | |
Biogen, Inc.* | | | 6,150 | | | | 940,458 | |
Block, Inc.* | | | 13,807 | | | | 1,173,457 | |
Boeing Co. (The)* | | | 10,951 | | | | 1,938,327 | |
Boston Scientific Corp.* | | | 72,535 | | | | 6,478,826 | |
BP PLC | | | 84,200 | | | | 416,198 | |
Broadcom, Inc. | | | 9,716 | | | | 2,252,557 | |
Cadence Design Systems, Inc.* | | | 7,057 | | | | 2,120,346 | |
CF Industries Holdings, Inc.(a) | | | 32,801 | | | | 2,798,581 | |
Charles Schwab Corp. (The) | | | 93,775 | | | | 6,940,288 | |
Cheniere Energy, Inc. | | | 13,444 | | | | 2,888,712 | |
Chipotle Mexican Grill, Inc.* | | | 36,559 | | | | 2,204,508 | |
Chubb Ltd. | | | 29,099 | | | | 8,040,054 | |
Cigna Group (The) | | | 5,733 | | | | 1,583,111 | |
Citigroup, Inc. | | | 69,844 | | | | 4,916,319 | |
Coca-Cola Co. (The) | | | 34,895 | | | | 2,172,563 | |
Colgate-Palmolive Co. | | | 55,209 | | | | 5,019,050 | |
Comcast Corp. (Class A Stock) | | | 86,935 | | | | 3,262,671 | |
Conagra Brands, Inc. | | | 78,946 | | | | 2,190,752 | |
ConocoPhillips | | | 62,713 | | | | 6,219,248 | |
CoStar Group, Inc.* | | | 27,580 | | | | 1,974,452 | |
Cummins, Inc. | | | 14,829 | | | | 5,169,389 | |
CVS Health Corp. | | | 60,019 | | | | 2,694,253 | |
Danaher Corp. | | | 13,638 | | | | 3,130,603 | |
Datadog, Inc. (Class A Stock)* | | | 11,489 | | | | 1,641,663 | |
Dominion Energy, Inc.(a) | | | 26,674 | | | | 1,436,662 | |
Eaton Corp. PLC | | | 18,477 | | | | 6,131,962 | |
Elevance Health, Inc. | | | 17,853 | | | | 6,585,972 | |
Eli Lilly & Co. | | | 5,782 | | | | 4,463,704 | |
EOG Resources, Inc. | | | 18,681 | | | | 2,289,917 | |
EQT Corp.(a) | | | 89,536 | | | | 4,128,505 | |
Equitable Holdings, Inc. | | | 106,333 | | | | 5,015,728 | |
Experian PLC | | | 50,684 | | | | 2,178,392 | |
| | | | | | | | |
| | | Shares | | | Value | |
COMMON STOCKS (continued) | | | | | | | | |
United States (cont’d.) | | | | | | | | |
Exxon Mobil Corp. | | | 59,016 | | | $ | 6,348,351 | |
Fifth Third Bancorp(a) | | | 50,932 | | | | 2,153,405 | |
Fiserv, Inc.* | | | 50,700 | | | | 10,414,794 | |
Fortive Corp. | | | 33,250 | | | | 2,493,750 | |
Gartner, Inc.* | | | 6,193 | | | | 3,000,323 | |
GE Vernova, Inc. | | | 11,584 | | | | 3,810,325 | |
General Electric Co. | | | 45,917 | | | | 7,658,496 | |
Goldman Sachs Group, Inc. (The) | | | 3,798 | | | | 2,174,811 | |
GSK PLC | | | 97,400 | | | | 1,642,873 | |
Guidewire Software, Inc.* | | | 3,784 | | | | 637,907 | |
Haleon PLC | | | 321,277 | | | | 1,514,870 | |
Hartford Financial Services Group, Inc. (The) | | | 66,428 | | | | 7,267,223 | |
Hilton Worldwide Holdings, Inc. | | | 18,106 | | | | 4,475,079 | |
Holcim AG* | | | 12,660 | | | | 1,218,968 | |
Home Depot, Inc. (The) | | | 6,919 | | | | 2,691,422 | |
Honeywell International, Inc. | | | 14,476 | | | | 3,269,984 | |
Howmet Aerospace, Inc. | | | 37,517 | | | | 4,103,234 | |
Huntington Bancshares, Inc. | | | 225,580 | | | | 3,670,187 | |
Intel Corp. | | | 60,624 | | | | 1,215,511 | |
International Paper Co.(a) | | | 80,028 | | | | 4,307,107 | |
Intuit, Inc. | | | 5,469 | | | | 3,437,267 | |
Intuitive Surgical, Inc.* | | | 6,166 | | | | 3,218,405 | |
Johnson & Johnson | | | 36,187 | | | | 5,233,364 | |
Kenvue, Inc. | | | 387,403 | | | | 8,271,054 | |
Kimberly-Clark Corp. | | | 35,044 | | | | 4,592,166 | |
KKR & Co., Inc. | | | 46,961 | | | | 6,946,002 | |
KLA Corp. | | | 1,912 | | | | 1,204,789 | |
L3Harris Technologies, Inc. | | | 32,944 | | | | 6,927,464 | |
Lam Research Corp. | | | 4,920 | | | | 355,372 | |
Las Vegas Sands Corp.(a) | | | 77,926 | | | | 4,002,279 | |
Linde PLC | | | 12,128 | | | | 5,077,630 | |
Manhattan Associates, Inc.* | | | 4,933 | | | | 1,333,094 | |
Marvell Technology, Inc. | | | 22,190 | | | | 2,450,886 | |
Mastercard, Inc. (Class A Stock) | | | 22,823 | | | | 12,017,907 | |
Meta Platforms, Inc. (Class A Stock) | | | 38,408 | | | | 22,488,268 | |
MetLife, Inc. | | | 53,436 | | | | 4,375,340 | |
Microsoft Corp. | | | 98,454 | | | | 41,498,361 | |
Moody’s Corp. | | | 3,451 | | | | 1,633,600 | |
MSCI, Inc. | | | 3,292 | | | | 1,975,233 | |
Netflix, Inc.* | | | 5,520 | | | | 4,920,086 | |
News Corp. (Class A Stock) | | | 162,138 | | | | 4,465,281 | |
NextEra Energy, Inc. | | | 8,321 | | | | 596,533 | |
Norfolk Southern Corp. | | | 22,894 | | | | 5,373,222 | |
NVIDIA Corp. | | | 223,899 | | | | 30,067,397 | |
O’Reilly Automotive, Inc.* | | | 1,460 | | | | 1,731,268 | |
Philip Morris International, Inc. | | | 70,780 | | | | 8,518,373 | |
QUALCOMM, Inc. | | | 24,643 | | | | 3,785,658 | |
Rexford Industrial Realty, Inc., REIT | | | 72,118 | | | | 2,788,082 | |
Roche Holding AG | | | 8,376 | | | | 2,341,986 | |
Rockwell Automation, Inc.(a) | | | 13,342 | | | | 3,813,010 | |
RPM International, Inc. | | | 14,794 | | | | 1,820,550 | |
Salesforce, Inc. | | | 13,191 | | | | 4,410,147 | |
Sanofi SA | | | 14,190 | | | | 1,379,421 | |
Sanofi SA, ADR | | | 47,197 | | | | 2,276,311 | |
Schlumberger NV | | | 62,444 | | | | 2,394,103 | |
Schneider Electric SE | | | 10,624 | | | | 2,644,909 | |
Sempra | | | 43,085 | | | | 3,779,416 | |
ServiceNow, Inc.* | | | 6,243 | | | | 6,618,329 | |
SEE NOTES TO FINANCIAL STATEMENTS.
A5
| | | | |
| | PSF GLOBAL PORTFOLIO (CONTINUED) | | |
SCHEDULE OF INVESTMENTS | | | | as of December 31, 2024 |
| | | | | | | | |
| | | Shares | | | Value | |
| |
COMMON STOCKS (continued) | | | | | |
United States (cont’d.) | | | | | | | | |
Shell PLC | | | 67,400 | | | $ | 2,100,926 | |
Signify NV, 144A | | | 18,700 | | | | 417,622 | |
Southern Co. (The) | | | 55,269 | | | | 4,549,744 | |
Southwest Airlines Co. | | | 65,833 | | | | 2,213,305 | |
Spotify Technology SA* | | | 14,266 | | | | 6,382,323 | |
Stanley Black & Decker, Inc. | | | 63,466 | | | | 5,095,685 | |
Stellantis NV | | | 29,800 | | | | 388,268 | |
Swiss Re AG | | | 10,400 | | | | 1,506,279 | |
Synopsys, Inc.*(a) | | | 5,021 | | | | 2,436,993 | |
Take-Two Interactive Software, Inc.* | | | 14,473 | | | | 2,664,190 | |
Tesla, Inc.* | | | 31,010 | | | | 12,523,078 | |
Texas Instruments, Inc. | | | 12,857 | | | | 2,410,816 | |
Thermo Fisher Scientific, Inc. | | | 17,363 | | | | 9,032,754 | |
Trane Technologies PLC | | | 6,634 | | | | 2,450,268 | |
TransUnion | | | 40,030 | | | | 3,711,181 | |
U.S. Bancorp | | | 71,566 | | | | 3,423,002 | |
Union Pacific Corp. | | | 15,562 | | | | 3,548,758 | |
United Parcel Service, Inc. (Class B Stock) | | | 41,843 | | | | 5,276,402 | |
UnitedHealth Group, Inc. | | | 11,927 | | | | 6,033,392 | |
Veeva Systems, Inc. (Class A Stock)* | | | 7,017 | | | | 1,475,324 | |
Verisk Analytics, Inc. | | | 14,146 | | | | 3,896,233 | |
Vertex Pharmaceuticals, Inc.* | | | 9,109 | | | | 3,668,194 | |
Vertiv Holdings Co. (Class A Stock) | | | 16,162 | | | | 1,836,165 | |
Viatris, Inc. | | | 181,451 | | | | 2,259,065 | |
Visa, Inc. (Class A Stock) | | | 19,030 | | | | 6,014,241 | |
Vistra Corp. | | | 17,444 | | | | 2,405,004 | |
Vulcan Materials Co. | | | 15,370 | | | | 3,953,625 | |
Walmart, Inc. | | | 49,734 | | | | 4,493,467 | |
Walt Disney Co. (The) | | | 35,386 | | | | 3,940,231 | |
Wells Fargo & Co. | | | 126,383 | | | | 8,877,142 | |
Western Digital Corp.* | | | 23,638 | | | | 1,409,534 | |
Weyerhaeuser Co., REIT | | | 187,116 | | | | 5,267,315 | |
Williams Cos., Inc. (The) | | | 37,894 | | | | 2,050,823 | |
Zimmer Biomet Holdings, Inc. | | | 53,287 | | | | 5,628,706 | |
| | | | | | | | |
| | |
| | | | | | | 670,282,775 | |
| | | | | | | | |
TOTAL LONG-TERM INVESTMENTS
(cost $638,082,875) | | | | | | | 912,144,187 | |
| | | | | | | | |
| |
SHORT-TERM INVESTMENTS — 5.2% | | | | | |
AFFILIATED MUTUAL FUNDS — 4.9% | | | | | |
PGIM Core Government Money Market Fund (7-day effective yield 4.604%)(wb) | | | 1,788 | | | | 1,788 | |
| | | | | | | | |
| | | Shares | | | Value | |
|
AFFILIATED MUTUAL FUNDS (continued) | |
PGIM Core Ultra Short Bond Fund(wb) | | | 7,250,484 | | | $ | 7,250,484 | |
PGIM Institutional Money Market Fund
(7-day effective yield 4.649%)
(cost $37,655,784; includes
$37,468,124 of cash collateral for
securities on loan)(b)(wb) | | | 37,697,771 | | | | 37,675,153 | |
| | | | | | | | |
TOTAL AFFILIATED MUTUAL FUNDS
(cost $44,908,056) | | | | | | | 44,927,425 | |
| | | | | | | | |
| | | | | | | | | | | | |
| | | | |
Interest Rate | | Maturity Date | | | | Principal
Amount
(000)# | | | | |
U.S. GOVERNMENT AGENCY OBLIGATION(n) — 0.3% | |
Federal Home Loan Bank | | | | | | | | |
4.101% | | 01/02/25 | | | | | 3,216 | | | | 3,215,189 | |
| | | | | | | | | | | | |
(cost $3,215,635) | | | | | | | | | | |
| | |
TOTAL SHORT-TERM INVESTMENTS
(cost $48,123,691) | | | | | | | 48,142,614 | |
| | | | | | | | | | | | |
| | |
TOTAL INVESTMENTS—103.8%
(cost $686,206,566) | | | | | | | 960,286,801 | |
Liabilities in excess of other assets — (3.8)% | | | | (34,765,896 | ) |
| | | | | | | | | | | | |
| |
NET ASSETS — 100.0% | | | $ | 925,520,905 | |
| | | | | | | | | | | | |
See the Glossary for a list of the abbreviation(s) used in the annual report.
| * | Non-income producing security. |
| # | Principal amount is shown in U.S. dollars unless otherwise stated. |
| (a) | All or a portion of security is on loan. The aggregate market value of such securities, including those sold and pending settlement, is $36,723,155; cash collateral of $37,468,124 (included in liabilities) was received with which the Portfolio purchased highly liquid short-term investments. In the event of significant appreciation in value of securities on loan on the last business day of the reporting period, the Portfolio may reflect a collateral value that is less than the market value of the loaned securities and such shortfall is remedied the following business day. |
| (b) | Represents security, or portion thereof, purchased with cash collateral received for securities on loan and includes dividend reinvestment. |
| (n) | Rate shown reflects yield to maturity at purchased date. |
| (wb) | Represents an investment in a Fund affiliated with the Manager. |
Fair Value Measurements:
Various inputs are used in determining the value of the Portfolio’s investments. These inputs are summarized in the three broad levels listed below.
Level 1—unadjusted quoted prices generally in active markets for identical securities.
Level 2—quoted prices for similar securities, interest rates and yield curves, prepayment speeds, foreign currency exchange rates and other observable inputs.
Level 3—unobservable inputs for securities valued in accordance with Board approved fair valuation procedures.
SEE NOTES TO FINANCIAL STATEMENTS.
A6
| | | | |
| | PSF GLOBAL PORTFOLIO (CONTINUED) | | |
SCHEDULE OF INVESTMENTS | | | | as of December 31, 2024 |
The following is a summary of the inputs used as of December 31, 2024 in valuing such portfolio securities:
| | | | | | | | | | | | | | |
| | | Level 1 | | | | | Level 2 | | | | | Level 3 |
Investments in Securities | | | | | | | | | | | | | | |
Assets | | | | | | | | | | | | | | |
Long-Term Investments | | | | | | | | | | | | | | |
Common Stocks | | | | | | | | | | | | | | |
Australia | | $ | — | | | | | $ | 9,068,022 | | | | | $— |
Austria | | | — | | | | | | 1,679,768 | | | | | — |
Belgium | | | — | | | | | | 1,843,288 | | | | | — |
Brazil | | | 1,833,074 | | | | | | 362,664 | | | | | — |
Canada | | | 14,867,561 | | | | | | — | | | | | — |
China | | | 1,425,109 | | | | | | 5,449,557 | | | | | — |
Denmark | | | — | | | | | | 6,374,364 | | | | | — |
Finland | | | — | | | | | | 2,039,433 | | | | | — |
France | | | 2,672,026 | | | | | | 19,361,552 | | | | | — |
Germany | | | 280,631 | | | | | | 15,707,310 | | | | | — |
Hong Kong | | | — | | | | | | 5,195,548 | | | | | — |
India | | | 3,888,052 | | | | | | — | | | | | — |
Indonesia | | | — | | | | | | 498,836 | | | | | — |
Ireland | | | 4,323,851 | | | | | | 1,665,128 | | | | | — |
Israel | | | — | | | | | | 1,003,393 | | | | | — |
Italy | | | 1,944,493 | | | | | | 4,735,299 | | | | | — |
Japan | | | — | | | | | | 45,494,609 | | | | | — |
Netherlands | | | 2,946,283 | | | | | | 8,020,801 | | | | | — |
New Zealand | | | 298,001 | | | | | | — | | | | | — |
Norway | | | — | | | | | | 1,255,807 | | | | | — |
Singapore | | | — | | | | | | 1,230,382 | | | | | — |
South Africa | | | — | | | | | | 328,196 | | | | | — |
South Korea | | | — | | | | | | 3,185,632 | | | | | — |
Spain | | | — | | | | | | 7,190,777 | | | | | — |
Sweden | | | — | | | | | | 5,852,190 | | | | | — |
Switzerland | | | 3,465,307 | | | | | | 15,430,792 | | | | | — |
Taiwan | | | 3,461,012 | | | | | | 7,697,997 | | | | | — |
United Kingdom | | | 3,046,168 | | | | | | 26,738,499 | | | | | — |
United States | | | 652,532,063 | | | | | | 17,750,712 | | | | | — |
Short-Term Investments | | | | | | | | | | | | | | |
Affiliated Mutual Funds | | | 44,927,425 | | | | | | — | | | | | — |
U.S. Government Agency Obligation | | | — | | | | | | 3,215,189 | | | | | — |
| | | | | | | | | | | | | | |
Total | | $ | 741,911,056 | | | | | $ | 218,375,745 | | | | | $— |
| | | | | | | | | | | | | | |
Industry Classification:
The industry classification of investments and liabilities in excess of other assets shown as a percentage of net assets as of December 31, 2024 were as follows:
| | | | |
Software | | | 8.4 | % |
Semiconductors & Semiconductor Equipment | | | 7.0 | |
Banks | | | 5.8 | |
Affiliated Mutual Funds (4.0% represents investments
purchased with collateral from securities on loan) | | | 4.9 | |
Interactive Media & Services | | | 4.8 | |
Insurance | | | 4.4 | |
Financial Services | | | 4.3 | |
Oil, Gas & Consumable Fuels | | | 4.2 | |
Pharmaceuticals | | | 4.1 | |
Capital Markets | | | 3.9 | |
Aerospace & Defense | | | 3.1 | |
Broadline Retail | | | 2.9 | |
Health Care Equipment & Supplies | | | 2.9 | |
Technology Hardware, Storage & Peripherals | | | 2.8 | |
Machinery | | | 2.7 | |
| | | | |
Electrical Equipment | | | 2.3 | % |
Hotels, Restaurants & Leisure | | | 2.3 | |
Automobiles | | | 2.1 | |
Entertainment | | | 1.9 | |
Health Care Providers & Services | | | 1.9 | |
Chemicals | | | 1.7 | |
Professional Services | | | 1.6 | |
Life Sciences Tools & Services | | | 1.5 | |
Electronic Equipment, Instruments & Components | | | 1.5 | |
Multi-Utilities | | | 1.3 | |
IT Services | | | 1.2 | |
Tobacco | | | 1.1 | |
Personal Care Products | | | 1.1 | |
Household Products | | | 1.0 | |
Ground Transportation | | | 1.0 | |
Specialty Retail | | | 1.0 | |
SEE NOTES TO FINANCIAL STATEMENTS.
A7
| | | | |
| | PSF GLOBAL PORTFOLIO (CONTINUED) | | |
SCHEDULE OF INVESTMENTS | | | | as of December 31, 2024 |
Industry Classification (continued):
| | | | |
Consumer Staples Distribution & Retail | | | 1.0 | % |
Air Freight & Logistics | | | 0.9 | |
Media | | | 0.9 | |
Industrial Conglomerates | | | 0.8 | |
Construction Materials | | | 0.6 | |
Food Products | | | 0.6 | |
Residential REITs | | | 0.6 | |
Specialized REITs | | | 0.6 | |
Building Products | | | 0.6 | |
Electric Utilities | | | 0.6 | |
Containers & Packaging | | | 0.5 | |
Biotechnology | | | 0.5 | |
Textiles, Apparel & Luxury Goods | | | 0.5 | |
Trading Companies & Distributors | | | 0.5 | |
Passenger Airlines | | | 0.4 | |
Beverages | | | 0.4 | |
U.S. Government Agency Obligation | | | 0.3 | |
Metals & Mining | | | 0.3 | |
Industrial REITs | | | 0.3 | |
Real Estate Management & Development | | | 0.3 | |
Independent Power & Renewable Electricity Producers | | | 0.3 | |
| | | | |
Energy Equipment & Services | | | 0.3 | % |
Health Care Technology | | | 0.2 | |
Diversified Telecommunication Services | | | 0.2 | |
Automobile Components | | | 0.2 | |
Commercial Services & Supplies | | | 0.2 | |
Communications Equipment | | | 0.1 | |
Construction & Engineering | | | 0.1 | |
Household Durables | | | 0.1 | |
Consumer Finance | | | 0.1 | |
Gas Utilities | | | 0.1 | |
Transportation Infrastructure | | | 0.0 | * |
Marine Transportation | | | 0.0 | * |
Wireless Telecommunication Services | | | 0.0 | * |
Diversified REITs | | | 0.0 | * |
| | | | |
| | | 103.8 | |
Liabilities in excess of other assets | | | (3.8 | ) |
| | | | |
| |
| | | 100.0 | % |
| | | | |
Financial Instruments/Transactions—Summary of Offsetting and Netting Arrangements:
The Portfolio entered into financial instruments/transactions during the reporting period that are either offset in accordance with current requirements or are subject to enforceable master netting arrangements or similar agreements that permit offsetting. The information about offsetting and related netting arrangements for financial instruments/transactions where the legal right to set-off exists is presented in the summary below.
Offsetting of financial instrument/transaction assets and liabilities:
| | | | | | |
Description | | Gross Market Value of Recognized Assets/(Liabilities) | | Collateral Pledged/(Received)(1) | | Net Amount |
Securities on Loan | | $36,723,155 | | $(36,723,155) | | $— |
| (1) | Collateral amount disclosed by the Portfolio is limited to the market value of financial instruments/transactions. |
SEE NOTES TO FINANCIAL STATEMENTS.
A8
| | | | |
| | PSF GLOBAL PORTFOLIO (CONTINUED) | | |
| | | | |
STATEMENT OF ASSETS AND LIABILITIES
as of December 31, 2024
| | | | |
ASSETS | | | | |
Investments at value, including securities on loan of $36,723,155: | | | | |
Unaffiliated investments (cost $641,298,510) | | $ | 915,359,376 | |
Affiliated investments (cost $44,908,056) | | | 44,927,425 | |
Foreign currency, at value (cost $1,566,803) | | | 1,559,591 | |
Tax reclaim receivable | | | 1,966,655 | |
Receivable for investments sold | | | 1,479,101 | |
Dividends and interest receivable | | | 785,332 | |
Receivable for Portfolio shares sold | | | 61,879 | |
Receivable from affiliate | | | 2,283 | |
Prepaid expenses | | | 38,329 | |
| | | | |
Total Assets | | | 966,179,971 | |
| | | | |
LIABILITIES | | | | |
Payable to broker for collateral for securities on loan | | | 37,468,124 | |
Payable for investments purchased | | | 1,174,091 | |
Payable to affiliate | | | 898,004 | |
Management fee payable | | | 566,258 | |
Accrued expenses and other liabilities | | | 373,697 | |
Payable for Portfolio shares purchased | | | 176,593 | |
Affiliated transfer agent fee payable | | | 1,190 | |
Trustees’ fees payable | | | 820 | |
Distribution fee payable | | | 289 | |
| | | | |
Total Liabilities | | | 40,659,066 | |
| | | | |
NET ASSETS | | $ | 925,520,905 | |
| | | | |
| |
Net assets were comprised of:
Partners’ Equity | | $ | 925,520,905 | |
| | | | |
| |
Class I: | | | | |
Net asset value and redemption price per share,
$924,181,825 / 14,545,476 outstanding shares of beneficial interest | | $ | 63.54 | |
| | | | |
| |
Class III: | | | | |
Net asset value and redemption price per share,
$1,339,080 / 21,272 outstanding shares of beneficial interest | | $ | 62.95 | |
| | | | |
STATEMENT OF OPERATIONS
Year Ended December 31, 2024
| | | | |
NET INVESTMENT INCOME (LOSS) | | | | |
INCOME | | | | |
Unaffiliated dividend income (net of $1,129,649
foreign withholding tax, of which $105,799 is
reimbursable by an affiliate) | | $ | 17,547,551 | |
Affiliated dividend income | | | 545,340 | |
Interest income | | | 206,121 | |
Income from securities lending, net (including
affiliated income of $88,096) | | | 120,073 | |
| | | | |
Total income | | | 18,419,085 | |
| | | | |
EXPENSES | | | | |
Management fee | | | 7,350,831 | |
Distribution fee—Class III | | | 3,308 | |
Custodian and accounting fees | | | 225,653 | |
Interest expense | | | 224,417 | |
Shareholders’ reports | | | 99,817 | |
Professional fees | | | 75,594 | |
Audit fee | | | 41,988 | |
Trustees’ fees | | | 24,190 | |
Transfer agent’s fees and expenses (including
affiliated expense of $7,143) | | | 11,943 | |
Miscellaneous | | | 228,506 | |
| | | | |
Total expenses | | | 8,286,247 | |
Less: Fee waivers and/or expense reimbursement | | | (842,052 | ) |
| | | | |
Net expenses | | | 7,444,195 | |
| | | | |
NET INVESTMENT INCOME (LOSS) | | | 10,974,890 | |
| | | | |
REALIZED AND UNREALIZED GAIN (LOSS) ON INVESTMENT AND FOREIGN CURRENCY TRANSACTIONS | | | | |
Net realized gain (loss) on:
Investment transactions (including affiliated of $5,284) | | | 138,326,765 | |
Foreign currency transactions | | | (111,077 | ) |
| | | | |
| | | 138,215,688 | |
| | | | |
Net change in unrealized appreciation
(depreciation) on: | | | | |
Investments (including affiliated of $(13,021)) | | | 696,029 | |
Foreign currencies | | | (73,359 | ) |
| | | | |
| | | 622,670 | |
| | | | |
NET GAIN (LOSS) ON INVESTMENT AND
FOREIGN CURRENCY TRANSACTIONS | | | 138,838,358 | |
| | | | |
NET INCREASE (DECREASE) IN NET ASSETS
RESULTING FROM OPERATIONS | | $ | 149,813,248 | |
| | | | |
STATEMENTS OF CHANGES IN NET ASSETS
| | | | | | | | |
| | | Year Ended
December 31, 2024 | | | Year Ended
December 31, 2023 | |
| INCREASE (DECREASE) IN NET ASSETS | | | | | | |
| OPERATIONS | | | | | | |
Net investment income (loss) | | $ | 10,974,890 | | | $ | 15,845,393 | |
Net realized gain (loss) on investment and foreign currency transactions | | | 138,215,688 | | | | 36,504,767 | |
Net change in unrealized appreciation (depreciation) on investments and foreign currencies | | | 622,670 | | | | 142,310,485 | |
| | | | | | | | |
NET INCREASE (DECREASE) IN NET ASSETS RESULTING FROM OPERATIONS | | | 149,813,248 | | | | 194,660,645 | |
| | | | | | | | |
PORTFOLIO SHARE TRANSACTIONS | | | | | | | | |
Portfolio shares sold | | | 17,465,316 | | | | 20,641,883 | |
Portfolio shares purchased | | | (321,783,089 | ) | | | (322,780,659 | ) |
| | | | | | | | |
NET INCREASE (DECREASE) IN NET ASSETS FROM PORTFOLIO SHARE TRANSACTIONS | | | (304,317,773 | ) | | | (302,138,776 | ) |
| | | | | | | | |
TOTAL INCREASE (DECREASE) | | | (154,504,525 | ) | | | (107,478,131 | ) |
NET ASSETS: | | | | | | | | |
Beginning of year | | | 1,080,025,430 | | | | 1,187,503,561 | |
| | | | | | | | |
End of year | | $ | 925,520,905 | | | $ | 1,080,025,430 | |
| | | | | | | | |
SEE NOTES TO FINANCIAL STATEMENTS.
A9
| | | | |
| | PSF GLOBAL PORTFOLIO (CONTINUED) | | |
FINANCIAL HIGHLIGHTS | | | | |
| | | | | | | | | | | | | | | | | | | | | | | | | | | | |
Class I | | | | | | | | | | | | | | | | | | | | | |
| | | | | | | | | Year Ended December 31, | |
| | | | | | | | | 2024 | | | 2023 | | | 2022 | | | 2021 | | | 2020 | |
Per Share Operating Performance(a): | | | | | | | | | | | | | | | | | | | | | | | | | | | | |
Net Asset Value, beginning of year | | | | | | | | | | $ | 55.18 | | | $ | 46.14 | | | $ | 56.82 | | | $ | 48.06 | | | $ | 41.49 | |
| | | | | | | | | | | | | | | | | | | | | | | | | | | | |
Income (Loss) From Investment Operations: | | | | | | | | | | | | | | | | | | | | | | | | | | | | |
Net investment income (loss) | | | | | | | | | | | 0.68 | | | | 0.74 | | | | 0.63 | | | | 0.46 | | | | 0.41 | |
| Net realized and unrealized gain (loss) on investment and foreign currency transactions | | | | | | | | | | | 7.68 | | | | 8.30 | | | | (11.31 | ) | | | 8.30 | | | | 6.16 | |
| | | | | | | | | | | | | | | | | | | | | | | | | | | | |
Total from investment operations | | | | | | | | | | | 8.36 | | | | 9.04 | | | | (10.68 | ) | | | 8.76 | | | | 6.57 | |
| | | | | | | | | | | | | | | | | | | | | | | | | | | | |
Net Asset Value, end of year | | | | | | | | | | $ | 63.54 | | | $ | 55.18 | | | $ | 46.14 | | | $ | 56.82 | | | $ | 48.06 | |
| | | | | | | | | | | | | | | | | | | | | | | | | | | | |
Total Return(b) | | | | | | | | | | | 15.15 | % | | | 19.59 | % | | | (18.80 | )% | | | 18.23 | % | | | 15.84 | % |
Ratios/Supplemental Data: | | | | | | | | | | | | | | | | | | | | | | | | | | | | |
Net assets, end of year (in millions) | | | | | | | | | | $ | 924.2 | | | $ | 1,078.9 | | | $ | 1,186.9 | | | $ | 1,518.5 | | | $ | 1,377.0 | |
Average net assets (in millions) | | | | | | | | | | $ | 978.8 | | | $ | 1,072.5 | | | $ | 1,262.8 | | | $ | 1,472.2 | | | $ | 1,190.6 | |
Ratios to average net assets(c): | | | | | | | | | | | | | | | | | | | | | | | | | | | | |
Expenses after waivers and/or expense reimbursement | | | | | | | | | | | 0.76 | % | | | 0.78 | % | | | 0.75 | % | | | 0.74 | % | | | 0.76 | % |
Expenses before waivers and/or expense reimbursement | | | | | | | | | | | 0.85 | % | | | 0.83 | % | | | 0.79 | % | | | 0.78 | % | | | 0.80 | % |
Net investment income (loss) | | | | | | | | | | | 1.12 | % | | | 1.48 | % | | | 1.30 | % | | | 0.86 | % | | | 1.01 | % |
Portfolio turnover rate(d) | | | | | | | | | | | 35 | % | | | 41 | % | | | 52 | % | | | 21 | % | | | 34 | % |
| | | | | | | | | | | | | | | | | | | | | | | | | |
Class III | | | | | | | | |
| | | | | | | | | | | |
| | | | | | | | | April 26, 2021(e)
through December 31,
2021 |
| | | Year Ended December 31, |
| | | 2024 | | 2023 | | 2022 |
Per Share Operating Performance(a): | | | | | | | | | | | | | | | | | | | | | | | | | |
Net Asset Value, beginning of period | | | | | | | | $ | 54.80 | | | | $ | 45.94 | | | | $ | 56.72 | | | | $ | 53.13 | |
| | | | | | | | | | | | | | | | | | | | | | | | | |
Income (Loss) From Investment Operations: | | | | | | | | | | | | | | | | | | | | | | | | | |
Net investment income (loss) | | | | | | | | | 0.53 | | | | | 0.58 | | | | | 0.54 | | | | | 0.15 | |
| Net realized and unrealized gain (loss) on investment and foreign currency transactions | | | | | | | | | 7.62 | | | | | 8.28 | | | | | (11.32 | ) | | | | 3.44 | |
| | | | | | | | | | | | | | | | | | | | | | | | | |
Total from investment operations | | | | | | | | | 8.15 | | | | | 8.86 | | | | | (10.78 | ) | | | | 3.59 | |
| | | | | | | | | | | | | | | | | | | | | | | | | |
Net Asset Value, end of period | | | | | | | | $ | 62.95 | | | | $ | 54.80 | | | | $ | 45.94 | | | | $ | 56.72 | |
| | | | | | | | | | | | | | | | | | | | | | | | | |
Total Return(b) | | | | | | | | | 14.87 | % | | | | 19.29 | % | | | | (19.01 | )% | | | | 6.76 | % |
Ratios/Supplemental Data: | | | | | | | | | | | | | | | | | | | | | | | | | |
Net assets, end of period (in millions) | | | | | | | | $ | 1.3 | | | | $ | 1.1 | | | | $ | 0.6 | | | | $ | 0.2 | |
Average net assets (in millions) | | | | | | | | $ | 1.3 | | | | $ | 0.8 | | | | $ | 0.5 | | | | $ | 0.1 | |
Ratios to average net assets(c): | | | | | | | | | | | | | | | | | | | | | | | | | |
Expenses after waivers and/or expense reimbursement | | | | | | | | | 1.01 | % | | | | 1.03 | % | | | | 1.00 | % | | | | 0.99 | %(f) |
Expenses before waivers and/or expense reimbursement | | | | | | | | | 1.10 | % | | | | 1.08 | % | | | | 1.04 | % | | | | 1.03 | %(f) |
Net investment income (loss) | | | | | | | | | 0.86 | % | | | | 1.15 | % | | | | 1.14 | % | | | | 0.40 | %(f) |
Portfolio turnover rate(d) | | | | | | | | | 35 | % | | | | 41 | % | | | | 52 | % | | | | 21 | % |
| (a) | Calculated based on average shares outstanding during the period. |
| (b) | Total return is calculated assuming a purchase of a share on the first day and a sale on the last day of each period reported and includes reinvestment of dividends and distributions, if any, and does not reflect the effect of insurance contract charges. Total return does not reflect expenses associated with the separate account such as administrative fees, account charges and surrender charges which, if reflected, would reduce the total returns for all periods shown. Performance figures may reflect fee waivers and/or expense reimbursements. In the absence of fee waivers and/or expense reimbursements, the total return would be lower. Past performance is no guarantee of future results. Total returns may reflect adjustments to conform to GAAP. Total returns for periods less than one full year are not annualized. |
| (c) | Does not include expenses of the underlying funds in which the Portfolio invests. |
| (d) | The Portfolio’s portfolio turnover rate is calculated in accordance with regulatory requirements, without regard to transactions involving short-term investments, certain derivatives and in-kind transactions (if any). If such transactions were included, the Portfolio’s portfolio turnover rate may be higher. |
| (e) | Commencement of offering. |
| (f) | Annualized, with the exception of certain non-recurring expenses. |
SEE NOTES TO FINANCIAL STATEMENTS.
A10
| | | | |
| | PSF MID-CAP GROWTH PORTFOLIO | | |
SCHEDULE OF INVESTMENTS | | | | as of December 31, 2024 |
| | | | | | | | |
| | | Shares | | | Value | |
LONG-TERM INVESTMENTS — 98.6% | |
COMMON STOCKS | |
Aerospace & Defense — 2.7% | | | | | | | | |
Axon Enterprise, Inc.* | | | 5,797 | | | $ | 3,445,273 | |
HEICO Corp. (Class A Stock) | | | 36,723 | | | | 6,833,416 | |
Howmet Aerospace, Inc. | | | 16,651 | | | | 1,821,120 | |
| | | | | | | | |
| | |
| | | | | | | 12,099,809 | |
| | | | | | | | |
Automobiles — 0.5% | | | | | | | | |
Thor Industries, Inc.(a) | | | 24,789 | | | | 2,372,555 | |
| | | | | | | | |
Banks — 0.7% | | | | | | | | |
NU Holdings Ltd. (Brazil) (Class A Stock)* | | | 314,177 | | | | 3,254,874 | |
| | | | | | | | |
Beverages — 0.5% | | | | | | | | |
Constellation Brands, Inc. (Class A Stock) | | | 9,345 | | | | 2,065,245 | |
| | | | | | | | |
Biotechnology — 5.1% | | | | | | | | |
Alnylam Pharmaceuticals, Inc.* | | | 27,041 | | | | 6,363,018 | |
Exact Sciences Corp.*(a) | | | 24,559 | | | | 1,379,970 | |
Exelixis, Inc.*(a) | | | 55,998 | | | | 1,864,733 | |
Insmed, Inc.* | | | 36,295 | | | | 2,505,807 | |
Natera, Inc.* | | | 44,339 | | | | 7,018,864 | |
REVOLUTION Medicines, Inc.*(a) | | | 29,545 | | | | 1,292,298 | |
Vaxcyte, Inc.* | | | 14,409 | | | | 1,179,521 | |
Viking Therapeutics, Inc.*(a) | | | 28,947 | | | | 1,164,827 | |
| | | | | | | | |
| | |
| | | | | | | 22,769,038 | |
| | | | | | | | |
Building Products — 2.0% | | | | | | | | |
AAON, Inc.(a) | | | 37,229 | | | | 4,381,109 | |
Simpson Manufacturing Co., Inc. | | | 15,613 | | | | 2,589,104 | |
Trane Technologies PLC | | | 5,686 | | | | 2,100,124 | |
| | | | | | | | |
| | |
| | | | | | | 9,070,337 | |
| | | | | | | | |
Capital Markets — 11.6% | | | | | | | | |
Ares Management Corp. (Class A Stock) | | | 42,326 | | | | 7,492,972 | |
Coinbase Global, Inc. (Class A Stock)* | | | 10,474 | | | | 2,600,694 | |
FactSet Research Systems, Inc.(a) | | | 9,376 | | | | 4,503,105 | |
Interactive Brokers Group, Inc. (Class A Stock) | | | 31,190 | | | | 5,510,337 | |
Jefferies Financial Group, Inc. | | | 44,660 | | | | 3,501,344 | |
LPL Financial Holdings, Inc. | | | 17,760 | | | | 5,798,817 | |
Moody’s Corp. | | | 5,494 | | | | 2,600,695 | |
MSCI, Inc. | | | 8,231 | | | | 4,938,682 | |
Raymond James Financial, Inc. | | | 19,117 | | | | 2,969,444 | |
Robinhood Markets, Inc. (Class A Stock)* | | | 133,064 | | | | 4,957,965 | |
TPG, Inc. | | | 35,396 | | | | 2,224,285 | |
Tradeweb Markets, Inc. (Class A Stock) | | | 35,514 | | | | 4,649,493 | |
| | | | | | | | |
| | |
| | | | | | | 51,747,833 | |
| | | | | | | | |
Commercial Services & Supplies — 1.9% | | | | | |
Cintas Corp. | | | 10,155 | | | | 1,855,319 | |
Copart, Inc.* | | | 72,029 | | | | 4,133,744 | |
MSA Safety, Inc. | | | 15,955 | | | | 2,644,860 | |
| | | | | | | | |
| | |
| | | | | | | 8,633,923 | |
| | | | | | | | |
Communications Equipment — 0.4% | | | | | |
Ciena Corp.*(a) | | | 22,745 | | | | 1,929,003 | |
| | | | | | | | |
| | | | | | | | |
| | | Shares | | | Value | |
COMMON STOCKS (continued) | |
Construction & Engineering — 2.1% | |
Comfort Systems USA, Inc. | | | 6,035 | | | $ | 2,559,202 | |
Quanta Services, Inc.(a) | | | 22,096 | | | | 6,983,441 | |
| | | | | | | | |
| | |
| | | | | | | 9,542,643 | |
| | | | | | | | |
Construction Materials — 0.8% | | | | | | | | |
Eagle Materials, Inc. | | | 13,830 | | | | 3,412,691 | |
| | | | | | | | |
Consumer Staples Distribution & Retail — 1.0% | | | | | |
Casey’s General Stores, Inc. | | | 11,072 | | | | 4,387,059 | |
| | | | | | | | |
Distributors — 0.9% | | | | | | | | |
Pool Corp.(a) | | | 12,281 | | | | 4,187,084 | |
| | | | | | | | |
Diversified Consumer Services — 1.0% | |
Bright Horizons Family Solutions, Inc.* . | | | 38,751 | | | | 4,295,548 | |
| | | | | | | | |
Electrical Equipment — 3.7% | | | | | | | | |
AMETEK, Inc. | | | 20,185 | | | | 3,638,548 | |
GE Vernova, Inc. | | | 5,513 | | | | 1,813,391 | |
Hubbell, Inc. | | | 6,638 | | | | 2,780,592 | |
Vertiv Holdings Co. (Class A Stock) | | | 71,474 | | | | 8,120,161 | |
| | | | | | | | |
| | |
| | | | | | | 16,352,692 | |
| | | | | | | | |
Electronic Equipment, Instruments & Components — 1.2% | |
Amphenol Corp. (Class A Stock) | | | 35,539 | | | | 2,468,184 | |
Teledyne Technologies, Inc.* | | | 6,215 | | | | 2,884,568 | |
| | | | | | | | |
| | |
| | | | | | | 5,352,752 | |
| | | | | | | | |
Energy Equipment & Services — 0.9% | |
TechnipFMC PLC (United Kingdom) | | | 137,548 | | | | 3,980,639 | |
| | | | | | | | |
Entertainment — 1.0% | | | | | | | | |
Take-Two Interactive Software, Inc.* | | | 24,591 | | | | 4,526,711 | |
| | | | | | | | |
Financial Services — 0.9% | | | | | | | | |
Block, Inc.* | | | 21,440 | | | | 1,822,186 | |
Rocket Cos., Inc. (Class A Stock)*(a) | | | 184,219 | | | | 2,074,306 | |
| | | | | | | | |
| | |
| | | | | | | 3,896,492 | |
| | | | | | | | |
Ground Transportation — 2.0% | |
J.B. Hunt Transport Services, Inc.(a) | | | 21,460 | | | | 3,662,363 | |
Saia, Inc.* | | | 11,731 | | | | 5,346,169 | |
| | | | | | | | |
| | |
| | | | | | | 9,008,532 | |
| | | | | | | | |
Health Care Equipment & Supplies — 2.2% | |
Cooper Cos., Inc. (The)* | | | 35,671 | | | | 3,279,235 | |
Dexcom, Inc.* | | | 28,889 | | | | 2,246,697 | |
IDEXX Laboratories, Inc.* | | | 4,834 | | | | 1,998,569 | |
Inspire Medical Systems, Inc.*(a) | | | 11,102 | | | | 2,058,089 | |
| | | | | | | | |
| | |
| | | | | | | 9,582,590 | |
| | | | | | | | |
Health Care Providers & Services — 0.9% | |
McKesson Corp. | | | 7,200 | | | | 4,103,352 | |
| | | | | | | | |
Health Care Technology — 1.1% | | | | | | | | |
Veeva Systems, Inc. (Class A Stock)* | | | 22,487 | | | | 4,727,892 | |
| | | | | | | | |
Hotels, Restaurants & Leisure — 6.9% | |
Domino’s Pizza, Inc. | | | 9,614 | | | | 4,035,573 | |
DoorDash, Inc. (Class A Stock)* | | | 29,967 | | | | 5,026,964 | |
Flutter Entertainment PLC (United Kingdom)* | | | 16,716 | | | | 4,320,250 | |
Hilton Worldwide Holdings, Inc. | | | 37,064 | | | | 9,160,738 | |
Las Vegas Sands Corp.(a) | | | 81,212 | | | | 4,171,049 | |
SEE NOTES TO FINANCIAL STATEMENTS.
A11
| | | | |
| | PSF MID-CAP GROWTH PORTFOLIO (CONTINUED) | | |
SCHEDULE OF INVESTMENTS | | | | as of December 31, 2024 |
| | | | | | | | |
| | | Shares | | | Value | |
COMMON STOCKS (continued) | |
Hotels, Restaurants & Leisure (cont’d.) | | | | | |
Planet Fitness, Inc. (Class A Stock)* | | | 40,045 | | | $ | 3,959,249 | |
| | | | | | | | |
| | |
| | | | | | | 30,673,823 | |
| | | | | | | | |
Household Durables — 0.7% | | | | | | | | |
Garmin Ltd. | | | 14,300 | | | | 2,949,518 | |
| | | | | | | | |
Independent Power & Renewable Electricity Producers — 0.9% | |
Vistra Corp. | | | 28,175 | | | | 3,884,487 | |
| | | | | | | | |
Insurance — 0.8% | | | | | | | | |
Arthur J. Gallagher & Co. | | | 13,181 | | | | 3,741,427 | |
| | | | | | | | |
IT Services — 4.1% | | | | | | | | |
Gartner, Inc.* | | | 16,034 | | | | 7,767,992 | |
Globant SA*(a) | | | 22,616 | | | | 4,849,323 | |
MongoDB, Inc.* | | | 18,047 | | | | 4,201,522 | |
Snowflake, Inc. (Class A Stock)* | | | 9,731 | | | | 1,502,563 | |
| | | | | | | | |
| | |
| | | | | | | 18,321,400 | |
| | | | | | | | |
Life Sciences Tools & Services — 2.7% | | | | | |
Agilent Technologies, Inc. | | | 15,869 | | | | 2,131,841 | |
IQVIA Holdings, Inc.* | | | 14,208 | | | | 2,792,014 | |
Mettler-Toledo International, Inc.* | | | 1,960 | | | | 2,398,413 | |
West Pharmaceutical Services, Inc. | | | 13,935 | | | | 4,564,549 | |
| | | | | | | | |
| | |
| | | | | | | 11,886,817 | |
| | | | | | | | |
Machinery — 3.2% | | | | | | | | |
Esab Corp.(a) | | | 31,486 | | | | 3,776,431 | |
Ingersoll Rand, Inc.(a) | | | 27,514 | | | | 2,488,916 | |
ITT, Inc. | | | 34,319 | | | | 4,903,499 | |
Westinghouse Air Brake Technologies Corp. | | | 16,431 | | | | 3,115,153 | |
| | | | | | | | |
| | |
| | | | | | | 14,283,999 | |
| | | | | | | | |
Media — 2.3% | | | | | | | | |
Trade Desk, Inc. (The) (Class A Stock)* | | | 85,849 | | | | 10,089,833 | |
| | | | | | | | |
Oil, Gas & Consumable Fuels — 2.2% | | | | | |
Cheniere Energy, Inc. | | | 26,806 | | | | 5,759,805 | |
EOG Resources, Inc. | | | 33,429 | | | | 4,097,727 | |
| | | | | | | | |
| | |
| | | | | | | 9,857,532 | |
| | | | | | | | |
Personal Care Products — 0.7% | | | | | | | | |
elf Beauty, Inc.*(a) | | | 26,285 | | | | 3,300,082 | |
| | | | | | | | |
Pharmaceuticals — 0.9% | | | | | | | | |
Intra-Cellular Therapies, Inc.* | | | 50,384 | | | | 4,208,072 | |
| | | | | | | | |
Professional Services — 1.1% | | | | | | | | |
Booz Allen Hamilton Holding Corp. | | | 38,972 | | | | 5,015,696 | |
| | | | | | | | |
Semiconductors & Semiconductor Equipment — 5.3% | |
Entegris, Inc. | | | 44,588 | | | | 4,416,887 | |
Marvell Technology, Inc. | | | 26,711 | | | | 2,950,230 | |
Monolithic Power Systems, Inc.(a) | | | 4,498 | | | | 2,661,467 | |
ON Semiconductor Corp.* | | | 49,172 | | | | 3,100,295 | |
Onto Innovation, Inc.* | | | 14,277 | | | | 2,379,548 | |
Rambus, Inc.* | | | 47,112 | | | | 2,490,340 | |
Teradyne, Inc. | | | 43,382 | | | | 5,462,661 | |
| | | | | | | | |
| | |
| | | | | | | 23,461,428 | |
| | | | | | | | |
Software — 15.4% | | | | | | | | |
AppLovin Corp. (Class A Stock)*(a) | | | 40,923 | | | | 13,252,095 | |
| | | | | | | | |
| | | Shares | | | Value | |
COMMON STOCKS (continued) | |
Software (cont’d.) | | | | | | | | |
Atlassian Corp. (Class A Stock)* | | | 16,651 | | | $ | 4,052,520 | |
Confluent, Inc. (Class A Stock)* | | | 131,370 | | | | 3,673,105 | |
Crowdstrike Holdings, Inc. (Class A Stock)*(a) | | | 8,258 | | | | 2,825,557 | |
CyberArk Software Ltd.* | | | 10,420 | | | | 3,471,423 | |
Datadog, Inc. (Class A Stock)* | | | 52,183 | | | | 7,456,429 | |
Elastic NV* | | | 16,674 | | | | 1,652,060 | |
Gitlab, Inc. (Class A Stock)* | | | 27,616 | | | | 1,556,162 | |
HubSpot, Inc.* | | | 13,545 | | | | 9,437,750 | |
Nutanix, Inc. (Class A Stock)* | | | 57,812 | | | | 3,536,938 | |
Palantir Technologies, Inc. (Class A Stock)*(a) | | | 121,143 | | | | 9,162,045 | |
Palo Alto Networks, Inc.*(a) | | | 12,490 | | | | 2,272,680 | |
Rubrik, Inc. (Class A Stock)* | | | 28,785 | | | | 1,881,388 | |
Tyler Technologies, Inc.* | | | 7,196 | | | | 4,149,502 | |
| | | | | | | | |
| | |
| | | | | | | 68,379,654 | |
| | | | | | | | |
Specialty Retail — 5.0% | | | | | | | | |
AutoZone, Inc.* | | | 727 | | | | 2,327,854 | |
Burlington Stores, Inc.* | | | 18,101 | | | | 5,159,871 | |
Floor & Decor Holdings, Inc. (Class A Stock)* | | | 21,582 | | | | 2,151,725 | |
Ross Stores, Inc. | | | 22,221 | | | | 3,361,371 | |
Tractor Supply Co.(a) | | | 126,545 | | | | 6,714,478 | |
Ulta Beauty, Inc.* | | | 5,920 | | | | 2,574,785 | |
| | | | | | | | |
| | |
| | | | | | | 22,290,084 | |
| | | | | | | | |
Textiles, Apparel & Luxury Goods — 0.7% | | | | | |
On Holding AG (Switzerland) (Class A Stock)*(a) | | | 53,616 | | | | 2,936,548 | |
| | | | | | | | |
Trading Companies & Distributors — 0.6% | | | | | |
Air Lease Corp.(a) | | | 51,062 | | | | 2,461,699 | |
| | | | | | | | |
TOTAL LONG-TERM INVESTMENTS
(cost $324,205,203) | | | | 439,041,393 | |
| | | | | | | | |
SHORT-TERM INVESTMENTS — 19.0% | | | | | |
AFFILIATED MUTUAL FUNDS | | | | | |
PGIM Core Ultra Short Bond Fund(wb) | | | 6,362,837 | | | | 6,362,837 | |
PGIM Institutional Money Market Fund (7-day effective yield 4.649%) (cost $78,290,132; includes $78,026,683 of cash collateral for securities on loan)(b)(wb) | | | 78,387,833 | | | | 78,340,801 | |
| | | | | | | | |
TOTAL SHORT-TERM INVESTMENTS
(cost $84,652,969) | | | | 84,703,638 | |
| | | | | | | | |
TOTAL INVESTMENTS—117.6%
(cost $408,858,172) | | | | | | | 523,745,031 | |
Liabilities in excess of other assets — (17.6)% | | | | (78,452,348 | ) |
| | | | | | | | |
| | |
NET ASSETS — 100.0% | | | | | | $ | 445,292,683 | |
| | | | | | | | |
SEE NOTES TO FINANCIAL STATEMENTS.
A12
| | | | |
| | PSF MID-CAP GROWTH PORTFOLIO (CONTINUED) | | |
SCHEDULE OF INVESTMENTS | | | | as of December 31, 2024 |
See the Glossary for a list of the abbreviation(s) used in the annual report.
| * | Non-income producing security. |
| (a) | All or a portion of security is on loan. The aggregate market value of such securities, including those sold and pending settlement, is $75,843,203; cash collateral of $78,026,683 (included in liabilities) was received with which the Portfolio purchased highly liquid short-term investments. In the event of significant appreciation in value of securities on loan on the last business day of the reporting period, the Portfolio may reflect a collateral value that is less than the market value of the loaned securities and such shortfall is remedied the following business day. |
| (b) | Represents security, or portion thereof, purchased with cash collateral received for securities on loan and includes dividend reinvestment. |
| (wb) | Represents an investment in a Fund affiliated with the Manager. |
Fair Value Measurements:
Various inputs are used in determining the value of the Portfolio’s investments. These inputs are summarized in the three broad levels listed below.
Level 1—unadjusted quoted prices generally in active markets for identical securities.
Level 2—quoted prices for similar securities, interest rates and yield curves, prepayment speeds, foreign currency exchange rates and other observable inputs.
Level 3—unobservable inputs for securities valued in accordance with Board approved fair valuation procedures.
The following is a summary of the inputs used as of December 31, 2024 in valuing such portfolio securities:
| | | | | | | | | | | | | | | | | | | | | | | | | | | | |
| | | Level 1 | | | | | | Level 2 | | | | | | | | | Level 3 | | | | |
Investments in Securities | | | | | | | | | | | | | | | | | | | | | | | | | | | | |
Assets | | | | | | | | | | | | | | | | | | | | | | | | | | | | |
Long-Term Investments | | | | | | | | | | | | | | | | | | | | | | | | | | | | |
Common Stocks | | | | | | | | | | | | | | | | | | | | | | | | | | | | |
Aerospace & Defense | | $ | 12,099,809 | | | | | | | | $— | | | | | | | | | | | | $— | | | | | |
Automobiles | | | 2,372,555 | | | | | | | | — | | | | | | | | | | | | — | | | | | |
Banks | | | 3,254,874 | | | | | | | | — | | | | | | | | | | | | — | | | | | |
Beverages | | | 2,065,245 | | | | | | | | — | | | | | | | | | | | | — | | | | | |
Biotechnology | | | 22,769,038 | | | | | | | | — | | | | | | | | | | | | — | | | | | |
Building Products | | | 9,070,337 | | | | | | | | — | | | | | | | | | | | | — | | | | | |
Capital Markets | | | 51,747,833 | | | | | | | | — | | | | | | | | | | | | — | | | | | |
Commercial Services & Supplies | | | 8,633,923 | | | | | | | | — | | | | | | | | | | | | — | | | | | |
Communications Equipment | | | 1,929,003 | | | | | | | | — | | | | | | | | | | | | — | | | | | |
Construction & Engineering | | | 9,542,643 | | | | | | | | — | | | | | | | | | | | | — | | | | | |
Construction Materials | | | 3,412,691 | | | | | | | | — | | | | | | | | | | | | — | | | | | |
Consumer Staples Distribution & Retail | | | 4,387,059 | | | | | | | | — | | | | | | | | | | | | — | | | | | |
Distributors | | | 4,187,084 | | | | | | | | — | | | | | | | | | | | | — | | | | | |
Diversified Consumer Services | | | 4,295,548 | | | | | | | | — | | | | | | | | | | | | — | | | | | |
Electrical Equipment | | | 16,352,692 | | | | | | | | — | | | | | | | | | | | | — | | | | | |
Electronic Equipment, Instruments & Components | | | 5,352,752 | | | | | | | | — | | | | | | | | | | | | — | | | | | |
Energy Equipment & Services | | | 3,980,639 | | | | | | | | — | | | | | | | | | | | | — | | | | | |
Entertainment | | | 4,526,711 | | | | | | | | — | | | | | | | | | | | | — | | | | | |
Financial Services | | | 3,896,492 | | | | | | | | — | | | | | | | | | | | | — | | | | | |
Ground Transportation | | | 9,008,532 | | | | | | | | — | | | | | | | | | | | | — | | | | | |
Health Care Equipment & Supplies | | | 9,582,590 | | | | | | | | — | | | | | | | | | | | | — | | | | | |
Health Care Providers & Services | | | 4,103,352 | | | | | | | | — | | | | | | | | | | | | — | | | | | |
Health Care Technology | | | 4,727,892 | | | | | | | | — | | | | | | | | | | | | — | | | | | |
Hotels, Restaurants & Leisure | | | 30,673,823 | | | | | | | | — | | | | | | | | | | | | — | | | | | |
Household Durables | | | 2,949,518 | | | | | | | | — | | | | | | | | | | | | — | | | | | |
Independent Power & Renewable Electricity Producers | | | 3,884,487 | | | | | | | | — | | | | | | | | | | | | — | | | | | |
Insurance | | | 3,741,427 | | | | | | | | — | | | | | | | | | | | | — | | | | | |
IT Services | | | 18,321,400 | | | | | | | | — | | | | | | | | | | | | — | | | | | |
Life Sciences Tools & Services | | | 11,886,817 | | | | | | | | — | | | | | | | | | | | | — | | | | | |
Machinery | | | 14,283,999 | | | | | | | | — | | | | | | | | | | | | — | | | | | |
Media | | | 10,089,833 | | | | | | | | — | | | | | | | | | | | | — | | | | | |
Oil, Gas & Consumable Fuels | | | 9,857,532 | | | | | | | | — | | | | | | | | | | | | — | | | | | |
Personal Care Products | | | 3,300,082 | | | | | | | | — | | | | | | | | | | | | — | | | | | |
Pharmaceuticals | | | 4,208,072 | | | | | | | | — | | | | | | | | | | | | — | | | | | |
SEE NOTES TO FINANCIAL STATEMENTS.
A13
| | | | |
| | PSF MID-CAP GROWTH PORTFOLIO (CONTINUED) | | |
SCHEDULE OF INVESTMENTS | | | | as of December 31, 2024 |
| | | | | | | | | | | | |
| | | Level 1 | | | Level 2 | | | Level 3 | |
Investments in Securities (continued) | | | | | | | | | | | | |
Assets (continued) | | | | | | | | | | | | |
Long-Term Investments (continued) | | | | | | | | | | | | |
Common Stocks (continued) | | | | | | | | | | | | |
Professional Services | | $ | 5,015,696 | | | | $— | | | | $— | |
Semiconductors & Semiconductor Equipment | | | 23,461,428 | | | | — | | | | — | |
Software | | | 68,379,654 | | | | — | | | | — | |
Specialty Retail | | | 22,290,084 | | | | — | | | | — | |
Textiles, Apparel & Luxury Goods | | | 2,936,548 | | | | — | | | | — | |
Trading Companies & Distributors | | | 2,461,699 | | | | — | | | | — | |
Short-Term Investments | | | | | | | | | | | | |
Affiliated Mutual Funds | | | 84,703,638 | | | | — | | | | — | |
| | | | | | | | | | | | |
Total | | $ | 523,745,031 | | | | $— | | | | $— | |
| | | | | | | | | | | | |
Industry Classification:
The industry classification of investments and liabilities in excess of other assets shown as a percentage of net assets as of December 31, 2024 were as follows:
| | | | |
Affiliated Mutual Funds (17.5% represents investments purchased with collateral from securities on loan) | | | 19.0 | % |
Software | | | 15.4 | |
Capital Markets | | | 11.6 | |
Hotels, Restaurants & Leisure | | | 6.9 | |
Semiconductors & Semiconductor Equipment | | | 5.3 | |
Biotechnology | | | 5.1 | |
Specialty Retail | | | 5.0 | |
IT Services | | | 4.1 | |
Electrical Equipment | | | 3.7 | |
Machinery | | | 3.2 | |
Aerospace & Defense | | | 2.7 | |
Life Sciences Tools & Services | | | 2.7 | |
Media | | | 2.3 | |
Oil, Gas & Consumable Fuels | | | 2.2 | |
Health Care Equipment & Supplies | | | 2.2 | |
Construction & Engineering | | | 2.1 | |
Building Products | | | 2.0 | |
Ground Transportation | | | 2.0 | |
Commercial Services & Supplies | | | 1.9 | |
Electronic Equipment, Instruments & Components | | | 1.2 | |
Professional Services | | | 1.1 | |
Health Care Technology | | | 1.1 | |
Entertainment | | | 1.0 | |
| | | | |
Consumer Staples Distribution & Retail | | | 1.0 | % |
Diversified Consumer Services | | | 1.0 | |
Pharmaceuticals | | | 0.9 | |
Distributors | | | 0.9 | |
Health Care Providers & Services | | | 0.9 | |
Energy Equipment & Services | | | 0.9 | |
Financial Services | | | 0.9 | |
Independent Power & Renewable Electricity Producers | | | 0.9 | |
Insurance | | | 0.8 | |
Construction Materials | | | 0.8 | |
Personal Care Products | | | 0.7 | |
Banks | | | 0.7 | |
Household Durables | | | 0.7 | |
Textiles, Apparel & Luxury Goods | | | 0.7 | |
Trading Companies & Distributors | | | 0.6 | |
Automobiles | | | 0.5 | |
Beverages | | | 0.5 | |
Communications Equipment | | | 0.4 | |
| | | | |
| | | 117.6 | |
Liabilities in excess of other assets | | | (17.6 | ) |
| | | | |
| |
| | | 100.0 | % |
| | | | |
Financial Instruments/Transactions—Summary of Offsetting and Netting Arrangements:
The Portfolio entered into financial instruments/transactions during the reporting period that are either offset in accordance with current requirements or are subject to enforceable master netting arrangements or similar agreements that permit offsetting. The information about offsetting and related netting arrangements for financial instruments/transactions where the legal right to set-off exists is presented in the summary below.
Offsetting of financial instrument/transaction assets and liabilities:
| | | | | | | | | | |
| Description | | Gross Market Value of Recognized
Assets/(Liabilities) | | | | Collateral Pledged/(Received)(1) | | | | Net Amount |
Securities on Loan | | $75,843,203 | | | | $(75,843,203) | | | | $— |
(1) Collateral amount disclosed by the Portfolio is limited to the market value of financial instruments/transactions.
SEE NOTES TO FINANCIAL STATEMENTS.
A14
| | | | |
| | PSF MID-CAP GROWTH PORTFOLIO (CONTINUED) | | |
| | | | |
STATEMENT OF ASSETS AND LIABILITIES
as of December 31, 2024
| | | | | |
ASSETS | | | | | |
Investments at value, including securities on loan of | | | | | |
$75,843,203: | | | | | |
Unaffiliated investments (cost $324,205,203) | | | $ | 439,041,393 | |
Affiliated investments (cost $84,652,969) | | | | 84,703,638 | |
Receivable for Portfolio shares sold | | | | 153,889 | |
Tax reclaim receivable | | | | 56,439 | |
Dividends receivable | | | | 47,341 | |
Prepaid expenses | | | | 4,403 | |
| | | | | |
Total Assets | | | | 524,007,103 | |
| | | | | |
LIABILITIES | | | | | |
Payable to broker for collateral for securities on loan | | | | 78,026,683 | |
Accrued expenses and other liabilities | | | | 379,908 | |
Management fee payable | | | | 231,797 | |
Payable for Portfolio shares purchased | | | | 66,919 | |
Payable to affiliate | | | | 6,717 | |
Affiliated transfer agent fee payable | | | | 1,190 | |
Distribution fee payable | | | | 624 | |
Trustees’ fees payable | | | | 561 | |
Administration fee payable | | | | 21 | |
| | | | | |
Total Liabilities | | | | 78,714,420 | |
| | | | | |
NET ASSETS | | | $ | 445,292,683 | |
| | | | | |
Net assets were comprised of: | | | | | |
Partners’ Equity | | | $ | 445,292,683 | |
| | | | | |
Class I: | | | | | |
Net asset value and redemption price per share, $442,434,758 / 14,005,964 outstanding shares of beneficial interest | | | $ | 31.59 | |
| | | | | |
Class II: | | | | | |
Net asset value and redemption price per share, $165,055 / 5,695 outstanding shares of beneficial interest | | | $ | 28.98 | |
| | | | | |
Class III: | | | | | |
Net asset value and redemption price per share, $2,692,870 / 86,024 outstanding shares of beneficial interest | | | $ | 31.30 | |
| | | | | |
STATEMENT OF OPERATIONS
Year Ended December 31, 2024
| | | | | |
NET INVESTMENT INCOME (LOSS) | | | | | |
INCOME | | | | | |
Unaffiliated dividend income (net of $2,104 foreign withholding tax) | | | $ | 1,750,616 | |
Affiliated dividend income | | | | 314,679 | |
Income from securities lending, net (including affiliated income of $96,495) | | | | 98,306 | |
| | | | | |
Total income | | | | 2,163,601 | |
| | | | | |
EXPENSES | | | | | |
Management fee | | | | 2,494,196 | |
Distribution fee—Class II | | | | 419 | |
Distribution fee—Class III | | | | 5,770 | |
Administration fee—Class II | | | | 252 | |
Custodian and accounting fees | | | | 61,513 | |
Shareholders’ reports | | | | 53,578 | |
Professional fees | | | | 41,129 | |
Audit fee | | | | 30,858 | |
Trustees’ fees | | | | 15,212 | |
Transfer agent’s fees and expenses (including affiliated expense of $7,143) | | | | 11,943 | |
Miscellaneous | | | | 28,130 | |
| | | | | |
Total expenses | | | | 2,743,000 | |
Less: Fee waivers and/or expense reimbursement | | | | (54,041 | ) |
| | | | | |
Net expenses | | | | 2,688,959 | |
| | | | | |
NET INVESTMENT INCOME (LOSS) | | | | (525,358 | ) |
| | | | | |
| REALIZED AND UNREALIZED GAIN (LOSS) ON INVESTMENT TRANSACTIONS | | | | | |
Net realized gain (loss) on investment transactions (including affiliated of $(3,358)) | | | | 43,456,488 | |
| | | | | |
Net change in unrealized appreciation (depreciation) on: Investments (including affiliated of $(7,936)) | | | | 11,752,840 | |
| | | | | |
NET GAIN (LOSS) ON INVESTMENT TRANSACTIONS | | | | 55,209,328 | |
| | | | | |
NET INCREASE (DECREASE) IN NET ASSETS RESULTING FROM OPERATIONS | | | $ | 54,683,970 | |
| | | | | |
STATEMENTS OF CHANGES IN NET ASSETS
| | | | | | | | | | | | | | | | | | | | | | | | | | | | | | |
| | | | | Year Ended
December 31, 2024 | | | | | | Year Ended
December 31, 2023 | | |
INCREASE (DECREASE) IN NET ASSETS | | | | | | | | | | | | | | | | | | | | | | | | | | | | | | |
OPERATIONS | | | | | | | | | | | | | | | | | | | | | | | | | | | | | | |
Net investment income (loss) | | | | | | | | $ | (525,358 | ) | | | | | | | | | | | | | $ | (181,068 | ) | | | | | |
Net realized gain (loss) on investment transactions. | | | | | | | | | 43,456,488 | | | | | | | | | | | | | | | 9,235,904 | | | | | | |
Net change in unrealized appreciation (depreciation) on investments | | | | | | | | | 11,752,840 | | | | | | | | | | | | | | | 64,349,757 | | | | | | |
| | | | | | | | | | | | | | | | | | | | | | | | | | | | | | |
NET INCREASE (DECREASE) IN NET ASSETS RESULTING FROM OPERATIONS | | | | | | | | | 54,683,970 | | | | | | | | | | | | | | | 73,404,593 | | | | | | |
| | | | | | | | | | | | | | | | | | | | | | | | | | | | | | |
PORTFOLIO SHARE TRANSACTIONS | | | | | | | | | | | | | | | | | | | | | | | | | | | | | | |
Portfolio shares sold | | | | | | | | | 28,339,826 | | | | | | | | | | | | | | | 21,933,711 | | | | | | |
Portfolio shares purchased | | | | | | | | | (25,097,747 | ) | | | | | | | | | | | | | | (16,715,451 | ) | | | | | |
| | | | | | | | | | | | | | | | | | | | | | | | | | | | | | |
NET INCREASE (DECREASE) IN NET ASSETS FROM PORTFOLIO SHARE TRANSACTIONS | | | | | | | | | 3,242,079 | | | | | | | | | | | | | | | 5,218,260 | | | | | | |
| | | | | | | | | | | | | | | | | | | | | | | | | | | | | | |
TOTAL INCREASE (DECREASE) | | | | | | | | | 57,926,049 | | | | | | | | | | | | | | | 78,622,853 | | | | | | |
NET ASSETS: | | | | | | | | | | | | | | | | | | | | | | | | | | | | | | |
Beginning of year | | | | | | | | | 387,366,634 | | | | | | | | | | | | | | | 308,743,781 | | | | | | |
| | | | | | | | | | | | | | | | | | | | | | | | | | | | | | |
End of year | | | | | | | | $ | 445,292,683 | | | | | | | | | | | | | | $ | 387,366,634 | | | | | | |
| | | | | | | | | | | | | | | | | | | | | | | | | | | | | | |
SEE NOTES TO FINANCIAL STATEMENTS.
A15
| | | | |
| | PSF MID-CAP GROWTH PORTFOLIO (CONTINUED) | | |
FINANCIAL HIGHLIGHTS | | | | |
| | | | | | | | | | | | | | | | | | | | | | |
Class I | | | | | |
| | | | | Year Ended December 31, | |
| | | | | 2024 | | | 2023 | | | 2022 | | | 2021 | | | 2020 | |
Per Share Operating Performance(a): | | | | | | | | | | | | | | | | | | | | | | |
Net Asset Value, beginning of year | | | | $ | 27.65 | | | $ | 22.38 | | | $ | 30.64 | | | $ | 27.68 | | | $ | 18.77 | |
| | | | | | | | | | | | | | | | | | | | | | |
Income (Loss) From Investment Operations: | | | | | | | | | | | | | | | | | | | | | | |
Net investment income (loss) | | | | | (0.04 | ) | | | (0.01 | ) | | | (0.03 | ) | | | (0.08 | ) | | | (0.03 | ) |
Net realized and unrealized gain (loss) on investment transactions | | | | | 3.98 | | | | 5.28 | | | | (8.23 | ) | | | 3.04 | | | | 8.94 | |
| | | | | | | | | | | | | | | | | | | | | | |
Total from investment operations | | | | | 3.94 | | | | 5.27 | | | | (8.26 | ) | | | 2.96 | | | | 8.91 | |
| | | | | | | | | | | | | | | | | | | | | | |
Net Asset Value, end of year | | | | $ | 31.59 | | | $ | 27.65 | | | $ | 22.38 | | | $ | 30.64 | | | $ | 27.68 | |
| | | | | | | | | | | | | | | | | | | | | | |
Total Return(b) | | | | | 14.25 | % | | | 23.55 | % | | | (26.96 | )% | | | 10.69 | % | | | 47.47 | % |
Ratios/Supplemental Data: | | | | | | | | | | | | | | | | | | | | | | |
Net assets, end of year (in millions) | | | | $ | 442.4 | | | $ | 385.4 | | | $ | 307.5 | | | $ | 424.7 | | | $ | 382.1 | |
Average net assets (in millions) | | | | $ | 413.2 | | | $ | 341.9 | | | $ | 329.7 | | | $ | 407.5 | | | $ | 302.1 | |
Ratios to average net assets(c): | | | | | | | | | | | | | | | | | | | | | | |
Expenses after waivers and/or expense reimbursement | | | | | 0.65 | % | | | 0.65 | % | | | 0.66 | % | | | 0.64 | % | | | 0.67 | % |
Expenses before waivers and/or expense reimbursement | | | | | 0.66 | % | | | 0.66 | % | | | 0.66 | % | | | 0.64 | % | | | 0.67 | % |
Net investment income (loss) | | | | | (0.12 | )% | | | (0.05 | )% | | | (0.13 | )% | | | (0.28 | )% | | | (0.15 | )% |
Portfolio turnover rate(d) | | | | | 56 | % | | | 49 | % | | | 43 | % | | | 46 | % | | | 63 | % |
| | |
Class II | | | | | |
| | | | | Year Ended December 31, | |
| | | | | 2024 | | | 2023 | | | 2022 | | | 2021 | | | 2020 | |
Per Share Operating Performance(a): | | | | | | | | | | | | | | | | | | | | | | |
Net Asset Value, beginning of year | | | | $ | 25.47 | | | $ | 20.70 | | | $ | 28.45 | | | $ | 25.81 | | | $ | 17.57 | |
| | | | | | | | | | | | | | | | | | | | | | |
Income (Loss) From Investment Operations: | | | | | | | | | | | | | | | | | | | | | | |
Net investment income (loss) | | | | | (0.14 | ) | | | (0.10 | ) | | | (0.12 | ) | | | (0.19 | ) | | | (0.10 | ) |
Net realized and unrealized gain (loss) on investment transactions | | | | | 3.65 | | | | 4.87 | | | | (7.63 | ) | | | 2.83 | | | | 8.34 | |
| | | | | | | | | | | | | | | | | | | | | | |
Total from investment operations | | | | | 3.51 | | | | 4.77 | | | | (7.75 | ) | | | 2.64 | | | | 8.24 | |
| | | | | | | | | | | | | | | | | | | | | | |
Net Asset Value, end of year | | | | $ | 28.98 | | | $ | 25.47 | | | $ | 20.70 | | | $ | 28.45 | | | $ | 25.81 | |
| | | | | | | | | | | | | | | | | | | | | | |
Total Return(b) | | | | | 13.78 | % | | | 23.04 | % | | | (27.24 | )% | | | 10.23 | % | | | 46.90 | % |
Ratios/Supplemental Data: | | | | | | | | | | | | | | | | | | | | | | |
Net assets, end of year (in millions) | | | | $ | 0.2 | | | $ | 0.2 | | | $ | 0.2 | | | $ | 0.3 | | | $ | 0.3 | |
Average net assets (in millions) | | | | $ | 0.2 | | | $ | 0.2 | | | $ | 0.2 | | | $ | 0.3 | | | $ | 0.4 | |
Ratios to average net assets(c): | | | | | | | | | | | | | | | | | | | | | | |
Expenses after waivers and/or expense reimbursement | | | | | 1.04 | % | | | 1.05 | % | | | 1.06 | % | | | 1.05 | % | | | 1.07 | % |
Expenses before waivers and/or expense reimbursement | | | | | 1.05 | % | | | 1.06 | % | | | 1.06 | % | | | 1.05 | % | | | 1.07 | % |
Net investment income (loss) | | | | | (0.53 | )% | | | (0.45 | )% | | | (0.54 | )% | | | (0.68 | )% | | | (0.53 | )% |
Portfolio turnover rate(d) | | | | | 56 | % | | | 49 | % | | | 43 | % | | | 46 | % | | | 63 | % |
SEE NOTES TO FINANCIAL STATEMENTS.
A16
| | | | |
| | PSF MID-CAP GROWTH PORTFOLIO (CONTINUED) | | |
FINANCIAL HIGHLIGHTS | | | | |
| | | | | | | | | | | | | | | | | | | | | | | | | | | |
Class III | | | | |
| | | | | |
| | | | | Year Ended December 31, | | | | April 26, 2021(e)
through December 31, |
| | | | | 2024 | | 2023 | | 2022 | | | | 2021 |
Per Share Operating Performance(a): | | | | | | | | | | | | | | | | | | | | | | | | | | | |
Net Asset Value, beginning of period. | | | | | $ | 27.47 | | | | $ | 22.29 | | | | $ | 30.60 | | | | | | | | | $ | 29.77 | |
| | | | | | | | | | | | | | | | | | | | | | | | | | | |
Income (Loss) From Investment Operations: | | | | | | | | | | | | | | | | | | | | | | | | | | | |
Net investment income (loss) | | | | | | (0.11 | ) | | | | (0.07 | ) | | | | (0.09 | ) | | | | | | | | | (0.11 | ) |
Net realized and unrealized gain (loss) on investment transactions | | | | | | 3.94 | | | | | 5.25 | | | | | (8.22 | ) | | | | | | | | | 0.94 | |
| | | | | | | | | | | | | | | | | | | | | | | | | | | |
Total from investment operations | | | | | | 3.83 | | | | | 5.18 | | | | | (8.31 | ) | | | | | | | | | 0.83 | |
| | | | | | | | | | | | | | | | | | | | | | | | | | | |
Net Asset Value, end of period | | | | | $ | 31.30 | | | | $ | 27.47 | | | | $ | 22.29 | | | | | | | | | $ | 30.60 | |
| | | | | | | | | | | | | | | | | | | | | | | | | | | |
Total Return(b) | | | | | | 13.94 | % | | | | 23.24 | % | | | | (27.16 | )% | | | | | | | | | 2.79 | % |
Ratios/Supplemental Data: | | | | | | | | | | | | | | | | | | | | | | | | | | | |
Net assets, end of period (in millions) | | | | | $ | 2.7 | | | | $ | 1.8 | | | | $ | 1.1 | | | | | | | | | $ | 0.8 | |
Average net assets (in millions) | | | | | $ | 2.3 | | | | $ | 1.4 | | | | $ | 1.0 | | | | | | | | | $ | 0.3 | |
Ratios to average net assets(c): | | | | | | | | | | | | | | | | | | | | | | | | | | | |
Expenses after waivers and/or expense reimbursement | | | | | | 0.90 | % | | | | 0.90 | % | | | | 0.91 | % | | | | | | | | | 0.88 | %(f) |
Expenses before waivers and/or expense reimbursement | | | | | | 0.91 | % | | | | 0.91 | % | | | | 0.91 | % | | | | | | | | | 0.88 | %(f) |
Net investment income (loss) | | | | | | (0.38 | )% | | | | (0.30 | )% | | | | (0.37 | )% | | | | | | | | | (0.53 | )%(f) |
Portfolio turnover rate(d) | | | | | | 56 | % | | | | 49 | % | | | | 43 | % | | | | | | | | | 46 | % |
| (a) | Calculated based on average shares outstanding during the period. |
| (b) | Total return is calculated assuming a purchase of a share on the first day and a sale on the last day of each period reported and includes reinvestment of dividends and distributions, if any, and does not reflect the effect of insurance contract charges. Total return does not reflect expenses associated with the separate account such as administrative fees, account charges and surrender charges which, if reflected, would reduce the total returns for all periods shown. Performance figures may reflect fee waivers and/or expense reimbursements. In the absence of fee waivers and/or expense reimbursements, the total return would be lower. Past performance is no guarantee of future results. Total returns may reflect adjustments to conform to GAAP. Total returns for periods less than one full year are not annualized. |
| (c) | Does not include expenses of the underlying funds in which the Portfolio invests. |
| (d) | The Portfolio’s portfolio turnover rate is calculated in accordance with regulatory requirements, without regard to transactions involving short-term investments, certain derivatives and in-kind transactions (if any). If such transactions were included, the Portfolio’s portfolio turnover rate may be higher. |
| (e) | Commencement of offering. |
| (f) | Annualized, with the exception of certain non-recurring expenses. |
SEE NOTES TO FINANCIAL STATEMENTS.
A17
| | | | |
| | PSF NATURAL RESOURCES PORTFOLIO | | |
SCHEDULE OF INVESTMENTS | | | | as of December 31, 2024 |
| | | | | | | | |
| | | Shares | | | Value | |
LONG-TERM INVESTMENTS — 99.7% | | | | | |
COMMON STOCKS | | | | | | | | |
Agricultural & Farm Machinery — 0.4% | | | | | |
AGCO Corp.(a) | | | 21,400 | | | $ | 2,000,472 | |
| | | | | | | | |
Aluminum — 0.2% | | | | | | | | |
Alcoa Corp. | | | 22,901 | | | | 865,200 | |
| | | | | | | | |
Coal & Consumable Fuels — 2.1% | | | | | |
Cameco Corp. (Canada) | | | 156,765 | | | | 8,056,153 | |
Uranium Energy Corp.*(a) | | | 411,400 | | | | 2,752,266 | |
| | | | | | | | |
| | |
| | | | | | | 10,808,419 | |
| | | | | | | | |
Construction & Engineering — 0.7% | | | | | |
Quanta Services, Inc. | | | 11,792 | | | | 3,726,862 | |
| | | | | | | | |
Construction Materials — 1.0% | | | | | |
Vulcan Materials Co. | | | 19,407 | | | | 4,992,063 | |
| | | | | | | | |
Copper — 1.6% | | | | | | | | |
Freeport-McMoRan, Inc. | | | 168,083 | | | | 6,400,601 | |
Southern Copper Corp. (Mexico)(a) | | | 17,872 | | | | 1,628,675 | |
| | | | | | | | |
| | |
| | | | | | | 8,029,276 | |
| | | | | | | | |
Diversified Chemicals — 1.0% | | | | | |
BASF SE (Germany) | | | 76,266 | | | | 3,344,349 | |
Huntsman Corp. | | | 96,387 | | | | 1,737,858 | |
| | | | | | | | |
| | |
| | | | | | | 5,082,207 | |
| | | | | | | | |
Diversified Metals & Mining — 3.9% | |
Anglo American PLC (South Africa) | | | 70,487 | | | | 2,084,101 | |
BHP Group Ltd. (Australia) | | | 204,988 | | | | 5,000,634 | |
Glencore PLC (Australia)* | | | 671,774 | | | | 2,958,612 | |
Ivanhoe Electric, Inc.*(a) | | | 239,312 | | | | 1,806,805 | |
Ivanhoe Mines Ltd. (Canada) (Class A Stock)* | | | 150,578 | | | | 1,787,096 | |
MP Materials Corp.*(a) | | | 168,000 | | | | 2,620,800 | |
Sedibelo Platinum Mines Ltd. (South Africa) Private Placement^(x) | | | 129,100 | | | | 16 | |
Teck Resources Ltd. (Canada)(Class B Stock) | | | 94,854 | | | | 3,844,433 | |
| | | | | | | | |
| | |
| | | | | | | 20,102,497 | |
| | | | | | | | |
Electric Utilities — 3.0% | | | | | | | | |
Constellation Energy Corp. | | | 11,000 | | | | 2,460,810 | |
NextEra Energy, Inc. | | | 72,479 | | | | 5,196,019 | |
NRG Energy, Inc. | | | 18,200 | | | | 1,642,004 | |
PG&E Corp. | | | 132,555 | | | | 2,674,960 | |
Southern Co. (The) | | | 43,138 | | | | 3,551,120 | |
| | | | | | | | |
| | |
| | | | | | | 15,524,913 | |
| | | | | | | | |
Electrical Components & Equipment — 0.9% | | | | | |
Hubbell, Inc. | | | 3,361 | | | | 1,407,889 | |
Schneider Electric SE | | | 12,844 | | | | 3,197,592 | |
| | | | | | | | |
| | |
| | | | | | | 4,605,481 | |
| | | | | | | | |
Fertilizers & Agricultural Chemicals — 1.7% | | | | | |
CF Industries Holdings, Inc.(a) | | | 44,212 | | | | 3,772,168 | |
Corteva, Inc.(a) | | | 47,200 | | | | 2,688,512 | |
Mosaic Co. (The) | | | 98,456 | | | | 2,420,048 | |
| | | | | | | | |
| | |
| | | | | | | 8,880,728 | |
| | | | | | | | |
| | | | | | | | |
| | | Shares | | | Value | |
COMMON STOCKS (continued) | | | | | |
Forest Products — 1.9% | | | | | | | | |
Louisiana-Pacific Corp. | | | 46,314 | | | $ | 4,795,815 | |
West Fraser Timber Co. Ltd. (Canada) | | | 59,298 | | | | 5,137,963 | |
| | | | | | | | |
| | |
| | | | | | | 9,933,778 | |
| | | | | | | | |
Gold — 3.1% | | | | | | | | |
Agnico Eagle Mines Ltd. (Canada)(a) | | | 36,854 | | | | 2,882,352 | |
Alamos Gold, Inc. (Canada) (Class A Stock) | | | 212,671 | | | | 3,921,653 | |
Artemis Gold, Inc. (Canada)* | | | 120,100 | | | | 1,148,823 | |
Franco-Nevada Corp. (Canada) | | | 29,160 | | | | 3,426,698 | |
Osisko Gold Royalties Ltd. (Canada) | | | 187,618 | | | | 3,397,472 | |
Skeena Resources Ltd. (Canada)* | | | 129,000 | | | | 1,121,778 | |
| | | | | | | | |
| | |
| | | | | | | 15,898,776 | |
| | | | | | | | |
Heavy Electrical Equipment — 1.0% | |
GE Vernova, Inc. | | | 15,419 | | | | 5,071,772 | |
| | | | | | | | |
Industrial Gases — 4.1% | | | | | | | | |
Air Liquide SA (France) | | | 43,889 | | | | 7,134,585 | |
Linde PLC | | | 33,404 | | | | 13,985,253 | |
| | | | | | | | |
| | |
| | | | | | | 21,119,838 | |
| | | | | | | | |
Industrial Machinery — 0.5% | | | | | | | | |
Stanley Black & Decker, Inc. | | | 33,317 | | | | 2,675,022 | |
| | | | | | | | |
Integrated Oil & Gas — 18.2% | | | | | | | | |
Chevron Corp. | | | 115,601 | | | | 16,743,649 | |
Exxon Mobil Corp. | | | 270,579 | | | | 29,106,183 | |
Galp Energia SGPS SA (Portugal) | | | 362,209 | | | | 6,003,498 | |
Shell PLC | | | 629,928 | | | | 19,635,488 | |
Suncor Energy, Inc. (Canada) | | | 242,365 | | | | 8,651,256 | |
TotalEnergies SE (France) | | | 230,747 | | | | 12,856,041 | |
| | | | | | | | |
| | |
| | | | | | | 92,996,115 | |
| | | | | | | | |
Multi-Utilities — 0.4% | | | | | | | | |
Ameren Corp. | | | 20,933 | | | | 1,865,968 | |
| | | | | | | | |
Oil & Gas Drilling — 0.5% | | | | | | | | |
Noble Corp. PLC(a) | | | 81,771 | | | | 2,567,609 | |
| | | | | | | | |
Oil & Gas Equipment & Services — 8.6% | | | | | |
Atlas Energy Solutions, Inc.(a) | | | 143,123 | | | | 3,174,468 | |
Baker Hughes Co. | | | 193,208 | | | | 7,925,392 | |
Expro Group Holdings NV* | | | 175,517 | | | | 2,188,697 | |
Halliburton Co.(a) | | | 116,512 | | | | 3,167,961 | |
Kodiak Gas Services, Inc. | | | 80,079 | | | | 3,269,626 | |
Schlumberger NV | | | 261,037 | | | | 10,008,159 | |
TechnipFMC PLC (United Kingdom) | | | 267,559 | | | | 7,743,157 | |
Tenaris SA, ADR | | | 88,882 | | | | 3,358,851 | |
Weatherford International PLC(a) | | | 44,500 | | | | 3,187,535 | |
| | | | | | | | |
| | |
| | | | | | | 44,023,846 | |
| | | | | | | | |
Oil & Gas Exploration & Production — 19.3% | | | | | |
Canadian Natural Resources Ltd. (Canada) | | | 359,164 | | | | 11,088,872 | |
ConocoPhillips | | | 219,561 | | | | 21,773,864 | |
Diamondback Energy, Inc. | | | 55,640 | | | | 9,115,501 | |
EOG Resources, Inc. | | | 106,966 | | | | 13,111,892 | |
EQT Corp.(a) | | | 197,088 | | | | 9,087,728 | |
Expand Energy Corp. | | | 90,049 | | | | 8,964,378 | |
Hess Corp. | | | 21,351 | | | | 2,839,897 | |
SEE NOTES TO FINANCIAL STATEMENTS.
A18
| | | | |
| | PSF NATURAL RESOURCES PORTFOLIO (CONTINUED) | | |
SCHEDULE OF INVESTMENTS | | | | as of December 31, 2024 |
| | | | | | | | |
| | | Shares | | | Value | |
COMMON STOCKS (continued) | | | | | |
Oil & Gas Exploration & Production (cont’d.) | |
Ovintiv, Inc. | | | 113,700 | | | $ | 4,604,850 | |
Permian Resources Corp. | | | 324,769 | | | | 4,670,178 | |
Range Resources Corp.(a) | | | 180,723 | | | | 6,502,414 | |
Texas Pacific Land Corp.(a) | | | 2,800 | | | | 3,096,688 | |
Viper Energy, Inc.(a) | | | 79,192 | | | | 3,885,951 | |
| | | | | | | | |
| | |
| | | | | | | 98,742,213 | |
| | | | | | | | |
Oil & Gas Refining & Marketing — 5.4% | | | | | |
Marathon Petroleum Corp. | | | 76,490 | | | | 10,670,355 | |
Phillips 66 | | | 73,016 | | | | 8,318,713 | |
Valero Energy Corp.(a) | | | 72,877 | | | | 8,933,991 | |
| | | | | | | | |
| | |
| | | | | | | 27,923,059 | |
| | | | | | | | |
Oil & Gas Storage & Transportation — 10.4% | | | | | |
Enbridge, Inc. (Canada)(a) | | | 262,407 | | | | 11,133,929 | |
Kinder Morgan, Inc. | | | 123,000 | | | | 3,370,200 | |
ONEOK, Inc.(a) | | | 97,200 | | | | 9,758,880 | |
South Bow Corp. (Canada) | | | 141,800 | | | | 3,346,103 | |
Targa Resources Corp. | | | 60,882 | | | | 10,867,437 | |
Williams Cos., Inc. (The) | | | 274,584 | | | | 14,860,486 | |
| | | | | | | | |
| | |
| | | | | | | 53,337,035 | |
| | | | | | | | |
Paper Packaging — 1.9% | | | | | | | | |
International Paper Co.(a) | | | 70,530 | | | | 3,795,925 | |
Packaging Corp. of America | | | 26,689 | | | | 6,008,494 | |
| | | | | | | | |
| | |
| | | | | | | 9,804,419 | |
| | | | | | | | |
Semiconductor Equipment — 0.5% | | | | | | | | |
Entegris, Inc. | | | 27,700 | | | | 2,743,962 | |
| | | | | | | | |
Specialty Chemicals — 4.7% | | | | | | | | |
HB Fuller Co. | | | 32,530 | | | | 2,195,124 | |
International Flavors & Fragrances, Inc. | | | 46,337 | | | | 3,917,793 | |
RPM International, Inc.(a) | | | 30,853 | | | | 3,796,770 | |
Sherwin-Williams Co. (The) | | | 23,122 | | | | 7,859,862 | |
Shin-Etsu Chemical Co. Ltd. (Japan) | | | 187,300 | | | | 6,169,125 | |
| | | | | | | | |
| | |
| | | | | | | 23,938,674 | |
| | | | | | | | |
Steel — 2.7% | | | | | | | | |
Champion Iron Ltd. (Australia) | | | 734,512 | | | | 2,607,385 | |
Cleveland-Cliffs, Inc.* | | | 281,057 | | | | 2,641,936 | |
Steel Dynamics, Inc. | | | 32,009 | | | | 3,651,267 | |
United States Steel Corp. | | | 54,300 | | | | 1,845,657 | |
Warrior Met Coal, Inc. | | | 52,677 | | | | 2,857,200 | |
| | | | | | | | |
| | |
| | | | | | | 13,603,445 | |
| | | | | | | | |
TOTAL LONG-TERM INVESTMENTS | | | | | | | | |
(cost $429,304,794) | | | | | | | 510,863,649 | |
| | | | | | | | |
| | | | | | | | |
| | | Shares | | | Value | |
| |
SHORT-TERM INVESTMENTS — 13.7% | | | | | |
AFFILIATED MUTUAL FUNDS | | | | | | | | |
PGIM Core Ultra Short Bond Fund(wb) | | | 2,680,664 | | | $ | 2,680,664 | |
PGIM Institutional Money Market Fund (7-day effective yield 4.649%) (cost $67,493,073; includes $67,234,333 of cash collateral for securities on
loan)(b)(wb) | | | 67,534,609 | | | | 67,494,088 | |
| | | | | | | | |
| | |
TOTAL SHORT-TERM INVESTMENTS
(cost $70,173,737) | | | | | | | 70,174,752 | |
| | | | | | | | |
| | |
TOTAL INVESTMENTS—113.4%
(cost $499,478,531) | | | | | | | 581,038,401 | |
Liabilities in excess of other assets — (13.4)% | | | | (68,681,545 | ) |
| | | | | | | | |
| | |
NET ASSETS — 100.0% | | | | | | $ | 512,356,856 | |
| | | | | | | | |
See the Glossary for a list of the abbreviation(s) used in the annual report:
| * | Non-income producing security. |
| ^ | Indicates a Level 3 instrument. The aggregate value of Level 3 instruments is $16 and 0.0% of net assets. |
| (a) | All or a portion of security is on loan. The aggregate market value of such securities, including those sold and pending settlement, is $65,990,475; cash collateral of $67,234,333 (included in liabilities) was received with which the Portfolio purchased highly liquid short-term investments. In the event of significant appreciation in value of securities on loan on the last business day of the reporting period, the Portfolio may reflect a collateral value that is less than the market value of the loaned securities and such shortfall is remedied the following business day. |
| (b) | Represents security, or portion thereof, purchased with cash collateral received for securities on loan and includes dividend reinvestment. |
| (wb) | Represents an investment in a Fund affiliated with the Manager. |
| (x) | The following represents restricted securities that are acquired in unregistered, private sales from the issuing company or from an affiliate of the issuer and is considered restricted as to disposition under federal securities law. |
(x) Restricted Securities:
| | | | | | | | |
Issuer Description | | Acquisition
Date | | Original
Cost | | Market
Value | | Percentage
of
Net Assets |
Sedibelo Platinum Mines Ltd. (South Africa)
Private Placement^ | | 11/27/07 | | $1,102,975 | | $16 | | 0.0% |
SEE NOTES TO FINANCIAL STATEMENTS.
A19
| | | | |
| | PSF NATURAL RESOURCES PORTFOLIO (CONTINUED) | | |
SCHEDULE OF INVESTMENTS | | | | as of December 31, 2024 |
Fair Value Measurements:
Various inputs are used in determining the value of the Portfolio’s investments. These inputs are summarized in the three broad levels listed below.
Level 1—unadjusted quoted prices generally in active markets for identical securities.
Level 2—quoted prices for similar securities, interest rates and yield curves, prepayment speeds, foreign currency exchange rates and other observable inputs.
Level 3—unobservable inputs for securities valued in accordance with Board approved fair valuation procedures.
The following is a summary of the inputs used as of December 31, 2024 in valuing such portfolio securities:
| | | | | | | | | | | | | | | |
| | | Level 1 | | Level 2 | | Level 3 |
Investments in Securities | | | | | | | | | | | | | | | |
Assets | | | | | | | | | | | | | | | |
Long-Term Investments | | | | | | | | | | | | | | | |
Common Stocks | | | | | | | | | | | | | | | |
Australia | | | $ | — | | | | $ | 10,566,631 | | | | | $— | |
Canada | | | | 68,944,581 | | | | | — | | | | | — | |
France | | | | — | | | | | 19,990,626 | | | | | — | |
Germany | | | | — | | | | | 3,344,349 | | | | | — | |
Japan | | | | — | | | | | 6,169,125 | | | | | — | |
Mexico | | | | 1,628,675 | | | | | — | | | | | — | |
Portugal | | | | — | | | | | 6,003,498 | | | | | — | |
South Africa | | | | — | | | | | 2,084,101 | | | | | 16 | |
United Kingdom | | | | 7,743,157 | | | | | — | | | | | — | |
United States | | | | 361,555,810 | | | | | 22,833,080 | | | | | — | |
Short-Term Investments | | | | | | | | | | | | | | | |
Affiliated Mutual Funds | | | | 70,174,752 | | | | | — | | | | | — | |
| | | | | | | | | | | | | | | |
Total | | | $ | 510,046,975 | | | | $ | 70,991,410 | | | | | $16 | |
| | | | | | | | | | | | | | | |
Country Classification:
The country classification of investments and liabilities in excess of other assets shown as a percentage of net assets as of December 31, 2024 were as follows:
| | | | |
United States (including 13.1% of collateral for securities on loan) | | | 88.7 | % |
Canada | | | 13.4 | |
France | | | 3.9 | |
Australia | | | 2.1 | |
United Kingdom | | | 1.5 | |
Japan | | | 1.2 | |
Portugal | | | 1.2 | |
| | | | |
Germany | | | 0.7 | % |
South Africa | | | 0.4 | |
Mexico | | | 0.3 | |
| | | | |
| | | 113.4 | |
Liabilities in excess of other assets | | | (13.4 | ) |
| | | | |
| |
| | | 100.0 | % |
| | | | |
Effects of Derivative Instruments on the Financial Statements and Primary Underlying Risk Exposure:
The Portfolio invested in derivative instruments during the reporting period. The primary type of risk associated with these derivative instruments is foreign exchange risk. See the Notes to Financial Statements for additional detail regarding these derivative instruments and their risks. The effect of such derivative instruments on the Portfolio’s financial position and financial performance as reflected in the Statement of Assets and Liabilities and Statement of Operations is presented in the summary below.
The Portfolio did not hold any derivative instruments as of December 31, 2024, accordingly, no derivative positions were presented in the Statement of Assets and Liabilities.
The effects of derivative instruments on the Statement of Operations for the year ended December 31, 2024 are as follows:
| | | | | | | | | | |
Amount of Realized Gain (Loss) on Derivatives Recognized in Income | |
Derivatives not accounted for as hedging
instruments, carried at fair value | | | | Forward
Currency
Exchange
Contracts |
Foreign exchange contracts | | | | | | | | | $256 | |
| | | | | | | | | | |
SEE NOTES TO FINANCIAL STATEMENTS.
A20
| | | | |
| | PSF NATURAL RESOURCES PORTFOLIO (CONTINUED) | | |
SCHEDULE OF INVESTMENTS | | | | as of December 31, 2024 |
For the year ended December 31, 2024, the Portfolio did not have any net change in unrealized appreciation (depreciation) on derivatives in the Statement of Operations.
For the year ended December 31, 2024, the Portfolio’s average volume of derivative activities is as follows:
| | |
| Derivative Contract Type | | Average Volume of Derivative Activities* |
Forward Foreign Currency Exchange Contracts - Sold (1) | | $73,134 |
| * | Average volume is based on average quarter end balances for the year ended December 31, 2024. |
| (1) | Value at Settlement Date. |
Financial Instruments/Transactions—Summary of Offsetting and Netting Arrangements:
The Portfolio entered into financial instruments/transactions during the reporting period that are either offset in accordance with current requirements or are subject to enforceable master netting arrangements or similar agreements that permit offsetting. The information about offsetting and related netting arrangements for financial instruments/transactions where the legal right to set-off exists is presented in the summary below.
Offsetting of financial instrument/transaction assets and liabilities:
| | | | | | |
| Description | | Gross Market Value of Recognized
Assets/(Liabilities) | | Collateral
Pledged/(Received)(1) | | Net
Amount |
Securities on Loan | | $65,990,475 | | $(65,990,475) | | $— |
| (1) | Collateral amount disclosed by the Portfolio is limited to the market value of financial instruments/transactions. |
SEE NOTES TO FINANCIAL STATEMENTS.
A21
| | | | |
| | PSF NATURAL RESOURCES PORTFOLIO (CONTINUED) | | |
| | | | |
STATEMENT OF ASSETS AND LIABILITIES
as of December 31, 2024
| | | | |
ASSETS | | | | |
Investments at value, including securities on loan of $65,990,475: | | | | |
Unaffiliated investments (cost $429,304,794) | | $ | 510,863,649 | |
Affiliated investments (cost $70,173,737) | | | 70,174,752 | |
Foreign currency, at value (cost $335,506) | | | 333,992 | |
Cash | | | 6,177 | |
Tax reclaim receivable | | | 1,668,040 | |
Dividends and interest receivable | | | 335,120 | |
Receivable for Portfolio shares sold | | | 12,062 | |
Receivable from affiliate | | | 182 | |
Prepaid expenses | | | 12,170 | |
| | | | |
Total Assets | | | 583,406,144 | |
| | | | |
LIABILITIES | | | | |
Payable to broker for collateral for securities on loan | | | 67,234,333 | |
Payable for investments purchased | | | 1,863,051 | |
Payable to affiliate | | | 1,132,543 | |
Accrued expenses and other liabilities | | | 357,552 | |
Payable for Portfolio shares purchased | | | 251,967 | |
Management fee payable | | | 198,356 | |
Distribution fee payable | | | 7,750 | |
Administration fee payable | | | 1,936 | |
Affiliated transfer agent fee payable | | | 1,190 | |
Trustees’ fees payable | | | 610 | |
| | | | |
Total Liabilities | | | 71,049,288 | |
| | | | |
NET ASSETS | | $ | 512,356,856 | |
| | | | |
Net assets were comprised of: | | | | |
Partners’ Equity | | $ | 512,356,856 | |
| | | | |
Class I: | | | | |
Net asset value and redemption price per share, $477,144,258 / 10,708,104 outstanding shares of beneficial interest | | $ | 44.56 | |
| | | | |
Class II: | | | | |
Net asset value and redemption price per share, $14,618,544 / 347,572 outstanding shares of beneficial interest | | $ | 42.06 | |
| | | | |
Class III: | | | | |
Net asset value and redemption price per share, $20,594,054 / 465,894 outstanding shares of beneficial interest | | $ | 44.20 | |
| | | | |
STATEMENT OF OPERATIONS
Year Ended December 31, 2024
| | | | |
NET INVESTMENT INCOME (LOSS) | | | | |
INCOME | | | | |
Unaffiliated dividend income (net of $768,463 foreign withholding tax, of which $8,820 is reimbursable by an affiliate) | | $ | 14,943,215 | |
Affiliated dividend income | | | 159,670 | |
Income from securities lending, net (including affiliated income of $116,570) | | | 125,977 | |
Interest income | | | 27,004 | |
| | | | |
Total income | | | 15,255,866 | |
| | | | |
EXPENSES | | | | |
Management fee | | | 2,498,754 | |
Distribution fee—Class II | | | 67,340 | |
Distribution fee—Class III | | | 59,314 | |
Administration fee—Class II | | | 40,404 | |
Custodian and accounting fees | | | 87,512 | |
Shareholders’ reports | | | 70,177 | |
Professional fees | | | 63,385 | |
Audit fee | | | 30,858 | |
Trustees’ fees | | | 17,420 | |
Transfer agent’s fees and expenses (including affiliated expense of $7,143) | | | 11,943 | |
Miscellaneous | | | 48,365 | |
| | | | |
Total expenses | | | 2,995,472 | |
Less: Fee waivers and/or expense reimbursement | | | (44,422 | ) |
| | | | |
Net expenses | | | 2,951,050 | |
| | | | |
NET INVESTMENT INCOME (LOSS) | | | 12,304,816 | |
| | | | |
REALIZED AND UNREALIZED GAIN (LOSS) ON
INVESTMENT AND FOREIGN CURRENCY
TRANSACTIONS | |
Net realized gain (loss) on: | | | | |
Investment transactions (including affiliated of $(1,130)) | | | 11,049,697 | |
Forward currency contract transactions | | | 256 | |
Foreign currency transactions | | | (54,641 | ) |
| | | | |
| |
| | | 10,995,312 | |
| | | | |
Net change in unrealized appreciation (depreciation) on: | | | | |
Investments (including affiliated of $(6,023)) | | | 1,924,669 | |
Foreign currencies | | | (25,506 | ) |
| | | | |
| |
| | | 1,899,163 | |
| | | | |
NET GAIN (LOSS) ON INVESTMENT AND FOREIGN CURRENCY TRANSACTIONS | | | 12,894,475 | |
| | | | |
NET INCREASE (DECREASE) IN NET ASSETS RESULTING FROM OPERATIONS | | $ | 25,199,291 | |
| | | | |
STATEMENTS OF CHANGES IN NET ASSETS
| | | | | | | | | | |
| | | Year Ended
December 31, 2024 | | Year Ended
December 31, 2023 |
INCREASE (DECREASE) IN NET ASSETS | | | | | | | | | | |
OPERATIONS | | | | | | | | | | |
Net investment income (loss) | | | $ | 12,304,816 | | | | $ | 13,830,257 | |
Net realized gain (loss) on investment and foreign currency transactions | | | | 10,995,312 | | | | | 18,889,995 | |
Net change in unrealized appreciation (depreciation) on investments and foreign currencies | | | | 1,899,163 | | | | | (21,818,020 | ) |
| | | | | | | | | | |
NET INCREASE (DECREASE) IN NET ASSETS RESULTING FROM OPERATIONS | | | | 25,199,291 | | | | | 10,902,232 | |
| | | | | | | | | | |
PORTFOLIO SHARE TRANSACTIONS | | | | | | | | | | |
Portfolio shares sold | | | | 11,346,085 | | | | | 81,300,058 | |
Portfolio shares purchased | | | | (80,827,823 | ) | | | | (73,536,303 | ) |
| | | | | | | | | | |
NET INCREASE (DECREASE) IN NET ASSETS FROM PORTFOLIO SHARE TRANSACTIONS | | | | (69,481,738 | ) | | | | 7,763,755 | |
| | | | | | | | | | |
TOTAL INCREASE (DECREASE) | | | | (44,282,447 | ) | | | | 18,665,987 | |
NET ASSETS: | | | | | | | | | | |
Beginning of year | | | | 556,639,303 | | | | | 537,973,316 | |
| | | | | | | | | | |
End of year | | | $ | 512,356,856 | | | | $ | 556,639,303 | |
| | | | | | | | | | |
SEE NOTES TO FINANCIAL STATEMENTS.
A22
| | | | |
| | PSF NATURAL RESOURCES PORTFOLIO (CONTINUED) | | |
FINANCIAL HIGHLIGHTS | | | | |
| | | | | | | | | | | | | | | | | | | | |
Class I | | | | | | | | | | | | | | | |
| | | Year Ended December 31, | |
| | | 2024 | | | 2023 | | | 2022 | | | 2021 | | | 2020 | |
Per Share Operating Performance(a): | | | | | | | | | | | | | | | | | | | | |
Net Asset Value, beginning of year | | $ | 42.69 | | | $ | 41.86 | | | $ | 34.30 | | | $ | 27.33 | | | $ | 24.34 | |
| | | | | | | | | | | | | | | | | | | | |
Income (Loss) From Investment Operations: | | | | | | | | | | | | | | | | | | | | |
Net investment income (loss) | | | 1.02 | (b) | | | 1.13 | | | | 1.23 | | | | 0.77 | | | | 0.49 | |
| Net realized and unrealized gain (loss) on investment and foreign currency transactions | | | 0.85 | (c) | | | (0.30 | ) | | | 6.33 | | | | 6.20 | | | | 2.50 | |
| | | | | | | | | | | | | | | | | | | | |
Total from investment operations | | | 1.87 | | | | 0.83 | | | | 7.56 | | | | 6.97 | | | | 2.99 | |
| | | | | | | | | | | | | | | | | | | | |
Net Asset Value, end of year | | $ | 44.56 | | | $ | 42.69 | | | $ | 41.86 | | | $ | 34.30 | | | $ | 27.33 | |
| | | | | | | | | | | | | | | | | | | | |
Total Return(d) | | | 4.38 | % | | | 1.98 | % | | | 22.04 | % | | | 25.50 | % | | | 12.28 | % |
Ratios/Supplemental Data: | | | | | | | | | | | | | | | | | | | | |
Net assets, end of year (in millions) | | $ | 477.1 | | | $ | 497.0 | | | $ | 497.9 | | | $ | 419.2 | | | $ | 351.8 | |
Average net assets (in millions) | | $ | 504.6 | | | $ | 482.4 | | | $ | 477.7 | | | $ | 402.7 | | | $ | 284.9 | |
Ratios to average net assets(e): | | | | | | | | | | | | | | | | | | | | |
Expenses after waivers and/or expense reimbursement | | | 0.50 | % | | | 0.50 | % | | | 0.49 | % | | | 0.50 | % | | | 0.54 | % |
Expenses before waivers and/or expense reimbursement | | | 0.51 | % | | | 0.51 | % | | | 0.50 | % | | | 0.51 | % | | | 0.55 | % |
Net investment income (loss) | | | 2.24 | % | | | 2.68 | % | | | 3.14 | % | | | 2.39 | % | | | 2.28 | % |
Portfolio turnover rate(f) | | | 27 | % | | | 94 | % | | | 109 | % | | | 79 | % | | | 136 | % |
| | | | | | | | | | | | | | | | | | | | |
Class II | | | | | | | | | | | | | | | |
| | | Year Ended December 31, | |
| | | 2024 | | | 2023 | | | 2022 | | | 2021 | | | 2020 | |
Per Share Operating Performance(a): | | | | | | | | | | | | | | | | | | | | |
Net Asset Value, beginning of year | | $ | 40.46 | | | $ | 39.83 | | | $ | 32.77 | | | $ | 26.21 | | | $ | 23.44 | |
| | | | | | | | | | | | | | | | | | | | |
Income (Loss) From Investment Operations: | | | | | | | | | | | | | | | | | | | | |
Net investment income (loss) | | | 0.79 | | | | 0.92 | | | | 1.04 | | | | 0.58 | | | | 0.41 | |
| Net realized and unrealized gain (loss) on investment and foreign currency transactions | | | 0.81 | | | | (0.29 | ) | | | 6.02 | | | | 5.98 | | | | 2.36 | |
| | | | | | | | | | | | | | | | | | | | |
Total from investment operations | | | 1.60 | | | | 0.63 | | | | 7.06 | | | | 6.56 | | | | 2.77 | |
| | | | | | | | | | | | | | | | | | | | |
Net Asset Value, end of year | | $ | 42.06 | | | $ | 40.46 | | | $ | 39.83 | | | $ | 32.77 | | | $ | 26.21 | |
| | | | | | | | | | | | | | | | | | | | |
Total Return(d) | | | 3.95 | % | | | 1.58 | % | | | 21.54 | % | | | 25.03 | % | | | 11.82 | % |
Ratios/Supplemental Data: | | | | | | | | | | | | | | | | | | | | |
Net assets, end of year (in millions) | | $ | 14.6 | | | $ | 35.0 | | | $ | 34.0 | | | $ | 25.6 | | | $ | 32.5 | |
Average net assets (in millions) | | $ | 26.9 | | | $ | 34.5 | | | $ | 33.5 | | | $ | 27.8 | | | $ | 37.6 | |
Ratios to average net assets(e): | | | | | | | | | | | | | | | | | | | | |
Expenses after waivers and/or expense reimbursement | | | 0.90 | % | | | 0.90 | % | | | 0.89 | % | | | 0.90 | % | | | 0.94 | % |
Expenses before waivers and/or expense reimbursement | | | 0.91 | % | | | 0.91 | % | | | 0.90 | % | | | 0.91 | % | | | 0.95 | % |
Net investment income (loss) | | | 1.85 | % | | | 2.28 | % | | | 2.77 | % | | | 1.89 | % | | | 2.05 | % |
Portfolio turnover rate(f) | | | 27 | % | | | 94 | % | | | 109 | % | | | 79 | % | | | 136 | % |
SEE NOTES TO FINANCIAL STATEMENTS.
A23
| | | | |
| | PSF NATURAL RESOURCES PORTFOLIO (CONTINUED) | | |
FINANCIAL HIGHLIGHTS | | | | |
| | | | | | | | | | | | | | | | | | | | |
Class III | | | | | | | | |
| | | Year Ended December 31, | | April 26, 2021(g) through December 31, |
| | | 2024 | | 2023 | | 2022 | | 2021 |
Per Share Operating Performance(a): | | | | | | | | | | | | | | | | | | | | |
Net Asset Value, beginning of period | | | $ | 42.46 | | | | $ | 41.73 | | | | $ | 34.24 | | | | | $31.02 | |
| | | | | | | | | | | | | | | | | | | | |
Income (Loss) From Investment Operations: | | | | | | | | | | | | | | | | | | | | |
Net investment income (loss) | | | | 0.91 | (b) | | | | 0.86 | | | | | 1.17 | | | | | 0.20 | |
Net realized and unrealized gain (loss) on investment and foreign currency transactions | | | | 0.83 | (c) | | | | (0.13 | ) | | | | 6.32 | | | | | 3.02 | |
| | | | | | | | | | | | | | | | | | | | |
Total from investment operations | | | | 1.74 | | | | | 0.73 | | | | | 7.49 | | | | | 3.22 | |
| | | | | | | | | | | | | | | | | | | | |
Net Asset Value, end of period | | | $ | 44.20 | | | | $ | 42.46 | | | | $ | 41.73 | | | | | $34.24 | |
| | | | | | | | | | | | | | | | | | | | |
Total Return(d) | | | | 4.10 | % | | | | 1.75 | % | | | | 21.88 | % | | | | 10.38 | % |
Ratios/Supplemental Data: | | | | | | | | | | | | | | | | | | | | |
Net assets, end of period (in millions) | | | $ | 20.6 | | | | $ | 24.7 | | | | $ | 6.1 | | | | | $1.0 | |
Average net assets (in millions) | | | $ | 23.7 | | | | $ | 5.9 | | | | $ | 3.7 | | | | | $0.3 | |
Ratios to average net assets(e): | | | | | | | | | | | | | | | | | | | | |
Expenses after waivers and/or expense reimbursement | | | | 0.75 | % | | | | 0.76 | % | | | | 0.73 | % | | | | 0.72 | %(h) |
Expenses before waivers and/or expense reimbursement | | | | 0.76 | % | | | | 0.77 | % | | | | 0.74 | % | | | | 0.73 | %(h) |
Net investment income (loss) | | | | 2.01 | % | | | | 1.99 | % | | | | 2.95 | % | | | | 0.82 | %(h) |
Portfolio turnover rate(f) | | | | 27 | % | | | | 94 | % | | | | 109 | % | | | | 79 | % |
| (a) | Calculated based on average shares outstanding during the period. |
| (b) | The per share amount of net investment income (loss) does not directly correlate to the amounts reported in the Statement of Operations due to class specific expenses. |
| (c) | The per share amount of realized and unrealized gain (loss) on investments does not directly correlate to the amounts reported in the Statement of Operations due to the timing of portfolio share transactions in relation to fluctuating market values. |
| (d) | Total return is calculated assuming a purchase of a share on the first day and a sale on the last day of each period reported and includes reinvestment of dividends and distributions, if any, and does not reflect the effect of insurance contract charges. Total return does not reflect expenses associated with the separate account such as administrative fees, account charges and surrender charges which, if reflected, would reduce the total returns for all periods shown. Performance figures may reflect fee waivers and/or expense reimbursements. In the absence of fee waivers and/or expense reimbursements, the total return would be lower. Past performance is no guarantee of future results. Total returns may reflect adjustments to conform to GAAP. Total returns for periods less than one full year are not annualized. |
| (e) | Does not include expenses of the underlying funds in which the Portfolio invests. |
| (f) | The Portfolio’s portfolio turnover rate is calculated in accordance with regulatory requirements, without regard to transactions involving short-term investments, certain derivatives and in-kind transactions (if any). If such transactions were included, the Portfolio’s portfolio turnover rate may be higher. |
| (g) | Commencement of offering. |
| (h) | Annualized, with the exception of certain non-recurring expenses. |
SEE NOTES TO FINANCIAL STATEMENTS.
A24
| | | | |
| | PSF PGIM 50/50 BALANCED PORTFOLIO | | |
SCHEDULE OF INVESTMENTS | | | | as of December 31, 2024 |
| | | | | | | | |
| | | Shares | | | Value | |
LONG-TERM INVESTMENTS — 90.1% | | | | | |
COMMON STOCKS — 49.6% | |
Aerospace & Defense — 0.9% | | | | | | | | |
Axon Enterprise, Inc.* | | | 1,900 | | | $ | 1,129,208 | |
Boeing Co. (The)* | | | 19,750 | | | | 3,495,750 | |
Dassault Aviation SA (France) | | | 30 | | | | 6,130 | |
General Dynamics Corp. | | | 6,800 | | | | 1,791,732 | |
General Electric Co. | | | 28,678 | | | | 4,783,204 | |
Howmet Aerospace, Inc. | | | 10,780 | | | | 1,179,009 | |
Huntington Ingalls Industries, Inc. | | | 1,000 | | | | 188,970 | |
Kongsberg Gruppen ASA (Norway) | | | 314 | | | | 35,327 | |
L3Harris Technologies, Inc. | | | 4,970 | | | | 1,045,092 | |
Lockheed Martin Corp. | | | 5,620 | | | | 2,730,983 | |
MTU Aero Engines AG (Germany) | | | 24 | | | | 8,016 | |
Northrop Grumman Corp. | | | 3,562 | | | | 1,671,611 | |
Rheinmetall AG (Germany) | | | 35 | | | | 22,362 | |
Rolls-Royce Holdings PLC (United Kingdom)* | | | 22,445 | | | | 159,166 | |
RTX Corp. | | | 35,155 | | | | 4,068,136 | |
Safran SA (France) | | | 538 | | | | 117,880 | |
Textron, Inc. | | | 4,900 | | | | 374,801 | |
TransDigm Group, Inc. | | | 1,480 | | | | 1,875,574 | |
| | | | | | | | |
| | |
| | | | | | | 24,682,951 | |
| | | | | | | | |
Air Freight & Logistics — 0.2% | |
C.H. Robinson Worldwide, Inc. | | | 3,200 | | | | 330,624 | |
Expeditors International of Washington, Inc. | | | 4,000 | | | | 443,080 | |
FedEx Corp. | | | 5,980 | | | | 1,682,353 | |
United Parcel Service, Inc. (Class B Stock) | | | 19,400 | | | | 2,446,340 | |
| | | | | | | | |
| | |
| | | | | | | 4,902,397 | |
| | | | | | | | |
Automobile Components — 0.0% | |
Aptiv PLC (United Kingdom)* | | | 6,200 | | | | 374,976 | |
BorgWarner, Inc. | | | 6,200 | | | | 197,098 | |
Cie Generale des Etablissements Michelin SCA (France) | | | 598 | | | | 19,677 | |
Sumitomo Electric Industries Ltd. (Japan) | | | 2,800 | | | | 50,057 | |
Toyo Tire Corp. (Japan) | | | 1,200 | | | | 18,457 | |
| | | | | | | | |
| | |
| | | | | | | 660,265 | |
| | | | | | | | |
Automobiles — 1.2% | | | | | | | | |
Ferrari NV (Italy) | | | 123 | | | | 52,484 | |
Ford Motor Co. | | | 103,385 | | | | 1,023,512 | |
General Motors Co. | | | 29,700 | | | | 1,582,119 | |
Subaru Corp. (Japan) | | | 5,800 | | | | 103,056 | |
Suzuki Motor Corp. (Japan) | | | 3,200 | | | | 35,854 | |
Tesla, Inc.* | | | 73,820 | | | | 29,811,469 | |
Toyota Motor Corp. (Japan) | | | 3,700 | | | | 72,243 | |
| | | | | | | | |
| | |
| | | | | | | 32,680,737 | |
| | | | | | | | |
Banks — 1.7% | | | | | | | | |
ABN AMRO Bank NV (Netherlands), 144A, CVA | | | 1,283 | | | | 19,799 | |
AIB Group PLC (Ireland) | | | 10,698 | | | | 59,159 | |
ANZ Group Holdings Ltd. (Australia) | | | 3,408 | | | | 60,048 | |
Banco Bilbao Vizcaya Argentaria SA (Spain) | | | 1,664 | | | | 16,281 | |
| | | | | | | | |
| | | Shares | | | Value | |
COMMON STOCKS (continued) | |
Banks (cont’d.) | | | | | | | | |
Banco BPM SpA (Italy) | | | 5,194 | | | $ | 42,054 | |
Banco Santander SA (Spain) | | | 13,259 | | | | 61,339 | |
Bank Leumi Le-Israel BM (Israel) | | | 1,360 | | | | 16,180 | |
Bank of America Corp. | | | 176,541 | | | | 7,758,977 | |
Barclays PLC (United Kingdom) | | | 29,823 | | | | 99,764 | |
BNP Paribas SA (France) | | | 756 | | | | 46,416 | |
BOC Hong Kong Holdings Ltd. (China) | | | 2,000 | | | | 6,386 | |
BPER Banca SpA (Italy) | | | 4,080 | | | | 26,022 | |
CaixaBank SA (Spain) | | | 7,144 | | | | 38,786 | |
Citigroup, Inc. | | | 50,035 | | | | 3,521,964 | |
Citizens Financial Group, Inc. | | | 11,800 | | | | 516,368 | |
Commonwealth Bank of Australia (Australia) | | | 654 | | | | 61,882 | |
Credit Agricole SA (France) | | | 2,847 | | | | 39,173 | |
DBS Group Holdings Ltd. (Singapore) | | | 2,100 | | | | 67,296 | |
Erste Group Bank AG (Austria) | | | 950 | | | | 58,801 | |
Fifth Third Bancorp(a) | | | 17,721 | | | | 749,244 | |
HSBC Holdings PLC (United Kingdom) | | | 15,287 | | | | 150,166 | |
Huntington Bancshares, Inc. | | | 39,336 | | | | 639,997 | |
ING Groep NV (Netherlands) | | | 2,130 | | | | 33,381 | |
Intesa Sanpaolo SpA (Italy) | | | 26,123 | | | | 104,775 | |
JPMorgan Chase & Co. | | | 74,445 | | | | 17,845,211 | |
KeyCorp. | | | 25,100 | | | | 430,214 | |
M&T Bank Corp. | | | 4,505 | | | | 846,985 | |
Mitsubishi UFJ Financial Group, Inc. (Japan) | | | 10,400 | | | | 121,417 | |
NatWest Group PLC (United Kingdom) | | | 11,675 | | | | 58,506 | |
Nordea Bank Abp (Finland) | | | 4,321 | | | | 47,145 | |
Oversea-Chinese Banking Corp. Ltd. (Singapore) | | | 1,600 | | | | 19,541 | |
PNC Financial Services Group, Inc. (The) | | | 10,433 | | | | 2,012,004 | |
Regions Financial Corp. | | | 25,203 | | | | 592,775 | |
Sumitomo Mitsui Financial Group, Inc. (Japan) | | | 1,800 | | | | 43,200 | |
Truist Financial Corp. | | | 35,401 | | | | 1,535,695 | |
U.S. Bancorp | | | 41,285 | | | | 1,974,662 | |
UniCredit SpA (Italy) | | | 2,834 | | | | 113,497 | |
Wells Fargo & Co. | | | 88,064 | | | | 6,185,615 | |
Westpac Banking Corp. (Australia) | | | 4,865 | | | | 97,110 | |
| | | | | | | | |
| | |
| | | | | | | 46,117,835 | |
| | | | | | | | |
Beverages — 0.6% | | | | | | | | |
Brown-Forman Corp. (Class B Stock)(a) | | | 5,275 | | | | 200,345 | |
Carlsberg A/S (Denmark) (Class B Stock) | | | 90 | | | | 8,644 | |
Coca-Cola Co. (The) | | | 104,201 | | | | 6,487,554 | |
Coca-Cola HBC AG (Italy)* | | | 184 | | | | 6,286 | |
Constellation Brands, Inc. (Class A Stock) | | | 4,140 | | | | 914,940 | |
Keurig Dr. Pepper, Inc. | | | 29,800 | | | | 957,176 | |
Molson Coors Beverage Co. (Class B Stock) | | | 5,000 | | | | 286,600 | |
Monster Beverage Corp.* | | | 18,600 | | | | 977,616 | |
PepsiCo, Inc. | | | 36,307 | | | | 5,520,842 | |
| | | | | | | | |
| | |
| | | | | | | 15,360,003 | |
| | | | | | | | |
SEE NOTES TO FINANCIAL STATEMENTS.
A25
| | | | |
| | PSF PGIM 50/50 BALANCED PORTFOLIO (CONTINUED) | | |
SCHEDULE OF INVESTMENTS | | | | as of December 31, 2024 |
| | | | | | | | |
| | | Shares | | | Value | |
COMMON STOCKS (continued) | | | | | |
Biotechnology — 0.8% | | | | | | | | |
AbbVie, Inc. | | | 46,701 | | | $ | 8,298,768 | |
Amgen, Inc. | | | 14,137 | | | | 3,684,667 | |
Biogen, Inc.* | | | 3,860 | | | | 590,271 | |
CSL Ltd. | | | 128 | | | | 22,330 | |
Gilead Sciences, Inc. | | | 32,900 | | | | 3,038,973 | |
Incyte Corp.* | | | 4,440 | | | | 306,671 | |
Moderna, Inc.* | | | 9,550 | | | | 397,089 | |
Regeneron Pharmaceuticals, Inc.* | | | 2,800 | | | | 1,994,524 | |
Vertex Pharmaceuticals, Inc.* | | | 6,800 | | | | 2,738,360 | |
| | | | | | | | |
| | |
| | | | | | | 21,071,653 | |
| | | | | | | | |
Broadline Retail — 2.1% | | | | | | | | |
Amazon.com, Inc.* | | | 247,600 | | | | 54,320,964 | |
eBay, Inc. | | | 12,600 | | | | 780,570 | |
Next PLC (United Kingdom) | | | 360 | | | | 42,704 | |
Prosus NV (China)* | | | 998 | | | | 39,667 | |
| | | | | | | | |
| | |
| | | | | | | 55,183,905 | |
| | | | | | | | |
Building Products — 0.3% | | | | | | | | |
A.O. Smith Corp. | | | 3,300 | | | | 225,093 | |
AGC, Inc. (Japan) | | | 1,100 | | | | 32,132 | |
Allegion PLC | | | 2,533 | | | | 331,012 | |
Builders FirstSource, Inc.* | | | 3,000 | | | | 428,790 | |
Carrier Global Corp. | | | 22,202 | | | | 1,515,509 | |
Cie de Saint-Gobain SA (France) | | | 1,418 | | | | 126,006 | |
Geberit AG (Switzerland) | | | 10 | | | | 5,671 | |
Johnson Controls International PLC | | | 17,622 | | | | 1,390,905 | |
Lennox International, Inc. | | | 840 | | | | 511,812 | |
Masco Corp. | | | 5,800 | | | | 420,906 | |
ROCKWOOL A/S (Denmark) (Class B Stock) | | | 41 | | | | 14,589 | |
Trane Technologies PLC | | | 5,900 | | | | 2,179,165 | |
| | | | | | | | |
| | |
| | | | | | | 7,181,590 | |
| | | | | | | | |
Capital Markets — 1.6% | | | | | | | | |
3i Group PLC (United Kingdom) | | | 2,385 | | | | 106,164 | |
Ameriprise Financial, Inc. | | | 2,560 | | | | 1,363,021 | |
Amundi SA (France), 144A | | | 582 | | | | 38,732 | |
Bank of New York Mellon Corp. (The) | | | 19,458 | | | | 1,494,958 | |
Blackrock, Inc. | | | 3,850 | | | | 3,946,673 | |
Blackstone, Inc. | | | 19,000 | | | | 3,275,980 | |
Cboe Global Markets, Inc. | | | 2,800 | | | | 547,120 | |
Charles Schwab Corp. (The) | | | 39,550 | | | | 2,927,095 | |
CME Group, Inc. | | | 9,500 | | | | 2,206,185 | |
Deutsche Bank AG (Germany) | | | 5,322 | | | | 91,841 | |
Euronext NV (Netherlands), 144A | | | 304 | | | | 34,105 | |
FactSet Research Systems, Inc.(a) | | | 1,000 | | | | 480,280 | |
Franklin Resources, Inc. | | | 8,700 | | | | 176,523 | |
Goldman Sachs Group, Inc. (The) | | | 8,300 | | | | 4,752,746 | |
Intercontinental Exchange, Inc. | | | 15,155 | | | | 2,258,247 | |
Invesco Ltd. | | | 12,400 | | | | 216,752 | |
Investec PLC (United Kingdom) | | | 1,014 | | | | 6,893 | |
KKR & Co., Inc. | | | 17,800 | | | | 2,632,798 | |
Magellan Financial Group Ltd. (Australia) | | | 1,225 | | | | 8,406 | |
MarketAxess Holdings, Inc. | | | 1,020 | | | | 230,561 | |
Moody’s Corp. | | | 4,130 | | | | 1,955,018 | |
Morgan Stanley | | | 32,919 | | | | 4,138,577 | |
| | | | | | | | |
| | | Shares | | | Value | |
COMMON STOCKS (continued) | | | | | |
Capital Markets (cont’d.) | | | | | | | | |
MSCI, Inc. | | | 2,060 | | | $ | 1,236,021 | |
Nasdaq, Inc. | | | 10,800 | | | | 834,948 | |
Nomura Holdings, Inc. (Japan) | | | 17,000 | | | | 98,631 | |
Northern Trust Corp. | | | 5,300 | | | | 543,250 | |
Plus500 Ltd. (Israel) | | | 224 | | | | 7,594 | |
Raymond James Financial, Inc. | | | 4,850 | | | | 753,351 | |
S&P Global, Inc. | | | 8,440 | | | | 4,203,373 | |
Singapore Exchange Ltd. (Singapore) | | | 3,200 | | | | 29,829 | |
State Street Corp. | | | 7,700 | | | | 755,755 | |
T. Rowe Price Group, Inc.(a) | | | 5,800 | | | | 655,922 | |
UBS Group AG (Switzerland) | | | 2,873 | | | | 87,962 | |
| | | | | | | | |
| | |
| | | | | | | 42,095,311 | |
| | | | | | | | |
Chemicals — 0.6% | | | | | | | | |
Air Products & Chemicals, Inc. | | | 5,900 | | | | 1,711,236 | |
Albemarle Corp.(a) | | | 3,100 | | | | 266,848 | |
Celanese Corp. | | | 2,800 | | | | 193,788 | |
CF Industries Holdings, Inc. | | | 4,700 | | | | 401,004 | |
Corteva, Inc.(a) | | | 18,247 | | | | 1,039,349 | |
Dow, Inc. | | | 18,547 | | | | 744,291 | |
DuPont de Nemours, Inc. | | | 10,947 | | | | 834,709 | |
Eastman Chemical Co.(a) | | | 3,100 | | | | 283,092 | |
Ecolab, Inc. | | | 6,600 | | | | 1,546,512 | |
Evonik Industries AG (Germany) | | | 351 | | | | 6,101 | |
FMC Corp. | | | 3,400 | | | | 165,274 | |
Givaudan SA (Switzerland) | | | 3 | | | | 13,114 | |
International Flavors & Fragrances, Inc. | | | 6,900 | | | | 583,395 | |
Linde PLC | | | 12,700 | | | | 5,317,109 | |
LyondellBasell Industries NV (Class A Stock) | | | 6,800 | | | | 505,036 | |
Mosaic Co. (The) | | | 9,200 | | | | 226,136 | |
Nitto Denko Corp. (Japan) | | | 1,100 | | | | 18,391 | |
Orica Ltd. (Australia) | | | 2,456 | | | | 25,178 | |
PPG Industries, Inc. | | | 6,100 | | | | 728,645 | |
Sherwin-Williams Co. (The) | | | 6,150 | | | | 2,090,569 | |
Solvay SA (Belgium) | | | 1,592 | | | | 51,469 | |
| | | | | | | | |
| | |
| | | | | | | 16,751,246 | |
| | | | | | | | |
Commercial Services & Supplies — 0.3% | | | | | |
Brambles Ltd. (Australia) | | | 7,224 | | | | 85,916 | |
Cintas Corp. | | | 9,020 | | | | 1,647,954 | |
Copart, Inc.* | | | 23,600 | | | | 1,354,404 | |
Republic Services, Inc. | | | 5,465 | | | | 1,099,449 | |
Rollins, Inc. | | | 7,400 | | | | 342,990 | |
Veralto Corp. | | | 6,633 | | | | 675,571 | |
Waste Management, Inc. | | | 9,842 | | | | 1,986,017 | |
| | | | | | | | |
| | |
| | | | | | | 7,192,301 | |
| | | | | | | | |
Communications Equipment — 0.5% | | | | | |
Arista Networks, Inc.* | | | 27,200 | | | | 3,006,416 | |
Cisco Systems, Inc. | | | 106,700 | | | | 6,316,640 | |
F5, Inc.* | | | 1,500 | | | | 377,205 | |
Juniper Networks, Inc. | | | 8,700 | | | | 325,815 | |
Motorola Solutions, Inc. | | | 4,409 | | | | 2,037,972 | |
Nokia OYJ (Finland) | | | 15,347 | | | | 67,886 | |
Telefonaktiebolaget LM Ericsson (Sweden) (Class B Stock) | | | 4,644 | | | | 37,609 | |
| | | | | | | | |
| | |
| | | | | | | 12,169,543 | |
| | | | | | | | |
SEE NOTES TO FINANCIAL STATEMENTS.
A26
| | | | |
| | PSF PGIM 50/50 BALANCED PORTFOLIO (CONTINUED) | | |
SCHEDULE OF INVESTMENTS | | | | as of December 31, 2024 |
| | | | | | | | |
| | | Shares | | | Value | |
|
COMMON STOCKS (continued) | |
Construction & Engineering — 0.1% | |
ACS Actividades de Construccion y Servicios SA (Spain) | | | 1,122 | | | $ | 56,226 | |
Eiffage SA (France) | | | 960 | | | | 84,184 | |
Quanta Services, Inc. | | | 3,800 | | | | 1,200,990 | |
Vinci SA (France) | | | 767 | | | | 78,968 | |
| | | | | | | | |
| | |
| | | | | | | 1,420,368 | |
| | | | | | | | |
Construction Materials — 0.1% | |
Buzzi SpA (Italy) | | | 182 | | | | 6,718 | |
Heidelberg Materials AG (Germany) | | | 850 | | | | 105,029 | |
Holcim AG* | | | 1,050 | | | | 101,099 | |
Martin Marietta Materials, Inc. | | | 1,600 | | | | 826,400 | |
Vulcan Materials Co. | | | 3,400 | | | | 874,582 | |
| | | | | | | | |
| | |
| | | | | | | 1,913,828 | |
| | | | | | | | |
Consumer Finance — 0.3% | |
American Express Co. | | | 14,600 | | | | 4,333,134 | |
Capital One Financial Corp. | | | 10,061 | | | | 1,794,078 | |
Discover Financial Services | | | 6,540 | | | | 1,132,924 | |
Synchrony Financial | | | 10,472 | | | | 680,680 | |
| | | | | | | | |
| | |
| | | | | | | 7,940,816 | |
| | | | | | | | |
Consumer Staples Distribution & Retail — 1.0% | |
Carrefour SA (France) | | | 4,056 | | | | 57,728 | |
Coles Group Ltd. (Australia) | | | 4,315 | | | | 50,371 | |
Colruyt Group NV (Belgium) | | | 174 | | | | 6,548 | |
Costco Wholesale Corp. | | | 11,700 | | | | 10,720,359 | |
Dollar General Corp. | | | 6,000 | | | | 454,920 | |
Dollar Tree, Inc.* | | | 5,465 | | | | 409,547 | |
Kesko OYJ (Finland) (Class B Stock) | | | 741 | | | | 13,981 | |
Koninklijke Ahold Delhaize NV (Netherlands) | | | 3,312 | | | | 108,234 | |
Kroger Co. (The)(a) | | | 17,592 | | | | 1,075,751 | |
Sysco Corp.(a) | | | 13,000 | | | | 993,980 | |
Target Corp. | | | 12,160 | | | | 1,643,789 | |
Tesco PLC (United Kingdom) | | | 12,167 | | | | 55,960 | |
Walgreens Boots Alliance, Inc. | | | 18,900 | | | | 176,337 | |
Walmart, Inc. | | | 115,000 | | | | 10,390,250 | |
| | | | | | | | |
| | |
| | | | | | | 26,157,755 | |
| | | | | | | | |
Containers & Packaging — 0.1% | |
Amcor PLC | | | 40,850 | | | | 384,398 | |
Avery Dennison Corp. | | | 2,100 | | | | 392,973 | |
Ball Corp. | | | 8,300 | | | | 457,579 | |
International Paper Co. | | | 9,173 | | | | 493,691 | |
Packaging Corp. of America | | | 2,300 | | | | 517,799 | |
Smurfit WestRock PLC(a) | | | 13,044 | | | | 702,550 | |
| | | | | | | | |
| | |
| | | | | | | 2,948,990 | |
| | | | | | | | |
Distributors — 0.0% | |
Genuine Parts Co. | | | 3,700 | | | | 432,012 | |
LKQ Corp. | | | 6,900 | | | | 253,575 | |
Pool Corp. | | | 880 | | | | 300,027 | |
| | | | | | | | |
| | |
| | | | | | | 985,614 | |
| | | | | | | | |
Diversified REITs — 0.0% | |
GPT Group (The) (Australia) | | | 8,447 | | | | 22,755 | |
| | | | | | | | |
| | | Shares | | | Value | |
|
COMMON STOCKS (continued) | |
Diversified REITs (cont’d.) | |
Stockland (Australia) | | | 1,757 | | | $ | 5,212 | |
| | | | | | | | |
| | |
| | | | | | | 27,967 | |
| | | | | | | | |
Diversified Telecommunication Services — 0.3% | |
AT&T, Inc. | | | 189,936 | | | | 4,324,843 | |
Deutsche Telekom AG (Germany) | | | 5,947 | | | | 178,190 | |
Koninklijke KPN NV (Netherlands) | | | 19,452 | | | | 70,931 | |
Orange SA (France) | | | 3,704 | | | | 36,958 | |
Telstra Group Ltd. (Australia) | | | 3,256 | | | | 8,069 | |
Verizon Communications, Inc. | | | 111,476 | | | | 4,457,925 | |
| | | | | | | | |
| | |
| | | | | | | 9,076,916 | |
| | | | | | | | |
Electric Utilities — 0.7% | |
Alliant Energy Corp. | | | 6,800 | | | | 402,152 | |
American Electric Power Co., Inc. | | | 14,060 | | | | 1,296,754 | |
Chubu Electric Power Co., Inc. (Japan) | | | 3,900 | | | | 40,915 | |
Constellation Energy Corp. | | | 8,204 | | | | 1,835,317 | |
Duke Energy Corp. | | | 20,361 | | | | 2,193,694 | |
Edison International | | | 10,200 | | | | 814,368 | |
Enel SpA (Italy) | | | 12,923 | | | | 92,221 | |
Entergy Corp. | | | 11,200 | | | | 849,184 | |
Evergy, Inc. | | | 6,100 | | | | 375,455 | |
Eversource Energy | | | 9,800 | | | | 562,814 | |
Exelon Corp. | | | 26,413 | | | | 994,185 | |
FirstEnergy Corp. | | | 13,856 | | | | 551,192 | |
Fortum OYJ (Finland) | | | 1,944 | | | | 27,213 | |
Iberdrola SA (Spain) | | | 8,260 | | | | 113,825 | |
Kansai Electric Power Co., Inc. (The) (Japan) | | | 1,800 | | | | 19,951 | |
NextEra Energy, Inc. | | | 54,400 | | | | 3,899,936 | |
NRG Energy, Inc. | | | 5,600 | | | | 505,232 | |
PG&E Corp. | | | 57,800 | | | | 1,166,404 | |
Pinnacle West Capital Corp.(a) | | | 3,200 | | | | 271,264 | |
PPL Corp. | | | 20,200 | | | | 655,692 | |
Shikoku Electric Power Co., Inc. (Japan) | | | 700 | | | | 5,460 | |
Southern Co. (The) | | | 28,900 | | | | 2,379,048 | |
Tokyo Electric Power Co. Holdings, Inc. (Japan)* | | | 9,100 | | | | 27,201 | |
Xcel Energy, Inc. | | | 15,210 | | | | 1,026,979 | |
| | | | | | | | |
| | |
| | | | | | | 20,106,456 | |
| | | | | | | | |
Electrical Equipment — 0.4% | |
ABB Ltd. (Switzerland) | | | 3,309 | | | | 178,681 | |
AMETEK, Inc. | | | 6,100 | | | | 1,099,586 | |
Eaton Corp. PLC | | | 10,337 | | | | 3,430,540 | |
Emerson Electric Co. | | | 15,100 | | | | 1,871,343 | |
Fujikura Ltd. (Japan) | | | 1,100 | | | | 44,908 | |
GE Vernova, Inc. | | | 7,194 | | | | 2,366,323 | |
Generac Holdings, Inc.* | | | 1,600 | | | | 248,080 | |
Hubbell, Inc. | | | 1,400 | | | | 586,446 | |
Legrand SA (France) | | | 304 | | | | 29,571 | |
Nidec Corp. (Japan) | | | 1,000 | | | | 17,962 | |
Rockwell Automation, Inc. | | | 3,100 | | | | 885,949 | |
Schneider Electric SE | | | 629 | | | | 156,593 | |
Siemens Energy AG (Germany)* | | | 815 | | | | 43,253 | |
| | | | | | | | |
| | |
| | | | | | | 10,959,235 | |
| | | | | | | | |
SEE NOTES TO FINANCIAL STATEMENTS.
A27
| | | | |
| | PSF PGIM 50/50 BALANCED PORTFOLIO (CONTINUED) | | |
SCHEDULE OF INVESTMENTS | | | | as of December 31, 2024 |
| | | | | | | | |
| | | Shares | | | Value | |
|
COMMON STOCKS (continued) | |
Electronic Equipment, Instruments & Components — 0.3% | |
Amphenol Corp. (Class A Stock) | | | 31,900 | | | $ | 2,215,455 | |
CDW Corp. | | | 3,450 | | | | 600,438 | |
Corning, Inc. | | | 20,400 | | | | 969,408 | |
Jabil, Inc. | | | 3,100 | | | | 446,090 | |
Keysight Technologies, Inc.* | | | 4,700 | | | | 754,961 | |
TDK Corp. (Japan) | | | 6,000 | | | | 77,272 | |
TE Connectivity PLC (Switzerland) | | | 7,900 | | | | 1,129,463 | |
Teledyne Technologies, Inc.* | | | 1,160 | | | | 538,391 | |
Trimble, Inc.* | | | 6,800 | | | | 480,488 | |
Yokogawa Electric Corp. (Japan) | | | 300 | | | | 6,381 | |
Zebra Technologies Corp. (Class A Stock)* | | | 1,370 | | | | 529,121 | |
| | | | | | | | |
| | |
| | | | | | | 7,747,468 | |
| | | | | | | | |
Energy Equipment & Services — 0.1% | | | | | |
Baker Hughes Co. | | | 26,898 | | | | 1,103,356 | |
Halliburton Co.(a) | | | 23,900 | | | | 649,841 | |
Schlumberger NV | | | 37,524 | | | | 1,438,670 | |
| | | | | | | | |
| | |
| | | | | | | 3,191,867 | |
| | | | | | | | |
Entertainment — 0.7% | | | | | | | | |
CTS Eventim AG & Co. KGaA (Germany) | | | 306 | | | | 25,868 | |
Electronic Arts, Inc. | | | 6,300 | | | | 921,690 | |
Konami Group Corp. (Japan) | | | 700 | | | | 65,499 | |
Live Nation Entertainment, Inc.* | | | 4,100 | | | | 530,950 | |
Netflix, Inc.* | | | 11,310 | | | | 10,080,829 | |
Sea Ltd. (Singapore), ADR* | | | 1,100 | | | | 116,710 | |
Spotify Technology SA* | | | 100 | | | | 44,738 | |
Take-Two Interactive Software, Inc.* | | | 4,300 | | | | 791,544 | |
Walt Disney Co. (The) | | | 47,982 | | | | 5,342,796 | |
Warner Bros Discovery, Inc.* | | | 59,076 | | | | 624,433 | |
| | | | | | | | |
| | |
| | | | | | | 18,545,057 | |
| | | | | | | | |
Financial Services — 2.2% | | | | | | | | |
Apollo Global Management, Inc. | | | 11,800 | | | | 1,948,888 | |
Berkshire Hathaway, Inc. (Class B Stock)* | | | 48,455 | | | | 21,963,682 | |
Corpay, Inc.* | | | 1,700 | | | | 575,314 | |
Fidelity National Information Services, Inc. | | | 14,400 | | | | 1,163,088 | |
Financial Partners Group Co. Ltd. (Japan) | | | 1,100 | | | | 20,064 | |
Fiserv, Inc.* | | | 15,000 | | | | 3,081,300 | |
Global Payments, Inc. | | | 6,877 | | | | 770,637 | |
Investor AB (Sweden) (Class B Stock) | | | 4,479 | | | | 118,635 | |
Jack Henry & Associates, Inc. | | | 1,900 | | | | 333,070 | |
Mastercard, Inc. (Class A Stock) | | | 21,850 | | | | 11,505,555 | |
PayPal Holdings, Inc.* | | | 26,500 | | | | 2,261,775 | |
Visa, Inc. (Class A Stock) | | | 45,700 | | | | 14,443,028 | |
| | | | | | | | |
| | |
| | | | | | | 58,185,036 | |
| | | | | | | | |
Food Products — 0.3% | | | | | | | | |
Archer-Daniels-Midland Co.(a) | | | 12,826 | | | | 647,969 | |
Associated British Foods PLC (United Kingdom) | | | 1,522 | | | | 38,824 | |
Bunge Global SA | | | 3,800 | | | | 295,488 | |
Conagra Brands, Inc. | | | 13,500 | | | | 374,625 | |
| | | | | | | | |
| | | Shares | | | Value | |
|
COMMON STOCKS (continued) | |
Food Products (cont’d.) | | | | | | | | |
General Mills, Inc. | | | 14,700 | | | $ | 937,419 | |
Hershey Co. (The)(a) | | | 3,900 | | | | 660,465 | |
Hormel Foods Corp. | | | 8,400 | | | | 263,508 | |
J.M. Smucker Co. (The) | | | 2,900 | | | | 319,348 | |
Kellanova | | | 7,600 | | | | 615,372 | |
Kraft Heinz Co. (The) | | | 22,967 | | | | 705,317 | |
Lamb Weston Holdings, Inc.(a) | | | 4,000 | | | | 267,320 | |
McCormick & Co., Inc. | | | 6,540 | | | | 498,610 | |
Mondelez International, Inc. (Class A Stock) | | | 35,353 | | | | 2,111,635 | |
Nestle SA | | | 1,721 | | | | 141,196 | |
Nippn Corp. (Japan) | | | 500 | | | | 6,929 | |
The Campbell’s Co. | | | 5,700 | | | | 238,716 | |
Tyson Foods, Inc. (Class A Stock) | | | 7,700 | | | | 442,288 | |
WH Group Ltd. (Hong Kong), 144A | | | 107,000 | | | | 82,458 | |
Wilmar International Ltd. (China) | | | 25,100 | | | | 56,970 | |
| | | | | | | | |
| | |
| | | | | | | 8,704,457 | |
| | | | | | | | |
Gas Utilities — 0.0% | | | | | | | | |
Atmos Energy Corp.(a) | | | 4,100 | | | | 571,007 | |
| | | | | | | | |
Ground Transportation — 0.4% | | | | | | | | |
CSX Corp. | | | 51,300 | | | | 1,655,451 | |
J.B. Hunt Transport Services, Inc. | | | 2,000 | | | | 341,320 | |
Norfolk Southern Corp. | | | 6,000 | | | | 1,408,200 | |
Old Dominion Freight Line, Inc. | | | 4,830 | | | | 852,012 | |
Uber Technologies, Inc.* | | | 55,600 | | | | 3,353,792 | |
Union Pacific Corp. | | | 16,060 | | | | 3,662,322 | |
| | | | | | | | |
| | |
| | | | | | | 11,273,097 | |
| | | | | | | | |
Health Care Equipment & Supplies — 1.1% | | | | | |
Abbott Laboratories | | | 46,050 | | | | 5,208,715 | |
Align Technology, Inc.* | | | 1,840 | | | | 383,658 | |
Baxter International, Inc. | | | 13,800 | | | | 402,408 | |
Becton, Dickinson & Co. | | | 7,610 | | | | 1,726,481 | |
Boston Scientific Corp.* | | | 38,967 | | | | 3,480,532 | |
Cooper Cos., Inc. (The)* | | | 5,460 | | | | 501,938 | |
Dexcom, Inc.* | | | 10,560 | | | | 821,251 | |
Edwards Lifesciences Corp.* | | | 15,900 | | | | 1,177,077 | |
Fisher & Paykel Healthcare Corp. Ltd. (New Zealand) | | | 2,559 | | | | 55,001 | |
GE HealthCare Technologies, Inc. | | | 12,092 | | | | 945,353 | |
Hologic, Inc.* | | | 6,100 | | | | 439,749 | |
Hoya Corp. (Japan) | | | 400 | | | | 49,643 | |
IDEXX Laboratories, Inc.* | | | 2,100 | | | | 868,224 | |
Insulet Corp.* | | | 1,800 | | | | 469,926 | |
Intuitive Surgical, Inc.* | | | 9,380 | | | | 4,895,985 | |
Medtronic PLC. | | | 33,890 | | | | 2,707,133 | |
ResMed, Inc.(a) | | | 3,900 | | | | 891,891 | |
Solventum Corp.* | | | 3,570 | | | | 235,834 | |
STERIS PLC | | | 2,650 | | | | 544,734 | |
Stryker Corp. | | | 9,000 | | | | 3,240,450 | |
Teleflex, Inc. | | | 1,200 | | | | 213,576 | |
Zimmer Biomet Holdings, Inc. | | | 5,300 | | | | 559,839 | |
| | | | | | | | |
| | |
| | | | | | | 29,819,398 | |
| | | | | | | | |
Health Care Providers & Services — 1.0% | | | | | |
Ambea AB (Sweden), 144A | | | 2,516 | | | | 21,921 | |
Cardinal Health, Inc. | | | 6,450 | | | | 762,841 | |
SEE NOTES TO FINANCIAL STATEMENTS.
A28
| | | | |
| | PSF PGIM 50/50 BALANCED PORTFOLIO (CONTINUED) | | |
SCHEDULE OF INVESTMENTS | | | | as of December 31, 2024 |
| | | | | | | | |
| | | Shares | | | Value | |
|
COMMON STOCKS (continued) | |
Health Care Providers & Services (cont’d.) | |
Cencora, Inc. | | | 4,700 | | | $ | 1,055,996 | |
Centene Corp.* | | | 13,250 | | | | 802,685 | |
Cigna Group (The) | | | 7,400 | | | | 2,043,436 | |
CVS Health Corp. | | | 33,283 | | | | 1,494,074 | |
DaVita, Inc.* | | | 1,200 | | | | 179,460 | |
EBOS Group Ltd. (Australia) | | | 273 | | | | 5,659 | |
Elevance Health, Inc. | | | 6,020 | | | | 2,220,778 | |
Fresenius Medical Care AG (Germany) | | | 1,292 | | | | 58,826 | |
HCA Healthcare, Inc. | | | 5,000 | | | | 1,500,750 | |
Henry Schein, Inc.* | | | 3,500 | | | | 242,200 | |
Humana, Inc. | | | 3,210 | | | | 814,409 | |
Labcorp Holdings, Inc. | | | 2,100 | | | | 481,572 | |
McKesson Corp. | | | 3,350 | | | | 1,909,198 | |
Medipal Holdings Corp. (Japan) | | | 700 | | | | 10,527 | |
Molina Healthcare, Inc.* | | | 1,550 | | | | 451,128 | |
Quest Diagnostics, Inc. | | | 3,000 | | | | 452,580 | |
Ship Healthcare Holdings, Inc. (Japan) | | | 400 | | | | 5,589 | |
UnitedHealth Group, Inc. | | | 24,460 | | | | 12,373,336 | |
Universal Health Services, Inc. (Class B Stock) | | | 1,600 | | | | 287,072 | |
| | | | | | | | |
| | |
| | | | | | | 27,174,037 | |
| | | | | | | | |
Health Care REITs — 0.1% | | | | | | | | |
Alexandria Real Estate Equities, Inc. | | | 4,180 | | | | 407,759 | |
Healthpeak Properties, Inc. | | | 18,600 | | | | 377,022 | |
Ventas, Inc. | | | 10,868 | | | | 640,017 | |
Welltower, Inc. | | | 15,600 | | | | 1,966,068 | |
| | | | | | | | |
| | |
| | | | | | | 3,390,866 | |
| | | | | | | | |
Health Care Technology — 0.0% | | | | | | | | |
| | |
Pro Medicus Ltd. (Australia) | | | 138 | | | | 21,317 | |
| | | | | | | | |
Hotel & Resort REITs — 0.0% | | | | | | | | |
| | |
Host Hotels & Resorts, Inc. | | | 19,682 | | | | 344,829 | |
| | | | | | | | |
Hotels, Restaurants & Leisure — 1.0% | |
Accor SA (France) | | | 156 | | | | 7,587 | |
Airbnb, Inc. (Class A Stock)* | | | 11,600 | | | | 1,524,356 | |
Aristocrat Leisure Ltd. (Australia) | | | 1,416 | | | | 59,798 | |
Booking Holdings, Inc. | | | 880 | | | | 4,372,210 | |
Caesars Entertainment, Inc.* | | | 5,900 | | | | 197,178 | |
Carnival Corp.* | | | 27,300 | | | | 680,316 | |
Chipotle Mexican Grill, Inc.* | | | 36,200 | | | | 2,182,860 | |
Darden Restaurants, Inc. | | | 3,050 | | | | 569,405 | |
Domino’s Pizza, Inc. | | | 820 | | | | 344,203 | |
Expedia Group, Inc.* | | | 3,350 | | | | 624,206 | |
Hilton Worldwide Holdings, Inc. | | | 6,300 | | | | 1,557,108 | |
La Francaise des Jeux SACA (France), 144A. | | | 1,700 | | | | 65,468 | |
Las Vegas Sands Corp. | | | 9,150 | | | | 469,944 | |
Marriott International, Inc. (Class A Stock) | | | 6,128 | | | | 1,709,344 | |
McDonald’s Corp. | | | 19,200 | | | | 5,565,888 | |
MGM Resorts International* | | | 6,400 | | | | 221,760 | |
Norwegian Cruise Line Holdings Ltd.* | | | 12,000 | | | | 308,760 | |
Royal Caribbean Cruises Ltd. | | | 6,500 | | | | 1,499,485 | |
Starbucks Corp. | | | 30,000 | | | | 2,737,500 | |
TUI AG (Germany)* | | | 945 | | | | 8,195 | |
Wynn Resorts Ltd. | | | 2,500 | | | | 215,400 | |
Yum! Brands, Inc. | | | 7,400 | | | | 992,784 | |
| | | | | | | | |
| | | Shares | | | Value | |
|
COMMON STOCKS (continued) | |
Hotels, Restaurants & Leisure (cont’d.) | |
Zensho Holdings Co. Ltd. (Japan) | | | 400 | | | $ | 22,653 | |
| | | | | | | | |
| | |
| | | | | | | 25,936,408 | |
| | | | | | | | |
Household Durables — 0.2% | | | | | | | | |
Breville Group Ltd. (Australia) | | | 324 | | | | 7,077 | |
D.R. Horton, Inc. | | | 7,800 | | | | 1,090,596 | |
Garmin Ltd. | | | 4,000 | | | | 825,040 | |
JVCKenwood Corp. (Japan) | | | 1,900 | | | | 20,923 | |
Lennar Corp. (Class A Stock) | | | 6,400 | | | | 872,768 | |
Mohawk Industries, Inc.* | | | 1,340 | | | | 159,634 | |
NVR, Inc.* | | | 80 | | | | 654,312 | |
PulteGroup, Inc. | | | 5,422 | | | | 590,456 | |
Sony Group Corp. (Japan) | | | 6,100 | | | | 128,561 | |
| | | | | | | | |
| | |
| | | | | | | 4,349,367 | |
| | | | | | | | |
Household Products — 0.6% | | | | | | | | |
Church & Dwight Co., Inc. | | | 6,500 | | | | 680,615 | |
Clorox Co. (The) | | | 3,300 | | | | 535,953 | |
Colgate-Palmolive Co. | | | 21,600 | | | | 1,963,656 | |
Essity AB (Sweden) (Class B Stock) | | | 3,867 | | | | 103,397 | |
Henkel AG & Co. KGaA (Germany) | | | 78 | | | | 6,010 | |
Kimberly-Clark Corp. | | | 9,200 | | | | 1,205,568 | |
Procter & Gamble Co. (The) | | | 62,325 | | | | 10,448,786 | |
Reckitt Benckiser Group PLC (United Kingdom) | | | 579 | | | | 35,047 | |
| | | | | | | | |
| | |
| | | | | | | 14,979,032 | |
| | | | | | | | |
Independent Power & Renewable Electricity Producers — 0.1% | |
AES Corp. (The) | | | 19,500 | | | | 250,965 | |
Vistra Corp. | | | 9,100 | | | | 1,254,617 | |
| | | | | | | | |
| | |
| | | | | | | 1,505,582 | |
| | | | | | | | |
Industrial Conglomerates — 0.2% | | | | | | | | |
3M Co. | | | 14,480 | | | | 1,869,223 | |
Hitachi Ltd. (Japan) | | | 4,500 | | | | 110,205 | |
Honeywell International, Inc. | | | 17,212 | | | | 3,888,019 | |
Sekisui Chemical Co. Ltd. (Japan) | | | 400 | | | | 6,849 | |
Siemens AG (Germany) | | | 725 | | | | 141,371 | |
| | | | | | | | |
| | |
| | | | | | | 6,015,667 | |
| | | | | | | | |
Industrial REITs — 0.1% | | | | | | | | |
Goodman Group (Australia) | | | 3,650 | | | | 80,234 | |
Prologis, Inc. | | | 24,484 | | | | 2,587,959 | |
| | | | | | | | |
| | |
| | | | | | | 2,668,193 | |
| | | | | | | | |
Insurance — 1.0% | | | | | | | | |
Aflac, Inc. | | | 13,300 | | | | 1,375,752 | |
Ageas SA/NV (Belgium) | | | 1,624 | | | | 78,959 | |
AIA Group Ltd. (Hong Kong) | | | 11,400 | | | | 81,885 | |
Allianz SE (Germany) | | | 235 | | | | 72,230 | |
Allstate Corp. (The) | | | 6,900 | | | | 1,330,251 | |
American International Group, Inc. | | | 16,439 | | | | 1,196,759 | |
Aon PLC (Class A Stock) | | | 5,800 | | | | 2,083,128 | |
Arch Capital Group Ltd. | | | 9,900 | | | | 914,265 | |
Arthur J. Gallagher & Co. | | | 6,600 | | | | 1,873,410 | |
Assurant, Inc. | | | 1,300 | | | | 277,186 | |
Aviva PLC (United Kingdom) | | | 14,533 | | | | 85,179 | |
AXA SA (France) | | | 4,012 | | | | 142,786 | |
SEE NOTES TO FINANCIAL STATEMENTS.
A29
| | | | |
| | PSF PGIM 50/50 BALANCED PORTFOLIO (CONTINUED) | | |
SCHEDULE OF INVESTMENTS | | | | as of December 31, 2024 |
| | | | | | | | |
| | | Shares | | | Value | |
COMMON STOCKS (continued) | |
Insurance (cont’d.) | | | | | | | | |
Brown & Brown, Inc. | | | 6,200 | | | $ | 632,524 | |
Chubb Ltd. | | | 10,286 | | | | 2,842,022 | |
Cincinnati Financial Corp. | | | 4,137 | | | | 594,487 | |
Erie Indemnity Co. (Class A Stock) | | | 700 | | | | 288,561 | |
Everest Group Ltd. | | | 1,040 | | | | 376,958 | |
Globe Life, Inc. | | | 2,225 | | | | 248,132 | |
Hannover Rueck SE (Germany) | | | 51 | | | | 12,771 | |
Hartford Financial Services Group, Inc. (The) | | | 7,700 | | | | 842,380 | |
Insurance Australia Group Ltd. | | | | | | | | |
(Australia) | | | 2,280 | | | | 11,925 | |
Japan Post Insurance Co. Ltd. (Japan) | | | 1,500 | | | | 27,552 | |
Loews Corp. | | | 4,975 | | | | 421,333 | |
Marsh & McLennan Cos., Inc. | | | 13,000 | | | | 2,761,330 | |
Medibank Private Ltd. (Australia) | | | 33,584 | | | | 78,717 | |
MetLife, Inc. | | | 15,550 | | | | 1,273,234 | |
Muenchener Rueckversicherungs-Gesellschaft AG in Muenchen (Germany) | | | 193 | | | | 97,565 | |
Principal Financial Group, Inc. | | | 5,600 | | | | 433,496 | |
Progressive Corp. (The) | | | 15,500 | | | | 3,713,955 | |
QBE Insurance Group Ltd. (Australia) | | | 1,518 | | | | 18,028 | |
Sompo Holdings, Inc. (Japan) | | | 3,600 | | | | 93,277 | |
Suncorp Group Ltd. (Australia) | | | 520 | | | | 6,109 | |
Talanx AG (Germany) | | | 81 | | | | 6,889 | |
Travelers Cos., Inc. (The) | | | 6,035 | | | | 1,453,771 | |
Unipol Gruppo SpA (Italy) | | | 2,990 | | | | 37,341 | |
W.R. Berkley Corp. | | | 8,100 | | | | 474,012 | |
Willis Towers Watson PLC | | | 2,540 | | | | 795,630 | |
Zurich Insurance Group AG (Switzerland) | | | 23 | | | | 13,680 | |
| | | | | | | | |
| | |
| | | | | | | 27,067,469 | |
| | | | | | | | |
Interactive Media & Services — 3.2% | |
Alphabet, Inc. (Class A Stock) | | | 154,600 | | | | 29,265,780 | |
Alphabet, Inc. (Class C Stock) | | | 125,860 | | | | 23,968,778 | |
Match Group, Inc.* | | | 6,600 | | | | 215,886 | |
Meta Platforms, Inc. (Class A Stock) | | | 57,670 | | | | 33,766,362 | |
Scout24 SE (Germany), 144A | | | 150 | | | | 13,236 | |
| | | | | | | | |
| | |
| | | | | | | 87,230,042 | |
| | | | | | | | |
IT Services — 0.6% | | | | | | | | |
Accenture PLC (Ireland) (Class A Stock) | | | 16,500 | | | | 5,804,535 | |
Akamai Technologies, Inc.* | | | 4,200 | | | | 401,730 | |
Cognizant Technology Solutions Corp. (Class A Stock) | | | 13,100 | | | | 1,007,390 | |
EPAM Systems, Inc.* | | | 1,540 | | | | 360,083 | |
Gartner, Inc.* | | | 2,040 | | | | 988,319 | |
GoDaddy, Inc. (Class A Stock)*(a) | | | 3,700 | | | | 730,269 | |
International Business Machines Corp.(a) | | | 24,400 | | | | 5,363,852 | |
VeriSign, Inc.* | | | 2,300 | | | | 476,008 | |
Wix.com Ltd. (Israel)* | | | 400 | | | | 85,820 | |
| | | | | | | | |
| | |
| | | | | | | 15,218,006 | |
| | | | | | | | |
Leisure Products — 0.0% | | | | | | | | |
Bandai Namco Holdings, Inc. (Japan) | | | 4,100 | | | | 97,765 | |
| | | | | | | | |
| | | Shares | | | Value | |
COMMON STOCKS (continued) | |
Leisure Products (cont’d.) | | | | | | | | |
Hasbro, Inc. | | | 3,600 | | | $ | 201,276 | |
Tomy Co. Ltd. (Japan) | | | 500 | | | | 14,321 | |
| | | | | | | | |
| | |
| | | | | | | 313,362 | |
| | | | | | | | |
Life Sciences Tools & Services — 0.5% | | | | | | | | |
Agilent Technologies, Inc. | | | 7,714 | | | | 1,036,299 | |
Bio-Techne Corp. | | | 4,400 | | | | 316,932 | |
Charles River Laboratories International, Inc.* | | | 1,360 | | | | 251,056 | |
Danaher Corp. | | | 17,000 | | | | 3,902,350 | |
IQVIA Holdings, Inc.* | | | 4,600 | | | | 903,946 | |
Mettler-Toledo International, Inc.* | | | 560 | | | | 685,261 | |
Revvity, Inc.(a) | | | 3,400 | | | | 379,474 | |
Thermo Fisher Scientific, Inc. | | | 10,120 | | | | 5,264,727 | |
Waters Corp.* | | | 1,600 | | | | 593,568 | |
West Pharmaceutical Services, Inc. | | | 1,800 | | | | 589,608 | |
| | | | | | | | |
| | |
| | | | | | | 13,923,221 | |
| | | | | | | | |
Machinery — 0.8% | | | | | | | | |
Alfa Laval AB (Sweden) | | | 498 | | | | 20,844 | |
Atlas Copco AB (Sweden) (Class B Stock) | | | 1,156 | | | | 15,619 | |
Caterpillar, Inc. | | | 12,800 | | | | 4,643,328 | |
Cummins, Inc. | | | 3,550 | | | | 1,237,530 | |
Deere & Co. | | | 6,840 | | | | 2,898,108 | |
Dover Corp. | | | 3,600 | | | | 675,360 | |
FANUC Corp. (Japan) | | | 2,000 | | | | 52,246 | |
Fortive Corp. | | | 9,450 | | | | 708,750 | |
GEA Group AG (Germany) | | | 889 | | | | 44,159 | |
Glory Ltd. (Japan) | | | 400 | | | | 6,540 | |
IDEX Corp. | | | 1,910 | | | | 399,744 | |
Illinois Tool Works, Inc.(a) | | | 7,100 | | | | 1,800,276 | |
Ingersoll Rand, Inc.(a) | | | 10,800 | | | | 976,968 | |
Knorr-Bremse AG (Germany) | | | 75 | | | | 5,444 | |
Komatsu Ltd. (Japan) | | | 2,200 | | | | 59,933 | |
Makita Corp. (Japan) | | | 2,000 | | | | 60,818 | |
Namura Shipbuilding Co. Ltd. (Japan) | | | 800 | | | | 8,695 | |
Nordson Corp. | | | 1,300 | | | | 272,012 | |
Otis Worldwide Corp. | | | 10,701 | | | | 991,019 | |
PACCAR, Inc. | | | 13,814 | | | | 1,436,932 | |
Parker-Hannifin Corp. | | | 3,405 | | | | 2,165,682 | |
Pentair PLC | | | 4,577 | | | | 460,629 | |
Rational AG (Germany) | | | 25 | | | | 21,413 | |
Schindler Holding AG (Switzerland) | | | 21 | | | | 5,729 | |
Schindler Holding AG (Switzerland) (Part. Cert.) | | | 31 | | | | 8,565 | |
Snap-on, Inc. | | | 1,300 | | | | 441,324 | |
Stanley Black & Decker, Inc. | | | 4,247 | | | | 340,992 | |
Volvo AB (Sweden) (Class B Stock) | | | 519 | | | | 12,613 | |
Wartsila OYJ Abp (Finland) | | | 2,331 | | | | 41,312 | |
Westinghouse Air Brake Technologies Corp. | | | 4,551 | | | | 862,824 | |
Xylem, Inc. | | | 6,500 | | | | 754,130 | |
| | | | | | | | |
| | |
| | | | | | | 21,429,538 | |
| | | | | | | | |
Marine Transportation — 0.0% | | | | | | | | |
| | |
Kawasaki Kisen Kaisha Ltd. (Japan) | | | 7,000 | | | | 99,588 | |
| | | | | | | | |
SEE NOTES TO FINANCIAL STATEMENTS.
A30
| | | | |
| | PSF PGIM 50/50 BALANCED PORTFOLIO (CONTINUED) | | |
SCHEDULE OF INVESTMENTS | | | | as of December 31, 2024 |
| | | | | | | | |
| | | Shares | | | Value | |
|
COMMON STOCKS (continued) | |
Media — 0.2% | |
Charter Communications, Inc. (Class A Stock)*(a) | | | 2,660 | | | $ | 911,768 | |
Comcast Corp. (Class A Stock) | | | 100,980 | | | | 3,789,779 | |
Fox Corp. (Class A Stock) | | | 5,800 | | | | 281,764 | |
Fox Corp. (Class B Stock) | | | 3,733 | | | | 170,747 | |
Interpublic Group of Cos., Inc. (The) | | | 10,731 | | | | 300,683 | |
News Corp. (Class A Stock) | | | 10,875 | | | | 299,497 | |
News Corp. (Class B Stock) | | | 3,500 | | | | 106,505 | |
Omnicom Group, Inc.(a) | | | 5,100 | | | | 438,804 | |
Paramount Global (Class B Stock)(a) | | | 14,030 | | | | 146,754 | |
Publicis Groupe SA (France) | | | 954 | | | | 101,563 | |
| | | | | | | | |
| | |
| | | | | | | 6,547,864 | |
| | | | | | | | |
Metals & Mining — 0.2% | |
BHP Group Ltd. (Australia) | | | 6,996 | | | | 170,666 | |
Boliden AB (Sweden) | | | 1,057 | | | | 29,739 | |
Fortescue Ltd. (Australia) | | | 3,890 | | | | 43,804 | |
Freeport-McMoRan, Inc. | | | 37,988 | | | | 1,446,583 | |
Mitsui Mining & Smelting Co. Ltd. (Japan) | | | 300 | | | | 8,799 | |
Newmont Corp. | | | 30,100 | | | | 1,120,322 | |
Northern Star Resources Ltd. (Australia) | | | 3,949 | | | | 37,520 | |
Nucor Corp. | | | 6,200 | | | | 723,602 | |
Rio Tinto Ltd. (Australia) | | | 275 | | | | 19,941 | |
Rio Tinto PLC (Australia) | | | 1,335 | | | | 78,805 | |
Steel Dynamics, Inc. | | | 3,850 | | | | 439,169 | |
| | | | | | | | |
| | |
| | | | | | | 4,118,950 | |
| | | | | | | | |
Multi-Utilities — 0.3% | |
AGL Energy Ltd. (Australia) | | | 1,938 | | | | 13,514 | |
Ameren Corp. | | | 7,100 | | | | 632,894 | |
CenterPoint Energy, Inc. | | | 18,100 | | | | 574,313 | |
Centrica PLC (United Kingdom) | | | 54,965 | | | | 91,702 | |
CMS Energy Corp. | | | 7,900 | | | | 526,535 | |
Consolidated Edison, Inc. | | | 9,200 | | | | 820,916 | |
Dominion Energy, Inc.(a) | | | 22,215 | | | | 1,196,500 | |
DTE Energy Co. | | | 5,400 | | | | 652,050 | |
E.ON SE (Germany) | | | 1,829 | | | | 21,304 | |
Engie SA (France) | | | 6,358 | | | | 100,834 | |
NiSource, Inc. | | | 12,400 | | | | 455,824 | |
Public Service Enterprise Group, Inc. | | | 13,100 | | | | 1,106,819 | |
Sembcorp Industries Ltd. (Singapore) | | | 2,000 | | | | 8,091 | |
Sempra | | | 16,738 | | | | 1,468,257 | |
WEC Energy Group, Inc. | | | 8,613 | | | | 809,967 | |
| | | | | | | | |
| | |
| | | | | | | 8,479,520 | |
| | | | | | | | |
Office REITs — 0.0% | |
| | |
BXP, Inc. | | | 4,000 | | | | 297,440 | |
| | | | | | | | |
Oil, Gas & Consumable Fuels — 1.5% | |
APA Corp.(a) | | | 11,014 | | | | 254,313 | |
Chevron Corp. | | | 44,222 | | | | 6,405,114 | |
ConocoPhillips | | | 34,545 | | | | 3,425,828 | |
Coterra Energy, Inc. | | | 19,500 | | | | 498,030 | |
Devon Energy Corp. | | | 17,100 | | | | 559,683 | |
Diamondback Energy, Inc. | | | 4,900 | | | | 802,767 | |
ENEOS Holdings, Inc. (Japan) | | | 5,600 | | | | 29,378 | |
EOG Resources, Inc. | | | 15,000 | | | | 1,838,700 | |
| | | | | | | | |
| | | Shares | | | Value | |
|
COMMON STOCKS (continued) | |
Oil, Gas & Consumable Fuels (cont’d.) | |
EQT Corp. | | | 16,100 | | | $ | 742,371 | |
Exxon Mobil Corp. | | | 117,114 | | | | 12,597,953 | |
Hess Corp. | | | 7,500 | | | | 997,575 | |
Idemitsu Kosan Co. Ltd. (Japan) | | | 10,900 | | | | 71,799 | |
Kinder Morgan, Inc. | | | 51,098 | | | | 1,400,085 | |
Marathon Petroleum Corp. | | | 8,519 | | | | 1,188,401 | |
Occidental Petroleum Corp.(a) | | | 18,304 | | | | 904,401 | |
ONEOK, Inc.(a) | | | 15,400 | | | | 1,546,160 | |
Phillips 66 | | | 11,038 | | | | 1,257,559 | |
Shell PLC | | | 4,501 | | | | 140,301 | |
Targa Resources Corp. | | | 5,800 | | | | 1,035,300 | |
Texas Pacific Land Corp. | | | 500 | | | | 552,980 | |
TotalEnergies SE (France) | | | 2,435 | | | | 135,666 | |
Valero Energy Corp. | | | 8,300 | | | | 1,017,497 | |
Williams Cos., Inc. (The) | | | 32,200 | | | | 1,742,664 | |
| | | | | | | | |
| | |
| | | | | | | 39,144,525 | |
| | | | | | | | |
Passenger Airlines — 0.1% | |
ANA Holdings, Inc. (Japan) | | | 1,200 | | | | 21,780 | |
Delta Air Lines, Inc. | | | 17,300 | | | | 1,046,650 | |
Japan Airlines Co. Ltd. (Japan) | | | 2,500 | | | | 39,411 | |
Qantas Airways Ltd. (Australia)* | | | 7,604 | | | | 42,095 | |
Southwest Airlines Co. | | | 16,200 | | | | 544,644 | |
United Airlines Holdings, Inc.* | | | 8,800 | | | | 854,480 | |
| | | | | | | | |
| | |
| | | | | | | 2,549,060 | |
| | | | | | | | |
Personal Care Products — 0.1% | |
Estee Lauder Cos., Inc. (The) (Class A Stock) | | | 6,300 | | | | 472,374 | |
Kenvue, Inc. | | | 50,700 | | | | 1,082,445 | |
Unilever PLC (United Kingdom) | | | 3,502 | | | | 198,986 | |
| | | | | | | | |
| | |
| | | | | | | 1,753,805 | |
| | | | | | | | |
Pharmaceuticals — 1.6% | |
AstraZeneca PLC (United Kingdom) | | | 1,128 | | | | 147,068 | |
Bristol-Myers Squibb Co. | | | 53,670 | | | | 3,035,575 | |
Chugai Pharmaceutical Co. Ltd. (Japan) | | | 1,000 | | | | 44,081 | |
Daiichi Sankyo Co. Ltd. (Japan) | | | 1,500 | | | | 41,045 | |
Eli Lilly & Co. | | | 20,840 | | | | 16,088,480 | |
GSK PLC | | | 7,842 | | | | 132,273 | |
Hikma Pharmaceuticals PLC (Jordan) | | | 1,247 | | | | 31,090 | |
Ipsen SA (France) | | | 90 | | | | 10,316 | |
Johnson & Johnson | | | 64,308 | | | | 9,300,223 | |
Kyowa Kirin Co. Ltd. (Japan) | | | 1,900 | | | | 28,572 | |
Merck & Co., Inc. | | | 67,133 | | | | 6,678,391 | |
Merck KGaA (Germany) | | | 65 | | | | 9,459 | |
Novartis AG (Switzerland) | | | 2,600 | | | | 253,129 | |
Novo Nordisk A/S (Denmark) (Class B Stock) | | | 3,092 | | | | 266,784 | |
Orion OYJ (Finland) (Class B Stock) | | | 695 | | | | 30,830 | |
Otsuka Holdings Co. Ltd. (Japan) | | | 600 | | | | 32,640 | |
Pfizer, Inc. | | | 150,070 | | | | 3,981,357 | |
Roche Holding AG | | | 816 | | | | 228,159 | |
Sanofi SA | | | 1,002 | | | | 97,405 | |
Shionogi & Co. Ltd. (Japan) | | | 6,100 | | | | 85,554 | |
Teva Pharmaceutical Industries Ltd. (Israel), ADR* | | | 500 | | | | 11,020 | |
SEE NOTES TO FINANCIAL STATEMENTS.
A31
| | | | |
| | PSF PGIM 50/50 BALANCED PORTFOLIO (CONTINUED) | | |
SCHEDULE OF INVESTMENTS | | | | as of December 31, 2024 |
| | | | | | | | |
| | | Shares | | | Value | |
|
COMMON STOCKS (continued) | |
Pharmaceuticals (cont’d.) | | | | | | | | |
Viatris, Inc. | | | 33,086 | | | $ | 411,921 | |
Zoetis, Inc. | | | 11,800 | | | | 1,922,574 | |
| | | | | | | | |
| | |
| | | | | | | 42,867,946 | |
| | | | | | | | |
Professional Services — 0.3% | | | | | | | | |
Automatic Data Processing, Inc. | | | 10,800 | | | | 3,161,484 | |
Broadridge Financial Solutions, Inc. | | | 3,000 | | | | 678,270 | |
Computershare Ltd. (Australia) | | | 2,854 | | | | 59,953 | |
Dayforce, Inc.*(a) | | | 4,150 | | | | 301,456 | |
Equifax, Inc. | | | 3,200 | | | | 815,520 | |
Jacobs Solutions, Inc. | | | 3,400 | | | | 454,308 | |
Leidos Holdings, Inc. | | | 3,500 | | | | 504,210 | |
Paychex, Inc. | | | 8,400 | | | | 1,177,848 | |
Paycom Software, Inc. | | | 1,320 | | | | 270,560 | |
Recruit Holdings Co. Ltd. (Japan) | | | 900 | | | | 62,557 | |
Verisk Analytics, Inc. | | | 3,700 | | | | 1,019,091 | |
Wolters Kluwer NV (Netherlands) | | | 86 | | | | 14,288 | |
| | | | | | | | |
| | |
| | | | | | | 8,519,545 | |
| | | | | | | | |
Real Estate Management & Development — 0.1% | |
CBRE Group, Inc. (Class A Stock)* | | | 8,100 | | | | 1,063,449 | |
CoStar Group, Inc.* | | | 10,800 | | | | 773,172 | |
Daito Trust Construction Co. Ltd. (Japan) | | | 400 | | | | 44,718 | |
Daiwa House Industry Co. Ltd. (Japan) . | | | 1,400 | | | | 42,982 | |
LEG Immobilien SE (Germany) | | | 394 | | | | 33,418 | |
Mitsui Fudosan Co. Ltd. (Japan) | | | 3,000 | | | | 23,992 | |
Sumitomo Realty & Development Co. Ltd. (Japan) | | | 200 | | | | 6,220 | |
Vonovia SE (Germany) | | | 1,457 | | | | 44,355 | |
| | | | | | | | |
| | |
| | | | | | | 2,032,306 | |
| | | | | | | | |
Residential REITs — 0.1% | | | | | | | | |
AvalonBay Communities, Inc. | | | 3,675 | | | | 808,390 | |
Camden Property Trust | | | 2,900 | | | | 336,516 | |
Equity Residential | | | 9,000 | | | | 645,840 | |
Essex Property Trust, Inc. | | | 1,550 | | | | 442,432 | |
Invitation Homes, Inc. | | | 15,800 | | | | 505,126 | |
Mid-America Apartment Communities, Inc. | | | 3,000 | | | | 463,710 | |
UDR, Inc. | | | 7,900 | | | | 342,939 | |
| | | | | | | | |
| | |
| | | | | | | 3,544,953 | |
| | | | | | | | |
Retail REITs — 0.1% | | | | | | | | |
Federal Realty Investment Trust | | | 2,100 | | | | 235,095 | |
Kimco Realty Corp. | | | 17,800 | | | | 417,054 | |
Klepierre SA (France) | | | 2,277 | | | | 65,577 | |
Realty Income Corp. | | | 23,000 | | | | 1,228,430 | |
Regency Centers Corp. | | | 4,700 | | | | 347,471 | |
Scentre Group (Australia) | | | 3,778 | | | | 7,997 | |
Simon Property Group, Inc. | | | 7,993 | | | | 1,376,475 | |
Unibail-Rodamco-Westfield (France) | | | 70 | | | | 5,272 | |
Vicinity Ltd. (Australia) | | | 29,154 | | | | 37,784 | |
| | | | | | | | |
| | |
| | | | | | | 3,721,155 | |
| | | | | | | | |
Semiconductors &Semiconductor Equipment — 5.7% | |
Advanced Micro Devices, Inc.* | | | 42,799 | | | | 5,169,691 | |
Advantest Corp. (Japan) | | | 1,900 | | | | 108,032 | |
| | | | | | | | |
| | | Shares | | | Value | |
|
COMMON STOCKS (continued) | |
Semiconductors & Semiconductor Equipment (cont’d.) | |
Analog Devices, Inc. | | | 13,147 | | | $ | 2,793,212 | |
Applied Materials, Inc.(a) | | | 21,700 | | | | 3,529,071 | |
ASM International NV (Netherlands) | | | 100 | | | | 57,819 | |
ASML Holding NV (Netherlands) | | | 252 | | | | 176,509 | |
Broadcom, Inc. | | | 123,500 | | | | 28,632,240 | |
Enphase Energy, Inc.* | | | 3,700 | | | | 254,116 | |
First Solar, Inc.* | | | 2,700 | | | | 475,848 | |
Intel Corp. | | | 113,000 | | | | 2,265,650 | |
KLA Corp. | | | 3,550 | | | | 2,236,926 | |
Kokusai Electric Corp. (Japan) | | | 400 | | | | 5,242 | |
Lam Research Corp. | | | 34,000 | | | | 2,455,820 | |
Lasertec Corp. (Japan) | | | 400 | | | | 37,498 | |
Microchip Technology, Inc.(a) | | | 14,600 | | | | 837,310 | |
Micron Technology, Inc. | | | 29,300 | | | | 2,465,888 | |
Monolithic Power Systems, Inc. | | | 1,320 | | | | 781,044 | |
NVIDIA Corp. | | | 649,000 | | | | 87,154,210 | |
NXP Semiconductors NV (China) | | | 6,700 | | | | 1,392,595 | |
ON Semiconductor Corp.* | | | 11,300 | | | | 712,465 | |
QUALCOMM, Inc. | | | 29,500 | | | | 4,531,790 | |
SCREEN Holdings Co. Ltd. (Japan) | | | 1,400 | | | | 82,652 | |
Skyworks Solutions, Inc. | | | 4,100 | | | | 363,588 | |
Teradyne, Inc. | | | 4,300 | | | | 541,456 | |
Texas Instruments, Inc. | | | 24,100 | | | | 4,518,991 | |
Tokyo Electron Ltd. (Japan) | | | 1,000 | | | | 150,319 | |
| | | | | | | | |
| | |
| | | | | | | 151,729,982 | |
| | | | | | | | |
Software — 5.1% | | | | | | | | |
Adobe, Inc.* | | | 11,540 | | | | 5,131,607 | |
ANSYS, Inc.* | | | 2,200 | | | | 742,126 | |
Autodesk, Inc.* | | | 5,800 | | | | 1,714,306 | |
Cadence Design Systems, Inc.* | | | 7,200 | | | | 2,163,312 | |
Crowdstrike Holdings, Inc. (Class A Stock)* | | | 6,200 | | | | 2,121,392 | |
Fair Isaac Corp.* | | | 640 | | | | 1,274,195 | |
Fortinet, Inc.* | | | 16,800 | | | | 1,587,264 | |
Gen Digital, Inc. | | | 14,678 | | | | 401,884 | |
Intuit, Inc. | | | 7,400 | | | | 4,650,900 | |
Microsoft Corp. | | | 196,720 | | | | 82,917,480 | |
Monday.com Ltd.* | | | 100 | | | | 23,544 | |
Nice Ltd. (Israel)* | | | 208 | | | | 35,323 | |
Oracle Corp. | | | 42,450 | | | | 7,073,868 | |
Palantir Technologies, Inc. (Class A Stock)* | | | 54,200 | | | | 4,099,146 | |
Palo Alto Networks, Inc.*(a) | | | 17,300 | | | | 3,147,908 | |
PTC, Inc.* | | | 3,200 | | | | 588,384 | |
Roper Technologies, Inc. | | | 2,840 | | | | 1,476,374 | |
Salesforce, Inc. | | | 25,250 | | | | 8,441,833 | |
SAP SE (Germany) | | | 897 | | | | 220,639 | |
ServiceNow, Inc.* | | | 5,450 | | | | 5,777,654 | |
Synopsys, Inc.* | | | 4,040 | | | | 1,960,854 | |
Tyler Technologies, Inc.*(a) | | | 1,110 | | | | 640,070 | |
Workday, Inc. (Class A Stock)* | | | 5,600 | | | | 1,444,968 | |
Xero Ltd. (New Zealand)* | | | 584 | | | | 60,773 | |
| | | | | | | | |
| | |
| | | | | | | 137,695,804 | |
| | | | | | | | |
Specialized REITs — 0.4% | | | | | | | | |
American Tower Corp. | | | 12,360 | | | | 2,266,947 | |
Crown Castle, Inc. | | | 11,700 | | | | 1,061,892 | |
Digital Realty Trust, Inc. | | | 8,200 | | | | 1,454,106 | |
SEE NOTES TO FINANCIAL STATEMENTS.
A32
| | | | |
| | PSF PGIM 50/50 BALANCED PORTFOLIO (CONTINUED) | | |
SCHEDULE OF INVESTMENTS | | | | as of December 31, 2024 |
| | | | | | | | |
| | | Shares | | | Value | |
COMMON STOCKS (continued) | |
Specialized REITs (cont’d.) | | | | | | | | |
Equinix, Inc. | | | 2,544 | | | $ | 2,398,712 | |
Extra Space Storage, Inc. | | | 5,600 | | | | 837,760 | |
Iron Mountain, Inc. | | | 7,902 | | | | 830,579 | |
Public Storage | | | 4,020 | | | | 1,203,749 | |
SBA Communications Corp. | | | 2,700 | | | | 550,260 | |
VICI Properties, Inc. | | | 27,700 | | | | 809,117 | |
Weyerhaeuser Co. | | | 19,218 | | | | 540,987 | |
| | | | | | | | |
| | |
| | | | | | | 11,954,109 | |
| | | | | | | | |
Specialty Retail — 0.9% | | | | | | | | |
AutoZone, Inc.* | | | 450 | | | | 1,440,900 | |
Best Buy Co., Inc. | | | 5,175 | | | | 444,015 | |
CarMax, Inc.* | | | 4,300 | | | | 351,568 | |
Fast Retailing Co. Ltd. (Japan) | | | 100 | | | | 33,734 | |
Home Depot, Inc. (The) | | | 26,250 | | | | 10,210,988 | |
Industria de Diseno Textil SA (Spain) | | | 2,791 | | | | 142,966 | |
JB Hi-Fi Ltd. (Australia) | | | 135 | | | | 7,723 | |
Lowe’s Cos., Inc. | | | 15,000 | | | | 3,702,000 | |
O’Reilly Automotive, Inc.* | | | 1,530 | | | | 1,814,274 | |
Ross Stores, Inc. | | | 8,800 | | | | 1,331,176 | |
TJX Cos., Inc. (The) | | | 30,600 | | | | 3,696,786 | |
Tractor Supply Co.(a) | | | 14,500 | | | | 769,370 | |
Ulta Beauty, Inc.* | | | 1,220 | | | | 530,615 | |
Zalando SE (Germany), 144A* | | | 2,058 | | | | 68,847 | |
| | | | | | | | |
| | |
| | | | | | | 24,544,962 | |
| | | | | | | | |
Technology Hardware, Storage & Peripherals — 3.9% | |
Apple, Inc. | | | 400,240 | | | | 100,228,101 | |
Dell Technologies, Inc. (Class C Stock) | | | 8,100 | | | | 933,444 | |
Hewlett Packard Enterprise Co. | | | 34,348 | | | | 733,330 | |
HP, Inc. | | | 25,448 | | | | 830,368 | |
Logitech International SA (Switzerland) | | | 1,175 | | | | 96,992 | |
NetApp, Inc.(a) | | | 5,600 | | | | 650,048 | |
Seagate Technology Holdings PLC | | | 5,500 | | | | 474,705 | |
Super Micro Computer, Inc.*(a) | | | 14,000 | | | | 426,720 | |
Western Digital Corp.* | | | 8,603 | | | | 512,997 | |
| | | | | | | | |
| | |
| | | | | | | 104,886,705 | |
| | | | | | | | |
Textiles, Apparel & Luxury Goods — 0.2% | | | | | |
adidas AG (Germany) | | | 467 | | | | 114,865 | |
Asics Corp. (Japan) | | | 6,100 | | | | 118,997 | |
Deckers Outdoor Corp.* | | | 4,120 | | | | 836,731 | |
Lululemon Athletica, Inc.* | | | 3,100 | | | | 1,185,471 | |
LVMH Moet Hennessy Louis Vuitton SE (France) | | | 107 | | | | 70,384 | |
NIKE, Inc. (Class B Stock) | | | 31,800 | | | | 2,406,306 | |
Pandora A/S (Denmark) | | | 325 | | | | 59,461 | |
Ralph Lauren Corp. | | | 1,000 | | | | 230,980 | |
Tapestry, Inc. | | | 6,200 | | | | 405,046 | |
| | | | | | | | |
| | |
| | | | | | | 5,428,241 | |
| | | | | | | | |
Tobacco — 0.3% | | | | | | | | |
Altria Group, Inc. | | | 45,200 | | | | 2,363,508 | |
British American Tobacco PLC (United Kingdom) | | | 2,126 | | | | 76,716 | |
Imperial Brands PLC (United Kingdom) | | | 4,185 | | | | 133,832 | |
Japan Tobacco, Inc. (Japan) | | | 1,000 | | | | 25,653 | |
| | | | | | | | |
| | | Shares | | | Value | |
COMMON STOCKS (continued) | |
Tobacco (cont’d.) | | | | | | | | |
Philip Morris International, Inc. | | | 41,100 | | | $ | 4,946,385 | |
| | | | | | | | |
| | |
| | | | | | | 7,546,094 | |
| | | | | | | | |
Trading Companies & Distributors — 0.1% | | | | | |
AerCap Holdings NV (Ireland) | | | 1,100 | | | | 105,270 | |
Bunzl PLC (United Kingdom) | | | 132 | | | | 5,435 | |
Fastenal Co. | | | 15,400 | | | | 1,107,414 | |
Mitsubishi Corp. (Japan) | | | 1,600 | | | | 26,179 | |
Mitsui & Co. Ltd. (Japan) | | | 500 | | | | 10,370 | |
Toyota Tsusho Corp. (Japan) | | | 700 | | | | 12,379 | |
United Rentals, Inc. | | | 1,760 | | | | 1,239,814 | |
W.W. Grainger, Inc. | | | 1,170 | | | | 1,233,238 | |
| | | | | | | | |
| | |
| | | | | | | 3,740,099 | |
| | | | | | | | |
Water Utilities — 0.0% | | | | | | | | |
American Water Works Co., Inc. | | | 5,300 | | | | 659,797 | |
| | | | | | | | |
Wireless Telecommunication Services — 0.1% | | | | | |
SoftBank Group Corp. (Japan) | | | 1,400 | | | | 80,004 | |
T-Mobile US, Inc. | | | 12,900 | | | | 2,847,417 | |
| | | | | | | | |
| | |
| | | | | | | 2,927,421 | |
| | | | | | | | |
TOTAL COMMON STOCKS
(cost $242,886,706) | | | | | | | 1,331,981,876 | |
| | | | | | | | |
PREFERRED STOCKS — 0.0% | |
Banks — 0.0% | | | | | | | | |
Citigroup Capital XIII, 11.221%(c), 3 Month SOFR + 6.632%, Maturing 10/30/40 | | | 20,000 | | | | 599,400 | |
| | | | | | | | |
Capital Markets — 0.0% | | | | | | | | |
State Street Corp., 5.350%(ff), Series G, Maturing 03/15/26(a)(oo) | | | 15,000 | | | | 352,350 | |
| | | | | | | | |
Household Products — 0.0% | | | | | | | | |
Henkel AG & Co. KGaA (Germany) (PRFC) | | | 1,191 | | | | 104,494 | |
| | | | | | | | |
TOTAL PREFERRED STOCKS
(cost $969,445) | | | | | | | 1,056,244 | |
| | | | | | | | |
UNAFFILIATED EXCHANGE-TRADED FUNDS — 0.4% | |
iShares Core S&P 500 ETF | | | 19,600 | | | | 11,538,128 | |
iShares MSCI EAFE ETF | | | 600 | | | | 45,366 | |
| | | | | | | | |
TOTAL UNAFFILIATED EXCHANGE-TRADED FUNDS
(cost $6,183,729) | | | | 11,583,494 | |
| | | | | | | | |
| | | | | | | | | | | | | | | | | | | | |
| | | | | | | | | Principal | | | | |
| Interest | | Maturity | | | | | | Amount | | | | |
Rate | | Date | | | | | | (000)# | | | | |
| |
ASSET-BACKED SECURITIES — 8.7% | | | | | |
Automobiles — 1.9% | | | | | | | | | | | | | | | | | |
AmeriCredit Automobile Receivables Trust, | | | | | |
Series 2021-02, Class C | | | | | | | | | | | | | |
1.010% | | | 01/19/27 | | | | | | | | | | | | 900 | | | | 881,716 | |
Series 2021-03, Class C | | | | | | | | | | | | | |
1.410% | | | 08/18/27 | | | | | | | | | | | | 900 | | | | 868,034 | |
SEE NOTES TO FINANCIAL STATEMENTS.
A33
| | | | |
| | PSF PGIM 50/50 BALANCED PORTFOLIO (CONTINUED) | | |
SCHEDULE OF INVESTMENTS | | | | as of December 31, 2024 |
| | | | | | | | | | | | | | | | | | |
| | | | | | | | Principal | | | | |
| Interest | | Maturity | | | | | Amount | | | | |
Rate | | Date | | | | | (000)# | | | Value | |
|
ASSET-BACKED SECURITIES (continued) | |
Automobiles (cont’d.) | | | | | |
ARI Fleet Lease Trust, | |
Series 2024-A, Class A2, 144A | |
5.300% | | | 11/15/32 | | | | | | | | | | 965 | | | $ | 970,602 | |
Avis Budget Rental Car Funding AESOP LLC, | |
Series 2021-01A, Class A, 144A | |
1.380% | | | 08/20/27 | | | | | | | | | | 2,400 | | | | 2,288,046 | |
Series 2021-02A, Class A, 144A | |
1.660% | | | 02/20/28 | | | | | | | | | | 2,600 | | | | 2,450,241 | |
Series 2022-01A, Class A, 144A | |
3.830% | | | 08/21/28 | | | | | | | | | | 2,900 | | | | 2,829,679 | |
Series 2023-02A, Class A, 144A | |
5.200% | | | 10/20/27 | | | | | | | | | | 1,100 | | | | 1,105,691 | |
Series 2024-01A, Class A, 144A | |
5.360% | | | 06/20/30 | | | | | | | | | | 1,100 | | | | 1,115,258 | |
Series 2024-03A, Class A, 144A | |
5.230% | | | 12/20/30 | | | | | | | | | | 400 | | | | 402,508 | |
BOF VII AL Funding Trust I, | |
Series 2023-CAR03, Class A2, 144A | |
6.291% | | | 07/26/32 | | | | | | | | | | 1,107 | | | | 1,124,399 | |
Series 2023-CAR03, Class B, 144A | |
6.632% | | | 07/26/32 | | | | | | | | | | 402 | | | | 408,427 | |
CarMax Auto Owner Trust, | |
Series 2021-02, Class C | |
1.340% | | | 02/16/27 | | | | | | | | | | 800 | | | | 789,061 | |
Series 2021-04, Class C | |
1.380% | | | 07/15/27 | | | | | | | | | | 600 | | | | 580,040 | |
Chesapeake Funding II LLC, | |
Series 2024-01A, Class A1, 144A | |
5.520% | | | 05/15/36 | | | | | | | | | | 832 | | | | 841,456 | |
Ford Credit Auto Owner Trust, | |
Series 2020-02, Class A, 144A | |
1.060% | | | 04/15/33 | | | | | | | | | | 900 | | | | 876,085 | |
Series 2021-02, Class B, 144A | |
1.910% | | | 05/15/34 | | | | | | | | | | 400 | | | | 377,619 | |
Series 2023-01, Class A, 144A | |
4.850% | | | 08/15/35 | | | | | | | | | | 2,700 | | | | 2,710,761 | |
Series 2023-02, Class A, 144A | |
5.280% | | | 02/15/36 | | | | | | | | | | 1,800 | | | | 1,832,668 | |
Series 2024-01, Class A, 144A | |
4.870% | | | 08/15/36 | | | | | | | | | | 3,700 | | | | 3,706,041 | |
GM Financial Revolving Receivables Trust, | |
Series 2021-01, Class B, 144A | |
1.490% | | | 06/12/34 | | | | | | | | | | 200 | | | | 188,053 | |
Series 2024-01, Class A, 144A | |
4.980% | | | 12/11/36 | | | | | | | | | | 500 | | | | 504,256 | |
GMF Floorplan Owner Revolving Trust, | |
Series 2024-04A, Class A1, 144A | |
4.730% | | | 11/15/29 | | | | | | | | | | 2,200 | | | | 2,201,286 | |
Hertz Vehicle Financing III LLC, | |
Series 2023-01A, Class A, 144A | |
5.490% | | | 06/25/27 | | | | | | | | | | 1,100 | | | | 1,106,808 | |
Hertz Vehicle Financing III LP, | |
Series 2021-02A, Class A, 144A | |
1.680% | | | 12/27/27 | | | | | | | | | | 1,300 | | | | 1,220,047 | |
Hertz Vehicle Financing LLC, | |
Series 2022-02A, Class A, 144A | |
2.330% | | | 06/26/28 | | | | | | | | | | 3,300 | | | | 3,099,215 | |
| | | | | | | | | | | | | | | | | | |
| | | | | | | | Principal | | | | |
| Interest | | Maturity | | | | | Amount | | | | |
Rate | | Date | | | | | (000)# | | | Value | |
|
ASSET-BACKED SECURITIES (continued) | |
Automobiles (cont’d.) | |
OneMain Direct Auto Receivables Trust, | |
Series 2019-01A, Class A, 144A | |
3.630% | | | 09/14/27 | | | | | | | | | | 1,627 | | | $ | 1,618,015 | |
Series 2021-01A, Class B, 144A | |
1.260% | | | 07/14/28 | | | | | | | | | | 1,800 | | | | 1,740,037 | |
Series 2023-01A, Class A, 144A | |
5.410% | | | 11/14/29 | | | | | | | | | | 3,200 | | | | 3,233,402 | |
Santander Drive Auto Receivables Trust, | |
Series 2021-02, Class D | |
1.350% | | | 07/15/27 | | | | | | | | | | 679 | | | | 672,591 | |
Series 2022-01, Class C | |
2.560% | | | 04/17/28 | | | | | | | | | | 299 | | | | 298,262 | |
Series 2023-01, Class C | |
5.090% | | | 05/15/30 | | | | | | | | | | 600 | | | | 602,123 | |
Series 2023-03, Class C | |
5.770% | | | 11/15/30 | | | | | | | | | | 900 | | | | 914,789 | |
Series 2023-04, Class C | |
6.040% | | | 12/15/31 | | | | | | | | | | 1,600 | | | | 1,634,395 | |
Series 2024-02, Class C | |
5.840% | | | 06/17/30 | | | | | | | | | | 500 | | | | 509,843 | |
Series 2024-05, Class C | |
4.780% | | | 01/15/31 | | | | | | | | | | 1,500 | | | | 1,489,051 | |
SFS Auto Receivables Securitization Trust, | |
Series 2023-01A, Class B, 144A | |
5.710% | | | 01/22/30 | | | | | | | | | | 200 | | | | 203,369 | |
Series 2023-01A, Class C, 144A | |
5.970% | | | 02/20/31 | | | | | | | | | | 300 | | | | 306,821 | |
Wheels Fleet Lease Funding LLC, | |
Series 2023-01A, Class A, 144A | |
5.800% | | | 04/18/38 | | | | | | | | | | 2,010 | | | | 2,023,022 | |
Series 2024-01A, Class A1, 144A | |
5.490% | | | 02/18/39 | | | | | | | | | | 1,500 | | | | 1,517,117 | |
World Omni Select Auto Trust, | |
Series 2021-A, Class C | |
1.090% | | | 11/15/27 | | | | | | | | | | 400 | | | | 390,132 | |
| | | | | | | | | | | | | | | | | | |
| | | | | |
| | | | | | | | | | | | | | | | | 51,630,966 | |
| | | | | | | | | | | | | | | | | | |
Collateralized Loan Obligations — 5.6% | | | | | |
AGL CLO Ltd. (Cayman Islands), | |
Series 2020-09A, Class AR, 144A, 3 Month SOFR + 1.530% (Cap N/A, Floor 1.530%) | |
6.147%(c) | | | 04/20/37 | | | | | | | | | | 6,750 | | | | 6,780,898 | |
Anchorage Capital CLO Ltd. (Cayman Islands), | |
Series 2020-15A, Class AR, 144A, 3 Month SOFR + 1.462% (Cap N/A, Floor 1.200%) | |
6.079%(c) | | | 07/20/34 | | | | | | | | | | 2,000 | | | | 2,002,209 | |
Anchorage Capital Europe CLO DAC (Ireland), | |
Series 06A, Class AR, 144A, 3 Month EURIBOR + 1.750% (Cap N/A, Floor 1.750%) | |
4.951%(c) | | | 01/22/38 | | | | | | EUR | | | | 2,500 | | | | 2,604,763 | |
Bain Capital Credit CLO Ltd. (United Kingdom), | |
Series 2022-04A, Class A1R, 144A, 3 Month SOFR + 1.380% (Cap N/A, Floor 1.380%) | |
6.027%(c) | | | 10/16/37 | | | | | | | | | | 7,250 | | | | 7,306,528 | |
Balboa Bay Loan Funding Ltd. (Cayman Islands), | |
Series 2021-01A, Class A, 144A, 3 Month SOFR + 1.462% (Cap N/A, Floor 1.462%) | |
6.079%(c) | | | 07/20/34 | | | | | | | | | | 2,500 | | | | 2,500,803 | |
SEE NOTES TO FINANCIAL STATEMENTS.
A34
| | | | |
| | PSF PGIM 50/50 BALANCED PORTFOLIO (CONTINUED) | | |
SCHEDULE OF INVESTMENTS | | | | as of December 31, 2024 |
| | | | | | | | | | | | | | | | |
| | | | | | | Principal | | | | |
| Interest | | Maturity | | | | Amount | | | | |
Rate | | Date | | | | (000)# | | | Value | |
|
ASSET-BACKED SECURITIES (continued) | |
Collateralized Loan Obligations (cont’d.) | | | | | |
Battalion CLO Ltd. (Cayman Islands), | |
Series 2016-10A, Class A1R2, 144A, 3 Month SOFR + 1.432% (Cap N/A, Floor 1.170%) | |
6.066%(c) | | 01/25/35 | | | | | | | | | 6,520 | | | $ | 6,526,304 | |
BNPP AM Euro CLO DAC (Ireland), | |
Series 2018-01A, Class AR, 144A, 3 Month EURIBOR + 0.600% (Cap N/A, Floor 0.600%) | |
3.779%(c) | | 04/15/31 | | | | | EUR | | | | 1,748 | | | | 1,798,053 | |
Canyon Capital CLO Ltd. (Cayman Islands), | |
Series 2017-01A, Class AR, 144A, 3 Month SOFR + 1.262% (Cap N/A, Floor 1.000%) | |
5.918%(c) | | 07/15/30 | | | | | | | | | 2,039 | | | | 2,041,490 | |
Clover CLO LLC, | |
Series 2018-01A, Class A1RR, 144A, 3 Month SOFR + 1.530% (Cap N/A, Floor 1.530%) | |
6.147%(c) | | 04/20/37 | | | | | | | | | 7,000 | | | | 7,055,625 | |
CVC Cordatus Loan Fund DAC (Ireland), | |
Series 14A, Class A1R, 144A, 3 Month EURIBOR + 0.850% (Cap N/A, Floor 0.850%) | |
3.850%(c) | | 05/22/32 | | | | | EUR | | | | 1,661 | | | | 1,714,045 | |
Series 14A, Class A2R, 144A | |
1.250% | | 05/22/32 | | | | | EUR | | | | 3,606 | | | | 3,586,613 | |
Elevation CLO Ltd. (Cayman Islands), | |
Series 2021-12A, Class A1R, 144A, 3 Month SOFR + 1.620% (Cap N/A, Floor 1.620%) | |
6.237%(c) | | 04/20/37 | | | | | | | | | 6,750 | | | | 6,778,773 | |
Elmwood CLO Ltd. (Cayman Islands), | |
Series 2024-05A, Class AR1, 144A, 3 Month SOFR + 1.520% (Cap N/A, Floor 1.520%) | |
6.137%(c) | | 04/20/37 | | | | | | | | | 6,000 | | | | 6,045,418 | |
Generate CLO Ltd. (Cayman Islands), | |
Series 08A, Class A1R2, 144A, 3 Month SOFR + 1.380% (Cap N/A, Floor 1.380%) | |
5.922%(c) | | 01/20/38 | | | | | | | | | 7,250 | | | | 7,271,836 | |
Greenwood Park CLO Ltd. (Cayman Islands), | |
Series 2018-01A, Class A2, 144A, 3 Month SOFR + 1.272% (Cap N/A, Floor 0.000%) | |
5.928%(c) | | 04/15/31 | | | | | | | | | 469 | | | | 469,244 | |
Grosvenor Place CLO DAC (Ireland), | |
Series 2022-01A, Class AR, 144A, 3 Month EURIBOR + 1.600% (Cap N/A, Floor 1.600%) | |
4.605%(c) | | 05/24/38 | | | | | EUR | | | | 6,500 | | | | 6,759,654 | |
ICG Euro CLO DAC (Ireland), | |
Series 2023-02A, Class A1, 144A, 3 Month EURIBOR + 1.730% (Cap N/A, Floor 1.730%) | |
4.802%(c) | | 01/26/38 | | | | | EUR | | | | 7,000 | | | | 7,294,346 | |
Madison Park Funding Ltd. (Cayman Islands), | |
Series 2019-33A, Class AR, 144A, 3 Month SOFR + 1.290% (Cap N/A, Floor 1.290%) | |
5.946%(c) | | 10/15/32 | | | | | | | | | 6,000 | | | | 6,007,565 | |
MidOcean Credit CLO (Cayman Islands), | |
Series 2014-03A, Class A1R, 144A, 3 Month SOFR + 1.382% (Cap N/A, Floor 1.120%) | |
5.999%(c) | | 04/21/31 | | | | | | | | | 886 | | | | 886,251 | |
Monument CLO DAC (Ireland), | |
Series 01A, Class A, 144A, 3 Month EURIBOR + 1.590% (Cap N/A, Floor 1.590%) | |
5.332%(c) | | 05/15/37 | | | | | EUR | | | | 6,750 | | | | 7,034,713 | |
| | | | | | | | | | | | | | | | |
| | | | | | | | Principal | | | | |
| Interest | | Maturity | | | | | Amount | | | | |
Rate | | Date | | | | | (000)# | | | Value | |
|
ASSET-BACKED SECURITIES (continued) | |
Collateralized Loan Obligations (cont’d.) | |
Mountain View CLO Ltd. (Cayman Islands), | |
Series 2015-09A, Class A1R, 144A, 3 Month SOFR + 1.382% (Cap N/A, Floor 0.000%) | |
6.038%(c) | | 07/15/31 | | | | | | | | | 1,220 | | | $ | 1,221,527 | |
OCP CLO Ltd. (Cayman Islands), | |
Series 2015-09A, Class A1R2, 144A, 3 Month SOFR + 1.250% (Cap N/A, Floor 1.250%) | |
5.897%(c) | | 01/15/33 | | | | | | | | | 2,500 | | | | 2,504,154 | |
OFSI BSL Ltd. (Cayman Islands), | |
Series 2023-12A, Class A1, 144A, 3 Month SOFR + 2.400% (Cap N/A, Floor 2.400%) | |
7.017%(c) | | 01/20/35 | | | | | | | | | 4,600 | | | | 4,602,349 | |
Palmer Square CLO Ltd. (Cayman Islands), | |
Series 2015-01A, Class A1A5, 144A, 3 Month SOFR + 1.050% (Cap N/A, Floor 1.050%) | |
0.000%(cc) | | 05/21/34 | | | | | | | | | 7,250 | | | | 7,250,000 | |
Series 2015-02A, Class A1R2, 144A, 3 Month SOFR + 1.362% (Cap N/A, Floor 1.100%) | |
5.979%(c) | | 07/20/30 | | | | | | | | | 926 | | | | 926,505 | |
Regatta Funding Ltd. (Cayman Islands), | |
Series 2016-01A, Class A1R2, 144A, 3 Month SOFR + 1.412% (Cap N/A, Floor 1.150%) | |
5.766%(c) | | 06/20/34 | | | | | | | | | 3,750 | | | | 3,754,867 | |
Series 2019-01A, Class ARR, 144A, 3 Month SOFR + 1.390% (Cap N/A, Floor 1.390%) | |
6.046%(c) | | 10/15/37 | | | | | | | | | 6,500 | | | | 6,517,421 | |
Rockford Tower CLO Ltd. (Cayman Islands), | |
Series 2023-01A, Class A, 144A, 3 Month SOFR + 1.900% (Cap N/A, Floor 1.900%) | |
6.517%(c) | | 01/20/36 | | | | | | | | | 3,750 | | | | 3,765,808 | |
Sound Point CLO Ltd. (Cayman Islands), | |
Series 2021-01A, Class A, 144A, 3 Month SOFR + 1.332% (Cap N/A, Floor 1.332%) | |
5.957%(c) | | 04/25/34 | | | | | | | | | 6,000 | | | | 6,010,367 | |
St. Pauls CLO (Netherlands), | |
Series 09A, Class A1R, 144A, 3 Month EURIBOR + 0.940% (Cap N/A, Floor 0.940%) | |
4.159%(c) | | 07/20/35 | | | | | | EUR | | | 2,000 | | | | 2,070,304 | |
TCW CLO Ltd. (Cayman Islands), | |
Series 2021-02A, Class AS, 144A, 3 Month SOFR + 1.442% (Cap N/A, Floor 1.180%) | |
6.067%(c) | | 07/25/34 | | | | | | | | | 4,750 | | | | 4,751,053 | |
Toro European CLO DAC (Ireland), | |
Series 02A, Class ARR, 144A, 3 Month EURIBOR + 0.990% (Cap N/A, Floor 0.990%) | |
4.076%(c) | | 07/25/34 | | | | | | EUR | | | 3,000 | | | | 3,105,884 | |
Trimaran Cavu Ltd., | |
Series 2019-01A, Class A1R, 144A, 3 Month SOFR + 1.190% (Cap N/A, Floor 1.190%) | |
5.505%(c) | | 01/20/37 | | | | | | | | | 7,250 | | | | 7,250,000 | |
Trinitas CLO Ltd. (Bermuda), | |
Series 2023-26A, Class A1, 144A, 3 Month SOFR + 1.690% (Cap N/A, Floor 1.690%) | |
6.307%(c) | | 01/20/35 | | | | | | | | | 2,400 | | | | 2,404,759 | |
SEE NOTES TO FINANCIAL STATEMENTS.
A35
| | | | |
| | PSF PGIM 50/50 BALANCED PORTFOLIO (CONTINUED) | | |
SCHEDULE OF INVESTMENTS | | | | as of December 31, 2024 |
| | | | | | | | | | | | | | | | |
| | | | | Principal | | | | |
| Interest | | Maturity | | | | Amount | | | | |
Rate | | Date | | | | (000)# | | | Value | |
|
ASSET-BACKED SECURITIES (continued) | |
Collateralized Loan Obligations (cont’d.) | | | | | |
Wellfleet CLO Ltd., | |
Series 2017-03A, Class A1, 144A, 3 Month SOFR + 1.412% (Cap N/A, Floor 1.150%) | |
6.059%(c) | | 01/17/31 | | | | | | | | | 599 | | | $ | 599,653 | |
| | | | | | | | | | | | | | | | |
| | | | | |
| | | | | | | | | | | | | | | 149,199,782 | |
| | | | | | | | | | | | | | | | |
Consumer Loans — 0.4% | |
Affirm Asset Securitization Trust, | |
Series 2024-A, Class 1A, 144A | |
5.610% | | 02/15/29 | | | | | | | | | 700 | | | | 705,464 | |
Series 2024-X02, Class A, 144A | |
5.220% | | 12/17/29 | | | | | | | | | 2,500 | | | | 2,503,615 | |
OneMain Financial Issuance Trust, | |
Series 2020-02A, Class A, 144A | |
1.750% | | 09/14/35 | | | | | | | | | 1,900 | | | | 1,824,890 | |
Series 2021-01A, Class A2, 144A, 30 Day Average SOFR + 0.760% (Cap N/A, Floor 0.000%) | |
5.358%(c) | | 06/16/36 | | | | | | | | | 2,000 | | | | 2,004,221 | |
Series 2023-02A, Class A1, 144A | |
5.840% | | 09/15/36 | | | | | | | | | 3,400 | | | | 3,468,194 | |
| | | | | | | | | | | | | | | | |
| | | | | |
| | | | | | | | | | | | | | | 10,506,384 | |
| | | | | | | | | | | | | | | | |
Credit Cards — 0.2% | |
NewDay Funding (United Kingdom), | |
Series 2024-01A, Class A, 144A, SONIA + 1.180% (Cap N/A, Floor 0.000%) | |
5.888%(c) | | 03/15/32 | | | | | GBP | | | | 3,400 | | | | 4,281,650 | |
NewDay Funding Master Issuer PLC (United Kingdom), | |
Series 2024-02A, Class A, 144A, SONIA + 0.900% (Cap N/A, Floor 0.000%) | |
5.608%(c) | | 07/15/32 | | | | | GBP | | | | 1,400 | | | | 1,753,038 | |
| | | | | | | | | | | | | | | | |
| | | | | |
| | | | | | | | | | | | | | | 6,034,688 | |
| | | | | | | | | | | | | | | | |
Equipment — 0.1% | |
MMAF Equipment Finance LLC, | |
Series 2017-B, Class A5, 144A | |
2.720% | | 06/15/40 | | | | | | | | | 358 | | | | 356,459 | |
Series 2019-A, Class A5, 144A | |
3.080% | | 11/12/41 | | | | | | | | | 518 | | | | 515,574 | |
Series 2019-B, Class A5, 144A | |
2.290% | | 11/12/41 | | | | | | | | | 1,600 | | | | 1,558,822 | |
| | | | | | | | | | | | | | | | |
| | | | | |
| | | | | | | | | | | | | | | 2,430,855 | |
| | | | | | | | | | | | | | | | |
Home Equity Loans — 0.4% | |
JPMorgan Mortgage Trust, | |
Series 2024-HE03, Class A1, 144A, 30 Day Average SOFR + 1.200% (Cap N/A, Floor 0.000%) | |
5.805%(c) | | 02/25/55 | | | | | | | | | 1,893 | | | | 1,896,937 | |
RCKT Mortgage Trust, | |
Series 2024-CES01, Class A1A, 144A | |
6.025%(cc) | | 02/25/44 | | | | | | | | | 827 | | | | 830,041 | |
Series 2024-CES03, Class A1A, 144A | |
6.591%(cc) | | 05/25/44 | | | | | | | | | 880 | | | | 890,953 | |
Towd Point HE Trust, | |
Series 2023-01, Class A1A, 144A | |
6.875% | | 02/25/63 | | | | | | | | | 194 | | | | 194,494 | |
| | | | | | | | | | | | | | | | |
| | | | | Principal | | | | |
| Interest | | Maturity | | | | Amount | | | | |
Rate | | Date | | | | (000)# | | | Value | |
|
ASSET-BACKED SECURITIES (continued) | |
Home Equity Loans (cont’d.) | |
Towd Point Mortgage Trust, | |
Series 2024-CES02, Class A1A, 144A | |
6.125%(cc) | | 02/25/64 | | | | | | | | | 163 | | | $ | 164,736 | |
Series 2024-CES03, Class A1, 144A | |
6.290%(cc) | | 05/25/64 | | | | | | | | | 1,322 | | | | 1,333,316 | |
Series 2024-CES04, Class A1, 144A | |
5.122%(cc) | | 09/25/64 | | | | | | | | | 1,416 | | | | 1,402,407 | |
Series 2024-CES05, Class A1, 144A | |
5.167%(cc) | | 09/25/64 | | | | | | | | | 2,146 | | | | 2,127,874 | |
| | | | | | | | | | | | | | | | |
| | | | | |
| | | | | | | | | | | | | | | 8,840,758 | |
| | | | | | | | | | | | | | | | |
Other — 0.0% | |
Home Partners of America Trust, | |
Series 2021-03, Class A, 144A | |
2.200% | | 01/17/41 | | | | | | | | | 518 | | | | 463,071 | |
| | | | | | | | | | | | | | | | |
Residential Mortgage-Backed Securities — 0.0% | |
TFS (Spain), | |
Series 2018-03, Class A1, 1 Month EURIBOR + 3.250% | |
6.349%(c) | | 03/15/26^ | | | | | EUR | | | | 608 | | | | 469,563 | |
| | | | | | | | | | | | | | | | |
Student Loans — 0.1% | |
Laurel Road Prime Student Loan Trust, | |
Series 2019-A, Class A2FX, 144A | |
2.730% | | 10/25/48 | | | | | | | | | 46 | | | | 45,443 | |
Navient Private Education Refi Loan Trust, | |
Series 2019-CA, Class A2, 144A | |
3.130% | | 02/15/68 | | | | | | | | | 267 | | | | 260,705 | |
Series 2020-BA, Class A2, 144A | |
2.120% | | 01/15/69 | | | | | | | | | 367 | | | | 346,017 | |
Pennsylvania Higher Education Assistance Agency, | |
Series 2021-01A, Class A, 144A, 30 Day Average SOFR + 0.644% (Cap N/A, Floor 0.530%) | |
5.213%(c) | | 05/25/70 | | | | | | | | | 764 | | | | 756,398 | |
SoFi Professional Loan Program LLC, | |
Series 2019-A, Class A2FX, 144A | |
3.690% | | 06/15/48 | | | | | | | | | 233 | | | | 228,991 | |
Series 2019-B, Class A2FX, 144A | |
3.090% | | 08/17/48 | | | | | | | | | 295 | | | | 286,997 | |
Series 2019-C, Class A2FX, 144A | |
2.370% | | 11/16/48 | | | | | | | | | 488 | | | | 465,003 | |
SoFi Professional Loan Program Trust, | |
Series 2018-B, Class A2FX, 144A | |
3.340% | | 08/25/47 | | | | | | | | | 157 | | | | 155,255 | |
Series 2020-A, Class A2FX, 144A | |
2.540% | | 05/15/46 | | | | | | | | | 665 | | | | 633,151 | |
| | | | | | | | | | | | | | | | |
| | | | | |
| | | | | | | | | | | | | | | 3,177,960 | |
| | | | | | | | | | | | | | | | |
TOTAL ASSET-BACKED SECURITIES
(cost $236,080,307) | | | | 232,754,027 | |
| | | | | | | | | | | | | | | | |
|
COMMERCIAL MORTGAGE-BACKED SECURITIES — 5.4% | |
BANK, | |
Series 2021-BN35, Class A3 | |
1.717% | | 06/15/64 | | | | | | | | | 3,500 | | | | 2,989,195 | |
Series 2021-BN35, Class ASB | |
2.067% | | 06/15/64 | | | | | | | | | 2,300 | | | | 2,058,117 | |
Series 2021-BN37, Class A4 | |
2.370% | | 11/15/64 | | | | | | | | | 3,900 | | | | 3,255,943 | |
SEE NOTES TO FINANCIAL STATEMENTS.
A36
| | | | |
| | PSF PGIM 50/50 BALANCED PORTFOLIO (CONTINUED) | | |
SCHEDULE OF INVESTMENTS | | | | as of December 31, 2024 |
| | | | | | | | | | | | | | |
| | | | | Principal | | | | |
| Interest | | Maturity | | | | Amount | | | | |
Rate | | Date | | | | (000)# | | | Value | |
|
| COMMERCIAL MORTGAGE-BACKED SECURITIES (continued) | |
BANK5, | |
Series 2024-5YR11, Class A3 | |
5.893% | | 11/15/57 | | | | | | | 4,660 | | | $ | 4,794,024 | |
Series 2024-5YR12, Class A3 | |
5.902%(cc) | | 12/15/57 | | | | | | | 4,035 | | | | 4,156,594 | |
Barclays Commercial Mortgage Securities Trust, | |
Series 2018-C02, Class A4 | |
4.047% | | 12/15/51 | | | | | | | 3,850 | | | | 3,724,430 | |
Series 2021-C12, Class A4 | |
2.421% | | 11/15/54 | | | | | | | 4,500 | | | | 3,848,832 | |
Series 2023-C19, Class A2A | |
5.756% | | 04/15/56 | | | | | | | 2,700 | | | | 2,731,338 | |
Benchmark Mortgage Trust, | |
Series 2018-B03, Class A4 | |
3.761% | | 04/10/51 | | | | | | | 3,579 | | | | 3,456,000 | |
Series 2021-B24, Class A3 | |
2.010% | | 03/15/54 | | | | | | | 2,000 | | | | 1,780,441 | |
Series 2023-B38, Class A2 | |
5.626% | | 04/15/56 | | | | | | | 3,000 | | | | 3,002,551 | |
Series 2024-V07, Class A3 | |
6.228%(cc) | | 05/15/56 | | | | | | | 4,700 | | | | 4,885,967 | |
Series 2024-V11, Class A3 | |
5.909%(cc) | | 11/15/57 | | | | | | | 5,140 | | | | 5,292,770 | |
BMO Mortgage Trust, | |
Series 2024-5C7, Class A3 | |
5.566%(cc) | | 11/15/57 | | | | | | | 4,500 | | | | 4,574,577 | |
BXP Trust, | |
Series 2021-601L, Class A, 144A | |
2.618% | | 01/15/44 | | | | | | | 3,990 | | | | 3,280,031 | |
CFCRE Commercial Mortgage Trust, | |
Series 2016-C04, Class A3 | |
3.014% | | 05/10/58 | | | | | | | 1,357 | | | | 1,334,011 | |
Citigroup Commercial Mortgage Trust, | |
Series 2016-C01, Class A3 | |
2.944% | | 05/10/49 | | | | | | | 2,684 | | | | 2,629,722 | |
Series 2017-P07, Class A3 | |
3.442% | | 04/14/50 | | | | | | | 3,564 | | | | 3,457,551 | |
CSAIL Commercial Mortgage Trust, | |
Series 2015-C04, Class A3 | |
3.544% | | 11/15/48 | | | | | | | 2,338 | | | | 2,321,318 | |
Series 2017-C08, Class A3 | |
3.127% | | 06/15/50 | | | | | | | 3,432 | | | | 3,270,278 | |
FHLMC Multifamily Structured Pass-Through Certificates, | |
Series K055, Class X1, IO | |
1.326%(cc) | | 03/25/26 | | | | | | | 4,056 | | | | 53,318 | |
GS Mortgage Securities Trust, | |
Series 2015-GC34, Class A3 | |
3.244% | | 10/10/48 | | | | | | | 4,275 | | | | 4,236,279 | |
Series 2016-GS03, Class A3 | |
2.592% | | 10/10/49 | | | | | | | 3,847 | | | | 3,734,627 | |
Series 2016-GS04, Class A3 | |
3.178% | | 11/10/49 | | | | | | | 3,795 | | | | 3,706,470 | |
Series 2020-GSA02, Class A4 | |
1.721% | | 12/12/53 | | | | | | | 4,150 | | | | 3,475,730 | |
JPMCC Commercial Mortgage Securities Trust, | |
Series 2017-JP06, Class A3 | |
3.109% | | 07/15/50 | | | | | | | 2,717 | | | | 2,620,033 | |
| | | | | | | | | | | | | | |
| | | | | Principal | | | | |
| Interest | | Maturity | | | | Amount | | | | |
Rate | | Date | | | | (000)# | | | Value | |
|
| COMMERCIAL MORTGAGE-BACKED SECURITIES (continued) | |
JPMDB Commercial Mortgage Securities Trust, | | | | | |
Series 2016-C02, Class A3A | |
2.881% | | 06/15/49 | | | | | | | 2,419 | | | $ | 2,370,963 | |
MHC Commercial Mortgage Trust, | |
Series 2021-MHC, Class C, 144A, 1 Month SOFR + 1.465% (Cap N/A, Floor 1.351%) | |
5.862%(c) | | 04/15/38 | | | | | | | 1,720 | | | | 1,717,312 | |
Morgan Stanley Capital I Trust, | |
Series 2015-UBS08, Class A3 | |
3.540% | | 12/15/48 | | | | | | | 3,723 | | | | 3,685,286 | |
Series 2016-BNK02, Class A3 | |
2.791% | | 11/15/49 | | | | | | | 2,000 | | | | 1,935,674 | |
Series 2016-UB11, Class A3 | |
2.531% | | 08/15/49 | | | | | | | 6,152 | | | | 5,963,129 | |
Series 2019-H06, Class A3 | |
3.158% | | 06/15/52 | | | | | | | 5,000 | | | | 4,639,972 | |
UBS Commercial Mortgage Trust, | |
Series 2017-C02, Class ASB | |
3.264% | | 08/15/50 | | | | | | | 1,138 | | | | 1,119,650 | |
Series 2017-C05, Class A4 | |
3.212% | | 11/15/50 | | | | | | | 5,000 | | | | 4,793,991 | |
Series 2018-C09, Class A3 | |
3.854% | | 03/15/51 | | | | | | | 1,576 | | | | 1,521,035 | |
Series 2018-C14, Class A3 | |
4.180% | | 12/15/51 | | | | | | | 2,141 | | | | 2,080,968 | |
Wells Fargo Commercial Mortgage Trust, | |
Series 2016-NXS06, Class A3 | |
2.642% | | 11/15/49 | | | | | | | 4,500 | | | | 4,389,488 | |
Series 2017-C38, Class A4 | |
3.190% | | 07/15/50 | | | | | | | 2,939 | | | | 2,824,664 | |
Series 2019-C49, Class A3 | |
3.749% | | 03/15/52 | | | | | | | 7,300 | | | | 7,213,845 | |
Series 2020-C58, Class A3 | |
1.810% | | 07/15/53 | | | | | | | 4,984 | | | | 4,279,938 | |
Series 2021-C61, Class A3 | |
2.406% | | 11/15/54 | | | | | | | 9,000 | | | | 7,665,252 | |
Series 2024-5C1, Class A3 | |
5.928% | | 07/15/57 | | | | | | | 5,200 | | | | 5,358,638 | |
| | | | | | | | | | | | | | |
TOTAL COMMERCIAL MORTGAGE-BACKED SECURITIES
(cost $155,150,744) | | | | 146,229,952 | |
| | | | | | | | | | | | | | |
|
CORPORATE BONDS — 11.7% | |
Aerospace & Defense — 0.2% | | | | | | | | | | |
Boeing Co. (The), | | | | | |
Sr. Unsec’d. Notes | |
2.196% | | 02/04/26 | | | | | | | 1,610 | | | | 1,561,095 | |
3.300% | | 03/01/35 | | | | | | | 1,920 | | | | 1,513,506 | |
3.550% | | 03/01/38 | | | | | | | 960 | | | | 725,612 | |
3.900% | | 05/01/49 | | | | | | | 1,500 | | | | 1,041,527 | |
RTX Corp., | | | | | | | | | | |
Sr. Unsec’d. Notes | |
4.125% | | 11/16/28 | | | | | | | 910 | | | | 886,235 | |
| | | | | | | | | | | | | | |
| | | | | |
| | | | | | | | | | | | | 5,727,975 | |
| | | | | | | | | | | | | | |
SEE NOTES TO FINANCIAL STATEMENTS.
A37
| | | | |
| | PSF PGIM 50/50 BALANCED PORTFOLIO (CONTINUED) | | |
SCHEDULE OF INVESTMENTS | | | | as of December 31, 2024 |
| | | | | | | | | | | | | | |
| | | | | Principal | | | | |
| Interest | | Maturity | | | | Amount | | | | |
Rate | | Date | | | | (000)# | | | Value | |
CORPORATE BONDS (continued) | |
Agriculture — 0.3% | | | | | | | | | | | | |
BAT Capital Corp. (United Kingdom),
Gtd. Notes | |
2.259% | | 03/25/28 | | | | | | | 3,190 | | | $ | 2,930,934 | |
3.557% | | 08/15/27 | | | | | | | 360 | | | | 348,295 | |
4.390% | | 08/15/37 | | | | | | | 2,075 | | | | 1,792,266 | |
6.343% | | 08/02/30 | | | | | | | 345 | | | | 362,766 | |
Philip Morris International, Inc.,
Sr. Unsec’d. Notes | |
5.125% | | 02/15/30 | | | | | | | 3,190 | | | | 3,208,155 | |
| | | | | | | | | | | | | | |
| | | | | | | | | | | | | 8,642,416 | |
| | | | | | | | | | | | | | |
Airlines — 0.1% | | | | | | | | | | | | |
American Airlines 2015-1 Class A Pass-Through Trust,
Pass-Through Certificates | |
3.375% | | 11/01/28 | | | | | | | 1,383 | | | | 1,320,255 | |
Southwest Airlines Co.,
Sr. Unsec’d. Notes | |
2.625% | | 02/10/30 | | | | | | | 1,375 | | | | 1,216,818 | |
United Airlines, Inc.,
Sr. Sec’d. Notes, 144A | |
4.375% | | 04/15/26 | | | | | | | 590 | | | | 579,898 | |
4.625% | | 04/15/29 | | | | | | | 115 | | | | 109,315 | |
| | | | | | | | | | | | | | |
| | | | | | | | | | | | | 3,226,286 | |
| | | | | | | | | | | | | | |
Apparel — 0.0% | | | | | | | | | | | | |
Wolverine World Wide, Inc.,
Gtd. Notes, 144A | |
4.000% | | 08/15/29 | | | | | | | 550 | | | | 482,286 | |
| | | | | | | | | | | | | | |
Auto Manufacturers — 0.3% | |
Ford Motor Co.,
Sr. Unsec’d. Notes | |
4.750% | | 01/15/43 | | | | | | | 660 | | | | 519,829 | |
Ford Motor Credit Co. LLC,
Sr. Unsec’d. Notes | |
2.900% | | 02/16/28 | | | | | | | 200 | | | | 184,543 | |
4.134% | | 08/04/25 | | | | | | | 300 | | | | 298,117 | |
5.800% | | 03/08/29 | | | | | | | 475 | | | | 475,035 | |
General Motors Co.,
Sr. Unsec’d. Notes | |
6.600% | | 04/01/36 | | | | | | | 585 | | | | 613,814 | |
General Motors Financial Co., Inc.,
Sr. Unsec’d. Notes | |
2.400% | | 10/15/28 | | | | | | | 2,055 | | | | 1,863,138 | |
Volkswagen Group of America Finance LLC (Germany),
Gtd. Notes, 144A | |
6.200% | | 11/16/28 | | | | | | | 2,854 | | | | 2,914,373 | |
| | | | | | | | | | | | | | |
| | | | | | | | | | | | | 6,868,849 | |
| | | | | | | | | | | | | | |
Banks —3.5% | |
Banco Santander SA (Spain),
Sr. Non-Preferred Notes | |
1.849% | | 03/25/26 | | | | | | | 800 | | | | 770,290 | |
5.538%(ff) | | 03/14/30 | | | | | | | 600 | | | | 602,530 | |
Bank of America Corp.,
Sr. Unsec’d. Notes | |
5.288%(ff) | | 04/25/34(a) | | | | | | | 905 | | | | 898,282 | |
| | | | | | | | | | | | | | |
Interest Rate | | Maturity
Date | | | | | | Principal
Amount
(000)# | | | Value | |
CORPORATE BONDS (continued) | |
Banks (cont’d.) | | | | | | | | | | | | |
Sr. Unsec’d. Notes, MTN | |
1.898%(ff) | | 07/23/31 | | | | | | | 1,805 | | | $ | 1,518,964 | |
2.496%(ff) | | 02/13/31 | | | | | | | 5,165 | | | | 4,534,257 | |
3.194%(ff) | | 07/23/30 | | | | | | | 1,050 | | | | 966,481 | |
3.824%(ff) | | 01/20/28 | | | | | | | 615 | | | | 602,254 | |
Sub. Notes, MTN | |
4.000% | | 01/22/25 | | | | | | | 1,700 | | | | 1,699,100 | |
4.450% | | 03/03/26 | | | | | | | 4,790 | | | | 4,771,443 | |
Bank of America NA,
Sub. Notes | |
6.000% | | 10/15/36 | | | | | | | 805 | | | | 832,413 | |
Barclays PLC (United Kingdom),
Sr. Unsec’d. Notes | |
3.650% | | 03/16/25 | | | | | | | 935 | | | | 932,411 | |
4.837%(ff) | | 09/10/28 | | | | | | | 705 | | | | 700,293 | |
5.690%(ff) | | 03/12/30 | | | | | | | 2,240 | | | | 2,262,335 | |
BNP Paribas SA (France),
Sr. Non-Preferred Notes, 144A | |
2.219%(ff) | | 06/09/26 | | | | | | | 480 | | | | 473,775 | |
3.132%(ff) | | 01/20/33 | | | | | | | 1,335 | | | | 1,135,490 | |
Sr. Preferred Notes, 144A | |
5.176%(ff) | | 01/09/30 | | | | | | | 2,200 | | | | 2,189,254 | |
Cassa Depositi e Prestiti SpA (Italy),
Sr. Unsec’d. Notes, 144A | |
5.875% | | 04/30/29 | | | | | | | 1,200 | | | | 1,217,384 | |
Citigroup, Inc.,
Jr. Sub. Notes, Series V | |
4.700%(ff) | | 01/30/25(oo) | | | | | | | 1,675 | | | | 1,667,402 | |
Sr. Unsec’d. Notes | |
2.561%(ff) | | 05/01/32 | | | | | | | 2,100 | | | | 1,779,463 | |
3.200% | | 10/21/26 | | | | | | | 670 | | | | 651,819 | |
3.700% | | 01/12/26 | | | | | | | 1,610 | | | | 1,595,168 | |
3.887%(ff) | | 01/10/28 | | | | | | | 560 | | | | 548,624 | |
4.542%(ff) | | 09/19/30 | | | | | | | 5,280 | | | | 5,129,208 | |
Sub. Notes | |
4.450% | | 09/29/27 | | | | | | | 1,485 | | | | 1,464,412 | |
4.750% | | 05/18/46 | | | | | | | 440 | | | | 383,601 | |
Danske Bank A/S (Denmark),
Sr. Non-Preferred Notes, 144A | |
5.705%(ff) | | 03/01/30 | | | | | | | 1,285 | | | | 1,301,625 | |
Deutsche Bank AG (Germany),
| |
Sr. Non-Preferred Notes | |
2.129%(ff) | | 11/24/26 | | | | | | | 460 | | | | 448,180 | |
2.311%(ff) | | 11/16/27 | | | | | | | 500 | | | | 475,201 | |
Discover Bank,
Sr. Unsec’d. Notes | |
4.250% | | 03/13/26 | | | | | | | 595 | | | | 589,995 | |
Goldman Sachs Group, Inc. (The),
Sr. Unsec’d. Notes | |
1.542%(ff) | | 09/10/27 | | | | | | | 2,345 | | | | 2,217,558 | |
3.750% | | 02/25/26 | | | | | | | 1,165 | | | | 1,152,939 | |
3.814%(ff) | | 04/23/29 | | | | | | | 440 | | | | 423,100 | |
3.850% | | 01/26/27 | | | | | | | 2,625 | | | | 2,576,964 | |
Sub. Notes | |
6.750% | | 10/01/37 | | | | | | | 225 | | | | 241,461 | |
SEE NOTES TO FINANCIAL STATEMENTS.
A38
| | | | |
| | PSF PGIM 50/50 BALANCED PORTFOLIO (CONTINUED) | | |
SCHEDULE OF INVESTMENTS | | | | as of December 31, 2024 |
| | | | | | | | | | | | | | | | |
| | | | | | Principal | | | | |
| Interest | | Maturity | | | | | Amount | | | | |
Rate | | Date | | | | | (000)# | | | Value | |
|
CORPORATE BONDS (continued) | |
Banks (cont’d.) | |
Huntington Bancshares, Inc., | |
Sr. Unsec’d. Notes | |
6.208%(ff) | | | 08/21/29 | | | | | | | | 395 | | | $ | 407,618 | |
JPMorgan Chase & Co., | |
Jr. Sub. Notes, Series HH | |
4.600%(ff) | | | 02/01/25 | (oo) | | | | | | | 1,245 | | | | 1,240,023 | |
Jr. Sub. Notes, Series II | |
4.000%(ff) | | | 04/01/25 | (oo) | | | | | | | 230 | | | | 228,133 | |
Sr. Unsec’d. Notes | |
2.580%(ff) | | | 04/22/32 | | | | | | | | 1,585 | | | | 1,360,468 | |
3.782%(ff) | | | 02/01/28 | | | | | | | | 270 | | | | 264,168 | |
3.964%(ff) | | | 11/15/48 | | | | | | | | 2,240 | | | | 1,750,644 | |
4.005%(ff) | | | 04/23/29 | | | | | | | | 1,360 | | | | 1,318,346 | |
5.299%(ff) | | | 07/24/29 | | | | | | | | 4,890 | | | | 4,935,197 | |
KeyCorp, | |
Sr. Unsec’d. Notes | |
6.401%(ff) | | | 03/06/35 | | | | | | | | 475 | | | | 494,647 | |
Mitsubishi UFJ Financial Group, Inc. (Japan), | |
Sr. Unsec’d. Notes | |
5.242%(ff) | | | 04/19/29 | | | | | | | | 1,740 | | | | 1,750,841 | |
Morgan Stanley, | |
Sr. Unsec’d. Notes | |
5.449%(ff) | | | 07/20/29 | | | | | | | | 1,855 | | | | 1,875,706 | |
6.407%(ff) | | | 11/01/29 | | | | | | | | 3,220 | | | | 3,363,757 | |
Sr. Unsec’d. Notes, GMTN | |
2.239%(ff) | | | 07/21/32 | | | | | | | | 2,770 | | | | 2,294,185 | |
3.875% | | | 01/27/26 | | | | | | | | 550 | | | | 545,709 | |
4.431%(ff) | | | 01/23/30 | | | | | | | | 455 | | | | 443,285 | |
Sr. Unsec’d. Notes, MTN | |
1.928%(ff) | | | 04/28/32 | | | | | | | | 775 | | | | 634,802 | |
3.591%(ff)(cc) | | | 07/22/28 | | | | | | | | 1,030 | | | | 993,386 | |
Sub. Notes, GMTN | |
4.350% | | | 09/08/26 | | | | | | | | 3,050 | | | | 3,028,576 | |
Societe Generale SA (France), | |
Sr. Non-Preferred Notes, 144A | |
1.488%(ff) | | | 12/14/26 | | | | | | | | 3,200 | | | | 3,087,675 | |
Truist Financial Corp., | |
Sr. Unsec’d. Notes, MTN | |
7.161%(ff) | | | 10/30/29 | | | | | | | | 745 | | | | 796,135 | |
UBS Group AG (Switzerland), | |
Sr. Unsec’d. Notes | |
4.550% | | | 04/17/26 | | | | | | | | 3,000 | | | | 2,986,717 | |
Sr. Unsec’d. Notes, 144A | |
1.364%(ff) | | | 01/30/27 | | | | | | | | 2,250 | | | | 2,163,013 | |
2.193%(ff) | | | 06/05/26 | | | | | | | | 1,100 | | | | 1,086,250 | |
3.091%(ff) | | | 05/14/32 | | | | | | | | 560 | | | | 487,200 | |
4.282% | | | 01/09/28 | | | | | | | | 980 | | | | 958,431 | |
Wells Fargo & Co., | |
Sr. Unsec’d. Notes | |
5.389%(ff) | | | 04/24/34 | | | | | | | | 1,635 | | | | 1,614,742 | |
6.491%(ff) | | | 10/23/34 | | | | | | | | 2,555 | | | | 2,713,624 | |
Sr. Unsec’d. Notes, MTN | |
2.572%(ff) | | | 02/11/31 | | | | | | | | 2,895 | | | | 2,553,502 | |
| | | | | | | | | | | | | | | | |
| | | | | |
| | | | | | | | | | | | | | | 94,130,456 | |
| | | | | | | | | | | | | | | | |
| | | | | | | | | | | | | | | | |
| | | | | | Principal | | | | |
| Interest | | Maturity | | | | | Amount | | | | |
Rate | | Date | | | | | (000)# | | | Value | |
|
CORPORATE BONDS (continued) | |
Beverages — 0.1% | |
Anheuser-Busch Cos. LLC/Anheuser-Busch InBev Worldwide, Inc. (Belgium), | |
Gtd. Notes | |
4.700% | | | 02/01/36 | | | | | | | | 1,220 | | | $ | 1,158,577 | |
Constellation Brands, Inc., | |
Sr. Unsec’d. Notes | |
2.250% | | | 08/01/31 | | | | | | | | 780 | | | | 648,388 | |
| | | | | | | | | | | | | | | | |
| | | | | |
| | | | | | | | | | | | | | | 1,806,965 | |
| | | | | | | | | | | | | | | | |
Biotechnology — 0.0% | |
Amgen, Inc., | |
Sr. Unsec’d. Notes | |
2.800% | | | 08/15/41 | | | | | | | | 140 | | | | 97,297 | |
| | | | | | | | | | | | | | | | |
Building Materials — 0.0% | |
Owens Corning, | |
Sr. Unsec’d. Notes | |
3.500% | | | 02/15/30 | | | | | | | | 400 | | | | 371,356 | |
Standard Industries, Inc., | |
Sr. Unsec’d. Notes, 144A | |
4.750% | | | 01/15/28 | | | | | | | | 300 | | | | 287,652 | |
| | | | | | | | | | | | | | | | |
| | | | | |
| | | | | | | | | | | | | | | 659,008 | |
| | | | | | | | | | | | | | | | |
Chemicals — 0.2% | |
Dow Chemical Co. (The), | |
Sr. Unsec’d. Notes | |
4.375% | | | 11/15/42 | | | | | | | | 5 | | | | 4,109 | |
9.400% | | | 05/15/39 | | | | | | | | 15 | | | | 19,805 | |
DuPont de Nemours, Inc., | |
Sr. Unsec’d. Notes | |
4.725% | | | 11/15/28 | | | | | | | | 1,590 | | | | 1,582,889 | |
5.419% | | | 11/15/48 | | | | | | | | 160 | | | | 159,108 | |
LYB International Finance BV, | |
Gtd. Notes | |
5.250% | | | 07/15/43 | | | | | | | | 620 | | | | 562,721 | |
OCP SA (Morocco), | |
Sr. Unsec’d. Notes, 144A | |
6.750% | | | 05/02/34 | | | | | | | | 901 | | | | 917,668 | |
Sasol Financing USA LLC (South Africa), | |
Gtd. Notes | |
6.500% | | | 09/27/28 | (a) | | | | | | | 405 | | | | 388,925 | |
Sherwin-Williams Co. (The), | |
Sr. Unsec’d. Notes | |
4.800% | | | 09/01/31 | | | | | | | | 585 | | | | 576,942 | |
| | | | | | | | | | | | | | | | |
| | | | | |
| | | | | | | | | | | | | | | 4,212,167 | |
| | | | | | | | | | | | | | | | |
Commercial Services — 0.1% | |
DCLI Bidco LLC, | |
Second Mortgage, 144A | |
7.750% | | | 11/15/29 | | | | | | | | 175 | | | | 178,834 | |
DP World Ltd. (United Arab Emirates), | |
Sr. Unsec’d. Notes, 144A | |
2.375% | | | 09/25/26 | | | | | EUR | | | 416 | | | | 423,239 | |
ERAC USA Finance LLC, | |
Gtd. Notes, 144A | |
7.000% | | | 10/15/37 | | | | | | | | 390 | | | | 439,347 | |
SEE NOTES TO FINANCIAL STATEMENTS.
A39
| | | | |
| | PSF PGIM 50/50 BALANCED PORTFOLIO (CONTINUED) | | |
SCHEDULE OF INVESTMENTS | | | | as of December 31, 2024 |
| | | | | | | | | | | | | | |
| | | | | Principal | | | | |
| Interest | | Maturity | | | | Amount | | | | |
Rate | | Date | | | | (000)# | | | Value | |
|
CORPORATE BONDS (continued) | |
Commercial Services (cont’d.) | | | | | | | | | | | | |
United Rentals North America, Inc., | |
Gtd. Notes | |
3.750% | | 01/15/32 | | | | | | | 250 | | | $ | 218,911 | |
4.875% | | 01/15/28 | | | | | | | 735 | | | | 714,330 | |
5.250% | | 01/15/30 | | | | | | | 165 | | | | 160,299 | |
University of Miami, | | | | | | | | | | | | |
Sr. Unsec’d. Notes, Series 2022 | |
4.063% | | 04/01/52 | | | | | | | 815 | | | | 654,575 | |
| | | | | | | | | | | | | | |
| | | | | |
| | | | | | | | | | | | | 2,789,535 | |
| | | | | | | | | | | | | | |
Distribution/Wholesale — 0.0% | |
Ritchie Bros Holdings, Inc. (Canada), | |
Sr. Sec’d. Notes, 144A | |
6.750% | | 03/15/28 | | | | | | | 50 | | | | 51,000 | |
| | | | | | | | | | | | | | |
Diversified Financial Services — 0.3% | |
Ally Financial, Inc., | |
Sr. Unsec’d. Notes | |
5.543%(ff) | | 01/17/31 | | | | | | | 465 | | | | 458,263 | |
Cantor Fitzgerald LP, | |
Sr. Unsec’d. Notes, 144A | |
4.500% | | 04/14/27 | | | | | | | 3,485 | | | | 3,412,290 | |
Nomura Holdings, Inc. (Japan), | |
Sr. Unsec’d. Notes | |
2.608% | | 07/14/31 | | | | | | | 1,490 | | | | 1,255,040 | |
6.070% | | 07/12/28 | | | | | | | 1,680 | | | | 1,728,601 | |
Private Export Funding Corp., | |
U.S. Gov’t. Gtd. Notes, Series NN | |
3.250% | | 06/15/25 | | | | | | | 255 | | | | 253,169 | |
| | | | | | | | | | | | | | |
| | | | | |
| | | | | | | | | | | | | 7,107,363 | |
| | | | | | | | | | | | | | |
Electric — 1.1% | |
Abu Dhabi National Energy Co. PJSC (United Arab Emirates), | |
Sr. Unsec’d. Notes, 144A, MTN | |
2.000% | | 04/29/28 | | | | | | | 370 | | | | 334,865 | |
AEP Texas, Inc., | |
Sr. Unsec’d. Notes | |
3.950% | | 06/01/28 | | | | | | | 2,105 | | | | 2,033,859 | |
Alfa Desarrollo SpA (Chile), | |
Sr. Sec’d. Notes, 144A | |
4.550% | | 09/27/51 | | | | | | | 436 | | | | 320,502 | |
Baltimore Gas & Electric Co., | |
Sr. Unsec’d. Notes | |
6.350% | | 10/01/36 | | | | | | | 530 | | | | 568,156 | |
Berkshire Hathaway Energy Co., | |
Sr. Unsec’d. Notes | |
5.950% | | 05/15/37 | | | | | | | 335 | | | | 346,501 | |
Calpine Corp., | |
Sr. Sec’d. Notes, 144A | |
3.750% | | 03/01/31 | | | | | | | 1,050 | | | | 939,217 | |
CenterPoint Energy Houston Electric LLC, | |
General Ref. Mortgage, Series K2 | |
6.950% | | 03/15/33 | | | | | | | 300 | | | | 330,912 | |
Comision Federal de Electricidad (Mexico), | |
Gtd. Notes, 144A | |
4.688% | | 05/15/29 | | | | | | | 1,000 | | | | 936,350 | |
| | | | | | | | | | | | | | |
| | | | | Principal | | | | |
| Interest | | Maturity | | | | Amount | | | | |
Rate | | Date | | | | (000)# | | | Value | |
|
CORPORATE BONDS (continued) | |
Electric (cont’d.) | | | | | |
Connecticut Light & Power Co. (The), | |
First Mortgage, Series A | |
2.050% | | 07/01/31 | | | | | | | 2,290 | | | $ | 1,914,966 | |
Consolidated Edison Co. of New York, Inc., | |
Sr. Unsec’d. Notes, Series 09-C | |
5.500% | | 12/01/39 | | | | | | | 145 | | | | 143,340 | |
Duke Energy Carolinas LLC, | |
First Mortgage | |
4.950% | | 01/15/33 | | | | | | | 2,260 | | | | 2,223,729 | |
6.050% | | 04/15/38 | | | | | | | 530 | | | | 557,432 | |
El Paso Electric Co., | |
Sr. Unsec’d. Notes | |
6.000% | | 05/15/35 | | | | | | | 845 | | | | 848,208 | |
Enel Finance International NV (Italy), | |
Gtd. Notes, 144A | |
2.500%(c) | | 07/12/31 | | | | | | | 1,500 | | | | 1,255,303 | |
Eskom Holdings SOC Ltd. (South Africa), | |
Gov’t. Gtd. Notes, 144A, MTN | |
6.350% | | 08/10/28 | | | | | | | 349 | | | | 346,927 | |
FirstEnergy Pennsylvania Electric Co., | |
Sr. Unsec’d. Notes, 144A | |
5.200% | | 04/01/28 | | | | | | | 530 | | | | 532,166 | |
Florida Power & Light Co., | |
First Mortgage | |
5.950% | | 10/01/33 | | | | | | | 380 | | | | 396,845 | |
Iberdrola International BV (Spain), | |
Gtd. Notes | |
6.750% | | 09/15/33 | | | | | | | 140 | | | | 149,574 | |
Israel Electric Corp. Ltd. (Israel), | |
Sr. Sec’d. Notes, 144A, GMTN | |
4.250% | | 08/14/28 | | | | | | | 575 | | | | 550,723 | |
NextEra Energy Capital Holdings, Inc., | |
Gtd. Notes | |
4.900% | | 02/28/28 | | | | | | | 2,515 | | | | 2,517,141 | |
6.051% | | 03/01/25 | | | | | | | 515 | | | | 515,894 | |
Northern States Power Co., | |
First Mortgage | |
3.600% | | 09/15/47 | | | | | | | 1,035 | | | | 764,289 | |
NRG Energy, Inc., | |
Gtd. Notes, 144A | |
3.625% | | 02/15/31 | | | | | | | 50 | | | | 43,675 | |
3.875% | | 02/15/32 | | | | | | | 150 | | | | 130,500 | |
Sr. Sec’d. Notes, 144A | |
2.000% | | 12/02/25 | | | | | | | 225 | | | | 218,234 | |
2.450% | | 12/02/27 | | | | | | | 345 | | | | 320,317 | |
Ohio Power Co., | |
Sr. Unsec’d. Notes | |
4.000% | | 06/01/49 | | | | | | | 465 | | | | 349,250 | |
Pacific Gas & Electric Co., | | | | | | | | | | | | |
First Mortgage | |
4.950% | | 07/01/50 | | | | | | | 855 | | | | 741,872 | |
PacifiCorp, | |
First Mortgage | |
5.350% | | 12/01/53(h) | | | | | | | 2,045 | | | | 1,877,695 | |
PECO Energy Co., | |
First Mortgage | |
2.800% | | 06/15/50 | | | | | | | 785 | | | | 488,414 | |
SEE NOTES TO FINANCIAL STATEMENTS.
A40
| | | | |
| | PSF PGIM 50/50 BALANCED PORTFOLIO (CONTINUED) | | |
SCHEDULE OF INVESTMENTS | | | | as of December 31, 2024 |
| | | | | | | | | | | | | | | | | | |
| | | | | | | | | | | Principal | | | | |
| Interest | | Maturity | | | | | | | | Amount | | | | |
Rate | | Date | | | | | | | | (000)# | | | Value | |
|
CORPORATE BONDS (continued) | |
Electric (cont’d.) | | | | | |
Public Service Electric & Gas Co., | |
First Mortgage, MTN | |
3.700% | | 05/01/28 | | | | | | | | | | | 850 | | | $ | 821,674 | |
4.900% | | 12/15/32 | | | | | | | | | | | 820 | | | | 812,563 | |
Sr. Sec’d. Notes, MTN | | | | | |
5.800% | | 05/01/37 | | | | | | | | | | | 515 | | | | 530,623 | |
Public Service Enterprise Group, Inc., | | | | | | | | | | | | | | | | |
Sr. Unsec’d. Notes | | | | | |
1.600% | | 08/15/30 | | | | | | | | | | | 1,235 | | | | 1,027,979 | |
San Diego Gas & Electric Co., | | | | | |
First Mortgage | | | | | |
4.150% | | 05/15/48 | | | | | | | | | | | 1,010 | | | | 802,882 | |
Southern California Edison Co., | | | | | |
First Ref. Mortgage | | | | | | | | | | | | | | | | |
4.000% | | 04/01/47 | | | | | | | | | | | 350 | | | | 269,553 | |
First Ref. Mortgage, Series C | | | | | |
3.600% | | 02/01/45 | | | | | | | | | | | 690 | | | | 508,879 | |
Vistra Operations Co. LLC, | |
Gtd. Notes, 144A | | | | | |
5.000% | | 07/31/27 | | | | | | | | | | | 495 | | | | 485,548 | |
Xcel Energy, Inc., | | | | | | | | | | | | | | | | |
Sr. Unsec’d. Notes | | | | | |
4.800% | | 09/15/41 | | | | | | | | | | | 480 | | | | 412,961 | |
| | | | | | | | | | | | | | | | | | |
| | | | | |
| | | | | | | | | | | | | | | | | 28,369,518 | |
| | | | | | | | | | | | | | | | | | |
Engineering & Construction — 0.1% | |
AECOM, | |
Gtd. Notes | |
5.125% | | 03/15/27 | | | | | | | | | | | 500 | | | | 494,595 | |
Mexico City Airport Trust (Mexico), | |
Sr. Sec’d. Notes, 144A | |
4.250% | | 10/31/26 | | | | | | | | | | | 415 | | | | 404,633 | |
5.500% | | 07/31/47 | | | | | | | | | | | 1,350 | | | | 1,083,794 | |
| | | | | | | | | | | | | | | | | | |
| | | | | |
| | | | | | | | | | | | | | | | | 1,983,022 | |
| | | | | | | | | | | | | | | | | | |
Entertainment — 0.1% | |
Caesars Entertainment, Inc., | |
Sr. Sec’d. Notes, 144A | |
7.000% | | 02/15/30 | | | | | | | | | | | 400 | | | | 407,331 | |
Warnermedia Holdings, Inc., | |
Gtd. Notes | |
5.050% | | 03/15/42 | | | | | | | | | | | 1,425 | | | | 1,143,680 | |
5.141% | | 03/15/52 | | | | | | | | | | | 650 | | | | 483,924 | |
| | | | | | | | | | | | | | | | | | |
| | | | | |
| | | | | | | | | | | | | | | | | 2,034,935 | |
| | | | | | | | | | | | | | | | | | |
Foods — 0.2% | |
JBS USA Holding Lux Sarl/JBS USA Food Co./JBS Lux Co. Sarl, | |
Gtd. Notes | |
5.125% | | 02/01/28 | | | | | | | | | | | 3,000 | | | | 2,983,274 | |
Lamb Weston Holdings, Inc., | |
Gtd. Notes, 144A | |
4.125% | | 01/31/30 | | | | | | | | | | | 200 | | | | 182,967 | |
4.375% | | 01/31/32 | | | | | | | | | | | 575 | | | | 520,196 | |
Mars, Inc., | |
Sr. Unsec’d. Notes, 144A | |
2.375% | | 07/16/40 | | | | | | | | | | | 535 | | | | 352,182 | |
| | | | | | | | | | | | | | | | | | |
| | | | | |
| | | | | | | | | | | | | | | | | 4,038,619 | |
| | | | | | | | | | | | | | | | | | |
| | | | | | | | | | | | | | | | | | |
| | | | | | | | | | | Principal | | | | |
| Interest | | Maturity | | | | | | | | Amount | | | | |
Rate | | Date | | | | | | | | (000)# | | | Value | |
|
CORPORATE BONDS (continued) | |
Gas — 0.1% | | | | | |
NiSource, Inc., | |
Sr. Unsec’d. Notes | |
1.700% | | 02/15/31 | | | | | | | | | | | 270 | | | $ | 220,882 | |
3.600% | | 05/01/30 | | | | | | | | | | | 1,600 | | | | 1,491,907 | |
Piedmont Natural Gas Co., Inc., | |
Sr. Unsec’d. Notes | |
3.500% | | 06/01/29 | | | | | | | | | | | 2,090 | | | | 1,969,557 | |
| | | | | | | | | | | | | | | | | | |
| | | | | |
| | | | | | | | | | | | | | | | | 3,682,346 | |
| | | | | | | | | | | | | | | | | | |
Healthcare-Products — 0.0% | |
Medline Borrower LP, | |
Sr. Sec’d. Notes,144A | |
3.875% | | 04/01/29 | | | | | | | | | | | 475 | | | | 440,021 | |
| | | | | | | | | | | | | | | | | | |
Healthcare-Services — 0.4% | |
Aetna, Inc., | |
Sr. Unsec’d. Notes | |
6.625% | | 06/15/36 | | | | | | | | | | | 480 | | | | 503,951 | |
Cigna Group (The), | |
Sr. Unsec’d. Notes | |
3.200% | | 03/15/40 | | | | | | | | | | | 1,555 | | | | 1,139,876 | |
CommonSpirit Health, | |
Sr. Sec’d. Notes | |
5.318% | | 12/01/34 | | | | | | | | | | | 2,650 | | | | 2,615,813 | |
Elevance Health, Inc., | |
Sr. Unsec’d. Notes | |
3.600% | | 03/15/51 | | | | | | | | | | | 885 | | | | 613,376 | |
4.625% | | 05/15/42 | | | | | | | | | | | 330 | | | | 285,034 | |
Kaiser Foundation Hospitals, | |
Gtd. Notes | |
4.150% | | 05/01/47 | | | | | | | | | | | 670 | | | | 546,913 | |
Roche Holdings, Inc., | |
Gtd. Notes,144A | |
4.592% | | 09/09/34(a) | | | | | | | | | | | 2,270 | | | | 2,177,810 | |
Tenet Healthcare Corp., | |
Sr. Sec’d. Notes | |
4.375% | | 01/15/30 | | | | | | | | | | | 425 | | | | 394,588 | |
UnitedHealth Group, Inc., | |
Sr. Unsec’d. Notes | |
4.750% | | 05/15/52 | | | | | | | | | | | 455 | | | | 390,406 | |
5.200% | | 04/15/63 | | | | | | | | | | | 1,030 | | | | 924,654 | |
5.500% | | 04/15/64 | | | | | | | | | | | 1,380 | | | | 1,291,709 | |
5.750% | | 07/15/64 | | | | | | | | | | | 650 | | | | 632,048 | |
| | | | | | | | | | | | | | | | | | |
| | | | | |
| | | | | | | | | | | | | | | | | 11,516,178 | |
| | | | | | | | | | | | | | | | | | |
Home Builders — 0.0% | |
KB Home, | |
Gtd. Notes | |
4.000% | | 06/15/31 | | | | | | | | | | | 400 | | | | 353,308 | |
Taylor Morrison Communities, Inc., | |
Gtd. Notes,144A | |
5.875% | | 06/15/27 | | | | | | | | | | | 405 | | | | 405,926 | |
| | | | | | | | | | | | | | | | | | |
| | | | | |
| | | | | | | | | | | | | | | | | 759,234 | |
| | | | | | | | | | | | | | | | | | |
Housewares — 0.0% | |
Newell Brands, Inc., | |
Sr. Unsec’d. Notes | |
6.375% | | 05/15/30 | | | | | | | | | | | 135 | | | | 135,467 | |
SEE NOTES TO FINANCIAL STATEMENTS.
A41
| | | | |
| | PSF PGIM 50/50 BALANCED PORTFOLIO (CONTINUED) | | |
SCHEDULE OF INVESTMENTS | | | | as of December 31, 2024 |
| | | | | | | | | | | | | | | | | | |
| | | | | | | | | | | Principal | | | | |
| Interest | | Maturity | | | | | | | | Amount | | | | |
Rate | | Date | | | | | | | | (000)# | | | Value | |
| |
CORPORATE BONDS (continued) | | | | | |
Housewares (cont’d.) | | | | | | | | | | | | | | | | |
6.625% | | 05/15/32 | | | | | | | | | | | 70 | | | $ | 70,473 | |
| | | | | | | | | | | | | | | | | | |
| | | | | | | | | | | | | | | | | 205,940 | |
| | | | | | | | | | | | | | | | | | |
Insurance — 0.3% | | | | | | | | | | | | | | | | |
Arthur J Gallagher & Co., | | | | | | | | | | | | | | | | |
Sr. Unsec’d. Notes | | | | | | | | | | | | | | | | |
4.850% | | 12/15/29 | | | | | | | | | | | 670 | | | | 666,841 | |
Fairfax Financial Holdings Ltd. (Canada), | |
Sr. Unsec’d. Notes | | | | | | | | | | | | | | | | |
6.000% | | 12/07/33 | | | | | | | | | | | 2,375 | | | | 2,448,037 | |
Liberty Mutual Group, Inc., | | | | | | | | | | | | | | | | |
Gtd. Notes, 144A | | | | | | | | | | | | | | | | |
3.951% | | 10/15/50 | | | | | | | | | | | 1,125 | | | | 818,980 | |
Lincoln National Corp., | | | | | | | | | | | | | | | | |
Sr. Unsec’d. Notes | | | | | | | | | | | | | | | | |
6.300% | | 10/09/37 | | | | | | | | | | | 701 | | | | 729,495 | |
Markel Group, Inc., | | | | | | | | | | | | | | | | |
Sr. Unsec’d. Notes | | | | | | | | | | | | | | | | |
5.000% | | 03/30/43 | | | | | | | | | | | 165 | | | | 144,710 | |
New York Life Insurance Co., | | | | | | | | | | | | | | | | |
Sub. Notes, 144A | | | | | | | | | | | | | | | | |
6.750% | | 11/15/39 | | | | | | | | | | | 650 | | | | 721,131 | |
Principal Financial Group, Inc., | |
Gtd. Notes | | | | | | | | | | | | | | | | |
4.625% | | 09/15/42 | | | | | | | | | | | 105 | | | | 92,344 | |
Teachers Insurance & Annuity Association of America, | |
Sub. Notes, 144A | | | | | | | | | | | | | | | | |
4.270% | | 05/15/47 | | | | | | | | | | | 1,430 | | | | 1,143,506 | |
6.850% | | 12/16/39 | | | | | | | | | | | 122 | | | | 135,264 | |
| | | | | | | | | | | | | | | | | | |
| | | | | | | | | | | | | | | | | 6,900,308 | |
| | | | | | | | | | | | | | | | | | |
Iron/Steel — 0.0% | | | | | | | | | | | | | | | | |
Cleveland-Cliffs, Inc., | | | | | | | | | | | | | | | | |
Gtd. Notes, 144A | | | | | | | | | | | | | | | | |
6.875% | | 11/01/29 | | | | | | | | | | | 245 | | | | 242,287 | |
7.375% | | 05/01/33 | | | | | | | | | | | 145 | | | | 142,613 | |
| | | | | | | | | | | | | | | | | | |
| | | | | | | | | | | | | | | | | 384,900 | |
| | | | | | | | | | | | | | | | | | |
Lodging — 0.0% | | | | | | | | | | | | | | | | |
Marriott International, Inc., | | | | | | | | | | | | | | | | |
Sr. Unsec’d. Notes | | | | | | | | | | | | | | | | |
4.900% | | 04/15/29 | | | | | | | | | | | 350 | | | | 349,476 | |
| | | | | | | | | | | | | | | | | | |
Media — 0.3% | |
CCO Holdings LLC/CCO Holdings Capital Corp., | |
Sr. Unsec’d. Notes, 144A | | | | | | | | | | | | | | | | |
5.125% | | 05/01/27 | | | | | | | | | | | 75 | | | | 73,665 | |
5.500% | | 05/01/26 | | | | | | | | | | | 425 | | | | 423,214 | |
Charter Communications Operating LLC/Charter Communications Operating Capital, | |
Sr. Sec’d. Notes | | | | | | | | | | | | | | | | |
3.900% | | 06/01/52 | | | | | | | | | | | 500 | | | | 321,722 | |
5.050% | | 03/30/29 | | | | | | | | | | | 1,370 | | | | 1,343,382 | |
6.384% | | 10/23/35 | | | | | | | | | | | 905 | | | | 903,359 | |
6.484% | | 10/23/45 | | | | | | | | | | | 635 | | | | 599,949 | |
Comcast Corp., | |
Gtd. Notes | | | | | | | | | | | | | | | | |
5.500% | | 05/15/64(a)(h) | | | | | | | | | | | 1,920 | | | | 1,792,944 | |
| | | | | | | | | | | | | | | | | | |
| | | | | | | | | | | Principal | | | | |
| Interest | | Maturity | | | | | | | | Amount | | | | |
Rate | | Date | | | | | | | | (000)# | | | Value | |
| |
CORPORATE BONDS (continued) | | | | | |
Media (cont’d.) | | | | | | | | | | | | | | | | |
Cox Communications, Inc., | | | | | | | | | | | | | | | | |
Sr. Unsec’d. Notes, 144A | | | | | | | | | | | | | | | | |
2.600% | | 06/15/31 | | | | | | | | | | | 3,695 | | | $ | 3,113,388 | |
Time Warner Cable LLC, | | | | | | | | | | | | | | | | |
Sr. Sec’d. Notes | | | | | | | | | | | | | | | | |
5.500% | | 09/01/41 | | | | | | | | | | | 270 | | | | 229,472 | |
| | | | | | | | | | | | | | | | | | |
| | | | | | | | | | | | | | | | | 8,801,095 | |
| | | | | | | | | | | | | | | | | | |
Mining — 0.1% | |
Newmont Corp., | |
Gtd. Notes | | | | | | | | | | | | | | | | |
2.800% | | 10/01/29 | | | | | | | | | | | 1,750 | | | | 1,596,920 | |
Newmont Corp./Newcrest Finance Pty Ltd., | | | | | |
Gtd. Notes | | | | | | | | | | | | | | | | |
5.350% | | 03/15/34 | | | | | | | | | | | 760 | | | | 756,627 | |
| | | | | | | | | | | | | | | | | | |
| | | | | | | | | | | | | | | | | 2,353,547 | |
| | | | | | | | | | | | | | | | | | |
Miscellaneous Manufacturing — 0.1% | |
Amsted Industries, Inc., | | | | | | | | | | | | | | | | |
Gtd. Notes,144A | | | | | | | | | | | | | | | | |
5.625% | | 07/01/27 | | | | | | | | | | | 800 | | | | 792,311 | |
Pentair Finance Sarl, | | | | | | | | | | | | | | | | |
Gtd. Notes | | | | | | | | | | | | | | | | |
4.500% | | 07/01/29 | | | | | | | | | | | 2,415 | | | | 2,344,026 | |
| | | | | | | | | | | | | | | | | | |
| | | | | | | | | | | | | | | | | 3,136,337 | |
| | | | | | | | | | | | | | | | | | |
Multi-National — 0.0% | | | | | | | | | | | | | | | | |
Corp. Andina de Fomento (Supranational Bank), | | | | | |
Sr. Unsec’d. Notes | | | | | | | | | | | | | | | | |
5.000% | | 01/24/29 | | | | | | | | | | | 965 | | | | 968,744 | |
| | | | | | | | | | | | | | | | | | |
Office/Business Equipment — 0.1% | |
CDW LLC/CDW Finance Corp., | |
Gtd. Notes | | | | | | | | | | | | | | | | |
2.670% | | 12/01/26 | | | | | | | | | | | 1,270 | | | | 1,218,055 | |
| | | | | | | | | | | | | | | | | | |
Oil & Gas — 0.5% | | | | | | | | | | | | | | | | |
Aker BP ASA (Norway), | | | | | | | | | | | | | | | | |
Gtd. Notes,144A | | | | | | | | | | | | | | | | |
3.100% | | 07/15/31 | | | | | | | | | | | 530 | | | | 458,587 | |
Sr. Unsec’d. Notes, 144A | | | | | | | | | | | | | | | | |
4.000% | | 01/15/31 | | | | | | | | | | | 2,045 | | | | 1,880,401 | |
5.125% | | 10/01/34 | | | | | | | | | | | 305 | | | | 286,798 | |
Canadian Natural Resources Ltd. (Canada), | | | | | |
Sr. Unsec’d. Notes, 144A | | | | | | | | | | | | | | | | |
5.000% | | 12/15/29 | | | | | | | | | | | 960 | | | | 949,382 | |
Cenovus Energy, Inc. (Canada), | |
Sr. Unsec’d. Notes | | | | | | | | | | | | | | | | |
5.400% | | 06/15/47 | | | | | | | | | | | 506 | | | | 449,545 | |
Devon Energy Corp., | | | | | | | | | | | | | | | | |
Sr. Unsec’d. Notes | | | | | | | | | | | | | | | | |
5.600% | | 07/15/41 | | | | | | | | | | | 225 | | | | 208,111 | |
Ecopetrol SA (Colombia), | | | | | | | | | | | | | | | | |
Sr. Unsec’d. Notes | | | | | | | | | | | | | | | | |
6.875% | | 04/29/30 | | | | | | | | | | | 440 | | | | 428,780 | |
7.750% | | 02/01/32 | | | | | | | | | | | 940 | | | | 913,210 | |
8.625% | | 01/19/29 | | | | | | | | | | | 1,315 | | | | 1,392,782 | |
SEE NOTES TO FINANCIAL STATEMENTS.
A42
| | | | |
| | PSF PGIM 50/50 BALANCED PORTFOLIO (CONTINUED) | | |
SCHEDULE OF INVESTMENTS | | | | as of December 31, 2024 |
| | | | | | | | | | | | | | | | | | |
| | | | | | | | Principal | | | | |
| Interest | | Maturity | | | | | Amount | | | | |
Rate | | Date | | | | | (000)# | | | Value | |
| |
CORPORATE BONDS (continued) | | | | | |
Oil & Gas (cont’d.) | | | | | | | | | | | | | | | | |
Expand Energy Corp., | | | | | | | | | | | | | | | | |
Gtd. Notes | | | | | | | | | | | | | | | | |
4.750% | | 02/01/32 | | | | | | | | | | | 325 | | | $ | 301,895 | |
Hilcorp Energy I LP/Hilcorp Finance Co., | | | | | |
Sr. Unsec’d. Notes, 144A | | | | | |
6.000% | | 04/15/30 | | | | | | | | | | | 215 | | | | 202,344 | |
6.250% | | 04/15/32 | | | | | | | | | | | 325 | | | | 299,210 | |
Korea National Oil Corp. (South Korea), | |
Sr. Unsec’d. Notes, 144A | |
4.750% | | 04/03/26 | | | | | | | | | | | 335 | | | | 333,687 | |
4.875% | | 04/03/28 | | | | | | | | | | | 345 | | | | 342,599 | |
Marathon Oil Corp., | | | | | | | | | | | | | | | | |
Sr. Unsec’d. Notes | | | | | | | | | | | | | | | | |
5.700% | | 04/01/34 | | | | | | | | | | | 1,275 | | | | 1,323,074 | |
Petroleos Mexicanos (Mexico), | | | | | |
Gtd. Notes | | | | | |
6.490% | | 01/23/27 | | | | | | | | | | | 346 | | | | 335,079 | |
6.500% | | 03/13/27 | | | | | | | | | | | 130 | | | | 125,268 | |
6.840% | | 01/23/30 | | | | | | | | | | | 100 | | | | 91,100 | |
Gtd. Notes, MTN | |
6.875% | | 08/04/26 | | | | | | | | | | | 770 | | | | 756,525 | |
QatarEnergy (Qatar), | | | | | | | | | | | | | | | | |
Sr. Unsec’d. Notes, 144A | |
1.375% | | 09/12/26 | | | | | | | | | | | 500 | | | | 471,150 | |
2.250% | | 07/12/31 | | | | | | | | | | | 545 | | | | 457,686 | |
Santos Finance Ltd. (Australia), | |
Gtd. Notes, 144A | | | | | | | | | | | | | | | | |
6.875% | | 09/19/33 | | | | | | | | | | | 635 | | | | 670,608 | |
| | | | | | | | | | | | | | | | | | |
| | | | | |
| | | | | | | | | | | | | | | | | 12,677,821 | |
| | | | | | | | | | | | | | | | | | |
Packaging & Containers — 0.2% | |
Ball Corp., | |
Gtd. Notes | |
3.125% | | 09/15/31(a) | | | | | | | | | | | 300 | | | | 254,523 | |
6.000% | | 06/15/29 | | | | | | | | | | | 725 | | | | 731,109 | |
Berry Global, Inc., | | | | | | | | | | | | | | | | |
Sr. Sec’d. Notes | | | | | | | | | | | | | | | | |
1.570% | | 01/15/26 | | | | | | | | | | | 3,570 | | | | 3,445,346 | |
Sealed Air Corp./Sealed Air Corp. US, | |
Gtd. Notes, 144A | |
6.125% | | 02/01/28 | | | | | | | | | | | 75 | | | | 75,281 | |
Smurfit Westrock Financing DAC (Ireland), | | | | | |
Gtd. Notes, 144A | | | | | |
5.418% | | 01/15/35(a) | | | | | | | | | | | 600 | | | | 595,773 | |
| | | | | | | | | | | | | | | | | | |
| | | | | |
| | | | | | | | | | | | | | | | | 5,102,032 | |
| | | | | | | | | | | | | | | | | | |
Pharmaceuticals — 0.2% | | | | | |
AbbVie, Inc., | |
Sr. Unsec’d. Notes | |
3.800% | | 03/15/25 | | | | | | | | | | | 950 | | | | 947,926 | |
4.050% | | 11/21/39 | | | | | | | | | | | 140 | | | | 119,709 | |
4.550% | | 03/15/35(h) | | | | | | | | | | | 1,770 | | | | 1,663,960 | |
4.700% | | 05/14/45 | | | | | | | | | | | 425 | | | | 375,812 | |
Bayer US Finance II LLC (Germany), | |
Gtd. Notes, 144A | |
4.250% | | 12/15/25 | | | | | | | | | | | 490 | | | | 486,467 | |
| | | | | | | | | | | | | | | | | | |
| | | | | | | | Principal | | | | |
| Interest | | Maturity | | | | | Amount | | | | |
Rate | | Date | | | | | (000)# | | | Value | |
| |
CORPORATE BONDS (continued) | | | | | |
Pharmaceuticals (cont’d.) | |
CVS Health Corp., | | | | | | | | | | | | | | | | |
Sr. Unsec’d. Notes | | | | | | | | | | | | | | | | |
5.125% | | 07/20/45 | | | | | | | | | | | 985 | | | $ | 828,438 | |
5.875% | | 06/01/53 | | | | | | | | | | | 150 | | | | 137,600 | |
Mylan, Inc., | |
Gtd. Notes | |
5.400% | | 11/29/43 | | | | | | | | | | | 590 | | | | 528,092 | |
Organon & Co./Organon Foreign Debt Co-Issuer BV, | | | | | |
Sr. Sec’d. Notes, 144A | | | | | |
4.125% | | 04/30/28 | | | | | | | | | | | 700 | | | | 657,839 | |
Viatris, Inc., | |
Gtd. Notes | |
3.850% | | 06/22/40 | | | | | | | | | | | 520 | | | | 389,375 | |
| | | | | | | | | | | | | | | | | | |
| | | | | |
| | | | | | | | | | | | | | | | | 6,135,218 | |
| | | | | | | | | | | | | | | | | | |
Pipelines — 0.9% | | | | | | | | | | | | | | | | |
Columbia Pipelines Operating Co. LLC, | |
Sr. Unsec’d. Notes, 144A | |
5.927% | | 08/15/30 | | | | | | | | | | | 590 | | | | 607,411 | |
DCP Midstream Operating LP, | |
Gtd. Notes | | | | | | | | | | | | | | | | |
5.125% | | 05/15/29 | | | | | | | | | | | 2,600 | | | | 2,602,285 | |
Eastern Gas Transmission & Storage, Inc., | | | | | |
Sr. Unsec’d. Notes | | | | | |
4.600% | | 12/15/44 | | | | | | | | | | | 45 | | | | 37,901 | |
EIG Pearl Holdings Sarl (Saudi Arabia), | |
Sr. Sec’d. Notes, 144A | |
3.545% | | 08/31/36 | | | | | | | | | | | 1,060 | | | | 907,956 | |
Energy Transfer LP, | | | | | | | | | | | | | | | | |
Sr. Unsec’d. Notes | | | | | | | | | | | | | | | | |
4.950% | | 06/15/28 | | | | | | | | | | | 795 | | | | 793,677 | |
6.125% | | 12/15/45 | | | | | | | | | | | 120 | | | | 118,412 | |
6.250% | | 04/15/49 | | | | | | | | | | | 885 | | | | 887,800 | |
6.400% | | 12/01/30 | | | | | | | | | | | 280 | | | | 295,644 | |
6.550% | | 12/01/33 | | | | | | | | | | | 4,380 | | | | 4,654,802 | |
EQM Midstream Partners LP, | |
Sr. Unsec’d. Notes, 144A | |
7.500% | | 06/01/27 | | | | | | | | | | | 25 | | | | 25,499 | |
7.500% | | 06/01/30 | | | | | | | | | | | 25 | | | | 26,654 | |
Greensaif Pipelines Bidco Sarl (Saudi Arabia), | | | | | |
Sr. Sec’d. Notes, 144A | | | | | |
6.129% | | 02/23/38 | | | | | | | | | | | 365 | | | | 366,599 | |
6.510% | | 02/23/42 | | | | | | | | | | | 475 | | | | 480,641 | |
Kinder Morgan, Inc., | | | | | | | | | | | | | | | | |
Gtd. Notes | | | | | | | | | | | | | | | | |
3.600% | | 02/15/51 | | | | | | | | | | | 1,575 | | | | 1,066,033 | |
MPLX LP, | |
Sr. Unsec’d. Notes | |
4.000% | | 02/15/25 | | | | | | | | | | | 1,140 | | | | 1,138,194 | |
4.875% | | 06/01/25 | | | | | | | | | | | 2,275 | | | | 2,273,299 | |
5.200% | | 03/01/47 | | | | | | | | | | | 25 | | | | 22,193 | |
5.500% | | 02/15/49 | | | | | | | | | | | 700 | | | | 643,159 | |
ONEOK Partners LP, | | | | | | | | | | | | | | | | |
Gtd. Notes | | | | | | | | | | | | | | | | |
6.650% | | 10/01/36 | | | | | | | | | | | 130 | | | | 138,155 | |
SEE NOTES TO FINANCIAL STATEMENTS.
A43
| | | | |
| | PSF PGIM 50/50 BALANCED PORTFOLIO (CONTINUED) | | |
SCHEDULE OF INVESTMENTS | | | | as of December 31, 2024 |
| | | | | | | | | | | | | | | | |
| | | | | | | Principal | | | | |
| Interest | | Maturity | | | | Amount | | | | |
Rate | | Date | | | | (000)# | | | Value | |
|
CORPORATE BONDS (continued) | |
Pipelines (cont’d.) | | | | | | | | | | | | |
ONEOK, Inc., | |
Gtd. Notes | |
3.100% | | 03/15/30 | | | | | | | | | 3,495 | | | $ | 3,169,117 | |
4.500% | | 03/15/50 | | | | | | | | | 245 | | | | 192,976 | |
6.050% | | 09/01/33 | | | | | | | | | 764 | | | | 786,522 | |
Venture Global Calcasieu Pass LLC, | |
Sr. Sec’d. Notes, 144A | | | | | | | | | | | | |
3.875% | | 08/15/29 | | | | | | | | | 80 | | | | 73,510 | |
4.125% | | 08/15/31 | | | | | | | | | 55 | | | | 49,350 | |
6.250% | | 01/15/30 | | | | | | | | | 400 | | | | 404,469 | |
Western Midstream Operating LP, | |
Sr. Unsec’d. Notes | | | | | | | | | | | | |
5.300% | | 03/01/48 | | | | | | | | | 80 | | | | 67,903 | |
Williams Cos., Inc. (The), | | | | | | | | | | | | |
Sr. Unsec’d. Notes | | | | | | | | | | | | |
4.900% | | 01/15/45 | | | | | | | | | 1,100 | | | | 959,162 | |
5.150% | | 03/15/34 | | | | | | | | | 370 | | | | 359,568 | |
| | | | | | | | | | | | | | | | |
| | | | | |
| | | | | | | | | | | | | | | 23,148,891 | |
| | | | | | | | | | | | | | | | |
Real Estate Investment Trusts (REITs) — 0.5% | | | | | |
Alexandria Real Estate Equities, Inc., | |
Gtd. Notes | | | | | | | | | | | | |
2.950% | | 03/15/34 | | | | | | | | | 420 | | | | 346,015 | |
5.250% | | 05/15/36 | | | | | | | | | 1,900 | | | | 1,842,789 | |
American Tower Corp., | | | | | | | | | | | | |
Sr. Unsec’d. Notes | | | | | | | | | | | | |
5.200% | | 02/15/29 | | | | | | | | | 2,235 | | | | 2,247,599 | |
COPT Defense Properties LP, | | | | | | | | | | | | |
Gtd. Notes | | | | | | | | | | | | |
2.900% | | 12/01/33 | | | | | | | | | 945 | | | | 759,586 | |
GLP Capital LP/GLP Financing II, Inc., | |
Gtd. Notes | |
5.375% | | 04/15/26 | | | | | | | | | 725 | | | | 725,696 | |
Healthpeak OP LLC, | | | | | | | | | | | | |
Gtd. Notes | | | | | | | | | | | | |
5.250% | | 12/15/32 | | | | | | | | | 2,500 | | | | 2,480,993 | |
Kimco Realty OP LLC, | | | | | | | | | | | | |
Gtd. Notes | | | | | | | | | | | | |
2.700% | | 10/01/30 | | | | | | | | | 2,420 | | | | 2,146,410 | |
MPT Operating Partnership LP/MPT Finance Corp., | |
Gtd. Notes | | | | | |
3.500% | | 03/15/31 | | | | | | | | | 625 | | | | 396,604 | |
5.000% | | 10/15/27 | | | | | | | | | 275 | | | | 232,417 | |
Sun Communities Operating LP, | | | | | | | | | | | | |
Gtd. Notes | | | | | | | | | | | | |
5.500% | | 01/15/29 | | | | | | | | | 3,005 | | | | 3,023,486 | |
| | | | | | | | | | | | | | | | |
| | | | | |
| | | | | | | | | | | | | | | 14,201,595 | |
| | | | | | | | | | | | | | | | |
Retail — 0.2% | |
1011778 BC ULC/New Red Finance, Inc. (Canada), | |
Sr. Sec’d. Notes, 144A | | | | | |
3.875% | | 01/15/28 | | | | | | | | | 400 | | | | 378,000 | |
AutoZone, Inc., | |
Sr. Unsec’d. Notes | |
3.750% | | 04/18/29 | | | | | | | | | 1,820 | | | | 1,735,333 | |
| | | | | | | | | | | | | | | | |
| | | | | | | Principal | | | | |
| Interest | | Maturity | | | | Amount | | | | |
Rate | | Date | | | | (000)# | | | Value | |
|
CORPORATE BONDS (continued) | |
Retail (cont’d.) | | | | | | | | | | | | |
Dollar Tree, Inc., | |
Sr. Unsec’d. Notes | |
4.000% | | 05/15/25 | | | | | | | | | 3,395 | | | $ | 3,380,949 | |
Gap, Inc. (The), | |
Gtd. Notes, 144A | |
3.625% | | 10/01/29 | | | | | | | | | 200 | | | | 179,660 | |
3.875% | | 10/01/31 | | | | | | | | | 375 | | | | 323,712 | |
| | | | | | | | | | | | | | | | |
| | | | | |
| | | | | | | | | | | | | | | 5,997,654 | |
| | | | | | | | | | | | | | | | |
Semiconductors — 0.1% | | | | | | | | | | | | | | |
Broadcom, Inc., | |
Sr. Unsec’d. Notes | |
5.050% | | 07/12/29 | | | | | | | | | 885 | | | | 888,304 | |
Sr. Unsec’d. Notes, 144A | |
3.187% | | 11/15/36 | | | | | | | | | 3,650 | | | | 2,939,744 | |
| | | | | | | | | | | | | | | | |
| | | | | |
| | | | | | | | | | | | | | | 3,828,048 | |
| | | | | | | | | | | | | | | | |
Shipbuilding — 0.1% | | | | | | | | | | | | | | |
Huntington Ingalls Industries, Inc., | |
Gtd. Notes | |
5.353% | | 01/15/30 | | | | | | | | | 2,560 | | | | 2,564,375 | |
5.749% | | 01/15/35 | | | | | | | | | 975 | | | | 971,568 | |
| | | | | | | | | | | | | | | | |
| | | | | |
| | | | | | | | | | | | | | | 3,535,943 | |
| | | | | | | | | | | | | | | | |
Software — 0.1% | | | | | | | | | | | | | | |
ServiceNow, Inc., | | | | | | | | | | | | | | |
Sr. Unsec’d. Notes | | | | | | | | | | | | | | |
1.400% | | 09/01/30 | | | | | | | | | 1,375 | | | | 1,141,855 | |
Workday, Inc., | |
Sr. Unsec’d. Notes | |
3.800% | | 04/01/32 | | | | | | | | | 1,845 | | | | 1,678,983 | |
| | | | | | | | | | | | | | | | |
| | | | | |
| | | | | | | | | | | | | | | 2,820,838 | |
| | | | | | | | | | | | | | | | |
Telecommunications — 0.7% | |
AT&T, Inc., | |
Sr. Unsec’d. Notes | |
2.550% | | 12/01/33 | | | | | | | | | 346 | | | | 278,683 | |
3.500% | | 09/15/53 | | | | | | | | | 1,367 | | | | 921,438 | |
3.650% | | 09/15/59 | | | | | | | | | 4 | | | | 2,653 | |
4.500% | | 05/15/35 | | | | | | | | | 1,095 | | | | 1,013,136 | |
5.400% | | 02/15/34 | | | | | | | | | 2,125 | | | | 2,134,650 | |
Level 3 Financing, Inc., | | | | | | | | | | | | | | |
Sec’d. Notes, 144A | | | | | | | | | | | | | | |
4.875% | | 06/15/29 | | | | | | | | | 75 | | | | 65,236 | |
Sr. Sec’d. Notes, 144A | |
10.500% | | 04/15/29 | | | | | | | | | 250 | | | | 278,514 | |
10.500% | | 05/15/30 | | | | | | | | | 250 | | | | 272,190 | |
11.000% | | 11/15/29 | | | | | | | | | 904 | | | | 1,017,710 | |
Rogers Communications, Inc. (Canada), | |
Gtd. Notes | |
3.800% | | 03/15/32 | | | | | | | | | 2,480 | | | | 2,229,273 | |
T-Mobile USA, Inc., | | | | | | | | | | | | | | |
Gtd. Notes | | | | | | | | | | | | | | |
2.550% | | 02/15/31 | | | | | | | | | 965 | | | | 829,731 | |
3.750% | | 04/15/27 | | | | | | | | | 200 | | | | 195,393 | |
3.875% | | 04/15/30 | | | | | | | | | 5,500 | | | | 5,175,884 | |
SEE NOTES TO FINANCIAL STATEMENTS.
A44
| | | | |
| | PSF PGIM 50/50 BALANCED PORTFOLIO (CONTINUED) | | |
SCHEDULE OF INVESTMENTS | | | | as of December 31, 2024 |
| | | | | | | | | | | | | | | | |
| | | | | | | | Principal | | | | |
| Interest | | Maturity | | | | | Amount | | | | |
Rate | | Date | | | | | (000)# | | | Value | |
|
CORPORATE BONDS (continued) | |
Telecommunications (cont’d.) | | | | | |
Verizon Communications, Inc., | |
Sr. Unsec’d. Notes | |
1.680% | | | 10/30/30 | | | | | | | | 490 | | | $ | 407,595 | |
2.550% | | | 03/21/31 | | | | | | | | 1,017 | | | | 876,262 | |
2.650% | | | 11/20/40 | | | | | | | | 1,095 | | | | 748,567 | |
3.150% | | | 03/22/30 | | | | | | | | 1,365 | | | | 1,249,063 | |
| | | | | | | | | | | | | | | | |
| | | | | |
| | | | | | | | | | | | | | | 17,695,978 | |
| | | | | | | | | | | | | | | | |
Transportation — 0.1% | | | | | |
Burlington Northern Santa Fe LLC, | | | | | |
Sr. Unsec’d. Notes | | | | | |
6.700% | | | 08/01/28 | | | | | | | | 585 | | | | 614,795 | |
CSX Corp., | | | | | | | | | | |
Sr. Unsec’d. Notes | | | | | | | | | | |
6.150% | | | 05/01/37 | | | | | | | | 690 | | | | 733,513 | |
GN Bondco LLC, | | | | | | | | | | |
Sr. Sec’d. Notes, 144A | | | | | | | | | | |
9.500% | | | 10/15/31(a) | | | | | | | | 350 | | | | 367,772 | |
Norfolk Southern Corp., | | | | | | | | | | |
Sr. Unsec’d. Notes | | | | | |
5.590% | | | 05/17/25 | | | | | | | | 120 | | | | 120,213 | |
XPO, Inc., | | | | | | | | | | |
Gtd. Notes, 144A | | | | | |
7.125% | | | 06/01/31 | | | | | | | | 100 | | | | 102,093 | |
| | | | | | | | | | | | | | | | |
| | | | | |
| | | | | | | | | | | | | | | 1,938,386 | |
| | | | | | | | | | | | | | | | |
Trucking & Leasing — 0.1% | | | | | |
Penske Truck Leasing Co. LP/PTL Finance Corp., | |
Sr. Unsec’d. Notes, 144A | | | | | |
5.250% | | | 07/01/29 | | | | | | | | 2,630 | | | | 2,638,231 | |
| | | | | | | | | | | | | | | | |
TOTAL CORPORATE BONDS
(cost $329,519,818) | | | | 312,664,513 | |
| | | | | | | | | | | | | | | | |
FLOATING RATE AND OTHER LOANS — 0.0% | |
Telecommunications | | | | | | | | | | | | | | | | |
Level 3 Financing, Inc., | |
Term B-1, 1 Month SOFR + 6.560% | | | | | |
10.917%(c) | | | 04/15/29 | | | | | | | | 60 | | | | 60,914 | |
Term B-2, 1 Month SOFR + 6.560% | | | | | |
10.917%(c) | | | 04/15/30 | | | | | | | | 60 | | | | 61,288 | |
| | | | | | | | | | | | | | | | |
TOTAL FLOATING RATE AND OTHER LOANS
(cost $118,027) | | | | 122,202 | |
| | | | | | | | | | | | | | | | |
MUNICIPAL BONDS — 0.3% | |
Alabama — 0.0% | | | | | |
Alabama Economic Settlement Authority, | |
Taxable, Revenue Bonds, Series B | | | | | |
4.263% | | | 09/15/32 | | | | | | | | 180 | | | | 172,657 | |
| | | | | | | | | | | | | | | | |
California — 0.1% | | | | | |
Bay Area Toll Authority, | |
Revenue Bonds, BABs, Series F2 | | | | | |
6.263% | | | 04/01/49 | | | | | | | | 1,305 | | | | 1,378,428 | |
State of California, | |
General Obligation Unlimited, BABs | | | | | |
7.300% | | | 10/01/39 | | | | | | | | 1,250 | | | | 1,430,911 | |
General Obligation Unlimited, Taxable, BABs | | | | | |
7.500% | | | 04/01/34 | | | | | | | | 350 | | | | 399,860 | |
| | | | | | | | | | | | | | | | |
| | | | | | | | Principal | | | | |
| Interest | | Maturity | | | | | Amount | | | | |
Rate | | Date | | | | | (000)# | | | Value | |
|
MUNICIPAL BONDS (continued) | |
California (cont’d.) | | | | | |
7.625% | | | 03/01/40 | | | | | | | | 205 | | | $ | 240,836 | |
| | | | | | | | | | | | | | | | |
| | | | | |
| | | | | | | | | | | | | | | 3,450,035 | |
| | | | | | | | | | | | | | | | |
Colorado — 0.0% | |
Regional Transportation District Sales Tax Revenue, | | | | | |
Revenue Bonds, BABs, Series B | | | | | | | | | | |
5.844% | | | 11/01/50 | | | | | | | | 565 | | | | 572,177 | |
| | | | | | | | | | | | | | | | |
Illinois — 0.1% | |
Chicago O’Hare International Airport, | |
Revenue Bonds, BABs, Series B | | | | | | | | | | |
6.395% | | | 01/01/40 | | | | | | | | 970 | | | | 1,022,194 | |
| | | | | | | | | | | | | | | | |
New Jersey — 0.1% | |
New Jersey Turnpike Authority, | |
Taxable, Revenue Bonds, BABs, Series F | | | | | |
7.414% | | | 01/01/40 | | | | | | | | 1,000 | | | | 1,153,640 | |
| | | | | | | | | | | | | | | | |
Ohio — 0.0% | |
Ohio State University (The), | |
Taxable, Revenue Bonds, BABs, Series C | | | | | |
4.910% | | | 06/01/40 | | | | | | | | 415 | | | | 389,291 | |
| | | | | | | | | | | | | | | | |
Pennsylvania — 0.0% | |
Pennsylvania Turnpike Commission, | |
Revenue Bonds, BABs, Series B | | | | | |
5.511% | | | 12/01/45 | | | | | | | | 505 | | | | 488,860 | |
| | | | | | | | | | | | | | | | |
Virginia — 0.0% | |
University of Virginia, | |
Taxable, Revenue Bonds, Series C | | | | | |
4.179% | | | 09/01/2117 | | | | | | | | 355 | | | | 266,448 | |
| | | | | | | | | | | | | | | | |
TOTAL MUNICIPAL BONDS
(cost $7,204,304) | | | | 7,515,302 | |
| | | | | | | | | | | | | | | | |
RESIDENTIAL MORTGAGE-BACKED SECURITIES — 0.9% | |
ATLX Trust, | | | | | |
Series 2024-RPL02, Class A1, 144A | | | | | |
3.850% | | | 04/25/63 | | | | | | | | 2,560 | | | | 2,448,721 | |
Banc of America Mortgage Trust, | | | | | |
Series 2005-A, Class 2A1 | | | | | |
4.904%(cc) | | | 02/25/35 | | | | | | | | 25 | | | | 24,198 | |
Bellemeade Re Ltd., | | | | | |
Series 2021-03A, Class A2, 144A, 30 Day Average SOFR + 1.000% (Cap N/A, Floor 1.000%) | |
5.569%(c) | | | 09/25/31 | | | | | | | | 1,500 | | | | 1,501,423 | |
BRAVO Residential Funding Trust, | |
Series 2023-RPL01, Class A1, 144A | | | | | |
5.000%(cc) | | | 05/25/63 | | | | | | | | 1,442 | | | | 1,426,527 | |
Chase Home Lending Mortgage Trust, | |
Series 2024-RPL03, Class A1A, 144A | | | | | |
3.250%(cc) | | | 09/25/64 | | | | | | | | 484 | | | | 427,396 | |
Chase Mortgage Finance Trust, | |
Series 2007-A01, Class 1A5 | | | | | |
6.620%(cc) | | | 02/25/37 | | | | | | | | 41 | | | | 39,727 | |
CIM Trust, | |
Series 2024-R01, Class A1, 144A | | | | | |
4.750%(cc) | | | 06/25/64 | | | | | | | | 1,409 | | | | 1,371,401 | |
Credit Suisse Mortgage Trust, | |
Series 2018-RPL09, Class A, 144A | | | | | |
3.850%(cc) | | | 09/25/57 | | | | | | | | 408 | | | | 389,228 | |
SEE NOTES TO FINANCIAL STATEMENTS.
A45
| | | | |
| | PSF PGIM 50/50 BALANCED PORTFOLIO (CONTINUED) | | |
SCHEDULE OF INVESTMENTS | | | | as of December 31, 2024 |
| | | | | | | | | | | | | | | | | | |
| | | | | | Principal | | | | |
| Interest | | Maturity | | Amount | | | | |
Rate | | Date | | (000)# | | | Value | |
|
RESIDENTIAL MORTGAGE-BACKED SECURITIES (continued) | |
|
Fannie Mae REMIC, | |
Series 2020-24, Class SP, IO, 30 Day Average SOFR x (1) + 5.936% (Cap 6.050%, Floor 0.000%) | |
1.367%(c) | | 04/25/50 | | | | | | | | | | | 683 | | | $ | 74,326 | |
Series 2022-51, Class PS, IO, 30 Day Average SOFR x (1) + 5.950% (Cap 5.950%, Floor 0.000%) | |
1.381%(c) | | 08/25/52 | | | | | | | | | | | 1,600 | | | | 146,380 | |
Series 2022-63, Class SB, IO, 30 Day Average SOFR x (1) + 4.750% (Cap 4.750%, Floor 0.000%) | |
0.181%(c) | | 09/25/52 | | | | | | | | | | | 1,312 | | | | 43,521 | |
FHLMC Structured Agency Credit Risk REMIC Trust, | | | | | |
Series 2021-DNA05, Class M2, 144A, 30 Day Average SOFR + 1.650% (Cap N/A, Floor 0.000%) | |
6.219%(c) | | 01/25/34 | | | | | | | | | | | 90 | | | | 90,819 | |
Series 2022-DNA01, Class M1A, 144A, 30 Day Average SOFR + 1.000% (Cap N/A, Floor 0.000%) | |
5.569%(c) | | 01/25/42 | | | | | | | | | | | 683 | | | | 683,529 | |
Freddie Mac REMIC, | | | | | | | | | | | | | | | | |
Series 4535, Class PA | | | | | | | | | | | | | | | | |
3.000% | | 03/15/44 | | | | | | | | | | | 252 | | | | 240,132 | |
Series 5021, Class SB, IO, 30 Day Average SOFR x (1) + 3.550% (Cap 3.550%, Floor 0.000%) | |
0.000%(c) | | 10/25/50 | | | | | | | | | | | 1,718 | | | | 33,396 | |
Series 5222, Class SA, IO, 30 Day Average SOFR x (1) + 3.500% (Cap 3.500%, Floor 0.000%) | |
0.000%(c) | | 05/25/52 | | | | | | | | | | | 261 | | | | 3,069 | |
Series 5269, Class AD | | | | | | | | | | | | | | | | |
2.000% | | 01/25/55 | | | | | | | | | | | 4,501 | | | | 3,459,485 | |
Freddie Mac Strips, | | | | | | | | | | | | | | | | |
Series 406, Class PO, PO | | | | | | | | | | | | | | | | |
1.208%(s) | | 10/25/53 | | | | | | | | | | | 1,970 | | | | 1,594,946 | |
Government National Mortgage Assoc., | | | | | |
Series 2018-121, Class KS, IO, 1 Month SOFR x (1) + 3.746% (Cap 3.860%, Floor 0.000%) | |
0.000%(c) | | 09/20/48 | | | | | | | | | | | 789 | | | | 12,461 | |
Series 2018-148, Class DS, IO, 1 Month SOFR x (1) + 3.726% (Cap 3.840%, Floor 0.000%) | |
0.000%(c) | | 10/20/48 | | | | | | | | | | | 1,008 | | | | 17,319 | |
Series 2018-151, Class SL, IO, 1 Month SOFR x (1) + 3.686% (Cap 3.800%, Floor 0.000%) | |
0.000%(c) | | 11/20/48 | | | | | | | | | | | 3,231 | | | | 59,465 | |
Series 2018-155, Class PS, IO, 1 Month SOFR x (1) + 3.186% (Cap 2.000%, Floor 0.000%) | |
0.000%(c) | | 11/20/48 | | | | | | | | | | | 1,748 | | | | 15,609 | |
Series 2019-092, Class S, IO, 1 Month SOFR x (1) + 2.696% (Cap 2.810%, Floor 0.000%) | |
0.000%(c) | | 07/20/49 | | | | | | | | | | | 3,115 | | | | 18,439 | |
Series 2019-097, Class MS, IO, 1 Month SOFR x (1) + 2.966% (Cap 3.080%, Floor 0.000%) | |
0.000%(c) | | 08/20/49 | | | | | | | | | | | 2,611 | | | | 20,869 | |
Series 2019-099, Class SA, IO, 1 Month SOFR x (1) + 3.236% (Cap 3.350%, Floor 0.000%) | |
0.000%(c) | | 08/20/49 | | | | | | | | | | | 1,624 | | | | 17,385 | |
Series 2021-114, Class TI, IO | |
3.000% | | 06/20/51 | | | | | | | | | | | 1,862 | | | | 260,719 | |
| | | | | | | | | | | | | | | | | | | | |
| | | | | | | | | Principal | | | | |
| Interest | | Maturity | | | | | | | | Amount | | | | |
Rate | | Date | | | | | | | | (000)# | | | Value | |
|
RESIDENTIAL MORTGAGE-BACKED SECURITIES (continued) | |
|
Series 2021-165, Class ST, IO, 1 Month SOFR x (1) + 3.246% (Cap 0.020%, Floor 0.000%) | |
0.000%(c) | | 01/20/50 | | | | | | | | | | | | | 394 | | | $ | 96 | |
Series 2022-046, Class S, IO, 30 Day Average SOFR x (1) + 3.500% (Cap 3.500%, Floor 0.000%) | |
0.000%(c) | | 03/20/52 | | | | | | | | | | | | | 662 | | | | 6,615 | |
Series 2022-051, Class SC, IO, 30 Day Average SOFR x (1) + 3.500% (Cap 3.500%, Floor 0.000%) | |
0.000%(c) | | 03/20/52 | | | | | | | | | | | | | 2,988 | | | | 46,851 | |
Series 2022-066, Class SB, IO, 30 Day Average SOFR x (1) + 3.850% (Cap 3.850%, Floor 0.000%) | |
0.000%(c) | | 04/20/52 | | | | | | | | | | | | | 989 | | | | 16,997 | |
Series 2022-068, Class SP, IO, 30 Day Average SOFR x (1) + 3.850% (Cap 3.850%, Floor 0.000%) | |
0.000%(c) | | 04/20/52 | | | | | | | | | | | | | 804 | | | | 16,900 | |
Series 2022-078, Class MS, IO, 30 Day Average SOFR x (1) + 3.600% (Cap 3.600%, Floor 0.000%) | |
0.000%(c) | | 04/20/52 | | | | | | | | | | | | | 2,638 | | | | 41,189 | |
Series 2022-078, Class SB, IO, 30 Day Average SOFR x (1) + 3.750% (Cap 3.750%, Floor 0.000%) | |
0.000%(c) | | 04/20/52 | | | | | | | | | | | | | 1,768 | | | | 30,847 | |
Series 2022-093, Class GS, IO, 30 Day Average SOFR x (1) + 3.650% (Cap 3.650%, Floor 0.000%) | |
0.000%(c) | | 05/20/52 | | | | | | | | | | | | | 625 | | | | 9,595 | |
Series 2022-126, Class CS, IO, 30 Day Average SOFR x (1) + 3.760% (Cap 3.760%, Floor 0.000%) | |
0.000%(c) | | 07/20/52 | | | | | | | | | | | | | 3,682 | | | | 51,259 | |
Series 2022-133, Class SA, IO, 30 Day Average SOFR x (1) + 3.950%(Cap 3.950%, Floor 0.000%) | |
0.000%(c) | | 07/20/52 | | | | | | | | | | | | | 1,350 | | | | 22,368 | |
Series 2022-148, Class DS, IO, 30 Day Average SOFR x (1) + 3.600% (Cap 3.600%, Floor 0.000%) | |
0.000%(c) | | 08/20/52 | | | | | | | | | | | | | 1,397 | | | | 17,065 | |
Series 2022-170, Class SB, IO, 30 Day Average SOFR x (1) + 4.500% (Cap 4.500%, Floor 0.000%) | |
0.000%(c) | | 09/20/52 | | | | | | | | | | | | | 10,198 | | | | 231,901 | |
Series 2022-178, Class SA, IO, 30 Day Average SOFR x (1) + 4.900% (Cap 4.900%, Floor 0.000%) | |
0.295%(c) | | 10/20/52 | | | | | | | | | | | | | 1,672 | | | | 72,176 | |
Series 2022-93, Class IO, IO | | | | | | | | |
3.000% | | 08/20/51 | | | | | | | | | | | | | 6,176 | | | | 687,292 | |
JPMorgan Mortgage Trust, | | | | | | | | | | | | | | | | | | |
Series 2007-A01, Class 4A1 | | | | | | | | |
7.198%(cc) | | 07/25/35 | | | | | | | | | | | | | 7 | | | | 6,837 | |
Kinbane DAC (Ireland), | | | | | | | | | | | | | | | | | | |
Series 2024-RPL2A, Class A, 144A, 1 Month EURIBOR + 1.100% (Cap N/A, Floor 0.000%) | |
4.189%(c) | | 01/24/63 | | | | | | | | | | EUR | | | 788 | | | | 816,338 | |
Legacy Mortgage Asset Trust, | |
Series 2021-GS01, Class A1, 144A | | | | | | | | |
4.892% | | 10/25/66 | | | | | | | | | | | | | 198 | | | | 198,073 | |
MFA Trust, | | | | | | | | | | | | | | | | | | | | |
Series 2021-RPL01, Class A1, 144A | | | | | | | | |
1.131%(cc) | | 07/25/60 | | | | | | | | | | | | | 1,320 | | | | 1,182,521 | |
SEE NOTES TO FINANCIAL STATEMENTS.
A46
| | | | |
| | PSF PGIM 50/50 BALANCED PORTFOLIO (CONTINUED) | | |
SCHEDULE OF INVESTMENTS | | | | as of December 31, 2024 |
| | | | | | | | | | | | | | | | | | | | |
Interest Rate | | Maturity
Date | | | | | | | | | Principal
Amount
(000)# | | | Value | |
|
RESIDENTIAL MORTGAGE-BACKED SECURITIES (continued) | |
|
New Residential Mortgage Loan Trust, | |
Series 2018-04A, Class A1S, 144A, 1 Month SOFR + 0.864% (Cap N/A, Floor 0.750%) | |
5.203%(c) | | | 01/25/48 | | | | | | | | | | | | 102 | | | $ | 99,703 | |
Oaktown Re VII Ltd., | | | | | | | | | | | | | | | | | |
Series 2021-02, Class M1A, 144A, 30 Day Average SOFR + 1.600% (Cap N/A, Floor 1.600%) | |
6.169%(c) | | | 04/25/34 | | | | | | | | | | | | 172 | | | | 172,165 | |
PRET Trust, | |
Series 2024-RPL02, Class A1, 144A | |
4.075%(cc) | | | 06/25/64 | | | | | | | | | | | | 965 | | | | 901,121 | |
PRPM LLC, | | | | | | | | | | | | | | | | | | | | |
Series 2024-RPL04, Class A1, 144A | |
4.000% | | | 12/25/54 | | | | | | | | | | | | 2,000 | | | | 1,926,040 | |
RCKT Mortgage Trust, | | | | | | | | | | | | | | | | | |
Series 2024-CES09, Class A1A, 144A | |
5.582% | | | 12/25/44 | | | | | | | | | | | | 1,200 | | | | 1,190,808 | |
Shamrock Residential (Ireland), | |
Series 2023-01A, Class A, 144A, 1 Month EURIBOR + 1.000% (Cap N/A, Floor 0.000%) | |
3.801%(c) | | | 06/24/71 | | | | | | | | EUR | | | | 229 | | | | 236,720 | |
Structured Adjustable Rate Mortgage Loan Trust, | |
Series 2004-01, Class 4A3 | |
7.203%(cc) | | | 02/25/34 | | | | | | | | | | | | 37 | | | | 35,769 | |
TFS (Spain), | | | | | | | | | | | | | | | | | | | | |
Series 2018-03, Class A1 | |
0.000%(s) | | | 04/16/40^ | | | | | | | | EUR | | | | — | (r) | | | 1 | |
Towd Point Mortgage Trust, | |
Series 2017-05, Class A1, 144A, 1 Month SOFR + 0.714% (Cap N/A, Floor 0.000%) | |
5.053%(c) | | | 02/25/57 | | | | | | | | | | | | 98 | | | | 102,634 | |
Series 2020-04, Class A1, 144A | |
1.750% | | | 10/25/60 | | | | | | | | | | | | 441 | | | | 394,995 | |
| | | | | | | | | | | | | | | | | | | | |
TOTAL RESIDENTIAL MORTGAGE-BACKED SECURITIES
(cost $23,439,596) | | | | 22,935,366 | |
| | | | | | | | | | | | | | | | | | | | |
SOVEREIGN BONDS — 0.3% | |
Bermuda Government International Bond (Bermuda), | |
Sr. Unsec’d. Notes, 144A | | | | | | | | | |
2.375% | | | 08/20/30 | | | | | | | | | | | | 465 | | | | 394,501 | |
Colombia Government International Bond (Colombia), | |
Sr. Unsec’d. Notes | | | | | | | | | |
4.500% | | | 01/28/26 | | | | | | | | | | | | 220 | | | | 217,140 | |
Export-Import Bank of India (India), | |
Sr. Unsec’d. Notes, 144A | | | | | | | | | |
3.875% | | | 02/01/28 | | | | | | | | | | | | 745 | | | | 719,521 | |
Finnvera OYJ (Finland), | |
Gov’t. Gtd. Notes, 144A, MTN | | | | | | | | | |
2.375% | | | 06/04/25 | | | | | | | | | | | | 400 | | | | 396,556 | |
Indonesia Government International Bond (Indonesia), | |
Sr. Unsec’d. Notes | | | | | | | | | | | | | | | | | |
1.450% | | | 09/18/26 | | | | | | | | EUR | | | | 1,510 | | | | 1,516,052 | |
Mexico Government International Bond (Mexico), | |
Sr. Unsec’d. Notes | | | | | | | | | | | | | | | | | |
6.000% | | | 05/07/36 | | | | | | | | | | | | 907 | | | | 853,430 | |
| | | | | | | | | | | | | | | | | | |
Interest Rate | | Maturity
Date | | | | | | | | Principal
Amount
(000)# | | | Value | |
|
SOVEREIGN BONDS(continued) | |
Oman Government International Bond (Oman), | | | | | |
Sr. Unsec’d. Notes, 144A | | | | | | | | | |
4.750% | | | 06/15/26 | | | | | | | | | | 1,500 | | | $ | 1,486,200 | |
Panama Government International Bond (Panama), | |
Sr. Unsec’d. Notes | | | | | |
4.500% | | | 04/16/50 | | | | | | | | | | 340 | | | | 209,518 | |
Peruvian Government International Bond (Peru), | |
Sr. Unsec’d. Notes | | | | | | | | | |
2.783% | | | 01/23/31 | | | | | | | | | | 514 | | | | 439,149 | |
Romanian Government International Bond (Romania), | |
Sr. Unsec’d. Notes, 144A, MTN | | | | | | | | | |
5.000% | | | 09/27/26 | | | | | | EUR | | | | 800 | | | | 847,740 | |
| | | | | | | | | | | | | | | | | | |
TOTAL SOVEREIGN BONDS
(cost $7,433,548) | | | | 7,079,807 | |
| | | | | | | | | | | | | | | | | | |
|
U.S. GOVERNMENT AGENCY OBLIGATIONS — 11.4% | |
Federal Home Loan Bank | |
5.500% | | | 07/15/36 | | | | | | | | | | 850 | | | | 898,876 | |
Federal Home Loan Mortgage Corp. | |
1.500% | | | 02/01/36 | | | | | | | | | | 761 | | | | 656,625 | |
1.500% | | | 06/01/36 | | | | | | | | | | 859 | | | | 739,261 | |
1.500% | | | 10/01/36 | | | | | | | | | | 4,576 | | | | 3,947,830 | |
1.500% | | | 11/01/50 | | | | | | | | | | 1,113 | | | | 825,794 | |
1.500% | | | 04/01/51 | | | | | | | | | | 588 | | | | 435,270 | |
2.000% | | | 01/01/32 | | | | | | | | | | 254 | | | | 236,797 | |
2.000% | | | 02/01/36 | | | | | | | | | | 749 | | | | 664,207 | |
2.000% | | | 06/01/40 | | | | | | | | | | 622 | | | | 520,395 | |
2.000% | | | 10/01/40 | | | | | | | | | | 1,050 | | | | 877,605 | |
2.000% | | | 09/01/50 | | | | | | | | | | 2,502 | | | | 1,966,254 | |
2.000% | | | 02/01/51 | | | | | | | | | | 1,971 | | | | 1,539,429 | |
2.000% | | | 03/01/51 | | | | | | | | | | 1,010 | | | | 788,213 | |
2.000% | | | 04/01/51 | | | | | | | | | | 63 | | | | 49,456 | |
2.000% | | | 07/01/51 | | | | | | | | | | 2,397 | | | | 1,878,194 | |
2.000% | | | 09/01/51 | | | | | | | | | | 419 | | | | 331,255 | |
2.500% | | | 03/01/30 | | | | | | | | | | 112 | | | | 107,091 | |
2.500% | | | 10/01/35 | | | | | | | | | | 1,421 | | | | 1,305,059 | |
2.500% | | | 01/01/51 | | | | | | | | | | 1,398 | | | | 1,152,534 | |
2.500% | | | 03/01/51 | | | | | | | | | | 555 | | | | 455,751 | |
2.500% | | | 04/01/51 | | | | | | | | | | 4,918 | | | | 4,037,299 | |
2.500% | | | 05/01/51 | | | | | | | | | | 2,272 | | | | 1,854,286 | |
2.500% | | | 08/01/51 | | | | | | | | | | 423 | | | | 347,169 | |
2.500% | | | 08/01/51 | | | | | | | | | | 2,345 | | | | 1,930,576 | |
2.500% | | | 09/01/51 | | | | | | | | | | 3,971 | | | | 3,268,779 | |
3.000% | | | 10/01/28 | | | | | | | | | | 68 | | | | 66,250 | |
3.000% | | | 06/01/29 | | | | | | | | | | 150 | | | | 145,732 | |
3.000% | | | 01/01/37 | | | | | | | | | | 66 | | | | 61,325 | |
3.000% | | | 06/01/42 | | | | | | | | | | 112 | | | | 98,517 | |
3.000% | | | 10/01/42 | | | | | | | | | | 278 | | | | 245,322 | |
3.000% | | | 01/01/43 | | | | | | | | | | 265 | | | | 234,281 | |
3.000% | | | 07/01/43 | | | | | | | | | | 713 | | | | 629,483 | |
3.000% | | | 09/01/46 | | | | | | | | | | 1,517 | | | | 1,317,392 | |
3.000% | | | 12/01/46 | | | | | | | | | | 4,426 | | | | 3,836,374 | |
3.000% | | | 11/01/49 | | | | | | | | | | 968 | | | | 834,670 | |
3.000% | | | 02/01/50 | | | | | | | | | | 1,202 | | | | 1,035,638 | |
3.000% | | | 05/01/50 | | | | | | | | | | 249 | | | | 213,634 | |
3.000% | | | 06/01/51 | | | | | | | | | | 1,466 | | | | 1,250,456 | |
3.000% | | | 02/01/52 | | | | | | | | | | 2,180 | | | | 1,872,197 | |
3.000% | | | 02/01/52 | | | | | | | | | | 3,315 | | | | 2,823,653 | |
SEE NOTES TO FINANCIAL STATEMENTS.
A47
| | | | |
| | PSF PGIM 50/50 BALANCED PORTFOLIO (CONTINUED) | | |
SCHEDULE OF INVESTMENTS | | | | as of December 31, 2024 |
| | | | | | | | | | | | | | | | |
| | | | | Principal | | | | |
| Interest | | Maturity | | | | Amount | | | | |
Rate | | Date | | | | (000)# | | | Value | |
|
| U.S. GOVERNMENT AGENCY OBLIGATIONS(continued) | |
3.500% | | 06/01/42 | | | | | | | | | 118 | | | $ | 107,422 | |
3.500% | | 01/01/47 | | | | | | | | | 199 | | | | 179,156 | |
3.500% | | 02/01/47 | | | | | | | | | 311 | | | | 279,510 | |
3.500% | | 03/01/48 | | | | | | | | | 2,347 | | | | 2,107,736 | |
4.000% | | 06/01/26 | | | | | | | | | 31 | | | | 30,763 | |
4.000% | | 09/01/26 | | | | | | | | | 11 | | | | 10,539 | |
4.000% | | 09/01/37 | | | | | | | | | 144 | | | | 138,323 | |
4.000% | | 03/01/38 | | | | | | | | | 131 | | | | 124,959 | |
4.000% | | 10/01/39 | | | | | | | | | 203 | | | | 191,761 | |
4.000% | | 09/01/40 | | | | | | | | | 261 | | | | 246,772 | |
4.000% | | 12/01/40 | | | | | | | | | 126 | | | | 119,306 | |
4.000% | | 10/01/41 | | | | | | | | | 98 | | | | 92,757 | |
4.000% | | 01/01/42 | | | | | | | | | 39 | | | | 36,976 | |
4.000% | | 04/01/52 | | | | | | | | | 727 | | | | 672,948 | |
4.500% | | 02/01/39 | | | | | | | | | 27 | | | | 25,866 | |
4.500% | | 09/01/39 | | | | | | | | | 41 | | | | 40,228 | |
4.500% | | 10/01/39 | | | | | | | | | 378 | | | | 366,822 | |
4.500% | | 12/01/39 | | | | | | | | | 40 | | | | 38,663 | |
4.500% | | 07/01/41 | | | | | | | | | 46 | | | | 44,578 | |
4.500% | | 07/01/41 | | | | | | | | | 860 | | | | 833,280 | |
4.500% | | 08/01/41 | | | | | | | | | 64 | | | | 62,139 | |
4.500% | | 08/01/41 | | | | | | | | | 78 | | | | 75,709 | |
4.500% | | 08/01/41 | | | | | | | | | 91 | | | | 87,253 | |
4.500% | | 10/01/41 | | | | | | | | | 90 | | | | 86,743 | |
4.500% | | 12/01/47 | | | | | | | | | 76 | | | | 72,637 | |
4.500% | | 08/01/48 | | | | | | | | | 155 | | | | 148,132 | |
5.000% | | 05/01/34 | | | | | | | | | 9 | | | | 8,802 | |
5.000% | | 05/01/34 | | | | | | | | | 97 | | | | 96,191 | |
5.000% | | 10/01/35 | | | | | | | | | 2 | | | | 2,415 | |
5.000% | | 07/01/37 | | | | | | | | | 141 | | | | 141,030 | |
5.000% | | 05/01/39 | | | | | | | | | 21 | | | | 20,730 | |
5.000% | | 10/01/52 | | | | | | | | | 877 | | | | 849,421 | |
5.000% | | 02/01/53 | | | | | | | | | 1,459 | | | | 1,411,972 | |
5.500% | | 12/01/33 | | | | | | | | | 19 | | | | 19,286 | |
5.500% | | 01/01/34 | | | | | | | | | 18 | | | | 17,821 | |
5.500% | | 06/01/34 | | | | | | | | | 32 | | | | 31,806 | |
5.500% | | 07/01/34 | | | | | | | | | 70 | | | | 70,238 | |
5.500% | | 05/01/37 | | | | | | | | | 19 | | | | 18,866 | |
5.500% | | 02/01/38 | | | | | | | | | 144 | | | | 145,337 | |
5.500% | | 05/01/38 | | | | | | | | | 16 | | | | 16,342 | |
5.500% | | 07/01/38 | | | | | | | | | 41 | | | | 41,099 | |
5.500% | | 02/01/53 | | | | | | | | | 8,602 | | | | 8,507,523 | |
6.000% | | 03/01/32 | | | | | | | | | 71 | | | | 73,702 | |
6.000% | | 12/01/33 | | | | | | | | | 18 | | | | 18,573 | |
6.000% | | 11/01/36 | | | | | | | | | 18 | | | | 18,869 | |
6.000% | | 01/01/37 | | | | | | | | | 9 | | | | 8,868 | |
6.000% | | 05/01/37 | | | | | | | | | 7 | | | | 7,506 | |
6.000% | | 02/01/38 | | | | | | | | | 1 | | | | 1,467 | |
6.000% | | 08/01/39 | | | | | | | | | 21 | | | | 22,280 | |
6.750% | | 03/15/31 | | | | | | | | | 500 | | | | 558,716 | |
7.000% | | 05/01/31 | | | | | | | | | 2 | | | | 2,292 | |
7.000% | | 06/01/31 | | | | | | | | | 9 | | | | 9,029 | |
7.000% | | 08/01/31 | | | | | | | | | 72 | | | | 74,609 | |
Federal National Mortgage Assoc. | |
1.500% | | 01/01/36 | | | | | | | | | 400 | | | | 344,904 | |
1.500% | | 04/01/36 | | | | | | | | | 831 | | | | 717,280 | |
1.500% | | 06/01/36 | | | | | | | | | 880 | | | | 758,903 | |
1.500% | | 11/01/36 | | | | | | | | | 1,414 | | | | 1,220,050 | |
| | | | | | | | | | | | | | | | |
| | | | | Principal | | | | |
| Interest | | Maturity | | | | Amount | | | | |
Rate | | Date | | | | (000)# | | | Value | |
|
| U.S. GOVERNMENT AGENCY OBLIGATIONS(continued) | |
1.500% | | 02/01/42 | | | | | | | | | 419 | | | $ | 330,912 | |
1.500% | | 11/01/50 | | | | | | | | | 2,930 | | | | 2,168,671 | |
1.500% | | 12/01/50 | | | | | | | | | 3,091 | | | | 2,289,841 | |
1.500% | | 01/01/51 | | | | | | | | | 922 | | | | 682,312 | |
1.500% | | 07/01/51 | | | | | | | | | 739 | | | | 547,299 | |
2.000% | | 03/01/31 | | | | | | | | | 659 | | | | 619,188 | |
2.000% | | 08/01/31 | | | | | | | | | 244 | | | | 227,718 | |
2.000% | | 01/01/32 | | | | | | | | | 1,365 | | | | 1,272,403 | |
2.000% | | 05/01/36 | | | | | | | | | 402 | | | | 356,222 | |
2.000% | | 12/01/36 | | | | | | | | | 1,336 | | | | 1,181,865 | |
2.000% | | 02/01/37 | | | | | | | | | 1,722 | | | | 1,522,924 | |
2.000% | | 02/01/41 | | | | | | | | | 1,323 | | | | 1,104,834 | |
2.000% | | 05/01/41(k) | | | | | | | | | 2,953 | | | | 2,466,284 | |
2.000% | | 10/01/50 | | | | | | | | | 5,959 | | | | 4,681,155 | |
2.000% | | 11/01/50 | | | | | | | | | 1,387 | | | | 1,089,817 | |
2.000% | | 01/01/51 | | | | | | | | | 1,161 | | | | 906,321 | |
2.000% | | 02/01/51 | | | | | | | | | 56 | | | | 43,626 | |
2.000% | | 03/01/51 | | | | | | | | | 6,215 | | | | 4,874,819 | |
2.000% | | 04/01/51 | | | | | | | | | 2,385 | | | | 1,870,743 | |
2.000% | | 05/01/51 | | | | | | | | | 18,550 | | | | 14,545,243 | |
2.000% | | 07/01/51 | | | | | | | | | 456 | | | | 357,381 | |
2.500% | | TBA | | | | | | | | | 2,500 | | | | 2,035,938 | |
2.500% | | 07/01/32 | | | | | | | | | 592 | | | | 555,639 | |
2.500% | | 08/01/32 | | | | | | | | | 657 | | | | 618,108 | |
2.500% | | 09/01/32 | | | | | | | | | 629 | | | | 591,524 | |
2.500% | | 01/01/35 | | | | | | | | | 4,014 | | | | 3,685,829 | |
2.500% | | 07/01/35 | | | | | | | | | 2,235 | | | | 2,099,594 | |
2.500% | | 10/01/37 | | | | | | | | | 473 | | | | 432,814 | |
2.500% | | 10/01/43 | | | | | | | | | 283 | | | | 240,754 | |
2.500% | | 12/01/46 | | | | | | | | | 605 | | | | 505,056 | |
2.500% | | 03/01/50 | | | | | | | | | 606 | | | | 500,235 | |
2.500% | | 08/01/50 | | | | | | | | | 2,125 | | | | 1,752,131 | |
2.500% | | 02/01/51 | | | | | | | | | 1,188 | | | | 977,008 | |
2.500% | | 02/01/51 | | | | | | | | | 1,447 | | | | 1,188,829 | |
2.500% | | 03/01/51 | | | | | | | | | 1,397 | | | | 1,144,712 | |
2.500% | | 04/01/51 | | | | | | | | | 2,456 | | | | 2,019,178 | |
2.500% | | 08/01/51 | | | | | | | | | 830 | | | | 679,802 | |
2.500% | | 09/01/51 | | | | | | | | | 877 | | | | 722,050 | |
2.500% | | 12/01/51 | | | | | | | | | 3,379 | | | | 2,787,953 | |
2.500% | | 02/01/52 | | | | | | | | | 411 | | | | 339,040 | |
2.500% | | 05/01/52 | | | | | | | | | 1,219 | | | | 1,006,926 | |
3.000% | | 02/01/27 | | | | | | | | | 167 | | | | 164,282 | |
3.000% | | 08/01/30 | | | | | | | | | 281 | | | | 271,032 | |
3.000% | | 05/01/35 | | | | | | | | | 2,379 | | | | 2,225,685 | |
3.000% | | 07/01/36 | | | | | | | | | 1,460 | | | | 1,365,893 | |
3.000% | | 11/01/36 | | | | | | | | | 494 | | | | 456,114 | |
3.000% | | 12/01/42 | | | | | | | | | 426 | | | | 376,056 | |
3.000% | | 03/01/43 | | | | | | | | | 98 | | | | 86,636 | |
3.000% | | 11/01/46 | | | | | | | | | 351 | | | | 303,850 | |
3.000% | | 01/01/47 | | | | | | | | | 524 | | | | 454,297 | |
3.000% | | 02/01/47 | | | | | | | | | 561 | | | | 487,236 | |
3.000% | | 03/01/47 | | | | | | | | | 294 | | | | 255,009 | |
3.000% | | 06/01/49 | | | | | | | | | 12 | | | | 10,348 | |
3.000% | | 12/01/49 | | | | | | | | | 1,099 | | | | 944,704 | |
3.000% | | 01/01/50 | | | | | | | | | 427 | | | | 363,646 | |
3.000% | | 02/01/50 | | | | | | | | | 436 | | | | 371,042 | |
3.000% | | 02/01/50 | | | | | | | | | 2,268 | | | | 1,954,365 | |
3.000% | | 03/01/50 | | | | | | | | | 230 | | | | 197,992 | |
SEE NOTES TO FINANCIAL STATEMENTS.
A48
| | | | |
| | PSF PGIM 50/50 BALANCED PORTFOLIO (CONTINUED) | | |
SCHEDULE OF INVESTMENTS | | | | as of December 31, 2024 |
| | | | | | | | | | | | | | |
| | | | | Principal | | | | |
| Interest | | Maturity | | | | Amount | | | | |
Rate | | Date | | | | (000)# | | | Value | |
|
U.S. GOVERNMENT AGENCY OBLIGATIONS(continued) | |
3.000% | | 04/01/51 | | | | | | | 115 | | | $ | 97,534 | |
3.000% | | 05/01/51 | | | | | | | 1,991 | | | | 1,699,370 | |
3.000% | | 11/01/51 | | | | | | | 97 | | | | 82,886 | |
3.000% | | 12/01/51 | | | | | | | 3,988 | | | | 3,436,025 | |
3.000% | | 03/01/52 | | | | | | | 816 | | | | 698,237 | |
3.000% | | 04/01/52 | | | | | | | 436 | | | | 371,598 | |
3.000% | | 04/01/52 | | | | | | | 836 | | | | 717,982 | |
3.000% | | 04/01/52 | | | | | | | 1,309 | | | | 1,114,416 | |
3.000% | | 05/01/52 | | | | | | | 1,901 | | | | 1,618,990 | |
3.500% | | 07/01/31 | | | | | | | 190 | | | | 185,309 | |
3.500% | | 02/01/33 | | | | | | | 558 | | | | 540,084 | |
3.500% | | 06/01/39 | | | | | | | 205 | | | | 187,959 | |
3.500% | | 01/01/42 | | | | | | | 1,205 | | | | 1,098,031 | |
3.500% | | 05/01/42 | | | | | | | 643 | | | | 586,148 | |
3.500% | | 07/01/42 | | | | | | | 356 | | | | 324,225 | |
3.500% | | 08/01/42 | | | | | | | 133 | | | | 121,472 | |
3.500% | | 08/01/42 | | | | | | | 301 | | | | 273,911 | |
3.500% | | 09/01/42 | | | | | | | 195 | | | | 177,352 | |
3.500% | | 09/01/42 | | | | | | | 682 | | | | 621,300 | |
3.500% | | 11/01/42 | | | | | | | 92 | | | | 83,933 | |
3.500% | | 03/01/43 | | | | | | | 1,013 | | | | 921,937 | |
3.500% | | 04/01/43 | | | | | | | 206 | | | | 187,350 | |
3.500% | | 04/01/43 | | | | | | | 280 | | | | 254,801 | |
3.500% | | 01/01/46 | | | | | | | 546 | | | | 490,137 | |
3.500% | | 07/01/46 | | | | | | | 355 | | | | 318,897 | |
3.500% | | 11/01/46 | | | | | | | 415 | | | | 372,761 | |
3.500% | | 09/01/47 | | | | | | | 225 | | | | 202,161 | |
3.500% | | 01/01/48 | | | | | | | 1,920 | | | | 1,723,364 | |
3.500% | | 05/01/48 | | | | | | | 381 | | | | 342,184 | |
3.500% | | 06/01/48 | | | | | | | 388 | | | | 347,833 | |
3.500% | | 07/01/48 | | | | | | | 228 | | | | 204,871 | |
3.500% | | 03/01/49 | | | | | | | 4,515 | | | | 4,052,235 | |
3.500% | | 05/01/49 | | | | | | | 326 | | | | 291,464 | |
3.500% | | 06/01/49 | | | | | | | 190 | | | | 170,215 | |
3.500% | | 02/01/52 | | | | | | | 2,370 | | | | 2,112,698 | |
3.500% | | 03/01/52 | | | | | | | 817 | | | | 730,852 | |
4.000% | | 10/01/41 | | | | | | | 797 | | | | 752,441 | |
4.000% | | 09/01/44 | | | | | | | 555 | | | | 517,751 | |
4.000% | | 10/01/46 | | | | | | | 197 | | | | 181,485 | |
4.000% | | 02/01/47 | | | | | | | 97 | | | | 90,173 | |
4.000% | | 09/01/47 | | | | | | | 351 | | | | 325,467 | |
4.000% | | 11/01/47 | | | | | | | 241 | | | | 224,078 | |
4.000% | | 11/01/47 | | | | | | | 517 | | | | 481,598 | |
4.000% | | 03/01/49 | | | | | | | 2,240 | | | | 2,076,008 | |
4.000% | | 04/01/52 | | | | | | | 400 | | | | 365,894 | |
4.000% | | 06/01/52 | | | | | | | 4,688 | | | | 4,295,262 | |
4.000% | | 07/01/52 | | | | | | | 1,865 | | | | 1,712,223 | |
4.000% | | 10/01/52 | | | | | | | 866 | | | | 793,562 | |
4.000% | | 12/01/52 | | | | | | | 4,803 | | | | 4,395,190 | |
4.500% | | 07/01/33 | | | | | | | 16 | | | | 15,299 | |
4.500% | | 08/01/33 | | | | | | | 15 | | | | 15,240 | |
4.500% | | 09/01/33 | | | | | | | 38 | | | | 36,807 | |
4.500% | | 10/01/33 | | | | | | | 2 | | | | 2,060 | |
4.500% | | 10/01/33 | | | | | | | 14 | | | | 13,912 | |
4.500% | | 10/01/33 | | | | | | | 40 | | | | 38,474 | |
4.500% | | 01/01/35 | | | | | | | 1 | | | | 498 | |
4.500% | | 07/01/39 | | | | | | | 301 | | | | 292,207 | |
4.500% | | 08/01/39 | | | | | | | 412 | | | | 399,253 | |
| | | | | | | | | | | | | | |
| | | | | Principal | | | | |
| Interest | | Maturity | | | | Amount | | | | |
Rate | | Date | | | | (000)# | | | Value | |
|
U.S. GOVERNMENT AGENCY OBLIGATIONS(continued) | |
4.500% | | 03/01/41 | | | | | | | 141 | | | $ | 136,488 | |
4.500% | | 11/01/47 | | | | | | | 819 | | | | 780,808 | |
4.500% | | 01/01/49 | | | | | | | 121 | | | | 114,960 | |
4.500% | | 06/01/52 | | | | | | | 1,425 | | | | 1,342,425 | |
4.500% | | 09/01/52 | | | | | | | 2,659 | | | | 2,506,003 | |
4.500% | | 01/01/53 | | | | | | | 2,461 | | | | 2,316,533 | |
4.500% | | 04/01/53 | | | | | | | 2,972 | | | | 2,797,899 | |
5.000% | | TBA | | | | | | | 7,500 | | | | 7,238,059 | |
5.000% | | 03/01/34 | | | | | | | 78 | | | | 77,784 | |
5.000% | | 06/01/35 | | | | | | | 28 | | | | 28,133 | |
5.000% | | 07/01/35 | | | | | | | 41 | | | | 40,520 | |
5.000% | | 09/01/35 | | | | | | | 38 | | | | 37,658 | |
5.000% | | 11/01/35 | | | | | | | 42 | | | | 42,034 | |
5.000% | | 02/01/36 | | | | | | | 36 | | | | 35,825 | |
5.000% | | 05/01/36 | | | | | | | 18 | | | | 18,002 | |
5.000% | | 06/01/49 | | | | | | | 418 | | | | 410,841 | |
5.000% | | 06/01/52 | | | | | | | 421 | | | | 408,109 | |
5.000% | | 09/01/52 | | | | | | | 418 | | | | 404,455 | |
5.000% | | 10/01/52 | | | | | | | 936 | | | | 906,479 | |
5.000% | | 02/01/53 | | | | | | | 3,241 | | | | 3,137,178 | |
5.500% | | TBA | | | | | | | 16,500 | | | | 16,281,351 | |
5.500% | | 09/01/33 | | | | | | | 43 | | | | 42,855 | |
5.500% | | 10/01/33 | | | | | | | 35 | | | | 35,530 | |
5.500% | | 12/01/33 | | | | | | | 18 | | | | 18,548 | |
5.500% | | 01/01/34 | | | | | | | —(r | ) | | | 408 | |
5.500% | | 12/01/34 | | | | | | | 64 | | | | 64,907 | |
5.500% | | 10/01/35 | | | | | | | 116 | | | | 116,163 | |
5.500% | | 03/01/36 | | | | | | | 39 | | | | 39,778 | |
5.500% | | 05/01/36 | | | | | | | 78 | | | | 78,433 | |
5.500% | | 04/01/37 | | | | | | | 33 | | | | 33,375 | |
5.500% | | 04/01/53 | | | | | | | 934 | | | | 922,239 | |
5.500% | | 11/01/53 | | | | | | | 2,430 | | | | 2,400,657 | |
5.500% | | 12/01/53 | | | | | | | 961 | | | | 949,409 | |
6.000% | | TBA | | | | | | | 1,000 | | | | 1,004,609 | |
6.000% | | 04/01/33 | | | | | | | 2 | | | | 2,118 | |
6.000% | | 06/01/33 | | | | | | | 2 | | | | 2,368 | |
6.000% | | 10/01/33 | | | | | | | 110 | | | | 111,305 | |
6.000% | | 11/01/33 | | | | | | | 2 | | | | 1,512 | |
6.000% | | 11/01/33 | | | | | | | 3 | | | | 3,465 | |
6.000% | | 11/01/33 | | | | | | | 34 | | | | 34,630 | |
6.000% | | 01/01/34 | | | | | | | 155 | | | | 159,705 | |
6.000% | | 02/01/34 | | | | | | | 23 | | | | 23,651 | |
6.000% | | 03/01/34 | | | | | | | 13 | | | | 13,646 | |
6.000% | | 07/01/34 | | | | | | | 81 | | | | 82,633 | |
6.000% | | 08/01/34 | | | | | | | —(r | ) | | | 447 | |
6.000% | | 10/01/34 | | | | | | | 2 | | | | 1,701 | |
6.000% | | 11/01/34 | | | | | | | 2 | | | | 1,945 | |
6.000% | | 11/01/34 | | | | | | | 6 | | | | 6,172 | |
6.000% | | 01/01/35 | | | | | | | 40 | | | | 40,843 | |
6.000% | | 01/01/35 | | | | | | | 52 | | | | 52,539 | |
6.000% | | 02/01/35 | | | | | | | 82 | | | | 84,181 | |
6.000% | | 03/01/35 | | | | | | | 1 | | | | 648 | |
6.000% | | 04/01/35 | | | | | | | —(r | ) | | | 316 | |
6.000% | | 07/01/36 | | | | | | | 13 | | | | 13,388 | |
6.000% | | 02/01/37 | | | | | | | 29 | | | | 29,776 | |
6.000% | | 05/01/37 | | | | | | | 10 | | | | 10,462 | |
6.000% | | 06/01/37 | | | | | | | —(r | ) | | | 218 | |
6.000% | | 08/01/37 | | | | | | | 5 | | | | 5,136 | |
SEE NOTES TO FINANCIAL STATEMENTS.
A49
| | | | |
| | PSF PGIM 50/50 BALANCED PORTFOLIO (CONTINUED) | | |
SCHEDULE OF INVESTMENTS | | | | as of December 31, 2024 |
| | | | | | | | | | | | | | | | |
Interest Rate | | Maturity
Date | | | | | Principal Amount (000)# | | | Value | |
|
U.S. GOVERNMENT AGENCY OBLIGATIONS(continued) | |
6.000% | | | 09/01/37 | | | | | | | | —(r | ) | | $ | 183 | |
6.000% | | | 10/01/37 | | | | | | | | 17 | | | | 17,914 | |
6.000% | | | 05/01/38 | | | | | | | | 24 | | | | 25,012 | |
6.000% | | | 01/01/53 | | | | | | | | 3,419 | | | | 3,437,610 | |
6.000% | | | 09/01/53 | | | | | | | | 1,327 | | | | 1,333,640 | |
6.500% | | | 07/01/32 | | | | | | | | 21 | | | | 20,933 | |
6.500% | | | 09/01/32 | | | | | | | | 1 | | | | 1,032 | |
6.500% | | | 09/01/32 | | | | | | | | 11 | | | | 11,664 | |
6.500% | | | 09/01/32 | | | | | | | | 28 | | | | 29,027 | |
6.500% | | | 09/01/32 | | | | | | | | 32 | | | | 32,330 | |
6.500% | | | 04/01/33 | | | | | | | | 29 | | | | 29,925 | |
6.500% | | | 11/01/33 | | | | | | | | 16 | | | | 16,159 | |
6.500% | | | 01/01/34 | | | | | | | | 7 | | | | 7,155 | |
6.500% | | | 09/01/34 | | | | | | | | 28 | | | | 28,859 | |
6.500% | | | 09/01/36 | | | | | | | | 32 | | | | 33,893 | |
6.500% | | | 10/01/36 | | | | | | | | 10 | | | | 10,222 | |
6.500% | | | 01/01/37 | | | | | | | | 32 | | | | 32,762 | |
6.500% | | | 01/01/37 | | | | | | | | 40 | | | | 41,235 | |
6.625% | | | 11/15/30 | | | | | | | | 995 | | | | 1,103,530 | |
7.000% | | | 02/01/32 | | | | | | | | 5 | | | | 5,456 | |
7.000% | | | 05/01/32 | | | | | | | | 6 | | | | 6,123 | |
7.000% | | | 06/01/32 | | | | | | | | 8 | | | | 7,821 | |
7.000% | | | 07/01/32 | | | | | | | | 12 | | | | 12,000 | |
7.125% | | | 01/15/30 | (k) | | | | | | | 3,195 | | | | 3,579,928 | |
Government National Mortgage Assoc. | |
2.000% | | | 10/20/50 | | | | | | | | 4,367 | | | | 3,496,228 | |
2.000% | | | 01/20/51 | | | | | | | | 2,339 | | | | 1,872,767 | |
2.000% | | | 03/20/51 | | | | | | | | 656 | | | | 525,709 | |
2.000% | | | 07/20/51 | | | | | | | | 919 | | | | 735,302 | |
2.000% | | | 10/20/51 | | | | | | | | 582 | | | | 466,140 | |
2.000% | | | 11/20/51 | | | | | | | | 464 | | | | 371,097 | |
2.500% | | | 03/20/43 | | | | | | | | 109 | | | | 92,848 | |
2.500% | | | 12/20/46 | | | | | | | | 196 | | | | 166,442 | |
2.500% | | | 08/20/50 | | | | | | | | 59 | | | | 49,232 | |
2.500% | | | 09/20/50 | | | | | | | | 437 | | | | 366,332 | |
2.500% | | | 10/20/50 | | | | | | | | 2,005 | | | | 1,680,539 | |
2.500% | | | 11/20/50 | | | | | | | | 1,528 | | | | 1,280,147 | |
2.500% | | | 02/20/51 | | | | | | | | 1,847 | | | | 1,543,461 | |
2.500% | | | 03/20/51 | | | | | | | | 1,026 | | | | 857,100 | |
2.500% | | | 05/20/51 | | | | | | | | 1,918 | | | | 1,604,578 | |
2.500% | | | 07/20/51 | | | | | | | | 2,347 | | | | 1,961,626 | |
2.500% | | | 08/20/51 | | | | | | | | 3,503 | | | | 2,927,365 | |
3.000% | | | 12/20/44 | | | | | | | | 73 | | | | 64,211 | |
3.000% | | | 03/15/45 | | | | | | | | 210 | | | | 183,438 | |
3.000% | | | 11/20/45 | | | | | | | | 225 | | | | 198,620 | |
3.000% | | | 03/20/46 | | | | | | | | 456 | | | | 402,285 | |
3.000% | | | 07/20/46 | | | | | | | | 1,158 | | | | 1,019,978 | |
3.000% | | | 08/20/46 | | | | | | | | 309 | | | | 272,402 | |
3.000% | | | 10/20/46 | | | | | | | | 2,219 | | | | 1,948,676 | |
3.000% | | | 04/20/47 | | | | | | | | 383 | | | | 336,482 | |
3.000% | | | 12/20/49 | | | | | | | | 129 | | | | 112,362 | |
3.000% | | | 01/20/50 | | | | | | | | 762 | | | | 664,050 | |
3.000% | | | 06/20/51 | | | | | | | | 560 | | | | 486,175 | |
3.000% | | | 10/20/51 | | | | | | | | 1,170 | | | | 1,015,990 | |
3.000% | | | 11/20/51 | | | | | | | | 410 | | | | 355,701 | |
3.000% | | | 12/20/51 | | | | | | | | 2,315 | | | | 2,009,556 | |
3.500% | | | 12/20/42 | | | | | | | | 440 | | | | 402,140 | |
3.500% | | | 05/20/43 | | | | | | | | 135 | | | | 123,217 | |
| | | | | | | | | | | | | | | | | | |
Interest Rate | | Maturity
Date | | | | | Principal
Amount
(000)# | | | Value | |
|
U.S. GOVERNMENT AGENCY OBLIGATIONS(continued) | |
3.500% | | | 04/20/45 | | | | | | | | | | 388 | | | $ | 352,369 | |
3.500% | | | 07/20/46 | | | | | | | | | | 1,399 | | | | 1,266,347 | |
3.500% | | | 07/20/48 | | | | | | | | | | 1,059 | | | | 956,648 | |
3.500% | | | 11/20/48 | | | | | | | | | | 354 | | | | 319,316 | |
3.500% | | | 06/20/49 | | | | | | | | | | 5,201 | | | | 4,681,298 | |
3.500% | | | 02/20/52 | | | | | | | | | | 5,529 | | | | 4,945,200 | |
3.500% | | | 05/20/52 | | | | | | | | | | 991 | | | | 886,307 | |
4.000% | | | 06/15/40 | | | | | | | | | | 26 | | | | 24,508 | |
4.000% | | | 05/20/41 | | | | | | | | | | 22 | | | | 20,807 | |
4.000% | | | 12/20/42 | | | | | | | | | | 252 | | | | 238,479 | |
4.000% | | | 08/20/44 | | | | | | | | | | 90 | | | | 84,568 | |
4.000% | | | 11/20/45 | | | | | | | | | | 173 | | | | 162,076 | |
4.000% | | | 12/20/45 | | | | | | | | | | 477 | | | | 447,775 | |
4.000% | | | 09/20/47 | | | | | | | | | | 1,280 | | | | 1,195,937 | |
4.000% | | | 04/20/48 | | | | | | | | | | 448 | | | | 417,196 | |
4.000% | | | 02/20/49 | | | | | | | | | | 452 | | | | 421,432 | |
4.000% | | | 04/20/49 | | | | | | | | | | 2,750 | | | | 2,562,048 | |
4.000% | | | 01/20/50 | | | | | | | | | | 488 | | | | 454,337 | |
4.000% | | | 02/20/50 | | | | | | | | | | 458 | | | | 425,701 | |
4.000% | | | 07/20/50 | | | | | | | | | | 686 | | | | 637,756 | |
4.000% | | | 06/20/52 | | | | | | | | | | 900 | | | | 829,585 | |
4.500% | | | 04/15/40 | | | | | | | | | | 145 | | | | 140,232 | |
4.500% | | | 01/20/41 | | | | | | | | | | 169 | | | | 163,694 | |
4.500% | | | 02/20/41 | | | | | | | | | | 265 | | | | 257,327 | |
4.500% | | | 03/20/41 | | | | | | | | | | 131 | | | | 127,441 | |
4.500% | | | 06/20/44 | | | | | | | | | | 199 | | | | 191,994 | |
4.500% | | | 09/20/46 | | | | | | | | | | 159 | | | | 151,026 | |
4.500% | | | 11/20/46 | | | | | | | | | | 207 | | | | 199,451 | |
4.500% | | | 03/20/47 | | | | | | | | | | 110 | | | | 105,737 | |
4.500% | | | 05/20/48 | | | | | | | | | | 178 | | | | 170,412 | |
4.500% | | | 08/20/48 | | | | | | | | | | 315 | | | | 301,771 | |
5.000% | | | 10/20/37 | | | | | | | | | | 46 | | | | 45,490 | |
5.000% | | | 04/20/45 | | | | | | | | | | 222 | | | | 219,977 | |
5.500% | | | TBA | | | | | | | | | | 2,500 | | | | 2,479,332 | |
5.500% | | | 08/15/33 | | | | | | | | | | 96 | | | | 96,805 | |
5.500% | | | 08/15/33 | | | | | | | | | | 124 | | | | 127,952 | |
5.500% | | | 12/15/33 | | | | | | | | | | 6 | | | | 5,549 | |
5.500% | | | 03/15/34 | | | | | | | | | | 83 | | | | 84,276 | |
5.500% | | | 12/15/34 | | | | | | | | | | 128 | | | | 130,309 | |
5.500% | | | 07/15/35 | | | | | | | | | | 24 | | | | 24,194 | |
5.500% | | | 04/15/36 | | | | | | | | | | 19 | | | | 18,841 | |
5.500% | | | 12/20/52 | | | | | | | | | | 1,908 | | | | 1,897,061 | |
5.500% | | | 01/20/53 | | | | | | | | | | 4,138 | | | | 4,120,134 | |
6.000% | | | 04/15/33 | | | | | | | | | | 3 | | | | 3,553 | |
6.000% | | | 12/15/33 | | | | | | | | | | 53 | | | | 53,911 | |
6.000% | | | 01/15/34 | | | | | | | | | | 12 | | | | 11,854 | |
6.000% | | | 01/15/34 | | | | | | | | | | 15 | | | | 15,758 | |
6.000% | | | 01/15/34 | | | | | | | | | | 26 | | | | 26,970 | |
6.000% | | | 06/20/34 | | | | | | | | | | 42 | | | | 43,224 | |
6.000% | | | 07/15/34 | | | | | | | | | | 31 | | | | 32,341 | |
6.500% | | | 11/15/28 | | | | | | | | | | 1 | | | | 1,340 | |
6.500% | | | 08/15/31 | | | | | | | | | | 1 | | | | 886 | |
6.500% | | | 12/15/31 | | | | | | | | | | 4 | | | | 4,487 | |
6.500% | | | 02/15/32 | | | | | | | | | | 11 | | | | 11,606 | |
6.500% | | | 06/15/32 | | | | | | | | | | 8 | | | | 7,954 | |
6.500% | | | 07/15/32 | | | | | | | | | | 14 | | | | 14,369 | |
6.500% | | | 08/15/32 | | | | | | | | | | 2 | | | | 1,950 | |
6.500% | | | 08/15/32 | | | | | | | | | | 3 | | | | 2,630 | |
SEE NOTES TO FINANCIAL STATEMENTS.
A50
| | | | |
| | PSF PGIM 50/50 BALANCED PORTFOLIO (CONTINUED) | | |
SCHEDULE OF INVESTMENTS | | | | as of December 31, 2024 |
| | | | | | | | | | | | | | |
| | | | | Principal | | | | |
| Interest | | Maturity | | | | Amount | | | | |
Rate | | Date | | | | (000)# | | | Value | |
|
U.S. GOVERNMENT AGENCY OBLIGATIONS(continued) | |
6.500% | | 08/15/32 | | | | | | | 5 | | | $ | 5,301 | |
6.500% | | 08/15/32 | | | | | | | 14 | | | | 14,242 | |
6.500% | | 08/15/32 | | | | | | | 73 | | | | 74,938 | |
6.500% | | 08/15/34 | | | | | | | 16 | | | | 16,417 | |
6.500% | | 06/15/35 | | | | | | | 12 | | | | 12,517 | |
6.500% | | 09/15/36 | | | | | | | 14 | | | | 14,854 | |
Tennessee Valley Authority, Sr. Unsec’d. Notes | |
1.500% | | 09/15/31 | | | | | | | 145 | | | | 118,849 | |
7.125% | | 05/01/30 | | | | | | | 435 | | | | 487,854 | |
Tennessee Valley Authority Generic Strips, Bonds | |
4.724%(s) | | 07/15/34 | | | | | | | 90 | | | | 54,316 | |
| | | | | | | | | | | | | | |
TOTAL U.S. GOVERNMENT AGENCY OBLIGATIONS
(cost $328,628,277) | | | | 306,320,808 | |
| | | | | | | | | | | | | | |
|
U.S. TREASURY OBLIGATIONS — 1.4% | |
U.S. Treasury Bonds | |
1.625% | | 11/15/50 | | | | | | | 18,965 | | | | 9,903,286 | |
3.000% | | 08/15/52 | | | | | | | 315 | | | | 226,308 | |
4.750% | | 11/15/43(h) | | | | | | | 11,705 | | | | 11,564,174 | |
4.750% | | 11/15/53(h) | | | | | | | 11,605 | | | | 11,496,203 | |
U.S. Treasury Notes | |
4.250% | | 11/15/34 | | | | | | | 210 | | | | 204,652 | |
U.S. Treasury Strips Coupon | |
1.760%(s) | | 08/15/40 | | | | | | | 200 | | | | 90,953 | |
2.679%(s) | | 11/15/43 | | | | | | | 2,175 | | | | 838,989 | |
3.021%(s) | | 11/15/41 | | | | | | | 7,605 | | | | 3,231,531 | |
4.327%(s) | | 08/15/43 | | | | | | | 600 | | | | 234,422 | |
4.349%(s) | | 02/15/43 | | | | | | | 20 | | | | 7,976 | |
4.568%(s) | | 11/15/42 | | | | | | | 310 | | | | 125,114 | |
4.608%(s) | | 11/15/48 | | | | | | | 160 | | | | 48,450 | |
4.924%(s) | | 02/15/49 | | | | | | | 465 | | | | 138,610 | |
5.331%(s) | | 02/15/40 | | | | | | | 755 | | | | 352,874 | |
| | | | | | | | | | | | | | |
TOTAL U.S. TREASURY OBLIGATIONS
(cost $43,785,647) | | | | 38,463,542 | |
| | | | | | | | | | | | | | |
TOTAL LONG-TERM INVESTMENTS
(cost $1,381,400,148) | | | | 2,418,707,133 | |
| | | | | | | | | | | | | | |
| | | | | | | Shares | | | | |
SHORT-TERM INVESTMENTS — 12.6% | |
AFFILIATED MUTUAL FUNDS — 12.5% | |
PGIM Core Ultra Short Bond Fund(wb) | | | | | 297,490,301 | | | | 297,490,301 | |
PGIM Institutional Money Market Fund (7-day effective yield 4.649%) (cost $38,533,756; includes $38,382,490 of cash collateral for securities on
loan)(b)(wb) | | | 38,618,349 | | | | 38,595,179 | |
| | | | | | | | | | | | | | |
TOTAL AFFILIATED MUTUAL FUNDS
(cost $336,024,057) | | | | 336,085,480 | |
| | | | | | | | | | | | | | |
| | | | | Principal | | | | |
| Interest | | Maturity | | | | Amount | | | | |
Rate | | Date | | | | (000)# | | | | |
|
U.S. TREASURY OBLIGATION(k)(n) — 0.1% | |
U.S. Treasury Bills | |
4.216% | | 03/20/25 | | | | | | | 1,060 | | | | 1,050,529 | |
| | | | | | | | | | | | | | |
(cost $1,050,423) | | | | | | | | | | | | |
| | | | | | | | | | | | | | |
| | | | | | | | | | | |
| | | | | | | | | | Value | |
OPTIONS PURCHASED*~ — 0.0%
(cost $22,969) | | | $ | 14,603 | |
| | | | | | | | | | | | | | |
TOTAL SHORT-TERM INVESTMENTS
(cost $337,097,449) | | | | 337,150,612 | |
| | | | | | | | | | | | | | |
TOTAL INVESTMENTS, BEFORE OPTION WRITTEN—102.7%
(cost $1,718,497,597) | | | | 2,755,857,745 | |
| | | | | | | | | | | | | | |
| |
OPTION WRITTEN*~ — (0.0)% (premiums received $21,345) | | | | (29,160 | ) |
| | | | | | | | | | | | | | |
TOTAL INVESTMENTS, NET OF OPTION
WRITTEN—102.7%
(cost $1,718,476,252) | | | | 2,755,828,585 | |
Liabilities in excess of other assets(z) — (2.7)% | | | | (73,265,566 | ) |
| | | | | | | | | | | | | | |
| | |
NET ASSETS — 100.0% | | | | | | $ | 2,682,563,019 | |
| | | | | | | | | | | | | | |
See the Glossary for a list of the abbreviation(s) used in the annual report.
| | * | Non-income producing security. |
| | # | Principal or notional amount is shown in U.S. dollars unless otherwise stated. |
| | ~ | See tables subsequent to the Schedule of Investments for options detail. Options with maturity dates greater than one year from date of acquisition would be considered long-term investments. |
| | ^ | Indicates a Level 3 instrument. The aggregate value of Level 3 instruments is $469,564 and 0.0% of net assets. |
| | (a) | All or a portion of security is on loan. The aggregate market value of such securities, including those sold and pending settlement, is $37,627,175; cash collateral of $38,382,490 (included in liabilities) was received with which the Portfolio purchased highly liquid short-term investments. In the event of significant appreciation in value of securities on loan on the last business day of the reporting period, the Portfolio may reflect a collateral value that is less than the market value of the loaned securities and such shortfall is remedied the following business day. |
| | (b) | Represents security, or portion thereof, purchased with cash collateral received for securities on loan and includes dividend reinvestment. |
| | (c) | Variable rate instrument. The interest rate shown reflects the rate in effect at December 31, 2024. |
| | (cc) | Variable rate instrument. The rate shown is based on the latest available information as of December 31, 2024. Certain variable rate securities are not based on a published reference rate and spread but are determined by the issuer or agent and are based on current market conditions. These securities do not indicate a reference rate and spread in their description. |
| | (ff) | Variable rate security. Security may be issued at a fixed coupon rate, which converts to a variable rate at a specified date. Rate shown is the rate in effect as of period end. |
| | (h) | Represents security, or a portion thereof, segregated as collateral for OTC derivatives. |
| | (k) | Represents security, or a portion thereof, segregated as collateral for centrally cleared/exchange-traded derivatives. |
| | (n) | Rate shown reflects yield to maturity at purchased date. |
| | (oo) | Perpetual security. Maturity date represents next call date. |
| | (r) | Principal or notional amount is less than $500 par. |
| | (s) | Represents zero coupon bond or principal only security. Rate represents yield to maturity at purchase date. |
SEE NOTES TO FINANCIAL STATEMENTS.
A51
| | | | |
| | PSF PGIM 50/50 BALANCED PORTFOLIO (CONTINUED) | | |
SCHEDULE OF INVESTMENTS | | | | as of December 31, 2024 |
| (wb) | Represents an investment in a Fund affiliated with the Manager. |
| (z) | Includes net unrealized appreciation/(depreciation) and/or market value of the below holdings which are excluded from the Schedule of Investments: |
Forward Commitment Contracts:
| | | | | | | | | | | | | | | | | | | | |
U.S. Government Agency Obligations | | Interest
Rate | | | Maturity
Date | | | Settlement
Date | | | Principal
Amount
(000)# | | | Value | |
Federal National Mortgage Assoc. | | | 2.000% | | | | TBA | | | | 01/14/25 | | | | $(1,000 | ) | | $ | (777,891 | ) |
Federal National Mortgage Assoc. | | | 3.000% | | | | TBA | | | | 01/14/25 | | | | (7,500 | ) | | | (6,369,141 | ) |
Federal National Mortgage Assoc. | | | 4.000% | | | | TBA | | | | 01/14/25 | | | | (8,000 | ) | | | (7,315,027 | ) |
Government National Mortgage Assoc. | | | 3.000% | | | | TBA | | | | 01/21/25 | | | | (4,500 | ) | | | (3,901,641 | ) |
| | | | | | | | | | | | | | | | | | | | |
TOTAL FORWARD COMMITMENT CONTRACTS
(proceeds receivable $18,648,457) | | | | | | | | | | | | | | | | | | $ | (18,363,700 | ) |
| | | | | | | | | | | | | | | | | | | | |
Option Purchased:
Exchange Traded
| | | | | | | | | | | | | | | | | | | | | | | | |
Description | | Call/
Put | | | Expiration
Date | | | Strike | | | Contracts | | | Notional
Amount
(000)# | | | Value | |
3 Month SOFR | | | Call | | | | 12/12/25 | | | $ | 98.00 | | | | 7 | | | | 18 | | | $ | 963 | |
| | | | | | | | | | | | | | | | | | | | | | | | |
(cost $887) | | | | | | | | | | | | | | | | | | | | | | | | |
OTC Traded
| | | | | | | | | | | | | | | | | | | | | | | | | | | | | | | | |
Description | | Call/
Put | | | Counterparty | | | Expiration
Date | | | Strike | | | Contracts | | | Notional
Amount
(000)# | | | Value | |
2-Year 10 CMS Curve CAP | | | Call | | | | JPM | | | | 01/02/25 | | | | 0.19 | % | | | — | | | | 15,110 | | | $ | — | |
2-Year 10 CMS Curve CAP | | | Call | | | | JPM | | | | 01/21/25 | | | | 0.13 | % | | | — | | | | 10,070 | | | | 1,194 | |
| | | | | | | | | | | | | | | | | | | | | | | | | | | | | | | | |
| | | | | | | | |
Total OTC Traded (cost $22,082) | | | | | | | | | | | | | | | | | | | | | | | | | | | | | | $ | 1,194 | |
| | | | | | | | | | | | | | | | | | | | | | | | | | | | | | | | |
OTC Swaptions
| | | | | | | | | | | | | | | | | | | | | | | | | | |
Description | | Call/
Put | | | Counterparty | | Expiration
Date | | | Strike | | | Receive | | Pay | | Notional
Amount
(000)# | | | Value | |
2-Year Interest
Rate Swap,
01/08/27 | | | Call | | | CITI | | | 01/06/25 | | | | 2.83% | | | 2.83%(A) | | 1 Day SOFR(A)/4.490% | | | 2,160 | | | $ | — | |
2-Year Interest
Rate Swap,
02/07/27 | | | Call | | | CITI | | | 02/05/25 | | | | 3.65% | | | 3.65%(A) | | 1 Day SOFR(A)/4.490% | | | 2,160 | | | | 842 | |
2-Year Interest
Rate Swap,
03/10/27 | | | Call | | | CITI | | | 03/06/25 | | | | 3.55% | | | 3.55%(A) | | 1 Day SOFR(A)/4.490% | | | 2,160 | | | | 1,518 | |
7-Year Interest
Rate Swap,
02/18/32 | | | Put | | | JPM | | | 02/13/25 | | | | 4.24% | | | 1 Day SOFR(A)/4.490% | | 4.24%(A) | | | 855 | | | | 3,362 | |
10-Year Interest
Rate Swap,
03/19/35 | | | Put | | | JPM | | | 03/17/25 | | | | 4.19% | | | 1 Day SOFR(A)/4.490% | | 4.19%(A) | | | 640 | | | | 6,724 | |
| | | | | | | | | | | | | | | | | | | | | | | | | | |
Total OTC Swaptions (cost $0) | | | | | | | | | | | | | | | | | | $ | 12,446 | |
| | | | | | | | | | | | | | | | | | | | | | | | | | |
Total Options Purchased (cost $22,969) | | | | | | | | | | | | | | | | | | $ | 14,603 | |
| | | | | | | | | | | | | | | | | | | | | | | | | | |
SEE NOTES TO FINANCIAL STATEMENTS.
A52
| | | | |
| | PSF PGIM 50/50 BALANCED PORTFOLIO (CONTINUED) | | |
SCHEDULE OF INVESTMENTS | | | | as of December 31, 2024 |
Option Written:
Exchange Traded
| | | | | | | | | | | | | | | | | | | | | | | | |
Description | | Call/
Put | | | Expiration
Date | | | Strike | | | Contracts | | | Notional
Amount
(000)# | | | Value | |
3 Month SOFR | | | Call | | | | 12/12/25 | | | | $96.50 | | | | 7 | | | | 18 | | | $ | (4,156 | ) |
3 Month SOFR | | | Put | | | | 12/12/25 | | | | $96.50 | | | | 7 | | | | 18 | | | | (11,725 | ) |
| | | | | | | | | | | | | | | | | | | | | | | | |
Total Exchange Traded (premiums received $15,503) | | | | | | | | | | | | | | | | | | | | | | $ | (15,881 | ) |
| | | | | | | | | | | | | | | | | | | | | | | | |
OTC Traded
| | | | | | | | | | | | | | | | | | | | | | | | | | | | | | | | | | | |
| | | | | | | | | | | | | Notional | | |
| | | Call/ | | | | Expiration | | | | | | Amount | | |
Description | | Put | | Counterparty | | Date | | Strike | | Contracts | | (000)# | | Value |
2-Year 10 CMS Curve CAP | | | | Call | | | | | JPM | | | | | 01/02/25 | | | | | 0.49 | % | | | | — | | | | | 15,110 | | | | | $— | |
2-Year 10 CMS Curve CAP | | | | Call | | | | | JPM | | | | | 01/21/25 | | | | | 0.43 | % | | | | — | | | | | 10,070 | | | | | (4 | ) |
| | | | | | | | | | | | | | | | | | | | | | | | | | | | | | | | | | | |
Total OTC Traded (premiums received $5,842) | | | | | | | | | | | | | | | | | | | | | | | | | | | | | | | | | | $(4 | ) |
| | | | | | | | | | | | | | | | | | | | | | | | | | | | | | | | | | | |
OTC Swaptions
| | | | | | | | | | | | | | | | | | | | | | | | | | |
| | | | | | | | | | | | | | | | | | Notional | | | | |
| | | Call/ | | | | Expiration | | | | | | | | | | | Amount | | | | |
Description | | Put | | Counterparty | | Date | | | Strike | | Receive | | | Pay | | | (000)# | | | Value | |
2-Year Interest
Rate Swap,
01/08/27 | | Call | | CITI | | | 01/06/25 | | | 2.52% | | | 1 Day SOFR(A)/4.490% | | | | 2.52%(A) | | | | 4,320 | | | $ | — | |
2-Year Interest
Rate Swap,
02/07/27 | | Call | | CITI | | | 02/05/25 | | | 3.10% | | | 1 Day SOFR(A)/4.490% | | | | 3.10%(A) | | | | 4,320 | | | | (107 | ) |
2-Year Interest
Rate Swap,
03/10/27 | | Call | | CITI | | | 03/06/25 | | | 3.29% | | | 1 Day SOFR(A)/4.490% | | | | 3.29%(A) | | | | 4,320 | | | | (1,304 | ) |
2-Year Interest
Rate Swap,
02/07/27 | | Put | | CITI | | | 02/05/25 | | | 4.32% | | | 4.32%(A) | | | | 1 Day SOFR(A)/4.490% | | | | 2,160 | | | | (1,384 | ) |
2-Year Interest
Rate Swap,
02/07/27 | | Put | | CITI | | | 02/05/25 | | | 4.35% | | | 4.35%(A) | | | | 1 Day SOFR(A)/4.490% | | | | 2,160 | | | | (1,133 | ) |
7-Year Interest
Rate Swap,
02/18/32 | | Put | | JPM | | | 02/13/25 | | | 4.48% | | | 4.48%(A) | | | | 1 Day SOFR(A)/4.490% | | | | 1,710 | | | | (2,235 | ) |
10-Year Interest
Rate Swap,
03/19/35 | | Put | | JPM | | | 03/17/25 | | | 4.39% | | | 4.39%(A) | | | | 1 Day SOFR(A)/4.490% | | | | 1,280 | | | | (7,112 | ) |
| | | | | | | | | | | | | | | | | | | | | | | | | | |
Total OTC Swaptions (premiums received $0) | | | | | | | | | | | | | | $ | (13,275 | ) |
| | | | | | | | | | | | | | | | | | | | | | | | | | |
Total Options Written (premiums received $21,345) | | | | | | | | | | | | | | $ | (29,160 | ) |
| | | | | | | | | | | | | | | | | | | | | | | | | | |
Futures contracts outstanding at December 31, 2024:
| | | | | | | | | | | | |
Number
of
Contracts | | Type | | Expiration
Date | | Current
Notional
Amount | | | Value /
Unrealized
Appreciation
(Depreciation) | |
Long Positions: | | | | | | | | | | |
190 | | 2 Year U.S. Treasury Notes | | Mar. 2025 | | $ | 39,065,781 | | | $ | (17,376) | |
236 | | 5 Year U.S. Treasury Notes | | Mar. 2025 | | | 25,087,907 | | | | (152,778) | |
312 | | 10 Year U.S. Treasury Notes | | Mar. 2025 | | | 33,930,000 | | | | (361,653) | |
137 | | 10 Year U.S. Ultra Treasury Notes | | Mar. 2025 | | | 15,249,813 | | | | (261,180) | |
134 | | 20 Year U.S. Treasury Bonds | | Mar. 2025 | | | 15,255,063 | | | | (414,836) | |
92 | | 30 Year U.S. Ultra Treasury Bonds | | Mar. 2025 | | | 10,939,375 | | | | (486,106) | |
2 | | Mini MSCI EAFE Index | | Mar. 2025 | | | 226,750 | | | | (7,471) | |
SEE NOTES TO FINANCIAL STATEMENTS.
A53
| | | | |
| | PSF PGIM 50/50 BALANCED PORTFOLIO (CONTINUED) | | |
SCHEDULE OF INVESTMENTS | | | | as of December 31, 2024 |
Futures contracts outstanding at December 31, 2024 (continued):
| | | | | | | | | | | | | | |
Number
of
Contracts | | Type | | Expiration
Date | | Current
Notional
Amount | | Value /
Unrealized
Appreciation
(Depreciation) |
Long Positions (cont’d): | | | | | | | | | | | | |
49 | | S&P 500 E-Mini Index | | Mar. 2025 | | | $ | 14,542,588 | | | | $ | (472,913 | ) |
| | | | | | | | | | | | | | |
| | | | | | | | | | | | | (2,174,313 | ) |
| | | | | | | | | | | | | | |
| | | |
Short Position: | | | | | | | | | | | | |
15 | | 5 Year Euro-Bobl | | Mar. 2025 | | | | 1,831,279 | | | | | 24,102 | |
| | | | | | | | | | | | | | |
| | | | | | | | | | | | $ | (2,150,211 | ) |
| | | | | | | | | | | | | | |
Forward foreign currency exchange contracts outstanding at December 31, 2024:
| | | | | | | | | | | | | | | | | | | | | | | | | | | | | | | | | | | | | | | | |
Purchase Contracts | | Counterparty | | | | Notional
Amount
(000) | | Value at
Settlement
Date | | Current
Value | | Unrealized
Appreciation | | Unrealized
Depreciation |
OTC Forward Foreign Currency Exchange Contracts: | | | | | | | | | | | |
Euro, | | | | | | | | | | | | | | | | | | | | | | | | | | | | | | | | | | | | | | | | |
Expiring 01/10/25 | | | | HSBC | | | | | | | | | | EUR | | | | | 1,394 | | | | | $1,467,941 | | | | | $1,444,517 | | | | | $— | | | | | $(23,424 | ) |
| | | | | | | | | | | | | | | | | | | | | | | | | | | | | | | | | | | | | | | | |
| | | | | | | | | | | | | | | | | | | | | | | | | | | | | | | | | | | | | | | | |
Sale Contracts | | Counterparty | | | | Notional
Amount
(000) | | Value at
Settlement
Date | | Current
Value | | Unrealized
Appreciation | | Unrealized
Depreciation |
OTC Forward Foreign Currency Exchange Contracts: | | | | | | | | | | | |
British Pound, | | | | | | | | | | | | | | | | | | | | | | | | | | | | | | | | | | | | | | | | |
Expiring 01/10/25 | | | | MSI | | | | | | | | | | GBP | | | | | 4,755 | | | | $ | 5,954,370 | | | | $ | 5,952,843 | | | | | $ 1,527 | | | | | $ — | |
Euro, | | | | | | | | | | | | | | | | | | | | | | | | | | | | | | | | | | | | | | | | |
Expiring 01/10/25 | | | | SCB | | | | | | | | | | EUR | | | | | 41,621 | | | | | 43,436,633 | | | | | 43,130,154 | | | | | 306,479 | | | | | — | |
| | | | | | | | | | | | | | | | | | | | | | | | | | | | | | | | | | | | | | | | |
| | | | | | | | | | | | | | | | | | | | | | | | $49,391,003 | | | | | $49,082,997 | | | | | 308,006 | | | | | — | |
| | | | | | | | | | | | | | | | | | | | | | | | | | | | | | | | | | | | | | | | |
| | | | | | | | | | | | | | | | | | | | | | | | | | | | | | | | | | $308,006 | | | | | $(23,424 | ) |
| | | | | | | | | | | | | | | | | | | | | | | | | | | | | | | | | | | | | | | | |
Credit default swap agreements outstanding at December 31, 2024:
| | | | | | | | | | | | | | | | | | | | | | | | | | | | | | | | | | |
Reference Entity/ Obligation | | Termination
Date | | Fixed
Rate | | Notional
Amount
(000)#(3) | | Fair
Value | | Upfront
Premiums
Paid
(Received) | | Unrealized
Appreciation
(Depreciation) | | Counterparty |
OTC Credit Default Swap Agreements on corporate and/or sovereign issues - Buy Protection(1): |
Credit Suisse Group AG | | 06/20/26 | | | | 1.000%(Q) | | | | | | | | | | 2,000 | | | | $ | (20,638 | ) | | | $ | 48,887 | | | | $ | (69,525 | ) | | BARC |
Credit Suisse Group AG | | 06/20/26 | | | | 1.000%(Q) | | | | | | | | | | 2,000 | | | | | (20,638 | ) | | | | 47,685 | | | | | (68,323 | ) | | BARC |
Credit Suisse Group AG | | 06/20/26 | | | | 1.000%(Q) | | | | | | | | | | 2,000 | | | | | (20,638 | ) | | | | 53,641 | | | | | (74,279 | ) | | BARC |
U.S. Treasury Notes | | 06/20/25 | | | | 0.250%(Q) | | | | | EUR | | | | | 1,865 | | | | | (1,430 | ) | | | | (476 | ) | | | | (954 | ) | | BARC |
U.S. Treasury Notes | | 06/20/25 | | | | 0.250%(Q) | | | | | EUR | | | | | 620 | | | | | (475 | ) | | | | (157 | ) | | | | (318 | ) | | BARC |
| | | | | | | | | | | | | | | | | | | | | | | | | | | | | | | | | | |
| | | | | | | | | | | | | | | | | | | | $ | (63,819 | ) | | | | $149,580 | | | | $ | (213,399 | ) | | |
| | | | | | | | | | | | | | | | | | | | | | | | | | | | | | | | | | |
| | | | | | | | | | | | | | | | | | | | | | | | | | | | | | | | | | | | | | | |
Reference Entity/ Obligation | | Termination
Date | | Fixed
Rate | | Notional
Amount
(000)#(3) | | Implied
Credit
Spread at
December 31,
2024(4) | | Fair
Value | | Upfront
Premiums
Paid
(Received) | | Unrealized
Appreciation
(Depreciation) | | Counterparty |
OTC Credit Default Swap Agreements on corporate and/or sovereign issues - Sell Protection(2): | | | |
Bank of America Corp. | | 12/20/25 | | | | 1.000 | %(Q) | | | | | | | | | 1,230 | | | | | 0.299 | % | | | $ | 8,652 | | | | $ | 8,555 | | | | $ | 97 | | | GSI |
Citigroup, Inc. | | 12/20/25 | | | | 1.000 | %(Q) | | | | | | | | | 1,230 | | | | | 0.258 | % | | | | 9,136 | | | | | 8,673 | | | | | 463 | | | GSI |
Kingdom of Norway | | 12/20/25 | | | | — | %(Q) | | | | | | | | | 2,700 | | | | | 0.036 | % | | | | (939 | ) | | | | (1,292 | ) | | | | 353 | | | BARC |
SEE NOTES TO FINANCIAL STATEMENTS.
A54
| | | | |
| | PSF PGIM 50/50 BALANCED PORTFOLIO (CONTINUED) | | |
SCHEDULE OF INVESTMENTS | | | | as of December 31, 2024 |
Credit default swap agreements outstanding at December 31, 2024 (continued):
| | | | | | | | | | | | | | | | | | | | | | | | | | | | | | | | | | | | | | | | |
Reference Entity/ Obligation | | Termination
Date | | Fixed
Rate | | Notional
Amount
(000)#(3) | | Implied
Credit
Spread at
December 31,
2024(4) | | Fair
Value | | Upfront
Premiums
Paid
(Received) | | Unrealized
Appreciation
(Depreciation) | | Counterparty |
OTC Credit Default Swap Agreements on corporate and/or sovereign issues - Sell Protection(2)(cont’d.): | | | | | | | | | | | |
Morgan Stanley | | | | 12/20/25 | | | | | 1.000 | %(Q) | | | | 1,230 | | | | | 0.261 | % | | | $ | 9,098 | | | | $ | 8,555 | | | | $ | 543 | | | | | GSI | |
U.S. Treasury Notes | | | | 03/20/25 | | | | | 0.250 | %(Q) | | | | EUR 1,260 | | | | | 0.091 | % | | | | 560 | | | | | 357 | | | | | 203 | | | | | BARC | |
| | | | | | | | | | | | | | | | | | | | | | | | | | | | | | | | | | | | | | | | |
| | | | | | | | | | | | | | | | | | | | | | | $ | 26,507 | | | | $ | 24,848 | | | | $ | 1,659 | | | | | | |
| | | | | | | | | | | | | | | | | | | | | | | | | | | | | | | | | | | | | | | | |
| | | | | | | | | | | | | | | | | | | | | | | | | | | | | | |
Reference Entity/ Obligation | | Termination
Date | | Fixed
Rate | | Notional
Amount
(000)#(3) | | Value at
Trade Date | | Value at
December 31,
2024 | | Unrealized
Appreciation
(Depreciation) |
Centrally Cleared Credit Default Swap Agreement on credit indices - Buy Protection(1): | | | | | | |
CDX.NA.IG.43.V1 | | | | 12/20/29 | | | | | 1.000 | %(Q) | | | | 12,830 | | | | $ | 298,680 | | | | $ | 290,651 | | | | $ | (8,029 | ) |
| | | | | | | | | | | | | | | | | | | | | | | | | | | | | | |
The Portfolio entered into credit default swaps (“CDS”) to provide a measure of protection against defaults or to take an active long or short position with respect to the likelihood of a particular issuer’s default or the reference entity’s credit soundness. CDS contracts generally trade based on a spread which represents the cost a protection buyer has to pay the protection seller. The protection buyer is said to be short the credit as the value of the contract rises the more the credit deteriorates. The value of the CDS contract increases for the protection buyer if the spread increases.
| (1) | If the Portfolio is a buyer of protection, it pays the fixed rate. When a credit event occurs, as defined under the terms of that particular swap agreement, the Portfolio will either (i) receive from the seller of protection an amount equal to the notional amount of the swap and make delivery of the referenced obligation or underlying securities comprising the referenced index or (ii) receive a net settlement amount in the form of cash or securities equal to the notional amount of the swap less the recovery value of the referenced obligation or underlying securities comprising the referenced index. |
| (2) | If the Portfolio is a seller of protection, it receives the fixed rate. When a credit event occurs, as defined under the terms of that particular swap agreement, the Portfolio will either (i) pay to the buyer of protection an amount equal to the notional amount of the swap and take delivery of the referenced obligation or underlying securities comprising the referenced index or (ii) pay a net settlement amount in the form of cash or securities equal to the notional amount of the swap less the recovery value of the referenced obligation or underlying securities comprising the referenced index. |
| (3) | Notional amount represents the maximum potential amount the Portfolio could be required to pay as a seller of credit protection or receive as a buyer of credit protection if a credit event occurs as defined under the terms of that particular swap agreement. |
| (4) | Implied credit spreads, represented in absolute terms, utilized in determining the fair value of credit default swap agreements where the Portfolio is the seller of protection as of the reporting date serve as an indicator of the current status of the payment/ performance risk and represent the likelihood of risk of default for the credit derivative. The implied credit spread of a particular referenced entity reflects the cost of buying/selling protection and may include up-front payments required to be made to enter into the agreement. Wider credit spreads represent a deterioration of the referenced entity’s credit soundness and a greater likelihood of risk of default or other credit event occurring as defined under the terms of the agreement. |
Interest rate swap agreements outstanding at December 31, 2024:
| | | | | | | | | | | | | | | | | | | | | |
Notional
Amount
(000)# | | Termination
Date | | Fixed
Rate | | Floating Rate | | Value at
Trade Date | | Value at
December 31,
2024 | | Unrealized
Appreciation
(Depreciation) |
Centrally Cleared Interest Rate Swap Agreements: | | | | | | | | | | | | | | | |
3,816 | | 03/08/25 | | 4.946%(A) | | 1 Day SOFR(2)(A)/ 4.490% | | | $ | — | | | | $ | (5,169 | ) | | | $ | (5,169 | ) |
4,664 | | 03/09/25 | | 5.110%(A) | | 1 Day SOFR(2)(A)/ 4.490% | | | | — | | | | | 1,497 | | | | | 1,497 | |
10,650 | | 03/10/25 | | 5.088%(A) | | 1 Day SOFR(2)(A)/ 4.490% | | | | — | | | | | 1,316 | | | | | 1,316 | |
20,590 | | 05/17/25 | | 5.113%(T) | | 1 Day SOFR(2)(T)/ 4.490% | | | | — | | | | | 53,340 | | | | | 53,340 | |
12,880 | | 08/31/25 | | 4.805%(A) | | 1 Day SOFR(1)(A)/ 4.490% | | | | — | | | | | (42,240 | ) | | | | (42,240) | |
10,550 | | 05/17/26 | | 4.669%(A) | | 1 Day SOFR(1)(A)/ 4.490% | | | | — | | | | | (43,022 | ) | | | | (43,022) | |
1,410 | | 09/25/26 | | 4.699%(A) | | 1 Day SOFR(1)(A)/ 4.490% | | | | 261 | | | | | (13,763 | ) | | | | (14,024) | |
14,315 | | 05/13/27 | | 4.497%(A) | | 1 Day SOFR(2)(A)/ 4.490% | | | | 4,207 | | | | | 73,854 | | | | | 69,647 | |
8,910 | | 05/13/29 | | 4.253%(A) | | 1 Day SOFR(1)(A)/ 4.490% | | | | (9,474 | ) | | | | (20,872 | ) | | | | (11,398) | |
SEE NOTES TO FINANCIAL STATEMENTS.
A55
| | | | |
| | PSF PGIM 50/50 BALANCED PORTFOLIO (CONTINUED) | | |
SCHEDULE OF INVESTMENTS | | | | as of December 31, 2024 |
| | | | | | | | | | | | | | | | | | | | | |
Notional Amount (000)# | | Termination Date | | Fixed Rate | | Floating Rate | | Value at
Trade Date | | Value at
December 31,
2024 | | Unrealized
Appreciation
(Depreciation) |
Centrally Cleared Interest Rate Swap Agreements (cont’d.): | | | | | | | | | | | | | | | |
1,655 | | 05/11/54 | | 1.350%(A) | | 1 Day SOFR(1)(A)/ 4.490% | | | $ | 755,453 | | | | $ | 776,280 | | | | $ | 20,827 | |
| | | | | | | | | | | | | | | | | | | | | |
| | | | | | | | | $ | 750,447 | | | | $ | 781,221 | | | | $ | 30,774 | |
| | | | | | | | | | | | | | | | | | | | | |
| (1) | The Portfolio pays the fixed rate and receives the floating rate. |
| (2) | The Portfolio pays the floating rate and receives the fixed rate. |
Total return swap agreements outstanding at December 31, 2024:
| | | | | | | | | | | | | | | | | | | | | | | | | | | | | | | | | | | |
Reference Entity | | Financing
Rate | | Counterparty | | Termination
Date | | Long (Short)
Notional
Amount
(000)#(1) | | Fair
Value | | Upfront
Premiums
Paid
(Received) | | Unrealized
Appreciation
(Depreciation)(2) |
OTC Total Return Swap Agreements: | | | | | | | | | | | | | | | | | | | | | | | | | | | | | | | | | | | |
Total Return Benchmark Bond
Index(T) | | |
| 1 Day USOIS
-54bps(T)/ 3.790% |
| | | | JPM | | | | | 03/20/25 | | | | | (5,553 | ) | | | $ | 507,360 | | | | | $— | | | | $ | 507,360 | |
U.S. Treasury Bond(T) | | |
| 1 Day USOIS
+20bps(T)/
4.530% |
| | | | JPM | | | | | 01/13/25 | | | | | 13,235 | | | | | (645,495 | ) | | | | — | | | | | (645,495 | ) |
U.S. Treasury Bond(T) | | |
| 1 Day USOIS
+20bps(T)/
4.530% |
| | | | JPM | | | | | 01/24/25 | | | | | 11,085 | | | | | (707,104 | ) | | | | — | | | | | (707,104 | ) |
U.S. Treasury Bond(T) | | |
| 1 Day USOIS
+22bps(T)/
4.550% |
| | | | GSI | | | | | 01/24/25 | | | | | 12,240 | | | | | (610,941 | ) | | | | — | | | | | (610,941 | ) |
U.S. Treasury Bond(T) | | |
| 1 Day USOIS
+23bps(T)/
4.560% |
| | | | GSI | | | | | 01/29/25 | | | | | 15,800 | | | | | (864,714 | ) | | | | — | | | | | (864,714 | ) |
U.S. Treasury Bond(T) | | |
| 1 Day USOIS
+20bps(T)/
4.530% |
| | | | JPM | | | | | 01/30/25 | | | | | 10,220 | | | | | (481,397 | ) | | | | — | | | | | (481,397 | ) |
U.S. Treasury Bond(T) | | |
| 1 Day USOIS
+24bps(T)/
4.570% |
| | | | BOA | | | | | 02/11/25 | | | | | 19,230 | | | | | (1,287,711 | ) | | | | — | | | | | (1,287,711 | ) |
U.S. Treasury Bond(T) | | |
| 1 Day USOIS
+25bps(T)/
4.580% |
| | | | JPM | | | | | 02/25/25 | | | | | 13,010 | | | | | (997,931 | ) | | | | — | | | | | (997,931 | ) |
| | | | | | | | | | | | | | | | | | | | | | | | | | | | | | | | | | | |
| | | | | | | | | | | | | | | | | | | | | | | $ | (5,087,933 | ) | | | | $— | | | | $ | (5,087,933 | ) |
| | | | | | | | | | | | | | | | | | | | | | | | | | | | | | | | | | | |
| (1) | On a long total return swap, the Portfolio receives payments for any positive return on the reference entity (makes payments for any negative return) and pays the financing rate. On a short total return swap, the Portfolio makes payments for any positive return on the reference entity (receives payments for any negative return) and receives the financing rate. |
| (2) | Upfront/recurring fees or commissions, as applicable, are included in the net unrealized appreciation (depreciation). |
Balances Reported in the Statement of Assets and Liabilities for OTC Swap Agreements:
| | | | | | | | |
| | | Premiums Paid | | Premiums Received | | Unrealized Appreciation | | Unrealized Depreciation |
| | | | |
OTC Swap Agreements | | $176,353 | | $(1,925) | | $509,019 | | $(5,808,692) |
SEE NOTES TO FINANCIAL STATEMENTS.
A56
| | | | |
| | PSF PGIM 50/50 BALANCED PORTFOLIO (CONTINUED) | | |
SCHEDULE OF INVESTMENTS | | | | as of December 31, 2024 |
Summary of Collateral for Centrally Cleared/Exchange-traded Derivatives:
Cash and securities segregated as collateral, including pending settlement for closed positions, to cover requirements for centrally cleared/exchange-traded derivatives are listed by broker as follows:
| | | | | | | | | | |
Broker | | Cash and/or Foreign Currency | | Securities Market Value |
CGM | | | $ | — | | | | $ | 3,622,535 | |
GS | | | | — | | | | | 1,050,529 | |
| | | | | | | | | | |
Total | | | $ | — | | | | $ | 4,673,064 | |
| | | | | | | | | | |
Fair Value Measurements:
Various inputs are used in determining the value of the Portfolio’s investments. These inputs are summarized in the three broad levels listed below.
Level 1—unadjusted quoted prices generally in active markets for identical securities.
Level 2—quoted prices for similar securities, interest rates and yield curves, prepayment speeds, foreign currency exchange rates and other observable inputs.
Level 3—unobservable inputs for securities valued in accordance with Board approved fair valuation procedures.
The following is a summary of the inputs used as of December 31, 2024 in valuing such portfolio securities:
| | | | | | | | | | | | | | | |
| | | Level 1 | | Level 2 | | Level 3 |
Investments in Securities | | | | | | | | | | | | | | | |
Assets | | | | | | | | | | | | | | | |
Long-Term Investments | | | | | | | | | | | | | | | |
Common Stocks | | | $ | 1,318,389,285 | | | | $ | 13,592,591 | | | | $ | — | |
Preferred Stocks | | | | 1,056,244 | | | | | — | | | | | — | |
Unaffiliated Exchange-Traded Funds | | | | 11,583,494 | | | | | — | | | | | — | |
Asset-Backed Securities | | | | | | | | | | | | | | | |
Automobiles | | | | — | | | | | 51,630,966 | | | | | — | |
Collateralized Loan Obligations | | | | — | | | | | 149,199,782 | | | | | — | |
Consumer Loans | | | | — | | | | | 10,506,384 | | | | | — | |
Credit Cards | | | | — | | | | | 6,034,688 | | | | | — | |
Equipment | | | | — | | | | | 2,430,855 | | | | | — | |
Home Equity Loans | | | | — | | | | | 8,840,758 | | | | | — | |
Other | | | | — | | | | | 463,071 | | | | | — | |
Residential Mortgage-Backed Securities | | | | — | | | | | — | | | | | 469,563 | |
Student Loans | | | | — | | | | | 3,177,960 | | | | | — | |
Corporate Bonds | | | | — | | | | | 312,664,513 | | | | | — | |
Floating Rate and Other Loans | | | | — | | | | | 122,202 | | | | | — | |
Commercial Mortgage-Backed Securities | | | | — | | | | | 146,229,952 | | | | | — | |
Municipal Bonds | | | | — | | | | | 7,515,302 | | | | | — | |
Residential Mortgage-Backed Securities | | | | — | | | | | 22,935,365 | | | | | 1 | |
Sovereign Bonds | | | | — | | | | | 7,079,807 | | | | | — | |
U.S. Government Agency Obligations | | | | — | | | | | 306,320,808 | | | | | — | |
U.S. Treasury Obligations | | | | — | | | | | 38,463,542 | | | | | — | |
Short-Term Investments | | | | | | | | | | | | | | | |
Affiliated Mutual Funds | | | | 336,085,480 | | | | | — | | | | | — | |
U.S. Treasury Obligation | | | | — | | | | | 1,050,529 | | | | | — | |
Options Purchased | | | | 963 | | | | | 13,640 | | | | | — | |
| | | | | | | | | | | | | | | |
Total | | | $ | 1,667,115,466 | | | | $ | 1,088,272,715 | | | | $ | 469,564 | |
| | | | | | | | | | | | | | | |
| | | |
Liabilities | | | | | | | | | | | | | | | |
Options Written | | | $ | (15,881 | ) | | | $ | (13,279 | ) | | | $ | — | |
| | | | | | | | | | | | | | | |
| | | |
Other Financial Instruments* | | | | | | | | | | | | | | | |
Assets | | | | | | | | | | | | | | | |
Futures Contracts | | | $ | 24,102 | | | | $ | — | | | | $ | — | |
OTC Forward Foreign Currency Exchange Contracts | | | | — | | | | | 308,006 | | | | | — | |
OTC Credit Default Swap Agreements | | | | — | | | | | 27,446 | | | | | — | |
SEE NOTES TO FINANCIAL STATEMENTS.
A57
| | | | |
| | PSF PGIM 50/50 BALANCED PORTFOLIO (CONTINUED) | | |
SCHEDULE OF INVESTMENTS | | | | as of December 31, 2024 |
| | | | | | | | | | | | |
| | | Level 1 | | | Level 2 | | | Level 3 | |
Other Financial Instruments* (continued) | | | | | | | | | | | | |
Assets (continued) | | | | | | | | | | | | |
Centrally Cleared Interest Rate Swap Agreements | | $ | — | | | $ | 146,627 | | | $ | — | |
OTC Total Return Swap Agreement | | | — | | | | 507,360 | | | | — | |
| | | | | | | | | | | | |
Total | | $ | 24,102 | | | $ | 989,439 | | | $ | — | |
| | | | | | | | | | | | |
Liabilities | | | | | | | | | | | | |
Forward Commitment Contracts | | $ | — | | | $ | (18,363,700 | ) | | $ | — | |
Futures Contracts | | | (2,174,313 | ) | | | — | | | | — | |
OTC Forward Foreign Currency Exchange Contract | | | — | | | | (23,424 | ) | | | — | |
Centrally Cleared Credit Default Swap Agreement | | | — | | | | (8,029 | ) | | | — | |
OTC Credit Default Swap Agreements | | | — | | | | (64,758 | ) | | | — | |
Centrally Cleared Interest Rate Swap Agreements | | | — | | | | (115,853 | ) | | | — | |
OTC Total Return Swap Agreements | | | — | | | | (5,595,293 | ) | | | — | |
| | | | | | | | | | | | |
Total | | $ | (2,174,313) | | | $ | (24,171,057) | | | $ | — | |
| | | | | | | | | | | | |
| * | Other financial instruments are derivative instruments, with the exception of forward commitment contracts, and are not reflected in the Schedule of Investments. Futures, forwards and centrally cleared swap contracts are recorded at unrealized appreciation (depreciation) and OTC swap contracts are recorded at fair value. Forward commitment contracts are recorded at market value. |
Industry Classification:
The industry classification of investments and liabilities in excess of other assets shown as a percentage of net assets as of December 31, 2024 were
as follows:
| | | | |
Affiliated Mutual Funds (1.4% represents investments purchased with collateral from securities on loan) | | | 12.5 | % |
U.S. Government Agency Obligations | | | 11.4 | |
Semiconductors & Semiconductor Equipment | | | 5.7 | |
Collateralized Loan Obligations | | | 5.6 | |
Commercial Mortgage-Backed Securities | | | 5.4 | |
Banks | | | 5.2 | |
Software | | | 5.2 | |
Technology Hardware, Storage & Peripherals | | | 3.9 | |
Interactive Media & Services | | | 3.2 | |
Automobiles | | | 3.1 | |
Financial Services | | | 2.2 | |
Broadline Retail | | | 2.1 | |
Pharmaceuticals | | | 1.8 | |
Capital Markets | | | 1.6 | |
U.S. Treasury Obligations | | | 1.5 | |
Oil, Gas & Consumable Fuels | | | 1.5 | |
Insurance | | | 1.3 | |
Aerospace & Defense | | | 1.1 | |
Health Care Equipment & Supplies | | | 1.1 | |
Electric | | | 1.1 | |
Health Care Providers & Services | | | 1.0 | |
Consumer Staples Distribution & Retail | | | 1.0 | |
Hotels, Restaurants & Leisure | | | 1.0 | |
Specialty Retail | | | 0.9 | |
Residential Mortgage-Backed Securities | | | 0.9 | |
Pipelines | | | 0.9 | |
Machinery | | | 0.8 | |
Biotechnology | | | 0.8 | |
Chemicals | | | 0.8 | |
Entertainment | | | 0.8 | |
Electric Utilities | | | 0.7 | |
Telecommunications | | | 0.7 | |
Beverages | | | 0.7 | |
| | | | |
IT Services | | | 0.6 | % |
Household Products | | | 0.6 | |
Media | | | 0.5 | |
Real Estate Investment Trusts (REITs) | | | 0.5 | |
Life Sciences Tools & Services | | | 0.5 | |
Oil & Gas | | | 0.5 | |
Communications Equipment | | | 0.5 | |
Specialized REITs | | | 0.4 | |
Unaffiliated Exchange-Traded Funds | | | 0.4 | |
Healthcare-Services | | | 0.4 | |
Ground Transportation | | | 0.4 | |
Electrical Equipment | | | 0.4 | |
Consumer Loans | | | 0.4 | |
Home Equity Loans | | | 0.4 | |
Diversified Telecommunication Services | | | 0.3 | |
Food Products | | | 0.3 | |
Agriculture | | | 0.3 | |
Professional Services | | | 0.3 | |
Multi-Utilities | | | 0.3 | |
Consumer Finance | | | 0.3 | |
Electronic Equipment, Instruments & Components | | | 0.3 | |
Tobacco | | | 0.3 | |
Municipal Bonds | | | 0.3 | |
Commercial Services & Supplies | | | 0.3 | |
Building Products | | | 0.3 | |
Diversified Financial Services | | | 0.3 | |
Sovereign Bonds | | | 0.3 | |
Auto Manufacturers | | | 0.3 | |
Credit Cards | | | 0.2 | |
Industrial Conglomerates | | | 0.2 | |
Retail | | | 0.2 | |
Textiles, Apparel & Luxury Goods | | | 0.2 | |
Packaging & Containers | | | 0.2 | |
Air Freight & Logistics | | | 0.2 | |
SEE NOTES TO FINANCIAL STATEMENTS.
A58
| | | | |
| | PSF PGIM 50/50 BALANCED PORTFOLIO (CONTINUED) | | |
SCHEDULE OF INVESTMENTS | | | | as of December 31, 2024 |
Industry Classification (continued):
| | | | |
Household Durables | | | 0.2 | % |
Metals & Mining | | | 0.2 | |
Foods | | | 0.2 | |
Semiconductors | | | 0.1 | |
Trading Companies & Distributors | | | 0.1 | |
Retail REITs | | | 0.1 | |
Gas | | | 0.1 | |
Residential REITs | | | 0.1 | |
Shipbuilding | | | 0.1 | |
Health Care REITs | | | 0.1 | |
Airlines | | | 0.1 | |
Energy Equipment & Services | | | 0.1 | |
Student Loans | | | 0.1 | |
Miscellaneous Manufacturing | | | 0.1 | |
Containers & Packaging | | | 0.1 | |
Wireless Telecommunication Services | | | 0.1 | |
Commercial Services | | | 0.1 | |
Industrial REITs | | | 0.1 | |
Trucking & Leasing | | | 0.1 | |
Passenger Airlines | | | 0.1 | |
Equipment | | | 0.1 | |
Mining | | | 0.1 | |
Real Estate Management & Development | | | 0.1 | |
Engineering & Construction | | | 0.1 | |
Transportation | | | 0.1 | |
Construction Materials | | | 0.1 | |
Personal Care Products | | | 0.1 | |
Independent Power & Renewable Electricity Producers | | | 0.1 | |
Construction & Engineering | | | 0.1 | |
| | | | |
Office/Business Equipment | | | 0.1 | % |
Distributors | | | 0.0 | * |
Multi-National | | | 0.0 | * |
Home Builders | | | 0.0 | * |
Automobile Components | | | 0.0 | * |
Water Utilities | | | 0.0 | * |
Building Materials | | | 0.0 | * |
Gas Utilities | | | 0.0 | * |
Apparel | | | 0.0 | * |
Other | | | 0.0 | * |
Healthcare-Products | | | 0.0 | * |
Iron/Steel | | | 0.0 | * |
Lodging | | | 0.0 | * |
Hotel & Resort REITs | | | 0.0 | * |
Leisure Products | | | 0.0 | * |
Office REITs | | | 0.0 | * |
Housewares | | | 0.0 | * |
Marine Transportation | | | 0.0 | * |
Distribution/Wholesale | | | 0.0 | * |
Diversified REITs | | | 0.0 | * |
Health Care Technology | | | 0.0 | * |
Options Purchased | | | 0.0 | * |
| | | | |
| | | 102.7 | |
Options Written | | | (0.0 | )* |
Liabilities in excess of other assets | | | (2.7 | ) |
| | | | |
| |
| | | 100.0 | % |
| | | | |
Effects of Derivative Instruments on the Financial Statements and Primary Underlying Risk Exposure:
The Portfolio invested in derivative instruments during the reporting period. The primary types of risk associated with these derivative instruments are credit risk, equity risk, foreign exchange risk and interest rate risk. See the Notes to Financial Statements for additional detail regarding these derivative instruments and their risks. The effect of such derivative instruments on the Portfolio’s financial position and financial performance as reflected in the Statement of Assets and Liabilities and Statement of Operations is presented in the summary below.
Fair values of derivative instruments as of December 31, 2024 as presented in the Statement of Assets and Liabilities:
| | | | | | | | | | | | | | |
| | | Asset Derivatives | | | Liability Derivatives | |
Derivatives not accounted for as hedging instruments, carried at fair value | | Statement of Assets and Liabilities Location | | | | Fair
Value | | | Statement of Assets and Liabilities Location | | Fair
Value | |
Credit contracts | | — | | | | $ | — | | | Due from/to broker-variation
margin swaps | | $ | 8,029 | * |
Credit contracts | | Premiums paid for OTC swap
agreements | | | | | 176,353 | | | Premiums received for OTC swap
agreements | | | 1,925 | |
Credit contracts | | Unrealized appreciation on OTC swap
agreements | | | | | 1,659 | | | Unrealized depreciation on OTC swap agreements | | | 213,399 | |
Equity contracts | | — | | | | | — | | | Due from/to broker-variation
margin futures | | | 480,384 | * |
Foreign exchange contracts | | Unrealized appreciation on OTC
forward foreign currency exchange contracts | | | | | 308,006 | | | Unrealized depreciation on OTC
forward foreign currency exchange contracts | | | 23,424 | |
Interest rate contracts | | Due from/to broker-variation
margin futures | | | | | 24,102 | * | | Due from/to broker-variation
margin futures | | | 1,693,929 | * |
Interest rate contracts | | Due from/to broker-variation
margin swaps | | | | | 146,627 | * | | Due from/to broker-variation
margin swaps | | | 115,853 | * |
SEE NOTES TO FINANCIAL STATEMENTS.
A59
| | | | |
| | PSF PGIM 50/50 BALANCED PORTFOLIO (CONTINUED) | | |
SCHEDULE OF INVESTMENTS | | | | as of December 31, 2024 |
| | | | | | | | | | | | |
| | | Asset Derivatives | | | Liability Derivatives | |
Derivatives not accounted for as hedging instruments, carried at fair value | | Statement of Assets and Liabilities Location | | Fair
Value | | | Statement of Assets and Liabilities Location | | Fair
Value | |
Interest rate contracts | | Unaffiliated investments | | $ | 14,603 | | | Options written outstanding, at value | | $ | 29,160 | |
Interest rate contracts | | Unrealized appreciation on OTC swap agreements | | | 507,360 | | | Unrealized depreciation on OTC swap agreements | | | 5,595,293 | |
| | | | | | | | | | | | |
| | | | $ | 1,178,710 | | | | | $ | 8,161,396 | |
| | | | | | | | | | | | |
| * | Includes cumulative appreciation (depreciation) as reported in the schedule of open futures and centrally cleared swap contracts. Only unsettled variation margin receivable (payable) is reported within the Statement of Assets and Liabilities. |
The effects of derivative instruments on the Statement of Operations for the year ended December 31, 2024 are as follows:
| | | | | | | | | | | | | | | | | | | | | | | | | |
| Amount of Realized Gain (Loss) on Derivatives Recognized in Income |
Derivatives not accounted for as hedging instruments, carried at fair value | | Options
Purchased(1) | | Options
Written | | Futures | | Forward
Currency
Exchange
Contracts | | Swaps |
Credit contracts | | | $ | — | | | | $ | — | | | | $ | — | | | | $ | — | | | | $ | (71,239 | ) |
Equity contracts | | | | — | | | | | — | | | | | 2,765,515 | | | | | — | | | | | — | |
Foreign exchange contracts | | | | — | | | | | — | | | | | — | | | | | 2,621,929 | | | | | — | |
Interest rate contracts | | | | 7,958 | | | | | (4,071 | ) | | | | (1,820,965 | ) | | | | — | | | | | (3,907,835 | ) |
| | | | | | | | | | | | | | | | | | | | | | | | | |
Total | | | $ | 7,958 | | | | $ | (4,071 | ) | | | $ | 944,550 | | | | $ | 2,621,929 | | | | $ | (3,979,074 | ) |
| | | | | | | | | | | | | | | | | | | | | | | | | |
| (1) | Included in net realized gain (loss) on investment transactions in the Statement of Operations. |
| | | | | | | | | | | | | | | | | | | | | | | | | |
| Change in Unrealized Appreciation (Depreciation) on Derivatives Recognized in Income |
Derivatives not accounted for as hedging instruments, carried at fair value | | Options
Purchased(2) | | Options
Written | | Futures | | Forward
Currency
Exchange
Contracts | | Swaps |
Credit contracts | | | $ | — | | | | $ | 24 | | | | $ | — | | | | $ | — | | | | $ | (61,239 | ) |
Equity contracts | | | | — | | | | | — | | | | | (943,099 | ) | | | | — | | | | | — | |
Foreign exchange contracts. | | | | — | | | | | — | | | | | — | | | | | 510,469 | | | | | — | |
Interest rate contracts | | | | (8,366 | ) | | | | (7,815 | ) | | | | (4,242,984 | ) | | | | — | | | | | (2,896,395 | ) |
| | | | | | | | | | | | | | | | | | | | | | | | | |
Total | | | $ | (8,366 | ) | | | $ | (7,791 | ) | | | $ | (5,186,083 | ) | | | $ | 510,469 | | | | $ | (2,957,634 | ) |
| | | | | | | | | | | | | | | | | | | | | | | | | |
| (2) | Included in net change in unrealized appreciation (depreciation) on investments in the Statement of Operations. |
For the year ended December 31, 2024, the Portfolio’s average volume of derivative activities is as follows:
| | | | | |
| Derivative Contract Type | | Average Volume of Derivative Activities |
Options Purchased (1) | | | $ | 4,594 | |
Options Written (2) | | | | 12,737,000 | |
Futures Contracts - Long Positions (2) | | | | 155,490,994 | |
Futures Contracts - Short Positions (2) | | | | 2,749,962 | |
Forward Foreign Currency Exchange Contracts - Purchased (3) | | | | 27,687,863 | |
Forward Foreign Currency Exchange Contracts - Sold (3) | | | | 68,761,613 | |
Interest Rate Swap Agreements (2) | | | | 82,017,000 | |
Credit Default Swap Agreements - Buy Protection (2) | | | | 9,634,053 | |
Credit Default Swap Agreements - Sell Protection (2) | | | | 19,202,053 | |
Total Return Swap Agreements (2) | | | | 96,527,361 | |
SEE NOTES TO FINANCIAL STATEMENTS.
A60
| | | | |
| | PSF PGIM 50/50 BALANCED PORTFOLIO (CONTINUED) | | |
SCHEDULE OF INVESTMENTS | | | | as of December 31, 2024 |
| (2) | Notional Amount in USD. |
| (3) | Value at Settlement Date. |
Financial Instruments/Transactions—Summary of Offsetting and Netting Arrangements:
The Portfolio invested in OTC derivatives and entered into financial instruments/transactions during the reporting period that are either offset in accordance with current requirements or are subject to enforceable master netting arrangements or similar agreements that permit offsetting. The information about offsetting and related netting arrangements for OTC derivatives and financial instruments/transactions where the legal right to set-off exists is presented in the summary below.
Offsetting of financial instrument/transaction assets and liabilities:
| | | | | | |
| Description | | Gross Market Value of Recognized Assets/(Liabilities) | | Collateral Pledged/(Received)(2) | | Net
Amount |
Securities on Loan | | $37,627,175 | | $(37,627,175) | | $— |
Offsetting of OTC derivative assets and liabilities:
| | | | | | | | | | | | | | | | | | | | | | | | | | | | | | | | | | | | | | | | | | | | | | | | | | | | | | | | | | | | |
Counterparty | | Gross Amounts of
Recognized
Assets(1) | | | Gross Amounts of
Recognized
Liabilities(1) | | | Net Amounts of
Recognized
Assets/(Liabilities) | | | Collateral
Pledged/(Received)(2) | | | Net Amount | |
BARC | | | | | | $ | 151,126 | | | | | | | | | | | $ | (215,324 | ) | | | | | | | | | | $ | (64,198 | ) | | | | | | | | | | $ | — | | | | | | | | | | | $ | (64,198 | ) | | | | |
BOA | | | | | | | — | | | | | | | | | | | | (1,287,711 | ) | | | | | | | | | | | (1,287,711 | ) | | | | | | | | | | | 1,287,711 | | | | | | | | | | | | — | | | | | |
CITI | | | | | | | 2,360 | | | | | | | | | | | | (3,928 | ) | | | | | | | | | | | (1,568 | ) | | | | | | | | | | | — | | | | | | | | | | | | (1,568 | ) | | | | |
GSI | | | | | | | 26,886 | | | | | | | | | | | | (1,475,655 | ) | | | | | | | | | | | (1,448,769 | ) | | | | | | | | | | | 1,380,813 | | | | | | | | | | | | (67,956 | ) | | | | |
HSBC | | | | | | | — | | | | | | | | | | | | (23,424 | ) | | | | | | | | | | | (23,424 | ) | | | | | | | | | | | — | | | | | | | | | | | | (23,424 | ) | | | | |
JPM | | | | | | | 518,640 | | | | | | | | | | | | (2,841,278 | ) | | | | | | | | | | | (2,322,638 | ) | | | | | | | | | | | 2,310,839 | | | | | | | | | | | | (11,799 | ) | | | | |
MSI | | | | | | | 1,527 | | | | | | | | | | | | — | | | | | | | | | | | | 1,527 | | | | | | | | | | | | — | | | | | | | | | | | | 1,527 | | | | | |
SCB | | | | | | | 306,479 | | | | | | | | | | | | — | | | | | | | | | | | | 306,479 | | | | | | | | | | | | — | | | | | | | | | | | | 306,479 | | | | | |
| | | | | | | | | | | | | | | | | | | | | | | | | | | | | | | | | | | | | | | | | | | | | | | | | | | | | | | | | | | | |
| | | | | | $ | 1,007,018 | | | | | | | | | | | $ | (5,847,320) | | | | | | | | | | | $ | (4,840,302 | ) | | | | | | | | | | $ | 4,979,363 | | | | | | | | | | | $ | 139,061 | | | | | |
| | | | | | | | | | | | | | | | | | | | | | | | | | | | | | | | | | | | | | | | | | | | | | | | | | | | | | | | | | | | |
| (1) | Includes unrealized appreciation/(depreciation) on swaps and forwards, premiums paid/(received) on swap agreements and market value of purchased and written options, as represented on the Statement of Assets and Liabilities. |
| (2) | Collateral amount disclosed by the Portfolio is limited to the market value of financial instruments/transactions and the Portfolio’s OTC derivative exposure by counterparty. |
SEE NOTES TO FINANCIAL STATEMENTS.
A61
| | | | |
| | PSF PGIM 50/50 BALANCED PORTFOLIO (CONTINUED) | | |
| | | | |
STATEMENT OF ASSETS AND LIABILITIES
as of December 31, 2024
| | | | |
ASSETS | | | | |
Investments at value, including securities on loan of $37,627,175: | | | | |
Unaffiliated investments (cost $1,382,473,540) | | $ | 2,419,772,265 | |
Affiliated investments (cost $336,024,057) | | | 336,085,480 | |
Foreign currency, at value (cost $127,741) | | | 126,870 | |
Cash | | | 243 | |
Receivable for investments sold | | | 18,716,089 | |
Dividends and interest receivable | | | 8,482,471 | |
Unrealized appreciation on OTC swap agreements | | | 509,019 | |
Unrealized appreciation on OTC forward foreign currency exchange contracts | | | 308,006 | |
Tax reclaim receivable | | | 280,573 | |
Premiums paid for OTC swap agreements | | | 176,353 | |
Due from broker-variation margin swaps | | | 6,973 | |
Receivable for Portfolio shares sold | | | 3,757 | |
Receivable from affiliate | | | 163 | |
Prepaid expenses | | | 26,616 | |
| | | | |
Total Assets | | | 2,784,494,878 | |
| | | | |
LIABILITIES | | | | |
Payable to broker for collateral for securities on loan | | | 38,382,490 | |
Payable for investments purchased | | | 36,580,055 | |
Forward commitment contracts, at value (proceeds receivable $18,648,457) | | | 18,363,700 | |
Unrealized depreciation on OTC swap agreements | | | 5,808,692 | |
Management fee payable. | | | 1,270,582 | |
Payable for Portfolio shares purchased | | | 710,083 | |
Accrued expenses and other liabilities | | | 466,508 | |
Due to broker-variation margin futures | | | 261,001 | |
Payable to affiliate | | | 29,299 | |
Options written outstanding, at value (premiums received $21,345) | | | 29,160 | |
Unrealized depreciation on OTC forward foreign currency exchange contracts | | | 23,424 | |
Distribution fee payable | | | 1,970 | |
Premiums received for OTC swap agreements | | | 1,925 | |
Trustees’ fees payable | | | 1,780 | |
Affiliated transfer agent fee payable | | | 1,190 | |
| | | | |
Total Liabilities | | | 101,931,859 | |
| | | | |
NET ASSETS | | $ | 2,682,563,019 | |
| | | | |
Net assets were comprised of: | | | | |
Partners’ Equity | | $ | 2,682,563,019 | |
| | | | |
Class I: | | | | |
Net asset value and redemption price per share, $2,672,976,110 / 60,531,308 outstanding shares of beneficial interest | | $ | 44.16 | |
| | | | |
Class III: | | | | |
Net asset value and redemption price per share, $9,586,909 / 219,108 outstanding shares of beneficial interest. | | $ | 43.75 | |
| | | | |
STATEMENT OF OPERATIONS
Year Ended December 31, 2024
| | | | |
NET INVESTMENT INCOME (LOSS) | | | | |
INCOME | | | | |
Interest income | | $ | 46,107,468 | |
Unaffiliated dividend income (net of $40,020 foreign withholding tax, of which $12,160 is reimbursable by an affiliate) | | | 18,644,941 | |
Affiliated dividend income | | | 15,237,896 | |
Income from securities lending, net (including affiliated income of $80,019) | | | 85,189 | |
| | | | |
Total income | | | 80,075,494 | |
| | | | |
EXPENSES | | | | |
Management fee. | | | 14,478,367 | |
Distribution fee—Class III | | | 20,852 | |
Custodian and accounting fees | | | 262,297 | |
Shareholders’ reports | | | 144,451 | |
Audit fee. | | | 61,465 | |
Professional fees | | | 51,569 | |
Trustees’ fees | | | 50,610 | |
Transfer agent’s fees and expenses (including affiliated expense of $7,143) | | | 11,943 | |
Miscellaneous | | | 106,406 | |
| | | | |
Total expenses | | | 15,187,960 | |
| | | | |
NET INVESTMENT INCOME (LOSS) | | | 64,887,534 | |
| | | | |
REALIZED AND UNREALIZED GAIN (LOSS) ON INVESTMENT AND FOREIGN CURRENCY TRANSACTIONS | | | | |
Net realized gain (loss) on: | | | | |
Investment transactions (including affiliated of $5,245) | | | 161,602,757 | |
Futures transactions. | | | 944,550 | |
Forward currency contract transactions | | | 2,621,929 | |
Options written transactions | | | (4,071 | ) |
Swap agreements transactions | | | (3,979,074 | ) |
Foreign currency transactions | | | (342,708 | ) |
| | | | |
| | | 160,843,383 | |
| | | | |
Net change in unrealized appreciation (depreciation) on: | | | | |
Investments (including affiliated of $(18,167)) | | | 102,353,034 | |
Futures | | | (5,186,083 | ) |
Forward currency contracts. | | | 510,469 | |
Options written | | | (7,791 | ) |
Swap agreements. | | | (2,957,634 | ) |
Foreign currencies | | | (22,087 | ) |
| | | | |
| | | 94,689,908 | |
| | | | |
NET GAIN (LOSS) ON INVESTMENT AND FOREIGN CURRENCY TRANSACTIONS | | | 255,533,291 | |
| | | | |
NET INCREASE (DECREASE) IN NET ASSETS RESULTING FROM OPERATIONS | | $ | 320,420,825 | |
| | | | |
STATEMENTS OF CHANGES IN NET ASSETS
| | | | | | | | | | | | | | | | | | | | | | | | |
| | | Year Ended December 31, 2024 | | | Year Ended December 31, 2023 | |
INCREASE (DECREASE) IN NET ASSETS | | | | | | | | | | | | | | | | | | | | | | | | |
OPERATIONS | | | | | | | | | | | | | | | | | | | | | | | | |
Net investment income (loss) | | | | | | $ | 64,887,534 | | | | | | | | | | | $ | 61,466,398 | | | | | |
Net realized gain (loss) on investment and foreign currency transactions | | | | | | | 160,843,383 | | | | | | | | | | | | 96,080,897 | | | | | |
Net change in unrealized appreciation (depreciation) on investments and foreign currencies | | | | | | | 94,689,908 | | | | | | | | | | | | 191,463,082 | | | | | |
| | | | | | | | | | | | | | | | | | | | | | | | |
NET INCREASE (DECREASE) IN NET ASSETS RESULTING FROM OPERATIONS | | | | | | | 320,420,825 | | | | | | | | | | | | 349,010,377 | | | | | |
| | | | | | | | | | | | | | | | | | | | | | | | |
PORTFOLIO SHARE TRANSACTIONS | | | | | | | | | | | | | | | | | | | | | | | | |
Portfolio shares sold | | | | | | | 16,795,349 | | | | | | | | | | | | 18,116,698 | | | | | |
Portfolio shares purchased | | | | | | | (188,507,083 | ) | | | | | | | | | | | (171,590,252 | ) | | | | |
| | | | | | | | | | | | | | | | | | | | | | | | |
NET INCREASE (DECREASE) IN NET ASSETS FROM PORTFOLIO SHARE TRANSACTIONS . | | | | | | | (171,711,734 | ) | | | | | | | | | | | (153,473,554 | ) | | | | |
| | | | | | | | | | | | | | | | | | | | | | | | |
TOTAL INCREASE (DECREASE) | | | | | | | 148,709,091 | | | | | | | | | | | | 195,536,823 | | | | | |
NET ASSETS: | | | | | | | | | | | | | | | | | | | | | | | | |
Beginning of year | | | | | | | 2,533,853,928 | | | | | | | | | | | | 2,338,317,105 | | | | | |
| | | | | | | | | | | | | | | | | | | | | | | | |
End of year. | | | | | | $ | 2,682,563,019 | | | | | | | | | | | $ | 2,533,853,928 | | | | | |
| | | | | | | | | | | | | | | | | | | | | | | | |
SEE NOTES TO FINANCIAL STATEMENTS.
A62
| | | | |
| | PSF PGIM 50/50 BALANCED PORTFOLIO (CONTINUED) | | |
FINANCIAL HIGHLIGHTS | | | | |
| | | | | | | | | | | | | | | | | | | | |
Class I | | | | | | | | | | | | | | | |
| | | Year Ended December 31, | |
| | | 2024 | | | 2023 | | | 2022 | | | 2021 | | | 2020 | |
Per Share Operating Performance(a): | | | | | | | | | | | | | | | | | | | | |
Net Asset Value, beginning of year | | $ | 39.07 | | | $ | 33.84 | | | $ | 39.67 | | | $ | 34.99 | | | $ | 31.40 | |
| | | | | | | | | | | | | | | | | | | | |
Income (Loss) From Investment Operations: | | | | | | | | | | | | | | | | | | | | |
Net investment income (loss) | | | 1.04 | | | | 0.92 | | | | 0.57 | | | | 0.40 | | | | 0.50 | |
Net realized and unrealized gain (loss) on investment and foreign currency transactions | | | 4.05 | | | | 4.31 | | | | (6.40 | ) | | | 4.28 | | | | 3.09 | |
| | | | | | | | | | | | | | | | | | | | |
Total from investment operations | | | 5.09 | | | | 5.23 | | | | (5.83 | ) | | | 4.68 | | | | 3.59 | |
| | | | | | | | | | | | | | | | | | | | |
Net Asset Value, end of year | | $ | 44.16 | | | $ | 39.07 | | | $ | 33.84 | | | $ | 39.67 | | | $ | 34.99 | |
| | | | | | | | | | | | | | | | | | | | |
Total Return(b) | | | 13.03 | % | | | 15.45 | % | | | (14.70 | )% | | | 13.38 | % | | | 11.43 | % |
Ratios/Supplemental Data: | | | | | | | | | | | | | | | | | | | | |
Net assets, end of year (in millions) | | $ | 2,673 | | | $ | 2,526 | | | $ | 2,332 | | | $ | 2,896 | | | $ | 2,710 | |
Average net assets (in millions) | | $ | 2,624 | | | $ | 2,411 | | | $ | 2,513 | | | $ | 2,800 | | | $ | 2,540 | |
Ratios to average net assets(c): | | | | | | | | | | | | | | | | | | | | |
Expenses after waivers and/or expense reimbursement | | | 0.58 | % | | | 0.57 | % | | | 0.57 | % | | | 0.57 | % | | | 0.58 | % |
Expenses before waivers and/or expense reimbursement | | | 0.58 | % | | | 0.57 | % | | | 0.57 | % | | | 0.57 | % | | | 0.58 | % |
Net investment income (loss) | | | 2.47 | % | | | 2.54 | % | | | 1.62 | % | | | 1.06 | % | | | 1.58 | % |
Portfolio turnover rate(d)(e) | | | 60 | % | | | 86 | % | | | 96 | % | | | 69 | % | | | 75 | % |
| | | | | | | | | | | | | | | | | | | | | | | | | | | | | | |
| | | | | | | | | |
Class III | | | | | | | | | | | | | | | | | | | | | | | | |
| | | | | Year Ended December 31, | | | April 26, 2021(f) through December 31, | |
| | | | | 2024 | | | | | 2023 | | | | | 2022 | | | 2021 | |
Per Share Operating Performance(a): | | | | | | | | | | | | | | | | | | | | | | | | | | | | | | |
Net Asset Value, beginning of period | | | | $ | 38.81 | | | | | $ | 33.70 | | | | | $ | 39.60 | | | | | | | $ | 36.75 | | | | | |
| | | | | | | | | | | | | | | | | | | | | | | | | | | | | | |
Income (Loss) From Investment Operations: | | | | | | | | | | | | | | | | | | | | | | | | | | | | | | |
Net investment income (loss) | | | | | 0.92 | | | | | | 0.83 | | | | | | 0.52 | | | | | | | | 0.21 | | | | | |
Net realized and unrealized gain (loss) on investment and foreign currency transactions | | | | | 4.02 | | | | | | 4.28 | | | | | | (6.42 | ) | | | | | | | 2.64 | | | | | |
| | | | | | | | | | | | | | | | | | | | | | | | | | | | | | |
Total from investment operations | | | | | 4.94 | | | | | | 5.11 | | | | | | (5.90 | ) | | | | | | | 2.85 | | | | | |
| | | | | | | | | | | | | | | | | | | | | | | | | | | | | | |
Net Asset Value, end of period | | | | $ | 43.75 | | | | | $ | 38.81 | | | | | $ | 33.70 | | | | | | | $ | 39.60 | | | | | |
| | | | | | | | | | | | | | | | | | | | | | | | | | | | | | |
Total Return(b) | | | | | 12.73 | % | | | | | 15.16 | % | | | | | (14.90 | )% | | | | | | | 7.76 | % | | | | |
Ratios/Supplemental Data: | | | | | | | | | | | | | | | | | | | | | | | | | | | | | | |
Net assets, end of period (in millions) | | | | $ | 10 | | | | | $ | 8 | | | | | $ | 7 | | | | | | | $ | 3 | | | | | |
Average net assets (in millions) | | | | $ | 8 | | | | | $ | 7 | | | | | $ | 5 | | | | | | | $ | 1 | | | | | |
Ratios to average net assets(c): | | | | | | | | | | | | | | | | | | | | | | | | | | | | | | |
Expenses after waivers and/or expense reimbursement | | | | | 0.83 | % | | | | | 0.82 | % | | | | | 0.82 | % | | | | | | | 0.81 | %(g) | | | | |
Expenses before waivers and/or expense reimbursement | | | | | 0.83 | % | | | | | 0.82 | % | | | | | 0.82 | % | | | | | | | 0.81 | %(g) | | | | |
Net investment income (loss) | | | | | 2.21 | % | | | | | 2.29 | % | | | | | 1.48 | % | | | | | | | 0.76 | %(g) | | | | |
Portfolio turnover rate(d)(e) | | | | | 60 | % | | | | | 86 | % | | | | | 96 | % | | | | | | | 69 | % | | | | |
| (a) | Calculated based on average shares outstanding during the period. |
| (b) | Total return is calculated assuming a purchase of a share on the first day and a sale on the last day of each period reported and includes reinvestment of dividends and distributions, if any, and does not reflect the effect of insurance contract charges. Total return does not reflect expenses associated with the separate account such as administrative fees, account charges and surrender charges which, if reflected, would reduce the total returns for all periods shown. Performance figures may reflect fee waivers and/or expense reimbursements. In the absence of fee waivers and/or expense reimbursements, the total return would be lower. Past performance is no guarantee of future results. Total returns may reflect adjustments to conform to GAAP. Total returns for periods less than one full year are not annualized. |
| (c) | Does not include expenses of the underlying funds in which the Portfolio invests. |
| (d) | The Portfolio accounts for mortgage dollar roll transactions, when applicable, as purchases and sales which, as a result, can increase its portfolio turnover rate. |
| (e) | The Portfolio’s portfolio turnover rate is calculated in accordance with regulatory requirements, without regard to transactions involving short-term investments, certain derivatives and in-kind transactions (if any). If such transactions were included, the Portfolio’s portfolio turnover rate may be higher. |
| (f) | Commencement of offering. |
| (g) | Annualized, with the exception of certain non-recurring expenses. |
SEE NOTES TO FINANCIAL STATEMENTS.
A63
| | | | |
| | PSF PGIM FLEXIBLE MANAGED PORTFOLIO | | |
SCHEDULE OF INVESTMENTS | | | | as of December 31, 2024 |
| | | | | | | | |
| | | Shares | | | Value | |
| |
LONG-TERM INVESTMENTS — 95.7% | | | | | |
COMMON STOCKS — 60.7% | | | | | | | | |
Aerospace & Defense — 1.2% | | | | | | | | |
Dassault Aviation SA (France) | | | 66 | | | $ | 13,486 | |
General Electric Co. | | | 120,600 | | | | 20,114,874 | |
Howmet Aerospace, Inc. | | | 9,500 | | | | 1,039,015 | |
Kongsberg Gruppen ASA (Norway) | | | 659 | | | | 74,142 | |
L3Harris Technologies, Inc. | | | 73,600 | | | | 15,476,608 | |
Lockheed Martin Corp. | | | 13,900 | | | | 6,754,566 | |
MTU Aero Engines AG (Germany) | | | 16 | | | | 5,344 | |
Northrop Grumman Corp. | | | 36,600 | | | | 17,176,014 | |
Rheinmetall AG (Germany) | | | 63 | | | | 40,251 | |
Rolls-Royce Holdings PLC (United Kingdom)* | | | 40,071 | | | | 284,160 | |
Safran SA (France) | | | 968 | | | | 212,096 | |
| | | | | | | | |
| | |
| | | | | | | 61,190,556 | |
| | | | | | | | |
Air Freight & Logistics — 0.3% | | | | | | | | |
United Parcel Service, Inc. (Class B Stock) | | | 124,800 | | | | 15,737,280 | |
| | | | | | | | |
Automobile Components — 0.0% | | | | | | | | |
Cie Generale des Etablissements Michelin SCA (France) | | | 1,434 | | | | 47,186 | |
FCC Co. Ltd. (Japan) | | | 300 | | | | 6,022 | |
Sumitomo Electric Industries Ltd. (Japan) | | | 2,200 | | | | 39,330 | |
Toyo Tire Corp. (Japan) | | | 900 | | | | 13,843 | |
| | | | | | | | |
| | |
| | | | | | | 106,381 | |
| | | | | | | | |
Automobiles — 1.6% | | | | | | | | |
Ferrari NV (Italy) | | | 245 | | | | 104,541 | |
Ford Motor Co. | | | 291,800 | | | | 2,888,820 | |
General Motors Co. | | | 248,600 | | | | 13,242,922 | |
Subaru Corp. (Japan) | | | 10,300 | | | | 183,014 | |
Suzuki Motor Corp. (Japan) | | | 8,900 | | | | 99,719 | |
Tesla, Inc.* | | | 159,100 | | | | 64,250,945 | |
Toyota Motor Corp. (Japan) | | | 6,700 | | | | 130,819 | |
| | | | | | | | |
| | |
| | | | | | | 80,900,780 | |
| | | | | | | | |
Banks — 2.2% | | | | | | | | |
ABN AMRO Bank NV (Netherlands), 144A, CVA | | | 1,985 | | | | 30,632 | |
AIB Group PLC (Ireland) | | | 21,585 | | | | 119,363 | |
ANZ Group Holdings Ltd. (Australia) | | | 5,668 | | | | 99,869 | |
Banco Bilbao Vizcaya Argentaria SA (Spain) | | | 2,309 | | | | 22,592 | |
Banco BPM SpA (Italy) | | | 9,264 | | | | 75,007 | |
Banco Santander SA (Spain) | | | 19,673 | | | | 91,012 | |
Bank Leumi Le-Israel BM (Israel) | | | 3,053 | | | | 36,323 | |
Bank of America Corp. | | | 394,400 | | | | 17,333,880 | |
Barclays PLC (United Kingdom) | | | 50,731 | | | | 169,705 | |
BNP Paribas SA (France) | | | 1,052 | | | | 64,589 | |
BOC Hong Kong Holdings Ltd. (China) | | | 9,000 | | | | 28,738 | |
BPER Banca SpA (Italy) | | | 5,865 | | | | 37,406 | |
CaixaBank SA (Spain) | | | 15,055 | | | | 81,736 | |
Citigroup, Inc. | | | 232,000 | | | | 16,330,480 | |
Commonwealth Bank of Australia (Australia) | | | 1,218 | | | | 115,249 | |
Credit Agricole SA (France) | | | 5,322 | | | | 73,228 | |
DBS Group Holdings Ltd. (Singapore) | | | 3,850 | | | | 123,375 | |
| | | | | | | | |
| | | Shares | | | Value | |
COMMON STOCKS (continued) | | | | | |
Banks (cont’d.) | | | | | | | | |
DNB Bank ASA (Norway) | | | 325 | | | $ | 6,488 | |
Erste Group Bank AG (Austria) | | | 1,795 | | | | 111,104 | |
HSBC Holdings PLC (United Kingdom) | | | 26,617 | | | | 261,462 | |
ING Groep NV (Netherlands) | | | 4,959 | | | | 77,715 | |
Intesa Sanpaolo SpA (Italy) | | | 48,748 | | | | 195,519 | |
JPMorgan Chase & Co. | | | 174,994 | | | | 41,947,812 | |
KeyCorp. | | | 139,100 | | | | 2,384,174 | |
Mitsubishi UFJ Financial Group, Inc. (Japan) | | | 18,000 | | | | 210,145 | |
Mizrahi Tefahot Bank Ltd. (Israel) | | | 210 | | | | 9,091 | |
NatWest Group PLC (United Kingdom) | | | 20,734 | | | | 103,903 | |
Nordea Bank Abp (Finland) | | | 7,465 | | | | 81,449 | |
Oversea-Chinese Banking Corp. Ltd. (Singapore) | | | 3,000 | | | | 36,639 | |
PNC Financial Services Group, Inc. (The) | | | 5,700 | | | | 1,099,245 | |
Sumitomo Mitsui Financial Group, Inc. (Japan) | | | 2,900 | | | | 69,601 | |
Truist Financial Corp. | | | 351,800 | | | | 15,261,084 | |
U.S. Bancorp | | | 292,000 | | | | 13,966,360 | |
UniCredit SpA (Italy) | | | 5,231 | | | | 209,493 | |
Westpac Banking Corp. (Australia) | | | 9,088 | | | | 181,406 | |
| | | | | | | | |
| | |
| | | | | | | 111,045,874 | |
| | | | | | | | |
Beverages — 0.6% | | | | | | | | |
Carlsberg A/S (Denmark) (Class B Stock) | | | 60 | | | | 5,763 | |
Coca-Cola Co. (The) | | | 234,500 | | | | 14,599,970 | |
Coca-Cola HBC AG (Italy)* | | | 330 | | | | 11,273 | |
Keurig Dr. Pepper, Inc. | | | 479,600 | | | | 15,404,752 | |
| | | | | | | | |
| | |
| | | | | | | 30,021,758 | |
| | | | | | | | |
Biotechnology — 0.9% | | | | | | | | |
AbbVie, Inc. | | | 112,900 | | | | 20,062,330 | |
Amgen, Inc. | | | 43,900 | | | | 11,442,096 | |
Biogen, Inc.* | | | 62,200 | | | | 9,511,624 | |
CSL Ltd. | | | 288 | | | | 50,242 | |
Gilead Sciences, Inc. | | | 22,800 | | | | 2,106,036 | |
| | | | | | | | |
| | |
| | | | | | | 43,172,328 | |
| | | | | | | | |
Broadline Retail — 2.6% | | | | | | | | |
Amazon.com, Inc.* | | | 600,000 | | | | 131,634,000 | |
Next PLC (United Kingdom) | | | 629 | | | | 74,613 | |
Prosus NV (China)* | | | 1,695 | | | | 67,371 | |
| | | | | | | | |
| | |
| | | | | | | 131,775,984 | |
| | | | | | | | |
Building Products — 0.2% | | | | | | | | |
AGC, Inc. (Japan) | | | 1,700 | | | | 49,659 | |
Allegion PLC(a) | | | 33,200 | | | | 4,338,576 | |
Cie de Saint-Gobain SA (France) | | | 2,435 | | | | 216,378 | |
Geberit AG (Switzerland) | | | 19 | | | | 10,775 | |
Hayward Holdings, Inc.* | | | 114,000 | | | | 1,743,060 | |
ROCKWOOL A/S (Denmark) (Class B Stock) | | | 73 | | | | 25,976 | |
Trane Technologies PLC | | | 8,200 | | | | 3,028,670 | |
| | | | | | | | |
| | |
| | | | | | | 9,413,094 | |
| | | | | | | | |
SEE NOTES TO FINANCIAL STATEMENTS.
A64
| | | | |
| | PSF PGIM FLEXIBLE MANAGED PORTFOLIO (CONTINUED) | | |
SCHEDULE OF INVESTMENTS | | | | as of December 31, 2024 |
| | | | | | | | |
| | | Shares | | | Value | |
COMMON STOCKS (continued) | | | | | |
Capital Markets — 2.1% | | | | | | | | |
3i Group PLC (United Kingdom) | | | 4,081 | | | $ | 181,659 | |
Amundi SA (France), 144A | | | 1,244 | | | | 82,789 | |
Bank of New York Mellon Corp. (The) | | | 210,900 | | | | 16,203,447 | |
Blackrock, Inc. | | | 8,000 | | | | 8,200,880 | |
Deutsche Bank AG (Germany) | | | 9,603 | | | | 165,718 | |
Euronext NV (Netherlands), 144A | | | 561 | | | | 62,937 | |
Goldman Sachs Group, Inc. (The) | | | 17,700 | | | | 10,135,374 | |
Houlihan Lokey, Inc. | | | 33,900 | | | | 5,887,074 | |
Investec PLC (United Kingdom) | | | 1,775 | | | | 12,066 | |
Janus Henderson Group PLC | | | 188,300 | | | | 8,008,399 | |
Magellan Financial Group Ltd. (Australia) | | | 2,200 | | | | 15,097 | |
Morgan Stanley | | | 115,700 | | | | 14,545,804 | |
MSCI, Inc. | | | 27,500 | | | | 16,500,275 | |
Nomura Holdings, Inc. (Japan) | | | 30,900 | | | | 179,277 | |
Plus500 Ltd. (Israel) | | | 405 | | | | 13,730 | |
Raymond James Financial, Inc. | | | 29,400 | | | | 4,566,702 | |
S&P Global, Inc. | | | 26,300 | | | | 13,098,189 | |
Singapore Exchange Ltd. (Singapore) | | | 5,200 | | | | 48,472 | |
State Street Corp. | | | 48,600 | | | | 4,770,090 | |
UBS Group AG (Switzerland) | | | 5,254 | | | | 160,860 | |
| | | | | | | | |
| | |
| | | | | | | 102,838,839 | |
| | | | | | | | |
Chemicals — 0.7% | | | | | | | | |
Air Products & Chemicals, Inc. | | | 22,800 | | | | 6,612,912 | |
Celanese Corp. | | | 91,800 | | | | 6,353,478 | |
DuPont de Nemours, Inc. | | | 181,300 | | | | 13,824,125 | |
Eastman Chemical Co.(a) | | | 13,000 | | | | 1,187,160 | |
Evonik Industries AG (Germany) | | | 2,238 | | | | 38,901 | |
Givaudan SA (Switzerland) | | | 6 | | | | 26,228 | |
Kemira OYJ (Finland) | | | 572 | | | | 11,568 | |
Linde PLC | | | 8,100 | | | | 3,391,227 | |
LyondellBasell Industries NV (Class A Stock) | | | 39,600 | | | | 2,941,092 | |
Nitto Denko Corp. (Japan) | | | 1,300 | | | | 21,735 | |
Orica Ltd. (Australia) | | | 2,892 | | | | 29,647 | |
Solvay SA (Belgium) | | | 2,836 | | | | 91,687 | |
| | | | | | | | |
| | |
| | | | | | | 34,529,760 | |
| | | | | | | | |
Commercial Services & Supplies — 0.3% | | | | | |
Brambles Ltd. (Australia) | | | 12,824 | | | | 152,518 | |
Cintas Corp. | | | 6,800 | | | | 1,242,360 | |
Veralto Corp. | | | 141,100 | | | | 14,371,035 | |
Waste Management, Inc. | | | 5,000 | | | | 1,008,950 | |
| | | | | | | | |
| | |
| | | | | | | 16,774,863 | |
| | | | | | | | |
Communications Equipment — 0.7% | | | | | |
Arista Networks, Inc.* | | | 125,600 | | | | 13,882,568 | |
Cisco Systems, Inc | | | 334,500 | | | | 19,802,400 | |
Nokia OYJ (Finland) | | | 25,586 | | | | 113,177 | |
Telefonaktiebolaget LM Ericsson (Sweden) (Class B Stock) | | | 7,280 | | | | 58,957 | |
| | | | | | | | |
| | |
| | | | | | | 33,857,102 | |
| | | | | | | | |
Construction & Engineering — 0.1% | |
ACS Actividades de Construccion y Servicios SA (Spain) | | | 2,290 | | | | 114,758 | |
Eiffage SA (France) | | | 1,399 | | | | 122,680 | |
| | | | | | | | |
| | | Shares | | | Value | |
COMMON STOCKS (continued) | | | | | |
Construction & Engineering (cont’d.) | | | | | |
Koninklijke BAM Groep NV (Netherlands) | | | 1,560 | | | $ | 6,782 | |
MasTec, Inc.* | | | 40,900 | | | | 5,568,126 | |
Vinci SA (France) | | | 1,656 | | | | 170,496 | |
| | | | | | | | |
| | |
| | | | | | | 5,982,842 | |
| | | | | | | | |
Construction Materials — 0.2% | |
Buzzi SpA (Italy) | | | 360 | | | | 13,289 | |
CRH PLC | | | 69,000 | | | | 6,383,880 | |
Heidelberg Materials AG (Germany) | | | 974 | | | | 120,351 | |
Holcim AG* | | | 1,877 | | | | 180,727 | |
Vulcan Materials Co. | | | 11,200 | | | | 2,880,976 | |
| | | | | | | | |
| | |
| | | | | | | 9,579,223 | |
| | | | | | | | |
Consumer Finance — 0.3% | |
American Express Co.(a) | | | 41,600 | | | | 12,346,464 | |
| | | | | | | | |
Consumer Staples Distribution & Retail — 1.2% | | | | | |
Carrefour SA (France) | | | 5,079 | | | | 72,288 | |
Coles Group Ltd. (Australia) | | | 7,938 | | | | 92,665 | |
Colruyt Group NV (Belgium) | | | 312 | | | | 11,740 | |
Costco Wholesale Corp. | | | 21,100 | | | | 19,333,297 | |
Dollar Tree, Inc.* | | | 96,100 | | | | 7,201,734 | |
Kesko OYJ (Finland) (Class B Stock) | | | 1,527 | | | | 28,810 | |
Koninklijke Ahold Delhaize NV (Netherlands) | | | 6,113 | | | | 199,770 | |
Tesco PLC (United Kingdom) | | | 24,598 | | | | 113,135 | |
Walmart, Inc. | | | 376,800 | | | | 34,043,880 | |
| | | | | | | | |
| | |
| | | | | | | 61,097,319 | |
| | | | | | | | |
Containers & Packaging — 0.0% | |
Ball Corp. | | | 16,000 | | | | 882,080 | |
| | | | | | | | |
Distributors — 0.1% | | | | | | | | |
LKQ Corp.(a) | | | 183,400 | | | | 6,739,950 | |
| | | | | | | | |
Diversified REITs — 0.0% | | | | | | | | |
GPT Group (The) (Australia) | | | 10,758 | | | | 28,981 | |
Stockland (Australia) | | | 1,755 | | | | 5,205 | |
| | | | | | | | |
| | |
| | | | | | | 34,186 | |
| | | | | | | | |
Diversified Telecommunication Services — 0.4% | |
AT&T, Inc. | | | 429,300 | | | | 9,775,161 | |
Deutsche Telekom AG (Germany) | | | 10,114 | | | | 303,047 | |
GCI Liberty, Inc. (Class A Stock)^ | | | 343 | | | | — | |
Koninklijke KPN NV (Netherlands) | | | 34,509 | | | | 125,835 | |
Orange SA (France) | | | 7,076 | | | | 70,603 | |
Telstra Group Ltd. (Australia) | | | 6,417 | | | | 15,903 | |
Verizon Communications, Inc. | | | 276,188 | | | | 11,044,758 | |
| | | | | | | | |
| | |
| | | | | | | 21,335,307 | |
| | | | | | | | |
Electric Utilities — 0.9% | | | | | | | | |
American Electric Power Co., Inc. | | | 98,400 | | | | 9,075,432 | |
Chubu Electric Power Co., Inc. (Japan) | | | 9,200 | | | | 96,518 | |
Enel SpA (Italy) | | | 20,687 | | | | 147,626 | |
Exelon Corp. | | | 373,300 | | | | 14,051,012 | |
Fortum OYJ (Finland) | | | 3,293 | | | | 46,098 | |
Iberdrola SA (Spain) | | | 16,833 | | | | 231,962 | |
Kansai Electric Power Co., Inc. (The) (Japan) | | | 1,900 | | | | 21,059 | |
SEE NOTES TO FINANCIAL STATEMENTS.
A65
| | | | |
| | PSF PGIM FLEXIBLE MANAGED PORTFOLIO (CONTINUED) | | |
SCHEDULE OF INVESTMENTS | | | | as of December 31, 2024 |
| | | | | | | | |
| | | Shares | | | Value | |
COMMON STOCKS (continued) | | | | | |
Electric Utilities (cont’d.) | | | | | | | | |
NextEra Energy, Inc. | | | 70,100 | | | $ | 5,025,469 | |
NRG Energy, Inc. | | | 162,900 | | | | 14,696,838 | |
Shikoku Electric Power Co., Inc. (Japan) | | | 600 | | | | 4,680 | |
Tokyo Electric Power Co. Holdings, Inc. (Japan)* | | | 14,800 | | | | 44,239 | |
| | | | | | | | |
| | |
| | | | | | | 43,440,933 | |
| | | | | | | | |
Electrical Equipment — 0.5% | | | | | | | | |
ABB Ltd. (Switzerland) | | | 5,849 | | | | 315,837 | |
Acuity Brands, Inc. | | | 23,200 | | | | 6,777,416 | |
Eaton Corp. PLC | | | 19,500 | | | | 6,471,465 | |
Emerson Electric Co.(a) | | | 90,000 | | | | 11,153,700 | |
Fujikura Ltd. (Japan) | | | 2,600 | | | | 106,147 | |
Legrand SA (France) | | | 536 | | | | 52,138 | |
Nidec Corp. (Japan) | | | 1,900 | | | | 34,127 | |
Schneider Electric SE | | | 1,211 | | | | 301,486 | |
Siemens Energy AG (Germany)* | | | 936 | | | | 49,675 | |
| | | | | | | | |
| | |
| | | | | | | 25,261,991 | |
| | | | | | | | |
Electronic Equipment, Instruments & Components — 0.2% | |
Amphenol Corp. (Class A Stock) | | | 60,400 | | | | 4,194,780 | |
TDK Corp. (Japan) | | | 7,600 | | | | 97,877 | |
Yokogawa Electric Corp. (Japan) | | | 2,500 | | | | 53,174 | |
Zebra Technologies Corp. (Class A Stock)* | | | 18,700 | | | | 7,222,314 | |
| | | | | | | | |
| | |
| | | | | | | 11,568,145 | |
| | | | | | | | |
Energy Equipment & Services — 0.0% | | | | | |
Schlumberger NV | | | 33,100 | | | | 1,269,054 | |
| | | | | | | | |
Entertainment — 0.9% | | | | | | | | |
CTS Eventim AG & Co. KGaA (Germany) | | | 605 | | | | 51,144 | |
Konami Group Corp. (Japan) | | | 800 | | | | 74,856 | |
Netflix, Inc.* | | | 24,800 | | | | 22,104,736 | |
Sea Ltd. (Singapore), ADR* | | | 2,000 | | | | 212,200 | |
Spotify Technology SA* | | | 100 | | | | 44,738 | |
Walt Disney Co. (The) | | | 184,700 | | | | 20,566,345 | |
Warner Bros Discovery, Inc.* | | | 141,600 | | | | 1,496,712 | |
| | | | | | | | |
| | |
| | | | | | | 44,550,731 | |
| | | | | | | | |
Financial Services — 2.5% | | | | | | | | |
Berkshire Hathaway, Inc. (Class B Stock)*(a) | | | 97,150 | | | | 44,036,152 | |
Fidelity National Information Services, Inc. | | | 130,700 | | | | 10,556,639 | |
Financial Partners Group Co. Ltd. (Japan) | | | 1,600 | | | | 29,184 | |
Industrivarden AB (Sweden) (Class A Stock) | | | 188 | | | | 5,943 | |
Investor AB (Sweden) (Class B Stock) | | | 8,517 | | | | 225,589 | |
Mastercard, Inc. (Class A Stock) | | | 64,100 | | | | 33,753,137 | |
PayPal Holdings, Inc.* | | | 204,400 | | | | 17,445,540 | |
Visa, Inc. (Class A Stock) | | | 65,200 | | | | 20,605,808 | |
| | | | | | | | |
| | |
| | | | | | | 126,657,992 | |
| | | | | | | | |
| | | | | | | | |
| | | Shares | | | Value | |
COMMON STOCKS (continued) | |
Food Products — 0.5% | | | | | | | | |
Associated British Foods PLC (United Kingdom) | | | 3,822 | | | $ | 97,493 | |
Conagra Brands, Inc. | | | 233,100 | | | | 6,468,525 | |
General Mills, Inc. | | | 141,800 | | | | 9,042,586 | |
Ingredion, Inc. | | | 58,800 | | | | 8,088,528 | |
J.M. Smucker Co. (The) | | | 13,000 | | | | 1,431,560 | |
Nestle SA. | | | 2,922 | | | | 239,730 | |
Nippn Corp. (Japan) | | | 500 | | | | 6,929 | |
Riken Vitamin Co. Ltd. (Japan) | | | 300 | | | | 4,656 | |
WH Group Ltd. (Hong Kong), 144A | | | 173,000 | | | | 133,320 | |
Wilmar International Ltd. (China) | | | 48,800 | | | | 110,763 | |
| | | | | | | | |
| | |
| | | | | | | 25,624,090 | |
| | | | | | | | |
Ground Transportation — 0.5% | | | | | | | | |
CSX Corp. | | | 80,500 | | | | 2,597,735 | |
Norfolk Southern Corp. | | | 10,400 | | | | 2,440,880 | |
Uber Technologies, Inc.* | | | 229,300 | | | | 13,831,376 | |
Union Pacific Corp. | | | 19,000 | | | | 4,332,760 | |
| | | | | | | | |
| | |
| | | | | | | 23,202,751 | |
| | | | | | | | |
Health Care Equipment & Supplies — 1.4% | | | | | |
Abbott Laboratories | | | 190,500 | | | | 21,547,455 | |
Becton, Dickinson & Co. | | | 30,200 | | | | 6,851,474 | |
Boston Scientific Corp.* | | | 121,500 | | | | 10,852,380 | |
Demant A/S (Denmark)* | | | 153 | | | | 5,631 | |
Fisher & Paykel Healthcare Corp. Ltd. (New Zealand) | | | 4,000 | | | | 85,973 | |
Hoya Corp. (Japan) | | | 800 | | | | 99,285 | |
Intuitive Surgical, Inc.* | | | 17,100 | | | | 8,925,516 | |
Medtronic PLC. | | | 247,200 | | | | 19,746,336 | |
STERIS PLC | | | 19,200 | | | | 3,946,752 | |
| | | | | | | | |
| | |
| | | | | | | 72,060,802 | |
| | | | | | | | |
Health Care Providers & Services — 1.1% | | | | | |
Ambea AB (Sweden), 144A | | | 1,525 | | | | 13,287 | |
Centene Corp.* | | | 278,100 | | | | 16,847,298 | |
Cigna Group (The) | | | 39,700 | | | | 10,962,758 | |
Fresenius Medical Care AG (Germany) | | | 3,104 | | | | 141,328 | |
McKesson Corp. | | | 12,700 | | | | 7,237,857 | |
Medipal Holdings Corp. (Japan) | | | 800 | | | | 12,031 | |
Quest Diagnostics, Inc. | | | 39,400 | | | | 5,943,884 | |
Sonic Healthcare Ltd. (Australia) | | | 448 | | | | 7,472 | |
UnitedHealth Group, Inc. | | | 31,900 | | | | 16,136,934 | |
| | | | | | | | |
| | |
| | | | | | | 57,302,849 | |
| | | | | | | | |
Health Care REITs — 0.1% | | | | | | | | |
Ventas, Inc. | | | 77,500 | | | | 4,563,975 | |
| | | | | | | | |
Health Care Technology — 0.0% | | | | | | | | |
Pro Medicus Ltd. (Australia) | | | 210 | | | | 32,439 | |
| | | | | | | | |
Hotels, Restaurants & Leisure — 1.1% | | | | | |
Accor SA (France) | | | 533 | | | | 25,924 | |
Aristocrat Leisure Ltd. (Australia) | | | 2,439 | | | | 103,000 | |
Booking Holdings, Inc. | | | 4,700 | | | | 23,351,574 | |
Chipotle Mexican Grill, Inc.* | | | 224,700 | | | | 13,549,410 | |
Compass Group PLC (United Kingdom) | | | 523 | | | | 17,402 | |
Darden Restaurants, Inc.(a) | | | 60,600 | | | | 11,313,414 | |
SEE NOTES TO FINANCIAL STATEMENTS.
A66
| | | | |
| | PSF PGIM FLEXIBLE MANAGED PORTFOLIO (CONTINUED) | | |
SCHEDULE OF INVESTMENTS | | | | as of December 31, 2024 |
| | | | | | | | |
| | | Shares | | | Value | |
|
COMMON STOCKS (continued) | |
Hotels, Restaurants & Leisure (cont’d.) | |
La Francaise des Jeux SACA (France), 144A | | | 3,205 | | | $ | 123,426 | |
MGM Resorts International*(a) | | | 158,800 | | | | 5,502,420 | |
TUI AG (Germany)* | | | 2,050 | | | | 17,777 | |
Zensho Holdings Co. Ltd. (Japan) | | | 600 | | | | 33,980 | |
| | | | | | | | |
| | |
| | | | | | | 54,038,327 | |
| | | | | | | | |
Household Durables — 0.1% | | | | | | | | |
Breville Group Ltd. (Australia) | | | 572 | | | | 12,494 | |
Garmin Ltd.(a) | | | 11,100 | | | | 2,289,486 | |
JVCKenwood Corp. (Japan) | | | 3,200 | | | | 35,240 | |
Lennar Corp. (Class A Stock) | | | 6,200 | | | | 845,494 | |
PulteGroup, Inc. | | | 7,700 | | | | 838,530 | |
Sony Group Corp. (Japan) | | | 11,400 | | | | 240,261 | |
| | | | | | | | |
| | |
| | | | | | | 4,261,505 | |
| | | | | | | | |
Household Products — 0.6% | | | | | | | | |
Colgate-Palmolive Co. | | | 173,800 | | | | 15,800,158 | |
Essity AB (Sweden) (Class B Stock) | | | 6,950 | | | | 185,831 | |
Henkel AG & Co. KGaA (Germany) | | | 144 | | | | 11,095 | |
Procter & Gamble Co. (The) | | | 92,405 | | | | 15,491,698 | |
Reckitt Benckiser Group PLC (United Kingdom) | | | 1,036 | | | | 62,710 | |
| | | | | | | | |
| | |
| | | | | | | 31,551,492 | |
| | | | | | | | |
Independent Power & Renewable Electricity Producers — 0.2% | |
AES Corp. (The) | | | 680,100 | | | | 8,752,887 | |
| | | | | | | | |
Industrial Conglomerates — 0.4% | | | | | | | | |
3M Co. | | | 143,000 | | | | 18,459,870 | |
Hitachi Ltd. (Japan) | | | 8,200 | | | | 200,818 | |
Siemens AG (Germany) | | | 1,346 | | | | 262,463 | |
| | | | | | | | |
| | |
| | | | | | | 18,923,151 | |
| | | | | | | | |
Industrial REITs — 0.2% | | | | | | | | |
Goodman Group (Australia) | | | 6,096 | | | | 134,002 | |
Prologis, Inc. | | | 108,000 | | | | 11,415,600 | |
| | | | | | | | |
| | |
| | | | | | | 11,549,602 | |
| | | | | | | | |
Insurance — 1.1% | | | | | | | | |
Ageas SA/NV (Belgium) | | | 2,260 | | | | 109,882 | |
AIA Group Ltd. (Hong Kong) | | | 23,600 | | | | 169,516 | |
Allianz SE (Germany) | | | 475 | | | | 145,997 | |
Allstate Corp. (The) | | | 79,000 | | | | 15,230,410 | |
American International Group, Inc. | | | 12,800 | | | | 931,840 | |
Assurant, Inc. | | | 29,100 | | | | 6,204,702 | |
Aviva PLC (United Kingdom) | | | 22,491 | | | | 131,822 | |
AXA SA (France) | | | 7,147 | | | | 254,359 | |
First American Financial Corp. | | | 74,600 | | | | 4,658,024 | |
Hannover Rueck SE (Germany) | | | 92 | | | | 23,039 | |
Insurance Australia Group Ltd. (Australia) | | | 5,541 | | | | 28,981 | |
Japan Post Insurance Co. Ltd. (Japan) | | | 2,500 | | | | 45,920 | |
Marsh & McLennan Cos., Inc. | | | 41,200 | | | | 8,751,292 | |
Medibank Private Ltd. (Australia) | | | 63,944 | | | | 149,878 | |
MetLife, Inc. | | | 84,200 | | | | 6,894,296 | |
Muenchener Rueckversicherungs-Gesellschaft AG in Muenchen (Germany) | | | 311 | | | | 157,215 | |
| | | | | | | | |
| | | Shares | | | Value | |
|
COMMON STOCKS (continued) | |
Insurance (cont’d.) | |
Progressive Corp. (The) | | | 24,100 | | | $ | 5,774,601 | |
QBE Insurance Group Ltd. (Australia) | | | 1,722 | | | | 20,450 | |
Sompo Holdings, Inc. (Japan) | | | 6,400 | | | | 165,826 | |
Swiss Re AG | | | 90 | | | | 13,035 | |
Talanx AG (Germany) | | | 324 | | | | 27,557 | |
Travelers Cos., Inc. (The) | | | 15,800 | | | | 3,806,062 | |
Unipol Gruppo SpA (Italy) | | | 5,208 | | | | 65,040 | |
Willis Towers Watson PLC | | | 10,600 | | | | 3,320,344 | |
Zurich Insurance Group AG (Switzerland) | | | 19 | | | | 11,300 | |
| | | | | | | | |
| | |
| | | | | | | 57,091,388 | |
| | | | | | | | |
Interactive Media & Services — 4.1% | |
Alphabet, Inc. (Class A Stock) | | | 370,800 | | | | 70,192,440 | |
Alphabet, Inc. (Class C Stock) | | | 306,640 | | | | 58,396,522 | |
Meta Platforms, Inc. (Class A Stock) | | | 132,550 | | | | 77,609,350 | |
Scout24 SE (Germany), 144A | | | 290 | | | | 25,589 | |
| | | | | | | | |
| | |
| | | | | | | 206,223,901 | |
| | | | | | | | |
IT Services — 0.6% | | | | | | | | |
Accenture PLC (Ireland) (Class A Stock) | | | 20,500 | | | | 7,211,695 | |
Cognizant Technology Solutions Corp. (Class A Stock) | | | 211,200 | | | | 16,241,280 | |
Indra Sistemas SA (Spain) | | | 392 | | | | 6,925 | |
International Business Machines Corp.(a) | | | 16,900 | | | | 3,715,127 | |
Snowflake, Inc. (Class A Stock)* | | | 7,200 | | | | 1,111,752 | |
Wix.com Ltd. (Israel)* | | | 600 | | | | 128,730 | |
| | | | | | | | |
| | |
| | | | | | | 28,415,509 | |
| | | | | | | | |
Leisure Products — 0.0% | | | | | | | | |
Bandai Namco Holdings, Inc. (Japan) | | | 7,800 | | | | 185,993 | |
Tomy Co. Ltd. (Japan) | | | 600 | | | | 17,185 | |
| | | | | | | | |
| | |
| | | | | | | 203,178 | |
| | | | | | | | |
Life Sciences Tools & Services — 0.8% | |
Danaher Corp. | | | 58,000 | | | | 13,313,900 | |
Thermo Fisher Scientific, Inc. | | | 47,200 | | | | 24,554,856 | |
| | | | | | | | |
| | |
| | | | | | | 37,868,756 | |
| | | | | | | | |
Machinery — 0.9% | | | | | | | | |
Alfa Laval AB (Sweden) | | | 940 | | | | 39,344 | |
Allison Transmission Holdings, Inc. | | | 112,800 | | | | 12,189,168 | |
Atlas Copco AB (Sweden) (Class B Stock) | | | 2,517 | | | | 34,007 | |
Cargotec OYJ (Finland) (Class B Stock) | | | 126 | | | | 6,677 | |
Caterpillar, Inc. | | | 3,800 | | | | 1,378,488 | |
Cummins, Inc. | | | 2,500 | | | | 871,500 | |
Deere & Co.(a) | | | 2,100 | | | | 889,770 | |
Donaldson Co., Inc. | | | 19,300 | | | | 1,299,855 | |
Epiroc AB (Sweden) (Class B Stock) | | | 550 | | | | 8,581 | |
FANUC Corp. (Japan) | | | 4,300 | | | | 112,329 | |
Flowserve Corp. | | | 251,600 | | | | 14,472,032 | |
GEA Group AG (Germany) | | | 1,647 | | | | 81,812 | |
Glory Ltd. (Japan) | | | 800 | | | | 13,081 | |
Knorr-Bremse AG (Germany) | | | 270 | | | | 19,597 | |
SEE NOTES TO FINANCIAL STATEMENTS.
A67
| | | | |
| | PSF PGIM FLEXIBLE MANAGED PORTFOLIO (CONTINUED) | | |
SCHEDULE OF INVESTMENTS | | | | as of December 31, 2024 |
| | | | | | | | |
| | | Shares | | | Value | |
|
COMMON STOCKS (continued) | |
Machinery (cont’d.) | | | | | | | | |
Komatsu Ltd. (Japan) | | | 3,800 | | | $ | 103,521 | |
Makita Corp. (Japan) | | | 3,400 | | | | 103,391 | |
Namura Shipbuilding Co. Ltd. (Japan) | | | 2,700 | | | | 29,345 | |
Pentair PLC | | | 107,700 | | | | 10,838,928 | |
Rational AG (Germany) | | | 57 | | | | 48,821 | |
Schindler Holding AG (Switzerland) | | | 35 | | | | 9,548 | |
Schindler Holding AG (Switzerland) | | | | | | | | |
(Part. Cert.) | | | 56 | | | | 15,472 | |
Volvo AB (Sweden) (Class A Stock) | | | 297 | | | | 7,259 | |
Volvo AB (Sweden) (Class B Stock) | | | 695 | | | | 16,890 | |
Wartsila OYJ Abp (Finland) | | | 4,272 | | | | 75,711 | |
| | | | | | | | |
| | |
| | | | | | | 42,665,127 | |
| | | | | | | | |
Marine Transportation — 0.0% | | | | | | | | |
AP Moller - Maersk A/S (Denmark) (Class A Stock) | | | 4 | | | | 6,435 | |
Kawasaki Kisen Kaisha Ltd. (Japan) | | | 11,900 | | | | 169,299 | |
| | | | | | | | |
| | |
| | | | | | | 175,734 | |
| | | | | | | | |
Media — 0.2% | | | | | | | | |
Comcast Corp. (Class A Stock) | | | 235,700 | | | | 8,845,821 | |
JCDecaux SE (France)* | | | 546 | | | | 8,564 | |
Publicis Groupe SA (France) | | | 1,665 | | | | 177,255 | |
| | | | | | | | |
| | |
| | | | | | | 9,031,640 | |
| | | | | | | | |
Metals & Mining — 0.2% | | | | | | | | |
BHP Group Ltd. (Australia) | | | 12,208 | | | | 297,811 | |
Boliden AB (Sweden) | | | 2,592 | | | | 72,926 | |
Fortescue Ltd. (Australia) | | | 6,592 | | | | 74,230 | |
Freeport-McMoRan, Inc. | | | 186,200 | | | | 7,090,496 | |
Mitsui Mining & Smelting Co. Ltd. (Japan) | | | 400 | | | | 11,732 | |
Nippon Steel Corp. (Japan) | | | 2,300 | | | | 46,220 | |
Northern Star Resources Ltd. (Australia) | | | 7,635 | | | | 72,541 | |
Rio Tinto Ltd. (Australia) | | | 576 | | | | 41,767 | |
Rio Tinto PLC (Australia) | | | 2,801 | | | | 165,343 | |
| | | | | | | | |
| | |
| | | | | | | 7,873,066 | |
| | | | | | | | |
Multi-Utilities — 0.4% | | | | | | | | |
AGL Energy Ltd. (Australia) | | | 3,468 | | | | 24,183 | |
Centrica PLC (United Kingdom) | | | 99,247 | | | | 165,581 | |
CMS Energy Corp. | | | 96,100 | | | | 6,405,065 | |
DTE Energy Co. | | | 98,800 | | | | 11,930,100 | |
E.ON SE (Germany) | | | 3,494 | | | | 40,699 | |
Engie SA (France) | | | 12,133 | | | | 192,422 | |
Sembcorp Industries Ltd. (Singapore) | | | 2,900 | | | | 11,732 | |
| | | | | | | | |
| | |
| | | | | | | 18,769,782 | |
| | | | | | | | |
Oil, Gas & Consumable Fuels — 1.8% | |
Chevron Corp.(a) | | | 44,100 | | | | 6,387,444 | |
ConocoPhillips | | | 117,800 | | | | 11,682,226 | |
Coterra Energy, Inc. | | | 71,000 | | | | 1,813,340 | |
ENEOS Holdings, Inc. (Japan) | | | 10,700 | | | | 56,134 | |
EOG Resources, Inc. | | | 11,200 | | | | 1,372,896 | |
Exxon Mobil Corp. | | | 349,400 | | | | 37,584,958 | |
Idemitsu Kosan Co. Ltd. (Japan) | | | 18,600 | | | | 122,519 | |
Phillips 66 | | | 7,600 | | | | 865,868 | |
| | | | | | | | |
| | | Shares | | | Value | |
COMMON STOCKS (continued) | | | | | | | | |
Oil, Gas & Consumable Fuels (cont’d.) | | | | | | | | |
Shell PLC | | | 7,997 | | | $ | 249,274 | |
Texas Pacific Land Corp.(a) | | | 900 | | | | 995,364 | |
TotalEnergies SE (France) | | | 4,261 | | | | 237,401 | |
Valero Energy Corp.(a) | | | 106,800 | | | | 13,092,612 | |
Williams Cos., Inc. (The) | | | 321,100 | | | | 17,377,932 | |
| | | | | | | | |
| | |
| | | | | | | 91,837,968 | |
| | | | | | | | |
Passenger Airlines — 0.2% | | | | | | | | |
ANA Holdings, Inc. (Japan) | | | 2,000 | | | | 36,299 | |
Japan Airlines Co. Ltd. (Japan) | | | 4,600 | | | | 72,516 | |
Qantas Airways Ltd. (Australia)* | | | 13,746 | | | | 76,097 | |
United Airlines Holdings, Inc.* | | | 105,500 | | | | 10,244,050 | |
| | | | | | | | |
| | |
| | | | | | | 10,428,962 | |
| | | | | | | | |
Personal Care Products — 0.0% | | | | | | | | |
Unilever PLC (United Kingdom) | | | 5,983 | | | | 339,958 | |
| | | | | | | | |
Pharmaceuticals — 2.1% | | | | | | | | |
AstraZeneca PLC (United Kingdom) | | | 1,911 | | | | 249,156 | |
Chugai Pharmaceutical Co. Ltd. (Japan) | | | 2,000 | | | | 88,162 | |
Daiichi Sankyo Co. Ltd. (Japan) | | | 2,100 | | | | 57,463 | |
Elanco Animal Health, Inc.* | | | 171,300 | | | | 2,074,443 | |
Eli Lilly & Co. | | | 54,300 | | | | 41,919,600 | |
GSK PLC | | | 13,710 | | | | 231,251 | |
Hikma Pharmaceuticals PLC (Jordan) | | | 1,993 | | | | 49,689 | |
Ipsen SA (France) | | | 566 | | | | 64,875 | |
Johnson & Johnson | | | 211,448 | | | | 30,579,610 | |
Kyowa Kirin Co. Ltd. (Japan) | | | 3,300 | | | | 49,625 | |
Merck & Co., Inc. | | | 162,600 | | | | 16,175,448 | |
Novartis AG (Switzerland) | | | 4,702 | | | | 457,774 | |
Novo Nordisk A/S (Denmark) (Class B Stock) | | | 5,330 | | | | 459,882 | |
Orion OYJ (Finland) (Class B Stock) | | | 1,064 | | | | 47,199 | |
Otsuka Holdings Co. Ltd. (Japan) | | | 500 | | | | 27,200 | |
Pfizer, Inc. | | | 406,300 | | | | 10,779,139 | |
Roche Holding AG | | | 1,459 | | | | 407,946 | |
Sanofi SA | | | 1,730 | | | | 168,175 | |
Shionogi & Co. Ltd. (Japan) | | | 10,900 | | | | 152,874 | |
Teva Pharmaceutical Industries Ltd. (Israel), ADR* | | | 800 | | | | 17,632 | |
| | | | | | | | |
| | |
| | | | | | | 104,057,143 | |
| | | | | | | | |
Professional Services — 0.3% | | | | | | | | |
Automatic Data Processing, Inc. | | | 24,800 | | | | 7,259,704 | |
Computershare Ltd. (Australia) | | | 5,368 | | | | 112,763 | |
Dun & Bradstreet Holdings, Inc. | | | 287,700 | | | | 3,584,742 | |
Leidos Holdings, Inc. | | | 11,700 | | | | 1,685,502 | |
Recruit Holdings Co. Ltd. (Japan) | | | 1,700 | | | | 118,163 | |
Science Applications International Corp. | | | 10,500 | | | | 1,173,690 | |
Wolters Kluwer NV (Netherlands) | | | 33 | | | | 5,483 | |
| | | | | | | | |
| | |
| | | | | | | 13,940,047 | |
| | | | | | | | |
Real Estate Management & Development — 0.2% | |
Daito Trust Construction Co. Ltd. (Japan) | | | 600 | | | | 67,077 | |
Daiwa House Industry Co. Ltd. (Japan) | | | 2,400 | | | | 73,683 | |
Jones Lang LaSalle, Inc.* | | | 33,400 | | | | 8,454,876 | |
SEE NOTES TO FINANCIAL STATEMENTS.
A68
| | | | |
| | PSF PGIM FLEXIBLE MANAGED PORTFOLIO (CONTINUED) | | |
SCHEDULE OF INVESTMENTS | | | | as of December 31, 2024 |
| | | | | | | | |
| | | Shares | | | Value | |
COMMON STOCKS (continued) | |
Real Estate Management & Development (cont’d.) | |
LEG Immobilien SE (Germany) | | | 725 | | | $ | 61,494 | |
Mitsui Fudosan Co. Ltd. (Japan) | | | 5,700 | | | | 45,585 | |
Sumitomo Realty & Development Co. Ltd. (Japan) | | | 500 | | | | 15,549 | |
Vonovia SE (Germany) | | | 2,712 | | | | 82,561 | |
| | | | | | | | |
| | |
| | | | | | | 8,800,825 | |
| | | | | | | | |
Residential REITs — 0.2% | |
Equity Residential | | | 120,600 | | | | 8,654,256 | |
| | | | | | | | |
Retail REITs — 0.1% | |
Kimco Realty Corp. | | | 115,800 | | | | 2,713,194 | |
Klepierre SA (France) | | | 4,496 | | | | 129,483 | |
Scentre Group (Australia) | | | 7,020 | | | | 14,860 | |
Vicinity Ltd. (Australia) | | | 74,101 | | | | 96,037 | |
| | | | | | | | |
| | |
| | | | | | | 2,953,574 | |
| | | | | | | | |
Semiconductors & Semiconductor Equipment — 7.0% | |
Advantest Corp. (Japan) | | | 4,000 | | | | 227,435 | |
Applied Materials, Inc.(a) | | | 27,300 | | | | 4,439,799 | |
ASM International NV (Netherlands) | | | 224 | | | | 129,514 | |
ASML Holding NV (Netherlands) | | | 452 | | | | 316,596 | |
Broadcom, Inc. | | | 263,400 | | | | 61,066,656 | |
Kokusai Electric Corp. (Japan) | | | 1,100 | | | | 14,414 | |
Lam Research Corp. | | | 216,000 | | | | 15,601,680 | |
Lasertec Corp. (Japan) | | | 700 | | | | 65,622 | |
Marvell Technology, Inc. | | | 39,000 | | | | 4,307,550 | |
Micron Technology, Inc. | | | 170,800 | | | | 14,374,528 | |
NVIDIA Corp. | | | 1,590,600 | | | | 213,601,674 | |
Onto Innovation, Inc.* | | | 30,300 | | | | 5,050,101 | |
Qorvo, Inc.* | | | 118,600 | | | | 8,293,698 | |
QUALCOMM, Inc. | | | 156,600 | | | | 24,056,892 | |
SCREEN Holdings Co. Ltd. (Japan) | | | 2,000 | | | | 118,075 | |
Tokyo Electron Ltd. (Japan) | | | 1,700 | | | | 255,543 | |
| | | | | | | | |
| | |
| | | | | | | 351,919,777 | |
| | | | | | | | |
Software — 6.2% | |
Adobe, Inc.* | | | 34,050 | | | | 15,141,354 | |
Autodesk, Inc.* | | | 26,100 | | | | 7,714,377 | |
Crowdstrike Holdings, Inc. (Class A Stock)*(a) | | | 16,500 | | | | 5,645,640 | |
Fortinet, Inc.* | | | 69,600 | | | | 6,575,808 | |
Gen Digital, Inc. | | | 52,000 | | | | 1,423,760 | |
Gitlab, Inc. (Class A Stock)* | | | 38,400 | | | | 2,163,840 | |
Intuit, Inc. | | | 14,700 | | | | 9,238,950 | |
Microsoft Corp. | | | 425,900 | | | | 179,516,850 | |
Monday.com Ltd.* | | | 100 | | | | 23,544 | |
Nice Ltd. (Israel)* | | | 466 | | | | 79,138 | |
Oracle Corp. | | | 80,500 | | | | 13,414,520 | |
Palantir Technologies, Inc. (Class A Stock)* | | | 90,100 | | | | 6,814,263 | |
Salesforce, Inc. | | | 101,300 | | | | 33,867,629 | |
SAP SE (Germany) | | | 1,608 | | | | 395,527 | |
ServiceNow, Inc.* | | | 26,200 | | | | 27,775,144 | |
Technology One Ltd. (Australia) | | | 700 | | | | 13,521 | |
Teradata Corp.* | | | 45,000 | | | | 1,401,750 | |
Xero Ltd. (New Zealand)* | | | 1,092 | | | | 113,637 | |
| | | | | | | | |
| | |
| | | | | | | 311,319,252 | |
| | | | | | | | |
| | | | | | | | |
| | | Shares | | | Value | |
COMMON STOCKS (continued) | |
Specialized REITs — 0.5% | |
American Tower Corp. | | | 17,900 | | | $ | 3,283,039 | |
Digital Realty Trust, Inc. | | | 19,500 | | | | 3,457,935 | |
Equinix, Inc. | | | 8,900 | | | | 8,391,721 | |
Public Storage | | | 35,400 | | | | 10,600,176 | |
| | | | | | | | |
| | |
| | | | | | | 25,732,871 | |
| | | | | | | | |
Specialty Retail — 1.0% | |
ABC-Mart, Inc. (Japan) | | | 300 | | | | 6,052 | |
Carvana Co.* | | | 56,000 | | | | 11,388,160 | |
Fast Retailing Co. Ltd. (Japan) | | | 200 | | | | 67,468 | |
Home Depot, Inc. (The)(a) | | | 30,700 | | | | 11,941,993 | |
Industria de Diseno Textil SA (Spain) | | | 4,599 | | | | 235,579 | |
JB Hi-Fi Ltd. (Australia) | | | 297 | | | | 16,992 | |
Lowe’s Cos., Inc. | | | 83,100 | | | | 20,509,080 | |
TJX Cos., Inc. (The) | | | 43,000 | | | | 5,194,830 | |
Zalando SE (Germany), 144A* | | | 4,350 | | | | 145,522 | |
| | | | | | | | |
| | |
| | | | | | | 49,505,676 | |
| | | | | | | | |
Technology Hardware, Storage & Peripherals — 4.9% | |
Apple, Inc. | | | 966,000 | | | | 241,905,720 | |
Hewlett Packard Enterprise Co. | | | 251,700 | | | | 5,373,795 | |
Logitech International SA (Switzerland) | | | 2,020 | | | | 166,743 | |
| | | | | | | | |
| | |
| | | | | | | 247,446,258 | |
| | | | | | | | |
Textiles, Apparel & Luxury Goods — 0.3% | |
adidas AG (Germany) | | | 814 | | | | 200,215 | |
Asics Corp. (Japan) | | | 10,900 | | | | 212,635 | |
Deckers Outdoor Corp.* | | | 30,100 | | | | 6,113,009 | |
LVMH Moet Hennessy Louis Vuitton SE (France) | | | 184 | | | | 121,034 | |
Pandora A/S (Denmark) | | | 276 | | | | 50,496 | |
Ralph Lauren Corp. | | | 25,900 | | | | 5,982,382 | |
| | | | | | | | |
| | |
| | | | | | | 12,679,771 | |
| | | | | | | | |
Tobacco — 0.4% | |
Altria Group, Inc. | | | 356,300 | | | | 18,630,927 | |
British American Tobacco PLC (United Kingdom) | | | 3,126 | | | | 112,801 | |
Imperial Brands PLC (United Kingdom) | | | 7,299 | | | | 233,414 | |
Japan Tobacco, Inc. (Japan) | | | 1,800 | | | | 46,175 | |
Philip Morris International, Inc. | | | 22,900 | | | | 2,756,015 | |
| | | | | | | | |
| | |
| | | | | | | 21,779,332 | |
| | | | | | | | |
Trading Companies & Distributors — 0.1% | |
AerCap Holdings NV (Ireland) | | | 1,900 | | | | 181,830 | |
Bunzl PLC (United Kingdom) | | | 187 | | | | 7,700 | |
Mitsubishi Corp. (Japan) | | | 2,000 | | | | 32,723 | |
Mitsui & Co. Ltd. (Japan) | | | 300 | | | | 6,222 | |
Toyota Tsusho Corp. (Japan) | | | 1,500 | | | | 26,527 | |
United Rentals, Inc.(a) | | | 1,200 | | | | 845,328 | |
W.W. Grainger, Inc. | | | 1,900 | | | | 2,002,695 | |
| | | | | | | | |
| | |
| | | | | | | 3,103,025 | |
| | | | | | | | |
Wireless Telecommunication Services — 0.2% | |
SoftBank Group Corp. (Japan) | | | 2,600 | | | | 148,579 | |
SEE NOTES TO FINANCIAL STATEMENTS.
A69
| | | | |
| | PSF PGIM FLEXIBLE MANAGED PORTFOLIO (CONTINUED) | | |
SCHEDULE OF INVESTMENTS | | | | as of December 31, 2024 |
| | | | | | | | |
| | | Shares | | | Value | |
COMMON STOCKS (continued) | |
Wireless Telecommunication Services (cont’d.) | |
T-Mobile US, Inc. | | | 43,800 | | | $ | 9,667,974 | |
| | | | | | | | |
| | |
| | | | | | | 9,816,553 | |
| | | | | | | | |
TOTAL COMMON STOCKS
(cost $1,819,721,998) | | | | | | | 3,036,608,015 | |
| | | | | | | | |
PREFERRED STOCKS — 0.0% | |
Automobiles — 0.0% | |
Bayerische Motoren Werke AG (Germany) (PRFC) | | | 87 | | | | 6,518 | |
| | | | | | | | |
Banks — 0.0% | |
Citigroup Capital XIII, 11.221%(c),
3 Month SOFR + 6.632%, Maturing 10/30/40 | | | 22,000 | | | | 659,340 | |
| | | | | | | | |
Household Products — 0.0% | |
Henkel AG & Co. KGaA (Germany) (PRFC) | | | 1,983 | | | | 173,981 | |
| | | | | | | | |
| | |
TOTAL PREFERRED STOCKS
(cost $712,486) | | | | | | | 839,839 | |
| | | | | | | | |
UNAFFILIATED EXCHANGE-TRADED FUND — 0.0% | |
iShares MSCI EAFE ETF
(cost $28,543) | | | 588 | | | | 44,459 | |
| | | | | | | | |
| | | | | | | | | | | | | | |
Interest Rate | | Maturity
Date | | | | Principal Amount (000)# | | | | |
|
ASSET-BACKED SECURITIES — 7.5% | |
Automobiles — 1.7% | | | | | | | | | | |
AmeriCredit Automobile Receivables Trust, | | | | | |
Series 2020-03, Class C | |
1.060% | | 08/18/26 | | | | | | | 4 | | | | 4,464 | |
Series 2021-02, Class C | |
1.010% | | 01/19/27 | | | | | | | 1,300 | | | | 1,273,589 | |
Series 2021-02, Class D | |
1.290% | | 06/18/27 | | | | | | | 10 | | | | 9,650 | |
Series 2021-03, Class C | |
1.410% | | 08/18/27 | | | | | | | 1,300 | | | | 1,253,827 | |
Series 2023-01, Class C | |
5.800% | | 12/18/28 | | | | | | | 2,100 | | | | 2,138,000 | |
ARI Fleet Lease Trust, | | | | | |
Series 2024-A, Class A2, 144A | |
5.300% | | 11/15/32 | | | | | | | 1,448 | | | | 1,455,903 | |
Avis Budget Rental Car Funding AESOP LLC, | | | | | |
Series 2021-01A, Class A, 144A | |
1.380% | | 08/20/27 | | | | | | | 3,500 | | | | 3,336,734 | |
Series 2021-02A, Class A, 144A | |
1.660% | | 02/20/28 | | | | | | | 3,700 | | | | 3,486,881 | |
Series 2022-01A, Class A, 144A | |
3.830% | | 08/21/28 | | | | | | | 4,200 | | | | 4,098,156 | |
Series 2023-01A, Class A, 144A | |
5.250% | | 04/20/29 | | | | | | | 4,353 | | | | 4,395,858 | |
Series 2023-02A, Class A, 144A | |
5.200% | | 10/20/27 | | | | | | | 1,800 | | | | 1,809,312 | |
Series 2024-01A, Class A, 144A | |
5.360% | | 06/20/30 | | | | | | | 1,800 | | | | 1,824,967 | |
Series 2024-03A, Class A, 144A | |
5.230% | | 12/20/30 | | | | | | | 800 | | | | 805,015 | |
| | | | | | | | | | | | | | |
Interest Rate | | Maturity
Date | | | | Principal Amount (000)# | | | Value | |
|
ASSET-BACKED SECURITIES (continued) | |
Automobiles (cont’d.) | | | | | | | | | | | | |
BOF VII AL Funding Trust I, | | | | | |
Series 2023-CAR03, Class A2, 144A | |
6.291% | | 07/26/32 | | | | | | | 1,735 | | | $ | 1,763,262 | |
Series 2023-CAR03, Class B, 144A | |
6.632% | | 07/26/32 | | | | | | | 654 | | | | 663,693 | |
CarMax Auto Owner Trust, | | | | | |
Series 2021-01, Class D | |
1.280% | | 07/15/27 | | | | | | | 10 | | | | 9,914 | |
Series 2021-02, Class C | |
1.340% | | 02/16/27 | | | | | | | 1,100 | | | | 1,084,958 | |
Series 2021-04, Class C | |
1.380% | | 07/15/27 | | | | | | | 800 | | | | 773,387 | |
Series 2022-02, Class C | |
4.260% | | 12/15/27 | | | | | | | 25 | | | | 24,808 | |
Chesapeake Funding II LLC, | | | | | |
Series 2024-01A, Class A1, 144A | |
5.520% | | 05/15/36 | | | | | | | 1,248 | | | | 1,262,184 | |
Exeter Automobile Receivables Trust, | | | | | |
Series 2021-04A, Class C | |
1.460% | | 10/15/27 | | | | | | | — | (r) | | | 81 | |
Ford Credit Auto Owner Trust, | | | | | |
Series 2020-02, Class A, 144A | |
1.060% | | 04/15/33 | | | | | | | 1,300 | | | | 1,265,456 | |
Series 2021-02, Class B, 144A | |
1.910% | | 05/15/34 | | | | | | | 500 | | | | 472,023 | |
Series 2023-01, Class A, 144A | |
4.850% | | 08/15/35 | | | | | | | 4,100 | | | | 4,116,341 | |
Series 2023-02, Class A, 144A | |
5.280% | | 02/15/36 | | | | | | | 2,900 | | | | 2,952,632 | |
Series 2024-01, Class A, 144A | |
4.870% | | 08/15/36 | | | | | | | 5,900 | | | | 5,909,633 | |
GM Financial Automobile Leasing Trust, | | | | | |
Series 2023-01, Class C | |
5.760% | | 01/20/27 | | | | | | | 25 | | | | 25,144 | |
GM Financial Revolving Receivables Trust, | | | | | |
Series 2021-01, Class B, 144A | |
1.490% | | 06/12/34 | | | | | | | 200 | | | | 188,053 | |
Series 2024-01, Class A, 144A | |
4.980% | | 12/11/36 | | | | | | | 900 | | | | 907,661 | |
GMF Floorplan Owner Revolving Trust, | |
Series 2024-04A, Class A1, 144A | |
4.730% | | 11/15/29 | | | | | | | 3,500 | | | | 3,502,046 | |
Hertz Vehicle Financing III LLC, | | | | | | | | |
Series 2023-01A, Class A, 144A | |
5.490% | | 06/25/27 | | | | | | | 1,700 | | | | 1,710,522 | |
Hertz Vehicle Financing III LP, | | | | | | | | |
Series 2021-02A, Class A, 144A | |
1.680% | | 12/27/27 | | | | | | | 1,900 | | | | 1,783,146 | |
Hertz Vehicle Financing LLC, | | | | | | | | |
Series 2022-02A, Class A, 144A | |
2.330% | | 06/26/28 | | | | | | | 4,700 | | | | 4,414,034 | |
OneMain Direct Auto Receivables Trust, | |
Series 2019-01A, Class A, 144A | |
3.630% | | 09/14/27 | | | | | | | 2,500 | | | | 2,486,218 | |
Series 2021-01A, Class B, 144A | |
1.260% | | 07/14/28 | | | | | | | 2,600 | | | | 2,513,386 | |
Series 2023-01A, Class A, 144A | |
5.410% | | 11/14/29 | | | | | | | 4,700 | | | | 4,749,060 | |
SEE NOTES TO FINANCIAL STATEMENTS.
A70
| | | | |
| | PSF PGIM FLEXIBLE MANAGED PORTFOLIO (CONTINUED) | | |
SCHEDULE OF INVESTMENTS | | | | as of December 31, 2024 |
| | | | | | | | | | | | | | | | | | |
Interest Rate | | Maturity
Date | | | | | Principal
Amount
(000)# | | | Value | |
|
ASSET-BACKED SECURITIES (continued) | |
Automobiles (cont’d.) | | | | | | | | | |
Santander Drive Auto Receivables Trust, | |
Series 2021-02, Class D | | | | | | | | | |
1.350% | | | 07/15/27 | | | | | | | | | | 919 | | | $ | 909,976 | |
Series 2022-01, Class C | | | | | | | | | |
2.560% | | | 04/17/28 | | | | | | | | | | 435 | | | | 433,836 | |
Series 2023-01, Class C | | | | | | | | | |
5.090% | | | 05/15/30 | | | | | | | | | | 800 | | | | 802,831 | |
Series 2023-03, Class C | | | | | | | | | |
5.770% | | | 11/15/30 | | | | | | | | | | 1,500 | | | | 1,524,649 | |
Series 2023-04, Class C | | | | | | | | | |
6.040% | | | 12/15/31 | | | | | | | | | | 2,600 | | | | 2,655,892 | |
Series 2023-06, Class B | | | | | | | | | |
5.980% | | | 04/16/29 | | | | | | | | | | 700 | | | | 712,206 | |
Series 2023-06, Class C | | | | | | | | | |
6.400% | | | 03/17/31 | | | | | | | | | | 300 | | | | 309,347 | |
Series 2024-02, Class C | | | | | | | | | |
5.840% | | | 06/17/30 | | | | | | | | | | 500 | | | | 509,843 | |
Series 2024-04, Class C | | | | | | | | | |
4.950% | | | 04/15/30 | | | | | | | | | | 3,000 | | | | 2,989,348 | |
SFS Auto Receivables Securitization Trust, | |
Series 2023-01A, Class B, 144A | | | | | | | | | |
5.710% | | | 01/22/30 | | | | | | | | | | 300 | | | | 305,054 | |
Series 2023-01A, Class C, 144A | | | | | | | | | |
5.970% | | | 02/20/31 | | | | | | | | | | 500 | | | | 511,369 | |
Wheels Fleet Lease Funding LLC, | |
Series 2023-01A, Class A, 144A | | | | | | | | | |
5.800% | | | 04/18/38 | | | | | | | | | | 3,231 | | | | 3,251,285 | |
Series 2024-01A, Class A1, 144A | | | | | | | | | |
5.490% | | | 02/18/39 | | | | | | | | | | 2,500 | | | | 2,528,528 | |
World Omni Select Auto Trust, | |
Series 2021-A, Class C | | | | | | | | | |
1.090% | | | 11/15/27 | | | | | | | | | | 600 | | | | 585,199 | |
| | | | | | | | | | | | | | | | | | |
| | | | | |
| | | | | | | | | | | | | | | | | 86,499,361 | |
| | | | | | | | | | | | | | | | | | |
Collateralized Loan Obligations — 4.8% | |
AGL CLO Ltd. (Cayman Islands), | |
Series 2020-09A, Class AR, 144A, 3 Month SOFR + 1.530%
(Cap N/A, Floor 1.530%) | |
6.147%(c) | | | 04/20/37 | | | | | | | | | | 11,250 | | | | 11,301,497 | |
Anchorage Capital CLO Ltd. (Cayman Islands), | |
Series 2022-24A, Class A1R, 144A, 3 Month SOFR + 1.430%
(Cap N/A, Floor 1.430%) | |
6.086%(c) | | | 07/15/37 | | | | | | | | | | 8,500 | | | | 8,565,843 | |
Anchorage Capital Europe CLO DAC (Ireland), | |
Series 06A, Class AR, 144A, 3 Month EURIBOR + 1.750%
(Cap N/A, Floor 1.750%) | |
4.951%(c) | | | 01/22/38 | | | | | | EUR | | | | 3,250 | | | | 3,386,192 | |
Balboa Bay Loan Funding Ltd. (Cayman Islands), | |
Series 2021-01A, Class A, 144A, 3 Month SOFR + 1.462%
(Cap N/A, Floor 1.462%) | |
6.079%(c) | | | 07/20/34 | | | | | | | | | | 3,750 | | | | 3,751,205 | |
Barrow Hanley CLO Ltd. (Cayman Islands), | |
Series 2024-03A, Class A1, 144A, 3 Month SOFR + 1.620%
(Cap N/A, Floor 1.620%) | |
6.237%(c) | | | 04/20/37 | | | | | | | | | | 11,250 | | | | 11,355,620 | |
| | | | | | | | | | | | | | | | |
Interest Rate | | Maturity
Date | | | | Principal
Amount
(000)# | | | Value | |
|
ASSET-BACKED SECURITIES (continued) | |
Collateralized Loan Obligations (cont’d.) | | | | | |
Battalion CLO Ltd. (Cayman Islands), | | | | | |
Series 2016-10A, Class A1R2, 144A, 3 Month SOFR + 1.432%
(Cap N/A, Floor 1.170%) | |
6.066%(c) | | 01/25/35 | | | | | | | | | 700 | | | $ | 700,677 | |
BNPP AM Euro CLO DAC (Ireland), | | | | | |
Series 2018-01A, Class AR, 144A, 3 Month EURIBOR + 0.600% (Cap N/A, Floor 0.600%) | |
3.779%(c) | | 04/15/31 | | | | | EUR | | | | 2,997 | | | | 3,082,377 | |
Canyon Capital CLO Ltd. (Cayman Islands), | | | | | |
Series 2017-01A, Class AR, 144A, 3 Month SOFR + 1.262%
(Cap N/A, Floor 1.000%) | |
5.918%(c) | | 07/15/30 | | | | | | | | | 2,225 | | | | 2,227,080 | |
Carlyle Euro CLO DAC (Ireland), | | | | | |
Series 2021-02A, Class A1, 144A, 3 Month EURIBOR + 0.990% (Cap N/A, Floor 0.990%) | |
4.174%(c) | | 10/15/35 | | | | | EUR | | | | 5,000 | | | | 5,172,246 | |
Clover CLO Ltd. (Cayman Islands), | | | | | |
Series 2019-02A, Class AR, 144A, 3 Month SOFR + 1.362%
(Cap N/A, Floor 1.362%) | |
5.987%(c) | | 10/25/33 | | | | | | | | | 11,000 | | | | 11,019,121 | |
Crown City CLO (Cayman Islands), | | | | | |
Series 2022-04A, Class A1R, 144A, 3 Month SOFR + 1.610%
(Cap N/A, Floor 1.610%) | |
6.227%(c) | | 04/20/37 | | | | | | | | | 6,250 | | | | 6,276,874 | |
Elevation CLO Ltd. (Cayman Islands), | | | | | |
Series 2021-12A, Class A1R, 144A, 3 Month SOFR + 1.620%
(Cap N/A, Floor 1.620%) | |
6.237%(c) | | 04/20/37 | | | | | | | | | 7,000 | | | | 7,029,839 | |
Generate CLO Ltd. (Cayman Islands), | | | | | |
Series 08A, Class A1R2, 144A, 3 Month SOFR + 1.380%
(Cap N/A, Floor 1.380%) | |
5.922%(c) | | 01/20/38 | | | | | | | | | 11,750 | | | | 11,785,390 | |
Greenwood Park CLO Ltd. (Cayman Islands), | | | | | |
Series 2018-01A, Class A2, 144A, 3 Month SOFR + 1.272%
(Cap N/A, Floor 0.000%) | |
5.928%(c) | | 04/15/31 | | | | | | | | | 937 | | | | 938,487 | |
Greywolf CLO Ltd. (Cayman Islands), | | | | | |
Series 2018-01A, Class A1, 144A, 3 Month SOFR + 1.292%
(Cap N/A, Floor 0.000%) | |
5.909%(c) | | 04/26/31 | | | | | | | | | 1,737 | | | | 1,736,816 | |
ICG Euro CLO DAC (Ireland), | | | | | |
Series 2023-02A, Class A1, 144A, 3 Month EURIBOR + 1.730% (Cap N/A, Floor 1.730%) | |
4.802%(c) | | 01/26/38 | | | | | EUR | | | | 14,500 | | | | 15,109,717 | |
Jamestown CLO Ltd. (Cayman Islands), | | | | | |
Series 2019-14A, Class A1AR, 144A, 3 Month SOFR + 1.462%
(Cap N/A, Floor 1.200%) | |
6.079%(c) | | 10/20/34 | | | | | | | | | 4,875 | | | | 4,882,294 | |
LCM Ltd. (Cayman Islands), | | | | | |
Series 34A, Class A1, 144A, 3 Month SOFR + 1.432%
(Cap N/A, Floor 1.170%) | |
6.049%(c) | | 10/20/34 | | | | | | | | | 11,500 | | | | 11,502,209 | |
Madison Park Funding Ltd. (Cayman Islands), | | | | | |
Series 2019-37A, Class AR2, 144A, 3 Month SOFR + 1.530%
(Cap N/A, Floor 1.530%) | |
6.186%(c) | | 04/15/37 | | | | | | | | | 11,000 | | | | 11,047,894 | |
SEE NOTES TO FINANCIAL STATEMENTS.
A71
| | | | |
| | PSF PGIM FLEXIBLE MANAGED PORTFOLIO (CONTINUED) | | |
SCHEDULE OF INVESTMENTS | | | | as of December 31, 2024 |
| | | | | | | | | | | | | | | | |
Interest Rate | | Maturity
Date | | | | Principal
Amount
(000)# | | | Value | |
|
ASSET-BACKED SECURITIES (continued) | |
Collateralized Loan Obligations (cont’d.) | | | | | |
MidOcean Credit CLO (Cayman Islands), | |
Series 2014-03A, Class A1R, 144A, 3 Month SOFR + 1.382%
(Cap N/A, Floor 1.120%) | |
5.999%(c) | | 04/21/31 | | | | | | | | | 607 | | | $ | 607,715 | |
Monument CLO DAC (Ireland), | |
Series 01A, Class A, 144A, 3 Month EURIBOR + 1.590%
(Cap N/A, Floor 1.590%) | |
5.332%(c) | | 05/15/37 | | | | | EUR | | | | 11,000 | | | | 11,463,976 | |
Northwoods Capital Ltd. (Cayman Islands), | |
Series 2017-15A, Class A1R, 144A, 3 Month SOFR + 1.472%
(Cap N/A, Floor 1.472%) | |
5.826%(c) | | 06/20/34 | | | | | | | | | 9,500 | | | | 9,514,839 | |
Oaktree CLO Ltd. (Cayman Islands), | |
Series 2020-01A, Class AR, 144A, 3 Month SOFR + 1.412%
(Cap N/A, Floor 1.150%) | |
6.068%(c) | | 07/15/34 | | | | | | | | | 3,000 | | | | 3,005,121 | |
OFSI BSL CLO Ltd. (Cayman Islands), | |
Series 2024-13A, Class A1, 144A, 3 Month SOFR + 1.620%
(Cap N/A, Floor 1.620%) | |
6.237%(c) | | 04/20/37 | | | | | | | | | 8,000 | | | | 8,036,991 | |
OFSI BSL Ltd. (Cayman Islands), | |
Series 2023-12A, Class A1, 144A, 3 Month SOFR + 2.400%
(Cap N/A, Floor 2.400%) | |
7.017%(c) | | 01/20/35 | | | | | | | | | 7,000 | | | | 7,003,575 | |
Palmer Square CLO Ltd. (Cayman Islands), | |
Series 2014-01A, Class A1R2, 144A, 3 Month SOFR + 1.392%
(Cap N/A, Floor 1.130%) | |
6.039%(c) | | 01/17/31 | | | | | | | | | 43 | | | | 42,874 | |
Park Avenue Institutional Advisers CLO Ltd. (Cayman Islands), | |
Series 2018-01A, Class A1AR, 144A, 3 Month SOFR + 1.262%
(Cap N/A, Floor 1.000%) | |
5.879%(c) | | 10/20/31 | | | | | | | | | 3,082 | | | | 3,086,635 | |
Regatta Funding Ltd. (Cayman Islands), | |
Series 2016-01A, Class A1R2, 144A, 3 Month SOFR + 1.412%
(Cap N/A, Floor 1.150%) | |
5.766%(c) | | 06/20/34 | | | | | | | | | 5,500 | | | | 5,507,138 | |
Series 2017-01A, Class A1R, 144A, 3 Month SOFR + 1.550%
(Cap N/A, Floor 1.550%) | |
6.197%(c) | | 04/17/37 | | | | | | | | | 10,000 | | | | 10,048,010 | |
Sound Point CLO Ltd. (Cayman Islands), | |
Series 2013-01A, Class A1R, 144A, 3 Month SOFR + 1.332%
(Cap N/A, Floor 1.332%) | |
5.949%(c) | | 01/26/31 | | | | | | | | | 2,017 | | | | 2,018,534 | |
TCW CLO Ltd. (Cayman Islands), | |
Series 2020-01A, Class A1R3, 144A, 3 Month SOFR + 1.050%
(Cap N/A, Floor 0.000%) | |
0.000%(c) | | 04/20/34 | | | | | | | | | 8,500 | | | | 8,500,000 | |
Series 2021-02A, Class AS, 144A, 3 Month SOFR + 1.442%
(Cap N/A, Floor 1.180%) | |
6.067%(c) | | 07/25/34 | | | | | | | | | 6,750 | | | | 6,751,496 | |
Telos CLO Ltd. (Cayman Islands), | |
Series 2013-04A, Class AR, 144A, 3 Month SOFR + 1.502%
(Cap N/A, Floor 0.000%) | |
6.149%(c) | | 01/17/30 | | | | | | | | | 280 | | | | 280,011 | |
Tikehau US CLO Ltd. (Bermuda), | |
Series 2022-02A, Class A1R, 144A, 3 Month SOFR + 1.870%
(Cap N/A, Floor 1.870%) | |
6.487%(c) | | 01/20/36 | | | | | | | | | 11,000 | | | | 11,050,417 | |
| | | | | | | | | | | | | | | | |
Interest Rate | | Maturity
Date | | | | Principal
Amount
(000)# | | | Value | |
|
ASSET-BACKED SECURITIES (continued) | |
Collateralized Loan Obligations (cont’d.) | | | | | |
Toro European CLO DAC (Ireland), | |
Series 02A, Class ARR, 144A, 3 Month EURIBOR + 0.990%
(Cap N/A, Floor 0.990%) | |
4.076%(c) | | 07/25/34 | | | | | EUR | | | | 4,500 | | | $ | 4,658,827 | |
Trimaran Cavu Ltd., | |
Series 2019-01A, Class A1R, 144A, 3 Month SOFR + 1.190%
(Cap N/A, Floor 1.190%) | |
5.505%(c) | | 01/20/37 | | | | | | | | | 9,000 | | | | 9,000,000 | |
Venture CLO Ltd. (Cayman Islands), | |
Series 2021-42A, Class A1A, 144A, 3 Month SOFR + 1.392%
(Cap N/A, Floor 1.130%) | |
6.048%(c) | | 04/15/34 | | | | | | | | | 10,000 | | | | 10,010,094 | |
Wellfleet CLO Ltd., | |
Series 2017-03A, Class A1, 144A, 3 Month SOFR + 1.412%
(Cap N/A, Floor 1.150%) | |
6.059%(c) | | 01/17/31 | | | | | | | | | 823 | | | | 824,523 | |
| | | | | | | | | | | | | | | | |
| | | | | |
| | | | | | | | | | | | | | | 242,282,154 | |
| | | | | | | | | | | | | | | | |
Consumer Loans — 0.4% | | | | | |
Affirm Asset Securitization Trust, | |
Series 2024-A, Class 1A, 144A | |
5.610% | | 02/15/29 | | | | | | | | | 1,400 | | | | 1,410,927 | |
Series 2024-X02, Class A, 144A | |
5.220% | | 12/17/29 | | | | | | | | | 4,100 | | | | 4,105,929 | |
OneMain Financial Issuance Trust, | |
Series 2020-02A, Class A, 144A | |
1.750% | | 09/14/35 | | | | | | | | | 2,900 | | | | 2,785,359 | |
Series 2021-01A, Class A2, 144A, 30 Day Average SOFR + 0.760%
(Cap N/A, Floor 0.000%) | |
5.358%(c) | | 06/16/36 | | | | | | | | | 2,800 | | | | 2,805,909 | |
Series 2022-02A, Class A, 144A | |
4.890% | | 10/14/34 | | | | | | | | | 1,673 | | | | 1,673,712 | |
Series 2023-02A, Class A1, 144A | |
5.840% | | 09/15/36 | | | | | | | | | 5,400 | | | | 5,508,307 | |
| | | | | | | | | | | | | | | | |
| | | | | |
| | | | | | | | | | | | | | | 18,290,143 | |
| | | | | | | | | | | | | | | | |
Credit Cards — 0.2% | | | | | |
NewDay Funding (United Kingdom), | |
Series 2024-01A, Class A, 144A, SONIA + 1.180% (Cap N/A, Floor 0.000%) | |
5.888%(c) | | 03/15/32 | | | | | GBP | | | | 5,400 | | | | 6,800,267 | |
NewDay Funding Master Issuer PLC (United Kingdom), | |
Series 2024-02A, Class A, 144A, SONIA + 0.900% (Cap N/A, Floor 0.000%) | |
5.608%(c) | | 07/15/32 | | | | | GBP | | | | 2,100 | | | | 2,629,558 | |
| | | | | | | | | | | | | | | | |
| | | | | |
| | | | | | | | | | | | | | | 9,429,825 | |
| | | | | | | | | | | | | | | | |
Equipment — 0.1% | | | | | | | | | | | | | | |
MMAF Equipment Finance LLC, | |
Series 2017-B, Class A5, 144A | |
2.720% | | 06/15/40 | | | | | | | | | 477 | | | | 475,279 | |
Series 2019-A, Class A5, 144A | |
3.080% | | 11/12/41 | | | | | | | | | 810 | | | | 805,584 | |
Series 2019-B, Class A5, 144A | |
2.290% | | 11/12/41 | | | | | | | | | 2,400 | | | | 2,338,234 | |
| | | | | | | | | | | | | | | | |
| | | | | |
| | | | | | | | | | | | | | | 3,619,097 | |
| | | | | | | | | | | | | | | | |
SEE NOTES TO FINANCIAL STATEMENTS.
A72
| | | | |
| | PSF PGIM FLEXIBLE MANAGED PORTFOLIO (CONTINUED) | | |
SCHEDULE OF INVESTMENTS | | | | as of December 31, 2024 |
| | | | | | | | | | | | | | | | | | |
Interest Rate | | Maturity
Date | | | | | Principal
Amount
(000)# | | | Value | |
|
ASSET-BACKED SECURITIES (continued) | |
Home Equity Loans — 0.2% | | | | | | | | |
JPMorgan Mortgage Trust, | | | | | |
Series 2024-HE03, Class A1, 144A, 30 Day Average SOFR + 1.200%
(Cap N/A, Floor 0.000%) | |
5.805%(c) | | | 02/25/55 | | | | | | | | | | 3,244 | | | $ | 3,251,891 | |
RCKT Mortgage Trust, | | | | | |
Series 2024-CES01, Class A1A, 144A | |
6.025%(cc) | | | 02/25/44 | | | | | | | | | | 827 | | | | 830,041 | |
Series 2024-CES03, Class A1A, 144A | |
6.591%(cc) | | | 05/25/44 | | | | | | | | | | 1,760 | | | | 1,781,905 | |
Towd Point HE Trust, | | | | | |
Series 2023-01, Class A1A, 144A | |
6.875% | | | 02/25/63 | | | | | | | | | | 292 | | | | 291,741 | |
Towd Point Mortgage Trust, | | | | | |
Series 2023-CES02, Class A1A, 144A | |
7.294%(cc) | | | 10/25/63 | | | | | | | | | | 609 | | | | 619,763 | |
Series 2024-CES01, Class A1A, 144A | |
5.848%(cc) | | | 01/25/64 | | | | | | | | | | 162 | | | | 162,651 | |
Series 2024-CES02, Class A1A, 144A | |
6.125%(cc) | | | 02/25/64 | | | | | | | | | | 327 | | | | 329,472 | |
Series 2024-CES03, Class A1, 144A | |
6.290%(cc) | | | 05/25/64 | | | | | | | | | | 2,379 | | | | 2,399,969 | |
Series 2024-CES04, Class A1, 144A | |
5.122%(cc) | | | 09/25/64 | | | | | | | | | | 1,793 | | | | 1,776,383 | |
| | | | | | | | | | | | | | | | | | |
| | | | | |
| | | | | | | | | | | | | | | | | 11,443,816 | |
| | | | | | | | | | | | | | | | | | |
Other — 0.0% | | | | | | | | |
Home Partners of America Trust, | | | | | |
Series 2021-03, Class A, 144A | |
2.200% | | | 01/17/41 | | | | | | | | | | 777 | | | | 694,607 | |
| | | | | | | | | | | | | | | | | | |
Residential Mortgage-Backed Securities — 0.0% | |
TFS (Spain), | | | | | |
Series 2018-03, Class A1 | |
0.000%(s) | | | 04/16/40^ | | | | | | EUR | | | | — | (r) | | | 1 | |
Series 2018-03, Class A1, 1 Month EURIBOR + 3.250% | |
6.349%(c) | | | 03/15/26^ | | | | | | EUR | | | | 847 | | | | 653,877 | |
| | | | | | | | | | | | | | | | | | |
| | | | | |
| | | | | | | | | | | | | | | | | 653,878 | |
| | | | | | | | | | | | | | | | | | |
Student Loans — 0.1% | | | | | | | | |
Laurel Road Prime Student Loan Trust, | | | | | |
Series 2019-A, Class A2FX, 144A | |
2.730% | | | 10/25/48 | | | | | | | | | | 64 | | | | 63,621 | |
Navient Private Education Refi Loan Trust, | | | | | |
Series 2019-CA, Class A2, 144A | |
3.130% | | | 02/15/68 | | | | | | | | | | 401 | | | | 391,057 | |
Series 2020-BA, Class A2, 144A | |
2.120% | | | 01/15/69 | | | | | | | | | | 534 | | | | 503,297 | |
Pennsylvania Higher Education Assistance Agency, | | | | | |
Series 2021-01A, Class A, 144A, 30 Day Average SOFR + 0.644%
(Cap N/A, Floor 0.530%) | |
5.213%(c) | | | 05/25/70 | | | | | | | | | | 1,086 | | | | 1,074,881 | |
SoFi Professional Loan Program LLC, | | | | | |
Series 2019-A, Class A2FX, 144A | |
3.690% | | | 06/15/48 | | | | | | | | | | 340 | | | | 334,679 | |
Series 2019-B, Class A2FX, 144A | |
3.090% | | | 08/17/48 | | | | | | | | | | 443 | | | | 430,496 | |
Series 2019-C, Class A2FX, 144A | |
2.370% | | | 11/16/48 | | | | | | | | | | 717 | | | | 683,828 | |
| | | | | | | | | | | | | | | | |
Interest Rate | | Maturity
Date | | | | Principal
Amount
(000)# | | | Value | |
|
ASSET-BACKED SECURITIES (continued) | |
Student Loans (cont’d.) | | | | | | | | |
SoFi Professional Loan Program Trust, | | | | | |
Series 2018-B, Class A2FX, 144A | |
3.340% | | 08/25/47 | | | | | | | | | 221 | | | $ | 218,768 | |
Series 2020-A, Class A2FX, 144A | |
2.540% | | 05/15/46 | | | | | | | | | 939 | | | | 893,860 | |
| | | | | | | | | | | | | | | | |
| | | | | |
| | | | | | | | | | | | | | | 4,594,487 | |
| | | | | | | | | | | | | | | | |
TOTAL ASSET-BACKED SECURITIES
(cost $380,767,290) | | | | | | | | | | | 377,507,368 | |
| | | | | | | | | | | | | | | | |
|
COMMERCIAL MORTGAGE-BACKED SECURITIES — 5.4% | |
Arbor Multifamily Mortgage Securities Trust, | | | | | |
Series 2021-MF03, Class A3, 144A | |
2.168% | | 10/15/54 | | | | | | | | | 8,000 | | | | 7,244,524 | |
Series 2021-MF03, Class ASB, 144A | |
2.378% | | 10/15/54 | | | | | | | | | 3,800 | | | | 3,441,244 | |
BANK, | | | | | |
Series 2017-BNK04, Class A3 | |
3.362% | | 05/15/50 | | | | | | | | | 6,465 | | | | 6,263,486 | |
Series 2019-BN22, Class A3 | |
2.726% | | 11/15/62 | | | | | | | | | 5,400 | | | | 4,851,688 | |
Series 2020-BN25, Class A4 | |
2.399% | | 01/15/63 | | | | | | | | | 6,700 | | | | 5,926,264 | |
Series 2021-BN35, Class A3 | |
1.717% | | 06/15/64 | | | | | | | | | 4,900 | | | | 4,184,873 | |
Series 2021-BN35, Class ASB | |
2.067% | | 06/15/64 | | | | | | | | | 3,200 | | | | 2,863,467 | |
BANK5, | | | | | |
Series 2023-5YR01, Class A3 | |
6.260%(cc) | | 04/15/56 | | | | | | | | | 10,000 | | | | 10,327,228 | |
Series 2024-5YR08, Class A3 | |
5.884% | | 08/15/57 | | | | | | | | | 7,800 | | | | 8,015,367 | |
Series 2024-5YR09, Class A3 | |
5.614% | | 08/15/57 | | | | | | | | | 8,150 | | | | 8,292,210 | |
Series 2024-5YR10, Class A3 | |
5.302% | | 10/15/57 | | | | | | | | | 8,000 | | | | 8,037,759 | |
Series 2024-5YR11, Class A3 | |
5.893% | | 11/15/57 | | | | | | | | | 7,550 | | | | 7,767,143 | |
Series 2024-5YR12, Class A3 | |
5.902%(cc) | | 12/15/57 | | | | | | | | | 6,540 | | | | 6,737,082 | |
Barclays Commercial Mortgage Securities Trust, | | | | | |
Series 2018-C02, Class A4 | |
4.047% | | 12/15/51 | | | | | | | | | 5,400 | | | | 5,223,875 | |
Series 2019-BWAY, Class D, 144A, 1 Month SOFR + 2.274%
(Cap N/A, Floor 2.160%) | |
6.671%(c) | | 11/15/34 | | | | | | | | | 10 | | | | 149 | |
Series 2020-BID, Class A, 144A, 1 Month SOFR + 2.254%
(Cap N/A, Floor 2.140%) | |
6.652%(c) | | 10/15/37 | | | | | | | | | 20 | | | | 20,062 | |
Benchmark Mortgage Trust, | | | | | |
Series 2018-B03, Class A4 | |
3.761% | | 04/10/51 | | | | | | | | | 4,971 | | | | 4,800,001 | |
Series 2018-B08, Class A4 | |
3.963% | | 01/15/52 | | | | | | | | | 8,200 | | | | 7,939,433 | |
Series 2021-B24, Class A3 | |
2.010% | | 03/15/54 | | | | | | | | | 2,900 | | | | 2,581,640 | |
Series 2023-B38, Class A3 | |
5.793% | | 04/15/56 | | | | | | | | | 5,000 | | | | 5,147,763 | |
SEE NOTES TO FINANCIAL STATEMENTS.
A73
| | | | |
| | PSF PGIM FLEXIBLE MANAGED PORTFOLIO (CONTINUED) | | |
SCHEDULE OF INVESTMENTS | | | | as of December 31, 2024 |
| | | | | | | | | | | | | | | | | | | | |
| | | | | | | | | | | | Principal | | | | |
| Interest | | Maturity | | | | | | | | | Amount | | | | |
Rate | | Date | | | | | | | | | (000)# | | | Value | |
COMMERCIAL MORTGAGE-BACKED SECURITIES (continued) | |
Series 2023-B39, Class A2 | |
6.574%(cc) | | | 07/15/56 | | | | | | | | | | | | 5,000 | | | $ | 5,159,676 | |
Series 2024-V07, Class A3 | |
6.228%(cc) | | | 05/15/56 | | | | | | | | | | | | 7,500 | | | | 7,796,756 | |
Series 2024-V09, Class A3 | |
5.602% | | | 08/15/57 | | | | | | | | | | | | 7,800 | | | | 7,928,812 | |
Series 2024-V11, Class A3 | |
5.909%(cc) | | | 11/15/57 | | | | | | | | | | | | 8,330 | | | | 8,577,582 | |
BXP Trust, | | | | | | | | | | | | | | | | | | | | |
Series 2021-601L, Class A, 144A | |
2.618% | | | 01/15/44 | | | | | | | | | | | | 5,620 | | | | 4,619,994 | |
Citigroup Commercial Mortgage Trust, | |
Series 2015-GC33, Class A4 | |
3.778% | | | 09/10/58 | | | | | | | | | | | | 10 | | | | 9,892 | |
Series 2016-C01, Class A3 | |
2.944% | | | 05/10/49 | | | | | | | | | | | | 4,970 | | | | 4,869,855 | |
Series 2016-GC37, Class A3 | |
3.050% | | | 04/10/49 | | | | | | | | | | | | 3,560 | | | | 3,503,531 | |
Series 2017-P07, Class A3 | |
3.442% | | | 04/14/50 | | | | | | | | | | | | 4,900 | | | | 4,754,132 | |
Commercial Mortgage Trust, | |
Series 2015-CR23, Class A3 | |
3.230% | | | 05/10/48 | | | | | | | | | | | | 6 | | | | 6,310 | |
Series 2015-CR24, Class A5 | |
3.696% | | | 08/10/48 | | | | | | | | | | | | 10 | | | | 9,926 | |
Series 2015-CR27, Class A3 | |
3.349% | | | 10/10/48 | | | | | | | | | | | | 5,938 | | | | 5,886,586 | |
Series 2015-LC21, Class A4 | |
3.708% | | | 07/10/48 | | | | | | | | | | | | 10 | | | | 9,943 | |
CSAIL Commercial Mortgage Trust, | |
Series 2015-C04, Class A3 | |
3.544% | | | 11/15/48 | | | | | | | | | | | | 2,806 | | | | 2,785,581 | |
Series 2017-C08, Class A3 | |
3.127% | | | 06/15/50 | | | | | | | | | | | | 4,787 | | | | 4,561,178 | |
FHLMC Multifamily Structured Pass-Through Certificates, | |
Series K055, Class X1, IO | |
1.326%(cc) | | | 03/25/26 | | | | | | | | | | | | 12,167 | | | | 159,927 | |
Series K068, Class A1 | |
2.952% | | | 02/25/27 | | | | | | | | | | | | 3 | | | | 3,371 | |
GS Mortgage Securities Trust, | |
Series 2015-GC32, Class A3 | |
3.498% | | | 07/10/48 | | | | | | | | | | | | 4,730 | | | | 4,700,469 | |
Series 2015-GC32, Class A4 | |
3.764% | | | 07/10/48 | | | | | | | | | | | | 10 | | | | 9,936 | |
Series 2016-GS03, Class A3 | |
2.592% | | | 10/10/49 | | | | | | | | | | | | 5,313 | | | | 5,157,341 | |
Series 2016-GS04, Class A3 | |
3.178% | | | 11/10/49 | | | | | | | | | | | | 5,219 | | | | 5,096,397 | |
Series 2018-GS09, Class A4 | |
3.992%(cc) | | | 03/10/51 | | | | | | | | | | | | 10 | | | | 9,646 | |
Series 2020-GSA02, Class A4 | |
1.721% | | | 12/12/53 | | | | | | | | | | | | 6,000 | | | | 5,025,151 | |
Series 2021-GSA03, Class A4 | |
2.369% | | | 12/15/54 | | | | | | | | | | | | 5,800 | | | | 4,841,906 | |
JPMBB Commercial Mortgage Securities Trust, | |
Series 2015-C30, Class A5 | |
3.822% | | | 07/15/48 | | | | | | | | | | | | 10 | | | | 9,846 | |
| | | | | | | | | | | | | | | | | | | | |
| | | | | | | | | | | | Principal | | | | |
| Interest | | Maturity | | | | | | | | | Amount | | | | |
Rate | | Date | | | | | | | | | (000)# | | | Value | |
COMMERCIAL MORTGAGE-BACKED SECURITIES (continued) | |
MHC Commercial Mortgage Trust, | |
Series 2021-MHC, Class C, 144A, 1 Month SOFR + 1.465% (Cap N/A, Floor 1.351%) | |
5.862%(c) | | | 04/15/38 | | | | | | | | | | | | 2,400 | | | $ | 2,396,250 | |
Morgan Stanley Capital I Trust, | |
Series 2016-BNK02, Class A3 | |
2.791% | | | 11/15/49 | | | | | | | | | | | | 3,000 | | | | 2,903,511 | |
Series 2016-UB11, Class A3 | |
2.531% | | | 08/15/49 | | | | | | | | | | | | 10,156 | | | | 9,843,895 | |
Series 2018-H04, Class A3 | |
4.043% | | | 12/15/51 | | | | | | | | | | | | 1,765 | | | | 1,709,115 | |
UBS Commercial Mortgage Trust, | |
Series 2017-C02, Class ASB | |
3.264% | | | 08/15/50 | | | | | | | | | | | | 1,593 | | | | 1,567,510 | |
Series 2017-C05, Class A4 | |
3.212% | | | 11/15/50 | | | | | | | | | | | | 6,750 | | | | 6,471,888 | |
Series 2018-C09, Class A3 | |
3.854% | | | 03/15/51 | | | | | | | | | | | | 2,189 | | | | 2,112,549 | |
Series 2018-C14, Class A3 | |
4.180% | | | 12/15/51 | | | | | | | | | | | | 3,027 | | | | 2,942,058 | |
Wells Fargo Commercial Mortgage Trust, | |
Series 2015-C30, Class A4 | |
3.664% | | | 09/15/58 | | | | | | | | | | | | 10 | | | | 9,918 | |
Series 2015-NXS02, Class A5 | |
3.767%(cc) | | | 07/15/58 | | | | | | | | | | | | 10 | | | | 9,915 | |
Series 2016-NXS06, Class A3 | |
2.642% | | | 11/15/49 | | | | | | | | | | | | 8,000 | | | | 7,803,534 | |
Series 2017-C38, Class A4 | |
3.190% | | | 07/15/50 | | | | | | | | | | | | 4,098 | | | | 3,937,410 | |
Series 2018-C48, Class A4 | |
4.037% | | | 01/15/52 | | | | | | | | | | | | 6,649 | | | | 6,461,725 | |
Series 2019-C53, Class A3 | |
2.787% | | | 10/15/52 | | | | | | | | | | | | 2,500 | | | | 2,270,777 | |
Series 2020-C58, Class A3 | |
1.810% | | | 07/15/53 | | | | | | | | | | | | 7,077 | | | | 6,077,512 | |
Series 2024-5C1, Class A3 | |
5.928% | | | 07/15/57 | | | | | | | | | | | | 8,500 | | | | 8,759,313 | |
Series 2024-5C2, Class A3 | |
5.920%(cc) | | | 11/15/57 | | | | | | | | | | | | 7,575 | | | | 7,804,304 | |
| | | | | | | | | | | | | | | | | | | | |
TOTAL COMMERCIAL MORTGAGE-BACKED SECURITIES
(cost $279,320,818) | | | | 268,240,186 | |
| | | | | | | | | | | | | | | | | | | | |
| |
CORPORATE BONDS — 10.5% | | | | | |
Aerospace & Defense — 0.2% | | | | | | | | | | | | | |
Boeing Co. (The), | | | | | | | | | | | | | |
Sr. Unsec’d. Notes | |
2.196% | | | 02/04/26 | | | | | | | | | | | | 2,160 | | | | 2,094,388 | |
3.300% | | | 03/01/35 | | | | | | | | | | | | 2,900 | | | | 2,286,025 | |
3.550% | | | 03/01/38 | | | | | | | | | | | | 1,296 | | | | 979,576 | |
3.900% | | | 05/01/49 | | | | | | | | | | | | 2,570 | | | | 1,784,483 | |
RTX Corp., | | | | | | | | | | | | | | | | | | | | |
Sr. Unsec’d. Notes | |
4.125% | | | 11/16/28 | | | | | | | | | | | | 1,270 | | | | 1,236,833 | |
| | | | | | | | | | | | | | | | | | | | |
| | | | | |
| | | | | | | | | | | | | | | | | | | 8,381,305 | |
| | | | | | | | | | | | | | | | | | | | |
SEE NOTES TO FINANCIAL STATEMENTS.
A74
| | | | |
| | PSF PGIM FLEXIBLE MANAGED PORTFOLIO (CONTINUED) | | |
SCHEDULE OF INVESTMENTS | | | | as of December 31, 2024 |
| | | | | | | | | | | | | | | | | | | | |
| | | | | | | | | | | | Principal | | | | |
| Interest | | Maturity | | | | | | | | | Amount | | | | |
Rate | | Date | | | | | | | | | (000)# | | | Value | |
|
CORPORATE BONDS (continued) | |
Agriculture — 0.4% | | | | | |
Altria Group, Inc., | | | | | | | | | | | | | |
Gtd. Notes | | | | | | | | | | | | | | | | | | | | |
3.400% | | | 02/04/41 | | | | | | | | | | | | 2,045 | | | $ | 1,476,539 | |
BAT Capital Corp. (United Kingdom), | | | | | | | | | | | | | |
Gtd. Notes | | | | | | | | | | | | | | | | | | | | |
2.259% | | | 03/25/28 | (a) | | | | | | | | | | | 5,140 | | | | 4,722,571 | |
3.557% | | | 08/15/27 | | | | | | | | | | | | 105 | | | | 101,586 | |
4.390% | | | 08/15/37 | | | | | | | | | | | | 1,675 | | | | 1,446,769 | |
6.343% | | | 08/02/30 | | | | | | | | | | | | 550 | | | | 578,322 | |
BAT International Finance PLC (United Kingdom), | | | | | |
Gtd. Notes | | | | | | | | | | | | | | | | | | | | |
4.448% | | | 03/16/28 | (a) | | | | | | | | | | | 1,500 | | | | 1,475,567 | |
Philip Morris International, Inc., | | | | | | | | | | | | | |
Sr. Unsec’d. Notes | |
5.125% | | | 02/15/30 | | | | | | | | | | | | 5,150 | | | | 5,179,310 | |
5.500% | | | 09/07/30 | | | | | | | | | | | | 2,942 | | | | 3,011,378 | |
Reynolds American, Inc. (United Kingdom), | | | | | |
Gtd. Notes | | | | | | | | | | | | | | | | | | | | |
5.700% | | | 08/15/35 | | | | | | | | | | | | 930 | | | | 932,130 | |
| | | | | | | | | | | | | | | | | | | | |
| | | | | |
| | | | | | | | | | | | | | | | | | | 18,924,172 | |
| | | | | | | | | | | | | | | | | | | | |
Airlines — 0.1% | | | | | | | | | | | | | |
American Airlines 2014-1 Class A Pass-Through Trust, | |
Pass-Through Certificates | |
3.700% | | | 04/01/28 | | | | | | | | | | | | 2 | | | | 2,346 | |
American Airlines 2015-1 Class A Pass-Through Trust, | |
Pass-Through Certificates | |
3.375% | | | 11/01/28 | | | | | | | | | | | | 1,711 | | | | 1,633,409 | |
American Airlines 2019-1 Class AA Pass-Through Trust, | |
Pass-Through Certificates | |
3.150% | | | 08/15/33 | | | | | | | | | | | | 19 | | | | 17,092 | |
Southwest Airlines Co., | | | | | | | | | | | | | |
Sr. Unsec’d. Notes | |
5.125% | | | 06/15/27 | | | | | | | | | | | | 905 | | | | 909,723 | |
United Airlines 2018-1 Class A Pass-Through Trust, | | | | | |
Pass-Through Certificates | |
3.700% | | | 09/01/31 | | | | | | | | | | | | 21 | | | | 19,416 | |
United Airlines, Inc., | | | | | | | | | | | | | |
Sr. Sec’d. Notes, 144A | |
4.375% | | | 04/15/26 | | | | | | | | | | | | 840 | | | | 825,618 | |
4.625% | | | 04/15/29 | | | | | | | | | | | | 165 | | | | 156,842 | |
| | | | | | | | | | | | | | | | | | | | |
| | | | | |
| | | | | | | | | | | | | | | | | | | 3,564,446 | |
| | | | | | | | | | | | | | | | | | | | |
Apparel — 0.0% | | | | | | | | | | | | | |
Wolverine World Wide, Inc., | | | | | | | | | | | | | |
Gtd. Notes, 144A | | | | | | | | | | | | | |
4.000% | | | 08/15/29 | | | | | | | | | | | | 725 | | | | 635,741 | |
| | | | | | | | | | | | | | | | | | | | |
Auto Manufacturers — 0.3% | | | | | | | | | | | | | |
Ford Motor Co., | | | | | | | | | | | | | | | | | | | | |
Sr. Unsec’d. Notes | |
4.750% | | | 01/15/43 | | | | | | | | | | | | 865 | | | | 681,291 | |
Ford Motor Credit Co. LLC, | | | | | | | | | | | | | |
Sr. Unsec’d. Notes | |
2.900% | | | 02/16/28 | | | | | | | | | | | | 200 | | | | 184,543 | |
2.900% | | | 02/10/29 | | | | | | | | | | | | 1,095 | | | | 980,149 | |
3.375% | | | 11/13/25 | | | | | | | | | | | | 325 | | | | 320,024 | |
4.125% | | | 08/17/27 | | | | | | | | | | | | 690 | | | | 667,738 | |
| | | | | | | | | | | | | | | | | | | | |
| | | | | | | | | | | | Principal | | | | |
| Interest | | Maturity | | | | | | | | | Amount | | | | |
Rate | | Date | | | | | | | | | (000)# | | | Value | |
|
CORPORATE BONDS (continued) | |
Auto Manufacturers (cont’d.) | | | | | |
5.800% | | | 03/08/29 | | | | | | | | | | | | 775 | | | $ | 775,058 | |
7.350% | | | 03/06/30 | | | | | | | | | | | | 1,255 | | | | 1,329,102 | |
General Motors Co., | | | | | | | | | | | | | |
Sr. Unsec’d. Notes | |
4.000% | | | 04/01/25 | | | | | | | | | | | | 5 | | | | 4,986 | |
6.250% | | | 10/02/43 | | | | | | | | | | | | 980 | | | | 971,219 | |
6.600% | | | 04/01/36 | | | | | | | | | | | | 760 | | | | 797,434 | |
General Motors Financial Co., Inc., | | | | | | | | | | | | | |
Sr. Unsec’d. Notes | | | | | | | | | | | | | | | | | |
2.400% | | | 10/15/28 | | | | | | | | | | | | 3,340 | | | | 3,028,166 | |
Hyundai Capital America, | | | | | | | | | | | | | |
Sr. Unsec’d. Notes, 144A | |
5.300% | | | 03/19/27 | (a) | | | | | | | | | | | 3,085 | | | | 3,109,072 | |
Volkswagen Group of America Finance LLC (Germany), | | | | | |
Gtd. Notes, 144A | | | | | | | | | | | | | | | | | | | | |
5.250% | | | 03/22/29 | | | | | | | | | | | | 2,690 | | | | 2,657,569 | |
| | | | | | | | | | | | | | | | | | | | |
| | | | | |
| | | | | | | | | | | | | | | | | | | 15,506,351 | |
| | | | | | | | | | | | | | | | | | | | |
Banks — 3.2% | | | | | | | | | | | | | |
Banco Santander SA (Spain), | | | | | | | | | | | | | |
Sr. Non-Preferred Notes | |
2.746% | | | 05/28/25 | | | | | | | | | | | | 1,000 | | | | 991,023 | |
5.538%(ff) | | | 03/14/30 | | | | | | | | | | | | 1,000 | | | | 1,004,216 | |
Bank of America Corp., | | | | | | | | | | | | | |
Sr. Unsec’d. Notes | |
2.592%(ff) | | | 04/29/31 | | | | | | | | | | | | 50 | | | | 43,948 | |
5.080%(ff) | | | 01/20/27 | | | | | | | | | | | | 25 | | | | 25,077 | |
Sr. Unsec’d. Notes, MTN | |
1.898%(ff) | | | 07/23/31 | | | | | | | | | | | | 2,600 | | | | 2,187,981 | |
1.922%(ff) | | | 10/24/31 | | | | | | | | | | | | 7,385 | | | | 6,162,816 | |
2.496%(ff) | | | 02/13/31 | | | | | | | | | | | | 3,085 | | | | 2,708,264 | |
3.824%(ff) | | | 01/20/28 | | | | | | | | | | | | 955 | | | | 935,207 | |
4.271%(ff) | | | 07/23/29 | | | | | | | | | | | | 510 | | | | 496,590 | |
Sr. Unsec’d. Notes, Series N | |
1.658%(ff) | | | 03/11/27 | | | | | | | | | | | | 2,550 | | | | 2,456,560 | |
Sub. Notes, MTN | | | | | | | | | | | | | | | | | | | | |
4.000% | | | 01/22/25 | | | | | | | | | | | | 2,000 | | | | 1,998,941 | |
4.450% | | | 03/03/26 | | | | | | | | | | | | 8,455 | | | | 8,422,245 | |
Bank of America NA, | | | | | | | | | | | | | |
Sub. Notes | | | | | | | | | | | | | | | | | | | | |
6.000% | | | 10/15/36 | | | | | | | | | | | | 410 | | | | 423,962 | |
Barclays PLC (United Kingdom), | | | | | | | | | | | | | |
Sr. Unsec’d. Notes | | | | | | | | | | | | | |
3.650% | | | 03/16/25 | | | | | | | | | | | | 850 | | | | 847,646 | |
5.690%(ff) | | | 03/12/30 | | | | | | | | | | | | 2,110 | | | | 2,131,039 | |
Sr. Unsec’d. Notes, MTN | |
4.972%(ff) | | | 05/16/29 | | | | | | | | | | | | 3,825 | | | | 3,789,979 | |
BNP Paribas SA (France), | | | | | | | | | | | | | |
Sr. Non-Preferred Notes, 144A | |
2.159%(ff) | | | 09/15/29 | | | | | | | | | | | | 975 | | | | 872,247 | |
2.219%(ff) | | | 06/09/26 | | | | | | | | | | | | 2,480 | | | | 2,447,840 | |
3.132%(ff) | | | 01/20/33 | | | | | | | | | | | | 1,505 | | | | 1,280,084 | |
Cassa Depositi e Prestiti SpA (Italy), | |
Sr. Unsec’d. Notes, 144A | |
5.875% | | | 04/30/29 | | | | | | | | | | | | 1,800 | | | | 1,826,076 | |
SEE NOTES TO FINANCIAL STATEMENTS.
A75
| | | | |
| | PSF PGIM FLEXIBLE MANAGED PORTFOLIO (CONTINUED) | | |
SCHEDULE OF INVESTMENTS | | | | as of December 31, 2024 |
| | | | | | | | | | | | |
Interest Rate | | Maturity
Date | | | | Principal
Amount
(000)# | | | Value | |
|
CORPORATE BONDS (continued) | |
Banks (cont’d.) | |
Citigroup, Inc., | |
Jr. Sub. Notes, Series V | |
4.700%(ff) | | 01/30/25(oo) | | | | | 1,400 | | | $ | 1,393,649 | |
Sr. Unsec’d. Notes | |
2.561%(ff) | | 05/01/32 | | | | | 1,260 | | | | 1,067,678 | |
3.200% | | 10/21/26 | | | | | 1,870 | | | | 1,819,257 | |
3.700% | | 01/12/26 | | | | | 6,180 | | | | 6,123,066 | |
3.887%(ff) | | 01/10/28 | | | | | 35 | | | | 34,289 | |
Sub. Notes | |
4.450% | | 09/29/27 | | | | | 5,975 | | | | 5,892,162 | |
4.600% | | 03/09/26 | | | | | 10 | | | | 9,973 | |
4.750% | | 05/18/46 | | | | | 820 | | | | 714,893 | |
Credit Agricole SA (France), | |
Sr. Non-Preferred Notes, 144A, MTN | |
1.907%(ff) | | 06/16/26 | | | | | 1,160 | | | | 1,143,150 | |
Danske Bank A/S (Denmark), | |
Sr. Non-Preferred Notes, 144A | |
5.705%(ff) | | 03/01/30 | | | | | 2,080 | | | | 2,106,911 | |
Deutsche Bank AG (Germany), | |
Sr. Non-Preferred Notes | |
2.129%(ff) | | 11/24/26 | | | | | 440 | | | | 428,694 | |
7.146%(ff) | | 07/13/27 | | | | | 800 | | | | 824,142 | |
Discover Bank, | |
Sr. Unsec’d. Notes | |
4.250% | | 03/13/26 | | | | | 970 | | | | 961,841 | |
Goldman Sachs Group, Inc. (The), | |
Sr. Unsec’d. Notes | |
2.650%(ff) | | 10/21/32 | | | | | 4,510 | | | | 3,809,804 | |
3.102%(ff) | | 02/24/33(a) | | | | | 2,730 | | | | 2,354,661 | |
3.500% | | 01/23/25 | | | | | 4,115 | | | | 4,111,359 | |
3.750% | | 02/25/26 | | | | | 1,010 | | | | 999,544 | |
3.814%(ff) | | 04/23/29 | | | | | 540 | | | | 519,259 | |
3.850% | | 01/26/27 | | | | | 2,920 | | | | 2,866,566 | |
6.484%(ff) | | 10/24/29 | | | | | 4,760 | | | | 4,986,275 | |
Sr. Unsec’d. Notes, MTN | |
4.800% | | 07/08/44 | | | | | 5 | | | | 4,424 | |
Sub. Notes | |
6.750% | | 10/01/37 | | | | | 104 | | | | 111,609 | |
JPMorgan Chase & Co., | |
Jr. Sub. Notes, Series HH | |
4.600%(ff) | | 02/01/25(oo) | | | | | 1,645 | | | | 1,638,424 | |
Jr. Sub. Notes, Series II | |
4.000%(ff) | | 04/01/25(oo) | | | | | 1,045 | | | | 1,036,518 | |
Sr. Unsec’d. Notes | |
1.953%(ff) | | 02/04/32 | | | | | 4,530 | | | | 3,758,948 | |
3.782%(ff) | | 02/01/28 | | | | | 695 | | | | 679,988 | |
3.882%(ff) | | 07/24/38 | | | | | 20 | | | | 16,980 | |
3.964%(ff) | | 11/15/48 | | | | | 3,250 | | | | 2,539,996 | |
4.005%(ff) | | 04/23/29 | | | | | 2,170 | | | | 2,103,538 | |
4.452%(ff) | | 12/05/29 | | | | | 3,350 | | | | 3,280,171 | |
5.299%(ff) | | 07/24/29 | | | | | 2,740 | | | | 2,765,325 | |
5.350%(ff) | | 06/01/34 | | | | | 20 | | | | 19,995 | |
Sub. Notes | |
2.956%(ff) | | 05/13/31 | | | | | 15 | | | | 13,405 | |
KeyCorp, | | | | | | | | | | | | |
Sr. Unsec’d. Notes | |
6.401%(ff) | | 03/06/35 | | | | | 765 | | | | 796,642 | |
| | | | | | | | | | | | |
Interest Rate | | Maturity
Date | | | | Principal
Amount
(000)# | | | Value | |
|
CORPORATE BONDS (continued) | |
Banks (cont’d.) | |
Sr. Unsec’d. Notes, MTN | |
2.250% | | 04/06/27 | | | | | 25 | | | $ | 23,587 | |
Mitsubishi UFJ Financial Group, Inc. (Japan), | |
Sr. Unsec’d. Notes | |
5.242%(ff) | | 04/19/29 | | | | | 2,760 | | | | 2,777,195 | |
Morgan Stanley, | |
Sr. Unsec’d. Notes | |
5.123%(ff) | | 02/01/29 | | | | | 6,225 | | | | 6,238,491 | |
5.449%(ff) | | 07/20/29 | | | | | 1,975 | | | | 1,997,045 | |
6.407%(ff) | | 11/01/29 | | | | | 3,030 | | | | 3,165,275 | |
Sr. Unsec’d. Notes, GMTN | |
2.239%(ff) | | 07/21/32 | | | | | 2,020 | | | | 1,673,016 | |
3.875% | | 01/27/26 | | | | | 675 | | | | 669,734 | |
4.431%(ff) | | 01/23/30 | | | | | 515 | | | | 501,740 | |
Sr. Unsec’d. Notes, MTN | |
2.188%(ff) | | 04/28/26 | | | | | 25 | | | | 24,775 | |
2.943%(ff) | | 01/21/33 | | | | | 2,465 | | | | 2,111,258 | |
3.591%(cc) | | 07/22/28 | | | | | 1,255 | | | | 1,210,388 | |
Sub. Notes, GMTN | |
4.350% | | 09/08/26 | | | | | 3,825 | | | | 3,798,132 | |
PNC Financial Services Group, Inc. (The), | |
Sr. Unsec’d. Notes | |
4.758%(ff) | | 01/26/27 | | | | | 35 | | | | 34,947 | |
Societe Generale SA (France), | |
Gtd. Notes, 144A | |
2.797%(ff) | | 01/19/28 | | | | | 1,495 | | | | 1,418,481 | |
Sr. Non-Preferred Notes, 144A | |
1.488%(ff) | | 12/14/26 | | | | | 4,400 | | | | 4,245,552 | |
State Street Corp., | |
Sr. Unsec’d. Notes | |
4.857%(ff) | | 01/26/26 | | | | | 10 | | | | 9,998 | |
Sumitomo Mitsui Financial Group, Inc. (Japan), | |
Sr. Unsec’d. Notes | |
5.880% | | 07/13/26 | | | | | 3,945 | | | | 4,009,089 | |
Sumitomo Mitsui Trust Bank Ltd. (Japan), | |
Sr. Unsec’d. Notes, 144A, MTN | |
5.650% | | 03/09/26 | | | | | 1,040 | | | | 1,050,689 | |
Toronto-Dominion Bank (The) (Canada), | |
Sr. Unsec’d. Notes, MTN | |
1.150% | | 06/12/25 | | | | | 35 | | | | 34,472 | |
Truist Financial Corp., | |
Sr. Unsec’d. Notes, MTN | |
1.950% | | 06/05/30 | | | | | 10 | | | | 8,520 | |
7.161%(ff) | | 10/30/29 | | | | | 1,190 | | | | 1,271,679 | |
UBS Group AG (Switzerland), | |
Sr. Unsec’d. Notes | |
4.550% | | 04/17/26 | | | | | 5,000 | | | | 4,977,861 | |
Sr. Unsec’d. Notes, 144A | |
2.193%(ff) | | 06/05/26 | | | | | 1,560 | | | | 1,540,500 | |
3.091%(ff) | | 05/14/32 | | | | | 885 | | | | 769,950 | |
4.282% | | 01/09/28 | | | | | 1,370 | | | | 1,339,847 | |
Wells Fargo & Co., | |
Sr. Unsec’d. Notes | |
2.188%(ff) | | 04/30/26 | | | | | 50 | | | | 49,544 | |
5.211%(ff) | | 12/03/35 | | | | | 3,220 | | | | 3,137,856 | |
5.389%(ff) | | 04/24/34 | | | | | 1,500 | | | | 1,481,415 | |
SEE NOTES TO FINANCIAL STATEMENTS.
A76
| | | | |
| | PSF PGIM FLEXIBLE MANAGED PORTFOLIO (CONTINUED) | | |
SCHEDULE OF INVESTMENTS | | | | as of December 31, 2024 |
| | | | | | | | | | | | | | |
Interest Rate | | Maturity Date | | | | | Principal
Amount
(000)# | | | Value | |
|
CORPORATE BONDS (continued) | |
Banks (cont’d.) | |
Sr. Unsec’d. Notes, MTN | |
2.572%(ff) | | 02/11/31 | | | | | | | 4,175 | | | $ | 3,682,512 | |
5.557%(ff) | | 07/25/34 | | | | | | | 3,130 | | | | 3,122,713 | |
5.574%(ff) | | 07/25/29 | | | | | | | 3,660 | | | | 3,714,101 | |
| | | | | | | | | | | | | | |
| | | | |
| | | | | | | | | | | | | 162,075,239 | |
| | | | | | | | | | | | | | |
Beverages — 0.1% | |
Anheuser-Busch Cos. LLC/Anheuser-Busch InBev Worldwide, Inc. (Belgium), | |
Gtd. Notes | |
4.900% | | 02/01/46 | | | | | | | 584 | | | | 531,955 | |
Anheuser-Busch InBev Worldwide, Inc. (Belgium), | |
Gtd. Notes | |
3.500% | | 06/01/30 | | | | | | | 25 | | | | 23,411 | |
8.000% | | 11/15/39(h) | | | | | | | 1,285 | | | | 1,597,943 | |
8.200% | | 01/15/39 | | | | | | | 250 | | | | 312,907 | |
Constellation Brands, Inc., | |
Sr. Unsec’d. Notes | |
2.250% | | 08/01/31 | | | | | | | 1,015 | | | | 843,735 | |
| | | | | | | | | | | | | | |
| | | | |
| | | | | | | | | | | | | 3,309,951 | |
| | | | | | | | | | | | | | |
Biotechnology — 0.0% | |
Amgen, Inc., | |
Sr. Unsec’d. Notes | |
2.800% | | 08/15/41 | | | | | | | 225 | | | | 156,370 | |
Biogen, Inc., | |
Sr. Unsec’d. Notes | |
2.250% | | 05/01/30 | | | | | | | 40 | | | | 34,566 | |
| | | | | | | | | | | | | | |
| | | | |
| | | | | | | | | | | | | 190,936 | |
| | | | | | | | | | | | | | |
Building Materials — 0.0% | |
Owens Corning, | |
Sr. Unsec’d. Notes | |
3.500% | | 02/15/30 | | | | | | | 550 | | | | 510,614 | |
Standard Industries, Inc., | |
Sr. Unsec’d. Notes, 144A | |
4.375% | | 07/15/30 | | | | | | | 760 | | | | 692,966 | |
4.750% | | 01/15/28 | | | | | | | 700 | | | | 671,189 | |
| | | | | | | | | | | | | | |
| | | | |
| | | | | | | | | | | | | 1,874,769 | |
| | | | | | | | | | | | | | |
Chemicals — 0.1% | |
Air Products & Chemicals, Inc., | |
Sr. Unsec’d. Notes | |
1.500% | | 10/15/25 | | | | | | | 5 | | | | 4,884 | |
Dow Chemical Co. (The), | |
Sr. Unsec’d. Notes | |
4.375% | | 11/15/42 | | | | | | | 95 | | | | 78,067 | |
9.400% | | 05/15/39 | | | | | | | 155 | | | | 204,652 | |
DuPont de Nemours, Inc., | |
Sr. Unsec’d. Notes | |
4.725% | | 11/15/28 | | | | | | | 2,580 | | | | 2,568,462 | |
5.419% | | 11/15/48 | | | | | | | 255 | | | | 253,578 | |
OCP SA (Morocco), | |
Sr. Unsec’d. Notes, 144A | |
6.750% | | 05/02/34 | | | | | | | 1,888 | | | | 1,922,928 | |
| | | | | | | | | | | | | | |
Interest Rate | | Maturity
Date | | | | | | Principal
Amount
(000)# | | | Value | |
|
CORPORATE BONDS (continued) | |
Chemicals (cont’d.) | |
Sasol Financing USA LLC (South Africa), | |
Gtd. Notes | |
6.500% | | 09/27/28(a) | | | | | | | 670 | | | $ | 643,407 | |
| | | | | | | | | | | | | | |
| | | | | |
| | | | | | | | | | | | | 5,675,978 | |
| | | | | | | | | | | | | | |
Commercial Services — 0.1% | |
DCLI Bidco LLC, | |
Second Mortgage, 144A | |
7.750% | | 11/15/29 | | | | | | | 270 | | | | 275,915 | |
DP World Ltd. (United Arab Emirates), | |
Sr. Unsec’d. Notes, 144A | |
2.375% | | 09/25/26 | | | | EUR | | | 693 | | | | 705,059 | |
ERAC USA Finance LLC, | |
Gtd. Notes, 144A | |
4.200% | | 11/01/46 | | | | | | | 456 | | | | 370,081 | |
5.000% | | 02/15/29 | | | | | | | 1,205 | | | | 1,208,834 | |
7.000% | | 10/15/37 | | | | | | | 380 | | | | 428,082 | |
George Washington University (The), | |
Unsec’d. Notes, Series 2014 | |
4.300% | | 09/15/44 | | | | | | | 5 | | | | 4,294 | |
Massachusetts Institute of Technology, | |
Unsec’d. Notes | |
3.885% | | 07/01/2116 | | | | | | | 1,500 | | | | 1,053,642 | |
Northwestern University, | |
Unsec’d. Notes, Series 2020 | |
2.640% | | 12/01/50 | | | | | | | 20 | | | | 12,594 | |
RELX Capital, Inc. (United Kingdom), | |
Gtd. Notes | |
3.000% | | 05/22/30 | | | | | | | 10 | | | | 9,073 | |
Transurban Finance Co. Pty Ltd. (Australia), | |
Sr. Sec’d. Notes, 144A | |
4.125% | | 02/02/26 | | | | | | | 5 | | | | 4,953 | |
United Rentals North America, Inc., | |
Gtd. Notes | |
3.750% | | 01/15/32 | | | | | | | 325 | | | | 284,584 | |
4.875% | | 01/15/28(a) | | | | | | | 1,190 | | | | 1,156,534 | |
5.250% | | 01/15/30 | | | | | | | 235 | | | | 228,304 | |
University of Miami, | |
Sr. Unsec’d. Notes, Series 2022 | |
4.063% | | 04/01/52 | | | | | | | 1,170 | | | | 939,697 | |
| | | | | | | | | | | | | | |
| | | | | |
| | | | | | | | | | | | | 6,681,646 | |
| | | | | | | | | | | | | | |
Computers — 0.0% | |
Apple, Inc., | |
Sr. Unsec’d. Notes | |
1.650% | | 05/11/30 | | | | | | | 15 | | | | 12,889 | |
3.200% | | 05/13/25 | | | | | | | 25 | | | | 24,867 | |
| | | | | | | | | | | | | | |
| | | | | |
| | | | | | | | | | | | | 37,756 | |
| | | | | | | | | | | | | | |
Distribution/Wholesale — 0.0% | |
Ritchie Bros Holdings, Inc. (Canada), | |
Sr. Sec’d. Notes, 144A | |
6.750% | | 03/15/28 | | | | | | | 50 | | | | 51,000 | |
| | | | | | | | | | | | | | |
Diversified Financial Services — 0.3% | |
Ally Financial, Inc., | |
Sr. Unsec’d. Notes | |
5.543%(ff) | | 01/17/31 | | | | | | | 755 | | | | 744,062 | |
SEE NOTES TO FINANCIAL STATEMENTS.
A77
| | | | |
| | PSF PGIM FLEXIBLE MANAGED PORTFOLIO (CONTINUED) | | |
SCHEDULE OF INVESTMENTS | | | | as of December 31, 2024 |
| | | | | | | | | | | | | | | | |
Interest Rate | | Maturity
Date | | | | | | Principal
Amount
(000)# | | | Value | |
|
|
|
CORPORATE BONDS (continued) | |
Diversified Financial Services (cont’d.) | |
Cantor Fitzgerald LP, | |
Sr. Unsec’d. Notes, 144A | |
4.500% | | | 04/14/27 | | | | | | | | 4,985 | | | $ | 4,880,994 | |
Capital One Financial Corp., | |
Sr. Unsec’d. Notes | |
3.650% | | | 05/11/27 | | | | | | | | 20 | | | | 19,474 | |
Discover Financial Services, | |
Sr. Unsec’d. Notes | |
3.750% | | | 03/04/25 | | | | | | | | 5 | | | | 4,989 | |
Jefferies Financial Group, Inc., | |
Sr. Unsec’d. Notes | |
5.875% | | | 07/21/28 | | | | | | | | 2,600 | | | | 2,658,120 | |
Nomura Holdings, Inc. (Japan), | |
Sr. Unsec’d. Notes | |
2.608% | | | 07/14/31 | | | | | | | | 2,055 | | | | 1,730,945 | |
6.070% | | | 07/12/28 | | | | | | | | 3,355 | | | | 3,452,057 | |
Private Export Funding Corp., | |
U.S. Gov’t. Gtd. Notes, Series NN | |
3.250% | | | 06/15/25 | | | | | | | | 330 | | | | 327,630 | |
| | | | | | | | | | | | | | | | |
| | | | |
| | | | | | | | | | | | | | | 13,818,271 | |
| | | | | | | | | | | | | | | | |
Electric — 1.0% | |
Abu Dhabi National Energy Co. PJSC (United Arab Emirates), | |
Sr. Unsec’d. Notes, 144A, MTN | |
2.000% | | | 04/29/28 | | | | | | | | 525 | | | | 475,146 | |
AEP Texas, Inc., | |
Sr. Unsec’d. Notes | |
3.950% | | | 06/01/28 | | | | | | | | 2,910 | | | | 2,811,654 | |
Alfa Desarrollo SpA (Chile), | |
Sr. Sec’d. Notes, 144A | |
4.550% | | | 09/27/51 | | | | | | | | 624 | | | | 458,901 | |
Appalachian Power Co., | |
Sr. Unsec’d. Notes | |
4.450% | | | 06/01/45 | | | | | | | | 10 | | | | 8,080 | |
Baltimore Gas & Electric Co., | |
Sr. Unsec’d. Notes | |
6.350% | | | 10/01/36 | | | | | | | | 550 | | | | 589,596 | |
Berkshire Hathaway Energy Co., | |
Sr. Unsec’d. Notes | |
3.800% | | | 07/15/48 | | | | | | | | 15 | | | | 11,137 | |
5.950% | | | 05/15/37 | | | | | | | | 305 | | | | 315,471 | |
Calpine Corp., | |
Sr. Sec’d. Notes, 144A | |
3.750% | | | 03/01/31 | | | | | | | | 1,500 | | | | 1,341,739 | |
CenterPoint Energy Houston Electric LLC, | |
General Ref. Mortgage, Series K2 | |
6.950% | | | 03/15/33 | | | | | | | | 590 | | | | 650,794 | |
Comision Federal de Electricidad (Mexico), | |
Gtd. Notes, 144A | |
4.688% | | | 05/15/29 | | | | | | | | 1,400 | | | | 1,310,890 | |
Commonwealth Edison Co., | |
First Mortgage, Series 123 | |
3.750% | | | 08/15/47 | | | | | | | | 1,610 | | | | 1,202,092 | |
Connecticut Light & Power Co. (The), | |
First Mortgage, Series A | |
2.050% | | | 07/01/31 | | | | | | | | 3,255 | | | | 2,721,928 | |
| | | | | | | | | | | | | | |
Interest Rate | | Maturity
Date | | | | | Principal
Amount
(000)# | | | Value | |
|
|
|
CORPORATE BONDS (continued) | |
Electric (cont’d.) | |
Consolidated Edison Co. of New York, Inc., | |
Sr. Unsec’d. Notes, Series 09-C | |
5.500% | | 12/01/39 | | | | | | | 220 | | | $ | 217,481 | |
Duke Energy Carolinas LLC, | |
First Mortgage | |
4.950% | | 01/15/33 | | | | | | | 4,425 | | | | 4,353,983 | |
6.050% | | 04/15/38 | | | | | | | 550 | | | | 578,468 | |
First Ref. Mortgage | |
4.000% | | 09/30/42 | | | | | | | 570 | | | | 461,897 | |
El Paso Electric Co., | |
Sr. Unsec’d. Notes | |
6.000% | | 05/15/35 | | | | | | | 670 | | | | 672,544 | |
Enel Finance International NV (Italy), | |
Gtd. Notes, 144A | |
2.500% | | 07/12/31 | | | | | | | 2,140 | | | | 1,790,898 | |
Eskom Holdings SOC Ltd. (South Africa), | |
Gov’t. Gtd. Notes, 144A, MTN | |
6.350% | | 08/10/28 | | | | | | | 905 | | | | 899,624 | |
Gov’t. Gtd. Notes, MTN | |
6.350% | | 08/10/28 | | | | | | | 211 | | | | 209,747 | |
Evergy Kansas Central, Inc., | |
First Mortgage | |
5.700% | | 03/15/53 | | | | | | | 1,310 | | | | 1,288,886 | |
Eversource Energy, | |
Sr. Unsec’d. Notes, Series M | |
3.300% | | 01/15/28 | | | | | | | 5 | | | | 4,753 | |
Exelon Corp., | |
Sr. Unsec’d. Notes | |
3.400% | | 04/15/26 | | | | | | | 25 | | | | 24,589 | |
FirstEnergy Pennsylvania Electric Co., | |
Sr. Unsec’d. Notes, 144A | |
5.200% | | 04/01/28 | | | | | | | 900 | | | | 903,678 | |
Florida Power & Light Co., | |
First Mortgage | |
5.100% | | 04/01/33 | | | | | | | 2,840 | | | | 2,822,062 | |
5.950% | | 10/01/33 | | | | | | | 295 | | | | 308,077 | |
Iberdrola International BV (Spain), | |
Gtd. Notes | |
6.750% | | 09/15/33 | | | | | | | 145 | | | | 154,916 | |
Israel Electric Corp. Ltd. (Israel), | |
Sr. Sec’d. Notes, 144A, GMTN | |
4.250% | | 08/14/28 | | | | | | | 470 | | | | 450,157 | |
Kentucky Utilities Co., | |
First Mortgage | |
4.375% | | 10/01/45 | | | | | | | 10 | | | | 8,286 | |
NextEra Energy Capital Holdings, Inc., | |
Gtd. Notes | |
2.440% | | 01/15/32 | | | | | | | 25 | | | | 20,868 | |
4.900% | | 02/28/28 | | | | | | | 3,800 | | | | 3,803,235 | |
6.051% | | 03/01/25 | | | | | | | 780 | | | | 781,354 | |
Northern States Power Co., | |
First Mortgage | |
3.600% | | 09/15/47 | | | | | | | 1,580 | | | | 1,166,741 | |
NRG Energy, Inc., | |
Gtd. Notes, 144A | |
3.625% | | 02/15/31 | | | | | | | 75 | | | | 65,512 | |
3.875% | | 02/15/32 | | | | | | | 200 | | | | 174,000 | |
SEE NOTES TO FINANCIAL STATEMENTS.
A78
| | | | |
| | PSF PGIM FLEXIBLE MANAGED PORTFOLIO (CONTINUED) | | |
SCHEDULE OF INVESTMENTS | | | | as of December 31, 2024 |
| | | | | | | | | | | | | | | | | | |
| | | | | | Principal | | | | |
| Interest | | Maturity | | | | | Amount | | | | |
Rate | | Date | | | | | (000)# | | | Value | |
|
CORPORATE BONDS (continued) | |
Electric (cont’d.) | | | | | |
Sr. Sec’d. Notes, 144A | | | | | |
2.000% | | | 12/02/25 | | | | | | | | | | 320 | | | $ | 310,377 | |
2.450% | | | 12/02/27 | | | | | | | | | | 1,395 | | | | 1,295,195 | |
Pacific Gas & Electric Co., | |
First Mortgage | | | | | |
2.100% | | | 08/01/27 | | | | | | | | | | 10 | | | | 9,326 | |
3.950% | | | 12/01/47 | | | | | | | | | | 2,000 | | | | 1,493,442 | |
4.950% | | | 07/01/50 | | | | | | | | | | 1,345 | | | | 1,167,038 | |
PacifiCorp, | | | | | |
First Mortgage | | | | | |
5.350% | | | 12/01/53 | (h) | | | | | | | | | 3,010 | | | | 2,763,747 | |
PECO Energy Co., | | | | | |
First Mortgage | |
2.800% | | | 06/15/50 | | | | | | | | | | 1,110 | | | | 690,623 | |
Public Service Electric & Gas Co., | | | | | |
First Mortgage, MTN | |
2.050% | | | 08/01/50 | | | | | | | | | | 1,005 | | | | 529,871 | |
3.700% | | | 05/01/28 | | | | | | | | | | 1,280 | | | | 1,237,344 | |
4.900% | | | 12/15/32 | | | | | | | | | | 1,050 | | | | 1,040,477 | |
Sr. Sec’d. Notes, MTN | |
5.800% | | | 05/01/37 | | | | | | | | | | 535 | | | | 551,229 | |
Public Service Enterprise Group, Inc., | | | | | |
Sr. Unsec’d. Notes | |
1.600% | | | 08/15/30 | | | | | | | | | | 710 | | | | 590,984 | |
San Diego Gas & Electric Co., | | | | | |
First Mortgage | |
4.150% | | | 05/15/48 | | | | | | | | | | 1,400 | | | | 1,112,906 | |
Sempra, | | | | | | | | | | | | | | | | | | |
Sr. Unsec’d. Notes | |
3.300% | | | 04/01/25 | | | | | | | | | | 20 | | | | 19,913 | |
Southern California Edison Co., | | | | | |
First Mortgage | |
5.300% | | | 03/01/28 | (a) | | | | | | | | | 1,670 | | | | 1,690,947 | |
First Ref. Mortgage | |
4.000% | | | 04/01/47 | | | | | | | | | | 580 | | | | 446,687 | |
First Ref. Mortgage, Series C | |
3.600% | | | 02/01/45 | | | | | | | | | | 860 | | | | 634,254 | |
Vistra Operations Co. LLC, | |
Gtd. Notes, 144A | |
5.000% | | | 07/31/27 | | | | | | | | | | 725 | | | | 711,156 | |
Xcel Energy, Inc., | |
Sr. Unsec’d. Notes | |
4.800% | | | 09/15/41 | | | | | | | | | | 480 | | | | 412,961 | |
| | | | | | | | | | | | | | | | | | |
| |
| | | | 49,767,661 | |
| | | | | | | | | | | | | | | | | | |
Engineering & Construction — 0.1% | |
AECOM, | | | | | |
Gtd. Notes | |
5.125% | | | 03/15/27 | (a) | | | | | | | | | 575 | | | | 568,784 | |
Mexico City Airport Trust (Mexico), | |
Sr. Sec’d. Notes, 144A | |
3.875% | | | 04/30/28 | | | | | | | | | | 919 | | | | 860,993 | |
4.250% | | | 10/31/26 | | | | | | | | | | 882 | | | | 859,968 | |
5.500% | | | 07/31/47 | | | | | | | | | | 800 | | | | 642,248 | |
| | | | | | | | | | | | | | | | | | |
| | | | | |
| | | | | | | | | | | | | | | | | 2,931,993 | |
| | | | | | | | | | | | | | | | | | |
| | | | | | | | | | | | | | | | | | |
| | | | | | Principal | | | | |
| Interest | | Maturity | | | | | Amount | | | | |
Rate | | Date | | | | | (000)# | | | Value | |
|
CORPORATE BONDS (continued) | |
Entertainment — 0.1% | | | | | |
Caesars Entertainment, Inc., | | | | | |
Sr. Sec’d. Notes, 144A | |
7.000% | | | 02/15/30 | | | | | | | | | | 600 | | | $ | 610,996 | |
Warnermedia Holdings, Inc., | |
Gtd. Notes | | | | | | | | | | | | | | | | | | |
5.050% | | | 03/15/42 | | | | | | | | | | 2,205 | | | | 1,769,694 | |
5.141% | | | 03/15/52 | | | | | | | | | | 1,210 | | | | 900,844 | |
| | | | | | | | | | | | | | | | | | |
| | | | | |
| | | | | | | | | | | | | | | | | 3,281,534 | |
| | | | | | | | | | | | | | | | | | |
Environmental Control — 0.0% | |
Waste Connections, Inc., | |
Sr. Unsec’d. Notes | |
3.200% | | | 06/01/32 | | | | | | | | | | 20 | | | | 17,464 | |
| | | | | | | | | | | | | | | | | | |
Foods — 0.1% | |
Bimbo Bakeries USA, Inc. (Mexico), | |
Gtd. Notes, 144A | |
6.050% | | | 01/15/29 | | | | | | | | | | 1,265 | | | | 1,291,021 | |
JBS USA Holding Lux Sarl/JBS USA Food Co./JBS Lux Co. Sarl, | |
Gtd. Notes | | | | | | | | | | | | | | | | | | |
5.125% | | | 02/01/28 | | | | | | | | | | 2,000 | | | | 1,988,849 | |
Lamb Weston Holdings, Inc., | |
Gtd. Notes, 144A | |
4.125% | | | 01/31/30 | | | | | | | | | | 275 | | | | 251,580 | |
4.375% | | | 01/31/32 | | | | | | | | | | 850 | | | | 768,986 | |
Mars, Inc., | |
Sr. Unsec’d. Notes, 144A | |
2.375% | | | 07/16/40 | | | | | | | | | | 660 | | | | 434,468 | |
| | | | | | | | | | | | | | | | | | |
| |
| | | | 4,734,904 | |
| | | | | | | | | | | | | | | | | | |
Gas — 0.1% | |
NiSource, Inc., | |
Sr. Unsec’d. Notes | |
1.700% | | | 02/15/31 | | | | | | | | | | 915 | | | | 748,544 | |
3.490% | | | 05/15/27 | | | | | | | | | | 1,425 | | | | 1,386,089 | |
3.600% | | | 05/01/30 | | | | | | | | | | 1,270 | | | | 1,184,201 | |
3.950% | | | 03/30/48 | | | | | | | | | | 15 | | | | 11,425 | |
Southern Co. Gas Capital Corp., | |
Gtd. Notes | | | | | | | | | | | | | | | | | | |
5.150% | | | 09/15/32 | | | | | | | | | | 30 | | | | 29,898 | |
| | | | | | | | | | | | | | | | | | |
| | | | | |
| | | | | | | | | | | | | | | | | 3,360,157 | |
| | | | | | | | | | | | | | | | | | |
Healthcare-Products — 0.0% | |
Abbott Laboratories, | |
Sr. Unsec’d. Notes | |
1.150% | | | 01/30/28 | | | | | | | | | | 20 | | | | 18,115 | |
Medline Borrower LP, | |
Sr. Sec’d. Notes, 144A | |
3.875% | | | 04/01/29 | | | | | | | | | | 675 | | | | 625,293 | |
| | | | | | | | | | | | | | | | | | |
| | | | | |
| | | | | | | | | | | | | | | | | 643,408 | |
| | | | | | | | | | | | | | | | | | |
Healthcare-Services — 0.6% | |
Aetna, Inc., | |
Sr. Unsec’d. Notes | |
6.625% | | | 06/15/36 | | | | | | | | | | 515 | | | | 540,697 | |
AHS Hospital Corp., | |
Unsec’d. Notes | |
5.024% | | | 07/01/45 | | | | | | | | | | 5 | | | | 4,663 | |
SEE NOTES TO FINANCIAL STATEMENTS.
A79
| | | | |
| | PSF PGIM FLEXIBLE MANAGED PORTFOLIO (CONTINUED) | | |
SCHEDULE OF INVESTMENTS | | | | as of December 31, 2024 |
| | | | | | | | | | | | | | | | | | |
| | | | | | Principal | | | | |
| Interest | | Maturity | | | | | Amount | | | | |
Rate | | Date | | | | | (000)# | | | Value | |
|
CORPORATE BONDS (continued) | |
Healthcare-Services (cont’d.) | | | | | |
Banner Health, | |
Unsec’d. Notes | |
1.897% | | | 01/01/31 | | | | | | | | | | 5 | | | $ | 4,177 | |
Centra Health, Inc., | |
Unsec’d. Notes | |
4.700% | | | 01/01/48 | | | | | | | | | | 25 | | | | 20,539 | |
Cigna Group (The), | |
Gtd. Notes | |
4.375% | | | 10/15/28 | | | | | | | | | | 8,000 | | | | 7,840,218 | |
CommonSpirit Health, | |
Sr. Sec’d. Notes | |
2.782% | | | 10/01/30 | | | | | | | | | | 5 | | | | 4,427 | |
5.318% | | | 12/01/34 | | | | | | | | | | 4,270 | | | | 4,214,914 | |
Elevance Health, Inc., | |
Sr. Unsec’d. Notes | |
4.625% | | | 05/15/42 | | | | | | | | | | 390 | | | | 336,859 | |
4.650% | | | 01/15/43 | | | | | | | | | | 15 | | | | 13,028 | |
Hackensack Meridian Health, Inc., | |
Sr. Sec’d. Notes | |
4.211% | | | 07/01/48 | | | | | | | | | | 20 | | | | 16,330 | |
HCA, Inc., | |
Gtd. Notes | |
4.125% | | | 06/15/29 | | | | | | | | | | 20 | | | | 19,092 | |
4.375% | | | 03/15/42 | | | | | | | | | | 10 | | | | 8,156 | |
5.375% | | | 02/01/25 | | | | | | | | | | 305 | | | | 304,808 | |
Gtd. Notes, MTN | |
7.750% | | | 07/15/36 | | | | | | | | | | 450 | | | | 502,779 | |
Humana, Inc., | |
Sr. Unsec’d. Notes | |
3.700% | | | 03/23/29 | | | | | | | | | | 15 | | | | 14,153 | |
Indiana University Health, Inc. Obligated Group, | | | | | |
Sec’d. Notes | |
3.970% | | | 11/01/48 | | | | | | | | | | 15 | | | | 11,866 | |
Kaiser Foundation Hospitals, | |
Gtd. Notes | |
4.150% | | | 05/01/47 | | | | | | | | | | 940 | | | | 767,311 | |
MedStar Health, Inc., | |
Sec’d. Notes, Series 20A | |
3.626% | | | 08/15/49 | | | | | | | | | | 20 | | | | 14,413 | |
Providence St. Joseph Health Obligated Group, | |
Unsec’d. Notes, Series 19A | |
2.532% | | | 10/01/29 | | | | | | | | | | 765 | | | | 684,553 | |
Quest Diagnostics, Inc., | |
Sr. Unsec’d. Notes | |
5.000% | | | 12/15/34 | | | | | | | | | | 2,240 | | | | 2,177,223 | |
Roche Holdings, Inc., | |
Gtd. Notes, 144A | |
4.592% | | | 09/09/34 | | | | | | | | | | 3,715 | | | | 3,564,125 | |
Sutter Health, | |
Unsec’d. Notes | |
5.164% | | | 08/15/33 | | | | | | | | | | 1,732 | | | | 1,721,781 | |
Tenet Healthcare Corp., | |
Sr. Sec’d. Notes | |
4.375% | | | 01/15/30 | | | | | | | | | | 625 | | | | 580,277 | |
Trinity Health Corp., | |
Sec’d. Notes | |
4.125% | | | 12/01/45 | | | | | | | | | | 5 | | | | 4,086 | |
| | | | | | | | | | | | | | | | | | |
| | | | | | Principal | | | | |
| Interest | | Maturity | | | | | Amount | | | | |
Rate | | Date | | | | | (000)# | | | Value | |
| |
CORPORATE BONDS (continued) | | | | | |
Healthcare-Services (cont’d.) | | | | | | | | | | | | |
UnitedHealth Group, Inc., | |
Sr. Unsec’d. Notes | |
2.000% | | | 05/15/30 | | | | | | | | | | 10 | | | $ | 8,612 | |
3.250% | | | 05/15/51 | | | | | | | | | | 1,000 | | | | 659,456 | |
3.750% | | | 07/15/25 | | | | | | | | | | 5 | | | | 4,979 | |
5.200% | | | 04/15/63 | (h) | | | | | | | | | 2,840 | | | | 2,549,532 | |
5.500% | | | 04/15/64 | (h) | | | | | | | | | 1,680 | | | | 1,572,516 | |
5.750% | | | 07/15/64 | | | | | | | | | | 945 | | | | 918,900 | |
| | | | | | | | | | | | | | | | | | |
| | | | | |
| | | | | | | | | | | | | | | | | 29,084,470 | |
| | | | | | | | | | | | | | | | | | |
Home Builders — 0.0% | |
KB Home, | |
Gtd. Notes | |
4.000% | | | 06/15/31 | | | | | | | | | | 575 | | | | 507,881 | |
Taylor Morrison Communities, Inc., | |
Gtd. Notes, 144A | |
5.875% | | | 06/15/27 | | | | | | | | | | 525 | | | | 526,199 | |
| | | | | | | | | | | | | | | | | | |
| | | | | |
| | | | | | | | | | | | | | | | | 1,034,080 | |
| | | | | | | | | | | | | | | | | | |
Housewares — 0.0% | |
Newell Brands, Inc., | |
Sr. Unsec’d. Notes | |
6.375% | | | 05/15/30 | | | | | | | | | | 220 | | | | 220,762 | |
6.625% | | | 05/15/32 | (a) | | | | | | | | | 115 | | | | 115,777 | |
| | | | | | | | | | | | | | | | | | |
| | | | | |
| | | | | | | | | | | | | | | | | 336,539 | |
| | | | | | | | | | | | | | | | | | |
Insurance — 0.2% | | | | | | | | | | | | | | | |
American International Group, Inc., | |
Sr. Unsec’d. Notes | |
3.400% | | | 06/30/30 | | | | | | | | | | 30 | | | | 27,686 | |
Aon Global Ltd., | |
Gtd. Notes | |
3.875% | | | 12/15/25 | | | | | | | | | | 5 | | | | 4,962 | |
Arthur J Gallagher & Co., | |
Sr. Unsec’d. Notes | |
5.000% | | | 02/15/32 | | | | | | | | | | 1,345 | | | | 1,327,393 | |
Berkshire Hathaway Finance Corp., | |
Gtd. Notes | |
3.850% | | | 03/15/52 | | | | | | | | | | 50 | | | | 37,827 | |
Corebridge Financial, Inc., | |
Sr. Unsec’d. Notes | |
4.400% | | | 04/05/52 | | | | | | | | | | 35 | | | | 28,152 | |
Fairfax Financial Holdings Ltd. (Canada), | |
Sr. Unsec’d. Notes | |
6.000% | | | 12/07/33 | | | | | | | | | | 3,785 | | | | 3,901,397 | |
Liberty Mutual Group, Inc., | |
Gtd. Notes, 144A | |
3.951% | | | 10/15/50 | | | | | | | | | | 1,215 | | | | 884,499 | |
Lincoln National Corp., | | | | | | | | | | | | | | | |
Sr. Unsec’d. Notes | |
6.300% | | | 10/09/37 | | | | | | | | | | 772 | | | | 803,380 | |
Markel Group, Inc., | |
Sr. Unsec’d. Notes | |
4.150% | | | 09/17/50 | | | | | | | | | | 410 | | | | 310,752 | |
5.000% | | | 03/30/43 | | | | | | | | | | 200 | | | | 175,406 | |
SEE NOTES TO FINANCIAL STATEMENTS.
A80
| | | | |
| | PSF PGIM FLEXIBLE MANAGED PORTFOLIO (CONTINUED) | | |
SCHEDULE OF INVESTMENTS | | | | as of December 31, 2024 |
| | | | | | | | | | | | | | | | | | |
Interest Rate | | Maturity
Date | | | | | | | | Principal
Amount
(000)# | | | Value | |
|
CORPORATE BONDS (continued) | |
Insurance (cont’d.) | | | | | |
Marsh & McLennan Cos., Inc., | |
Sr. Unsec’d. Notes | |
2.250% | | | 11/15/30 | | | | | | | | | | 10 | | | $ | 8,622 | |
4.350% | | | 01/30/47 | | | | | | | | | | 5 | | | | 4,183 | |
New York Life Insurance Co., | |
Sub. Notes, 144A | |
6.750% | | | 11/15/39 | | | | | | | | | | 660 | | | | 732,226 | |
Principal Financial Group, Inc., | |
Gtd. Notes | | | | | | | | | | | | | | | |
2.125% | | | 06/15/30 | | | | | | | | | | 20 | | | | 17,230 | |
3.400% | | | 05/15/25 | | | | | | | | | | 10 | | | | 9,943 | |
4.625% | | | 09/15/42 | | | | | | | | | | 130 | | | | 114,331 | |
Teachers Insurance & Annuity Association of America, | |
Sub. Notes, 144A | |
4.270% | | | 05/15/47 | | | | | | | | | | 575 | | | | 459,801 | |
6.850% | | | 12/16/39 | | | | | | | | | | 124 | | | | 137,481 | |
| | | | | | | | | | | | | | | | | | |
| | | | | |
| | | | | | | | | | | | | | | | | 8,985,271 | |
| | | | | | | | | | | | | | | | | | |
Internet — 0.0% | | | | | | | | | | | | | | | |
Booking Holdings, Inc., | |
Sr. Unsec’d. Notes | |
3.650% | | | 03/15/25 | | | | | | | | | | 5 | | | | 4,984 | |
| | | | | | | | | | | | | | | | | | |
Iron/Steel — 0.0% | |
Cleveland-Cliffs, Inc., | |
Gtd. Notes, 144A | |
6.875% | | | 11/01/29 | | | | | | | | | | 375 | | | | 370,847 | |
7.375% | | | 05/01/33 | | | | | | | | | | 250 | | | | 245,885 | |
Nucor Corp., | |
Sr. Unsec’d. Notes | |
2.700% | | | 06/01/30 | | | | | | | | | | 10 | | | | 8,929 | |
3.950% | | | 05/01/28 | | | | | | | | | | 15 | | | | 14,579 | |
| | | | | | | | | | | | | | | | | | |
| | | | | |
| | | | | | | | | | | | | | | | | 640,240 | |
| | | | | | | | | | | | | | | | | | |
Lodging — 0.0% | |
Marriott International, Inc., | |
Sr. Unsec’d. Notes | |
4.900% | | | 04/15/29 | | | | | | | | | | 555 | | | | 554,168 | |
5.000% | | | 10/15/27 | | | | | | | | | | 15 | | | | 15,109 | |
Sands China Ltd. (Macau), | |
Sr. Unsec’d. Notes | |
5.400% | | | 08/08/28 | | | | | | | | | | 288 | | | | 284,400 | |
| | | | | | | | | | | | | | | | | | |
| | | | | |
| | | | | | | | | | | | | | | | | 853,677 | |
| | | | | | | | | | | | | | | | | | |
Machinery-Diversified — 0.0% | |
John Deere Capital Corp., | |
Sr. Unsec’d. Notes, MTN | |
2.125% | | | 03/07/25 | | | | | | | | | | 25 | | | | 24,887 | |
4.150% | | | 09/15/27 | | | | | | | | | | 25 | | | | 24,754 | |
| | | | | | | | | | | | | | | | | | |
| | | | | |
| | | | | | | | | | | | | | | | | 49,641 | |
| | | | | | | | | | | | | | | | | | |
Media — 0.2% | |
CCO Holdings LLC/CCO Holdings Capital Corp., | | | | | |
Sr. Unsec’d. Notes, 144A | |
5.125% | | | 05/01/27 | | | | | | | | | | 125 | | | | 122,776 | |
5.500% | | | 05/01/26 | | | | | | | | | | 625 | | | | 622,373 | |
| | | | | | | | | | | | | | | | | | | | |
Interest Rate | | Maturity
Date | | | | | | | | | Principal
Amount
(000)# | | | Value | |
|
CORPORATE BONDS (continued) | |
Media (cont’d.) | |
Charter Communications Operating LLC/Charter Communications | |
Operating Capital, | |
Sr. Sec’d. Notes | |
2.250% | | | 01/15/29 | | | | | | | | | | | | 2,870 | | | $ | 2,529,967 | |
3.900% | | | 06/01/52 | | | | | | | | | | | | 580 | | | | 373,198 | |
4.908% | | | 07/23/25 | | | | | | | | | | | | 3 | | | | 2,996 | |
5.375% | | | 04/01/38 | | | | | | | | | | | | 1,630 | | | | 1,455,666 | |
6.484% | | | 10/23/45 | | | | | | | | | | | | 1,021 | | | | 964,643 | |
Cox Communications, Inc., | |
Sr. Unsec’d. Notes, 144A | |
2.600% | | | 06/15/31 | | | | | | | | | | | | 5,275 | | | | 4,444,687 | |
Thomson Reuters Corp. (Canada), | |
Sr. Unsec’d. Notes | |
3.350% | | | 05/15/26 | | | | | | | | | | | | 5 | | | | 4,908 | |
Time Warner Cable LLC, | |
Sr. Sec’d. Notes | |
5.500% | | | 09/01/41 | | | | | | | | | | | | 360 | | | | 305,963 | |
Walt Disney Co. (The), | |
Gtd. Notes | |
3.800% | | | 03/22/30 | | | | | | | | | | | | 50 | | | | 47,859 | |
| | | | | | | | | | | | | | | | | | | | |
| | | | | |
| | | | | | | | | | | | | | | | | | | 10,875,036 | |
| | | | | | | | | | | | | | | | | | | | |
Mining — 0.1% | |
Freeport Indonesia PT (Indonesia), | |
Sr. Unsec’d. Notes, 144A, MTN | |
4.763% | | | 04/14/27 | | | | | | | | | | | | 215 | | | | 212,850 | |
Newmont Corp., | |
Gtd. Notes | | | | | | | | | | | | | | | | | | | | |
2.800% | | | 10/01/29 | | | | | | | | | | | | 2,750 | | | | 2,509,445 | |
Newmont Corp./Newcrest Finance Pty Ltd., | | | | | |
Gtd. Notes | | | | | | | | | | | | | | | | | | | | |
5.350% | | | 03/15/34 | | | | | | | | | | | | 1,280 | | | | 1,274,320 | |
Yamana Gold, Inc. (Canada), | |
Gtd. Notes | | | | | | | | | | | | | | | | | | | | |
2.630% | | | 08/15/31 | | | | | | | | | | | | 3,050 | | | | 2,563,773 | |
| | | | | | | | | | | | | | | | | | | | |
| | | | | |
| | | | | | | | | | | | | | | | | | | 6,560,388 | |
| | | | | | | | | | | | | | | | | | | | |
Miscellaneous Manufacturing — 0.0% | |
Amsted Industries, Inc., | | | | | | | | | | | | | | | | | |
Gtd. Notes, 144A | |
5.625% | | | 07/01/27 | | | | | | | | | | | | 1,200 | | | | 1,188,467 | |
| | | | | | | | | | | | | | | | | | | | |
Multi-National — 0.0% | |
Corp. Andina de Fomento (Supranational Bank), | | | | | |
Sr. Unsec’d. Notes | |
5.000% | | | 01/24/29 | | | | | | | | | | | | 1,545 | | | | 1,550,995 | |
| | | | | | | | | | | | | | | | | | | | |
Office/Business Equipment — 0.0% | |
CDW LLC/CDW Finance Corp., | |
Gtd. Notes | |
2.670% | | | 12/01/26 | | | | | | | | | | | | 1,810 | | | | 1,735,969 | |
| | | | | | | | | | | | | | | | | | | | |
Oil & Gas — 0.4% | |
Aker BP ASA (Norway), | |
Gtd. Notes, 144A | |
3.100% | | | 07/15/31 | | | | | | | | | | | | 755 | | | | 653,270 | |
Sr. Unsec’d. Notes, 144A | |
3.750% | | | 01/15/30 | | | | | | | | | | | | 2,412 | | | | 2,237,294 | |
4.000% | | | 01/15/31 | | | | | | | | | | | | 770 | | | | 708,024 | |
SEE NOTES TO FINANCIAL STATEMENTS.
A81
| | | | |
| | PSF PGIM FLEXIBLE MANAGED PORTFOLIO (CONTINUED) | | |
SCHEDULE OF INVESTMENTS | | | | as of December 31, 2024 |
| | | | | | | | | | | | | | | | | | |
| | | | | | Principal | | | | |
| Interest | | Maturity | | | | | Amount | | | | |
Rate | | Date | | | | | (000)# | | | Value | |
|
CORPORATE BONDS (continued) | |
Oil & Gas (cont’d.) | | | | | |
5.125% | | | 10/01/34 | | | | | | | | | | 585 | | | $ | 550,088 | |
BP Capital Markets America, Inc., | | | | | |
Gtd. Notes | |
3.410% | | | 02/11/26 | | | | | | | | | | 25 | | | | 24,696 | |
Canadian Natural Resources Ltd. (Canada), | | | | | |
Sr. Unsec’d. Notes | |
2.950% | | | 07/15/30 | | | | | | | | | | 20 | | | | 17,759 | |
Sr. Unsec’d. Notes, 144A | | | | | |
5.000% | | | 12/15/29 | | | | | | | | | | 1,560 | | | | 1,542,746 | |
Cenovus Energy, Inc. (Canada), | |
Sr. Unsec’d. Notes | |
5.400% | | | 06/15/47 | | | | | | | | | | 714 | | | | 634,338 | |
Chevron Corp., | |
Sr. Unsec’d. Notes | |
1.995% | | | 05/11/27 | | | | | | | | | | 10 | | | | 9,454 | |
Civitas Resources, Inc., | |
Gtd. Notes, 144A | |
8.625% | | | 11/01/30 | | | | | | | | | | 150 | | | | 157,156 | |
Devon Energy Corp., | |
Sr. Unsec’d. Notes | |
5.600% | | | 07/15/41 | | | | | | | | | | 300 | | | | 277,482 | |
Ecopetrol SA (Colombia), | |
Sr. Unsec’d. Notes | |
6.875% | | | 04/29/30 | | | | | | | | | | 637 | | | | 620,756 | |
7.750% | | | 02/01/32 | | | | | | | | | | 1,520 | | | | 1,476,680 | |
8.625% | | | 01/19/29 | | | | | | | | | | 2,105 | | | | 2,229,511 | |
Expand Energy Corp., | |
Gtd. Notes | |
4.750% | | | 02/01/32 | | | | | | | | | | 500 | | | | 464,454 | |
Hilcorp Energy I LP/Hilcorp Finance Co., | |
Sr. Unsec’d. Notes, 144A | |
6.000% | | | 04/15/30 | | | | | | | | | | 300 | | | | 282,341 | |
6.250% | | | 04/15/32 | | | | | | | | | | 500 | | | | 460,323 | |
Korea National Oil Corp. (South Korea), | |
Sr. Unsec’d. Notes, 144A | |
4.750% | | | 04/03/26 | | | | | | | | | | 510 | | | | 508,001 | |
4.875% | | | 04/03/28 | | | | | | | | | | 530 | | | | 526,311 | |
Marathon Oil Corp., | |
Sr. Unsec’d. Notes | | | | | |
5.700% | | | 04/01/34 | | | | | | | | | | 2,536 | | | | 2,631,620 | |
Petroleos Mexicanos (Mexico), | |
Gtd. Notes | |
5.950% | | | 01/28/31 | | | | | | | | | | 2,146 | | | | 1,805,151 | |
6.490% | | | 01/23/27 | | | | | | | | | | 471 | | | | 456,134 | |
6.500% | | | 03/13/27 | | | | | | | | | | 330 | | | | 317,988 | |
Gtd. Notes, MTN | |
6.875% | | | 08/04/26 | | | | | | | | | | 670 | | | | 658,275 | |
QatarEnergy (Qatar), | |
Sr. Unsec’d. Notes, 144A | |
1.375% | | | 09/12/26 | | | | | | | | | | 600 | | | | 565,380 | |
2.250% | | | 07/12/31 | | | | | | | | | | 820 | | | | 688,628 | |
Santos Finance Ltd. (Australia), | |
Gtd. Notes, 144A | |
6.875% | | | 09/19/33 | | | | | | | | | | 1,015 | | | | 1,071,917 | |
| | | | | | | | | | | | | | | | | | |
| | | | | | Principal | | | | |
| Interest | | Maturity | | | | | Amount | | | | |
Rate | | Date | | | | | (000)# | | | Value | |
|
CORPORATE BONDS (continued) | |
Oil & Gas (cont’d.) | | | | | |
TotalEnergies Capital International SA (France), | |
Gtd. Notes | | | | | |
2.434% | | | 01/10/25 | | | | | | | | | | 30 | | | $ | 29,982 | |
| | | | | | | | | | | | | | | | | | |
| | | | | |
| | | | | | | | | | | | | | | | | 21,605,759 | |
| | | | | | | | | | | | | | | | | | |
Packaging & Containers — 0.2% | | | | | |
Ball Corp., | |
Gtd. Notes | |
3.125% | | | 09/15/31 | (a) | | | | | | | | | 425 | | | | 360,574 | |
6.000% | | | 06/15/29 | | | | | | | | | | 1,150 | | | | 1,159,691 | |
Berry Global, Inc., | |
Sr. Sec’d. Notes | |
1.570% | | | 01/15/26 | | | | | | | | | | 5,135 | | | | 4,955,701 | |
Sealed Air Corp./Sealed Air Corp. US, | |
Gtd. Notes, 144A | |
6.125% | | | 02/01/28 | | | | | | | | | | 125 | | | | 125,468 | |
Smurfit Westrock Financing DAC (Ireland), | |
Gtd. Notes, 144A | |
5.418% | | | 01/15/35 | | | | | | | | | | 1,000 | | | | 992,955 | |
| | | | | | | | | | | | | | | | | | |
| |
| | | | 7,594,389 | |
| | | | | | | | | | | | | | | | | | |
Pharmaceuticals — 0.3% | |
AbbVie, Inc., | |
Sr. Unsec’d. Notes | |
2.950% | | | 11/21/26 | | | | | | | | | | 10 | | | | 9,718 | |
3.600% | | | 05/14/25 | | | | | | | | | | 10 | | | | 9,957 | |
3.800% | | | 03/15/25 | | | | | | | | | | 1,175 | | | | 1,172,435 | |
4.050% | | | 11/21/39 | | | | | | | | | | 250 | | | | 213,765 | |
4.550% | | | 03/15/35 | (h) | | | | | | | | | 2,190 | | | | 2,058,798 | |
4.700% | | | 05/14/45 | | | | | | | | | | 735 | | | | 649,934 | |
Bayer US Finance II LLC (Germany), | |
Gtd. Notes, 144A | |
4.250% | | | 12/15/25 | | | | | | | | | | 685 | | | | 680,061 | |
Becton, Dickinson & Co., | |
Sr. Unsec’d. Notes | |
2.823% | | | 05/20/30 | | | | | | | | | | 20 | | | | 17,915 | |
Cardinal Health, Inc., | |
Sr. Unsec’d. Notes | |
3.410% | | | 06/15/27 | | | | | | | | | | 15 | | | | 14,539 | |
3.750% | | | 09/15/25 | | | | | | | | | | 5 | | | | 4,965 | |
CVS Health Corp., | | | | | |
Sr. Unsec’d. Notes | |
3.250% | | | 08/15/29 | | | | | | | | | | 50 | | | | 45,515 | |
4.780% | | | 03/25/38 | | | | | | | | | | 3,750 | | | | 3,241,363 | |
5.875% | | | 06/01/53 | | | | | | | | | | 200 | | | | 183,467 | |
Eli Lilly & Co., | |
Sr. Unsec’d. Notes | |
4.875% | | | 02/27/53 | | | | | | | | | | 340 | | | | 306,827 | |
Mylan, Inc., | |
Gtd. Notes | |
5.200% | | | 04/15/48 | | | | | | | | | | 685 | | | | 566,567 | |
5.400% | | | 11/29/43 | | | | | | | | | | 845 | | | | 756,335 | |
Organon & Co./Organon Foreign Debt Co-Issuer BV, | |
Sr. Sec’d. Notes, 144A | |
4.125% | | | 04/30/28 | | | | | | | | | | 900 | | | | 845,793 | |
| | | | | | | | | | | | | | | | | | |
SEE NOTES TO FINANCIAL STATEMENTS.
A82
| | | | |
| | PSF PGIM FLEXIBLE MANAGED PORTFOLIO (CONTINUED) | | |
SCHEDULE OF INVESTMENTS | | | | as of December 31, 2024 |
| | | | | | | | | | | | | | | | | | | | |
Interest
Rate | | Maturity
Date | | | | | | | | | Principal
Amount
(000)# | | | Value | |
|
CORPORATE BONDS (continued) | |
Pharmaceuticals (cont’d.) | |
Utah Acquisition Sub, Inc., | |
Gtd. Notes | |
5.250% | | | 06/15/46 | | | | | | | | | | | | 690 | | | $ | 579,200 | |
Viatris, Inc., | |
Gtd. Notes | |
3.850% | | | 06/22/40 | | | | | | | | | | | | 470 | | | | 351,935 | |
Zoetis, Inc., | |
Sr. Unsec’d. Notes | |
2.000% | | | 05/15/30 | | | | | | | | | | | | 2,695 | | | | 2,318,849 | |
| | | | | | | | | | | | | | | | | | | | |
| | | | | |
| | | | | | | | | | | | | | | | | | | 14,027,938 | |
| | | | | | | | | | | | | | | | | | | | |
Pipelines — 0.8% | |
Antero Midstream Partners LP/Antero Midstream Finance Corp., | |
Gtd. Notes, 144A | |
5.750% | | | 01/15/28 | | | | | | | | | | | | 750 | | | | 743,703 | |
Boardwalk Pipelines LP, | |
Gtd. Notes | |
3.400% | | | 02/15/31 | | | | | | | | | | | | 1,625 | | | | 1,451,191 | |
DCP Midstream Operating LP, | |
Gtd. Notes | |
5.125% | | | 05/15/29 | | | | | | | | | | | | 2,690 | | | | 2,692,364 | |
Eastern Gas Transmission & Storage, Inc., | |
Sr. Unsec’d. Notes | |
4.600% | | | 12/15/44 | | | | | | | | | | | | 65 | | | | 54,746 | |
EIG Pearl Holdings Sarl (Saudi Arabia), | |
Sr. Sec’d. Notes, 144A | |
3.545% | | | 08/31/36 | | | | | | | | | | | | 1,429 | | | | 1,224,028 | |
Energy Transfer LP, | |
Gtd. Notes | |
5.250% | | | 04/15/29 | | | | | | | | | | | | 10 | | | | 10,038 | |
Sr. Unsec’d. Notes | |
4.950% | | | 06/15/28 | | | | | | | | | | | | 1,115 | | | | 1,113,145 | |
5.550% | | | 05/15/34 | | | | | | | | | | | | 1,495 | | | | 1,482,624 | |
6.100% | | | 02/15/42 | | | | | | | | | | | | 25 | | | | 24,584 | |
6.125% | | | 12/15/45 | | | | | | | | | | | | 180 | | | | 177,617 | |
6.250% | | | 04/15/49 | | | | | | | | | | | | 1,900 | | | | 1,906,011 | |
6.400% | | | 12/01/30 | | | | | | | | | | | | 480 | | | | 506,818 | |
6.550% | | | 12/01/33 | | | | | | | | | | | | 1,265 | | | | 1,344,366 | |
EQM Midstream Partners LP, | |
Sr. Unsec’d. Notes, 144A | |
7.500% | | | 06/01/27 | | | | | | | | | | | | 50 | | | | 50,999 | |
7.500% | | | 06/01/30 | | | | | | | | | | | | 50 | | | | 53,309 | |
Florida Gas Transmission Co. LLC, | |
Sr. Unsec’d. Notes, 144A | |
4.350% | | | 07/15/25 | | | | | | | | | | | | 5 | | | | 4,978 | |
Greensaif Pipelines Bidco Sarl (Saudi Arabia), | |
Sr. Sec’d. Notes, 144A | |
6.129% | | | 02/23/38 | | | | | | | | | | | | 550 | | | | 552,409 | |
6.510% | | | 02/23/42 | | | | | | | | | | | | 715 | | | | 723,491 | |
Kinder Morgan, Inc., | |
Gtd. Notes | |
3.600% | | | 02/15/51 | | | | | | | | | | | | 2,260 | | | | 1,529,673 | |
MPLX LP, | |
Sr. Unsec’d. Notes | |
2.650% | | | 08/15/30 | | | | | | | | | | | | 595 | | | | 520,598 | |
4.000% | | | 02/15/25 | | | | | | | | | | | | 1,430 | | | | 1,427,734 | |
4.000% | | | 03/15/28 | | | | | | | | | | | | 1,385 | | | | 1,343,129 | |
| | | | | | | | | | | | | | | | | | | | |
Interest
Rate | | Maturity
Date | | | | | | | | | Principal
Amount
(000)# | | | Value | |
|
CORPORATE BONDS (continued) | |
Pipelines (cont’d.) | |
4.875% | | | 06/01/25 | | | | | | | | | | | | 3,250 | | | $ | 3,247,570 | |
5.200% | | | 03/01/47 | | | | | | | | | | | | 40 | | | | 35,509 | |
5.500% | | | 02/15/49 | | | | | | | | | | | | 395 | | | | 362,925 | |
Northwest Pipeline LLC, | |
Sr. Unsec’d. Notes | |
4.000% | | | 04/01/27 | | | | | | | | | | | | 3,725 | | | | 3,654,859 | |
ONEOK Partners LP, | |
Gtd. Notes | |
6.650% | | | 10/01/36 | | | | | | | | | | | | 145 | | | | 154,096 | |
ONEOK, Inc., | |
Gtd. Notes | |
3.100% | | | 03/15/30 | | | | | | | | | | | | 5,205 | | | | 4,719,672 | |
4.500% | | | 03/15/50 | | | | | | | | | | | | 295 | | | | 232,359 | |
6.050% | | | 09/01/33 | | | | | | | | | | | | 2,160 | | | | 2,223,673 | |
Spectra Energy Partners LP, | |
Gtd. Notes | |
3.375% | | | 10/15/26 | | | | | | | | | | | | 15 | | | | 14,645 | |
Targa Resources Corp., | |
Gtd. Notes | |
4.200% | | | 02/01/33 | | | | | | | | | | | | 755 | | | | 685,792 | |
6.125% | | | 03/15/33 | | | | | | | | | | | | 1,895 | | | | 1,954,185 | |
Venture Global Calcasieu Pass LLC, | |
Sr. Sec’d. Notes, 144A | |
3.875% | | | 08/15/29 | | | | | | | | | | | | 115 | | | | 105,670 | |
4.125% | | | 08/15/31 | | | | | | | | | | | | 90 | | | | 80,754 | |
6.250% | | | 01/15/30 | | | | | | | | | | | | 650 | | | | 657,262 | |
Western Midstream Operating LP, | |
Sr. Unsec’d. Notes | |
5.300% | | | 03/01/48 | | | | | | | | | | | | 125 | | | | 106,099 | |
Williams Cos., Inc. (The), | |
Sr. Unsec’d. Notes | |
4.900% | | | 01/15/45 | | | | | | | | | | | | 1,000 | | | | 871,966 | |
5.100% | | | 09/15/45 | | | | | | | | | | | | 500 | | | | 448,466 | |
5.150% | | | 03/15/34 | | | | | | | | | | | | 510 | | | | 495,621 | |
8.750% | | | 03/15/32 | | | | | | | | | | | | 1,130 | | | | 1,336,077 | |
| | | | | | | | | | | | | | | | | | | | |
| | | | | |
| | | | | | | | | | | | | | | | | | | 40,324,755 | |
| | | | | | | | | | | | | | | | | | | | |
Real Estate Investment Trusts (REITs) — 0.5% | |
Alexandria Real Estate Equities, Inc., | |
Gtd. Notes | | | | | | | | | | | | | | | | | | | | |
2.000% | | | 05/18/32 | | | | | | | | | | | | 1,815 | | | | 1,446,812 | |
2.950% | | | 03/15/34 | | | | | | | | | | | | 480 | | | | 395,446 | |
5.250% | | | 05/15/36 | | | | | | | | | | | | 2,445 | | | | 2,371,378 | |
American Tower Corp., | |
Sr. Unsec’d. Notes | |
1.450% | | | 09/15/26 | | | | | | | | | | | | 30 | | | | 28,352 | |
3.600% | | | 01/15/28 | | | | | | | | | | | | 5,420 | | | | 5,208,106 | |
Brixmor Operating Partnership LP, | |
Sr. Unsec’d. Notes | |
3.850% | | | 02/01/25 | | | | | | | | | | | | 5 | | | | 4,993 | |
3.900% | | | 03/15/27 | | | | | | | | | | | | 5 | | | | 4,895 | |
4.050% | | | 07/01/30 | | | | | | | | | | | | 5 | | | | 4,725 | |
COPT Defense Properties LP, | |
Gtd. Notes | |
2.900% | | | 12/01/33 | | | | | | | | | | | | 1,345 | | | | 1,081,104 | |
SEE NOTES TO FINANCIAL STATEMENTS.
A83
| | | | |
| | PSF PGIM FLEXIBLE MANAGED PORTFOLIO (CONTINUED) | | |
SCHEDULE OF INVESTMENTS | | | | as of December 31, 2024 |
| | | | | | | | | | | | | | | | |
| | | | | | Principal | | | | |
| Interest | | Maturity | | | | | Amount | | | | |
Rate | | Date | | | | | (000)# | | | Value | |
|
CORPORATE BONDS (continued) | |
| Real Estate Investment Trusts (REITs) (cont’d.) | |
Crown Castle, Inc., | |
Sr. Unsec’d. Notes | |
2.900% | | | 03/15/27 | | | | | | | | 10 | | | $ | 9,607 | |
3.700% | | | 06/15/26 | | | | | | | | 10 | | | | 9,838 | |
4.750% | | | 05/15/47 | | | | | | | | 5 | | | | 4,235 | |
Essex Portfolio LP, | | | | | | | | | | |
Gtd. Notes | |
3.000% | | | 01/15/30 | | | | | | | | 5 | | | | 4,523 | |
GLP Capital LP/GLP Financing II, Inc., | |
Gtd. Notes | |
5.375% | | | 04/15/26 | | | | | | | | 1,050 | | | | 1,051,008 | |
Healthpeak OP LLC, | |
Gtd. Notes | |
2.125% | | | 12/01/28 | | | | | | | | 5 | | | | 4,495 | |
2.875% | | | 01/15/31 | | | | | | | | 5 | | | | 4,402 | |
Kimco Realty OP LLC, | |
Gtd. Notes | |
2.700% | | | 10/01/30 | | | | | | | | 3,480 | | | | 3,086,573 | |
MPT Operating Partnership LP/MPT Finance Corp., | |
Gtd. Notes | |
3.500% | | | 03/15/31 | | | | | | | | 950 | | | | 602,839 | |
5.000% | | | 10/15/27 | | | | | | | | 400 | | | | 338,061 | |
Prologis LP, | |
Sr. Unsec’d. Notes | |
2.125% | | | 04/15/27 | | | | | | | | 5 | | | | 4,736 | |
Public Storage Operating Co., | |
Gtd. Notes | |
1.950% | | | 11/09/28 | | | | | | | | 10 | | | | 8,999 | |
2.250% | | | 11/09/31 | | | | | | | | 1,288 | | | | 1,076,786 | |
Realty Income Corp., | |
Sr. Unsec’d. Notes | |
4.625% | | | 11/01/25 | | | | | | | | 20 | | | | 19,978 | |
Sun Communities Operating LP, | |
Gtd. Notes | |
2.700% | | | 07/15/31 | | | | | | | | 3,000 | | | | 2,523,412 | |
5.500% | | | 01/15/29 | | | | | | | | 3,445 | | | | 3,466,193 | |
WP Carey, Inc., | |
Sr. Unsec’d. Notes | |
3.850% | | | 07/15/29 | (a) | | | | | | | 20 | | | | 19,030 | |
| | | | | | | | | | | | | | | | |
| | | | | |
| | | | | | | | | | | | | | | 22,780,526 | |
| | | | | | | | | | | | | | | | |
Retail — 0.1% | |
1011778 BC ULC/New Red Finance, Inc. (Canada), | | | | | |
Sr. Sec’d. Notes, 144A | |
3.875% | | | 01/15/28 | | | | | | | | 525 | | | | 496,125 | |
AutoZone, Inc., | |
Sr. Unsec’d. Notes | |
1.650% | | | 01/15/31 | | | | | | | | 770 | | | | 632,941 | |
3.125% | | | 04/21/26 | | | | | | | | 5 | | | | 4,898 | |
3.750% | | | 06/01/27 | | | | | | | | 15 | | | | 14,655 | |
Dollar Tree, Inc., | |
Sr. Unsec’d. Notes | |
4.000% | | | 05/15/25 | | | | | | | | 4,705 | | | | 4,685,527 | |
Gap, Inc. (The), | |
Gtd. Notes, 144A | |
3.625% | | | 10/01/29 | | | | | | | | 275 | | | | 247,032 | |
3.875% | | | 10/01/31 | | | | | | | | 250 | | | | 215,808 | |
| | | | | | | | | | | | | | | | |
| | | | | | Principal | | | | |
| Interest | | Maturity | | | | | Amount | | | | |
Rate | | Date | | | | | (000)# | | | Value | |
|
CORPORATE BONDS (continued) | |
| Retail (cont’d.) | |
Home Depot, Inc. (The), | |
Sr. Unsec’d. Notes | |
2.500% | | | 04/15/27 | | | | | | | | 50 | | | $ | 47,847 | |
Lowe’s Cos., Inc., | |
Sr. Unsec’d. Notes | |
5.000% | | | 04/15/33 | | | | | | | | 30 | | | | 29,543 | |
O’Reilly Automotive, Inc., | |
Sr. Unsec’d. Notes | |
3.600% | | | 09/01/27 | | | | | | | | 20 | | | | 19,410 | |
TJX Cos., Inc. (The), | |
Sr. Unsec’d. Notes | |
1.600% | | | 05/15/31 | | | | | | | | 5 | | | | 4,092 | |
Walmart, Inc., | |
Sr. Unsec’d. Notes | |
3.900% | | | 09/09/25 | | | | | | | | 20 | | | | 19,929 | |
| | | | | | | | | | | | | | | | |
| | | | | |
| | | | | | | | | | | | | | | 6,417,807 | |
| | | | | | | | | | | | | | | | |
Semiconductors — 0.1% | |
Broadcom, Inc., | |
Sr. Unsec’d. Notes | |
5.050% | | | 07/12/29 | | | | | | | | 1,858 | | | | 1,864,937 | |
Sr. Unsec’d. Notes, 144A | |
3.137% | | | 11/15/35 | | | | | | | | 320 | | | | 261,401 | |
3.187% | | | 11/15/36 | | | | | | | | 4,445 | | | | 3,580,045 | |
NXP BV/NXP Funding LLC/NXP USA, Inc. (China), | |
Gtd. Notes | |
2.650% | | | 02/15/32 | | | | | | | | 25 | | | | 20,982 | |
3.150% | | | 05/01/27 | | | | | | | | 5 | | | | 4,805 | |
QUALCOMM, Inc., | |
Sr. Unsec’d. Notes | |
2.150% | | | 05/20/30 | | | | | | | | 25 | | | | 21,941 | |
3.250% | | | 05/20/27 | | | | | | | | 12 | | | | 11,673 | |
Texas Instruments, Inc., | |
Sr. Unsec’d. Notes | |
1.750% | | | 05/04/30 | | | | | | | | 15 | | | | 12,836 | |
| | | | | | | | | | | | | | | | |
| | | | | |
| | | | | | | | | | | | | | | 5,778,620 | |
| | | | | | | | | | | | | | | | |
Shipbuilding — 0.1% | |
Huntington Ingalls Industries, Inc., | |
Gtd. Notes | |
5.353% | | | 01/15/30 | | | | | | | | 4,172 | | | | 4,179,130 | |
5.749% | | | 01/15/35 | | | | | | | | 1,575 | | | | 1,569,456 | |
| | | | | | | | | | | | | | | | |
| | | | | |
| | | | | | | | | | | | | | | 5,748,586 | |
| | | | | | | | | | | | | | | | |
Software — 0.1% | |
Fiserv, Inc., | |
Sr. Unsec’d. Notes | |
3.200% | | | 07/01/26 | | | | | | | | 10 | | | | 9,779 | |
5.450% | | | 03/02/28 | | | | | | | | 2,560 | | | | 2,600,045 | |
Roper Technologies, Inc., | |
Sr. Unsec’d. Notes | |
2.950% | | | 09/15/29 | | | | | | | | 5 | | | | 4,566 | |
3.800% | | | 12/15/26 | | | | | | | | 15 | | | | 14,765 | |
ServiceNow, Inc., | |
Sr. Unsec’d. Notes | |
1.400% | | | 09/01/30 | | | | | | | | 2,055 | | | | 1,706,553 | |
| | | | | | | | | | | | | | | | |
| | | | | |
| | | | | | | | | | | | | | | 4,335,708 | |
| | | | | | | | | | | | | | | | |
SEE NOTES TO FINANCIAL STATEMENTS.
A84
| | | | |
| | PSF PGIM FLEXIBLE MANAGED PORTFOLIO (CONTINUED) | | |
SCHEDULE OF INVESTMENTS | | | | as of December 31, 2024 |
| | | | | | | | | | | | | | | | | | | | |
Interest
Rate | | Maturity
Date | | | | | | Principal
Amount
(000)# | | | Value | |
|
CORPORATE BONDS (continued) | |
Telecommunications — 0.6% | |
AT&T, Inc., | |
Sr. Unsec’d. Notes | |
2.250% | | | 02/01/32 | | | | | | | | | | | | 50 | | | $ | 41,307 | |
2.550% | | | 12/01/33 | | | | | | | | | | | | 576 | | | | 463,935 | |
3.500% | | | 09/15/53 | | | | | | | | | | | | 850 | | | | 572,950 | |
3.650% | | | 09/15/59 | | | | | | | | | | | | 160 | | | | 106,113 | |
4.500% | | | 05/15/35 | | | | | | | | | | | | 545 | | | | 504,255 | |
5.400% | | | 02/15/34 | | | | | | | | | | | | 6,540 | | | | 6,569,700 | |
Level 3 Financing, Inc., | |
Sec’d. Notes, 144A | |
4.875% | | | 06/15/29 | | | | | | | | | | | | 100 | | | | 86,981 | |
Sr. Sec’d. Notes, 144A | |
10.500% | | | 04/15/29 | | | | | | | | | | | | 300 | | | | 334,217 | |
10.500% | | | 05/15/30 | | | | | | | | | | | | 425 | | | | 462,722 | |
11.000% | | | 11/15/29 | | | | | | | | | | | | 1,095 | | | | 1,232,507 | |
Rogers Communications, Inc. (Canada), | |
Gtd. Notes | |
3.800% | | | 03/15/32 | | | | | | | | | | | | 4,030 | | | | 3,622,569 | |
4.500% | | | 03/15/42 | | | | | | | | | | | | 60 | | | | 50,603 | |
T-Mobile USA, Inc., | |
Gtd. Notes | |
2.050% | | | 02/15/28 | | | | | | | | | | | | 380 | | | | 348,999 | |
2.550% | | | 02/15/31 | | | | | | | | | | | | 1,385 | | | | 1,190,857 | |
3.875% | | | 04/15/30 | | | | | | | | | | | | 8,000 | | | | 7,528,558 | |
Verizon Communications, Inc., | |
Sr. Unsec’d. Notes | |
1.680% | | | 10/30/30 | | | | | | | | | | | | 615 | | | | 511,574 | |
2.550% | | | 03/21/31 | | | | | | | | | | | | 1,074 | | | | 925,375 | |
2.650% | | | 11/20/40 | | | | | | | | | | | | 1,595 | | | | 1,090,378 | |
3.150% | | | 03/22/30 | | | | | | | | | | | | 1,900 | | | | 1,738,622 | |
Sr. Unsec’d. Notes, 144A | |
4.780% | | | 02/15/35 | | | | | | | | | | | | 43 | | | | 40,989 | |
| | | | | | | | | | | | | | | | | | | | |
| | | | | |
| | | | | | | | | | | | | | | | | | | 27,423,211 | |
| | | | | | | | | | | | | | | | | | | | |
Transportation — 0.0% | |
Burlington Northern Santa Fe LLC, | |
Sr. Unsec’d. Notes | |
4.150% | | | 04/01/45 | | | | | | | | | | | | 10 | | | | 8,225 | |
6.700% | | | 08/01/28 | | | | | | | | | | | | 670 | | | | 704,125 | |
Canadian Pacific Railway Co. (Canada), | |
Gtd. Notes | |
1.750% | | | 12/02/26 | | | | | | | | | | | | 10 | | | | 9,459 | |
2.875% | | | 11/15/29 | | | | | | | | | | | | 5 | | | | 4,570 | |
3.500% | | | 05/01/50 | | | | | | | | | | | | 20 | | | | 14,200 | |
CSX Corp., | |
Sr. Unsec’d. Notes | |
6.150% | | | 05/01/37 | | | | | | | | | | | | 715 | | | | 760,089 | |
GN Bondco LLC, | |
Sr. Sec’d. Notes, 144A | |
9.500% | | | 10/15/31 | (a) | | | | | | | | | | | 575 | | | | 604,197 | |
Norfolk Southern Corp., | |
Sr. Unsec’d. Notes | |
5.590% | | | 05/17/25 | | | | | | | | | | | | 100 | | | | 100,177 | |
| | | | | | | | | | | | | | | | |
Interest
Rate | | Maturity
Date | | | | | Principal
Amount
(000)# | | Value | |
|
CORPORATE BONDS (continued) | |
Transportation (cont’d.) | |
XPO, Inc., | |
Gtd. Notes, 144A | |
7.125% | | | 06/01/31 | | | | | | | | | 150 | | $ | 153,139 | |
| | | | | | | | | | | | | | | | |
| | | | | |
| | | | | | | | | | | | | | | 2,358,181 | |
| | | | | | | | | | | | | | | | |
TOTAL CORPORATE BONDS
(cost $549,149,293) | | | 526,759,919 | |
| | | | | | | | | | | | | | | | |
|
FLOATING RATE AND OTHER LOANS — 0.0% | |
Telecommunications | |
Level 3 Financing, Inc., | |
Term B-1, 1 Month SOFR + 6.560% | |
10.917%(c) | | | 04/15/29 | | | | | | | | | 105 | | | 106,600 | |
Term B-2, 1 Month SOFR + 6.560% | |
10.917%(c) | | | 04/15/30 | | | | | | | | | 105 | | | 107,253 | |
| | | | | | | | | | | | | | | | |
TOTAL FLOATING RATE AND OTHER LOANS
(cost $206,618) | | | 213,853 | |
| | | | | | | | | | | | | | | | |
|
MUNICIPAL BONDS — 0.2% | |
Alabama — 0.0% | |
Alabama Economic Settlement Authority, | |
Taxable, Revenue Bonds, Series B | |
4.263% | | | 09/15/32 | | | | | | | | | 240 | | | 230,210 | |
| | | | | | | | | | | | | | | | |
California — 0.1% | |
Bay Area Toll Authority, | |
Revenue Bonds, BABs, Series F2 | |
6.263% | | | 04/01/49 | | | | | | | | | 1,325 | | | 1,399,553 | |
Taxable, Revenue Bonds, Series S | |
3.176% | | | 04/01/41 | | | | | | | | | 25 | | | 19,456 | |
State of California, | |
General Obligation Unlimited, BABs | |
7.300% | | | 10/01/39 | | | | | | | | | 1,270 | | | 1,453,806 | |
General Obligation Unlimited, Taxable, BABs | |
7.500% | | | 04/01/34 | | | | | | | | | 475 | | | 542,668 | |
7.625% | | | 03/01/40 | | | | | | | | | 220 | | | 258,458 | |
7.550% | | | 04/01/39 | | | | | | | | | 245 | | | 289,153 | |
University of California, | |
Taxable, Revenue Bonds, Series J | |
4.131% | | | 05/15/45 | | | | | | | | | 5 | | | 4,395 | |
| | | | | | | | | | | | | | | | |
| | | | | |
| | | | | | | | | | | | | | | 3,967,489 | |
| | | | | | | | | | | | | | | | |
Colorado — 0.0% | | | | | | | | | | | | | |
Regional Transportation District Sales Tax Revenue, | |
Revenue Bonds, BABs, Series B | |
5.844% | | | 11/01/50 | | | | | | | | | 680 | | | 688,637 | |
| | | | | | | | | | | | | | | | |
Florida — 0.0% | |
County of Miami-Dade Transit System, | |
Revenue Bonds, BABs, Series B | |
5.624% | | | 07/01/40 | | | | | | | | | 10 | | | 9,922 | |
Florida Development Finance Corp., | |
Taxable, Revenue Bonds, Series B | |
4.109% | | | 04/01/50 | | | | | | | | | 40 | | | 32,676 | |
| | | | | | | | | | | | | | | | |
| | | | | |
| | | | | | | | | | | | | | | 42,598 | |
| | | | | | | | | | | | | | | | |
SEE NOTES TO FINANCIAL STATEMENTS.
A85
| | | | |
| | PSF PGIM FLEXIBLE MANAGED PORTFOLIO (CONTINUED) | | |
SCHEDULE OF INVESTMENTS | | | | as of December 31, 2024 |
| | | | | | | | | | | | | | | | | | |
| | | | | | Principal | | | | |
| Interest | | Maturity | | | | | Amount | | | | |
Rate | | Date | | | | | (000)# | | | Value | |
|
MUNICIPAL BONDS (continued) | |
Georgia — 0.0% | | | | | |
Municipal Electric Authority of Georgia, | |
Taxable, Revenue Bonds, BABs | | | | | |
6.655% | | | 04/01/57 | | | | | | | | | | 14 | | | $ | 15,024 | |
| | | | | | | | | | | | | | | | | | |
Illinois — 0.0% | |
Chicago O’Hare International Airport, | | | | | |
Revenue Bonds, BABs, Series B | |
6.395% | | | 01/01/40 | | | | | | | | | | 1,030 | | | | 1,085,422 | |
| | | | | | | | | | | | | | | | | | |
New Jersey — 0.1% | | | | | |
New Jersey Turnpike Authority, | |
Taxable, Revenue Bonds, BABs, Series F | |
7.414% | | | 01/01/40 | | | | | | | | | | 1,070 | | | | 1,234,395 | |
| | | | | | | | | | | | | | | | | | |
New York — 0.0% | |
New York State Urban Development Corp., | |
Taxable, Revenue Bonds, Series B | |
2.590% | | | 03/15/35 | | | | | | | | | | 30 | | | | 24,082 | |
| | | | | | | | | | | | | | | | | | |
Ohio — 0.0% | |
Ohio State University (The), | |
Taxable, Revenue Bonds, BABs, Series C | |
4.910% | | | 06/01/40 | | | | | | | | | | 455 | | | | 426,813 | |
| | | | | | | | | | | | | | | | | | |
Pennsylvania — 0.0% | |
Pennsylvania Turnpike Commission, | |
Revenue Bonds, BABs, Series B | |
5.511% | | | 12/01/45 | | | | | | | | | | 550 | | | | 532,422 | |
| | | | | | | | | | | | | | | | | | |
Texas — 0.0% | | | | | | | | | | | | |
Central Texas Regional Mobility Authority, | |
Taxable, Revenue Bonds, Series E | |
3.167% | | | 01/01/41 | | | | | | | | | | 15 | | | | 11,631 | |
Dallas Fort Worth International Airport, | |
Taxable, Revenue Bonds | |
2.843% | | | 11/01/46 | | | | | | | | | | 15 | | | | 10,638 | |
Taxable, Revenue Bonds, Series A | |
4.087% | | | 11/01/51 | | | | | | | | | | 25 | | | | 20,718 | |
Texas A&M University, | |
Taxable, Revenue Bonds, Series B | |
3.330% | | | 05/15/39 | | | | | | | | | | 25 | | | | 20,786 | |
| | | | | | | | | | | | | | | | | | |
| |
| | | | 63,773 | |
| | | | | | | | | | | | | | | | | | |
Virginia — 0.0% | |
University of Virginia, | |
Taxable, Revenue Bonds, Series C | | | | | |
4.179% | | | 09/01/2117 | | | | | | | | | | 495 | | | | 371,526 | |
| | | | | | | | | | | | | | | | | | |
Wisconsin — 0.0% | |
State of Wisconsin, | |
Taxable, Revenue Bonds, Series A | |
3.954% | | | 05/01/36 | | | | | | | | | | 15 | | | | 13,590 | |
| | | | | | | | | | | | | | | | | | |
TOTAL MUNICIPAL BONDS | |
(cost $8,391,734) | | | | 8,695,981 | |
| | | | | | | | | | | | | | | | | | |
RESIDENTIAL MORTGAGE-BACKED SECURITIES — 0.7% | |
Angel Oak Mortgage Trust, | |
Series 2021-01, Class A1, 144A | |
0.909%(cc) | | | 01/25/66 | | | | | | | | | | 12 | | | | 10,130 | |
Banc of America Mortgage Trust, | |
Series 2005-A, Class 2A1 | |
4.904%(cc) | | | 02/25/35 | | | | | | | | | | 68 | | | | 65,496 | |
| | | | | | | | | | | | | | | | | | |
| | | | | | Principal | | | | |
| Interest | | Maturity | | | | | Amount | | | | |
Rate | | Date | | | | | (000)# | | | Value | |
|
RESIDENTIAL MORTGAGE-BACKED SECURITIES | |
(continued) | | | | | |
Bellemeade Re Ltd., | |
Series 2021-03A, Class A2, 144A, 30 Day Average SOFR + 1.000% (Cap N/A, Floor 1.000%) | |
5.569%(c) | | | 09/25/31 | | | | | | | | | | 2,100 | | | $ | 2,101,992 | |
BRAVO Residential Funding Trust, | | | | | |
Series 2023-RPL01, Class A1, 144A | |
5.000%(cc) | | | 05/25/63 | | | | | | | | | | 3,862 | | | | 3,820,191 | |
Chase Home Lending Mortgage Trust, | | | | | |
Series 2024-RPL03, Class A1A, 144A | |
3.250%(cc) | | | 09/25/64 | | | | | | | | | | 484 | | | | 427,396 | |
Chase Mortgage Finance Trust, | |
Series 2007-A01, Class 1A5 | | | | | |
6.620%(cc) | | | 02/25/37 | | | | | | | | | | 42 | | | | 41,145 | |
CIM Trust, | |
Series 2024-R01, Class A1, 144A | |
4.750%(cc) | | | 06/25/64 | | | | | | | | | | 2,349 | | | | 2,285,668 | |
Citigroup Mortgage Loan Trust, | |
Series 2022-A, Class A1, 144A | |
6.170% | | | 09/25/62 | | | | | | | | | | 568 | | | | 568,462 | |
Connecticut Avenue Securities Trust, | |
Series 2022-R01, Class 1M1, 144A, 30 Day Average SOFR + 1.000% (Cap N/A, Floor 0.000%) | |
5.569%(c) | | | 12/25/41 | | | | | | | | | | 3 | | | | 2,895 | |
Series 2022-R01, Class 1M2, 144A, 30 Day Average SOFR + 1.900% (Cap N/A, Floor 0.000%) | |
6.469%(c) | | | 12/25/41 | | | | | | | | | | 1,260 | | | | 1,277,964 | |
Series 2022-R04, Class 1M1, 144A, 30 Day Average SOFR + 2.000% (Cap N/A, Floor 0.000%) | |
6.569%(c) | | | 03/25/42 | | | | | | | | | | 5 | | | | 4,915 | |
Series 2023-R02, Class 1M1, 144A, 30 Day Average SOFR + 2.300% (Cap N/A, Floor 0.000%) | |
6.869%(c) | | | 01/25/43 | | | | | | | | | | 7 | | | | 7,358 | |
Series 2023-R08, Class 1M1, 144A, 30 Day Average SOFR + 1.500% (Cap N/A, Floor 0.000%) | |
6.069%(c) | | | 10/25/43 | | | | | | | | | | 432 | | | | 433,785 | |
Credit Suisse Mortgage Trust, | |
Series 2018-RPL09, Class A, 144A | |
3.850%(cc) | | | 09/25/57 | | | | | | | | | | 551 | | | | 526,066 | |
EFMT, | |
Series 2024-CES01, Class A1, 144A | |
5.522% | | | 01/26/60 | | | | | | | | | | 3,200 | | | | 3,200,694 | |
Fannie Mae Connecticut Avenue Securities, | |
Series 2021-R02, Class 2M1, 144A, 30 Day Average SOFR + 0.900% (Cap N/A, Floor 0.000%) | |
5.469%(c) | | | 11/25/41 | | | | | | | | | | 2 | | | | 1,925 | |
Fannie Mae REMIC, | |
Series 2020-24, Class SP, IO, 30 Day Average SOFR x (1) + 5.936% (Cap 6.050%, Floor 0.000%) | |
1.367%(c) | | | 04/25/50 | | | | | | | | | | 975 | | | | 106,037 | |
Series 2020-73, Class ID, IO, 30 Day Average SOFR x (1) + 5.136% (Cap 5.250%, Floor 0.000%) | |
0.453%(c) | | | 05/25/40 | | | | | | | | | | 12,562 | | | | 749,173 | |
Series 2022-51, Class PS, IO, 30 Day Average SOFR x (1) + 5.950% (Cap 5.950%, Floor 0.000%) | |
1.381%(c) | | | 08/25/52 | | | | | | | | | | 2,284 | | | | 208,944 | |
SEE NOTES TO FINANCIAL STATEMENTS.
A86
| | | | |
| | PSF PGIM FLEXIBLE MANAGED PORTFOLIO (CONTINUED) | | |
SCHEDULE OF INVESTMENTS | | | | as of December 31, 2024 |
| | | | | | | | | | | | | | |
Interest Rate | | Maturity
Date | | | | | | Principal
Amount
(000)# | | | Value | |
|
RESIDENTIAL MORTGAGE-BACKED SECURITIES | |
(continued) | |
FHLMC Structured Agency Credit Risk REMIC Trust, | |
Series 2021-DNA05, Class M2, 144A, 30 Day Average SOFR + 1.650% (Cap N/A, Floor 0.000%) | |
6.219%(c) | | 01/25/34 | | | | | | | 133 | | | $ | 134,065 | |
Series 2021-DNA07, Class M1, 144A, 30 Day Average SOFR + 0.850% (Cap N/A, Floor 0.000%) | |
5.419%(c) | | 11/25/41 | | | | | | | 6 | | | | 5,927 | |
Series 2022-DNA01, Class M1A, 144A, 30 Day Average SOFR + 1.000% (Cap N/A, Floor 0.000%) | |
5.569%(c) | | 01/25/42 | | | | | | | 866 | | | | 866,520 | |
Series 2022-DNA03, Class M1A, 144A, 30 Day Average SOFR + 2.000% (Cap N/A, Floor 0.000%) | |
6.569%(c) | | 04/25/42 | | | | | | | 9 | | | | 9,469 | |
Series 2022-DNA04, Class M1A, 144A, 30 Day Average SOFR + 2.200% (Cap N/A, Floor 0.000%) | |
6.769%(c) | | 05/25/42 | | | | | | | 12 | | | | 12,443 | |
Series 2022-DNA05, Class M1A, 144A, 30 Day Average SOFR + 2.950% (Cap N/A, Floor 0.000%) | |
7.684%(c) | | 06/25/42 | | | | | | | 13 | | | | 13,240 | |
Series 2022-HQA01, Class M1A, 144A, 30 Day Average SOFR + 2.100% (Cap N/A, Floor 0.000%) | |
6.669%(c) | | 03/25/42 | | | | | | | 7 | | | | 7,091 | |
Freddie Mac REMIC, | |
Series 4535, Class PA | |
3.000% | | 03/15/44 | | | | | | | 364 | | | | 346,770 | |
Series 5021, Class SB, IO, 30 Day Average SOFR x (1) + 3.550% (Cap 3.550%, Floor 0.000%) | |
0.000%(c) | | 10/25/50 | | | | | | | 3,437 | | | | 66,793 | |
Series 5222, Class SA, IO, 30 Day Average SOFR x (1) + 3.500% (Cap 3.500%, Floor 0.000%) | |
0.000%(c) | | 05/25/52 | | | | | | | 373 | | | | 4,381 | |
Series 5281, Class AY | |
2.500% | | 08/25/52 | | | | | | | 811 | | | | 636,642 | |
Freddie Mac Strips, | |
Series 406, Class PO, PO | |
1.214%(s) | | 10/25/53 | | | | | | | 3,210 | | | | 2,599,059 | |
Government National Mortgage Assoc., | |
Series 2018-121, Class KS, IO, 1 Month SOFR x (1) + 3.746% (Cap 3.860%, Floor 0.000%) | |
0.000%(c) | | 09/20/48 | | | | | | | 1,420 | | | | 22,430 | |
Series 2018-148, Class DS, IO, 1 Month SOFR x (1) + 3.726% (Cap 3.840%, Floor 0.000%) | |
0.000%(c) | | 10/20/48 | | | | | | | 1,814 | | | | 31,174 | |
Series 2018-155, Class PS, IO, 1 Month SOFR x (1) + 3.186% (Cap 2.000%, Floor 0.000%) | |
0.000%(c) | | 11/20/48 | | | | | | | 2,404 | | | | 21,462 | |
Series 2019-092, Class S, IO, 1 Month SOFR x (1) + 2.696% (Cap 2.810%, Floor 0.000%) | |
0.000%(c) | | 07/20/49 | | | | | | | 4,205 | | | | 24,893 | |
Series 2019-097, Class MS, IO, 1 Month SOFR x (1) + 2.966% (Cap 3.080%, Floor 0.000%) | |
0.000%(c) | | 08/20/49 | | | | | | | 2,611 | | | | 20,869 | |
Series 2019-099, Class SA, IO, 1 Month SOFR x (1) + 3.236% (Cap 3.350%, Floor 0.000%) | |
0.000%(c) | | 08/20/49 | | | | | | | 2,923 | | | | 31,293 | |
Series 2021-114, Class TI, IO | |
3.000% | | 06/20/51 | | | | | | | 3,021 | | | | 423,174 | |
| | | | | | | | | | | | | | | | |
Interest Rate | | Maturity
Date | | | | | Principal Amount (000)# | | | Value | |
|
RESIDENTIAL MORTGAGE-BACKED SECURITIES | |
(continued) | | | | | | | | | | | | | | | | |
Series 2021-165, Class ST, IO, 1 Month SOFR x (1) + 3.246% (Cap 0.020%, Floor 0.000%) | |
0.000%(c) | | | 01/20/50 | | | | | | | | 562 | | | $ | 138 | |
Series 2022-046, Class S, IO, 30 Day Average SOFR x (1) + 3.500% (Cap 3.500%, Floor 0.000%) | |
0.000%(c) | | | 03/20/52 | | | | | | | | 993 | | | | 9,923 | |
Series 2022-051, Class SC, IO, 30 Day Average SOFR x (1) + 3.500% (Cap 3.500%, Floor 0.000%) | |
0.000%(c) | | | 03/20/52 | | | | | | | | 4,262 | | | | 66,839 | |
Series 2022-066, Class SB, IO, 30 Day Average SOFR x (1) + 3.850% (Cap 3.850%, Floor 0.000%) | |
0.000%(c) | | | 04/20/52 | | | | | | | | 1,410 | | | | 24,250 | |
Series 2022-068, Class SP, IO, 30 Day Average SOFR x (1) + 3.850% (Cap 3.850%, Floor 0.000%) | |
0.000%(c) | | | 04/20/52 | | | | | | | | 1,146 | | | | 24,111 | |
Series 2022-078, Class MS, IO, 30 Day Average SOFR x (1) + 3.600% (Cap 3.600%, Floor 0.000%) | |
0.000%(c) | | | 04/20/52 | | | | | | | | 3,763 | | | | 58,762 | |
Series 2022-078, Class SB, IO, 30 Day Average SOFR x (1) + 3.750% (Cap 3.750%, Floor 0.000%) | |
0.000%(c) | | | 04/20/52 | | | | | | | | 2,524 | | | | 44,031 | |
Series 2022-093, Class GS, IO, 30 Day Average SOFR x (1) + 3.650% (Cap 3.650%, Floor 0.000%) | |
0.000%(c) | | | 05/20/52 | | | | | | | | 891 | | | | 13,688 | |
Series 2022-093, Class IO, IO | |
3.000% | | | 08/20/51 | | | | | | | | 10,041 | | | | 1,117,392 | |
Series 2022-126, Class CS, IO, 30 Day Average SOFR x (1) + 3.760% (Cap 3.760%, Floor 0.000%) | |
0.000%(c) | | | 07/20/52 | | | | | | | | 5,253 | | | | 73,129 | |
Series 2022-133, Class SA, IO, 30 Day Average SOFR x (1) + 3.950% (Cap 3.950%, Floor 0.000%) | |
0.000%(c) | | | 07/20/52 | | | | | | | | 1,928 | | | | 31,929 | |
Series 2022-148, Class DS, IO, 30 Day Average SOFR x (1) + 3.600% (Cap 3.600%, Floor 0.000%) | |
0.000%(c) | | | 08/20/52 | | | | | | | | 1,994 | | | | 24,359 | |
Series 2022-170, Class SB, IO, 30 Day Average SOFR x (1) + 4.500% (Cap 4.500%, Floor 0.000%) | |
0.000%(c) | | | 09/20/52 | | | | | | | | 15,297 | | | | 347,852 | |
JPMorgan Mortgage Trust, | |
Series 2007-A01, Class 4A1 | |
7.198%(cc) | | | 07/25/35 | | | | | | | | 7 | | | | 7,380 | |
Series 2020-INV02, Class A3, 144A | |
3.000%(cc) | | | 10/25/50 | | | | | | | | 6 | | | | 4,892 | |
Kinbane DAC (Ireland), | |
Series 2024-RPL2A, Class A, 144A, 1 Month EURIBOR + 1.100% (Cap N/A, Floor 0.000%) | |
4.189%(c) | | | 01/24/63 | | | | | EUR | | | 1,380 | | | | 1,428,591 | |
Legacy Mortgage Asset Trust, | |
Series 2021-GS01, Class A1, 144A | |
4.892%(cc) | | | 10/25/66 | | | | | | | | 284 | | | | 283,905 | |
MFA Trust, | |
Series 2021-RPL01, Class A1, 144A | |
1.131%(cc) | | | 07/25/60 | | | | | | | | 1,883 | | | | 1,686,981 | |
New Residential Mortgage Loan Trust, | |
Series 2018-04A, Class A1S, 144A, 1 Month SOFR + 0.864% (Cap N/A, Floor 0.750%) | |
5.203%(c) | | | 01/25/48 | | | | | | | | 160 | | | | 156,677 | |
SEE NOTES TO FINANCIAL STATEMENTS.
A87
| | | | |
| | PSF PGIM FLEXIBLE MANAGED PORTFOLIO (CONTINUED) | | |
SCHEDULE OF INVESTMENTS | | | | as of December 31, 2024 |
| | | | | | | | | | | | | | | | | | |
Interest Rate | | Maturity
Date | | | | | Principal
Amount
(000)# | | | Value | |
|
RESIDENTIAL MORTGAGE-BACKED SECURITIES | |
(continued) | | | | | | | | | | | | | | | | |
Oaktown Re VII Ltd., | |
Series 2021-02, Class M1A, 144A, 30 Day Average SOFR + 1.600% (Cap N/A, Floor 1.600%) | |
6.169%(c) | | 04/25/34 | | | | | | | | | | | 83 | | | $ | 82,894 | |
PRET Trust, | |
Series 2024-RPL02, Class A1, 144A | |
4.075%(cc) | | 06/25/64 | | | | | | | | | | | 1,640 | | | | 1,531,906 | |
PRPM LLC, | | | | | | | | | | | | | | | | | | |
Series 2024-RPL04, Class A1, 144A | |
4.000% | | 12/25/54 | | | | | | | | | | | 3,400 | | | | 3,274,268 | |
RCKT Mortgage Trust, | |
Series 2024-CES09, Class A1A, 144A | |
5.582% | | 12/25/44 | | | | | | | | | | | 2,000 | | | | 1,984,680 | |
Shamrock Residential (Ireland), | |
Series 2023-01A, Class A, 144A, 1 Month EURIBOR + 1.000% (Cap N/A, Floor 0.000%) | |
3.801%(c) | | 06/24/71 | | | | | | | EUR | | | | 358 | | | | 370,143 | |
Structured Adjustable Rate Mortgage Loan Trust, | |
Series 2004-01, Class 4A3 | |
7.203%(cc) | | 02/25/34 | | | | | | | | | | | 30 | | | | 28,615 | |
Towd Point Mortgage Trust, | |
Series 2017-05, Class A1, 144A, 1 Month SOFR + 0.714% (Cap N/A, Floor 0.000%) | |
5.053%(c) | | 02/25/57 | | | | | | | | | | | 140 | | | | 145,969 | |
Series 2020-04, Class A1, 144A | |
1.750% | | 10/25/60 | | | | | | | | | | | 582 | | | | 521,472 | |
| | | | | | | | | | | | | | | | | | |
TOTAL RESIDENTIAL MORTGAGE-BACKED SECURITIES
(cost $34,667,862) | | | | 34,462,707 | |
| | | | | | | | | | | | | | | | | | |
|
SOVEREIGN BONDS — 0.2% | |
Bermuda Government International Bond (Bermuda), | |
Sr. Unsec’d. Notes, 144A | | | | | | | | | | | | | | | | |
2.375% | | 08/20/30 | | | | | | | | | | | 710 | | | | 602,357 | |
Export-Import Bank of India (India), | |
Sr. Unsec’d. Notes, 144A | |
3.875% | | 02/01/28 | | | | | | | | | | | 1,040 | | | | 1,004,432 | |
Finnvera OYJ (Finland), | |
Gov’t. Gtd. Notes, 144A, MTN | |
2.375% | | 06/04/25 | | | | | | | | | | | 400 | | | | 396,556 | |
Indonesia Government International Bond (Indonesia), | |
Sr. Unsec’d. Notes | | | | | | | | | | | | | | | | |
1.450% | | 09/18/26 | | | | | | | EUR | | | | 2,100 | | | | 2,108,417 | |
Mexico Government International Bond (Mexico), | |
Sr. Unsec’d. Notes | |
6.000% | | 05/07/36 | | | | | | | | | | | 1,463 | | | | 1,376,592 | |
Oman Government International Bond (Oman), | |
Sr. Unsec’d. Notes, 144A | | | | | | | | | | | | | | | | |
4.750% | | 06/15/26 | | | | | | | | | | | 2,422 | | | | 2,399,718 | |
Panama Government International Bond (Panama), | |
Sr. Unsec’d. Notes | |
4.500% | | 04/16/50 | | | | | | | | | | | 475 | | | | 292,709 | |
Peruvian Government International Bond (Peru), | |
Sr. Unsec’d. Notes | |
2.783% | | 01/23/31 | | | | | | | | | | | 453 | | | | 387,032 | |
| | | | | | | | | | | | | | | | | | |
Interest Rate | | Maturity
Date | | | | | Principal
Amount
(000)# | | | Value | |
|
SOVEREIGN BONDS(continued) | |
Province of Alberta (Canada), | |
Sr. Unsec’d. Notes | |
3.300% | | 03/15/28 | | | | | | | | | | | 20 | | | $ | 19,295 | |
Province of New Brunswick (Canada), | |
Sr. Unsec’d. Notes | |
3.625% | | 02/24/28 | | | | | | | | | | | 20 | | | | 19,444 | |
Romanian Government International Bond (Romania), | |
Sr. Unsec’d. Notes, 144A, MTN | |
5.000% | | 09/27/26 | | | | | | | EUR | | | | 1,400 | | | | 1,483,544 | |
| | | | | | | | | | | | | | | | | | |
TOTAL SOVEREIGN BONDS
(cost $10,564,498) | | | | 10,090,096 | |
| | | | | | | | | | | | | | | | | | |
|
U.S. GOVERNMENT AGENCY OBLIGATIONS — 9.7% | |
Federal Home Loan Bank | |
5.500% | | 07/15/36(k) | | | | | | | | | | | 960 | | | | 1,015,201 | |
Federal Home Loan Mortgage Corp. | |
1.500% | | 07/01/36 | | | | | | | | | | | 1,931 | | | | 1,663,173 | |
1.500% | | 11/01/50 | | | | | | | | | | | 3,736 | | | | 2,771,122 | |
2.000% | | 01/01/32 | | | | | | | | | | | 277 | | | | 257,876 | |
2.000% | | 02/01/36 | | | | | | | | | | | 1,123 | | | | 996,311 | |
2.000% | | 06/01/40 | | | | | | | | | | | 932 | | | | 780,393 | |
2.000% | | 10/01/40 | | | | | | | | | | | 1,400 | | | | 1,169,972 | |
2.000% | | 09/01/50 | | | | | | | | | | | 2,883 | | | | 2,265,118 | |
2.000% | | 03/01/51 | | | | | | | | | | | 1,520 | | | | 1,186,652 | |
2.000% | | 04/01/51 | | | | | | | | | | | 95 | | | | 74,184 | |
2.000% | | 07/01/51 | | | | | | | | | | | 8,845 | | | | 6,930,027 | |
2.000% | | 09/01/51 | | | | | | | | | | | 419 | | | | 331,255 | |
2.500% | | 03/01/30 | | | | | | | | | | | 112 | | | | 107,091 | |
2.500% | | 10/01/32 | | | | | | | | | | | 297 | | | | 278,494 | |
2.500% | | 10/01/35 | | | | | | | | | | | 2,242 | | | | 2,058,994 | |
2.500% | | 01/01/51 | | | | | | | | | | | 1,398 | | | | 1,152,534 | |
2.500% | | 03/01/51 | | | | | | | | | | | 895 | | | | 734,266 | |
2.500% | | 04/01/51 | | | | | | | | | | | 7,202 | | | | 5,912,161 | |
2.500% | | 05/01/51 | | | | | | | | | | | 4,089 | | | | 3,337,714 | |
2.500% | | 08/01/51 | | | | | | | | | | | 423 | | | | 347,169 | |
2.500% | | 10/01/51 | | | | | | | | | | | 3,055 | | | | 2,525,196 | |
2.500% | | 12/01/51 | | | | | | | | | | | 2,932 | | | | 2,397,670 | |
3.000% | | 10/01/28 | | | | | | | | | | | 68 | | | | 66,250 | |
3.000% | | 06/01/29 | | | | | | | | | | | 187 | | | | 182,165 | |
3.000% | | 03/01/32 | | | | | | | | | | | 270 | | | | 259,201 | |
3.000% | | 01/01/37 | | | | | | | | | | | 155 | | | | 143,092 | |
3.000% | | 01/01/43 | | | | | | | | | | | 354 | | | | 312,375 | |
3.000% | | 07/01/43 | | | | | | | | | | | 713 | | | | 629,483 | |
3.000% | | 09/01/46 | | | | | | | | | | | 2,022 | | | | 1,756,523 | |
3.000% | | 12/01/46 | | | | | | | | | | | 5,902 | | | | 5,115,166 | |
3.000% | | 01/01/47 | | | | | | | | | | | 1,809 | | | | 1,571,036 | |
3.000% | | 02/01/50 | | | | | | | | | | | 1,503 | | | | 1,294,427 | |
3.000% | | 03/01/51 | | | | | | | | | | | 1,370 | | | | 1,168,670 | |
3.000% | | 06/01/51 | | | | | | | | | | | 550 | | | | 468,921 | |
3.000% | | 07/01/51 | | | | | | | | | | | 894 | | | | 761,263 | |
3.000% | | 02/01/52 | | | | | | | | | | | 436 | | | | 374,439 | |
3.500% | | 06/01/37 | | | | | | | | | | | 112 | | | | 106,037 | |
3.500% | | 03/01/42 | | | | | | | | | | | 168 | | | | 153,191 | |
3.500% | | 06/01/42 | | | | | | | | | | | 118 | | | | 107,422 | |
3.500% | | 01/01/47 | | | | | | | | | | | 299 | | | | 268,812 | |
3.500% | | 02/01/47 | | | | | | | | | | | 406 | | | | 365,074 | |
3.500% | | 03/01/48 | | | | | | | | | | | 4,264 | | | | 3,828,779 | |
3.500% | | 04/01/52 | | | | | | | | | | | 2,633 | | | | 2,337,722 | |
SEE NOTES TO FINANCIAL STATEMENTS.
A88
| | | | |
| | PSF PGIM FLEXIBLE MANAGED PORTFOLIO (CONTINUED) | | |
SCHEDULE OF INVESTMENTS | | | | as of December 31, 2024 |
| | | | | | | | | | | | | | | | | | |
Interest Rate | | Maturity
Date | | | | | | | | Principal
Amount
(000)# | | | Value | |
|
U.S. GOVERNMENT AGENCY OBLIGATIONS(continued) | |
3.500% | | 09/01/52 | | | | | | | | | | | 5,000 | | | $ | 4,424,822 | |
4.000% | | 06/01/26 | | | | | | | | | | | 36 | | | | 35,890 | |
4.000% | | 09/01/26 | | | | | | | | | | | 18 | | | | 17,758 | |
4.000% | | 09/01/37 | | | | | | | | | | | 316 | | | | 303,465 | |
4.000% | | 10/01/39 | | | | | | | | | | | 271 | | | | 255,681 | |
4.000% | | 12/01/40 | | | | | | | | | | | 126 | | | | 119,306 | |
4.000% | | 10/01/41 | | | | | | | | | | | 98 | | | | 92,757 | |
4.000% | | 01/01/42 | | | | | | | | | | | 42 | | | | 39,869 | |
4.000% | | 10/01/45 | | | | | | | | | | | 137 | | | | 127,584 | |
4.000% | | 04/01/52 | | | | | | | | | | | 1,091 | | | | 1,009,422 | |
4.500% | | 09/01/39 | | | | | | | | | | | 83 | | | | 80,455 | |
4.500% | | 10/01/39 | | | | | | | | | | | 481 | | | | 466,864 | |
4.500% | | 12/01/39 | | | | | | | | | | | 159 | | | | 154,651 | |
4.500% | | 07/01/41 | | | | | | | | | | | 48 | | | | 46,770 | |
4.500% | | 07/01/41 | | | | | | | | | | | 903 | | | | 874,261 | |
4.500% | | 08/01/41 | | | | | | | | | | | 68 | | | | 65,195 | |
4.500% | | 08/01/41 | | | | | | | | | | | 82 | | | | 79,432 | |
4.500% | | 08/01/41 | | | | | | | | | | | 95 | | | | 91,544 | |
4.500% | | 10/01/41 | | | | | | | | | | | 90 | | | | 86,743 | |
4.500% | | 10/01/46 | | | | | | | | | | | 80 | | | | 76,783 | |
4.500% | | 12/01/47 | | | | | | | | | | | 357 | | | | 341,710 | |
4.500% | | 07/01/52 | | | | | | | | | | | 6,546 | | | | 6,162,410 | |
5.000% | | 05/01/34 | | | | | | | | | | | 8 | | | | 7,558 | |
5.000% | | 05/01/34 | | | | | | | | | | | 77 | | | | 76,953 | |
5.000% | | 08/01/35 | | | | | | | | | | | 8 | | | | 8,144 | |
5.000% | | 09/01/35 | | | | | | | | | | | 16 | | | | 15,649 | |
5.000% | | 10/01/36 | | | | | | | | | | | 13 | | | | 13,352 | |
5.000% | | 05/01/37 | | | | | | | | | | | 8 | | | | 7,818 | |
5.000% | | 07/01/37 | | | | | | | | | | | 147 | | | | 146,615 | |
5.000% | | 09/01/38 | | | | | | | | | | | 20 | | | | 19,574 | |
5.000% | | 09/01/38 | | | | | | | | | | | 21 | | | | 20,493 | |
5.000% | | 09/01/38 | | | | | | | | | | | 23 | | | | 23,261 | |
5.000% | | 02/01/39 | | | | | | | | | | | 8 | | | | 8,051 | |
5.000% | | 06/01/39 | | | | | | | | | | | 24 | | | | 23,930 | |
5.000% | | 10/01/52 | | | | | | | | | | | 422 | | | | 408,878 | |
5.000% | | 11/01/52 | | | | | | | | | | | 1,313 | | | | 1,271,180 | |
5.500% | | 02/01/34 | | | | | | | | | | | 11 | | | | 11,115 | |
5.500% | | 04/01/34 | | | | | | | | | | | 225 | | | | 226,298 | |
5.500% | | 06/01/34 | | | | | | | | | | | 34 | | | | 34,085 | |
5.500% | | 06/01/34 | | | | | | | | | | | 65 | | | | 65,649 | |
5.500% | | 05/01/37 | | | | | | | | | | | 19 | | | | 18,866 | |
5.500% | | 02/01/38 | | | | | | | | | | | 144 | | | | 145,337 | |
5.500% | | 05/01/38 | | | | | | | | | | | 27 | | | | 27,237 | |
5.500% | | 07/01/38 | | | | | | | | | | | 135 | | | | 135,628 | |
5.500% | | 02/01/53 | | | | | | | | | | | 13,381 | | | | 13,233,925 | |
6.000% | | 03/01/32 | | | | | | | | | | | 71 | | | | 73,702 | |
6.000% | | 12/01/33 | | | | | | | | | | | 18 | | | | 18,573 | |
6.000% | | 07/01/36 | | | | | | | | | | | 2 | | | | 1,734 | |
6.000% | | 12/01/36 | | | | | | | | | | | 3 | | | | 3,155 | |
6.000% | | 05/01/37 | | | | | | | | | | | 5 | | | | 4,692 | |
6.000% | | 12/01/37 | | | | | | | | | | | 9 | | | | 8,708 | |
6.000% | | 01/01/38 | | | | | | | | | | | 2 | | | | 1,763 | |
6.000% | | 01/01/38 | | | | | | | | | | | 4 | | | | 3,934 | |
6.000% | | 01/01/38 | | | | | | | | | | | 90 | | | | 93,612 | |
6.000% | | 10/01/38 | | | | | | | | | | | 32 | | | | 32,970 | |
6.000% | | 08/01/39 | | | | | | | | | | | 15 | | | | 15,518 | |
6.000% | | 12/01/52 | | | | | | | | | | | 410 | | | | 412,239 | |
6.750% | | 03/15/31 | | | | | | | | | | | 455 | | | | 508,432 | |
| | | | | | | | | | | | | | | | | | |
Interest Rate | | Maturity
Date | | | | | | | | Principal
Amount
(000)# | | | Value | |
|
U.S. GOVERNMENT AGENCY OBLIGATIONS(continued) | |
7.000% | | 01/01/31 | | | | | | | | | | | 4 | | | $ | 3,846 | |
7.000% | | 06/01/31 | | | | | | | | | | | 2 | | | | 2,091 | |
7.000% | | 09/01/31 | | | | | | | | | | | 1 | | | | 1,029 | |
7.000% | | 10/01/31 | | | | | | | | | | | 14 | | | | 15,010 | |
7.000% | | 10/01/32 | | | | | | | | | | | 11 | | | | 11,269 | |
Federal National Mortgage Assoc. | |
1.500% | | 01/01/36 | | | | | | | | | | | 2,399 | | | | 2,069,421 | |
1.500% | | 05/01/36 | | | | | | | | | | | 362 | | | | 311,706 | |
1.500% | | 06/01/36 | | | | | | | | | | | 379 | | | | 326,908 | |
1.500% | | 07/01/36 | | | | | | | | | | | 1,384 | | | | 1,186,729 | |
1.500% | | 12/01/36 | | | | | | | | | | | 1,694 | | | | 1,453,824 | |
1.500% | | 02/01/42 | | | | | | | | | | | 419 | | | | 330,912 | |
1.500% | | 10/01/50 | | | | | | | | | | | 353 | | | | 261,305 | |
1.500% | | 11/01/50 | | | | | | | | | | | 3,795 | | | | 2,808,666 | |
1.500% | | 12/01/50 | | | | | | | | | | | 4,248 | | | | 3,147,142 | |
1.500% | | 01/01/51 | | | | | | | | | | | 1,845 | | | | 1,364,624 | |
1.500% | | 03/01/51 | | | | | | | | | | | 897 | | | | 664,197 | |
2.000% | | 03/01/31 | | | | | | | | | | | 1,054 | | | | 990,324 | |
2.000% | | 08/01/31 | | | | | | | | | | | 407 | | | | 379,530 | |
2.000% | | 01/01/32 | | | | | | | | | | | 2,183 | | | | 2,035,071 | |
2.000% | | 05/01/36 | | | | | | | | | | | 1,105 | | | | 979,612 | |
2.000% | | 12/01/36 | | | | | | | | | | | 2,178 | | | | 1,927,137 | |
2.000% | | 02/01/37 | | | | | | | | | | | 2,454 | | | | 2,170,824 | |
2.000% | | 02/01/41 | | | | | | | | | | | 1,903 | | | | 1,589,637 | |
2.000% | | 05/01/41(k) | | | | | | | | | | | 4,297 | | | | 3,588,712 | |
2.000% | | 08/01/50 | | | | | | | | | | | 1,020 | | | | 801,643 | |
2.000% | | 10/01/50 | | | | | | | | | | | 9,560 | | | | 7,509,713 | |
2.000% | | 12/01/50 | | | | | | | | | | | 37 | | | | 28,988 | |
2.000% | | 01/01/51 | | | | | | | | | | | 1,741 | | | | 1,359,481 | |
2.000% | | 02/01/51(k) | | | | | | | | | | | 13,376 | | | | 10,496,478 | |
2.000% | | 03/01/51 | | | | | | | | | | | 3,406 | | | | 2,671,625 | |
2.000% | | 04/01/51 | | | | | | | | | | | 3,578 | | | | 2,806,114 | |
2.000% | | 05/01/51(k) | | | | | | | | | | | 22,971 | | | | 18,011,374 | |
2.000% | | 08/01/51 | | | | | | | | | | | 3,352 | | | | 2,623,614 | |
2.500% | | TBA | | | | | | | | | | | 7,500 | | | | 6,107,813 | |
2.500% | | 07/01/32 | | | | | | | | | | | 888 | | | | 833,458 | |
2.500% | | 08/01/32 | | | | | | | | | | | 986 | | | | 927,163 | |
2.500% | | 09/01/32 | | | | | | | | | | | 944 | | | | 887,286 | |
2.500% | | 07/01/35 | | | | | | | | | | | 3,353 | | | | 3,149,390 | |
2.500% | | 08/01/35 | | | | | | | | | | | 484 | | | | 442,583 | |
2.500% | | 11/01/36 | | | | | | | | | | | 4,593 | | | | 4,189,386 | |
2.500% | | 10/01/37 | | | | | | | | | | | 924 | | | | 845,835 | |
2.500% | | 10/01/43 | | | | | | | | | | | 425 | | | | 361,131 | |
2.500% | | 12/01/46 | | | | | | | | | | | 783 | | | | 653,602 | |
2.500% | | 03/01/50 | | | | | | | | | | | 606 | | | | 500,235 | |
2.500% | | 08/01/50 | | | | | | | | | | | 2,656 | | | | 2,190,288 | |
2.500% | | 12/01/50 | | | | | | | | | | | 266 | | | | 220,680 | |
2.500% | | 12/01/50 | | | | | | | | | | | 3,339 | | | | 2,747,109 | |
2.500% | | 02/01/51 | | | | | | | | | | | 2,139 | | | | 1,758,615 | |
2.500% | | 02/01/51 | | | | | | | | | | | 2,605 | | | | 2,139,892 | |
2.500% | | 04/01/51 | | | | | | | | | | | 3,151 | | | | 2,590,934 | |
2.500% | | 08/01/51 | | | | | | | | | | | 830 | | | | 679,802 | |
2.500% | | 09/01/51 | | | | | | | | | | | 2,631 | | | | 2,166,151 | |
2.500% | | 10/01/51 | | | | | | | | | | | 909 | | | | 743,820 | |
2.500% | | 12/01/51 | | | | | | | | | | | 7,723 | | | | 6,372,463 | |
2.500% | | 02/01/52 | | | | | | | | | | | 411 | | | | 339,040 | |
2.500% | | 05/01/52 | | | | | | | | | | | 813 | | | | 671,284 | |
3.000% | | 02/01/27 | | | | | | | | | | | 185 | | | | 181,755 | |
SEE NOTES TO FINANCIAL STATEMENTS.
A89
| | | | |
| | PSF PGIM FLEXIBLE MANAGED PORTFOLIO (CONTINUED) | | |
SCHEDULE OF INVESTMENTS | | | | as of December 31, 2024 |
| | | | | | | | | | | | | | | | | | |
Interest Rate | | Maturity
Date | | | | | | | | Principal
Amount
(000)# | | | Value | |
|
U.S. GOVERNMENT AGENCY OBLIGATIONS(continued) | |
3.000% | | 08/01/30 | | | | | | | | | | | 281 | | | $ | 271,032 | |
3.000% | | 05/01/35 | | | | | | | | | | | 2,379 | | | | 2,225,685 | |
3.000% | | 07/01/36 | | | | | | | | | | | 1,460 | | | | 1,365,893 | |
3.000% | | 11/01/36 | | | | | | | | | | | 659 | | | | 608,151 | |
3.000% | | 12/01/42 | | | | | | | | | | | 398 | | | | 351,287 | |
3.000% | | 12/01/42 | | | | | | | | | | | 511 | | | | 451,267 | |
3.000% | | 03/01/43 | | | | | | | | | | | 98 | | | | 86,636 | |
3.000% | | 11/01/46 | | | | | | | | | | | 98 | | | | 84,503 | |
3.000% | | 01/01/47 | | | | | | | | | | | 786 | | | | 681,926 | |
3.000% | | 02/01/47 | | | | | | | | | | | 561 | | | | 487,236 | |
3.000% | | 03/01/47 | | | | | | | | | | | 441 | | | | 382,513 | |
3.000% | | 11/01/49 | | | | | | | | | | | 429 | | | | 370,289 | |
3.000% | | 12/01/49 | | | | | | | | | | | 282 | | | | 243,921 | |
3.000% | | 12/01/49 | | | | | | | | | | | 371 | | | | 318,914 | |
3.000% | | 01/01/50 | | | | | | | | | | | 427 | | | | 363,646 | |
3.000% | | 02/01/50 | | | | | | | | | | | 377 | | | | 325,491 | |
3.000% | | 02/01/50 | | | | | | | | | | | 436 | | | | 371,042 | |
3.000% | | 02/01/50 | | | | | | | | | | | 4,619 | | | | 3,980,973 | |
3.000% | | 03/01/50 | | | | | | | | | | | 322 | | | | 277,151 | |
3.000% | | 05/01/51 | | | | | | | | | | | 747 | | | | 637,264 | |
3.000% | | 12/01/51 | | | | | | | | | | | 4,625 | | | | 3,980,477 | |
3.000% | | 12/01/51 | | | | | | | | | | | 14,957 | | | | 12,885,092 | |
3.000% | | 03/01/52 | | | | | | | | | | | 892 | | | | 759,471 | |
3.000% | | 03/01/52 | | | | | | | | | | | 1,633 | | | | 1,396,474 | |
3.000% | | 04/01/52 | | | | | | | | | | | 872 | | | | 743,197 | |
3.000% | | 04/01/52 | | | | | | | | | | | 1,673 | | | | 1,435,963 | |
3.000% | | 05/01/52 | | | | | | | | | | | 2,282 | | | | 1,942,787 | |
3.500% | | TBA | | | | | | | | | | | 4,000 | | | | 3,537,667 | |
3.500% | | 07/01/31 | | | | | | | | | | | 190 | | | | 185,309 | |
3.500% | | 11/01/32 | | | | | | | | | | | 133 | | | | 127,978 | |
3.500% | | 02/01/33 | | | | | | | | | | | 276 | | | | 267,280 | |
3.500% | | 05/01/33 | | | | | | | | | | | 377 | | | | 364,169 | |
3.500% | | 06/01/39 | | | | | | | | | | | 256 | | | | 234,948 | |
3.500% | | 01/01/42 | | | | | | | | | | | 1,771 | | | | 1,614,751 | |
3.500% | | 05/01/42 | | | | | | | | | | | 900 | | | | 820,542 | |
3.500% | | 07/01/42 | | | | | | | | | | | 356 | | | | 324,225 | |
3.500% | | 08/01/42 | | | | | | | | | | | 133 | | | | 121,472 | |
3.500% | | 08/01/42 | | | | | | | | | | | 301 | | | | 273,911 | |
3.500% | | 09/01/42 | | | | | | | | | | | 390 | | | | 354,704 | |
3.500% | | 09/01/42 | | | | | | | | | | | 653 | | | | 594,933 | |
3.500% | | 11/01/42 | | | | | | | | | | | 184 | | | | 167,866 | |
3.500% | | 03/01/43 | | | | | | | | | | | 1,289 | | | | 1,173,374 | |
3.500% | | 04/01/43 | | | | | | | | | | | 206 | | | | 187,350 | |
3.500% | | 04/01/43 | | | | | | | | | | | 467 | | | | 424,668 | |
3.500% | | 07/01/43 | | | | | | | | | | | 94 | | | | 85,696 | |
3.500% | | 06/01/45 | | | | | | | | | | | 1,700 | | | | 1,527,766 | |
3.500% | | 07/01/46 | | | | | | | | | | | 220 | | | | 197,626 | |
3.500% | | 11/01/46 | | | | | | | | | | | 415 | | | | 372,761 | |
3.500% | | 09/01/47 | | | | | | | | | | | 415 | | | | 372,062 | |
3.500% | | 01/01/48 | | | | | | | | | | | 4,187 | | | | 3,758,217 | |
3.500% | | 05/01/48 | | | | | | | | | | | 381 | | | | 342,184 | |
3.500% | | 06/01/48 | | | | | | | | | | | 1,858 | | | | 1,667,477 | |
3.500% | | 02/01/52 | | | | | | | | | | | 4,739 | | | | 4,225,396 | |
3.500% | | 03/01/52 | | | | | | | | | | | 817 | | | | 730,852 | |
3.500% | | 06/01/52 | | | | | | | | | | | 405 | | | | 358,891 | |
4.000% | | 12/01/36 | | | | | | | | | | | 313 | | | | 301,363 | |
4.000% | | 10/01/41 | | | | | | | | | | | 997 | | | | 940,552 | |
4.000% | | 07/01/44 | | | | | | | | | | | 395 | | | | 368,403 | |
| | | | | | | | | | | | | | | | | | |
Interest Rate | | Maturity
Date | | | | | | | | Principal
Amount
(000)# | | | Value | |
|
U.S. GOVERNMENT AGENCY OBLIGATIONS(continued) | |
4.000% | | 09/01/44 | | | | | | | | | | | 634 | | | $ | 591,715 | |
4.000% | | 10/01/46 | | | | | | | | | | | 312 | | | | 287,728 | |
4.000% | | 06/01/47 | | | | | | | | | | | 281 | | | | 260,191 | |
4.000% | | 09/01/47 | | | | | | | | | | | 104 | | | | 96,824 | |
4.000% | | 11/01/47 | | | | | | | | | | | 337 | | | | 313,483 | |
4.000% | | 11/01/47 | | | | | | | | | | | 460 | | | | 428,675 | |
4.000% | | 12/01/47 | | | | | | | | | | | 1,433 | | | | 1,332,063 | |
4.000% | | 03/01/49 | | | | | | | | | | | 2,912 | | | | 2,698,811 | |
4.000% | | 01/01/50 | | | | | | | | | | | 1,277 | | | | 1,182,932 | |
4.000% | | 05/01/50 | | | | | | | | | | | 1,775 | | | | 1,642,161 | |
4.000% | | 05/01/52 | | | | | | | | | | | 839 | | | | 768,950 | |
4.000% | | 06/01/52 | | | | | | | | | | | 3,270 | | | | 2,995,843 | |
4.000% | | 07/01/52 | | | | | | | | | | | 2,798 | | | | 2,568,336 | |
4.000% | | 07/01/52 | | | | | | | | | | | 6,269 | | | | 5,739,948 | |
4.000% | | 09/01/52 | | | | | | | | | | | 1,023 | | | | 937,067 | |
4.000% | | 10/01/52 | | | | | | | | | | | 866 | | | | 793,562 | |
4.000% | | 12/01/52 | | | | | | | | | | | 6,243 | | | | 5,713,747 | |
4.500% | | 07/01/33 | | | | | | | | | | | 16 | | | | 15,299 | |
4.500% | | 08/01/33 | | | | | | | | | | | 5 | | | | 4,644 | |
4.500% | | 09/01/33 | | | | | | | | | | | 16 | | | | 15,874 | |
4.500% | | 10/01/33 | | | | | | | | | | | 40 | | | | 38,474 | |
4.500% | | 03/01/34 | | | | | | | | | | | 11 | | | | 10,769 | |
4.500% | | 01/01/35 | | | | | | | | | | | 1 | | | | 860 | |
4.500% | | 07/01/39 | | | | | | | | | | | 301 | | | | 292,207 | |
4.500% | | 08/01/39 | | | | | | | | | | | 206 | | | | 199,627 | |
4.500% | | 09/01/39 | | | | | | | | | | | 127 | | | | 123,109 | |
4.500% | | 12/01/39 | | | | | | | | | | | 2 | | | | 1,882 | |
4.500% | | 03/01/41 | | | | | | | | | | | 493 | | | | 477,706 | |
4.500% | | 07/01/42 | | | | | | | | | | | 46 | | | | 44,550 | |
4.500% | | 06/01/50 | | | | | | | | | | | 615 | | | | 584,105 | |
4.500% | | 07/01/52 | | | | | | | | | | | 3,856 | | | | 3,634,281 | |
4.500% | | 09/01/52 | | | | | | | | | | | 3,799 | | | | 3,580,005 | |
4.500% | | 01/01/53 | | | | | | | | | | | 985 | | | | 926,613 | |
4.500% | | 04/01/53 | | | | | | | | | | | 2,972 | | | | 2,797,899 | |
5.000% | | TBA | | | | | | | | | | | 7,500 | | | | 7,238,059 | |
5.000% | | 03/01/34 | | | | | | | | | | | 78 | | | | 77,784 | |
5.000% | | 04/01/35 | | | | | | | | | | | 186 | | | | 184,727 | |
5.000% | | 06/01/35 | | | | | | | | | | | 45 | | | | 44,689 | |
5.000% | | 07/01/35 | | | | | | | | | | | 35 | | | | 34,462 | |
5.000% | | 07/01/35 | | | | | | | | | | | 49 | | | | 48,624 | |
5.000% | | 09/01/35 | | | | | | | | | | | 42 | | | | 41,423 | |
5.000% | | 11/01/35 | | | | | | | | | | | 47 | | | | 46,237 | |
5.000% | | 02/01/36 | | | | | | | | | | | 26 | | | | 25,706 | |
5.000% | | 06/01/49 | | | | | | | | | | | 418 | | | | 410,841 | |
5.000% | | 08/01/52 | | | | | | | | | | | 403 | | | | 390,483 | |
5.000% | | 09/01/52 | | | | | | | | | | | 418 | | | | 404,454 | |
5.000% | | 10/01/52 | | | | | | | | | | | 1,784 | | | | 1,727,220 | |
5.000% | | 02/01/53 | | | | | | | | | | | 12,864 | | | | 12,451,881 | |
5.500% | | TBA | | | | | | | | | | | 26,500 | | | | 26,148,836 | |
5.500% | | 02/01/33 | | | | | | | | | | | 40 | | | | 40,200 | |
5.500% | | 08/01/33 | | | | | | | | | | | 81 | | | | 82,184 | |
5.500% | | 10/01/33 | | | | | | | | | | | 23 | | | | 23,687 | |
5.500% | | 12/01/33 | | | | | | | | | | | 18 | | | | 18,548 | |
5.500% | | 12/01/34 | | | | | | | | | | | 51 | | | | 51,925 | |
5.500% | | 10/01/35 | | | | | | | | | | | 104 | | | | 104,547 | |
5.500% | | 03/01/36 | | | | | | | | | | | 20 | | | | 19,932 | |
5.500% | | 04/01/36 | | | | | | | | | | | 40 | | | | 40,459 | |
5.500% | | 01/01/37 | | | | | | | | | | | 27 | | | | 27,155 | |
SEE NOTES TO FINANCIAL STATEMENTS.
A90
| | | | |
| | PSF PGIM FLEXIBLE MANAGED PORTFOLIO (CONTINUED) | | |
SCHEDULE OF INVESTMENTS | | | | as of December 31, 2024 |
| | | | | | | | | | | | | | | | | | |
Interest Rate | | Maturity
Date | | | | | | | | Principal
Amount
(000)# | | | Value | |
|
U.S. GOVERNMENT AGENCY OBLIGATIONS(continued) | |
5.500% | | 04/01/37 | | | | | | | | | | | 13 | | | $ | 12,699 | |
5.500% | | 05/01/37 | | | | | | | | | | | 80 | | | | 80,132 | |
5.500% | | 08/01/37 | | | | | | | | | | | 90 | | | | 91,147 | |
5.500% | | 04/01/53 | | | | | | | | | | | 934 | | | | 922,239 | |
5.500% | | 09/01/53 | | | | | | | | | | | 549 | | | | 542,688 | |
5.500% | | 11/01/53 | | | | | | | | | | | 3,889 | | | | 3,841,051 | |
5.500% | | 12/01/53 | | | | | | | | | | | 1,923 | | | | 1,898,816 | |
6.000% | | TBA | | | | | | | | | | | 1,500 | | | | 1,506,914 | |
6.000% | | 10/01/33 | | | | | | | | | | | 95 | | | | 95,404 | |
6.000% | | 11/01/33 | | | | | | | | | | | 4 | | | | 4,279 | |
6.000% | | 11/01/33 | | | | | | | | | | | 6 | | | | 5,573 | |
6.000% | | 01/01/34 | | | | | | | | | | | 136 | | | | 139,742 | |
6.000% | | 02/01/34 | | | | | | | | | | | 37 | | | | 37,908 | |
6.000% | | 03/01/34 | | | | | | | | | | | 1 | | | | 771 | |
6.000% | | 03/01/34 | | | | | | | | | | | 9 | | | | 9,098 | |
6.000% | | 01/01/35 | | | | | | | | | | | 17 | | | | 17,548 | |
6.000% | | 01/01/35 | | | | | | | | | | | 39 | | | | 39,404 | |
6.000% | | 02/01/35 | | | | | | | | | | | 1 | | | | 853 | |
6.000% | | 02/01/35 | | | | | | | | | | | 71 | | | | 72,786 | |
6.000% | | 02/01/35 | | | | | | | | | | | 82 | | | | 83,429 | |
6.000% | | 04/01/35 | | | | | | | | | | | 6 | | | | 6,515 | |
6.000% | | 05/01/36 | | | | | | | | | | | 10 | | | | 10,522 | |
6.000% | | 06/01/36 | | | | | | | | | | | 11 | | | | 10,853 | |
6.000% | | 02/01/37 | | | | | | | | | | | 29 | | | | 29,776 | |
6.000% | | 06/01/37 | | | | | | | | | | | 10 | | | | 10,149 | |
6.000% | | 05/01/38 | | | | | | | | | | | 70 | | | | 72,589 | |
6.000% | | 01/01/53 | | | | | | | | | | | 5,970 | | | | 6,002,558 | |
6.000% | | 09/01/53 | | | | | | | | | | | 2,211 | | | | 2,222,734 | |
6.500% | | 09/01/32 | | | | | | | | | | | 1 | | | | 688 | |
6.500% | | 09/01/32 | | | | | | | | | | | 8 | | | | 7,776 | |
6.500% | | 09/01/32 | | | | | | | | | | | 9 | | | | 9,566 | |
6.500% | | 09/01/32 | | | | | | | | | | | 16 | | | | 16,246 | |
6.500% | | 10/01/32 | | | | | | | | | | | 16 | | | | 16,200 | |
6.500% | | 04/01/33 | | | | | | | | | | | 19 | | | | 19,680 | |
6.500% | | 11/01/33 | | | | | | | | | | | 16 | | | | 16,159 | |
6.500% | | 01/01/34 | | | | | | | | | | | 7 | | | | 7,155 | |
6.500% | | 09/01/34 | | | | | | | | | | | 23 | | | | 23,928 | |
6.500% | | 09/01/36 | | | | | | | | | | | 72 | | | | 74,835 | |
6.500% | | 10/01/36 | | | | | | | | | | | 14 | | | | 14,669 | |
6.500% | | 01/01/37 | | | | | | | | | | | 32 | | | | 32,762 | |
6.500% | | 01/01/37 | | | | | | | | | | | 40 | | | | 41,235 | |
6.500% | | 09/01/37 | | | | | | | | | | | 8 | | | | 7,840 | |
6.625% | | 11/15/30(k) | | | | | | | | | | | 945 | | | | 1,048,076 | |
7.000% | | 02/01/32 | | | | | | | | | | | 5 | | | | 5,456 | |
7.000% | | 05/01/32 | | | | | | | | | | | 6 | | | | 6,123 | |
7.000% | | 06/01/32 | | | | | | | | | | | 5 | | | | 5,587 | |
7.000% | | 07/01/32 | | | | | | | | | | | 12 | | | | 12,000 | |
7.125% | | 01/15/30(k) | | | | | | | | | | | 3,600 | | | | 4,033,722 | |
Government National Mortgage Assoc. | |
2.000% | | 10/20/50 | | | | | | | | | | | 6,310 | | | | 5,051,201 | |
2.000% | | 01/20/51 | | | | | | | | | | | 4,211 | | | | 3,370,981 | |
2.000% | | 03/20/51 | | | | | | | | | | | 1,312 | | | | 1,050,885 | |
2.000% | | 07/20/51 | | | | | | | | | | | 1,436 | | | | 1,149,489 | |
2.000% | | 10/20/51 | | | | | | | | | | | 825 | | | | 660,366 | |
2.000% | | 11/20/51 | | | | | | | | | | | 464 | | | | 371,097 | |
2.500% | | 03/20/43 | | | | | | | | | | | 292 | | | | 248,629 | |
2.500% | | 12/20/46 | | | | | | | | | | | 269 | | | | 228,858 | |
2.500% | | 09/20/50 | | | | | | | | | | | 534 | | | | 447,739 | |
| | | | | | | | | | | | | | | | | | |
Interest Rate | | Maturity
Date | | | | | | | | Principal
Amount
(000)# | | | Value | |
|
U.S. GOVERNMENT AGENCY OBLIGATIONS(continued) | |
2.500% | | 10/20/50 | | | | | | | | | | | 2,451 | | | $ | 2,053,992 | |
2.500% | | 11/20/50 | | | | | | | | | | | 1,867 | | | | 1,564,625 | |
2.500% | | 02/20/51 | | | | | | | | | | | 3,694 | | | | 3,086,923 | |
2.500% | | 05/20/51 | | | | | | | | | | | 11,739 | | | | 9,818,276 | |
2.500% | | 07/20/51 | | | | | | | | | | | 4,463 | | | | 3,729,704 | |
2.500% | | 08/20/51 | | | | | | | | | | | 879 | | | | 734,999 | |
3.000% | | 03/15/45 | | | | | | | | | | | 262 | | | | 229,298 | |
3.000% | | 11/20/45 | | | | | | | | | | | 337 | | | | 297,869 | |
3.000% | | 03/20/46 | | | | | | | | | | | 1,976 | | | | 1,743,235 | |
3.000% | | 07/20/46 | | | | | | | | | | | 1,287 | | | | 1,132,976 | |
3.000% | | 10/20/46 | | | | | | | | | | | 2,381 | | | | 2,090,231 | |
3.000% | | 02/20/47 | | | | | | | | | | | 656 | | | | 576,664 | |
3.000% | | 12/20/49 | | | | | | | | | | | 129 | | | | 112,362 | |
3.000% | | 01/20/50 | | | | | | | | | | | 1,142 | | | | 996,075 | |
3.000% | | 06/20/51 | | | | | | | | | | | 305 | | | | 264,779 | |
3.000% | | 10/20/51 | | | | | | | | | | | 4,055 | | | | 3,520,241 | |
3.000% | | 11/20/51 | | | | | | | | | | | 1,182 | | | | 1,025,335 | |
3.000% | | 12/20/51 | | | | | | | | | | | 1,368 | | | | 1,187,747 | |
3.500% | | 12/20/42 | | | | | | | | | | | 660 | | | | 603,209 | |
3.500% | | 05/20/43 | | | | | | | | | | | 135 | | | | 123,217 | |
3.500% | | 03/20/45 | | | | | | | | | | | 412 | | | | 374,776 | |
3.500% | | 04/20/45 | | | | | | | | | | | 554 | | | | 503,385 | |
3.500% | | 07/20/46 | | | | | | | | | | | 1,908 | | | | 1,726,836 | |
3.500% | | 06/20/49 | | | | | | | | | | | 2,898 | | | | 2,608,163 | |
3.500% | | 08/20/49 | | | | | | | | | | | 1,361 | | | | 1,228,443 | |
3.500% | | 03/20/50 | | | | | | | | | | | 1,928 | | | | 1,736,441 | |
3.500% | | 06/20/50 | | | | | | | | | | | 272 | | | | 244,780 | |
3.500% | | 08/20/50 | | | | | | | | | | | 297 | | | | 267,941 | |
3.500% | | 01/20/52 | | | | | | | | | | | 2,881 | | | | 2,579,007 | |
3.500% | | 02/20/52 | | | | | | | | | | | 5,361 | | | | 4,794,950 | |
4.000% | | 06/15/40 | | | | | | | | | | | 53 | | | | 49,958 | |
4.000% | | 05/20/41 | | | | | | | | | | | 98 | | | | 93,322 | |
4.000% | | 12/20/42 | | | | | | | | | | | 252 | | | | 238,479 | |
4.000% | | 08/20/44 | | | | | | | | | | | 90 | | | | 84,568 | |
4.000% | | 11/20/45 | | | | | | | | | | | 432 | | | | 405,189 | |
4.000% | | 12/20/45 | | | | | | | | | | | 477 | | | | 447,775 | |
4.000% | | 11/20/46 | | | | | | | | | | | 102 | | | | 95,368 | |
4.000% | | 09/20/47 | | | | | | | | | | | 1,305 | | | | 1,218,502 | |
4.000% | | 04/20/48 | | | | | | | | | | | 896 | | | | 834,392 | |
4.000% | | 02/20/49 | | | | | | | | | | | 724 | | | | 674,708 | |
4.000% | | 04/20/49 | | | | | | | | | | | 5,514 | | | | 5,135,957 | |
4.000% | | 01/20/50 | | | | | | | | | | | 1,436 | | | | 1,335,650 | |
4.000% | | 02/20/50 | | | | | | | | | | | 992 | | | | 922,353 | |
4.000% | | 07/20/50 | | | | | | | | | | | 1,601 | | | | 1,488,098 | |
4.000% | | 06/20/52 | | | | | | | | | | | 1,808 | | | | 1,667,442 | |
4.000% | | 08/20/52 | | | | | | | | | | | 1,885 | | | | 1,736,921 | |
4.500% | | 04/15/40 | | | | | | | | | | | 181 | | | | 175,290 | |
4.500% | | 01/20/41 | | | | | | | | | | | 459 | | | | 445,491 | |
4.500% | | 02/20/41 | | | | | | | | | | | 275 | | | | 267,094 | |
4.500% | | 06/20/44 | | | | | | | | | | | 298 | | | | 288,350 | |
4.500% | | 09/20/46 | | | | | | | | | | | 159 | | | | 151,026 | |
4.500% | | 11/20/46 | | | | | | | | | | | 275 | | | | 265,935 | |
4.500% | | 03/20/47 | | | | | | | | | | | 220 | | | | 211,474 | |
4.500% | | 05/20/48 | | | | | | | | | | | 221 | | | | 211,957 | |
4.500% | | 06/20/48 | | | | | | | | | | | 287 | | | | 275,238 | |
4.500% | | 08/20/48 | | | | | | | | | | | 955 | | | | 915,511 | |
5.000% | | 10/20/37 | | | | | | | | | | | 60 | | | | 59,939 | |
5.000% | | 04/20/45 | | | | | | | | | | | 293 | | | | 290,610 | |
SEE NOTES TO FINANCIAL STATEMENTS.
A91
| | | | |
| | PSF PGIM FLEXIBLE MANAGED PORTFOLIO (CONTINUED) | | |
SCHEDULE OF INVESTMENTS | | | | as of December 31, 2024 |
| | | | | | | | | | | | | | |
| | | | | Principal | | | | |
| Interest | | Maturity | | | | Amount | | | | |
Rate | | Date | | | | (000)# | | | Value | |
|
U.S. GOVERNMENT AGENCY OBLIGATIONS(continued) | |
5.500% | | TBA | | | | | | | 9,500 | | | $ | 9,421,463 | |
5.500% | | 11/15/32 | | | | | | | 14 | | | | 14,306 | |
5.500% | | 02/15/33 | | | | | | | 18 | | | | 18,563 | |
5.500% | | 08/15/33 | | | | | | | 39 | | | | 39,744 | |
5.500% | | 08/15/33 | | | | | | | 54 | | | | 55,485 | |
5.500% | | 09/15/33 | | | | | | | 29 | | | | 28,553 | |
5.500% | | 10/15/33 | | | | | | | 28 | | | | 28,354 | |
5.500% | | 12/15/33 | | | | | | | 3 | | | | 2,775 | |
5.500% | | 04/15/34 | | | | | | | 106 | | | | 107,978 | |
5.500% | | 07/15/35 | | | | | | | 24 | | | | 24,194 | |
5.500% | | 02/15/36 | | | | | | | 69 | | | | 70,700 | |
5.500% | | 12/20/52 | | | | | | | 2,862 | | | | 2,845,592 | |
5.500% | | 01/20/53 | | | | | | | 2,200 | | | | 2,190,643 | |
6.000% | | 02/15/33 | | | | | | | 1 | | | | 1,259 | |
6.000% | | 04/15/33 | | | | | | | 10 | | | | 10,373 | |
6.000% | | 09/15/33 | | | | | | | 7 | | | | 7,117 | |
6.000% | | 12/15/33 | | | | | | | 15 | | | | 15,734 | |
6.000% | | 12/15/33 | | | | | | | 53 | | | | 53,911 | |
6.000% | | 01/15/34 | | | | | | | 8 | | | | 8,571 | |
6.000% | | 01/15/34 | | | | | | | 12 | | | | 11,854 | |
6.000% | | 06/20/34 | | | | | | | 28 | | | | 28,816 | |
6.000% | | 07/15/34 | | | | | | | 62 | | | | 64,682 | |
6.000% | | 10/15/34 | | | | | | | 67 | | | | 69,047 | |
6.500% | | 12/15/30 | | | | | | | 2 | | | | 2,110 | |
6.500% | | 01/15/32 | | | | | | | 10 | | | | 9,802 | |
6.500% | | 02/15/32 | | | | | | | 5 | | | | 5,310 | |
6.500% | | 07/15/32 | | | | | | | 15 | | | | 15,364 | |
6.500% | | 08/15/32 | | | | | | | 3 | | | | 2,793 | |
6.500% | | 08/15/32 | | | | | | | 6 | | | | 5,601 | |
6.500% | | 08/15/32 | | | | | | | 15 | | | | 15,124 | |
6.500% | | 08/15/32 | | | | | | | 78 | | | | 79,595 | |
6.500% | | 06/15/35 | | | | | | | 12 | | | | 12,260 | |
6.500% | | 07/15/35 | | | | | | | 5 | | | | 5,334 | |
8.000% | | 04/15/25 | | | | | | | —(r | ) | | | 1 | |
Tennessee Valley Authority, Sr. Unsec’d. Notes | |
1.500% | | 09/15/31 | | | | | | | 450 | | | | 368,841 | |
Tennessee Valley Authority Generic Strips, Bonds | |
4.724%(s) | | 07/15/34 | | | | | | | 170 | | | | 102,597 | |
| | | | | | | | | | | | | | |
TOTAL U.S. GOVERNMENT AGENCY OBLIGATIONS
(cost $515,757,995) | | | | 483,544,216 | |
| | | | | | | | | | | | | | |
|
U.S. TREASURY OBLIGATIONS — 0.8% | |
U.S. Treasury Bonds | |
1.625% | | 11/15/50(h) | | | | | | | 37,770 | | | | 19,723,022 | |
2.250% | | 08/15/49 | | | | | | | 3,325 | | | | 2,060,981 | |
3.000% | | 02/15/49 | | | | | | | 4,475 | | | | 3,259,059 | |
4.125% | | 08/15/44 | | | | | | | 410 | | | | 371,370 | |
4.750% | | 11/15/53 | | | | | | | 7,755 | | | | 7,682,297 | |
U.S. Treasury Notes | |
4.250% | | 11/15/34 | | | | | | | 1,260 | | | | 1,227,909 | |
U.S. Treasury Strips Coupon | |
2.365%(s) | | 08/15/44 | | | | | | | 3,095 | | | | 1,150,107 | |
3.351%(s) | | 11/15/41 | | | | | | | 14,090 | | | | 5,987,149 | |
4.728%(s) | | 11/15/43 | | | | | | | 426 | | | | 164,326 | |
| | | | | | | | | | | | | | |
| | | | | Principal | | | | |
| Interest | | Maturity | | | | Amount | | | | |
Rate | | Date | | | | (000)# | | | Value | |
|
U.S. TREASURY OBLIGATIONS(continued) | |
5.331%(s) | | 02/15/40 | | | | | | | 1,155 | | | $ | 539,827 | |
| | | | | | | | | | | | | | |
TOTAL U.S. TREASURY OBLIGATIONS
(cost $48,424,929) | | | | 42,166,047 | |
| | | | | | | | | | | | | | |
TOTAL LONG-TERM INVESTMENTS
(cost $3,647,714,064) | | | | 4,789,172,686 | |
| | | | | | | | | | | | | | |
| | | | | | | | | | | | | | |
| | | | | | | | | Shares | | | | |
|
| SHORT-TERM INVESTMENTS — 7.4% | |
|
| AFFILIATED MUTUAL FUNDS — 7.4% | |
PGIM Core Ultra Short Bond Fund(wb) | | | 272,258,983 | | | | 272,258,983 | |
PGIM Institutional Money Market Fund (7-day effective yield 4.649%) (cost $95,996,064; includes $95,638,101 of cash collateral for securities on loan)(b)(wb) | | | 96,133,646 | | | | 96,075,965 | |
| | | | | | | | | | | | | | |
TOTAL AFFILIATED MUTUAL FUNDS
(cost $368,255,047) | | | | 368,334,948 | |
| | | | | | | | | | | | | | |
| | | | | | | | | | | | | | | | | | |
| | | | | |
Interest Rate | | Maturity
Date | | | | | | | | Principal
Amount
(000)# | | | | |
U.S. TREASURY OBLIGATION(k)(n) — 0.0% | |
U.S. Treasury Bills | | | | | |
4.216% | | 03/20/25 | | | | | | | | | | | 140 | | | | 138,749 | |
| | | | | | | | | | | | | | | | | | |
(cost $138,735) | | | | | | | | | |
| |
OPTIONS PURCHASED*~ — 0.0% | | | | | |
(cost $37,300) | | | | | | | | 23,874 | |
| | | | | | | | | | | | | | | | | | |
TOTAL SHORT-TERM INVESTMENTS
(cost $368,431,082) | | | | 368,497,571 | |
| | | | | | | | | | | | | | | | | | |
TOTAL INVESTMENTS, BEFORE OPTIONS
WRITTEN—103.1%
(cost $4,016,145,146) | | | | 5,157,670,257 | |
| | | | | | | | | | | | | | | | | | |
| |
OPTIONS WRITTEN*~ — (0.0)%
(premiums received $35,978) | | | | (48,854 | ) |
| | | | | | | | | | | | | | | | | | |
TOTAL INVESTMENTS, NET OF OPTIONS
WRITTEN—103.1%
(cost $4,016,109,168) | | | | 5,157,621,403 | |
Liabilities in excess of other assets(z) — (3.1)% | | | | (153,317,916 | ) |
| | | | | | | | | | | | | | | | | | |
| |
NET ASSETS — 100.0% | | | $ | 5,004,303,487 | |
| | | | | | | | | | | | | | | | | | |
See the Glossary for a list of the abbreviation(s) used in the annual report.
| * | Non-income producing security. |
| # | Principal or notional amount is shown in U.S. dollars unless otherwise stated. |
| ~ | See tables subsequent to the Schedule of Investments for options detail. Options with maturity dates greater than one year from date of acquisition would be considered long-term investments. |
SEE NOTES TO FINANCIAL STATEMENTS.
A92
| | | | |
| | PSF PGIM FLEXIBLE MANAGED PORTFOLIO (CONTINUED) | | |
SCHEDULE OF INVESTMENTS | | | | as of December 31, 2024 |
| ^ | Indicates a Level 3 instrument. The aggregate value of Level 3 instruments is $653,878 and 0.0% of net assets. |
| (a) | All or a portion of security is on loan. The aggregate market value of such securities, including those sold and pending settlement, is $93,578,611; cash collateral of $95,638,101 (included in liabilities) was received with which the Portfolio purchased highly liquid short-term investments. In the event of significant appreciation in value of securities on loan on the last business day of the reporting period, the Portfolio may reflect a collateral value that is less than the market value of the loaned securities and such shortfall is remedied the following business day. |
| (b) | Represents security, or portion thereof, purchased with cash collateral received for securities on loan and includes dividend reinvestment. |
| (c) | Variable rate instrument. The interest rate shown reflects the rate in effect at December 31, 2024. |
| (cc) | Variable rate instrument. The rate shown is based on the latest available information as of December 31, 2024. Certain variable rate securities are not based on a published reference rate and spread but are determined by the issuer or agent and are based on current market conditions. These securities do not indicate a reference rate and spread in their description. |
| (ff) | Variable rate security. Security may be issued at a fixed coupon rate, which converts to a variable rate at a specified date. Rate shown is the rate in effect as of period end. |
| (h) | Represents security, or a portion thereof, segregated as collateral for OTC derivatives. |
| (k) | Represents security, or a portion thereof, segregated as collateral for centrally cleared/exchange-traded derivatives. |
| (n) | Rate shown reflects yield to maturity at purchased date. |
| (oo) | Perpetual security. Maturity date represents next call date. |
| (r) | Principal or notional amount is less than $500 par. |
| (s) | Represents zero coupon bond or principal only security. Rate represents yield to maturity at purchase date. |
| (wb) | Represents an investment in a Fund affiliated with the Manager. |
| (z) | Includes net unrealized appreciation/(depreciation) and/or market value of the below holdings which are excluded from the Schedule of Investments: |
Forward Commitment Contracts:
| | | | | | | | | | | | | | | | | | | | |
U.S. Government Agency Obligations | | Interest
Rate | | | Maturity
Date | | | Settlement
Date | | | Principal
Amount
(000)# | | | Value | |
Federal National Mortgage Assoc. | | | 2.000% | | | | TBA | | | | 01/14/25 | | | $ | (1,000 | ) | | $ | (777,891 | ) |
Federal National Mortgage Assoc. | | | 4.000% | | | | TBA | | | | 01/14/25 | | | | (15,000 | ) | | | (13,715,675 | ) |
Government National Mortgage Assoc. | | | 3.000% | | | | TBA | | | | 01/21/25 | | | | (7,500 | ) | | | (6,502,734 | ) |
| | | | | | | | | | | | | | | | | | | | |
TOTAL FORWARD COMMITMENT CONTRACTS
(proceeds receivable $21,285,410) | | | | | | | | | | | | | | | | | | $ | (20,996,300 | ) |
| | | | | | | | | | | | | | | | | | | | |
Options Purchased:
Exchange Traded
| | | | | | | | | | | | | | | | | | | | | | | | |
Description | | Call/
Put | | | Expiration
Date | | | Strike | | | Contracts | | | Notional
Amount
(000)# | | | Value | |
3 Month SOFR | | | Call | | | | 12/12/25 | | | | $98.00 | | | | 12 | | | | 30 | | | | $1,650 | |
| | | | | | | | | | | | | | | | | | | | | | | | |
(cost $1,519) | | | | | | | | | | | | | | | | | | | | | | | | |
OTC Traded
| | | | | | | | | | | | | | | | | | | | |
Description | | Call/
Put | | Counterparty | | Expiration
Date | | Strike | | | Contracts | | Notional
Amount
(000)# | | | Value | |
2-Year 10 CMS Curve CAP | | Call | | JPM | | 01/02/25 | | | 0.19 | % | | — | | | 24,480 | | | $ | — | |
2-Year 10 CMS Curve CAP | | Call | | JPM | | 01/21/25 | | | 0.13 | % | | — | | | 16,320 | | | | 1,936 | |
| | | | | | | | | | | | | | | | | | | | |
Total OTC Traded (cost $35,781) | | | | | | | | | | | | | | | | | | $ | 1,936 | |
| | | | | | | | | | | | | | | | | | | | |
OTC Swaptions
| | | | | | | | | | | | | | | | | | | | |
Description | | Call/
Put | | Counterparty | | Expiration
Date | | Strike | | Receive | | Pay | | Notional
Amount
(000)# | | | Value | |
2-Year Interest Rate Swap, 01/08/27 | | Call | | CITI | | 01/06/25 | | 2.83% | | 2.83%(A) | | 1 Day SOFR(A)/ 4.490% | | | 3,500 | | | $ | — | |
2-Year Interest Rate Swap, 02/07/27 | | Call | | CITI | | 02/05/25 | | 3.65% | | 3.65%(A) | | 1 Day SOFR(A)/ 4.490% | | | 3,500 | | | | 1,364 | |
SEE NOTES TO FINANCIAL STATEMENTS.
A93
| | | | |
| | PSF PGIM FLEXIBLE MANAGED PORTFOLIO (CONTINUED) | | |
SCHEDULE OF INVESTMENTS | | | | as of December 31, 2024 |
Options Purchased (continued):
OTC Swaptions
| | | | | | | | | | | | | | | | | | | | |
Description | | Call/
Put | | Counterparty | | Expiration
Date | | Strike | | Receive | | Pay | | Notional
Amount
(000)# | | | Value | |
2-Year Interest Rate Swap, 03/10/27 | | Call | | CITI | | 03/06/25 | | 3.55% | | 3.55%(A) | | 1 Day SOFR(A)/ 4.490% | | | 3,500 | | | $ | 2,459 | |
7-Year Interest Rate Swap, 02/18/32 | | Put | | JPM | | 02/13/25 | | 4.24% | | 1 Day SOFR(A)/ 4.490% | | 4.24%(A) | | | 1,395 | | | | 5,486 | |
10-Year Interest Rate Swap, 03/19/35 | | Put | | JPM | | 03/17/25 | | 4.19% | | 1 Day SOFR(A)/ 4.490% | | 4.19%(A) | | | 1,045 | | | | 10,979 | |
| | | | | | | | | | | | | | | | | | | | |
Total OTC Swaptions (cost $0) | | | | | | $ | 20,288 | |
| | | | | | | | | | | | | | | | | | | | |
Total Options Purchased (cost $37,300) | | | | | | $ | 23,874 | |
| | | | | | | | | | | | | | | | | | | | |
Options Written:
Exchange Traded
| | | | | | | | | | | | | | | | | | | | | | | | |
Description | | Call/
Put | | | Expiration
Date | | | Strike | | | Contracts | | | Notional
Amount
(000)# | | | Value | |
3 Month SOFR | | | Call | | | | 12/12/25 | | | $ | 96.50 | | | | 12 | | | | 30 | | | $ | (7,125 | ) |
3 Month SOFR | | | Put | | | | 12/12/25 | | | $ | 96.50 | | | | 12 | | | | 30 | | | | (20,100 | ) |
| | | | | | | | | | | | | | | | | | | | | | | | |
Total Exchange Traded (premiums received $26,512) | | | | | | | | | | | | | | | | | | | | | | $ | (27,225 | ) |
| | | | | | | | | | | | | | | | | | | | | | | | |
OTC Traded
| | | | | | | | | | | | | | | | | | | | | | | | | | | | |
Description | | Call/
Put | | | Counterparty | | | Expiration
Date | | | Strike | | | Contracts | | | Notional
Amount
(000)# | | | Value | |
2-Year 10 CMS Curve CAP | | | Call | | | | JPM | | | | 01/02/25 | | | | 0.49 | % | | | — | | | | 24,480 | | | $ | — | |
2-Year 10 CMS Curve CAP | | | Call | | | | JPM | | | | 01/21/25 | | | | 0.43 | % | | | — | | | | 16,320 | | | | (6 | ) |
| | | | | | | | | | | | | | | | | | | | | | | | | | | | |
Total OTC Traded (premiums received $9,466) | | | | | | | | | | | | | | | | | | | | | | | | | | $ | (6 | ) |
| | | | | | | | | | | | | | | | | | | | | | | | | | | | |
OTC Swaptions
| | | | | | | | | | | | | | | | | | | | |
Description | | Call/
Put | | Counterparty | | Expiration
Date | | Strike | | Receive | | Pay | | Notional
Amount
(000)# | | | Value | |
2-Year Interest Rate Swap, 01/08/27 | | Call | | CITI | | 01/06/25 | | 2.52% | | 1 Day SOFR(A)/ 4.490% | | 2.52%(A) | | | 7,000 | | | $ | — | |
2-Year Interest Rate Swap, 02/07/27 | | Call | | CITI | | 02/05/25 | | 3.10% | | 1 Day SOFR(A)/ 4.490% | | 3.10%(A) | | | 7,000 | | | | (174 | ) |
2-Year Interest Rate Swap, 03/10/27 | | Call | | CITI | | 03/06/25 | | 3.29% | | 1 Day SOFR(A)/ 4.490% | | 3.29%(A) | | | 7,000 | | | | (2,112 | ) |
2-Year Interest Rate Swap, 02/07/27 | | Put | | CITI | | 02/05/25 | | 4.32% | | 4.32%(A) | | 1 Day SOFR(A)/ 4.490% | | | 3,500 | | | | (2,243 | ) |
2-Year Interest Rate Swap, 02/07/27 | | Put | | CITI | | 02/05/25 | | 4.35% | | 4.35%(A) | | 1 Day SOFR(A)/ 4.490% | | | 3,500 | | | | (1,836 | ) |
7-Year Interest Rate Swap, 02/18/32 | | Put | | JPM | | 02/13/25 | | 4.48% | | 4.48%(A) | | 1 Day SOFR(A)/ 4.490% | | | 2,790 | | | | (3,646 | ) |
SEE NOTES TO FINANCIAL STATEMENTS.
A94
| | | | |
| | PSF PGIM FLEXIBLE MANAGED PORTFOLIO (CONTINUED) | | |
SCHEDULE OF INVESTMENTS | | | | as of December 31, 2024 |
Options Written (continued):
OTC Swaptions
| | | | | | | | | | | | | | | | | | | | | | | | | | |
Description | | Call/
Put | | Counterparty | | | Expiration
Date Strike | | | Receive | | | Pay | | | Notional
Amount
(000)# | | | Value | |
10-Year Interest | | | | | | | | | | | | | | | | | | | | | | | | | | |
Rate Swap, 03/19/35 | | Put | | | JPM | | | | 03/17/25 4.39% | | | | 4.39%(A) | | | | 1 Day SOFR(A)/ 4.490% | | | | 2,090 | | | $ | (11,612 | ) |
| | | | | | | | | | | | | | | | | | | | | | | | | | |
Total OTC Swaptions (premiums received $0) | | | | | | | | | | | $ | (21,623 | ) |
| | | | | | | | | | | | | | | | | | | | | | | | | | |
Total Options Written (premiums received $35,978) | | | | | | | | | | | | | | | $ | (48,854 | ) |
| | | | | | | | | | | | | | | | | | | | | | | | | | |
Futures contracts outstanding at December 31, 2024:
| | | | | | | | | | | | | | |
Number of
Contracts | | Type | | Expiration
Date | | | Current
Notional
Amount | | | Value /
Unrealized
Appreciation
(Depreciation) | |
Long Positions: | | | | | | | | | | | | |
416 | | 2 Year U.S. Treasury Notes | | | Mar. 2025 | | | $ | 85,533,500 | | | $ | (24,118 | ) |
564 | | 10 Year U.S. Treasury Notes | | | Mar. 2025 | | | | 61,335,000 | | | | (613,451 | ) |
276 | | 10 Year U.S. Ultra Treasury Notes | | | Mar. 2025 | | | | 30,722,250 | | | | (483,065 | ) |
213 | | 20 Year U.S. Treasury Bonds | | | Mar. 2025 | | | | 24,248,719 | | | | (700,430 | ) |
215 | | 30 Year U.S. Ultra Treasury Bonds | | | Mar. 2025 | | | | 25,564,844 | | | | (1,025,229 | ) |
4 | | Mini MSCI EAFE Index | | | Mar. 2025 | | | | 453,500 | | | | (14,943 | ) |
6 | | S&P 500 E-Mini Index | | | Mar. 2025 | | | | 1,780,725 | | | | (57,908 | ) |
| | | | | | | | | | | | | | |
| | | | | | | | | | | | | (2,919,144 | ) |
| | | | | | | | | | | | | | |
| |
Short Positions: | | | | | |
8 | | 5 Year Euro-Bobl | | | Mar. 2025 | | | | 976,682 | | | | 12,817 | |
151 | | 5 Year U.S. Treasury Notes | | | Mar. 2025 | | | | 16,052,008 | | | | 69,752 | |
2 | | 10 Year Euro-Bund | | | Mar. 2025 | | | | 276,448 | | | | 7,322 | |
| | | | | | | | | | | | | | |
| | | | | | | | | | | | | 89,891 | |
| | | | | | | | | | | | | | |
| | | | | | | | | | | | $ | (2,829,253 | ) |
| | | | | | | | | | | | | | |
Forward foreign currency exchange contracts outstanding at December 31, 2024:
| | | | | | | | | | | | | | | | | | | | | | | | | | | | |
Sale
Contracts | | Counterparty | | | Notional
Amount (000) | | | Value at
Settlement
Date | | | Current
Value | | | Unrealized
Appreciation | | | Unrealized
Depreciation | |
OTC Forward Foreign Currency Exchange Contracts: | | | | | | | | | | | | | | | | | |
British Pound, | | | | | | | | | | | | | | | | | | | | | | | | | | | | |
Expiring 01/10/25 | | | MSI | | | | GBP | | | | 7,429 | | | $ | 9,301,671 | | | $ | 9,299,879 | | | $ | 1,792 | | | $ | — | |
Canadian Dollar, | | | | | | | | | | | | | | | | | | | | | | | | | | | | |
Expiring 01/21/25 | | | HSBC | | | | CAD | | | | 1,167 | | | | 847,960 | | | | 812,237 | | | | 35,723 | | | | — | |
Euro, | | | | | | | | | | | | | | | | | | | | | | | | | | | | |
Expiring 01/10/25 | | | SCB | | | | EUR | | | | 50,284 | | | | 52,477,959 | | | | 52,107,687 | | | | 370,272 | | | | — | |
| | | | | | | | | | | | | | | | | | | | | | | | | | | | |
| | | | | | | | | | | | | | $ | 62,627,590 | | | $ | 62,219,803 | | | $ | 407,787 | | | $ | — | |
| | | | | | | | | | | | | | | | | | | | | | | | | | | | |
Credit default swap agreements outstanding at December 31, 2024:
| | | | | | | | | | | | | | | | | | | | | | | | | | |
Reference Entity/
Obligation | | Termination
Date | | | Fixed
Rate | | | Notional
Amount
(000)#(3) | | | Fair
Value | | | Upfront
Premiums
Paid
(Received) | | | Unrealized
Appreciation
(Depreciation) | | | Counterparty |
OTC Credit Default Swap Agreements on corporate and/or sovereign issues - Buy Protection(1): |
Credit Suisse Group AG | | | 06/20/26 | | | | 1.000%(Q) | | | | 3,000 | | | $ | (30,957 | ) | | $ | 73,330 | | | $ | (104,287 | ) | | BARC |
Credit Suisse Group AG | | | 06/20/26 | | | | 1.000%(Q) | | | | 3,000 | | | | (30,958 | ) | | | 71,527 | | | | (102,485 | ) | | BARC |
Credit Suisse Group AG | | | 06/20/26 | | | | 1.000%(Q) | | | | 3,000 | | | | (30,957 | ) | | | 80,462 | | | | (111,419 | ) | | BARC |
SEE NOTES TO FINANCIAL STATEMENTS.
A95
| | | | |
| | PSF PGIM FLEXIBLE MANAGED PORTFOLIO (CONTINUED) | | |
SCHEDULE OF INVESTMENTS | | | | as of December 31, 2024 |
Credit default swap agreements outstanding at December 31, 2024 (continued):
| | | | | | | | | | | | | | | | | | | | | | | | | | | | |
Reference Entity/
Obligation | | Termination
Date | | | Fixed
Rate | | | Notional
Amount
(000)#(3) | | | Fair
Value | | | Upfront
Premiums
Paid
(Received) | | | Unrealized
Appreciation
(Depreciation) | | | Counterparty | |
OTC Credit Default Swap Agreements on corporate and/or sovereign issues - Buy Protection(1)(cont’d.): | | | | | |
U.S. Treasury Notes | | | 06/20/25 | | | | 0.250%(Q) | | | | EUR 3,045 | | | $ | (2,334 | ) | | $ | (777 | ) | | $ | (1,557 | ) | | | BARC | |
U.S. Treasury Notes | | | 06/20/25 | | | | 0.250%(Q) | | | | EUR 1,015 | | | | (778 | ) | | | (258 | ) | | | (520 | ) | | | BARC | |
| | | | | | | | | | | | | | | | | | | | | | | | | | | | |
| | | | | | | | | | | | | | $ | (95,984 | ) | | $ | 224,284 | | | $ | (320,268 | ) | | | | |
| | | | | | | | | | | | | | | | | | | | | | | | | | | | |
| | | | | | | | | | | | | | | | | | | | | | | | | | | | | | | | |
Reference Entity/
Obligation | |
| Termination
Date |
| |
| Fixed
Rate |
| |
| Notional
Amount
(000)#(3) |
| |
| Implied
Credit
Spread at
December 31,
2024(4) |
| |
| Fair
Value |
| |
| Upfront
Premiums
Paid
(Received) |
| |
| Unrealized
Appreciation
(Depreciation) |
| | | Counterparty | |
OTC Credit Default Swap Agreements on corporate and/or sovereign issues - Sell Protection(2): | | | | | | | | | |
Bank of America Corp. | | | 12/20/25 | | | | 1.000%(Q) | | | | 2,000 | | | | 0.299% | | | $ | 14,068 | | | $ | 13,910 | | | $ | 158 | | | | GSI | |
Citigroup, Inc. | | | 12/20/25 | | | | 1.000%(Q) | | | | 2,000 | | | | 0.258% | | | | 14,855 | | | | 14,102 | | | | 753 | | | | GSI | |
Kingdom of Norway | | | 12/20/25 | | | | —%(Q) | | | | 4,390 | | | | 0.036% | | | | (1,528) | | | | (2,101) | | | | 573 | | | | BARC | |
Morgan Stanley | | | 12/20/25 | | | | 1.000%(Q) | | | | 2,000 | | | | 0.261% | | | | 14,794 | | | | 13,910 | | | | 884 | | | | GSI | |
U.S. Treasury Notes | | | 03/20/25 | | | | 0.250%(Q) | | | | EUR 2,060 | | | | 0.091% | | | | 916 | | | | 584 | | | | 332 | | | | BARC | |
| | | | | | | | | | | | | | | | | | | | | | | | | | | | | | | | |
| | | | | | | | | | | | | | | | | | $ | 43,105 | | | $ | 40,405 | | | $ | 2,700 | | | | | |
| | | | | | | | | | | | | | | | | | | | | | | | | | | | | | | | |
| | | | | | | | | | | | | | | | | | | | | | | | |
Reference Entity/
Obligation | | Termination
Date | | | Fixed Rate | | Notional
Amount
(000)#(3) | | | Implied Credit
Spread at
December 31,
2024(4) | | Value at
Trade
Date | | | Value at
December 31,
2024 | | | Unrealized
Appreciation
(Depreciation) | |
Centrally Cleared Credit Default Swap Agreement on credit indices - Sell Protection(2): | |
CDX.NA.IG.43.V1 | | | 12/20/29 | | | 1.000%(Q) | | | 38,390 | | | 0.499% | | $ | 844,199 | | | $ | 869,689 | | | $ | 25,490 | |
| | | | | | | | | | | | | | | | | | | | | | | | |
The Portfolio entered into credit default swaps (“CDS”) to provide a measure of protection against defaults or to take an active long or short position with respect to the likelihood of a particular issuer’s default or the reference entity’s credit soundness. CDS contracts generally trade based on a spread which represents the cost a protection buyer has to pay the protection seller. The protection buyer is said to be short the credit as the value of the contract rises the more the credit deteriorates. The value of the CDS contract increases for the protection buyer if the spread increases.
| (1) | If the Portfolio is a buyer of protection, it pays the fixed rate. When a credit event occurs, as defined under the terms of that particular swap agreement, the Portfolio will either (i) receive from the seller of protection an amount equal to the notional amount of the swap and make delivery of the referenced obligation or underlying securities comprising the referenced index or (ii) receive a net settlement amount in the form of cash or securities equal to the notional amount of the swap less the recovery value of the referenced obligation or underlying securities comprising the referenced index. |
| (2) | If the Portfolio is a seller of protection, it receives the fixed rate. When a credit event occurs, as defined under the terms of that particular swap agreement, the Portfolio will either (i) pay to the buyer of protection an amount equal to the notional amount of the swap and take delivery of the referenced obligation or underlying securities comprising the referenced index or (ii) pay a net settlement amount in the form of cash or securities equal to the notional amount of the swap less the recovery value of the referenced obligation or underlying securities comprising the referenced index. |
| (3) | Notional amount represents the maximum potential amount the Portfolio could be required to pay as a seller of credit protection or receive as a buyer of credit protection if a credit event occurs as defined under the terms of that particular swap agreement. |
| (4) | Implied credit spreads, represented in absolute terms, utilized in determining the fair value of credit default swap agreements where the Portfolio is the seller of protection as of the reporting date serve as an indicator of the current status of the payment/ performance risk and represent the likelihood of risk of default for the credit derivative. The implied credit spread of a particular referenced entity reflects the cost of buying/selling protection and may include up-front payments required to be made to enter into the agreement. Wider credit spreads represent a deterioration of the referenced entity’s credit soundness and a greater likelihood of risk of default or other credit event occurring as defined under the terms of the agreement. |
SEE NOTES TO FINANCIAL STATEMENTS.
A96
| | | | |
| | PSF PGIM FLEXIBLE MANAGED PORTFOLIO (CONTINUED) | | |
SCHEDULE OF INVESTMENTS | | | | as of December 31, 2024 |
Interest rate swap agreements outstanding at December 31, 2024:
| | | | | | | | | | | | | | | | | | | | | | |
Notional Amount (000)# | | Termination Date | | | Fixed Rate | | | Floating Rate | | Value at Trade
Date | | | Value at December 31, 2024 | | | Unrealized Appreciation (Depreciation) | |
|
|
Centrally Cleared Interest Rate Swap Agreements: | | | | | | | | | | | | |
7,208 | | | 03/08/25 | | | | 4.946%(A) | | | 1 Day SOFR(2)(A)/ 4.490% | | $ | — | | | $ | (9,764 | ) | | $ | (9,764 | ) |
9,116 | | | 03/09/25 | | | | 5.110%(A) | | | 1 Day SOFR(2)(A)/ 4.490% | | | — | | | | 2,926 | | | | 2,926 | |
20,448 | | | 03/10/25 | | | | 5.088%(A) | | | 1 Day SOFR(2)(A)/ 4.490% | | | — | | | | 2,526 | | | | 2,526 | |
33,275 | | | 05/17/25 | | | | 5.113%(T) | | | 1 Day SOFR(2)(T)/ 4.490% | | | — | | | | 86,201 | | | | 86,201 | |
29,210 | | | 08/31/25 | | | | 4.805%(A) | | | 1 Day SOFR(1)(A)/ 4.490% | | | — | | | | (95,794 | ) | | | (95,794 | ) |
17,045 | | | 05/17/26 | | | | 4.669%(A) | | | 1 Day SOFR(1)(A)/ 4.490% | | | — | | | | (69,508 | ) | | | (69,508 | ) |
2,250 | | | 09/25/26 | | | | 4.699%(A) | | | 1 Day SOFR(1)(A)/ 4.490% | | | 416 | | | | (21,963 | ) | | | (22,379 | ) |
2,685 | | | 05/11/54 | | | | 1.350%(A) | | | 1 Day SOFR(1)(A)/ 4.490% | | | 1,225,614 | | | | 1,259,402 | | | | 33,788 | |
| | | | | | | | | | | | | | | | | | | | | | |
| | | | | | | | | | | | $ | 1,226,030 | | | $ | 1,154,026 | | | $ | (72,004 | ) |
| | | | | | | | | | | | | | | | | | | | | | |
| (1) | The Portfolio pays the fixed rate and receives the floating rate. |
| (2) | The Portfolio pays the floating rate and receives the fixed rate. |
Total return swap agreements outstanding at December 31, 2024:
| | | | | | | | | | | | | | | | | | | | | | | | | | |
Reference Entity | | Financing Rate | | Counterparty | | | Termination
Date | | | Long (Short)
Notional
Amount
(000)#(1) | | | Fair
Value | | | Upfront
Premiums
Paid
(Received) | | | Unrealized
Appreciation
(Depreciation)(2) | |
|
|
|
OTC Total Return Swap Agreements: | | | | | | | | | | | | | | | | | | | | | | | | |
Total Return Benchmark Bond Index(T) | | 1 Day USOIS
-54bps(T)/
3.790% | | | JPM | | | | 03/20/25 | | | | (8,144 | ) | | $ | 744,134 | | | $ | — | | | $ | 744,134 | |
U.S. Treasury Bond(T) | | 1 Day USOIS
+20bps(T)/
4.530% | | | JPM | | | | 01/13/25 | | | | 20,385 | | | | (994,214 | ) | | | — | | | | (994,214 | ) |
U.S. Treasury Bond(T) | | 1 Day USOIS
+21bps(T)/
4.540% | | | BOA | | | | 01/13/25 | | | | 33,495 | | | | (1,656,678 | ) | | | — | | | | (1,656,678 | ) |
U.S. Treasury Bond(T) | | 1 Day USOIS
+20bps(T)/
4.530% | | | JPM | | | | 01/24/25 | | | | 15,745 | | | | (1,004,362 | ) | | | — | | | | (1,004,362 | ) |
U.S. Treasury Bond(T) | | 1 Day USOIS
+22bps(T)/
4.550% | | | GSI | | | | 01/24/25 | | | | 17,470 | | | | (871,988 | ) | | | — | | | | (871,988 | ) |
U.S. Treasury Bond(T) | | 1 Day USOIS
+23bps(T)/
4.560% | | | GSI | | | | 01/29/25 | | | | 23,175 | | | | (1,268,338 | ) | | | — | | | | (1,268,338 | ) |
U.S. Treasury Bond(T) | | 1 Day USOIS
+20bps(T)/
4.530% | | | JPM | | | | 01/30/25 | | | | 14,990 | | | | (706,080 | ) | | | — | | | | (706,080 | ) |
U.S. Treasury Bond(T) | | 1 Day USOIS
+24bps(T)/
4.570% | | | BOA | | | | 02/11/25 | | | | 27,440 | | | | (1,837,483 | ) | | | — | | | | (1,837,483 | ) |
U.S. Treasury Bond(T) | | 1 Day USOIS
+25bps(T)/
4.580% | | | JPM | | | | 02/25/25 | | | | 18,765 | | | | (1,439,368 | ) | | | — | | | | (1,439,368 | ) |
| | | | | | | | | | | | | | | | | | | | | | | | | | |
| | | | | | | | | | | | | | | | $ | (9,034,377 | ) | | $ | — | | | $ | (9,034,377 | ) |
| | | | | | | | | | | | | | | | | | | | | | | | | | |
| (1) | On a long total return swap, the Portfolio receives payments for any positive return on the reference entity (makes payments for any negative return) and pays the financing rate. On a short total return swap, the Portfolio makes payments for any positive return on the reference entity (receives payments for any negative return) and receives the financing rate. |
| (2) | Upfront/recurring fees or commissions, as applicable, are included in the net unrealized appreciation (depreciation). |
SEE NOTES TO FINANCIAL STATEMENTS.
A97
| | | | |
| | PSF PGIM FLEXIBLE MANAGED PORTFOLIO (CONTINUED) | | |
SCHEDULE OF INVESTMENTS | | | | as of December 31, 2024 |
Balances Reported in the Statement of Assets and Liabilities for OTC Swap Agreements:
| | | | | | | | |
| | | Premiums Paid | | Premiums Received | | Unrealized
Appreciation | | Unrealized
Depreciation |
| | | | |
OTC Swap Agreements | | $267,825 | | $(3,136) | | $746,834 | | $(10,098,779) |
Summary of Collateral for Centrally Cleared/Exchange-traded Derivatives:
Cash and securities segregated as collateral, including pending settlement for closed positions, to cover requirements for centrally cleared/exchange-traded derivatives are listed by broker as follows:
| | | | | | | | | | |
Broker | | Cash and/or Foreign Currency | | Securities Market Value |
CGM | | | $ | — | | | | $ | 6,233,731 | |
GS | | | | — | | | | | 138,749 | |
| | | | | | | | | | |
Total | | | $ | — | | | | $ | 6,372,480 | |
| | | | | | | | | | |
Fair Value Measurements:
Various inputs are used in determining the value of the Portfolio’s investments. These inputs are summarized in the three broad levels listed below.
Level 1—unadjusted quoted prices generally in active markets for identical securities.
Level 2—quoted prices for similar securities, interest rates and yield curves, prepayment speeds, foreign currency exchange rates and other observable inputs.
Level 3—unobservable inputs for securities valued in accordance with Board approved fair valuation procedures.
The following is a summary of the inputs used as of December 31, 2024 in valuing such portfolio securities:
| | | | | | | | | | | | |
| | | Level 1 | | | Level 2 | | | Level 3 | |
Investments in Securities | | | | | | | | | | | | |
Assets | | | | | | | | | | | | |
Long-Term Investments | | | | | | | | | | | | |
Common Stocks | | | $3,012,272,955 | | | $ | 24,335,060 | | | $ | — | ** |
Preferred Stocks | | | 833,321 | | | | 6,518 | | | | — | |
Unaffiliated Exchange-Traded Fund | | | 44,459 | | | | — | | | | — | |
Asset-Backed Securities | | | | | | | | | | | | |
Automobiles | | | — | | | | 86,499,361 | | | | — | |
Collateralized Loan Obligations. | | | — | | | | 242,282,154 | | | | — | |
Consumer Loans | | | — | | | | 18,290,143 | | | | — | |
Credit Cards. | | | — | | | | 9,429,825 | | | | — | |
Equipment | | | — | | | | 3,619,097 | | | | — | |
Home Equity Loans | | | — | | | | 11,443,816 | | | | — | |
Other | | | — | | | | 694,607 | | | | — | |
Residential Mortgage-Backed Securities | | | — | | | | — | | | | 653,878 | |
Student Loans | | | — | | | | 4,594,487 | | | | — | |
Commercial Mortgage-Backed Securities | | | — | | | | 268,240,186 | | | | — | |
Corporate Bonds | | | — | | | | 526,759,919 | | | | — | |
Floating Rate and Other Loans | | | — | | | | 213,853 | | | | — | |
Municipal Bonds | | | — | | | | 8,695,981 | | | | — | |
Residential Mortgage-Backed Securities | | | — | | | | 34,462,707 | | | | — | |
Sovereign Bonds | | | — | | | | 10,090,096 | | | | — | |
U.S. Government Agency Obligations | | | — | | | | 483,544,216 | | | | — | |
U.S. Treasury Obligations | | | — | | | | 42,166,047 | | | | — | |
Short-Term Investments | | | | | | | | | | | | |
Affiliated Mutual Funds | | | 368,334,948 | | | | — | | | | — | |
U.S. Treasury Obligation | | | — | | | | 138,749 | | | | — | |
Options Purchased | | | 1,650 | | | | 22,224 | | | | — | |
| | | | | | | | | | | | |
Total | | | $3,381,487,333 | | | $ | 1,775,529,046 | | | $ | 653,878 | |
| | | | | | | | | | | | |
| | | |
Liabilities | | | | | | | | | | | | |
Options Written | | $ | (27,225) | | | $ | (21,629) | | | $ | — | |
| | | | | | | | | | | | |
SEE NOTES TO FINANCIAL STATEMENTS.
A98
| | | | |
| | PSF PGIM FLEXIBLE MANAGED PORTFOLIO (CONTINUED) | | |
SCHEDULE OF INVESTMENTS | | | | as of December 31, 2024 |
| | | | | | | | | | | | |
| | | Level 1 | | | Level 2 | | | Level 3 | |
| | | |
Other Financial Instruments* | | | | | | | | | | | | |
Assets | | | | | | | | | | | | |
Futures Contracts | | $ | 89,891 | | | $ | — | | | $ | — | |
OTC Forward Foreign Currency Exchange Contracts | | | — | | | | 407,787 | | | | — | |
Centrally Cleared Credit Default Swap Agreement | | | — | | | | 25,490 | | | | — | |
OTC Credit Default Swap Agreements | | | — | | | | 44,633 | | | | — | |
Centrally Cleared Interest Rate Swap Agreements | | | — | | | | 125,441 | | | | — | |
OTC Total Return Swap Agreement | | | — | | | | 744,134 | | | | — | |
| | | | | | | | | | | | |
Total | | $ | 89,891 | | | $ | 1,347,485 | | | $ | — | |
| | | | | | | | | | | | |
| | | |
Liabilities | | | | | | | | | | | | |
Forward Commitment Contracts | | $ | — | | | $ | (20,996,300 | ) | | $ | — | |
Futures Contracts | | | (2,919,144 | ) | | | — | | | | — | |
OTC Credit Default Swap Agreements | | | — | | | | (97,512 | ) | | | — | |
Centrally Cleared Interest Rate Swap Agreements | | | — | | | | (197,445 | ) | | | — | |
OTC Total Return Swap Agreements | | | — | | | | (9,778,511 | ) | | | — | |
| | | | | | | | | | | | |
Total | | $ | (2,919,144 | ) | | $ | (31,069,768 | ) | | $ | — | |
| | | | | | | | | | | | |
| * | Other financial instruments are derivative instruments, with the exception of forward commitment contracts, and are not reflected in the Schedule of Investments. Futures, forwards and centrally cleared swap contracts are recorded at unrealized appreciation (depreciation) and OTC swap contracts are recorded at fair value. Forward commitment contracts are recorded at market value. |
| ** | Includes Level 3 investments with an aggregate value of $0. |
Industry Classification:
The industry classification of investments and liabilities in excess of other assets shown as a percentage of net assets as of December 31, 2024 were as follows:
| | | | |
U.S. Government Agency Obligations | | | 9.7 | % |
Affiliated Mutual Funds (1.9% represents investments purchased with collateral from securities on loan) | | | 7.4 | |
Semiconductors & Semiconductor Equipment | | | 7.0 | |
Software | | | 6.3 | |
Banks | | | 5.4 | |
Commercial Mortgage-Backed Securities | | | 5.4 | |
Technology Hardware, Storage & Peripherals | | | 4.9 | |
Collateralized Loan Obligations | | | 4.8 | |
Interactive Media & Services | | | 4.1 | |
Automobiles | | | 3.3 | |
Broadline Retail | | | 2.6 | |
Financial Services | | | 2.5 | |
Pharmaceuticals | | | 2.4 | |
Capital Markets | | | 2.1 | |
Oil, Gas & Consumable Fuels | | | 1.8 | |
Health Care Equipment & Supplies | | | 1.4 | |
Aerospace & Defense | | | 1.4 | |
Insurance | | | 1.3 | |
Consumer Staples Distribution & Retail | | | 1.2 | |
Health Care Providers & Services | | | 1.1 | |
Hotels, Restaurants & Leisure | | | 1.1 | |
Electric | | | 1.0 | |
Specialty Retail | | | 1.0 | |
Entertainment | | | 1.0 | |
Electric Utilities | | | 0.9 | |
Biotechnology | | | 0.9 | |
Machinery | | | 0.9 | |
U.S. Treasury Obligations | | | 0.8 | |
Pipelines | | | 0.8 | |
Chemicals | | | 0.8 | |
| | | | |
Life Sciences Tools & Services | | | 0.8 | % |
Residential Mortgage-Backed Securities | | | 0.7 | |
Communications Equipment | | | 0.7 | |
Beverages | | | 0.7 | |
Household Products | | | 0.6 | |
Healthcare-Services | | | 0.6 | |
IT Services | | | 0.6 | |
Telecommunications | | | 0.6 | |
Specialized REITs | | | 0.5 | |
Food Products | | | 0.5 | |
Electrical Equipment | | | 0.5 | |
Ground Transportation | | | 0.5 | |
Real Estate Investment Trusts (REITs) | | | 0.5 | |
Tobacco | | | 0.4 | |
Oil & Gas | | | 0.4 | |
Diversified Telecommunication Services | | | 0.4 | |
Media | | | 0.4 | |
Agriculture | | | 0.4 | |
Industrial Conglomerates | | | 0.4 | |
Multi-Utilities | | | 0.4 | |
Consumer Loans | | | 0.4 | |
Commercial Services & Supplies | | | 0.3 | |
Air Freight & Logistics | | | 0.3 | |
Auto Manufacturers | | | 0.3 | |
Professional Services | | | 0.3 | |
Diversified Financial Services | | | 0.3 | |
Textiles, Apparel & Luxury Goods | | | 0.3 | |
Consumer Finance | | | 0.3 | |
Electronic Equipment, Instruments & Components | | | 0.2 | |
Industrial REITs | | | 0.2 | |
Home Equity Loans | | | 0.2 | |
SEE NOTES TO FINANCIAL STATEMENTS.
A99
| | | | |
| | PSF PGIM FLEXIBLE MANAGED PORTFOLIO (CONTINUED) | | |
SCHEDULE OF INVESTMENTS | | | | as of December 31, 2024 |
Industry Classification (continued):
| | | | |
Passenger Airlines | | | 0.2 | % |
Sovereign Bonds | | | 0.2 | |
Wireless Telecommunication Services | | | 0.2 | |
Construction Materials | | | 0.2 | |
Credit Cards | | | 0.2 | |
Building Products | | | 0.2 | |
Real Estate Management & Development | | | 0.2 | |
Independent Power & Renewable Electricity Producers | | | 0.2 | |
Municipal Bonds | | | 0.2 | |
Residential REITs | | | 0.2 | |
Metals & Mining | | | 0.2 | |
Packaging & Containers | | | 0.2 | |
Distributors | | | 0.1 | |
Commercial Services | | | 0.1 | |
Mining | | | 0.1 | |
Retail | | | 0.1 | |
Construction & Engineering | | | 0.1 | |
Semiconductors | | | 0.1 | |
Shipbuilding | | | 0.1 | |
Foods | | | 0.1 | |
Student Loans | | | 0.1 | |
Health Care REITs | | | 0.1 | |
Household Durables | | | 0.1 | |
Equipment | | | 0.1 | |
Airlines | | | 0.1 | |
Gas | | | 0.1 | |
Trading Companies & Distributors | | | 0.1 | |
Retail REITs | | | 0.1 | |
Engineering & Construction | | | 0.1 | |
Transportation | | | 0.0 | * |
Building Materials | | | 0.0 | * |
Office/Business Equipment | | | 0.0 | * |
| | | | |
Multi-National | | | 0.0 | *% |
Energy Equipment & Services | | | 0.0 | * |
Miscellaneous Manufacturing | | | 0.0 | * |
Home Builders | | | 0.0 | * |
Containers & Packaging | | | 0.0 | * |
Lodging | | | 0.0 | * |
Other | | | 0.0 | * |
Healthcare-Products | | | 0.0 | * |
Iron/Steel | | | 0.0 | * |
Apparel | | | 0.0 | * |
Personal Care Products | | | 0.0 | * |
Housewares | | | 0.0 | * |
Leisure Products | | | 0.0 | * |
Marine Transportation | | | 0.0 | * |
Automobile Components | | | 0.0 | * |
Distribution/Wholesale | | | 0.0 | * |
Machinery-Diversified | | | 0.0 | * |
Unaffiliated Exchange-Traded Fund | | | 0.0 | * |
Computers | | | 0.0 | * |
Diversified REITs | | | 0.0 | * |
Health Care Technology | | | 0.0 | * |
Options Purchased | | | 0.0 | * |
Environmental Control | | | 0.0 | * |
Internet | | | 0.0 | * |
| | | | |
| | | 103.1 | |
Options Written | | | (0.0 | )* |
Liabilities in excess of other assets | | | (3.1 | ) |
| | | | |
| | | 100.0 | % |
| | | | |
Effects of Derivative Instruments on the Financial Statements and Primary Underlying Risk Exposure:
The Portfolio invested in derivative instruments during the reporting period. The primary types of risk associated with these derivative instruments are credit risk, equity risk, foreign exchange risk and interest rate risk. See the Notes to Financial Statements for additional detail regarding these derivative instruments and their risks. The effect of such derivative instruments on the Portfolio’s financial position and financial performance as reflected in the Statement of Assets and Liabilities and Statement of Operations is presented in the summary below.
Fair values of derivative instruments as of December 31, 2024 as presented in the Statement of Assets and Liabilities:
| | | | | | | | | | | | | | | | |
| | | Asset Derivatives | | | Liability Derivatives | |
Derivatives not accounted for as hedging instruments, carried at fair value | | Statement of
Assets and
Liabilities Location | | | Fair
Value | | | Statement of
Assets and
Liabilities Location | | | Fair
Value | |
|
|
Credit contracts | |
| Due from/to broker-variation
margin swaps |
| | $ | 25,490 | * | | | — | | | $ | — | |
Credit contracts | |
| Premiums paid for OTC swap
agreements |
| | | 267,825 | | |
| Premiums received for OTC swap
agreements |
| | | 3,136 | |
Credit contracts | |
| Unrealized appreciation on OTC
swap agreements |
| | | 2,700 | | |
| Unrealized depreciation on OTC
swap agreements |
| | | 320,268 | |
|
Equity contracts | | | — | | | | — | | |
| Due from/to broker-variation
margin futures |
| | | 72,851 | * |
|
Foreign exchange contracts | |
| Unrealized appreciation on OTC
forward foreign currency exchange contracts |
| | | 407,787 | | | | — | | | | — | |
|
|
Interest rate contracts | |
| Due from/to broker-variation
margin futures |
| | | 89,891 | * | |
| Due from/to broker-variation
margin futures |
| | | 2,846,293 | * |
|
SEE NOTES TO FINANCIAL STATEMENTS.
A100
| | | | |
| | PSF PGIM FLEXIBLE MANAGED PORTFOLIO (CONTINUED) | | |
SCHEDULE OF INVESTMENTS | | | | as of December 31, 2024 |
| | | | | | | | | | | | |
| | | Asset Derivatives | | | Liability Derivatives | |
Derivatives not accounted for as
hedging instruments, carried at fair
value | | Statement of Assets and Liabilities Location | | Fair Value | | | Statement of Assets and Liabilities Location | | Fair
Value | |
Interest rate contracts | | Due from/to broker-variation margin swaps | | | $ 125,441 | * | | Due from/to broker-variation margin swaps | | | $ 197,445 | * |
Interest rate contracts | | Unaffiliated investments | | | 23,874 | | | Options written outstanding, at value | | | 48,854 | |
Interest rate contracts | | Unrealized appreciation on OTC swap agreements | | | 744,134 | | | Unrealized depreciation on OTC swap agreements | | | 9,778,511 | |
| | | | | | | | | | | | |
| | | | | $1,687,142 | | | | | | $13,267,358 | |
| | | | | | | | | | | | |
| * | Includes cumulative appreciation (depreciation) as reported in the schedule of open futures and centrally cleared swap contracts. Only unsettled variation margin receivable (payable) is reported within the Statement of Assets and Liabilities. |
The effects of derivative instruments on the Statement of Operations for the year ended December 31, 2024 are as follows:
| | | | | | | | | | | | | | | | | | | | | | | | | |
Amount of Realized Gain (Loss) on Derivatives Recognized in Income |
Derivatives not accounted for as hedging instruments, carried at fair value | | Options
Purchased(1) | | Options
Written | | Futures | | Forward
Currency
Exchange
Contracts | | Swaps |
Credit contracts | | | | $ — | | | | | $ — | | | | | $ — | | | | | $ — | | | | | $ 1,471,910 | |
Equity contracts | | | | — | | | | | — | | | | | 402,090 | | | | | — | | | | | — | |
Foreign exchange contracts | | | | — | | | | | — | | | | | — | | | | | 3,235,283 | | | | | — | |
Interest rate contracts | | | | 13,014 | | | | | (6,662 | ) | | | | (4,232,886 | ) | | | | — | | | | | (8,223,987 | ) |
| | | | | | | | | | | | | | | | | | | | | | | | | |
Total | | | | $13,014 | | | | | $(6,662 | ) | | | | $(3,830,796 | ) | | | | $3,235,283 | | | | | $(6,752,077 | ) |
| | | | | | | | | | | | | | | | | | | | | | | | | |
| (1) | Included in net realized gain (loss) on investment transactions in the Statement of Operations. |
| | | | | | | | | | | | | | | | | | | | | | | | | |
Change in Unrealized Appreciation (Depreciation) on Derivatives Recognized in Income |
Derivatives not accounted for as hedging instruments, carried at fair value | | Options
Purchased(2) | | Options
Written | | Futures | | Forward
Currency
Exchange
Contracts | | Swaps |
Credit contracts | | | | $ — | | | | | $ 35 | | | | | $ — | | | | | $ — | | | | | $ (534,116 | ) |
Equity contracts | | | | — | | | | | — | | | | | (146,785 | ) | | | | — | | | | | — | |
Foreign exchange contracts. | | | | — | | | | | — | | | | | — | | | | | 810,378 | | | | | — | |
Interest rate contracts | | | | (13,426 | ) | | | | (12,876 | ) | | | | (7,248,430 | ) | | | | — | | | | | (5,099,795 | ) |
| | | | | | | | | | | | | | | | | | | | | | | | | |
Total | | | | $(13,426 | ) | | | | $(12,841 | ) | | | | $(7,395,215 | ) | | | | $810,378 | | | | | $(5,633,911 | ) |
| | | | | | | | | | | | | | | | | | | | | | | | | |
| (2) | Included in net change in unrealized appreciation (depreciation) on investments in the Statement of Operations. |
For the year ended December 31, 2024, the Portfolio’s average volume of derivative activities is as follows:
| | |
| Derivative Contract Type | | Average Volume of Derivative Activities* |
Options Purchased (1) | | $ 7,460 |
Options Written (2) | | 20,148,000 |
Futures Contracts - Long Positions (2) | | 239,922,275 |
Futures Contracts - Short Positions (2) | | 13,559,706 |
Forward Foreign Currency Exchange Contracts - Purchased (3) | | 35,356,164 |
Forward Foreign Currency Exchange Contracts - Sold (3) | | 90,925,193 |
Interest Rate Swap Agreements (2) | | 134,022,000 |
Credit Default Swap Agreements - Buy Protection (2) | | 10,744,988 |
Credit Default Swap Agreements - Sell Protection (2) | | 41,539,980 |
SEE NOTES TO FINANCIAL STATEMENTS.
A101
| | | | |
| | PSF PGIM FLEXIBLE MANAGED PORTFOLIO (CONTINUED) | | |
SCHEDULE OF INVESTMENTS | | | | as of December 31, 2024 |
| | | | | |
| Derivative Contract Type | | Average Volume of Derivative Activities* |
Total Return Swap Agreements (2) | | | $ | 173,153,053 | |
| * | Average volume is based on average quarter end balances for the year ended December 31, 2024. |
| (2) | Notional Amount in USD. |
| (3) | Value at Settlement Date. |
Financial Instruments/Transactions—Summary of Offsetting and Netting Arrangements:
The Portfolio invested in OTC derivatives and entered into financial instruments/transactions during the reporting period that are either offset in accordance with current requirements or are subject to enforceable master netting arrangements or similar agreements that permit offsetting. The information about offsetting and related netting arrangements for OTC derivatives and financial instruments/transactions where the legal right to set-off exists is presented in the summary below.
Offsetting of financial instrument/transaction assets and liabilities:
| | | | | | | | | | | | |
| Description | | Gross Market
Value of
Recognized
Assets/(Liabilities) | | | Collateral
Pledged/(Received)(2) | | | Net Amount | |
Securities on Loan | | $ | 93,578,611 | | | $ | (93,578,611 | ) | | $ | — | |
Offsetting of OTC derivative assets and liabilities:
| | | | | | | | | | | | | | | | | | | | | | | | | |
Counterparty | | Gross Amounts of
Recognized
Assets(1) | | Gross Amounts of
Recognized
Liabilities(1) | | Net Amounts of
Recognized
Assets/(Liabilities) | | Collateral
Pledged/(Received)(2) | | Net Amount |
BARC | | | $ | 226,808 | | | | $ | (323,404 | ) | | | $ | (96,596 | ) | | | $ | — | | | | $ | (96,596 | ) |
BOA | | | | — | | | | | (3,494,161 | ) | | | | (3,494,161 | ) | | | | 3,494,161 | | | | | — | |
CITI | | | | 3,823 | | | | | (6,365 | ) | | | | (2,542 | ) | | | | — | | | | | (2,542 | ) |
GSI | | | | 43,717 | | | | | (2,140,326 | ) | | | | (2,096,609 | ) | | | | 2,096,609 | | | | | — | |
HSBC | | | | 35,723 | | | | | — | | | | | 35,723 | | | | | (10,000 | ) | | | | 25,723 | |
JPM | | | | 762,535 | | | | | (4,159,288 | ) | | | | (3,396,753 | ) | | | | 3,396,753 | | | | | — | |
MSI | | | | 1,792 | | | | | — | | | | | 1,792 | | | | | — | | | | | 1,792 | |
SCB | | | | 370,272 | | | | | — | | | | | 370,272 | | | | | (270,000 | ) | | | | 100,272 | |
| | | | | | | | | | | | | | | | | | | | | | | | | |
| | | $ | 1,444,670 | | | | $ | (10,123,544 | ) | | | $ | (8,678,874 | ) | | | $ | 8,707,523 | | | | $ | 28,649 | |
| | | | | | | | | | | | | | | | | | | | | | | | | |
| (1) | Includes unrealized appreciation/(depreciation) on swaps and forwards, premiums paid/(received) on swap agreements and market value of purchased and written options, as represented on the Statement of Assets and Liabilities. |
| (2) | Collateral amount disclosed by the Portfolio is limited to the market value of financial instruments/transactions and the Portfolio’s OTC derivative exposure by counterparty. |
SEE NOTES TO FINANCIAL STATEMENTS.
A102
| | | | |
| | PSF PGIM FLEXIBLE MANAGED PORTFOLIO (CONTINUED) | | |
| | | | |
STATEMENT OF ASSETS AND LIABILITIES
as of December 31, 2024
| | | | |
ASSETS | | | | |
Investments at value, including securities on loan of $93,578,611: | | | | |
Unaffiliated investments (cost $3,647,890,099) | | $ | 4,789,335,309 | |
Affiliated investments (cost $368,255,047) | | | 368,334,948 | |
Foreign currency, at value (cost $2,395,986) | | | 2,354,916 | |
Cash | | | 365 | |
Receivable for investments sold | | | 21,411,885 | |
Dividends and interest receivable | | | 14,637,804 | |
Unrealized appreciation on OTC swap agreements | | | 746,834 | |
Tax reclaim receivable | | | 520,942 | |
Unrealized appreciation on OTC forward foreign currency exchange contracts | | | 407,787 | |
Premiums paid for OTC swap agreements | | | 267,825 | |
Receivable for Portfolio shares sold | | | 16,780 | |
Due from broker-variation margin swaps | | | 10,809 | |
Receivable from affiliate | | | 244 | |
Prepaid expenses and other assets | | | 575,934 | |
| | | | |
Total Assets | | | 5,198,622,382 | |
| | | | |
LIABILITIES | | | | |
Payable to broker for collateral for securities on loan | | | 95,638,101 | |
Payable for investments purchased | | | 62,976,665 | |
Forward commitment contracts, at value (proceeds receivable $21,285,410) | | | 20,996,300 | |
Unrealized depreciation on OTC swap agreements | | | 10,098,779 | |
Management fee payable. | | | 2,557,683 | |
Payable for Portfolio shares purchased | | | 853,810 | |
Accrued expenses and other liabilities | | | 662,594 | |
Due to broker-variation margin futures | | | 342,341 | |
Payable to affiliate | | | 91,187 | |
Options written outstanding, at value (premiums received $35,978) | | | 48,854 | |
Distribution fee payable | | | 45,185 | |
Premiums received for OTC swap agreements | | | 3,136 | |
Trustees’ fees payable | | | 3,070 | |
Affiliated transfer agent fee payable | | | 1,190 | |
| | | | |
Total Liabilities | | | 194,318,895 | |
| | | | |
NET ASSETS | | $ | 5,004,303,487 | |
| | | | |
Net assets were comprised of: | | | | |
Partners’ Equity | | $ | 5,004,303,487 | |
| | | | |
Class I: | | | | |
Net asset value and redemption price per share, $4,797,366,149 / 93,527,034 outstanding shares of beneficial interest | | $ | 51.29 | |
| | | | |
Class III: | | | | |
Net asset value and redemption price per share, $206,937,338 / 4,071,074 outstanding shares of beneficial interest. | | $ | 50.83 | |
| | | | |
STATEMENT OF OPERATIONS
Year Ended December 31, 2024
| | | | |
NET INVESTMENT INCOME (LOSS) | | | | |
INCOME | | | | |
Interest income | | $ | 77,026,624 | |
Unaffiliated dividend income (net of $95,700 foreign withholding tax, of which $22,334 is reimbursable by an affiliate) | | | 41,157,464 | |
Affiliated dividend income | | | 14,729,303 | |
Income from securities lending, net (including affiliated income of $125,934) | | | 131,604 | |
| | | | |
Total income | | | 133,044,995 | |
| | | | |
EXPENSES | | | | |
Management fee | | | 29,428,727 | |
Distribution fee—Class III | | | 542,227 | |
Custodian and accounting fees | | | 389,967 | |
Shareholders’ reports | | | 183,059 | |
Professional fees | | | 89,005 | |
Audit fee | | | 87,725 | |
Trustees’ fees | | | 87,161 | |
Transfer agent’s fees and expenses (including affiliated expense of $7,143) | | | 11,943 | |
Miscellaneous | | | 141,276 | |
| | | | |
Total expenses | | | 30,961,090 | |
Less: Fee waivers and/or expense reimbursement | | | (247,093 | ) |
| | | | |
Net expenses | | | 30,713,997 | |
| | | | |
NET INVESTMENT INCOME (LOSS) | | | 102,330,998 | |
| | | | |
| REALIZED AND UNREALIZED GAIN (LOSS) ON INVESTMENT AND FOREIGN CURRENCY TRANSACTIONS | | | | |
Net realized gain (loss) on: | | | | |
Investment transactions (including affiliated of $(7,512)) | | | 391,937,737 | |
Futures transactions | | | (3,830,796 | ) |
Forward currency contract transactions | | | 3,235,283 | |
Options written transactions | | | (6,662 | ) |
Swap agreements transactions | | | (6,752,077 | ) |
Foreign currency transactions | | | 145,063 | |
| | | | |
| | | 384,728,548 | |
| | | | |
Net change in unrealized appreciation (depreciation) on: | | | | |
Investments (including affiliated of $(8,488)) | | | 225,903,813 | |
Futures | | | (7,395,215 | ) |
Forward currency contracts. | | | 810,378 | |
Options written | | | (12,841 | ) |
Swap agreements | | | (5,633,911 | ) |
Foreign currencies | | | 74 | |
| | | | |
| | | 213,672,298 | |
| | | | |
NET GAIN (LOSS) ON INVESTMENT AND FOREIGN CURRENCY TRANSACTIONS | | | 598,400,846 | |
| | | | |
NET INCREASE (DECREASE) IN NET ASSETS RESULTING FROM OPERATIONS | | $ | 700,731,844 | |
| | | | |
STATEMENTS OF CHANGES IN NET ASSETS
| | | | | | | | |
| | | Year Ended
December 31, 2024 | | | Year Ended
December 31, 2023 | |
INCREASE (DECREASE) IN NET ASSETS | | | | | | | | |
OPERATIONS | | | | | | | | |
Net investment income (loss) | | $ | 102,330,998 | | | $ | 95,984,624 | |
Net realized gain (loss) on investment and foreign currency transactions | | | 384,728,548 | | | | 79,541,009 | |
Net change in unrealized appreciation (depreciation) on investments and foreign currencies | | | 213,672,298 | | | | 547,017,729 | |
| | | | | | | | |
NET INCREASE (DECREASE) IN NET ASSETS RESULTING FROM OPERATIONS | | | 700,731,844 | | | | 722,543,362 | |
| | | | | | | | |
PORTFOLIO SHARE TRANSACTIONS | | | | | | | | |
Portfolio shares sold | | | 8,433,238 | | | | 16,528,640 | |
Net asset value of shares issued in merger | | | — | | | | 223,240,047 | |
Portfolio shares purchased | | | (352,398,300 | ) | | | (312,002,050 | ) |
| | | | | | | | |
NET INCREASE (DECREASE) IN NET ASSETS FROM PORTFOLIO SHARE TRANSACTIONS | | | (343,965,062 | ) | | | (72,233,363 | ) |
| | | | | | | | |
TOTAL INCREASE (DECREASE) | | | 356,766,782 | | | | 650,309,999 | |
NET ASSETS: | | | | | | | | |
Beginning of year | | | 4,647,536,705 | | | | 3,997,226,706 | |
| | | | | | | | |
End of year. | | $ | 5,004,303,487 | | | $ | 4,647,536,705 | |
| | | | | | | | |
SEE NOTES TO FINANCIAL STATEMENTS.
A103
| | | | |
| | PSF PGIM FLEXIBLE MANAGED PORTFOLIO (CONTINUED) | | |
SCHEDULE OF INVESTMENTS | | | | as of December 31, 2024 |
| | | | | | | | | | | | | | | | | | | | | | | | |
Class I | | | | | | | | | | | | | | | | | | | | | | | | |
| | | | | | Year Ended December 31, | |
| | | | | | 2024 | | | 2023 | | | 2022 | | | 2021 | | | 2020 | |
Per Share Operating Performance(a): | | | | | | | | | | | | | | | | | | | | | | | | |
Net Asset Value, beginning of year | | | | | | $ | 44.40 | | | $ | 37.65 | | | $ | 44.14 | | | $ | 37.61 | | | $ | 34.32 | |
| | | | | | | | | | | | | | | | | | | | | | | | |
Income (Loss) From Investment Operations: | | | | | | | | | | | | | | | | | | | | | | | | |
Net investment income (loss) | | | | | | | 1.02 | | | | 0.90 | | | | 0.62 | | | | 0.49 | | | | 0.56 | |
Net realized and unrealized gain (loss) on investment and foreign currency transactions | | | | | | | 5.87 | | | | 5.85 | | | | (7.11 | ) | | | 6.04 | | | | 2.73 | |
| | | | | | | | | | | | | | | | | | | | | | | | |
Total from investment operations | | | | | | | 6.89 | | | | 6.75 | | | | (6.49 | ) | | | 6.53 | | | | 3.29 | |
| | | | | | | | | | | | | | | | | | | | | | | | |
Net Asset Value, end of year | | | | | | $ | 51.29 | | | $ | 44.40 | | | $ | 37.65 | | | $ | 44.14 | | | $ | 37.61 | |
| | | | | | | | | | | | | | | | | | | | | | | | |
Total Return(b) | | | | | | | 15.52 | % | | | 17.93 | % | | | (14.70 | )% | | | 17.36 | % | | | 9.59 | % |
Ratios/Supplemental Data: | | | | | | | | | | | | | | | | | | | | | | | | |
Net assets, end of year (in millions) | | | | | | $ | 4,797 | | | $ | 4,428 | | | $ | 3,994 | | | $ | 4,968 | | | $ | 4,479 | |
Average net assets (in millions) | | | | | | $ | 4,688 | | | $ | 4,175 | | | $ | 4,335 | | | $ | 4,766 | | | $ | 4,171 | |
Ratios to average net assets(c): | | | | | | | | | | | | | | | | | | | | | | | | |
Expenses after waivers and/or expense reimbursement | | | | | | | 0.62 | % | | | 0.61 | % | | | 0.62 | % | | | 0.61 | % | | | 0.62 | % |
Expenses before waivers and/or expense reimbursement | | | | | | | 0.63 | % | | | 0.62 | % | | | 0.62 | % | | | 0.61 | % | | | 0.62 | % |
Net investment income (loss) | | | | | | | 2.10 | % | | | 2.21 | % | | | 1.55 | % | | | 1.18 | % | | | 1.64 | % |
Portfolio turnover rate(d)(e) | | | | | | | 114 | % | | | 149 | % | | | 139 | % | | | 119 | % | | | 120 | % |
| | | | | | | | | | | | | | | | | | | | |
| Class III | | | | | | | | |
| | | Year Ended December 31, | | April 26, 2021(f)
through December 31,
2021 |
| | | 2024 | | 2023 | | 2022 |
Per Share Operating Performance(a): | | | | | | | | | | | | | | | | | | | | |
Net Asset Value, beginning of period | | | $ | 44.11 | | | | $ | 37.49 | | | | $ | 44.06 | | | | $ | 40.73 | |
| | | | | | | | | | | | | | | | | | | | |
Income (Loss) From Investment Operations: | | | | | | | | | | | | | | | | | | | | |
Net investment income (loss) | | | | 0.89 | | | | | 0.81 | | | | | 0.55 | | | | | 0.26 | |
Net realized and unrealized gain (loss) on investment and foreign currency transactions | | | | 5.83 | | | | | 5.81 | | | | | (7.12 | ) | | | | 3.07 | |
| | | | | | | | | | | | | | | | | | | | |
Total from investment operations | | | | 6.72 | | | | | 6.62 | | | | | (6.57 | ) | | | | 3.33 | |
| | | | | | | | | | | | | | | | | | | | |
Net Asset Value, end of period | | | $ | 50.83 | | | | $ | 44.11 | | | | $ | 37.49 | | | | $ | 44.06 | |
| | | | | | | | | | | | | | | | | | | | |
Total Return(b) | | | | 15.23 | % | | | | 17.66 | % | | | | (14.91 | )% | | | | 8.18 | % |
Ratios/Supplemental Data: | | | | | | | | | | | | | | | | | | | | |
Net assets, end of period (in millions) | | | $ | 207 | | | | $ | 219 | | | | $ | 4 | | | | $ | 2 | |
Average net assets (in millions) | | | $ | 217 | | | | $ | 188 | | | | $ | 3 | | | | $ | 1 | |
Ratios to average net assets(c): | | | | | | | | | | | | | | | | | | | | |
Expenses after waivers and/or expense reimbursement | | | | 0.87 | % | | | | 0.86 | % | | | | 0.87 | % | | | | 0.86 | %(g) |
Expenses before waivers and/or expense reimbursement | | | | 0.88 | % | | | | 0.87 | % | | | | 0.87 | % | | | | 0.86 | %(g) |
Net investment income (loss) | | | | 1.85 | % | | | | 1.98 | % | | | | 1.39 | % | | | | 0.86 | %(g) |
Portfolio turnover rate(d)(e) | | | | 114 | % | | | | 149 | % | | | | 139 | % | | | | 119 | % |
| (a) | Calculated based on average shares outstanding during the period. |
| (b) | Total return is calculated assuming a purchase of a share on the first day and a sale on the last day of each period reported and includes reinvestment of dividends and distributions, if any, and does not reflect the effect of insurance contract charges. Total return does not reflect expenses associated with the separate account such as administrative fees, account charges and surrender charges which, if reflected, would reduce the total returns for all periods shown. Performance figures may reflect fee waivers and/or expense reimbursements. In the absence of fee waivers and/or expense reimbursements, the total return would be lower. Past performance is no guarantee of future results. Total returns may reflect adjustments to conform to GAAP. Total returns for periods less than one full year are not annualized. |
| (c) | Does not include expenses of the underlying funds in which the Portfolio invests. |
| (d) | The Portfolio accounts for mortgage dollar roll transactions, when applicable, as purchases and sales which, as a result, can increase its portfolio turnover rate. |
| (e) | The Portfolio’s portfolio turnover rate is calculated in accordance with regulatory requirements, without regard to transactions involving short-term investments, certain derivatives and in-kind transactions (if any). If such transactions were included, the Portfolio’s portfolio turnover rate may be higher. |
| (f) | Commencement of offering. |
| (g) | Annualized, with the exception of certain non-recurring expenses. |
SEE NOTES TO FINANCIAL STATEMENTS.
A104
| | | | |
| | PSF PGIM GOVERNMENT INCOME PORTFOLIO | | |
SCHEDULE OF INVESTMENTS | | | | as of December 31, 2024 |
| | | | | | | | | | |
Interest Rate | | Maturity Date | | | | Principal Amount
(000)# | | Value | |
LONG-TERM INVESTMENTS — 97.0% | |
ASSET-BACKED SECURITIES — 8.4% | |
Collateralized Loan Obligations | | | | |
Apidos CLO, | |
Series 2018-18A, Class A1R2, 144A, 3 Month SOFR + 1.330% (Cap N/A, Floor 1.330%) | |
5.696%(c) | | 01/22/38 | | | | 1,000 | | $ | 1,005,170 | |
Balboa Bay Loan Funding Ltd. (Cayman Islands), | |
Series 2021-01A, Class A, 144A, 3 Month SOFR + 1.462% (Cap N/A, Floor 1.462%) | |
6.079%(c) | | 07/20/34 | | | | 2,000 | | | 2,000,642 | |
Columbia Cent CLO Ltd. (Cayman Islands), | |
Series 2024-33A, Class A1, 144A, 3 Month SOFR + 1.600% (Cap N/A, Floor 1.600%) | |
6.217%(c) | | 04/20/37 | | | | 1,500 | | | 1,507,533 | |
Generate CLO Ltd. (Cayman Islands), | |
Series 02A, Class AR2, 144A, 3 Month SOFR + 1.410% (Cap N/A, Floor 1.410%) | |
6.042%(c) | | 10/22/37 | | | | 1,500 | | | 1,508,200 | |
Jamestown CLO Ltd. (Cayman Islands), | |
Series 2019-14A, Class A1AR, 144A, 3 Month SOFR + 1.462% (Cap N/A, Floor 1.200%) | |
6.079%(c) | | 10/20/34 | | | | 500 | | | 500,748 | |
LCM Ltd. (Cayman Islands), | |
Series 42A, Class A1, 144A, 3 Month SOFR + 1.380% (Cap N/A, Floor 1.380%) | |
5.794%(c) | | 01/15/38 | | | | 1,000 | | | 1,007,848 | |
Regatta Funding Ltd. (Cayman Islands), | |
Series 2016-01A, Class A1R2, 144A, 3 Month SOFR + 1.412% (Cap N/A, Floor 1.150%) | |
5.766%(c) | | 06/20/34 | | | | 3,250 | | | 3,254,218 | |
Rockford Tower CLO Ltd. (Cayman Islands), | |
Series 2021-03A, Class A1R, 144A, 3 Month SOFR + 1.400% (Cap N/A, Floor 1.400%) | |
5.842%(c) | | 01/15/38 | | | | 1,000 | | | 1,005,170 | |
TCW CLO Ltd. (Cayman Islands), | |
Series 2017-01A, Class A1RR, 144A, 3 Month SOFR + 1.442% (Cap N/A, Floor 1.180%) | |
6.046%(c) | | 10/29/34 | | | | 500 | | | 500,121 | |
Wind River CLO Ltd. (Cayman Islands), | |
Series 2016-01KRA, Class A1R2, 144A, 3 Month SOFR + 1.472% (Cap N/A, Floor 1.210%) | |
6.128%(c) | | 10/15/34 | | | | 500 | | | 500,463 | |
| | | | | | | | | | |
TOTAL ASSET-BACKED SECURITIES
(cost $12,772,922) | | | 12,790,113 | |
| | | | | | | | | | |
COMMERCIAL MORTGAGE-BACKED SECURITIES — 8.9% | |
Barclays Commercial Mortgage Securities Trust, | |
Series 2019-C04, Class A4 | |
2.661% | | 08/15/52 | | | | 2,666 | | | 2,449,764 | |
CD Mortgage Trust, | |
Series 2019-CD08, Class A3 | |
2.657% | | 08/15/57 | | | | 2,000 | | | 1,810,001 | |
Citigroup Commercial Mortgage Trust, | |
Series 2016-P05, Class A3 | |
2.684% | | 10/10/49 | | | | 2,163 | | | 2,095,495 | |
Fannie Mae-Aces, | |
Series 2019-M22, Class A2 | |
2.522% | | 08/25/29 | | | | 1,769 | | | 1,614,048 | |
| | | | | | | | | | | | |
Interest Rate | | Maturity Date | | | | | Principal Amount (000)# | | Value | |
|
COMMERCIAL MORTGAGE-BACKED SECURITIES (continued) | |
Series 2022-M03, Class A2 | |
1.707%(cc) | | 11/25/31 | | | | | | 4,000 | | $ | 3,260,811 | |
Series 2022-M13, Class A2 | |
2.594%(cc) | | 06/25/32 | | | | | | 2,000 | | | 1,719,052 | |
FHLMC Multifamily Structured Pass-Through Certificates, | |
Series K0151, Class A3 | |
3.511% | | 04/25/30 | | | | | | 400 | | | 377,337 | |
Series K0152, Class A2 | |
3.080% | | 01/25/31 | | | | | | 140 | | | 127,600 | |
| | | | | | | | | | | | |
TOTAL COMMERCIAL MORTGAGE-BACKED SECURITIES
(cost $14,532,211) | | | 13,454,108 | |
| | | | | | | | | | | | |
CORPORATE BONDS — 0.6% | |
Diversified Financial Services — 0.5% | |
Private Export Funding Corp., | | | | | | | | | | |
U.S. Gov’t. Gtd. Notes, Series PP | |
1.400% | | 07/15/28 | | | | | | 885 | | | 793,522 | |
| | | | | | | | | | | | |
Multi-National — 0.1% | | | | | | | | | | |
International Bank for Reconstruction & Development (Supranational Bank), Unsec’d. Notes, MTN | |
4.472%(s) | | 09/17/30 | | | | | | 235 | | | 175,973 | |
| | | | | | | | | | | | |
TOTAL CORPORATE BONDS
(cost $1,066,468) | | | 969,495 | |
| | | | | | | | | | | | |
RESIDENTIAL MORTGAGE-BACKED SECURITY — 0.1% | |
Government National Mortgage Assoc., | |
Series 2015-143, Class WA | |
4.000% | | 10/20/45 | | | | | | 135 | | | 128,383 | |
| | | | | | | | | | | | |
(cost $140,404) | | | | |
U.S. GOVERNMENT AGENCY OBLIGATIONS — 48.4% | |
Fannie Mae Interest Strips | |
4.264%(s) | | 05/15/30 | | | | | | 75 | | | 58,621 | |
Federal Agricultural Mortgage Corp., MTN | |
1.440% | | 09/25/35 | | | | | | 45 | | | 30,945 | |
Federal Farm Credit Bank | |
1.230% | | 07/29/30 | | | | | | 185 | | | 153,225 | |
1.240% | | 08/11/31 | | | | | | 75 | | | 59,709 | |
1.670% | | 03/03/31 | | | | | | 100 | | | 83,284 | |
1.730% | | 09/22/31 | | | | | | 115 | | | 94,213 | |
1.770% | | 02/04/31 | | | | | | 125 | | | 104,932 | |
2.040% | | 03/19/40 | | | | | | 240 | | | 156,681 | |
2.150% | | 12/01/31 | | | | | | 1,125 | | | 942,444 | |
2.170% | | 10/29/29 | | | | | | 70 | | | 62,681 | |
2.200% | | 12/09/31 | | | | | | 355 | | | 297,974 | |
2.350% | | 03/10/36 | | | | | | 115 | | | 85,891 | |
2.460% | | 02/05/35 | | | | | | 90 | | | 70,959 | |
2.490% | | 05/19/36 | | | | | | 140 | | | 108,906 | |
2.750% | | 02/02/37 | | | | | | 100 | | | 78,575 | |
3.300% | | 03/23/32 | | | | | | 112 | | | 100,931 | |
5.480% | | 06/27/42 | | | | | | 500 | | | 484,071 | |
Federal Home Loan Bank | |
1.150%(cc) | | 02/10/31 | | | | | | 200 | | | 163,730 | |
1.240% | | 08/19/30 | | | | | | 50 | | | 41,204 | |
1.250% | | 12/30/30 | | | | | | 140 | | | 114,482 | |
1.410% | | 10/14/32 | | | | | | 150 | | | 116,017 | |
1.500%(cc) 05/27/31 | | | | | | 100 | | | 88,498 | |
SEE NOTES TO FINANCIAL STATEMENTS.
A105
| | | | |
| | PSF PGIM GOVERNMENT INCOME PORTFOLIO (CONTINUED) | | |
SCHEDULE OF INVESTMENTS | | | | as of December 31, 2024 |
| | | | | | | | | | | | | | |
Interest Rate | | Maturity
Date | | | | | Principal
Amount
(000)# | | | Value | |
|
U.S. GOVERNMENT AGENCY OBLIGATIONS (continued) | |
1.500% | | 09/30/33 | | | | | | | 115 | | | $ | 86,478 | |
1.750% | | 06/20/31 | | | | | | | 90 | | | | 74,302 | |
1.790% | | 12/21/35 | | | | | | | 185 | | | | 132,181 | |
2.000%(cc) | | 05/27/31 | | | | | | | 100 | | | | 88,681 | |
2.000%(cc) | | 05/27/31 | | | | | | | 200 | | | | 176,983 | |
2.050% | | 05/12/31 | | | | | | | 105 | | | | 88,930 | |
2.050% | | 03/19/35 | | | | | | | 153 | | | | 116,052 | |
2.090% | | 02/22/36 | | | | | | | 110 | | | | 81,267 | |
4.250% | | 09/10/32 | | | | | | | 210 | | | | 203,284 | |
5.500% | | 07/15/36 | | | | | | | 885 | | | | 935,888 | |
Federal Home Loan Mortgage Corp. | |
1.500% | | 01/01/36 | | | | | | | 157 | | | | 135,271 | |
1.500% | | 11/01/50 | | | | | | | 382 | | | | 283,209 | |
2.000% | | 01/01/32 | | | | | | | 81 | | | | 75,546 | |
2.000% | | 12/01/50 | | | | | | | 1,568 | | | | 1,230,845 | |
2.500% | | 03/01/30 | | | | | | | 112 | | | | 107,091 | |
2.500% | | 11/01/46 | | | | | | | 221 | | | | 184,615 | |
2.500% | | 04/01/51 | | | | | | | 2,284 | | | | 1,874,861 | |
3.000% | | 06/01/29 | | | | | | | 75 | | | | 72,866 | |
3.000% | | 01/01/37 | | | | | | | 215 | | | | 198,285 | |
3.000% | | 06/01/45 | | | | | | | 44 | | | | 39,474 | |
3.000% | | 01/01/48 | | | | | | | 182 | | | | 157,811 | |
3.000% | | 10/01/49 | | | | | | | 63 | | | | 54,176 | |
3.000% | | 04/01/52 | | | | | | | 442 | | | | 379,221 | |
3.000% | | 05/01/52 | | | | | | | 678 | | | | 576,709 | |
3.000% | | 06/01/52 | | | | | | | 435 | | | | 370,138 | |
3.500% | | 12/01/32 | | | | | | | 169 | | | | 163,303 | |
3.500% | | 07/01/42 | | | | | | | 205 | | | | 186,610 | |
3.500% | | 10/01/42 | | | | | | | 322 | | | | 292,917 | |
3.500% | | 08/01/43 | | | | | | | 391 | | | | 355,369 | |
3.500% | | 09/01/45 | | | | | | | 128 | | | | 114,880 | |
3.500% | | 10/01/45 | | | | | | | 114 | | | | 102,373 | |
3.500% | | 02/01/47 | | | | | | | 140 | | | | 125,780 | |
3.500% | | 07/01/47 | | | | | | | 226 | | | | 203,041 | |
3.500% | | 03/01/48 | | | | | | | 307 | | | | 276,149 | |
3.500% | | 02/01/52 | | | | | | | 807 | | | | 717,075 | |
4.000% | | 06/01/26 | | | | | | | 4 | | | | 3,659 | |
4.000% | | 09/01/26 | | | | | | | 12 | | | | 11,839 | |
4.000% | | 09/01/40 | | | | | | | 103 | | | | 97,212 | |
4.000% | | 12/01/40 | | | | | | | 106 | | | | 100,037 | |
4.000% | | 12/01/40 | | | | | | | 126 | | | | 119,306 | |
4.000% | | 11/01/43 | | | | | | | 220 | | | | 207,102 | |
4.000% | | 09/01/48 | | | | | | | 5 | | | | 4,269 | |
4.000% | | 05/01/52 | | | | | | | 422 | | | | 386,927 | |
4.500% | | 01/01/38 | | | | | | | 411 | | | | 402,875 | |
4.500% | | 09/01/39 | | | | | | | 373 | | | | 362,048 | |
4.500% | | 08/01/48 | | | | | | | 109 | | | | 104,241 | |
5.000% | | 06/01/33 | | | | | | | 96 | | | | 95,552 | |
5.000% | | 05/01/34 | | | | | | | 47 | | | | 47,099 | |
5.000% | | 09/01/52 | | | | | | | 859 | | | | 832,031 | |
5.500% | | 05/01/37 | | | | | | | 19 | | | | 18,866 | |
5.500% | | 02/01/38 | | | | | | | 62 | | | | 62,287 | |
5.500% | | 05/01/38 | | | | | | | 27 | | | | 27,237 | |
5.500% | | 10/01/52 | | | | | | | 1,062 | | | | 1,050,363 | |
6.000% | | 09/01/34 | | | | | | | 33 | | | | 33,608 | |
6.000% | | 01/01/37 | | | | | | | 16 | | | | 16,371 | |
6.000% | | 09/01/38 | | | | | | | 19 | | | | 19,370 | |
6.000% | | 08/01/39 | | | | | | | 21 | | | | 22,280 | |
| | | | | | | | | | | | | | |
Interest Rate | | Maturity
Date | | | | | Principal
Amount
(000)# | | | Value | |
|
U.S. GOVERNMENT AGENCY OBLIGATIONS (continued) | |
6.250% | | 07/15/32 | | | | | | | 220 | | | $ | 243,292 | |
6.500% | | 09/01/32 | | | | | | | 9 | | | | 9,614 | |
6.750% | | 03/15/31 | | | | | | | 190 | | | | 212,312 | |
Federal Home Loan Mortgage Corp., MTN | | | | | |
1.220% | | 08/19/30 | | | | | | | 95 | | | | 78,219 | |
1.899%(s) | | 11/15/38 | | | | | | | 95 | | | | 46,331 | |
Federal National Mortgage Assoc. | |
0.875% | | 08/05/30 | | | | | | | 75 | | | | 61,902 | |
1.500% | | 02/01/36 | | | | | | | 181 | | | | 155,779 | |
1.500% | | 08/01/36 | | | | | | | 186 | | | | 159,635 | |
1.500% | | 11/01/50 | | | | | | | 1,178 | | | | 871,647 | |
1.500% | | 12/01/50 | | | | | | | 752 | | | | 557,024 | |
2.000% | | 08/01/31 | | | | | | | 81 | | | | 75,906 | |
2.000% | | 05/01/36 | | | | | | | 627 | | | | 555,439 | |
2.000% | | 06/01/40 | | | | | | | 274 | | | | 229,096 | |
2.000% | | 07/01/40 | | | | | | | 292 | | | | 244,281 | |
2.000% | | 02/01/41 | | | | | | | 559 | | | | 466,865 | |
2.000% | | 05/01/41 | | | | | | | 1,618 | | | | 1,351,562 | |
2.000% | | 09/01/50 | | | | | | | 2,117 | | | | 1,659,863 | |
2.000% | | 10/01/50 | | | | | | | 1,182 | | | | 928,593 | |
2.000% | | 12/01/50 | | | | | | | 348 | | | | 272,758 | |
2.000% | | 02/01/51(k) | | | | | | | 3,107 | | | | 2,438,412 | |
2.500% | | 06/01/28 | | | | | | | 307 | | | | 297,344 | |
2.500% | | 05/01/41 | | | | | | | 847 | | | | 721,456 | |
2.500% | | 02/01/43 | | | | | | | 79 | | | | 67,478 | |
2.500% | | 12/01/46 | | | | | | | 285 | | | | 237,673 | |
2.500% | | 01/01/50 | | | | | | | 583 | | | | 480,629 | |
2.500% | | 03/01/50 | | | | | | | 187 | | | | 154,790 | |
2.500% | | 05/01/50 | | | | | | | 714 | | | | 589,805 | |
2.500% | | 08/01/50 | | | | | | | 1,819 | | | | 1,500,129 | |
2.500% | | 09/01/50 | | | | | | | 1,267 | | | | 1,059,467 | |
2.500% | | 10/01/50 | | | | | | | 2,044 | | | | 1,675,111 | |
2.500% | | 04/01/51 | | | | | | | 451 | | | | 370,530 | |
2.500% | | 04/01/51 | | | | | | | 908 | | | | 753,103 | |
2.500% | | 05/01/52 | | | | | | | 813 | | | | 671,284 | |
3.000% | | 02/01/31 | | | | | | | 155 | | | | 149,110 | |
3.000% | | 11/01/36 | | | | | | | 165 | | | | 152,038 | |
3.000% | | 03/01/43 | | | | | | | 295 | | | | 260,385 | |
3.000% | | 07/01/43 | | | | | | | 370 | | | | 326,237 | |
3.000% | | 07/01/43 | | | | | | | 481 | | | | 424,204 | |
3.000% | | 09/01/46 | | | | | | | 256 | | | | 222,078 | |
3.000% | | 11/01/46 | | | | | | | 120 | | | | 103,785 | |
3.000% | | 11/01/46 | | | | | | | 156 | | | | 134,665 | |
3.000% | | 11/01/46 | | | | | | | 664 | | | | 577,345 | |
3.000% | | 12/01/47 | | | | | | | 349 | | | | 304,035 | |
3.000% | | 02/01/50 | | | | | | | 148 | | | | 127,595 | |
3.000% | | 06/01/50 | | | | | | | 258 | | | | 221,768 | |
3.000% | | 11/01/51 | | | | | | | 775 | | | | 663,210 | |
3.000% | | 02/01/52 | | | | | | | 482 | | | | 410,884 | |
3.000% | | 04/01/52 | | | | | | | 824 | | | | 704,980 | |
3.000% | | 04/01/52 | | | | | | | 834 | | | | 718,208 | |
3.000% | | 04/01/52 | | | | | | | 844 | | | | 718,544 | |
3.500% | | 07/01/31 | | | | | | | 190 | | | | 185,309 | |
3.500% | | 02/01/33 | | | | | | | 40 | | | | 38,628 | |
3.500% | | 06/01/39 | | | | | | | 102 | | | | 93,979 | |
3.500% | | 04/01/42 | | | | | | | 174 | | | | 158,524 | |
3.500% | | 06/01/42 | | | | | | | 272 | | | | 247,992 | |
3.500% | | 07/01/42 | | | | | | | 132 | | | | 120,076 | |
SEE NOTES TO FINANCIAL STATEMENTS.
A106
| | | | |
| | PSF PGIM GOVERNMENT INCOME PORTFOLIO (CONTINUED) | | |
SCHEDULE OF INVESTMENTS | | | | as of December 31, 2024 |
| | | | | | | | | | | | | | | | |
| | | | | Principal | | | | |
| Interest | | Maturity | | | | Amount | | | | |
Rate | | Date | | | | (000)# | | | Value | |
|
| U.S. GOVERNMENT AGENCY OBLIGATIONS (continued) | |
3.500% | | 07/01/42 | | | | | | | | | 356 | | | $ | 324,225 | |
3.500% | | 06/01/45 | | | | | | | | | 447 | | | | 401,969 | |
3.500% | | 07/01/46 | | | | | | | | | 140 | | | | 125,762 | |
3.500% | | 12/01/46 | | | | | | | | | 140 | | | | 125,388 | |
3.500% | | 12/01/46 | | | | | | | | | 321 | | | | 292,484 | |
3.500% | | 11/01/48 | | | | | | | | | 243 | | | | 217,963 | |
4.000% | | 07/01/37 | | | | | | | | | 276 | | | | 264,869 | |
4.000% | | 09/01/40 | | | | | | | | | 396 | | | | 373,611 | |
4.000% | | 06/01/42 | | | | | | | | | 263 | | | | 246,926 | |
4.000% | | 09/01/44 | | | | | | | | | 158 | | | | 147,929 | |
4.000% | | 09/01/44 | | | | | | | | | 282 | | | | 264,368 | |
4.000% | | 04/01/45 | | | | | | | | | 156 | | | | 144,900 | |
4.000% | | 07/01/45 | | | | | | | | | 108 | | | | 100,492 | |
4.000% | | 10/01/45 | | | | | | | | | 190 | | | | 176,072 | |
4.000% | | 10/01/46 | | | | | | | | | 59 | | | | 55,023 | |
4.000% | | 02/01/47 | | | | | | | | | 49 | | | | 45,087 | |
4.000% | | 06/01/47 | | | | | | | | | 90 | | | | 83,261 | |
4.000% | | 07/01/47 | | | | | | | | | 93 | | | | 86,181 | |
4.000% | | 10/01/47 | | | | | | | | | 292 | | | | 270,850 | |
4.000% | | 11/01/47 | | | | | | | | | 74 | | | | 68,368 | |
4.000% | | 11/01/47 | | | | | | | | | 106 | | | | 98,966 | |
4.000% | | 05/01/52 | | | | | | | | | 835 | | | | 765,638 | |
4.500% | | 05/01/40 | | | | | | | | | 413 | | | | 397,362 | |
4.500% | | 04/01/42 | | | | | | | | | 223 | | | | 216,550 | |
4.500% | | 07/01/52 | | | | | | | | | 868 | | | | 817,819 | |
5.000% | | 12/01/31 | | | | | | | | | 17 | | | | 16,971 | |
5.000% | | 03/01/34 | | | | | | | | | 104 | | | | 103,712 | |
5.000% | | 06/01/35 | | | | | | | | | 45 | | | | 44,689 | |
5.000% | | 07/01/35 | | | | | | | | | 25 | | | | 24,312 | |
5.000% | | 05/01/36 | | | | | | | | | 31 | | | | 30,944 | |
5.000% | | 07/01/52 | | | | | | | | | 413 | | | | 399,632 | |
5.000% | | 08/01/52 | | | | | | | | | 524 | | | | 507,628 | |
5.500% | | 02/01/34 | | | | | | | | | 67 | | | | 66,727 | |
5.500% | | 09/01/34 | | | | | | | | | 75 | | | | 76,137 | |
5.500% | | 02/01/35 | | | | | | | | | 90 | | | | 90,846 | |
5.500% | | 06/01/35 | | | | | | | | | 27 | | | | 26,812 | |
5.500% | | 06/01/35 | | | | | | | | | 43 | | | | 43,460 | |
5.500% | | 09/01/35 | | | | | | | | | 20 | | | | 20,598 | |
5.500% | | 09/01/35 | | | | | | | | | 54 | | | | 54,370 | |
5.500% | | 10/01/35 | | | | | | | | | 83 | | | | 83,383 | |
5.500% | | 11/01/35 | | | | | | | | | 23 | | | | 23,140 | |
5.500% | | 11/01/35 | | | | | | | | | 34 | | | | 33,898 | |
5.500% | | 11/01/35 | | | | | | | | | 159 | | | | 160,557 | |
6.000% | | 12/01/33 | | | | | | | | | 7 | | | | 6,977 | |
6.000% | | 02/01/34 | | | | | | | | | 37 | | | | 37,908 | |
6.000% | | 08/01/34 | | | | | | | | | —(r | ) | | | 153 | |
6.000% | | 11/01/34 | | | | | | | | | —(r | ) | | | 179 | |
6.000% | | 01/01/36 | | | | | | | | | 46 | | | | 46,838 | |
6.000% | | 05/01/38 | | | | | | | | | 15 | | | | 15,859 | |
6.000% | | 10/01/53 | | | | | | | | | 884 | | | | 888,367 | |
6.500% | | 07/01/32 | | | | | | | | | 48 | | | | 49,211 | |
6.500% | | 08/01/32 | | | | | | | | | 20 | | | | 20,729 | |
6.500% | | 10/01/32 | | | | | | | | | 65 | | | | 66,464 | |
6.500% | | 10/01/37 | | | | | | | | | 54 | | | | 56,123 | |
6.625% | | 11/15/30 | | | | | | | | | 2,535 | | | | 2,811,506 | |
7.000% | | 12/01/31 | | | | | | | | | 15 | | | | 15,789 | |
7.000% | | 01/01/36 | | | | | | | | | 10 | | | | 10,252 | |
9.000% | | 04/01/25 | | | | | | | | | —(r | ) | | | 1 | |
| | | | | | | | | | | | | | | | |
| | | | | Principal | | | | |
| Interest | | Maturity | | | | Amount | | | | |
Rate | | Date | | | | (000)# | | | Value | |
|
| U.S. GOVERNMENT AGENCY OBLIGATIONS (continued) | |
4.336%(s) | | 03/17/31 | | | | | | | | | 315 | | | $ | 234,577 | |
Freddie Mac Coupon Strips | |
5.245%(s) | | 03/15/31 | | | | | | | | | 105 | | | | 77,982 | |
Freddie Mac Strips | |
5.078%(s) | | 07/15/32 | | | | | | | | | 330 | | | | 230,918 | |
Government National Mortgage Assoc. | |
2.000% | | 09/20/51 | | | | | | | | | 269 | | | | 215,328 | |
2.000% | | 10/20/51 | | | | | | | | | 1,320 | | | | 1,056,957 | |
2.500% | | 12/20/46 | | | | | | | | | 73 | | | | 62,416 | |
2.500% | | 05/20/51 | | | | | | | | | 836 | | | | 698,948 | |
2.500% | | 08/20/51 | | | | | | | | | 1,258 | | | | 1,051,204 | |
3.000% | | 03/15/45 | | | | | | | | | 314 | | | | 275,157 | |
3.000% | | 07/20/46 | | | | | | | | | 293 | | | | 258,151 | |
3.000% | | 09/20/46 | | | | | | | | | 315 | | | | 277,423 | |
3.000% | | 10/20/46 | | | | | | | | | 79 | | | | 69,788 | |
3.000% | | 04/20/47 | | | | | | | | | 374 | | | | 328,470 | |
3.000% | | 12/20/48 | | | | | | | | | 247 | | | | 217,287 | |
3.000% | | 04/20/49 | | | | | | | | | 221 | | | | 193,855 | |
3.000% | | 07/20/49 | | | | | | | | | 58 | | | | 50,771 | |
3.000% | | 12/20/49 | | | | | | | | | 247 | | | | 215,692 | |
3.000% | | 09/20/51 | | | | | | | | | 864 | | | | 750,875 | |
3.500% | | 01/20/43 | | | | | | | | | 352 | | | | 322,000 | |
3.500% | | 04/20/43 | | | | | | | | | 167 | | | | 152,278 | |
3.500% | | 03/20/45 | | | | | | | | | 206 | | | | 187,388 | |
3.500% | | 04/20/45 | | | | | | | | | 166 | | | | 150,814 | |
3.500% | | 04/20/46 | | | | | | | | | 277 | | | | 251,256 | |
3.500% | | 07/20/46 | | | | | | | | | 403 | | | | 364,968 | |
3.500% | | 07/20/48 | | | | | | | | | 326 | | | | 294,323 | |
3.500% | | 11/20/48 | | | | | | | | | 86 | | | | 77,693 | |
3.500% | | 01/20/49 | | | | | | | | | 151 | | | | 136,779 | |
3.500% | | 05/20/49 | | | | | | | | | 281 | | | | 253,994 | |
4.000% | | 06/15/40 | | | | | | | | | 54 | | | | 50,900 | |
4.000% | | 08/20/46 | | | | | | | | | 166 | | | | 155,364 | |
4.000% | | 11/20/46 | | | | | | | | | 102 | | | | 95,368 | |
4.000% | | 09/20/47 | | | | | | | | | 133 | | | | 124,107 | |
4.000% | | 06/20/48 | | | | | | | | | 202 | | | | 188,616 | |
4.000% | | 02/20/49 | | | | | | | | | 179 | | | | 166,904 | |
4.500% | | 02/20/41 | | | | | | | | | 159 | | | | 154,396 | |
4.500% | | 03/20/41 | | | | | | | | | 133 | | | | 129,468 | |
4.500% | | 06/20/44 | | | | | | | | | 103 | | | | 99,794 | |
4.500% | | 09/20/46 | | | | | | | | | 118 | | | | 112,416 | |
4.500% | | 11/20/46 | | | | | | | | | 207 | | | | 199,451 | |
4.500% | | 01/20/47 | | | | | | | | | 26 | | | | 25,166 | |
4.500% | | 05/20/52 | | | | | | | | | 442 | | | | 418,633 | |
5.000% | | 07/15/33 | | | | | | | | | 47 | | | | 46,744 | |
5.000% | | 09/15/33 | | | | | | | | | 80 | | | | 79,367 | |
5.000% | | 04/15/34 | | | | | | | | | 28 | | | | 27,713 | |
5.000% | | 10/20/48 | | | | | | | | | 37 | | | | 36,449 | |
5.500% | | 03/15/34 | | | | | | | | | 89 | | | | 91,080 | |
5.500% | | 03/15/36 | | | | | | | | | 26 | | | | 26,663 | |
6.500% | | 07/15/32 | | | | | | | | | 6 | | | | 6,300 | |
6.500% | | 08/15/32 | | | | | | | | | 1 | | | | 1,152 | |
6.500% | | 08/15/32 | | | | | | | | | 2 | | | | 2,301 | |
6.500% | | 08/15/32 | | | | | | | | | 6 | | | | 6,302 | |
6.500% | | 08/15/32 | | | | | | | | | 32 | | | | 32,741 | |
7.000% | | 08/15/28 | | | | | | | | | 6 | | | | 6,617 | |
7.500% | | 12/15/25 | | | | | | | | | 3 | | | | 3,056 | |
7.500% | | 02/15/26 | | | | | | | | | 1 | | | | 1,047 | |
SEE NOTES TO FINANCIAL STATEMENTS.
A107
| | | | |
| | PSF PGIM GOVERNMENT INCOME PORTFOLIO (CONTINUED) | | |
SCHEDULE OF INVESTMENTS | | | | as of December 31, 2024 |
| | | | | | | | | | | | | | | | | | | | | | |
| | | | | Principal | | |
| Interest | | Maturity | | | | Amount | | |
Rate | | Date | | | | (000)# | | Value |
|
U.S. GOVERNMENT AGENCY OBLIGATIONS (continued) | |
8.500% | | | | 04/15/25 | | | | | | | | | | | | —(r) | | | | $ | 3 | |
Resolution Funding Corp. Interest Strips, Bonds | |
3.230%(s) | | | | 01/15/30 | | | | | | | | | | | | 450 | | | | | 356,142 | |
3.574%(s) | | | | 04/15/30 | | | | | | | | | | | | 615 | | | | | 478,063 | |
Resolution Funding Corp. Principal Strips, Bonds | |
3.323%(s) | | | | 04/15/30 | | | | | | | | | | | | 2,130 | | | | | 1,666,267 | |
3.672%(s) | | | | 01/15/30 | | | | | | | | | | | | 2,390 | | | | | 1,893,175 | |
Tennessee Valley Authority, Sr. Unsec’d. Notes | |
0.750% | | | | 05/15/25 | | | | | | | | | | | | 325 | | | | | 320,685 | |
1.500% | | | | 09/15/31 | | | | | | | | | | | | 360 | | | | | 295,072 | |
5.880% | | | | 04/01/36 | | | | | | | | | | | | 230 | | | | | 249,206 | |
7.125% | | | | 05/01/30 | | | | | | | | | | | | 530 | | | | | 594,397 | |
Tennessee Valley Authority, Sr. Unsec’d. Notes, Series A | |
2.875% | | | | 02/01/27 | | | | | | | | | | | | 175 | | | | | 170,049 | |
Tennessee Valley Authority, Sr. Unsec’d. Notes, Series E | |
6.750% | | | | 11/01/25 | | | | | | | | | | | | 510 | | | | | 519,966 | |
Tennessee Valley Authority Generic Strips, Bonds | |
4.724%(s) | | | | 07/15/34 | | | | | | | | | | | | 10 | | | | | 6,035 | |
| | | | | | | | | | | | | | | | | | | | | | |
TOTAL U.S. GOVERNMENT AGENCY OBLIGATIONS
(cost $82,549,102) | | | | | 73,285,823 | |
| | | | | | | | | | | | | | | | | | | | | | |
U.S. TREASURY OBLIGATIONS — 30.6% | |
U.S. Treasury Bonds | |
1.625% | | | | 11/15/50 | | | | | | | | | | | | 1,340 | | | | | 699,731 | |
1.875% | | | | 02/15/51 | | | | | | | | | | | | 4,445 | | | | | 2,475,309 | |
1.875% | | | | 11/15/51 | | | | | | | | | | | | 4,815 | | | | | 2,658,783 | |
2.250% | | | | 05/15/41(k) | | | | | | | | | | | | 690 | | | | | 489,792 | |
2.250% | | | | 08/15/49 | | | | | | | | | | | | 565 | | | | | 350,212 | |
2.375% | | | | 11/15/49 | | | | | | | | | | | | 3,180 | | | | | 2,023,275 | |
2.375% | | | | 05/15/51 | | | | | | | | | | | | 715 | | | | | 450,115 | |
2.875% | | | | 05/15/43(k) | | | | | | | | | | | | 815 | | | | | 617,490 | |
3.000% | | | | 02/15/49 | | | | | | | | | | | | 2,380 | | | | | 1,733,309 | |
3.625% | | | | 02/15/53 | | | | | | | | | | | | 310 | | | | | 252,214 | |
U.S. Treasury Notes | |
3.500% | | | | 02/15/33 | | | | | | | | | | | | 335 | | | | | 311,759 | |
3.750% | | | | 06/30/30 | | | | | | | | | | | | 2,895 | | | | | 2,801,139 | |
3.875% | | | | 08/15/33 | | | | | | | | | | | | 465 | | | | | 442,767 | |
4.250% | | | | 12/31/25 | | | | | | | | | | | | 1,250 | | | | | 1,250,293 | |
4.250% | | | | 11/15/34 | | | | | | | | | | | | 1,315 | | | | | 1,281,509 | |
4.375% | | | | 12/31/29 | | | | | | | | | | | | 355 | | | | | 354,861 | |
4.375% | | | | 05/15/34 | | | | | | | | | | | | 5,600 | | | | | 5,517,750 | |
4.500% | | | | 12/31/31 | | | | | | | | | | | | 1,552 | | | | | 1,553,197 | |
4.625% | | | | 04/30/29 | | | | | | | | | | | | 1,740 | | | | | 1,757,264 | |
U.S. Treasury Strips Coupon | |
1.450%(s) | | | | 08/15/42 | | | | | | | | | | | | 60 | | | | | 24,551 | |
1.982%(s) | | | | 08/15/39 | | | | | | | | | | | | 1,025 | | | | | 493,481 | |
2.208%(s) | | | | 05/15/39 | | | | | | | | | | | | 455 | | | | | 222,292 | |
2.353%(s) | | | | 02/15/44 | | | | | | | | | | | | 440 | | | | | 167,578 | |
2.402%(s) | | | | 05/15/41 | | | | | | | | | | | | 1,995 | | | | | 869,384 | |
2.424%(s) | | | | 11/15/40 | | | | | | | | | | | | 10 | | | | | 4,479 | |
2.434%(s) | | | | 11/15/45 | | | | | | | | | | | | 345 | | | | | 120,534 | |
2.436%(s) | | | | 02/15/46 | | | | | | | | | | | | 390 | | | | | 134,504 | |
2.443%(s) | | | | 08/15/44 | | | | | | | | | | | | 210 | | | | | 78,036 | |
2.486%(s) | | | | 02/15/45 | | | | | | | | | | | | 150 | | | | | 54,422 | |
2.525%(s) | | | | 11/15/43 | | | | | | | | | | | | 2,070 | | | | | 798,486 | |
2.857%(s) | | | | 05/15/31 | | | | | | | | | | | | 33 | | | | | 24,517 | |
3.336%(s) | | | | 08/15/40 | | | | | | | | | | | | 895 | | | | | 407,015 | |
| | | | | | | | | | | | |
| | | | | Principal | | | |
| Interest | | Maturity | | | | Amount | | | |
Rate | | Date | | | | (000)# | | Value | |
|
U.S. TREASURY OBLIGATIONS (continued) | |
3.387%(s) | | 05/15/42 | | | | | | 135 | | $ | 55,957 | |
3.666%(s) | | 08/15/41 | | | | | | 5,440 | | | 2,337,925 | |
3.870%(s) | | 02/15/41 | | | | | | 730 | | | 322,227 | |
3.922%(s) | | 11/15/41 | | | | | | 5,200 | | | 2,209,594 | |
3.995%(s) | | 02/15/42 | | | | | | 4,020 | | | 1,687,144 | |
4.120%(s) | | 11/15/42 | | | | | | 1,075 | | | 433,863 | |
4.197%(s) | | 02/15/39 | | | | | | 3,835 | | | 1,905,216 | |
4.461%(s) | | 05/15/44 | | | | | | 1,670 | | | 628,599 | |
4.608%(s) | | 11/15/48 | | | | | | 25 | | | 7,570 | |
4.652%(s) | | 05/15/49 | | | | | | 2,100 | | | 619,910 | |
4.691%(s) | | 05/15/38 | | | | | | 1,685 | | | 875,410 | |
4.722%(s) | | 05/15/50 | | | | | | 1,600 | | | 452,875 | |
4.770%(s) | | 11/15/49 | | | | | | 455 | | | 131,328 | |
4.924%(s) | | 02/15/49 | | | | | | 75 | | | 22,357 | |
5.311%(s) | | 02/15/40 | | | | | | 2,130 | | | 995,525 | |
5.357%(s) | | 05/15/40 | | | | | | 7,030 | | | 3,242,588 | |
| | | | | | | | | | | | |
TOTAL U.S. TREASURY OBLIGATIONS
(cost $52,104,827) | | | 46,348,136 | |
| | | | | | | | | | | | |
TOTAL LONG-TERM INVESTMENTS
(cost $163,165,934) | | | 146,976,058 | |
| | | | | | | | | | | | |
| | | | | |
| | | | | | | | | Shares | | | |
SHORT-TERM INVESTMENT — 2.7% | |
AFFILIATED MUTUAL FUND | |
PGIM Core Ultra Short Bond Fund
(cost $4,026,409)(wb) | | | | 4,026,409 | | | 4,026,409 | |
| | | | | | | | | | | | |
TOTAL INVESTMENTS—99.7%
(cost $167,192,343) | | | 151,002,467 | |
Other assets in excess of liabilities(z) — 0.3% | | | 512,132 | |
| | | | | | | | | | | | |
| | |
NET ASSETS — 100.0% | | | | $ | 151,514,599 | |
| | | | | | | | | | | | |
See the Glossary for a list of the abbreviation(s) used in the annual report.
# Principal or notional amount is shown in U.S. dollars unless otherwise stated.
(c) Variable rate instrument. The interest rate shown reflects the rate in effect at December 31, 2024.
(cc) Variable rate instrument. The rate shown is based on the latest available information as of December 31, 2024. Certain variable rate securities are not based on a published reference rate and spread but are determined by the issuer or agent and are based on current market conditions. These securities do not indicate a reference rate and spread in their description.
(k) Represents security, or a portion thereof, segregated as collateral for centrally cleared/exchange-traded derivatives.
(r) Principal or notional amount is less than $500 par.
(s) Represents zero coupon bond or principal only security. Rate represents yield to maturity at purchase date.
(wb) Represents an investment in a Fund affiliated with the Manager.
(z) Includes net unrealized appreciation/(depreciation) and/or market value of the below holdings which are excluded from the Schedule of Investments:
SEE NOTES TO FINANCIAL STATEMENTS.
A108
| | | | |
| | PSF PGIM GOVERNMENT INCOME PORTFOLIO (CONTINUED) | | |
SCHEDULE OF INVESTMENTS | | | | as of December 31, 2024 |
Forward Commitment Contract:
| | | | | | | | | | | | | | | | | | | | | | | | | |
U.S. Government Agency Obligation | | Interest
Rate | | Maturity
Date | | Settlement
Date | | Principal
Amount
(000)# | | Value |
Federal National Mortgage Assoc.
(proceeds receivable $1,729,063) | | | | 3.000% | | | | | TBA | | | | | 01/14/25 | | | | | $(2,000) | | | | | $(1,698,438) | |
| | | | | | | | | | | | | | | | | | | | | | | | | |
Futures contracts outstanding at December 31, 2024:
| | | | | | | | | | | | | | | | | |
Number of
Contracts | | Type | | Expiration
Date | | Current
Notional
Amount | | Value /
Unrealized
Appreciation
(Depreciation) |
Long Positions: | | | | | | | | | | | | | | | |
112 | | 2 Year U.S. Treasury Notes | | | | Mar. 2025 | | | | | $23,028,250 | | | | | $(13,516) | |
148 | | 5 Year U.S. Treasury Notes | | | | Mar. 2025 | | | | | 15,733,094 | | | | | (72,247 | ) |
| | | | | | | | | | | | | | | | | |
| | | | | | | | | | | | | | | | (85,763 | ) |
| | | | | | | | | | | | | | | | | |
| |
Short Positions: | | | | | | |
4 | | 10 Year U.S. Ultra Treasury Notes | | | | Mar. 2025 | | | | | 445,250 | | | | | 6,245 | |
199 | | 20 Year U.S. Treasury Bonds | | | | Mar. 2025 | | | | | 22,654,907 | | | | | 496,703 | |
37 | | 30 Year U.S. Ultra Treasury Bonds | | | | Mar. 2025 | | | | | 4,399,531 | | | | | 168,601 | |
| | | | | | | | | | | | | | | | | |
| | | | | | | | | | | | | | | | 671,549 | |
| | | | | | | | | | | | | | | | | |
| | | | | | | | | | | | | | | | $585,786 | |
| | | | | | | | | | | | | | | | | |
Interest rate swap agreements outstanding at December 31, 2024:
| | | | | | | | | | | | | | | | | | | | | | | | | | | | | | | | | | | | | |
Notional
Amount
(000)# | | Termination
Date | | Fixed
Rate | | Floating
Rate | | Value at
Trade Date | | Value at
December 31,
2024 | | | | Unrealized
Appreciation
(Depreciation) |
Centrally Cleared Interest Rate Swap Agreements: | | | | | | | | | | | | | | | | | | | | | | | | | |
1,908 | | | | 03/08/25 | | | | | 4.946%(A) | | | 1 Day SOFR(2)(A)/ 4.490% | | | | $— | | | | | $(2,584) | | | | | | | | | | $(2,584) | | | | | | |
2,332 | | | | 03/09/25 | | | | | 5.110%(A) | | | 1 Day SOFR(2)(A)/ 4.490% | | | | — | | | | | 749 | | | | | | | | | | 749 | | | | | | |
| | | | | | | | | | | | | | | | | | | | | | | | | | | | | | | | | | | | | |
| | | | | | | | | | | | | | | | $— | | | | | $(1,835) | | | | | | | | | | $(1,835) | | | | | | |
| | | | | | | | | | | | | | | | | | | | | | | | | | | | | | | | | | | | | |
| (1) | The Portfolio pays the fixed rate and receives the floating rate. |
| (2) | The Portfolio pays the floating rate and receives the fixed rate. |
Summary of Collateral for Centrally Cleared/Exchange-traded Derivatives:
Cash and securities segregated as collateral, including pending settlement for closed positions, to cover requirements for centrally cleared/exchange-traded derivatives are listed by broker as follows:
| | | | | | | | | | |
Broker | | Cash and/or Foreign Currency | | Securities Market Value |
CGM | | | | $— | | | | | $1,226,103 | |
| | | | | | | | | | |
Fair Value Measurements:
Various inputs are used in determining the value of the Portfolio’s investments. These inputs are summarized in the three broad levels listed below.
Level 1—unadjusted quoted prices generally in active markets for identical securities.
Level 2—quoted prices for similar securities, interest rates and yield curves, prepayment speeds, foreign currency exchange rates and other observable inputs.
Level 3—unobservable inputs for securities valued in accordance with Board approved fair valuation procedures.
SEE NOTES TO FINANCIAL STATEMENTS.
A109
| | | | |
| | PSF PGIM GOVERNMENT INCOME PORTFOLIO (CONTINUED) | | |
SCHEDULE OF INVESTMENTS | | | | as of December 31, 2024 |
The following is a summary of the inputs used as of December 31, 2024 in valuing such portfolio securities:
| | | | | | | | | | | | | | | |
| | | Level 1 | | Level 2 | | Level 3 |
Investments in Securities | | | | | | | | | | | | | | | |
Assets | | | | | | | | | | | | | | | |
Long-Term Investments | | | | | | | | | | | | | | | |
Asset-Backed Securities | | | | | | | | | | | | | | | |
Collateralized Loan Obligations | | | $ | — | | | | $ | 12,790,113 | | | | | $— | |
Commercial Mortgage-Backed Securities | | | | — | | | | | 13,454,108 | | | | | — | |
Corporate Bonds | | | | — | | | | | 969,495 | | | | | — | |
Residential Mortgage-Backed Security | | | | — | | | | | 128,383 | | | | | — | |
U.S. Government Agency Obligations | | | | — | | | | | 73,285,823 | | | | | — | |
U.S. Treasury Obligations | | | | — | | | | | 46,348,136 | | | | | — | |
Short-Term Investment | | | | | | | | | | | | | | | |
Affiliated Mutual Fund | | | | 4,026,409 | | | | | — | | | | | — | |
| | | | | | | | | | | | | | | |
Total | | | $ | 4,026,409 | | | | $ | 146,976,058 | | | | | $— | |
| | | | | | | | | | | | | | | |
Other Financial Instruments* | | | | | | | | | | | | | | | |
Assets | | | | | | | | | | | | | | | |
Futures Contracts | | | $ | 671,549 | | | | $ | — | | | | | $— | |
Centrally Cleared Interest Rate Swap Agreement | | | | — | | | | | 749 | | | | | — | |
| | | | | | | | | | | | | | | |
Total | | | $ | 671,549 | | | | $ | 749 | | | | | $— | |
| | | | | | | | | | | | | | | |
Liabilities | | | | | | | | | | | | | | | |
Forward Commitment Contract | | | $ | — | | | | $ | (1,698,438 | ) | | | | $— | |
Futures Contracts | | | | (85,763 | ) | | | | — | | | | | — | |
Centrally Cleared Interest Rate Swap Agreement | | | | — | | | | | (2,584 | ) | | | | — | |
| | | | | | | | | | | | | | | |
Total | | | $ | (85,763 | ) | | | $ | (1,701,022 | ) | | | | $— | |
| | | | | | | | | | | | | | | |
| * | Other financial instruments are derivative instruments, with the exception of forward commitment contracts, and are not reflected in the Schedule of Investments. Futures, forwards and centrally cleared swap contracts are recorded at unrealized appreciation (depreciation) and OTC swap contracts are recorded at fair value. Forward commitment contracts are recorded at market value. |
Industry Classification:
The industry classification of investments and other assets in excess of liabilities shown as a percentage of net assets as of December 31, 2024 were as follows:
| | | | |
U.S. Government Agency Obligations | | | 48.4 | % |
U.S. Treasury Obligations | | | 30.6 | |
Commercial Mortgage-Backed Securities | | | 8.9 | |
Collateralized Loan Obligations | | | 8.4 | |
Affiliated Mutual Fund | | | 2.7 | |
Diversified Financial Services | | | 0.5 | |
| | | | | |
Multi-National | | | | 0.1 | % |
Residential Mortgage-Backed Security | | | | 0.1 | |
| | | | | |
| | | | 99.7 | |
Other assets in excess of liabilities | | | | 0.3 | |
| | | | | |
| |
| | | | 100.0 | % |
| | | | | |
Effects of Derivative Instruments on the Financial Statements and Primary Underlying Risk Exposure:
The Portfolio invested in derivative instruments during the reporting period. The primary type of risk associated with these derivative instruments is interest rate risk. See the Notes to Financial Statements for additional detail regarding these derivative instruments and their risks. The effect of such derivative instruments on the Portfolio’s financial position and financial performance as reflected in the Statement of Assets and Liabilities and Statement of Operations is presented in the summary below.
Fair values of derivative instruments as of December 31, 2024 as presented in the Statement of Assets and Liabilities:
| | | | | | | | | | | | | | | | | | | | |
| | | Asset Derivatives | | Liability Derivatives |
Derivatives not accounted for as hedging instruments, carried at fair value | | Statement of
Assets and
Liabilities Location | | Fair
Value | | Statement of
Assets and
Liabilities Location | | Fair
Value |
Interest rate contracts | | |
| Due from/to broker-variation
margin futures |
| | | $ | 671,549 | * | | |
| Due from/to broker-variation
margin futures |
| | | $ | 85,763 | * |
Interest rate contracts | | |
| Due from/to broker-variation
margin swaps |
| | | | 749 | * | | |
| Due from/to broker-variation
margin swaps |
| | | | 2,584 | * |
| | | | | | | | | | | | | | | | | | | | |
| | | | | | | | $ | 672,298 | | | | | | | | | $ | 88,347 | |
| | | | | | | | | | | | | | | | | | | | |
SEE NOTES TO FINANCIAL STATEMENTS.
A110
| | | | |
| | PSF PGIM GOVERNMENT INCOME PORTFOLIO (CONTINUED) | | |
SCHEDULE OF INVESTMENTS | | | | as of December 31, 2024 |
| * | Includes cumulative appreciation (depreciation) as reported in the schedule of open futures and centrally cleared swap contracts. Only unsettled variation margin receivable (payable) is reported within the Statement of Assets and Liabilities. |
The effects of derivative instruments on the Statement of Operations for the year ended December 31, 2024 are as follows:
| | | | | | | | |
Amount of Realized Gain (Loss) on Derivatives Recognized in Income | |
Derivatives not accounted for as hedging instruments, carried at fair value | | Futures | | | Swaps | |
Interest rate contracts | | $ | (69,976 | ) | | $ | (11,450 | ) |
| | | | | | | | |
| | | | | | | | |
Change in Unrealized Appreciation (Depreciation) on Derivatives Recognized in Income | |
Derivatives not accounted for as hedging instruments, carried at fair value | | Futures | | | Swaps | |
Interest rate contracts | | $ | 2,286,648 | | | $ | (17,905 | ) |
| | | | | | | | |
For the year ended December 31, 2024, the Portfolio’s average volume of derivative activities is as follows:
| | |
| Derivative Contract Type | | Average Volume of Derivative Activities* |
Futures Contracts - Long Positions (1) | | $50,636,320 |
Futures Contracts - Short Positions (1) | | 35,891,666 |
Interest Rate Swap Agreements (1) | | 4,240,000 |
| * | Average volume is based on average quarter end balances for the year ended December 31, 2024. |
| (1) | Notional Amount in USD. |
SEE NOTES TO FINANCIAL STATEMENTS.
A111
| | | | |
| | PSF PGIM GOVERNMENT INCOME PORTFOLIO (CONTINUED) | | |
| | | | |
STATEMENT OF ASSETS AND LIABILITIES
as of December 31, 2024
| | | | |
ASSETS | | | | |
Investments at value: | | | | |
Unaffiliated investments (cost $163,165,934) | | $ | 146,976,058 | |
Affiliated investments (cost $4,026,409) | | | 4,026,409 | |
Receivable for investments sold | | | 1,731,229 | |
Dividends and interest receivable | | | 553,041 | |
Due from broker-variation margin futures | | | 51,243 | |
Receivable for Portfolio shares sold | | | 29,169 | |
Due from broker-variation margin swaps | | | 25 | |
Prepaid expenses | | | 2,025 | |
| | | | |
Total Assets | | | 153,369,199 | |
| | | | |
LIABILITIES | | | | |
Forward commitment contracts, at value (proceeds receivable $1,729,063) | | | 1,698,438 | |
Accrued expenses and other liabilities | | | 92,591 | |
Management fee payable | | | 51,819 | |
Payable for Portfolio shares purchased | | | 9,479 | |
Affiliated transfer agent fee payable | | | 1,190 | |
Distribution fee payable | | | 704 | |
Trustees’ fees payable | | | 379 | |
| | | | |
Total Liabilities | | | 1,854,600 | |
| | | | |
NET ASSETS | | $ | 151,514,599 | |
| | | | |
Net assets were comprised of: | | | | |
Partners’ Equity | | $ | 151,514,599 | |
| | | | |
Class I: | | | | |
Net asset value and redemption price per share, $148,293,771 / 11,487,827 outstanding shares of beneficial interest | | $ | 12.91 | |
| | | | |
| | | | |
Class III: | | | | |
Net asset value and redemption price per share, $3,220,828 / 251,742 outstanding shares of beneficial interest | | $ | 12.79 | |
| | | | |
STATEMENT OF OPERATIONS
Year Ended December 31, 2024
| | | | |
NET INVESTMENT INCOME (LOSS) | | | | |
INCOME | | | | |
Interest income | | $ | 6,332,292 | |
Affiliated dividend income | | | 107,081 | |
Affiliated income from securities lending, net | | | 329 | |
| | | | |
Total income | | | 6,439,702 | |
| | | | |
EXPENSES | | | | |
Management fee | | | 621,933 | |
Distribution fee—Class III | | | 8,909 | |
Shareholders’ reports | | | 56,518 | |
Custodian and accounting fees | | | 50,768 | |
Professional fees | | | 38,283 | |
Audit fee | | | 33,640 | |
Transfer agent’s fees and expenses (including affiliated expense of $7,143) | | | 11,942 | |
Trustees’ fees | | | 10,818 | |
Miscellaneous | | | 36,938 | |
| | | | |
Total expenses | | | 869,749 | |
| | | | |
NET INVESTMENT INCOME (LOSS) | | | 5,569,953 | |
| | | | |
REALIZED AND UNREALIZED GAIN (LOSS) ON | | | | |
INVESTMENT TRANSACTIONS | | | | |
Net realized gain (loss) on: | | | | |
Investment transactions (including affiliated of $(224)) | | | (4,637,590 | ) |
|
Futures transactions | | | (69,976 | ) |
Swap agreements transactions | | | (11,450 | ) |
| | | | |
| | | (4,719,016 | ) |
| | | | |
Net change in unrealized appreciation (depreciation) on: | | | | |
Investments | | | (1,720,203 | ) |
Futures | | | 2,286,648 | |
Swap agreements | | | (17,905 | ) |
| | | | |
| | | 548,540 | |
| | | | |
NET GAIN (LOSS) ON INVESTMENT TRANSACTIONS | | | (4,170,476 | ) |
| | | | |
NET INCREASE (DECREASE) IN NET ASSETS RESULTING FROM OPERATIONS | | $ | 1,399,477 | |
| | | | |
STATEMENTS OF CHANGES IN NET ASSETS
| | | | | | | | | | | | | | | | | | | | | | | | |
| | | Year Ended
December 31, 2024 | | | Year Ended
December 31, 2023 | |
INCREASE (DECREASE) IN NET ASSETS | | | | | | | | | | | | | | | | | | | | | | | | |
OPERATIONS | | | | | | | | | | | | | | | | | | | | | | | | |
Net investment income (loss) | | | | | | $ | 5,569,953 | | | | | | | | | | | $ | 5,729,086 | | | | | |
Net realized gain (loss) on investment transactions | | | | | | | (4,719,016 | ) | | | | | | | | | | | (8,315,887 | ) | | | | |
Net change in unrealized appreciation (depreciation) on investments | | | | | | | 548,540 | | | | | | | | | | | | 11,202,555 | | | | | |
| | | | | | | | | | | | | | | | | | | | | | | | |
NET INCREASE (DECREASE) IN NET ASSETS RESULTING FROM OPERATIONS | | | | | | | 1,399,477 | | | | | | | | | | | | 8,615,754 | | | | | |
| | | | | | | | | | | | | | | | | | | | | | | | |
PORTFOLIO SHARE TRANSACTIONS | | | | | | | | | | | | | | | | | | | | | | | | |
Portfolio shares sold | | | | | | | 6,686,677 | | | | | | | | | | | | 5,933,349 | | | | | |
Portfolio shares purchased | | | | | | | (19,231,070 | ) | | | | | | | | | | | (36,216,200 | ) | | | | |
| | | | | | | | | | | | | | | | | | | | | | | | |
NET INCREASE (DECREASE) IN NET ASSETS FROM PORTFOLIO SHARE TRANSACTIONS | | | | | | | (12,544,393 | ) | | | | | | | | | | | (30,282,851 | ) | | | | |
| | | | | | | | | | | | | | | | | | | | | | | | |
TOTAL INCREASE (DECREASE) | | | | | | | (11,144,916 | ) | | | | | | | | | | | (21,667,097 | ) | | | | |
NET ASSETS: | | | | | | | | | | | | | | | | | | | | | | | | |
Beginning of year | | | | | | | 162,659,515 | | | | | | | | | | | | 184,326,612 | | | | | |
| | | | | | | | | | | | | | | | | | | | | | | | |
End of year | | | | | | $ | 151,514,599 | | | | | | | | | | | $ | 162,659,515 | | | | | |
| | | | | | | | | | | | | | | | | | | | | | | | |
SEE NOTES TO FINANCIAL STATEMENTS.
A112
| | | | |
| | PSF PGIM GOVERNMENT INCOME PORTFOLIO (CONTINUED) | | |
FINANCIAL HIGHLIGHTS | | | | |
| | | | | | | | | | | | | | | | | | | | |
Class I | | | | | | | | | | | | | | | |
| | | Year Ended December 31, | |
| | | 2024 | | | 2023 | | | 2022 | | | 2021 | | | 2020 | |
Per Share Operating Performance(a): | | | | | | | | | | | | | | | | | | | | |
Net Asset Value, beginning of year | | $ | 12.78 | | | $ | 12.16 | | | $ | 14.05 | | | $ | 14.51 | | | $ | 13.54 | |
| | | | | | | | | | | | | | | | | | | | |
Income (Loss) From Investment Operations: | | | | | | | | | | | | | | | | | | | | |
Net investment income (loss) | | | 0.46 | | | | 0.41 | | | | 0.29 | | | | 0.19 | | | | 0.23 | |
| Net realized and unrealized gain (loss) on investment transactions | | | (0.33 | ) | | | 0.21 | | | | (2.18 | ) | | | (0.65 | ) | | | 0.74 | |
| | | | | | | | | | | | | | | | | | | | |
Total from investment operations | | | 0.13 | | | | 0.62 | | | | (1.89 | ) | | | (0.46 | ) | | | 0.97 | |
| | | | | | | | | | | | | | | | | | | | |
Net Asset Value, end of year | | $ | 12.91 | | | $ | 12.78 | | | $ | 12.16 | | | $ | 14.05 | | | $ | 14.51 | |
| | | | | | | | | | | | | | | | | | | | |
Total Return(b) | | | 1.02 | % | | | 5.10 | % | | | (13.45 | )% | | | (3.17 | )% | | | 7.16 | % |
Ratios/Supplemental Data: | | | | | | | | | | | | | | | | | | | | |
Net assets, end of year (in millions) | | $ | 148.3 | | | $ | 159.0 | | | $ | 181.3 | | | $ | 223.1 | | | $ | 246.2 | |
Average net assets (in millions) | | $ | 151.9 | | | $ | 167.9 | | | $ | 196.8 | | | $ | 231.5 | | | $ | 246.6 | |
Ratios to average net assets(c): | | | | | | | | | | | | | | | | | | | | |
Expenses after waivers and/or expense reimbursement | | | 0.55 | % | | | 0.52 | % | | | 0.49 | % | | | 0.48 | % | | | 0.51 | % |
Expenses before waivers and/or expense reimbursement | | | 0.55 | % | | | 0.52 | % | | | 0.49 | % | | | 0.48 | % | | | 0.51 | % |
Net investment income (loss) | | | 3.59 | % | | | 3.35 | % | | | 2.28 | % | | | 1.35 | % | | | 1.58 | % |
Portfolio turnover rate(d)(e) | | | 86 | % | | | 87 | % | | | 177 | % | | | 222 | % | | | 150 | % |
| | | | | | | | | | | | | | | | | | | | | | | | | | | | | | | | | | | |
Class III | | | | | | | | | | | | | | |
| | | Year Ended December 31, | | | | April 26, 2021(f) through December 31, |
| | | 2024 | | 2023 | | 2022 | | | | 2021 |
Per Share Operating Performance(a): | | | | | | | | | | | | | | | | | | | | | | | | | | | | | | | | | | | |
Net Asset Value, beginning of period | | | $ | 12.70 | | | | $ | 12.11 | | | | $ | 14.03 | | | | | | | | | | | | | | | $14.17 | | | | | | |
| | | | | | | | | | | | | | | | | | | | | | | | | | | | | | | | | | | |
Income (Loss) From Investment Operations: | | | | | | | | | | | | | | | | | | | | | | | | | | | | | | | | | | | |
Net investment income (loss) | | | | 0.42 | | | | | 0.38 | | | | | 0.28 | | | | | | | | | | | | | | | 0.11 | | | | | | |
Net realized and unrealized gain (loss) on investment transactions | | | | (0.33 | ) | | | | 0.21 | | | | | (2.20 | ) | | | | | | | | | | | | | | (0.25 | ) | | | | | |
| | | | | | | | | | | | | | | | | | | | | | | | | | | | | | | | | | | |
Total from investment operations | | | | 0.09 | | | | | 0.59 | | | | | (1.92 | ) | | | | | | | | | | | | | | (0.14 | ) | | | | | |
| | | | | | | | | | | | | | | | | | | | | | | | | | | | | | | | | | | |
Net Asset Value, end of period | | | $ | 12.79 | | | | $ | 12.70 | | | | $ | 12.11 | | | | | | | | | | | | | | | $14.03 | | | | | | |
| | | | | | | | | | | | | | | | | | | | | | | | | | | | | | | | | | | |
Total Return(b) | | | | 0.71 | % | | | | 4.87 | % | | | | (13.68 | )% | | | | | | | | | | | | | | (0.99 | )% | | | | | |
Ratios/Supplemental Data: | | | | | | | | | | | | | | | | | | | | | | | | | | | | | | | | | | | |
Net assets, end of period (in millions) | | | $ | 3.2 | | | | $ | 3.7 | | | | $ | 3.0 | | | | | | | | | | | | | | | $ 0.3 | | | | | | |
Average net assets (in millions) | | | $ | 3.6 | | | | $ | 3.3 | | | | $ | 1.6 | | | | | | | | | | | | | | | $ 0.2 | | | | | | |
Ratios to average net assets(c): | | | | | | | | | | | | | | | | | | | | | | | | | | | | | | | | | | | |
Expenses after waivers and/or expense reimbursement | | | | 0.80 | % | | | | 0.77 | % | | | | 0.74 | % | | | | | | | | | | | | | | 0.68 | %(g) | | | | | |
Expenses before waivers and/or expense reimbursement | | | | 0.80 | % | | | | 0.77 | % | | | | 0.74 | % | | | | | | | | | | | | | | 0.68 | %(g) | | | | | |
Net investment income (loss) | | | | 3.33 | % | | | | 3.11 | % | | | | 2.26 | % | | | | | | | | | | | | | | 1.09 | %(g) | | | | | |
Portfolio turnover rate(d)(e) | | | | 86 | % | | | | 87 | % | | | | 177 | % | | | | | | | | | | | | | | 222 | % | | | | | |
| (a) | Calculated based on average shares outstanding during the period. |
| (b) | Total return is calculated assuming a purchase of a share on the first day and a sale on the last day of each period reported and includes reinvestment of dividends and distributions, if any, and does not reflect the effect of insurance contract charges. Total return does not reflect expenses associated with the separate account such as administrative fees, account charges and surrender charges which, if reflected, would reduce the total returns for all periods shown. Performance figures may reflect fee waivers and/or expense reimbursements. In the absence of fee waivers and/or expense reimbursements, the total return would be lower. Past performance is no guarantee of future results. Total returns may reflect adjustments to conform to GAAP. Total returns for periods less than one full year are not annualized. |
| (c) | Does not include expenses of the underlying funds in which the Portfolio invests. |
| (d) | The Portfolio accounts for mortgage dollar roll transactions, when applicable, as purchases and sales which, as a result, can increase its portfolio turnover rate. |
| (e) | The Portfolio’s portfolio turnover rate is calculated in accordance with regulatory requirements, without regard to transactions involving short-term investments, certain derivatives and in-kind transactions (if any). If such transactions were included, the Portfolio’s portfolio turnover rate may be higher. |
| (f) | Commencement of offering. |
| (g) | Annualized, with the exception of certain non-recurring expenses. |
SEE NOTES TO FINANCIAL STATEMENTS.
A113
| | | | |
| | PSF PGIM GOVERNMENT MONEY MARKET PORTFOLIO | | |
SCHEDULE OF INVESTMENTS | | | | as of December 31, 2024 |
| | | | | | | | | | | | |
Interest Rate | | Maturity
Date | | | | Principal
Amount
(000)# | | | Value | |
|
REPURCHASE AGREEMENTS — 46.4% | |
Bank of America Securities, Inc. | |
4.46%, dated 12/31/24, due 01/02/25 in the amount of $65,016,106 collateralized by FHLMC (coupon rates 3.000%-3.500%, maturity dates 12/01/29-04/01/32), FNMA (coupon rates 2.000%-3.590%, maturity dates 05/01/34-04/01/53) and GNMA (coupon rates 3.000%-6.000%, maturity dates 12/15/36-10/20/74) with the aggregate value, including accrued interest, of $66,300,000 | | | 65,000 | | | $ | 65,000,000 | |
Bank of Nova Scotia | |
4.46%, dated 12/31/24, due 01/02/25 in the amount of $50,012,389 collateralized by FNMA (coupon rate 4.500%, maturity date 12/01/48) and U.S. Treasury Securities (coupon rate 4.000%, maturity date 11/15/42) with the aggregate value, including accrued interest, of $51,012,695 | | | 50,000 | | | | 50,000,000 | |
Canadian Imperial Bank of Commerce | |
4.43%, dated 12/12/24, due 01/14/25 in the amount of $17,069,034 collateralized by FHLMC (coupon rates 2.500%-7.000%, maturity dates 06/01/44-12/01/54), FNMA (coupon rates 2.000%-7.000%, maturity dates 12/01/30-11/01/54), GNMA (coupon rate 5.716%, maturity date 10/20/74) and U.S. Treasury Securities (coupon rates 0.125%-3.875%, maturity dates 04/15/25-11/15/31) with the aggregate value, including accrued interest, of $17,384,816 | | | 17,000 | | | | 17,000,000 | |
4.31%, dated 12/19/24, due 01/30/25 in the amount of $40,201,133 collateralized by U.S. Treasury Securities (coupon rates 0.125%-5.000%, maturity dates 08/31/25-02/15/54) with the aggregate value, including accrued interest, of $40,868,413 | | | 40,000 | | | | 40,000,000 | |
| | | | | | | | | | | | |
Interest Rate | | Maturity
Date | | | | Principal
Amount
(000)# | | | Value | |
|
REPURCHASE AGREEMENTS (continued) | |
Credit Agricole Securities Inc. | |
4.39%, dated 12/16/24, due 02/06/25 in the amount of $20,126,822 collateralized by U.S. Treasury Securities (coupon rate 1.500%, maturity date 08/15/26) with the aggregate value, including accrued interest, of $20,400,019 | | | 20,000 | | | $ | 20,000,000 | |
4.3%, dated 12/19/24, due 01/30/25 in the amount of $19,095,317 collateralized by U.S. Treasury Securities (coupon rate 2.250%, maturity date 08/15/27) with the aggregate value, including accrued interest, of $19,380,074 | | | 19,000 | | | | 19,000,000 | |
4.3%, dated 12/19/24, due 01/30/25 in the amount of $30,150,500 collateralized by U.S. Treasury Securities (coupon rate 1.250%, maturity date 12/31/26) with the aggregate value, including accrued interest, of $30,600,029 | | | 30,000 | | | | 30,000,000 | |
4.46%, dated 12/31/24, due 01/02/25 in the amount of $9,051,242 collateralized by U.S. Treasury Securities (coupon rate 2.250%, maturity date 08/15/27) with the aggregate value, including accrued interest, of $9,229,981 | | | 9,049 | | | | 9,049,000 | |
ING Financial Markets LLC | |
4.32%, dated 12/19/24, due 01/30/25 in the amount of $25,126,000 collateralized by FNMA (coupon rate 2.000%, maturity date 07/01/51) with the aggregate value, including accrued interest, of $25,500,000 | | | 25,000 | | | | 25,000,000 | |
4.46%, dated 12/31/24, due 01/02/25 in the amount of $65,016,106 collateralized by FHLMC (coupon rate 6.500%, maturity date 10/01/53) with the aggregate value, including accrued interest, of $66,300,000 | | | 65,000 | | | | 65,000,000 | |
SEE NOTES TO FINANCIAL STATEMENTS.
A114
| | | | |
| | PSF PGIM GOVERNMENT MONEY MARKET PORTFOLIO (CONTINUED) | | |
SCHEDULE OF INVESTMENTS | | | | as of December 31, 2024 |
| | | | | | | | | | | | |
Interest Rate | | Maturity
Date | | | | Principal
Amount
(000)# | | | Value | |
|
REPURCHASE AGREEMENTS (continued) | |
Natixis | |
4.33%, dated 12/19/24, due 01/30/25 in the amount of $20,101,033 collateralized by FHLMC (coupon rates 5.000%-5.500%, maturity dates 08/01/53-11/01/54), FNMA (coupon rates 4.250%-6.000%, maturity dates 01/01/30-11/01/54) and U.S. Treasury Securities (coupon rates 0.000%-4.750%, maturity dates 01/07/25-11/15/53) with the aggregate value, including accrued interest, of $20,400,001 | | | 20,000 | | | $ | 20,000,000 | |
4.55%, dated 12/31/24, due 01/02/25 in the amount of $65,016,431 collateralized by FNMA (coupon rate 6.000%, maturity date 01/01/53) and U.S. Treasury Securities (coupon rates 0.000%-4.500%, maturity dates 01/14/25-08/15/53) with the aggregate value, including accrued interest, of $66,300,002 | | | 65,000 | | | | 65,000,000 | |
NatWest Markets Securities, Inc. | |
4.45%, dated 12/31/24, due 01/07/25 in the amount of $65,056,243 collateralized by U.S. Treasury Securities (coupon rate 0.000%, maturity dates 02/06/25-03/27/25) with the aggregate value, including accrued interest, of $66,357,446 | | | 65,000 | | | | 65,000,000 | |
TD Securities (USA) LLC | | | | | | | | |
4.5%, dated 12/31/24, due 01/02/25 in the amount of $65,016,250 collateralized by U.S. Treasury Securities (coupon rates 0.375%-3.375%, maturity dates 04/30/25-05/15/30) with the aggregate value, including accrued interest, of $66,300,009 | | | 65,000 | | | | 65,000,000 | |
Wells Fargo Securities LLC | |
4.46%, dated 12/31/24, due 01/02/25 in the amount of $65,016,106 collateralized by FHLMC (coupon rates 3.500%-5.500%, maturity dates 02/01/47-08/01/54) with the aggregate value, including accrued interest, of $66,316,428 | | | 65,000 | | | | 65,000,000 | |
4.45%, dated 12/31/24, due 01/07/25 in the amount of $19,016,440 collateralized by FNMA (coupon rate 5.000%, maturity date 12/01/54) with the aggregate value, including accrued interest, of $19,396,770 | | | 19,000 | | | | 19,000,000 | |
| | | | | | | | | | | | |
TOTAL REPURCHASE AGREEMENTS
(cost $639,049,000) | | | | 639,049,000 | |
| | | | | | | | | | | | |
|
U.S. GOVERNMENT AGENCY OBLIGATIONS — 29.4% | |
Federal Farm Credit Bank
4.404%(n) 02/06/25 | | | 13,000 | | | | 12,943,190 | |
| | | | | | | | | | | | |
Interest Rate | | Maturity Date | | | | Principal
Amount
(000)# | | | Value | |
|
U.S. GOVERNMENT AGENCY OBLIGATIONS (continued) | |
Federal Farm Credit Bank, SOFR + 0.010% (Cap N/A, Floor 0.000%) | |
4.380%(c) | | 05/22/25 | | | | | 1,400 | | | $ | 1,400,000 | |
Federal Farm Credit Bank, SOFR + 0.020% (Cap N/A, Floor 0.000%) | |
4.390%(c) | | 05/02/25 | | | | | 5,000 | | | | 5,000,000 | |
Federal Farm Credit Bank, SOFR + 0.040% (Cap N/A, Floor 0.000%) | |
4.410%(c) | | 04/09/25 | | | | | 9,000 | | | | 9,000,000 | |
4.410%(c) | | 07/02/25 | | | | | 8,000 | | | | 8,000,000 | |
4.410%(c) | | 07/29/25 | | | | | 7,500 | | | | 7,500,000 | |
Federal Farm Credit Bank, SOFR + 0.045% (Cap N/A, Floor 0.000%) | |
4.415%(c) | | 02/12/25 | | | | | 8,000 | | | | 8,000,000 | |
4.415%(c) | | 07/23/25 | | | | | 8,000 | | | | 8,000,000 | |
Federal Farm Credit Bank, SOFR + 0.050% (Cap N/A, Floor 0.000%) | |
4.420%(c) | | 01/22/25 | | | | | 8,000 | | | | 8,000,000 | |
Federal Farm Credit Bank, SOFR + 0.060% (Cap N/A, Floor 0.000%) | |
4.430%(c) | | 08/26/25 | | | | | 9,000 | | | | 9,000,000 | |
Federal Farm Credit Bank, SOFR + 0.065% (Cap N/A, Floor 0.000%) | |
4.435%(c) | | 08/28/25 | | | | | 8,000 | | | | 8,000,000 | |
Federal Farm Credit Bank, SOFR + 0.080% (Cap N/A, Floor 0.000%) | |
4.450%(c) | | 11/21/25 | | | | | 7,500 | | | | 7,500,000 | |
4.450%(c) | | 01/08/26 | | | | | 8,000 | | | | 8,000,000 | |
Federal Farm Credit Bank, SOFR + 0.085% (Cap N/A, Floor 0.000%) | |
4.455%(c) | | 12/29/25 | | | | | 8,000 | | | | 8,000,000 | |
4.455%(c) | | 03/20/26 | | | | | 2,500 | | | | 2,500,000 | |
Federal Farm Credit Bank, SOFR + 0.090% (Cap N/A, Floor 0.000%) | |
4.460%(c) | | 08/26/25 | | | | | 8,000 | | | | 8,002,068 | |
Federal Farm Credit Bank, SOFR + 0.100% (Cap N/A, Floor 0.000%) | |
4.470%(c) | | 02/25/26 | | | | | 9,000 | | | | 8,999,953 | |
Federal Farm Credit Bank, SOFR + 0.105% (Cap N/A, Floor 0.000%) | |
4.475%(c) | | 01/08/26 | | | | | 7,000 | | | | 7,001,635 | |
4.475%(c) | | 02/23/26 | | | | | 4,000 | | | | 4,000,000 | |
Federal Farm Credit Bank, SOFR + 0.110% (Cap N/A, Floor 0.000%) | |
4.480%(c) | | 01/17/25 | | | | | 8,000 | | | | 8,000,257 | |
Federal Farm Credit Bank, SOFR + 0.120% (Cap N/A, Floor 0.000%) | |
4.490%(c) | | 05/08/26 | | | | | 5,000 | | | | 5,000,000 | |
Federal Farm Credit Bank, SOFR + 0.150% (Cap N/A, Floor 0.000%) | |
4.520%(c) | | 01/03/25 | | | | | 4,000 | | | | 4,000,025 | |
Federal Farm Credit Bank, SOFR + 0.155% (Cap N/A, Floor 0.000%) | |
4.525%(c) | | 09/05/25 | | | | | 8,000 | | | | 8,004,438 | |
Federal Farm Credit Bank, US Federal Funds Effective Rate + 0.115% (Cap N/A, Floor 0.000%) | |
4.445%(c) | | 12/26/25 | | | | | 12,000 | | | | 12,001,328 | |
Federal Home Loan Bank | |
4.413%(n) | | 01/29/25 | | | | | 13,000 | | | | 12,955,673 | |
4.413%(n) | | 03/05/25 | | | | | 13,000 | | | | 12,900,696 | |
Federal Home Loan Bank, SOFR + 0.005% (Cap N/A, Floor 0.000%) | |
4.375%(c) | | 01/13/25 | | | | | 8,000 | | | | 8,000,000 | |
Federal Home Loan Bank, SOFR + 0.010% (Cap N/A, Floor 0.000%) | |
4.380%(c) | | 01/08/25 | | | | | 8,000 | | | | 8,000,000 | |
4.380%(c) | | 02/05/25 | | | | | 12,000 | | | | 12,000,000 | |
4.380%(c) | | 03/03/25 | | | | | 8,000 | | | | 8,000,000 | |
4.380%(c) | | 03/19/25 | | | | | 8,000 | | | | 8,000,000 | |
4.380%(c) | | 03/26/25 | | | | | 8,000 | | | | 8,000,000 | |
Federal Home Loan Bank, SOFR + 0.015% (Cap N/A, Floor 0.000%) | |
4.505%(c) | | 03/17/25 | | | | | 8,000 | | | | 8,000,000 | |
4.385%(c) | | 04/16/25 | | | | | 8,000 | | | | 8,000,000 | |
Federal Home Loan Bank, SOFR + 0.020% (Cap N/A, Floor 0.000%) | |
4.390%(c) | | 01/27/25 | | | | | 5,500 | | | | 5,500,000 | |
SEE NOTES TO FINANCIAL STATEMENTS.
A115
| | | | |
| | PSF PGIM GOVERNMENT MONEY MARKET PORTFOLIO (CONTINUED) | | |
SCHEDULE OF INVESTMENTS | | | | as of December 31, 2024 |
| | | | | | | | | | | | |
Interest
Rate | | Maturity
Date | | | | Principal
Amount
(000)# | | | Value | |
|
U.S. GOVERNMENT AGENCY OBLIGATIONS (continued) | |
Federal Home Loan Bank, SOFR + 0.025% (Cap N/A, Floor 0.000%) | |
4.395%(c) | | 03/11/25 | | | | | 7,000 | | | $ | 7,000,000 | |
4.515%(c) | | 04/15/25 | | | | | 8,000 | | | | 8,000,000 | |
Federal Home Loan Bank, SOFR + 0.030% (Cap N/A, Floor 0.000%) | |
4.400%(c) | | 03/26/25 | | | | | 5,500 | | | | 5,500,000 | |
4.400%(c) | | 05/15/25 | | | | | 7,500 | | | | 7,500,000 | |
Federal Home Loan Bank, SOFR + 0.035% (Cap N/A, Floor 0.000%) | |
4.405%(c) | | 04/23/25 | | | | | 9,000 | | | | 9,000,000 | |
Federal Home Loan Bank, SOFR + 0.050% (Cap N/A, Floor 0.000%) | |
4.420%(c) | | 08/08/25 | | | | | 7,000 | | | | 7,000,000 | |
Federal Home Loan Bank, SOFR + 0.060% (Cap N/A, Floor 0.000%) | |
4.430%(c) | | 08/19/25 | | | | | 4,000 | | | | 4,000,000 | |
Federal Home Loan Bank, SOFR + 0.100% (Cap N/A, Floor 0.000%) | |
4.470%(c) | | 02/13/26 | | | | | 7,000 | | | | 7,000,000 | |
Federal Home Loan Bank, SOFR + 0.115% (Cap N/A, Floor 0.000%) | |
4.485%(c) | | 06/20/25 | | | | | 13,000 | | | | 13,000,000 | |
4.485%(c) | | 07/10/25 | | | | | 11,000 | | | | 11,000,000 | |
Federal Home Loan Bank, SOFR + 0.125% (Cap N/A, Floor 0.000%) | |
4.495%(c) | | 01/24/25 | | | | | 12,000 | | | | 12,000,000 | |
Federal Home Loan Bank, SOFR + 0.140% (Cap N/A, Floor 0.000%) | |
4.510%(c) | | 03/12/26 | | | | | 14,000 | | | | 13,999,828 | |
Federal Home Loan Mortgage Corp., SOFR + 0.090% (Cap N/A, Floor 0.000%) | |
4.460%(c) | | 01/26/26 | | | | | 15,750 | | | | 15,752,304 | |
Federal Home Loan Mortgage Corp., SOFR + 0.100% (Cap N/A, Floor 0.000%) | |
4.470%(c) | | 02/09/26 | | | | | 8,000 | | | | 8,000,000 | |
| | | | | | | | | | | | |
| |
TOTAL U.S. GOVERNMENT AGENCY OBLIGATIONS
(cost $403,961,395) | | | | 403,961,395 | |
| | | | | | | | | | | | |
|
U.S. TREASURY OBLIGATIONS(n) — 24.6% | |
U.S. Treasury Bills | |
4.284% | | 10/30/25 | | | | | 9,000 | | | | 8,689,762 | |
4.290% | | 04/22/25 | | | | | 10,000 | | | | 9,869,544 | |
4.350% | | 03/13/25 | | | | | 13,000 | | | | 12,889,689 | |
| | | | | | | | | | | | |
Interest
Rate | | Maturity
Date | | | | Principal
Amount
( 000)# | | | Value | |
|
U.S. TREASURY OBLIGATIONS(n) (continued) | |
4.372% | | 04/08/25 | | | | | 13,500 | | | $ | 13,343,241 | |
4.392% | | 04/17/25 | | | | | 21,000 | | | | 20,734,236 | |
4.400% | | 04/24/25 | | | | | 20,000 | | | | 19,729,789 | |
4.401% | | 04/03/25 | | | | | 10,000 | | | | 9,889,792 | |
4.401% | | 04/10/25 | | | | | 20,000 | | | | 19,763,087 | |
4.402% | | 02/04/25 | | | | | 10,000 | | | | 9,958,704 | |
4.411% | | 04/01/25 | | | | | 10,000 | | | | 9,891,300 | |
4.418% | | 03/11/25 | | | | | 6,750 | | | | 6,693,508 | |
4.426% | | 02/25/25 | | | | | 17,000 | | | | 16,886,356 | |
4.439% | | 01/16/25 | | | | | 10,000 | | | | 9,981,600 | |
4.440% | | 05/01/25 | | | | | 20,000 | | | | 19,710,517 | |
4.447% | | 03/06/25 | | | | | 15,000 | | | | 14,882,733 | |
4.469% | | 01/28/25 | | | | | 44,000 | | | | 43,853,842 | |
4.471% | | 02/13/25 | | | | | 4,000 | | | | 3,978,875 | |
4.505% | | 01/21/25 | | | | | 14,000 | | | | 13,965,463 | |
4.515% | | 02/11/25 | | | | | 12,000 | | | | 11,939,183 | |
4.519% | | 02/18/25 | | | | | 20,000 | | | | 19,881,240 | |
4.583% | | 01/09/25 | | | | | 26,500 | | | | 26,473,279 | |
4.827% | | 01/14/25 | | | | | 15,000 | | | | 14,974,263 | |
| | | | | | | | | | | | |
| |
TOTAL U.S. TREASURY OBLIGATIONS
(cost $337,980,003) | | | | 337,980,003 | |
| | | | | | | | | | | | |
| |
TOTAL INVESTMENTS—100.4%
(cost $1,380,990,398) | | | | 1,380,990,398 | |
Liabilities in excess of other assets — (0.4)% | | | | (5,281,659 | ) |
| | | | | | | | | | | | |
| |
NET ASSETS — 100.0% | | | $ | 1,375,708,739 | |
| | | | | | | | | | | | |
See the Glossary for a list of the abbreviation(s) used in the annual report.
| # | Principal amount is shown in U.S. dollars unless otherwise stated. |
| (c) | Variable rate instrument. The interest rate shown reflects the rate in effect at December 31, 2024. |
| (n) | Rate shown reflects yield to maturity at purchased date. |
Fair Value Measurements:
Various inputs are used in determining the value of the Portfolio’s investments. These inputs are summarized in the three broad levels listed below.
Level 1—unadjusted quoted prices generally in active markets for identical securities.
Level 2—quoted prices for similar securities, interest rates and yield curves, prepayment speeds, foreign currency exchange rates and other observable inputs.
Level 3—unobservable inputs for securities valued in accordance with Board approved fair valuation procedures.
The following is a summary of the inputs used as of December 31, 2024 in valuing such portfolio securities:
| | | | | | | | | | | | | | | | | | | | | | | | | | | | | | | | | | | |
| | | Level 1 | | Level 2 | | Level 3 |
Investments in Securities | | | | | | | | | | | | | | | | | | | | | | | | | | | | | | | | | | | |
Assets | | | | | | | | | | | | | | | | | | | | | | | | | | | | | | | | | | | |
Short-Term Investments | | | | | | | | | | | | | | | | | | | | | | | | | | | | | | | | | | | |
Repurchase Agreements | | | | | | | | $ | — | | | | | | | | | $ | 639,049,000 | | | | | | | | | $ | — | | | | | | |
U.S. Government Agency Obligations. | | | | | | | | | — | | | | | | | | | | 403,961,395 | | | | | | | | | | — | | | | | | |
U.S. Treasury Obligations | | | | | | | | | — | | | | | | | | | | 337,980,003 | | | | | | | | | | — | | | | | | |
| | | | | | | | | | | | | | | | | | | | | | | | | | | | | | | | | | | |
Total | | | | | | | | $ | — | | | | | | | | | $ | 1,380,990,398 | | | | | | | | | $ | — | | | | | | |
| | | | | | | | | | | | | | | |
SEE NOTES TO FINANCIAL STATEMENTS.
A116
| | | | |
| | PSF PGIM GOVERNMENT MONEY MARKET PORTFOLIO (CONTINUED) | | |
SCHEDULE OF INVESTMENTS | | | | as of December 31, 2024 |
Sector Classification:
The sector classification of investments and liabilities in excess of other assets shown as a percentage of net assets as of December 31, 2024 were as follows:
| | | | |
Repurchase Agreements | | | 46.4 | % |
U.S. Government Agency Obligations | | | 29.4 | |
U.S. Treasury Obligations | | | 24.6 | |
| | | | |
| | | 100.4 | |
Liabilities in excess of other assets | | | (0.4 | ) |
| | | | |
| | | 100.0 | % |
| | | | |
Financial Instruments/Transactions—Summary of Offsetting and Netting Arrangements:
The Portfolio entered into financial instruments/transactions during the reporting period that are either offset in accordance with current requirements or are subject to enforceable master netting arrangements or similar agreements that permit offsetting. The information about offsetting and related netting arrangements for financial instruments/transactions where the legal right to set-off exists is presented in the summary below.
Offsetting of financial instrument/transaction assets and liabilities:
| | | | | | | | | | | | | | | | | | | | | | | | | | | |
| Description | | Counterparty | | Gross Market Value of
Recognized Assets/(Liabilities) | | Collateral Pledged/(Received)(1) | | Net Amount |
Repurchase Agreement | | Bank of America Securities, Inc. | | | | | | | | $ | 65,000,000 | | | | | | | | | $ | (65,000,000 | ) | | | $ | — | |
Repurchase Agreement | | Bank of Nova Scotia | | | | | | | | | 50,000,000 | | | | | | | | | | (50,000,000 | ) | | | | — | |
Repurchase Agreements | | Canadian Imperial Bank of Commerce | | | | | | | | | 57,000,000 | | | | | | | | | | (57,000,000 | ) | | | | — | |
Repurchase Agreements | | Credit Agricole Securities Inc. | | | | | | | | | 78,049,000 | | | | | | | | | | (78,049,000 | ) | | | | — | |
Repurchase Agreements | | ING Financial Markets LLC | | | | | | | | | 90,000,000 | | | | | | | | | | (90,000,000 | ) | | | | — | |
Repurchase Agreements | | Natixis | | | | | | | | | 85,000,000 | | | | | | | | | | (85,000,000 | ) | | | | — | |
Repurchase Agreement | | NatWest Markets Securities, Inc. | | | | | | | | | 65,000,000 | | | | | | | | | | (65,000,000 | ) | | | | — | |
Repurchase Agreement | | TD Securities (USA) LLC | | | | | | | | | 65,000,000 | | | | | | | | | | (65,000,000 | ) | | | | — | |
Repurchase Agreements | | Wells Fargo Securities LLC | | | | | | | | | 84,000,000 | | | | | | | | | | (84,000,000 | ) | | | | — | |
| | | | | | | | | | | | | | | | | | | | | | | | | | | |
| | | | | | | | | | $ | 639,049,000 | | | | | | | | | | | | | | | | |
| | | | | | | | | | | | | | | | | | | | | | | | | | | |
| (1) | Collateral amount disclosed by the Portfolio is limited to the market value of financial instruments/transactions. |
SEE NOTES TO FINANCIAL STATEMENTS.
A117
| | | | |
| | PSF PGIM GOVERNMENT MONEY MARKET PORTFOLIO (CONTINUED) | | |
| | | | |
STATEMENT OF ASSETS AND LIABILITIES
as of December 31, 2024
| | | | |
ASSETS | | | | |
Investments, at value: | | $ | 741,941,398 | |
Repurchase Agreements (cost $639,049,000) | | | 639,049,000 | |
Cash | | | 466 | |
Interest receivable | | | 2,756,881 | |
Receivable for Portfolio shares sold | | | 535,343 | |
Prepaid expenses | | | 12,723 | |
| | | | |
Total Assets | | | 1,384,295,811 | |
| | | | |
LIABILITIES | | | | |
Payable for Portfolio shares purchased | | | 8,025,165 | |
Management fee payable | | | 351,913 | |
Accrued expenses and other liabilities | | | 134,941 | |
Distribution fee payable | | | 72,833 | |
Affiliated transfer agent fee payable | | | 1,190 | |
Trustees’ fees payable | | | 1,030 | |
| | | | |
Total Liabilities | | | 8,587,072 | |
| | | | |
NET ASSETS | | $ | 1,375,708,739 | |
| | | | |
Net assets were comprised of: | | | | |
Partners’ Equity | | $ | 1,375,708,739 | |
| | | | |
Class I: | | | | |
Net asset value and redemption price per share, $1,044,317,142 / 104,428,905 outstanding shares of beneficial interest | | $ | 10.00 | |
| | | | |
Class III: | | | | |
Net asset value and redemption price per share, $331,391,597 / 33,139,336 outstanding shares of beneficial interest | | $ | 10.00 | |
| | | | |
STATEMENT OF OPERATIONS
Year Ended December 31, 2024
| | | | |
NET INVESTMENT INCOME (LOSS) | | | | |
Interest income | | $ | 67,214,488 | |
| | | | |
EXPENSES | | | | |
Management fee | | | 3,870,509 | |
Distribution fee—Class III | | | 773,002 | |
Custodian and accounting fees | | | 124,223 | |
Shareholders’ reports | | | 106,898 | |
Professional fees | | | 51,104 | |
Audit fee | | | 33,640 | |
Trustees’ fees | | | 28,960 | |
Transfer agent’s fees and expenses (including affiliated expense of $7,143) | | | 11,942 | |
Miscellaneous | | | 37,567 | |
| | | | |
Total expenses | | | 5,037,845 | |
| | | | |
NET INVESTMENT INCOME (LOSS) | | | 62,176,643 | |
| | | | |
REALIZED AND UNREALIZED GAIN (LOSS) ON INVESTMENT TRANSACTIONS | | | | |
Net realized gain (loss) on investment transactions | | | 43,762 | |
| | | | |
NET INCREASE (DECREASE) IN NET ASSETS RESULTING FROM OPERATIONS | | $ | 62,220,405 | |
| | | | |
STATEMENTS OF CHANGES IN NET ASSETS
| | | | | | | | | | | | | | | | | | | | | | | | |
| | | Year Ended
December 31, 2024 | | | Year Ended
December 31, 2023 | |
| | | | | | | | | | | | | | | | | | |
INCREASE (DECREASE) IN NET ASSETS | | | | | | | | | | | | | | | | | | | | | | | | |
OPERATIONS | | | | | | | | | | | | | | | | | | | | | | | | |
Net investment income (loss) | | | | | | $ | 62,176,643 | | | | | | | | | | | $ | 51,728,929 | | | | | |
Net realized gain (loss) on investment transactions | | | | | | | 43,762 | | | | | | | | | | | | 56,927 | | | | | |
| | | | | | | | | | | | | | | | | | | | | | | | |
NET INCREASE (DECREASE) IN NET ASSETS RESULTING FROM OPERATIONS | | | | | | | 62,220,405 | | | | | | | | | | | | 51,785,856 | | | | | |
| | | | | | | | | | | | | | | | | | | | | | | | |
DISTRIBUTIONS | | | | | | | | | | | | | | | | | | | | | | | | |
Class I | | | | | | | (47,937,044 | ) | | | | | | | | | | | (43,482,898 | ) | | | | |
Class III | | | | | | | (14,283,308 | ) | | | | | | | | | | | (8,302,958 | ) | | | | |
| | | | | | | | | | | | | | | | | | | | | | | | |
| | | | | | | (62,220,352 | ) | | | | | | | | | | | (51,785,856 | ) | | | | |
| | | | | | | | | | | | | | | | | | | | | | | | |
PORTFOLIO SHARE TRANSACTIONS | | | | | | | | | | | | | | | | | | | | | | | | |
Portfolio shares sold | | | | | | | 1,405,805,895 | | | | | | | | | | | | 1,691,793,375 | | | | | |
Portfolio shares issued in reinvestment of distributions | | | | | | | 62,220,352 | | | | | | | | | | | | 51,785,856 | | | | | |
Portfolio shares purchased | | | | | | | (1,260,849,322 | ) | | | | | | | | | | | (1,520,358,197 | ) | | | | |
| | | | | | | | | | | | | | | | | | | | | | | | |
NET INCREASE (DECREASE) IN NET ASSETS FROM PORTFOLIO SHARE TRANSACTIONS | | | | | | | 207,176,925 | | | | | | | | | | | | 223,221,034 | | | | | |
| | | | | | | | | | | | | | | | | | | | | | | | |
TOTAL INCREASE (DECREASE) | | | | | | | 207,176,978 | | | | | | | | | | | | 223,221,034 | | | | | |
NET ASSETS: | | | | | | | | | | | | | | | | | | | | | | | | |
Beginning of year | | | | | | | 1,168,531,761 | | | | | | | | | | | | 945,310,727 | | | | | |
| | | | | | | | | | | | | | | | | | | | | | | | |
End of year | | | | | | $ | 1,375,708,739 | | | | | | | | | | | $ | 1,168,531,761 | | | | | |
| | | | | | | | | | | | | | | | | | | | | | | | |
SEE NOTES TO FINANCIAL STATEMENTS.
A118
| | | | |
| | PSF PGIM GOVERNMENT MONEY MARKET PORTFOLIO (CONTINUED) | | |
FINANCIAL HIGHLIGHTS | | | | |
| | | | | | | | | | | | | | | | | | | | |
Class I | | | | | | | | | | | | | | | |
| | | Year Ended December 31, | |
| | | 2024 | | | 2023 | | | 2022 | | | 2021 | | | 2020 | |
Per Share Operating Performance(a): | | | | | | | | | | | | | | | | | | | | |
Net Asset Value, beginning of year | | $ | 10.00 | | | $ | 10.00 | | | $ | 10.00 | | | $ | 10.00 | | | $ | 10.00 | |
| | | | | | | | | | | | | | | | | | | | |
Income (Loss) From Investment Operations: | | | | | | | | | | | | | | | | | | | | |
Net investment income (loss) and realized gains (losses) | | | 0.49 | | | | 0.48 | | | | 0.14 | | | | — | (b) | | | 0.03 | |
Less Dividends and Distributions | | | (0.49 | ) | | | (0.48 | ) | | | (0.14 | ) | | | (— | )(b) | | | (0.03 | ) |
| | | | | | | | | | | | | | | | | | | | |
Net Asset Value, end of year | | $ | 10.00 | | | $ | 10.00 | | | $ | 10.00 | | | $ | 10.00 | | | $ | 10.00 | |
| | | | | | | | | | | | | | | | | | | | |
Total Return(c) | | | 5.02 | % | | | 4.87 | % | | | 1.39 | % | | | 0.04 | % | | | 0.30 | % |
Ratios/Supplemental Data: | | | | | | | | | | | | | | | | | | | | |
Net assets, end of year (in millions) | | $ | 1,044 | | | $ | 931 | | | $ | 803 | | | $ | 725 | | | $ | 792 | |
Average net assets (in millions) | | $ | 981 | | | $ | 910 | | | $ | 780 | | | $ | 748 | | | $ | 667 | |
Ratios to average net assets(d): | | | | | | | | | | | | | | | | | | | | |
Expenses after waivers and/or expense reimbursement | | | 0.33 | % | | | 0.33 | % | | | 0.27 | % | | | 0.06 | % | | | 0.21 | % |
Expenses before waivers and/or expense reimbursement | | | 0.33 | % | | | 0.33 | % | | | 0.32 | % | | | 0.32 | % | | | 0.34 | % |
Net investment income (loss) | | | 4.88 | % | | | 4.78 | % | | | 1.37 | % | | | — | % | | | 0.26 | % |
| | | | | | | | | | | | | | | | | | | | | | | | | | | | |
Class III | | | | | | | | | | | | | | | | | | | | | |
| | | Year Ended December 31, | | | May 18, 2020(e)
through December 31,
2020 | |
| | | 2024 | | | 2023 | | | 2022 | | | 2021 | |
Per Share Operating Performance(a): | | | | | | | | | | | | | | | | | | | | | | | | | | | | |
Net Asset Value, beginning of period | | | $10.00 | | | | $10.00 | | | | $10.00 | | | | $10.00 | | | | | | | $ | 10.00 | | | | | |
| | | | | | | | | | | | | | | | | | | | | | | | | | | | |
Income (Loss) From Investment Operations: | | | | | | | | | | | | | | | | | | | | | | | | | | | | |
Net investment income (loss) and realized gains (losses) | | | 0.46 | | | | 0.45 | | | | 0.12 | | | | — | (b) | | | | | | | — | (b) | | | | |
Less Dividends and Distributions: | | | (0.46 | ) | | | (0.45 | ) | | | (0.12 | ) | | | (— | )(b) | | | | | | | (— | )(b) | | | | |
| | | | | | | | | | | | | | | | | | | | | | | | | | | | |
Net Asset Value, end of period | | | $10.00 | | | | $10.00 | | | | $10.00 | | | | $10.00 | | | | | | | $ | 10.00 | | | | | |
| | | | | | | | | | | | | | | | | | | | | | | | | | | | |
Total Return(c) | | | 4.75 | % | | | 4.61 | % | | | 1.22 | % | | | 0.04 | % | | | | | | | — | %(b) | | | | |
Ratios/Supplemental Data: | | | | | | | | | | | | | | | | | | | | | | | | | | | | |
Net assets, end of period (in millions) | | $ | 331 | | | $ | 237 | | | $ | 143 | | | $ | 144 | | | | | | | $ | 66 | | | | | |
Average net assets (in millions) | | $ | 309 | | | $ | 182 | | | $ | 137 | | | $ | 118 | | | | | | | $ | 34 | | | | | |
Ratios to average net assets(d): | | | | | | | | | | | | | | | | | | | | | | | | | | | | |
Expenses after waivers and/or expense reimbursement | | | 0.58 | % | | | 0.58 | % | | | 0.44 | % | | | 0.06 | % | | | | | | | 0.13 | %(f) | | | | |
Expenses before waivers and/or expense reimbursement | | | 0.58 | % | | | 0.58 | % | | | 0.58 | % | | | 0.58 | % | | | | | | | 0.58 | %(f) | | | | |
Net investment income (loss) | | | 4.62 | % | | | 4.57 | % | | | 1.23 | % | | | — | % | | | | | | | — | %(b)(f) | | | | |
| (a) | Calculated based on average shares outstanding during the period. |
| (b) | Amount rounds to zero. |
| (c) | Total return is calculated assuming a purchase of a share on the first day and a sale on the last day of each period reported and includes reinvestment of dividends and distributions, if any, and does not reflect the effect of insurance contract charges. Total return does not reflect expenses associated with the separate account such as administrative fees, account charges and surrender charges which, if reflected, would reduce the total returns for all periods shown. Performance figures may reflect fee waivers and/or expense reimbursements. In the absence of fee waivers and/or expense reimbursements, the total return would be lower. Past performance is no guarantee of future results. Total returns may reflect adjustments to conform to GAAP. Total returns for periods less than one full year are not annualized. |
| (d) | Does not include expenses of the underlying funds in which the Portfolio invests. |
| (e) | Commencement of offering. |
SEE NOTES TO FINANCIAL STATEMENTS.
A119
| | | | |
| | PSF PGIM HIGH YIELD BOND PORTFOLIO | | |
| | | | |
SCHEDULE OF INVESTMENTS | | | | as of December 31, 2024 |
| | | | | | | | | | | | |
Interest
Rate | | Maturity
Date | | | | Principal
Amount
(000)# | | | Value | |
|
LONG-TERM INVESTMENTS — 96.0% | |
ASSET-BACKED SECURITIES — 0.4% | |
Collateralized Loan Obligations | |
BlueMountain CLO Ltd. (Cayman Islands), | |
Series 2018-22A, Class A1, 144A, 3 Month SOFR + 1.342% (Cap N/A, Floor 1.080%) | |
5.998%(c) | | 07/15/31 | | | | | 1,628 | | | $ | 1,629,646 | |
KKR CLO Ltd. (Cayman Islands), | |
Series 11, Class AR, 144A, 3 Month SOFR + 1.442% (Cap N/A, Floor 1.442%) | |
6.098%(c) | | 01/15/31 | | | | | 986 | | | | 988,097 | |
| | | | | | | | | | | | |
| |
TOTAL ASSET-BACKED SECURITIES
(cost $2,573,595) | | | | 2,617,743 | |
| | | | | | | | | | | | |
|
COMMERCIAL MORTGAGE-BACKED SECURITY — 0.2% | |
ROCK Trust, | |
Series 2024-CNTR, Class E, 144A | |
8.819% | | 11/13/41 | | | | | 1,475 | | | | 1,525,054 | |
| | | | | | | | | | | | |
(cost $1,475,000) | |
|
CORPORATE BONDS — 84.4% | |
Advertising — 0.4% | |
Clear Channel Outdoor Holdings, Inc., | |
Sr. Sec’d. Notes, 144A | |
5.125% | | 08/15/27(a) | | | | | 1,975 | | | | 1,901,647 | |
9.000% | | 09/15/28(a) | | | | | 550 | | | | 575,858 | |
CMG Media Corp., | |
Sec’d. Notes, 144A | |
8.875% | | 06/18/29 | | | | | 600 | | | | 450,303 | |
| | | | | | | | | | | | |
| | | | |
| | | | | | | | | | | 2,927,808 | |
| | | | | | | | | | | | |
Aerospace & Defense — 2.0% | |
Boeing Co. (The), | |
Sr. Unsec’d. Notes | |
5.805% | | 05/01/50 | | | | | 1,025 | | | | 951,507 | |
5.930% | | 05/01/60 | | | | | 725 | | | | 668,218 | |
Bombardier, Inc. (Canada), | |
Sr. Unsec’d. Notes, 144A | |
6.000% | | 02/15/28 | | | | | 1,115 | | | | 1,109,425 | |
7.000% | | 06/01/32(a) | | | | | 395 | | | | 400,925 | |
7.125% | | 06/15/26 | | | | | 863 | | | | 865,157 | |
7.250% | | 07/01/31 | | | | | 400 | | | | 411,264 | |
7.500% | | 02/01/29(a) | | | | | 1,300 | | | | 1,352,312 | |
7.875% | | 04/15/27 | | | | | 2,675 | | | | 2,678,344 | |
8.750% | | 11/15/30 | | | | | 860 | | | | 923,425 | |
Goat Holdco LLC, | |
Sr. Sec’d. Notes, 144A | |
6.750% | | 02/01/32 | | | | | 195 | | | | 193,086 | |
TransDigm, Inc., | |
Gtd. Notes | |
4.625% | | 01/15/29 | | | | | 1,500 | | | | 1,404,803 | |
5.500% | | 11/15/27 | | | | | 775 | | | | 762,741 | |
Sr. Sec’d. Notes, 144A | |
6.000% | | 01/15/33 | | | | | 640 | | | | 627,263 | |
6.375% | | 03/01/29 | | | | | 990 | | | | 993,069 | |
6.625% | | 03/01/32 | | | | | 750 | | | | 756,836 | |
| | | | | | | | | | | | |
| | | | |
| | | | | | | | | | | 14,098,375 | |
| | | | | | | | | | | | |
| | | | | | | | | | | | |
Interest
Rate | | Maturity
Date | | | | Principal
Amount
(000)# | | | Value | |
|
CORPORATE BONDS (continued) | |
Airlines — 1.1% | |
American Airlines, Inc., | |
Sr. Sec’d. Notes, 144A | |
7.250% | | 02/15/28 | | | | | 300 | | | $ | 307,037 | |
American Airlines, Inc./AAdvantage Loyalty IP Ltd., | |
Sr. Sec’d. Notes, 144A | |
5.500% | | 04/20/26 | | | | | 63 | | | | 62,363 | |
5.750% | | 04/20/29(a) | | | | | 2,075 | | | | 2,053,088 | |
United Airlines, Inc., | |
Sr. Sec’d. Notes, 144A | |
4.375% | | 04/15/26 | | | | | 640 | | | | 629,042 | |
4.625% | | 04/15/29 | | | | | 1,515 | | | | 1,440,100 | |
VistaJet Malta Finance PLC/Vista Management Holding, Inc. (Switzerland), | |
Sr. Unsec’d. Notes, 144A | |
6.375% | | 02/01/30 | | | | | 1,575 | | | | 1,370,250 | |
7.875% | | 05/01/27 | | | | | 1,140 | | | | 1,105,800 | |
9.500% | | 06/01/28 | | | | | 720 | | | | 720,000 | |
| | | | | | | | | | | | |
| | | | |
| | | | | | | | | | | 7,687,680 | |
| | | | | | | | | | | | |
Apparel — 0.5% | |
Kontoor Brands, Inc., | |
Gtd. Notes, 144A | |
4.125% | | 11/15/29 | | | | | 1,225 | | | | 1,128,085 | |
Wolverine World Wide, Inc., | |
Gtd. Notes, 144A | |
4.000% | | 08/15/29 | | | | | 2,825 | | | | 2,477,197 | |
| | | | | | | | | | | | |
| | | | |
| | | | | | | | | | | 3,605,282 | |
| | | | | | | | | | | | |
Auto Manufacturers — 0.6% | |
Ford Motor Co., | |
Sr. Unsec’d. Notes | |
4.750% | | 01/15/43 | | | | | 100 | | | | 78,762 | |
7.400% | | 11/01/46 | | | | | 275 | | | | 290,006 | |
Ford Motor Credit Co. LLC, | |
Sr. Unsec’d. Notes | |
3.375% | | 11/13/25 | | | | | 800 | | | | 787,752 | |
JB Poindexter & Co., Inc., | |
Sr. Unsec’d. Notes, 144A | |
8.750% | | 12/15/31 | | | | | 985 | | | | 1,036,373 | |
PM General Purchaser LLC, | |
Sr. Sec’d. Notes, 144A | |
9.500% | | 10/01/28 | | | | | 2,125 | | | | 2,111,001 | |
| | | | | | | | | | | | |
| | | | |
| | | | | | | | | | | 4,303,894 | |
| | | | | | | | | | | | |
Auto Parts & Equipment — 1.4% | |
Adient Global Holdings Ltd., | |
Gtd. Notes, 144A | |
4.875% | | 08/15/26 | | | | | 1,025 | | | | 1,009,235 | |
Sr. Sec’d. Notes, 144A | |
7.000% | | 04/15/28 | | | | | 975 | | | | 984,750 | |
American Axle & Manufacturing, Inc., | |
Gtd. Notes | |
6.500% | | 04/01/27(a) | | | | | 625 | | | | 618,750 | |
Dana Financing Luxembourg Sarl, | |
Gtd. Notes, 144A | |
5.750% | | 04/15/25 | | | | | 237 | | | | 235,519 | |
SEE NOTES TO FINANCIAL STATEMENTS.
A120
| | | | |
| | PSF PGIM HIGH YIELD BOND PORTFOLIO (CONTINUED) | | |
| | | | |
SCHEDULE OF INVESTMENTS | | | | as of December 31, 2024 |
| | | | | | | | | | | | |
Interest
Rate | | Maturity
Date | | | | Principal
Amount
(000)# | | | Value | |
|
CORPORATE BONDS (continued) | |
Auto Parts & Equipment (cont’d.) | |
Dana, Inc., | |
Sr. Unsec’d. Notes | |
4.250% | | 09/01/30 | | | | | 275 | | | $ | 255,661 | |
5.375% | | 11/15/27 | | | | | 175 | | | | 172,529 | |
5.625% | | 06/15/28 | | | | | 475 | | | | 468,512 | |
Garrett Motion Holdings, Inc./Garrett LX I Sarl, | |
Gtd. Notes, 144A | |
7.750% | | 05/31/32 | | | | | 830 | | | | 840,892 | |
Phinia, Inc., | |
Gtd. Notes, 144A | |
6.625% | | 10/15/32 | | | | | 255 | | | | 253,219 | |
Sr. Sec’d. Notes, 144A | |
6.750% | | 04/15/29 | | | | | 225 | | | | 229,515 | |
Tenneco, Inc., | |
Sr. Sec’d. Notes, 144A | |
8.000% | | 11/17/28 | | | | | 3,925 | | | | 3,651,179 | |
Titan International, Inc., | |
Sr. Sec’d. Notes | |
7.000% | | 04/30/28(a) | | | | | 1,600 | | | | 1,567,922 | |
| | | | | | | | | | | | |
| | | | |
| | | | | | | | | | | 10,287,683 | |
| | | | | | | | | | | | |
Banks — 1.0% | |
Citigroup, Inc., | |
Jr. Sub. Notes, Series EE | |
6.750%(ff) | | 02/15/30(oo) | | | | | 392 | | | | 390,084 | |
Jr. Sub. Notes, Series X | |
3.875%(ff) | | 02/18/26(oo) | | | | | 1,275 | | | | 1,234,995 | |
Freedom Mortgage Corp., | |
Sr. Unsec’d. Notes, 144A | |
6.625% | | 01/15/27 | | | | | 1,975 | | | | 1,972,738 | |
7.625% | | 05/01/26 | | | | | 925 | | | | 927,975 | |
12.000% | | 10/01/28 | | | | | 325 | | | | 352,570 | |
12.250% | | 10/01/30 | | | | | 350 | | | | 387,367 | |
Intesa Sanpaolo SpA (Italy), | |
Sub. Notes, 144A | |
4.198%(ff) | | 06/01/32 | | | | | 975 | | | | 844,418 | |
4.950%(ff) | | 06/01/42 | | | | | 675 | | | | 523,672 | |
Wells Fargo & Co., | |
Jr. Sub. Notes | |
6.850%(ff) | | 09/15/29(oo) | | | | | 270 | | | | 278,013 | |
| | | | | | | | | | | | |
| | | | |
| | | | | | | | | | | 6,911,832 | |
| | | | | | | | | | | | |
Building Materials — 1.8% | |
Builders FirstSource, Inc., | |
Gtd. Notes, 144A | |
5.000% | | 03/01/30 | | | | | 165 | | | | 156,954 | |
Camelot Return Merger Sub, Inc., | |
Sr. Sec’d. Notes, 144A | |
8.750% | | 08/01/28 | | | | | 550 | | | | 527,000 | |
Cornerstone Building Brands, Inc., | |
Gtd. Notes, 144A | |
6.125% | | 01/15/29 | | | | | 1,660 | | | | 1,324,170 | |
Eco Material Technologies, Inc., | |
Sr. Sec’d. Notes, 144A | |
7.875% | | 01/31/27 | | | | | 1,730 | | | | 1,758,544 | |
| | | | | | | | | | | | |
Interest Rate | | Maturity
Date | | | | Principal
Amount
(000)# | | | Value | |
|
CORPORATE BONDS (continued) | |
Building Materials (cont’d.) | |
EMRLD Borrower LP/Emerald Co-Issuer, Inc., | |
Sr. Sec’d. Notes, 144A | |
6.750% | | 07/15/31 | | | | | 275 | | | $ | 276,468 | |
Griffon Corp., | |
Gtd. Notes | |
5.750% | | 03/01/28 | | | | | 425 | | | | 416,593 | |
Knife River Corp., | |
Sr. Unsec’d. Notes, 144A | |
7.750% | | 05/01/31 | | | | | 150 | | | | 156,222 | |
Masterbrand, Inc., | |
Gtd. Notes, 144A | |
7.000% | | 07/15/32 | | | | | 250 | | | | 251,807 | |
Miter Brands Acquisition Holdco, Inc./MIWD Borrower LLC, | |
Sr. Sec’d. Notes, 144A | |
6.750% | | 04/01/32 | | | | | 218 | | | | 219,181 | |
MIWD Holdco II LLC/MIWD Finance Corp., | |
Gtd. Notes, 144A | |
5.500% | | 02/01/30 | | | | | 1,035 | | | | 977,612 | |
Smyrna Ready Mix Concrete LLC, | |
Sr. Sec’d. Notes, 144A | |
6.000% | | 11/01/28 | | | | | 1,198 | | | | 1,168,103 | |
8.875% | | 11/15/31 | | | | | 1,080 | | | | 1,132,596 | |
Standard Building Solutions, Inc., | |
Sr. Unsec’d. Notes, 144A | |
6.500% | | 08/15/32 | | | | | 530 | | | | 531,441 | |
Standard Industries, Inc., | | | | | | | | | | |
Sr. Unsec’d. Notes, 144A | |
3.375% | | 01/15/31 | | | | | 1,600 | | | | 1,371,904 | |
4.375% | | 07/15/30 | | | | | 1,525 | | | | 1,390,491 | |
4.750% | | 01/15/28 | | | | | 525 | | | | 503,392 | |
5.000% | | 02/15/27 | | | | | 890 | | | | 870,566 | |
| | | | | | | | | | | | |
| | | | |
| | | | | | | | | | | 13,033,044 | |
| | | | | | | | | | | | |
|
Chemicals — 1.4% | |
Ashland, Inc., | |
Sr. Unsec’d. Notes | |
6.875% | | 05/15/43 | | | | | 1,705 | | | | 1,772,250 | |
ASP Unifrax Holdings, Inc., | |
Sec’d. Notes, 144A, Cash coupon 5.850% and PIK 1.250% or Cash coupon 7.100% | |
7.100% | | 09/30/29 | | | | | 402 | | | | 264,226 | |
Avient Corp., | |
Sr. Unsec’d. Notes, 144A | |
6.250% | | 11/01/31 | | | | | 205 | | | | 202,623 | |
Celanese US Holdings LLC, | |
Gtd. Notes | |
6.600% | | 11/15/28 | | | | | 300 | | | | 306,997 | |
6.800% | | 11/15/30 | | | | | 75 | | | | 77,597 | |
Chemours Co. (The), | |
Gtd. Notes, 144A | |
8.000% | | 01/15/33 | | | | | 365 | | | | 356,598 | |
Cornerstone Chemical Co. LLC, | |
Sr. Sec’d. Notes, 144A, Cash coupon 5.000% and PIK 10.000% | |
15.000% | | 12/06/28 | | | | | 497 | | | | 472,340 | |
Sr. Sec’d. Notes, 144A | |
15.000% | | 12/06/28 | | | | | 79 | | | | 74,449 | |
15.000% | | 12/06/28 | | | | | 51 | | | | 46,200 | |
SEE NOTES TO FINANCIAL STATEMENTS.
A121
| | | | |
| | PSF PGIM HIGH YIELD BOND PORTFOLIO (CONTINUED) | | |
| | | | |
SCHEDULE OF INVESTMENTS | | | | as of December 31, 2024 |
| | | | | | | | | | | | |
Interest
Rate | | Maturity
Date | | | | Principal
Amount
(000)# | | | Value | |
|
CORPORATE BONDS (continued) | |
Chemicals (cont’d.) | |
Methanex US Operations, Inc., | |
Gtd. Notes, 144A | |
6.250% | | 03/15/32 | | | | | 205 | | | $ | 202,691 | |
NOVA Chemicals Corp. (Canada), | |
Sr. Unsec’d. Notes, 144A | |
7.000% | | 12/01/31 | | | | | 150 | | | | 148,875 | |
Olympus Water US Holding Corp., | |
Sr. Sec’d. Notes, 144A | |
4.250% | | 10/01/28 | | | | | 500 | | | | 468,301 | |
7.250% | | 06/15/31 | | | | | 395 | | | | 401,014 | |
9.750% | | 11/15/28 | | | | | 1,575 | | | | 1,670,216 | |
Sr. Unsec’d. Notes, 144A | |
6.250% | | 10/01/29 | | | | | 1,475 | | | | 1,402,382 | |
SK Invictus Intermediate II Sarl, | |
Sr. Sec’d. Notes, 144A | |
5.000% | | 10/30/29 | | | | | 665 | | | | 616,787 | |
SNF Group SACA (France), | |
Sr. Unsec’d. Notes, 144A | |
3.375% | | 03/15/30 | | | | | 425 | | | | 371,875 | |
Tronox, Inc., | |
Gtd. Notes, 144A | |
4.625% | | 03/15/29(a) | | | | | 1,245 | | | | 1,117,410 | |
WR Grace Holdings LLC, | |
Sr. Sec’d. Notes, 144A | |
7.375% | | 03/01/31 | | | | | 150 | | | | 153,183 | |
| | | | | | | | | | | | |
| | | | |
| | | | | | | | | | | 10,126,014 | |
| | | | | | | | | | | | |
Coal — 0.2% | |
Conuma Resources Ltd. (Canada), | |
Sr. Sec’d. Notes, 144A | |
13.125% | | 05/01/28 | | | | | 604 | | | | 608,530 | |
Coronado Finance Pty Ltd. (Australia), | |
Sr. Sec’d. Notes, 144A | |
9.250% | | 10/01/29 | | | | | 560 | | | | 564,200 | |
| | | | | | | | | | | | |
| | | | |
| | | | | | | | | | | 1,172,730 | |
| | | | | | | | | | | | |
Commercial Services — 4.5% | |
Adtalem Global Education, Inc., | |
Sr. Sec’d. Notes, 144A | |
5.500% | | 03/01/28 | | | | | 390 | | | | 381,488 | |
Allied Universal Holdco LLC, | |
Sr. Sec’d. Notes, 144A | |
7.875% | | 02/15/31 | | | | | 1,175 | | | | 1,202,316 | |
Allied Universal Holdco LLC/Allied Universal Finance Corp., | |
Sr. Unsec’d. Notes, 144A | |
6.000% | | 06/01/29 | | | | | 3,200 | | | | 2,918,811 | |
9.750% | | 07/15/27 | | | | | 2,200 | | | | 2,214,524 | |
Allied Universal Holdco LLC/Allied Universal Finance Corp./Atlas Luxco 4 Sarl, | |
Sr. Sec’d. Notes, 144A | |
4.625% | | 06/01/28 | | | | | 2,360 | | | | 2,224,158 | |
4.625% | | 06/01/28 | | | | | 1,065 | | | | 1,000,780 | |
Alta Equipment Group, Inc., | |
Sec’d. Notes, 144A | |
9.000% | | 06/01/29 | | | | | 670 | | | | 639,139 | |
| | | | | | | | | | | | |
Interest
Rate | | Maturity
Date | | | | Principal
Amount
(000)# | | | Value | |
|
CORPORATE BONDS (continued) | |
Commercial Services (cont’d.) | |
AMN Healthcare, Inc., | |
Gtd. Notes, 144A | |
4.000% | | 04/15/29(a) | | | | | 2,000 | | | $ | 1,793,825 | |
4.625% | | 10/01/27 | | | | | 800 | | | | 759,192 | |
APi Group DE, Inc., | |
Gtd. Notes, 144A | |
4.750% | | 10/15/29 | | | | | 1,200 | | | | 1,128,390 | |
Avis Budget Car Rental LLC/Avis Budget Finance, Inc., | |
Gtd. Notes, 144A | |
4.750% | | 04/01/28(a) | | | | | 1,050 | | | | 981,258 | |
5.750% | | 07/15/27 | | | | | 220 | | | | 215,015 | |
5.750% | | 07/15/27(a) | | | | | 575 | | | | 564,908 | |
Belron UK Finance PLC (United Kingdom), | |
Sr. Sec’d. Notes, 144A | |
5.750% | | 10/15/29 | | | | | 200 | | | | 199,250 | |
Boost Newco Borrower LLC, | |
Sr. Sec’d. Notes, 144A | |
7.500% | | 01/15/31 | | | | | 850 | | | | 890,464 | |
Brink’s Co. (The), | |
Gtd. Notes, 144A | |
6.500% | | 06/15/29 | | | | | 125 | | | | 126,324 | |
DCLI Bidco LLC, | |
Second Mortgage, 144A | |
7.750% | | 11/15/29 | | | | | 475 | | | | 485,406 | |
Herc Holdings, Inc., | |
Gtd. Notes, 144A | |
6.625% | | 06/15/29 | | | | | 930 | | | | 941,333 | |
Hertz Corp. (The), | |
Gtd. Notes, 144A | |
4.625% | | 12/01/26 | | | | | 245 | | | | 206,088 | |
5.000% | | 12/01/29 | | | | | 145 | | | | 100,516 | |
Mavis Tire Express Services Topco Corp., | |
Sr. Unsec’d. Notes, 144A | |
6.500% | | 05/15/29 | | | | | 3,825 | | | | 3,659,746 | |
NESCO Holdings II, Inc., | |
Sec’d. Notes, 144A | |
5.500% | | 04/15/29(a) | | | | | 1,500 | | | | 1,391,938 | |
Service Corp. International, | |
Sr. Unsec’d. Notes | |
3.375% | | 08/15/30(a) | | | | | 1,625 | | | | 1,424,447 | |
5.750% | | 10/15/32 | | | | | 350 | | | | 340,275 | |
Shift4 Payments LLC/Shift4 Payments Finance Sub, Inc., | |
Gtd. Notes, 144A | |
6.750% | | 08/15/32 | | | | | 330 | | | | 335,740 | |
United Rentals North America, Inc., | |
Gtd. Notes | |
3.750% | | 01/15/32 | | | | | 1,025 | | | | 897,534 | |
4.000% | | 07/15/30 | | | | | 100 | | | | 91,057 | |
4.875% | | 01/15/28(a) | | | | | 3,500 | | | | 3,401,570 | |
Valvoline, Inc., | |
Sr. Unsec’d. Notes, 144A | |
3.625% | | 06/15/31 | | | | | 1,375 | | | | 1,170,799 | |
Veritiv Operating Co., | |
Sr. Sec’d. Notes, 144A | |
10.500% | | 11/30/30 | | | | | 150 | | | | 161,656 | |
SEE NOTES TO FINANCIAL STATEMENTS.
A122
| | | | |
| | PSF PGIM HIGH YIELD BOND PORTFOLIO (CONTINUED) | | |
| | | | |
SCHEDULE OF INVESTMENTS | | | | as of December 31, 2024 |
| | | | | | | | | | | | |
Interest
Rate | | Maturity
Date | | | | Principal
Amount
(000)# | | | Value | |
|
CORPORATE BONDS (continued) | |
Commercial Services (cont’d.) | |
VT Topco, Inc., | |
Sr. Sec’d. Notes, 144A | |
8.500% | | 08/15/30 | | | | | 325 | | | $ | 344,177 | |
Williams Scotsman, Inc., | |
Sr. Sec’d. Notes, 144A | |
6.625% | | 06/15/29 | | | | | 235 | | | | 237,726 | |
| | | | | | | | | | | | |
| | | | |
| | | | | | | | | | | 32,429,850 | |
| | | | | | | | | | | | |
Computers — 1.2% | |
Amentum Holdings, Inc., | |
Gtd. Notes, 144A | |
7.250% | | 08/01/32 | | | | | 340 | | | | 342,913 | |
CA Magnum Holdings (India), | |
Sr. Sec’d. Notes, 144A | |
5.375% | | 10/31/26 | | | | | 200 | | | | 195,250 | |
Fortress Intermediate 3, Inc., | |
Sr. Sec’d. Notes, 144A | |
7.500% | | 06/01/31 | | | | | 1,030 | | | | 1,049,340 | |
Gartner, Inc., | |
Gtd. Notes, 144A | |
3.625% | | 06/15/29 | | | | | 325 | | | | 302,376 | |
3.750% | | 10/01/30 | | | | | 225 | | | | 205,866 | |
McAfee Corp., | |
Sr. Unsec’d. Notes, 144A | |
7.375% | | 02/15/30 | | | | | 3,485 | | | | 3,392,042 | |
NCR Atleos Corp., | |
Sr. Sec’d. Notes, 144A | |
9.500% | | 04/01/29 | | | | | 1,305 | | | | 1,411,765 | |
NCR Voyix Corp., | |
Gtd. Notes, 144A | |
5.000% | | 10/01/28 | | | | | 700 | | | | 672,787 | |
5.125% | | 04/15/29 | | | | | 1,049 | | | | 1,003,813 | |
| | | | | | | | | | | | |
| | | | |
| | | | | | | | | | | 8,576,152 | |
| | | | | | | | | | | | |
Cosmetics/Personal Care — 0.1% | |
Perrigo Finance Unlimited Co., | |
Gtd. Notes | |
6.125% | | 09/30/32(a) | | | | | 525 | | | | 512,531 | |
| | | | | | | | | | | | |
Distribution/Wholesale — 0.7% | |
H&E Equipment Services, Inc., | |
Gtd. Notes, 144A | |
3.875% | | 12/15/28 | | | | | 2,900 | | | | 2,655,620 | |
Ritchie Bros Holdings, Inc. (Canada), | |
Gtd. Notes, 144A | |
7.750% | | 03/15/31 | | | | | 260 | | | | 271,050 | |
Sr. Sec’d. Notes, 144A | |
6.750% | | 03/15/28 | | | | | 150 | | | | 153,000 | |
Velocity Vehicle Group LLC, | |
Sr. Unsec’d. Notes, 144A | |
8.000% | | 06/01/29 | | | | | 175 | | | | 181,951 | |
Windsor Holdings III LLC, | |
Sr. Sec’d. Notes, 144A | |
8.500% | | 06/15/30 | | | | | 1,375 | | | | 1,446,301 | |
| | | | | | | | | | | | |
| | | | |
| | | | | | | | | | | 4,707,922 | |
| | | | | | | | | | | | |
| | | | | | | | | | | | |
Interest
Rate | | Maturity
Date | | | | Principal
Amount
(000)# | | | Value | |
|
CORPORATE BONDS (continued) | |
Diversified Financial Services — 4.3% | |
Azorra Finance Ltd. (Cayman Islands), | |
Gtd. Notes, 144A | |
7.750% | | 04/15/30 | | | | | 1,105 | | | $ | 1,088,779 | |
Bread Financial Holdings, Inc., | |
Gtd. Notes, 144A | |
9.750% | | 03/15/29 | | | | | 1,575 | | | | 1,693,202 | |
Encore Capital Group, Inc., | |
Sr. Sec’d. Notes, 144A | |
8.500% | | 05/15/30 | | | | | 675 | | | | 710,962 | |
Freedom Mortgage Holdings LLC, | |
Sr. Unsec’d. Notes, 144A | |
9.125% | | 05/15/31 | | | | | 495 | | | | 511,038 | |
9.250% | | 02/01/29 | | | | | 310 | | | | 319,796 | |
GGAM Finance Ltd. (Ireland), | |
Gtd. Notes, 144A | |
6.875% | | 04/15/29 | | | | | 150 | | | | 151,500 | |
8.000% | | 02/15/27 | | | | | 400 | | | | 412,000 | |
Sr. Unsec’d. Notes, 144A | |
5.875% | | 03/15/30 | | | | | 290 | | | | 283,475 | |
8.000% | | 06/15/28 | | | | | 400 | | | | 418,635 | |
goeasy Ltd. (Canada), | |
Gtd. Notes, 144A | |
6.875% | | 05/15/30 | | | | | 340 | | | | 342,550 | |
9.250% | | 12/01/28 | | | | | 55 | | | | 58,455 | |
Sr. Unsec’d. Notes, 144A | |
7.625% | | 07/01/29 | | | | | 685 | | | | 698,700 | |
Intercontinental Exchange, Inc., | |
Sr. Unsec’d. Notes | |
3.625% | | 09/01/28(a) | | | | | 1,165 | | | | 1,117,529 | |
Jefferies Finance LLC/JFIN Co-Issuer Corp., | |
Sr. Sec’d. Notes, 144A | |
6.625% | | 10/15/31 | | | | | 1,075 | | | | 1,072,602 | |
Sr. Unsec’d. Notes, 144A | |
5.000% | | 08/15/28 | | | | | 250 | | | | 234,368 | |
LD Holdings Group LLC, | |
Gtd. Notes, 144A | |
6.125% | | 04/01/28 | | | | | 500 | | | | 427,412 | |
Macquarie Airfinance Holdings Ltd. (United Kingdom), | |
Sr. Unsec’d. Notes, 144A | |
6.400% | | 03/26/29 | | | | | 175 | | | | 179,986 | |
6.500% | | 03/26/31 | | | | | 455 | | | | 469,693 | |
8.375% | | 05/01/28 | | | | | 75 | | | | 78,636 | |
Nationstar Mortgage Holdings, Inc., | |
Gtd. Notes, 144A | |
5.125% | | 12/15/30 | | | | | 1,725 | | | | 1,609,614 | |
5.500% | | 08/15/28 | | | | | 175 | | | | 169,972 | |
5.750% | | 11/15/31(a) | | | | | 1,320 | | | | 1,261,165 | |
6.000% | | 01/15/27 | | | | | 510 | | | | 506,839 | |
6.500% | | 08/01/29 | | | | | 1,670 | | | | 1,666,942 | |
Navient Corp., | |
Sr. Unsec’d. Notes | |
4.875% | | 03/15/28 | | | | | 600 | | | | 571,746 | |
5.500% | | 03/15/29 | | | | | 700 | | | | 660,198 | |
6.750% | | 06/25/25 | | | | | 375 | | | | 375,627 | |
9.375% | | 07/25/30 | | | | | 275 | | | | 294,476 | |
SEE NOTES TO FINANCIAL STATEMENTS.
A123
| | | | |
| | PSF PGIM HIGH YIELD BOND PORTFOLIO (CONTINUED) | | |
| | | | |
SCHEDULE OF INVESTMENTS | | | | as of December 31, 2024 |
| | | | | | | | | | | | |
Interest
Rate | | Maturity
Date | | | | Principal
Amount
(000)# | | | Value | |
|
CORPORATE BONDS (continued) | |
Diversified Financial Services (cont’d.) | |
OneMain Finance Corp., | |
Gtd. Notes | |
3.875% | | 09/15/28 | | | | | 1,276 | | | $ | 1,175,971 | |
4.000% | | 09/15/30 | | | | | 425 | | | | 376,217 | |
6.625% | | 01/15/28 | | | | | 75 | | | | 75,962 | |
6.625% | | 05/15/29 | | | | | 1,125 | | | | 1,138,768 | |
7.125% | | 03/15/26 | | | | | 2,250 | | | | 2,289,713 | |
PennyMac Financial Services, Inc., | |
Gtd. Notes, 144A | |
4.250% | | 02/15/29 | | | | | 1,295 | | | | 1,199,764 | |
5.375% | | 10/15/25 | | | | | 1,200 | | | | 1,195,831 | |
5.750% | | 09/15/31 | | | | | 800 | | | | 761,547 | |
7.125% | | 11/15/30 | | | | | 95 | | | | 96,183 | |
7.875% | | 12/15/29 | | | | | 100 | | | | 104,773 | |
PHH Escrow Issuer LLC, | |
Sr. Unsec’d. Notes, 144A | |
9.875% | | 11/01/29 | | | | | 620 | | | | 622,630 | |
PRA Group, Inc., | |
Gtd. Notes, 144A | |
8.875% | | 01/31/30(a) | | | | | 1,045 | | | | 1,084,252 | |
Rocket Mortgage LLC/Rocket Mortgage Co-Issuer, Inc., | |
Gtd. Notes, 144A | |
3.875% | | 03/01/31 | | | | | 1,100 | | | | 958,350 | |
4.000% | | 10/15/33(a) | | | | | 2,000 | | | | 1,664,995 | |
UWM Holdings LLC, | |
Gtd. Notes, 144A | |
6.625% | | 02/01/30 | | | | | 795 | | | | 789,960 | |
| | | | | | | | | | | | |
| | | | |
| | | | | | | | | | | 30,920,813 | |
| | | | | | | | | | | | |
Electric — 4.0% | |
Calpine Corp., | |
Sr. Sec’d. Notes, 144A | |
4.500% | | 02/15/28 | | | | | 1,550 | | | | 1,486,762 | |
Sr. Unsec’d. Notes, 144A | |
4.625% | | 02/01/29 | | | | | 2,732 | | | | 2,576,632 | |
5.000% | | 02/01/31 | | | | | 2,525 | | | | 2,375,846 | |
5.125% | | 03/15/28 | | | | | 4,050 | | | | 3,927,570 | |
Keystone Power Pass-Through Holders LLC/Conemaugh Power Pass-Through Holders, | |
Sub. Notes, 144A, Cash coupon 1.000% and PIK 12.000% | |
13.000% | | 06/01/28(x) | | | | | 294 | | | | 247,223 | |
NRG Energy, Inc., | |
Gtd. Notes | |
5.750% | | 01/15/28 | | | | | 750 | | | | 746,854 | |
Gtd. Notes, 144A | |
3.375% | | 02/15/29 | | | | | 300 | | | | 272,079 | |
3.625% | | 02/15/31 | | | | | 950 | | | | 829,819 | |
3.875% | | 02/15/32 | | | | | 1,275 | | | | 1,109,250 | |
5.250% | | 06/15/29 | | | | | 625 | | | | 607,454 | |
Jr. Sub. Notes, 144A | |
10.250%(ff) | | 03/15/28(oo) | | | | | 2,100 | | | | 2,320,951 | |
Vistra Corp., | |
Jr. Sub. Notes, 144A | |
7.000%(ff) | | 12/15/26(oo) | | | | | 1,675 | | | | 1,674,837 | |
8.000%(ff) | | 10/15/26(oo) | | | | | 4,050 | | | | 4,123,709 | |
Jr. Sub. Notes, Series C, 144A | |
8.875%(ff) | | 01/15/29(oo) | | | | | 725 | | | | 775,143 | |
| | | | | | | | | | | | |
Interest
Rate | | Maturity
Date | | | | Principal
Amount
(000)# | | | Value | |
|
CORPORATE BONDS (continued) | |
Electric (cont’d.) | |
Vistra Operations Co. LLC, | |
Gtd. Notes, 144A | |
4.375% | | 05/01/29(a) | | | | | 1,200 | | | $ | 1,129,859 | |
5.000% | | 07/31/27 | | | | | 1,565 | | | | 1,535,116 | |
5.500% | | 09/01/26 | | | | | 1,050 | | | | 1,047,498 | |
5.625% | | 02/15/27 | | | | | 1,583 | | | | 1,578,290 | |
6.875% | | 04/15/32 | | | | | 405 | | | | 414,562 | |
| | | | | | | | | | | | |
| | | | |
| | | | | | | | | | | 28,779,454 | |
| | | | | | | | | | | | |
Electrical Components & Equipment — 0.4% | |
Energizer Holdings, Inc., | |
Gtd. Notes, 144A | |
4.375% | | 03/31/29(a) | | | | | 750 | | | | 696,035 | |
4.750% | | 06/15/28 | | | | | 225 | | | | 214,596 | |
EnerSys, | |
Gtd. Notes, 144A | |
6.625% | | 01/15/32 | | | | | 140 | | | | 140,736 | |
WESCO Distribution, Inc., | |
Gtd. Notes, 144A | |
6.375% | | 03/15/29 | | | | | 390 | | | | 394,582 | |
6.625% | | 03/15/32(a) | | | | | 695 | | | | 705,017 | |
7.250% | | 06/15/28 | | | | | 785 | | | | 798,112 | |
| | | | | | | | | | | | |
| | | | |
| | | | | | | | | | | 2,949,078 | |
| | | | | | | | | | | | |
Engineering & Construction — 0.3% | |
Brand Industrial Services, Inc., | |
Sr. Sec’d. Notes, 144A | |
10.375% | | 08/01/30(a) | | | | | 950 | | | | 968,053 | |
TopBuild Corp., | |
Gtd. Notes, 144A | |
3.625% | | 03/15/29 | | | | | 375 | | | | 342,708 | |
4.125% | | 02/15/32 | | | | | 525 | | | | 464,873 | |
| | | | | | | | | | | | |
| | | | |
| | | | | | | | | | | 1,775,634 | |
| | | | | | | | | | | | |
Entertainment — 2.7% | |
Caesars Entertainment, Inc., | |
Gtd. Notes, 144A | |
4.625% | | 10/15/29(a) | | | | | 2,100 | | | | 1,967,359 | |
Sr. Sec’d. Notes, 144A | |
6.500% | | 02/15/32 | | | | | 2,420 | | | | 2,431,758 | |
7.000% | | 02/15/30 | | | | | 1,800 | | | | 1,832,987 | |
CCM Merger, Inc., | |
Sr. Unsec’d. Notes, 144A | |
6.375% | | 05/01/26 | | | | | 450 | | | | 449,345 | |
Churchill Downs, Inc., | |
Sr. Unsec’d. Notes, 144A | |
5.750% | | 04/01/30 | | | | | 1,000 | | | | 981,382 | |
Cinemark USA, Inc., | |
Gtd. Notes, 144A | |
7.000% | | 08/01/32 | | | | | 250 | | | | 254,996 | |
International Game Technology PLC, | |
Sr. Sec’d. Notes, 144A | |
5.250% | | 01/15/29 | | | | | 475 | | | | 463,719 | |
6.250% | | 01/15/27 | | | | | 450 | | | | 451,687 | |
Jacobs Entertainment, Inc., | |
Sr. Unsec’d. Notes, 144A | |
6.750% | | 02/15/29 | | | | | 1,625 | | | | 1,567,508 | |
SEE NOTES TO FINANCIAL STATEMENTS.
A124
| | | | |
| | PSF PGIM HIGH YIELD BOND PORTFOLIO (CONTINUED) | | |
| | | | |
SCHEDULE OF INVESTMENTS | | | | as of December 31, 2024 |
| | | | | | | | | | | | |
Interest
Rate | | Maturity Date | | | | Principal
Amount
(000)# | | | Value | |
|
CORPORATE BONDS (continued) | |
Entertainment (cont’d.) | |
6.750% | | 02/15/29 | | | | | 400 | | | $ | 387,270 | |
Midwest Gaming Borrower LLC/Midwest Gaming Finance Corp., | |
Sr. Sec’d. Notes, 144A | |
4.875% | | 05/01/29 | | | | | 1,800 | | | | 1,697,343 | |
Penn Entertainment, Inc., | |
Sr. Unsec’d. Notes, 144A | |
4.125% | | 07/01/29(a) | | | | | 775 | | | | 692,977 | |
5.625% | | 01/15/27(a) | | | | | 1,775 | | | | 1,747,550 | |
Premier Entertainment Sub LLC/Premier Entertainment Finance Corp., | |
Gtd. Notes, 144A | |
5.875% | | 09/01/31 | | | | | 925 | | | | 646,848 | |
Scientific Games Holdings LP/Scientific Games US FinCo, Inc., | |
Sr. Unsec’d. Notes, 144A | |
6.625% | | 03/01/30 | | | | | 1,325 | | | | 1,269,846 | |
Wynn Resorts Finance LLC/Wynn Resorts Capital Corp., | |
Gtd. Notes, 144A | |
5.125% | | 10/01/29(a) | | | | | 1,020 | | | | 976,971 | |
6.250% | | 03/15/33 | | | | | 425 | | | | 416,826 | |
7.125% | | 02/15/31 | | | | | 1,115 | | | | 1,159,947 | |
| | | | | | | | | | | | |
| | | | |
| | | | | | | | | | | 19,396,319 | |
| | | | | | | | | | | | |
Environmental Control — 0.7% | |
GFL Environmental, Inc., | |
Gtd. Notes, 144A | |
4.000% | | 08/01/28 | | | | | 175 | | | | 165,375 | |
4.375% | | 08/15/29 | | | | | 1,625 | | | | 1,536,194 | |
4.750% | | 06/15/29 | | | | | 225 | | | | 216,567 | |
Sr. Sec’d. Notes, 144A | |
6.750% | | 01/15/31 | | | | | 480 | | | | 492,379 | |
Reworld Holding Corp., | |
Gtd. Notes | |
5.000% | | 09/01/30 | | | | | 1,525 | | | | 1,404,168 | |
Gtd. Notes, 144A | |
4.875% | | 12/01/29 | | | | | 925 | | | | 855,463 | |
Wrangler Holdco Corp. (Canada), | |
Gtd. Notes, 144A | |
6.625% | | 04/01/32 | | | | | 165 | | | | 167,970 | |
| | | | | | | | | | | | |
| | | | |
| | | | | | | | | | | 4,838,116 | |
| | | | | | | | | | | | |
Foods — 1.4% | |
Albertson’s Cos., Inc./Safeway, Inc./New Albertson’s LP/Albertson’s LLC, | |
Gtd. Notes, 144A | |
3.500% | | 03/15/29 | | | | | 725 | | | | 660,695 | |
B&G Foods, Inc., | |
Gtd. Notes | |
5.250% | | 09/15/27 | | | | | 2,210 | | | | 2,098,001 | |
Sr. Sec’d. Notes, 144A | |
8.000% | | 09/15/28 | | | | | 2,195 | | | | 2,257,489 | |
Lamb Weston Holdings, Inc., | |
Gtd. Notes, 144A | |
4.375% | | 01/31/32 | | | | | 500 | | | | 452,345 | |
Pilgrim’s Pride Corp., | |
Gtd. Notes | |
3.500% | | 03/01/32 | | | | | 300 | | | | 258,627 | |
4.250% | | 04/15/31 | | | | | 650 | | | | 597,738 | |
| | | | | | | | | | | | | | | | |
Interest Rate | | Maturity
Date | | | | | | Principal
Amount
(000)# | | | Value | |
|
CORPORATE BONDS (continued) | |
Foods (cont’d.) | |
Post Holdings, Inc., | |
Gtd. Notes, 144A | |
4.625% | | | 04/15/30 | | | | | | | | 1,535 | | | $ | 1,414,762 | |
5.500% | | | 12/15/29 | | | | | | | | 325 | | | | 314,521 | |
6.250% | | | 10/15/34(a) | | | | | | | | 565 | | | | 551,922 | |
6.375% | | | 03/01/33 | | | | | | | | 350 | | | | 343,306 | |
Sr. Sec’d. Notes, 144A | |
6.250% | | | 02/15/32 | | | | | | | | 240 | | | | 238,338 | |
Sr. Unsec’d. Notes, 144A | |
4.500% | | | 09/15/31 | | | | | | | | 600 | | | | 537,482 | |
US Foods, Inc., | |
Gtd. Notes, 144A | |
5.750% | | | 04/15/33 | | | | | | | | 25 | | | | 24,291 | |
| | | | | | | | | | | | | | | | |
| | | | |
| | | | | | | | | | | | | | | 9,749,517 | |
| | | | | | | | | | | | | | | | |
Forest Products & Paper — 0.1% | |
Magnera Corp., | |
Sr. Sec’d. Notes, 144A | |
7.250% | | | 11/15/31 | | | | | | | | 600 | | | | 586,872 | |
| | | | | | | | | | | | | | | | |
Gas — 0.2% | |
AmeriGas Partners LP/AmeriGas Finance Corp., | |
Sr. Unsec’d. Notes | |
5.500% | | | 05/20/25 | | | | | | | | 168 | | | | 167,237 | |
5.750% | | | 05/20/27 | | | | | | | | 830 | | | | 770,636 | |
5.875% | | | 08/20/26 | | | | | | | | 493 | | | | 476,117 | |
| | | | | | | | | | | | | | | | |
| | | | |
| | | | | | | | | | | | | | | 1,413,990 | |
| | | | | | | | | | | | | | | | |
Healthcare-Products — 0.9% | |
Medline Borrower LP, | |
Sr. Sec’d. Notes, 144A | |
3.875% | | | 04/01/29 | | | | | | | | 6,850 | | | | 6,345,566 | |
| | | | | | | | | | | | | | | | |
Healthcare-Services — 3.7% | |
DaVita, Inc., | |
Gtd. Notes, 144A | |
3.750% | | | 02/15/31 | | | | | | | | 4,525 | | | | 3,911,632 | |
4.625% | | | 06/01/30 | | | | | | | | 3,750 | | | | 3,444,688 | |
6.875% | | | 09/01/32 | | | | | | | | 625 | | | | 629,711 | |
HCA, Inc., | | | | | | | | | | | | | | | | |
Gtd. Notes | |
7.050% | | | 12/01/27 | | | | | | | | 1,750 | | | | 1,838,052 | |
7.500% | | | 11/06/33 | | | | | | | | 650 | | | | 719,711 | |
Gtd. Notes, MTN | |
7.750% | | | 07/15/36 | | | | | | | | 400 | | | | 446,914 | |
LifePoint Health, Inc., | |
Gtd. Notes, 144A | |
5.375% | | | 01/15/29 | | | | | | | | 2,575 | | | | 2,253,241 | |
Sr. Sec’d. Notes, 144A | |
4.375% | | | 02/15/27 | | | | | | | | 1,250 | | | | 1,195,452 | |
MPH Acquisition Holdings LLC, | |
Sr. Sec’d. Notes, 144A | |
5.500% | | | 09/01/28 | | | | | | | | 1,675 | | | | 1,435,810 | |
Prime Healthcare Services, Inc., | |
Sr. Sec’d. Notes, 144A | |
9.375% | | | 09/01/29 | | | | | | | | 1,060 | | | | 1,032,438 | |
Select Medical Corp., | |
Gtd. Notes, 144A | |
6.250% | | | 12/01/32 | | | | | | | | 390 | | | | 375,446 | |
SEE NOTES TO FINANCIAL STATEMENTS.
A125
| | | | |
| | PSF PGIM HIGH YIELD BOND PORTFOLIO (CONTINUED) | | |
| | | | |
SCHEDULE OF INVESTMENTS | | | | as of December 31, 2024 |
| | | | | | | | | | | | |
Interest Rate | | Maturity Date | | | | Principal
Amount
(000)# | | | Value | |
|
CORPORATE BONDS (continued) | |
Healthcare-Services (cont’d.) | |
Tenet Healthcare Corp., | |
Sr. Sec’d. Notes | |
4.250% | | 06/01/29 | | | | | 1,925 | | | $ | 1,805,502 | |
4.375% | | 01/15/30 | | | | | 5,400 | | | | 5,013,594 | |
Sr. Unsec’d. Notes | |
6.875% | | 11/15/31 | | | | | 2,350 | | | | 2,429,396 | |
| | | | | | | | | | | | |
| | | | |
| | | | | | | | | | | 26,531,587 | |
| | | | | | | | | | | | |
Home Builders — 4.3% | |
Ashton Woods USA LLC/Ashton Woods Finance Co., | |
Sr. Unsec’d. Notes, 144A | |
4.625% | | 08/01/29 | | | | | 900 | | | | 827,346 | |
4.625% | | 04/01/30 | | | | | 800 | | | | 724,989 | |
6.625% | | 01/15/28 | | | | | 550 | | | | 549,889 | |
Beazer Homes USA, Inc., | |
Gtd. Notes | |
5.875% | | 10/15/27 | | | | | 1,300 | | | | 1,280,194 | |
7.250% | | 10/15/29(a) | | | | | 3,425 | | | | 3,469,425 | |
Sr. Unsec’d. Notes, 144A | |
7.500% | | 03/15/31 | | | | | 465 | | | | 469,485 | |
Brookfield Residential Properties, Inc./Brookfield Residential US LLC (Canada), | |
Gtd. Notes, 144A | |
4.875% | | 02/15/30 | | | | | 2,425 | | | | 2,200,687 | |
6.250% | | 09/15/27 | | | | | 625 | | | | 617,188 | |
Sr. Unsec’d. Notes, 144A | |
5.000% | | 06/15/29 | | | | | 900 | | | | 834,750 | |
Empire Communities Corp. (Canada), | |
Sr. Unsec’d. Notes, 144A | |
9.750% | | 05/01/29 | | | | | 575 | | | | 605,188 | |
Forestar Group, Inc., | |
Gtd. Notes, 144A | |
3.850% | | 05/15/26 | | | | | 350 | | | | 340,121 | |
5.000% | | 03/01/28 | | | | | 1,825 | | | | 1,762,851 | |
KB Home, | |
Gtd. Notes | |
4.000% | | 06/15/31 | | | | | 1,075 | | | | 949,516 | |
4.800% | | 11/15/29 | | | | | 1,500 | | | | 1,414,436 | |
7.250% | | 07/15/30 | | | | | 250 | | | | 256,027 | |
Landsea Homes Corp., | |
Gtd. Notes, 144A | |
8.875% | | 04/01/29 | | | | | 1,535 | | | | 1,532,291 | |
M/I Homes, Inc., | |
Gtd. Notes | |
3.950% | | 02/15/30 | | | | | 1,050 | | | | 944,457 | |
4.950% | | 02/01/28 | | | | | 450 | | | | 434,327 | |
Mattamy Group Corp. (Canada), | |
Sr. Unsec’d. Notes, 144A | |
4.625% | | 03/01/30 | | | | | 2,525 | | | | 2,329,312 | |
5.250% | | 12/15/27 | | | | | 1,000 | | | | 974,630 | |
New Home Co., Inc. (The), | |
Sr. Unsec’d. Notes, 144A | |
9.250% | | 10/01/29 | | | | | 430 | | | | 449,992 | |
Shea Homes LP/Shea Homes Funding Corp., | |
Sr. Unsec’d. Notes | |
4.750% | | 02/15/28 | | | | | 1,075 | | | | 1,025,062 | |
4.750% | | 04/01/29 | | | | | 1,500 | | | | 1,407,380 | |
| | | | | | | | | | | | | | | | |
Interest Rate | | Maturity
Date | | | | | | Principal
Amount
(000)# | | | Value | |
|
CORPORATE BONDS (continued) | |
Home Builders (cont’d.) | |
STL Holding Co. LLC, | |
Sr. Unsec’d. Notes, 144A | |
8.750% | | | 02/15/29 | | | | | | | | 655 | | | $ | 691,752 | |
Taylor Morrison Communities, Inc., | |
Gtd. Notes, 144A | |
5.875% | | | 06/15/27 | | | | | | | | 1,000 | | | | 1,002,285 | |
Sr. Unsec’d. Notes, 144A | |
5.125% | | | 08/01/30 | | | | | | | | 2,217 | | | | 2,119,787 | |
Tri Pointe Homes, Inc., | |
Gtd. Notes | |
5.250% | | | 06/01/27 | | | | | | | | 425 | | | | 416,932 | |
5.700% | | | 06/15/28 | | | | | | | | 1,090 | | | | 1,081,215 | |
| | | | | | | | | | | | | | | | |
| | | | |
| | | | | | | | | | | | | | | 30,711,514 | |
| | | | | | | | | | | | | | | | |
Household Products/Wares — 0.5% | |
ACCO Brands Corp., | |
Gtd. Notes, 144A | |
4.250% | | | 03/15/29(a) | | | | | | | | 1,925 | | | | 1,753,292 | |
Kronos Acquisition Holdings, Inc. (Canada), | |
Sr. Sec’d. Notes, 144A | |
8.250% | | | 06/30/31 | | | | | | | | 180 | | | | 171,225 | |
Sr. Unsec’d. Notes, 144A | |
10.750% | | | 06/30/32 | | | | | | | | 1,955 | | | | 1,789,705 | |
| | | | | | | | | | | | | | | | |
| | | | |
| | | | | | | | | | | | | | | 3,714,222 | |
| | | | | | | | | | | | | | | | |
Housewares — 0.7% | |
Newell Brands, Inc., | |
Sr. Unsec’d. Notes | |
6.375% | | | 05/15/30 | | | | | | | | 700 | | | | 702,424 | |
6.625% | | | 05/15/32(a) | | | | | | | | 215 | | | | 216,452 | |
Scotts Miracle-Gro Co. (The), | |
Gtd. Notes | |
4.000% | | | 04/01/31 | | | | | | | | 1,950 | | | | 1,700,140 | |
4.375% | | | 02/01/32 | | | | | | | | 1,750 | | | | 1,525,067 | |
SWF Holdings I Corp., | |
Sr. Unsec’d. Notes, 144A | |
6.500% | | | 10/01/29 | | | | | | | | 1,900 | | | | 1,178,511 | |
| | | | | | | | | | | | | | | | |
| | | | |
| | | | | | | | | | | | | | | 5,322,594 | |
| | | | | | | | | | | | | | | | |
Insurance — 1.0% | |
Acrisure LLC/Acrisure Finance, Inc., | |
Sr. Sec’d. Notes, 144A | |
7.500% | | | 11/06/30 | | | | | | | | 670 | | | | 689,262 | |
Sr. Unsec’d. Notes, 144A | |
6.000% | | | 08/01/29 | | | | | | | | 450 | | | | 431,426 | |
8.250% | | | 02/01/29 | | | | | | | | 1,635 | | | | 1,687,727 | |
8.500% | | | 06/15/29 | | | | | | | | 1,925 | | | | 2,003,326 | |
AmWINS Group, Inc., | |
Sr. Unsec’d. Notes, 144A | |
4.875% | | | 06/30/29 | | | | | | | | 900 | | | | 844,530 | |
AssuredPartners, Inc., | |
Sr. Unsec’d. Notes, 144A | |
5.625% | | | 01/15/29 | | | | | | | | 585 | | | | 591,292 | |
BroadStreet Partners, Inc., | |
Sr. Unsec’d. Notes, 144A | |
5.875% | | | 04/15/29 | | | | | | | | 725 | | | | 701,304 | |
| | | | | | | | | | | | | | | | |
| | | | |
| | | | | | | | | | | | | | | 6,948,867 | |
| | | | | | | | | | | | | | | | |
SEE NOTES TO FINANCIAL STATEMENTS.
A126
| | | | |
| | PSF PGIM HIGH YIELD BOND PORTFOLIO (CONTINUED) | | |
| | | | |
SCHEDULE OF INVESTMENTS | | | | as of December 31, 2024 |
| | | | | | | | | | | | |
Interest Rate | | Maturity Date | | | | Principal
Amount
(000)# | | | Value | |
|
CORPORATE BONDS (continued) | |
Internet — 0.7% | |
Cablevision Lightpath LLC, | |
Sr. Sec’d. Notes, 144A | |
3.875% | | 09/15/27 | | | | | 1,325 | | | $ | 1,242,617 | |
Sr. Unsec’d. Notes, 144A | |
5.625% | | 09/15/28 | | | | | 1,495 | | | | 1,386,319 | |
Gen Digital, Inc., | |
Sr. Unsec’d. Notes, 144A | |
5.000% | | 04/15/25 | | | | | 1,775 | | | | 1,772,257 | |
Go Daddy Operating Co. LLC/GD Finance Co., Inc., | |
Gtd. Notes, 144A | |
3.500% | | 03/01/29 | | | | | 850 | | | | 777,329 | |
| | | | | | | | | | | | |
| | | | |
| | | | | | | | | | | 5,178,522 | |
| | | | | | | | | | | | |
Iron/Steel — 0.8% | |
ATI, Inc., | |
Sr. Unsec’d. Notes | |
7.250% | | 08/15/30 | | | | | 670 | | | | 689,538 | |
Big River Steel LLC/BRS Finance Corp., | |
Sr. Sec’d. Notes, 144A | |
6.625% | | 01/31/29 | | | | | 863 | | | | 862,223 | |
Cleveland-Cliffs, Inc., | |
Gtd. Notes, 144A | |
6.750% | | 04/15/30(a) | | | | | 1,145 | | | | 1,120,668 | |
6.875% | | 11/01/29 | | | | | 565 | | | | 558,743 | |
7.000% | | 03/15/32 | | | | | 455 | | | | 446,747 | |
7.375% | | 05/01/33 | | | | | 1,170 | | | | 1,150,742 | |
Mineral Resources Ltd. (Australia), | |
Sr. Unsec’d. Notes, 144A | |
9.250% | | 10/01/28 | | | | | 1,075 | | | | 1,125,366 | |
| | | | | | | | | | | | |
| | | | |
| | | | | | | | | | | 5,954,027 | |
| | | | | | | | | | | | |
Leisure Time — 3.8% | |
Amer Sports Co. (Finland), | |
Sr. Sec’d. Notes, 144A | |
6.750% | | 02/16/31 | | | | | 1,040 | | | | 1,051,991 | |
Carnival Corp., | |
Gtd. Notes, 144A | |
5.750% | | 03/01/27 | | | | | 5,050 | | | | 5,025,257 | |
6.000% | | 05/01/29 | | | | | 125 | | | | 124,754 | |
Sr. Sec’d. Notes, 144A | |
4.000% | | 08/01/28 | | | | | 1,525 | | | | 1,440,648 | |
Life Time, Inc., | |
Sr. Sec’d. Notes, 144A | |
6.000% | | 11/15/31 | | | | | 475 | | | | 470,187 | |
Lindblad Expeditions Holdings, Inc., | |
Sr. Sec’d. Notes, 144A | |
9.000% | | 05/15/28 | | | | | 1,050 | | | | 1,094,580 | |
Lindblad Expeditions LLC, | |
Sr. Sec’d. Notes, 144A | |
6.750% | | 02/15/27(a) | | | | | 850 | | | | 850,599 | |
NCL Corp. Ltd., | |
Gtd. Notes, 144A | |
5.875% | | 03/15/26 | | | | | 1,600 | | | | 1,593,200 | |
Sr. Sec’d. Notes, 144A | |
5.875% | | 02/15/27 | | | | | 125 | | | | 123,750 | |
8.125% | | 01/15/29 | | | | | 400 | | | | 420,500 | |
8.375% | | 02/01/28 | | | | | 600 | | | | 627,900 | |
| | | | | | | | | | | | |
Interest
Rate | | Maturity
Date | | | | Principal
Amount
(000)# | | | Value | |
|
CORPORATE BONDS (continued) | |
Leisure Time (cont’d.) | |
Sr. Unsec’d. Notes, 144A | |
6.250% | | 03/01/30 | | | | | 2,340 | | | $ | 2,313,588 | |
7.750% | | 02/15/29 | | | | | 1,050 | | | | 1,102,500 | |
NCL Finance Ltd., | |
Gtd. Notes, 144A | |
6.125% | | 03/15/28 | | | | | 1,325 | | | | 1,323,662 | |
Royal Caribbean Cruises Ltd., | |
Sr. Unsec’d. Notes, 144A | |
5.375% | | 07/15/27 | | | | | 300 | | | | 297,240 | |
5.500% | | 04/01/28(a) | | | | | 1,125 | | | | 1,117,125 | |
5.625% | | 09/30/31 | | | | | 2,285 | | | | 2,247,869 | |
6.000% | | 02/01/33 | | | | | 520 | | | | 518,700 | |
Viking Cruises Ltd., | |
Gtd. Notes, 144A | |
5.875% | | 09/15/27 | | | | | 2,575 | | | | 2,552,469 | |
9.125% | | 07/15/31 | | | | | 1,125 | | | | 1,206,450 | |
Viking Ocean Cruises Ship VII Ltd., | |
Sr. Sec’d. Notes, 144A | |
5.625% | | 02/15/29(a) | | | | | 850 | | | | 833,892 | |
VOC Escrow Ltd., | |
Sr. Sec’d. Notes, 144A | |
5.000% | | 02/15/28 | | | | | 1,000 | | | | 970,000 | |
| | | | | | | | | | | | |
| | | | |
| | | | | | | | | | | 27,306,861 | |
| | | | | | | | | | | | |
Lodging — 1.7% | |
Boyd Gaming Corp., | |
Gtd. Notes, 144A | |
4.750% | | 06/15/31 | | | | | 1,650 | | | | 1,523,244 | |
Hilton Domestic Operating Co., Inc., | |
Gtd. Notes, 144A | |
3.625% | | 02/15/32 | | | | | 850 | | | | 737,867 | |
4.000% | | 05/01/31 | | | | | 75 | | | | 67,386 | |
5.875% | | 04/01/29 | | | | | 480 | | | | 478,500 | |
MGM Resorts International, | |
Gtd. Notes | |
4.625% | | 09/01/26 | | | | | 375 | | | | 369,644 | |
4.750% | | 10/15/28(a) | | | | | 2,000 | | | | 1,914,148 | |
5.500% | | 04/15/27 | | | | | 600 | | | | 595,610 | |
6.125% | | 09/15/29 | | | | | 450 | | | | 448,834 | |
6.500% | | 04/15/32(a) | | | | | 3,105 | | | | 3,093,223 | |
Sugarhouse HSP Gaming Prop Mezz LP/Sugarhouse HSP Gaming Finance Corp., | |
Sr. Sec’d. Notes, 144A | |
5.875% | | 05/15/25 | | | | | 650 | | | | 648,918 | |
Wynn Las Vegas LLC/Wynn Las Vegas Capital Corp., | |
Gtd. Notes, 144A | |
5.250% | | 05/15/27 | | | | | 450 | | | | 444,640 | |
Wynn Macau Ltd. (Macau), | |
Sr. Unsec’d. Notes, 144A | |
5.625% | | 08/26/28 | | | | | 2,175 | | | | 2,088,000 | |
| | | | | | | | | | | | |
| | | | |
| | | | | | | | | | | 12,410,014 | |
| | | | | | | | | | | | |
Machinery-Construction & Mining — 0.2% | |
Terex Corp., | |
Gtd. Notes, 144A | |
5.000% | | 05/15/29 | | | | | 600 | | | | 571,264 | |
SEE NOTES TO FINANCIAL STATEMENTS.
A127
| | | | |
| | PSF PGIM HIGH YIELD BOND PORTFOLIO (CONTINUED) | | |
| | | | |
SCHEDULE OF INVESTMENTS | | | | as of December 31, 2024 |
| | | | | | | | | | | | |
Interest
Rate | | Maturity Date | | | | Principal
Amount
(000)# | | | Value | |
|
CORPORATE BONDS (continued) | |
Machinery-Construction & Mining (cont’d.) | |
6.250% | | 10/15/32 | | | | | 1,035 | | | $ | 1,015,715 | |
| | | | | | | | | | | | |
| | | | |
| | | | | | | | | | | 1,586,979 | |
| | | | | | | | | | | | |
Machinery-Diversified — 0.7% | |
Chart Industries, Inc., | |
Gtd. Notes, 144A | |
9.500% | | 01/01/31(a) | | | | | 845 | | | | 905,069 | |
Sr. Sec’d. Notes, 144A | |
7.500% | | 01/01/30(a) | | | | | 725 | | | | 753,988 | |
GrafTech Finance, Inc., | |
Sec’d. Notes, 144A | |
4.625% | | 12/23/29 | | | | | 1,135 | | | | 917,905 | |
Maxim Crane Works Holdings Capital LLC, | |
Sec’d. Notes, 144A | |
11.500% | | 09/01/28 | | | | | 1,780 | | | | 1,882,510 | |
TK Elevator US Newco, Inc. (Germany), | |
Sr. Sec’d. Notes, 144A | |
5.250% | | 07/15/27 | | | | | 224 | | | | 218,960 | |
| | | | | | | | | | | | |
| | | | |
| | | | | | | | | | | 4,678,432 | |
| | | | | | | | | | | | |
Media — 4.0% | |
CCO Holdings LLC/CCO Holdings Capital Corp., | |
Sr. Unsec’d. Notes | |
4.500% | | 05/01/32 | | | | | 1,290 | | | | 1,110,853 | |
Sr. Unsec’d. Notes, 144A | |
4.750% | | 03/01/30 | | | | | 400 | | | | 365,250 | |
5.000% | | 02/01/28 | | | | | 1,480 | | | | 1,426,776 | |
5.125% | | 05/01/27 | | | | | 825 | | | | 810,320 | |
5.375% | | 06/01/29 | | | | | 25 | | | | 23,883 | |
CSC Holdings LLC, | |
Gtd. Notes, 144A | |
3.375% | | 02/15/31(x) | | | | | 1,190 | | | | 839,012 | |
4.125% | | 12/01/30(x) | | | | | 575 | | | | 414,057 | |
5.375% | | 02/01/28(x) | | | | | 890 | | | | 766,576 | |
5.500% | | 04/15/27(x) | | | | | 475 | | | | 424,739 | |
6.500% | | 02/01/29(x) | | | | | 400 | | | | 336,175 | |
Sr. Unsec’d. Notes, 144A | |
4.625% | | 12/01/30(x) | | | | | 1,875 | | | | 974,995 | |
5.000% | | 11/15/31(x) | | | | | 310 | | | | 161,939 | |
5.750% | | 01/15/30(x) | | | | | 2,325 | | | | 1,321,798 | |
7.500% | | 04/01/28(x) | | | | | 200 | | | | 136,766 | |
Diamond Sports Group LLC/Diamond Sports Finance Co., | |
Gtd. Notes, 144A | |
6.625% | | 08/15/27(d)(x) | | | | | 6,605 | | | | 7,549 | |
Sec’d. Notes, 144A | |
5.375% | | 08/15/26(d)(x) | | | | | 6,440 | | | | 14,334 | |
DISH DBS Corp., | |
Gtd. Notes | |
5.125% | | 06/01/29 | | | | | 2,465 | | | | 1,565,116 | |
7.375% | | 07/01/28 | | | | | 950 | | | | 678,002 | |
7.750% | | 07/01/26 | | | | | 5,950 | | | | 5,000,675 | |
DISH Network Corp., | |
Sr. Sec’d. Notes, 144A | |
11.750% | | 11/15/27 | | | | | 1,325 | | | | 1,401,387 | |
News Corp., | |
Sr. Unsec’d. Notes, 144A | |
3.875% | | 05/15/29 | | | | | 250 | | | | 232,032 | |
| | | | | | | | | | |
Interest
Rate | | Maturity
Date | | | | Principal
Amount
(000)# | | Value | |
|
CORPORATE BONDS (continued) | |
Media (cont’d.) | |
Radiate Holdco LLC/Radiate Finance, Inc., | |
Sr. Sec’d. Notes, 144A | |
4.500% | | 09/15/26(x) | | | | 505 | | $ | 440,582 | |
Sr. Unsec’d. Notes, 144A | |
6.500% | | 09/15/28(x) | | | | 2,065 | | | 1,359,432 | |
Sinclair Television Group, Inc., | |
Gtd. Notes, 144A | |
5.125% | | 02/15/27(x) | | | | 1,095 | | | 997,668 | |
Univision Communications, Inc., | |
Sr. Sec’d. Notes, 144A | |
4.500% | | 05/01/29 | | | | 720 | | | 643,088 | |
6.625% | | 06/01/27 | | | | 3,100 | | | 3,089,942 | |
8.000% | | 08/15/28 | | | | 1,080 | | | 1,099,743 | |
Virgin Media Secured Finance PLC (United Kingdom), | |
Sr. Sec’d. Notes, 144A | |
4.500% | | 08/15/30 | | | | 800 | | | 687,600 | |
5.500% | | 05/15/29 | | | | 700 | | | 656,250 | |
VZ Secured Financing BV (Netherlands), | |
Sr. Sec’d. Notes, 144A | |
5.000% | | 01/15/32 | | | | 1,725 | | | 1,524,469 | |
| | | | | | | | | | |
| | | | |
| | | | | | | | | 28,511,008 | |
| | | | | | | | | | |
Metal Fabricate/Hardware — 0.1% | |
Roller Bearing Co. of America, Inc., | |
Sr. Unsec’d. Notes, 144A | |
4.375% | | 10/15/29 | | | | 825 | | | 768,094 | |
| | | | | | | | | | |
Mining — 1.8% | |
Arsenal AIC Parent LLC, | |
Sr. Sec’d. Notes, 144A | |
8.000% | | 10/01/30 | | | | 550 | | | 569,082 | |
Unsec’d. Notes, 144A | |
11.500% | | 10/01/31 | | | | 535 | | | 597,731 | |
Eldorado Gold Corp. (Turkey), | |
Sr. Unsec’d. Notes, 144A | |
6.250% | | 09/01/29 | | | | 1,655 | | | 1,621,106 | |
First Quantum Minerals Ltd. (Zambia), | |
Gtd. Notes, 144A | |
6.875% | | 10/15/27 | | | | 1,350 | | | 1,342,832 | |
8.625% | | 06/01/31 | | | | 625 | | | 640,431 | |
Sec’d. Notes, 144A | |
9.375% | | 03/01/29 | | | | 480 | | | 507,902 | |
Hecla Mining Co., | |
Gtd. Notes | |
7.250% | | 02/15/28 | | | | 845 | | | 850,955 | |
Hudbay Minerals, Inc. (Canada), | |
Gtd. Notes, 144A | |
4.500% | | 04/01/26 | | | | 1,225 | | | 1,205,094 | |
6.125% | | 04/01/29 | | | | 1,270 | | | 1,268,413 | |
New Gold, Inc. (Canada), | |
Gtd. Notes, 144A | |
7.500% | | 07/15/27 | | | | 1,775 | | | 1,781,656 | |
Novelis Corp., | |
Gtd. Notes, 144A | |
3.875% | | 08/15/31 | | | | 625 | | | 538,742 | |
4.750% | | 01/30/30 | | | | 1,650 | | | 1,529,845 | |
SEE NOTES TO FINANCIAL STATEMENTS.
A128
| | | | |
| | PSF PGIM HIGH YIELD BOND PORTFOLIO (CONTINUED) | | |
| | | | |
SCHEDULE OF INVESTMENTS | | | | as of December 31, 2024 |
| | | | | | | | | | | | |
Interest Rate | | Maturity Date | | | | Principal
Amount
(000)# | | | Value | |
|
CORPORATE BONDS (continued) | |
Mining (cont’d.) | |
Taseko Mines Ltd. (Canada), | |
Sr. Sec’d. Notes, 144A | |
8.250% | | 05/01/30 | | | | | 235 | | | $ | 239,907 | |
| | | | | | | | | | | | |
| | | | |
| | | | | | | | | | | 12,693,696 | |
| | | | | | | | | | | | |
Miscellaneous Manufacturing — 0.4% | |
Amsted Industries, Inc., | |
Gtd. Notes, 144A | |
5.625% | | 07/01/27 | | | | | 425 | | | | 420,915 | |
Sr. Unsec’d. Notes, 144A | |
4.625% | | 05/15/30 | | | | | 1,270 | | | | 1,194,354 | |
Trinity Industries, Inc., | |
Gtd. Notes, 144A | |
7.750% | | 07/15/28 | | | | | 1,010 | | | | 1,047,835 | |
| | | | | | | | | | | | |
| | | | |
| | | | | | | | | | | 2,663,104 | |
| | | | | | | | | | | | |
Office/Business Equipment — 0.0% | |
Zebra Technologies Corp., | |
Gtd. Notes, 144A | |
6.500% | | 06/01/32 | | | | | 215 | | | | 217,947 | |
| | | | | | | | | | | | |
Oil & Gas — 5.8% | |
Aethon United BR LP/Aethon United Finance Corp., | |
Sr. Unsec’d. Notes, 144A | |
7.500% | | 10/01/29 | | | | | 410 | | | | 419,659 | |
Alta Mesa Holdings LP/Alta Mesa Finance Services Corp., | |
Gtd. Notes | |
7.875% | | 12/15/24(d) | | | | | 5,200 | | | | 520 | |
Antero Resources Corp., | |
Gtd. Notes, 144A | |
7.625% | | 02/01/29 | | | | | 128 | | | | 131,074 | |
Ascent Resources Utica Holdings LLC/ARU Finance Corp., | |
Gtd. Notes, 144A | |
9.000% | | 11/01/27 | | | | | 776 | | | | 937,386 | |
Sr. Unsec’d. Notes, 144A | |
6.625% | | 10/15/32 | | | | | 480 | | | | 477,294 | |
8.250% | | 12/31/28 | | | | | 2,207 | | | | 2,252,650 | |
CITGO Petroleum Corp., | |
Sr. Sec’d. Notes, 144A | |
7.000% | | 06/15/25 | | | | | 2,175 | | | | 2,176,840 | |
Civitas Resources, Inc., | |
Gtd. Notes, 144A | |
8.375% | | 07/01/28 | | | | | 800 | | | | 831,315 | |
8.625% | | 11/01/30 | | | | | 985 | | | | 1,031,990 | |
CNX Resources Corp., | |
Gtd. Notes, 144A | |
7.250% | | 03/01/32 | | | | | 355 | | | | 360,992 | |
Comstock Resources, Inc., | |
Gtd. Notes, 144A | |
5.875% | | 01/15/30(a) | | | | | 1,175 | | | | 1,098,252 | |
6.750% | | 03/01/29 | | | | | 825 | | | | 805,060 | |
Crescent Energy Finance LLC, | |
Gtd. Notes, 144A | |
7.375% | | 01/15/33 | | | | | 925 | | | | 900,085 | |
7.625% | | 04/01/32 | | | | | 620 | | | | 616,921 | |
9.250% | | 02/15/28 | | | | | 880 | | | | 919,706 | |
| | | | | | | | | | |
Interest
Rate | | Maturity
Date | | | | Principal
Amount
(000)# | | Value | |
|
CORPORATE BONDS (continued) | |
Oil & Gas (cont’d.) | |
CrownRock LP/CrownRock Finance, Inc., | |
Sr. Unsec’d. Notes, 144A | |
5.000% | | 05/01/29 | | | | 131 | | $ | 132,793 | |
Diamond Foreign Asset Co./Diamond Finance LLC, | |
Sec’d. Notes, 144A | |
8.500% | | 10/01/30 | | | | 275 | | | 284,529 | |
Expand Energy Corp., | |
Gtd. Notes | |
4.750% | | 02/01/32 | | | | 530 | | | 492,321 | |
5.375% | | 03/15/30 | | | | 885 | | | 865,402 | |
Gtd. Notes, 144A | |
5.875% | | 02/01/29 | | | | 275 | | | 273,409 | |
6.750% | | 04/15/29 | | | | 110 | | | 111,154 | |
Hilcorp Energy I LP/Hilcorp Finance Co., | |
Sr. Unsec’d. Notes, 144A | |
5.750% | | 02/01/29 | | | | 1,450 | | | 1,383,366 | |
6.000% | | 04/15/30 | | | | 1,040 | | | 978,783 | |
6.000% | | 02/01/31 | | | | 900 | | | 835,719 | |
6.250% | | 11/01/28 | | | | 1,310 | | | 1,270,335 | |
6.250% | | 04/15/32 | | | | 435 | | | 400,481 | |
7.250% | | 02/15/35 | | | | 1,450 | | | 1,364,664 | |
8.375% | | 11/01/33 | | | | 160 | | | 163,366 | |
Kraken Oil & Gas Partners LLC, | |
Sr. Unsec’d. Notes, 144A | |
7.625% | | 08/15/29 | | | | 140 | | | 134,812 | |
Matador Resources Co., | |
Gtd. Notes, 144A | |
6.500% | | 04/15/32 | | | | 860 | | | 849,237 | |
MEG Energy Corp. (Canada), | |
Gtd. Notes, 144A | |
5.875% | | 02/01/29 | | | | 510 | | | 496,271 | |
Nabors Industries Ltd., | |
Gtd. Notes, 144A | |
7.500% | | 01/15/28 | | | | 880 | | | 811,800 | |
Nabors Industries, Inc., | |
Gtd. Notes, 144A | |
7.375% | | 05/15/27 | | | | 250 | | | 249,798 | |
8.875% | | 08/15/31 | | | | 1,620 | | | 1,504,458 | |
9.125% | | 01/31/30 | | | | 1,375 | | | 1,397,230 | |
New Generation Gas Gathering LLC, | |
Sr. Sec’d. Notes, 144A, 3 Month SOFR + 5.750% (Cap N/A, Floor 2.000%) | |
10.335%(c) | | 09/30/29^ | | | | 162 | | | 159,730 | |
Noble Finance II LLC, | |
Gtd. Notes, 144A | |
8.000% | | 04/15/30 | | | | 1,130 | | | 1,141,005 | |
Parkland Corp. (Canada), | |
Gtd. Notes, 144A | |
4.500% | | 10/01/29(a) | | | | 975 | | | 904,313 | |
4.625% | | 05/01/30(a) | | | | 2,000 | | | 1,830,000 | |
Sr. Unsec’d. Notes, 144A | |
6.625% | | 08/15/32 | | | | 235 | | | 232,356 | |
Permian Resources Operating LLC, | |
Gtd. Notes, 144A | |
6.250% | | 02/01/33 | | | | 345 | | | 340,641 | |
7.000% | | 01/15/32 | | | | 955 | | | 970,918 | |
8.000% | | 04/15/27 | | | | 275 | | | 280,699 | |
SEE NOTES TO FINANCIAL STATEMENTS.
A129
| | | | |
| | PSF PGIM HIGH YIELD BOND PORTFOLIO (CONTINUED) | | |
| | | | |
SCHEDULE OF INVESTMENTS | | | | as of December 31, 2024 |
| | | | | | | | | | | | | | | | |
| | | | | | | | | Principal | | | | |
| Interest | | Maturity | | | | | | Amount | | | | |
Rate | | Date | | | | | | (000)# | | | Value | |
|
CORPORATE BONDS (continued) | |
Oil & Gas (cont’d.) | |
Precision Drilling Corp. (Canada), | |
Gtd. Notes, 144A | |
6.875% | | | 01/15/29 | | | | | | | | 900 | | | $ | 888,651 | |
7.125% | | | 01/15/26 | | | | | | | | 108 | | | | 107,892 | |
Range Resources Corp., | |
Gtd. Notes | |
4.875% | | | 05/15/25 | | | | | | | | 475 | | | | 473,955 | |
Gtd. Notes, 144A | |
4.750% | | | 02/15/30 | | | | | | | | 219 | | | | 205,548 | |
SM Energy Co., | |
Sr. Unsec’d. Notes, 144A | |
6.750% | | | 08/01/29 | | | | | | | | 320 | | | | 316,811 | |
7.000% | | | 08/01/32 | | | | | | | | 225 | | | | 221,553 | |
Sunoco LP, | |
Gtd. Notes, 144A | |
7.000% | | | 05/01/29 | | | | | | | | 360 | | | | 369,433 | |
Sunoco LP/Sunoco Finance Corp., | |
Gtd. Notes | |
4.500% | | | 05/15/29 | | | | | | | | 375 | | | | 352,635 | |
4.500% | | | 04/30/30 | | | | | | | | 1,900 | | | | 1,759,479 | |
5.875% | | | 03/15/28 | | | | | | | | 175 | | | | 174,252 | |
Transocean, Inc., | |
Gtd. Notes, 144A | |
8.000% | | | 02/01/27 | | | | | | | | 197 | | | | 196,754 | |
8.250% | | | 05/15/29 | | | | | | | | 1,555 | | | | 1,522,469 | |
8.500% | | | 05/15/31 | | | | | | | | 650 | | | | 637,065 | |
Sr. Sec’d. Notes, 144A | |
8.750% | | | 02/15/30 | | | | | | | | 60 | | | | 61,136 | |
Valaris Ltd., | |
Sec’d. Notes, 144A | |
8.375% | | | 04/30/30 | | | | | | | | 1,125 | | | | 1,134,304 | |
Vital Energy, Inc., | |
Gtd. Notes | |
9.750% | | | 10/15/30 | | | | | | | | 225 | | | | 237,230 | |
| | | | | | | | | | | | | | | | |
| | | | |
| | | | | | | | | | | | | | | 41,478,501 | |
| | | | | | | | | | | | | | | | |
Packaging & Containers — 1.7% | |
ARD Finance SA (Luxembourg), | |
Sr. Sec’d. Notes, 144A, Cash coupon 6.500% or PIK 7.250% | |
6.500% | | | 06/30/27(x) | | | | | | | | 1,354 | | | | 191,233 | |
Ardagh Packaging Finance PLC/Ardagh Holdings USA, Inc., | |
Sr. Sec’d. Notes, 144A | |
4.125% | | | 08/15/26(x) | | | | | | | | 400 | | | | 348,000 | |
Graham Packaging Co., Inc., | |
Gtd. Notes, 144A | |
7.125% | | | 08/15/28 | | | | | | | | 455 | | | | 448,276 | |
Graphic Packaging International LLC, | |
Gtd. Notes, 144A | |
3.500% | | | 03/01/29 | | | | | | | | 725 | | | | 661,066 | |
Intelligent Packaging Ltd. Finco, Inc./Intelligent Packaging Ltd. | |
Co-Issuer LLC (Canada), | |
Sr. Sec’d. Notes, 144A | |
6.000% | | | 09/15/28 | | | | | | | | 1,645 | | | | 1,616,212 | |
Iris Holding, Inc., | |
Sr. Unsec’d. Notes, 144A | |
10.000% | | | 12/15/28 | | | | | | | | 670 | | | | 637,891 | |
| | | | | | | | | | | | | | | | |
| | | | | | | | | Principal | | | | |
| Interest | | Maturity | | | | | | Amount | | | | |
Rate | | Date | | | | | | (000)# | | | Value | |
|
CORPORATE BONDS (continued) | |
Packaging & Containers (cont’d.) | |
LABL, Inc., | |
Sr. Sec’d. Notes, 144A | |
5.875% | | | 11/01/28 | | | | | | | | 525 | | | $ | 468,559 | |
8.625% | | | 10/01/31 | | | | | | | | 590 | | | | 545,791 | |
9.500% | | | 11/01/28 | | | | | | | | 225 | | | | 225,380 | |
Sr. Unsec’d. Notes, 144A | |
8.250% | | | 11/01/29 | | | | | | | | 1,455 | | | | 1,262,297 | |
10.500% | | | 07/15/27 | | | | | | | | 1,140 | | | | 1,100,835 | |
Mauser Packaging Solutions Holding Co., | |
Sr. Sec’d. Notes, 144A | |
7.875% | | | 04/15/27(a) | | | | | | | | 720 | | | | 733,854 | |
OI European Group BV, | |
Gtd. Notes, 144A | |
4.750% | | | 02/15/30 | | | | | | | | 225 | | | | 199,688 | |
Owens-Brockway Glass Container, Inc., | |
Gtd. Notes, 144A | |
6.625% | | | 05/13/27 | | | | | | | | 170 | | | | 169,012 | |
7.250% | | | 05/15/31 | | | | | | | | 350 | | | | 341,241 | |
Pactiv Evergreen Group Issuer LLC/Pactiv Evergreen Group Issuer, Inc., | |
Sr. Sec’d. Notes, 144A | |
4.375% | | | 10/15/28 | | | | | | | | 600 | | | | 599,632 | |
Sealed Air Corp./Sealed Air Corp. US, | |
Gtd. Notes, 144A | |
6.125% | | | 02/01/28 | | | | | | | | 125 | | | | 125,468 | |
Trident TPI Holdings, Inc., | |
Gtd. Notes, 144A | |
12.750% | | | 12/31/28 | | | | | | | | 2,070 | | | | 2,280,738 | |
TriMas Corp., | |
Gtd. Notes, 144A | |
4.125% | | | 04/15/29 | | | | | | | | 325 | | | | 297,648 | |
| | | | | | | | | | | | | | | | |
| | | | |
| | | | | | | | | | | | | | | 12,252,821 | |
| | | | | | | | | | | | | | | | |
Pharmaceuticals — 2.3% | |
AdaptHealth LLC, | |
Gtd. Notes, 144A | |
4.625% | | | 08/01/29 | | | | | | | | 1,025 | | | | 921,462 | |
5.125% | | | 03/01/30(a) | | | | | | | | 2,550 | | | | 2,308,697 | |
6.125% | | | 08/01/28(a) | | | | | | | | 920 | | | | 901,659 | |
Bausch Health Cos., Inc., | |
Gtd. Notes, 144A | |
5.000% | | | 01/30/28 | | | | | | | | 1,050 | | | | 712,687 | |
5.000% | | | 02/15/29 | | | | | | | | 1,600 | | | | 952,000 | |
5.250% | | | 01/30/30 | | | | | | | | 750 | | | | 405,937 | |
5.250% | | | 02/15/31 | | | | | | | | 1,250 | | | | 653,125 | |
6.250% | | | 02/15/29 | | | | | | | | 1,385 | | | | 851,775 | |
7.000% | | | 01/15/28 | | | | | | | | 250 | | | | 175,938 | |
9.000% | | | 12/15/25 | | | | | | | | 500 | | | | 485,600 | |
Sr. Sec’d. Notes, 144A | |
4.875% | | | 06/01/28 | | | | | | | | 700 | | | | 560,000 | |
11.000% | | | 09/30/28 | | | | | | | | 2,525 | | | | 2,398,750 | |
Jazz Securities DAC, | |
Sr. Sec’d. Notes, 144A | |
4.375% | | | 01/15/29(a) | | | | | | | | 350 | | | | 328,125 | |
Organon & Co./Organon Foreign Debt Co-Issuer BV, | |
Sr. Unsec’d. Notes, 144A | |
5.125% | | | 04/30/31(a) | | | | | | | | 4,750 | | | | 4,271,144 | |
SEE NOTES TO FINANCIAL STATEMENTS.
A130
| | | | |
| | PSF PGIM HIGH YIELD BOND PORTFOLIO (CONTINUED) | | |
| | | | |
SCHEDULE OF INVESTMENTS | | | | as of December 31, 2024 |
| | | | | | | | | | | | | | | | |
| | | | | | | | | Principal | | | | |
| Interest | | Maturity | | | | | | Amount | | | | |
Rate | | Date | | | | | | (000)# | | | Value | |
|
CORPORATE BONDS (continued) | |
Pharmaceuticals (cont’d.) | |
P&L Development LLC/PLD Finance Corp., | |
Sr. Sec’d. Notes, 144A, Cash coupon 9.000% and PIK 3.500% or Cash coupon 12.000% | |
12.000% | | | 05/15/29 | | | | | | | | 312 | | | $ | 322,121 | |
| | | | | | | | | | | | | | | | |
| | | | |
| | | | | | | | | | | | | | | 16,249,020 | |
| | | | | | | | | | | | | | | | |
Pipelines — 3.7% | | | | | | | | | | | | | |
Antero Midstream Partners LP/Antero Midstream Finance Corp., | |
Gtd. Notes, 144A | |
5.375% | | | 06/15/29 | | | | | | | | 600 | | | | 583,655 | |
5.750% | | | 01/15/28 | | | | | | | | 1,825 | | | | 1,809,677 | |
6.625% | | | 02/01/32 | | | | | | | | 1,445 | | | | 1,456,155 | |
Blue Racer Midstream LLC/Blue Racer Finance Corp., | |
Sr. Unsec’d. Notes, 144A | |
7.000% | | | 07/15/29 | | | | | | | | 120 | | | | 122,549 | |
7.250% | | | 07/15/32 | | | | | | | | 675 | | | | 693,584 | |
Cheniere Energy, Inc., | |
Sr. Unsec’d. Notes | |
4.625% | | | 10/15/28 | | | | | | | | 1,145 | | | | 1,122,800 | |
DCP Midstream Operating LP, | |
Gtd. Notes, 144A | |
6.450% | | | 11/03/36 | | | | | | | | 200 | | | | 204,515 | |
Energy Transfer LP, | |
Jr. Sub. Notes, Series G | |
7.125%(ff) | | | 05/15/30(oo) | | | | | | | | 625 | | | | 629,855 | |
EQM Midstream Partners LP, | |
Sr. Unsec’d. Notes, 144A | |
6.500% | | | 07/01/27 | | | | | | | | 790 | | | | 800,611 | |
7.500% | | | 06/01/27 | | | | | | | | 175 | | | | 178,496 | |
7.500% | | | 06/01/30 | | | | | | | | 435 | | | | 463,786 | |
Global Partners LP/GLP Finance Corp., | |
Gtd. Notes | |
6.875% | | | 01/15/29 | | | | | | | | 400 | | | | 397,310 | |
7.000% | | | 08/01/27 | | | | | | | | 525 | | | | 525,149 | |
Gtd. Notes, 144A | |
8.250% | | | 01/15/32 | | | | | | | | 825 | | | | 848,774 | |
Howard Midstream Energy Partners LLC, | |
Sr. Unsec’d. Notes, 144A | |
7.375% | | | 07/15/32 | | | | | | | | 175 | | | | 177,886 | |
8.875% | | | 07/15/28 | | | | | | | | 225 | | | | 236,089 | |
Rockies Express Pipeline LLC, | |
Sr. Unsec’d. Notes, 144A | |
4.800% | | | 05/15/30 | | | | | | | | 495 | | | | 465,617 | |
6.875% | | | 04/15/40 | | | | | | | | 2,029 | | | | 1,930,479 | |
7.500% | | | 07/15/38 | | | | | | | | 425 | | | | 422,674 | |
Tallgrass Energy Partners LP/Tallgrass Energy Finance Corp., | |
Gtd. Notes, 144A | |
5.500% | | | 01/15/28 | | | | | | | | 1,600 | | | | 1,539,998 | |
6.000% | | | 12/31/30 | | | | | | | | 515 | | | | 488,121 | |
6.000% | | | 09/01/31 | | | | | | | | 875 | | | | 825,700 | |
Sr. Unsec’d. Notes, 144A | |
7.375% | | | 02/15/29 | | | | | | | | 395 | | | | 396,168 | |
Venture Global Calcasieu Pass LLC, | |
Sr. Sec’d. Notes, 144A | |
3.875% | | | 08/15/29 | | | | | | | | 840 | | | | 771,854 | |
4.125% | | | 08/15/31 | | | | | | | | 765 | | | | 686,414 | |
6.250% | | | 01/15/30 | | | | | | | | 275 | | | | 278,072 | |
| | | | | | | | | | | | | | | | |
| | | | | | | | | Principal | | | | |
| Interest | | Maturity | | | | | | Amount | | | | |
Rate | | Date | | | | | | (000)# | | | Value | |
| |
CORPORATE BONDS (continued) | | | | | |
Pipelines (cont’d.) | |
Venture Global LNG, Inc., | |
Jr. Sub. Notes, 144A | |
9.000%(ff) | | | 09/30/29(oo) | | | | | | | | 1,465 | | | $ | 1,532,043 | |
Sr. Sec’d. Notes, 144A | |
7.000% | | | 01/15/30 | | | | | | | | 445 | | | | 451,797 | |
9.500% | | | 02/01/29 | | | | | | | | 2,575 | | | | 2,845,659 | |
9.875% | | | 02/01/32 | | | | | | | | 2,660 | | | | 2,922,892 | |
Western Midstream Operating LP, | |
Sr. Unsec’d. Notes | |
4.050% | | | 02/01/30 | | | | | | | | 575 | | | | 539,394 | |
5.500% | | | 08/15/48 | | | | | | | | 300 | | | | 259,995 | |
| | | | | | | | | | | | | | | | |
| | | | |
| | | | | | | | | | | | | | | 26,607,768 | |
| | | | | | | | | | | | | | | | |
Real Estate — 1.0% | |
Five Point Operating Co. LP/Five Point Capital Corp., | |
Gtd. Notes, 144A | |
10.500%(cc) | | | 01/15/28 | | | | | | | | 1,424 | | | | 1,451,439 | |
Greystar Real Estate Partners LLC, | |
Sr. Sec’d. Notes, 144A | |
7.750% | | | 09/01/30 | | | | | | | | 225 | | | | 237,766 | |
Howard Hughes Corp. (The), | |
Gtd. Notes, 144A | |
4.125% | | | 02/01/29 | | | | | | | | 1,125 | | | | 1,038,138 | |
4.375% | | | 02/01/31 | | | | | | | | 2,075 | | | | 1,867,895 | |
5.375% | | | 08/01/28 | | | | | | | | 895 | | | | 869,482 | |
Hunt Cos., Inc., | |
Sr. Sec’d. Notes, 144A | |
5.250% | | | 04/15/29 | | | | | | | | 2,125 | | | | 2,014,913 | |
| | | | | | | | | | | | | | | | |
| | | | |
| | | | | | | | | | | | | | | 7,479,633 | |
| | | | | | | | | | | | | | | | |
Real Estate Investment Trusts (REITs) — 2.0% | |
Diversified Healthcare Trust, | |
Gtd. Notes | |
4.375% | | | 03/01/31 | | | | | | | | 550 | | | | 405,002 | |
9.750% | | | 06/15/25 | | | | | | | | 46 | | | | 46,007 | |
Sr. Unsec’d. Notes | |
4.750% | | | 02/15/28 | | | | | | | | 2,275 | | | | 1,952,392 | |
MPT Operating Partnership LP/MPT Finance Corp., | |
Gtd. Notes | |
3.500% | | | 03/15/31 | | | | | | | | 1,775 | | | | 1,126,357 | |
5.000% | | | 10/15/27 | | | | | | | | 250 | | | | 211,288 | |
Park Intermediate Holdings LLC/PK Domestic Property LLC/PK Finance Co-Issuer, | |
Gtd. Notes, 144A | |
7.000% | | | 02/01/30 | | | | | | | | 785 | | | | 796,285 | |
RHP Hotel Properties LP/RHP Finance Corp., | |
Gtd. Notes, 144A | |
4.500% | | | 02/15/29 | | | | | | | | 375 | | | | 353,478 | |
6.500% | | | 04/01/32 | | | | | | | | 980 | | | | 984,586 | |
Sabra Health Care LP, | |
Gtd. Notes | | | | | | | | | | | | | | | | |
5.125% | | | 08/15/26 | | | | | | | | 300 | | | | 300,029 | |
SBA Communications Corp., | |
Sr. Unsec’d. Notes | |
3.125% | | | 02/01/29 | | | | | | | | 555 | | | | 501,116 | |
SEE NOTES TO FINANCIAL STATEMENTS.
A131
| | | | |
| | PSF PGIM HIGH YIELD BOND PORTFOLIO (CONTINUED) | | |
| | | | |
SCHEDULE OF INVESTMENTS | | | | as of December 31, 2024 |
| | | | | | | | | | | | | | |
| | | | | | | | Principal | | | | |
| Interest | | Maturity | | | | | Amount | | | | |
Rate | | Date | | | | | (000)# | | | Value | |
|
CORPORATE BONDS (continued) | |
Real Estate Investment Trusts (REITs) (cont’d.) | |
Starwood Property Trust, Inc., | |
Sr. Unsec’d. Notes, 144A | |
3.625% | | 07/15/26 | | | | | | | 425 | | | $ | 410,181 | |
4.375% | | 01/15/27 | | | | | | | 75 | | | | 72,499 | |
6.500% | | 07/01/30 | | | | | | | 450 | | | | 450,440 | |
7.250% | | 04/01/29(a) | | | | | | | 580 | | | | 594,566 | |
Uniti Group LP/Uniti Group Finance 2019, Inc./CSL Capital LLC, | |
Sr. Sec’d. Notes, 144A | |
4.750% | | 04/15/28 | | | | | | | 1,450 | | | | 1,359,585 | |
10.500% | | 02/15/28 | | | | | | | 1,750 | | | | 1,865,431 | |
Uniti Group LP/Uniti Group Finance, Inc./CSL Capital LLC, | |
Gtd. Notes, 144A | |
6.500% | | 02/15/29 | | | | | | | 450 | | | | 408,716 | |
VICI Properties LP/VICI Note Co., Inc., | |
Gtd. Notes, 144A | |
4.500% | | 01/15/28 | | | | | | | 1,175 | | | | 1,147,393 | |
4.625% | | 12/01/29 | | | | | | | 1,175 | | | | 1,126,189 | |
| | | | | | | | | | | | | | |
| | | | |
| | | | | | | | | | | | | 14,111,540 | |
| | | | | | | | | | | | | | |
Retail — 5.1% | |
1011778 BC ULC/New Red Finance, Inc. (Canada), | |
Sec’d. Notes, 144A | |
4.000% | | 10/15/30 | | | | | | | 4,315 | | | | 3,846,467 | |
Arko Corp., | |
Gtd. Notes, 144A | |
5.125% | | 11/15/29(a) | | | | | | | 1,625 | | | | 1,478,780 | |
BCPE Ulysses Intermediate, Inc., | |
Sr. Unsec’d. Notes, 144A, Cash coupon 7.750% or PIK 8.500% | |
7.750% | | 04/01/27 | | | | | | | 500 | | | | 493,961 | |
Beacon Roofing Supply, Inc., | |
Sr. Sec’d. Notes, 144A | |
6.500% | | 08/01/30(a) | | | | | | | 125 | | | | 126,776 | |
Brinker International, Inc., | |
Gtd. Notes, 144A | |
8.250% | | 07/15/30 | | | | | | | 1,650 | | | | 1,742,025 | |
Carvana Co., | |
Sr. Sec’d. Notes, 144A, Cash coupon 9.000% or PIK 12.000% | |
9.000% | | 12/01/28 | | | | | | | 696 | | | | 743,606 | |
Sr. Sec’d. Notes, 144A, Cash coupon 11.000% or PIK 13.000% | |
13.000% | | 06/01/30 | | | | | | | 2,494 | | | | 2,746,290 | |
Sr. Sec’d. Notes, 144A, PIK 14.000% | |
14.000% | | 06/01/31 | | | | | | | 2,553 | | | | 3,061,463 | |
Cougar JV Subsidiary LLC, | |
Sr. Unsec’d. Notes, 144A | |
8.000% | | 05/15/32 | | | | | | | 240 | | | | 249,014 | |
eG Global Finance PLC (United Kingdom), | |
Sr. Sec’d. Notes, 144A | |
12.000% | | 11/30/28 | | | | | | | 475 | | | | 530,366 | |
Fertitta Entertainment LLC/Fertitta Entertainment Finance Co., Inc., | |
Gtd. Notes, 144A | |
6.750% | | 01/15/30 | | | | | | | 3,925 | | | | 3,618,967 | |
Sr. Sec’d. Notes, 144A | |
4.625% | | 01/15/29 | | | | | | | 425 | | | | 393,401 | |
Foundation Building Materials, Inc., | |
Gtd. Notes, 144A | |
6.000% | | 03/01/29 | | | | | | | 1,180 | | | | 1,035,773 | |
| | | | | | | | | | | | | | |
| | | | | | | | Principal | | | | |
| Interest | | Maturity | | | | | Amount | | | | |
Rate | | Date | | | | | (000)# | | | Value | |
|
CORPORATE BONDS (continued) | |
Retail (cont’d.) | |
Gap, Inc. (The), | |
Gtd. Notes, 144A | |
3.625% | | 10/01/29 | | | | | | | 1,575 | | | $ | 1,414,821 | |
3.875% | | 10/01/31 | | | | | | | 675 | | | | 582,682 | |
LBM Acquisition LLC, | |
Gtd. Notes, 144A | |
6.250% | | 01/15/29 | | | | | | | 1,875 | | | | 1,723,663 | |
LCM Investments Holdings II LLC, | |
Sr. Unsec’d. Notes, 144A | |
4.875% | | 05/01/29 | | | | | | | 1,975 | | | | 1,844,136 | |
8.250% | | 08/01/31 | | | | | | | 185 | | | | 191,734 | |
Lithia Motors, Inc., | |
Sr. Unsec’d. Notes, 144A | |
3.875% | | 06/01/29 | | | | | | | 875 | | | | 799,785 | |
Park River Holdings, Inc., | |
Gtd. Notes, 144A | |
5.625% | | 02/01/29 | | | | | | | 1,620 | | | | 1,404,827 | |
Sr. Unsec’d. Notes, 144A | |
6.750% | | 08/01/29 | | | | | | | 1,125 | | | | 989,018 | |
Patrick Industries, Inc., | |
Gtd. Notes, 144A | |
4.750% | | 05/01/29 | | | | | | | 600 | | | | 565,519 | |
6.375% | | 11/01/32 | | | | | | | 490 | | | | 474,147 | |
Sally Holdings LLC/Sally Capital, Inc., | |
Gtd. Notes | |
6.750% | | 03/01/32(a) | | | | | | | 2,335 | | | | 2,339,599 | |
Suburban Propane Partners LP/Suburban Energy Finance Corp., | |
Sr. Unsec’d. Notes | |
5.875% | | 03/01/27 | | | | | | | 275 | | | | 273,105 | |
Sr. Unsec’d. Notes, 144A | |
5.000% | | 06/01/31 | | | | | | | 2,575 | | | | 2,298,003 | |
Superior Plus LP/Superior General Partner, Inc. (Canada), | |
Gtd. Notes, 144A | |
4.500% | | 03/15/29(a) | | | | | | | 1,235 | | | | 1,117,289 | |
White Cap Buyer LLC, | |
Sr. Unsec’d. Notes, 144A | |
6.875% | | 10/15/28 | | | | | | | 720 | | | | 711,266 | |
| | | | | | | | | | | | | | |
| | | | |
| | | | | | | | | | | | | 36,796,483 | |
| | | | | | | | | | | | | | |
Software — 0.3% | |
Clarivate Science Holdings Corp., | |
Gtd. Notes, 144A | |
4.875% | | 07/01/29(a) | | | | | | | 1,500 | | | | 1,398,552 | |
SS&C Technologies, Inc., | |
Gtd. Notes, 144A | |
5.500% | | 09/30/27 | | | | | | | 1,075 | | | | 1,063,243 | |
| | | | | | | | | | | | | | |
| | | | |
| | | | | | | | | | | | | 2,461,795 | |
| | | | | | | | | | | | | | |
Telecommunications — 5.6% | |
Altice Financing SA (Luxembourg), | |
Sr. Sec’d. Notes, 144A | |
5.000% | | 01/15/28 | | | | | | | 2,125 | | | | 1,663,280 | |
5.750% | | 08/15/29 | | | | | | | 2,025 | | | | 1,475,719 | |
9.625% | | 07/15/27 | | | | | | | 1,950 | | | | 1,813,500 | |
Connect Finco Sarl/Connect US Finco LLC (United Kingdom), | |
Sr. Sec’d. Notes, 144A | |
9.000% | | 09/15/29(a) | | | | | | | 1,225 | | | | 1,115,595 | |
SEE NOTES TO FINANCIAL STATEMENTS.
A132
| | | | |
| | PSF PGIM HIGH YIELD BOND PORTFOLIO (CONTINUED) | | |
| | | | |
SCHEDULE OF INVESTMENTS | | | | as of December 31, 2024 |
| | | | | | | | | | | | | | |
| | | | | | | | Principal | | | | |
| Interest | | Maturity | | | | | Amount | | | | |
Rate | | Date | | | | | (000)# | | | Value | |
|
CORPORATE BONDS (continued) | |
Telecommunications (cont’d.) | |
Digicel Group Holdings Ltd. (Jamaica), | |
Sr. Sec’d. Notes, Series 1B14, 144A | |
0.000% | | 12/31/30^ | | | | | | | 372 | | | $ | 27,772 | |
Sr. Sec’d. Notes, Series 3A14, 144A | |
0.000% | | 12/31/30^ | | | | | | | 4 | | | | 3,910 | |
Sr. Sec’d. Notes, Series 3B14, 144A | |
0.000% | | 12/31/30^ | | | | | | | 481 | | | | 3,267 | |
Digicel Intermediate Holdings Ltd./Digicel International Finance Ltd./DIFL US (Jamaica), | |
Sr. Sec’d. Notes, Cash coupon 9.000% and PIK 1.942% | |
10.942% | | 05/25/27 | | | | | | | 2,386 | | | | 2,344,468 | |
Digicel MidCo Ltd./DIFL US II LLC (Jamaica), | |
Sr. Unsec’d. Notes, PIK 10.500% | |
10.500% | | 11/25/28 | | | | | | | 1,115 | | | | 1,001,330 | |
Frontier Communications Holdings LLC, | |
Sec’d. Notes | |
5.875% | | 11/01/29 | | | | | | | 5,700 | | | | 5,665,088 | |
Sec’d. Notes, 144A | |
6.000% | | 01/15/30 | | | | | | | 975 | | | | 972,715 | |
6.750% | | 05/01/29 | | | | | | | 500 | | | | 502,374 | |
Sr. Sec’d. Notes, 144A | |
5.000% | | 05/01/28 | | | | | | | 1,300 | | | | 1,275,747 | |
5.875% | | 10/15/27(a) | | | | | | | 1,275 | | | | 1,270,332 | |
8.750% | | 05/15/30 | | | | | | | 250 | | | | 264,190 | |
Iliad Holding SASU (France), | |
Sr. Sec’d. Notes, 144A | |
7.000% | | 10/15/28 | | | | | | | 925 | | | | 935,848 | |
7.000% | | 04/15/32 | | | | | | | 1,075 | | | | 1,079,074 | |
8.500% | | 04/15/31 | | | | | | | 310 | | | | 328,399 | |
Intelsat Jackson Holdings SA (Luxembourg), | |
Sr. Sec’d. Notes, 144A | |
6.500% | | 03/15/30 | | | | | | | 2,305 | | | | 2,123,389 | |
Level 3 Financing, Inc., | |
Gtd. Notes, 144A | |
3.625% | | 01/15/29 | | | | | | | 450 | | | | 359,268 | |
Sec’d. Notes, 144A | |
3.875% | | 10/15/30 | | | | | | | 275 | | | | 219,154 | |
4.000% | | 04/15/31 | | | | | | | 320 | | | | 253,670 | |
4.500% | | 04/01/30 | | | | | | | 1,135 | | | | 943,639 | |
4.875% | | 06/15/29 | | | | | | | 655 | | | | 569,728 | |
10.000% | | 10/15/32 | | | | | | | 200 | | | | 199,846 | |
Sr. Sec’d. Notes, 144A | |
10.500% | | 04/15/29 | | | | | | | 425 | | | | 473,474 | |
10.500% | | 05/15/30 | | | | | | | 540 | | | | 587,930 | |
10.750% | | 12/15/30(a) | | | | | | | 1,025 | | | | 1,148,941 | |
11.000% | | 11/15/29 | | | | | | | 3,848 | | | | 4,331,454 | |
Lumen Technologies, Inc., | |
Sr. Sec’d. Notes, 144A | |
10.000% | | 10/15/32 | | | | | | | 225 | | | | 223,918 | |
Sprint Capital Corp., | |
Gtd. Notes | |
6.875% | | 11/15/28 | | | | | | | 430 | | | | 456,175 | |
8.750% | | 03/15/32 | | | | | | | 731 | | | | 873,970 | |
Sprint LLC, | |
Gtd. Notes | |
7.625% | | 03/01/26 | | | | | | | 500 | | | | 511,322 | |
| | | | | | | | | | | | | | |
| | | | | | | | Principal | | | | |
| Interest | | Maturity | | | | | Amount | | | | |
Rate | | Date | | | | | (000)# | | | Value | |
|
CORPORATE BONDS (continued) | |
Telecommunications (cont’d.) | |
Viasat, Inc., | |
Sr. Unsec’d. Notes,144A | |
5.625% | | 09/15/25 | | | | | | | 855 | | | $ | 846,685 | |
Vmed O2 UK Financing I PLC (United Kingdom), | |
Sr. Sec’d. Notes, 144A | |
4.750% | | 07/15/31 | | | | | | | 750 | | | | 645,000 | |
Windstream Services LLC/Windstream Escrow Finance Corp., | |
Sr. Sec’d. Notes, 144A | |
8.250% | | 10/01/31 | | | | | | | 1,550 | | | | 1,600,660 | |
Zegona Finance PLC (United Kingdom), | |
Sr. Sec’d. Notes, 144A | |
8.625% | | 07/15/29 | | | | | | | 1,595 | | | | 1,691,545 | |
| | | | | | | | | | | | | | |
| | | | |
| | | | | | | | | | | | | 39,802,376 | |
| | | | | | | | | | | | | | |
Transportation — 0.6% | |
GN Bondco LLC, | |
Sr. Sec’d. Notes, 144A | |
9.500% | | 10/15/31(a) | | | | | | | 2,350 | | | | 2,469,327 | |
RXO, Inc., | |
Gtd. Notes, 144A | |
7.500% | | 11/15/27 | | | | | | | 585 | | | | 602,194 | |
XPO, Inc., | |
Gtd. Notes, 144A | |
7.125% | | 06/01/31 | | | | | | | 125 | | | | 127,616 | |
7.125% | | 02/01/32 | | | | | | | 950 | | | | 972,701 | |
| | | | | | | | | | | | | | |
| | | | |
| | | | | | | | | | | | | 4,171,838 | |
| | | | | | | | | | | | | | |
| | |
TOTAL CORPORATE BONDS
(cost $627,436,588) | | | | | | | | 603,745,399 | |
| | | | | | | | | | | | | | |
|
FLOATING RATE AND OTHER LOANS — 3.9% | |
Advertising — 0.0% | |
Terrier Media Buyer, Inc., | |
Term Facility, 3 Month SOFR + 3.600% | |
7.929%(c) | | 06/18/29 | | | | | | | 106 | | | | 95,300 | |
| | | | | | | | | | | | | | |
Auto Parts & Equipment — 0.3% | |
First Brands Group LLC, | |
Second Lien 2021 Term Loan, 3 Month SOFR + 8.762% | |
13.347%(c) | | 03/30/28 | | | | | | | 1,510 | | | | 1,359,000 | |
Tenneco, Inc., | |
Term A Loan, 3 Month SOFR + 4.850% | |
9.371%(c) | | 11/17/28 | | | | | | | 588 | | | | 565,790 | |
| | | | | | | | | | | | | | |
| | | | |
| | | | | | | | | | | | | 1,924,790 | |
| | | | | | | | | | | | | | |
Chemicals — 0.4% | |
Consolidated Energy Finance SA (Switzerland), | |
2024 Incremental Term Loan, 3 Month SOFR + 4.500% | |
9.014%(c) | | 11/15/30 | | | | | | | 1,166 | | | | 1,131,202 | |
Iris Holdings Ltd., | |
Initial Term Loan, 3 Month SOFR + 4.850% | |
9.435%(c) | | 06/28/28 | | | | | | | 706 | | | | 678,766 | |
Venator Finance Sarl, | |
Initial First-Out Term Loan, 3 Month SOFR + 10.000% | |
14.647%(c) | | 12/31/25^ | | | | | | | 548 | | | | 548,192 | |
SEE NOTES TO FINANCIAL STATEMENTS.
A133
| | | | |
| | PSF PGIM HIGH YIELD BOND PORTFOLIO (CONTINUED) | | |
| | | | |
SCHEDULE OF INVESTMENTS | | | | as of December 31, 2024 |
| | | | | | | | | | | | | | | | |
| | | | | | | | | Principal | | | | |
| Interest | | Maturity | | | | | | Amount | | | | |
Rate | | Date | | | | | | (000)# | | | Value | |
|
FLOATING RATE AND OTHER LOANS (continued) | |
Chemicals (cont’d.) | |
Term Loan, 3 Month SOFR + 10.000% | |
14.656%(c) | | | 10/12/28 | | | | | | | | 782 | | | $ | 775,689 | |
| | | | | | | | | | | | | | | | |
| | | | |
| | | | | | | | | | | | | | | 3,133,849 | |
| | | | | | | | | | | | | | | | |
Commercial Services — 0.0% | |
Catawba Nation Gaming Authority, | |
Term B Loan, 1 Month SOFR + 4.750% | |
9.125%(c) | | | 02/28/32 | | | | | | | | 225 | | | | 225,423 | |
MPH Acquisition Holdings LLC, | |
Initial Term Loan, 3 Month SOFR + 4.512% | |
9.026%(c) | | | 09/01/28 | | | | | | | | 100 | | | | 83,783 | |
| | | | | | | | | | | | | | | | |
| | | | |
| | | | | | | | | | | | | | | 309,206 | |
| | | | | | | | | | | | | | | | |
Computers — 0.1% | |
McAfee Corp., | |
Tranche B-1 Term Loan, 1 Month SOFR + 3.250% | |
7.803%(c) | | | 03/01/29 | | | | | | | | 605 | | | | 604,964 | |
NCR Atleos Corp., | |
Term A Loan, 3 Month SOFR + 2.750% | |
7.335%(c) | | | 09/27/28^ | | | | | | | | 236 | | | | 237,142 | |
| | | | | | | | | | | | | | | | |
| | | | |
| | | | | | | | | | | | | | | 842,106 | |
| | | | | | | | | | | | | | | | |
Electric — 0.0% | |
Heritage Power LLC, | |
Term Loan, 1 Month SOFR + 7.000% | |
11.357%(c) | | | 07/20/28^ | | | | | | | | 211 | | | | 210,857 | |
| | | | | | | | | | | | | | | | |
Electronics — 0.1% | |
Likewize Corp., | |
Closing Date Term Loan, 3 Month SOFR + 5.750% | |
10.350%(c) | | | 08/15/29 | | | | | | | | 497 | | | | 485,074 | |
| | | | | | | | | | | | | | | | |
Forest Products & Paper — 0.0% | |
Magnera Corp., | |
New Term Loan, 3 Month SOFR + 4.250% | |
8.764%(c) | | | 10/31/31 | | | | | | | | 250 | | | | 250,313 | |
| | | | | | | | | | | | | | | | |
Holding Companies-Diversified — 0.0% | |
Clue OpCo LLC, | |
Term B Loan, 3 Month SOFR + 4.500% | |
9.085%(c) | | | 12/19/30 | | | | | | | | 337 | | | | 337,660 | |
| | | | | | | | | | | | | | | | |
Household Products/Wares — 0.1% | |
Kronos Acquisition Holdings, Inc. (Canada), | |
2024 Initial Loan, 3 Month SOFR + 4.000% | |
8.584%(c) | | | 07/08/31 | | | | | | | | 623 | | | | 586,291 | |
| | | | | | | | | | | | | | | | |
Housewares — 0.1% | |
SWF Holdings I Corp., | |
Term Loan | |
—%(p) | | | 12/18/29 | | | | | | | | 129 | | | | 128,893 | |
—%(p) | | | 12/18/29 | | | | | | | | 171 | | | | 171,857 | |
Tranche A-2, 1 Month SOFR + 4.114% | |
8.471%(c) | | | 10/06/28^ | | | | | | | | 732 | | | | 654,905 | |
| | | | | | | | | | | | | | | | |
| | | | |
| | | | | | | | | | | | | | | 955,655 | |
| | | | | | | | | | | | | | | | |
Insurance — 0.3% | |
Acrisure LLC, | |
2024 Repricing Term B-6 Loan, 1 Month SOFR + 3.000% | |
7.357%(c) | | | 11/06/30 | | | | | | | | 299 | | | | 299,125 | |
| | | | | | | | | | | | | | | | |
| | | | | | | | | Principal | | | | |
| Interest | | Maturity | | | | | | Amount | | | | |
Rate | | Date | | | | | | (000)# | | | Value | |
|
FLOATING RATE AND OTHER LOANS (continued) | |
Insurance (cont’d.) | |
Asurion LLC, | |
New B-04 Term Loan, 1 Month SOFR + 5.364% | |
9.721%(c) | | | 01/20/29 | | | | | | | | 1,040 | | | $ | 1,001,743 | |
New B-08 Term Loan, 1 Month SOFR + 3.364% | |
7.721%(c) | | | 12/23/26 | | | | | | | | 279 | | | | 279,199 | |
New B-12 Term Loan, 1 Month SOFR + 4.250% | |
8.607%(c) | | | 09/19/30 | | | | | | | | 298 | | | | 297,668 | |
| | | | | | | | | | | | | | | | |
| | | | |
| | | | | | | | | | | | | | | 1,877,735 | |
| | | | | | | | | | | | | | | | |
Internet — 0.1% | |
Cablevision Lightpath LLC, | |
Initial Term Loan, 1 Month SOFR + 3.364% | |
7.762%(c) | | | 11/30/27 | | | | | | | | 383 | | | | 382,782 | |
| | | | | | | | | | | | | | | | |
Machinery-Diversified — 0.1% | |
Graftech Global Enterprises Inc, | |
Delayed Draw Term Loan | |
—%(p) | | | 12/31/29^ | | | | | | | | 168 | | | | 168,149 | |
Initial Term Loan | |
—%(p) | | | 12/31/29^ | | | | | | | | 294 | | | | 294,260 | |
| | | | | | | | | | | | | | | | |
| | | | |
| | | | | | | | | | | | | | | 462,409 | |
| | | | | | | | | | | | | | | | |
Media — 1.1% | |
Altice Financing SA (Luxembourg), | |
2022 Dollar Loan, 3 Month SOFR + 5.000% | |
9.656%(c) | | | 10/31/27 | | | | | | | | 1,710 | | | | 1,447,405 | |
CSC Holdings LLC, | |
2022 Refinancing Term Loan, 1 Month SOFR + 4.500% | |
8.897%(c) | | | 01/18/28 | | | | | | | | 3,293 | | | | 3,216,371 | |
Diamond Sports Group LLC, | |
Dip Term Loan | |
10.000% | | | 01/14/25 | | | | | | | | 937 | | | | 1,005,195 | |
First Lien Term Loan, 1 Month SOFR + 10.100% | |
14.712%(c) | | | 05/25/26 | | | | | | | | 34 | | | | 28,676 | |
Second Lien Term Loan | |
8.175% | | | 08/24/26 | | | | | | | | 2,226 | | | | 5,638 | |
Radiate Holdco LLC, | |
Amendment No. 6 Term Loan, 1 Month SOFR + 3.364% | |
7.721%(c) | | | 09/25/26 | | | | | | | | 2,595 | | | | 2,263,200 | |
| | | | | | | | | | | | | | | | |
| | | | |
| | | | | | | | | | | | | | | 7,966,485 | |
| | | | | | | | | | | | | | | | |
Metal Fabricate/Hardware — 0.3% | |
Doncasters US Finance LLC (United Kingdom), | |
Initial Term Loan, 3 Month SOFR + 6.500% | |
10.829%(c) | | | 04/23/30^ | | | | | | | | 1,960 | | | | 1,940,586 | |
| | | | | | | | | | | | | | | | |
Pharmaceuticals — 0.2% | |
Bausch Health Cos., Inc., | |
Second Amendment Term Loan, 1 Month SOFR + 5.250% | |
9.707%(c) | | | 02/01/27 | | | | | | | | 1,331 | | | | 1,294,384 | |
| | | | | | | | | | | | | | | | |
Retail — 0.0% | |
Great Outdoors Group LLC, | |
Term B-2 Loan, 1 Month SOFR + 3.864% | |
8.221%(c) | | | 03/06/28 | | | | | | | | 231 | | | | 231,914 | |
| | | | | | | | | | | | | | | | |
Software — 0.2% | |
athenahealth, Inc., | |
Initial Term Loan, 1 Month SOFR + 3.250% | |
7.607%(c) | | | 02/15/29 | | | | | | | | 336 | | | | 336,161 | |
SEE NOTES TO FINANCIAL STATEMENTS.
A134
| | | | |
| | PSF PGIM HIGH YIELD BOND PORTFOLIO (CONTINUED) | | |
| | | | |
SCHEDULE OF INVESTMENTS | | | | as of December 31, 2024 |
| | | | | | | | | | | | | | |
| | | | | | | | Principal | | | | |
| Interest | | Maturity | | | | | Amount | | | | |
Rate | | Date | | | | | (000)# | | | Value | |
|
FLOATING RATE AND OTHER LOANS (continued) | |
Software (cont’d.) | |
Boxer Parent Co., Inc., | |
2031 New First Lien Dollar Term Loan, 3 Month SOFR + 3.750% | |
8.335%(c) | | 07/30/31 | | | | | | | 175 | | | $ | 176,312 | |
Skillsoft Finance II, Inc., | |
Initial Term Loan, 1 Month SOFR + 5.364% | |
9.721%(c) | | 07/14/28 | | | | | | | 1,093 | | | | 951,603 | |
| | | | | | | | | | | | | | |
| | | | |
| | | | | | | | | | | | | 1,464,076 | |
| | | | | | | | | | | | | | |
Telecommunications — 0.5% | |
Connect Finco Sarl (United Kingdom), | |
Amendment No. 4 Term Loan, 1 Month SOFR + 4.500% | |
8.857%(c) | | 09/27/29 | | | | | | | 1,266 | | | | 1,123,965 | |
Digicel International Finance Ltd. (Jamaica), | |
Initial Term Loan, 3 Month SOFR + 6.750% | |
11.335%(c) | | 05/25/27 | | | | | | | 102 | | | | 98,742 | |
Level 3 Financing, Inc., | |
Term B-1, 1 Month SOFR + 6.560% | |
10.917%(c) | | 04/15/29 | | | | | | | 592 | | | | 603,621 | |
Term B-2, 1 Month SOFR + 6.560% | |
10.917%(c) | | 04/15/30 | | | | | | | 368 | | | | 374,135 | |
Xplore, Inc., | | | | | | | | | | | | | | |
Initial Term Loan, 1 Month SOFR + 5.114% | |
9.471%(c) | | 10/24/29 | | | | | | | 112 | | | | 110,272 | |
Second Out Term Loan, 1 Month SOFR + 1.614% | |
6.000%(c) | | 10/24/31 | | | | | | | 393 | | | | 318,555 | |
Zegona Holdco Ltd., | |
Facility B (USD), 6 Month SOFR + 4.250% | |
9.401%(c) | | 07/17/29 | | | | | | | 773 | | | | 773,062 | |
| | | | | | | | | | | | | | |
| | | | |
| | | | | | | | | | | | | 3,402,352 | |
| | | | | | | | | | | | | | |
| |
TOTAL FLOATING RATE AND OTHER LOANS
(cost $28,834,598) | | | | 28,153,824 | |
| | | | | | | | | | | | | | |
|
RESIDENTIAL MORTGAGE-BACKED SECURITIES — 0.0% | |
Adjustable Rate Mortgage Trust, | |
Series 2005-07, Class 1A1 | |
5.935%(cc) | | 10/25/35 | | | | | | | 4 | | | | 2,705 | |
Alternative Loan Trust, | |
Series 2005-43, Class 4A3 | |
4.160%(cc) | | 10/25/35 | | | | | | | 1 | | | | 1,130 | |
Series 2006-HY13, Class 4A1 | |
4.674%(cc) | | 02/25/37 | | | | | | | 1 | | | | 1,042 | |
Series 2006-OA09, Class 2A1A, 1 Month SOFR + 0.324% (Cap N/A, Floor 0.210%) | |
4.695%(c) | | 07/20/46 | | | | | | | 2 | | | | 1,427 | |
American Home Mortgage Assets Trust, | |
Series 2006-04, Class 1A12, 1 Month SOFR + 0.324% (Cap N/A,
Floor 0.324%) | |
4.912%(c) | | 10/25/46 | | | | | | | 14 | | | | 7,319 | |
Banc of America Funding Trust, | |
Series 2006-B, Class 2A1 | |
4.615%(cc) | | 03/20/36 | | | | | | | 2 | | | | 1,953 | |
Citigroup Mortgage Loan Trust, | |
Series 2007-10, Class 22AA | |
4.959%(cc) | | 09/25/37 | | | | | | | 5 | | | | 4,799 | |
| | | | | | | | | | | | | | |
| | | | | | | | Principal | | | | |
| Interest | | Maturity | | | | | Amount | | | | |
Rate | | Date | | | | | (000)# | | | Value | |
|
| RESIDENTIAL MORTGAGE-BACKED SECURITIES (continued) | |
HarborView Mortgage Loan Trust, | |
Series 2006-05, Class 2A1A, 1 Month SOFR + 0.474% (Cap N/A,
Floor 0.360%) | |
4.841%(c) | | 07/19/46 | | | | | | | 4 | | | $ | 2,098 | |
IndyMac INDX Mortgage Loan Trust, | |
Series 2006-AR12, Class A1, 1 Month SOFR + 0.494% (Cap N/A, Floor 0.380%) | |
4.833%(c) | | 09/25/46 | | | | | | | 3 | | | | 2,327 | |
JPMorgan Mortgage Trust, | |
Series 2007-S03, Class 1A96 | |
6.000% | | 08/25/37 | | | | | | | 9 | | | | 4,222 | |
MASTR Adjustable Rate Mortgages Trust, | |
Series 2006-OA01, Class 1A1, 1 Month SOFR + 0.324% (Cap N/A,
Floor 0.210%) | |
4.663%(c) | | 04/25/46 | | | | | | | 1 | | | | 1,105 | |
Residential Accredit Loans Trust, | |
Series 2006-QA02, Class 3A1 | |
6.446%(cc) | | 02/25/36 | | | | | | | 7 | | | | 5,559 | |
Residential Asset Securitization Trust, | |
Series 2007-A05, Class 2A3 | |
6.000% | | 05/25/37 | | | | | | | 2 | | | | 1,260 | |
Washington Mutual Mortgage Pass-Through Certificates Trust, | |
Series 2007-HY01, Class 2A3 | |
4.216%(cc) | | 02/25/37 | | | | | | | 1 | | | | 1,166 | |
Series 2007-HY01, Class 4A1 | |
4.367%(cc) | | 02/25/37 | | | | | | | 2 | | | | 1,764 | |
| | | | | | | | | | | | | | |
|
TOTAL RESIDENTIAL MORTGAGE-BACKED SECURITIES | |
(cost $48,583) | | | | 39,876 | |
| | | | | | | | | | | | | | |
U.S. TREASURY OBLIGATIONS — 5.3% | |
U.S. Treasury Notes | |
2.750% | | 04/30/27 | | | | | | | 1,854 | | | | 1,792,586 | |
3.875% | | 11/30/27(k) | | | | | | | 5,000 | | | | 4,944,141 | |
4.125% | | 10/31/26 | | | | | | | 10,800 | | | | 10,776,797 | |
4.125% | | 07/31/28(k) | | | | | | | 10,000 | | | | 9,932,031 | |
4.250% | | 01/31/26 | | | | | | | 4,250 | | | | 4,250,498 | |
4.625% | | 06/30/26 | | | | | | | 6,000 | | | | 6,033,047 | |
| | | | | | | | | | | | | | |
| |
TOTAL U.S. TREASURY OBLIGATIONS
(cost $37,801,777) | | | | 37,729,100 | |
| | | | | | | | | | | | | | |
| | | | |
| | | | | | | | Shares | | | | |
| | |
COMMON STOCKS — 1.4% | | | | | | | | | |
Chemicals — 0.4% | | | | | | | | | |
Cornerstone Chemical Co.*^ | | | | 26,744 | | | | 508,136 | |
TPC Group, Inc.*^ | | | | 49,934 | | | | 1,498,020 | |
Venator Materials PLC*^(x) | | | | 2,264 | | | | 633,920 | |
| | | | | | | | | | | | | | |
| | | | |
| | | | | | | | | | | | | 2,640,076 | |
| | | | | | | | | | | | | | |
Electric Utilities — 0.0% | |
GenOn Energy Holdings, Inc. (Class A Stock)*^ | | | | 11,836 | | | | 355,080 | |
Keycon Power Holdings LLC*^ | | | | 21,440 | | | | 2 | |
| | | | | | | | | | | | | | |
| | | | |
| | | | | | | | | | | | | 355,082 | |
| | | | | | | | | | | | | | |
SEE NOTES TO FINANCIAL STATEMENTS.
A135
| | | | |
| | PSF PGIM HIGH YIELD BOND PORTFOLIO (CONTINUED) | | |
| | | | |
SCHEDULE OF INVESTMENTS | | | | as of December 31, 2024 |
| | | | | | | | |
| | | Shares | | | Value | |
|
COMMON STOCKS (continued) | |
Gas Utilities — 0.2% | |
Ferrellgas Partners LP (Class B Stock) | | | 12,116 | | | $ | 1,519,883 | |
| | | | | | | | |
Oil, Gas & Consumable Fuels — 0.3% | |
Expand Energy Corp | | | 7,184 | | | | 715,167 | |
Heritage Power LLC*^ | | | 28,339 | | | | 1,473,628 | |
Heritage Power LLC*^ | | | 1,246 | | | | 64,792 | |
Heritage Power LLC*^ | | | 32,615 | | | | 16,308 | |
| | | | | | | | |
| | |
| | | | | | | 2,269,895 | |
| | | | | | | | |
Wireless Telecommunication Services — 0.5% | |
Digicel International Finance Ltd. (Jamaica)*^ | | | 264,007 | | | | 1,584,042 | |
Intelsat Emergence SA (Luxembourg)* | | | 52,851 | | | | 1,608,652 | |
Xplore, Inc. (Canada)* | | | 24,108 | | | | 94,970 | |
Xplore, Inc., CVR*^ | | | 1,680 | | | | — | |
| | | | | | | | |
| | |
| | | | | | | 3,287,664 | |
| | | | | | | | |
TOTAL COMMON STOCKS
(cost $8,462,996) | | | | 10,072,600 | |
| | | | | | | | |
|
PREFERRED STOCKS — 0.4% | |
Electronic Equipment, Instruments & Components — 0.4% | |
Ferrellgas Escrow LLC, 8.956%, Maturing 03/30/31^ | | | 2,850 | | | | 2,850,000 | |
| | | | | | | | |
|
Wireless Telecommunication Services — 0.0% | |
Digicel International Finance Ltd. (Jamaica)*^ | | | 28,035 | | | | 311,326 | |
| | | | | | | | |
| |
TOTAL PREFERRED STOCKS
(cost $2,933,610) | | | | 3,161,326 | |
| | | | | | | | |
| |
TOTAL LONG-TERM INVESTMENTS
(cost $709,566,747) | | | | 687,044,922 | |
| | | | | | | | |
|
SHORT-TERM INVESTMENTS — 8.2% | |
AFFILIATED MUTUAL FUNDS | |
PGIM Core Ultra Short Bond Fund(wb) | | | 19,820,827 | | | | 19,820,827 | |
PGIM Institutional Money Market Fund (7-day effective yield 4.649%) (cost $38,563,581; includes $38,387,473 of cash collateral for securities on loan)(b)(wb) | | | 38,618,173 | | | | 38,595,002 | |
| | | | | | | | |
TOTAL SHORT-TERM INVESTMENTS
(cost $58,384,408) | | | | 58,415,829 | |
| | | | | | | | |
TOTAL INVESTMENTS—104.2%
(cost $767,951,155) | | | | 745,460,751 | |
Liabilities in excess of other assets(z) — (4.2)% | | | | (29,773,487 | ) |
| | | | | | | | |
| | |
NET ASSETS — 100.0% | | | | | | $ | 715,687,264 | |
| | | | | | | | |
See the Glossary for a list of the abbreviation(s) used in the annual report.
| * | Non-income producing security. |
| # | Principal or notional amount is shown in U.S. dollars unless otherwise stated. |
| ^ | Indicates a Level 3 instrument. The aggregate value of Level 3 instruments is $13,544,073 and 1.9% of net assets. |
| (a) | All or a portion of security is on loan. The aggregate market value of such securities, including those sold and pending settlement, is $37,739,176; cash collateral of $38,387,473 (included in liabilities) was received with which the Portfolio purchased highly liquid short-term investments. In the event of significant appreciation in value of securities on loan on the last business day of the reporting period, the Portfolio may reflect a collateral value that is less than the market value of the loaned securities and such shortfall is remedied the following business day. |
| (b) | Represents security, or portion thereof, purchased with cash collateral received for securities on loan and includes dividend reinvestment. |
| (c) | Variable rate instrument. The interest rate shown reflects the rate in effect at December 31, 2024. |
| (cc) | Variable rate instrument. The rate shown is based on the latest available information as of December 31, 2024. Certain variable rate securities are not based on a published reference rate and spread but are determined by the issuer or agent and are based on current market conditions. These securities do not indicate a reference rate and spread in their description. |
| (d) | Represents issuer in default on interest payments and/or principal repayment. Non-income producing security. Such securities may be post-maturity. |
| (ff) | Variable rate security. Security may be issued at a fixed coupon rate, which converts to a variable rate at a specified date. Rate shown is the rate in effect as of period end. |
| (k) | Represents security, or a portion thereof, segregated as collateral for centrally cleared/exchange-traded derivatives. |
| (oo) | Perpetual security. Maturity date represents next call date. |
| (p) | Represents a security with a delayed settlement and therefore the interest rate is not available until settlement which is after the period end. |
| (wb) | Represents an investment in a Fund affiliated with the Manager. |
| (x) | The following represents restricted securities that are acquired in unregistered, private sales from the issuing company or from an affiliate of the issuer and is considered restricted as to disposition under federal securities law. |
SEE NOTES TO FINANCIAL STATEMENTS.
A136
| | | | |
| | PSF PGIM HIGH YIELD BOND PORTFOLIO (CONTINUED) | | |
| | | | |
SCHEDULE OF INVESTMENTS | | | | as of December 31, 2024 |
(x) Restricted Securities:
| | | | | | | | | | | | | | | | | | | | | | | | | |
Issuer Description | | | | Acquisition
Date | | Original
Cost | | Market
Value | | Percentage
of
Net Assets |
ARD Finance SA (Luxembourg), | | | | | | | | | | | | | | | | | | | | | | | | | |
Sr. Sec’d. Notes, 144A, Cash coupon 6.500% or PIK 7.250%, 6.500%, 06/30/27 | | | | | | | | | 11/06/19-12/30/24 | | | | $ | 1,293,252 | | | | $ | 191,233 | | | | | 0.0% | |
Ardagh Packaging Finance PLC/Ardagh Holdings USA, Inc., | | | | | | | | | | | | | | | | | | | | | | | | | |
Sr. Sec’d. Notes, 144A, 4.125%, 08/15/26 | | | | | | | | | 03/25/24-03/26/24 | | | | | 356,250 | | | | | 348,000 | | | | | 0.1 | |
CSC Holdings LLC, | | | | | | | | | | | | | | | | | | | | | | | | | |
Gtd. Notes, 144A, 3.375%, 02/15/31 | | | | | | | | | 08/03/20-10/29/20 | | | | | 1,173,800 | | | | | 839,012 | | | | | 0.1 | |
CSC Holdings LLC, | | | | | | | | | | | | | | | | | | | | | | | | | |
Gtd. Notes, 144A, 4.125%, 12/01/30 | | | | | | | | | 06/02/20 | | | | | 575,000 | | | | | 414,057 | | | | | 0.1 | |
CSC Holdings LLC, | | | | | | | | | | | | | | | | | | | | | | | | | |
Gtd. Notes, 144A, 5.375%, 02/01/28 | | | | | | | | | 04/19/21-02/04/22 | | | | | 913,900 | | | | | 766,576 | | | | | 0.1 | |
CSC Holdings LLC, | | | | | | | | | | | | | | | | | | | | | | | | | |
Gtd. Notes, 144A, 5.500%, 04/15/27 | | | | | | | | | 11/30/22-06/13/24 | | | | | 413,594 | | | | | 424,739 | | | | | 0.1 | |
CSC Holdings LLC, | | | | | | | | | | | | | | | | | | | | | | | | | |
Gtd. Notes, 144A, 6.500%, 02/01/29 | | | | | | | | | 02/11/22-05/06/22 | | | | | 389,000 | | | | | 336,175 | | | | | 0.0 | |
CSC Holdings LLC, | | | | | | | | | | | | | | | | | | | | | | | | | |
Sr. Unsec’d. Notes, 144A, 4.625%, 12/01/30 | | | | | | | | | 08/03/20-10/28/20 | | | | | 1,920,258 | | | | | 974,995 | | | | | 0.1 | |
CSC Holdings LLC, | | | | | | | | | | | | | | | | | | | | | | | | | |
Sr. Unsec’d. Notes, 144A, 5.000%, 11/15/31 | | | | | | | | | 09/27/21 | | | | | 297,213 | | | | | 161,939 | | | | | 0.0 | |
CSC Holdings LLC, | | | | | | | | | | | | | | | | | | | | | | | | | |
Sr. Unsec’d. Notes, 144A, 5.750%, 01/15/30 | | | | | | | | | 10/13/21-12/05/22 | | | | | 2,032,500 | | | | | 1,321,798 | | | | | 0.2 | |
CSC Holdings LLC, | | | | | | | | | | | | | | | | | | | | | | | | | |
Sr. Unsec’d. Notes, 144A, 7.500%, 04/01/28 | | | | | | | | | 02/17/22 | | | | | 197,750 | | | | | 136,766 | | | | | 0.0 | |
Diamond Sports Group LLC/Diamond Sports Finance Co., | | | | | | | | | | | | | | | | | | | | | | | | | |
Gtd. Notes, 144A, 6.625%, 08/15/27(d) | | | | | | | | | 07/18/19-06/03/22 | | | | | 5,052,669 | | | | | 7,549 | | | | | 0.0 | |
Diamond Sports Group LLC/Diamond Sports Finance Co., | | | | | | | | | | | | | | | | | | | | | | | | | |
Sec’d. Notes, 144A, 5.375%, 08/15/26(d) | | | | | | | | | 07/18/19-08/30/22 | | | | | 2,812,977 | | | | | 14,334 | | | | | 0.0 | |
Keystone Power Pass-Through Holders LLC/Conemaugh Power Pass-Through Holders, | | | | | | | | | | | | | | | | | | | | | | | | | |
Sub. Notes, 144A, Cash coupon 1.000% and PIK 12.000%, 13.000%, 06/01/28 | | | | | | | | | 08/28/24-12/01/24 | | | | | 239,089 | | | | | 247,223 | | | | | 0.0 | |
Radiate Holdco LLC/Radiate Finance, Inc., | | | | | | | | | | | | | | | | | | | | | | | | | |
Sr. Sec’d. Notes, 144A, 4.500%, 09/15/26 | | | | | | | | | 09/11/20-02/03/21 | | | | | 509,500 | | | | | 440,582 | | | | | 0.1 | |
Radiate Holdco LLC/Radiate Finance, Inc., | | | | | | | | | | | | | | | | | | | | | | | | | |
Sr. Unsec’d. Notes, 144A, 6.500%, 09/15/28 | | | | | | | | | 11/21/22-05/04/23 | | | | | 1,050,125 | | | | | 1,359,432 | | | | | 0.2 | |
Sinclair Television Group, Inc., | | | | | | | | | | | | | | | | | | | | | | | | | |
Gtd. Notes, 144A, 5.125%, 02/15/27 | | | | | | | | | 05/05/23-06/06/23 | | | | | 898,106 | | | | | 997,668 | | | | | 0.1 | |
Venator Materials PLC*^ | | | | | | | | | 06/29/17-10/19/23 | | | | | 3,574,374 | | | | | 633,920 | | | | | 0.1 | |
| | | | | | | | | | | | | | | | | | | | | | | | | |
Total | | | | | | | | | | | | | $ | 23,699,357 | | | | $ | 9,615,998 | | | | | 1.3% | |
| | | | | | | | | | | | | | | | | | | | | | | | | |
| (z) | Includes net unrealized appreciation/(depreciation) and/or market value of the below holdings which are excluded from the Schedule of Investments: |
Unfunded corporate bond commitment outstanding at December 31, 2024:
| | | | | | | | | | | | | | | | | | | | | | | | | |
Issuer | | | | Principal
Amount
(000)# | | Current
Value | | Unrealized
Appreciation | | Unrealized
Depreciation |
New Generation Gas Gathering LLC, Sr. Sec’d. Notes, 144A, —%(p), Maturity Date 09/30/29 (cost $431,269)^ | | | | | | | | | 438 | | | | $ | 431,269 | | | | $ | — | | | | $ | — | |
| | | | | | | | | | | | | | | | | | | | | | | | | |
SEE NOTES TO FINANCIAL STATEMENTS.
A137
| | | | |
| | PSF PGIM HIGH YIELD BOND PORTFOLIO (CONTINUED) | | |
| | | | |
SCHEDULE OF INVESTMENTS | | | | as of December 31, 2024 |
Unfunded loan commitment outstanding at December 31, 2024:
| | | | | | | | | | | | | | | | | | | | | | | | | |
Borrower | | | | Principal
Amount
(000)# | | Current
Value | | Unrealized
Appreciation
Depreciation | | Unrealized |
Doncasters US Finance LLC, Delayed Draw Term Loan, 1.500%, Maturity Date 04/23/30 (cost $195,476)^ | | | | | | | | | 198 | | | | $ | 195,525 | | | | $ | 49 | | | | $ | — | |
| | | | | | | | | | | | | | | | | | | | | | | | | |
Futures contracts outstanding at December 31, 2024:
| | | | | | | | | | | | | | | | | | | | | | | | | | |
Number
of
Contracts | | Type | | | | | Expiration
Date | | | Current
Notional
Amount | | | Value /
Unrealized
Appreciation
(Depreciation) | |
| Long Positions: | | | | | | | | | | | | | | | | | | | | | | | | |
133 | | 2 Year U.S. Treasury Notes | | | | | | | Mar. 2025 | | | | $27,346,047 | | | | | | | | $ (17,101 | ) | | | | |
156 | | 5 Year U.S. Treasury Notes | | | | | | | Mar. 2025 | | | | 16,583,532 | | | | | | | | (68,694 | ) | | | | |
229 | | 10 Year U.S. Treasury Notes | | | | | | | Mar. 2025 | | | | 24,903,750 | | | | | | | | (222,089 | ) | | | | |
27 | | 20 Year U.S. Treasury Bonds | | | | | | | Mar. 2025 | | | | 3,073,781 | | | | | | | | (72,903 | ) | | | | |
18 | | 30 Year U.S. Ultra Treasury Bonds | | | | | | | Mar. 2025 | | | | 2,140,313 | | | | | | | | (62,534 | ) | | | | |
| | | | | | | | | | | | | | | | | | | | | | | | | | |
| | | | | | | | | | | | | | | | | | | | | $(443,321 | ) | | | | |
| | | | | | | | | | | | | | | | | | | | | | | | | | |
Credit default swap agreement outstanding at December 31, 2024:
| | | | | | | | | | | | | | | | | | | | | | | | | | | | | | | | | | | |
Reference Entity/ Obligation | | Termination
Date | | Fixed
Rate | | Notional
Amount
(000)#(3) | | Implied Credit
Spread at
December 31,
2024(4) | | Value at
Trade Date | | Value at
December 31,
2024 | | Unrealized
Appreciation
(Depreciation) |
Centrally Cleared Credit Default Swap Agreement on credit indices - Sell Protection(2): | | | | | | | | | | | |
CDX.NA.HY.43.V1 | | | | 12/20/29 | | | | | 5.000%(Q) | | | | | 31,395 | | | | | 3.117 | % | | | $ | 2,551,571 | | | | $ | 2,468,434 | | | | $ | (83,137 | ) |
| | | | | | | | | | | | | | | | | | | | | | | | | | | | | | | | | | | |
The Portfolio entered into credit default swaps (“CDS”) to provide a measure of protection against defaults or to take an active long or short position with respect to the likelihood of a particular issuer’s default or the reference entity’s credit soundness. CDS contracts generally trade based on a spread which represents the cost a protection buyer has to pay the protection seller. The protection buyer is said to be short the credit as the value of the contract rises the more the credit deteriorates. The value of the CDS contract increases for the protection buyer if the spread increases.
| (1) | If the Portfolio is a buyer of protection, it pays the fixed rate. When a credit event occurs, as defined under the terms of that particular swap agreement, the Portfolio will either (i) receive from the seller of protection an amount equal to the notional amount of the swap and make delivery of the referenced obligation or underlying securities comprising the referenced index or (ii) receive a net settlement amount in the form of cash or securities equal to the notional amount of the swap less the recovery value of the referenced obligation or underlying securities comprising the referenced index. |
| (2) | If the Portfolio is a seller of protection, it receives the fixed rate. When a credit event occurs, as defined under the terms of that particular swap agreement, the Portfolio will either (i) pay to the buyer of protection an amount equal to the notional amount of the swap and take delivery of the referenced obligation or underlying securities comprising the referenced index or (ii) pay a net settlement amount in the form of cash or securities equal to the notional amount of the swap less the recovery value of the referenced obligation or underlying securities comprising the referenced index. |
| (3) | Notional amount represents the maximum potential amount the Portfolio could be required to pay as a seller of credit protection or receive as a buyer of credit protection if a credit event occurs as defined under the terms of that particular swap agreement. |
| (4) | Implied credit spreads, represented in absolute terms, utilized in determining the fair value of credit default swap agreements where the Portfolio is the seller of protection as of the reporting date serve as an indicator of the current status of the payment/ performance risk and represent the likelihood of risk of default for the credit derivative. The implied credit spread of a particular referenced entity reflects the cost of buying/selling protection and may include up-front payments required to be made to enter into the agreement. Wider credit spreads represent a deterioration of the referenced entity’s credit soundness and a greater likelihood of risk of default or other credit event occurring as defined under the terms of the agreement. |
SEE NOTES TO FINANCIAL STATEMENTS.
A138
| | | | |
| | PSF PGIM HIGH YIELD BOND PORTFOLIO (CONTINUED) | | |
| | | | |
SCHEDULE OF INVESTMENTS | | | | as of December 31, 2024 |
Total return swap agreements outstanding at December 31, 2024:
| | | | | | | | | | | | | | | | | | | | | | | | | | | | | | | | | | | | | | | | | | | | |
Reference Entity | | Financing
Rate | | | Counterparty | | | Termination
Date | | | Long (Short)
Notional
Amount
(000)#(1) | | | Fair
Value | | | Upfront
Premiums
Paid
(Received) | | | Unrealized
Appreciation
(Depreciation)(2) | |
OTC Total Return Swap Agreements: | | | | | | | | | | | | | | | | | | | | | | | | | | | | | | | | | | | | | |
iBoxx US Dollar Liquid Investment Grade Index(T) | |
| 1 Day SOFR(Q)/
4.490% |
| | | GSI | | | | 03/20/25 | | | | (8,610) | | | | $214,420 | | | | | | | $ | — | | | | | | | | | | | $ | 214,420 | | | | | |
iBoxx US Dollar Liquid Investment Grade Index(T) | |
| 1 Day SOFR(Q)/
4.490% |
| | | MSI | | | | 03/20/25 | | | | (8,180) | | | | 228,299 | | | | | | | | — | | | | | | | | | | | | 228,299 | | | | | |
| | | | | | | | | | | | | | | | | | | | | | | | | | | | | | | | | | | | | | | | | | | | |
| | | | | | | | | | | | | | | | | | | $442,719 | | | | | | | $ | — | | | | | | | | | | | $ | 442,719 | | | | | |
| | | | | | | | | | | | | | | | | | | | | | | | | | | | | | | | | | | | | | | | | | | | |
| (1) | On a long total return swap, the Portfolio receives payments for any positive return on the reference entity (makes payments for any negative return) and pays the financing rate. On a short total return swap, the Portfolio makes payments for any positive return on the reference entity (receives payments for any negative return) and receives the financing rate. |
| (2) | Upfront/recurring fees or commissions, as applicable, are included in the net unrealized appreciation (depreciation). |
Balances Reported in the Statement of Assets and Liabilities for OTC Swap Agreements:
| | | | | | | | |
| | | Premiums Paid | | Premiums Received | | Unrealized
Appreciation | | Unrealized
Depreciation |
OTC Swap Agreements | | $— | | $— | | $442,719 | | $— |
Summary of Collateral for Centrally Cleared/Exchange-traded Derivatives:
Cash and securities segregated as collateral, including pending settlement for closed positions, to cover requirements for centrally cleared/exchange-traded derivatives are listed by broker as follows:
| | | | | | | | | | |
Broker | | Cash and/or Foreign Currency | | Securities Market Value |
CGM | | | $ | — | | | | $ | 3,373,233 | |
| | | | | | | | | | |
Fair Value Measurements:
Various inputs are used in determining the value of the Portfolio’s investments. These inputs are summarized in the three broad levels listed below.
Level 1—unadjusted quoted prices generally in active markets for identical securities.
Level 2—quoted prices for similar securities, interest rates and yield curves, prepayment speeds, foreign currency exchange rates and other observable inputs.
Level 3—unobservable inputs for securities valued in accordance with Board approved fair valuation procedures.
The following is a summary of the inputs used as of December 31, 2024 in valuing such portfolio securities:
| | | | | | | | | | | | |
| | | Level 1 | | | Level 2 | | | Level 3 | |
Investments in Securities | | | | | | | | | | | | |
Assets | | | | | | | | | | | | |
Long-Term Investments | | | | | | | | | | | | |
Asset-Backed Securities | | | | | | | | | | | | |
Collateralized Loan Obligations | | $ | — | | | $ | 2,617,743 | | | $ | — | |
Commercial Mortgage-Backed Security | | | — | | | | 1,525,054 | | | | — | |
Corporate Bonds | | | — | | | | 603,550,720 | | | | 194,679 | |
Floating Rate and Other Loans | | | — | | | | 24,099,733 | | | | 4,054,091 | |
Residential Mortgage-Backed Securities | | | — | | | | 39,876 | | | | — | |
U.S. Treasury Obligations | | | — | | | | 37,729,100 | | | | — | |
Common Stocks | | | 715,167 | | | | 3,223,505 | | | | 6,133,928 | |
Preferred Stocks | | | — | | | | — | | | | 3,161,326 | |
Short-Term Investments | | | | | | | | | | | | |
Affiliated Mutual Funds | | | 58,415,829 | | | | — | | | | — | |
| | | | | | | | | | | | |
Total | | $ | 59,130,996 | | | $ | 672,785,731 | | | $ | 13,544,024 | |
| | | | | | | | | | | | |
SEE NOTES TO FINANCIAL STATEMENTS.
A139
| | | | |
| | PSF PGIM HIGH YIELD BOND PORTFOLIO (CONTINUED) | | |
| | | | |
SCHEDULE OF INVESTMENTS | | | | as of December 31, 2024 |
| | | | | | | | | | | | |
| | | Level 1 | | | Level 2 | | | Level 3 | |
| | | |
Other Financial Instruments* | | | | | | | | | | | | |
Assets | | | | | | | | | | | | |
Unfunded Corporate Bond Commitment | | $ | — | | | $ | — | | | $ | — | ** |
Unfunded Loan Commitment | | | — | | | | — | | | | 49 | |
OTC Total Return Swap Agreements | | | — | | | | 442,719 | | | | — | |
| | | | | | | | | | | | |
Total | | $ | — | | | $ | 442,719 | | | $ | 49 | |
| | | | | | | | | | | | |
| | | |
Liabilities | | | | | | | | | | | | |
Futures Contracts | | $ | (443,321 | ) | | $ | — | | | $ | — | |
Centrally Cleared Credit Default Swap Agreement | | | — | | | | (83,137 | ) | | | — | |
| | | | | | | | | | | | |
Total | | $ | (443,321 | ) | | $ | (83,137 | ) | | $ | — | |
| | | | | | | | | | | | |
| * | Other financial instruments are derivative instruments, with the exception of unfunded corporate bond commitments and unfunded loan commitments, and are not reflected in the Schedule of Investments. Futures, forwards, centrally cleared swap contracts, unfunded corporate bond commitments and unfunded loan commitments are recorded at unrealized appreciation (depreciation) and OTC swap contracts are recorded at fair value. |
| ** | Includes Level 3 investments with an aggregate value of $0. |
The following is a reconciliation of assets in which unobservable inputs (Level 3) were used in determining fair value:
| | | | | | | | | | | | | | | | | | | | | | | | |
| | Corporate
Bonds | | | Floating Rate
and
Other Loans | | | Common
Stocks | | | Preferred
Stocks | | | Unfunded
Corporate
Bond
Commitment | | | Unfunded
Loan
Commitment | |
Balance as of 12/31/23 | | $ | 1,278,167 | | | $ | 251,741 | | | $ | 2,902,922 | | | $ | 2,850,819 | | | $ | — | | | $ | — | |
Realized gain (loss) | | | (8,734 | ) | | | 1,051 | | | | (18,279 | ) | | | 19,554 | | | | — | | | | — | |
Change in unrealized appreciation (depreciation) | | | 948 | | | | 119,997 | | | | (869,202 | ) | | | 142,064 | | | | — | | | | 49 | |
Purchases/Exchanges/Issuances | | | 186,393 | | | | 3,748,974 | | | | 4,118,487 | | | | 739,820 | | | | — | | | | — | |
Sales/Paydowns | | | (145,961 | ) | | | (78,454 | ) | | | — | | | | (590,931 | ) | | | — | | | | — | |
Accrued discount/premium | | | 96 | | | | 10,782 | | | | — | | | | — | | | | — | | | | — | |
Transfers into Level 3* | | | — | | | | — | | | | — | | | | — | | | | — | | | | — | |
Transfers out of Level 3* | | | (1,116,230 | ) | | | — | | | | — | | | | — | | | | — | | | | — | |
| | | | | | | | | | | | | | | | | | | | | | | | |
Balance as of 12/31/24 | | $ | 194,679 | | | $ | 4,054,091 | | | $ | 6,133,928 | | | $ | 3,161,326 | | | $ | — | | | $ | 49 | |
| | | | | | | | | | | | | | | | | | | | | | | | |
Change in unrealized appreciation (depreciation) relating to securities still held at reporting period end | | $ | 25,863 | | | $ | 118,743 | | | $ | (869,202 | ) | | $ | 142,216 | | | $ | — | | | $ | 49 | |
| | | | | | | | | | | | | | | | | | | | | | | | |
| * | It is the Portfolio’s policy to recognize transfers in and transfers out at the securities’ fair values as of the beginning of period. Securities transferred between Level 2 and Level 3 are due to changes in the method utilized in valuing the investments. Transfers from Level 2 to Level 3 are typically a result of a change from the use of methods used by independent pricing services (Level 2) to the use of a single broker quote or valuation technique which utilizes significant unobservable inputs due to an absence of current or reliable market quotations (Level 3). Transfers from Level 3 to Level 2 are a result of the availability of current and reliable market data provided by independent pricing services or other valuation techniques which utilize observable inputs. In accordance with the requirements of ASC 820, the amounts of transfers into and out of Level 3, if material, are disclosed in the Notes to the Schedule of Investments of the Portfolio. |
Level 3 securities as presented in the table above are being fair valued using pricing methodologies approved by the Board, which contain unobservable inputs as follows:
| | | | | | | | | | | | | | | | | | | | | | | | | |
Level 3 Securities** | | Fair Value as of
December 31, 2024 | | Valuation
Approach | | Valuation
Methodology | | Unobservable
Inputs | | Inputs (Range) |
Corporate Bonds | | | $ | 34,949 | | | | | Market | | | | | Recovery Value | | | | | Recovery Rate | | | | | 0.68% -100.00% | |
Corporate Bonds | | | | 159,730 | | | | | Market | | | | | Transaction Based | | | | | Unadjusted Price | | | | | NA | |
Common Stocks | | | | 508,136 | | | | | Market | | | | | Enterprise Value | | | | | EBITDA Multiple | | | | | 12.2x | |
Common Stocks | | | | 16,308 | | | | | Market | | | | | Enterprise Value | | | | | Recovery Rate | | | | | 0.50% | |
Common Stocks | | | | 2 | | | | | Market | | | | | Recovery Value | | | | | Recovery Rate | | | | | 0.00% | |
Preferred Stocks | | | | 311,326 | | | | | Market | | | | | Enterprise Value | | | | | Recovery Rate | | | | | 11.11% | |
Preferred Stocks | | | | 2,850,000 | | | | | Market | | | | | Transaction Based | | | | | Unadjusted Price | | | | | NA | |
SEE NOTES TO FINANCIAL STATEMENTS.
A140
| | | | |
| | PSF PGIM HIGH YIELD BOND PORTFOLIO (CONTINUED) | | |
| | | | |
SCHEDULE OF INVESTMENTS | | | | as of December 31, 2024 |
| | | | | | | | | | | | | | | | | | | | | | |
Level 3 Securities** | | Fair Value as of
December 31, 2024 | | Valuation
Approach | | Valuation
Methodology | | Unobservable
Inputs | | Inputs (Range) |
Unfunded Corporate Bond Commitment | | | $ | — | | | Market | | | | Transaction Based | | | | | Unadjusted Price | | | | | NA | |
| | | | | | | | | | | | | | | | | | | | | | |
| | | $3,880,451 | | | | | | | | |
| | | | | | | | | | | | | | | | | | | | | | |
| ** | The table does not include Level 3 securities and/or derivatives that are valued by independent pricing vendors or brokers. As of December 31, 2024, the aggregate value of these securities and/or derivatives was $9,663,622. The unobservable inputs for these investments were not developed by the Portfolio and are not readily available (e.g. single broker quotes). |
Industry Classification:
The industry classification of investments and liabilities in excess of other assets shown as a percentage of net assets as of December 31, 2024 were as follows:
| | | | |
Affiliated Mutual Funds (5.4% represents investments purchased with collateral from securities on loan) | | | 8.2 | % |
Telecommunications | | | 6.1 | |
Oil & Gas | | | 5.8 | |
U.S. Treasury Obligations | | | 5.3 | |
Retail | | | 5.1 | |
Media | | | 5.1 | |
Commercial Services | | | 4.5 | |
Diversified Financial Services | | | 4.3 | |
Home Builders | | | 4.3 | |
Electric | | | 4.0 | |
Leisure Time | | | 3.8 | |
Pipelines | | | 3.7 | |
Healthcare-Services | | | 3.7 | |
Entertainment | | | 2.7 | |
Pharmaceuticals | | | 2.5 | |
Chemicals | | | 2.2 | |
Real Estate Investment Trusts (REITs) | | | 2.0 | |
Aerospace & Defense | | | 2.0 | |
Building Materials | | | 1.8 | |
Mining | | | 1.8 | |
Lodging | | | 1.7 | |
Packaging & Containers | | | 1.7 | |
Auto Parts & Equipment | | | 1.7 | |
Foods | | | 1.4 | |
Computers | | | 1.3 | |
Insurance | | | 1.3 | |
Airlines | | | 1.1 | |
Real Estate | | | 1.0 | |
Banks | | | 1.0 | |
Healthcare-Products | | | 0.9 | |
Housewares | | | 0.8 | |
Iron/Steel | | | 0.8 | |
Internet | | | 0.8 | |
Machinery-Diversified | | | 0.8 | |
| | | | |
Environmental Control | | | 0.7 | % |
Distribution/Wholesale | | | 0.7 | |
Auto Manufacturers | | | 0.6 | |
Household Products/Wares | | | 0.6 | |
Transportation | | | 0.6 | |
Software | | | 0.5 | |
Apparel | | | 0.5 | |
Wireless Telecommunication Services | | | 0.5 | |
Advertising | | | 0.4 | |
Electrical Components & Equipment | | | 0.4 | |
Electronic Equipment, Instruments & Components | | | 0.4 | |
Metal Fabricate/Hardware | | | 0.4 | |
Miscellaneous Manufacturing | | | 0.4 | |
Collateralized Loan Obligations | | | 0.4 | |
Oil, Gas & Consumable Fuels | | | 0.3 | |
Engineering & Construction | | | 0.3 | |
Machinery-Construction & Mining | | | 0.2 | |
Commercial Mortgage-Backed Security | | | 0.2 | |
Gas Utilities | | | 0.2 | |
Gas | | | 0.2 | |
Coal | | | 0.2 | |
Forest Products & Paper | | | 0.1 | |
Cosmetics/Personal Care | | | 0.1 | |
Electronics | | | 0.1 | |
Electric Utilities | | | 0.0 | * |
Holding Companies-Diversified | | | 0.0 | * |
Office/Business Equipment | | | 0.0 | * |
Residential Mortgage-Backed Securities | | | 0.0 | * |
| | | | |
| | | 104.2 | |
Liabilities in excess of other assets | | | (4.2 | ) |
| | | | |
| |
| | | 100.0 | % |
| | | | |
Effects of Derivative Instruments on the Financial Statements and Primary Underlying Risk Exposure:
The Portfolio invested in derivative instruments during the reporting period. The primary types of risk associated with these derivative instruments are credit risk and interest rate risk. See the Notes to Financial Statements for additional detail regarding these derivative instruments and their risks. The effect of such derivative instruments on the Portfolio’s financial position and financial performance as reflected in the Statement of Assets and Liabilities and Statement of Operations is presented in the summary below.
Fair values of derivative instruments as of December 31, 2024 as presented in the Statement of Assets and Liabilities:
SEE NOTES TO FINANCIAL STATEMENTS.
A141
| | | | |
| | PSF PGIM HIGH YIELD BOND PORTFOLIO (CONTINUED) | | |
| | | | |
SCHEDULE OF INVESTMENTS | | | | as of December 31, 2024 |
| | | | | | | | | | | | | | | | |
| | | Asset Derivatives | | Liability Derivatives |
Derivatives not accounted for as hedging
instruments, carried at fair value | | Statement of Assets and Liabilities Location | | | | Fair
Value | | Statement of Assets and Liabilities Location | | Fair
Value |
Credit contracts | | — | | | | | $ | — | | | Due from/to broker-variation margin swaps | | | $ | 83,137 | * |
Interest rate contracts | | — | | | | | | — | | | Due from/to broker-variation margin futures | | | | 443,321 | * |
Interest rate contracts | | Unrealized appreciation on OTC swap agreements | | | | | | 442,719 | | | — | | | | — | |
| | | | | | | | | | | | | | | | |
| | | | | | | $ | 442,719 | | | | | | $ | 526,458 | |
| | | | | | | | | | | | | | | | |
| * | Includes cumulative appreciation (depreciation) as reported in the schedule of open futures and centrally cleared swap contracts. Only unsettled variation margin receivable (payable) is reported within the Statement of Assets and Liabilities. |
The effects of derivative instruments on the Statement of Operations for the year ended December 31, 2024 are as follows:
| | | | | | | | |
Amount of Realized Gain (Loss) on Derivatives Recognized in Income | |
Derivatives not accounted for as hedging instruments, carried at fair value | | Futures | | | Swaps | |
Credit contracts | | $ | — | | | $ | 1,481,661 | |
Interest rate contracts | | | (410,558 | ) | | | (226,377 | ) |
| | | | | | | | |
Total | | $ | (410,558 | ) | | $ | 1,255,284 | |
| | | | | | | | |
| | | | | | | | |
|
Change in Unrealized Appreciation (Depreciation) on Derivatives Recognized in Income | |
Derivatives not accounted for as hedging instruments, carried at fair value | | Futures | | | Swaps | |
Credit contracts | | $ | — | | | $ | (571,530 | ) |
Interest rate contracts | | | (1,864,841 | ) | | | 1,002,421 | |
| | | | | | | | |
Total | | $ | (1,864,841 | ) | | $ | 430,891 | |
| | | | | | | | |
For the year ended December 31, 2024, the Portfolio’s average volume of derivative activities is as follows:
| | |
| Derivative Contract Type | | Average Volume of Derivative Activities* |
Futures Contracts - Long Positions (1) | | $63,836,745 |
Credit Default Swap Agreements - Buy Protection (1) | | 1,946,000 |
Credit Default Swap Agreements - Sell Protection (1) | | 18,288,420 |
Total Return Swap Agreements (1) | | 17,414,600 |
| * | Average volume is based on average quarter end balances for the year ended December 31, 2024. |
| (1) | Notional Amount in USD. |
Financial Instruments/Transactions—Summary of Offsetting and Netting Arrangements:
The Portfolio invested in OTC derivatives and entered into financial instruments/transactions during the reporting period that are either offset in accordance with current requirements or are subject to enforceable master netting arrangements or similar agreements that permit offsetting. The information about offsetting and related netting arrangements for OTC derivatives and financial instruments/transactions where the legal right to set-off exists is presented in the summary below.
Offsetting of financial instrument/transaction assets and liabilities:
| | | | | | | | |
| Description | | Gross Market
Value of Recognized
Assets/(Liabilities) | | | | Collateral
Pledged/(Received)(2) | | Net
Amount |
| | | | |
Securities on Loan | | $37,739,176 | | | | $(37,739,176) | | $— |
SEE NOTES TO FINANCIAL STATEMENTS.
A142
| | | | |
| | PSF PGIM HIGH YIELD BOND PORTFOLIO (CONTINUED) | | |
| | | | |
SCHEDULE OF INVESTMENTS | | | | as of December 31, 2024 |
Offsetting of OTC derivative assets and liabilities:
| | | | | | | | | | | | | | | | | | | | | | | | | |
Counterparty | | Gross Amounts of
Recognized
Assets(1) | | Gross Amounts of
Recognized
Liabilities(1) | | Net Amounts of
Recognized
Assets/(Liabilities) | | Collateral
Pledged/(Received)(2) | | Net Amount |
GSI | | | $ | 214,420 | | | | $ | — | | | | $ | 214,420 | | | | $ | (214,420) | | | | $ | — | |
MSI | | | | 228,299 | | | | | — | | | | | 228,299 | | | | | — | | | | | 228,299 | |
| | | | | | | | | | | | | | | | | | | | | | | | | |
| | | $ | 442,719 | | | | $ | — | | | | $ | 442,719 | | | | $ | (214,420) | | | | $ | 228,299 | |
| | | | | | | | | | | | | | | | | | | | | | | | | |
| (1) | Includes unrealized appreciation/(depreciation) on swaps and forwards, premiums paid/(received) on swap agreements and market value of purchased and written options, as represented on the Statement of Assets and Liabilities. |
| (2) | Collateral amount disclosed by the Portfolio is limited to the market value of financial instruments/transactions and the Portfolio’s OTC derivative exposure by counterparty. |
SEE NOTES TO FINANCIAL STATEMENTS.
A143
| | | | |
| | PSF PGIM HIGH YIELD BOND PORTFOLIO (CONTINUED) | | |
STATEMENT OF ASSETS AND LIABILITIES
as of December 31, 2024
| | | | |
ASSETS | | | | |
Investments at value, including securities on loan of $37,739,176: | | | | |
Unaffiliated investments (cost $709,566,747) | | $ | 687,044,922 | |
Affiliated investments (cost $58,384,408) | | | 58,415,829 | |
Cash | | | 24,513 | |
Dividends and interest receivable | | | 12,273,427 | |
Unrealized appreciation on OTC swap agreements | | | 442,719 | |
Receivable for Portfolio shares sold | | | 104,092 | |
Due from broker-variation margin swaps | | | 19,285 | |
Receivable for investments sold | | | 8,494 | |
Tax reclaim receivable | | | 305 | |
Unrealized appreciation on unfunded loan commitment | | | 49 | |
Prepaid expenses and other assets | | | 51,095 | |
| | | | |
Total Assets | | | 758,384,730 | |
| | | | |
LIABILITIES | | | | |
Payable to broker for collateral for securities on loan | | | 38,387,473 | |
Payable for investments purchased | | | 3,472,024 | |
Accrued expenses and other liabilities | | | 451,655 | |
Management fee payable | | | 282,128 | |
Due to broker-variation margin futures | | | 81,422 | |
Payable for Portfolio shares purchased | | | 17,546 | |
Distribution fee payable | | | 3,122 | |
Affiliated transfer agent fee payable | | | 1,190 | |
Trustees’ fees payable | | | 601 | |
Payable to affiliate | | | 305 | |
| | | | |
Total Liabilities | | | 42,697,466 | |
| | | | |
NET ASSETS | | $ | 715,687,264 | |
| | | | |
Net assets were comprised of: | | | | |
Partners’ Equity | | $ | 715,687,264 | |
| | | | |
Class I: | | | | |
Net asset value and redemption price per share, $700,827,039 / 97,519,013 outstanding shares of beneficial interest | | $ | 7.19 | |
| | | | |
Class III: | | | | |
Net asset value and redemption price per share, $14,860,225 / 2,086,425 outstanding shares of beneficial interest | | $ | 7.12 | |
| | | | |
STATEMENT OF OPERATIONS
Year Ended December 31, 2024
| | | | |
NET INVESTMENT INCOME (LOSS) | | | | |
INCOME | | | | |
Interest income (net of $8,268 foreign withholding tax) | | $ | 39,036,145 | |
Affiliated dividend income | | | 692,855 | |
Unaffiliated dividend income | | | 559,949 | |
Income from securities lending, net (including affiliated income of $176,773) | | | 179,004 | |
| | | | |
Total income | | | 40,467,953 | |
| | | | |
EXPENSES | | | | |
Management fee | | | 3,022,072 | |
Distribution fee—Class III | | | 32,700 | |
Custodian and accounting fees | | | 81,244 | |
Audit fee | | | 72,595 | |
Shareholders’ reports | | | 63,889 | |
Professional fees | | | 37,440 | |
Trustees’ fees | | | 17,061 | |
Transfer agent’s fees and expenses (including affiliated expense of $7,143) | | | 11,942 | |
Miscellaneous | | | 48,997 | |
| | | | |
Total expenses | | | 3,387,940 | |
Less: Fee waivers and/or expense reimbursement | | | (223,274 | ) |
| | | | |
Net expenses | | | 3,164,666 | |
| | | | |
NET INVESTMENT INCOME (LOSS) | | | 37,303,287 | |
| | | | |
| REALIZED AND UNREALIZED GAIN (LOSS) ON INVESTMENT TRANSACTIONS | | | | |
Net realized gain (loss) on: | | | | |
Investment transactions (including affiliated of $4,274) | | | (11,818,864 | ) |
Futures transactions | | | (410,558 | ) |
Swap agreements transactions | | | 1,255,284 | |
| | | | |
| | | (10,974,138 | ) |
| | | | |
Net change in unrealized appreciation (depreciation) on: | | | | |
Investments (including affiliated of $(27,545)) | | | 18,030,976 | |
Futures | | | (1,864,841 | ) |
Swap agreements | | | 430,891 | |
Unfunded loan commitments | | | 49 | |
| | | | |
| | | 16,597,075 | |
| | | | |
NET GAIN (LOSS) ON INVESTMENT TRANSACTIONS | | | 5,622,937 | |
| | | | |
NET INCREASE (DECREASE) IN NET ASSETS RESULTING FROM OPERATIONS | | $ | 42,926,224 | |
| | | | |
STATEMENTS OF CHANGES IN NET ASSETS
| | | | | | | | | | |
| | | Year Ended
December 31, 2024 | | Year Ended
December 31, 2023 |
INCREASE (DECREASE) IN NET ASSETS | | | | | | | | | | |
OPERATIONS | | | | | | | | | | |
Net investment income (loss) | | | $ | 37,303,287 | | | | $ | 33,071,285 | |
Net realized gain (loss) on investment transactions | | | | (10,974,138 | ) | | | | (10,854,706 | ) |
Net change in unrealized appreciation (depreciation) on investments | | | | 16,597,075 | | | | | 33,787,724 | |
| | | | | | | | | | |
NET INCREASE (DECREASE) IN NET ASSETS RESULTING FROM OPERATIONS | | | | 42,926,224 | | | | | 56,004,303 | |
| | | | | | | | | | |
PORTFOLIO SHARE TRANSACTIONS | | | | | | | | | | |
Portfolio shares sold | | | | 183,149,374 | | | | | 28,046,086 | |
Portfolio shares purchased | | | | (36,125,009 | ) | | | | (43,285,647 | ) |
| | | | | | | | | | |
NET INCREASE (DECREASE) IN NET ASSETS FROM PORTFOLIO SHARE TRANSACTIONS | | | | 147,024,365 | | | | | (15,239,561 | ) |
| | | | | | | | | | |
TOTAL INCREASE (DECREASE) | | | | 189,950,589 | | | | | 40,764,742 | |
NET ASSETS: | | | | | | | | | | |
Beginning of year | | | | 525,736,675 | | | | | 484,971,933 | |
| | | | | | | | | | |
End of year | | | $ | 715,687,264 | | | | $ | 525,736,675 | |
| | | | | | | | | | |
SEE NOTES TO FINANCIAL STATEMENTS.
A144
| | | | |
| | PSF PGIM HIGH YIELD BOND PORTFOLIO (CONTINUED) | | |
| | | | | | | | | | | | | | | | | | | | |
Class I | | | | | | | | | | | | | | | |
| | | Year Ended December 31, | |
| | | 2024 | | | 2023 | | | 2022 | | | 2021 | | | 2020 | |
Per Share Operating Performance(a): | | | | | | | | | | | | | | | | | | | | |
Net Asset Value, beginning of year | | $ | 6.62 | | | $ | 5.92 | | | $ | 6.67 | | | $ | 6.18 | | | $ | 5.77 | |
| | | | | | | | | | | | | | | | | | | | |
Income (Loss) From Investment Operations: | | | | | | | | | | | | | | | | | | | | |
Net investment income (loss) | | | 0.47 | | | | 0.41 | | | | 0.36 | | | | 0.33 | | | | 0.35 | |
Net realized and unrealized gain (loss) on investment and foreign currency transactions | | | 0.10 | | | | 0.29 | | | | (1.11 | ) | | | 0.16 | | | | 0.06 | |
| | | | | | | | | | | | | | | | | | | | |
Total from investment operations | | | 0.57 | | | | 0.70 | | | | (0.75 | ) | | | 0.49 | | | | 0.41 | |
| | | | | | | | | | | | | | | | | | | | |
Net Asset Value, end of year | | $ | 7.19 | | | $ | 6.62 | | | $ | 5.92 | | | $ | 6.67 | | | $ | 6.18 | |
| | | | | | | | | | | | | | | | | | | | |
Total Return(b) | | | 8.61 | % | | | 11.82 | % | | | (11.24 | )% | | | 7.93 | % | | | 7.11 | % |
Ratios/Supplemental Data: | | | | | | | | | | | | | | | | | | | | |
Net assets, end of year (in millions) | | $ | 701 | | | $ | 513 | | | $ | 476 | | | $ | 562 | | | $ | 529 | |
Average net assets (in millions) | | $ | 536 | | | $ | 486 | | | $ | 502 | | | $ | 550 | | | $ | 497 | |
Ratios to average net assets(c): | | | | | | | | | | | | | | | | | | | | |
Expenses after waivers and/or expense reimbursement | | | 0.57 | % | | | 0.57 | % | | | 0.57 | % | | | 0.57 | % | | | 0.57 | % |
Expenses before waivers and/or expense reimbursement | | | 0.61 | % | | | 0.61 | % | | | 0.60 | % | | | 0.59 | % | | | 0.61 | % |
Net investment income (loss) | | | 6.80 | % | | | 6.66 | % | | | 5.93 | % | | | 5.11 | % | | | 6.16 | % |
Portfolio turnover rate(d) | | | 37 | % | | | 26 | % | | | 33 | % | | | 48 | % | | | 61 | % |
| | | | | | | | | | | | | | | | | | | | | | | | |
Class III | | | | | | | | | | | | | | | | | | |
| | | Year Ended December 31, | | | April 26, 2021(e)
through December 31, | |
| | | 2024 | | | 2023 | | | 2022 | | | 2021 | |
Per Share Operating Performance(a): | | | | | | | | | | | | | | | | | | | | | | | | |
Net Asset Value, beginning of period | | $ | 6.58 | | | $ | 5.90 | | | $ | 6.66 | | | | | | | $ | 6.41 | | | | | |
| | | | | | | | | | | | | | | | | | | | | | | | |
Income (Loss) From Investment Operations: | | | | | | | | | | | | | | | | | | | | | | | | |
Net investment income (loss) | | | 0.45 | | | | 0.39 | | | | 0.35 | | | | | | | | 0.22 | | | | | |
| Net realized and unrealized gain (loss) on investment and foreign currency transactions | | | 0.09 | | | | 0.29 | | | | (1.11 | ) | | | | | | | 0.03 | | | | | |
| | | | | | | | | | | | | | | | | | | | | | | | |
Total from investment operations | | | 0.54 | | | | 0.68 | | | | (0.76 | ) | | | | | | | 0.25 | | | | | |
| | | | | | | | | | | | | | | | | | | | | | | | |
Net Asset Value, end of period | | $ | 7.12 | | | $ | 6.58 | | | $ | 5.90 | | | | | | | $ | 6.66 | | | | | |
| | | | | | | | | | | | | | | | | | | | | | | | |
Total Return(b) | | | 8.21 | % | | | 11.53 | % | | | (11.41 | )% | | | | | | | 3.90 | % | | | | |
Ratios/Supplemental Data: | | | | | | | | | | | | | | | | | | | | | | | | |
Net assets, end of period (in millions) | | $ | 15 | | | $ | 12 | | | $ | 9 | | | | | | | $ | 6 | | | | | |
Average net assets (in millions) | | $ | 13 | | | $ | 11 | | | $ | 8 | | | | | | | $ | 2 | | | | | |
Ratios to average net assets(c): | | | | | | | | | | | | | | | | | | | | | | | | |
Expenses after waivers and/or expense reimbursement | | | 0.82 | % | | | 0.82 | % | | | 0.82 | % | | | | | | | 0.80 | %(f) | | | | |
Expenses before waivers and/or expense reimbursement | | | 0.86 | % | | | 0.86 | % | | | 0.85 | % | | | | | | | 0.82 | %(f) | | | | |
Net investment income (loss) | | | 6.53 | % | | | 6.41 | % | | | 5.76 | % | | | | | | | 4.72 | %(f) | | | | |
Portfolio turnover rate(d) | | | 37 | % | | | 26 | % | | | 33 | % | | | | | | | 48 | % | | | | |
| (a) | Calculated based on average shares outstanding during the period. |
| (b) | Total return is calculated assuming a purchase of a share on the first day and a sale on the last day of each period reported and includes reinvestment of dividends and distributions, if any, and does not reflect the effect of insurance contract charges. Total return does not reflect expenses associated with the separate account such as administrative fees, account charges and surrender charges which, if reflected, would reduce the total returns for all periods shown. Performance figures may reflect fee waivers and/or expense reimbursements. In the absence of fee waivers and/or expense reimbursements, the total return would be lower. Past performance is no guarantee of future results. Total returns may reflect adjustments to conform to GAAP. Total returns for periods less than one full year are not annualized. |
| (c) | Does not include expenses of the underlying funds in which the Portfolio invests. |
| (d) | The Portfolio’s portfolio turnover rate is calculated in accordance with regulatory requirements, without regard to transactions involving short-term investments, certain derivatives and in-kind transactions (if any). If such transactions were included, the Portfolio’s portfolio turnover rate may be higher. |
| (e) | Commencement of offering. |
| (f) | Annualized, with the exception of certain non-recurring expenses. |
SEE NOTES TO FINANCIAL STATEMENTS.
A145
| | | | |
| | PSF PGIM JENNISON BLEND PORTFOLIO | | |
| | | | |
SCHEDULE OF INVESTMENTS | | | | as of December 31, 2024 |
| | | | | | | | |
| | | Shares | | | Value | |
|
LONG-TERM INVESTMENTS — 99.5% | |
COMMON STOCKS | | | | | | | | |
Aerospace & Defense — 2.6% | |
General Electric Co. | | | 551,314 | | | $ | 91,953,662 | |
RTX Corp. | | | 746,838 | | | | 86,424,093 | |
| | | | | | | | |
| | |
| | | | | | | 178,377,755 | |
| | | | | | | | |
Automobiles — 1.6% | | | | | | | | |
Tesla, Inc.* | | | 267,340 | | | | 107,962,586 | |
| | | | | | | | |
Banks — 6.9% | | | | | | | | |
Bank of America Corp. | | | 1,604,413 | | | | 70,513,951 | |
East West Bancorp, Inc. | | | 299,882 | | | | 28,716,700 | |
JPMorgan Chase & Co. | | | 498,573 | | | | 119,512,934 | |
NU Holdings Ltd. (Brazil) (Class A Stock)* | | | 6,027,649 | | | | 62,446,444 | |
Pinnacle Financial Partners, Inc.(a) | | | 159,484 | | | | 18,243,375 | |
PNC Financial Services Group, Inc. (The) | | | 675,478 | | | | 130,265,932 | |
Truist Financial Corp. | | | 773,536 | | | | 33,555,992 | |
| | | | | | | | |
| | |
| | | | | | | 463,255,328 | |
| | | | | | | | |
Biotechnology — 0.8% | | | | | | | | |
AbbVie, Inc. | | | 96,368 | | | | 17,124,593 | |
Natera, Inc.* | | | 228,793 | | | | 36,217,932 | |
| | | | | | | | |
| | |
| | | | | | | 53,342,525 | |
| | | | | | | | |
Broadline Retail — 4.2% | | | | | | | | |
Amazon.com, Inc.* | | | 1,298,049 | | | | 284,778,970 | |
| | | | | | | | |
Capital Markets — 2.1% | | | | | | | | |
Blackstone, Inc. | | | 387,023 | | | | 66,730,506 | |
Goldman Sachs Group, Inc. (The) | | | 99,533 | | | | 56,994,586 | |
Houlihan Lokey, Inc. | | | 104,007 | | | | 18,061,856 | |
| | | | | | | | |
| | |
| | | | | | | 141,786,948 | |
| | | | | | | | |
Commercial Services & Supplies — 0.6% | |
Republic Services, Inc. | | | 107,269 | | | | 21,580,377 | |
Tetra Tech, Inc. | | | 441,837 | | | | 17,602,786 | |
| | | | | | | | |
| | |
| | | | | | | 39,183,163 | |
| | | | | | | | |
Communications Equipment — 1.5% | |
Cisco Systems, Inc. | | | 1,659,700 | | | | 98,254,240 | |
| | | | | | | | |
Construction & Engineering — 0.7% | |
Comfort Systems USA, Inc. | | | 119,811 | | | | 50,807,053 | |
| | | | | | | | |
Consumer Finance — 0.3% | | | | | | | | |
Ally Financial, Inc. | | | 515,611 | | | | 18,567,152 | |
| | | | | | | | |
Consumer Staples Distribution & Retail — 2.5% | |
Costco Wholesale Corp. | | | 20,165 | | | | 18,476,585 | |
Walmart, Inc. | | | 1,691,546 | | | | 152,831,181 | |
| | | | | | | | |
| | |
| | | | | | | 171,307,766 | |
| | | | | | | | |
Containers & Packaging — 0.5% | |
Crown Holdings, Inc. | | | 416,787 | | | | 34,464,117 | |
| | | | | | | | |
Diversified Telecommunication Services — 1.2% | |
AT&T, Inc. | | | 2,617,545 | | | | 59,601,500 | |
Verizon Communications, Inc. | | | 519,447 | | | | 20,772,685 | |
| | | | | | | | |
| | |
| | | | | | | 80,374,185 | |
| | | | | | | | |
| | | | | | | | |
| | | Shares | | | Value | |
|
COMMON STOCKS (continued) | |
Electric Utilities — 0.8% | |
NextEra Energy, Inc. | | | 726,692 | | | $ | 52,096,549 | |
| | | | | | | | |
Electrical Equipment — 0.7% | |
AMETEK, Inc. | | | 92,241 | | | | 16,627,362 | |
Generac Holdings, Inc.*(a) | | | 218,594 | | | | 33,893,000 | |
| | | | | | | | |
| | |
| | | | | | | 50,520,362 | |
| | | | | | | | |
Energy Equipment & Services — 0.4% | |
TechnipFMC PLC (United Kingdom) | | | 856,173 | | | | 24,777,647 | |
| | | | | | | | |
Entertainment — 2.7% | |
Netflix, Inc.* | | | 141,525 | | | | 126,144,063 | |
Walt Disney Co. (The) | | | 526,207 | | | | 58,593,149 | |
| | | | | | | | |
| | |
| | | | | | | 184,737,212 | |
| | | | | | | | |
Financial Services — 1.2% | |
Apollo Global Management, Inc. | | | 263,548 | | | | 43,527,588 | |
Mastercard, Inc. (Class A Stock) | | | 37,895 | | | | 19,954,370 | |
Shift4 Payments, Inc. (Class A Stock)*(a) | | | 168,199 | | | | 17,455,692 | |
| | | | | | | | |
| | |
| | | | | | | 80,937,650 | |
| | | | | | | | |
Food Products — 0.5% | |
Freshpet, Inc.* | | | 210,012 | | | | 31,104,877 | |
| | | | | | | | |
Ground Transportation — 2.4% | |
Uber Technologies, Inc.* | | | 1,225,179 | | | | 73,902,797 | |
Union Pacific Corp. | | | 372,302 | | | | 84,899,748 | |
| | | | | | | | |
| | |
| | | | | | | 158,802,545 | |
| | | | | | | | |
Health Care Equipment & Supplies — 2.7% | |
Abbott Laboratories | | | 362,483 | | | | 41,000,452 | |
Boston Scientific Corp.* | | | 518,500 | | | | 46,312,420 | |
GE HealthCare Technologies, Inc. | | | 921,229 | | | | 72,021,683 | |
Intuitive Surgical, Inc.* | | | 37,336 | | | | 19,487,899 | |
| | | | | | | | |
| | |
| | | | | | | 178,822,454 | |
| | | | | | | | |
Health Care Providers & Services — 0.9% | |
Cigna Group (The) | | | 152,489 | | | | 42,108,312 | |
Encompass Health Corp. | | | 189,005 | | | | 17,454,612 | |
| | | | | | | | |
| | |
| | | | | | | 59,562,924 | |
| | | | | | | | |
Hotels, Restaurants & Leisure — 1.3% | |
Airbnb, Inc. (Class A Stock)* | | | 280,102 | | | | 36,808,204 | |
Marriott International, Inc. (Class A Stock) | | | 74,871 | | | | 20,884,517 | |
Texas Roadhouse, Inc. | | | 183,828 | | | | 33,168,086 | |
| | | | | | | | |
| | |
| | | | | | | 90,860,807 | |
| | | | | | | | |
Household Durables — 1.2% | |
Lennar Corp. (Class A Stock) | | | 118,133 | | | | 16,109,797 | |
Toll Brothers, Inc. | | | 490,433 | | | | 61,770,037 | |
| | | | | | | | |
| | |
| | | | | | | 77,879,834 | |
| | | | | | | | |
Household Products — 0.7% | |
Procter & Gamble Co. (The) | | | 277,162 | | | | 46,466,209 | |
| | | | | | | | |
Independent Power & Renewable Electricity Producers — 0.6% | |
Vistra Corp. | | | 293,453 | | | | 40,458,365 | |
| | | | | | | | |
Industrial Conglomerates — 0.6% | |
3M Co. | | | 333,834 | | | | 43,094,631 | |
| | | | | | | | |
SEE NOTES TO FINANCIAL STATEMENTS.
A146
| | | | |
| | PSF PGIM JENNISON BLEND PORTFOLIO (CONTINUED) | | |
| | | | |
SCHEDULE OF INVESTMENTS | | | | as of December 31, 2024 |
| | | | | | | | |
| | | Shares | | | Value | |
|
COMMON STOCKS (continued) | |
Industrial REITs — 0.6% | |
Prologis, Inc. | | | 394,155 | | | $ | 41,662,183 | |
| | | | | | | | |
Insurance — 6.5% | |
Axis Capital Holdings Ltd. | | | 253,635 | | | | 22,477,134 | |
Chubb Ltd. | | | 418,299 | | | | 115,576,014 | |
Markel Group, Inc.* | | | 20,802 | | | | 35,909,036 | |
Marsh & McLennan Cos., Inc. | | | 169,434 | | | | 35,989,476 | |
MetLife, Inc. | | | 1,342,200 | | | | 109,899,336 | |
Progressive Corp. (The) | | | 349,708 | | | | 83,793,534 | |
RenaissanceRe Holdings Ltd. (Bermuda)(a) | | | 144,132 | | | | 35,861,483 | |
| | | | | | | | |
| | |
| | | | | | | 439,506,013 | |
| | | | | | | | |
Interactive Media & Services — 7.2% | |
Alphabet, Inc. (Class A Stock) | | | 1,478,496 | | | | 279,879,293 | |
Meta Platforms, Inc. (Class A Stock) | | | 355,101 | | | | 207,915,186 | |
| | | | | | | | |
| | |
| | | | | | | 487,794,479 | |
| | | | | | | | |
IT Services — 1.1% | |
International Business Machines
Corp.(a) | | | 334,487 | | | | 73,530,277 | |
| | | | | | | | |
Leisure Products — 0.2% | |
Hasbro, Inc.(a) | | | 291,683 | | | | 16,307,997 | |
| | | | | | | | |
Machinery — 3.2% | |
Allison Transmission Holdings, Inc. | | | 156,046 | | | | 16,862,331 | |
Caterpillar, Inc.(a) | | | 145,714 | | | | 52,859,211 | |
Otis Worldwide Corp.(a) | | | 390,125 | | | | 36,129,476 | |
Parker-Hannifin Corp. | | | 171,165 | | | | 108,866,075 | |
| | | | | | | | |
| | |
| | | | | | | 214,717,093 | |
| | | | | | | | |
Marine Transportation — 0.3% | |
Kirby Corp.* | | | 203,048 | | | | 21,482,478 | |
| | | | | | | | |
Multi-Utilities — 1.6% | |
NiSource, Inc. | | | 1,000,513 | | | | 36,778,858 | |
Public Service Enterprise Group, Inc. | | | 865,253 | | | | 73,105,226 | |
| | | | | | | | |
| | |
| | | | | | | 109,884,084 | |
| | | | | | | | |
Oil, Gas & Consumable Fuels — 2.9% | |
Cheniere Energy, Inc. | | | 221,852 | | | | 47,669,339 | |
Exxon Mobil Corp. | | | 156,677 | | | | 16,853,745 | |
Permian Resources Corp. | | | 2,547,195 | | | | 36,628,664 | |
Shell PLC, ADR | | | 939,973 | | | | 58,889,309 | |
Williams Cos., Inc. (The) | | | 641,168 | | | | 34,700,012 | |
| | | | | | | | |
| | |
| | | | | | | 194,741,069 | |
| | | | | | | | |
Personal Care Products — 1.5% | |
Unilever PLC (United Kingdom), ADR(a) | | | 1,729,808 | | | | 98,080,114 | |
| | | | | | | | |
Pharmaceuticals — 2.6% | |
AstraZeneca PLC (United Kingdom), ADR | | | 1,547,568 | | | | 101,396,655 | |
Eli Lilly & Co. | | | 55,232 | | | | 42,639,104 | |
Novo Nordisk A/S (Denmark), ADR(a) | | | 331,302 | | | | 28,498,598 | |
| | | | | | | | |
| | |
| | | | | | | 172,534,357 | |
| | | | | | | | |
Real Estate Management & Development — 0.6% | |
CBRE Group, Inc. (Class A Stock)* | | | 296,378 | | | | 38,911,468 | |
| | | | | | | | |
| | | | | | | | |
| | | Shares | | | Value | |
|
COMMON STOCKS (continued) | |
Residential REITs — 0.3% | |
AvalonBay Communities, Inc.(a) | | | 93,339 | | | $ | 20,531,780 | |
| | | | | | | | |
Semiconductors & Semiconductor Equipment — 9.6% | |
Applied Materials, Inc.(a) | | | 102,528 | | | | 16,674,129 | |
Broadcom, Inc. | | | 710,449 | | | | 164,710,496 | |
Lam Research Corp. | | | 382,912 | | | | 27,657,734 | |
NVIDIA Corp. | | | 3,030,102 | | | | 406,912,397 | |
Universal Display Corp. | | | 189,590 | | | | 27,718,058 | |
| | | | | | | | |
| | |
| | | | | | | 643,672,814 | |
| | | | | | | | |
Software — 9.0% | | | | | | | | |
Microsoft Corp. | | | 918,113 | | | | 386,984,629 | |
Oracle Corp. | | | 632,126 | | | | 105,337,477 | |
Salesforce, Inc. | | | 332,260 | | | | 111,084,486 | |
| | | | | | | | |
| | |
| | | | | | | 603,406,592 | |
| | | | | | | | |
Specialized REITs — 0.4% | |
Gaming & Leisure Properties, Inc. | | | 546,875 | | | | 26,337,500 | |
| | | | | | | | |
Specialty Retail — 1.5% | | | | | | | | |
Lowe’s Cos., Inc. | | | 66,745 | | | | 16,472,666 | |
TJX Cos., Inc. (The) | | | 689,960 | | | | 83,354,068 | |
| | | | | | | | |
| | |
| | | | | | | 99,826,734 | |
| | | | | | | | |
Technology Hardware, Storage & Peripherals — 7.6% | |
Apple, Inc. | | | 1,794,624 | | | | 449,409,742 | |
Dell Technologies, Inc. (Class C Stock) | | | 534,745 | | | | 61,624,014 | |
| | | | | | | | |
| | |
| | | | | | | 511,033,756 | |
| | | | | | | | |
Textiles, Apparel & Luxury Goods — 0.6% | |
Ralph Lauren Corp. | | | 169,121 | | | | 39,063,569 | |
| | | | | | | | |
TOTAL LONG-TERM INVESTMENTS
(cost $4,235,468,536) | | | | 6,695,608,211 | |
| | | | | | | | |
| |
SHORT-TERM INVESTMENTS — 3.9% | | | | | |
AFFILIATED MUTUAL FUNDS | |
PGIM Core Ultra Short Bond Fund(wb) | | | 37,074,843 | | | | 37,074,843 | |
PGIM Institutional Money Market Fund (7-day effective yield 4.649%) (cost $226,365,649; includes $225,899,044 of cash collateral for securities on
loan)(b)(wb) | | | 226,529,522 | | | | 226,393,605 | |
| | | | | | | | |
| |
TOTAL SHORT-TERM INVESTMENTS
(cost $263,440,492) | | | | 263,468,448 | |
| | | | | | | | |
| |
TOTAL INVESTMENTS—103.4%
(cost $4,498,909,028) | | | | 6,959,076,659 | |
Liabilities in excess of other assets — (3.4)% | | | | (226,742,941 | ) |
| | | | | | | | |
| |
NET ASSETS — 100.0% | | | $ | 6,732,333,718 | |
| | | | | | | | |
SEE NOTES TO FINANCIAL STATEMENTS.
A147
| | | | |
| | PSF PGIM JENNISON BLEND PORTFOLIO (CONTINUED) | | |
| | | | |
SCHEDULE OF INVESTMENTS | | | | as of December 31, 2024 |
See the Glossary for a list of the abbreviation(s) used in the annual report.
| * | Non-income producing security. |
| (a) | All or a portion of security is on loan. The aggregate market value of such securities, including those sold and pending settlement, is $220,419,476; cash collateral of $225,899,044 (included in liabilities) was received with which the Portfolio purchased highly liquid short-term investments. In the event of significant appreciation in value of securities on loan on the last business day of the reporting period, the Portfolio may reflect a collateral value that is less than the market value of the loaned securities and such shortfall is remedied the following business day. |
| (b) | Represents security, or portion thereof, purchased with cash collateral received for securities on loan and includes dividend reinvestment. |
| (wb) | Represents an investment in a Fund affiliated with the Manager. |
Fair Value Measurements:
Various inputs are used in determining the value of the Portfolio’s investments. These inputs are summarized in the three broad levels listed below.
Level 1—unadjusted quoted prices generally in active markets for identical securities.
Level 2—quoted prices for similar securities, interest rates and yield curves, prepayment speeds, foreign currency exchange rates and other observable inputs.
Level 3—unobservable inputs for securities valued in accordance with Board approved fair valuation procedures.
The following is a summary of the inputs used as of December 31, 2024 in valuing such portfolio securities:
| | | | | | | | | | | | | | | | | | | | | | | | | | | | |
| | | Level 1 | | | Level 2 | | | Level 3 | |
Investments in Securities | | | | | | | | | | | | | | | | | | | | | | | | | | | | |
Assets | | | | | | | | | | | | | | | | | | | | | | | | | | | | |
Long-Term Investments | | | | | | | | | | | | | | | | | | | | | | | | | | | | |
Common Stocks | | | | | | | | | | | | | | | | | | | | | | | | | | | | |
Aerospace & Defense | | $ | 178,377,755 | | | | | | | | $— | | | | | | | | | | | | $— | | | | | |
Automobiles | | | 107,962,586 | | | | | | | | — | | | | | | | | | | | | — | | | | | |
Banks | | | 463,255,328 | | | | | | | | — | | | | | | | | | | | | — | | | | | |
Biotechnology | | | 53,342,525 | | | | | | | | — | | | | | | | | | | | | — | | | | | |
Broadline Retail | | | 284,778,970 | | | | | | | | — | | | | | | | | | | | | — | | | | | |
Capital Markets | | | 141,786,948 | | | | | | | | — | | | | | | | | | | | | — | | | | | |
Commercial Services & Supplies | | | 39,183,163 | | | | | | | | — | | | | | | | | | | | | — | | | | | |
Communications Equipment | | | 98,254,240 | | | | | | | | — | | | | | | | | | | | | — | | | | | |
Construction & Engineering | | | 50,807,053 | | | | | | | | — | | | | | | | | | | | | — | | | | | |
Consumer Finance | | | 18,567,152 | | | | | | | | — | | | | | | | | | | | | — | | | | | |
Consumer Staples Distribution & Retail | | | 171,307,766 | | | | | | | | — | | | | | | | | | | | | — | | | | | |
Containers & Packaging | | | 34,464,117 | | | | | | | | — | | | | | | | | | | | | — | | | | | |
Diversified Telecommunication Services | | | 80,374,185 | | | | | | | | — | | | | | | | | | | | | — | | | | | |
Electric Utilities | | | 52,096,549 | | | | | | | | — | | | | | | | | | | | | — | | | | | |
Electrical Equipment | | | 50,520,362 | | | | | | | | — | | | | | | | | | | | | — | | | | | |
Energy Equipment & Services | | | 24,777,647 | | | | | | | | — | | | | | | | | | | | | — | | | | | |
Entertainment | | | 184,737,212 | | | | | | | | — | | | | | | | | | | | | — | | | | | |
Financial Services | | | 80,937,650 | | | | | | | | — | | | | | | | | | | | | — | | | | | |
Food Products | | | 31,104,877 | | | | | | | | — | | | | | | | | | | | | — | | | | | |
Ground Transportation | | | 158,802,545 | | | | | | | | — | | | | | | | | | | | | — | | | | | |
Health Care Equipment & Supplies | | | 178,822,454 | | | | | | | | — | | | | | | | | | | | | — | | | | | |
Health Care Providers & Services | | | 59,562,924 | | | | | | | | — | | | | | | | | | | | | — | | | | | |
Hotels, Restaurants & Leisure | | | 90,860,807 | | | | | | | | — | | | | | | | | | | | | — | | | | | |
Household Durables | | | 77,879,834 | | | | | | | | — | | | | | | | | | | | | — | | | | | |
Household Products | | | 46,466,209 | | | | | | | | — | | | | | | | | | | | | — | | | | | |
Independent Power & Renewable Electricity Producers | | | 40,458,365 | | | | | | | | — | | | | | | | | | | | | — | | | | | |
Industrial Conglomerates | | | 43,094,631 | | | | | | | | — | | | | | | | | | | | | — | | | | | |
Industrial REITs | | | 41,662,183 | | | | | | | | — | | | | | | | | | | | | — | | | | | |
Insurance | | | 439,506,013 | | | | | | | | — | | | | | | | | | | | | — | | | | | |
Interactive Media & Services | | | 487,794,479 | | | | | | | | — | | | | | | | | | | | | — | | | | | |
IT Services | | | 73,530,277 | | | | | | | | — | | | | | | | | | | | | — | | | | | |
Leisure Products | | | 16,307,997 | | | | | | | | — | | | | | | | | | | | | — | | | | | |
Machinery | | | 214,717,093 | | | | | | | | — | | | | | | | | | | | | — | | | | | |
Marine Transportation | | | 21,482,478 | | | | | | | | — | | | | | | | | | | | | — | | | | | |
SEE NOTES TO FINANCIAL STATEMENTS.
A148
| | | | |
| | PSF PGIM JENNISON BLEND PORTFOLIO (CONTINUED) | | |
| | | | |
SCHEDULE OF INVESTMENTS | | | | as of December 31, 2024 |
| | | | | | | | | | | | | | | | | | | | | | | | | | | | | | | | | | | |
| | | Level 1 | | Level 2 | | Level 3 |
Investments in Securities (continued) | | | | | | | | | | | | | | | | | | | | | | | | | | | | | | | | | | | |
Assets (continued) | | | | | | | | | | | | | | | | | | | | | | | | | | | | | | | | | | | |
Long-Term Investments (continued) | | | | | | | | | | | | | | | | | | | | | | | | | | | | | | | | | | | |
Common Stocks (continued) | | | | | | | | | | | | | | | | | | | | | | | | | | | | | | | | | | | |
Multi-Utilities | | | | $ 109,884,084 | | | | | | | | | | $— | | | | | | | | | | | | | | | $— | | | | | | |
Oil, Gas & Consumable Fuels | | | | 194,741,069 | | | | | | | | | | — | | | | | | | | | | | | | | | — | | | | | | |
Personal Care Products | | | | 98,080,114 | | | | | | | | | | — | | | | | | | | | | | | | | | — | | | | | | |
Pharmaceuticals | | | | 172,534,357 | | | | | | | | | | — | | | | | | | | | | | | | | | — | | | | | | |
Real Estate Management & Development | | | | 38,911,468 | | | | | | | | | | — | | | | | | | | | | | | | | | — | | | | | | |
Residential REITs | | | | 20,531,780 | | | | | | | | | | — | | | | | | | | | | | | | | | — | | | | | | |
Semiconductors & Semiconductor Equipment | | | | 643,672,814 | | | | | | | | | | — | | | | | | | | | | | | | | | — | | | | | | |
Software | | | | 603,406,592 | | | | | | | | | | — | | | | | | | | | | | | | | | — | | | | | | |
Specialized REITs | | | | 26,337,500 | | | | | | | | | | — | | | | | | | | | | | | | | | — | | | | | | |
Specialty Retail | | | | 99,826,734 | | | | | | | | | | — | | | | | | | | | | | | | | | — | | | | | | |
Technology Hardware, Storage & Peripherals | | | | 511,033,756 | | | | | | | | | | — | | | | | | | | | | | | | | | — | | | | | | |
Textiles, Apparel & Luxury Goods | | | | 39,063,569 | | | | | | | | | | — | | | | | | | | | | | | | | | — | | | | | | |
Short-Term Investments | | | | | | | | | | | | | | | | | | | | | | | | | | | | | | | | | | | |
Affiliated Mutual Funds | | | | 263,468,448 | | | | | | | | | | — | | | | | | | | | | | | | | | — | | | | | | |
| | | | | | | | | | | | | | | | | | | | | | | | | | | | | | | | | | | |
Total | | | | $6,959,076,659 | | | | | | | | | | $— | | | | | | | | | | | | | | | $— | | | | | | |
| | | | | | | | | | | | | | | | | | | | | | | | | | | | | | | | | | | |
Industry Classification:
The industry classification of investments and liabilities in excess of other assets shown as a percentage of net assets as of December 31, 2024 were as follows:
| | | | |
Semiconductors & Semiconductor Equipment | | | 9.6 | % |
Software | | | 9.0 | |
Technology Hardware, Storage & Peripherals | | | 7.6 | |
Interactive Media & Services | | | 7.2 | |
Banks | | | 6.9 | |
Insurance | | | 6.5 | |
Broadline Retail | | | 4.2 | |
Affiliated Mutual Funds (3.4% represents investments purchased with collateral from securities on loan) | | | 3.9 | |
Machinery | | | 3.2 | |
Oil, Gas & Consumable Fuels | | | 2.9 | |
Entertainment | | | 2.7 | |
Health Care Equipment & Supplies | | | 2.7 | |
Aerospace & Defense | | | 2.6 | |
Pharmaceuticals | | | 2.6 | |
Consumer Staples Distribution & Retail | | | 2.5 | |
Ground Transportation | | | 2.4 | |
Capital Markets | | | 2.1 | |
Multi-Utilities | | | 1.6 | |
Automobiles | | | 1.6 | |
Specialty Retail | | | 1.5 | |
Communications Equipment | | | 1.5 | |
Personal Care Products | | | 1.5 | |
Hotels, Restaurants & Leisure | | | 1.3 | |
Financial Services | | | 1.2 | |
Diversified Telecommunication Services | | | 1.2 | |
Household Durables | | | 1.2 | |
| | | | |
IT Services | | | 1.1 | % |
Health Care Providers & Services | | | 0.9 | |
Biotechnology | | | 0.8 | |
Electric Utilities | | | 0.8 | |
Construction & Engineering | | | 0.7 | |
Electrical Equipment | | | 0.7 | |
Household Products | | | 0.7 | |
Industrial Conglomerates | | | 0.6 | |
Industrial REITs | | | 0.6 | |
Independent Power & Renewable Electricity Producers | | | 0.6 | |
Commercial Services & Supplies | | | 0.6 | |
Textiles, Apparel & Luxury Goods | | | 0.6 | |
Real Estate Management & Development | | | 0.6 | |
Containers & Packaging | | | 0.5 | |
Food Products | | | 0.5 | |
Specialized REITs | | | 0.4 | |
Energy Equipment & Services | | | 0.4 | |
Marine Transportation | | | 0.3 | |
Residential REITs | | | 0.3 | |
Consumer Finance | | | 0.3 | |
Leisure Products | | | 0.2 | |
| | | | |
| | | 103.4 | |
Liabilities in excess of other assets | | | (3.4 | ) |
| | | | |
| |
| | | 100.0 | % |
| | | | |
SEE NOTES TO FINANCIAL STATEMENTS.
A149
| | | | |
| | PSF PGIM JENNISON BLEND PORTFOLIO (CONTINUED) | | |
| | | | |
SCHEDULE OF INVESTMENTS | | | | as of December 31, 2024 |
Financial Instruments/Transactions—Summary of Offsetting and Netting Arrangements:
The Portfolio entered into financial instruments/transactions during the reporting period that are either offset in accordance with current requirements or are subject to enforceable master netting arrangements or similar agreements that permit offsetting. The information about offsetting and related netting arrangements for financial instruments/transactions where the legal right to set-off exists is presented in the summary below.
Offsetting of financial instrument/transaction assets and liabilities:
| | | | | | |
Description | | Gross Market Value of Recognized Assets/(Liabilities) | | Collateral
Pledged/(Received)(1) | | Net
Amount |
Securities on Loan | | $220,419,476 | | $(220,419,476) | | $— |
| (1) | Collateral amount disclosed by the Portfolio is limited to the market value of financial instruments/transactions. |
SEE NOTES TO FINANCIAL STATEMENTS.
A150
| | | | |
| | PSF PGIM JENNISON BLEND PORTFOLIO (CONTINUED) | | |
STATEMENT OF ASSETS AND LIABILITIES
as of December 31, 2024
| | | | |
ASSETS | | | | |
Investments at value, including securities on loan of $220,419,476: | | | | |
Unaffiliated investments (cost $4,235,468,536) | | $ | 6,695,608,211 | |
Affiliated investments (cost $263,440,492) | | | 263,468,448 | |
Foreign currency, at value (cost $434) | | | 406 | |
Dividends receivable | | | 1,855,769 | |
Tax reclaim receivable | | | 1,248,535 | |
Receivable for Portfolio shares sold | | | 3,081 | |
Prepaid expenses and other assets | | | 665,067 | |
| | | | |
Total Assets | | | 6,962,849,517 | |
| | | | |
LIABILITIES | | | | |
Payable to broker for collateral for securities on loan | | | 225,899,044 | |
Management fee payable | | | 2,625,030 | |
Payable for Portfolio shares purchased | | | 1,105,250 | |
Accrued expenses and other liabilities | | | 690,108 | |
Payable to affiliate | | | 175,292 | |
Distribution fee payable | | | 10,151 | |
Administration fee payable | | | 5,714 | |
Trustees’ fees payable | | | 4,020 | |
Affiliated transfer agent fee payable | | | 1,190 | |
| | | | |
Total Liabilities | | | 230,515,799 | |
| | | | |
NET ASSETS | | $ | 6,732,333,718 | |
| | | | |
Net assets were comprised of: | | | | |
Partners’ Equity | | $ | 6,732,333,718 | |
| | | | |
Class I: | | | | |
Net asset value and redemption price per share, $6,684,143,717 / 54,353,072 outstanding shares of beneficial interest | | $ | 122.98 | |
| | | | |
Class II: | | | | |
Net asset value and redemption price per share, $44,565,176 / 376,183 outstanding shares of beneficial interest | | $ | 118.47 | |
| | | | |
Class III: | | | | |
Net asset value and redemption price per share, $3,624,825 / 29,749 outstanding shares of beneficial interest | | $ | 121.85 | |
| | | | |
STATEMENT OF OPERATIONS
Year Ended December 31, 2024
| | | | |
NET INVESTMENT INCOME (LOSS) | | | | |
INCOME | | | | |
Unaffiliated dividend income
(net of $174,404 foreign withholding tax) | | $ | 76,195,110 | |
Affiliated dividend income | | | 2,131,160 | |
Affiliated income from securities lending, net | | | 198,630 | |
| | | | |
Total income | | | 78,524,900 | |
| | | | |
EXPENSES | | | | |
Management fee | | | 28,609,163 | |
Distribution fee—Class II | | | 108,151 | |
Distribution fee—Class III | | | 8,568 | |
Administration fee—Class II | | | 64,891 | |
Custodian and accounting fees | | | 335,930 | |
Shareholders’ reports | | | 183,288 | |
Professional fees | | | 134,385 | |
Trustees’ fees | | | 111,020 | |
Audit fee | | | 34,858 | |
Transfer agent’s fees and expenses (including affiliated expense of $7,143) | | | 11,943 | |
Miscellaneous | | | 119,574 | |
| | | | |
Total expenses | | | 29,721,771 | |
| | | | |
NET INVESTMENT INCOME (LOSS) | | | 48,803,129 | |
| | | | |
REALIZED AND UNREALIZED GAIN (LOSS) ON INVESTMENT AND FOREIGN CURRENCY TRANSACTIONS | | | | |
Net realized gain (loss) on: | | | | |
Investment transactions (including affiliated of $143,250) | | | 968,609,938 | |
Foreign currency transactions | | | (125,835 | ) |
| | | | |
| | | 968,484,103 | |
| | | | |
Net change in unrealized appreciation (depreciation) on: | | | | |
Investments (including affiliated of $(164,455)) | | | 432,521,124 | |
Foreign currencies | | | (7,848 | ) |
| | | | |
| | | 432,513,276 | |
| | | | |
NET GAIN (LOSS) ON INVESTMENT AND FOREIGN CURRENCY TRANSACTIONS | | | 1,400,997,379 | |
| | | | |
NET INCREASE (DECREASE) IN NET ASSETS RESULTING FROM OPERATIONS | | $ | 1,449,800,508 | |
| | | | |
STATEMENTS OF CHANGES IN NET ASSETS
| | | | | | | | | | |
| | | Year Ended
December 31, 2024 | | Year Ended
December 31, 2023 |
INCREASE (DECREASE) IN NET ASSETS | | | | | | | | | | |
OPERATIONS | | | | | | | | | | |
Net investment income (loss) | | | $ | 48,803,129 | | | | $ | 45,295,597 | |
Net realized gain (loss) on investment and foreign currency transactions | | | | 968,484,103 | | | | | 878,613,699 | |
Net change in unrealized appreciation (depreciation) on investments and foreign currencies | | | | 432,513,276 | | | | | 489,318,305 | |
| | | | | | | | | | |
NET INCREASE (DECREASE) IN NET ASSETS RESULTING FROM OPERATIONS | | | | 1,449,800,508 | | | | | 1,413,227,601 | |
| | | | | | | | | | |
PORTFOLIO SHARE TRANSACTIONS | | | | | | | | | | |
Portfolio shares sold | | | | 101,159,472 | | | | | 15,963,040 | |
Net asset value of shares issued in merger | | | | — | | | | | 124,013,410 | |
Portfolio shares purchased | | | | (505,102,237 | ) | | | | (352,109,688 | ) |
| | | | | | | | | | |
NET INCREASE (DECREASE) IN NET ASSETS FROM PORTFOLIO SHARE TRANSACTIONS | | | | (403,942,765 | ) | | | | (212,133,238 | ) |
| | | | | | | | | | |
TOTAL INCREASE (DECREASE) | | | | 1,045,857,743 | | | | | 1,201,094,363 | |
NET ASSETS: | | | | | | | | | | |
Beginning of year | | | | 5,686,475,975 | | | | | 4,485,381,612 | |
| | | | | | | | | | |
End of year | | | $ | 6,732,333,718 | | | | $ | 5,686,475,975 | |
| | | | | | | | | | |
SEE NOTES TO FINANCIAL STATEMENTS.
A151
| | | | |
| | PSF PGIM JENNISON BLEND PORTFOLIO (CONTINUED) | | |
FINANCIAL HIGHLIGHTS | | | | |
| | | | | | | | | | | | | | | | | | | | |
Class I | | | | | | | | | | | | | | | |
| | | Year Ended December 31, | |
| | | 2024 | | | 2023 | | | 2022 | | | 2021 | | | 2020 | |
Per Share Operating Performance(a): | | | | | | | | | | | | | | | | | | | | |
Net Asset Value, beginning of year | | $ | 97.36 | | | $ | 73.47 | | | $ | 98.09 | | | $ | 81.50 | | | $ | 63.18 | |
| | | | | | | | | | | | | | | | | | | | |
Income (Loss) From Investment Operations: | | | | | | | | | | | | | | | | | | | | |
Net investment income (loss) | | | 0.87 | | | | 0.77 | | | | 0.76 | | | | 0.40 | | | | 0.53 | |
| Net realized and unrealized gain (loss) on investment and foreign currency transactions | | | 24.75 | | | | 23.12 | | | | (25.38 | ) | | | 16.19 | | | | 17.79 | |
| | | | | | | | | | | | | | | | | | | | |
Total from investment operations | | | 25.62 | | | | 23.89 | | | | (24.62 | ) | | | 16.59 | | | | 18.32 | |
| | | | | | | | | | | | | | | | | | | | |
Net Asset Value, end of year | | $ | 122.98 | | | $ | 97.36 | | | $ | 73.47 | | | $ | 98.09 | | | $ | 81.50 | |
| | | | | | | | | | | | | | | | | | | | |
Total Return(c) | | | 26.32 | % | | | 32.52 | % | | | (25.10 | )% | | | 20.36 | % | | | 29.00 | % |
Ratios/Supplemental Data: | | | | | | | | | | | | | | | | | | | | |
Net assets, end of year (in millions) | | $ | 6,684.1 | | | $ | 5,644.6 | | | $ | 4,482.9 | | | $ | 6,379.2 | | | $ | 5,672.4 | |
Average net assets (in millions) | | $ | 6,310.9 | | | $ | 5,012.2 | | | $ | 5,044.7 | | | $ | 6,084.1 | | | $ | 4,776.8 | |
Ratios to average net assets(d): | | | | | | | | | | | | | | | | | | | | |
Expenses after waivers and/or expense reimbursement | | | 0.46 | % | | | 0.46 | % | | | 0.46 | % | | | 0.46 | % | | | 0.47 | % |
Expenses before waivers and/or expense reimbursement | | | 0.46 | % | | | 0.46 | % | | | 0.46 | % | | | 0.46 | % | | | 0.47 | % |
Net investment income (loss) | | | 0.77 | % | | | 0.90 | % | | | 0.95 | % | | | 0.45 | % | | | 0.80 | % |
Portfolio turnover rate(e) | | | 102 | % | | | 77 | % | | | 22 | % | | | 29 | % | | | 62 | % |
| | | | | | | | | | | | | | | | | | | | |
Class II | | | | | | | | | | | | | | | |
| | | Year Ended December 31, | |
| | | 2024 | | | 2023 | | | 2022 | | | 2021 | | | 2020 | |
Per Share Operating Performance(a): | | | | | | | | | | | | | | | | | | | | |
Net Asset Value, beginning of year | | $ | 94.17 | | | $ | 71.35 | | | $ | 95.64 | | | $ | 79.78 | | | $ | 62.09 | |
| | | | | | | | | | | | | | | | | | | | |
Income (Loss) From Investment Operations: | | | | | | | | | | | | | | | | | | | | |
Net investment income (loss) | | | 0.40 | | | | (0.01 | )(b) | | | 0.43 | | | | 0.04 | | | | 0.26 | |
| Net realized and unrealized gain (loss) on investment and foreign currency transactions | | | 23.90 | | | | 22.83 | | | | (24.72 | ) | | | 15.82 | | | | 17.43 | |
| | | | | | | | | | | | | | | | | | | | |
Total from investment operations | | | 24.30 | | | | 22.82 | | | | (24.29 | ) | | | 15.86 | | | | 17.69 | |
| | | | | | | | | | | | | | | | | | | | |
Net Asset Value, end of year | | $ | 118.47 | | | $ | 94.17 | | | $ | 71.35 | | | $ | 95.64 | | | $ | 79.78 | |
| | | | | | | | | | | | | | | | | | | | |
Total Return(c) | | | 25.80 | % | | | 31.98 | % | | | (25.40 | )% | | | 19.88 | % | | | 28.49 | % |
Ratios/Supplemental Data: | | | | | | | | | | | | | | | | | | | | |
Net assets, end of year (in millions) | | $ | 44.6 | | | $ | 39.1 | | | $ | 1.6 | | | $ | 2.3 | | | $ | 2.0 | |
Average net assets (in millions) | | $ | 43.3 | | | $ | 4.1 | | | $ | 1.8 | | | $ | 2.2 | | | $ | 1.7 | |
Ratios to average net assets(d): | | | | | | | | | | | | | | | | | | | | |
Expenses after waivers and/or expense reimbursement | | | 0.86 | % | | | 0.85 | % | | | 0.86 | % | | | 0.86 | % | | | 0.87 | % |
Expenses before waivers and/or expense reimbursement | | | 0.86 | % | | | 0.85 | % | | | 0.86 | % | | | 0.86 | % | | | 0.87 | % |
Net investment income (loss) | | | 0.37 | % | | | (0.01 | )% | | | 0.55 | % | | | 0.04 | % | | | 0.40 | % |
Portfolio turnover rate(e) | | | 102 | % | | | 77 | % | | | 22 | % | | | 29 | % | | | 62 | % |
SEE NOTES TO FINANCIAL STATEMENTS.
A152
| | | | |
| | PSF PGIM JENNISON BLEND PORTFOLIO (CONTINUED) | | |
FINANCIAL HIGHLIGHTS | | | | |
| | | | | | | | | | | | | | | | | | | | | | | | |
Class III | | | | | | | | | | | | | | | | | | |
| | | Year Ended December 31, | | | April 26, 2021(f)
through December 31, | |
| | | 2024 | | | 2023 | | | 2022 | | | 2021 | |
Per Share Operating Performance(a): | | | | | | | | | | | | | | | | | | | | | | | | |
Net Asset Value, beginning of period | | $ | 96.71 | | | $ | 73.16 | | | $ | 97.92 | | | | | | | $ | 87.74 | | | | | |
| | | | | | | | | | | | | | | | | | | | | | | | |
Income (Loss) From Investment Operations: | | | | | | | | | | | | | | | | | | | | | | | | |
Net investment income (loss) | | | 0.59 | | | | 0.52 | | | | 0.58 | | | | | | | | 0.12 | | | | | |
Net realized and unrealized gain (loss) on investment and foreign currency transactions | | | 24.55 | | | | 23.03 | | | | (25.34 | ) | | | | | | | 10.06 | | | | | |
| | | | | | | | | | | | | | | | | | | | | | | | |
Total from investment operations | | | 25.14 | | | | 23.55 | | | | (24.76 | ) | | | | | | | 10.18 | | | | | |
| | | | | | | | | | | | | | | | | | | | | | | | |
Net Asset Value, end of period | | $ | 121.85 | | | $ | 96.71 | | | $ | 73.16 | | | | | | | $ | 97.92 | | | | | |
| | | | | | | | | | | | | | | | | | | | | | | | |
Total Return(c) | | | 26.00 | % | | | 32.19 | % | | | (25.29 | )% | | | | | | | 11.60 | % | | | | |
Ratios/Supplemental Data: | | | | | | | | | | | | | | | | | | | | | | | | |
Net assets, end of period (in millions) | | $ | 3.6 | | | $ | 2.7 | | | $ | 0.9 | | | | | | | $ | 0.6 | | | | | |
Average net assets (in millions) | | $ | 3.4 | | | $ | 1.4 | | | $ | 0.8 | | | | | | | $ | 0.2 | | | | | |
Ratios to average net assets(d): | | | | | | | | | | | | | | | | | | | | | | | | |
Expenses after waivers and/or expense reimbursement | | | 0.71 | % | | | 0.71 | % | | | 0.71 | % | | | | | | | 0.70 | %(g) | | | | |
Expenses before waivers and/or expense reimbursement | | | 0.71 | % | | | 0.71 | % | | | 0.71 | % | | | | | | | 0.70 | %(g) | | | | |
Net investment income (loss) | | | 0.52 | % | | | 0.61 | % | | | 0.74 | % | | | | | | | 0.18 | %(g) | | | | |
Portfolio turnover rate(e) | | | 102 | % | | | 77 | % | | | 22 | % | | | | | | | 29 | % | | | | |
| (a) | Calculated based on average shares outstanding during the period. |
| (b) | The per share amount of net investment income (loss) does not directly correlate to the amounts reported in the Statement of Operations due to class specific expenses. |
| (c) | Total return is calculated assuming a purchase of a share on the first day and a sale on the last day of each period reported and includes reinvestment of dividends and distributions, if any, and does not reflect the effect of insurance contract charges. Total return does not reflect expenses associated with the separate account such as administrative fees, account charges and surrender charges which, if reflected, would reduce the total returns for all periods shown. Performance figures may reflect fee waivers and/or expense reimbursements. In the absence of fee waivers and/or expense reimbursements, the total return would be lower. Past performance is no guarantee of future results. Total returns may reflect adjustments to conform to GAAP. Total returns for periods less than one full year are not annualized. |
| (d) | Does not include expenses of the underlying funds in which the Portfolio invests. |
| (e) | The Portfolio’s portfolio turnover rate is calculated in accordance with regulatory requirements, without regard to transactions involving short-term investments, certain derivatives and in-kind transactions (if any). If such transactions were included, the Portfolio’s portfolio turnover rate may be higher. |
| (f) | Commencement of offering. |
| (g) | Annualized, with the exception of certain non-recurring expenses. |
SEE NOTES TO FINANCIAL STATEMENTS.
A153
| | | | |
| | PSF PGIM JENNISON GROWTH PORTFOLIO | | |
SCHEDULE OF INVESTMENTS | | | | as of December 31, 2024 |
| | | | | | | | |
| | | Shares | | | Value | |
LONG-TERM INVESTMENTS — 98.7% | |
COMMON STOCKS | | | | | | | | |
Aerospace & Defense — 2.5% | | | | | |
Boeing Co. (The)* | | | 349,316 | | | $ | 61,828,932 | |
General Electric Co. | | | 202,102 | | | | 33,708,592 | |
| | | | | | | | |
| | |
| | | | | | | 95,537,524 | |
| | | | | | | | |
Automobiles — 3.2% | | | | | | | | |
Tesla, Inc.* | | | 300,115 | | | | 121,198,442 | |
| | |
Biotechnology — 1.4% | | | | | | | | |
Vertex Pharmaceuticals, Inc.* | | | 131,136 | | | | 52,808,467 | |
Broadline Retail — 9.4% | |
Amazon.com, Inc.* | | | 1,493,521 | | | | 327,663,572 | |
MercadoLibre, Inc. (Brazil)* | | | 18,433 | | | | 31,344,211 | |
| | |
| | | | | | | 359,007,783 | |
| | | | | | | | |
Capital Markets — 1.4% | | | | | | | | |
Goldman Sachs Group, Inc. (The) | | | 31,583 | | | | 18,085,058 | |
Moody’s Corp. | | | 75,612 | | | | 35,792,452 | |
| | | | | | | | |
| | |
| | | | | | | 53,877,510 | |
| | | | | | | | |
Consumer Staples Distribution & Retail — 3.8% | |
Costco Wholesale Corp. | | | 82,396 | | | | 75,496,983 | |
| | |
Walmart, Inc. | | | 776,461 | | | | 70,153,251 | |
| | | | | | | | |
| | |
| | | | | | | 145,650,234 | |
| | |
Electrical Equipment — 1.7% | | | | | | | | |
Eaton Corp. PLC | | | 108,635 | | | | 36,052,697 | |
Vertiv Holdings Co. (Class A Stock) | | | 266,737 | | | | 30,303,991 | |
| | | | | | | | |
| | |
| | | | | | | 66,356,688 | |
Entertainment — 6.4% | | | | | | | | |
Netflix, Inc.* | | | 171,248 | | | | 152,636,767 | |
Spotify Technology SA* | | | 57,100 | | | | 25,545,398 | |
Walt Disney Co. (The) | | | 583,871 | | | | 65,014,036 | |
| | | | | | | | |
| | |
| | | | | | | 243,196,201 | |
| | | | | | | | |
Financial Services — 4.4% | | | | | | | | |
Mastercard, Inc. (Class A Stock) | | | 186,975 | | | | 98,455,426 | |
Visa, Inc. (Class A Stock) | | | 220,191 | | | | 69,589,163 | |
| | | | | | | | |
| | |
| | | | | | | 168,044,589 | |
| | | | | | | | |
Ground Transportation — 1.2% | |
Uber Technologies, Inc.* | | | 738,229 | | | | 44,529,973 | |
| | | | | | | | |
Health Care Equipment & Supplies — 2.1% | |
Dexcom, Inc.* | | | 286,740 | | | | 22,299,770 | |
Edwards Lifesciences Corp.* | | | 260,800 | | | | 19,307,024 | |
| | |
Intuitive Surgical, Inc.* | | | 77,052 | | | | 40,218,062 | |
| | | | | | | | |
| | |
| | | | | | | 81,824,856 | |
Hotels, Restaurants & Leisure —2.9% | |
Airbnb, Inc. (Class A Stock)* | | | 291,508 | | | | 38,307,066 | |
Flutter Entertainment PLC (United Kingdom)* | | | 43,074 | | | | 11,132,475 | |
| | |
Hilton Worldwide Holdings, Inc. | | | 153,609 | | | | 37,966,001 | |
Marriott International, Inc. (Class A Stock) | | | 81,233 | | | | 22,659,133 | |
| | | | | | | | |
| | |
| | | | | | | 110,064,675 | |
| | | | | | | | |
| | | | | | | | |
| | | Shares | | | Value | |
COMMON STOCKS (continued) | | | | | | | | |
Insurance — 1.1% | | | | | | | | |
Progressive Corp. (The) | | | 168,407 | | | $ | 40,352,001 | |
| | | | | | | | |
Interactive Media & Services — 9.4% | | | | | | | | |
Alphabet, Inc. (Class A Stock) | | | 403,705 | | | | 76,421,357 | |
Alphabet, Inc. (Class C Stock) | | | 400,462 | | | | 76,263,983 | |
Meta Platforms, Inc. (Class A Stock) | | | 350,522 | | | | 205,234,136 | |
| | | | | | | | |
| | |
| | | | | | 357,919,476 | |
| | | | | | | | |
IT Services — 0.8% | | | | | | | | |
| | |
Snowflake, Inc. (Class A Stock)* | | | 193,514 | | | | 29,880,497 | |
| | | | | | | | |
Media — 1.1% | | | | | | | | |
Trade Desk, Inc. (The) (Class A Stock)*. | | | 351,413 | | | | 41,301,570 | |
| | | | | | | | |
Pharmaceuticals — 4.5% | | | | | | | | |
AstraZeneca PLC (United Kingdom), ADR | | | 351,576 | | | | 23,035,260 | |
Eli Lilly & Co. | | | 124,917 | | | | 96,435,924 | |
Novo Nordisk A/S (Denmark), ADR | | | 600,407 | | | | 51,647,010 | |
| | | | | | | | |
| | |
| | | | | | 171,118,194 | |
| | | | | | | | |
Semiconductors & Semiconductor Equipment — 16.2% | |
Advanced Micro Devices, Inc.* | | | 295,965 | | | | 35,749,612 | |
Analog Devices, Inc. | | | 89,762 | | | | 19,070,835 | |
Broadcom, Inc. | | | 912,914 | | | | 211,649,982 | |
NVIDIA Corp. | | | 2,613,293 | | | | 350,939,117 | |
| | | | | | | | |
| | |
| | | | | | 617,409,546 | |
| | | | | | | | |
Software — 15.6% | | | | | | | | |
Adobe, Inc.* | | | 61,414 | | | | 27,309,578 | |
AppLovin Corp. (Class A Stock)* | | | 49,511 | | | | 16,033,147 | |
Cadence Design Systems, Inc.* | | | 195,158 | | | | 58,637,173 | |
Crowdstrike Holdings, Inc. (Class A Stock)* | | | 148,791 | | | | 50,910,329 | |
Datadog, Inc. (Class A Stock)* | | | 234,552 | | | | 33,515,135 | |
Microsoft Corp. | | | 644,133 | | | | 271,502,060 | |
Palo Alto Networks, Inc.*(a) | | | 136,190 | | | | 24,781,132 | |
Salesforce, Inc. | | | 142,468 | | | | 47,631,326 | |
ServiceNow, Inc.* | | | 61,220 | | | | 64,900,546 | |
| | | | | | | | |
| | |
| | | | | | 595,220,426 | |
| | | | | | | | |
Specialty Retail — 2.9% | | | | | | | | |
Home Depot, Inc. (The) | | | 66,190 | | | | 25,747,248 | |
Industria de Diseno Textil SA (Spain) | | | 312,989 | | | | 16,032,537 | |
O’Reilly Automotive, Inc.* | | | 36,096 | | | | 42,802,637 | |
TJX Cos., Inc. (The) | | | 217,936 | | | | 26,328,848 | |
| | | | | | | | |
| | |
| | | | | | 110,911,270 | |
| | | | | | | | |
Technology Hardware, Storage & Peripherals — 5.9% | | | | | |
| | |
Apple, Inc. | | | 889,817 | | | | 222,827,973 | |
| | | | | | | | |
Textiles, Apparel & Luxury Goods — 0.8% | | | | | |
| | |
adidas AG (Germany) | | | 124,569 | | | | 30,639,544 | |
| | | | | | | | |
TOTAL LONG-TERM INVESTMENTS
(cost $1,511,770,205) | | | | | | | 3,759,677,439 | |
| | | | | | | | |
SEE NOTES TO FINANCIAL STATEMENTS.
A154
| | | | |
| | PSF PGIM JENNISON GROWTH PORTFOLIO (CONTINUED) | | |
SCHEDULE OF INVESTMENTS | | | | as of December 31, 2024 |
| | | | | | | | |
| | | Shares | | | Value | |
SHORT-TERM INVESTMENTS — 2.0% | | | | | |
AFFILIATED MUTUAL FUNDS | | | | | | | | |
PGIM Core Ultra Short Bond Fund(wb) | | | 50,056,889 | | | $ | 50,056,889 | |
PGIM Institutional Money Market Fund (7-day effective yield 4.649%) (cost $24,284,011; includes $24,201,520 of cash collateral for securities on loan)(b)(wb) | | | 24,298,590 | | | | 24,284,011 | |
| | | | | | | | |
TOTAL SHORT-TERM INVESTMENTS
(cost $74,340,900) | | | | 74,340,900 | |
| | | | | | | | |
TOTAL INVESTMENTS—100.7%
(cost $1,586,111,105) | | | | 3,834,018,339 | |
Liabilities in excess of other assets — (0.7)% | | | | (26,409,182 | ) |
| | | | | | | | |
NET ASSETS — 100.0% | | | $ | 3,807,609,157 | |
| | | | | | | | |
See the Glossary for a list of the abbreviation(s) used in the annual report.
| * | Non-income producing security. |
| (a) | All or a portion of security is on loan. The aggregate market value of such securities, including those sold and pending settlement, is $23,436,448; cash collateral of $24,201,520 (included in liabilities) was received with which the Portfolio purchased highly liquid short-term investments. In the event of significant appreciation in value of securities on loan on the last business day of the reporting period, the Portfolio may reflect a collateral value that is less than the market value of the loaned securities and such shortfall is remedied the following business day. |
| (b) | Represents security, or portion thereof, purchased with cash collateral received for securities on loan and includes dividend reinvestment. |
| (wb) | Represents an investment in a Fund affiliated with the Manager. |
Fair Value Measurements:
Various inputs are used in determining the value of the Portfolio’s investments. These inputs are summarized in the three broad levels listed below.
Level 1—unadjusted quoted prices generally in active markets for identical securities.
Level 2—quoted prices for similar securities, interest rates and yield curves, prepayment speeds, foreign currency exchange rates and other observable inputs.
Level 3—unobservable inputs for securities valued in accordance with Board approved fair valuation procedures.
The following is a summary of the inputs used as of December 31, 2024 in valuing such portfolio securities:
| | | | | | | | | | | | |
| | | Level 1 | | | Level 2 | | | Level 3 | |
Investments in Securities | | | | | | | | | | | | |
Assets | | | | | | | | | | | | |
Long-Term Investments | | | | | | | | | | | | |
Common Stocks | | | | | | | | | | | | |
Aerospace & Defense | | $ | 95,537,524 | | | $ | — | | | | $— | |
Automobiles | | | 121,198,442 | | | | — | | | | — | |
Biotechnology | | | 52,808,467 | | | | — | | | | — | |
Broadline Retail | | | 359,007,783 | | | | — | | | | — | |
Capital Markets | | | 53,877,510 | | | | — | | | | — | |
Consumer Staples Distribution & Retail | | | 145,650,234 | | | | — | | | | — | |
Electrical Equipment | | | 66,356,688 | | | | — | | | | — | |
Entertainment | | | 243,196,201 | | | | — | | | | — | |
Financial Services | | | 168,044,589 | | | | — | | | | — | |
Ground Transportation | | | 44,529,973 | | | | — | | | | — | |
Health Care Equipment & Supplies | | | 81,824,856 | | | | — | | | | — | |
Hotels, Restaurants & Leisure | | | 110,064,675 | | | | — | | | | — | |
Insurance | | | 40,352,001 | | | | — | | | | — | |
Interactive Media & Services | | | 357,919,476 | | | | — | | | | — | |
IT Services | | | 29,880,497 | | | | — | | | | — | |
Media | | | 41,301,570 | | | | — | | | | — | |
Pharmaceuticals | | | 171,118,194 | | | | — | | | | — | |
Semiconductors & Semiconductor Equipment | | | 617,409,546 | | | | — | | | | — | |
Software | | | 595,220,426 | | | | — | | | | — | |
Specialty Retail | | | 94,878,733 | | | | 16,032,537 | | | | — | |
Technology Hardware, Storage & Peripherals | | | 222,827,973 | | | | — | | | | — | |
Textiles, Apparel & Luxury Goods | | | — | | | | 30,639,544 | | | | — | |
SEE NOTES TO FINANCIAL STATEMENTS.
A155
| | | | |
| | PSF PGIM JENNISON GROWTH PORTFOLIO (CONTINUED) | | |
SCHEDULE OF INVESTMENTS | | | | as of December 31, 2024 |
| | | | | | | | | | | | |
| | | Level 1 | | | Level 2 | | | Level 3 | |
Investments in Securities (continued) | | | | | | | | | | | | |
Assets (continued) | | | | | | | | | | | | |
Short-Term Investments | | | | | | | | | | | | |
Affiliated Mutual Funds | | $ | 74,340,900 | | | $ | — | | | | $— | |
| | | | | | | | | | | | |
Total | | $ | 3,787,346,258 | | | $ | 46,672,081 | | | | $— | |
| | | | | | | | | | | | |
Industry Classification:
The industry classification of investments and liabilities in excess of other assets shown as a percentage of net assets as of December 31, 2024 were as follows:
| | | | |
Semiconductors & Semiconductor Equipment | | | 16.2 | % |
Software | | | 15.6 | |
Broadline Retail | | | 9.4 | |
Interactive Media & Services | | | 9.4 | |
Entertainment | | | 6.4 | |
Technology Hardware, Storage & Peripherals | | | 5.9 | |
Pharmaceuticals | | | 4.5 | |
Financial Services | | | 4.4 | |
Consumer Staples Distribution & Retail | | | 3.8 | |
Automobiles | | | 3.2 | |
Specialty Retail | | | 2.9 | |
Hotels, Restaurants & Leisure | | | 2.9 | |
Aerospace & Defense | | | 2.5 | |
Health Care Equipment & Supplies | | | 2.1 | |
Affiliated Mutual Funds (0.6% represents investments purchased with collateral from securities on loan) | | | 2.0 | |
| | | | |
Electrical Equipment | | | 1.7 | % |
Capital Markets | | | 1.4 | |
Biotechnology | | | 1.4 | |
Ground Transportation | | | 1.2 | |
Media | | | 1.1 | |
Insurance | | | 1.1 | |
Textiles, Apparel & Luxury Goods | | | 0.8 | |
IT Services | | | 0.8 | |
| | | | |
| | | 100.7 | |
Liabilities in excess of other assets | | | (0.7 | ) |
| | | | |
| | | 100.0 | % |
| | | | |
Financial Instruments/Transactions—Summary of Offsetting and Netting Arrangements:
The Portfolio entered into financial instruments/transactions during the reporting period that are either offset in accordance with current requirements or are subject to enforceable master netting arrangements or similar agreements that permit offsetting. The information about offsetting and related netting arrangements for financial instruments/transactions where the legal right to set-off exists is presented in the summary below.
Offsetting of financial instrument/transaction assets and liabilities:
| | | | | | |
| Description | | Gross Market
Value of
Recognized
Assets/(Liabilities) | | Collateral
Pledged/(Received)(1) | | Net
Amount |
Securities on Loan | | $23,436,448 | | $(23,436,448) | | $— |
(1) Collateral amount disclosed by the Portfolio is limited to the market value of financial instruments/transactions.
SEE NOTES TO FINANCIAL STATEMENTS.
A156
| | | | |
| | PSF PGIM JENNISON GROWTH PORTFOLIO (CONTINUED) | | |
| | | | |
STATEMENT OF ASSETS AND LIABILITIES
as of December 31, 2024
| | | | |
ASSETS | | | | |
Investments at value, including securities on loan of $23,436,448: | | | | |
Unaffiliated investments (cost $1,511,770,205) | | $ | 3,759,677,439 | |
Affiliated investments (cost $74,340,900) | | | 74,340,900 | |
Dividends receivable | | | 566,490 | |
Tax reclaim receivable | | | 275,586 | |
Receivable for Portfolio shares sold | | | 11,645 | |
Prepaid expenses | | | 36,960 | |
| | | | |
Total Assets | | | 3,834,909,020 | |
| | | | |
LIABILITIES | | | | |
Payable to broker for collateral for securities on loan | | | 24,201,520 | |
Management fee payable | | | 1,986,910 | |
Payable for Portfolio shares purchased | | | 771,341 | |
Accrued expenses and other liabilities | | | 239,086 | |
Payable to affiliate | | | 88,062 | |
Distribution fee payable | | | 6,405 | |
Trustees’ fees payable | | | 2,360 | |
Administration fee payable | | | 1,861 | |
Affiliated transfer agent fee payable | | | 1,190 | |
Payable to custodian | | | 1,128 | |
| | | | |
Total Liabilities | | | 27,299,863 | |
| | | | |
NET ASSETS | | $ | 3,807,609,157 | |
| | | | |
Net assets were comprised of: | | | | |
Partners’ Equity | | $ | 3,807,609,157 | |
| | | | |
Class I: | | | | |
Net asset value and redemption price per share, $3,777,708,628 / 20,374,516 outstanding shares of beneficial interest | | $ | 185.41 | |
| | | | |
Class II: | | | | |
Net asset value and redemption price per share, $13,688,388 / 78,874 outstanding shares of beneficial interest | | $ | 173.55 | |
| | | | |
Class III: | | | | |
Net asset value and redemption price per share, $16,212,141 / 88,251 outstanding shares of beneficial interest | | $ | 183.70 | |
| | | | |
STATEMENT OF OPERATIONS
Year Ended December 31, 2024
| | | | |
NET INVESTMENT INCOME (LOSS) | | | | |
INCOME | | | | |
Unaffiliated dividend income (net of $383,524 foreign withholding tax) | | $ | 16,205,798 | |
Affiliated dividend income | | | 973,662 | |
Affiliated income from securities lending, net | | | 119,066 | |
| | | | |
Total income | | | 17,298,526 | |
| | | | |
EXPENSES | | | | |
Management fee | | | 21,155,494 | |
Distribution fee—Class II | | | 31,910 | |
Distribution fee—Class III | | | 36,202 | |
Administration fee—Class II | | | 19,146 | |
Custodian and accounting fees | | | 212,987 | |
Shareholders’ reports | | | 108,466 | |
Professional fees | | | 75,336 | |
Trustees’ fees | | | 65,310 | |
Audit fee | | | 30,858 | |
Transfer agent’s fees and expenses (including affiliated expense of $7,143) | | | 11,943 | |
Miscellaneous | | | 84,104 | |
| | | | |
Total expenses | | | 21,831,756 | |
| | | | |
NET INVESTMENT INCOME (LOSS) | | | (4,533,230 | ) |
| | | | |
REALIZED AND UNREALIZED GAIN (LOSS) ON INVESTMENT AND FOREIGN CURRENCY TRANSACTIONS | | | | |
Net realized gain (loss) on: | | | | |
Investment transactions (including affiliated of $133,430) | | | 419,155,545 | |
Foreign currency transactions | | | 8,161 | |
| | | | |
| | | 419,163,706 | |
| | | | |
Net change in unrealized appreciation (depreciation) on: | | | | |
Investments (including affiliated of $(156,578)) | | | 514,432,104 | |
Foreign currencies | | | (246 | ) |
| | | | |
| | | 514,431,858 | |
| | | | |
NET GAIN (LOSS) ON INVESTMENT AND FOREIGN CURRENCY TRANSACTIONS | | | 933,595,564 | |
| | | | |
NET INCREASE (DECREASE) IN NET ASSETS RESULTING FROM OPERATIONS | | $ | 929,062,334 | |
| | | | |
STATEMENTS OF CHANGES IN NET ASSETS
| | | | | | | | |
| | | Year Ended
December 31, 2024 | | | Year Ended
December 31, 2023 | |
INCREASE (DECREASE) IN NET ASSETS | | | | | | | | |
OPERATIONS | | | | | | | | |
Net investment income (loss) | | $ | (4,533,230 | ) | | $ | 911,855 | |
Net realized gain (loss) on investment and foreign currency transactions | | | 419,163,706 | | | | 238,747,750 | |
Net change in unrealized appreciation (depreciation) on investments and foreign currencies | | | 514,431,858 | | | | 881,015,994 | |
| | | | | | | | |
NET INCREASE (DECREASE) IN NET ASSETS RESULTING FROM OPERATIONS | | | 929,062,334 | | | | 1,120,675,599 | |
| | | | | | | | |
PORTFOLIO SHARE TRANSACTIONS | | | | | | | | |
Portfolio shares sold | | | 46,807,146 | | | | 38,128,467 | |
Portfolio shares purchased | | | (257,299,190 | ) | | | (229,754,606 | ) |
| | | | | | | | |
NET INCREASE (DECREASE) IN NET ASSETS FROM PORTFOLIO SHARE TRANSACTIONS | | | (210,492,044 | ) | | | (191,626,139 | ) |
| | | | | | | | |
TOTAL INCREASE (DECREASE) | | | 718,570,290 | | | | 929,049,460 | |
NET ASSETS: | | | | | | | | |
Beginning of year | | | 3,089,038,867 | | | | 2,159,989,407 | |
| | | | | | | | |
End of year | | $ | 3,807,609,157 | | | $ | 3,089,038,867 | |
| | | | | | | | |
SEE NOTES TO FINANCIAL STATEMENTS.
A157
| | | | |
| | PSF PGIM JENNISON GROWTH PORTFOLIO (CONTINUED) | | |
FINANCIAL HIGHLIGHTS | | | | |
| | | | | | | | | | | | | | | | | | | | |
Class I | | | | | | | | | | | | | | | |
| | | Year Ended December 31, | |
| | | 2024 | | | 2023 | | | 2022 | | | 2021 | | | 2020 | |
Per Share Operating Performance(a): | | | | | | | | | | | | | | | | | | | | |
Net Asset Value, beginning of year | | $ | 141.67 | | | $ | 92.29 | | | $ | 147.90 | | | $ | 127.49 | | | $ | 81.62 | |
| | | | | | | | | | | | | | | | | | | | |
Income (Loss) From Investment Operations: | | | | | | | | | | | | | | | | | | | | |
Net investment income (loss) | | | (0.21 | ) | | | 0.05 | | | | (0.01 | ) | | | (0.45 | ) | | | (0.13 | ) |
Net realized and unrealized gain (loss) on investment and foreign currency transactions | | | 43.95 | | | | 49.33 | | | | (55.60 | ) | | | 20.86 | | | | 46.00 | |
| | | | | | | | | | | | | | | | | | | | |
Total from investment operations. | | | 43.74 | | | | 49.38 | | | | (55.61 | ) | | | 20.41 | | | | 45.87 | |
| | | | | | | | | | | | | | | | | | | | |
Net Asset Value, end of year | | $ | 185.41 | | | $ | 141.67 | | | $ | 92.29 | | | $ | 147.90 | | | $ | 127.49 | |
| | | | | | | | | | | | | | | | | | | | |
Total Return(c) | | | 30.88 | % | | | 53.51 | % | | | (37.60 | )% | | | 16.01 | % | | | 56.20 | % |
Ratios/Supplemental Data: | | | | | | | | | | | | | | | | | | | | |
Net assets, end of year (in millions) | | $ | 3,778 | | | $ | 3,065 | | | $ | 2,111 | | | $ | 3,566 | | | $ | 3,260 | |
Average net assets (in millions) | | $ | 3,499 | | | $ | 2,635 | | | $ | 2,537 | | | $ | 3,435 | | | $ | 2,606 | |
Ratios to average net assets(d): | | | | | | | | | | | | | | | | | | | | |
Expenses after waivers and/or expense reimbursement | | | 0.62 | % | | | 0.62 | % | | | 0.62 | % | | | 0.61 | % | | | 0.62 | % |
Expenses before waivers and/or expense reimbursement | | | 0.62 | % | | | 0.62 | % | | | 0.62 | % | | | 0.61 | % | | | 0.62 | % |
Net investment income (loss) | | | (0.13 | )% | | | 0.04 | % | | | (0.01 | )% | | | (0.32 | )% | | | (0.13 | )% |
Portfolio turnover rate(e) | | | 31 | % | | | 32 | % | | | 32 | % | | | 40 | % | | | 56 | % |
| | | | | |
Class II | | | | | | | | | | | | | | | |
| | | Year Ended December 31, | |
| | | 2024 | | | 2023 | | | 2022 | | | 2021 | | | 2020 | |
Per Share Operating Performance(a): | | | | | | | | | | | | | | | | | | | | |
Net Asset Value, beginning of year | | $ | 133.14 | | | $ | 87.07 | | | $ | 140.11 | | | $ | 121.26 | | | $ | 77.94 | |
| | | | | | | | | | | | | | | | | | | | |
Income (Loss) From Investment Operations: | | | | | | | | | | | | | | | | | | | | |
Net investment income (loss) | | | (0.82 | ) | | | (0.37 | )(b) | | | (0.43 | ) | | | (0.95 | ) | | | (0.49 | ) |
Net realized and unrealized gain (loss) on investment and foreign currency transactions | | | 41.23 | | | | 46.44 | | | | (52.61 | ) | | | 19.80 | | | | 43.81 | |
| | | | | | | | | | | | | | | | | | | | |
Total from investment operations | | | 40.41 | | | | 46.07 | | | | (53.04 | ) | | | 18.85 | | | | 43.32 | |
| | | | | | | | | | | | | | | | | | | | |
Net Asset Value, end of year | | $ | 173.55 | | | $ | 133.14 | | | $ | 87.07 | | | $ | 140.11 | | | $ | 121.26 | |
| | | | | | | | | | | | | | | | | | | | |
Total Return(c) | | | 30.35 | % | | | 52.89 | % | | | (37.85 | )% | | | 15.55 | % | | | 55.57 | % |
Ratios/Supplemental Data: | | | | | | | | | | | | | | | | | | | | |
Net assets, end of year (in millions) | | $ | 14 | | | $ | 12 | | | $ | 43 | | | $ | 82 | | | $ | 88 | |
Average net assets (in millions) | | $ | 13 | | | $ | 36 | | | $ | 55 | | | $ | 85 | | | $ | 72 | |
Ratios to average net assets(d): | | | | | | | | | | | | | | | | | | | | |
Expenses after waivers and/or expense reimbursement | | | 1.02 | % | | | 1.02 | % | | | 1.02 | % | | | 1.01 | % | | | 1.02 | % |
Expenses before waivers and/or expense reimbursement | | | 1.02 | % | | | 1.02 | % | | | 1.02 | % | | | 1.01 | % | | | 1.02 | % |
Net investment income (loss) | | | (0.53 | )% | | | (0.35 | )% | | | (0.42 | )% | | | (0.72 | )% | | | (0.53 | )% |
Portfolio turnover rate(e) | | | 31 | % | | | 32 | % | | | 32 | % | | | 40 | % | | | 56 | % |
SEE NOTES TO FINANCIAL STATEMENTS.
A158
| | | | |
| | PSF PGIM JENNISON GROWTH PORTFOLIO (CONTINUED) | | |
FINANCIAL HIGHLIGHTS | | | | |
| | | | | | | | | | | | | | | | | | | | |
Class III | | | | | | | | |
| | | Year Ended December 31, | | April 26, 2021(f) through December 31, |
| | | 2024 | | 2023 | | 2022 | | 2021 |
Per Share Operating Performance(a): | | | | | | | | | | | | | | | | | | | | |
Net Asset Value, beginning of period | | | $ | 140.72 | | | | $ | 91.90 | | | | $ | 147.64 | | | | $ | 132.99 | |
| | | | | | | | | | | | | | | | | | | | |
Income (Loss) From Investment Operations: | | | | | | | | | | | | | | | | | | | | |
Net investment income (loss) | | | | (0.62 | ) | | | | (0.25 | )(b) | | | | (0.24 | ) | | | | (0.59 | ) |
Net realized and unrealized gain (loss) on investment and foreign currency transactions | | | | 43.60 | | | | | 49.07 | | | | | (55.50 | ) | | | | 15.24 | |
| | | | | | | | | | | | | | | | | | | | |
Total from investment operations | | | | 42.98 | | | | | 48.82 | | | | | (55.74 | ) | | | | 14.65 | |
| | | | | | | | | | | | | | | | | | | | |
Net Asset Value, end of period | | | $ | 183.70 | | | | $ | 140.72 | | | | $ | 91.90 | | | | $ | 147.64 | |
| | | | | | | | | | | | | | | | | | | | |
Total Return(c) | | | | 30.54 | % | | | | 53.12 | % | | | | (37.75 | )% | | | | 11.02 | % |
Ratios/Supplemental Data: | | | | | | | | | | | | | | | | | | | | |
Net assets, end of period (in millions) | | | $ | 16 | | | | $ | 12 | | | | $ | 6 | | | | $ | 5 | |
Average net assets (in millions) | | | $ | 14 | | | | $ | 9 | | | | $ | 6 | | | | $ | 2 | |
Ratios to average net assets(d): | | | | | | | | | | | | | | | | | | | | |
Expenses after waivers and/or expense reimbursement | | | | 0.87 | % | | | | 0.87 | % | | | | 0.86 | % | | | | 0.86 | %(g) |
Expenses before waivers and/or expense reimbursement | | | | 0.87 | % | | | | 0.87 | % | | | | 0.86 | % | | | | 0.86 | %(g) |
Net investment income (loss) | | | | (0.38 | )% | | | | (0.21 | )% | | | | (0.23 | )% | | | | (0.58 | )%(g) |
Portfolio turnover rate(e) | | | | 31 | % | | | | 32 | % | | | | 32 | % | | | | 40 | % |
| (a) | Calculated based on average shares outstanding during the period. |
| (b) | The per share amount of net investment income (loss) does not directly correlate to the amounts reported in the Statement of Operations due to class specific expenses. |
| (c) | Total return is calculated assuming a purchase of a share on the first day and a sale on the last day of each period reported and includes reinvestment of dividends and distributions, if any, and does not reflect the effect of insurance contract charges. Total return does not reflect expenses associated with the separate account such as administrative fees, account charges and surrender charges which, if reflected, would reduce the total returns for all periods shown. Performance figures may reflect fee waivers and/or expense reimbursements. In the absence of fee waivers and/or expense reimbursements, the total return would be lower. Past performance is no guarantee of future results. Total returns may reflect adjustments to conform to GAAP. Total returns for periods less than one full year are not annualized. |
| (d) | Does not include expenses of the underlying funds in which the Portfolio invests. |
| (e) | The Portfolio’s portfolio turnover rate is calculated in accordance with regulatory requirements, without regard to transactions involving short-term investments, certain derivatives and in-kind transactions (if any). If such transactions were included, the Portfolio’s portfolio turnover rate may be higher. |
| (f) | Commencement of offering. |
| (g) | Annualized, with the exception of certain non-recurring expenses. |
SEE NOTES TO FINANCIAL STATEMENTS.
A159
| | | | |
| | PSF PGIM JENNISON VALUE PORTFOLIO | | |
SCHEDULE OF INVESTMENTS | | | | as of December 31, 2024 |
| | | | | | | | |
| | | Shares | | | Value | |
LONG-TERM INVESTMENTS — 97.4% | |
COMMON STOCKS | | | | | | | | |
Aerospace & Defense — 6.1% | |
Airbus SE (France) | | | 120,343 | | | $ | 19,270,645 | |
Boeing Co. (The)* | | | 176,443 | | | | 31,230,411 | |
General Electric Co. | | | 172,048 | | | | 28,695,886 | |
RTX Corp. | | | 255,121 | | | | 29,522,602 | |
| | | | | | | | |
| | |
| | | | | | | 108,719,544 | |
| | | | | | | | |
Automobiles — 2.0% | | | | | | | | |
General Motors Co. | | | 674,804 | | | | 35,946,809 | |
| | | | | | | | |
Banks — 13.7% | | | | | | | | |
Bank of America Corp. | | | 1,397,229 | | | | 61,408,214 | |
JPMorgan Chase & Co. | | | 374,389 | | | | 89,744,787 | |
PNC Financial Services Group, Inc. (The) | | | 278,741 | | | | 53,755,202 | |
Truist Financial Corp. | | | 939,357 | | | | 40,749,307 | |
| | | | | | | | |
| | |
| | | | | | | 245,657,510 | |
| | | | | | | | |
Beverages — 1.2% | | | | | | | | |
PepsiCo, Inc. | | | 136,459 | | | | 20,749,956 | |
| | | | | | | | |
Biotechnology — 3.2% | | | | | | | | |
AbbVie, Inc. | | | 225,848 | | | | 40,133,190 | |
Amgen, Inc. | | | 65,604 | | | | 17,099,026 | |
| | | | | | | | |
| | |
| | | | | | | 57,232,216 | |
| | | | | | | | |
Building Products — 1.4% | | | | | | | | |
Johnson Controls International PLC | | | 315,064 | | | | 24,868,002 | |
| | | | | | | | |
Capital Markets — 5.0% | | | | | | | | |
Blackstone, Inc. | | | 213,483 | | | | 36,808,739 | |
Goldman Sachs Group, Inc. (The) | | | 93,159 | | | | 53,344,706 | |
| | | | | | | | |
| | |
| | | | | | | 90,153,445 | |
| | | | | | | | |
Chemicals — 2.5% | | | | | | | | |
DuPont de Nemours, Inc. | | | 273,417 | | | | 20,848,046 | |
Linde PLC | | | 57,711 | | | | 24,161,865 | |
| | | | | | | | |
| | |
| | | | | | | 45,009,911 | |
| | | | | | | | |
Communications Equipment — 2.0% | |
Cisco Systems, Inc. | | | 618,019 | | | | 36,586,725 | |
| | | | | | | | |
Consumer Staples Distribution & Retail — 3.5% | |
Walmart, Inc. | | | 696,426 | | | | 62,922,089 | |
| | | | | | | | |
Electric Utilities — 1.7% | | | | | | | | |
PG&E Corp. | | | 1,506,903 | | | | 30,409,303 | |
| | | | | | | | |
Entertainment — 0.8% | | | | | | | | |
Walt Disney Co. (The) | | | 125,528 | | | | 13,977,543 | |
| | | | | | | | |
Food Products — 0.8% | | | | | | | | |
Hershey Co. (The)(a) | | | 81,341 | | | | 13,775,098 | |
| | | | | | | | |
Ground Transportation — 1.3% | |
Union Pacific Corp. | | | 98,335 | | | | 22,424,313 | |
| | | | | | | | |
Health Care Equipment & Supplies — 1.2% | |
GE HealthCare Technologies, Inc. | | | 270,710 | | | | 21,164,108 | |
| | | | | | | | |
Health Care Providers & Services — 0.9% | |
Cigna Group (The) | | | 58,441 | | | | 16,137,898 | |
| | | | | | | | |
Hotels, Restaurants & Leisure — 1.5% | |
McDonald’s Corp. | | | 89,424 | | | | 25,923,123 | |
| | | | | | | | |
| | | | | | | | |
| | | Shares | | | Value | |
COMMON STOCKS (continued) | |
Household Durables — 0.9% | |
Toll Brothers, Inc. | | | 129,644 | | | $ | 16,328,662 | |
| | | | | | | | |
Industrial REITs — 0.9% | | | | | | | | |
Prologis, Inc. | | | 155,247 | | | | 16,409,608 | |
| | | | | | | | |
Insurance — 5.9% | | | | | | | | |
Chubb Ltd. | | | 143,425 | | | | 39,628,327 | |
Marsh & McLennan Cos., Inc. | | | 147,500 | | | | 31,330,475 | |
MetLife, Inc. | | | 431,911 | | | | 35,364,873 | |
| | | | | | | | |
| | |
| | | | | | | 106,323,675 | |
| | | | | | | | |
Interactive Media & Services — 2.6% | |
Alphabet, Inc. (Class A Stock) | | | 76,348 | | | | 14,452,676 | |
Meta Platforms, Inc. (Class A Stock) | | | 54,806 | | | | 32,089,461 | |
| | | | | | | | |
| | |
| | | | | | | 46,542,137 | |
| | | | | | | | |
Machinery — 3.2% | | | | | | | | |
Fortive Corp. | | | 215,433 | | | | 16,157,475 | |
Otis Worldwide Corp.(a) | | | 126,955 | | | | 11,757,303 | |
Parker-Hannifin Corp. | | | 45,898 | | | | 29,192,505 | |
| | | | | | | | |
| | |
| | | | | | | 57,107,283 | |
| | | | | | | | |
Multi-Utilities — 4.9% | | | | | | | | |
CenterPoint Energy, Inc. | | | 813,746 | | | | 25,820,161 | |
NiSource, Inc. | | | 1,194,592 | | | | 43,913,202 | |
Public Service Enterprise Group, Inc.(a) | | | 217,480 | | | | 18,374,885 | |
| | | | | | | | |
| | |
| | | | | | | 88,108,248 | |
| | | | | | | | |
Oil, Gas & Consumable Fuels — 9.2% | |
Cheniere Energy, Inc. | | | 107,364 | | | | 23,069,303 | |
Chevron Corp.(a) | | | 249,878 | | | | 36,192,330 | |
Exxon Mobil Corp. | | | 469,599 | | | | 50,514,764 | |
Shell PLC, ADR | | | 259,996 | | | | 16,288,749 | |
Williams Cos., Inc. (The) | | | 706,770 | | | | 38,250,392 | |
| | | | | | | | |
| | |
| | | | | | | 164,315,538 | |
| | | | | | | | |
Passenger Airlines — 1.2% | | | | | | | | |
Delta Air Lines, Inc. | | | 367,424 | | | | 22,229,152 | |
| | | | | | | | |
Personal Care Products — 1.5% | |
Unilever PLC (United Kingdom), ADR | | | 476,137 | | | | 26,996,968 | |
| | | | | | | | |
Pharmaceuticals — 4.5% | | | | | | | | |
AstraZeneca PLC (United Kingdom), ADR | | | 454,794 | | | | 29,798,103 | |
Bristol-Myers Squibb Co. | | | 571,776 | | | | 32,339,650 | |
Eli Lilly & Co. | | | 23,039 | | | | 17,786,108 | |
| | | | | | | | |
| | |
| | | | | | | 79,923,861 | |
| | | | | | | | |
Residential REITs — 1.2% | | | | | | | | |
Camden Property Trust | | | 184,129 | | | | 21,366,329 | |
| | | | | | | | |
Semiconductors & Semiconductor Equipment — 2.4% | |
Advanced Micro Devices,
Inc.*(a) | | | 143,111 | | | | 17,286,378 | |
Broadcom, Inc. | | | 109,651 | | | | 25,421,488 | |
| | | | | | | | |
| | |
| | | | | | | 42,707,866 | |
| | | | | | | | |
Software — 4.9% | | | | | | | | |
Microsoft Corp. | | | 81,198 | | | | 34,224,957 | |
Oracle Corp. | | | 157,451 | | | | 26,237,635 | |
SEE NOTES TO FINANCIAL STATEMENTS.
A160
| | | | |
| | PSF PGIM JENNISON VALUE PORTFOLIO (CONTINUED) | | |
SCHEDULE OF INVESTMENTS | | | | as of December 31, 2024 |
| | | | | | | | |
| | | Shares | | | Value | |
COMMON STOCKS (continued) | |
Software (cont’d.) | | | | | | | | |
Salesforce, Inc. | | | 83,045 | | | $ | 27,764,435 | |
| | | | | | | | |
| | |
| | | | | | | 88,227,027 | |
| | | | | | | | |
Specialized REITs — 1.5% | | | | | | | | |
Gaming & Leisure Properties, Inc. | | | 571,365 | | | | 27,516,938 | |
| | | | | | | | |
Specialty Retail — 1.3% | | | | | | | | |
Lowe’s Cos., Inc.(a) | | | 96,828 | | | | 23,897,150 | |
| | | | | | | | |
Technology Hardware, Storage & Peripherals — 2.5% | |
Apple, Inc. | | | 89,847 | | | | 22,499,486 | |
Dell Technologies, Inc. (Class C Stock) . | | | 196,168 | | | | 22,606,400 | |
| | | | | | | | |
| | |
| | | | | | | 45,105,886 | |
| | | | | | | | |
TOTAL LONG-TERM INVESTMENTS
(cost $1,055,603,326) | | | | 1,744,763,921 | |
| | | | | | | | |
|
SHORT-TERM INVESTMENTS — 8.1% | |
AFFILIATED MUTUAL FUNDS | | | | | | | | |
PGIM Core Ultra Short Bond Fund(wb) | | | 45,598,859 | | | | 45,598,859 | |
PGIM Institutional Money Market Fund (7-day effective yield 4.649%) (cost $99,836,916; includes $99,467,046 of cash collateral for securities on
loan)(b)(wb) | | | 99,898,305 | | | | 99,838,366 | |
| | | | | | | | |
TOTAL SHORT-TERM INVESTMENTS
(cost $145,435,775) | | | | 145,437,225 | |
| | | | | | | | |
TOTAL INVESTMENTS—105.5%
(cost $1,201,039,101) | | | | | | | 1,890,201,146 | |
Liabilities in excess of other assets — (5.5)% | | | | (99,019,794 | ) |
| | | | | | | | |
NET ASSETS — 100.0% | | | | | | $ | 1,791,181,352 | |
| | | | | | | | |
See the Glossary for a list of the abbreviation(s) used in the annual report.
| * | Non-income producing security. |
| (a) | All or a portion of security is on loan. The aggregate market value of such securities, including those sold and pending settlement, is $97,620,202; cash collateral of $99,467,046 (included in liabilities) was received with which the Portfolio purchased highly liquid short-term investments. In the event of significant appreciation in value of securities on loan on the last business day of the reporting period, the Portfolio may reflect a collateral value that is less than the market value of the loaned securities and such shortfall is remedied the following business day. |
| (b) | Represents security, or portion thereof, purchased with cash collateral received for securities on loan and includes dividend reinvestment. |
| (wb) | Represents an investment in a Fund affiliated with the Manager. |
Fair Value Measurements:
Various inputs are used in determining the value of the Portfolio’s investments. These inputs are summarized in the three broad levels listed below.
Level 1—unadjusted quoted prices generally in active markets for identical securities.
Level 2—quoted prices for similar securities, interest rates and yield curves, prepayment speeds, foreign currency exchange rates and other observable inputs.
Level 3—unobservable inputs for securities valued in accordance with Board approved fair valuation procedures.
The following is a summary of the inputs used as of December 31, 2024 in valuing such portfolio securities:
| | | | | | | | | | | | |
| | | Level 1 | | | Level 2 | | | Level 3 | |
Investments in Securities | | | | | | | | | | | | |
Assets | | | | | | | | | | | | |
Long-Term Investments | | | | | | | | | | | | |
Common Stocks | | | | | | | | | | | | |
Aerospace & Defense | | $ | 89,448,899 | | | $ | 19,270,645 | | | | $— | |
Automobiles | | | 35,946,809 | | | | — | | | | — | |
Banks | | | 245,657,510 | | | | — | | | | — | |
Beverages | | | 20,749,956 | | | | — | | | | — | |
Biotechnology | | | 57,232,216 | | | | — | | | | — | |
Building Products | | | 24,868,002 | | | | — | | | | — | |
Capital Markets | | | 90,153,445 | | | | — | | | | — | |
Chemicals | | | 45,009,911 | | | | — | | | | — | |
SEE NOTES TO FINANCIAL STATEMENTS.
A161
| | | | |
| | PSF PGIM JENNISON VALUE PORTFOLIO (CONTINUED) | | |
SCHEDULE OF INVESTMENTS | | | | as of December 31, 2024 |
| | | | | | | | | | | | |
| | | Level 1 | | | Level 2 | | | Level 3 | |
Investments in Securities (continued) | | | | | | | | | | | | |
Assets (continued) | | | | | | | | | | | | |
Long-Term Investments (continued) | | | | | | | | | | | | |
Common Stocks (continued) | | | | | | | | | | | | |
Communications Equipment | | $ | 36,586,725 | | | $ | — | | | | $— | |
Consumer Staples Distribution & Retail | | | 62,922,089 | | | | — | | | | — | |
Electric Utilities | | | 30,409,303 | | | | — | | | | — | |
Entertainment | | | 13,977,543 | | | | — | | | | — | |
Food Products | | | 13,775,098 | | | | — | | | | — | |
Ground Transportation | | | 22,424,313 | | | | — | | | | — | |
Health Care Equipment & Supplies | | | 21,164,108 | | | | — | | | | — | |
Health Care Providers & Services | | | 16,137,898 | | | | — | | | | — | |
Hotels, Restaurants & Leisure | | | 25,923,123 | | | | — | | | | — | |
Household Durables | | | 16,328,662 | | | | — | | | | — | |
Industrial REITs | | | 16,409,608 | | | | — | | | | — | |
Insurance | | | 106,323,675 | | | | — | | | | — | |
Interactive Media & Services | | | 46,542,137 | | | | — | | | | — | |
Machinery | | | 57,107,283 | | | | — | | | | — | |
Multi-Utilities | | | 88,108,248 | | | | — | | | | — | |
Oil, Gas & Consumable Fuels | | | 164,315,538 | | | | — | | | | — | |
Passenger Airlines | | | 22,229,152 | | | | — | | | | — | |
Personal Care Products | | | 26,996,968 | | | | — | | | | — | |
Pharmaceuticals | | | 79,923,861 | | | | — | | | | — | |
Residential REITs | | | 21,366,329 | | | | — | | | | — | |
Semiconductors & Semiconductor Equipment | | | 42,707,866 | | | | — | | | | — | |
Software | | | 88,227,027 | | | | — | | | | — | |
Specialized REITs | | | 27,516,938 | | | | — | | | | — | |
Specialty Retail | | | 23,897,150 | | | | — | | | | — | |
Technology Hardware, Storage & Peripherals | | | 45,105,886 | | | | — | | | | — | |
Short-Term Investments | | | | | | | | | | | | |
Affiliated Mutual Funds | | | 145,437,225 | | | | — | | | | — | |
| | | | | | | | | | | | |
Total | | $ | 1,870,930,501 | | | $ | 19,270,645 | | | | $— | |
| | | | | | | | | | | | |
Industry Classification:
The industry classification of investments and liabilities in excess of other assets shown as a percentage of net assets as of December 31, 2024 were as follows:
| | | | |
Banks | | | 13.7 | % |
Oil, Gas & Consumable Fuels | | | 9.2 | |
Affiliated Mutual Funds (5.6% represents investments
purchased with collateral from securities on loan) | | | 8.1 | |
Aerospace & Defense | | | 6.1 | |
Insurance | | | 5.9 | |
Capital Markets | | | 5.0 | |
Software | | | 4.9 | |
Multi-Utilities | | | 4.9 | |
Pharmaceuticals | | | 4.5 | |
Consumer Staples Distribution & Retail | | | 3.5 | |
Biotechnology | | | 3.2 | |
Machinery | | | 3.2 | |
Interactive Media & Services | | | 2.6 | |
Technology Hardware, Storage & Peripherals | | | 2.5 | |
Chemicals | | | 2.5 | |
Semiconductors & Semiconductor Equipment | | | 2.4 | |
Communications Equipment | | | 2.0 | |
Automobiles | | | 2.0 | |
Electric Utilities | | | 1.7 | |
| | | | |
Specialized REITs | | | 1.5 | % |
Personal Care Products | | | 1.5 | |
Hotels, Restaurants & Leisure | | | 1.5 | |
Building Products | | | 1.4 | |
Specialty Retail | | | 1.3 | |
Ground Transportation | | | 1.3 | |
Passenger Airlines | | | 1.2 | |
Residential REITs | | | 1.2 | |
Health Care Equipment & Supplies | | | 1.2 | |
Beverages | | | 1.2 | |
Industrial REITs | | | 0.9 | |
Household Durables | | | 0.9 | |
Health Care Providers & Services | | | 0.9 | |
Entertainment | | | 0.8 | |
Food Products | | | 0.8 | |
| | | | |
| | | 105.5 | |
Liabilities in excess of other assets | | | (5.5 | ) |
| | | | |
| | | 100.0 | % |
| | | | |
SEE NOTES TO FINANCIAL STATEMENTS.
A162
| | | | |
| | PSF PGIM JENNISON VALUE PORTFOLIO (CONTINUED) | | |
SCHEDULE OF INVESTMENTS | | | | as of December 31, 2024 |
Financial Instruments/Transactions—Summary of Offsetting and Netting Arrangements:
The Portfolio entered into financial instruments/transactions during the reporting period that are either offset in accordance with current requirements or are subject to enforceable master netting arrangements or similar agreements that permit offsetting. The information about offsetting and related netting arrangements for financial instruments/transactions where the legal right to set-off exists is presented in the summary below.
Offsetting of financial instrument/transaction assets and liabilities:
| | | | | | | | |
| Description | | Gross Market Value of Recognized Assets/(Liabilities) | | | | Collateral Pledged/(Received)(1) | | Net Amount |
| | | | |
Securities on Loan | | $97,620,202 | | | | $(97,620,202) | | $— |
(1) Collateral amount disclosed by the Portfolio is limited to the market value of financial instruments/transactions.
SEE NOTES TO FINANCIAL STATEMENTS.
A163
| | | | |
| | PSF PGIM JENNISON VALUE PORTFOLIO (CONTINUED) | | |
| | | | |
STATEMENT OF ASSETS AND LIABILITIES
as of December 31, 2024
| | | | |
ASSETS | | | | |
Investments at value, including securities on loan of $97,620,202: | | | | |
Unaffiliated investments (cost $1,055,603,326) | | $ | 1,744,763,921 | |
Affiliated investments (cost $145,435,775) | | | 145,437,225 | |
Dividends receivable | | | 964,398 | |
Tax reclaim receivable | | | 717,216 | |
Receivable for Portfolio shares sold | | | 304,681 | |
Prepaid expenses and other assets | | | 181,467 | |
| | | | |
Total Assets | | | 1,892,368,908 | |
| | | | |
LIABILITIES | | | | |
Payable to broker for collateral for securities on loan | | | 99,467,046 | |
Management fee payable | | | 619,137 | |
Accrued expenses and other liabilities | | | 491,178 | |
Payable for Portfolio shares purchased | | | 387,648 | |
Payable to affiliate | | | 214,869 | |
Distribution fee payable | | | 3,650 | |
Administration fee payable | | | 1,528 | |
Trustees’ fees payable | | | 1,310 | |
Affiliated transfer agent fee payable | | | 1,190 | |
| | | | |
Total Liabilities | | | 101,187,556 | |
| | | | |
NET ASSETS | | $ | 1,791,181,352 | |
| | | | |
Net assets were comprised of: | | | | |
Partners’ Equity | | $ | 1,791,181,352 | |
| | | | |
Class I: | | | | |
Net asset value and redemption price per share, $1,774,029,437 / 29,010,965 outstanding shares of beneficial interest | | $ | 61.15 | |
| | | | |
Class II: | | | | |
Net asset value and redemption price per share, $11,734,570 / 199,910 outstanding shares of beneficial interest | | $ | 58.70 | |
| | | | |
Class III: | | | | |
Net asset value and redemption price per share, $5,417,345 / 89,408 outstanding shares of beneficial interest | | $ | 60.59 | |
| | | | |
STATEMENT OF OPERATIONS
Year Ended December 31, 2024
| | | | |
NET INVESTMENT INCOME (LOSS) | | | | |
INCOME | | | | |
Unaffiliated dividend income (net of $66,919 foreign withholding tax, of which $50,689 is reimbursable by an affiliate) | | $ | 35,789,962 | |
Affiliated dividend income | | | 2,116,602 | |
Affiliated income from securities lending, net | | | 85,236 | |
| | | | |
Total income | | | 37,991,800 | |
| | | | |
EXPENSES | | | | |
Management fee | | | 6,834,073 | |
Distribution fee—Class II | | | 27,732 | |
Distribution fee—Class III | | | 10,356 | |
Administration fee—Class II | | | 16,639 | |
Custodian and accounting fees | | | 116,107 | |
Shareholders’ reports | | | 87,282 | |
Professional fees | | | 44,952 | |
Trustees’ fees | | | 36,150 | |
Audit fee | | | 30,858 | |
Transfer agent’s fees and expenses (including affiliated expense of $7,143) | | | 11,942 | |
Miscellaneous | | | 49,282 | |
| | | | |
Total expenses | | | 7,265,373 | |
| | | | |
NET INVESTMENT INCOME (LOSS) | | | 30,726,427 | |
| | | | |
REALIZED AND UNREALIZED GAIN (LOSS) ON INVESTMENT AND FOREIGN CURRENCY TRANSACTIONS | | | | |
Net realized gain (loss) on: | | | | |
Investment transactions (including affiliated of $(17,189)) | | | 148,133,751 | |
Foreign currency transactions | | | 10,310 | |
| | | | |
| | | 148,144,061 | |
| | | | |
Net change in unrealized appreciation
(depreciation) on: | | | | |
Investments (including affiliated of $(5,938)) | | | 140,189,162 | |
| | | | |
NET GAIN (LOSS) ON INVESTMENT AND FOREIGN CURRENCY TRANSACTIONS | | | 288,333,223 | |
| | | | |
NET INCREASE (DECREASE) IN NET ASSETS RESULTING FROM OPERATIONS | | $ | 319,059,650 | |
| | | | |
STATEMENTS OF CHANGES IN NET ASSETS
| | | | | | | | | | | | | | | | | | | | | | | | |
| | | Year Ended
December 31, 2024 | | | Year Ended
December 31, 2023 | |
INCREASE (DECREASE) IN NET ASSETS | | | | | | | | | | | | | | | | | | | | | | | | |
OPERATIONS | | | | | | | | | | | | | | | | | | | | | | | | |
Net investment income (loss) | | | | | | $ | 30,726,427 | | | | | | | | | | | $ | 27,026,116 | | | | | |
Net realized gain (loss) on investment and foreign currency transactions | | | | | | | 148,144,061 | | | | | | | | | | | | 117,006,275 | | | | | |
Net change in unrealized appreciation (depreciation) on investments | | | | | | | 140,189,162 | | | | | | | | | | | | 66,138,560 | | | | | |
| | | | | | | | | | | | | | | | | | | | | | | | |
NET INCREASE (DECREASE) IN NET ASSETS RESULTING FROM OPERATIONS | | | | | | | 319,059,650 | | | | | | | | | | | | 210,170,951 | | | | | |
| | | | | | | | | | | | | | | | | | | | | | | | |
PORTFOLIO SHARE TRANSACTIONS | | | | | | | | | | | | | | | | | | | | | | | | |
Portfolio shares sold | | | | | | | 36,344,201 | | | | | | | | | | | | 38,644,895 | | | | | |
Portfolio shares purchased | | | | | | | (131,319,778 | ) | | | | | | | | | | | (124,920,304 | ) | | | | |
| | | | | | | | | | | | | | | | | | | | | | | | |
NET INCREASE (DECREASE) IN NET ASSETS FROM PORTFOLIO SHARE TRANSACTIONS | | | | | | | (94,975,577 | ) | | | | | | | | | | | (86,275,409 | ) | | | | |
| | | | | | | | | | | | | | | | | | | | | | | | |
TOTAL INCREASE (DECREASE) | | | | | | | 224,084,073 | | | | | | | | | | | | 123,895,542 | | | | | |
NET ASSETS: | | | | | | | | | | | | | | | | | | | | | | | | |
Beginning of year | | | | | | | 1,567,097,279 | | | | | | | | | | | | 1,443,201,737 | | | | | |
| | | | | | | | | | | | | | | | | | | | | | | | |
End of year | | | | | | $ | 1,791,181,352 | | | | | | | | | | | $ | 1,567,097,279 | | | | | |
| | | | | | | | | | | | | | | | | | | | | | | | |
SEE NOTES TO FINANCIAL STATEMENTS.
A164
| | | | |
| | PSF PGIM JENNISON VALUE PORTFOLIO (CONTINUED) | | |
FINANCIAL HIGHLIGHTS | | | | |
| | | | | | | | | | | | | | | | | | | | |
Class I | | | | | | | | | | | | | | | |
| | | Year Ended December 31, | |
| | | 2024 | | | 2023 | | | 2022 | | | 2021 | | | 2020 | |
Per Share Operating Performance(a): | | | | | | | | | | | | | | | | | | | | |
Net Asset Value, beginning of year | | $ | 50.55 | | | $ | 43.88 | | | $ | 47.64 | | | $ | 37.28 | | | $ | 35.99 | |
| | | | | | | | | | | | | | | | | | | | |
Income (Loss) From Investment Operations: | | | | | | | | | | | | | | | | | | | | |
Net investment income (loss) | | | 1.03 | | | | 0.85 | | | | 0.74 | | | | 0.61 | | | | 0.66 | |
Net realized and unrealized gain (loss) on investment and foreign currency transactions | | | 9.57 | | | | 5.82 | | | | (4.50 | ) | | | 9.75 | | | | 0.63 | |
| | | | | | | | | | | | | | | | | | | | |
Total from investment operations | | | 10.60 | | | | 6.67 | | | | (3.76 | ) | | | 10.36 | | | | 1.29 | |
| | | | | | | | | | | | | | | | | | | | |
Net Asset Value, end of year | | $ | 61.15 | | | $ | 50.55 | | | $ | 43.88 | | | $ | 47.64 | | | $ | 37.28 | |
| | | | | | | | | | | | | | | | | | | | |
Total Return(b) | | | 20.97 | % | | | 15.20 | % | | | (7.89 | )% | | | 27.79 | % | | | 3.58 | % |
Ratios/Supplemental Data: | | | | | | | | | | | | | | | | | | | | |
Net assets, end of year (in millions) | | $ | 1,774.0 | | | $ | 1,553.8 | | | $ | 1,431.5 | | | $ | 1,646.0 | | | $ | 1,371.2 | |
Average net assets (in millions) | | $ | 1,693.3 | | | $ | 1,451.0 | | | $ | 1,479.3 | | | $ | 1,543.8 | | | $ | 1,236.8 | |
Ratios to average net assets(c): | | | | | | | | | | | | | | | | | | | | |
Expenses after waivers and/or expense reimbursement | | | 0.42 | % | | | 0.42 | % | | | 0.42 | % | | | 0.42 | % | | | 0.43 | % |
Expenses before waivers and/or expense reimbursement | | | 0.42 | % | | | 0.42 | % | | | 0.42 | % | | | 0.42 | % | | | 0.43 | % |
Net investment income (loss) | | | 1.80 | % | | | 1.85 | % | | | 1.68 | % | | | 1.40 | % | | | 2.03 | % |
Portfolio turnover rate(d) | | | 23 | % | | | 33 | % | | | 23 | % | | | 17 | % | | | 32 | % |
| | | | | |
Class II | | | | | | | | | | | | | | | |
| | | Year Ended December 31, | |
| | | 2024 | | | 2023 | | | 2022 | | | 2021 | | | 2020 | |
Per Share Operating Performance(a): | | | | | | | | | | | | | | | | | | | | |
Net Asset Value, beginning of year | | $ | 48.72 | | | $ | 42.46 | | | $ | 46.28 | | | $ | 36.36 | | | $ | 35.25 | |
| | | | | | | | | | | | | | | | | | | | |
Income (Loss) From Investment Operations: | | | | | | | | | | | | | | | | | | | | |
Net investment income (loss) | | | 0.77 | | | | 0.64 | | | | 0.55 | | | | 0.42 | | | | 0.51 | |
Net realized and unrealized gain (loss) on investment and foreign currency transactions | | | 9.21 | | | | 5.62 | | | | (4.37 | ) | | | 9.50 | | | | 0.60 | |
| | | | | | | | | | | | | | | | | | | | |
Total from investment operations | | | 9.98 | | | | 6.26 | | | | (3.82 | ) | | | 9.92 | | | | 1.11 | |
| | | | | | | | | | | | | | | | | | | | |
Net Asset Value, end of year | | $ | 58.70 | | | $ | 48.72 | | | $ | 42.46 | | | $ | 46.28 | | | $ | 36.36 | |
| | | | | | | | | | | | | | | | | | | | |
Total Return(b) | | | 20.48 | % | | | 14.74 | % | | | (8.25 | )% | | | 27.28 | % | | | 3.15 | % |
Ratios/Supplemental Data: | | | | | | | | | | | | | | | | | | | | |
Net assets, end of year (in millions) | | $ | 11.7 | | | $ | 10.0 | | | $ | 9.2 | | | $ | 10.7 | | | $ | 9.0 | |
Average net assets (in millions) | | $ | 11.1 | | | $ | 9.4 | | | $ | 9.5 | | | $ | 10.1 | | | $ | 7.9 | |
Ratios to average net assets(c): | | | | | | | | | | | | | | | | | | | | |
Expenses after waivers and/or expense reimbursement | | | 0.82 | % | | | 0.82 | % | | | 0.82 | % | | | 0.82 | % | | | 0.83 | % |
Expenses before waivers and/or expense reimbursement | | | 0.82 | % | | | 0.82 | % | | | 0.82 | % | | | 0.82 | % | | | 0.83 | % |
Net investment income (loss) | | | 1.40 | % | | | 1.45 | % | | | 1.28 | % | | | 1.00 | % | | | 1.62 | % |
Portfolio turnover rate(d) | | | 23 | % | | | 33 | % | | | 23 | % | | | 17 | % | | | 32 | % |
SEE NOTES TO FINANCIAL STATEMENTS.
A165
| | | | |
| | PSF PGIM JENNISON VALUE PORTFOLIO (CONTINUED) | | |
FINANCIAL HIGHLIGHTS | | | | |
| | | | | | | | | | | | | | | | | | | | |
Class III | | | | | | | | |
| | | Year Ended December 31, | | April 26, 2021(e)
through December 31, |
| | | 2024 | | 2023 | | 2022 | | 2021 |
Per Share Operating Performance(a): | | | | | | | | | | | | | | | | | | | | |
Net Asset Value, beginning of period | | | $ | 50.22 | | | | $ | 43.70 | | | | $ | 47.56 | | | | $ | 42.77 | |
| | | | | | | | | | | | | | | | | | | | |
Income (Loss) From Investment Operations: | | | | | | | | | | | | | | | | | | | | |
Net investment income (loss) | | | | 0.87 | | | | | 0.72 | | | | | 0.62 | | | | | 0.29 | |
Net realized and unrealized gain (loss) on investment and foreign currency transactions | | | | 9.50 | | | | | 5.80 | | | | | (4.48 | ) | | | | 4.50 | |
| | | | | | | | | | | | | | | | | | | | |
Total from investment operations | | | | 10.37 | | | | | 6.52 | | | | | (3.86 | ) | | | | 4.79 | |
| | | | | | | | | | | | | | | | | | | | |
Net Asset Value, end of period | | | $ | 60.59 | | | | $ | 50.22 | | | | $ | 43.70 | | | | $ | 47.56 | |
| | | | | | | | | | | | | | | | | | | | |
Total Return(b) | | | | 20.65 | % | | | | 14.92 | % | | | | (8.12 | )% | | | | 11.20 | % |
Ratios/Supplemental Data: | | | | | | | | | | | | | | | | | | | | |
Net assets, end of period (in millions) | | | $ | 5.4 | | | | $ | 3.4 | | | | $ | 2.6 | | | | $ | 1.0 | |
Average net assets (in millions) | | | $ | 4.1 | | | | $ | 2.6 | | | | $ | 1.7 | | | | $ | 0.4 | |
Ratios to average net assets(c): | | | | | | | | | | | | | | | | | | | | |
Expenses after waivers and/or expense reimbursement | | | | 0.67 | % | | | | 0.67 | % | | | | 0.67 | % | | | | 0.66 | %(f) |
Expenses before waivers and/or expense reimbursement | | | | 0.67 | % | | | | 0.67 | % | | | | 0.67 | % | | | | 0.66 | %(f) |
Net investment income (loss) | | | | 1.53 | % | | | | 1.58 | % | | | | 1.41 | % | | | | 0.92 | %(f) |
Portfolio turnover rate(d) | | | | 23 | % | | | | 33 | % | | | | 23 | % | | | | 17 | % |
| (a) | Calculated based on average shares outstanding during the period. |
| (b) | Total return is calculated assuming a purchase of a share on the first day and a sale on the last day of each period reported and includes reinvestment of dividends and distributions, if any, and does not reflect the effect of insurance contract charges. Total return does not reflect expenses associated with the separate account such as administrative fees, account charges and surrender charges which, if reflected, would reduce the total returns for all periods shown. Performance figures may reflect fee waivers and/or expense reimbursements. In the absence of fee waivers and/or expense reimbursements, the total return would be lower. Past performance is no guarantee of future results. Total returns may reflect adjustments to conform to GAAP. Total returns for periods less than one full year are not annualized. |
| (c) | Does not include expenses of the underlying funds in which the Portfolio invests. |
| (d) | The Portfolio’s portfolio turnover rate is calculated in accordance with regulatory requirements, without regard to transactions involving short-term investments, certain derivatives and in-kind transactions (if any). If such transactions were included, the Portfolio’s portfolio turnover rate may be higher. |
| (e) | Commencement of offering. |
| (f) | Annualized, with the exception of certain non-recurring expenses. |
SEE NOTES TO FINANCIAL STATEMENTS.
A166
| | | | |
| | PSF PGIM TOTAL RETURN BOND PORTFOLIO | | |
SCHEDULE OF INVESTMENTS | | | | as of December 31, 2024 |
| | | | | | | | | | | | | | | | | | | | |
Interest Rate | | Maturity
Date | | | | | | | | | Principal
Amount
(000)# | | | Value | |
|
|
|
LONG-TERM INVESTMENTS — 100.2% | |
|
ASSET-BACKED SECURITIES — 21.0% | |
Automobiles — 0.7% | |
Ally Bank Auto Credit-Linked Notes, | | | | | |
Series 2024-A, Class D, 144A | | | | | |
6.315% | | | 05/17/32 | | | | | | | | | | | | 391 | | | $ | 395,173 | |
Avis Budget Rental Car Funding AESOP LLC, | |
Series 2020-02A, Class A, 144A | |
2.020% | | | 02/20/27 | | | | | | | | | | | | 600 | | | | 585,604 | |
Series 2023-03A, Class B, 144A | |
6.120% | | | 02/22/28 | | | | | | | | | | | | 1,200 | | | | 1,218,237 | |
Series 2024-01A, Class A, 144A | |
5.360% | | | 06/20/30 | | | | | | | | | | | | 1,600 | | | | 1,622,193 | |
Series 2024-01A, Class B, 144A | |
5.850% | | | 06/20/30 | | | | | | | | | | | | 200 | | | | 201,250 | |
Bayview Opportunity Master Fund VII Trust, | |
Series 2024-CAR1F, Class A, 144A | |
6.971% | | | 07/29/32 | | | | | | | | | | | | 585 | | | | 585,066 | |
Exeter Automobile Receivables Trust, | |
Series 2021-02A, Class D | |
1.400% | | | 04/15/27 | | | | | | | | | | | | 14 | | | | 14,066 | |
Hertz Vehicle Financing III LP, | |
Series 2021-02A, Class A, 144A | |
1.680% | | | 12/27/27 | | | | | | | | | | | | 2,300 | | | | 2,158,545 | |
Huntington Bank Auto Credit-Linked Notes, | |
Series 2024-01, Class C, 144A, 30 Day Average SOFR + 3.150% (Cap N/A, Floor 0.000%) | |
7.755%(c) | | | 05/20/32 | | | | | | | | | | | | 383 | | | | 387,158 | |
JPMorgan Chase Bank NA, | |
Series 2020-01, Class R, 144A | |
33.784% | | | 01/25/28 | | | | | | | | | | | | 160 | | | | 170,595 | |
OneMain Direct Auto Receivables Trust, | |
Series 2019-01A, Class A, 144A | |
3.630% | | | 09/14/27 | | | | | | | | | | | | 1,389 | | | | 1,381,232 | |
Series 2019-01A, Class B, 144A | |
3.950% | | | 11/14/28 | | | | | | | | | | | | 800 | | | | 789,711 | |
Series 2023-01A, Class C, 144A | |
6.140% | | | 02/14/31 | | | | | | | | | | | | 1,300 | | | | 1,316,291 | |
Santander Bank Auto Credit-Linked Notes, | | | | | |
Series 2022-A, Class C, 144A | | | | | |
7.375% | | | 05/15/32 | | | | | | | | | | | | 64 | | | | 63,986 | |
Series 2022-C, Class E, 144A | |
11.366% | | | 12/15/32 | | | | | | | | | | | | 55 | | | | 55,650 | |
Series 2024-B, Class C, 144A | |
5.141% | | | 01/18/33 | | | | | | | | | | | | 4,250 | | | | 4,241,114 | |
Santander Drive Auto Receivables Trust, | |
Series 2024-02, Class D | |
6.280% | | | 08/15/31 | | | | | | | | | | | | 500 | | | | 514,356 | |
| | | | | | | | | | | | | | | | | | | | |
| | | | | |
| | | | | | | | | | | | | | | | | | | 15,700,227 | |
| | | | | | | | | | | | | | | | | | | | |
Collateralized Loan Obligations — 17.7% | | | | | |
AGL CLO Ltd. (Cayman Islands), | | | | | |
Series 2020-05A, Class A1RR, 144A, 3 Month SOFR + 0.938% (Cap N/A, Floor 0.938%) | |
5.817%(c) | | | 07/20/34 | | | | | | | | | | | | 7,000 | | | | 7,007,003 | |
Series 2020-09A, Class AR, 144A, 3 Month SOFR + 1.530% (Cap N/A, Floor 1.530%) | |
6.147%(c) | | | 04/20/37 | | | | | | | | | | | | 15,000 | | | | 15,068,662 | |
| | | | | | | | | | | | | | | | | | |
Interest Rate | | Maturity
Date | | | | | | | | Principal
Amount
(000)# | | | Value | |
|
|
|
ASSET-BACKED SECURITIES (continued) | |
Collateralized Loan Obligations (cont’d.) | |
Anchorage Capital CLO Ltd. (Cayman Islands), | |
Series 2022-24A, Class A1R, 144A, 3 Month SOFR + 1.430% (Cap N/A, Floor 1.430%) | |
|
6.086%(c) | | 07/15/37 | | | | | | | | | | | 8,500 | | | $ | 8,565,843 | |
Series 2023-26A, Class A1, 144A, 3 Month SOFR + 2.200% (Cap N/A, Floor 2.200%) | |
|
6.817%(c) | | 07/19/34 | | | | | | | | | | | 10,000 | | | | 10,010,376 | |
Ares European CLO DAC (Ireland), | |
Series 11A, Class A1R, 144A, 3 Month EURIBOR + 0.770% (Cap N/A, Floor 0.770%) | |
|
3.954%(c) | | 04/15/32 | | | EUR | | | | | | | | 7,716 | | | | 7,976,297 | |
Atlas Static Senior Loan Fund Ltd. (Cayman Islands), | |
Series 2022-01A, Class AR, 144A, 3 Month SOFR + 1.750% (Cap N/A, Floor 1.750%) | |
|
6.406%(c) | | 07/15/30 | | | | | | | | | | | 2,185 | | | | 2,190,382 | |
Bain Capital Credit CLO Ltd. (United Kingdom), | |
Series 2024-02A, Class A1, 144A, 3 Month SOFR + 1.520% (Cap N/A, Floor 1.520%) | |
|
6.176%(c) | | 07/15/37 | | | | | | | | | | | 7,500 | | | | 7,547,512 | |
Barrow Hanley CLO Ltd. (Cayman Islands), | |
Series 2024-03A, Class A1, 144A, 3 Month SOFR + 1.620% (Cap N/A, Floor 1.620%) | |
|
6.237%(c) | | 04/20/37 | | | | | | | | | | | 16,750 | | | | 16,907,256 | |
Battalion CLO Ltd. (Cayman Islands), | |
Series 2016-10A, Class A1R2, 144A, 3 Month SOFR + 1.432% (Cap N/A, Floor 1.170%) | |
|
6.066%(c) | | 01/25/35 | | | | | | | | | | | 9,000 | | | | 9,008,701 | |
Series 2018-12A, Class A1, 144A, 3 Month SOFR + 1.332% (Cap N/A, Floor 1.070%) | |
|
5.817%(c) | | 05/17/31 | | | | | | | | | | | 2,092 | | | | 2,094,016 | |
Carlyle Euro CLO DAC (Ireland), | |
Series 2021-02A, Class A1, 144A, 3 Month EURIBOR + 0.990% (Cap N/A, Floor 0.990%) | |
|
4.174%(c) | | 10/15/35 | | | EUR | | | | | | | | 6,500 | | | | 6,723,920 | |
Series 2021-02A, Class A2B, 144A | |
2.100% | | 10/15/35 | | | EUR | | | | | | | | 6,250 | | | | 5,982,568 | |
Carlyle Global Market Strategies Euro CLO Ltd. (Ireland), | |
Series 2014-02A, Class AR1, 144A, 3 Month EURIBOR + 0.750% (Cap N/A, Floor 0.750%) | |
|
3.773%(c) | | 11/15/31 | | | EUR | | | | | | | | 7,694 | | | | 7,943,330 | |
CIFC Funding Ltd. (Cayman Islands), | |
Series 2013-03RA, Class A1, 144A, 3 Month SOFR + 1.242% (Cap N/A, Floor 0.980%) | |
|
5.876%(c) | | 04/24/31 | | | | | | | | | | | 974 | | | | 973,596 | |
Series 2015-01A, Class ARR, 144A, 3 Month SOFR + 1.372% (Cap N/A, Floor 1.110%) | |
|
6.003%(c) | | 01/22/31 | | | | | | | | | | | 1,109 | | | | 1,110,188 | |
Elevation CLO Ltd. (Cayman Islands), | |
Series 2021-12A, Class A1R, 144A, 3 Month SOFR + 1.620% (Cap N/A, Floor 1.620%) | |
|
6.237%(c) | | 04/20/37 | | | | | | | | | | | 16,000 | | | | 16,068,203 | |
Elmwood CLO Ltd. (Cayman Islands), | |
Series 2019-02A, Class A1RR, 144A, 3 Month SOFR + 1.350% (Cap N/A, Floor 1.350%) | |
|
5.907%(c) | | 10/20/37 | | | | | | | | | | | 17,500 | | | | 17,582,745 | |
Series 2022-07A, Class AR, 144A, 3 Month SOFR + 1.500% (Cap N/A, Floor 1.500%) | |
|
6.147%(c) | | 01/17/37 | | | | | | | | | | | 19,000 | | | | 19,123,403 | |
SEE NOTES TO FINANCIAL STATEMENTS.
A167
| | | | |
| | PSF PGIM TOTAL RETURN BOND PORTFOLIO (CONTINUED) | | |
SCHEDULE OF INVESTMENTS | | | | as of December 31, 2024 |
| | | | | | | | | | | | | | |
Interest Rate | | Maturity
Date | | | | Principal Amount
(000)# | | | Value | |
ASSET-BACKED SECURITIES (continued) | |
Collateralized Loan Obligations (cont’d.) | |
Galaxy CLO Ltd. (Cayman Islands), | |
Series 2018-25A, Class A1R, 144A, 3 Month SOFR + 1.420% (Cap N/A, Floor 1.420%) | |
6.046%(c) | | 04/25/36 | | | | | | | 11,000 | | | $ | 11,017,491 | |
Greenwood Park CLO Ltd. (Cayman Islands), | | | | | |
Series 2018-01A, Class A2, 144A, 3 Month SOFR + 1.272% (Cap N/A, Floor 0.000%) | |
5.928%(c) | | 04/15/31 | | | | | | | 2,812 | | | | 2,815,462 | |
Greywolf CLO Ltd. (Cayman Islands), | |
Series 2018-01A, Class A1, 144A, 3 Month SOFR + 1.292% (Cap N/A, Floor 0.000%) | |
5.909%(c) | | 04/26/31 | | | | | | | 1,519 | | | | 1,519,714 | |
Hayfin Emerald CLO DAC (Ireland), | |
Series 14A, Class B, 144A, 3 Month EURIBOR + 2.200% (Cap N/A, Floor 2.200%) | |
4.914%(c) | | 01/22/39 | | | | EUR | | | 13,300 | | | | 13,776,805 | |
ICG Euro CLO DAC (Ireland), | |
Series 2023-02A, Class A1, 144A, 3 Month EURIBOR + 1.730% (Cap N/A, Floor 1.730%) | |
4.802%(c) | | 01/26/38 | | | | EUR | | | 10,000 | | | | 10,420,495 | |
Jamestown CLO Ltd. (Cayman Islands), | |
Series 2019-14A, Class A1AR, 144A, 3 Month SOFR + 1.462% (Cap N/A, Floor 1.200%) | |
6.079%(c) | | 10/20/34 | | | | | | | 6,625 | | | | 6,634,912 | |
Series 2019-14A, Class A2R, 144A, 3 Month SOFR + 2.012% (Cap N/A, Floor 1.750%) | |
6.629%(c) | | 10/20/34 | | | | | | | 6,750 | | | | 6,783,668 | |
Madison Park Funding Ltd. (Cayman Islands), | |
Series 2019-37A, Class AR2, 144A, 3 Month SOFR + 1.530% (Cap N/A, Floor 1.530%) | |
6.186%(c) | | 04/15/37 | | | | | | | 14,000 | | | | 14,060,956 | |
MidOcean Credit CLO (Cayman Islands), | |
Series 2014-03A, Class A1R, 144A, 3 Month SOFR + 1.382% (Cap N/A, Floor 1.120%) | |
5.999%(c) | | 04/21/31 | | | | | | | 1,076 | | | | 1,076,161 | |
Mountain View CLO Ltd. (Cayman Islands), | |
Series 2015-09A, Class A1R, 144A, 3 Month SOFR + 1.382% (Cap N/A, Floor 0.000%) | |
6.038%(c) | | 07/15/31 | | | | | | | 2,927 | | | | 2,931,666 | |
Neuberger Berman Loan Advisers CLO Ltd. (Cayman Islands), | |
Series 2017-24A, Class AR2, 144A, 3 Month SOFR + 1.360% (Cap N/A, Floor 1.360%) | |
5.977%(c) | | 10/19/38 | | | | | | | 9,500 | | | | 9,542,659 | |
Ocean Trails CLO Ltd. (Cayman Islands), | |
Series 2024-16A, Class B, 144A, 3 Month SOFR + 1.800% (Cap N/A, Floor 1.800%) | |
6.361%(c) | | 01/20/38 | | | | | | | 10,250 | | | | 10,287,098 | |
OFSI BSL CLO Ltd. (Cayman Islands), | |
Series 2024-13A, Class A1, 144A, 3 Month SOFR + 1.620% (Cap N/A, Floor 1.620%) | |
6.237%(c) | | 04/20/37 | | | | | | | 12,000 | | | | 12,055,487 | |
OHA Credit Partners Ltd. (Cayman Islands), | |
Series 2024-17A, Class A, 144A, 3 Month SOFR + 1.320% (Cap N/A, Floor 1.320%) | |
5.722%(c) | | 01/18/38 | | | | | | | 9,500 | | | | 9,543,686 | |
| | | | | | | | | | | | | | |
Interest Rate | | Maturity
Date | | | | Principal
Amount
(000)# | | | Value | |
ASSET-BACKED SECURITIES (continued) | |
Collateralized Loan Obligations (cont’d.) | |
Palmer Square CLO Ltd. (Cayman Islands), | |
Series 2015-01A, Class A1A5, 144A, 3 Month SOFR + 1.050% (Cap N/A, Floor 1.050%) | |
0.000%(c) | | 05/21/34 | | | | | |
| 15,750
|
| | $ | 15,750,000 | |
Park Avenue Institutional Advisers CLO Ltd. (Cayman Islands), | |
Series 2019-02A, Class A1R, 144A, 3 Month SOFR + 1.442% (Cap N/A, Floor 1.180%) | |
6.098%(c) | | 10/15/34 | | | | | | | 7,000 | | | | 7,012,454 | |
Pikes Peak CLO (Cayman Islands), | |
Series 2022-10A, Class BR, 144A, 3 Month SOFR + 1.700% (Cap N/A, Floor 1.700%) | |
6.092%(c) | | 01/22/38 | | | | | | | 10,000 | | | | 10,001,690 | |
Rad CLO Ltd. (Cayman Islands), | |
Series 2019-05A, Class AR, 144A, 3 Month SOFR + 1.382% (Cap N/A, Floor 1.120%) | |
6.016%(c) | | 07/24/32 | | | | | | | 8,168 | | | | 8,176,383 | |
Series 2023-19A, Class A1, 144A, 3 Month SOFR + 2.000% (Cap N/A, Floor 2.000%) | |
6.617%(c) | | 04/20/35 | | | | | | | 10,800 | | | | 10,826,755 | |
Romark WM-R Ltd. (Cayman Islands), | |
Series 2018-01A, Class A1, 144A, 3 Month SOFR + 1.292% (Cap N/A, Floor 0.000%) | |
5.909%(c) | | 04/20/31 | | | | | | | 2,418 | | | | 2,419,573 | |
Shackleton CLO Ltd. (Cayman Islands), | |
Series 2014-05RA, Class A, 144A, 3 Month SOFR + 1.362% (Cap N/A, Floor 0.262%) | |
5.884%(c) | | 05/07/31 | | | | | | | 2,220 | | | | 2,222,602 | |
Sixth Street CLO Ltd. (Cayman Islands), | |
Series 2020-16A, Class A1R, 144A, 3 Month SOFR + 1.790% (Cap N/A, Floor 1.790%) | |
6.407%(c) | | 01/20/37 | | | | | | | 6,500 | | | | 6,522,911 | |
Sona Fios CLO DAC (Ireland), | |
Series 01A, Class A1, 144A, 3 Month EURIBOR + 1.850% (Cap N/A, Floor 1.850%) | |
5.034%(c) | | 07/15/36 | | | | EUR | | | 8,750 | | | | 9,185,221 | |
Sound Point CLO Ltd. (Cayman Islands), | |
Series 2013-01A, Class A1R, 144A, 3 Month SOFR + 1.332% (Cap N/A, Floor 1.332%) | |
5.949%(c) | | 01/26/31 | | | | | | | 1,661 | | | | 1,662,322 | |
TCW CLO Ltd. (Cayman Islands), | |
Series 2017-01A, Class A1RR, 144A, 3 Month SOFR + 1.442% (Cap N/A, Floor 1.180%) | |
6.046%(c) | | 10/29/34 | | | | | | | 3,000 | | | | 3,000,724 | |
Series 2017-01A, Class BRR, 144A, 3 Month SOFR + 1.962% (Cap N/A, Floor 1.700%) | |
6.566%(c) | | 10/29/34 | | | | | | | 4,000 | | | | 3,994,040 | |
Telos CLO Ltd. (Cayman Islands), | |
Series 2013-04A, Class AR, 144A, 3 Month SOFR + 1.502% (Cap N/A, Floor 0.000%) | |
6.149%(c) | | 01/17/30 | | | | | | | 392 | | | | 392,016 | |
Tikehau US CLO Ltd. (Bermuda), | |
Series 2022-02A, Class A1R, 144A, 3 Month SOFR + 1.870% (Cap N/A, Floor 1.870%) | |
6.487%(c) | | 01/20/36 | | | | | | | 4,500 | | | | 4,520,625 | |
Series 2023-01A, Class A1, 144A, 3 Month SOFR + 2.200% (Cap N/A, Floor 2.200%) | |
6.856%(c) | | 07/15/34 | | | | | | | 8,750 | | | | 8,800,984 | |
SEE NOTES TO FINANCIAL STATEMENTS.
A168
| | | | |
| | PSF PGIM TOTAL RETURN BOND PORTFOLIO (CONTINUED) | | |
SCHEDULE OF INVESTMENTS | | | | as of December 31, 2024 |
| | | | | | | | | | | | | | | | | | | | |
Interest Rate | | Maturity
Date | | | | | | | | | Principal
Amount
(000)# | | | Value | |
ASSET-BACKED SECURITIES (continued) | |
Collateralized Loan Obligations (cont’d.) | |
Toro European CLO DAC (Ireland), | |
Series 03A, Class ARR, 144A, 3 Month EURIBOR + 0.990% (Cap N/A, Floor 0.990%) | |
4.169%(c) | | | 07/15/34 | | | | | | | | EUR | | | | 8,000 | | | $ | 8,277,252 | |
Trimaran Cavu Ltd., | | | | | | | | | | | | | | | | | |
Series 2019-01A, Class A1R, 144A, 3 Month SOFR + 1.190% (Cap N/A, Floor 1.190%) | |
5.505%(c) | | | 01/20/37 | | | | | | | | | | | | 12,000 | | | | 12,000,000 | |
Trinitas CLO Ltd. (Bermuda), | | | | | | | | | | | | | | | | | |
Series 2023-26A, Class A1, 144A, 3 Month SOFR + 1.690% (Cap N/A, Floor 1.690%) | |
6.307%(c) | | | 01/20/35 | | | | | | | | | | | | 7,500 | | | | 7,514,873 | |
Venture CLO Ltd. (Cayman Islands), | | | | | | | | | | | | | | | | | |
Series 2018-32A, Class A1, 144A, 3 Month SOFR + 1.362% (Cap N/A, Floor 1.100%) | |
5.994%(c) | | | 07/18/31 | | | | | | | | | | | | 236 | | | | 235,898 | |
Voya CLO Ltd. (Cayman Islands), | | | | | | | | | | | | | | | | | |
Series 2013-02A, Class A1R, 144A, 3 Month SOFR + 1.232% (Cap N/A, Floor 0.970%) | |
5.857%(c) | | | 04/25/31 | | | | | | | | | | | | 1,158 | | | | 1,160,107 | |
Wellfleet CLO Ltd., | | | | | | | | | | | | | | | | | |
Series 2017-03A, Class A1, 144A, 3 Month SOFR + 1.412% (Cap N/A, Floor 1.150%) | |
6.059%(c) | | | 01/17/31 | | | | | | | | | | | | 1,946 | | | | 1,948,873 | |
Wind River CLO Ltd. (Cayman Islands), | | | | | |
Series 2016-01KRA, Class A1R2, 144A, 3 Month SOFR + 1.472% (Cap N/A, Floor 1.210%) | |
6.128%(c) | | | 10/15/34 | | | | | | | | | | | | 1,750 | | | | 1,751,620 | |
| | | | | | | | | | | | | | | | | | | | |
| | | | | |
| | | | | | | | | | | | | | | | | | | 401,727,184 | |
| | | | | | | | | | | | | | | | | | | | |
Consumer Loans — 0.7% | | | | | | | | | | | | | | | | | |
Fairstone Financial Issuance Trust (Canada), | |
Series 2020-01A, Class A, 144A | |
2.509% | | | 10/20/39 | | | | | | | | CAD | | | | 78 | | | | 54,229 | |
GreenSky Home Improvement Trust, | |
Series 2024-01, Class A4, 144A | |
5.670% | | | 06/25/59 | | | | | | | | | | | | 599 | | | | 603,331 | |
Lending Funding Trust, | |
Series 2020-02A, Class A, 144A | |
2.320% | | | 04/21/31 | | | | | | | | | | | | 300 | | | | 288,495 | |
OneMain Financial Issuance Trust, | |
Series 2020-02A, Class A, 144A | |
1.750% | | | 09/14/35 | | | | | | | | | | | | 1,500 | | | | 1,440,703 | |
Series 2023-01A, Class A, 144A | |
5.500% | | | 06/14/38 | | | | | | | | | | | | 5,500 | | | | 5,591,886 | |
Series 2023-02A, Class C, 144A | |
6.740% | | | 09/15/36 | | | | | | | | | | | | 700 | | | | 718,829 | |
Series 2023-02A, Class D, 144A | |
7.520% | | | 09/15/36 | | | | | | | | | | | | 800 | | | | 827,878 | |
Series 2024-01A, Class A, 144A | |
5.790% | | | 05/14/41 | | | | | | | | | | | | 2,700 | | | | 2,767,801 | |
Regional Management Issuance Trust, | | | | | |
Series 2022-01, Class A, 144A | |
3.070% | | | 03/15/32 | | | | | | | | | | | | 1,200 | | | | 1,184,576 | |
| | | | | | | | | | | | | | | | | | | | |
Interest Rate | | Maturity
Date | | | | | | | | | Principal
Amount
(000)# | | | Value | |
ASSET-BACKED SECURITIES (continued) | | | | | |
Consumer Loans (cont’d.) | | | | | | | | | | | | | | | | | |
Stream Innovations Issuer Trust, | | | | | | | | | | | | | |
Series 2024-02A, Class A, 144A | |
5.210% | | | 02/15/45 | | | | | | | | | | | | 2,486 | | | $ | 2,477,404 | |
| | | | | | | | | | | | | | | | | | | | |
| | | | | | | | | | | | | | | | | | | 15,955,132 | |
| | | | | | | | | | | | | | | | | | | | |
Credit Cards — 0.2% | | | | | | | | | | | | | | | | | |
Genesis Sales Finance Master Trust, | |
Series 2024-B, Class A, 144A | | | | | | | | | | | | | | | | | |
5.870% | | | 12/20/32 | | | | | | | | | | | | 4,400 | | | | 4,397,908 | |
| | | | | | | | | | | | | | | | | | | | |
Home Equity Loans — 0.6% | |
BRAVO Residential Funding Trust, | |
Series 2024-CES01, Class A1A, 144A | |
6.377% | | | 04/25/54 | | | | | | | | | | | | 1,314 | | | | 1,327,308 | |
Floating Rate Mortgage Pass-Through Certificates, | | | | | |
Series 2001-02, Class M3, 1 Month SOFR + 3.039% (Cap N/A, Floor 2.925%) | |
7.378%(c) | | | 10/25/31 | | | | | | | | | | | | 126 | | | | 127,039 | |
JPMorgan Mortgage Trust, | | | | | | | | | | | | | | | | | |
Series 2023-HE02, Class A1, 144A, 30 Day Average SOFR + 1.700% (Cap N/A, Floor 0.000%) | |
6.305%(c) | | | 03/20/54 | | | | | | | | | | | | 476 | | | | 479,617 | |
Series 2023-HE03, Class A1, 144A, 30 Day Average SOFR + 1.600% (Cap N/A, Floor 0.000%) | |
6.205%(c) | | | 05/25/54 | | | | | | | | | | | | 155 | | | | 156,276 | |
Series 2024-HE02, Class A1, 144A, 30 Day Average SOFR + 1.200% (Cap N/A, Floor 0.000%) | |
5.805%(c) | | | 10/20/54 | | | | | | | | | | | | 389 | | | | 389,440 | |
Morgan Stanley ABS Capital I, Inc. Trust, | |
Series 2003-HE03, Class M1, 1 Month SOFR + 1.134% (Cap N/A, Floor 1.020%) | |
5.473%(c) | | | 10/25/33 | | | | | | | | | | | | 7 | | | | 7,009 | |
RCKT Mortgage Trust, | | | | | | | | | | | | | | | | | |
Series 2024-CES01, Class A1A, 144A | |
6.025%(cc) | | | 02/25/44 | | | | | | | | | | | | 827 | | | | 830,041 | |
Series 2024-CES03, Class A1A, 144A | |
6.591%(cc) | | | 05/25/44 | | | | | | | | | | | | 1,760 | | | | 1,781,905 | |
Towd Point HE Trust, | | | | | | | | | | | | | | | | | |
Series 2023-01, Class A1A, 144A | |
6.875% | | | 02/25/63 | | | | | | | | | | | | 272 | | | | 272,291 | |
Towd Point Mortgage Trust, | | | | | | | | | | | | | | | | | |
Series 2023-CES02, Class A1A, 144A | |
7.294%(cc) | | | 10/25/63 | | | | | | | | | | | | 913 | | | | 929,644 | |
Series 2024-CES01, Class A1A, 144A | |
5.848%(cc) | | | 01/25/64 | | | | | | | | | | | | 324 | | | | 325,302 | |
Series 2024-CES02, Class A1A, 144A | |
6.125%(cc) | | | 02/25/64 | | | | | | | | | | | | 327 | | | | 329,472 | |
Series 2024-CES03, Class A1, 144A | |
6.290%(cc) | | | 05/25/64 | | | | | | | | | | | | 1,057 | | | | 1,066,653 | |
Series 2024-CES05, Class A1, 144A | |
5.167%(cc) | | | 09/25/64 | | | | | | | | | | | | 3,578 | | | | 3,547,088 | |
Series 2024-CES05, Class A2, 144A | |
5.202%(cc) | | | 09/25/64 | | | | | | | | | | | | 1,750 | | | | 1,708,965 | |
| | | | | | | | | | | | | | | | | | | | |
| | | | | |
| | | | | | | | | | | | | | | | | | | 13,278,050 | |
| | | | | | | | | | | | | | | | | | | | |
SEE NOTES TO FINANCIAL STATEMENTS.
A169
| | | | |
| | PSF PGIM TOTAL RETURN BOND PORTFOLIO (CONTINUED) | | |
SCHEDULE OF INVESTMENTS | | | | as of December 31, 2024 |
| | | | | | | | | | | | | | | | |
Interest Rate | | Maturity
Date | | | | | | | | Principal
Amount
(000)# | | Value | |
ASSET-BACKED SECURITIES (continued) | |
Other — 0.8% | | | | | | | | | | | | | | | | |
Capital Street Master Trust, | |
Series 2024-01, Class A, 144A, 30 Day Average SOFR + 1.350% (Cap N/A, Floor 1.350%) | |
5.948%(c) | | | 10/16/28 | | | | | | | | | 2,700 | | $ | 2,699,984 | |
GoodLeap Home Improvement Solutions Trust, | |
Series 2024-01A, Class A, 144A | |
5.350% | | | 10/20/46 | | | | | | | | | 2,134 | | | 2,125,321 | |
GoodLeap Sustainable Home Solutions Trust, | | | | |
Series 2023-03C, Class A, 144A | |
6.500% | | | 07/20/55 | | | | | | | | | 437 | | | 434,333 | |
Series 2023-04C, Class A, 144A | |
6.480% | | | 03/20/57 | | | | | | | | | 542 | | | 536,106 | |
Series 2024-01GS, Class A, 144A | |
6.250% | | | 06/20/57 | | | | | | | | | 1,724 | | | 1,679,112 | |
Invitation Homes Trust, | | | | | | | | | |
Series 2024-SFR01, Class C, 144A | |
4.250% | | | 09/17/41 | | | | | | | | | 2,700 | | | 2,517,058 | |
PMT Issuer Trust - FMSR, | | | | | | | | | |
Series 2024-FT01, Class A, 144A, 1 Month SOFR + 2.750% (Cap N/A, Floor 2.750%) | |
7.089%(c) | | | 12/25/27 | | | | | | | | | 3,500 | | | 3,515,631 | |
Sunrun Artemis Issuer LLC, | | | | | | | | | |
Series 2024-02A, Class A1, 144A | |
6.250% | | | 07/30/59 | | | | | | | | | 989 | | | 966,687 | |
Sunrun Vesta Issuer LLC, | | | | | | | | | |
Series 2024-03A, Class A1, 144A | |
5.490% | | | 10/30/59 | | | | | | | | | 573 | | | 552,463 | |
Series 2024-03A, Class A2, 144A | |
5.880% | | | 10/30/59 | | | | | | | | | 2,498 | | | 2,366,581 | |
| | | | | | | | | | | | | | | | |
| | | | | |
| | | | | | | | | | | | | | | 17,393,276 | |
| | | | | | | | | | | | | | | | |
Residential Mortgage-Backed Securities — 0.1% | |
Argent Securities, Inc., Asset-Backed Pass-Through Certificates, | |
Series 2004-W10, Class A2, 1 Month SOFR + 0.894% (Cap N/A, Floor 0.780%) | |
3.687%(c) | | | 10/25/34 | | | | | | | | | 378 | | | 364,969 | |
LSF11 Boson Investments Sarl Compartment 2 (Spain), | |
Series 2021-NPLA, Class A1, 144A, 3 Month EURIBOR + 2.000% (Cap N/A, Floor 0.000%) | |
5.005%(c) | | | 11/25/60 | | | | EUR | | | | | 126 | | | 125,665 | |
TFS (Spain), | | | | | | | | | | | | | | | | |
Series 2018-03, Class A1 | |
0.000%(s) | | | 04/16/40^ | | | | EUR | | | | | —(r) | | | 1 | |
Series 2018-03, Class A1, 1 Month EURIBOR + 3.250% | |
6.349%(c) | | | 03/15/26^ | | | | EUR | | | | | 1,251 | | | 965,457 | |
| | | | | | | | | | | | | | | | |
| | | | | | | | | | | | | | | 1,456,092 | |
| | | | | | | | | | | | | | | | |
Student Loans — 0.2% | | | | | | | | | |
Bayview Opportunity Master Fund VII LLC, | | | | |
Series 2024-EDU01, Class A, 144A, 30 Day Average SOFR + 1.450% (Cap N/A, Floor 0.000%) | |
6.019%(c) | | | 06/25/47 | | | | | | | | | 1,706 | | | 1,714,555 | |
Series 2024-EDU01, Class B, 144A, 30 Day Average SOFR + 1.600% (Cap N/A, Floor 0.000%) | |
6.169%(c) | | | 06/25/47 | | | | | | | | | 853 | | | 857,371 | |
Laurel Road Prime Student Loan Trust, | | | | |
Series 2018-A, Class A, 144A | |
0.000% | | | 02/25/43 | | | | | | | | | 2,980 | | | 479,614 | |
| | | | | | | | | | | | | | | | | | | | |
Interest Rate | | Maturity
Date | | | | | | | | | Principal
Amount
(000)# | | | Value | |
ASSET-BACKED SECURITIES (continued) | |
Student Loans (cont’d.) | |
Series 2018-C, Class A, 144A | |
0.000%(cc) | | | 08/25/43 | | | | | | | | | | | | 527 | | | $ | 506,617 | |
Series 2018-D, Class A, 144A | |
0.000%(cc) | | | 11/25/43 | | | | | | | | | | | | 558 | | | | 519,178 | |
Series 2019-A, Class R, 144A | |
0.000% | | | 10/25/48 | | | | | | | | | | | | 927 | | | | 263,183 | |
Navient Private Education Refi Loan Trust, | |
Series 2020-DA, Class A, 144A | |
1.690% | | | 05/15/69 | | | | | | | | | | | | 19 | | | | 18,029 | |
SMB Private Education Loan Trust, | |
Series 2024-A, Class A1A, 144A | |
5.240% | | | 03/15/56 | | | | | | | | | | | | 642 | | | | 639,493 | |
Series 2024-D, Class A1A, 144A | |
5.380% | | | 07/15/53 | | | | | | | | | | | | 949 | | | | 949,314 | |
| | | | | | | | | | | | | | | | | | | | |
| | | | | |
| | | | | | | | | | | | | | | | | | | 5,947,354 | |
| | | | | | | | | | | | | | | | | | | | |
TOTAL ASSET-BACKED SECURITIES
(cost $482,261,805) | | | | 475,855,223 | |
| | | | | | | | | | | | | | | | | | | | |
|
COMMERCIAL MORTGAGE-BACKED SECURITIES — 11.0% | |
BANK, | | | | | | | | | | | | | | | | | | | | |
Series 2017-BNK04, Class A3 | |
3.362% | | | 05/15/50 | | | | | | | | | | | | 9,151 | | | | 8,865,241 | |
Series 2017-BNK05, Class A4 | |
3.131% | | | 06/15/60 | | | | | | | | | | | | 4,281 | | | | 4,112,507 | |
Series 2017-BNK06, Class A4 | |
3.254% | | | 07/15/60 | | | | | | | | | | | | 861 | | | | 828,171 | |
Series 2017-BNK08, Class A3 | |
3.229% | | | 11/15/50 | | | | | | | | | | | | 2,016 | | | | 1,936,351 | |
Series 2019-BN18, Class A3 | |
3.325% | | | 05/15/62 | | | | | | | | | | | | 1,500 | | | | 1,380,936 | |
Series 2020-BN29, Class A3 | |
1.742% | | | 11/15/53 | | | | | | | | | | | | 1,000 | | | | 831,995 | |
Bank of America Merrill Lynch Commercial Mortgage Trust, | | | | | |
Series 2016-UB10, Class A3 | | | | | |
2.903% | | | 07/15/49 | | | | | | | | | | | | 927 | | | | 910,918 | |
BANK5, | |
Series 2024-5YR08, Class A3 | |
5.884% | | | 08/15/57 | | | | | | | | | | | | 8,100 | | | | 8,323,651 | |
Series 2024-5YR9, Class A3 | |
5.614% | | | 08/15/57 | | | | | | | | | | | | 8,400 | | | | 8,546,573 | |
Barclays Commercial Mortgage Securities Trust, | |
Series 2016-ETC, Class A, 144A | |
2.937% | | | 08/14/36 | | | | | | | | | | | | 1,170 | | | | 1,106,703 | |
Series 2016-ETC, Class B, 144A | |
3.189% | | | 08/14/36 | | | | | | | | | | | | 510 | | | | 474,385 | |
Series 2016-ETC, Class C, 144A | |
3.391% | | | 08/14/36 | | | | | | | | | | | | 430 | | | | 391,247 | |
Series 2016-ETC, Class D, 144A | |
3.609%(cc) | | | 08/14/36 | | | | | | | | | | | | 1,560 | | | | 1,379,797 | |
Series 2019-C03, Class A3 | |
3.319% | | | 05/15/52 | | | | | | | | | | | | 3,250 | | | | 3,056,384 | |
Series 2020-BID, Class A, 144A, 1 Month SOFR + 2.254% (Cap N/A, Floor 2.140%) | |
6.652%(c) | | | 10/15/37 | | | | | | | | | | | | 5,000 | | | | 5,015,625 | |
SEE NOTES TO FINANCIAL STATEMENTS.
A170
| | | | |
| | PSF PGIM TOTAL RETURN BOND PORTFOLIO (CONTINUED) | | |
SCHEDULE OF INVESTMENTS | | | | as of December 31, 2024 |
| | | | | | | | | | | | | | | | |
Interest Rate | | Maturity
Date | | | | | | | Principal
Amount
(000)# | | | Value | |
|
COMMERCIAL MORTGAGE-BACKED SECURITIES (continued) | |
Series 2024-5C27, Class A3 | |
6.014% | | 07/15/57 | | | | | | | | | 3,700 | | | $ | 3,824,228 | |
Series 2024-C24, Class XB, IO | |
1.331%(cc) | | 02/15/57 | | | | | | | | | 27,150 | | | | 2,554,201 | |
Benchmark Mortgage Trust, | |
Series 2019-B09, Class A4 | |
3.751% | | 03/15/52 | | | | | | | | | 3,386 | | | | 3,242,241 | |
Series 2020-B18, Class A4 | |
1.672% | | 07/15/53 | | | | | | | | | 2,900 | | | | 2,462,534 | |
Series 2020-B21, Class A4 | |
1.704% | | 12/17/53 | | | | | | | | | 1,000 | | | | 836,062 | |
Series 2020-IG01, Class A3 | |
2.687% | | 09/15/43 | | | | | | | | | 5,000 | | | | 4,096,339 | |
Series 2023-B40, Class A2 | |
6.930% | | 12/15/56 | | | | | | | | | 2,687 | | | | 2,818,710 | |
Series 2023-V02, Class A3 | |
5.812%(cc) | | 05/15/55 | | | | | | | | | 7,000 | | | | 7,143,729 | |
Series 2023-V03, Class A3 | |
6.363%(cc) | | 07/15/56 | | | | | | | | | 6,000 | | | | 6,225,256 | |
Series 2024-V08, Class A3 | |
6.189%(cc) | | 07/15/57 | | | | | | | | | 6,400 | | | | 6,651,843 | |
Series 2024-V09, Class A3 | |
5.602% | | 08/15/57 | | | | | | | | | 8,100 | | | | 8,233,767 | |
Series 2024-V12, Class A3 | |
5.738% | | 12/15/57 | | | | | | | | | 4,750 | | | | 4,869,303 | |
BMARK, | |
Series 2023-V04, Class A3 | |
6.841%(cc) | | 11/15/56 | | | | | | | | | 5,900 | | | | 6,228,085 | |
BMO Mortgage Trust, | |
Series 2024-5C05, Class A3 | |
5.857% | | 02/15/57 | | | | | | | | | 3,600 | | | | 3,687,007 | |
Series 2024-5C05, Class XB, IO | |
0.392%(cc) | | 02/15/57 | | | | | | | | | 188,084 | | | | 3,050,516 | |
BPR Trust, | |
Series 2023-BRK02, Class A, 144A | |
6.899%(cc) | | 10/05/38 | | | | | | | | | 2,300 | | | | 2,369,358 | |
BX Commercial Mortgage Trust, | |
Series 2021-ACNT, Class E, 144A, 1 Month SOFR + 2.311% (Cap N/A, Floor 2.197%) | |
6.708%(c) | | 11/15/38 | | | | | | | | | 2,901 | | | | 2,893,335 | |
Series 2024-AIRC, Class A, 144A, 1 Month SOFR + 1.691% (Cap N/A, Floor 1.691%) | |
6.088%(c) | | 08/15/39 | | | | | | | | | 3,400 | | | | 3,423,406 | |
BX Trust, | |
Series 2022-LBA06, Class E, 144A, 1 Month SOFR + 2.700% (Cap N/A, Floor 2.700%) | |
7.097%(c) | | 01/15/39 | | | | | | | | | 5,000 | | | | 4,984,375 | |
CD Mortgage Trust, | |
Series 2017-CD05, Class A3 | |
3.171% | | 08/15/50 | | | | | | | | | 3,500 | | | | 3,345,073 | |
CENT Trust, | |
Series 2023-CITY, Class A, 144A, 1 Month SOFR + 2.620% (Cap N/A, Floor 2.620%) | |
7.017%(c) | | 09/15/38 | | | | | | | | | 2,750 | | | | 2,760,313 | |
CFK Trust, | |
Series 2020-MF02, Class A, 144A | |
2.387% | | 03/15/39 | | | | | | | | | 4,040 | | | | 3,732,668 | |
| | | | | | | | | | | | | | | | |
Interest Rate | | Maturity
Date | | | | | | | Principal
Amount
(000)# | | | Value | |
|
COMMERCIAL MORTGAGE-BACKED SECURITIES (continued) | |
Citigroup Commercial Mortgage Trust, | |
Series 2020-GC46, Class A2 | |
2.708% | | 02/15/53 | | | | | | | | | 1,372 | | | $ | 1,349,204 | |
Commercial Mortgage Trust, | |
Series 2016-COR01, Class A3 | |
2.826% | | 10/10/49 | | | | | | | | | 2,474 | | | | 2,393,150 | |
Series 2017-COR02, Class A2 | |
3.239% | | 09/10/50 | | | | | | | | | 3,829 | | | | 3,658,099 | |
Series 2024-277P, Class A, 144A | |
6.338% | | 08/10/44 | | | | | | | | | 1,100 | | | | 1,132,324 | |
Series 2024-277P, Class X, IO, 144A | |
0.661%(cc) | | 08/10/44 | | | | | | | | | 3,600 | | | | 105,439 | |
CSAIL Commercial Mortgage Trust, | |
Series 2019-C16, Class A2 | |
3.067% | | 06/15/52 | | | | | | | | | 1,172 | | | | 1,074,270 | |
DBGS Mortgage Trust, | |
Series 2018-BIOD, Class G, 144A, 1 Month SOFR + 2.796% (Cap N/A, Floor 2.500%) | |
7.193%(c) | | 05/15/35 | | | | | | | | | 2,454 | | | | 2,425,960 | |
DBWF Mortgage Trust, | |
Series 2016-85T, Class D, 144A | |
3.808%(cc) | | 12/10/36 | | | | | | | | | 1,400 | | | | 1,257,754 | |
Deutsche Bank Commercial Mortgage Trust, | | | | | |
Series 2017-C06, Class A4 | | | | | |
3.071% | | 06/10/50 | | | | | | | | | 4,857 | | | | 4,636,916 | |
Eleven Madison Mortgage Trust, | |
Series 2015-11MD, Class C, 144A | |
3.555%(cc) | | 09/10/35 | | | | | | | | | 3,000 | | | | 2,876,496 | |
FHLMC Multifamily Structured Pass-Through Certificates, | |
Series K044, Class X1, IO | |
0.699%(cc) | | 01/25/25 | | | | | | | | | 16,424 | | | | 164 | |
Series K053, Class X1, IO | |
0.862%(cc) | | 12/25/25 | | | | | | | | | 82,313 | | | | 527,034 | |
Series K055, Class X1, IO | |
1.326%(cc) | | 03/25/26 | | | | | | | | | 12,169 | | | | 159,955 | |
Series KG03, Class X1, IO | |
1.371%(cc) | | 06/25/30 | | | | | | | | | 28,898 | | | | 1,696,695 | |
Fontainebleau Miami Beach Mortgage Trust, | |
Series 2024-FBLU, Class A, 144A, 1 Month SOFR + 1.450% (Cap N/A, Floor 1.450%) | |
5.943%(c) | | 12/15/39 | | | | | | | | | 2,200 | | | | 2,203,438 | |
GS Mortgage Securities Corp. Trust, | |
Series 2024-RVR, Class A, 144A | |
5.198%(cc) | | 08/10/41 | | | | | | | | | 4,800 | | | | 4,747,754 | |
GS Mortgage Securities Trust, | |
Series 2015-GC30, Class A3 | |
3.119% | | 05/10/50 | | | | | | | | | 1,974 | | | | 1,965,091 | |
Series 2017-GS06, Class A2 | |
3.164% | | 05/10/50 | | | | | | | | | 3,141 | | | | 3,012,282 | |
Series 2019-GC38, Class A3 | |
3.703% | | 02/10/52 | | | | | | | | | 5,800 | | | | 5,528,676 | |
JPMDB Commercial Mortgage Securities Trust, | |
Series 2016-C02, Class A3A | |
2.881% | | 06/15/49 | | | | | | | | | 1,035 | | | | 1,014,772 | |
Series 2017-C05, Class A4 | |
3.414% | | 03/15/50 | | | | | | | | | 1,321 | | | | 1,281,263 | |
SEE NOTES TO FINANCIAL STATEMENTS.
A171
| | | | |
| | PSF PGIM TOTAL RETURN BOND PORTFOLIO (CONTINUED) | | |
SCHEDULE OF INVESTMENTS | | | | as of December 31, 2024 |
| | | | | | | | | | | | | | | | | | |
Interest Rate | | Maturity
Date | | | | | | | | Principal
Amount
(000)# | | | Value | |
|
|
|
COMMERCIAL MORTGAGE-BACKED SECURITIES (continued) | |
Series 2017-C07, Class A4 | |
|
3.147% | | 10/15/50 | | | | | | | | | | | 3,563 | | | $ | 3,407,437 | |
JPMorgan Chase Commercial Mortgage Securities Trust, | |
Series 2016-JP02, Class A3 | |
2.559% | | 08/15/49 | | | | | | | | | | | 1,122 | | | | 1,097,077 | |
Series 2018-AON, Class E, 144A | |
4.613%(cc) | | 07/05/31 | | | | | | | | | | | 5,875 | | | | 1,828,575 | |
Series 2018-WPT, Class AFX, 144A | |
4.248% | | 07/05/33 | | | | | | | | | | | 5,000 | | | | 4,690,397 | |
Morgan Stanley Capital I Trust, | |
Series 2017-H01, Class A4 | |
3.259% | | 06/15/50 | | | | | | | | | | | 2,750 | | | | 2,678,081 | |
Series 2017-HR02, Class A3 | |
3.330% | | 12/15/50 | | | | | | | | | | | 5,448 | | | | 5,199,192 | |
Series 2019-L03, Class A3 | |
2.874% | | 11/15/52 | | | | | | | | | | | 1,061 | | | | 970,227 | |
MSWF Commercial Mortgage Trust, | |
Series 2023-01, Class A2 | |
6.451% | | 05/15/56 | | | | | | | | | | | 4,000 | | | | 4,143,128 | |
Series 2023-02, Class A2 | |
6.890% | | 12/15/56 | | | | | | | | | | | 4,400 | | | | 4,607,593 | |
New York City Housing Development Corp., | |
Series 2024-08SPR, Class A | |
5.458% | | 12/15/43 | | | | | | | | | | | 8,530 | | | | 8,534,746 | |
ROCK Trust, | |
Series 2024-CNTR, Class A, 144A | |
5.388% | | 11/13/41 | | | | | | | | | | | 4,100 | | | | 4,088,570 | |
Series 2024-CNTR, Class C, 144A | |
6.471% | | 11/13/41 | | | | | | | | | | | 1,230 | | | | 1,242,702 | |
Series 2024-CNTR, Class D, 144A | |
7.109% | | 11/13/41 | | | | | | | | | | | 2,760 | | | | 2,801,389 | |
Shops at Crystals Trust, | |
Series 2016-CSTL, Class A, 144A | |
3.126% | | 07/05/36 | | | | | | | | | | | 140 | | | | 135,538 | |
UBS Commercial Mortgage Trust, | |
Series 2017-C02, Class A3 | |
3.225% | | 08/15/50 | | | | | | | | | | | 1,829 | | | | 1,760,323 | |
Series 2017-C07, Class A3 | |
3.418% | | 12/15/50 | | | | | | | | | | | 3,938 | | | | 3,763,422 | |
Series 2018-C10, Class A3 | |
4.048% | | 05/15/51 | | | | | | | | | | | 2,187 | | | | 2,119,420 | |
Series 2019-C17, Class A3 | |
2.669% | | 10/15/52 | | | | | | | | | | | 2,610 | | | | 2,333,351 | |
Wells Fargo Commercial Mortgage Trust, | |
Series 2016-C32, Class A3 | |
3.294% | | 01/15/59 | | | | | | | | | | | 1,808 | | | | 1,783,682 | |
Series 2016-C34, Class A3 | |
2.834% | | 06/15/49 | | | | | | | | | | | 6,500 | | | | 6,362,578 | |
Series 2016-C35, Class A3 | |
2.674% | | 07/15/48 | | | | | | | | | | | 3,808 | | | | 3,710,057 | |
Series 2017-C40, Class A3 | |
3.317% | | 10/15/50 | | | | | | | | | | | 1,370 | | | | 1,315,821 | |
Series 2019-C54, Class A3 | |
2.892% | | 12/15/52 | | | | | | | | | | | 1,200 | | | | 1,085,482 | |
TOTAL COMMERCIAL MORTGAGE-BACKED SECURITIES
(cost $257,986,997) | | | | 249,298,357 | |
|
|
| | | | | | | | | | | | | | | | | | |
| | | | | | | | | | | | | | | | | | | | |
Interest Rate | | Maturity
Date | | | | | | | | | Principal
Amount
(000)# | | | Value | |
|
|
|
CORPORATE BONDS — 30.4% | |
Aerospace & Defense — 0.5% | |
BAE Systems PLC (United Kingdom), | |
Sr. Unsec’d. Notes, 144A | |
1.900% | | | 02/15/31 | | | | | | | | | | | | 2,770 | | | $ | 2,287,151 | |
3.400% | | | 04/15/30 | | | | | | | | | | | | 385 | | | | 354,952 | |
Boeing Co. (The),
| |
Sr. Unsec’d. Notes | |
2.196% | | | 02/04/26 | | | | | | | | | | | | 180 | | | | 174,532 | |
2.750% | | | 02/01/26 | | | | | | | | | | | | 90 | | | | 87,794 | |
2.950% | | | 02/01/30 | | | | | | | | | | | | 30 | | | | 26,764 | |
3.250% | | | 02/01/28 | | | | | | | | | | | | 1,700 | | | | 1,600,710 | |
3.900% | | | 05/01/49 | | | | | | | | | | | | 1,230 | | | | 854,052 | |
3.950% | | | 08/01/59 | | | | | | | | | | | | 1,450 | | | | 959,177 | |
5.805% | | | 05/01/50 | | | | | | | | | | | | 2,900 | | | | 2,692,069 | |
6.875% | | | 03/15/39 | | | | | | | | | | | | 20 | | | | 21,060 | |
Bombardier, Inc. (Canada),
Sr. Unsec’d. Notes, 144A | |
6.000% | | | 02/15/28 | | | | | | | | | | | | 75 | | | | 74,625 | |
7.500% | | | 02/01/29(a) | | | | | | | | | | | | 85 | | | | 88,420 | |
7.875% | | | 04/15/27 | | | | | | | | | | | | 3,118 | | | | 3,121,898 | |
General Dynamics Corp.,
Gtd. Notes | |
|
1.150% | | | 06/01/26 | | | | | | | | | | | | 20 | | | | 19,120 | |
3.250% | | | 04/01/25 | | | | | | | | | | | | 10 | | | | 9,965 | |
3.500% | | | 04/01/27 | | | | | | | | | | | | 30 | | | | 29,354 | |
L3Harris Technologies, Inc.,
Sr. Unsec’d. Notes | |
2.900% | | | 12/15/29 | | | | | | | | | | | | 40 | | | | 36,194 | |
4.400% | | | 06/15/28 | | | | | | | | | | | | 37 | | | | 36,366 | |
4.400% | | | 06/15/28 | | | | | | | | | | | | 15 | | | | 14,738 | |
Lockheed Martin Corp.,
Sr. Unsec’d. Notes | |
2.800% | | | 06/15/50 | | | | | | | | | | | | 10 | | | | 6,257 | |
4.500% | | | 05/15/36 | | | | | | | | | | | | 30 | | | | 28,162 | |
RTX Corp.,
Sr. Unsec’d. Notes | |
3.500% | | | 03/15/27 | | | | | | | | | | | | 5 | | | | 4,874 | |
| | | | | | | | | | | | | | | | | | | | |
| | | | | | | | | | | | | | | | | | | 12,528,234 | |
| | | | | | | | | | | | | | | | | | | | |
Agriculture — 0.8% | |
Altria Group, Inc.,
Gtd. Notes | |
|
2.625% | | | 09/16/26 | | | | | | | | | | | | 35 | | | | 33,807 | |
3.875% | | | 09/16/46 | | | | | | | | | | | | 10 | | | | 7,218 | |
4.400% | | | 02/14/26 | | | | | | | | | | | | 43 | | | | 42,812 | |
5.950% | | | 02/14/49 | | | | | | | | | | | | 30 | | | | 29,394 | |
BAT Capital Corp. (United Kingdom),
Gtd. Notes | |
|
2.259% | | | 03/25/28(a) | | | | | | | | | | | | 1,570 | | | | 1,442,497 | |
2.726% | | | 03/25/31 | | | | | | | | | | | | 10 | | | | 8,625 | |
3.462% | | | 09/06/29 | | | | | | | | | | | | 10 | | | | 9,297 | |
3.557% | | | 08/15/27 | | | | | | | | | | | | 422 | | | | 408,279 | |
4.390% | | | 08/15/37 | | | | | | | | | | | | 3,000 | | | | 2,591,228 | |
4.540% | | | 08/15/47 | | | | | | | | | | | | 14 | | | | 11,095 | |
5.834% | | | 02/20/31 | | | | | | | | | | | | 1,260 | | | | 1,288,077 | |
6.343% | | | 08/02/30 | | | | | | | | | | | | 960 | | | | 1,009,435 | |
7.750% | | | 10/19/32 | | | | | | | | | | | | 1,500 | | | | 1,698,314 | |
SEE NOTES TO FINANCIAL STATEMENTS.
A172
| | | | |
| | PSF PGIM TOTAL RETURN BOND PORTFOLIO (CONTINUED) | | |
SCHEDULE OF INVESTMENTS | | | | as of December 31, 2024 |
| | | | | | | | | | | | | | | | | | | | |
Interest Rate | | Maturity
Date | | | | | | | | | Principal
Amount
(000)# | | | Value | |
|
|
| |
CORPORATE BONDS (continued) | | | | | |
Agriculture (cont’d.) | | | | | | | | | | | | | | | | | |
BAT International Finance PLC (United Kingdom), | |
|
Gtd. Notes | | | | | | | | | | | | | | | | | | | | |
5.931% | | | 02/02/29 | | | | | | | | | | | | 311 | | | $ | 320,107 | |
Cargill, Inc., | |
Sr. Unsec’d. Notes, 144A | |
0.750% | | | 02/02/26 | | | | | | | | | | | | 40 | | | | 38,421 | |
Philip Morris International, Inc., | |
Sr. Unsec’d. Notes | | | | | | | | | | | | | | | | | | | | |
4.875% | | | 02/13/26 | | | | | | | | | | | | 25 | | | | 25,075 | |
5.000% | | | 11/17/25 | | | | | | | | | | | | 10 | | | | 10,035 | |
5.125% | | | 02/15/30 | | | | | | | | | | | | 6,085 | | | | 6,119,632 | |
5.500% | | | 09/07/30 | | | | | | | | | | | | 2,125 | | | | 2,175,111 | |
Reynolds American, Inc. (United Kingdom), | |
|
Gtd. Notes | | | | | | | | | | | | | | | | | | | | |
4.450% | | | 06/12/25 | | | | | | | | | | | | 13 | | | | 12,967 | |
| | | | | | | | | | | | | | | | | | | | |
| | | | | |
| | | | | | | | | | | | | | | | | | | 17,281,426 | |
| | | | | | | | | | | | | | | | | | | | |
Airlines — 0.3% | | | | | | | | | | | | | | | | | |
Air Canada (Canada), | |
Sr. Sec’d. Notes, 144A | |
3.875% | | | 08/15/26 | | | | | | | | | | | | 50 | | | | 48,419 | |
American Airlines 2016-1 Class AA Pass-Through Trust,
Pass-Through Certificates | |
3.575% | | | 07/15/29 | | | | | | | | | | | | 1,199 | | | | 1,152,526 | |
American Airlines 2017-2 Class AA Pass-Through Trust,
Pass-Through Certificates | |
3.350% | | | 04/15/31(a) | | | | | | | | | | | | 32 | | | | 30,360 | |
Delta Air Lines, Inc., | |
Sr. Unsec’d. Notes | | | | | | | | | | | | | | | | | | | | |
3.750% | | | 10/28/29 | | | | | | | | | | | | 10 | | | | 9,348 | |
Delta Air Lines, Inc./SkyMiles IP Ltd., | |
Sr. Sec’d. Notes, 144A | |
4.500% | | | 10/20/25 | | | | | | | | | | | | 7 | | | | 6,468 | |
4.750% | | | 10/20/28 | | | | | | | | | | | | 75 | | | | 73,925 | |
Mileage Plus Holdings LLC/Mileage Plus Intellectual Property Assets Ltd.,
| |
Sr. Sec’d. Notes, 144A | |
6.500% | | | 06/20/27 | | | | | | | | | | | | 15 | | | | 15,098 | |
Southwest Airlines Co., | |
Sr. Unsec’d. Notes | | | | | | | | | | | | | | | | | | | | |
5.125% | | | 06/15/27 | | | | | | | | | | | | 3,355 | | | | 3,372,509 | |
United Airlines 2019-1 Class AA Pass-Through Trust,
Pass-Through Certificates | |
4.150% | | | 02/25/33 | | | | | | | | | | | | 37 | | | | 35,733 | |
United Airlines 2019-2 Class AA Pass-Through Trust,
Pass-Through Certificates | |
2.700% | | | 11/01/33(a) | | | | | | | | | | | | 47 | | | | 41,373 | |
United Airlines 2020-1 Class A Pass-Through Trust,
Pass-Through Certificates | |
5.875% | | | 04/15/29 | | | | | | | | | | | | 59 | | | | 60,106 | |
United Airlines 2020-1 Class B Pass-Through Trust,
Pass-Through Certificates | |
4.875% | | | 07/15/27 | | | | | | | | | | | | 10 | | | | 9,984 | |
United Airlines, Inc., | |
Sr. Sec’d. Notes, 144A | |
4.375% | | | 04/15/26 | | | | | | | | | | | | 825 | | | | 810,875 | |
4.625% | | | 04/15/29 | | | | | | | | | | | | 195 | | | | 185,359 | |
| | | | | | | | | | | | | | | | | | | | |
| | | | | |
| | | | | | | | | | | | | | | | | | | 5,852,083 | |
| | | | | | | | | | | | | | | | | | | | |
| | | | | | | | | | | | | | | | | | | | |
Interest Rate | | Maturity
Date | | | | | | | | | Principal
Amount
(000)# | | | Value | |
|
|
| |
CORPORATE BONDS (continued) | | | | | |
Apparel — 0.0% | | | | | | | | | | | | | | | | | |
Hanesbrands, Inc., | |
Gtd. Notes, 144A | | | | | | | | | | | | | | | | | | | | |
4.875% | | | 05/15/26 | | | | | | | | | | | | 600 | | | $ | 590,358 | |
Wolverine World Wide, Inc., | |
Gtd. Notes, 144A | | | | | | | | | | | | | | | | | | | | |
4.000% | | | 08/15/29 | | | | | | | | | | | | 675 | | | | 591,897 | |
| | | | | | | | | | | | | | | | | | | | |
| | | | | |
| | | | | | | | | | | | | | | | | | | 1,182,255 | |
| | | | | | | | | | | | | | | | | | | | |
Auto Manufacturers — 0.8% | |
Ford Motor Co., | |
Sr. Unsec’d. Notes | | | | | | | | | | | | | | | | | | | | |
3.250% | | | 02/12/32 | | | | | | | | | | | | 10 | | | | 8,322 | |
4.750% | | | 01/15/43 | | | | | | | | | | | | 920 | | | | 724,611 | |
Ford Motor Credit Co. LLC, | |
Sr. Unsec’d. Notes | | | | | | | | | | | | | | | | | | | | |
2.900% | | | 02/16/28 | | | | | | | | | | | | 275 | | | | 253,746 | |
3.375% | | | 11/13/25 | | | | | | | | | | | | 725 | | | | 713,900 | |
4.134% | | | 08/04/25 | | | | | | | | | | | | 1,100 | | | | 1,093,096 | |
4.950% | | | 05/28/27 | | | | | | | | | | | | 1,000 | | | | 991,197 | |
5.113% | | | 05/03/29 | | | | | | | | | | | | 1,745 | | | | 1,698,458 | |
5.125% | | | 11/05/26(a) | | | | | | | | | | | | 1,260 | | | | 1,259,007 | |
5.800% | | | 03/08/29 | | | | | | | | | | | | 2,230 | | | | 2,230,166 | |
6.950% | | | 03/06/26 | | | | | | | | | | | | 400 | | | | 407,058 | |
General Motors Co., | |
Sr. Unsec’d. Notes | | | | | | | | | | | | | | | | | | | | |
4.000% | | | 04/01/25 | | | | | | | | | | | | 17 | | | | 16,954 | |
5.000% | | | 04/01/35 | | | | | | | | | | | | 1,365 | | | | 1,277,593 | |
5.150% | | | 04/01/38 | | | | | | | | | | | | 65 | | | | 59,814 | |
6.125% | | | 10/01/25 | | | | | | | | | | | | 26 | | | | 26,201 | |
6.600% | | | 04/01/36 | | | | | | | | | | | | 285 | | | | 299,038 | |
General Motors Financial Co., Inc., | |
|
Gtd. Notes | | | | | | | | | | | | | | | | | | | | |
4.300% | | | 07/13/25 | | | | | | | | | | | | 70 | | | | 69,757 | |
Jr. Sub. Notes, Series C | |
5.700%(ff) | | | 09/30/30(oo) | | | | | | | | | | | | 5 | | | | 4,840 | |
Sr. Unsec’d. Notes | |
2.350% | | | 01/08/31 | | | | | | | | | | | | 20 | | | | 16,764 | |
2.400% | | | 04/10/28 | | | | | | | | | | | | 1,065 | | | | 978,493 | |
2.400% | | | 10/15/28 | | | | | | | | | | | | 1,180 | | | | 1,069,831 | |
2.700% | | | 08/20/27 | | | | | | | | | | | | 38 | | | | 35,902 | |
2.700% | | | 06/10/31 | | | | | | | | | | | | 25 | | | | 21,181 | |
3.100% | | | 01/12/32 | | | | | | | | | | | | 20 | | | | 17,110 | |
Hyundai Capital America, | |
Sr. Unsec’d. Notes, 144A | | | | | | | | | | | | | | | | | | | | |
1.800% | | | 10/15/25 | | | | | | | | | | | | 40 | | | | 39,005 | |
2.375% | | | 10/15/27 | | | | | | | | | | | | 15 | | | | 13,992 | |
2.650% | | | 02/10/25 | | | | | | | | | | | | 15 | | | | 14,960 | |
Sr. Unsec’d. Notes, 144A, MTN | |
1.800% | | | 01/10/28 | | | | | | | | | | | | 15 | | | | 13,596 | |
Mercedes-Benz Finance North America LLC (Germany), | |
Gtd. Notes, 144A | | | | | | | | | | | | | | | | | | | | |
1.450% | | | 03/02/26 | | | | | | | | | | | | 150 | | | | 144,378 | |
Nissan Motor Acceptance Co. LLC, | |
Sr. Unsec’d. Notes, 144A, MTN | |
1.850% | | | 09/16/26 | | | | | | | | | | | | 54 | | | | 50,675 | |
SEE NOTES TO FINANCIAL STATEMENTS.
A173
| | | | |
| | PSF PGIM TOTAL RETURN BOND PORTFOLIO (CONTINUED) | | |
SCHEDULE OF INVESTMENTS | | | | as of December 31, 2024 |
| | | | | | | | | | | | | | | | | | | | |
Interest Rate | | Maturity
Date | | | | | | | | | Principal
Amount
(000)# | | | Value | |
|
|
| |
CORPORATE BONDS (continued) | | | | | |
Auto Manufacturers (cont’d.) | | | | | | | | | | | | | | | | | |
Toyota Motor Credit Corp., | | | | | | | | | | | | | | | | | |
Sr. Unsec’d. Notes, MTN | |
1.150% | | | 08/13/27 | | | | | | | | | | | | 25 | | | $ | 22,905 | |
1.900% | | | 04/06/28 | | | | | | | | | | | | 50 | | | | 45,740 | |
2.150% | | | 02/13/30 | | | | | | | | | | | | 10 | | | | 8,766 | |
Volkswagen Group of America Finance LLC (Germany), | |
Gtd. Notes, 144A | |
6.200% | | | 11/16/28 | | | | | | | | | | | | 4,000 | | | | 4,084,615 | |
| | | | | | | | | | | | | | | | | | | | |
| | | | | |
| | | | | | | | | | | | | | | | | | | 17,711,671 | |
| | | | | | | | | | | | | | | | | | | | |
Auto Parts & Equipment — 0.3% | |
American Axle & Manufacturing, Inc., | |
Gtd. Notes | |
6.500% | | | 04/01/27(a) | | | | | | | | | | | | 445 | | | | 440,550 | |
Aptiv Swiss Holdings Ltd., | |
Gtd. Notes | |
4.150% | | | 05/01/52 | | | | | | | | | | | | 20 | | | | 14,064 | |
4.650% | | | 09/13/29 | | | | | | | | | | | | 4,130 | | | | 3,997,364 | |
Dana Financing Luxembourg Sarl, | |
Gtd. Notes, 144A | |
5.750% | | | 04/15/25 | | | | | | | | | | | | 437 | | | | 434,269 | |
Dana, Inc., | |
Sr. Unsec’d. Notes | |
5.375% | | | 11/15/27 | | | | | | | | | | | | 350 | | | | 345,058 | |
Phinia, Inc., | | | | | | | | | | | | | | | | | |
Sr. Sec’d. Notes, 144A | |
6.750% | | | 04/15/29 | | | | | | | | | | | | 290 | | | | 295,819 | |
Tenneco, Inc., | | | | | | | | | | | | | | | | | |
Sr. Sec’d. Notes, 144A | | | | | | | | | | | | | | | | | |
8.000% | | | 11/17/28 | | | | | | | | | | | | 2,225 | | | | 2,069,776 | |
| | | | | | | | | | | | | | | | | | | | |
| | | | | |
| | | | | | | | | | | | | | | | | | | 7,596,900 | |
| | | | | | | | | | | | | | | | | | | | |
Banks — 7.4% | | | | | | | | | | | | | | | | | | | | |
Banco Santander SA (Spain), | | | | | | | | | | | | | | | | | |
Sr. Non-Preferred Notes | |
1.849% | | | 03/25/26 | | | | | | | | | | | | 600 | | | | 577,718 | |
5.538%(ff) | | | 03/14/30 | | | | | | | | | | | | 1,000 | | | | 1,004,216 | |
Sub. Notes | | | | | | | | | | | | | | | | | | | | |
2.749% | | | 12/03/30 | | | | | | | | | | | | 1,000 | | | | 845,253 | |
Bank of America Corp., | | | | | | | | | | | | | | | | | |
Sr. Unsec’d. Notes | |
1.734%(ff) | | | 07/22/27 | | | | | | | | | | | | 45 | | | | 42,902 | |
2.299%(ff) | | | 07/21/32 | | | | | | | | | | | | 20 | | | | 16,680 | |
2.572%(ff) | | | 10/20/32 | | | | | | | | | | | | 10 | | | | 8,420 | |
2.687%(ff) | | | 04/22/32 | | | | | | | | | | | | 2,565 | | | | 2,205,560 | |
3.419%(ff) | | | 12/20/28 | | | | | | | | | | | | 10 | | | | 9,588 | |
5.288%(ff) | | | 04/25/34(a) | | | | | | | | | | | | 2,295 | | | | 2,277,963 | |
5.819%(ff) | | | 09/15/29 | | | | | | | | | | | | 7,630 | | | | 7,820,830 | |
Sr. Unsec’d. Notes, GMTN | | | | | |
3.593%(ff) | | | 07/21/28 | | | | | | | | | | | | 740 | | | | 716,270 | |
Sr. Unsec’d. Notes, MTN | | | | | |
1.898%(ff) | | | 07/23/31 | | | | | | | | | | | | 50 | | | | 42,077 | |
1.922%(ff) | | | 10/24/31 | | | | | | | | | | | | 20 | | | | 16,690 | |
2.496%(ff) | | | 02/13/31 | | | | | | | | | | | | 92 | | | | 80,765 | |
3.824%(ff) | | | 01/20/28 | | | | | | | | | | | | 3,410 | | | | 3,339,326 | |
3.974%(ff) | | | 02/07/30 | | | | | | | | | | | | 685 | | | | 656,700 | |
4.078%(ff) | | | 04/23/40 | | | | | | | | | | | | 2,340 | | | | 1,989,143 | |
| | | | | | | | | | | | | | |
Interest Rate | | Maturity Date | | | | | | Principal
Amount
(000)# | | | Value | |
|
|
| |
CORPORATE BONDS (continued) | | | | | |
Banks (cont’d.) | | | | | | | | | | | | |
4.271%(ff) | | 07/23/29 | | | | | | | 945 | | | $ | 920,153 | |
Sr. Unsec’d. Notes, Series N | | | | | |
2.651%(ff) | | 03/11/32 | | | | | | | 5,020 | | | | 4,321,721 | |
Sub. Notes, MTN | | | | | |
4.000% | | 01/22/25 | | | | | | | 1,122 | | | | 1,121,406 | |
Sub. Notes, Series L, MTN | | | | | |
3.950% | | 04/21/25 | | | | | | | 90 | | | | 89,724 | |
4.183% | | 11/25/27 | | | | | | | 50 | | | | 49,103 | |
Bank of New York Mellon Corp. (The), | |
Jr. Sub. Notes, Series H | |
3.700%(ff) | | 03/20/26(oo) | | | | | | | 15 | | | | 14,517 | |
Barclays PLC (United Kingdom), | |
Sr. Unsec’d. Notes | |
2.279%(ff) | | 11/24/27 | | | | | | | 1,245 | | | | 1,182,907 | |
3.650% | | 03/16/25 | | | | | | | 700 | | | | 698,062 | |
4.837%(ff) | | 09/10/28 | | | | | | | 1,200 | | | | 1,191,988 | |
BNP Paribas SA (France), | |
Sr. Non-Preferred Notes, 144A | |
1.323%(ff) | | 01/13/27 | | | | | | | 710 | | | | 683,184 | |
1.904%(ff) | | 09/30/28 | | | | | | | 2,200 | | | | 2,015,180 | |
2.871%(ff) | | 04/19/32 | | | | | | | 1,815 | | | | 1,544,951 | |
Sub. Notes, 144A | | | | | | | | | | | | |
5.906%(ff) | | 11/19/35 | | | | | | | 4,325 | | | | 4,205,863 | |
BPCE SA (France), | |
Sr. Non-Preferred Notes, 144A | |
2.045%(ff) | | 10/19/27 | | | | | | | 2,595 | | | | 2,453,949 | |
Sr. Non-Preferred Notes, 144A, MTN | | | | | |
3.500% | | 10/23/27 | | | | | | | 300 | | | | 286,432 | |
Sub. Notes, 144A, MTN | | | | | |
4.500% | | 03/15/25 | | | | | | | 1,120 | | | | 1,117,305 | |
4.875% | | 04/01/26 | | | | | | | 380 | | | | 377,720 | |
Cassa Depositi e Prestiti SpA (Italy), | |
Sr. Unsec’d. Notes, 144A | |
5.750% | | 05/05/26 | | | | | | | 600 | | | | 603,311 | |
5.875% | | 04/30/29 | | | | | | | 1,600 | | | | 1,623,179 | |
Citigroup, Inc., | |
Jr. Sub. Notes, Series EE | |
6.750%(ff) | | 02/15/30(oo) | | | | | | | 3,430 | | | | 3,413,237 | |
Jr. Sub. Notes, Series V | | | | | |
4.700%(ff) | | 01/30/25(oo) | | | | | | | 1,445 | | | | 1,438,445 | |
Jr. Sub. Notes, Series W | | | | | |
4.000%(ff) | | 12/10/25(oo) | | | | | | | 890 | | | | 867,001 | |
Jr. Sub. Notes, Series X | | | | | |
3.875%(ff) | | 02/18/26(oo) | | | | | | | 1,880 | | | | 1,821,011 | |
Jr. Sub. Notes, Series Y | | | | | |
4.150%(ff) | | 11/15/26(oo) | | | | | | | 25 | | | | 23,796 | |
Sr. Unsec’d. Notes | | | | | |
2.520%(ff) | | 11/03/32 | | | | | | | 10 | | | | 8,331 | |
2.561%(ff) | | 05/01/32 | | | | | | | 875 | | | | 741,443 | |
2.572%(ff) | | 06/03/31 | | | | | | | 70 | | | | 61,007 | |
2.666%(ff) | | 01/29/31 | | | | | | | 1,225 | | | | 1,082,452 | |
2.976%(ff) | | 11/05/30 | | | | | | | 20 | | | | 18,054 | |
3.200% | | 10/21/26 | | | | | | | 3,255 | | | | 3,166,675 | |
3.668%(ff) | | 07/24/28 | | | | | | | 30 | | | | 29,045 | |
3.785%(ff) | | 03/17/33 | | | | | | | 1,160 | | | | 1,042,161 | |
3.887%(ff) | | 01/10/28 | | | | | | | 1,725 | | | | 1,689,960 | |
3.980%(ff) | | 03/20/30 | | | | | | | 35 | | | | 33,364 | |
SEE NOTES TO FINANCIAL STATEMENTS.
A174
| | | | |
| | PSF PGIM TOTAL RETURN BOND PORTFOLIO (CONTINUED) | | |
SCHEDULE OF INVESTMENTS | | | | as of December 31, 2024 |
| | | | | | | | | | | | | | | | | | |
Interest Rate | | Maturity
Date | | | | | Principal
Amount
(000)# | | | Value | |
|
CORPORATE BONDS (continued) | |
Banks (cont’d.) | |
4.542%(ff) | | 09/19/30 | | | | | | | | | | | 8,000 | | | $ | 7,771,528 | |
5.174%(ff) | | 02/13/30 | | | | | | | | | | | 2,475 | | | | 2,471,175 | |
Sub. Notes | |
4.300% | | 11/20/26 | | | | | | | | | | | 110 | | | | 109,001 | |
4.450% | | 09/29/27 | | | | | | | | | | | 2,735 | | | | 2,697,082 | |
Deutsche Bank AG (Germany), | |
Sr. Non-Preferred Notes, EMTN | |
1.750%(ff) | | 11/19/30 | | | | | | | EUR | | | | 100 | | | | 95,322 | |
Sub. Notes | |
3.742%(ff) | | 01/07/33 | | | | | | | | | | | 2,415 | | | | 2,043,214 | |
Discover Bank, | |
Sr. Unsec’d. Notes | |
3.450% | | 07/27/26 | | | | | | | | | | | 280 | | | | 273,797 | |
4.250% | | 03/13/26 | | | | | | | | | | | 1,150 | | | | 1,140,327 | |
Fifth Third Bancorp, | |
Sr. Unsec’d. Notes | |
6.339%(ff) | | 07/27/29 | | | | | | | | | | | 4,000 | | | | 4,148,290 | |
Freedom Mortgage Corp., | |
Sr. Unsec’d. Notes, 144A | |
12.000% | | 10/01/28 | | | | | | | | | | | 200 | | | | 216,966 | |
Goldman Sachs Group, Inc. (The), | |
Jr. Sub. Notes, Series U | |
3.650%(ff) | | 08/10/26(oo) | | | | | | | | | | | 950 | | | | 907,256 | |
Sr. Unsec’d. Notes | |
1.948%(ff) | | 10/21/27 | | | | | | | | | | | 50 | | | | 47,435 | |
1.992%(ff) | | 01/27/32 | | | | | | | | | | | 20 | | | | 16,523 | |
2.383%(ff) | | 07/21/32 | | | | | | | | | | | 1,480 | | | | 1,236,201 | |
2.600% | | 02/07/30 | | | | | | | | | | | 35 | | | | 30,982 | |
2.615%(ff) | | 04/22/32 | | | | | | | | | | | 4,715 | | | | 4,018,886 | |
2.650%(ff) | | 10/21/32 | | | | | | | | | | | 10 | | | | 8,447 | |
2.908%(ff) | | 07/21/42 | | | | | | | | | | | 25 | | | | 17,357 | |
3.436%(ff) | | 02/24/43 | | | | | | | | | | | 35 | | | | 26,047 | |
3.500% | | 01/23/25 | | | | | | | | | | | 20 | | | | 19,982 | |
3.691%(ff) | | 06/05/28 | | | | | | | | | | | 50 | | | | 48,538 | |
3.750% | | 02/25/26 | | | | | | | | | | | 125 | | | | 123,706 | |
3.814%(ff) | | 04/23/29 | | | | | | | | | | | 1,080 | | | | 1,038,519 | |
3.850% | | 01/26/27 | | | | | | | | | | | 1,765 | | | | 1,732,702 | |
6.484%(ff) | | 10/24/29 | | | | | | | | | | | 3,230 | | | | 3,383,544 | |
Sr. Unsec’d. Notes, GMTN, 3 Month SOFR + 2.012% | |
6.629%(c) | | 10/28/27 | | | | | | | | | | | 21 | | | | 21,469 | |
Sr. Unsec’d. Notes, MTN | |
4.800% | | 07/08/44 | | | | | | | | | | | 20 | | | | 17,695 | |
Sr. Unsec’d. Notes, Series VAR | |
1.093%(ff) | | 12/09/26 | | | | | | | | | | | 85 | | | | 82,049 | |
Huntington Bancshares, Inc., | |
Sr. Unsec’d. Notes | |
6.208%(ff) | | 08/21/29 | | | | | | | | | | | 545 | | | | 562,409 | |
JPMorgan Chase & Co., | |
Jr. Sub. Notes, Series HH | |
4.600%(ff) | | 02/01/25(oo) | | | | | | | | | | | 1,940 | | | | 1,932,244 | |
Jr. Sub. Notes, Series II | |
4.000%(ff) | | 04/01/25(oo) | | | | | | | | | | | 1,350 | | | | 1,339,042 | |
Jr. Sub. Notes, Series KK | |
3.650%(ff) | | 06/01/26(oo) | | | | | | | | | | | 1,860 | | | | 1,806,347 | |
Sr. Unsec’d. Notes | |
1.045%(ff) | | 11/19/26 | | | | | | | | | | | 20 | | | | 19,359 | |
1.578%(ff) | | 04/22/27 | | | | | | | | | | | 785 | | | | 753,805 | |
| | | | | | | | | | | | | | | | | | |
Interest Rate | | Maturity
Date | | | | | | | | Principal
Amount
(000)# | | | Value | |
|
CORPORATE BONDS (continued) | |
Banks (cont’d.) | | | | | | | | | | | | | |
1.953%(ff) | | 02/04/32 | | | | | | | | | | | 130 | | | $ | 107,873 | |
2.069%(ff) | | 06/01/29 | | | | | | | | | | | 50 | | | | 45,406 | |
2.545%(ff) | | 11/08/32 | | | | | | | | | | | 1,135 | | | | 957,602 | |
2.580%(ff) | | 04/22/32 | | | | | | | | | | | 1,775 | | | | 1,523,553 | |
2.947%(ff) | | 02/24/28 | | | | | | | | | | | 1,715 | | | | 1,648,523 | |
3.300% | | 04/01/26 | | | | | | | | | | | 1,110 | | | | 1,093,418 | |
3.782%(ff) | | 02/01/28 | | | | | | | | | | | 1,235 | | | | 1,208,325 | |
3.897%(ff) | | 01/23/49 | | | | | | | | | | | 10 | | | | 7,696 | |
3.960%(ff) | | 01/29/27 | | | | | | | | | | | 930 | | | | 921,935 | |
3.964%(ff) | | 11/15/48 | | | | | | | | | | | 985 | | | | 769,814 | |
4.005%(ff) | | 04/23/29 | | | | | | | | | | | 1,200 | | | | 1,163,247 | |
4.452%(ff) | | 12/05/29 | | | | | | | | | | | 17 | | | | 16,646 | |
5.581%(ff) | | 04/22/30 | | | | | | | | | | | 2,050 | | | | 2,088,655 | |
Sub. Notes | |
2.956%(ff) | | 05/13/31 | | | | | | | | | | | 155 | | | | 138,515 | |
4.125% | | 12/15/26 | | | | | | | | | | | 40 | | | | 39,589 | |
JPMorgan Chase Bank NA, | | | | | | | | | | | | | |
Sr. Unsec’d. Notes | |
5.110% | | 12/08/26 | | | | | | | | | | | 360 | | | | 363,885 | |
Morgan Stanley, | |
Sr. Unsec’d. Notes | |
5.449%(ff) | | 07/20/29 | | | | | | | | | | | 860 | | | | 869,599 | |
Sr. Unsec’d. Notes, GMTN | |
1.512%(ff) | | 07/20/27 | | | | | | | | | | | 15 | | | | 14,274 | |
2.239%(ff) | | 07/21/32 | | | | | | | | | | | 5,518 | | | | 4,570,149 | |
2.699%(ff) | | 01/22/31 | | | | | | | | | | | 35 | | | | 31,081 | |
4.431%(ff) | | 01/23/30 | | | | | | | | | | | 1,340 | | | | 1,305,499 | |
Sr. Unsec’d. Notes, MTN | |
1.794%(ff) | | 02/13/32 | | | | | | | | | | | 1,015 | | | | 828,509 | |
1.928%(ff) | | 04/28/32 | | | | | | | | | | | 193 | | | | 158,086 | |
2.511%(ff) | | 10/20/32 | | | | | | | | | | | 1,590 | | | | 1,331,279 | |
2.943%(ff) | | 01/21/33 | | | | | | | | | | | 1,470 | | | | 1,259,046 | |
3.125% | | 07/27/26 | | | | | | | | | | | 2,725 | | | | 2,662,224 | |
5.250%(ff) | | 04/21/34 | | | | | | | | | | | 2,230 | | | | 2,196,043 | |
5.831%(ff) | | 04/19/35 | | | | | | | | | | | 965 | | | | 983,411 | |
Sub. Notes | |
2.484%(ff) | | 09/16/36 | | | | | | | | | | | 20 | | | | 16,267 | |
Sub. Notes, GMTN | |
4.350% | | 09/08/26 | | | | | | | | | | | 756 | | | | 750,690 | |
PNC Financial Services Group, Inc. (The), | |
Sr. Unsec’d. Notes | |
5.582%(ff) | | 06/12/29 | | | | | | | | | | | 2,390 | | | | 2,429,925 | |
Societe Generale SA (France), | | | | | | | | | | | | | |
Gtd. Notes, 144A | |
2.797%(ff) | | 01/19/28 | | | | | | | | | | | 2,210 | | | | 2,096,885 | |
Sr. Non-Preferred Notes, 144A | |
2.889%(ff) | | 06/09/32 | | | | | | | | | | | 1,500 | | | | 1,252,475 | |
3.337%(ff) | | 01/21/33 | | | | | | | | | | | 1,330 | | | | 1,123,985 | |
5.519%(ff) | | 01/19/28 | | | | | | | | | | | 2,390 | | | | 2,395,230 | |
Standard Chartered PLC (United Kingdom), | |
Sr. Unsec’d. Notes, 144A | |
2.819%(ff) | | 01/30/26 | | | | | | | | | | | 25 | | | | 24,950 | |
Sumitomo Mitsui Financial Group, Inc. (Japan), | |
Sr. Unsec’d. Notes | |
3.364% | | 07/12/27 | | | | | | | | | | | 50 | | | | 48,254 | |
SEE NOTES TO FINANCIAL STATEMENTS.
A175
| | | | |
| | PSF PGIM TOTAL RETURN BOND PORTFOLIO (CONTINUED) | | |
SCHEDULE OF INVESTMENTS | | | | as of December 31, 2024 |
| | | | | | | | | | | | | | | | | | |
Interest Rate | | Maturity Date | | | | | | | | Principal
Amount
(000)# | | | Value | |
|
CORPORATE BONDS (continued) | |
Banks (cont’d.) | |
Truist Financial Corp., | |
Sr. Unsec’d. Notes, MTN | |
7.161%(ff) | | 10/30/29 | | | | | | | | | | | 995 | | | $ | 1,063,295 | |
U.S. Bancorp, | |
Jr. Sub. Notes | |
3.700%(ff) | | 01/15/27(oo) | | | | | | | | | | | 30 | | | | 28,390 | |
Jr. Sub. Notes, Series J | |
5.300%(ff) | | 04/15/27(oo) | | | | | | | | | | | 25 | | | | 24,613 | |
UBS Group AG (Switzerland), | |
Sr. Unsec’d. Notes, 144A | |
3.091%(ff) | | 05/14/32 | | | | | | | | | | | 1,695 | | | | 1,474,650 | |
6.537%(ff) | | 08/12/33 | | | | | | | | | | | 870 | | | | 920,025 | |
UniCredit SpA (Italy), | |
Sr. Non-Preferred Notes, 144A | |
2.569%(ff) | | 09/22/26 | | | | | | | | | | | 685 | | | | 671,357 | |
Sr. Preferred Notes, 144A | |
3.127%(ff) | | 06/03/32 | | | | | | | | | | | 1,225 | | | | 1,059,978 | |
Wells Fargo & Co., | |
Sr. Unsec’d. Notes | |
3.068%(ff) | | 04/30/41 | | | | | | | | | | | 2,690 | | | | 1,954,160 | |
5.389%(ff) | | 04/24/34 | | | | | | | | | | | 12,985 | | | | 12,824,115 | |
6.303%(ff) | | 10/23/29 | | | | | | | | | | | 3,690 | | | | 3,836,138 | |
Sr. Unsec’d. Notes, MTN | |
2.393%(ff) | | 06/02/28 | | | | | | | | | | | 60 | | | | 56,503 | |
2.572%(ff) | | 02/11/31 | | | | | | | | | | | 3,525 | | | | 3,109,186 | |
Sub. Notes, MTN | |
4.100% | | 06/03/26 | | | | | | | | | | | 20 | | | | 19,799 | |
| | | | | | | | | | | | | | | | | | |
| | | | | |
| | | | | | | | | | | | | | | | | 167,228,736 | |
| | | | | | | | | | | | | | | | | | |
Beverages — 0.2% | |
Anheuser-Busch Cos. LLC/Anheuser-Busch InBev Worldwide, Inc. (Belgium), | |
Gtd. Notes | |
4.700% | | 02/01/36 | | | | | | | | | | | 31 | | | | 29,439 | |
4.900% | | 02/01/46 | | | | | | | | | | | 4,294 | | | | 3,911,323 | |
Anheuser-Busch InBev Worldwide, Inc. (Belgium), | |
Gtd. Notes | |
3.500% | | 06/01/30 | | | | | | | | | | | 30 | | | | 28,093 | |
4.750% | | 01/23/29 | | | | | | | | | | | 118 | | | | 117,902 | |
Coca-Cola Co. (The), | |
Sr. Unsec’d. Notes | |
1.375% | | 03/15/31 | | | | | | | | | | | 10 | | | | 8,186 | |
1.650% | | 06/01/30 | | | | | | | | | | | 10 | | | | 8,527 | |
Constellation Brands, Inc., | |
Sr. Unsec’d. Notes | |
2.875% | | 05/01/30 | | | | | | | | | | | 70 | | | | 62,554 | |
| | | | | | | | | | | | | | | | | | |
| | | | | |
| | | | | | | | | | | | | | | | | 4,166,024 | |
| | | | | | | | | | | | | | | | | | |
Biotechnology — 0.2% | |
Amgen, Inc., | |
Sr. Unsec’d. Notes | |
2.000% | | 01/15/32 | | | | | | | | | | | 10 | | | | 8,114 | |
2.800% | | 08/15/41 | | | | | | | | | | | 1,825 | | | | 1,268,334 | |
3.150% | | 02/21/40 | | | | | | | | | | | 20 | | | | 14,866 | |
4.875% | | 03/01/53 | | | | | | | | | | | 15 | | | | 12,866 | |
5.150% | | 11/15/41 | | | | | | | | | | | 16 | | | | 14,838 | |
5.600% | | 03/02/43 | | | | | | | | | | | 3,180 | | | | 3,094,991 | |
| | | | | | | | | | | | | | | | | | |
Interest Rate | | Maturity Date | | | | | | | | Principal
Amount
(000)# | | | Value | |
|
CORPORATE BONDS (continued) | |
Biotechnology (cont’d.) | |
Baxalta, Inc., | |
Gtd. Notes | |
4.000% | | 06/23/25 | | | | | | | | | | | 75 | | | $ | 74,745 | |
Gilead Sciences, Inc., | |
Sr. Unsec’d. Notes | |
2.600% | | 10/01/40 | | | | | | | | | | | 1,055 | | | | 730,138 | |
2.800% | | 10/01/50 | | | | | | | | | | | 10 | | | | 6,149 | |
2.950% | | 03/01/27 | | | | | | | | | | | 7 | | | | 6,761 | |
4.750% | | 03/01/46 | | | | | | | | | | | 10 | | | | 8,820 | |
| | | | | | | | | | | | | | | | | | |
| | | | | |
| | | | | | | | | | | | | | | | | 5,240,622 | |
| | | | | | | | | | | | | | | | | | |
Building Materials — 0.1% | |
JELD-WEN, Inc., | |
Gtd. Notes, 144A | |
4.875% | | 12/15/27 | | | | | | | | | | | 675 | | | | 638,185 | |
Johnson Controls International PLC/Tyco Fire & Security Finance SCA, | |
Sr. Unsec’d. Notes | |
1.750% | | 09/15/30 | | | | | | | | | | | 20 | | | | 16,701 | |
Owens Corning, | |
Sr. Unsec’d. Notes | |
5.500% | | 06/15/27 | | | | | | | | | | | 1,470 | | | | 1,495,669 | |
Smyrna Ready Mix Concrete LLC, | |
Sr. Sec’d. Notes, 144A | |
6.000% | | 11/01/28 | | | | | | | | | | | 1,275 | | | | 1,243,181 | |
Vulcan Materials Co., | |
Sr. Unsec’d. Notes | |
3.500% | | 06/01/30 | | | | | | | | | | | 15 | | | | 13,910 | |
| | | | | | | | | | | | | | | | | | |
| | | | | |
| | | | | | | | | | | | | | | | | 3,407,646 | |
| | | | | | | | | | | | | | | | | | |
Chemicals — 0.9% | | | | | | | | | | | | | | | | |
Ashland, Inc., | |
Sr. Unsec’d. Notes | |
6.875% | | 05/15/43 | | | | | | | | | | | 1,400 | | | | 1,455,220 | |
Braskem Netherlands Finance BV (Brazil), | |
Gtd. Notes, 144A | |
4.500% | | 01/10/28 | | | | | | | | | | | 214 | | | | 195,676 | |
4.500% | | 01/31/30 | | | | | | | | | | | 271 | | | | 227,602 | |
8.500% | | 01/12/31 | | | | | | | | | | | 2,965 | | | | 2,960,552 | |
Celanese US Holdings LLC, | |
Gtd. Notes | |
6.600% | | 11/15/28 | | | | | | | | | | | 700 | | | | 716,327 | |
CF Industries, Inc., | |
Gtd. Notes | |
4.950% | | 06/01/43 | | | | | | | | | | | 675 | | | | 594,506 | |
Dow Chemical Co. (The), | |
Sr. Unsec’d. Notes | |
3.600% | | 11/15/50 | | | | | | | | | | | 5 | | | | 3,435 | |
DuPont de Nemours, Inc., | |
Sr. Unsec’d. Notes | |
4.725% | | 11/15/28 | | | | | | | | | | | 2,610 | | | | 2,598,328 | |
FMC Corp., | |
Sr. Unsec’d. Notes | |
3.450% | | 10/01/29 | | | | | | | | | | | 2,810 | | | | 2,575,222 | |
5.650% | | 05/18/33(a) | | | | | | | | | | | 1,405 | | | | 1,389,474 | |
LYB International Finance III LLC, | |
Gtd. Notes | |
1.250% | | 10/01/25 | | | | | | | | | | | 35 | | | | 34,064 | |
SEE NOTES TO FINANCIAL STATEMENTS.
A176
| | | | |
| | PSF PGIM TOTAL RETURN BOND PORTFOLIO (CONTINUED) | | |
SCHEDULE OF INVESTMENTS | | | | as of December 31, 2024 |
| | | | | | | | | | | | | | | | |
| | | | | | Principal | | | | |
| Interest | | Maturity | | | | | Amount | | | | |
Rate | | Date | | | | | (000)# | | | Value | |
|
CORPORATE BONDS (continued) | |
Chemicals (cont’d.) | |
3.375% | | | 10/01/40 | | | | | | | | 60 | | | $ | 43,852 | |
4.200% | | | 10/15/49 | | | | | | | | 5 | | | | 3,768 | |
Nutrien Ltd. (Canada), | |
Sr. Unsec’d. Notes | |
4.900% | | | 06/01/43 | | | | | | | | 870 | | | | 768,760 | |
5.250% | | | 01/15/45 | | | | | | | | 305 | | | | 279,260 | |
OCP SA (Morocco), | |
Sr. Unsec’d. Notes, 144A | |
3.750% | | | 06/23/31 | | | | | | | | 1,230 | | | | 1,063,187 | |
6.750% | | | 05/02/34 | | | | | | | | 1,385 | | | | 1,410,623 | |
Olympus Water US Holding Corp., | |
Sr. Sec’d. Notes, 144A | |
9.750% | | | 11/15/28 | | | | | | | | 1,750 | | | | 1,855,796 | |
Sasol Financing USA LLC (South Africa), | |
Gtd. Notes | |
4.375% | | | 09/18/26 | | | | | | | | 460 | | | | 440,593 | |
Sherwin-Williams Co. (The), | |
Sr. Unsec’d. Notes | |
2.300% | | | 05/15/30 | | | | | | | | 20 | | | | 17,456 | |
3.450% | | | 08/01/25 | | | | | | | | 449 | | | | 445,531 | |
Yara International ASA (Brazil), | |
Sr. Unsec’d. Notes, 144A | |
4.750% | | | 06/01/28 | | | | | | | | 2,410 | | | | 2,369,560 | |
| | | | | | | | | | | | | | | | |
| | | | | |
| | | | | | | | | | | | | | | 21,448,792 | |
| | | | | | | | | | | | | | | | |
Commercial Services — 0.4% | |
Allied Universal Holdco LLC/Allied Universal Finance Corp./Atlas Luxco 4 Sarl, | |
Sr. Sec’d. Notes, 144A | |
4.625% | | | 06/01/28 | | | | | | | | 1,300 | | | | 1,221,610 | |
Alta Equipment Group, Inc., | |
Sec’d. Notes, 144A | |
9.000% | | | 06/01/29 | | | | | | | | 645 | | | | 615,291 | |
Belron UK Finance PLC (United Kingdom), | |
Sr. Sec’d. Notes, 144A | |
5.750% | | | 10/15/29 | | | | | | | | 455 | | | | 453,294 | |
Boost Newco Borrower LLC, | |
Sr. Sec’d. Notes, 144A | |
7.500% | | | 01/15/31 | | | | | | | | 200 | | | | 209,521 | |
DCLI Bidco LLC, | |
Second Mortgage, 144A | |
7.750% | | | 11/15/29 | | | | | | | | 290 | | | | 296,353 | |
DP World Ltd. (United Arab Emirates), | |
Sr. Unsec’d. Notes, 144A | |
2.375% | | | 09/25/26 | | | EUR | | | | | 785 | | | | 798,660 | |
ERAC USA Finance LLC, | |
Gtd. Notes, 144A | |
7.000% | | | 10/15/37 | | | | | | | | 770 | | | | 867,430 | |
Global Payments, Inc., | |
Sr. Unsec’d. Notes | |
1.200% | | | 03/01/26 | | | | | | | | 145 | | | | 138,969 | |
2.650% | | | 02/15/25 | | | | | | | | 40 | | | | 39,851 | |
3.200% | | | 08/15/29 | | | | | | | | 30 | | | | 27,502 | |
S&P Global, Inc., | |
Gtd. Notes | |
4.250% | | | 05/01/29 | | | | | | | | 60 | | | | 58,685 | |
| | | | | | | | | | | | | | | | | | | | |
| | | | | | | Principal | | | | |
| Interest | | Maturity | | | | | | Amount | | | | |
Rate | | Date | | | | | | (000)# | | | Value | |
|
CORPORATE BONDS (continued) | |
Commercial Services (cont’d.) | |
Service Corp. International, | |
Sr. Unsec’d. Notes | |
5.750% | | | 10/15/32 | | | | | | | | | | | | 310 | | | $ | 301,386 | |
United Rentals North America, Inc., | |
Gtd. Notes | |
3.750% | | | 01/15/32 | | | | | | | | | | | | 50 | | | | 43,782 | |
3.875% | | | 02/15/31 | | | | | | | | | | | | 392 | | | | 350,265 | |
4.875% | | | 01/15/28 | | | | | | | | | | | | 1,325 | | | | 1,287,737 | |
5.250% | | | 01/15/30 | | | | | | | | | | | | 300 | | | | 291,452 | |
University of Southern California, | |
Sr. Unsec’d. Notes | |
4.976% | | | 10/01/53(a) | | | | | | | | | | | | 1,690 | | | | 1,578,937 | |
| | | | | | | | | | | | | | | | | | | | |
| | | | | |
| | | | | | | | | | | | | | | | | | | 8,580,725 | |
| | | | | | | | | | | | | | | | | | | | |
Computers — 0.1% | |
Apple, Inc., | |
Sr. Unsec’d. Notes | |
0.700% | | | 02/08/26 | | | | | | | | | | | | 40 | | | | 38,435 | |
1.400% | | | 08/05/28 | | | | | | | | | | | | 29 | | | | 26,030 | |
1.650% | | | 02/08/31 | | | | | | | | | | | | 55 | | | | 46,262 | |
2.375% | | | 02/08/41 | | | | | | | | | | | | 40 | | | | 27,530 | |
2.950% | | | 09/11/49 | | | | | | | | | | | | 25 | | | | 16,676 | |
3.350% | | | 02/09/27 | | | | | | | | | | | | 70 | | | | 68,572 | |
Gartner, Inc., | |
Gtd. Notes, 144A | |
4.500% | | | 07/01/28 | | | | | | | | | | | | 230 | | | | 224,039 | |
NCR Atleos Corp., | |
Sr. Sec’d. Notes, 144A | |
9.500% | | | 04/01/29 | | | | | | | | | | | | 866 | | | | 936,850 | |
Seagate HDD Cayman, | |
Gtd. Notes | |
4.875% | | | 06/01/27 | | | | | | | | | | | | 40 | | | | 39,406 | |
| | | | | | | | | | | | | | | | | | | | |
| | | | | |
| | | | | | | | | | | | | | | | | | | 1,423,800 | |
| | | | | | | | | | | | | | | | | | | | |
Distribution/Wholesale — 0.1% | |
H&E Equipment Services, Inc., | |
Gtd. Notes, 144A | |
3.875% | | | 12/15/28 | | | | | | | | | | | | 1,550 | | | | 1,419,383 | |
Ritchie Bros Holdings, Inc. (Canada), | |
Sr. Sec’d. Notes, 144A | |
6.750% | | | 03/15/28 | | | | | | | | | | | | 50 | | | | 51,000 | |
| | | | | | | | | | | | | | | | | | | | |
| | | | | |
| | | | | | | | | | | | | | | | | | | 1,470,383 | |
| | | | | | | | | | | | | | | | | | | | |
Diversified Financial Services — 0.5% | |
American Express Co., | |
Jr. Sub. Notes | |
3.550%(ff) | | | 09/15/26(oo) | | | | | | | | | | | | 10 | | | | 9,555 | |
Blackstone Private Credit Fund, | |
Sr. Sec’d. Notes | |
5.610% | | | 05/03/27^ | | | | | | | | | | | | 1,100 | | | | 1,087,185 | |
Capital One Financial Corp., | |
Sr. Unsec’d. Notes | |
3.800% | | | 01/31/28 | | | | | | | | | | | | 5 | | | | 4,826 | |
Sub. Notes | |
2.359%(ff) | | | 07/29/32 | | | | | | | | | | | | 45 | | | | 36,225 | |
SEE NOTES TO FINANCIAL STATEMENTS.
A177
| | | | |
| | PSF PGIM TOTAL RETURN BOND PORTFOLIO (CONTINUED) | | |
SCHEDULE OF INVESTMENTS | | | | as of December 31, 2024 |
| | | | | | | | | | | | | | | | | | | | |
Interest Rate | | Maturity
Date | | | | | | | | | Principal
Amount
(000)# | | | Value | |
|
CORPORATE BONDS (continued) | |
Diversified Financial Services (cont’d.) | | | | | |
Charles Schwab Corp. (The), | | | | | | | | | | | | | | | | | |
Jr. Sub. Notes, Series H | | | | | | | | | | | | | | | | | |
4.000%(ff) | | | 12/01/30(oo) | | | | | | | | | | | | 20 | | | $ | 17,248 | |
Jr. Sub. Notes, Series I | | | | | | | | | | | | | | | | | |
4.000%(ff) | | | 06/01/26(oo) | | | | | | | | | | | | 35 | | | | 33,803 | |
LPL Holdings, Inc., | | | | | | | | | | | | | | | | | |
Gtd. Notes | | | | | | | | | | | | | | | | | | | | |
6.750% | | | 11/17/28(a) | | | | | | | | | | | | 3,170 | | | | 3,330,759 | |
LSEG US Fin Corp. (United Kingdom), | | | | | |
Gtd. Notes, 144A | | | | | | | | | | | | | | | | | |
5.297% | | | 03/28/34 | | | | | | | | | | | | 2,155 | | | | 2,146,727 | |
Mastercard, Inc., | | | | | | | | | | | | | | | | | | | | |
Sr. Unsec’d. Notes | | | | | | | | | | | | | | | | | |
1.900% | | | 03/15/31 | | | | | | | | | | | | 15 | | | | 12,685 | |
3.850% | | | 03/26/50 | | | | | | | | | | | | 20 | | | | 15,506 | |
Nationstar Mortgage Holdings, Inc., | | | | | | | | | |
Gtd. Notes, 144A | | | | | | | | | | | | | |
5.125% | | | 12/15/30 | | | | | | | | | | | | 75 | | | | 69,983 | |
5.500% | | | 08/15/28 | | | | | | | | | | | | 805 | | | | 781,871 | |
6.000% | | | 01/15/27 | | | | | | | | | | | | 275 | | | | 273,296 | |
Nomura Holdings, Inc. (Japan), | | | | | | | | | | | | | | | | | |
Sr. Unsec’d. Notes | | | | | | | | | | | | | |
2.608% | | | 07/14/31 | | | | | | | | | | | | 515 | | | | 433,789 | |
Nuveen LLC, | | | | | | | | | | | | | | | | | | | | |
Sr. Unsec’d. Notes, 144A | | | | | | | | | | | | | |
5.850% | | | 04/15/34 | | | | | | | | | | | | 965 | | | | 974,625 | |
OneMain Finance Corp., | | | | | | | | | | | | | | | | | |
Gtd. Notes | | | | | | | | | | | | | | | | | | | | |
3.875% | | | 09/15/28 | | | | | | | | | | | | 575 | | | | 529,924 | |
6.625% | | | 05/15/29 | | | | | | | | | | | | 565 | | | | 571,914 | |
PennyMac Financial Services, Inc., | | | | | | | | | |
Gtd. Notes, 144A | | | | | | | | | | | | | | | | | |
7.875% | | | 12/15/29 | | | | | | | | | | | | 535 | | | | 560,535 | |
Power Finance Corp. Ltd. (India), | | | | | |
Sr. Unsec’d. Notes, 144A, MTN | | | | | |
6.150% | | | 12/06/28 | | | | | | | | | | | | 400 | | | | 409,940 | |
Rocket Mortgage LLC/Rocket Mortgage Co-Issuer, Inc., | |
Gtd. Notes, 144A | | | | | | | | | | | | | | | | | |
2.875% | | | 10/15/26 | | | | | | | | | | | | 10 | | | | 9,471 | |
Visa, Inc., | | | | | | | | | | | | | | | | | | | | |
Sr. Unsec’d. Notes | | | | | | | | | | | | | | | | | |
1.100% | | | 02/15/31 | | | | | | | | | | | | 10 | | | | 8,093 | |
| | | | | | | | | | | | | | | | | | | | |
| | |
| | | | | | | 11,317,960 | |
| | | | | | | | | | | | | | | | | | | | |
Electric — 2.3% | | | | | | | | | | | | | | | | | | | | |
AEP Transmission Co. LLC, | | | | | | | | | | | | | | | | | |
Sr. Unsec’d. Notes | | | | | | | | | | | | | | | | | |
3.750% | | | 12/01/47 | | | | | | | | | | | | 100 | | | | 74,207 | |
AES Corp. (The), | | | | | | | | | | | | | | | | | |
Sr. Unsec’d. Notes | | | | | | | | | | | | | |
1.375% | | | 01/15/26 | | | | | | | | | | | | 35 | | | | 33,693 | |
2.450% | | | 01/15/31 | | | | | | | | | | | | 15 | | | | 12,506 | |
Sr. Unsec’d. Notes, 144A | | | | | | | | | | | | | |
3.300% | | | 07/15/25 | | | | | | | | | | | | 45 | | | | 44,494 | |
3.950% | | | 07/15/30 | | | | | | | | | | | | 5 | | | | 4,614 | |
| | | | | | | | | | | | | | | | | | | | |
Interest Rate | | Maturity
Date | | | | | | | | | Principal
Amount
(000)# | | | Value | |
|
CORPORATE BONDS (continued) | |
Electric (cont’d.) | | | | | | | | | | | | | |
Alfa Desarrollo SpA (Chile), | | | | | | | | | | | | | | | | | |
Sr. Sec’d. Notes, 144A | | | | | | | | | | | | | | | | | |
4.550% | | | 09/27/51 | | | | | | | | | | | | 307 | | | $ | 225,808 | |
Ameren Illinois Co., | | | | | | | | | | | | | | | | | |
First Mortgage | | | | | | | | | | | | | | | | | | | | |
4.500% | | | 03/15/49 | | | | | | | | | | | | 40 | | | | 33,822 | |
American Electric Power Co., Inc., | | | | | |
Sr. Unsec’d. Notes, Series J | | | | | |
4.300% | | | 12/01/28 | | | | | | | | | | | | 45 | | | | 43,968 | |
American Transmission Systems, Inc., | | | | | |
Sr. Unsec’d. Notes, 144A | | | | | | | | | | | | | |
2.650% | | | 01/15/32 | | | | | | | | | | | | 10 | | | | 8,481 | |
Arizona Public Service Co., | | | | | | | | | | | | | | | | | |
Sr. Unsec’d. Notes | | | | | | | | | | | | | |
2.200% | | | 12/15/31 | | | | | | | | | | | | 25 | | | | 20,496 | |
Atlantic City Electric Co., | | | | | | | | | | | | | | | | | |
First Mortgage | | | | | | | | | | | | | | | | | | | | |
2.300% | | | 03/15/31 | | | | | | | | | | | | 25 | | | | 21,254 | |
Baltimore Gas & Electric Co., | | | | | | | | | | | | | | | | | |
Sr. Unsec’d. Notes | | | | | | | | | | | | | |
2.250% | | | 06/15/31 | | | | | | | | | | | | 5 | | | | 4,234 | |
Berkshire Hathaway Energy Co., | | | | | |
Sr. Unsec’d. Notes | | | | | | | | | | | | | | | | | |
4.050% | | | 04/15/25 | | | | | | | | | | | | 35 | | | | 34,922 | |
4.250% | | | 10/15/50 | | | | | | | | | | | | 20 | | | | 15,797 | |
Calpine Corp., | | | | | | | | | | | | | | | | | | | | |
Sr. Unsec’d. Notes, 144A | | | | | |
4.625% | | | 02/01/29 | | | | | | | | | | | | 600 | | | | 565,878 | |
5.000% | | | 02/01/31 | | | | | | | | | | | | 1,575 | | | | 1,481,963 | |
5.125% | | | 03/15/28 | | | | | | | | | | | | 1,700 | | | | 1,648,610 | |
CenterPoint Energy, Inc., | | | | | | | | | | | | | | | | | |
Sr. Unsec’d. Notes | | | | | | | | | | | | | |
2.950% | | | 03/01/30 | | | | | | | | | | | | 36 | | | | 32,360 | |
CMS Energy Corp., | | | | | | | | | | | | | | | | | |
Sr. Unsec’d. Notes | | | | | | | | | | | | | |
3.000% | | | 05/15/26 | | | | | | | | | | | | 20 | | | | 19,516 | |
Comision Federal de Electricidad (Mexico), | | | | | |
Gtd. Notes, 144A | | | | | | | | | | | | | | | | | | | | |
4.688% | | | 05/15/29 | | | | | | | | | | | | 1,325 | | | | 1,240,664 | |
Consolidated Edison Co. of New York, Inc., | | | | | |
Sr. Unsec’d. Notes | | | | | | | | | | | | | |
4.500% | | | 12/01/45 | | | | | | | | | | | | 10 | | | | 8,465 | |
Sr. Unsec’d. Notes, Series C | | | | | | | | | | | | | |
3.000% | | | 12/01/60 | | | | | | | | | | | | 20 | | | | 11,777 | |
4.300% | | | 12/01/56 | | | | | | | | | | | | 235 | | | | 183,402 | |
Constellation Energy Generation LLC, | | | | | |
Sr. Unsec’d. Notes | | | | | | | | | | | | | |
3.250% | | | 06/01/25 | | | | | | | | | | | | 20 | | | | 19,861 | |
Dominion Energy South Carolina, Inc., | | | | | |
First Mortgage | | | | | | | | | | | | | | | | | | | | |
4.600% | | | 06/15/43 | | | | | | | | | | | | 2,025 | | | | 1,760,248 | |
Dominion Energy, Inc., | | | | | | | | | | | | | | | | | |
Sr. Unsec’d. Notes | | | | | | | | | | | | | |
3.900% | | | 10/01/25 | | | | | | | | | | | | 15 | | | | 14,903 | |
Sr. Unsec’d. Notes, Series C | | | | | |
3.375% | | | 04/01/30 | | | | | | | | | | | | 10 | | | | 9,200 | |
SEE NOTES TO FINANCIAL STATEMENTS.
A178
| | | | |
| | PSF PGIM TOTAL RETURN BOND PORTFOLIO (CONTINUED) | | |
SCHEDULE OF INVESTMENTS | | | | as of December 31, 2024 |
| | | | | | | | | | | | | | | | | | | | |
Interest Rate | | Maturity
Date | | | | | | | | | Principal
Amount
(000)# | | | Value | |
|
CORPORATE BONDS (continued) | |
Electric (cont’d.) | | | | | |
DPL, Inc., | | | | | | | | | | | | | | | | | | | | |
Sr. Unsec’d. Notes | |
4.125% | | | 07/01/25 | | | | | | | | | | | | 10 | | | $ | 9,886 | |
DTE Electric Co., | | | | | | | | | | | | | | | | | |
First Mortgage, Series C | |
2.625% | | | 03/01/31 | | | | | | | | | | | | 10 | | | | 8,757 | |
Duke Energy Carolinas LLC, | | | | | | | | | | | | | | | | | |
First Mortgage | | | | | | | | | | | | | | | | | | | | |
3.950% | | | 11/15/28 | | | | | | | | | | | | 40 | | | | 38,849 | |
Duke Energy Corp., | | | | | | | | | | | | | | | | | |
Sr. Unsec’d. Notes | |
2.450% | | | 06/01/30 | | | | | | | | | | | | 5 | | | | 4,379 | |
Duke Energy Florida LLC, | | | | | | | | | | | | | | | | | |
First Mortgage | | | | | | | | | | | | | | | | | | | | |
1.750% | | | 06/15/30 | | | | | | | | | | | | 50 | | | | 42,377 | |
2.500% | | | 12/01/29(a) | | | | | | | | | | | | 75 | | | | 67,387 | |
3.850% | | | 11/15/42 | | | | | | | | | | | | 25 | | | | 19,650 | |
Duke Energy Indiana LLC, | | | | | | | | | | | | | | | | | |
First Mortgage | | | | | | | | | | | | | | | | | | | | |
2.750% | | | 04/01/50 | | | | | | | | | | | | 10 | | | | 6,029 | |
5.400% | | | 04/01/53 | | | | | | | | | | | | 3,500 | | | | 3,312,155 | |
Duke Energy Ohio, Inc., | | | | | | | | | | | | | | | | | |
First Mortgage | | | | | | | | | | | | | | | | | | | | |
2.125% | | | 06/01/30 | | | | | | | | | | | | 30 | | | | 25,948 | |
Duke Energy Progress LLC, | | | | | | | | | | | | | | | | | |
First Mortgage | | | | | | | | | | | | | | | | | | | | |
3.450% | | | 03/15/29 | | | | | | | | | | | | 45 | | | | 42,661 | |
Edison International, | | | | | | | | | | | | | | | | | |
Sr. Unsec’d. Notes | |
4.950% | | | 04/15/25 | | | | | | | | | | | | 5 | | | | 4,995 | |
El Paso Electric Co., | | | | | | | | | | | | | | | | | |
Sr. Unsec’d. Notes | |
6.000% | | | 05/15/35 | | | | | | | | | | | | 2,325 | | | | 2,333,828 | |
Entergy Corp., | |
Sr. Unsec’d. Notes | |
0.900% | | | 09/15/25 | | | | | | | | | | | | 10 | | | | 9,725 | |
Entergy Louisiana LLC, | | | | | | | | | | | | | | | | | |
First Mortgage | | | | | | | | | | | | | | | | | | | | |
2.350% | | | 06/15/32 | | | | | | | | | | | | 120 | | | | 99,862 | |
Entergy Texas, Inc., | | | | | | | | | | | | | | | | | |
First Mortgage | | | | | | | | | | | | | | | | | | | | |
3.550% | | | 09/30/49 | | | | | | | | | | | | 25 | | | | 17,563 | |
Eskom Holdings SOC Ltd. (South Africa), | | | | | |
Gov’t. Gtd. Notes, 144A, MTN | |
6.350% | | | 08/10/28 | | | | | | | | | | | | 895 | | | | 889,684 | |
Gov’t. Gtd. Notes, MTN | |
6.350% | | | 08/10/28 | | | | | | | | | | | | 1,562 | | | | 1,552,722 | |
Sr. Unsec’d. Notes, 144A | |
7.125% | | | 02/11/25 | | | | | | | | | | | | 390 | | | | 389,513 | |
Sr. Unsec’d. Notes, 144A, MTN | |
8.450% | | | 08/10/28(a) | | | | | | | | | | | | 209 | | | | 219,189 | |
Sr. Unsec’d. Notes, MTN | |
8.450% | | | 08/10/28 | | | | | | | | | | | | 1,411 | | | | 1,479,786 | |
Eversource Energy, | | | | | | | | | | | | | | | | | |
Sr. Unsec’d. Notes, Series M | | | | | | | | | | | | | |
3.300% | | | 01/15/28 | | | | | | | | | | | | 40 | | | | 38,023 | |
| | | | | | | | | | | | | | | | | | | | |
Interest Rate | | Maturity
Date | | | | | | | | | Principal
Amount
(000)# | | | Value | |
|
CORPORATE BONDS (continued) | |
Electric (cont’d.) | | | | | | | | | | | | | |
Sr. Unsec’d. Notes, Series U | | | | | | | | | | | | | |
1.400% | | | 08/15/26 | | | | | | | | | | | | 20 | | | $ | 18,921 | |
Exelon Corp., | | | | | | | | | | | | | | | | | | | | |
Sr. Unsec’d. Notes | |
3.400% | | | 04/15/26 | | | | | | | | | | | | 5 | | | | 4,918 | |
3.950% | | | 06/15/25 | | | | | | | | | | | | 35 | | | | 34,835 | |
4.050% | | | 04/15/30 | | | | | | | | | | | | 25 | | | | 23,824 | |
FirstEnergy Corp., | | | | | | | | | | | | | | | | | |
Sr. Unsec’d. Notes, Series C | |
4.850% | | | 07/15/47 | | | | | | | | | | | | 4 | | | | 3,402 | |
FirstEnergy Transmission LLC, | | | | | | | | | | | | | | | | | |
Sr. Unsec’d. Notes, 144A | | | | | | | | | | | | | | | | | | | | |
5.450% | | | 07/15/44 | | | | | | | | | | | | 280 | | | | 268,218 | |
Florida Power & Light Co., | | | | | | | | | | | | | | | | | |
First Mortgage | | | | | | | | | | | | | | | | | | | | |
2.875% | | | 12/04/51 | | | | | | | | | | | | 5 | | | | 3,136 | |
3.150% | | | 10/01/49 | | | | | | | | | | | | 36 | | | | 24,261 | |
Georgia Power Co., | | | | | | | | | | | | | | | | | |
Sr. Unsec’d. Notes, Series B | | | | | | | | | | | | | |
2.650% | | | 09/15/29 | | | | | | | | | | | | 95 | | | | 86,152 | |
Iberdrola International BV (Spain), | | | | | | | | | | | | | | | | | |
Gtd. Notes | | | | | | | | | | | | | | | | | | | | |
6.750% | | | 09/15/33(a) | | | | | | | | | | | | 1,150 | | | | 1,228,644 | |
Interstate Power & Light Co., | | | | | | | | | | | | | | | | | |
Sr. Unsec’d. Notes | |
3.600% | | | 04/01/29 | | | | | | | | | | | | 50 | | | | 47,320 | |
Israel Electric Corp. Ltd. (Israel), | | | | | | | | | | | | | | | | | |
Sr. Sec’d. Notes, 144A, GMTN | | | | | | | | | | | | | |
4.250% | | | 08/14/28 | | | | | | | | | | | | 680 | | | | 651,290 | |
Kentucky Utilities Co., | | | | | | | | | | | | | | | | | |
First Mortgage | | | | | | | | | | | | | | | | | | | | |
4.375% | | | 10/01/45 | | | | | | | | | | | | 3,050 | | | | 2,527,180 | |
MidAmerican Energy Co., | | | | | | | | | | | | | | | | | |
First Mortgage | | | | | | | | | | | | | | | | | | | | |
3.150% | | | 04/15/50 | | | | | | | | | | | | 5 | | | | 3,353 | |
3.650% | | | 04/15/29 | | | | | | | | | | | | 20 | | | | 19,073 | |
3.650% | | | 08/01/48 | | | | | | | | | | | | 20 | | | | 14,830 | |
Narragansett Electric Co. (The), | | | | | | | | | | | | | | | | | |
Sr. Unsec’d. Notes, 144A | |
3.395% | | | 04/09/30 | | | | | | | | | | | | 1,050 | | | | 967,245 | |
New York State Electric & Gas Corp., | |
Sr. Unsec’d. Notes, 144A | |
3.250% | | | 12/01/26 | | | | | | | | | | | | 20 | | | | 19,399 | |
NextEra Energy Capital Holdings, Inc., | |
Gtd. Notes | | | | | | | | | | | | | | | | | | | | |
1.900% | | | 06/15/28 | | | | | | | | | | | | 15 | | | | 13,582 | |
2.250% | | | 06/01/30 | | | | | | | | | | | | 20 | | | | 17,306 | |
2.440% | | | 01/15/32 | | | | | | | | | | | | 11 | | | | 9,182 | |
3.000% | | | 01/15/52 | | | | | | | | | | | | 58 | | | | 36,228 | |
5.749% | | | 09/01/25 | | | | | | | | | | | | 6,060 | | | | 6,095,631 | |
Northern States Power Co., | | | | | | | | | | | | | | | | | |
First Mortgage | | | | | | | | | | | | | | | | | | | | |
2.250% | | | 04/01/31 | | | | | | | | | | | | 10 | | | | 8,499 | |
2.600% | | | 06/01/51 | | | | | | | | | | | | 4 | | | | 2,390 | |
3.600% | | | 09/15/47 | | | | | | | | | | | | 10 | | | | 7,384 | |
SEE NOTES TO FINANCIAL STATEMENTS.
A179
| | | | |
| | PSF PGIM TOTAL RETURN BOND PORTFOLIO (CONTINUED) | | |
SCHEDULE OF INVESTMENTS | | | | as of December 31, 2024 |
| | | | | | | | | | | | | | | | | | |
Interest Rate | | Maturity
Date | | | | | | Principal
Amount (000)# | | | Value | |
|
CORPORATE BONDS (continued) | |
Electric (cont’d.) | | | | |
NRG Energy, Inc., | | | | | | | | | | | | | | | |
Gtd. Notes, 144A | | | | | | | | | | | | | | | |
3.625% | | | 02/15/31 | | | | | | | | | | 100 | | | $ | 87,349 | |
3.875% | | | 02/15/32 | | | | | | | | | | 500 | | | | 435,000 | |
5.250% | | | 06/15/29 | | | | | | | | | | 200 | | | | 194,385 | |
Jr. Sub. Notes, 144A | | | | | | | | | | | | | | | |
10.250%(ff) | | | 03/15/28(oo) | | | | | | | | | | 225 | | | | 248,673 | |
Sr. Sec’d. Notes, 144A | | | | | | | | | | | | | | | |
2.000% | | | 12/02/25 | | | | | | | | | | 285 | | | | 276,429 | |
2.450% | | | 12/02/27 | | | | | | | | | | 1,245 | | | | 1,155,927 | |
Ohio Power Co., | | | | | | | | | | | | | | | | | | |
Sr. Unsec’d. Notes, Series P | | | | | | | | | | | |
2.600% | | | 04/01/30 | | | | | | | | | | 25 | | | | 22,141 | |
Sr. Unsec’d. Notes, Series Q | | | | | | | | | | | |
1.625% | | | 01/15/31 | | | | | | | | | | 5 | | | | 4,072 | |
Sr. Unsec’d. Notes, Series R | | | | | | | | | | | |
2.900% | | | 10/01/51 | | | | | | | | | | 5 | | | | 3,006 | |
Pacific Gas & Electric Co., | | | | | | | | | | | | | | | |
First Mortgage | | | | | | | | | | | | | | | | | | |
2.100% | | | 08/01/27 | | | | | | | | | | 10 | | | | 9,326 | |
3.450% | | | 07/01/25 | | | | | | | | | | 13 | | | | 12,901 | |
3.750% | | | 08/15/42 | | | | | | | | | | 50 | | | | 37,553 | |
4.000% | | | 12/01/46 | | | | | | | | | | 15 | | | | 11,313 | |
4.450% | | | 04/15/42 | | | | | | | | | | 5 | | | | 4,149 | |
4.750% | | | 02/15/44 | | | | | | | | | | 75 | | | | 63,943 | |
4.950% | | | 07/01/50 | | | | | | | | | | 2,645 | | | | 2,295,031 | |
Sr. Sec’d. Notes | | | | | | | | | | | | | | | |
3.250% | | | 06/01/31 | | | | | | | | | | 1,650 | | | | 1,462,763 | |
PacifiCorp, | | | | | | | | | | | | | | | | | | |
First Mortgage | | | | | | | | | | | | | | | | | | |
3.300% | | | 03/15/51 | | | | | | | | | | 390 | | | | 253,505 | |
PECO Energy Co., | | | | | | | | | | | | | | | |
First Mortgage | | | | | | | | | | | | | | | | | | |
2.800% | | | 06/15/50 | | | | | | | | | | 25 | | | | 15,555 | |
Perusahaan Perseroan Persero PT Perusahaan Listrik Negara (Indonesia), | |
Sr. Unsec’d. Notes | | | | | | | | | | | | | | | |
1.875% | | | 11/05/31 | | | | | | | EUR | | | 324 | | | | 286,324 | |
PG&E Energy Recovery Funding LLC, | | | | | | | | |
Sr. Sec’d. Notes, Series A-3 | | | | | | | | | | | |
2.822% | | | 07/15/48 | | | | | | | | | | 20 | | | | 14,059 | |
Progress Energy, Inc., | | | | | | | | | | | | | | | |
Sr. Unsec’d. Notes | | | | | | | | | | | | | | | |
7.000% | | | 10/30/31 | | | | | | | | | | 90 | | | | 99,585 | |
Public Service Co. of Colorado, | | | | | | | | | | | |
First Mortgage | | | | | | | | | | | | | | | | | | |
5.350% | | | 05/15/34 | | | | | | | | | | 4,500 | | | | 4,505,673 | |
First Mortgage, Series 34 | | | | | | | | | | | | | | | |
3.200% | | | 03/01/50 | | | | | | | | | | 5 | | | | 3,318 | |
Public Service Electric & Gas Co., | | | | | | | | | | | |
First Mortgage, MTN | | | | | | | | | | | | | | | |
2.050% | | | 08/01/50 | | | | | | | | | | 45 | | | | 23,726 | |
Public Service Enterprise Group, Inc., | | | | | |
Sr. Unsec’d. Notes | | | | | | | | | | | | | | | |
1.600% | | | 08/15/30 | | | | | | | | | | 35 | | | | 29,133 | |
Rochester Gas & Electric Corp., | | | | | | | | | | | |
First Mortgage, 144A | | | | | | | | | | | | | | | |
3.100% | | | 06/01/27 | | | | | | | | | | 45 | | | | 43,054 | |
| | | | | | | | | | | | | | | | | | | | |
Interest Rate | | Maturity
Date | | | | | | | | | Principal
Amount
(000)# | | | Value | |
|
CORPORATE BONDS (continued) | |
Electric (cont’d.) | | | | | |
San Diego Gas & Electric Co., | | | | | | | | | | | | | | | | | |
First Mortgage | | | | | | | | | | | | | | | | | | | | |
4.150% | | | 05/15/48 | | | | | | | | | | | | 20 | | | $ | 15,899 | |
5.350% | | | 05/15/35 | | | | | | | | | | | | 40 | | | | 39,688 | |
First Mortgage, Series WWW | | | | | | | | | | | | | | | | | |
2.950% | | | 08/15/51 | | | | | | | | | | | | 5 | | | | 3,225 | |
Sr. Sec’d. Notes, Series VVV | | | | | | | | | | | | | | | | | |
1.700% | | | 10/01/30 | | | | | | | | | | | | 10 | | | | 8,384 | |
Sempra, | | | | | | | | | | | | | | | | | | | | |
Sr. Unsec’d. Notes | |
4.000% | | | 02/01/48 | | | | | | | | | | | | 5 | | | | 3,791 | |
Sierra Pacific Power Co., | | | | | | | | | | | | | | | | | |
General Ref. Mortgage | |
2.600% | | | 05/01/26 | | | | | | | | | | | | 20 | | | | 19,467 | |
Southern California Edison Co., | | | | | | | | | | | | | | | | | |
First Mortgage | | | | | | | | | | | | | | | | | | | | |
2.250% | | | 06/01/30 | | | | | | | | | | | | 35 | | | | 30,387 | |
2.850% | | | 08/01/29 | | | | | | | | | | | | 40 | | | | 36,527 | |
3.650% | | | 02/01/50 | | | | | | | | | | | | 25 | | | | 17,890 | |
First Mortgage, Series 20A | | | | | | | | | | | | | | | | | |
2.950% | | | 02/01/51 | | | | | | | | | | | | 5 | | | | 3,141 | |
First Mortgage, Series A | |
4.200% | | | 03/01/29 | | | | | | | | | | | | 20 | | | | 19,382 | |
First Mortgage, Series G | |
2.500% | | | 06/01/31 | | | | | | | | | | | | 10 | | | | 8,554 | |
First Mortgage, Series H | |
3.650% | | | 06/01/51 | | | | | | | | | | | | 5 | | | | 3,542 | |
First Ref. Mortgage | |
5.500% | | | 03/15/40 | | | | | | | | | | | | 10 | | | | 9,743 | |
First Ref. Mortgage, Series C | | | | | | | | | | | | | | | | | |
4.125% | | | 03/01/48 | | | | | | | | | | | | 50 | | | | 39,009 | |
Southwestern Public Service Co., | | | | | | | | | | | | | | | | | |
First Mortgage | | | | | | | | | | | | | | | | | | | | |
3.750% | | | 06/15/49 | | | | | | | | | | | | 30 | | | | 21,756 | |
Tampa Electric Co., | | | | | | | | | | | | | | | | | |
Sr. Unsec’d. Notes | |
3.450% | | | 03/15/51 | | | | | | | | | | | | 40 | | | | 27,247 | |
Toledo Edison Co. (The), | | | | | | | | | | | | | | | | | |
First Mortgage, 144A | |
2.650% | | | 05/01/28 | | | | | | | | | | | | 10 | | | | 9,165 | |
Trans-Allegheny Interstate Line Co., | |
Sr. Unsec’d. Notes, 144A | |
3.850% | | | 06/01/25 | | | | | | | | | | | | 100 | | | | 99,437 | |
Tucson Electric Power Co., | | | | | | | | | | | | | | | | | |
Sr. Unsec’d. Notes | |
4.000% | | | 06/15/50 | | | | | | | | | | | | 1,500 | | | | 1,132,941 | |
Virginia Electric & Power Co., | | | | | | | | | | | | | | | | | |
Sr. Unsec’d. Notes | |
4.450% | | | 02/15/44 | | | | | | | | | | | | 15 | | | | 12,720 | |
Vistra Corp., | | | | | | | | | | | | | | | | | | | | |
Jr. Sub. Notes, 144A | |
7.000%(ff) | | | 12/15/26(oo) | | | | | | | | | | | | 1,050 | | | | 1,049,898 | |
8.000%(ff) | | | 10/15/26(oo) | | | | | | | | | | | | 2,075 | | | | 2,112,764 | |
Jr. Sub. Notes, Series C, 144A | |
8.875%(ff) | | | 01/15/29(oo) | | | | | | | | | | | | 1,600 | | | | 1,710,661 | |
SEE NOTES TO FINANCIAL STATEMENTS.
A180
| | | | |
| | PSF PGIM TOTAL RETURN BOND PORTFOLIO (CONTINUED) | | |
SCHEDULE OF INVESTMENTS | | | | as of December 31, 2024 |
| | | | | | | | | | | | | | | | | | | | |
Interest Rate | | Maturity
Date | | | | | | | | | Principal
Amount
(000)# | | | Value | |
|
CORPORATE BONDS (continued) | |
Electric (cont’d.) | |
Vistra Operations Co. LLC, | |
Gtd. Notes, 144A | |
5.000% | | | 07/31/27 | | | | | | | | | | | | 450 | | | $ | 441,407 | |
5.625% | | | 02/15/27 | | | | | | | | | | | | 550 | | | | 548,364 | |
Sr. Sec’d. Notes, 144A | |
3.700% | | | 01/30/27 | | | | | | | | | | | | 2,000 | | | | 1,946,406 | |
| | | | | | | | | | | | | | | | | | | | |
| | | | | |
| | | | | | | | | | | | | | | | | | | 51,293,602 | |
| | | | | | | | | | | | | | | | | | | | |
Electrical Components & Equipment — 0.0% | |
WESCO Distribution, Inc., | |
Gtd. Notes, 144A | |
6.375% | | | 03/15/29 | | | | | | | | | | | | 295 | | | | 298,466 | |
6.625% | | | 03/15/32(a) | | | | | | | | | | | | 225 | | | | 228,243 | |
7.250% | | | 06/15/28 | | | | | | | | | | | | 450 | | | | 457,516 | |
| | | | | | | | | | | | | | | | | | | | |
| | | | | |
| | | | | | | | | | | | | | | | | | | 984,225 | |
| | | | | | | | | | | | | | | | | | | | |
Electronics — 0.0% | |
TD SYNNEX Corp., | |
Sr. Unsec’d. Notes | |
2.650% | | | 08/09/31 | | | | | | | | | | | | 25 | | | | 21,035 | |
| | | | | | | | | | | | | | | | | | | | |
Engineering & Construction — 0.3% | |
Cellnex Telecom SA (Spain), | |
Sr. Unsec’d. Notes, EMTN | |
1.750% | | | 10/23/30(a) | | | | | | | | EUR | | | | 2,800 | | | | 2,662,764 | |
GMR Hyderabad International Airport Ltd. (India), | |
Sr. Sec’d. Notes, 144A | |
4.250% | | | 10/27/27 | | | | | | | | | | | | 345 | | | | 329,044 | |
GTP Acquisition Partners I LLC, | |
Sr. Sec’d. Notes, 144A | |
3.482% | | | 06/15/50 | | | | | | | | | | | | 100 | | | | 99,305 | |
MasTec, Inc., | | | | | | | | | | | | | | | | | | | | |
Sr. Unsec’d. Notes | |
5.900% | | | 06/15/29 | | | | | | | | | | | | 380 | | | | 386,452 | |
Mexico City Airport Trust (Mexico), | |
Sr. Sec’d. Notes, 144A | |
3.875% | | | 04/30/28 | | | | | | | | | | | | 201 | | | | 188,313 | |
4.250% | | | 10/31/26 | | | | | | | | | | | | 605 | | | | 589,887 | |
5.500% | | | 10/31/46 | | | | | | | | | | | | 415 | | | | 331,352 | |
5.500% | | | 07/31/47 | | | | | | | | | | | | 3,480 | | | | 2,793,779 | |
| | | | | | | | | | | | | | | | | | | | |
| | | | | |
| | | | | | | | | | | | | | | | | | | 7,380,896 | |
| | | | | | | | | | | | | | | | | | | | |
Entertainment — 0.3% | |
Caesars Entertainment, Inc., | |
Gtd. Notes, 144A | |
4.625% | | | 10/15/29(a) | | | | | | | | | | | | 575 | | | | 538,682 | |
Sr. Sec’d. Notes, 144A | |
6.500% | | | 02/15/32 | | | | | | | | | | | | 580 | | | | 582,818 | |
7.000% | | | 02/15/30 | | | | | | | | | | | | 400 | | | | 407,330 | |
CCM Merger, Inc., | |
Sr. Unsec’d. Notes, 144A | |
6.375% | | | 05/01/26 | | | | | | | | | | | | 550 | | | | 549,200 | |
Jacobs Entertainment, Inc., | |
Sr. Unsec’d. Notes, 144A | |
6.750% | | | 02/15/29 | | | | | | | | | | | | 750 | | | | 723,466 | |
Penn Entertainment, Inc., | |
Sr. Unsec’d. Notes, 144A | |
5.625% | | | 01/15/27(a) | | | | | | | | | | | | 800 | | | | 787,628 | |
| | | | | | | | | | | | | | | | | | | | |
Interest Rate | | Maturity
Date | | | | | | | | | Principal
Amount
(000)# | | | Value | |
|
CORPORATE BONDS (continued) | |
Entertainment (cont’d.) | |
Warnermedia Holdings, Inc., | |
Gtd. Notes | | | | | | | | | | | | | | | | | | | | |
5.050% | | | 03/15/42 | | | | | | | | | | | | 1,065 | | | $ | 854,750 | |
5.141% | | | 03/15/52 | | | | | | | | | | | | 3,490 | | | | 2,598,301 | |
Wynn Resorts Finance LLC/Wynn Resorts Capital Corp., | |
Gtd. Notes, 144A | |
6.250% | | | 03/15/33 | | | | | | | | | | | | 340 | | | | 333,461 | |
7.125% | | | 02/15/31 | | | | | | | | | | | | 260 | | | | 270,481 | |
| | | | | | | | | | | | | | | | | | | | |
| | | | | |
| | | | | | | | | | | | | | | | | | | 7,646,117 | |
| | | | | | | | | | | | | | | | | | | | |
Environmental Control — 0.0% | |
GFL Environmental, Inc., | |
Sr. Sec’d. Notes, 144A | |
6.750% | | | 01/15/31 | | | | | | | | | | | | 300 | | | | 307,737 | |
Republic Services, Inc., | |
Sr. Unsec’d. Notes | |
0.875% | | | 11/15/25 | | | | | | | | | | | | 10 | | | | 9,674 | |
3.950% | | | 05/15/28 | | | | | | | | | | | | 20 | | | | 19,484 | |
Waste Connections, Inc., | |
Sr. Unsec’d. Notes | |
3.500% | | | 05/01/29 | | | | | | | | | | | | 35 | | | | 33,013 | |
| | | | | | | | | | | | | | | | | | | | |
| | | | | |
| | | | | | | | | | | | | | | | | | | 369,908 | |
| | | | | | | | | | | | | | | | | | | | |
Foods — 0.7% | |
Albertson’s Cos., Inc./Safeway, Inc./New Albertson’s LP/Albertson’s LLC, | |
Gtd. Notes, 144A | |
6.500% | | | 02/15/28(a) | | | | | | | | | | | | 375 | | | | 379,875 | |
B&G Foods, Inc., | |
Gtd. Notes | | | | | | | | | | | | | | | | | | | | |
5.250% | | | 09/15/27 | | | | | | | | | | | | 1,475 | | | | 1,400,250 | |
Bellis Acquisition Co. PLC (United Kingdom), | |
Sr. Sec’d. Notes, 144A | |
8.125% | | | 05/14/30 | | | | GBP | | | | | | | | 3,000 | | | | 3,623,762 | |
Bellis Finco PLC (United Kingdom), | |
Sr. Unsec’d. Notes, 144A | |
4.000% | | | 02/16/27 | | | | GBP | | | | | | | | 1,600 | | | | 1,885,361 | |
Hershey Co. (The), | |
Sr. Unsec’d. Notes | |
1.700% | | | 06/01/30 | | | | | | | | | | | | 10 | | | | 8,513 | |
Mars, Inc., | |
Gtd. Notes, 144A | |
3.875% | | | 04/01/39 | | | | | | | | | | | | 440 | | | | 368,549 | |
4.125% | | | 04/01/54 | | | | | | | | | | | | 415 | | | | 319,243 | |
Mondelez International, Inc., | |
Sr. Unsec’d. Notes | |
1.500% | | | 02/04/31 | | | | | | | | | | | | 30 | | | | 24,436 | |
Post Holdings, Inc., | |
Gtd. Notes, 144A | |
4.625% | | | 04/15/30 | | | | | | | | | | | | 125 | | | | 115,209 | |
6.375% | | | 03/01/33 | | | | | | | | | | | | 565 | | | | 554,194 | |
Sr. Sec’d. Notes, 144A | | | | | | | | | | | | | | | | | |
6.250% | | | 02/15/32(a) | | | | | | | | | | | | 570 | | | | 566,053 | |
Smithfield Foods, Inc., | |
Sr. Unsec’d. Notes, 144A | |
2.625% | | | 09/13/31 | | | | | | | | | | | | 1,858 | | | | 1,526,332 | |
3.000% | | | 10/15/30 | | | | | | | | | | | | 10 | | | | 8,644 | |
5.200% | | | 04/01/29 | | | | | | | | | | | | 3,726 | | | | 3,644,774 | |
SEE NOTES TO FINANCIAL STATEMENTS.
A181
| | | | |
| | PSF PGIM TOTAL RETURN BOND PORTFOLIO (CONTINUED) | | |
SCHEDULE OF INVESTMENTS | | | | as of December 31, 2024 |
| | | | | | | | | | | | | | | | | | | | |
Interest Rate | | Maturity
Date | | | | | | | | | Principal
Amount
(000)# | | | Value | |
|
CORPORATE BONDS (continued) | |
Foods (cont’d.) | | | | | | | | | | | | | | | | | | | | |
The Campbell’s Co., | | | | | | | | | | | | | | | | | |
Sr. Unsec’d. Notes | | | | | | | | | | | | | | | | | |
3.950% | | | 03/15/25 | | | | | | | | | | | | 45 | | | $ | 44,899 | |
US Foods, Inc., | | | | | | | | | | | | | | | | | | | | |
Gtd. Notes, 144A | | | | | | | | | | | | | | | | | |
5.750% | | | 04/15/33 | | | | | | | | | | | | 415 | | | | 403,226 | |
| | | | | | | | | | | | | | | | | | | | |
| | | | | |
| | | | | | | | | | | | | | | | | | | 14,873,320 | |
| | | | | | | | | | | | | | | | | | | | |
Forest Products & Paper — 0.0% | |
Georgia-Pacific LLC, | |
Sr. Unsec’d. Notes, 144A | |
0.950% | | | 05/15/26(a) | | | | | | | | | | | | 40 | | | | 37,988 | |
| | | | | | | | | | | | | | | | | | | | |
Gas — 0.1% | | | | | | | | | | | | | | | | | | | | |
AmeriGas Partners LP/AmeriGas Finance Corp., | |
Sr. Unsec’d. Notes | |
5.875% | | | 08/20/26 | | | | | | | | | | | | 1,100 | | | | 1,062,330 | |
Atmos Energy Corp., | |
Sr. Unsec’d. Notes | |
1.500% | | | 01/15/31 | | | | | | | | | | | | 55 | | | | 45,115 | |
2.625% | | | 09/15/29 | | | | | | | | | | | | 15 | | | | 13,664 | |
CenterPoint Energy Resources Corp., | |
Sr. Unsec’d. Notes | |
1.750% | | | 10/01/30 | | | | | | | | | | | | 10 | | | | 8,380 | |
NiSource, Inc., | | | | | | | | | | | | | | | | | | | | |
Sr. Unsec’d. Notes | |
0.950% | | | 08/15/25 | | | | | | | | | | | | 75 | | | | 73,201 | |
1.700% | | | 02/15/31 | | | | | | | | | | | | 120 | | | | 98,170 | |
3.600% | | | 05/01/30 | | | | | | | | | | | | 36 | | | | 33,568 | |
4.800% | | | 02/15/44 | | | | | | | | | | | | 300 | | | | 264,677 | |
Piedmont Natural Gas Co., Inc., | |
Sr. Unsec’d. Notes | |
4.100% | | | 09/18/34 | | | | | | | | | | | | 20 | | | | 17,826 | |
Southern California Gas Co., | |
First Mortgage, Series WW | |
3.950% | | | 02/15/50 | | | | | | | | | | | | 45 | | | | 34,159 | |
Southern Co. Gas Capital Corp., | |
Gtd. Notes | | | | | | | | | | | | | | | | | | | | |
4.400% | | | 06/01/43 | | | | | | | | | | | | 1,050 | | | | 882,144 | |
| | | | | | | | | | | | | | | | | | | | |
| | | | | |
| | | | | | | | | | | | | | | | | | | 2,533,234 | |
| | | | | | | | | | | | | | | | | | | | |
Healthcare-Products — 0.1% | |
Agilent Technologies, Inc., | |
Sr. Unsec’d. Notes | |
2.300% | | | 03/12/31 | | | | | | | | | | | | 45 | | | | 38,184 | |
Medline Borrower LP, | |
Sr. Sec’d. Notes, 144A | |
3.875% | | | 04/01/29 | | | | | | | | | | | | 1,175 | | | | 1,088,473 | |
Medtronic Global Holdings SCA, | |
Gtd. Notes | | | | | | | | | | | | | | | | | | | | |
1.375% | | | 10/15/40 | | | | | | | | EUR | | | | 540 | | | | 407,913 | |
Stryker Corp., | | | | | | | | | | | | | | | | | | | | |
Sr. Unsec’d. Notes | |
2.125% | | | 11/30/27 | | | | | | | | EUR | | | | 510 | | | | 517,609 | |
3.650% | | | 03/07/28 | | | | | | | | | | | | 30 | | | | 28,975 | |
| | | | | | | | | | | | | | | | | | | | |
Interest Rate | | Maturity
Date | | | | | | | | | Principal
Amount
(000)# | | | Value | |
| |
CORPORATE BONDS (continued) | | | | | |
Healthcare-Products (cont’d.) | | | | | | | | | |
Thermo Fisher Scientific, Inc., | |
Sr. Unsec’d. Notes, EMTN | |
1.500% | | | 10/01/39 | | | | | | | | EUR | | | | 600 | | | $ | 467,998 | |
| | | | | | | | | | | | | | | | | | | | |
| | | | | |
| | | | | | | | | | | | | | | | | | | 2,549,152 | |
| | | | | | | | | | | | | | | | | | | | |
Healthcare-Services — 1.5% | |
Advocate Health & Hospitals Corp., | |
Sr. Unsec’d. Notes | |
3.387% | | | 10/15/49 | | | | | | | | | | | | 20 | | | | 14,211 | |
Aetna, Inc., | | | | | | | | | | | | | | | | | | | | |
Sr. Unsec’d. Notes | |
6.750% | | | 12/15/37 | | | | | | | | | | | | 1,900 | | | | 2,003,608 | |
AHS Hospital Corp., | |
Sr. Unsec’d. Notes, Series 2021 | |
2.780% | | | 07/01/51 | | | | | | | | | | | | 10 | | | | 6,180 | |
Ascension Health, | |
Sr. Unsec’d. Notes, Series B | |
3.106% | | | 11/15/39 | | | | | | | | | | | | 20 | | | | 15,072 | |
Baylor Scott & White Holdings, | |
Unsec’d. Notes, Series 2021 | |
2.839% | | | 11/15/50 | | | | | | | | | | | | 10 | | | | 6,342 | |
Bon Secours Mercy Health, Inc., | |
Sec’d. Notes, Series 20-2 | |
2.095% | | | 06/01/31 | | | | | | | | | | | | 10 | | | | 8,334 | |
Cigna Group (The), | |
Gtd. Notes | |
3.250% | | | 04/15/25 | | | | | | | | | | | | 20 | | | | 19,899 | |
3.875% | | | 10/15/47 | | | | | | | | | | | | 20 | | | | 14,564 | |
4.500% | | | 02/25/26 | | | | | | | | | | | | 2,407 | | | | 2,401,275 | |
Sr. Unsec’d. Notes | | | | | | | | | | | | | | | | | |
2.375% | | | 03/15/31 | | | | | | | | | | | | 990 | | | | 838,245 | |
2.400% | | | 03/15/30 | | | | | | | | | | | | 122 | | | | 106,662 | |
3.200% | | | 03/15/40 | | | | | | | | | | | | 1,745 | | | | 1,279,153 | |
City of Hope, | | | | | | | | | | | | | | | | | | | | |
Sr. Sec’d. Notes, Series 2013 | |
5.623% | | | 11/15/43 | | | | | | | | | | | | 20 | | | | 19,039 | |
CommonSpirit Health, | |
Sr. Sec’d. Notes | |
1.547% | | | 10/01/25 | | | | | | | | | | | | 35 | | | | 34,170 | |
2.782% | | | 10/01/30 | | | | | | | | | | | | 5 | | | | 4,427 | |
3.910% | | | 10/01/50 | | | | | | | | | | | | 5 | | | | 3,692 | |
4.187% | | | 10/01/49 | | | | | | | | | | | | 30 | | | | 23,494 | |
5.205% | | | 12/01/31(a) | | | | | | | | | | | | 4,015 | | | | 4,000,139 | |
DaVita, Inc., | | | | | | | | | | | | | | | | | | | | |
Gtd. Notes, 144A | |
4.625% | | | 06/01/30 | | | | | | | | | | | | 850 | | | | 780,796 | |
6.875% | | | 09/01/32 | | | | | | | | | | | | 620 | | | | 624,673 | |
Duke University Health System, Inc., | |
Sr. Unsec’d. Notes, Series 2017 | |
3.920% | | | 06/01/47 | | | | | | | | | | | | 25 | | | | 19,671 | |
Elevance Health, Inc., | |
Sr. Unsec’d. Notes | |
2.375% | | | 01/15/25 | | | | | | | | | | | | 15 | | | | 14,985 | |
4.650% | | | 01/15/43 | | | | | | | | | | | | 385 | | | | 334,391 | |
HCA, Inc., | | | | | | | | | | | | | | | | |
Gtd. Notes | | | | | | | | | | | | | | | | |
5.375% | | | 02/01/25 | | | | | | | | | | | | 940 | | | | 939,408 | |
SEE NOTES TO FINANCIAL STATEMENTS.
A182
| | | | |
| | PSF PGIM TOTAL RETURN BOND PORTFOLIO (CONTINUED) | | |
SCHEDULE OF INVESTMENTS | | | | as of December 31, 2024 |
| | | | | | | | | | | | | | | | | | | | |
Interest Rate | | Maturity
Date | | | | | | | | | Principal
Amount
(000)# | | | Value | |
|
CORPORATE BONDS (continued) | |
Healthcare-Services (cont’d.) | | | | | |
7.500% | | | 11/06/33 | | | | | | | | | | | | 500 | | | $ | 553,624 | |
Gtd. Notes, MTN | | | | | | | | | | | | | | | | | |
7.750% | | | 07/15/36 | | | | | | | | | | | | 500 | | | | 558,643 | |
Icon Investments Six DAC, | | | | | | | | | | | | | |
Sr. Sec’d. Notes | | | | | | | | | | | | | |
5.809% | | | 05/08/27 | | | | | | | | | | | | 2,060 | | | | 2,093,340 | |
Kaiser Foundation Hospitals, | | | | | |
Unsec’d. Notes, Series 2021 | |
3.002% | | | 06/01/51 | | | | | | | | | | | | 10 | | | | 6,502 | |
Laboratory Corp. of America Holdings, | |
Gtd. Notes | | | | | | | | | | | | | | | | |
2.950% | | | 12/01/29 | | | | | | | | | | | | 25 | | | | 22,676 | |
3.600% | | | 02/01/25 | | | | | | | | | | | | 675 | | | | 673,846 | |
4.350% | | | 04/01/30 | | | | | | | | | | | | 6,155 | | | | 5,935,222 | |
Mount Sinai Hospital (The), | | | | | | | | | | | | | |
Sec’d. Notes, Series 2019 | | | | | | | | | | | | | |
3.737% | | | 07/01/49 | | | | | | | | | | | | 29 | | | | 19,099 | |
Unsec’d. Notes, Series 2020 | | | | | |
3.391% | | | 07/01/50 | | | | | | | | | | | | 10 | | | | 6,000 | |
Orlando Health Obligated Group, | | | | | |
Unsec’d. Notes | | | | | | | | | | | | | |
4.089% | | | 10/01/48 | | | | | | | | | | | | 25 | | | | 19,900 | |
PeaceHealth Obligated Group, | | | | | |
Sr. Unsec’d. Notes, Series 2020 | |
1.375% | | | 11/15/25 | | | | | | | | | | | | 10 | | | | 9,693 | |
Piedmont Healthcare, Inc., | | | | | | | | | | | | | |
Sec’d. Notes, Series 2032 | | | | | | | | | | | | | |
2.044% | | | 01/01/32 | | | | | | | | | | | | 10 | | | | 8,189 | |
Providence St. Joseph Health Obligated Group, | |
Unsec’d. Notes, Series 19A | | | | | |
2.532% | | | 10/01/29 | | | | | | | | | | | | 50 | | | | 44,742 | |
Quest Diagnostics, Inc., | | | | | | | | | | | | | |
Sr. Unsec’d. Notes | | | | | | | | | | | | | |
2.950% | | | 06/30/30 | | | | | | | | | | | | 50 | | | | 44,908 | |
Sutter Health, | | | | | | | | | | | | | | | | |
Unsec’d. Notes, Series 20A | | | | | |
2.294% | | | 08/15/30 | | | | | | | | | | | | 6 | | | | 5,221 | |
3.361% | | | 08/15/50 | | | | | | | | | | | | 4 | | | | 2,806 | |
Tenet Healthcare Corp., | | | | | |
Sr. Sec’d. Notes | | | | | |
4.250% | | | 06/01/29 | | | | | | | | | | | | 400 | | | | 375,169 | |
4.375% | | | 01/15/30 | | | | | | | | | | | | 1,675 | | | | 1,555,142 | |
4.625% | | | 06/15/28 | | | | | | | | | | | | 435 | | | | 416,638 | |
5.125% | | | 11/01/27 | | | | | | | | | | | | 100 | | | | 98,058 | |
6.750% | | | 05/15/31(a) | | | | | | | | | | | | 975 | | | | 985,060 | |
Trinity Health Corp., | | | | | |
Sr. Unsec’d. Notes, Series 2019 | |
3.434% | | | 12/01/48 | | | | | | | | | | | | 30 | | | | 22,249 | |
UnitedHealth Group, Inc., | | | | | |
Sr. Unsec’d. Notes | | | | | |
2.900% | | | 05/15/50 | | | | | | | | | | | | 20 | | | | 12,418 | |
3.050% | | | 05/15/41 | | | | | | | | | | | | 895 | | | | 647,198 | |
3.250% | | | 05/15/51 | | | | | | | | | | | | 5 | | | | 3,297 | |
3.500% | | | 08/15/39 | | | | | | | | | | | | 25 | | | | 19,825 | |
3.950% | | | 10/15/42 | | | | | | | | | | | | 220 | | | | 176,532 | |
4.450% | | | 12/15/48 | | | | | | | | | | | | 10 | | | | 8,237 | |
5.200% | | | 04/15/63 | | | | | | | | | | | | 5,805 | | | | 5,211,280 | |
| | | | | | | | | | | | | | | | | | | | |
Interest Rate | | Maturity
Date | | | | | | | | | Principal
Amount
(000)# | | | Value | |
|
CORPORATE BONDS (continued) | |
Healthcare-Services (cont’d.) | | | | | | | | | | | | | |
Universal Health Services, Inc., | | | | | |
Sr. Sec’d. Notes | | | | | | | | | | | | | |
2.650% | | | 10/15/30 | | | | | | | | | | | | 25 | | | $ | 21,490 | |
| | | | | | | | | | | | | | | | | | | | |
| | |
| | | | | | | 33,069,434 | |
| | | | | | | | | | | | | | | | | | | | |
Home Builders — 0.1% | | | | | | | | | | | | | |
Taylor Morrison Communities, Inc., | |
Gtd. Notes, 144A | | | | | | | | | | | | | |
5.875% | | | 06/15/27 | | | | | | | | | | | | 1,725 | | | | 1,728,941 | |
Sr. Unsec’d. Notes, 144A | | | | | | | | | | | | | |
5.125% | | | 08/01/30 | | | | | | | | | | | | 45 | | | | 43,027 | |
| | | | | | | | | | | | | | | | | | | | |
| | |
| | | | | | | 1,771,968 | |
| | | | | | | | | | | | | | | | | | | | |
Housewares — 0.0% | | | | | | | | | | | | | |
Newell Brands, Inc., | |
Sr. Unsec’d. Notes | | | | | | | | | | | | | |
6.375% | | | 05/15/30 | | | | | | | | | | | | 240 | | | | 240,831 | |
6.625% | | | 05/15/32(a) | | | | | | | | | | | | 115 | | | | 115,777 | |
Scotts Miracle-Gro Co. (The), | | | | | |
Gtd. Notes | | | | | | | | | | | | | | | | |
4.375% | | | 02/01/32 | | | | | | | | | | | | 850 | | | | 740,747 | |
| | | | | | | | | | | | | | | | | | | | |
| | |
| | | | | | | 1,097,355 | |
| | | | | | | | | | | | | | | | | | | | |
Insurance — 0.5% | | | | | | | | | | | | | |
Arthur J Gallagher & Co., | |
Sr. Unsec’d. Notes | | | | | | | | | | | | | |
5.150% | | | 02/15/35 | | | | | | | | | | | | 1,955 | | | | 1,905,684 | |
Everest Reinsurance Holdings, Inc., | |
Sr. Unsec’d. Notes | | | | | |
3.500% | | | 10/15/50 | | | | | | | | | | | | 20 | | | | 13,597 | |
Fairfax Financial Holdings Ltd. (Canada), | |
Sr. Unsec’d. Notes | | | | | |
6.000% | | | 12/07/33 | | | | | | | | | | | | 6,210 | | | | 6,400,972 | |
Great-West Lifeco US Finance 2020 LP (Canada), | |
Gtd. Notes, 144A | | | | | |
0.904% | | | 08/12/25 | | | | | | | | | | | | 25 | | | | 24,394 | |
Liberty Mutual Group, Inc., | | | | | |
Gtd. Notes, 144A | | | | | |
3.951% | | | 10/15/50 | | | | | | | | | | | | 1,030 | | | | 749,822 | |
Lincoln National Corp., | | | | | |
Sr. Unsec’d. Notes | | | | | |
7.000% | | | 06/15/40 | | | | | | | | | | | | 405 | | | | 442,672 | |
Markel Group, Inc., | | | | | |
Sr. Unsec’d. Notes | | | | | |
5.000% | | | 03/30/43 | | | | | | | | | | | | 350 | | | | 306,961 | |
Marsh & McLennan Cos., Inc., | | | | | |
Sr. Unsec’d. Notes | | | | | |
2.250% | | | 11/15/30 | | | | | | | | | | | | 5 | | | | 4,311 | |
2.375% | | | 12/15/31 | | | | | | | | | | | | 15 | | | | 12,581 | |
New York Life Insurance Co., | | | | | |
Sub. Notes, 144A | | | | | |
3.750% | | | 05/15/50(a) | | | | | | | | | | | | 25 | | | | 18,266 | |
Principal Financial Group, Inc., | | | | | |
Gtd. Notes | | | | | | | | | | | | | | | | |
4.625% | | | 09/15/42 | | | | | | | | | | | | 150 | | | | 131,920 | |
SEE NOTES TO FINANCIAL STATEMENTS.
A183
| | | | |
| | PSF PGIM TOTAL RETURN BOND PORTFOLIO (CONTINUED) | | |
SCHEDULE OF INVESTMENTS | | | | as of December 31, 2024 |
| | | | | | | | | | | | | | | | | | |
Interest Rate | | Maturity
Date | | | | | | | | Principal
Amount
(000)# | | | Value | |
| |
CORPORATE BONDS (continued) | | | | | |
Insurance (cont’d.) | | | | | | | | | | | | | | | | |
Protective Life Corp., | | | | | | | | | | | | | | | | |
Sr. Unsec’d. Notes, 144A | |
3.400% | | 01/15/30 | | | | | | | | | | | 15 | | | $ | 13,785 | |
Sompo International Holdings Ltd. (Bermuda), | | | | | |
Sr. Unsec’d. Notes | | | | | | | | | | | | | | | | |
7.000% | | 07/15/34 | | | | | | | | | | | 1,350 | | | | 1,468,480 | |
Teachers Insurance & Annuity Association of America, | |
Sub. Notes, 144A | | | | | | | | | | | | | | | | |
3.300% | | 05/15/50 | | | | | | | | | | | 10 | | | | 6,686 | |
4.270% | | 05/15/47 | | | | | | | | | | | 910 | | | | 727,685 | |
6.850% | | 12/16/39 | | | | | | | | | | | 196 | | | | 217,309 | |
W.R. Berkley Corp., | | | | | | | | | | | | | | | | |
Sr. Unsec’d. Notes | | | | | | | | | | | | | | | | |
4.000% | | 05/12/50 | | | | | | | | | | | 15 | | | | 11,367 | |
| | | | | | | | | | | | | | | | | | |
| | | | | |
| | | | | | | | | | | | | | | | | 12,456,492 | |
| | | | | | | | | | | | | | | | | | |
Internet — 0.0% | | | | | | | | | | | | | | | | |
Alphabet, Inc., | |
Sr. Unsec’d. Notes | | | | | | | | | | | | | | | | |
1.100% | | 08/15/30 | | | | | | | | | | | 20 | | | | 16,636 | |
Amazon.com, Inc., | | | | | | | | | | | | | | | | |
Sr. Unsec’d. Notes | | | | | | | | | | | | | | | | |
1.000% | | 05/12/26(a) | | | | | | | | | | | 100 | | | | 95,676 | |
1.200% | | 06/03/27 | | | | | | | | | | | 20 | | | | 18,541 | |
2.100% | | 05/12/31 | | | | | | | | | | | 30 | | | | 25,611 | |
2.500% | | 06/03/50 | | | | | | | | | | | 25 | | | | 14,901 | |
3.150% | | 08/22/27 | | | | | | | | | | | 45 | | | | 43,512 | |
Arches Buyer, Inc., | | | | | | | | | | | | | | | | |
Sr. Sec’d. Notes, 144A | | | | | | | | | | | | | | | | |
4.250% | | 06/01/28 | | | | | | | | | | | 25 | | | | 22,964 | |
Expedia Group, Inc., | | | | | | | | | | | | | | | | |
Gtd. Notes, 144A | | | | | | | | | | | | | | | | |
6.250% | | 05/01/25 | | | | | | | | | | | 3 | | | | 3,002 | |
Netflix, Inc., | |
Sr. Unsec’d. Notes | | | | | | | | | | | | | | | | |
4.375% | | 11/15/26 | | | | | | | | | | | 18 | | | | 17,949 | |
| | | | | | | | | | | | | | | | | | |
| | | | | |
| | | | | | | | | | | | | | | | | 258,792 | |
| | | | | | | | | | | | | | | | | | |
Iron/Steel — 0.1% | | | | | | | | | | | | | | | | |
Cleveland-Cliffs, Inc., | | | | | | | | | | | | | | | | |
Gtd. Notes, 144A | | | | | | | | | | | | | | | | |
6.875% | | 11/01/29 | | | | | | | | | | | 415 | | | | 410,404 | |
7.375% | | 05/01/33 | | | | | | | | | | | 250 | | | | 245,885 | |
Mineral Resources Ltd. (Australia), | |
Sr. Unsec’d. Notes, 144A | | | | | | | | | | | | | | | | |
9.250% | | 10/01/28 | | | | | | | | | | | 475 | | | | 497,255 | |
Nucor Corp., | |
Sr. Unsec’d. Notes | | | | | | | | | | | | | | | | |
2.000% | | 06/01/25 | | | | | | | | | | | 5 | | | | 4,939 | |
Steel Dynamics, Inc., | | | | | | | | | | | | | | | | |
Sr. Unsec’d. Notes | | | | | | | | | | | | | | | | |
2.400% | | 06/15/25 | | | | | | | | | | | 5 | | | | 4,941 | |
3.250% | | 01/15/31 | | | | | | | | | | | 20 | | | | 18,035 | |
3.250% | | 10/15/50 | | | | | | | | | | | 5 | | | | 3,284 | |
3.450% | | 04/15/30 | | | | | | | | | | | 5 | | | | 4,630 | |
| | | | | | | | | | | | | | | | | | |
| | | | | |
| | | | | | | | | | | | | | | | | 1,189,373 | |
| | | | | | | | | | | | | | | | | | |
| | | | | | | | | | | | | | | | | | |
Interest Rate | | Maturity
Date | | | | | | | | Principal
Amount
(000)# | | | Value | |
| |
CORPORATE BONDS (continued) | | | | | |
Leisure Time — 0.3% | | | | | | | | | | | | | | | | |
Carnival Corp., | |
Gtd. Notes, 144A | | | | | | | | | | | | | | | | |
5.750% | | 03/01/27 | | | | | | | | | | | 675 | | | $ | 671,692 | |
6.000% | | 05/01/29 | | | | | | | | | | | 700 | | | | 698,621 | |
Sr. Sec’d. Notes, 144A | |
4.000% | | 08/01/28 | | | | | | | | | | | 100 | | | | 94,469 | |
Carnival Holdings Bermuda Ltd., | |
Gtd. Notes, 144A | | | | | | | | | | | | | | | | |
10.375% | | 05/01/28 | | | | | | | | | | | 250 | | | | 266,348 | |
Lindblad Expeditions LLC, | |
Sr. Sec’d. Notes, 144A | |
6.750% | | 02/15/27(a) | | | | | | | | | | | 1,400 | | | | 1,400,987 | |
NCL Corp. Ltd., | |
Gtd. Notes, 144A | | | | | | | | | | | | | | | | |
5.875% | | 03/15/26 | | | | | | | | | | | 1,450 | | | | 1,443,837 | |
Sr. Unsec’d. Notes, 144A | |
6.250% | | 03/01/30 | | | | | | | | | | | 50 | | | | 49,436 | |
NCL Finance Ltd., | | | | | | | | | | | | | | | | |
Gtd. Notes, 144A | | | | | | | | | | | | | | | | |
6.125% | | 03/15/28 | | | | | | | | | | | 375 | | | | 374,621 | |
Royal Caribbean Cruises Ltd., | |
Sr. Unsec’d. Notes, 144A | |
5.500% | | 08/31/26 | | | | | | | | | | | 550 | | | | 547,415 | |
5.500% | | 04/01/28 | | | | | | | | | | | 25 | | | | 24,825 | |
Viking Cruises Ltd., | | | | | | | | | | | | | | | | |
Gtd. Notes, 144A | | | | | | | | | | | | | | | | |
5.875% | | 09/15/27 | | | | | | | | | | | 800 | | | | 793,000 | |
VOC Escrow Ltd., | | | | | | | | | | | | | | | | |
Sr. Sec’d. Notes, 144A | |
5.000% | | 02/15/28 | | | | | | | | | | | 500 | | | | 485,000 | |
| | | | | | | | | | | | | | | | | | |
| | | | | |
| | | | | | | | | | | | | | | | | 6,850,251 | |
| | | | | | | | | | | | | | | | | | |
Lodging — 0.2% | | | | | | | | | | | | | | | | |
Las Vegas Sands Corp., | |
Sr. Unsec’d. Notes | | | | | | | | | | | | | | | | |
2.900% | | 06/25/25 | | | | | | | | | | | 40 | | | | 39,561 | |
3.500% | | 08/18/26 | | | | | | | | | | | 30 | | | | 29,222 | |
Marriott International, Inc., | |
Sr. Unsec’d. Notes | | | | | | | | | | | | | | | | |
3.750% | | 10/01/25 | | | | | | | | | | | 5 | | | | 4,961 | |
MGM Resorts International, | |
Gtd. Notes | |
4.750% | | 10/15/28 | | | | | | | | | | | 1,375 | | | | 1,315,976 | |
5.500% | | 04/15/27 | | | | | | | | | | | 700 | | | | 694,879 | |
6.500% | | 04/15/32(a) | | | | | | | | | | | 560 | | | | 557,876 | |
Sands China Ltd. (Macau), | |
Sr. Unsec’d. Notes | | | | | | | | | | | | | | | | |
5.400% | | 08/08/28 | | | | | | | | | | | 400 | | | | 395,000 | |
Wynn Macau Ltd. (Macau), | |
Sr. Unsec’d. Notes, 144A | |
5.500% | | 01/15/26 | | | | | | | | | | | 725 | | | | 717,975 | |
| | | | | | | | | | | | | | | | | | |
| | | | | |
| | | | | | | | | | | | | | | | | 3,755,450 | |
| | | | | | | | | | | | | | | | | | |
Machinery-Construction & Mining — 0.0% | |
Caterpillar Financial Services Corp., | |
Sr. Unsec’d. Notes, MTN | |
0.800% | | 11/13/25 | | | | | | | | | | | 10 | | | | 9,681 | |
SEE NOTES TO FINANCIAL STATEMENTS.
A184
| | | | |
| | PSF PGIM TOTAL RETURN BOND PORTFOLIO (CONTINUED) | | |
SCHEDULE OF INVESTMENTS | | | | as of December 31, 2024 |
| | | | | | | | | | | | | | | | | | |
Interest Rate | | Maturity
Date | | | | | | | | Principal
Amount
(000)# | | | Value | |
|
CORPORATE BONDS (continued) | |
Machinery-Construction & Mining (cont’d.) | |
1.100% | | 09/14/27 | | | | | | | | | | | 10 | | | $ | 9,171 | |
Caterpillar, Inc., | |
Sr. Unsec’d. Notes | |
2.600% | | 04/09/30 | | | | | | | | | | | 10 | | | | 9,017 | |
| | | | | | | | | | | | | | | | | | |
| | | | | |
| | | | | | | | | | | | | | | | | 27,869 | |
| | | | | | | | | | | | | | | | | | |
Machinery-Diversified — 0.1% | |
Chart Industries, Inc., | | | | | | | | | | | | | | | | |
Sr. Sec’d. Notes, 144A | |
7.500% | | 01/01/30 | | | | | | | | | | | 550 | | | | 571,991 | |
Deere & Co., | |
Sr. Unsec’d. Notes | |
3.100% | | 04/15/30 | | | | | | | | | | | 10 | | | | 9,200 | |
Maxim Crane Works Holdings Capital LLC, | | | | | |
Sec’d. Notes, 144A | |
11.500% | | 09/01/28 | | | | | | | | | | | 1,275 | | | | 1,348,427 | |
Westinghouse Air Brake Technologies Corp., | | | | | |
Gtd. Notes | |
4.700% | | 09/15/28 | | | | | | | | | | | 30 | | | | 29,727 | |
5.611% | | 03/11/34 | | | | | | | | | | | 790 | | | | 800,085 | |
| | | | | | | | | | | | | | | | | | |
| | | | | |
| | | | | | | | | | | | | | | | | 2,759,430 | |
| | | | | | | | | | | | | | | | | | |
Media — 0.8% | |
CCO Holdings LLC/CCO Holdings Capital Corp., | |
Sr. Unsec’d. Notes | |
4.500% | | 05/01/32 | | | | | | | | | | | 450 | | | | 387,507 | |
Sr. Unsec’d. Notes, 144A | |
4.500% | | 08/15/30 | | | | | | | | | | | 5 | | | | 4,488 | |
4.750% | | 03/01/30 | | | | | | | | | | | 8 | | | | 7,305 | |
5.125% | | 05/01/27 | | | | | | | | | | | 275 | | | | 270,107 | |
5.375% | | 06/01/29 | | | | | | | | | | | 800 | | | | 764,247 | |
5.500% | | 05/01/26 | | | | | | | | | | | 1,375 | | | | 1,369,220 | |
Charter Communications Operating LLC/Charter Communications Operating Capital, | |
Sr. Sec’d. Notes | |
2.250% | | 01/15/29 | | | | | | | | | | | 40 | | | | 35,261 | |
2.800% | | 04/01/31 | | | | | | | | | | | 100 | | | | 84,397 | |
3.500% | | 06/01/41 | | | | | | | | | | | 45 | | | | 30,855 | |
3.500% | | 03/01/42 | | | | | | | | | | | 50 | | | | 34,004 | |
3.700% | | 04/01/51 | | | | | | | | | | | 620 | | | | 389,116 | |
4.908% | | 07/23/25 | | | | | | | | | | | 15 | | | | 14,979 | |
5.050% | | 03/30/29 | | | | | | | | | | | 85 | | | | 83,348 | |
5.375% | | 05/01/47 | | | | | | | | | | | 20 | | | | 16,342 | |
6.384% | | 10/23/35 | | | | | | | | | | | 2,487 | | | | 2,482,491 | |
6.484% | | 10/23/45 | | | | | | | | | | | 1,140 | | | | 1,077,074 | |
Comcast Corp., | |
Gtd. Notes | |
2.350% | | 01/15/27 | | | | | | | | | | | 30 | | | | 28,670 | |
2.650% | | 02/01/30 | | | | | | | | | | | 10 | | | | 8,957 | |
2.937% | | 11/01/56 | | | | | | | | | | | 26 | | | | 15,158 | |
3.150% | | 02/15/28 | | | | | | | | | | | 80 | | | | 76,181 | |
3.250% | | 11/01/39 | | | | | | | | | | | 35 | | | | 26,554 | |
3.900% | | 03/01/38 | | | | | | | | | | | 25 | | | | 21,008 | |
3.999% | | 11/01/49 | | | | | | | | | | | 85 | | | | 64,279 | |
4.000% | | 03/01/48 | | | | | | | | | | | 40 | | | | 30,407 | |
4.150% | | 10/15/28 | | | | | | | | | | | 50 | | | | 48,780 | |
| | | | | | | | | | | | | | | | | | | | |
Interest Rate | | Maturity
Date | | | | | | Principal
Amount
(000)# | | | Value | |
|
CORPORATE BONDS (continued) | |
Media (cont’d.) | |
Cox Communications, Inc., | |
Gtd. Notes, 144A | | | | | | | | | | | | | | | | | |
2.950% | | | 10/01/50 | | | | | | | | | | | | 60 | | | $ | 34,793 | |
5.450% | | | 09/01/34 | | | | | | | | | | | | 1,290 | | | | 1,246,099 | |
Sr. Unsec’d. Notes, 144A | |
3.500% | | | 08/15/27 | | | | | | | | | | | | 65 | | | | 62,844 | |
CSC Holdings LLC, | | | | | | | | | | | | | | | | | |
Gtd. Notes, 144A(x) | |
3.375% | | | 02/15/31 | | | | | | | | | | | | 1,000 | | | | 705,052 | |
Gtd. Notes, 144A(x) | |
4.125% | | | 12/01/30 | | | | | | | | | | | | 200 | | | | 144,020 | |
Gtd. Notes, 144A(x) | |
5.375% | | | 02/01/28 | | | | | | | | | | | | 400 | | | | 344,529 | |
Gtd. Notes, 144A(x) | |
5.500% | | | 04/15/27 | | | | | | | | | | | | 650 | | | | 581,222 | |
Sr. Unsec’d. Notes, 144A(x) | |
4.625% | | | 12/01/30 | | | | | | | | | | | | 1,000 | | | | 519,997 | |
Diamond Sports Group LLC/Diamond Sports Finance Co., | |
Gtd. Notes, 144A(x) | |
6.625% | | | 08/15/27(d) | | | | | | | | | | | | 520 | | | | 594 | |
Sec’d. Notes, 144A(x) | |
5.375% | | | 08/15/26(d) | | | | | | | | | | | | 3,180 | | | | 7,078 | |
DISH DBS Corp., | | | | | | | | | | | | | | | | | |
Gtd. Notes | |
5.125% | | | 06/01/29 | | | | | | | | | | | | 375 | | | | 238,101 | |
7.375% | | | 07/01/28 | | | | | | | | | | | | 400 | | | | 285,474 | |
7.750% | | | 07/01/26 | | | | | | | | | | | | 475 | | | | 399,213 | |
DISH Network Corp., | |
Sr. Sec’d. Notes, 144A | |
11.750% | | | 11/15/27 | | | | | | | | | | | | 2,275 | | | | 2,406,155 | |
Fox Corp., | |
Sr. Unsec’d. Notes | |
3.050% | | | 04/07/25 | | | | | | | | | | | | 5 | | | | 4,974 | |
NBCUniversal Media LLC, | |
Gtd. Notes | |
4.450% | | | 01/15/43 | | | | | | | | | | | | 10 | | | | 8,515 | |
Sirius XM Radio LLC, | |
Gtd. Notes, 144A | | | | | | | | | | | | | | | | | |
3.125% | | | 09/01/26 | | | | | | | | | | | | 15 | | | | 14,416 | |
4.000% | | | 07/15/28 | | | | | | | | | | | | 15 | | | | 13,822 | |
TCI Communications, Inc., | |
Sr. Unsec’d. Notes | |
7.875% | | | 02/15/26 | | | | | | | | | | | | 750 | | | | 776,249 | |
TWDC Enterprises 18 Corp., | |
Gtd. Notes, MTN | | | | | | | | | | | | | | | | | |
1.850% | | | 07/30/26 | | | | | | | | | | | | 30 | | | | 28,799 | |
Univision Communications, Inc., | |
Sr. Sec’d. Notes, 144A | |
6.625% | | | 06/01/27 | | | | | | | | | | | | 975 | | | | 971,837 | |
Virgin Media Secured Finance PLC (United Kingdom), | |
Sr. Sec’d. Notes | | | | | | | | | | | | | | | | | |
4.125% | | | 08/15/30 | | | | | | | | GBP | | | | 900 | | | | 964,210 | |
4.250% | | | 01/15/30 | | | | | | | | GBP | | | | 1,300 | | | | 1,426,660 | |
Walt Disney Co. (The), | |
Gtd. Notes | |
3.800% | | | 03/22/30 | | | | | | | | | | | | 85 | | | | 81,360 | |
| | | | | | | | | | | | | | | | | | | | |
| | | | | |
| | | | | | | | | | | | | | | | | | | 18,636,748 | |
| | | | | | | | | | | | | | | | | | | | |
SEE NOTES TO FINANCIAL STATEMENTS.
A185
| | | | |
| | PSF PGIM TOTAL RETURN BOND PORTFOLIO (CONTINUED) | | |
SCHEDULE OF INVESTMENTS | | | | as of December 31, 2024 |
| | | | | | | | | | | | | | | | | | |
Interest Rate | | Maturity
Date | | | | | | | | Principal
Amount
(000)# | | | Value | |
| |
CORPORATE BONDS (continued) | | | | | |
Mining — 0.4% | | | | | | | | | | | | | | | | |
Arsenal AIC Parent LLC, | | | | | | | | | | | | | | | | |
Unsec’d. Notes, 144A | |
11.500% | | 10/01/31 | | | | | | | | | | | 505 | | | $ | 564,213 | |
Barrick North America Finance LLC (Canada), | |
Gtd. Notes | |
5.700% | | 05/30/41 | | | | | | | | | | | 464 | | | | 454,799 | |
BHP Billiton Finance USA Ltd. (Australia), | |
Gtd. Notes | |
6.420% | | 03/01/26 | | | | | | | | | | | 120 | | | | 122,367 | |
First Quantum Minerals Ltd. (Zambia), | |
Gtd. Notes, 144A | |
6.875% | | 10/15/27 | | | | | | | | | | | 700 | | | | 696,283 | |
Sec’d. Notes, 144A | |
9.375% | | 03/01/29 | | | | | | | | | | | 1,250 | | | | 1,322,663 | |
FMG Resources August 2006 Pty Ltd. (Australia), | | | | | |
Gtd. Notes, 144A | |
4.375% | | 04/01/31 | | | | | | | | | | | 25 | | | | 22,656 | |
Freeport Indonesia PT (Indonesia), | |
Sr. Unsec’d. Notes, EMTN | |
5.315% | | 04/14/32 | | | | | | | | | | | 450 | | | | 438,750 | |
Hecla Mining Co., | | | | | | | | | | | | | | | | |
Gtd. Notes | |
7.250% | | 02/15/28 | | | | | | | | | | | 325 | | | | 327,291 | |
Kinross Gold Corp. (Canada), | |
Gtd. Notes | |
4.500% | | 07/15/27 | | | | | | | | | | | 25 | | | | 24,750 | |
Newmont Corp., | |
Gtd. Notes | |
2.800% | | 10/01/29 | | | | | | | | | | | 3,030 | | | | 2,764,952 | |
Newmont Corp./Newcrest Finance Pty Ltd., | | | | | |
Gtd. Notes | |
5.350% | | 03/15/34 | | | | | | | | | | | 1,200 | | | | 1,194,675 | |
Novelis Corp., | |
Gtd. Notes, 144A | |
3.250% | | 11/15/26 | | | | | | | | | | | 750 | | | | 715,155 | |
Southern Copper Corp. (Mexico), | |
Sr. Unsec’d. Notes | |
3.875% | | 04/23/25 | | | | | | | | | | | 50 | | | | 49,602 | |
Yamana Gold, Inc. (Canada), | |
Gtd. Notes | |
4.625% | | 12/15/27 | | | | | | | | | | | 45 | | | | 44,175 | |
| | | | | | | | | | | | | | | | | | |
| | | | | |
| | | | | | | | | | | | | | | | | 8,742,331 | |
| | | | | | | | | | | | | | | | | | |
Miscellaneous Manufacturing — 0.0% | |
Carlisle Cos., Inc., | | | | | | | | | | | | | | | | |
Sr. Unsec’d. Notes | |
2.200% | | 03/01/32 | | | | | | | | | | | 15 | | | | 12,244 | |
Hillenbrand, Inc., | |
Gtd. Notes | |
5.000% | | 09/15/26 | | | | | | | | | | | 100 | | | | 99,177 | |
Pentair Finance Sarl, | | | | | | | | | | | | | | | | |
Gtd. Notes | |
4.500% | | 07/01/29 | | | | | | | | | | | 50 | | | | 48,530 | |
Teledyne Technologies, Inc., | |
Gtd. Notes | |
2.750% | | 04/01/31 | | | | | | | | | | | 60 | | | | 52,174 | |
| | | | | | | | | | | | | | | | | | |
Interest Rate | | Maturity
Date | | | | | | | | Principal
Amount
(000)# | | | Value | |
| |
CORPORATE BONDS (continued) | | | | | |
Miscellaneous Manufacturing (cont’d.) | |
Textron, Inc., | |
Sr. Unsec’d. Notes | | | | | | | | | | | | | | | | |
2.450% | | 03/15/31 | | | | | | | | | | | 64 | | | $ | 54,471 | |
| | | | | | | | | | | | | | | | | | |
| | | | | |
| | | | | | | | | | | | | | | | | 266,596 | |
| | | | | | | | | | | | | | | | | | |
Multi-National — 0.1% | | | | | | | | | | | | | | | | |
Corp. Andina de Fomento (Supranational Bank), | |
Sr. Unsec’d. Notes | | | | | | | | | | | | | | | | |
5.000% | | 01/24/29 | | | | | | | | | | | 240 | | | | 240,931 | |
Inter-American Development Bank (Supranational Bank), | |
Unsec’d. Notes | | | | | | | | | | | | | | | | |
6.950% | | 08/01/26 | | | | | | | | | | | 1,500 | | | | 1,541,268 | |
| | | | | | | | | | | | | | | | | | |
| | | | | |
| | | | | | | | | | | | | | | | | 1,782,199 | |
| | | | | | | | | | | | | | | | | | |
Office/Business Equipment — 0.1% | |
CDW LLC/CDW Finance Corp., | |
Gtd. Notes | |
2.670% | | 12/01/26 | | | | | | | | | | | 20 | | | | 19,182 | |
3.276% | | 12/01/28 | | | | | | | | | | | 25 | | | | 23,305 | |
4.250% | | 04/01/28 | | | | | | | | | | | 3,390 | | | | 3,283,283 | |
| | | | | | | | | | | | | | | | | | |
| | | | | |
| | | | | | | | | | | | | | | | | 3,325,770 | |
| | | | | | | | | | | | | | | | | | |
Oil & Gas — 2.1% | | | | | | | | | | | | | | | | |
Aker BP ASA (Norway), | | | | | | | | | | | | | | | | |
Gtd. Notes, 144A | | | | | | | | | | | | | | | | |
3.100% | | 07/15/31 | | | | | | | | | | | 3,775 | | | | 3,266,350 | |
Sr. Unsec’d. Notes, 144A | |
5.600% | | 06/13/28 | | | | | | | | | | | 4,000 | | | | 4,048,586 | |
Ascent Resources Utica Holdings LLC/ARU Finance Corp., | |
Gtd. Notes, 144A | | | | | | | | | | | | | | | | |
9.000% | | 11/01/27 | | | | | | | | | | | 179 | | | | 216,227 | |
Sr. Unsec’d. Notes, 144A | |
6.625% | | 10/15/32 | | | | | | | | | | | 195 | | | | 193,901 | |
8.250% | | 12/31/28 | | | | | | | | | | | 1,325 | | | | 1,352,407 | |
BP Capital Markets America, Inc., | |
Gtd. Notes | |
1.749% | | 08/10/30 | | | | | | | | | | | 10 | | | | 8,465 | |
2.772% | | 11/10/50 | | | | | | | | | | | 145 | | | | 87,048 | |
2.939% | | 06/04/51 | | | | | | | | | | | 1,845 | | | | 1,142,709 | |
3.000% | | 02/24/50 | | | | | | | | | | | 60 | | | | 38,186 | |
3.060% | | 06/17/41 | | | | | | | | | | | 7 | | | | 5,050 | |
3.379% | | 02/08/61 | | | | | | | | | | | 5 | | | | 3,174 | |
4.234% | | 11/06/28 | | | | | | | | | | | 50 | | | | 48,961 | |
Canadian Natural Resources Ltd. (Canada), | | | | | |
Sr. Unsec’d. Notes | | | | | | | | | | | | | | | | |
2.950% | | 07/15/30 | | | | | | | | | | | 10 | | | | 8,880 | |
Sr. Unsec’d. Notes, 144A | |
5.000% | | 12/15/29 | | | | | | | | | | | 1,845 | | | | 1,824,594 | |
Cenovus Energy, Inc. (Canada), | |
Sr. Unsec’d. Notes | | | | | | | | | | | | | | | | |
3.750% | | 02/15/52 | | | | | | | | | | | 340 | | | | 233,273 | |
5.250% | | 06/15/37 | | | | | | | | | | | 12 | | | | 11,249 | |
5.400% | | 06/15/47 | | | | | | | | | | | 1,325 | | | | 1,177,167 | |
Chevron Corp., | |
Sr. Unsec’d. Notes | | | | | | | | | | | | | | | | |
2.954% | | 05/16/26 | | | | | | | | | | | 20 | | | | 19,611 | |
SEE NOTES TO FINANCIAL STATEMENTS.
A186
| | | | |
| | PSF PGIM TOTAL RETURN BOND PORTFOLIO (CONTINUED) | | |
SCHEDULE OF INVESTMENTS | | | | as of December 31, 2024 |
| | | | | | | | | | | | | | | | | | |
Interest Rate | | Maturity
Date | | | | | | | | Principal
Amount
(000)# | | | Value | |
| |
CORPORATE BONDS (continued) | | | | | |
Oil & Gas (cont’d.) | | | | | | | | | | | | | | | | |
Chevron USA, Inc., | | | | | | | | | | | | | | | | |
Gtd. Notes | |
1.018% | | 08/12/27 | | | | | | | | | | | 10 | | | $ | 9,152 | |
3.850% | | 01/15/28 | | | | | | | | | | | 10 | | | | 9,864 | |
Cimarex Energy Co., | | | | | | | | | | | | | | | | |
Sr. Unsec’d. Notes | | | | | | | | | | | | | | | | |
4.375% | | 03/15/29 | | | | | | | | | | | 10 | | | | 9,143 | |
CITGO Petroleum Corp., | |
Sr. Sec’d. Notes, 144A | |
7.000% | | 06/15/25 | | | | | | | | | | | 800 | | | | 800,677 | |
Civitas Resources, Inc., | |
Gtd. Notes, 144A | | | | | | | | | | | | | | | | |
8.375% | | 07/01/28 | | | | | | | | | | | 250 | | | | 259,786 | |
8.625% | | 11/01/30 | | | | | | | | | | | 125 | | | | 130,963 | |
Continental Resources, Inc., | |
Gtd. Notes, 144A | | | | | | | | | | | | | | | | |
2.268% | | 11/15/26 | | | | | | | | | | | 10 | | | | 9,476 | |
Crescent Energy Finance LLC, | |
Gtd. Notes, 144A | | | | | | | | | | | | | | | | |
7.625% | | 04/01/32 | | | | | | | | | | | 375 | | | | 373,138 | |
9.250% | | 02/15/28 | | | | | | | | | | | 215 | | | | 224,701 | |
Devon Energy Corp., | | | | | | | | | | | | | | | | |
Sr. Unsec’d. Notes | | | | | | | | | | | | | | | | |
5.250% | | 10/15/27 | | | | | | | | | | | 15 | | | | 15,013 | |
5.600% | | 07/15/41 | | | | | | | | | | | 870 | | | | 804,697 | |
5.850% | | 12/15/25 | | | | | | | | | | | 30 | | | | 30,222 | |
Devon OEI Operating LLC, | |
Sr. Unsec’d. Notes | | | | | | | | | | | | | | | | |
7.500% | | 09/15/27 | | | | | | | | | | | 20 | | | | 21,103 | |
Diamondback Energy, Inc., | |
Gtd. Notes | |
3.125% | | 03/24/31 | | | | | | | | | | | 25 | | | | 22,124 | |
3.250% | | 12/01/26 | | | | | | | | | | | 20 | | | | 19,474 | |
5.750% | | 04/18/54 | | | | | | | | | | | 960 | | | | 901,083 | |
6.250% | | 03/15/33 | | | | | | | | | | | 3,307 | | | | 3,439,351 | |
Ecopetrol SA (Colombia), | |
Sr. Unsec’d. Notes | | | | | | | | | | | | | | | | |
4.625% | | 11/02/31 | | | | | | | | | | | 1,526 | | | | 1,261,331 | |
6.875% | | 04/29/30 | | | | | | | | | | | 497 | | | | 484,326 | |
7.750% | | 02/01/32 | | | | | | | | | | | 2,145 | | | | 2,083,867 | |
8.625% | | 01/19/29 | | | | | | | | | | | 2,520 | | | | 2,669,058 | |
8.875% | | 01/13/33 | | | | | | | | | | | 495 | | | | 502,529 | |
Energean Israel Finance Ltd. (Israel), | |
Sr. Sec’d. Notes, 144A | |
5.375% | | 03/30/28 | | | | | | | | | | | 193 | | | | 178,656 | |
EOG Resources, Inc., | | | | | | | | | | | | | | | | |
Sr. Unsec’d. Notes | | | | | | | | | | | | | | | | |
4.375% | | 04/15/30 | | | | | | | | | | | 15 | | | | 14,592 | |
Equinor ASA (Norway), | | | | | | | | | | | | | | | | |
Gtd. Notes | |
1.750% | | 01/22/26 | | | | | | | | | | | 10 | | | | 9,698 | |
Expand Energy Corp., | | | | | | | | | | | | | | | | |
Gtd. Notes | |
4.750% | | 02/01/32 | | | | | | | | | | | 525 | | | | 487,676 | |
5.375% | | 02/01/29 | | | | | | | | | | | 700 | | | | 689,240 | |
| | | | | | | | | | | | | | | | | | |
Interest Rate | | Maturity
Date | | | | | Principal
Amount
(000)# | | | Value | |
| |
CORPORATE BONDS (continued) | | | | | |
Oil & Gas (cont’d.) | | | | | | | | | | | | | | | | |
Exxon Mobil Corp., | | | | | | | | | | | | | | | | |
Sr. Unsec’d. Notes | | | | | | | | | | | | | | | | |
2.992% | | 03/19/25 | | | | | | | | | | | 15 | | | $ | 14,949 | |
3.482% | | 03/19/30 | | | | | | | | | | | 10 | | | | 9,415 | |
4.114% | | 03/01/46 | | | | | | | | | | | 25 | | | | 20,254 | |
Hess Corp., | |
Sr. Unsec’d. Notes | | | | | | | | | | | | | | | | |
4.300% | | 04/01/27 | | | | | | | | | | | 45 | | | | 44,549 | |
5.600% | | 02/15/41 | | | | | | | | | | | 15 | | | | 14,793 | |
7.300% | | 08/15/31 | | | | | | | | | | | 5 | | | | 5,553 | |
Hilcorp Energy I LP/Hilcorp Finance Co., | | | | | | | | | |
Sr. Unsec’d. Notes, 144A | |
8.375% | | 11/01/33 | | | | | | | | | | | 983 | | | | 1,003,680 | |
KazMunayGas National Co. JSC (Kazakhstan), | |
Sr. Unsec’d. Notes, 144A | |
4.750% | | 04/19/27 | | | | | | | | | | | 200 | | | | 196,816 | |
Marathon Petroleum Corp., | | | | | | | | | | | | | | | | |
Sr. Unsec’d. Notes | | | | | | | | | | | | | | | | |
5.125% | | 12/15/26 | | | | | | | | | | | 50 | | | | 50,347 | |
New Generation Gas Gathering LLC, | |
Sr. Sec’d. Notes, 144A, 3 Month SOFR + 5.750% (Cap N/A, Floor 2.000%) | |
10.335%(c) | | 09/30/29^ | | | | | | | | | | | 243 | | | | 239,595 | |
Parkland Corp. (Canada), | | | | | | | | | | | | | | | | |
Sr. Unsec’d. Notes, 144A | |
6.625% | | 08/15/32 | | | | | | | | | | | 385 | | | | 380,669 | |
Permian Resources Operating LLC, | |
Gtd. Notes, 144A | | | | | | | | | | | | | | | | |
8.000% | | 04/15/27 | | | | | | | | | | | 675 | | | | 688,987 | |
Petrobras Global Finance BV (Brazil), | | | | | | | | | |
Gtd. Notes | |
6.625% | | 01/16/34 | | | | | | | GBP | | | | 880 | | | | 1,053,099 | |
Petroleos Mexicanos (Mexico), | |
Gtd. Notes | |
3.625% | | 11/24/25 | | | | | | | EUR | | | | 500 | | | | 509,509 | |
4.750% | | 02/26/29 | | | | | | | EUR | | | | 100 | | | | 95,493 | |
5.350% | | 02/12/28 | | | | | | | | | | | 1,412 | | | | 1,292,870 | |
5.950% | | 01/28/31 | | | | | | | | | | | 20 | | | | 16,823 | |
6.490% | | 01/23/27 | | | | | | | | | | | 1,550 | | | | 1,501,078 | |
6.500% | | 03/13/27 | | | | | | | | | | | 2,513 | | | | 2,421,527 | |
6.500% | | 01/23/29 | | | | | | | | | | | 600 | | | | 558,426 | |
6.700% | | 02/16/32 | | | | | | | | | | | 16 | | | | 13,970 | |
6.840% | | 01/23/30 | | | | | | | | | | | 800 | | | | 728,800 | |
Gtd. Notes, EMTN | | | | | | | | | | | | | | | | |
2.750% | | 04/21/27 | | | | | | | EUR | | | | 1,200 | | | | 1,141,092 | |
4.875% | | 02/21/28 | | | | | | | EUR | | | | 1,395 | | | | 1,366,258 | |
Phillips 66, | |
Gtd. Notes | |
1.300% | | 02/15/26 | | | | | | | | | | | 22 | | | | 21,198 | |
2.150% | | 12/15/30 | | | | | | | | | | | 53 | | | | 44,957 | |
Phillips 66 Co., | |
Gtd. Notes | |
4.680% | | 02/15/45 | | | | | | | | | | | 1,900 | | | | 1,591,647 | |
Pioneer Natural Resources Co., | |
Sr. Unsec’d. Notes | | | | | | | | | | | | | | | | |
1.125% | | 01/15/26 | | | | | | | | | | | 25 | | | | 24,129 | |
1.900% | | 08/15/30 | | | | | | | | | | | 795 | | | | 677,005 | |
SEE NOTES TO FINANCIAL STATEMENTS.
A187
| | | | |
| | PSF PGIM TOTAL RETURN BOND PORTFOLIO (CONTINUED) | | |
SCHEDULE OF INVESTMENTS | | | | as of December 31, 2024 |
| | | | | | | | | | | | | | | | | | |
Interest Rate | | Maturity
Date | | | | | | | | Principal
Amount
(000)# | | | Value | |
| |
CORPORATE BONDS (continued) | | | | | |
Oil & Gas (cont’d.) | | | | | | | | | | | | | | | | |
2.150% | | 01/15/31 | | | | | | | | | | | 5 | | | $ | 4,246 | |
Shell Finance US, Inc., | |
Gtd. Notes | |
3.250% | | 04/06/50 | | | | | | | | | | | 10 | | | | 6,736 | |
4.000% | | 05/10/46 | | | | | | | | | | | 20 | | | | 15,685 | |
TotalEnergies Capital International SA (France), | |
Gtd. Notes | |
3.127% | | 05/29/50 | | | | | | | | | | | 4 | | | | 2,615 | |
Transocean, Inc., | | | | | | | | | | | | | | | | |
Gtd. Notes, 144A | |
8.000% | | 02/01/27 | | | | | | | | | | | 111 | | | | 110,861 | |
8.250% | | 05/15/29 | | | | | | | | | | | 295 | | | | 288,829 | |
Valero Energy Corp., | | | | | | | | | | | | | | | | |
Sr. Unsec’d. Notes | |
2.150% | | 09/15/27 | | | | | | | | | | | 845 | | | | 790,137 | |
Var Energi ASA (Norway), | |
Sr. Unsec’d. Notes, 144A | |
7.500% | | 01/15/28 | | | | | | | | | | | 2,000 | | | | 2,111,443 | |
| | | | | | | | | | | | | | | | | | |
| | | | | |
| | | | | | | | | | | | | | | | | 48,204,818 | |
| | | | | | | | | | | | | | | | | | |
Oil & Gas Services — 0.0% | |
Cameron International Corp., | |
Gtd. Notes | |
7.000% | | 07/15/38 | | | | | | | | | | | 450 | | | | 484,777 | |
Halliburton Co., | |
Sr. Unsec’d. Notes | |
2.920% | | 03/01/30 | | | | | | | | | | | 6 | | | | 5,405 | |
3.800% | | 11/15/25 | | | | | | | | | | | 8 | | | | 7,930 | |
| | | | | | | | | | | | | | | | | | |
| | | | | |
| | | | | | | | | | | | | | | | | 498,112 | |
| | | | | | | | | | | | | | | | | | |
Packaging & Containers — 0.4% | |
Amcor Flexibles North America, Inc., | |
Gtd. Notes | |
2.630% | | 06/19/30 | | | | | | | | | | | 55 | | | | 48,191 | |
Ball Corp., | |
Gtd. Notes | |
6.000% | | 06/15/29 | | | | | | | | | | | 875 | | | | 882,373 | |
Berry Global, Inc., | | | | | | | | | | | | | | | | |
Sr. Sec’d. Notes | |
1.570% | | 01/15/26 | | | | | | | | | | | 90 | | | | 86,858 | |
Sr. Sec’d. Notes, 144A | |
4.875% | | 07/15/26 | | | | | | | | | | | 10 | | | | 9,971 | |
Graphic Packaging International LLC, | |
Sr. Sec’d. Notes, 144A | |
1.512% | | 04/15/26 | | | | | | | | | | | 30 | | | | 28,595 | |
Pactiv Evergreen Group Issuer LLC/Pactiv Evergreen Group Issuer, Inc., | |
Sr. Sec’d. Notes, 144A | |
4.375% | | 10/15/28 | | | | | | | | | | | 1,450 | | | | 1,449,111 | |
Sealed Air Corp./Sealed Air Corp. US, | | | | | | | | | | | | | | | | |
Gtd. Notes, 144A | |
6.125% | | 02/01/28 | | | | | | | | | | | 100 | | | | 100,374 | |
Silgan Holdings, Inc., | | | | | | | | | | | | | | | | |
Sr. Sec’d. Notes, 144A | |
1.400% | | 04/01/26 | | | | | | | | | | | 6,233 | | | | 5,944,046 | |
| | | | | | | | | | | | | | | | | | |
| | | | | |
| | | | | | | | | | | | | | | | | 8,549,519 | |
| | | | | | | | | | | | | | | | | | |
| | | | | | | | | | | | | | | | | | |
Interest Rate | | Maturity
Date | | | | | | | | Principal
Amount
(000)# | | | Value | |
| |
CORPORATE BONDS (continued) | | | | | |
Pharmaceuticals — 0.6% | | | | | | | | | | | | | | | | |
AbbVie, Inc., | |
Sr. Unsec’d. Notes | |
2.950% | | 11/21/26 | | | | | | | | | | | 300 | | | $ | 291,539 | |
3.200% | | 11/21/29 | | | | | | | | | | | 49 | | | | 45,494 | |
3.800% | | 03/15/25 | | | | | | | | | | | 1,040 | | | | 1,037,729 | |
4.050% | | 11/21/39 | | | | | | | | | | | 1,120 | | | | 957,670 | |
4.250% | | 11/14/28 | | | | | | | | | | | 50 | | | | 49,227 | |
4.550% | | 03/15/35 | | | | | | | | | | | 2,040 | | | | 1,917,785 | |
Astrazeneca Finance LLC (United Kingdom), | | | | | |
Gtd. Notes | |
2.250% | | 05/28/31 | | | | | | | | | | | 8 | | | | 6,803 | |
AstraZeneca PLC (United Kingdom), | |
Sr. Unsec’d. Notes | |
0.700% | | 04/08/26 | | | | | | | | | | | 45 | | | | 42,932 | |
Bausch Health Cos., Inc., | |
Gtd. Notes, 144A | |
5.000% | | 01/30/28 | | | | | | | | | | | 430 | | | | 291,862 | |
5.000% | | 02/15/29 | | | | | | | | | | | 250 | | | | 148,750 | |
5.250% | | 01/30/30 | | | | | | | | | | | 325 | | | | 175,906 | |
5.250% | | 02/15/31 | | | | | | | | | | | 225 | | | | 117,562 | |
6.250% | | 02/15/29 | | | | | | | | | | | 1,150 | | | | 707,250 | |
7.000% | | 01/15/28 | | | | | | | | | | | 225 | | | | 158,344 | |
9.000% | | 12/15/25 | | | | | | | | | | | 100 | | | | 97,120 | |
Sr. Sec’d. Notes, 144A | |
4.875% | | 06/01/28 | | | | | | | | | | | 225 | | | | 180,000 | |
Becton, Dickinson & Co., | |
Sr. Unsec’d. Notes | |
1.957% | | 02/11/31 | | | | | | | | | | | 20 | | | | 16,647 | |
3.794% | | 05/20/50 | | | | | | | | | | | 27 | | | | 19,979 | |
4.685% | | 12/15/44 | | | | | | | | | | | 9 | | | | 7,788 | |
Bristol-Myers Squibb Co., | |
Sr. Unsec’d. Notes | |
2.350% | | 11/13/40 | | | | | | | | | | | 10 | | | | 6,627 | |
CVS Health Corp., | | | | | | | | | | | | | | | | |
Jr. Sub. Notes | |
7.000%(ff) | | 03/10/55 | | | | | | | | | | | 3,745 | | | | 3,759,656 | |
Sr. Unsec’d. Notes | |
1.750% | | 08/21/30 | | | | | | | | | | | 60 | | | | 48,869 | |
2.125% | | 09/15/31 | | | | | | | | | | | 40 | | | | 32,039 | |
3.000% | | 08/15/26 | | | | | | | | | | | 12 | | | | 11,628 | |
3.250% | | 08/15/29 | | | | | | | | | | | 50 | | | | 45,515 | |
3.750% | | 04/01/30 | | | | | | | | | | | 110 | | | | 100,848 | |
5.000% | | 01/30/29 | | | | | | | | | | | 98 | | | | 96,672 | |
Johnson & Johnson, | | | | | | | | | | | | | | | | |
Sr. Unsec’d. Notes | |
2.100% | | 09/01/40 | | | | | | | | | | | 10 | | | | 6,661 | |
Merck & Co., Inc., | | | | | | | | | | | | | | | | |
Sr. Unsec’d. Notes | |
1.450% | | 06/24/30 | | | | | | | | | | | 25 | | | | 20,966 | |
2.350% | | 06/24/40 | | | | | | | | | | | 10 | | | | 6,751 | |
2.750% | | 12/10/51 | | | | | | | | | | | 15 | | | | 9,064 | |
Mylan, Inc., | |
Gtd. Notes | |
5.200% | | 04/15/48 | | | | | | | | | | | 890 | | | | 736,123 | |
Organon & Co./Organon Foreign Debt Co-Issuer BV, | | | | | |
Sr. Unsec’d. Notes, 144A | |
5.125% | | 04/30/31(a) | | | | | | | | | | | 800 | | | | 719,351 | |
SEE NOTES TO FINANCIAL STATEMENTS.
A188
| | | | |
| | PSF PGIM TOTAL RETURN BOND PORTFOLIO (CONTINUED) | | |
SCHEDULE OF INVESTMENTS | | | | as of December 31, 2024 |
| | | | | | | | | | | | | | | | | | | | |
Interest Rate | | Maturity
Date | | | | | | | | | Principal
Amount
(000)# | | | Value | |
| | | | | | |
| | | | | | |
|
CORPORATE BONDS (continued) | |
Pharmaceuticals (cont’d.) | | | | | | | | | |
Pfizer, Inc., | | | | | | | | | | | | | | | | | | | | |
Sr. Unsec’d. Notes
| | | | | | | | | | | | | | | | | |
3.000% | | | 12/15/26 | | | | | | | | | | | | 20 | | | $ | 19,462 | |
Shire Acquisitions Investments Ireland DAC, | | | | | |
Gtd. Notes
| | | | | | | | | | | | | | | | | | | | |
3.200% | | | 09/23/26 | | | | | | | | | | | | 87 | | | | 85,038 | |
Takeda Pharmaceutical Co. Ltd. (Japan), | | | | | |
Sr. Unsec’d. Notes
| | | | | | | | | | | | | | | | | |
3.025% | | | 07/09/40 | | | | | | | | | | | | 525 | | | | 379,789 | |
Utah Acquisition Sub, Inc., | | | | | | | | | | | | | |
Gtd. Notes | | | | | | | | | | | | | | | | | | | | |
3.950% | | | 06/15/26 | | | | | | | | | | | | 19 | | | | 18,716 | |
5.250% | | | 06/15/46 | | | | | | | | | | | | 185 | | | | 155,293 | |
Viatris, Inc., | | | | | | | | | | | | | | | | | | | | |
Gtd. Notes | | | | | | | | | | | | | | | | | | | | |
3.850% | | | 06/22/40 | | | | | | | | | | | | 5 | | | | 3,744 | |
4.000% | | | 06/22/50 | | | | | | | | | | | | 1,292 | | | | 881,028 | |
Zoetis, Inc., | | | | | | | | | | | | | | | | | | | | |
Sr. Unsec’d. Notes
| | | | | | | | | | | | | | | | | |
3.900% | | | 08/20/28 | | | | | | | | | | | | 30 | | | | 29,077 | |
| | | | | | | | | | | | | | | | | | | | |
| | | | | |
| | | | | | | | | | | | | | | | | | | 13,443,304 | |
| | | | | | | | | | | | | | | | | | | | |
Pipelines — 2.6% | |
Antero Midstream Partners LP/Antero Midstream Finance Corp., | |
Gtd. Notes, 144A | | | | | | | | | | | | | | | | | |
5.375% | | | 06/15/29 | | | | | | | | | | | | 900 | | | | 875,483 | |
6.625% | | | 02/01/32 | | | | | | | | | | | | 590 | | | | 594,555 | |
Boardwalk Pipelines LP, | | | | | | | | | | | | | | | | | |
Gtd. Notes | | | | | | | | | | | | | | | | | | | | |
3.400% | | | 02/15/31 | | | | | | | | | | | | 1,805 | | | | 1,611,938 | |
4.450% | | | 07/15/27 | | | | | | | | | | | | 60 | | | | 59,365 | |
Columbia Pipelines Operating Co. LLC, | |
Sr. Unsec’d. Notes, 144A | | | | | | | | | | | | | | | | | |
6.036% | | | 11/15/33 | | | | | | | | | | | | 4,660 | | | | 4,783,947 | |
DCP Midstream Operating LP, | | | | | | | | | | | | | |
Gtd. Notes | | | | | | | | | | | | | | | | | | | | |
3.250% | | | 02/15/32 | | | | | | | | | | | | 18 | | | | 15,487 | |
Energy Transfer LP, | | | | | | | | | | | | | | | | | |
Gtd. Notes | | | | | | | | | | | | | | | | | | | | |
5.250% | | | 04/15/29 | | | | | | | | | | | | 25 | | | | 25,095 | |
Jr. Sub. Notes, Series B | | | | | | | | | | | | | | | | | |
6.625%(ff) | | | 02/15/28 | (oo) | | | | | | | | | | | 10 | | | | 9,827 | |
Jr. Sub. Notes, Series G | | | | | | | | | | | | | | | | | |
7.125%(ff) | | | 05/15/30 | (oo) | | | | | | | | | | | 895 | | | | 901,953 | |
Jr. Sub. Notes, Series H | | | | | | | | | | | | | | | | | |
6.500%(ff) | | | 11/15/26 | (oo) | | | | | | | | | | | 1,365 | | | | 1,361,226 | |
Sr. Unsec’d. Notes | |
2.900% | | | 05/15/25 | | | | | | | | | | | | 5 | | | | 4,961 | |
3.750% | | | 05/15/30 | | | | | | | | | | | | 60 | | | | 55,939 | |
4.050% | | | 03/15/25 | | | | | | | | | | | | 50 | | | | 49,884 | |
4.200% | | | 04/15/27 | | | | | | | | | | | | 120 | | | | 118,441 | |
4.950% | | | 06/15/28 | | | | | | | | | | | | 20 | | | | 19,967 | |
5.000% | | | 05/15/50 | | | | | | | | | | | | 293 | | | | 249,076 | |
5.150% | | | 03/15/45 | | | | | | | | | | | | 55 | | | | 48,137 | |
5.300% | | | 04/15/47 | | | | | | | | | | | | 120 | | | | 106,036 | |
5.400% | | | 10/01/47 | | | | | | | | | | | | 60 | | | | 53,867 | |
5.500% | | | 06/01/27 | | | | | | | | | | | | 50 | | | | 50,659 | |
| | | | | | | | | | | | | | | | | | | | |
Interest Rate | | Maturity
Date | | | | | | | | | Principal
Amount
(000)# | | | Value | |
|
|
| |
CORPORATE BONDS (continued) | | | | | |
Pipelines (cont’d.) | | | | | | | | | | | | | | | | | |
6.100% | | | 02/15/42 | | | | | | | | | | | | 5 | | | $ | 4,917 | |
6.125% | | | 12/15/45 | | | | | | | | | | | | 90 | | | | 88,809 | |
6.250% | | | 04/15/49 | | | | | | | | | | | | 3,633 | | | | 3,644,494 | |
Sr. Unsec’d. Notes, Series 20Y | | | | | | | | | |
5.800% | | | 06/15/38 | | | | | | | | | | | | 20 | | | | 19,684 | |
Enterprise Products Operating LLC, | | | | | |
Gtd. Notes | | | | | | | | | | | | | |
3.125% | | | 07/31/29 | | | | | | | | | | | | 30 | | | | 27,912 | |
3.700% | | | 01/31/51 | | | | | | | | | | | | 145 | | | | 104,115 | |
4.250% | | | 02/15/48 | | | | | | | | | | | | 45 | | | | 36,045 | |
4.850% | | | 03/15/44 | | | | | | | | | | | | 25 | | | | 22,381 | |
4.900% | | | 05/15/46 | | | | | | | | | | | | 2,115 | | | | 1,882,488 | |
Gtd. Notes, Series D | |
6.875% | | | 03/01/33 | | | | | | | | | | | | 10 | | | | 11,005 | |
EQM Midstream Partners LP, | |
Sr. Unsec’d. Notes, 144A | |
6.500% | | | 07/01/27 | | | | | | | | | | | | 550 | | | | 557,387 | |
Fermaca Enterprises S de RL de CV (Mexico), | | | | | |
Sr. Sec’d. Notes, 144A | |
6.375% | | | 03/30/38 | | | | | | | | | | | | 312 | | | | 302,407 | |
Florida Gas Transmission Co. LLC, | |
Sr. Unsec’d. Notes, 144A | |
2.300% | | | 10/01/31 | | | | | | | | | | | | 30 | | | | 24,533 | |
Kinder Morgan Energy Partners LP, | |
Gtd. Notes | | | | | | | | | | | | | |
4.700% | | | 11/01/42 | | | | | | | | | | | | 5 | | | | 4,207 | |
5.400% | | | 09/01/44 | | | | | | | | | | | | 13 | | | | 11,832 | |
7.300% | | | 08/15/33 | | | | | | | | | | | | 10 | | | | 11,121 | |
Kinder Morgan, Inc., | | | | | | | | | | | | | | | | | |
Gtd. Notes | |
1.750% | | | 11/15/26 | | | | | | | | | | | | 30 | | | | 28,439 | |
3.250% | | | 08/01/50 | | | | | | | | | | | | 782 | | | | 495,392 | |
3.600% | | | 02/15/51 | | | | | | | | | | | | 1,178 | | | | 797,325 | |
4.300% | | | 06/01/25 | | | | | | | | | | | | 30 | | | | 29,929 | |
MPLX LP, | | | | | | | | | | | | | | | | | | | | |
Sr. Unsec’d. Notes | | | | | | | | | | | | | | | | | |
1.750% | | | 03/01/26 | | | | | | | | | | | | 85 | | | | 82,095 | |
2.650% | | | 08/15/30 | | | | | | | | | | | | 12,565 | | | | 10,993,798 | |
4.000% | | | 02/15/25 | | | | | | | | | | | | 55 | | | | 54,913 | |
4.125% | | | 03/01/27 | | | | | | | | | | | | 30 | | | | 29,559 | |
4.875% | | | 06/01/25 | | | | | | | | | | | | 10 | | | | 9,993 | |
5.200% | | | 03/01/47 | | | | | | | | | | | | 115 | | | | 102,088 | |
5.500% | | | 02/15/49 | | | | | | | | | | | | 40 | | | | 36,752 | |
NGPL PipeCo LLC, | | | | | | | | | | | | | | | | | |
Sr. Unsec’d. Notes, 144A | | | | | | | | | | | | | | | | | |
4.875% | | | 08/15/27 | | | | | | | | | | | | 255 | | | | 253,122 | |
Northern Natural Gas Co., | | | | | | | | | | | | | | | | | |
Sr. Unsec’d. Notes, 144A | | | | | | | | | | | | | | | | | |
3.400% | | | 10/16/51 | | | | | | | | | | | | 5 | | | | 3,307 | |
Northwest Pipeline LLC, | | | | | | | | | | | | | | | | | |
Sr. Unsec’d. Notes | | | | | | | | | | | | | | | | | |
7.125% | | | 12/01/25 | | | | | | | | | | | | 40 | | | | 40,590 | |
ONEOK Partners LP, | | | | | | | | | | | | | | | | | |
Gtd. Notes | | | | | | | | | | | | | | | | | | | | |
6.850% | | | 10/15/37 | | | | | | | | | | | | 1,250 | | | | 1,343,172 | |
SEE NOTES TO FINANCIAL STATEMENTS.
A189
| | | | |
| | PSF PGIM TOTAL RETURN BOND PORTFOLIO (CONTINUED) | | |
SCHEDULE OF INVESTMENTS | | | | as of December 31, 2024 |
| | | | | | | | | | | | | | | | | | | | |
Interest Rate | | Maturity
Date | | | | | | | | | Principal
Amount
(000)# | | | Value | |
|
|
|
CORPORATE BONDS (continued) | |
Pipelines (cont’d.) | |
ONEOK, Inc., | |
Gtd. Notes | |
2.200% | | | 09/15/25 | | | | | | | | | | | | 50 | | | $ | 49,085 | |
3.100% | | | 03/15/30 | | | | | | | | | | | | 75 | | | | 68,007 | |
4.200% | | | 03/15/45 | | | | | | | | | | | | 1,000 | | | | 745,601 | |
4.350% | | | 03/15/29 | | | | | | | | | | | | 100 | | | | 97,367 | |
4.500% | | | 03/15/50 | | | | | | | | | | | | 2,685 | | | | 2,114,863 | |
Plains All American Pipeline LP/PAA Finance Corp., | |
Sr. Unsec’d. Notes | |
3.550% | | | 12/15/29 | | | | | | | | | | | | 20 | | | | 18,605 | |
4.650% | | | 10/15/25 | | | | | | | | | | | | 10 | | | | 9,984 | |
Rockies Express Pipeline LLC, | |
Sr. Unsec’d. Notes, 144A | |
3.600% | | | 05/15/25 | | | | | | | | | | | | 75 | | | | 74,255 | |
Southern Natural Gas Co. LLC, | |
Sr. Unsec’d. Notes | |
8.000% | | | 03/01/32 | | | | | | | | | | | | 10 | | | | 11,271 | |
Targa Resources Corp., | |
Gtd. Notes | |
5.500% | | | 02/15/35 | | | | | | | | | | | | 860 | | | | 846,623 | |
6.500% | | | 03/30/34 | | | | | | | | | | | | 4,934 | | | | 5,218,288 | |
Targa Resources Partners LP/Targa Resources Partners Finance Corp., | |
Gtd. Notes | |
5.500% | | | 03/01/30 | | | | | | | | | | | | 15 | | | | 15,041 | |
Tennessee Gas Pipeline Co. LLC, | |
Gtd. Notes | |
7.000% | | | 03/15/27 | | | | | | | | | | | | 10 | | | | 10,432 | |
7.000% | | | 10/15/28 | | | | | | | | | | | | 10 | | | | 10,632 | |
Gtd. Notes, 144A | |
2.900% | | | 03/01/30 | | | | | | | | | | | | 10 | | | | 8,955 | |
Texas Eastern Transmission LP, | |
Sr. Unsec’d. Notes, | |
144A 3.500% | | | 01/15/28 | | | | | | | | | | | | 3,540 | | | | 3,375,867 | |
Transcontinental Gas Pipe Line Co. LLC, | |
Sr. Unsec’d. Notes | |
3.250% | | | 05/15/30 | | | | | | | | | | | | 80 | | | | 72,861 | |
Venture Global Calcasieu Pass LLC, | |
Sr. Sec’d. Notes, 144A | |
3.875% | | | 08/15/29 | | | | | | | | | | | | 115 | | | | 105,671 | |
4.125% | | | 08/15/31 | | | | | | | | | | | | 80 | | | | 71,782 | |
Venture Global LNG, Inc., | |
Jr. Sub. Notes, 144A | |
9.000%(ff) | | | 09/30/29 | (oo) | | | | | | | | | | | 2,340 | | | | 2,447,085 | |
Western Midstream Operating LP, | |
Sr. Unsec’d. Notes | |
4.050% | | | 02/01/30 | | | | | | | | | | | | 5,925 | | | | 5,558,102 | |
5.250% | | | 02/01/50 | | | | | | | | | | | | 5 | | | | 4,282 | |
Williams Cos., Inc. (The), | |
Sr. Unsec’d. Notes | |
2.600% | | | 03/15/31 | | | | | | | | | | | | 30 | | | | 25,840 | |
3.750% | | | 06/15/27 | | | | | | | | | | | | 25 | | | | 24,359 | |
4.000% | | | 09/15/25 | | | | | | | | | | | | 60 | | | | 59,675 | |
4.900% | | | 01/15/45 | | | | | | | | | | | | 1,200 | | | | 1,046,359 | |
5.150% | | | 03/15/34 | | | | | | | | | | | | 4,630 | | | | 4,499,460 | |
8.750% | | | 03/15/32 | | | | | | | | | | | | 10 | | | | 11,824 | |
| | | | | | | | | | | | | | | | | | | | |
| | | | | |
| | | | | | | | | | | | | | | | | | | 58,651,830 | |
| | | | | | | | | | | | | | | | | | | | |
| | | | | | | | | | | | | | | | | | | | |
Interest Rate | | Maturity
Date | | | | | | | | | Principal
Amount
(000)# | | | Value | |
| | | | | | |
| | | | | | |
|
CORPORATE BONDS (continued) | |
Real Estate Investment Trusts (REITs) — 1.3% | |
Alexandria Real Estate Equities, Inc., | | | | | | | | | | | | | | | | | |
Gtd. Notes | |
1.875% | | | 02/01/33 | | | | | | | | | | | | 5 | | | $ | 3,853 | |
2.000% | | | 05/18/32 | | | | | | | | | | | | 5 | | | | 3,986 | |
3.800% | | | 04/15/26 | | | | | | | | | | | | 25 | | | | 24,676 | |
American Tower Corp., | |
Sr. Unsec’d. Notes | |
1.300% | | | 09/15/25 | | | | | | | | | | | | 25 | | | | 24,389 | |
1.600% | | | 04/15/26 | | | | | | | | | | | | 50 | | | | 48,032 | |
2.700% | | | 04/15/31 | | | | | | | | | | | | 90 | | | | 77,732 | |
3.600% | | | 01/15/28 | | | | | | | | | | | | 17 | | | | 16,335 | |
4.000% | | | 06/01/25 | | | | | | | | | | | | 75 | | | | 74,640 | |
4.400% | | | 02/15/26 | | | | | | | | | | | | 25 | | | | 24,868 | |
Brixmor Operating Partnership LP, | |
Sr. Unsec’d. Notes | |
3.900% | | | 03/15/27 | | | | | | | | | | | | 35 | | | | 34,263 | |
4.050% | | | 07/01/30 | | | | | | | | | | | | 1,145 | | | | 1,082,072 | |
Crown Castle, Inc., | |
Sr. Unsec’d. Notes | |
1.350% | | | 07/15/25 | | | | | | | | | | | | 25 | | | | 24,526 | |
2.250% | | | 01/15/31 | | | | | | | | | | | | 75 | | | | 63,005 | |
2.500% | | | 07/15/31 | | | | | | | | | | | | 35 | | | | 29,480 | |
3.300% | | | 07/01/30 | | | | | | | | | | | | 30 | | | | 27,266 | |
4.000% | | | 03/01/27 | | | | | | | | | | | | 10 | | | | 9,822 | |
Diversified Healthcare Trust, | |
Gtd. Notes | |
9.750% | | | 06/15/25 | | | | | | | | | | | | 76 | | | | 76,012 | |
Essex Portfolio LP, | |
Gtd. Notes | |
1.650% | | | 01/15/31 | | | | | | | | | | | | 25 | | | | 20,315 | |
Global Net Lease, Inc./Global Net Lease Operating Partnership LP, | |
Gtd. Notes, 144A | |
3.750% | | | 12/15/27 | | | | | | | | | | | | 20 | | | | 18,275 | |
GLP Capital LP/GLP Financing II, Inc., | | | | | | | | | | | | | | | | | |
Gtd. Notes | |
4.000% | | | 01/15/30 | | | | | | | | | | | | 50 | | | | 46,435 | |
4.000% | | | 01/15/31 | | | | | | | | | | | | 10 | | | | 9,162 | |
5.250% | | | 06/01/25 | | | | | | | | | | | | 50 | | | | 49,912 | |
5.750% | | | 06/01/28 | | | | | | | | | | | | 50 | | | | 50,426 | |
Healthpeak OP LLC, | |
Gtd. Notes | |
1.350% | | | 02/01/27 | | | | | | | | | | | | 15 | | | | 13,990 | |
Host Hotels & Resorts LP, | |
Sr. Unsec’d. Notes, Series E | |
4.000% | | | 06/15/25 | | | | | | | | | | | | 40 | | | | 39,772 | |
Kimco Realty OP LLC, | |
Gtd. Notes | |
2.250% | | | 12/01/31 | | | | | | | | | | | | 20 | | | | 16,583 | |
MPT Operating Partnership LP/MPT Finance Corp., | |
Gtd. Notes | |
3.500% | | | 03/15/31 | | | | | | | | | | | | 925 | | | | 586,975 | |
Necessity Retail REIT, Inc. (The)/American Finance Operating Partner LP, | |
Gtd. Notes, 144A | |
4.500% | | | 09/30/28 | | | | | | | | | | | | 10 | | | | 9,165 | |
Prologis LP, | |
Sr. Unsec’d. Notes | |
1.750% | | | 02/01/31 | | | | | | | | | | | | 25 | | | | 20,736 | |
SEE NOTES TO FINANCIAL STATEMENTS.
A190
| | | | |
| | PSF PGIM TOTAL RETURN BOND PORTFOLIO (CONTINUED) | | |
SCHEDULE OF INVESTMENTS | | | | as of December 31, 2024 |
| | | | | | | | | | | | | | | | | | | | |
Interest Rate | | Maturity
Date | | | | | | | | | Principal
Amount
(000)# | | | Value | |
|
|
|
CORPORATE BONDS (continued) | |
Real Estate Investment Trusts (REITs) (cont’d.) | |
Realty Income Corp., | |
Sr. Unsec’d. Notes | |
1.800% | | | 03/15/33 | | | | | | | | | | | | 15 | | | $ | 11,484 | |
2.100% | | | 03/15/28 | | | | | | | | | | | | 15 | | | | 13,787 | |
2.200% | | | 06/15/28 | | | | | | | | | | | | 5 | | | | 4,572 | |
2.700% | | | 02/15/32 | | | | | | | | | | | | 2,190 | | | | 1,858,205 | |
2.850% | | | 12/15/32 | | | | | | | | | | | | 530 | | | | 447,427 | |
3.950% | | | 08/15/27 | | | | | | | | | | | | 91 | | | | 89,519 | |
4.875% | | | 06/01/26 | | | | | | | | | | | | 50 | | | | 50,129 | |
RHP Hotel Properties LP/RHP Finance Corp., | | | | | |
Gtd. Notes, 144A | |
6.500% | | | 04/01/32 | | | | | | | | | | | | 750 | | | | 753,510 | |
SBA Communications Corp., | |
Sr. Unsec’d. Notes | |
3.125% | | | 02/01/29 | | | | | | | | | | | | 1,150 | | | | 1,038,348 | |
Simon Property Group LP, | |
Sr. Unsec’d. Notes | |
1.750% | | | 02/01/28 | | | | | | | | | | | | 50 | | | | 45,754 | |
3.250% | | | 11/30/26 | | | | | | | | | | | | 20 | | | | 19,509 | |
Sun Communities Operating LP, | |
Gtd. Notes | |
2.700% | | | 07/15/31 | | | | | | | | | | | | 2,650 | | | | 2,229,014 | |
4.200% | | | 04/15/32 | | | | | | | | | | | | 4,361 | | | | 3,977,975 | |
5.500% | | | 01/15/29 | | | | | | | | | | | | 8,422 | | | | 8,473,810 | |
Uniti Group LP/Uniti Group Finance 2019, Inc./CSL Capital LLC, | |
Sr. Sec’d. Notes, 144A | |
10.500% | | | 02/15/28 | | | | | | | | | | | | 3,225 | | | | 3,437,723 | |
VICI Properties LP/VICI Note Co., Inc., | |
Gtd. Notes, 144A | |
4.625% | | | 06/15/25 | | | | | | | | | | | | 405 | | | | 403,431 | |
5.750% | | | 02/01/27 | | | | | | | | | | | | 2,480 | | | | 2,501,949 | |
Welltower OP LLC, | |
Gtd. Notes | | | | | | | | | | | | | | | | | | | | |
2.050% | | | 01/15/29 | | | | | | | | | | | | 15 | | | | 13,412 | |
2.800% | | | 06/01/31 | | | | | | | | | | | | 35 | | | | 30,452 | |
WP Carey, Inc., | |
Sr. Unsec’d. Notes | |
2.250% | | | 04/01/33 | | | | | | | | | | | | 1,930 | | | | 1,521,713 | |
| | | | | | | | | | | | | | | | | | | | |
| | | | | |
| | | | | | | | | | | | | | | | | | | 29,448,426 | |
| | | | | | | | | | | | | | | | | | | | |
Retail — 0.6% | |
1011778 BC ULC/New Red Finance, Inc. (Canada), | |
Sec’d. Notes, 144A | |
4.000% | | | 10/15/30 | | | | | | | | | | | | 1,500 | | | | 1,337,126 | |
Alimentation Couche-Tard, Inc. (Canada), | |
Sr. Unsec’d. Notes, 144A | |
3.800% | | | 01/25/50 | | | | | | | | | | | | 20 | | | | 14,371 | |
AutoNation, Inc., | |
Sr. Unsec’d. Notes | |
2.400% | | | 08/01/31 | | | | | | | | | | | | 25 | | | | 20,619 | |
Brinker International, Inc., | |
Gtd. Notes, 144A | |
8.250% | | | 07/15/30 | | | | | | | | | | | | 950 | | | | 1,002,984 | |
Carvana Co., | |
Sr. Sec’d. Notes, 144A, Cash coupon 9.000% or PIK 12.000% | |
9.000% | | | 12/01/28 | | | | | | | | | | | | 451 | | | | 481,670 | |
| | | | | | | | | | | | | | | | | | | | |
Interest Rate | | Maturity
Date | | | | | | | | | Principal
Amount
(000)# | | | Value | |
|
|
| |
CORPORATE BONDS (continued) | | | | | |
Retail (cont’d.) | | | | | | | | | | | | | | | | | | | | |
Sr. Sec’d. Notes, 144A, Cash coupon 11.000% or PIK 13.000% | |
13.000% | | | 06/01/30 | | | | | | | | | | | | 1,900 | | | $ | 2,092,517 | |
Fertitta Entertainment LLC/Fertitta Entertainment Finance Co., Inc., | |
Sr. Sec’d. Notes, 144A | | | | | |
4.625% | | | 01/15/29 | | | | | | | | | | | | 25 | | | | 23,141 | |
Home Depot, Inc. (The), | | | | | |
Sr. Unsec’d. Notes | |
3.900% | | | 12/06/28 | | | | | | | | | | | | 10 | | | | 9,747 | |
4.750% | | | 06/25/29 | | | | | | | | | | | | 3,295 | | | | 3,301,043 | |
4.875% | | | 02/15/44 | | | | | | | | | | | | 10 | | | | 9,142 | |
Lithia Motors, Inc., | |
Sr. Unsec’d. Notes, 144A | |
3.875% | | | 06/01/29 | | | | | | | | | | | | 950 | | | | 868,338 | |
Lowe’s Cos., Inc., | |
Sr. Unsec’d. Notes | |
1.700% | | | 09/15/28 | | | | | | | | | | | | 20 | | | | 17,889 | |
1.700% | | | 10/15/30 | | | | | | | | | | | | 10 | | | | 8,353 | |
3.650% | | | 04/05/29 | | | | | | | | | | | | 30 | | | | 28,566 | |
McDonald’s Corp., | |
Sr. Unsec’d. Notes, MTN | |
3.800% | | | 04/01/28 | | | | | | | | | | | | 30 | | | | 29,200 | |
O’Reilly Automotive, Inc., | |
Sr. Unsec’d. Notes | |
1.750% | | | 03/15/31 | | | | | | | | | | | | 2,155 | | | | 1,766,516 | |
Ross Stores, Inc., | |
Sr. Unsec’d. Notes | |
4.600% | | | 04/15/25 | | | | | | | | | | | | 50 | | | | 49,938 | |
4.700% | | | 04/15/27 | | | | | | | | | | | | 2 | | | | 1,984 | |
Sally Holdings LLC/Sally Capital, Inc., | |
Gtd. Notes | |
6.750% | | | 03/01/32 | (a) | | | | | | | | | | | 350 | | | | 350,689 | |
Suburban Propane Partners LP/Suburban Energy Finance Corp., | |
Sr. Unsec’d. Notes | |
5.875% | | | 03/01/27 | | | | | | | | | | | | 1,125 | | | | 1,117,248 | |
Tractor Supply Co., | | | | | | | | | | | | | | | | | |
Sr. Unsec’d. Notes | |
1.750% | | | 11/01/30 | | | | | | | | | | | | 55 | | | | 45,974 | |
Walmart, Inc., | | | | | | | | | | | | | | | | | | | | |
Sr. Unsec’d. Notes | |
2.375% | | | 09/24/29 | | | | | | | | | | | | 2 | | | | 1,822 | |
| | | | | | | | | | | | | | | | | | | | |
| | | | | |
| | | | | | | | | | | | | | | | | | | 12,578,877 | |
| | | | | | | | | | | | | | | | | | | | |
Semiconductors — 0.3% | | | | | | | | | | | | | | | | | |
Analog Devices, Inc., | |
Sr. Unsec’d. Notes | |
2.950% | | | 04/01/25 | | | | | | | | | | | | 5 | | | | 4,977 | |
Broadcom Corp./Broadcom Cayman Finance Ltd., | | | | | |
Gtd. Notes | |
3.875% | | | 01/15/27 | | | | | | | | | | | | 80 | | | | 78,681 | |
Broadcom, Inc., | |
Gtd. Notes | |
4.150% | | | 11/15/30 | | | | | | | | | | | | 9 | | | | 8,620 | |
Gtd. Notes, 144A | |
2.450% | | | 02/15/31 | | | | | | | | | | | | 30 | | | | 25,888 | |
Sr. Unsec’d. Notes | |
5.050% | | | 07/12/29 | | | | | | | | | | | | 2,503 | | | | 2,512,344 | |
SEE NOTES TO FINANCIAL STATEMENTS.
A191
| | | | |
| | PSF PGIM TOTAL RETURN BOND PORTFOLIO (CONTINUED) | | |
SCHEDULE OF INVESTMENTS | | | | as of December 31, 2024 |
| | | | | | | | | | | | | | | | | | | | |
Interest Rate | | Maturity
Date | | | | | | | | | Principal
Amount
(000)# | | | Value | |
| |
CORPORATE BONDS (continued) | | | | | |
Semiconductors (cont’d.) | | | | | | | | | | | | | |
Sr. Unsec’d. Notes, 144A | | | | | | | | | | | | | |
3.137% | | | 11/15/35 | | | | | | | | | | | | 3,006 | | | $ | 2,455,538 | |
3.187% | | | 11/15/36 | | | | | | | | | | | | 110 | | | | 88,595 | |
3.419% | | | 04/15/33 | | | | | | | | | | | | 1,442 | | | | 1,262,653 | |
Intel Corp.,
| |
Sr. Unsec’d. Notes | |
3.100% | | | 02/15/60 | | | | | | | | | | | | 10 | | | | 5,332 | |
3.900% | | | 03/25/30 | | | | | | | | | | | | 20 | | | | 18,714 | |
Lam Research Corp.,
| | | | | | | | | | | | | |
Sr. Unsec’d. Notes | | | | | | | | | | | | | |
1.900% | | | 06/15/30 | | | | | | | | | | | | 25 | | | | 21,411 | |
NVIDIA Corp.,
| |
Sr. Unsec’d. Notes | |
1.550% | | | 06/15/28 | | | | | | | | | | | | 30 | | | | 27,234 | |
NXP BV/NXP Funding LLC/NXP USA, Inc. (China),
| |
Gtd. Notes | |
2.500% | | | 05/11/31 | | | | | | | | | | | | 65 | | | | 55,345 | |
2.650% | | | 02/15/32 | | | | | | | | | | | | 35 | | | | 29,375 | |
3.400% | | | 05/01/30 | | | | | | | | | | | | 40 | | | | 36,647 | |
Texas Instruments, Inc.,
| | | | | | | | | | | | | |
Sr. Unsec’d. Notes | | | | | | | | | | | | | |
2.900% | | | 11/03/27 | | | | | | | | | | | | 10 | | | | 9,586 | |
| | | | | | | | | | | | | | | | | | | | |
| | | | | |
| | | | | | | | | | | | | | | | | | | 6,640,940 | |
| | | | | | | | | | | | | | | | | | | | |
Shipbuilding — 0.3% | | | | | | | | | | | | | |
Huntington Ingalls Industries, Inc.,
| |
Gtd. Notes | |
2.043% | | | 08/16/28 | | | | | | | | | | | | 1,300 | | | | 1,167,784 | |
4.200% | | | 05/01/30 | | | | | | | | | | | | 20 | | | | 18,947 | |
5.353% | | | 01/15/30 | | | | | | | | | | | | 5,865 | | | | 5,875,024 | |
| | | | | | | | | | | | | | | | | | | | |
| | | | | |
| | | | | | | | | | | | | | | | | | | 7,061,755 | |
| | | | | | | | | | | | | | | | | | | | |
Software — 0.1% | | | | | | | | | | | | | |
Autodesk, Inc.,
| |
Sr. Unsec’d. Notes | |
2.400% | | | 12/15/31 | | | | | | | | | | | | 30 | | | | 25,198 | |
Electronic Arts, Inc.,
| | | | | | | | | | | | | |
Sr. Unsec’d. Notes | | | | | | | | | | | | | |
1.850% | | | 02/15/31 | | | | | | | | | | | | 65 | | | | 53,975 | |
Fiserv, Inc.,
| |
Sr. Unsec’d. Notes | |
2.250% | | | 06/01/27 | | | | | | | | | | | | 21 | | | | 19,809 | |
3.500% | | | 07/01/29 | | | | | | | | | | | | 40 | | | | 37,537 | |
Microsoft Corp.,
| |
Sr. Unsec’d. Notes | |
2.400% | | | 08/08/26 | | | | | | | | | | | | 10 | | | | 9,705 | |
Oracle Corp.,
| |
Sr. Unsec’d. Notes | |
1.650% | | | 03/25/26 | | | | | | | | | | | | 80 | | | | 77,129 | |
2.650% | | | 07/15/26 | | | | | | | | | | | | 50 | | | | 48,509 | |
2.950% | | | 04/01/30 | | | | | | | | | | | | 100 | | | | 90,285 | |
3.850% | | | 04/01/60 | | | | | | | | | | | | 5 | | | | 3,427 | |
3.950% | | | 03/25/51 | | | | | | | | | | | | 5 | | | | 3,699 | |
4.000% | | | 11/15/47 | | | | | | | | | | | | 25 | | | | 19,056 | |
Salesforce, Inc.,
| |
Sr. Unsec’d. Notes | |
1.500% | | | 07/15/28 | | | | | | | | | | | | 10 | | | | 8,982 | |
| | | | | | | | | | | | | | | | | | | | | | | | |
Interest Rate | | Maturity
Date | | | | | | | | | Principal
Amount
(000)# | | | Value | |
|
CORPORATE BONDS (continued) | |
Software (cont’d.) | | | | | | | | | | | | | | | | | | | | | |
Take-Two Interactive Software, Inc.,
| |
Sr. Unsec’d. Notes | |
5.000% | | | 03/28/26 | | | | | | | | | | | | | | | | 1,860 | | | $ | 1,865,827 | |
| | | | | | | | | | | | | | | | | | | | | | | | |
| | | | | | | | | | | | | | | | | | | | | | | 2,263,138 | |
| | | | | | | | | | | | | | | | | | | | | | | | |
Telecommunications — 1.1% | |
AT&T, Inc., | |
Sr. Unsec’d. Notes | |
1.700% | | | 03/25/26 | | | | | | | | | | | | | | | | 200 | | | | 193,001 | |
2.250% | | | 02/01/32 | | | | | | | | | | | | | | | | 45 | | | | 37,176 | |
2.300% | | | 06/01/27 | | | | | | | | | | | | | | | | 75 | | | | 70,806 | |
2.550% | | | 12/01/33 | | | | | | | | | | | | | | | | 347 | | | | 279,489 | |
2.750% | | | 06/01/31 | | | | | | | | | | | | | | | | 110 | | | | 95,696 | |
3.550% | | | 09/15/55 | | | | | | | | | | | | | | | | 972 | | | | 655,662 | |
3.800% | | | 12/01/57 | | | | | | | | | | | | | | | | 13 | | | | 9,002 | |
4.250% | | | 03/01/27 | | | | | | | | | | | | | | | | 10 | | | | 9,905 | |
4.500% | | | 05/15/35 | | | | | | | | | | | | | | | | 900 | | | | 832,714 | |
4.500% | | | 03/09/48 | | | | | | | | | | | | | | | | 10 | | | | 8,243 | |
5.400% | | | 02/15/34 | | | | | | | | | | | | | | | | 3,340 | | | | 3,355,168 | |
6.950% | | | 01/15/28 | | | | | | | | | | | | | | | | 10 | | | | 10,478 | |
Deutsche Telekom International Finance BV (Germany), | |
Gtd. Notes | |
8.750% | | | 06/15/30 | | | | | | | | | | | | | | | | 10 | | | | 11,599 | |
Digicel Group Holdings Ltd. (Jamaica), | |
Sr. Sec’d. Notes, Series 1B14, 144A | |
0.000%(s) | | | 12/31/30^ | | | | | | | | | | | | | | | | 145 | | | | 10,786 | |
Sr. Sec’d. Notes, Series 3A14, 144A | |
0.000%(s) | | | 12/31/30^ | | | | | | | | | | | | | | | | 1 | | | | 724 | |
Sr. Sec’d. Notes, Series 3B14, 144A | |
0.000%(s) | | | 12/31/30^ | | | | | | | | | | | | | | | | 89 | | | | 605 | |
Digicel Intermediate Holdings Ltd./Digicel International Finance Ltd./DIFL US (Jamaica), | |
Sr. Sec’d. Notes, Cash coupon 9.000% and PIK 1.942% | |
10.942% | | | 05/25/27 | | | | | | | | | | | | | | | | 1,237 | | | | 1,215,711 | |
Digicel MidCo Ltd./DIFL US II LLC (Jamaica), | |
Sr. Unsec’d. Notes, PIK 10.500% | |
10.500% | | | 11/25/28 | | | | | | | | | | | | | | | | 664 | | | | 595,915 | |
Frontier Communications Holdings LLC, | |
Sr. Sec’d. Notes, 144A | |
5.000% | | | 05/01/28 | | | | | | | | | | | | | | | | 900 | | | | 883,209 | |
5.875% | | | 10/15/27 | | | | | | | | | | | | | | | | 525 | | | | 523,078 | |
Level 3 Financing, Inc., | |
Sec’d. Notes, 144A | |
4.000% | | | 04/15/31 | | | | | | | | | | | | | | | | 1,000 | | | | 792,719 | |
4.500% | | | 04/01/30 | | | | | | | | | | | | | | | | 1,300 | | | | 1,080,820 | |
4.875% | | | 06/15/29 | | | | | | | | | | | | | | | | 100 | | | | 86,981 | |
10.000% | | | 10/15/32 | | | | | | | | | | | | | | | | 875 | | | | 874,327 | |
Sr. Sec’d. Notes, 144A | |
10.500% | | | 04/15/29 | | | | | | | | | | | | | | | | 1,225 | | | | 1,364,720 | |
10.500% | | | 05/15/30 | | | | | | | | | | | | | | | | 238 | | | | 259,125 | |
10.750% | | | 12/15/30(a) | | | | | | | | | | | | | | | | 469 | | | | 525,711 | |
11.000% | | | 11/15/29 | | | | | | | | | | | | | | | | 1,040 | | | | 1,171,031 | |
Lorca Telecom Bondco SA (Spain), | |
Sr. Sec’d. Notes, 144A | |
5.750% | | | 04/30/29 | | | | | | | | | | | | EUR | | | | 2,000 | | | | 2,176,497 | |
SEE NOTES TO FINANCIAL STATEMENTS.
A192
| | | | |
| | PSF PGIM TOTAL RETURN BOND PORTFOLIO (CONTINUED) | | |
SCHEDULE OF INVESTMENTS | | | | as of December 31, 2024 |
| | | | | | | | | | | | | | | | | | |
Interest Rate | | Maturity
Date | | | | | | | | Principal
Amount
(000)# | | | Value | |
|
|
|
CORPORATE BONDS (continued) | |
Telecommunications (cont’d.) | |
Motorola Solutions, Inc., | |
Sr. Unsec’d. Notes | |
2.300% | | 11/15/30 | | | | | | | | | | | 109 | | | $ | 93,315 | |
Sprint LLC, | |
Gtd. Notes | |
7.625% | | 03/01/26 | | | | | | | | | | | 785 | | | | 802,776 | |
TalkTalk Telecom Group Ltd. (United Kingdom), | |
Gtd. Notes, 144A | |
8.250% | | 09/01/27 | | | | | | | GBP | | | | 732 | | | | 767,452 | |
11.750% | | 03/01/28 | | | | | | | GBP | | | | 432 | | | | 153,735 | |
T-Mobile USA, Inc., | |
Gtd. Notes | |
2.250% | | 02/15/26 | | | | | | | | | | | 45 | | | | 43,744 | |
2.550% | | 02/15/31 | | | | | | | | | | | 10 | | | | 8,598 | |
2.625% | | 02/15/29 | | | | | | | | | | | 10 | | | | 9,097 | |
3.300% | | 02/15/51 | | | | | | | | | | | 5 | | | | 3,299 | |
3.750% | | 04/15/27 | | | | | | | | | | | 125 | | | | 122,121 | |
3.875% | | 04/15/30 | | | | | | | | | | | 137 | | | | 128,927 | |
4.375% | | 04/15/40 | | | | | | | | | | | 435 | | | | 376,587 | |
Verizon Communications, Inc., | |
Sr. Unsec’d. Notes | |
1.500% | | 09/18/30 | | | | | | | | | | | 75 | | | | 62,223 | |
1.680% | | 10/30/30 | | | | | | | | | | | 577 | | | | 479,964 | |
1.750% | | 01/20/31 | | | | | | | | | | | 55 | | | | 45,324 | |
2.355% | | 03/15/32 | | | | | | | | | | | 5,160 | | | | 4,276,695 | |
2.550% | | 03/21/31 | | | | | | | | | | | 54 | | | | 46,527 | |
2.850% | | 09/03/41 | | | | | | | | | | | 10 | | | | 6,927 | |
2.875% | | 11/20/50 | | | | | | | | | | | 105 | | | | 64,339 | |
3.150% | | 03/22/30 | | | | | | | | | | | 140 | | | | 128,109 | |
Sr. Unsec’d. Notes, 144A | |
4.780% | | 02/15/35 | | | | | | | | | | | 330 | | | | 314,566 | |
Vmed O2 UK Financing I PLC (United Kingdom), | |
Sr. Sec’d. Notes | |
4.000% | | 01/31/29 | | | | | | | GBP | | | | 470 | | | | 523,487 | |
Windstream Services LLC/Windstream Escrow Finance Corp., | |
Sr. Sec’d. Notes, 144A | |
8.250% | | 10/01/31 | | | | | | | | | | | 260 | | | | 268,498 | |
| | | | | | | | | | | | | | | | | | |
| | | | | |
| | | | | | | | | | | | | | | | | 25,857,208 | |
| | | | | | | | | | | | | | | | | | |
Transportation — 0.2% | |
Burlington Northern Santa Fe LLC, | |
Sr. Unsec’d. Notes | |
3.050% | | 02/15/51 | | | | | | | | | | | 5 | | | | 3,274 | |
4.900% | | 04/01/44 | | | | | | | | | | | 10 | | | | 9,144 | |
Canadian Pacific Railway Co. (Canada), | |
Gtd. Notes | |
3.500% | | 05/01/50 | | | | | | | | | | | 25 | | | | 17,749 | |
CSX Corp., | |
Sr. Unsec’d. Notes | |
3.250% | | 06/01/27 | | | | | | | | | | | 10 | | | | 9,689 | |
3.800% | | 03/01/28 | | | | | | | | | | | 16 | | | | 15,555 | |
GN Bondco LLC, | |
Sr. Sec’d. Notes, 144A | |
9.500% | | 10/15/31(a) | | | | | | | | | | | 2,500 | | | | 2,626,944 | |
Indian Railway Finance Corp. Ltd. (India), | |
Sr. Unsec’d. Notes, 144A, MTN | |
3.570% | | 01/21/32(a) | | | | | | | | | | | 480 | | | | 427,440 | |
| | | | | | | | | | | | | | | | | | | | |
Interest Rate | | Maturity
Date | | | | | | Principal
Amount
(000)# | | | Value | |
|
CORPORATE BONDS (continued) | |
Transportation (cont’d.) | |
Lima Metro Line 2 Finance Ltd. (Peru), | |
Sr. Sec’d. Notes | |
5.875% | | | 07/05/34 | | | | | | | | | | | | 83 | | | $ | 82,211 | |
Norfolk Southern Corp., | |
Sr. Unsec’d. Notes | |
2.900% | | | 06/15/26 | | | | | | | | | | | | 14 | | | | 13,676 | |
3.800% | | | 08/01/28 | | | | | | | | | | | | 54 | | | | 52,320 | |
Union Pacific Corp., | |
Sr. Unsec’d. Notes | |
3.799% | | | 10/01/51 | | | | | | | | | | | | 9 | | | | 6,716 | |
3.950% | | | 08/15/59 | | | | | | | | | | | | 35 | | | | 25,501 | |
XPO, Inc., | |
Gtd. Notes, 144A | |
7.125% | | | 06/01/31 | | | | | | | | | | | | 850 | | | | 867,787 | |
| | | | | | | | | | | | | | | | | | | | |
| | | | | |
| | | | | | | | | | | | | | | | | | | 4,158,006 | |
| | | | | | | | | | | | | | | | | | | | |
Trucking & Leasing — 0.2% | |
Penske Truck Leasing Co. LP/PTL Finance Corp., | |
Sr. Unsec’d. Notes, 144A | |
1.200% | | | 11/15/25 | | | | | | | | | | | | 20 | | | | 19,362 | |
1.700% | | | 06/15/26 | | | | | | | | | | | | 30 | | | | 28,657 | |
4.000% | | | 07/15/25 | | | | | | | | | | | | 25 | | | | 24,869 | |
5.550% | | | 05/01/28 | | | | | | | | | | | | 4,000 | | | | 4,059,027 | |
| | | | | | | | | | | | | | | | | | | | |
| | | | | |
| | | | | | | | | | | | | | | | | | | 4,131,915 | |
| | | | | | | | | | | | | | | | | | | | |
TOTAL CORPORATE BONDS
(cost $721,829,616) | | | | 691,604,640 | |
| | | | | | | | | | | | | | | | | | | | |
|
FLOATING RATE AND OTHER LOANS — 1.0% | |
Auto Parts & Equipment — 0.0% | |
Tenneco, Inc., | |
Term A Loan, 3 Month SOFR + 4.850% | |
9.371%(c) | | | 11/17/28 | | | | | | | | | | | | 473 | | | | 455,954 | |
| | | | | | | | | | | | | | | | | | | | |
Commercial Services — 0.0% | |
OCS Group Investments Limited (United Kingdom), | |
Facility B1 Loan, SONIA + 5.750% | |
10.464%(c) | | | 12/01/31 | | | | | | | | GBP | | | | 625 | | | | 774,939 | |
| | | | | | | | | | | | | | | | | | | | |
Computers — 0.1% | |
McAfee Corp., | |
Tranche B-1 Term Loan, 1 Month SOFR + 3.250% | |
7.803%(c) | | | 03/01/29 | | | | | | | | | | | | 1,323 | | | | 1,323,059 | |
| | | | | | | | | | | | | | | | | | | | |
Insurance — 0.1% | |
Asurion LLC, | |
New B-09 Term Loan, 1 Month SOFR + 3.364% | |
7.721%(c) | | | 07/31/27 | | | | | | | | | | | | 337 | | | | 335,348 | |
New B-11 Term Loan, 1 Month SOFR + 4.350% | |
8.707%(c) | | | 08/21/28 | | | | | | | | | | | | 452 | | | | 452,444 | |
| | | | | | | | | | | | | | | | | | | | |
| | | | | |
| | | | | | | | | | | | | | | | | | | 787,792 | |
| | | | | | | | | | | | | | | | | | | | |
Media — 0.0% | |
CSC Holdings LLC, | |
2022 Refinancing Term Loan, 1 Month SOFR + 4.500% | |
8.897%(c) | | | 01/18/28 | | | | | | | | | | | | 338 | | | | 329,815 | |
Diamond Sports Group LLC, | |
Dip Term Loan | |
10.000% | | | 01/14/25 | | | | | | | | | | | | 345 | | | | 370,378 | |
SEE NOTES TO FINANCIAL STATEMENTS.
A193
| | | | |
| | PSF PGIM TOTAL RETURN BOND PORTFOLIO (CONTINUED) | | |
SCHEDULE OF INVESTMENTS | | | | as of December 31, 2024 |
| | | | | | | | | | | | | | | | |
Interest Rate | | Maturity
Date | | | | Principal
Amount
(000)# | | | Value | |
|
FLOATING RATE AND OTHER LOANS (continued) | |
Media (cont’d.) | |
First Lien Term Loan, 1 Month SOFR + 10.100% | |
14.712%(c) | | 05/25/26 | | | | | | | | | 15 | | | $ | 12,709 | |
Second Lien Term Loan | |
8.175% | | 08/24/26 | | | | | | | | | 1,959 | | | | 4,962 | |
| | | | | | | | | | | | | | | | |
| | | | | |
| | | | | | | | | | | | | | | 717,864 | |
| | | | | | | | | | | | | | | | |
Metal Fabricate/Hardware — 0.1% | |
Doncasters US Finance LLC (United Kingdom), | |
Initial Term Loan, 3 Month SOFR + 6.500% | |
10.829%(c) | | 04/23/30 | | | | | | | | | 2,670 | | | | 2,643,127 | |
Tank Holding Corp., | |
Term Loan, 3 Month SOFR + 6.000% | |
10.245%(c) | | 03/31/28 | | | | | | | | | 255 | | | | 250,019 | |
| | | | | | | | | | | | | | | | |
| | | | | |
| | | | | | | | | | | | | | | 2,893,146 | |
| | | | | | | | | | | | | | | | |
Pharmaceuticals — 0.0% | |
Bausch Health Cos., Inc., | |
Second Amendment Term Loan, 1 Month SOFR + 5.250% | |
9.707%(c) | | 02/01/27 | | | | | | | | | 197 | | | | 191,761 | |
| | | | | | | | | | | | | | | | |
Real Estate Investment Trusts (REITs) — 0.0% | |
Blackstone Mortgage Trust, Inc., | |
Term B-5 Loan, 1 Month SOFR + 3.750% | |
8.227%(c) | | 12/10/28 | | | | | | | | | 368 | | | | 367,570 | |
Term Loan, 1 Month SOFR + 2.364% | |
6.709%(c) | | 04/23/26 | | | | | | | | | 40 | | | | 40,185 | |
| | | | | | | | | | | | | | | | |
| | | | | |
| | | | | | | | | | | | | | | 407,755 | |
| | | | | | | | | | | | | | | | |
Retail — 0.4% | |
CD&R Firefly Bidco Plc (United Kingdom), | |
Facility B8, SONIA + 5.250% | |
10.032%(c) | | 06/21/28 | | | | | GBP | | | | 1,100 | | | | 1,370,205 | |
EG Finco Ltd. (United Kingdom), | |
Additional Facility B2, 3 Month EURIBOR + 4.500% | |
—%(p) | | 02/07/28 | | | | | EUR | | | | 3,500 | | | | 3,626,606 | |
Peer Holding III BV (Netherlands), | |
Term B-6 Loan, 3 Month EURIBOR + 3.250% | |
5.933%(c) | | 07/01/31 | | | | | EUR | | | | 3,425 | | | | 3,560,352 | |
WSH Services Holding Ltd (United Kingdom), | |
Term B Loan, SONIA + 5.000% | |
9.701%(c) | | 05/16/31 | | | | | GBP | | | | 225 | | | | 282,100 | |
| | | | | | | | | | | | | | | | |
| | | | | |
| | | | | | | | | | | | | | | 8,839,263 | |
| | | | | | | | | | | | | | | | |
Telecommunications — 0.3% | |
Digicel International Finance Ltd. (Jamaica), | |
Initial Term Loan, 3 Month SOFR + 6.750% | |
11.335%(c) | | 05/25/27 | | | | | | | | | 1,407 | | | | 1,357,852 | |
Level 3 Financing, Inc., | |
Term B-1, 1 Month SOFR + 6.560% | |
10.917%(c) | | 04/15/29 | | | | | | | | | 90 | | | | 91,371 | |
Term B-2, 1 Month SOFR + 6.560% | |
10.917%(c) | | 04/15/30 | | | | | | | | | 90 | | | | 91,933 | |
| | | | | | | | | | | | | | | | |
Interest Rate | | Maturity
Date | | | | Principal
Amount
(000)# | | | Value | |
|
FLOATING RATE AND OTHER LOANS (continued) | |
Telecommunications (cont’d.) | |
Zegona Holdco Ltd. (United Kingdom), | |
Facility B (EUR) Loan, 6 Month EURIBOR + 4.250% | |
7.886%(c) | | 07/17/29 | | | | | EUR | | | | 4,250 | | | $ | 4,440,883 | |
| | | | | | | | | | | | | | | | |
| | | | | |
| | | | | | | | | | | | | | | 5,982,039 | |
| | | | | | | | | | | | | | | | |
| |
TOTAL FLOATING RATE AND OTHER LOANS
(cost $23,189,560) | | | | 22,373,572 | |
| | | | | | | | | | | | | | | | |
|
MUNICIPAL BONDS — 0.5% | |
Arizona — 0.0% | |
Salt River Project Agricultural Improvement & Power District, | |
Revenue Bonds, BABs | |
4.839% | | 01/01/41 | | | | | | | | | 30 | | | | 27,667 | |
| | | | | | | | | | | | | | | | |
California — 0.2% | |
Bay Area Toll Authority, | |
Taxable, Revenue Bonds, BABs, Series S3 | |
6.907% | | 10/01/50 | | | | | | | | | 1,125 | | | | 1,277,688 | |
State of California, | |
General Obligation Unlimited, BABs | |
7.300% | | 10/01/39 | | | | | | | | | 1,550 | | | | 1,774,330 | |
General Obligation Unlimited, Taxable, BABs | |
7.625% | | 03/01/40 | | | | | | | | | 725 | | | | 851,737 | |
| | | | | | | | | | | | | | | | |
| | | | | |
| | | | | | | | | | | | | | | 3,903,755 | |
| | | | | | | | | | | | | | | | |
Colorado — 0.0% | |
Colorado Health Facilities Authority, | |
Taxable, Revenue Bonds, Series B | |
2.800% | | 12/01/26 | | | | | | | | | 5 | | | | 4,793 | |
Regional Transportation District Sales Tax Revenue, | |
Revenue Bonds, BABs, Series B | |
5.844% | | 11/01/50 | | | | | | | | | 770 | | | | 779,781 | |
| | | | | | | | | | | | | | | | |
| | | | | |
| | | | | | | | | | | | | | | 784,574 | |
| | | | | | | | | | | | | | | | |
Illinois — 0.1% | |
Chicago O’Hare International Airport, | |
Revenue Bonds, BABs, Series B | |
6.395% | | 01/01/40 | | | | | | | | | 1,380 | | | | 1,454,255 | |
| | | | | | | | | | | | | | | | |
Missouri — 0.0% | |
Health & Educational Facilities Authority of the State of Missouri, | |
Taxable, Revenue Bonds, Series A | |
3.652% | | 08/15/57 | | | | | | | | | 20 | | | | 14,740 | |
| | | | | | | | | | | | | | | | |
New Jersey — 0.2% | |
New Jersey Turnpike Authority, | |
Taxable, Revenue Bonds, BABs, Series A | |
7.102% | | 01/01/41 | | | | | | | | | 1,175 | | | | 1,314,665 | |
Taxable, Revenue Bonds, BABs, Series F | |
7.414% | | 01/01/40 | | | | | | | | | 2,050 | | | | 2,364,962 | |
| | | | | | | | | | | | | | | | |
| | | | | |
| | | | | | | | | | | | | | | 3,679,627 | |
| | | | | | | | | | | | | | | | |
New York — 0.0% | |
New York State Urban Development Corp., | |
Taxable, Revenue Bonds, Series B | |
2.590% | | 03/15/35 | | | | | | | | | 20 | | | | 16,055 | |
SEE NOTES TO FINANCIAL STATEMENTS.
A194
| | | | |
| | PSF PGIM TOTAL RETURN BOND PORTFOLIO (CONTINUED) | | |
SCHEDULE OF INVESTMENTS | | | | as of December 31, 2024 |
| | | | | | | | | | | | | | | | | | | | |
Interest Rate | | Maturity
Date | | | | | | | | | Principal
Amount
(000)# | | | Value | |
|
MUNICIPAL BONDS (continued) | |
New York (cont’d.) | |
Port Authority of New York & New Jersey, | |
Revenue Bonds, Series 159 | |
6.040% | | | 12/01/29 | | | | | | | | | | | | 25 | | | $ | 26,291 | |
| | | | | | | | | | | | | | | | | | | | |
| | | | | |
| | | | | | | | | | | | | | | | | | | 42,346 | |
| | | | | | | | | | | | | | | | | | | | |
Ohio — 0.0% | | | | | | | | | | | | | |
Ohio State University (The), | |
Taxable, Revenue Bonds, BABs, Series C | |
4.910% | | | 06/01/40 | | | | | | | | | | | | 695 | | | | 651,945 | |
| | | | | | | | | | | | | | | | | | | | |
Pennsylvania — 0.0% | |
Pennsylvania Turnpike Commission, | |
Revenue Bonds, BABs, Series B | |
5.511% | | | 12/01/45 | | | | | | | | | | | | 825 | | | | 798,633 | |
| | | | | | | | | | | | | | | | | | | | |
Texas — 0.0% | |
Grand Parkway Transportation Corp., | |
Taxable, Revenue Bonds, Series B | |
3.236% | | | 10/01/52 | | | | | | | | | | | | 20 | | | | 13,745 | |
| | | | | | | | | | | | | | | | | | | | |
Texas Private Activity Bond Surface Transportation Corp., | |
Taxable, Revenue Bonds, Series B | |
3.922% | | | 12/31/49 | | | | | | | | | | | | 450 | | | | 356,373 | |
| | | | | | | | | | | | | | | | | | | | |
| | | | | |
| | | | | | | | | | | | | | | | | | | 370,118 | |
| | | | | | | | | | | | | | | | | | | | |
| |
TOTAL MUNICIPAL BONDS
(cost $10,906,665) | | | | 11,727,660 | |
| | | | | | | | | | | | | | | | | | | | |
|
RESIDENTIAL MORTGAGE-BACKED SECURITIES — 2.5% | |
ATLX Trust, | |
Series 2024-RPL02, Class A1, 144A | |
3.850% | | | 04/25/63 | | | | | | | | | | | | 4,234 | | | | 4,049,807 | |
Bayview Financing Trust, | |
Series 2023-01F, Class A, 144A, 30 Day Average SOFR + 4.000% (Cap N/A, Floor 4.000%) | |
8.535%(c) | | | 07/01/26^ | | | | | | | | | | | | 914 | | | | 914,774 | |
Bellemeade Re Ltd., | |
Series 2021-03A, Class M1B, 144A, 30 Day Average SOFR + 1.400% (Cap N/A, Floor 1.400%) | |
5.969%(c) | | | 09/25/31 | | | | | | | | | | | | 89 | | | | 89,449 | |
Series 2022-01, Class M1B, 144A, 30 Day Average SOFR + 2.150% (Cap N/A, Floor 2.150%) | |
6.719%(c) | | | 01/26/32 | | | | | | | | | | | | 372 | | | | 374,013 | |
Series 2022-01, Class M1C, 144A, 30 Day Average SOFR + 3.700% (Cap N/A, Floor 3.700%) | |
8.269%(c) | | | 01/26/32 | | | | | | | | | | | | 1,240 | | | | 1,273,311 | |
Chase Home Lending Mortgage Trust, | |
Series 2024-RPL02, Class A1A, 144A | |
3.250%(cc) | | | 08/25/64 | | | | | | | | | | | | 478 | | | | 421,117 | |
CIM Trust, | |
Series 2024-R01, Class A1, 144A | |
4.750%(cc) | | | 06/25/64 | | | | | | | | | | | | 1,409 | | | | 1,371,401 | |
Citigroup Mortgage Loan Trust, | |
Series 2011-12, Class 3A2, 144A | |
4.937%(cc) | | | 09/25/47 | | | | | | | | | | | | 215 | | | | 196,643 | |
Connecticut Avenue Securities Trust, | |
Series 2022-R04, Class 1B1, 144A, 30 Day Average SOFR + 5.250% (Cap N/A, Floor 0.000%) | |
9.819%(c) | | | 03/25/42 | | | | | | | | | | | | 260 | | | | 279,443 | |
| | | | | | | | | | | | | | | | | | |
Interest Rate | | Maturity
Date | | | | | | | | Principal
Amount
(000)# | | | Value | |
|
RESIDENTIAL MORTGAGE-BACKED SECURITIES (continued) | |
Series 2023-R05, Class 1M2, 144A, 30 Day Average SOFR + 3.100% (Cap N/A, Floor 3.100%) | |
7.660%(c) | | 06/25/43 | | | | | | | | | | | 1,400 | | | $ | 1,475,003 | |
Series 2023-R06, Class 1M2, 144A, 30 Day Average SOFR + 2.700% (Cap N/A, Floor 0.000%) | |
7.269%(c) | | 07/25/43 | | | | | | | | | | | 300 | | | | 311,666 | |
Series 2024-R05, Class 2M2, 144A, 30 Day Average SOFR + 1.700% (Cap N/A, Floor 1.900%) | |
6.269%(c) | | 07/25/44 | | | | | | | | | | | 250 | | | | 250,982 | |
Credit Suisse Mortgage Trust, | |
Series 2022-RPL04, Class A1, 144A | |
3.904%(cc) | | 04/25/62 | | | | | | | | | | | 1,112 | | | | 1,047,436 | |
Eagle Re Ltd., | |
Series 2021-02, Class M1C, 144A, 30 Day Average SOFR + 3.450% (Cap N/A, Floor 3.450%) | |
8.019%(c) | | 04/25/34 | | | | | | | | | | | 857 | | | | 869,239 | |
EFMT, | |
Series 2024-CES01, Class A1, 144A | |
5.522% | | 01/26/60 | | | | | | | | | | | 4,200 | | | | 4,200,911 | |
Fannie Mae REMIC, | |
Series 2011-116, Class ZA | |
3.500% | | 11/25/41 | | | | | | | | | | | 1,430 | | | | 1,321,448 | |
Series 2012-34, Class EB | |
4.000% | | 04/25/42 | | | | | | | | | | | 1,575 | | | | 1,426,345 | |
FHLMC Structured Agency Credit Risk REMIC Trust, | |
Series 2020-HQA05, Class B1, 144A, 30 Day Average SOFR + 4.000% (Cap N/A, Floor 0.000%) | |
8.569%(c) | | 11/25/50 | | | | | | | | | | | 900 | | | | 1,015,867 | |
Series 2021-DNA05, Class M2, 144A, 30 Day Average SOFR + 1.650% (Cap N/A, Floor 0.000%) | |
6.219%(c) | | 01/25/34 | | | | | | | | | | | 168 | | | | 168,663 | |
Series 2021-DNA07, Class M2, 144A, 30 Day Average SOFR + 1.800% (Cap N/A, Floor 0.000%) | |
6.369%(c) | | 11/25/41 | | | | | | | | | | | 100 | | | | 100,937 | |
Series 2021-HQA03, Class B1, 144A, 30 Day Average SOFR + 3.350% (Cap N/A, Floor 0.000%) | |
7.919%(c) | | 09/25/41 | | | | | | | | | | | 100 | | | | 103,007 | |
Series 2021-HQA03, Class M2, 144A, 30 Day Average SOFR + 2.100% (Cap N/A, Floor 0.000%) | |
6.669%(c) | | 09/25/41 | | | | | | | | | | | 1,020 | | | | 1,026,982 | |
Series 2021-HQA04, Class M2, 144A, 30 Day Average SOFR + 2.350% (Cap N/A, Floor 0.000%) | |
6.919%(c) | | 12/25/41 | | | | | | | | | | | 900 | | | | 910,363 | |
Series 2022-DNA01, Class M1B, 144A, 30 Day Average SOFR + 1.850% (Cap N/A, Floor 0.000%) | |
6.419%(c) | | 01/25/42 | | | | | | | | | | | 100 | | | | 101,421 | |
Series 2022-DNA01, Class M2, 144A, 30 Day Average SOFR + 2.500% (Cap N/A, Floor 0.000%) | |
7.069%(c) | | 01/25/42 | | | | | | | | | | | 40 | | | | 40,723 | |
Series 2022-DNA02, Class M1B, 144A, 30 Day Average SOFR + 2.400% (Cap N/A, Floor 0.000%) | |
6.969%(c) | | 02/25/42 | | | | | | | | | | | 1,100 | | | | 1,125,951 | |
Series 2022-DNA03, Class M1B, 144A, 30 Day Average SOFR + 2.900% (Cap N/A, Floor 0.000%) | |
7.469%(c) | | 04/25/42 | | | | | | | | | | | 100 | | | | 103,562 | |
SEE NOTES TO FINANCIAL STATEMENTS.
A195
| | | | |
| | PSF PGIM TOTAL RETURN BOND PORTFOLIO (CONTINUED) | | |
SCHEDULE OF INVESTMENTS | | | | as of December 31, 2024 |
| | | | | | | | | | | | | | | | | | |
Interest Rate | | Maturity
Date | | | | | | | | Principal
Amount
(000)# | | | Value | |
|
| RESIDENTIAL MORTGAGE-BACKED SECURITIES (continued) | |
Freddie Mac REMIC, | |
Series 4289, Class WZ | |
3.000% | | 01/15/44 | | | | | | | | | | | 622 | | | $ | 548,566 | |
Series 4768, Class GA | |
3.500% | | 09/15/45 | | | | | | | | | | | 343 | | | | 332,213 | |
Series 4939, Class KT | |
3.000% | | 07/15/48 | | | | | | | | | | | 371 | | | | 325,051 | |
Home Re Ltd., | |
Series 2021-02, Class M1C, 144A, 30 Day Average SOFR + 2.800% (Cap N/A, Floor 0.000%) | |
7.369%(c) | | 01/25/34 | | | | | | | | | | | 439 | | | | 443,233 | |
Kinbane DAC (Ireland), | |
Series 2024-RPL2A, Class A, 144A, 1 Month EURIBOR + 1.100% (Cap N/A, Floor 0.000%) | |
4.189%(c) | | 01/24/63 | | | | | | | EUR | | | | 1,380 | | | | 1,428,591 | |
LHOME Mortgage Trust, | |
Series 2024-RTL04, Class A1, 144A | |
5.921% | | 07/25/39 | | | | | | | | | | | 1,000 | | | | 1,002,267 | |
Lincoln Senior Participation Trust, | |
Series 2024-01, Class A1X, 144A, 1 Month SOFR + 3.000% | |
2.750%(c) | | 08/04/25^ | | | | | | | | | | | 3,700 | | | | 3,702,187 | |
Lugo Funding DAC (Spain), | |
Series 2024-01A, Class A, 144A, 3 Month EURIBOR + 1.000% (Cap N/A, Floor 0.000%) | |
3.992%(c) | | 05/26/66 | | | | | | | EUR | | | | 2,000 | | | | 2,061,611 | |
Series 2024-01A, Class B, 144A, 3 Month EURIBOR + 1.500% (Cap N/A, Floor 0.000%) | |
4.492%(c) | | 05/26/66 | | | | | | | EUR | | | | 4,200 | | | | 4,303,780 | |
New Residential Mortgage Loan Trust, | |
Series 2018-04A, Class A1S, 144A, 1 Month SOFR + 0.864% (Cap N/A, Floor 0.750%) | |
5.203%(c) | | 01/25/48 | | | | | | | | | | | 261 | | | | 256,380 | |
Oaktown Re VII Ltd., | |
Series 2021-02, Class M1B, 144A, 30 Day Average SOFR + 2.900% (Cap N/A, Floor 2.900%) | |
7.469%(c) | | 04/25/34 | | | | | | | | | | | 900 | | | | 912,854 | |
PMT Credit Risk Transfer Trust, | |
Series 2024-01R, Class A, 144A, 30 Day Average SOFR + 3.500% (Cap N/A, Floor 0.000%) | |
8.069%(c) | | 05/25/33 | | | | | | | | | | | 3,709 | | | | 3,754,402 | |
Series 2024-02R, Class A, 144A, 30 Day Average SOFR + 3.350% (Cap N/A, Floor 0.000%) | |
7.910%(c) | | 03/29/27 | | | | | | | | | | | 2,705 | | | | 2,730,979 | |
PRET Trust, | |
Series 2024-RPL02, Class A1, 144A | |
4.075%(cc) | | 06/25/64 | | | | | | | | | | | 1,736 | | | | 1,622,018 | |
PRPM LLC, | |
Series 2024-RPL02, Class A1, 144A | |
3.500% | | 05/25/54 | | | | | | | | | | | 699 | | | | 668,537 | |
Radnor Re Ltd., | |
Series 2021-02, Class M1B, 144A, 30 Day Average SOFR + 3.700% (Cap N/A, Floor 3.700%) | |
8.269%(c) | | 11/25/31 | | | | | | | | | | | 688 | | | | 702,908 | |
Series 2023-01, Class M1A, 144A, 30 Day Average SOFR + 2.700% (Cap N/A, Floor 2.700%) | |
7.260%(c) | | 07/25/33 | | | | | | | | | | | 651 | | | | 656,860 | |
| | | | | | | | | | | | | | | | | | |
Interest Rate | | Maturity
Date | | | | | | | | Principal
Amount
(000)# | | | Value | |
|
| RESIDENTIAL MORTGAGE-BACKED SECURITIES (continued) | |
RCKT Mortgage Trust, | |
Series 2024-CES05, Class A1A, 144A | |
5.846% | | 08/25/44 | | | | | | | | | | | 938 | | | $ | 944,021 | |
Series 2024-CES09, Class A1A, 144A | |
5.582% | | 12/25/44 | | | | | | | | | | | 2,600 | | | | 2,580,084 | |
Shamrock Residential (Ireland), | |
Series 2023-01A, Class A, 144A, 1 Month EURIBOR + 1.000% (Cap N/A, Floor 0.000%) | |
3.801%(c) | | 06/24/71 | | | | | | | EUR | | | | 324 | | | | 335,711 | |
Structured Adjustable Rate Mortgage Loan Trust, | |
Series 2004-01, Class 4A3 | |
7.203%(cc) | | 02/25/34 | | | | | | | | | | | 105 | | | | 100,153 | |
Series 2004-18, Class 3A1 | |
5.282%(cc) | | 12/25/34 | | | | | | | | | | | 828 | | | | 757,351 | |
Towd Point Mortgage Trust, | |
Series 2024-CES06, Class A1, 144A | |
5.725% | | 11/25/64 | | | | | | | | | | | 2,067 | | | | 2,071,160 | |
| | | | | | | | | | | | | | | | | | |
TOTAL RESIDENTIAL MORTGAGE-BACKED SECURITIES
(cost $57,374,568) | | | | 56,811,381 | |
| | | | | | | | | | | | | | | | | | |
|
SOVEREIGN BONDS — 1.2% | |
Bermuda Government International Bond (Bermuda), | |
Sr. Unsec’d. Notes, 144A | |
2.375% | | 08/20/30 | | | | | | | | | | | 570 | | | | 483,582 | |
Brazil Minas SPE via State of Minas Gerais (Brazil), | |
Gov’t. Gtd. Notes | |
5.333% | | 02/15/28 | | | | | | | | | | | 642 | | | | 635,066 | |
Colombia Government International Bond (Colombia), | |
Sr. Unsec’d. Notes | |
4.500% | | 01/28/26 | | | | | | | | | | | 250 | | | | 246,750 | |
Dominican Republic International Bond (Dominican Republic), | |
Sr. Unsec’d. Notes, 144A | |
5.500% | | 02/22/29 | | | | | | | | | | | 2,418 | | | | 2,334,579 | |
6.000% | | 07/19/28 | | | | | | | | | | | 770 | | | | 761,915 | |
6.875% | | 01/29/26 | | | | | | | | | | | 300 | | | | 302,250 | |
Indonesia Government International Bond (Indonesia), | |
Sr. Unsec’d. Notes | |
1.100% | | 03/12/33 | | | | | | | EUR | | | | 410 | | | | 347,456 | |
1.450% | | 09/18/26 | | | | | | | EUR | | | | 375 | | | | 376,503 | |
Sr. Unsec’d. Notes, EMTN | |
3.750% | | 06/14/28 | | | | | | | EUR | | | | 1,250 | | | | 1,312,616 | |
Ivory Coast Government International Bond (Ivory Coast), | |
Sr. Unsec’d. Notes | |
4.875% | | 01/30/32 | | | | | | | EUR | | | | 978 | | | | 892,444 | |
5.250% | | 03/22/30 | | | | | | | EUR | | | | 1,242 | | | | 1,215,365 | |
5.875% | | 10/17/31 | | | | | | | EUR | | | | 1,513 | | | | 1,467,329 | |
Peruvian Government International Bond (Peru), | |
Sr. Unsec’d. Notes | |
2.783% | | 01/23/31 | | | | | | | | | | | 10 | | | | 8,544 | |
Republic of Italy Government International Bond (Italy), | |
Sr. Unsec’d. Notes, Series 10Y | |
2.875% | | 10/17/29 | | | | | | | | | | | 200 | | | | 181,427 | |
Sr. Unsec’d. Notes, Series 30Y, MTN | |
5.375% | | 06/15/33 | | | | | | | | | | | 3,770 | | | | 3,721,102 | |
SEE NOTES TO FINANCIAL STATEMENTS.
A196
| | | | |
| | PSF PGIM TOTAL RETURN BOND PORTFOLIO (CONTINUED) | | |
SCHEDULE OF INVESTMENTS | | | | as of December 31, 2024 |
| | | | | | | | | | | | | | | | | | |
Interest Rate | | Maturity
Date | | | | | | Principal Amount (000)# | | | Value | |
|
| SOVEREIGN BONDS (continued) | |
Romanian Government International Bond (Romania), | |
Sr. Unsec’d. Notes, 144A, MTN | | | | | |
5.000% | | | 09/27/26 | | | | | | | EUR | | | 1,200 | | | $ | 1,271,609 | |
Serbia International Bond (Serbia), | | | | | |
Sr. Unsec’d. Notes | | | | | |
1.500% | | | 06/26/29 | | | | | | | EUR | | | 4,701 | | | | 4,391,733 | |
1.650% | | | 03/03/33 | | | | | | | EUR | | | 582 | | | | 483,612 | |
3.125% | | | 05/15/27 | | | | | | | EUR | | | 3,060 | | | | 3,115,222 | |
Sr. Unsec’d. Notes, 144A | | | | | |
1.650% | | | 03/03/33 | | | | | | | EUR | | | 351 | | | | 291,663 | |
3.125% | | | 05/15/27 | | | | | | | EUR | | | 961 | | | | 978,343 | |
6.000% | | | 06/12/34 | | | | | | | | | | 1,333 | | | | 1,311,339 | |
6.250% | | | 05/26/28 | | | | | | | | | | 440 | | | | 447,150 | |
| | | | | | | | | | | | | | | | | | |
TOTAL SOVEREIGN BONDS
(cost $28,106,399) | | | | | | | 26,577,599 | |
| | | | | | | | | | | | | | | | | | |
U.S. GOVERNMENT AGENCY OBLIGATIONS — 18.7% | |
Federal Home Loan Mortgage Corp. | | | | | |
2.000% | | | 11/01/50 | | | | | | | | | | 4,618 | | | | 3,626,104 | |
2.000% | | | 01/01/51 | | | | | | | | | | 879 | | | | 690,127 | |
2.000% | | | 05/01/51 | (k) | | | | | | | | | 6,660 | | | | 5,220,738 | |
2.000% | | | 10/01/51 | | | | | | | | | | 2,120 | | | | 1,656,163 | |
2.500% | | | 08/01/50 | | | | | | | | | | 1,436 | | | | 1,182,654 | |
2.500% | | | 08/01/50 | | | | | | | | | | 3,218 | | | | 2,653,126 | |
2.500% | | | 09/01/50 | | | | | | | | | | 4,059 | | | | 3,346,684 | |
2.500% | | | 12/01/50 | | | | | | | | | | 1,088 | | | | 902,844 | |
2.500% | | | 01/01/51 | | | | | | | | | | 1,446 | | | | 1,187,772 | |
2.500% | | | 03/01/51 | | | | | | | | | | 2,697 | | | | 2,210,616 | |
2.500% | | | 04/01/51 | | | | | | | | | | 2,268 | | | | 1,861,469 | |
2.500% | | | 05/01/51 | | | | | | | | | | 5,561 | | | | 4,551,557 | |
2.500% | | | 07/01/51 | | | | | | | | | | 3,227 | | | | 2,657,295 | |
2.500% | | | 07/01/51 | | | | | | | | | | 8,707 | | | | 7,109,024 | |
2.500% | | | 08/01/51 | | | | | | | | | | 3,412 | | | | 2,807,949 | |
2.500% | | | 08/01/51 | | | | | | | | | | 11,292 | | | | 9,349,895 | |
2.500% | | | 11/01/51 | | | | | | | | | | 1,103 | | | | 913,385 | |
2.500% | | | 01/01/52 | | | | | | | | | | 2,060 | | | | 1,703,931 | |
2.500% | | | 01/01/52 | | | | | | | | | | 2,857 | | | | 2,359,560 | |
2.500% | | | 04/01/52 | | | | | | | | | | 488 | | | | 402,804 | |
3.000% | | | 07/01/51 | | | | | | | | | | 2,219 | | | | 1,899,212 | |
3.000% | | | 11/01/51 | | | | | | | | | | 887 | | | | 758,350 | |
3.000% | | | 01/01/52 | | | | | | | | | | 4,445 | | | | 3,837,494 | |
3.000% | | | 02/01/52 | | | | | | | | | | 6,364 | | | | 5,421,050 | |
3.000% | | | 03/01/52 | | | | | | | | | | 1,071 | | | | 922,845 | |
3.000% | | | 06/01/52 | | | | | | | | | | 518 | | | | 445,518 | |
3.000% | | | 06/01/52 | | | | | | | | | | 946 | | | | 814,043 | |
3.500% | | | 02/01/47 | | | | | | | | | | 503 | | | | 455,074 | |
3.500% | | | 01/01/52 | | | | | | | | | | 2,092 | | | | 1,857,763 | |
3.500% | | | 03/01/52 | | | | | | | | | | 2,651 | | | | 2,361,024 | |
3.500% | | | 04/01/52 | | | | | | | | | | 7,074 | | | | 6,265,587 | |
3.500% | | | 05/01/52 | | | | | | | | | | 6,918 | | | | 6,130,237 | |
4.500% | | | 06/01/52 | | | | | | | | | | 4,095 | | | | 3,859,510 | |
4.500% | | | 09/01/52 | | | | | | | | | | 3,498 | | | | 3,296,817 | |
4.500% | | | 11/01/52 | | | | | | | | | | 3,084 | | | | 2,904,885 | |
5.000% | | | 08/01/52 | | | | | | | | | | 1,669 | | | | 1,613,345 | |
5.000% | | | 10/01/52 | | | | | | | | | | 5,668 | | | | 5,488,418 | |
5.000% | | | 11/01/52 | | | | | | | | | | 951 | | | | 920,553 | |
5.000% | | | 12/01/52 | | | | | | | | | | 694 | | | | 671,674 | |
5.000% | | | 01/01/53 | | | | | | | | | | 2,407 | | | | 2,323,806 | |
| | | | | | | | | | | | | | | | | | |
Interest Rate | | Maturity
Date | | | | | | Principal Amount (000)# | | | Value | |
|
U.S. GOVERNMENT AGENCY OBLIGATIONS (continued) | |
5.500% | | | 10/01/33 | | | | | | | | | | 250 | | | $ | 253,046 | |
5.500% | | | 06/01/34 | | | | | | | | | | 2 | | | | 2,072 | |
5.500% | | | 11/01/52 | | | | | | | | | | 3,435 | | | | 3,390,839 | |
5.500% | | | 12/01/52 | | | | | | | | | | 804 | | | | 795,843 | |
5.500% | | | 10/01/54 | | | | | | | | | | 974 | | | | 961,375 | |
6.000% | | | 11/01/33 | | | | | | | | | | 23 | | | | 23,054 | |
6.000% | | | 05/01/34 | | | | | | | | | | 32 | | | | 32,677 | |
6.000% | | | 06/01/34 | | | | | | | | | | 58 | | | | 58,113 | |
6.000% | | | 01/01/53 | | | | | | | | | | 902 | | | | 906,851 | |
6.000% | | | 03/01/53 | | | | | | | | | | 909 | | | | 913,586 | |
6.000% | | | 03/01/53 | | | | | | | | | | 939 | | | | 952,880 | |
6.000% | | | 04/01/53 | | | | | | | | | | 915 | | | | 921,397 | |
6.250% | | | 07/15/32 | (k) | | | | | | | | | 170 | | | | 187,998 | |
6.500% | | | 07/01/32 | | | | | | | | | | 3 | | | | 3,561 | |
6.500% | | | 08/01/32 | | | | | | | | | | 12 | | | | 12,491 | |
6.500% | | | 08/01/32 | | | | | | | | | | 12 | | | | 12,739 | |
6.500% | | | 08/01/32 | | | | | | | | | | 18 | | | | 18,391 | |
6.500% | | | 09/01/32 | | | | | | | | | | 19 | | | | 19,196 | |
6.500% | | | 09/01/32 | | | | | | | | | | 54 | | | | 55,325 | |
6.750% | | | 03/15/31 | (k) | | | | | | | | | 545 | | | | 609,001 | |
Federal National Mortgage Assoc. | | | | | |
1.500% | | | 02/01/51 | (k) | | | | | | | | | 16,197 | | | | 11,999,039 | |
1.500% | | | 03/01/51 | | | | | | | | | | 360 | | | | 266,449 | |
1.500% | | | 05/01/51 | | | | | | | | | | 529 | | | | 392,633 | |
2.000% | | | 03/01/51 | | | | | | | | | | 6,415 | | | | 5,031,860 | |
2.000% | | | 04/01/51 | | | | | | | | | | 6,258 | | | | 4,907,796 | |
2.000% | | | 06/01/51 | | | | | | | | | | 21,150 | | | | 16,576,610 | |
2.000% | | | 07/01/51 | | | | | | | | | | 3,016 | | | | 2,363,205 | |
2.000% | | | 10/01/51 | | | | | | | | | | 8,313 | | | | 6,501,505 | |
2.500% | | | 06/01/50 | | | | | | | | | | 2,250 | | | | 1,856,908 | |
2.500% | | | 10/01/50 | | | | | | | | | | 7,666 | | | | 6,283,010 | |
2.500% | | | 01/01/51 | | | | | | | | | | 2,419 | | | | 1,994,734 | |
2.500% | | | 02/01/51 | | | | | | | | | | 1,970 | | | | 1,622,951 | |
2.500% | | | 03/01/51 | | | | | | | | | | 4,946 | | | | 4,053,451 | |
2.500% | | | 04/01/51 | | | | | | | | | | 1,062 | | | | 873,507 | |
2.500% | | | 05/01/51 | | | | | | | | | | 1,249 | | | | 1,026,871 | |
2.500% | | | 07/01/51 | | | | | | | | | | 3,192 | | | | 2,622,747 | |
2.500% | | | 09/01/51 | | | | | | | | | | 3,470 | | | | 2,856,901 | |
2.500% | | | 10/01/51 | | | | | | | | | | 7,546 | | | | 6,171,902 | |
2.500% | | | 11/01/51 | | | | | | | | | | 4,675 | | | | 3,833,086 | |
2.500% | | | 02/01/52 | | | | | | | | | | 1,332 | | | | 1,104,639 | |
2.500% | | | 03/01/52 | | | | | | | | | | 597 | | | | 493,604 | |
3.000% | | | 01/01/47 | | | | | | | | | | 1,050 | | | | 926,965 | |
3.000% | | | 04/01/48 | | | | | | | | | | 5,840 | | | | 5,149,569 | |
3.000% | | | 11/01/48 | | | | | | | | | | 776 | | | | 684,470 | |
3.000% | | | 07/01/50 | | | | | | | | | | 1,196 | | | | 1,029,487 | |
3.000% | | | 07/01/51 | | | | | | | | | | 493 | | | | 422,235 | |
3.000% | | | 11/01/51 | | | | | | | | | | 1,397 | | | | 1,195,343 | |
3.000% | | | 11/01/51 | | | | | | | | | | 1,567 | | | | 1,338,620 | |
3.000% | | | 11/01/51 | | | | | | | | | | 12,197 | | | | 10,434,922 | |
3.000% | | | 12/01/51 | | | | | | | | | | 2,646 | | | | 2,291,877 | |
3.000% | | | 12/01/51 | | | | | | | | | | 4,501 | | | | 3,855,136 | |
3.000% | | | 01/01/52 | | | | | | | | | | 1,183 | | | | 1,011,637 | |
3.000% | | | 02/01/52 | | | | | | | | | | 855 | | | | 731,986 | |
3.000% | | | 02/01/52 | | | | | | | | | | 1,202 | | | | 1,024,441 | |
3.000% | | | 03/01/52 | | | | | | | | | | 1,784 | | | | 1,518,253 | |
3.000% | | | 04/01/52 | | | | | | | | | | 9,328 | | | | 7,939,654 | |
3.500% | | | TBA | | | | | | | | | | 7,000 | | | | 6,190,917 | |
SEE NOTES TO FINANCIAL STATEMENTS.
A197
| | | | |
| | PSF PGIM TOTAL RETURN BOND PORTFOLIO (CONTINUED) | | |
SCHEDULE OF INVESTMENTS | | | | as of December 31, 2024 |
| | | | | | | | | | | | | | | | | | | | |
Interest Rate | | Maturity
Date | | | | | | Principal
Amount
(000)# | | | Value | |
|
U.S. GOVERNMENT AGENCY OBLIGATIONS (continued) | |
3.500% | | | 05/01/51 | | | | | | | | | | | | 3,485 | | | $ | 3,122,651 | |
3.500% | | | 07/01/51 | | | | | | | | | | | | 1,025 | | | | 914,122 | |
3.500% | | | 02/01/52 | | | | | | | | | | | | 5,395 | | | | 4,810,023 | |
3.500% | | | 03/01/52 | | | | | | | | | | | | 622 | | | | 552,477 | |
3.500% | | | 05/01/52 | | | | | | | | | | | | 5,356 | | | | 4,746,709 | |
3.500% | | | 06/01/52 | | | | | | | | | | | | 2,268 | | | | 2,017,472 | |
4.000% | | | 03/01/48 | | | | | | | | | | | | 11,056 | | | | 10,369,556 | |
4.000% | | | 04/01/52 | | | | | | | | | | | | 577 | | | | 527,741 | |
4.000% | | | 05/01/52 | | | | | | | | | | | | 461 | | | | 422,822 | |
4.000% | | | 06/01/52 | | | | | | | | | | | | 14,161 | | | | 12,973,390 | |
4.500% | | | TBA | | | | | | | | | | | | 9,000 | | | | 8,464,251 | |
4.500% | | | 08/01/40 | | | | | | | | | | | | 709 | | | | 687,851 | |
4.500% | | | 09/01/49 | | | | | | | | | | | | 1,350 | | | | 1,288,217 | |
4.500% | | | 06/01/52 | | | | | | | | | | | | 5,427 | | | | 5,113,068 | |
4.500% | | | 08/01/52 | | | | | | | | | | | | 502 | | | | 473,300 | |
5.000% | | | 03/01/53 | | | | | | | | | | | | 7,741 | | | | 7,511,655 | |
5.000% | | | 05/01/53 | | | | | | | | | | | | 772 | | | | 750,067 | |
5.500% | | | 02/01/33 | | | | | | | | | | | | 3 | | | | 2,693 | |
5.500% | | | 02/01/33 | | | | | | | | | | | | 6 | | | | 5,943 | |
5.500% | | | 03/01/33 | | | | | | | | | | | | 7 | | | | 7,520 | |
5.500% | | | 03/01/33 | | | | | | | | | | | | 13 | | | | 12,855 | |
5.500% | | | 03/01/33 | | | | | | | | | | | | 17 | | | | 16,877 | |
5.500% | | | 04/01/33 | | | | | | | | | | | | 2 | | | | 2,200 | |
5.500% | | | 04/01/33 | | | | | | | | | | | | 8 | | | | 8,428 | |
5.500% | | | 04/01/33 | | | | | | | | | | | | 11 | | | | 10,539 | |
5.500% | | | 04/01/33 | | | | | | | | | | | | 12 | | | | 12,527 | |
5.500% | | | 07/01/33 | | | | | | | | | | | | 10 | | | | 10,206 | |
5.500% | | | 07/01/33 | | | | | | | | | | | | 11 | | | | 11,413 | |
5.500% | | | 08/01/33 | | | | | | | | | | | | 11 | | | | 11,254 | |
5.500% | | | 02/01/34 | | | | | | | | | | | | 11 | | | | 10,736 | |
5.500% | | | 04/01/34 | | | | | | | | | | | | 11 | | | | 10,639 | |
5.500% | | | 06/01/34 | | | | | | | | | | | | 14 | | | | 14,345 | |
5.500% | | | 11/01/52 | | | | | | | | | | | | 11,541 | | | | 11,450,283 | |
5.500% | | | 04/01/53 | | | | | | | | | | | | 2,863 | | | | 2,827,223 | |
5.500% | | | 09/01/54 | | | | | | | | | | | | 3,984 | | | | 3,932,940 | |
6.000% | | | 10/01/33 | | | | | | | | | | | | 1 | | | | 1,307 | |
6.000% | | | 10/01/33 | | | | | | | | | | | | 133 | | | | 134,346 | |
6.000% | | | 03/01/34 | | | | | | | | | | | | 18 | | | | 18,195 | |
6.000% | | | 02/01/35 | | | | | | | | | | | | 67 | | | | 69,191 | |
6.000% | | | 11/01/36 | | | | | | | | | | | | 18 | | | | 19,016 | |
6.000% | | | 11/01/52 | | | | | | | | | | | | 894 | | | | 899,471 | |
6.000% | | | 11/01/52 | | | | | | | | | | | | 1,846 | | | | 1,855,999 | |
6.000% | | | 12/01/52 | | | | | | | | | | | | 2,847 | | | | 2,864,663 | |
6.000% | | | 04/01/53 | | | | | | | | | | | | 445 | | | | 447,918 | |
6.500% | | | 08/01/32 | | | | | | | | | | | | 45 | | | | 46,186 | |
6.500% | | | 09/01/32 | | | | | | | | | | | | 19 | | | | 19,441 | |
6.500% | | | 09/01/32 | | | | | | | | | | | | 55 | | | | 56,085 | |
6.500% | | | 10/01/32 | | | | | | | | | | | | 31 | | | | 31,500 | |
6.500% | | | 04/01/33 | | | | | | | | | | | | 49 | | | | 50,612 | |
6.500% | | | 11/01/33 | | | | | | | | | | | | 1 | | | | 1,465 | |
6.625% | | | 11/15/30 | (k) | | | | | | | | | | | 830 | | | | 920,532 | |
7.000% | | | 05/01/32 | | | | | | | | | | | | 17 | | | | 17,721 | |
7.000% | | | 06/01/32 | | | | | | | | | | | | 3 | | | | 3,147 | |
7.000% | | | 03/01/53 | | | | | | | | | | | | 297 | | | | 308,007 | |
7.125% | | | 01/15/30 | (k) | | | | | | | | | | | 785 | | | | 879,575 | |
Government National Mortgage Assoc. | |
2.000% | | | 10/20/50 | | | | | | | | | | | | 2,357 | | | | 1,886,897 | |
2.000% | | | 12/20/50 | | | | | | | | | | | | 4,212 | | | | 3,376,099 | |
| | | | | | | | | | | | | | | | | | | | |
Interest Rate | | Maturity
Date | | | | | | Principal
Amount
(000)# | | | Value | |
|
U.S. GOVERNMENT AGENCY OBLIGATIONS (continued) | |
2.000% | | | 02/20/51 | | | | | | | | | | | | 6,269 | | | $ | 5,021,891 | |
2.500% | | | 09/20/50 | | | | | | | | | | | | 3,198 | | | | 2,679,594 | |
2.500% | | | 03/20/51 | | | | | | | | | | | | 980 | | | | 819,205 | |
2.500% | | | 04/20/51 | | | | | | | | | | | | 9,139 | | | | 7,637,435 | |
2.500% | | | 08/20/51 | | | | | | | | | | | | 2,119 | | | | 1,770,763 | |
2.500% | | | 09/20/51 | | | | | | | | | | | | 971 | | | | 811,621 | |
3.000% | | | 08/20/51 | | | | | | | | | | | | 9,423 | | | | 8,176,359 | |
3.500% | | | 01/20/48 | | | | | | | | | | | | 89 | | | | 80,333 | |
3.500% | | | 11/20/51 | | | | | | | | | | | | 3,972 | | | | 3,562,677 | |
3.500% | | | 12/20/51 | | | | | | | | | | | | 10,147 | | | | 9,093,496 | |
3.500% | | | 01/20/52 | | | | | | | | | | | | 2,792 | | | | 2,499,563 | |
3.500% | | | 04/20/52 | | | | | | | | | | | | 557 | | | | 498,476 | |
3.500% | | | 05/20/52 | | | | | | | | | | | | 419 | | | | 374,391 | |
4.000% | | | 02/20/49 | | | | | | | | | | | | 179 | | | | 166,904 | |
4.000% | | | 08/20/52 | | | | | | | | | | | | 4,222 | | | | 3,891,317 | |
4.500% | | | 08/20/52 | | | | | | | | | | | | 5,836 | | | | 5,529,057 | |
5.000% | | | 07/20/52 | | | | | | | | | | | | 3,111 | | | | 3,025,803 | |
5.000% | | | 09/20/52 | | | | | | | | | | | | 1,257 | | | | 1,223,027 | |
5.500% | | | 01/15/33 | | | | | | | | | | | | 21 | | | | 21,697 | |
5.500% | | | 02/15/33 | | | | | | | | | | | | 13 | | | | 13,219 | |
5.500% | | | 05/15/33 | | | | | | | | | | | | 72 | | | | 73,757 | |
5.500% | | | 06/15/33 | | | | | | | | | | | | 83 | | | | 85,883 | |
5.500% | | | 09/15/33 | | | | | | | | | | | | 18 | | | | 18,015 | |
5.500% | | | 07/15/35 | | | | | | | | | | | | 24 | | | | 24,194 | |
5.500% | | | 04/20/52 | | | | | | | | | | | | 1,144 | | | | 1,142,409 | |
5.500% | | | 05/20/52 | | | | | | | | | | | | 1,198 | | | | 1,195,904 | |
5.500% | | | 06/20/52 | | | | | | | | | | | | 1,037 | | | | 1,028,793 | |
5.500% | | | 09/20/52 | | | | | | | | | | | | 1,370 | | | | 1,364,922 | |
5.500% | | | 11/20/52 | | | | | | | | | | | | 1,225 | | | | 1,220,037 | |
6.000% | | | TBA | | | | | | | | | | | | 6,500 | | | | 6,542,656 | |
6.000% | | | 12/15/32 | | | | | | | | | | | | 45 | | | | 47,043 | |
6.000% | | | 11/15/33 | | | | | | | | | | | | 18 | | | | 18,583 | |
6.000% | | | 01/15/34 | | | | | | | | | | | | 5 | | | | 4,835 | |
6.000% | | | 06/20/34 | | | | | | | | | | | | 125 | | | | 129,672 | |
6.000% | | | 11/15/34 | | | | | | | | | | | | 145 | | | | 150,045 | |
6.000% | | | 09/20/52 | | | | | | | | | | | | 1,652 | | | | 1,672,267 | |
6.000% | | | 02/20/53 | | | | | | | | | | | | 1,292 | | | | 1,305,635 | |
6.000% | | | 06/20/53 | | | | | | | | | | | | 961 | | | | 972,050 | |
6.500% | | | TBA | | | | | | | | | | | | 7,000 | | | | 7,119,868 | |
6.500% | | | 09/15/32 | | | | | | | | | | | | 25 | | | | 24,969 | |
6.500% | | | 09/15/32 | | | | | | | | | | | | 63 | | | | 64,130 | |
6.500% | | | 09/15/32 | | | | | | | | | | | | 89 | | | | 91,365 | |
6.500% | | | 11/15/33 | | | | | | | | | | | | 47 | | | | 47,688 | |
| | | | | | | | | | | | | | | | | | | | |
TOTAL U.S. GOVERNMENT AGENCY OBLIGATIONS
(cost $435,126,351) | | | | 425,603,171 | |
| | | | | | | | | | | | | | | | | | | | |
| |
U.S. TREASURY OBLIGATIONS — 13.7% | | | | | |
U.S. Treasury Bonds | | | | | | | | | | | | | | | | | |
1.625% | | | 11/15/50 | | | | | | | | | | | | 26,215 | | | | 13,689,145 | |
2.000% | | | 11/15/41 | | | | | | | | | | | | 15,455 | | | | 10,383,828 | |
2.250% | | | 05/15/41 | | | | | | | | | | | | 11,420 | | | | 8,106,416 | |
2.250% | | | 08/15/49 | | | | | | | | | | | | 26,085 | | | | 16,168,624 | |
2.375% | | | 11/15/49 | | | | | | | | | | | | 20,800 | | | | 13,234,000 | |
3.000% | | | 11/15/44 | | | | | | | | | | | | 21,665 | | | | 16,448,474 | |
3.000% | | | 02/15/49 | | | | | | | | | | | | 27,810 | | | | 20,253,502 | |
4.000% | | | 11/15/52 | | | | | | | | | | | | 10,700 | | | | 9,330,734 | |
4.125% | | | 08/15/44 | | | | | | | | | | | | 5,255 | | | | 4,759,881 | |
4.250% | | | 08/15/54 | (h)(k) | | | | | | | | | | | 32,955 | | | | 30,153,825 | |
SEE NOTES TO FINANCIAL STATEMENTS.
A198
| | | | |
| | PSF PGIM TOTAL RETURN BOND PORTFOLIO (CONTINUED) | | |
SCHEDULE OF INVESTMENTS | | | | as of December 31, 2024 |
| | | | | | | | | | | | |
Interest Rate | | Maturity Date | | | | Principal
Amount
(000)# | | | Value | |
|
|
|
U.S. TREASURY OBLIGATIONS (continued) | |
4.625% | | 11/15/44(h) | | | | | 25,000 | | | $ | 24,253,906 | |
4.750% | | 11/15/43 | | | | | 1,740 | | | | 1,719,066 | |
4.750% | | 11/15/53 | | | | | 9,795 | | | | 9,703,172 | |
U.S. Treasury Notes | |
3.875% | | 08/15/33 | | | | | 18,915 | | | | 18,010,627 | |
4.125% | | 11/15/27 | | | | | 18,360 | | | | 18,283,978 | |
4.125% | | 11/30/31(h) | | | | | 700 | | | | 685,344 | |
4.250% | | 11/30/26 | | | | | 25,000 | | | | 24,999,024 | |
4.250% | | 11/15/34 | | | | | 12,780 | | | | 12,454,509 | |
4.500% | | 12/31/31 | | | | | 28,625 | | | | 28,656,709 | |
U.S. Treasury Strips Coupon | |
2.335%(s) | | 08/15/44 | | | | | 2,500 | | | | 929,004 | |
2.364%(s) | | 05/15/45 | | | | | 3,420 | | | | 1,226,658 | |
2.377%(s) | | 08/15/45 | | | | | 1,250 | | | | 442,090 | |
3.143%(s) | | 08/15/41 | | | | | 1,350 | | | | 580,184 | |
3.641%(s) | | 05/15/44 | | | | | 15,225 | | | | 5,730,785 | |
3.986%(s) | | 11/15/41 | | | | | 2,215 | | | | 941,202 | |
4.146%(s) | | 05/15/43 | | | | | 11,475 | | | | 4,533,970 | |
4.327%(s) | | 08/15/43 | | | | | 120 | | | | 46,884 | |
4.483%(s) | | 11/15/45 | | | | | 2,605 | | | | 910,122 | |
4.500%(s) | | 05/15/46 | | | | | 865 | | | | 294,674 | |
4.652%(s) | | 05/15/49 | | | | | 620 | | | | 183,021 | |
4.663%(s) | | 02/15/50 | | | | | 1,090 | | | | 311,544 | |
4.709%(s) | | 05/15/39 | | | | | 8,275 | | | | 4,042,790 | |
4.768%(s) | | 11/15/40 | | | | | 1,905 | | | | 853,157 | |
4.791%(s) | | 02/15/42 | | | | | 19,545 | | | | 8,202,792 | |
4.920%(s) | | 08/15/48 | | | | | 830 | | | | 253,993 | |
5.158%(s) | | 02/15/41 | | | | | 130 | | | | 57,383 | |
| | | | | | | | | | | | |
| |
TOTAL U.S. TREASURY OBLIGATIONS
(cost $330,127,207) | | | | 310,835,017 | |
| | | | | | | | | | | | |
| | | | | | | Shares | | | | |
|
COMMON STOCKS — 0.1% | |
Chemicals — 0.0% | | | | | | | | | | |
TPC Group, Inc.*^ | | | | | 14,880 | | | | 446,400 | |
| | | | | | | | | | | | |
Gas Utilities — 0.0% | | | | | | | | | | |
Ferrellgas Partners LP (Class B Stock) | | | | | 5,622 | | | | 705,248 | |
| | | | | | | | | | | | |
Oil, Gas & Consumable Fuels — 0.1% | | | | | |
Expand Energy Corp. | | | | | 12,213 | | | | 1,215,804 | |
| | | | | | | | | | | | |
Wireless Telecommunication Services — 0.0% | |
Digicel International Finance Ltd. (Jamaica)*^ | | | 65,188 | | | | 391,128 | |
| | | | | | | | | | | | |
TOTAL COMMON STOCKS (cost $748,057) | | | | | | | | | 2,758,580 | |
| | | | | | | | | | | | |
|
PREFERRED STOCKS — 0.1% | |
Banks — 0.1% | | | | | | | | | | |
Citigroup Capital XIII, 11.221%(c), 3 Month SOFR + 6.632%, Maturing 10/30/40 | | | | | 45,000 | | | | 1,348,650 | |
| | | | | | | | | | | | |
Capital Markets — 0.0% | |
State Street Corp., 5.350%(ff), Series G, Maturing 03/15/26(oo) | | | 25,000 | | | | 587,250 | |
| | | | | | | | | | | | |
Electronic Equipment, Instruments & Components — 0.0% | | | | | |
Ferrellgas Escrow LLC, 8.956%, Maturing 03/30/31^ | | | 402 | | | | 402,000 | |
| | | | | | | | | | | | |
| | | | | | | | |
| | | Shares | | | Value | |
|
PREFERRED STOCKS (continued) | |
Wireless Telecommunication Services — 0.0% | |
Digicel International Finance Ltd.
(Jamaica)*^ | | | 6,874 | | | $ | 76,335 | |
| | | | | | | | |
| | |
TOTAL PREFERRED STOCKS
(cost $2,197,370) | | | | | | | 2,414,235 | |
| | | | | | | | |
| | |
TOTAL LONG-TERM INVESTMENTS
(cost $2,349,854,595) | | | | | | | 2,275,859,435 | |
| | | | | | | | |
| |
SHORT-TERM INVESTMENTS — 2.3% | | | | | |
AFFILIATED MUTUAL FUNDS — 2.3% | | | | | |
PGIM Core Ultra Short Bond Fund(wb) | | | 33,254,976 | | | | 33,254,976 | |
PGIM Institutional Money Market Fund (7-day effective yield 4.649%) (cost $19,727,742; includes $19,547,165 of cash collateral for securities on loan)(b)(wb) | | | 19,755,144 | | | | 19,743,291 | |
| | | | | | | | |
| |
TOTAL AFFILIATED MUTUAL FUNDS
(cost $52,982,718) | | | | 52,998,267 | |
| | | | | | | | |
| | |
OPTIONS PURCHASED*~ — 0.0% | | | | | | | | |
(cost $74,001) | | | | | | | 167,142 | |
| | | | | | | | |
| | | | | | | | |
| |
TOTAL SHORT-TERM INVESTMENTS
(cost $53,056,719) | | | | 53,165,409 | |
| | | | | | | | |
| |
TOTAL INVESTMENTS, BEFORE OPTIONS WRITTEN—102.5% | | | | | |
(cost $2,402,911,314) | | | | | | | 2,329,024,844 | |
| | | | | | | | |
| |
OPTIONS WRITTEN*~ — (0.0)% | | | | | |
(premiums received $367,448) | | | | (417,881 | ) |
| | | | | | | | |
| |
TOTAL INVESTMENTS, NET OF OPTIONS WRITTEN—102.5% | | | | | |
(cost $2,402,543,866) | | | | | | | 2,328,606,963 | |
| |
Liabilities in excess of other assets(z) — (2.5)% | | | | (57,318,403 | ) |
| | | | | | | | |
| | |
NET ASSETS — 100.0% | | | | | | $ | 2,271,288,560 | |
| | | | | | | | |
See the Glossary for a list of the abbreviation(s) used in the annual report.
| * | Non-income producing security. |
| # | Principal or notional amount is shown in U.S. dollars unless otherwise stated. |
| ~ | See tables subsequent to the Schedule of Investments for options detail. Excludes centrally cleared swaptions. Options with maturity dates greater than one year from date of acquisition would be considered long-term investments. |
| ^ | Indicates a Level 3 instrument. The aggregate value of Level 3 instruments is $11,293,340 and 0.5% of net assets. |
| (a) | All or a portion of security is on loan. The aggregate market value of such securities, including those sold and pending settlement, is $19,046,407; cash collateral of $19,547,165 (included in liabilities) was received with which the Portfolio purchased highly liquid short-term investments. In the event of significant appreciation in value of securities on loan on the last business day of the reporting period, the Portfolio may reflect a collateral value that is less than the market value of the loaned securities and such shortfall is remedied the following business day. |
SEE NOTES TO FINANCIAL STATEMENTS.
A199
| | | | |
| | PSF PGIM TOTAL RETURN BOND PORTFOLIO (CONTINUED) | | |
SCHEDULE OF INVESTMENTS | | | | as of December 31, 2024 |
| (b) | Represents security, or portion thereof, purchased with cash collateral received for securities on loan and includes dividend reinvestment. |
| (c) | Variable rate instrument. The interest rate shown reflects the rate in effect at December 31, 2024. |
| (cc) | Variable rate instrument. The rate shown is based on the latest available information as of December 31, 2024. Certain variable rate securities are not based on a published reference rate and spread but are determined by the issuer or agent and are based on current market conditions. These securities do not indicate a reference rate and spread in their description. |
| (d) | Represents issuer in default on interest payments and/or principal repayment. Non-income producing security. Such securities may be post-maturity. |
| (ff) | Variable rate security. Security may be issued at a fixed coupon rate, which converts to a variable rate at a specified date. Rate shown is the rate in effect as of period end. |
| (h) | Represents security, or a portion thereof, segregated as collateral for OTC derivatives. |
| (k) | Represents security, or a portion thereof, segregated as collateral for centrally cleared/exchange-traded derivatives. |
| (oo) | Perpetual security. Maturity date represents next call date. |
| (p) | Represents a security with a delayed settlement and therefore the interest rate is not available until settlement which is after the period end. |
| (r) | Principal or notional amount is less than $500 par. |
| (s) | Represents zero coupon bond or principal only security. Rate represents yield to maturity at purchase date. |
| (wb) | Represents an investment in a Fund affiliated with the Manager. |
| (x) | The following represents restricted securities that are acquired in unregistered, private sales from the issuing company or from an affiliate of the issuer and is considered restricted as to disposition under federal securities law. |
| (z) | Includes net unrealized appreciation/(depreciation) and/or market value of the below holdings which are excluded from the Schedule of Investments: |
(x) Restricted Securities:
| | | | | | | | | | | | | | | | | | | | |
Issuer Description | | Acquisition
Date | | Original
Cost | | Market
Value | | Percentage
of
Net Assets |
CSC Holdings LLC, | | | | | | | | | | | | | | | | | | | | |
Gtd. Notes, 144A, 3.375%, 02/15/31 | | | | 08/03/20 | | | | $ | 1,000,000 | | | | $ | 705,052 | | | | | 0.1% | |
CSC Holdings LLC, | | | | | | | | | | | | | | | | | | | | |
Gtd. Notes, 144A, 4.125%, 12/01/30 | | | | 06/07/24 | | | | | 127,500 | | | | | 144,020 | | | | | 0.0 | |
CSC Holdings LLC, | | | | | | | | | | | | | | | | | | | | |
Gtd. Notes, 144A, 5.375%, 02/01/28 | | | | 06/06/24 | | | | | 301,000 | | | | | 344,529 | | | | | 0.0 | |
CSC Holdings LLC, | | | | | | | | | | | | | | | | | | | | |
Gtd. Notes, 144A, 5.500%, 04/15/27 | | | | 10/19/20 | | | | | 686,969 | | | | | 581,222 | | | | | 0.0 | |
CSC Holdings LLC, | | | | | | | | | | | | | | | | | | | | |
Sr. Unsec’d. Notes, 144A, 4.625%, 12/01/30 | | | | 08/03/20 | | | | | 1,032,500 | | | | | 519,997 | | | | | 0.0 | |
Diamond Sports Group LLC/Diamond Sports Finance Co., | | | | | | | | | | | | | | | | | | | | |
Gtd. Notes, 144A, 6.625%, 08/15/27(d) | | | | 07/18/19-09/21/20 | | | | | 401,250 | | | | | 594 | | | | | 0.0 | |
Diamond Sports Group LLC/Diamond Sports Finance Co., | | | | | | | | | | | | | | | | | | | | |
Sec’d. Notes, 144A, 5.375%, 08/15/26(d) | | | | 07/18/19-08/30/22 | | | | | 1,322,435 | | | | | 7,078 | | | | | 0.0 | |
| | | | | | | | | | | | | | | | | | | | |
Total | | | | | | | | $ | 4,871,654 | | | | $ | 2,302,492 | | | | | 0.1% | |
| | | | | | | | | | | | | | | | | | | | |
Unfunded corporate bond commitment outstanding at December 31, 2024:
| | | | | | | | | | | | | | | | | | | | |
Issuer | | Principal
Amount
(000)# | | Current
Value | | Unrealized
Appreciation | | Unrealized
Depreciation |
New Generation Gas Gathering LLC, Sr. Sec’d. Notes, 144A, —%(p), Maturity Date 09/30/29 (cost $646,905)^ | | | | 657 | | | | $ | 646,905 | | | | $ | — | | | | $ | — | |
| | | | | | | | | | | | | | | | | | | | |
Unfunded loan commitment outstanding at December 31, 2024:
| | | | | | | | | | | | | | | | | | | | |
Borrower | | Principal
Amount
(000)# | | Current
Value | | Unrealized
Appreciation | | Unrealized
Depreciation |
Doncasters US Finance LLC, Delayed Draw Term Loan, 1.500%, Maturity Date 04/23/30 (cost $266,244) | | | | 269 | | | | $ | 266,310 | | | | $ | 66 | | | | $ | — | |
| | | | | | | | | | | | | | | | | | | | |
SEE NOTES TO FINANCIAL STATEMENTS.
A200
| | | | |
| | PSF PGIM TOTAL RETURN BOND PORTFOLIO (CONTINUED) | | |
SCHEDULE OF INVESTMENTS | | | | as of December 31, 2024 |
Options Purchased:
Exchange Traded
| | | | | | | | | | | | | | | | | | | | | | | | |
Description | | Call/
Put | | | Expiration
Date | | | Strike | | | Contracts | | | Notional
Amount
(000)# | | | Value | |
3 Month SOFR | | | Call | | | | 12/12/25 | | | | $98.00 | | | | 62 | | | | 155 | | | | $8,525 | |
| | | | | | | | | | | | | | | | | | | | | | | | |
(cost $7,848) | | | | | | | | | | | | | | | | | | | | | | | | |
OTC Traded
| | | | | | | | | | | | | | | | | | | | |
Description | | Call/
Put | | Counterparty | | Expiration
Date | | Strike | | | Contracts | | Notional
Amount
(000)# | | | Value | |
2-Year 10 CMS Curve CAP | | Call | | JPM | | 01/02/25 | | | 0.19% | | | — | | | 25,850 | | | $ | — | |
2-Year 10 CMS Curve CAP | | Call | | JPM | | 01/21/25 | | | 0.13% | | | — | | | 17,230 | | | | 2,043 | |
Currency Option USD vs CLP | | Call | | GSI | | 01/02/25 | | | 1,150.00 | | | — | | | 1,385 | | | | — | |
Currency Option USD vs CNH | | Call | | JPM | | 05/08/25 | | | 7.20 | | | — | | | 2,149 | | | | 51,028 | |
Currency Option USD vs COP | | Call | | JPM | | 01/09/25 | | | 5,100.00 | | | — | | | 1,399 | | | | 1 | |
Currency Option USD vs KRW | | Call | | JPM | | 01/02/25 | | | 1,650.00 | | | — | | | 1,086 | | | | — | |
Currency Option USD vs TRY | | Call | | BOA | | 01/02/25 | | | 60.00 | | | — | | | 700 | | | | — | |
Currency Option USD vs ZAR | | Call | | DB | | 01/02/25 | | | 21.00 | | | — | | | 1,086 | | | | — | |
Currency Option USD vs BRL | | Put | | MSI | | 01/02/25 | | | 5.20 | | | — | | | 831 | | | | — | |
Currency Option USD vs BRL | | Put | | JPM | | 01/08/25 | | | 5.20 | | | — | | | 1,401 | | | | — | |
Currency Option USD vs BRL | | Put | | JPM | | 01/16/25 | | | 5.40 | | | — | | | 1,387 | | | | 14 | |
Currency Option USD vs BRL | | Put | | MSI | | 01/21/25 | | | 5.00 | | | — | | | 1,378 | | | | 2 | |
Currency Option USD vs BRL | | Put | | MSI | | 01/21/25 | | | 5.00 | | | — | | | 689 | | | | 1 | |
Currency Option USD vs CNH | | Put | | MSI | | 01/02/25 | | | 6.70 | | | — | | | 1,086 | | | | — | |
Currency Option USD vs CNH | | Put | | JPM | | 05/08/25 | | | 6.10 | | | — | | | 2,149 | | | | 113 | |
Currency Option USD vs COP | | Put | | MSI | | 01/16/25 | | | 3,900.00 | | | — | | | 1,071 | | | | — | |
Currency Option USD vs MXN | | Put | | MSI | | 01/02/25 | | | 18.00 | | | — | | | 652 | | | | — | |
Currency Option USD vs MXN | | Put | | MSI | | 01/16/25 | | | 18.00 | | | — | | | 648 | | | | — | |
Currency Option USD vs MXN | | Put | | MSI | | 01/21/25 | | | 18.50 | | | — | | | 827 | | | | 1 | |
| | | | | | | | | | | | | | | | | | | | |
Total OTC Traded (cost $66,153) | | | | | | | | | | | | | | | | | | $ | 53,203 | |
| | | | | | | | | | | | | | | | | | | | |
OTC Swaptions
| | | | | | | | | | | | | | | | | | | | |
Description | | Call/
Put | | Counterparty | | Expiration
Date | | Strike | | Receive | | Pay | | Notional
Amount
(000)# | | | Value | |
2-Year Interest Rate Swap, 01/08/27 | | Call | | CITI | | 01/06/25 | | 2.83% | | 2.83%(A) | | 1 Day SOFR(A)/ 4.490% | | | 18,490 | | | $ | — | |
2-Year Interest Rate Swap, 02/07/27 | | Call | | CITI | | 02/05/25 | | 3.65% | | 3.65%(A) | | 1 Day SOFR(A)/ 4.490% | | | 18,490 | | | | 7,207 | |
2-Year Interest Rate Swap, 03/10/27 | | Call | | CITI | | 03/06/25 | | 3.55% | | 3.55%(A) | | 1 Day SOFR(A)/ 4.490% | | | 18,490 | | | | 12,992 | |
7-Year Interest Rate Swap, 02/18/32 | | Put | | JPM | | 02/13/25 | | 4.24% | | 1 Day SOFR(A)/ 4.490% | | 4.24%(A) | | | 7,215 | | | | 28,375 | |
10-Year Interest Rate Swap, 03/19/35 | | Put | | JPM | | 03/17/25 | | 4.19% | | 1 Day SOFR(A)/ 4.490% | | 4.19%(A) | | | 5,410 | | | | 56,840 | |
| | | | | | | | | | | | | | | | | | | | |
Total OTC Swaptions (cost $0) | | | | | | $ | 105,414 | |
| | | | | | | | | | | | | | | | | | | | |
Total Options Purchased (cost $74,001) | | | | | | $ | 167,142 | |
| | | | | | | | | | | | | | | | | | | | |
SEE NOTES TO FINANCIAL STATEMENTS.
A201
| | | | |
| | PSF PGIM TOTAL RETURN BOND PORTFOLIO (CONTINUED) | | |
SCHEDULE OF INVESTMENTS | | | | as of December 31, 2024 |
Options Written:
Exchange Traded
| | | | | | | | | | | | | | | | | | | | | | | | |
Description | | Call/
Put | | | Expiration
Date | | | Strike | | | Contracts | | | Notional
Amount
(000)# | | | Value | |
3 Month SOFR | | | Call | | | | 12/12/25 | | | $ | 96.50 | | | | 62 | | | | 155 | | | $ | (36,812) | |
3 Month SOFR | | | Put | | | | 12/12/25 | | | $ | 96.50 | | | | 62 | | | | 155 | | | | (103,850) | |
| | | | | | | | | | | | | | | | | | | | | | | | |
Total Exchange Traded (premiums received $137,129) | | | | | | | | | | | | | | | | | | | | | | $ | (140,662) | |
| | | | | | | | | | | | | | | | | | | | | | | | |
OTC Traded
| | | | | | | | | | | | | | | | | | | | | | | | | | | | |
Description | | Call/
Put | | | Counterparty | | | Expiration
Date | | | Strike | | | Contracts | | | Notional
Amount
(000)# | | | Value | |
2-Year 10 CMS Curve CAP | | | Call | | | | JPM | | | | 01/02/25 | | | | 0.49% | | | | — | | | | 25,850 | | | $ | — | |
2-Year 10 CMS Curve CAP | | | Call | | | | JPM | | | | 01/21/25 | | | | 0.43% | | | | — | | | | 17,230 | | | | (6 | ) |
Currency Option USD vs CLP | | | Call | | | | GSI | | | | 01/02/25 | | | | 990.00 | | | | — | | | | 1,385 | | | | (7,492 | ) |
Currency Option USD vs CNH | | | Call | | | | JPM | | | | 05/08/25 | | | | 7.45 | | | | — | | | | 2,149 | | | | (17,486 | ) |
Currency Option USD vs COP | | | Call | | | | JPM | | | | 01/09/25 | | | | 4,350.00 | | | | — | | | | 1,399 | | | | (21,533 | ) |
Currency Option USD vs TRY | | | Call | | | | BOA | | | | 01/02/25 | | | | 35.40 | | | | — | | | | 700 | | | | (1,689 | ) |
Currency Option USD vs ZAR | | | Call | | | | DB | | | | 01/02/25 | | | | 18.30 | | | | — | | | | 1,086 | | | | (34,078 | ) |
Currency Option USD vs BRL | | | Put | | | | MSI | | | | 01/02/25 | | | | 5.97 | | | | — | | | | 831 | | | | (2 | ) |
Currency Option USD vs BRL | | | Put | | | | JPM | | | | 01/08/25 | | | | 6.00 | | | | — | | | | 1,401 | | | | (1,092 | ) |
Currency Option USD vs BRL | | | Put | | | | JPM | | | | 01/16/25 | | | | 6.15 | | | | — | | | | 1,387 | | | | (12,626 | ) |
Currency Option USD vs BRL | | | Put | | | | MSI | | | | 01/21/25 | | | | 6.15 | | | | — | | | | 689 | | | | (7,648 | ) |
Currency Option USD vs BRL | | | Put | | | | MSI | | | | 01/21/25 | | | | 6.20 | | | | — | | | | 1,378 | | | | (20,587 | ) |
Currency Option USD vs CNH | | | Put | | | | MSI | | | | 01/02/25 | | | | 7.25 | | | | — | | | | 1,086 | | | | (12 | ) |
Currency Option USD vs CNH | | | Put | | | | JPM | | | | 05/08/25 | | | | 6.98 | | | | — | | | | 2,149 | | | | (6,491 | ) |
Currency Option USD vs COP | | | Put | | | | MSI | | | | 01/16/25 | | | | 4,300.00 | | | | — | | | | 1,071 | | | | (1,443 | ) |
Currency Option USD vs MXN | | | Put | | | | MSI | | | | 01/16/25 | | | | 20.18 | | | | — | | | | 648 | | | | (330 | ) |
Currency Option USD vs MXN | | | Put | | | | MSI | | | | 01/21/25 | | | | 20.40 | | | | — | | | | 827 | | | | (1,885 | ) |
| | | | | | | | | | | | | | | | | | | | | | | | | | | | |
Total OTC Traded (premiums received $188,133) | | | | | | | | | | | | | | | | | | | | | | | | | | $ | (134,400 | ) |
| | | | | | | | | | | | | | | | | | | | | | | | | | | | |
OTC Swaption
| | | | | | | | | | | | | | | | | | | | |
Description | | Call/
Put | | Counterparty | | Expiration
Date | | Strike | | Receive | | Pay | | Notional
Amount
(000)# | | | Value | |
2-Year Interest Rate Swap, 01/08/27 | | Call | | CITI | | 01/06/25 | | 2.52% | | 1 Day SOFR(A)/ 4.490% | | 2.52%(A) | | | 36,980 | | | $ | — | |
2-Year Interest Rate Swap, 02/07/27 | | Call | | CITI | | 02/05/25 | | 3.10% | | 1 Day SOFR(A)/ 4.490% | | 3.10%(A) | | | 36,980 | | | | (918 | ) |
2-Year Interest Rate Swap, 03/10/27 | | Call | | CITI | | 03/06/25 | | 3.29% | | 1 Day SOFR(A)/ 4.490% | | 3.29%(A) | | | 36,980 | | | | (11,160 | ) |
2-Year Interest Rate Swap, 02/07/27 | | Put | | CITI | | 02/05/25 | | 4.32% | | 4.32%(A) | | 1 Day SOFR(A)/ 4.490% | | | 18,490 | | | | (11,848 | ) |
2-Year Interest Rate Swap, 02/07/27 | | Put | | CITI | | 02/05/25 | | 4.35% | | 4.35%(A) | | 1 Day SOFR(A)/ 4.490% | | | 18,490 | | | | (9,700 | ) |
7-Year Interest Rate Swap, 02/18/32 | | Put | | JPM | | 02/13/25 | | 4.48% | | 4.48%(A) | | 1 Day SOFR(A)/ 4.490% | | | 14,430 | | | | (18,857 | ) |
10-Year Interest Rate Swap, 03/19/35 | | Put | | JPM | | 03/17/25 | | 4.39% | | 4.39%(A) | | 1 Day SOFR(A)/ 4.490% | | | 10,820 | | | | (60,115 | ) |
CDX.NA.IG.43.V1, 12/20/29 | | Put | | GSI | | 02/19/25 | | 0.60% | | 1.00%(Q) | | CDX.NA.IG.43.V1(Q) | | | 20,930 | | | | (12,453 | ) |
SEE NOTES TO FINANCIAL STATEMENTS.
A202
| | | | |
| | PSF PGIM TOTAL RETURN BOND PORTFOLIO (CONTINUED) | | |
SCHEDULE OF INVESTMENTS | | | | as of December 31, 2024 |
Options Written (continued):
OTC Swaption
| | | | | | | | | | | | | | | | | | | | | | | | |
Description | | Call/
Put | | Counterparty | | Expiration
Date | | Strike | | | Receive | | Pay | | | Notional
Amount
(000)# | | | Value | |
CDX.NA.IG.43.V1,
12/20/29 | | Put | | BNP | | 02/19/25 | | | 0.65% | | | 1.00%(Q) | | | CDX.NA.IG.43.V1(Q) | | | | 20,900 | | | $ | (8,884 | ) |
CDX.NA.IG.43.V1,
12/20/29 | | Put | | GSI | | 02/19/25 | | | 0.65% | | | 1.00%(Q) | | | CDX.NA.IG.43.V1(Q) | | | | 20,900 | | | | (8,884 | ) |
| | | | | | | | | | | | | | | | | | | | | | | | |
Total OTC Swaptions (premiums received $ 42,186) | | | | | | | | | | | | | $ | (142,819 | ) |
| | | | | | | | | | | | | | | | | | | | | | | | |
Total Options Written (premiums received $367,448) | | | | | | | | | | | | | | | | $ | (417,881 | ) |
| | | | | | | | | | | | | | | | | | | | | | | | |
Option Purchased:
Centrally Cleared Swaptions
| | | | | | | | | | | | | | | | | | | | | | |
Description | | Call/ Put | | Expiration Date | | Strike | | Receive | | Pay | | Notional
Amount
(000)# | | Value at
December 31,
2024 | | Unrealized
Appreciation
(Depreciation) |
CDX.NA.HY.43.V1, | | | | | | | | | | | | | | | | | | | | | | |
12/20/29 | | Put | | 01/15/25 | | $106.00 | | CDX.NA.HY.43.V1(Q) | | 5.00%(Q) | | 6,800 | | | $ | 6,270 | | | | $ | (56,970 | ) |
| | | | | | | | | | | | | | | | | | | | | | |
(cost $63,240) | | | | | | | | | | | | | | | | | | | | | | |
Options Written:
Centrally Cleared Swaptions
| | | | | | | | | | | | | | | | | | | | | | |
Description | | Call/ Put | | Expiration Date | | Strike | | Receive | | Pay | | Notional
Amount
(000)# | | Value at
December 31,
2024 | | Unrealized
Appreciation
(Depreciation) |
CDX.NA.IG.43.V1, | | | | | | | | | | | | | | |
12/20/29 | | Call | | 01/15/25 | | 0.50% | | CDX.NA.IG.43.V1(Q) | | 1.00%(Q) | | 34,000 | | | | $(17,728 | ) | | | | $17,547 | |
CDX.NA.IG.43.V1, | | | | | | | | | | | | | | |
12/20/29 | | Put | | 01/15/25 | | 0.75% | | 1.00%(Q) | | CDX.NA.IG.43. V1(Q) | | 34,000 | | | | (3,711) | | | | | 22,214 | |
| | | | | | | | | | | | | | | | | | | | | | |
Total Centrally Cleared Swaptions (premiums received $61,200) | | | | $(21,439 | ) | | | | $39,761 | |
| | | | | | | | | | | | | | | | | | | | | | |
Futures contracts outstanding at December 31, 2024:
| | | | | | | | | | | | | | | | | |
Number
of
Contracts | | Type | | Expiration
Date | | Current
Notional
Amount | | Value /
Unrealized
Appreciation
(Depreciation) |
| | | Long Positions: | | | | | | | | | | | | |
| | | 1,048 | | | 2 Year U.S. Treasury Notes | | Mar. 2025 | | | $ | 215,478,626 | | | | | $ (215,762 | ) |
| | | 1,398 | | | 5 Year U.S. Treasury Notes | | Mar. 2025 | | | | 148,613,957 | | | | | (1,288,461 | ) |
| | | 598 | | | 10 Year U.S. Treasury Notes | | Mar. 2025 | | | | 65,032,500 | | | | | (845,804 | ) |
| | | 771 | | | 10 Year U.S. Ultra Treasury Notes | | Mar. 2025 | | | | 85,821,938 | | | | | (1,417,609 | ) |
| | | 433 | | | 20 Year U.S. Treasury Bonds | | Mar. 2025 | | | | 49,294,344 | | | | | (1,574,543 | ) |
| | | | | | | | | | | | | | | | | | |
| | | | | | | | | | | | | | | | | (5,342,179 | ) |
| | | | | | | | | | | | | | | | | | |
| | | Short Positions: | | | | | | | | | | | | | |
| | | 58 | | | 5 Year Euro-Bobl | | Mar. 2025 | | | | 7,080,946 | | | | | 93,095 | |
| | | 75 | | | 10 Year Euro-Bund | | Mar. 2025 | | | | 10,366,787 | | | | | 274,567 | |
| | | 173 | | | 30 Year U.S. Ultra Treasury Bonds | | Mar. 2025 | | | | 20,570,781 | | | | | 1,054,471 | |
| | | 15 | | | Euro Schatz Index | | Mar. 2025 | | | | 1,662,306 | | | | | 7,136 | |
| | | | | | | | | | | | | | | | | | |
| | | | | | | | | | | | | | | | | 1,429,269 | |
| | | | | | | | | | | | | | | | | | |
| | | | | | | | | | | | | | | | | $(3,912,910 | ) |
| | | | | | | | | | | | | | | | | | |
SEE NOTES TO FINANCIAL STATEMENTS.
A203
| | | | |
| | PSF PGIM TOTAL RETURN BOND PORTFOLIO (CONTINUED) | | |
SCHEDULE OF INVESTMENTS | | | | as of December 31, 2024 |
Forward foreign currency exchange contracts outstanding at December 31, 2024:
| | | | | | | | | | | | | | | | | | | | | | | | | | | | |
Purchase
Contracts | | | | Counterparty | | | | Notional
Amount
(000) | | | Value at
Settlement
Date | | | Current
Value | | | Unrealized
Appreciation | | | Unrealized
Depreciation | |
OTC Forward Foreign Currency Exchange Contracts: | | | | | | | | | |
Brazilian Real, | | | | | | | | | | | | | | | | | |
Expiring 01/23/25 | | | | MSI | | | | BRL | | | 3,425 | | | $ | 545,300 | | | $ | 551,969 | | | $ | 6,669 | | | $ | — | |
Expiring 02/04/25 | | | | BOA | | | | BRL | | | 9,875 | | | | 1,619,937 | | | | 1,588,003 | | | | — | | | | (31,934 | ) |
Expiring 02/04/25 | | | | GSI | | | | BRL | | | 30,031 | | | | 5,146,548 | | | | 4,829,255 | | | | — | | | | (317,293 | ) |
Expiring 02/04/25 | | | | GSI | | | | BRL | | | 6,537 | | | | 1,113,000 | | | | 1,051,246 | | | | — | | | | (61,754 | ) |
Czech Koruna, | | | | | | | | | | | | | | | | | | | | |
Expiring 01/21/25 | | | | DB | | | | CZK | | | 37,170 | | | | 1,570,000 | | | | 1,528,356 | | | | — | | | | (41,644 | ) |
Expiring 01/21/25 | | | | MSI | | | | CZK | | | 27,894 | | | | 1,199,000 | | | | 1,146,944 | | | | — | | | | (52,056 | ) |
Euro, | | | | | | | | | | | | | | | | | | | | |
Expiring 01/21/25 | | | | BOA | | | | EUR | | | 1,321 | | | | 1,400,500 | | | | 1,369,289 | | | | — | | | | (31,211 | ) |
Expiring 01/21/25 | | | | CITI | | | | EUR | | | 1,324 | | | | 1,400,500 | | | | 1,372,529 | | | | — | | | | (27,971 | ) |
Expiring 01/21/25 | | | | CITI | | | | EUR | | | 515 | | | | 540,500 | | | | 533,912 | | | | — | | | | (6,588 | ) |
Expiring 01/21/25 | | | | CITI | | | | EUR | | | 511 | | | | 540,500 | | | | 530,022 | | | | — | | | | (10,478 | ) |
Expiring 01/21/25 | | | | SSB | | | | EUR | | | 11,058 | | | | 11,743,396 | | | | 11,463,928 | | | | — | | | | (279,468 | ) |
Hungarian Forint, | | | | | | | | | | | | | | | | | | | | |
Expiring 01/21/25 | | | | DB | | | | HUF | | | 618,702 | | | | 1,654,000 | | | | 1,556,022 | | | | — | | | | (97,978 | ) |
Indian Rupee, | | | | | | | | | | | | | | | | | | | | |
Expiring 03/19/25 | | | | BOA | | | | INR | | | 256,064 | | | | 3,008,000 | | | | 2,968,053 | | | | — | | | | (39,947 | ) |
Expiring 03/19/25 | | | | BOA | | | | INR | | | 165,565 | | | | 1,944,000 | | | | 1,919,073 | | | | — | | | | (24,927 | ) |
Expiring 03/19/25 | | | | HSBC | | | | INR | | | 195,999 | | | | 2,294,000 | | | | 2,271,845 | | | | — | | | | (22,155 | ) |
Expiring 03/19/25 | | | | UAG | | | | INR | | | 669,393 | | | | 7,834,943 | | | | 7,758,992 | | | | — | | | | (75,951 | ) |
Indonesian Rupiah, | | | | | | | | | | | | | | | | | | | | |
Expiring 03/19/25 | | | | JPM | | | | IDR | | | 122,288,000 | | | | 7,669,844 | | | | 7,505,703 | | | | — | | | | (164,141 | ) |
Mexican Peso, | | | | | | | | | | | | | | | | | | | | |
Expiring 03/19/25 | | | | JPM | | | | MXN | | | 17,854 | | | | 869,126 | | | | 845,144 | | | | — | | | | (23,982 | ) |
Expiring 03/19/25 | | | | UAG | | | | MXN | | | 35,742 | | | | 1,747,386 | | | | 1,691,917 | | | | — | | | | (55,469 | ) |
New Taiwanese Dollar, | | | | | | | | | | | | | | | | | | | | |
Expiring 03/19/25 | | | | BOA | | | | TWD | | | 79,367 | | | | 2,439,000 | | | | 2,419,442 | | | | — | | | | (19,558 | ) |
Expiring 03/19/25 | | | | CITI | | | | TWD | | | 76,833 | | | | 2,378,000 | | | | 2,342,186 | | | | — | | | | (35,814 | ) |
Expiring 03/19/25 | | | | CITI | | | | TWD | | | 61,286 | | | | 1,898,000 | | | | 1,868,258 | | | | — | | | | (29,742 | ) |
Philippine Peso, | | | | | | | | | | | | | | | | | | | | |
Expiring 03/19/25 | | | | GSI | | | | PHP | | | 208,633 | | | | 3,566,552 | | | | 3,568,965 | | | | 2,413 | | | | — | |
Expiring 03/19/25 | | | | JPM | | | | PHP | | | 72,726 | | | | 1,226,000 | | | | 1,244,090 | | | | 18,090 | | | | — | |
Expiring 03/19/25 | | | | JPM | | | | PHP | | | 72,507 | | | | 1,226,000 | | | | 1,240,336 | | | | 14,336 | | | | — | |
Polish Zloty, | | | | | | | | | | | | | | | | | | | | |
Expiring 01/21/25 | | | | BOA | | | | PLN | | | 2,833 | | | | 692,668 | | | | 685,485 | | | | — | | | | (7,183 | ) |
Expiring 01/21/25 | | | | UAG | | | | PLN | | | 7,187 | | | | 1,797,424 | | | | 1,738,783 | | | | — | | | | (58,641 | ) |
South African Rand, | | | | | | | | | | | | | | | | | | | | |
Expiring 03/19/25 | | | | BARC | | | | ZAR | | | 29,621 | | | | 1,648,184 | | | | 1,558,410 | | | | — | | | | (89,774 | ) |
South Korean Won, | | | | | | | | | | | | | | | | | | | | |
Expiring 01/02/25 | | | | MSI | | | | KRW | | | 2,007,565 | | | | 1,399,000 | | | | 1,362,466 | | | | — | | | | (36,534 | ) |
Thai Baht, | | | | | | | | | | | | | | | | | | | | |
Expiring 03/19/25 | | | | BOA | | | | THB | | | 52,158 | | | | 1,537,000 | | | | 1,537,767 | | | | 767 | | | | — | |
Expiring 03/19/25 | | | | CITI | | | | THB | | | 62,699 | | | | 1,821,000 | | | | 1,848,539 | | | | 27,539 | | | | — | |
Turkish Lira, | | | | | | | | | | | | | | | | | | | | |
Expiring 01/08/25 | | | | HSBC | | | | TRY | | | 81,297 | | | | 2,258,357 | | | | 2,281,157 | | | | 22,800 | | | | — | |
Expiring 01/15/25 | | | | HSBC | | | | TRY | | | 109,385 | | | | 3,034,214 | | | | 3,047,074 | | | | 12,860 | | | | — | |
Expiring 01/22/25 | | | | CITI | | | | TRY | | | 63,028 | | | | 1,737,137 | | | | 1,743,119 | | | | 5,982 | | | | — | |
| | | | | | | | | | | | | | | | | | | | | | | | | | | | |
| | | | | | | | | | | | | | $ | 82,499,016 | | | $ | 80,968,279 | | | | 111,456 | | | | (1,642,193 | ) |
| | | | | | | | | | | | | | | | | | | | | | | | | | | | |
| | | | | | | | |
Sale Contracts | | | | Counterparty | | | | Notional
Amount
(000) | | | Value at
Settlement
Date | | | Current
Value | | | Unrealized
Appreciation | | | Unrealized
Depreciation | |
OTC Forward Foreign Currency Exchange Contracts: | | | | | | | | | |
Brazilian Real, | | | | | | | | | | | | | | | | | |
Expiring 01/23/25 | | | | JPM | | | | BRL | | | 3,425 | | | $ | 545,300 | | | $ | 551,969 | | | $ | — | | | $ | (6,669 | ) |
SEE NOTES TO FINANCIAL STATEMENTS.
A204
| | | | |
| | PSF PGIM TOTAL RETURN BOND PORTFOLIO (CONTINUED) | | |
SCHEDULE OF INVESTMENTS | | | | as of December 31, 2024 |
Forward foreign currency exchange contracts outstanding at December 31, 2024 (continued):
| | | | | | | | | | | | | | | | | | | | | | | | | | | | | | | | |
Sale Contracts | | Counterparty | | | | | | Notional
Amount
(000) | | | Value at
Settlement
Date | | | Current
Value | | | Unrealized
Appreciation | | | Unrealized
Depreciation | |
OTC Forward Foreign Currency Exchange Contracts (cont’d.): | | | | | | | | | |
British Pound, | | | | | | | | | | | | | | | | | | | | | | | | | | | | | | | | |
Expiring 01/21/25 | | | HSBC | | | | | | | | GBP | | | | 1,309 | | | $ | 1,697,240 | | | $ | 1,637,943 | | | $ | 59,297 | | | $ | — | |
Expiring 01/21/25 | | | SCB | | | | | | | | GBP | | | | 11,500 | | | | 14,594,830 | | | | 14,394,274 | | | | 200,556 | | | | — | |
Expiring 01/21/25 | | | SCB | | | | | | | | GBP | | | | 545 | | | | 694,485 | | | | 681,658 | | | | 12,827 | | | | — | |
Chilean Peso, | | | | | | | | | | | | | | | | | | | | | | | | | | | | | | | | |
Expiring 03/19/25 | | | TD | | | | | | | | CLP | | | | 579,537 | | | | 597,215 | | | | 582,171 | | | | 15,044 | | | | — | |
Chinese Renminbi, | | | | | | | | | | | | | | | | | | | | | | | | | | | | | | | | |
Expiring 03/19/25 | | | BOA | | | | | | | | CNH | | | | 19,635 | | | | 2,716,000 | | | | 2,680,978 | | | | 35,022 | | | | — | |
Expiring 03/19/25 | | | GSI | | | | | | | | CNH | | | | 16,600 | | | | 2,287,210 | | | | 2,266,634 | | | | 20,576 | | | | — | |
Expiring 03/19/25 | | | SCB | | | | | | | | CNH | | | | 15,202 | | | | 2,101,000 | | | | 2,075,664 | | | | 25,336 | | | | — | |
Czech Koruna, | | | | | | | | | | | | | | | | | | | | | | | | | | | | | | | | |
Expiring 01/21/25 | | | BOA | | | | | | | | CZK | | | | 33,232 | | | | 1,391,876 | | | | 1,366,422 | | | | 25,454 | | | | — | |
Expiring 01/21/25 | | | UAG | | | | | | | | CZK | | | | 158,869 | | | | 6,830,211 | | | | 6,532,390 | | | | 297,821 | | | | — | |
Expiring 01/21/25 | | | UAG | | | | | | | | CZK | | | | 48,837 | | | | 2,022,000 | | | | 2,008,082 | | | | 13,918 | | | | — | |
Euro, | | | | | | | | | | | | | | | | | | | | | | | | | | | | | | | | |
Expiring 01/21/25 | | | BOA | | | | | | | | EUR | | | | 877 | | | | 923,972 | | | | 908,924 | | | | 15,048 | | | | — | |
Expiring 01/21/25 | | | CITI | | | | | | | | EUR | | | | 2,642 | | | | 2,801,000 | | | | 2,739,343 | | | | 61,657 | | | | — | |
Expiring 01/21/25 | | | CITI | | | | | | | | EUR | | | | 1,989 | | | | 2,149,000 | | | | 2,062,474 | | | | 86,526 | | | | — | |
Expiring 01/21/25 | | | CITI | | | | | | | | EUR | | | | 1,028 | | | | 1,081,000 | | | | 1,065,828 | | | | 15,172 | | | | — | |
Expiring 01/21/25 | | | CITI | | | | | | | | EUR | | | | 127 | | | | 133,618 | | | | 131,552 | | | | 2,066 | | | | — | |
Expiring 01/21/25 | | | GSI | | | | | | | | EUR | | | | 1,938 | | | | 2,120,284 | | | | 2,009,153 | | | | 111,131 | | | | — | |
Expiring 01/21/25 | | | HSBC | | | | | | | | EUR | | | | 102,000 | | | | 107,883,176 | | | | 105,744,873 | | | | 2,138,303 | | | | — | |
Expiring 01/21/25 | | | HSBC | | | | | | | | EUR | | | | 5,982 | | | | 6,347,245 | | | | 6,201,150 | | | | 146,095 | | | | — | |
Expiring 01/21/25 | | | HSBC | | | | | | | | EUR | | | | 918 | | | | 959,031 | | | | 951,834 | | | | 7,197 | | | | — | |
Expiring 01/21/25 | | | JPM | | | | | | | | EUR | | | | 259 | | | | 275,036 | | | | 268,213 | | | | 6,823 | | | | — | |
Expiring 01/21/25 | | | JPM | | | | | | | | EUR | | | | 25 | | | | 26,042 | | | | 25,680 | | | | 362 | | | | — | |
Expiring 01/21/25 | | | TD | | | | | | | | EUR | | | | 1,965 | | | | 2,071,815 | | | | 2,037,485 | | | | 34,330 | | | | — | |
Hungarian Forint, | | | | | | | | | | | | | | | | | | | | | | | | | | | | | | | | |
Expiring 01/21/25 | | | UAG | | | | | | | | HUF | | | | 462,802 | | | | 1,168,000 | | | | 1,163,939 | | | | 4,061 | | | | — | |
Expiring 01/21/25 | | | UAG | | | | | | | | HUF | | | | 333,597 | | | | 898,712 | | | | 838,990 | | | | 59,722 | | | | — | |
Indonesian Rupiah, | | | | | | | | | | | | | | | | | | | | | | | | | | | | | | | | |
Expiring 03/19/25 | | | CITI | | | | | | | | IDR | | | | 22,593,315 | | | | 1,409,000 | | | | 1,386,716 | | | | 22,284 | | | | — | |
New Taiwanese Dollar, | | | | | | | | | | | | | | | | | | | | | | | | | | | | | | | | |
Expiring 03/19/25 | | | BOA | | | | | | | | TWD | | | | 104,749 | | | | 3,229,022 | | | | 3,193,187 | | | | 35,835 | | | | — | |
Expiring 03/19/25 | | | CITI | | | | | | | | TWD | | | | 268,720 | | | | 8,330,322 | | | | 8,191,657 | | | | 138,665 | | | | — | |
Expiring 03/19/25 | | | SCB | | | | | | | | TWD | | | | 65,679 | | | | 2,025,000 | | | | 2,002,157 | | | | 22,843 | | | | — | |
Peruvian Nuevo Sol, | | | | | | | | | | | | | | | | | | | | | | | | | | | | | | | | |
Expiring 03/19/25 | | | SCB | | | | | | | | PEN | | | | 5,217 | | | | 1,399,000 | | | | 1,385,327 | | | | 13,673 | | | | — | |
Polish Zloty, | | | | | | | | | | | | | | | | | | | | | | | | | | | | | | | | |
Expiring 01/21/25 | | | BARC | | | | | | | | PLN | | | | 4,883 | | | | 1,199,000 | | | | 1,181,399 | | | | 17,601 | | | | — | |
Expiring 01/21/25 | | | BOA | | | | | | | | PLN | | | | 4,908 | | | | 1,207,000 | | | | 1,187,509 | | | | 19,491 | | | | — | |
Expiring 01/21/25 | | | GSI | | | | | | | | PLN | | | | 6,246 | | | | 1,538,000 | | | | 1,511,222 | | | | 26,778 | | | | — | |
Singapore Dollar, | | | | | | | | | | | | | | | | | | | | | | | | | | | | | | | | |
Expiring 03/19/25 | | | JPM | | | | | | | | SGD | | | | 3,326 | | | | 2,469,000 | | | | 2,443,304 | | | | 25,696 | | | | — | |
Expiring 03/19/25 | | | SCB | | | | | | | | SGD | | | | 8,329 | | | | 6,248,412 | | | | 6,118,122 | | | | 130,290 | | | | — | |
South African Rand, | | | | | | | | | | | | | | | | | | | | | | | | | | | | | | | | |
Expiring 01/02/25 | | | BARC | | | | | | | | ZAR | | | | 38,168 | | | | 2,033,130 | | | | 2,022,181 | | | | 10,949 | | | | — | |
South Korean Won, | | | | | | | | | | | | | | | | | | | | | | | | | | | | | | | | |
Expiring 03/19/25 | | | BOA | | | | | | | | KRW | | | | 3,092,724 | | | | 2,138,000 | | | | 2,099,558 | | | | 38,442 | | | | — | |
Expiring 03/19/25 | | | HSBC | | | | | | | | KRW | | | | 1,945,787 | | | | 1,382,000 | | | | 1,320,937 | | | | 61,063 | | | | — | |
Expiring 03/19/25 | | | JPM | | | | | | | | KRW | | | | 10,277,750 | | | | 7,216,153 | | | | 6,977,259 | | | | 238,894 | | | | — | |
Thai Baht, | | | | | | | | | | | | | | | | | | | | | | | | | | | | | | | | |
Expiring 03/19/25 | | | HSBC | | | | | | | | THB | | | | 228,038 | | | | 6,727,680 | | | | 6,723,204 | | | | 4,476 | | | | — | |
Expiring 03/19/25 | | | JPM | | | | | | | | THB | | | | 64,529 | | | | 1,886,000 | | | | 1,902,494 | | | | — | | | | (16,494 | ) |
Turkish Lira, | | | | | | | | | | | | | | | | | | | | | | | | | | | | | | | | |
Expiring 01/22/25 | | | CITI | | | | | | | | TRY | | | | 40,864 | | | | 1,134,000 | | | | 1,130,143 | | | | 3,857 | | | | — | |
SEE NOTES TO FINANCIAL STATEMENTS.
A205
| | | | |
| | PSF PGIM TOTAL RETURN BOND PORTFOLIO (CONTINUED) | | |
SCHEDULE OF INVESTMENTS | | | | as of December 31, 2024 |
Forward foreign currency exchange contracts outstanding at December 31, 2024 (continued):
| | | | | | | | | | | | | | | | | | | | | | | | | | | | | | | | | | | | | | | | |
Sale Contracts | | Counterparty | | | | Notional
Amount
(000) | | Value at
Settlement
Date | | Current
Value | | Unrealized
Appreciation | | Unrealized
Depreciation |
OTC Forward Foreign Currency Exchange Contracts (cont’d.): | | | | | | | | | | | |
Turkish Lira (cont’d.), | | | | | | | | | | | | | | | | | | | | | | | | | | | | | | | | | | | | | | | | |
Expiring 01/22/25 | | | | CITI | | | | | | | | | | TRY | | | | | 25,242 | | | | $ | 700,000 | | | | $ | 698,103 | | | | $ | 1,897 | | | | $ | — | |
| | | | | | | | | | | | | | | | | | | | | | | | | | | | | | | | | | | | | | | | |
| | | | | | | | | | | | | | | | | | | | | | | $ | 216,586,017 | | | | $ | 212,402,102 | | | | | 4,207,078 | | | | | (23,163 | ) |
| | | | | | | | | | | | | | | | | | | | | | | | | | | | | | | | | | | | | | | | |
| | | | | | | | | | | | | | | | | | | | | | | | | | | | | | | | | $ | 4,318,534 | | | | $ | (1,665,356 | ) |
| | | | | | | | | | | | | | | | | | | | | | | | | | | | | | | | | | | | | | | | |
Credit default swap agreements outstanding at December 31, 2024:
| | | | | | | | | | | | | | | | | | | | | | | | | | | | | | | | | | | | | | | | |
Reference Entity/
Obligation | | Termination
Date | | Fixed
Rate | | Notional
Amount
(000)#(3) | | Implied
Credit
Spread at
December 31,
2024(4) | | Fair
Value | | Upfront
Premiums
Paid
(Received) | | Unrealized
Appreciation
(Depreciation) | | Counterparty |
OTC Credit Default Swap Agreement on asset-backed and/or mortgage-backed securities - Sell Protection(2)^: | | | | | | |
GS_24-PCA | | | | 08/02/27 | | | | | 1.650 | %(M) | | | | 3,711 | | | | | * | | | | | $5,215 | | | | | $(259) | | | | | $5,474 | | | | | GSI | |
| | | | | | | | | | | | | | | | | | | | | | | | | | | | | | | | | | | | | | | | |
| | | | | | | | | | | | | | | | | | | | | | | | | | | | | | | | |
Reference Entity/
Obligation | | Termination
Date | | | Fixed
Rate | | | Notional
Amount
(000)#(3) | | | Fair
Value | | | Upfront
Premiums
Paid
(Received) | | | Unrealized
Appreciation
(Depreciation) | | | Counterparty | |
OTC Credit Default Swap Agreements on corporate and/or sovereign issues - Buy Protection(1): | | | | | |
Republic of Italy | | | 12/20/27 | | | | 1.000%(Q) | | | | EUR | | | | 1,755 | | | $ | (48,565 | ) | | $ | (39,032 | ) | | $ | (9,533 | ) | | | BARC | |
U.S. Treasury Notes | | | 06/20/25 | | | | 0.250%(Q) | | | | EUR | | | | 3,145 | | | | (2,411 | ) | | | (802 | ) | | | (1,609 | ) | | | BARC | |
U.S. Treasury Notes | | | 06/20/25 | | | | 0.250%(Q) | | | | EUR | | | | 1,050 | | | | (804 | ) | | | (266 | ) | | | (538 | ) | | | BARC | |
| | | | | | | | | | | | | | | | | | | | | | | | | | | | | | | | |
| | | | | | | | | | | | | | | | | | $ | (51,780 | ) | | $ | (40,100 | ) | | $ | (11,680 | ) | | | | |
| | | | | | | | | | | | | | | | | | | | | | | | | | | | | | | | |
| | | | | | | | | | | | | | | | | | | | | | | | | | | | | | | | | | | | |
Reference Entity/
Obligation | | Termination
Date | | | Fixed
Rate | | | Notional
Amount
(000)#(3) | | | Implied
Credit
Spread at
December 31,
2024(4) | | | Fair
Value | | | Upfront
Premiums
Paid
(Received) | | | Unrealized
Appreciation
(Depreciation) | | | Counterparty | |
OTC Credit Default Swap Agreements on corporate and/or sovereign issues - Sell Protection(2): | | | | | | | | | |
Bank of America Corp. | | | 12/20/25 | | | | 1.000%(Q) | | | | | | | | 2,120 | | | | 0.299 | % | | $ | 14,912 | | | $ | 14,745 | | | $ | 167 | | | | GSI | |
Citigroup, Inc. | | | 12/20/25 | | | | 1.000%(Q) | | | | | | | | 2,120 | | | | 0.258 | % | | | 15,746 | | | | 14,948 | | | | 798 | | | | GSI | |
Kingdom of Norway | | | 12/20/25 | | | | —%(Q) | | | | | | | | 5,780 | | | | 0.036 | % | | | (2,011 | ) | | | (2,766 | ) | | | 755 | | | | BARC | |
Morgan Stanley | | | 12/20/25 | | | | 1.000%(Q) | | | | | | | | 2,120 | | | | 0.261 | % | | | 15,682 | | | | 14,745 | | | | 937 | | | | GSI | |
U.S. Treasury Notes | | | 03/20/25 | | | | 0.250%(Q) | | | | EUR | | | | 2,130 | | | | 0.091 | % | | | 948 | | | | 604 | | | | 344 | | | | BARC | |
UBS Group AG | | | 03/20/25 | | | | 1.000%(Q) | | | | EUR | | | | 3,900 | | | | 0.183 | % | | | 8,540 | | | | 7,620 | | | | 920 | | | | GSI | |
United Mexican States | | | 06/20/25 | | | | 1.000%(Q) | | | | | | | | 330 | | | | 2.259 | % | | | (1,820 | ) | | | (838 | ) | | | (982 | ) | | | MSI | |
United Mexican States | | | 12/20/25 | | | | 1.000%(Q) | | | | | | | | 1,160 | | | | 2.738 | % | | | (18,622 | ) | | | (17,996 | ) | | | (626 | ) | | | MSI | |
United Mexican States | | | 12/24/25 | | | | 3.750%(M) | | | | | | | | 3,720 | | | | 2.747 | % | | | 38,662 | | | | — | | | | 38,662 | | | | GSI | |
| | | | | | | | | | | | | | | | | | | | | | | | | | | | | | | | | | | | |
| | | | | | | | | | | | | | | | | | | | | | $ | 72,037 | | | $ | 31,062 | | | $ | 40,975 | | | | | |
| | | | | | | | | | | | | | | | | | | | | | | | | | | | | | | | | | | | |
| | | | | | | | | | | | | | | | | | | | | | | | |
Reference Entity/
Obligation | | Termination
Date | | | Fixed
Rate | | | Notional
Amount
(000)#(3) | | | Value at
Trade
Date | | | Value at
December 31,
2024 | | | Unrealized
Appreciation
(Depreciation) | |
Centrally Cleared Credit Default Swap Agreement on credit indices - Buy Protection(1): | | | | | | | | | | | | | |
CDX.NA.HY.43.V1 | | | 12/20/29 | | | | 5.000 | %(Q) | | | 6,090 | | | $ | (498,038 | ) | | $ | (478,827 | ) | | $ | 19,211 | |
| | | | | | | | | | | | | | | | | | | | | | | | |
SEE NOTES TO FINANCIAL STATEMENTS.
A206
| | | | |
| | PSF PGIM TOTAL RETURN BOND PORTFOLIO (CONTINUED) | | |
SCHEDULE OF INVESTMENTS | | | | as of December 31, 2024 |
Credit default swap agreements outstanding at December 31, 2024 (continued):
| | | | | | | | | | | | | | | | | | | | | | | | | | | | | | | | | | | |
Reference Entity/
Obligation | | Termination
Date | | Fixed
Rate | | Notional
Amount
(000)#(3) | | Implied Credit
Spread at
December 31,
2024(4) | | Value at
Trade Date | | Value at
December 31,
2024 | | Unrealized
Appreciation
(Depreciation) |
Centrally Cleared Credit Default Swap Agreement on credit indices - Sell Protection(2): | |
CDX.NA.IG.43.V1 | | | | 12/20/29 | | | | | 1.000 | %(Q) | | | | 126,910 | | | | | 0.499 | % | | | $ | 2,980,239 | | | | $ | 2,875,026 | | | | $ | (105,213 | ) |
| | | | | | | | | | | | | | | | | | | | | | | | | | | | | | | | | | | |
The Portfolio entered into credit default swaps (“CDS”) to provide a measure of protection against defaults or to take an active long or short position with respect to the likelihood of a particular issuer’s default or the reference entity’s credit soundness. CDS contracts generally trade based on a spread which represents the cost a protection buyer has to pay the protection seller. The protection buyer is said to be short the credit as the value of the contract rises the more the credit deteriorates. The value of the CDS contract increases for the protection buyer if the spread increases.
| (1) | If the Portfolio is a buyer of protection, it pays the fixed rate. When a credit event occurs, as defined under the terms of that particular swap agreement, the Portfolio will either (i) receive from the seller of protection an amount equal to the notional amount of the swap and make delivery of the referenced obligation or underlying securities comprising the referenced index or (ii) receive a net settlement amount in the form of cash or securities equal to the notional amount of the swap less the recovery value of the referenced obligation or underlying securities comprising the referenced index. |
| (2) | If the Portfolio is a seller of protection, it receives the fixed rate. When a credit event occurs, as defined under the terms of that particular swap agreement, the Portfolio will either (i) pay to the buyer of protection an amount equal to the notional amount of the swap and take delivery of the referenced obligation or underlying securities comprising the referenced index or (ii) pay a net settlement amount in the form of cash or securities equal to the notional amount of the swap less the recovery value of the referenced obligation or underlying securities comprising the referenced index. |
| (3) | Notional amount represents the maximum potential amount the Portfolio could be required to pay as a seller of credit protection or receive as a buyer of credit protection if a credit event occurs as defined under the terms of that particular swap agreement. |
| (4) | Implied credit spreads, represented in absolute terms, utilized in determining the fair value of credit default swap agreements where the Portfolio is the seller of protection as of the reporting date serve as an indicator of the current status of the payment/ performance risk and represent the likelihood of risk of default for the credit derivative. The implied credit spread of a particular referenced entity reflects the cost of buying/selling protection and may include up-front payments required to be made to enter into the agreement. Wider credit spreads represent a deterioration of the referenced entity’s credit soundness and a greater likelihood of risk of default or other credit event occurring as defined under the terms of the agreement. |
| * | When an implied credit spread is not available, reference the fair value of credit default swap agreements on credit indices and asset-backed securities. Where the Portfolio is the seller of protection, it serves as an indicator of the current status of the payment/performance risk and represents the likelihood of an expected liability (or profit) for the credit derivative should the notional amount of the swap agreement be closed/sold as of the reporting date. Increasing fair value in absolute terms, when compared to the notional amount of the swap, represents a deterioration of the referenced entity’s credit soundness and a greater likelihood of risk of default or other credit event occurring as defined under the terms of the agreement. |
Interest rate swap agreements outstanding at December 31, 2024:
| | | | | | | | | | | | | | | | | | | | | | | | | | |
Notional Amount (000)# | | | Termination
Date | | | Fixed Rate | | | Floating
Rate | | Value at
Trade Date | | | Value at
December 31,
2024 | | | Unrealized
Appreciation
(Depreciation) | |
Centrally Cleared Interest Rate Swap Agreements: | | | | | | | | | | | | |
GBP | | | 3,946 | | | | 05/08/26 | | | | 1.000%(A) | | | 1 Day SONIA(1)(A)/ 4.700% | | $ | (184,608 | ) | | $ | 345,112 | | | $ | 529,720 | |
GBP | | | 2,920 | | | | 05/08/27 | | | | 1.050%(A) | | | 1 Day SONIA(1)(A)/ 4.700% | | | 150,731 | | | | 342,061 | | | | 191,330 | |
GBP | | | 2,100 | | | | 05/08/30 | | | | 1.100%(A) | | | 1 Day SONIA(1)(A)/ 4.700% | | | (145,549 | ) | | | 432,601 | | | | 578,150 | |
GBP | | | 230 | | | | 05/08/34 | | | | 1.200%(A) | | | 1 Day SONIA(1)(A)/ 4.700% | | | (9,088 | ) | | | 70,207 | | | | 79,295 | |
| | | 13,780 | | | | 03/08/25 | | | | 4.946%(A) | | | 1 Day SOFR(2)(A)/ 4.490% | | | — | | | | (18,666 | ) | | | (18,666 | ) |
| | | 17,596 | | | | 03/09/25 | | | | 5.110%(A) | | | 1 Day SOFR(2)(A)/ 4.490% | | | — | | | | 5,649 | | | | 5,649 | |
| | | 35,145 | | | | 03/10/25 | | | | 5.088%(A) | | | 1 Day SOFR(2)(A)/ 4.490% | | | — | | | | 4,342 | | | | 4,342 | |
| | | 140,270 | | | | 05/17/25 | | | | 5.113%(T) | | | 1 Day SOFR(2)(T)/ 4.490% | | | — | | | | 363,378 | | | | 363,378 | |
| | | 42,315 | | | | 08/31/25 | | | | 4.805%(A) | | | 1 Day SOFR(1)(A)/ 4.490% | | | — | | | | (138,771 | ) | | | (138,771 | ) |
| | | 51,000 | | | | 05/11/26 | | | | 4.750%(A) | | | 1 Day SOFR(2)(A)/ 4.490% | | | 339,602 | | | | 278,121 | | | | (61,481 | ) |
| | | 71,865 | | | | 05/17/26 | | | | 4.669%(A) | | | 1 Day SOFR(1)(A)/ 4.490% | | | — | | | | (293,057 | ) | | | (293,057 | ) |
| | | 9,580 | | | | 09/25/26 | | | | 4.699%(A) | | | 1 Day SOFR(1)(A)/ 4.490% | | | 1,772 | | | | (93,513 | ) | | | (95,285 | ) |
| | | 22,980 | | | | 12/20/44 | | | | 3.995%(A) | | | 1 Day SOFR(2)(A)/ 4.490% | | | — | | | | (333,992 | ) | | | (333,992 | ) |
SEE NOTES TO FINANCIAL STATEMENTS.
A207
| | | | |
| | PSF PGIM TOTAL RETURN BOND PORTFOLIO (CONTINUED) | | |
SCHEDULE OF INVESTMENTS | | | | as of December 31, 2024 |
| | | | | | | | | | | | | | | | | | | | | | |
Notional Amount (000)# | | Termination
Date | | | Fixed
Rate | | | Floating
Rate | | Value at
Trade Date | | | Value at
December 31,
2024 | | | Unrealized
Appreciation
(Depreciation) | |
Centrally Cleared Interest Rate Swap Agreements (cont’d.): | | | | | | | | | | | | |
6,285 | | | 12/16/49 | | | | 3.805%(A) | | | 1 Day SOFR(2)(A)/ 4.490% | | $ | (45,342 | ) | | $ | (217,824 | ) | | $ | (172,482 | ) |
2,800 | | | 05/11/54 | | | | 1.350%(A) | | | 1 Day SOFR(1)(A)/ 4.490% | | | 1,278,108 | | | | 1,313,343 | | | | 35,235 | |
5,565 | | | 12/16/54 | | | | 3.719%(A) | | | 1 Day SOFR(1)(A)/ 4.490% | | | 43,136 | | | | 207,553 | | | | 164,417 | |
17,515 | | | 12/20/54 | | | | 3.825%(A) | | | 1 Day SOFR(1)(A)/ 4.490% | | | — | | | | 328,550 | | | | 328,550 | |
| | | | | | | | | | | | | | | | | | | | | | |
| | | | | | | | | | | | $ | 1,428,762 | | | $ | 2,595,094 | | | $ | 1,166,332 | |
| | | | | | | | | | | | | | | | | | | | | | |
| (1) | The Portfolio pays the fixed rate and receives the floating rate. |
| (2) | The Portfolio pays the floating rate and receives the fixed rate. |
Total return swap agreements outstanding at December 31, 2024:
| | | | | | | | | | | | | | | | | | | | | | | | | | | | | | | | |
Reference Entity | | Financing
Rate | | Counterparty | | Termination
Date | | Long (Short)
Notional
Amount
(000)#(1) | | Fair
Value | | Upfront
Premiums
Paid
(Received) | | Unrealized
Appreciation
(Depreciation)(2) |
OTC Total Return Swap Agreements: | | | | | | | | | | | | | | | | | | | | | |
Total Return Benchmark Bond Index(T) | | 1 Day USOIS -40bps(T)/ 3.930% | | | | GSI | | | | | 03/20/25 | | | | | (20,600) | | | | | $ 2,040,649 | | | | | $— | | | | | $ 2,040,649 | |
U.S. Treasury Bond(T) | | 1 Day USOIS +20bps(T)/ 4.530% | | | | JPM | | | | | 01/13/25 | | | | | 19,625 | | | | | (957,147 | ) | | | | — | | | | | (957,147 | ) |
U.S. Treasury Bond(T) | | 1 Day USOIS +20bps(T)/ 4.530% | | | | JPM | | | | | 01/24/25 | | | | | 14,300 | | | | | (912,187 | ) | | | | — | | | | | (912,187 | ) |
U.S. Treasury Bond(T) | | 1 Day USOIS +22bps(T)/ 4.550% | | | | GSI | | | | | 01/24/25 | | | | | 15,820 | | | | | (789,631 | ) | | | | — | | | | | (789,631 | ) |
U.S. Treasury Bond(T) | | 1 Day USOIS +20bps(T)/ 4.530% | | | | JPM | | | | | 01/30/25 | | | | | 12,265 | | | | | (577,723 | ) | | | | — | | | | | (577,723 | ) |
U.S. Treasury Bond(T) | | 1 Day USOIS +23bps(T)/ 4.560% | | | | GSI | | | | | 02/03/25 | | | | | 17,905 | | | | | (1,119,042 | ) | | | | — | | | | | (1,119,042 | ) |
U.S. Treasury Bond(T) | | 1 Day USOIS +28bps(T)/ 4.610% | | | | JPM | | | | | 05/06/25 | | | | | 15,220 | | | | | (780,962 | ) | | | | — | | | | | (780,962 | ) |
| | | | | | | | | | | | | | | | | | | | | | | | | | | | | | | | |
| | | | | | | | | | | | | | | | | | | | | $(3,096,043 | ) | | | | $— | | | | | $(3,096,043 | ) |
| | | | | | | | | | | | | | | | | | | | | | | | | | | | | | | | |
| (1) | On a long total return swap, the Portfolio receives payments for any positive return on the reference entity (makes payments for any negative return) and pays the financing rate. On a short total return swap, the Portfolio makes payments for any positive return on the reference entity (receives payments for any negative return) and receives the financing rate. |
| (2) | Upfront/recurring fees or commissions, as applicable, are included in the net unrealized appreciation (depreciation). |
Balances Reported in the Statement of Assets and Liabilities for OTC Swap Agreements:
| | | | | | | | | | | | | | | | | | | | |
| | | | | Premiums Paid | | | | | Premiums Received | | | |
| Unrealized
Appreciation |
| | |
| Unrealized
Depreciation |
|
| | | | |
OTC Swap Agreements | | | | $52,662 | | | | | $(61,959) | | | | | $2,088,706 | | | | | $(5,149,980) | |
Summary of Collateral for Centrally Cleared/Exchange-traded Derivatives:
Cash and securities segregated as collateral, including pending settlement for closed positions, to cover requirements for centrally cleared/exchange-traded derivatives are listed by broker as follows:
| | | | | | | | | | |
Broker | | Cash and/or Foreign Currency | | Securities Market Value |
CGM | | | | $— | | | | | $11,767,326 | |
| | | | | | | | | | |
SEE NOTES TO FINANCIAL STATEMENTS.
A208
| | | | |
| | PSF PGIM TOTAL RETURN BOND PORTFOLIO (CONTINUED) | | |
SCHEDULE OF INVESTMENTS | | | | as of December 31, 2024 |
Fair Value Measurements:
Various inputs are used in determining the value of the Portfolio’s investments. These inputs are summarized in the three broad levels listed below.
Level 1—unadjusted quoted prices generally in active markets for identical securities.
Level 2—quoted prices for similar securities, interest rates and yield curves, prepayment speeds, foreign currency exchange rates and other observable inputs.
Level 3—unobservable inputs for securities valued in accordance with Board approved fair valuation procedures.
The following is a summary of the inputs used as of December 31, 2024 in valuing such portfolio securities:
| | | | | | | | | | | | |
| | | Level 1 | | | Level 2 | | | Level 3 | |
Investments in Securities | | | | | | | | | | | | |
Assets | | | | | | | | | | | | |
Long-Term Investments | | | | | | | | | | | | |
Asset-Backed Securities | | | | | | | | | | | | |
Automobiles | | $ | — | | | $ | 15,700,227 | | | $ | — | |
Collateralized Loan Obligations. | | | — | | | | 401,727,184 | | | | — | |
Consumer Loans | | | — | | | | 15,955,132 | | | | — | |
Credit Cards. | | | — | | | | 4,397,908 | | | | — | |
Home Equity Loans | | | — | | | | 13,278,050 | | | | — | |
Other | | | — | | | | 17,393,276 | | | | — | |
Residential Mortgage-Backed Securities | | | — | | | | 490,634 | | | | 965,458 | |
Student Loans | | | — | | | | 5,947,354 | | | | — | |
Commercial Mortgage-Backed Securities | | | — | | | | 249,298,357 | | | | — | |
Corporate Bonds | | | — | | | | 690,265,745 | | | | 1,338,895 | |
Floating Rate and Other Loans | | | — | | | | 19,322,690 | | | | 3,050,882 | |
Municipal Bonds | | | — | | | | 11,727,660 | | | | — | |
Residential Mortgage-Backed Securities | | | — | | | | 52,194,420 | | | | 4,616,961 | |
Sovereign Bonds | | | — | | | | 26,577,599 | | | | — | |
U.S. Government Agency Obligations | | | — | | | | 425,603,171 | | | | — | |
U.S. Treasury Obligations | | | — | | | | 310,835,017 | | | | — | |
Common Stocks | | | 1,215,804 | | | | 705,248 | | | | 837,528 | |
Preferred Stocks | | | 1,935,900 | | | | — | | | | 478,335 | |
Short-Term Investments | | | | | | | | | | | | |
Affiliated Mutual Funds | | | 52,998,267 | | | | — | | | | — | |
Options Purchased | | | 8,525 | | | | 158,617 | | | | — | |
| | | | | | | | | | | | |
Total | | $ | 56,158,496 | | | $ | 2,261,578,289 | | | $ | 11,288,059 | |
| | | | | | | | | | | | |
Liabilities | | | | | | | | | | | | |
Options Written | | $ | (140,662 | ) | | $ | (277,219 | ) | | $ | — | |
| | | | | | | | | | | | |
| | | |
Other Financial Instruments* | | | | | | | | | | | | |
Assets | | | | | | | | | | | | |
Unfunded Corporate Bond Commitment | | $ | — | | | $ | — | | | $ | — | ** |
Unfunded Loan Commitment. | | | — | | | | — | | | | 66 | |
Centrally Cleared Swaptions Written | | | — | | | | 39,761 | | | | — | |
Futures Contracts | | | 1,429,269 | | | | — | | | | — | |
OTC Forward Foreign Currency Exchange Contracts | | | — | | | | 4,318,534 | | | | — | |
Centrally Cleared Credit Default Swap Agreement | | | — | | | | 19,211 | | | | — | |
OTC Credit Default Swap Agreements | | | — | | | | 94,490 | | | | 5,215 | |
Centrally Cleared Interest Rate Swap Agreements | | | — | | | | 2,280,066 | | | | — | |
OTC Total Return Swap Agreement | | | — | | | | 2,040,649 | | | | — | |
| | | | | | | | | | | | |
Total | | $ | 1,429,269 | | | $ | 8,792,711 | | | $ | 5,281 | |
| | | | | | | | | | | | |
Liabilities | | | | | | | | | | | | |
Centrally Cleared Swaptions Purchased | | $ | — | | | $ | (56,970 | ) | | $ | — | |
Futures Contracts | | | (5,342,179 | ) | | | — | | | | — | |
OTC Forward Foreign Currency Exchange Contracts | | | — | | | | (1,665,356 | ) | | | — | |
Centrally Cleared Credit Default Swap Agreement | | | — | | | | (105,213 | ) | | | — | |
OTC Credit Default Swap Agreements | | | — | | | | (74,233 | ) | | | — | |
SEE NOTES TO FINANCIAL STATEMENTS.
A209
| | | | |
| | PSF PGIM TOTAL RETURN BOND PORTFOLIO (CONTINUED) | | |
SCHEDULE OF INVESTMENTS | | | | as of December 31, 2024 |
| | | | | | | | | | | | |
| | | Level 1 | | | Level 2 | | | Level 3 | |
Other Financial Instruments* (continued) | | | | | | | | | | | | |
Liabilities (continued) | | | | | | | | | | | | |
Centrally Cleared Interest Rate Swap Agreements | | $ | — | | | $ | (1,113,734 | ) | | $ | — | |
OTC Total Return Swap Agreements | | | — | | | | (5,136,692 | ) | | | — | |
| | | | | | | | | | | | |
Total | | $ | (5,342,179 | ) | | $ | (8,152,198 | ) | | $ | — | |
| | | | | | | | | | | | |
| * | Other financial instruments are derivative instruments, with the exception of unfunded corporate bond commitments, unfunded loan commitments and forward commitment contracts, and are not reflected in the Schedule of Investments. Centrally cleared swaptions, futures, forwards, centrally cleared swap contracts, unfunded corporate bond commitments and unfunded loan commitments are recorded at unrealized appreciation (depreciation) and OTC swap contracts are recorded at fair value. Forward commitment contracts are recorded at market value. |
| ** | Includes Level 3 investments with an aggregate value of $0. |
Industry Classification:
The industry classification of investments and liabilities in excess of other assets shown as a percentage of net assets as of December 31, 2024 were as follows:
| | | | |
U.S. Government Agency Obligations | | | 18.7 | % |
Collateralized Loan Obligations | | | 17.7 | |
U.S. Treasury Obligations | | | 13.7 | |
Commercial Mortgage-Backed Securities | | | 11.0 | |
Banks | | | 7.5 | |
Pipelines | | | 2.6 | |
Residential Mortgage-Backed Securities | | | 2.6 | |
Affiliated Mutual Funds (0.9% represents investments purchased with collateral from securities on loan) | | | 2.3 | |
Electric | | | 2.3 | |
Oil & Gas | | | 2.1 | |
Healthcare-Services | | | 1.5 | |
Telecommunications | | | 1.4 | |
Real Estate Investment Trusts (REITs) | | | 1.3 | |
Sovereign Bonds | | | 1.2 | |
Chemicals | | | 0.9 | |
Retail | | | 0.9 | |
Media | | | 0.9 | |
Auto Manufacturers | | | 0.8 | |
Other | | | 0.8 | |
Agriculture | | | 0.8 | |
Consumer Loans | | | 0.7 | |
Automobiles | | | 0.7 | |
Foods | | | 0.7 | |
Pharmaceuticals | | | 0.6 | |
Home Equity Loans | | | 0.6 | |
Insurance | | | 0.6 | |
Aerospace & Defense | | | 0.5 | |
Municipal Bonds | | | 0.5 | |
Diversified Financial Services | | | 0.5 | |
Commercial Services | | | 0.4 | |
Mining | | | 0.4 | |
Packaging & Containers | | | 0.4 | |
Auto Parts & Equipment | | | 0.4 | |
Entertainment | | | 0.3 | |
Engineering & Construction | | | 0.3 | |
Shipbuilding | | | 0.3 | |
Leisure Time | | | 0.3 | |
Semiconductors | | | 0.3 | |
Airlines | | | 0.3 | |
Student Loans | | | 0.2 | |
| | | | |
Biotechnology | | | 0.2 | % |
Credit Cards | | | 0.2 | |
Beverages | | | 0.2 | |
Transportation | | | 0.2 | |
Trucking & Leasing | | | 0.2 | |
Lodging | | | 0.2 | |
Building Materials | | | 0.1 | |
Office/Business Equipment | | | 0.1 | |
Metal Fabricate/Hardware | | | 0.1 | |
Machinery-Diversified | | | 0.1 | |
Computers | | | 0.1 | |
Healthcare-Products | | | 0.1 | |
Gas | | | 0.1 | |
Software | | | 0.1 | |
Multi-National | | | 0.1 | |
Home Builders | | | 0.1 | |
Distribution/Wholesale | | | 0.1 | |
Oil, Gas & Consumable Fuels | | | 0.1 | |
Iron/Steel | | | 0.1 | |
Apparel | | | 0.0 | * |
Housewares | | | 0.0 | * |
Electrical Components & Equipment | | | 0.0 | * |
Gas Utilities | | | 0.0 | * |
Capital Markets | | | 0.0 | * |
Oil & Gas Services | | | 0.0 | * |
Wireless Telecommunication Services | | | 0.0 | * |
Electronic Equipment, Instruments & Components | | | 0.0 | * |
Environmental Control | | | 0.0 | * |
Miscellaneous Manufacturing | | | 0.0 | * |
Internet | | | 0.0 | * |
Options Purchased | | | 0.0 | * |
Forest Products & Paper | | | 0.0 | * |
Machinery-Construction & Mining | | | 0.0 | * |
Electronics | | | 0.0 | * |
| | | | |
| | | 102.5 | |
Options Written | | | (0.0 | )* |
Liabilities in excess of other assets | | | (2.5 | ) |
| | | | |
| | | 100.0 | % |
| | | | |
* Less than 0.05%
SEE NOTES TO FINANCIAL STATEMENTS.
A210
| | | | |
| | PSF PGIM TOTAL RETURN BOND PORTFOLIO (CONTINUED) | | |
SCHEDULE OF INVESTMENTS | | | | as of December 31, 2024 |
Effects of Derivative Instruments on the Financial Statements and Primary Underlying Risk Exposure:
The Portfolio invested in derivative instruments during the reporting period. The primary types of risk associated with these derivative instruments are credit risk, foreign exchange risk and interest rate risk. See the Notes to Financial Statements for additional detail regarding these derivative instruments and their risks. The effect of such derivative instruments on the Portfolio’s financial position and financial performance as reflected in the Statement of Assets and Liabilities and Statement of Operations is presented in the summary below.
Fair values of derivative instruments as of December 31, 2024 as presented in the Statement of Assets and Liabilities:
| | | | | | | | | | | | | | | | | | |
| | | | | Asset Derivatives | | | Liability Derivatives | |
Derivatives not accounted for as
hedging instruments, carried at fair
value | | | | Statement of Assets and Liabilities Location | | | | Fair Value | | | Statement of Assets and Liabilities Location | | | | Fair
Value | |
Credit contracts | | | | Due from/to broker-variation margin swaps and swaptions | | | | $ | 58,972 | * | | Due from/to broker-variation margin swaps and swaptions | | | | $ | 162,183 | * |
Credit contracts | | | | Premiums paid for OTC swap agreements | | | | | 52,662 | | | Premiums received for OTC swap agreements | | | | | 61,959 | |
Credit contracts | | | | — | | | | | — | | | Options written outstanding, at value | | | | | 30,221 | |
Credit contracts | | | | Unrealized appreciation on OTC swap agreements | | | | | 48,057 | | | Unrealized depreciation on OTC swap agreements | | | | | 13,288 | |
Foreign exchange contracts | | | | Unaffiliated investments | | | | | 51,160 | | | Options written outstanding, at value | | | | | 134,394 | |
Foreign exchange contracts | | | | Unrealized appreciation on OTC forward foreign currency exchange contracts | | | | | 4,318,534 | | | Unrealized depreciation on OTC forward foreign currency exchange contracts | | | | | 1,665,356 | |
Interest rate contracts | | | | Due from/to broker-variation margin futures | | | | | 1,429,269 | * | | Due from/to broker-variation margin futures | | | | | 5,342,179 | * |
Interest rate contracts | | | | Due from/to broker-variation margin swaps | | | | | 2,280,066 | * | | Due from/to broker-variation margin swaps | | | | | 1,113,734 | * |
Interest rate contracts | | | | Unaffiliated investments | | | | | 115,982 | | | Options written outstanding, at value | | | | | 253,266 | |
Interest rate contracts | | | | Unrealized appreciation on OTC swap agreements | | | | | 2,040,649 | | | Unrealized depreciation on OTC swap agreements | | | | | 5,136,692 | |
| | | | | | | | | | | | | | | | | | |
| | | | | | | | $ | 10,395,351 | | | | | | | $ | 13,913,272 | |
| | | | | | | | | | | | | | | | | | |
| * | Includes cumulative appreciation (depreciation) as reported in the schedule of open futures, centrally cleared swap contracts, and centrally cleared swaptions. Only unsettled variation margin receivable (payable) is reported within the Statement of Assets and Liabilities. |
The effects of derivative instruments on the Statement of Operations for the year ended December 31, 2024 are as follows:
| | | | | | | | | | | | | | | | | | | | | | | | | |
| Amount of Realized Gain (Loss) on Derivatives Recognized in Income |
Derivatives not accounted for as hedging instruments, carried at fair value | | Options
Purchased(1) | | Options
Written | | Futures | | Forward
Currency
Exchange
Contracts | | Swaps |
Credit contracts | | | | $ — | | | | | $ 32,256 | | | | | $ — | | | | | $ — | | | | | $ 2,320,044 | |
Foreign exchange contracts | | | | (9,735 | ) | | | | 185,137 | | | | | — | | | | | 7,270,626 | | | | | — | |
Interest rate contracts | | | | 70,012 | | | | | (35,948 | ) | | | | (9,804,848 | ) | | | | — | | | | | (6,355,487 | ) |
| | | | | | | | | | | | | | | | | | | | | | | | | |
Total | | | | $60,277 | | | | | $181,445 | | | | | $(9,804,848 | ) | | | | $7,270,626 | | | | | $(4,035,443 | ) |
| | | | | | | | | | | | | | | | | | | | | | | | | |
| |
| (1) | Included in net realized gain (loss) on investment transactions in the Statement of Operations. |
| | | | | | | | | | | | | | | | | | | | | | | | | |
| Change in Unrealized Appreciation (Depreciation) on Derivatives Recognized in Income |
Derivatives not accounted for
as hedging instruments, carried at fair value | | Options
Purchased(2) | | Options
Written | | Futures | | Forward
Currency
Exchange
Contracts | | Swaps |
Credit contracts | | | | $(56,970) | | | | | $51,765 | | | | | $ — | | | | | $ — | | | | | $(263,011) | |
SEE NOTES TO FINANCIAL STATEMENTS.
A211
| | | | |
| | PSF PGIM TOTAL RETURN BOND PORTFOLIO (CONTINUED) | | |
SCHEDULE OF INVESTMENTS | | | | as of December 31, 2024 |
| | | | | | | | | | | | | | | | | | | | | | | | | | | | |
Change in Unrealized Appreciation (Depreciation) on Derivatives Recognized in Income | |
Derivatives not accounted for as hedging instruments, carried at fair value | | Options
Purchased(2) | | | Options
Written | | | Futures | | | Forward
Currency
Exchange
Contracts | | | Swaps | |
Foreign exchange contracts | | | | | | $ | 22,788 | | | | | | | $ | 43,744 | | | $ | — | | | $ | 3,781,518 | | | $ | — | |
Interest rate contracts | | | | | | | 70,353 | | | | | | | | (106,142 | ) | | | (11,465,746 | ) | | | — | | | | (262,010 | ) |
| | | | | | | | | | | | | | | | | | | | | | | | | | | | |
Total | | | | | | $ | 36,171 | | | | | | | $ | (10,633 | ) | | $ | (11,465,746 | ) | | $ | 3,781,518 | | | $ | (525,021 | ) |
| | | | | | | | | | | | | | | | | | | | | | | | | | | | |
| (2) | Included in net change in unrealized appreciation (depreciation) on investments in the Statement of Operations. |
For the year ended December 31, 2024, the Portfolio’s average volume of derivative activities is as follows:
| | |
| Derivative Contract Type | | Average Volume of Derivative Activities* |
Options Purchased (1) | | $ 27,448 |
Options Written (2) | | 87,455,200 |
Futures Contracts - Long Positions (2) | | 504,427,995 |
Futures Contracts - Short Positions (2) | | 34,684,590 |
Forward Foreign Currency Exchange Contracts - Purchased (3) | | 96,725,722 |
Forward Foreign Currency Exchange Contracts - Sold (3) | | 228,880,999 |
Interest Rate Swap Agreements (2) | | 369,710,620 |
Credit Default Swap Agreements - Buy Protection (2) | | 5,149,376 |
Credit Default Swap Agreements - Sell Protection (2) | | 79,555,815 |
Total Return Swap Agreements (2) | | 108,508,358 |
| * | Average volume is based on average quarter end balances for the year ended December 31, 2024. |
| (2) | Notional Amount in USD. |
| (3) | Value at Settlement Date. |
Financial Instruments/Transactions—Summary of Offsetting and Netting Arrangements:
The Portfolio invested in OTC derivatives and entered into financial instruments/transactions during the reporting period that are either offset in accordance with current requirements or are subject to enforceable master netting arrangements or similar agreements that permit offsetting. The information about offsetting and related netting arrangements for OTC derivatives and financial instruments/transactions where the legal right to set-off exists is presented in the summary below.
Offsetting of financial instrument/transaction assets and liabilities:
| | | | | | |
| Description | | Gross Market
Value of
Recognized
Assets/(Liabilities) | | Collateral
Pledged/(Received)(2) | | Net
Amount |
Securities on Loan | | $19,046,407 | | $(19,046,407) | | $— |
Offsetting of OTC derivative assets and liabilities:
| | | | | | | | | | | | | | | | | | | | | | | | | | | | | | | | | | | | | | | | | | | | | | | | | | | | | | | | | | | | |
Counterparty | | Gross Amounts of
Recognized
Assets(1) | | | Gross Amounts of
Recognized
Liabilities(1) | | | Net Amounts of
Recognized
Assets/(Liabilities) | | | Collateral
Pledged/(Received)(2) | | | Net Amount | |
BARC | | | | | | $ | 30,253 | | | | | | | | | | | $ | (144,320 | ) | | | | | | | | | | $ | (114,067 | ) | | | | | | | | | | $ | — | | | | | | | | | | | $ | (114,067 | ) | | | | |
BNP | | | | | | | — | | | | | | | | | | | | (8,884 | ) | | | | | | | | | | | (8,884 | ) | | | | | | | | | | | — | | | | | | | | | | | | (8,884 | ) | | | | |
BOA | | | | | | | 170,059 | | | | | | | | | | | | (156,449 | ) | | | | | | | | | | | 13,610 | | | | | | | | | | | | — | | | | | | | | | | | | 13,610 | | | | | |
CITI | | | | | | | 385,844 | | | | | | | | | | | | (144,219 | ) | | | | | | | | | | | 241,625 | | | | | | | | | | | | (241,625 | ) | | | | | | | | | | | — | | | | | |
DB | | | | | | | — | | | | | | | | | | | | (173,700 | ) | | | | | | | | | | | (173,700 | ) | | | | | | | | | | | — | | | | | | | | | | | | (173,700 | ) | | | | |
GSI | | | | | | | 2,300,563 | | | | | | | | | | | | (2,316,808 | ) | | | | | | | | | | | (16,245 | ) | | | | | | | | | | | 16,245 | | | | | | | | | | | | — | | | | | |
HSBC | | | | | | | 2,452,091 | | | | | | | | | | | | (22,155 | ) | | | | | | | | | | | 2,429,936 | | | | | | | | | | | | (1,990,022 | ) | | | | | | | | | | | 439,914 | | | | | |
JPM | | | | | | | 442,615 | | | | | | | | | | | | (3,577,511 | ) | | | | | | | | | | | (3,134,896 | ) | | | | | | | | | | | 3,134,896 | | | | | | | | | | | | — | | | | | |
MSI | | | | | | | 6,673 | | | | | | | | | | | | (140,939 | ) | | | | | | | | | | | (134,266 | ) | | | | | | | | | | | — | | | | | | | | | | | | (134,266 | ) | | | | |
SCB | | | | | | | 405,525 | | | | | | | | | | | | — | | | | | | | | | | | | 405,525 | | | | | | | | | | | | (320,000 | ) | | | | | | | | | | | 85,525 | | | | | |
SEE NOTES TO FINANCIAL STATEMENTS.
A212
| | | | |
| | PSF PGIM TOTAL RETURN BOND PORTFOLIO (CONTINUED) | | |
SCHEDULE OF INVESTMENTS | | | | as of December 31, 2024 |
| | | | | | | | | | | | | | | | | | | | | | | | | | | | | | | | | | | | | | | | | | | | | | | | | | | | | | | | |
Counterparty | | Gross Amounts of
Recognized
Assets(1) | | | Gross Amounts of
Recognized
Liabilities(1) | | | Net Amounts of
Recognized
Assets/(Liabilities) | | | Collateral
Pledged/(Received)(2) | | | Net
Amount | |
SSB | | | | | | $ | — | | | | | | | | | | | $ | (279,468 | ) | | | | | | | | | | $ | (279,468 | ) | | | | | | | | | | $ | 270,928 | | | | | | | | | | | $ | (8,540 | ) |
TD | | | | | | | 49,374 | | | | | | | | | | | | — | | | | | | | | | | | | 49,374 | | | | | | | | | | | | — | | | | | | | | | | | | 49,374 | |
UAG | | | | | | | 375,522 | | | | | | | | | | | | (190,061 | ) | | | | | | | | | | | 185,461 | | | | | | | | | | | | (185,461 | ) | | | | | | | | | | | — | |
| | | | | | | | | | | | | | | | | | | | | | | | | | | | | | | | | | | | | | | | | | | | | | | | | | | | | | | | |
| | | | | | $ | 6,618,519 | | | | | | | | | | | $ | (7,154,514 | ) | | | | | | | | | | $ | (535,995 | ) | | | | | | | | | | $ | 684,961 | | | | | | | | | | | $ | 148,966 | |
| | | | | | | | | | | | | | | | | | | | | | | | | | | | | | | | | | | | | | | | | | | | | | | | | | | | | | | | |
| (1) | Includes unrealized appreciation/(depreciation) on swaps and forwards, premiums paid/(received) on swap agreements and market value of purchased and written options, as represented on the Statement of Assets and Liabilities. |
| (2) | Collateral amount disclosed by the Portfolio is limited to the market value of financial instruments/transactions and the Portfolio’s OTC derivative exposure by counterparty. |
SEE NOTES TO FINANCIAL STATEMENTS.
A213
| | | | |
| | PSF PGIM TOTAL RETURN BOND PORTFOLIO (CONTINUED) | | |
| | | | |
STATEMENT OF ASSETS AND LIABILITIES
as of December 31, 2024
| | | | |
ASSETS | | | | |
Investments at value, including securities on loan of $19,046,407: | | | | |
Unaffiliated investments (cost $2,349,928,596) | | $ | 2,276,026,577 | |
Affiliated investments (cost $52,982,718) | | | 52,998,267 | |
Foreign currency, at value (cost $5,660,653) | | | 5,635,406 | |
Cash | | | 96,837 | |
Receivable for investments sold | | | 54,170,389 | |
Dividends and interest receivable | | | 19,921,194 | |
Unrealized appreciation on OTC forward foreign currency exchange contracts | | | 4,318,534 | |
Unrealized appreciation on OTC swap agreements | | | 2,088,706 | |
Receivable for Portfolio shares sold | | | 426,450 | |
Premiums paid for OTC swap agreements | | | 52,662 | |
Unrealized appreciation on unfunded loan commitment | | | 66 | |
Prepaid expenses | | | 17,464 | |
| | | | |
Total Assets | | | 2,415,752,552 | |
| | | | |
LIABILITIES | | | | |
Payable for investments purchased | | | 115,840,079 | |
Payable to broker for collateral for securities on loan | | | 19,547,165 | |
Unrealized depreciation on OTC swap agreements | | | 5,149,980 | |
Unrealized depreciation on OTC forward foreign currency exchange contracts | | | 1,665,356 | |
Management fee payable | | | 764,251 | |
Due to broker-variation margin futures | | | 504,195 | |
Accrued expenses and other liabilities | | | 461,670 | |
Options written outstanding, at value (premiums received $367,448) | | | 417,881 | |
Premiums received for OTC swap agreements | | | 61,959 | |
Payable for Portfolio shares purchased | | | 37,374 | |
Due to broker-variation margin swaps and swaptions | | | 7,756 | |
Distribution fee payable | | | 3,866 | |
Trustees’ fees payable | | | 1,270 | |
Affiliated transfer agent fee payable | | | 1,190 | |
| | | | |
Total Liabilities | | | 144,463,992 | |
| | | | |
NET ASSETS | | $ | 2,271,288,560 | |
| | | | |
Net assets were comprised of: | | | | |
Partners’ Equity | | $ | 2,271,288,560 | |
| | | | |
Class I: | | | | |
Net asset value and redemption price per share, $2,252,449,470 / 152,838,440 outstanding shares of beneficial interest | | $ | 14.74 | |
| | | | |
Class III: | | | | |
Net asset value and redemption price per share, $18,839,090 / 1,290,027 outstanding shares of beneficial interest | | $ | 14.60 | |
| | | | |
STATEMENT OF OPERATIONS
Year Ended December 31, 2024
| | | | |
NET INVESTMENT INCOME (LOSS) | | | | |
INCOME | | | | |
Interest income | | $ | 90,036,141 | |
Affiliated dividend income | | | 2,404,148 | |
Unaffiliated dividend income | | | 319,009 | |
Income from securities lending, net (including affiliated income of $121,157) | | | 122,601 | |
| | | | |
Total income | | | 92,881,899 | |
| | | | |
EXPENSES | | | | |
Management fee | | | 6,823,995 | |
Distribution fee—Class III | | | 39,768 | |
Custodian and accounting fees | | | 119,897 | |
Audit fee | | | 111,550 | |
Shareholders’ reports | | | 77,075 | |
Professional fees | | | 45,621 | |
Trustees’ fees | | | 35,050 | |
Transfer agent’s fees and expenses (including affiliated expense of $7,143) | | | 11,944 | |
Miscellaneous | | | 76,354 | |
| | | | |
Total expenses | | | 7,341,254 | |
| | | | |
NET INVESTMENT INCOME (LOSS) | | | 85,540,645 | |
| | | | |
REALIZED AND UNREALIZED GAIN (LOSS) ON INVESTMENT AND FOREIGN CURRENCY TRANSACTIONS | | | | |
Net realized gain (loss) on: | | | | |
Investment transactions (including affiliated of $(2,863)) | | | (24,366,740 | ) |
Futures transactions | | | (9,804,848 | ) |
Forward currency contract transactions | | | 7,270,626 | |
Options written transactions | | | 181,445 | |
Swap agreements transactions | | | (4,035,443 | ) |
Foreign currency transactions | | | (4,218,160 | ) |
| | | | |
| | | (34,973,120 | ) |
| | | | |
Net change in unrealized appreciation (depreciation) on: | | | | |
Investments (including affiliated of $(7,416)) | | | 2,290,990 | |
Futures | | | (11,465,746 | ) |
Forward currency contracts | | | 3,781,518 | |
Options written | | | (10,633 | ) |
Swap agreements | | | (525,021 | ) |
Foreign currencies | | | (331,399 | ) |
Unfunded loan commitments | | | 1,629 | |
| | | | |
| | | (6,258,662 | ) |
| | | | |
NET GAIN (LOSS) ON INVESTMENT AND FOREIGN CURRENCY TRANSACTIONS | | | (41,231,782 | ) |
| | | | |
NET INCREASE (DECREASE) IN NET ASSETS RESULTING FROM OPERATIONS | | $ | 44,308,863 | |
| | | | |
STATEMENTS OF CHANGES IN NET ASSETS
| | | | | | | | |
| | | Year Ended
December 31, 2024 | | | Year Ended
December 31, 2023 | |
INCREASE (DECREASE) IN NET ASSETS | | | | | | | | |
OPERATIONS | | | | | | | | |
Net investment income (loss) | | $ | 85,540,645 | | | $ | 60,275,117 | |
Net realized gain (loss) on investment and foreign currency transactions | | | (34,973,120 | ) | | | (38,205,842 | ) |
Net change in unrealized appreciation (depreciation) on investments and foreign currencies | | | (6,258,662 | ) | | | 65,028,210 | |
| | | | | | | | |
NET INCREASE (DECREASE) IN NET ASSETS RESULTING FROM OPERATIONS | | | 44,308,863 | | | | 87,097,485 | |
| | | | | | | | |
PORTFOLIO SHARE TRANSACTIONS | | | | | | | | |
Portfolio shares sold | | | 917,574,180 | | | | 317,587,803 | |
Portfolio shares purchased | | | (102,332,586 | ) | | | (86,800,418 | ) |
| | | | | | | | |
NET INCREASE (DECREASE) IN NET ASSETS FROM PORTFOLIO SHARE TRANSACTIONS | | | 815,241,594 | | | | 230,787,385 | |
| | | | | | | | |
TOTAL INCREASE (DECREASE) | | | 859,550,457 | | | | 317,884,870 | |
NET ASSETS: | | | | | | | | |
Beginning of year | | | 1,411,738,103 | | | | 1,093,853,233 | |
| | | | | | | | |
End of year | | $ | 2,271,288,560 | | | $ | 1,411,738,103 | |
| | | | | | | | |
SEE NOTES TO FINANCIAL STATEMENTS.
A214
| | | | |
| | PSF PGIM TOTAL RETURN BOND PORTFOLIO (CONTINUED) | | |
FINANCIAL HIGHLIGHTS | | | | |
| | | | | | | | | | | | | | | | | | | | | | | | | |
Class I | | | | | | | | | | |
| | | Year Ended December 31, |
| | | 2024 | | 2023 | | 2022 | | 2021 | | 2020 |
Per Share Operating Performance(a): | | | | | | | | | | | | | | | | | | | | | | | | | |
Net Asset Value, beginning of year | | | $ | 14.31 | | | | $ | 13.33 | | | | $ | 15.66 | | | | $ | 15.78 | | | | $ | 14.55 | |
| | | | | | | | | | | | | | | | | | | | | | | | | |
Income (Loss) From Investment Operations: | | | | | | | | | | | | | | | | | | | | | | | | | |
Net investment income (loss) | | | | 0.73 | | | | | 0.64 | | | | | 0.45 | | | | | 0.40 | | | | | 0.45 | |
Net realized and unrealized gain (loss) on investment and foreign currency transactions | | | | (0.30 | ) | | | | 0.34 | | | | | (2.78 | ) | | | | (0.52 | ) | | | | 0.78 | |
| | | | | | | | | | | | | | | | | | | | | | | | | |
Total from investment operations | | | | 0.43 | | | | | 0.98 | | | | | (2.33 | ) | | | | (0.12 | ) | | | | 1.23 | |
| | | | | | | | | | | | | | | | | | | | | | | | | |
Net Asset Value, end of year | | | $ | 14.74 | | | | $ | 14.31 | | | | $ | 13.33 | | | | $ | 15.66 | | | | $ | 15.78 | |
| | | | | | | | | | | | | | | | | | | | | | | | | |
Total Return(b) | | | | 3.00 | % | | | | 7.27 | % | | | | (14.81 | )% | | | | (0.76 | )% | | | | 8.45 | % |
Ratios/Supplemental Data: | | | | | | | | | | | | | | | | | | | | | | | | | |
Net assets, end of year (in millions) | | | $ | 2,252 | | | | $ | 1,398 | | | | $ | 1,085 | | | | $ | 1,298 | | | | $ | 1,293 | |
Average net assets (in millions) | | | $ | 1,690 | | | | $ | 1,279 | | | | $ | 1,155 | | | | $ | 1,292 | | | | $ | 1,235 | |
Ratios to average net assets(c): | | | | | | | | | | | | | | | | | | | | | | | | | |
Expenses after waivers and/or expense reimbursement | | | | 0.43 | % | | | | 0.43 | % | | | | 0.43 | % | | | | 0.42 | % | | | | 0.43 | % |
Expenses before waivers and/or expense reimbursement | | | | 0.43 | % | | | | 0.43 | % | | | | 0.43 | % | | | | 0.42 | % | | | | 0.43 | % |
Net investment income (loss) | | | | 5.02 | % | | | | 4.68 | % | | | | 3.25 | % | | | | 2.55 | % | | | | 2.99 | % |
Portfolio turnover rate(d)(e) | | | | 111 | % | | | | 224 | % | | | | 182 | % | | | | 49 | % | | | | 35 | % |
| | | | | | | | | | | | | | | | | | | | |
Class III | | | | | | | | |
| | | Year Ended December 31, | | April 26, 2021(f)
through December 31, |
| | | 2024 | | 2023 | | 2022 | | 2021 |
Per Share Operating Performance(a): | | | | | | | | | | | | | | | | | | | | |
Net Asset Value, beginning of period | | | $ | 14.22 | | | | $ | 13.28 | | | | $ | 15.64 | | | | $ | 15.35 | |
| | | | | | | | | | | | | | | | | | | | |
Income (Loss) From Investment Operations: | | | | | | | | | | | | | | | | | | | | |
Net investment income (loss) | | | | 0.69 | | | | | 0.60 | | | | | 0.43 | | | | | 0.24 | |
Net realized and unrealized gain (loss) on investment and foreign currency transactions | | | | (0.31 | ) | | | | 0.34 | | | | | (2.79 | ) | | | | 0.05 | (g) |
| | | | | | | | | | | | | | | | | | | | |
Total from investment operations | | | | 0.38 | | | | | 0.94 | | | | | (2.36 | ) | | | | 0.29 | |
| | | | | | | | | | | | | | | | | | | | |
Net Asset Value, end of period | | | $ | 14.60 | | | | $ | 14.22 | | | | $ | 13.28 | | | | $ | 15.64 | |
| | | | | | | | | | | | | | | | | | | | |
Total Return(b) | | | | 2.67 | % | | | | 7.08 | % | | | | (15.09 | )% | | | | 1.89 | % |
Ratios/Supplemental Data: | | | | | | | | | | | | | | | | | | | | |
Net assets, end of period (in millions) | | | $ | 19 | | | | $ | 13 | | | | $ | 9 | | | | $ | 5 | |
Average net assets (in millions) | | | $ | 16 | | | | $ | 11 | | | | $ | 8 | | | | $ | 2 | |
Ratios to average net assets(c): | | | | | | | | | | | | | | | | | | | | |
Expenses after waivers and/or expense reimbursement | | | | 0.68 | % | | | | 0.68 | % | | | | 0.68 | % | | | | 0.66 | %(h) |
Expenses before waivers and/or expense reimbursement | | | | 0.68 | % | | | | 0.68 | % | | | | 0.68 | % | | | | 0.66 | %(h) |
Net investment income (loss) | | | | 4.76 | % | | | | 4.43 | % | | | | 3.08 | % | | | | 2.24 | %(h) |
Portfolio turnover rate(d)(e) | | | | 111 | % | | | | 224 | % | | | | 182 | % | | | | 49 | % |
| (a) | Calculated based on average shares outstanding during the period. |
| (b) | Total return is calculated assuming a purchase of a share on the first day and a sale on the last day of each period reported and includes reinvestment of dividends and distributions, if any, and does not reflect the effect of insurance contract charges. Total return does not reflect expenses associated with the separate account such as administrative fees, account charges and surrender charges which, if reflected, would reduce the total returns for all periods shown. Performance figures may reflect fee waivers and/or expense reimbursements. In the absence of fee waivers and/or expense reimbursements, the total return would be lower. Past performance is no guarantee of future results. Total returns may reflect adjustments to conform to GAAP. Total returns for periods less than one full year are not annualized. |
| (c) | Does not include expenses of the underlying funds in which the Portfolio invests. |
| (d) | The Portfolio’s portfolio turnover rate is calculated in accordance with regulatory requirements, without regard to transactions involving short-term investments, certain derivatives and in-kind transactions (if any). If such transactions were included, the Portfolio’s portfolio turnover rate may be higher. |
| (e) | The Portfolio accounts for mortgage dollar roll transactions as purchases and sales which, as a result, can increase its portfolio turnover rate. |
| (f) | Commencement of offering. |
| (g) | The per share amount of realized and unrealized gain (loss) on investments does not directly correlate to the amounts reported in the Statement of Operations due to the timing of portfolio share transactions in relation to fluctuating market values. |
| (h) | Annualized, with the exception of certain non-recurring expenses. |
SEE NOTES TO FINANCIAL STATEMENTS.
A215
| | | | |
| | PSF SMALL-CAP STOCK INDEX PORTFOLIO | | |
SCHEDULE OF INVESTMENTS | | | | as of December 31, 2024 |
| | | | | | | | |
| | | Shares | | | Value | |
LONG-TERM INVESTMENTS — 99.7% | |
COMMON STOCKS — 99.0% | |
Aerospace & Defense — 1.2% | |
AAR Corp.* | | | 32,781 | | | $ | 2,008,820 | |
AeroVironment, Inc.*(a) | | | 26,003 | | | | 4,001,602 | |
Mercury Systems, Inc.* | | | 47,300 | | | | 1,986,600 | |
Moog, Inc. (Class A Stock) | | | 26,704 | | | | 5,256,415 | |
National Presto Industries, Inc. | | | 4,657 | | | | 458,342 | |
Triumph Group, Inc.* | | | 72,401 | | | | 1,351,002 | |
| | | | | | | | |
| |
| | | | 15,062,781 | |
| | | | | | | | |
Air Freight & Logistics — 0.2% | |
Forward Air Corp.*(a) | | | 18,051 | | | | 582,145 | |
Hub Group, Inc. (Class A Stock) | | | 56,430 | | | | 2,514,521 | |
| | | | | | | | |
| |
| | | | 3,096,666 | |
| | | | | | | | |
Automobile Components — 1.4% | |
Adient PLC* | | | 81,650 | | | | 1,406,830 | |
American Axle & Manufacturing Holdings, Inc.* | | | 111,250 | | | | 648,588 | |
Dana, Inc. | | | 120,850 | | | | 1,397,026 | |
Dorman Products, Inc.* | | | 25,211 | | | | 3,266,085 | |
Fox Factory Holding Corp.* | | | 39,000 | | | | 1,180,530 | |
Gentherm, Inc.* | | | 28,569 | | | | 1,140,617 | |
LCI Industries(a) | | | 23,778 | | | | 2,458,407 | |
Patrick Industries, Inc.(a) | | | 31,315 | | | | 2,601,650 | |
Phinia, Inc. | | | 39,050 | | | | 1,881,038 | |
Standard Motor Products, Inc. | | | 19,473 | | | | 603,274 | |
XPEL, Inc.* | | | 20,852 | | | | 832,829 | |
| | | | | | | | |
| |
| | | | 17,416,874 | |
| | | | | | | | |
Automobiles — 0.1% | |
Winnebago Industries, Inc.(a) | | | 26,846 | | | | 1,282,702 | |
| | | | | | | | |
Banks — 9.1% | |
Ameris Bancorp | | | 59,852 | | | | 3,744,940 | |
Atlantic Union Bankshares Corp.(a) | | | 83,668 | | | | 3,169,344 | |
Axos Financial, Inc.* | | | 50,480 | | | | 3,526,028 | |
Banc of California, Inc. | | | 129,000 | | | | 1,994,340 | |
BancFirst Corp. | | | 18,557 | | | | 2,174,509 | |
Bancorp, Inc. (The)* | | | 44,476 | | | | 2,340,772 | |
Bank of Hawaii Corp.(a) | | | 36,950 | | | | 2,632,318 | |
BankUnited, Inc. | | | 69,687 | | | | 2,659,953 | |
Banner Corp. | | | 31,987 | | | | 2,135,772 | |
Berkshire Hills Bancorp, Inc. | | | 39,523 | | | | 1,123,639 | |
Brookline Bancorp, Inc. | | | 82,911 | | | | 978,350 | |
Capitol Federal Financial, Inc. | | | 115,531 | | | | 682,788 | |
Cathay General Bancorp. | | | 66,100 | | | | 3,147,021 | |
Central Pacific Financial Corp. | | | 25,484 | | | | 740,310 | |
City Holding Co. | | | 13,768 | | | | 1,631,233 | |
Community Financial System, Inc. | | | 48,886 | | | | 3,015,288 | |
Customers Bancorp, Inc.* | | | 27,046 | | | | 1,316,599 | |
CVB Financial Corp. | | | 121,773 | | | | 2,607,160 | |
Dime Community Bancshares, Inc. | | | 36,440 | | | | 1,119,983 | |
Eagle Bancorp, Inc. | | | 28,485 | | | | 741,465 | |
FB Financial Corp. | | | 32,505 | | | | 1,674,333 | |
First Bancorp | | | 38,662 | | | | 1,699,968 | |
First BanCorp. (Puerto Rico)(a) | | | 151,111 | | | | 2,809,153 | |
First Commonwealth Financial Corp. | | | 95,582 | | | | 1,617,247 | |
First Financial Bancorp | | | 89,424 | | | | 2,403,717 | |
First Hawaiian, Inc. | | | 119,432 | | | | 3,099,260 | |
| | | | | | | | |
| | | Shares | | | Value | |
COMMON STOCKS (continued) | |
Banks (cont’d.) | |
Fulton Financial Corp. | | | 169,000 | | | $ | 3,258,320 | |
Hanmi Financial Corp. | | | 28,252 | | | | 667,312 | |
Heritage Financial Corp. | | | 32,186 | | | | 788,557 | |
Hilltop Holdings, Inc. | | | 43,159 | | | | 1,235,642 | |
Hope Bancorp, Inc. | | | 113,095 | | | | 1,389,938 | |
Independent Bank Corp. | | | 39,585 | | �� | | 2,540,961 | |
Independent Bank Group, Inc. | | | 33,464 | | | | 2,030,261 | |
Lakeland Financial Corp. | | | 23,678 | | | | 1,628,099 | |
National Bank Holdings Corp. (Class A Stock) | | | 35,519 | | | | 1,529,448 | |
NBT Bancorp, Inc. | | | 44,117 | | | | 2,107,028 | |
Northwest Bancshares, Inc. | | | 119,273 | | | | 1,573,211 | |
OFG Bancorp (Puerto Rico) | | | 42,606 | | | | 1,803,086 | |
Pacific Premier Bancorp, Inc. | | | 89,825 | | | | 2,238,439 | |
Park National Corp.(a) | | | 13,465 | | | | 2,308,305 | |
Pathward Financial, Inc. | | | 23,153 | | | | 1,703,598 | |
Preferred Bank(a) | | | 11,448 | | | | 988,878 | |
Provident Financial Services, Inc. | | | 122,209 | | | | 2,306,084 | |
Renasant Corp.(a) | | | 59,495 | | | | 2,126,946 | |
S&T Bancorp, Inc. | | | 35,829 | | | | 1,369,384 | |
Seacoast Banking Corp. of Florida | | | 79,157 | | | | 2,179,192 | |
ServisFirst Bancshares, Inc. | | | 46,521 | | | | 3,942,190 | |
Simmons First National Corp. (Class A Stock) | | | 117,149 | | | | 2,598,365 | |
Southside Bancshares, Inc. | | | 26,593 | | | | 844,594 | |
Stellar Bancorp, Inc. | | | 44,642 | | | | 1,265,601 | |
Tompkins Financial Corp. | | | 11,563 | | | | 784,318 | |
Triumph Financial, Inc.* | | | 20,345 | | | | 1,848,954 | |
TrustCo Bank Corp. | | | 17,880 | | | | 595,583 | |
Trustmark Corp. | | | 56,583 | | | | 2,001,341 | |
United Community Banks, Inc.(a) | | | 111,208 | | | | 3,593,130 | |
Veritex Holdings, Inc. | | | 50,910 | | | | 1,382,716 | |
WaFd, Inc. | | | 75,941 | | | | 2,448,338 | |
Westamerica BanCorp | | | 24,705 | | | | 1,296,024 | |
WSFS Financial Corp. | | | 54,660 | | | | 2,904,086 | |
| | | | | | | | |
| |
| | | | 116,063,419 | |
| | | | | | | | |
Beverages — 0.1% | |
MGP Ingredients, Inc.(a) | | | 13,123 | | | | 516,653 | |
National Beverage Corp. | | | 21,803 | | | | 930,334 | |
| | | | | | | | |
| |
| | | | 1,446,987 | |
| | | | | | | | |
Biotechnology — 2.2% | |
ADMA Biologics, Inc.* | | | 218,300 | | | | 3,743,845 | |
Alkermes PLC*(a) | | | 150,250 | | | | 4,321,190 | |
Arcus Biosciences, Inc.* | | | 50,423 | | | | 750,799 | |
Catalyst Pharmaceuticals, Inc.* | | | 104,469 | | | | 2,180,268 | |
Dynavax Technologies Corp.*(a) | | | 114,160 | | | | 1,457,823 | |
Ironwood Pharmaceuticals, Inc.* | | | 132,077 | | | | 585,101 | |
Krystal Biotech, Inc.*(a) | | | 23,610 | | | | 3,698,743 | |
Myriad Genetics, Inc.* | | | 85,044 | | | | 1,165,953 | |
Protagonist Therapeutics, Inc.*(a) | | | 54,900 | | | | 2,119,140 | |
TG Therapeutics, Inc.*(a) | | | 124,600 | | | | 3,750,460 | |
Vericel Corp.*(a) | | | 45,886 | | | | 2,519,600 | |
Vir Biotechnology, Inc.* | | | 85,417 | | | | 626,961 | |
Xencor, Inc.* | | | 64,955 | | | | 1,492,666 | |
| | | | | | | | |
| |
| | | | 28,412,549 | |
| | | | | | | | |
SEE NOTES TO FINANCIAL STATEMENTS.
A216
| | | | |
| | PSF SMALL-CAP STOCK INDEX PORTFOLIO (CONTINUED) | | |
SCHEDULE OF INVESTMENTS | | | | as of December 31, 2024 |
| | | | | | | | |
| | | Shares | | | Value | |
COMMON STOCKS (continued) | |
Broadline Retail — 0.5% | |
Etsy, Inc.* | | | 104,450 | | | $ | 5,524,360 | |
Kohl’s Corp.(a) | | | 104,150 | | | | 1,462,266 | |
| | | | | | | | |
| |
| | | | 6,986,626 | |
| | | | | | | | |
Building Products — 2.7% | |
American Woodmark Corp.* | | | 14,470 | | | | 1,150,799 | |
Apogee Enterprises, Inc. | | | 20,345 | | | | 1,452,836 | |
Armstrong World Industries, Inc. | | | 40,470 | | | | 5,719,625 | |
AZZ, Inc. | | | 27,711 | | | | 2,270,085 | |
CSW Industrials, Inc. | | | 15,610 | | | | 5,507,208 | |
Gibraltar Industries, Inc.* | | | 28,333 | | | | 1,668,814 | |
Griffon Corp. | | | 36,855 | | | | 2,626,656 | |
Hayward Holdings, Inc.* | | | 133,000 | | | | 2,033,570 | |
Insteel Industries, Inc. | | | 18,243 | | | | 492,743 | |
Masterbrand, Inc.* | | | 118,987 | | | | 1,738,400 | |
Quanex Building Products Corp. | | | 44,227 | | | | 1,072,063 | |
Resideo Technologies, Inc.* | | | 136,757 | | | | 3,152,249 | |
Zurn Elkay Water Solutions Corp.(a) | | | 132,350 | | | | 4,936,655 | |
| | | | | | | | |
| |
| | | | 33,821,703 | |
| | | | | | | | |
Capital Markets — 2.7% | |
Artisan Partners Asset Management, Inc. (Class A Stock)(a) | | | 65,250 | | | | 2,809,012 | |
BGC Group, Inc. (Class A Stock) | | | 343,850 | | | | 3,115,281 | |
Brightsphere Investment Group, Inc. | | | 25,781 | | | | 679,072 | |
Cohen & Steers, Inc.(a) | | | 24,750 | | | | 2,285,415 | |
Donnelley Financial Solutions, Inc.* | | | 24,786 | | | | 1,554,826 | |
Moelis & Co. (Class A Stock) | | | 65,700 | | | | 4,853,916 | |
Piper Sandler Cos.(a) | | | 14,762 | | | | 4,427,862 | |
PJT Partners, Inc. (Class A Stock)(a) | | | 22,010 | | | | 3,473,398 | |
StepStone Group, Inc. (Class A Stock) | | | 58,400 | | | | 3,380,192 | |
StoneX Group, Inc.* | | | 26,300 | | | | 2,576,611 | |
Virtu Financial, Inc. (Class A Stock) | | | 75,000 | | | | 2,676,000 | |
Virtus Investment Partners, Inc. | | | 6,113 | | | | 1,348,405 | |
WisdomTree, Inc.(a) | | | 106,248 | | | | 1,115,604 | |
| | | | | | | | |
| |
| | | | 34,295,594 | |
| | | | | | | | |
Chemicals — 1.9% | |
AdvanSix, Inc. | | | 24,743 | | | | 704,928 | |
Balchem Corp. | | | 30,305 | | | | 4,939,564 | |
Hawkins, Inc. | | | 17,814 | | | | 2,185,243 | |
HB Fuller Co. | | | 50,828 | | | | 3,429,873 | |
Ingevity Corp.* | | | 34,000 | | | | 1,385,500 | |
Innospec, Inc. | | | 23,289 | | | | 2,563,187 | |
Koppers Holdings, Inc. | | | 18,969 | | | | 614,596 | |
Mativ Holdings, Inc. | | | 50,795 | | | | 553,666 | |
Minerals Technologies, Inc. | | | 29,571 | | | | 2,253,606 | |
Quaker Chemical Corp.(a) | | | 12,715 | | | | 1,789,763 | |
Sensient Technologies Corp. | | | 39,400 | | | | 2,807,644 | |
Stepan Co. | | | 19,579 | | | | 1,266,761 | |
| | | | | | | | |
| |
| | | | 24,494,331 | |
| | | | | | | | |
Commercial Services & Supplies — 2.2% | |
ABM Industries, Inc. | | | 58,512 | | | | 2,994,644 | |
Brady Corp. (Class A Stock) | | | 40,880 | | | | 3,018,988 | |
CoreCivic, Inc.* | | | 103,273 | | | | 2,245,155 | |
Deluxe Corp. | | | 41,784 | | | | 943,900 | |
Enviri Corp.* | | | 75,776 | | | | 583,475 | |
| | | | | | | | |
| | | Shares | | | Value | |
COMMON STOCKS (continued) | |
Commercial Services & Supplies (cont’d.) | |
GEO Group, Inc. (The)* | | | 126,367 | | | $ | 3,535,749 | |
Healthcare Services Group, Inc.* | | | 69,389 | | | | 805,953 | |
HNI Corp. | | | 43,897 | | | | 2,211,092 | |
Interface, Inc. | | | 54,600 | | | | 1,329,510 | |
Liquidity Services, Inc.* | | | 20,841 | | | | 672,956 | |
Matthews International Corp. (Class A Stock) | | | 28,907 | | | | 800,146 | |
MillerKnoll, Inc.(a) | | | 64,217 | | | | 1,450,662 | |
OPENLANE, Inc.*(a) | | | 101,737 | | | | 2,018,462 | |
Pitney Bowes, Inc. | | | 146,275 | | | | 1,059,031 | |
UniFirst Corp. | | | 14,013 | | | | 2,397,484 | |
Vestis Corp. | | | 107,150 | | | | 1,632,966 | |
Viad Corp.* | | | 19,866 | | | | 844,504 | |
| | | | | | | | |
| |
| | | | 28,544,677 | |
| | | | | | | | |
Communications Equipment — 0.8% | |
Calix, Inc.* | | | 54,850 | | | | 1,912,619 | |
Digi International, Inc.*(a) | | | 34,098 | | | | 1,030,783 | |
Extreme Networks, Inc.* | | | 122,078 | | | | 2,043,586 | |
Harmonic, Inc.* | | | 108,958 | | | | 1,441,514 | |
NetScout Systems, Inc.* | | | 66,787 | | | | 1,446,606 | |
Viasat, Inc.*(a) | | | 79,765 | | | | 678,800 | |
Viavi Solutions, Inc.* | | | 207,837 | | | | 2,099,154 | |
| | | | | | | | |
| |
| | | | 10,653,062 | |
| | | | | | | | |
Construction & Engineering — 1.4% | |
Arcosa, Inc.(a) | | | 45,213 | | | | 4,373,906 | |
Dycom Industries, Inc.* | | | 27,018 | | | | 4,702,753 | |
Everus Construction Group, Inc.* | | | 47,212 | | | | 3,104,189 | |
Granite Construction, Inc. | | | 40,724 | | | | 3,571,902 | |
MYR Group, Inc.* | | | 14,970 | | | | 2,227,087 | |
| | | | | | | | |
| |
| | | | 17,979,837 | |
| | | | | | | | |
Consumer Finance — 0.9% | |
Bread Financial Holdings, Inc. | | | 46,230 | | | | 2,822,804 | |
Encore Capital Group, Inc.*(a) | | | 22,083 | | | | 1,054,905 | |
Enova International, Inc.* | | | 24,253 | | | | 2,325,378 | |
EZCORP, Inc. (Class A Stock)* | | | 48,632 | | | | 594,283 | |
Green Dot Corp. (Class A Stock)* | | | 50,786 | | | | 540,363 | |
Navient Corp. | | | 71,750 | | | | 953,557 | |
PRA Group, Inc.* | | | 37,293 | | | | 779,051 | |
PROG Holdings, Inc. | | | 38,579 | | | | 1,630,349 | |
World Acceptance Corp.*(a) | | | 3,094 | | | | 347,889 | |
| | | | | | | | |
| |
| | | | 11,048,579 | |
| | | | | | | | |
Consumer Staples Distribution & Retail — 0.7% | |
Andersons, Inc. (The) | | | 30,078 | | | | 1,218,760 | |
Chefs’ Warehouse, Inc. (The)* | | | 31,827 | | | | 1,569,708 | |
Grocery Outlet Holding Corp.* | | | 90,200 | | | | 1,408,022 | |
PriceSmart, Inc. | | | 23,049 | | | | 2,124,426 | |
SpartanNash Co. | | | 31,890 | | | | 584,225 | |
United Natural Foods, Inc.* | | | 55,686 | | | | 1,520,785 | |
| | | | | | | | |
| |
| | | | 8,425,926 | |
| | | | | | | | |
Containers & Packaging — 0.5% | |
O-I Glass, Inc.* | | | 145,875 | | | | 1,581,285 | |
Sealed Air Corp. | | | 135,250 | | | | 4,575,507 | |
| | | | | | | | |
| |
| | | | 6,156,792 | |
| | | | | | | | |
SEE NOTES TO FINANCIAL STATEMENTS.
A217
| | | | |
| | PSF SMALL-CAP STOCK INDEX PORTFOLIO (CONTINUED) | | |
SCHEDULE OF INVESTMENTS | | | | as of December 31, 2024 |
| | | | | | | | |
| | | Shares | | | Value | |
COMMON STOCKS (continued) | |
Diversified Consumer Services — 1.2% | |
Adtalem Global Education, Inc.* | | | 34,790 | | | $ | 3,160,671 | |
Frontdoor, Inc.* | | | 70,402 | | | | 3,848,877 | |
Mister Car Wash, Inc.*(a) | | | 87,706 | | | | 639,377 | |
Perdoceo Education Corp. | | | 57,806 | | | | 1,530,125 | |
Strategic Education, Inc. | | | 22,625 | | | | 2,113,628 | |
Stride, Inc.*(a) | | | 39,700 | | | | 4,126,021 | |
| | | | | | | | |
| |
| | | | 15,418,699 | |
| | | | | | | | |
Diversified REITs — 0.8% | |
Alexander & Baldwin, Inc. | | | 68,005 | | | | 1,206,409 | |
American Assets Trust, Inc. | | | 44,452 | | | | 1,167,309 | |
Armada Hoffler Properties, Inc. | | | 74,004 | | | | 757,061 | |
Essential Properties Realty Trust, Inc.(a) | | | 162,785 | | | | 5,091,915 | |
Global Net Lease, Inc.(a) | | | 185,360 | | | | 1,353,128 | |
| | | | | | | | |
| |
| | | | 9,575,822 | |
| | | | | | | | |
Diversified Telecommunication Services — 0.7% | |
Cogent Communications Holdings, Inc.(a) | | | 39,296 | | | | 3,028,543 | |
Lumen Technologies, Inc.* | | | 942,368 | | | | 5,003,974 | |
Shenandoah Telecommunications Co. | | | 43,338 | | | | 546,492 | |
| | | | | | | | |
| |
| | | | 8,579,009 | |
| | | | | | | | |
Electric Utilities — 0.5% | |
MGE Energy, Inc. | | | 33,650 | | | | 3,161,754 | |
Otter Tail Corp.(a) | | | 38,899 | | | | 2,872,302 | |
| | | | | | | | |
| |
| | | | 6,034,056 | |
| | | | | | | | |
Electrical Equipment — 0.4% | |
Powell Industries, Inc.(a) | | | 8,710 | | | | 1,930,572 | |
Sunrun, Inc.*(a) | | | 209,400 | | | | 1,936,950 | |
Vicor Corp.*(a) | | | 21,350 | | | | 1,031,632 | |
| | | | | | | | |
| |
| | | | 4,899,154 | |
| | | | | | | | |
Electronic Equipment, Instruments & Components — 3.4% | |
Advanced Energy Industries, Inc. | | | 35,166 | | | | 4,066,244 | |
Arlo Technologies, Inc.*(a) | | | 93,588 | | | | 1,047,250 | |
Badger Meter, Inc. | | | 27,303 | | | | 5,791,512 | |
Benchmark Electronics, Inc. | | | 33,815 | | | | 1,535,201 | |
CTS Corp. | | | 27,926 | | | | 1,472,538 | |
ePlus, Inc.* | | | 24,694 | | | | 1,824,393 | |
Insight Enterprises, Inc.*(a) | | | 25,361 | | | | 3,857,408 | |
Itron, Inc.* | | | 42,000 | | | | 4,560,360 | |
Knowles Corp.* | | | 82,799 | | | | 1,650,184 | |
OSI Systems, Inc.*(a) | | | 14,432 | | | | 2,416,350 | |
PC Connection, Inc. | | | 11,462 | | | | 793,973 | |
Plexus Corp.* | | | 25,252 | | | | 3,951,433 | |
Rogers Corp.* | | | 15,855 | | | | 1,611,026 | |
Sanmina Corp.* | | | 50,588 | | | | 3,827,994 | |
ScanSource, Inc.* | | | 20,331 | | | | 964,706 | |
TTM Technologies, Inc.* | | | 95,492 | | | | 2,363,427 | |
Vishay Intertechnology, Inc. | | | 104,550 | | | | 1,771,077 | |
| | | | | | | | |
| |
| | | | 43,505,076 | |
| | | | | | | | |
Energy Equipment & Services — 2.2% | |
Archrock, Inc. | | | 162,627 | | | | 4,047,786 | |
Atlas Energy Solutions, Inc.(a) | | | 56,250 | | | | 1,247,625 | |
| | | | | | | | |
| | | Shares | | | Value | |
COMMON STOCKS (continued) | |
Energy Equipment & Services (cont’d.) | |
Bristow Group, Inc.* | | | 23,050 | | | $ | 790,615 | |
Cactus, Inc. (Class A Stock)(a) | | | 61,950 | | | | 3,615,402 | |
Core Laboratories, Inc.(a) | | | 43,598 | | | | 754,681 | |
Helix Energy Solutions Group, Inc.* | | | 133,875 | | | | 1,247,715 | |
Helmerich & Payne, Inc.(a) | | | 92,086 | | | | 2,948,594 | |
Innovex International, Inc.* | | | 34,968 | | | | 488,503 | |
Liberty Energy, Inc. | | | 151,750 | | | | 3,018,307 | |
Nabors Industries Ltd.* | | | 8,194 | | | | 468,451 | |
Oceaneering International, Inc.*(a) | | | 94,598 | | | | 2,467,116 | |
Patterson-UTI Energy, Inc. | | | 329,523 | | | | 2,721,860 | |
ProPetro Holding Corp.* | | | 75,845 | | | | 707,634 | |
RPC, Inc. | | | 78,167 | | | | 464,312 | |
Tidewater, Inc.* | | | 44,950 | | | | 2,459,215 | |
| | | | | | | | |
| |
| | | | 27,447,816 | |
| | | | | | | | |
Entertainment — 0.5% | |
Cinemark Holdings, Inc.*(a) | | | 99,721 | | | | 3,089,357 | |
Madison Square Garden Sports Corp.* | | | 15,580 | | | | 3,516,094 | |
| | | | | | | | |
| |
| | | | 6,605,451 | |
| | | | | | | | |
Financial Services — 2.5% | |
EVERTEC, Inc. (Puerto Rico) | | | 59,032 | | | | 2,038,375 | |
HA Sustainable Infrastructure Capital,
Inc.(a) | | | 110,000 | | | | 2,951,300 | |
Jackson Financial, Inc. (Class A Stock)(a) | | | 68,580 | | | | 5,971,946 | |
Mr. Cooper Group, Inc.* | | | 59,411 | | | | 5,704,050 | |
NCR Atleos Corp.* | | | 67,700 | | | | 2,296,384 | |
NMI Holdings, Inc.* | | | 73,457 | | | | 2,700,279 | |
Payoneer Global, Inc.* | | | 237,068 | | | | 2,380,163 | |
Radian Group, Inc. | | | 138,269 | | | | 4,385,893 | |
Walker & Dunlop, Inc. | | | 29,725 | | | | 2,889,567 | |
| | | | | | | | |
| |
| | | | 31,317,957 | |
| | | | | | | | |
Food Products — 1.2% | |
B&G Foods, Inc.(a) | | | 74,357 | | | | 512,320 | |
Cal-Maine Foods, Inc. | | | 37,927 | | | | 3,903,447 | |
Fresh Del Monte Produce, Inc. | | | 31,276 | | | | 1,038,676 | |
Hain Celestial Group, Inc. (The)* | | | 84,884 | | | | 522,037 | |
J & J Snack Foods Corp. | | | 14,392 | | | | 2,232,631 | |
John B. Sanfilippo & Son, Inc. | | | 8,258 | | | | 719,354 | |
Simply Good Foods Co. (The)* | | | 85,055 | | | | 3,315,444 | |
Tootsie Roll Industries, Inc. | | | 15,573 | | | | 503,475 | |
TreeHouse Foods, Inc.* | | | 42,778 | | | | 1,502,791 | |
WK Kellogg Co.(a) | | | 61,950 | | | | 1,114,480 | |
| | | | | | | | |
| |
| | | | 15,364,655 | |
| | | | | | | | |
Gas Utilities — 0.6% | |
Chesapeake Utilities Corp. | | | 21,147 | | | | 2,566,188 | |
MDU Resources Group, Inc. | | | 190,450 | | | | 3,431,909 | |
Northwest Natural Holding Co. | | | 37,250 | | | | 1,473,610 | |
| | | | | | | | |
| |
| | | | 7,471,707 | |
| | | | | | | | |
Ground Transportation — 0.8% | |
ArcBest Corp.(a) | | | 21,696 | | | | 2,024,671 | |
Heartland Express, Inc. | | | 40,834 | | | | 458,157 | |
Hertz Global Holdings, Inc.*(a) | | | 115,950 | | | | 424,377 | |
Marten Transport Ltd. | | | 54,066 | | | | 843,970 | |
SEE NOTES TO FINANCIAL STATEMENTS.
A218
| | | | |
| | PSF SMALL-CAP STOCK INDEX PORTFOLIO (CONTINUED) | | |
SCHEDULE OF INVESTMENTS | | | | as of December 31, 2024 |
| | | | | | | | |
| | | Shares | | | Value | |
COMMON STOCKS (continued) | |
Ground Transportation (cont’d.) | |
RXO, Inc.*(a) | | | 129,869 | | | $ | 3,096,077 | |
Schneider National, Inc. (Class B
Stock)(a) | | | 44,150 | | | | 1,292,712 | |
Werner Enterprises, Inc.(a) | | | 57,150 | | | | 2,052,828 | |
| | | | | | | | |
| |
| | | | 10,192,792 | |
| | | | | | | | |
Health Care Equipment & Supplies — 3.8% | |
Artivion, Inc.* | | | 35,234 | | | | 1,007,340 | |
Avanos Medical, Inc.* | | | 42,998 | | | | 684,528 | |
CONMED Corp.(a) | | | 28,605 | | | | 1,957,726 | |
Embecta Corp. | | | 54,562 | | | | 1,126,705 | |
Glaukos Corp.* | | | 51,324 | | | | 7,695,521 | |
ICU Medical, Inc.* | | | 22,810 | | | | 3,539,428 | |
Inari Medical, Inc.* | | | 46,900 | | | | 2,394,245 | |
Inspire Medical Systems, Inc.*(a) | | | 27,850 | | | | 5,162,833 | |
Integer Holdings Corp.*(a) | | | 31,103 | | | | 4,121,770 | |
Integra LifeSciences Holdings Corp.* | | | 62,500 | | | | 1,417,500 | |
LeMaitre Vascular, Inc. | | | 19,033 | | | | 1,753,701 | |
Merit Medical Systems, Inc.* | | | 54,070 | | | | 5,229,650 | |
Omnicell, Inc.* | | | 43,000 | | | | 1,914,360 | |
QuidelOrtho Corp.* | | | 61,400 | | | | 2,735,370 | |
STAAR Surgical Co.*(a) | | | 46,050 | | | | 1,118,554 | |
Tandem Diabetes Care, Inc.* | | | 61,294 | | | | 2,207,810 | |
TransMedics Group, Inc.*(a) | | | 31,240 | | | | 1,947,814 | |
UFP Technologies, Inc.* | | | 6,760 | | | | 1,652,888 | |
| | | | | | | | |
| |
| | | | 47,667,743 | |
| | | | | | | | |
Health Care Providers & Services — 2.7% | |
AdaptHealth Corp.* | | | 98,965 | | | | 942,147 | |
Addus HomeCare Corp.* | | | 16,761 | | | | 2,100,991 | |
AMN Healthcare Services, Inc.* | | | 35,553 | | | | 850,428 | |
Astrana Health, Inc.* | | | 38,615 | | | | 1,217,531 | |
Concentra Group Holdings Parent, Inc. | | | 100,474 | | | | 1,987,376 | |
CorVel Corp.* | | | 25,404 | | | | 2,826,449 | |
Fulgent Genetics, Inc.*(a) | | | 18,782 | | | | 346,904 | |
Hims & Hers Health, Inc.*(a) | | | 177,050 | | | | 4,281,069 | |
National HealthCare Corp. | | | 11,550 | | | | 1,242,318 | |
NeoGenomics, Inc.*(a) | | | 120,055 | | | | 1,978,506 | |
Owens & Minor, Inc.* | | | 69,144 | | | | 903,712 | |
Patterson Cos., Inc. | | | 73,450 | | | | 2,266,667 | |
Pediatrix Medical Group, Inc.* | | | 79,382 | | | | 1,041,492 | |
Premier, Inc. (Class A Stock)(a) | | | 89,250 | | | | 1,892,100 | |
Privia Health Group, Inc.* | | | 96,100 | | | | 1,878,755 | |
Progyny, Inc.*(a) | | | 68,750 | | | | 1,185,937 | |
RadNet, Inc.* | | | 60,332 | | | | 4,213,587 | |
Select Medical Holdings Corp. | | | 96,837 | | | | 1,825,377 | |
U.S. Physical Therapy, Inc. | | | 14,074 | | | | 1,248,505 | |
| | | | | | | | |
| |
| | | | 34,229,851 | |
| | | | | | | | |
Health Care REITs — 0.7% | |
CareTrust REIT, Inc. | | | 173,935 | | | | 4,704,942 | |
LTC Properties, Inc. | | | 42,008 | | | | 1,451,376 | |
Medical Properties Trust, Inc.(a) | | | 560,500 | | | | 2,213,975 | |
Universal Health Realty Income Trust | | | 11,750 | | | | 437,218 | |
| | | | | | | | |
| |
| | | | 8,807,511 | |
| | | | | | | | |
Health Care Technology — 0.3% | |
Certara, Inc.* | | | 102,445 | | | | 1,091,039 | |
| | | | | | | | |
| | | Shares | | | Value | |
COMMON STOCKS (continued) | |
Health Care Technology (cont’d.) | |
HealthStream, Inc. | | | 22,621 | | | $ | 719,348 | |
Schrodinger, Inc.*(a) | | | 51,750 | | | | 998,258 | |
Simulations Plus, Inc. | | | 15,181 | | | | 423,398 | |
| | | | | | | | |
| |
| | | | 3,232,043 | |
| | | | | | | | |
Hotel & Resort REITs — 0.8% | |
Apple Hospitality REIT, Inc. | | | 207,200 | | | | 3,180,520 | |
DiamondRock Hospitality Co. | | | 194,154 | | | | 1,753,211 | |
Pebblebrook Hotel Trust | | | 112,881 | | | | 1,529,538 | |
Summit Hotel Properties, Inc.(a) | | | 102,499 | | | | 702,118 | |
Sunstone Hotel Investors, Inc. | | | 186,542 | | | | 2,208,657 | |
Xenia Hotels & Resorts, Inc. | | | 95,505 | | | | 1,419,204 | |
| | | | | | | | |
| |
| | | | 10,793,248 | |
| | | | | | | | |
Hotels, Restaurants & Leisure — 2.2% | |
BJ’s Restaurants, Inc.* | | | 21,575 | | | | 758,038 | |
Bloomin’ Brands, Inc. | | | 70,818 | | | | 864,688 | |
Brinker International, Inc.* | | | 41,254 | | | | 5,457,492 | |
Cheesecake Factory, Inc. (The)(a) | | | 43,835 | | | | 2,079,532 | |
Cracker Barrel Old Country Store,
Inc.(a) | | | 20,666 | | | | 1,092,405 | |
Dave & Buster’s Entertainment,
Inc.*(a) | | | 29,599 | | | | 863,995 | |
Golden Entertainment, Inc. | | | 19,096 | | | | 603,433 | |
Jack in the Box, Inc.(a) | | | 17,750 | | | | 739,110 | |
Monarch Casino & Resort, Inc. | | | 11,889 | | | | 938,042 | |
Papa John’s International, Inc.(a) | | | 30,300 | | | | 1,244,421 | |
Penn Entertainment, Inc.*(a) | | | 140,100 | | | | 2,776,782 | |
Sabre Corp.*(a) | | | 361,306 | | | | 1,318,767 | |
Shake Shack, Inc. (Class A Stock)* | | | 37,129 | | | | 4,819,344 | |
Six Flags Entertainment Corp.(a) | | | 86,800 | | | | 4,182,892 | |
| | | | | | | | |
| |
| | | | 27,738,941 | |
| | | | | | | | |
Household Durables — 3.2% | |
Cavco Industries, Inc.* | | | 7,520 | | | | 3,355,650 | |
Century Communities, Inc. | | | 25,641 | | | | 1,881,024 | |
Champion Homes, Inc.* | | | 49,000 | | | | 4,316,900 | |
Dream Finders Homes, Inc. (Class A Stock)*(a) | | | 24,500 | | | | 570,115 | |
Ethan Allen Interiors, Inc. | | | 21,373 | | | | 600,795 | |
Green Brick Partners, Inc.* | | | 28,534 | | | | 1,611,886 | |
Helen of Troy Ltd.*(a) | | | 21,150 | | | | 1,265,404 | |
Installed Building Products, Inc.(a) | | | 21,563 | | | | 3,778,916 | |
La-Z-Boy, Inc. | | | 38,767 | | | | 1,689,078 | |
Leggett & Platt, Inc. | | | 125,650 | | | | 1,206,240 | |
LGI Homes, Inc.*(a) | | | 19,070 | | | | 1,704,858 | |
M/I Homes, Inc.* | | | 25,263 | | | | 3,358,716 | |
Meritage Homes Corp. | | | 33,598 | | | | 5,168,044 | |
Newell Brands, Inc. | | | 388,550 | | | | 3,869,958 | |
Sonos, Inc.*(a) | | | 113,343 | | | | 1,704,679 | |
Tri Pointe Homes, Inc.* | | | 87,355 | | | | 3,167,492 | |
Worthington Enterprises, Inc. | | | 29,100 | | | | 1,167,201 | |
| | | | | | | | |
| |
| | | | 40,416,956 | |
| | | | | | | | |
Household Products — 0.6% | |
Central Garden & Pet Co.* | | | 8,916 | | | | 345,941 | |
Central Garden & Pet Co. (Class A Stock)* | | | 48,702 | | | | 1,609,601 | |
Energizer Holdings, Inc. | | | 60,450 | | | | 2,109,100 | |
SEE NOTES TO FINANCIAL STATEMENTS.
A219
| | | | |
| | PSF SMALL-CAP STOCK INDEX PORTFOLIO (CONTINUED) | | |
SCHEDULE OF INVESTMENTS | | | | as of December 31, 2024 |
| | | | | | | | |
| | | Shares | | | Value | |
COMMON STOCKS (continued) | |
Household Products (cont’d.) | |
WD-40 Co.(a) | | | 12,626 | | | $ | 3,064,078 | |
| | | | | | | | |
| |
| | | | 7,128,720 | |
| | | | | | | | |
Independent Power & Renewable Electricity Producers — 0.2% | |
Clearway Energy, Inc. (Class A Stock) | | | 32,350 | | | | 790,958 | |
Clearway Energy, Inc. (Class C Stock) | | | 77,600 | | | | 2,017,600 | |
| | | | | | | | |
| |
| | | | 2,808,558 | |
| | | | | | | | |
Industrial REITs — 0.7% | |
Innovative Industrial Properties, Inc.(a) | | | 26,432 | | | | 1,761,429 | |
LXP Industrial Trust | | | 275,687 | | | | 2,238,578 | |
Terreno Realty Corp. | | | 92,600 | | | | 5,476,364 | |
| | | | | | | | |
| |
| | | | 9,476,371 | |
| | | | | | | | |
Insurance — 2.4% | |
Ambac Financial Group, Inc.* | | | 44,340 | | | | 560,901 | |
AMERISAFE, Inc. | | | 17,797 | | | | 917,257 | |
Assured Guaranty Ltd. | | | 44,415 | | | | 3,997,794 | |
Employers Holdings, Inc. | | | 23,160 | | | | 1,186,487 | |
Genworth Financial, Inc. (Class A Stock)* | | | 396,563 | | | | 2,771,975 | |
Goosehead Insurance, Inc. (Class A Stock)*(a) | | | 22,500 | | | | 2,412,450 | |
HCI Group, Inc.(a) | | | 7,734 | | | | 901,243 | |
Horace Mann Educators Corp. | | | 38,161 | | | | 1,497,056 | |
Lincoln National Corp. | | | 158,050 | | | | 5,011,766 | |
Mercury General Corp. | | | 24,685 | | | | 1,641,059 | |
Palomar Holdings, Inc.* | | | 24,339 | | | | 2,569,955 | |
ProAssurance Corp.* | | | 48,044 | | | | 764,380 | |
Safety Insurance Group, Inc. | | | 13,784 | | | | 1,135,802 | |
SiriusPoint Ltd. (Sweden)* | | | 85,643 | | | | 1,403,689 | |
Stewart Information Services Corp. | | | 25,676 | | | | 1,732,873 | |
Trupanion, Inc.*(a) | | | 30,915 | | | | 1,490,103 | |
United Fire Group, Inc. | | | 19,898 | | | | 566,098 | |
| | | | | | | | |
| |
| | | | 30,560,888 | |
| | | | | | | | |
Interactive Media & Services — 1.2% | |
Cargurus, Inc.* | | | 81,500 | | | | 2,978,010 | |
Cars.com, Inc.* | | | 55,150 | | | | 955,750 | |
IAC, Inc.* | | | 65,900 | | | | 2,842,926 | |
QuinStreet, Inc.* | | | 51,526 | | | | 1,188,705 | |
Shutterstock, Inc.(a) | | | 22,791 | | | | 691,707 | |
TripAdvisor, Inc.* | | | 102,550 | | | | 1,514,663 | |
Yelp, Inc.* | | | 61,082 | | | | 2,363,873 | |
Ziff Davis, Inc.*(a) | | | 39,650 | | | | 2,154,581 | |
| | | | | | | | |
| |
| | | | 14,690,215 | |
| | | | | | | | |
IT Services — 0.5% | |
DigitalOcean Holdings, Inc.*(a) | | | 59,050 | | | | 2,011,833 | |
DXC Technology Co.* | | | 168,100 | | | | 3,358,638 | |
Grid Dynamics Holdings, Inc.* | | | 54,600 | | | | 1,214,304 | |
| | | | | | | | |
| |
| | | | 6,584,775 | |
| | | | | | | | |
Leisure Products — 0.2% | |
Revelyst, Inc.* | | | 54,463 | | | | 1,047,323 | |
Sturm Ruger & Co., Inc. | | | 15,624 | | | | 552,621 | |
Topgolf Callaway Brands Corp.* | | | 132,550 | | | | 1,041,843 | |
| | | | | | | | |
| |
| | | | 2,641,787 | |
| | | | | | | | |
| | | | | | | | |
| | | Shares | | | Value | |
COMMON STOCKS (continued) | |
Life Sciences Tools & Services — 0.5% | |
Azenta, Inc.* | | | 42,300 | | | $ | 2,115,000 | |
BioLife Solutions, Inc.* | | | 33,597 | | | | 872,178 | |
Cytek Biosciences, Inc.* | | | 100,757 | | | | 653,913 | |
Fortrea Holdings, Inc.*(a) | | | 83,900 | | | | 1,564,735 | |
Mesa Laboratories, Inc. | | | 4,938 | | | | 651,174 | |
| | | | | | | | |
| |
| | | | 5,857,000 | |
| | | | | | | | |
Machinery — 4.2% | |
Alamo Group, Inc. | | | 9,715 | | | | 1,806,116 | |
Albany International Corp. (Class A Stock) | | | 29,019 | | | | 2,320,649 | |
Astec Industries, Inc. | | | 21,115 | | | | 709,464 | |
Barnes Group, Inc. | | | 42,723 | | | | 2,019,089 | |
Enerpac Tool Group Corp. | | | 50,246 | | | | 2,064,608 | |
Enpro, Inc. | | | 19,587 | | | | 3,377,778 | |
ESCO Technologies, Inc. | | | 24,048 | | | | 3,203,434 | |
Federal Signal Corp.(a) | | | 56,703 | | | | 5,238,790 | |
Franklin Electric Co., Inc. | | | 36,365 | | | | 3,543,769 | |
Gates Industrial Corp. PLC* | | | 211,050 | | | | 4,341,299 | |
Greenbrier Cos., Inc. (The) | | | 28,881 | | | | 1,761,452 | |
Hillenbrand, Inc. | | | 65,759 | | | | 2,024,062 | |
John Bean Technologies Corp.(a) | | | 29,570 | | | | 3,758,347 | |
Kennametal, Inc.(a) | | | 72,955 | | | | 1,752,379 | |
Lindsay Corp. | | | 10,192 | | | | 1,205,816 | |
Proto Labs, Inc.* | | | 23,254 | | | | 908,999 | |
SPX Technologies, Inc.* | | | 43,180 | | | | 6,283,554 | |
Standex International Corp. | | | 11,101 | | | | 2,075,776 | |
Tennant Co. | | | 17,595 | | | | 1,434,520 | |
Titan International, Inc.* | | | 46,426 | | | | 315,233 | |
Trinity Industries, Inc. | | | 76,253 | | | | 2,676,480 | |
Wabash National Corp. | | | 40,085 | | | | 686,656 | |
| | | | | | | | |
| |
| | | | 53,508,270 | |
| | | | | | | | |
Marine Transportation — 0.3% | |
Matson, Inc. | | | 30,838 | | | | 4,158,196 | |
| | | | | | | | |
Media — 0.8% | |
Cable One, Inc.(a) | | | 4,270 | | | | 1,546,253 | |
EchoStar Corp. (Class A Stock)*(a) | | | 112,700 | | | | 2,580,830 | |
John Wiley & Sons, Inc. (Class A Stock) | | | 38,500 | | | | 1,682,835 | |
Scholastic Corp. | | | 23,119 | | | | 493,128 | |
TechTarget, Inc.* | | | 23,815 | | | | 472,013 | |
TEGNA, Inc. | | | 149,600 | | | | 2,736,184 | |
Thryv Holdings, Inc.* | | | 37,425 | | | | 553,890 | |
| | | | | | | | |
| |
| | | | 10,065,133 | |
| | | | | | | | |
Metals & Mining — 1.8% | |
Alpha Metallurgical Resources, Inc.* | | | 10,240 | | | | 2,049,229 | |
Arch Resources, Inc. | | | 16,870 | | | | 2,382,381 | |
ATI, Inc.* | | | 132,456 | | | | 7,290,378 | |
Century Aluminum Co.* | | | 48,368 | | | | 881,265 | |
Kaiser Aluminum Corp. | | | 14,711 | | | | 1,033,742 | |
Materion Corp. | | | 19,128 | | | | 1,891,377 | |
Metallus, Inc.*(a) | | | 36,183 | | | | 511,266 | |
MP Materials Corp.*(a) | | | 112,150 | | | | 1,749,540 | |
SunCoke Energy, Inc. | | | 79,026 | | | | 845,578 | |
Warrior Met Coal, Inc. | | | 48,756 | | | | 2,644,525 | |
SEE NOTES TO FINANCIAL STATEMENTS.
A220
| | | | |
| | PSF SMALL-CAP STOCK INDEX PORTFOLIO (CONTINUED) | | |
SCHEDULE OF INVESTMENTS | | | | as of December 31, 2024 |
| | | | | | | | |
| | | Shares | | | Value | |
COMMON STOCKS (continued) | |
Metals & Mining (cont’d.) | | | | | | | | |
Worthington Steel, Inc. | | | 32,550 | | | $ | 1,035,741 | |
| | | | | | | | |
| | |
| | | | | | | 22,315,022 | |
| | | | | | | | |
Mortgage Real Estate Investment Trusts (REITs) — 1.1% | |
Apollo Commercial Real Estate Finance, Inc.(a) | | | 119,196 | | | | 1,032,237 | |
Arbor Realty Trust, Inc.(a) | | | 176,600 | | | | 2,445,910 | |
ARMOUR Residential REIT, Inc.(a) | | | 45,796 | | | | 863,713 | |
Blackstone Mortgage Trust, Inc. (Class A Stock)(a) | | | 160,600 | | | | 2,796,046 | |
Ellington Financial, Inc.(a) | | | 81,030 | | | | 982,084 | |
Franklin BSP Realty Trust, Inc. | | | 76,625 | | | | 960,877 | |
KKR Real Estate Finance Trust, Inc. | | | 55,058 | | | | 556,086 | |
New York Mortgage Trust, Inc. | | | 85,680 | | | | 519,221 | |
PennyMac Mortgage Investment Trust(a) | | | 81,356 | | | | 1,024,272 | |
Ready Capital Corp.(a) | | | 157,533 | | | | 1,074,375 | |
Redwood Trust, Inc.(a) | | | 123,763 | | | | 808,172 | |
Two Harbors Investment Corp.(a) | | | 97,029 | | | | 1,147,853 | |
| | | | | | | | |
| | |
| | | | | | | 14,210,846 | |
| | | | | | | | |
Multi-Utilities — 0.3% | | | | | | | | |
Avista Corp. | | | 73,504 | | | | 2,692,451 | |
Unitil Corp. | | | 15,061 | | | | 816,156 | |
| | | | | | | | |
| | |
| | | | | | | 3,508,607 | |
| | | | | | | | |
Office REITs — 1.1% | | | | | | | | |
Brandywine Realty Trust(a) | | | 161,311 | | | | 903,342 | |
Douglas Emmett, Inc.(a) | | | 156,350 | | | | 2,901,856 | |
Easterly Government Properties, Inc. | | | 90,668 | | | | 1,029,988 | |
Highwoods Properties, Inc. | | | 98,900 | | | | 3,024,362 | |
JBG SMITH Properties | | | 78,411 | | | | 1,205,177 | |
SL Green Realty Corp.(a) | | | 65,593 | | | | 4,455,077 | |
| | | | | | | | |
| | |
| | | | | | | 13,519,802 | |
| | | | | | | | |
Oil, Gas & Consumable Fuels — 2.5% | |
California Resources Corp. | | | 66,400 | | | | 3,445,496 | |
Comstock Resources, Inc.*(a) | | | 84,779 | | | | 1,544,673 | |
CONSOL Energy, Inc.(a) | | | 24,980 | | | | 2,664,866 | |
Crescent Energy Co. (Class A Stock) | | | 162,700 | | | | 2,377,047 | |
CVR Energy, Inc.(a) | | | 31,880 | | | | 597,431 | |
Dorian LPG Ltd. | | | 33,912 | | | | 826,435 | |
Green Plains, Inc.* | | | 61,167 | | | | 579,863 | |
International Seaways, Inc. | | | 35,600 | | | | 1,279,464 | |
Magnolia Oil & Gas Corp. (Class A Stock)(a) | | | 177,400 | | | | 4,147,612 | |
Northern Oil & Gas, Inc.(a) | | | 92,204 | | | | 3,426,301 | |
Par Pacific Holdings, Inc.* | | | 52,296 | | | | 857,132 | |
Peabody Energy Corp.(a) | | | 112,800 | | | | 2,362,032 | |
REX American Resources Corp.* | | | 14,443 | | | | 602,129 | |
SM Energy Co.(a) | | | 106,102 | | | | 4,112,514 | |
Talos Energy, Inc.* | | | 116,420 | | | | 1,130,438 | |
Vital Energy, Inc.*(a) | | | 25,331 | | | | 783,235 | |
World Kinect Corp.(a) | | | 53,920 | | | | 1,483,339 | |
| | | | | | | | |
| | |
| | | | | | | 32,220,007 | |
| | | | | | | | |
Paper & Forest Products — 0.2% | | | | | |
Sylvamo Corp. | | | 32,022 | | | | 2,530,378 | |
| | | | | | | | |
| | | | | | | | |
| | | Shares | | | Value | |
COMMON STOCKS (continued) | |
Passenger Airlines — 1.2% | | | | | | | | |
Alaska Air Group, Inc.* | | | 117,800 | | | $ | 7,627,550 | |
Allegiant Travel Co.(a) | | | 13,396 | | | | 1,260,832 | |
JetBlue Airways Corp.*(a) | | | 279,400 | | | | 2,196,084 | |
SkyWest, Inc.* | | | 37,386 | | | | 3,743,460 | |
Sun Country Airlines Holdings, Inc.* | | | 37,221 | | | | 542,682 | |
| | | | | | | | |
| | |
| | | | | | | 15,370,608 | |
| | | | | | | | |
Personal Care Products — 0.3% | | | | | | | | |
Edgewell Personal Care Co. | | | 45,215 | | | | 1,519,224 | |
Interparfums, Inc.(a) | | | 16,797 | | | | 2,208,973 | |
USANA Health Sciences, Inc.* | | | 10,213 | | | | 366,545 | |
| | | | | | | | |
| | |
| | | | | | | 4,094,742 | |
| | | | | | | | |
Pharmaceuticals — 1.7% | | | | | | | | |
Amphastar Pharmaceuticals, Inc.*(a) | | | 35,308 | | | | 1,310,986 | |
ANI Pharmaceuticals, Inc.* | | | 15,480 | | | | 855,735 | |
Collegium Pharmaceutical, Inc.*(a) | | | 30,169 | | | | 864,342 | |
Corcept Therapeutics, Inc.*(a) | | | 86,792 | | | | 4,373,449 | |
Harmony Biosciences Holdings, Inc.* | | | 35,279 | | | | 1,213,950 | |
Innoviva, Inc.*(a) | | | 51,556 | | | | 894,497 | |
Ligand Pharmaceuticals, Inc.*(a) | | | 17,541 | | | | 1,879,518 | |
Organon & Co. | | | 240,400 | | | | 3,586,768 | |
Pacira BioSciences, Inc.* | | | 42,868 | | | | 807,633 | |
Phibro Animal Health Corp. (Class A Stock) | | | 18,900 | | | | 396,900 | |
Prestige Consumer Healthcare,
Inc.*(a) | | | 45,780 | | | | 3,574,960 | |
Supernus Pharmaceuticals, Inc.* | | | 51,600 | | | | 1,865,856 | |
| | | | | | | | |
| | |
| | | | | | | 21,624,594 | |
| | | | | | | | |
Professional Services — 1.5% | | | | | | | | |
Amentum Holdings, Inc.* | | | 115,200 | | | | 2,422,656 | |
CSG Systems International, Inc. | | | 25,831 | | | | 1,320,223 | |
Heidrick & Struggles International, Inc. | | | 19,056 | | | | 844,371 | |
Korn Ferry | | | 48,282 | | | | 3,256,621 | |
NV5 Global, Inc.* | | | 48,040 | | | | 905,074 | |
Robert Half, Inc.(a) | | | 94,200 | | | | 6,637,332 | |
Verra Mobility Corp.*(a) | | | 153,713 | | | | 3,716,780 | |
| | | | | | | | |
| | |
| | | | | | | 19,103,057 | |
| | | | | | | | |
Real Estate Management & Development — 0.6% | |
Cushman & Wakefield PLC* | | | 214,707 | | | | 2,808,368 | |
eXp World Holdings, Inc.(a) | | | 79,200 | | | | 911,592 | |
Kennedy-Wilson Holdings, Inc. | | | 110,667 | | | | 1,105,563 | |
Marcus & Millichap, Inc. | | | 22,380 | | | | 856,259 | |
St. Joe Co. (The) | | | 35,237 | | | | 1,583,198 | |
| | | | | | | | |
| | |
| | | | | | | 7,264,980 | |
| | | | | | | | |
Residential REITs — 0.3% | | | | | | | | |
Centerspace | | | 15,343 | | | | 1,014,940 | |
Elme Communities | | | 82,409 | | | | 1,258,385 | |
NexPoint Residential Trust, Inc. | | | 20,595 | | | | 859,841 | |
Veris Residential, Inc. | | | 75,629 | | | | 1,257,710 | |
| | | | | | | | |
| | |
| | | | | | | 4,390,876 | |
| | | | | | | | |
Retail REITs — 1.9% | | | | | | | | |
Acadia Realty Trust | | | 111,076 | | | | 2,683,596 | |
Curbline Properties Corp.(a) | | | 88,472 | | | | 2,054,320 | |
Getty Realty Corp. | | | 46,661 | | | | 1,405,896 | |
SEE NOTES TO FINANCIAL STATEMENTS.
A221
| | | | |
| | PSF SMALL-CAP STOCK INDEX PORTFOLIO (CONTINUED) | | |
SCHEDULE OF INVESTMENTS | | | | as of December 31, 2024 |
| | | | | | | | |
| | | Shares | | | Value | |
COMMON STOCKS (continued) | |
Retail REITs (cont’d.) | | | | | | | | |
Macerich Co. (The)(a) | | | 228,000 | | | $ | 4,541,760 | |
Phillips Edison & Co., Inc.(a) | | | 114,400 | | | | 4,285,424 | |
Retail Opportunity Investments Corp. | | | 119,389 | | | | 2,072,593 | |
Saul Centers, Inc. | | | 11,378 | | | | 441,466 | |
SITE Centers Corp. | | | 44,236 | | | | 676,368 | |
Tanger, Inc. | | | 101,998 | | | | 3,481,192 | |
Urban Edge Properties | | | 115,916 | | | | 2,492,194 | |
Whitestone REIT | | | 41,687 | | | | 590,705 | |
| | | | | | | | |
| | |
| | | | | | | 24,725,514 | |
| | | | | | | | |
Semiconductors & Semiconductor Equipment — 3.2% | |
Alpha & Omega Semiconductor Ltd.*(a) | | | 22,245 | | | | 823,732 | |
Axcelis Technologies, Inc.*(a) | | | 30,350 | | | | 2,120,555 | |
CEVA, Inc.* | | | 22,243 | | | | 701,767 | |
Cohu, Inc.*(a) | | | 43,902 | | | | 1,172,183 | |
Diodes, Inc.*(a) | | | 43,200 | | | | 2,664,144 | |
FormFactor, Inc.*(a) | | | 71,793 | | | | 3,158,892 | |
Ichor Holdings Ltd.* | | | 31,401 | | | | 1,011,740 | |
Impinj, Inc.*(a) | | | 21,270 | | | | 3,089,680 | |
Kulicke & Soffa Industries, Inc. (Singapore)(a) | | | 49,984 | | | | 2,332,253 | |
MaxLinear, Inc.* | | | 71,455 | | | | 1,413,380 | |
PDF Solutions, Inc.* | | | 28,718 | | | | 777,683 | |
Penguin Solutions, Inc.*(a) | | | 49,230 | | | | 944,724 | |
Photronics, Inc.* | | | 59,321 | | | | 1,397,603 | |
Qorvo, Inc.* | | | 87,750 | | | | 6,136,358 | |
Semtech Corp.* | | | 78,046 | | | | 4,827,145 | |
SiTime Corp.*(a) | | | 17,540 | | | | 3,762,856 | |
SolarEdge Technologies, Inc.*(a) | | | 53,650 | | | | 729,640 | |
Ultra Clean Holdings, Inc.* | | | 42,150 | | | | 1,515,293 | |
Veeco Instruments, Inc.*(a) | | | 53,149 | | | | 1,424,393 | |
Wolfspeed, Inc.*(a) | | | 117,850 | | | | 784,881 | |
| | | | | | | | |
| | |
| | | | | | | 40,788,902 | |
| | | | | | | | |
Software — 3.9% | | | | | | | | |
A10 Networks, Inc. | | | 68,696 | | | | 1,264,006 | |
ACI Worldwide, Inc.* | | | 97,250 | | | | 5,048,247 | |
Adeia, Inc.(a) | | | 102,009 | | | | 1,426,086 | |
Agilysys, Inc.*(a) | | | 20,873 | | | | 2,749,183 | |
Alarm.com Holdings, Inc.* | | | 45,889 | | | | 2,790,051 | |
BlackLine, Inc.*(a) | | | 48,100 | | | | 2,922,556 | |
Box, Inc. (Class A Stock)*(a) | | | 133,000 | | | | 4,202,800 | |
Clear Secure, Inc. (Class A Stock)(a) | | | 87,300 | | | | 2,325,672 | |
DoubleVerify Holdings, Inc.* | | | 130,389 | | | | 2,504,773 | |
InterDigital, Inc. | | | 23,545 | | | | 4,561,137 | |
LiveRamp Holdings, Inc.* | | | 60,594 | | | | 1,840,240 | |
MARA Holdings, Inc.*(a) | | | 298,850 | | | | 5,011,715 | |
N-able, Inc.* | | | 65,588 | | | | 612,592 | |
NCR Voyix Corp.*(a) | | | 136,150 | | | | 1,884,316 | |
Progress Software Corp. | | | 39,812 | | | | 2,593,752 | |
SolarWinds Corp. | | | 50,900 | | | | 725,325 | |
Sprinklr, Inc. (Class A Stock)*(a) | | | 103,000 | | | | 870,350 | |
SPS Commerce, Inc.* | | | 34,883 | | | | 6,418,123 | |
| | | | | | | | |
| | |
| | | | | | | 49,750,924 | |
| | | | | | | | |
Specialized REITs — 0.5% | | | | | | | | |
Four Corners Property Trust,
Inc.(a) | | | 89,825 | | | | 2,437,850 | |
| | | | | | | | |
| | | Shares | | | Value | |
COMMON STOCKS (continued) | |
Specialized REITs (cont’d.) | | | | | | | | |
Outfront Media, Inc.(a) | | | 131,651 | | | $ | 2,335,484 | |
Safehold, Inc.(a) | | | 42,783 | | | | 790,630 | |
Uniti Group, Inc. | | | 228,681 | | | | 1,257,746 | |
| | | | | | | | |
| | |
| | | | | | | 6,821,710 | |
| | | | | | | | |
Specialty Retail — 4.0% | | | | | | | | |
Academy Sports & Outdoors, Inc.(a) | | | 65,260 | | | | 3,754,408 | |
Advance Auto Parts, Inc.(a) | | | 55,100 | | | | 2,605,679 | |
American Eagle Outfitters, Inc. | | | 162,279 | | | | 2,705,191 | |
Asbury Automotive Group, Inc.*(a) | | | 18,186 | | | | 4,419,744 | |
Bath & Body Works, Inc. | | | 203,450 | | | | 7,887,757 | |
Boot Barn Holdings, Inc.* | | | 28,487 | | | | 4,324,896 | |
Buckle, Inc. (The)(a) | | | 27,977 | | | | 1,421,511 | |
Caleres, Inc.(a) | | | 32,877 | | | | 761,431 | |
Foot Locker, Inc.* | | | 77,150 | | | | 1,678,784 | |
Group 1 Automotive, Inc. | | | 12,069 | | | | 5,086,842 | |
Guess?, Inc.(a) | | | 26,725 | | | | 375,754 | |
Leslie’s, Inc.* | | | 173,591 | | | | 387,108 | |
MarineMax, Inc.* | | | 18,559 | | | | 537,283 | |
Monro, Inc.(a) | | | 27,855 | | | | 690,804 | |
National Vision Holdings, Inc.* | | | 74,358 | | | | 774,810 | |
ODP Corp. (The)* | | | 27,937 | | | | 635,287 | |
Sally Beauty Holdings, Inc.*(a) | | | 96,111 | | | | 1,004,360 | |
Shoe Carnival, Inc.(a) | | | 16,399 | | | | 542,479 | |
Signet Jewelers Ltd.(a) | | | 40,880 | | | | 3,299,425 | |
Sonic Automotive, Inc. (Class A Stock)(a) | | | 13,586 | | | | 860,673 | |
Upbound Group, Inc. | | | 45,549 | | | | 1,328,664 | |
Urban Outfitters, Inc.* | | | 52,255 | | | | 2,867,755 | |
Victoria’s Secret & Co.* | | | 73,300 | | | | 3,036,086 | |
| | | | | | | | |
| | |
| | | | | | | 50,986,731 | |
| | | | | | | | |
Technology Hardware, Storage & Peripherals — 0.1% | |
Corsair Gaming, Inc.* | | | 41,902 | | | | 276,972 | |
Xerox Holdings Corp.(a) | | | 108,300 | | | | 912,969 | |
| | | | | | | | |
| | |
| | | | | | | 1,189,941 | |
| | | | | | | | |
Textiles, Apparel & Luxury Goods — 1.7% | |
Carter’s, Inc.(a) | | | 33,450 | | | | 1,812,655 | |
G-III Apparel Group Ltd.*(a) | | | 35,856 | | | | 1,169,623 | |
Hanesbrands, Inc.*(a) | | | 329,406 | | | | 2,681,365 | |
Kontoor Brands, Inc.(a) | | | 46,080 | | | | 3,935,693 | |
Oxford Industries, Inc.(a) | | | 13,580 | | | | 1,069,832 | |
Steven Madden Ltd. | | | 66,997 | | | | 2,848,712 | |
VF Corp.(a) | | | 307,300 | | | | 6,594,658 | |
Wolverine World Wide, Inc.(a) | | | 74,904 | | | | 1,662,869 | |
| | | | | | | | |
| | |
| | | | | | | 21,775,407 | |
| | | | | | | | |
Tobacco — 0.1% | | | | | | | | |
Universal Corp. | | | 22,840 | | | | 1,252,546 | |
| | | | | | | | |
Trading Companies & Distributors — 1.4% | |
Air Lease Corp.(a) | | | 96,150 | | | | 4,635,392 | |
Boise Cascade Co. | | | 35,664 | | | | 4,239,023 | |
DNOW, Inc.* | | | 99,733 | | | | 1,297,526 | |
DXP Enterprises, Inc.* | | | 11,812 | | | | 975,907 | |
GMS, Inc.* | | | 36,469 | | | | 3,093,665 | |
SEE NOTES TO FINANCIAL STATEMENTS.
A222
| | | | |
| | PSF SMALL-CAP STOCK INDEX PORTFOLIO (CONTINUED) | | |
SCHEDULE OF INVESTMENTS | | | | as of December 31, 2024 |
| | | | | | | | |
| | | Shares | | | Value | |
COMMON STOCKS (continued) | |
Trading Companies & Distributors (cont’d.) | | | | | |
Rush Enterprises, Inc. (Class A Stock) | | | 57,650 | | | $ | 3,158,644 | |
| | | | | | | | |
| | |
| | | | | | | 17,400,157 | |
| | | | | | | | |
Water Utilities — 0.6% | | | | | | | | |
American States Water Co. | | | 34,952 | | | | 2,716,469 | |
California Water Service Group | | | 54,777 | | | | 2,483,041 | |
Middlesex Water Co.(a) | | | 16,457 | | | | 866,132 | |
SJW Group | | | 27,635 | | | | 1,360,195 | |
| | | | | | | | |
| | |
| | | | | | | 7,425,837 | |
| | | | | | | | |
Wireless Telecommunication Services — 0.3% | | | | | |
Gogo, Inc.* | | | 56,044 | | | | 453,396 | |
Telephone & Data Systems, Inc. | | | 90,560 | | | | 3,089,002 | |
| | | | | | | | |
| | |
| | | | | | | 3,542,398 | |
| | | | | | | | |
TOTAL COMMON STOCKS
(cost $869,575,167) | | | | | | | 1,257,781,091 | |
| | | | | | | | |
UNAFFILIATED EXCHANGE-TRADED FUND — 0.7% | |
iShares Core S&P Small-Cap ETF(a) | | | 77,020 | | | | 8,874,245 | |
| | | | | | | | |
(cost $8,908,039) | | | | | | | | |
TOTAL LONG-TERM INVESTMENTS
(cost $878,483,206) | | | | 1,266,655,336 | |
| | | | | | | | |
| |
SHORT-TERM INVESTMENTS — 23.5% | | | | | |
AFFILIATED MUTUAL FUNDS — 23.5% | | | | | |
PGIM Core Ultra Short Bond Fund(wb) | | | 2,896,448 | | | | 2,896,448 | |
PGIM Institutional Money Market Fund (7-day effective yield 4.649%) (cost $294,846,954; includes $293,695,120 of cash collateral for securities on loan)(b)(wb) | | | 295,243,567 | | | | 295,066,421 | |
| | | | | | | | |
TOTAL AFFILIATED MUTUAL FUNDS
(cost $297,743,402) | | | | 297,962,869 | |
| | | | | | | | |
| | | | | | | | | | | | | | |
Interest Rate | | Maturity
Date | | | | | Principal
Amount
(000)# | | | Value | |
|
U.S. TREASURY OBLIGATION(k)(n) — 0.0% | |
U.S. Treasury Bills | | | | | | | | | | | | |
4.216% | | 03/20/25 | | | | | | | 400 | | | $ | 396,426 | |
| | | | | | | | | | | | | | |
(cost $396,386) | | | | | | | | | | | | |
| |
TOTAL SHORT-TERM INVESTMENTS
(cost $298,139,788) | | | | 298,359,295 | |
| | | | | | | | | | | | | | |
| |
TOTAL INVESTMENTS—123.2%
(cost $1,176,622,994) | | | | 1,565,014,631 | |
Liabilities in excess of other assets(z) — (23.2)% | | | | (294,258,577 | ) |
| | | | | | | | | | | | | | |
| | | |
NET ASSETS — 100.0% | | | | | | | | | | $ | 1,270,756,054 | |
| | | | | | | | | | | | | | |
See the Glossary for a list of the abbreviation(s) used in the annual report.
| * | Non-income producing security. |
| # | Principal amount is shown in U.S. dollars unless otherwise stated. |
| (a) | All or a portion of security is on loan. The aggregate market value of such securities, including those sold and pending settlement, is $287,730,119; cash collateral of $293,695,120 (included in liabilities) was received with which the Portfolio purchased highly liquid short-term investments. In the event of significant appreciation in value of securities on loan on the last business day of the reporting period, the Portfolio may reflect a collateral value that is less than the market value of the loaned securities and such shortfall is remedied the following business day. |
| (b) | Represents security, or portion thereof, purchased with cash collateral received for securities on loan and includes dividend reinvestment. |
| (k) | Represents security, or a portion thereof, segregated as collateral for centrally cleared/exchange-traded derivatives. |
| (n) | Rate shown reflects yield to maturity at purchased date. |
| (wb) | Represents an investment in a Fund affiliated with the Manager. |
| (z) | Includes net unrealized appreciation/(depreciation) and/or market value of the below holdings which are excluded from the Schedule of Investments: |
Futures contracts outstanding at December 31, 2024:
| | | | | | | | | | | | | | | | | |
Number
of
Contracts | | Type | | Expiration
Date | | Current
Notional
Amount | | Value /
Unrealized
Appreciation
(Depreciation) |
| | | | | | | | | |
Long Position: | | | | | | | | | | | | | | | |
28 | | Russell 2000 E-Mini Index | | | | Mar. 2025 | | | | $ | 3,149,720 | | | | $ | (198,597 | ) |
| | | | | | | | | | | | | | | | | |
Summary of Collateral for Centrally Cleared/Exchange-traded Derivatives:
Cash and securities segregated as collateral, including pending settlement for closed positions, to cover requirements for centrally cleared/exchange-traded derivatives are listed by broker as follows:
| | | | | | | | | | | | | | | | | | | | | | | | |
Broker | | Cash and/or Foreign Currency | | | Securities Market Value | |
UBS | | | | | | $ | — | | | | | | | | | | | $ | 396,426 | | | | | |
| | | | | | | | | | | | | | | | | | | | | | | | |
Fair Value Measurements:
Various inputs are used in determining the value of the Portfolio’s investments. These inputs are summarized in the three broad levels listed below.
Level 1—unadjusted quoted prices generally in active markets for identical securities.
SEE NOTES TO FINANCIAL STATEMENTS.
A223
| | | | |
| | PSF SMALL-CAP STOCK INDEX PORTFOLIO (CONTINUED) | | |
SCHEDULE OF INVESTMENTS | | | | as of December 31, 2024 |
Level 2—quoted prices for similar securities, interest rates and yield curves, prepayment speeds, foreign currency exchange rates and other observable inputs.
Level 3—unobservable inputs for securities valued in accordance with Board approved fair valuation procedures.
The following is a summary of the inputs used as of December 31, 2024 in valuing such portfolio securities:
| | | | | | | | | | | | |
| | | Level 1 | | | Level 2 | | | Level 3 | |
Investments in Securities | | | | | | | | | | | | |
Assets | | | | | | | | | | | | |
Long-Term Investments | | | | | | | | | | | | |
Common Stocks | | | | | | | | | | | | |
Aerospace & Defense | | $ | 15,062,781 | | | $ | — | | | | $— | |
Air Freight & Logistics | | | 3,096,666 | | | | — | | | | — | |
Automobile Components | | | 17,416,874 | | | | — | | | | — | |
Automobiles | | | 1,282,702 | | | | — | | | | — | |
Banks | | | 116,063,419 | | | | — | | | | — | |
Beverages | | | 1,446,987 | | | | — | | | | — | |
Biotechnology | | | 28,412,549 | | | | — | | | | — | |
Broadline Retail | | | 6,986,626 | | | | — | | | | — | |
Building Products | | | 33,821,703 | | | | — | | | | — | |
Capital Markets | | | 34,295,594 | | | | — | | | | — | |
Chemicals | | | 24,494,331 | | | | — | | | | — | |
Commercial Services & Supplies | | | 28,544,677 | | | | — | | | | — | |
Communications Equipment | | | 10,653,062 | | | | — | | | | — | |
Construction & Engineering | | | 17,979,837 | | | | — | | | | — | |
Consumer Finance | | | 11,048,579 | | | | — | | | | — | |
Consumer Staples Distribution & Retail | | | 8,425,926 | | | | — | | | | — | |
Containers & Packaging | | | 6,156,792 | | | | — | | | | — | |
Diversified Consumer Services | | | 15,418,699 | | | | — | | | | — | |
Diversified REITs | | | 9,575,822 | | | | — | | | | — | |
Diversified Telecommunication Services | | | 8,579,009 | | | | — | | | | — | |
Electric Utilities | | | 6,034,056 | | | | — | | | | — | |
Electrical Equipment | | | 4,899,154 | | | | — | | | | — | |
Electronic Equipment, Instruments & Components | | | 43,505,076 | | | | — | | | | — | |
Energy Equipment & Services | | | 27,447,816 | | | | — | | | | — | |
Entertainment | | | 6,605,451 | | | | — | | | | — | |
Financial Services | | | 31,317,957 | | | | — | | | | — | |
Food Products | | | 15,364,655 | | | | — | | | | — | |
Gas Utilities | | | 7,471,707 | | | | — | | | | — | |
Ground Transportation | | | 10,192,792 | | | | — | | | | — | |
Health Care Equipment & Supplies | | | 47,667,743 | | | | — | | | | — | |
Health Care Providers & Services | | | 34,229,851 | | | | — | | | | — | |
Health Care REITs | | | 8,807,511 | | | | — | | | | — | |
Health Care Technology | | | 3,232,043 | | | | — | | | | — | |
Hotel & Resort REITs | | | 10,793,248 | | | | — | | | | — | |
Hotels, Restaurants & Leisure | | | 27,738,941 | | | | — | | | | — | |
Household Durables | | | 40,416,956 | | | | — | | | | — | |
Household Products | | | 7,128,720 | | | | — | | | | — | |
Independent Power & Renewable Electricity Producers | | | 2,808,558 | | | | — | | | | — | |
Industrial REITs | | | 9,476,371 | | | | — | | | | — | |
Insurance | | | 30,560,888 | | | | — | | | | — | |
Interactive Media & Services | | | 14,690,215 | | | | — | | | | — | |
IT Services | | | 6,584,775 | | | | — | | | | — | |
Leisure Products | | | 2,641,787 | | | | — | | | | — | |
Life Sciences Tools & Services | | | 5,857,000 | | | | — | | | | — | |
Machinery | | | 53,508,270 | | | | — | | | | — | |
Marine Transportation | | | 4,158,196 | | | | — | | | | — | |
Media | | | 10,065,133 | | | | — | | | | — | |
Metals & Mining | | | 22,315,022 | | | | — | | | | — | |
Mortgage Real Estate Investment Trusts (REITs) | | | 14,210,846 | | | | — | | | | — | |
Multi-Utilities | | | 3,508,607 | | | | — | | | | — | |
Office REITs | | | 13,519,802 | | | | — | | | | — | |
Oil, Gas & Consumable Fuels | | | 32,220,007 | | | | — | | | | — | |
SEE NOTES TO FINANCIAL STATEMENTS.
A224
| | | | |
| | PSF SMALL-CAP STOCK INDEX PORTFOLIO (CONTINUED) | | |
SCHEDULE OF INVESTMENTS | | | | as of December 31, 2024 |
| | | | | | | | | | | | |
| | | Level 1 | | | Level 2 | | | Level 3 | |
Investments in Securities (continued) | | | | | | | | | | | | |
Assets (continued) | | | | | | | | | | | | |
Long-Term Investments (continued) | | | | | | | | | | | | |
Common Stocks (continued) | | | | | | | | | | | | |
Paper & Forest Products | | $ | 2,530,378 | | | $ | — | | | | $— | |
Passenger Airlines | | | 15,370,608 | | | | — | | | | — | |
Personal Care Products | | | 4,094,742 | | | | — | | | | — | |
Pharmaceuticals | | | 21,624,594 | | | | — | | | | — | |
Professional Services | | | 19,103,057 | | | | — | | | | — | |
Real Estate Management & Development | | | 7,264,980 | | | | — | | | | — | |
Residential REITs | | | 4,390,876 | | | | — | | | | — | |
Retail REITs | | | 24,725,514 | | | | — | | | | — | |
Semiconductors & Semiconductor Equipment | | | 40,788,902 | | | | — | | | | — | |
Software | | | 49,750,924 | | | | — | | | | — | |
Specialized REITs | | | 6,821,710 | | | | — | | | | — | |
Specialty Retail | | | 50,986,731 | | | | — | | | | — | |
Technology Hardware, Storage & Peripherals | | | 1,189,941 | | | | — | | | | — | |
Textiles, Apparel & Luxury Goods | | | 21,775,407 | | | | — | | | | — | |
Tobacco | | | 1,252,546 | | | | — | | | | — | |
Trading Companies & Distributors | | | 17,400,157 | | | | — | | | | — | |
Water Utilities | | | 7,425,837 | | | | — | | | | — | |
Wireless Telecommunication Services | | | 3,542,398 | | | | — | | | | — | |
Unaffiliated Exchange-Traded Fund | | | 8,874,245 | | | | — | | | | — | |
Short-Term Investments | | | | | | | | | | | | |
Affiliated Mutual Funds | | | 297,962,869 | | | | — | | | | — | |
U.S. Treasury Obligation | | | — | | | | 396,426 | | | | — | |
| | | | | | | | | | | | |
Total | | $ | 1,564,618,205 | | | $ | 396,426 | | | | $— | |
| | | | | | | | | | | | |
| | | |
Other Financial Instruments* | | | | | | | | | | | | |
Liabilities | | | | | | | | | | | | |
Futures Contracts | | $ | (198,597 | ) | | $ | — | | | | $— | |
| | | | | | | | | | | | |
| * | Other financial instruments are derivative instruments not reflected in the Schedule of Investments, such as futures, forwards and centrally cleared swap contracts, which are recorded at unrealized appreciation (depreciation) on the instrument, and OTC swap contracts which are recorded at fair value. |
Industry Classification:
The industry classification of investments and liabilities in excess of other assets shown as a percentage of net assets as of December 31, 2024 were as follows:
| | | | |
Affiliated Mutual Funds (23.1% represents investments purchased with collateral from securities on loan) | | | 23.5 | % |
Banks | | | 9.1 | |
Machinery | | | 4.2 | |
Specialty Retail | | | 4.0 | |
Software | | | 3.9 | |
Health Care Equipment & Supplies | | | 3.8 | |
Electronic Equipment, Instruments & Components | | | 3.4 | |
Semiconductors & Semiconductor Equipment | | | 3.2 | |
Household Durables | | | 3.2 | |
Capital Markets | | | 2.7 | |
Health Care Providers & Services | | | 2.7 | |
Building Products | | | 2.7 | |
Oil, Gas & Consumable Fuels | | | 2.5 | |
Financial Services | | | 2.5 | |
Insurance | | | 2.4 | |
Commercial Services & Supplies | | | 2.2 | |
Biotechnology | | | 2.2 | |
Hotels, Restaurants & Leisure | | | 2.2 | |
Energy Equipment & Services | | | 2.2 | |
| | | | |
Retail REITs | | | 1.9 | % |
Chemicals | | | 1.9 | |
Metals & Mining | | | 1.8 | |
Textiles, Apparel & Luxury Goods | | | 1.7 | |
Pharmaceuticals | | | 1.7 | |
Professional Services | | | 1.5 | |
Construction & Engineering | | | 1.4 | |
Automobile Components | | | 1.4 | |
Trading Companies & Distributors | | | 1.4 | |
Diversified Consumer Services | | | 1.2 | |
Passenger Airlines | | | 1.2 | |
Food Products | | | 1.2 | |
Aerospace & Defense | | | 1.2 | |
Interactive Media & Services | | | 1.2 | |
Mortgage Real Estate Investment Trusts (REITs) | | | 1.1 | |
Office REITs | | | 1.1 | |
Consumer Finance | | | 0.9 | |
Hotel & Resort REITs | | | 0.8 | |
Communications Equipment | | | 0.8 | |
Ground Transportation | | | 0.8 | |
SEE NOTES TO FINANCIAL STATEMENTS.
A225
| | | | |
| | PSF SMALL-CAP STOCK INDEX PORTFOLIO (CONTINUED) | | |
SCHEDULE OF INVESTMENTS | | | | as of December 31, 2024 |
Industry Classification (continued):
| | | | |
Media | | | 0.8 | % |
Diversified REITs | | | 0.8 | |
Industrial REITs | | | 0.7 | |
Unaffiliated Exchange-Traded Fund | | | 0.7 | |
Health Care REITs | | | 0.7 | |
Diversified Telecommunication Services | | | 0.7 | |
Consumer Staples Distribution & Retail | | | 0.7 | |
Gas Utilities | | | 0.6 | |
Water Utilities | | | 0.6 | |
Real Estate Management & Development | | | 0.6 | |
Household Products | | | 0.6 | |
Broadline Retail | | | 0.5 | |
Specialized REITs | | | 0.5 | |
Entertainment | | | 0.5 | |
IT Services | | | 0.5 | |
Containers & Packaging | | | 0.5 | |
Electric Utilities | | | 0.5 | |
Life Sciences Tools & Services | | | 0.5 | |
Electrical Equipment | | | 0.4 | |
Residential REITs | | | 0.3 | |
| | | | |
Marine Transportation | | | 0.3 | % |
Personal Care Products | | | 0.3 | |
Wireless Telecommunication Services | | | 0.3 | |
Multi-Utilities | | | 0.3 | |
Health Care Technology | | | 0.3 | |
Air Freight & Logistics | | | 0.2 | |
Independent Power & Renewable Electricity Producers | | | 0.2 | |
Leisure Products | | | 0.2 | |
Paper & Forest Products | | | 0.2 | |
Beverages | | | 0.1 | |
Automobiles | | | 0.1 | |
Tobacco | | | 0.1 | |
Technology Hardware, Storage & Peripherals | | | 0.1 | |
U.S. Treasury Obligation | | | 0.0 | * |
| | | | |
| |
| | | 123.2 | |
Liabilities in excess of other assets | | | (23.2 | ) |
| | | | |
| |
| | | 100.0 | % |
| | | | |
Effects of Derivative Instruments on the Financial Statements and Primary Underlying Risk Exposure:
The Portfolio invested in derivative instruments during the reporting period. The primary type of risk associated with these derivative instruments is equity risk. See the Notes to Financial Statements for additional detail regarding these derivative instruments and their risks. The effect of such derivative instruments on the Portfolio’s financial position and financial performance as reflected in the Statement of Assets and Liabilities and Statement of Operations is presented in the summary below.
Fair values of derivative instruments as of December 31, 2024 as presented in the Statement of Assets and Liabilities:
| | | | | | | | |
| | | Asset Derivatives | | Liability Derivatives |
Derivatives not accounted for as hedging instruments, carried at fair value | | Statement of Assets and Liabilities Location | | Fair Value | | Statement of Assets and Liabilities Location | | Fair Value |
| | | | | | | | | |
Equity contracts | | — | | $— | | Due from/to broker-variation margin futures | | $198,597* |
| | | | | | | | |
| * | Includes cumulative appreciation (depreciation) as reported in the schedule of open futures and centrally cleared swap contracts. Only unsettled variation margin receivable (payable) is reported within the Statement of Assets and Liabilities. |
The effects of derivative instruments on the Statement of Operations for the year ended December 31, 2024 are as follows:
| | | | | | |
Amount of Realized Gain (Loss) on Derivatives Recognized in Income | |
Derivatives not accounted for as hedging instruments, carried at fair value | | | | Futures | |
Equity contracts | | | | $ | 1,021,982 | |
| | | | | | |
| | | | | | |
Change in Unrealized Appreciation (Depreciation) on Derivatives Recognized in Income | |
Derivatives not accounted for as hedging instruments, carried at fair value | | | | Futures | |
Equity contracts | | | | $ | (598,158 | ) |
| | | | | | |
For the year ended December 31, 2024, the Portfolio’s average volume of derivative activities is as follows:
| | |
| Derivative Contract Type | | Average Volume of Derivative Activities* |
|
| | | |
Futures Contracts - Long Positions (1) | | $4,178,282 |
|
SEE NOTES TO FINANCIAL STATEMENTS.
A226
| | | | |
| | PSF SMALL-CAP STOCK INDEX PORTFOLIO (CONTINUED) | | |
SCHEDULE OF INVESTMENTS | | | | as of December 31, 2024 |
| * | Average volume is based on average quarter end balances for the year ended December 31, 2024. |
| (1) | Notional Amount in USD. |
Financial Instruments/Transactions—Summary of Offsetting and Netting Arrangements:
The Portfolio entered into financial instruments/transactions during the reporting period that are either offset in accordance with current requirements or are subject to enforceable master netting arrangements or similar agreements that permit offsetting. The information about offsetting and related netting arrangements for financial instruments/transactions where the legal right to set-off exists is presented in the summary below.
Offsetting of financial instrument/transaction assets and liabilities:
| | | | | | |
|
| Description | | Gross Market Value of Recognized Assets/(Liabilities) | | Collateral Pledged/(Received)(1) | | Net Amount |
|
Securities on Loan | | $287,730,119 | | $(287,730,119) | | $— |
|
| (1) | Collateral amount disclosed by the Portfolio is limited to the market value of financial instruments/transactions. |
SEE NOTES TO FINANCIAL STATEMENTS.
A227
| | | | |
| | PSF SMALL-CAP STOCK INDEX PORTFOLIO (CONTINUED) | | |
| | | | |
STATEMENT OF ASSETS AND LIABILITIES | |
as of December 31, 2024 | |
| |
ASSETS | | | | |
Investments at value, including securities on loan of $287,730,119: | | | | |
Unaffiliated investments (cost $878,879,592) | | $ | 1,267,051,762 | |
Affiliated investments (cost $297,743,402) | | | 297,962,869 | |
Cash | | | 66,266 | |
Dividends and interest receivable | | | 1,705,737 | |
Receivable for investments sold | | | 691,286 | |
Receivable for Portfolio shares sold | | | 405,012 | |
Tax reclaim receivable | | | 7,156 | |
Due from broker-variation margin futures | | | 2,940 | |
Prepaid expenses | | | 13,099 | |
| | | | |
Total Assets | | | 1,567,906,127 | |
| | | | |
LIABILITIES | | | | |
Payable to broker for collateral for securities on loan | | | 293,695,120 | |
Accrued expenses and other liabilities | | | 1,527,792 | |
Payable for investments purchased | | | 1,261,976 | |
Management fee payable. | | | 393,617 | |
Payable for Portfolio shares purchased | | | 259,316 | |
Payable to affiliate | | | 7,156 | |
Distribution fee payable | | | 2,856 | |
Affiliated transfer agent fee payable | | | 1,190 | |
Trustees’ fees payable | | | 1,050 | |
| | | | |
Total Liabilities | | | 297,150,073 | |
| | | | |
NET ASSETS | | $ | 1,270,756,054 | |
| | | | |
Net assets were comprised of: | | | | |
Partners’ Equity | | $ | 1,270,756,054 | |
| | | | |
Class I: | | | | |
Net asset value and redemption price per share, $1,257,683,327 / 19,874,589 outstanding shares of beneficial interest | | $ | 63.28 | |
| | | | |
Class III: | | | | |
Net asset value and redemption price per share, $13,072,727 / 208,490 outstanding shares of beneficial interest | | $ | 62.70 | |
| | | | |
| | | | |
STATEMENT OF OPERATIONS | |
Year Ended December 31, 2024 | |
|
NET INVESTMENT INCOME (LOSS) | |
INCOME | | | | |
Unaffiliated dividend income
(net of $18,949 foreign withholding tax) | | $ | 18,614,817 | |
Income from securities lending, net (including affiliated income of $642,817) | | | 721,515 | |
Affiliated dividend income | | | 219,687 | |
Interest income | | | 29,479 | |
| | | | |
Total income | | | 19,585,498 | |
| | | | |
EXPENSES | | | | |
Management fee | | | 4,327,867 | |
Distribution fee—Class III | | | 29,580 | |
Custodian and accounting fees | | | 98,791 | |
Shareholders’ reports | | | 93,316 | |
Audit fee | | | 47,205 | |
Professional fees | | | 40,876 | |
Trustees’ fees | | | 28,600 | |
Transfer agent’s fees and expenses (including affiliated expense of $7,143) | | | 11,944 | |
Miscellaneous | | | 73,367 | |
| | | | |
Total expenses | | | 4,751,546 | |
| | | | |
| NET INVESTMENT INCOME (LOSS) | | | 14,833,952 | |
| | | | |
| REALIZED AND UNREALIZED GAIN (LOSS) ON | | | | |
| INVESTMENT TRANSACTIONS | | | | |
Net realized gain (loss) on: | | | | |
Investment transactions (including affiliated of $(10,533)) | | | 70,769,463 | |
Futures transactions | | | 1,021,982 | |
| | | | |
| | | 71,791,445 | |
| | | | |
Net change in unrealized appreciation (depreciation) on: | | | | |
Investments (including affiliated of $(43,097)) | | | 13,144,621 | |
Futures | | | (598,158 | ) |
| | | | |
| | | 12,546,463 | |
| | | | |
NET GAIN (LOSS) ON INVESTMENT TRANSACTIONS | | | 84,337,908 | |
| | | | |
NET INCREASE (DECREASE) IN NET ASSETS RESULTING FROM OPERATIONS | | $ | 99,171,860 | |
| | | | |
STATEMENTS OF CHANGES IN NET ASSETS
| | | | | | | | | | | | | | | | | | | | | | | | |
| | | Year Ended December 31, 2024 | | | Year Ended December 31, 2023 | |
| | | | | | | | | | | | | | | | | | | |
INCREASE (DECREASE) IN NET ASSETS | | | | | | | | | | | | | | | | | | | | | | | | |
OPERATIONS | | | | | | | | | | | | | | | | | | | | | | | | |
Net investment income (loss) | | | | | | $ | 14,833,952 | | | | | | | | | | | $ | 14,071,558 | | | | | |
Net realized gain (loss) on investment transactions | | | | | | | 71,791,445 | | | | | | | | | | | | 3,559,480 | | | | | |
Net change in unrealized appreciation (depreciation) on investments | | | | | | | 12,546,463 | | | | | | | | | | | | 137,588,292 | | | | | |
| | | | | | | | | | | | | | | | | | | | | | | | |
NET INCREASE (DECREASE) IN NET ASSETS RESULTING FROM OPERATIONS | | | | | | | 99,171,860 | | | | | | | | | | | | 155,219,330 | | | | | |
| | | | | | | | | | | | | | | | | | | | | | | | |
PORTFOLIO SHARE TRANSACTIONS | | | | | | | | | | | | | | | | | | | | | | | | |
Portfolio shares sold | | | | | | | 42,062,884 | | | | | | | | | | | | 42,578,494 | | | | | |
Net asset value of shares issued in merger | | | | | | | — | | | | | | | | | | | | 284,937,009 | | | | | |
Portfolio shares purchased | | | | | | | (98,991,223 | ) | | | | | | | | | | | (68,714,581 | ) | | | | |
| | | | | | | | | | | | | | | | | | | | | | | | |
NET INCREASE (DECREASE) IN NET ASSETS FROM PORTFOLIO SHARE TRANSACTIONS | | | | | | | (56,928,339 | ) | | | | | | | | | | | 258,800,922 | | | | | |
| | | | | | | | | | | | | | | | | | | | | | | | |
TOTAL INCREASE (DECREASE) | | | | | | | 42,243,521 | | | | | | | | | | | | 414,020,252 | | | | | |
NET ASSETS: | | | | | | | | | | | | | | | | | | | | | | | | |
Beginning of year | | | | | | | 1,228,512,533 | | | | | | | | | | | | 814,492,281 | | | | | |
| | | | | | | | | | | | | | | | | | | | | | | | |
End of year | | | | | | $ | 1,270,756,054 | | | | | | | | | | | $ | 1,228,512,533 | | | | | |
| | | | | | | | | | | | | | | | | | | | | | | | |
SEE NOTES TO FINANCIAL STATEMENTS.
A228
| | | | |
| | PSF SMALL-CAP STOCK INDEX PORTFOLIO (CONTINUED) | | |
FINANCIAL HIGHLIGHTS | | | | |
| | | | | | | | | | | | | | | | | | | | |
Class I | | | | | | | | | | | | | | | |
| | | Year Ended December 31, | |
| | | 2024 | | | 2023 | | | 2022 | | | 2021 | | | 2020 | |
Per Share Operating Performance(a): | | | | | | | | | | | | | | | | | | | | |
Net Asset Value, beginning of year | | $ | 58.40 | | | $ | 50.46 | | | $ | 60.34 | | | $ | 47.76 | | | $ | 43.03 | |
| | | | | | | | | | | | | | | | | | | | |
Income (Loss) From Investment Operations: | | | | | | | | | | | | | | | | | | | | |
Net investment income (loss) | | | 0.73 | | | | 0.75 | | | | 0.59 | | | | 0.51 | | | | 0.40 | |
Net realized and unrealized gain (loss) on investment transactions | | | 4.15 | | | | 7.19 | | | | (10.47 | ) | | | 12.07 | | | | 4.33 | |
| | | | | | | | | | | | | | | | | | | | |
Total from investment operations | | | 4.88 | | | | 7.94 | | | | (9.88 | ) | | | 12.58 | | | | 4.73 | |
| | | | | | | | | | | | | | | | | | | | |
Net Asset Value, end of year | | $ | 63.28 | | | $ | 58.40 | | | $ | 50.46 | | | $ | 60.34 | | | $ | 47.76 | |
| | | | | | | | | | | | | | | | | | | | |
Total Return(b) | | | 8.36 | % | | | 15.74 | % | | | (16.37 | )% | | | 26.34 | % | | | 10.99 | % |
Ratios/Supplemental Data: | | | | | | | | | | | | | | | | | | | | |
Net assets, end of year (in millions) | | $ | 1,258 | | | $ | 1,217 | | | $ | 806 | | | $ | 1,024 | | | $ | 858 | |
Average net assets (in millions) | | $ | 1,225 | | | $ | 979 | | | $ | 870 | | | $ | 1,002 | | | $ | 701 | |
Ratios to average net assets(c): | | | | | | | | | | | | | | | | | | | | |
Expenses after waivers and/or expense reimbursement | | | 0.38 | % | | | 0.38 | % | | | 0.38 | % | | | 0.38 | % | | | 0.40 | % |
Expenses before waivers and/or expense reimbursement | | | 0.38 | % | | | 0.38 | % | | | 0.38 | % | | | 0.38 | % | | | 0.40 | % |
Net investment income (loss) | | | 1.20 | % | | | 1.43 | % | | | 1.11 | % | | | 0.89 | % | | | 1.07 | % |
Portfolio turnover rate(d) | | | 23 | % | | | 31 | % | | | 17 | % | | | 18 | % | | | 18 | % |
| | | | | | | | | | | | | | | | | | | | | | | | |
Class III | | | | | | | | | | | | | | | | | | |
| | | Year Ended December 31, | | | April 26, 2021(e) through December 31, | |
| | | 2024 | | | 2023 | | | 2022 | | | 2021 | |
Per Share Operating Performance(a): | | | | | | | | | | | | | | | | | | | | | | | | |
Net Asset Value, beginning of period | | $ | 58.01 | | | $ | 50.25 | | | $ | 60.24 | | | | | | | $ | 57.73 | | | | | |
| | | | | | | | | | | | | | | | | | | | | | | | |
Income (Loss) From Investment Operations: | | | | | | | | | | | | | | | | | | | | | | | | |
Net investment income (loss) | | | 0.57 | | | | 0.61 | | | | 0.47 | | | | | | | | 0.31 | | | | | |
Net realized and unrealized gain (loss) on investment transactions | | | 4.12 | | | | 7.15 | | | | (10.46 | ) | | | | | | | 2.20 | | | | | |
| | | | | | | | | | | | | | | | | | | | | | | | |
Total from investment operations | | | 4.69 | | | | 7.76 | | | | (9.99 | ) | | | | | | | 2.51 | | | | | |
| | | | | | | | | | | | | | | | | | | | | | | | |
Net Asset Value, end of period | | $ | 62.70 | | | $ | 58.01 | | | $ | 50.25 | | | | | | | $ | 60.24 | | | | | |
| | | | | | | | | | | | | | | | | | | | | | | | |
Total Return(b) | | | 8.08 | % | | | 15.44 | % | | | (16.58 | )% | | | | | | | 4.35 | % | | | | |
Ratios/Supplemental Data: | | | | | | | | | | | | | | | | | | | | | | | | |
Net assets, end of period (in millions) | | $ | 13 | | | $ | 11 | | | $ | 9 | | | | | | | $ | 6 | | | | | |
Average net assets (in millions) | | $ | 12 | | | $ | 10 | | | $ | 8 | | | | | | | $ | 3 | | | | | |
Ratios to average net assets(c): | | | | | | | | | | | | | | | | | | | | | | | | |
Expenses after waivers and/or expense reimbursement | | | 0.63 | % | | | 0.63 | % | | | 0.63 | % | | | | | | | 0.62 | %(f) | | | | |
Expenses before waivers and/or expense reimbursement | | | 0.63 | % | | | 0.63 | % | | | 0.63 | % | | | | | | | 0.62 | %(f) | | | | |
Net investment income (loss) | | | 0.95 | % | | | 1.18 | % | | | 0.90 | % | | | | | | | 0.76 | %(f) | | | | |
Portfolio turnover rate(d) | | | 23 | % | | | 31 | % | | | 17 | % | | | | | | | 18 | % | | | | |
| (a) | Calculated based on average shares outstanding during the period. |
| (b) | Total return is calculated assuming a purchase of a share on the first day and a sale on the last day of each period reported and includes reinvestment of dividends and distributions, if any, and does not reflect the effect of insurance contract charges. Total return does not reflect expenses associated with the separate account such as administrative fees, account charges and surrender charges which, if reflected, would reduce the total returns for all periods shown. Performance figures may reflect fee waivers and/or expense reimbursements. In the absence of fee waivers and/or expense reimbursements, the total return would be lower. Past performance is no guarantee of future results. Total returns may reflect adjustments to conform to GAAP. Total returns for periods less than one full year are not annualized. |
| (c) | Does not include expenses of the underlying funds in which the Portfolio invests. |
| (d) | The Portfolio’s portfolio turnover rate is calculated in accordance with regulatory requirements, without regard to transactions involving short-term investments, certain derivatives and in-kind transactions (if any). If such transactions were included, the Portfolio’s portfolio turnover rate may be higher. |
| (e) | Commencement of offering. |
| (f) | Annualized, with the exception of certain non-recurring expenses. |
SEE NOTES TO FINANCIAL STATEMENTS.
A229
| | | | |
| | PSF STOCK INDEX PORTFOLIO | | |
SCHEDULE OF INVESTMENTS | | | | as of December 31, 2024 |
| | | | | | | | |
| | | Shares | | | Value | |
LONG-TERM INVESTMENTS — 98.0% | | | | | |
COMMON STOCKS — 96.5% | | | | | |
Aerospace & Defense — 1.8% | | | | | |
Axon Enterprise, Inc.* | | | 12,360 | | | $ | 7,345,795 | |
Boeing Co. (The)* | | | 127,136 | | | | 22,503,072 | |
General Dynamics Corp. | | | 43,860 | | | | 11,556,671 | |
General Electric Co. | | | 183,955 | | | | 30,681,855 | |
Howmet Aerospace, Inc. | | | 69,192 | | | | 7,567,529 | |
Huntington Ingalls Industries, Inc. | | | 6,600 | | | | 1,247,202 | |
L3Harris Technologies, Inc. | | | 32,680 | | | | 6,871,950 | |
Lockheed Martin Corp. | | | 35,668 | | | | 17,332,508 | |
Northrop Grumman Corp. | | | 23,066 | | | | 10,824,643 | |
RTX Corp. | | | 225,548 | | | | 26,100,415 | |
Textron, Inc. | | | 31,750 | | | | 2,428,558 | |
TransDigm Group, Inc. | | | 9,590 | | | | 12,153,215 | |
| | | | | |
| |
| | | | 156,613,413 | |
| | | | | |
Air Freight & Logistics — 0.4% | | | | | |
C.H. Robinson Worldwide, Inc. | | | 19,900 | | | | 2,056,068 | |
Expeditors International of Washington, Inc.(a) | | | 23,900 | | | | 2,647,403 | |
FedEx Corp. | | | 38,340 | | | | 10,786,192 | |
United Parcel Service, Inc. (Class B Stock) | | | 124,200 | | | | 15,661,620 | |
| | | | | | | | |
| |
| | | | 31,151,283 | |
| | | | | | | | |
Automobile Components — 0.0% | | | | | |
Aptiv PLC (United Kingdom)* | | | 39,800 | | | | 2,407,104 | |
BorgWarner, Inc.(a) | | | 38,600 | | | | 1,227,094 | |
| | | | | | | | |
| |
| | | | 3,634,198 | |
| | | | | | | | |
Automobiles — 2.4% | | | | | |
Ford Motor Co. | | | 662,059 | | | | 6,554,384 | |
General Motors Co. | | | 186,200 | | | | 9,918,874 | |
Tesla, Inc.* | | | 474,550 | | | | 191,642,272 | |
| | | | | | | | |
| |
| | | | 208,115,530 | |
| | | | | | | | |
Banks — 3.3% | | | | | |
Bank of America Corp. | | | 1,134,332 | | | | 49,853,891 | |
Citigroup, Inc. | | | 321,722 | | | | 22,646,012 | |
Citizens Financial Group, Inc. | | | 76,000 | | | | 3,325,760 | |
Fifth Third Bancorp(a) | | | 114,749 | | | | 4,851,588 | |
Huntington Bancshares, Inc. | | | 246,275 | | | | 4,006,894 | |
JPMorgan Chase & Co. | | | 478,395 | | | | 114,676,065 | |
KeyCorp. | | | 167,800 | | | | 2,876,092 | |
M&T Bank Corp. | | | 28,361 | | | | 5,332,152 | |
PNC Financial Services Group, Inc. (The) | | | 67,443 | | | | 13,006,383 | |
Regions Financial Corp.(a) | | | 155,212 | | | | 3,650,586 | |
Truist Financial Corp. | | | 224,726 | | | | 9,748,614 | |
U.S. Bancorp | | | 264,581 | | | | 12,654,909 | |
Wells Fargo & Co. | | | 565,776 | | | | 39,740,106 | |
| | | | | | | | |
| |
| | | | 286,369,052 | |
| | | | | | | | |
Beverages — 1.1% | | | | | |
Brown-Forman Corp. (Class B Stock)(a) | | | 31,125 | | | | 1,182,128 | |
Coca-Cola Co. (The) | | | 657,750 | | | | 40,951,515 | |
Constellation Brands, Inc. (Class A Stock) | | | 26,600 | | | | 5,878,600 | |
| | | | | | | | |
| | | Shares | | | Value | |
COMMON STOCKS (continued) | | | | | |
Beverages (cont’d.) | | | | | |
Keurig Dr. Pepper, Inc. | | | 190,900 | | | $ | 6,131,708 | |
Molson Coors Beverage Co. (Class B Stock)(a) | | | 29,800 | | | | 1,708,136 | |
Monster Beverage Corp.* | | | 119,590 | | | | 6,285,650 | |
PepsiCo, Inc. | | | 233,144 | | | | 35,451,877 | |
| | | | | | | | |
| |
| | | | 97,589,614 | |
| | | | | | | | |
Biotechnology — 1.5% | | | | | |
AbbVie, Inc. | | | 300,289 | | | | 53,361,355 | |
Amgen, Inc. | | | 91,594 | | | | 23,873,060 | |
Biogen, Inc.* | | | 24,655 | | | | 3,770,243 | |
Gilead Sciences, Inc. | | | 211,100 | | | | 19,499,307 | |
Incyte Corp.* | | | 27,070 | | | | 1,869,725 | |
Moderna, Inc.*(a) | | | 57,400 | | | | 2,386,692 | |
Regeneron Pharmaceuticals, Inc.* | | | 17,810 | | | | 12,686,597 | |
Vertex Pharmaceuticals, Inc.* | | | 43,760 | | | | 17,622,152 | |
| | | | | | | | |
| |
| | | | 135,069,131 | |
| | | | | | | | |
Broadline Retail — 4.0% | | | | | |
Amazon.com, Inc.* | | | 1,590,200 | | | | 348,873,978 | |
eBay, Inc.(a) | | | 81,100 | | | | 5,024,145 | |
| | | | | | | | |
| |
| | | | 353,898,123 | |
| | | | | | | | |
Building Products — 0.5% | | | | | |
A.O. Smith Corp. | | | 20,300 | | | | 1,384,663 | |
Allegion PLC | | | 14,733 | | | | 1,925,309 | |
Builders FirstSource, Inc.*(a) | | | 19,700 | | | | 2,815,721 | |
Carrier Global Corp. | | | 141,167 | | | | 9,636,059 | |
Johnson Controls International PLC | | | 113,315 | | | | 8,943,953 | |
Lennox International, Inc. | | | 5,420 | | | | 3,302,406 | |
Masco Corp. | | | 37,030 | | | | 2,687,267 | |
Trane Technologies PLC | | | 38,300 | | | | 14,146,105 | |
| | | | | | | | |
| |
| | | | 44,841,483 | |
| | | | | | | | |
Capital Markets — 3.1% | | | | | |
Ameriprise Financial, Inc. | | | 16,430 | | | | 8,747,825 | |
Bank of New York Mellon Corp. (The) | | | 123,049 | | | | 9,453,855 | |
Blackrock, Inc. | | | 24,780 | | | | 25,402,226 | |
Blackstone, Inc. | | | 122,700 | | | | 21,155,934 | |
Cboe Global Markets, Inc. | | | 17,700 | | | | 3,458,580 | |
Charles Schwab Corp. (The) | | | 253,300 | | | | 18,746,733 | |
CME Group, Inc. | | | 61,560 | | | | 14,296,079 | |
FactSet Research Systems, Inc.(a) | | | 6,600 | | | | 3,169,848 | |
Franklin Resources, Inc.(a) | | | 52,300 | | | | 1,061,167 | |
Goldman Sachs Group, Inc. (The) | | | 53,350 | | | | 30,549,277 | |
Intercontinental Exchange, Inc. | | | 97,390 | | | | 14,512,084 | |
Invesco Ltd. | | | 76,300 | | | | 1,333,724 | |
KKR & Co., Inc. | | | 114,400 | | | | 16,920,904 | |
MarketAxess Holdings, Inc. | | | 6,500 | | | | 1,469,260 | |
Moody’s Corp. | | | 26,570 | | | | 12,577,441 | |
Morgan Stanley | | | 210,978 | | | | 26,524,154 | |
MSCI, Inc. | | | 13,330 | | | | 7,998,133 | |
Nasdaq, Inc. | | | 70,200 | | | | 5,427,162 | |
Northern Trust Corp. | | | 33,400 | | | | 3,423,500 | |
Raymond James Financial, Inc. | | | 30,850 | | | | 4,791,930 | |
S&P Global, Inc. | | | 54,306 | | | | 27,046,017 | |
State Street Corp. | | | 49,575 | | | | 4,865,786 | |
SEE NOTES TO FINANCIAL STATEMENTS.
A230
| | | | |
| | PSF STOCK INDEX PORTFOLIO (CONTINUED) | | |
SCHEDULE OF INVESTMENTS | | | | as of December 31, 2024 |
| | | | | | | | |
| | | Shares | | | Value | |
COMMON STOCKS (continued) | |
Capital Markets (cont’d.) | |
T. Rowe Price Group, Inc.(a) | | | 37,700 | | | $ | 4,263,493 | |
| | | | | | | | |
| |
| | | | 267,195,112 | |
| | | | | | | | |
Chemicals — 1.2% | |
Air Products & Chemicals, Inc. | | | 38,050 | | | | 11,036,022 | |
Albemarle Corp.(a) | | | 19,900 | | | | 1,712,992 | |
Celanese Corp. | | | 18,500 | | | | 1,280,385 | |
CF Industries Holdings, Inc. | | | 29,400 | | | | 2,508,408 | |
Corteva, Inc.(a) | | | 117,356 | | | | 6,684,598 | |
Dow, Inc. | | | 118,822 | | | | 4,768,327 | |
DuPont de Nemours, Inc. | | | 70,756 | | | | 5,395,145 | |
Eastman Chemical Co.(a) | | | 19,800 | | | | 1,808,136 | |
Ecolab, Inc. | | | 42,500 | | | | 9,958,600 | |
FMC Corp. | | | 21,150 | | | | 1,028,101 | |
International Flavors & Fragrances, Inc. | | | 43,340 | | | | 3,664,397 | |
Linde PLC | | | 81,000 | | | | 33,912,270 | |
LyondellBasell Industries NV (Class A Stock) | | | 44,100 | | | | 3,275,307 | |
Mosaic Co. (The) | | | 54,000 | | | | 1,327,320 | |
PPG Industries, Inc. | | | 39,600 | | | | 4,730,220 | |
Sherwin-Williams Co. (The) | | | 39,400 | | | | 13,393,242 | |
| | | | | | | | |
| |
| | | | 106,483,470 | |
| | | | | | | | |
Commercial Services & Supplies — 0.5% | |
Cintas Corp. | | | 58,100 | | | | 10,614,870 | |
Copart, Inc.* | | | 148,500 | | | | 8,522,415 | |
Republic Services, Inc. | | | 34,635 | | | | 6,967,869 | |
Rollins, Inc. | | | 47,625 | | | | 2,207,419 | |
Veralto Corp. | | | 41,966 | | | | 4,274,237 | |
Waste Management, Inc. | | | 61,930 | | | | 12,496,855 | |
| | | | | | | | |
| |
| | | | 45,083,665 | |
| | | | | | | | |
Communications Equipment — 0.9% | |
Arista Networks, Inc.* | | | 175,800 | | | | 19,431,174 | |
Cisco Systems, Inc. | | | 683,175 | | | | 40,443,960 | |
F5, Inc.* | | | 9,850 | | | | 2,476,980 | |
Juniper Networks, Inc. | | | 55,800 | | | | 2,089,710 | |
Motorola Solutions, Inc. | | | 28,127 | | | | 13,001,143 | |
| | | | | | | | |
| |
| | | | 77,442,967 | |
| | | | | | | | |
Construction & Engineering — 0.1% | |
Quanta Services, Inc. | | | 25,400 | | | | 8,027,670 | |
| | | | | | | | |
Construction Materials — 0.1% | |
Martin Marietta Materials, Inc. | | | 10,360 | | | | 5,350,940 | |
Vulcan Materials Co. | | | 22,800 | | | | 5,864,844 | |
| | | | | | | | |
| |
| | | | 11,215,784 | |
| | | | | | | | |
Consumer Finance — 0.6% | |
American Express Co. | | | 94,650 | | | | 28,091,174 | |
Capital One Financial Corp. | | | 64,769 | | | | 11,549,608 | |
Discover Financial Services | | | 42,605 | | | | 7,380,464 | |
Synchrony Financial | | | 65,830 | | | | 4,278,950 | |
| | | | | | | | |
| |
| | | | 51,300,196 | |
| | | | | | | | |
Consumer Staples Distribution & Retail — 1.9% | |
Costco Wholesale Corp. | | | 75,292 | | | | 68,987,801 | |
Dollar General Corp. | | | 37,300 | | | | 2,828,086 | |
Dollar Tree, Inc.* | | | 34,247 | | | | 2,566,470 | |
| | | | | | | | |
| | | Shares | | | Value | |
COMMON STOCKS (continued) | |
Consumer Staples Distribution & Retail (cont’d.) | |
Kroger Co. (The)(a) | | | 112,600 | | | $ | 6,885,490 | |
Sysco Corp.(a) | | | 83,400 | | | | 6,376,764 | |
Target Corp. | | | 77,868 | | | | 10,526,196 | |
Walgreens Boots Alliance, Inc.(a) | | | 121,500 | | | | 1,133,595 | |
Walmart, Inc. | | | 737,600 | | | | 66,642,160 | |
| | | | | | | | |
| |
| | | | 165,946,562 | |
| | | | | | | | |
Containers & Packaging — 0.2% | |
Amcor PLC | | | 245,100 | | | | 2,306,391 | |
Amcor PLC(a) | | | — | | | | — | |
Avery Dennison Corp. | | | 13,700 | | | | 2,563,681 | |
Ball Corp. | | | 51,500 | | | | 2,839,195 | |
International Paper Co.(a) | | | 58,867 | | | | 3,168,222 | |
Packaging Corp. of America | | | 15,100 | | | | 3,399,463 | |
Smurfit WestRock PLC(a) | | | 83,661 | | | | 4,505,981 | |
| | | | | | | | |
| |
| | | | 18,782,933 | |
| | | | | | | | |
Distributors — 0.1% | |
Genuine Parts Co.(a) | | | 23,625 | | | | 2,758,455 | |
LKQ Corp. | | | 44,600 | | | | 1,639,050 | |
Pool Corp.(a) | | | 6,620 | | | | 2,257,023 | |
| | | | | | | | |
| |
| | | | 6,654,528 | |
| | | | | | | | |
Diversified Telecommunication Services — 0.6% | |
AT&T, Inc. | | | 1,215,971 | | | | 27,687,660 | |
Verizon Communications, Inc. | | | 713,888 | | | | 28,548,381 | |
| | | | | | | | |
| |
| | | | 56,236,041 | |
| | | | | | | | |
Electric Utilities — 1.4% | |
Alliant Energy Corp.(a) | | | 43,500 | | | | 2,572,590 | |
American Electric Power Co., Inc. | | | 90,240 | | | | 8,322,835 | |
Constellation Energy Corp. | | | 53,524 | | | | 11,973,854 | |
Duke Energy Corp. | | | 130,948 | | | | 14,108,338 | |
Edison International | | | 65,500 | | | | 5,229,520 | |
Entergy Corp. | | | 72,600 | | | | 5,504,532 | |
Evergy, Inc. | | | 39,000 | | | | 2,400,450 | |
Eversource Energy | | | 62,000 | | | | 3,560,660 | |
Exelon Corp. | | | 169,573 | | | | 6,382,728 | |
FirstEnergy Corp. | | | 90,980 | | | | 3,619,184 | |
NextEra Energy, Inc. | | | 348,400 | | | | 24,976,796 | |
NRG Energy, Inc. | | | 34,100 | | | | 3,076,502 | |
PG&E Corp. | | | 370,300 | | | | 7,472,654 | |
Pinnacle West Capital Corp.(a) | | | 19,300 | | | | 1,636,061 | |
PPL Corp. | | | 125,100 | | | | 4,060,746 | |
Southern Co. (The) | | | 185,400 | | | | 15,262,128 | |
Xcel Energy, Inc. | | | 97,595 | | | | 6,589,614 | |
| | | | | | | | |
| |
| | | | 126,749,192 | |
| | | | | | | | |
Electrical Equipment — 0.8% | |
AMETEK, Inc. | | | 39,300 | | | | 7,084,218 | |
Eaton Corp. PLC | | | 67,311 | | | | 22,338,501 | |
Emerson Electric Co.(a) | | | 97,100 | | | | 12,033,603 | |
GE Vernova, Inc. | | | 46,988 | | | | 15,455,763 | |
Generac Holdings, Inc.* | | | 10,200 | | | | 1,581,510 | |
Hubbell, Inc. | | | 9,100 | | | | 3,811,899 | |
Rockwell Automation, Inc.(a) | | | 19,220 | | | | 5,492,884 | |
| | | | | | | | |
| |
| | | | 67,798,378 | |
| | | | | | | | |
SEE NOTES TO FINANCIAL STATEMENTS.
A231
| | | | |
| | PSF STOCK INDEX PORTFOLIO (CONTINUED) | | |
SCHEDULE OF INVESTMENTS | | | | as of December 31, 2024 |
| | | | | | | | |
| | | Shares | | | Value | |
COMMON STOCKS (continued) | |
Electronic Equipment, Instruments & Components — 0.6% | |
Amphenol Corp. (Class A Stock) | | | 204,200 | | | $ | 14,181,690 | |
CDW Corp. | | | 22,600 | | | | 3,933,304 | |
Corning, Inc. | | | 130,600 | | | | 6,206,112 | |
Jabil, Inc. | | | 19,200 | | | | 2,762,880 | |
Keysight Technologies, Inc.* | | | 29,600 | | | | 4,754,648 | |
TE Connectivity PLC (Switzerland) | | | 50,600 | | | | 7,234,282 | |
Teledyne Technologies, Inc.* | | | 8,079 | | | | 3,749,706 | |
Trimble, Inc.* | | | 41,400 | | | | 2,925,324 | |
Zebra Technologies Corp. (Class A Stock)* | | | 8,780 | | | | 3,391,012 | |
| | | | | | | | |
| |
| | | | 49,138,958 | |
| | | | | | | | |
Energy Equipment & Services — 0.2% | |
Baker Hughes Co. | | | 168,448 | | | | 6,909,737 | |
Halliburton Co.(a) | | | 149,700 | | | | 4,070,343 | |
Schlumberger NV | | | 240,798 | | | | 9,232,195 | |
| | | | | | | | |
| |
| | | | 20,212,275 | |
| | | | | | | | |
Entertainment — 1.3% | |
Electronic Arts, Inc. | | | 40,200 | | | | 5,881,260 | |
Live Nation Entertainment, Inc.*(a) | | | 26,600 | | | | 3,444,700 | |
Netflix, Inc.* | | | 72,650 | | | | 64,754,398 | |
Take-Two Interactive Software, Inc.* | | | 27,650 | | | | 5,089,812 | |
Walt Disney Co. (The) | | | 307,522 | | | | 34,242,575 | |
Warner Bros Discovery, Inc.* | | | 378,408 | | | | 3,999,772 | |
| | | | | | | | |
| |
| | | | 117,412,517 | |
| | | | | | | | |
Financial Services — 4.3% | |
Apollo Global Management, Inc. | | | 75,700 | | | | 12,502,612 | |
Berkshire Hathaway, Inc. (Class B Stock)* | | | 310,610 | | | | 140,793,301 | |
Corpay, Inc.* | | | 12,200 | | | | 4,128,724 | |
Fidelity National Information Services, Inc. | | | 91,100 | | | | 7,358,147 | |
Fiserv, Inc.* | | | 96,900 | | | | 19,905,198 | |
Global Payments, Inc. | | | 43,113 | | | | 4,831,243 | |
Jack Henry & Associates, Inc. | | | 12,350 | | | | 2,164,955 | |
Mastercard, Inc. (Class A Stock) | | | 139,910 | | | | 73,672,408 | |
PayPal Holdings, Inc.* | | | 169,700 | | | | 14,483,895 | |
Visa, Inc. (Class A Stock) | | | 293,700 | | | | 92,820,948 | |
| | | | | | | | |
| |
| | | | 372,661,431 | |
| | | | | | | | |
Food Products — 0.6% | |
Archer-Daniels-Midland Co.(a) | | | 81,038 | | | | 4,094,040 | |
Bunge Global SA(a) | | | 24,000 | | | | 1,866,240 | |
Conagra Brands, Inc. | | | 81,200 | | | | 2,253,300 | |
General Mills, Inc. | | | 94,400 | | | | 6,019,888 | |
Hershey Co. (The)(a) | | | 25,000 | | | | 4,233,750 | |
Hormel Foods Corp. | | | 49,300 | | | | 1,546,541 | |
J.M. Smucker Co. (The) | | | 18,000 | | | | 1,982,160 | |
Kellanova | | | 47,550 | | | | 3,850,124 | |
Kraft Heinz Co. (The) | | | 149,437 | | | | 4,589,210 | |
Lamb Weston Holdings, Inc.(a) | | | 24,400 | | | | 1,630,652 | |
McCormick & Co., Inc. | | | 42,700 | | | | 3,255,448 | |
Mondelez International, Inc. (Class A Stock) | | | 226,511 | | | | 13,529,502 | |
The Campbell’s Co.(a) | | | 33,400 | | | | 1,398,792 | |
| | | | | | | | |
| | | Shares | | | Value | |
COMMON STOCKS (continued) | |
Food Products (cont’d.) | |
Tyson Foods, Inc. (Class A Stock) | | | 48,500 | | | $ | 2,785,840 | |
| | | | | | | | |
| |
| | | | 53,035,487 | |
| | | | | | | | |
Gas Utilities — 0.0% | |
Atmos Energy Corp.(a) | | | 26,300 | | | | 3,662,801 | |
| | | | | | | | |
|
Ground Transportation — 0.8% | |
CSX Corp.(a) | | | 328,816 | | | | 10,610,892 | |
J.B. Hunt Transport Services, Inc.(a) | | | 13,700 | | | | 2,338,042 | |
Norfolk Southern Corp. | | | 38,800 | | | | 9,106,360 | |
Old Dominion Freight Line, Inc. | | | 32,000 | | | | 5,644,800 | |
Uber Technologies, Inc.* | | | 356,300 | | | | 21,492,016 | |
Union Pacific Corp. | | | 103,250 | | | | 23,545,130 | |
| | | | | | | | |
| |
| | | | 72,737,240 | |
| | | | | | | | |
Health Care Equipment & Supplies — 2.2% | |
Abbott Laboratories | | | 295,025 | | | | 33,370,278 | |
Align Technology, Inc.* | | | 11,920 | | | | 2,485,439 | |
Baxter International, Inc. | | | 86,500 | | | | 2,522,340 | |
Becton, Dickinson & Co. | | | 49,499 | | | | 11,229,838 | |
Boston Scientific Corp.* | | | 249,749 | | | | 22,307,581 | |
Cooper Cos., Inc. (The)* | | | 33,720 | | | | 3,099,880 | |
Dexcom, Inc.* | | | 66,120 | | | | 5,142,152 | |
Edwards Lifesciences Corp.* | | | 99,850 | | | | 7,391,895 | |
GE HealthCare Technologies, Inc. | | | 77,518 | | | | 6,060,357 | |
Hologic, Inc.* | | | 39,350 | | | | 2,836,742 | |
IDEXX Laboratories, Inc.* | | | 13,940 | | | | 5,763,354 | |
Insulet Corp.* | | | 11,900 | | | | 3,106,733 | |
Intuitive Surgical, Inc.* | | | 60,540 | | | | 31,599,458 | |
Medtronic PLC | | | 217,528 | | | | 17,376,137 | |
ResMed, Inc.(a) | | | 25,400 | | | | 5,808,726 | |
Solventum Corp.* | | | 23,397 | | | | 1,545,606 | |
STERIS PLC | | | 17,200 | | | | 3,535,632 | |
Stryker Corp. | | | 58,470 | | | | 21,052,123 | |
Teleflex, Inc. | | | 7,950 | | | | 1,414,941 | |
Zimmer Biomet Holdings, Inc. | | | 33,686 | | | | 3,558,252 | |
| | | | | | | | |
| |
| | | | 191,207,464 | |
| | | | | | | | |
Health Care Providers & Services — 2.0% | |
Cardinal Health, Inc. | | | 41,375 | | | | 4,893,421 | |
Cencora, Inc. | | | 29,600 | | | | 6,650,528 | |
Centene Corp.* | | | 85,468 | | | | 5,177,652 | |
Cigna Group (The) | | | 47,432 | | | | 13,097,873 | |
CVS Health Corp. | | | 213,299 | | | | 9,574,992 | |
DaVita, Inc.*(a) | | | 7,800 | | | | 1,166,490 | |
Elevance Health, Inc. | | | 39,640 | | | | 14,623,196 | |
HCA Healthcare, Inc. | | | 31,200 | | | | 9,364,680 | |
Henry Schein, Inc.* | | | 21,500 | | | | 1,487,800 | |
Humana, Inc. | | | 20,430 | | | | 5,183,295 | |
Labcorp Holdings, Inc. | | | 14,200 | | | | 3,256,344 | |
McKesson Corp. | | | 21,487 | | | | 12,245,656 | |
Molina Healthcare, Inc.* | | | 10,000 | | | | 2,910,500 | |
Quest Diagnostics, Inc. | | | 18,900 | | | | 2,851,254 | |
UnitedHealth Group, Inc. | | | 156,390 | | | | 79,111,445 | |
Universal Health Services, Inc. (Class B Stock) | | | 10,100 | | | | 1,812,142 | |
| | | | | | | | |
| |
| | | | 173,407,268 | |
| | | | | | | | |
SEE NOTES TO FINANCIAL STATEMENTS.
A232
| | | | |
| | PSF STOCK INDEX PORTFOLIO (CONTINUED) | | |
SCHEDULE OF INVESTMENTS | | | | as of December 31, 2024 |
| | | | | | | | |
| | | Shares | | | Value | |
COMMON STOCKS (continued) | |
Health Care REITs — 0.2% | |
Alexandria Real Estate Equities, Inc. | | | 26,380 | | | $ | 2,573,369 | |
Healthpeak Properties, Inc. | | | 119,300 | | | | 2,418,211 | |
Ventas, Inc. | | | 70,104 | | | | 4,128,425 | |
Welltower, Inc. | | | 100,100 | | | | 12,615,603 | |
| | | | | | | | |
| |
| | | | 21,735,608 | |
| | | | | | | | |
Hotel & Resort REITs — 0.0% | |
Host Hotels & Resorts, Inc.(a) | | | 119,126 | | | | 2,087,088 | |
| | | | | | | | |
|
Hotels, Restaurants & Leisure — 1.9% | |
Airbnb, Inc. (Class A Stock)* | | | 73,300 | | | | 9,632,353 | |
Booking Holdings, Inc. | | | 5,630 | | | | 27,972,205 | |
Caesars Entertainment, Inc.* | | | 36,700 | | | | 1,226,514 | |
Carnival Corp.* | | | 175,900 | | | | 4,383,428 | |
Chipotle Mexican Grill, Inc.* | | | 230,750 | | | | 13,914,225 | |
Darden Restaurants, Inc. | | | 20,100 | | | | 3,752,469 | |
Domino’s Pizza, Inc. | | | 5,900 | | | | 2,476,584 | |
Expedia Group, Inc.* | | | 21,100 | | | | 3,931,563 | |
Hilton Worldwide Holdings, Inc. | | | 41,700 | | | | 10,306,572 | |
Las Vegas Sands Corp.(a) | | | 59,900 | | | | 3,076,464 | |
Marriott International, Inc. (Class A Stock) | | | 39,373 | | | | 10,982,705 | |
McDonald’s Corp. | | | 121,360 | | | | 35,181,050 | |
MGM Resorts International*(a) | | | 39,100 | | | | 1,354,815 | |
Norwegian Cruise Line Holdings Ltd.* | | | 75,500 | | | | 1,942,615 | |
Royal Caribbean Cruises Ltd. | | | 42,300 | | | | 9,758,187 | |
Starbucks Corp. | | | 192,200 | | | | 17,538,250 | |
Wynn Resorts Ltd.(a) | | | 15,900 | | | | 1,369,944 | |
Yum! Brands, Inc.(a) | | | 47,100 | | | | 6,318,936 | |
| | | | | | | | |
| |
| | | | 165,118,879 | |
| | | | | | | | |
Household Durables — 0.3% | |
D.R. Horton, Inc. | | | 49,200 | | | | 6,879,144 | |
Garmin Ltd. | | | 26,100 | | | | 5,383,386 | |
Lennar Corp. (Class A Stock) | | | 40,400 | | | | 5,509,348 | |
Mohawk Industries, Inc.* | | | 8,900 | | | | 1,060,257 | |
NVR, Inc.* | | | 520 | | | | 4,253,028 | |
PulteGroup, Inc. | | | 35,185 | | | | 3,831,647 | |
| | | | | | | | |
| |
| | | | 26,916,810 | |
| | | | | | | | |
Household Products — 1.1% | |
Church & Dwight Co., Inc. | | | 41,500 | | | | 4,345,465 | |
Clorox Co. (The) | | | 21,000 | | | | 3,410,610 | |
Colgate-Palmolive Co. | | | 138,600 | | | | 12,600,126 | |
Kimberly-Clark Corp. | | | 56,438 | | | | 7,395,636 | |
Procter & Gamble Co. (The) | | | 398,576 | | | | 66,821,266 | |
| | | | | | | | |
| |
| | | | 94,573,103 | |
| | | | | | | | |
Independent Power & Renewable Electricity Producers — 0.1% | |
AES Corp. (The) | | | 120,500 | | | | 1,550,835 | |
Vistra Corp. | | | 57,600 | | | | 7,941,312 | |
| | | | | | | | |
| |
| | | | 9,492,147 | |
| | | | | | | | |
Industrial Conglomerates — 0.4% | |
3M Co. | | | 92,190 | | | | 11,900,807 | |
Honeywell International, Inc. | | | 110,550 | | | | 24,972,140 | |
| | | | | | | | |
| |
| | | | 36,872,947 | |
| | | | | | | | |
| | | | | | | | |
| | | Shares | | | Value | |
COMMON STOCKS (continued) | |
Industrial REITs — 0.2% | |
Prologis, Inc. | | | 156,980 | | | $ | 16,592,786 | |
| | | | | | | | |
Insurance — 2.0% | |
Aflac, Inc.(a) | | | 84,600 | | | | 8,751,024 | |
Allstate Corp. (The) | | | 44,728 | | | | 8,623,111 | |
American International Group, Inc. | | | 105,629 | | | | 7,689,791 | |
Aon PLC (Class A Stock) | | | 36,825 | | | | 13,226,067 | |
Arch Capital Group Ltd. | | | 63,500 | | | | 5,864,225 | |
Arthur J. Gallagher & Co. | | | 42,450 | | | | 12,049,432 | |
Assurant, Inc. | | | 8,800 | | | | 1,876,336 | |
Brown & Brown, Inc. | | | 40,100 | | | | 4,091,002 | |
Chubb Ltd. | | | 63,730 | | | | 17,608,599 | |
Cincinnati Financial Corp. | | | 26,528 | | | | 3,812,074 | |
Erie Indemnity Co. (Class A Stock)(a) | | | 4,260 | | | | 1,756,100 | |
Everest Group Ltd. | | | 7,300 | | | | 2,645,958 | |
Globe Life, Inc. | | | 14,175 | | | | 1,580,796 | |
Hartford Financial Services Group, Inc. (The) | | | 48,900 | | | | 5,349,660 | |
Loews Corp.(a) | | | 30,926 | | | | 2,619,123 | |
Marsh & McLennan Cos., Inc. | | | 83,500 | | | | 17,736,235 | |
MetLife, Inc. | | | 98,480 | | | | 8,063,542 | |
Principal Financial Group, Inc. | | | 36,100 | | | | 2,794,501 | |
Progressive Corp. (The) | | | 99,800 | | | | 23,913,078 | |
Prudential Financial, Inc. | | | 60,500 | | | | 7,171,065 | |
Travelers Cos., Inc. (The) | | | 38,648 | | | | 9,309,917 | |
W.R. Berkley Corp. | | | 50,950 | | | | 2,981,594 | |
Willis Towers Watson PLC | | | 17,300 | | | | 5,419,052 | |
| | | | | | | | |
| |
| | | | 174,932,282 | |
| | | | | | | | |
Interactive Media & Services — 6.4% | |
Alphabet, Inc. (Class A Stock) | | | 992,880 | | | | 187,952,184 | |
Alphabet, Inc. (Class C Stock) | | | 808,700 | | | | 154,008,828 | |
Match Group, Inc.* | | | 43,700 | | | | 1,429,427 | |
Meta Platforms, Inc. (Class A Stock) | | | 370,440 | | | | 216,896,324 | |
| | | | | | | | |
| |
| | | | 560,286,763 | |
| | | | | | | | |
IT Services — 1.1% | |
Accenture PLC (Ireland) (Class A Stock) | | | 106,250 | | | | 37,377,687 | |
Akamai Technologies, Inc.* | | | 25,700 | | | | 2,458,205 | |
Cognizant Technology Solutions Corp. (Class A Stock) | | | 84,100 | | | | 6,467,290 | |
EPAM Systems, Inc.* | | | 9,640 | | | | 2,254,025 | |
Gartner, Inc.* | | | 13,170 | | | | 6,380,470 | |
GoDaddy, Inc. (Class A Stock)*(a) | | | 23,900 | | | | 4,717,143 | |
International Business Machines Corp.(a) | | | 157,325 | | | | 34,584,755 | |
VeriSign, Inc.* | | | 14,300 | | | | 2,959,528 | |
| | | | | | | | |
| |
| | | | 97,199,103 | |
| | | | | | | | |
Leisure Products — 0.0% | |
Hasbro, Inc.(a) | | | 22,250 | | | | 1,243,998 | |
| | | | | | | | |
|
Life Sciences Tools & Services — 1.0% | |
Agilent Technologies, Inc. | | | 48,582 | | | | 6,526,506 | |
Bio-Techne Corp.(a) | | | 26,720 | | | | 1,924,641 | |
Charles River Laboratories International, Inc.*(a) | | | 8,800 | | | | 1,624,480 | |
Danaher Corp. | | | 109,500 | | | | 25,135,725 | |
IQVIA Holdings, Inc.* | | | 29,400 | | | | 5,777,394 | |
SEE NOTES TO FINANCIAL STATEMENTS.
A233
| | | | |
| | PSF STOCK INDEX PORTFOLIO (CONTINUED) | | |
SCHEDULE OF INVESTMENTS | | | | as of December 31, 2024 |
| | | | | | | | |
| | | Shares | | | Value | |
COMMON STOCKS (continued) | |
Life Sciences Tools & Services (cont’d.) | |
Mettler-Toledo International, Inc.* | | | 3,600 | | | $ | 4,405,248 | |
Revvity, Inc.(a) | | | 20,900 | | | | 2,332,649 | |
Thermo Fisher Scientific, Inc. | | | 65,000 | | | | 33,814,950 | |
Waters Corp.* | | | 10,350 | | | | 3,839,643 | |
West Pharmaceutical Services, Inc. | | | 12,300 | | | | 4,028,988 | |
| | | | | | | | |
| |
| | | | 89,410,224 | |
| | | | | | | | |
Machinery — 1.5% | |
Caterpillar, Inc. | | | 82,050 | | | | 29,764,458 | |
Cummins, Inc. | | | 23,350 | | | | 8,139,810 | |
Deere & Co.(a) | | | 43,250 | | | | 18,325,025 | |
Dover Corp. | | | 23,300 | | | | 4,371,080 | |
Fortive Corp. | | | 59,400 | | | | 4,455,000 | |
IDEX Corp. | | | 13,300 | | | | 2,783,557 | |
Illinois Tool Works, Inc.(a) | | | 45,475 | | | | 11,530,641 | |
Ingersoll Rand, Inc.(a) | | | 68,437 | | | | 6,190,811 | |
Nordson Corp. | | | 9,200 | | | | 1,925,008 | |
Otis Worldwide Corp. | | | 67,883 | | | | 6,286,645 | |
PACCAR, Inc. | | | 88,892 | | | | 9,246,546 | |
Parker-Hannifin Corp. | | | 21,807 | | | | 13,869,906 | |
Pentair PLC | | | 28,107 | | | | 2,828,688 | |
Snap-on, Inc.(a) | | | 8,950 | | | | 3,038,346 | |
Stanley Black & Decker, Inc. | | | 26,135 | | | | 2,098,379 | |
Westinghouse Air Brake Technologies Corp. | | | 29,112 | | | | 5,519,344 | |
Xylem, Inc.(a) | | | 41,200 | | | | 4,780,024 | |
| | | | | | | | |
| |
| | | | 135,153,268 | |
| | | | | | | | |
Media — 0.5% | |
Charter Communications, Inc. (Class A Stock)*(a) | | | 16,450 | | | | 5,638,566 | |
Comcast Corp. (Class A Stock) | | | 646,392 | | | | 24,259,092 | |
Fox Corp. (Class A Stock)(a) | | | 38,066 | | | | 1,849,246 | |
Fox Corp. (Class B Stock) | | | 22,366 | | | | 1,023,021 | |
Interpublic Group of Cos., Inc. (The) | | | 63,662 | | | | 1,783,809 | |
News Corp. (Class A Stock) | | | 64,125 | | | | 1,766,003 | |
News Corp. (Class B Stock) | | | 19,000 | | | | 578,170 | |
Omnicom Group, Inc.(a) | | | 33,200 | | | | 2,856,528 | |
Paramount Global (Class B Stock)(a) | | | 100,866 | | | | 1,055,058 | |
| | | | | | | | |
| |
| | | | 40,809,493 | |
| | | | | | | | |
Metals & Mining — 0.3% | |
Freeport-McMoRan, Inc. | | | 243,612 | | | | 9,276,745 | |
Newmont Corp. | | | 194,603 | | | | 7,243,124 | |
Nucor Corp. | | | 40,200 | | | | 4,691,742 | |
Steel Dynamics, Inc. | | | 24,300 | | | | 2,771,901 | |
| | | | | | | | |
| |
| | | | 23,983,512 | |
| | | | | | | | |
Multi-Utilities — 0.6% | |
Ameren Corp. | | | 45,200 | | | | 4,029,128 | |
CenterPoint Energy, Inc. | | | 110,510 | | | | 3,506,482 | |
CMS Energy Corp. | | | 50,700 | | | | 3,379,155 | |
Consolidated Edison, Inc. | | | 58,600 | | | | 5,228,878 | |
Dominion Energy, Inc.(a) | | | 142,240 | | | | 7,661,046 | |
DTE Energy Co. | | | 35,100 | | | | 4,238,325 | |
NiSource, Inc. | | | 79,350 | | | | 2,916,906 | |
Public Service Enterprise Group, Inc. | | | 84,500 | | | | 7,139,405 | |
Sempra | | | 107,408 | | | | 9,421,830 | |
| | | | | | | | |
| | | Shares | | | Value | |
COMMON STOCKS (continued) | |
Multi-Utilities (cont’d.) | |
WEC Energy Group, Inc.(a) | | | 53,576 | | | $ | 5,038,287 | |
| | | | | | | | |
| |
| | | | 52,559,442 | |
| | | | | | | | |
Office REITs — 0.0% | |
BXP, Inc.(a) | | | 24,600 | | | | 1,829,256 | |
| | | | | | | | |
|
Oil, Gas & Consumable Fuels — 2.8% | |
APA Corp.(a) | | | 62,750 | | | | 1,448,897 | |
Chevron Corp. | | | 284,059 | | | | 41,143,106 | |
ConocoPhillips | | | 219,018 | | | | 21,720,015 | |
Coterra Energy, Inc. | | | 125,400 | | | | 3,202,716 | |
Devon Energy Corp. | | | 111,200 | | | | 3,639,576 | |
Diamondback Energy, Inc. | | | 31,800 | | | | 5,209,794 | |
EOG Resources, Inc. | | | 95,200 | | | | 11,669,616 | |
EQT Corp. | | | 100,700 | | | | 4,643,277 | |
Exxon Mobil Corp. | | | 744,319 | | | | 80,066,395 | |
Hess Corp. | | | 46,875 | | | | 6,234,844 | |
Kinder Morgan, Inc. | | | 327,443 | | | | 8,971,938 | |
Marathon Petroleum Corp. | | | 54,387 | | | | 7,586,986 | |
Occidental Petroleum Corp.(a) | | | 114,228 | | | | 5,644,005 | |
ONEOK, Inc.(a) | | | 99,040 | | | | 9,943,616 | |
Phillips 66 | | | 69,864 | | | | 7,959,606 | |
Targa Resources Corp. | | | 37,100 | | | | 6,622,350 | |
Texas Pacific Land Corp. | | | 3,200 | | | | 3,539,072 | |
Valero Energy Corp. | | | 53,600 | | | | 6,570,824 | |
Williams Cos., Inc. (The) | | | 206,700 | | | | 11,186,604 | |
| | | | | | | | |
| |
| | | | 247,003,237 | |
| | | | | | | | |
Passenger Airlines — 0.2% | |
Delta Air Lines, Inc. | | | 108,700 | | | | 6,576,350 | |
Southwest Airlines Co. | | | 101,637 | | | | 3,417,036 | |
United Airlines Holdings, Inc.* | | | 55,800 | | | | 5,418,180 | |
| | | | | | | | |
| |
| | | | 15,411,566 | |
| | | | | | | | |
Personal Care Products — 0.1% | |
Estee Lauder Cos., Inc. (The) (Class A Stock) | | | 39,500 | | | | 2,961,710 | |
Kenvue, Inc. | | | 324,800 | | | | 6,934,480 | |
| | | | | | | | |
| |
| | | | 9,896,190 | |
| | | | | | | | |
Pharmaceuticals — 3.0% | |
Bristol-Myers Squibb Co. | | | 343,790 | | | | 19,444,762 | |
Eli Lilly & Co. | | | 133,900 | | | | 103,370,800 | |
Johnson & Johnson | | | 409,146 | | | | 59,170,695 | |
Merck & Co., Inc. | | | 429,903 | | | | 42,766,751 | |
Pfizer, Inc. | | | 960,923 | | | | 25,493,287 | |
Viatris, Inc. | | | 202,394 | | | | 2,519,805 | |
Zoetis, Inc. | | | 77,000 | | | | 12,545,610 | |
| | | | | | | | |
| |
| | | | 265,311,710 | |
| | | | | | | | |
Professional Services — 0.6% | |
Automatic Data Processing, Inc. | | | 69,310 | | | | 20,289,116 | |
Broadridge Financial Solutions, Inc. | | | 20,300 | | | | 4,589,627 | |
Dayforce, Inc.*(a) | | | 26,800 | | | | 1,946,752 | |
Equifax, Inc. | | | 21,350 | | | | 5,441,048 | |
Jacobs Solutions, Inc. | | | 21,200 | | | | 2,832,744 | |
Leidos Holdings, Inc. | | | 22,850 | | | | 3,291,771 | |
Paychex, Inc. | | | 54,350 | | | | 7,620,957 | |
Paycom Software, Inc.(a) | | | 8,700 | | | | 1,783,239 | |
SEE NOTES TO FINANCIAL STATEMENTS.
A234
| | | | |
| | PSF STOCK INDEX PORTFOLIO (CONTINUED) | | |
SCHEDULE OF INVESTMENTS | | | | as of December 31, 2024 |
| | | | | | | | |
| | | Shares | | | Value | |
COMMON STOCKS (continued) | |
Professional Services (cont’d.) | |
Verisk Analytics, Inc. | | | 24,100 | | | $ | 6,637,863 | |
| | | | | | | | |
| |
| | | | 54,433,117 | |
| | | | | | | | |
Real Estate Management & Development — 0.1% | |
CBRE Group, Inc. (Class A Stock)* | | | 51,100 | | | | 6,708,919 | |
CoStar Group, Inc.* | | | 69,500 | | | | 4,975,505 | |
| | | | | | | | |
| |
| | | | 11,684,424 | |
| | | | | | | | |
Residential REITs — 0.3% | |
AvalonBay Communities, Inc.(a) | | | 24,568 | | | | 5,404,223 | |
Camden Property Trust | | | 18,100 | | | | 2,100,324 | |
Equity Residential | | | 57,900 | | | | 4,154,904 | |
Essex Property Trust, Inc. | | | 11,270 | | | | 3,216,909 | |
Invitation Homes, Inc. | | | 96,600 | | | | 3,088,302 | |
Mid-America Apartment Communities, Inc.(a) | | | 19,800 | | | | 3,060,486 | |
UDR, Inc.(a) | | | 50,900 | | | | 2,209,569 | |
| | | | | | | | |
| |
| | | | 23,234,717 | |
| | | | | | | | |
Retail REITs — 0.3% | |
Federal Realty Investment Trust | | | 12,800 | | | | 1,432,960 | |
Kimco Realty Corp. | | | 114,300 | | | | 2,678,049 | |
Realty Income Corp.(a) | | | 147,700 | | | | 7,888,657 | |
Regency Centers Corp.(a) | | | 27,600 | | | | 2,040,468 | |
Simon Property Group, Inc. | | | 52,011 | | | | 8,956,814 | |
| | | | | | | | |
| |
| | | | 22,996,948 | |
| | | | | | | | |
Semiconductors & Semiconductor Equipment — 11.1% | |
Advanced Micro Devices, Inc.* | | | 275,795 | | | | 33,313,278 | |
Analog Devices, Inc. | | | 84,694 | | | | 17,994,087 | |
Applied Materials, Inc.(a) | | | 140,400 | | | | 22,833,252 | |
Broadcom, Inc. | | | 793,700 | | | | 184,011,408 | |
Enphase Energy, Inc.*(a) | | | 23,000 | | | | 1,579,640 | |
First Solar, Inc.* | | | 18,100 | | | | 3,189,944 | |
Intel Corp. | | | 730,400 | | | | 14,644,520 | |
KLA Corp. | | | 22,640 | | | | 14,265,917 | |
Lam Research Corp. | | | 217,900 | | | | 15,738,917 | |
Microchip Technology, Inc.(a) | | | 91,000 | | | | 5,218,850 | |
Micron Technology, Inc. | | | 188,000 | | | | 15,822,080 | |
Monolithic Power Systems, Inc.(a) | | | 8,260 | | | | 4,887,442 | |
NVIDIA Corp. | | | 4,168,200 | | | | 559,747,578 | |
NXP Semiconductors NV (China) | | | 43,200 | | | | 8,979,120 | |
ON Semiconductor Corp.* | | | 72,600 | | | | 4,577,430 | |
QUALCOMM, Inc. | | | 188,850 | | | | 29,011,137 | |
Skyworks Solutions, Inc.(a) | | | 27,100 | | | | 2,403,228 | |
Teradyne, Inc. | | | 27,700 | | | | 3,487,984 | |
Texas Instruments, Inc. | | | 154,700 | | | | 29,007,797 | |
| | | | | | | | |
| |
| | | | 970,713,609 | |
| | | | | | | | |
Software — 10.1% | |
Adobe, Inc.* | | | 74,995 | | | | 33,348,776 | |
ANSYS, Inc.* | | | 15,200 | | | | 5,127,416 | |
Autodesk, Inc.* | | | 36,670 | | | | 10,838,552 | |
Cadence Design Systems, Inc.* | | | 46,400 | | | | 13,941,344 | |
Crowdstrike Holdings, Inc. (Class A Stock)* | | | 39,800 | | | | 13,617,968 | |
Fair Isaac Corp.* | | | 4,120 | | | | 8,202,632 | |
Fortinet, Inc.* | | | 107,700 | | | | 10,175,496 | |
| | | | | | | | |
| | | Shares | | | Value | |
COMMON STOCKS (continued) | |
Software (cont’d.) | |
Gen Digital, Inc. | | | 91,811 | | | $ | 2,513,785 | |
Intuit, Inc. | | | 47,720 | | | | 29,992,020 | |
Microsoft Corp. | | | 1,263,380 | | | | 532,514,670 | |
Oracle Corp. | | | 273,095 | | | | 45,508,551 | |
Palantir Technologies, Inc. (Class A Stock)* | | | 347,100 | | | | 26,251,173 | |
Palo Alto Networks, Inc.*(a) | | | 110,800 | | | | 20,161,168 | |
PTC, Inc.* | | | 20,400 | | | | 3,750,948 | |
Roper Technologies, Inc. | | | 18,180 | | | | 9,450,873 | |
Salesforce, Inc. | | | 162,500 | | | | 54,328,625 | |
ServiceNow, Inc.* | | | 35,030 | | | | 37,136,003 | |
Synopsys, Inc.*(a) | | | 26,280 | | | | 12,755,261 | |
Tyler Technologies, Inc.*(a) | | | 7,240 | | | | 4,174,874 | |
Workday, Inc. (Class A Stock)* | | | 36,400 | | | | 9,392,292 | |
| | | | | | | | |
| |
| | | | 883,182,427 | |
| | | | | | | | |
Specialized REITs — 0.9% | |
American Tower Corp. | | | 79,200 | | | | 14,526,072 | |
Crown Castle, Inc. | | | 73,650 | | | | 6,684,474 | |
Digital Realty Trust, Inc. | | | 52,800 | | | | 9,363,024 | |
Equinix, Inc. | | | 16,335 | | | | 15,402,108 | |
Extra Space Storage, Inc. | | | 35,900 | | | | 5,370,640 | |
Iron Mountain, Inc. | | | 49,730 | | | | 5,227,120 | |
Public Storage | | | 26,750 | | | | 8,010,020 | |
SBA Communications Corp. | | | 18,730 | | | | 3,817,174 | |
VICI Properties, Inc. | | | 177,600 | | | | 5,187,696 | |
Weyerhaeuser Co. | | | 123,330 | | | | 3,471,740 | |
| | | | | | | | |
| |
| | | | 77,060,068 | |
| | | | | | | | |
Specialty Retail — 1.8% | |
AutoZone, Inc.* | | | 2,900 | | | | 9,285,800 | |
Best Buy Co., Inc.(a) | | | 33,325 | | | | 2,859,285 | |
CarMax, Inc.* | | | 26,500 | | | | 2,166,640 | |
Home Depot, Inc. (The) | | | 168,869 | | | | 65,688,352 | |
Lowe’s Cos., Inc. | | | 96,075 | | | | 23,711,310 | |
O’Reilly Automotive, Inc.* | | | 9,770 | | | | 11,585,266 | |
Ross Stores, Inc. | | | 56,000 | | | | 8,471,120 | |
TJX Cos., Inc. (The) | | | 191,600 | | | | 23,147,196 | |
Tractor Supply Co.(a) | | | 91,500 | | | | 4,854,990 | |
Ulta Beauty, Inc.*(a) | | | 8,070 | | | | 3,509,885 | |
| | | | | | | | |
| |
| | | | 155,279,844 | |
| | | | | | | | |
Technology Hardware, Storage & Peripherals — 7.7% | |
Apple, Inc. | | | 2,568,520 | | | | 643,208,778 | |
Dell Technologies, Inc. (Class C Stock) | | | 52,000 | | | | 5,992,480 | |
Hewlett Packard Enterprise Co. | | | 220,366 | | | | 4,704,814 | |
HP, Inc. | | | 163,166 | | | | 5,324,107 | |
NetApp, Inc.(a) | | | 34,900 | | | | 4,051,192 | |
Seagate Technology Holdings PLC(a) | | | 35,650 | | | | 3,076,951 | |
Super Micro Computer, Inc.*(a) | | | 85,400 | | | | 2,602,992 | |
Western Digital Corp.* | | | 58,468 | | | | 3,486,447 | |
| | | | | | | | |
| |
| | | | 672,447,761 | |
| | | | | | | | |
Textiles, Apparel & Luxury Goods — 0.4% | |
Deckers Outdoor Corp.* | | | 25,840 | | | | 5,247,846 | |
Lululemon Athletica, Inc.* | | | 19,300 | | | | 7,380,513 | |
NIKE, Inc. (Class B Stock) | | | 201,600 | | | | 15,255,072 | |
Ralph Lauren Corp | | | 6,800 | | | | 1,570,664 | |
SEE NOTES TO FINANCIAL STATEMENTS.
A235
| | | | |
| | PSF STOCK INDEX PORTFOLIO (CONTINUED) | | |
SCHEDULE OF INVESTMENTS | | | | as of December 31, 2024 |
| | | | | | | | |
| | |
| | | Shares | | | Value | |
COMMON STOCKS (continued) | |
Textiles, Apparel & Luxury Goods (cont’d.) | | | | | |
Tapestry, Inc. | | | 39,000 | | | $ | 2,547,870 | |
| | | | | | | | |
| | |
| | | | | | | 32,001,965 | |
| | | | | | | | |
Tobacco — 0.5% | | | | | | | | |
Altria Group, Inc. | | | 287,000 | | | | 15,007,230 | |
Philip Morris International, Inc. | | | 263,700 | | | | 31,736,295 | |
| | | | | | | | |
| | |
| | | | | | | 46,743,525 | |
| | | | | | | | |
Trading Companies & Distributors — 0.3% | | | | | |
Fastenal Co.(a) | | | 97,100 | | | | 6,982,461 | |
United Rentals, Inc.(a) | | | 11,100 | | | | 7,819,284 | |
W.W. Grainger, Inc. | | | 7,530 | | | | 7,936,997 | |
| | | | | | | | |
| | |
| | | | | | | 22,738,742 | |
| | | | | | | | |
Water Utilities — 0.0% | | | | | | | | |
American Water Works Co., Inc. | | | 33,050 | | | | 4,114,395 | |
| | | | | | | | |
Wireless Telecommunication Services — 0.2% | | | | | |
T-Mobile US, Inc. | | | 82,500 | | | | 18,210,225 | |
| | | | | | | | |
TOTAL COMMON STOCKS
(cost $1,631,044,076) | | | | 8,462,934,945 | |
| | | | | | | | |
UNAFFILIATED EXCHANGE-TRADED FUND — 1.5% | |
iShares Core S&P 500 ETF | | | 220,000 | | | | 129,509,600 | |
| | | | | | | | |
(cost $91,086,310) | | | | | | | | |
| |
TOTAL LONG-TERM INVESTMENTS
(cost $1,722,130,386) | | | | 8,592,444,545 | |
| | | | | | | | |
| |
SHORT-TERM INVESTMENTS — 5.9% | | | | | |
AFFILIATED MUTUAL FUNDS — 5.8% | | | | | |
PGIM Core Ultra Short Bond Fund(wb) | | | 172,512,127 | | | | 172,512,127 | |
PGIM Institutional Money Market Fund (7-day effective yield 4.649%) (cost $334,883,066; includes $333,684,442 of cash collateral for securities on loan)(b)(wb) | | | 335,262,823 | | | | 335,061,665 | |
| | | | | | | | |
| |
TOTAL AFFILIATED MUTUAL FUNDS
(cost $507,395,193) | | | | 507,573,792 | |
| | | | | | | | |
| | | | | | | | | | | | |
Interest Rate | | Maturity
Date | | | | Principal
Amount
(000)# | | | Value | |
|
U.S. TREASURY OBLIGATION(k)(n) — 0.1% | |
U.S. Treasury Bills | |
| 4.216% | | 03/20/25 | | | | | 10,700 | | | $ | 10,604,398 | |
| | | | | | | | | | | | |
(cost $10,603,326) | |
| |
TOTAL SHORT-TERM INVESTMENTS
(cost $517,998,519) | | | | 518,178,190 | |
| | | | | | | | | | | | |
| |
TOTAL INVESTMENTS—103.9%
(cost $2,240,128,905) | | | | 9,110,622,735 | |
Liabilities in excess of other assets(z) — (3.9)% | | | | (345,646,967 | ) |
| | | | | | | | | | | | |
| |
NET ASSETS — 100.0% | | | $ | 8,764,975,768 | |
| | | | | | | | | | | | |
See the Glossary for a list of the abbreviation(s) used in the annual report.
| * | Non-income producing security. |
| # | Principal amount is shown in U.S. dollars unless otherwise stated. |
| (a) | All or a portion of security is on loan. The aggregate market value of such securities, including those sold and pending settlement, is $326,272,029; cash collateral of $333,684,442 (included in liabilities) was received with which the Portfolio purchased highly liquid short-term investments. In the event of significant appreciation in value of securities on loan on the last business day of the reporting period, the Portfolio may reflect a collateral value that is less than the market value of the loaned securities and such shortfall is remedied the following business day. |
| (b) | Represents security, or portion thereof, purchased with cash collateral received for securities on loan and includes dividend reinvestment. |
| (k) | Represents security, or a portion thereof, segregated as collateral for centrally cleared/exchange-traded derivatives. |
| (n) | Rate shown reflects yield to maturity at purchased date. |
| (wb) | Represents an investment in a Fund affiliated with the Manager. |
| (z) | Includes net unrealized appreciation/(depreciation) and/or market value of the below holdings which are excluded from the Schedule of Investments: |
Futures contracts outstanding at December 31, 2024:
| | | | | | | | | | | | | | | | | | | | | | |
Number of Contracts | | Type | | Expiration
Date | | | Current
Notional
Amount | | | Value /
Unrealized
Appreciation
(Depreciation) | |
Long Position: | | | | | | | | | | | | | | | | | | | | |
555 | | S&P 500 E-Mini Index | | | Mar. 2025 | | | $ | 164,717,063 | | | | | | | $ | (5,343,101 | ) | | | | |
| | | | | | | | | | | | | | | | | | | | | | |
Summary of Collateral for Centrally Cleared/Exchange-traded Derivatives:
Cash and securities segregated as collateral, including pending settlement for closed positions, to cover requirements for centrally cleared/exchange-traded derivatives are listed by broker as follows:
| | | | | | | | | | |
Broker | | Cash and/or Foreign Currency | | Securities Market Value |
UBS | | | | $— | | | | | $10,604,398 | |
| | | | | | | | | | |
SEE NOTES TO FINANCIAL STATEMENTS.
A236
| | | | |
| | PSF STOCK INDEX PORTFOLIO (CONTINUED) | | |
SCHEDULE OF INVESTMENTS | | | | as of December 31, 2024 |
Fair Value Measurements:
Various inputs are used in determining the value of the Portfolio’s investments. These inputs are summarized in the three broad levels listed below.
Level 1—unadjusted quoted prices generally in active markets for identical securities.
Level 2—quoted prices for similar securities, interest rates and yield curves, prepayment speeds, foreign currency exchange rates and other observable inputs.
Level 3—unobservable inputs for securities valued in accordance with Board approved fair valuation procedures.
The following is a summary of the inputs used as of December 31, 2024 in valuing such portfolio securities:
| | | | | | | | | | |
| | | Level 1 | | | Level 2 | | | Level 3 |
| | | |
Investments in Securities | | | | | | | | | | |
Assets | | | | | | | | | | |
Long-Term Investments | | | | | | | | | | |
Common Stocks | | | | | | | | | | |
Aerospace & Defense | | $ | 156,613,413 | | | $ | — | | | $— |
Air Freight & Logistics | | | 31,151,283 | | | | — | | | — |
Automobile Components | | | 3,634,198 | | | | — | | | — |
Automobiles | | | 208,115,530 | | | | — | | | — |
Banks | | | 286,369,052 | | | | — | | | — |
Beverages | | | 97,589,614 | | | | — | | | — |
Biotechnology | | | 135,069,131 | | | | — | | | — |
Broadline Retail | | | 353,898,123 | | | | — | | | — |
Building Products | | | 44,841,483 | | | | — | | | — |
Capital Markets | | | 267,195,112 | | | | — | | | — |
Chemicals | | | 106,483,470 | | | | — | | | — |
Commercial Services & Supplies | | | 45,083,665 | | | | — | | | — |
Communications Equipment | | | 77,442,967 | | | | — | | | — |
Construction & Engineering | | | 8,027,670 | | | | — | | | — |
Construction Materials | | | 11,215,784 | | | | — | | | — |
Consumer Finance | | | 51,300,196 | | | | — | | | — |
Consumer Staples Distribution & Retail | | | 165,946,562 | | | | — | | | — |
Containers & Packaging | | | 18,782,933 | | | | — | | | — |
Distributors | | | 6,654,528 | | | | — | | | — |
Diversified Telecommunication Services | | | 56,236,041 | | | | — | | | — |
Electric Utilities | | | 126,749,192 | | | | — | | | — |
Electrical Equipment | | | 67,798,378 | | | | — | | | — |
Electronic Equipment, Instruments & Components | | | 49,138,958 | | | | — | | | — |
Energy Equipment & Services | | | 20,212,275 | | | | — | | | — |
Entertainment | | | 117,412,517 | | | | — | | | — |
Financial Services | | | 372,661,431 | | | | — | | | — |
Food Products | | | 53,035,487 | | | | — | | | — |
Gas Utilities | | | 3,662,801 | | | | — | | | — |
Ground Transportation | | | 72,737,240 | | | | — | | | — |
Health Care Equipment & Supplies | | | 191,207,464 | | | | — | | | — |
Health Care Providers & Services | | | 173,407,268 | | | | — | | | — |
Health Care REITs | | | 21,735,608 | | | | — | | | — |
Hotel & Resort REITs | | | 2,087,088 | | | | — | | | — |
Hotels, Restaurants & Leisure | | | 165,118,879 | | | | — | | | — |
Household Durables | | | 26,916,810 | | | | — | | | — |
Household Products | | | 94,573,103 | | | | — | | | — |
Independent Power & Renewable Electricity Producers | | | 9,492,147 | | | | — | | | — |
Industrial Conglomerates | | | 36,872,947 | | | | — | | | — |
Industrial REITs | | | 16,592,786 | | | | — | | | — |
Insurance | | | 174,932,282 | | | | — | | | — |
Interactive Media & Services | | | 560,286,763 | | | | — | | | — |
IT Services | | | 97,199,103 | | | | — | | | — |
Leisure Products | | | 1,243,998 | | | | — | | | — |
Life Sciences Tools & Services | | | 89,410,224 | | | | — | | | — |
Machinery | | | 135,153,268 | | | | — | | | — |
Media | | | 40,809,493 | | | | — | | | — |
Metals & Mining | | | 23,983,512 | | | | — | | | — |
SEE NOTES TO FINANCIAL STATEMENTS.
A237
| | | | |
| | PSF STOCK INDEX PORTFOLIO (CONTINUED) | | |
SCHEDULE OF INVESTMENTS | | | | as of December 31, 2024 |
| | | | | | | | | | |
| | | Level 1 | | | Level 2 | | | Level 3 |
Investments in Securities (continued) | | | | | | | | | | |
Assets (continued) | | | | | | | | | | |
Long-Term Investments (continued) | | | | | | | | | | |
Common Stocks (continued) | | | | | | | | | | |
Multi-Utilities | | $ | 52,559,442 | | | $ | — | | | $— |
Office REITs | | | 1,829,256 | | | | — | | | — |
Oil, Gas & Consumable Fuels | | | 247,003,237 | | | | — | | | — |
Passenger Airlines | | | 15,411,566 | | | | — | | | — |
Personal Care Products | | | 9,896,190 | | | | — | | | — |
Pharmaceuticals | | | 265,311,710 | | | | — | | | — |
Professional Services | | | 54,433,117 | | | | — | | | — |
Real Estate Management & Development | | | 11,684,424 | | | | — | | | — |
Residential REITs | | | 23,234,717 | | | | — | | | — |
Retail REITs | | | 22,996,948 | | | | — | | | — |
Semiconductors & Semiconductor Equipment | | | 970,713,609 | | | | — | | | — |
Software | | | 883,182,427 | | | | — | | | — |
Specialized REITs | | | 77,060,068 | | | | — | | | — |
Specialty Retail | | | 155,279,844 | | | | — | | | — |
Technology Hardware, Storage & Peripherals | | | 672,447,761 | | | | — | | | — |
Textiles, Apparel & Luxury Goods | | | 32,001,965 | | | | — | | | — |
Tobacco | | | 46,743,525 | | | | — | | | — |
Trading Companies & Distributors | | | 22,738,742 | | | | — | | | — |
Water Utilities | | | 4,114,395 | | | | — | | | — |
Wireless Telecommunication Services | | | 18,210,225 | | | | — | | | — |
Unaffiliated Exchange-Traded Fund | | | 129,509,600 | | | | — | | | — |
Short-Term Investments | | | | | | | | | | |
Affiliated Mutual Funds | | | 507,573,792 | | | | — | | | — |
U.S. Treasury Obligation | | | — | | | | 10,604,398 | | | — |
| | | | | | | | | | |
Total | | $ | 9,100,018,337 | | | $ | 10,604,398 | | | $— |
| | | | | | | | | | |
| | | |
Other Financial Instruments* | | | | | | | | | | |
Liabilities | | | | | | | | | | |
Futures Contracts | | $ | (5,343,101 | ) | | $ | — | | | $— |
| | | | | | | | | | |
| * | Other financial instruments are derivative instruments not reflected in the Schedule of Investments, such as futures, forwards and centrally cleared swap contracts, which are recorded at unrealized appreciation (depreciation) on the instrument, and OTC swap contracts which are recorded at fair value. |
Industry Classification:
The industry classification of investments and liabilities in excess of other assets shown as a percentage of net assets as of December 31, 2024 were as follows:
| | | | |
Semiconductors & Semiconductor Equipment | | | 11.1 | % |
Software | | | 10.1 | |
Technology Hardware, Storage & Peripherals | | | 7.7 | |
Interactive Media & Services | | | 6.4 | |
Affiliated Mutual Funds (3.8% represents investments purchased with collateral from securities on loan) | | | 5.8 | |
Financial Services | | | 4.3 | |
Broadline Retail | | | 4.0 | |
Banks | | | 3.3 | |
Capital Markets | | | 3.1 | |
Pharmaceuticals | | | 3.0 | |
Oil, Gas & Consumable Fuels | | | 2.8 | |
Automobiles | | | 2.4 | |
Health Care Equipment & Supplies | | | 2.2 | |
Insurance | | | 2.0 | |
Health Care Providers & Services | | | 2.0 | |
Consumer Staples Distribution & Retail | | | 1.9 | |
Hotels, Restaurants & Leisure | | | 1.9 | |
| | | | |
Aerospace & Defense | | | 1.8 | % |
Specialty Retail | | | 1.8 | |
Machinery | | | 1.5 | |
Biotechnology | | | 1.5 | |
Unaffiliated Exchange-Traded Fund | | | 1.5 | |
Electric Utilities | | | 1.4 | |
Entertainment | | | 1.3 | |
Chemicals | | | 1.2 | |
Beverages | | | 1.1 | |
IT Services | | | 1.1 | |
Household Products | | | 1.1 | |
Life Sciences Tools & Services | | | 1.0 | |
Communications Equipment | | | 0.9 | |
Specialized REITs | | | 0.9 | |
Ground Transportation | | | 0.8 | |
Electrical Equipment | | | 0.8 | |
Diversified Telecommunication Services | | | 0.6 | |
Professional Services | | | 0.6 | |
SEE NOTES TO FINANCIAL STATEMENTS.
A238
| | | | |
| | PSF STOCK INDEX PORTFOLIO (CONTINUED) | | |
SCHEDULE OF INVESTMENTS | | | | as of December 31, 2024 |
Industry Classification (continued):
| | | | |
Food Products | | | 0.6 | % |
Multi-Utilities | | | 0.6 | |
Consumer Finance | | | 0.6 | |
Electronic Equipment, Instruments & Components | | | 0.6 | |
Tobacco | | | 0.5 | |
Commercial Services & Supplies | | | 0.5 | |
Building Products | | | 0.5 | |
Media | | | 0.5 | |
Industrial Conglomerates | | | 0.4 | |
Textiles, Apparel & Luxury Goods | | | 0.4 | |
Air Freight & Logistics | | | 0.4 | |
Household Durables | | | 0.3 | |
Metals & Mining | | | 0.3 | |
Residential REITs | | | 0.3 | |
Retail REITs | | | 0.3 | |
Trading Companies & Distributors | | | 0.3 | |
Health Care REITs | | | 0.2 | |
Energy Equipment & Services | | | 0.2 | |
Containers & Packaging | | | 0.2 | |
Wireless Telecommunication Services | | | 0.2 | |
Industrial REITs | | | 0.2 | |
| | | | |
Passenger Airlines | | | 0.2 | % |
Real Estate Management & Development | | | 0.1 | |
Construction Materials | | | 0.1 | |
U.S. Treasury Obligation | | | 0.1 | |
Personal Care Products | | | 0.1 | |
Independent Power & Renewable Electricity Producers | | | 0.1 | |
Construction & Engineering | | | 0.1 | |
Distributors | | | 0.1 | |
Water Utilities | | | 0.0 | * |
Gas Utilities | | | 0.0 | * |
Automobile Components | | | 0.0 | * |
Hotel & Resort REITs | | | 0.0 | * |
Office REITs | | | 0.0 | * |
Leisure Products | | | 0.0 | * |
| | | | |
| |
| | | 103.9 | |
Liabilities in excess of other assets | | | (3.9 | ) |
| | | | |
| |
| | | 100.0 | % |
| | | | |
Effects of Derivative Instruments on the Financial Statements and Primary Underlying Risk Exposure:
The Portfolio invested in derivative instruments during the reporting period. The primary type of risk associated with these derivative instruments is equity risk. See the Notes to Financial Statements for additional detail regarding these derivative instruments and their risks. The effect of such derivative instruments on the Portfolio’s financial position and financial performance as reflected in the Statement of Assets and Liabilities and Statement of Operations is presented in the summary below.
Fair values of derivative instruments as of December 31, 2024 as presented in the Statement of Assets and Liabilities:
| | | | | | | | | | |
| | | Asset Derivatives | | Liability Derivatives | |
| | | | |
Derivatives not accounted for as hedging instruments, carried at fair value | | Statement of Assets and Liabilities Location | | Fair
Value | | Statement of Assets and Liabilities Location | | Fair
Value | |
Equity contracts | | — | | $— | | Due from/to broker-variation margin futures | | $ | 5,343,101 | * |
| | | | | | | | | | |
| * | Includes cumulative appreciation (depreciation) as reported in the schedule of open futures and centrally cleared swap contracts. Only unsettled variation margin receivable (payable) is reported within the Statement of Assets and Liabilities. |
The effects of derivative instruments on the Statement of Operations for the year ended December 31, 2024 are as follows:
| | | | |
Amount of Realized Gain (Loss) on Derivatives Recognized in Income | |
Derivatives not accounted for as hedging instruments, carried at fair value | | Futures | |
Equity contracts | | $ | 26,823,824 | |
| | | | |
| | | | |
Change in Unrealized Appreciation (Depreciation) on Derivatives Recognized in Income | |
Derivatives not accounted for as hedging instruments, carried at fair value | | Futures | |
Equity contracts | | $ | (7,894,542 | ) |
| | | | |
SEE NOTES TO FINANCIAL STATEMENTS.
A239
| | | | |
| | PSF STOCK INDEX PORTFOLIO (CONTINUED) | | |
SCHEDULE OF INVESTMENTS | | | | as of December 31, 2024 |
For the year ended December 31, 2024, the Portfolio’s average volume of derivative activities is as follows:
| | |
| Derivative Contract Type | | Average Volume of Derivative Activities* |
|
Futures Contracts - Long Positions (1) | | $125,754,525 |
|
| * | Average volume is based on average quarter end balances for the year ended December 31, 2024. |
| (1) | Notional Amount in USD. |
Financial Instruments/Transactions—Summary of Offsetting and Netting Arrangements:
The Portfolio entered into financial instruments/transactions during the reporting period that are either offset in accordance with current requirements or are subject to enforceable master netting arrangements or similar agreements that permit offsetting. The information about offsetting and related netting arrangements for financial instruments/transactions where the legal right to set-off exists is presented in the summary below.
Offsetting of financial instrument/transaction assets and liabilities:
| | | | | | |
|
| Description | | Gross Market Value of Recognized Assets/(Liabilities) | | Collateral Pledged/(Received)(1) | | Net Amount |
|
Securities on Loan | | $326,272,029 | | $(326,272,029) | | $— |
|
| (1) | Collateral amount disclosed by the Portfolio is limited to the market value of financial instruments/transactions. |
SEE NOTES TO FINANCIAL STATEMENTS.
A240
| | | | |
| | PSF STOCK INDEX PORTFOLIO (CONTINUED) | | |
| | | | |
STATEMENT OF ASSETS AND LIABILITIES | |
as of December 31, 2024 | |
| |
ASSETS | | | | |
Investments at value, including securities on loan of $326,272,029: | | | | |
Unaffiliated investments (cost $1,732,733,712) | | $ | 8,603,048,943 | |
Affiliated investments (cost $507,395,193) | | | 507,573,792 | |
Receivable for Portfolio shares sold | | | 6,696,944 | |
Dividends and interest receivable | | | 5,234,673 | |
Tax reclaim receivable | | | 957,253 | |
Prepaid expenses and other assets | | | 662,332 | |
| | | | |
Total Assets | | | 9,124,173,937 | |
| | | | |
LIABILITIES | | | | |
Payable to broker for collateral for securities on loan | | | 333,684,442 | |
Payable for investments purchased | | | 20,552,572 | |
Management fee payable. | | | 1,841,459 | |
Accrued expenses and other liabilities | | | 1,480,345 | |
Payable for Portfolio shares purchased | | | 982,367 | |
Due to broker-variation margin futures | | | 638,250 | |
Distribution fee payable | | | 12,134 | |
Trustees’ fees payable | | | 5,410 | |
Affiliated transfer agent fee payable | | | 1,190 | |
| | | | |
Total Liabilities | | | 359,198,169 | |
| | | | |
NET ASSETS | | $ | 8,764,975,768 | |
| | | | |
Net assets were comprised of: | | | | |
Partners’ Equity | | $ | 8,764,975,768 | |
| | | | |
Class I: | | | | |
Net asset value and redemption price per share, $8,707,851,005 / 60,419,727 outstanding shares of beneficial interest | | $ | 144.12 | |
| | | | |
Class III: | | | | |
Net asset value and redemption price per share, $57,124,763 / 400,020 outstanding shares of beneficial interest | | $ | 142.80 | |
| | | | |
| | | | |
STATEMENT OF OPERATIONS | |
Year Ended December 31, 2024 | |
| |
NET INVESTMENT INCOME (LOSS) | | | | |
INCOME | | | | |
Unaffiliated dividend income | | $ | 113,661,819 | |
Affiliated dividend income | | | 6,586,550 | |
Interest income | | | 405,150 | |
Income from securities lending, net (including affiliated income of $358,927) | | | 389,160 | |
| | | | |
Total income | | | 121,042,679 | |
| | | | |
EXPENSES | | | | |
Management fee | | | 23,066,678 | |
Distribution fee—Class III | | | 122,469 | |
Custodian and accounting fees | | | 420,550 | |
Shareholders’ reports | | | 204,672 | |
Trustees’ fees | | | 145,590 | |
Professional fees | | | 83,566 | |
Audit fee | | | 30,858 | |
Transfer agent’s fees and expenses (including affiliated expense of $7,143) | | | 11,944 | |
Miscellaneous | | | 144,810 | |
| | | | |
Total expenses | | | 24,231,137 | |
Less: Fee waivers and/or expense reimbursement | | | (1,338,908 | ) |
| | | | |
Net expenses | | | 22,892,229 | |
| | | | |
| NET INVESTMENT INCOME (LOSS) | | | 98,150,450 | |
| | | | |
| REALIZED AND UNREALIZED GAIN (LOSS) ON INVESTMENT AND FOREIGN CURRENCY TRANSACTIONS | | | | |
Net realized gain (loss) on: | | | | |
Investment transactions (including affiliated of $(22,562)) | | | 333,636,491 | |
Futures transactions | | | 26,823,824 | |
Foreign currency transactions | | | (562 | ) |
| | | | |
| | | 360,459,753 | |
| | | | |
Net change in unrealized appreciation (depreciation) on: | | | | |
Investments (including affiliated of $(52,608)) | | | 1,386,227,208 | |
Futures | | | (7,894,542 | ) |
| | | | |
| | | 1,378,332,666 | |
| | | | |
NET GAIN (LOSS) ON INVESTMENT AND FOREIGN CURRENCY TRANSACTIONS | | | 1,738,792,419 | |
| | | | |
NET INCREASE (DECREASE) IN NET ASSETS RESULTING FROM OPERATIONS | | $ | 1,836,942,869 | |
| | | | |
STATEMENTS OF CHANGES IN NET ASSETS
| | | | | | | | | | | | | | | | | | | | | | | | |
| | | Year Ended December 31, 2024 | | | Year Ended December 31, 2023 | |
| | | | | | | | | | | | | | | | | | | |
INCREASE (DECREASE) IN NET ASSETS | | | | | | | | | | | | | | | | | | | | | | | | |
OPERATIONS | | | | | | | | | | | | | | | | | | | | | | | | |
Net investment income (loss) | | | | | | $ | 98,150,450 | | | | | | | | | | | $ | 92,645,806 | | | | | |
Net realized gain (loss) on investment and foreign currency transactions | | | | | | | 360,459,753 | | | | | | | | | | | | 28,529,079 | | | | | |
Net change in unrealized appreciation (depreciation) on investments | | | | | | | 1,378,332,666 | | | | | | | | | | | | 1,404,142,166 | | | | | |
| | | | | | | | | | | | | | | | | | | | | | | | |
NET INCREASE (DECREASE) IN NET ASSETS RESULTING FROM OPERATIONS | | | | | | | 1,836,942,869 | | | | | | | | | | | | 1,525,317,051 | | | | | |
| | | | | | | | | | | | | | | | | | | | | | | | |
PORTFOLIO SHARE TRANSACTIONS | | | | | | | | | | | | | | | | | | | | | | | | |
Portfolio shares sold | | | | | | | 395,283,655 | | | | | | | | | | | | 273,329,112 | | | | | |
Portfolio shares purchased | | | | | | | (880,032,406 | ) | | | | | | | | | | | (290,805,416 | ) | | | | |
| | | | | | | | | | | | | | | | | | | | | | | | |
NET INCREASE (DECREASE) IN NET ASSETS FROM PORTFOLIO SHARE TRANSACTIONS | | | | | | | (484,748,751 | ) | | | | | | | | | | | (17,476,304 | ) | | | | |
| | | | | | | | | | | | | | | | | | | | | | | | |
TOTAL INCREASE (DECREASE) | | | | | | | 1,352,194,118 | | | | | | | | | | | | 1,507,840,747 | | | | | |
NET ASSETS: | | | | | | | | | | | | | | | | | | | | | | | | |
Beginning of year | | | | | | | 7,412,781,650 | | | | | | | | | | | | 5,904,940,903 | | | | | |
| | | | | | | | | | | | | | | | | | | | | | | | |
End of year | | | | | | $ | 8,764,975,768 | | | | | | | | | | | $ | 7,412,781,650 | | | | | |
| | | | | | | | | | | | | | | | | | | | | | | | |
SEE NOTES TO FINANCIAL STATEMENTS.
A241
| | | | |
| | PSF STOCK INDEX PORTFOLIO (CONTINUED) | | |
FINANCIAL HIGHLIGHTS | | | | |
| | | | | | | | | | | | | | | | | | | | |
Class I | | | | | | | | | | | | | | | |
| | | Year Ended December 31, | |
| | | 2024 | | | 2023 | | | 2022 | | | 2021 | | | 2020 | |
Per Share Operating Performance(a): | | | | | | | | | | | | | | | | | | | | |
Net Asset Value, beginning of year | | $ | 115.63 | | | $ | 91.83 | | | $ | 112.45 | | | $ | 87.66 | | | $ | 74.24 | |
| | | | | | | | | | | | | | | | | | | | |
Income (Loss) From Investment Operations: | | | | | | | | | | | | | | | | | | | | |
Net investment income (loss) | | | 1.54 | | | | 1.44 | | | | 1.29 | | | | 1.06 | | | | 1.12 | |
Net realized and unrealized gain (loss) on investment transactions | | | 26.95 | | | | 22.36 | | | | (21.91 | ) | | | 23.73 | | | | 12.30 | |
| | | | | | | | | | | | | | | | | | | | |
Total from investment operations | | | 28.49 | | | | 23.80 | | | | (20.62 | ) | | | 24.79 | | | | 13.42 | |
| | | | | | | | | | | | | | | | | | | | |
Net Asset Value, end of year | | $ | 144.12 | | | $ | 115.63 | | | $ | 91.83 | | | $ | 112.45 | | | $ | 87.66 | |
| | | | | | | | | | | | | | | | | | | | |
Total Return(b) | | | 24.65 | % | | | 25.92 | % | | | (18.34 | )% | | | 28.28 | % | | | 18.08 | % |
Ratios/Supplemental Data: | | | | | | | | | | | | | | | | | | | | |
Net assets, end of year (in millions) | | $ | 8,708 | | | $ | 7,372 | | | $ | 5,880 | | | $ | 7,244 | | | $ | 5,620 | |
Average net assets (in millions) | | $ | 8,378 | | | $ | 6,589 | | | $ | 6,252 | | | $ | 6,427 | | | $ | 4,802 | |
Ratios to average net assets(c): | | | | | | | | | | | | | | | | | | | | |
Expenses after waivers and/or expense reimbursement | | | 0.27 | % | | | 0.29 | % | | | 0.29 | % | | | 0.29 | % | | | 0.31 | % |
Expenses before waivers and/or expense reimbursement | | | 0.29 | % | | | 0.29 | % | | | 0.29 | % | | | 0.29 | % | | | 0.31 | % |
Net investment income (loss) | | | 1.17 | % | | | 1.40 | % | | | 1.32 | % | | | 1.06 | % | | | 1.50 | % |
Portfolio turnover rate(d) | | | 3 | % | | | 3 | % | | | 3 | % | | | 2 | % | | | 4 | % |
| | | | | | | | | | | | | | | | | | | | | | | | |
Class III | | | | | | | | | | | | | | | | | | |
| | | Year Ended December 31, | | | April 26, 2021(e) through December 31, | |
| | | 2024 | | | 2023 | | | 2022 | | | 2021 | |
Per Share Operating Performance(a): | | | | | | | | | | | | | | | | | | | | | | | | |
Net Asset Value, beginning of period | | $ | 114.86 | | | $ | 91.45 | | | $ | 112.26 | | | | | | | $ | 97.90 | | | | | |
| | | | | | | | | | | | | | | | | | | | | | | | |
Income (Loss) From Investment Operations: | | | | | | | | | | | | | | | | | | | | | | | | |
Net investment income (loss) | | | 1.20 | | | | 1.18 | | | | 1.06 | | | | | | | | 0.54 | | | | | |
Net realized and unrealized gain (loss) on investment transactions | | | 26.74 | | | | 22.23 | | | | (21.87 | ) | | | | | | | 13.82 | | | | | |
| | | | | | | | | | | | | | | | | | | | | | | | |
Total from investment operations | | | 27.94 | | | | 23.41 | | | | (20.81 | ) | | | | | | | 14.36 | | | | | |
| | | | | | | | | | | | | | | | | | | | | | | | |
Net Asset Value, end of period | | $ | 142.80 | | | $ | 114.86 | | | $ | 91.45 | | | | | | | $ | 112.26 | | | | | |
| | | | | | | | | | | | | | | | | | | | | | | | |
Total Return(b) | | | 24.33 | % | | | 25.60 | % | | | (18.54 | )% | | | | | | | 14.67 | % | | | | |
Ratios/Supplemental Data: | | | | | | | | | | | | | | | | | | | | | | | | |
Net assets, end of period (in millions) | | $ | 57 | | | $ | 40 | | | $ | 25 | | | | | | | $ | 17 | | | | | |
Average net assets (in millions) | | $ | 49 | | | $ | 32 | | | $ | 21 | | | | | | | $ | 7 | | | | | |
Ratios to average net assets(c): | | | | | | | | | | | | | | | | | | | | | | | | |
Expenses after waivers and/or expense reimbursement | | | 0.52 | % | | | 0.54 | % | | | 0.54 | % | | | | | | | 0.54 | %(f) | | | | |
Expenses before waivers and/or expense reimbursement | | | 0.54 | % | | | 0.54 | % | | | 0.54 | % | | | | | | | 0.54 | %(f) | | | | |
Net investment income (loss) | | | 0.91 | % | | | 1.15 | % | | | 1.09 | % | | | | | | | 0.74 | %(f) | | | | |
Portfolio turnover rate(d) | | | 3 | % | | | 3 | % | | | 3 | % | | | | | | | 2 | % | | | | |
| (a) | Calculated based on average shares outstanding during the period. |
| (b) | Total return is calculated assuming a purchase of a share on the first day and a sale on the last day of each period reported and includes reinvestment of dividends and distributions, if any, and does not reflect the effect of insurance contract charges. Total return does not reflect expenses associated with the separate account such as administrative fees, account charges and surrender charges which, if reflected, would reduce the total returns for all periods shown. Performance figures may reflect fee waivers and/or expense reimbursements. In the absence of fee waivers and/or expense reimbursements, the total return would be lower. Past performance is no guarantee of future results. Total returns may reflect adjustments to conform to GAAP. Total returns for periods less than one full year are not annualized. |
| (c) | Does not include expenses of the underlying funds in which the Portfolio invests. |
| (d) | The Portfolio’s portfolio turnover rate is calculated in accordance with regulatory requirements, without regard to transactions involving short-term investments, certain derivatives and in-kind transactions (if any). If such transactions were included, the Portfolio’s portfolio turnover rate may be higher. |
| (e) | Commencement of offering. |
| (f) | Annualized, with the exception of certain non-recurring expenses. |
SEE NOTES TO FINANCIAL STATEMENTS.
A242
NOTES TO FINANCIAL STATEMENTS OF
THE PRUDENTIAL SERIES FUND
1. Organization
The Prudential Series Fund (“Series Fund”), a Delaware statutory trust, is registered under the Investment Company Act of 1940, as amended (“1940 Act”), as an open-end management investment company. The Series Fund is currently composed of 14 Portfolios (each, a “Portfolio” and collectively, the “Portfolios”). The information presented in these financial statements pertains to the 14 Portfolios listed below together with their investment objectives. Each Portfolio is a diversified portfolio for purposes of the 1940 Act.
The PSF PGIM Government Money Market Portfolio seeks to maintain a stable $10.00 net asset value (“NAV”). The Series Fund’s Board of Trustees (the “Board”) has determined that the PSF PGIM Government Money Market Portfolio, as a “government money market fund,” is not subject to liquidity fees. The Board has reserved its ability to change this determination with respect to liquidity fees, but such change would become effective only after providing appropriate prior notice to shareholders.
The Portfolios have the following investment objective(s):
| | |
| | |
| Portfolio | | Investment Objective(s) |
| |
PSF Global Portfolio | | Long-term growth of capital. |
| |
PSF Mid-Cap Growth Portfolio | | Long-term capital appreciation. |
| |
PSF Natural Resources Portfolio | | Long-term growth of capital. |
| |
PSF PGIM 50/50 Balanced Portfolio | | Total investment return consistent with a conservatively managed diversified portfolio. |
| |
PSF PGIM Flexible Managed Portfolio | | Total return consistent with an aggressively managed diversified portfolio. |
| |
PSF PGIM Government Income Portfolio | | High level of income over the long-term consistent with the preservation of capital. |
| |
PSF PGIM Government Money Market Portfolio | | Maximum current income consistent with the stability of capital and maintenance of liquidity. |
| |
PSF PGIM High Yield Bond Portfolio | | High total return. |
| |
PSF PGIM Jennison Blend Portfolio | | Long-term growth of capital. |
| |
PSF PGIM Jennison Growth Portfolio | | Long-term growth of capital. |
| |
PSF PGIM Jennison Value Portfolio | | Capital appreciation. |
B1
| | |
| | |
| Portfolio | | Investment Objective(s) |
| |
PSF PGIM Total Return Bond Portfolio | | High level of income over a longer term while providing reasonable safety of capital. |
| |
PSF Small-Cap Stock Index Portfolio | | Long-term growth of capital. |
| |
PSF Stock Index Portfolio | | Achieve investment results that generally correspond to the performance of publicly traded common stocks. |
During the reporting period, the Portfolios adopted FASB Accounting Standards Update 2023-07, Segment Reporting (Topic 280) - Improvements to Reportable Segment Disclosures (“ASU 2023-07”). Adoption of ASU 2023-07 exclusively impacted financial statement disclosures only and did not affect the Portfolios’ financial position or performance. The intent of ASU 2023-07 is, through improved segment disclosures, to enable investors to better understand an entity’s overall performance. PGIM Investments LLC (“PGIM Investments”, the “Investment Manager” or the “Manager”) acts as each Portfolio’s chief operating decision maker (“CODM”). The CODM has determined that each Portfolio has a single operating segment as the CODM monitors the operating results of each Portfolio as a whole and the Portfolios’ long-term strategic asset allocation is pre-determined in accordance with the terms of their respective prospectus, based on a defined investment strategy which is executed by the Portfolios’ sub-advisor.
The CODM allocates resources and assesses performance based on the operating results of each Portfolio, which is consistent with the results presented in the Portfolio’s Schedule of Investments, Statement of Changes in Net Assets and Financial Highlights.
2. Accounting Policies
The Series Fund follows the investment company accounting and reporting guidance of the Financial Accounting Standards Board (“FASB”) Accounting Standard Codification (“ASC”) Topic 946 Financial Services — Investment Companies.The following is a summary of significant accounting policies followed by the Series Fund in the preparation of the Portfolios’ financial statements. The policies conform to U.S. generally accepted accounting principles (“GAAP”). The Series Fund and the Portfolios consistently follow such policies in the preparation of their financial statements.
Securities Valuation: Each Portfolio holds securities and other assets and liabilities that are fair valued as of the close of each day (generally, 4:00 PM Eastern time) the New York Stock Exchange (“NYSE”) is open for trading. As described in further detail below, the Portfolios’ investments are valued daily based on a number of factors, including the type of investment and whether market quotations are readily available. The Board has approved the Portfolios’ valuation policies and procedures for security valuation and designated the Investment Manager as the “Valuation Designee,” as defined by Rule 2a-5(b) under the 1940 Act, to perform the fair value determination relating to all Portfolio investments. Pursuant to the Board’s oversight, the Valuation Designee has established a Valuation Committee to perform the duties and responsibilities of the Valuation Designee under Rule 2a-5. The valuation procedures permit each Portfolio to utilize independent pricing vendor services, quotations from market makers, and alternative valuation methods when market quotations are either not readily available or not deemed representative of fair value. Fair value is the estimated price that would be received to sell an asset or paid to transfer a liability in an orderly transaction between market participants on the measurement date.
For the fiscal reporting year-end, securities and other assets and liabilities were fair valued at the close of the last U.S. business day. Trading in certain foreign securities may occur when the NYSE is closed (including weekends and holidays). Because such foreign securities trade in markets that are open on weekends and U.S. holidays, the values of some of the Portfolios’ foreign investments may change on days when investors cannot purchase or redeem Portfolio shares.
Various inputs determine how the Portfolios’ investments are valued, all of which are categorized according to the three broad levels (Level 1, 2, or 3) detailed in the Schedule of Investments and referred to herein as the “fair value hierarchy” in accordance with FASB ASC Topic 820 Fair Value Measurement.
Common or preferred stocks, exchange-traded funds (“ETFs”) and derivative instruments, if applicable, that are traded on a national securities exchange are valued at the last sale price as of the close of trading on the applicable exchange where
B2
the security principally trades. Securities traded via NASDAQ are valued at the NASDAQ official closing price. To the extent these securities are valued at the last sale price or NASDAQ official closing price, they are classified as Level 1 in the fair value hierarchy. In the event that no sale or official closing price on a valuation date exists, these securities are generally valued at the mean between the last reported bid and ask prices, or at the last bid price in the absence of an ask price. These securities are classified as Level 2 in the fair value hierarchy.
Foreign equities traded on foreign securities exchanges are generally valued using pricing vendor services that provide model prices derived using adjustment factors based on information such as local closing price, relevant general and sector indices, currency fluctuations, depositary receipts, and futures, as applicable. Securities valued using such model prices are classified as Level 2 in the fair value hierarchy. The models generate an evaluated adjustment factor for each security, which is applied to the local closing price to adjust it for post closing market movements up to the time each Portfolio is valued. Utilizing that evaluated adjustment factor, the vendor provides an evaluated price for each security. If the vendor does not provide an evaluated price, securities are valued in accordance with exchange-traded common and preferred stock valuation policies discussed above.
Investments in open-end funds (other than ETFs) are valued at their net asset values as of the close of the NYSE on the date of valuation. These securities are classified as Level 1 in the fair value hierarchy since they may be purchased or sold at their net asset values on the date of valuation.
Fixed income securities traded in the over-the-counter (“OTC”) market are generally classified as Level 2 in the fair value hierarchy. Such fixed income securities are typically valued using the market approach which generally involves obtaining data from an approved independent third-party vendor source. The Portfolios utilize the market approach as the primary method to value securities when market prices of identical or comparable instruments are available. The third-party vendors’ valuation techniques used to derive the evaluated bid price are based on evaluating observable inputs, including but not limited to, yield curves, yield spreads, credit ratings, deal terms, tranche level attributes, default rates, cash flows, prepayment speeds, broker/dealer quotations and reported trades. Certain Level 3 securities are also valued using the market approach when obtaining a single broker quote or when utilizing transaction prices for identical securities that have been used in excess of five business days. During the reporting period, there were no changes to report with respect to the valuation approach and/or valuation techniques discussed above.
The Government Money Market Portfolio values all of its securities of sufficient credit quality at amortized cost, which approximates fair value. The amortized cost method involves valuing a security at its cost on the date of purchase and thereafter assuming a constant amortization to maturity of the difference between the principal amount due at maturity and cost. These securities are categorized as Level 2 of the fair value hierarchy.
Floating rate and other loans are generally valued at prices provided by approved independent pricing vendors. The pricing vendors utilize broker/dealer quotations and provide prices based on the average of such quotations. Floating rate and other loans valued using such vendor prices are generally classified as Level 2 in the fair value hierarchy. Floating rate and other loans valued based on a single broker quote or at the original transaction price in excess of five business days are classified as Level 3 in the fair value hierarchy.
OTC and centrally cleared derivative instruments are generally classified as Level 2 in the fair value hierarchy. Such derivative instruments are typically valued using the market approach and/or income approach which generally involves obtaining data from an approved independent third-party vendor source. The Portfolios utilize the market approach when quoted prices in broker-dealer markets are available but also include consideration of alternative valuation approaches, including the income approach. In the absence of reliable market quotations, the income approach is typically utilized for purposes of valuing derivatives such as interest rate swaps based on a discounted cash flow analysis whereby the value of the instrument is equal to the present value of its future cash inflows or outflows. Such analysis includes projecting future cash flows and determining the discount rate (including the present value factors that affect the discount rate) used to discount the future cash flows. In addition, the third-party vendors’ valuation techniques used to derive the evaluated derivative price is based on evaluating observable inputs, including but not limited to, underlying asset prices, indices, spreads, interest rates and exchange rates. Certain derivatives may be classified as Level 3 when valued using the market approach by obtaining a single broker quote or when utilizing unobservable inputs in the income approach. During the reporting period, there were no changes to report with respect to the valuation approach and/or valuation techniques discussed above.
Securities and other assets that cannot be priced according to the methods described above are valued based on policies and procedures approved by the Board. In the event that unobservable inputs are used when determining such valuations, the securities will be classified as Level 3 in the fair value hierarchy. Altering one or more unobservable inputs may result in a significant change to a Level 3 security’s fair value measurement.
B3
When determining the fair value of securities, some of the factors influencing the valuation include: the nature of any restrictions on disposition of the securities; assessment of the general liquidity of the securities; the issuer’s financial condition and the markets in which it does business; the cost of the investment; the size of the holding and the capitalization of the issuer; the prices of any recent transactions or bids/offers for such securities or any comparable securities; and any available analyst media or other reports or information deemed reliable by the Valuation Designee regarding the issuer or the markets or industry in which it operates. Using fair value to price securities may result in a value that is different from a security’s most recent closing price and from the price used by other unaffiliated mutual funds to calculate their net asset values.
Foreign Currency Translation: The books and records of the Portfolios are maintained in U.S. dollars. Foreign currency amounts are translated into U.S. dollars on the following basis:
(i) market value of investment securities, other assets and liabilities — at the exchange rate as of the valuation date;
(ii) purchases and sales of investment securities, income and expenses — at the rates of exchange prevailing on the respective dates of such transactions.
Although the net assets of the Portfolios are presented at the foreign exchange rates and market values at the close of the period, the Portfolios do not generally isolate that portion of the results of operations arising as a result of changes in the foreign exchange rates from the fluctuations arising from changes in the market prices of long-term portfolio securities held at the end of the period. Similarly, the Portfolios do not isolate the effect of changes in foreign exchange rates from the fluctuations arising from changes in the market prices of long-term portfolio securities sold during the period. Accordingly, holding period unrealized and realized foreign currency gains (losses) are included in the reported net change in unrealized appreciation (depreciation) on investments and net realized gains (losses) on investment transactions on the Statements of Operations. Notwithstanding the above, the Portfolios do isolate the effect of fluctuations in foreign currency exchange rates when determining the gain (loss) upon the sale or maturity of foreign currency denominated debt obligations; such amounts are included in net realized gains (losses) on foreign currency transactions.
Additionally, net realized gains (losses) on foreign currency transactions represent net foreign exchange gains (losses) from the disposition of holdings of foreign currencies, currency gains (losses) realized between the trade and settlement dates on investment transactions, and the difference between the amounts of interest, dividends and foreign withholding taxes recorded on the Portfolios’ books and the U.S. dollar equivalent amounts actually received or paid. Net unrealized currency gains (losses) arise from valuing foreign currency denominated assets and liabilities (other than investments) at period end exchange rates.
Forward and Cross Currency Contracts: A forward currency contract is a commitment to purchase or sell a foreign currency at a future date at a negotiated forward rate. Certain Portfolios entered into forward currency contracts, as defined in the prospectus, in order to hedge their exposure to changes in foreign currency exchange rates on their foreign portfolio holdings or on specific receivables and payables denominated in a foreign currency and to gain exposures to certain currencies. The contracts are valued daily at current forward exchange rates and any unrealized gain (loss) is included in net unrealized appreciation or depreciation on forward and cross currency contracts. Gain (loss) is realized on the settlement date of the contract equal to the difference between the settlement value of the original and negotiated forward contracts. This gain (loss), if any, is included in net realized gain (loss) on forward and cross currency contract transactions. Risks may arise upon entering into these contracts from the potential inability of the counterparties to meet the terms of their contracts. Forward currency contracts involve risks from currency exchange rate and credit risk in excess of the amounts reflected on the Statement of Assets and Liabilities. The Portfolios’ maximum risk of loss from counterparty credit risk is the net value of the cash flows to be received from the counterparty at the end of the contract’s life.Across currency contract is a forward contract where a specified amount of one foreign currency will be exchanged for a specified amount of another foreign currency.
Options: Certain Portfolios purchased and/or wrote options in order to hedge against adverse market movements or fluctuations in value caused by changes in prevailing interest rates, value of equities or foreign currency exchange rates with respect to securities or financial instruments which the Portfolio currently owns or intends to purchase. The Portfolios may also use options to gain additional market exposure. The Portfolios’ principal reason for writing options is to realize, through receipt of premiums, a greater current return than would be realized on the underlying security alone. When the Portfolio purchases an option, it pays a premium and an amount equal to that premium is recorded as an asset. When the Portfolio writes an option, it receives a premium and an amount equal to that premium is recorded as a liability. The asset or liability is adjusted daily to reflect the current market value of the option. If an option expires unexercised, the Portfolio realizes a gain (loss) to the extent of the premium received or paid. If an option is exercised, the premium received or paid is recorded as an adjustment to the proceeds from the sale or the cost of the purchase in determining whether the Portfolio has realized a gain (loss). The difference between the premium and the amount received or paid at the closing of a purchase or sale transaction is also treated as a realized gain (loss). Gain (loss) on purchased options is included in net realized gain (loss)
B4
on investment transactions. Gain (loss) on written options is presented separately as net realized gain (loss) on options written transactions.
The Portfolio, as writer of an option, may have no control over whether the underlying securities or financial instruments may be sold (called) or purchased (put). As a result, the Portfolio bears the market risk of an unfavorable change in the price of the security or financial instrument underlying the written option. The Portfolio, as purchaser of an OTC option, bears the risk of the potential inability of the counterparties to meet the terms of their contracts. With exchange-traded options contracts, there is minimal counterparty credit risk to the Portfolio since the exchanges’ clearinghouse acts as counterparty to all exchange-traded options and guarantees the options contracts against default.
When a Portfolio writes an option on a swap, an amount equal to any premium received by the Portfolio is recorded as a liability and is subsequently adjusted to the current market value of the written option on the swap. If a call option on a swap is exercised, the Portfolio becomes obligated to pay a fixed interest rate (noted as the strike price) and receive a variable interest rate on a notional amount. If a put option on a swap is exercised, the Portfolio becomes obligated to pay a variable interest rate and receive a fixed interest rate (noted as the strike price) on a notional amount. Premiums received from writing options on swaps that expire or are exercised are treated as realized gains upon the expiration or exercise of such options on swaps. The risk associated with writing put and call options on swaps is that the Portfolio will be obligated to be party to a swap agreement if an option on a swap is exercised. Certain Portfolios entered into options on swaps that are executed through a central clearing facility, such as a registered exchange. Such options pay or receive an amount known as “variation margin”, based on daily changes in the valuation of the contract. The daily variation margin, rather than the contract market value, is recorded for financial statement purposes on the Statement of Assets and Liabilities.
Financial Futures Contracts: A financial futures contract is an agreement to purchase (long) or sell (short) an agreed amount of securities at a set price for delivery on a future date. Upon entering into a financial futures contract, the Portfolios are required to deposit collateral with a futures commission merchant an amount of cash and/or other assets equal to a certain percentage of the contract amount. This amount is known as the “initial margin.” Subsequent payments, known as “variation margin,” are made or received by the Portfolios each day, equal to the change in the mark-to-market value of the futures contract. Such variation margin is recorded for financial statement purposes on a daily basis as unrealized gain (loss). When the contract expires or is closed, the gain (loss) is realized and is presented in the Statement of Operations as net realized gain (loss) on futures transactions.
Certain Portfolios invested in financial futures contracts in order to hedge their existing portfolio securities, or securities the Portfolios intend to purchase, against fluctuations in value caused by changes in prevailing interest rates. Should interest rates move unexpectedly, the Portfolios may not achieve the anticipated benefits of the financial futures contracts and may realize a loss. The use of futures transactions involves the risk of imperfect correlation in movements in the price of futures contracts, interest rates and the underlying hedged assets. Since futures contracts are exchange-traded, there is minimal counterparty credit risk to the Portfolios since the exchanges’ clearinghouse acts as counterparty to all exchange-traded futures and guarantees the futures contracts against default.
Swap Agreements: Certain Portfolios entered into certain types of swap agreements detailed in the disclosures below. A swap agreement is an agreement to exchange the return generated by one instrument for the return generated by another instrument. Swap agreements are negotiated in the OTC market and may be executed either directly with a counterparty (“OTC-traded”) or through a central clearing facility, such as a registered exchange. Swap agreements are valued daily at current market value and any change in value is included in the net unrealized appreciation or depreciation on swap agreements. Centrally cleared swaps pay or receive an amount known as “variation margin”, based on daily changes in the valuation of the swap contract. For OTC-traded, upfront premiums paid and received are shown as swap premiums paid and swap premiums received in the Statement of Assets and Liabilities. Risk of loss may exceed amounts recognized on the Statement of Assets and Liabilities. Swap agreements outstanding at period end, if any, are listed on the Schedule of Investments.
Interest Rate Swaps: Interest rate swaps represent an agreement between counterparties to exchange cash flows based on the difference between two interest rates, applied to a notional principal amount for a specified period. Certain Portfolios are subject to interest rate risk exposure in the normal course of pursuing their investment objective. Certain Portfolios used interest rate swaps to maintain their ability to generate steady cash flow by receiving a stream of fixed rate payments or to increase exposure to prevailing market rates by receiving floating rate payments. The Portfolios’ maximum risk of loss from counterparty credit risk is the discounted net present value of the cash flows to be received from the counterparty over the contract’s remaining life.
Credit Default Swaps (“CDS”): CDS involve one party (the protection buyer) making a stream of payments to another party (the protection seller) in exchange for the right to receive a specified payment in the event of a default or as a result of a default (collectively, a “credit event”) for the referenced entity (typically corporate issues or sovereign issues of an emerging
B5
country) on its obligation; or in the event of a write-down, principal shortfall, interest shortfall or default of all or part of the referenced entities comprising a credit index.
Certain Portfolios are subject to credit risk in the normal course of pursuing their investment objectives, and as such, have entered into CDS contracts to provide a measure of protection against defaults or to take an active long or short position with respect to the likelihood of a particular issuer’s default or the reference entity’s credit soundness. CDS contracts generally trade based on a spread which represents the cost a protection buyer has to pay the protection seller. The protection buyer is said to be “short the credit” because the higher the contract value rises, the more the credit deteriorates. The value of the CDS contract increases for the protection buyer if the spread increases. A Portfolio’s maximum risk of loss from counterparty credit risk for purchased CDS is the inability of the counterparty to honor the contract up to the notional value due to a credit event.
As a seller of protection on credit default swap agreements, the Portfolio generally receives an agreed upon payment from the buyer of protection throughout the term of the swap, provided no credit event occurs.As the seller, the Portfolio effectively increases its investment risk because, in addition to its total net assets, the Portfolio may be subject to investment exposure on the notional amount of the swap.
The maximum amount of the payment that the Portfolio, as a seller of protection, could be required to make under a credit default swap agreement would be equal to the notional amount of the underlying security or index contract as a result of a credit event. This potential amount will be partially offset by any recovery values of the respective referenced obligations or net amounts received from the settlement of buy protection credit default swap agreements which the Portfolio entered into for the same referenced entity or index. As a buyer of protection, the Portfolio generally receives an amount up to the notional value of the swap if a credit event occurs.
Implied credit spreads, represented in absolute terms, utilized in determining the market value of credit default swap agreements where the Portfolio is the seller of protection as of period end are disclosed in the footnotes to the Schedule of Investments, if applicable. These spreads serve as indicators of the current status of the payment/performance risk and represent the likelihood of default risk for the credit derivative. The implied credit spread of a particular referenced entity reflects the cost of buying/selling protection and may include upfront payments required to enter into the agreement. Wider credit spreads and increased market value in absolute terms, when compared to the notional amount of the swap, represent a deterioration of the referenced entity’s credit soundness and a greater likelihood of risk of default or other credit event occurring as defined under the terms of the agreement.
Total Return Swaps: In a total return swap, one party receives payments based on the market value of the security or the commodity involved, or total return of a specific referenced asset, such as an equity, index or bond, and in return pays a defined amount. Certain Portfolios are subject to risk exposures associated with the referenced asset in the normal course of pursuing their investment objectives. Certain Portfolios entered into total return swaps to manage their exposure to a security or an index. The Portfolios’ maximum risk of loss from counterparty credit risk is the change in the value of the security, in favor of the Portfolio, from the point of entering into the contract.
Floating Rate and Other Loans: Certain Portfolios invested in floating rate and other loans. Floating rate and other loans include loans that are privately negotiated between a corporate borrower and one or more financial institutions, including, but not limited to, term loans, revolvers, and other instruments issued in the floating rate and other loans market. The Portfolios acquire interests in loans directly (by way of assignment from the selling institution) and/or indirectly (by way of the purchase of a participation interest from the selling institution). Under a floating rate and other loans assignment, the Portfolios generally will succeed to all the rights and obligations of an assigning lending institution and become a lender under the loan agreement with the relevant borrower in connection with that loan. Under a floating rate and other loans participation, the Portfolios generally will have a contractual relationship only with the lender, not with the relevant borrower. As a result, the Portfolios generally will have the right to receive payments of principal, interest, and any fees to which they are entitled only from the lender selling the participation and only upon receipt by the lender of the payments from the relevant borrower. The Portfolios may not directly benefit from the collateral supporting the debt obligation in which they have purchased the participation. As a result, the Portfolios will assume the credit risk of both the borrower and the institution selling the participation to the Portfolios.
Repurchase Agreements: Certain Portfolios entered into repurchase agreements. In connection with transactions in repurchase agreements with United States financial institutions, it is each Portfolio’s policy that its custodian or designated subcustodians under triparty repurchase agreements, as the case may be, take possession of the underlying collateral securities, the value of which exceeds the principal amount of the repurchase transactions, including accrued interest. To the extent that any repurchase transaction exceeds one business day, the value of the collateral is marked-to-market on a daily basis to ensure the adequacy of the collateral. If the seller defaults and the value of the collateral declines or, if bankruptcy proceedings are commenced with respect to the seller of the security, realization of the collateral by the Portfolio may be
B6
delayed or limited.
Mortgage-Backed and Asset-Backed Securities: Mortgage-backed securities are pass-through securities, meaning that principal and interest payments made by the borrower on the underlying mortgages are passed through to the Portfolio. Asset-backed securities directly or indirectly represent a participation interest in, or are secured by and payable from, a stream of payments generated by particular assets such as motor vehicle or credit card receivables. Asset-backed securities may be classified as pass-through certificates or collateralized obligations, such as collateralized bond obligations, collateralized loan obligations and other similarly structured securities. The value of mortgage-backed and asset-backed securities varies with changes in interest rates and may be affected by changes in credit quality or value of the mortgage loans or other assets that support the securities.
Stripped mortgage-backed securities are usually structured with two classes that receive different proportions of the interest (“IO”) and principal (“PO”) distributions on a pool of mortgage assets. Payments received for IOs are included in interest income on the Statements of Operations. Because no principal will be received at the maturity of an IO, adjustments are made to the cost of the security on a monthly basis until maturity. These adjustments are included in interest income on the Statements of Operations. Payments received for POs are treated as reductions to the cost and par value of the securities.
Master Netting Arrangements: The Series Fund, on behalf of certain Portfolios, is subject to various Master Agreements, or netting arrangements, with select counterparties. These are agreements which a subadviser may have negotiated and entered into on behalf of all or a portion of each Portfolio. For multi-sleeve Portfolios, different subadvisers who manage their respective sleeve, may enter into such agreements with the same counterparty and are disclosed separately for each sleeve when presenting information about offsetting and related netting arrangements for OTC derivatives. A master netting arrangement between each Portfolio and the counterparty permits each Portfolio to offset amounts payable by each Portfolio to the same counterparty against amounts to be received and by the receipt of collateral from the counterparty by each Portfolios to cover each Portfolios’ exposure to the counterparty. However, there is no assurance that such mitigating factors are easily enforceable. In addition to master netting arrangements, the right to set-off exists when all the conditions are met such that each of the parties owes the other determinable amounts, the reporting party has the right to set-off the amount owed with the amount owed by the other party, the reporting party intends to set-off and the right of set-off is enforceable by law.
The Series Fund, on behalf of certain Portfolios, is a party to International Swaps and Derivatives Association, Inc. (“ISDA”) Master Agreements with certain counterparties that govern OTC derivative and foreign exchange contracts entered into from time to time. The Master Agreements may contain provisions regarding, among other things, the parties’ general obligations, representations, agreements, collateral requirements, events of default and early termination. With respect to certain counterparties, in accordance with the terms of the Master Agreements, collateral posted to the Portfolio is held in a segregated account by the Portfolio’s custodian and with respect to those amounts which can be sold or re-pledged, are presented in the Schedule of Investments. Collateral pledged by the Portfolio is segregated by the Portfolio’s custodian and identified in the Schedule of Investments. Collateral can be in the form of cash or debt securities issued by the U.S. Government or related agencies or other securities as agreed to by the Portfolio and the applicable counterparty. Collateral requirements are determined based on the Portfolio’s net position with each counterparty. Termination events applicable to the Portfolio may occur upon a decline in the Portfolio’s net assets below a specified threshold over a certain period of time. Termination events applicable to counterparties may occur upon a decline in the counterparty’s long-term and short-term credit ratings below a specified level. In each case, upon occurrence, the other party may elect to terminate early and cause settlement of all derivative and foreign exchange contracts outstanding, including the payment of any losses and costs resulting from such early termination, as reasonably determined by the terminating party. Any decision by one or more of the Portfolio’s counterparties to elect early termination could impact the Portfolio’s future derivative activity.
In addition to each instrument’s primary underlying risk exposure (e.g. interest rate, credit, equity or foreign exchange, etc.), swap agreements involve, to varying degrees, elements of credit, market and documentation risk. Such risks involve the possibility that no liquid market for these agreements will exist, the counterparty to the agreement may default on its obligation to perform or disagree on the contractual terms of the agreement, and changes in net interest rates will be unfavorable. In connection with these agreements, securities in a portfolio may be identified or received as collateral from the counterparty in accordance with the terms of the respective swap agreements to provide or receive assets of value and to serve as recourse in the event of default or bankruptcy/ insolvency of either party. Such OTC derivative agreements include conditions which, when materialized, give the counterparty the right to cause an early termination of the transactions under those agreements. Any election by the counterparty for early termination of the contract(s) may impact the amounts reported on financial statements.
Short sales and OTC contracts, including forward foreign currency exchange contracts, swaps, forward rate agreements and written options involve elements of both market and credit risk in excess of the amounts reflected on the Statement of Assets
B7
and Liabilities, if applicable. Such risks may be mitigated by engaging in master netting arrangements.
Rights: Certain Portfolios held rights acquired either through a direct purchase or pursuant to corporate actions. Rights entitle the holder to buy a proportionate amount of common stock, or such other security that the issuer may specify, at a specific price and time through the expiration dates. Such rights are held as long positions by the Portfolios until exercised, sold or expired. Rights are valued at fair value in accordance with the Board approved fair valuation procedures.
Payment-In-Kind: Certain fixed income Portfolios invested in the open market or received pursuant to debt restructuring securities that pay-in-kind (“PIK”) the interest due on such debt instruments. The PIK interest, computed at the contractual rate specified, is added to the existing principal balance of the debt when issued bonds have the same terms as the bond or recorded as a separate bond when terms are different from the existing debt, and is recorded as interest income.
Delayed-Delivery Transactions: Certain Portfolios purchased or sold securities on a when-issued or delayed-delivery and forward commitment basis, including TBA securities. These transactions involve a commitment by the Portfolio to purchase or sell securities for a predetermined price or yield, with payment and delivery taking place beyond the customary settlement period. When delayed-delivery purchases are outstanding, the Portfolio will set aside and maintain an amount of liquid assets sufficient to meet the purchase price in a segregated account until the settlement date. When purchasing a security on a delayed-delivery basis, the Portfolio assumes the rights and risks of ownership of the security, including the risk of price and yield fluctuations, and takes such fluctuations into account when determining its net asset value (“NAV”). The Portfolio may dispose of or renegotiate a delayed-delivery transaction subsequent to establishment, and may sell when-issued securities before they are delivered, which may result in a realized gain (loss). When selling a security on a delayed-delivery basis, the Portfolio forfeits its eligibility to realize future gains (losses) with respect to the security.
Securities Lending: Certain Portfolios lend their portfolio securities to banks and broker-dealers. The loans are secured by collateral at least equal to the market value of the securities loaned. Collateral pledged by each borrower is invested in an affiliated money market fund and is marked to market daily, based on the previous day’s market value, such that the value of the collateral exceeds the value of the loaned securities. In the event of significant appreciation in value of the securities on loan on the last business day of the reporting period, the financial statements may reflect a collateral value that is less than the market value of the loaned securities. Such shortfall is remedied as described above. Loans are subject to termination at the option of the borrower or the Portfolio. Upon termination of the loan, the borrower will return to the Portfolio securities identical to the loaned securities. The remaining open loans of the securities lending transactions are considered overnight and continuous. Should the borrower of the securities fail financially, the Portfolio has the right to repurchase the securities in the open market using the collateral.
The Portfolios recognize income, net of any rebate and securities lending agent fees, for lending its securities in the form of fees or interest on the investment of any cash received as collateral. The borrower receives all interest and dividends from the securities loaned and such payments are passed back to the lender in amounts equivalent thereto, which are reflected in interest income or unaffiliated dividend income based on the nature of the payment on the Statement of Operations. The Portfolios also continue to recognize any unrealized gain (loss) in the market price of the securities loaned and on the change in the value of the collateral invested that may occur during the term of the loan. In addition, realized gain (loss) is recognized on changes in the value of the collateral invested upon liquidation of the collateral. Net earnings from securities lending are disclosed in the Statement of Operations.
Mortgage Dollar Rolls: Certain Portfolios entered into mortgage dollar rolls in which the Portfolios sell mortgage securities for delivery in the current month, realizing a gain (loss), and simultaneously enter into contracts to repurchase somewhat similar (same type, coupon and maturity) securities on a specified future date. During the roll period, the Portfolios forgo principal and interest paid on the securities. The Portfolios are compensated by the interest earned on the cash proceeds of the initial sale and by the lower repurchase price at the future date. The difference between the sale proceeds and the lower repurchase price is recorded as a realized gain on investment transactions. The Portfolios maintain a segregated account, the dollar value of which is at least equal to its obligations, with respect to dollar rolls. The Portfolios are subject to the risk that the market value of the securities the Portfolios are obligated to repurchase under the agreement may decline below the repurchase price.
Equity and Mortgage Real Estate Investment Trusts (collectively “REITs”): Certain Portfolios invested in REITs, which report information on the source of their distributions annually. Based on current and historical information, a portion of distributions received from REITs during the period is estimated to be dividend income, capital gain or return of capital and recorded accordingly. When material, these estimates are adjusted periodically when the actual source of distributions is disclosed by the REITs.
Securities Transactions and Net Investment Income: Securities transactions are recorded on the trade date. Realized gains (losses) from investment and currency transactions are calculated on the specific identification method. Dividend income is
B8
recorded on the ex-date, or for certain foreign securities, when the Portfolios become aware of such dividends. Interest income, including amortization of premium and accretion of discount on debt securities, as required, is recorded on the accrual basis. Expenses are recorded on an accrual basis, which may require the use of certain estimates by management that may differ from actual expense amounts. For Portfolios with multiple classes of shares, net investment income or loss (other than administration and distribution fees which are charged directly to the respective class) and unrealized and realized gains (losses) are allocated daily to each class of shares based upon the relative proportion of adjusted net assets of each class at the beginning of the day.
Taxes: For federal income tax purposes, each Portfolio is treated as a separate taxpaying entity. Each Portfolio currently intends to be treated as a partnership for US federal income tax purposes that is not a “publicly traded partnership” as defined in Section 7704 of the Internal Revenue Code of 1986, as amended (the Code) for US federal income tax purposes. No provision has been made in the financial statements for U.S. federal, state, or local taxes, as any tax liability arising from operations of the Portfolios is the responsibility of the Participating Insurance Companies. Each Portfolio is not generally subject to entity-level taxation. Shareholders of each Portfolio are subject to taxes on their distributive share of partnership items. Withholding taxes on foreign dividends, interest and capital gains are accrued in accordance with each Portfolio’s understanding of the applicable country’s tax rules and regulations. Such taxes are accrued net of reclaimable amounts, at the time the related income/gain is recorded taking into account any agreements in place with Prudential Financial, Inc. (“Prudential”) as referenced below. Each Portfolio generally attempts to manage its diversification in a manner that supports the diversification requirements of the underlying separate accounts.
Distributions: Distributions, if any, from each Portfolio are made in cash and automatically reinvested in additional shares of the Portfolio. The Government Money Market Portfolio declares and reinvests distributions, if any, daily. Distributions are recorded on the ex-date.
Estimates: The preparation of financial statements requires management to make estimates and assumptions that affect the reported amounts and disclosures in the financial statements. Actual results could differ from those estimates.
3. Agreements
The Series Fund, on behalf of the Portfolios, has entered into investment management agreements with the Manager which provide that the Manager will furnish each Portfolio with investment advice, investment management and administrative services subject to the supervision of the Board and in conformity with the stated policies of the Portfolios. The Manager has engaged the firms referenced in the below table as subadvisers for their respective Portfolios. Subadvisory fees are paid by the Manager out of the management fee that it receives from the Portfolios.
| | |
| | |
| Portfolio | | Subadviser(s) |
| |
PSF Global Portfolio | | Jennison Associates LLC (“Jennison”) (a wholly-owned subsidiary of PGIM, Inc.); LSV Asset Management (“LSV”); Massachusetts Financial Services Company (“MFS”); PGIM Fixed Income (“PFI”) (a business unit of PGIM, Inc.); PGIM Quantitative Solutions LLC (“PGIM Quantitative Solutions”) (a wholly-owned subsidiary of PGIM, Inc.); T. Rowe Price Associates, Inc. (“T. Rowe”); William Blair Investment Management, LLC (“William Blair”)* |
| |
PSF Mid-Cap Growth Portfolio | | J.P. Morgan Investment Management Inc. (“J.P. Morgan”) |
| |
PSF Natural Resources Portfolio | | T. Rowe |
| |
PSF PGIM 50/50 Balanced Portfolio | | PFI, PGIM Limited (an indirect, wholly-owned subsidiary of PGIM, Inc.); PGIM Quantitative Solutions |
| |
PSF PGIM Flexible Managed Portfolio | | PFI; PGIM Limited; PGIM Quantitative Solutions |
| |
PSF PGIM Government Income Portfolio | | PFI |
| |
PSF PGIM Government Money Market Portfolio | | PFI |
| |
PSF PGIM High Yield Bond Portfolio | | PFI; PGIM Limited |
| |
PSF PGIM Jennison Blend Portfolio | | Jennison |
| |
PSF PGIM Jennison Growth Portfolio | | Jennison |
| |
PSF PGIM Jennison Value Portfolio | | Jennison |
| |
PSF PGIM Total Return Bond Portfolio | | PFI; PGIM Limited |
| |
PSF Small-Cap Stock Index Portfolio | | PGIM Quantitative Solutions |
| |
PSF Stock Index Portfolio | | PGIM Quantitative Solutions |
B9
*The asset allocation strategy for the Portfolio is determined by the Manager and PGIM Quantitative Solutions, as described in the Portfolio’s Prospectus. During the period ended December 31, 2024, Jennison and PFI were not allocated assets to manage.
The Manager receives a management fee, accrued daily and payable monthly, based on the annual rates specified below, using the value of each Portfolio’s average daily net assets at the respective annual rate specified below. The Manager pays each subadviser a fee as compensation for advisory services provided to the Portfolios. All amounts paid or payable by the Portfolios to the Manager, under the agreements, are reflected in the Statement of Operations.
The Manager has contractually agreed to waive a portion of its management fee and/or reimburse certain expenses of the Portfolio so that the Portfolio’s management fee plus other expenses (exclusive in all cases of distribution and/or service (12b-1) fees, administration fees, interest, brokerage, taxes (such as income and foreign withholding taxes, stamp duty and deferred tax expenses), extraordinary expenses, and certain other Portfolio expenses such as dividend and interest expense and broker charges on short sales, do not exceed the percentage stated below, of the Portfolio’s average daily net assets unless otherwise noted. Fees and/or expenses waived and/or reimbursed by the Manager for the purpose of preventing the expenses from exceeding a certain expense ratio limit may be recouped by the Manager within the same fiscal year during which such waiver and/or reimbursement is made if such recoupment can be realized without exceeding the expense limit in effect at the time of the recoupment for that fiscal year.
| | | | | | |
| | | |
| Portfolio | | Management Fee | | Effective
Management Fee, Net of Waiver, if Applicable |
| | |
PSF Global Portfolio | | 0.75% | | | 0.66 | % |
| | |
PSF Mid-Cap Growth Portfolio | | 0.60 | | | 0.59 | |
| | |
PSF Natural Resources Portfolio | | 0.45 | | | 0.44 | |
| | |
PSF PGIM 50/50 Balanced Portfolio | | 0.55 | | | 0.55 | |
| | |
PSF PGIM Flexible Managed Portfolio | | 0.60 | | | 0.59 | |
| | |
PSF PGIM Government Income Portfolio | | 0.40 | | | 0.40 | |
| | |
PSF PGIM Government Money Market Portfolio | | 0.30 | | | 0.30 | |
| | |
PSF PGIM High Yield Bond Portfolio | | 0.55 | | | 0.51 | |
| | |
PSF PGIM Jennison Blend Portfolio | | 0.45 | | | 0.45 | |
| | |
PSF PGIM Jennison Growth Portfolio | | 0.60 | | | 0.60 | |
| | |
PSF PGIM Jennison Value Portfolio | | 0.40 | | | 0.40 | |
| | |
PSF PGIM Total Return Bond Portfolio | | 0.40 | | | 0.40 | |
| | |
PSF Small-Cap Stock Index Portfolio | | 0.35 | | | 0.35 | |
| | |
PSF Stock Index Portfolio | | 0.30% up to $4 billion | | | | |
| | | 0.25% over $4 billion | | | 0.26 | |
| | | | |
| | | |
| Portfolio | | Fee Waivers and/or
Expense Limitations | | |
| | |
PSF Global Portfolio | | contractually waive 0.0465%
through June 30, 2025; effective
April 4, 2024 through
April 9, 2024, voluntarily waive
0.04% | | |
PSF Mid-Cap Growth Portfolio | | contractually waive 0.013%
through June 30, 2025 | | |
PSF Natural Resources Portfolio | | contractually waive 0.008%
through June 30, 2025 | | |
PSF PGIM Flexible Managed Portfolio | | contractually limit expenses to
0.61% through June 30, 2024;
effective July 1, 2024,
contractually limit expenses to
0.62% through June 30, 2025 | | |
PSF PGIM High Yield Bond Portfolio | | contractually limit expenses to
0.57% through June 30, 2025 | | |
B10
| | | | |
| | | |
| Portfolio | | Fee Waivers and/or
Expense Limitations | | |
PSF Stock Index Portfolio | | effective July 1, 2024, voluntarily
waive 0.03% | | |
The Series Fund, on behalf of the Portfolios, has a distribution agreement, pursuant to Rule 12b-1 under the 1940 Act, with Prudential Investment Management Services LLC (“PIMS”), which acts as the distributor of the Class I, Class II and Class III shares of the Portfolios. The Portfolios compensate PIMS for distributing and servicing the Portfolios’ Class II and Class III shares pursuant to a plan of distribution (the “Class II Plan” and “Class III Plan”, together, the Plans), regardless of expenses actually incurred by PIMS. The distribution fees are accrued daily and payable monthly. No distribution or service fees are paid to PIMS as distributor of the Class I shares of the Portfolios. Pursuant to the Plans, the Class II and Class III shares of each Portfolio compensate PIMS for distribution-related activities at an annual rate of 0.25% of the average daily net assets of the Class II and Class III shares.
The Series Fund has an administration agreement with the Manager, which acts as the administrator of the Class II shares of the Portfolios. The administration fee paid to the Manager is accrued daily and payable monthly, at the annual rate of 0.15% of the average daily net assets of the Class II shares.
The Series Fund, on behalf of the Portfolios, has entered into brokerage commission recapture agreements with certain registered broker-dealers. Under the brokerage commission recapture program, a portion of the commission is returned to the Portfolio on whose behalf the trades were made. Commission recapture is paid solely to those Portfolios generating the applicable trades. Such amounts are included within realized gain (loss) on investment transactions presented in the Statement of Operations. For the year ended December 31, 2024, brokerage commissions recaptured under these agreements was as follows:
| | | | |
| | |
| Portfolio | | Amount | |
PSF Mid-Cap Growth Portfolio | | | $13,307 | |
PSF PGIM Jennison Growth Portfolio | | | 51,800 | |
PSF PGIM Jennison Value Portfolio | | | 20,234 | |
PIMS, PGIM Investments, PGIM, Inc., PGIM Limited, PGIM Quantitative Solutions and Jennison are indirect, wholly-owned subsidiaries of Prudential.
4. Other Transactions with Affiliates
a.) Related Parties
Prudential Mutual Fund Services LLC (“PMFS”), an affiliate of PGIM Investments and an indirect, wholly-owned subsidiary of Prudential, serves as the transfer agent and shareholder servicing agent of the Portfolios. The transfer agent’s fees and expenses in the Statement of Operations include certain out-of-pocket expenses paid to non-affiliates, where applicable.
The Portfolios may invest their overnight sweep cash in the PGIM Core Government Money Market Fund, a series of the Prudential Government Money Market Fund, Inc. and/or in the PGIM Core Ultra Short Bond Fund, a series of Prudential Investment Portfolios 2 (together with PGIM Core Government Money Market Fund, the “Core Funds”), each registered under the 1940 Act and managed by PGIM Investments. The Portfolios may invest their securities lending cash collateral in the PGIM Institutional Money Market Fund (the “Money Market Fund”), a series of Prudential Investment Portfolios 2, registered under the 1940 Act and managed by PGIM Investments. PGIM Investments and/or its affiliates are paid fees or reimbursed for providing their services to the Core Funds and the Money Market Fund. In addition to the realized and unrealized gains on investments in the Core Funds and Money Market Fund, earnings from such investments are disclosed on the Statement of Operations as “Affiliated dividend income” and “Income from securities lending, net”, respectively.
Certain Portfolios may enter into certain securities purchase or sale transactions under Board approved Rule 17a-7 procedures. Rule 17a-7 is an exemptive rule under the 1940 Act that, subject to certain conditions, permits purchase and sale transactions among affiliated investment companies, or between an investment company and a person that is affiliated solely by reason of having a common (or affiliated) investment adviser, common directors/trustees, and/or common officers.
For the year ended December 31, 2024, the Portfolios’ purchase and sales transactions under Rule 17a-7 and realized gain
B11
(loss) as a result of Rule 17a-7 sales transactions were as follows:
| | | | | | |
| | | | |
| Portfolio | | Purchases | | Sales | | Realized
Gain (Loss) |
| | | |
PSF Global Portfolio | | $221,347 | | $794,310 | | $(19,593) |
b.) Foreign Withholding Tax Reclaims
The Portfolios are considered partnerships for tax purposes rather than regulated investment companies (“RICs”). As a result of their partnership status, the Portfolios are subject to higher foreign withholding tax rates on dividend and interest income in certain foreign jurisdictions and/or are subject to delays in repayment of taxes withheld by certain foreign jurisdictions (collectively, “excess withholding tax”).
Prudential instituted a process in consultation with the Series Fund’s independent trustees to reimburse the affected Portfolios for any excess withholding tax on the first business day following the pay-date of the applicable dividend or interest income event regardless of whether the excess withholding tax is due to timing differences (i.e., jurisdictions in which the Portfolio was subject to a higher withholding tax rate due to its tax status which is reclaimable) or permanent detriments (i.e., jurisdictions in which the Portfolio was subject to a higher withholding tax rate due to its tax status which is not reclaimable) resulting from the Portfolios’ partnership tax status.
In cases in which the excess withholding tax is due to timing differences and is reclaimable from the foreign jurisdiction, the affected Portfolios have the ability to recover the excess withholding tax withheld by filing a reclaim with the relevant foreign tax authority. To avoid a Portfolio receiving and retaining a duplicate payment for the same excess withholding tax, payments received by an applicable Portfolio from a foreign tax authority for reclaims for which a Portfolio previously received reimbursement from Prudential will be payable to Prudential. Pending tax reclaim amounts due to Prudential for excess withholding tax which Prudential previously paid to the Portfolios are reported as “Payable to affiliate” on the Statement of Assets and Liabilities and any amounts accrued but not yet reimbursed by Prudential for excess withholding tax is recorded as “Receivable from affiliate” on the Statement of Assets and Liabilities. The full amount of tax reclaims due to a Portfolio, inclusive of timing differences and routine tax reclaims for foreign jurisdictions where the Portfolios do not incur an excess withholding tax is included as “Tax reclaim receivable” on the Statement of Assets and Liabilities. To the extent that there are costs associated with the filing of any reclaim attributable to excess withholding tax, those costs are borne by Prudential.
The following amounts have been paid by Prudential for excess withholding taxes related to permanent tax detriments as described above for certain countries due to the Portfolios’ status as partnerships for tax purposes.
| | | | | |
| | |
| Portfolio | | 2024 Payments |
| |
PSF Global Portfolio | | | | $105,799 | |
| |
PSF Natural Resources Portfolio | | | | 8,820 | |
| |
PSF PGIM 50/50 Balanced Portfolio | | | | 12,160 | |
PSF PGIM Flexible Managed Portfolio | | | | 22,334 | |
PSF PGIM Jennison Value Portfolio | | | | 50,689 | |
The following amounts have been paid by Prudential for excess withholding taxes related to timing differences as described above for certain countries due to the Portfolios’ status as partnerships for tax purposes.
| | | | | |
| | |
| Portfolio | | 2024 Payments |
| |
PSF Global Portfolio | | | | $ 93,663 | |
PSF Natural Resources Portfolio | | | | 202,679 | |
PSF PGIM 50/50 Balanced Portfolio | | | | 3,416 | |
PSF PGIM Flexible Managed Portfolio | | | | 6,019 | |
PSF PGIM Jennison Blend Portfolio | | | | 78,967 | |
PSF PGIM Jennison Growth Portfolio | | | | 80,602 | |
B12
5. Portfolio Securities
The aggregate cost of purchases and proceeds from sales of portfolio securities (excluding short-term investments and U.S. Government securities) for the year ended December 31, 2024, were as follows:
| | | | | | | | |
| | | |
| Portfolio | | Cost of
Purchases | | | Proceeds
from Sales | |
| | |
PSF Global Portfolio | | $ | 341,253,219 | | | $ | 626,341,044 | |
| | |
PSF Mid-Cap Growth Portfolio | | | 232,606,969 | | | | 230,921,826 | |
| | |
PSF Natural Resources Portfolio | | | 148,987,607 | | | | 200,798,531 | |
| | |
PSF PGIM 50/50 Balanced Portfolio | | | 1,324,917,272 | | | | 1,468,527,121 | |
| | |
PSF PGIM Flexible Managed Portfolio | | | 5,179,353,505 | | | | 5,455,157,160 | |
| | |
PSF PGIM Government Income Portfolio | | | 49,605,699 | | | | 65,330,966 | |
| | |
PSF PGIM Government Money Market Portfolio | | | — | | | | — | |
| | |
PSF PGIM High Yield Bond Portfolio | | | 350,576,957 | | | | 187,875,353 | |
| | |
PSF PGIM Jennison Blend Portfolio | | | 6,390,943,857 | | | | 6,750,074,628 | |
| | |
PSF PGIM Jennison Growth Portfolio | | | 1,070,642,204 | | | | 1,320,293,791 | |
| | |
PSF PGIM Jennison Value Portfolio | | | 381,744,648 | | | | 458,088,430 | |
| | |
PSF PGIM Total Return Bond Portfolio | | | 2,287,889,727 | | | | 1,623,267,280 | |
| | |
PSF Small-Cap Stock Index Portfolio | | | 284,956,573 | | | | 321,370,205 | |
| | |
PSF Stock Index Portfolio | | | 259,788,482 | | | | 711,759,661 | |
A summary of the cost of purchases and proceeds from sales of shares of affiliated mutual funds for the year ended December 31, 2024, is presented as follows:
PSF Global Portfolio
| | | | | | | | | | | | | | | | | | | | | | | | | | | | |
| | | | | | | | |
Value,
Beginning
of Year | | Cost of Purchases | | | Proceeds from Sales | | | Change in Unrealized Gain (Loss) | | | Realized Gain
(Loss) | | | Value,
End of Year | | | Shares, End
of Year | | | Income | |
Short-Term Investments - Affiliated Mutual Funds: | | | | | | | | | | | | | | | | | |
| | | |
PGIM Core Government Money Market Fund (7-day effective yield 4.604%)(1)(wb) | | | | | | | | | |
| | | | | | | | |
$ 4,680,293 | | | $ 29,004,877 | | | | $ 33,683,382 | | | | $ — | | | | $ — | | | | $ 1,788 | | | | 1,788 | | | | $ 6,359 | |
| | | |
PGIM Core Ultra Short Bond Fund(1)(wb) | | | | | | | | | |
| | | | | | | | |
13,087,808 | | | 153,809,467 | | | | 159,646,791 | | | | — | | | | — | | | | 7,250,484 | | | | 7,250,484 | | | | 538,981 | |
| | | |
PGIM Institutional Money Market Fund (7-day effective yield 4.649%)(1)(b)(wb) | | | | | | | | | |
| | | | | | | |
51,321,088 | | | 388,515,591 | | | | 402,153,789 | | | | (13,021) | | | | 5,284 | | | | 37,675,153 | | | | 37,697,771 | | | | 88,096 | (2) |
| | | | | | | |
$69,089,189 | | | $571,329,935 | | | | $595,483,962 | | | | $(13,021) | | | | $5,284 | | | | $44,927,425 | | | | | | | | $633,436 | |
PSF Mid-Cap Growth Portfolio
| | | | | | | | | | | | | | | | | | | | | | | | | | | | |
| | | | | | | | |
Value,
Beginning
of Year | | Cost of Purchases | | | Proceeds from Sales | | | Change in Unrealized Gain (Loss) | | | Realized Gain
(Loss) | | | Value,
End of Year | | | Shares, End
of Year | | | Income | |
Short-Term Investments - Affiliated Mutual Funds: | | | | | | | | | | | | | | | | | |
| | | |
PGIM Core Ultra Short Bond Fund(1)(wb) | | | | | | | | | |
| | | | | | | | |
$ 3,441,275 | | | $ 72,396,460 | | | | $ 69,474,898 | | | | $ — | | | | $ — | | | | $ 6,362,837 | | | | 6,362,837 | | | | $314,679 | |
| | | |
PGIM Institutional Money Market Fund (7-day effective yield 4.649%)(1)(b)(wb) | | | | | | | | | |
| | | | | | | |
56,004,482 | | | 504,657,060 | | | | 482,309,447 | | | | (7,936) | | | | (3,358) | | | | 78,340,801 | | | | 78,387,833 | | | | 96,495 | (2) |
| | | | | | | |
$59,445,757 | | | $577,053,520 | | | | $551,784,345 | | | | $(7,936) | | | | $(3,358) | | | | $84,703,638 | | | | | | | | $411,174 | |
B13
PSF Natural Resources Portfolio
| | | | | | | | | | | | | | | | | | | | | | | | | | | | |
| | | | | | | | |
Value,
Beginning
of Year | | Cost of Purchases | | | Proceeds from Sales | | | Change in Unrealized Gain (Loss) | | | Realized Gain
(Loss) | | | Value,
End of Year | | | Shares, End
of Year | | | Income | |
Short-Term Investments - Affiliated Mutual Funds: | | | | | | | | | | | | | | | | | |
| | | |
PGIM Core Ultra Short Bond Fund(1)(wb) | | | | | | | | | |
| | | | | | | | |
$ 6,071,857 | | | $ 73,696,083 | | | | $ 77,087,276 | | | | $ — | | | | $ — | | | | $ 2,680,664 | | | | 2,680,664 | | | | $159,670 | |
| | | |
PGIM Institutional Money Market Fund (7-day effective yield 4.649%)(1)(b)(wb) | | | | | | | | | |
| | | | | | | |
33,596,239 | | | 621,210,136 | | | | 587,305,134 | | | | (6,023) | | | | (1,130) | | | | 67,494,088 | | | | 67,534,609 | | | | 116,570 | (2) |
| | | | | | | |
$39,668,096 | | | $694,906,219 | | | | $664,392,410 | | | | $(6,023) | | | | $(1,130) | | | | $70,174,752 | | | | | | | | $276,240 | |
PSF PGIM 50/50 Balanced Portfolio
| | | | | | | | | | | | | | | | | | | | | | | | | | | | |
| | | | | | | | |
Value,
Beginning
of Year | | Cost of Purchases | | | Proceeds from Sales | | | Change in Unrealized Gain (Loss) | | | Realized Gain
(Loss) | | | Value,
End of Year | | | Shares, End of Year | | | Income | |
Short-Term Investments - Affiliated Mutual Funds: | | | | | | | | | | | | | | | | | |
| | | |
PGIM Core Ultra Short Bond Fund(1)(wb) | | | | | | | | | |
| | | | | | | | |
$262,653,550 | | | $632,854,048 | | | | $598,017,297 | | | | $ — | | | | $ — | | | | $297,490,301 | | | | 297,490,301 | | | | $15,237,896 | |
| | | |
PGIM Institutional Money Market Fund (7-day effective yield 4.649%)(1)(b)(wb) | | | | | | | | | |
| | | | | | | |
62,347,675 | | | 338,123,486 | | | | 361,863,060 | | | | (18,167) | | | | 5,245 | | | | 38,595,179 | | | | 38,618,349 | | | | 80,019 | (2) |
| | | | | | | |
$325,001,225 | | | $970,977,534 | | | | $959,880,357 | | | | $(18,167) | | | | $5,245 | | | | $336,085,480 | | | | | | | | $15,317,915 | |
PSF PGIM Flexible Managed Portfolio
| | | | | | | | | | | | | | | | | | | | | | | | | | | | |
| | | | | | | | |
Value,
Beginning
of Year | | Cost of Purchases | | | Proceeds from Sales | | | Change in Unrealized Gain (Loss) | | | Realized Gain
(Loss) | | | Value,
End of Year | | | Shares, End of Year | | | Income | |
Short-Term Investments - Affiliated Mutual Funds: | | | | | | | | | | | | | | | | | |
| | | |
PGIM Core Ultra Short Bond Fund(1)(wb) | | | | | | | | | |
| | | | | | | | |
$252,653,789 | | | $1,146,426,649 | | | | $1,126,821,455 | | | | $ — | | | | $ — | | | | $272,258,983 | | | | 272,258,983 | | | | $14,729,303 | |
| | | |
PGIM Institutional Money Market Fund (7-day effective yield 4.649%)(1)(b)(wb) | | | | | | | | | |
| | | | | | | |
143,529,091 | | | 1,102,347,647 | | | | 1,149,784,773 | | | | (8,488) | | | | (7,512) | | | | 96,075,965 | | | | 96,133,646 | | | | 125,934 | (2) |
| | | | | | | |
$396,182,880 | | | $2,248,774,296 | | | | $2,276,606,228 | | | | $(8,488) | | | | $(7,512) | | | | $368,334,948 | | | | | | | | $14,855,237 | |
PSF PGIM Government Income Portfolio
| | | | | | | | | | | | | | | | | | | | | | | | | | | | |
| | | | | | | | |
Value,
Beginning
of Year | | Cost of Purchases | | | Proceeds from Sales | | | Change in Unrealized Gain (Loss) | | | Realized Gain
(Loss) | | | Value,
End of Year | | | Shares, End
of Year | | | Income | |
Short-Term Investments - Affiliated Mutual Funds: | | | | | | | | | | | | | | | | | |
| | | |
PGIM Core Ultra Short Bond Fund(1)(wb) | | | | | | | | | |
| | | | | | | | |
$2,434,023 | | | $48,920,751 | | | | $47,328,365 | | | | $— | | | | $ — | | | | $4,026,409 | | | | 4,026,409 | | | | $107,081 | |
| | | |
PGIM Institutional Money Market Fund (7-day effective yield 4.649%)(1)(b)(wb) | | | | | | | | | |
| | | | | | | |
— | | | 9,792,257 | | | | 9,792,033 | | | | — | | | | (224) | | | | — | | | | — | | | | 329 | (2) |
| | | | | | | |
$2,434,023 | | | $58,713,008 | | | | $57,120,398 | | | | $— | | | | $(224) | | | | $4,026,409 | | | | | | | | $107,410 | |
B14
PSF PGIM High Yield Bond Portfolio
| | | | | | | | | | | | | | | | | | | | | | | | | | | | |
| | | | | | | | |
Value,
Beginning
of Year | | Cost of Purchases | | | Proceeds from Sales | | | Change in Unrealized Gain (Loss) | | | Realized Gain
(Loss) | | | Value,
End of Year | | | Shares, End
of Year | | | Income | |
Short-Term Investments - Affiliated Mutual Funds: | | | | | | | | | | | | | | | | | |
| | | |
PGIM Core Ultra Short Bond Fund(1)(wb) | | | | | | | | | |
| | | | | | | | |
$ 12,727,484 | | | $261,697,444 | | | | $254,604,101 | | | | $ — | | | | $ — | | | | $19,820,827 | | | | 19,820,827 | | | | $692,855 | |
| | | |
PGIM Institutional Money Market Fund (7-day effective yield 4.649%)(1)(b)(wb) | | | | | | | | | |
| | | | | | | |
109,421,977 | | | 344,906,725 | | | | 415,710,429 | | | | (27,545) | | | | 4,274 | | | | 38,595,002 | | | | 38,618,173 | | | | 176,773 | (2) |
| | | | | | | |
$122,149,461 | | | $606,604,169 | | | | $670,314,530 | | | | $(27,545) | | | | $4,274 | | | | $58,415,829 | | | | | | | | $869,628 | |
PSF PGIM Jennison Blend Portfolio
| | | | | | | | | | | | | | | | | | | | | | | | | | | | |
| | | | | | | | |
Value,
Beginning
of Year | | Cost of Purchases | | | Proceeds from Sales | | | Change in Unrealized Gain (Loss) | | | Realized Gain
(Loss) | | | Value,
End of Year | | | Shares, End of Year | | | Income | |
Short-Term Investments - Affiliated Mutual Funds: | | | | | | | | | | | | | | | | | |
| | | |
PGIM Core Ultra Short Bond Fund(1)(wb) | | | | | | | | | |
| | | | | | | | |
$ 24,114,237 | | | $ 820,855,491 | | | | $ 807,894,885 | | | | $ — | | | | $ — | | | | $ 37,074,843 | | | | 37,074,843 | | | | $2,131,160 | |
| | | |
PGIM Institutional Money Market Fund (7-day effective yield 4.649%)(1)(b)(wb) | | | | | | | | | |
| | | | | | | |
315,171,537 | | | 1,665,729,152 | | | | 1,754,485,879 | | | | (164,455) | | | | 143,250 | | | | 226,393,605 | | | | 226,529,522 | | | | 198,630 | (2) |
| | | | | | | |
$339,285,774 | | | $2,486,584,643 | | | | $2,562,380,764 | | | | $(164,455) | | | | $143,250 | | | | $263,468,448 | | | | | | | | $2,329,790 | |
PSF PGIM Jennison Growth Portfolio
| | | | | | | | | | | | | | | | | | | | | | | | | | | | |
| | | | | | | | |
Value,
Beginning
of Year | | Cost of Purchases | | | Proceeds from Sales | | | Change in Unrealized Gain (Loss) | | | Realized Gain
(Loss) | | | Value,
End of Year | | | Shares, End
of Year | | | Income | |
Short-Term Investments - Affiliated Mutual Funds: | | | | | | | | | | | | | | | | | |
| | | |
PGIM Core Ultra Short Bond Fund(1)(wb) | | | | | | | | | |
| | | | | | | | |
$ 12,489,055 | | | $ 658,645,559 | | | | $ 621,077,725 | | | | $ — | | | | $ — | | | | $50,056,889 | | | | 50,056,889 | | | | $ 973,662 | |
| | | |
PGIM Institutional Money Market Fund (7-day effective yield 4.649%)(1)(b)(wb) | | | | | | | | | |
| | | | | | | |
136,417,760 | | | 523,198,975 | | | | 635,309,576 | | | | (156,578) | | | | 133,430 | | | | 24,284,011 | | | | 24,298,590 | | | | 119,066 | (2) |
| | | | | | | |
$148,906,815 | | | $1,181,844,534 | | | | $1,256,387,301 | | | | $(156,578) | | | | $133,430 | | | | $74,340,900 | | | | | | | | $1,092,728 | |
PSF PGIM Jennison Value Portfolio
| | | | | | | | | | | | | | | | | | | | | | | | | | | | |
| | | | | | | | |
Value,
Beginning
of Year | | Cost of Purchases | | | Proceeds from Sales | | | Change in Unrealized Gain (Loss) | | | Realized Gain
(Loss) | | | Value,
End of Year | | | Shares, End
of Year | | | Income | |
Short-Term Investments - Affiliated Mutual Funds: | | | | | | | | | | | | | | | | | |
| | | |
PGIM Core Ultra Short Bond Fund(1)(wb) | | | | | | | | | |
| | | | | | | | |
$ 32,523,439 | | | $ 217,390,338 | | | | $ 204,314,918 | | | | $ — | | | | $ — | | | | $ 45,598,859 | | | | 45,598,859 | | | | $2,116,602 | |
| | | |
PGIM Institutional Money Market Fund (7-day effective yield 4.649%)(1)(b)(wb) | | | | | | | | | |
| | | | | | | |
123,017,752 | | | 1,227,229,940 | | | | 1,250,386,199 | | | | (5,938) | | | | (17,189) | | | | 99,838,366 | | | | 99,898,305 | | | | 85,236 | (2) |
| | | | | | | |
$155,541,191 | | | $1,444,620,278 | | | | $1,454,701,117 | | | | $(5,938) | | | | $(17,189) | | | | $145,437,225 | | | | | | | | $2,201,838 | |
B15
PSF PGIM Total Return Bond Portfolio
| | | | | | | | | | | | | | | | | | | | | | | | | | | | |
| | | | | | | | |
Value,
Beginning
of Year | | Cost of Purchases | | | Proceeds from Sales | | | Change in Unrealized Gain (Loss) | | | Realized Gain
(Loss) | | | Value,
End of Year | | | Shares, End of Year | | | Income | |
Short-Term Investments - Affiliated Mutual Funds: | |
| | | | | | |
PGIM Core Ultra Short Bond Fund(1)(wb) | | | | | | | | | | | | | | | | | | | | | |
| | | | | | | |
$24,486,109 | | | $1,123,546,273 | | | | $1,114,777,406 | | | | $ — | | | | $ — | | | | $33,254,976 | | | | 33,254,976 | | | | $2,404,148 | |
|
PGIM Institutional Money Market Fund (7-day effective yield 4.649%)(1)(b)(wb) | |
| | | | | | | |
31,857,281 | | | 365,667,554 | | | | 377,771,265 | | | | (7,416) | | | | (2,863) | | | | 19,743,291 | | | | 19,755,144 | | | | 121,157 | (2) |
| | | | | | | |
$56,343,390 | | | $1,489,213,827 | | | | $1,492,548,671 | | | | $(7,416) | | | | $(2,863) | | | | $52,998,267 | | | | | | | | $2,525,305 | |
PSF Small-Cap Stock Index Portfolio
| | | | | | | | | | | | | | | | | | | | | | | | | | | | |
| | | | | | | | |
Value,
Beginning
of Year | | Cost of Purchases | | | Proceeds from Sales | | | Change in Unrealized Gain (Loss) | | | Realized Gain
(Loss) | | | Value,
End of Year | | | Shares, End of Year | | | Income | |
Short-Term Investments - Affiliated Mutual Funds: | | | | | | | | | | | | | | | | | |
| | | |
PGIM Core Ultra Short Bond Fund(1)(wb) | | | | | | | | | |
| | | | | | | | |
$ 5,700,543 | | | $ 83,162,446 | | | | $ 85,966,541 | | | | $ — | | | | $ — | | | | $ 2,896,448 | | | | 2,896,448 | | | | $219,687 | |
| | | |
PGIM Institutional Money Market Fund (7-day effective yield 4.649%)(1)(b)(wb) | | | | | | | | | |
| | | | | | | |
313,212,131 | | | 1,066,444,382 | | | | 1,084,536,462 | | | | (43,097) | | | | (10,533) | | | | 295,066,421 | | | | 295,243,567 | | | | 642,817 | (2) |
| | | | | | | |
$318,912,674 | | | $1,149,606,828 | | | | $1,170,503,003 | | | | $(43,097) | | | | $(10,533) | | | | $297,962,869 | | | | | | | | $862,504 | |
PSF Stock Index Portfolio
| | | | | | | | | | | | | | | | | | | | | | | | | | | | |
| | | | | | | | |
Value,
Beginning
of Year | | Cost of Purchases | | | Proceeds from Sales | | | Change in Unrealized Gain (Loss) | | | Realized Gain
(Loss) | | | Value,
End of Year | | | Shares, End of Year | | | Income | |
Short-Term Investments - Affiliated Mutual Funds: | | | | | | | | | | | | | | | | | |
| | | |
PGIM Core Ultra Short Bond Fund(1)(wb) | | | | | | | | | |
| | | | | | | | |
$ 75,066,905 | | | $ 341,537,145 | | | | $ 244,091,923 | | | | $ — | | | | $ — | | | | $172,512,127 | | | | 172,512,127 | | | | $6,586,550 | |
| | | |
PGIM Institutional Money Market Fund (7-day effective yield 4.649%)(1)(b)(wb) | | | | | | | | | |
| | | | | | | |
371,269,694 | | | 2,072,843,749 | | | | 2,108,976,608 | | | | (52,608) | | | | (22,562) | | | | 335,061,665 | | | | 335,262,823 | | | | 358,927 | (2) |
| | | | | | | |
$446,336,599 | | | $2,414,380,894 | | | | $2,353,068,531 | | | | $(52,608) | | | | $(22,562) | | | | $507,573,792 | | | | | | | | $6,945,477 | |
| (1) | The Fund did not have any capital gain distributions during the reporting period. |
| (2) | The amount, or a portion thereof, represents the affiliated securities lending income shown on the Statement of Operations. |
| (b) | Represents security, or portion thereof, purchased with cash collateral received for securities on loan and includes dividend reinvestment. |
| (wb) | Represents an investment in a Fund affiliated with the Manager. |
6. Tax Information
All Portfolios are treated as partnerships for federal income tax purposes. The character of the cash distributions, if any, made by the partnerships is generally classified as nontaxable return of capital distributions. After each fiscal year each shareholder of record will receive information regarding their distributive allocable share of the partnership’s income, gains, losses and deductions.
With respect to the Portfolios, book cost of assets differs from tax cost of assets as a result of each Portfolio’s adoption of a mark-to-market method of accounting for tax purposes. Under this method, tax cost of assets will approximate fair market value.
The Investment Manager has analyzed the Portfolios’ tax positions taken on federal, state and local income tax returns for all open tax years and has concluded that no provision for income tax is required in the Portfolios’ financial statements for the current reporting period. Since tax authorities can examine previously filed tax returns, the Portfolios’ U.S. federal and state tax returns for each of the four fiscal years up to the most recent fiscal year ended December 31, 2024 are subject to
B16
such review.
7. Borrowings
The Series Fund, on behalf of the Portfolios, (excluding the PSF PGIM Government Money Market Portfolio), along with other affiliated registered investment companies (the “Participating Funds”), is a party to a Syndicated Credit Agreement (“SCA”) with a group of banks. The purpose of the SCA is to provide an alternative source of temporary funding for capital share redemptions. The table below provides details of the current SCA in effect at the reporting period-end as well as the prior SCA.
| | | | |
| | | |
| | | Current SCA | | Prior SCA |
| | |
Term of Commitment | | 9/27/2024 – 9/25/2025 | | 9/29/2023 – 9/26/2024 |
| | |
Total Commitment | | $ 1,200,000,000 | | $ 1,200,000,000 |
| | |
Annualized Commitment Fee on the Unused Portion of the SCA | | 0.15% | | 0.15% |
| | |
Annualized Interest Rate on Borrowings | | 1.00% plus the higher of (1) the effective federal funds rate, (2) the daily SOFR rate plus 0.10% or (3) zero percent | | 1.00% plus the higher of (1) the effective federal funds rate, (2) the daily SOFR rate plus 0.10% or (3) zero percent |
Certain affiliated registered investment companies that are parties to the SCA include portfolios that are subject to a predetermined mathematical formula used to manage certain benefit guarantees offered under variable annuity contracts. The formula may result in large scale asset flows into and out of these portfolios. Consequently, these portfolios may be more likely to utilize the SCA for purposes of funding redemptions. It may be possible for those portfolios to fully exhaust the committed amount of the SCA, thereby requiring the Investment Manager to allocate available funding per a Board-approved methodology designed to treat the Participating Funds in the SCA equitably.
The following Portfolios utilized the SCA during the year ended December 31, 2024. The average balance outstanding is for the number of days the Portfolios utilized the credit facility.
| | | | | | | | | | | | | | | | | | | | | | | | | | | | | | | | |
| | | | | | | | | | |
| Portfolio | | Average
Balance
Outstanding | | | | | Weighted
Average
Interest Rates | | | | | Number
of Days
Outstanding | | | | | Maximum
Balance
Outstanding | | | | | Balance Outstanding at December 31, 2024 |
| | | | | | | | | |
PSF Global Portfolio | | $ | 209,804,500 | | | | | | | | 6.42 | % | | | | | | 6 | | | | | | | $251,911,000 | | | | | | | $— |
| | | | | | | | | |
PSF Natural Resources Portfolio | | | 2,582,857 | | | | | | | | 6.37 | | | | | | | 7 | | | | | | | 15,977,000 | | | | | | | — |
| | | | | | | | | |
PSF PGIM Government Income Portfolio | | | 325,000 | | | | | | | | 5.69 | | | | | | | 1 | | | | | | | 325,000 | | | | | | | — |
| | | | | | | | | |
PSF PGIM Jennison Blend Portfolio | | | 1,272,000 | | | | | | | | 6.45 | | | | | | | 1 | | | | | | | 1,272,000 | | | | | | | — |
| | | | | | | | | |
PSF PGIM Jennison Growth Portfolio | | | 967,750 | | | | | | | | 6.42 | | | | | | | 16 | | | | | | | 3,106,000 | | | | | | | — |
| | | | | | | | | |
PSF Small-Cap Stock Index Portfolio | | | 3,041,500 | | | | | | | | 6.41 | | | | | | | 14 | | | | | | | 9,698,000 | | | | | | | — |
8. Capital and Ownership
The Agreement and Declaration of Trust permits the Trust’s Board to issue multiple classes of shares, and within each class, an unlimited number of shares of beneficial interest of the Portfolios. The Portfolios offer Class I shares and certain Portfolios offer Class II and/or Class III shares. All share classes are not subject to any sales charge or redemption charge and are sold at the net asset value of the Portfolio. Class I and Class III shares are sold only to certain separate accounts of Prudential to fund benefits under certain variable life insurance and variable annuity contracts (“contracts”). Class II shares are sold only to separate accounts of non-Prudential insurance companies as investment options under certain contracts. Class I shares are also offered to separate accounts of non-affiliated insurers for which Prudential or its affiliates administer and/or reinsure the variable life insurance or variable annuity contracts issued in connection with the separate accounts. The separate accounts invest in shares of the Portfolios through subaccounts that correspond to the Portfolios. The separate accounts will redeem shares of the Portfolios to the extent necessary to provide benefits under the contracts or for such other purposes as may be consistent with the contracts.
As of December 31, 2024, the following number of shares of the Portfolios were owned of record directly or by other
B17
Portfolios as part of their investments by insurance affiliates of Prudential.
| | | | | | | | |
| | | |
| Portfolio | | Number of Shares | | Percentage of
Outstanding Shares |
PSF Global Portfolio–Class I | | | 14,545,476 | | | | 100.0 | % |
PSF Global Portfolio–Class III | | | 21,272 | | | | 100.0 | |
PSF Mid-Cap Growth Portfolio–Class I | | | 14,005,964 | | | | 100.0 | |
PSF Mid-Cap Growth Portfolio–Class III | | | 86,024 | | | | 100.0 | |
PSF Natural Resources Portfolio–Class I | | | 10,708,104 | | | | 100.0 | |
PSF Natural Resources Portfolio–Class III | | | 465,894 | | | | 100.0 | |
PSF PGIM 50/50 Balanced Portfolio–Class I | | | 60,531,308 | | | | 100.0 | |
PSF PGIM 50/50 Balanced Portfolio–Class III | | | 219,108 | | | | 100.0 | |
PSF PGIM Flexible Managed Portfolio–Class I | | | 93,527,034 | | | | 100.0 | |
PSF PGIM Flexible Managed Portfolio–Class III | | | 4,071,074 | | | | 100.0 | |
PSF PGIM Government Income Portfolio–Class I | | | 11,487,827 | | | | 100.0 | |
PSF PGIM Government Income Portfolio–Class III | | | 251,742 | | | | 100.0 | |
PSF PGIM Government Money Market Portfolio–Class I | | | 102,166,303 | | | | 97.8 | |
PSF PGIM Government Money Market Portfolio–Class III | | | 30,245,069 | | | | 91.3 | |
PSF PGIM High Yield Bond Portfolio–Class I | | | 97,484,906 | | | | 99.9 | |
PSF PGIM High Yield Bond Portfolio–Class III | | | 2,086,425 | | | | 100.0 | |
PSF PGIM Jennison Blend Portfolio–Class I | | | 54,353,072 | | | | 100.0 | |
PSF PGIM Jennison Blend Portfolio–Class III | | | 29,749 | | | | 100.0 | |
PSF PGIM Jennison Growth Portfolio–Class I | | | 20,374,516 | | | | 100.0 | |
PSF PGIM Jennison Growth Portfolio–Class III | | | 88,251 | | | | 100.0 | |
PSF PGIM Jennison Value Portfolio–Class I | | | 29,010,965 | | | | 100.0 | |
PSF PGIM Jennison Value Portfolio–Class III | | | 89,408 | | | | 100.0 | |
PSF PGIM Total Return Bond Portfolio–Class I | | | 151,556,054 | | | | 99.2 | |
PSF PGIM Total Return Bond Portfolio–Class III | | | 1,290,027 | | | | 100.0 | |
PSF Small-Cap Stock Index Portfolio–Class I | | | 19,874,589 | | | | 100.0 | |
PSF Small-Cap Stock Index Portfolio–Class III | | | 208,490 | | | | 100.0 | |
PSF Stock Index Portfolio–Class I | | | 60,419,727 | | | | 100.0 | |
PSF Stock Index Portfolio–Class III | | | 400,020 | | | | 100.0 | |
The following number of shareholders of record, each holding greater than 5% of the Portfolio, held the following percentage of outstanding shares, on behalf of multiple beneficial owners:
| | | | |
| Portfolio | | Number of Shareholders | | Percentage of Outstanding Shares |
Affiliated: | | | | |
PSF Global Portfolio | | 2 | | 95.7% |
PSF Mid-Cap Growth Portfolio | | 2 | | 99.6 |
PSF Natural Resources Portfolio | | 2 | | 93.2 |
PSF PGIM 50/50 Balanced Portfolio | | 3 | | 100.0 |
PSF PGIM Flexible Managed Portfolio | | 3 | | 100.0 |
PSF PGIM Government Income Portfolio | | 2 | | 97.4 |
PSF PGIM Government Money Market Portfolio | | 3 | | 97.8 |
PSF PGIM High Yield Bond Portfolio | | 5 | | 94.1 |
PSF PGIM Jennison Blend Portfolio | | 3 | | 98.0 |
PSF PGIM Jennison Growth Portfolio | | 3 | | 99.6 |
PSF PGIM Jennison Value Portfolio | | 2 | | 93.7 |
PSF PGIM Total Return Bond Portfolio | | 3 | | 99.2 |
PSF Small-Cap Stock Index Portfolio | | 3 | | 100.0 |
PSF Stock Index Portfolio | | 3 | | 100.0 |
B18
| | | | |
| | | |
| Portfolio | | Number of Shareholders | | Percentage of Outstanding Shares |
Unaffiliated: | | | | |
PSF Global Portfolio | | — | | —% |
PSF Mid-Cap Growth Portfolio | | — | | — |
PSF Natural Resources Portfolio | | — | | — |
PSF PGIM 50/50 Balanced Portfolio | | — | | — |
PSF PGIM Flexible Managed Portfolio | | — | | — |
PSF PGIM Government Income Portfolio | | — | | — |
PSF PGIM Government Money Market Portfolio | | — | | — |
PSF PGIM High Yield Bond Portfolio | | — | | — |
PSF PGIM Jennison Blend Portfolio | | — | | — |
PSF PGIM Jennison Growth Portfolio | | — | | — |
PSF PGIM Jennison Value Portfolio | | — | | — |
PSF PGIM Total Return Bond Portfolio | | — | | — |
PSF Small-Cap Stock Index Portfolio | | — | | — |
PSF Stock Index Portfolio | | — | | — |
Transactions in shares of beneficial interest of the Portfolios were as follows:
PSF Global Portfolio
| | | | | | | | | | | | |
| | | | |
| Share Class | | Shares | | | | | | Amount | |
| | | |
Class I: | | | | | | | | | | | | |
Year ended December 31, 2024: | | | | | | | | | | | | |
Portfolio shares sold | | | 279,165 | | | | | | | $ | 17,194,743 | |
Portfolio shares purchased | | | (5,287,502 | ) | | | | | | | (321,584,953 | ) |
| | | |
Net increase (decrease) in shares outstanding | | | (5,008,337 | ) | | | | | | $ | (304,390,210 | ) |
| | | |
Year ended December 31, 2023: | | | | | | | | | | | | |
Portfolio shares sold | | | 405,963 | | | | | | | $ | 20,240,881 | |
Portfolio shares purchased | | | (6,576,091 | ) | | | | | | | (322,694,051 | ) |
| | | |
Net increase (decrease) in shares outstanding | | | (6,170,128 | ) | | | | | | $ | (302,453,170 | ) |
| | | |
Class III: | | | | | | | | | | | | |
| | | |
Year ended December 31, 2024: | | | | | | | | | | | | |
Portfolio shares sold | | | 4,505 | | | | | | | $ | 270,573 | |
Portfolio shares purchased | | | (3,193 | ) | | | | | | | (198,136 | ) |
| | | |
Net increase (decrease) in shares outstanding | | | 1,312 | | | | | | | $ | 72,437 | |
| | | |
Year ended December 31, 2023: | | | | | | | | | | | | |
Portfolio shares sold | | | 8,068 | | | | | | | $ | 401,002 | |
Portfolio shares purchased | | | (1,751 | ) | | | | | | | (86,608 | ) |
| | | |
Net increase (decrease) in shares outstanding | | | 6,317 | | | | | | | $ | 314,394 | |
B19
PSF Mid-Cap Growth Portfolio
| | | | | | | | | | | | |
| | | | |
| Share Class | | Shares | | | | | | Amount | |
| | | |
Class I: | | | | | | | | | | | | |
Year ended December 31, 2024: | | | | | | | | | | | | |
Portfolio shares sold | | | 910,112 | | | | | | | $ | 27,538,807 | |
Portfolio shares purchased | | | (840,404 | ) | | | | | | | (24,887,004 | ) |
| | | |
Net increase (decrease) in shares outstanding | | | 69,708 | | | | | | | $ | 2,651,803 | |
| | | |
Year ended December 31, 2023: | | | | | | | | | | | | |
Portfolio shares sold | | | 861,718 | | | | | | | $ | 21,220,361 | |
Portfolio shares purchased | | | (663,996 | ) | | | | | | | (16,389,966 | ) |
| | | |
Net increase (decrease) in shares outstanding | | | 197,722 | | | | | | | $ | 4,830,395 | |
| | | |
Class II: | | | | | | | | | | | | |
| | | |
Year ended December 31, 2024: | | | | | | | | | | | | |
Portfolio shares sold | | | 74 | | | | | | | $ | 1,974 | |
Portfolio shares purchased | | | (1,420 | ) | | | | | | | (37,833 | ) |
| | | |
Net increase (decrease) in shares outstanding | | | (1,346 | ) | | | | | | $ | (35,859 | ) |
| | | |
Year ended December 31, 2023: | | | | | | | | | | | | |
Portfolio shares sold | | | 76 | | | | | | | $ | 1,677 | |
Portfolio shares purchased | | | (716 | ) | | | | | | | (16,324 | ) |
| | | |
Net increase (decrease) in shares outstanding | | | (640 | ) | | | | | | $ | (14,647 | ) |
| | | |
Class III: | | | | | | | | | | | | |
| | | |
Year ended December 31, 2024: | | | | | | | | | | | | |
Portfolio shares sold | | | 26,633 | | | | | | | $ | 799,045 | |
Portfolio shares purchased | | | (5,829 | ) | | | | | | | (172,910 | ) |
| | | |
Net increase (decrease) in shares outstanding | | | 20,804 | | | | | | | $ | 626,135 | |
| | | |
Year ended December 31, 2023: | | | | | | | | | | | | |
Portfolio shares sold | | | 28,508 | | | | | | | $ | 711,673 | |
Portfolio shares purchased | | | (12,386 | ) | | | | | | | (309,161 | ) |
| | | |
Net increase (decrease) in shares outstanding | | | 16,122 | | | | | | | $ | 402,512 | |
PSF Natural Resources Portfolio
| | | | | | | | | | | | |
| | | | |
| Share Class | | Shares | | | | | | Amount | |
| | | |
Class I: | | | | | | | | | | | | |
Year ended December 31, 2024: | | | | | | | | | | | | |
Portfolio shares sold | | | 148,418 | | | | | | | $ | 6,859,037 | |
Portfolio shares purchased | | | (1,080,119 | ) | | | | | | | (48,445,893 | ) |
| | | |
Net increase (decrease) in shares outstanding | | | (931,701 | ) | | | | | | $ | (41,586,856 | ) |
| | | |
Year ended December 31, 2023: | | | | | | | | | | | | |
Portfolio shares sold | | | 858,159 | | | | | | | $ | 35,325,898 | |
Portfolio shares purchased | | | (1,114,014 | ) | | | | | | | (46,660,312 | ) |
| | | |
Net increase (decrease) in shares outstanding | | | (255,855 | ) | | | | | | $ | (11,334,414 | ) |
B20
| | | | | | | | | | | | |
| | | | |
| Share Class | | Shares | | | | | | Amount | |
| | | |
Class II: | | | | | | | | | | | | |
Year ended December 31, 2024: | | | | | | | | | | | | |
Portfolio shares sold | | | 76,951 | | | | | | | $ | 3,274,541 | |
Portfolio shares purchased | | | (594,412 | ) | | | | | | | (25,898,516 | ) |
| | | |
Net increase (decrease) in shares outstanding | | | (517,461 | ) | | | | | | $ | (22,623,975 | ) |
| | | |
Year ended December 31, 2023: | | | | | | | | | | | | |
Portfolio shares sold | | | 591,564 | | | | | | | $ | 24,044,796 | |
Portfolio shares purchased | | | (579,460 | ) | | | | | | | (22,600,942 | ) |
| | | |
Net increase (decrease) in shares outstanding | | | 12,104 | | | | | | | $ | 1,443,854 | |
| | | |
Class III: | | | | | | | | | | | | |
Year ended December 31, 2024: | | | | | | | | | | | | |
Portfolio shares sold | | | 26,775 | | | | | | | $ | 1,212,507 | |
Portfolio shares purchased | | | (142,184 | ) | | | | | | | (6,483,414 | ) |
| | | |
Net increase (decrease) in shares outstanding | | | (115,409 | ) | | | | | | $ | (5,270,907 | ) |
| | | |
Year ended December 31, 2023: | | | | | | | | | | | | |
Portfolio shares sold | | | 537,011 | | | | | | | $ | 21,929,364 | |
Portfolio shares purchased | | | (101,337 | ) | | | | | | | (4,275,049 | ) |
| | | |
Net increase (decrease) in shares outstanding | | | 435,674 | | | | | | | $ | 17,654,315 | |
PSF PGIM 50/50 Balanced Portfolio
| | | | | | | | | | | | |
| | | | |
| Share Class | | Shares | | | | | | Amount | |
| | | |
Class I: | | | | | | | | | | | | |
Year ended December 31, 2024: | | | | | | | | | | | | |
Portfolio shares sold | | | 347,727 | | | | | | | $ | 14,799,280 | |
Portfolio shares purchased | | | (4,477,604 | ) | | | | | | | (187,626,063 | ) |
| | | |
Net increase (decrease) in shares outstanding | | | (4,129,877 | ) | | | | | | $ | (172,826,783 | ) |
| | | |
Year ended December 31, 2023: | | | | | | | | | | | | |
Portfolio shares sold | | | 440,290 | | | | | | | $ | 15,885,637 | |
Portfolio shares purchased | | | (4,684,646 | ) | | | | | | | (169,158,873 | ) |
| | | |
Net increase (decrease) in shares outstanding | | | (4,244,356 | ) | | | | | | $ | (153,273,236 | ) |
| | | |
Class III: | | | | | | | | | | | | |
Year ended December 31, 2024: | | | | | | | | | | | | |
Portfolio shares sold | | | 47,042 | | | | | | | $ | 1,996,069 | |
Portfolio shares purchased | | | (21,223 | ) | | | | | | | (881,020 | ) |
| | | |
Net increase (decrease) in shares outstanding | | | 25,819 | | | | | | | $ | 1,115,049 | |
| | | |
Year ended December 31, 2023: | | | | | | | | | | | | |
Portfolio shares sold | | | 62,256 | | | | | | | $ | 2,231,061 | |
Portfolio shares purchased | | | (68,105 | ) | | | | | | | (2,431,379 | ) |
| | | |
Net increase (decrease) in shares outstanding | | | (5,849 | ) | | | | | | $ | (200,318 | ) |
B21
PSF PGIM Flexible Managed Portfolio
| | | | | | | | | | |
| | | |
| Share Class | | Shares | | Amount |
| | |
Class I: | | | | | | | | | | |
Year ended December 31, 2024: | | | | | | | | | | |
Portfolio shares sold | | | | 162,587 | | | | $ | 7,798,541 | |
Portfolio shares purchased | | | | (6,365,043 | ) | | | | (308,597,699 | ) |
Net increase (decrease) in shares outstanding | | | | (6,202,456 | ) | | | $ | (300,799,158 | ) |
| | |
Year ended December 31, 2023: | | | | | | | | | | |
Portfolio shares sold | | | | 378,526 | | | | $ | 15,324,956 | |
Portfolio shares purchased | | | | (6,709,097 | ) | | | | (272,058,784 | ) |
Net increase (decrease) in shares outstanding | | | | (6,330,571 | ) | | | $ | (256,733,828 | ) |
| | |
Class III: | | | | | | | | | | |
Year ended December 31, 2024: | | | | | | | | | | |
Portfolio shares sold | | | | 13,324 | | | | $ | 634,697 | |
Portfolio shares purchased | | | | (910,712 | ) | | | | (43,800,601 | ) |
Net increase (decrease) in shares outstanding | | | | (897,388 | ) | | | $ | (43,165,904 | ) |
| | |
Year ended December 31, 2023: | | | | | | | | | | |
Portfolio shares sold | | | | 30,002 | | | | $ | 1,203,684 | |
Shares issued in merger | | | | 5,821,122 | | | | | 223,240,047 | |
Portfolio shares purchased | | | | (980,976 | ) | | | | (39,943,266 | ) |
Net increase (decrease) in shares outstanding | | | | 4,870,148 | | | | $ | 184,500,465 | |
PSF PGIM Government Income Portfolio
| | | | | | | | | | |
| | | |
| Share Class | | Shares | | Amount |
| | |
Class I: | | | | | | | | | | |
Year ended December 31, 2024: | | | | | | | | | | |
Portfolio shares sold | | | | 390,218 | | | | $ | 5,072,727 | |
Portfolio shares purchased | | | | (1,338,592 | ) | | | | (17,142,835 | ) |
Net increase (decrease) in shares outstanding | | | | (948,374 | ) | | | $ | (12,070,108 | ) |
| | |
Year ended December 31, 2023: | | | | | | | | | | |
Portfolio shares sold | | | | 283,568 | | | | $ | 3,513,735 | |
Portfolio shares purchased | | | | (2,764,351 | ) | | | | (34,304,246 | ) |
Net increase (decrease) in shares outstanding | | | | (2,480,783 | ) | | | $ | (30,790,511 | ) |
| | |
Class III: | | | | | | | | | | |
Year ended December 31, 2024: | | | | | | | | | | |
Portfolio shares sold | | | | 126,100 | | | | $ | 1,613,950 | |
Portfolio shares purchased | | | | (163,429 | ) | | | | (2,088,235 | ) |
Net increase (decrease) in shares outstanding | | | | (37,329 | ) | | | $ | (474,285 | ) |
| | |
Year ended December 31, 2023: | | | | | | | | | | |
Portfolio shares sold | | | | 197,031 | | | | $ | 2,419,614 | |
Portfolio shares purchased | | | | (155,199 | ) | | | | (1,911,954 | ) |
Net increase (decrease) in shares outstanding | | | | 41,832 | | | | $ | 507,660 | |
B22
PSF PGIM Government Money Market Portfolio
| | | | | | | | | | |
| | | |
| Share Class | | Shares | | Amount |
| | |
Class I: | | | | | | | | | | |
Year ended December 31, 2024: | | | | | | | | | | |
Portfolio shares sold | | | | 107,943,838 | | | | $ | 1,079,438,373 | |
Shares issued in reinvestment of dividends and distributions | | | | 4,793,704 | | | | | 47,937,044 | |
Portfolio shares purchased | | | | (101,452,468 | ) | | | | (1,014,524,676 | ) |
Net increase (decrease) in shares outstanding | | | | 11,285,074 | | | | $ | 112,850,741 | |
| | |
Year ended December 31, 2023: | | | | | | | | | | |
Portfolio shares sold | | | | 148,491,034 | | | | $ | 1,484,910,341 | |
Shares issued in reinvestment of dividends and distributions | | | | 4,348,290 | | | | | 43,482,898 | |
Portfolio shares purchased | | | | (139,952,271 | ) | | | | (1,399,522,712 | ) |
Net increase (decrease) in shares outstanding | | | | 12,887,053 | | | | $ | 128,870,527 | |
| | |
Class III: | | | | | | | | | | |
Year ended December 31, 2024: | | | | | | | | | | |
Portfolio shares sold | | | | 32,636,748 | | | | $ | 326,367,522 | |
Shares issued in reinvestment of dividends and distributions | | | | 1,428,331 | | | | | 14,283,308 | |
Portfolio shares purchased | | | | (24,632,465 | ) | | | | (246,324,646 | ) |
Net increase (decrease) in shares outstanding | | | | 9,432,614 | | | | $ | 94,326,184 | |
| | |
Year ended December 31, 2023: | | | | | | | | | | |
Portfolio shares sold | | | | 20,688,303 | | | | $ | 206,883,034 | |
Shares issued in reinvestment of dividends and distributions | | | | 830,300 | | | | | 8,302,958 | |
Portfolio shares purchased | | | | (12,083,548 | ) | | | | (120,835,485 | ) |
Net increase (decrease) in shares outstanding | | | | 9,435,055 | | | | $ | 94,350,507 | |
PSF PGIM High Yield Bond Portfolio
| | | | | | | | |
| | | |
| Share Class | | Shares | | | Amount | |
| | |
Class I: | | | | | | | | |
Year ended December 31, 2024: | | | | | | | | |
Portfolio shares sold | | | 24,955,911 | | | $ | 179,615,048 | |
Portfolio shares purchased | | | (4,949,564 | ) | | | (34,081,342 | ) |
Net increase (decrease) in shares outstanding | | | 20,006,347 | | | $ | 145,533,706 | |
| | |
Year ended December 31, 2023: | | | | | | | | |
Portfolio shares sold | | | 4,068,099 | | | $ | 25,084,667 | |
Portfolio shares purchased | | | (6,855,367 | ) | | | (42,217,023 | ) |
Net increase (decrease) in shares outstanding | | | (2,787,268 | ) | | $ | (17,132,356 | ) |
| | |
Class III: | | | | | | | | |
Year ended December 31, 2024: | | | | | | | | |
Portfolio shares sold | | | 510,157 | | | $ | 3,534,326 | |
Portfolio shares purchased | | | (299,862 | ) | | | (2,043,667 | ) |
Net increase (decrease) in shares outstanding | | | 210,295 | | | $ | 1,490,659 | |
B23
| | | | | | | | | | |
| | | |
| Share Class | | Shares | | Amount |
| | |
Year ended December 31, 2023: | | | | | | | | | | |
Portfolio shares sold | | | | 481,345 | | | | $ | 2,961,419 | |
Portfolio shares purchased | | | | (174,580 | ) | | | | (1,068,624 | ) |
Net increase (decrease) in shares outstanding | | | | 306,765 | | | | $ | 1,892,795 | |
PSF PGIM Jennison Blend Portfolio
| | | | | | | | |
| | | |
| Share Class | | Shares | | | Amount | |
| | |
Class I: | | | | | | | | |
Year ended December 31, 2024: | | | | | | | | |
Portfolio shares sold | | | 787,989 | | | $ | 98,055,848 | |
Portfolio shares purchased | | | (4,410,496 | ) | | | (497,779,783 | ) |
Net increase (decrease) in shares outstanding | | | (3,622,507 | ) | | $ | (399,723,935 | ) |
| | |
Year ended December 31, 2023: | | | | | | | | |
Portfolio shares sold | | | 179,572 | | | $ | 14,726,967 | |
Shares issued in merger | | | 919,306 | | | | 86,157,355 | |
Portfolio shares purchased | | | (4,136,952 | ) | | | (350,009,601 | ) |
Net increase (decrease) in shares outstanding | | | (3,038,074 | ) | | $ | (249,125,279 | ) |
| | |
Class II: | | | | | | | | |
Year ended December 31, 2024: | | | | | | | | |
Portfolio shares sold | | | 20,329 | | | $ | 2,098,935 | |
Portfolio shares purchased | | | (59,345 | ) | | | (6,436,935 | ) |
Net increase (decrease) in shares outstanding | | | (39,016 | ) | | $ | (4,338,000 | ) |
| | |
Year ended December 31, 2023: | | | | | | | | |
Portfolio shares sold | | | 4,078 | | | $ | 381,773 | |
Shares issued in merger | | | 407,354 | | | | 36,934,825 | |
Portfolio shares purchased | | | (19,045 | ) | | | (1,746,702 | ) |
Net increase (decrease) in shares outstanding | | | 392,387 | | | $ | 35,569,896 | |
| | |
Class III: | | | | | | | | |
Year ended December 31, 2024: | | | | | | | | |
Portfolio shares sold | | | 9,102 | | | $ | 1,004,689 | |
Portfolio shares purchased | | | (7,723 | ) | | | (885,519 | ) |
Net increase (decrease) in shares outstanding | | | 1,379 | | | $ | 119,170 | |
| | |
Year ended December 31, 2023: | | | | | | | | |
Portfolio shares sold | | | 10,152 | | | $ | 854,300 | |
Shares issued in merger | | | 9,894 | | | | 921,230 | |
Portfolio shares purchased | | | (4,031 | ) | | | (353,385 | ) |
Net increase (decrease) in shares outstanding | | | 16,015 | | | $ | 1,422,145 | |
B24
PSF PGIM Jennison Growth Portfolio
| | | | | | | | |
| | | |
| Share Class | | Shares | | | Amount | |
| | |
Class I: | | | | | | | | |
Year ended December 31, 2024: | | | | | | | | |
Portfolio shares sold | | | 251,543 | | | $ | 42,124,512 | |
Portfolio shares purchased | | | (1,508,516 | ) | | | (251,038,412 | ) |
Net increase (decrease) in shares outstanding | | | (1,256,973 | ) | | $ | (208,913,900 | ) |
| | |
Year ended December 31, 2023: | | | | | | | | |
Portfolio shares sold | | | 277,424 | | | $ | 32,419,340 | |
Portfolio shares purchased | | | (1,519,161 | ) | | | (179,933,952 | ) |
Net increase (decrease) in shares outstanding | | | (1,241,737 | ) | | $ | (147,514,612 | ) |
| | |
Class II: | | | | | | | | |
Year ended December 31, 2024: | | | | | | | | |
Portfolio shares sold | | | 6,272 | | | $ | 984,769 | |
Portfolio shares purchased | | | (19,239 | ) | | | (2,862,851 | ) |
Net increase (decrease) in shares outstanding | | | (12,967 | ) | | $ | (1,878,082 | ) |
| | |
Year ended December 31, 2023: | | | | | | | | |
Portfolio shares sold | | | 23,179 | | | $ | 2,314,382 | |
Portfolio shares purchased | | | (421,342 | ) | | | (48,552,268 | ) |
Net increase (decrease) in shares outstanding | | | (398,163 | ) | | $ | (46,237,886 | ) |
| | |
Class III: | | | | | | | | |
Year ended December 31, 2024: | | | | | | | | |
Portfolio shares sold | | | 22,047 | | | $ | 3,697,865 | |
Portfolio shares purchased | | | (20,554 | ) | | | (3,397,927 | ) |
Net increase (decrease) in shares outstanding | | | 1,493 | | | $ | 299,938 | |
| | |
Year ended December 31, 2023: | | | | | | | | |
Portfolio shares sold | | | 27,929 | | | $ | 3,394,745 | |
Portfolio shares purchased | | | (10,571 | ) | | | (1,268,386 | ) |
Net increase (decrease) in shares outstanding | | | 17,358 | | | $ | 2,126,359 | |
| | |
PSF PGIM Jennison Value Portfolio | | | | | | | | |
| | | |
| Share Class | | Shares | | | Amount | |
| | |
Class I: | | | | | | | | |
Year ended December 31, 2024: | | | | | | | | |
Portfolio shares sold | | | 556,919 | | | $ | 33,453,172 | |
Portfolio shares purchased | | | (2,280,577 | ) | | | (129,493,904 | ) |
Net increase (decrease) in shares outstanding | | | (1,723,658 | ) | | $ | (96,040,732 | ) |
| | |
Year ended December 31, 2023: | | | | | | | | |
Portfolio shares sold | | | 815,146 | | | $ | 37,306,551 | |
Portfolio shares purchased | | | (2,703,435 | ) | | | (123,470,854 | ) |
Net increase (decrease) in shares outstanding | | | (1,888,289 | ) | | $ | (86,164,303 | ) |
B25
| | | | | | | | |
| | | |
| Share Class | | Shares | | | Amount | |
| | |
Class II: | | | | | | | | |
Year ended December 31, 2024: | | | | | | | | |
Portfolio shares sold | | | 17,504 | | | $ | 960,217 | |
Portfolio shares purchased | | | (22,722 | ) | | | (1,244,469 | ) |
Net increase (decrease) in shares outstanding | | | (5,218 | ) | | $ | (284,252 | ) |
| | |
Year ended December 31, 2023: | | | | | | | | |
Portfolio shares sold | | | 4,557 | | | $ | 199,909 | |
Portfolio shares purchased | | | (15,190 | ) | | | (679,162 | ) |
Net increase (decrease) in shares outstanding | | | (10,633 | ) | | $ | (479,253 | ) |
| | |
Class III: | | | | | | | | |
Year ended December 31, 2024: | | | | | | | | |
Portfolio shares sold | | | 32,853 | | | $ | 1,930,812 | |
Portfolio shares purchased | | | (10,191 | ) | | | (581,405 | ) |
Net increase (decrease) in shares outstanding | | | 22,662 | | | $ | 1,349,407 | |
| | |
Year ended December 31, 2023: | | | | | | | | |
Portfolio shares sold | | | 24,663 | | | $ | 1,138,435 | |
Portfolio shares purchased | | | (17,113 | ) | | | (770,288 | ) |
Net increase (decrease) in shares outstanding | | | 7,550 | | | $ | 368,147 | |
| | |
PSF PGIM Total Return Bond Portfolio | | | | | | | | |
| | | |
| Share Class | | Shares | | | Amount | |
| | |
Class I: | | | | | | | | |
Year ended December 31, 2024: | | | | | | | | |
Portfolio shares sold | | | 61,951,148 | | | $ | 909,477,675 | |
Portfolio shares purchased | | | (6,840,158 | ) | | | (99,329,584 | ) |
Net increase (decrease) in shares outstanding | | | 55,110,990 | | | $ | 810,148,091 | |
| | |
Year ended December 31, 2023: | | | | | | | | |
Portfolio shares sold | | | 22,648,627 | | | $ | 312,817,887 | |
Portfolio shares purchased | | | (6,254,317 | ) | | | (85,273,193 | ) |
Net increase (decrease) in shares outstanding | | | 16,394,310 | | | $ | 227,544,694 | |
| | |
Class III: | | | | | | | | |
Year ended December 31, 2024: | | | | | | | | |
Portfolio shares sold | | | 560,844 | | | $ | 8,096,505 | |
Portfolio shares purchased | | | (206,994 | ) | | | (3,003,002 | ) |
Net increase (decrease) in shares outstanding | | | 353,850 | | | $ | 5,093,503 | |
| | |
Year ended December 31, 2023: | | | | | | | | |
Portfolio shares sold | | | 350,343 | | | $ | 4,769,916 | |
Portfolio shares purchased | | | (112,835 | ) | | | (1,527,225 | ) |
Net increase (decrease) in shares outstanding | | | 237,508 | | | $ | 3,242,691 | |
B26
PSF Small-Cap Stock Index Portfolio
| | | | | | | | |
| | | |
| Share Class | | Shares | | | Amount | |
| | |
Class I: | | | | | | | | |
Year ended December 31, 2024: | | | | | | | | |
Portfolio shares sold | | | 652,173 | | | $ | 39,342,576 | |
Portfolio shares purchased | | | (1,622,261 | ) | | | (97,217,951 | ) |
Net increase (decrease) in shares outstanding | | | (970,088 | ) | | $ | (57,875,375 | ) |
| | |
Year ended December 31, 2023: | | | | | | | | |
Portfolio shares sold | | | 751,003 | | | $ | 40,331,528 | |
Shares issued in merger | | | 5,405,749 | | | | 284,937,009 | |
Portfolio shares purchased | | | (1,277,215 | ) | | | (67,354,542 | ) |
Net increase (decrease) in shares outstanding | | | 4,879,537 | | | $ | 257,913,995 | |
| | |
Class III: | | | | | | | | |
Year ended December 31, 2024: | | | | | | | | |
Portfolio shares sold | | | 44,617 | | | $ | 2,720,308 | |
Portfolio shares purchased | | | (29,593 | ) | | | (1,773,272 | ) |
Net increase (decrease) in shares outstanding | | | 15,024 | | | $ | 947,036 | |
| | |
Year ended December 31, 2023: | | | | | | | | |
Portfolio shares sold | | | 43,381 | | | $ | 2,246,966 | |
Portfolio shares purchased | | | (26,279 | ) | | | (1,360,039 | ) |
Net increase (decrease) in shares outstanding | | | 17,102 | | | $ | 886,927 | |
| | |
PSF Stock Index Portfolio | | | | | | | | |
| | | |
| Share Class | | Shares | | | Amount | |
| | |
Class I: | | | | | | | | |
Year ended December 31, 2024: | | | | | | | | |
Portfolio shares sold | | | 2,875,979 | | | $ | 383,089,791 | |
Portfolio shares purchased | | | (6,214,627 | ) | | | (874,260,401 | ) |
Net increase (decrease) in shares outstanding | | | (3,338,648 | ) | | $ | (491,170,610 | ) |
| | |
Year ended December 31, 2023: | | | | | | | | |
Portfolio shares sold | | | 2,539,915 | | | $ | 262,081,414 | |
Portfolio shares purchased | | | (2,813,161 | ) | | | (287,956,077 | ) |
Net increase (decrease) in shares outstanding | | | (273,246 | ) | | $ | (25,874,663 | ) |
| | |
Class III: | | | | | | | | |
Year ended December 31, 2024: | | | | | | | | |
Portfolio shares sold | | | 91,909 | | | $ | 12,193,864 | |
Portfolio shares purchased | | | (44,045 | ) | | | (5,772,005 | ) |
Net increase (decrease) in shares outstanding | | | 47,864 | | | $ | 6,421,859 | |
| | |
Year ended December 31, 2023: | | | | | | | | |
Portfolio shares sold | | | 108,498 | | | $ | 11,247,698 | |
Portfolio shares purchased | | | (27,827 | ) | | | (2,849,339 | ) |
Net increase (decrease) in shares outstanding | | | 80,671 | | | $ | 8,398,359 | |
B27
9. Risks of Investing in the Portfolios
Each Portfolio’s principal risks include, but are not limited to, some or all of the risks discussed below. For further information on the risks applicable to any given Portfolio, please refer to the Prospectus and Statement of Additional Information of that Portfolio.
| | | | | | | | | | |
| | | | | | |
| Risks | | PSF
Global
Portfolio | | PSF
Mid-Cap
Growth
Portfolio | | PSF
Natural
Resources
Portfolio | | PSF
PGIM
50/50
Balanced
Portfolio | | PSF
PGIM
Flexible
Managed
Portfolio |
Adjustable and Floating-Rate Securities | | – | | – | | – | | – | | – |
Asset-Backed and/or Mortgage-Backed Securities | | – | | – | | – | | X | | X |
Bank Loan Investments | | – | | – | | – | | X | | X |
Blend Style | | X | | – | | – | | – | | X |
Collateralized Debt Obligations (CDO) | | – | | – | | – | | X | | X |
Commodity | | – | | – | | X | | – | | – |
Covenant-Lite | | – | | – | | – | | – | | – |
Credit | | – | | – | | – | | X | | X |
Currency | | – | | – | | – | | X | | X |
Derivatives | | – | | – | | – | | X | | X |
Dollar Roll Transactions | | – | | – | | – | | – | | – |
Economic and Market Events | | X | | X | | X | | X | | X |
Emerging Markets | | – | | – | | X | | – | | – |
Equity and Equity-Related Securities | | – | | – | | – | | X | | X |
Equity Securities | | X | | X | | X | | X | | X |
Exchange-Traded Funds (ETF) | | – | | – | | X | | – | | – |
Expense | | X | | X | | X | | X | | X |
Fixed Income Securities | | – | | – | | X | | X | | X |
Focus | | X | | – | | X | | – | | – |
Foreign Investment | | X | | – | | X | | X | | X |
High Yield | | – | | – | | X | | X | | X |
Illiquid Investment | | – | | – | | X | | – | | – |
Investment Company | | – | | – | | X | | – | | – |
Index Tracking | | – | | – | | – | | X | | – |
Interest Rate | | – | | – | | – | | X | | X |
Investment Style | | X | | X | | – | | – | | – |
Large Company | | X | | – | | – | | X | | X |
Leverage | | – | | X | | – | | – | | – |
Liquidity and Valuation | | X | | X | | X | | X | | X |
Market and Management | | X | | X | | X | | X | | X |
Market Capitalization | | – | | – | | – | | – | | – |
Mid-Sized Company | | X | | X | | – | | – | | X |
Natural Resources Investment | | – | | – | | X | | – | | – |
Portfolio Turnover | | – | | – | | X | | – | | X |
Prepayment or Call | | – | | – | | – | | X | | X |
Quantitative Model | | X | | – | | – | | – | | X |
Real Estate | | – | | – | | – | | – | | – |
Regulatory | | X | | X | | X | | X | | X |
Reverse Repurchase Agreement | | – | | – | | – | | – | | – |
Short Sale | | – | | – | | – | | – | | X |
Small Sized Company | | – | | – | | X | | – | | – |
US Government Securities | | – | | – | | – | | – | | X |
B28
| | | | | | | | | | |
| | | | | | |
| Risks | | PSF
Global
Portfolio | | PSF
Mid-Cap
Growth
Portfolio | | PSF
Natural
Resources
Portfolio | | PSF
PGIM
50/50
Balanced
Portfolio | | PSF
PGIM
Flexible
Managed
Portfolio |
Yield | | – | | – | | – | | – | | – |
| | | | | | | | |
| Risks | | PSF PGIM
Government Income Portfolio | | PSF PGIM Government Money Market Portfolio | | PSF PGIM High Yield Bond Portfolio | | PSF PGIM Jennison Blend Portfolio |
| | | | |
Adjustable and Floating-Rate Securities | | – | | X | | – | | – |
| | | | |
Asset-Backed and/or Mortgage-Backed Securities | | X | | – | | – | | – |
| | | | |
Bank Loan Investments | | X | | – | | X | | – |
| | | | |
Blend Style | | – | | – | | – | | X |
| | | | |
Collateralized Debt Obligations (CDO) | | X | | – | | X | | – |
| | | | |
Commodity | | – | | – | | – | | – |
| | | | |
Covenant-Lite | | – | | – | | – | | – |
| | | | |
Credit | | X | | X | | X | | X |
| | | | |
Currency | | – | | – | | X | | – |
| | | | |
Derivatives | | X | | – | | X | | – |
| | | | |
Dollar Roll Transactions | | X | | – | | X | | – |
| | | | |
Economic and Market Events | | X | | X | | X | | X |
| | | | |
Emerging Markets | | – | | – | | X | | – |
| | | | |
Equity and Equity-Related Securities | | X | | – | | X | | – |
| | | | |
Equity Securities | | – | | – | | – | | X |
| | | | |
Exchange-Traded Funds (ETF) | | – | | – | | – | | – |
| | | | |
Expense | | X | | X | | X | | X |
| | | | |
Fixed Income Securities | | X | | X | | X | | X |
| | | | |
Focus | | – | | – | | – | | – |
| | | | |
Foreign Investment | | – | | – | | X | | X |
| | | | |
High Yield | | X | | – | | X | | X |
| | | | |
Illiquid Investment | | – | | – | | – | | – |
| | | | |
Investment Company | | – | | – | | – | | – |
| | | | |
Index Tracking | | – | | – | | – | | – |
| | | | |
Interest Rate | | X | | X | | X | | X |
| | | | |
Investment Style | | – | | – | | – | | – |
| | | | |
Large Company | | – | | – | | – | | X |
| | | | |
Leverage | | X | | – | | X | | – |
| | | | |
Liquidity and Valuation | | X | | – | | X | | – |
| | | | |
Market and Management | | X | | X | | X | | X |
| | | | |
Market Capitalization | | – | | – | | – | | X |
| | | | |
Mid-Sized Company | | – | | – | | – | | X |
| | | | |
Natural Resources Investment | | – | | – | | – | | – |
| | | | |
Portfolio Turnover | | X | | – | | – | | – |
| | | | |
Prepayment or Call | | X | | X | | X | | X |
| | | | |
Quantitative Model | | – | | – | | – | | – |
| | | | |
Real Estate | | – | | – | | – | | – |
| | | | |
Regulatory | | X | | X | | X | | X |
| | | | |
Reverse Repurchase Agreement | | X | | – | | X | | – |
Short Sale | | X | | – | | X | | – |
B29
| | | | | | | | |
| Risks | | PSF PGIM
Government Income Portfolio | | PSF PGIM Government Money Market Portfolio | | PSF PGIM High Yield Bond Portfolio | | PSF PGIM Jennison Blend Portfolio |
Small Sized Company | | – | | – | | – | | X |
US Government Securities | | X | | X | | – | | – |
Yield | | – | | X | | – | | – |
| | | | | | | | | | |
| | | | | | |
| Risks | | PSF PGIM Jennison Growth Portfolio | | PSF PGIM Jennison Value Portfolio | | PSF PGIM Total Return Bond Portfolio | | PSF Small- Cap Stock Index Portfolio | | PSF Stock Index Portfolio |
Adjustable and Floating-Rate Securities | | – | | – | | – | | – | | – |
Asset-Backed and/or Mortgage-Backed Securities | | – | | – | | X | | – | | – |
Bank Loan Investments | | – | | – | | X | | – | | – |
Blend Style | | – | | – | | – | | – | | – |
Collateralized Debt Obligations (CDO) | | – | | – | | X | | – | | – |
Commodity | | – | | – | | – | | – | | – |
Covenant-Lite | | – | | – | | X | | – | | – |
Credit | | – | | X | | X | | – | | – |
Currency | | – | | X | | X | | – | | – |
Derivatives | | – | | – | | X | | – | | – |
Dollar Roll Transactions | | – | | – | | X | | – | | – |
Economic and Market Events | | X | | X | | X | | X | | X |
Emerging Markets | | – | | – | | – | | – | | – |
Equity and Equity-Related Securities | | – | | – | | X | | – | | – |
Equity Securities | | X | | X | | – | | X | | X |
Exchange-Traded Funds (ETF) | | – | | – | | – | | – | | – |
Expense | | X | | X | | X | | X | | X |
Fixed Income Securities | | X | | X | | X | | – | | – |
Focus | | – | | – | | – | | – | | – |
Foreign Investment | | X | | X | | X | | – | | – |
High Yield | | X | | – | | X | | – | | – |
Illiquid Investment | | – | | – | | – | | – | | – |
Investment Company | | – | | – | | – | | – | | – |
Index Tracking | | – | | – | | – | | X | | X |
Interest Rate | | – | | X | | X | | – | | – |
Investment Style | | X | | X | | – | | – | | – |
Large Company | | X | | X | | – | | – | | X |
Leverage | | – | | – | | X | | – | | – |
Liquidity and Valuation | | X | | X | | X | | X | | X |
Market and Management | | X | | X | | X | | X | | X |
Market Capitalization | | – | | X | | – | | – | | – |
Mid-Sized Company | | – | | – | | – | | – | | – |
Natural Resources Investment | | – | | – | | – | | – | | – |
Portfolio Turnover | | – | | – | | X | | – | | – |
Prepayment or Call | | – | | X | | X | | – | | – |
Quantitative Model | | – | | – | | – | | – | | – |
Real Estate | | – | | X | | – | | – | | – |
B30
| | | | | | | | | | |
| | | | | | |
| Risks | | PSF PGIM Jennison Growth Portfolio | | PSF PGIM Jennison Value Portfolio | | PSF PGIM Total Return Bond Portfolio | | PSF Small- Cap Stock Index Portfolio | | PSF Stock Index Portfolio |
Regulatory | | X | | X | | X | | X | | X |
Reverse Repurchase Agreement | | – | | – | | X | | – | | – |
Short Sale | | – | | – | | X | | – | | – |
Small Sized Company | | – | | – | | – | | X | | – |
US Government Securities | | X | | – | | – | | – | | – |
Yield | | – | | – | | – | | – | | – |
Adjustable and Floating-Rate Securities Risk: The value of adjustable and floating-rate securities may lag behind the value of fixed-rate securities when interest rates change. Adjustable and floating rate securities generally are less sensitive to interest rate changes, but may decline in value if their interest rates do not rise as much or as quickly as interest rates in general. Conversely, adjustable and floating rate securities generally will not increase in value as much as fixed rate debt instruments if interest rates decline. Adjustable and floating rate securities are also subject to credit risk, market risk and interest rate risk. In addition, the absence of an active market for these securities could make it difficult for the Portfolio to dispose of them if the issuer defaults.
Asset-Backed and/or Mortgage-Backed Securities Risk: Asset-backed and mortgage-backed securities primarily are fixed income securities that represent an interest in an underlying pool of assets, such as credit card receivables or, in the case of mortgage-backed securities, mortgage loans. Like fixed income securities, asset-backed and mortgage-backed securities are subject to interest rate risk, liquidity risk, and credit risk, which may be heightened in connection with investments in loans to “subprime” borrowers. Certain asset-backed and mortgage-backed securities are subject to the risk that those obligations will be repaid sooner than expected or later than expected, either of which may result in lower-than-expected returns. Mortgage-backed securities, because they are backed by mortgage loans, are also subject to risks related to real estate, and securities backed by private-issued mortgages may experience higher rates of default on the underlying mortgages than securities backed by government-issued mortgages.
Bank Loan Investments Risk: A Portfolio’s ability to receive payments of principal and interest and other amounts in connection with loans (whether through participations, assignments, or otherwise) will depend primarily on the financial condition of the borrower. The failure by the Portfolio to receive scheduled interest or principal payments on a loan because of a default, bankruptcy, or any other reason would adversely affect the income of the Portfolio and would likely reduce the value of its assets. Even with loans secured by collateral, there is the risk that the value of the collateral may decline, may be insufficient to meet the obligations of the borrower, or be difficult to liquidate. In the event of a default, the Portfolio may have difficulty collecting on any collateral and would not have the ability to collect on any collateral for an uncollateralized loan. Further, the Portfolio’s access to collateral, if any, may be limited by bankruptcy laws. In addition, loan participations generally are subject to restrictions on transfer, and only limited opportunities may exist to sell loan participations in secondary markets. As a result, it may be difficult for the Portfolio to value loans or sell loans at an acceptable price when it wants to sell them. Loans trade in an over-the-counter market, and confirmation and settlement, which are effected through standardized procedures and documentation, may have an impact on the length and timing of completing trades. To the extent the Portfolio invests in loans of non-US issuers, the risks of investing in non-US issuers are applicable. Loans may not be considered to be “securities” and as a result may not benefit from the protections of the federal securities laws, including anti-fraud protections and those with respect to the use of material non-public information, so that purchasers, such as the Portfolio, may not have the benefit of these protections.
Blend Style Risk: A Portfolio’s blend investment style may subject the Portfolio to risks of both value and growth investing. The portion of the Portfolio’s portfolio that makes investments pursuant to a growth strategy may be subject to above-average market price fluctuations as a result of seeking high-quality stocks with good future growth prospects. The portion of the Portfolio’s portfolio that makes investments pursuant to a value strategy may be subject to the risk that the market may not recognize a security’s intrinsic value for long periods of time or that a stock judged to be undervalued may actually be appropriately priced. Issuers of value stocks may have experienced adverse business developments or may be subject to special risks that have caused the stock to be out of favor. If the Portfolio’s assessment of market conditions or a company’s value is inaccurate, the Portfolio could suffer losses or produce poor performance relative to other funds. Historically, growth stocks have performed best during later stages of economic expansion and value stocks have performed best during periods of economic recovery. Therefore, both styles may over time go in and out of favor depending on market
B31
conditions. At times when a style is out of favor, that portion of the portfolio may lag the other portion of the portfolio, which may cause the Portfolio to underperform the market in general, its benchmark, and other mutual funds.
Collateralized Debt Obligations Risk (CDO): The risks of an investment in a CDO, which can include collateralized loan obligations (CLOs), depend largely on the quality and type of the collateral and the tranche of the CDO in which the Portfolio invests. Investments in CDOs may be illiquid. In addition to the risks associated with debt instruments (e.g., interest rate risk and credit risk), CDOs carry additional risks including, but not limited to: (i) the possibility that distributions from collateral will not be adequate to make interest or other payments; (ii) the quality of the collateral may decline in value or default; (iii) the possibility that the Portfolio may invest in CDOs that are subordinate to other classes of the issuer’s securities; and (iv) the complex structure of the security may not be fully understood at the time of investment and may produce disputes with the issuer or unexpected investment results.
Commodity Risk: The value of a commodity-linked investment is affected by, among other things, overall market movements, factors affecting a particular industry or commodity, and changes in interest and exchange rates and may be more volatile than traditional equity and debt securities. The value of the commodities underlying commodity-linked instruments may be subject to various economic and non-economic factors, such as drought, floods or other weather conditions, livestock disease, embargoes, competition from substitute products, transportation bottlenecks or shortages, fluctuations in supply and demand, tariffs, war and international economic, political, and regulatory developments.
Covenant-Lite Risk: Some of the loans or debt obligations in which the Portfolio may invest or get exposure to may be “covenant-lite,” which means the loans or obligations contain fewer financial maintenance covenants than other loans or obligations (in some cases, none) and do not include terms that allow the lender to monitor the borrower’s performance and declare a default if certain criteria are breached. An investment by the Portfolio in a covenant-lite loan may potentially hinder the ability to reprice credit risk associated with the issuer and reduce the ability to restructure a problematic loan and mitigate potential loss. The Portfolio may also experience difficulty, expenses or delays in enforcing its rights on its holdings of covenant-lite loans or obligations. As a result of these risks, the Portfolio’s exposure to losses may be increased, which could result in an adverse impact on the Portfolio’s net income and net asset value.
Credit Risk: This is the risk that the issuer, the guarantor or the insurer of a fixed income security, or the counterparty to a contract, may be unable or unwilling to make timely principal and interest payments, or to otherwise honor its obligations. Litigation, legislation or other political events, business or economic conditions, or the bankruptcy of the issuer could have a significant effect on an issuer’s or obligor’s ability to make payments of principal and/or interest. The lower the credit quality of a bond, the more sensitive it is to credit risk, and the credit quality of an investment can deteriorate rapidly.
Currency Risk: Currency risk is the risk that fluctuations in exchange rates will adversely affect the market value of a Portfolio’s investments, including the risk that the currencies in which the Portfolio’s investments are traded or in which the Portfolio receives income will decline in value relative to the US dollar. The overall impact on a Portfolio’s holdings can be significant, and long-lasting, depending on the currencies represented in the portfolio and how each foreign currency appreciates or depreciates in relation to the US dollar and whether currency positions are hedged. Further, since exchange rate movements are volatile, a Portfolio’s attempt at hedging could be unsuccessful, and it is not possible to effectively hedge the currency risks of many emerging market countries.
Derivatives Risk: A derivative is a financial contract, the value of which depends upon, or is derived from, the value of one or more underlying investments, such as an asset, reference rate, or index. The use of derivatives is a highly specialized activity that involves a variety of risks in addition to and greater than those associated with investing directly in securities, including the risk that: the party on the other side of a derivative transaction will be unable to honor its financial obligation; leverage created by investing in derivatives may result in losses to the Portfolio; derivatives may be difficult or impossible for the Portfolio to buy or sell at an opportune time or price, and may be difficult to terminate or otherwise offset; derivatives used for hedging may reduce or magnify losses but also may reduce or eliminate gains; the price of derivatives may be more volatile than the prices of traditional equity and debt securities; and changes in a derivative’s value may not correlate perfectly with the assets, rates, indices or instruments it is designed to hedge or closely track. The Portfolio is subject to a derivatives risk management program, which may limit the ability of the Portfolio to invest in derivatives.
Dollar Roll Transactions Risk: Dollar rolls involve the sale by a Portfolio of a security for delivery in the current month with a promise to repurchase from the buyer a substantially similar—but not necessarily the same—security at a set price and date in the future. In a dollar roll, the Portfolio takes the risk that: (i) the market price of the mortgage-backed securities will drop below their future repurchase price; (ii) the securities that it repurchases at a later date will have less favorable market characteristics; (iii) the other party to the agreement will not be able to perform; (iv) the roll adds leverage to the Portfolio; and (v) the roll increases the Portfolio’s sensitivity to interest rate changes. In addition, investments in dollar rolls may increase the portfolio turnover rate of the Portfolio.
B32
Economic and Market Events Risk: Economic and market events risk is the risk that one or more markets in which the Portfolio invests will decline in value, including the possibility that the markets will decline sharply and unpredictably. While a Portfolio’s Manager or Subadviser(s) may make efforts to control the risks associated with market changes, and may attempt to identify changes as they occur, market environment changes can be sudden and extreme. Significant shocks to or disruptions of the financial markets or the economy, including those relating to general economic, political, or financial market conditions; significant or unexpected failures, near-failures or credit downgrades of key institutions; investor sentiment and market perceptions; unexpected changes in the prices of key commodities; government actions; geopolitical events or changes; and factors related to a specific issuer, geography, industry or sector, could adversely affect the liquidity and volatility of securities held by the Portfolio. In periods of market volatility and/or declines, the Portfolio may experience high levels of shareholder redemptions, and may have to sell securities at times when it would otherwise not do so, and at unfavorable prices.
Emerging Markets Risk: The risks of non-US investments are greater for investments in or exposed to emerging markets. Emerging market countries typically have economic, political, and social systems that are less developed, and can be expected to be less stable, than those of more developed countries. As a result, there could be less information available about issuers in emerging market countries, which could negatively affect the ability of the manager or a Portfolio’s subadviser(s) to evaluate local companies or their potential impact on a Portfolio’s performance. Characteristics of emerging market economies can include heavy economic dependence on international aid, agriculture or exports (particularly commodities), undeveloped or overburdened infrastructures and legal systems, vulnerability to natural disasters, significant and unpredictable government intervention in markets or the economy, volatile currency exchange rates, currency devaluations, runaway inflation, business practices that depart from norms for developed countries, and generally less liquid markets. For example, the economies of such countries can be subject to currency devaluations and rapid and unpredictable (and in some cases, extremely high) rates of inflation or deflation. Low trading volumes may result in a lack of liquidity, price volatility, and valuation difficulties. Regulatory regimes outside of the US may not require or enforce corporate governance standards comparable to that of the US, which may result in less protections for investors in such issuers and make such issuers more susceptible to actions not in the best interest of the issuer or its investors. Emerging market countries may have policies that restrict investments by foreign investors, or that prevent foreign investors from withdrawing their money at will, which may make it difficult for a Portfolio to invest in such countries or increase the administrative costs of such investments. Countries with emerging markets can be found in regions including, but not limited to, Asia, Latin America, the Middle East, Southern Europe, Eastern Europe, Africa and the region comprising the former Soviet Union. A Portfolio may invest in some emerging markets through trading structures or protocols that subject it to risks such as those associated with decreased liquidity, custody of assets, different settlement and clearance procedures, and asserting legal title under a developing legal and regulatory regime to a greater degree than in developed markets or even in other emerging markets.
Equity and Equity-Related Securities Risk: From time to time, the Portfolio may purchase or hold equity or equity-related securities incidental to the purchase or ownership of fixed income instruments or in connection with a reorganization of a borrower. These include common stock, preferred stock or securities that may be converted into or exchanged for common stock—known as convertible securities—like rights and warrants. The value of a particular equity or equity-related security held by a Portfolio could fluctuate, perhaps greatly, in response to a number of factors, such as changes in the issuer’s financial condition, changes in interest rates, or heightened levels of inflation. Such events may result in losses to the Portfolio. In addition, due to decreases in liquidity, the Portfolio may be unable to sell its securities holdings within a reasonable time at the price it values the security or at any price.
Equity Securities Risk: The value of a particular stock or equity-related security held by the Portfolio could fluctuate, perhaps greatly, in response to a number of factors, such as changes in the issuer’s financial condition or the value of the equity markets or a sector of those markets. Such events may result in losses to the Portfolio. In addition, due to decreases in liquidity, the Portfolio may be unable to sell its securities holdings within a reasonable time at the price it values the security or at any price.
Exchange-Traded Funds (ETF) Risk: An investment in an ETF generally presents the same primary risks as an investment in a mutual fund that has the same investment objective, strategies, and policies. In addition, the market price of an ETF’s shares may trade above or below its net asset value and there may not be an active trading market for an ETF’s shares. The Portfolio could lose money investing in an ETF if the prices of the securities owned by the ETF go down.
Expense Risk: The actual cost of investing in the Portfolio may be higher than the expenses shown in the “Annual Portfolio Operating Expenses” table in the Portfolio’s prospectus for a variety of reasons, including, for example, if the Portfolio’s average net assets decrease.
Fixed Income Securities Risk: Investment in fixed income securities involves a variety of risks, including that: an issuer or guarantor of a security will be unable or unwilling to pay obligations when due; due to decreases in liquidity, the Portfolio may
B33
be unable to sell its securities holdings within a reasonable time at the price it values the security or at any price; and the Portfolio’s investment may decrease in value when interest rates rise. Volatility in interest rates and in fixed income markets may increase the risk that the Portfolio’s investment in fixed income securities will go down in value. In recent years, the Federal Open Market Committee (FOMC) began implementing increases to the federal funds interest rate and there may be further rate increases. To the extent rates increase substantially and/or rapidly, a Portfolio with significant investment in fixed income investments may be subject to significant losses. Changes in interest rates may also affect the liquidity of the Portfolio’s investments in fixed income securities.
Focus Risk: The Portfolio focuses or may focus its investments in particular countries, regions, industries, sectors, markets, or types of investments and may accumulate large positions in such areas. As a result, the Portfolio invests in the securities of a small number of issuers and has greater exposure to adverse developments affecting those issuers and a resulting decline in the market price of those issuers’ securities as compared to a portfolio that invests in the securities of a larger number of issuers.
Foreign Investment Risk: Foreign markets tend to be more volatile than US markets and are generally not subject to regulatory requirements comparable to those in the US. Foreign securities include investments in securities of foreign issuers denominated in foreign currencies, as well as securities of foreign issuers denominated in US dollars and American Depositary Receipts. Foreign investment risk includes the risk that: changes in currency exchange rates may affect the value of foreign securities held by the Portfolio; foreign markets generally are more volatile than, and generally are not subject to regulatory requirements comparable to, US markets; foreign financial reporting and tax standards usually differ from those in the US; foreign exchanges are often less liquid than US markets; political or social developments may adversely affect the value of foreign securities; foreign holdings may be subject to special taxation and limitations on repatriating investment proceeds; and certain events in foreign markets may adversely affect foreign and domestic issuers, including, among others, military conflict, geopolitical developments, interruptions in the global supply chain, natural disasters, and outbreaks of infectious diseases.
High Yield Risk: Investments in fixed income instruments rated below investment grade and unrated instruments of similar credit quality (i.e., “high yield” securities or “junk bonds”) may be more sensitive to interest rate, credit, call, and liquidity risks than investments in investment grade securities, and have predominantly speculative characteristics. An economic downturn generally leads to a higher non-payment rate, and a high yield investment may lose significant value before a default occurs.
Illiquid Investments Risk: Illiquid investments risk exists when particular investments made by the Portfolio are difficult to purchase or sell. The Portfolio may make investments that may become less liquid in response to market developments, lack of a trading market, or adverse investor perceptions. If the Portfolio is forced to sell these investments to pay redemption proceeds or for other reasons, the Portfolio may lose money. In addition, when there is no willing buyer and investments cannot be readily sold at the desired time or price, the Portfolio may have to accept a lower price or may not be able to sell the instrument at all. It also may be the case that other market participants may be attempting to liquidate illiquid holdings at the same time as the Portfolio, causing increased supply in the market and contributing to liquidity risk and downward pricing pressure. An inability to sell a portfolio position can adversely affect the Portfolio’s value or prevent the Portfolio from being able to take advantage of other investment opportunities.
Investment Company Risk: The risks of owning another investment company are generally similar to the risks of investing directly in the securities in which that investment company invests. However, an investment company may not achieve its investment objective or execute its investment strategy effectively, which may adversely affect the Portfolio’s performance. In addition, because closed-end funds and exchange-traded funds trade on a secondary market, their shares may trade at a premium or discount to the actual net asset value of their portfolio securities and their shares may have greater volatility because of the potential lack of liquidity.
Index Tracking Risk: The Portfolio’s ability to track the performance and/or holdings and weightings of an index with a high degree of correlation may be affected by, among other things, transaction costs and shareholder purchases and redemptions.
Interest Rate Risk: The value of your investment may go down when interest rates rise. A rise in interest rates tends to have a greater impact on the prices of longer term or duration securities. When interest rates fall, the issuers of debt obligations may prepay principal more quickly than expected, and the Portfolio may be required to reinvest the proceeds at a lower interest rate. This is referred to as “prepayment risk.” When interest rates rise, debt obligations may be repaid more slowly than expected, and the value of the Portfolio’s holdings may fall sharply. This is referred to as “extension risk.” The Portfolio currently faces a heightened level of interest rate risk because of recent increases in interest rates in the US and globally. In recent years, the Federal Open Market Committee (FOMC) began implementing increases to the federal funds interest rate and there may be further rate increases. As interest rates rise, the value of fixed income investments typically decreases
B34
and there is risk that rates across the financial system also may rise. To the extent rates increase substantially and/or rapidly, a Portfolio with significant investment in fixed income investments may be subject to significant losses. Interest rates may continue to increase, possibly suddenly and significantly, with unpredictable effects on the markets and the Portfolio’s investments. The Portfolio may lose money if short-term or long-term interest rates rise sharply or in a manner not anticipated by the subadviser.
Investment Style Risk: Securities held by the Portfolio as a result of a particular investment style, such as growth or value, tend to perform differently (i.e., better or worse than other segments of, or the overall, stock market) depending on market and economic conditions and investor sentiment. At times when the investment style is out of favor, the Portfolio may underperform other funds that invest in similar asset classes but use different investment styles.
Large Company Risk: Large-capitalization stocks as a group could fall out of favor with the market, causing the Portfolio to underperform investments that focus on small- or medium-capitalization stocks. Larger, more established companies may be slow to respond to challenges and may grow more slowly than smaller companies. Investments in securities of certain issuers with the largest market capitalizations can result in greater investment exposure to a limited number of issuers and sectors, primarily the technology sector, which can result in greater losses in the event of a market downturn or deteriorating fundamentals in those issuers or sectors.
Leverage Risk: Borrowings, certain derivatives and other trading strategies can create leverage (i.e., a Portfolio’s investment exposures exceed its net asset value), which may amplify the Portfolio’s gains and losses and cause the Portfolio to be more volatile and riskier than if it had not been leveraged.
Liquidity and Valuation Risk: The Portfolio may hold one or more securities for which there are no or few buyers and sellers or the securities are subject to limitations on transfer. The Portfolio may be unable to sell those portfolio holdings at the desired time or price, and may have difficulty determining the value of such securities for the purpose of determining the Portfolio’s net asset value. In such cases, investments owned by the Portfolio may be valued at fair value pursuant to policies and procedures adopted and implemented by the Manager. No assurance can be given that the fair value prices accurately reflect the value of the security. The Portfolio is subject to a liquidity risk management program, which limits the ability of the Portfolio to invest in illiquid investments.
Market and Management Risk: Markets in which the Portfolio invests may experience volatility and go down in value, and possibly sharply and unpredictably in short periods of time. Investment techniques, risk analyses, and investment strategies, which may include quantitative models or methods, used by a subadviser in making investment decisions for the Portfolio are subject to human error and may not produce the intended or desired results. The value of the Portfolio’s investments may be negatively affected by the occurrence of domestic or global events, including war, terrorism, environmental disasters, natural disasters, sanctions, cybersecurity events, supply chain disruptions, political or civil instability, and public health emergencies, among others. Such events may reduce consumer demand or economic output, result in market closures, travel restrictions or quarantines, and significantly adversely impact the economy. There is no guarantee that the investment objective of the Portfolio will be achieved.
Market Capitalization Risk: Investing in issuers within the same market capitalization category carries the risk that the category may be out of favor due to current market conditions or investor sentiment. Because the Portfolio may invest a portion of its assets in securities issued by small-cap companies, it is likely to be more volatile than a portfolio that focuses on securities issued by larger companies. Small-sized companies often have less experienced management, narrower product lines, more limited financial resources, and less publicly available information than larger companies. In addition, smaller companies are typically more sensitive to changes in overall economic conditions and their securities may be difficult to trade.
Mid-Sized Company Risk: The shares of mid-sized companies tend to trade less frequently than those of larger, more established companies, which can have an adverse effect on the pricing and volatility of these securities and on the Portfolio’s ability to sell the securities.
Natural Resources Investment Risk: The Portfolio’s investments will expose the Portfolio to the risk of investment in natural resource companies. The market value of securities of natural resource companies may be affected by numerous factors, including changes in commodity prices, events occurring in nature, inflationary pressures, imposition of import controls, international political and economic developments, environmental incidents, resources conservation, the success of exploration projects, and tax and other government regulations. For example, events occurring in nature (such as earthquakes or fires in prime natural resource areas) and political events (such as coups, military confrontations or acts of terrorism) can affect the overall supply of a natural resource and the value of companies involved in such natural resource. Companies in the natural resources industry are at risk for environmental damage claims. Political risks and the other risks
B35
to which non-US securities are subject may affect domestic companies if they have significant operations or investments in non-US countries. In addition, rising interest rates and general economic conditions may affect the demand for natural resources.
Portfolio Turnover Risk: A subadviser may engage in active trading on behalf of the Portfolio—that is, frequent trading of the Portfolio’s securities—in order to take advantage of new investment opportunities or yield differentials. The Portfolio’s turnover rate may be higher than that of other mutual funds. Portfolio turnover generally involves some expense to the Portfolio, including brokerage commissions or dealer mark-ups and other transaction costs on the sale of securities and reinvestment in other securities.
Prepayment or Call Risk: Prepayment or call risk is the risk that issuers will prepay fixed-rate obligations held by the Portfolio when interest rates fall, forcing a Portfolio to reinvest in obligations with lower interest rates than the original obligations. Mortgage-related securities and asset-backed securities are particularly subject to prepayment risk.
Quantitative Model Risk: The Portfolio and certain underlying portfolios, if applicable, may use quantitative models as part of their investment process. Securities or other investments selected using quantitative methods may perform differently from the market as a whole or from their expected performance for many reasons, including factors used in building the quantitative analytical framework, the weights placed on each factor, and changing sources of market returns. There can be no assurance that these methodologies will produce the desired results or enable the Portfolio to achieve its objective. A given model may be more effective with certain instruments or strategies than others, and there can be no assurance that any model can identify and incorporate all factors that will affect an investment’s price or performance. When models prove to be incorrect or incomplete, including because data is stale, missing or unavailable, any decisions made in reliance thereon expose the Portfolio to potential risks. Models rely on correct data inputs. If incorrect data is entered into even a well-founded model, the resulting information will be incorrect.
Real Estate Risk: Investments in real estate investment trusts (“REITs”) and real estate-linked derivative instruments are subject to risks similar to those associated with direct ownership of real estate. Poor performance by the manager of the REIT and adverse changes to or inability to qualify for favorable tax laws will adversely affect the Portfolio. In addition, some REITs have limited diversification because they invest in a limited number of properties, a narrow geographic area, or a single type of property. Higher interest rates have a negative impact on real estate markets by increasing financing costs associated with purchasing new real estate or refinancing debt obligations. Additionally, occupancy rates for commercial real estate can reduce the value of existing real estate investments and rental income.
Regulatory Risk: The Portfolio is subject to a variety of laws and regulations which govern its operations. The Portfolio is subject to regulation by the (the SEC), and depending on the Portfolio, the Commodity Futures Trading Commission (the CFTC). Similarly, the businesses and other issuers of the securities and other instruments in which the Portfolio invests are also subject to considerable regulation. Changes in laws and regulations may materially impact the Portfolio, a security, business, sector, or market.
Reverse Repurchase Agreement Risk: Reverse repurchase agreements involve the sale of securities with an agreement to repurchase the securities at an agreed-upon price, date and interest payment and have the characteristics of borrowing. The use of reverse repurchase agreements may exaggerate any increase or decrease in the value of a Portfolio’s assets. The use of reverse repurchase agreements is a form of leverage because the proceeds derived from reverse repurchase agreements may be invested in additional securities.
Short Sale Risk: A short sale involves the risk that the price of a borrowed security or derivative will increase during the time the Portfolio has borrowed the security or derivative and the Portfolio will incur a loss equal to the increase in price from the time that the short sale was entered into plus any premiums and interest paid to the third party. Short sales may result in losses that are greater than the cost of the investment. In addition, the third party to the short sale may fail to honor its contract terms, causing a loss to the Portfolio.
Small Sized Company Risk: Securities of small sized companies tend to be less liquid than those of larger, more established companies, which can have an adverse effect on the price of these securities and on the Portfolio’s ability to sell these securities. The market price of such investments also may rise more in response to buying demand and fall more in response to selling pressure and be more volatile than investments in larger companies.
US Government Securities Risk: US Government securities may be adversely affected by changes in interest rates, a default by, or a downgrade in the credit quality rating of, the US Government, and may not be backed by the full faith and credit of the US Government.
B36
Yield Risk: The amount of income received by a Portfolio will go up or down depending on day-to-day variations in short-term interest rates, and when interest rates are very low, the Portfolio’s expenses could absorb all or a significant portion of the Portfolio’s income. If interest rates increase, the Portfolio’s yield may not increase proportionately. For example, the Portfolio’s investment manager may discontinue any temporary voluntary fee limitation.
10. Reorganization
On September 19-20, 2022, the Board approved Agreements and Plans of Reorganization (the “Plans”) which provided for the transfer of all the assets ofAST Prudential Flexible Multi-Strategy Portfolio (“Prudential Flexible Multi-Strategy”), andAST T. Rowe Price Diversified Real Growth Portfolio (“T. Rowe Price Diversified Real Growth”) (the “Merged Portfolios”) for shares of PSF PGIM Flexible Managed Portfolio (the “Acquiring Portfolio”) and the assumption of the liabilities of the Merged Portfolios, respectively. Shareholders approved the Plan at a meeting on January 24, 2023 and the reorganization took place at the close of business on February 24, 2023.
On the reorganization date, the Merged Portfolios had the following total investment cost and value, representing the principal assets acquired by the Acquiring Portfolio:
| | | | | | | | | | | | | | | |
| Merged Portfolios | | Total Investment
Value | | | | Total Investment
Cost |
| | | |
Prudential Flexible Multi-Strategy | | | | $95,229,428 | | | | | | | | | $ | 101,172,903 | |
| | | |
T. Rowe Price Diversified Real Growth | | | | 118,897,074 | | | | | | | | | | 121,398,225 | |
The purpose of the transaction was to combine three portfolios with substantially similar investment objectives, policies and strategies.
The acquisition was accomplished by a tax-free exchange of the following shares on February 24, 2023:
| | | | | | | | | | | | |
| Merged Portfolios | | | | | | | | Shares | |
| | | |
Prudential Flexible Multi-Strategy | | | | | | | | | | | 6,656,780 | |
| | | |
T. Rowe Price Diversified Real Growth | | | | | | | | | | | 7,305,602 | |
| Acquiring Portfolio | | Class | | | Shares | | | Value | |
| | | |
PSF PGIM Flexible Managed Portfolio | | | III | | | | 5,821,122 | | | $ | 223,240,047 | |
For financial reporting purposes, assets received and shares issued by the Acquiring Portfolio were recorded at fair value; however, the cost basis of the investments received from the Merged Portfolios was carried forward to reflect the tax-free status of the acquisition.
The net assets and net unrealized depreciation immediately before the acquisition were as follows:
| | | | | | | | |
| Merged Portfolios | | Unrealized Depreciation on Investments | | | Net Assets | |
Prudential Flexible Multi-Strategy | | | $(5,943,475) | | | | $ 99,727,888 | |
T. Rowe Price Diversified Real Growth | | | (2,501,151) | | | | 123,512,159 | |
| Acquiring Portfolio | | Class | | | Net Assets | |
PSF PGIM Flexible Managed Portfolio | | | I | | | | $4,048,284,445 | |
| | | | III | | | | 3,838,041 | |
Assuming the acquisition had been completed on January 1, 2023, the Acquiring Portfolio’s unaudited pro forma results of operations for the year ended December 31, 2023 would have been as follows:
| | | | | | |
| Acquiring Portfolio | | Net
investment
income (a) | | Net realized and
unrealized gain
on investments (b) | | Net increase in
net assets resulting
from operations |
PSF PGIM Flexible Managed Portfolio | | $96,121,518 | | $632,480,338 | | $728,601,856 |
| (a) | Net investment income as reported in the Statement of Operations (Year ended December 31, 2023) of the Acquiring Portfolio, plus net investment income from the Merged Portfolios pre-merger as follows: Prudential Flexible Multi-Strategy $22,273 and T. Rowe Price Diversified Real Growth $114,621. |
B37
| (b) | Net realized and unrealized gain on investments as reported in the Statement of Operations (Year ended December 31, 2023) of the Acquiring Portfolio, plus net realized and unrealized gain on investments from the Merged Portfolios pre-merger as follows: Prudential Flexible Multi-Strategy $2,016,346 and T. Rowe Price Diversified Real Growth $3,905,254. |
Since both the Merged Portfolios and the Acquiring Portfolio sold and redeemed shares throughout the period, it is not practicable to provide pro-forma information on a per-share basis.
Since the combined investment portfolios had been managed as a single integrated portfolio since the acquisition was completed, it is also not practicable to separate the amounts of revenue and earnings of the Merged Portfolios that have been included in the Acquiring Portfolio’s Statement of Operations since February 24, 2023.
On March 14-15, 2023, the Board approved an Agreement and Plan of Reorganization (the “Plan”) which provided for the transfer of all the assets of PSF Small-Cap Value Portfolio (the “Merged Portfolio”) for shares of PSF Small-Cap Stock Index Portfolio (the “Acquiring Portfolio”) and the assumption of the liabilities of the Merged Portfolio, respectively. The reorganization took place at the close of business on June 9, 2023.
On the reorganization date, the Merged Portfolio had the following total investment cost and value, representing the principal assets acquired by the Acquiring Portfolio:
| | | | | | | | |
| Merged Portfolio | | Total Investment
Value | | | Total Investment
Cost | |
PSF Small-Cap Value Portfolio | | | $286,063,672 | | | | $267,361,367 | |
The purpose of the transaction was to combine two portfolios with substantially similar investment objectives, policies and strategies.
The acquisition was accomplished by a tax-free exchange of the following shares on June 9, 2023:
| | | | | | | | | | | | |
| Merged Portfolio | | | | | | | | Shares | |
PSF Small-Cap Value Portfolio | | | | | | | | | | | 9,253,605 | |
| Acquiring Portfolio | | Class | | | Shares | | | Value | |
PSF Small-Cap Stock Index Portfolio | | | I | | | | 5,405,749 | | | | $284,937,009 | |
For financial reporting purposes, assets received and shares issued by the Acquiring Portfolio were recorded at fair value; however, the cost basis of the investments received from the Merged Portfolio was carried forward to reflect the tax-free status of the acquisition.
The net assets and net unrealized appreciation immediately before the acquisition were as follows:
| | | | | | | | |
| Merged Portfolio | | Unrealized Appreciation on Investments | | | Net Assets | |
PSF Small-Cap Value Portfolio | | | $18,702,305 | | | | $284,937,009 | |
| Acquiring Portfolio | | Class | | | Net Assets | |
PSF Small-Cap Stock Index Portfolio | | | I | | | | $822,088,416 | |
| | | | III | | | | 9,831,092 | |
Assuming the acquisition had been completed on January 1, 2023, the Acquiring Portfolio’s unaudited pro forma results of operations for the year ended December 31, 2023 would have been as follows:
| | | | | | |
| Acquiring Portfolio | | Net
investment
income (a) | | Net realized and
unrealized gain
on investments (b) | | Net increase in
net assets resulting
from operations |
PSF Small-Cap Stock Index Portfolio | | $15,109,493 | | $141,425,452 | | $156,534,945 |
| (a) | Net investment income as reported in the Statement of Operations (Year ended December 31, 2023) of the Acquiring Portfolio, plus net investment income from the Merged Portfolio pre-merger as follows: PSF Small-Cap Value Portfolio $1,037,935. |
| (b) | Net realized and unrealized gain on investments as reported in the Statement of Operations (Year ended December 31, 2023) of the Acquiring Portfolio, plus net realized and unrealized gain on investments from the Merged Portfolio pre-merger as follows: PSF Small-Cap Value Portfolio $277,680. |
B38
Since both the Merged Portfolio and the Acquiring Portfolio sold and redeemed shares throughout the period, it is not practicable to provide pro-forma information on a per-share basis.
Since the combined investment portfolios had been managed as a single integrated portfolio since the acquisition was completed, it is also not practicable to separate the amounts of revenue and earnings of the Merged Portfolio that have been included in the Acquiring Portfolio’s Statement of Operations since June 9, 2023.
On September 19-20, 2023, the Board approved an Agreement and Plan of Reorganization (the “Plan”) which provided for the transfer of all the assets of PSF PGIM Jennison Focused Blend Portfolio (the “Merged Portfolio”) for shares of PSF PGIM Jennison Blend Portfolio (the “Acquiring Portfolio”) and the assumption of the liabilities of the Merged Portfolio, respectively. The reorganization took place at the close of business on December 8, 2023.
On the reorganization date, the Merged Portfolio had the following total investment cost and value, representing the principal assets acquired by the Acquiring Portfolio:
| | | | |
| Merged Portfolio | | Total Investment
Value | | Total Investment
Cost |
PSF PGIM Jennison Focused Blend Portfolio | | $122,956,664 | | $94,600,348 |
The purpose of the transaction was to combine two portfolios with substantially similar investment objectives, policies and strategies.
The acquisition was accomplished by a tax-free exchange of the following shares on December 8, 2023:
| | | | | | | | | | | | |
| Merged Portfolio | | | | | Class | | | Shares | |
PSF PGIM Jennison Focused Blend Portfolio | | | | | | | I | | | | 1,570,026 | |
| | | | | | | | II | | | | 719,464 | |
| | | | | | | | III | | | | 16,898 | |
| Acquiring Portfolio | | Class | | | Shares | | | Value | |
PSF PGIM Jennison Blend Portfolio | | | I | | | | 919,306 | | | | $86,157,355 | |
| | | | II | | | | 407,354 | | | | 36,934,825 | |
| | | | III | | | | 9,894 | | | | 921,230 | |
For financial reporting purposes, assets received and shares issued by the Acquiring Portfolio were recorded at fair value; however, the cost basis of the investments received from the Merged Portfolio was carried forward to reflect the tax-free status of the acquisition.
The net assets and net unrealized appreciation immediately before the acquisition were as follows:
| | | | | | | | | | | | |
| Merged Portfolio | | Class | | | Unrealized
Appreciation
on Investments | | | Net Assets | |
PSF PGIM Jennison Focused Blend Portfolio | | | I | | | | $19,700,338 | | | | $86,157,355 | |
| | | | II | | | | 8,445,334 | | | | 36,934,825 | |
| | | | III | | | | 210,644 | | | | 921,230 | |
| Acquiring Portfolio | | | | | Class | | | Net Assets | |
PSF PGIM Jennison Blend Portfolio | | | | | | | I | | | | $5,368,410,594 | |
| | | | | | | | II | | | | 1,738,401 | |
| | | | | | | | III | | | | 1,822,305 | |
Assuming the acquisition had been completed on January 1, 2023, the Acquiring Portfolio’s unaudited pro forma results of operations for the year ended December 31, 2023 would have been as follows:
| | | | | | |
| Acquiring Portfolio | | Net
investment
income (a) | | Net realized and
unrealized gain
on investments (b) | | Net increase in
net assets resulting
from operations |
PSF PGIM Jennison Blend Portfolio | | $45,865,562 | | $1,404,376,087 | | $1,450,241,649 |
| (a) | Net investment income as reported in the Statement of Operations (Year ended December 31, 2023) of the Acquiring Portfolio, plus net investment income from the Merged Portfolio pre-merger as follows: PSF PGIM Jennison Focused Blend Portfolio $569,965. |
B39
| (b) | Net realized and unrealized gain on investments as reported in the Statement of Operations (Year ended December 31, 2023) of the Acquiring Portfolio, plus net realized and unrealized gain on investments from the Merged Portfolios pre-merger as follows: PSF PGIM Jennison Focused Blend Portfolio $36,444,083. |
Since both the Merged Portfolio and the Acquiring Portfolio sold and redeemed shares throughout the period, it is not practicable to provide pro-forma information on a per-share basis.
Since the combined investment portfolios had been managed as a single integrated portfolio since the acquisition was completed, it is also not practicable to separate the amounts of revenue and earnings of the Merged Portfolio that have been included in the Acquiring Portfolio’s Statement of Operations since December 8, 2023.
11. Subsequent Events
On November 20, 2024, the Board approved the reorganization (the “Reorganization”) of PSF Mid-Cap Growth Portfolio (the “Target Portfolio”) into PSF PGIM Jennison Growth Portfolio (the “Acquiring Portfolio”). The shareholder meeting is expected to take place on or about March 25, 2025. If approved by shareholders of the Target Portfolio, it is expected that the Reorganization will be completed on or about April 14, 2025.
On November 20, 2024, the Board approved the reorganization (the “Reorganization”) of PSF Natural Resources Portfolio (the “Target Portfolio”) into PSF PGIM Jennison Blend Portfolio (the “Acquiring Portfolio”). The shareholder meeting is expected to take place on or about March 25, 2025. If approved by shareholders of the Target Portfolio, it is expected that the Reorganization will be completed on or about April 14, 2025.
On November 20, 2024, the Board approved the reorganization (the “Reorganization”) of PSF Government Income Portfolio (the “Target Portfolio”) into PSF PGIM Total Return Bond Portfolio (the “Acquiring Portfolio”). The shareholder meeting is expected to take place on or about March 25, 2025. If approved by the shareholders of the Target Portfolio, it is expected that the Reorganization will be completed on or about April 28, 2025.
B40
REPORT OF INDEPENDENT REGISTERED PUBLIC ACCOUNTING FIRM
To the Board of Trustees of Prudential Series Fund and Shareholders of PSF Global Portfolio, PSF Mid-Cap Growth Portfolio, PSF Natural Resources Portfolio, PSF PGIM 50/50 Balanced Portfolio, PSF PGIM Flexible Managed Portfolio, PSF PGIM Government Income Portfolio, PSF PGIM Government Money Market Portfolio, PSF PGIM High Yield Bond Portfolio, PSF PGIM Jennison Blend Portfolio, PSF PGIM Jennison Growth Portfolio, PSF PGIM Jennison Value Portfolio, PSF PGIM Total Return Bond Portfolio, PSF Small-Cap Stock Index Portfolio and PSF Stock Index Portfolio
Opinions on the Financial Statements
We have audited the accompanying statements of assets and liabilities, including the schedules of investments, of PSF Global Portfolio, PSF Mid-Cap Growth Portfolio, PSF Natural Resources Portfolio, PSF PGIM 50/50 Balanced Portfolio, PSF PGIM Flexible Managed Portfolio, PSF PGIM Government Income Portfolio, PSF PGIM Government Money Market Portfolio, PSF PGIM High Yield Bond Portfolio, PSF PGIM Jennison Blend Portfolio, PSF PGIM Jennison Growth Portfolio, PSF PGIM Jennison Value Portfolio, PSF PGIM Total Return Bond Portfolio, PSF Small-Cap Stock Index Portfolio and PSF Stock Index Portfolio (constituting Prudential Series Fund, hereafter collectively referred to as the “Portfolios”) as of December 31, 2024, the related statements of operations for the year ended December 31, 2024, the statements of changes in net assets for each of the two years in the period ended December 31, 2024, including the related notes, and the financial highlights for each of the periods indicated therein (collectively referred to as the “financial statements”). In our opinion, the financial statements present fairly, in all material respects, the financial position of each of the Portfolios as of December 31, 2024, the results of each of their operations for the year then ended, the changes in each of their net assets for each of the two years in the period ended December 31, 2024 and each of the financial highlights for each of the periods indicated therein in conformity with accounting principles generally accepted in the United States of America.
Basis for Opinions
These financial statements are the responsibility of the Portfolios’ management. Our responsibility is to express an opinion on the Portfolios’ financial statements based on our audits. We are a public accounting firm registered with the Public Company Accounting Oversight Board (United States) (PCAOB) and are required to be independent with respect to the Portfolios in accordance with the U.S. federal securities laws and the applicable rules and regulations of the Securities and Exchange Commission and the PCAOB.
We conducted our audits of these financial statements in accordance with the standards of the PCAOB. Those standards require that we plan and perform the audit to obtain reasonable assurance about whether the financial statements are free of material misstatement, whether due to error or fraud.
Our audits included performing procedures to assess the risks of material misstatement of the financial statements, whether due to error or fraud, and performing procedures that respond to those risks. Such procedures included examining, on a test basis, evidence regarding the amounts and disclosures in the financial statements. Our audits also included evaluating the accounting principles used and significant estimates made by management, as well as evaluating the overall presentation of the financial statements. Our procedures included confirmation of securities owned as of December 31, 2024 by correspondence with the custodian, transfer agent, agent banks and brokers; when replies were not received from agent banks or brokers, we performed other auditing procedures. We believe that our audits provide a reasonable basis for our opinions.
/s/ PricewaterhouseCoopers LLP
New York, New York
February 18, 2025
We have served as the auditor of one or more investment companies in the Prudential Insurance Portfolios complex since 2020.
C1
Other Information
Form N-CSR Item 8 - Changes in and Disagreements with Accountants for Open-End Management Investment Companies - None.
Form N-CSR Item 9 - Proxy Disclosures for Open-End Management Investment Companies - None.
Form N-CSR Item 10 - Remuneration Paid to Directors, Officers, and Others of Open-End Management Investment Companies - Included within the Statement of Operations of the financial statements filed under Item 7 of this Form.
Form N-CSR Item 11 - Statement Regarding Basis for Approval of Investment Advisory Contract. - None.
Item 12 – Disclosure of Proxy Voting Policies and Procedures for Closed-End Management Investment Companies – Not
applicable.
Item 13 – Portfolio Managers of Closed-End Management Investment Companies – Not applicable.
| Item 14 | – Purchases of Equity Securities by Closed-End Management Investment Company and Affiliated Purchasers – Not applicable. |
| Item 15 | – Submission of Matters to a Vote of Security Holders – There have been no material changes to the procedures by which shareholders may recommend nominees to the registrant’s board of directors. |
Item 16 – Controls and Procedures
| | (a) | It is the conclusion of the registrant’s principal executive officer and principal financial officer that the effectiveness of the registrant’s current disclosure controls and procedures (such disclosure controls and procedures having been evaluated within 90 days of the date of this filing) provide reasonable assurance that the information required to be disclosed by the registrant has been recorded, processed, summarized and reported within the time period specified in the Commission’s rules and forms and that the information required to be disclosed by the registrant has been accumulated and communicated to the registrant’s principal executive officer and principal financial officer in order to allow timely decisions regarding required disclosure. |
| | (b) | There has been no significant change in the registrant’s internal control over financial reporting (as defined in Rule 30a-3(d) under the Act (17 CFR 270.30a-3(d))) that occurred during the period covered by this report that has materially affected, or is reasonably likely to materially affect, the registrant’s internal control over financial reporting. |
| Item 17 | – Disclosure of Securities Lending Activities for Closed-End Management Investment Companies – Not applicable. |
Item 18 – Recovery of Erroneously Awarded Compensation – Not applicable.
Item 19 – Exhibits
(a)(1) Code of Ethics – Attached hereto as Exhibit EX-99.CODE-ETH.
(a)(2) Policy required by the listing standards adopted pursuant to Rule 10D-1 under the Securities Exchange Act of 1934 – Not applicable.
(a)(3) Certifications pursuant to Section 302 of the Sarbanes-Oxley Act of 2002 – Attached hereto as Exhibit EX-99.CERT.
(a)(4) Any written solicitation to purchase securities under Rule 23c-1 under the Investment Company Act of 1940 – Not applicable.
(a)(5) Change in the registrant’s independent public accountant – Not applicable.
(b) Certifications pursuant to Section 906 of the Sarbanes-Oxley Act of 2002 – Attached hereto as Exhibit EX-99.906CERT.
SIGNATURES
Pursuant to the requirements of the Securities Exchange Act of 1934 and the Investment Company Act of 1940, the registrant has duly caused this report to be signed on its behalf by the undersigned, thereunto duly authorized.
Registrant: The Prudential Series Fund
| | |
| By: | | /s/ Andrew R. French |
| | Andrew R. French |
| | Secretary |
| |
| Date: | | February 18, 2025 |
Pursuant to the requirements of the Securities Exchange Act of 1934 and the Investment Company Act of 1940, this report has been signed below by the following persons on behalf of the registrant and in the capacities and on the dates indicated.
| | |
| By: | | /s/ Timothy S. Cronin |
| | Timothy S. Cronin |
| | President and Principal Executive Officer |
| |
| Date: | | February 18, 2025 |
| |
| By: | | /s/ Christian J. Kelly |
| | Christian J. Kelly |
| | Chief Financial Officer |
| | (Principal Financial Officer) |
| |
| Date: | | February 18, 2025 |