UNITED STATES
SECURITIES AND EXCHANGE COMMISSION
Washington, D.C. 20549
FORM N-CSR
CERTIFIED SHAREHOLDER REPORT OF REGISTERED
MANAGEMENT INVESTMENT COMPANIES
Investment Company Act file number 811-03627
Greenspring Fund, Incorporated
(Exact name of registrant as specified in charter)
2330 West Joppa Road, Suite 110
Lutherville, MD 21093-4641
(Address of principal executive offices) (Zip code)
Mr. Charles vK. Carlson, President
2330 West Joppa Road, Suite 110
Lutherville, MD 21093-4641
(Name and address of agent for service)
(410) 823-5353
Registrant's telephone number, including area code
Date of fiscal year end: December 31, 2013
Date of reporting period: June 30, 2013
Item 1. Reports to Stockholders.
SEMI-ANNUAL REPORT
JUNE 30, 2013
This report is intended for shareholders of the
Greenspring Fund, Incorporated and may not be
used as sales literature unless preceded or
accompanied by a current prospectus.
Greenspring Fund, Incorporated
Dear Fellow Shareholders:
We are pleased to report that the Greenspring Fund generated a positive return during the second quarter of 2013, gaining 1.66%. When combined with the gain achieved in the first quarter, performance for the first six months of the year totaled 8.31%. Similar to the first quarter, both the equity and fixed income holdings in the Fund contributed to the overall gain, with the equity securities having the greatest influence on the Fund’s total return.
During the second quarter of 2013, volatility returned to the equity and fixed income markets. Using the S&P 500 Index as a barometer of the equity markets, there were seventeen days during the second quarter when the S&P either gained or lost more than one percent in value, compared to just seven such days during the first quarter. Despite this volatility, the equity markets overall posted positive returns for the quarter, with gains generally in the low single digit range. Fixed income securities also experienced volatility as interest rates increased, causing many bond prices to decline. The interest rate on a 10-year U.S. Treasury bond increased from 1.85% at the beginning of April to 2.48% by the end of June, with much of the rise occurring during the last several weeks of the quarter. This rather sharp percentage increase led to painful losses for some fixed income investors, with longer dated securities suffering the greatest losses.
During the early weeks of the quarter, equity prices moved steadily higher as the Federal Reserve (“Fed”) continued to supply liquidity to the markets through its aggressive program of open market purchases of government bonds and mortgage-backed securities. Adding to this positive backdrop, numerous economic reports indicated the continuation of moderate economic growth in the United States. The languid conditions in the financial markets changed suddenly once Federal Reserve Chairman Ben Bernanke indicated that the Fed might reduce or “taper” its open market bond purchases if economic conditions continue to strengthen. Interest rates shot higher, volatility in equity markets ramped up, and “risk-off” was the rallying cry on trading desks. Investors
| | Greenspring Fund | |
| | Performance for the | |
| | Periods Ended June 30, 2013 | |
| | Quarter | 1.66% | |
| | Year to Date | 8.31% | |
| | 1 Year | 15.69% | |
| | 3 Years* | 9.00% | |
| | 5 Years* | 5.93% | |
| | 10 Years* | 7.76% | |
| | 15 Years* | 6.31% | |
| | 20 Years* | 8.19% | |
| | Since inception on 7/1/83* | 9.90% | |
| | Expense Ratio** | 0.94% | |
| | | | |
| | * | annualized. | | |
| | ** | as stated in Prospectus dated 5-1-13. See note on last page of letter. | | |
| | | | | |
| | Performance data quoted represents past performance; past performance does not guarantee future results. The investment return and principal value of an investment will fluctuate so that an investor’s shares, when redeemed, may be worth more or less than their original cost. Current performance of the Fund may be lower or higher than the performance quoted. Performance data current to the most recent month end may be obtained by calling 1-800-366-3863 or visiting the Fund’s web site. The Fund imposes a 2.00% redemption fee for shares held 60 days or less. Performance data does not reflect the redemption fee. If reflected, total returns would be reduced. | |
began to adopt a “good news (on the economic front) is bad news (for bond markets)” mentality, with growing expectations that positive economic news would cause the Fed to reduce its much-loved liquidity support.
For most fixed income investors, the second quarter proved to be very challenging. Although many fixed income investors have been predicting that interest rates would rise significantly at some point in the future, most were caught
Greenspring Fund, Incorporated
off guard by the sudden spike in rates. As interest rates drifted lower during the last several years, many investors attempted to lock in higher rates by investing in longer-dated fixed income securities. Unfortunately, as interest rates moved higher during the quarter, many of these same investors were unprepared for the downside price volatility caused by rising interest rates.
INFLUENCES on FUND PERFORMANCE
The gains in the Greenspring Fund portfolio were widespread with just over 60% of the Fund’s holdings producing positive returns during the quarter. The greatest single influence on the portfolio was the positive return produced by the Fund’s holdings in stocks of companies involved in the Communications Equipment industry. The Fund has two holdings in this industry, Cisco Systems, Inc. (which will be discussed later in this letter) and Harmonic, Inc. Harmonic, under pressure from an activist shareholder, saw its share price increase after the Company aggressively increased its share repurchase program by purchasing over 10% of its outstanding shares and it also replaced its Chairman of the Board.
The individual securities that had the greatest impact on the Fund’s performance during the second quarter were the common stock investments in FTI Consulting, Inc., Cisco Systems, Inc., MasTec, Inc., j2 Global, Inc. and Rosetta Resources, Inc. Cisco Systems, MasTec and j2 Global generated positive returns, while FTI Consulting and Rosetta Resources declined in value.
FTI Consulting, Inc.
The Fund has owned shares in FTI Consulting, Inc. (“FTI”) in varying amounts for a number of years. FTI provides high-level business consulting services to large corporations, financial institutions and law firms throughout the world. FTI’s consulting services include corporate finance/restructuring, economic consulting, forensic and litigation consulting, document review software and services, and strategic communications. With its broadly diversified mix of consulting services, FTI appears positioned to profit in a variety of economic climates. Its bankruptcy/restructuring operations have performed well during difficult economic times, while its pro-cyclical operations have thrived during more robust economic times. FTI’s stock price moved lower early in the quarter reflecting uncertainty about the upcoming first quarter earnings report. In early May, FTI reported first quarter earnings that were in line with Wall Street expectations and the stock price moved higher, although it declined again late in the quarter, and finished almost 13% lower for the quarter. This volatility was likely caused by investor concern over FTI’s ability to produce consistent earnings growth in the current tepid economic environment. Fortunately, FTI has historically generated a significant amount of cash flow from operations and, since it requires little capital investment to sustain its business, the majority of its cash is available to reinvest in the business or be returned to shareholders through stock repurchase programs. As a result, despite the current challenges, we expect FTI to continue to grow its business through small acquisitions and to repurchase shares if available at attractive prices, creating value for long-term shareholders.
Cisco Systems, Inc.
Cisco Systems, Inc. (“Cisco”), the global bellwether provider of communications equipment and services, generated an 18% total return during the second quarter of 2013, as investors cheered a solid fiscal third-quarter
| | | % of Net | |
| | Greenspring Fund | Assets | |
| | Top 10 Holdings | as of | |
| | | 6/30/13 | |
| | Republic Services, Inc. | 3.6% | |
| | FTI Consulting, Inc. | 3.4% | |
| | j2 Global, Inc. | 3.3% | |
| | Harmonic, Inc. | 3.1% | |
| | Rosetta Resources, Inc., 9.500%, 4/15/18 | 2.9% | |
| | PartnerRe, Ltd. | 2.7% | |
| | Michael Baker Corp. | 2.5% | |
| | MasTec, Inc. | 2.5% | |
| | Leucadia National Corp., 7.000%, 8/15/13 | 2.5% | |
| | BioScrip, Inc., 10.250%, 10/1/15 | 2.5% | |
Greenspring Fund, Incorporated
MasTec, Inc.
MasTec, Inc. (“MasTec”) builds, installs and maintains infrastructure projects for the energy, communications and utility industries. The Company works on very diverse types of projects, including oil and natural gas pipelines, wind farms, electrical transmission and distribution lines, wireline and wireless communication systems, and home satellite TV installation. MasTec reported strong first-quarter earnings during the quarter reflecting very solid underlying trends in several of its business units, particularly the pipeline unit. The continued heavy investment in developing oil and gas reserves in North America requires significant new pipeline construction and we believe MasTec is well positioned to capture this work. Additionally, the constant evolution of wireless communication infrastructure is providing numerous growth opportunities for MasTec. The Company is also well positioned to benefit from expenditures on significant new electric transmission projects designed to bring additional renewable energy sources online and improve overall system reliability and safety. During the quarter, MasTec provided a total return of just over 13%. With numerous opportunities available to MasTec, we expect continued solid financial performance.
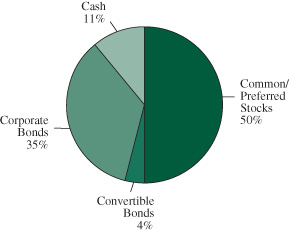
| Greenspring Fund |
| Portfolio Allocation |
| as of June 30, 2013 |
| |
 |
| |
PORTFOLIO ACTIVITY
Allocation among the Fund’s three main asset classes (common stocks, fixed income securities and cash equivalents) did not change significantly from the end of 2012 or the end of the first quarter of 2013. The Fund’s exposure to common stocks decreased slightly from the end of the first quarter reflecting our decision to reduce certain holdings as prices neared our fair valuation targets. We reduced the position size of several equity holdings including Assurant, Inc., Lumos Networks Corp., MasTec, Inc. and Michael Baker Corp. Holdings in BioScrip, Inc., Body Central Corp. and Newpark Resources, Inc. were completely eliminated. Additions to the Fund’s equity holdings include new positions established in Body Central Corp. and Flow International Corp. We also increased our holdings in several existing equity positions by purchasing additional shares of Denbury Resources, Inc., GSI Group, Inc., MYR Group, Inc. and Suncor Energy, Inc.
As we have discussed in prior letters, activity in the fixed income portfolio is often influenced by the maturity or redemption of holdings and this quarter was no exception.
Greenspring Fund, Incorporated
During the quarter, a number of fixed income positions were redeemed, tendered or put. In addition, we established several new fixed income positions and increased the Fund’s holdings in various existing securities. The three largest fixed income purchases include securities of Live Nation Entertainment, Inc., iGATE Corp. and HD Supply Holdings, Inc. Please refer to the Schedule of Investments in the financial statements for a complete list of fixed income holdings and the percentage of the portfolio each investment represents.
INVESTMENT STRATEGY
Looking forward, our fixed income strategy will continue to emphasize short duration bonds of companies that we believe are well positioned to retire the particular security that the Fund holds. In recent months, greater stated yields were available in longer duration bonds, but at far greater risk of potential volatility. Our focus on short duration bonds helped to shield the Fund from the recent volatility in the bond market. Short duration bonds not only reduce potential price volatility, they also potentially allow investors to take advantage of higher interest rates in the future. Since a significant portion of the Fund’s short duration fixed income holdings mature (or are redeemed/tendered/put) on a rolling basis, funds are frequently available to re-invest in securities at prevailing interest rates. We aggressively took advantage of the recent increase in interest rates by investing cash reserves in higher yielding securities and are well positioned to invest future cash flows at more opportune rates as available.
Given the low growth economic environment, our equity strategy remains focused on searching for a select group of securities that we believe are undervalued and that either contain a catalyst, or exhibit strong business fundamentals that should help shareholders realize the full value of the business.
We remain steadfast in our desire and efforts to provide consistent investment performance and look forward to reporting our progress to you at the end of the third quarter.
Respectfully,
 |  |
| Charles vK. Carlson | Michael J. Fusting |
| Portfolio Manager and Co-Chief Investment Officer | Co-Chief Investment Officer |
**Total Annual Fund Operating Expenses for the Fund will not correlate to the Ratio of Expenses to Average Net Assets shown in the Fund’s most recent Annual Report and in the Financial Highlights section of the Prospectus, which reflects the operating expenses of the Fund and does not include acquired fund fees and expenses.
Mutual fund investing involves risk. Principal loss is possible. Small-capitalization companies tend to have limited liquidity and greater price volatility than large-capitalization companies. Investments by the Fund in lower-rated and non-rated securities present a greater risk of loss to principal and interest than higher-rated securities. Investments in debt securities typically decrease in value when interest rates rise. This risk is usually greater for longer-term debt securities.
Opinions expressed are subject to change, are not guaranteed and should not be considered recommendations to buy or sell any security. Fund holdings and/or sector allocations are subject to change at any time and are not recommendations to buy or sell any security. Current and future portfolio holdings are subject to risk.
The S&P 500 Index is a broad based unmanaged index of 500 stocks, which is widely recognized as representative of the equity market in general. You cannot invest directly in an index. Cash flow measures the cash generating capability of a company by adding non-cash charges (e.g. depreciation) and interest expense to pretax income. Duration is a commonly used measure of the potential volatility of the price of a debt security, or the aggregate market value of a portfolio of debt securities, prior to maturity. Securities with a longer duration generally have more volatile prices than securities of comparable quality with a shorter duration.
Distributed by Quasar Distributors, LLC
Greenspring Fund, Incorporated
EXPENSE EXAMPLE For the Six Months Ended June 30, 2013 (Unaudited) |
As a shareholder of the Fund, you incur two types of costs: (1) redemption fees if you redeem within 60 days of purchase; and (2) ongoing costs, including management fees and other Fund expenses. This example is intended to help you understand your ongoing costs (in dollars) of investing in the Fund and to compare these costs with the ongoing costs of investing in other mutual funds. The example is based on an investment of $1,000 invested at the beginning of the period and held for the entire period (1/1/2013 – 6/30/2013).
Actual Expenses
The first line of the table below provides information about actual account values based on actual returns and actual expenses. You may use the information in this line, together with the amount you invested, to estimate the expenses that you paid over the period. Simply divide your account value by $1,000 (for example, an $8,600 account value divided by $1,000 = 8.6), then multiply the result by the number in the first line under the heading entitled “Expenses Paid During the Period” to estimate the expenses you paid on your account during this period.
Hypothetical Example for Comparison Purposes
The second line of the table below provides information about hypothetical account values and hypothetical expenses based on the Fund’s actual expense ratio and an assumed rate of return of 5% per year before expenses, which is not the Fund’s actual return. The hypothetical account values and expenses may not be used to estimate the actual ending account balance or expenses you paid for the period. You may use this information to compare the ongoing costs of investing in the Fund and other funds. To do so, compare this 5% hypothetical example with the 5% hypothetical examples that appear in the shareholder reports of the other funds. Please note that the expenses shown in the table are meant to highlight your ongoing costs only and do not reflect any transactional costs, such as redemption fees. Therefore, the second line of the table is useful in comparing ongoing costs only, and will not help you determine the relative total costs of owning different funds. In addition, if these transactional costs were included, your costs would have been higher.
| | | | | Expenses Paid |
| | | Beginning | Ending | During the Period |
| | | Account Value | Account Value | 1/1/2013 – |
| | | 1/1/2013 | 6/30/2013 | 6/30/2013* |
| Actual | | $1,000.00 | $1,083.10 | $4.86 |
| Hypothetical | | | | |
| (5% annual return before expenses) | | $1,000.00 | $1,020.13 | $4.71 |
| * | Expenses are equal to the Fund’s annualized expense ratio of 0.94%, multiplied by the average account value over the period multiplied by 181/365 (to reflect the one-half year period). |
Greenspring Fund, Incorporated
SCHEDULE OF INVESTMENTS at June 30, 2013 (Unaudited) |
| Shares | | | | Value | |
| COMMON STOCKS: 49.3% | | | |
| | | | |
| Business Software & Services: 2.1% | | | |
| | 514,224 | | CA, Inc. | | $ | 14,722,233 | |
| | | | | |
| Commercial Banks & Thrifts: 2.4% | | | | |
| | 44,774 | | American National Bankshares, Inc. | | | 1,040,548 | |
| | 109,287 | | BCSB Bancorp, Inc.* | | | 2,558,409 | |
| | 65,389 | | Chicopee Bancorp, Inc. | | | 1,105,074 | |
| | 10,271 | | Clifton Savings Bancorp, Inc. | | | 121,711 | |
| | 279,112 | | ESSA Bancorp, Inc. | | | 3,059,067 | |
| | 47,542 | | First Connecticut Bancorp, Inc. | | | 661,785 | |
| | 53,165 | | Heritage Financial Group, Inc. | | | 784,184 | |
| | 31,654 | | Middleburg Financial Corp. | | | 604,591 | |
| | 52,900 | | OceanFirst Financial Corp. | | | 822,595 | |
| | 85,144 | | Shore Bancshares, Inc. | | | 626,660 | |
| | 589,083 | | Southern National Bancorp of Virginia º | | | 5,761,232 | |
| | | | | | | 17,145,856 | |
| Communications Equipment: 5.3% | | | | |
| | 654,289 | | Cisco Systems, Inc. | | | 15,905,765 | |
| | 3,383,952 | | Harmonic, Inc.* | | | 21,488,095 | |
| | | | | | | 37,393,860 | |
| Construction & Engineering: 8.8% | | | | |
| | 102,400 | | Dycom Industries, Inc.* | | | 2,369,536 | |
| | 339,375 | | EMCOR Group, Inc. | | | 13,795,594 | |
| | 530,483 | | MasTec, Inc.* | | | 17,452,891 | |
| | 644,952 | | Michael Baker Corp. º | | | 17,484,649 | |
| | 547,939 | | MYR Group, Inc.* | | | 10,657,413 | |
| | | | | | | 61,760,083 | |
| Electrical Equipment & Instruments: 1.2% | | | | |
| | 17,400 | | Emerson Electric Co. | | | 948,996 | |
| | 904,940 | | GSI Group, Inc.*# | | | 7,275,718 | |
| | | | | | | 8,224,714 | |
| Insurance: 3.7% | | | | |
| | 141,913 | | Assurant, Inc. | | | 7,224,791 | |
| | 208,584 | | PartnerRe, Ltd.# | | | 18,889,367 | |
| | | | | | | 26,114,158 | |
| Internet Software & Services: 3.3% | | | | |
| | 545,505 | | j2 Global, Inc. | | | 23,189,417 | |
| | | | | |
| Machinery: 0.2% | | | | |
| | 22,030 | | Flow International Corp.* | | | 81,291 | |
| | 20,000 | | Pentair, Ltd.# | | | 1,153,800 | |
| | | | | | | 1,235,091 | |
| Management Consulting: 3.4% | | | | |
| | 727,138 | | FTI Consulting, Inc.* | | | 23,915,569 | |
| | | | | |
| Oil & Gas Exploration & Production: 8.0% | | | | |
| | 5,626 | | ConocoPhillips | | | 340,373 | |
| | 380,813 | | Denbury Resources, Inc.* | | | 6,595,681 | |
| | 319,077 | | Energen Corp. | | | 16,674,964 | |
| | 61,905 | | EOG Resources, Inc. | | | 8,151,650 | |
| | 375,296 | | Rosetta Resources, Inc.* | | | 15,957,586 | |
| | 300,375 | | Suncor Energy, Inc.# | | | 8,858,059 | |
| | | | | | | 56,578,313 | |
| Oil Refining & Marketing: 0.0% | | | | |
| | 2,813 | | Phillips 66 | | | 165,714 | |
| | | | | |
| Semiconductors: 1.9% | | | | |
| | 1,697,822 | | ON Semiconductor Corp.* | | | 13,718,402 | |
| | | | | |
| Telecommunications: 1.5% | | | | |
| | 249,343 | | Lumos Networks Corp. | | | 4,263,765 | |
| | 391,432 | | NTELOS Holdings Corp. | | | 6,442,971 | |
| | | | | | | 10,706,736 | |
| Truck Dealerships: 1.7% | | | | |
| | 219,105 | | Rush Enterprises, Inc. – Class A* | | | 5,422,849 | |
| | 295,798 | | Rush Enterprises, Inc. – Class B* | | | 6,365,573 | |
| | | | | | | 11,788,422 | |
| Utilities: 2.2% | | | | |
| | 516,918 | | PPL Corp. | | | 15,641,939 | |
| | | | | |
| Waste Management Services: 3.6% | | | | |
| | 737,658 | | Republic Services, Inc. | | | 25,036,112 | |
| | | | | |
| TOTAL COMMON STOCKS | | | | |
| (cost $247,251,836) | | | 347,336,619 | |
| | | | | | | | |
| PREFERRED STOCK: 0.2% | | | | |
| | | | | |
| Real Estate: 0.2% | | | | |
| | 45,865 | | MPG Office Trust, Inc.* | | | 1,164,512 | |
| | | | | |
| TOTAL PREFERRED STOCK | | | | |
| (cost $1,194,335) | | | 1,164,512 | |
The accompanying notes are an integral part of these financial statements.
Greenspring Fund, Incorporated
SCHEDULE OF INVESTMENTS at June 30, 2013 (Unaudited) (Con’t) |
| Principal | | | | Value | |
| CONVERTIBLE BONDS: 3.6% | | | |
| | | | |
| Internet Software & Services: 0.9% | | | |
| $ | 5,946,000 | | Digital River, Inc., 2.000%, 11/1/30 | | $ | 5,934,851 | |
| | | | | |
| Oil & Gas Exploration & Production: 0.5% | | | | |
| | 3,784,000 | | Bill Barrett Corp., 5.000%, 3/15/28 | | | 3,791,114 | |
| | | | | |
| Semiconductors: 2.1% | | | | |
| | 14,447,000 | | Rambus, Inc., 5.000%, 6/15/14 | | | 14,916,528 | |
| | | | | |
| Telecommunications: 0.1% | | | | |
| | 657,000 | | Cogent Communications Group, Inc., | | | | |
| | | | 1.000%, 6/15/27 | | | 644,681 | |
| | | | | |
| TOTAL CONVERTIBLE BONDS | | | | |
| (cost $23,785,381) | | | 25,287,174 | |
| | | | | | | | |
| CORPORATE BONDS: 34.7% | | | | |
| | | | | |
| Airlines: 0.7% | | | | |
| | 4,000,000 | | American Airlines, Inc., | | | | |
| | | | 7.500%, 3/15/16 – *144A@ | | | 4,670,000 | |
| | | | | |
| Automotive: 0.3% | | | | |
| | 1,750,000 | | DriveTime Automotive Group, Inc., | | | | |
| | | | 12.625%, 6/15/17 – 144A | | | 1,881,250 | |
| | | | | |
| Automotive Parts: 0.6% | | | | |
| | 3,965,000 | | TRW Automotive, Inc., | | | | |
| | | | 8.875%, 12/1/17 – 144A | | | 4,232,638 | |
| | | | | |
| Business Services: 0.0% | | | | |
| | 239,000 | | Harsco Corp., 5.125%, 9/15/13 | | | 241,006 | |
| | | | | |
| Coal Producers: 0.6% | | | | |
| | 4,036,000 | | CONSOL Energy, Inc., 8.000%, 4/1/17 | | | 4,268,070 | |
| | | | | |
| Consumer Goods: 3.6% | | | | |
| | 975,000 | | Hanesbrands, Inc., 8.000%, 12/15/16 | | | 1,038,375 | |
| | 6,787,000 | | Pilgrim’s Pride Corp., 7.875%, 12/15/18 | | | 7,262,090 | |
| | 8,684,000 | | The Scotts Miracle-Gro Co., | | | | |
| | | | 7.250%, 1/15/18 | | | 9,161,620 | |
| | 7,738,000 | | TreeHouse Foods, Inc., 7.750%, 3/1/18 | | | 8,211,953 | |
| | | | | | | 25,674,038 | |
| Entertainment: 2.9% | | | | |
| | 3,597,000 | | Entravision Communications Corp., | | | | |
| | | | 8.750%, 8/1/17 | | | 3,844,294 | |
| | 3,010,000 | | Lions Gate Entertainment Corp., | | | | |
| | | | 10.250%, 11/1/16# | | | 3,239,512 | |
| | 12,773,000 | | Live Nation Entertainment, Inc., | | | | |
| | | | 8.125%, 5/15/18 – 144A | | | 13,603,245 | |
| | | | | | | 20,687,051 | |
| Financial Services: 0.8% | | | | |
| | 483,000 | | Cardtronics, Inc., 8.250%, 9/1/18 | | | 514,395 | |
| | 4,751,000 | | National Money Mart Co., | | | | |
| | | | 10.375%, 12/15/16# | | | 5,059,815 | |
| | | | | | | 5,574,210 | |
| Government Services: 0.2% | | | | |
| | 1,029,000 | | ManTech International Corp., | | | | |
| | | | 7.250%, 4/15/18 | | | 1,075,305 | |
| | | | | |
| Healthcare: 3.6% | | | | |
| | 16,337,000 | | BioScrip, Inc., 10.250%, 10/1/15 | | | 17,358,062 | |
| | 7,616,000 | | Valeant Pharmaceuticals International, Inc., | | | | |
| | | | 6.500%, 7/15/16 – 144A | | | 7,882,560 | |
| | | | | | | 25,240,622 | |
| Homebuilding: 0.9% | | | | |
| | 5,000,000 | | Lennar Corp., 12.250%, 6/1/17 | | | 6,437,500 | |
| | | | | |
| Information Technology Services: 1.3% | | | | |
| | 8,502,000 | | iGATE Corp., 9.000%, 5/1/16 | | | 8,884,590 | |
| | | | | |
| Internet Software & Services: 1.6% | | | | |
| | 10,909,000 | | Bankrate, Inc., 11.750%, 7/15/15 | | | 11,631,721 | |
| | | | | |
| Management Consulting: 0.8% | | | | |
| | 5,533,000 | | FTI Consulting, Inc., 6.750%, 10/1/20 | | | 5,851,148 | |
| | | | | |
| Oil & Gas Exploration & Production: 9.6% | | | | |
| | 2,472,000 | | Bill Barrett Corp., 9.875%, 7/15/16 | | | 2,602,089 | |
| | 8,882,000 | | EPL Oil & Gas, Inc., 8.250%, 2/15/18 | | | 9,192,870 | |
| | 5,134,000 | | McMoRan Exploration Co., | | | | |
| | | | 11.875%, 11/15/14 | | | 5,339,909 | |
| | 3,750,000 | | Petrohawk Energy Corp., 10.500%, 8/1/14 | | | 3,950,625 | |
| | 5,000,000 | | PetroQuest Energy, Inc., | | | | |
| | | | 10.000%, 9/1/17 – 144A | | | 5,000,000 | |
| | 15,667,000 | | PetroQuest Energy, Inc., 10.000%, 9/1/17 | | | 16,058,675 | |
| | 18,820,000 | | Rosetta Resources, Inc., 9.500%, 4/15/18 | | | 20,419,700 | |
| | 5,000,000 | | Stone Energy Corp., 8.625%, 2/1/17 | | | 5,237,500 | |
| | | | | | | 67,801,368 | |
The accompanying notes are an integral part of these financial statements.
Greenspring Fund, Incorporated
SCHEDULE OF INVESTMENTS at June 30, 2013 (Unaudited) (Con’t) |
| Principal | | | | Value | |
| CORPORATE BONDS: 34.7% (Con’t) | | | |
| | | | |
| Publishing: 0.1% | | | |
| $ | 817,000 | | Gannett Co, Inc., 9.375%, 11/15/17 | | $ | 872,147 | |
| | | | | |
| Retail: 2.6% | | | | |
| | 2,317,000 | | CDW LLC/CDW Finance Corp., | | | | |
| | | | 12.535%, 10/12/17 | | | 2,456,020 | |
| | 8,038,000 | | Rite Aid Corp., 7.500%, 3/1/17 | | | 8,269,173 | |
| | 7,217,000 | | Rite Aid Corp., 9.500%, 6/15/17 | | | 7,498,824 | |
| | | | | | | 18,224,017 | |
| Security Services: 0.4% | | | | |
| | 3,000,000 | | Interface Security Systems Holdings, Inc., | | | | |
| | | | 9.250%, 1/15/18 – 144A | | | 3,075,000 | |
| | | | | |
| Telecommunications: 1.0% | | | | |
| | 2,637,000 | | Avaya, Inc., 10.125%, 11/1/15 | | | 2,623,815 | |
| | 2,651,000 | | EarthLink, Inc., 8.875%, 5/15/19 | | | 2,591,353 | |
| | 250,000 | | EarthLink, Inc., 7.375%, 6/1/20 – 144A | | | 241,250 | |
| | 1,183,000 | | Level 3 Financing, Inc., 10.000%, 2/1/18 | | | 1,277,640 | |
| | | | | | | 6,734,058 | |
| Transportation Equipment Manufacturing: 0.4% | | | | |
| | 100,000 | | Titan International, Inc., | | | | |
| | | | 7.875%, 10/1/17 – 144A | | | 105,500 | |
| | 2,545,000 | | Westinghouse Air Brake | | | | |
| | | | Technologies Corp., 6.875%, 7/31/13 | | | 2,560,906 | |
| | | | | | | 2,666,406 | |
| Trucking: 0.1% | | | | |
| | 422,000 | | Swift Services Holdings, Inc., | | | | |
| | | | 10.000%, 11/15/18 | | | 468,420 | |
| | | | | |
| Wood Product Manufacturing: 2.6% | | | | |
| | 17,308,000 | | Leucadia National Corp., 7.000%, 8/15/13 | | | 17,433,483 | |
| | 1,158,000 | | Leucadia National Corp., 7.750%, 8/15/13 | | | 1,167,901 | |
| | | | | | | 18,601,384 | |
| TOTAL CORPORATE BONDS | | | | |
| (cost $244,811,890) | | | 244,791,949 | |
| | | | | | | | |
| SHORT-TERM INVESTMENTS: 11.3% | | | | |
| | | | | |
| Money Market Instruments^ | | | | |
| | 27,700,000 | | AIM Liquid Assets, 0.090% | | | 27,700,000 | |
| | 27,700,000 | | AIM STIC Prime Portfolio, 0.020% | | | 27,700,000 | |
| | 24,349,122 | | Fidelity Money Market Portfolio, 0.080% | | | 24,349,122 | |
| | | | | |
| TOTAL SHORT-TERM INVESTMENTS | | | | |
| (cost $79,749,122) | | | 79,749,122 | |
| | | | | |
| TOTAL INVESTMENTS IN SECURITIES | | | | |
| (cost $596,792,564): 99.1% | | | 698,329,376 | |
| Other Assets and Liabilities 0.9% | | | 6,591,938 | |
| NET ASSETS: 100.0% | | $ | 704,921,314 | |
| * | | Non-income producing security. |
| º | | Investment in affiliated security (note 5). |
| # | | U.S. security of foreign issuer. |
| 144A | | Securities purchased pursuant to Rule 144A of the Securities Act of 1933, as amended, and may be sold only to dealers in that program or other “qualified institutional buyers.” These securities have been deemed to be liquid by the Fund’s adviser under the supervision of the Board of Directors. As of June 30, 2013, the value of these investments was $40,691,443, or 5.8% of total net assets. |
| @ | | Security is in default. |
| ^ | | Rate shown is the 7-day effective yield at June 30, 2013. |
The accompanying notes are an integral part of these financial statements.
Greenspring Fund, Incorporated
STATEMENT OF ASSETS AND LIABILITIES at June 30, 2013 (Unaudited) |
| ASSETS | | | |
| Investments in securities, at value (cost $596,792,564) | | $ | 698,329,376 | |
| Receivables: | | | | |
| Securities sold | | | 8,479,667 | |
| Fund shares sold | | | 2,539,185 | |
| Dividends and interest | | | 6,306,111 | |
| Prepaid expenses | | | 24,492 | |
| Total assets | | | 715,678,831 | |
| | | | | |
| LIABILITIES | | | | |
| Payables: | | | | |
| Due to affiliate (Note 5) | | | 411,791 | |
| Securities purchased | | | 9,958,207 | |
| Fund shares redeemed | | | 179,657 | |
| Accrued expenses | | | 207,862 | |
| Total liabilities | | | 10,757,517 | |
| | | | | |
| NET ASSETS | | $ | 704,921,314 | |
| | | | | |
| Capital shares issued and outstanding (60,000,000 shares authorized, $0.01 par value) | | | 28,015,872 | |
| | | | | |
| Net asset value, offering and redemption price per share | | $ | 25.16 | |
| | | | | |
| COMPONENTS OF NET ASSETS | | | | |
| Capital stock at par value | | $ | 280,159 | |
| Paid-in capital | | | 595,096,452 | |
| Accumulated net investment loss | | | (108,358 | ) |
| Undistributed net realized gain on investments | | | 8,116,249 | |
| Net unrealized appreciation on investments | | | 101,536,812 | |
| NET ASSETS | | $ | 704,921,314 | |
The accompanying notes are an integral part of these financial statements.
Greenspring Fund, Incorporated
STATEMENT OF OPERATIONS For the Six Months Ended June 30, 2013 (Unaudited) |
| INVESTMENT INCOME | | | |
| Income | | | |
| Interest | | $ | 8,670,681 | |
| Dividends (net of foreign withholding taxes of $13,922) | | | 2,773,874 | |
| Total income | | | 11,444,555 | |
| | | | | |
| Expenses | | | | |
| Advisory fees (Note 5) | | | 2,370,498 | |
| Transfer agent fees | | | 362,253 | |
| Administration fees | | | 135,537 | |
| Fund accounting fees | | | 56,442 | |
| Administration fees – Corbyn (Note 5) | | | 48,485 | |
| Reports to shareholders | | | 32,480 | |
| Custody fees | | | 27,563 | |
| Legal fees | | | 25,743 | |
| Miscellaneous fees | | | 21,413 | |
| Blue sky fees | | | 19,923 | |
| Directors fees | | | 19,333 | |
| Audit fees | | | 14,109 | |
| Insurance fees | | | 13,941 | |
| Total expenses | | | 3,147,720 | |
| Net investment income | | | 8,296,835 | |
| | | | | |
| REALIZED AND UNREALIZED GAIN ON INVESTMENTS | | | | |
| Net realized gain on investments | | | 7,253,232 | |
| Change in net unrealized appreciation/depreciation on investments | | | 38,019,180 | |
| Net realized and unrealized gain on investments | | | 45,272,412 | |
| Net increase in net assets resulting from operations | | $ | 53,569,247 | |
The accompanying notes are an integral part of these financial statements.
Greenspring Fund, Incorporated
| STATEMENTS OF CHANGES IN NET ASSETS |
| | | Six Months Ended | | | Year Ended | |
| | | June 30, 2013# | | | December 31, 2012 | |
| INCREASE (DECREASE) IN NET ASSETS FROM: | | | | | | |
| | | | | | | |
| OPERATIONS | | | | | | |
| Net investment income | | $ | 8,296,835 | | | $ | 20,736,122 | |
| Net realized gain on investments | | | 7,253,232 | | | | 19,448,250 | |
| Change in net unrealized appreciation/depreciation on investments | | | 38,019,180 | | | | 20,345,518 | |
| Net increase in net assets resulting from operations | | | 53,569,247 | | | | 60,529,890 | |
| | | | | | | | | |
| DISTRIBUTIONS TO SHAREHOLDERS | | | | | | | | |
| From net investment income | | | — | | | | (25,524,402 | ) |
| From net realized gain | | | — | | | | (17,097,170 | ) |
| Total distributions to shareholders | | | — | | | | (42,621,572 | ) |
| | | | | | | | | |
| CAPITAL SHARE TRANSACTIONS | | | | | | | | |
| Net increase (decrease) in net assets derived | | | | | | | | |
| from net change in outstanding shares (a)+ | | | 451,196 | | | | (105,963,365 | ) |
| Total increase (decrease) in net assets | | | 54,020,443 | | | | (88,055,047 | ) |
| | | | | | | | | |
| NET ASSETS | | | | | | | | |
| Beginning of period | | | 650,900,871 | | | | 738,955,918 | |
| End of period (including accumulated net investment | | | | | | | | |
| loss of ($108,358) and ($8,405,193), respectively) | | $ | 704,921,314 | | | $ | 650,900,871 | |
| (a) | A summary of capital share transactions is as follows: |
| | | | Six Months Ended | | | Year Ended | |
| | | | June 30, 2013# | | | December 31, 2012 | |
| | | | Shares | | | Value | | | Shares | | | Value | |
| | Shares sold | | | 3,146,266 | | | $ | 77,264,337 | | | | 4,711,945 | | | $ | 110,538,884 | |
| | Shares issued in reinvestment of distributions | | | — | | | | — | | | | 1,827,772 | | | | 41,890,711 | |
| | Shares redeemed+ | | | (3,148,000 | ) | | | (76,813,141 | ) | | | (11,075,533 | ) | | | (258,392,960 | ) |
| | Net increase (decrease) | | | (1,734 | ) | | $ | 451,196 | | | | (4,535,816 | ) | | $ | (105,963,365 | ) |
| # | Unaudited. |
| + | Net of redemption fees of $12,388 and $32,665, respectively. |
The accompanying notes are an integral part of these financial statements.
Greenspring Fund, Incorporated
FINANCIAL HIGHLIGHTS For a capital share outstanding throughout each period |
| | | | Six Months | | | | | | | | | | | | | | | | |
| | | | Ended | | | | | | | | | | | | | | | | |
| | | | June 30, | | | Year Ended December 31, | |
| | | | 2013# | | | | 2012 | | | | 2011 | | | | 2010 | | | | 2009 | | | | 2008 | |
| | Net asset value, beginning of period | | $ | 23.23 | | | $ | 22.70 | | | $ | 24.19 | | | $ | 22.69 | | | $ | 20.36 | | | $ | 23.59 | |
| | | | | | | | | | | | | | | | | | | | | | | | | | |
| | INCOME (LOSS) FROM INVESTMENT OPERATIONS: | | | | | | | | | | | | | | | | | | | | | |
| | Net investment income | | | 0.30 | | | | 0.67 | | | | 0.58 | | | | 0.56 | | | | 0.71 | | | | 0.43 | |
| | Net realized and unrealized gain (loss) on investments | | | 1.63 | | | | 1.35 | | | | (0.66 | ) | | | 1.82 | | | | 2.47 | | | | (3.18 | ) |
| | Total from investment operations | | | 1.93 | | | | 2.02 | | | | (0.08 | ) | | | 2.38 | | | | 3.18 | | | | (2.75 | ) |
| | | | | | | | | | | | | | | | | | | | | | | | | | |
| | LESS DISTRIBUTIONS: | | | | | | | | | | | | | | | | | | | | | | | | |
| | From net investment income | | | — | | | | (0.88 | ) | | | (0.82 | ) | | | (0.72 | ) | | | (0.83 | ) | | | (0.34 | ) |
| | From net realized gain | | | — | | | | (0.61 | ) | | | (0.59 | ) | | | (0.16 | ) | | | (0.02 | ) | | | (0.16 | ) |
| | Total distributions | | | — | | | | (1.49 | ) | | | (1.41 | ) | | | (0.88 | ) | | | (0.85 | ) | | | (0.50 | ) |
| | Paid-in capital from redemption fees (Note 1) | | | — | * | | | — | * | | | — | * | | | — | * | | | — | * | | | 0.02 | |
| | Net asset value, end of period | | $ | 25.16 | | | $ | 23.23 | | | $ | 22.70 | | | $ | 24.19 | | | $ | 22.69 | | | $ | 20.36 | |
| | Total return | | 8.31 | %^ | | | 9.07 | % | | | (0.26 | %) | | | 10.63 | % | | | 15.83 | % | | | (11.72 | %) |
| | | | | | | | | | | | | | | | | | | | | | | | | | |
| | RATIOS/SUPPLEMENTAL DATA: | | | | | | | | | | | | | | | | | | | | | | | | |
| | Net assets, end of period (millions) | | $ | 704.9 | | | $ | 650.9 | | | $ | 739.0 | | | $ | 830.7 | | | $ | 528.5 | | | $ | 308.2 | |
| | Ratio of expenses to average net assets | | | 0.94 | %+ | | | 0.93 | % | | | 0.91 | % | | | 0.95 | % | | | 1.03 | % | | | 1.06 | % |
| | Ratio of net investment income to average net assets | | | 2.47 | %+ | | | 2.89 | % | | | 2.40 | % | | | 2.51 | % | | | 3.67 | % | | | 2.15 | % |
| | Portfolio turnover rate | | 31.91 | %^ | | | 27.67 | % | | | 58.32 | % | | | 59.99 | % | | | 46.77 | % | | | 47.11 | % |
| # | Unaudited. |
| * | Amount less than $0.01 per share. |
| ^ | Not Annualized. |
| + | Annualized. |
The accompanying notes are an integral part of these financial statements.
Greenspring Fund, Incorporated
NOTES TO FINANCIAL STATEMENTS June 30, 2013 (Unaudited) |
| Note 1 – Significant Accounting Policies |
Greenspring Fund, Incorporated (the “Fund”) is a diversified, open-end management investment company registered under the Investment Company Act of 1940, as amended (the “1940 Act”). The Fund is organized as a Maryland corporation and commenced operations on July 1, 1983.
The preparation of the financial statements in accordance with accounting principles generally accepted in the United States of America requires management to make estimates and assumptions that affect the reported amounts and disclosures in the financial statements. Actual results could differ from those estimates. In preparing these financial statements, the Fund has evaluated events and transactions for potential recognition or disclosure through the date the financial statements were issued.
Investment transactions and related investment income – Investment transactions are recorded on the trade date. Dividend income is recorded on the ex-dividend date and interest income, including amortization of premiums and accretion of discounts, is recorded on the accrual basis. Dividends determined to be a return of capital are recorded as a reduction of the cost basis of the security. Realized gains and losses from investment transactions are reported on an identified cost basis.
Valuation of investments – Securities listed on a national securities exchange or the NASDAQ National Market are valued at the last reported sale price or the official closing price for certain markets on the exchange of major listing as of the close of the regular session of the New York Stock Exchange.
Securities that are traded principally in the over-the-counter market, listed securities for which no sale was reported on the day of valuation, and listed securities whose primary market is believed by Corbyn Investment Management, Inc. (“Corbyn” or the “Adviser”) to be over-the counter are valued at the mean of the closing bid and asked prices obtained from sources that the Adviser deems appropriate.
Investments in open-end management investment companies are valued at the net asset value of the shares of that investment company.
Short-term investments are valued at amortized cost, which approximates fair market value. The value of securities that mature, or have an announced call, within 60 days will be valued at market value.
Securities for which market quotations are not readily available are valued at fair value as determined in good faith by the Adviser as directed by the Fund’s Board of Directors (the “Board”). The values assigned to fair value investments are based on available information and do not necessarily represent amounts that might ultimately be realized, since such amounts depend on future developments inherent in long-term investments. Further, because of the inherent uncertainty of valuation, those estimated values may differ significantly from the values that would have been used had a ready market of the investments existed, and the differences could be material.
The Fund has adopted fair valuation accounting standards that establish an authoritative definition of fair value and set out a hierarchy for measuring fair value. These standards require additional disclosures about the various input and valuation techniques used in measuring fair value. Fair value inputs are summarized in the three broad levels listed below:
Greenspring Fund, Incorporated
NOTES TO FINANCIAL STATEMENTS June 30, 2013 (Unaudited) (Con’t) |
| Level 1 – | Unadjusted quoted prices in active markets for identical securities that the Fund has the ability to access. |
| | |
| Level 2 – | Observable inputs other than quoted prices included in Level 1 that are observable for the security, either directly or indirectly. These inputs may include quoted prices for the identical instrument on an inactive market, prices for similar instruments, interest rates, prepayment speeds, credit risk, yield curves, default rates and similar data. |
| | |
| Level 3 – | Unobservable inputs for the security, to the extent relevant observable inputs are not available, representing the Fund’s own assumptions about the assumptions a market participant would use in valuing the security, and which would be based on the best information available. |
The inputs or methodology used for valuing securities are not necessarily an indication of the risk associated with investing in these securities. The following is a summary of the inputs used to value the Fund’s net assets as of June 30, 2013:
| | | Quoted Prices | | | Significant Other | | | Significant | | | Carrying Value | |
| | | in Active | | | Observable | | | Unobservable | | | at June 30, | |
| | | Markets | | | Inputs | | | Inputs | | | 2013 | |
| | | Level 1 | | | Level 2 | | | Level 3 | | | Total | |
| Common Stocks | | $ | 347,336,619 | | | $ | — | | | $ | — | | | $ | 347,336,619 | |
| Preferred Stock | | | 1,164,512 | | | | — | | | | — | | | | 1,164,512 | |
| Convertible Bonds | | | — | | | | 25,287,174 | | | | — | | | | 25,287,174 | |
| Corporate Bonds | | | — | | | | 244,791,949 | | | | — | | | | 244,791,949 | |
| Short-Term Investment | | | 79,749,122 | | | | — | | | | — | | | | 79,749,122 | |
| Total | | $ | 428,250,253 | | | $ | 270,079,123 | | | $ | — | | | $ | 698,329,376 | |
See Schedule of Investments for industry breakdown.
Transfers between levels are recognized at the end of the reporting period. During the six months ended June 30, 2013, the Fund recognized no transfers between valuation levels.
Dividends and distributions to stockholders – The Fund records dividends and distributions to shareholders on the ex-dividend date.
Redemption fees – The Fund’s Board of Directors has adopted policies and procedures with respect to frequent purchases and redemptions of Fund shares by Fund shareholders. The Fund is intended for long-term investors. The Fund discourages and does not accommodate frequent purchases and redemptions of Fund shares by Fund shareholders. The Fund reserves the right to decline a purchase order for any reason.
“Market-timers” who engage in frequent purchases and redemptions over a short period can disrupt the Fund’s investment program by requiring the Fund to have excess cash on hand or to liquidate holdings to accommodate redemptions. In addition, frequent purchases and redemptions may impede efficient Fund management and create additional transaction costs that are borne by all shareholders. To the extent that the Fund invests a significant portion of its assets in small-cap securities or high-yield bonds, it may be subject to the risks of market timing more than a fund that does not. Therefore, the Fund imposes a 2% redemption fee for shares held 60 days or less. The fee is deducted from the seller’s redemption proceeds and deposited into the Fund to help offset brokerage commissions, market impact, and other costs associated with fluctuations in Fund asset levels and cash flow caused by short-term trading. All shareholders are
Greenspring Fund, Incorporated
NOTES TO FINANCIAL STATEMENTS June 30, 2013 (Unaudited) (Con’t) |
subject to these restrictions regardless of whether you purchased your shares directly from the Fund or through a financial intermediary. However, the Fund is limited in its ability to determine whether trades placed through financial intermediaries may signal excessive trading. Accordingly, the Fund may not be able to determine whether trading in combined orders or in omnibus accounts is contrary to the Fund’s policies. The Fund reserves the right to reject combined or omnibus orders in whole or in part.
To calculate redemption fees, after first redeeming any shares associated with reinvested dividends or other distributions, the “first-in, first out” method is used to determine the holding period. Under this method, the date of redemption will be compared with the earliest purchase date of shares held in the account. If the holding period for shares purchased is 60 days or less, the fee will be charged. The redemption fee may be modified or discontinued at any time, in which case, shareholders will be notified. The redemption fee does not apply to shares acquired through the reinvestment of dividends or other distributions, or shares redeemed pursuant to a systematic withdrawal plan or a mandatory IRA distribution.
In compliance with Rule 22c-2 under the 1940 Act, Quasar Distributors, LLC, on behalf of the Fund, has entered into written agreements with each of the Fund’s financial intermediaries, under which the intermediaries must, upon request, provide the Fund with certain shareholder and identity trading information so that the Fund can enforce its frequent trading policies.
Risk of loss arising from indemnifications – In the normal course of business, the Fund enters into contracts that contain a variety of representations, which provide general indemnifications. The Fund’s maximum exposure under these arrangements is unknown as this would involve future claims that may be made against the Fund that have not yet occurred. However, based on experience, the Fund expects the risk of loss to be remote.
| Note 2 – Dividends and Distributions |
It is the Fund’s policy to declare dividends from net investment income and distributions from net realized gains as determined in accordance with income tax regulations, which may differ from accounting principles generally accepted in the United States of America. Accordingly, periodic reclassifications are made within the portfolio’s capital accounts to reflect income and gains available for distribution under income tax regulations.
On July 11, 2012 an income dividend of $0.45 per share and a long-term capital gain distribution of $0.0734 per share were declared, payable on July 12, 2012, to shareholders of record on July 10, 2012. Additionally, on December 19, 2012, an income dividend of $0.425 per share, a short-term capital gain distribution of $0.187 per share, and a long-term capital gain distribution of $0.352 per share were declared, payable on December 20, 2012 to shareholders of record on December 18, 2012. The tax character of distributions paid during the six months ended June 30, 2013 and the year ended December 31, 2012 were as follows:
| | Distributions paid from: | | June 30, 2013 | | | December 31, 2012 | | |
| | Ordinary income | | $ | – | | | $ | 30,673,956 | | |
| | Long-term capital gain | | $ | – | | | $ | 11,947,616 | | |
These dividends are either distributed to shareholders or reinvested in the Fund as additional shares issued to shareholders. For those shareholders reinvesting the dividends, the number of shares issued is based on the net asset value per share as of the close of business on the ex-dividend date.
Greenspring Fund, Incorporated
NOTES TO FINANCIAL STATEMENTS June 30, 2013 (Unaudited) (Con’t) |
The Fund designated as long-term capital gain dividend, pursuant to Internal Revenue Code Section 852(b)(3), the amount necessary to reduce the earnings and profits of the Fund related to net capital gain to zero for the tax year ended December 31, 2012.
| Note 3 – Purchases and Sales of Investments |
For the six months ended June 30, 2013, purchases and sales of investments, other than short-term investments, aggregated $192,670,191 and $232,583,921, respectively.
| Note 4 – Federal Income Taxes |
It is the Fund’s policy to comply with the requirements of the Internal Revenue Code applicable to regulated investment companies. Accordingly, the Fund intends to distribute substantially all of its taxable income. Therefore, no federal income tax provision is required.
As of and during the six months ended June 30, 2013, the Fund did not have any tax positions that did not meet the “more-likely-than-not” threshold of being sustained by the applicable tax authority. Tax positions not deemed to meet the “more-likely-than-not” threshold would be recorded as a tax benefit or expense in the current year. Generally, tax authorities can examine tax returns filed for all open tax years (2009-2012).
Required Fund distributions are based on income and capital gain amounts determined in accordance with federal income tax regulations, which differ from net investment income and realized gains recognized for financial reporting purposes.
Accordingly, the composition of net assets and distributions on a tax basis may differ from those reflected in the accompanying financial statements. As of December 31, 2012, the Fund’s most recently completed year end, the components of distributable earnings on a tax basis were as follows:
| | Cost of investments | | $ | 589,966,855 | | |
| | Gross tax unrealized appreciation | | | 85,119,085 | | |
| | Gross tax unrealized depreciation | | | (30,208,495 | ) | |
| | Net tax unrealized appreciation | | | 54,910,590 | | |
| | Undistributed ordinary income | | | 240,081 | | |
| | Undistributed long-term capital gain | | | 824,785 | | |
| | Total distributable earnings | | | 1,064,866 | | |
| | Other accumulated gains/(losses) | | | — | | |
| | Total accumulated earnings/(losses) | | $ | 55,975,456 | | |
Accounting principles generally accepted in the United States of America require that certain components of net assets relating to permanent differences be reclassified between financial and tax reporting. These reclassifications have no effect on net assets or net asset value per share. For the year ended December 31, 2012, the Fund decreased accumulated net investment loss by $3,450,044 and decreased undistributed net realized gain on investments by $3,450,044.
Greenspring Fund, Incorporated
NOTES TO FINANCIAL STATEMENTS June 30, 2013 (Unaudited) (Con’t) |
| Note 5 – Transactions with Affiliated Parties |
Corbyn serves as the Fund’s investment adviser. Under an agreement between the Fund and Corbyn, the Fund pays Corbyn a fee of 0.75% of the first $250 million of average daily net assets, 0.70% of average daily net assets between $250 million and $500 million and 0.65% of average daily net assets in excess of $500 million, which is computed daily and paid monthly. For the six months ended June 30, 2013, the Fund incurred $2,370,498 in advisory fees.
The Fund has also entered into a Services Agreement with Corbyn to provide various administrative services. As compensation, the Fund pays Corbyn a fee of $2,500 per month plus 0.01% of average daily net assets, which is computed daily and paid monthly. For the six months ended June 30, 2013, the Fund incurred $48,485 in administrative fees to Corbyn.
At June 30, 2013, investors for whom Corbyn was investment adviser held 916,164 shares of the Fund.
A company is considered to be an affiliate of the Fund under the 1940 Act if the Fund’s holdings of that company represent 5% or more of the outstanding voting securities of the company. Transactions with companies that are or were affiliates during the six months ended June 30, 2013 are as follows:
| | | Beginning | | | Purchase | | | Sales | | | Ending | | | Dividend | | | | | | | |
| Issuer | | Cost | | | Cost | | | Cost | | | Cost | | | Income | | | Shares | | | Value | |
| Michael Baker Corp. | | $ | 16,417,839 | | | $ | — | | | $ | 82,169 | | | $ | 16,335,670 | | | $ | 219,660 | | | | 644,952 | | | $ | 17,484,649 | |
| Southern National | | | | | | | | | | | | | | | | | | | | | | | | | | | | |
| Bancorp of Virginia | | | 4,167,109 | | | | — | | | | — | | | | 4,167,109 | | | | 64,799 | | | | 589,083 | | | | 5,761,232 | |
| Note 6 – Recent Accounting Pronouncement |
In January 2013, the Financial Accounting Standards Board (“FASB”) issued Accounting Standards Update (“ASU”) No. 2013-01 Clarifying the Scope of Disclosures about Offsetting Assets and Liabilities. This update gives additional clarification to the FASB ASU No. 2011-11 Disclosures about Offsetting Assets and Liabilities. The amendments in this ASU require an entity to disclose information about offsetting and related arrangements to enable users of its financial statements to understand the effect of those arrangements on its financial position. The ASU is effective for annual reporting periods beginning on or after January 1, 2013, and interim periods within those annual periods. The guidance requires retrospective application for all comparative periods presented. Management has evaluated ASU 2013-01 and determined there will be no impact on financial statement disclosures.
Greenspring Fund, Incorporated
APPROVAL OF INVESTMENT ADVISORY AGREEMENT (Unaudited) |
Continuance of the Investment Advisory Agreement (the “Agreement”) must be considered annually by the directors of the Fund who are not parties to the Agreement or “interested persons” of any such party (as defined in the 1940 Act) (the “Independent Directors”). In order for continuance to be approved, a majority of the Independent Directors must vote for such approval at an in-person meeting called for this purpose.
The Board of Directors (the “Board”), including a majority of the Independent Directors, approved the continuance of the Agreement most recently at an in-person meeting in February 2013. To assist the Directors in their evaluation of the Agreement, the Board was supplied with extensive information by the Adviser in advance of the meeting. After a detailed presentation by the Adviser, during which the written materials were reviewed and questions from the Board were answered, the Independent Directors met separately to consider the approval of the Agreement. The Board as a whole, and the Independent Directors voting separately, then approved the continuation of the Agreement as being in the best interest of the Fund. In considering the Agreement, the Board did not identify any particular overriding factor, but considered all the information available.
Below is a summary of the primary factors considered by the Board and the conclusions thereto that formed the basis for the Board approving the continuance of the Agreement:
| | 1. | The nature, extent, and quality of the services to be provided by the Adviser under the Agreement. The Board considered the specific responsibilities of all aspects of the daily management of the Fund. The Board considered the qualifications and experience of the portfolio manager and other key personnel of the Adviser involved with the day-to-day activities of the Fund. The Board also considered the resources and compliance structure of the Adviser, including the backgrounds of the chief compliance officers of both the Fund and the Adviser, as well as the Adviser’s compliance record. The Board also considered the Adviser’s marketing efforts and its continued commitment to the Fund’s growth. The Board noted that the Adviser has managed the Fund since its inception, providing a consistent investment approach with low turnover of the Adviser’s staff. The Board concluded that the Adviser had sufficient quality and depth of personnel, resources, investment methods and compliance policies and procedures essential to performing its duties under its advisory agreement and that the nature, overall quality, and extent of the management services were satisfactory and reliable. |
| | | |
| | 2. | The Fund’s historical investment performance. In assessing the quality of the portfolio management delivered by the Adviser, the Board reviewed the short-term and long-term performance of the Fund for periods ended December 31, 2012 on both an absolute basis, and in comparison to the performance of various category, relative index and major market benchmarks. The Board noted that the Fund’s 1-year return of 9.07% was mixed when compared against the 1-year performance of its category benchmarks, which are groups of other mutual funds with similar investment styles selected by independent providers of mutual fund information. The Fund’s long-term performance continued to exceed that of the category benchmarks. The Board also considered the consistency of returns and the level of risk taken. The Board concluded that the Adviser’s historical investment performance was highly satisfactory given the market conditions and consistent with the Fund’s long-term performance objective. |
| | | |
| | 3. | The costs of the services to be provided by the Adviser and the structure of the Adviser’s fees under the Advisory Agreement. In considering the advisory fee and total fees and expenses of the Fund, the Board |
Greenspring Fund, Incorporated
APPROVAL OF INVESTMENT ADVISORY AGREEMENT (Unaudited) (Con’t) |
| | | reviewed a presentation prepared by the Adviser comparing the Fund to a group of peer funds. Each of the peer funds used a research-intensive investment style similar to that of the Fund, were not part of large fund complexes, and did not have a 12b-1 Plan. The Board considered that the Fund’s contractual advisory fee of 0.70% was less than the median contractual advisory fee of the peer funds at a common net asset level. The Board also considered that the Fund’s total expense ratio of 0.93% was lower than the median total expense ratio of the peer funds. The Board concluded that, although the Adviser had not agreed to waive and/or reimburse Fund expenses at a certain level, the Adviser had consistently maintained an annual expense ratio below the peer group median. Additionally, the fees charged by the Adviser were comparable with the fees it charged to its other separately managed accounts and were not excessive. |
| | | |
| | 4. | Economies of scale. The Board also considered that economies of scale would be expected to be realized by the Adviser as the assets of the Fund grow. The Board noted that the Agreement’s fee schedule included breakpoints at net asset levels of $250 million and $500 million, whereby the fees paid by the Fund would decrease at the higher asset levels. The Board concluded that net assets were above $500 million for the entire year allowing the Fund and its shareholders to take advantage of these economies of scale. |
| | | |
| | 5. | Costs of services provided and profits to be realized by the Adviser. The Board then discussed the costs of the services to be provided and the profitability of the Adviser. Specific attention was given to the methodologies followed in allocating shared costs to the Fund. The Board recognized that the cost allocation methodologies are inherently subjective and various allocation methodologies may each be reasonable while producing different results. In this regard, the Board noted that the allocation appeared reasonable. After such review, the Board determined that the profitability of the Adviser with respect to the Agreement was not excessive, and that the Adviser had maintained adequate profit levels to support the services to the Fund. |
| | | |
| | 6. | Other factors and considerations. The Board periodically reviews and considers other material information throughout the year relating to the quality of services provided to the Fund, such as the receipt of research services in exchange for soft dollar credit in connection with commissions on the Fund’s equity transactions. The Board noted that the commissions paid by the Fund are reasonable and that the Fund receives quality execution, regardless of whether the commissions are used to pay for research through soft dollar arrangements. Other material information considered includes the Adviser’s management of its relationship with the Fund’s third party service providers and expenses paid to those third parties. Also, at its quarterly meetings, the Board reviews detailed information relating to the Fund’s portfolio and performance, and receives a presentation from the Fund’s portfolio manager. |
The Board did not identify any single factor discussed previously, but instead considered all factors collectively in its determination to approve the Agreement. The Directors, including a majority of the Independent Directors, concluded that the terms of the Agreement are fair and reasonable, that the Adviser’s fees are reasonable in light of the services provided to the Fund and the benefits received by the Adviser and that the Agreement is in the best interest of the Fund.
Greenspring Fund, Incorporated
NOTICE TO SHAREHOLDERS June 30, 2013 (Unaudited) |
Proxy Voting Policies and Proxy Voting Record
The Fund’s proxy voting policies and procedures, as well as its proxy voting record for the most recent 12-month period ended June 30, are available without charge, upon request, by contacting the Fund at (800) 366-3863 or info@greenspringfund.com. The Fund will send the information within three business days of receipt of the request, by first class mail or other means designed to ensure equally prompt delivery. The Fund’s proxy voting record is also available on the U.S. Securities and Exchange Commission’s website at www.sec.gov.
Form N-Q Holdings Information
The Fund files its complete schedule of portfolio holdings with the U.S. Securities and Exchange Commission for the first and third quarters of each fiscal year on Form N-Q. The Fund’s Forms N-Q are available on the Commission’s website at www.sec.gov and may be reviewed and copied at the Commission’s Public Reference Room in Washington, DC. Information on the operation of the Public Reference Room may be obtained by calling (800) SEC-0330.
Reports and Householding
In an attempt to reduce shareholder expenses, we will mail only one copy of the Fund’s Summary Prospectus and each Annual and Semi-Annual Report to those addresses shared by two or more accounts. If you wish to receive individual copies of these documents, please call us at (800) 366-3863. We will begin sending you individual copies 30 days after receiving your request.
The Fund’s Prospectus, Statement of Additional Information, Annual Report, and Semi-Annual Report, along with its first and third quarter portfolio holdings, are available on the Fund’s website at www.greenspringfund.com.
Privacy Policy
The Greenspring Fund recognizes that individuals expect an exceptional level of privacy in their financial affairs. The Fund assures the confidentiality of personal information provided to it.
The information we collect is limited to what the Fund believes is necessary or useful to conduct our business; administer your records, accounts and funds; to comply with laws and regulations; and to help us design or improve products and services. The Fund collects non public personal information about you from information it receives from you on applications or other forms or through its website, as well as from information about your transactions with the Fund.
Some of this information may be disclosed to the Fund’s investment adviser, but not for marketing solicitation, as well as non-affiliated third parties who provide non-financial services to the Fund such as our Transfer Agent, in order to administer customer accounts and mail transaction confirmations and tax forms, and the mailing house the Fund utilizes for mailing shareholder reports. Such information may also be disclosed to a non-affiliated third party engaged to provide fund accounting and administrative services to us. Disclosing this information enables us to meet customers’ financial needs and regulatory requirements. These third parties act on its behalf and are obligated to keep the information we provide to them confidential and to use the information only for the purposes authorized. The Fund does not disclose any non-public personal information about you or former customers to anyone, except as permitted by law.
To protect your non-public personal information, the Fund permits access to it only by authorized employees and maintains security practices to safeguard your information.
If you have any questions regarding our Privacy Policy, please contact us at (800) 366-3863 or info@greenspringfund.com. Thank you.
Greenspring Fund, Incorporated
Performance Since Inception on
July 1, 1983 through June 30, 2013
(Unaudited)
| |
| HOW $10,000 INVESTED ON 7/1/83 WOULD HAVE GROWN* |
| |
 |
| |
| * | Figures include changes in principal value, reinvested dividends and capital gains distributions. Past expense limitations increased the Fund’s return. This chart illustrates the performance of a hypothetical $10,000 investment made in the Fund since inception through June 30, 2013. The total value of $169,853 assumes the reinvestment of dividends and capital gains, but does not reflect the effect of any redemption fees. This chart does not imply any future performance. |
Average annual total returns for the one, three, five and ten year periods ended June 30, 2013 were 15.69%, 9.00%, 5.93% and 7.76%, respectively. Average annual returns for more than one year assume a compounded rate of return and are not the Fund’s year-by-year results, which fluctuated over the periods shown. Returns do not reflect taxes that shareholders may pay on Fund distributions or redemption of Fund shares.
Greenspring Fund, Incorporated
2330 West Joppa Road, Suite 110
Lutherville, MD 21093
(410) 823-5353
(800) 366-3863
www.greenspringfund.com
DIRECTORS
Charles vK. Carlson, Chairman
William E. Carlson
David T. Fu
Sean T. Furlong
Michael J. Fusting
Michael P. O’Boyle
OFFICERS
Charles vK. Carlson
President and Chief Executive Officer
Michael J. Fusting
Sr. Vice President and
Chief Financial Officer
Elizabeth Agresta Swam
Chief Compliance Officer,
Secretary, Treasurer
and AML Officer
INVESTMENT ADVISER
Corbyn Investment Management, Inc.
2330 West Joppa Road, Suite 108
Lutherville, MD 21093-7207
ADMINISTRATOR, FUND ACCOUNTANT
AND TRANSFER AGENT
U.S. Bancorp Fund Services, LLC
615 East Michigan Street
Milwaukee, WI 53202
DISTRIBUTOR
Quasar Distributors, LLC
615 East Michigan Street
Milwaukee, WI 53202
CUSTODIAN
U.S. Bank, N.A.
1555 N. RiverCenter Dr., Suite 302
Milwaukee, WI 53212
LEGAL COUNSEL
K&L Gates LLP
1601 K Street NW
Washington, DC 20006
Symbol – GRSPX
CUSIP – 395724107
Item 2. Code of Ethics.
Not applicable for semi-annual reports.
Item 3. Audit Committee Financial Expert.
Not applicable for semi-annual reports.
Item 4. Principal Accountant Fees and Services.
Not applicable for semi-annual reports.
Item 5. Audit Committee of Listed Registrants.
Not applicable to registrants who are not listed issuers (as defined in Rule 10A-3 under the Securities Exchange Act of 1934).
Item 6. Investments.
(a) Schedule of Investments is included as part of the report to shareholders filed under Item 1 of this Form.
(b) Not applicable
Item 7. Disclosure of Proxy Voting Policies and Procedures for Closed-End Management Investment Companies.
Not applicable to open-end investment companies.
Item 8. Portfolio Managers of Closed-End Management Investment Companies.
Not applicable to open-end investment companies.
Item 9. Purchases of Equity Securities by Closed-End Management Investment Company and Affiliated Purchasers.
Not applicable to open-end investment companies.
Item 10. Submission of Matters to a Vote of Security Holders.
Not Applicable.
Item 11. Controls and Procedures.
| (a) | The Registrant’s Chief Executive Officer and Chief Financial Officer have reviewed the Registrant's disclosure controls and procedures (as defined in Rule 30a-3(c) under the Investment Company Act of 1940 (the “Act”) (17 CFR 270.30a-3(c))) as of a date within 90 days of the filing date of the report that includes the disclosure required by this paragraph, based on the evaluation of these controls and procedures required by Rule 30a-3(b) under the Act (17 CFR 270.30a-3(b)) and Rules 13a-15(b) or 15d-15(b) under the Securities Exchange Act of 1934 (17 CFR 240.13a-(15(b) or 240.15d-15(b)). Based on their review, such officers have concluded that the disclosure controls and procedures are effective in ensuring that information required to be disclosed in this report is appropriately recorded, processed, summarized and reported and made known to them by others within the Registrant and by the Registrant’s service provider. |
| (b) | There were no changes in the Registrant's internal control over financial reporting (as defined in Rule 30a-3(d) under the Act (17 CFR 270.30a-3(d)) that occurred during the second fiscal quarter of the period covered by this report that has materially affected, or is reasonably likely to materially affect, the Registrant's internal control over financial reporting. |
Item 12. Exhibits.
| (a) | (1) Any code of ethics, or amendment thereto, that is the subject of the disclosure required by Item 2, to the extent that the registrant intends to satisfy Item 2 requirements through filing an exhibit. Not Applicable. |
(2) A separate certification for each principal executive and principal financial officer of the registrant as required by Rule 30a-2(a) under the Act (17 CFR 270.30a-2(a)), exactly as set forth below: Filed herewith.
(3) Any written solicitation to purchase securities under Rule 23c-1 under the Act (17 CFR 270.23 C-1) sent or given during the period covered by the report by or on behalf of the registrant to 10 or more persons. Not applicable to open-end investment companies.
| (b) | Certifications pursuant to Section 906 of the Sarbanes-Oxley Act of 2002. Furnished herewith. |
SIGNATURES
Pursuant to the requirements of the Securities Exchange Act of 1934 and the Investment Company Act of 1940, the registrant has duly caused this report to be signed on its behalf by the undersigned, thereunto duly authorized.
(Registrant) Greenspring Fund, Incorporated
By (Signature and Title)* /s/Charles vK. Carlson
Charles vK. Carlson, Chief Executive Officer
Date August 21, 2013
Pursuant to the requirements of the Securities Exchange Act of 1934 and the Investment Company Act of 1940, this report has been signed below by the following persons on behalf of the registrant and in the capacities and on the dates indicated.
By (Signature and Title)* /s/Charles vK. Carlson
Charles vK. Carlson, Chief Executive Officer
By (Signature and Title)* /s/Michael J. Fusting
Michael J. Fusting, Chief Financial Officer
* Print the name and title of each signing officer under his or her signature.