UNITED STATES
SECURITIES AND EXCHANGE COMMISSION
Washington, D.C. 20549
FORM N-CSR
CERTIFIED SHAREHOLDER REPORT OF REGISTERED
MANAGEMENT INVESTMENT COMPANIES
Investment Company Act file number 811-3627
Greenspring Fund, Incorporated
(Exact name of registrant as specified in charter)
2330 West Joppa Road, Suite 110
Lutherville, MD 21093-4641
(Address of principal executive offices) (Zip code)
Mr. Charles vK. Carlson, President
2330 West Joppa Road, Suite 110
Lutherville, MD 21093-4641
(Name and address of agent for service)
(410) 823-5353
Registrant's telephone number, including area code
Date of fiscal year end: December 31, 2011
Date of reporting period: June 30, 2011
Item 1. Reports to Stockholders.
SEMI-ANNUAL REPORT
JUNE 30, 2011
This report is intended for shareholders of the
Greenspring Fund, Incorporated and may not be
used as sales literature unless preceded or
accompanied by a current prospectus.
Greenspring Fund, Incorporated
July 2011
Dear Fellow Shareholders:
The Greenspring Fund had stable performance during the second quarter of 2011, with the NAV declining from $24.65 to $24.58 per share. Performance results for other periods of time are shown in the accompanying chart.
| | | | | | |
| | Greenspring Fund | |
| | Performance for the | |
| | Periods Ended June 30, 2011 | |
| | | | | | |
| | Quarter | | | -0.28 | % | |
| | Year to Date | | | 1.61 | % | |
| | 1 Year | | | 11.67 | % | |
| | 3 Years* | | | 4.77 | % | |
| | 5 Years* | | | 5.03 | % | |
| | 10 Years* | | | 6.92 | % | |
| | 15 Years* | | | 7.65 | % | |
| | 20 Years* | | | 8.94 | % | |
| | Since inception on 7/1/83* | | | 10.06 | % | |
| | Expense Ratio** | | | 0.98 | % | |
| | | | | | | |
| | * annualized. | | | | | |
| | **as stated in Prospectus dated 5-1-11. See note on last page of letter. | | | | | |
| | | | | | | |
| | Performance data quoted represents past performance; past performance does not guarantee future results. The investment return and principal value of an investment will fluctuate so that an investor’s shares, when redeemed, may be worth more or less than their original cost. Current performance of the Fund may be lower or higher than the performance quoted. Performance data current to the most recent month end may be obtained by calling 1-800-366-3863 or visiting the Fund’s web site. The Fund imposes a 2.00% redemption fee for shares held 60 days or less. Performance data does not reflect the redemption fee. If reflected, total returns would be reduced. | |
| | | | | | | |
The second quarter of 2011 was a tumultuous one for the financial markets. Concerns about global economic growth, including fears about the possibility of a double-dip recession in the U.S. economy, dominated many investors’ strategies. During the early weeks of the quarter, investors focused on the potential impact that the earthquake and ensuing tsunami in Japan would have on its economy and the global supply chain. As the quarter progressed, investors turned their attention toward the financial woes of Greece, with fears that their sovereign debt problems would spread throughout Europe (and beyond), as many European banks hold significant amounts of Greek debt.
As investors digested the latest news on these crises, whipsaw moves in the financial markets reflected tenuous convictions on the part of investors and their rapidly changing sentiments. The Dow Jones Industrial Average had gained more than 4% through the end of April, then dropped 7% through mid-June, but subsequently rallied to finish the quarter barely positive. Crude oil was particularly volatile, soaring early in the quarter, only to drop more than 16% from its high and finished the quarter 11% lower than where it began. Yields on U.S. Treasury securities were also volatile, as rates on 10 year Treasuries (the foundation for many consumer lending rates) climbed to more than 3.5% in early April, only to drop to less than 2.9% by mid-June.
INFLUENCES on FUND PERFORMANCE
During the second quarter, Greenspring Fund’s equities slipped a bit in value, while our fixed income holdings generated steady positive total returns. In order of magnitude, the securities with the largest impact on the Fund’s performance during the quarter were the common stock investments in Ralcorp Holdings, Michael Baker Corp., Harmonic Inc., PartnerRe Ltd., and Carpenter Technology Corp. Ralcorp and Carpenter Technology produced positive returns for the Fund, while the others declined in value.
Greenspring Fund, Incorporated
| | | | | | |
| | | | % of Net | | |
| | Greenspring Fund | | Assets | | |
| | Top 10 Holdings | | as of | | |
| | | | 6/30/11 | | |
| | | | | | |
| | PartnerRe Ltd. | | | 3.7 | % | |
| | Charter Communications 13.50% 11/30/16 Corporate Bonds | | | 3.7 | % | |
| | Lucent Technologies 2.875% 6/15/25 Convertible Bonds | | | 3.3 | % | |
| | FTI Consulting, Inc. | | | 3.3 | % | |
| | Hanesbrands, Inc. 3.769% 12/15/14 Corporate Bonds | | | 3.2 | % | |
| | CA, Inc. | | | 3.1 | % | |
| | Cisco Systems, Inc. | | | 3.0 | % | |
| | Plains Exploration and Production 7.75% 6/15/15 Corporate Bonds | | | 2.9 | % | |
| | j2 Global Communications, Inc. | | | 2.5 | % | |
| | Gulfmark Offshore, Inc. 7.75% 7/15/14 Corporate Bonds | | | 2.5 | % | |
Ralcorp Holdings
Shares of Ralcorp, a maker of private label food products and Post brand cereals, rose substantially in late April and early May when ConAgra Foods, one of North America’s largest packaged food companies, proposed to buy Ralcorp for $4.9 billion or $86 per share. Ralcorp’s board of directors rejected the bid, adopted a “poison pill” designed to ward off a hostile takeover, and later in the quarter decided to spin-off their troubled Post cereals unit in an effort to convince shareholders that the ConAgra offer was not in their best interests. We disagree with this plan to stay independent and believe that ConAgra Foods has the capacity and willingness to raise their offer to get a deal done. Investors seem to be anticipating a higher offer as the stock has consistently traded above ConAgra’s offering price since the announcement. However, we had to weigh the possible reward of a higher bid from ConAgra against the risk of the stock price falling back to pre-offer levels. We sold a substantial portion of the Fund’s position (at a price higher than ConAgra Foods’s offer), during the second quarter. We divested the remainder during the third quarter after those shares attained long-term status.
Michael Baker
The Greenspring Fund has held shares of this engineering company for many years, with the size of the Fund’s position varying over time. During the second quarter, shares of Michael Baker declined in value, as investors were disappointed with the direction and magnitude of the Company’s recent earnings. Several of Michael Baker’s significant engineering projects, such as its contract with FEMA to digitize the maps of the nation’s flood plains and many infrastructure projects in Iraq, have been winding down over the last several years. Michael Baker has been successful at securing new contracts, but at reduced levels of profitability. Furthermore, the Company has been frustrated by reduced funding levels and numerous bottlenecks in releasing contracts from government agencies. We remain very optimistic about the long term potential for Michael Baker, as projects such as the relocation of military bases from Okinawa, Japan to Guam, as well as assignments to redesign the nation’s crumbling infrastructure should ensure a steady flow of contracts for the Company. In the meantime, Michael Baker boasts a debt-free balance sheet with more than $10 per share in cash. The Company will most likely pursue additional earnings growth by using its strong balance sheet to make strategic acquisitions of other companies in order to diversify the Company’s product offerings and geographic reach.
Harmonic Inc.
Harmonic offers niche, market dominant products to all participants in the video supply chain, from content producers to distributors. The Company has struggled to live up to the investment community’s expectations following the mid-2010 acquisition of Omneon, a privately-held producer of equipment used by media companies to prepare, store and produce video content. The stock declined in the second quarter after Harmonic reported its first quarter results. The Company
Greenspring Fund, Incorporated
experienced greater than expected sales disruptions as management realigned and cross-trained the combined sales forces, hurting sales of Omneon’s products and the profitability of the entire enterprise. By failing to show meaningful profitability improvement, investors viewed Harmonic’s aggressive 2011 guidance as unattainable. Management completed the sales force integration early in the second quarter and, while delayed in the short-term, management’s goals for the combined company remain viable.
In mid-July, Harmonic announced second quarter results that also disappointed investors as domestic customers, including the major cable companies, reduced their ordering activity while they strategized over the architecture for next-generation video delivery through the internet, tablet computers, and smartphones. We believe this pause is also temporary, as Harmonic’s products will play a valuable role in next-generation networks. We look forward to the Company working through these issues and restoring investor confidence. Meanwhile, Harmonic continues to generate earnings and free cash flow, carrying more than $1 per share in cash (shares were trading at about $7 at quarter end) on its balance sheet, and is very well situated to participate in the rapidly developing marketplace for video delivery.
| |
| Greenspring Fund Portfolio Allocation as of June 30, 2011 |
| |
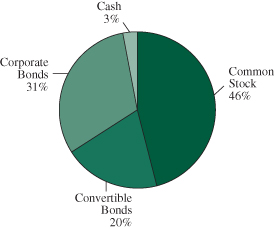 |
PORTFOLIO ACTIVITY
Much of the Greenspring Fund’s purchase activity during the quarter was directed towards the acquisition of additional fixed income securities, many of which were “cushion” bonds. These are bonds with relatively high coupons where the issuing corporations have the option to redeem the bonds in the not too distant future. These bonds are purchased at levels that should produce attractive returns if the bonds are redeemed on these upcoming call dates. However, if for some reason (turbulent capital markets, rising interest rates) the bonds are not redeemed on the first call date, the Fund’s returns should actually improve, due to the bonds’ high coupon rate. Many of these bond purchases have been in the oil and gas sector, with new holdings established in bonds issued by Bill Barrett Corp., McMoran Exploration, Quicksilver Resources, Range Resources, and Sandridge Energy. Additional purchases of already existing oil and gas sector investments were made in the bonds of Gulfmark Offshore, Petrohawk Energy, Plains Exploration and Rosetta Resources.
In the common stock portion of the Fund’s portfolio, new positions were established in NCI, Inc., an IT-based government contractor with a solid niche in the area of defense and national security, and Tekelec, a company with a pristine, cash-rich balance sheet that provides equipment to telecommunications companies. Additions to already existing investments were made in the shares of CA, Inc., Cisco Systems, Harmonic Inc., and TNS, Inc. In the small regional thrift and bank sector, we established a position in ESSA Bancorp and purchased additional shares of American National Bankshares, Chicopee Bancorp, Heritage Financial Group, Shore Bancshares and Southern National Bancorp of Virginia.
Most of the Greenspring Fund’s dispositions during the quarter were of bonds that matured or were redeemed early by the issuing corporations. However, we also sold the convertible bonds of Dollar Financial Corp at a premium to par, as the underlying common stock had increased to the extent that the convertible bond (that we
Greenspring Fund, Incorporated
had originally purchased due only to its attractive yield to maturity) had been driven higher, through par, due to its convertibility feature.
In the common stock portfolio, we completely liquidated the Fund’s holdings of Carpenter Technology, at a significant profit. We believed that much of the promising outlook for Carpenter’s business was already reflected in its stock price and decided to sell the Fund’s entire position. As mentioned above, we sold the majority of our investment in the common stock of Ralcorp Holdings, after the Company received an acquisition offer from ConAgra Foods.
INVESTMENT STRATEGY
Looking ahead to the future, with respect to equities, we continue to focus on companies with extremely strong finances and industry positions that generate significant amounts of free cash flow that can be used to improve their future prospects even in these uncertain financial times. Whether by reinvesting in current operations, acquiring businesses that allow them to increase their growth prospects, or returning cash to shareholders by way of dividends or stock repurchases, these companies are well positioned to create value for shareholders regardless of the crosscurrents affecting the global economy.
With our fixed income investments, we remain opportunistic and will continue to seek to uncover additional attractive short duration high-yielding bond investments that should generate solid calculable total returns during these uncertain economic times. With a view that interest rates will be moving higher in the not too distant future, we will continue to focus on “cushion” bonds. As always, we will only purchase our fixed income investments after careful analysis of the issuing company’s balance sheet, available financing, looming capital requirements, and expected cash flow metrics.
We remain disciplined in our approach to both equity and fixed income investments and are confident that our equity investments should generate solid returns for our shareholders over time, as their strong financial characteristics allow the companies to create value for shareholders. We are also confident that our fixed income investments should continue to produce solid, steady returns for the Greenspring Fund.
We hope that all of our shareholders are enjoying the summer season, and we look forward to reporting further progress with respect to our goals at the Greenspring Fund as the year unfolds.
Respectfully,
 |  |
| Charles vK. Carlson | Michael J. Fusting |
| Portfolio Manager and Co-Chief Investment Officer | Co-Chief Investment Officer |
**Total Annual Fund Operating Expenses for the Fund will not correlate to the Ratio of Expenses to Average Net Assets shown in the Fund’s most recent Annual Report and in the financial Highlights section of this Prospectus, which reflects the operating expenses of the Fund and does not include acquired fund fees and expenses.
Greenspring Fund, Incorporated
Mutual fund investing involves risk. Principal loss is possible. Small-capitalization companies tend to have limited liquidity and greater price volatility than large-capitalization companies. Investments by the Fund in lower-rated and non-rated securities present a greater risk of loss to principal and interest than higher-rated securities. Investments in debt securities typically decrease in value when interest rates rise. This risk is usually greater for longer-term debt securities.
Opinions expressed are subject to change, are not guaranteed and should not be considered recommendations to buy or sell any security. Fund holdings and/or sector allocations are subject to change at any time and are not recommendations to buy or sell any security. Current and future portfolio holdings are subject to risk.
The Dow Jones Industrial Average is an unmanaged index of common stocks comprised of major industrial companies and assumes reinvestment of dividends. You can not invest directly in an index. Cash flow measures the cash generating capability of a company by adding non-cash charges (e.g. depreciation) and interest expense to pretax income.
Distributed by Quasar Distributors, LLC
Greenspring Fund, Incorporated
EXPENSE EXAMPLE For the Six Months Ended June 30, 2011 (Unaudited) |
As a shareholder of the Fund, you incur two types of costs: (1) redemption fees if you redeem within 60 days of purchase; and (2) ongoing costs, including management fees and other Fund expenses. This example is intended to help you understand your ongoing costs (in dollars) of investing in the Fund and to compare these costs with the ongoing costs of investing in other mutual funds. The example is based on an investment of $1,000 invested at the beginning of the period and held for the entire period (1/1/2011 – 6/30/2011).
Actual Expenses
The first line of the table below provides information about actual account values based on actual returns and actual expenses. You may use the information in this line, together with the amount you invested, to estimate the expenses that you paid over the period. Simply divide your account value by $1,000 (for example, an $8,600 account value divided by $1,000 = 8.6), then multiply the result by the number in the first line under the heading entitled “Expenses Paid During the Period” to estimate the expenses you paid on your account during this period.
Hypothetical Example for Comparison Purposes
The second line of the table below provides information about hypothetical account values and hypothetical expenses based on the Fund’s actual expense ratio and an assumed rate of return of 5% per year before expenses, which is not the Fund’s actual return. The hypothetical account values and expenses may not be used to estimate the actual ending account balance or expenses you paid for the period. You may use this information to compare the ongoing costs of investing in the Fund and other funds. To do so, compare this 5% hypothetical example with the 5% hypothetical examples that appear in the shareholder reports of the other funds. Please note that the expenses shown in the table are meant to highlight your ongoing costs only and do not reflect any transactional costs, such as redemption fees. Therefore, the second line of the table is useful in comparing ongoing costs only, and will not help you determine the relative total costs of owning different funds. In addition, if these transactional costs were included, your costs would have been higher.
| | | | | Expenses Paid |
| | | Beginning | Ending | During the Period |
| | | Account Value | Account Value | 1/1/2011 – |
| | | 1/1/2011 | 6/30/2011 | 6/30/2011* |
| Actual | | $1,000 | $1,016 | $4.55 |
| Hypothetical | | | | |
| (5% annual return before expenses) | | $1,000 | $1,020 | $4.56 |
| * | Expenses are equal to the Fund’s annualized expense ratio of 0.91%, multiplied by the average account value over the period multiplied by 181/365 (to reflect the one-half year period). |
Greenspring Fund, Incorporated
SCHEDULE OF INVESTMENTS at June 30, 2011 (Unaudited) |
| Shares | | | | Value | |
| COMMON STOCKS: 45.5% | | | |
| | | | |
| Business Software and Services: 3.1% | | | |
| | 1,200,954 | | CA, Inc. | | $ | 27,429,789 | |
| | | | | |
| Commercial Banks & Thrifts: 1.8% | | | | |
| | 55,184 | | American National Bankshares, Inc. | | | 1,014,834 | |
| | 109,287 | | BCSB Bancorp, Inc.* | | | 1,538,761 | |
| | 398,801 | | Cardinal Financial Corp. | | | 4,366,871 | |
| | 48,907 | | Chicopee Bancorp, Inc.* | | | 699,370 | |
| | 80,714 | | ESSA Bancorp, Inc. | | | 1,002,468 | |
| | 5,382 | | Hampden Bancorp, Inc. | | | 71,419 | |
| | 53,165 | | Heritage Financial Group, Inc. | | | 633,727 | |
| | 5,050 | | Home Bancorp, Inc.* | | | 74,689 | |
| | 41,897 | | Middleburg Financial Corp. | | | 625,941 | |
| | 56,400 | | OceanFirst Financial Corp. | | | 730,380 | |
| | 38,650 | | OmniAmerican Bancorp, Inc.* | | | 578,590 | |
| | 103,425 | | Shore Bancshares, Inc. | | | 718,804 | |
| | 563,983 | | Southern National Bancorp of Virginia* | | | 3,829,445 | |
| | | | | | | 15,885,299 | |
| Communications Equipment: 6.0% | | | | |
| | 1,712,934 | | Cisco Systems, Inc. | | | 26,738,900 | |
| | 2,857,896 | | Harmonic, Inc.* | | | 20,662,588 | |
| | 371,157 | | TNS, Inc.* | | | 6,161,206 | |
| | | | | | | 53,562,694 | |
| Computer & Information Technology: 0.1% | | | | |
| | 41,900 | | NCI, Inc.* | | | 951,968 | |
| | | | | |
| Construction & Engineering: 3.7% | | | | |
| | 315,700 | | EMCOR Group, Inc.* | | | 9,253,167 | |
| | 526,448 | | Mastec, Inc.* | | | 10,381,554 | |
| | 644,305 | | Michael Baker Corp.* º | | | 13,607,722 | |
| | | | | | | 33,242,443 | |
| Consumer Goods: 1.6% | | | | |
| | 1,096,472 | | Prestige Brands Holdings, Inc.* | | | 14,078,700 | |
| | | | | |
| Electrical Equipment: 0.1% | | | | |
| | 17,400 | | Emerson Electric Co. | | | 978,750 | |
| | | | | |
Food – Packaged: 1.6% | | | | |
| | 162,714 | | Ralcorp Holdings, Inc.* | | | 14,087,778 | |
| | | | | | | | |
| | | | | | | | |
| Insurance: 7.9% | | | | |
| | 505,425 | | Assurant, Inc. | | | 18,331,765 | |
| | 520,917 | | Global Indemnity plc*# | | | 11,553,939 | |
| | 483,672 | | PartnerRe, Ltd.# | | | 33,300,817 | |
| | 236,050 | | W.R. Berkley Corp. | | | 7,657,462 | |
| | | | | | | 70,843,983 | |
| Internet Software & Services: 2.5% | | | | |
| | 795,184 | | j2 Global Communications, Inc.* | | | 22,448,044 | |
| | | | | |
| Machinery: 0.1% | | | | |
| | 20,000 | | Pentair, Inc. | | | 807,200 | |
| | | | | |
| Management Consulting: 3.3% | | | | |
| | 770,611 | | FTI Consulting, Inc.* | | | 29,236,981 | |
| | | | | |
| Oil & Gas Exploration & Production: 4.0% | | | | |
| | 5,626 | | ConocoPhillips | | | 423,019 | |
| | 108,400 | | Energen Corp. | | | 6,124,600 | |
| | 22,280 | | EOG Resources, Inc. | | | 2,329,374 | |
| | 375,296 | | Rosetta Resources, Inc.* | | | 19,342,756 | |
| | 192,000 | | Suncor Energy, Inc.# | | | 7,507,200 | |
| | | | | | | 35,726,949 | |
| Real Estate: 0.1% | | | | |
| | 4,500 | | First Potomac Realty Trust | | | 68,895 | |
| | 27,500 | | Urstadt Biddle Properties, Inc. – Class A | | | 498,025 | |
| | | | | | | 566,920 | |
| Semiconductors & Semiconductor Equipment: 2.6% | | | | |
| | 1,776,894 | | ON Semiconductor Corp.* | | | 18,604,080 | |
| | 34,093 | | Rudolph Technologies, Inc.* | | | 365,136 | |
| | 264,405 | | Tessera Technologies, Inc.* | | | 4,531,902 | |
| | | | | | | 23,501,118 | |
| Telecommunications: 1.6% | | | | |
| | 459,785 | | NTELOS Holdings Corp. | | | 9,388,810 | |
| | 572,250 | | Tekelec* | | | 5,224,643 | |
| | | | | | | 14,613,453 | |
| Truck Dealerships: 1.0% | | | | |
| | 211,930 | | Rush Enterprises, Inc. – Class A* | | | 4,033,028 | |
| | 295,798 | | Rush Enterprises, Inc. – Class B* | | | 4,762,348 | |
| | | | | | | 8,795,376 | |
The accompanying notes are an integral part of these financial statements.
Greenspring Fund, Incorporated
SCHEDULE OF INVESTMENTS at June 30, 2011 (Unaudited) (Con’t) |
| Shares/Principal | | Value | |
| COMMON STOCKS: 45.5% (Con’t) | | | |
| | | | |
| Utilities: 2.4% | | | |
| | 785,167 | | PPL Corp. | | $ | 21,851,198 | |
| | | | | |
| Waste Management Services: 2.0% | | | | |
| | 577,958 | | Republic Services, Inc. | | | 17,830,004 | |
| | | | | |
| TOTAL COMMON STOCKS | | | | |
| (cost $331,126,018) | | | | 406,438,647 | |
| | | | | | |
| INVESTMENT COMPANIES: 0.1% | | | | | |
| | 94,140 | | NGP Capital Resources Co. | | | | |
| | | | (cost $1,243,376) | | | 771,948 | |
| | | | | | |
| CONVERTIBLE BONDS: 19.6% | | | | | |
| | | | | | |
| Biotechnology: 1.9% | | | | | |
| $ | 17,435,000 | | Affymetrix, Inc., 3.500%, 1/15/38 | | | 17,347,825 | |
| | | | | | |
| Communications Equipment Manufacturing: 3.3% | | | | | |
| | 29,997,000 | | Alcatel-Lucent, Inc., 2.875%, 6/15/25 | | | 29,397,060 | |
| | | | | | |
| Educational: 2.5% | | | | | |
| | 10,000,000 | | School Specialty, Inc., 3.750%, 11/30/26 | | | 10,650,000 | |
| | 11,282,000 | | School Specialty, Inc., 3.750%, 11/30/26 | | | 11,366,615 | |
| | | | | | | | 22,016,615 | |
| Entertainment: 0.8% | | | | | |
| | 7,340,000 | | Live Nation Entertainment, Inc., | | | | |
| | | | 2.875%, 7/15/27 | | | 6,936,300 | |
| | | | | | |
| Financial Services: 1.3% | | | | | |
| | 11,698,000 | | Euronet Worldwide, Inc., | | | | |
| | | | 3.500%, 10/15/25 | | | 11,800,358 | |
| | | | | | |
| Home Improvements: 2.1% | | | | | |
| | 35,284,000 | | Masco Corp., 0.000%, 7/20/31 | | | 19,097,465 | |
| | | | | | |
| Housewares: 0.0% | | | | | |
| | 226,000 | | Lifetime Brands, Inc., 4.750%, 7/15/11 | | | 226,282 | |
| | | | | | |
| Medical Equipment: 3.2% | | | | | |
| | 20,645,000 | | Hologic, Inc., 2.000%, 12/15/37 | | | 20,128,875 | |
| | 8,496,000 | | Integra Lifesciences Holdings, | | | | |
| | | | 2.375%, 6/1/12 – 144A | | | 8,570,340 | |
| | | | | | | | 28,699,215 | |
| | | | | | |
| Oil & Gas Exploration & Production: 0.5% | | | | | |
| | 4,050,000 | | GMX Resources, Inc., 5.000%, 2/1/13 | | | 3,842,437 | |
| | 375,000 | | GMX Resources, Inc., 4.500%, 5/1/15 | | | 309,844 | |
| | | | | | | | 4,152,281 | |
| | | | | | | | | |
| Real Estate: 0.6% | | | | | |
| | 5,375,000 | | Alexandria Real Estate, Inc., | | | | |
| | | | 3.700%, 1/15/27 – 144A | | | 5,428,750 | |
| | | | | | |
| Semiconductors & Semiconductor Equipment: 2.2% | | | | | |
| | 4,911,000 | | Advanced Micro Devices, Inc., | | | | |
| | | | 5.750%, 8/15/12 | | | 5,058,330 | |
| | 14,875,000 | | Sandisk Corp., 1.000%, 5/15/13 | | | 14,447,344 | |
| | | | | | | | 19,505,674 | |
| Telecommunications: 1.2% | | | | | |
| | 10,764,000 | | Level 3 Communications, Inc., | | | | |
| | | | 3.500%, 6/15/12 | | | 10,790,910 | |
| | | | | | |
| TOTAL CONVERTIBLE BONDS | | | | | |
| (cost $167,887,785) | | | | 175,398,735 | |
| | | | | | |
| CORPORATE BONDS: 31.3% | | | | | |
| | | | | | |
| Asset Management: 0.0% | | | | | |
| | 30,000 | | Janus Capital Group, Inc., 6.119%, 4/15/14 | | | 32,275 | |
| | | | | | |
| Automotive: 1.0% | | | | | |
| | 8,700,000 | | Sonic Automotive, Inc., 8.625%, 8/15/13 | | | 8,808,750 | |
| | | | | | |
| Business Equipment: 0.0% | | | | | |
| | 100,000 | | Xerox Corp., 6.875%, 8/15/11 | | | 100,674 | |
| | | | | | |
| Construction & Engineering: 0.5% | | | | | |
| | 4,374,000 | | Mastec, Inc., 7.625%, 2/1/17 | | | 4,472,415 | |
| | | | | | |
| Consumer Goods: 4.1% | | | | | |
| | 28,606,000 | | Hanesbrands, Inc., 3.769%, 12/15/14 | | | 28,570,243 | |
| | 7,738,000 | | Treehouse Foods, Inc., 7.750%, 3/1/18 | | | 8,240,970 | |
| | | | | | | | 36,811,213 | |
| Electrical Equipment: 0.4% | | | | | |
| | 3,256,000 | | Wesco Distribution, Inc., 7.500%, 10/15/17 | | | 3,321,120 | |
| | | | | | |
| Healthcare: 1.4% | | | | | |
| | 11,546,000 | | HealthSouth Corp., 10.750%, 6/15/16 | | | 12,238,760 | |
| | 324,000 | | Omnicare, Inc., 6.125%, 6/1/13 | | | 325,620 | |
| | | | | | | | 12,564,380 | |
| Insurance: 1.0% | | | | | |
| | 7,989,000 | | Assurant, Inc., 5.625%, 2/15/14 | | | 8,541,184 | |
| | | | | | |
| Oil & Gas Equipment & Services: 2.5% | | | | | |
| | 21,836,000 | | Gulfmark Offshore, Inc., 7.750%, 7/15/14 | | | 22,163,540 | |
The accompanying notes are an integral part of these financial statements.
Greenspring Fund, Incorporated
SCHEDULE OF INVESTMENTS at June 30, 2011 (Unaudited) (Con’t) |
| Principal | | | | Value | |
| CORPORATE BONDS: 31.3% (Con’t) | | | |
| | | | |
| Oil & Gas Exploration & Production: 10.1% | | | |
| $ | 1,421,000 | | Bill Barrett Corp., 9.875%, 7/15/16 | | $ | 1,598,625 | |
| | 7,204,000 | | Forest Oil Corp., 8.000%, 12/15/11 | | | 7,402,110 | |
| | 3,550,000 | | McMoran Exploration Co., | | | | |
| | | | 11.875%, 11/15/14 | | | 3,851,750 | |
| | 985,000 | | Petrohawk Energy Corp., 10.500%, 8/1/14 | | | 1,113,050 | |
| | 24,759,000 | | Plains Exploration & Production, Co., | | | | |
| | | | 7.750%, 6/15/15 | | | 25,780,309 | |
| | 14,355,000 | | Plains Exploration & Production, Co., | | | | |
| | | | 10.000%, 3/1/16 | | | 16,221,150 | |
| | 6,652,000 | | Quicksilver Resources, Inc., 8.250%, 8/1/15 | | | 7,042,805 | |
| | 11,789,000 | | Range Resources Corp., 7.500%, 10/1/17 | | | 12,584,757 | |
| | 10,715,000 | | Rosetta Resources, Inc., 9.500%, 4/15/18 | | | 11,920,437 | |
| | 2,764,000 | | SandRidge Energy, Inc., 3.930%, 4/1/14 | | | 2,738,743 | |
| | | | | | | 90,253,736 | |
| Oil & Gas Pipelines: 0.1% | | | | |
| | 1,237,000 | | Sonat, Inc., 7.625%, 7/15/11 | | | 1,239,261 | |
| | | | | |
| Retail: 1.4% | | | | |
| | 11,007,000 | | GameStop Corp., 8.000%, 10/1/12 | | | 11,199,623 | |
| | 1,339,000 | | Saks, Inc., 9.875%, 10/1/11 | | | 1,363,462 | |
| | | | | | | 12,563,085 | |
| Specialty Chemicals: 1.1% | | | | |
| | 9,646,000 | | NewMarket Corp., 7.125%, 12/15/16 | | | 10,080,070 | |
| | | | | |
| Telecommunications: 3.6% | | | | |
| | 27,619,395 | | CCH II LLC, 13.500%, 11/30/16 | | | 32,659,934 | |
| | | | | |
| Transportation Equipment Manufacturing: 1.1% | | | | |
| | 9,094,000 | | Westinghouse Air Brake | | | | |
| | | | Technologies Corp., | | | | |
| | | | 6.875%, 7/31/13 | | | 9,776,050 | |
| Utilities: 0.6% | | | | |
| | 1,882,000 | | Aquila, Inc., 11.875%, 7/1/12 | | | 2,073,992 | |
| | 3,582,000 | | National Fuel Gas Co., 6.700%, 11/21/11 | | | 3,659,178 | |
| | | | | | | 5,733,170 | |
| Wood Product Manufacturing: 2.4% | | | | |
| | 18,318,000 | | Leucadia National Corp., 7.000%, 8/15/13 | | | 19,875,030 | |
| | 1,158,000 | | Leucadia National Corp., 7.750%, 8/15/13 | | | 1,253,535 | |
| | | | | | | 21,128,565 | |
| TOTAL CORPORATE BONDS | | | | |
| (cost $277,842,216) | | | 280,249,422 | |
| | | | | | | | |
| Shares | | | | | | |
| | | | | |
| SHORT-TERM INVESTMENT: 3.2% | | | | |
| | | | | |
| Money Market Instrument^ | | | | |
| | 28,537,866 | | AIM Liquid Assets, 0.060% | | | | |
| | | | (cost $28,537,866) | | | 28,537,866 | |
| | | | | |
| TOTAL INVESTMENTS IN SECURITIES | | | | |
| (cost $806,637,261): 99.7% | | | 891,396,618 | |
| Other Assets and Liabilities 0.3% | | | 2,748,882 | |
| NET ASSETS: 100.0% | | $ | 894,145,500 | |
| * | Non-income producing security. |
| º | Investment in affiliated security (note 5). |
| # | U.S. security of foreign issuer. |
| 144A | Securities purchased pursuant to Rule 144A of the Securities Act of 1933, as amended, and may be sold only to dealers in that program or other “qualified institutional buyers.” These securities have been deemed to be liquid by the Fund’s adviser under the supervision of the Board of Directors. As of June 30, 2011, the value of these investments was $13,999,090, or 1.6% of total net assets. |
| ^ | Rate shown is the 7-day effective yield at June 30, 2011. |
The accompanying notes are an integral part of these financial statements.
Greenspring Fund, Incorporated
STATEMENT OF ASSETS AND LIABILITIES at June 30, 2011 (Unaudited) |
| ASSETS | | | |
| Investments in securities, at value (cost $806,637,261) | | $ | 891,396,618 | |
| Receivables: | | | | |
| Securities sold | | | 134,770 | |
| Fund shares sold | | | 1,171,216 | |
| Dividends and interest | | | 7,322,531 | |
| Prepaid expenses | | | 37,949 | |
| Total assets | | | 900,063,084 | |
| | | | | |
| LIABILITIES | | | | |
| Payables: | | | | |
| Due to affiliate (Note 5) | | | 523,981 | |
| Securities purchased | | | 4,615,983 | |
| Fund shares redeemed | | | 556,169 | |
| Accrued expenses | | | 221,451 | |
| Total liabilities | | | 5,917,584 | |
| | | | | |
| NET ASSETS | | $ | 894,145,500 | |
| | | | | |
| Capital shares issued and outstanding (60,000,000 shares authorized, $0.01 par value) | | | 36,369,775 | |
| | | | | |
| Net asset value, offering and redemption price per share | | $ | 24.58 | |
| | | | | |
| COMPONENTS OF NET ASSETS | | | | |
| Capital stock at par value | | $ | 363,698 | |
| Paid-in capital | | | 788,525,874 | |
| Accumulated net investment gain | | | 5,707,369 | |
| Undistributed net realized gain on investments | | | 14,789,202 | |
| Net unrealized appreciation on investments | | | 84,759,357 | |
| NET ASSETS | | $ | 894,145,500 | |
The accompanying notes are an integral part of these financial statements.
Greenspring Fund, Incorporated
STATEMENT OF OPERATIONS For the Six Months Ended June 30, 2011 (Unaudited) |
| INVESTMENT INCOME | | | |
| Income | | | |
| Interest | | $ | 11,595,386 | |
| Dividends (net of foreign withholding taxes of $6,224) | | | 2,113,858 | |
| Total income | | | 13,709,244 | |
| | | | | |
| Expenses | | | | |
| Advisory fees (Note 5) | | | 3,112,717 | |
| Transfer agent fees (Note 6) | | | 428,496 | |
| Administration fees | | | 206,425 | |
| Fund accounting fees | | | 62,324 | |
| Administration fees – Corbyn (Note 5) | | | 59,903 | |
| Custody fees | | | 45,319 | |
| Reports to shareholders | | | 41,500 | |
| Miscellaneous fees | | | 24,344 | |
| Blue sky fees | | | 21,949 | |
| Directors fees | | | 21,335 | |
| Registration fees | | | 20,254 | |
| Legal fees | | | 16,990 | |
| Audit fees | | | 13,766 | |
| Insurance fees | | | 10,860 | |
| Total expenses | | | 4,086,182 | |
| Net investment income | | | 9,623,062 | |
| | | | | |
| REALIZED AND UNREALIZED GAIN ON INVESTMENTS | | | | |
| Net realized gain on investments | | | 14,195,525 | |
| Change in net unrealized appreciation/depreciation on investments | | | (10,530,834 | ) |
| Net realized and unrealized gain on investments | | | 3,664,691 | |
| Net increase in net assets resulting from operations | | $ | 13,287,753 | |
The accompanying notes are an integral part of these financial statements.
Greenspring Fund, Incorporated
| STATEMENTS OF CHANGES IN NET ASSETS |
| | | Six Months Ended | | | Year Ended |
| | | June 30, 2011# | | | December 31, 2010 |
| INCREASE (DECREASE) IN NET ASSETS FROM: | | | | | | |
| | | | | | | |
| OPERATIONS | | | | | | |
| Net investment income | | $ | 9,623,062 | | | $ | 16,518,600 | |
| Net realized gain on investments | | | 14,195,525 | | | | 10,392,646 | |
| Change in net unrealized appreciation/depreciation on investments | | | (10,530,834 | ) | | | 44,738,105 | |
| Net increase in net assets resulting from operations | | | 13,287,753 | | | | 71,649,351 | |
| | | | | | | | | |
| DISTRIBUTIONS TO SHAREHOLDERS | | | | | | | | |
| From net investment income | | | — | | | | (22,581,527 | ) |
| From net realized gain | | | — | | | | (5,386,895 | ) |
| Total distributions to shareholders | | | — | | | | (27,968,422 | ) |
| | | | | | | | | |
| CAPITAL SHARE TRANSACTIONS | | | | | | | | |
| Net increase in net assets derived from net change in outstanding shares (a)+ | | | 50,147,078 | | | | 258,531,954 | |
| Total increase in net assets | | | 63,434,831 | | | | 302,212,883 | |
| | | | | | | | | |
| NET ASSETS | | | | | | | | |
| Beginning of period | | | 830,710,669 | | | | 528,497,786 | |
| End of period (including accumulated net investment income (loss) | | | | | | | | |
| of $5,707,369 and ($3,915,693), respectively) | | $ | 894,145,500 | | | $ | 830,710,669 | |
(a)A summary of capital share transactions is as follows:
| | | Six Months Ended | | | Year Ended | |
| | | June 30, 2011# | | | December 31, 2010 | |
| | | Shares | | | Value | | | Shares | | | Value | |
| Shares sold | | | 8,782,712 | | | $ | 214,950,031 | | | | 15,468,309 | | | $ | 361,466,064 | |
| Shares issued in reinvestment of distributions | | | — | | | | — | | | | 1,166,189 | | | | 27,536,092 | |
| Shares redeemed+ | | | (6,747,601 | ) | | | (164,802,953 | ) | | | (5,595,309 | ) | | | (130,470,202 | ) |
| Net increase | | | 2,035,111 | | | $ | 50,147,078 | | | | 11,039,189 | | | $ | 258,531,954 | |
#Unaudited
+Net of redemption fees of $27,564 and $52,507, respectively.
The accompanying notes are an integral part of these financial statements.
Greenspring Fund, Incorporated
FINANCIAL HIGHLIGHTS For a capital share outstanding throughout each period |
| | | Six Months | | | | | | | | | | | | | | | | |
| | | Ended | | | | | | | | | | | | | | | | |
| | | June 30, | | | Year Ended December 31, |
| | | 2011# | | | | 2010 | | | | 2009 | | | | 2008 | | | | 2007 | | | | 2006 | |
| Net asset value, beginning of period | | $ | 24.19 | | | $ | 22.69 | | | $ | 20.36 | | | $ | 23.59 | | | $ | 23.43 | | | $ | 21.57 | |
| | | | | | | | | | | | | | | | | | | | | | | | | |
| INCOME (LOSS) FROM | | | | | | | | | | | | | | | | | | | | | | | | |
| INVESTMENT OPERATIONS: | | | | | | | | | | | | | | | | | | | | | | | | |
| Net investment income | | | 0.27 | | | | 0.56 | | | | 0.71 | | | | 0.43 | | | | 0.55 | | | | 0.53 | |
| Net realized and unrealized gain (loss) on investments | | 0.12 | | | | 1.82 | | | | 2.47 | | | | (3.18 | ) | | | 0.70 | | | | 2.10 | |
| Total from investment operations | | | 0.39 | | | | 2.38 | | | | 3.18 | | | | (2.75 | ) | | | 1.25 | | | | 2.63 | |
| | | | | | | | | | | | | | | | | | | | | | | | | |
| LESS DISTRIBUTIONS: | | | | | | | | | | | | | | | | | | | | | | | | |
| From net investment income | | | — | | | | (0.72 | ) | | | (0.83 | ) | | | (0.34 | ) | | | (0.56 | ) | | | (0.58 | ) |
| From net realized gain | | | — | | | | (0.16 | ) | | | (0.02 | ) | | | (0.16 | ) | | | (0.53 | ) | | | (0.19 | ) |
| Total distributions | | | — | | | | (0.88 | ) | | | (0.85 | ) | | | (0.50 | ) | | | (1.09 | ) | | | (0.77 | ) |
| Paid-in capital from redemption fees (Note 1) | | | —* | | | | —* | | | | —* | | | | 0.02 | | | | —* | | | | —* | |
| Net asset value, end of period | | $ | 24.58 | | | $ | 24.19 | | | $ | 22.69 | | | $ | 20.36 | | | $ | 23.59 | | | $ | 23.43 | |
| Total return | | 1.61 | %^ | | | 10.63 | % | | | 15.83 | % | | | (11.72 | )% | | | 5.32 | % | | | 12.29 | % |
| | | | | | | | | | | | | | | | | | | | | | | | | |
| RATIOS/SUPPLEMENTAL DATA: | | | | | | | | | | | | | | | | | | | | | | | | |
| Net assets, end of year (millions) | | $ | 894.1 | | | $ | 830.7 | | | $ | 528.5 | | | $ | 308.2 | | | $ | 257.9 | | | $ | 243.9 | |
| Ratio of expenses to average net assets | | | 0.91 | %+ | | | 0.95 | % | | | 1.03 | % | | | 1.06 | % | | | 1.03 | % | | | 1.07 | % |
| Ratio of net investment income to average net assets | 2.14 | %+ | | | 2.51 | % | | | 3.67 | % | | | 2.15 | % | | | 2.24 | % | | | 2.56 | % |
| Portfolio turnover rate | | 26.12 | %^ | | | 59.99 | % | | | 46.77 | % | | | 47.11 | % | | | 53.75 | % | | | 38.58 | % |
#Unaudited.
*Amount less than $0.01 per share.
^Not Annualized.
+Annualized.
The accompanying notes are an integral part of these financial statements.
Greenspring Fund, Incorporated
NOTES TO FINANCIAL STATEMENTS June 30, 2011 (Unaudited) |
| Note 1 – Significant Accounting Policies |
Greenspring Fund, Incorporated (the “Fund”) is a diversified, open-end management investment company registered under the Investment Company Act of 1940, as amended (the “1940 Act”). The Fund is organized as a Maryland corporation and commenced operations on July 1, 1983.
The preparation of the financial statements in accordance with accounting principles generally accepted in the United States of America requires management to make estimates and assumptions that affect the reported amounts and disclosures in the financial statements. Actual results could differ from those estimates. In preparing these financial statements, the Fund has evaluated events and transactions for potential recognition or disclosure through the date the financial statements were issued.
Investment transactions and related investment income – Investment transactions are recorded on the trade date. Dividend income is recorded on the ex-dividend date and interest income, including amortization of premiums and accretion of discounts, is recorded on the accrual basis. Dividends determined to be a return of capital are recorded as a reduction of the cost basis of the security. Realized gains and losses from investment transactions are reported on an identified cost basis.
Valuation of investments – Securities listed on a national securities exchange or the NASDAQ National Market are valued at the last reported sale price or the official closing price for certain markets on the exchange of major listing as of the close of the regular session of the New York Stock Exchange.
Securities that are traded principally in the over-the-counter market, listed securities for which no sale was reported on the day of valuation, and listed securities whose primary market is believed by Corbyn Investment Management, Inc. (“Corbyn” or the “Adviser”) to be over-the-counter are valued at the mean of the closing bid and asked prices obtained from sources that the Adviser deems appropriate.
Short-term investments are valued at amortized cost, which approximates fair market value. The value of securities that mature, or have an announced call, within 60 days will be valued at market value.
Securities for which market quotations are not readily available are valued at fair value as determined in good faith by the Adviser as directed by the Fund’s Board of Directors (the “Board”).
In determining fair value, the Adviser, as directed by the Board, considers all relevant qualitative and quantitative information available. These factors are subject to change over time and are reviewed periodically. The values assigned to fair value investments are based on available information and do not necessarily represent amounts that might ultimately be realized, since such amounts depend on future developments inherent in long-term investments. Further, because of the inherent uncertainty of valuation, those estimated values may differ significantly from the values that would have been used had a ready market of the investments existed, and the differences could be material.
The Fund has adopted fair valuation accounting standards that establish an authoritative definition of fair value and set out a hierarchy for measuring fair value. These standards require additional disclosures about the various input and valuation techniques used in measuring fair value. Fair value inputs are summarized in the three broad levels listed below:
| Level 1 – | Unadjusted quoted prices in active markets for identical securities that the Fund has the ability to access. |
| Level 2 – | Observable inputs other than quoted prices included in Level 1 that are observable for the security, either directly or indirectly. These inputs may include quoted prices for the identical instrument on an inactive market, prices for similar instruments, interest rates, prepayment speeds, credit risk, yield curves, default rates and similar data. |
Greenspring Fund, Incorporated
NOTES TO FINANCIAL STATEMENTS June 30, 2011 (Unaudited) (Con’t) |
| Level 3 – | Unobservable inputs for the security, to the extent relevant observable inputs are not available, representing the Fund’s own assumptions about the assumptions a market participant would use in valuing the security, and which would be based on the best information available. |
The inputs or methodology used for valuing securities are not necessarily an indication of the risk associated with investing in these securities. The following is a summary of the inputs used to value the Fund’s net assets as of June 30, 2011:
| | | Quoted Prices | | | Significant Other | | | Significant | | | Carrying Value | |
| | | in Active | | | Observable | | | Unobservable | | | at June 30, | |
| | | Markets | | | Inputs | | | Inputs | | | 2011 | |
| | | Level 1 | | | Level 2 | | | Level 3 | | | Total | |
| Common Stocks | | $ | 406,438,647 | | | $ | — | | | $ | — | | | $ | 406,438,647 | |
| Investment Companies | | | 771,948 | | | | — | | | | — | | | | 771,948 | |
| Convertible Bonds | | | — | | | | 175,398,735 | | | | — | | | | 175,398,735 | |
| Corporate Bonds | | | — | | | | 280,249,422 | | | | — | | | | 280,249,422 | |
| Short-Term Investment | | | 28,537,866 | | | | — | | | | — | | | | 28,537,866 | |
| Total | | $ | 435,748,461 | | | $ | 455,648,157 | | | $ | — | | | $ | 891,396,618 | |
See Schedule of Investments for industry breakdown.
Transfers between levels are recognized at the end of the reporting period. During the six months ended June 30, 2011, the Fund recognized no significant transfers between valuation levels.
Dividends and distributions to stockholders – The Fund records dividends and distributions to shareholders on the ex-dividend date.
Redemption fees – The Board has adopted policies and procedures with respect to frequent purchases and redemptions of Fund shares by Fund shareholders. The Fund is intended for long-term investors. The Fund discourages and does not accommodate frequent purchases and redemptions of Fund shares by Fund shareholders. The Fund reserves the right to decline a purchase order for any reason.
“Market-timers” who engage in frequent purchases and redemptions over a short period can disrupt the Fund’s investment program by requiring the Fund to have excess cash on hand or to liquidate holdings to accommodate redemptions. In addition, frequent purchases and redemptions may impede efficient Fund management and create additional transaction costs that are borne by all shareholders. To the extent that the Fund invests a significant portion of its assets in small-cap securities or high-yield bonds, it may be subject to the risks of market timing more than a fund that does not. Therefore, the Fund imposes a 2% redemption fee for shares held 60 days or less. The fee is deducted from the seller’s redemption proceeds and deposited into the Fund to help offset brokerage commissions, market impact, and other costs associated with fluctuations in Fund asset levels and cash flow caused by short-term trading. All shareholders are subject to these restrictions regardless of whether you purchased your shares directly from the Fund or through a financial intermediary. However, the Fund is limited in its ability to determine whether trades placed through financial intermediaries may signal excessive trading. Accordingly, the Fund may not be able to determine whether trading in combined orders or in omnibus accounts is contrary to the Fund’s policies. The Fund reserves the right to reject combined or omnibus orders in whole or in part.
Greenspring Fund, Incorporated
NOTES TO FINANCIAL STATEMENTS June 30, 2011 (Unaudited) (Con’t) |
The “first-in, first-out” method is used to determine the holding period. Under this method, the date of redemption will be compared with the earliest purchase date of shares held in the account. If the holding period for shares purchased is 60 days or less, the fee will be charged. The redemption fee may be modified or discontinued at any time, in which case, shareholders will be notified.
In compliance with Rule 22c-2 under the 1940 Act, Quasar Distributors, LLC, on behalf of the Fund, has entered into written agreements with each of the Fund’s financial intermediaries, under which the intermediaries must, upon request, provide the Fund with certain shareholder and identity trading information so that the Fund can enforce its frequent trading policies.
The fee does not apply to shares acquired through the reinvestment of dividends or other distributions, or shares redeemed pursuant to a systematic withdrawal plan or a mandatory IRA distribution.
Risk of loss arising from indemnifications – In the normal course of business, the Fund enters into contracts that contain a variety of representations, which provide general indemnifications. The Fund’s maximum exposure under these arrangements is unknown as this would involve future claims that may be made against the Fund that have not yet occurred. However, based on experience, the Fund expects the risk of loss to be remote.
Note 2 – Dividends and Distributions |
It is the Fund’s policy to declare dividends from net investment income and distributions from net realized gains as determined in accordance with income tax regulations, which may differ from accounting principles generally accepted in the United States of America. Accordingly, periodic reclassifications are made within the portfolio’s capital accounts to reflect income and gains available for distribution under income tax regulations.
On July 14, 2010 an income dividend of $0.29000 per share was declared, payable on July 15, 2010, to shareholders of record on July 13, 2010. Additionally, on December 15, 2010, an income dividend of $0.42852 per share, a short-term capital gain distribution of $0.05455 per share, and a long-term capital gain distribution of $0.10816 per share were declared, payable on December 16, 2010 to shareholders of record on December 14, 2010. The tax character of distributions paid during the six months ended June 30, 2011 and the year ended December 31, 2010 was as follows:
| Distributions paid from: | | June 30, 2011 | | December 31, 2010 |
| Ordinary income | | $ | — | | | $ | 24,387,532 | |
| Long-term capital gain | | $ | — | | | $ | 3,580,890 | |
These dividends are either distributed to shareholders or reinvested in the Fund as additional shares issued to shareholders. For those shareholders reinvesting the dividends, the number of shares issued is based on the net asset value per share as of the close of business on the ex-dividend date.
The Fund designated as long-term capital gain dividend, pursuant to Internal Revenue Code Section 852(b)(3), the amount necessary to reduce the earnings and profits of the Fund related to net capital gain to zero for the tax year ended December 31, 2010.
Note 3 – Purchases and Sales of Investments |
For the six months ended June 30, 2011, purchases and sales of investments, other than short-term investments, aggregated $358,221,943 and $208,075,104, respectively.
Greenspring Fund, Incorporated
NOTES TO FINANCIAL STATEMENTS June 30, 2011 (Unaudited) (Con’t) |
Note 4 – Federal Income Taxes |
It is the Fund’s policy to comply with the requirements of the Internal Revenue Code applicable to regulated investment companies. Accordingly, the Fund intends to distribute substantially all of its taxable income. Therefore, no federal income tax provision is required.
As of and during the six months ended June 30, 2011, the Fund did not have any tax positions that did not meet the “more-likely-than-not” threshold of being sustained by the applicable tax authority. Tax positions not deemed to meet the “more-likely-than-not” threshold would be recorded as a tax benefit or expense in the current year. Generally, tax authorities can examine tax returns filed for all open tax years (2007-2010).
Required Fund distributions are based on income and capital gain amounts determined in accordance with federal income tax regulations, which differ from net investment income and realized gains recognized for financial reporting purposes.
Accordingly, the composition of net assets and distributions on a tax basis may differ from those reflected in the accompanying financial statements. As of December 31, 2010, the Fund’s most recently completed year end, the components of distributable earnings on a tax basis were as follows:
| Cost of investments | | $ | 732,092,701 | |
| | | | | |
| Gross tax unrealized appreciation | | | 97,317,800 | |
| Gross tax unrealized depreciation | | | (6,113,113 | ) |
| Net tax unrealized appreciation | | | 91,204,687 | |
| | | | | |
| Undistributed ordinary income | | | 169,811 | |
| Undistributed long-term capital gain | | | 593,677 | |
| Total distributable earnings | | | 763,488 | |
| | | | | |
| Other accumulated gains/(losses) | | | — | |
| Total accumulated earnings/(losses) | | $ | 91,968,175 | |
Accounting principles generally accepted in the United States of America require that certain components of net assets relating to permanent differences be reclassified between financial and tax reporting. These reclassifications have no effect on net assets or net asset value per share. For the year ended December 31, 2010, the Fund decreased accumulated net investment loss by $3,205,529 and decreased undistributed net realized gain on investments by $3,205,529.
As of December 31, 2010, the Fund had utilized its capital loss carryforward of $463,089.
Greenspring Fund, Incorporated
NOTES TO FINANCIAL STATEMENTS June 30, 2011 (Unaudited) (Con’t) |
Note 5 – Transactions with Affiliated Parties |
Corbyn serves as the Fund’s investment adviser. Under an agreement between the Fund and Corbyn, the Fund pays Corbyn a fee of 0.75% of the first $250 million of average daily net assets, 0.70% of average daily net assets between $250 million and $500 million and 0.65% of average daily net assets in excess of $500 million, which is computed daily and paid monthly. For the six months ended June 30, 2011, the Fund incurred $3,112,717 in advisory fees.
The Fund has also entered into a Services Agreement with Corbyn to provide various administrative services. As compensation, the Fund pays Corbyn a fee of $2,500 per month plus 0.01% of average daily net assets, which is computed daily and paid monthly. For the six months ended June 30, 2011, the Fund incurred $59,903 in administrative fees to Corbyn.
At June 30, 2011, investors for whom Corbyn was investment adviser held 810,672 shares of the Fund.
A company is considered to be an affiliate of the Fund under the 1940 Act if the Fund’s holdings of that company represent 5% or more of the outstanding voting securities of the company. Transactions with companies that are or were affiliates during the six months ended June 30, 2011 are as follows:
| | | Beginning | | | Purchase | | | Sales | | | Ending | | | Dividend | | | | | | | |
| Issuer | | Cost | | | Cost | | | Cost | | | Cost | | | Income | | | Shares | | | Value | |
| Michael Baker Corp. | | $ | 16,184,033 | | | $ | 169,124 | | | $ | — | | | $ | 16,353,157 | | | $ | — | | | 644,305 | | | $ | 13,607,722 | |
| Note 6 – Shareholder Servicing Fees |
Both the Fund and Corbyn have entered into various Shareholder Servicing Agreements, whereby a fee is paid to certain service agents who administer omnibus accounts for indirect shareholders of the Fund. The Board of Directors has authorized the Fund to pay the amount of the fees it estimates the Fund would have been charged by its transfer agent for administering the accounts on an individual basis. The amount is included in “Transfer agent fees” on the accompanying Statement of Operations. For the six months ended June 30, 2011, the Fund incurred $384,962 of such fees.
| Note 7 – New Accounting Pronouncement |
In May 2011, the Financial Accounting Standards Board issued Accounting Standards Update (“ASU”) No. 2011-04 “Amendments to Achieve Common Fair Value Measurement and Disclosure Requirements in U.S. GAAP and IFRSs.” ASU No. 2011-04 requires additional disclosures regarding fair value measurements. Effective for fiscal years beginning after December 15, 2011, and for interim periods within those fiscal years, entities will need to disclose the following:
1) the amounts of any transfers between Level 1 and Level 2 and the reasons for those transfers, and
2) for Level 3 fair value measurements, quantitative information about the significant unobservable inputs used, a description of the entity’s valuation processes, and a narrative description of the sensitivity of the fair value measurement to changes in the unobservable inputs and the interrelationship between inputs.
Management is currently evaluating the impact ASU No. 2011-04 will have on the Fund’s financial statement disclosures.
Greenspring Fund, Incorporated
APPROVAL OF INVESTMENT ADVISORY AGREEMENT (Unaudited) |
Continuance of the Investment Advisory Agreement (the “Agreement”) must be considered annually by the directors of the Fund who are not parties to the Agreement or “interested persons” of any such party (as defined in the 1940 Act) (the “Independent Directors”). In order for continuance to be approved, a majority of the Independent Directors must vote for such approval at an in-person meeting called for this purpose.
The Board of Directors (the “Board”), including a majority of the Independent Directors, approved the continuance of the Agreement most recently at an in-person meeting in February 2011. To assist the Directors in their evaluation of the Agreement, the Board was supplied with extensive information by the Adviser in advance of the meeting. After a detailed presentation by the Adviser, during which the written materials were reviewed and questions from the Board were answered, the Independent Directors met separately to consider the approval of the Agreement. The Board as a whole, and the Independent Directors voting separately, then approved the continuation of the Agreement as being in the best interest of the Fund. In considering the Agreement, the Board did not identify any particular overriding factor, but considered all the information available.
Below is a summary of the primary factors considered by the Board and the conclusions thereto that formed the basis for the Board approving the continuance of the Agreement:
1. The nature, extent, and quality of the services to be provided by the Adviser under the Agreement. The Board considered the specific responsibilities of all aspects of the daily management of the Fund. The Board considered the qualifications and experience of the portfolio manager and other key personnel of the Adviser involved with the day-to-day activities of the Fund. The Board also considered the resources and compliance structure of the Adviser, including the backgrounds of the chief compliance officers of both the Fund and the Adviser, as well as the Adviser’s compliance record. The Board also considered the Adviser’s marketing efforts and its continued commitment to the Fund’s growth. The Board noted that the Adviser has managed the Fund since its inception, providing a consistent investment approach with low turnover of the Adviser’s staff. The Board concluded that the Adviser had sufficient quality and depth of personnel, resources, investment methods and compliance policies and procedures essential to performing its duties under its advisory agreement and that the nature, overall quality, and extent of the management services were satisfactory and reliable.
2. The Fund’s historical investment performance. In assessing the quality of the portfolio management delivered by the Adviser, the Board reviewed the short-term and long-term performance of the Fund for periods ended December 31, 2010 on both an absolute basis, and in comparison to the performance of various category, relative index and major market benchmarks. The Board noted that, while the Fund’s 1-year return of 10.6% slightly trailed the 1-year performance of its category benchmarks, which are groups of other mutual funds with similar investment styles selected by independent providers of mutual fund information, the Fund’s long-term performance for the 3-, 5- and 10-year periods continued to exceed that of the category benchmarks. The Board also considered the consistency of returns and the level of risk taken. The Board concluded that the Adviser’s historical investment performance was highly satisfactory given the market conditions and consistent with the Fund’s long-term performance objective.
3. The costs of the services to be provided by the Adviser and the structure of the Adviser’s fees under the Advisory Agreement. In considering the advisory fee and total fees and expenses of the Fund, the Board reviewed a presentation prepared by the Adviser comparing the Fund to a group of peer funds. Each of the peer funds used a
Greenspring Fund, Incorporated
APPROVAL OF INVESTMENT ADVISORY AGREEMENT (Unaudited) (Con’t) |
| | research-intensive investment style similar to that of the Fund, were not part of large fund complexes, and did not have a 12b-1 Plan. The Board considered that the Fund’s contractual advisory fee of 0.71% was less than the median contractual advisory fee of the peer funds at a common net asset level. The Board also considered that the Fund’s total expense ratio of 0.95% was lower than the median total expense ratio of the peer funds. The Board concluded that, although the Adviser had not agreed to waive and/or reimburse Fund expenses at a certain level, the Adviser had consistently maintained an annual expense ratio below the peer group median. Additionally, the fees charged by the Adviser were comparable with the fees it charged to its other separately managed accounts and were not excessive. |
4.Economies of scale. The Board also considered that economies of scale would be expected to be realized by the Adviser as the assets of the Fund grow. The Board noted that the Agreement’s fee schedule included breakpoints at net asset levels of $250 million and $500 million, whereby the fees paid by the Fund would decrease at the higher asset levels. The Board concluded that net assets were above $500 million for the entire year allowing the Fund and its shareholders to take advantage of these economies of scale.
5.Costs of services provided and profits to be realized by the Adviser. The Board then discussed the costs of the services to be provided and the profitability of the Adviser. Specific attention was given to the methodologies followed in allocating shared costs to the Fund. The Board recognized that the cost allocation methodologies are inherently subjective and various allocation methodologies may each be reasonable while producing different results. In this regard, the Board noted that the allocation appeared reasonable. After such review, the Board determined that the profitability of the Adviser with respect to the Agreement was not excessive, and that the Adviser had maintained adequate profit levels to support the services to the Fund.
6.Other factors and considerations. The Board periodically reviews and considers other material information throughout the year relating to the quality of services provided to the Fund, such as the receipt of research services in exchange for soft dollar credit in connection with commissions on the Fund’s equity transactions. The Board noted that the commissions paid by the Fund are reasonable and that the Fund receives quality execution, regardless of whether the commissions are used to pay for research through soft dollar arrangements. Other material information considered includes the Adviser’s management of its relationship with the Fund’s third party service providers and expenses paid to those third parties. Also, at its quarterly meetings, the Board reviews detailed information relating to the Fund’s portfolio and performance, and receives a presentation from the Fund’s portfolio manager.
The Board did not identify any single factor discussed previously, but instead considered all factors collectively in its determination to approve the Agreement. The Directors, including a majority of the Independent Directors, concluded that the terms of the Agreement are fair and reasonable, that the Adviser’s fees are reasonable in light of the services provided to the Fund and the benefits received by the Adviser and that the Agreement is in the best interest of the Fund.
Greenspring Fund, Incorporated
NOTICE TO SHAREHOLDERS June 30, 2011 (Unaudited) |
Proxy Voting Policies and Proxy Voting Record
The Fund’s proxy voting policies and procedures, as well as its proxy voting record for the most recent 12-month period ended June 30, are available without charge, upon request, by contacting the Fund at (800) 366-3863 or greenspring@greenspringfund.com. The Fund will send the information within three business days of receipt of the request, by first class mail or other means designed to ensure equally prompt delivery. The Fund’s proxy voting record is also available on the U.S. Securities and Exchange Commission’s website at www.sec.gov.
Form N-Q Holdings Information
The Fund files its complete schedule of portfolio holdings with the U.S. Securities and Exchange Commission for the first and third quarters of each fiscal year on Form N-Q. The Fund’s Forms N-Q are available on the Commission’s website at www.sec.gov and may be reviewed and copied at the Commission’s Public Reference Room in Washington, DC. Information on the operation of the Public Reference Room may be obtained by calling (800) SEC-0330.
Reports and Householding
In an attempt to reduce shareholder expenses, we will mail only one copy of the Fund’s Summary Prospectus and each Annual and Semi-Annual Report to those addresses shared by two or more accounts. If you wish to receive individual copies of these documents, please call us at (800) 366-3863. We will begin sending you individual copies 30 days after receiving your request.
The Fund’s Prospectus, Statement of Additional Information, Annual Report, and Semi-Annual Report, along with its first and third quarter portfolio holdings, are available on the Fund’s website at www.greenspringfund.com.
Greenspring Fund, Incorporated
Performance Since Inception on
July 1, 1983 through June 30, 2011
(Unaudited)
| HOW $10,000 INVESTED ON 7/1/83 WOULD HAVE GROWN* |
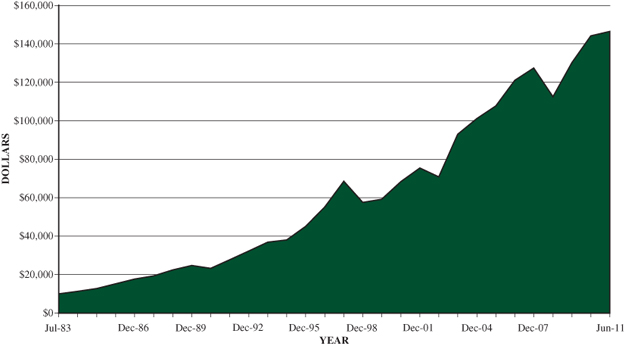 |
| * | Figures include changes in principal value, reinvested dividends and capital gains distributions. Past expense limitations increased the Fund’s return. This chart illustrates the performance of a hypothetical $10,000 investment made in the Fund since inception through June 30, 2011. The total value of $146,475 assumes the reinvestment of dividends and capital gains, but does not reflect the effect of any redemption fees. This chart does not imply any future performance. |
Average annual total returns for the one, three, five and ten year periods ended June 30, 2011 were 11.67%, 4.77%, 5.03% and 6.92%, respectively. Average annual returns for more than one year assume a compounded rate of return and are not the Fund’s year-by-year results, which fluctuated over the periods shown. Returns do not reflect taxes that shareholders may pay on Fund distributions or redemption of Fund shares.
(This Page Intentionally Left Blank.)
(This Page Intentionally Left Blank.)
Greenspring Fund, Incorporated
Privacy Policy
The Greenspring Fund recognizes that individuals expect an exceptional level of privacy in their financial affairs. The Fund assures the confidentiality of personal information provided to it.
The information we collect is limited to what the Fund believes is necessary or useful to conduct our business; administer your records, accounts and funds; to comply with laws and regulations; and to help us design or improve products and services. The Fund collects non-public personal information about you from information it receives from you on applications or other forms or through its website, as well as from information about your transactions with the Fund.
Some of this information may be disclosed to the Fund’s investment adviser, but not for marketing solicitation, as well as non-affiliated third parties who provide non-financial services to the Fund such as our Transfer Agent, in order to administer customer accounts and mail transaction confirmations and tax forms, and the mailing house the Fund utilizes for mailing shareholder reports. Such information may also be disclosed to a non-affiliated third party engaged to provide fund accounting and administrative services to us. Disclosing this information enables us to meet customers’ financial needs and regulatory requirements. These third parties act on its behalf and are obligated to keep the information we provide to them confidential and to use the information only for the purposes authorized. The Fund does not disclose any non-public personal information about you or former customers to anyone, except as permitted by law.
To protect your non-public personal information, the Fund permits access to it only by authorized employees and maintains security practices to safeguard your information.
If you have any questions regarding our Privacy Policy, please contact us at 1-800-366-3863 or greenspring@greenspringfund.com. Thank you.
Greenspring Fund, Incorporated
2330 West Joppa Road, Suite 110
Lutherville, MD 21093
(410) 823-5353
(800) 366-3863
www.greenspringfund.com
DIRECTORS
Charles vK. Carlson, Chairman
William E. Carlson
David T. Fu
Sean T. Furlong
Michael J. Fusting
Richard Hynson, Jr.
Michael P. O’Boyle
OFFICERS
Charles vK. Carlson
President and Chief Executive Officer
Michael J. Fusting
Sr. Vice President and
Chief Financial Officer
Elizabeth Agresta Swam
Chief Compliance Officer,
Secretary, Treasurer
and AML Officer
INVESTMENT ADVISER
Corbyn Investment Management, Inc.
2330 West Joppa Road, Suite 108
Lutherville, MD 21093-7207
ADMINISTRATOR, FUND ACCOUNTANT
AND TRANSFER AGENT
U.S. Bancorp Fund Services, LLC
615 East Michigan Street
Milwaukee, WI 53202
DISTRIBUTOR
Quasar Distributors, LLC
615 East Michigan Street
Milwaukee, WI 53202
CUSTODIAN
U.S. Bank, N.A.
1555 N. RiverCenter Dr., Suite 302
Milwaukee, WI 53212
LEGAL COUNSEL
K&L Gates LLP
1601 K Street NW
Washington, DC 20006
Symbol – GRSPX
CUSIP – 395724107
Item 2. Code of Ethics.
Not applicable for semi-annual reports.
Item 3. Audit Committee Financial Expert.
Not applicable for semi-annual reports.
Item 4. Principal Accountant Fees and Services.
Not applicable for semi-annual reports.
Item 5. Audit Committee of Listed Registrants.
Not applicable to registrants who are not listed issuers (as defined in Rule 10A-3 under the Securities Exchange Act of 1934).
Item 6. Investments.
Schedule of Investments is included as part of the report to shareholders filed under Item 1 of this Form.
Item 7. Disclosure of Proxy Voting Policies and Procedures for Closed-End Management Investment Companies.
Not applicable to open-end investment companies.
Item 8. Portfolio Managers of Closed-End Management Investment Companies.
Not applicable to open-end investment companies.
Item 9. Purchases of Equity Securities by Closed-End Management Investment Company and Affiliated Purchasers.
Not applicable to open-end investment companies.
Item 10. Submission of Matters to a Vote of Security Holders.
Not Applicable.
Item 11. Controls and Procedures.
| (a) | The Registrant’s Chief Executive Officer and Chief Financial Officer have reviewed the Registrant's disclosure controls and procedures (as defined in Rule 30a-3(c) under the Investment Company Act of 1940 (the “Act”)) as of a date within 90 days of the filing of this report, as required by Rule 30a-3(b) under the Act and Rules 13a-15(b) or 15d-15(b) under the Securities Exchange Act of 1934. Based on their review, such officers have concluded that the disclosure controls and procedures are effective in ensuring that information required to be disclosed in this report is appropriately recorded, processed, summarized and reported and made known to them by others within the Registrant and by the Registrant’s service provider. |
| (b) | There were no changes in the Registrant's internal control over financial reporting (as defined in Rule 30a-3(d) under the Act) that occurred during the second fiscal quarter of the period covered by this report that has materially affected, or is reasonably likely to materially affect, the Registrant's internal control over financial reporting. |
Item 12. Exhibits.
| (a) | (1) Any code of ethics or amendment thereto, that is the subject of the disclosure required by Item 2, to the extent that the registrant intends to satisfy Item 2 requirements through filing an exhibit. Not Applicable. |
(2) A separate certification for each principal executive and principal financial officer pursuant to Section 302 of the Sarbanes-Oxley Act of 2002. Filed herewith.
(3) Any written solicitation to purchase securities under Rule 23c-1 under the Act sent or given during the period covered by the report by or on behalf of the registrant to 10 or more persons. Not applicable to open-end investment companies.
| (b) | Certifications pursuant to Section 906 of the Sarbanes-Oxley Act of 2002. Furnished herewith. |
SIGNATURES
Pursuant to the requirements of the Securities Exchange Act of 1934 and the Investment Company Act of 1940, the registrant has duly caused this report to be signed on its behalf by the undersigned, thereunto duly authorized.
(Registrant) Greenspring Fund, Incorporated
By (Signature and Title)* /s/ Charles vK. Carlson
Charles vK. Carlson, Chief Executive Officer
Date 8/22/11 ��
Pursuant to the requirements of the Securities Exchange Act of 1934 and the Investment Company Act of 1940, this report has been signed below by the following persons on behalf of the registrant and in the capacities and on the dates indicated.
By (Signature and Title)* /s/ Charles vK. Carlson
Charles vK. Carlson, Chief Executive Officer
Date 8/22/11
By (Signature and Title)* /s/ Michael J. Fusting
Michael J. Fusting, Chief Financial Officer
Date 8/22/11
* Print the name and title of each signing officer under his or her signature.