UNITED STATES
SECURITIES AND EXCHANGE COMMISSION
Washington, D.C. 20549
FORM N-CSR
CERTIFIED SHAREHOLDER REPORT OF REGISTERED
MANAGEMENT INVESTMENT COMPANIES
Investment Company Act file number 811-3627
Greenspring Fund, Incorporated
(Exact name of registrant as specified in charter)
2330 West Joppa Road, Suite 110
Lutherville, MD 21093-4641
(Address of principal executive offices) (Zip code)
Mr. Charles vK. Carlson, President
2330 West Joppa Road, Suite 110
Lutherville, MD 21093-4641
(Name and address of agent for service)
(410) 823-5353
Registrant's telephone number, including area code
Date of fiscal year end: December 31, 2009
Date of reporting period: June 30, 2009
Item 1. Reports to Stockholders.
SEMI-ANNUAL REPORT
JUNE 30, 2009
This report is authorized for distribution
only to shareholders who have received a
copy of the official Prospectus of the
Greenspring Fund, Incorporated.
Greenspring Fund, Incorporated
July 2009
Dear Fellow Shareholders:
The second quarter of 2009 was a period of healing and reinvigoration for the financial markets. The credit markets, which had been the epicenter of the financial meltdown, began to stabilize, and corporate borrowers slowly began to regain access to the credit markets for their borrowing needs. As investors’ fears and concerns abated, they became more willing to invest in stocks and corporate bonds. Many stock market averages and corporate bond indexes posted double-digit gains during the quarter. Coming on the heels of a dreadful first quarter of 2009, this (much hoped for) rebound was a great source of relief for many. As investors began to venture back into equities and lower-rated corporate bonds, many reversed a “flight-to-quality” strategy that they had previously employed and sold their U.S. Treasury securities, sending prices of U.S. Treasury securities lower.
GREENSPRING FUND PERFORMANCE
During this eventful second quarter ending June 30, 2009, the Greenspring Fund gained 12.21%, bringing the Fund’s year-to-date performance to a positive 5.65%. All asset types – stocks, bonds and convertible bonds – achieved positive results during the second quarter, with the Fund’s stocks sharply outperforming the bonds. The Greenspring Fund’s gain of 5.65% during the first half of 2009 is due in large part to the steady, positive contribution from our fixed income securities during both quarters, combined with the fact that the rebound in our equities
Greenspring FundPerformance for thePeriods EndedJune 30, 2009 |
| Quarter | 12.21% |
| Year to Date | 5.65% |
| 1 Year | -6.69% |
| 3 Years* | 1.22% |
| 5 Years* | 4.46% |
| 10 Years* | 7.05% |
| 15 Years* | 7.95% |
| 20 Years* | 8.29% |
| Since inception on 7/1/83* | 9.99% |
| Expense Ratio** | 1.18% |
| ** | | as stated in Prospectus dated 5-1-09. |
| ** | | The expense ratio of 1.18% includes indirect expenses that the Fund incurs from investing in the shares of other investment companies. The indirect fees represent the Fund’s pro rata portion of the cumulative expenses charged by the other investment companies. Without those indirect fees, the Fund’s Total Annual Operating Expenses would be 1.06%. |
Performance data quoted represents past performance; past performance does not guarantee future results. The investment return and principal value of an investment will fluctuate so that an investor’s shares, when redeemed, may be worth more or less than their original cost. Current performance of the Fund may be lower or higher than the performance quoted. Performance data current to the most recent month end may be obtained by calling 1-800-366-3863 or visiting the Fund’s web site. The Fund imposes a 2.00% redemption fee for shares held 60 days or less. Performance data does not reflect the redemption fee. If reflected, total returns would be reduced.
Greenspring Fund, Incorporated
during the second quarter offset the slippage in the equities experienced during the first quarter.
Positive performances were widespread throughout the Fund’s portfolio during the second quarter. Of the 116 different securities owned in the Greenspring Fund during that time, 112 generated positive performances. In order of magnitude, the largest impacts to the Fund’s performance were provided by investments in the following companies: Michael Baker Corporation (common stock), Sonic Automotive (convertible and non-convertible bonds), Tessera Technologies (common stock), Republic Services (common stock, convertible and non-convertible bonds), and Carpenter Technology (common stock and non-convertible bonds). All of these securities generated positive performances during the quarter.
Michael Baker Corporation
The Fund’s investment in the common stock of Michael Baker Corporation was the largest individual holding in the Greenspring Fund at the end of the second quarter. Our investment in Michael Baker, an engineering services company, began in February of 2000, and we have written about it many times through the years. The size of the Fund’s position in the stock has ebbed and flowed over time, as we have reacted to company-specific developments, as well as changes in the stock market valuation of the firm. Michael Baker’s widely diversified engineering services capabilities are offered to a wide range of customers (including U.S. Government agencies, state and local governments, major domestic and multinational corporations, and foreign governments), which we believe provides a more stable and predictable revenue stream that should be less sensitive to general economic activity. Michael Baker’s common stock had declined during the first quarter of 2009 for no particular reason that we could identify other than overall stock market weakness. Its stock rebounded from $26 per share to more than $42 per share during the second quarter, benefiting from the general stock market rebound as well as the Company’s announcements of record first quarter earnings and an increase in its backlog of projects. Additionally, there is growing recognition in the investment community that Michael Baker stands to benefit from increased government spending on infrastructure projects designed to help stimulate the economy.
Sonic Automotive
The Fund’s investments in the convertible (5.25% due May 7, 2009) and non-convertible (8.625% due August 15, 2013) bonds of Sonic Automotive have taken a far more volatile path than is typical for Greenspring Fund’s fixed income investments. Sonic Automotive owns one of the nation’s largest chains of auto dealerships, particularly prominent in the Southeast and West. When we first purchased the bonds of Sonic Automotive, the Company was earning significant profits and generating substantial cash flows. The Company was using this excess cash flow to expand and improve its nationwide dealership operations. While Sonic
Greenspring Fund, Incorporated
was more leveraged than most of the companies whose bonds we typically purchase, we felt that Sonic’s solid profitability would enable the Company to easily refinance these bonds at their maturity, or even possibly redeem the 8.625% bonds prior to their maturity. However, the sharp downturn in the economy during 2008 and the sudden lockdown of the capital markets called into question the ability of many companies, including Sonic, to successfully access the capital markets to refinance maturing debt. During the fourth quarter of 2008 and the first quarter of 2009, the market prices of Sonic’s bonds dropped significantly, reflecting investors’ concerns about the future profitability of the Company and its ability to refinance its maturing debt. Despite the decline in the prices of the bonds, we remained confident in the inherent value of Sonic’s franchise, which was still marginally profitable even with the unprecedentedly rapid drop-off in automotive purchases. In early May, Sonic successfully completed an exchange offer for the majority of its 5.25% convertible notes, relieving the near-term pressure on the Company. The Fund’s convertible bonds matured, as scheduled, on May 7, 2009. The 8.625% Sonic bond has rebounded in price and we remain very confident in the Company’s prospects and expect Sonic to continue to service its debts in a timely fashion.
Greenspring FundTop 10 Holdings | |
| Michael Baker Corporation | 3.8% |
| Sepracor 0% Convertible Bonds | 3.6% |
| Assurant Inc. | 2.9% |
| Johnson Controls 5.25% Corporate Bonds | 2.8% |
| Maxtor Corp. 6.8% Convertible Bonds | 2.8% |
| Prestige Brands 9.25% Corporate Bonds | 2.8% |
| FTI Consulting Inc. | 2.5% |
| Everest Reins Holdings 8.75% Corporate Bonds | 2.4% |
| Jabil Circuit 5.875% Corporate Bonds | 2.4% |
| Mohawk Industries 6.25% Corporate Bonds | 2.3% |
Tessera Technologies
Tessera Technologies is a leading provider of packaging solutions for semiconductor chips. The Company owns approximately 1,000 patents that were either developed internally or obtained through acquisitions. Tessera licenses its technology to many of the world’s most prominent semiconductor manufacturers and in turn receives royalties from those manufacturers. The Fund first purchased shares of Tessera in the spring of 2008 after the stock had dropped sharply due to the announcement that the U.S. Patent and Trademark Office (PTO) was going to review the validity of several of Tessera’s significant patents. At the time we originally purchased the stock at a price of less than $15 per share, we believed there was minimal downside risk in the stock. The Company had more than $6 per share in cash, no debt, and was generating more than $1 per share in free cash flow annually. We believed that much
Greenspring Fund, Incorporated
of the bad news was already reflected in the depressed stock price and that the upside potential was significant should subsequent rulings from PTO be in Tessera’s favor. During the second quarter of 2009, there were several announcements of decisions that were favorable to the Company. Additionally, the sentiment towards prospects for semiconductor companies improved. These factors provided the impetus for Tessera’s stock to climb during the quarter from a starting value of just over $13 per share to a closing value of more than $25 per share.
INVESTMENT STRATEGY
We continue to maintain significant fixed income holdings in the Greenspring Fund. We are still finding good values in bonds that present potential opportunities to achieve capital appreciation in addition to generating current income at yields that are sharply superior to prevailing risk-free interest rates. Importantly, these bonds should provide attractive total returns while at the same time the bonds should reduce the risk and volatility of the Fund’s portfolio during these uncertain market conditions.
Purchases of Securities:
The majority of the Greenspring Fund’s purchases during the second quarter were of convertible bonds, although we also purchased selected common stocks and non-convertible bonds.
1) Rambus Inc. convertible bonds 0% due February 1, 2010 – Rambus Inc. designs and develops semiconductor chip technologies that the Company licenses to many customers including Intel, Panasonic, Toshiba and other leading semiconductor chip manufacturers. We purchased the convertible bonds of Rambus in April of 2009 after analyzing the Company’s balance sheet and near-term operating prospects. With the bond’s maturity of February 1, 2010, we certainly did not have to make a judgment on Rambus’ long-term prospects, but instead only had to concern ourselves with the next ten months. At the time we purchased the bond, the Company had more than $350 million in cash, which compared very favorably with its total debt of $128 million. The Company had more-than-adequate resources available to retire this bond at its maturity. Despite this comfortable cushion, we were still able to purchase the bonds at a yield to maturity of approximately 8.5%, a very attractive yield in the current environment. In addition to the generous yield, however, the convertible bond carried a relatively low conversion premium, meaning that upward movements in the underlying common stock could propel the convertible bond higher, increasing the potential return to bondholders. In June, Rambus announced that they had reached a settlement with the European Commission regarding an antitrust probe. The common stock reacted favorably, pushing the price of the convertible bond higher as well.
Greenspring Fund, Incorporated
2) Everest Reinsurance Holding Co. 8.75% due March 15, 2010 – Bond prices of many financial companies declined significantly during the early months of 2009, some justifiably, some without cause. We have been very wary of investing in financial companies during the last several years as many of them rely upon ready access to the capital markets for their continued success and/or they have made significant investments in hard-to-value securities. However, some financial companies do not require frequent access to the capital markets and have clean investment portfolios. We believe Everest Reinsurance Holding Co. is such a company and have purchased some of its bonds. Reinsurance companies such as Everest Re allow primary insurance companies to offload some of their risk by selling them reinsurance, which shifts a portion of the insurance companies’ risk to the reinsurance companies in exchange for a share of the insurance premiums. The bond we purchased is the next bond in Everest Re’s capital structure to mature. The Company has a very strong balance sheet with a very conservative investment portfolio, and should not have any difficulties retiring these bonds at their maturity.
Greenspring Fund Portfolio Allocation as of June 30, 2009 |
|
3) Par Pharmaceutical Inc. convertible bonds 2.875% due September 30, 2010 – Par Pharmaceuticals is one of the nation’s leading manufacturers and distributors of generic drugs. We purchased the convertible bonds of Par Pharmaceuticals in May of 2009 after studying the Company’s balance sheet, profitability and cash flow prospects. At the time of our purchase, the Company had more than $200 million in cash, compared with total debt of $172 million, was solidly profitable and was generating significant free cash flow. Notwithstanding these attractive characteristics, we were able to purchase the bonds at prices that should generate a yield to maturity of more than 8.5% if the bonds are held to maturity, a very attractive short-term yield in the current interest rate environment.
Sales of Securities:
Most of the “sales” of securities during the second quarter of 2009 were not open market sales, but were actually dispositions due to maturities or other corporate actions. Some bonds were redeemed early by issuing corporations, some bonds were sold back to corporations as a result of tender offers, some were sold back pursuant to the bonds’ “put” feature, and some matured as scheduled. However, we also sold
Greenspring Fund, Incorporated
some bonds in order to purchase what we believed were more attractive investments, sold some convertible bonds whose prices had been driven higher due to a rebound in the underlying common stock, and trimmed some common stock holdings where we believed it was in the Fund’s best interest to do so.
1) Agere Systems convertible bonds 6.5% due December 15, 2009 – The Greenspring Fund first purchased the convertible bonds of Agere Systems in December of 2005, and we added to the Fund’s position many times through the years. Agere was acquired by LSI Logic in April of 2007, which made the newly combined company stronger and more diversified. LSI Logic called the bonds for redemption in June of 2009, marking the end of a successful investment for the Greenspring Fund, as the Agere Systems (LSI Logic) convertible bonds provided steady, consistent performance for the Fund’s portfolio during many quarters since the bonds were first purchased.
2) Comverse Technology convertible bonds 0% due May 15, 2023 – The Fund’s investment in the convertible bonds of Comverse Technology was a short-term investment. We first purchased the bonds in January of 2009 and it was our intention at that time to “put” the bonds back to the Company on the next-scheduled put date of May 15, 2009. Bonds that have “put” features allow the holders of the bonds to sell (if the holders so choose) their bonds back to the issuing companies at predetermined dates and prices. The Fund has invested in many put bonds through the years, as we find them attractive because they give the holders more options for potentially making money than standard convertible bonds. We sold the Comverse convertible bonds back to the Company, as we originally intended, concluding a successful short-term investment.
3) CTS Corporation convertible bonds 2.125% due May 1, 2024 – The CTS convertible bonds were another example of a bond with a “put” feature. Although the bond’s final maturity date was May 1, 2024, holders had the option to sell the bond back to CTS at a price of $100 on three different dates. In accordance with our original intention, we “put” the bonds back to CTS at the earliest of the put dates – May 1, 2009. Although CTS Corporation is a very small company, our analysis showed that the Company had a solid balance sheet with sufficient resources and a financing commitment from banks to provide the resources to satisfy the put requirements, even if all holders chose to put the bonds back to the Company on the first put date.
While we have experienced a much appreciated and rewarding “bounce” in the financial markets, it remains to be seen how long this positive trend will continue. At this point, the stock market appears to be ready to take a rest, and perhaps test the strength of the recent rebound. Further sustained positive progress in the general stock market will most likely depend upon evidence of a real and sustainable
Greenspring Fund, Incorporated
economic recovery. Consequently, we are maintaining a conservative mix in the Fund’s portfolio, a strategy designed to allow us to continue to achieve returns that should be far less volatile than the returns achieved by many other investment strategies.
Respectfully,
 |  |
| Charles vK. Carlson | Michael J. Fusting |
| Portfolio Manager | Co-Chief Investment Officer |
| Co-Chief Investment Officer | |
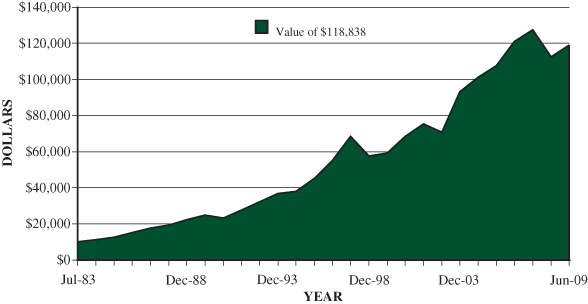
GREENSPRING FUND
PERFORMANCE SINCE INCEPTION
HOW $10,000 INVESTED ON 7/1/83 WOULD HAVE GROWN*
* Figures include changes in principal value, reinvested dividends and capital gains distributions. Past expense limitations increased the Fund’s return. This chart illustrates the performance of a hypothetical $10,000 investment made in the Fund since inception through June 30, 2009. The total value of $118,838 assumes the reinvestment of dividends and capital gains, but does not reflect the effect of any redemption fees. This chart does not imply any future performance.
Average annual total returns for the one, three, five and ten year periods ended June 30, 2009 were -6.69%, 1.22%, 4.46% and 7.05%, respectively. Average annual returns for more than one year assume a compounded rate of return and are not the Fund’s year-by-year results, which fluctuated over the periods shown. Returns do not reflect taxes that shareholders may pay on Fund distributions or redemption of Fund shares.
Please see the following page for important disclosure information.
Greenspring Fund, Incorporated
Mutual fund investing involves risk. Principal loss is possible. Small-capitalization companies tend to have limited liquidity and greater price volatility than large-capitalization companies. Investments by the Fund in lower-rated and non-rated securities present a greater risk of loss to principal and interest than higher-rated securities. Investments in debt securities typically decrease in value when interest rates rise. This risk is usually greater for longer-term debt securities.
Opinions expressed are subject to change, are not guaranteed and should not be considered recommendations to buy or sell any security. Fund holdings and/or sector allocations are subject to change at any time and are not recommendations to buy or sell any security.
Current and future portfolio holdings are subject to risk.
Free cash flow measures the cash generating capability of a company by adding certain non-cash charges (e.g. depreciation and amortization) to earnings and subtracting recurring capital expenditures.
Distributed by Quasar Distributors, LLC 8/09
Greenspring Fund, Incorporated
Expense Example For the Six Months Ended June 30, 2009 (Unaudited) |
As a shareholder of the Fund, you incur two types of costs: (1) redemption fees if you redeem within 60 days of purchase; and (2) ongoing costs, including management fees and other Fund expenses. This example is intended to help you understand your ongoing costs (in dollars) of investing in the Fund and to compare these costs with the ongoing costs of investing in other mutual funds. The example is based on an investment of $1,000 invested at the beginning of the period and held for the entire period (1/1/2009 – 6/30/2009).
Actual Expenses
The first line of the table below provides information about actual account values based on actual returns and actual expenses. You may use the information in this line, together with the amount you invested, to estimate the expenses that you paid over the period. Simply divide your account value by $1,000 (for example, an $8,600 account value divided by $1,000 = 8.6), then multiply the result by the number in the first line under the heading entitled “Expenses Paid During the Period” to estimate the expenses you paid on your account during this period.
Hypothetical Example for Comparison Purposes
The second line of the table below provides information about hypothetical account values and hypothetical expenses based on the Fund’s actual expense ratio and an assumed rate of return of 5% per year before expenses, which is not the Fund’s actual return. The hypothetical account values and expenses may not be used to estimate the actual ending account balance or expenses you paid for the period. You may use this information to compare the ongoing costs of investing in the Fund and other funds. To do so, compare this 5% hypothetical example with the 5% hypothetical examples that appear in the shareholder reports of the other funds. Please note that the expenses shown in the table are meant to highlight your ongoing costs only and do not reflect any transactional costs, such as redemption fees. Therefore, the second line of the table is useful in comparing ongoing costs only, and will not help you determine the relative total costs of owning different funds. In addition, if these transactional costs were included, your costs would have been higher.
| | | | Expenses Paid |
| | Beginning | Ending | During the Period |
| | Account Value | Account Value | 1/1/2009 – |
| | 1/1/2009 | 6/30/2009 | 6/30/2009* |
Actual | $1,000 | $1,057 | $5.35 |
Hypothetical | | | |
(5% annual return | | | |
before expenses) | $1,000 | $1,020 | $5.26 |
| * | Expenses are equal to the Fund’s annualized expense ratio of 1.05%, multiplied by the average account value over the period multiplied by 181/365 (to reflect the one-half year period). |
Greenspring Fund, Incorporated
SCHEDULE OF INVESTMENTS at June 30, 2009 (Unaudited) |
| Shares | | | | Value | |
| COMMON STOCKS: 27.6% | | | |
Business & Professional Services: 2.5% | | | |
| | 208,576 | | FTI Consulting, Inc.* | | $ | 10,578,975 | |
Commercial Banks: 1.1% | | | | |
| | 40,074 | | American National | | | | |
| | | | Bankshares, Inc. | | | 772,627 | |
| | 398,801 | | Cardinal | | | | |
| | | | Financial Corp. | | | 3,122,612 | |
| | 25,000 | | Middleburg | | | | |
| | | | Financial Corp. | | | 344,000 | |
| | 23,752 | | Patriot National | | | | |
| | | | Bancorp, Inc. | | | 67,693 | |
| | 27,500 | | Southern National | | | | |
| | | | Bancorp of Virginia* | | | 217,250 | |
| | 14,476 | | SunTrust Banks, Inc. | | | 238,130 | |
| | | | | | | 4,762,312 | |
| Construction & Engineering: 5.3% | | | | |
| | 315,700 | | EMCOR Group, Inc.* | | | 6,351,884 | |
| | 379,275 | | Michael Baker Corp.* | | | 16,066,089 | |
| | | | | | | 22,417,973 | |
| Diversified Gas Utilities: 1.0% | | | | |
| | 108,400 | | Energen Corp. | | | 4,325,160 | |
Electric Utilities: 0.8% | | | | |
| | 99,000 | | PPL Corp. | | | 3,263,040 | |
Electrical Equipment: 0.1% | | | | |
| | 17,400 | | Emerson Electric Co. | | | 563,760 | |
Energy Equipment & Services: 0.4% | | | | |
| | 204,414 | | Cal Dive | | | | |
| | | | International, Inc.* | | | 1,764,093 | |
Environmental Services: 0.9% | | | | |
| | 163,350 | | Republic | | | | |
| | | | Services, Inc. | | | 3,987,373 | |
Household & Personal Products: 1.1% | | | | |
| | 747,511 | | Prestige Brands | | | | |
| | | | Holdings, Inc.* | | | 4,597,193 | |
Industrial Distribution: 1.0% | | | | |
| | 84,100 | | Watsco, Inc. | | | 4,115,013 | |
Insurance: 6.1% | | | | |
| | 505,425 | | Assurant, Inc. | | | 12,175,688 | |
| | 34,450 | | PartnerRe, Ltd.# | | | 2,237,528 | |
| | 1,293,760 | | United America | | | | |
| | | | Indemnity, Ltd.*# | | | 6,197,110 | |
| | 236,050 | | W.R. Berkley Corp. | | | 5,067,993 | |
| | | | | | | 25,678,319 | |
| Machinery: 0.1% | | | | |
| | 20,000 | | Pentair, Inc. | | | 512,400 | |
Metals & Mining: 1.7% | | | | |
| | 86,000 | | Brush Engineered | | | | |
| | | | Materials, Inc.* | | | 1,440,500 | |
| | 270,927 | | Carpenter | | | | |
| | | | Technology Corp. | | | 5,637,991 | |
| | | | | | | 7,078,491 | |
| Oil & Gas Exploration & Production: 2.6% | | | | |
| | 5,626 | | ConocoPhillips | | | 236,630 | |
| | 22,280 | | EOG Resources, Inc. | | | 1,513,258 | |
| | 375,296 | | Rosetta | | | | |
| | | | Resources, Inc.* | | | 3,283,840 | |
| | 192,000 | | Suncor Energy, Inc.# | | | 5,825,280 | |
| | | | | | | 10,859,008 | |
| Real Estate: 0.1% | | | | |
| | 4,500 | | First Potomac | | | | |
| | | | Realty Trust | | | 43,875 | |
| | 27,500 | | Urstadt Biddle | | | | |
| | | | Properties, Inc. - | | | | |
| | | | Class A | | | 387,200 | |
| | | | | | | 431,075 | |
| Semiconductors & Semiconductor | | | | |
| Equipment: 1.4% | | | | |
| | 34,093 | | Rudolph | | | | |
| | | | Technologies, Inc.* | | | 188,193 | |
| | 235,780 | | Tessera | | | | |
| | | | Technologies, Inc.* | | | 5,962,876 | |
| | | | | | | 6,151,069 | |
| Thrifts & Mortgage Finance: 0.1% | | | | |
| | 60,000 | | BCSB Bancorp, Inc.* | | | 487,500 | |
| | 3,500 | | OceanFirst | | | | |
| | | | Financial Corp. | | | 41,895 | |
| | | | | | | 529,395 | |
The accompanying notes are an integral part of these financial statements.
Greenspring Fund, Incorporated
SCHEDULE OF INVESTMENTS at June 30, 2009 (Unaudited) (Con’t) |
| Shares/Principal | | | | Value | |
| COMMON STOCKS: 27.6% (Con’t) | | | |
Transportation: 1.3% | | | |
| | 211,930 | | Rush Enterprises, | | | |
| | | | Inc. - Class A* | | $ | 2,468,984 | |
| | 295,798 | | Rush Enterprises, | | | | |
| | | | Inc. - Class B* | | | 2,931,358 | |
| | | | | | | 5,400,342 | |
| TOTAL COMMON STOCKS | | | | |
| (cost $102,511,529) | | | 117,014,991 | |
INVESTMENT COMPANIES: 0.3% | | | | |
| | 217,078 | | NGP Capital | | | | |
| | | | Resources Co. | | | | |
| | | | (cost $2,889,006) | | | 1,274,248 | |
CONVERTIBLE BONDS: 26.0% | | | | |
Building Products: 1.6% | | | | |
| $ | 7,319,000 | | Griffon Corp., | | | | |
| | | | 4.000%, 7/18/23 | | | 6,971,347 | |
Business Services: 0.6% | | | | |
| | 2,633,000 | | Euronet | | | | |
| | | | Worldwide, Inc., | | | | |
| | | | 1.625%, 12/15/24 | | | 2,590,214 | |
Consumer Goods: 0.7% | | | | |
| | 3,245,000 | | JAKKS Pacific, Inc., | | | | |
| | | | 4.625%, 6/15/23 | | | 3,151,706 | |
Data Storage Devices: 2.8% | | | | |
| | 11,804,000 | | Maxtor Corp., | | | | |
| | | | 6.800%, 4/30/10 | | | 11,804,000 | |
Diversified Telecommunication Services: 1.4% | | | | |
| | 5,919,000 | | Level 3 | | | | |
| | | | Communications, Inc., | | | | |
| | | | 6.000%, 9/15/09 | | | 5,919,000 | |
| | 68,000 | | Level 3 | | | | |
| | | | Communications, Inc., | | | | |
| | | | 6.000%, 3/15/10 | | | 68,000 | |
| | | | | | | 5,987,000 | |
| Electrical Equipment: 1.7% | | | | |
| | 7,710,000 | | Wesco | | | | |
| | | | International, Inc., | | | | |
| | | | 2.625%, 10/15/25 | | | 7,276,312 | |
Environmental Services: 1.8% | | | | |
| | 7,686,000 | | Allied Waste | | | | |
| | | | Industries, Inc., | | | | |
| | | | 4.250%, 4/15/34 | | | 7,493,850 | |
Medical Equipment: 0.8% | | | | |
| | 3,274,000 | | Integra Lifesciences | | | | |
| | | | Holdings, | | | | |
| | | | | | | 3,159,410 | |
Metals & Mining: 0.3% | | | | |
| | 1,535,000 | | Coeur d’Alene | | | | |
| | | | Mines Corp., | | | | |
| | | | 1.250%, 1/15/24 | | | 1,346,962 | |
Movie Theaters: 1.8% | | | | |
| | 7,990,000 | | Regal Entertainment | | | | |
| | | | Group, | | | | |
| | | | | | | 7,730,325 | |
Pharmaceuticals: 6.2% | | | | |
| | 9,320,000 | | Par | | | |
| | | | Pharmaceutical, Inc., | | | | |
| | | | 2.875%, 9/30/10 | | | 8,970,500 | |
| | 2,500,000 | | Sepracor, Inc., | | | | |
| | | | 0.000%, 12/15/10 | | | 2,325,000 | |
| | 15,253,000 | | Sepracor, Inc., | | | | |
| | | | 0.000%, 10/15/24 | | | 15,081,404 | |
| | | | | | | 26,376,904 | |
| Semiconductors & Semiconductor | | | | |
| Equipment: 3.6% | | | | |
| | 6,445,000 | | ON Semiconductor | | | | |
| | | | Corp., | | | | |
| | | | 0.000%, 4/15/24 | | | 6,187,200 | |
| | 9,067,000 | | Rambus, Inc., | | | | |
| | | | 0.000%, 2/1/10 | | | 9,146,336 | |
| | | | | | | 15,333,536 | |
| Software: 0.8% | | | | |
| | 5,230,000 | | Magma Design | | | | |
| | | | Automation, | | | | |
| | | | 2.000%, 5/15/10 | | | 3,288,362 | |
The accompanying notes are an integral part of these financial statements.
Greenspring Fund, Incorporated
SCHEDULE OF INVESTMENTS at June 30, 2009 (Unaudited) (Con’t) |
| Principal | | | | Value | |
| CONVERTIBLE BONDS: 26.0% (Con’t) | | | |
Wireless Telecommunication Services: 1.9% | | | |
| $ | 7,863,000 | | Nextel | | | |
| | | | Communications, Inc., | | | |
| | | | 5.250%, 1/15/10 | | $ | 7,823,685 | |
| TOTAL CONVERTIBLE BONDS | | | | |
| (cost $107,345,842) | | | 110,333,613 | |
CORPORATE BONDS: 37.9% | | | | |
Automotive: 4.0% | | | | |
| | 1,198,000 | | Goodyear Tire & | | | | |
| | | | Rubber Co., | | | | |
| | | | 5.010%, 12/1/09 | | | 1,192,010 | |
| | 11,853,000 | | Johnson Controls, Inc., | | | | |
| | | | 5.250%, 1/15/11 | | | 11,985,884 | |
| | 5,213,000 | | Sonic Automotive, Inc., | | | | |
| | | | 8.625%, 8/15/13 | | | 3,675,165 | |
| | | | | | | 16,853,059 | |
| Business & Professional Services: 1.5% | | | | |
| | 6,315,000 | | FTI Consulting, Inc., | | | | |
| | | | 7.625%, 6/15/13 | | | 6,172,912 | |
Chemicals: 0.2% | | | | |
| | 924,000 | | Cytec Industries, Inc., | | | | |
| | | | 5.500%, 10/1/10 | | | 941,691 | |
Communications Equipment: 0.0% | | | | |
| | 121,000 | | Motorola, Inc., | | | | |
| | | | 7.625%, 11/15/10 | | | 123,143 | |
Computers & Peripherals: 0.4% | | | | |
| | 1,795,000 | | Sun | | | | |
| | | | Microsystems, Inc., | | | | |
| | | | 7.650%, 8/15/09 | | | 1,806,219 | |
Data Storage Devices: 0.5% | | | | |
| | 2,000,000 | | Seagate | | | | |
| | | | Technology HDD, | | | | |
| | | | 2.275%, 10/1/09# | | | 1,985,000 | |
Diversified Financial Services: 0.3% | | | | |
| | 1,496,000 | | Waddell & Reed | | | | |
| | | | Financial, Inc., | | | | |
| | | | 5.600%, 1/15/11 | | | 1,499,704 | |
Diversified Gas Utilities: 2.0% | | | | |
| | 4,715,000 | | Energen Corp., | | | | |
| | | | 7.625%, 12/15/10 | | | 4,880,695 | |
| | 3,582,000 | | National Fuel | | | | |
| | | | Gas Co., | | | | |
| | | | 6.700%, 11/21/11 | | | 3,765,456 | |
| | | | | | | 8,646,151 | |
| Diversified Telecommunication Services: 0.5% | | | | |
| | 1,908,000 | | Rogers | | | | |
| | | | Communications, Inc., | | | | |
| | | | 8.000%, 12/15/12# | | | 1,974,780 | |
Electric Utilities: 7.2% | | | | |
| | 4,913,000 | | Allegheny Energy | | | | |
| | | | Supply Co., | | | | |
| | | | 7.800%, 3/15/11 | | | 5,084,857 | |
| | 1,784,000 | | Aquila, Inc., | | | | |
| | | | 11.875%, 7/1/12 | | | 1,972,576 | |
| | 4,855,000 | | Constellation Energy | | | | |
| | | | Group, Inc., | | | | |
| | | | 6.125%, 9/1/09 | | | 4,876,119 | |
| | 7,711,000 | | Entergy Gulf | | | | |
| | | | Systems, Inc., | | | | |
| | | | 1.068%, 12/1/09 | | | 7,670,286 | |
| | 1,958,000 | | Nisource Finance Corp., | | | | |
| | | | 1.231%, 11/23/09 | | | 1,942,639 | |
| | 1,845,000 | | Reliant Energy | | | | |
| | | | Reserve Corp., | | | | |
| | | | 7.750%, 2/15/11 | | | 1,956,187 | |
| | 1,192,000 | | Utilicorp United, Inc., | | | | |
| | | | 7.625%, 11/15/09 | | | 1,203,448 | |
| | 5,605,000 | | Westar Energy, Inc., | | | | |
| | | | 7.125%, 8/1/09 | | | 5,630,833 | |
| | | | | | | 30,336,945 | |
| Electrical Equipment: 3.5% | | | | |
| | 3,374,000 | | Arrow Electronics, Inc., | | | | |
| | | | 9.150%, 10/1/10 | | | 3,432,583 | |
| | 530,000 | | Graftech Finance, Inc., | | | | |
| | | | 10.250%, 2/15/12 | | | 503,500 | |
| | 10,223,000 | | Jabil Circuit, Inc., | | | | |
| | | | 5.875%, 7/15/10 | | | 10,069,655 | |
| | 885,000 | | Tyco International | | | | |
| | | | Finance, | | | | |
| | | | 6.375%, 10/15/11# | | | 933,047 | |
| | | | | | | 14,938,785 | |
The accompanying notes are an integral part of these financial statements.
Greenspring Fund, Incorporated
SCHEDULE OF INVESTMENTS at June 30, 2009 (Unaudited) (Con’t) |
| Principal | | | | Value | |
| CORPORATE BONDS: 37.9% (Con’t) | | | |
Environmental Services: 1.3% | | | |
| $ | 3,004,000 | | Allied Waste | | | |
| | | | Industries, Inc., | | | |
| | | | 6.500%, 11/15/10 | | $ | 3,057,555 | |
| | 185,000 | | Allied Waste | | | | |
| | | | Industries, Inc., | | | | |
| | | | 5.750%, 2/15/11 | | | 186,459 | |
| | 783,000 | | Allied Waste | | | | |
| | | | Industries, Inc., | | | | |
| | | | 6.375%, 4/15/11 | | | 797,040 | |
| | 1,464,000 | | Allied Waste | | | | |
| | | | Industries, Inc., | | | | |
| | | | 7.875%, 4/15/13 | | | 1,494,491 | |
| | | | | | | 5,535,545 | |
| Floor Covering: 2.3% | | | | |
| | 9,896,000 | | Mohawk | | | | |
| | | | Industries, Inc., | | | | |
| | | | 6.250%, 1/15/11 | | | 9,625,592 | |
Household & Personal Products: 2.8% | | | | |
| | 11,837,000 | | Prestige Brands, Inc., | | | | |
| | | | 9.250%, 4/15/12 | | | 11,777,815 | |
Insurance: 2.8% | | | | |
| | 1,669,000 | | Assurant, Inc., | | | | |
| | | | 5.625%, 2/15/14 | | | 1,490,135 | |
| | 10,073,000 | | Everest Reinsurance | | | | |
| | | | Holdings, Inc., | | | | |
| | | | 8.750% 3/15/10 | | | 10,274,792 | |
| | | | | | | 11,764,927 | |
| Metals & Mining: 0.2% | | | | |
| | 969,000 | | Carpenter | | | | |
| | | | Technology Corp., | | | | |
| | | | 6.650%, 6/7/10 | | | 955,468 | |
| | 78,000 | | Massey Energy Co., | | | | |
| | | | 6.625%, 11/15/10 | | | 74,118 | |
| | | | | | | 1,029,586 | |
| Office Electronics: 2.3% | | | | |
| | 1,000,000 | | Xerox Corp., | | | | |
| | | | 1.363%, 12/18/09 | | | 989,717 | |
| | 100,000 | | Xerox Corp., | | | | |
| | | | 6.875%, 8/15/11 | | | 103,551 | |
| | 8,572,000 | | Xerox Corp., | | | | |
| | | | 7.625%, 6/15/13 | | | 8,641,236 | |
| | | | | | | 9,734,504 | |
| Oil & Gas Exploration & Production: 4.3% | | | | |
| | 6,365,000 | | Forest Oil Corp., | | | | |
| | | | 8.000%, 12/15/11 | | | 6,365,000 | |
| | 3,388,000 | | Pennzoil Co., | | | | |
| | | | 10.125%, 11/15/09 | | | 3,443,340 | |
| | 9,216,000 | | Swift Energy Co., | | | | |
| | | | 7.625%, 7/15/11 | | | 8,663,040 | |
| | | | | | | 18,471,380 | |
| Oil & Gas Pipelines: 1.1% | | | | |
| | 560,000 | | El Paso Energy Corp., | | | | |
| | | | 7.000%, 5/15/11 | | | 552,091 | |
| | 3,079,000 | | Enogex, Inc., | | | | |
| | | | | | | 3,161,887 | |
| | 834,000 | | Sonat, Inc., | | | | |
| | | | 7.625%, 7/15/11 | | | 821,350 | |
| | | | | | | 4,535,328 | |
| Railroad: 0.7% | | | | |
| | 3,062,000 | | Westinghouse Air Brake | | | | |
| | | | Technologies Corp., | | | | |
| | | | 6.875%, 7/31/13 | | | 2,993,105 | |
TOTAL CORPORATE BONDS | | | | |
| (cost $157,781,304) | | | 160,746,171 | |
The accompanying notes are an integral part of these financial statements.
Greenspring Fund, Incorporated
SCHEDULE OF INVESTMENTS at June 30, 2009 (Unaudited) (Con’t) |
| Shares | | | | Value | |
| SHORT-TERM INVESTMENTS: 5.9% | | | |
Money Market Instruments | | | |
| | 11,963,889 | | AIM Liquid Assets | | $ | 11,963,889 | |
| | 13,000,000 | | AIM STIC | | | | |
| | | | Prime Portfolio | | | 13,000,000 | |
TOTAL SHORT-TERM | | | | |
| INVESTMENTS | | | | |
| (cost $24,963,889) | | 24,963,889 | |
TOTAL INVESTMENTS | | | | |
| IN SECURITIES | | | | |
| (cost $395,491,570): 97.7% | | | 414,332,912 | |
| Other Assets less Liabilities: 2.3% | | | 9,584,528 | |
NET ASSETS: 100.0% | | $ | 423,917,440 | |
| * | | Non-income producing security. |
| # | | U.S. security of foreign issuer. |
| 144A | | Securities purchased pursuant to Rule 144A of the Securities Act of 1933, as amended, and may be sold only to dealers in that program or other “qualified institutional buyers.” These securities have been determined to be liquid by the Fund’s adviser under the supervision of the Board of Directors. As of June 30, 2009, the value of these investments were $14,051,622, or 3.3% of total net assets. |
The accompanying notes are an integral part of these financial statements.
Greenspring Fund, Incorporated
STATEMENT OF ASSETS AND LIABILITIES at June 30, 2009 (Unaudited) |
| ASSETS | | | |
| Investments in securities, at value (cost $395,491,570) | | $ | 414,332,912 | |
| Receivables: | | | | |
| Fund shares sold | | | 5,808,681 | |
| Dividends and interest | | | 4,241,628 | |
| Prepaid expenses | | | 34,915 | |
| Total assets | | | 424,418,136 | |
| | | | | |
| LIABILITIES | | | | |
| Payables: | | | | |
| Due to affiliate (Note 5) | | | 251,391 | |
| Fund shares redeemed | | | 123,438 | |
| Accrued expenses | | | 125,867 | |
| Total liabilities | | | 500,696 | |
| | | | | |
| NET ASSETS | | $ | 423,917,440 | |
| | | | | |
| Capital shares issued and outstanding | | | | |
| (60,000,000 shares authorized, $0.01 par value) | | | 19,708,083 | |
| | | | | |
| Net asset value, offering and redemption price per share | | $ | 21.51 | |
| | | | | |
| COMPONENTS OF NET ASSETS | | | | |
| Capital stock at par value | | $ | 197,081 | |
| Paid-in capital | | | 400,847,123 | |
| Accumulated net investment income | | | 8,156,360 | |
| Undistributed net realized loss on investments | | | (4,124,466 | ) |
| Net unrealized appreciation on investments | | | 18,841,342 | |
| NET ASSETS | | $ | 423,917,440 | |
The accompanying notes are an integral part of these financial statements.
Greenspring Fund, Incorporated
STATEMENT OF OPERATIONS For the Six Months Ended June 30, 2009 (Unaudited) |
| INVESTMENT INCOME | | | |
| Income | | | |
| Interest | | $ | 8,163,357 | |
| Dividends (net of foreign withholding taxes of $2,452) | | | 737,381 | |
| Total income | | | 8,900,738 | |
| | | | | |
| Expenses | | | | |
| Advisory fees (Note 5) | | | 1,281,577 | |
| Transfer agent fees (Note 6) | | | 218,246 | |
| Administration fees | | | 124,712 | |
| Fund accounting fees | | | 39,256 | |
| Administration fees - Corbyn (Note 5) | | | 32,299 | |
| Custody fees | | | 24,219 | |
| Reports to shareholders | | | 21,171 | |
| Blue sky fees | | | 17,960 | |
| Legal fees | | | 16,106 | |
| Audit fees | | | 13,108 | |
| Directors fees | | | 10,620 | |
| Miscellaneous fees | | | 10,581 | |
| Insurance fees | | | 7,234 | |
| Registration fees | | | 4,007 | |
| Total expenses | | | 1,821,096 | |
| Net investment income | | | 7,079,642 | |
| | | | | |
| REALIZED AND UNREALIZED GAIN (LOSS) ON INVESTMENTS | | | | |
| Net realized gain on investments | | | 671,047 | |
| Change in net unrealized appreciation/depreciation on investments | | | 15,692,476 | |
| Net realized and unrealized gain on investments | | | 16,363,523 | |
| Net increase in net assets resulting from operations | | $ | 23,443,165 | |
The accompanying notes are an integral part of these financial statements.
Greenspring Fund, Incorporated
| STATEMENTS OF CHANGES IN NET ASSETS |
| | | Six Months Ended | | | Year Ended | |
| | | June 30, 2009# | | | December 31, 2008 | |
| INCREASE (DECREASE) IN NET ASSETS FROM: | | | | | | |
| | | | | | | |
| OPERATIONS | | | | | | |
| Net investment income | | $ | 7,079,642 | | | $ | 5,601,008 | |
| Net realized gain (loss) on investments | | | 671,047 | | | | (4,431,162 | ) |
| Change in net unrealized | | | | | | | | |
| appreciation/depreciation on investments | | | 15,692,476 | | | | (36,830,320 | ) |
| Net increase (decrease) in net assets | | | | | | | | |
| resulting from operations | | | 23,443,165 | | | | (35,660,474 | ) |
| | | | | | | | | |
| DISTRIBUTIONS TO SHAREHOLDERS | | | | | | | | |
| From net investment income | | | — | | | | (4,323,046 | ) |
| From net realized gain | | | — | | | | (1,723,623 | ) |
| Total distributions to shareholders | | | — | | | | (6,046,669 | ) |
| | | | | | | | | |
| CAPITAL SHARE TRANSACTIONS | | | | | | | | |
| Net increase in net assets derived from | | | | | | | | |
| net change in outstanding shares (a)+ | | | 92,279,304 | | | | 92,024,547 | |
| Total increase in net assets | | | 115,722,469 | | | | 50,317,404 | |
| | | | | | | | | |
| NET ASSETS | | | | | | | | |
| Beginning of period | | | 308,194,971 | | | | 257,877,567 | |
| End of period (including accumulated | | | | | | | | |
| net investment income of $8,156,360 | | | | | | | | |
| and $1,076,718, respectively) | | $ | 423,917,440 | | | $ | 308,194,971 | |
| | (a) | A summary of capital share transactions is as follows: |
| | | Six Months Ended | | | Year Ended | |
| | | June 30, 2009# | | | December 31, 2008 | |
| | | Shares | | | Value | | | Shares | | | Value | |
| Shares sold | | | 7,409,808 | | | $ | 149,234,780 | | | | 6,908,031 | | | $ | 149,546,293 | |
| Shares issued in reinvestment | | | | | | | | | | | | | | | | |
| of distributions | | | — | | | | — | | | | 272,476 | | | | 5,966,021 | |
| Shares redeemed + | | | (2,840,196 | ) | | | (56,955,476 | ) | | | (2,973,924 | ) | | | (63,487,767 | ) |
| Net increase | | | 4,569,612 | | | $ | 92,279,304 | | | | 4,206,583 | | | $ | 92,024,547 | |
| | | | | | | | | | | | | | | | | |
| | + | Net of redemption fees of $47,858 and $238,604, respectively. |
The accompanying notes are an integral part of these financial statements.
Greenspring Fund, Incorporated
FINANCIAL HIGHLIGHTS For a capital share outstanding throughout each period |
| | | Six Months | | | | | | | | | | | | | | | | |
| | | Ended | | | | | | | | | | | | | | | | |
| | | June 30, | | | Year Ended December 31, | |
| | | 2009# | | | 2008 | | | 2007 | | | 2006 | | | 2005 | | | 2004 | |
| Net asset value, | | | | | | | | | | | | | | | | | | | |
| beginning of year | | $ | 20.36 | | | $ | 23.59 | | | $ | 23.43 | | | $ | 21.57 | | | $ | 20.91 | | | $ | 19.96 | |
| | | | | | | | | | | | | | | | | | | | | | | | | |
| INCOME (LOSS) FROM INVESTMENT OPERATIONS: | | | | | | | | | | | | | | | | | | | | | | | | |
| Net investment income | | | 0.34 | | | | 0.43 | | | | 0.55 | | | | 0.53 | | | | 0.47 | | | | 0.52 | |
| Net realized and unrealized | | | | | | | | | | | | | | | | | | | | | | | | |
| gain (loss) on investments | | | 0.81 | | | | (3.18 | ) | | | 0.70 | | | | 2.10 | | | | 0.88 | | | | 1.18 | |
| Total from | | | | | | | | | | | | | | | | | | | | | | | | |
| investment operations | | | 1.15 | | | | (2.75 | ) | | | 1.25 | | | | 2.63 | | | | 1.35 | | | | 1.70 | |
| | | | | | | | | | | | | | | | | | | | | | | | | |
| LESS DISTRIBUTIONS: | | | | | | | | | | | | | | | | | | | | | | | | |
| From net investment income | | | — | | | | (0.34 | ) | | | (0.56 | ) | | | (0.58 | ) | | | (0.44 | ) | | | (0.56 | ) |
| From net realized gain | | | — | | | | (0.16 | ) | | | (0.53 | ) | | | (0.19 | ) | | | (0.25 | ) | | | (0.19 | ) |
| Total distributions | | | — | | | | (0.50 | ) | | | (1.09 | ) | | | (0.77 | ) | | | (0.69 | ) | | | (0.75 | ) |
| Paid-in capital from | | | | | | | | | | | | | | | | | | | | | | | | |
| redemption fees (Note 1) | | | —* | | | | 0.02 | | | | —* | | | | —* | | | | —* | | | | —* | |
| Net asset value, | | | | | | | | | | | | | | | | | | | | | | | | |
| end of period | | $ | 21.51 | | | $ | 20.36 | | | $ | 23.59 | | | $ | 23.43 | | | $ | 21.57 | | | $ | 20.91 | |
| Total return | | 5.65% | ^ | | | (11.72)% | | | | 5.32% | | | | 12.29% | | | | 6.57% | | | | 8.69% | |
| | | | | | | | | | | | | | | | | | | | | | | | | |
| RATIOS/SUPPLEMENTAL DATA: | | | | | | | | | | | | | | | | | | | | | | | | |
| Net assets, end | | | | | | | | | | | | | | | | | | | | | | | | |
| of period (millions) | | $ | 423.9 | | | $ | 308.2 | | | $ | 257.9 | | | $ | 243.9 | | | $ | 157.6 | | | $ | 132.5 | |
| Ratio of expenses to | | | | | | | | | | | | | | | | | | | | | | | | |
| average net assets | | | 1.05% | + | | | 1.06% | | | | 1.03% | | | | 1.07% | | | | 1.16% | | | | 1.06% | |
| Ratio of net | | | | | | | | | | | | | | | | | | | | | | | | |
| investment income | | | | | | | | | | | | | | | | | | | | | | | | |
| to average net assets | | | 4.06% | + | | | 2.15% | | | | 2.24% | | | | 2.56% | | | | 2.30% | | | | 2.60% | |
| Portfolio turnover rate | | 21.28% | ^ | | | 47.11% | | | | 53.75% | | | | 38.58% | | | | 36.22% | | | | 35.21% | |
| * | Amount less than $0.01 per share. |
The accompanying notes are an integral part of these financial statements.
Greenspring Fund, Incorporated
NOTES TO FINANCIAL STATEMENTS June 30, 2009 (Unaudited) |
| Note 1 - Significant Accounting Policies |
Greenspring Fund, Incorporated (the “Fund”) is a diversified, open-end management investment company registered under the Investment Company Act of 1940, as amended (the “1940 Act”). The Fund is organized as a Maryland corporation and commenced operations on July 1, 1983.
The preparation of the financial statements in accordance with accounting principles generally accepted in the United States of America requires management to make estimates and assumptions that affect the reported amounts and disclosures in the financial statements. Actual results could differ from those estimates. In preparing these financial statements, the Fund has evaluated events and transactions for potential recognition or disclosure through August 24, 2009, the date the financial statements were issued.
Investment transactions and related investment income - Investment transactions are recorded on the trade date. Dividend income is recorded on the ex-dividend date and interest income, including amortization of premiums and accretion of discounts, is recorded on the accrual basis. Dividends determined to be a return of capital are recorded as a reduction of the cost basis of the security. Realized gains and losses from investment transactions are reported on an identified cost basis.
Valuation of investments – Securities listed on a national securities exchange or the NASDAQ National Market are valued at the last reported sale price or the official closing price for certain markets on the exchange of major listing as of the close of the regular session of the New York Stock Exchange.
Securities that are traded principally in the over-the-counter market, listed securities for which no sale was reported on the day of valuation, and listed securities whose primary market is believed by Corbyn Investment Management, Inc. (“Corbyn” or the “Adviser”) to be over-the-counter are valued at the mean of the closing bid and asked prices obtained from sources that the Adviser deems appropriate.
Short-term investments are valued at amortized cost, which approximates fair market value. The value of securities that mature, or have an announced call, within 60 days will be valued at market value.
Securities for which market quotations are not readily available are valued at fair value as determined in good faith by the Adviser as directed by the Board of Directors.
In determining fair value, the Adviser, as directed by the Board of Directors, considers all relevant qualitative and quantitative information available. These factors are subject to change over time and are reviewed periodically. The values assigned to fair value investments are based on available information and do not necessarily represent amounts that might ultimately be realized, since such amounts
Greenspring Fund, Incorporated
NOTES TO FINANCIAL STATEMENTS June 30, 2009 (Unaudited) (Con’t) |
depend on future developments inherent in long-term investments. Further, because of the inherent uncertainty of valuation, those estimated values may differ significantly from the values that would have been used had a ready market of the investments existed, and the differences could be material.
The Fund adopted the provisions of Statement of Financial Accounting Standards No. 157, “Fair Value Measurements” (“SFAS 157”), effective January 1, 2008. SFAS 157 establishes an authoritative definition of fair value and sets out a hierarchy for measuring fair value. SFAS 157 requires additional disclosures about the various inputs used to develop the measurements of fair value. These inputs are summarized in the three broad levels listed below:
Level 1 - Quoted prices in active markets for identical securities.
Level 2 - Other significant observable inputs (including quoted prices for similar securities, interest rates, prepayment speeds, credit risk, etc.).
Level 3 - Significant unobservable inputs (including the Fund’s own assumptions in determining the fair value of investments).
The inputs or methodology used for valuing securities are not necessarily an indication of the risk associated with investing in those securities. The following is a summary of the inputs used to value the Fund’s net assets as of June 30, 2009:
| | | | | | Significant | | | | | | | |
| | | Quoted Prices | | | Other | | | Significant | | | Carrying | |
| | | in Active | | | Observable | | | Unobservable | | | Value at | |
| | | Markets | | | Inputs | | | Inputs | | | June 30, 2009 | |
| | | Level 1 | | | Level 2 | | | Level 3 | | | Total | |
| Common Stocks | | $ | 117,014,991 | | | $ | — | | | $ | — | | | $ | 117,014,991 | |
| Investment Companies | | | 1,274,248 | | | | — | | | | — | | | | 1,274,248 | |
| Convertible Bonds | | | — | | | | 110,333,613 | | | | — | | | | 110,333,613 | |
| Corporate Bonds | | | — | | | | 160,746,171 | | | | — | | | | 160,746,171 | |
| Short-Term Investments | | | 24,963,889 | | | | — | | | | — | | | | 24,963,889 | |
| Total | | $ | 143,253,128 | | | $ | 271,079,784 | | | $ | — | | | $ | 414,332,912 | |
The Fund adopted the provisions of Statement of Financial Accounting Standards No. 157-4, “Determining Fair Value When the Volume and Level of Activity for the Asset or Liability Have Significantly Decreased and Identifying Transactions That Are Not Orderly” (“SFAS 157-4”), effective January 1, 2009. SFAS 157-4 provides additional guidance for estimating fair value in accordance with SFAS 157 when the volume and level of activity for the asset or liability have significantly decreased, as well as guidance on identifying circumstances that indicate a transaction is not orderly. Management has determined the adoption of SFAS 157-4 had no material impact on the Fund’s financial statements and related disclosures.
Greenspring Fund, Incorporated
NOTES TO FINANCIAL STATEMENTS June 30, 2009 (Unaudited) (Con’t) |
The Fund adopted the provisions of Statement of Financial Accounting Standards No. 161, “Disclosures about Derivative Instruments and Hedging Activities” (“SFAS 161”), effective January 1, 2009. SFAS 161 requires enhanced disclosures about a Fund’s derivative and hedging activities, including how such activities are accounted for and their effect on a Fund’s financial position, performance and cash flows. Management has determined the adoption of SFAS 161 had no material impact on the Fund’s financial statements and related disclosures.
Dividends and distributions to stockholders - The Fund records dividends and distributions to stockholders on the ex-dividend date.
Redemption fees - The Fund’s Board of Directors has adopted policies and procedures with respect to frequent purchases and redemptions of Fund shares by Fund shareholders. The Fund is intended for long-term investors. The Fund discourages and does not accommodate frequent purchases and redemptions of Fund shares by Fund shareholders. The Fund reserves the right to decline a purchase order for any reason.
“Market-timers” who engage in frequent purchases and redemptions over a short period can disrupt the Fund’s investment program by requiring the Fund to have excess cash on hand or to liquidate holdings to accommodate redemptions. In addition, frequent purchases and redemptions may impede efficient Fund management and create additional transaction costs that are borne by all shareholders. To the extent that the Fund invests a significant portion of its assets in small-cap securities or high-yield bonds, it may be subject to the risks of market timing more than a fund that does not. Therefore, the Fund imposes a 2% redemption fee for shares held 60 days or less. The fee is deducted from the seller’s redemption proceeds and deposited into the Fund to help offset brokerage commissions, market impact, and other costs associated with fluctuations in Fund asset levels and cash flow caused by short-term trading. All shareholders are subject to these restrictions regardless of whether you purchased your shares directly from the Fund or through a financial intermediary. However, the Fund is limited in its ability to determine whether trades placed through financial intermediaries may signal excessive trading. Accordingly, the Fund may not be able to determine whether trading in combined orders or in omnibus accounts is contrary to the Fund’s policies. The Fund reserves the right to reject combined or omnibus orders in whole or in part.
The “first-in, first-out” method is used to determine the holding period. Under this method, the date of redemption will be compared with the earliest purchase date of shares held in the account. If the holding period for shares purchased is 60 days or less, the fee will be charged. The redemption fee may be modified or discontinued at any time, in which case, shareholders will be notified.
Greenspring Fund, Incorporated
NOTES TO FINANCIAL STATEMENTS June 30, 2009 (Unaudited) (Con’t) |
In compliance with Rule 22c-2 under the 1940 Act, Quasar Distributors, LLC, on behalf of the Fund, has entered into written agreements with each of the Fund’s financial intermediaries, under which the intermediaries must, upon request, provide the Fund with certain shareholder and identity trading information so that the Fund can enforce its frequent trading policies.
The fee does not apply to shares acquired through the reinvestment of dividends or other distributions, or shares redeemed pursuant to a systematic withdrawal plan or a mandatory IRA distribution.
Risk of loss arising from indemnifications - In the normal course of business, the Fund enters into contracts that contain a variety of representations, which provide general indemnifications. The Fund’s maximum exposure under these arrangements is unknown as this would involve future claims that may be made against the Fund that have not yet occurred. However, based on experience, the Fund expects the risk of loss to be remote.
| Note 2 - Dividends and Distributions |
It is the Fund’s policy to declare dividends from net investment income and distributions from net realized gains as determined in accordance with income tax regulations, which may differ from accounting principles generally accepted in the United States of America. Accordingly, periodic reclassifications are made within the portfolio’s capital accounts to reflect income and gains available for distribution under income tax regulations.
On July 23, 2008 an income dividend of $0.19 per share, a short-term capital gain distribution of $0.15235 per share and a long-term capital gain distribution of $0.00648 per share were declared, payable on July 24, 2008, to shareholders of record on July 22, 2008. Additionally, on December 18, 2008, an income dividend of $0.15503 per share, was declared, payable on December 19, 2008 to shareholders of record on December 17, 2008. The tax character of distributions paid during the six months ended June 30, 2009 and the year ended December 31, 2008 was as follows:
| | June 30, 2009 | December 31, 2008 |
| Distributions paid from: | | |
| Ordinary income | $ — | $5,796,454 |
| Long-term capital gain | $ — | $ 70,215 |
These dividends are either distributed to shareholders or reinvested by the Fund in additional shares of common stock, which are issued to shareholders. For those shareholders reinvesting the dividends, the number of shares issued is based on the net asset value per share as of the close of business on the ex-dividend date.
Greenspring Fund, Incorporated
NOTES TO FINANCIAL STATEMENTS June 30, 2009 (Unaudited) (Con’t) |
| Note 3 - Purchases and Sales of Investments |
For the six months ended June 30, 2009, purchases and sales of investments, other than short-term investments, aggregated $129,887,974 and $60,312,147, respectively.
| Note 4 - Federal Income Taxes |
It is the Fund’s policy to comply with the requirements of the Internal Revenue Code applicable to regulated investment companies. Accordingly, the Fund intends to distribute substantially all of its taxable income. Therefore, no federal income tax provision is required.
The Fund recognizes the tax benefits of uncertain tax positions only where the position is “more likely than not” to be sustained assuming examination by tax authorities. The Fund has analyzed its tax positions, and has concluded that no liability for unrecognized tax benefits should be recorded related to uncertain tax positions taken on returns filed for open tax years (2005 – 2008), or expected to be taken in the Fund’s 2009 tax returns. The Fund identifies its major tax jurisdiction as U.S. Federal; however, the Fund is not aware of any tax positions for which it is reasonably possible that the total amounts of unrecognized tax benefits will change materially in the next twelve months.
Required Fund distributions are based on income and capital gain amounts determined in accordance with federal income tax regulations, which differ from net investment income and realized gains recognized for financial reporting purposes.
Accordingly, the composition of net assets and distributions on a tax basis may differ from those reflected in the accompanying financial statements.
As of December 31, 2008, the Fund’s most recently completed year end, the components of distributable earnings on a tax basis were as follows:
| Cost of investments | | $ | 296,606,902 | |
| Gross tax unrealized appreciation | | | 31,548,783 | |
| Gross tax unrealized depreciation | | | (29,058,601 | ) |
| Net tax unrealized appreciation | | | 2,490,182 | |
| Undistributed ordinary income | | | 1,735,402 | |
| Undistributed long-term capital loss | | | — | |
| Total distributable earnings | | | 1,735,402 | |
| Other accumulated gains/(losses) | | | (4,795,513 | ) |
| Total accumulated earnings/(losses) | | $ | (569,929 | ) |
As of December 31, 2008, the Fund had a capital loss carryforward of $3,506,803, which if not offset by subsequent capital gains, will expire on December 31, 2016.
Greenspring Fund, Incorporated
NOTES TO FINANCIAL STATEMENTS June 30, 2009 (Unaudited) (Con’t) |
The Fund incurred capital losses for tax purposes of $1,288,710 for the period from November 1, 2008 to December 31, 2008. As permitted by tax regulations, the Fund intends to elect to defer and treat these capital losses as arising in the fiscal year ending December 31, 2009.
| Note 5 - Transactions with Related Parties |
Corbyn serves as the Fund’s investment adviser. Under an agreement between the Fund and Corbyn, the Fund pays Corbyn a fee of 0.75% of the first $250 million of average daily net assets, 0.70% of average daily net assets between $250 million and $500 million and 0.65% of average daily net assets in excess of $500 million, which is computed daily and paid monthly. For the six months ended June 30, 2009, the Fund incurred $1,281,577 in advisory fees.
The Fund has also entered into a Services Agreement with Corbyn to provide various administrative services. As compensation, the Fund pays Corbyn a fee of $2,500 per month plus 0.01% of average daily net assets, which is computed daily and paid monthly. For the six months ended June 30, 2009, the Fund incurred $32,299 in administrative fees to Corbyn.
At June 30, 2009, investors for whom Corbyn was investment adviser held 788,481 shares of the Fund’s common stock.
| Note 6 - Shareholder Servicing Fees |
Both the Fund and Corbyn have entered into various Shareholder Servicing Agreements, whereby a fee is paid to certain service agents who administer omnibus accounts for indirect shareholders of the Fund. The Board of Directors has authorized the Fund to pay the amount of the fees it estimates the Fund would have been charged by its transfer agent for administering the accounts on an individual basis. The amount is included in “Transfer agent fees” on the accompanying Statement of Operations. For the six months ended June 30, 2009, the Fund incurred $195,431 of such fees.
Greenspring Fund, Incorporated
APPROVAL OF INVESTMENT ADVISORY AGREEMENT (Unaudited) |
Continuance of the Investment Advisory Agreement (the “Agreement”) must be considered annually by the directors of the Fund who are not parties to the Agreement or “interested persons” of any such party (as defined in the 1940 Act) (the “Independent Directors”). In order for continuance to be approved, a majority of the Independent Directors must vote for such approval at an in-person meeting called for this purpose.
The Board of Directors (the “Board”), including a majority of the Independent Directors, approved the continuance of the Agreement most recently at an in-person meeting in February 2009. One of the Fund’s three Independent Directors attended portions of this meeting telephonically. To assist the Directors in their evaluation of the Agreement, the Board was supplied with extensive information by the Adviser in advance of the meeting. After a detailed presentation by the Adviser, during which the written materials were reviewed and questions from the Board were answered, the Independent Directors met separately to consider the approval of the Agreement. The Board as a whole, and the Independent Directors voting separately, then approved the continuation of the Agreement as being in the best interest of the Fund. In considering the Agreement, the Board did not identify any particular overriding factor, but considered all the information available. Below is a summary of the primary factors considered by the Board and the conclusions thereto that formed the basis for the Board approving the continuance of the Agreement:
| | 1. | The nature, extent, and quality of the services to be provided by the Adviser under the Agreement. The Board considered the specific responsibilities of all aspects of the day-to-day management of the Fund. The Board considered the qualifications and experience of the portfolio manager and other key personnel of the Adviser involved with the day-to-day activities of the Fund. The Board also considered the resources and compliance structure of the Adviser, including the backgrounds of the chief compliance officers of both the Fund and the Adviser, as well as the Adviser’s compliance record. The Board also considered the Adviser’s marketing efforts and its continued commitment to the Fund’s growth. The Board noted that the Adviser has managed the Fund since its inception, providing a consistent investment approach with low turnover of the Adviser’s staff. The Board concluded that the Adviser had sufficient quality and depth of personnel, resources, investment methods and compliance policies and procedures essential to performing its duties under its advisory agreement and that the nature, overall quality, and extent of the management services were satisfactory and reliable. |
| | 2. | The Fund’s historical investment performance. In assessing the quality of the portfolio management delivered by the Adviser, the Board reviewed the short-term and long-term performance of the Fund for periods ended December |
Greenspring Fund, Incorporated
APPROVAL OF INVESTMENT ADVISORY AGREEMENT (Unaudited) (Con’t) |
| | | 31, 2008 on both an absolute basis, and in comparison to the performance of various category, relative index and major market benchmarks. The Board noted that the Fund’s long-term performance exceeded that of its category benchmarks, which are groups of other mutual funds with similar investment styles selected by independent providers of mutual fund information, for the 3-, 5- and 10-year periods. The Board also noted that the Fund’s 1-year performance significantly outperformed that of its category benchmarks in a very volatile investing environment. The Board also considered the consistency of returns and the level of risk taken. The Board concluded that the Adviser’s historical investment performance was very satisfactory under current market conditions and consistent with the Fund’s long-term performance objective. |
| | 3. | The costs of the services to be provided by the Adviser and the structure of the Adviser’s fees under the Advisory Agreement. In considering the advisory fee and total fees and expenses of the Fund, the Board reviewed a presentation comparing the Fund to a group of peer funds. Each of the peer funds used a research-intensive investment style similar to that of the Fund and did not have a 12b-1 Plan. The Board considered that the Fund’s contractual advisory fee was less than the median contractual advisory fee of the peer funds at a common net asset level. The Board also considered that the Fund’s total expense ratio was lower than the median total expense ratio of the peer funds. The Board concluded that, although the Adviser had not agreed to waive and/or reimburse Fund expenses at a certain level, the Adviser had consistently maintained an annual expense ratio in line with its peer group. Additionally, the fees charged by the Adviser were in line with the fees it charged to its other separately managed accounts and were not excessive. |
| | 4. | Economies of scale. The Board also considered that economies of scale would be expected to be realized by the Adviser as the assets of the Fund grow. The Board noted that the Agreement’s fee schedule included breakpoints at net asset levels of $250 million and $500 million, whereby the fees paid by the Fund would decrease at the higher asset levels. The Board concluded that net assets were above $250 million for much of the year, allowing the Fund and its shareholders to take advantage of these economies of scale. |
| | 5. | Costs of services provided and profits to be realized by the Adviser. The Board then discussed the costs of the services to be provided and the profitability of the Adviser. Specific attention was given to the methodologies followed in allocating shared costs to the Fund. The Board recognized that the cost allocation methodologies are inherently subjective and various allocation methodologies may each be reasonable while producing different results. In |
Greenspring Fund, Incorporated
APPROVAL OF INVESTMENT ADVISORY AGREEMENT (Unaudited) (Con’t) |
| | this regard, the Board noted that the allocation appeared reasonable. After such review, the Board determined that the profitability of the Adviser with respect to the Agreement was not excessive, and that the Adviser had maintained adequate profit levels to support the services to the Fund. |
| | 6. | Other factors and considerations. The Board periodically reviews and considers other material information throughout the year relating to the quality of services provided to the Fund and benefits that the Adviser may have realized, such as the receipt of research services in exchange for soft dollar credit in connection with commissions on the Fund’s equity transactions. The Board noted that the commissions paid by the Fund are reasonable and that the Fund receives quality execution, regardless of whether the commissions are used to pay for research through soft dollar arrangements. Other material information considered includes the Adviser’s management of its relationship with the Fund’s third party service providers, and expenses paid to those third parties. Also, at its quarterly meetings, the Board reviews detailed information relating to the Fund’s portfolio and performance, and receives a presentation from the Fund’s portfolio manager. |
The Board did not identify any single factor discussed previously, but instead considered all factors collectively in its determination to approve the Agreement. The Directors, including a majority of the Independent Directors, concluded that the terms of the Agreement are fair and reasonable, that the Adviser’s fees are reasonable in light of the services provided to the Fund and the benefits received by the Adviser and that the Agreement is in the best interest of the Fund.
(This Page Intentionally Left Blank.)
(This Page Intentionally Left Blank.)
Greenspring Fund, Incorporated
2330 West Joppa Road, Suite 110
Lutherville, MD 21093
(410) 823-5353
(800) 366-3863
www.greenspringfund.com
The Fund’s proxy voting policies and procedures, as well as its proxy voting record for the most recent 12 month period ended June 30, are available without charge, upon request, by contacting the Fund at (800) 366-3863 or greenspring@greenspringfund.com. The Fund will send the information within three business days of receipt of the request, by first class mail or other means designed to ensure equally prompt delivery. The Fund’s proxy voting record is also available on the Commission’s website at http://www.sec.gov. The Fund files its complete schedule of portfolio holdings with the Commission for the first and third quarters of each fiscal year on Form N-Q. The Fund’s Forms N-Q are available on the Commission’s website and may be reviewed and copied at the Commission’s Public Reference Room in Washington, DC. Information on the operation of the Public Reference Room may be obtained by calling (202) 551-8090. The Fund’s first and third quarter reports are available on its website at www.greenspringfund.com.
| DIRECTORS | ADMINISTRATOR, |
| Charles vK. Carlson, Chairman | FUND ACCOUNTANT AND |
| William E. Carlson | TRANSFER AGENT |
| David T. Fu | U.S. Bancorp Fund Services, LLC |
| Sean T. Furlong | 615 East Michigan Street |
| Michael J. Fusting | Milwaukee, WI 53202 |
| Richard Hynson, Jr. | |
| Michael P. O’Boyle | DISTRIBUTOR |
| | Quasar Distributors, LLC |
| OFFICERS | 615 East Michigan Street |
| Charles vK. Carlson | Milwaukee, WI 53202 |
| President and Chief Executive Officer | |
| | CUSTODIAN |
| Michael J. Fusting | U.S. Bank, N.A. |
| Sr. Vice President and | 1555 N. RiverCenter Dr., Suite 302 |
| Chief Financial Officer | Milwaukee, WI 53212 |
| | |
| Elizabeth Agresta Swam | INDEPENDENT REGISTERED |
| Chief Compliance Officer, | PUBLIC ACCOUNTING FIRM |
| Secretary, Treasurer | Tait, Weller & Baker LLP |
| and AML Officer | 1818 Market Street, Suite 2400 |
| | Philadelphia, PA 19103 |
| INVESTMENT ADVISER | |
| Corbyn Investment Management, Inc. | LEGAL COUNSEL |
| 2330 West Joppa Road, Suite 108 | K&L Gates LLP |
| Lutherville, MD 21093-7207 | 1601 K Street NW |
| | Washington, DC 20006 |
Item 2. Code of Ethics.
Not applicable for semi-annual reports.
Item 3. Audit Committee Financial Expert.
Not applicable for semi-annual reports.
Item 4. Principal Accountant Fees and Services.
Not applicable for semi-annual reports.
Item 5. Audit Committee of Listed Registrants.
Not applicable to registrants who are not listed issuers (as defined in Rule 10A-3 under the Securities Exchange Act of 1934).
Item 6. Investments.
Schedule of Investments is included as part of the report to shareholders filed under Item 1 of this Form.
Item 7. Disclosure of Proxy Voting Policies and Procedures for Closed-End Management Investment Companies.
Not applicable to open-end investment companies.
Item 8. Portfolio Managers of Closed-End Management Investment Companies.
Not applicable to open-end investment companies.
Item 9. Purchases of Equity Securities by Closed-End Management Investment Company and Affiliated Purchasers.
Not applicable to open-end investment companies.
Item 10. Submission of Matters to a Vote of Security Holders.
Not Applicable.
Item 11. Controls and Procedures.
| (a) | The Registrant’s Chief Executive Officer and Chief Financial Officer have reviewed the Registrant's disclosure controls and procedures (as defined in Rule 30a-3(c) under the Investment Company Act of 1940 (the “Act”)) as of a date within 90 days of the filing of this report, as required by Rule 30a-3(b) under the Act and Rules 13a-15(b) or 15d-15(b) under the Securities Exchange Act of 1934. Based on their review, such officers have concluded that the disclosure controls and procedures are effective in ensuring that information required to be disclosed in this report is appropriately recorded, processed, summarized and reported and made known to them by others within the Registrant and by the Registrant’s service provider. |
| (b) | There were no changes in the Registrant's internal control over financial reporting (as defined in Rule 30a-3(d) under the Act) that occurred during the second fiscal quarter of the period covered by this report that has materially affected, or is reasonably likely to materially affect, the Registrant's internal control over financial reporting. |
Item 12. Exhibits.
| (a) | (1) Any code of ethics or amendment thereto, that is the subject of the disclosure required by Item 2, to the extent that the registrant intends to satisfy Item 2 requirements through filing an exhibit. Not Applicable. |
(2) A separate certification for each principal executive and principal financial officer pursuant to Section 302 of the Sarbanes-Oxley Act of 2002. Filed herewith.
(3) Any written solicitation to purchase securities under Rule 23c-1 under the Act sent or given during the period covered by the report by or on behalf of the registrant to 10 or more persons. Not applicable to open-end investment companies.
| (b) | Certification pursuant to Section 906 of the Sarbanes-Oxley Act of 2002. Furnished herewith. |
SIGNATURES
Pursuant to the requirements of the Securities Exchange Act of 1934 and the Investment Company Act of 1940, the registrant has duly caused this report to be signed on its behalf by the undersigned, thereunto duly authorized.
(Registrant) Greenspring Fund, Incorporated
By (Signature and Title)* /s/Charles vK. Carlson
Charles vK. Carlson, Chief Executive Officer
Date August 27, 2009
Pursuant to the requirements of the Securities Exchange Act of 1934 and the Investment Company Act of 1940, this report has been signed below by the following persons on behalf of the registrant and in the capacities and on the dates indicated.
By (Signature and Title)* /s/Charles vK. Carlson
Charles vK. Carlson, Chief Executive Officer
Date August 27, 2009
By (Signature and Title)* /s/Michael J. Fusting
Michael J. Fusting, Chief Financial Officer
Date August 27, 2009
* Print the name and title of each signing officer under his or her signature.