UNITED STATES
SECURITIES AND EXCHANGE COMMISSION
Washington, D.C. 20549
FORM N-CSR
CERTIFIED SHAREHOLDER REPORT OF REGISTERED
MANAGEMENT INVESTMENT COMPANIES
Investment Company Act file number 811-3627
Greenspring Fund, Incorporated
(Exact name of registrant as specified in charter)
2330 West Joppa Road, Suite 110
Lutherville, MD 21093-4641
(Address of principal executive offices) (Zip code)
Mr. Charles vK. Carlson, President
2330 West Joppa Road, Suite 110
Lutherville, MD 21093-4641
(Name and address of agent for service)
(410) 823-5353
Registrant's telephone number, including area code
Date of fiscal year end: December 31, 2007
Date of reporting period: June 30, 2007
Item 1. Report to Stockholders.
SEMI-ANNUAL REPORT
JUNE 30, 2007
This report is authorized for distribution
only to shareholders who have received a
copy of the official Prospectus of the
Greenspring Fund, Incorporated.
Greenspring Fund, Incorporated
July 2007
Dear Fellow Shareholders:
We are pleased to provide this report discussing the Greenspring Fund’s portfolio activity and performance for the second quarter of 2007. Through the years, we have made an effort to keep our shareholders informed on a regular basis by providing a quarterly discussion of portfolio activity as opposed to the semi-annual reports mandated by the SEC. Discussions of the Fund’s activity and performance during the first quarter of 2007, and previous quarters, are available on the Greenspring Fund’s website (www.greenspringfund.com) under “FUND REPORTS.”
PERFORMANCE REVIEW
During the second quarter of 2007, the Greenspring Fund gained 6.15%, with the net asset value (NAV) increasing from $23.58 to $25.03 per share. All of the Fund’s asset classes – common stocks, preferred stocks, convertible bonds, corporate bonds and cash equivalents - generated positive returns during the quarter. The strongest performing asset class for the Greenspring Fund was common stocks. This fact is not surprising as the equity markets in general posted solid performance, while the fixed income markets had mixed results, with the longer-term bond indices posting small losses, and shorter-duration bond indices achieving small gains.
INFLUENCES on PORTFOLIO PERFORMANCE
The securities that had the five largest influences on the Fund’s performance during the quarter were all common stocks – Michael Baker Corporation, Horizon Offshore, Suncor Energy, FTI Consulting, and Radyne Corporation. All of these investments generated positive results for the Fund. A brief synopsis of the three largest influences follows.
Greenspring FundPerformance for the Periods Ended June 30, 2007 |
| Quarter | 6.15% |
| Year to Date | 6.83% |
| 1 Year | 12.80% |
| 3 Years* | 10.60% |
| 5 Years* | 11.45% |
| 10 Years* | 7.60% |
| 15 Years* | 10.51% |
| 20 Years* | 9.75% |
| Since inception on 7/1/83* | 11.25% |
| Expense Ratio** | 1.08% |
** | as stated in Prospectus dated 5-1-07. See note on last page of letter. |
Performance data quoted represents past performance; past performance does not guarantee future results. The investment return and principal value of an investment will fluctuate so that an investor’s shares, when redeemed, may be worth more or less than their original cost. Current performance of the Fund may be lower or higher than the performance quoted. Performance data current to the most recent month end may be obtained by calling 1-800-366-3863 or visiting the Fund’s web site. The Fund imposes a 2.00% redemption fee for shares held 60 days or less. Performance data does not reflect the redemption fee. If reflected, total returns would be reduced.
Greenspring Fund, Incorporated
Michael Baker Corporation has two principal business lines – engineering services provided to government and industrial customers, and oil field services. Its stock price rose from $24.30 to $37.15 per share during the quarter. Principal reasons for strength in its shares were strong earnings results with expectations for continued increases in earnings. Furthermore, the Company has announced that it is studying strategic alternatives that may include selling its oil field services division, merging its engineering division with another company, or selling the entire company.
Horizon Offshore Services installs for oil and natural gas companies the infrastructure necessary to connect a newly drilled offshore well to existing pipelines and processing facilities. To a certain degree, its fortunes are dependent upon a healthy environment for energy companies. Horizon Offshore generates a significant amount of free cash flow, which enables the Company to maintain a strong balance sheet and pursue additional business opportunities. During the quarter, Horizon agreed to merge with Cal Dive International, a larger and more diversified offshore oil and natural gas services company. The combined company will be more vertically integrated and will be a major participant in the global offshore oil and gas services industry with substantial operations in the Gulf of Mexico. During the quarter, Horizon’s stock price rose from $14.46 to $19.20 per share.
Suncor Energy has been on the Fund’s “largest influence” list several times since we purchased shares in the Company in June of 2004. Suncor Energy controls a vast amount of oil sands reserves in northwestern Canada. Although oil sands are expensive to develop and refine, at current oil prices Suncor is generating substantial profits. The Company is reinvesting its profits by expanding its production capacity. Suncor is fortunate in that it is able to significantly increase its production of oil through the expansion of its processing plant and equipment. This business model is quite different from that of conventional energy companies, which have to spend tremendous amounts of money exploring for new reserves, with the risk of drilling dry holes. During the quarter, Suncor’s stock price increased from $76.35 to $89.92 per share.
Greenspring Fund Top 10 Holdings | % of Net Assets as of 6/30/07 |
| Ciena Corporation 3.75% Convertible Bonds | 4.2% |
| FTI Consulting Inc. | 3.9% |
| Level 3 Communications 6% Convertible Bonds | 3.7% |
| Suncor Energy Inc. | 3.2% |
| Michael Baker Corp. | 3.1% |
| Watsco Inc. | 3.1% |
| CIT Group | 3.0% |
| Xerox Corporation 7.625% Bonds | 3.0% |
| Radyne Corporation | 3.0% |
| Case New Holland 9.25% Bonds | 2.9% |
Greenspring Fund, Incorporated
The strength in the Greenspring Fund’s common stocks was widespread as 36 out of 47 common stock holdings increased in value during the quarter. The fixed income holdings posted even more consistent performance, as every single fixed income security in the Greenspring Fund’s portfolio generated positive performance during the three month period. We have kept the duration of the fixed income portfolio quite short, enabling us to avoid the downward pressures experienced by holders of longer-term bonds.
INVESTMENT STRATEGY
During the quarter, the Greenspring Fund added to its holdings of the common stocks of Cardinal Financial, First Mariner Bancorp and Radyne Corporation, and established an initial position in OceanFirst Financial. In the fixed income portion of the portfolio, the Fund added to the positions of several existing holdings and established new holdings of several short-duration bonds. In order of magnitude, the largest purchases during the quarter were of the 7.625% Xerox bonds maturing on June 15, 2013 (which we expect to be redeemed on June 15, 2008), the Winston Hotels 8% Preferred stock (subsequently redeemed by the Company in early July of 2007), the common stock of Cardinal Financial (a high quality bank headquartered in northern Virginia), and the convertible bonds of Level 3 Communications (a provider of telecommunications services).
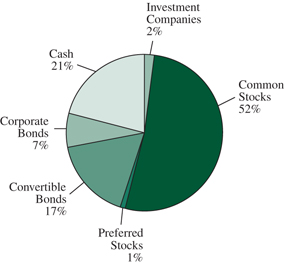
Greenspring Fund Portfolio Allocation as of June 30, 2007 |
|
We continue to diligently scour the common stock, convertible bond and corporate bond markets for securities that will aid us in achieving our objective of providing all our fellow shareholders with steady, consistent gains, achieved by using a total return strategy. We may take advantage of the recent increase in longer-term interest rates by lengthening the duration of our bond portfolio a bit. Additionally, spreads in the fixed income market have widened recently. We view this as a favorable development, as many of our fixed income holdings are set to mature in the near future, at which time
Greenspring Fund, Incorporated
proceeds can be reinvested in higher yielding securities. We look forward to exploring the opportunities that will arise during the third quarter and will be reporting on our progress in the next quarterly report.
Respectfully,
 |  |
| Charles vK. Carlson | Michael J. Fusting |
| Portfolio Manager | Co-Chief Investment Officer |
| Co-Chief Investment Officer | |
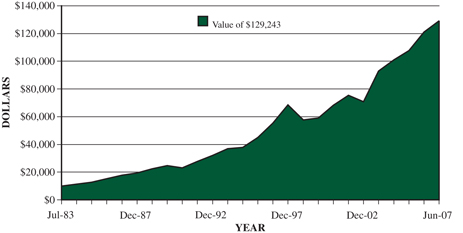
GREENSPRING FUND
PERFORMANCE SINCE INCEPTION
HOW $10,000 INVESTED ON 7/1/83 WOULD HAVE GROWN*
* Figures include changes in principal value, reinvested dividends and capital gains distributions. Past expense limitations increased the Fund’s return. This chart illustrates the performance of a hypothetical $10,000 investment made in the Fund since inception through June 30, 2007. The total value of $129,243 assumes the reinvestment of dividends and capital gains, but does not reflect the effect of any redemption fees. This chart does not imply any future performance.
Average annual total returns for the one, three, five and ten year periods ended June 30, 2007 were 12.80%, 10.60%, 11.45% and 7.60%, respectively. Average annual returns for more than one year assume a compounded rate of return and are not the Fund’s year-by-year results, which fluctuated over the periods shown. Returns do not reflect taxes that shareholders may pay on Fund distributions or redemptions of Fund shares.
Greenspring Fund, Incorporated
| Features available on our Web Site: www.greenspringfund.com |
| v | Online access to your account |
| Register to make ACH Greenspring Fund purchases |
| Sign up for quarterly Greenspring Fund e-mails |
| Daily price updates |
| Month-end top 10 holdings |
| Schedule of Investments as of quarter-end |
| Month-end sector weightings |
| IRA Rollover forms |
Fund holdings and/or sector allocations are subject to change at any time and are not recommendations to buy or sell any security.
Mutual fund investing involves risk. Principal loss is possible. Small-capitalization companies tend to have limited liquidity and greater price volatility than large-capitalization companies. Investments by the Fund in lower-rated and non-rated securities present a greater risk of loss to principal and interest than higher-rated securities. Investments in debt securities typically decrease in value when interest rates rise. This risk is usually greater for longer-term debt securities.
Opinions expressed are subject to change, are not guaranteed and should not be considered recommendations to buy or sell any security. Free cash flow measures the cash generating capability of a company by adding certain non-cash charges (e.g. depreciation and amortization) to earnings and subtracting recurring capital expenditures.
** The expense ratio of 1.08% includes indirect expenses that the Fund incurs from investing in the shares of other investment companies. The indirect fees represent the Fund’s pro rata portion of the cumulative expenses charged by the other investment companies. Without those indirect fees, the Fund’s Total Annual Operating Expenses would be 1.07%.
Distributed by Quasar Distributors, LLC. 8/07
Greenspring Fund, Incorporated
Expense Example For the Six Months Ended June 30, 2007 (Unaudited) |
As a shareholder of the Fund, you incur two types of costs: (1) redemption fees if you redeem within 60 days of purchase; and (2) ongoing costs, including management fees and other Fund expenses. This example is intended to help you understand your ongoing costs (in dollars) of investing in the Fund and to compare these costs with the ongoing costs of investing in other mutual funds. The example is based on an investment of $1,000 invested at the beginning of the period and held for the entire period (1/1/2007 - 6/30/2007).
Actual Expenses
The first line of the table below provides information about actual account values based on actual returns and actual expenses. You may use the information in this line, together with the amount you invested, to estimate the expenses that you paid over the period. Simply divide your account value by $1,000 (for example, an $8,600 account value divided by $1,000 = 8.6), then multiply the result by the number in the first line under the heading entitled “Expenses Paid During the Period” to estimate the expenses you paid on your account during this period.
Hypothetical Example for Comparison Purposes
The second line of the table below provides information about hypothetical account values and hypothetical expenses based on the Fund’s actual expense ratio and an assumed rate of return of 5% per year before expenses, which is not the Fund’s actual return. The hypothetical account values and expenses may not be used to estimate the actual ending account balance or expenses you paid for the period. You may use this information to compare the ongoing costs of investing in the Fund and other funds. To do so, compare this 5% hypothetical example with the 5% hypothetical examples that appear in the shareholder reports of the other funds. Please note that the expenses shown in the table are meant to highlight your ongoing costs only and do not reflect any transactional costs, such as redemption fees. Therefore, the second line of the table is useful in comparing ongoing costs only, and will not help you determine the relative total costs of owning different funds. In addition, if these transactional costs were included, your costs would have been higher.
| | | | | Expenses Paid |
| | | Beginning | Ending | During the Period |
| | | Account Value | Account Value | 1/1/2007 – |
| | | 1/1/2007 | 6/30/2007 | 6/30/2007* |
| Actual | | $1,000 | $1,068 | $5.33 |
| Hypothetical | | | | |
| (5% annual return | | | | |
| before expenses) | | $1,000 | $1,020 | $5.21 |
| * | Expenses are equal to the Fund’s annualized expense ratio of 1.04%, multiplied by the average account value over the period multiplied by 181/365 (to reflect the one-half year period). |
Greenspring Fund, Incorporated
SCHEDULE OF INVESTMENTS at June 30, 2007 (Unaudited) |
Shares | | | | Value | |
COMMON STOCKS: 52.3% | | | |
Building Products: 0.3% | | | |
| | 38,400 | | Griffon Corp.* | | $ | 836,352 | |
Business & Professional Services: 3.9% | | | | |
| | 282,800 | | FTI Consulting, Inc.* | | | 10,754,884 | |
Commercial Banks: 3.9% | | | | |
| | 40,074 | | American National | | | | |
| | | | Bankshares, Inc. | | | 901,665 | |
| | 388,801 | | Cardinal | | | | |
| | | | Financial Corp. | | | 3,837,466 | |
| | 149,935 | | First Mariner | | | | |
| | | | Bancorp, Inc.* | | | 1,929,663 | |
| | 759 | | Fulton Financial Corp. | | | 10,945 | |
| | 25,000 | | Middleburg | | | | |
| | | | Financial Corp. | | | 812,500 | |
| | 30,000 | | Patriot National | | | | |
| | | | Bancorp, Inc. | | | 659,400 | |
| | 26,190 | | Provident | | | | |
| | | | Bankshares Corp. | | | 858,508 | |
| | 27,500 | | Southern National | | | | |
| | | | Bancorp of Virginia* | | | 385,000 | |
| | 14,476 | | SunTrust Banks, Inc. | | | 1,241,172 | |
| | | | | | | 10,636,319 | |
Communications Equipment: 3.0% | | | | |
| | 761,741 | | Radyne Corp.* | | | 8,127,776 | |
Computer Storage & Peripherals: 0.4% | | | | |
| | 75,000 | | Neoware | | | | |
| | | | Systems, Inc.* | | | 1,015,500 | |
Construction & Engineering: 4.9% | | | | |
| | 67,800 | | EMCOR Group, Inc.* | | | 4,942,620 | |
| | 227,700 | | Michael Baker Corp.* | | | 8,459,055 | |
| | | | | | | 13,401,675 | |
Diversified Financial Services: 2.9% | | | | |
| | 148,400 | | CIT Group, Inc. | | | 8,136,772 | |
Diversified Gas Utilities: 2.2% | | | | |
| | 108,400 | | Energen Corp. | | | 5,955,496 | |
Electric Utilities: 1.7% | | | | |
| | 99,000 | | PPL Corp. | | | 4,632,210 | |
Electrical Equipment: 2.4% | | | | |
| | 17,400 | | Emerson Electric Co. | | | 814,320 | |
| | 215,000 | | Lamson & | | | | |
| | | | Sessions Co.* | | | 5,712,550 | |
| | | | | | | 6,526,870 | |
Energy Equipment & Services: 2.3% | | | | |
| | 327,063 | | Horizon | | | | |
| | | | Offshore, Inc.* | | | 6,279,610 | |
Environmental Services: 3.1% | | | | |
| | 363,000 | | Allied Waste | | | | |
| | | | Industries, Inc.* | | | 4,885,980 | |
| | 108,500 | | Waste Industries | | | | |
| | | | USA, Inc. | | | 3,704,190 | |
| | | | | | | 8,590,170 | |
Household & Personal Products: 1.2% | | | | |
| | 249,950 | | Prestige Brands | | | | |
| | | | Holdings, Inc.* | | | 3,244,351 | |
Industrial Distribution: 3.1% | | | | |
| | 155,000 | | Watsco, Inc. | | | 8,432,000 | |
Insurance: 5.4% | | | | |
| | 11,300 | | Assurant, Inc. | | | 665,796 | |
| | 758,725 | | KMG America Corp.* | | | 3,983,306 | |
| | 34,450 | | PartnerRe, Ltd.# | | | 2,669,875 | |
| | 226,184 | | United America | | | | |
| | | | Indemnity, Ltd.#* | | | 5,625,196 | |
| | 55,575 | | W.R. Berkley Corp. | | | 1,808,411 | |
| | | | | | | 14,752,584 | |
Machinery: 0.3% | | | | |
| | 20,000 | | Pentair, Inc. | | | 771,400 | |
Metals & Mining: 1.2% | | | | |
| | 76,700 | | Brush Engineered | | | | |
| | | | Materials, Inc.* | | | 3,220,633 | |
The accompanying notes are an integral part of these financial statements.
Greenspring Fund, Incorporated
SCHEDULE OF INVESTMENTS at June 30, 2007 (Unaudited) (Con’t) |
Shares/Principal | | | | Value | |
COMMON STOCKS: 52.3% (Con’t) | | | |
Oil & Gas Exploration & Production: 4.6% | | | |
| | 40,300 | | CNX Gas Corp.* | | $ | 1,233,180 | |
| | 5,626 | | ConocoPhillips | | | 441,641 | |
| | 22,280 | | EOG Resources, Inc. | | | 1,627,777 | |
| | 36,500 | | Rosetta | | | | |
| | | | Resources, Inc.* | | | 786,210 | |
| | 96,000 | | Suncor | | | | |
| | | | Energy, Inc.# | | | 8,632,320 | |
| | | | | | | 12,721,128 | |
Real Estate: 0.2% | | | | |
| | 4,500 | | First Potomac | | | | |
| | | | Realty Trust | | | 104,805 | |
| | 27,500 | | Urstadt Biddle | | | | |
| | | | Properties, Inc. - | | | | |
| | | | Class A | | | 467,775 | |
| | | | | | | 572,580 | |
Thrifts & Mortgage Finance: 0.5% | | | | |
| | 3,500 | | OceanFirst | | | | |
| | | | Financial Corp. | | | 61,600 | |
| | 30,000 | | Washington | | | | |
| | | | Mutual, Inc. | | | 1,279,200 | |
| | | | | | | 1,340,800 | |
Transportation: 4.8% | | | | |
| | 141,287 | | Rush Enterprises, | | | | |
| | | | Inc. - Class A* | | | 3,068,754 | |
| | 197,199 | | Rush Enterprises, | | | | |
| | | | Inc. - Class B* | | | 4,129,347 | |
| | 28,200 | | SAIA, Inc.* | | | 768,732 | |
| | 360,350 | | Wabash | | | | |
| | | | National Corp. | | | 5,271,920 | |
| | | | | | | 13,238,753 | |
TOTAL COMMON STOCKS | | | | |
| (cost $93,134,876) | | | 143,187,863 | |
INVESTMENT COMPANIES: 2.4% | | | | |
| | 385,762 | | NGP Capital | | | | |
| | | | Resources Co. | | | | |
| | | | (cost $5,228,882) | | | 6,449,941 | |
PREFERRED STOCKS: 1.3% | | | | |
Real Estate: 1.3% | | | | |
| | 142,600 | | Winston Hotels, Inc. - | | | | |
| | | | Series B, 8.000% | | | | |
| | | | (cost $3,586,785) | | | 3,617,762 | |
CONVERTIBLE BONDS: 17.0% | | | | |
Automotive Retail: 0.3% | | | | |
| $ | 938,000 | | Sonic | | | | |
| | | | Automotive, Inc., | | | | |
| | | | 5.250%, 5/7/09 | | | 923,930 | |
Biotechnology: 0.1% | | | | |
| | 216,000 | | Enzon Pharmaceuticals, | | | | |
| | | | Inc., 4.500%, 7/1/08 | | | 213,570 | |
Communications Equipment: 4.2% | | | | |
| | 11,502,000 | | Ciena Corp., | | | | |
| | | | 3.750%, 2/1/08 | | | 11,430,113 | |
Construction & Engineering: 2.6% | | | | |
| | 7,168,000 | | Quanta Services, Inc., | | | | |
| | | | 4.000%, 7/1/07 | | | 7,168,000 | |
Diversified Telecommunication Services: 4.3% | | | | |
| | 10,127,000 | | Level 3 | | | | |
| | | | Communications, | | | | |
| | | | Inc., 6.000%, 9/15/09 | | | 9,873,825 | |
| | 1,995,000 | | Level 3 | | | | |
| | | | Communications, | | | | |
| | | | Inc., 6.000%, 3/15/10 | | | 1,922,681 | |
| | | | | | | 11,796,506 | |
Energy Equipment & Services: 0.1% | | | | |
| | 149,000 | | Hanover | | | | |
| | | | Compressor Co., | | | | |
| | | | 4.750%, 3/15/08 | | | 146,765 | |
Environmental Services: 0.7% | | | | |
| | 1,975,000 | | Allied Waste | | | | |
| | | | Industries, Inc., | | | | |
| | | | 4.250%, 4/15/34 | | | 1,898,469 | |
Pharmaceuticals: 2.6% | | | | |
| | 7,306,000 | | Nektar Therapeutics, | | | | |
| | | | 3.500%, 10/17/07 | | | 7,196,410 | |
The accompanying notes are an integral part of these financial statements.
Greenspring Fund, Incorporated
SCHEDULE OF INVESTMENTS at June 30, 2007 (Unaudited) (Con’t) |
Principal/Shares | | | | Value | |
CONVERTIBLE BONDS: 17.0% (Con’t) | | | |
Semiconductor Equipment: 2.1% | | | |
| $ | 5,622,000 | | Agere Systems, Inc., | | | |
| | | | 6.500%, 12/15/09 | | $ | 5,741,468 | |
TOTAL CONVERTIBLE BONDS | | | | |
| (cost $46,105,516) | | | 46,515,231 | |
CORPORATE BONDS: 6.7% | | | | |
Commercial Banks: 0.2% | | | | |
| | 500,000 | | Union Planters Bank, | | | | |
| | | | 6.500%, 3/15/08 | | | 503,417 | |
Industrial Machinery: 2.8% | | | | |
| | 7,366,000 | | Case New Holland, | | | | |
| | | | Inc., 9.250%, 8/1/11 | | | 7,757,871 | |
Insurance: 0.1% | | | | |
| | 300,000 | | Safeco Corp., | | | | |
| | | | 6.875%, 7/15/07 | | | 300,138 | |
Metals & Mining: 0.3% | | | | |
| | 935,000 | | Alcoa, Inc., | | | | |
| | | | 4.250%, 8/15/07 | | | 933,745 | |
Office Electronics: 3.0% | | | | |
| | 7,740,000 | | Xerox Corp., | | | | |
| | | | 7.625%, 6/15/13 | | | 8,111,241 | |
Wireless Communication Services: 0.3% | | | | |
| | 821,000 | | Alamosa | | | | |
| | | | Delaware, Inc., | | | | |
| | | | 11.000%, 7/31/10 | | | 869,841 | |
TOTAL CORPORATE BONDS | | | | |
| (cost $18,507,569) | | | 18,476,253 | |
SHORT-TERM INVESTMENTS: 19.8% | | | | |
Commercial Paper: 14.4% | | | | |
| | 13,500,000 | | American Express | | | | |
| | | | Credit Co., | | | | |
| | | | 5.266%, 7/10/07 | | | 13,500,000 | |
| | 13,000,000 | | General Electric | | | | |
| | | | Capital Corp., | | | | |
| | | | 5.266%, 7/17/07 | | | 13,000,000 | |
| | 13,000,000 | | Toyota Motor | | | | |
| | | | Credit Co., | | | | |
| | | | 5.241%, 7/3/07 | | | 13,000,000 | |
| | | | | | | 39,500,000 | |
Money Market Investments: 5.4% | | | | |
| | 3,255,984 | | AIM Liquid Assets | | | 3,255,984 | |
| | 11,413,320 | | AIM STIC | | | | |
| | | | Prime Portfolio | | | 11,413,320 | |
| | | | | | | 14,669,304 | |
TOTAL SHORT-TERM | | | | |
INVESTMENTS | | | | |
| (cost $54,169,304) | | | 54,169,304 | |
TOTAL INVESTMENTS | | | | |
IN SECURITIES | | | | |
| (cost $220,732,932): 99.5% | | | 272,416,354 | |
| | | | | | | | |
| Other Assets less Liabilities: 0.5% | | | 1,268,548 | |
| | | | | | | | |
NET ASSETS: 100.0% | | $ | 273,684,902 | |
| * | Non-income producing security. |
| # | U.S. security of foreign issuer. |
The accompanying notes are an integral part of these financial statements.
Greenspring Fund, Incorporated
STATEMENT OF ASSETS AND LIABILITIES at June 30, 2007 (Unaudited) |
ASSETS | | | |
| Investments in securities, at value (cost $220,732,932) | | $ | 272,416,354 | |
| Receivables: | | | | |
| Fund shares sold | | | 382,142 | |
| Dividends and interest | | | 1,387,653 | |
| Prepaid expenses | | | 23,557 | |
| Total assets | | | 274,209,706 | |
| | | | | |
LIABILITIES | | | | |
| Payables: | | | | |
| Fund shares redeemed | | | 262,881 | |
| Accrued expenses | | | 261,923 | |
| Total liabilities | | | 524,804 | |
| | | | | |
NET ASSETS | | $ | 273,684,902 | |
| | | | | |
| Capital shares issued and outstanding | | | | |
| (60,000,000 shares authorized, $0.01 par value) | | | 10,932,529 | |
| | | | | |
| Net asset value, offering and redemption price per share | | $ | 25.03 | |
| | | | | |
COMPONENTS OF NET ASSETS | | | | |
| Capital stock at par value | | $ | 109,325 | |
| Paid-in capital | | | 216,783,514 | |
| Undistributed net investment income | | | 2,910,199 | |
| Undistributed net realized gain on investments | | | 2,198,442 | |
| Net unrealized appreciation on investments | | | 51,683,422 | |
NET ASSETS | | $ | 273,684,902 | |
The accompanying notes are an integral part of these financial statements.
Greenspring Fund, Incorporated
STATEMENT OF OPERATIONS For the Six Months Ended June 30, 2007 (Unaudited) |
INVESTMENT INCOME | | | |
| Income | | | |
| Interest | | $ | 3,635,240 | |
| Dividends (net of foreign withholding taxes of $2,333) | | | 750,110 | |
| Total income | | | 4,385,350 | |
| Expenses | | | | |
| Advisory fees (Note 5) | | | 965,901 | |
| Transfer agent fees (Note 6) | | | 108,419 | |
| Administration fees | | | 99,288 | |
| Fund accounting fees | | | 28,649 | |
| Administration fees - Corbyn (Note 5) | | | 27,792 | |
| Legal fees | | | 22,067 | |
| Custody fees | | | 19,168 | |
| Reports to shareholders | | | 17,695 | |
| Blue sky fees | | | 13,066 | |
| Audit fees | | | 11,358 | |
| Directors fees | | | 9,470 | |
| Insurance fees | | | 7,240 | |
| Miscellaneous fees | | | 7,045 | |
| Registration fees | | | 803 | |
| Total expenses | | | 1,337,961 | |
| Net investment income | | | 3,047,389 | |
| | | | | |
REALIZED AND UNREALIZED GAIN ON INVESTMENTS | | | | |
| Net realized gain on investments | | | 1,916,376 | |
| Change in net unrealized | | | | |
| appreciation/depreciation on investments | | | 12,557,399 | |
| Net realized and unrealized gain on investments | | | 14,473,775 | |
| Net increase in net assets resulting from operations | | $ | 17,521,164 | |
The accompanying notes are an integral part of these financial statements.
Greenspring Fund, Incorporated
STATEMENTS OF CHANGES IN NET ASSETS |
| | | Six Months Ended | | | Year Ended | |
| | | June 30, 2007# | | | December 31, 2006 | |
INCREASE (DECREASE) IN NET ASSETS FROM: | | | | | | |
OPERATIONS | | | | | | |
| Net investment income | | $ | 3,047,389 | | | $ | 5,255,819 | |
| Net realized gain on investments | | | 1,916,376 | | | | 2,202,233 | |
| Change in net unrealized | | | | | | | | |
| appreciation/depreciation on investments | | | 12,557,399 | | | | 15,317,304 | |
Net increase in net assets | | | | | | | | |
resulting from operations | | | 17,521,164 | | | | 22,775,356 | |
| | | | | | | | | |
DISTRIBUTIONS TO SHAREHOLDERS | | | | | | | | |
| From net investment income | | | — | | | | (5,676,613 | ) |
| From net realized gain | | | — | | | | (1,948,942 | ) |
Total distributions to shareholders | | | — | | | | (7,625,555 | ) |
| | | | | | | | | |
CAPITAL SHARE TRANSACTIONS | | | | | | | | |
| Net increase in net assets derived from net | | | | | | | | |
| change in outstanding shares (a)+ | | | 12,272,026 | | | | 71,155,724 | |
Total increase in net assets | | | 29,793,190 | | | | 86,305,525 | |
| | | | | | | | | |
NET ASSETS | | | | | | | | |
| Beginning of period | | | 243,891,712 | | | | 157,586,187 | |
End of period (including undistributed net | | | | | | | | |
investment income (loss) of $2,910,199 | | | | | | | | |
and $(136,832), respectively) | | $ | 273,684,902 | | | $ | 243,891,712 | |
(a) A summary of capital share transactions is as follows:
| | | Six Months Ended | | | | |
| | | June 30, 2007# | | | | |
| | | Shares | | | Value | | | Shares | | | Value | |
| Shares sold | | | 1,501,863 | | | $ | 35,904,223 | | | | 4,142,954 | | | $ | 94,837,670 | |
| Shares issued in reinvestment | | | | | | | | | | | | | | | | |
| of distributions | | | — | | | | — | | | | 306,541 | | | | 7,072,530 | |
| Shares redeemed + | | | (980,513 | ) | | | (23,632,197 | ) | | | (1,342,980 | ) | | | (30,754,476 | ) |
| Net increase | | | 521,350 | | | $ | 12,272,026 | | | | 3,106,515 | | | $ | 71,155,724 | |
| + | Net of redemption fees of $10,043 and $19,017, respectively. |
The accompanying notes are an integral part of these financial statements.
Greenspring Fund, Incorporated
FINANCIAL HIGHLIGHTS For a capital share outstanding throughout each period |
| | | Six Months | | | | | | | | | | | | | | | | |
| | | Ended | | | | | | | | | | | | | | | | |
| | | June 30, | | | Year Ended December 31, | |
| | | | 2007# | | | 2006 | | | 2005 | | | 2004 | | | 2003 | | �� | 2002 | |
| Net asset value, | | | | | | | | | | | | | | | | | | | |
| beginning of period | | $ | 23.43 | | | $ | 21.57 | | | $ | 20.91 | | | $ | 19.96 | | | $ | 15.70 | | | $ | 17.74 | |
| | | | | | | | | | | | | | | | | | | | | | | | | |
INCOME (LOSS) FROM INVESTMENT OPERATIONS: | | | | | | | | | | | | | | | | | | | | | | | | |
| Net investment income | | | 0.28 | | | | 0.53 | | | | 0.47 | | | | 0.52 | | | | 0.53 | | | | 0.88 | |
| Net realized and unrealized | | | | | | | | | | | | | | | | | | | | | | | | |
| gain (loss) on investments | | | 1.32 | | | | 2.10 | | | | 0.88 | | | | 1.18 | | | | 4.34 | | | | (1.98 | ) |
| Total from | | | | | | | | | | | | | | | | | | | | | | | | |
| investment operations | | | 1.60 | | | | 2.63 | | | | 1.35 | | | | 1.70 | | | | 4.87 | | | | (1.10 | ) |
| | | | | | | | | | | | | | | | | | | | | | | | | |
LESS DISTRIBUTIONS: | | | | | | | | | | | | | | | | | | | | | | | | |
| From net investment income | | | — | | | | (0.58 | ) | | | (0.44 | ) | | | (0.56 | ) | | | (0.61 | ) | | | (0.94 | ) |
| From net realized gain | | | — | | | | (0.19 | ) | | | (0.25 | ) | | | (0.19 | ) | | | — | | | | — | |
| Total distributions | | | — | | | | (0.77 | ) | | | (0.69 | ) | | | (0.75 | ) | | | (0.61 | ) | | | (0.94 | ) |
| Paid-in capital from | | | | | | | | | | | | | | | | | | | | | | | | |
| redemption fees (Note 1) | | | — | * | | | — | * | | | — | * | | | — | * | | | — | * | | | — | * |
| Net asset value, | | | | | | | | | | | | | | | | | | | | | | | | |
| end of period | | $ | 25.03 | | | $ | 23.43 | | | $ | 21.57 | | | $ | 20.91 | | | $ | 19.96 | | | $ | 15.70 | |
| Total return | | 6.83 | %^ | | | 12.29 | % | | | 6.57 | % | | | 8.69 | % | | | 31.34 | % | | | (5.99 | )% |
| | | | | | | | | | | | | | | | | | | | | | | | | |
RATIOS/SUPPLEMENTAL DATA: | | | | | | | | | | | | | | | | | | | | | | | | |
| Net assets, end of | | | | | | | | | | | | | | | | | | | | | | | | |
| period (millions) | | $ | 273.7 | | | $ | 243.9 | | | $ | 157.6 | | | $ | 132.5 | | | $ | 109.3 | | | $ | 51.3 | |
| Ratio of expenses to | | | | | | | | | | | | | | | | | | | | | | | | |
| average net assets | | | 1.04 | %+ | | | 1.07 | % | | | 1.16 | % | | | 1.06 | % | | | 1.14 | % | | | 1.19 | % |
| Ratio of net | | | | | | | | | | | | | | | | | | | | | | | | |
| investment income | | | | | | | | | | | | | | | | | | | | | | | | |
| to average net assets | | | 2.36 | %+ | | | 2.56 | % | | | 2.30 | % | | | 2.60 | % | | | 3.44 | % | | | 5.33 | % |
| Portfolio turnover rate | | 27.97 | %^ | | | 38.58 | % | | | 36.22 | % | | | 35.21 | % | | | 102.43 | % | | | 78.58 | % |
| * | Amount less than $0.01 per share. |
The accompanying notes are an integral part of these financial statements.
Greenspring Fund, Incorporated
NOTES TO FINANCIAL STATEMENTS June 30, 2007 (Unaudited) |
Note 1 - Significant Accounting Policies |
Greenspring Fund, Incorporated (the “Fund”) is a diversified, open-end management investment company registered under the Investment Company Act of 1940, as amended (the “1940 Act”). The Fund is organized as a Maryland corporation and commenced operations on July 1, 1983.
The preparation of the financial statements in accordance with accounting principles generally accepted in the United States of America requires management to make estimates and assumptions that affect the reported amounts and disclosures in the financial statements. Actual results could differ from those estimates.
Investment transactions and related investment income - Investment transactions are recorded on the trade date. Dividend income is recorded on the ex-dividend date and interest income, including amortization of premiums and accretion of discounts, is recorded on the accrual basis. Dividends determined to be a return of capital are recorded as a reduction of the cost basis of the security. Realized gains and losses from investment transactions are reported on an identified cost basis.
Valuation of investments - Securities listed on a national securities exchange or the NASDAQ National Market are valued at the last reported sale price or the official closing price for certain markets on the exchange of major listing as of the close of the regular session of the New York Stock Exchange.
Securities that are traded principally in the over-the-counter market, listed securities for which no sale was reported on the day of valuation, and listed securities whose primary market is believed by Corbyn Investment Management, Inc. (“Corbyn” or the “Adviser”) to be over-the-counter are valued at the mean of the closing bid and asked prices obtained from sources that the Adviser deems appropriate.
Short-term investments are valued at amortized cost, which approximates fair market value. The value of securities that mature, or have an announced call, within 60 days will be valued at market value.
Securities for which market quotations are not readily available are valued at fair value as determined in good faith by the Adviser as directed by the Board of Directors.
In determining fair value, the Adviser, as directed by the Board of Directors, considers all relevant qualitative and quantitative information available. These factors are subject to change over time and are reviewed periodically. The values assigned to fair value investments are based on available information and do not necessarily represent amounts that might ultimately be realized, since such amounts depend on future developments inherent in long-term investments. Further, because
Greenspring Fund, Incorporated
NOTES TO FINANCIAL STATEMENTS June 30, 2007 (Unaudited) (Con’t) |
of the inherent uncertainty of valuation, those estimated values may differ significantly from the values that would have been used had a ready market of the investments existed, and the differences could be material.
Dividends and distributions to stockholders - The Fund records dividends and distributions to stockholders on the ex-dividend date.
Redemption fees - The Fund’s Board of Directors has adopted policies and procedures with respect to frequent purchases and redemptions of Fund shares by Fund shareholders. The Fund is intended for long-term investors. The Fund discourages and does not accommodate frequent purchases and redemptions of Fund shares by Fund shareholders. The Fund reserves the right to decline a purchase order for any reason.
“Market-timers” who engage in frequent purchases and redemptions over a short period can disrupt the Fund’s investment program by requiring the Fund to have excess cash on hand or to liquidate holdings to accommodate redemptions. In addition, frequent purchases and redemptions may impede efficient Fund management and create additional transaction costs that are borne by all shareholders. To the extent that the Fund invests a significant portion of it’s assets in small-cap securities or high-yield bonds, it may be subject to the risks of market timing more than a fund that does not. Therefore, the Fund imposes a 2% redemption fee for shares held 60 days or less. The fee is deducted from the seller’s redemption proceeds and deposited into the Fund to help offset brokerage commissions, market impact, and other costs associated with fluctuations in Fund asset levels and cash flow caused by short-term trading. All shareholders are subject to these restrictions regardless of whether you purchased your shares directly from the Fund or through a financial intermediary. However, the Fund is limited in its ability to determine whether trades placed through financial intermediaries may signal excessive trading. Accordingly, the Fund may not be able to determine whether trading in combined orders or in omnibus accounts is contrary to the Fund’s policies. The Fund reserves the right to reject combined or omnibus orders in whole or in part.
The “first-in, first-out” method is used to determine the holding period. Under this method, the date of redemption will be compared with the earliest purchase date of shares held in the account. If the holding period for shares purchased is 60 days or less, the fee will be charged. The redemption fee may be modified or discontinued at any time, in which case, shareholders will be notified.
The fee does not apply to shares acquired through the reinvestment of dividends or other distributions, or shares redeemed pursuant to a systematic withdrawal plan or a mandatory IRA distribution.
Greenspring Fund, Incorporated
NOTES TO FINANCIAL STATEMENTS June 30, 2007 (Unaudited) (Con’t) |
Risk of loss arising from indemnifications - In the normal course of business, the Fund enters into contracts that contain a variety of representations, which provide general indemnifications. The Fund’s maximum exposure under these arrangements is unknown as this would involve future claims that may be made against the Fund that have not yet occurred. However, based on experience, the Fund expects the risk of loss to be remote.
Note 2 - Dividends and Distributions |
It is the Fund’s policy to declare dividends from net investment income and distributions from net realized gains as determined in accordance with income tax regulations which may differ from accounting principles generally accepted in the United States of America. Accordingly, periodic reclassifications are made within the portfolio’s capital accounts to reflect income and gains available for distribution under income tax regulations.
These dividends are either distributed to shareholders or reinvested by the Fund in additional shares of common stock, which are issued to shareholders. For those shareholders reinvesting the dividends, the number of shares issued is based on the net asset value per share as of the close of business on the business day previous to the payment date.
Note 3 - Purchases and Sales of Investments |
For the six months ended June 30, 2007, purchases and sales of investments, other than short-term investments, aggregated $65,794,504 and $56,213,237, respectively.
Note 4 - Federal Income Taxes |
It is the policy of the Fund to comply with the requirements of the Internal Revenue Code applicable to regulated investment companies. Accordingly, the Fund intends to distribute substantially all of its taxable income. Therefore, no federal income tax provision is required.
Required Fund distributions are based on income and capital gain amounts determined in accordance with federal income tax regulations, which differ from net investment income and realized gains recognized for financial reporting purposes.
Accordingly, the composition of net assets and distributions on a tax basis may differ from those reflected in the accompanying financial statements. As of December 31, 2006, the Fund’s most recently completed year end, the components of distributable earnings on a tax basis were as follows:
Greenspring Fund, Incorporated
NOTES TO FINANCIAL STATEMENTS June 30, 2007 (Unaudited) (Con’t) |
| Cost of investments | | $ | 204,142,066 | |
| Gross tax unrealized appreciation | | | 40,827,431 | |
| Gross tax unrealized depreciation | | | (1,838,240 | ) |
| Net tax unrealized appreciation | | | 38,989,191 | |
| Undistributed ordinary income | | | 124,893 | |
| Undistributed long-term capital gain | | | 157,374 | |
| Total distributable earnings | | | 282,267 | |
| Other accumulated gains/(losses) | | | — | |
| Total accumulated earnings/(losses) | | $ | 39,271,458 | |
Note 5 - Transactions with Related Parties |
Corbyn serves as the Fund’s investment adviser. Under an agreement between the Fund and Corbyn, the Fund pays Corbyn a fee of 0.75% of the first $250 million of average daily net assets, 0.70% of average daily net assets between $250 million and $500 million and 0.65% of average daily net assets in excess of $500 million, which is computed daily and paid monthly. For the six months ended June 30, 2007, the Fund incurred $965,901 in advisory fees.
The Fund has also entered into a Services Agreement with Corbyn to provide various administrative services. As compensation, the Fund pays Corbyn a fee of $2,500 per month plus 0.01% of average daily net assets, which is computed daily and paid monthly. For the six months ended June 30, 2007, the Fund incurred $27,792 in administrative fees to Corbyn.
At June 30, 2007, investors for whom Corbyn was investment adviser held 739,874 shares of the Fund’s common stock.
Note 6 - Shareholder Servicing Fees |
Both the Fund and Corbyn have entered into various Shareholder Servicing Agreements, whereby a fee is paid to certain service agents who administer omnibus accounts for indirect shareholders of the Fund. The Board of Directors has authorized the Fund to pay the amount of the fees it estimates the Fund would have been charged by its transfer agent for administering the accounts on an individual basis. The amount is included in “Transfer agent fees” on the accompanying Statement of Operations. For the six months ended June 30, 2007, the Fund incurred $71,829 of such fees.
Greenspring Fund, Incorporated
NOTES TO FINANCIAL STATEMENTS June 30, 2007 (Unaudited) (Con’t) |
Note 7 - New Accounting Pronouncements |
Effective June 29, 2007, the Fund adopted Financial Accounting Standards Board (“FASB”) Interpretation No. 48 (“FIN 48”), “Accounting for Uncertainty in Income Taxes,” a clarification of FASB Statement No. 109, “Accounting for Income Taxes.” FIN 48 establishes financial reporting rules regarding recognition and measurement of tax positions taken or expected to be taken on a tax return. The adoption of FIN 48 had no impact on the Fund’s net assets or results of operations.
In September 2006, the FASB issued Statement of Financial Accounting Standards (“SFAS”) No. 157, “Fair Value Measurements” (“SFAS 157”). SFAS 157 defines fair value, establishes a framework for measuring fair value in accordance with GAAP, and expands disclosure about fair value measurements. SFAS 157 is effective for financial statements issued for fiscal years beginning after November 15, 2007. Management is currently evaluating the implications of SFAS 157, and its impact on the financial statements has not yet been determined.
Greenspring Fund, Incorporated
APPROVAL OF INVESTMENT ADVISORY AGREEMENT (Unaudited) |
Continuance of the Investment Advisory Agreement (the “Agreement”) must be considered annually by the directors of the Fund who are not parties to the Agreement or “interested persons” of any such party (as defined in the 1940 Act) (the “Independent Directors”). In order for continuance to be approved, a majority of the Independent Directors must vote for such approval at an in-person meeting called for this purpose.
The Board of Directors (the “Board”), including a majority of the Independent Directors, approved the continuance of the Agreement most recently at an in-person meeting in February 2007. One of the Fund’s three Independent Directors was unable to attend this meeting. To assist the Directors in their evaluation of the Agreement, the Board was supplied with extensive information by the Adviser in advance of the meeting. After a detailed presentation by the Adviser, during which the written materials were reviewed and questions from the Board were answered, the Independent Directors present met in executive session with legal counsel to the Fund to consider the approval of the Agreement. In considering the Agreement, the Board did not identify any particular overriding factor, but considered all the information available. Following this session, the Board reconvened and approved the continuation of the Agreement as being in the best interest of the Fund. Below is a summary of the primary factors considered by the Board and the conclusions thereto that formed the basis for the Board approving the continuance of the Agreement:
| 1. | The nature, extent, and quality of the services to be provided by the Adviser under the Agreement. The Board considered the specific responsibilities of all aspects of the day-to-day management of the Fund. The Board considered the qualifications and experience of the portfolio manager and other key personnel of the Adviser involved with the day-to-day activities of the Fund. The Board also considered the resources and compliance structure of the Adviser, including the backgrounds of the chief compliance officers of both the Fund and the Adviser, as well as the Adviser’s compliance record. The Board also considered the Adviser’s marketing efforts and its continued commitment to the Fund’s growth. The Board noted that the Adviser has managed the Fund since its inception, providing a consistent investment approach with low turnover of the Adviser’s staff. The Board concluded that the Adviser had sufficient quality and depth of personnel, resources, investment methods and compliance policies and procedures essential to performing its duties under its advisory agreement and that the nature, overall quality, and extent of the management services were satisfactory and reliable. |
Greenspring Fund, Incorporated
APPROVAL OF INVESTMENT ADVISORY AGREEMENT (Unaudited) (Con’t) |
| 2. | The Fund’s historical investment performance. In assessing the quality of the portfolio management delivered by the Adviser, the Board reviewed the short-term and long-term performance of the Fund on both an absolute basis, and in comparison to the performance of various category, relative index and major market benchmarks. The Board noted that the Fund’s performance compared favorably with the performance of both of its category benchmarks, which are groups of other mutual funds with similar investment styles selected by independent providers of mutual fund information, for the 1-, 3-, 5- and 10-year periods ended December 31, 2006. The Board also considered the consistency of returns and the level of risk taken. The Board concluded that the Adviser’s historical investment performance was highly satisfactory under current market conditions and consistent with the Fund’s long-term performance objective. |
| 3. | The costs of the services to be provided by the Adviser and the structure of the Adviser’s fees under the Advisory Agreement. In considering the advisory fee and total fees and expenses of the Fund, the Board reviewed a presentation comparing the Fund to a group of peer funds. Each of the peer funds used a research-intensive investment style similar to that of the Fund and did not have a 12b-1 Plan. The Board considered that the Fund’s contractual advisory fee of 0.75% was less than the median contractual advisory fee of the peer funds at a common net asset level. The Board also considered that the Fund’s total expense ratio of 1.07% was lower than the median total expense ratio of the peer funds. The Board concluded that, although the Adviser had not agreed to waive and/or reimburse Fund expenses at a certain level, the Adviser had consistently maintained an annual expense ratio in line with its peer group. Additionally, the fees charged by the Adviser were in line with the fees it charged to its other separately managed accounts and were not excessive. |
| 4. | Economies of scale. The Board also considered that economies of scale would be expected to be realized by the Adviser as the assets of the Fund grow. The Board noted that the Agreement’s fee schedule included breakpoints at net asset levels of $250 million and $500 million, whereby the fees paid by the Fund would decrease at the higher asset levels. The Board concluded that there were no significant economies of scale to be shared by the Adviser at current asset levels, but anticipated that the Fund would receive the benefits of such economies of scale in the current fiscal year if asset levels continued to increase. |
| 5. | Costs of services provided and profits to be realized by the Adviser. The Board then discussed the costs of the services to be provided and the profitability of the Adviser. Specific attention was given to the methodologies |
Greenspring Fund, Incorporated
APPROVAL OF INVESTMENT ADVISORY AGREEMENT (Unaudited) (Con’t) |
| | followed in allocating shared costs to the Fund. The Board recognized that the cost allocation methodologies are inherently subjective and various allocation methodologies may each be reasonable while producing different results. In this regard, the Board noted that the allocation appeared reasonable. After such review, the Board determined that the profitability of the Adviser with respect to the Agreement was not excessive, and that the Adviser had maintained adequate profit levels to support the services to the Fund. |
| 6. | Other factors and considerations. The Board periodically reviews and considers other material information throughout the year relating to the quality of services provided to the Fund, such as the receipt of research services in exchange for soft dollar credit in connection with commissions on the Fund’s equity transactions. The Board noted that the commissions paid by the Fund are reasonable and that the Fund receives quality execution, regardless of whether the commissions are used to pay for research through soft dollar arrangements. Other material information considered includes the Adviser’s management of its relationship with the Fund’s third party service providers, and expenses paid to those third parties. Also, at its quarterly meetings, the Board reviews detailed information relating to the Fund’s portfolio and performance, and receives a presentation from the Fund’s portfolio manager. |
The Board did not identify any single factor discussed previously, but instead considered all factors collectively in its determination to approve the Agreement. The Directors, including a majority of the Independent Directors, concluded that the terms of the Agreement are fair and reasonable, that the Adviser’s fees are reasonable in light of the services provided to the Fund and the benefits received by the Adviser and that the Agreement is in the best interest of the Fund.
Greenspring Fund, Incorporated
2330 West Joppa Road, Suite 110
Lutherville, MD 21093
(410) 823-5353
(800) 366-3863
www.greenspringfund.com
The Fund’s proxy voting policies and procedures, as well as its proxy voting record for the most recent 12 month period ended June 30, are available without charge, upon request, by contacting the Fund at (800) 366-3863 or greenspring@greenspringfund.com. The Fund will send the information within three business days of receipt of the request, by first class mail or other means designed to ensure equally prompt delivery. The Fund’s proxy voting record is also available on the Commission’s website at http://www.sec.gov. The Fund files its complete schedule of portfolio holdings with the Commission for the first and third quarters of each fiscal year on Form N-Q. The Fund’s Forms N-Q are available on the Commission’s website and may be reviewed and copied at the Commission’s Public Reference Room in Washington, DC. Information on the operation of the Public Reference Room may be obtained by calling (202) 551-8090. The Fund’s first and third quarter reports are available on its website at www.greenspringfund.com.
DIRECTORS
Charles vK. Carlson, Chairman
William E. Carlson
David T. Fu
Sean T. Furlong
Michael J. Fusting
Michael T. Godack
Richard Hynson, Jr.
Michael P. O’Boyle
OFFICERS
Charles vK. Carlson
President and Chief Executive Officer
Michael J. Fusting
Sr. Vice President and
Chief Financial Officer
Michael T. Godack
Sr. Vice President
Elizabeth Agresta Swam
Chief Compliance Officer,
Secretary, Treasurer
and AML Officer
INVESTMENT ADVISER
Corbyn Investment Management, Inc.
2330 West Joppa Road, Suite 108
Lutherville, MD 21093-7207
ADMINISTRATOR,
FUND ACCOUNTANT AND
TRANSFER AGENT
U.S. Bancorp Fund Services, LLC
615 East Michigan Street
Milwaukee, WI 53202
DISTRIBUTOR
Quasar Distributors, LLC
615 East Michigan Street
Milwaukee, WI 53202
CUSTODIAN
U.S. Bank, N.A.
1555 N. RiverCenter Dr., Suite 302
Milwaukee, WI 53212
INDEPENDENT REGISTERED
PUBLIC ACCOUNTING FIRM
Tait, Weller & Baker LLP
1818 Market Street, Suite 2400
Philadelphia, PA 19103
LEGAL COUNSEL
Kirkpatrick & Lockhart
Preston Gates Ellis LLP
1601 K Street NW
Washington, DC 20006
Item 2. Code of Ethics.
Not applicable for semi-annual reports.
Item 3. Audit Committee Financial Expert.
Not applicable for semi-annual reports.
Item 4. Principal Accountant Fees and Services.
Not applicable for semi-annual reports.
Item 5. Audit Committee of Listed Registrants.
Not applicable to registrants who are not listed issuers (as defined in Rule 10A-3 under the Securities Exchange Act of 1934).
Item 6. Schedule of Investments.
Schedule of Investments is included as part of the report to shareholders filed under Item 1 of this Form.
Item 7. Disclosure of Proxy Voting Policies and Procedures for Closed-End Management Investment Companies.
Not applicable to open-end investment companies.
Item 8. Portfolio Managers of Closed-End Management Investment Companies.
Not applicable to open-end investment companies.
Item 9. Purchases of Equity Securities by Closed-End Management Investment Company and Affiliated Purchasers.
Not applicable to open-end investment companies.
Item 10. Submission of Matters to a Vote of Security Holders.
Not Applicable.
Item 11. Controls and Procedures.
| (a) | The Registrant’s Chief Executive Officer and Chief Financial Officer have reviewed the Registrant's disclosure controls and procedures (as defined in Rule 30a-3(c) under the Investment Company Act of 1940 (the “Act”)) as of a date within 90 days of the filing of this report, as required by Rule 30a-3(b) under the Act and Rules 13a-15(b) or 15d-15(b) under the Securities Exchange Act of 1934. Based on their review, such officers have concluded that the disclosure controls and procedures are effective in ensuring that information required to be disclosed in this report is appropriately recorded, processed, summarized and reported and made known to them by others within the Registrant and by the Registrant’s service provider. |
| (b) | There were no changes in the Registrant's internal control over financial reporting (as defined in Rule 30a-3(d) under the Act) that occurred during the second fiscal quarter of the period covered by this report that has materially affected, or is reasonably likely to materially affect, the Registrant's internal control over financial reporting. |
Item 12. Exhibits.
(a) | (1) Any code of ethics or amendment thereto, that is subject of the disclosure required by Item 2, to the extent that the registrant intends to satisfy Item 2 requirements through filing an exhibit. Not Applicable. |
(2) Certifications pursuant to Section 302 of the Sarbanes-Oxley Act of 2002. Filed herewith.
(3) Any written solicitation to purchase securities under Rule 23c-1 under the Act sent or given during the period covered by the report by or on behalf of the registrant to 10 or more persons. Not applicable to open-end investment companies.
(b) | Certification pursuant to Section 906 of the Sarbanes-Oxley Act of 2002. Furnished herewith. |
SIGNATURES
Pursuant to the requirements of the Securities Exchange Act of 1934 and the Investment Company Act of 1940, the registrant has duly caused this report to be signed on its behalf by the undersigned, thereunto duly authorized.
(Registrant) Greenspring Fund, Incorporated
By (Signature and Title)* /s/ Charles vK. Carlson
Charles vK. Carlson, Chief Executive Officer
Date August 24, 2007
Pursuant to the requirements of the Securities Exchange Act of 1934 and the Investment Company Act of 1940, this report has been signed below by the following persons on behalf of the registrant and in the capacities and on the dates indicated.
By (Signature and Title)* /s/ Charles vK. Carlson
Charles vK. Carlson, Chief Executive Officer
Date August 24, 2007
By (Signature and Title)* /s/ Michael J. Fusting
Michael J. Fusting, Chief Financial Officer
Date August 24, 2007