UNITED STATES
SECURITIES AND EXCHANGE COMMISSION
Washington, D.C. 20549
FORM N-CSR
CERTIFIED SHAREHOLDER REPORT OF REGISTERED
MANAGEMENT INVESTMENT COMPANIES
Investment Company Act file number 811-3627
Greenspring Fund, Incorporated
(Exact name of registrant as specified in charter)
2330 West Joppa Road, Suite 110
Lutherville, MD 21093-4641
(Address of principal executive offices) (Zip code)
Mr. Charles vK. Carlson, President
2330 West Joppa Road, Suite 110
Lutherville, MD 21093-4641
(Name and address of agent for service)
(410) 823-5353
Registrant's telephone number, including area code
Date of fiscal year end: December 31, 2008
Date of reporting period: June 30, 2008
Item 1. Report to Stockholders.
SEMI-ANNUAL REPORT
JUNE 30, 2008
This report is authorized for distribution
only to shareholders who have received a
copy of the official Prospectus of the
Greenspring Fund, Incorporated.
Greenspring Fund, Incorporated
Dear Fellow Shareholders:
We are pleased to provide this report discussing the Greenspring Fund’s portfolio activity and performance for the quarter ended June 30, 2008. Discussions of the Fund’s activity and performance for the first quarter of 2008, and previous quarters, can be found on the Fund’s website (www.greenspringfund.com) under “FUND REPORTS.”
During the second quarter of 2008, the Greenspring Fund gained 2.79% during a period of mixed performances by the major market averages. The stock market began the quarter in constructive fashion as stocks rebounded in the wake of the Bear Stearns bailout amid hopes that the worst of the credit contraction was over. However, lingering problems in the investment portfolios of the major investment banks, surging oil prices, and downwardly spiraling consumer confidence helped roil the stock market as the quarter progressed.
INFLUENCES on FUND PERFORMANCE
During the quarter, all of the Greenspring Fund’s asset classes – common stocks, convertible bonds, corporate bonds and cash equivalents – generated positive performances for the Fund, a notable achievement of consistency during a period when both the equity and fixed income indices produced mixed returns. The securities that had the largest influences on the Fund’s performance were all common stocks – United America Indemnity, Radyne Corp., EMCOR Group, Rush Enterprises,
| | Greenspring Fund | |
| | Performance for the | |
| | Periods Ended | |
| | June 30, 2008 | |
| | Quarter | 2.79% | |
| | Year to Date | -0.04% | |
| | 1 Year | -1.46% | |
| | 3 Years* | 8.07% | |
| | 5 Years* | 9.63% | |
| | 10 Years* | 6.50% | |
| | 15 Years* | 8.96% | |
| | 20 Years* | 9.22% | |
| | Since inception on 7/1/83* | 10.71% | |
| | Expense Ratio** | 1.21% | |
| * | | annualized. |
| ** | | as stated in Prospectus dated 5-1-08. See note on last page of letter. |
Performance data quoted represents past performance; past performance does not guarantee future results. The investment return and principal value of an investment will fluctuate so that an investor’s shares, when redeemed, may be worth more or less than their original cost. Current performance of the Fund may be lower or higher than the performance quoted. Performance data current to the most recent month end may be obtained by calling 1-800-366-3863 or visiting the Fund’s web site. The Fund imposes a 2.00% redemption fee for shares held 60 days or less. Performance data does not reflect the redemption fee. If reflected, total returns would be reduced.
Greenspring Fund, Incorporated
and Suncor Energy. Radyne, EMCOR, and Suncor produced positive results, while United America Indemnity and Rush Enterprises declined in value. A brief synopsis of the three largest influences follows.
United America Indemnity
United America Indemnity is a specialty property and casualty insurer, shares of which the Fund first purchased in December 2003. During the quarter, the Company’s stock price dropped from $19.26 per share to $13.37, with the majority of the decline occurring after the Company issued a disappointing earnings report. The earnings were less than expected for several reasons: 1) insurance premiums decreased throughout the industry causing revenues to decline; 2) United America’s new CEO decided to exit certain business lines that were not meeting profit expectations; 3) business was lost due to the high level of management turnover during the last several years; and 4) investment income declined due to lower short-term interest rates. After the stock price declined, however, the Fund added to its investment position, as we believe that the stock price already discounted many of the difficulties facing the Company. In addition, United America’s stock sells at a significant discount to its book value, and the Company is using its excess capital to buy back its stock in the open market, an action that should increase its book value per share.
| | | % of Net |
| | Greenspring Fund | Assets |
| | Top 10 Holdings | as of |
| | | 6/30/08 |
| | FTI Consulting Inc. | 6.6% |
| | Suncor Energy Inc. | 4.4% |
| | Level 3 Communications 6% Convertible Bonds | 4.0% |
| | Adaptec 0.75% Convertible Bonds | 3.7% |
| | Emcor Group | 3.6% |
| | Assurant Inc. | 3.5% |
| | Xerox Corporation 7.625% Bonds | 3.5% |
| | Energen Corporation | 3.3% |
| | Michael Baker Corp. | 3.3% |
| | United America Indemnity | 2.8% |
Radyne Corporation
Radyne Corporation designs and manufactures equipment used in the transmission and reception of data over satellite networks. In mid-May, Radyne announced an agreement to be purchased for $11.50 per share by Comtech Telecommunications Corp., one of its larger competitors. The Greenspring Fund first purchased shares of Radyne Corporation in May 2004, but had bought, and sold, additional shares on several occasions since the initial purchase. During the quarter, Radyne’s stock rose from $8.52 per share to $11.43. The merger transaction is expected to close early in August.
Greenspring Fund, Incorporated
Emcor Group
EMCOR provides comprehensive services for the construction, maintenance and operation of mechanical and electrical systems in a wide range of industrial, commercial and institutional facilities worldwide. During the second quarter of 2008, the Company reported record first quarter results that exceeded Wall Street’s expectations, due to strong revenue growth and improving profit margins. In addition, EMCOR announced a series of new construction and facilities services contracts during the last several months, highlighting the strength and diversity of its business. Not only is its construction business strong, but the Company has increasingly been called upon to help businesses improve the energy efficiency of their facilities in an effort to curtail the ever rising cost of energy. Near the end of the quarter, the Company raised its earnings guidance for the year due to strong order activity and improved profit margins. During the quarter, EMCOR’s stock price increased from $22.21 per share to $28.53.
INVESTMENT STRATEGY
We continued to reposition the Fund’s portfolio as the markets’ volatility created potential opportunities. While the Fund established several new common stock positions (BCSB Bancorp, CKX, Inc., Tessera Technologies), the more significant additions to the common stock portfolio were incremental purchases of stocks that the Fund had already owned. The Fund also established new positions in several corporate bonds, both convertible and non-convertible, and added to some existing bond holdings.
During June, the Fund sold its holdings in the common stock of CIT Group, a company about which we have written several times in the past. CIT is a specialty lender that experienced difficulties within its home loan portfolio during the ongoing credit crisis. CIT requires constant access to the capital markets, as it has a large amount of debt that matures regularly and needs to be refinanced in order to sustain its lending program. With access to the capital markets severely strained, CIT has had to resort to some very dilutive stock offerings, as well as asset sales, to raise capital. These actions, while necessary, had a detrimental impact on the book value of CIT and reduced our estimate of the future value of the Company. While CIT has been successful raising capital that has provided some near-term stability, we are concerned that any further deterioration in the Company’s loan portfolio may result in CIT’s access to the capital markets becoming even more challenged. Consequently, the Fund sold its common stock holdings, realizing a capital loss.
However, the Fund also established new positions in some short-term CIT bonds during the quarter, as we believe that the Company’s ability to redeem its short-term debt has been solidified by the capital the Company has recently raised. The longest-
Greenspring Fund, Incorporated
dated bond that was purchased matures in mid-November of 2008, with the largest CIT holding in the Fund maturing on August 15, 2008. The bonds were purchased at prices that will generate very attractive yields-to-maturity.
A discussion of the three largest purchases, and three largest sales, in the Greenspring Fund during the second quarter follows:
Purchases of Securities:
1) Michael Baker Corporation – The Greenspring Fund added to its position of this long-time holding (shares were first purchased in February 2000), as the price of its common stock remained under pressure due to the Company’s continued delinquency in filing its recent financial statements. In February 2008, the Company had announced that it would have to restate its previously issued financial statements for the first three quarters of 2007 because it had discovered that it had improperly recognized revenue on certain projects, specifically within the energy area. However, we remain very confident in Michael Baker’s ability to generate strong earnings due to the strength of its engineering division, which has continued to secure many new contracts from its government and corporate customers. The Company filed its delinquent 10-K on June 30, 2008 and should file its delayed 10-Q by the end of July, actions that should further help Michael Baker’s stock price.
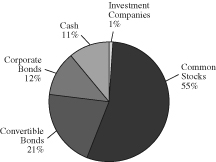
| Greenspring Fund |
| Portfolio Allocation |
| as of June 30, 2008 |
| |
|
| |
2) United America Indemnity – See discussion above.
3) QLT Inc. 3% Convertible Bonds due September 15, 2023 – QLT, Inc. is a biopharmaceutical company that develops ophthalmological and dermatological products and is a world leader in the field of light-activated drugs. The Fund purchased convertible bonds of QLT due to the bond’s attractive short-term total return prospects. Holders’ of these bonds have the ability to “put” (sell) the bonds back to the Company on September 15, 2008 at a price of par ($100). The Company recently announced the sale of its Aczone product line to Allergan for $150 million. These sale proceeds, combined with QLT’s current cash holdings, should provide the Company with plenty of resources to retire the bonds on September 15, 2008, which
Greenspring Fund, Incorporated
would result in the Fund generating a solid return on its investment in the QLT convertible bonds.
Sales of Securities:
The largest outright sales in the Greenspring Fund during the quarter were the following:
1) Nortel Networks 4.25% convertible bonds due September 1, 2008 – Nortel called these convertible bonds for redemption on June 16, 2008, almost three months prior to their maturity. This early redemption improved the annualized total return above the rate that was anticipated at the time of the Fund’s purchases of the bonds in October 2007 and March 2008.
2) Getty Images 0.5% convertible bonds due June 9, 2023 – The Getty Images convertible bonds were another bond with a “put” feature – meaning that holders of the bonds were allowed to sell their bonds back to the issuing company on certain dates at predefined prices. The Fund purchased the bonds in August 2007 as a short-term total return investment. We anticipated at the time of purchase that we would put the bonds back to the Company on the first put date of June 9, 2008.
3) Waste Industries common stock – Waste Industries, a solid waste services company located in the Southeast, was acquired in May 2008 for $38 per share by a management-led consortium. The Greenspring Fund had first purchased its shares of Waste Industries in March 1999, and had increased and decreased its position in the stock several times since the initial investment. The Fund realized a significant long-term capital gain on the sale of its common stock holdings in Waste Industries.
We would like to note that the Greenspring Fund celebrated its 25th Anniversary on July 1, 2008. We recently strolled down memory lane by dusting off and reading our first shareholder reports and were struck by the number of similarities between then and now. The Greenspring Fund began operations on July 1, 1983 just as the stock market was entering a difficult period amid concerns about the Mideast and the loan portfolios of major banks (sound familiar?). The Fund’s relative performance 25 years ago was remarkably similar to its performance during the most recent six months.
Although much has changed in the financial markets in the ensuing 25 years, the Greenspring Fund’s approach to managing assets remains the same. We view ourselves as stewards charged with the responsibility of seeking to preserve capital during difficult times, as well as growing assets steadily during more buoyant environments. The Fund continues to invest in a variety of asset classes, with the goal of navigating the sometimes treacherous markets in a risk-averse manner, as we
Greenspring Fund, Incorporated
strive to provide steady, consistent investment returns with fewer bumps along the way.
Respectfully,
 |  |
| Charles vK. Carlson | Michael J. Fusting |
| Portfolio Manager | Co-Chief Investment Officer |
| Co-Chief Investment Officer | |
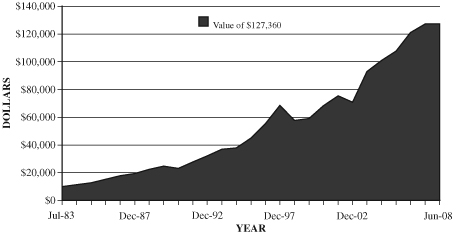
GREENSPRING FUND
PERFORMANCE SINCE INCEPTION
HOW $10,000 INVESTED ON 7/1/83 WOULD HAVE GROWN*
* Figures include changes in principal value, reinvested dividends and capital gains distributions. Past expense limitations increased the Fund’s return. This chart illustrates the performance of a hypothetical $10,000 investment made in the Fund since inception through June 30, 2008. The total value of $127,360 assumes the reinvestment of dividends and capital gains, but does not reflect the effect of any redemption fees. This chart does not imply any future performance.
Average annual total returns for the one, three, five and ten year periods ended June 30, 2008 were -1.46%, 8.07%, 9.63% and 6.50%, respectively. Average annual returns for more than one year assume a compounded rate of return and are not the Fund’s year-by-year results, which fluctuated over the periods shown. Returns do not reflect taxes that shareholders may pay on Fund distributions or redemptions of Fund shares.
Greenspring Fund, Incorporated
Fund holdings and/or sector allocations are subject to change at any time and are not recommendations to buy or sell any security.
Mutual fund investing involves risk. Principal loss is possible. Small-capitalization companies tend to have limited liquidity and greater price volatility than large-capitalization companies. Investments by the Fund in lower-rated and non-rated securities present a greater risk of loss to principal and interest than higher-rated securities. Investments in debt securities typically decrease in value when interest rates rise. This risk is usually greater for longer-term debt securities.
Opinions expressed are subject to change, are not guaranteed and should not be considered recommendations to buy or sell any security.
** The expense ratio of 1.21% includes indirect expenses that the Fund incurs from investing in the shares of other investment companies. The indirect fees represent the Fund’s pro rata portion of the cumulative expenses charged by the other investment companies. Without those indirect fees, the Fund’s Total Annual Operating Expenses would be 1.03%.
Book Value is the net asset value of a company, calculated by subtracting total liabilities from total assets.
Distributed by Quasar Distributors, LLC 7/08
The Fund’s investment objectives, risks, charges and expenses must be considered carefully before investing. The Prospectus contains this and other information about the Fund, and it may be obtained by calling 1-800-366-3863 or visiting www.greenspringfund.com. Please read the Fund’s Prospectus carefully before investing.
Greenspring Fund, Incorporated
Expense Example For the Six Months Ended June 30, 2008 (Unaudited) |
As a shareholder of the Fund, you incur two types of costs: (1) redemption fees if you redeem within 60 days of purchase; and (2) ongoing costs, including management fees and other Fund expenses. This example is intended to help you understand your ongoing costs (in dollars) of investing in the Fund and to compare these costs with the ongoing costs of investing in other mutual funds. The example is based on an investment of $1,000 invested at the beginning of the period and held for the entire period (1/1/2008 - 6/30/2008).
Actual Expenses
The first line of the table below provides information about actual account values based on actual returns and actual expenses. You may use the information in this line, together with the amount you invested, to estimate the expenses that you paid over the period. Simply divide your account value by $1,000 (for example, an $8,600 account value divided by $1,000 = 8.6), then multiply the result by the number in the first line under the heading entitled “Expenses Paid During the Period” to estimate the expenses you paid on your account during this period.
Hypothetical Example for Comparison Purposes
The second line of the table below provides information about hypothetical account values and hypothetical expenses based on the Fund’s actual expense ratio and an assumed rate of return of 5% per year before expenses, which is not the Fund’s actual return. The hypothetical account values and expenses may not be used to estimate the actual ending account balance or expenses you paid for the period. You may use this information to compare the ongoing costs of investing in the Fund and other funds. To do so, compare this 5% hypothetical example with the 5% hypothetical examples that appear in the shareholder reports of the other funds. Please note that the expenses shown in the table are meant to highlight your ongoing costs only and do not reflect any transactional costs, such as redemption fees. Therefore, the second line of the table is useful in comparing ongoing costs only, and will not help you determine the relative total costs of owning different funds. In addition, if these transactional costs were included, your costs would have been higher.
| | | | | Expenses Paid |
| | | Beginning | Ending | During the Period |
| | | Account Value | Account Value | 1/1/2008 – |
| | | 1/1/2008 | 6/30/2008 | 6/30/2008* |
| Actual | | $1,000 | $1,000 | $5.27 |
| Hypothetical | | | | |
| (5% annual return | | | | |
| before expenses) | | $1,000 | $1,020 | $5.32 |
| * | Expenses are equal to the Fund’s annualized expense ratio of 1.06%, multiplied by the average account value over the period multiplied by 182/366 (to reflect the one-half year period). |
Greenspring Fund, Incorporated
SCHEDULE OF INVESTMENTS at June 30, 2008 (Unaudited) |
| Shares | | | | Value | |
| COMMON STOCKS: 55.3% | | | |
| | | | | | |
| Building Products: 0.1% | | | |
| | 17,300 | | Griffon Corp.* | | $ | 151,548 | |
| | | | | |
| Business & Professional Services: 6.6% | | | | |
| | 243,000 | | FTI Consulting, Inc.* | | | 16,635,780 | |
| | | | | |
| Chemicals: 1.3% | | | | |
| | 199,325 | | Hercules, Inc. | | | 3,374,572 | |
| | | | | |
| Commercial Banks: 2.2% | | | | |
| | 40,074 | | American National | | | | |
| | | | Bankshares, Inc. | | | 728,946 | |
| | 398,801 | | Cardinal | | | | |
| | | | Financial Corp. | | | 2,496,494 | |
| | 162,924 | | First Mariner | | | | |
| | | | Bancorp, Inc.* | | | 506,694 | |
| | 759 | | Fulton Financial Corp. | | | 7,628 | |
| | 25,000 | | Middleburg | | | | |
| | | | Financial Corp. | | | 480,000 | |
| | 30,000 | | Patriot National | | | | |
| | | | Bancorp, Inc. | | | 457,500 | |
| | 26,190 | | Provident | | | | |
| | | | Bankshares Corp. | | | 167,092 | |
| | 27,500 | | Southern National | | | | |
| | | | Bancorp of Virginia* | | | 222,613 | |
| | 14,476 | | SunTrust Banks, Inc. | | | 524,321 | |
| | | | | | | 5,591,288 | |
| Communications Equipment: 1.7% | | | | |
| | 364,911 | | Radyne Corp.* | | | 4,170,933 | |
| | | | | |
| Construction & Engineering: 6.8% | | | | |
| | 315,700 | | EMCOR Group, Inc.* | | | 9,006,921 | |
| | 377,400 | | Michael Baker Corp.* | | | 8,257,512 | |
| | | | | | | 17,264,433 | |
| Diversified Gas Utilities: 3.3% | | | | |
| | 108,400 | | Energen Corp. | | | 8,458,452 | |
| | | | | |
| Electric Utilities: 2.0% | | | | |
| | 99,000 | | PPL Corp. | | | 5,174,730 | |
| | | | | |
| Electrical Equipment: 0.3% | | | | |
| | 17,400 | | Emerson Electric Co. | | | 860,430 | |
| | | | | |
| Energy Equipment & Services: 1.2% | | | | |
| | 204,414 | | Cal Dive | | | | |
| | | | International, Inc.* | | | 2,921,076 | |
| | | | | |
| Entertainment: 0.9% | | | | |
| | 275,000 | | CKX, Inc.* | | | 2,406,250 | |
| | | | | |
| Environmental Services: 1.8% | | | | |
| | 363,000 | | Allied Waste | | | | |
| | | | Industries, Inc.* | | | 4,581,060 | |
| | | | | |
| Household & Personal Products: 2.7% | | | | |
| | 634,505 | | Prestige Brands | | | | |
| | | | Holdings, Inc.* | | | 6,763,823 | |
| | | | | |
| Industrial Distribution: 2.5% | | | | |
| | 151,800 | | Watsco, Inc. | | | 6,345,240 | |
| | | | | |
| Insurance: 9.2% | | | | |
| | 136,100 | | Assurant, Inc. | | | 8,977,156 | |
| | 34,450 | | PartnerRe, Ltd.# | | | 2,381,529 | |
| | 537,999 | | United America | | | | |
| | | | Indemnity, Ltd.#* | | | 7,193,047 | |
| | 201,050 | | W.R. Berkley Corp. | | | 4,857,368 | |
| | | | | | | 23,409,100 | |
| Machinery: 0.3% | | | | |
| | 20,000 | | Pentair, Inc. | | | 700,400 | |
| | | | | |
| Metals & Mining: 0.8% | | | | |
| | 86,000 | | Brush Engineered | | | | |
| | | | Materials, Inc.* | | | 2,100,120 | |
| | | | | |
| Oil & Gas Exploration & Production: 6.8% | | | | |
| | 5,626 | | ConocoPhillips | | | 531,038 | |
| | 22,280 | | EOG Resources, Inc. | | | 2,923,136 | |
| | 92,000 | | Rosetta | | | | |
| | | | Resources, Inc.* | | | 2,622,000 | |
| | 192,000 | | Suncor Energy, Inc.# | | | 11,159,040 | |
| | | | | | | 17,235,214 | |
| Real Estate: 0.2% | | | | |
| | 4,500 | | First Potomac | | | | |
| | | | Realty Trust | | | 68,580 | |
| | 27,500 | | Urstadt Biddle | | | | |
| | | | Properties, Inc. - | | | | |
| | | | Class A | | | 403,150 | |
| | | | | | | 471,730 | |
The accompanying notes are an integral part of these financial statements.
Greenspring Fund, Incorporated
SCHEDULE OF INVESTMENTS at June 30, 2008 (Unaudited) (Con’t) |
| Shares/Principal | | | | Value | |
| COMMON STOCKS: 55.3% (Con’t) | | | |
| | | | |
| Semiconductors & | | | |
| Semiconductor Equipment: 1.9% | | | |
| | 34,093 | | Rudolph | | | |
| | | | Technologies, Inc.* | | $ | 262,516 | |
| | 275,000 | | Tessera | | | | |
| | | | Technologies, Inc.* | | | 4,501,750 | |
| | | | | | | 4,764,266 | |
| Thrifts & Mortgage Finance: 0.3% | | | | |
| | 60,000 | | BCSB Bancorp, Inc.* | | | 642,000 | |
| | 3,500 | | OceanFirst | | | | |
| | | | Financial Corp. | | | 63,175 | |
| | | | | | | 705,175 | |
| Transportation: 2.4% | | | | |
| | 211,930 | | Rush Enterprises, | | | | |
| | | | Inc. - Class A* | | | 2,545,279 | |
| | 295,798 | | Rush Enterprises, | | | | |
| | | | Inc. - Class B* | | | 3,212,366 | |
| | 28,200 | | SAIA, Inc.* | | | 307,944 | |
| | | | | | | 6,065,589 | |
| TOTAL COMMON STOCKS | | | | |
| (cost $96,004,005) | | | 140,151,209 | |
| | | | | |
| INVESTMENT COMPANIES: 1.3% | | | | |
| | 217,078 | | NGP Capital | | | | |
| | | | Resources Co. | | | | |
| | | | (cost $2,889,006) | | | 3,345,172 | |
| | | | | |
| CONVERTIBLE BONDS: 21.0% | | | | |
| | | | | |
| Automotive: 0.4% | | | | |
| $ | 1,038,000 | | Sonic Automotive, | | | | |
| | | | Inc., 5.250%, 5/7/09 | | | 1,012,050 | |
| | | | | |
| Business and Professional Services: 1.0% | | | | |
| | 2,409,000 | | Fair Isaac Corp., | | | | |
| | | | 1.500%, 8/15/23 | | | 2,399,966 | |
| | | | | |
| Communications Equipment: 1.1% | | | | |
| | 2,915,000 | | Finisar Corp., | | | | |
| | | | 5.250%, 10/15/08 | | | 2,900,425 | |
| | | | | |
| Computers & Peripherals: 3.7% | | | | |
| | 9,671,000 | | Adaptec, Inc., | | | | |
| | | | 0.750%, 12/22/23 | | | 9,489,669 | |
| | | | | |
| Diversified Telecommunication Services: 4.9% | | | | |
| | 10,590,000 | | Level 3 | | | | |
| | | | Communications, Inc., | | | | |
| | | | 6.000%, 9/15/09 | | | 10,139,925 | |
| | 2,503,000 | | Level 3 | | | | |
| | | | Communications, Inc., | | | | |
| | | | 6.000%, 3/15/10 | | | 2,340,305 | |
| | | | | | | 12,480,230 | |
| Environmental Services: 2.1% | | | | |
| | 5,449,000 | | Allied Waste Industries, | | | | |
| | | | Inc., 4.250%, 4/15/34 | | | 5,203,795 | |
| | | | | |
| Pharmaceuticals: 3.8% | | | | |
| | 3,309,000 | | QLT, Inc., | | | | |
| | | | 3.000%, 9/15/23# | | | 3,284,183 | |
| | 6,948,000 | | Sepracor, Inc., | | | | |
| | | | 0.000%, 10/15/24 | | | 6,392,160 | |
| | | | | | | 9,676,343 | |
| Semiconductor Equipment: 4.0% | | | | |
| | 7,015,000 | | Agere Systems, Inc., | | | | |
| | | | 6.500%, 12/15/09 | | | 7,155,300 | |
| | 2,982,000 | | Kulicke & Soffa | | | | |
| | | | Industries, Inc., | | | | |
| | | | 0.500%, 11/30/08 | | | 2,899,995 | |
| | | | | | | 10,055,295 | |
| TOTAL CONVERTIBLE BONDS | | | | |
| (cost $52,829,719) | | | 53,217,773 | |
| | | | | |
| CORPORATE BONDS: 11.4% | | | | |
| | | | | |
| Automotive: 1.9% | | | | |
| | 5,213,000 | | Sonic Automotive, | | | | |
| | | | Inc., 8.625%, 8/15/13 | | | 4,848,090 | |
The accompanying notes are an integral part of these financial statements.
Greenspring Fund, Incorporated
SCHEDULE OF INVESTMENTS at June 30, 2008 (Unaudited) (Con’t) |
| Principal/Shares | | | | Value | |
| CORPORATE BONDS: 11.4% (Con’t) | | | |
| | | | |
| Diversified Financial Services: 1.1% | | | |
| $ | 74,000 | | CIT Group, Inc., | | | |
| | | | 2.826%, 8/15/08 | | $ | 73,922 | |
| | 2,000,000 | | CIT Group, Inc., | | | | |
| | | | 4.750%, 8/15/08 | | | 1,989,954 | |
| | 60,000 | | CIT Group, Inc., | | | | |
| | | | 5.150%, 9/15/08 | | | 58,274 | |
| | 430,000 | | CIT Group, Inc., | | | | |
| | | | 5.875%, 10/15/08 | | | 423,082 | |
| | 135,000 | | CIT Group, Inc., | | | | |
| | | | 3.875%, 11/3/08 | | | 132,060 | |
| | 125,000 | | CIT Group, Inc., | | | | |
| | | | 4.800%, 11/15/08 | | | 120,534 | |
| | | | | | | 2,797,826 | |
| Diversified Telecommunication Services: 3.1% | | | | |
| | 3,379,000 | | Qwest Capital | | | | |
| | | | Funding, Inc., | | | | |
| | | | 6.375%, 7/15/08 | | | 3,379,000 | |
| | 100,000 | | Qwest Communications | | | | |
| | | | International, | | | | |
| | | | 7.500%, 11/1/08 | | | 100,125 | |
| | 1,908,000 | | Rogers | | | | |
| | | | Communications, Inc., | | | | |
| | | | 8.000%, 12/15/12# | | | 1,979,550 | |
| | 2,203,000 | | U.S. Unwired, Inc. - | | | | |
| | | | Series B, | | | | |
| | | | 10.000%, 6/15/12 | | | 2,252,612 | |
| | | | | | | 7,711,287 | |
| Electric Utilities: 0.1% | | | | |
| | 307,000 | | Dominion Resources, | | | | |
| | | | Inc., 8.125%, 6/15/10 | | | 327,573 | |
| | | | | |
| Electrical Equipment: 0.0% | | | | |
| | 41,000 | | GrafTech Finance, Inc., | | | | |
| | | | 10.250%, 2/15/12 | | | 42,640 | |
| | | | | |
| Environmental Services: 0.2% | | | | |
| | 35,000 | | Allied Waste | | | | |
| | | | Industries, Inc., | | | | |
| | | | 6.500%, 11/15/10 | | | 35,175 | |
| | 454,000 | | Allied Waste | | | | |
| | | | Industries, Inc., | | | | |
| | | | 7.875%, 4/15/13 | | | 464,215 | |
| | | | | | | 499,390 | |
| Household & Personal Products: 1.2% | | | | |
| | 2,890,000 | | Prestige Brands, Inc., | | | | |
| | | | 9.250%, 4/15/12 | | | 2,904,450 | |
| | | | | |
| Machinery: 0.1% | | | | |
| | 145,000 | | Briggs & | | | | |
| | | | Stratton Corp., | | | | |
| | | | 8.875%, 3/15/11 | | | 148,625 | |
| | | | | |
| Media: 0.2% | | | | |
| | 165,000 | | Belo Corp., | | | | |
| | | | 8.000%, 11/1/08^ | | | 165,873 | |
| | 313,000 | | CSC Holdings, Inc., | | | | |
| | | | 7.250%, 7/15/08 | | | 313,782 | |
| | | | | | | 479,655 | |
| Office Electronics: 3.4% | | | | |
| | 100,000 | | Xerox Credit Corp., | | | | |
| | | | 7.200%, 1/17/12 | | | 99,977 | |
| | 50,000 | | Xerox Corp., | | | | |
| | | | 9.750%, 1/15/09 | | | 51,475 | |
| | 54,000 | | Xerox Corp., | | | | |
| | | | 6.600%, 3/15/11 | | | 53,494 | |
| | 41,000 | | Xerox Corp., | | | | |
| | | | 7.410%, 5/16/11 | | | 41,034 | |
| | 8,162,000 | | Xerox Corp., | | | | |
| | | | 7.625%, 6/15/13 | | | 8,475,649 | |
| | | | | | | 8,721,629 | |
| Utilities: 0.1% | | | | |
| | 300,000 | | Sonat, Inc., | | | | |
| | | | 7.625%, 7/15/11 | | | 304,340 | |
| TOTAL CORPORATE BONDS | | | | |
| (cost $28,761,377) | | | 28,785,505 | |
The accompanying notes are an integral part of these financial statements.
Greenspring Fund, Incorporated
SCHEDULE OF INVESTMENTS at June 30, 2008 (Unaudited) (Con’t) |
| Shares | | | | Value | |
| SHORT-TERM INVESTMENTS: 10.6% | | | |
| | | | |
| Commercial Paper: 5.5% | | | |
| | 7,000,000 | | American Express Credit | | | |
| | | | Co., 2.081%, 7/7/08 | | $ | 7,000,000 | |
| | 7,000,000 | | GE Capital Corp., | | | | |
| | | | 2.031%, 7/10/08 | | | 7,000,000 | |
| | | | | | | 14,000,000 | |
| Money Market Investments: 5.1% | | | | |
| | 3,743,686 | | AIM Liquid Assets | | | 3,743,686 | |
| | 9,125,877 | | AIM STIC | | | | |
| | | | Prime Portfolio | | | 9,125,877 | |
| | | | | | | 12,869,563 | |
| TOTAL SHORT-TERM | | | | |
| INVESTMENTS | | | | |
| (cost $26,869,564) | | | 26,869,563 | |
| TOTAL INVESTMENTS | | | | |
| IN SECURITIES | | | | |
| (cost $207,353,671): 99.6% | | | 252,369,222 | |
| Other Assets less Liabilities: 0.4% | | | 1,058,269 | |
| NET ASSETS: 100.0% | | $ | 253,427,491 | |
| * | Non-income producing security. |
| # | U.S. security of foreign issuer. |
| ^ | Security valued at fair value by the Fund’s adviser under the supervision of the Fund’s Board of Directors. |
The accompanying notes are an integral part of these financial statements.
Greenspring Fund, Incorporated
STATEMENT OF ASSETS AND LIABILITIES at June 30, 2008 (Unaudited) |
| ASSETS | | | |
| Investments in securities, at value (cost $207,353,671) | | $ | 252,369,222 | |
| Receivables: | | | | |
| Securities sold | | | 1,005,934 | |
| Fund shares sold | | | 321,222 | |
| Dividends and interest | | | 1,020,996 | |
| Prepaid expenses | | | 23,434 | |
| Total assets | | | 254,740,808 | |
| | | | | |
| LIABILITIES | | | | |
| Payables: | | | | |
| Due to affiliate (Note 5) | | | 162,235 | |
| Securities purchased | | | 905,445 | |
| Fund shares redeemed | | | 57,967 | |
| Accrued expenses | | | 187,670 | |
| Total liabilities | | | 1,313,317 | |
| | | | | |
| NET ASSETS | | $ | 253,427,491 | |
| | | | | |
| Capital shares issued and outstanding | | | | |
| (60,000,000 shares authorized, $0.01 par value) | | | 10,748,979 | |
| | | | | |
| Net asset value, offering and redemption price per share | | $ | 23.58 | |
| | | | | |
| COMPONENTS OF NET ASSETS | | | | |
| Capital stock at par value | | $ | 107,490 | |
| Paid-in capital | | | 212,714,565 | |
| Accumulated net investment income | | | 2,042,022 | |
| Undistributed net realized loss on investments | | | (6,452,137 | ) |
| Net unrealized appreciation on investments | | | 45,015,551 | |
| NET ASSETS | | $ | 253,427,491 | |
The accompanying notes are an integral part of these financial statements.
Greenspring Fund, Incorporated
STATEMENT OF OPERATIONS For the Six Months Ended June 30, 2008 (Unaudited) |
| INVESTMENT INCOME | | | |
| Income | | | |
| Interest | | $ | 2,742,250 | |
| Dividends (net of foreign withholding taxes of $2,837) | | | 807,716 | |
| Total income | | | 3,549,966 | |
| | | | | |
| Expenses | | | | |
| Advisory fees (Note 5) | | | 927,860 | |
| Transfer agent fees (Note 6) | | | 112,972 | |
| Administration fees | | | 101,829 | |
| Fund accounting fees | | | 29,823 | |
| Administration fees - Corbyn (Note 5) | | | 27,296 | |
| Legal fees | | | 20,776 | |
| Custody fees | | | 19,066 | |
| Reports to shareholders | | | 19,005 | |
| Audit fees | | | 12,315 | |
| Blue sky fees | | | 11,990 | |
| Directors fees | | | 10,704 | |
| Miscellaneous fees | | | 8,402 | |
| Insurance fees | | | 7,098 | |
| Registration fees | | | 79 | |
| Total expenses | | | 1,309,215 | |
| Net investment income | | | 2,240,751 | |
| | | | | |
| REALIZED AND UNREALIZED GAIN (LOSS) ON INVESTMENTS | | | | |
| Net realized loss on investments | | | (7,808,894 | ) |
| Change in net unrealized | | | | |
| appreciation/depreciation on investments | | | 5,036,365 | |
| Net realized and unrealized loss on investments | | | (2,772,529 | ) |
| Net decrease in net assets resulting from operations | | $ | (531,778 | ) |
The accompanying notes are an integral part of these financial statements.
Greenspring Fund, Incorporated
| STATEMENTS OF CHANGES IN NET ASSETS |
| | | Six Months Ended | | | Year Ended | |
| | | June 30, 2008# | | | December 31, 2007 | |
| INCREASE (DECREASE) IN NET ASSETS FROM: | | | | | | |
| | | | | | | |
| OPERATIONS | | | | | | |
| Net investment income | | $ | 2,240,751 | | | $ | 5,921,394 | |
| Net realized gain (loss) on investments | | | (7,808,894 | ) | | | 6,802,433 | * |
| Change in net unrealized | | | | | | | | |
| appreciation/depreciation on investments | | | 5,036,365 | | | | 853,163 | * |
| Net increase (decrease) in net assets | | | | | | | | |
| resulting from operations | | | (531,778 | ) | | | 13,576,990 | |
| | | | | | | | | |
| DISTRIBUTIONS TO SHAREHOLDERS | | | | | | | | |
| From net investment income | | | — | | | | (6,053,466 | ) |
| From net realized gain | | | — | | | | (5,657,768 | ) |
| Total distributions to shareholders | | | — | | | | (11,711,234 | ) |
| | | | | | | | | |
| CAPITAL SHARE TRANSACTIONS | | | | | | | | |
| Net increase (decrease) in net assets derived | | | | | | | | |
| from net change in outstanding shares (a)+ | | | (3,918,298 | ) | | | 12,120,099 | |
| Total increase (decrease) in net assets | | | (4,450,076 | ) | | | 13,985,855 | |
| | | | | | | | | |
| NET ASSETS | | | | | | | | |
| Beginning of period | | | 257,877,567 | | | | 243,891,712 | |
| End of period (including accumulated net | | | | | | | | |
| investment income (loss) of $2,042,022 | | | | | | | | |
| and $(198,729), respectively) | | $ | 253,427,491 | | | $ | 257,877,567 | |
| (a) | A summary of capital share transactions is as follows: |
| | | Six Months Ended | | | Year Ended | |
| | | June 30, 2008# | | | December 31, 2007 | |
| | | Shares | | | Value | | | Shares | | | Value | |
| Shares sold | | | 835,231 | | | $ | 19,652,546 | | | | 2,144,163 | | | $ | 51,718,315 | |
| Shares issued in reinvestment | | | | | | | | | | | | | | | | |
| of distributions | | | — | | | | — | | | | 437,963 | | | | 10,439,468 | |
| Shares redeemed + | | | (1,018,140 | ) | | | (23,570,844 | ) | | | (2,061,417 | ) | | | (50,037,684 | ) |
| Net increase | | | (182,909 | ) | | $ | (3,918,298 | ) | | | 520,709 | | | $ | 12,120,099 | |
| # | Unaudited. |
| * | A reclassification of $2,701,646 decreased Net Realized Gain on Investments and increased the Change in Net Unrealized Appreciation/Depreciation on Investments. The reclassification had no impact on net assets. |
| + | Net of redemption fees of $603 and $11,271, respectively. |
The accompanying notes are an integral part of these financial statements.
Greenspring Fund, Incorporated
FINANCIAL HIGHLIGHTS For a capital share outstanding throughout each period |
| | | Six Months | | | | | | | | | | | | | | | | |
| | | Ended | | | | | | | | | | | | | | | | |
| | | June 30, | | | Year Ended December 31, | |
| | | 2008# | | | 2007 | | | 2006 | | | 2005 | | | 2004 | | | 2003 | |
| Net asset value, | | | | | | | | | | | | | | | | | | | |
| beginning of period | | $ | 23.59 | | | $ | 23.43 | | | $ | 21.57 | | | $ | 20.91 | | | $ | 19.96 | | | $ | 15.70 | |
| | | | | | | | | | | | | | | | | | | | | | | | | |
| INCOME (LOSS) FROM INVESTMENT OPERATIONS: | | | | | | | | | | | | | | | | | | | | | |
| Net investment income | | | 0.21 | | | | 0.55 | | | | 0.53 | | | | 0.47 | | | | 0.52 | | | | 0.53 | |
| Net realized and unrealized | | | | | | | | | | | | | | | | | | | | | | | | |
| gain (loss) on investments | | | (0.22 | ) | | | 0.70 | | | | 2.10 | | | | 0.88 | | | | 1.18 | | | | 4.34 | |
| Total from | | | | | | | | | | | | | | | | | | | | | | | | |
| investment operations | | | (0.01 | ) | | | 1.25 | | | | 2.63 | | | | 1.35 | | | | 1.70 | | | | 4.87 | |
| | | | | | | | | | | | | | | | | | | | | | | | |
| LESS DISTRIBUTIONS: | | | | | | | | | | | | | | | | | | | | | | | | |
| From net investment income | | | — | | | | (0.56 | ) | | | (0.58 | ) | | | (0.44 | ) | | | (0.56 | ) | | | (0.61 | ) |
| From net realized gain | | | — | | | | (0.53 | ) | | | (0.19 | ) | | | (0.25 | ) | | | (0.19 | ) | | | — | |
| Total distributions | | | — | | | | (1.09 | ) | | | (0.77 | ) | | | (0.69 | ) | | | (0.75 | ) | | | (0.61 | ) |
| Paid-in capital from | | | | | | | | | | | | | | | | | | | | | | | | |
| redemption fees (Note 1) | | | — | * | | | — | * | | | — | * | | | — | * | | | — | * | | | — | * |
| Net asset value, | | | | | | | | | | | | | | | | | | | | | | | | |
| end of period | | $ | 23.58 | | | $ | 23.59 | | | $ | 23.43 | | | $ | 21.57 | | | $ | 20.91 | | | $ | 19.96 | |
| Total return | | (0.04) | %^ | | | 5.32 | % | | | 12.29 | % | | | 6.57 | % | | | 8.69 | % | | | 31.34 | % |
| | | | | | | | | | | | | | | | | | | | | | | | |
| RATIOS/SUPPLEMENTAL DATA: | | | | | | | | | | | | | | | | | | | | | |
| Net assets, end of | | | | | | | | | | | | | | | | | | | | | | | | |
| period (millions) | | $ | 253.4 | | | $ | 257.9 | | | $ | 243.9 | | | $ | 157.6 | | | $ | 132.5 | | | $ | 109.3 | |
| Ratio of expenses to | | | | | | | | | | | | | | | | | | | | | | | | |
| average net assets | | | 1.06 | %+ | | | 1.03 | % | | | 1.07 | % | | | 1.16 | % | | | 1.06 | % | | | 1.14 | % |
| Ratio of net | | | | | | | | | | | | | | | | | | | | | | | | |
| investment income | | | | | | | | | | | | | | | | | | | | | | | | |
| to average net assets | | | 1.81 | %+ | | | 2.24 | % | | | 2.56 | % | | | 2.30 | % | | | 2.60 | % | | | 3.44 | % |
| Portfolio turnover rate | | 25.54 | %^ | | | 53.75 | % | | | 38.58 | % | | | 36.22 | % | | | 35.21 | % | | | 102.43 | % |
| # | Unaudited. |
| * | Amount less than $0.01 per share. |
| ^ | Not Annualized. |
| + | Annualized. |
The accompanying notes are an integral part of these financial statements.
Greenspring Fund, Incorporated
NOTES TO FINANCIAL STATEMENTS June 30, 2008 (Unaudited) |
| Note 1 - Significant Accounting Policies |
Greenspring Fund, Incorporated (the “Fund”) is a diversified, open-end management investment company registered under the Investment Company Act of 1940, as amended (the “1940 Act”). The Fund is organized as a Maryland corporation and commenced operations on July 1, 1983.
The preparation of the financial statements in accordance with accounting principles generally accepted in the United States of America requires management to make estimates and assumptions that affect the reported amounts and disclosures in the financial statements. Actual results could differ from those estimates.
Investment transactions and related investment income - Investment transactions are recorded on the trade date. Dividend income is recorded on the ex-dividend date and interest income, including amortization of premiums and accretion of discounts, is recorded on the accrual basis. Dividends determined to be a return of capital are recorded as a reduction of the cost basis of the security. Realized gains and losses from investment transactions are reported on an identified cost basis.
Valuation of investments - Equity securities listed on a national securities exchange or the NASDAQ National Market are valued at the last reported sale price or the official closing price for certain markets on the exchange of major listing as of the close of the regular session of the New York Stock Exchange.
Equity securities that are traded principally in the over-the-counter market, listed securities for which no sale was reported on the day of valuation, and listed securities whose primary market is believed by Corbyn Investment Management, Inc. (“Corbyn” or the “Adviser”) to be over-the-counter are valued at the mean of the closing bid and asked prices obtained from sources that the Adviser deems appropriate.
Debt securities generally trade in the over-the-counter market. Debt securities are valued by using quotations supplied by bond dealers who make markets in such securities or by an independent pricing service, which may use valuation models that consider the yield or price of bonds of similar quality, maturity and coupon, as well as prices provided by bond dealers, who make markets in such securities.
Short-term investments are valued at amortized cost, which approximates fair market value. The value of securities that mature, or have an announced call, within 60 days will be valued at market value.
Securities for which market quotations are not readily available or for which the available quotations do not appear to reflect the current value of the securities are valued at fair value as determined in good faith by the Adviser under the direction of the Board of Directors.
Greenspring Fund, Incorporated
NOTES TO FINANCIAL STATEMENTS June 30, 2008 (Unaudited) (Con’t) |
In determining fair value, the Adviser, as directed by the Board of Directors, considers all relevant qualitative and quantitative information available. These factors are subject to change over time and are reviewed periodically. The values assigned to fair value investments are based on available information and do not necessarily represent amounts that might ultimately be realized, since such amounts depend on future developments inherent in long-term investments. Further, because of the inherent uncertainty of valuation, those estimated values may differ significantly from the values that would have been used had a ready market of the investments existed, and the differences could be material.
The Fund adopted the provisions of Statement of Financial Accounting Standards No. 157, “Fair Value Measurements” (“SFAS 157”), effective January 1, 2008. SFAS 157 establishes a hierarchy that prioritizes the inputs to valuation techniques, giving the highest priority to readily available unadjusted quoted prices in active markets for identical assets (Level 1 measurements) and the lowest priority to unobservable inputs (Level 3 measurements) when market prices are not readily available or reliable.
Various inputs are used in determining the value of the Fund’s investments. These inputs are summarized in the three broad levels listed below:
Level 1 - Quoted prices in active markets for identical securities.
Level 2 - Other significant observable inputs (including quoted prices for similar securities, interest rates, prepayment speeds, credit risk, etc.).
Level 3 - Significant unobservable inputs (including the Fund’s own assumptions in determining the fair value of investments).
The inputs or methodology used for valuing securities are not an indication of the risk associated with investing in those securities.
The following is a summary of the inputs used to value the Fund’s net assets as of June 30, 2008:
| | | | | | Significant | | | | | | | |
| | | Quoted Prices | | | Other | | | Significant | | | Carrying | |
| | | in Active | | | Observable | | | Unobservable | | | Value at | |
| | | Markets | | | Inputs | | | Inputs | | | June 30, 2008 | |
| | | Level 1 | | | Level 2 | | | Level 3 | | | Total | |
| Common Stocks | | $ | 140,151,209 | | | $ | — | | | $ | — | | | $ | 140,151,209 | |
| Investment Companies | | | 3,345,172 | | | | — | | | | — | | | | 3,345,172 | |
| Convertible Bonds | | | — | | | | 53,217,773 | | | | — | | | | 53,217,773 | |
| Corporate Bonds | | | — | | | | 28,785,505 | | | | — | | | | 28,785,505 | |
| Short-Term Investments | | | 12,869,563 | | | | 14,000,000 | | | | — | | | | 26,869,563 | |
| Total | | $ | 156,365,944 | | | $ | 96,003,278 | | | $ | — | | | $ | 252,369,222 | |
Greenspring Fund, Incorporated
NOTES TO FINANCIAL STATEMENTS June 30, 2008 (Unaudited) (Con’t) |
Dividends and distributions to stockholders - The Fund records dividends and distributions to stockholders on the ex-dividend date.
Redemption fees - The Fund’s Board of Directors has adopted policies and procedures with respect to frequent purchases and redemptions of Fund shares by Fund shareholders. The Fund is intended for long-term investors. The Fund discourages and does not accommodate frequent purchases and redemptions of Fund shares by Fund shareholders. The Fund reserves the right to decline a purchase order for any reason.
“Market-timers” who engage in frequent purchases and redemptions over a short period can disrupt the Fund’s investment program by requiring the Fund to have excess cash on hand or to liquidate holdings to accommodate redemptions. In addition, frequent purchases and redemptions may impede efficient Fund management and create additional transaction costs that are borne by all shareholders. To the extent that the Fund invests a significant portion of its assets in small-cap securities or high-yield bonds, it may be subject to the risks of market timing more than a fund that does not. Therefore, the Fund imposes a 2% redemption fee for shares held 60 days or less. The fee is deducted from the seller’s redemption proceeds and deposited into the Fund to help offset brokerage commissions, market impact, and other costs associated with fluctuations in Fund asset levels and cash flow caused by short-term trading. All shareholders are subject to these restrictions regardless of whether you purchased your shares directly from the Fund or through a financial intermediary. However, the Fund is limited in its ability to determine whether trades placed through financial intermediaries may signal excessive trading. Accordingly, the Fund may not be able to determine whether trading in combined orders or in omnibus accounts is contrary to the Fund’s policies. The Fund reserves the right to reject combined or omnibus orders in whole or in part.
The “first-in, first-out” method is used to determine the holding period. Under this method, the date of redemption will be compared with the earliest purchase date of shares held in the account. If the holding period for shares purchased is 60 days or less, the fee will be charged. The redemption fee may be modified or discontinued at any time, in which case, shareholders will be notified.
The fee does not apply to shares acquired through the reinvestment of dividends or other distributions, or shares redeemed pursuant to a systematic withdrawal plan or a mandatory IRA distribution.
Risk of loss arising from indemnifications - In the normal course of business, the Fund enters into contracts that contain a variety of representations, which provide
Greenspring Fund, Incorporated
NOTES TO FINANCIAL STATEMENTS June 30, 2008 (Unaudited) (Con’t) |
general indemnifications. The Fund’s maximum exposure under these arrangements is unknown as this would involve future claims that may be made against the Fund that have not yet occurred. However, based on experience, the Fund expects the risk of loss to be remote.
| Note 2 - Dividends and Distributions |
It is the Fund’s policy to declare dividends from net investment income and distributions from net realized gains as determined in accordance with income tax regulations, which may differ from accounting principles generally accepted in the United States of America. Accordingly, periodic reclassifications are made within the portfolio’s capital accounts to reflect income and gains available for distribution under income tax regulations.
These dividends are either distributed to shareholders or reinvested by the Fund in additional shares of common stock, which are issued to shareholders. For those shareholders reinvesting the dividends, the number of shares issued is based on the net asset value per share as of the close of business on the ex-dividend date.
| Note 3 - Purchases and Sales of Investments |
For the six months ended June 30, 2008, purchases and sales of investments, other than short-term investments, aggregated $60,839,628 and $54,420,368, respectively.
| Note 4 - Federal Income Taxes |
It is the Fund’s policy to comply with the requirements of the Internal Revenue Code applicable to regulated investment companies. Accordingly, the Fund intends to distribute substantially all of its taxable income. Therefore, no federal income tax provision is required.
In July 2006, the Financial Accounting Standards Board (“FASB”) released FASB Interpretation No. 48, “Accounting for Uncertainty in Income Taxes” (“FIN 48”). FIN 48 provides guidance for how uncertain tax positions should be recognized, measured, presented, and disclosed in the financial statements. FIN 48 requires the evaluation of tax positions taken or expected to be taken in the course of preparing the Fund’s tax returns to determine whether the tax positions are “more-likely-than-not” of being sustained by the applicable tax authority. Tax positions not deemed to meet the “more-likely-than-not” threshold would be recorded as a tax benefit or expense in the current year. The Fund has adopted FIN 48 and, as of June 30, 2008, did not have any tax positions that did not meet the “more-likely-than-not” threshold of being sustained by the applicable tax authority.
Greenspring Fund, Incorporated
NOTES TO FINANCIAL STATEMENTS June 30, 2008 (Unaudited) (Con’t) |
Required Fund distributions are based on income and capital gain amounts determined in accordance with federal income tax regulations, which differ from net investment income and realized gains recognized for financial reporting purposes.
Accordingly, the composition of net assets and distributions on a tax basis may differ from those reflected in the accompanying financial statements.
As of December 31, 2007, the Fund’s most recently completed year end, the components of distributable earnings on a tax basis were as follows:
| | Cost of investments | | $ | 217,568,598 | |
| | | | | | |
| | Gross tax unrealized appreciation | | | 57,015,080 | |
| | Gross tax unrealized depreciation | | | (17,237,357 | ) |
| | Net tax unrealized appreciation | | | 39,777,723 | |
| | | | | | |
| | Undistributed ordinary income | | | 1,479,411 | |
| | Undistributed long-term capital gain | | | (119,920 | ) |
| | Total distributable earnings | | | 1,359,491 | |
| | | | | | |
| | Other accumulated gains/(losses) | | | — | |
| | Total accumulated earnings/(losses) | | $ | 41,137,214 | |
| Note 5 - Transactions with Related Parties |
Corbyn serves as the Fund’s investment adviser. Under an agreement between the Fund and Corbyn, the Fund pays Corbyn a fee of 0.75% of the first $250 million of average daily net assets, 0.70% of average daily net assets between $250 million and $500 million and 0.65% of average daily net assets in excess of $500 million, which is computed daily and paid monthly. For the six months ended June 30, 2008, the Fund incurred $927,860 in advisory fees.
The Fund has also entered into a Services Agreement with Corbyn to provide various administrative services. As compensation, the Fund pays Corbyn a fee of $2,500 per month plus 0.01% of average daily net assets, which is computed daily and paid monthly. For the six months ended June 30, 2008, the Fund incurred $27,296 in administrative fees to Corbyn.
At June 30, 2008, investors for whom Corbyn was investment adviser held 804,644 shares of the Fund’s common stock.
| Note 6 - Shareholder Servicing Fees |
Both the Fund and Corbyn have entered into various Shareholder Servicing Agreements, whereby a fee is paid to certain service agents who administer omnibus
Greenspring Fund, Incorporated
NOTES TO FINANCIAL STATEMENTS June 30, 2008 (Unaudited) (Con’t) |
accounts for indirect shareholders of the Fund. The Board of Directors has authorized the Fund to pay the amount of the fees it estimates the Fund would have been charged by its transfer agent for administering the accounts on an individual basis. The amount is included in “Transfer agent fees” on the accompanying Statement of Operations. For the six months ended June 30, 2008, the Fund incurred $77,361 of such fees.
| Note 7 - New Accounting Pronouncement |
In March 2008, Statement of Financial Accounting Standards No. 161, “Disclosures about Derivative Instruments and Hedging Activities” (“SFAS 161”) was issued and is effective for fiscal years beginning after November 15, 2008. SFAS 161 is intended to improve financial reporting for derivative instruments by requiring enhanced disclosure that enables investors to understand how and why an entity uses derivatives, how derivatives are accounted for, and how derivative instruments affect an entity’s results of operations and financial position. Management is currently evaluating the implications of SFAS 161. The impact on the Fund’s financial statement disclosures, if any, is currently being assessed.
Greenspring Fund, Incorporated
APPROVAL OF INVESTMENT ADVISORY AGREEMENT (Unaudited) |
Continuance of the Investment Advisory Agreement (the “Agreement”) must be considered annually by the directors of the Fund who are not parties to the Agreement or “interested persons” of any such party (as defined in the 1940 Act) (the “Independent Directors”). In order for continuance to be approved, a majority of the Independent Directors must vote for such approval at an in-person meeting called for this purpose.
The Board of Directors (the “Board”), including a majority of the Independent Directors, approved the continuance of the Agreement most recently at an in-person meeting in February 2008. One of the Fund’s three Independent Directors attended portions of this meeting telephonically. To assist the Directors in their evaluation of the Agreement, the Board was supplied with extensive information by the Adviser in advance of the meeting. After a detailed presentation by the Adviser, during which the written materials were reviewed and questions from the Board were answered, the Independent Directors present met in executive session with legal counsel to the Fund to consider the approval of the Agreement. In considering the Agreement, the Board did not identify any particular overriding factor, but considered all the information available. Following this session, the Board reconvened and approved the continuation of the Agreement as being in the best interest of the Fund. Below is a summary of the primary factors considered by the Board and the conclusions thereto that formed the basis for the Board approving the continuance of the Agreement:
| 1. | | The nature, extent, and quality of the services to be provided by the Adviser under the Agreement. The Board considered the specific responsibilities of all aspects of the day-to-day management of the Fund. The Board considered the qualifications and experience of the portfolio manager and other key personnel of the Adviser involved with the day-to-day activities of the Fund. The Board also considered the resources and compliance structure of the Adviser, including the backgrounds of the chief compliance officers of both the Fund and the Adviser, as well as the Adviser’s compliance record. The Board also considered the Adviser’s marketing efforts and its continued commitment to the Fund’s growth. The Board noted that the Adviser has managed the Fund since its inception, providing a consistent investment approach with low turnover of the Adviser’s staff. The Board concluded that the Adviser had sufficient quality and depth of personnel, resources, investment methods and compliance policies and procedures essential to performing its duties under its advisory agreement and that the nature, overall quality, and extent of the management services were satisfactory and reliable. |
Greenspring Fund, Incorporated
APPROVAL OF INVESTMENT ADVISORY AGREEMENT (Unaudited) (Con’t) |
| 2. | | The Fund’s historical investment performance. In assessing the quality of the portfolio management delivered by the Adviser, the Board reviewed the short-term and long-term performance of the Fund for periods ended December 31, 2007 on both an absolute basis, and in comparison to the performance of various category, relative index and major market benchmarks. The Board noted that the Fund’s long-term performance was in line with that of its category benchmarks, which are groups of other mutual funds with similar investment styles selected by independent providers of mutual fund information, for the 3-, 5- and 10-year periods. The Board commented that the Fund’s 1-year performance underperformed that of its category benchmarks, due primarily to the Fund’s exposure to small- and mid-cap value stocks, which were out of favor much of the year. The Board also considered the consistency of returns and the level of risk taken. The Board concluded that the Adviser’s historical investment performance was very satisfactory under current market conditions and consistent with the Fund’s long-term performance objective. |
| | | |
| 3. | | The costs of the services to be provided by the Adviser and the structure of the Adviser’s fees under the Advisory Agreement. In considering the advisory fee and total fees and expenses of the Fund, the Board reviewed a presentation comparing the Fund to a group of peer funds. Each of the peer funds used a research-intensive investment style similar to that of the Fund and did not have a 12b-1 Plan. The Board considered that the Fund’s contractual advisory fee of 0.75% was less than the median contractual advisory fee of the peer funds at a common net asset level. The Board also considered that the Fund’s total expense ratio of 1.03% was lower than the median total expense ratio of the peer funds. The Board concluded that, although the Adviser had not agreed to waive and/or reimburse Fund expenses at a certain level, the Adviser had consistently maintained an annual expense ratio in line with its peer group. Additionally, the fees charged by the Adviser were in line with the fees it charged to its other separately managed accounts and were not excessive. |
| | | |
| 4. | | Economies of scale. The Board also considered that economies of scale would be expected to be realized by the Adviser as the assets of the Fund grow. The Board noted that the Agreement’s fee schedule included breakpoints at net asset levels of $250 million and $500 million, whereby the fees paid by the Fund would decrease at the higher asset levels. The Board concluded that net assets were above $250 million for much of the year, allowing the Fund and its shareholders to take advantage of these economies of scale. |
| | | |
| 5. | | Costs of services provided and profits to be realized by the Adviser. The Board then discussed the costs of the services to be provided and the |
Greenspring Fund, Incorporated
APPROVAL OF INVESTMENT ADVISORY AGREEMENT (Unaudited) (Con’t) |
| | | profitability of the Adviser. Specific attention was given to the methodologies followed in allocating shared costs to the Fund. The Board recognized that the cost allocation methodologies are inherently subjective and various allocation methodologies may each be reasonable while producing different results. In this regard, the Board noted that the allocation appeared reasonable. After such review, the Board determined that the profitability of the Adviser with respect to the Agreement was not excessive, and that the Adviser had maintained adequate profit levels to support the services to the Fund. |
| | | |
| 6. | | Other factors and considerations. The Board periodically reviews and considers other material information throughout the year relating to the quality of services provided to the Fund, such as the receipt of research services in exchange for soft dollar credit in connection with commissions on the Fund’s equity transactions. The Board noted that the commissions paid by the Fund are reasonable and that the Fund receives quality execution, regardless of whether the commissions are used to pay for research through soft dollar arrangements. Other material information considered includes the Adviser’s management of its relationship with the Fund’s third party service providers, and expenses paid to those third parties. Also, at its quarterly meetings, the Board reviews detailed information relating to the Fund’s portfolio and performance, and receives a presentation from the Fund’s portfolio manager. |
The Board did not identify any single factor discussed previously, but instead considered all factors collectively in its determination to approve the Agreement. The Directors, including a majority of the Independent Directors, concluded that the terms of the Agreement are fair and reasonable, that the Adviser’s fees are reasonable in light of the services provided to the Fund and the benefits received by the Adviser and that the Agreement is in the best interest of the Fund.
Greenspring Fund, Incorporated
2330 West Joppa Road, Suite 110
Lutherville, MD 21093
(410) 823-5353
(800) 366-3863
www.greenspringfund.com
The Fund’s proxy voting policies and procedures, as well as its proxy voting record for the most recent 12 month period ended June 30, are available without charge, upon request, by contacting the Fund at (800) 366-3863 or greenspring@greenspringfund.com. The Fund will send the information within three business days of receipt of the request, by first class mail or other means designed to ensure equally prompt delivery. The Fund’s proxy voting record is also available on the Commission’s website at http://www.sec.gov. The Fund files its complete schedule of portfolio holdings with the Commission for the first and third quarters of each fiscal year on Form N-Q. The Fund’s Forms N-Q are available on the Commission’s website and may be reviewed and copied at the Commission’s Public Reference Room in Washington, DC. Information on the operation of the Public Reference Room may be obtained by calling (202) 551-8090. The Fund’s first and third quarter reports are available on its website at www.greenspringfund.com.
DIRECTORS
Charles vK. Carlson, Chairman
William E. Carlson
David T. Fu
Sean T. Furlong
Michael J. Fusting
Michael T. Godack
Richard Hynson, Jr.
Michael P. O’Boyle
OFFICERS
Charles vK. Carlson
President and Chief Executive Officer
Michael J. Fusting
Sr. Vice President and
Chief Financial Officer
Michael T. Godack
Sr. Vice President
Elizabeth Agresta Swam
Chief Compliance Officer,
Secretary, Treasurer
and AML Officer
INVESTMENT ADVISER
Corbyn Investment Management, Inc.
2330 West Joppa Road, Suite 108
Lutherville, MD 21093-7207
ADMINISTRATOR,
FUND ACCOUNTANT AND TRANSFER AGENT
U.S. Bancorp Fund Services, LLC
615 East Michigan Street
Milwaukee, WI 53202
DISTRIBUTOR
Quasar Distributors, LLC
615 East Michigan Street
Milwaukee, WI 53202
CUSTODIAN
U.S. Bank, N.A.
1555 N. RiverCenter Dr., Suite 302
Milwaukee, WI 53212
INDEPENDENT REGISTERED
PUBLIC ACCOUNTING FIRM
Tait, Weller & Baker LLP
1818 Market Street, Suite 2400
Philadelphia, PA 19103
LEGAL COUNSEL
K&L Gates LLP
1601 K Street NW
Washington, DC 20006
Item 2. Code of Ethics.
Not applicable for semi-annual reports.
Item 3. Audit Committee Financial Expert.
Not applicable for semi-annual reports.
Item 4. Principal Accountant Fees and Services.
Not applicable for semi-annual reports.
Item 5. Audit Committee of Listed Registrants.
Not applicable to registrants who are not listed issuers (as defined in Rule 10A-3 under the Securities Exchange Act of 1934).
Item 6. Schedule of Investments.
Schedule of Investments is included as part of the report to shareholders filed under Item 1 of this Form.
Item 7. Disclosure of Proxy Voting Policies and Procedures for Closed-End Management Investment Companies.
Not applicable to open-end investment companies.
Item 8. Portfolio Managers of Closed-End Management Investment Companies.
Not applicable to open-end investment companies.
Item 9. Purchases of Equity Securities by Closed-End Management Investment Company and Affiliated Purchasers.
Not applicable to open-end investment companies.
Item 10. Submission of Matters to a Vote of Security Holders.
Not Applicable.
Item 11. Controls and Procedures.
| (a) | The Registrant’s Chief Executive Officer and Chief Financial Officer have reviewed the Registrant's disclosure controls and procedures (as defined in Rule 30a-3(c) under the Investment Company Act of 1940 (the “Act”)) as of a date within 90 days of the filing of this report, as required by Rule 30a-3(b) under the Act and Rules 13a-15(b) or 15d-15(b) under the Securities Exchange Act of 1934. Based on their review, such officers have concluded that the disclosure controls and procedures are effective in ensuring that information required to be disclosed in this report is appropriately recorded, processed, summarized and reported and made known to them by others within the Registrant and by the Registrant’s service provider. |
| (b) | There were no changes in the Registrant's internal control over financial reporting (as defined in Rule 30a-3(d) under the Act) that occurred during the second fiscal quarter of the period covered by this report that has materially affected, or is reasonably likely to materially affect, the Registrant's internal control over financial reporting. |
Item 12. Exhibits.
| (a) | (1) Any code of ethics or amendment thereto, that is subject of the disclosure required by Item 2, to the extent that the registrant intends to satisfy Item 2 requirements through filing an exhibit. Not Applicable. |
(2) Certifications pursuant to Section 302 of the Sarbanes-Oxley Act of 2002. Filed herewith.
(3) Any written solicitation to purchase securities under Rule 23c-1 under the Act sent or given during the period covered by the report by or on behalf of the registrant to 10 or more persons. Not applicable to open-end investment companies.
| (b) | Certification pursuant to Section 906 of the Sarbanes-Oxley Act of 2002. Furnished herewith. |
SIGNATURES
Pursuant to the requirements of the Securities Exchange Act of 1934 and the Investment Company Act of 1940, the registrant has duly caused this report to be signed on its behalf by the undersigned, thereunto duly authorized.
(Registrant) Greenspring Fund, Incorporated
By (Signature and Title)* /s/ Charles vK. Carlson
Charles vK. Carlson, Chief Executive Officer
Date August 25, 2008
Pursuant to the requirements of the Securities Exchange Act of 1934 and the Investment Company Act of 1940, this report has been signed below by the following persons on behalf of the registrant and in the capacities and on the dates indicated.
By (Signature and Title)* /s/ Charles vK. Carlson
Charles vK. Carlson, Chief Executive Officer
Date___August 25, 2008_______________________________________
By (Signature and Title)* /s/ Michael J. Fusting
Michael J. Fusting, Chief Financial Officer
Date___August 25, 2008_______________________________________
* Print the name and title of each signing officer under his or her signature.