ANNUAL REPORT
DECEMBER 31, 2020
This report is intended for shareholders of the
Greenspring Fund, Incorporated and may not be
used as sales literature unless preceded or
accompanied by a current prospectus.
Beginning on January 1, 2021, as permitted by regulations adopted by the U.S. Securities and Exchange Commission, paper copies of the Fund’s annual and semi-annual shareholder reports will no longer be sent by mail, unless you specifically request paper copies of the reports. Instead, the reports will be made available on the Fund’s website (www.greenspringfund.com). You will be notified by mail each time a report is posted and provided with a website link to access the report.
The Fund does not currently offer electronic delivery of shareholder reports to direct investors. If you have already elected to receive shareholder reports electronically from your financial intermediary (such as a broker-dealer or bank), you will not be affected by this change and you need not take any action. If you invest through a financial intermediary and want to receive electronic delivery of shareholder reports, you must contact your financial intermediary to sign up.
You may elect to receive all future reports in paper free of charge. If you are a direct investor, you can inform the Fund that you wish to continue receiving paper copies of your shareholder reports after January 1, 2021 by calling 1-800-576-7498. If you invest through a financial intermediary, you must contact your financial intermediary to elect to continue to receive paper copies of the Fund’s shareholder reports.
Dear Fellow Shareholders:
We are pleased to report that Greenspring Fund (the “Fund”) ended 2020 with a strong fourth quarter gain of 16.94%. For the 2020 calendar year, Greenspring gained 3.78% after taking into consideration the reinvestment of dividends and capital gain distributions. During the fourth quarter, the Fund’s equity and fixed income investments benefitted from increased optimism toward a “re-opening” of the United States economy, driven by fiscal stimulus and the approval of two vaccines to fight the coronavirus. In our previous shareholder letters, we discussed our belief that equity market performance would broaden out beyond the highly concentrated leadership that existed since the market’s trough, once the markets began to factor in a recovery of the global economy. We witnessed this increasing market breadth during the fourth quarter of 2020 as an improving economic outlook gave investors greater confidence to invest in a more diverse range of companies where valuations remained attractive, driving solid performance in many of Greenspring Fund’s holdings.
There is no question that 2020 was an unusual year for investors, with the financial markets yielding a number of unexpected outcomes. As the pandemic spread early in the year, stay-at-home orders led to the virtual shutdown of a large portion of the global economy. Equity, fixed income, and commodity markets all declined sharply and rapidly as investors struggled to develop a roadmap for investing during a pandemic. To address the global economic shock and calm the spreading dysfunction within the financial markets, the Federal Reserve (the “Fed”) reduced short-term interest rates to near zero and flooded the markets with liquidity by purchasing U.S. Treasury securities, mortgages, corporate bonds and other securities. These actions, combined with fiscal stimulus provided by the Federal Government, including direct checks sent to individuals and families, enhanced unemployment benefits and Payroll Protection Program loans, provided the fuel to spark a rally in the markets.
| | Greenspring Fund | |
| | Performance for the | |
| | Periods Ended December 31, 2020 | |
| | | | |
| | Quarter | 16.94% | |
| | Year to Date | 3.78% | |
| | 1 Year | 3.78% | |
| | 3 Years* | 4.07% | |
| | 5 Years* | 7.80% | |
| | 10 Years* | 5.55% | |
| | 15 Years* | 5.70% | |
| | 20 Years* | 6.64% | |
| | Since inception on 7/1/83* | 8.93% | |
| | Expense Ratio** | 1.05% | |
| * | | Annualized. |
| ** | | As stated in Prospectus dated 5-1-20. See note on last page of letter. |
| | | |
| | Performance data quoted represents past performance; past performance does not guarantee future results. The investment return and principal value of an investment will fluctuate so that an investor’s shares, when redeemed, may be worth more or less than their original cost. Current performance of the Fund may be lower or higher than the performance quoted. Performance data current to the most recent month end may be obtained by calling 1-800-366-3863 or by visiting www.greenspringfund.com. | |
As markets began to recover, investors initially focused on those companies that benefitted from lockdowns, working from home and social distancing. This included companies in the technology, home improvement and outdoor recreation industries. The focus on these industries initially created a “lag” in the stock price performance of many companies that were more dependent on a traditional base of economic activity. During the last several months of 2020, however, the stock market staged a broad rally as the approval of effective vaccines to combat the coronavirus encouraged investors. Investors increasingly looked to identify companies that had performed relatively
well operationally despite pandemic headwinds and/or had outlooks poised to improve in an economic recovery. We expect investors will continue to view these companies as attractively valued as they grow more comfortable investing in broader areas of the market.
INFLUENCES on FUND PERFORMANCE
Similar to the broader equity market, the Fund’s performance was influenced by market trends that changed drastically throughout the year. After a very difficult first quarter, the Fund generated positive returns during each of the next three quarters of 2020. For the most part, gains and losses within the Fund’s portfolio were concentrated in those industries or sectors that were particularly impacted, positively or negatively, by the pandemic. For the year, equity holdings within the financial sector including banks, thrifts and consumer finance companies had the largest negative influence on the Fund’s performance. As the pandemic unfolded, the share prices of holdings within this sector declined rapidly, with investors concerned that the economic contraction and the related increase in unemployment would lead to a deep recession and a wave of defaulted loans. At the same time, the Fed’s move to reduce short-term interest rates to near zero put pressure on banks’ net interest margins, while banks struggled to grow their loan portfolios. Despite these valid concerns, banks experienced minimal deterioration in the quality of their loan portfolios, as government stimulus and Fed liquidity measures worked together to keep borrowers healthy. As the year progressed, bank share prices began to slowly recover as fundamentals continued to exceed investor fears. This share price recovery accelerated in the fall, particularly as vaccine news buoyed the future economic outlook. With interest rates creeping higher and solid prospects for continued economic recovery, the outlook for financial sector companies continues to improve.
Equity holdings within the energy sector also hurt the Fund’s performance during 2020. Similar to the financial sector, share prices of energy companies fell sharply and quickly in the early stages of the pandemic. The economic slowdown caused by the pandemic led to an abrupt and significant decline in the demand for crude oil, and consequently, oil prices fell sharply. Given lower oil prices and decreased demand, the profits of energy producers declined considerably. By the end of 2020, even though the price of crude oil had recovered to levels similar to the beginning of the year, share prices of most energy companies remained lower for the year. We significantly reduced our exposure to the energy sector during the year as the outlook remains clouded by the uncertain pace of the global economic recovery and accelerating decarbonization efforts.
The greatest positive influence on the Fund’s performance came from its equity holdings in the industrial and information technology sectors. Most of the holdings within the industrial sector generated gains, with the largest gains coming from MYR Group and United Parcel Service (“UPS”). MYR Group had better than expected earnings throughout the year, as both its electric transmission and commercial electric businesses performed very well despite the pandemic. United Parcel Service benefitted from a substantial increase in e-commerce deliveries and strong international trends. New management at UPS also announced a new company theme of “better not bigger” with an emphasis on productivity improvements that should result in higher profit margins, more efficient capital allocation, and higher free cash flow over time.
| | | % of Net |
| | Greenspring Fund | Assets |
| | Top 10 Holdings | as of |
| | | 12/31/20 |
| | Republic Services, Inc. | 7.6% |
| | KBR, Inc. | 4.4% |
| | j2 Global, Inc. | 4.4% |
| | Amdocs, Ltd. | 4.1% |
| | Alphabet, Inc. – Class C | 3.9% |
| | United Parcel Service, Inc. – Class B | 3.7% |
| | Southern National Bancorp of Virginia, Inc. | 3.5% |
| | Medtronic plc | 3.2% |
| | Invesco Solar ETF | 3.0% |
| | The Sherwin-Williams Company | 2.9% |
Within the information technology sector, the positive performance came primarily from our holdings within the solar power industry. The Invesco Solar ETF and First Solar both benefitted from several tailwinds, including continued improvement in the economics of solar power, the extension of favorable tax credits and global political support.
The individual securities that had the greatest influence on the Funds’ performance all fell within the industry sectors discussed above and included, in order of magnitude, the common shares of Discover Financial Services, Suncor Energy, Invesco Solar ETF, MYR Group and Southern National Bancorp of Virginia. Invesco Solar ETF and MYR Group had positive performance while the remaining securities suffered losses.
PORTFOLIO ACTIVITY
With respect to portfolio activity, 2020 was an active year. We took advantage of the harsh market volatility during the last half of the first and beginning of the second quarters to establish or add to existing positions that had experienced share price declines but, in our view, remained well positioned in a post-COVID world. We initiated new positions in Amazon.com, T-Mobile US, Visa and Johnson & Johnson. For each of these companies, we saw very attractive long-term outlooks for growth as well as strong balance sheets that should not only support the companies through the pandemic, but also provide the flexibility to take advantage of opportunities that may arise. During this period of market turmoil, we also sold shares in a number of holdings in order to reinvest the proceeds into companies that we believed had prospects that were more attractive, including those mentioned above. The most significant sales during this period included the Fund’s entire positions in Suncor Energy, Discover Financial and Cleveland Cliffs. We also reduced the Fund’s holdings in Wyndham Hotels & Resorts.
Amazon.com seemed uniquely positioned for the pandemic, as user engagement increased significantly when shoppers pivoted to online shopping to avoid crowded shopping venues and respect stay-at-home orders. As more and more consumers grow accustomed to the convenience of online shopping it will likely accelerate the ongoing shift to e-commerce, a business that Amazon dominates. Amazon’s leading web services business (AWS) is also well positioned to benefit as more and more software applications shift to a cloud-based structure, accelerated by the adoption of a work-from-anywhere environment. Market volatility gave us the opportunity to purchase shares of Amazon at a reasonable valuation relative to our expectation of future cash flows.
| | Greenspring Fund |
| | Ten Largest 2020 Purchases |
| | Common and Preferred Stocks: |
| | Americold Realty Trust |
| | Amazon.com, Inc. |
| | Gaslog Partners LP, 8.625% |
| | T-Mobile US, Inc. |
| | Alphabet, Inc. – Class C |
| | Bonds: |
| | Dycom Industries, Inc. 0.750%, 9/15/21 |
| | Teva Pharmaceutical, 0.250%, 2/1/26 |
| | FireEye, Inc., 1.625%, 6/1/35 |
| | Tempur Sealy International, 5.625%, 10/15/23 |
| | j2 Global, 1.750%, 11/1/26 |
| | Greenspring Fund |
| | Ten Largest 2020 Sales |
| | Common Stocks: |
| | The Sherwin-Williams Company |
| | MasTec, Inc. |
| | Republic Services |
| | MYR Group |
| | Suncor Energy |
| | Bonds: |
| | Acadia Healthcare, 6.125%, 3/15/21 |
| | Reynolds Group, 5.750%, 10/15/20 |
| | j2 Cloud LLC, 6.000%, 7/15/25 |
| | CCO Holdings, 5.250%, 9/30/22 |
| | AES Corp., 5.500%, 3/15/24 |
Our purchase of T-Mobile was driven by the decline in its share price despite its then-pending merger with Sprint, an event that we believed would create a formidable competitor in the wireless communications industry. The Company is moving aggressively to capture merger efficiencies and to strategically build out a leading 5G wireless network, supported by what many consider to be the industry’s best wireless spectrum assets. T-Mobile should be well positioned to grow the business and drive multi-year market share gains, free cash flow growth, and positive shareholder returns.
As the world’s largest electronic payments network, Visa benefits from a strong competitive moat and significant economies of scale that support strong profit margins, returns on invested capital, and free cash flow. We purchased shares of Visa during the market sell-off as the lower share price allowed us to opportunistically invest in a high-quality company at what we considered an attractive price relative to its longer-term growth prospects. Although it was apparent that the coronavirus would hurt Visa’s near-term earnings, we thought the impact would be relatively short-lived and largely reflected in Visa’s lower share price. With an extremely strong balance sheet and no exposure to credit losses, as credit risk is borne by the card issuer not the payment network, Visa should be well positioned to weather the current storm and participate strongly as the virus is controlled and the world returns to a more normal environment.
One of the largest additions to the Fund’s existing equity holdings during the market sell-off was in shares of Alphabet Inc., the holding company for Google and other businesses. The share price of Alphabet declined during the first quarter partly due to the general market decline, but also due to the fear that the Company’s advertising business would suffer as a result of the economic slowdown. Although we shared the belief that advertising revenues would decline, we saw the decline as transient and that, when a recovery in advertising spending occurred, Alphabet would benefit quickly and ultimately grow its leading position in the digital advertising market. When taking into consideration Alphabet’s rock-solid balance sheet and large cash holdings, we purchased shares at what we believe was a very attractive ratio of enterprise value to EBITDA.
Throughout the year, significant equity purchases included two classes of preferred units of GasLog Partners. GasLog is an owner and operator of liquefied natural gas (LNG) carriers with 15 ships operating under term charters or in the spot market. Early in 2020, a weak pricing outlook and several near-term charter expirations led GasLog to significantly reduce the quarterly distribution paid to its common unitholders. We viewed
| Greenspring Fund |
| Portfolio Allocation |
| as of December 31, 2020 |
| |
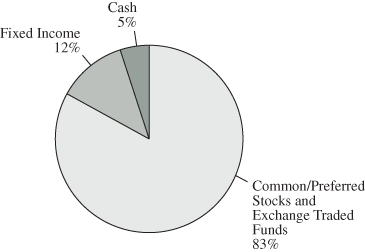 |
| |
| Greenspring Fund |
| Portfolio Allocation |
| as of December 31, 2019 |
| |
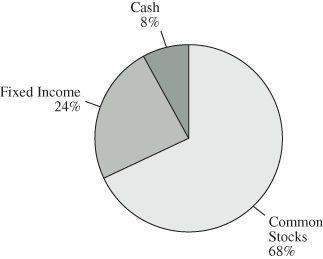 |
| |
this move as prudent and favorable for preferred unitholders, and started to buy GasLog’s preferred units, believing that, by retaining the cash that was formerly paid to common unitholders, the Company would strengthen its balance sheet and improve the position of the preferred unitholders. Throughout the summer months, the pandemic, combined with abundant global inventories of gas in storage, further depressed the demand for, and pricing of, the services provided by LNG carriers. This allowed us to make additional purchases of GasLog’s preferred units during the third and fourth quarters of 2020 at double-digit dividend yields despite our view that cash flow was more than sufficient to cover the dividend. Charter prices for LNG carriers bounced back strongly during the fourth quarter, which should provide a meaningful boost to near-term cash flow and help to continue to strengthen the outlook for GasLog.
We also initiated equity positions in four electric utilities, CMS Energy, Eversource Energy, IDACORP and NextEra Energy that, when added together, constitute a significant purchase. Each of these companies exhibited strong, resilient fundamentals through the economic downturn, yet volatility in their share prices gave us the opportunity to purchase shares at what we considered attractive prices. Historically, these companies have generated above-average industry earnings growth and we expect this to continue as each company operates in a state with a supportive regulatory environment and has significant long-term investment opportunities driven by the transition to renewable energy sources.
Americold Realty Trust was another new and significant equity purchase. Americold is a real estate investment trust that owns and operates temperature-controlled warehouses used primarily for refrigerated and frozen food storage. Although this business may sound simple, it is actually quite complex as Americold serves critical customer needs beyond refrigeration including logistics and inventory management. Americold is the largest publicly-owned company in this highly specialized niche and continues to use its scale and expertise to grow through both acquisitions and new property development. We believe management will continue to deliver solid earnings and dividend growth that should result in increased value for shareholders.
We also initiated a position in American Homes 4 Rent (“AMH”), a real estate investment trust focused on acquiring, developing, renovating, leasing, and operating single-family homes as rental properties with homes located in 35 different markets. Recent trends that have provided tailwinds to the single-family home rental business include increasing household formations, the desire to have an asset light (rent vs. own) lifestyle in a suburban location and continued affordability issues related to purchasing a home. The pandemic has only accelerated these trends as the shift to a more flexible, work from home culture has increased the desire for more family and home office space, while reducing the need to live near a city-based office. With strong demand for its properties, AMH has multiple channels to grow its portfolio including buying existing or newly constructed homes. Additionally, AMH has developed an in-house build-for-rent program where AMH does not actually build the home, but manages its construction. We believe this program provides AMH with a competitive advantage as AMH can build the floor plan that renters want, use materials that can handle the wear and tear of renters and reduce the cost of repairs and maintenance over time. Given the healthy market and favorable trends for AMH homes, we expect an attractive total return from our investment resulting from growth in earnings and cash flow per share combined with future dividend growth.
The fixed income securities in the Greenspring Fund continued to produce positive returns. The Fed’s move to bring interest rates down to near zero resulted in many companies tapping the debt markets to refinance existing debt at lower rates. This led to a large number of early redemptions of our bonds. As we write this letter, money market returns are close to zero and the 10-year Treasury yield is just over one percent. In such a low interest rate environment, the annual total return earned on fixed income investments is heavily influenced by bond price changes, which are typically driven by movements in
interest rates. As rates moved lower over the last several years, the returns from longer-dated bonds benefitted more than shorter-dated securities. We continue to prefer to be less dependent on changes in interest rates in order to achieve our expected return, especially when rates have so little room to move lower from here. We have written many times about the benefits of having short-duration fixed income securities, and we believe this is especially true today, given the current economic environment and our expectation that the recent increase in the 10-year interest rate may be a harbinger of rising rates during 2021.
OUTLOOK
News of effective vaccines has encouraged investors to begin to look past the virus and focus on the outlook for future economic activity. A more optimistic attitude, fueled by the ongoing economic recovery in the United States, is supported by improving employment, manufacturing, and construction markets. This acceleration in economic activity spurred generally stronger than expected earnings reports late last year, with many corporate executives articulating increasing levels of optimism. Recently, the Fed reiterated that it would maintain its low short-term interest rate policy and purchases of securities until it meets its targets of full employment and an inflation rate of 2% or higher. The Fed’s actions, coupled with the potential for Congressional approval of additional fiscal stimulus, will inject a substantial amount of additional dollars into the economy. This increased liquidity may result in higher inflation, once this money finds its way in to the economic system.
One of the metrics worth watching to gain insight into the outlook for inflation is the difference or “spread” between the yields of the 2-year and 10-year Treasury notes. This yield spread can often act as an indication of investors’ expectations for future economic activity and/or inflation, with a higher spread indicating the possibility of an improving economy and/or heightened inflation. During the fourth quarter of 2020 and the early days of 2021, this spread widened significantly, helping fuel speculation that inflation may increasingly become part of the discussion in the not-too-distant future.
Looking back, 2020 was a year with many events that fueled flames of concern and uncertainty. The pandemic presented significant and unprecedented challenges to many companies, forcing many previously uncontemplated decisions to address issues that may not have existed during the operating environment prior to March. Even when news headlines are overwhelmingly negative, it is important to remember that financial markets focus far more on future expectations than current events. We live in a world where local, national, and global events are delivered to our physical or digital “front doors” on a real-time basis. It is easy to focus on the new, sensational event that is “trending” on social media and forget to maintain a longer-term view of the real catalysts that are affecting the trajectory of economic activity. As an investor, one must constantly differentiate between the various media narratives and identify the events that may fundamentally change the outlook for the future. Daily headlines – positive or negative – should never indiscriminately control your longer-term investment decisions or strategies, and we remain on guard against this temptation.
We sincerely appreciate your confidence and investment in Greenspring Fund. We remain focused on generating solid, less volatile total returns in the Fund’s portfolio and look forward to updating you on performance at the end of the first quarter.
Respectfully,
 |  |
| Charles vK. Carlson | Michael J. Fusting |
| Portfolio Manager and Co-Chief Investment Officer | Co-Chief Investment Officer |
**Total Annual Fund Operating Expenses for the Fund will not correlate to the Ratio of Expenses to Average Net Assets shown in the Fund’s most recent Annual Report and in the Financial Highlights section of the Prospectus, which reflects the operating expenses of the Fund and does not include acquired fund fees and expenses.
Mutual fund investing involves risk. Principal loss is possible. Small and mid-capitalization companies tend to have limited liquidity and greater price volatility than large-capitalization companies. Investments by the Fund in lower-rated and non-rated securities present a greater risk of loss to principal and interest than higher-rated securities. Investments in debt securities typically decrease in value when interest rates rise. This risk is usually greater for longer-term debt securities.
Opinions expressed are subject to change, are not guaranteed and should not be considered recommendations to buy or sell any security. Fund holdings and/or sector allocations are subject to change at any time and are not recommendations to buy or sell any security. Current and future portfolio holdings are subject to risk.
Free cash flow measures the cash generating capability of a company by adding certain non-cash charges (e.g. depreciation and amortization) to earnings and subtracting recurring capital expenditures. EBITDA, or earnings before interest, taxes, depreciation, and amortization, is a measure of a company’s overall financial performance and is used as an alternative to simple earnings or net income in some circumstances. Enterprise value is a measure of a company’s total value, often used as a more comprehensive alternative to equity market capitalization and includes in its calculation the market capitalization of a company but also short-term and long-term debt as well as any cash on the company’s balance sheet. Cash flow measures the cash generating capability of a company by adding non-cash charges (e.g. depreciation) and interest expense to pre-tax income. Earnings growth is not a measure of the Fund’s future performance. Earnings growth is not a measure of the Fund’s future performance. Duration is a commonly used measure of the potential volatility of the price of a debt security, or the aggregate market value of a portfolio of debt securities, prior to maturity. Securities with a longer duration generally have more volatile prices than securities of comparable quality with a shorter duration. Return on invested capital is a calculation used to assess a company's efficiency at allocating the capital under its control to profitable investments. Dividend yield is the ratio of a company's current annualized dividend amount to its share price.
Distributed by Quasar Distributors, LLC
Growth of a $10,000 Investment in the Greenspring Fund
Over the Last Ten Years
Average Annual Total Returns | For Years Ended December 31, 2020 |
| | 1 Year | 3 Years | 5 Years | 10 Years |
| Greenspring Fund | 3.78% | 4.07% | 7.80% | 5.55% |
| Russell 3000 Value Index | 2.87% | 5.89% | 9.74% | 10.36% |
| Blended Benchmark | 4.10% | 5.61% | 7.84% | 7.95% |
| Lipper Flexible Portfolio Fund Index | 15.01% | 9.03% | 9.91% | 7.76% |
The graph and table do not reflect the deduction of taxes that a shareholder would pay on Greenspring Fund (the “Fund”) distributions or the redemption of Fund shares.
Performance data quoted represents past performance; past performance does not guarantee future results. The investment return and principal value of an investment will fluctuate so that an investor’s shares, when redeemed, may be worth more or less than their original cost. Current performance of the Fund may be lower or higher than the performance quoted. Performance data current to the most recent month end is available at www.greenspringfund.com or by calling 1-800-366-3863 toll free. Effective May 1, 2018, the Fund no longer imposes a 2.00% redemption fee for shares held 60 days or less. Performance data does not reflect the redemption fee. If reflected, total returns would be reduced.
The Russell 3000 Value Index is a capitalization-weighted index composed of those companies that are among the largest 3,000 US-incorporated equities by market capitalization that exhibit value characteristics such as lower price-to book ratios and lower expected growth rates. This index is a total return market index, which assumes that all cash distributions are reinvested, in addition to tracking the price movements. The “Blended Benchmark” is a weighted average comprised of 60% Russell 3000 Value Index / 30% ICE BAML 1-3yr BB Cash Pay High Yield Index / 10% ICE BAML 3-month T-Bill Index (rebalanced monthly). The Russell 3000 Value Index is described above. The ICE BAML 1-3 year BB Cash Pay High Yield Index, a subset of ICE BAML U.S. Cash Pay High Yield Index, consists of all securities rated BB- through BB+ by S&P with a remaining term to final maturity of 3 years or less. The ICE BAML U.S. 3-month T-Bill Index reflects the performance of purchasing a single T-Bill issue at the beginning of the month and holding it for a full month. The Lipper Flexible Portfolio Index is an unmanaged index of the 30 largest funds in the Lipper Flexible Portfolio Fund category, which includes funds that allocate investments across various asset classes, including domestic common stocks, bonds and money market instruments, with a focus on total return. Investors cannot invest directly in an index, although they may invest in the underlying securities included in the index. An index return does not reflect a deduction for fees, expenses, or taxes.
EXPENSE EXAMPLE For the Six Months Ended December 31, 2020 (Unaudited) |
As a shareholder of Greenspring Fund, Incorporated (the “Fund”), you incur two types of costs: (1) transaction costs and (2) ongoing costs, including management fees, and other fund specific expenses. The expense example is intended to help the shareholder understand ongoing costs (in dollars) of investing in a fund and to compare these costs with the ongoing costs of investing in other mutual funds. The example is based on an investment of $1,000 invested at the beginning of the period and held for the most recent six-month period.
The Actual Expenses comparison provides information about actual account values and actual expenses. A shareholder may use the information in this line, together with the amount invested, to estimate the expenses paid over the period. A shareholder may divide his/her account value by $1,000 (e.g., an $8,600 account value divided by $1,000 = 8.6), then multiply the result by the number in the first line under the heading entitled “Expenses Paid During Period” to estimate the expenses paid on his/her account during this period.
The Hypothetical Example for Comparison Purposes provides information about hypothetical account values and hypothetical expenses based on the Fund’s actual expense ratio and an assumed rate of return of 5% per year before expenses, which is not the Fund’s actual return. The hypothetical account values and expenses may not be used to estimate the actual ending account balance or expenses paid for the period. A shareholder may use this information to compare the ongoing costs of investing in the Fund and other funds. To do so, a shareholder would compare this 5% hypothetical example with the 5% hypothetical examples that appear in the shareholder reports of other funds.
The expenses shown in the table are meant to highlight your ongoing costs only and do not reflect any transactional costs, such as sales charges (loads), redemptions fees, or exchange fees. Therefore, the Hypothetical Example for Comparison Purposes is useful in comparing ongoing costs only, and will not help to determine the relevant total costs of owning different funds. In addition, if these transactional costs were included, shareholder costs would have been higher.
| | | Annualized | Beginning | Ending | Expenses Paid |
| | | Net Expense Ratio | Account Value | Account Value | During Period |
| | | 12/31/20 | 7/1/20 | 12/31/20 | 7/1/20 – 12/31/20(1) |
Actual Expenses(2) | | 1.11% | $1,000.00 | $1,246.80 | $6.27 |
| Hypothetical Example | | | | | |
| for Comparison Purposes | | | | | |
| (5% return before expenses) | | 1.11% | $1,000.00 | $1,019.56 | $5.63 |
(1) | Expenses are equal to the Fund’s annualized net expense ratio, multiplied by the average account value over the period, multiplied by 184/366 to reflect the one-half year period. |
(2) | Based on the actual returns of 24.68% for the six month-period ended December 31, 2020. |
SCHEDULE OF INVESTMENTS at December 31, 2020 |
| | | Shares | | | Value | |
| COMMON STOCKS: 77.9% | | | | | | |
| | | | | | | |
| Building Products: 1.7% | | | | | | |
| Owens Corning | | | 30,851 | | | $ | 2,337,272 | |
| | | | | | | | | |
| Business Software & Services: 4.2% | | | | | | | | |
| Amdocs Limited# | | | 80,851 | | | | 5,734,762 | |
| CDK Global, Inc. | | | 2,599 | | | | 134,706 | |
| | | | | | | | 5,869,468 | |
| Chemicals: 3.0% | | | | | | | | |
| DuPont de Nemours, Inc. | | | 1,500 | | | | 106,665 | |
| The Sherwin-Williams Company | | | 5,550 | | | | 4,078,751 | |
| | | | | | | | 4,185,416 | |
| Commercial Banks & Thrifts: 7.4% | | | | | | | | |
| American National Bankshares, Inc. | | | 35,987 | | | | 943,219 | |
| OceanFirst Financial Corp. | | | 47,753 | | | | 889,638 | |
| Prudential Bancorp, Inc. | | | 6,225 | | | | 86,216 | |
| Shore Bancshares, Inc. | | | 122,477 | | | | 1,788,164 | |
| Southern National Bancorp of Virginia | | | 400,587 | | | | 4,851,109 | |
| Western New England Bancorp, Inc. | | | 4,559 | | | | 31,412 | |
| WSFS Financial Corporation | | | 36,726 | | | | 1,648,263 | |
| | | | | | | | 10,238,021 | |
| Commercial Services & Supplies: 2.6% | | | | | | | | |
| Johnson Controls International plc# | | | 76,685 | | | | 3,572,754 | |
| | | | | | | | | |
| Computer Communications: 2.7% | | | | | | | | |
| Cisco Systems, Inc. | | | 83,760 | | | | 3,748,260 | |
| | | | | | | | | |
| Electrical Equipment & Instruments: 1.2% | | | | | | | | |
| Emerson Electric Co. | | | 15,400 | | | | 1,237,698 | |
| nVent Electric plc# | | | 20,000 | | | | 465,800 | |
| | | | | | | | 1,703,498 | |
| Engineering & Construction: 4.7% | | | | | | | | |
| EMCOR Group, Inc. | | | 34,395 | | | | 3,145,767 | |
| MYR Group, Inc.* | | | 55,730 | | | | 3,349,373 | |
| | | | | | | | 6,495,140 | |
| Healthcare-Products: 4.1% | | | | | | | | |
| Abbott Laboratories | | | 11,000 | | | | 1,204,390 | |
| Medtronic plc# | | | 38,331 | | | | 4,490,093 | |
| | | | | | | | 5,694,483 | |
| Hotels, Restaurants & Leisure: 2.8% | | | | | | | | |
| Wyndham Hotels & Resorts, Inc. | | | 65,745 | | | | 3,907,883 | |
| | | | | | | | | |
| Information Technology Services: 5.6% | | | | | | | | |
| KBR, Inc. | | | 198,555 | | | | 6,141,306 | |
| Visa, Inc. – Class A | | | 7,716 | | | | 1,687,721 | |
| | | | | | | | 7,829,027 | |
| Insurance: 2.9% | | | | | | | | |
| Chubb Limited# | | | 12,009 | | | | 1,848,425 | |
| W.R. Berkley Corp. | | | 31,740 | | | | 2,108,171 | |
| | | | | | | | 3,956,596 | |
| Internet Retail: 2.8% | | | | | | | | |
| Amazon.com, Inc.* | | | 1,210 | | | | 3,940,885 | |
| | | | | | | | | |
| Machinery: 0.7% | | | | | | | | |
| Pentair plc# | | | 19,360 | | | | 1,027,822 | |
| | | | | | | | | |
| Media & Entertainment: 3.9% | | | | | | | | |
| Alphabet, Inc. – Class C* | | | 3,080 | | | | 5,395,790 | |
| | | | | | | | | |
| Oil & Gas Exploration & Production: 1.6% | | | | | | | | |
| EOG Resources, Inc. | | | 44,861 | | | | 2,237,218 | |
| | | | | | | | | |
| Oil Refining & Marketing: 0.1% | | | | | | | | |
| Phillips 66 | | | 2,813 | | | | 196,741 | |
| | | | | | | | | |
| Pharmaceuticals: 1.3% | | | | | | | | |
| Johnson & Johnson | | | 11,189 | | | | 1,760,925 | |
| | | | | | | | | |
| Real Estate Investment Trusts: 3.5% | | | | | | | | |
| American Homes 4 Rent | | | 50,901 | | | | 1,527,030 | |
| Americold Realty Trust | | | 86,481 | | | | 3,228,336 | |
| Physicians Realty Trust | | | 3,000 | | | | 53,400 | |
| | | | | | | | 4,808,766 | |
| Renewable Energy: 0.1% | | | | | | | | |
| First Solar, Inc.* | | | 1,534 | | | | 151,743 | |
| | | | | | | | | |
| Software & Services: 4.4% | | | | | | | | |
| j2 Global, Inc.* | | | 62,736 | | | | 6,128,680 | |
| | | | | | | | | |
| Specialty Insurance: 0.1% | | | | | | | | |
| Radian Group, Inc. | | | 5,950 | | | | 120,488 | |
| | | | | | | | | |
| Transportation & Logistics: 3.7% | | | | | | | | |
| United Parcel Service, Inc. – Class B | | | 30,073 | | | | 5,064,293 | |
| | | | | | | | | |
| Truck Dealerships: 0.5% | | | | | | | | |
| Rush Enterprises, Inc. – Class B | | | 17,178 | | | | 650,874 | |
The accompanying notes are an integral part of these financial statements.
SCHEDULE OF INVESTMENTS at December 31, 2020 (Con’t) |
| | | Shares/Principal | | | Value | |
| COMMON STOCKS: 77.9% (Con’t) | | | | | | |
| | | | | | | |
| Utilities: 2.6% | | | | | | |
| CMS Energy Corp. | | | 7,917 | | | $ | 483,016 | |
| Eversource Energy | | | 11,907 | | | | 1,030,075 | |
| IDACORP, Inc. | | | 9,902 | | | | 950,889 | |
| NextEra Energy, Inc. | | | 14,748 | | | | 1,137,808 | |
| | | | | | | | 3,601,788 | |
| Waste Management Services: 7.6% | | | | | | | | |
| Republic Services, Inc. | | | 109,545 | | | | 10,549,184 | |
| | | | | | | | | |
| Wireless Telecommunication Services: 2.1% | | | | | | | | |
| T-Mobile USA, Inc.* | | | 21,735 | | | | 2,930,965 | |
| | | | | | | | | |
| TOTAL COMMON STOCKS | | | | | | | | |
| (cost $63,725,151) | | | | | | | 108,103,980 | |
| | | | | | | | | |
| PREFERRED STOCKS: 2.7% | | | | | | | | |
| | | | | | | | | |
| Healthcare Providers & Services: 0.6% | | | | | | | | |
| Ontrak, Inc., 9.500% | | | 36,070 | | | | 858,827 | |
| | | | | | | | | |
| Oil & Gas Storage & Transportation: 1.8% | | | | | | | | |
| GasLog Partners LP, Series A, 8.625%#° | | | 109,349 | | | | 1,749,584 | |
| GasLog Partners LP, Series B, 8.200%#° | | | 48,119 | | | | 703,019 | |
| | | | | | | | 2,452,603 | |
| Real Estate Investment Trusts: 0.3% | | | | | | | | |
| American Homes 4 Rent | | | 914 | | | | 23,161 | |
| American Homes 4 Rent | | | 12,694 | | | | 322,681 | |
| | | | | | | | 345,842 | |
| TOTAL PREFERRED STOCKS | | | | | | | | |
| (cost $4,309,182) | | | | | | | 3,657,272 | |
| | | | | | | | | |
| EXCHANGE TRADED FUNDS: 3.0% | | | | | | | | |
| | | | | | | | | |
| Semiconductors: 3.0% | | | | | | | | |
| Invesco Solar ETF | | | 40,986 | | | | 4,211,721 | |
| | | | | | | | | |
| TOTAL EXCHANGE TRADED FUNDS | | | | | | | | |
| (cost $1,372,240) | | | | | | | 4,211,721 | |
| | | | | | | | | |
| CONVERTIBLE BONDS: 2.2% | | | | | | | | |
| | | | | | | | | |
| Pharmaceuticals: 0.8% | | | | | | | | |
| Teva Pharmaceutical Finance Co. LLC, | | | | | | | | |
| 0.250%, 2/1/26 | | $ | 1,050,000 | | | | 1,055,250 | |
| | | | | | | | | |
| Software & Services: 1.4% | | | | | | | | |
| FireEye, Inc., 1.625%, 6/1/35 | |
| 992,000 | | | | 978,387 | |
| J2 Global, Inc., 1.750%, 11/1/26 144A | | | 1,000,000 | | | | 1,041,339 | |
| | | | | | | | 2,019,726 | |
| TOTAL CONVERTIBLE BONDS | | | | | | | | |
| (cost $2,811,918) | | | | | | | 3,074,976 | |
| | | | | | | | | |
| CORPORATE BONDS: 9.5% | | | | | | | | |
| | | | | | | | | |
| Apparel & Textiles: 0.1% | | | | | | | | |
| Levi Strauss & Co., 5.000%, 5/1/25 | | | 161,000 | | | | 165,226 | |
| | | | | | | | | |
| Auto Components: 0.2% | | | | | | | | |
| Dana, Inc., 5.500%, 12/15/24 | | | 250,000 | | | | 255,469 | |
| | | | | | | | | |
| Business Software & Services: 0.1% | | | | | | | | |
| CDK Global, Inc., 5.875%, 6/15/26 | | | 66,000 | | | | 69,364 | |
| | | | | | | | | |
| Chemicals: 0.0% | | | | | | | | |
| Blue Cube Spinco LLC, 9.750%, 10/15/23 | | | 2,000 | | | | 2,056 | |
| | | | | | | | | |
| Consumer Finance: 0.5% | | | | | | | | |
| Credit Acceptance Corp., | | | | | | | | |
| 5.125%, 12/31/24 144A | | | 150,000 | | | | 156,360 | |
| 6.625%, 3/15/26 | | | 500,000 | | | | 534,375 | |
| | | | | | | | 690,735 | |
| Food and Staples Retailing: 0.1% | | | | | | | | |
| Albertsons Co., 5.750%, 3/15/25 | | | 160,000 | | | | 165,383 | |
| | | | | | | | | |
| Healthcare-Products: 0.0% | | | | | | | | |
| Teleflex, Inc., 4.875%, 6/1/26 | | | 20,000 | | | | 20,897 | |
| | | | | | | | | |
| Healthcare-Providers & Services: 0.2% | | | | | | | | |
| Centene Corp., 4.750%, 1/15/25 | | | 254,000 | | | | 260,980 | |
| Encompass Health Corp., 5.750%, 9/15/25 | | | 10,000 | | | | 10,362 | |
| | | | | | | | 271,342 | |
| Homebuilding: 0.0% | | | | | | | | |
| M/I Homes, Inc., 5.625%, 8/1/25 | | | 25,000 | | | | 26,091 | |
| | | | | | | | | |
| Hotels, Restaurants & Leisure: 0.2% | | | | | | | | |
| MGM Resorts International, | | | | | | | | |
| 7.750%, 3/15/22 | | | 257,000 | | | | 274,187 | |
| | | | | | | | | |
| Household & Personal Products: 0.5% | | | | | | | | |
| Spectrum Brands, Inc., | | | | | | | | |
| 6.125%, 12/15/24 | | | 255,000 | | | | 261,215 | |
| 5.750%, 7/15/25 | | | 362,000 | | | | 374,254 | |
| | | | | | | | 635,469 | |
The accompanying notes are an integral part of these financial statements.
SCHEDULE OF INVESTMENTS at December 31, 2020 (Con’t) |
| | | Principal/Shares | | | Value | |
| CORPORATE BONDS: 9.5% (Con’t) | | | | | | |
| | | | | | | |
| Household Durables: 0.5% | | | | | | |
| Tempur Sealy International, | | | | | | |
| 5.625%, 10/15/23 | | $ | 728,000 | | | $ | 742,484 | |
| | | | | | | | | |
| Independent Power & Renewable Energy: 0.1% | | | | | | | | |
| Clearway Energy Operating LLC, | | | | | | | | |
| 5.750%, 10/15/25 | | | 130,000 | | | | 137,069 | |
| | | | | | | | | |
| Industrial Conglomerates: 0.5% | | | | | | | | |
| Icahn Enterprises LP/Icahn | | | | | | | | |
| Enterprises Finance Corp., | | | | | | | | |
| 6.250%, 2/1/22 | | | 500,000 | | | | 502,363 | |
| 6.750%, 2/1/24 | | | 217,000 | | | | 221,227 | |
| | | | | | | | 723,590 | |
| Machinery: 1.7% | | | | | | | | |
| EnPro Industries, Inc., 5.750%, 10/15/26 | | | 292,000 | | | | 311,290 | |
| Tennant Co., 5.625%, 5/1/25 | | | 1,000,000 | | | | 1,043,750 | |
| Welbilt, Inc., 9.500%, 2/15/24 | | | 931,000 | | | | 963,971 | |
| | | | | | | | 2,319,011 | |
| Media & Entertainment: 0.5% | | | | | | | | |
| Cinemark USA, Inc., 5.125%, 12/15/22 | | | 674,000 | | | | 661,784 | |
| | | | | | | | | |
| Metals & Mining: 0.8% | | | | | | | | |
| Allegheny Technologies, Inc., | | | | | | | | |
| 7.875%, 8/15/23 | | | 313,000 | | | | 343,344 | |
| Cleveland-Cliffs, Inc., 5.750%, 3/1/25 | | | 30,000 | | | | 30,506 | |
| Commercial Metals Co., 5.750%, 4/15/26 | | | 665,000 | | | | 688,584 | |
| | | | | | | | 1,062,434 | |
| Oil & Gas Exploration & Production: 1.1% | | | | | | | | |
| Talos Production LLC, 11.000%, 4/3/22 | | | 1,510,000 | | | | 1,569,947 | |
| | | | | | | | | |
| Packaging & Containers: 0.1% | | | | | | | | |
| Berry Global, Inc., 5.125%, 7/15/23 | | | 83,000 | | | | 84,141 | |
| Silgan Holdings, Inc., 4.750%, 3/15/25 | | | 121,000 | | | | 123,344 | |
| | | | | | | | 207,485 | |
| Real Estate Investment Trusts: 1.1% | | | | | | | | |
| FelCor Lodging LP, 6.000%, 6/1/25 | | | 281,000 | | | | 287,644 | |
| Lamar Media Corp., 5.750%, 2/1/26 | | | 750,000 | | | | 774,769 | |
| MPT Operating Partnership LP / | | | | | | | | |
| MPT Finance Corp., 5.000%, 10/15/27 | | | 250,000 | | | | 266,381 | |
| SBA Communications Corp., | | | | | | | | |
| 4.000%, 10/1/22 | | | 252,000 | | | | 254,993 | |
| | | | | | | | 1,583,787 | |
| Telecommunication Services: 0.1% | | | | | | | | |
| Level 3 Financing, Inc., 5.375%, 5/1/25 | | | 111,000 | | | | 114,366 | |
| | | | | | | | | |
| Trading Companies & Distributors: 1.1% | | | | | | | | |
| WESCO Distribution, Inc., | | | | | | | | |
| 5.375%, 12/15/21 | | | 1,499,000 | | | | 1,500,649 | |
| | | | | | | | | |
| Wireless Telecommunication Services: 0.0% | | | | | | | | |
| T-Mobile USA, Inc., 6.000%, 3/1/23 | | | 45,000 | | | | 45,112 | |
| | | | | | | | | |
| TOTAL CORPORATE BONDS | | | | | | | | |
| (cost $13,123,129) | | | | | | | 13,243,937 | |
| | | | | | | | | |
| SHORT-TERM INVESTMENTS: 5.0% | | | | | | | | |
| | | | | | | | | |
| Money Market Funds: 5.0%^ | | | | | | | | |
| First American Treasury | | | | | | | | |
| Obligations Fund, | | | | | | | | |
| Institutional Share Class, 0.040% | | | 6,172,125 | | | | 6,172,125 | |
| The Treasury Portfolio, | | | | | | | | |
| Institutional Share Class, 0.010% | | | 703,802 | | | | 703,802 | |
| | | | | | | | | |
| TOTAL SHORT-TERM INVESTMENTS | | | | | | | | |
| (cost $6,875,927) | | | | | | | 6,875,927 | |
| | | | | | | | | |
| TOTAL INVESTMENTS IN SECURITIES | | | | | | | | |
| (cost $92,217,547): 100.3% | | | | | | | 139,167,813 | |
| Other Assets and Liabilities: (0.3)% | | | | | | | (441,175 | ) |
| NET ASSETS: 100.0% | | | | | | $ | 138,726,638 | |
| * | | Non-income producing security. |
| # | | U.S. security of foreign issuer. |
| 144A | | Securities purchased pursuant to Rule 144A of the Securities Act of 1933, as amended, and may be sold only to “qualified institutional buyers.” These securities have been deemed to be liquid by the Fund’s adviser under the supervision of the Board of Directors. As of December 31, 2020, the value of these investments was $1,197,699 or 0.9% of total net assets. |
| ^ | | Rate shown is the 7-day effective yield at December 31, 2020. |
| º | | The coupon rate shown on variable rate securities represents the rate as of December 31, 2020. |
The accompanying notes are an integral part of these financial statements.
STATEMENT OF ASSETS AND LIABILITIES at December 31, 2020 |
| ASSETS | | | |
| Investments in securities, at value (cost $92,217,547) | | $ | 139,167,813 | |
| Receivables: | | | | |
| Dividends and interest | | | 371,799 | |
| Securities sold | | | 54,550 | |
| Fund shares sold | | | 3,735 | |
| Prepaid expenses | | | 39,549 | |
| Total assets | | | 139,637,446 | |
| | | | | |
| LIABILITIES | | | | |
| Payables: | | | | |
| Securities purchased | | | 697,222 | |
| Due to affiliate (Note 5) | | | 91,969 | |
| Fund shares redeemed | | | 45,753 | |
| Accrued expenses | | | 75,864 | |
| Total liabilities | | | 910,808 | |
| | | | | |
| NET ASSETS | | $ | 138,726,638 | |
| | | | | |
| Capital shares issued and outstanding (60,000,000 shares authorized, $0.01 par value) | | | 6,204,149 | |
| | | | | |
| Net asset value, offering and redemption price per share | | $ | 22.36 | |
| | | | | |
| COMPONENTS OF NET ASSETS | | | | |
| Capital stock at par value | | $ | 62,041 | |
| Paid-in capital | | | 87,806,582 | |
| Distributable earnings | | | 50,858,015 | |
| NET ASSETS | | $ | 138,726,638 | |
The accompanying notes are an integral part of these financial statements.
STATEMENT OF OPERATIONS For the Year Ended December 31, 2020 |
| INVESTMENT INCOME | | | |
| Income | | | |
| Dividends (net of foreign withholding taxes of $9,119) | | $ | 2,010,612 | |
| Interest | | | 1,678,516 | |
| Total income | | | 3,689,128 | |
| | | | | |
| Expenses | | | | |
| Advisory fees (Note 5) | | | 1,080,346 | |
| Sub transfer agent fees | | | 80,305 | |
| Administration fees | | | 71,928 | |
| Legal fees | | | 52,816 | |
| Transfer agent fees | | | 52,551 | |
| Directors fees | | | 46,501 | |
| Administration fees – Corbyn (Note 5) | | | 44,406 | |
| Fund accounting fees | | | 37,459 | |
| Blue sky fees | | | 33,749 | |
| Audit fees | | | 29,500 | |
| Insurance fees | | | 26,878 | |
| Reports to shareholders | | | 18,605 | |
| Miscellaneous fees | | | 17,889 | |
| Custody fees | | | 14,296 | |
| Total expenses | | | 1,607,229 | |
| Net investment income | | | 2,081,899 | |
| | | | | |
| NET REALIZED AND CHANGE IN NET UNREALIZED GAIN (LOSS) ON INVESTMENTS | | | | |
| Net realized gain on sale of investments | | | 4,163,381 | |
| Change in net unrealized depreciation on investments | | | (9,149,548 | ) |
| Net realized and change in net unrealized loss on investments | | | (4,986,167 | ) |
| Net decrease in net assets resulting from operations | | $ | (2,904,268 | ) |
The accompanying notes are an integral part of these financial statements.
| STATEMENTS OF CHANGES IN NET ASSETS |
| | | Year Ended | | | Year Ended | |
| | | December 31, 2020 | | | December 31, 2019 | |
| INCREASE (DECREASE) IN NET ASSETS FROM: | | | | | | |
| | | | | | | |
| OPERATIONS | | | | | | |
| Net investment income | | $ | 2,081,899 | | | $ | 2,617,951 | |
| Net realized gain on sale of investments | | | 4,163,381 | | | | 13,031,812 | |
| Change in net unrealized appreciation (depreciation) on investments | | | (9,149,548 | ) | | | 23,347,093 | |
| Net increase (decrease) in net assets resulting from operations | | | (2,904,268 | ) | | | 38,996,856 | |
| | | | | | | | | |
| DISTRIBUTIONS TO SHAREHOLDERS (Note 2) | | | | | | | | |
| Total distributions to shareholders | | | (3,567,021 | ) | | | (14,569,230 | ) |
| | | | | | | | | |
| CAPITAL SHARE TRANSACTIONS | | | | | | | | |
| Net decrease in net assets derived | | | | | | | | |
from net change in outstanding shares(a) | | | (46,999,690 | ) | | | (35,808,309 | ) |
| | | | | | | | | |
| Total decrease in net assets | | | (53,470,979 | ) | | | (11,380,683 | ) |
| | | | | | | | | |
| NET ASSETS | | | | | | | | |
| Beginning of year | | | 192,197,617 | | | | 203,578,300 | |
| End of year | | $ | 138,726,638 | | | $ | 192,197,617 | |
(a) | A summary of capital share transactions is as follows: |
| | | | Year Ended | | | Year Ended | |
| | | | December 31, 2020 | | | December 31, 2019 | |
| | | | Shares | | | Value | | | Shares | | | Value | |
| | Shares sold | | | 152,069 | | | $ | 3,032,608 | | | | 276,145 | | | $ | 6,108,024 | |
| | Shares issued in reinvestment of distributions | | | 173,574 | | | | 3,437,668 | | | | 639,447 | | | | 14,129,860 | |
| | Shares redeemed | | | (2,806,172 | ) | | | (53,469,966 | ) | | | (2,525,693 | ) | | | (56,046,193 | ) |
| | Net decrease | | | (2,480,529 | ) | | $ | (46,999,690 | ) | | | (1,610,101 | ) | | $ | (35,808,309 | ) |
The accompanying notes are an integral part of these financial statements.
FINANCIAL HIGHLIGHTS For a capital share outstanding throughout each year |
| | | Year Ended December 31, | |
| | | 2020 | | | 2019 | | | 2018 | | | 2017 | | | 2016 | |
| Net asset value, beginning of year | | $ | 22.13 | | | $ | 19.77 | | | $ | 24.33 | | | $ | 24.77 | | | $ | 22.18 | |
| INCOME (LOSS) FROM INVESTMENT OPERATIONS: | | | | | | | | | | | | | | | | | |
| Net investment income | | | 0.30 | | | | 0.30 | | | | 0.40 | | | | 0.41 | | | | 0.32 | |
| Net realized and unrealized gain (loss) on investments | | | 0.47 | | | | 3.80 | | | | (2.78 | ) | | | 1.50 | | | | 3.96 | |
| Total from investment operations | | | 0.77 | | | | 4.10 | | | | (2.38 | ) | | | 1.91 | | | | 4.28 | |
| LESS DISTRIBUTIONS: | | | | | | | | | | | | | | | | | | | | |
| From net investment income | | | (0.33 | ) | | | (0.35 | ) | | | (0.39 | ) | | | (0.43 | ) | | | (0.33 | ) |
| From net realized gain | | | (0.21 | ) | | | (1.39 | ) | | | (1.79 | ) | | | (1.92 | ) | | | (1.36 | ) |
| Total distributions | | | (0.54 | ) | | | (1.74 | ) | | | (2.18 | ) | | | (2.35 | ) | | | (1.69 | ) |
| Net asset value, end of year | | $ | 22.36 | | | $ | 22.13 | | | $ | 19.77 | | | $ | 24.33 | | | $ | 24.77 | |
| Total return | | | 3.78 | % | | | 20.86 | % | | | (10.15 | %) | | | 7.82 | % | | | 19.78 | % |
| RATIOS/SUPPLEMENTAL DATA: | | | | | | | | | | | | | | | | | | | | |
| Net assets, end of year (millions) | | $ | 138.7 | | | $ | 192.2 | | | $ | 203.6 | | | $ | 272.6 | | | $ | 322.9 | |
| Ratio of expenses to average net assets | | | 1.12 | % | | | 1.04 | % | | | 1.01 | % | | | 0.98 | % | | | 1.01 | % |
| Ratio of net investment income to average net assets | | | 1.45 | % | | | 1.29 | % | | | 1.60 | % | | | 1.53 | % | | | 1.32 | % |
| Portfolio turnover rate | | | 31 | % | | | 13 | % | | | 30 | % | | | 40 | % | | | 48 | % |
The accompanying notes are an integral part of these financial statements.
NOTES TO FINANCIAL STATEMENTS December 31, 2020 |
| Note 1 – Significant Accounting Policies |
Greenspring Fund, Incorporated (the “Fund”) is a diversified, open-end management investment company registered under the Investment Company Act of 1940, as amended (the “1940 Act”). The Fund is organized as a Maryland corporation and commenced operations on July 1, 1983. Corbyn Investment Management, Inc. (the “Adviser” or “Corbyn”) is the Fund’s investment adviser.
The preparation of the financial statements in accordance with accounting principles generally accepted in the United States of America (“GAAP”) requires management to make estimates and assumptions that affect the reported amounts and disclosures in the financial statements. Actual results could differ from those estimates. In preparing these financial statements, the Fund has evaluated events and transactions for potential recognition or disclosure through the date the financial statements were issued.
The Fund is an investment company and accordingly follows the investment company accounting and reporting guidance of the Financial Accounting Standards Board (FASB) Accounting Standard codification topic 946 “Financial Services – Investment Companies.”
Investment transactions and related investment income – Investment transactions are recorded on the trade date. Dividend income is recorded on the ex-dividend date and interest income, including amortization of premiums and accretion of discounts, is recorded on the accrual basis using the effective interest method. Dividends determined to be a return of capital are recorded as a reduction of the cost basis of the security. Realized gains and losses from investment transactions are reported on an identified cost basis.
Valuation of Investments – Generally, the Fund’s investments are valued at market value. Equity securities traded on a principal stock exchange are valued at the last quoted sale price. Equity securities traded on the NASDAQ Stock Market are normally valued at the NASDAQ Official Closing Price (“NOCP”) provided by NASDAQ each business day. The NOCP is the most recently reported price as of 4:00:02 p.m., Eastern time, unless that price is outside the range of the “inside” bid and asked prices (the bid and asked prices that dealers quote to each other when trading for their own accounts); in that case, NASDAQ will adjust the price to equal the inside bid or asked price, whichever is closer. Because of delays in reporting trades, the NOCP may not be based on the price of the last trade to occur before the market closes. Equity securities that are not traded on a principal exchange or NASDAQ are valued at the last sale price in the over-the- counter market. In the absence of a last sale price or official closing price, or if there is no trading in a security on a business day, the security will be valued at the mean between its closing bid and asked prices obtained from sources Corbyn deems appropriate pursuant to policies and procedures approved by the Board.
Investments in mutual funds, including money market funds, are valued at the mutual fund’s closing NAV per share on the day of valuation. The prospectuses for such investment companies contain information on those investment companies’ valuation procedures and the effects of fair valuation.
Short-term debt instruments, including commercial paper or U.S. Treasury bills, having a maturity of 60 days or less may be valued at amortized cost, which approximates fair value. Amortized cost will not be used if its use would be inappropriate due to credit or other impairments of the issuer.
Debt securities, such as corporate or convertible bonds, including those having a maturity or an announced call within 60 days, are generally traded in the over-the-counter market. These securities are valued at prices obtained from an independent pricing service, which may consider the yield or price of bonds of similar quality, coupon, maturity and
NOTES TO FINANCIAL STATEMENTS December 31, 2020 (Con’t) |
type, as well as prices supplied by dealers who make markets in such securities. In the absence of a price from a pricing service, or if a quotation does not appear to accurately reflect the current value of a security, debt securities are valued at the mean of the closing bid and asked prices from sources Corbyn deems appropriate pursuant to policies and procedures approved by the Board.
Any securities for which market quotations are not readily available, the above valuation procedures are not appropriate, or do not appear to accurately reflect the current value of the security, are valued at fair value as determined in good faith by Corbyn pursuant to policies and procedures approved by the Board.
In determining fair value, Corbyn, as directed by the Board, considers all relevant qualitative and quantitative information available. These factors are subject to change over time and are reviewed periodically. The values assigned to fair value investments are based on available information and do not necessarily represent amounts that might ultimately be realized, since such amounts depend on future developments inherent in long-term investments. Further, because of the inherent uncertainty of valuation, those estimated values may differ significantly from the values that would have been used had a ready market for the investments existed, and the differences could be material.
The Fund has adopted fair valuation accounting standards that establish an authoritative definition of fair value and set out a hierarchy for measuring fair value. These standards require additional disclosures about the various input and valuation techniques used in measuring fair value. Fair value inputs are summarized in the three broad levels listed below:
| Level 1 – | Unadjusted quoted prices in active markets for identical securities that the Fund has the ability to access. |
| | |
| Level 2 – | Observable inputs other than quoted prices included in Level 1 that are observable for the security, either directly or indirectly. These inputs may include quoted prices for the identical instrument on an inactive market, prices for similar instruments, interest rates, prepayment speeds, credit risk, yield curves, default rates and similar data. |
| | |
| Level 3 – | Unobservable inputs for the security, to the extent relevant observable inputs are not available, representing the Fund’s own assumptions about the assumptions a market participant would use in valuing the security, and which would be based on the best information available. |
The inputs or methodology used for valuing securities are not necessarily an indication of the risk associated with investing in these securities. The following is a summary of the inputs used to value the Fund’s net assets as of December 31, 2020:
| | | Quoted Prices | | | Significant Other | | | Significant | | | Carrying Value, | |
| | | in Active | | | Observable | | | Unobservable | | | at December 31, | |
| | | Market | | | Inputs | | | Inputs | | | 2020 | |
| | | Level 1 | | | Level 2 | | | Level 3 | | | Total | |
| Common Stocks* | | $ | 108,103,980 | | | $ | — | | | $ | — | | | $ | 108,103,980 | |
| Preferred Stocks* | | | 3,657,272 | | | | — | | | | — | | | | 3,657,272 | |
| Exchange Traded Funds* | | | 4,211,721 | | | | — | | | | — | | | | 4,211,721 | |
| Convertible Bonds* | | | — | | | | 3,074,976 | | | | — | | | | 3,074,976 | |
| Corporate Bonds* | | | — | | | | 13,243,937 | | | | — | | | | 13,243,937 | |
| Short-Term Investments | | | 6,875,927 | | | | — | | | | — | | | | 6,875,927 | |
| Total | | $ | 122,848,900 | | | $ | 16,318,913 | | | $ | — | | | $ | 139,167,813 | |
* See Schedule of Investments for industry breakdown.
NOTES TO FINANCIAL STATEMENTS December 31, 2020 (Con’t) |
The Fund did not have any Level 3 securities during the year.
Dividends and distributions to stockholders – The Fund records dividends and distributions to shareholders on the ex-dividend date.
Risk of loss arising from indemnifications – In the normal course of business, the Fund enters into contracts that contain a variety of representations, which provide general indemnifications. The Fund’s maximum exposure under these arrangements is unknown as this would involve future claims that may be made against the Fund that have not yet occurred. However, based on experience, the Fund expects the risk of loss to be remote.
| Note 2 – Dividends and Distributions |
The Fund’s policy is to declare dividends from net investment income and distributions from net realized gains as determined in accordance with the Internal Revenue Code which may differ from GAAP. Accordingly, periodic reclassifications are made within the portfolio’s capital accounts to reflect income and gains available for distribution under income tax regulations.
On July 15, 2020 an income dividend of $0.19 per share was declared, payable on July 16, 2020, to shareholders of record on July 14, 2020. On November 3, 2020 a long-term capital gain distribution of $0.2077 was declared, payable on November 4, 2020 to shareholders of record on November 2, 2020. Additionally, on December 16, 2020, an income dividend of $0.136 per share was declared, payable on December 17, 2020 to shareholders of record on December 15, 2020. The tax character of distributions paid during the years ended December 31, 2020 and December 31, 2019 were as follows:
| Distributions paid from: | December 31, 2020 | December 31, 2019 |
| Ordinary income | $2,215,999 | $ 3,416,565 |
| Long-term capital gain | $1,351,022 | $11,152,665 |
These dividends are either distributed to shareholders or reinvested in the Fund as additional shares issued to shareholders. For those shareholders reinvesting the dividends, the number of shares issued is based on the net asset value per share as of the close of business on the ex-dividend date.
The Fund designated as long-term capital gain dividend, pursuant to Internal Revenue Code Section 852(b)(3), the amount necessary to reduce the earnings and profits of the Fund related to net capital gain to zero for the tax year ended December 31, 2020.
| Note 3 – Purchases and Sales of Investments |
For the year ended December 31, 2020, purchases and sales of investments, other than short-term investments, aggregated $42,397,790 and $77,127,289, respectively. There were no purchases or sales of U.S. government securities for the Fund.
| Note 4 – Federal Income Taxes |
The Fund’s policy is to comply with the requirements of the Internal Revenue Code applicable to regulated investment companies. Accordingly, the Fund intends to distribute substantially all of its taxable income. Therefore, no federal income tax provision is required.
NOTES TO FINANCIAL STATEMENTS December 31, 2020 (Con’t) |
As of, and during, the year ended December 31, 2020, the Fund did not have any tax positions that did not meet the “more-likely-than-not” threshold of being sustained by the applicable tax authority. Tax positions not deemed to meet the “more-likely-than-not” threshold would be recorded as a tax benefit or expense in the current year. Generally, tax authorities can examine tax returns filed for all open tax years (2017-2020).
Required Fund distributions are based on income and capital gain amounts determined in accordance with federal income tax regulations, which differ from net investment income and realized gains recognized for financial reporting purposes.
Accordingly, the composition of net assets and distributions on a tax basis may differ from those reflected in the accompanying financial statements. As of December 31, 2020, the Fund’s most recently completed year end, the components of distributable earnings on a tax basis were as follows:
| Cost of investments | | $ | 92,337,469 | |
| Gross tax unrealized appreciation | | | 47,801,251 | |
| Gross tax unrealized depreciation | | | (970,907 | ) |
| Net tax unrealized appreciation | | | 46,830,344 | |
| Undistributed ordinary income | | | 13,111 | |
| Undistributed long-term capital gain | | | 4,014,560 | |
| Total distributable earnings | | | 4,027,671 | |
| Other accumulated gains/losses | | | — | |
| Total accumulated earnings | | $ | 50,858,015 | |
Accounting principles generally accepted in the United States of America require that certain components of net assets relating to permanent differences be reclassified between financial and tax reporting. These reclassifications have no effect on net assets or net asset value per share. For the year ended December 31, 2020, the Fund had the following reclassifications between paid in capital and distributable earnings:
Distributable Earnings | Paid in Capital |
| $73,443 | $(73,443) |
As of December 31, 2020, the Fund did not have a post-October capital loss or a capital loss carryforward.
| Note 5 – Transactions with Affiliated Parties |
Under an advisory agreement between the Fund and Corbyn, the Fund pays Corbyn a fee of 0.75% of the first $250 million of average daily net assets, 0.70% of average daily net assets between $250 million and $500 million and 0.65% of average daily net assets in excess of $500 million, which is computed daily and paid monthly. For the year ended December 31, 2020, the Fund incurred $1,080,346 in advisory fees.
The Fund has also entered into a Services Agreement with Corbyn to provide various administrative services. As compensation, the Fund pays Corbyn a fee of $2,500 per month plus 0.01% of average daily net assets, which is computed daily and paid monthly. For the year ended December 31, 2020, the Fund incurred $44,406 in administrative fees to Corbyn.
At December 31, 2020, investors for whom Corbyn was investment adviser held 864,982 shares of the Fund.
NOTES TO FINANCIAL STATEMENTS December 31, 2020 (Con’t) |
The global outbreak of COVID-19 (commonly referred to as “coronavirus”) has disrupted economic markets and the prolonged economic impact is uncertain. The ultimate economic fallout from the pandemic, and the long-term impact on economies, markets, industries and individual issuers, are not known. The operational and financial performance of the issuers of securities in which the Fund invests depends on future developments, including the duration and spread of COVID-19, and such uncertainty may in turn adversely affect the value and/or liquidity of the Fund’s investments, impair the Fund’s ability to satisfy redemption requests, and negatively impact the Fund’s performance.
| Note 7 – Subsequent Events |
Management has evaluated events and transactions occurring after December 31, 2020 through the date that the financial statements were issued, and has determined that no additional disclosure in the financial statements is required.
REPORT OF INDEPENDENT REGISTERED PUBLIC ACCOUNTING FIRM
To the Board of Directors and
Shareholders of Greenspring Fund, Incorporated
Opinion on the Financial Statements
We have audited the accompanying statement of assets and liabilities of Greenspring Fund, Incorporated, including the schedule of investments, as of December 31, 2020, the related statement of operations for the year then ended, the statements of changes in net assets for each of the two years in the period then ended, and financial highlights for each of the five years in the period then ended, and the related notes (collectively referred to as the “financial statements”). In our opinion, the financial statements present fairly, in all material respects, the financial position of Greenspring Fund, Incorporated as of December 31, 2020, the results of its operations for the year then ended, the changes in its net assets for each of the two years in the period then ended, and the financial highlights for each of the five years in the period then ended, in conformity with accounting principles generally accepted in the United States of America.
Basis for Opinion
These financial statements are the responsibility of the Fund’s management. Our responsibility is to express an opinion on the Fund’s financial statements based on our audits. We are a public accounting firm registered with the Public Company Accounting Oversight Board (United States) (“PCAOB”) and are required to be independent with respect to the Fund in accordance with the U.S. federal securities laws and the applicable rules and regulations of the Securities and Exchange Commission and the PCAOB. We have served as the Fund’s auditor since 2004.
We conducted our audits in accordance with the standards of the PCAOB. Those standards require that we plan and perform the audit to obtain reasonable assurance about whether the financial statements are free of material misstatement, whether due to error or fraud. The Fund is not required to have, nor were we engaged to perform, an audit of its internal control over financial reporting. As part of our audits we are required to obtain an understanding of internal control over financial reporting, but not for the purpose of expressing an opinion on the effectiveness of the Fund’s internal control over financial reporting. Accordingly, we express no such opinion.
Our audits included performing procedures to assess the risks of material misstatement of the financial statements, whether due to error or fraud, and performing procedures that respond to those risks. Such procedures included examining, on a test basis, evidence regarding the amounts and disclosures in the financial statements. Our audits also included evaluating the accounting principles used and significant estimates made by management, as well as evaluating the overall presentation of the financial statements. Our procedures included confirmation of securities owned as of December 31, 2020 by correspondence with the custodian and brokers, when replies were not received from brokers, we performed other auditing procedures. We believe that our audits provide a reasonable basis for our opinion.
TAIT, WELLER & BAKER LLP
Philadelphia, Pennsylvania
February 24, 2021
NOTICE TO SHAREHOLDERS December 31, 2020 (Unaudited) |
Tax Information
For the year ended December 31, 2020, certain dividends paid by the Fund may be reported as qualified dividend income (QDI) and may be eligible for taxation at capital gains rates. The percentage of dividends declared from ordinary income designated as QDI was 74.54%.
For corporate shareholders in the Fund, the percentage of ordinary dividend income distributed for the year ended December 31, 2020, which is designated as qualifying for the dividends-received deduction, is 65.26%.
For foreign shareholders in the Fund, for the year ended December 31, 2020, 48.56% of the ordinary distributions paid qualify as interest-related dividends under the Internal Revenue Code Section 871(k)(1)(c), and 0.00% of the ordinary income distributions are designated as short-term capital gain distributions under Internal Revenue Code Section 871(k)(2)(c).
Proxy Voting Policies and Proxy Voting Record
The Fund’s proxy voting policies and procedures, as well as its proxy voting record for the most recent 12-month period ended December 31, are available without charge, upon request, by contacting the Fund at (800) 366-3863 or info@greenspringfund.com. The Fund will send the information within three business days of receipt of the request, by first class mail or other means designed to ensure equally prompt delivery. The Fund’s proxy voting record is also available on the U.S. Securities and Exchange Commission’s website at www.sec.gov.
Form N-Port Part F Holdings Information
The Fund files its complete schedule of portfolio holdings with the U.S. Securities and Exchange Commission for the first and third quarter of each fiscal year on Part F of Form N-PORT. The Fund’s Part F of Form N-PORT is available on the Commission’s website at www.sec.gov and may be reviewed and copied at the Commission’s Public Reference Room in Washington, DC. Information on the operation of the Public Reference Room may be obtained by calling (800) SEC-0330.
Reports and Householding
We will mail only one physical copy of the Fund’s Summary Prospectus and each Annual and Semi-Annual Report to those addresses that have made such elections in accordance with Rule 30e-3 and shared by two or more accounts. If you wish to receive individual copies of these documents, please call us at (800) 366-3863. We will begin sending you individual copies 30 days after receiving your request.
The Fund’s Summary Prospectus, Prospectus, Statement of Additional Information, Annual Report, and Semi-Annual Report, along with its first and third quarter portfolio holdings, are available on the Fund’s website at www.greenspringfund.com.
BASIC INFORMATION ABOUT FUND DIRECTORS AND OFFICERS (Unaudited) |
The Board of Directors supervises the management of the Fund. The following list summarizes information on the directors and officers of the Fund for the past five years. The address of each is 2330 West Joppa Road, Suite 110, Lutherville, MD 21093. The Fund’s Statement of Additional Information contains additional information about Fund directors and is available, without charge, upon request, by calling the Fund at (800) 366-3863, or by emailing the Fund at greenspring@greenspringfund.com.
| | | | | Number | |
| Name and | Position(s) Held | Term of Office(1) and | Principal Occupation(s) | of Funds | Other |
Year of Birth | with the Fund | Length of Time Served | During the Past Five Years | Overseen | Directorship |
| | | Term of Director | | | |
| | | Indefinite | | | |
| | | Term of Officer | | | |
| | | One year | | | |
| Interested | | | | | |
Directors and Officers | | | | | |
Charles vK. Carlson(2) | President | From March 1993 to present. | President and Director of the | One | None |
| Year of Birth: 1959 | Chairman of the Board | From January 1994 to present. | Fund’s Adviser. | | |
| | Chief Executive Officer | From February 1994 to present. | | | |
| | Director | From March 1987 to present. | | | |
| | | | | | |
William E. Carlson(2) | Director | From February 1994 to present. | President and Chair of the | One | None |
| Year of Birth: 1957 | | | Business Department at Shapiro | | |
| | | | Sher Guinot & Sandler (a law | | |
| | | | firm) from February 1999 to | | |
| | | | present. Partner of Shapiro Sher | | |
| | | | Guinot & Sandler from February | | |
| | | | 1990 to present. | | |
| | | | | | |
| Michael J. Fusting | Sr. Vice President | From May 1998 to present. | Sr. Vice President and Director of | One | None |
| Year of Birth: 1961 | Chief Financial Officer | From February 1994 to present. | the Fund’s Adviser. | | |
| | Director | From March 1992 to present. | | | |
| | | | | | |
Independent Directors(3) | | | | | |
| David T. Fu | Director | From May 1990 to present. | Retired. | One | None |
| Year of Birth: 1956 | | | | | |
| | | | | | |
| Sean T. Furlong | Director | From March 2003 to present. | Director of Finance and | One | None |
| Year of Birth: 1965 | | | Operations at the Gilman | | |
| | | | School from June 2003 to present. | | |
| | | | Adjunct Professor of Financial | | |
| | | | Accounting at Johns Hopkins | | |
| | | | University from February 2013 | | |
| | | | to present. | | |
BASIC INFORMATION ABOUT FUND DIRECTORS AND OFFICERS (Unaudited) (Con’t) |
| | | | Number | | |
| Name and | Position(s) Held | Term of Office(1) and | Principal Occupation(s) | of Funds | Other |
Year of Birth | with the Fund | Length of Time Served | During the Past Five Years | Overseen | Directorship |
| | | Term of Director | | | |
| | | Indefinite | | | |
| | | Term of Officer | | | |
| | | One year | | | |
Officers | | | | | |
| Elizabeth Agresta Swam | Secretary and Treasurer | From May 1998 to present. | Employee of the Fund’s Adviser | N/A | None |
| Year of Birth: 1967 | AML Officer | From July 2002 to present. | from May 1998 to present. | | |
| | Chief Compliance Officer | From July 2004 to present. | Chief Compliance Officer | | |
| | | | of the Fund’s Adviser from | | |
| | | | December 31, 2016 to present. | | |
| | | | Secretary of the Fund’s Adviser | | |
| | | | from June 14, 2017 to present. | | |
(1) | Directors serve an indefinite term; officers serve a term of one year. |
(2) | Mr. Charles vK. Carlson and Mr. William E. Carlson are brothers. |
(3) | Directors who are not “interested persons” (as defined in the 1940 Act) of the Fund. |
| STATEMENT REGARDING THE FUND’S LIQUIDITY RISK MANAGEMENT PROGRAM |
In accordance with Rule 22e-4 under the Investment Company Act of 1940, as amended, Greenspring Fund (the “Fund”) has adopted and implemented a Liquidity Risk Management Program (the “Program”). The Board of Directors (the “Board”) of the Fund has appointed Corbyn Investment Management, the Fund’s investment adviser, to serve as the administrator (the “Administrator”) of the Program. The Administrator implemented the Program effective June 1, 2019 and is responsible for the day-to-day administration of the Program. Under the Program, the Administrator manages the Fund’s liquidity risk, which is the risk that the Fund can’t meet shareholder redemption requests without significant dilution of remaining shareholders’ interests in the Fund. This risk is managed by monitoring the degree of liquidity of the Fund’s investments, limiting the amount of the Fund’s illiquid investments, and utilizing various risk management tools and facilities available to the Fund for meeting shareholder redemptions, among other means. The Administrator’s process of determining the degree of liquidity of the Fund’s investments is supported by a third-party liquidity assessment vendor. The Board reviewed a report prepared by the Administrator regarding the operation and effectiveness of the Program for the period June 1, 2019 through June 30, 2020. No significant liquidity events impacting the Fund were noted in the report. In addition, the Administrator provided its assessment that the Program has been effective in managing the Fund’s liquidity risk.
PRIVACY POLICY December 31, 2020 (Unaudited) |
Greenspring Fund recognizes that individuals expect an exceptional level of privacy in their financial affairs. The Fund assures the confidentiality of personal information provided to it.
The information we collect is limited to what the Fund believes is necessary or useful to conduct its business; administer your records, accounts and funds; to comply with laws and regulations; and to help us design or improve products and services. The Fund collects non-public personal information about you from information it receives from you on applications or other forms or through its website, as well as from information about your transactions with the Fund.
Some of this information may be disclosed to the Fund’s investment adviser, but not for marketing solicitation, as well as non-affiliated third parties who provide non-financial services to the Fund such as its Transfer Agent, in order to administer customer accounts and mail transaction confirmations and tax forms, and the mailing house the Fund utilizes for mailing shareholder reports. Such information may also be disclosed to a non-affiliated third party engaged to provide fund accounting and administrative services to us. Disclosing this information enables us to meet shareholders’ financial needs and regulatory requirements. These third parties act on our behalf and are obligated to keep the information we provide to them confidential and to use the information only for the purposes authorized. The Fund does not disclose any non-public personal information about you or former shareholders to anyone, except as permitted by law.
To protect your non-public personal information, the Fund permits access to it only by authorized employees and maintains security practices to safeguard your information.
If you have any questions regarding our Privacy Policy, please contact us at 1-800-366-3863 or greenspring@greenspringfund.com. Thank you.
This Privacy Policy is not part of the Annual Report.
Performance Since Inception on
July 1, 1983 through December 31, 2020
(Unaudited)
HOW $10,000 INVESTED ON 7/1/83 WOULD HAVE GROWN*
| * | Figures include changes in principal value, reinvested dividends and capital gains distributions. Past expense limitations increased the Fund’s return. This chart illustrates the performance of a hypothetical $10,000 investment made in the Fund since inception through December 31, 2020. The total value of $247,467 assumes the reinvestment of dividends and capital gains, but does not reflect the effect of any redemption fees (the Fund no longer imposes a redemption fee effective May 1, 2018). This chart does not imply any future performance. |
Average annual total returns for the one, three, five, ten year and since inception periods ended December 31, 2020 were 3.78%, 4.07%, 7.80%, 5.55% and 8.93%, respectively. Average annual returns for more than one year assume a compounded rate of return and are not the Fund’s year-by-year results, which fluctuated over the periods shown. Returns do not reflect taxes that shareholders may pay on Fund distributions or redemption of Fund shares.
(This Page Intentionally Left Blank.)
Greenspring Fund, Incorporated
2330 West Joppa Road, Suite 110
Lutherville, MD 21093
(410) 823-5353
(800) 366-3863
www.greenspringfund.com
DIRECTORS
Charles vK. Carlson, Chairman
William E. Carlson
David T. Fu
Sean T. Furlong
Michael J. Fusting
OFFICERS
Charles vK. Carlson
President and Chief Executive Officer
Michael J. Fusting
Sr. Vice President and
Chief Financial Officer
Elizabeth Agresta Swam
Chief Compliance Officer,
Secretary, Treasurer
and AML Officer
INVESTMENT ADVISER
Corbyn Investment Management, Inc.
2330 West Joppa Road, Suite 108
Lutherville, MD 21093-7207
ADMINISTRATOR, FUND ACCOUNTANT AND
TRANSFER AGENT
U.S. Bancorp Fund Services, LLC
615 East Michigan Street
Milwaukee, WI 53202
DISTRIBUTOR
Quasar Distributors, LLC
111 East Kilbourn Avenue, Suite 2200
Milwaukee, WI 53202
CUSTODIAN
U.S. Bank, N.A.
1555 N. Rivercenter Dr., Suite 302
Milwaukee, WI 53212
INDEPENDENT REGISTERED
PUBLIC ACCOUNTING FIRM
Tait, Weller & Baker LLP
Two Liberty Place
50 South 16th Street, Suite 2900
Philadelphia, PA 19102-2529
LEGAL COUNSEL
K&L Gates LLP
State Street Financial Center
One Lincoln Street
Boston, MA 02111
Symbol – GRSPX
CUSIP – 395724107
Item 2. Code of Ethics.
The registrant has adopted a code of ethics that applies to the registrant’s principal executive officer and principal financial officer. The registrant has not made any amendments to its code of ethics during the period covered by this report. The registrant has not granted any waivers from any provisions of the code of ethics during the period covered by this report.
A copy of the registrant’s Code of Ethics is filed herewith.
Item 3. Audit Committee Financial Expert.
The registrant’s board of directors has determined that there is at least one audit committee financial expert serving on its audit committee. Mr. Sean T. Furlong is the “audit committee financial expert” and is considered to be “independent” as each term is defined in Item 3 of Form N CSR.
Item 4. Principal Accountant Fees and Services.
The registrant has engaged its principal accountant to perform audit services, audit-related services, tax services or other services during the past two fiscal years. “Audit services” refer to performing an audit of the registrant's annual financial statements or services that are normally provided by the accountant in connection with statutory and regulatory filings or engagements for those fiscal years. “Audit-related services” refer to the assurance and related services by the principal accountant that are reasonably related to the performance of the audit. “Tax services” refer to professional services rendered by the principal accountant for tax compliance, tax advice, and tax planning. There were no “other services” provided by the principal accountant. The following table details the aggregate fees billed, or expected to be billed, for each of the last two fiscal years for audit fees, audit-related fees, tax fees or other fees by the principal accountant:
| | FYE 12/31/2020 | FYE 12/31/2019 |
Audit Fees | $26,000 | $26,000 |
Audit-Related Fees | N/A | N/A |
Tax Fees | $3,500 | $3,500 |
All Other Fees | N/A | N/A |
The audit committee has adopted pre-approval policies and procedures that require the audit committee to pre approve all audit and non-audit services of the registrant, including services provided to any entity affiliated with the registrant. All of the principal accountant’s hours spent on auditing the registrant’s financial statements were attributed to work performed by full time permanent employees of the principal accountant.
The percentage of fees billed by Tait, Weller & Baker LLP applicable to non-audit services pursuant to waiver of pre-approval requirement were as follows:
| | FYE 12/31/2020 | FYE 12/31/2019 |
Audit-Related Fees | 0% | 0% |
Tax Fees | 0% | 0% |
All Other Fees | 0% | 0% |
The following table indicates the non-audit fees billed, or expected to be billed, by the registrant’s accountant for services to the registrant and to the registrant’s investment adviser for the last two years. The audit committee of the board of directors has considered whether the provision of non-audit services that were rendered to the registrant's investment adviser is compatible with maintaining the principal accountant's independence and has concluded that the provision of such non-audit services by the accountant has not compromised the accountant’s independence.
Non-Audit Related Fees | FYE 12/31/2020 | FYE 12/31/2019 |
Registrant | N/A | N/A |
Registrant’s Investment Adviser | N/A | N/A |
Item 5. Audit Committee of Listed Registrants.
Not applicable to registrants who are not listed issuers (as defined in Rule 10A-3 under the Securities Exchange Act of 1934).
Item 6. Investments.
Schedule of Investments is included as part of the report to shareholders filed under Item 1 of this Form.
Item 7. Disclosure of Proxy Voting Policies and Procedures for Closed-End Management Investment Companies.
Not applicable to open-end investment companies.
Item 8. Portfolio Managers of Closed-End Management Investment Companies.
Not applicable to open-end investment companies.
Item 9. Purchases of Equity Securities by Closed‑End Management Investment Company and Affiliated Purchasers.
Not applicable to open-end investment companies.
Item 10. Submission of Matters to a Vote of Security Holders.
Not Applicable.
Item 11. Controls and Procedures.
(a) | The Registrant’s Chief Executive Officer and Chief Financial Officer have reviewed the Registrant's disclosure controls and procedures (as defined in Rule 30a-3(c) under the Investment Company Act of 1940 (the “Act”) (17 CFR 270.30a-3(c))) as of a date within 90 days of the filing date of the report that includes the disclosure required by this paragraph, based on the evaluation of these controls and procedures required by Rule 30a-3(b) under the Act (17 CFR 270.30a-3(b)) and Rules 13a-15(b) or 15d‑15(b) under the Securities Exchange Act of 1934 (17 CFR 240.13a-(15(b) or 240.15d-15(b)). Based on their review, such officers have concluded that the disclosure controls and procedures are effective in ensuring that information required to be disclosed in this report is appropriately recorded, processed, summarized and reported and made known to them by others within the Registrant and by the Registrant’s service provider. |
(b) | There were no changes in the Registrant's internal control over financial reporting (as defined in Rule 30a-3(d) under the Act (17 CFR 270.30a-3(d)) that occurred during the second fiscal quarter of the period covered by this report that has materially affected, or is reasonably likely to materially affect, the Registrant's internal control over financial reporting. |
Item 12. Disclosure of Securities Lending Activities for Closed-End Management Investment Companies.
Not applicable to open-end investment companies.
Item 13. Exhibits.
(3) Any written solicitation to purchase securities under Rule 23c‑1 under the Act (17 CFR 270.23 C-1) sent or given during the period covered by the report by or on behalf of the registrant to 10 or more persons. Not applicable to open-end investment companies.
(4) Change in the registrant’s independent public accountant. Provide the information called for by Item 4 of Form 8-K under the Exchange Act (17 CFR 249.308). Unless otherwise specified by Item 4, or related to and necessary for a complete understanding of information not previously disclosed, the information should relate to events occurring during the reporting period. Not Applicable.
SIGNATURES
Pursuant to the requirements of the Securities Exchange Act of 1934 and the Investment Company Act of 1940, the registrant has duly caused this report to be signed on its behalf by the undersigned, thereunto duly authorized.
(Registrant) Greenspring Fund, Incorporated
By (Signature and Title)* /s/ Charles vK. Carlson
Charles vK. Carlson, Chief Executive Officer
Date 3/3/2021
Pursuant to the requirements of the Securities Exchange Act of 1934 and the Investment Company Act of 1940, this report has been signed below by the following persons on behalf of the registrant and in the capacities and on the dates indicated.
By (Signature and Title)* /s/ Charles vK. Carlson
Charles vK. Carlson, Chief Executive Officer
Date 3/3/2021
By (Signature and Title)* /s/ Michael J. Fusting
Michael J. Fusting, Chief Financial Officer
Date 3/3/2021
* Print the name and title of each signing officer under his or her signature.

