Item 1. Reports to Stockholders.

ANNUAL REPORT
DECEMBER 31, 2019
This report is intended for shareholders of the
Greenspring Fund, Incorporated and may not be
used as sales literature unless preceded or
accompanied by a current prospectus.
Beginning on January 1, 2021, as permitted by regulations adopted by the U.S. Securities and Exchange Commission, paper copies of the Fund’s annual and semi-annual shareholder reports will no longer be sent by mail, unless you specifically request paper copies of the reports. Instead, the reports will be made available on the Fund’s website (www.greenspringfund.com). You will be notified by mail each time a report is posted and provided with a website link to access the report.
The Fund does not currently offer electronic delivery of shareholder reports. If you have already elected to receive shareholder reports electronically from your financial intermediary (such as a broker-dealer or bank), you will not be affected by this change and you need not take any action. If you invest through a financial intermediary and want to receive electronic delivery of shareholder reports, you must contact your financial intermediary to sign up.
You may elect to receive all future reports in paper free of charge. If you are a direct investor, you can inform the Fund that you wish to continue receiving paper copies of your shareholder reports after January 1, 2021 by calling 1-800-576-7498. If you invest through a financial intermediary, you must contact your financial intermediary to elect to continue to receive paper copies of the Fund’s shareholder reports.
| Dear Fellow Shareholders: | February 2020 |
We are pleased to report that during 2019 Greenspring Fund posted a gain of 20.86% including the reinvestment of all dividend and capital gain distributions. The 2019 performance represented the highest calendar year return since 2003, with performance driven by strong returns from the equity holdings and continued consistent returns from the Fund’s fixed income securities.
As we write this letter and reflect over the last year, it is quite apparent that there was a significant shift in investor sentiment throughout the year. At the beginning of 2019, equity investors were extremely anxious, as many prognosticators were predicting the U.S. would slip into a recession. As the year progressed, however, recession fears eased as U.S. consumers showed a resilience that was underpinned by a strong and improving job market, the Federal Reserve (“Fed”) did an about-face to a more accommodative posture, and trade tensions eased towards the end of the year. These strengthening perceptions about the economy fueled a stock market rally. The market advance was noteworthy given the many events that at times shook investor confidence, such as the extremely combative political environment, uncertainty related to Brexit, unrest in Hong Kong, and slowing global economic activity resulting from the trade dispute.
The softness in certain economic data that had driven recession fears late in 2018 pushed the Fed to cut interest rates three times during the second half of 2019. This was a sharp change from prior policy as the Fed had raised rates on a consistent basis from late 2016 through the end of 2018. The decision to cut rates despite extremely low unemployment and moderate U.S economic growth indicated the Fed was shifting to a proactively defensive posture. Although Fed officials acknowledged that the economy was still expanding, they wanted to provide an insurance policy against any potential disruption that might develop in the domestic economy due to broader global economic concerns. This policy move fueled a rally in the fixed income market as rates across the yield curve moved lower, pushing bond prices higher. It was also instrumental in driving the shift in investor sentiment that helped to fuel the rally in the equity market.
| Greenspring Fund | |
| Performance for the | |
| Periods Ended December 31, 2019 | |
| | Quarter | 4.33% | |
| | Year to Date | 20.86% | |
| | 1 Year | 20.86% | |
| | 3 Years* | 5.40% | |
| | 5 Years* | 5.71% | |
| | 10 Years* | 6.23% | |
| | 15 Years* | 5.89% | |
| | 20 Years* | 7.22% | |
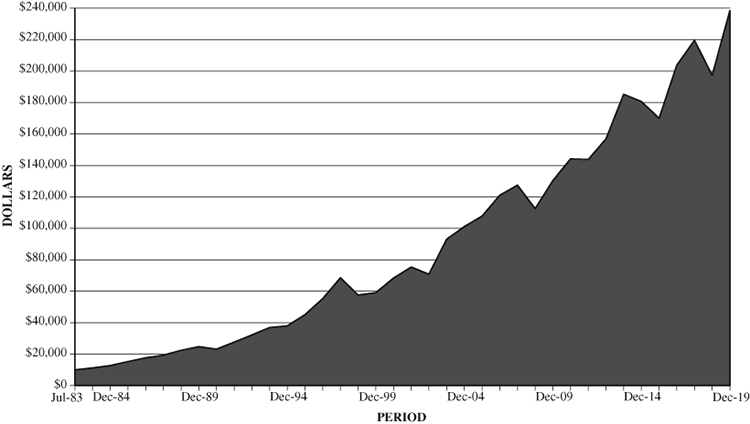
| | Since inception on 7/1/83* | 9.08% | |
| | Expense Ratio** | 1.02% | |
| * | | Annualized. |
| ** | | As stated in Prospectus dated 5-1-19. See note on last page of letter. |
| Performance data quoted represents past performance; past performance does not guarantee future results. The investment return and principal value of an investment will fluctuate so that an investor’s shares, when redeemed, may be worth more or less than their original cost. Current performance of the Fund may be lower or higher than the performance quoted. Performance data current to the most recent month end may be obtained by calling 1-800-366-3863 or by visiting www.greenspringfund.com. |
While emotion influenced many investors’ investment decisions during the late 2018 equity market sell-off, 2019 turned into a classic example of how difficult it is to predict market movements and the danger of reacting to short-term anxieties. The strong 2019 market performance that unexpectedly followed this time of angst and fear serves as a good reminder of the importance of maintaining a disciplined, long-term investment approach in order to participate in rallies that very few are able to predict. Many investors who were frightened by the worrisome economic predictions highlighted in the financial media, significantly reduced their stock positions late in 2018, and
missed the ensuing rally. Given the long-term approach we take when managing the Fund’s portfolio, our asset allocation remained relatively unchanged, allowing the Fund to successfully participate in the year’s market rally.
INFLUENCES on FUND PERFORMANCE
The Fund’s performance benefited from the fact that over 90% of our holdings posted positive returns. Furthermore, within the equity holdings, only two securities suffered material price declines, and neither of these were among the top ten influencers of overall portfolio performance. The performance of the Fund’s fixed income securities was in-line with our expectations, generating positive performance on a consistent basis throughout the year. The equity portion of the Fund’s portfolio gained more than 30% and was responsible for the vast majority of 2019’s performance. The Fund’s holdings in the Engineering and Construction sector had the largest positive influence on performance. Strong quarterly earnings reports, combined with continued solid future prospects, pushed the prices of these holdings higher throughout the year.
The individual securities that had the most significant influence on the Fund’s performance during the year, in order of magnitude, were the positive returns generated in the common stock investments in MasTec, Republic Services, KBR, Sherwin-Williams, and EMCOR Group.
MasTec, an engineering and construction company, builds, installs and maintains infrastructure for the energy, communication and utility industries. A long-time, successful Fund holding, management has created substantial shareholder value by more than doubling its earnings per share over the last three years. MasTec has benefitted from strength in the end markets that it serves, particularly the oil and gas pipeline sector that has grown significantly as new pipelines have been built to serve the increased level of domestic energy production. Management handled this growth exceptionally well, with consistent project execution and a sizeable increase in profit margins. Looking forward, we continue to believe that MasTec will benefit from strong end markets as the pipeline, communications and electric transmission and distribution segments all show evidence of continued strength. MasTec should also find additional opportunities for future growth related to the deployment and expansion of 5G and other communication networks, renewable power generation projects and the infrastructure needed to connect renewable energy to the existing electric transmission grid.
Republic Services is the second largest provider of nonhazardous solid waste collection, transfer, and disposal services in North America. Strong industry fundamentals, supported by continued economic growth and healthy construction activity, coupled with company-specific initiatives drove improved core waste pricing and volume growth, enabling solid revenue and profit growth. The Company continued to generate high levels of free cash flow which management returned to shareholders through dividends and stock buybacks while also making accretive acquisitions. We continue to see value in Republic’s high-quality management team, disciplined capital allocation strategy and leading position in a predictable and defensive industry. While Republic remains the Fund’s single largest holding, we sold some shares during the year as the valuation continued to expand.
KBR’s share price rose during the year as the Company continued to transition from an engineering and construction company to a professional services and
| | % of Net |
| Greenspring Fund | Assets |
| Top 10 Holdings | as of |
| | 12/31/19 |
| Republic Services, Inc. | 6.7% |
| The Sherwin-Williams Company | 4.6% |
| Southern National Bancorp of Virginia | 4.2% |
| Wyndham Hotels & Resorts, Inc. | 4.2% |
| Discover Financial Services | 3.2% |
| KBR, Inc. | 3.1% |
| United Parcel Service, Inc. | 3.1% |
| Amdocs Ltd. | 3.0% |
| Suncor Energy, Inc. | 3.0% |
| j2 Global, Inc. | 2.8% |
technology company focused on providing services to governments around the world. As the year progressed, investors recognized the attractiveness of the recurring government services business and started to place a higher valuation multiple on its earnings. The Company posted strong growth in the government services unit by successfully defending a large U.S. Army contract that was up for renewal and winning several other long-term contracts. On the energy side of the business, KBR won new work on various downstream energy projects and completed a large multi-year energy project in Australia that had been problematic. Its completion should allow KBR to receive payments that will allow it to greatly improve an already solid balance sheet. With a large, diverse, and multi-year backlog, a strong pipeline of new opportunities, and a conservative management team, we remain positive with regard to the Company’s long-term prospects for growth and free cash flow generation.
Sherwin-Williams is the world’s largest manufacturer of paints and coatings. Its share price moved higher throughout the year as the Company posted solid earnings results driven by outperformance in the core U.S. paint store business, as strong execution and growth in professional residential remodel activity continued. Management also continued to successfully integrate its 2017 acquisition of Valspar, leading to improved product sales and cost savings, especially in international markets. Management increased pricing throughout various product lines, offsetting the impact of rising input prices, thus expanding profit margins. The solid financial results supported significant free cash flow generation that the Company used to pay down debt, repurchase stock, and significantly grow its dividend. We remain confident that this strong management team will continue to grow the value of this market-leading franchise.
EMCOR Group is a leader in mechanical and electrical construction with a particular emphasis on commercial and industrial building services, as well as highly specialized services for the refinery and petrochemical industries. We discussed EMCOR in two of our quarterly letters during 2019 as the Company delivered consistent and strong quarterly earnings growth that was reflected in the solid performance of its stock. Double-digit revenue growth in both the construction and building services segments, as well as healthy profit margins, drove the increase in earnings. In addition to strong revenue performance, EMCOR took advantage of sustained demand within its markets to grow the backlog of contracts for work to be performed within the next year or so. Although strong revenues underpin a solid foundation, the crucial elements of EMCOR’s success continue to be a disciplined approach to project selection, bid pricing, cost
Greenspring Fund Ten Largest 2019 Purchases |
| | Common Stocks: |
| | Cysco Systems, Inc. |
| | Du Pont de Nemours, Inc. |
| | Alphabet, Inc. – Class C |
| | Party City Holdco Inc. |
| | Medtronic plc |
| | Bonds: |
| | Ctrip.com International, Ltd., 1.000%, 7/1/20 |
| | j2 Cloud LLC, 6.000%, 7/15/25 |
| | Talos Production LLC, 11.000%, 4/2/22 |
| | Encompass Health Corp., 5.750%, 11/1/24 |
| | Level 3 Financing, Inc., 5.625%, 2/1/23 |
Greenspring Fund Ten Largest 2019 Sales |
| | Common Stocks: |
| | Republic Services, Inc. |
| | MasTec, Inc. |
| | Six Flags Entertainment Corp. |
| | Condor Hospitality Trust, Inc. |
| | EMCOR Group, Inc. |
| | Bonds: |
| | Michaels Stores, Inc., 5.875%, 12/15/20 |
| | Gulfport Energy Corp., 6.625%, 5/1/23 |
| | Level 3 Financing, Inc., 6.125%, 1/15/21 |
| | DaVita, Inc., 5.750%, 8/15/22 |
| | LIN Television Corporation, 5.875%, 11/15/22 |
management and effective project execution. EMCOR generates substantial free cash flow from its earnings, and we remain confident that the seasoned management team will continue to grow shareholder value by using its cash flow to expand geographically through acquisitions, opportunistically repurchase shares, and pay dividends.
PORTFOLIO ACTIVITY
Within the Fund’s equity holdings, the largest new addition was a position in Cisco Systems. Cisco maintains a dominant position in large portions of the networking equipment market and we believe it is well-positioned to capitalize on several technology trends in the coming years. A slowdown in sales, partly driven by the trade dispute with China, pressured Cisco’s share price during the fourth quarter and allowed us to purchase shares at an attractive valuation relative to our expectations for future earnings and cash flow. We believe these issues should prove transitory and Cisco’s strong management team will use its rock-solid balance sheet and free cash flow to grow long-term shareholder value.
The most significant expansion of the Fund’s existing equity holdings was in shares of Alphabet Inc., the holding company for Google and other businesses. With leading, highly defensible market positions in rapidly growing businesses, we expect the Company to continue to use its brand recognition, data expertise and innovative management to broaden its product offerings and bring customers deeper into its ecosystem. After first quarter revenue grew slightly less than expected, we took advantage of a decline in the share price to purchase shares at what we believe was a very reasonable price relative to its growth prospects, profit margins, and cash-rich balance sheet. Despite many impressive attributes, our valuation work indicated that Alphabet’s stock was trading at a lower ratio of enterprise value to EBITDA than many industrial companies with weaker balance sheets and slower growth profiles.
The most significant equity sales during the year were shares of Republic Services and MasTec, Inc., both long-time, successful Fund holdings. Although we remain confident in the future opportunities for these companies, valuation has increased significantly so we reduced the number of shares owned. We sold the Fund’s entire position in Six Flags Entertainment, initially by significantly reducing our stake early in the year as valuation became less attractive, then by selling the remaining shares early in the fourth quarter as we became less confident in its growth prospects and the sustainability of the current dividend level. We also sold the Fund’s holdings in Zayo Group, Condor Hospitality Trust, and Beneficial Bancorp after these companies accepted takeover proposals.
| Greenspring Fund |
| Portfolio Allocation |
| as of December 31, 2019 |
| |
 |
| Greenspring Fund |
| Portfolio Allocation |
| as of December 31, 2018 |
| |
 |
Bond maturities and redemptions were responsible for the majority of the sales made in the fixed income portfolio throughout the year. We sold the Fund’s holdings of Gulfport Energy and Whiting Petroleum bonds as lower oil and natural gas prices began to concern us, calling into question the ability of these companies to grow production and generate cash flow. We purchased a large number of short-duration high yield fixed income securities similar in nature to the bonds that we have purchased during the last several years. While yields declined and spreads between U.S. Treasury securities and high yield bonds narrowed considerably during 2019, we are being very careful to not “stretch” for yield. If an unexpected shock hits the economy, we want to be holding bonds of companies in which we have confidence in management’s ability to navigate through difficult times. As always, but particularly at times like these, we focus on companies with balance sheets and business models that are less vulnerable to unexpected downturns.
Please refer to the Schedule of Investments for a complete list of the Fund’s current holdings.
OUTLOOK
Given the fear and uncertainty that gripped investors at the end of 2018, the sharp rally in the equity market during 2019 highlights the constant struggle investors face between trying to predict short-term influences on stock prices and investing for the long term. We believe in the importance of identifying companies that create shareholder value through effective capital allocation and compounding cash flows. On a daily basis, headline news and market forecasters will influence the movement of stock prices but, as time passes, much of this proves to be just noise or distractions with little impact on the operations or true underlying value of businesses in the marketplace.
We listen to the unrelenting media output, as it is hard to avoid. However, we try to filter through the noise and stay focused on the issues that we believe will have a meaningful long-term impact on the underlying fundamentals of a business or industry. We try to discern how these issues may alter our outlook for the value that a capable management team with a well-positioned business can generate. The decision to buy or sell a security should be driven by an understanding of a business’s long-term prospects. Significant changes to the portfolio should be the result of major shifts to that outlook, not due to daily news headlines. We remain confident that the companies in the Fund’s portfolio are well-positioned to create value and that over time the share prices will reflect the higher value.
We greatly appreciate your interest and your investment in Greenspring Fund and look forward to providing you with an update on the Fund’s performance after the end of the first quarter.
Respectfully,
 |  |
| Charles vK. Carlson | Michael J. Fusting |
| Portfolio Manager and Co-Chief Investment Officer | Co-Chief Investment Officer |
**Total Annual Fund Operating Expenses for the Fund will not correlate to the Ratio of Expenses to Average Net Assets shown in the Fund’s most recent Annual Report and in the Financial Highlights section of the Prospectus, which reflects the operating expenses of the Fund and does not include acquired fund fees and expenses.
Mutual fund investing involves risk. Principal loss is possible. Small and mid-capitalization companies tend to have limited liquidity and greater price volatility than large-capitalization companies. Investments by the Fund in lower-rated and non-rated securities present a greater risk of loss to principal and interest than higher-rated securities. Investments in debt securities typically decrease in value when interest rates rise. This risk is usually greater for longer-term debt securities.
Opinions expressed are subject to change, are not guaranteed and should not be considered recommendations to buy or sell any security. Fund holdings and/or sector allocations are subject to change at any time and are not recommendations to buy or sell any security. Current and future portfolio holdings are subject to risk.
Cash flow measures the cash generating capability of a company by adding non-cash charges (e.g. depreciation) and interest expense to pre-tax income. Free cash flow measures the cash generating capability of a company by adding certain non-cash charges (e.g. depreciation and amortization) to earnings and subtracting recurring capital expenditures. Duration is a commonly used measure of the potential volatility of the price of a debt security, or the aggregate market value of a portfolio of debt securities, prior to maturity. Securities with a longer duration generally have more volatile prices than securities of comparable quality with a shorter duration. Earnings per share is the portion of a company’s profit allocated to each outstanding share of common stock and serves as an indicator of a company’s profitability. Earnings growth is not a measure of the Fund’s future performance. EBITDA, or earnings before interest, taxes, depreciation, and amortization, is a measure of a company’s overall financial performance and is used as an alternative to simple earnings or net income in some circumstances. Enterprise value is a measure of a company’s total value, often used as a more comprehensive alternative to equity market capitalization and includes in its calculation the market capitalization of a company but also short-term and long-term debt as well as any cash on the company’s balance sheet.
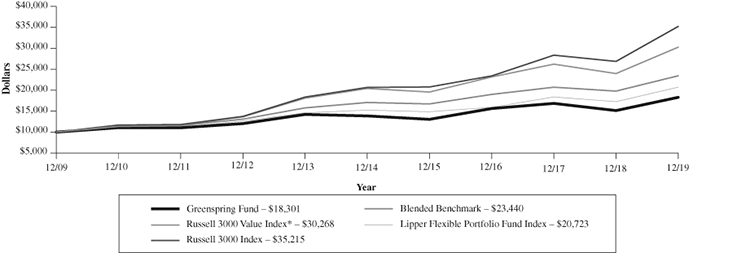
Growth of a $10,000 Investment in the Greenspring Fund
Over the Last Ten Years
Average Annual Total Returns | For Years Ended December 31, 2019 |
| | 1 Year | 3 Years | 5 Years | 10 Years |
| Greenspring Fund | 20.86% | 5.40% | 5.71% | 6.23% |
| Russell 3000 Value Index* | 26.26% | 9.32% | 8.20% | 11.71% |
| Russell 3000 Index | 31.02% | 14.57% | 11.24% | 13.42% |
| Blended Benchmark | 18.44% | 7.24% | 6.54% | 8.89% |
| Lipper Flexible Portfolio Fund Index | 20.01% | 9.17% | 6.33% | 7.56% |
The graph and table do not reflect the deduction of taxes that a shareholder would pay on Greenspring Fund (the “Fund”) distributions or the redemption of Fund shares.
Performance data quoted represents past performance; past performance does not guarantee future results. The investment return and principal value of an investment will fluctuate so that an investor’s shares, when redeemed, may be worth more or less than their original cost. Current performance of the Fund may be lower or higher than the performance quoted. Performance data current to the most recent month end is available at www.greenspringfund.com or by calling 1-800-366-3863 toll free. Effective May 1, 2018, the Fund no longer imposes a 2.00% redemption fee for shares held 60 days or less. Performance data does not reflect the redemption fee. If reflected, total returns would be reduced.
The Russell 3000 Value Index is a capitalization-weighted index composed of those companies that are among the largest 3,000 US-incorporated equities by market capitalization that exhibit value characteristics such as lower price-to book ratios and lower expected growth rates. This index is a total return market index, which assumes that all cash distributions are reinvested, in addition to tracking the price movements. The “Blended Benchmark” is a weighted average comprised of 60% Russell 3000 Value Index / 30% ICE BAML 1-3yr BB Cash Pay High Yield Index / 10% ICE BAML 3-month T-Bill Index (rebalanced monthly). The Russell 3000 Value Index is described above. The ICE BAML 1-3 year BB Cash Pay High Yield Index, a subset of ICE BAML U.S. Cash Pay High Yield Index, consists of all securities rated BB- through BB+ by S&P with a remaining term to final maturity of 3 years or less. The ICE BAML U.S. 3-month T-Bill Index reflects the performance of purchasing a single T-Bill issue at the beginning of the month and holding it for a full month. The Russell 3000 Index is a capitalization-weighted index composed of those companies that are among the largest 3,000 US-incorporated equities by market capitalization. This index is a total return market index, which assumes that all cash distributions are reinvested, in addition to tracking the price movements. The Lipper Flexible Portfolio Index is an unmanaged index of the 30 largest funds in the Lipper Flexible Portfolio Fund category, which includes funds that allocate investments across various asset classes, including domestic common stocks, bonds and money market instruments, with a focus on total return. Investors cannot invest directly in an index, although they may invest in the underlying securities included in the index. An index return does not reflect a deduction for fees, expenses, or taxes.
| * | The Fund compares its performance in this annual report to the Russell 3000 Value Index. The Fund’s Advisor believes the Russell 3000 Value Index is a more appropriate index against which to compare the Fund’s performance than the Fund’s former index, the Russell 3000 Index, in light of the Fund’s investment strategy. |
EXPENSE EXAMPLE For the Six Months Ended December 31, 2019 (Unaudited) |
As a shareholder of Greenspring Fund, Incorporated (the “Fund”), you incur two types of costs: (1) transaction costs, including redemption fees (the Fund no longer imposes a redemption fee effective May 1, 2018), and (2) ongoing costs, including management fees, and other fund specific expenses. The expense example is intended to help the shareholder understand ongoing costs (in dollars) of investing in a fund and to compare these costs with the ongoing costs of investing in other mutual funds. The example is based on an investment of $1,000 invested at the beginning of the period and held for the most recent six-month period.
The Actual Expenses comparison provides information about actual account values and actual expenses. A shareholder may use the information in this line, together with the amount invested, to estimate the expenses paid over the period. A shareholder may divide his/her account value by $1,000 (e.g., an $8,600 account value divided by $1,000 = 8.6), then multiply the result by the number in the first line under the heading entitled “Expenses Paid During Period” to estimate the expenses paid on his/her account during this period.
The Hypothetical Example for Comparison Purposes provides information about hypothetical account values and hypothetical expenses based on the Fund’s actual expense ratio and an assumed rate of return of 5% per year before expenses, which is not the Fund’s actual return. The hypothetical account values and expenses may not be used to estimate the actual ending account balance or expenses paid for the period. A shareholder may use this information to compare the ongoing costs of investing in the Fund and other funds. To do so, a shareholder would compare this 5% hypothetical example with the 5% hypothetical examples that appear in the shareholder reports of other funds.
The expenses shown in the table are meant to highlight your ongoing costs only and do not reflect any transactional costs, such as sales charges (loads), redemptions fees, or exchange fees. Therefore, the Hypothetical Example for Comparison Purposes is useful in comparing ongoing costs only, and will not help to determine the relevant total costs of owning different funds. In addition, if these transactional costs were included, shareholder costs would have been higher.
| | | Annualized | Beginning | Ending | Expenses Paid |
| | | Net Expense Ratio | Account Value | Account Value | During Period |
| | | 12/31/19 | 7/1/19 | 12/31/19 | 7/1/19 – 12/31/19(1) |
Actual Expenses(2) | | 1.04% | $1,000.00 | $1,055.00 | $5.39 |
| Hypothetical Example | | | | | |
| for Comparison Purposes | | | | | |
| (5% return before expenses) | | 1.04% | $1,000.00 | $1,019.96 | $5.30 |
(1) | Expenses are equal to the Fund’s annualized net expense ratio, multiplied by the average account value over the period, multiplied by 184/365 to reflect the one-half year period. |
(2) | Based on the actual returns of 5.50% for the six month-period ended December 31, 2019. |
SCHEDULE OF INVESTMENTS at December 31, 2019 |
| | | Shares | | | Value | |
| COMMON STOCKS: 67.9% | | | | | | |
| | | | | | | |
| Building Products: 1.4% | | | | | | |
| Owens Corning | | | 39,865 | | | $ | 2,596,009 | |
| | | | | | | | | |
| Business Software & Services: 3.0% | | | | | | | | |
| Amdocs Limited# | | | 80,851 | | | | 5,836,634 | |
| | | | | | | | | |
| Chemicals: 4.6% | | | | | | | | |
| The Sherwin-Williams Company | | | 15,119 | | | | 8,822,541 | |
| | | | | | | | | |
| Commercial Banks & Thrifts: 8.1% | | | | | | | | |
| American National Bankshares, Inc. | | | 35,987 | | | | 1,424,005 | |
| OceanFirst Financial Corp. | | | 52,900 | | | | 1,351,066 | |
| Prudential Bancorp, Inc. | | | 6,225 | | | | 115,349 | |
| Shore Bancshares, Inc. | | | 122,477 | | | | 2,126,201 | |
| Southern National Bancorp of Virginia | | | 498,380 | | | | 8,148,513 | |
| Westbury Bancorp, Inc.* | | | 26,352 | | | | 751,032 | |
| Western New England Bancorp, Inc. | | | 4,559 | | | | 43,903 | |
| WSFS Financial Corporation | | | 36,726 | | | | 1,615,577 | |
| | | | | | | | 15,575,646 | |
| Commercial Services & Supplies: 1.9% | | | | | | | | |
| Johnson Controls International plc# | | | 92,035 | | | | 3,746,745 | |
| | | | | | | | | |
| Computer Communications: 1.2% | | | | | | | | |
| Cisco Systems, Inc. | | | 46,520 | | | | 2,231,099 | |
| | | | | | | | | |
| Consumer Finance: 3.2% | | | | | | | | |
| Discover Financial Services | | | 71,766 | | | | 6,087,192 | |
| | | | | | | | | |
| Electrical Equipment & Instruments: 0.9% | | | | | | | | |
| Emerson Electric Co. | | | 15,400 | | | | 1,174,404 | |
| nVent Electric plc# | | | 20,000 | | | | 511,600 | |
| | | | | | | | 1,686,004 | |
| Engineering & Construction: 7.0% | | | | | | | | |
| EMCOR Group, Inc. | | | 60,339 | | | | 5,207,256 | |
| MasTec, Inc.* | | | 67,888 | | | | 4,355,694 | |
| MYR Group, Inc.* | | | 117,345 | | | | 3,824,273 | |
| | | | | | | | 13,387,223 | |
| Healthcare-Products: 2.8% | | | | | | | | |
| Abbott Laboratories | | | 11,000 | | | | 955,460 | |
| Medtronic plc# | | | 39,670 | | | | 4,500,562 | |
| | | | | | | | 5,456,022 | |
| Hotels, Restaurants & Leisure: 5.6% | | | | | | | | |
| Marriott International, Inc. – Class A | | | 18,000 | | | | 2,725,740 | |
| Wyndham Hotels & Resorts, Inc. | | | 128,282 | | | | 8,057,392 | |
| | | | | | | | 10,783,132 | |
| Information Technology Services: 4.0% | | | | | | | | |
| Conduent, Inc.* | | | 265,455 | | | | 1,645,821 | |
| KBR, Inc. | | | 198,555 | | | | 6,055,928 | |
| | | | | | | | 7,701,749 | |
| Insurance: 1.6% | | | | | | | | |
| Chubb Limited# | | | 5,736 | | | | 892,866 | |
| W.R. Berkley Corp. | | | 32,284 | | | | 2,230,824 | |
| | | | | | | | 3,123,690 | |
| Machinery: 0.5% | | | | | | | | |
| Pentair plc# | | | 20,000 | | | | 917,400 | |
| | | | | | | | | |
| Media & Entertainment: 1.2% | | | | | | | | |
| Alphabet, Inc. – Class C* | | | 1,772 | | | | 2,369,199 | |
| | | | | | | | | |
| Metals & Mining: 1.1% | | | | | | | | |
| Cleveland-Cliffs, Inc. | | | 248,785 | | | | 2,089,794 | |
| | | | | | | | | |
| Oil & Gas Exploration & Production: 5.5% | | | | | | | | |
| EOG Resources, Inc. | | | 57,254 | | | | 4,795,595 | |
| Suncor Energy, Inc.# | | | 176,735 | | | | 5,796,908 | |
| | | | | | | | 10,592,503 | |
| Oil Refining & Marketing: 0.2% | | | | | | | | |
| Phillips 66 | | | 2,813 | | | | 313,396 | |
| | | | | | | | | |
| Software & Services: 2.8% | | | | | | | | |
| j2 Global, Inc. | | | 58,028 | | | | 5,437,804 | |
| | | | | | | | | |
| Specialty Retail: 0.2% | | | | | | | | |
| Party City Holdco Inc.* | | | 167,928 | | | | 392,952 | |
| | | | | | | | | |
| Transportation & Logistics: 3.1% | | | | | | | | |
| United Parcel Service, Inc. – Class B | | | 50,338 | | | | 5,892,566 | |
| | | | | | | | | |
| Truck Dealerships: 0.4% | | | | | | | | |
| Rush Enterprises, Inc. – Class B | | | 17,847 | | | | 815,608 | |
| | | | | | | | | |
| Waste Management Services: 6.7% | | | | | | | | |
| Republic Services, Inc. | | | 143,124 | | | | 12,828,204 | |
| | | | | | | | | |
| Wholesale Distribution: 0.9% | | | | | | | | |
| LKQ Corporation* | | | 50,174 | | | | 1,791,212 | |
| | | | | | | | | |
| TOTAL COMMON STOCKS | | | | | | | | |
| (cost $74,538,763) | | | | | | | 130,474,324 | |
The accompanying notes are an integral part of these financial statements.
SCHEDULE OF INVESTMENTS at December 31, 2019 (Con’t) |
| | | Principal | | | Value | |
| CONVERTIBLE BONDS: 1.5% | | | | | | |
| | | | | | | |
| Retail-Internet & Direct Marketing: 1.5% | | | | | | |
| Ctrip.com International, Ltd., | | | | | | |
| 1.000%, 7/1/20# | | $ | 3,000,000 | | | $ | 2,959,170 | |
| | | | | | | | | |
| TOTAL CONVERTIBLE BONDS | | | | | | | | |
| (cost $2,958,579) | | | | | | | 2,959,170 | |
| | | | | | | | | |
| CORPORATE BONDS: 22.0% | | | | | | | | |
| | | | | | | | | |
| Aerospace & Defense: 0.1% | | | | | | | | |
| Arconic, Inc., 6.150%, 8/15/20 | | | 269,000 | | | | 275,125 | |
| | | | | | | | | |
| Business & Professional Services: 0.5% | | | | | | | | |
| Nielsen Finance LLC, 4.500%, 10/1/20 | | | 1,026,000 | | | | 1,028,565 | |
| | | | | | | | | |
| Chemicals: 0.1% | | | | | | | | |
| Blue Cube Spinco LLC, | | | | | | | | |
| 9.750%, 10/15/23 | | | 175,000 | | | | 188,617 | |
| | | | | | | | | |
| Commercial Services & Supplies: 0.0% | | | | | | | | |
| Mobile Mini, Inc., 5.875%, 7/1/24 | | | 98,000 | | | | 102,165 | |
| | | | | | | | | |
| Consumer Finance: 0.5% | | | | | | | | |
| Credit Acceptance Corp. | | | | | | | | |
| 6.125%, 2/15/21 | | | 258,000 | | | | 258,387 | |
| 7.375%, 3/15/23 | | | 36,000 | | | | 37,050 | |
| 5.125%, 12/31/24 144A | | | 150,000 | | | | 156,144 | |
| 6.625%, 3/15/26 144A | | | 500,000 | | | | 541,811 | |
| | | | | | | | 993,392 | |
| Consumer Services: 0.1% | | | | | | | | |
| Service Corp. International, | | | | | | | | |
| 5.375%, 5/15/24 | | | 212,000 | | | | 218,802 | |
| | | | | | | | | |
| Engineering & Construction: 0.3% | | | | | | | | |
| MasTec, Inc., 4.875%, 3/15/23 | | | 541,000 | | | | 549,340 | |
| | | | | | | | | |
| Healthcare-Providers & Services: 3.8% | | | | | | | | |
| Acadia Healthcare Company, Inc., | | | | | | | | |
| 6.125%, 3/15/21 | | | 5,097,000 | | | | 5,109,742 | |
| Centene Corporation, | | | | | | | | |
| 6.125%, 2/15/24 | | | 960,000 | | | | 997,200 | |
| Encompass Health Corp., | | | | | | | | |
| 5.750%, 11/1/24 | | | 1,169,000 | | | | 1,184,589 | |
| | | | | | | | 7,291,531 | |
| Homebuilding: 0.1% | | | | | | | | |
| M/I Homes, Inc., 6.750%, 1/15/21 | | | 245,000 | | | | 246,017 | |
| | | | | | | | | |
| Hotels, Restaurants & Leisure: 0.1% | | | | | | | | |
| Eldorado Resorts, Inc., 7.000%, 8/1/23 | |
| 100,000 | | | | 104,291 | |
| | | | | | | | | |
| Household & Personal Products: 0.1% | | | | | | | | |
| Spectrum Brands, Inc., | | | | | | | | |
| 6.125%, 12/15/24 | | | 255,000 | | | | 264,031 | |
| | | | | | | | | |
| Household Durables: 0.3% | | | | | | | | |
| Tempur Sealy International, | | | | | | | | |
| 5.625%, 10/15/23 | | | 500,000 | | | | 515,833 | |
| | | | | | | | | |
| Industrial Conglomerates: 0.7% | | | | | | | | |
| Icahn Enterprises LP/Icahn | | | | | | | | |
| Enterprises Finance Corp. | | | | | | | | |
| 5.875%, 2/1/22 | | | 793,000 | | | | 795,403 | |
| 6.250%, 2/1/22 | | | 257,000 | | | | 262,340 | |
| 6.750%, 2/1/24 | | | 217,000 | | | | 225,770 | |
| | | | | | | | 1,283,513 | |
| Machinery: 1.4% | | | | | | | | |
| Actuant Corporation, 5.625%, 6/15/22 | | | 578,000 | | | | 585,405 | |
| Tennant Co., 5.625%, 5/1/25 | | | 250,000 | | | | 261,979 | |
| Welbilt, Inc., 9.500%, 2/15/24 | | | 1,671,000 | | | | 1,776,131 | |
| | | | | | | | 2,623,515 | |
| Media & Entertainment: 2.6% | | | | | | | | |
| CCO Holdings LLC/CCO | | | | | | | | |
| Holdings Capital Corp. | | | | | | | | |
| 5.250%, 9/30/22 | | | 2,692,000 | | | | 2,727,077 | |
| 5.750%, 9/1/23 | | | 816,000 | | | | 833,679 | |
| Cinemark USA, Inc., 5.125%, 12/15/22 | | | 250,000 | | | | 253,453 | |
| Match Group, Inc., 6.375%, 6/1/24 | | | 595,000 | | | | 625,741 | |
| TEGNA, Inc. | | | | | | | | |
| 5.125%, 7/15/20 | | | 277,000 | | | | 277,969 | |
| 6.375%, 10/15/23 | | | 306,000 | | | | 315,562 | |
| | | | | | | | 5,033,481 | |
| Metals & Mining: 0.6% | | | | | | | | |
| Allegheny Technologies, Inc., | | | | | | | | |
| 7.875%, 8/15/23 | | | 500,000 | | | | 561,458 | |
| Cleveland-Cliffs, Inc., 5.750%, 3/1/25 | | | 115,000 | | | | 113,778 | |
| Commercial Metals Co., | | | | | | | | |
| 5.750%, 4/15/26 | | | 250,000 | | | | 261,843 | |
| Steel Dynamics, Inc. | | | | | | | | |
| 5.125%, 10/1/21 | | | 53,000 | | | | 53,032 | |
| 5.500%, 10/1/24 | | | 89,000 | | | | 91,681 | |
| | | | | | | | 1,081,792 | |
The accompanying notes are an integral part of these financial statements.
SCHEDULE OF INVESTMENTS at December 31, 2019 (Con’t) |
| | | Principal | | | Value | |
| CORPORATE BONDS: 22.0% (Con’t) | | | | | | |
| | | | | | | |
| Oil & Gas Exploration & Production: 1.0% | | | | | | |
| Talos Production LLC, | | | | | | |
| 11.000%, 4/3/22 | | $ | 1,804,000 | | | $ | 1,849,663 | |
| | | | | | | | | |
| Packaging & Containers: 2.7% | | | | | | | | |
| Ball Corporation, 4.375%, 12/15/20 | | | 250,000 | | | | 255,810 | |
| Reynolds Group Issuer Inc./ | | | | | | | | |
| Reynolds Group Issuer LLC/ | | | | | | | | |
| Reynolds Group Issuer | | | | | | | | |
| (Luxembourg), 5.750%, 10/15/20 | | | 4,845,539 | | | | 4,857,652 | |
| | | | | | | | 5,113,462 | |
| Real Estate Investment Trusts: 0.3% | | | | | | | | |
| FelCor Lodging LP, 6.000%, 6/1/25 | | | 281,000 | | | | 294,464 | |
| Lamar Media Corp., 5.375%, 1/15/24 | | | 145,000 | | | | 148,202 | |
| Lamar Media Group, 5.000%, 5/1/23 | | | 49,000 | | | | 49,980 | |
| | | | | | | | 492,646 | |
| Software & Services: 2.0% | | | | | | | | |
| Infor US, Inc., 6.500%, 5/15/22 | | | 844,000 | | | | 858,162 | |
| j2 Cloud Services LLC, | | | | | | | | |
| 6.000%, 7/15/25 144A | | | 2,613,000 | | | | 2,775,228 | |
| Symantec Corp., 4.200%, 9/15/20 | | | 150,000 | | | | 151,801 | |
| | | | | | | | 3,785,191 | |
| Specialty Retail: 0.4% | | | | | | | | |
| Penske Auto Group, Inc., | | | | | | | | |
| 5.750%, 10/1/22 | | | 845,000 | | | | 858,725 | |
| | | | | | | | | |
| Technology Hardware & Equipment: 0.0% | | | | | | | | |
| EMC Corp., 2.650%, 6/1/20 | | | 25,000 | | | | 25,036 | |
| | | | | | | | | |
| Telecommunications Services: 1.6% | | | | | | | | |
| Consolidated Communications, Inc., | | | | | | | | |
| 6.500%, 10/1/22 | | | 841,000 | | | | 763,207 | |
| Level 3 Financing, Inc. | | | | | | | | |
| 5.375%, 8/15/22 | | | 588,000 | | | | 590,323 | |
| 5.625%, 2/1/23 | | | 1,242,000 | | | | 1,248,819 | |
| Zayo Group LLC/Zayo Capital, Inc., | | | | | | | | |
| 6.000%, 4/1/23 | | | 500,000 | | | | 512,292 | |
| | | | | | | | 3,114,641 | |
| Trading Companies & Distributors: 0.8% | | | | | | | | |
| WESCO Distribution, Inc., | | | | | | | | |
| 5.375%, 12/15/21 | | | 1,499,000 | | | | 1,505,476 | |
| | | | | | | | | |
| Utilities: 0.8% | | | | | | | | |
| The AES Corporation, | | | | | | | | |
| 5.500%, 3/15/24 | |
| 1,476,000 | | | | 1,512,900 | |
| | | | | | | | | |
| Wireless Telecommunication Services: 1.1% | | | | | | | | |
| T-Mobile USA, Inc. | | | | | | | | |
| 6.500%, 1/15/24 | | | 44,000 | | | | 45,376 | |
| 6.375%, 3/1/25 | | | 2,039,000 | | | | 2,111,211 | |
| | | | | | | | 2,156,587 | |
| TOTAL CORPORATE BONDS | | | | | | | | |
| (cost $42,050,675) | | | | | | | 42,214,337 | |
| | | | | | | | | |
| SHORT-TERM INVESTMENTS: 8.2% | | | | | | | | |
| | | | | | | | | |
| Money Market Funds: 8.2%^ | | | | | | | | |
| First American Treasury | | | | | | | | |
| Obligations Fund, | | | | | | | | |
| Institutional Share Class, 1.528% | | | 8,585,000 | | | | 8,585,000 | |
| The Treasury Portfolio, | | | | | | | | |
| Institutional Share Class, 1.488% | | | 7,107,106 | | | | 7,107,106 | |
| | | | | | | | | |
| TOTAL SHORT-TERM INVESTMENTS | | | | | | | | |
| (cost $15,692,106) | | | | | | | 15,692,106 | |
| | | | | | | | | |
| TOTAL INVESTMENTS IN SECURITIES | | | | | | | | |
| (cost $135,240,123): 99.6% | | | | | | | 191,339,937 | |
| Other Assets and Liabilities 0.4% | | | | | | | 857,680 | |
| NET ASSETS: 100.0% | | | | | | $ | 192,197,617 | |
| * | | Non-income producing security. |
| # | | U.S. security of foreign issuer. |
| 144A | | Securities purchased pursuant to Rule 144A of the Securities Act of 1933, as amended, and may be sold only to “qualified institutional buyers.” These securities have been deemed to be liquid by the Fund’s adviser under the supervision of the Board of Directors. As of December 31, 2019, the value of these investments was $3,473,183, or 1.8% of total net assets. |
| ^ | | Rate shown is the 7-day effective yield at December 31, 2019. |
The accompanying notes are an integral part of these financial statements.
STATEMENT OF ASSETS AND LIABILITIES at December 31, 2019 |
| ASSETS | | | |
| Investments in securities, at value (cost $135,240,123) | | $ | 191,339,937 | |
| Receivables: | | | | |
| Dividends and interest | | | 866,776 | |
| Securities sold | | | 171,312 | |
| Fund shares sold | | | 82,651 | |
| Prepaid expenses | | | 40,786 | |
| Total assets | | | 192,501,462 | |
| | | | | |
| LIABILITIES | | | | |
| Payables: | | | | |
| Due to affiliate (Note 5) | | | 127,435 | |
| Fund shares redeemed | | | 92,059 | |
| Accrued expenses | | | 84,351 | |
| Total liabilities | | | 303,845 | |
| | | | | |
| NET ASSETS | | $ | 192,197,617 | |
| | | | | |
| Capital shares issued and outstanding (60,000,000 shares authorized, $0.01 par value) | | | 8,684,678 | |
| | | | | |
| Net asset value, offering and redemption price per share | | $ | 22.13 | |
| | | | | |
| COMPONENTS OF NET ASSETS | | | | |
| Capital stock at par value | | $ | 86,847 | |
| Paid-in capital | | | 134,854,909 | |
| Distributable earnings | | | 57,255,861 | |
| NET ASSETS | | $ | 192,197,617 | |
The accompanying notes are an integral part of these financial statements.
STATEMENT OF OPERATIONS For the Year Ended December 31, 2019 |
| INVESTMENT INCOME | | | |
| Income | | | |
| Interest | | $ | 2,870,607 | |
| Dividends (net of foreign withholding taxes of $34,089) | | | 1,855,808 | |
| Total income | | | 4,726,415 | |
| | | | | |
| Expenses | | | | |
| Advisory fees (Note 5) | | | 1,517,108 | |
| Sub transfer agent fees | | | 114,970 | |
| Administration fees | | | 92,174 | |
| Transfer agent fees | | | 53,800 | |
| Administration fees – Corbyn (Note 5) | | | 50,227 | |
| Fund accounting fees | | | 47,301 | |
| Legal fees | | | 47,093 | |
| Directors fees | | | 41,500 | |
| Blue sky fees | | | 34,285 | |
| Audit fees | | | 29,500 | |
| Insurance fees | | | 27,062 | |
| Reports to shareholders | | | 25,454 | |
| Custody fees | | | 17,422 | |
| Miscellaneous fees | | | 10,568 | |
| Total expenses | | | 2,108,464 | |
| Net investment income | | | 2,617,951 | |
| | | | | |
| NET REALIZED AND CHANGE IN NET UNREALIZED GAIN ON INVESTMENTS | | | | |
| Net realized gain on sale of investments | | | 13,031,812 | |
| Change in net unrealized appreciation on investments | | | 23,347,093 | |
| Net realized and change in net unrealized gain on investments | | | 36,378,905 | |
| Net increase in net assets resulting from operations | | $ | 38,996,856 | |
The accompanying notes are an integral part of these financial statements.
| STATEMENTS OF CHANGES IN NET ASSETS |
| | | Year Ended | | | Year Ended | |
| | | December 31, 2019 | | | December 31, 2018 | |
| INCREASE (DECREASE) IN NET ASSETS FROM: | | | | | | |
| | | | | | | |
| OPERATIONS | | | | | | |
| Net investment income | | $ | 2,617,951 | | | $ | 4,104,556 | |
| Net realized gain on sale of investments | | | 13,031,812 | | | | 13,009,717 | |
| Change in net unrealized appreciation on investments | | | 23,347,093 | | | | (41,075,520 | ) |
| Net increase (decrease) in net assets resulting from operations | | | 38,996,856 | | | | (23,961,247 | ) |
| | | | | | | | | |
| DISTRIBUTIONS TO SHAREHOLDERS (Note 2) | | | | | | | | |
| Total distributions to shareholders | | | (14,569,230 | ) | | | (22,198,249 | ) |
| | | | | | | | | |
| CAPITAL SHARE TRANSACTIONS | | | | | | | | |
| Net decrease in net assets derived | | | | | | | | |
from net change in outstanding shares(a) | | | (35,808,309 | ) | | | (22,851,578 | ) |
| | | | | | | | | |
| Total decrease in net assets | | | (11,380,683 | ) | | | (69,011,074 | ) |
| | | | | | | | | |
| NET ASSETS | | | | | | | | |
| Beginning of year | | | 203,578,300 | | | | 272,589,374 | |
| End of year | | $ | 192,197,617 | | | $ | 203,578,300 | |
(a) | A summary of capital share transactions is as follows: |
| | | | Year Ended December 31, 2019 | | | Year Ended December 31, 2018 | |
| | | | Shares | | | Value | | | Shares | | | Value | |
| | Shares sold | | | 276,145 | | | $ | 6,108,024 | | | | 544,861 | | | $ | 13,236,893 | |
| | Shares issued in reinvestment of distributions | | | 639,447 | | | | 14,129,860 | | | | 1,022,166 | | | | 21,691,359 | |
| | Shares redeemed+ | | | (2,525,693 | ) | | | (56,046,193 | ) | | | (2,476,022 | ) | | | (57,779,830 | ) |
| | Net decrease | | | (1,610,101 | ) | | $ | (35,808,309 | ) | | | (908,995 | ) | | $ | (22,851,578 | ) |
+ | Net of redemption fees of $— and $97, respectively. The Fund no longer imposes a redemption fee effective May 1, 2018. |
The accompanying notes are an integral part of these financial statements.
FINANCIAL HIGHLIGHTS For a capital share outstanding throughout each year |
| | | Year Ended December 31, | |
| | | 2019 | | | 2018 | | | 2017 | | | 2016 | | | 2015 | |
| Net asset value, beginning of year | | $ | 19.77 | | | $ | 24.33 | | | $ | 24.77 | | | $ | 22.18 | | | $ | 24.80 | |
| | | | | | | | | | | | | | | | | | | | | |
| INCOME (LOSS) FROM INVESTMENT OPERATIONS: | | | | | | | | | | | | | | | | | | | | |
| Net investment income | | | 0.30 | | | | 0.40 | | | | 0.41 | | | | 0.32 | | | | 0.54 | |
| Net realized and unrealized gain (loss) on investments | | | 3.80 | | | | (2.78 | ) | | | 1.50 | | | | 3.96 | | | | (1.98 | ) |
| Total from investment operations | | | 4.10 | | | | (2.38 | ) | | | 1.91 | | | | 4.28 | | | | (1.44 | ) |
| | | | | | | | | | | | | | | | | | | | | |
| LESS DISTRIBUTIONS: | | | | | | | | | | | | | | | | | | | | |
| From net investment income | | | (0.35 | ) | | | (0.39 | ) | | | (0.43 | ) | | | (0.33 | ) | | | (0.53 | ) |
| From net realized gain | | | (1.39 | ) | | | (1.79 | ) | | | (1.92 | ) | | | (1.36 | ) | | | (0.65 | ) |
| Total distributions | | | (1.74 | ) | | | (2.18 | ) | | | (2.35 | ) | | | (1.69 | ) | | | (1.18 | ) |
| Net asset value, end of year | | $ | 22.13 | | | $ | 19.77 | | | $ | 24.33 | | | $ | 24.77 | | | $ | 22.18 | |
| Total return | | | 20.86 | % | | | (10.15 | %) | | | 7.82 | % | | | 19.78 | % | | | (5.86 | %) |
| | | | | | | | | | | | | | | | | | | | | |
| RATIOS/SUPPLEMENTAL DATA: | | | | | | | | | | | | | | | | | | | | |
| Net assets, end of year (millions) | | $ | 192.2 | | | $ | 203.6 | | | $ | 272.6 | | | $ | 322.9 | | | $ | 317.4 | |
| Ratio of expenses to average net assets | | | 1.04 | % | | | 1.01 | % | | | 0.98 | % | | | 1.01 | % | | | 0.95 | % |
| Ratio of net investment income to average net assets | | | 1.29 | % | | | 1.60 | % | | | 1.53 | % | | | 1.32 | % | | | 1.93 | % |
| Portfolio turnover rate | | | 13 | % | | | 30 | % | | | 40 | % | | | 48 | % | | | 25 | % |
The accompanying notes are an integral part of these financial statements.
NOTES TO FINANCIAL STATEMENTS December 31, 2019 |
| Note 1 – Significant Accounting Policies |
Greenspring Fund, Incorporated (the “Fund”) is a diversified, open-end management investment company registered under the Investment Company Act of 1940, as amended (the “1940 Act”). The Fund is organized as a Maryland corporation and commenced operations on July 1, 1983. Corbyn Investment Management, Inc. (the “Adviser” or “Corbyn”) is the Fund’s investment adviser.
The preparation of the financial statements in accordance with accounting principles generally accepted in the United States of America (“GAAP”) requires management to make estimates and assumptions that affect the reported amounts and disclosures in the financial statements. Actual results could differ from those estimates. In preparing these financial statements, the Fund has evaluated events and transactions for potential recognition or disclosure through the date the financial statements were issued.
The Fund is an investment company and accordingly follows the investment company accounting and reporting guidance of the Financial Accounting Standards Board (FASB) Accounting Standard codification topic 946 “Financial Services –Investment Companies.”
Investment transactions and related investment income – Investment transactions are recorded on the trade date. Dividend income is recorded on the ex-dividend date and interest income, including amortization of premiums and accretion of discounts, is recorded on the accrual basis using the effective interest method. Dividends determined to be a return of capital are recorded as a reduction of the cost basis of the security. Realized gains and losses from investment transactions are reported on an identified cost basis.
Valuation of Investments – Generally, the Fund’s investments are valued at market value. Equity securities traded on a principal stock exchange are valued at the last quoted sale price. Equity securities traded on the NASDAQ Stock Market are normally valued at the NASDAQ Official Closing Price (“NOCP”) provided by NASDAQ each business day. The NOCP is the most recently reported price as of 4:00:02 p.m., Eastern time, unless that price is outside the range of the “inside” bid and asked prices (the bid and asked prices that dealers quote to each other when trading for their own accounts); in that case, NASDAQ will adjust the price to equal the inside bid or asked price, whichever is closer. Because of delays in reporting trades, the NOCP may not be based on the price of the last trade to occur before the market closes. Equity securities that are not traded on a principal exchange or NASDAQ are valued at the last sale price in the over-the-counter market. In the absence of a last sale price or official closing price, or if there is no trading in a security on a business day, the security will be valued at the mean between its closing bid and asked prices obtained from sources Corbyn deems appropriate pursuant to policies and procedures approved by the Board.
Investments in mutual funds, including money market funds, are valued at the mutual fund’s closing NAV per share on the day of valuation. The prospectuses for such investment companies contain information on those investment companies’ valuation procedures and the effects of fair valuation.
Short-term debt instruments, including commercial paper or U.S. Treasury bills, having a maturity of 60 days or less may be valued at amortized cost, which approximates fair value. Amortized cost will not be used if its use would be inappropriate due to credit or other impairments of the issuer.
Debt securities, such as corporate or convertible bonds, including those having a maturity or an announced call within 60 days, are generally traded in the over-the-counter market. These securities are valued at prices obtained from an independent pricing service, which may consider the yield or price of bonds of similar quality, coupon, maturity and
NOTES TO FINANCIAL STATEMENTS December 31, 2019 (Con’t) |
type, as well as prices supplied by dealers who make markets in such securities. In the absence of a price from a pricing service, or if a quotation does not appear to accurately reflect the current value of a security, debt securities are valued at the mean of the closing bid and asked prices from sources Corbyn deems appropriate pursuant to policies and procedures approved by the Board.
Any securities for which market quotations are not readily available, the above valuation procedures are not appropriate, or do not appear to accurately reflect the current value of the security, are valued at fair value as determined in good faith by Corbyn pursuant to policies and procedures approved by the Board.
In determining fair value, Corbyn, as directed by the Board, considers all relevant qualitative and quantitative information available. These factors are subject to change over time and are reviewed periodically. The values assigned to fair value investments are based on available information and do not necessarily represent amounts that might ultimately be realized, since such amounts depend on future developments inherent in long-term investments. Further, because of the inherent uncertainty of valuation, those estimated values may differ significantly from the values that would have been used had a ready market for the investments existed, and the differences could be material.
The Fund has adopted fair valuation accounting standards that establish an authoritative definition of fair value and set out a hierarchy for measuring fair value. These standards require additional disclosures about the various input and valuation techniques used in measuring fair value. Fair value inputs are summarized in the three broad levels listed below:
| Level 1 – | Unadjusted quoted prices in active markets for identical securities that the Fund has the ability to access. |
| | |
| Level 2 – | Observable inputs other than quoted prices included in Level 1 that are observable for the security, either directly or indirectly. These inputs may include quoted prices for the identical instrument on an inactive market, prices for similar instruments, interest rates, prepayment speeds, credit risk, yield curves, default rates and similar data. |
| | |
| Level 3 – | Unobservable inputs for the security, to the extent relevant observable inputs are not available, representing the Fund’s own assumptions about the assumptions a market participant would use in valuing the security, and which would be based on the best information available. |
The inputs or methodology used for valuing securities are not necessarily an indication of the risk associated with investing in these securities. The following is a summary of the inputs used to value the Fund’s net assets as of December 31, 2019:
| | | Quoted Prices | | | Significant Other | | | Significant | | | Carrying Value, | |
| | | in Active | | | Observable | | | Unobservable | | | at December 31, | |
| | | Market | | | Inputs | | | Inputs | | | 2019 | |
| | | Level 1 | | | Level 2 | | | Level 3 | | | Total | |
| Common Stocks* | | $ | 130,474,324 | | | $ | — | | | $ | — | | | $ | 130,474,324 | |
| Convertible Bonds* | | | — | | | | 2,959,170 | | | | — | | | | 2,959,170 | |
| Corporate Bonds* | | | — | | | | 42,214,337 | | | | — | | | | 42,214,337 | |
| Short-Term Investments | | | 15,692,106 | | | | — | | | | — | | | | 15,692,106 | |
| Total | | $ | 146,166,430 | | | $ | 45,173,507 | | | $ | — | | | $ | 191,339,937 | |
* See Schedule of Investments for industry breakdown.
During the year ended December 31, 2019, the Fund had no transfers between levels. The Fund did not have any Level 3 securities during the year.
NOTES TO FINANCIAL STATEMENTS December 31, 2019 (Con’t) |
Dividends and distributions to stockholders – The Fund records dividends and distributions to shareholders on the ex-dividend date.
Redemption fees (policy no longer in effect beginning May 1, 2018) – The Board has adopted policies and procedures with respect to frequent purchases and redemptions of Fund shares by Fund shareholders. The Fund is intended for long-term investors. The Fund discourages and does not accommodate frequent purchases and redemptions of Fund shares by Fund shareholders. The Fund reserves the right to decline a purchase order for any reason.
“Market-timers” who engage in frequent purchases and redemptions over a short period can disrupt the Fund’s investment program by requiring the Fund to have excess cash on hand or to liquidate holdings to accommodate redemptions. In addition, frequent purchases and redemptions may impede efficient Fund management and create additional transaction costs that are borne by all shareholders. To the extent that the Fund invests a significant portion of its assets in small-cap securities or high-yield bonds, it may be subject to the risks of market timing more than a fund that does not. Therefore, the Fund imposes a 2% redemption fee for shares held 60 days or less (the Fund no longer imposes a redemption fee effective May 1, 2018). The fee is deducted from the seller’s redemption proceeds and deposited into the Fund to help offset brokerage commissions, market impact, and other costs associated with fluctuations in Fund asset levels and cash flow caused by short-term trading. All shareholders are subject to these restrictions regardless of whether you purchased your shares directly from the Fund or through a financial intermediary. However, the Fund is limited in its ability to determine whether trades placed through financial intermediaries may signal excessive trading. Accordingly, the Fund may not be able to determine whether trading in combined orders or in omnibus accounts is contrary to the Fund’s policies. The Fund reserves the right to reject combined or omnibus orders in whole or in part.
To calculate redemption fees, after first redeeming any shares associated with reinvested dividends or other distributions, the “first-in, first out” method is used to determine the holding period. Under this method, the date of redemption will be compared with the earliest purchase date of shares held in the account. If the holding period for shares purchased is 60 days or less, the fee will be charged. The redemption fee may be modified or discontinued at any time, in which case, shareholders will be notified. The redemption fee does not apply to shares acquired through the reinvestment of dividends or other distributions, or shares redeemed pursuant to a systematic withdrawal plan or a mandatory IRA distribution.
In compliance with Rule 22c-2 under the 1940 Act, Quasar Distributors, LLC, on behalf of the Fund, has entered into written agreements with each of the Fund’s financial intermediaries, under which the intermediaries must, upon request, provide the Fund with certain shareholder and identity trading information so that the Fund can enforce its frequent trading policies.
Risk of loss arising from indemnifications – In the normal course of business, the Fund enters into contracts that contain a variety of representations, which provide general indemnifications. The Fund’s maximum exposure under these arrangements is unknown as this would involve future claims that may be made against the Fund that have not yet occurred. However, based on experience, the Fund expects the risk of loss to be remote.
| Note 2 – Dividends and Distributions |
The Fund’s policy is to declare dividends from net investment income and distributions from net realized gains as determined in accordance with the Internal Revenue Code which may differ from GAAP. Accordingly, periodic reclassifications are made within the portfolio’s capital accounts to reflect income and gains available for distribution under income tax regulations.
NOTES TO FINANCIAL STATEMENTS December 31, 2019 (Con’t) |
On July 17, 2019 an income dividend of $0.21 per share and a long-term capital gain distribution of $0.0093 were declared, payable on July 18, 2019, to shareholders of record on July 16, 2019. Additionally, on December 18, 2019, an income dividend of $0.1439 per share, a short-term capital gain distribution of $0.0438 and a long-term capital gain distribution of $1.34 per share were declared, payable on December 19, 2019 to shareholders of record on December 17, 2019. The tax character of distributions paid during the year ended December 31, 2019 and the year ended December 31, 2018 were as follows:
| | Distributions paid from: | | December 31, 2019 | | | December 31, 2018 | |
| | Ordinary income | | $ | 3,416,565 | | | $ | 3,991,448 | |
| | Long-term capital gain | | $ | 11,152,665 | | | $ | 18,206,801 | |
These dividends are either distributed to shareholders or reinvested in the Fund as additional shares issued to shareholders. For those shareholders reinvesting the dividends, the number of shares issued is based on the net asset value per share as of the close of business on the ex-dividend date.
The Fund designated as long-term capital gain dividend, pursuant to Internal Revenue Code Section 852(b)(3), the amount necessary to reduce the earnings and profits of the Fund related to net capital gain to zero for the tax year ended December 31, 2019.
| Note 3 – Purchases and Sales of Investments |
For the year ended December 31, 2019, purchases and sales of investments, other than short-term investments, aggregated $24,914,877 and $85,495,982, respectively. There were no purchases or sales of U.S. government securities for the Fund.
| Note 4 – Federal Income Taxes |
The Fund’s policy is to comply with the requirements of the Internal Revenue Code applicable to regulated investment companies. Accordingly, the Fund intends to distribute substantially all of its taxable income. Therefore, no federal income tax provision is required.
As of, and during, the year ended December 31, 2019, the Fund did not have any tax positions that did not meet the “more-likely-than-not” threshold of being sustained by the applicable tax authority. Tax positions not deemed to meet the “more-likely-than-not” threshold would be recorded as a tax benefit or expense in the current year. Generally, tax authorities can examine tax returns filed for all open tax years (2016-2019).
Required Fund distributions are based on income and capital gain amounts determined in accordance with federal income tax regulations, which differ from net investment income and realized gains recognized for financial reporting purposes.
NOTES TO FINANCIAL STATEMENTS December 31, 2019 (Con’t) |
Accordingly, the composition of net assets and distributions on a tax basis may differ from those reflected in the accompanying financial statements. As of December 31, 2019, the Fund’s most recently completed year end, the components of distributable earnings on a tax basis were as follows:
| | Cost of investments | | $ | 135,438,698 | |
| | Gross tax unrealized appreciation | | | 60,574,220 | |
| | Gross tax unrealized depreciation | | | (4,672,981 | ) |
| | Net tax unrealized appreciation | | | 55,901,239 | |
| | Undistributed ordinary income | | | 3,600 | |
| | Undistributed long-term capital gain | | | 1,351,022 | |
| | Total distributable earnings | | | 1,354,622 | |
| | Other accumulated gains/losses | | | — | |
| | Total accumulated earnings | | $ | 57,255,861 | |
Accounting principles generally accepted in the United States of America require that certain components of net assets relating to permanent differences be reclassified between financial and tax reporting. These reclassifications have no effect on net assets or net asset value per share. For the year ended December 31, 2019, the Fund did not have any reclassifications between paid-in capital and distributable earnings. As of December 31, 2019, the Fund did not have a post-October capital loss or a capital loss carryforward.
| Note 5 – Transactions with Affiliated Parties |
Under an advisory agreement between the Fund and Corbyn, the Fund pays Corbyn a fee of 0.75% of the first $250 million of average daily net assets, 0.70% of average daily net assets between $250 million and $500 million and 0.65% of average daily net assets in excess of $500 million, which is computed daily and paid monthly. For the year ended December 31, 2019, the Fund incurred $1,517,108 in advisory fees.
The Fund has also entered into a Services Agreement with Corbyn to provide various administrative services. As compensation, the Fund pays Corbyn a fee of $2,500 per month plus 0.01% of average daily net assets, which is computed daily and paid monthly. For the year ended December 31, 2019, the Fund incurred $50,227 in administrative fees to Corbyn.
At December 31, 2019, investors for whom Corbyn was investment adviser held 1,061,893 shares of the Fund.
| Note 6 – Accounting Pronouncements |
In March 2017, the FASB issued – ASU 2017-08, Receivables—Nonrefundable Fees and Other Costs (Subtopic 310-20): Premium Amortization on Purchased Callable Debt Securities (“ASU 2017-08”). The amendments in the ASU 2017-08 shorten the amortization period for certain callable debt securities, held at a premium, to be amortized to the earliest call date. The ASU 2017-08 does not require an accounting change for securities held at a discount; which continues to be amortized to maturity. The ASU 2017-08 is effective for fiscal years and interim periods within those fiscal years beginning after December 15, 2018. Management has adopted these amendments as currently required and these are reflected in the Fund’s financial statements and related disclosures.
The adoption of ASU 2017-08 represents a change in accounting principle for the Fund. Prior to the adoption, the Fund amortized premium on callable debt securities utilizing a yield-to-maturity methodology.
NOTES TO FINANCIAL STATEMENTS December 31, 2019 (Con’t) |
The Fund adopted ASU 2017-08 using the modified retrospective approach with an effective date of January 1, 2019. The cumulative effect of the adoption is presented as an adjustment to the opening balances of amortized cost and unrealized appreciation (depreciation).
The following table presents the impact of the adoption of ASU 2017-08 on the Fund’s Statement of Assets and Liabilities effective January 1, 2019:
Statement of Assets and Liabilities
| | | December 31, 2018 | |
| | | | | | | | | As Adjusted for | |
| | | | | | | | | Adoption of | |
| | | As Reported | | | Adjustment | | | ASU 2017-08 | |
| Cost of investments | | $ | 171,834,115 | | | $ | (254,832 | ) | | $ | 171,579,283 | |
| Net unrealized appreciation | | | | | | | | | | | | |
| (depreciation) on investments* | | | 32,497,889 | | | | 254,832 | | | | 32,752,721 | |
In accordance with the ASU 2017-08 disclosure requirements, the following tables present the adjustments to remove the effects of adopting ASU 2017-08 on the fund’s financial statements as of and for the year ended December 31, 2019:
Statement of Assets and Liabilities
| | | December 31, 2019 | |
| | | | | | | | | Without Adoption | |
| | | As Reported | | | Adjustment | | | of ASU 2017-08 | |
| Cost of investments | | $ | 135,240,123 | | | $ | 197,842 | | | $ | 135,437,965 | |
| Net unrealized appreciation | | | | | | | | | | | | |
| (depreciation) on investments* | | | 56,099,814 | | | | (197,842 | ) | | | 55,901,972 | |
| * | Net unrealized appreciation (depreciation) on investments is a component of total distributable earnings under the “Components of Net Assets” caption on the Fund’s Statement of Assets and Liabilities. |
NOTES TO FINANCIAL STATEMENTS December 31, 2019 (Con’t) |
Statement of Operations
| | | For the Year Ended December 31, 2019 | |
| | | | | | | | | Without Adoption | |
| | | As Reported | | | Adjustment | | | of ASU 2017-08 | |
| Investment Income: | | | | | | | | | |
| Interest income | | $ | 2,870,607 | | | $ | 170,089 | | | $ | 3,040,696 | |
| Total investment income | | | 4,726,415 | | | | 170,089 | | | | 4,896,504 | |
| Net investment income | | | 2,617,951 | | | | 170,089 | | | | 2,788,040 | |
| Realized and unrealized | | | | | | | | | | | | |
| gain (loss) on investments: | | | | | | | | | | | | |
| Realized gain (loss) | | | 13,031,812 | | | | 227,079 | | | | 13,258,891 | |
| Net change in unrealized appreciation | | | | | | | | | | | | |
| (depreciation) on investments | | | 23,347,093 | | | | (170,089 | ) | | | 23,177,004 | |
| Net realized and unrealized | | | | | | | | | | | | |
| gain (loss) on investments | | $ | 36,378,905 | | | $ | 56,990 | | | $ | 36,435,895 | |
The adoption of ASU 2017-08 had no impact to either the Fund’s net assets or net asset value per share.
| Note 7 – Subsequent Events |
In preparing these financial statements, the Fund has evaluated events and transactions for potential recognition or disclosure through the date the financial statements were issued.
On November 25, 2019, U.S. Bancorp, the parent company of Quasar Distributors, LLC, the Fund’s distributor, announced that it had signed a purchase agreement to sell Quasar to Foreside Financial Group, LLC such that Quasar will become a wholly-owned broker-dealer subsidiary of Foreside. The transaction is expected to close by the end of March 2020. Quasar will remain the Fund’s distributor at the close of the transaction, subject to Board approval.
REPORT OF INDEPENDENT REGISTERED PUBLIC ACCOUNTING FIRM
To the Board of Directors and
Shareholders of Greenspring Fund, Incorporated
Opinion on the Financial Statements
We have audited the accompanying statement of assets and liabilities of Greenspring Fund, Incorporated, including the schedule of investments, as of December 31, 2019, the related statement of operations for the year then ended, the statements of changes in net assets for each of the two years in the period then ended, and financial highlights for each of the five years in the period then ended, and the related notes (collectively referred to as the “financial statements”). In our opinion, the financial statements present fairly, in all material respects, the financial position of Greenspring Fund, Incorporated as of December 31, 2019, the results of its operations for the year then ended, the changes in its net assets for each of the two years in the period then ended, and the financial highlights for each of the five years in the period then ended, in conformity with accounting principles generally accepted in the United States of America.
Basis for Opinion
These financial statements are the responsibility of the Fund’s management. Our responsibility is to express an opinion on the Fund’s financial statements based on our audits. We are a public accounting firm registered with the Public Company Accounting Oversight Board (United States) (“PCAOB”) and are required to be independent with respect to the Fund in accordance with the U.S. federal securities laws and the applicable rules and regulations of the Securities and Exchange Commission and the PCAOB. We have served as the Fund’s auditor since 2004.
We conducted our audits in accordance with the standards of the PCAOB. Those standards require that we plan and perform the audit to obtain reasonable assurance about whether the financial statements are free of material misstatement, whether due to error or fraud. The Fund is not required to have, nor were we engaged to perform, an audit of its internal control over financial reporting. As part of our audits we are required to obtain an understanding of internal control over financial reporting, but not for the purpose of expressing an opinion on the effectiveness of the Fund’s internal control over financial reporting. Accordingly, we express no such opinion.
Our audits included performing procedures to assess the risks of material misstatement of the financial statements, whether due to error or fraud, and performing procedures that respond to those risks. Such procedures included examining, on a test basis, evidence regarding the amounts and disclosures in the financial statements. Our audits also included evaluating the accounting principles used and significant estimates made by management, as well as evaluating the overall presentation of the financial statements. Our procedures included confirmation of securities owned as of December 31, 2019 by correspondence with the custodian. We believe that our audits provide a reasonable basis for our opinion.
TAIT, WELLER & BAKER LLP
Philadelphia, Pennsylvania
February 26, 2020
NOTICE TO SHAREHOLDERS December 31, 2019 (Unaudited) |
Tax Information
For the year ended December 31, 2019, certain dividends paid by the Fund may be reported as qualified dividend income (QDI) and may be eligible for taxation at capital gains rates. The percentage of dividends declared from ordinary income designated as QDI was 60.93%.
For corporate shareholders in the Fund, the percentage of ordinary dividend income distributed for the year ended December 31, 2019, which is designated as qualifying for the dividends-received deduction, is 50.35%.
For foreign shareholders in the Fund, for the year ended December 31, 2019, 54.47% of the ordinary distributions paid qualify as interest-related dividends under the Internal Revenue Code Section 871(k)(1)(c), and 7.90% of the ordinary income distributions are designated as short-term capital gain distributions under Internal Revenue Code Section 871(k)(2)(c).
Proxy Voting Policies and Proxy Voting Record
The Fund’s proxy voting policies and procedures, as well as its proxy voting record for the most recent 12-month period ended June 30, are available without charge, upon request, by contacting the Fund at (800) 366-3863 or info@greenspringfund.com. The Fund will send the information within three business days of receipt of the request, by first class mail or other means designed to ensure equally prompt delivery. The Fund’s proxy voting record is also available on the U.S. Securities and Exchange Commission’s website at www.sec.gov.
Form N-Q Holdings Information
The Fund files its complete schedule of portfolio holdings with the U.S. Securities and Exchange Commission for the first and third quarters of each fiscal year on Form N-Q or Part F of Form N-PORT (beginning with filings after March 31, 2020). The Fund’s Forms N-Q or Part F of Form N-PORT (beginning with filings after March 31, 2020) are available on the Commission’s website at www.sec.gov and may be reviewed and copied at the Commission’s Public Reference Room in Washington, DC. Information on the operation of the Public Reference Room may be obtained by calling (800) SEC-0330.
Reports and Householding
In an attempt to reduce shareholder expenses, we will mail only one copy of the Fund’s Summary Prospectus and each Annual and Semi-Annual Report to those addresses shared by two or more accounts. If you wish to receive individual copies of these documents, please call us at (800) 366-3863. We will begin sending you individual copies 30 days after receiving your request.
The Fund’s Summary Prospectus, Prospectus, Statement of Additional Information, Annual Report, and Semi-Annual Report, along with its first and third quarter portfolio holdings, are available on the Fund’s website at www.greenspringfund.com.
BASIC INFORMATION ABOUT FUND DIRECTORS AND OFFICERS (Unaudited) |
The Board of Directors supervises the management of the Fund. The following list summarizes information on the directors and officers of the Fund for the past five years. The address of each is 2330 West Joppa Road, Suite 110, Lutherville, MD 21093. The Fund’s Statement of Additional Information contains additional information about Fund directors and is available, without charge, upon request, by calling the Fund at (800) 366-3863, or by emailing the Fund at greenspring@greenspringfund.com.
| | | | | Number | |
| Name and | Position(s) Held | Term of Office(1) and | Principal Occupation(s) | of Funds | Other |
Year of Birth | with the Fund | Length of Time Served | During the Past Five Years | Overseen | Directorship |
| | | Term of Director | | | |
| | | Indefinite | | | |
| | | Term of Officer | | | |
| | | One year | | | |
| Interested | | | | | |
Directors and Officers | | | | | |
Charles vK. Carlson(2) | President | From March 1993 to present. | President and Director of the | One | None |
| Year of Birth: 1959 | Chairman of the Board | From January 1994 to present. | Fund’s Adviser. | | |
| | Chief Executive Officer | From February 1994 to present. | | | |
| | Director | From March 1987 to present. | | | |
| | | | | | |
William E. Carlson(2) | Director | From February 1994 to present. | President and Chair of the | One | None |
| Year of Birth: 1957 | | | Business Department at Shapiro | | |
| | | | Sher Guinot & Sandler (a law | | |
| | | | firm) from February 1999 to | | |
| | | | present. Partner of Shapiro Sher | | |
| | | | Guinot & Sandler from February | | |
| | | | 1990 to present. | | |
| | | | | | |
| Michael J. Fusting | Sr. Vice President | From May 1998 to present. | Sr. Vice President and Director of | One | None |
| Year of Birth: 1961 | Chief Financial Officer | From February 1994 to present. | the Fund’s Adviser. | | |
| | Director | From March 1992 to present. | | | |
| | | | | | |
Independent Directors(3) | | | | |
| David T. Fu | Director | From May 1990 to present. | Retired. Managing Director | One | None |
| Year of Birth: 1956 | | | of Kanturk Partners, LLC (a | | |
| | | | merchant bank) from February | | |
| | | | 2004 to December 2014. | | |
| | | | | | |
| Sean T. Furlong | Director | From March 2003 to present. | Director of Finance and | One | None |
| Year of Birth: 1965 | | | Operations at the Gilman | | |
| | | | School from June 2003 to present. | | |
| | | | Adjunct Professor of Financial | | |
| | | | Accounting at Johns Hopkins | | |
| | | | University from February 2013 to | | |
| | | | present. | | |
BASIC INFORMATION ABOUT FUND DIRECTORS AND OFFICERS (Unaudited) (Con’t) |
| | | | | Number | |
| Name and | Position(s) Held | Term of Office(1) and | Principal Occupation(s) | of Funds | Other |
Year of Birth | with the Fund | Length of Time Served | During the Past Five Years | Overseen | Directorship |
| | | Term of Director | | | |
| | | Indefinite | | | |
| | | Term of Officer | | | |
| | | One year | | | |
Officers | | | | | |
| Elizabeth Agresta Swam | Secretary and Treasurer | From May 1998 to present. | Employee of the Fund’s Adviser | N/A | None |
| Year of Birth: 1967 | AML Officer | From July 2002 to present. | from May 1998 to present. | | |
| | Chief Compliance Officer | From July 2004 to present. | Chief Compliance Officer | | |
| | | | of the Fund’s Adviser from | | |
| | | | December 31, 2016 to present. | | |
| | | | Secretary of the Fund’s Adviser | | |
| | | | from June 14, 2017 to present. | | |
(1) | Directors serve an indefinite term; officers serve a term of one year. |
(2) | Mr. Charles vK. Carlson and Mr. William E. Carlson are brothers. |
(3) | Directors who are not “interested persons” (as defined in the 1940 Act) of the Fund. |
PRIVACY POLICY December 31, 2019 (Unaudited) |
The Greenspring Fund recognizes that individuals expect an exceptional level of privacy in their financial affairs. The Fund assures the confidentiality of personal information provided to it.
The information we collect is limited to what the Fund believes is necessary or useful to conduct our business; administer your records, accounts and funds; to comply with laws and regulations; and to help us design or improve products and services. The Fund collects non-public personal information about you from information it receives from you on applications or other forms or through its website, as well as from information about your transactions with the Fund.
Some of this information may be disclosed to the Fund’s investment adviser, but not for marketing solicitation, as well as non-affiliated third parties who provide non-financial services to the Fund such as our Transfer Agent, in order to administer customer accounts and mail transaction confirmations and tax forms, and the mailing house the Fund utilizes for mailing shareholder reports. Such information may also be disclosed to a non-affiliated third party engaged to provide fund accounting and administrative services to us. Disclosing this information enables us to meet customers’ financial needs and regulatory requirements. These third parties act on its behalf and are obligated to keep the information we provide to them confidential and to use the information only for the purposes authorized. The Fund does not disclose any non-public personal information about you or former customers to anyone, except as permitted by law.
To protect your non-public personal information, the Fund permits access to it only by authorized employees and maintains security practices to safeguard your information.
If you have any questions regarding our Privacy Policy, please contact us at 1-800-366-3863 or greenspring@greenspringfund.com. Thank you.
This Privacy Policy is not part of the Annual Report.
Performance Since Inception on
July 1, 1983 through December 31, 2019
(Unaudited)
HOW $10,000 INVESTED ON 7/1/83 WOULD HAVE GROWN*
| * | Figures include changes in principal value, reinvested dividends and capital gains distributions. Past expense limitations increased the Fund’s return. This chart illustrates the performance of a hypothetical $10,000 investment made in the Fund since inception through December 31, 2019. The total value of $238,460 assumes the reinvestment of dividends and capital gains, but does not reflect the effect of any redemption fees (the Fund no longer imposes a redemption fee effective May 1, 2018). This chart does not imply any future performance. |
Average annual total returns for the one, three, five, ten year and since inception periods ended December 31, 2019 were 20.86%, 5.40%, 5.71%, 6.23% and 9.08%, respectively. Average annual returns for more than one year assume a compounded rate of return and are not the Fund’s year-by-year results, which fluctuated over the periods shown. Returns do not reflect taxes that shareholders may pay on Fund distributions or redemption of Fund shares.
(This Page Intentionally Left Blank.)
Greenspring Fund, Incorporated
2330 West Joppa Road, Suite 110
Lutherville, MD 21093
(410) 823-5353
(800) 366-3863
www.greenspringfund.com
DIRECTORS
Charles vK. Carlson, Chairman
William E. Carlson
David T. Fu
Sean T. Furlong
Michael J. Fusting
OFFICERS
Charles vK. Carlson
President and Chief Executive Officer
Michael J. Fusting
Sr. Vice President and
Chief Financial Officer
Elizabeth Agresta Swam
Chief Compliance Officer,
Secretary, Treasurer
and AML Officer
INVESTMENT ADVISER
Corbyn Investment Management, Inc.
2330 West Joppa Road, Suite 108
Lutherville, MD 21093-7207
ADMINISTRATOR, FUND ACCOUNTANT
AND TRANSFER AGENT
U.S. Bancorp Fund Services, LLC
615 East Michigan Street
Milwaukee, WI 53202
DISTRIBUTOR
Quasar Distributors, LLC
777 East Wisconsin Avenue
Milwaukee, WI 53202
CUSTODIAN
U.S. Bank, N.A.
1555 N. Rivercenter Dr., Suite 302
Milwaukee, WI 53212
INDEPENDENT REGISTERED
PUBLIC ACCOUNTING FIRM
Tait, Weller & Baker LLP
Two Liberty Place
50 South 16th Street, Suite 2900
Philadelphia, PA 19102-2529
LEGAL COUNSEL
K&L Gates LLP
State Street Financial Center
One Lincoln Street
Boston, MA 02111
Symbol – GRSPX
CUSIP – 395724107
Item 2. Code of Ethics.
The registrant has adopted a code of ethics that applies to the registrant’s principal executive officer and principal financial officer. The registrant has not made any amendments to its code of ethics during the period covered by this report. The registrant has not granted any waivers from any provisions of the code of ethics during the period covered by this report.
A copy of the registrant’s Code of Ethics is filed herewith.
Item 3. Audit Committee Financial Expert.
The registrant’s board of directors has determined that there is at least one audit committee financial expert serving on its audit committee. Mr. Sean T. Furlong is the “audit committee financial expert” and is considered to be “independent” as each term is defined in Item 3 of Form N CSR.
Item 4. Principal Accountant Fees and Services.
The registrant has engaged its principal accountant to perform audit services, audit-related services, tax services or other services during the past two fiscal years. “Audit services” refer to performing an audit of the registrant's annual financial statements or services that are normally provided by the accountant in connection with statutory and regulatory filings or engagements for those fiscal years. “Audit-related services” refer to the assurance and related services by the principal accountant that are reasonably related to the performance of the audit. “Tax services” refer to professional services rendered by the principal accountant for tax compliance, tax advice, and tax planning. There were no “other services” provided by the principal accountant. The following table details the aggregate fees billed, or expected to be billed, for each of the last two fiscal years for audit fees, audit-related fees, tax fees or other fees by the principal accountant:
| | FYE 12/31/2019 | FYE 12/31/2018 |
Audit Fees | $26,000 | $26,000 |
Audit-Related Fees | N/A | N/A |
Tax Fees | $3,500 | $3,500 |
All Other Fees | N/A | N/A |
The audit committee has adopted pre-approval policies and procedures that require the audit committee to pre approve all audit and non-audit services of the registrant, including services provided to any entity affiliated with the registrant. All of the principal accountant’s hours spent on auditing the registrant’s financial statements were attributed to work performed by full time permanent employees of the principal accountant.
The percentage of fees billed by Tait, Weller & Baker LLP applicable to non-audit services pursuant to waiver of pre-approval requirement were as follows:
| | FYE 12/31/2019 | FYE 12/31/2018 |
Audit-Related Fees | 0% | 0% |
Tax Fees | 0% | 0% |
All Other Fees | 0% | 0% |
The following table indicates the non-audit fees billed, or expected to be billed, by the registrant’s accountant for services to the registrant and to the registrant’s investment adviser for the last two years. The audit committee of the board of directors has considered whether the provision of non-audit services that were rendered to the registrant's investment adviser is compatible with maintaining the principal accountant's independence and has concluded that the provision of such non-audit services by the accountant has not compromised the accountant’s independence.
Non-Audit Related Fees | FYE 12/31/2019 | FYE 12/31/2018 |
Registrant | N/A | N/A |
Registrant’s Investment Adviser | N/A | N/A |
Item 5. Audit Committee of Listed Registrants.
Not applicable to registrants who are not listed issuers (as defined in Rule 10A-3 under the Securities Exchange Act of 1934).
Item 6. Investments.
Schedule of Investments is included as part of the report to shareholders filed under Item 1 of this Form.
Item 7. Disclosure of Proxy Voting Policies and Procedures for Closed-End Management Investment Companies.
Not applicable to open-end investment companies.
Item 8. Portfolio Managers of Closed-End Management Investment Companies.
Not applicable to open-end investment companies.
Item 9. Purchases of Equity Securities by Closed‑End Management Investment Company and Affiliated Purchasers.
Not applicable to open-end investment companies.
Item 10. Submission of Matters to a Vote of Security Holders.
Not Applicable.
Item 11. Controls and Procedures.
(a) | The Registrant’s Chief Executive Officer and Chief Financial Officer have reviewed the Registrant's disclosure controls and procedures (as defined in Rule 30a-3(c) under the Investment Company Act of 1940 (the “Act”) (17 CFR 270.30a-3(c))) as of a date within 90 days of the filing date of the report that includes the disclosure required by this paragraph, based on the evaluation of these controls and procedures required by Rule 30a-3(b) under the Act (17 CFR 270.30a-3(b)) and Rules 13a-15(b) or 15d‑15(b) under the Securities Exchange Act of 1934 (17 CFR 240.13a-(15(b) or 240.15d-15(b)). Based on their review, such officers have concluded that the disclosure controls and procedures are effective in ensuring that information required to be disclosed in this report is appropriately recorded, processed, summarized and reported and made known to them by others within the Registrant and by the Registrant’s service provider. |
(b) | There were no changes in the Registrant's internal control over financial reporting (as defined in Rule 30a-3(d) under the Act (17 CFR 270.30a-3(d)) that occurred during the second fiscal quarter of the period covered by this report that has materially affected, or is reasonably likely to materially affect, the Registrant's internal control over financial reporting. |
Item 12. Disclosure of Securities Lending Activities for Closed-End Management Investment Companies.
Not applicable to open-end investment companies.
Item 13. Exhibits.
(a) | (1) Any code of ethics, or amendment thereto, that is the subject of the disclosure required by Item 2, to the extent that the registrant intends to satisfy Item 2 requirements through filing an exhibit. Filed herewith. |
(2) A separate certification for each principal executive and principal financial officer of the registrant as required by Rule 30a-2(a) under the Act (17 CFR 270.30a-2(a)), exactly as set forth below: Filed herewith.
(3) Any written solicitation to purchase securities under Rule 23c‑1 under the Act (17 CFR 270.23 C-1) sent or given during the period covered by the report by or on behalf of the registrant to 10 or more persons. Not applicable to open-end investment companies.
(4) Change in the registrant’s independent public accountant. Provide the information called for by Item 4 of Form 8-K under the Exchange Act (17 CFR 249.308). Unless otherwise specified by Item 4, or related to and necessary for a complete understanding of information not previously disclosed, the information should relate to events occurring during the reporting period. Not Applicable.
| (b) | Certifications pursuant to Section 906 of the Sarbanes‑Oxley Act of 2002. Furnished herewith. |
SIGNATURES
Pursuant to the requirements of the Securities Exchange Act of 1934 and the Investment Company Act of 1940, the registrant has duly caused this report to be signed on its behalf by the undersigned, thereunto duly authorized.
(Registrant) Greenspring Fund, Incorporated
By (Signature and Title)* /s/ Charles vK. Carlson
Charles vK. Carlson, Chief Executive Officer
Date 3/2/2020
Pursuant to the requirements of the Securities Exchange Act of 1934 and the Investment Company Act of 1940, this report has been signed below by the following persons on behalf of the registrant and in the capacities and on the dates indicated.
By (Signature and Title)* /s/ Charles vK. Carlson
Charles vK. Carlson, Chief Executive Officer
Date 3/2/2020
By (Signature and Title)* /s/ Michael J. Fusting
Michael J. Fusting, Chief Financial Officer
Date 3/2/2020
* Print the name and title of each signing officer under his or her signature.