ANNUAL REPORT
DECEMBER 31, 2016
This report is intended for shareholders of the
Greenspring Fund, Incorporated and may not be
used as sales literature unless preceded or
accompanied by a current prospectus.
Greenspring Fund, Incorporated
February 2017
Dear Fellow Shareholders:
We are pleased to report that Greenspring Fund generated strong positive performance during the fourth quarter of 2016, and for the full year. For 2016, Greenspring Fund achieved a total return of 19.78%, after taking into consideration the reinvestment of all dividend and capital gain distributions. The Fund’s annual performance compared favorably to the major equity market indices that also posted meaningful gains for the year. The Dow Jones Industrial Average and the S&P 500 Index produced total returns of 16.50% and 11.96%, respectively, while the NASDAQ Composite Index gained 7.50%.
The year began with a sharp sell-off in equity prices as investors feared that the global economy was slowing, evidenced by a languishing Chinese economy and a near free fall in the price of crude oil. As the year progressed, equity prices began to rebound, following economic data that indicated the economy was still on track to produce relatively modest growth and accommodative monetary policies that continued to provide significant liquidity to the financial markets. After a temporary setback in late June due to Britain’s vote to leave the European Union (Brexit), equity prices continued to advance for the balance of the year, reflecting evidence of accelerating U.S. economic growth, higher crude oil prices and stabilizing corporate profits. The enthusiasm in the stock market increased significantly following the Presidential election as investors seemed to anticipate that a business-friendly Trump administration focused on less regulation, lower taxes and fiscal stimulus would result in stronger economic growth and higher corporate earnings.
The fixed income markets were mixed during 2016. Many U.S. Treasury securities declined in price as interest rates on 1-year and 10-year Treasury securities increased from 0.65% and 2.27% at the beginning of the year to 0.85% and 2.45%, respectively, at the end of the year. Prices of fixed income securities were volatile throughout the year as investors continued to debate when the Federal Reserve might raise interest rates and how frequent the hikes would be. The rate on the 10-year U.S. Treasury hit a record low in July, reflecting a flight to safety following the Brexit vote, but climbed significantly after the Presidential election as investor expectations shifted, incorporating faster economic growth and the prospect for higher inflation. Unlike U.S. Treasury securities, many investment grade and high-yield corporate bonds generated positive returns for the year, as credit spreads relative to Treasury securities tightened, reflecting the belief that stronger economic growth would improve the credit profile of corporate bond issuers.
| Greenspring Fund |
| Performance for the |
| Periods Ended December 31, 2016 |
| Quarter | | | 6.92 | % | |
| Year to Date | | | 19.78 | % | |
| 1 Year | | | 19.78 | % | |
| 3 Years* | | | 3.21 | % | |
| 5 Years* | | | 7.21 | % | |
| 10 Years* | | | 5.34 | % | |
| 15 Years* | | | 6.85 | % | |
| 20 Years* | | | 6.74 | % | |
| Since inception on 7/1/83* | | | 9.41 | % | |
| Expense Ratio** | | | 0.96 | % | |
| | | |
| * | | Annualized. |
| ** | | As stated in Prospectus dated 5-1-16. See note on last page of letter. |
| | | |
Performance data quoted represents past performance; past performance does not guarantee future results. The investment return and principal value of an investment will fluctuate so that an investor’s shares, when redeemed, may be worth more or less than their original cost. Current performance of the Fund may be lower or higher than the performance quoted. Performance data current to the most recent month end may be obtained by calling 1-800-366-3863 or by visiting www.greenspringfund.com. The Fund imposes a 2.00% redemption fee for shares held 60 days or less. Performance data does not reflect the redemption fee. If reflected, total returns would be reduced. |
Greenspring Fund, Incorporated
INFLUENCES on FUND PERFORMANCE
The vast majority of the securities held in the portfolio contributed to the Fund’s positive performance, with the equity holdings providing most of the gain for the year. Several of the equity holdings had very strong returns, bouncing back from depressed valuations at the beginning of the year, combined with improving business fundamentals. Other companies in which the Fund was invested continued to generate steadily increasing profits, dividends and cash flows with management teams intently focused on strategies designed to further increase shareholder value. The equity holdings within the Engineering and Construction and the Commercial Banks and Thrifts industry sectors contributed significantly to the Fund’s gain. Holdings within the Engineering and Construction sector benefitted from steady to improving business fundamentals, combined with increasing investor confidence related to future earnings growth that accelerated after the election. The equity holdings in the Commercial Banks and Thrifts sector appreciated in price significantly following the Presidential election as the prospects for reduced regulation and higher interest rates improved the earnings outlook for firms in the financial industry. The individual securities that had the most significant influence on the Fund’s performance during the year in order of magnitude were the common stock holdings in MasTec, Inc., EMCOR Group, Inc., Novanta, Inc. (formerly GSI Group), Republic Services, Inc. and MYR Group, Inc. All of these holdings produced positive returns.
MasTec, EMCOR Group and MYR Group are all holdings included in the Engineering & Construction industry sector, although each company’s primary lines of business are quite different. MasTec, the Fund’s best performing holding for the year, saw its share price increase steadily throughout the year. MasTec builds, installs and maintains infrastructure projects for the energy, communication and utility industries. The Company entered 2016 with a record backlog of pending work, reflecting a robust outlook in both the oil and gas pipeline and communication business segments. As the year progressed, MasTec reported strong quarterly earnings as the Company performed a significant amount of work on several large oil and gas pipeline projects and the communications segment performed better than expected. It became clear that MasTec had put the weak 2015 performance behind it, as strong operating conditions in 2016 led to increased profit margins and pushed earnings expectations higher. Furthermore, Company management indicated that MasTec is well-positioned to enter 2017 with another record backlog of projects and that the renewed focus on infrastructure development/spending may provide additional opportunities for the Company in the near future.
EMCOR Group is a leader in mechanical and electrical construction with a particular emphasis on building services as well as highly specialized services for the refinery and petrochemical industries. EMCOR had a slow start to the year, but revenue growth and increasing profit margins drove higher earnings results as the year progressed, and the stock price followed accordingly. The non-residential construction market remains quite healthy and supports a positive outlook profit margins drove higher earnings results as the year progressed, and the stock price followed accordingly. The non-residential construction market remains quite healthy and supports a positive outlook for EMCOR’s revenue and earnings. EMCOR’s strong and experienced management team is focused on improving shareholder value by using its healthy balance sheet to pursue a strategic capital allocation program that includes dividends, share repurchases and opportunistic acquisitions.
| | % of Net |
| Greenspring Fund | Assets |
| Top 10 Holdings | as of |
| | 12/31/16 |
| Republic Services, Inc. | 4.3% |
| MasTec, Inc. | 3.9% |
| Gramercy Property Trust, Inc. | 3.7% |
| Discover Financial Services | 3.4% |
| EMCOR Group, Inc. | 3.0% |
| Southern National Bancorp of Virginia | 2.8% |
| Novanta, Inc. | 2.7% |
| FTI Consulting, Inc. | 2.3% |
| Lumos Networks Corp. | 2.1% |
| CVS Health Corporation | 2.1% |
Greenspring Fund, Incorporated
Novanta, formerly known as GSI Group, is a manufacturer of laser, vision and precision motion components and subsystems used by industrial and healthcare equipment manufacturers. The Company performed well during the year, achieving its earnings guidance despite an uncertain industrial backdrop and headwinds from a strong U.S. dollar. Organic growth, strong new orders and the positive contribution from recent acquisitions all combined to deliver the positive results, including several new orders on products that are expected to have long product life cycles, helping to complement growth over the next several years. Novanta’s stock price made steady progress through most of the year but rose strongly following the election, benefitting from the rally in small-capitalization companies.
Republic Services is the second largest provider of non-hazardous solid waste collection, transfer and disposal services in North America. The slow but steady growth of the domestic economy provided an attractive environment for Republic Services to benefit from both price and volume growth in its business, resulting in higher earnings and cash flow. In addition, the Company maintained its relentless focus on increasing profit margins by improving operational efficiency and controlling costs. Using its strong cash flow, Republic continues to reinvest in its business, provide a growing dividend to shareholders and bolster earnings per share through opportunistic share repurchases.
| Greenspring Fund |
| Largest 2016 Purchases |
| Common Stocks: |
| The Kroger Co. |
| Johnson Controls International plc |
| Hanesbrands, Inc. |
| Discover Financial Services |
| CVS Health Corporation |
| Corporate Bonds: |
| Smithfield Foods, Inc., 6.625%, 8/15/22 |
| Aramark Services, Inc., 5.750%, 3/15/20 |
| HD Supply Holdings, Inc., 7.500%, 7/15/20 |
| Spectrum Brands, Inc., 6.625%, 11/15/22 |
| Hilton Worldwide Finance LLC/Hilton |
| Worldwide Finance Corp., 5.625%, 10/15/21 |
MYR Group is a leading specialty contractor focused on constructing and servicing electric transmission, distribution and substation facilities. Relatively stable operations and a positive longer-term outlook combined with aggressive share repurchases helped to move the stock price higher early in the year despite earnings being pressured from increased costs associated with recent geographic expansion efforts. As the year progressed, MYR announced that it had been awarded a contract to construct a large electrical transmission line in Texas, its first such award in several years. This helped to provide investors with further confidence that the Company was well-positioned for additional potential contract wins, and the Trump election victory further improved the outlook for possible increased spending on electrical infrastructure projects.
The fixed income securities held in the Fund’s portfolio generated steady positive performance throughout the year, consistent with our expectations for these holdings. The short duration of the securities held in the portfolio helped to reduce price volatility and contributed significantly to the consistency of the returns during the course of the year.
| Greenspring Fund |
| Largest 2016 Sales |
| Common Stocks: |
| CA, Inc. |
| PPL Corporation |
| Lumos Networks Corp. |
| Novanta, Inc. |
| MYR Group, Inc. |
| Corporate Bonds: |
| US Foods, Inc., 8.500%, 6/30/19 |
| Hanger, Inc., 10.625%, 11/15/18 |
| Cinemark USA, Inc., 7.375%,, 6/15/21 |
| Bankrate, Inc., 6.125%, 8/15/18 |
| MedAssets, Inc., 8.000%, 11/15/18 |
Greenspring Fund, Incorporated
PORTFOLIO ACTIVITY
Allocation among the three main asset classes in the portfolio (common stocks, fixed income securities and cash equivalents) did not change substantially from the end of 2015. The percentage of the portfolio invested in common stocks and fixed income securities declined somewhat during the year with a corresponding increase in cash equivalents. This small shift does not reflect a strategic change in the portfolio allocation, but is more reflective of normal portfolio activity discussed below. During the year, we established a number of new common stock positions, the most significant of which include shares in The Kroger Co., Johnson Controls International plc, CSRA, Inc., Medtronic plc and LKQ Corporation. We also made sizeable additions to the Fund’s holdings in Discover Financial Services and CVS Health Corporation. Throughout the year, we also reduced the position size of a number of the equity holdings as prices approached our fair valuation range or to adjust the overall weighting within the portfolio. Those sales that resulted in meaningful reductions included shares in CA, Inc., PPL Corporation, Lumos Networks Corp., Novanta, Inc. and MYR Group, Inc. We also sold the Fund’s entire position in the common stock of several holdings including Harmonic, Inc., Silicon Graphics International Corp., Essa Bancorp, Inc. and Datalink Corporation.
| Greenspring Fund |
| Portfolio Allocation |
| as of December 31, 2016 |
| |
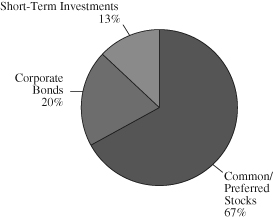 |
| |
The majority of the activity within the Fund’s fixed income holdings was related to the short duration nature of the securities, as we continuously worked to opportunistically reinvest the proceeds from holdings that were called or redeemed during the year. Early in the year, we did sell the Fund’s holdings in the debt of Hanger, Inc. based on certain developments within the Company’s operations and credit profile that changed our fundamental outlook for the Company. Please refer to the Schedule of Investments for a complete list of the Fund’s current holdings.
OUTLOOK
In last year’s Annual Letter to shareholders, we discussed how the outperformance of growth stocks over value stocks during 2015 left many of the Fund’s holdings priced at what we considered to be meaningful discounts to our appraisal of fair values. These trends tend to reverse over time, and as 2016 progressed, we witnessed a shift back to value stocks as investors gained confidence that corporate earnings and revenues would begin to improve amidst signs of strengthening economic growth. Following the election, investor optimism increased further with a focus on the improving outlook for the future earnings of many domestically oriented small, mid and large sized companies. Changes in Washington usually result in a period of economic and political
| Greenspring Fund |
| Portfolio Allocation |
| as of December 31, 2015 |
| |
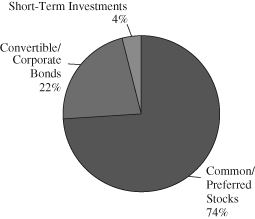 |
| |
Greenspring Fund, Incorporated
uncertainty and the transition to the Trump administration may bring with it an elevated level of uncertainty. This could lead to periods of volatility within the financial markets, but the Trump administration’s message of lower taxes, less regulation and increased spending on infrastructure should continue to support a positive outlook for the economy and future corporate earnings growth. If the financial markets do experience volatility, we are positioned to use cash reserves to take advantage of price dislocations and purchase securities if they reach prices that we believe are not reflective of underlying business fundamentals, with the overriding goal to improve the overall prospects of the Fund’s portfolio. We have seen interest rates move higher since the election and if the economic growth rate accelerates, we could see a more sustained move higher in rates. The short duration of the Fund’s fixed income securities should help the Fund benefit from an increase in interest rates as the proceeds from maturities and other redemptions can be reinvested at the higher prevailing interest rate.
We thank you for your investment in Greenspring Fund and look forward to reporting on our progress following the end of the first quarter.
Respectfully,
 |  |
| | |
| Charles vK. Carlson | Michael J. Fusting |
| Portfolio Manager and Co-Chief Investment Officer | Co-Chief Investment Officer |
**Total Annual Fund Operating Expenses for the Fund will not correlate to the Ratio of Expenses to Average Net Assets shown in the Fund’s most recent Annual Report and in the Financial Highlights section of the Prospectus, which reflects the operating expenses of the Fund and does not include acquired fund fees and expenses.
Mutual fund investing involves risk. Principal loss is possible. Small and mid-capitalization companies tend to have limited liquidity and greater price volatility than large-capitalization companies. Investments by the Fund in lower-rated and non-rated securities present a greater risk of loss to principal and interest than higher-rated securities. Investments in debt securities typically decrease in value when interest rates rise. This risk is usually greater for longer-term debt securities.
Opinions expressed are subject to change, are not guaranteed and should not be considered recommendations to buy or sell any security. Fund holdings and/or sector allocations are subject to change at any time and are not recommendations to buy or sell any security. Current and future portfolio holdings are subject to risk.
The Dow Jones Industrial Average is a broad based unmanaged index comprised of 30 actively traded large-capitalization stocks. The S&P 500 Index is a broad based unmanaged index of 500 stocks, which is widely recognized as representative of the equity market in general. The Nasdaq stock market comprises two separate markets, namely the Nasdaq National Market, which trades large, active securities and the Nasdaq Smallcap market that trades emerging growth companies. It is not possible to invest directly in an index.
Cash flow measures the cash generating capability of a company by adding non-cash charges (e.g. depreciation) and interest expense to pre-tax income. Duration is a commonly used measure of the potential volatility of the price of a debt security, or the aggregate market value of a portfolio of debt securities, prior to maturity. Securities with a longer duration generally have more volatile prices than securities of comparable quality with a shorter duration. Earnings per share is the portion of a company’s profit allocated to each outstanding share of common stock.
Earnings growth is not a measure of a Fund’s future performance.
Distributed by Quasar Distributors, LLC.
Greenspring Fund, Incorporated
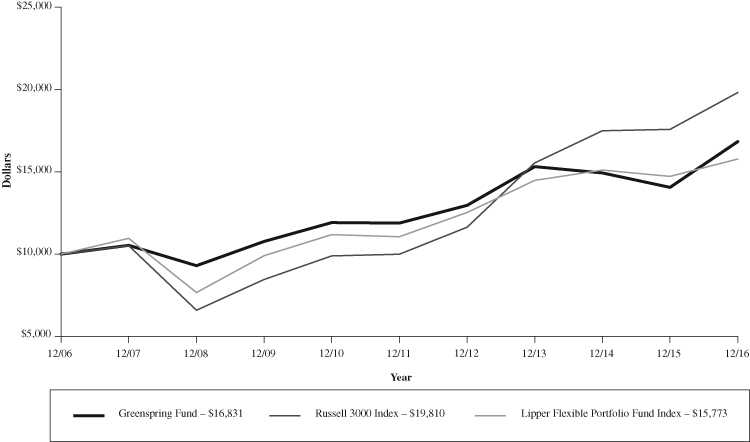
Growth of a $10,000 Investment in the Greenspring Fund
Over the Last Ten Years
Average Annual Total Returns
| | For Years Ended December 31, 2016 |
| | 1 Year | 3 Years | 5 Years | 10 Years |
| Greenspring Fund | 19.78% | 3.21% | 7.21% | 5.34% |
| Russell 3000 Index | 12.74% | 8.43% | 14.67% | 7.07% |
| Lipper Flexible Portfolio Fund Index | 7.16% | 2.90% | 7.37% | 4.66% |
The graph and table do not reflect the deduction of taxes that a shareholder would pay on Greenspring Fund (the “Fund”) distributions or the redemption of Fund shares.
Performance data quoted represents past performance; past performance does not guarantee future results. The investment return and principal value of an investment will fluctuate so that an investor’s shares, when redeemed, may be worth more or less than their original cost. Current performance of the Fund may be lower or higher than the performance quoted. Performance data current to the most recent month end is available at www.greenspringfund.com or by calling 1-800-366-3863 toll free. The Fund imposes a 2.00% redemption fee for shares held 60 days or less. Performance data does not reflect the redemption fee. If reflected, total returns would be reduced.
The Russell 3000 Index measures the performance of the 3,000 largest U.S. companies based on total market capitalization. The Lipper Flexible Portfolio Index is an unmanaged index of the 30 largest funds in the Lipper Flexible Portfolio Fund category, which includes funds that allocate investments across various asset classes, including domestic common stocks, bonds and money market instruments, with a focus on total return. Investors cannot invest directly in an index, although they may invest in the underlying securities included in the index. An index return does not reflect a deduction for fees, expenses, or taxes.
Greenspring Fund, Incorporated
EXPENSE EXAMPLE For the Six Months Ended December 31, 2016 (Unaudited) |
As a shareholder of the Fund, you incur two types of costs: (1) redemption fees if you redeem within 60 days of purchase; and (2) ongoing costs, including management fees and other Fund expenses. This example is intended to help you understand your ongoing costs (in dollars) of investing in the Fund and to compare these costs with the ongoing costs of investing in other mutual funds. The example is based on an investment of $1,000 invested at the beginning of the period and held for the entire period (7/1/2016 – 12/31/2016).
Actual Expenses
The first line of the table below provides information about actual account values based on actual returns and actual expenses. You may use the information in this line, together with the amount you invested, to estimate the expenses that you paid over the period. Simply divide your account value by $1,000 (for example, an $8,600 account value divided by $1,000 = 8.6), then multiply the result by the number in the first line under the heading entitled “Expenses Paid During the Period” to estimate the expenses you paid on your account during this period.
Hypothetical Example for Comparison Purposes
The second line of the table below provides information about hypothetical account values and hypothetical expenses based on the Fund’s actual expense ratio and an assumed rate of return of 5% per year before expenses, which is not the Fund’s actual return. The hypothetical account values and expenses may not be used to estimate the actual ending account balance or expenses you paid for the period. You may use this information to compare the ongoing costs of investing in the Fund and other funds. To do so, compare this 5% hypothetical example with the 5% hypothetical examples that appear in the shareholder reports of the other funds. Please note that the expenses shown in the table are meant to highlight your ongoing costs only and do not reflect any transactional costs, such as redemption fees. Therefore, the second line of the table is useful in comparing ongoing costs only, and will not help you determine the relative total costs of owning different funds. In addition, if these transactional costs were included, your costs would have been higher.
| | | | | Expenses Paid |
| | | Beginning | Ending | During the Period |
| | | Account Value | Account Value | 7/1/2016 – |
| | | 7/1/2016 | 12/31/2016 | 12/31/2016* |
| Actual | | $1,000.00 | $1,129.60 | $5.30 |
| Hypothetical | | | | |
| (5% annual return before expenses) | | $1,000.00 | $1,020.16 | $5.03 |
| * | Expenses are equal to the Fund’s annualized expense ratio of 0.99%, multiplied by the average account value over the period multiplied by 184/366 (to reflect the one-half year period). |
Greenspring Fund, Incorporated
SCHEDULE OF INVESTMENTS at December 31, 2016 |
| Shares | | | | Value | |
| | |
| COMMON STOCKS: 66.7% | |
| | |
| Apparel & Textiles: 0.6% | |
| | 95,105 | | Hanesbrands, Inc. | | $ | 2,051,415 | |
| | |
| Building Products: 4.2% | |
| | 147,055 | | Johnson Controls International plc# | | | 6,057,195 | |
| | 29,670 | | Mohawk Industries, Inc.* | | | 5,924,506 | |
| | 150,699 | | PGT, Inc.* | | | 1,725,504 | |
| | | | | | | 13,707,205 | |
| Business Software & Services: 1.9% | |
| | 88,061 | | Amdocs Limited# | | | 5,129,553 | |
| | 33,065 | | CA, Inc. | | | 1,050,475 | |
| | | | | | | 6,180,028 | |
| Commercial Banks & Thrifts: 7.5% | |
| | 35,987 | | American National Bankshares, Inc. | | | 1,252,348 | |
| | 184,985 | | Beneficial Bancorp, Inc. | | | 3,403,724 | |
| | 148,688 | | Clifton Bancorp, Inc. | | | 2,515,801 | |
| | 37,301 | | First Connecticut Bancorp, Inc. | | | 844,868 | |
| | 52,900 | | OceanFirst Financial Corp. | | | 1,588,587 | |
| | 48,885 | | Polonia Bancorp, Inc.* | | | 542,624 | |
| | 194,329 | | Shore Bancshares, Inc. | | | 2,963,517 | |
| | 561,583 | | Southern National Bancorp of Virginia | | | 9,176,266 | |
| | 26,352 | | Westbury Bancorp, Inc.* | | | 545,486 | |
| | 156,380 | | Western New England Bancorp, Inc. | | | 1,462,153 | |
| | | | | | | 24,295,374 | |
| Consulting Services: 2.3% | |
| | 164,974 | | FTI Consulting, Inc.* | | | 7,437,028 | |
| | |
| Distributors: 0.8% | |
| | 81,831 | | LKQ Corporation* | | | 2,508,120 | |
| | |
| Diversified Financial Services: 3.4% | |
| | 152,457 | | Discover Financial Services | | | 10,990,625 | |
| | |
| Electrical Equipment & Instruments: 3.0% | |
| | 17,400 | | Emerson Electric Co. | | | 970,050 | |
| | 417,152 | | Novanta, Inc.*# | | | 8,760,192 | |
| | | | | | | 9,730,242 | |
| Engineering & Construction: 9.1% | |
| | 135,600 | | EMCOR Group, Inc. | | | 9,595,056 | |
| | 219,426 | | KBR, Inc. | | | 3,662,220 | |
| | 332,788 | | MasTec, Inc.* | | | 12,729,141 | |
| | 92,921 | | MYR Group, Inc.* | | | 3,501,263 | |
| | | | | | | 29,487,680 | |
| Entertainment: 2.7% | |
| | 102,607 | | AMC Entertainment | | | | |
| | | | Holdings, Inc. - Class A | | | 3,452,726 | |
| | 88,121 | | Six Flags Entertainment Corp. | | | 5,283,735 | |
| | | | | | | 8,736,461 | |
| Food & Staples Retailing: 4.0% | |
| | 85,768 | | CVS Health Corporation | | | 6,767,953 | |
| | 174,745 | | The Kroger Co. | | | 6,030,450 | |
| | | | | | | 12,798,403 | |
| Healthcare-Products: 1.1% | |
| | 11,000 | | Abbott Laboratories | | | 422,510 | |
| | 42,870 | | Medtronic PLC# | | | 3,053,630 | |
| | | | | | | 3,476,140 | |
| Hotels, Restaurants & Leisure: 0.5% | |
| | 20,000 | | Marriott International, Inc. – Class A | | | 1,653,600 | |
| | |
| Household & Personal Products: 0.3% | |
| | 2,000 | | The Clorox Company | | | 240,040 | |
| | 18,038 | | Energizer Holdings, Inc. | | | 804,675 | |
| | | | | | | 1,044,715 | |
| Industrial Equipment: 0.4% | |
| | 20,000 | | Pentair PLC# | | | 1,121,400 | |
| | |
| Information Technology Services: 1.2% | |
| | 124,317 | | CSRA, Inc. | | | 3,958,253 | |
| | |
| Internet Software & Services: 0.8% | |
| | 32,850 | | j2 Global, Inc. | | | 2,687,130 | |
| | |
| Machinery: 1.0% | |
| | 20,102 | | Blue Bird Corp. | | | 310,576 | |
| | 16,378 | | Snap-on Incorporated | | | 2,805,060 | |
| | | | | | | 3,115,636 | |
| Oil & Gas Exploration & Production: 3.7% | |
| | 4,403 | | Energen Corporation* | | | 253,921 | |
| | 57,254 | | EOG Resources, Inc. | | | 5,788,380 | |
| | 176,735 | | Suncor Energy, Inc.# | | | 5,777,467 | |
| | | | | | | 11,819,768 | |
| Oil Refining & Marketing: 0.1% | |
| | 2,813 | | Phillips 66 | | | 243,071 | |
| | |
| Real Estate Investment Trusts: 3.7% | |
| | 1,309,810 | | Gramercy Property Trust, Inc. | | | 12,024,056 | |
The accompanying notes are an integral part of these financial statements.
Greenspring Fund, Incorporated
SCHEDULE OF INVESTMENTS at December 31, 2016 (Con’t) |
| Shares/Principal | | Value | |
| | |
| COMMON STOCKS: 66.7% (Con’t) | |
| | |
| Retail: 1.6% | |
| | 354,640 | | Party City Holdco Inc.* | | $ | 5,035,888 | |
| | |
| Telecommunications Services: 2.1% | |
| | 438,750 | | Lumos Networks Corp.* | | | 6,853,275 | |
| | |
| Trading Companies & Distributors: 0.4% | |
| | 5,000 | | HD Supply Holdings, Inc.* | | | 212,550 | |
| | 114,508 | | Nexeo Solutions, Inc.* | | | 1,066,070 | |
| | | | | | | 1,278,620 | |
| Transportation & Logistics: 2.0% | |
| | 55,338 | | United Parcel Service, Inc. - Class B | | | 6,343,948 | |
| | |
| Truck Dealerships: 1.2% | |
| | 79,256 | | Rush Enterprises, Inc. - Class A* | | | 2,528,266 | |
| | 41,984 | | Rush Enterprises, Inc. - Class B* | | | 1,296,046 | |
| | | | | | | 3,824,312 | |
| Utilities: 2.8% | |
| | 556,900 | | The AES Corporation | | | 6,471,178 | |
| | 78,825 | | PPL Corporation | | | 2,683,991 | |
| | | | | | | 9,155,169 | |
| Waste Management Services: 4.3% | |
| | 243,740 | | Republic Services, Inc. | | | 13,905,367 | |
| | |
| TOTAL COMMON STOCKS | |
| (cost $138,192,674) | | | 215,462,929 | |
| | | | | | | | |
| PREFERRED STOCKS: 0.3% | |
| | |
| Homebuilding: 0.3% | |
| | 38,712 | | M/I Homes, Inc., 9.750%, Series A | | | 988,705 | |
| | |
| TOTAL PREFERRED STOCKS | |
| (cost $968,725) | | | 988,705 | |
| | | | | | | | |
| CORPORATE BONDS: 20.1% | |
| | |
| Aerospace & Defense: 0.2% | |
| $ | 720,000 | | Spirit AeroSystems, Inc., 5.250%, 3/15/22 | | | 752,272 | |
| | |
| Apparel & Textiles: 0.3% | |
| | 1,037,000 | | Levi Strauss & Co, 6.875%, 5/1/22 | | | 1,088,850 | |
| | |
| Automobile Components: 0.3% | |
| | 983,000 | | The Goodyear Tire & Rubber Company, | | | | |
| | | | 7.000%, 5/15/22 | | | 1,039,523 | |
| | | | | | |
| Beverages: 0.7% | |
| | 2,087,000 | | Cott Beverages Inc., 6.750%, 1/1/20 | | | 2,166,567 | |
| | |
| Building Products: 0.7% | |
| | 1,021,000 | | Allegion US Holding Co, Inc., | | | | |
| | | | 5.750%, 10/1/21 | | | 1,069,497 | |
| | 1,002,000 | | Gibraltar Industries, Inc., 6.250%, 2/1/21 | | | 1,034,565 | |
| | | | | | | 2,104,062 | |
| Cable/Satellite TV: 0.3% | |
| | 1,033,000 | | CCO Holdings LLC/CCO Holdings | | | | |
| | | | Capital Corp., 6.625%, 1/31/22 | | | 1,071,737 | |
| | |
| Chemicals: 0.6% | |
| | 1,812,000 | | Chemtura Corporation, 5.750%, 7/15/21 | | | 1,885,612 | |
| | |
| Commercial Services & Supplies: 0.7% | |
| | 2,000,000 | | ACCO Brands Corporation, | | | | |
| | | | 6.750%, 4/30/20 | | | 2,105,000 | |
| | |
| Consulting Services: 0.3% | |
| | 906,000 | | FTI Consulting, Inc., 6.000%, 11/15/22 | | | 945,638 | |
| | |
| Diversified Consumer Services: 0.4% | |
| | 1,103,000 | | Graham Holdings Company, | | | | |
| | | | 7.250%, 2/1/19 | | | 1,202,722 | |
| | |
| Engineering & Construction: 0.7% | |
| | 656,000 | | AECOM Global II, LLC/URS Fox US LP, | | | | |
| | | | 3.850%, 4/1/17 | | | 658,034 | |
| | 1,553,000 | | MasTec, Inc., 4.875%, 3/15/23 | | | 1,525,823 | |
| | | | | | | 2,183,857 | |
| Food & Beverage: 0.7% | |
| | 2,020,000 | | Post Holdings, Inc., 7.375%, 2/15/22 | | | 2,108,375 | |
| | |
| Food & Staples Retailing: 0.3% | |
| | 1,004,000 | | Rite Aid Corporation, 9.250%, 3/15/20 | | | 1,042,905 | |
| | |
| Food-Packaged: 1.2% | |
| | 36,000 | | Smithfield Foods, Inc., 7.750%, 7/1/17 | | | 37,080 | |
| | 3,772,000 | | Smithfield Foods, Inc., 6.625%, 8/15/22 | | | 3,993,605 | |
| | | | | | | 4,030,685 | |
| Healthcare-Products: 0.4% | |
| | 1,217,000 | | Alere, Inc., 7.250%, 7/1/18 | | | 1,232,973 | |
The accompanying notes are an integral part of these financial statements.
Greenspring Fund, Incorporated
SCHEDULE OF INVESTMENTS at December 31, 2016 (Con’t) |
| Principal | | | | Value | |
| | |
| CORPORATE BONDS: 20.1% (Con’t) | |
| | |
| Healthcare-Providers & Services: 1.6% | |
| $ | 1,148,000 | | Acadia Healthcare Company, Inc., | | | |
| | | | 6.125%, 3/15/21 | | $ | 1,189,615 | |
| | 1,635,000 | | Centene Corporation, 5.625%, 2/15/21 | | | 1,723,126 | |
| | 2,286,000 | | DaVita, Inc., 5.750%, 8/15/22 | | | 2,397,443 | |
| | | | | | | 5,310,184 | |
| Homebuilding: 0.0% | |
| | 100,000 | | Lennar Corporation, 12.250%, 6/1/17 | | | 104,750 | |
| | |
| Hotels, Restaurants & Leisure: 2.2% | |
| | 2,444,000 | | Aramark Services, Inc., 5.750%, 3/15/20 | | | 2,497,462 | |
| | 2,407,000 | | Hilton Worldwide Finance LLC/Hilton | | | | |
| | | | Worldwide Finance Corp., | | | | |
| | | | 5.625%, 10/15/21 | | | 2,486,590 | |
| | 1,930,000 | | NPC International, Inc./NPC Operating | | | | |
| | | | Company A, Inc./NPC Operating | | | | |
| | | | Company B, Inc., 10.500%, 1/15/20 | | | 1,992,725 | |
| | | | | | | 6,976,777 | |
| Household & Personal Products: 0.9% | |
| | 2,620,000 | | Spectrum Brands, Inc., 6.625%, 11/15/22 | | | 2,796,850 | |
| | |
| Information Technology Services: 0.6% | |
| | 772,000 | | CDW LLC/CDW Finance Corp., | | | | |
| | | | 6.000%, 8/15/22 | | | 819,285 | |
| | 920,000 | | Lender Processing Services, Inc., | | | | |
| | | | 5.750%, 4/15/23 | | | 968,300 | |
| | | | | | | 1,787,585 | |
| Internet Software & Services: 1.3% | |
| | 4,014,000 | | j2 Global, Inc., 8.000%, 8/1/20 | | | 4,177,069 | |
| | |
| Media: 1.3% | |
| | 2,071,000 | | LIN Television Corporation, | | | | |
| | | | 6.375%, 1/15/21 | | | 2,146,074 | |
| | 783,000 | | Starz LLC/Starz Finance Corp., | | | | |
| | | | 5.000%, 9/15/19 | | | 791,809 | |
| | 1,222,000 | | TEGNA, Inc., 5.125%, 7/15/20 | | | 1,269,352 | |
| | | | | | | 4,207,235 | |
| Metals & Mining: 0.3% | |
| | 74,000 | | Commercial Metals Company, | | | | |
| | | | 6.500%, 7/15/17 | | | 75,665 | |
| | 813,000 | | Steel Dynamics, Inc., 6.375%, 8/15/22 | | | 851,618 | |
| | | | | | | 927,283 | |
| Oil & Gas Exploration & Production: 0.2% | |
| | 80,000 | | Parsley Energy LLC/Parsley Finance Corp., | | | | |
| | | | 7.500%, 2/15/22 - 144A | | | 85,058 | |
| | 636,000 | | PDC Energy, Inc., 7.750%, 10/15/22 | | | 680,520 | |
| | | | | | | 765,578 | |
| Packaging & Containers: 0.4% | |
| | 394,000 | | Reynolds Group Issuer Inc./Reynolds | | | | |
| | | | Group Issuer LLC/Reynolds Group Issuer | | | | |
| | | | (Luxembourg), 5.750%, 10/15/20 | | | 406,805 | |
| | 932,019 | | Reynolds Group Issuer Inc./Reynolds | | | | |
| | | | Group Issuer LLC/Reynolds Group Issuer | | | | |
| | | | (Luxembourg), 6.875%, 2/15/21 | | | 959,049 | |
| | | | | | | 1,365,854 | |
| Real Estate Investment Trusts: 0.6% | |
| | 1,818,000 | | Lamar Media Group, 5.875%, 2/1/22 | | | 1,877,085 | |
| | |
| Road & Rail: 0.2% | |
| | 678,000 | | The Hertz Corporation, 6.750%, 4/15/19 | | | 679,695 | |
| | |
| Software & Services: 0.2% | |
| | 735,000 | | Emdeon, Inc., 11.000%, 12/31/19 | | | 759,071 | |
| | |
| Telecommunications Services: 0.5% | |
| | 250,000 | | Earthlink, Inc., 7.375%, 6/1/20 | | | 264,375 | |
| | 1,195,000 | | Level 3 Financing, Inc., 6.125%, 1/15/21 | | | 1,241,306 | |
| | 249,000 | | Qwest Corporation, 6.500%, 6/1/17 | | | 254,155 | |
| | | | | | | 1,759,836 | |
| Transport-Marine: 0.8% | |
| | 2,428,000 | | Overseas Shipholding Group, Inc., | | | | |
| | | | 8.125%, 3/30/18 | | | 2,531,190 | |
| | |
| Utilities: 0.2% | |
| | 565,000 | | The AES Corporation, 3.931%, 6/1/19º | | | 566,412 | |
| | |
| Waste Management Services: 0.2% | |
| | 714,000 | | Clean Harbors, Inc., 5.250%, 8/1/20 | | | 731,315 | |
| | |
| Wireless Telecommunication Services: 0.8% | |
| | 2,608,000 | | T-Mobile USA, Inc., 6.464%, 4/28/19 | | | 2,656,900 | |
| | |
| TOTAL CORPORATE BONDS | |
| (cost $64,643,955) | | | 64,941,447 | |
The accompanying notes are an integral part of these financial statements.
Greenspring Fund, Incorporated
SCHEDULE OF INVESTMENTS at December 31, 2016 (Con’t) |
| Shares | | | | Value | |
| | |
| SHORT-TERM INVESTMENTS: 12.7% | |
| | |
| Money Market Funds: 12.7%^ | |
| | 11,918,293 | | Fidelity Institutional Government Portfolio, | | | |
| | | | Institutional Share Class, 0.390% | | $ | 11,918,293 | |
| | 14,466,674 | | The Government & Agency Portfolio, | | | | |
| | | | Institutional Share Class, 0.430% | | | 14,466,674 | |
| | 14,466,674 | | The Treasury Portfolio, Institutional | | | | |
| | | | Share Class, 0.370% | | | 14,466,674 | |
| | |
| TOTAL SHORT-TERM INVESTMENTS | |
| (cost $40,851,641) | | | 40,851,641 | |
| | |
| TOTAL INVESTMENTS IN SECURITIES | |
| (cost $244,656,995): 99.8% | | | 322,244,722 | |
| Other Assets and Liabilities 0.2% | | | 633,535 | |
| NET ASSETS: 100.0% | | $ | 322,878,257 | |
| * | | Non-income producing security. |
| # | | U.S. security of foreign issuer. |
| 144A | | Securities purchased pursuant to Rule 144A of the Securities Act of 1933, as amended, and may be sold only to dealers in that program or other “qualified institutional buyers.” These securities have been deemed to be liquid by the Fund’s Adviser under the supervision of the Board of Directors. As of December 31, 2016, the value of these investments was $85,058, or 0.0% of total net assets. |
| º | | The coupon rate shown on variable rate securities represents the rates at December 31, 2016. |
| ^ | | Rate shown is the 7-day effective yield at December 31, 2016. |
The accompanying notes are an integral part of these financial statements.
Greenspring Fund, Incorporated
STATEMENT OF ASSETS AND LIABILITIES at December 31, 2016 |
| ASSETS | | | |
| Investments in securities, at value (cost $244,656,995) | | $ | 322,244,722 | |
| Receivables: | | | | |
| Dividends and interest | | | 1,737,826 | |
| Fund shares sold | | | 464,936 | |
| Securities sold | | | 48,012 | |
| Prepaid expenses | | | 37,463 | |
| Total assets | | | 324,532,959 | |
| | | | | |
| LIABILITIES | | | | |
| Payables: | | | | |
| Due to affiliate (Note 5) | | | 204,325 | |
| Securities purchased | | | 1,178,078 | |
| Fund shares redeemed | | | 145,142 | |
| Accrued expenses | | | 127,157 | |
| Total liabilities | | | 1,654,702 | |
| | | | | |
| NET ASSETS | | $ | 322,878,257 | |
| | | | | |
| Capital shares issued and outstanding (60,000,000 shares authorized, $0.01 par value) | | | 13,036,085 | |
| | | | | |
| Net asset value, offering and redemption price per share | | $ | 24.77 | |
| | | | | |
| COMPONENTS OF NET ASSETS | | | | |
| Capital stock at par value | | $ | 130,361 | |
| Paid-in capital | | | 239,663,762 | |
| Accumulated undistributed net investment income | | | 225,158 | |
| Accumulated net realized gain on investments | | | 5,271,249 | |
| Net unrealized appreciation on investments | | | 77,587,727 | |
| NET ASSETS | | $ | 322,878,257 | |
The accompanying notes are an integral part of these financial statements.
Greenspring Fund, Incorporated
STATEMENT OF OPERATIONS For the Year Ended December 31, 2016 |
| INVESTMENT INCOME | | | |
| Income | | | |
| Interest | | $ | 3,832,631 | |
| Dividends (net of foreign withholding taxes of $23,179) | | | 3,062,737 | |
| Total income | | | 6,895,368 | |
| | | | | |
| Expenses | | | | |
| Advisory fees (Note 5) | | | 2,194,077 | |
| Sub transfer agent fees | | | 205,535 | |
| Administration fees | | | 150,393 | |
| Transfer agent fees | | | 70,691 | |
| Fund accounting fees | | | 62,594 | |
| Administration fees - Corbyn (Note 5) | | | 59,559 | |
| Directors fees | | | 45,000 | |
| Legal fees | | | 41,734 | |
| Reports to shareholders | | | 35,074 | |
| Blue sky fees | | | 33,139 | |
| Insurance fees | | | 29,609 | |
| Audit fees | | | 29,500 | |
| Custody fees | | | 27,137 | |
| Miscellaneous fees | | | 5,644 | |
| Total expenses | | | 2,989,686 | |
| Net investment income | | | 3,905,682 | |
| | | | | |
| NET REALIZED AND CHANGE IN NET UNREALIZED GAIN ON INVESTMENTS | | | | |
| Net realized gain on sale of investments | | | 10,160,677 | |
| Change in net unrealized appreciation on investments | | | 38,285,096 | |
| Net realized and change in net unrealized gain on investments | | | 48,445,773 | |
| Net increase in net assets resulting from operations | | $ | 52,351,455 | |
The accompanying notes are an integral part of these financial statements.
Greenspring Fund, Incorporated
| STATEMENTS OF CHANGES IN NET ASSETS |
| | | Year Ended | | | Year Ended | |
| | | December 31, 2016 | | | December 31, 2015 | |
| INCREASE (DECREASE) IN NET ASSETS FROM: | | | | | | |
| | | | | | | |
| OPERATIONS | | | | | | |
| Net investment income | | $ | 3,905,682 | | | $ | 9,135,526 | |
| Net realized gain (loss) on sale of: | | | | | | | | |
| Unaffiliated investments | | | 10,160,677 | | | | 34,401,354 | |
| Affiliated investments | | | — | | | | (1,967,528 | ) |
| Change in net unrealized appreciation (depreciation) on investments | | | 38,285,096 | | | | (67,420,627 | ) |
| Net increase (decrease) in net assets resulting from operations | | | 52,351,455 | | | | (25,851,275 | ) |
| | | | | | | | | |
| DISTRIBUTIONS TO SHAREHOLDERS | | | | | | | | |
| From net investment income | | | (4,067,707 | ) | | | (9,147,096 | ) |
| From net realized gain | | | (16,730,381 | ) | | | (9,467,311 | ) |
| Total distributions to shareholders | | | (20,798,088 | ) | | | (18,614,407 | ) |
| | | | | | | | | |
| CAPITAL SHARE TRANSACTIONS | | | | | | | | |
| Net decrease in net assets derived | | | | | | | | |
from net change in outstanding shares(a) | | | (26,110,999 | ) | | | (309,236,406 | ) |
| | | | | | | | | |
| Total increase (decrease) in net assets | | | 5,442,368 | | | | (353,702,088 | ) |
| | | | | | | | | |
| NET ASSETS | | | | | | | | |
| Beginning of year | | | 317,435,889 | | | | 671,137,977 | |
| End of year (including accumulated net investment | | | | | | | | |
| income of $225,158 and $386,812, respectively) | | $ | 322,878,257 | | | $ | 317,435,889 | |
(a) | A summary of capital share transactions is as follows: |
| | | | Year Ended | | | Year Ended | |
| | | | December 31, 2016 | | | December 31, 2015 | |
| | | | Shares | | | Value | | | Shares | | | Value | |
| | Shares sold | | | 1,548,414 | | | $ | 36,991,034 | | | | 963,131 | | | $ | 23,468,525 | |
| | Shares issued in reinvestment of distributions | | | 864,943 | | | | 20,391,300 | | | | 796,549 | | | | 18,222,252 | |
| | Shares redeemed+ | | | (3,690,374 | ) | | | (83,493,333 | ) | | | (14,503,573 | ) | | | (350,927,183 | ) |
| | Net decrease | | | (1,277,017 | ) | | $ | (26,110,999 | ) | | | (12,743,893 | ) | | $ | (309,236,406 | ) |
+ | Net of redemption fees of $2,795 and $23,494, respectively. |
The accompanying notes are an integral part of these financial statements.
Greenspring Fund, Incorporated
FINANCIAL HIGHLIGHTS For a capital share outstanding throughout each year |
| | | Year Ended December 31, | |
| | | 2016 | | | 2015 | | | 2014 | | | 2013 | | | 2012 | |
| Net asset value, beginning of year | | $ | 22.18 | | | $ | 24.80 | | | $ | 26.47 | | | $ | 23.23 | | | $ | 22.70 | |
| INCOME (LOSS) FROM INVESTMENT OPERATIONS: | |
| Net investment income | | | 0.32 | | | | 0.54 | | | | 0.70 | | | | 0.61 | | | | 0.67 | |
| Net realized and unrealized gain (loss) on investments | | | 3.96 | | | | (1.98 | ) | | | (1.35 | ) | | | 3.57 | | | | 1.35 | |
| Total from investment operations | | | 4.28 | | | | (1.44 | ) | | | (0.65 | ) | | | 4.18 | | | | 2.02 | |
| | | | | | | | | | | | | | | | | | | | | |
| LESS DISTRIBUTIONS: | |
| From net investment income | | | (0.33 | ) | | | (0.53 | ) | | | (0.70 | ) | | | (0.58 | ) | | | (0.88 | ) |
| From net realized gain | | | (1.36 | ) | | | (0.65 | ) | | | (0.32 | ) | | | (0.36 | ) | | | (0.61 | ) |
| Total distributions | | | (1.69 | ) | | | (1.18 | ) | | | (1.02 | ) | | | (0.94 | ) | | | (1.49 | ) |
| Net asset value, end of year | | $ | 24.77 | | | $ | 22.18 | | | $ | 24.80 | | | $ | 26.47 | | | $ | 23.23 | |
| Total return | | | 19.78 | % | | | (5.86 | %) | | | (2.51 | %) | | | 18.13 | % | | | 9.07 | % |
| RATIOS/SUPPLEMENTAL DATA: | |
| Net assets, end of year (millions) | | $ | 322.9 | | | $ | 317.4 | | | $ | 671.1 | | | $ | 868.3 | | | $ | 650.9 | |
| Ratio of expenses to average net assets | | | 1.01 | % | | | 0.95 | % | | | 0.89 | % | | | 0.92 | % | | | 0.93 | % |
| Ratio of net investment income to average net assets | | | 1.32 | % | | | 1.93 | % | | | 2.54 | % | | | 2.25 | % | | | 2.89 | % |
| Portfolio turnover rate | | | 48 | % | | | 25 | % | | | 50 | % | | | 68 | % | | | 28 | % |
| | | | | | | | | | | | | | | | | | | | | |
The accompanying notes are an integral part of these financial statements.
Greenspring Fund, Incorporated
NOTES TO FINANCIAL STATEMENTS December 31, 2016 |
| Note 1 – Significant Accounting Policies |
Greenspring Fund, Incorporated (the “Fund”) is a diversified, open-end management investment company registered under the Investment Company Act of 1940, as amended (the “1940 Act”). The Fund is organized as a Maryland corporation and commenced operations on July 1, 1983. Corbyn Investment Management, Inc. (the “Adviser” or “Corbyn”) is the Fund’s investment adviser.
The preparation of the financial statements in accordance with accounting principles generally accepted in the United States of America (“GAAP”) requires management to make estimates and assumptions that affect the reported amounts and disclosures in the financial statements. Actual results could differ from those estimates. In preparing these financial statements, the Fund has evaluated events and transactions for potential recognition or disclosure through the date the financial statements were issued.
The Fund is an investment company and accordingly follows the investment company accounting and reporting guidance of the Financial Accounting Standards Board (FASB) Accounting Standard codification topic 946 “Financial Services – Investment Companies.”
Investment transactions and related investment income – Investment transactions are recorded on the trade date. Dividend income is recorded on the ex-dividend date and interest income, including amortization of premiums and accretion of discounts, is recorded on the accrual basis. Dividends determined to be a return of capital are recorded as a reduction of the cost basis of the security. Realized gains and losses from investment transactions are reported on an identified cost basis.
Valuation of Investments – Generally, the Fund’s investments are valued at market value. Equity securities traded on a principal stock exchange are valued at the last quoted sale price. Equity securities traded on the NASDAQ National Market System (“NASDAQ”) are normally valued at the official closing price provided by NASDAQ. Equity securities that are not traded on a principal exchange or NASDAQ are valued at the last sale price in the over-the-counter market. In the absence of a last sale price or official closing price, or if there is no trading in a security on a business day, the security will be valued at the mean between its closing bid and asked prices obtained from sources the Adviser deems appropriate pursuant to policies and procedures approved by the Fund’s Board of Directors (the “Board”). Equity securities in an active market will be classified as Level 1 securities.
Investments in mutual funds, including money market funds, are valued at the mutual fund’s closing net asset value per share on the day of valuation. The prospectuses for such investment companies contain information on those investment companies’ valuation procedures and the effects of fair valuation. These securities will be classified as Level 1 securities.
Short-term debt instruments, including commercial paper or U.S. Treasury bills, having a maturity of 60 days or less may be valued at amortized cost, which approximates fair value. Amortized cost will not be used if its use would be inappropriate due to credit or other impairments of the issuer. These debt instruments will generally be classified as Level 2 securities.
Debt securities, such as corporate or convertible bonds, including those having a maturity or an announced call within 60 days, are generally traded in the over-the-counter market. These securities are valued at prices obtained from an independent pricing service, which may consider the yield or price of bonds of similar quality, coupon, maturity and type, as well as prices supplied by dealers who make markets in such securities. In the absence of a price from a pricing service, or if a quotation does not appear to accurately reflect the current value of a security, debt securities are valued at
Greenspring Fund, Incorporated
NOTES TO FINANCIAL STATEMENTS December 31, 2016 (Con’t) |
the mean of the closing bid and asked prices from sources the Adviser deems appropriate pursuant to policies and procedures approved by the Board. Debt securities will generally be classified as Level 2 securities.
Any securities for which market quotations are not readily available or for which the above valuation procedures are not appropriate or do not reflect fair market value are valued at fair value as determined in good faith by the Adviser pursuant to policies and procedures approved by the Board.
In determining fair value, the Adviser, as directed by the Board, considers all relevant qualitative and quantitative information available. These factors are subject to change over time and are reviewed periodically. The values assigned to fair value investments are based on available information and do not necessarily represent amounts that might ultimately be realized, since such amounts depend on future developments inherent in long-term investments. Further, because of the inherent uncertainty of valuation, those estimated values may differ significantly from the values that would have been used had a ready market for the investments existed, and the differences could be material.
The Fund has adopted fair valuation accounting standards that establish an authoritative definition of fair value and set out a hierarchy for measuring fair value. These standards require additional disclosures about the various input and valuation techniques used in measuring fair value. Fair value inputs are summarized in the three broad levels listed below:
| Level 1 – | Unadjusted quoted prices in active markets for identical securities that the Fund has the ability to access. |
| | |
| Level 2 – | Observable inputs other than quoted prices included in Level 1 that are observable for the security, either directly or indirectly. These inputs may include quoted prices for the identical instrument on an inactive market, prices for similar instruments, interest rates, prepayment speeds, credit risk, yield curves, default rates and similar data. |
| | |
| Level 3 – | Unobservable inputs for the security, to the extent relevant observable inputs are not available, representing the Fund’s own assumptions about the assumptions a market participant would use in valuing the security, and which would be based on the best information available. |
The inputs or methodology used for valuing securities are not necessarily an indication of the risk associated with investing in these securities. The following is a summary of the inputs used to value the Fund’s net assets as of December 31, 2016:
| | | Quoted Prices | | | Significant Other | | | Significant | | | Carrying Value | |
| | | in Active | | | Observable | | | Unobservable | | | at December 31, | |
| | | Markets | | | Inputs | | | Inputs | | | 2016 | |
| | | Level 1 | | | Level 2 | | | Level 3 | | | Total | |
| Common Stocks | | $ | 215,462,929 | | | $ | — | | | $ | — | | | $ | 215,462,929 | |
| Preferred Stocks | | | 988,705 | | | | — | | | | — | | | | 988,705 | |
| Corporate Bonds | | | — | | | | 64,941,447 | | | | — | | | | 64,941,447 | |
| Short- Term Investments | | | 40,851,641 | | | | — | | | | — | | | | 40,851,641 | |
| Total | | $ | 257,303,275 | | | $ | 64,941,447 | | | $ | — | | | $ | 322,244,722 | |
See Schedule of Investments for industry breakdown.
Transfers between levels are recognized at the end of the reporting period. During the year ended December 31, 2016, the Fund had no transfers between levels. The Fund did not have any Level 3 securities during the period.
Greenspring Fund, Incorporated
NOTES TO FINANCIAL STATEMENTS December 31, 2016 (Con’t) |
Dividends and distributions to stockholders – The Fund records dividends and distributions to shareholders on the ex-dividend date.
Redemption fees – The Board has adopted policies and procedures with respect to frequent purchases and redemptions of Fund shares by Fund shareholders. The Fund is intended for long-term investors. The Fund discourages and does not accommodate frequent purchases and redemptions of Fund shares by Fund shareholders. The Fund reserves the right to decline a purchase order for any reason.
“Market-timers” who engage in frequent purchases and redemptions over a short period can disrupt the Fund’s investment program by requiring the Fund to have excess cash on hand or to liquidate holdings to accommodate redemptions. In addition, frequent purchases and redemptions may impede efficient Fund management and create additional transaction costs that are borne by all shareholders. To the extent that the Fund invests a significant portion of its assets in small-cap securities or high-yield bonds, it may be subject to the risks of market timing more than a fund that does not. Therefore, the Fund imposes a 2% redemption fee for shares held 60 days or less. The fee is deducted from the seller’s redemption proceeds and deposited into the Fund to help offset brokerage commissions, market impact, and other costs associated with fluctuations in Fund asset levels and cash flow caused by short-term trading. All shareholders are subject to these restrictions regardless of whether you purchased your shares directly from the Fund or through a financial intermediary. However, the Fund is limited in its ability to determine whether trades placed through financial intermediaries may signal excessive trading. Accordingly, the Fund may not be able to determine whether trading in combined orders or in omnibus accounts is contrary to the Fund’s policies. The Fund reserves the right to reject combined or omnibus orders in whole or in part.
To calculate redemption fees, after first redeeming any shares associated with reinvested dividends or other distributions, the “first-in, first out” method is used to determine the holding period. Under this method, the date of redemption will be compared with the earliest purchase date of shares held in the account. If the holding period for shares purchased is 60 days or less, the fee will be charged. The redemption fee may be modified or discontinued at any time, in which case, shareholders will be notified. The redemption fee does not apply to shares acquired through the reinvestment of dividends or other distributions, or shares redeemed pursuant to a systematic withdrawal plan or a mandatory IRA distribution.
In compliance with Rule 22c-2 under the 1940 Act, Quasar Distributors, LLC, on behalf of the Fund, has entered into written agreements with each of the Fund’s financial intermediaries, under which the intermediaries must, upon request, provide the Fund with certain shareholder and identity trading information so that the Fund can enforce its frequent trading policies.
Risk of loss arising from indemnifications – In the normal course of business, the Fund enters into contracts that contain a variety of representations, which provide general indemnifications. The Fund’s maximum exposure under these arrangements is unknown as this would involve future claims that may be made against the Fund that have not yet occurred. However, based on experience, the Fund expects the risk of loss to be remote.
| Note 2 – Dividends and Distributions |
The Fund’s policy is to declare dividends from net investment income and distributions from net realized gains as determined in accordance with the Internal Revenue Code which may differ from GAAP. Accordingly, periodic reclassifications are made within the portfolio’s capital accounts to reflect income and gains available for distribution under income tax regulations.
Greenspring Fund, Incorporated
NOTES TO FINANCIAL STATEMENTS December 31, 2016 (Con’t) |
On July 13, 2016 an income dividend of $0.23 per share and a long-term capital gain distribution of $0.9777 were declared, payable on July 14, 2016, to shareholders of record on July 12, 2016. Additionally, on December 20, 2016, an income dividend of $0.0997 per share and a long-term capital gain distribution of $0.3792 per share were declared, payable on December 21, 2016 to shareholders of record on December 19, 2016. The tax character of distributions paid during the year ended December 31, 2016 and the year ended December 31, 2015 were as follows:
| | Distributions paid from: | December 31, 2016 | December 31, 2015 | |
| | Ordinary income | $ 4,067,707 | $9,147,096 | |
| | Long-term capital gain | $16,730,381 | $9,467,311 | |
These dividends are either distributed to shareholders or reinvested in the Fund as additional shares issued to shareholders. For those shareholders reinvesting the dividends, the number of shares issued is based on the net asset value per share as of the close of business on the ex-dividend date.
The Fund designated as long-term capital gain dividend, pursuant to Internal Revenue Code Section 852(b)(3), the amount necessary to reduce the earnings and profits of the Fund related to net capital gain to zero for the tax year ended December 31, 2016.
| Note 3 – Purchases and Sales of Investments |
For the year ended December 31, 2016, purchases and sales of investments, other than short-term investments, aggregated $128,178,416 and $195,640,825, respectively. There were no purchases or sales of U.S. government securities for the Fund.
| Note 4 – Federal Income Taxes |
The Fund’s policy is to comply with the requirements of the Internal Revenue Code applicable to regulated investment companies. Accordingly, the Fund intends to distribute substantially all of its taxable income. Therefore, no federal income tax provision is required.
As of, and during, the year ended December 31, 2016, the Fund did not have any tax positions that did not meet the “more-likely-than-not” threshold of being sustained by the applicable tax authority. Tax positions not deemed to meet the “more-likely-than-not” threshold would be recorded as a tax benefit or expense in the current year. Generally, tax authorities can examine tax returns filed for all open tax years (2013-2016).
Required Fund distributions are based on income and capital gain amounts determined in accordance with federal income tax regulations, which differ from net investment income and realized gains recognized for financial reporting purposes.
Accordingly, the composition of net assets and distributions on a tax basis may differ from those reflected in the accompanying financial statements. As of December 31, 2016, the Fund’s most recently completed year end, the components of distributable earnings on a tax basis were as follows:
Greenspring Fund, Incorporated
NOTES TO FINANCIAL STATEMENTS December 31, 2016 (Con’t) |
| | Cost of investments | | $ | 244,688,035 | |
| | Gross tax unrealized appreciation | | | 82,307,450 | |
| | Gross tax unrealized depreciation | | | (4,750,763 | ) |
| | Net tax unrealized appreciation | | | 77,556,687 | |
| | Undistributed ordinary income | | | 225,158 | |
| | Undistributed long-term capital gain | | | 5,302,289 | |
| | Total distributable earnings | | | 5,527,447 | |
| | Other accumulated losses | | | — | |
| | Total accumulated earnings | | $ | 83,084,134 | |
Accounting principles generally accepted in the United States of America require that certain components of net assets relating to permanent differences be reclassified between financial and tax reporting. These reclassifications have no effect on net assets or net asset value per share. For the year ended December 31, 2016, the Fund increased undistributed net investment income by $371 and decreased accumulated net realized gain on investments by $371. As of December 31, 2016, the Fund did not have a post-October capital loss or a capital loss carryforward.
| Note 5 – Transactions with Affiliated Parties |
Under an agreement between the Fund and Corbyn, the Fund pays Corbyn a fee of 0.75% of the first $250 million of average daily net assets, 0.70% of average daily net assets between $250 million and $500 million and 0.65% of average daily net assets in excess of $500 million, which is computed daily and paid monthly. For the year ended December 31, 2016, the Fund incurred $2,194,077 in advisory fees.
The Fund has also entered into a Services Agreement with Corbyn to provide various administrative services. As compensation, the Fund pays Corbyn a fee of $2,500 per month plus 0.01% of average daily net assets, which is computed daily and paid monthly. For the year ended December 31, 2016, the Fund incurred $59,559 in administrative fees to Corbyn.
At December 31, 2016, investors for whom Corbyn was investment adviser held 1,037,169 shares of the Fund.
| Note 6 – Subsequent Events |
Management has evaluated events and transactions occurring after December 31, 2016 through the date that the financial statements were issued, and has determined that no additional disclosure in the financial statements is required.
Greenspring Fund, Incorporated
REPORT OF INDEPENDENT REGISTERED PUBLIC ACCOUNTING FIRM
Board of Directors and Shareholders
Greenspring Fund, Incorporated
Lutherville, Maryland
We have audited the accompanying statement of assets and liabilities of the Greenspring Fund, Incorporated (the “Fund”), including the schedule of investments, as of December 31, 2016, and the related statement of operations for the year then ended, the statements of changes in net assets for each of the two years in the period then ended, and the financial highlights for each of the five years in the period then ended. These financial statements and financial highlights are the responsibility of the Fund’s management. Our responsibility is to express an opinion on these financial statements and financial highlights based on our audits.
We conducted our audits in accordance with the standards of the Public Company Accounting Oversight Board (United States). Those standards require that we plan and perform the audit to obtain reasonable assurance about whether the financial statements and financial highlights are free of material misstatement. The Fund is not required to have, nor were we engaged to perform, an audit of its internal control over financial reporting. Our audits included consideration of internal control over financial reporting as a basis for designing audit procedures that are appropriate in the circumstances, but not for the purpose of expressing an opinion on the effectiveness of the Fund’s internal control over financial reporting. Accordingly, we express no such opinion. An audit includes examining, on a test basis, evidence supporting the amounts and disclosures in the financial statements. Our procedures included confirmation of securities owned as of December 31, 2016, by correspondence with the custodian and brokers or by other appropriate auditing procedures where replies from brokers were not received. An audit also includes assessing the accounting principles used and significant estimates made by management, as well as evaluating the overall financial statement presentation. We believe that our audits provide a reasonable basis for our opinion.
In our opinion, the financial statements and financial highlights referred to above present fairly, in all material respects, the financial position of the Greenspring Fund, Incorporated as of December 31, 2016, the results of its operations for the year then ended, the changes in its net assets for each of the two years in the period then ended, and the financial highlights for each of the five years in the period then ended, in conformity with accounting principles generally accepted in the United States of America.
TAIT, WELLER & BAKER LLP
Philadelphia, Pennsylvania
February 23, 2017
Greenspring Fund, Incorporated
NOTICE TO SHAREHOLDERS December 31, 2016 (Unaudited) |
Tax Information
The Fund designates 65.87% of dividends declared from net investment income during the fiscal year ended December 31, 2016 as qualified income under the Jobs and Growth Tax Relief Reconciliation Act of 2003.
For corporate shareholders in the Fund, the percentage of ordinary dividend income distributed for the year ended December 31, 2016, which is designated as qualifying for the dividends-received deduction, is 59.03%.
For foreign shareholders in the Fund, for the year ended December 31, 2016, 62.36% of the ordinary distributions paid qualify as interest-related dividends under the Internal Revenue Code Section 871(k)(1)(c), and 0.00% of the ordinary income distributions are designated as short-term capital gain distributions under Internal Revenue Code Section 871(k)(2)(c).
Proxy Voting Policies and Proxy Voting Record
The Fund’s proxy voting policies and procedures, as well as its proxy voting record for the most recent 12-month period ended June 30, are available without charge, upon request, by contacting the Fund at (800) 366-3863 or info@greenspringfund.com. The Fund will send the information within three business days of receipt of the request, by first class mail or other means designed to ensure equally prompt delivery. The Fund’s proxy voting record is also available on the U.S. Securities and Exchange Commission’s website at www.sec.gov.
Form N-Q Holdings Information
The Fund files its complete schedule of portfolio holdings with the U.S. Securities and Exchange Commission for the first and third quarters of each fiscal year on Form N-Q. The Fund’s Forms N-Q are available on the Commission’s website at www.sec.gov and may be reviewed and copied at the Commission’s Public Reference Room in Washington, DC. Information on the operation of the Public Reference Room may be obtained by calling (800) SEC-0330.
Reports and Householding
In an attempt to reduce shareholder expenses, we will mail only one copy of the Fund’s Summary Prospectus and each Annual and Semi-Annual Report to those addresses shared by two or more accounts. If you wish to receive individual copies of these documents, please call us at (800) 366-3863. We will begin sending you individual copies 30 days after receiving your request.
The Fund’s Summary Prospectus, Prospectus, Statement of Additional Information, Annual Report, and Semi-Annual Report, along with its first and third quarter portfolio holdings, are available on the Fund’s website at www.greenspringfund.com.
Greenspring Fund, Incorporated
BASIC INFORMATION ABOUT FUND DIRECTORS AND OFFICERS (Unaudited) |
The Board of Directors supervises the management of the Fund. The following list summarizes information on the directors and officers of the Fund for the past five years. The address of each is 2330 West Joppa Road, Suite 110, Lutherville, MD 21093. The Fund’s Statement of Additional Information contains additional information about Fund directors and is available, without charge, upon request, by calling the Fund at (800) 366-3863, or by emailing the Fund at greenspring@greenspringfund.com.
| | | | | Number | |
| Name and | Position(s) Held | Term of Office and | Principal Occupation(s) | of Funds | Other |
Year of Birth | with the Fund | Length of Time Served | During the Past Five Years | Overseen | Directorship |
| |
| Term of Director |
| Indefinite |
| Term of Officer |
| One year |
| | | | | | |
| Interested | | | | | |
Directors/Officers | | | | | |
| Charles vK. Carlson | President | From March 1993 to present. | President and Director of the | One | None |
| Year of Birth: 1959 | Chairman of the Board | From January 1994 to present. | Fund’s Adviser. | | |
| | Chief Executive Officer | From February 1994 to present. | | | |
| | Director | From March 1987 to present. | | | |
| | | | | | |
| William E. Carlson | Director | From February 1994 to present. | President and Chair of the | One | None |
| Year of Birth: 1957 | | | Business Department at Shapiro | | |
| | | | Sher Guinot & Sandler (a law | | |
| | | | firm) from February 1999 to | | |
| | | | present. Partner of Shapiro Sher | | |
| | | | Guinot & Sandler from February | | |
| | | | 1990 to present. | | |
| | | | | | |
| Michael J. Fusting | Sr. Vice President | From May 1998 to present. | Sr. Vice President and Director of | One | None |
| Year of Birth: 1961 | Chief Financial Officer | From February 1994 to present. | the Fund’s Adviser. | | |
| | Director | From March 1992 to present. | | | |
| | | | | | |
Disinterested Directors |
| David T. Fu | Director | From May 1990 to present. | Retired. Managing Director | One | None |
| Year of Birth: 1956 | | | of Kanturk Partners, LLC (a | | |
| | | | merchant bank) from February | | |
| | | | 2004 to December 2014. | | |
| | | | | | |
| Sean T. Furlong | Director | From March 2003 to present. | Director of Finance and | One | None |
| Year of Birth: 1965 | | | Operations at the Gilman | | |
| | | | School from June 2003 to present. | | |
| | | | Adjunct Professor of Financial | | |
| | | | Accounting at Johns Hopkins | | |
| | | | University from February 2013 to | | |
| | | | present. | | |
| | | | | | |
Greenspring Fund, Incorporated
BASIC INFORMATION ABOUT FUND DIRECTORS AND OFFICERS (Unaudited) (Con’t) |
| | | | | Number | |
| Name and | Position(s) Held | Term of Office and | Principal Occupation(s) | of Funds | Other |
Year of Birth | with the Fund | Length of Time Served | During the Past Five Years | Overseen | Directorship |
| |
| Term of Director |
| Indefinite |
| Term of Officer |
| One year |
| | | | | | |
Officers | | | | | |
| Elizabeth Agresta Swam | Secretary and Treasurer | From May 1998 to present. | Employee of the Fund’s Adviser | N/A | None |
| Year of Birth: 1967 | AML Officer | From July 2002 to present. | from May 1998 to present. | | |
| | Chief Compliance Officer | From July 2004 to present. | Chief Compliance Officer | | |
| | | | of the Fund’s Adviser from | | |
| | | | December 31, 2016 to present. | | |
Greenspring Fund, Incorporated
PRIVACY POLICY December 31, 2016 (Unaudited) |
The Greenspring Fund recognizes that individuals expect an exceptional level of privacy in their financial affairs. The Fund assures the confidentiality of personal information provided to it.
The information we collect is limited to what the Fund believes is necessary or useful to conduct our business; administer your records, accounts and funds; to comply with laws and regulations; and to help us design or improve products and services. The Fund collects non-public personal information about you from information it receives from you on applications or other forms or through its website, as well as from information about your transactions with the Fund.
Some of this information may be disclosed to the Fund’s investment adviser, but not for marketing solicitation, as well as non-affiliated third parties who provide non-financial services to the Fund such as our Transfer Agent, in order to administer customer accounts and mail transaction confirmations and tax forms, and the mailing house the Fund utilizes for mailing shareholder reports. Such information may also be disclosed to a non-affiliated third party engaged to provide fund accounting and administrative services to us. Disclosing this information enables us to meet customers’ financial needs and regulatory requirements. These third parties act on its behalf and are obligated to keep the information we provide to them confidential and to use the information only for the purposes authorized. The Fund does not disclose any non-public personal information about you or former customers to anyone, except as permitted by law.
To protect your non-public personal information, the Fund permits access to it only by authorized employees and maintains security practices to safeguard your information.
If you have any questions regarding our Privacy Policy, please contact us at 1-800-366-3863 or greenspring@greenspringfund.com. Thank you.
This Privacy Policy is not part of the Annual Report.
Greenspring Fund, Incorporated
Performance Since Inception on
July 1, 1983 through December 31, 2016
(Unaudited)
|
| HOW $10,000 INVESTED ON 7/1/83 WOULD HAVE GROWN* |
|
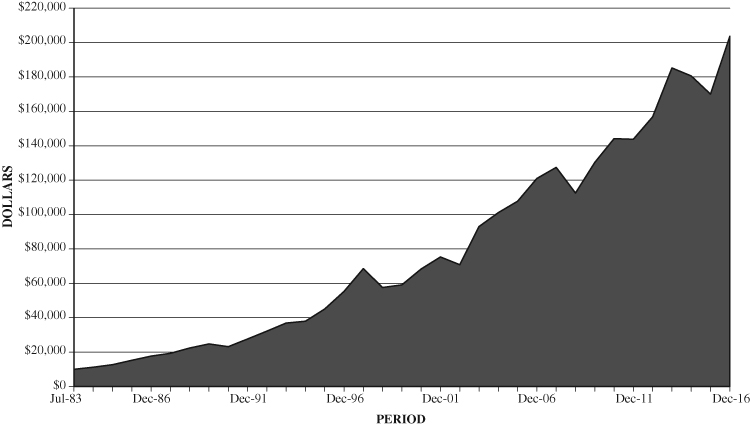 |
|
| * | Figures include changes in principal value, reinvested dividends and capital gains distributions. Past expense limitations increased the Fund’s return. This chart illustrates the performance of a hypothetical $10,000 investment made in the Fund since inception through December 31, 2016. The total value of $203,650 assumes the reinvestment of dividends and capital gains, but does not reflect the effect of any redemption fees. This chart does not imply any future performance. |
Average annual total returns for the one, three, five, ten year and since inception periods ended December 31, 2016 were 19.78%, 3.21%, 7.21%, 5.34% and 9.41%, respectively. Average annual returns for more than one year assume a compounded rate of return and are not the Fund’s year-by-year results, which fluctuated over the periods shown. Returns do not reflect taxes that shareholders may pay on Fund distributions or redemption of Fund shares.
(This Page Intentionally Left Blank.)
Greenspring Fund, Incorporated
2330 West Joppa Road, Suite 110
Lutherville, MD 21093
(410) 823-5353
(800) 366-3863
www.greenspringfund.com
DIRECTORS
Charles vK. Carlson, Chairman
William E. Carlson
David T. Fu
Sean T. Furlong
Michael J. Fusting
OFFICERS
Charles vK. Carlson
President and Chief Executive Officer
Michael J. Fusting
Sr. Vice President and
Chief Financial Officer
Elizabeth Agresta Swam
Chief Compliance Officer,
Secretary, Treasurer
and AML Officer
INVESTMENT ADVISER
Corbyn Investment Management, Inc.
2330 West Joppa Road, Suite 108
Lutherville, MD 21093-7207
ADMINISTRATOR, FUND ACCOUNTANT
AND TRANSFER AGENT
U.S. Bancorp Fund Services, LLC
615 East Michigan Street
Milwaukee, WI 53202
DISTRIBUTOR
Quasar Distributors, LLC
615 East Michigan Street
Milwaukee, WI 53202
CUSTODIAN
U.S. Bank, N.A.
1555 N. Rivercenter Dr., Suite 302
Milwaukee, WI 53212
INDEPENDENT REGISTERED
PUBLIC ACCOUNTING FIRM
Tait, Weller & Baker LLP
1818 Market Street, Suite 2400
Philadelphia, PA 19103
LEGAL COUNSEL
K&L Gates LLP
1601 K Street NW
Washington, DC 20006
Symbol – GRSPX
CUSIP – 395724107
Item 2. Code of Ethics.
The registrant has adopted a code of ethics that applies to the registrant’s principal executive officer and principal financial officer. The registrant has not made any amendments to its code of ethics during the period covered by this report. The registrant has not granted any waivers from any provisions of the code of ethics during the period covered by this report.
A copy of the registrant’s Code of Ethics is filed herewith.
Item 3. Audit Committee Financial Expert.
The registrant’s board of directors has determined that there is at least one audit committee financial expert serving on its audit committee. Mr. Sean T. Furlong is the “audit committee financial expert” and is considered to be “independent” as each term is defined in Item 3 of Form N CSR.
Item 4. Principal Accountant Fees and Services.
The registrant has engaged its principal accountant to perform audit services, audit-related services, tax services or other services during the past two fiscal years. “Audit services” refer to performing an audit of the registrant's annual financial statements or services that are normally provided by the accountant in connection with statutory and regulatory filings or engagements for those fiscal years. “Audit-related services” refer to the assurance and related services by the principal accountant that are reasonably related to the performance of the audit. “Tax services” refer to professional services rendered by the principal accountant for tax compliance, tax advice, and tax planning. There were no “other services” provided by the principal accountant. The following table details the aggregate fees billed, or expected to be billed, for each of the last two fiscal years for audit fees, audit-related fees, tax fees or other fees by the principal accountant:
| | FYE 12/31/2016 | FYE 12/31/2015 |
| Audit Fees | $26,000 | $26,000 |
| Audit-Related Fees | N/A | N/A |
| Tax Fees | $3,500 | $3,500 |
| All Other Fees | N/A | N/A |
The audit committee has adopted pre-approval policies and procedures that require the audit committee to pre approve all audit and non audit services of the registrant, including services provided to any entity affiliated with the registrant. All of the principal accountant’s hours spent on auditing the registrant’s financial statements were attributed to work performed by full time permanent employees of the principal accountant.
The percentage of fees billed by Tait, Weller & Baker LLP applicable to non-audit services pursuant to waiver of pre-approval requirement were as follows:
| | FYE 12/31/2016 | FYE 12/31/2015 |
| Audit-Related Fees | 0% | 0% |
| Tax Fees | 0% | 0% |
| All Other Fees | 0% | 0% |
The following table indicates the non-audit fees billed, or expected to be billed, by the registrant’s accountant for services to the registrant and to the registrant’s investment adviser for the last two years. The audit committee of the board of directors has considered whether the provision of non-audit services that were rendered to the registrant's investment adviser is compatible with maintaining the principal accountant's independence and has concluded that the provision of such non-audit services by the accountant has not compromised the accountant’s independence.
| Non-Audit Related Fees | FYE 12/31/2016 | FYE 12/31/2015 |
| Registrant | N/A | N/A |
| Registrant’s Investment Adviser | N/A | N/A |
Item 5. Audit Committee of Listed Registrants.
Not applicable to registrants who are not listed issuers (as defined in Rule 10A-3 under the Securities Exchange Act of 1934).
Item 6. Investments.
Schedule of Investments is included as part of the report to shareholders filed under Item 1 of this Form.
Item 7. Disclosure of Proxy Voting Policies and Procedures for Closed-End Management Investment Companies.
Not applicable to open-end investment companies.
Item 8. Portfolio Managers of Closed-End Management Investment Companies.
Not applicable to open-end investment companies.
Item 9. Purchases of Equity Securities by Closed‑End Management Investment Company and Affiliated Purchasers.
Not applicable to open-end investment companies.
Item 10. Submission of Matters to a Vote of Security Holders.
Not Applicable.
Item 11. Controls and Procedures.
| (a) | The Registrant’s Chief Executive Officer and Chief Financial Officer have reviewed the Registrant's disclosure controls and procedures (as defined in Rule 30a-3(c) under the Investment Company Act of 1940 (the “Act”) (17 CFR 270.30a-3(c))) as of a date within 90 days of the filing date of the report that includes the disclosure required by this paragraph, based on the evaluation of these controls and procedures required by Rule 30a-3(b) under the Act (17 CFR 270.30a-3(b)) and Rules 13a-15(b) or 15d‑15(b) under the Securities Exchange Act of 1934 (17 CFR 240.13a-(15(b) or 240.15d-15(b)). Based on their review, such officers have concluded that the disclosure controls and procedures are effective in ensuring that information required to be disclosed in this report is appropriately recorded, processed, summarized and reported and made known to them by others within the Registrant and by the Registrant’s service provider. |
| (b) | There were no changes in the Registrant's internal control over financial reporting (as defined in Rule 30a-3(d) under the Act (17 CFR 270.30a-3(d)) that occurred during the second fiscal quarter of the period covered by this report that has materially affected, or is reasonably likely to materially affect, the Registrant's internal control over financial reporting. |
Item 12. Exhibits.
| (a) | (1) Any code of ethics, or amendment thereto, that is the subject of the disclosure required by Item 2, to the extent that the registrant intends to satisfy Item 2 requirements through filing an exhibit. Filed herewith. |
(2) A separate certification for each principal executive and principal financial officer of the registrant as required by Rule 30a-2(a) under the Act (17 CFR 270.30a-2(a)), exactly as set forth below: Filed herewith.
(3) Any written solicitation to purchase securities under Rule 23c‑1 under the Act (17 CFR 270.23 C-1) sent or given during the period covered by the report by or on behalf of the registrant to 10 or more persons. Not applicable to open-end investment companies.
| (b) | Certifications pursuant to Section 906 of the Sarbanes‑Oxley Act of 2002. Furnished herewith. |
SIGNATURES
Pursuant to the requirements of the Securities Exchange Act of 1934 and the Investment Company Act of 1940, the registrant has duly caused this report to be signed on its behalf by the undersigned, thereunto duly authorized.
(Registrant) Greenspring Fund, Incorporated
By (Signature and Title)* /s/Charles vK. Carlson
Charles vK. Carlson, Chief Executive Officer
Date March 3, 2017
Pursuant to the requirements of the Securities Exchange Act of 1934 and the Investment Company Act of 1940, this report has been signed below by the following persons on behalf of the registrant and in the capacities and on the dates indicated.
By (Signature and Title)* /s/Charles vK. Carlson
Charles vK. Carlson, Chief Executive Officer
Date March 3, 2017
By (Signature and Title)* /s/Michael J. Fusting
Michael J. Fusting, Chief Financial Officer
Date March 3, 2017
* Print the name and title of each signing officer under his or her signature.