UNITED STATES
SECURITIES AND EXCHANGE COMMISSION
Washington, D.C. 20549
FORM N-CSR
CERTIFIED SHAREHOLDER REPORT OF REGISTERED
MANAGEMENT INVESTMENT COMPANIES
Investment Company Act file number 811-03627
Greenspring Fund, Incorporated
(Exact name of registrant as specified in charter)
2330 West Joppa Road, Suite 110
Lutherville, MD 21093-4641
(Address of principal executive offices) (Zip code)
Mr. Charles vK. Carlson, President
2330 West Joppa Road, Suite 110
Lutherville, MD 21093-4641
(Name and address of agent for service)
(410) 823-5353
Registrant's telephone number, including area code
Date of fiscal year end: December 31, 2015
Date of reporting period: December 31, 2015
Item 1. Reports to Stockholders.
ANNUAL REPORT
DECEMBER 31, 2015
This report is intended for shareholders of the
Greenspring Fund, Incorporated and may not be
used as sales literature unless preceded or
accompanied by a current prospectus.
Greenspring Fund, Incorporated
February 2016
Dear Fellow Shareholders:
Investors entered 2015 with a relatively optimistic outlook as many economists predicted that domestic economic growth would strengthen, allowing the economy to break out of the malaise of the last few years. The equity markets recorded small gains during the first half of the year, but were unable to sustain the momentum as confidence in domestic and global economic growth waned. By mid-summer, declining commodity prices, a strong dollar and a sharp drop in the Chinese stock market spooked investors. As the world’s second largest economy, China has a significant and growing influence on global economic activity. As the year progressed, economic data coming out of China attracted intense scrutiny as investors attempted to determine the magnitude of the slowdown in China’s economic growth rate. Falling commodity prices, combined with a strong dollar, put further pressure on many emerging market economies that are dependent on commodity exports, further calling into question the anticipated global economic growth rate.
As investors struggled to gauge the fallout from the challenges faced by many global economies, the Federal Reserve, after months of speculation and delay, cited healthy domestic economic data, and finally raised short-term interest rates in December - by one-quarter of one percent. The bond market had been worried about the impact of such a move for many months and this concern contributed to the volatility in bond prices during 2015. The yield on the 10-year U.S. Treasury bond increased slightly during the year from 2.17% to 2.27%, but the yield on shorter-term U.S. Treasury securities, such as the 1-year Treasury, increased even more sharply, rising by approximately one-half of one percent. With global economic uncertainty and investor concerns about further actions by the Federal Reserve, the equity markets struggled to post relatively flat performances for the year.
INFLUENCES on FUND PERFORMANCE
The performance of the securities in Greenspring Fund’s portfolio during the year was mixed, with the Fund’s bonds generating solid returns while the performance of
| Greenspring Fund |
| Performance for the |
| Periods Ended December 31, 2015 |
| Quarter | | | 1.37 | % |
| Year to Date | | | -5.86 | % |
| 1 Year | | | -5.86 | % |
| 3 Years* | | | 2.73 | % |
| 5 Years* | | | 3.36 | % |
| 10 Years* | | | 4.67 | % |
| 15 Years* | | | 6.26 | % |
| 20 Years* | | | 6.86 | % |
| Since inception on 7/1/83* | | | 9.11 | % |
| Expense Ratio** | | | 0.90 | % |
| * | | Annualized. |
| ** | | As stated in Prospectus dated 5-1-15. See note on last page of letter. |
Performance data quoted represents past performance; past performance does not guarantee future results. The investment return and principal value of an investment will fluctuate so that an investor’s shares, when redeemed, may be worth more or less than their original cost. Current performance of the Fund may be lower or higher than the performance quoted. Performance data current to the most recent month end may be obtained by calling 1-800-366-3863 or by visiting www.greenspringfund.com. The Fund imposes a 2.00% redemption fee for shares held 60 days or less. Performance data does not reflect the redemption fee. If reflected, total returns would be reduced.
the equities was disappointing. The solidly positive performance of the Fund’s bond portfolio was widespread, as more than 90% of the Fund’s bonds registered positive total returns, during a year of much volatility in the fixed income markets, especially in the high yield sector. Our core short duration high yield bonds grinded out steady and consistent returns. In some cases, individual bond performance was enhanced due to
Greenspring Fund, Incorporated
an earlier-than-expected redemption or tender offer, while in other situations the Fund may have benefitted from a bond remaining outstanding beyond the anticipated call date, with returns enhanced as the Fund continued to receive the high coupons for a longer period of time. The Fund also had success in several special situation bonds, benefitting from our research process that focuses on balance sheet strength, expected future cash flows, and a bond’s position within a company’s capital structure. Overall, we were pleased with the performance of the Fund’s fixed income securities during an environment that was challenging for most fixed income investors.
Although more than half of the equity holdings in the Fund generated positive returns, the overall equity return was negative as several of the Fund’s larger holdings had disappointing returns. Equity performance was also influenced by the fact that value investors such as Greenspring Fund, who seek to purchase shares of companies with solid fundamentals that are priced at discounted levels relative to earnings, book value, yield or various other criteria, faced headwinds as value stocks significantly underperformed growth stocks during 2015. This type of divergent performance is not unprecedented and it often temporarily drives the prices of the favored securities or sectors to unsustainable levels, resulting in a subsequent price correction.
The equity holdings within the Commercial Banks and Thrifts, Internet Software and Services, and Insurance industry sectors contributed positively to performance, while holdings in the Computer Systems, Telecommunications, and Oil and Gas Exploration and Development sectors had a negative impact on performance. The individual securities that had the most significant influence on the Fund’s performance during the year in order of magnitude were the common stock holdings in Silicon Graphics International Corp., Lumos Networks Corp., Datalink Corporation, Harmonic, Inc. and MasTec, Inc. All of these holding declined in value.
Silicon Graphics International, a leading manufacturer of high-performance computing systems, faced a difficult transition year during 2015 amidst continuing uncertainty regarding expected improvements in revenue and profitability. The share price declined significantly during the first nine months of the year, as management announced that two new large Department of Defense contracts, while beneficial to the bottom line, would require the Company to borrow additional funds to support the working capital required to complete the contracts. The additional interest expense associated with the borrowings reduced near-term profitability. In addition, the completion of one of these contracts was delayed by a few months, further damaging management’s credibility. However, later in the year, with the successful closure and collection of the cash proceeds from both of these large contracts, management began rebuilding trust with investors. Additionally, the Company’s growing partnership with SAP to provide high performance database hardware, new partnerships with Oracle and Dell, and continued new government contract wins increased optimism for the future. As a result, the stock price rose significantly during the fourth quarter of 2015 and in the early part of 2016. While our investment in Silicon Graphics has been more volatile than expected, we are encouraged by the recent results and are optimistic that the Company has turned an important corner on the
| | % of Net |
| Greenspring Fund | Assets |
| Top 10 Holdings | as of |
| | 12/31/15 |
| Republic Services, Inc. | 5.2% |
| US Foods, Inc., 8.500%, 6/30/19 | 4.7% |
| GSI Group, Inc. | 3.8% |
| Gramercy Property Trust, Inc. | 3.7% |
| Lumos Networks Corp. | 3.7% |
| FTI Consulting, Inc. | 3.6% |
| PPL Corporation | 3.4% |
| CA, Inc. | 3.4% |
| MasTec, Inc. | 3.3% |
| Hanger, Inc., 9.125%, 11/15/18 | 3.3% |
Greenspring Fund, Incorporated
road to a meaningful increase in profitability. We reduced the position size of Silicon Graphics during the latter part of 2015 and will continue to vigilantly evaluate the risk-reward of this investment during 2016.
Throughout 2015, Lumos Networks Corp. continued its transition into a niche, Mid-Atlantic pure-play fiber-based telecom service provider. However, the stock price fell as investors struggled with evaluating the capital necessary for, and the timing of, the value-creating separation of Lumos’ fiber-based business from its legacy telecommunication assets. To accelerate its transformation and provide capital for potential growth opportunities, the Company suspended its dividend and raised additional funds through the issuance of debt and associated warrants to a private equity firm. Fundamentally, management continues to successfully grow the fiber-to-the-cell and enterprise connectivity segments and has expanded the fiber network into Richmond and Norfolk, VA. Both of these organic initiatives should provide an ongoing source of growth due to the strong market demand for fiber connectivity within the region. In addition, the funds raised from the private equity firm provide the Company with significant cash resources to quickly take advantage of additional growth opportunities. We continue to believe that the current stock price does not adequately reflect the value of Lumos’ underlying assets and the potential future prospects within the fiber business.
| Greenspring Fund |
| Ten Largest 2015 Purchases |
| Common Stocks: |
| Gramercy Property Trust, Inc. |
| Cabela’s Incorporated |
| Party City Holdco Inc. |
| United Parcel Service, Inc. – Class B |
| Mohawk Industries, Inc. |
| Bonds: |
| Cinemark USA, Inc., 7.375%, 6/15/21 |
| Entercom Radio, LLC, 10.500%, 12/1/19 |
| Nortek, Inc., 10.000%, 12/1/18 |
| CCO Holdings LLC/CCO Holdings Capital Corp., 7.000%, 1/15/19 |
| Tenneco, Inc., 6.875%, 12/15/20 |
Datalink Corporation, a provider of datacenter equipment and value-added services to large domestic enterprises, struggled through a difficult 2015 as a dramatic market shift in data storage technology reduced the market’s expectations for the Company’s growth and profitability. As newer flash-based storage products gained market momentum, customers delayed spending on storage equipment while they evaluated the efficacy of newer flash-based storage products. While Datalink will play an important role when customers ultimately purchase storage equipment to meet the needs of their exponential computing data growth, the timing of these purchases has proven far more difficult to predict than originally expected. After appearing to stabilize in late 2014 and early 2015, the storage markets took another leg down in the spring of 2015, causing a significant decline in Datalink’s stock price as optimism over the recovery dissipated. To combat the shortfall from the storage business, management reduced storage-related expenses but earnings results were still disappointing despite positive results from other segments of the business. With a very strong balance sheet and solid free cash flow generation, management has the resources necessary to
| Greenspring Fund |
| Ten Largest 2015 Sales |
| Common Stocks: |
| j2 Global, Inc. |
| PartnerRe Ltd. |
| Republic Services, Inc. |
| FTI Consulting, Inc. |
| Harmonic, Inc. |
| Bonds: |
| PetroQuest Energy, Inc., 10.000%, 9/1/17 |
| Biomet, Inc., 6.500%, 8/1/20 |
| Brown Shoe Co., Inc., 7.125%, 5/15/19 |
| FTI Consulting, Inc., 6.750%, 10/1/20 |
| Level 3 Financing, Inc., 9.375%, 4/1/19 |
Greenspring Fund, Incorporated
navigate through the difficult storage market while investing in the ingredients for long-term shareholder value creation. However, given the vagaries of the storage market, we have tempered our outlook and changed our valuation parameters, leading us to reduce the Fund’s holdings in Datalink.
Harmonic, Inc. is a leading provider of solutions that facilitate the delivery of video over cable networks. The domestic cable TV industry is poised to enter into a significant network upgrade cycle required to keep up with consumers’ massive and growing bandwidth demands. While investors initially expected this upgrade cycle to gain momentum during 2015, this proved inaccurate as cable TV providers took longer than expected to design next-generation network architectures, compounded by the distractions and order delays resulting from numerous large proposed mergers within the cable industry. Unfortunately, this caused Harmonic to miss earnings expectations, and the stock price declined materially as a result. Despite these delays, we remain confident that Harmonic will play a crucial role in the inevitable upgrade cycle once cable TV providers move forward. On the encoder side of the business, Harmonic remains a market leader with a strong product offering for providers looking to leverage software-based solutions to enable the proliferation of ultra-high-definition channels and over-the-top video content. Within the edgeQAM business, new products are being developed for the emerging DOCSIS 3.1 protocol, which serve to address providers’ needs for bandwidth efficiency and dramatically increases Harmonic’s addressable market. In December, Harmonic announced the acquisition of Thomson Video Networks, and we believe investors will view the synergistic aspects of the deal favorably as it becomes better understood. We reduced the Fund’s holdings in Harmonic with most of the sales occurring during the first quarter of 2015 when the stock was trading at a higher valuation. We are disappointed that the Company did not deliver on 2015 earnings expectations and remain concerned that Harmonic will face headwinds until spending by cable providers accelerates; however, we see the potential opportunities to create shareholder value when the upgrade cycle takes hold.
MasTec, Inc. builds, installs and maintains infrastructure projects for the energy, communications and utility industries. The Company’s largest business units are focused on wireless and wireline communication systems and oil and gas pipelines. MasTec also constructs and maintains electric transmission and distribution lines, and renewable energy projects such as solar facilities and wind farms. We discussed MasTec in two of our quarterly letters during 2015 as the Company experienced a number of challenges within several business units during the year. MasTec’s share price declined during the year as the Company reported disappointing quarterly earnings reports and reduced its earnings expectations several times during the year. Although MasTec is a diversified business, almost all of its business lines experienced headwinds during 2015. The communications unit struggled due to reduced spending on wireless infrastructure by AT&T, its largest customer. Lower construction activity in the Canadian oil and gas business combined with the weak Canadian dollar led to lower earnings in the pipeline unit. The electric transmission business suffered losses during the year due to problem contracts and distractions from an independent review by the Board of Directors of certain accounting issues in the division. Adverse weather conditions in certain areas of the United States also hurt the profitability of some contracts. Despite the difficulties experienced in 2015, we are encouraged by recent trends in both the oil and gas pipeline, and communication businesses that should help improve future profitability. Another encouraging sign was the fact that during the third quarter several members of the management team purchased a significant amount of stock in the open market, adding to their already substantial holdings. During 2016, we expect the Company to build two large natural gas pipelines in Texas that will be used to transport natural gas to Mexico. Additionally, press reports indicate that the Company has been chosen to build sections of a large oil pipeline in the Midwest. Spending activity in the wireless segment
Greenspring Fund, Incorporated
appears to be improving, following a significant decline last year. The wireline business should also see a higher level of activity as internet service providers, spurred by Google’s 1-gigabit Fiber projects, continue to move forward with the construction of fiber-based infrastructure capable of delivering ultra-high speed internet service to businesses and local communities. Given the potential for improving operations within several business units, we believe MasTec will experience a strong recovery in its revenues, earnings and cash flow per share.
Despite the disappointing performance of several of the Fund’s larger equity holdings discussed above, more than half of the equity holdings generated positive returns for the year. Shares of Dycom Industries, Inc., a holding in the Engineering and Construction sector more than doubled during the year. Dycom constructs and maintains infrastructure primarily for the telecommunications industry. Earnings growth accelerated substantially as Dycom benefitted from several key customers ramping up spending to design and build fiber-based infrastructure capable of delivering ultra-high speed internet service. As the share price increased and the valuation fully reflected our future outlook for the company, we sold the shares.
PartnerRe Ltd., a global diversified reinsurer, delivered strong returns during the first half of 2015 due to a series of proposed strategic alternatives that ultimately
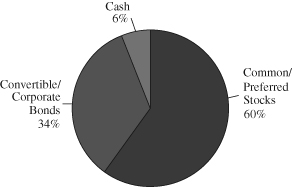
| Greenspring Fund |
| Portfolio Allocation |
| as of December 31, 2015 |
| |
 |
| |
culminated in the sale of the Company. The Fund held shares of PartnerRe since 1994, and it has been one of the ten largest holdings for years. We have long admired management’s ability to conservatively grow tangible book value through both organic growth and acquisitions. Coupled with a solid underwriting philosophy and wise free cash flow deployment, this growth translated into solid shareholder value creation over time. In January 2015, the Company proposed a merger with peer Axis Capital Holdings Limited. However, the Company’s willingness to entertain merger activity quickly attracted a separate proposal from Italian conglomerate Exor, which proposed to acquire PartnerRe for cash. These proposals kicked off a nearly nine month bidding war for the Company with both sides improving their offers several times. Ultimately, a cash offer from Exor was approved by PartnerRe shareholders in November with the deal expected to close in the first quarter of 2016. We sold shares as the value appreciated throughout the year in conjunction with the raised offers, ultimately exiting our entire position this past summer when it became clear that additional offers were unlikely.
j2 Global, Inc., a Fund holding since 2009, generated a strong return during 2015 as management continued to deliver stable earnings growth combined with strategic capital deployment. Organically, the Company continues
| Greenspring Fund |
| Portfolio Allocation |
| as of December 31, 2014 |
| |
 |
| |
Greenspring Fund, Incorporated
to show accelerating growth rates from its stable internet fax franchise, rapidly growing cloud backup service, and email hosting/security/archival businesses. Within the media business, where j2 owns several niche websites, management has successfully grown traffic and materially expanded margins through the application of a highly effective advertising model. Management continues to use the balance sheet and free cash flow to acquire businesses at attractive prices and rapidly and accretively integrate them into the core business. We remain pleased that management continues to effectively execute its strategy, but we have reduced the Fund’s holdings to balance risk/reward as the valuation multiple has significantly expanded.
PORTFOLIO ACTIVITY
During the year, we initiated a number of new common stock positions the most significant of which include shares in Party City Holdco Inc., United Parcel Service, Inc., Mohawk Industries, Inc., Discover Financial Services, and CVS Health Corporation. We also purchased shares in several small commercial banks and thrifts that individually were not significant, but, when taken as a whole, represented one of the Fund’s larger purchases and included new positions as well as additions to existing holdings. Significant additions to existing equity holdings included the purchase of shares of Gramercy Property Trust, Inc. and Emerson Electric Co. Throughout the year, we trimmed the position size of various equity holdings as they approached our fundamental price targets or to adjust their weighting within the portfolio. Significant reductions included shares in j2 Global, Inc., Republic Services, Inc., FTI Consulting, Inc., Harmonic, Inc. and KBR, Inc. We also sold the Fund’s entire position in a number of holdings including Cytec Industries, Inc., Dycom Industries, Inc., Francesca’s Holding Corp., and PartnerRe Ltd.
Activity within the fixed income portfolio was heavily influenced by the maturity and redemption of securities due to the relatively short duration of most of the holdings. In addition to anticipated redemptions, we reduced the Fund’s holdings in US Foods, Inc. and sold our holdings in Petroquest Energy, Inc. and Bill Barrett Corp. early in the year. Please refer to the Schedule of Investments for a complete list of the Fund’s portfolio holdings.
INVESTMENT STRATEGY
The underperformance of value stocks, as well as a number of short-term company-specific setbacks negatively impacted the performance of the equity holdings in the portfolio. During the recent market environment, modest disappointments in near-term earnings prospects often led to considerable volatility in stock prices. Additionally, stocks that had performed poorly during the year were subject to further selling pressure at year-end, as some investors sold shares for tax purposes as opposed to fundamental reasons. We were very disappointed with the performance of the equity holdings during 2015 and have worked throughout the year to reposition the portfolio, by either exiting or reducing the position size of a number of holdings. In addition, we added several new holdings in companies that we believe are extremely well-managed and have solid finances and attractive prospects for enhancing shareholder value. To balance the equity investments and reduce overall portfolio volatility, we will continue to purchase short-term high yield fixed income securities that we believe will provide steady and attractive returns in the current interest rate environment.
Despite the difficulties experienced in 2015, we believe that the companies in the equity portion of Greenspring Fund’s portfolio are well-positioned to grow shareholder value as profits and cash flow are used for organic growth opportunities, acquisitions, dividends and share repurchases. Furthermore, a number of the holdings in the Fund are priced at meaningful discounts to our appraisal of value, and if this undervaluation is not corrected by appreciation in their stock price, several of these companies may become takeover targets. The markets have been extremely volatile during the first several weeks of 2016, reflecting increasing global economic uncertainty. Investors, in an effort to reduce risk, seem to be moving away from high priced growth stocks, and into more
Greenspring Fund, Incorporated
value-oriented investments, which should benefit value investors such as Greenspring Fund. We look to take advantage of this unstable market environment to make additional opportunistic purchases and sales of securities with the goal of further improving the overall future prospects of the portfolio. We very much look forward to reporting on our progress at the end of the first quarter.
Respectfully,
 |  |
| | |
| Charles vK. Carlson | Michael J. Fusting |
| Portfolio Manager and Co-Chief Investment Officer | Co-Chief Investment Officer |
**Total Annual Fund Operating Expenses for the Fund will not correlate to the Ratio of Expenses to Average Net Assets shown in the Fund’s most recent Annual Report and in the Financial Highlights section of the Prospectus, which reflects the operating expenses of the Fund and does not include acquired fund fees and expenses.
Mutual fund investing involves risk. Principal loss is possible. Small-capitalization companies tend to have limited liquidity and greater price volatility than large-capitalization companies. Investments by the Fund in lower-rated and non-rated securities present a greater risk of loss to principal and interest than higher-rated securities. Investments in debt securities typically decrease in value when interest rates rise. This risk is usually greater for longer-term debt securities.
Earnings growth is not a measure of the Fund’s future performance.
Opinions expressed are subject to change, are not guaranteed and should not be considered recommendations to buy or sell any security. Fund holdings and/or sector allocations are subject to change at any time and are not recommendations to buy or sell any security. Current and future portfolio holdings are subject to risk.
Duration is a commonly used measure of the potential volatility of the price of a debt security, or the aggregate market value of a portfolio of debt securities, prior to maturity. Securities with a longer duration generally have more volatile prices than securities of comparable quality with a shorter duration. Book value is the net asset value of a company, calculated by subtracting total liabilities from total assets. Free cash flow measures the cash generating capability of a company by adding certain non-cash charges (e.g. depreciation and amortization) to earnings and subtracting recurring capital expenditures. Cash flow measures the cash generating capability of a company by adding non-cash charges (e.g. depreciation) and interest expense to pre-tax income. Future cash flow is the cash flow a company expects to generate.
Distributed by Quasar Distributors, LLC
Greenspring Fund, Incorporated
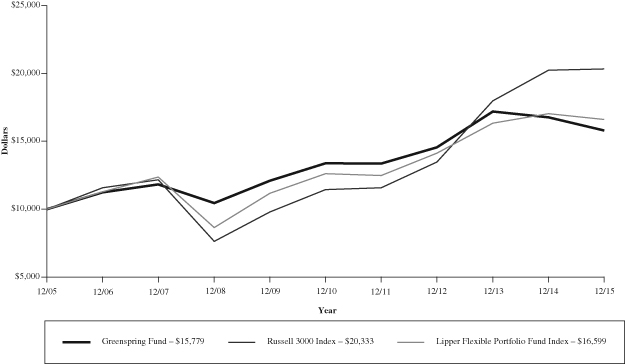
Growth of a $10,000 Investment in the Greenspring Fund
Over the Last Ten Years
Average Annual Total Returns
| | For Years Ended December 31, 2015 |
| | 1 Year | 3 Years | 5 Years | 10 Years |
| Greenspring Fund | -5.86% | 2.73% | 3.36% | 4.67% |
| Russell 3000 Index | 0.48% | 14.74% | 12.18% | 7.35% |
| Lipper Flexible Portfolio Fund Index | -2.53% | 5.52% | 5.65% | 5.20% |
The graph and table do not reflect the deduction of taxes that a shareholder would pay on Greenspring Fund (the “Fund”) distributions or the redemption of Fund shares.
Performance data quoted represents past performance; past performance does not guarantee future results. The investment return and principal value of an investment will fluctuate so that an investor’s shares, when redeemed, may be worth more or less than their original cost. Current performance of the Fund may be lower or higher than the performance quoted. Performance data current to the most recent month end is available at www.greenspringfund.com or by calling 1-800-366-3863 toll free. The Fund imposes a 2.00% redemption fee for shares held 60 days or less. Performance data does not reflect the redemption fee. If reflected, total returns would be reduced.
The Russell 3000 Index measures the performance of the 3,000 largest U.S. companies based on total market capitalization. The Lipper Flexible Portfolio Index is an unmanaged index of the 30 largest funds in the Lipper Flexible Portfolio Fund category, which includes funds that allocate investments across various asset classes, including domestic common stocks, bonds and money market instruments, with a focus on total return. Investors cannot invest directly in an index, although they may invest in the underlying securities included in the index. An index return does not reflect a deduction for fees, expenses, or taxes.
Greenspring Fund, Incorporated
EXPENSE EXAMPLE For the Six Months Ended December 31, 2015 (Unaudited) |
As a shareholder of the Fund, you incur two types of costs: (1) transaction costs, such as redemption fees if you redeem within 60 days of purchase; and (2) ongoing costs, including management fees and other Fund expenses. This example is intended to help you understand your ongoing costs (in dollars) of investing in the Fund and to compare these costs with the ongoing costs of investing in other mutual funds. The example is based on an investment of $1,000 invested at the beginning of the period and held for the entire period (7/1/2015 – 12/31/2015).
Actual Expenses
The first line of the table below provides information about actual account values based on actual returns and actual expenses. You may use the information in this line, together with the amount you invested, to estimate the expenses that you paid over the period. Simply divide your account value by $1,000 (for example, an $8,600 account value divided by $1,000 = 8.6), then multiply the result by the number in the first line under the heading entitled “Expenses Paid During the Period” to estimate the expenses you paid on your account during this period.
Hypothetical Example for Comparison Purposes
The second line of the table below provides information about hypothetical account values and hypothetical expenses based on the Fund’s actual expense ratio and an assumed rate of return of 5% per year before expenses, which is not the Fund’s actual return. The hypothetical account values and expenses may not be used to estimate the actual ending account balance or expenses you paid for the period. You may use this information to compare the ongoing costs of investing in the Fund and other funds. To do so, compare this 5% hypothetical example with the 5% hypothetical examples that appear in the shareholder reports of the other funds. Please note that the expenses shown in the table are meant to highlight your ongoing costs only and do not reflect any transactional costs, such as redemption fees. Therefore, the second line of the table is useful in comparing ongoing costs only, and will not help you determine the relative total costs of owning different funds. In addition, if these transactional costs were included, your costs would have been higher.
| | | | | Expenses Paid |
| | | Beginning | Ending | During the Period |
| | | Account Value | Account Value | 7/1/2015 – |
| | | 7/1/2015 | 12/31/2015 | 12/31/2015* |
| Actual | | $1,000.00 | $939.10 | $4.79 |
| Hypothetical | | | | |
| (5% annual return before expenses) | | $1,000.00 | $1,020.27 | $4.99 |
| * | Expenses are equal to the Fund’s annualized expense ratio of 0.98%, multiplied by the average account value over the period multiplied by 184/365 (to reflect the one-half year period). |
Greenspring Fund, Incorporated
SCHEDULE OF INVESTMENTS at December 31, 2015 |
| Shares | | | | Value | |
| | | | |
| COMMON STOCKS: 73.2% | | | |
| | |
| Building Products: 2.1% | |
| | 29,670 | | Mohawk Industries, Inc.* | | $ | 5,619,201 | |
| | 100,056 | | PGT, Inc.* | | | 1,139,638 | |
| | | | | | | 6,758,839 | |
| | |
| Business Software & Services: 4.9% | |
| | 88,061 | | Amdocs Limited# | | | 4,805,489 | |
| | 374,595 | | CA, Inc. | | | 10,698,433 | |
| | | | | | | 15,503,922 | |
| | |
| Chemicals: 0.3% | |
| | 27,002 | | CF Industries Holdings, Inc. | | | 1,101,952 | |
| | |
| Commercial Banks & Thrifts: 7.8% | |
| | 35,987 | | American National Bankshares, Inc. | | | 921,627 | |
| | 203,050 | | Beneficial Bancorp, Inc.* | | | 2,704,626 | |
| | 65,389 | | Chicopee Bancorp, Inc. | | | 1,133,845 | |
| | 211,667 | | Clifton Bancorp, Inc. | | | 3,035,305 | |
| | 208,414 | | ESSA Bancorp, Inc. | | | 2,851,103 | |
| | 60,586 | | First Connecticut Bancorp, Inc. | | | 1,054,802 | |
| | 31,654 | | Middleburg Financial Corp. | | | 584,966 | |
| | 52,900 | | OceanFirst Financial Corp. | | | 1,059,587 | |
| | 37,383 | | Polonia Bancorp Inc.* | | | 431,400 | |
| | 194,329 | | Shore Bancshares, Inc. | | | 2,114,300 | |
| | 567,665 | | Southern National Bancorp of Virginia | | | 7,413,705 | |
| | 26,352 | | Westbury Bancorp, Inc.* | | | 468,012 | |
| | 124,831 | | Westfield Financial, Inc. | | | 1,048,580 | |
| | | | | | | 24,821,858 | |
| | |
| Computer Systems: 1.8% | |
| | 970,603 | | Silicon Graphics International Corp.* | | | 5,726,558 | |
| | |
| Consulting Services: 3.7% | |
| | 334,240 | | FTI Consulting, Inc.* | | | 11,584,758 | |
| | |
| Diversified Financial Services: 0.7% | |
| | 38,510 | | Discover Financial Services | | | 2,064,906 | |
| | |
| Electrical Equipment & Instruments: 4.0% | |
| | 17,400 | | Emerson Electric Co. | | | 832,242 | |
| | 880,598 | | GSI Group, Inc.*# | | | 11,993,745 | |
| | | | | | | 12,825,987 | |
| | |
| Engineering & Construction: 11.2% | |
| | 198,366 | | EMCOR Group, Inc. | | | 9,529,503 | |
| | 516,826 | | KBR, Inc. | | | 8,744,696 | |
| | 611,375 | | MasTec, Inc.* | | | 10,625,697 | |
| | 326,037 | | MYR Group, Inc.* | | | 6,719,623 | |
| | | | | | | 35,619,519 | |
| | |
| Entertainment: 1.7% | |
| | 58,042 | | AMC Entertainment | | | | |
| | | | Holdings, Inc.- Class A | | | 1,393,008 | |
| | 73,501 | | Six Flags Entertainment Corp. | | | 4,038,145 | |
| | | | | | | 5,431,153 | |
| | |
| Independent Power Producers: 0.0% | |
| | 12,365 | | Talen Energy Corporation* | | | 77,034 | |
| | |
| Industrial Equipment: 0.3% | |
| | 20,000 | | Pentair PLC # | | | 990,600 | |
| | |
| Information Technology Services: 0.4% | |
| | 202,146 | | Datalink Corporation* | | | 1,374,593 | |
| | |
| Internet Software & Services: 1.2% | |
| | 44,685 | | j2 Global, Inc. | | | 3,678,469 | |
| | |
| Oil & Gas Exploration & Production: 5.5% | |
| | 110,355 | | Energen Corp. | | | 4,523,452 | |
| | 112,400 | | EOG Resources, Inc. | | | 7,956,796 | |
| | 191,950 | | Suncor Energy, Inc.# | | | 4,952,310 | |
| | | | | | | 17,432,558 | |
| | |
| Oil Refining & Marketing: 0.1% | |
| | 2,813 | | Phillips 66 | | | 230,103 | |
| | |
| Pulp & Paper: 0.2% | |
| | 19,325 | | International Paper Co. | | | 728,553 | |
| | |
| Real Estate Investment Trust: 3.7% | |
| | 1,539,860 | | Gramercy Property Trust, Inc. | | | 11,887,719 | |
| | |
| Retail: 2.3% | |
| | 25,490 | | CVS Health Corporation | | | 2,492,157 | |
| | 355,962 | | Party City Holdco Inc.* | | | 4,595,469 | |
| | | | | | | 7,087,626 | |
| | |
| Telecommunications: 3.7% | |
| | 1,060,217 | | Lumos Networks Corp.* | | | 11,874,430 | |
| | |
| Telecommunications Equipment: 2.3% | |
| | 1,756,303 | | Harmonic, Inc.* | | | 7,148,153 | |
| | |
| Trading Companies & Distributors: 0.0% | |
| | 5,000 | | HD Supply Holdings, Inc.* | | | 150,150 | |
| | |
| Transportation & Logistics: 1.7% | |
| | 55,338 | | United Parcel Service, Inc. - Class B | | | 5,325,176 | |
The accompanying notes are an integral part of these financial statements.
Greenspring Fund, Incorporated
SCHEDULE OF INVESTMENTS at December 31, 2015 (Con’t) |
| Shares/Principal | | | | Value | |
| | |
| COMMON STOCKS: 73.2% (Con’t) | |
| | |
| Truck Dealerships: 2.3% | |
| | 81,386 | | Rush Enterprises, Inc. - Class A* | | $ | 1,781,539 | |
| | 248,384 | | Rush Enterprises, Inc. - Class B* | | | 5,439,610 | |
| | | | | | | 7,221,149 | |
| | |
| Utilities: 6.1% | |
| | 891,150 | | The AES Corporation | | | 8,528,306 | |
| | 313,625 | | PPL Corporation | | | 10,704,021 | |
| | | | | | | 19,232,327 | |
| | |
| Waste Management Services: 5.2% | |
| | 374,062 | | Republic Services, Inc. | | | 16,454,987 | |
| | |
| TOTAL COMMON STOCKS | |
| (cost $191,042,947) | | | | | 232,333,079 | |
| | | | | | | | |
| | |
| PREFERRED STOCKS: 0.4% | |
| | |
| Homebuilding: 0.4% | |
| | 45,655 | | M/I Homes, Inc., 9.750%, Series A | | | 1,161,007 | |
| | |
| TOTAL PREFERRED STOCKS | |
| (cost $1,160,869) | | | | | 1,161,007 | |
| | | | | | | | |
| | |
| CONVERTIBLE BONDS: 0.0% | |
| | |
| Financial Services: 0.0% | |
| $ | 110,000 | | Ares Capital Corporation, 5.125%, 6/1/16 | | | 110,412 | |
| | |
| TOTAL CONVERTIBLE BONDS | |
| (cost $110,104) | | | | | 110,412 | |
| | | | | | | | |
| | |
| CORPORATE BONDS: 21.3% | |
| | |
| Aerospace & Defense: 0.0% | |
| | 88,000 | | Spirit AeroSystems, Inc., 6.750%, 12/15/20 | | | 91,135 | |
| | |
| Apparel: 0.1% | |
| | 95,000 | | Hanesbrands, Inc., 6.375%, 12/15/20 | | | 98,349 | |
| | 100,000 | | Wolverine World Wide, Inc., | | | | |
| | | | 6.125%, 10/15/20 | | | 104,500 | |
| | | | | | | 202,849 | |
| | |
| Automobile Parts: 0.6% | |
| | 100,000 | | Dana Holding Corporation, | | | | |
| | | | 6.750%, 2/15/21 | | | 103,125 | |
| | 1,761,000 | | Tenneco, Inc., 6.875%, 12/15/20 | | | 1,831,440 | |
| | | | | | | 1,934,565 | |
| | |
| Building Products: 0.1% | |
| | 337,000 | | USG Corporation, 6.300%, 11/15/16 | | | 348,997 | |
| | | | | | |
| Cable/Satellite TV: 0.6% | |
| | 2,018,000 | | CCO Holdings LLC/CCO Holdings | | | | |
| | | | Capital Corp., 7.000%, 1/15/19 | | | 2,063,405 | |
| | |
| Chemicals: 0.4% | |
| | 1,267,000 | | Kraton Polymers LLC, 6.750%, 3/1/19 | | | 1,274,919 | |
| | |
| Commercial & Residential Building | |
| Equipment & Systems: 0.1% | |
| | 265,000 | | Nortek, Inc., 8.500%, 4/15/21 | | | 276,289 | |
| | |
| Consumer Goods: 0.2% | |
| | 100,000 | | Jarden Corp., 6.125%, 11/15/22 | | | 103,312 | |
| | 629,000 | | Tempur Sealy International, Inc., | | | | |
| | | | 6.875%, 12/15/20 | | | 662,023 | |
| | | | | | | 765,335 | |
| | |
| Engineering & Construction: 0.3% | |
| | 250,000 | | AECOM Global II, LLC/URS | | | | |
| | | | Fox US LP, 3.850%, 4/1/17 | | | 250,625 | |
| | 623,000 | | MasTec, Inc., 4.875%, 3/15/23 | | | 542,010 | |
| | | | | | | 792,635 | |
| | |
| Entertainment: 2.0% | |
| | 5,927,000 | | Cinemark USA, Inc., 7.375%, 6/15/21 | | | 6,260,394 | |
| | |
| Equipment Rentals: 0.3% | |
| | 825,000 | | The Hertz Corporation, 7.500%, 10/15/18 | | | 843,562 | |
| | |
| Food & Beverage: 0.2% | |
| | 603,000 | | Chiquita Brands International, Inc./ | | | | |
| | | | Chiquita Brands LLC, 7.875%, 2/1/21 | | | 633,904 | |
| | |
| Food Distribution: 4.7% | |
| | 14,421,000 | | US Foods, Inc., 8.500%, 6/30/19 | | | 14,889,683 | |
| | |
| Healthcare-Facilities: 3.4% | |
| | 68,000 | | CHS/Community Health Systems, Inc., | | | | |
| | | | 5.125%, 8/15/18 | | | 68,680 | |
| | 11,534,000 | | Hanger, Inc., 9.125%, 11/15/18 | | | 10,611,280 | |
| | 58,000 | | HealthSouth Corp., 7.750%, 9/15/22 | | | 60,610 | |
| | | | | | | 10,740,570 | |
| | |
| Healthcare-Products: 0.2% | |
| | 621,000 | | Alere, Inc., 7.250%, 7/1/18 | | | 637,301 | |
| | |
| Healthcare-Services: 1.3% | |
| | 3,918,000 | | MedAssets, Inc., 8.000%, 11/15/18 | | | 3,996,360 | |
The accompanying notes are an integral part of these financial statements.
Greenspring Fund, Incorporated
SCHEDULE OF INVESTMENTS at December 31, 2015 (Con’t) |
| Principal/Shares | | | Value | |
| | |
| CORPORATE BONDS: 21.3% (Con’t) | |
| | |
| Internet Software & Services: 2.4% | |
| $ | 4,999,000 | | Bankrate, Inc., 6.125%, 8/15/18 - 144A | | $ | 5,073,985 | |
| | 2,565,000 | | j2 Global, Inc., 8.000%, 8/1/20 | | | 2,693,250 | |
| | | | | | | 7,767,235 | |
| | |
| Media: 1.6% | |
| | 896,000 | | AMC Networks Inc., 7.750%, 7/15/21 | | | 945,280 | |
| | 3,839,000 | | Entercom Radio, LLC, 10.500%, 12/1/19 | | | 3,992,560 | |
| | 18,000 | | TEGNA, Inc., 7.125%, 9/1/18 | | | 18,382 | |
| | | | | | | 4,956,222 | |
| | |
| Metals & Mining: 0.2% | |
| | 589,000 | | Kaiser Aluminum Corporation, | | | | |
| | | | 8.250%, 6/1/20 | | | 618,450 | |
| | |
| Oil & Gas Exploration & Production: 0.3% | |
| | 1,062,000 | | Gulfport Energy Corporation, | | | | |
| | | | 7.750%, 11/1/20 | | | 955,800 | |
| | |
| Packaging & Containers: 0.0% | |
| | 123,000 | | Crown Americas LLC/Crown Americas | | | | |
| | | | Capital Corp. III, 6.250%, 2/1/21 | | | 127,151 | |
| | |
| Personal Products: 0.5% | |
| | 1,488,000 | | Prestige Brands, Inc., 8.125%, 2/1/20 | | | 1,547,520 | |
| | |
| Retail: 0.1% | |
| | 274,000 | | Rite Aid Corporation, 9.250%, 3/15/20 | | | 290,098 | |
| | |
| Storage & Logistics: 0.0% | |
| | 138,000 | | Mobile Mini, Inc., 7.875%, 12/1/20 | | | 143,520 | |
| | |
| Trading Companies & Distributors: 0.4% | |
| | 1,087,000 | | HD Supply, Inc., 11.500%, 7/15/20 | | | 1,209,287 | |
| | |
| Telecommunications: 0.4% | |
| | 250,000 | | Earthlink, Inc., 7.375%, 6/1/20 | | | 255,625 | |
| | 405,000 | | Level 3 Financing, Inc., 7.000%, 6/1/20 | | | 424,237 | |
| | 236,000 | | T-Mobile USA, Inc., 6.464%, 4/28/19 | | | 243,628 | |
| | 438,000 | | Zayo Group, LLC/Zayo Capital, Inc., | | | | |
| | | | 10.125%, 7/1/20 | | | 474,135 | |
| | | | | | | 1,397,625 | |
| | |
| Transport-Marine: 0.8% | |
| | 2,428,000 | | Overseas Shipholding Group, Inc., | | | | |
| | | | 8.125%, 3/30/18 | | | 2,488,700 | |
| | | | | | | | |
| Utilities: 0.1% | |
| | 100,000 | | The AES Corporation, 8.000%, 10/15/17 | | | 106,250 | |
| | 123,000 | | The AES Corporation, 3.414%, 6/1/19° | | | 113,160 | |
| | | | | | | 219,410 | |
| | |
| TOTAL CORPORATE BONDS | |
| (cost $69,460,868) | | | | | 67,472,921 | |
| | | | | | | | |
| | |
| SHORT-TERM INVESTMENTS: 3.3% | |
| | |
| Money Market Instruments: 3.3% | |
| | 10,600,466 | | The Liquid Assets Portfolio, 0.290%^ | | | 10,600,466 | |
| | |
| TOTAL SHORT-TERM INVESTMENTS | |
| (cost $10,600,466) | | | | | 10,600,466 | |
| | |
| TOTAL INVESTMENTS IN SECURITIES | |
| (cost $272,375,254): 98.2% | | | 311,677,885 | |
| Other Assets and Liabilities 1.8% | | | 5,758,004 | |
| NET ASSETS: 100.0% | | $ | 317,435,889 | |
| * | | Non-income producing security. |
| # | | U.S. security of foreign issuer. |
| 144A | | Securities purchased pursuant to Rule 144A of the Securities Act of 1933, as amended, and may be sold only to dealers in that program or other “qualified institutional buyers.” These securities have been deemed to be liquid by the Fund’s adviser under the supervision of the Board of Directors. As of December 31, 2015, the value of these investments was $5,073,985, or 1.6% of total net assets. |
| ° | | The coupon rate shown on variable rate securities represents the rates at December 31, 2015. |
| ^ | | Rate shown is the 7-day effective yield at December 31, 2015. |
The accompanying notes are an integral part of these financial statements.
Greenspring Fund, Incorporated
STATEMENT OF ASSETS AND LIABILITIES at December 31, 2015 |
| ASSETS | | | |
| Investments in securities, at value (cost $272,375,254) | | $ | 311,677,885 | |
| Receivables: | | | | |
| Securities sold | | | 5,896,245 | |
| Dividends and interest | | | 1,151,484 | |
| Fund shares sold | | | 50,930 | |
| Prepaid expenses | | | 42,577 | |
| Total assets | | | 318,819,121 | |
| | | | | |
| LIABILITIES | | | | |
| Payables: | | | | |
| Fund shares redeemed | | | 954,585 | |
| Due to affiliate (Note 5) | | | 222,700 | |
| Securities purchased | | | 100,025 | |
| Accrued expenses | | | 105,922 | |
| Total liabilities | | | 1,383,232 | |
| | | | | |
| NET ASSETS | | $ | 317,435,889 | |
| | | | | |
| Capital shares issued and outstanding (60,000,000 shares authorized, $0.01 par value) | | | 14,313,102 | |
| | | | | |
| Net asset value, offering and redemption price per share | | $ | 22.18 | |
| | | | | |
| COMPONENTS OF NET ASSETS | | | | |
| Capital stock at par value | | $ | 143,131 | |
| Paid-in capital | | | 265,761,991 | |
| Accumulated undistributed net investment income | | | 386,812 | |
| Accumulated net realized gain on investments | | | 11,841,324 | |
| Net unrealized appreciation on investments | | | 39,302,631 | |
| NET ASSETS | | $ | 317,435,889 | |
The accompanying notes are an integral part of these financial statements.
Greenspring Fund, Incorporated
STATEMENT OF OPERATIONS For the Year Ended December 31, 2015 |
| INVESTMENT INCOME | | | |
| Income | | | |
| Interest | | $ | 9,419,299 | |
| Dividends (net of foreign withholding taxes of $34,736) | | | 4,226,261 | |
| Total income | | | 13,645,560 | |
| | | | | |
| Expenses | | | | |
| Advisory fees (Note 5) | | | 3,418,200 | |
| Sub transfer agent fees | | | 356,445 | |
| Administration fees | | | 206,100 | |
| Transfer agent fees | | | 86,264 | |
| Administration fees - Corbyn (Note 5) | | | 77,253 | |
| Fund accounting fees | | | 74,360 | |
| Legal fees | | | 63,831 | |
| Directors fees | | | 54,250 | |
| Custody fees | | | 37,077 | |
| Reports to shareholders | | | 35,172 | |
| Blue sky fees | | | 33,864 | |
| Insurance fees | | | 32,134 | |
| Audit fees | | | 29,500 | |
| Miscellaneous fees | | | 5,584 | |
| Total expenses | | | 4,510,034 | |
| Net investment income | | | 9,135,526 | |
| | | | | |
| REALIZED AND UNREALIZED GAIN (LOSS) ON INVESTMENTS | | | | |
| Net realized gain (loss) on sale of: | | | | |
| Unaffiliated investments | | | 34,401,354 | |
| Affiliated investments (Note 5) | | | (1,967,528 | ) |
| Change in net unrealized appreciation on investments | | | (67,420,627 | ) |
| Net realized and unrealized loss on investments | | | (34,986,801 | ) |
| Net decrease in net assets resulting from operations | | $ | (25,851,275 | ) |
The accompanying notes are an integral part of these financial statements.
Greenspring Fund, Incorporated
| STATEMENTS OF CHANGES IN NET ASSETS |
| | | Year Ended | | | Year Ended | |
| | | December 31, 2015 | | | December 31, 2014 | |
| INCREASE (DECREASE) IN NET ASSETS FROM: | | | | | | |
| OPERATIONS | | | | | | |
| Net investment income | | $ | 9,135,526 | | | $ | 21,149,991 | |
| Net realized gain (loss) on sale of: | | | | | | | | |
| Unaffiliated investments | | | 34,401,354 | | | | (8,992,273 | ) |
| Affiliated investments (Note 5) | | | (1,967,528 | ) | | | — | |
| Change in net unrealized appreciation on investments | | | (67,420,627 | ) | | | (32,312,899 | ) |
| Net decrease in net assets resulting from operations | | | (25,851,275 | ) | | | (20,155,181 | ) |
| | | | | | | | |
| DISTRIBUTIONS TO SHAREHOLDERS | | | | | | | | |
| From net investment income | | | (9,147,096 | ) | | | (21,211,081 | ) |
| From net realized gain | | | (9,467,311 | ) | | | (10,219,967 | ) |
| Total distributions to shareholders | | | (18,614,407 | ) | | | (31,431,048 | ) |
| | | | | | | | | |
| CAPITAL SHARE TRANSACTIONS | | | | | | | | |
| Net decrease in net assets derived | | | | | | | | |
from net change in outstanding shares(a) | | | (309,236,406 | ) | | | (145,532,056 | ) |
| Total decrease in net assets | | | (353,702,088 | ) | | | (197,118,285 | ) |
| | | | | | | | |
| NET ASSETS | | | | | | | | |
| Beginning of year | | | 671,137,977 | | | | 868,256,262 | |
| End of year (including accumulated net investment | | | | | | | | |
| income of $386,812 and $399,334, respectively) | | $ | 317,435,889 | | | $ | 671,137,977 | |
(a) | A summary of capital share transactions is as follows: |
| | | Year Ended | | | Year Ended | |
| | | December 31, 2015 | | | December 31, 2014 | |
| | | Shares | | | Value | | | Shares | | | Value | |
| Shares sold | | | 963,131 | | | $ | 23,468,525 | | | | 5,868,702 | | | $ | 153,725,489 | |
| Shares issued in reinvestment of distributions | | | 796,549 | | | | 18,222,252 | | | | 1,204,083 | | | | 30,667,126 | |
Shares redeemed+ | | | (14,503,573 | ) | | | (350,927,183 | ) | | | (12,822,477 | ) | | | (329,924,671 | ) |
| Net increase (decrease) | | | (12,743,893 | ) | | $ | (309,236,406 | ) | | | (5,749,692 | ) | | $ | (145,532,056 | ) |
+ | Net of redemption fees of $23,494 and $29,425, respectively. |
The accompanying notes are an integral part of these financial statements.
Greenspring Fund, Incorporated
FINANCIAL HIGHLIGHTS For a capital share outstanding throughout each year |
| | | Year Ended December 31, | |
| | | 2015 | | | 2014 | | | 2013 | | | 2012 | | | 2011 | |
| Net asset value, beginning of year | | $ | 24.80 | | | $ | 26.47 | | | $ | 23.23 | | | $ | 22.70 | | | $ | 24.19 | |
| INCOME (LOSS) FROM INVESTMENT OPERATIONS: | | | | | | | | | | | | | | | | | | | | |
| Net investment income | | | 0.54 | | | | 0.70 | | | | 0.61 | | | | 0.67 | | | | 0.58 | |
| Net realized and unrealized gain (loss) on investments | | | (1.98 | ) | | | (1.35 | ) | | | 3.57 | | | | 1.35 | | | | (0.66 | ) |
| Total from investment operations | | | (1.44 | ) | | | (0.65 | ) | | | 4.18 | | | | 2.02 | | | | (0.08 | ) |
| | | | | | | | | | | | | | | | | | | | | |
| LESS DISTRIBUTIONS: | | | | | | | | | | | | | | | | | | | | |
| From net investment income | | | (0.53 | ) | | | (0.70 | ) | | | (0.58 | ) | | | (0.88 | ) | | | (0.82 | ) |
| From net realized gain | | | (0.65 | ) | | | (0.32 | ) | | | (0.36 | ) | | | (0.61 | ) | | | (0.59 | ) |
| Total distributions | | | (1.18 | ) | | | (1.02 | ) | | | (0.94 | ) | | | (1.49 | ) | | | (1.41 | ) |
| Net asset value, end of year | | $ | 22.18 | | | $ | 24.80 | | | $ | 26.47 | | | $ | 23.23 | | | $ | 22.70 | |
| Total return | | | (5.86 | %) | | | (2.51 | %) | | | 18.13 | % | | | 9.07 | % | | | (0.26 | %) |
| | | | | | | | | | | | | | | | | | | | | |
| RATIOS/SUPPLEMENTAL DATA: | | | | | | | | | | | | | | | | | | | | |
| Net assets, end of year (millions) | | $ | 317.4 | | | $ | 671.1 | | | $ | 868.3 | | | $ | 650.9 | | | $ | 739.0 | |
| Ratio of expenses to average net assets | | | 0.95 | % | | | 0.89 | % | | | 0.92 | % | | �� | 0.93 | % | | | 0.91 | % |
| Ratio of net investment income to average net assets | | | 1.93 | % | | | 2.54 | % | | | 2.25 | % | | | 2.89 | % | | | 2.40 | % |
| Portfolio turnover rate | | | 25 | % | | | 50 | % | | | 68 | % | | | 28 | % | | | 58 | % |
The accompanying notes are an integral part of these financial statements.
Greenspring Fund, Incorporated
NOTES TO FINANCIAL STATEMENTS December 31, 2015 |
| Note 1 – Significant Accounting Policies |
Greenspring Fund, Incorporated (the “Fund”) is a diversified, open-end management investment company registered under the Investment Company Act of 1940, as amended (the “1940 Act”). The Fund is organized as a Maryland corporation and commenced operations on July 1, 1983.
The preparation of the financial statements in accordance with accounting principles generally accepted in the United States of America requires management to make estimates and assumptions that affect the reported amounts and disclosures in the financial statements. Actual results could differ from those estimates. In preparing these financial statements, the Fund has evaluated events and transactions for potential recognition or disclosure through the date the financial statements were issued.
The Fund is an investment company and accordingly follows the investment company accounting and reporting guidance of the Financial Accounting Standards Board (FASB) Accounting Standard codification topic 946 “Financial Services – Investment Companies.”
Investment transactions and related investment income – Investment transactions are recorded on the trade date. Dividend income is recorded on the ex-dividend date and interest income, including amortization of premiums and accretion of discounts, is recorded on the accrual basis. Dividends determined to be a return of capital are recorded as a reduction of the cost basis of the security. Realized gains and losses from investment transactions are reported on an identified cost basis.
Valuation of Investments – Generally, the Fund’s investments are valued at market value. Equity securities traded on a principal stock exchange are valued at the last quoted sale price. Equity securities traded on the NASDAQ National Market System (“NASDAQ”) are normally valued at the official closing price provided by NASDAQ. Equity securities that are not traded on a principal exchange or NASDAQ are valued at the last sale price in the over-the-counter market. In the absence of a last sale price or official closing price, or if there is no trading in a security on a business day, the security will be valued at the mean between its closing bid and asked prices obtained from sources the Adviser deems appropriate pursuant to policies and procedures approved by the Fund’s Board. Equity securities in an active market will be classified as Level 1 securities.
Investments in mutual funds, including money market funds, are valued at the mutual fund’s closing net asset value per share on the day of valuation. The prospectuses for such investment companies contain information on those investment companies’ valuation procedures and the effects of fair valuation. These securities will be classified as Level 1 securities.
Short-term debt instruments, including commercial paper or U.S. Treasury bills, having a maturity of 60 days or less may be valued at amortized cost, which approximates fair value. Amortized cost will not be used if its use would be inappropriate due to credit or other impairments of the issuer. These debt instruments will generally be classified as Level 2 securities.
Debt securities, such as corporate or convertible bonds, including those having a maturity or an announced call within 60 days, are generally traded in the over-the-counter market. These securities are valued at prices obtained from an independent pricing service, which may consider the yield or price of bonds of similar quality, coupon, maturity and type, as well as prices supplied by dealers who make markets in such securities. In the absence of a price from a pricing service, or if a quotation does not appear to accurately reflect the current value of a security, debt securities are valued at the mean of the closing bid and asked prices from sources the Adviser deems appropriate pursuant to policies and procedures approved by the Fund’s Board. Debt securities will generally be classified as Level 2 securities.
Greenspring Fund, Incorporated
NOTES TO FINANCIAL STATEMENTS December 31, 2015 (Con’t) |
Any securities for which market quotations are not readily available are valued at fair value as determined in good faith by the Adviser pursuant to policies and procedures approved by the Fund’s Board. These securities will be classified as Level 3 securities.
In determining fair value, the Adviser, as directed by the Board, considers all relevant qualitative and quantitative information available. These factors are subject to change over time and are reviewed periodically. The values assigned to fair value investments are based on available information and do not necessarily represent amounts that might ultimately be realized, since such amounts depend on future developments inherent in long-term investments. Further, because of the inherent uncertainty of valuation, those estimated values may differ significantly from the values that would have been used had a ready market for the investments existed, and the differences could be material.
The Fund has adopted fair valuation accounting standards that establish an authoritative definition of fair value and set out a hierarchy for measuring fair value. These standards require additional disclosures about the various input and valuation techniques used in measuring fair value. Fair value inputs are summarized in the three broad levels listed below:
| Level 1 – | Unadjusted quoted prices in active markets for identical securities that the Fund has the ability to access. |
| | |
| Level 2 – | Observable inputs other than quoted prices included in Level 1 that are observable for the security, either directly or indirectly. These inputs may include quoted prices for the identical instrument on an inactive market, prices for similar instruments, interest rates, prepayment speeds, credit risk, yield curves, default rates and similar data. |
| | |
| Level 3 – | Unobservable inputs for the security, to the extent relevant observable inputs are not available, representing the Fund’s own assumptions about the assumptions a market participant would use in valuing the security, and which would be based on the best information available. |
The inputs or methodology used for valuing securities are not necessarily an indication of the risk associated with investing in these securities. The following is a summary of the inputs used to value the Fund’s net assets as of December 31, 2015:
| | | Quoted Prices | | | Significant Other | | | Significant | | | Carrying Value | |
| | | in Active | | | Observable | | | Unobservable | | | at December 31, | |
| | | Markets | | | Inputs | | | Inputs | | | 2015 | |
| | | Level 1 | | | Level 2 | | | Level 3 | | | Total | |
| Common Stocks | | $ | 232,333,079 | | | $ | — | | | $ | — | | | $ | 232,333,079 | |
| Preferred Stocks | | | 1,161,007 | | | | — | | | | — | | | | 1,161,007 | |
| Convertible Bonds | | | — | | | | 110,412 | | | | — | | | | 110,412 | |
| Corporate Bonds | | | — | | | | 67,472,921 | | | | — | | | | 67,472,921 | |
| Short-Term Investments | | | 10,600,466 | | | | — | | | | — | | | | 10,600,466 | |
| Total | | $ | 244,094,552 | | | $ | 67,583,333 | | | $ | — | | | $ | 311,677,885 | |
See Schedule of Investments for industry breakdown.
Transfers between levels are recognized at the end of the reporting period. During the year ended December 31, 2015 transfers into Level 1 and out of Level 2 were $2,114,300. The security transferred out of Level 2 and into Level 1 due to increased market activity.
The Fund did not have any Level 3 securities during the year.
Greenspring Fund, Incorporated
NOTES TO FINANCIAL STATEMENTS December 31, 2015 (Con’t) |
Dividends and distributions to stockholders – The Fund records dividends and distributions to shareholders on the ex-dividend date.
Redemption fees – The Fund’s Board of Directors has adopted policies and procedures with respect to frequent purchases and redemptions of Fund shares by Fund shareholders. The Fund is intended for long-term investors. The Fund discourages and does not accommodate frequent purchases and redemptions of Fund shares by Fund shareholders. The Fund reserves the right to decline a purchase order for any reason.
“Market-timers” who engage in frequent purchases and redemptions over a short period can disrupt the Fund’s investment program by requiring the Fund to have excess cash on hand or to liquidate holdings to accommodate redemptions. In addition, frequent purchases and redemptions may impede efficient Fund management and create additional transaction costs that are borne by all shareholders. To the extent that the Fund invests a significant portion of its assets in small-cap securities or high-yield bonds, it may be subject to the risks of market timing more than a fund that does not. Therefore, the Fund imposes a 2% redemption fee for shares held 60 days or less. The fee is deducted from the seller’s redemption proceeds and deposited into the Fund to help offset brokerage commissions, market impact, and other costs associated with fluctuations in Fund asset levels and cash flow caused by short-term trading. All shareholders are subject to these restrictions regardless of whether you purchased your shares directly from the Fund or through a financial intermediary. However, the Fund is limited in its ability to determine whether trades placed through financial intermediaries may signal excessive trading. Accordingly, the Fund may not be able to determine whether trading in combined orders or in omnibus accounts is contrary to the Fund’s policies. The Fund reserves the right to reject combined or omnibus orders in whole or in part.
To calculate redemption fees, after first redeeming any shares associated with reinvested dividends or other distributions, the “first-in, first out” method is used to determine the holding period. Under this method, the date of redemption will be compared with the earliest purchase date of shares held in the account. If the holding period for shares purchased is 60 days or less, the fee will be charged. The redemption fee may be modified or discontinued at any time, in which case, shareholders will be notified. The redemption fee does not apply to shares acquired through the reinvestment of dividends or other distributions, or shares redeemed pursuant to a systematic withdrawal plan or a mandatory IRA distribution.
In compliance with Rule 22c-2 under the 1940 Act, Quasar Distributors, LLC, on behalf of the Fund, has entered into written agreements with each of the Fund’s financial intermediaries, under which the intermediaries must, upon request, provide the Fund with certain shareholder and identity trading information so that the Fund can enforce its frequent trading policies.
Risk of loss arising from indemnifications – In the normal course of business, the Fund enters into contracts that contain a variety of representations, which provide general indemnifications. The Fund’s maximum exposure under these arrangements is unknown as this would involve future claims that may be made against the Fund that have not yet occurred. However, based on experience, the Fund expects the risk of loss to be remote.
| Note 2 – Dividends and Distributions |
It is the Fund’s policy to declare dividends from net investment income and distributions from net realized gains as determined in accordance with the Internal Revenue Code which may differ from accounting principles generally accepted in the United States of America. Accordingly, periodic reclassifications are made within the portfolio’s capital accounts to reflect income and gains available for distribution under income tax regulations.
Greenspring Fund, Incorporated
NOTES TO FINANCIAL STATEMENTS December 31, 2015 (Con’t) |
On July 9, 2015 an income dividend of $0.34 per share was declared, payable on July 10, 2015, to shareholders of record on July 8, 2015. Additionally, on December 16, 2015, an income dividend of $0.191 per share and a long-term capital gain distribution of $0.654 per share were declared, payable on December 17, 2015 to shareholders of record on December 15, 2015. The tax character of distributions paid during the year ended December 31, 2015 and the year ended December 31, 2014 were as follows:
| Distributions paid from: | December 31, 2015 | December 31, 2014 |
| Ordinary income | $9,147,096 | $21,211,081 |
| Long-term capital gain | $9,467,311 | $10,219,967 |
These dividends are either distributed to shareholders or reinvested in the Fund as additional shares issued to shareholders. For those shareholders reinvesting the dividends, the number of shares issued is based on the net asset value per share as of the close of business on the ex-dividend date.
The Fund designated as long-term capital gain dividend, pursuant to Internal Revenue Code Section 852(b)(3), the amount necessary to reduce the earnings and profits of the Fund related to net capital gain to zero for the tax year ended December 31, 2015.
| Note 3 – Purchases and Sales of Investments |
For the year ended December 31, 2015, purchases and sales of investments, other than short-term investments and U.S. government obligations aggregated $112,372,467 and $399,753,302, respectively.
| Note 4 – Federal Income Taxes |
It is the Fund’s policy to comply with the requirements of the Internal Revenue Code applicable to regulated investment companies. Accordingly, the Fund intends to distribute substantially all of its taxable income. Therefore, no federal income tax provision is required.
As of and during the year ended December 31, 2015, the Fund did not have any tax positions that did not meet the “more-likely-than-not” threshold of being sustained by the applicable tax authority. Tax positions not deemed to meet the “more-likely-than-not” threshold would be recorded as a tax benefit or expense in the current year. Generally, tax authorities can examine tax returns filed for all open tax years (2012-2015).
Required Fund distributions are based on income and capital gain amounts determined in accordance with federal income tax regulations, which differ from net investment income and realized gains recognized for financial reporting purposes.
Accordingly, the composition of net assets and distributions on a tax basis may differ from those reflected in the accompanying financial statements. As of December 31, 2015, the Fund’s most recently completed year end, the components of distributable earnings on a tax basis were as follows:
Greenspring Fund, Incorporated
NOTES TO FINANCIAL STATEMENTS December 31, 2015 (Con’t) |
| | Cost of investments | | $ | 272,495,567 | |
| | Gross tax unrealized appreciation | | | 64,099,567 | |
| | Gross tax unrealized depreciation | | | (24,917,249 | ) |
| | Net tax unrealized appreciation | | | 39,182,318 | |
| | Undistributed ordinary income | | | 386,812 | |
| | Undistributed long-term capital gain | | | 11,961,637 | |
| | Total distributable earnings | | | 12,348,449 | |
| | Other accumulated losses | | | — | |
| | Total accumulated earnings | | $ | 51,530,767 | |
Accounting principles generally accepted in the United States of America require that certain components of net assets relating to permanent differences be reclassified between financial and tax reporting. These reclassifications have no effect on net assets or net asset value per share. For the year ended December 31, 2015, the Fund decreased undistributed net investment income by $952 and increased accumulated net realized gain on investments by $952. At December 31, 2015, the Fund did not have a post-October capital loss or a capital loss carryforward.
| Note 5 – Transactions with Affiliated Parties |
Corbyn serves as the Fund’s investment adviser. Under an agreement between the Fund and Corbyn, the Fund pays Corbyn a fee of 0.75% of the first $250 million of average daily net assets, 0.70% of average daily net assets between $250 million and $500 million and 0.65% of average daily net assets in excess of $500 million, which is computed daily and paid monthly. For the year ended December 31, 2015, the Fund incurred $3,418,200 in advisory fees.
The Fund has also entered into a Services Agreement with Corbyn to provide various administrative services. As compensation, the Fund pays Corbyn a fee of $2,500 per month plus 0.01% of average daily net assets, which is computed daily and paid monthly. For the year ended December 31, 2015, the Fund incurred $77,253 in administrative fees to Corbyn.
At December 31, 2015, investors for whom Corbyn was investment adviser held 1,030,471 shares of the Fund.
A company is considered to be an affiliate of the Fund under the 1940 Act if the Fund’s holdings of that company represent 5% or more of the outstanding voting securities of the company. Transactions with companies that are or were affiliates during the year ended December 31, 2015 are as follows:
| | Beginning | Purchase | Sales | Ending | Dividend | Realized | | |
| Issuer | Cost | Cost | Cost | Cost | Income | Loss | Shares | Value |
| Lumos Networks Corp.* | $18,446,259 | $1,644,325 | $6,230,072 | $13,860,512 | $— | $(1,967,528) | 1,060,217 | $11,874,430 |
| * | No longer an affiliate as of December 31, 2015. |
| Note 6 – Subsequent Events |
Management has evaluated events and transactions occurring after December 31, 2015 through the date that the financial statements were issued, and has determined that no additional disclosure in the financial statements is required.
Greenspring Fund, Incorporated
REPORT OF INDEPENDENT REGISTERED PUBLIC ACCOUNTING FIRM
Board of Directors and Shareholders
Greenspring Fund, Incorporated
Lutherville, Maryland
We have audited the accompanying statement of assets and liabilities of the Greenspring Fund, Incorporated (the “Fund”), including the schedule of investments, as of December 31, 2015, and the related statement of operations for the year then ended, the statements of changes in net assets for each of the two years in the period then ended, and financial highlights for each of the five years in the period then ended. These financial statements and financial highlights are the responsibility of the Fund’s management. Our responsibility is to express an opinion on these financial statements and financial highlights based on our audits.
We conducted our audits in accordance with the standards of the Public Company Accounting Oversight Board (United States). Those standards require that we plan and perform the audit to obtain reasonable assurance about whether the financial statements and financial highlights are free of material misstatement. The Fund is not required to have, nor were we engaged to perform, an audit of its internal control over financial reporting. Our audits included consideration of internal control over financial reporting as a basis for designing audit procedures that are appropriate in the circumstances, but not for the purpose of expressing an opinion on the effectiveness of the Fund’s internal control over financial reporting. Accordingly, we express no such opinion. An audit includes examining, on a test basis, evidence supporting the amounts and disclosures in the financial statements. Our procedures included confirmation of securities owned as of December 31, 2015, by correspondence with the custodian and brokers or by other appropriate auditing procedures where replies from brokers were not received. An audit also includes assessing the accounting principles used and significant estimates made by management, as well as evaluating the overall financial statement presentation. We believe that our audits provide a reasonable basis for our opinion.
In our opinion, the financial statements and financial highlights referred to above present fairly, in all material respects, the financial position of the Greenspring Fund, Incorporated as of December 31, 2015, the results of its operations for the year then ended, the changes in its net assets for each of the two years in the period then ended, and the financial highlights for each of the five years in the period then ended, in conformity with accounting principles generally accepted in the United States of America.
Philadelphia, Pennsylvania
February 19, 2016
Greenspring Fund, Incorporated
NOTICE TO SHAREHOLDERS December 31, 2015 (Unaudited) |
Tax Information
The Fund designates 47.86% of dividends declared from net investment income during the fiscal year ended December 31, 2015 as qualified income under the Jobs and Growth Tax Relief Reconciliation Act of 2003.
For corporate shareholders in the Fund, the percentage of ordinary dividend income distributed for the year ended December 31, 2015, which is designated as qualifying for the dividends-received deduction, is 43.68%.
For foreign shareholders in the Fund, for the year ended December 31, 2015, 73.56% of the ordinary distributions paid qualify as interest-related dividends under the Internal Revenue Code Section 871(k)(1)(c), and 0.00% of the ordinary income distributions are designated as short-term capital gain distributions under Internal Revenue Code Section 871(k)(2)(c).
Proxy Voting Policies and Proxy Voting Record
The Fund’s proxy voting policies and procedures, as well as its proxy voting record for the most recent 12-month period ended June 30, are available without charge, upon request, by contacting the Fund at (800) 366-3863 or info@greenspringfund.com. The Fund will send the information within three business days of receipt of the request, by first class mail or other means designed to ensure equally prompt delivery. The Fund’s proxy voting record is also available on the U.S. Securities and Exchange Commission’s website at www.sec.gov.
Form N-Q Holdings Information
The Fund files its complete schedule of portfolio holdings with the U.S. Securities and Exchange Commission for the first and third quarters of each fiscal year on Form N-Q. The Fund’s Forms N-Q are available on the Commission’s website at www.sec.gov and may be reviewed and copied at the Commission’s Public Reference Room in Washington, DC. Information on the operation of the Public Reference Room may be obtained by calling (800) SEC-0330.
Reports and Householding
In an attempt to reduce shareholder expenses, we will mail only one copy of the Fund’s Summary Prospectus and each Annual and Semi-Annual Report to those addresses shared by two or more accounts. If you wish to receive individual copies of these documents, please call us at (800) 366-3863. We will begin sending you individual copies 30 days after receiving your request.
The Fund’s Summary Prospectus, Prospectus, Statement of Additional Information, Annual Report, and Semi-Annual Report, along with its first and third quarter portfolio holdings, are available on the Fund’s website at www.greenspringfund.com.
Greenspring Fund, Incorporated
BASIC INFORMATION ABOUT FUND DIRECTORS AND OFFICERS (Unaudited) |
The Board of Directors supervises the management of the Fund. The following list summarizes information on the directors and officers of the Fund for the past five years. The address of each is 2330 West Joppa Road, Suite 110, Lutherville, MD 21093. The Fund’s Statement of Additional Information contains additional information about Fund directors and is available, without charge, upon request, by calling the Fund at (800) 366-3863, or by emailing the Fund at greenspring@greenspringfund.com.
| | | | | Number | |
| Name and | Position(s) Held | Term of Office and | Principal Occupation(s) | of Funds | Other |
Year of Birth | with the Fund | Length of Time Served | During the Past Five Years | Overseen | Directorship |
| | | Term of Director | | | |
| | | Indefinite | | | |
| | | Term of Officer | | | |
| | | One year | | | |
| Interested | | | | | |
Directors/Officers | | | | | |
| Charles vK. Carlson | President | From March 1993 to present. | President and Director of the | One | None |
| Year of Birth: 1959 | Chairman of the Board | From January 1994 to present. | Fund’s Adviser. | | |
| | Chief Executive Officer | From February 1994 to present. | | | |
| | Director | From March 1987 to present. | | | |
| | | | | | |
| William E. Carlson | Director | From February 1994 to present. | President and Chair of the | One | None |
| Year of Birth: 1957 | | | Business Department at Shapiro | | |
| | | | Sher Guinot & Sandler (a law | | |
| | | | firm) from February 1999 to | | |
| | | | present. Partner of Shapiro Sher | | |
| | | | Guinot & Sandler from February | | |
| | | | 1990 to present. | | |
| | | | | | |
| Michael J. Fusting | Sr. Vice President | From May 1998 to present. | Sr. Vice President and Director of | One | None |
| Year of Birth: 1961 | Chief Financial Officer | From February 1994 to present. | the Fund’s Adviser. | | |
| | Director | From March 1992 to present. | | | |
| | | | | | |
Disinterested Directors | | | | | |
| David T. Fu | Director | From May 1990 to present. | Retired. Managing Director | One | None |
| Year of Birth: 1956 | | | of Kanturk Partners, LLC (a | | |
| | | | merchant bank) from February | | |
| | | | 2004 to December 2014. | | |
| | | | | | |
| Sean T. Furlong | Director | From March 2003 to present. | Director of Finance and | One | None |
| Year of Birth: 1965 | | | Operations at the Gilman | | |
| | | | School from June 2003 to present. | | |
| | | | Adjunct Professor of Financial | | |
| | | | Accounting at Johns Hopkins | | |
| | | | University from February 2013 to | | |
| | | | present. | | |
Greenspring Fund, Incorporated
BASIC INFORMATION ABOUT FUND DIRECTORS AND OFFICERS (Unaudited) (Con’t) |
| | | | | Number | |
| Name and | Position(s) Held | Term of Office and | Principal Occupation(s) | of Funds | Other |
Year of Birth | with the Fund | Length of Time Served | During the Past Five Years | Overseen | Directorship |
| | | Term of Director | | | |
| | | Indefinite | | | |
| | | Term of Officer | | | |
| | | One year | | | |
| | | | | | |
Officers | | | | | |
| Elizabeth Agresta Swam | Secretary and Treasurer | From May 1998 to present. | Employee of the Fund’s Adviser | N/A | None |
| Year of Birth: 1967 | AML Officer | From July 2002 to present. | from May 1998 to present. | | |
| | Chief Compliance Officer | From July 2004 to present. | | | |
Privacy Policy
The Greenspring Fund recognizes that individuals expect an exceptional level of privacy in their financial affairs. The Fund assures the confidentiality of personal information provided to it.
The information we collect is limited to what the Fund believes is necessary or useful to conduct our business; administer your records, accounts and funds; to comply with laws and regulations; and to help us design or improve products and services. The Fund collects non-public personal information about you from information it receives from you on applications or other forms or through its website, as well as from information about your transactions with the Fund.
Some of this information may be disclosed to the Fund’s investment adviser, but not for marketing solicitation, as well as non-affiliated third parties who provide non-financial services to the Fund such as our Transfer Agent, in order to administer customer accounts and mail transaction confirmations and tax forms, and the mailing house the Fund utilizes for mailing shareholder reports. Such information may also be disclosed to a non-affiliated third party engaged to provide fund accounting and administrative services to us. Disclosing this information enables us to meet customers’ financial needs and regulatory requirements. These third parties act on its behalf and are obligated to keep the information we provide to them confidential and to use the information only for the purposes authorized. The Fund does not disclose any non-public personal information about you or former customers to anyone, except as permitted by law.
To protect your non-public personal information, the Fund permits access to it only by authorized employees and maintains security practices to safeguard your information.
If you have any questions regarding our Privacy Policy, please contact us at 1-800-366-3863 or greenspring@greenspringfund.com. Thank you.
This Privacy Policy is not part of the Annual Report.
Greenspring Fund, Incorporated
Performance Since Inception on
July 1, 1983 through December 31, 2015
(Unaudited)
|
| HOW $10,000 INVESTED ON 7/1/83 WOULD HAVE GROWN* |
|
 |
| |
| * | Figures include changes in principal value, reinvested dividends and capital gains distributions. Past expense limitations increased the Fund’s return. This chart illustrates the performance of a hypothetical $10,000 investment made in the Fund since inception through December 31, 2015. The total value of $170,017 assumes the reinvestment of dividends and capital gains, but does not reflect the effect of any redemption fees. This chart does not imply any future performance. |
Average annual total returns for the one, three, five, ten year and since inception periods ended December 31, 2015 were -5.86%, 2.73%, 3.36%, 4.67% and 9.11%, respectively. Average annual returns for more than one year assume a compounded rate of return and are not the Fund’s year-by-year results, which fluctuated over the periods shown. Returns do not reflect taxes that shareholders may pay on Fund distributions or redemption of Fund shares.
(This Page Intentionally Left Blank.)
Greenspring Fund, Incorporated
2330 West Joppa Road, Suite 110
Lutherville, MD 21093
(410) 823-5353
(800) 366-3863
www.greenspringfund.com
DIRECTORS
Charles vK. Carlson, Chairman
William E. Carlson
David T. Fu
Sean T. Furlong
Michael J. Fusting
OFFICERS
Charles vK. Carlson
President and Chief Executive Officer
Michael J. Fusting
Sr. Vice President and
Chief Financial Officer
Elizabeth Agresta Swam
Chief Compliance Officer,
Secretary, Treasurer
and AML Officer
INVESTMENT ADVISER
Corbyn Investment Management, Inc.
2330 West Joppa Road, Suite 108
Lutherville, MD 21093-7207
ADMINISTRATOR, FUND ACCOUNTANT
AND TRANSFER AGENT
U.S. Bancorp Fund Services, LLC
615 East Michigan Street
Milwaukee, WI 53202
DISTRIBUTOR
Quasar Distributors, LLC
615 East Michigan Street
Milwaukee, WI 53202
CUSTODIAN
U.S. Bank, N.A.
1555 N. Rivercenter Dr., Suite 302
Milwaukee, WI 53212
INDEPENDENT REGISTERED
PUBLIC ACCOUNTING FIRM
Tait, Weller & Baker LLP
1818 Market Street, Suite 2400
Philadelphia, PA 19103
LEGAL COUNSEL
K&L Gates LLP
1601 K Street NW
Washington, DC 20006
Symbol – GRSPX
CUSIP – 395724107
Item 2. Code of Ethics.
The registrant has adopted a code of ethics that applies to the registrant’s principal executive officer and principal financial officer. The registrant has not made any amendments to its code of ethics during the period covered by this report. The registrant has not granted any waivers from any provisions of the code of ethics during the period covered by this report.
A copy of the registrant’s Code of Ethics is filed herewith.
Item 3. Audit Committee Financial Expert.
The registrant’s board of directors has determined that there is at least one audit committee financial expert serving on its audit committee. Mr. Sean T. Furlong is the “audit committee financial expert” and is considered to be “independent” as each term is defined in Item 3 of Form N CSR.
Item 4. Principal Accountant Fees and Services.
The registrant has engaged its principal accountant to perform audit services, audit-related services, tax services or other services during the past two fiscal years. “Audit services” refer to performing an audit of the registrant's annual financial statements or services that are normally provided by the accountant in connection with statutory and regulatory filings or engagements for those fiscal years. “Audit-related services” refer to the assurance and related services by the principal accountant that are reasonably related to the performance of the audit. “Tax services” refer to professional services rendered by the principal accountant for tax compliance, tax advice, and tax planning. There were no “other services” provided by the principal accountant. The following table details the aggregate fees billed, or expected to be billed, for each of the last two fiscal years for audit fees, audit-related fees, tax fees or other fees by the principal accountant:
| | FYE 12/31/2015 | FYE 12/31/2014 |
| Audit Fees | $26,000 | $25,750 |
| Audit-Related Fees | N/A | N/A |
| Tax Fees | $3,500 | $3,400 |
| All Other Fees | N/A | N/A |
The audit committee has adopted pre-approval policies and procedures that require the audit committee to pre approve all audit and non audit services of the registrant, including services provided to any entity affiliated with the registrant. All of the principal accountant’s hours spent on auditing the registrant’s financial statements were attributed to work performed by full time permanent employees of the principal accountant.
The percentage of fees billed by Tait, Weller & Baker LLP applicable to non-audit services pursuant to waiver of pre-approval requirement were as follows:
| | FYE 12/31/2015 | FYE 12/31/2014 |
| Audit-Related Fees | 0% | 0% |
| Tax Fees | 0% | 0% |
| All Other Fees | 0% | 0% |
The following table indicates the non-audit fees billed, or expected to be billed, by the registrant’s accountant for services to the registrant and to the registrant’s investment adviser for the last two years. The audit committee of the board of directors has considered whether the provision of non-audit services that were rendered to the registrant's investment adviser is compatible with maintaining the principal accountant's independence and has concluded that the provision of such non-audit services by the accountant has not compromised the accountant’s independence.
| Non-Audit Related Fees | FYE 12/31/2015 | FYE 12/31/2015 |
| Registrant | N/A | N/A |
| Registrant’s Investment Adviser | N/A | N/A |
Item 5. Audit Committee of Listed Registrants.
Not applicable to registrants who are not listed issuers (as defined in Rule 10A-3 under the Securities Exchange Act of 1934).
Item 6. Investments.
Schedule of Investments is included as part of the report to shareholders filed under Item 1 of this Form.
Item 7. Disclosure of Proxy Voting Policies and Procedures for Closed-End Management Investment Companies.
Not applicable to open-end investment companies.
Item 8. Portfolio Managers of Closed-End Management Investment Companies.
Not applicable to open-end investment companies.
Item 9. Purchases of Equity Securities by Closed‑End Management Investment Company and Affiliated Purchasers.
Not applicable to open-end investment companies.
Item 10. Submission of Matters to a Vote of Security Holders.
Not Applicable.
Item 11. Controls and Procedures.
| (a) | The Registrant’s Chief Executive Officer and Chief Financial Officer have reviewed the Registrant's disclosure controls and procedures (as defined in Rule 30a-3(c) under the Investment Company Act of 1940 (the “Act”) (17 CFR 270.30a-3(c))) as of a date within 90 days of the filing date of the report that includes the disclosure required by this paragraph, based on the evaluation of these controls and procedures required by Rule 30a-3(b) under the Act (17 CFR 270.30a-3(b)) and Rules 13a-15(b) or 15d‑15(b) under the Securities Exchange Act of 1934 (17 CFR 240.13a-(15(b) or 240.15d-15(b)). Based on their review, such officers have concluded that the disclosure controls and procedures are effective in ensuring that information required to be disclosed in this report is appropriately recorded, processed, summarized and reported and made known to them by others within the Registrant and by the Registrant’s service provider. |
| (b) | There were no changes in the Registrant's internal control over financial reporting (as defined in Rule 30a-3(d) under the Act (17 CFR 270.30a-3(d)) that occurred during the second fiscal quarter of the period covered by this report that has materially affected, or is reasonably likely to materially affect, the Registrant's internal control over financial reporting. |
Item 12. Exhibits.
| (a) | (1) Any code of ethics, or amendment thereto, that is the subject of the disclosure required by Item 2, to the extent that the registrant intends to satisfy Item 2 requirements through filing an exhibit. Filed herewith. |
(2) A separate certification for each principal executive and principal financial officer of the registrant as required by Rule 30a-2(a) under the Act (17 CFR 270.30a-2(a)), exactly as set forth below: Filed herewith.
(3) Any written solicitation to purchase securities under Rule 23c‑1 under the Act (17 CFR 270.23 C-1) sent or given during the period covered by the report by or on behalf of the registrant to 10 or more persons. Not applicable to open-end investment companies.
| (b) | Certifications pursuant to Section 906 of the Sarbanes‑Oxley Act of 2002. Furnished herewith. |
SIGNATURES
Pursuant to the requirements of the Securities Exchange Act of 1934 and the Investment Company Act of 1940, the registrant has duly caused this report to be signed on its behalf by the undersigned, thereunto duly authorized.
(Registrant) Greenspring Fund, Incorporated
By (Signature and Title)* /s/Charles vK. Carlson
Charles vK. Carlson, Chief Executive Officer
Date March 2, 2016
Pursuant to the requirements of the Securities Exchange Act of 1934 and the Investment Company Act of 1940, this report has been signed below by the following persons on behalf of the registrant and in the capacities and on the dates indicated.
By (Signature and Title)* /s/Charles vK. Carlson
Charles vK. Carlson, Chief Executive Officer
Date March 2, 2016
By (Signature and Title)* /s/Michael J. Fusting
Michael J. Fusting, Chief Financial Officer
Date March 2, 2016
* Print the name and title of each signing officer under his or her signature.