UNITED STATES
SECURITIES AND EXCHANGE COMMISSION
Washington, D.C. 20549
FORM N-CSR
CERTIFIED SHAREHOLDER REPORT OF REGISTERED
MANAGEMENT INVESTMENT COMPANIES
Investment Company Act file number 811-03627
Greenspring Fund, Incorporated
(Exact name of registrant as specified in charter)
2330 West Joppa Road, Suite 110
Lutherville, MD 21093-4641
(Address of principal executive offices) (Zip code)
Mr. Charles vK. Carlson, President
2330 West Joppa Road, Suite 110
Lutherville, MD 21093-4641
(Name and address of agent for service)
(410) 823-5353
Registrant's telephone number, including area code
Date of fiscal year end: December 31, 2013
Date of reporting period: December 31, 2013
Item 1. Reports to Stockholders.
ANNUAL REPORT
DECEMBER 31, 2013
This report is intended for shareholders of the
Greenspring Fund, Incorporated and may not be
used as sales literature unless preceded or
accompanied by a current prospectus.
Greenspring Fund, Incorporated
Dear Fellow Shareholders:
We are pleased to report that the Greenspring Fund generated positive returns during the fourth quarter of 2013 and for the full year, gaining 2.13% and 18.13%, respectively, including the reinvestment of all dividends and capital gain distributions. Major equity market indexes also advanced in 2013 as the Federal Reserve continued to inject significant amounts of liquidity into the financial system and the economy continued to expand, albeit at an uninspiring pace. In the fixed income markets, investors who held longer-term bonds experienced losses for the first time in many years. The yield on the 10-year U.S. Treasury note increased from approximately 1.75% to 3% during the year, driving bond prices, which move inversely to interest rates, lower. At the same time, short-term interest rates, heavily influenced by the Federal Reserve’s zero interest rate policy, remained at extremely low levels, forcing many investors seeking yield to move up the risk spectrum.
In response to the financial crisis of 2008/09, the Federal Reserve has consistently held short-term interest rates close to zero and aggressively pursued the open market purchase of mortgage securities and government bonds in an effort to expand the monetary base and bring down long-term interest rates. Little precedent exists, at least in recent history, to indicate what effects these extraordinary monetary actions will have on investors, markets and the economy over the long term. To date, investors have applauded the Federal Reserve’s actions by bidding up stock prices, enabling the major stock market indexes to recover the severe losses suffered during 2008 with several indexes hitting new highs during 2013, even though the impact on the economy has been far more muted. Throughout the markets’ recovery, investors seemed to focus more on the actions of the Federal Reserve than the performance of the economy or the companies in which they were investing. As we mentioned in the third quarter shareholder letter, recent equity market gains have outpaced the growth in company earnings, an indication that many stocks are more richly valued now versus earlier in 2013.
| Greenspring Fund | | | |
| Performance for the | | | |
| Periods Ended December 31, 2013 | | | |
| Quarter | | | 2.13 | % |
| 1 Year | | | 18.13 | % |
| 3 Years* | | | 8.72 | % |
| 5 Years* | | | 10.49 | % |
| 10 Years* | | | 7.13 | % |
| 15 Years* | | | 8.10 | % |
| 20 Years* | | | 8.40 | % |
| Since Inception on 7/1/83* | | | 10.04 | % |
| Expense Ratio** | | | 0.94 | % |
| |
| * Annualized. |
| ** As stated in Prospectus dated 5-1-13. See note on last page of letter. |
| |
| Performance data quoted represents past performance; past performance does not guarantee future results. The investment return and principal value of an investment will fluctuate so that an investor’s shares, when redeemed, may be worth more or less than their original cost. Current performance of the Fund may be lower or higher than the performance quoted. Performance data current to the most recent month end may be obtained by calling 1-800-366-3863 or visiting the Fund’s web site. The Fund imposes a 2.00% redemption fee for shares held 60 days or less. Performance data does not reflect the redemption fee. If reflected, total returns would be reduced. |
INFLUENCES on PERFORMANCE
During 2013, approximately 95% of the equity and fixed income securities held in the Fund’s portfolio throughout the year generated positive returns. The Fund’s overall performance for the year was heavily influenced by the robust returns generated by the common stock holdings in the portfolio. Many of the equity holdings increased in value in response to strong earnings and cash flows reported throughout the year, and benefitted from the general stock market rally that pushed prices higher. The Fund’s fixed income securities also provided positive total
Greenspring Fund, Incorporated
returns, despite the headwinds many fixed income investors faced resulting from rising long-term interest rates, as we continued to maintain a short-duration fixed income portfolio.
The largest single influence on the Fund’s performance was the positive return achieved by the equity holdings within the Construction and Engineering industry group (Dycom Industries, Inc., EMCOR Group, Inc., KBR, Inc., MYR Group, Inc., MasTec, Inc., and Michael Baker Corp). During the last few years within the equity portfolio, we have maintained a relatively large holding of companies involved in various aspects of the Construction and Engineering industries. These companies have benefitted from increased spending on infrastructure investments such as the development of domestic oil and gas reserves, expansion and improvement of telecommunication systems, upgrading and expanding the electric transmission and distribution network, and improvements to roads and bridges. All of the holdings within the Construction and Engineering industry group produced positive returns for the year. During the year, we sold the Fund’s holdings in Michael Baker Corp. (discussed later in this letter) after it agreed to be acquired by a private company, reduced the Fund’s holdings of MasTec, Inc., but purchased additional shares in MYR Group, Inc.
Taking into consideration the Fund’s entire portfolio, the five individual securities that had the largest influences (measured by dollars gained or lost) on the Fund’s total performance for the year are discussed below.
j2 Global, Inc.
j2 Global, Inc., a long-term holding of the Fund, is a digital media and cloud-based service provider offering digital communication, storage and messaging services. The share price of j2 Global increased substantially during 2013 as management continued to successfully execute its strategy of creating a more diversified and faster growing offering of business lines. Since late 2012, through the acquisitions of Ziff Davis, IGN and NetShelter, the Company has created one of the leading digital publishers catering to technology and video game enthusiasts. At the same time, the legacy j2 Global business continued its solid, if unspectacular, growth driven by its cloud-based subscription services such as eFax and the backup service KeepItSafe. j2 Global continued to report strong earnings and cash flow during 2013, allowing the Company to increase dividends paid to shareholders and complete several small acquisitions while maintaining a strong balance sheet with significant cash reserves.
We reduced the Fund’s holdings in j2 Global during the year as the rising stock price was more representative of our estimate of its current fair value, but we continue to have a very favorable outlook for the ability of the Company to grow earnings and cash flow in the future. j2 Global remains one of the larger holdings in the Fund’s portfolio.
Michael Baker Corp.
Michael Baker Corp. provides engineering and consulting services to governments and corporations with a strong focus on infrastructure projects such as bridges, roads, airports, water systems and urban development projects. Michael Baker Corp. has been a long term holding of the Fund and was recently discussed in our third quarter letter to shareholders. After reporting disappointing earnings in late 2012, the Company’s share price was depressed. Consequently, in early 2013, a private investor, attracted by the low share price, offered to acquire Michael Baker Corp. for $24.25 per share. This offer was significantly
| | | % of Net |
| Greenspring Fund | | Assets |
| Top 10 Holdings | | as of |
| | | 12/31/13 |
| j2 Global, Inc. | | | 3.2 | % |
| FTI Consulting, Inc. | | | 3.1 | % |
| Harmonic, Inc. | | | 2.8 | % |
| Republic Services, Inc. | | | 2.8 | % |
| Energen Corp. | | | 2.6 | % |
| PartnerRe, Ltd. | | | 2.5 | % |
| PetroQuest Energy, Inc., 10.000%, 9/1/17 | | | 2.5 | % |
| iGATE Corp., 9.000%, 5/1/16 | | | 2.5 | % |
| Silicon Graphics International Corp. | | | 2.3 | % |
| Rosetta Resources, Inc., 9.500%, 4/15/18 | | | 2.3 | % |
Greenspring Fund, Incorporated
below the price where the stock had traded in the past and was arguably a large discount to a reasonable estimate of the inherent value of the Company. Management quickly refocused their efforts on improving the profitability of the Company by implementing cost cuts and a profit improvement plan. At the same time, management retained independent financial advisors to study various longer-term restructuring options available to the Company.
After reporting improved financial results reflecting the positive impact of the profit improvement plan, Michael Baker Corp.’s earnings outlook strengthened. Following extensive work with its financial advisors, the management team and the Board were able to negotiate a merger transaction for a far higher valuation. In late July, Michael Baker Corp. entered into a merger agreement with Integrated Mission Systems, by which shareholders would receive $40.50 per share in cash. The merger closed in mid-October and all of the Fund’s holdings have been sold.
Energen Corporation
Energen Corporation is another long-term holding of the Fund. At the time of the Fund’s initial purchase of Energen’s shares in 2004, the Company was a producer of natural gas from properties in Texas, Louisiana, Alabama and New Mexico and a distributor of natural gas to residential and business customers through its subsidiary Alabama Gas Corporation, the largest gas utility in Alabama. Over the last several years, the Company has transformed itself by significantly growing and diversifying its non-utility energy business and has successfully created a large independent energy producer with its energy production now equally balanced between oil and natural gas. During the second half of the year, Energen and other oil and gas companies with land holdings in the Permian Basin in Texas reported that oil and gas production from wells recently drilled in the area was higher than expectations. These results provided strong evidence that the value of the oil and gas reserves located on Energens large Permian Basin land holdings is likely to be substantially greater than originally expected. Additionally, as the Company continues to drill more wells, we expect it to gain incremental basin-specific knowledge that may lead to improved drilling techniques, enhancing the development of its remaining land holdings.
As Energens oil and gas business has grown, the natural gas utility has become less significant to the operations of the Company as a whole. Recently, management indicated that it may sell the utility and use the cash proceeds to accelerate the development of its oil and gas reserves. Energens stock price increased substantially during the year, responding favorably to both the recently reported well results and the potential sale of the utility. We remain
| Greenspring Fund |
| Largest 2013 Purchases |
| Common Stocks: |
| Silicon Graphics International Corp. |
| Denbury Resources, Inc. |
| MYR Group, Inc. |
| Datalink Corp. |
| Lumos Networks Corp. |
| Bonds: |
| iGate Corporation, 9.000%, 5/1/16 |
| Bankrate, Inc., 11.750%, 7/15/15 |
| Level 3 Financing, Inc., 10.000%, 2/1/18 |
| US Foods, Inc., 8.500%, 6/30/19 |
| Live Nation Entertainment, Inc., 8.125%, 5/15/18 |
| Greenspring Fund |
| Largest 2013 Sales |
| Common Stocks: |
| Michael Baker Corp. |
| Assurant, Inc. |
| BioScrip, Inc. |
| Cisco Systems, Inc. |
| Lumos Networks Corp. |
| Bonds: |
| Alcatel-Lucent USA, Inc., 2.875%, 6/15/25 Convertible Bonds |
| BioScrip, Inc., 10.250%, 10/1/15 |
| RadioShack Corp., 2.500%, 8/1/13 – 144A Convertible Bonds |
| Leucadia National Corp., 7.000%, 8/15/13 |
| Level 3 Financing, Inc., 10.000%, 2/1/18 |
Greenspring Fund, Incorporated
confident that Energen will continue to create shareholder value through the development of its large Permian Basin acreage position and the potential execution of a sale of its natural gas utility.
Harmonic, Inc.
Harmonic, Inc. designs and sells niche market-dominant products that enable its customers to create and deliver a wide range of video services to various consumer devices such as televisions, computers, tablets and smart phones. Harmonic had a difficult 2012, as capital spending by its major cable and telecommunication customers was less than expected. At the beginning of 2013, the stock price was depressed and shareholders of Harmonic, Inc. were pressing management to focus on the allocation of its sizeable cash holdings and the composition of its management team including the Board of Directors. In response to shareholder pressure, during 2013 the Company announced a variety of actions. First, management sold a small and not particularly profitable segment of the Company raising nearly $50 million. Second, the Company announced a tender offer for approximately 15% of its outstanding shares and committed to an additional share buyback program to be executed throughout the year. Third, the Chairman of the Board was replaced, allowing for new leadership with a fresh, energized vision for the Company. Finally, several new high-level employees were brought on board to improve sales and marketing efforts, strengthening the management team.
Although all of the steps taken by the Company during 2013 should result in greater shareholder value in the future, business fundamentals in 2013 remained challenging. Major cable customers continued to delay the adoption of new technologies, and therefore were hesitant to increase spending on Harmonic products. Despite this difficult business environment, shares of Harmonic, Inc. produced strong gains during the year. Looking forward, we are confident that the recent management changes, combined with the Company’s market-leading niche video distribution products, will allow the Company to benefit from several emerging trends in the video distribution landscape, including the expansion of delivery of video services over the Internet and the transition to UltraHD television, driving positive shareholder returns going forward.
Assurant, Inc.
Assurant, Inc. provides specialized niche insurance products within the property casualty, life, and health insurance industries. The Company’s largest business segment, specialty property insurance, serves some of the nation’s largest mortgage lenders by tracking millions of individual mortgage loans and notifying the lender if the mortgagee fails to maintain adequate insurance on the home. Assurant then issues a lender-placed policy to protect the interest of the mortgage holder. Lender-placed policies tend to have higher premiums than standard homeowners policies since Assurant does not underwrite each policy individually, but agrees to issue a policy upon the request of the lender. The housing crisis led to a large increase in the issuance of lender-placed policies and several state insurance regulators began to pressure Assurant to lower rates, leading to investor concerns that premiums could decline substantially. In addition, investors also feared that fewer foreclosures and an improving housing market would result in a decrease in the issuance of lender-placed policies. However, investor fears subsided as the number of lender-placed policies in force actually grew during the year, and rate reductions were less than expectations. Catastrophe losses during the year were also very low, helping Assurant’s specialty property segment to report earnings that were higher than anticipated. In addition, management continued to aggressively repurchase shares of its stock in the open market at a discount to book value, increasing the book value of the remaining shares outstanding. As the uncertainty dissipated and investor confidence grew, the stock price moved significantly higher. We sold the Fund’s position throughout the year as our view of the potential future return was matched by the perceived risk of continuing to own shares.
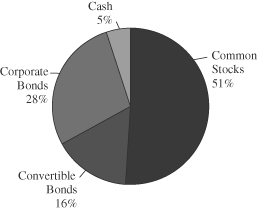
PORTFOLIO ACTIVITY
Allocation among the three main asset classes within the portfolio (common stocks, fixed income securities and cash equivalents) did not change materially versus last
Greenspring Fund, Incorporated
| Greenspring Fund |
| Portfolio Allocation |
| as of December 31, 2012 |
| |
 |
| |
| Greenspring Fund |
| Portfolio Allocation |
| as of December 31, 2013 |
| |
 |
| |
year. Compared to the end of 2012, the allocation to common stocks and fixed income securities decreased by 4% and 6%, respectively, while cash equivalents increased by 10%. These variations, which we consider normal, do not reflect a strategic change but are more reflective of the normal ebb and flow of any actively managed portfolio. Please refer to the Schedule of Investments in the financial statements for a complete list of portfolio holdings and the percentage of the portfolio each investment represents.
The most significant new common stock positions initiated during the year include the purchase of shares of Silicon Graphics International Corp., Denbury Resources, Inc. and Datalink Corporation. We also increased the Fund’s common stock holdings in a number of positions with purchases of additional shares of MYR Group, Inc., NTELOS Holdings Corp., GSI Group, Inc., and Suncor Energy, Inc. During the year, we eliminated sixteen of the Fund’s common stock holdings. These sales were the result of takeover proposals or share prices trading at levels that we believe represented fair value. The three largest positions sold during the year include the shares of Michael Baker Corp., Assurant, Inc. and BioScrip, Inc. We also reduced the Fund’s holdings in several securities as share prices began to approach our estimate of fair value with the most significant being sales of Cisco Systems, Inc., FTI Consulting, Inc., and j2 Global, Inc. Throughout the course of the year, we both sold and purchased shares of Lumos Networks, as we attempted to take advantage of the volatility in the price of its common stock. Overall, for the year as a whole, the Fund’s investment in Lumos Networks increased significantly, but our purchase and sale of shares is a good illustration of how we try to react when opportunities present themselves.
Portfolio activity within the fixed income portion of the portfolio was, once again, heavily influenced by the maturity or redemption of many of the Fund’s fixed income holdings. Throughout the year, we continued to maintain a short-duration fixed income portfolio and, consequently, expected to have a large number of the Fund’s holdings mature or be redeemed. As fixed income securities matured, were redeemed or sold, the cash proceeds were typically reinvested in additional short-duration securities with similar credit profiles. We view turnover related to bond maturities and redemptions to be ongoing and expected and, therefore, not particularly significant to the discussion of overall portfolio activity. Instead, we believe portfolio activity designed to cause a meaningful shift in the duration of the portfolio or a modification of our credit analysis would be noteworthy. There was no such activity during 2013 and we continue to emphasize short-duration securities of companies that we believe are well positioned to retire the particular security held in the Fund’s portfolio.
Greenspring Fund, Incorporated
INVESTMENT STRATEGY
Global economic and political uncertainty, combined with liquidity-focused central bank policies, continues to influence investors and the financial markets. Despite these challenges, we remain focused on the successful execution of the Greenspring Fund’s total return approach to investing. We continue to search for and purchase shares of companies that we believe are well-managed and financially strong but may have fallen out of favor with investors, allowing us to purchase shares at modest valuations relative to the companies’ abilities to generate free cash flow and future earnings. In addition to being reasonably valued, we work to identify companies where there are company-specific or macroeconomic events that may serve as catalysts to increase shareholder value. With regard to the fixed income portfolio, we believe it serves the dual purpose of reducing the inherent volatility of the Fund’s portfolio while also producing a steady total return. In the current low interest rate environment, we will continue to emphasize short-duration securities that should help to buffer the portfolio against the impact of potential future increases in interest rates. In addition, the maturities and redemptions resulting from the short-duration portfolio will provide a source of cash flow that can be reinvested in higher-yielding securities if interest rates increase or in equity securities that we believe are undervalued.
We wish all of our fellow shareholders a happy and prosperous 2014. We look forward to reporting our progress to you at the end of the first quarter.
Respectfully,
 |  |
| Charles vK. Carlson | Michael J. Fusting |
| Portfolio Manager and Co-Chief Investment Officer | Co-Chief Investment Officer |
**Total Annual Fund Operating Expenses will not correlate to the Ratio of Expenses to Average Net Assets shown in the Fund’s most recent Annual Report and in the Financial Highlights section of the Prospectus, which reflects the operating expenses of the Fund and does not include acquired fund fees and expenses.
Mutual fund investing involves risk. Principal loss is possible. Small-capitalization companies tend to have limited liquidity and greater price volatility than large-capitalization companies. Investments by the Fund in lower-rated and non-rated securities present a greater risk of loss to principal and interest than higher-rated securities. Investments in debt securities typically decrease in value when interest rates rise. This risk is usually greater for longer-term debt securities.
Opinions expressed are subject to change, are not guaranteed and should not be considered recommendations to buy or sell any security. Fund holdings and/or sector allocations are subject to change at any time and are not recommendations to buy or sell any security. Current and future portfolio holdings are subject to risk.
Free cash flow measures the cash generating capability of a company by adding certain non-cash charges (e.g. depreciation and amortization) to earnings and subtracting recurring capital expenditures. Duration is a commonly used measure of the potential volatility of the price of a debt security, or the aggregate market value of a portfolio of debt securities, prior to maturity. Securities with a longer duration generally have more volatile prices than securities of comparable quality with a shorter duration. Book value is net asset value of a company, calculated by subtracting total liabilities from total assets. Cash flow measures the cash generating capability of a company by adding non-cash charges (e.g. depreciation) and interest expense to pretax income.
Distributed by Quasar Distributors, LLC
Greenspring Fund, Incorporated
Growth of a $10,000 Investment in the Greenspring Fund
Over the Last Ten Years
Average Annual Total Returns
| | | For Periods Ended December 31, 2013 | |
| | | 1 Year | | | 3 Years | | | 5 Years | | | 10 Years | |
| Greenspring Fund | | | 18.13 | % | | | 8.72 | % | | | 10.49 | % | | | 7.13 | % |
| Russell 3000 Index | | | 33.55 | % | | | 16.24 | % | | | 18.71 | % | | | 7.88 | % |
| Lipper Flexible Portfolio Fund Index | | | 15.55 | % | | | 8.98 | % | | | 13.55 | % | | | 6.63 | % |
The graph and table do not reflect the deduction of taxes that a shareholder would pay on Greenspring Fund (the “Fund”) distributions or the redemption of Fund shares.
Performance data quoted represents past performance; past performance does not guarantee future results. The investment return and principal value of an investment will fluctuate so that an investor’s shares, when redeemed, may be worth more or less than their original cost. Current performance of the Fund may be lower or higher than the performance quoted. Performance data current to the most recent month end is available at www.greenspringfund.com or by calling 1-800-366-3863 toll free. The Fund imposes a 2.00% redemption fee for shares held 60 days or less. Performance data does not reflect the redemption fee. If reflected, total returns would be reduced.
Greenspring Fund, Incorporated
| EXPENSE EXAMPLE For the Six Months Ended December 31, 2013 (Unaudited) |
As a shareholder of the Fund, you incur two types of costs: (1) redemption fees if you redeem within 60 days of purchase; and (2) ongoing costs, including management fees and other Fund expenses. This example is intended to help you understand your ongoing costs (in dollars) of investing in the Fund and to compare these costs with the ongoing costs of investing in other mutual funds. The example is based on an investment of $1,000 invested at the beginning of the period and held for the entire period (7/1/2013 – 12/31/2013).
Actual Expenses
The first line of the table below provides information about actual account values based on actual returns and actual expenses. You may use the information in this line, together with the amount you invested, to estimate the expenses that you paid over the period. Simply divide your account value by $1,000 (for example, an $8,600 account value divided by $1,000 = 8.6), then multiply the result by the number in the first line under the heading entitled “Expenses Paid During the Period” to estimate the expenses you paid on your account during this period.
Hypothetical Example for Comparison Purposes
The second line of the table below provides information about hypothetical account values and hypothetical expenses based on the Fund’s actual expense ratio and an assumed rate of return of 5% per year before expenses, which is not the Fund’s actual return. The hypothetical account values and expenses may not be used to estimate the actual ending account balance or expenses you paid for the period. You may use this information to compare the ongoing costs of investing in the Fund and other funds. To do so, compare this 5% hypothetical example with the 5% hypothetical examples that appear in the shareholder reports of the other funds. Please note that the expenses shown in the table are meant to highlight your ongoing costs only and do not reflect any transactional costs, such as redemption fees. Therefore, the second line of the table is useful in comparing ongoing costs only, and will not help you determine the relative total costs of owning different funds. In addition, if these transactional costs were included, your costs would have been higher.
| | | | | Expenses Paid |
| | | Beginning | Ending | During the Period |
| | | Account Value | Account Value | 7/1/2013 – |
| | | 7/1/2013 | 12/31/2013 | 12/31/2013* |
| Actual | | $1,000.00 | $1,090.70 | $4.74 |
| Hypothetical | | | | |
| (5% annual return before expenses) | | $1,000.00 | $1,020.67 | $4.58 |
| * | Expenses are equal to the Fund’s annualized expense ratio of 0.90%, multiplied by the average account value over the period multiplied by 184/365 (to reflect the one-half year period). |
Greenspring Fund, Incorporated
| SCHEDULE OF INVESTMENTS at December 31, 2013 |
| Shares | | | | Value | |
| | | | |
| COMMON STOCKS: 46.6% | | | |
| | | | |
| Business Software & Services: 2.0% | | | |
| | 514,224 | | CA, Inc. | | $ | 17,303,637 | |
| | | | | |
| Commercial Banks & Thrifts: 1.8% | | | | |
| | 44,774 | | American National Bankshares, Inc. | | | 1,175,317 | |
| | 65,389 | | Chicopee Bancorp, Inc. | | | 1,138,422 | |
| | 10,271 | | Clifton Savings Bancorp, Inc. | | | 131,469 | |
| | 279,112 | | ESSA Bancorp, Inc. | | | 3,226,535 | |
| | 47,542 | | First Connecticut Bancorp, Inc. | | | 766,377 | |
| | 53,165 | | Heritage Financial Group, Inc.* | | | 1,023,426 | |
| | 31,654 | | Middleburg Financial Corp. | | | 571,038 | |
| | 52,900 | | OceanFirst Financial Corp. | | | 906,177 | |
| | 85,144 | | Shore Bancshares, Inc.* | | | 785,028 | |
| | 589,083 | | Southern National Bancorp of Virginiaº | | | 5,896,721 | |
| | | | | | | 15,620,510 | |
| Computer Communications: 1.7% | | | | |
| | 654,289 | | Cisco Systems, Inc. | | | 14,688,788 | |
| | | | | |
| Computer Systems: 2.3% | | | | |
| | 1,514,510 | | Silicon Graphics International Corp.* | | | 20,309,579 | |
| | | | | |
| Construction & Engineering: 5.8% | | | | |
| | 102,400 | | Dycom Industries, Inc.* | | | 2,845,696 | |
| | 339,375 | | EMCOR Group, Inc. | | | 14,403,075 | |
| | 511 | | KBR, Inc. | | | 16,296 | |
| | 530,483 | | MasTec, Inc.* | | | 17,357,404 | |
| | 618,439 | | MYR Group, Inc.* | | | 15,510,450 | |
| | | | | | | 50,132,921 | |
| | | | | |
| Electrical Equipment & Instruments: 1.3% | | | | |
| | 17,400 | | Emerson Electric Co. | | | 1,221,132 | |
| | 904,940 | | GSI Group, Inc.*# | | | 10,171,526 | |
| | | | | | | 11,392,658 | |
| | | | | |
| Information Technology Services: 1.1% | | | | |
| | 836,248 | | Datalink Corp.* | | | 9,115,103 | |
| | | | | |
| Insurance: 2.5% | | | | |
| | 208,584 | | PartnerRe, Ltd.# | | | 21,991,011 | |
| | | | | |
| Internet Software & Services: 3.2% | | | | |
| | 545,505 | | j2 Global, Inc. | | | 27,280,705 | |
| | | | | |
| Machinery: 0.2% | | | | |
| | 20,000 | | Pentair, Ltd.# | | | 1,553,400 | |
| | | | | |
| Management Consulting: 3.1% | | | | |
| | 646,405 | | FTI Consulting, Inc.* | | | 26,593,102 | |
| | | | | |
| Oil & Gas Exploration & Production: 8.2% | | | | |
| | 606,413 | | Denbury Resources, Inc.* | | | 9,963,365 | |
| | 319,077 | | Energen Corp. | | | 22,574,698 | |
| | 61,905 | | EOG Resources, Inc. | | | 10,390,135 | |
| | 375,296 | | Rosetta Resources, Inc.* | | | 18,029,220 | |
| | 300,375 | | Suncor Energy, Inc.# | | | 10,528,144 | |
| | | | | | | 71,485,562 | |
| | | | | |
| Oil Refining & Marketing: 0.0% | | | | |
| | 2,813 | | Phillips 66 | | | 216,967 | |
| | | | | |
| Pulp & Paper: 0.3% | | | | |
| | 50,000 | | International Paper Co. | | | 2,451,500 | |
| | | | | |
| Retail: 0.1% | | | | |
| | 53,166 | | Francesca’s Holdings Corp.* | | | 978,786 | |
| | | | | |
| Semiconductors: 1.6% | | | | |
| | 1,697,822 | | ON Semiconductor Corp.* | | | 13,990,053 | |
| | | | | |
| Telecommunications: 2.1% | | | | |
| | 468,623 | | Lumos Networks Corp. | | | 9,841,083 | |
| | 427,008 | | NTELOS Holdings Corp. | | | 8,638,372 | |
| | | | | | | 18,479,455 | |
| | | | | |
| Telecommunications Equipment: 2.8% | | | | |
| | 3,318,631 | | Harmonic, Inc.* | | | 24,491,497 | |
| | | | | |
| Transportation: 0.1% | | | | |
| | 23,500 | | Quality Distribution, Inc.* | | | 301,505 | |
| | | | | |
| Truck Dealerships: 1.6% | | | | |
| | 219,105 | | Rush Enterprises, Inc. – Class A* | | | 6,496,463 | |
| | 295,798 | | Rush Enterprises, Inc. – Class B* | | | 7,542,849 | |
| | | | | | | 14,039,312 | |
| | | | | |
| Utilities: 2.0% | | | | |
| | 138,500 | | The AES Corp. | | | 2,009,635 | |
| | 516,918 | | PPL Corp. | | | 15,554,063 | |
| | | | | | | 17,563,698 | |
| | | | | |
| Waste Management Services: 2.8% | | | | |
| | 737,658 | | Republic Services, Inc. | | | 24,490,246 | |
| | | | | |
| TOTAL COMMON STOCKS | | | | |
| (cost $269,312,539) | | | 404,469,995 | |
The accompanying notes are an integral part of these financial statements.
Greenspring Fund, Incorporated
| SCHEDULE OF INVESTMENTS at December 31, 2013 (Con't) |
| Shares/Principal | | Value | |
| | | | |
| PREFERRED STOCK: 0.1% | | | |
| | | | |
| Homebuilding: 0.1% | | | |
| | 19,001 | | M/I Homes, Inc., 9.750%, Series A | | $ | 494,501 | |
| | | | | |
| TOTAL PREFERRED STOCK | | | | |
| (cost $475,209) | | | | | 494,501 | |
| | | | | | | | |
| | | | | |
| CONVERTIBLE BONDS: 2.8% | | | | |
| | | | | |
| Internet Software & Services: 0.7% | | | | |
| $ | 5,946,000 | | Digital River, Inc., 2.000%, 11/1/30 | | | 5,901,405 | |
| | | | | |
| Oil & Gas Exploration & Production: 0.4% | | | | |
| | 3,784,000 | | Bill Barrett Corp., 5.000%, 3/15/28 | | | 3,791,114 | |
| | | | | |
| Semiconductors: 1.6% | | | | |
| | 14,075,000 | | Rambus, Inc., 5.000%, 6/15/14 | | | 14,338,906 | |
| | | | | |
| Telecommunications: 0.1% | | | | |
| | 657,000 | | Cogent Communications | | | | |
| | | | Group, Inc., 1.000%, 6/15/27 | | | 684,922 | |
| | | | | |
| TOTAL CONVERTIBLE BONDS | | | | |
| (cost $23,487,317) | | | 24,716,347 | |
| | | | | |
| CORPORATE BONDS: 34.7% | | | | |
| | | | | |
| Aerospace & Defense: 0.9% | | | | |
| | 476,000 | | Esterline Technologies | | | | |
| | | | Corp., 7.000%, 8/1/20 | | | 516,460 | |
| | 6,955,000 | | Kratos Defense & Security | | | | |
| | | | Solutions, Inc., 10.000%, 6/1/17 | | | 7,537,481 | |
| | | | | | | 8,053,941 | |
| | | | | |
| Airlines: 0.5% | | | | |
| | 4,000,000 | | American Airlines, Inc., | | | | |
| | | | 7.500%, 3/15/16 -144A | | | 4,170,000 | |
| | | | | |
| Automotive: 0.9% | | | | |
| | 5,000,000 | | Chrysler Group LLC, 8.000%, 6/15/19 | | | 5,550,000 | |
| | 1,750,000 | | DriveTime Automotive Group, Inc., | | | | |
| | | | 12.625%, 6/15/17 | | | 1,942,500 | |
| | | | | | | 7,492,500 | |
| | | | | |
| Business Services: 0.5% | | | | |
| | 4,416,000 | | Iron Mountain, Inc., 8.375%, 8/15/21 | | | 4,780,320 | |
| | | | | |
| Business Software & Services: 0.6% | | | | |
| | 4,674,000 | | SunGard Data Systems, Inc., | | | | |
| | | | 7.375%, 11/15/18 | | | 4,960,282 | |
| | | | | |
| Coal Producers: 0.5% | | | | |
| | 4,036,000 | | CONSOL Energy, Inc., 8.000%, 4/1/17 | | | 4,268,070 | |
| | | | | |
| Construction & Engineering: 0.7% | | | | |
| | 6,000,000 | | Michael Baker International LLC, | | | | |
| | | | 8.250%, 10/15/18 – 144A | | | 6,180,000 | |
| | | | | |
| Consumer Goods: 4.9% | | | | |
| | 2,582,000 | | Brown Shoe Co., Inc., 7.125%, 5/15/19 | | | 2,756,285 | |
| | 687,000 | | Jarden Corp., 7.500%, 1/15/20 | | | 745,395 | |
| | 6,787,000 | | Pilgrim’s Pride Corp., 7.875%, 12/15/18 | | | 7,431,765 | |
| | 9,151,000 | | The Scotts Miracle-Gro Co., | | | | |
| | | | 7.250%, 1/15/18 | | | 9,562,795 | |
| | 7,738,000 | | TreeHouse Foods, Inc., 7.750%, 3/1/18 | | | 8,124,900 | |
| | 13,018,000 | | US Foods, Inc., 8.500%, 6/30/19 | | | 14,270,982 | |
| | | | | | | 42,892,122 | |
| | | | | |
| Entertainment: 0.9% | | | | |
| | 7,086,000 | | Regal Cinemas Corp., 8.625%, 7/15/19 | | | 7,635,165 | |
| | | | | |
| Financial Services: 1.1% | | | | |
| | 483,000 | | Cardtronics, Inc., 8.250%, 9/1/18 | | | 521,640 | |
| | 8,744,000 | | National Money Mart Co., | | | | |
| | | | 10.375%, 12/15/16# | | | 8,897,020 | |
| | | | | | | 9,418,660 | |
| | | | | |
| Government Services: 0.2% | | | | |
| | 1,692,000 | | ManTech International Corp., | | | | |
| | | | 7.250%, 4/15/18 | | | 1,785,060 | |
| | | | | |
| Healthcare: 2.4% | | | | |
| | 6,985,000 | | Acadia Healthcare Co., Inc., | | | | |
| | | | 12.875%, 11/1/18 | | | 8,486,775 | |
| | 3,661,000 | | ExamWorks Group, Inc., 9.000%, 7/15/19 | | | 3,981,338 | |
| | 2,360,000 | | Grifols, Inc., 8.250%, 2/1/18 | | | 2,519,300 | |
| | 726,000 | | HealthSouth Corp., 8.125%, 2/15/20 | | | 799,507 | |
| | 5,387,000 | | Valeant Pharmaceuticals International, Inc., | | | | |
| | | | 6.500%, 7/15/16 – 144A | | | 5,562,077 | |
| | | | | | | 21,348,997 | |
| | | | | |
| Homebuilding: 1.3% | | | | |
| | 8,260,000 | | Lennar Corp., 12.250%, 6/1/17 | | | 10,665,725 | |
| | 351,000 | | M/I Homes, Inc., 8.625%, 11/15/18 | | | 381,713 | |
| | | | | | | 11,047,438 | |
| | | | | |
| Hotels & Resorts: 0.1% | | | | |
| | 1,070,000 | | Host Hotels & Resorts LP, 6.750%, 6/1/16 | | | 1,085,443 | |
| | | | | |
| Information Technology Services: 2.5% | | | | |
| | 20,407,000 | | iGATE Corp., 9.000%, 5/1/16 | | | 21,784,473 | |
The accompanying notes are an integral part of these financial statements.
Greenspring Fund, Incorporated
| SCHEDULE OF INVESTMENTS at December 31, 2013 (Con't) |
| Principal | | Value | |
| | | | |
| CORPORATE BONDS: 34.7% (Con’t) | | | |
| | | | |
| Internet Software & Services: 0.8% | | | |
| $ | 5,000,000 | | Bankrate, Inc., 6.125%, 8/15/18 – 144A | | $ | 5,225,000 | |
| | 1,751,000 | | j2 Global, Inc., 8.000%, 8/1/20 | | | 1,899,835 | |
| | | | | | | 7,124,835 | |
| | | | | |
| Management Consulting: 0.7% | | | | |
| | 5,533,000 | | FTI Consulting, Inc., 6.750%, 10/1/20 | | | 6,003,305 | |
| | | | | |
| Oil & Gas Equipment & Services: 1.5% | | | | |
| | 1,204,000 | | CGG, 9.500%, 5/15/16# | | | 1,273,230 | |
| | 8,022,000 | | CGG, 7.750%, 5/15/17# | | | 8,282,715 | |
| | 2,898,000 | | Exterran Holdings, Inc., 7.250%, 12/1/18 | | | 3,075,503 | |
| | | | | | | 12,631,448 | |
| | | | | |
| Oil & Gas Exploration & Production: 7.5% | | | | |
| | 9,472,000 | | EPL Oil & Gas, Inc., 8.250%, 2/15/18 | | | 10,229,760 | |
| | 3,247,000 | | Newfield Exploration Co., 7.125%, 5/15/18 | | | 3,380,127 | |
| | 6,403,000 | | Petrohawk Energy Corp., 10.500%, 8/1/14 | | | 6,473,830 | |
| | 20,917,000 | | PetroQuest Energy, Inc., 10.000%, 9/1/17 | | | 21,805,972 | |
| | 18,820,000 | | Rosetta Resources, Inc., 9.500%, 4/15/18 | | | 20,231,500 | |
| | 3,000,000 | | Stone Energy Corp., 7.500%, 11/15/22 | | | 3,150,000 | |
| | | | | | | 65,271,189 | |
| | | | | |
| Packaging: 0.4% | | | | |
| | 3,061,000 | | Berry Plastics Corp., 9.500%, 5/15/18 | | | 3,298,228 | |
| | | | | |
| Publishing: 0.1% | | | | |
| | 817,000 | | Gannett Co, Inc., 9.375%, 11/15/17 | | | 860,914 | |
| | | | | |
| Real Estate: 1.3% | | | | |
| | 824,000 | | CB Richard Ellis Services, Inc., | | | | |
| | | | 6.625%, 10/15/20 | | | 885,800 | |
| | 9,578,000 | | Realogy Group LLC, | | | | |
| | | | 7.875%, 2/15/19 – 144A | | | 10,559,745 | |
| | | | | | | 11,445,545 | |
| | | | | |
| Retail: 0.8% | | | | |
| | 848,000 | | CDW LLC/CDW Finance Corp., | | | | |
| | | | 12.535%, 10/12/17 | | | 890,400 | |
| | 1,807,000 | | Levi Strauss & Co., 7.625%, 5/15/20 | | | 1,992,217 | |
| | 1,763,000 | | Rite Aid Corp., 10.250%, 10/15/19 | | | 1,983,375 | |
| | 2,300,000 | | Rite Aid Corp., 8.000%, 8/15/20 | | | 2,599,000 | |
| | | | | | | 7,464,992 | |
| | | | | |
| Security Services: 0.4% | | | | |
| | 3,000,000 | | Interface Security Systems Holdings, Inc., | | | | |
| | | | 9.250%, 1/15/18 – 144A | | | 3,120,000 | |
| | | | | |
| Telecommunications: 2.4% | | | | |
| | 2,781,000 | | Avaya, Inc., 10.125%, 11/1/15 | | | 2,774,048 | |
| | 7,404,000 | | CCO Holdings LLC/CCO Holdings | | | | |
| | | | Capital Corp., 7.250%, 10/30/17 | | | 7,857,495 | |
| | 2,651,000 | | Earthlink, Inc., 8.875%, 5/15/19 | | | 2,624,490 | |
| | 250,000 | | Earthlink, Inc., 7.375%, 6/1/20 | | | 250,625 | |
| | 7,000,000 | | T-Mobile USA, Inc., 6.464%, 4/28/19 | | | 7,455,000 | |
| | 85,000 | | Videotron, Ltd., 9.125%, 4/15/18# | | | 89,250 | |
| | | | | | | 21,050,908 | |
| | | | | |
| Trucking: 0.7% | | | | |
| | 4,624,000 | | Quality Distribution LLC/QD Capital Corp., | | | | |
| | | | 9.875%, 11/1/18 | | | 5,144,200 | |
| | 422,000 | | Swift Services Holdings, Inc., | | | | |
| | | | 10.000%, 11/15/18 | | | 471,585 | |
| | | | | | | 5,615,785 | |
| | | | | |
| Water Infrastructure: 0.1% | | | | |
| | 841,000 | | Mueller Water Products, Inc., | | | | |
| | | | 7.375%, 6/1/17 | | | 866,230 | |
| | | | | |
| TOTAL CORPORATE BONDS | | | | |
| (cost $299,025,471) | | | 301,655,850 | |
| | | | | |
| SHORT-TERM INVESTMENTS: 14.9% | | | | |
| | | | | |
| Money Market Instruments^ | | | | |
| | 38,000,000 | | AIM Liquid Assets, 0.070% | | | 38,000,000 | |
| | 38,000,000 | | AIM STIC Prime Portfolio, 0.060% | | | 38,000,000 | |
| | 38,000,000 | | Fidelity Money Market Portfolio, 0.030% | | | 38,000,000 | |
| | 14,970,359 | | First American Prime Obligations, | | | | |
| | | | Class Z, 0.020% | | | 14,970,359 | |
| | | | | |
| TOTAL SHORT-TERM INVESTMENTS | | | | |
| (cost $128,970,359) | | | 128,970,359 | |
| | | | | |
| TOTAL INVESTMENTS IN SECURITIES | | | | |
| (cost $721,270,895): 99.1% | | | 860,307,052 | |
| Other Assets and Liabilities 0.9% | | | 7,949,210 | |
| NET ASSETS: 100.0% | | $ | 868,256,262 | |
| * | Non-income producing security. |
| º | Investment in affiliated security (Note 5). |
| # | U.S. security of foreign issuer. |
| 144A | Securities purchased pursuant to Rule 144A of the Securities Act of 1933, as amended, and may be sold only to dealers in that program or other “qualified institutional buyers.” These securities have been deemed to be liquid by the Fund’s adviser under the supervision of the Board of Directors. As of December 31, 2013, the value of these investments was $34,816,822, or 4.0% of total net assets. |
| ^ | Rate shown is the 7-day effective yield at December 31, 2013. |
The accompanying notes are an integral part of these financial statements.
Greenspring Fund, Incorporated
| STATEMENT OF ASSETS AND LIABILITIES at December 31, 2013 |
| ASSETS | | | |
| Investments in securities, at value: | | | |
| Unaffiliated issuers (cost $717,103,786) | | $ | 854,410,331 | |
| Affiliated issuers (cost $4,167,109) (Note 5) | | | 5,896,721 | |
| Total investments, at value (cost $721,270,895) | | | 860,307,052 | |
| Receivables: | | | | |
| Dividends and interest | | | 7,029,828 | |
| Fund shares sold | | | 2,203,069 | |
| Prepaid expenses | | | 38,474 | |
| Total assets | | | 869,578,423 | |
| | | | | |
| LIABILITIES | | | | |
| Payables: | | | | |
| Fund shares redeemed | | | 573,932 | |
| Due to affiliate (Note 5) | | | 519,410 | |
| Securities purchased | | | 15,943 | |
| Accrued expenses | | | 212,876 | |
| Total liabilities | | | 1,322,161 | |
| | | | | |
| NET ASSETS | | $ | 868,256,262 | |
| | | | | |
| Capital shares issued and outstanding (60,000,000 shares authorized, $0.01 par value) | | | 32,806,687 | |
| | | | | |
| Net asset value, offering and redemption price per share | | $ | 26.47 | |
| | | | | |
| COMPONENTS OF NET ASSETS | | | | |
| Capital stock at par value | | $ | 328,067 | |
| Paid-in capital | | | 720,345,517 | |
| Accumulated net investment gain | | | 462,848 | |
| Undistributed net realized gain on investments | | | 8,083,673 | |
| Net unrealized appreciation on investments | | | 139,036,157 | |
| NET ASSETS | | $ | 868,256,262 | |
The accompanying notes are an integral part of these financial statements.
Greenspring Fund, Incorporated
| STATEMENT OF OPERATIONS For the Year Ended December 31, 2013 |
| INVESTMENT INCOME | | | |
| Income | | | |
| Interest | | $ | 18,010,919 | |
| Dividends: | | | | |
| Unaffiliated issuers (net of foreign withholding taxes of $30,982) | | | 5,115,200 | |
| Affiliated issuers (Note 5) | | | 482,801 | |
| Total income | | | 23,608,920 | |
| | | | | |
| Expenses | | | | |
| Advisory fees (Note 5) | | | 5,220,999 | |
| Transfer agent fees | | | 733,698 | |
| Administration fees | | | 293,661 | |
| Fund accounting fees | | | 107,791 | |
| Administration fees – Corbyn (Note 5) | | | 104,553 | |
| Legal fees | | | 88,282 | |
| Reports to shareholders | | | 56,974 | |
| Custody fees | | | 56,052 | |
| Miscellaneous fees | | | 40,849 | |
| Blue sky fees | | | 39,592 | |
| Directors fees | | | 39,500 | |
| Insurance fees | | | 29,326 | |
| Audit fees | | | 28,300 | |
| Total expenses | | | 6,839,577 | |
| Net investment income | | | 16,769,343 | |
| | | | | |
| REALIZED AND UNREALIZED GAIN ON INVESTMENTS | | | | |
| Net realized gain: | | | | |
| Unaffiliated investments | | | 18,348,353 | |
| Affiliated investments (Note 5) | | | 9,749,869 | |
| Change in net unrealized appreciation/depreciation on investments | | | 75,518,525 | |
| Net realized and unrealized gain on investments | | | 103,616,747 | |
| Net increase in net assets resulting from operations | | $ | 120,386,090 | |
The accompanying notes are an integral part of these financial statements.
Greenspring Fund, Incorporated
| STATEMENTS OF CHANGES IN NET ASSETS |
| | | Year Ended | | | Year Ended | |
| | | December 31, 2013 | | | December 31, 2012 | |
| INCREASE (DECREASE) IN NET ASSETS FROM: | | | | | | |
| OPERATIONS | | | | | | |
| Net investment income | | $ | 16,769,343 | | | $ | 20,736,122 | |
| Net realized gain: | | | | | | | | |
| Unaffiliated investments | | | 18,348,353 | | | | 19,448,250 | |
| Affiliated investments (Note 5) | | | 9,749,869 | | | | — | |
| Change in net unrealized appreciation/depreciation on investments | | | 75,518,525 | | | | 20,345,518 | |
| Net increase in net assets resulting from operations | | | 120,386,090 | | | | 60,529,890 | |
| | | | | | | | | |
| DISTRIBUTIONS TO SHAREHOLDERS | | | | | | | | |
| From net investment income | | | (17,379,823 | ) | | | (25,524,402 | ) |
| From net realized gain | | | (11,399,045 | ) | | | (17,097,170 | ) |
| Total distributions to shareholders | | | (28,778,868 | ) | | | (42,621,572 | ) |
| | | | | | | | | |
| CAPITAL SHARE TRANSACTIONS | | | | | | | | |
| Net increase (decrease) in net assets derived | | | | | | | | |
| from net change in outstanding shares (a)+ | | | 125,748,169 | | | | (105,963,365 | ) |
| Total increase (decrease) in net assets | | | 217,355,391 | | | | (88,055,047 | ) |
| | | | | | | | | |
| NET ASSETS | | | | | | | | |
| Beginning of year | | | 650,900,871 | | | | 738,955,918 | |
| End of year (including accumulated net investment | | | | | | | | |
| gain (loss) of $462,848 and ($8,405,193), respectively) | | $ | 868,256,262 | | | $ | 650,900,871 | |
| (a) | A summary of capital share transactions is as follows: |
| | | Year Ended | | | Year Ended | |
| | | December 31, 2013 | | | December 31, 2012 | |
| | | Shares | | | Value | | | Shares | | | Value | |
| Shares sold | | | 9,502,509 | | | $ | 244,326,525 | | | | 4,711,945 | | | $ | 110,538,884 | |
| Shares issued in reinvestment of distributions | | | 1,091,670 | | | | 28,124,296 | | | | 1,827,772 | | | | 41,890,711 | |
| Shares redeemed+ | | | (5,805,098 | ) | | | (146,702,652 | ) | | | (11,075,533 | ) | | | (258,392,960 | ) |
| Net increase (decrease) | | | 4,789,081 | | | $ | 125,748,169 | | | | (4,535,816 | ) | | $ | (105,963,365 | ) |
+Net of redemption fees of $39,784 and $32,665, respectively.
The accompanying notes are an integral part of these financial statements.
Greenspring Fund, Incorporated
FINANCIAL HIGHLIGHTS For a capital share outstanding throughout each year |
| | | Year Ended December 31, | |
| | | 2013 | | | 2012 | | | 2011 | | | 2010 | | | 2009 | |
| Net asset value, beginning of year | | $ | 23.23 | | | $ | 22.70 | | | $ | 24.19 | | | $ | 22.69 | | | $ | 20.36 | |
| | | | | | | | | | | | | | | | | | | | | |
| INCOME (LOSS) FROM INVESTMENT OPERATIONS: | | | | | | | | | | | | | | | | | | | | |
| Net investment income | | | 0.61 | | | | 0.67 | | | | 0.58 | | | | 0.56 | | | | 0.71 | |
| Net realized and unrealized gain (loss) on investments | | | 3.57 | | | | 1.35 | | | | (0.66 | ) | | | 1.82 | | | | 2.47 | |
| Total from investment operations | | | 4.18 | | | | 2.02 | | | | (0.08 | ) | | | 2.38 | | | | 3.18 | |
| | | | | | | | | | | | | | | | | | | | | |
| LESS DISTRIBUTIONS: | | | | | | | | | | | | | | | | | | | | |
| From net investment income | | | (0.58 | ) | | | (0.88 | ) | | | (0.82 | ) | | | (0.72 | ) | | | (0.83 | ) |
| From net realized gain | | | (0.36 | ) | | | (0.61 | ) | | | (0.59 | ) | | | (0.16 | ) | | | (0.02 | ) |
| Total distributions | | | (0.94 | ) | | | (1.49 | ) | | | (1.41 | ) | | | (0.88 | ) | | | (0.85 | ) |
| Net asset value, end of year | | $ | 26.47 | | | $ | 23.23 | | | $ | 22.70 | | | $ | 24.19 | | | $ | 22.69 | |
| Total return | | | 18.13 | % | | | 9.07 | % | | | (0.26 | %) | | | 10.63 | % | | | 15.83 | % |
| | | | | | | | | | | | | | | | | | | | | |
| RATIOS/SUPPLEMENTAL DATA: | | | | | | | | | | | | | | | | | | | | |
| Net assets, end of year (millions) | | $ | 868.3 | | | $ | 650.9 | | | $ | 739.0 | | | $ | 830.7 | | | $ | 528.5 | |
| Ratio of expenses to average net assets | | | 0.92 | % | | | 0.93 | % | | | 0.91 | % | | | 0.95 | % | | | 1.03 | % |
| Ratio of net investment income to average net assets | | | 2.25 | % | | | 2.89 | % | | | 2.40 | % | | | 2.51 | % | | | 3.67 | % |
| Portfolio turnover rate | | | 67.74 | % | | | 27.67 | % | | | 58.32 | % | | | 59.99 | % | | | 46.77 | % |
The accompanying notes are an integral part of these financial statements.
Greenspring Fund, Incorporated
| NOTES TO FINANCIAL STATEMENTS December 31, 2013 |
| Note 1 – Significant Accounting Policies |
Greenspring Fund, Incorporated (the “Fund”) is a diversified, open-end management investment company registered under the Investment Company Act of 1940, as amended (the “1940 Act”). The Fund is organized as a Maryland corporation and commenced operations on July 1, 1983.
The preparation of the financial statements in accordance with accounting principles generally accepted in the United States of America requires management to make estimates and assumptions that affect the reported amounts and disclosures in the financial statements. Actual results could differ from those estimates. In preparing these financial statements, the Fund has evaluated events and transactions for potential recognition or disclosure through the date the financial statements were issued.
Investment transactions and related investment income – Investment transactions are recorded on the trade date. Dividend income is recorded on the ex-dividend date and interest income, including amortization of premiums and accretion of discounts, is recorded on the accrual basis. Dividends determined to be a return of capital are recorded as a reduction of the cost basis of the security. Realized gains and losses from investment transactions are reported on an identified cost basis.
Valuation of investments – Securities listed on a national securities exchange or the NASDAQ National Market are valued at the last reported sale price or the official closing price for certain markets on the exchange of major listing as of the close of the regular session of the New York Stock Exchange.
Securities that are traded principally in the over-the-counter market, listed securities for which no sale was reported on the day of valuation, and listed securities whose primary market is believed by Corbyn Investment Management, Inc. (“Corbyn” or the “Adviser”) to be over-the counter are valued at the mean of the closing bid and asked prices obtained from sources that the Adviser deems appropriate.
Investments in open-end management investment companies are valued at the net asset value of the shares of that investment company.
Short-term investments are valued at amortized cost, which approximates fair market value. The value of securities that mature, or have an announced call, within 60 days will be valued at market value.
Securities for which market quotations are not readily available are valued at fair value as determined in good faith by the Adviser as directed by the Fund’s Board of Directors (the “Board”).
In determining fair value, the Adviser, as directed by the Board, considers all relevant qualitative and quantitative information available. These factors are subject to change over time and are reviewed periodically. The values assigned to fair value investments are based on available information and do not necessarily represent amounts that might ultimately be realized, since such amounts depend on future developments inherent in long-term investments. Further, because of the inherent uncertainty of valuation, those estimated values may differ significantly from the values that would have been used had a ready market of the investments existed, and the differences could be material.
The Fund has adopted fair valuation accounting standards that establish an authoritative definition of fair value and set out a hierarchy for measuring fair value. These standards require additional disclosures about the various input and valuation techniques used in measuring fair value. Fair value inputs are summarized in the three broad levels listed below:
Greenspring Fund, Incorporated
| NOTES TO FINANCIAL STATEMENTS December 31, 2013 (Con't) |
| Level 1 – | Unadjusted quoted prices in active markets for identical securities that the Fund has the ability to access. |
| | |
| Level 2 – | Observable inputs other than quoted prices included in Level 1 that are observable for the security, either directly or indirectly. These inputs may include quoted prices for the identical instrument on an inactive market, prices for similar instruments, interest rates, prepayment speeds, credit risk, yield curves, default rates and similar data. |
| | |
| Level 3 – | Unobservable inputs for the security, to the extent relevant observable inputs are not available, representing the Fund’s own assumptions about the assumptions a market participant would use in valuing the security, and which would be based on the best information available. |
| | |
The inputs or methodology used for valuing securities are not necessarily an indication of the risk associated with investing in these securities. The following is a summary of the inputs used to value the Fund’s net assets as of December 31, 2013:
| | | Quoted Prices | | | Significant Other | | | Significant | | | Carrying Value | |
| | | in Active | | | Observable | | | Unobservable | | | at December 31, | |
| | | Markets | | | Inputs | | | Inputs | | | 2013 | |
| | | Level 1 | | | Level 2 | | | Level 3 | | | Total | |
| Common Stocks | | $ | 404,469,995 | | | $ | — | | | $ | — | | | $ | 404,469,995 | |
| Preferred Stock | | | — | | | | 494,501 | | | | — | | | | 494,501 | |
| Convertible Bonds | | | — | | | | 24,716,347 | | | | — | | | | 24,716,347 | |
| Corporate Bonds | | | — | | | | 301,655,850 | | | | — | | | | 301,655,850 | |
| Short-Term Investment | | | 128,970,359 | | | | — | | | | — | | | | 128,970,359 | |
| Total | | $ | 533,440,354 | | | $ | 326,866,698 | | | $ | — | | | $ | 860,307,052 | |
See Schedule of Investments for industry breakdown.
Transfers between levels are recognized at the end of the reporting period. During the twelve months ended December 31, 2013, the Fund recognized no transfers between valuation levels.
The Fund did not have any Level 3 securities during the year.
Dividends and distributions to stockholders – The Fund records dividends and distributions to shareholders on the ex-dividend date.
Redemption fees – The Fund’s Board of Directors has adopted policies and procedures with respect to frequent purchases and redemptions of Fund shares by Fund shareholders. The Fund is intended for long-term investors. The Fund discourages and does not accommodate frequent purchases and redemptions of Fund shares by Fund shareholders. The Fund reserves the right to decline a purchase order for any reason.
“Market-timers” who engage in frequent purchases and redemptions over a short period can disrupt the Fund’s investment program by requiring the Fund to have excess cash on hand or to liquidate holdings to accommodate redemptions. In addition, frequent purchases and redemptions may impede efficient Fund management and create additional transaction costs that are borne by all shareholders. To the extent that the Fund invests a significant portion of its assets in small-cap securities or high-yield bonds, it may be subject to the risks of market timing more than a fund that
Greenspring Fund, Incorporated
| NOTES TO FINANCIAL STATEMENTS December 31, 2013 (Con't) |
does not. Therefore, the Fund imposes a 2% redemption fee for shares held 60 days or less. The fee is deducted from the seller’s redemption proceeds and deposited into the Fund to help offset brokerage commissions, market impact, and other costs associated with fluctuations in Fund asset levels and cash flow caused by short-term trading. All shareholders are subject to these restrictions regardless of whether you purchased your shares directly from the Fund or through a financial intermediary. However, the Fund is limited in its ability to determine whether trades placed through financial intermediaries may signal excessive trading. Accordingly, the Fund may not be able to determine whether trading in combined orders or in omnibus accounts is contrary to the Fund’s policies. The Fund reserves the right to reject combined or omnibus orders in whole or in part.
To calculate redemption fees, after first redeeming any shares associated with reinvested dividends or other distributions, the “first-in, first out” method is used to determine the holding period. Under this method, the date of redemption will be compared with the earliest purchase date of shares held in the account. If the holding period for shares purchased is 60 days or less, the fee will be charged. The redemption fee may be modified or discontinued at any time, in which case, shareholders will be notified. The redemption fee does not apply to shares acquired through the reinvestment of dividends or other distributions, or shares redeemed pursuant to a systematic withdrawal plan or a mandatory IRA distribution.
In compliance with Rule 22c-2 under the 1940 Act, Quasar Distributors, LLC, on behalf of the Fund, has entered into written agreements with each of the Fund’s financial intermediaries, under which the intermediaries must, upon request, provide the Fund with certain shareholder and identity trading information so that the Fund can enforce its frequent trading policies.
Risk of loss arising from indemnifications – In the normal course of business, the Fund enters into contracts that contain a variety of representations, which provide general indemnifications. The Fund’s maximum exposure under these arrangements is unknown as this would involve future claims that may be made against the Fund that have not yet occurred. However, based on experience, the Fund expects the risk of loss to be remote.
| Note 2 – Dividends and Distributions |
It is the Fund’s policy to declare dividends from net investment income and distributions from net realized gains as determined in accordance with income tax regulations, which may differ from accounting principles generally accepted in the United States of America. Accordingly, periodic reclassifications are made within the portfolio’s capital accounts to reflect income and gains available for distribution under income tax regulations.
On July 10, 2013 an income dividend of $0.34 per share, a short-term capital gain distribution of $0.00261 and a long-term capital gain distribution of $0.02921 per share were declared, payable on July 11, 2013, to shareholders of record on July 9, 2013. Additionally, on December 18, 2013, an income dividend of $0.24 per share and a long-term capital gain distribution of $0.324 per share were declared, payable on December 19, 2013 to shareholders of record on December 17, 2013. The tax character of distributions paid during the year ended December 31, 2013 and the year ended December 31, 2012 were as follows:
| Distributions paid from: | December 31, 2013 | December 31, 2012 |
| Ordinary income | $17,453,531 | $30,673,956 |
| Long-term capital gain | $11,325,337 | $11,947,616 |
Greenspring Fund, Incorporated
| NOTES TO FINANCIAL STATEMENTS December 31, 2013 (Con't) |
These dividends are either distributed to shareholders or reinvested in the Fund as additional shares issued to shareholders. For those shareholders reinvesting the dividends, the number of shares issued is based on the net asset value per share as of the close of business on the ex-dividend date.
The Fund designated as long-term capital gain dividend, pursuant to Internal Revenue Code Section 852(b)(3), the amount necessary to reduce the earnings and profits of the Fund related to net capital gain to zero for the tax year ended December 31, 2013.
| Note 3 – Purchases and Sales of Investments |
For the year ended December 31, 2013, purchases and sales of investments, other than short-term investments and U.S. government obligations aggregated $450,912,375 and $429,122,075, respectively.
| Note 4 – Federal Income Taxes |
It is the Fund’s policy to comply with the requirements of the Internal Revenue Code applicable to regulated investment companies. Accordingly, the Fund intends to distribute substantially all of its taxable income. Therefore, no federal income tax provision is required.
As of and during the year ended December 31, 2013, the Fund did not have any tax positions that did not meet the “more-likely-than-not” threshold of being sustained by the applicable tax authority. Tax positions not deemed to meet the “more-likely-than-not” threshold would be recorded as a tax benefit or expense in the current year. Generally, tax authorities can examine tax returns filed for all open tax years (2010-2013).
Required Fund distributions are based on income and capital gain amounts determined in accordance with federal income tax regulations, which differ from net investment income and realized gains recognized for financial reporting purposes.
Accordingly, the composition of net assets and distributions on a tax basis may differ from those reflected in the accompanying financial statements. As of December 31, 2013, the Fund’s most recently completed year end, the components of distributable earnings on a tax basis were as follows:
| | Cost of investments | | $ | 721,272,057 | |
| | Gross tax unrealized appreciation | | | 147,512,203 | |
| | Gross tax unrealized depreciation | | | (8,477,208 | ) |
| | Net tax unrealized appreciation | | | 139,034,995 | |
| | Undistributed ordinary income | | | 463,002 | |
| | Undistributed long-term capital gain | | | 8,084,835 | |
| | Total distributable earnings | | | 8,547,837 | |
| | Other accumulated gains/(losses) | | | (154 | ) |
| | Total accumulated earnings/(losses) | | $ | 147,582,678 | |
Accounting principles generally accepted in the United States of America require that certain components of net assets relating to permanent differences be reclassified between financial and tax reporting. These reclassifications have no effect
Greenspring Fund, Incorporated
| NOTES TO FINANCIAL STATEMENTS December 31, 2013 (Con't) |
on net assets or net asset value per share. For the year ended December 31, 2013, the Fund decreased accumulated net investment loss by $9,478,521 and decreased undistributed net realized gain on investments by $9,478,521. The Fund incurred losses for tax purposes of $154 for the period of November 1, 2013 to December 31, 2013. As permitted by tax regulations, the Fund intends to elect to defer and treat these losses as arising in the fiscal year ending December 31, 2013.
| Note 5 – Transactions with Affiliated Parties |
Corbyn serves as the Fund’s investment adviser. Under an agreement between the Fund and Corbyn, the Fund pays Corbyn a fee of 0.75% of the first $250 million of average daily net assets, 0.70% of average daily net assets between $250 million and $500 million and 0.65% of average daily net assets in excess of $500 million, which is computed daily and paid monthly. For the year ended December 31, 2013, the Fund incurred $5,220,999 in advisory fees.
The Fund has also entered into a Services Agreement with Corbyn to provide various administrative services. As compensation, the Fund pays Corbyn a fee of $2,500 per month plus 0.01% of average daily net assets, which is computed daily and paid monthly. For the year ended December 31, 2013, the Fund incurred $104,553 in administrative fees to Corbyn.
At December 31, 2013, investors for whom Corbyn was investment adviser held 989,745 shares of the Fund.
A company is considered to be an affiliate of the Fund under the 1940 Act if the Fund’s holdings of that company represent 5% or more of the outstanding voting securities of the company. Transactions with companies that are or were affiliates during the year ended December 31, 2013 are as follows:
| | | | | | | | | | | | | | | | | | Dividend | | | | | | | |
| Issuer | | Cost | | | Cost | | | Cost | | | Cost | | | Loss for Period | | | Income | | | Shares | | | Value | |
| Michael Baker Corp. | | $ | 16,417,839 | | | $ | — | | | $ | 16,417,839 | | | $ | — | | | $ | 9,749,869 | | | $ | 335,530 | | | | — | | | $ | — | |
| Southern National | | | | | | | | | | | | | | | | | | | | | | | | | | | | | | | | |
| Bancorp of Virginia | | | 4,167,109 | | | | — | | | | — | | | | 4,167,109 | | | | — | | | | 147,271 | | | | 589,083 | | | | 5,896,721 | |
| | | $ | 20,584,948 | | | $ | — | | | $ | 16,417,839 | | | $ | 4,167,109 | | | $ | 9,749,869 | | | $ | 482,801 | | | | 589,083 | | | $ | 5,896,721 | |
Greenspring Fund, Incorporated
REPORT OF INDEPENDENT REGISTERED PUBLIC ACCOUNTING FIRM
Board of Directors and Shareholders
Greenspring Fund, Incorporated
Lutherville, Maryland
We have audited the accompanying statement of assets and liabilities of the Greenspring Fund, Incorporated (the “Fund”), including the schedule of investments, as of December 31, 2013, and the related statement of operations for the year then ended, the statements of changes in net assets for each of the two years in the period then ended, and financial highlights for each of the five years in the period then ended. These financial statements and financial highlights are the responsibility of the Fund’s management. Our responsibility is to express an opinion on these financial statements and financial highlights based on our audits.
We conducted our audits in accordance with the standards of the Public Company Accounting Oversight Board (United States). Those standards require that we plan and perform the audit to obtain reasonable assurance about whether the financial statements and financial highlights are free of material misstatement. The Fund is not required to have, nor were we engaged to perform, an audit of its internal control over financial reporting. Our audits included consideration of internal control over financial reporting as a basis for designing audit procedures that are appropriate in the circumstances, but not for the purpose of expressing an opinion on the effectiveness of the Fund’s internal control over financial reporting. Accordingly, we express no such opinion. An audit includes examining, on a test basis, evidence supporting the amounts and disclosures in the financial statements. Our procedures included confirmation of securities owned as of December 31, 2013, by correspondence with the custodian and broker. An audit also includes assessing the accounting principles used and significant estimates made by management, as well as evaluating the overall financial statement presentation. We believe that our audits provide a reasonable basis for our opinion.
In our opinion, the financial statements and financial highlights referred to above present fairly, in all material respects, the financial position of the Greenspring Fund, Incorporated as of December 31, 2013, the results of its operations for the year then ended, the changes in its net assets for each of the two years in the period then ended, and the financial highlights for each of the five years in the period then ended, in conformity with accounting principles generally accepted in the United States of America.
| |  |
| | |
| | TAIT, WELLER & BAKER LLP |
| Philadelphia, Pennsylvania | |
| February 18, 2014 | |
Greenspring Fund, Incorporated
| NOTICE TO SHAREHOLDERS December 31, 2013 (Unaudited) |
Tax Information
The Fund designates 31.65% of dividends declared from net investment income during the fiscal year ended December 31, 2013 as qualified income under the Jobs and Growth Tax Relief Reconciliation Act of 2003.
For corporate shareholders in the Fund, the percentage of ordinary dividend income distributed for the year ended December 31, 2013, which is designated as qualifying for the dividends-received deduction, is 27.40%.
For foreign shareholders in the Fund, for the year ended December 31, 2013, 82.76% of the ordinary distributions paid qualify as interest-related dividends under the Internal Revenue Code Section 871(k)(1)(c), and 0.42% of the ordinary income distributions are designated as short-term capital gain distributions under Internal Revenue Code Section 871(k)(2)(c).
Proxy Voting Policies and Proxy Voting Record
The Fund’s proxy voting policies and procedures, as well as its proxy voting record for the most recent 12-month period ended June 30, are available without charge, upon request, by contacting the Fund at (800) 366-3863 or info@greenspringfund.com. The Fund will send the information within three business days of receipt of the request, by first class mail or other means designed to ensure equally prompt delivery. The Fund’s proxy voting record is also available on the U.S. Securities and Exchange Commission’s website at www.sec.gov.
Form N-Q Holdings Information
The Fund files its complete schedule of portfolio holdings with the U.S. Securities and Exchange Commission for the first and third quarters of each fiscal year on Form N-Q. The Fund’s Forms N-Q are available on the Commission’s website at www.sec.gov and may be reviewed and copied at the Commission’s Public Reference Room in Washington, DC. Information on the operation of the Public Reference Room may be obtained by calling (800) SEC-0330.
Reports and Householding
In an attempt to reduce shareholder expenses, we will mail only one copy of the Fund’s Summary Prospectus and each Annual and Semi-Annual Report to those addresses shared by two or more accounts. If you wish to receive individual copies of these documents, please call us at (800) 366-3863. We will begin sending you individual copies 30 days after receiving your request.
The Fund’s Prospectus, Statement of Additional Information, Annual Report, and Semi-Annual Report, along with its first and third quarter portfolio holdings, are available on the Fund’s website at www.greenspringfund.com.
Greenspring Fund, Incorporated
| BASIC INFORMATION ABOUT FUND DIRECTORS AND OFFICERS (Unaudited) |
The Board of Directors supervises the management of the Fund. The following list summarizes information on the directors and officers of the Fund for the past five years. The address of each is 2330 West Joppa Road, Suite 110, Lutherville, MD 21093. The Fund’s Statement of Additional Information contains additional information about Fund directors and is available, without charge, upon request, by calling the Fund at (800) 366-3863, or by emailing the Fund at info@greenspringfund.com.
| | | | | Number | |
| | Position(s) Held | Term of Office and | Principal Occupation(s) | of Funds | Other |
| Name and Age | with the Fund | Length of Time Served | During the Past Five Years | Overseen | Directorship |
| | | | | | |
| | | Term of Director | | | |
| | | Indefinite | | | |
| | | Term of Officer | | | |
| | | One year | | | |
| Interested | | | | | |
| Directors/Officers | | | | | |
| | | | | | |
| Charles vK. Carlson | President | From March 1993 to present. | President and Director of the | One | None |
| 54 | Chairman of the Board | From January 1994 to present. | Fund’s Adviser. | | |
| | | From February 1994 to present. | | | |
| | | From March 1987 to present. | | | |
| | | | | | |
| William E. Carlson | Director | From February 1994 to present. | President of Shapiro Sher Guinot | One | None |
| 56 | | | & Sandler (a law firm) from | | |
| | | | February 1999 to present. Partner | | |
| | | | of Shapiro Sher Guinot & Sandler | | |
| | | | from February 1990 to present. | | |
| | | | | | |
| Michael J. Fusting | Sr. Vice President | From May 1998 to present. | Sr. Vice President and Director of | One | None |
| 52 | Chief Financial Officer | From February 1994 to present. | the Fund’s Adviser. | | |
| | | From March 1992 to present. | | | |
| | | | | | |
| Disinterested Directors | | | | | |
| David T. Fu | Director | From May 1990 to present. | Managing Director of Kanturk | One | None |
| 57 | | | Partners, LLC (a merchant bank) | | |
| | | | from February 2004 to present. | | |
| | | | | | |
| Sean T. Furlong | Director | From March 2003 to present. | Director of Finance and | One | None |
| 48 | | | Operations at the Gilman | | |
| | | | School from June 2003 to present. | | |
| | | | Adjunct Professor of Financial | | |
| | | | Accounting at Johns Hopkins | | |
| | | | University from February 2013 to | | |
| | | | present. | | |
Greenspring Fund, Incorporated
| BASIC INFORMATION ABOUT FUND DIRECTORS AND OFFICERS (Unaudited) (Con't) |
| | | | | Number | |
| | Position(s) Held | Term of Office and | Principal Occupation(s) | of Funds | Other |
| Name and Age | with the Fund | Length of Time Served | During the Past Five Years | Overseen | Directorship |
| | | | | | |
| | | Term of Director | | | |
| | | Indefinite | | | |
| | | Term of Officer | | | |
| | | One year | | | |
| | | | | | |
| Michael P. O’Boyle | Director | From July 2000 to present. | President and CEO of Parallon | One | None |
| 57 | | | Business Solutions, a subsidiary | | |
| | | | of Hospital Corporation of | | |
| | | | America (a provider of healthcare | | |
| | | | services) from January 2012 to | | |
| | | | October 2013. President of | | |
| | | | UnitedHealth Networks, a division | | |
| | | | of United Healthcare (a managed | | |
| | | | health care company) from May | | |
| | | | 2008 to December 2011. Chief | | |
| | | | Operating Officer of The | | |
| | | | Cleveland Clinic Foundation | | |
| | | | (world-renowned non-profit | | |
| | | | provider of health care services, | | |
| | | | education and research) and The | | |
| | | | Cleveland Clinic Health System | | |
| | | | from July 2005 to March 2008. | | |
| Officers | | | | | |
| | | | | | |
| Elizabeth Agresta Swam | Secretary and Treasurer | From May 1998 to present. | Employee of the Fund’s Adviser | N/A | None |
| 46 | AML Officer | From July 2002 to present. | from May 1998 to present. | | |
| | Chief Compliance Officer | From July 2004 to present. | | | |
Privacy Policy
The Greenspring Fund recognizes that individuals expect an exceptional level of privacy in their financial affairs. The Fund assures the confidentiality of personal information provided to it.
The information we collect is limited to what the Fund believes is necessary or useful to conduct our business; administer your records, accounts and funds; to comply with laws and regulations; and to help us design or improve products and services. The Fund collects non public personal information about you from information it receives from you on applications or other forms or through its website, as well as from information about your transactions with the Fund.
Some of this information may be disclosed to the Fund’s investment adviser, but not for marketing solicitation, as well as non-affiliated third parties who provide non-financial services to the Fund such as our Transfer Agent, in order to administer customer accounts and mail transaction confirmations and tax forms, and the mailing house the Fund utilizes for mailing shareholder reports. Such information may also be disclosed to a nonaffiliated third party engaged to provide fund accounting and administrative services to us. Disclosing this information enables us to meet customers’ financial needs and regulatory requirements. These third parties act on its behalf and are obligated to keep the information we provide to them confidential and to use the information only for the purposes authorized. The Fund does not disclose any non-public personal information about you or former customers to anyone, except as permitted by law.
To protect your non-public personal information, the Fund permits access to it only by authorized employees and maintains security practices to safeguard your information.
If you have any questions regarding our Privacy Policy, please contact us at 1-800-366-3863 or info@greenspringfund.com. Thank you.
This Privacy Policy is not part of the Annual Report.
Greenspring Fund, Incorporated
Performance Since Inception on
July 1, 1983 through December 31, 2013
(Unaudited)
| |
| HOW $10,000 INVESTED ON 7/1/83 WOULD HAVE GROWN* |
| |
 |
| |
| * | Figures include changes in principal value, reinvested dividends and capital gains distributions. Past expense limitations increased the Fund’s return. This chart illustrates the performance of a hypothetical $10,000 investment made in the Fund since inception through December 31, 2013. The total value of $185,251 assumes the reinvestment of dividends and capital gains, but does not reflect the effect of any redemption fees. This chart does not imply any future performance. |
Average annual total returns for the one, three, five, ten year and since inception periods ended December 31, 2013 were 18.13%, 8.72%, 10.49%, 7.13% and 10.04%, respectively. Average annual returns for more than one year assume a compounded rate of return and are not the Fund’s year-by-year results, which fluctuated over the periods shown. Returns do not reflect taxes that shareholders may pay on Fund distributions or redemption of Fund shares.
Greenspring Fund, Incorporated
2330 West Joppa Road, Suite 110
Lutherville, MD 21093
(410) 823-5353
(800) 366-3863
www.greenspringfund.com
DIRECTORS
Charles vK. Carlson, Chairman
William E. Carlson
David T. Fu
Sean T. Furlong
Michael J. Fusting
Michael P. O’Boyle
OFFICERS
Charles vK. Carlson
President and Chief Executive Officer
Michael J. Fusting
Sr. Vice President and
Chief Financial Officer
Elizabeth Agresta Swam
Chief Compliance Officer,
Secretary, Treasurer
and AML Officer
INVESTMENT ADVISER
Corbyn Investment Management, Inc.
2330 West Joppa Road, Suite 108
Lutherville, MD 21093-7207
ADMINISTRATOR, FUND ACCOUNTANT
AND TRANSFER AGENT
U.S. Bancorp Fund Services, LLC
615 East Michigan Street
Milwaukee, WI 53202
DISTRIBUTOR
Quasar Distributors, LLC
615 East Michigan Street
Milwaukee, WI 53202
CUSTODIAN
U.S. Bank, N.A.
1555 N. RiverCenter Dr., Suite 302
Milwaukee, WI 53212
INDEPENDENT REGISTERED
PUBLIC ACCOUNTING FIRM
Tait, Weller & Baker LLP
1818 Market Street, Suite 2400
Philadelphia, PA 19103
LEGAL COUNSEL
K&L Gates LLP
1601 K Street NW
Washington, DC 20006
Symbol – GRSPX
CUSIP – 395724107
The registrant has adopted a code of ethics that applies to the registrant’s principal executive officer and principal financial officer. The registrant has not made any amendments to its code of ethics during the period covered by this report. The registrant has not granted any waivers from any provisions of the code of ethics during the period covered by this report.
A copy of the registrant’s Code of Ethics is filed herewith.
Item 3. Audit Committee Financial Expert.
The registrant’s board of directors has determined that there is at least one audit committee financial expert serving on its audit committee. Mr. Sean T. Furlong is the “audit committee financial expert” and is considered to be “independent” as each term is defined in Item 3 of Form N-CSR.
Item 4. Principal Accountant Fees and Services.
The registrant has engaged its principal accountant to perform audit services, audit-related services, tax services or other services during the past two fiscal years. “Audit services” refer to performing an audit of the registrant's annual financial statements or services that are normally provided by the accountant in connection with statutory and regulatory filings or engagements for those fiscal years. “Audit-related services” refer to the assurance and related services by the principal accountant that are reasonably related to the performance of the audit. “Tax services” refer to professional services rendered by the principal accountant for tax compliance, tax advice, and tax planning. There were no “other services” provided by the principal accountant. The following table details the aggregate fees billed, or expected to be billed, for each of the last two fiscal years for audit fees, audit-related fees, tax fees or other fees by the principal accountant:
| | FYE 12/31/2013 | FYE 12/31/2012 |
| Audit Fees | $25,000 | $25,000 |
| Audit-Related Fees | N/A | N/A |
| Tax Fees | $3,300 | $3,300 |
| All Other Fees | N/A | N/A |
The audit committee has adopted pre-approval policies and procedures that require the audit committee to pre-approve all audit and non-audit services of the registrant, including services provided to any entity affiliated with the registrant. All of the principal accountant’s hours spent on auditing the registrant’s financial statements were attributed to work performed by full-time permanent employees of the principal accountant.
The percentage of fees billed by Tait, Weller & Baker LLP applicable to non-audit services pursuant to waiver of pre-approval requirement were as follows:
| | FYE 12/31/2013 | FYE 12/31/2012 |
| Audit-Related Fees | 0% | 0% |
| Tax Fees | 0% | 0% |
| All Other Fees | 0% | 0% |
The following table indicates the non-audit fees billed, or expected to be billed, by the registrant’s accountant for services to the registrant and to the registrant’s investment adviser for the last two years. The audit committee of the board of directors has considered whether the provision of non-audit services that were rendered to the registrant's investment adviser is compatible with maintaining the principal accountant's independence and has concluded that the provision of such non-audit services by the accountant has not compromised the accountant’s independence.
| Non-Audit Related Fees | FYE 12/31/2013 | FYE 12/31/2012 |
| Registrant | N/A | N/A |
| Registrant’s Investment Adviser | N/A | N/A |
Item 5. Audit Committee of Listed Registrants.
Not applicable to registrants who are not listed issuers (as defined in Rule 10A-3 under the Securities Exchange Act of 1934).
Item 6. Investments.
Schedule of Investments is included as part of the report to shareholders filed under Item 1 of this Form.
Item 7. Disclosure of Proxy Voting Policies and Procedures for Closed-End Management Investment Companies.
Not applicable to open-end investment companies.
Item 8. Portfolio Managers of Closed-End Management Investment Companies.
Not applicable to open-end investment companies.
Item 9. Purchases of Equity Securities by Closed-End Management Investment Company and Affiliated Purchasers.
Not applicable to open-end investment companies.
Item 10. Submission of Matters to a Vote of Security Holders.
Not Applicable.
Item 11. Controls and Procedures.
| (a) | The Registrant’s Chief Executive Officer and Chief Financial Officer have reviewed the Registrant's disclosure controls and procedures (as defined in Rule 30a-3(c) under the Investment Company Act of 1940 (the “Act”)) as of a date within 90 days of the filing of this report, as required by Rule 30a-3(b) under the Act and Rules 13a-15(b) or 15d-15(b) under the Securities Exchange Act of 1934. Based on their review, such officers have concluded that the disclosure controls and procedures are effective in ensuring that information required to be disclosed in this report is appropriately recorded, processed, summarized and reported and made known to them by others within the Registrant and by the Registrant’s service provider. |
| (b) | There were no changes in the Registrant's internal control over financial reporting (as defined in Rule 30a-3(d) under the Act) that occurred during the second fiscal quarter of the period covered by this report that has materially affected, or is reasonably likely to materially affect, the Registrant's internal control over financial reporting. |
Item 12. Exhibits.
| (a) | (1) Any code of ethics or amendment thereto, that is the subject of the disclosure required by Item 2, to the extent that the registrant intends to satisfy Item 2 requirements through filing an exhibit. Filed herewith. |
(2) A separate certification for each principal executive and principal financial officer pursuant to Section 302 of the Sarbanes-Oxley Act of 2002. Filed herewith.
(3) Any written solicitation to purchase securities under Rule 23c-1 under the Act sent or given during the period covered by the report by or on behalf of the registrant to 10 or more persons. Not applicable to open-end investment companies.
| (b) | Certifications pursuant to Section 906 of the Sarbanes-Oxley Act of 2002. Furnished herewith. |
SIGNATURES
Pursuant to the requirements of the Securities Exchange Act of 1934 and the Investment Company Act of 1940, the registrant has duly caused this report to be signed on its behalf by the undersigned, thereunto duly authorized.
(Registrant) Greenspring Fund, Incorporated
By (Signature and Title)* /s/ Charles vK. Carlson
Charles vK. Carlson, Chief Executive Officer
Date March 5, 2014
Pursuant to the requirements of the Securities Exchange Act of 1934 and the Investment Company Act of 1940, this report has been signed below by the following persons on behalf of the registrant and in the capacities and on the dates indicated.
By (Signature and Title)* /s/ Charles vK. Carlson
Charles vK. Carlson, Chief Executive Officer
By (Signature and Title)* /s/ Michael J. Fusting
Michael J. Fusting, Chief Financial Officer
* Print the name and title of each signing officer under his or her signature.
