UNITED STATES
SECURITIES AND EXCHANGE COMMISSION
Washington, D.C. 20549
FORM N-CSR
CERTIFIED SHAREHOLDER REPORT OF REGISTERED
MANAGEMENT INVESTMENT COMPANIES
Investment Company Act file number 811-03627
Greenspring Fund, Incorporated
(Exact name of registrant as specified in charter)
2330 West Joppa Road, Suite 110
Lutherville, MD 21093-4641
(Address of principal executive offices) (Zip code)
Mr. Charles vK. Carlson, President
2330 West Joppa Road, Suite 110
Lutherville, MD 21093-4641
(Name and address of agent for service)
(410) 823-5353
Registrant's telephone number, including area code
Date of fiscal year end: December 31, 2011
Date of reporting period: December 31, 2011
Item 1. Reports to Stockholders.
ANNUAL REPORT
DECEMBER 31, 2011
This report is intended for shareholders of the
Greenspring Fund, Incorporated and may not be
used as sales literature unless preceded or
accompanied by a current prospectus.
Greenspring Fund, Incorporated
January 2012
Dear Fellow Shareholders:
The Greenspring Fund’s performance during 2011 as a whole was relatively flat, as the Fund declined 0.26% for the year. What might appear, on the surface, to have been an uneventful year for the financial markets, as the major U.S. stock market averages also experienced relatively flat performances when merely comparing beginning and ending values, belies the extreme turmoil and volatility of the financial markets throughout the year. For instance, between August and November of 2011, the Dow Jones Industrial Average had an average intraday swing of 270 points – more than twice the average daily movement of the previous year!
The year started on solid footing, as hopes for an improving economy grew, along with stock prices, amid low interest rates and a steady flow of liquidity courtesy of the Federal Reserve’s quantitative easing program. Many businesses and creditworthy individuals enhanced their liquidity positions by cutting spending and lowering their interest burden by refinancing debt at lower rates. However, consumer spending and employment growth proved to be tepid at best. Banks have been ready and willing to lend but increasingly restrictive lending standards imposed by bank regulators and a scarcity of creditworthy loan applicants have constrained loan growth. At the same time, our government has continued to add steadily to its growing debt burden, culminating in our country’s first-ever credit rating downgrade amidst political disagreements and gamesmanship in Washington. With little confidence in the prospects for the economy, businesses and individuals have had little incentive to spend their growing liquidity.
Compounding our own domestic challenges, fears of widespread European sovereign debt defaults further reduced the outlook for global growth. With Greece teetering on the brink of default and other European countries facing suddenly rising interest rates amid a crisis of confidence, governments, banks, and corporations
| | | | | |
| | Greenspring Fund | |
| | Performance for the | |
| | Periods Ended December 31, 2011 | |
| | | | | |
| | Quarter | 7.01% | |
| | 1 Year | -0.26% | |
| | 3 Years* | 8.52% | |
| | 5 Years* | 3.51% | |
| | 10 Years* | 6.68% | |
| | 15 Years* | 6.58% | |
| | 20 Years* | 8.60% | |
| | Since inception on 7/1/83* | 9.80% | |
| | Expense Ratio** | 0.98% | |
| | | | | |
| | * | annualized. | | |
| | ** | as stated in Prospectus dated 5-1-11. See note on last page of letter. | | |
| | | | | |
| | Performance data quoted represents past performance; past performance does not guarantee future results. The investment return and principal value of an investment will fluctuate so that an investor’s shares, when redeemed, may be worth more or less than their original cost. Current performance of the Fund may be lower or higher than the performance quoted. Performance data current to the most recent month end may be obtained by calling 1-800-366-3863 or visiting the Fund’s web site. The Fund imposes a 2.00% redemption fee for shares held 60 days or less. Performance data does not reflect the redemption fee. If reflected, total returns would be reduced. | |
| | | | | |
hunkered down in an effort to protect their own liquidity. While more solvent European countries wrestle with possible solutions to the problems of their Euro brethren, proposed austerity measures designed to structurally reduce European indebtedness are likely to hamper growth in the region for years to come.
Greenspring Fund, Incorporated
| | | | | | | | |
| | Performance Comparison (Total Return*) | |
| | for Periods Ended December 31, 2011 | |
| | | | | | | | |
| | | | 5 Years | 10 Years | |
| | | 1 Year | Annualized/Cumulative | Annualized/Cumulative | |
| | Greenspring Fund | -0.26% | 3.51% | 18.83% | 6.68% | 90.85% | |
| | Dow Jones | 8.38% | 2.37% | 12.41% | 4.57% | 56.29% | |
| | S&P 500 | 2.11% | -0.25% | -1.24% | 2.92% | 33.35% | |
| | NASDAQ* | -1.80% | 1.52% | 7.86% | 2.94% | 33.57% | |
| | Russell 3000 | 1.03% | -0.01% | -0.07% | 3.51% | 41.26% | |
| | Russell 3000 Value | -0.10% | -2.58% | -12.25% | 4.08% | 49.21% | |
| | Russell 2000 | -4.18% | 0.15% | 0.75% | 5.62% | 72.76% | |
| | Russell 2000 Value | -5.50% | -1.87% | -9.03% | 6.40% | 85.98% | |
| | Lipper Flexible Portfolio | -1.16% | 2.02% | 10.54% | 4.30% | 52.32% | |
| | *All data is Total Return except for NASDAQ. | | | | | | |
| | The Dow Jones Industrial Average, Standard and Poor’s 500 Index, NASDAQ, the Russell 3000, Russell 3000 Value, Russell 2000, Russell 2000 Value Indexes and Lipper Flexible Portfolio are unmanaged indices commonly used to measure performance of U.S. stocks. You cannot invest directly in an index. Past performance does not guarantee future results. | |
| | | | | | | | |
INFLUENCES on PERFORMANCE
During 2011, the Fund’s bond holdings generated positive performance, while the Fund’s equities declined slightly in value. Within the Fund’s equity portfolio, exactly half of the stocks posted gains, while the other half declined. Similar to the seemingly humdrum performance of the financial markets that masked deeper volatility beneath the surface, the Fund’s stocks experienced more individual volatility than is typical for our holdings. As has been the case during the last several years, the bond portion of the portfolio was far less volatile and the gains were far more widespread. Brief discussions of the five securities that had the largest influences during the year follow.
Harmonic, Inc. common stock
Harmonic designs and manufactures niche, market dominant products that allow participants in the video supply chain, from content producers to distributors, to better produce and distribute video to consumers. As 2011 unfolded, Harmonic’s stock price suffered as investors lost faith in management’s ability to achieve its optimistic earnings expectations. Disruptions to Harmonic’s sales force following a significant acquisition early in the year, and a mid-year pause in industry-wide customer ordering patterns, caused the Company to miss its earnings target. Major domestic cable companies reduced ordering activity of video processing equipment due to concerns about the broader economy and the poor performance, and harsh criticism, of the industry’s early attempts at live video
| | | |
| | | % of Net |
| | Greenspring Fund | Assets |
| | Top 10 Holdings | as of |
| | | 12/31/11 |
| | | |
| | PartnerRe, Ltd. | 4.2% |
| | FTI Consulting, Inc. | 4.0% |
| | CCH II LLC 13.500% 11/30/16 | 3.9% |
| | Alcatel-Lucent, Inc. 2.875% 6/15/25 | 3.6% |
| | Cisco Systems, Inc. | 3.3% |
| | Gulfmark Offshore, Inc. 7.750% 7/15/14 | 3.0% |
| | CA, Inc. | 2.8% |
| | Assurant, Inc. | 2.8% |
| | j2 Global, Inc. | 2.7% |
| | Hologic, Inc. 2.000% | |
| | 12/15/37 Convertible Bonds | 2.7% |
Greenspring Fund, Incorporated
We continue to believe that Harmonic’s products will play a valuable role in next-generation video content delivery and that Harmonic will continue to be a significant player in this rapidly evolving, and fast growing, industry. Despite the disappointing operating results, the Company has continued to generate positive free cash flow, remains debt-free, and currently holds more than $1 per share in cash on its balance sheet, providing dry powder for management to use to increase shareholder value in a variety of ways. Domestic cable companies have re-started their multi-screen video delivery initiatives, and international content providers continue to increase the penetration of digital and high-definition television overseas. We look forward to renewed momentum in the Company’s operations, which should help restore management’s credibility and drive its common stock price higher.
Ralcorp Holdings, Inc. common stock
Ralcorp produces a variety of private label cereal, snacks, pasta, and frozen bakery products, as well as the Post cereal
| | Greenspring Fund |
| | Ten Largest 2011 Purchases |
| | Common Stocks: |
| | Cisco Systems, Inc. |
| | CA, Inc. |
| | ON Semiconductor Corp. |
| | PartnerRe, Ltd. |
| | Harmonic, Inc. |
| | Bonds: |
| | CCH II LLC 13.500% 11/30/16 |
| | Alcatel-Lucent, Inc. 2.875% 6/15/25 Convertible Bonds |
| | Gulfmark Offshore, Inc. 7.750% 7/15/14 |
| | Plains Exploration & Production, Co. 7.750% 6/15/15 |
| | Ticketmaster Entertainment, Inc. 10.750% 8/1/16 |
brand. Shares moved sideways in the early part of 2011 as the highly competitive branded cereal business and rising commodity prices threatened to derail the Company’s profitability. However, the stock price jumped nearly 30% in late April when the Company received a $4.9 billion ($86 per share) takeover proposal from Conagra, one of North America’s largest packaged food companies. Ralcorp’s board of directors eventually rejected the takeover offer, adopted a poison pill to ward off the hostile takeover, and later decided to spin-off its troubled Post cereals unit. Following the announcement of the takeover proposal initially, investors had bid up Ralcorp’s stock price above the offer price on speculation that Conagra would be required (and willing) to pay a higher price in order to garner Ralcorp’s board approval. After weighing the possible reward of a higher bid against the risk of the offer falling through, we sold all the Fund’s Ralcorp shares at a price above Conagra’s initial offer price.
Michael Baker Corp. common stock
This long-time Greenspring Fund holding provides engineering and consulting services to corporations and government agencies worldwide. The Company has particular expertise in engineering services for large infrastructure projects, such as the design of bridges, highway systems, and airports. Michael Baker is also a
| | Greenspring Fund |
| | Ten Largest 2011 Sales |
| | Common Stocks: |
| | Ralcorp Holdings, Inc. |
| | Carpenter Technology Corp. |
| | PPL Corp. |
| | Tekelec |
| | Cisco Systems, Inc. |
| | Bonds: |
| | HealthSouth Corp. 10.750% 6/15/16 |
| | Mirant North America, LLC 7.375% 12/31/13 |
| | Plains Exploration & Production, Co. 7.750% 6/15/15 |
| | US Oncology, Inc. 10.750% 8/15/14 |
| | Masco Corp. 0.000% 7/20/31 Convertible Bonds |
Greenspring Fund, Incorporated
During 2011, Michael Baker’s stock price declined from just over $30 per share to below $20 per share at the end of the year. Analysts were concerned that the Company’s growth rate had slowed due to the completion of Department of Defense projects in Iraq and Afghanistan and an overall slowdown in business, especially contracts that emanated from cash-strapped local, state and national governments. Concern about the funding and renewal likelihood of the FAA and Transportation bills also weighed heavily on investors’ minds.
We believe that Michael Baker has weathered the storm well. It has a debt-free balance sheet with over $50 million in cash (a little more than $5 per share), and generates free cash flow, even in this period of slowed growth. With its strong balance sheet, the Company was able to complete two acquisitions in the last year that diversify the Company geographically and by type of service offered. The common stock sells at a very low multiple to its expected earnings, and we believe that a significant bounce is possible once the Company reports growing earnings.
ON Semiconductor Corp. common stock
ON Semiconductor designs and manufactures high performance semiconductor components that address the design needs of a wide-range of end markets including computing, consumer electronics, automotive, industrial, and medical. We started accumulating shares at the beginning of the year, following ON’s acquisition of Sanyo’s semiconductor unit. We believed, and continue to believe, that management can apply their time-tested integration procedures to bolster the profitability of Sanyo’s operations after years of neglect under its prior owner. However, a perfect storm of external negative events forced the Company to delay its integration activities, and caused their overall results to fall short of initial expectations. First, the earthquake in Japan in March of 2011 and the resulting tsunami and nuclear power plant disaster sharply restricted the productivity of several plants in the area. Secondly, the severe flooding in Thailand during the summer of 2011 damaged several of ON’s manufacturing facilities, resulting in production disruptions and significant one-time repair costs. Thirdly, weak global macroeconomic results spurred a semiconductor industry slowdown as product manufacturers drew down on their existing inventories and reduced new orders in light of tepid end-demand. These events led to disappointing fundamental results throughout the year and a lower stock price.
While these external events led to poor stock performance in 2011, we remain excited about the long-term earnings potential of the combined ON-Sanyo entity. Recent news stories point to a possible industry bottom during the fourth quarter of 2011. Additionally, the repercussions of the natural disasters in the Far East have been addressed and the integration of Sanyo into ON is hitting full stride, with the shift of high cost Sanyo manufacturing to lower-cost regions occurring. We look forward to ON Semiconductor eventually realizing the potential of the acquisition and driving positive shareholder return going forward.
PartnerRe, Ltd. common stock
PartnerRe provides multi-line reinsurance to primary insurance companies allowing the insurance company to transfer risks above specified limits. PartnerRe is a long-term holding of the Greenspring Fund and from time to time over the years we have added to our holdings. As long-time shareholders, we have enjoyed substantial growth in earnings, book value and dividends per share as the Company has grown both organically and through acquisitions. In many years, PartnerRe is extremely profitable; however, because the Company insures against large potential losses from catastrophic events, significant losses can occur if it experiences a year with an unusually large catastrophe or a large number of catastrophes. Unfortunately, 2011 was such a year, as PartnerRe (and the entire reinsurance industry) sustained losses from an
Greenspring Fund, Incorporated
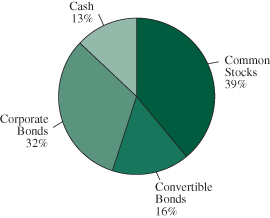
| Greenspring Fund |
| Portfolio Allocation |
| as of December 31, 2010 |
| |
 |
| |
earthquake in New Zealand, flooding in Australia, an earthquake and tsunami in Japan, a large number of destructive tornados in the United States and flooding in Thailand. While PartnerRe budgets for a certain level of losses to occur every year, the large magnitude of total losses will prevent the Company from reporting a profit for 2011. We continue to like the long-term prospects for PartnerRe, its experienced management team, strong balance sheet and the potential for earnings to bounce back very quickly (absent more major catastrophes in 2012). Reinsurance pricing should improve as the industry seeks to recover its recent losses. During the year, we added to the Fund’s holdings of PartnerRe, as we expect the Company should return to profitability in 2012.
PORTFOLIO ACTIVITY
With regard to the Fund’s sales during the year, as has been the case during recent years, much of the sales activity resulted from the maturity or redemption of the Fund’s bond holdings. With our focus on bonds with relatively short duration (typically averaging between 18 and 36 months the last several years), a high percentage of our bonds will naturally mature. Furthermore, in the low interest rate environment of recent times, corporations have been aggressively taking advantage of early redemption opportunities (with redemptions typically at premiums to par), in their quest to bolster future earnings by reducing interest expense. Additionally, when we
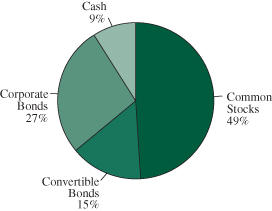
| Greenspring Fund |
| Portfolio Allocation |
| as of December 31, 2011 |
| |
 |
| |
analyze a company’s outstanding bonds, we frequently purchase the bond within a company’s capital structure that is the next bond to mature. With CFOs anxious to manage their corporate finances as conservatively as possible, corporations have an additional incentive to retire their next-to-mature debt on early redemption dates.
The Fund managed its equity holdings a bit more actively than in past years. With the extreme volatility of the financial markets, we tried to take advantage of the market’s swings by selectively adding to positions during periods of declining prices, while trimming back certain positions during periods of market strength. In addition, we initiated positions in several common stocks (BioScrip, Inc., CA, Inc., Cisco Systems, Inc., GSI Group, Inc., Hanesbrands, Inc., NCI, Inc., ON Semiconductor Corp., Solutia, Inc., TNS, Inc., Tekelec and several small banks) and completely liquidated the Fund’s holdings of the common stocks of Carpenter Technology Corp., First Potomac Realty Trust, NGP Capital Resources Co., Ralcorp Holdings, Inc., Red Robin Gourmet Burgers, Inc., Tekelec, Tessera Technologies, Inc., and Urstadt Biddle Properties, Inc., as these stocks reached our target prices or were subject to takeover proposals.
We have written consistently in the last several quarterly letters about some of the attributes that we look for when scouring the common stock universe. Namely, we try to find companies that have leading positions within their
Greenspring Fund, Incorporated
industries, are strongly capitalized, generate ample amounts of free cash flow and are led by shareholder-friendly management teams likely to make smart capital deployment decisions with their strong balance sheets and free cash flow. During 2011, many of the companies in the Fund’s portfolio took actions that exemplified why we seek out these characteristics. For example, Michael Baker used some of its plentiful cash holdings to make two acquisitions that diversify them geographically and by product offering. Cisco Systems initiated its first ever dividend accompanied by a significant share repurchase program. EMCOR Group and j2 Global also made small acquisitions and commenced common stock dividends. Most of the small banks and thrifts in the Fund’s portfolio are regular purchasers of their common stocks, which trade at discounts to their tangible book values per share. Additionally, in early January 2012, CA, Inc. significantly increased its common stock dividend, and instituted an aggressive share repurchase program. All of these actions should directly lead to increased per share value for the companies’ shareholders, regardless of the direction of the overall stock market.
The past several years have been challenging ones for investors in general. The markets have experienced a tremendous amount of volatility, amidst significant challenges to the financial system. Overall, Greenspring Fund’s investment philosophy has fared well during these rocky times, and we feel that we have been successful preserving capital during periods of market weakness, while growing the Fund’s NAV steadily during better times. We continue to work diligently in an effort to improve the Fund’s portfolio each and every day, striving to continue to achieve our goal of providing shareholders with steady, consistent investment returns over the long term. We wish each of our shareholders a happy, healthy and prosperous New Year!
 |  |
| Charles vK. Carlson | Michael J. Fusting |
| Portfolio Manager and Co-Chief Investment Officer | Co-Chief Investment Officer |
**Total Annual Fund Operating Expenses for the Fund will not correlate to the Ratio of Expenses to Average Net Assets shown in the Fund’s most recent Annual Report and in the Financial Highlights section of the Prospectus, which reflects the operating expenses of the Fund and does not include acquired fund fees and expenses.
Mutual fund investing involves risk. Principal loss is possible. Small-capitalization companies tend to have limited liquidity and greater price volatility than large-capitalization companies. Investments by the Fund in lower-rated and non-rated securities present a greater risk of loss to principal and interest than higher-rated securities. Investments in debt securities typically decrease in value when interest rates rise. This risk is usually greater for longer-term debt securities.
Opinions expressed are subject to change, are not guaranteed and should not be considered recommendations to buy or sell any security. Fund holdings and/or sector allocations are subject to change at any time and are not recommendations to buy or sell any security. Current and future portfolio holdings are subject to risk.
Free cash flow measures the cash generating capability of a company by adding certain non-cash charges (e.g. depreciation and amortization) to earnings and subtracting recurring capital expenditures. Duration is a commonly used measure of the potential volatility of the price of a debt security, or the aggregate market value of a portfolio of debt securities, prior to maturity. Securities with a longer duration generally have more volatile prices than securities of comparable quality with a shorter duration. Book value: net asset value of a company, calculated by subtracting total liabilities from total assets.
Distributed by Quasar Distributors, LLC
Greenspring Fund, Incorporated
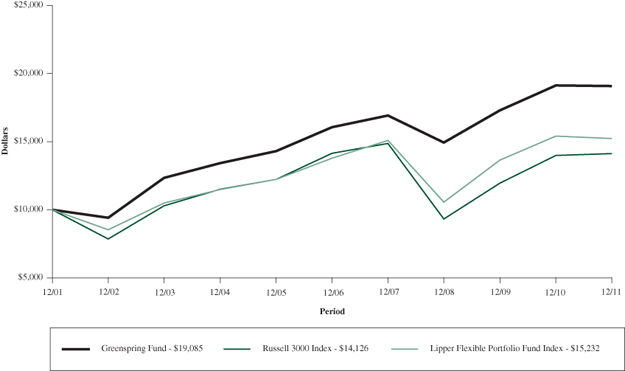
Growth of a $10,000 Investment in the Greenspring Fund
Over the Last Ten Years
Average Annual Total Returns
| | For Periods Ended December 31, 2011 |
| | 1 Year | 3 Years | 5 Years | 10 Years |
| Greenspring Fund | -0.26% | 8.52% | 3.51% | 6.68% |
| Russell 3000 Index | 1.03% | 14.88% | -0.01% | 3.51% |
| Lipper Flexible Portfolio Fund Index | -1.16% | 12.96% | 2.02% | 4.30% |
The graph and table do not reflect the deduction of taxes that a shareholder would pay on Greenspring Fund (the “Fund”) distributions or the redemption of Fund shares.
Performance data quoted represents past performance; past performance does not guarantee future results. The investment return and principal value of an investment will fluctuate so that an investor’s shares, when redeemed, may be worth more or less than their original cost. Current performance of the Fund may be lower or higher than the performance quoted. Performance data current to the most recent month end is available at www.greenspringfund.com or by calling 1-800-366-3863 toll free. The Fund imposes a 2.00% redemption fee for shares held 60 days or less. Performance data does not reflect the redemption fee. If reflected, total returns would be reduced.
Greenspring Fund, Incorporated
EXPENSE EXAMPLE For the Six Months Ended December 31, 2011 (Unaudited) |
As a shareholder of the Fund, you incur two types of costs: (1) redemption fees if you redeem within 60 days of purchase; and (2) ongoing costs, including management fees and other Fund expenses. This example is intended to help you understand your ongoing costs (in dollars) of investing in the Fund and to compare these costs with the ongoing costs of investing in other mutual funds. The example is based on an investment of $1,000 invested at the beginning of the period and held for the entire period (7/1/2011 – 12/31/2011).
Actual Expenses
The first line of the table below provides information about actual account values based on actual returns and actual expenses. You may use the information in this line, together with the amount you invested, to estimate the expenses that you paid over the period. Simply divide your account value by $1,000 (for example, an $8,600 account value divided by $1,000 = 8.6), then multiply the result by the number in the first line under the heading entitled “Expenses Paid During the Period” to estimate the expenses you paid on your account during this period.
Hypothetical Example for Comparison Purposes
The second line of the table below provides information about hypothetical account values and hypothetical expenses based on the Fund’s actual expense ratio and an assumed rate of return of 5% per year before expenses, which is not the Fund’s actual return. The hypothetical account values and expenses may not be used to estimate the actual ending account balance or expenses you paid for the period. You may use this information to compare the ongoing costs of investing in the Fund and other funds. To do so, compare this 5% hypothetical example with the 5% hypothetical examples that appear in the shareholder reports of the other funds. Please note that the expenses shown in the table are meant to highlight your ongoing costs only and do not reflect any transactional costs, such as redemption fees. Therefore, the second line of the table is useful in comparing ongoing costs only, and will not help you determine the relative total costs of owning different funds. In addition, if these transactional costs were included, your costs would have been higher.
| | | | | Expenses Paid |
| | | Beginning | Ending | During the Period |
| | | Account Value | Account Value | 7/1/2011 – |
| | | 7/1/2011 | 12/31/2011 | 12/31/2011* |
| Actual | | $1,000.00 | $981.60 | $4.60 |
| Hypothetical | | | | |
| (5% annual return before expenses) | | $1,000.00 | $1,020.60 | $4.69 |
| * | Expenses are equal to the Fund’s annualized expense ratio of 0.92%, multiplied by the average account value over the period multiplied by 184/365 (to reflect the one-half year period). |
Greenspring Fund, Incorporated
SCHEDULE OF INVESTMENTS at December 31, 2011 |
| Shares | | | | Value | |
| COMMON STOCKS: 48.8% | | | |
| | | | |
| Business Software and Services: 2.8% | | | |
| | 1,035,066 | | CA, Inc. | | $ | 20,923,859 | |
| | | | | |
| Commercial Banks & Thrifts: 2.8% | | | | |
| | 55,184 | | American National Bankshares, Inc. | | | 1,075,536 | |
| | 109,287 | | BCSB Bancorp, Inc.* | | | 1,174,835 | |
| | 398,801 | | Cardinal Financial Corp. | | | 4,283,123 | |
| | 65,389 | | Chicopee Bancorp, Inc.* | | | 915,446 | |
| | 279,112 | | ESSA Bancorp, Inc. | | | 2,922,303 | |
| | 47,542 | | First Connecticut Bancorp, Inc. | | | 618,521 | |
| | 5,382 | | Hampden Bancorp, Inc. | | | 63,508 | |
| | 53,165 | | Heritage Financial Group, Inc. | | | 590,663 | |
| | 5,050 | | Home Bancorp, Inc.* | | | 78,124 | |
| | 42,897 | | Middleburg Financial Corp. | | | 611,282 | |
| | 56,400 | | OceanFirst Financial Corp. | | | 737,148 | |
| | 138,510 | | OmniAmerican Bancorp, Inc.* | | | 2,174,607 | |
| | 97,021 | | Shore Bancshares, Inc. | | | 499,658 | |
| | 589,083 | | Southern National Bancorp of Virginia* º | | | 3,593,406 | |
| | 147,178 | | Westfield Financial, Inc. | | | 1,083,230 | |
| | | | | | | 20,421,390 | |
| Communications Equipment: 6.1% | | | | |
| | 1,360,634 | | Cisco Systems, Inc. | | | 24,600,263 | |
| | 3,296,252 | | Harmonic, Inc.* | | | 16,613,110 | |
| | 211,583 | | TNS, Inc.* | | | 3,749,251 | |
| | | | | | | 44,962,624 | |
| Computer & Information Technology: 0.0% | | | | |
| | 20,449 | | NCI, Inc.* | | | 238,231 | |
| | | | | |
| Construction & Engineering: 4.3% | | | | |
| | 339,375 | | EMCOR Group, Inc. | | | 9,098,644 | |
| | 578,758 | | MasTec, Inc.* | | | 10,053,026 | |
| | 644,305 | | Michael Baker Corp.* º | | | 12,634,821 | |
| | | | | | | 31,786,491 | |
| Consumer Goods: 1.8% | | | | |
| | 122,937 | | Hanesbrands, Inc.* | | | 2,687,403 | |
| | 963,096 | | Prestige Brands Holdings, Inc.* | | | 10,854,092 | |
| | | | | | | 13,541,495 | |
| Electrical Equipment and Instruments: 0.4% | | | | |
| | 17,400 | | Emerson Electric Co. | | | 810,666 | |
| | 177,000 | | GSI Group, Inc.* # | | | 1,810,710 | |
| | | | | | | 2,621,376 | |
| Healthcare: 0.2% | | | | |
| | 282,900 | | BioScrip, Inc.* | | | 1,544,634 | |
| | | | | |
| Insurance: 9.3% | | | | |
| | 496,992 | | Assurant, Inc. | | | 20,406,492 | |
| | 520,917 | | Global Indemnity plc* # | | | 10,329,784 | |
| | 484,697 | | PartnerRe, Ltd.# | | | 31,122,394 | |
| | 201,050 | | W.R. Berkley Corp. | | | 6,914,110 | |
| | | | | | | 68,772,780 | |
| Internet Software & Services: 2.7% | | | | |
| | 719,560 | | j2 Global, Inc. | | | 20,248,418 | |
| | | | | |
| Machinery: 0.1% | | | | |
| | 20,000 | | Pentair, Inc. | | | 665,800 | |
| | | | | |
| Management Consulting: 4.0% | | | | |
| | 691,224 | | FTI Consulting, Inc.* | | | 29,321,722 | |
| | | | | |
| Oil & Gas Exploration & Production: 5.0% | | | | |
| | 5,626 | | ConocoPhillips | | | 409,967 | |
| | 171,359 | | Energen Corp. | | | 8,567,950 | |
| | 61,905 | | EOG Resources, Inc. | | | 6,098,261 | |
| | 375,296 | | Rosetta Resources, Inc.* | | | 16,325,376 | |
| | 192,000 | | Suncor Energy, Inc.# | | | 5,535,360 | |
| | | | | | | 36,936,914 | |
| Semiconductors & Semiconductor Equipment: 1.8% | | | | |
| | 1,697,822 | | ON Semiconductor Corp.* | | | 13,107,186 | |
| | 34,093 | | Rudolph Technologies, Inc.* | | | 315,701 | |
| | | | | | | 13,422,887 | |
| Specialty Chemicals: 0.4% | | | | |
| | 152,890 | | Solutia, Inc.* | | | 2,641,939 | |
| | | | | |
| Telecommunications: 1.5% | | | | |
| | 456,543 | | Lumos Networks Corp. | | | 7,003,370 | |
| | 211,826 | | nTelos Holdings Corp. | | | 4,317,014 | |
| | | | | | | 11,320,384 | |
| Truck Dealerships: 1.3% | | | | |
| | 211,930 | | Rush Enterprises, Inc. – Class A* | | | 4,433,575 | |
| | 295,798 | | Rush Enterprises, Inc. – Class B* | | | 5,078,852 | |
| | | | | | | 9,512,427 | |
| Utilities: 2.0% | | | | |
| | 502,518 | | PPL Corp. | | | 14,784,080 | |
| | | | | |
| Waste Management Services: 2.3% | | | | |
| | 618,108 | | Republic Services, Inc. | | | 17,028,875 | |
| | | | | |
| TOTAL COMMON STOCKS | | | | |
| (cost $310,090,333) | | | 360,696,326 | |
The accompanying notes are an integral part of these financial statements.
Greenspring Fund, Incorporated
SCHEDULE OF INVESTMENTS at December 31, 2011 (Con’t) |
| Principal | | | | Value | |
| CONVERTIBLE BONDS: 15.1% | | | |
| | | | |
| Communications Equipment Manufacturing: 3.6% | | | |
| $ | 30,145,000 | | Alcatel-Lucent, Inc., 2.875%, 6/15/25 | | $ | 26,602,963 | |
| | | | | |
| Educational: 2.1% | | | | |
| | 21,282,000 | | School Specialty, Inc., 3.750%, 11/30/26 | | | 15,429,450 | |
| | | | | |
| Entertainment: 1.0% | | | | |
| | 8,375,000 | | Live Nation Entertainment, Inc., | | | | |
| | | | 2.875%, 7/15/27 | | | 7,443,281 | |
| | | | | |
| Financial Services: 1.6% | | | | |
| | 12,161,000 | | Euronet Worldwide, Inc., 3.500%, 10/15/25 | | | 12,100,195 | |
| | | | | |
| Internet Software & Services: 0.7% | | | | |
| | 5,946,000 | | Digital River, Inc., 2.000%, 11/1/30 – 144A | | | 4,898,018 | |
| | | | | |
| Medical Equipment: 3.5% | | | | |
| | 20,645,000 | | Hologic, Inc., 2.000%, 12/15/37 | | | 19,793,394 | |
| | 6,496,000 | | Integra Lifesciences Holdings, | | | | |
| | | | 2.375%, 6/1/12 – 144A | | | 6,463,520 | |
| | | | | | | 26,256,914 | |
| Oil & Gas Exploration & Production: 0.4% | | | | |
| | 4,050,000 | | GMX Resources, Inc., 5.000%, 2/1/13 | | | 2,612,250 | |
| | 375,000 | | GMX Resources, Inc., 4.500%, 5/1/15 | | | 181,406 | |
| | | | | | | 2,793,656 | |
| Semiconductors & Semiconductor Equipment: 1.7% | | | | |
| | 4,911,000 | | Advanced Micro Devices, Inc., | | | | |
| | | | 5.750%, 8/15/12 | | | 4,984,665 | |
| | 7,761,000 | | Rambus, Inc., 5.000%, 6/15/14 | | | 7,634,884 | |
| | | | | | | 12,619,549 | |
| Transportation Equipment Manufacturing: 0.5% | | | | |
| | 3,602,000 | | Greenbrier Co., Inc., 2.375%, 5/15/26 | | | 3,507,447 | |
| | | | | |
| TOTAL CONVERTIBLE BONDS | | | | |
| (cost $118,929,077) | | | 111,651,473 | |
| | | | | | | | |
| CORPORATE BONDS: 27.2% | | | | |
| | | | | |
| Asset Management: 0.0% | | | | |
| | 30,000 | | Janus Capital Group, Inc., 6.119%, 4/15/14 | | | 31,138 | |
| | | | | |
| Construction & Engineering: 0.7% | | | | |
| | 4,972,000 | | MasTec, Inc., 7.625%, 2/1/17 | | | 5,195,740 | |
| | | | | |
| Consumer Goods: 3.2% | | | | |
| | 15,137,000 | | Hanesbrands, Inc., 4.146%, 12/15/14 | | | 15,137,000 | |
| | 7,738,000 | | TreeHouse Foods, Inc., 7.750%, 3/1/18 | | | 8,395,730 | |
| | | | | | | 23,532,730 | |
| Electrical Equipment and Instruments: 1.2% | | | | |
| | 8,685,000 | | Wesco Distribution, Inc., 7.500%, 10/15/17 | | | 8,912,981 | |
| | | | | |
| Entertainment: 2.2% | | | | |
| | 14,903,000 | | Ticketmaster Entertainment, Inc., | | | | |
| | | | 10.750%, 8/1/16 | | | 15,946,210 | |
| | | | | |
| Environmental Services: 0.0% | | | | |
| | 305,000 | | Clean Harbors, Inc., 7.625%, 8/15/16 | | | 325,587 | |
| | | | | |
| Healthcare: 0.9% | | | | |
| | 6,770,000 | | BioScrip, Inc., 10.250%, 10/1/15 | | | 6,719,225 | |
| | | | | |
| Oil & Gas Equipment & Services: 3.0% | | | | |
| | 536,000 | | Complete Production Services, Inc., | | | | |
| | | | 8.000%, 12/15/16 | | | 560,120 | |
| | 21,836,000 | | Gulfmark Offshore, Inc., 7.750%, 7/15/14 | | | 21,945,180 | |
| | | | | | | 22,505,300 | |
| Oil & Gas Exploration & Production: 6.3% | | | | |
| | 2,472,000 | | Bill Barrett Corp., 9.875%, 7/15/16 | | | 2,731,560 | |
| | 5,829,000 | | McMoRan Exploration Co., | | | | |
| | | | 11.875%, 11/15/14 | | | 6,207,885 | |
| | 6,652,000 | | Quicksilver Resources, Inc., 8.250%, 8/1/15 | | | 6,918,080 | |
| | 11,789,000 | | Range Resources Corp., 7.500%, 10/1/17 | | | 12,584,758 | |
| | 12,285,000 | | Rosetta Resources, Inc., 9.500%, 4/15/18 | | | 13,329,225 | |
| | 2,764,000 | | Sandridge Energy, Inc., 3.997%, 4/1/14 | | | 2,687,849 | |
| | 1,974,000 | | Stone Energy Corp., 6.750%, 12/15/14 | | | 1,954,260 | |
| | | | | | | 46,413,617 | |
| Pulp & Paper: 0.8% | | | | |
| | 5,164,000 | | AbitibiBowater, Inc., | | | | |
| | | | 10.250%, 10/15/18 – 144A | | | 5,719,130 | |
| | | | | |
| Real Estate: 0.1% | | | | |
| | 529,000 | | General Growth Properties, Inc., | | | | |
| | | | 7.200%, 9/15/12 | | | 538,919 | |
The accompanying notes are an integral part of these financial statements.
Greenspring Fund, Incorporated
SCHEDULE OF INVESTMENTS at December 31, 2011 (Con’t) |
| Principal | | | | Value | |
| CORPORATE BONDS: 27.2% (Con’t) | | | |
| | | | |
| Specialty Chemicals: 1.4% | | | |
| $ | 10,407,000 | | NewMarket Corp., 7.125%, 12/15/16 | | $ | 10,667,175 | |
| | | | | |
| Telecommunications: 3.9% | | | | |
| | 25,034,619 | | CCH II LLC, 13.500%, 11/30/16 | | | 29,040,158 | |
| | | | | |
| Transportation Equipment Manufacturing: 0.8% | | | | |
| | 5,325,000 | | Westinghouse Air Brake | | | | |
| | | | Technologies Corp., 6.875%, 7/31/13 | | | 5,577,937 | |
| | | | | |
| Wood Product Manufacturing: 2.7% | | | | |
| | 17,857,000 | | Leucadia National Corp., 7.000%, 8/15/13 | | | 18,660,565 | |
| | 1,158,000 | | Leucadia National Corp., 7.750%, 8/15/13 | | | 1,214,453 | |
| | | | | | | 19,875,018 | |
| TOTAL CORPORATE BONDS | | | | |
| (cost $201,157,140) | | | 201,000,865 | |
| | | | | | | | |
| Shares | | | | | | |
| SHORT-TERM INVESTMENTS: 8.6% | | | | |
| | | | | |
| Money Market Instruments^ | | | | |
| | 29,000,000 | | AIM Liquid Assets, 0.160% | | | 29,000,000 | |
| | 29,000,000 | | AIM STIC Prime Portfolio, 0.090% | | | 29,000,000 | |
| | 5,646,200 | | Fidelity Money Market Portfolio, 0.190% | | | 5,646,200 | |
| | | | | |
| TOTAL SHORT-TERM INVESTMENTS | | | | |
| (cost $63,646,200) | | | 63,646,200 | |
| | | | | |
| TOTAL INVESTMENTS IN SECURITIES | | | | |
| (cost $693,822,750): 99.7% | | | 736,994,864 | |
| Other Assets and Liabilities: 0.3% | | | 1,961,054 | |
| NET ASSETS: 100.0% | | $ | 738,955,918 | |
| * | Non-income producing security. |
| º | Investment in affiliated security (note 5). |
| # | U.S. security of foreign issuer. |
| 144A | Securities purchased pursuant to Rule 144A of the Securities Act of 1933, as amended, and may be sold only to dealers in that program or other “qualified institutional buyers.” These securities have been deemed to be liquid by the Fund’s adviser under the supervision of the Board of Directors. As of December 31, 2011, the value of these investments was $17,080,668, or 2.3% of total net assets. |
| ^ | Rate shown is the 7-day effective yield at December 31, 2011. |
The accompanying notes are an integral part of these financial statements.
Greenspring Fund, Incorporated
STATEMENT OF ASSETS AND LIABILITIES at December 31, 2011 |
| ASSETS | | | |
| Investments in securities, at value (cost $693,822,750) | | $ | 736,994,864 | |
| Receivables: | | | | |
| Fund shares sold | | | 1,128,250 | |
| Dividends and interest | | | 6,247,539 | |
| Prepaid expenses | | | 43,049 | |
| Total assets | | | 744,413,702 | |
| | | | | |
| LIABILITIES | | | | |
| Payables: | | | | |
| Due to affiliate (Note 5) | | | 450,437 | |
| Securities purchased | | | 2,489,994 | |
| Fund shares redeemed | | | 2,293,533 | |
| Accrued expenses | | | 223,820 | |
| Total liabilities | | | 5,457,784 | |
| | | | | |
| NET ASSETS | | $ | 738,955,918 | |
| | | | | |
| Capital shares issued and outstanding (60,000,000 shares authorized, $0.01 par value) | | | 32,553,422 | |
| | | | | |
| Net asset value, offering and redemption price per share | | $ | 22.70 | |
| | | | | |
| COMPONENTS OF NET ASSETS | | | | |
| Capital stock at par value | | $ | 325,534 | |
| Paid-in capital | | | 700,563,246 | |
| Accumulated net investment loss | | | (7,066,957 | ) |
| Undistributed net realized gain on investments | | | 1,961,981 | |
| Net unrealized appreciation on investments | | | 43,172,114 | |
| NET ASSETS | | $ | 738,955,918 | |
The accompanying notes are an integral part of these financial statements.
Greenspring Fund, Incorporated
STATEMENT OF OPERATIONS For the Year Ended December 31, 2011 |
| INVESTMENT INCOME | | | |
| Income | | | |
| Interest | | $ | 23,189,614 | |
| Dividends (net of foreign withholding taxes of $12,534) | | | 4,772,267 | |
| Total income | | | 27,961,881 | |
| | | | | |
| Expenses | | | | |
| Advisory fees (Note 5) | | | 5,859,861 | |
| Transfer agent fees (Note 6) | | | 857,310 | |
| Administration fees | | | 359,927 | |
| Fund accounting fees | | | 125,847 | |
| Administration fees – Corbyn (Note 5) | | | 114,382 | |
| Custody fees | | | 80,339 | |
| Reports to shareholders | | | 74,408 | |
| Miscellaneous fees | | | 49,808 | |
| Blue sky fees | | | 46,221 | |
| Directors fees | | | 43,003 | |
| Legal fees | | | 42,814 | |
| Audit fees | | | 27,600 | |
| Insurance fees | | | 23,102 | |
| Total expenses | | | 7,704,622 | |
| Net investment income | | | 20,257,259 | |
| | | | | |
| REALIZED AND UNREALIZED GAIN ON INVESTMENTS | | | | |
| Net realized gain on investments | | | 24,260,039 | |
| Change in net unrealized appreciation/depreciation on investments | | | (52,118,077 | ) |
| Net realized and unrealized loss on investments | | | (27,858,038 | ) |
| Net decrease in net assets resulting from operations | | $ | (7,600,779 | ) |
The accompanying notes are an integral part of these financial statements.
Greenspring Fund, Incorporated
| STATEMENTS OF CHANGES IN NET ASSETS |
| | | Year Ended | | | | Year Ended | |
| | December 31, 2011 | | December 31, 2010 |
| INCREASE (DECREASE) IN NET ASSETS FROM: | | | | | | | |
| | | | | | | | |
| OPERATIONS | | | | | | | |
| Net investment income | | $ | 20,257,259 | | | | $ | 16,518,600 | |
| Net realized gain on investments | | | 24,260,039 | | | | | 10,392,646 | |
| Change in net unrealized appreciation/depreciation on investments | | | (52,118,077 | ) | | | | 44,738,105 | |
| Net increase (decrease) in net assets resulting from operations | | | (7,600,779 | ) | | | | 71,649,351 | |
| | | | | | | | | | |
| DISTRIBUTIONS TO SHAREHOLDERS | | | | | | | | | |
| From net investment income | | | (27,706,977 | ) | | | | (22,581,527 | ) |
| From net realized gain | | | (18,593,281 | ) | | | | (5,386,895 | ) |
| Total distributions to shareholders | | | (46,300,258 | ) | | | | (27,968,422 | ) |
| | | | | | | | | | |
| CAPITAL SHARE TRANSACTIONS | | | | | | | | | |
| Net increase (decrease) in net assets derived | | | | | | | | | |
| from net change in outstanding shares (a)+ | | | (37,853,714 | ) | | | | 258,531,954 | |
| Total increase (decrease) in net assets | | | (91,754,751 | ) | | | | 302,212,883 | |
| | | | | | | | | | |
| NET ASSETS | | | | | | | | | |
| Beginning of year | | | 830,710,669 | | | | | 528,497,786 | |
| End of year (including accumulated net investment loss | | | | | | | | | |
| of ($7,066,957) and ($3,915,693), respectively) | | $ | 738,955,918 | | | | $ | 830,710,669 | |
(a)A summary of capital share transactions is as follows:
| | | Year Ended | | | Year Ended | |
| | | December 31, 2011 | | | December 31, 2010 | |
| | | Shares | | | Value | | | Shares | | | Value | |
| Shares sold | | | 11,522,484 | | | $ | 278,987,824 | | | | 15,468,309 | | | $ | 361,466,064 | |
| Shares issued in reinvestment of distributions | | | 2,002,046 | | | | 45,518,365 | | | | 1,166,189 | | | | 27,536,092 | |
| Shares redeemed + | | | (15,305,772 | ) | | | (362,359,903 | ) | | | (5,595,309 | ) | | | (130,470,202 | ) |
| Net increase (decrease) | | | (1,781,242 | ) | | $ | (37,853,714 | ) | | | 11,039,189 | | | $ | 258,531,954 | |
+Net of redemption fees of $74,850 and $52,507, respectively.
The accompanying notes are an integral part of these financial statements.
Greenspring Fund, Incorporated
FINANCIAL HIGHLIGHTS For a capital share outstanding throughout each year |
| | | Year Ended December 31, | |
| | | 2011 | | | 2010 | | | 2009 | | | 2008 | | | 2007 | |
| Net asset value, beginning of year | | $ | 24.19 | | | $ | 22.69 | | | $ | 20.36 | | | $ | 23.59 | | | $ | 23.43 | |
| | | | | | | | | | | | | | | | | | | | | |
| INCOME (LOSS) FROM INVESTMENT OPERATIONS: | | | | | | | | | | | | | | | | | | | | |
| Net investment income | | | 0.58 | | | | 0.56 | | | | 0.71 | | | | 0.43 | | | | 0.55 | |
| Net realized and unrealized gain (loss) on investments | | | (0.66 | ) | | | 1.82 | | | | 2.47 | | | | (3.18 | ) | | | 0.70 | |
| Total from investment operations | | | (0.08 | ) | | | 2.38 | | | | 3.18 | | | | (2.75 | ) | | | 1.25 | |
| | | | | | | | | | | | | | | | | | | | | |
| LESS DISTRIBUTIONS: | | | | | | | | | | | | | | | | | | | | |
| From net investment income | | | (0.82 | ) | | | (0.72 | ) | | | (0.83 | ) | | | (0.34 | ) | | | (0.56 | ) |
| From net realized gain | | | (0.59 | ) | | | (0.16 | ) | | | (0.02 | ) | | | (0.16 | ) | | | (0.53 | ) |
| Total distributions | | | (1.41 | ) | | | (0.88 | ) | | | (0.85 | ) | | | (0.50 | ) | | | (1.09 | ) |
| Paid-in capital from redemption fees (Note 1) | | | — | * | | | — | * | | | — | * | | | 0.02 | | | | — | * |
| Net asset value, end of year | | $ | 22.70 | | | $ | 24.19 | | | $ | 22.69 | | | $ | 20.36 | | | $ | 23.59 | |
| Total return | | | (0.26 | %) | | | 10.63 | % | | | 15.83 | % | | | (11.72 | %) | | | 5.32 | % |
| | | | | | | | | | | | | | | | | | | | | |
| RATIOS/SUPPLEMENTAL DATA: | | | | | | | | | | | | | | | | | | | | |
| Net assets, end of year (millions) | | $ | 739.0 | | | $ | 830.7 | | | $ | 528.5 | | | $ | 308.2 | | | $ | 257.9 | |
| Ratio of expenses to average net assets | | | 0.91 | % | | | 0.95 | % | | | 1.03 | % | | | 1.06 | % | | | 1.03 | % |
| Ratio of net investment income to average net assets | | | 2.40 | % | | | 2.51 | % | | | 3.67 | % | | | 2.15 | % | | | 2.24 | % |
| Portfolio turnover rate | | | 58.32 | % | | | 59.99 | % | | | 46.77 | % | | | 47.11 | % | | | 53.75 | % |
*Amount less than $0.01 per share.
The accompanying notes are an integral part of these financial statements.
Greenspring Fund, Incorporated
NOTES TO FINANCIAL STATEMENTS December 31, 2011 |
| Note 1 – Significant Accounting Policies |
Greenspring Fund, Incorporated (the “Fund”) is a diversified, open-end management investment company registered under the Investment Company Act of 1940, as amended (the “1940 Act”). The Fund is organized as a Maryland corporation and commenced operations on July 1, 1983.
The preparation of the financial statements in accordance with accounting principles generally accepted in the United States of America requires management to make estimates and assumptions that affect the reported amounts and disclosures in the financial statements. Actual results could differ from those estimates. In preparing these financial statements, the Fund has evaluated events and transactions for potential recognition or disclosure through the date the financial statements were issued.
Investment transactions and related investment income – Investment transactions are recorded on the trade date. Dividend income is recorded on the ex-dividend date and interest income, including amortization of premiums and accretion of discounts, is recorded on the accrual basis. Dividends determined to be a return of capital are recorded as a reduction of the cost basis of the security. Realized gains and losses from investment transactions are reported on an identified cost basis.
Valuation of investments – Securities listed on a national securities exchange or the NASDAQ National Market are valued at the last reported sale price or the official closing price for certain markets on the exchange of major listing as of the close of the regular session of the New York Stock Exchange.
Securities that are traded principally in the over-the-counter market, listed securities for which no sale was reported on the day of valuation, and listed securities whose primary market is believed by Corbyn Investment Management, Inc. (“Corbyn” or the “Adviser”) to be over-the-counter are valued at the mean of the closing bid and asked prices obtained from sources that the Adviser deems appropriate.
Investments in open-end management investment companies are valued at the net asset value of the shares of that investment company.
Short-term investments are valued at amortized cost, which approximates fair market value. The value of securities that mature, or have an announced call, within 60 days will be valued at market value.
Securities for which market quotations are not readily available are valued at fair value as determined in good faith by the Adviser as directed by the Fund’s Board of Directors (the “Board”).
In determining fair value, the Adviser, as directed by the Board, considers all relevant qualitative and quantitative information available. These factors are subject to change over time and are reviewed periodically. The values assigned to fair value investments are based on available information and do not necessarily represent amounts that might ultimately be realized, since such amounts depend on future developments inherent in long-term investments. Further, because of the inherent uncertainty of valuation, those estimated values may differ significantly from the values that would have been used had a ready market of the investments existed, and the differences could be material.
The Fund has adopted fair valuation accounting standards that establish an authoritative definition of fair value and set out a hierarchy for measuring fair value. These standards require additional disclosures about the various input and valuation techniques used in measuring fair value. Fair value inputs are summarized in the three broad levels listed below:
Greenspring Fund, Incorporated
NOTES TO FINANCIAL STATEMENTS December 31, 2011 (Con’t) |
| Level 1 – | Unadjusted quoted prices in active markets for identical securities that the Fund has the ability to access. |
| | |
| Level 2 – | Observable inputs other than quoted prices included in Level 1 that are observable for the security, either directly or indirectly. These inputs may include quoted prices for the identical instrument on an inactive market, prices for similar instruments, interest rates, prepayment speeds, credit risk, yield curves, default rates and similar data. |
| | |
| Level 3 – | Unobservable inputs for the security, to the extent relevant observable inputs are not available, representing the Fund’s own assumptions about the assumptions a market participant would use in valuing the security, and which would be based on the best information available. |
The inputs or methodology used for valuing securities are not necessarily an indication of the risk associated with investing in these securities. The following is a summary of the inputs used to value the Fund’s net assets as of December 31, 2011:
| | | Quoted Prices | | | Significant Other | | | Significant | | | Carrying Value | |
| | | in Active | | | Observable | | | Unobservable | | | at December 31, | |
| | | Markets | | | Inputs | | | Inputs | | | 2011 | |
| | | Level 1 | | | Level 2 | | | Level 3 | | | Total | |
| Common Stocks | | $ | 360,696,326 | | | $ | — | | | $ | — | | | $ | 360,696,326 | |
| Convertible Bonds | | | — | | | | 111,651,473 | | | | — | | | | 111,651,473 | |
| Corporate Bonds | | | — | | | | 201,000,865 | | | | — | | | | 201,000,865 | |
| Short-Term Investment | | | 63,646,200 | | | | — | | | | — | | | | 63,646,200 | |
| Total | | $ | 424,342,526 | | | $ | 312,652,338 | | | $ | — | | | $ | 736,994,864 | |
See Schedule of Investments for industry breakdown.
Transfers between levels are recognized at the end of the reporting period. During the year ended December 31, 2011, the Fund recognized no transfers between valuation levels.
Dividends and distributions to stockholders – The Fund records dividends and distributions to shareholders on the ex-dividend date.
Redemption fees – The Fund’s Board of Directors has adopted policies and procedures with respect to frequent purchases and redemptions of Fund shares by Fund shareholders. The Fund is intended for long-term investors. The Fund discourages and does not accommodate frequent purchases and redemptions of Fund shares by Fund shareholders. The Fund reserves the right to decline a purchase order for any reason.
“Market-timers” who engage in frequent purchases and redemptions of Fund shares over a short period can disrupt the Fund’s investment program by requiring the Fund to have excess cash on hand or to liquidate holdings to accommodate redemptions. In addition, frequent purchases and redemptions may impede efficient Fund management and create additional transaction costs that are borne by all shareholders. To the extent that the Fund invests a significant portion of its assets in small-cap securities or high-yield bonds, it may be subject to the risks of market timing more than a fund that does not. Therefore, the Fund imposes a 2% redemption fee for shares held 60 days or less. The fee is deducted from the seller’s redemption proceeds and deposited into the Fund to help offset brokerage commissions, market impact, and other costs associated with fluctuations in Fund asset levels and cash flow caused by short-term trading. All shareholders are subject to these restrictions regardless of whether you purchased your shares directly from the Fund or through a
Greenspring Fund, Incorporated
NOTES TO FINANCIAL STATEMENTS December 31, 2011 (Con’t) |
financial intermediary. However, the Fund is limited in its ability to determine whether trades placed through financial intermediaries may signal excessive trading. Accordingly, the Fund may not be able to determine whether trading in combined orders or in omnibus accounts is contrary to the Fund’s policies. The Fund reserves the right to reject combined or omnibus orders in whole or in part.
In compliance with Rule 22c-2 under the 1940 Act, Quasar Distributors, LLC, on behalf of the Fund, has entered into written agreements with each of the Fund’s financial intermediaries, under which the intermediaries must, upon request, provide the Fund with certain shareholder and identity trading information so that the Fund can enforce its frequent trading policies.
To calculate redemption fees, after first redeeming any shares associated with reinvested dividends or other distributions, the “first-in, first-out” method is used to determine the holding period. Under this method, the date of redemption will be compared with the earliest purchase date of shares held in the account. If the holding period for shares purchased is 60 days or less, the fee will be charged. The redemption fee may be modified or discontinued at any time, in which case, shareholders will be notified.
The fee does not apply to shares acquired through the reinvestment of dividends or other distributions, or shares redeemed pursuant to a systematic withdrawal plan or a mandatory IRA distribution.
Risk of loss arising from indemnifications – In the normal course of business, the Fund enters into contracts that contain a variety of representations, which provide general indemnifications. The Fund’s maximum exposure under these arrangements is unknown as this would involve future claims that may be made against the Fund that have not yet occurred. However, based on experience, the Fund expects the risk of loss to be remote.
Note 2 – Dividends and Distributions |
It is the Fund’s policy to declare dividends from net investment income and distributions from net realized gains as determined in accordance with income tax regulations, which may differ from accounting principles generally accepted in the United States of America. Accordingly, periodic reclassifications are made within the portfolio’s capital accounts to reflect income and gains available for distribution under income tax regulations.
On July 13, 2011 an income dividend of $0.39 per share was declared, payable on July 14, 2011, to shareholders of record on July 12, 2011. Additionally, on December 14, 2011, an income dividend of $0.43 per share and a long-term capital gain distribution of $0.59 per share were declared, payable on December 15, 2011 to shareholders of record on December 13, 2011. The tax character of distributions paid during the year ended December 31, 2011 and the year ended December 31, 2010 were as follows:
| | Distributions paid from: | December 31, 2011 | December 31, 2010 | |
| | Ordinary income | $27,660,406 | $24,387,532 | |
| | Long-term capital gain | $18,639,852 | $ 3,580,890 | |
These dividends are either distributed to shareholders or reinvested in the Fund as additional shares issued to shareholders. For those shareholders reinvesting the dividends, the number of shares issued is based on the net asset value per share as of the close of business on the ex-dividend date.
Greenspring Fund, Incorporated
NOTES TO FINANCIAL STATEMENTS December 31, 2011 (Con’t) |
The Fund designated as long-term capital gain dividend, pursuant to Internal Revenue Code Section 852(b)(3), the amount necessary to reduce the earnings and profits of the Fund related to net capital gain to zero for the tax year ended December 31, 2011.
Note 3 – Purchases and Sales of Investments |
For the year ended December 31, 2011, purchases and sales of investments, other than short-term investments, aggregated $448,396,490 and $460,578,349, respectively.
Note 4 – Federal Income Taxes |
It is the Fund’s policy to comply with the requirements of the Internal Revenue Code applicable to regulated investment companies. Accordingly, the Fund intends to distribute substantially all of its taxable income. Therefore, no federal income tax provision is required.
As of and during the year ended December 31, 2011, the Fund did not have any tax positions that did not meet the “more-likely-than-not” threshold of being sustained by the applicable tax authority. Tax positions not deemed to meet the “more-likely-than-not” threshold would be recorded as a tax benefit or expense in the current year. Generally, tax authorities can examine tax returns filed for all open tax years (2008-2011).
Required Fund distributions are based on income and capital gain amounts determined in accordance with federal income tax regulations, which differ from net investment income and realized gains recognized for financial reporting purposes.
Accordingly, the composition of net assets and distributions on a tax basis may differ from those reflected in the accompanying financial statements. As of December 31, 2011, the Fund’s most recently completed year end, the components of distributable earnings on a tax basis were as follows:
| Cost of investments | | $ | 700,889,707 | |
| | | | | |
| Gross tax unrealized appreciation | | | 74,988,290 | |
| Gross tax unrealized depreciation | | | (38,883,133 | ) |
| Net tax unrealized appreciation | | | 36,105,157 | |
| | | | | |
| Undistributed ordinary income | | | — | |
| Undistributed long-term capital gain | | | 2,252,976 | |
| Total distributable earnings | | | 2,252,976 | |
| | | | | |
| Other accumulated gains/(losses) | | | (290,995 | ) |
| Total accumulated earnings/(losses) | | $ | 38,067,138 | |
Accounting principles generally accepted in the United States of America require that certain components of net assets relating to permanent differences be reclassified between financial and tax reporting. These reclassifications have no effect on net assets or net asset value per share. For the year ended December 31, 2011, the Fund decreased accumulated net investment loss by $4,298,454 and decreased undistributed net realized gain on investments by $4,298,454. The Fund incurred losses for tax purposes of $290,995 for the period of November 1, 2011 to December 31, 2011. As permitted by tax regulations, the Fund intends to elect to defer and treat these losses as arising in the fiscal year ending December 31, 2012.
Greenspring Fund, Incorporated
NOTES TO FINANCIAL STATEMENTS December 31, 2011 (Con’t) |
Note 5 – Transactions with Affiliated Parties |
Corbyn serves as the Fund’s investment adviser. Under an agreement between the Fund and Corbyn, the Fund pays Corbyn a fee of 0.75% of the first $250 million of average daily net assets, 0.70% of average daily net assets between $250 million and $500 million and 0.65% of average daily net assets in excess of $500 million, which is computed daily and paid monthly. For the year ended December 31, 2011, the Fund incurred $5,859,861 in advisory fees.
The Fund has also entered into a Services Agreement with Corbyn to provide various administrative services. As compensation, the Fund pays Corbyn a fee of $2,500 per month plus 0.01% of average daily net assets, which is computed daily and paid monthly. For the year ended December 31, 2011, the Fund incurred $114,382 in administrative fees to Corbyn.
At December 31, 2011, investors for whom Corbyn was investment adviser held 855,705 shares of the Fund.
A company is considered to be an affiliate of the Fund under the 1940 Act if the Fund’s holdings of that company represent 5% or more of the outstanding voting securities of the company. Transactions with companies that are or were affiliates during the year ended December 31, 2011 are as follows:
| | | Beginning | | | Purchase | | | Sales | | | Ending | | | Dividend | | | | | | | |
| Issuer | | Cost | | | Cost | | | Cost | | | Cost | | | Income | | | Shares | | | Value | |
| Michael Baker Corp. | | $ | 16,184,033 | | | $ | 169,124 | | | $ | — | | | $ | 16,353,157 | | | $ | — | | | | 644,305 | | | $ | 12,634,821 | |
| Southern National | | | | | | | | | | | | | | | | | | | | | | | | | | | | |
| Bancorp of Virginia | | | 1,403,790 | | | | 2,763,319 | | | | — | | | | 4,167,109 | | | | — | | | | 589,083 | | | | 3,593,406 | |
| Note 6 – Shareholder Servicing Fees |
Both the Fund and Corbyn have entered into various Shareholder Servicing Agreements, whereby a fee is paid to certain service agents who administer omnibus accounts for indirect shareholders of the Fund. The Board of Directors has authorized the Fund to pay the amount of the fees it estimates the Fund would have been charged by its transfer agent for administering the accounts on an individual basis. The amount is included in “Transfer agent fees” on the accompanying Statement of Operations. For the year ended December 31, 2011, the Fund incurred $744,554 of such fees.
| Note 7 – New Accounting Pronouncement |
In May 2011, the Financial Accounting Standards Board (“FASB”) issued Accounting Standards Update (“ASU”) No. 2011-04, “Fair Value Measurement (Topic 820): Amendments to Achieve Common Fair Value Measurement and Disclosure Requirements in U.S. GAAP and International Financial Reporting Standards (“IFRS”). ASU No. 2011-04 clarifies existing requirements for measuring fair value and for disclosure about fair value measurements in converged guidance of the FASB and the International Accounting Standards Board. The amendments are to be applied prospectively. The amendments are effective during interim and annual periods beginning after December 15, 2011. Early application by public entities is not permitted. The Adviser is currently evaluating the impact ASU No. 2011-04 will have on the financial statement disclosures.
In December 2011, FASB issued ASU No. 2011-11 related to disclosures about offsetting assets and liabilities. The amendments in this ASU require an entity to disclose information about offsetting and related arrangements to enable users of its financial statements to understand the effect of those arrangements on its financial position. The ASU is effective for annual reporting periods beginning on or after January 1, 2013, and interim periods within those annual periods. The guidance requires retrospective application for all comparative periods presented. The Adviser is currently evaluating the impact ASU No. 2011-11 will have on the financial statement disclosures.
Greenspring Fund, Incorporated
REPORT OF INDEPENDENT REGISTERED PUBLIC ACCOUNTING FIRM
Board of Directors and Shareholders
Greenspring Fund, Incorporated
Lutherville, Maryland
We have audited the accompanying statement of assets and liabilities of the Greenspring Fund, Incorporated (the “Fund”), including the schedule of investments, as of December 31, 2011, and the related statement of operations for the year then ended, the statements of changes in net assets for each of the two years in the period then ended, and financial highlights for each of the five years in the period then ended. These financial statements and financial highlights are the responsibility of the Fund’s management. Our responsibility is to express an opinion on these financial statements and financial highlights based on our audits.
We conducted our audits in accordance with the standards of the Public Company Accounting Oversight Board (United States). Those standards require that we plan and perform the audit to obtain reasonable assurance about whether the financial statements and financial highlights are free of material misstatement. The Fund is not required to have, nor were we engaged to perform, an audit of its internal control over financial reporting. Our audits included consideration of internal control over financial reporting as a basis for designing audit procedures that are appropriate in the circumstances, but not for the purpose of expressing an opinion on the effectiveness of the Fund’s internal control over financial reporting. Accordingly, we express no such opinion. An audit includes examining, on a test basis, evidence supporting the amounts and disclosures in the financial statements. Our procedures included confirmation of securities owned as of December 31, 2011, by correspondence with the custodian and brokers or by other appropriate auditing procedures where replies from brokers were not received. An audit also includes assessing the accounting principles used and significant estimates made by management, as well as evaluating the overall financial statement presentation. We believe that our audits provide a reasonable basis for our opinion.
In our opinion, the financial statements and financial highlights referred to above present fairly, in all material respects, the financial position of the Greenspring Fund, Incorporated as of December 31, 2011, the results of its operations for the year then ended, the changes in its net assets for each of the two years in the period then ended, and the financial highlights for each of the five years in the period then ended, in conformity with accounting principles generally accepted in the United States of America.
Philadelphia, Pennsylvania
February 20, 2012
Greenspring Fund, Incorporated
NOTICE TO SHAREHOLDERS December 31, 2011 (Unaudited) |
Tax Information
The Fund designates 13.49% of dividends declared from net investment income during the fiscal year ended December 31, 2011 as qualified income under the Jobs and Growth Tax Relief Reconciliation Act of 2003.
For corporate shareholders in the Fund, the percentage of ordinary dividend income distributed for the year ended December 31, 2011, which is designated as qualifying for the dividends-received deduction, is13.49%.
For foreign shareholders in the Fund, for the year ended December 31, 2011, 67.00% of the ordinary distributions paid qualify as interest-related dividends under the Internal Revenue Code Section 871(k)(1)(c), and 0.00% of the ordinary income distributions are designated as short-term capital gain distributions under Internal Revenue Code Section 871(k)(2)(c).
Proxy Voting Policies and Proxy Voting Record
The Fund’s proxy voting policies and procedures, as well as its proxy voting record for the most recent 12-month period ended June 30, are available without charge, upon request, by contacting the Fund at (800) 366-3863 or greenspring@greenspringfund.com. The Fund will send the information within three business days of receipt of the request, by first class mail or other means designed to ensure equally prompt delivery. The Fund’s proxy voting record is also available on the U.S. Securities and Exchange Commission’s website at www.sec.gov.
Form N-Q Holdings Information
The Fund files its complete schedule of portfolio holdings with the U.S. Securities and Exchange Commission for the first and third quarters of each fiscal year on Form N-Q. The Fund’s Forms N-Q are available on the Commission’s website at www.sec.gov and may be reviewed and copied at the Commission’s Public Reference Room in Washington, DC. Information on the operation of the Public Reference Room may be obtained by calling (800) SEC-0330.
Reports and Householding
In an attempt to reduce shareholder expenses, we will mail only one copy of the Fund’s Summary Prospectus and each Annual and Semi-Annual Report to those addresses shared by two or more accounts. If you wish to receive individual copies of these documents, please call us at (800) 366-3863. We will begin sending you individual copies 30 days after receiving your request.
The Fund’s Prospectus, Statement of Additional Information, Annual Report, and Semi-Annual Report, along with its first and third quarter portfolio holdings, are available on the Fund’s website at www.greenspringfund.com.
Greenspring Fund, Incorporated
BASIC INFORMATION ABOUT FUND DIRECTORS AND OFFICERS (Unaudited) |
The Board of Directors supervises the management of the Fund. The following list summarizes information on the directors and officers of the Fund for the past five years. The address of each is 2330 West Joppa Road, Suite 110, Lutherville, MD 21093. The Fund’s Statement of Additional Information contains additional information about Fund directors and is available, without charge, upon request, by calling the Fund at (800) 366-3863, or by emailing the Fund at greenspring@greenspringfund.com.
| | | | | Number | |
| | Position(s) Held | Term of Office and | Principal Occupation(s) | of Funds | Other |
| Name and Age | with the Fund | Length of Time Served | During the Past Five Years | Overseen | Directorships |
| | | Term of Director | | | |
| | | Indefinite | | | |
| | | Term of Officer | | | |
| | | One year | | | |
| Interested | | | | | |
| Directors/Officers | | | | | |
| Charles vK. Carlson | President | From March 1993 to present. | President and Director of the | One | None |
| 52 | Chairman of the Board | From January 1994 to present. | Fund’s Adviser. | | |
| | Chief Executive Officer | From February 1994 to present. | | | |
| | Director | From March 1987 to present. | | | |
| | | | | | |
| William E. Carlson | Director | From February 1994 to present. | President of Shapiro Sher Guinot | One | None |
| 54 | | | & Sandler (a law firm) from | | |
| | | | February 1999 to present. Partner | | |
| | | | of Shapiro Sher Guinot & Sandler | | |
| | | | from February 1990 to present. | | |
| | | | | | |
| Michael J. Fusting | Sr. Vice President | From May 1998 to present. | Sr. Vice President and Director of | One | None |
| 50 | Chief Financial Officer | From February 1994 to present. | the Fund’s Adviser. | | |
| | Director | From March 1992 to present. | | | |
| | | | | | |
| Disinterested Directors | | | | | |
| David T. Fu | Director | From May 1990 to present. | Managing Director of Kanturk | One | None |
| 55 | | | Partners, LLC (a merchant bank) | | |
| | | | from February 2004 to present. | | |
| | | | | | |
| Sean T. Furlong | Director | From March 2003 to present. | Director of Finance and | One | None |
| 46 | | | Operations at the Gilman | | |
| | | | School from June 2003 to present. | | |
Greenspring Fund, Incorporated
BASIC INFORMATION ABOUT FUND DIRECTORS AND OFFICERS (Unaudited) (Con’t) |
| | | | | Number | |
| | Position(s) Held | Term of Office and | Principal Occupation(s) | | Other |
| Name and Age | with the Fund | Length of Time Served | During the Past Five Years | Overseen | Directorships |
| | | Term of Director | | | |
| | | Indefinite | | | |
| | | Term of Officer | | | |
| | | One year | | | |
| | | | | | |
| Michael P. O’Boyle | Director | From July 2000 to present. | President and CEO of Parallon | One | None |
| 55 | | | Business Solutions, a subsidiary | | |
| | | | of Hospital Corporation of | | |
| | | | America (a provider of healthcare | | |
| | | | services) from January 2012 to | | |
| | | | present. President of UnitedHealth | | |
| | | | Networks, a division of United | | |
| | | | Healthcare (a managed health | | |
| | | | care company) from May 2008 to | | |
| | | | December 2011. Chief Operating | | |
| | | | Officer of The Cleveland Clinic | | |
| | | | Foundation (world-renowned | | |
| | | | non-profit provider of health care | | |
| | | | services, education and research) | | |
| | | | and The Cleveland Clinic Health | | |
| | | | System from July 2005 to March | | |
| | | | 2008. | | |
| Officers | | | | | |
| Elizabeth Agresta Swam | Secretary and Treasurer | From May 1998 to present. | Employee of the Fund’s Adviser | | None |
| 44 | AML Officer | From July 2002 to present. | from May 1998 to present. | | |
| | Chief Compliance Officer | From July 2004 to present. | | | |
Privacy Policy
The Greenspring Fund recognizes that individuals expect an exceptional level of privacy in their financial affairs. The Fund assures the confidentiality of personal information provided to it.
The information we collect is limited to what the Fund believes is necessary or useful to conduct our business; administer your records, accounts and funds; to comply with laws and regulations; and to help us design or improve products and services. The Fund collects non-public personal information about you from information it receives from you on applications or other forms or through its website, as well as from information about your transactions with the Fund.
Some of this information may be disclosed to the Fund’s investment adviser, but not for marketing solicitation, as well as non-affiliated third parties who provide non-financial services to the Fund such as our Transfer Agent, in order to administer customer accounts and mail transaction confirmations and tax forms, and the mailing house the Fund utilizes for mailing shareholder reports. Such information may also be disclosed to a non-affiliated third party engaged to provide fund accounting and administrative services to us. Disclosing this information enables us to meet customers’ financial needs and regulatory requirements. These third parties act on its behalf and are obligated to keep the information we provide to them confidential and to use the information only for the purposes authorized. The Fund does not disclose any non-public personal information about you or former customers to anyone, except as permitted by law.
To protect your non-public personal information, the Fund permits access to it only by authorized employees and maintains security practices to safeguard your information.
If you have any questions regarding our Privacy Policy, please contact us at 1-800-366-3863 or greenspring@greenspringfund.com. Thank you.
Greenspring Fund, Incorporated
Performance Since Inception on
July 1, 1983 through December 31, 2011
(Unaudited)
| |
| HOW $10,000 INVESTED ON 7/1/83 WOULD HAVE GROWN* |
| |
 |
| |
| * | Figures include changes in principal value, reinvested dividends and capital gains distributions. Past expense limitations increased the Fund’s return. This chart illustrates the performance of a hypothetical $10,000 investment made in the Fund since inception through December 31, 2011. The total value of $143,782 assumes the reinvestment of dividends and capital gains, but does not reflect the effect of any redemption fees. This chart does not imply any future performance. |
Average annual total returns for the one, three, five and ten year periods ended December 31, 2011 were -0.26%, 8.52%, 3.51% and 6.68%, respectively. Average annual returns for more than one year assume a compounded rate of return and are not the Fund’s year-by-year results, which fluctuated over the periods shown. Returns do not reflect taxes that shareholders may pay on Fund distributions or redemption of Fund shares.
Greenspring Fund, Incorporated
2330 West Joppa Road, Suite 110
Lutherville, MD 21093
(410) 823-5353
(800) 366-3863
www.greenspringfund.com
DIRECTORS
Charles vK. Carlson, Chairman
William E. Carlson
David T. Fu
Sean T. Furlong
Michael J. Fusting
Michael P. O’Boyle
OFFICERS
Charles vK. Carlson
President and Chief Executive Officer
Michael J. Fusting
Sr. Vice President and
Chief Financial Officer
Elizabeth Agresta Swam
Chief Compliance Officer,
Secretary, Treasurer
and AML Officer
INVESTMENT ADVISER
Corbyn Investment Management, Inc.
2330 West Joppa Road, Suite 108
Lutherville, MD 21093-7207
ADMINISTRATOR, FUND ACCOUNTANT
AND TRANSFER AGENT
U.S. Bancorp Fund Services, LLC
615 East Michigan Street
Milwaukee, WI 53202
DISTRIBUTOR
Quasar Distributors, LLC
615 East Michigan Street
Milwaukee, WI 53202
CUSTODIAN
U.S. Bank, N.A.
1555 N. RiverCenter Dr., Suite 302
Milwaukee, WI 53212
INDEPENDENT REGISTERED
PUBLIC ACCOUNTING FIRM
Tait, Weller & Baker LLP
1818 Market Street, Suite 2400
Philadelphia, PA 19103
LEGAL COUNSEL
K&L Gates LLP
1601 K Street NW
Washington, DC 20006
Symbol – GRSPX
CUSIP – 395724107
Item 2. Code of Ethics.
The registrant has adopted a code of ethics that applies to the registrant’s principal executive officer and principal financial officer. The registrant has not made any amendments to its code of ethics during the period covered by this report. The registrant has not granted any waivers from any provisions of the code of ethics during the period covered by this report.
A copy of the registrant’s Code of Ethics is filed herewith.
Item 3. Audit Committee Financial Expert.
The registrant’s board of directors has determined that there is at least one audit committee financial expert serving on its audit committee. Mr. Sean T. Furlong is the “audit committee financial expert” and is considered to be “independent” as each term is defined in Item 3 of Form N-CSR.
Item 4. Principal Accountant Fees and Services.
The registrant has engaged its principal accountant to perform audit services, audit-related services, tax services or other services during the past two fiscal years. “Audit services” refer to performing an audit of the registrant's annual financial statements or services that are normally provided by the accountant in connection with statutory and regulatory filings or engagements for those fiscal years. “Audit-related services” refer to the assurance and related services by the principal accountant that are reasonably related to the performance of the audit. “Tax services” refer to professional services rendered by the principal accountant for tax compliance, tax advice, and tax planning. There were no “other services” provided by the principal accountant. The following table details the aggregate fees billed, or expected to be billed, for each of the last two fiscal years for audit fees, audit-related fees, tax fees or other fees by the principal accountant:
| | FYE 12/31/2011 | FYE 12/31/2010 |
| Audit Fees | $24,400 | $23,700 |
| Audit-Related Fees | N/A | N/A |
| Tax Fees | $3,200 | $3,100 |
| All Other Fees | N/A | N/A |
The audit committee has adopted pre-approval policies and procedures that require the audit committee to pre-approve all audit and non-audit services of the registrant, including services provided to any entity affiliated with the registrant. All of the principal accountant’s hours spent on auditing the registrant’s financial statements were attributed to work performed by full-time permanent employees of the principal accountant.
The percentage of fees billed by Tait, Weller & Baker LLP applicable to non-audit services pursuant to waiver of pre-approval requirement were as follows:
| | FYE 12/31/2011 | FYE 12/31/2010 |
| Audit-Related Fees | 0% | 0% |
| Tax Fees | 0% | 0% |
| All Other Fees | 0% | 0% |
The following table indicates the non-audit fees billed, or expected to be billed, by the registrant’s accountant for services to the registrant and to the registrant’s investment adviser for the last two years. The audit committee of the board of directors has considered whether the provision of non-audit services that were rendered to the registrant's investment adviser is compatible with maintaining the principal accountant's independence and has concluded that the provision of such non-audit services by the accountant has not compromised the accountant’s independence.
| Non-Audit Related Fees | FYE 12/31/2011 | FYE 12/31/2010 |
| Registrant | N/A | N/A |
| Registrant’s Investment Adviser | N/A | N/A |
Item 5. Audit Committee of Listed Registrants.
Not applicable to registrants who are not listed issuers (as defined in Rule 10A-3 under the Securities Exchange Act of 1934).
Item 6. Investments.
Schedule of Investments is included as part of the report to shareholders filed under Item 1 of this Form.
Item 7. Disclosure of Proxy Voting Policies and Procedures for Closed-End Management Investment Companies.
Not applicable to open-end investment companies.
Item 8. Portfolio Managers of Closed-End Management Investment Companies.
Not applicable to open-end investment companies.
Item 9. Purchases of Equity Securities by Closed-End Management Investment Company and Affiliated Purchasers.
Not applicable to open-end investment companies.
Item 10. Submission of Matters to a Vote of Security Holders.
Not Applicable.
Item 11. Controls and Procedures.
| (a) | The Registrant’s Chief Executive Officer and Chief Financial Officer have reviewed the Registrant's disclosure controls and procedures (as defined in Rule 30a-3(c) under the Investment Company Act of 1940 (the “Act”)) as of a date within 90 days of the filing of this report, as required by Rule 30a-3(b) under the Act and Rules 13a-15(b) or 15d-15(b) under the Securities Exchange Act of 1934. Based on their review, such officers have concluded that the disclosure controls and procedures are effective in ensuring that information required to be disclosed in this report is appropriately recorded, processed, summarized and reported and made known to them by others within the Registrant and by the Registrant’s service provider. |
| (b) | There were no changes in the Registrant's internal control over financial reporting (as defined in Rule 30a-3(d) under the Act) that occurred during the second fiscal quarter of the period covered by this report that has materially affected, or is reasonably likely to materially affect, the Registrant's internal control over financial reporting. |
Item 12. Exhibits.
| (a) | (1) Any code of ethics or amendment thereto, that is the subject of the disclosure required by Item 2, to the extent that the registrant intends to satisfy Item 2 requirements through filing an exhibit. Filed herewith. |
(2) A separate certification for each principal executive and principal financial officer pursuant to Section 302 of the Sarbanes-Oxley Act of 2002. Filed herewith.
(3) Any written solicitation to purchase securities under Rule 23c-1 under the Act sent or given during the period covered by the report by or on behalf of the registrant to 10 or more persons. Not applicable to open-end investment companies.
| (b) | Certifications pursuant to Section 906 of the Sarbanes-Oxley Act of 2002. Furnished herewith. |
SIGNATURES
Pursuant to the requirements of the Securities Exchange Act of 1934 and the Investment Company Act of 1940, the registrant has duly caused this report to be signed on its behalf by the undersigned, thereunto duly authorized.
(Registrant) Greenspring Fund, Incorporated
By (Signature and Title)* /s/ Charles vK. Carlson
Charles vK. Carlson, Chief Executive Officer
Date March 1, 2012
Pursuant to the requirements of the Securities Exchange Act of 1934 and the Investment Company Act of 1940, this report has been signed below by the following persons on behalf of the registrant and in the capacities and on the dates indicated.
By (Signature and Title)* /s/ Charles vK. Carlson
Charles vK. Carlson, Chief Executive Officer
Date March 1, 2012
By (Signature and Title)* /s/ Michael J. Fusting
Michael J. Fusting, Chief Financial Officer
Date March 1, 2012
* Print the name and title of each signing officer under his or her signature.