UNITED STATES
SECURITIES AND EXCHANGE COMMISSION
Washington, D.C. 20549
FORM N-CSR
CERTIFIED SHAREHOLDER REPORT OF REGISTERED
MANAGEMENT INVESTMENT COMPANIES
Investment Company Act file number 811-3627
Greenspring Fund, Incorporated
(Exact name of registrant as specified in charter)
2330 West Joppa Road, Suite 110
Lutherville, MD 21093-4641
(Address of principal executive offices) (Zip code)
Mr. Charles vK. Carlson, President
2330 West Joppa Road, Suite 110
Lutherville, MD 21093-4641
(Name and address of agent for service)
(410) 823-5353
Registrant's telephone number, including area code
Date of fiscal year end: December 31, 2009
Date of reporting period: December 31, 2009
Item 1. Reports to Stockholders.
ANNUAL REPORT
DECEMBER 31, 2009
This report is intended for shareholders of the
Greenspring Fund, Incorporated and may not be
used as sales literature unless preceded or
accompanied by a current prospectus.
Greenspring Fund, Incorporated
February 2010
Dear Fellow Shareholders:
The financial markets began the 2009 year by continuing the freefall of the previous months, prompting the Federal Reserve, Treasury Department and U.S. Government to employ virtually every weapon in their combined arsenal in an attempt to unfreeze the capital markets and stem the tide of the panic that had been spreading to more and more sectors of the markets and economy. The equity markets bottomed in early March of 2009, after having dropped more than 50% from their October 2007 highs. By the end of 2009, equity markets had posted solid double-digit gains, helping to mitigate, but not eliminate, the losses suffered by most investors during 2008, although investors remained scarred and humbled by the events of the previous year.
The Greenspring Fund gained 15.83% during 2009, including the reinvestment of the July and December dividends. The accompanying chart shows the Greenspring Fund’s performance (all positive) over several longer time horizons. While many mutual funds had positive performances during 2009, the financial press is full of stories discussing the negative performances of many of the major stock market indexes over longer periods of time.
In the wake of these historically tumultuous times in the financial markets, it seems timely to re-examine one of the fundamental elements of Greenspring Fund’s investment philosophy. The Greenspring Fund has always utilized an investment strategy that places primary emphasis on striving to preserve capital during unfavorable market
Greenspring Fund Performance for Periods Ended December 31, 2009 |
| | |
| 1 Year | 15.83% |
| 3 Years* | 2.50% |
| 5 Years* | 5.20% |
| 10 Years* | 8.23% |
| 15 Years* | 8.57% |
| 20 Years* | 8.66% |
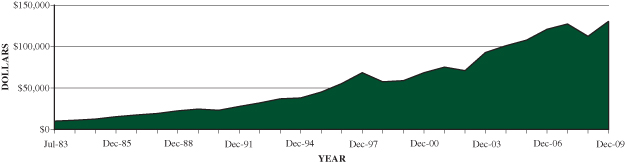
| Since inception on 7/1/83* | 10.16% |
| Expense Ratio** | 1.18% |
* annualized.
**as stated in Prospectus dated 5-1-09.
The expense ratio of 1.18% includes indirect expenses that the Fund incurs from investing in the shares of other investment companies. The indirect fees represent the Fund’s pro rata portion of the cumulative expenses charged by the other investment companies. Without those indirect fees, the Fund’s Total Annual Operating Expenses would be 1.06%.
Performance data quoted represents past performance; past performance does not guarantee future results. The investment return and principal value of an investment will fluctuate so that an investor’s shares, when redeemed, may be worth more or less than their original cost. Current performance of the Fund may be lower or higher than the performance quoted. Performance data current to the most recent month end may be obtained by calling 1-800-366-3863 or visiting the Fund’s web site. The Fund imposes a 2.00% redemption fee for shares held 60 days or less. Performance data does not reflect the redemption fee. If reflected, total returns would be reduced.
Greenspring Fund, Incorporated
conditions, a principal that has served us particularly well over the last several years. Seeking to generate solid returns during better times in the markets is an important consideration but secondary to capital preservation. Our investment style may result in returns that are less than average during buoyant times; however, by preserving the Fund’s assets during difficult periods, our performance over an entire market cycle has typically matched, even well exceeded, the performances of the Dow Jones, S&P 500 and NASDAQ, as shown in the Performance Comparison chart here…and has been achieved, we believe, with far less anxiety and stress for our shareholders.
Performance Comparison (Total Return**) for Periods Ended December 31, 2009 |
| | 1 Year | 2 Years* | 3 Years* | 5 Years* | 10 Years* |
| Greenspring Fund | 15.83% | 1.12% | 2.50% | 5.20% | 8.23% |
| Dow Jones | 22.68% | -8.62% | -3.12% | 1.95% | 1.30% |
| S&P 500 | 26.46% | -10.74% | -5.63% | 0.42% | -0.95% |
| NASDAQ | 43.89% | -7.50% | -2.06% | 0.85% | -5.67% |
* annualized **All data is Total Return except for NASDAQ.
The Dow Jones Industrial Average, Standard and Poor’s 500 and NASDAQ Indices are unmanaged indices commonly used to measure performance of U.S. stocks. You cannot invest directly in an index. Past performance does not guarantee future results.
A basic arithmetic example illustrates the importance of preservation of capital and the fallacy of comparing results year to year. Assume an investor starts with a hypothetical portfolio valued at $100,000, which drops by 33% during the year, ending with a value of $67,000. In order to recover the lost amount and return to the starting value of $100,000, the investor would need to gain approximately 50% during the following year ($33,000 divided by the new starting value of $67,000). If the investor’s 33% loss were to be followed by a 33% gain, the investor’s portfolio would have returned to only $89,110. Another unfortunate, but all-too-familiar, scenario occurs when investors, alarmed by significant declines in their portfolios, bail out of the market and sell their securities, and thus are holding cash while the market recovers. Investors that preserve capital in difficult markets may minimize the anxiety that unfolds in tumultuous markets so that they are not driven to liquidate their holdings at the market lows, thus potentially realizing significant losses and missing the opportunity to participate in a market recovery.
The performance of the NASDAQ during the last two years provided a good example of the importance of preservation of capital and the fallacy of comparing year-to-year returns. After declining by more than 40% during 2008, the NASDAQ rebounded by more than 45% during 2009. A casual observer might incorrectly think that the NASDAQ investor had more than recovered everything lost in 2008. However,
Greenspring Fund, Incorporated
because the 45% gain was from a lower base (as explained in the previous paragraph), investors in the NASDAQ are still more than 12% below the level of the NASDAQ at the beginning of 2008. Similarly, despite the attractive gains achieved during 2009, the Dow Jones Industrial Average and the S&P 500 Index are still more than 16% and 20%, respectively, below their levels at the beginning of 2008. Due principally to the fact that the Greenspring Fund declined markedly less than the market averages during 2008, the Fund performed far better during the same two-year period (January 1, 2008 through December 31, 2009) gaining 2.3% over the last two years.
The importance of preserving capital during challenging market conditions is even more apparent when looking at the last ten years. This period includes many volatile times, such as the Crash of the high-flying tech stocks during 2000 as well as the credit crisis that started in 2008. During this span, the Dow Jones, S&P 500 and NASDAQ declined during 2000, 2001, and 2002, as well as 2008. The Greenspring Fund, however, declined in only two of the four years in which the general stock market dropped and in those two years the Fund dropped considerably less. During the “up” years, it has not been unusual for the Greenspring Fund to underperform the major averages. However, when you look at the 10-year period as a whole, the performance of the Greenspring Fund sharply exceeded that of the Dow Jones, S&P 500 and NASDAQ (as shown in the Perfor-mance Comparison chart on page 2) and was achieved with far less volatility, likely creating less anxiety for our shareholders. The Greenspring Fund gained more than 120% cumulatively over the last ten years, while the major stock market indexes, also on a cumulative total return basis, had mixed performances, with the Dow Jones gaining just over 14% and the S&P 500 Index dropping more than 9% over the same 10-year period!
Greenspring Fund Top 10 Holdings | % of Net Assets as of 12/31/09 |
| Prestige Brands 9.25% 04/15/12 Corporate Bonds | 4.0% |
| Verizon Communications | 3.1% |
| Republic Services | 3.1% |
| Michael Baker Corp. | 3.0% |
| Leucadia National Corp. 7% 08/15/13 Corporate Bonds | 3.0% |
| Assurant Inc. | 2.8% |
| SunPower Corp. 0.75% 08/01/27 Convertible Bonds | 2.8% |
| Maxtor Corp. 6.8% 04/30/10 Convertible Bonds | 2.8% |
| School Specialty, 3.75% 08/01/23 Convertible Bonds | 2.7% |
| Johnson Controls 5.25% 01/15/11 Corporate Bonds | 2.4% |
INFLUENCES on PERFORMANCE
During 2009, the Greenspring Fund benefited from positive performances from all its asset classes – common stocks, preferred stocks, convertible bonds, corporate bonds,
Greenspring Fund, Incorporated
and cash equivalents. In general, the positive performance of the Greenspring Fund can be attributed to positive performances from most of the Fund’s securities, as opposed to having been the result of extremely strong performances from a limited number of securities. In fact, the gains were very widespread with 34 of the Fund’s 40 common stocks generating positive performances during the year, and 102 out of 103 bonds gaining. Our common stocks slightly outperformed our bonds, while the return on the Fund’s cash equivalents was minimal as short-term interest rates were miniscule.
The ten securities that had the largest impact (as measured, not by percentage gain, but by total dollars gained or lost during 2009) are shown in the accompanying chart. All of these securities generated positive performances during the year. A discussion of the top five follows.
ROSETTA RESOURCES common stock
Rosetta Resources owns and operates a diverse portfolio of natural gas fields primarily in South Texas, California, and the Rocky Mountains. These mature assets provide a steady stream of cash flow, even at low commodity prices, that provides management with capital to pursue faster-growing prospects. During 2008, the economic downturn caused demand for natural gas to drop, while new gas discoveries provided more than ample gas supplies, leading to a supply/demand imbalance and a precipitous fall in natural gas prices. In response to lower natural gas prices, Rosetta pulled back on drilling projects and instead deployed its excess capital into expanding its reserves of properties with significant potential by accumulating large acreage positions in emerging growth areas, such as South Texas’s Eagle Ford Shale natural gas fields and Northwestern Montana’s Alberta Bakken oil fields. We believe that Rosetta’s well-regarded management team will effectively monetize this acreage through a disciplined drilling program poised to drive significant production growth in the near future at attractive rates of return. Rosetta’s common stock increased from approximately $7 per share to about $20 at year-end.
Securities that had the Most Significant Impact on Greenspring Fund Performance During 2009 |
| Rosetta Resources |
| Sonic Automotive 8.625% 08/15/13 |
| Suncor Energy |
| Tessera Technologies |
| Xerox Corporation 7.625% 06/15/13 |
| Johnson Controls 5.250% 01/15/11 |
| Swift Energy Company 7.625% 07/15/11 |
| Energen Corporation |
| Carpenter Technology Corp. |
| Verizon Communications |
Greenspring Fund, Incorporated
SONIC AUTOMOTIVE corporate bonds 8.625% due 08/15/13
Sonic Automotive is the nation’s third largest automotive retailer, operating 148 dealer franchises located primarily in the Southeast and the West. The Fund’s investments in Sonic were comprised of two separate bond issues, a convertible bond (5.25% due May 7, 2009) and a non-convertible bond (8.625% due August 15, 2013). At the time we originally purchased the bonds of Sonic Automotive, the Company was earning significant profits and generating substantial cash flows, leading us to believe that the Company would be able to easily refinance the bonds at maturity or might even redeem the 8.625% bonds prior to maturity, due to their high coupon. However, the sharp downturn in the economy during 2008, the inability of consumers to easily obtain auto loans, the increase in the unemployment rate and the decline in consumer confidence resulted in a sudden and significant decline in automobile sales and a corresponding decrease in the profitability of Sonic Automotive. Sonic responded quickly to the rapid deterioration in automobile sales and was still able to report operating profits throughout the downturn, with the exception of the fourth quarter of 2008 when it reported a small operating loss. This operating loss, combined with the difficult credit markets, made investors nervous about Sonic’s ability to successfully refinance the convertible debt maturing in May. The price of all Sonic bonds declined significantly leading up to the May maturity date, but we remained confident in the value of Sonic’s franchise and felt certain the Company would quickly return to profitability. In early May, Sonic announced that it had successfully negotiated an exchange offer with holders of a majority of its 5.25% convertible notes, eliminating the need for Sonic to access the capital markets to refinance the debt. The Fund chose not to participate in the exchange offer and our convertible bonds matured as scheduled on May 7, 2009. With the near-term refinancing risk gone, the 8.625% bond rebounded in price, reflecting the more stable financial situation at the Company. As economic conditions stabilized during 2009, Sonic returned to profitability and regained access to the capital markets, raising cash by selling both common stock and bonds. We remain very confident in the Company’s prospects and its ability to service its debt.
SUNCOR ENERGY common stock
Suncor Energy is a large Canadian-based integrated energy company. Suncor is involved in the development of large oil sands reserves as well as conventional oil and gas production, refining and marketing. During 2009, Suncor was a direct beneficiary of the significant increase in crude oil prices that occurred throughout the year. In March, Suncor and Petro-Canada agreed to merge in a common share exchange that gave Suncor shareholders a 60% ownership interest in the combined company. The merger made Suncor a much larger producer of conventional oil and gas, increased its refining and marketing capacity and significantly strengthened its balance sheet. The merger should also result in annual operating expense reductions,
Greenspring Fund, Incorporated
on a combined basis, of over $300 million. Capital expenditures of the combined company will also decrease and should be fully funded by current cash flow and will include only those projects with the highest return potential. The merger has positioned Suncor to more easily fund the development of its vast oil sands reserves that we believe will provide attractive growth in earnings and shareholder value. During the year, shares of Suncor increased in price from $19.50 to $35.00.
TESSERA TECHNOLOGIES common stock
Tessera Technologies is a leading provider of innovative miniaturization technologies that it licenses to many of the world’s most prominent semi-conductor manufacturers. The Company owns approximately 1,000 patents that Tessera either developed internally or obtained through acquisitions. The Fund first purchased shares of Tessera in the spring of 2008 after the stock had dropped sharply due to the announce-ment that the U.S. Patent and Trademark Office was going to review the validity of several of Tessera’s significant patents. At the time we originally purchased the stock at a price of less than $15 per share, the Company had more than $6 per share in cash, no debt, and was generating more than $1 per share in free cash flow annually. During 2008, Tessera’s stock price declined due to several unfavorable rulings regarding their patents and the difficulties that the semiconductor industry faced because of the economic turmoil. Fortunately, during 2009, several positive announcements with regard to the patent litigation were announced. Additionally, the sentiment towards prospects for semiconductor companies greatly improved. These factors provided the impetus for Tessera’s stock to climb during the year from a starting value of just over $13 per share to a closing value of more than $23 per share.
Greenspring Fund Largest 2009 Sales |
| Common Stocks: |
| CKX Inc. |
| Cal Dive International |
| Tessera Technologies |
| Patriot National Bancorp |
| NGP Capital Resources Company |
| Bonds: |
| Sepracor 0% 12/15/2010 and 0% 10/15/24 |
| Swift Energy Company 7.625% 07/15/11 |
| Rambus, Inc. 0% 02/01/10 |
| Entergy Gulf States 1.0675% 12/01/09 |
| CommScope 1.0% 03/15/24 |
XEROX CORP. corporate bonds 7.625% due 06/15/13
Xerox Corp. is the world’s leading designer and manufacturer of imaging equipment. Although the Company has a significant amount of debt, it has been comfortably servicing its debt through the years, due to its strong cash flows and ready access to the capital markets. During the meltdown of the capital markets in 2008, however, when even the strongest corporations were locked out of the capital markets, investors shunned the bonds of companies with above-average leverage, such as
Greenspring Fund, Incorporated
Xerox. Consequently, Xerox’ bonds declined in price during the later part of 2008, ending 2008 at a price of $83.46 per bond. As the capital markets stabilized, the prices of many depressed bonds, such as these Xerox bonds, rose in value. Even in the difficult economic environment of 2009 during which Xerox’s revenue declined by 13%, the Company produced more than $2 billion in cash flow, reduced debt by more than $1 billion, and ended the year with a cash balance of almost $4 billion. Reflecting the improved capital markets environment, as well as the Xerox’s sturdy financial position, the bonds closed 2009 at a price of $102 per bond. This price appreciation, combined with the attractive coupon payments, resulted in a very attractive total return for the Greenspring Fund. In addition, the Fund also owned smaller amounts of other Xerox bonds that had similarly positive performances during 2009.
PORTFOLIO ACTIVITY
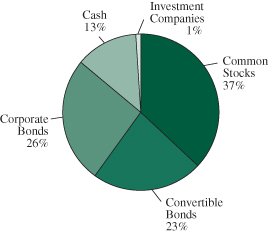
As reflected in the Portfolio Allocation charts, during 2009, the Fund redeployed a significant portion of its cash reserves into common stocks, convertible bonds and corporate bonds, as cash levels dropped from 13% to 8% by the end of the year. In the equity portion of the portfolio, we continue to focus on well-managed companies with leading industry positions, solid balance sheets, and the capability of generating strong cash flow. We established new positions in j2 Global Communications, MasTec, Inc., Ralcorp Holdings, and Verizon Communications. Other significant additions to already established positions were made in PartnerRe Ltd., Prestige Brands Holdings, Republic Services Inc., Southern National Bancorp of Virginia and United America Indemnity.
Greenspring Fund Portfolio Allocation December 31, 2008 | | Greenspring Fund Portfolio Allocation December 31, 2009 |
| | |
In the bond portion of the portfolio, there was quite a bit of activity, as many of our fixed income holdings matured, were redeemed early, or were “put” back to the
Greenspring Fund, Incorporated
issuing companies. As these positions were successfully liquidated, we redeployed the proceeds into other fixed income investments with similar characteristics. We continue to focus our purchases of both convertible and non-convertible bonds on those with fairly short durations. We are targeting for purchase obligations of companies that are conservatively managed and have a combination of current cash holdings and expected future cash flows that should allow the companies to retire the debt issues we own without an undue reliance on having to tap the capital markets for refinancing needs.
Greenspring Fund’s largest purchases are shown in the chart below and the largest sales are shown in the chart on page 6.
OUTLOOK
Much of the strength in the financial markets during the last nine months can be attributed to the dramatic surge in liquidity that the Federal Reserve injected into the financial system in its effort to prevent the furthering of the downward spiral. While the intention of the surge in liquidity was to provide cheap financing to stimulate the economy, much of the new money has been sloshing around the financial markets and seems to have had more of a beneficial impact on Wall Street than on Main Street. This liquidity has yet to flow to businesses and consumers and for the most part remains stashed on banks’ balance sheets due to their continued reluctance to lend. Until the economy appears capable of standing on its own feet, the Fed has indicated it will err on the side of support, and will only slowly begin to drain reserves from the system.
In this environment, we are carefully selecting our opportunities. We believe that many stocks have moved to levels that are not strongly supported by underlying fundamentals. While earnings have recovered somewhat, much of the improvement has been due to cost cutting and expense reductions that are relatively short term in nature and hard to sustain. For earnings to continue to recover, corporations
Greenspring Fund Ten Largest 2009 Purchases |
| Common Stocks: |
| Verizon |
| Republic Services, Inc. |
| j2 Global Communications, Inc. |
| PartnerRe Ltd. |
| Ralcorp Holdings, Inc. |
| Bonds: |
| Leucadia National Corp. 7.0% 08/15/13 and 7.75% 08/15/13 |
| Prestige Brands Inc. 9.25% 04/15/12 |
| Sunpower Corp. 0.75% 08/01/27 |
| School Specialty, Inc. 3.75% 08/01/23 |
| Swift Energy Co. 7.625% 07/15/11 |
Greenspring Fund, Incorporated
need to achieve better top line sales growth. Consequently, with regard to the Fund’s equity investments, we are focusing on companies that have the potential to achieve earnings growth through top-line, expense-line, and cash deployment efforts. Regarding the Fund’s fixed income investments, we are keeping the duration of our securities relatively short term due to our belief that interest rates are more likely to increase than decrease. While the capital markets are once again an available option for companies needing to refinance their debt, we continue to avoid companies that are overly dependent upon frequently tapping the capital markets, as the risk of relying on unfettered access to the capital markets was made clear during the freezing of these markets in 2008.
We are pleased with the overall performance of the Greenspring Fund during the volatile last two years, as well as over the last decade. However, while we feel it is important to learn lessons from the past, we prefer not to dwell on past successes. Each year presents new challenges and we remain committed and are striving to produce strong investment results over the next market cycle, by employing the Fund’s typical slow-but-steady approach. In closing, we wish all of our shareholders a healthy and prosperous year in 2010.
Respectfully,
 |  |
| Charles vK. Carlson | Michael J. Fusting |
| President | Senior Vice President |
| Co-Chief Investment Officer | Co-Chief Investment Officer |
Mutual fund investing involves risk. Principal loss is possible. Small-capitalization companies tend to have limited liquidity and greater price volatility than large-capitalization companies. Investments by the Fund in lower-rated and non-rated securities present a greater risk of loss to principal and interest than higher-rated securities. Investments in debt securities typically decrease in value when interest rates rise. This risk is usually greater for longer-term debt securities.
Opinions expressed are subject to change, are not guaranteed and should not be considered recommendations to buy or sell any security. Fund holdings and/or sector allocations are subject to change at any time and are not recommendations to buy or sell any security. Current and future portfolio holdings are subject to risk.
Cash flow measures the cash generating capability of a company by adding non-cash charges (e.g. depreciation) and interest expense to pretax income. Earnings per share is calculated by taking the total earnings divided by the number of shares outstanding.
Greenspring Fund, Incorporated
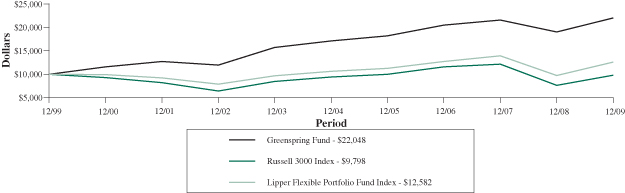
Growth of a $10,000 Investment in the Greenspring Fund
Over the Last Ten Years
| Average Annual Total Returns | | | | | | | | | | | | |
| | | For Periods Ended December 31, 2009 | |
| | | 1 Year | | | 3 Years | | | 5 Years | | | 10 Years | |
| Greenspring Fund | | | 15.83% | | | | 2.50% | | | | 5.20% | | | | 8.23% | |
| Russell 3000 Index | | | 28.34% | | | | -5.42% | | | | 0.76% | | | | -0.20% | |
| Lipper Flexible Portfolio Fund Index | | | 29.17% | | | | -0.32% | | | | 3.50% | | | | 2.32% | |
The graph and table do not reflect the deduction of taxes that a shareholder would pay on Greenspring Fund (the “Fund”) distributions or the redemption of Fund shares.
Performance data quoted represents past performance; past performance does not guarantee future results. The investment return and principal value of an investment will fluctuate so that an investor's shares, when redeemed, may be worth more or less than their original cost. Current performance of the Fund may be lower or higher than the performance quoted. Performance data current to the most recent month end is available at www.greenspringfund.com or by calling 1-800-366-3863 toll free. The Fund imposes a 2.00% redemption fee for shares held 60 days or less. Performance data does not reflect the redemption fee. If reflected, total returns would be reduced.
Greenspring Fund, Incorporated
Expense Example For the Six Months Ended December 31, 2009 (Unaudited) |
As a shareholder of the Fund, you incur two types of costs: (1) redemption fees if you redeem within 60 days of purchase; and (2) ongoing costs, including management fees and other Fund expenses. This example is intended to help you understand your ongoing costs (in dollars) of investing in the Fund and to compare these costs with the ongoing costs of investing in other mutual funds. The example is based on an investment of $1,000 invested at the beginning of the period and held for the entire period (7/1/2009 - 12/31/2009).
Actual Expenses
The first line of the table below provides information about actual account values based on actual returns and actual expenses. You may use the information in this line, together with the amount you invested, to estimate the expenses that you paid over the period. Simply divide your account value by $1,000 (for example, an $8,600 account value divided by $1,000 = 8.6), then multiply the result by the number in the first line under the heading entitled “Expenses Paid During the Period’’ to estimate the expenses you paid on your account during this period.
Hypothetical Example for Comparison Purposes
The second line of the table below provides information about hypothetical account values and hypothetical expenses based on the Fund’s actual expense ratio and an assumed rate of return of 5% per year before expenses, which is not the Fund’s actual return. The hypothetical account values and expenses may not be used to estimate the actual ending account balance or expenses you paid for the period. You may use this information to compare the ongoing costs of investing in the Fund and other funds. To do so, compare this 5% hypothetical example with the 5% hypothetical examples that appear in the shareholder reports of the other funds. Please note that the expenses shown in the table are meant to highlight your ongoing costs only and do not reflect any transactional costs, such as redemption fees. Therefore, the second line of the table is useful in comparing ongoing costs only, and will not help you determine the relative total costs of owning different funds. In addition, if these transactional costs were included, your costs would have been higher.
| | | | Expenses Paid |
| | Beginning | Ending | During the Period |
| | Account Value | Account Value | 7/1/2009 – |
| | 7/1/2009 | 12/31/2009 | 12/31/2009* |
| Actual | $1,000 | $1,096 | $5.34 |
| Hypothetical | | | |
| (5% annual return | | | |
| before expenses) | $1,000 | $1,020 | $5.14 |
| * | Expenses are equal to the Fund’s annualized expense ratio of 1.01%, multiplied by the average account value over the period multiplied by 184/365 (to reflect the one-half year period). |
Greenspring Fund, Incorporated
SCHEDULE OF INVESTMENTS at December 31, 2009 |
| Shares | | | | Value | |
| COMMON STOCKS: 38.7% | | | |
Building Material & Fixtures: 0.8% | | | |
| | 84,100 | | Watsco, Inc. | | $ | 4,119,218 | |
Commercial Banking: 1.3% | | | | |
| | 40,074 | | American National | | | | |
| | | | Bankshares, Inc. | | | 877,621 | |
| | 398,801 | | Cardinal | | | | |
| | | | Financial Corp. | | | 3,485,521 | |
| | 65,000 | | Middleburg | | | | |
| | | | Financial Corp. | | | 798,200 | |
| | 199,862 | | Southern National | | | | |
| | | | Bancorp of Virginia* | | | 1,429,013 | |
| | 14,476 | | SunTrust Banks, Inc. | | | 293,718 | |
| | | | | | | 6,884,073 | |
| Construction & Engineering: 5.9% | | | | |
| | 315,700 | | EMCOR Group, Inc.* | | | 8,492,330 | |
| | 526,448 | | MasTec, Inc.* | | | 6,580,600 | |
| | 383,277 | | Michael Baker Corp.* | | | 15,867,668 | |
| | | | | | | 30,940,598 | |
| Consumer Goods: 1.6% | | | | |
| | 1,096,472 | | Prestige Brands | | | | |
| | | | Holdings, Inc.* | | | 8,618,270 | |
Electrical Equipment: 0.1% | | | | |
| | 17,400 | | Emerson Electric Co. | | | 741,240 | |
Food – Packaged: 1.7% | | | | |
| | 150,875 | | Ralcorp | | | | |
| | | | Holdings, Inc.* | | | 9,008,746 | |
Insurance: 8.1% | | | | |
| | 505,425 | | Assurant, Inc. | | | 14,899,929 | |
| | 159,600 | | PartnerRe, Ltd.# | | | 11,915,736 | |
| | 1,293,760 | | United America | | | | |
| | | | Indemnity, Ltd. - | | | | |
| | | | Class A*# | | | 10,246,579 | |
| | 236,050 | | W.R. Berkley Corp. | | | 5,816,272 | |
| | | | | | | 42,878,516 | |
| Internet Services: 1.9% | | | | |
| | 504,434 | | j2 Global | | | | |
| | | | Communications, | | | | |
| | | | Inc.* | | | 10,265,232 | |
Machinery: 0.1% | | | | |
| | 20,000 | | Pentair, Inc. | | | 646,000 | |
Management Consulting: 1.9% | | | | |
| | 208,576 | | FTI Consulting, Inc.* | | | 9,836,444 | |
Metals & Mining: 1.7% | | | | |
| | 86,000 | | Brush Engineered | | | | |
| | | | Materials, Inc.* | | | 1,594,440 | |
| | 270,927 | | Carpenter | | | | |
| | | | Technology Corp. | | | 7,301,483 | |
| | | | | | | 8,895,923 | |
| Motor Vehicle and Parts Dealer: 1.1% | | | | |
| | 211,930 | | Rush Enterprises, | | | | |
| | | | Inc. - Class A* | | | 2,519,848 | |
| | 295,798 | | Rush Enterprises, | | | | |
| | | | Inc. - Class B* | | | 3,105,879 | |
| | | | | | | 5,625,727 | |
| Oil & Gas Exploration & Production: 4.1% | | | | |
| | 5,626 | | ConocoPhillips | | | 287,320 | |
| | 108,400 | | Energen Corp. | | | 5,073,120 | |
| | 22,280 | | EOG Resources, Inc. | | | 2,167,844 | |
| | 375,296 | | Rosetta | | | | |
| | | | Resources, Inc.* | | | 7,479,649 | |
| | 192,000 | | Suncor Energy, Inc.# | | | 6,779,520 | |
| | | | | | | 21,787,453 | |
| Real Estate: 0.1% | | | | |
| | 4,500 | | First Potomac | | | | |
| | | | Realty Trust | | | 56,565 | |
| | 27,500 | | Urstadt Biddle | | | | |
| | | | Properties, Inc. - | | | | |
| | | | Class A | | | 419,925 | |
| | | | | | | 476,490 | |
| Savings Institutions: 0.3% | | | | |
| | 109,187 | | BCSB Bancorp, Inc.* | | | 890,966 | |
| | 56,400 | | OceanFirst | | | | |
| | | | Financial Corp. | | | 637,320 | |
| | | | | | | 1,528,286 | |
The accompanying notes are an integral part of these financial statements.
Greenspring Fund, Incorporated
SCHEDULE OF INVESTMENTS at December 31, 2009 (Con’t) |
| Shares/Principal | | | | Value | |
| Semiconductors & | | | |
| Semiconductor Equipment: 1.1% | | | |
| | 34,093 | | Rudolph | | | |
| | | | Technologies, Inc.* | | $ | 229,105 | |
| | 233,480 | | Tessera | | | | |
| | | | Technologies, Inc.* | | | 5,433,080 | |
| | | | | | | 5,662,185 | |
| Telecommunications: 3.1% | | | | |
| | 497,900 | | Verizon | | | | |
| | | | Communications, | | | | |
| | | | Inc. | | | 16,495,427 | |
Utilities: 0.8% | | | | |
| | 128,250 | | PPL Corp. | | | 4,143,757 | |
Waste Management Services: 3.0% | | | | |
| | 569,408 | | Republic | | | | |
| | | | Services, Inc. | | | 16,119,940 | |
| TOTAL COMMON STOCKS | | | | |
| (cost $163,042,367) | | | 204,673,525 | |
INVESTMENT COMPANIES: 0.3% | | | | |
| | 212,153 | | NGP Capital | | | | |
| | | | Resources Co. | | | | |
| | | | (cost $2,822,159) | | | 1,724,804 | |
CONVERTIBLE BONDS: 24.3% | | | | |
Building Materials: 1.4% | | | | |
| $ | 7,319,000 | | Griffon Corp., | | | | |
| | | | 4.000%, 7/18/23 | | | 7,383,041 | |
Communication Equipment | | | | |
| Manufacturing: 2.1% | | | | |
| | 11,401,000 | | Lucent Technologies, | | | | |
| | | | Inc., 2.875%, | | | | |
| | | | 6/15/23 | | | 11,358,246 | |
Construction & Engineering: 0.3% | | | | |
| | 1,307,000 | | MasTec, Inc., | | | | |
| | | | 4.000%, 6/15/14 | | | 1,382,152 | |
Consumer Goods: 0.6% | | | | |
| | 3,245,000 | | JAKKS Pacific, Inc., | | | | |
| | | | 4.625%, 6/15/23 | | | 3,192,269 | |
Data Storage Devices: 3.3% | | | | |
| | 2,904,000 | | Hutchinson | | | | |
| | | | Technology, Inc., | | | | |
| | | | 2.250%, 3/15/10 | | | 2,904,000 | |
| | 14,368,000 | | Maxtor Corp., | | | | |
| | | | 6.800%, 4/30/10 | | | 14,583,520 | |
| | | | | | | 17,487,520 | |
| Educational: 2.7% | | | | |
| | 14,272,000 | | School Specialty, Inc., | | | | |
| | | | 3.750%, 8/1/23 | | | 14,075,760 | |
Electrical & Electronic Goods: 1.5% | | | | |
| | 7,710,000 | | Wesco | | | | |
| | | | International, Inc., | | | | |
| | | | 2.625%, 10/15/25 | | | 7,652,175 | |
Medical Equipment: 2.2% | | | | |
| | 9,753,000 | | Hologic, Inc., | | | | |
| | | | 2.000%, 12/15/37 | | | 8,375,389 | |
| | 3,278,000 | | Integra Lifesciences | | | | |
| | | | Holdings, | | | | |
| | | | | | | 3,253,415 | |
| | | | | | | 11,628,804 | |
| Movie Theater: 1.6% | | | | |
| | 8,423,000 | | Regal Entertainment | | | | |
| | | | Group, 6.250%, | | | | |
| | | | 3/15/11 - 144A | | | 8,538,816 | |
Pharmaceuticals: 1.7% | | | | |
| | 9,320,000 | | Par Pharmaceutical, | | | | |
| | | | Inc., 2.875%, | | | | |
| | | | 9/30/10 | | | 9,156,900 | |
Real Estate: 1.0% | | | | |
| | 5,375,000 | | Alexandria Real | | | | |
| | | | Estate, Inc., 3.700%, | | | | |
| | | | 1/15/27 - 144A | | | 5,106,250 | |
The accompanying notes are an integral part of these financial statements.
Greenspring Fund, Incorporated
SCHEDULE OF INVESTMENTS at December 31, 2009 (Con’t) |
| Principal | | | | Value | |
Semiconductors & | | | |
| Semiconductor Equipment: 4.5% | | | |
| $ | 2,862,000 | | Advance Micro | | | |
| | | | Devices, Inc., | | | |
| | | | 5.750%, 8/15/12 | | $ | 2,836,957 | |
| | 6,211,000 | | ON Semiconductor | | | | |
| | | | Corp., | | | | |
| | | | 0.000%, 4/15/24 | | | 6,490,495 | |
| | 15,067,000 | | SunPower Corp., | | | | |
| | | | 0.750%, 8/1/27 | | | 14,614,990 | |
| | | | | | | 23,942,442 | |
| Telecommunications: 1.4% | | | | |
| | 3,491,000 | | Level 3 | | | | |
| | | | Communications, | | | | |
| | | | Inc., 6.000%, | | | | |
| | | | 3/15/10 | | | 3,491,000 | |
| | 3,937,000 | | Level 3 | | | | |
| | | | Communications, | | | | |
| | | | Inc., 2.875%, | | | | |
| | | | 7/15/10 | | | 3,843,496 | |
| | | | | | | 7,334,496 | |
| TOTAL CONVERTIBLE BONDS | | | | |
| (cost $123,725,992) | | | 128,238,871 | |
CORPORATE BONDS: 27.6% | | | | |
Asset Management: 0.3% | | | | |
| | 1,496,000 | | Waddell & Reed | | | | |
| | | | Financial, Inc., | | | | |
| | | | 5.600%, 1/15/11 | | | 1,539,631 | |
Automotive: 3.3% | | | | |
| | 11,853,000 | | Johnson Controls, | | | | |
| | | | Inc., 5.250%, | | | | |
| | | | 1/15/11 | | | 12,441,739 | |
| | 5,213,000 | | Sonic Automotive, | | | | |
| | | | Inc., 8.625%, | | | | |
| | | | 8/15/13 | | | 5,213,000 | |
| | | | | | | 17,654,739 | |
| Business Equipment: 2.3% | | | | |
| | 100,000 | | Xerox Corp., | | | | |
| | | | 6.875%, 8/15/11 | | | 106,897 | |
| | 11,926,000 | | Xerox Corp., | | | | |
| | | | 7.625%, 6/15/13 | | | 12,168,098 | |
| | | | | | | 12,274,995 | |
| Communication Equipment | | | | |
| Manufacturing: 0.0% | | | | |
| | 121,000 | | Motorola, Inc., | | | | |
| | | | 7.625%, 11/15/10 | | | 125,385 | |
Consumer Goods: 4.0% | | | | |
| | 20,610,000 | | Prestige Brands, Inc., | | | | |
| | | | 9.250%, 4/15/12 | | | 20,996,437 | |
Electrical & Electronic Goods: 0.2% | | | | |
| | 885,000 | | Tyco International | | | | |
| | | | Finance, | | | | |
| | | | 6.375%, 10/15/11# | | | 949,387 | |
Floor Covering: 2.0% | | | | |
| | 10,307,000 | | Mohawk | | | | |
| | | | Industries, Inc., | | | | |
| | | | 6.500%, 1/15/11 | | | 10,616,210 | |
Insurance: 2.3% | | | | |
| | 1,669,000 | | Assurant, Inc., | | | | |
| | | | 5.625%, 2/15/14 | | | 1,712,815 | |
| | 10,073,000 | | Everest Reinsurance | | | | |
| | | | Holdings, Inc., | | | | |
| | | | 8.750%, 3/15/10 | | | 10,196,626 | |
| | | | | | | 11,909,441 | |
| Management Consulting: 1.2% | | | | |
| | 6,315,000 | | FTI Consulting, Inc., | | | | |
| | | | 7.625%, 6/15/13 | | | 6,433,406 | |
Oil & Gas Exploration & Production: 3.1% | | | | |
| | 4,715,000 | | Energen Corp., | | | | |
| | | | 7.625%, 12/15/10 | | | 4,913,148 | |
| | 6,365,000 | | Forest Oil Corp., | | | | |
| | | | 8.000%, 12/15/11 | | | 6,667,337 | |
| | 5,007,000 | | Frontier Oil Corp., | | | | |
| | | | 6.625%, 10/1/11 | | | 5,063,329 | |
| | | | | | | 16,643,814 | |
| Oil & Gas Pipelines: 0.3% | | | | |
| | 560,000 | | El Paso Corp., | | | | |
| | | | 7.000%, 5/15/11 | | | 575,090 | |
| | 834,000 | | Sonat, Inc., | | | | |
| | | | 7.625%, 7/15/11 | | | 863,775 | |
| | | | | | | 1,438,865 | |
The accompanying notes are an integral part of these financial statements.
Greenspring Fund, Incorporated
SCHEDULE OF INVESTMENTS at December 31, 2009 (Con’t) |
| Principal/Shares | | | | Value | |
Packaging & Containers: 0.5% | | | |
| $ | 2,808,000 | | Owens-Brockway | | | |
| | | | Glass Container, | | | |
| | | | Inc., 8.250%, | | | |
| | | | 5/15/13 | | $ | 2,899,260 | |
Specialty Metals: 0.2% | | | | |
| | 969,000 | | Carpenter | | | | |
| | | | Technology Corp., | | | | |
| | | | 6.650%, 6/7/10 | | | 975,216 | |
Transportation Equipment | | | | |
| Manufacturing: 0.8% | | | | |
| | 4,226,000 | | Westinghouse Air | | | | |
| | | | Brake Technologies | | | | |
| | | | Corp., 6.875%, | | | | |
| | | | 7/31/13 | | | 4,289,390 | |
Telecommunications: 0.8% | | | | |
| | 4,123,000 | | Sprint Nextel Corp., | | | | |
| | | | 0.651%, 6/28/10 | | | 4,058,525 | |
Utilities: 2.5% | | | | |
| | 4,913,000 | | Allegheny Energy | | | | |
| | | | Supply Co., | | | | |
| | | | 7.800%, 3/15/11 | | | 5,176,494 | |
| | 1,784,000 | | Aquila, Inc., | | | | |
| | | | 11.875%, 7/1/12 | | | 2,066,930 | |
| | 3,582,000 | | National Fuel | | | | |
| | | | Gas Co., | | | | |
| | | | 6.700%, 11/21/11 | | | 3,834,234 | |
| | 1,845,000 | | Reliant Energy | | | | |
| | | | Reserve Corp., | | | | |
| | | | 7.750%, 2/15/11 | | | 1,951,790 | |
| | | | | | | 13,029,448 | |
| Waste Management Services: 0.8% | | | | |
| | 3,004,000 | | Allied Waste | | | | |
| | | | North America, Inc., | | | | |
| | | | 6.500%, 11/15/10 | | | 3,124,370 | |
| | 185,000 | | Allied Waste | | | | |
| | | | North America, Inc., | | | | |
| | | | 5.750%, 2/15/11 | | | 192,538 | |
| | 783,000 | | Allied Waste | | | | |
| | | | North America, Inc., | | | | |
| | | | 6.375%, 4/15/11 | | | 817,658 | |
| | | | | | | 4,134,566 | |
| Wood Product Manufacturing: 3.0% | | | | |
| | 15,475,000 | | Leucadia | | | | |
| | | | National Corp., | | | | |
| | | | 7.000%, 8/15/13 | | | 15,610,406 | |
| | 50,000 | | Leucadia | | | | |
| | | | National Corp., | | | | |
| | | | 7.750%, 8/15/13 | | | 50,438 | |
| | | | | | | 15,660,844 | |
| TOTAL CORPORATE BONDS | | | | |
| (cost $140,124,155) | | | 145,629,559 | |
SHORT-TERM INVESTMENTS: 8.2% | | | | |
Money Market Instruments^ | | | | |
| | 20,250,292 | | AIM Liquid Assets, | | | | |
| | | | 0.100% | | | 20,250,292 | |
| | 23,047,360 | | AIM STIC Prime | | | | |
| | | | Portfolio, 0.030% | | | 23,047,360 | |
| TOTAL SHORT-TERM | | | | |
| INVESTMENTS | | | | |
| (cost $43,297,652) | | | 43,297,652 | |
TOTAL INVESTMENTS | | | | |
| IN SECURITIES | | | | |
| (cost $473,012,325): 99.1% | | | 523,564,411 | |
| Other Assets less Liabilities: 0.9% | | | 4,933,375 | |
| NET ASSETS: 100.0% | | $ | 528,497,786 | |
| * | Non-income producing security. |
| # | U.S. security of foreign issuer. |
| 144A | Securities purchased pursuant to Rule 144A of the Securities Act of 1933, as amended, and may be sold only to dealers in that program or other “qualified institutional buyers.” These securities have been determined to be liquid by the Fund’s adviser under the supervision of the Board of Directors. As of December 31, 2009, the value of these investments was $16,898,481, or 3.2% of total net assets. |
| ^ | Rate shown is the 7-day effective yield at December 31, 2009. |
The accompanying notes are an integral part of these financial statements.
Greenspring Fund, Incorporated
STATEMENT OF ASSETS AND LIABILITIES at December 31, 2009 |
| ASSETS | | | |
| Investments in securities, at value (cost $473,012,325) | | $ | 523,564,411 | |
| Receivables: | | | | |
| Fund shares sold | | | 1,712,566 | |
| Dividends and interest | | | 4,112,542 | |
| Prepaid expenses | | | 38,193 | |
| Total assets | | | 529,427,712 | |
| | | | | |
| LIABILITIES | | | | |
| Payables: | | | | |
| Due to affiliate (Note 5) | | | 327,763 | |
| Securities purchased | | | 186,500 | |
| Fund shares redeemed | | | 219,737 | |
| Accrued expenses | | | 195,926 | |
| Total liabilities | | | 929,926 | |
| | | | | |
| NET ASSETS | | $ | 528,497,786 | |
| | | | | |
| Capital shares issued and outstanding | | | | |
| (60,000,000 shares authorized, $0.01 par value) | | | 23,295,475 | |
| | | | | |
| Net asset value, offering and redemption price per share | | $ | 22.69 | |
| | | | | |
| COMPONENTS OF NET ASSETS | | | | |
| Capital stock at par value | | $ | 232,955 | |
| Paid-in capital | | | 479,977,585 | |
| Accumulated net investment loss | | | (1,058,295 | ) |
| Accumulated net realized loss on investments | | | (1,206,545 | ) |
| Net unrealized appreciation on investments | | | 50,552,086 | |
| NET ASSETS | | $ | 528,497,786 | |
The accompanying notes are an integral part of these financial statements.
Greenspring Fund, Incorporated
STATEMENT OF OPERATIONS For the Year Ended December 31, 2009 |
| INVESTMENT INCOME | | | |
| Income | | | |
| Interest | | $ | 17,805,971 | |
| Dividends (net of foreign withholding taxes of $7,770) | | | 1,769,723 | |
| Total income | | | 19,575,694 | |
| | | | | |
| Expenses | | | | |
| Advisory fees (Note 5) | | | 3,042,004 | |
| Transfer agent fees (Note 6) | | | 526,697 | |
| Administration fees | | | 265,975 | |
| Fund accounting fees | | | 85,439 | |
| Administration fees - Corbyn (Note 5) | | | 71,689 | |
| Reports to shareholders | | | 60,323 | |
| Custody fees | | | 55,765 | |
| Blue sky fees | | | 39,765 | |
| Legal fees | | | 34,422 | |
| Audit fees | | | 26,000 | |
| Miscellaneous fees | | | 22,556 | |
| Directors fees | | | 21,500 | |
| Insurance fees | | | 16,056 | |
| Registration fees | | | 11,922 | |
| Total expenses | | | 4,280,113 | |
| Net investment income | | | 15,295,581 | |
| | | | | |
| REALIZED AND UNREALIZED GAIN ON INVESTMENTS | | | | |
| Net realized gain on investments | | | 4,198,368 | |
| Change in net unrealized appreciation/depreciation on investments | | | 47,403,220 | |
| Net realized and unrealized gain on investments | | | 51,601,588 | |
| Net increase in net assets resulting from operations | | $ | 66,897,169 | |
The accompanying notes are an integral part of these financial statements.
Greenspring Fund, Incorporated
| STATEMENTS OF CHANGES IN NET ASSETS |
| | | Year Ended | | | Year Ended | |
| | | December 31, 2009 | | | December 31, 2008 | |
| INCREASE (DECREASE) IN NET ASSETS FROM: | | | | | | |
| | | | | | | |
| OPERATIONS | | | | | | |
| Net investment income | | $ | 15,295,581 | | | $ | 5,601,008 | |
| Net realized gain (loss) on investments | | | 4,198,368 | | | | (4,431,162 | ) |
| Change in net unrealized | | | | | | | | |
| appreciation/depreciation on investments | | | 47,403,220 | | | | (36,830,320 | ) |
| Net increase (decrease) in net assets | | | | | | | | |
| resulting from operations | | | 66,897,169 | | | | (35,660,474 | ) |
| | | | | | | | | |
| DISTRIBUTIONS TO SHAREHOLDERS | | | | | | | | |
| From net investment income | | | (17,520,873 | ) | | | (4,323,046 | ) |
| From net realized gain | | | (466,637 | ) | | | (1,723,623 | ) |
| Total distributions to shareholders | | | (17,987,510 | ) | | | (6,046,669 | ) |
| | | | | | | | | |
| CAPITAL SHARE TRANSACTIONS | | | | | | | | |
| Net increase in net assets derived from net | | | | | | | | |
| change in outstanding shares (a)+ | | | 171,393,156 | | | | 92,024,547 | |
| Total increase in net assets | | | 220,302,815 | | | | 50,317,404 | |
| | | | | | | | | |
| NET ASSETS | | | | | | | | |
| Beginning of year | | | 308,194,971 | | | | 257,877,567 | |
| End of year (including accumulated net | | | | | | | | |
| investment income (loss) of ($1,058,295) | | | | | | | | |
| and $1,076,718, respectively) | | $ | 528,497,786 | | | $ | 308,194,971 | |
| | (a) | A summary of capital share transactions is as follows: |
| | | Year Ended | | | Year Ended | |
| | | December 31, 2009 | | | December 31, 2008 | |
| | | Shares | | | Value | | | Shares | | | Value | |
| Shares sold | | | 13,178,198 | | | $ | 276,898,159 | | | | 6,908,031 | | | $ | 149,546,293 | |
| Shares issued in | | | | | | | | | | | | | | | | |
| reinvestment of | | | | | | | | | | | | | | | | |
| distributions | | | 811,228 | | | | 17,657,563 | | | | 272,476 | | | | 5,966,021 | |
| Shares redeemed+ | | | (5,832,422 | ) | | | (123,162,566 | ) | | | (2,973,924 | ) | | | (63,487,767 | ) |
| Net increase | | | 8,157,004 | | | $ | 171,393,156 | | | | 4,206,583 | | | $ | 92,024,547 | |
| | | | | | | | | | | | | | | | | |
| | + | Net of redemption fees of $63,422 and $238,604, respectively. |
The accompanying notes are an integral part of these financial statements.
Greenspring Fund, Incorporated
FINANCIAL HIGHLIGHTS For a capital share outstanding throughout each year |
| | | Year Ended December 31, | |
| | | 2009 | | | 2008 | | | 2007 | | | 2006 | | | 2005 | |
| Net asset value, beginning of year | | $ | 20.36 | | | $ | 23.59 | | | $ | 23.43 | | | $ | 21.57 | | | $ | 20.91 | |
| | | | | | | | | | | | | | | | | | | | | |
| INCOME (LOSS) FROM INVESTMENT OPERATIONS: | | | | | | | | | | | | | | | | | | | | |
| Net investment income | | | 0.71 | | | | 0.43 | | | | 0.55 | | | | 0.53 | | | | 0.47 | |
| Net realized and unrealized | | | | | | | | | | | | | | | | | | | | |
| gain (loss) on investments | | | 2.47 | | | | (3.18 | ) | | | 0.70 | | | | 2.10 | | | | 0.88 | |
| Total from investment operations | | | 3.18 | | | | (2.75 | ) | | | 1.25 | | | | 2.63 | | | | 1.35 | |
| | | | | | | | | | | | | | | | | | | | | |
| LESS DISTRIBUTIONS: | | | | | | | | | | | | | | | | | | | | |
| From net investment income | | | (0.83 | ) | | | (0.34 | ) | | | (0.56 | ) | | | (0.58 | ) | | | (0.44 | ) |
| From net realized gain | | | (0.02 | ) | | | (0.16 | ) | | | (0.53 | ) | | | (0.19 | ) | | | (0.25 | ) |
| Total distributions | | | (0.85 | ) | | | (0.50 | ) | | | (1.09 | ) | | | (0.77 | ) | | | (0.69 | ) |
| Paid-in capital from | | | | | | | | | | | | | | | | | | | | |
| redemption fees (Note 1) | | | —* | | | | 0.02 | | | | —* | | | | —* | | | | —* | |
| Net asset value, end of year | | $ | 22.69 | | | $ | 20.36 | | | $ | 23.59 | | | $ | 23.43 | | | $ | 21.57 | |
| Total return | | | 15.83% | | | | (11.72)% | | | | 5.32% | | | | 12.29% | | | | 6.57% | |
| | | | | | | | | | | | | | | | | | | | | |
| RATIOS/SUPPLEMENTAL DATA: | | | | | | | | | | | | | | | | | | | | |
| Net assets, end of year (millions) | | $ | 528.5 | | | $ | 308.2 | | | $ | 257.9 | | | $ | 243.9 | | | $ | 157.6 | |
| Ratio of expenses to average net assets | | | 1.03% | | | | 1.06% | | | | 1.03% | | | | 1.07% | | | | 1.16% | |
| Ratio of net investment income | | | | | | | | | | | | | | | | | | | | |
| to average net assets | | | 3.67% | | | | 2.15% | | | | 2.24% | | | | 2.56% | | | | 2.30% | |
| Portfolio turnover rate | | | 46.77% | | | | 47.11% | | | | 53.75% | | | | 38.58% | | | | 36.22% | |
| * | Amount less than $0.01 per share. |
The accompanying notes are an integral part of these financial statements.
Greenspring Fund, Incorporated
NOTES TO FINANCIAL STATEMENTS December 31, 2009 |
| Note 1 - Significant Accounting Policies |
Greenspring Fund, Incorporated (the “Fund”) is a diversified, open-end management investment company registered under the Investment Company Act of 1940, as amended (the “1940 Act”). The Fund is organized as a Maryland corporation and commenced operations on July 1, 1983.
The preparation of the financial statements in accordance with accounting principles generally accepted in the United States of America requires management to make estimates and assumptions that affect the reported amounts and disclosures in the financial statements. Actual results could differ from those estimates. In preparing these financial statements, the Fund has evaluated events and transactions for potential recognition or disclosure through February 24, 2010, the date the financial statements were issued.
Investment transactions and related investment income - Investment transactions are recorded on the trade date. Dividend income is recorded on the ex-dividend date and interest income, including amortization of premiums and accretion of discounts, is recorded on the accrual basis. Dividends determined to be a return of capital are recorded as a reduction of the cost basis of the security. Realized gains and losses from investment transactions are reported on an identified cost basis.
Valuation of investments - Securities listed on a national securities exchange or the NASDAQ National Market are valued at the last reported sale price or the official closing price for certain markets on the exchange of major listing as of the close of the regular session of the New York Stock Exchange.
Securities that are traded principally in the over-the-counter market, listed securities for which no sale was reported on the day of valuation, and listed securities whose primary market is believed by Corbyn Investment Management, Inc. (“Corbyn” or the “Adviser”) to be over-the-counter are valued at the mean of the closing bid and asked prices obtained from sources that the Adviser deems appropriate.
Short-term investments are valued at amortized cost, which approximates fair market value. The value of securities that mature, or have an announced call, within 60 days will be valued at market value.
Securities for which market quotations are not readily available are valued at fair value as determined in good faith by the Adviser as directed by the Board of Directors.
In determining fair value, the Adviser, as directed by the Board of Directors, considers all relevant qualitative and quantitative information available. These factors are subject to change over time and are reviewed periodically. The values assigned to fair value investments are based on available information and do not necessarily
Greenspring Fund, Incorporated
NOTES TO FINANCIAL STATEMENTS December 31, 2009 (Con’t) |
represent amounts that might ultimately be realized, since such amounts depend on future developments inherent in long-term investments. Further, because of the inherent uncertainty of valuation, those estimated values may differ significantly from the values that would have been used had a ready market of the investments existed, and the differences could be material.
The Fund has adopted fair valuation accounting standards that establish an authoritative definition of fair value and set out a hierarchy for measuring fair value. These standards require additional disclosures about the various inputs used to develop the measurements of fair value. These inputs are summarized in the three broad levels listed below:
| Level 1 – | Unadjusted quoted prices in active markets for identical securities that the Fund has the ability to access. |
| Level 2 – | Observable inputs other than quoted prices included in level 1 that are observable for the security, either directly or indirectly. These inputs may include quoted prices for the identical instrument on an inactive market, prices for similar instruments, interest rates, prepayment speeds, credit risk, yield curves, default rates and similar data. |
| Level 3 – | Unobservable inputs for the security, to the extent relevant observable inputs are not available, representing the Fund’s own assumptions about the assumptions a market participant would use in valuing the security, and would be based on the best information available. |
The inputs or methodology used for valuing securities are not necessarily an indication of the risk associated with investing in these securities. The following is a summary of the inputs used to value the Fund’s net assets as of December 31, 2009:
| | | | | | Significant | | | | | | Carrying | |
| | | Quoted Prices | | | Other | | | Significant | | | Value at | |
| | | in Active | | | Observable | | | Unobservable | | | December 31, | |
| | | Markets | | | Inputs | | | Inputs | | | 2009 | |
| | | Level 1 | | | Level 2 | | | Level 3 | | | Total | |
| Common Stocks | | $ | 204,673,525 | | | $ | — | | | $ | — | | | $ | 204,673,525 | |
| Investment Companies | | | 1,724,804 | | | | — | | | | — | | | | 1,724,804 | |
| Convertible Bonds | | | — | | | | 128,238,871 | | | | — | | | | 128,238,871 | |
| Corporate Bonds | | | — | | | | 145,629,559 | | | | — | | | | 145,629,559 | |
| Short-Term Investments | | | 43,297,652 | | | | — | | | | — | | | | 43,297,652 | |
| Total | | $ | 249,695,981 | | | $ | 273,868,430 | | | $ | — | | | $ | 523,564,411 | |
Greenspring Fund, Incorporated
NOTES TO FINANCIAL STATEMENTS December 31, 2009 (Con’t) |
The Fund has adopted accounting provisions that provide additional guidance for estimating fair value when the volume and level of activity for the security have significantly decreased, as well as guidance on identifying circumstances that indicate a transaction is not orderly. Management has determined the adoption of such accounting provisions had no material impact on the Fund’s financial statements and related disclosures.
The Fund has adopted accounting provisions that require enhanced disclosures about the Fund’s derivative and hedging activities, including how such activities are accounted for and their effect on the Fund’s financial position, performance and cash flows. Management has determined the adoption of such accounting provisions had no material impact on the Fund’s financial statements and related disclosures.
Dividends and distributions to stockholders - The Fund records dividends and distributions to shareholders on the ex-dividend date.
Redemption fees - The Fund’s Board of Directors has adopted policies and procedures with respect to frequent purchases and redemptions of Fund shares by Fund shareholders. The Fund is intended for long-term investors. The Fund discourages and does not accommodate frequent purchases and redemptions of Fund shares by Fund shareholders. The Fund reserves the right to decline a purchase order for any reason.
“Market-timers” who engage in frequent purchases and redemptions over a short period can disrupt the Fund’s investment program by requiring the Fund to have excess cash on hand or to liquidate holdings to accommodate redemptions. In addition, frequent purchases and redemptions may impede efficient Fund management and create additional transaction costs that are borne by all shareholders. To the extent that the Fund invests a significant portion of its assets in small-cap securities or high-yield bonds, it may be subject to the risks of market timing more than a fund that does not. Therefore, the Fund imposes a 2% redemption fee for shares held 60 days or less. The fee is deducted from the seller’s redemption proceeds and deposited into the Fund to help offset brokerage commissions, market impact, and other costs associated with fluctuations in Fund asset levels and cash flow caused by short-term trading. All shareholders are subject to these restrictions regardless of whether you purchased your shares directly from the Fund or through a financial intermediary. However, the Fund is limited in its ability to determine whether trades placed through financial intermediaries may signal excessive trading. Accordingly, the Fund may not be able to determine whether trading in combined orders or in omnibus accounts is contrary to the Fund’s policies. The Fund reserves the right to reject combined or omnibus orders in whole or in part.
The “first-in, first-out” method is used to determine the holding period. Under this method, the date of redemption will be compared with the earliest purchase date of
Greenspring Fund, Incorporated
NOTES TO FINANCIAL STATEMENTS December 31, 2009 (Con’t) |
shares held in the account. If the holding period for shares purchased is 60 days or less, the fee will be charged. The redemption fee may be modified or discontinued at any time, in which case, shareholders will be notified.
In compliance with Rule 22c-2 under the 1940 Act, Quasar Distributors, LLC, on behalf of the Fund, has entered into written agreements with each of the Fund’s financial intermediaries, under which the intermediaries must, upon request, provide the Fund with certain shareholder and identity trading information so that the Fund can enforce its frequent trading policies.
The fee does not apply to shares acquired through the reinvestment of dividends or other distributions, or shares redeemed pursuant to a systematic withdrawal plan or a mandatory IRA distribution.
Risk of loss arising from indemnifications - In the normal course of business, the Fund enters into contracts that contain a variety of representations, which provide general indemnifications. The Fund’s maximum exposure under these arrangements is unknown as this would involve future claims that may be made against the Fund that have not yet occurred. However, based on experience, the Fund expects the risk of loss to be remote.
| Note 2 - Dividends and Distributions |
It is the Fund’s policy to declare dividends from net investment income and distributions from net realized gains as determined in accordance with income tax regulations, which may differ from accounting principles generally accepted in the United States of America. Accordingly, periodic reclassifications are made within the portfolio’s capital accounts to reflect income and gains available for distribution under income tax regulations.
On July 15, 2009 an income dividend of $0.47000 per share was declared, payable on July 16, 2009, to shareholders of record on July 14, 2009. Additionally, on December 16, 2009, an income dividend of $0.35600 and a short-term capital gain distribution of $0.02038 per share, respectively, were declared, payable on December 17, 2009 to shareholders of record on December 15, 2009. The tax character of distributions paid during the years ended December 31, 2009 and 2008 were as follows:
| Distributions paid from: | December 31, 2009 | December 31, 2008 |
| Ordinary income | $17,987,510 | $5,976,454 |
| Long-term capital gain | $ — | $ 70,215 |
These dividends are either distributed to shareholders or reinvested in the Fund as additional shares issued to shareholders. For those shareholders reinvesting the dividends, the number of shares issued is based on the net asset value per share as of the close of business on the ex-dividend date.
Greenspring Fund, Incorporated
NOTES TO FINANCIAL STATEMENTS December 31, 2009 (Con’t) |
| Note 3 - Purchases and Sales of Investments |
For the year ended December 31, 2009, purchases and sales of investments, other than short-term investments, aggregated $306,122,099 and $155,951,165, respectively.
| Note 4 - Federal Income Taxes |
It is the Fund’s policy to comply with the requirements of the Internal Revenue Code applicable to regulated investment companies. Accordingly, the Fund intends to distribute substantially all of its taxable income. Therefore, no federal income tax provision is required.
As of December 31, 2009, the Fund did not have any tax positions that did not meet the “more-likely-than-not” threshold of being sustained by the applicable tax authority. Tax positions not deemed to meet the “more-likely-than-not” threshold would be recorded as a tax benefit or expense in the current year. Generally, tax authorities can examine all tax returns filed for the last three years.
Required Fund distributions are based on income and capital gain amounts determined in accordance with federal income tax regulations, which differ from net investment income and realized gains recognized for financial reporting purposes.
Accordingly, the composition of net assets and distributions on a tax basis may differ from those reflected in the accompanying financial statements. As of December 31, 2009, the components of distributable earnings on a tax basis were as follows:
| Cost of investments | | $ | 474,070,620 | |
| Gross tax unrealized appreciation | | | 62,303,884 | |
| Gross tax unrealized depreciation | | | (12,810,093 | ) |
| Net tax unrealized appreciation | | | 49,493,791 | |
| Undistributed ordinary income | | | — | |
| Undistributed long-term capital gain | | | — | |
| Total distributable earnings | | | 49,493,791 | |
| Other accumulated gains/(losses) | | | (1,206,545 | ) |
| Total accumulated earnings/(losses) | | $ | 48,287,246 | |
Accounting principles generally accepted in the United States of America require that certain components of net assets relating to permanent differences be reclassified between financial and tax reporting. These reclassifications have no effect on net assets or net asset value per share. For the year ended December 31, 2009, the Fund decreased accumulated net investment loss by $90,279, increased accumulated net realized loss on investments by $142,763 and increased paid-in capital by $52,484.
Greenspring Fund, Incorporated
NOTES TO FINANCIAL STATEMENTS December 31, 2009 (Con’t) |
As of December 31, 2009, the Fund had a capital loss carryforward of $463,089, which, if not offset by subsequent capital gains, will expire on December 31, 2016.
The Fund incurred losses for tax purposes of $743,456 for the period from November 1, 2009 to December 31, 2009. As permitted by tax regulations, the Fund intends to elect to defer and treat these losses as arising in the fiscal year ending December 31, 2010.
| Note 5 - Transactions with Related Parties |
Corbyn serves as the Fund’s investment adviser. Under an agreement between the Fund and Corbyn, the Fund pays Corbyn a fee of 0.75% of the first $250 million of average daily net assets, 0.70% of average daily net assets between $250 million and $500 million and 0.65% of average daily net assets in excess of $500 million, which is computed daily and paid monthly. For the year ended December 31, 2009, the Fund incurred $3,042,004 in advisory fees.
The Fund has also entered into a Services Agreement with Corbyn to provide various administrative services. As compensation, the Fund pays Corbyn a fee of $2,500 per month plus 0.01% of average daily net assets, which is computed daily and paid monthly. For the year ended December 31, 2009, the Fund incurred $71,689 in administrative fees to Corbyn.
At December 31, 2009, investors for whom Corbyn was investment adviser held 773,297 shares of the Fund.
| Note 6 - Shareholder Servicing Fees |
Both the Fund and Corbyn have entered into various Shareholder Servicing Agreements, whereby a fee is paid to certain service agents who administer omnibus accounts for indirect shareholders of the Fund. The Board of Directors has authorized the Fund to pay the amount of the fees it estimates the Fund would have been charged by its transfer agent for administering the accounts on an individual basis. The amount is included in “Transfer agent fees” on the accompanying Statement of Operations. For the year ended December 31, 2009, the Fund incurred $437,388 of such fees.
| Note 7 - New Accounting Pronouncement |
On January 21, 2010, the Financial Accounting Standards Board issued an Accounting Standards Update, Fair Value Measurements and Disclosures (Topic 820): Improving Disclosures about Fair Value Measurements, which provides guidance on how investment securities are to be valued and disclosed. Specifically, the amendment requires reporting entities to disclose i) the input and valuation techniques used to measure fair value for both recurring and nonrecurring fair value
Greenspring Fund, Incorporated
NOTES TO FINANCIAL STATEMENTS December 31, 2009 (Con’t) |
measurements, for Level 2 or Level 3 positions; ii) transfers between all levels (including Level 1 and Level 2) will be required to be disclosed on a gross basis (i.e. transfers out must be disclosed separately from transfers in) as well as the reason(s) for the transfer; and iii) purchases, sales, issuances and settlements must be shown on a gross basis in the Level 3 rollforward rather than as one net number. The effective date of the amendment is for interim and annual periods beginning after December 15, 2009; however, the requirement to provide the Level 3 activity for purchases, sales, issuances and settlements on a gross basis will be effective for interim and annual periods beginning after December 15, 2010. At this time, the Fund is evaluating the implications of the update and the impact to the financial statements.
Greenspring Fund, Incorporated
REPORT OF INDEPENDENT REGISTERED PUBLIC ACCOUNTING FIRM
Board of Directors and Shareholders
Greenspring Fund, Incorporated
Lutherville, Maryland
We have audited the accompanying statement of assets and liabilities of the Greenspring Fund, Incorporated (the “Fund”), including the schedule of investments, as of December 31, 2009, and the related statement of operations for the year then ended, the statements of changes in net assets for each of the two years in the period then ended, and financial highlights for each of the five years in the period then ended. These financial statements and financial highlights are the responsibility of the Fund’s management. Our responsibility is to express an opinion on these financial statements and financial highlights based on our audits.
We conducted our audits in accordance with the standards of the Public Company Accounting Oversight Board (United States). Those standards require that we plan and perform the audit to obtain reasonable assurance about whether the financial statements and financial highlights are free of material misstatement. The Fund is not required to have, nor were we engaged to perform, an audit of its internal control over financial reporting. Our audits included consideration of internal control over financial reporting as a basis for designing audit procedures that are appropriate in the circumstances, but not for the purpose of expressing an opinion on the effectiveness of the Fund’s internal control over financial reporting. Accordingly, we express no such opinion. An audit includes examining, on a test basis, evidence supporting the amounts and disclosures in the financial statements. Our procedures included confirmation of securities owned as of December 31, 2009, by correspondence with the custodian and brokers. An audit also includes assessing the accounting principles used and significant estimates made by management, as well as evaluating the overall financial statement presentation. We believe that our audits provide a reasonable basis for our opinion.
In our opinion, the financial statements and financial highlights referred to above present fairly, in all material respects, the financial position of the Greenspring Fund, Incorporated as of December 31, 2009, the results of its operations for the year then ended, the changes in its net assets for each of the two years in the period then ended, and the financial highlights for each of the five years in the period then ended, in conformity with accounting principles generally accepted in the United States of America.
TAIT, WELLER & BAKER LLP
Philadelphia, Pennsylvania
February 24, 2010
Greenspring Fund, Incorporated
NOTICE TO SHAREHOLDERS December 31, 2009 (Unaudited) |
Tax Information
The Fund designates 12.46% of dividends declared from net investment income during the fiscal year ended December 31, 2009 as qualified income under the Jobs and Growth Tax Relief Reconciliation Act of 2003.
For corporate shareholders in the Fund, the percentage of ordinary dividend income distributed for the year ended December 31, 2009, which is designated as qualifying for the dividends-received deduction, is 11.96%.
For foreign shareholders in the Fund, for the year ended December 31, 2009, 89.66% of the ordinary distributions paid qualify as interest-related dividends under the Internal Revenue Code Section 871(k)(1)(c), and 2.59% of the ordinary income distributions are designated as short-term capital gain distributions under Internal Revenue Code Section 871(k)(2)(c).
Proxy Voting Policies and Proxy Voting Record
The Fund’s proxy voting policies and procedures, as well as its proxy voting record for the most recent 12-month period ended June 30, are available without charge, upon request, by contacting the Fund at (800) 366-3863 or greenspring@greenspringfund.com. The Fund will send the information within three business days of receipt of the request, by first class mail or other means designed to ensure equally prompt delivery. The Fund’s proxy voting record is also available on the U.S. Securities and Exchange Commission’s website at www.sec.gov.
Form N-Q Holdings Information
The Fund files its complete schedule of portfolio holdings with the U.S. Securities and Exchange Commission for the first and third quarters of each fiscal year on Form N-Q. The Fund’s Forms N-Q are available on the Commission’s website at www.sec.gov and may be reviewed and copied at the Commission’s Public Reference Room in Washington, DC. Information on the operation of the Public Reference Room may be obtained by calling (800) SEC-0330.
Reports and Householding
In an attempt to reduce shareholder expenses, we will mail only one copy of the Fund’s Prospectus and each Annual and Semi-Annual Report to those addresses shared by two or more accounts. If you wish to receive individual copies of these documents, please call us at (800) 366-3863. We will begin sending you individual copies 30 days after receiving your request.
The Fund’s Prospectus, Statement of Additional Information, and semi-annual shareholder reports, along with its first and third quarter portfolio holdings, are available on the Fund’s website at www.greenspringfund.com.
Greenspring Fund, Incorporated
Basic Information About Fund Directors and Officers
(Unaudited)
The Board of Directors supervises the management of the Fund. The following list summarizes information on the directors and officers of the Fund for the past five years. The address of each is 2330 West Joppa Road, Suite 110, Lutherville, MD 21093. The Fund’s Statement of Additional Information contains additional information about Fund directors and is available, without charge, upon request, by calling the Fund at (800) 366-3863, or by emailing the Fund at greenspring@greenspringfund.com.
| Name, Address and | Position Held with | Term of Office and | Principal Occupation(s) | Number of | Other |
| Date of Birth | the Fund | Length of Time Served | During the Past Five Years | Funds Overseen | Directorships |
| | | Term of Director | | | |
| | | Until next Annual Meeting of | | | |
| | | Stockholders and thereafter until a | | | |
| | | successor is elected. | | | |
| | | Term of Officer | | | |
| | | One year | | | |
| Interested | | | | | |
| Directors/Officers | | | | | |
| PresidentChairman of the BoardChief Executive OfficerDirector | From March 1993 to present.From January 1994 to present.From February 1994 to present.From March 1987 to present. | President and Managing Director of the Fund’s Adviser. | One | None |
| | | | | | |
William E. Carlson 52 | Director | From February 1994 to present. | President of Shapiro Sher Guinot & Sandler (a law firm) from February 1999 to present. Partner of Shapiro Sher Guinot & Sandler from February 1990 to present. | One | None |
| | | | | | |
| Sr. Vice PresidentChief Financial OfficerDirector | From May 1998 to present.From February 1994 to present.From March 1992 to present. | Sr. Vice President and Managing Director of the Fund’s Adviser. | One | None |
| | | | | | |
| Director | From March 1985 to present. | Sr. Vice President and Managing Director of the Fund’s Adviser. | One | None |
Greenspring Fund, Incorporated
| Name, Address and | Position Held with | Term of Office and | Principal Occupation(s) | Number of | Other |
| Date of Birth | the Fund | Length of Time Served | During the Past Five Years | Funds Overseen | Directorships |
| | | Term of Director | | | |
| | | Until next Annual Meeting of | | | |
| | | Stockholders and thereafter until a | | | |
| | | successor is elected. | | | |
| | | Term of Officer | | | |
| | | One year | | | |
| Disinterested Directors | | | | | |
| Director | From May 1990 to present. | Managing Director of Kanturk Partners, LLC (a merchant bank) from February 2004 to present. Managing Director of Galway Partners LLC (a merchant bank) from May 2001 to January 2004. | One | None |
| | | | | | |
| Director | From March 2003 to present. | Director of Finance and Administration at the Gilman School from June 2003 to present. | One | None |
Greenspring Fund, Incorporated
| Name, Address and | Position Held with | Term of Office and | Principal Occupation(s) | Number of | Other |
| Date of Birth | the Fund | Length of Time Served | During the Past Five Years | Funds Overseen | Directorships |
| | | Term of Director | | | |
| | | Until next Annual Meeting of | | | |
| | | Stockholders and thereafter until a | | | |
| | | successor is elected. | | | |
| | | Term of Officer | | | |
| | | One year | | | |
| | | | | | |
| Director | From July 2000 to present. | President of UnitedHealth Networks, a division of United Healthcare (a managed health care company) from May 2008 to present. Chief Operating Officer of The Cleveland Clinic Foundation (world-renowned non-profit provider of health care services, education and research) and The Cleveland Clinic Health System from July 2005 to March 2008. Chief Financial Officer of The Cleveland Clinic Foundation and The Cleveland Clinic Health System from October 2001 to June 2005. | One | None |
| | | | | | |
| Officers | | | | | |
| | From May 1998 to present.From July 2002 to present.From July 2004 to present. | Employee of the Fund’s Adviser from May 1998 to present. | One | None |
Greenspring Fund, Incorporated
Greenspring Fund, Incorporated
Performance Since Inception on
July 1, 1983 through December 31, 2009
(Unaudited)
HOW $10,000 INVESTED ON 7/1/83 WOULD HAVE GROWN* |
| * | Figures include changes in principal value, reinvested dividends and capital gains distributions. Past expense limitations increased the Fund's return. This chart illustrates the performance of a hypothetical $10,000 investment made in the Fund since inception through December 31, 2009. The total value of $130,289 assumes the reinvestment of dividends and capital gains, but does not reflect the effect of any redemption fees. This chart does not imply any future performance. |
Average annual total returns for the one, three, five and ten year periods ended December 31, 2009 were 15.83%, 2.50%, 5.20% and 8.23%, respectively. Average annual returns for more than one year assume a compounded rate of return and are not the Fund's year-by-year results, which fluctuated over the periods shown. Returns do not reflect taxes that shareholders may pay on Fund distributions or redemption of Fund shares.
Greenspring Fund, Incorporated
Privacy Policy
The Greenspring Fund recognizes that individuals expect an exceptional level of privacy in their financial affairs. The Fund assures the confidentiality of personal information provided to it.
The information we collect is limited to what the Fund believes is necessary or useful to conduct our business; administer your records, accounts and funds; to comply with laws and regulations; and to help us design or improve products and services. The Fund collects non-public personal information about you from information it receives from you on applications or other forms or through its website, as well as from information about your transactions with the Fund.
Some of this information may be disclosed to the Fund’s investment adviser, but not for marketing solicitation, as well as non-affiliated third parties who provide non-financial services to the Fund such as our Transfer Agent, in order to administer customer accounts and mail transaction confirmations and tax forms, and the mailing house the Fund utilizes for mailing shareholder reports. Such information may also be disclosed to a non-affiliated third party engaged to provide fund accounting and administrative services to us. Disclosing this information enables us to meet customers’ financial needs and regulatory requirements. These third parties act on its behalf and are obligated to keep the information we provide to them confidential and to use the information only for the purposes authorized. The Fund does not disclose any non-public personal information about you or former customers to anyone, except as permitted by law.
To protect your non-public personal information, the Fund permits access to it only by authorized employees and maintains security practices to safeguard your information.
If you have any questions regarding our Privacy Policy, please contact us at 1-800-366-3863 or greenspring@greenspringfund.com. Thank you.
Greenspring Fund, Incorporated
2330 West Joppa Road, Suite 110
Lutherville, MD 21093
(410) 823-5353
(800) 366-3863
www.greenspringfund.com
DIRECTORS
Charles vK. Carlson, Chairman
William E. Carlson
David T. Fu
Sean T. Furlong
Michael J. Fusting
Richard Hynson, Jr.
Michael P. O’Boyle
OFFICERS
Charles vK. Carlson
President and Chief Executive Officer
Michael J. Fusting
Sr. Vice President and
Chief Financial Officer
Elizabeth Agresta Swam
Chief Compliance Officer,
Secretary, Treasurer
and AML Officer
INVESTMENT ADVISER
Corbyn Investment Management, Inc.
2330 West Joppa Road, Suite 108
Lutherville, MD 21093-7207
ADMINISTRATOR, FUND ACCOUNTANT AND
TRANSFER AGENT
U.S. Bancorp Fund Services, LLC
615 East Michigan Street
Milwaukee, WI 53202
DISTRIBUTOR
Quasar Distributors, LLC
615 East Michigan Street
Milwaukee, WI 53202
CUSTODIAN
U.S. Bank, N.A.
1555 N. RiverCenter Dr., Suite 302
Milwaukee, WI 53212
INDEPENDENT REGISTERED
PUBLIC ACCOUNTING FIRM
Tait, Weller & Baker LLP
1818 Market Street, Suite 2400
Philadelphia, PA 19103
LEGAL COUNSEL
K&L Gates LLP
1601 K Street NW
Washington, DC 20006
Symbol - GRSPX
CUSIP - 395724107
Item 2. Code of Ethics.
The registrant has adopted a code of ethics that applies to the registrant’s principal executive officer and principal financial officer. The registrant has not made any amendments to its code of ethics during the period covered by this report. The registrant has not granted any waivers from any provisions of the code of ethics during the period covered by this report.
A copy of the registrant’s Code of Ethics is filed herewith.
Item 3. Audit Committee Financial Expert.
The registrant’s board of directors has determined that there is at least one audit committee financial expert serving on its audit committee. Mr. Sean T. Furlong is the “audit committee financial expert” and is considered to be “independent” as each term is defined in Item 3 of Form N-CSR.
Item 4. Principal Accountant Fees and Services.
The registrant has engaged its principal accountant to perform audit services, audit-related services, tax services or other services during the past two fiscal years. “Audit services” refer to performing an audit of the registrant's annual financial statements or services that are normally provided by the accountant in connection with statutory and regulatory filings or engagements for those fiscal years. “Audit-related services” refer to the assurance and related services by the principal accountant that are reasonably related to the performance of the audit. “Tax services” refer to professional services rendered by the principal accountant for tax compliance, tax advice, and tax planning. There were no “other services” provided by the principal accountant. The following table details the aggregate fees billed, or expected to be billed, for each of the last two fiscal years for audit fees, audit-related fees, tax fees or other fees by the principal accountant:
| | FYE 12/31/2009 | FYE 12/31/2008 |
| Audit Fees | $23,000 | $22,100 |
| Audit-Related Fees | N/A | N/A |
| Tax Fees | $3,000 | $2,900 |
| All Other Fees | N/A | N/A |
The audit committee has adopted pre-approval policies and procedures that require the audit committee to pre-approve all audit and non-audit services of the registrant, including services provided to any entity affiliated with the registrant. All of the principal accountant’s hours spent on auditing the registrant’s financial statements were attributed to work performed by full-time permanent employees of the principal accountant.
The following table indicates the non-audit fees billed, or expected to be billed, by the registrant’s accountant for services to the registrant and to the registrant’s investment adviser for the last two years. The audit committee of the board of directors has considered whether the provision of non-audit services that were rendered to the registrant's investment adviser is compatible with maintaining the principal accountant's independence and has concluded that the provision of such non-audit services by the accountant has not compromised the accountant’s independence.
| Non-Audit Related Fees | FYE 12/31/2009 | FYE 12/31/2008 |
| Registrant | N/A | N/A |
| Registrant’s Investment Adviser | N/A | N/A |
Item 5. Audit Committee of Listed Registrants.
Not applicable to registrants who are not listed issuers (as defined in Rule 10A-3 under the Securities Exchange Act of 1934).
Item 6. Investments.
Schedule of Investments is included as part of the report to shareholders filed under Item 1 of this Form.
Item 7. Disclosure of Proxy Voting Policies and Procedures for Closed-End Management Investment Companies.
Not applicable to open-end investment companies.
Item 8. Portfolio Managers of Closed-End Management Investment Companies.
Not applicable to open-end investment companies.
Item 9. Purchases of Equity Securities by Closed-End Management Investment Company and Affiliated Purchasers.
Not applicable to open-end investment companies.
Item 10. Submission of Matters to a Vote of Security Holders.
Not Applicable.
Item 11. Controls and Procedures.
| (a) | The Registrant’s Chief Executive Officer and Chief Financial Officer have reviewed the Registrant's disclosure controls and procedures (as defined in Rule 30a-3(c) under the Investment Company Act of 1940 (the “Act”)) as of a date within 90 days of the filing of this report, as required by Rule 30a-3(b) under the Act and Rules 13a-15(b) or 15d-15(b) under the Securities Exchange Act of 1934. Based on their review, such officers have concluded that the disclosure controls and procedures are effective in ensuring that information required to be disclosed in this report is appropriately recorded, processed, summarized and reported and made known to them by others within the Registrant and by the Registrant’s service provider. |
| (b) | There were no changes in the Registrant's internal control over financial reporting (as defined in Rule 30a-3(d) under the Act) that occurred during the second fiscal quarter of the period covered by this report that has materially affected, or is reasonably likely to materially affect, the Registrant's internal control over financial reporting. |
Item 12. Exhibits.
| (a) | (1) Any code of ethics or amendment thereto, that is the subject of the disclosure required by Item 2, to the extent that the registrant intends to satisfy Item 2 requirements through filing an exhibit. Filed herewith. |
(2) A separate certification for each principal executive and principal financial officer pursuant to Section 302 of the Sarbanes-Oxley Act of 2002. Filed herewith.
(3) Any written solicitation to purchase securities under Rule 23c-1 under the Act sent or given during the period covered by the report by or on behalf of the registrant to 10 or more persons. Not applicable to open-end investment companies.
| (b) | Certifications pursuant to Section 906 of the Sarbanes-Oxley Act of 2002. Furnished herewith. |
SIGNATURES
Pursuant to the requirements of the Securities Exchange Act of 1934 and the Investment Company Act of 1940, the registrant has duly caused this report to be signed on its behalf by the undersigned, thereunto duly authorized.
(Registrant) Greenspring Fund, Incorporated
By (Signature and Title)* /s/ Charles vK. Carlson
Charles vK. Carlson, Chief Executive Officer
Date March 4, 2010
Pursuant to the requirements of the Securities Exchange Act of 1934 and the Investment Company Act of 1940, this report has been signed below by the following persons on behalf of the registrant and in the capacities and on the dates indicated.
By (Signature and Title)* /s/ Charles vK. Carlson
Charles vK. Carlson, Chief Executive Officer
Date March 4, 2010
By (Signature and Title)* /s/ Michael J. Fusting
Michael J. Fusting, Chief Financial Officer
Date March 4, 2010
* Print the name and title of each signing officer under his or her signature.