UNITED STATES
SECURITIES AND EXCHANGE COMMISSION
Washington, D.C. 20549
FORM N-CSR
CERTIFIED SHAREHOLDER REPORT OF REGISTERED
MANAGEMENT INVESTMENT COMPANIES
Investment Company Act file number 811-3627
Greenspring Fund, Incorporated
(Exact name of registrant as specified in charter)
2330 West Joppa Road, Suite 110
Lutherville, MD 21093-4641
(Address of principal executive offices) (Zip code)
Mr. Charles vK. Carlson, President
2330 West Joppa Road, Suite 110
Lutherville, MD 21093-4641
(Name and address of agent for service)
(410) 823-5353
Registrant's telephone number, including area code
Date of fiscal year end: December 31, 2010
Date of reporting period: December 31, 2010
Item 1. Reports to Stockholders.
ANNUAL REPORT
DECEMBER 31, 2010
This report is intended for shareholders of the
Greenspring Fund, Incorporated and may not be
used as sales literature unless preceded or
accompanied by a current prospectus.
Greenspring Fund, Incorporated
Dear Fellow Shareholders:
The year 2010 ended on a high note for the financial markets but experienced its fair share of volatility along the way. After achieving solid gains through April, the specter of a U.S. “double-dip” recession and continued European bond woes came to the front of investors’ minds and a broad sell-off in the equity markets ensued. The market erosion lasted through summer, but Federal Reserve Chairman Ben Bernanke’s announcement during a speech in late August that the Federal Reserve was leaning toward an additional round of quantitative easing (“QE2”) helped spark a sharp rally that continued through the end of year. Despite this second year of recovery in the financial markets, however, the major stock market averages remain significantly below their record high levels.
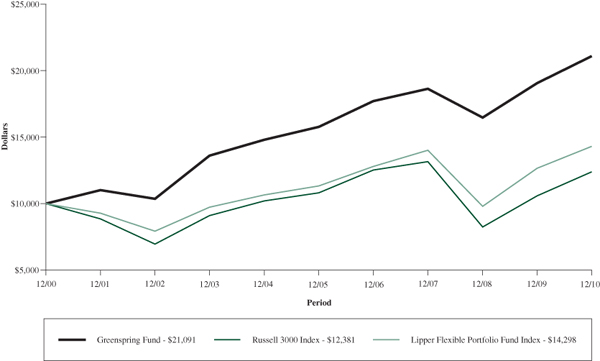
The Greenspring Fund also generated solid returns during 2010. Propelled by widespread gains throughout the portfolio, the Greenspring Fund gained 10.63%, including the reinvestment of the July and December dividends. We achieved this positive return while subjecting shareholders to sharply less volatility than was incurred by the overall market. We also notched a progression of record highs throughout the year, and ended 2010 especially strong. The accompanying charts show the Greenspring Fund’s performance over several longer time horizons, in addition to the performance of several major market indexes.
INFLUENCES on PERFORMANCE
As was the case during 2009, positive returns were generated by each of the asset classes in which the Fund was invested during 2010. Common stocks, convertible bonds, corporate bonds, and short-term investments (cash equivalents) all contributed to the Fund’s overall positive performance. The gains in the common stock portfolio were widespread, with 42 of the Fund’s 48 common stock investments gaining in value, while 85 of the 90 bonds held in the Fund during 2010 provided positive total returns. The Fund’s common stocks significantly outperformed both the convertible and corporate bonds.
| | Greenspring Fund | |
| | Performance for the | |
| | Periods Ended December 31, 2010 | |
| | Quarter | 4.90% | |
| | 1 Year | 10.63% | |
| | 3 Years* | 4.20% | |
| | 5 Years* | 5.99% | |
| | 10 Years* | 7.75% | |
| | 15 Years* | 8.06% | |
| | 20 Years* | 9.57% | |
| | Since inception on 7/1/83* | 10.18% | |
| | Expense Ratio** | 1.08% | |
| | | |
| | *annualized. | |
| | **as stated in Prospectus dated 5-1-10. See note on last page of letter. | |
| | | | |
| | Performance data quoted represents past performance; past performance does not guarantee future results. The investment return and principal value of an investment will fluctuate so that an investor’s shares, when redeemed, may be worth more or less than their original cost. Current performance of the Fund may be lower or higher than the performance quoted. Performance data current to the most recent month end may be obtained by calling 1-800-366-3863 or visiting the Fund’s web site. The Fund imposes a 2.00% redemption fee for shares held 60 days or less. Performance data does not reflect the redemption fee. If reflected, total returns would be reduced. | |
| | | | |
The accompanying chart shows the ten securities that most significantly influenced the Greenspring Fund’s performance during 2010 (as measured by total dollars gained or lost). Brief discussions of the five securities that had the largest impacts on the Fund’s overall performance during the year follow.
Greenspring Fund, Incorporated
| | Performance Comparison (Total Return*) | |
| | for Periods Ended December 31, 2010 | |
| | | | 3 Years | 5 Years | 10 Years | |
| | | 1 Year | Annualized/Cumulative | Annualized/Cumulative | Annualized/Cumulative | |
| | Greenspring Fund | 10.63% | 4.20% | 13.12% | 5.99% | 33.78% | 7.75% | 110.91% | |
| | Dow Jones | 14.06% | -1.61% | -4.75% | 4.31% | 23.47% | 3.15% | 36.37% | |
| | S&P 500 | 15.06% | -2.86% | -8.32% | 2.29% | 11.99% | 1.41% | 15.07% | |
| | NASDAQ | 16.91% | 0.01% | 0.02% | 3.76% | 20.29% | 0.71% | 7.38% | |
| | Russell 3000 | 16.93% | -2.01% | -5.92% | 2.74% | 14.46% | 2.16% | 23.80% | |
| | Lipper Flexible Portfolio | 12.91% | 0.68% | 2.06% | 4.75% | 26.11% | 3.64% | 42.99% | |
| | | | | | | | | | |
| | * All data is Total Return except for NASDAQ. | |
| | | | | | | | | | |
| | The Dow Jones Industrial Average, Standard and Poor’s 500 Index, NASDAQ, Russell 3000 Index and Lipper Flexible Portfolio are unmanaged indexes commonly used to measure performance of U.S. stocks. You cannot invest directly in an index. Past performance does not guarantee future results. | |
| | | |
j2 Global Communications common stock
j2 Global Communications provides outsourced, value-added messaging and communications services primarily to small and mid-sized businesses around the world. j2 enjoys a dominant market position in eFax, a technology that allows users to send and receive faxes using traditional email, thereby increasing employee mobility and decreasing the need for hardware. Its stock price rose throughout 2010 as management continued to execute their plan of low-cost customer acquisition, resulting in accelerating organic revenue growth. j2 also continued to consolidate the fragmented eFax market by acquiring several smaller players including the number two eFax competitor, Protus, in what appears to be a highly accretive acquisition. In addition, investors became more confident in management’s ability to deploy their significant excess cash into new growth opportunities as management fine-tuned their go-to-market strategy for their recently introduced outsourced telecommunications service and acquired additional technology in the email hosting and cloud-based backup arenas. We continue to hold our position in j2 and anticipate continued strong execution and accretive cash deployment.
Rosetta Resources common stock
Rosetta Resources explores for and develops oil and natural gas properties in North America with significant acreage positions in South Texas and Northwest Montana. The stock’s significant rise in value during 2010 can be directly attributed to its far better-than-expected success in developing new wells in the Eagle Ford shale located in South Texas. These new Eagle Ford wells are producing at a higher rate than originally expected and the production is heavily weighted towards oil and natural gas liquids that
| | Securities that had the Most Significant Impact | |
| | on Greenspring Fund Performance | |
| | During 2010 | |
| | All Common Stocks | |
| | j2 Global Communications, Inc. | |
| | Rosetta Resources, Inc. | |
| | Harmonic, Inc. | |
| | Assurant, Inc. | |
| | Michael Baker Corp. | |
| | Prestige Brands Holdings, Inc. | |
| | Carpenter Technology Corp. | |
| | Global Indemnity PLC | |
| | Ralcorp Holdings, Inc. | |
| | PartnerRe Ltd. | |
Greenspring Fund, Incorporated
Harmonic Inc. common stock
Harmonic designs and manufactures products that enable telecommunications companies to efficiently upgrade their networks and service offerings. Strong financial results and accretive deployment of cash reserves during 2010 propelled the stock higher as the Company’s customers around the world used Harmonic products to add high definition television channels, develop more robust video-on-demand capability, and bolster mobile video applications. In early May, Harmonic announced the proposed acquisition of Omneon, a privately owned company whose products help companies produce, manage, and distribute video content. The merger closed in September and the combined entity now uniquely offers market-dominant products to participants in the
| | Greenspring Fund | |
| | Ten Largest 2010 Purchases | |
| | Common Stocks: | |
| | FTI Consulting, Inc. | |
| | PPL Corporation | |
| | Cogent, Inc. | |
| | Harmonic, Inc. | |
| | Ralcorp Holdings, Inc. | |
| | Bonds: | |
| | HEALTHSOUTH Corp. 10.750% 06/15/16 | |
| | Mirant North America 7.375% 12/31/13 | |
| | Hanesbrands, Inc. Floating Rate 12/15/14 | |
| | US Oncology, Inc. 10.750% 08/15/14 | |
| | Polypore Intl., Inc. 8.750% 05/15/12 | |
supply chain from video content production to distribution. We continue to maintain our position in Harmonic and anticipate that management can continue to add value by fulfilling strong customer demand and integrating the Omneon acquisition.
Assurant, Inc. common stock
The Greenspring Fund first purchased shares in this insurance company during 2004 and increased its holdings during 2007, 2008 and 2009. Since 2007, Assurant has frequently been ranked as one of the Fund’s top ten largest holdings. Assurant operates primarily in specialized niche markets within the property casualty, health and life insurance industries. Insurance products include creditor-placed homeowner’s insurance, warranties and extended service contracts, individual and small-employer group health insurance, group dental, disability and life insurance, and pre-funded funeral insurance. Assurant is a rather distinctive insurance company in that it serves a number of markets that require an extensive investment in systems and procedures to effectively manage the insurance products. For example, in the credito r-placed homeowner’s insurance business, Assurant monitors approximately 30 million mortgage loans for some of the nation’s largest mortgage lenders in order to verify that the borrower maintains adequate property insurance. In
| | Greenspring Fund | |
| | Ten Largest 2010 Sales | |
| | Common Stocks: | |
| | Cogent, Inc. | |
| | Verizon Communications | |
| | Watsco, Inc. | |
| | Brush Engineered Materials | |
| | NGP Capital Resources | |
| | Bonds: | |
| | SunPower Corp. 0.750% 08/01/27 Convertible | |
| | Polypore Intl., Inc. 8.750% 05/15/12 | |
| | Prestige Brands, Inc. 9.250% 04/15/12 | |
| | MetroPCS Wireless 9.250% 11/01/14 | |
| | Maxtor Corporation 6.800% 04/30/10 Convertible | |
Greenspring Fund, Incorporated
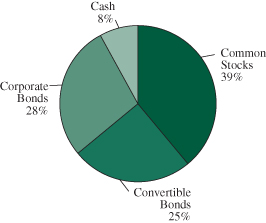
| Greenspring Fund |
| Portfolio Allocation |
| as of December 31, 2009 |
| |
 |
situations where the mortgaged property no longer has adequate insurance, Assurant issues a creditor-placed policy, which protects and is paid for by the mortgage company, not the delinquent borrower. This back office monitoring system adds great value to the relationship between Assurant and mortgage lenders.
Assurant, like many other insurance companies, began 2010 at a relatively low valuation, still recovering from the significant selloff that affected most financial stocks during the financial crisis. The stock was selling at a meaningful discount to book value and at a price to earnings ratio that was in the high single digits. While the financial crisis negatively impacted Assurant’s stock price, its business remained quite strong. As 2010 progressed, Assurant’s diversified base of business combined to produce earnings that exceeded Wall Street expectations and resulted in an improving outlook for the Company. Additionally, Assurant took advantage of its strong balance sheet and low stock price to repurchase approximately 12% of its common stock during 2010.
Michael Baker Corporation common stock
Michael Baker Corporation is another long-term holding in the Greenspring Fund, with the Fund’s position having been initiated in 2000, but added to (and at times
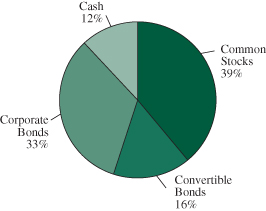
| Greenspring Fund |
| Portfolio Allocation |
| as of December 31, 2010 |
| |
 |
decreased) on many occasions since then. The Company provides a wide range of complex large-scale engineering and construction services to its clients around the world. Michael Baker’s business lines are diversified with expertise in aviation, defense, environmental, homeland security, utilities, transportation systems and water systems. Its stock price declined during 2010 as investors began to anticipate a slight decline in earnings. Much of Michael Baker’s revenues are dependent upon winning contracts from state and Federal governments. Delays in the passage of a new Federal Transportation bill, challenging state budget situations, and the winding down of profitable contracts in Iraq and with FEMA have all contributed to a tempering of investors’ expectations r egarding Michael Baker’s near-term earnings prospects. Nevertheless, we are confident that Michael Baker has very attractive longer-term prospects as the Company is well diversified, highly regarded in the industry and well managed. A balance sheet that reflects no outstanding debt and more than $8 per share in cash indicates the strong cash flow generation of the Company. The recent acquisition of LPA Group, a highly respected provider of engineering services for the aviation industry, further diversifies the Company’s product offerings and we anticipate additional value-creating acquisitions in the near future.
Greenspring Fund, Incorporated
PORTFOLIO ACTIVITY
Much of the activity during 2010 took place in the fixed income portion of the portfolio as many of the Fund’s bonds matured, were redeemed early, were tendered for by the issuing companies, or sold back to the issuers in accordance with “put” features. Because the capital markets were very accommodating during the year, many corporations sought to refinance their existing debt in order to reduce their interest expense and/or extend the maturities of the debt issues that were nearing their maturity dates. These refinancing activities had an especially busy effect on Greenspring Fund’s fixed income portfolio because of its relatively short duration of less than two years. As our existing bonds – both convertible and non-convertible – matured or were redeemed, we redeployed the pr oceeds into new investments that provided yields that were attractive in the current interest rate environment, while keeping the duration of our portfolio relatively short term.
Less activity occurred in our common stock portfolio, as we were comfortable maintaining the position size of many of our existing investments. However, we did initiate positions in American Physicians Capital, Chicopee Bancorp, Cogent, Inc., Harmonic, Inc., Heritage Financial Group, NTELOS Holdings, OmniAmerican Bancorp, Red Robin Gourmet Burgers and Shore Bancshares. We also added significantly to the current positions in Carpenter Technology Corp., FTI Consulting, j2 Global Communications, Michael Baker Corporation, PPL Corporation, PartnerRe Ltd., and Ralcorp Holdings.
The new common stock investments in American Physicians Capital, Cogent, Inc. and Red Robin Gourmet Burgers were ultimately liquidated later in the year, all at appreciable gains, as they reached our target prices due in part to announced or rumored takeover proposals. In addition to these sales, we also sold our entire positions in the common stocks of Brush Engineered Materials, Frontier Communications, SunTrust Banks, Verizon Communications and Watsco, Inc.
| | | % of Net | |
| | Greenspring Fund | Assets | |
| | Top 10 Holdings | as of | |
| | | 12/31/10 | |
| | HEALTHSOUTH Corp. 10.75% 06/15/16 | 4.6% | |
| | FTI Consulting, Inc. | 3.2% | |
| | Mirant North America 7.375% 12/31/13 | 3.1% | |
| | Hanesbrands, Inc. Floating Rate 12/15/14 | 3.0% | |
| | Ralcorp Holdings, Inc. | 2.8% | |
| | j2 Global Communications, Inc. | 2.8% | |
| | PartnerRe Ltd. | 2.7% | |
| | US Oncology, Inc. 10.75% 08/15/14 | 2.5% | |
| | PPL Corp. | 2.4% | |
| | Michael Baker Corp. | 2.4% | |
OUTLOOK
As we enter 2011, the Greenspring Fund team is prepared to meet the challenges that will surely occur in these times of continued uncertainty. The Greenspring Fund’s investment philosophy of utilizing a total return approach in which we purchase value-oriented equities and high yielding convertible bonds as well as other fixed income investments has served our shareholders well over the past 27 years. By structuring the Fund’s portfolio in this manner, we seek to achieve attractive total returns with tempered volatility.
With regard to specific investments, we will continue to target equity securities of companies with solid balance sheets, shareholder-friendly management teams, and strong cash flow-generating capability. With our fixed income investments, the focus will remain on corporate and convertible bonds with fairly short durations that we expect to generate yields significantly superior to U.S. Treasury securities of similar maturity. Preserving capital by limiting volatility and managing risk remains our paramount priority and we will continue to exercise careful discernment in managing the Fund’s portfolio.
Greenspring Fund, Incorporated
Respectfully,
 |  |
| Charles vK. Carlson | Michael J. Fusting |
| Portfolio Manager and Co-Chief Investment Officer | Co-Chief Investment Officer |
**Total Annual Fund Operating Expenses for the Fund will not correlate to the Ratio of Expenses to Average Net Assets shown in the Fund’s most recent Annual Report and in the Financial Highlights section of this Prospectus, which reflects the operating expenses of the Fund and does not include acquired fund fees and expenses.
Mutual fund investing involves risk. Principal loss is possible. Small-capitalization companies tend to have limited liquidity and greater price volatility than large-capitalization companies. Investments by the Fund in lower-rated and non-rated securities present a greater risk of loss to principal and interest than higher-rated securities. Investments in debt securities typically decrease in value when interest rates rise. This risk is usually greater for longer-term debt securities.
Opinions expressed are subject to change, are not guaranteed and should not be considered recommendations to buy or sell any security. Fund holdings and/or sector allocations are subject to change at any time and are not recommendations to buy or sell any security. Current and future portfolio holdings are subject to risk.
Cash flow measures the cash generating capability of a company by adding non-cash charges (e.g. depreciation) and interest expense to pretax income. Duration is a commonly used measure of the potential volatility of the price of a debt security, or the aggregate market value of a portfolio of debt securities, prior to maturity. Securities with a longer duration generally have more volatile prices than securities of comparable quality with a shorter duration. Book value: net asset value of a company, calculated by subtracting total liabilities from total assets. Price to earnings ratio is a common tool for comparing the prices of different common stocks and is calculated by dividing the current market price of a stock by the earnings per share.
Distributed by Quasar Distributors, LLC
Greenspring Fund, Incorporated
Growth of a $10,000 Investment in the Greenspring Fund
Over the Last Ten Years
| Average Annual Total Returns | | | | |
| | For Periods Ended December 31, 2010 |
| | 1 Year | 3 Years | 5 Years | 10 Years |
| Greenspring Fund | 10.63% | 4.20% | 5.99% | 7.75% |
| Russell 3000 Index | 16.93% | -2.01% | 2.74% | 2.16% |
| Lipper Flexible Portfolio Fund Index | 12.91% | 0.68% | 4.75% | 3.64% |
The graph and table do not reflect the deduction of taxes that a shareholder would pay on Greenspring Fund (the "Fund") distributions or the redemption of Fund shares.
Performance data quoted represents past performance; past performance does not guarantee future results. The investment return and principal value of an investment will fluctuate so that an investor’s shares, when redeemed, may be worth more or less than their original cost. Current performance of the Fund may be lower or higher than the performance quoted. Performance data current to the most recent month end is available at www.greenspringfund.com or by calling 1-800-366-3863 toll free. The Fund imposes a 2.00% redemption fee for shares held 60 days or less. Performance data does not reflect the redemption fee. If reflected, total returns would be reduced.
Greenspring Fund, Incorporated
EXPENSE EXAMPLE For the Six Months Ended December 31, 2010 (Unaudited) |
As a shareholder of the Fund, you incur two types of costs: (1) redemption fees if you redeem within 60 days of purchase; and (2) ongoing costs, including management fees and other Fund expenses. This example is intended to help you understand your ongoing costs (in dollars) of investing in the Fund and to compare these costs with the ongoing costs of investing in other mutual funds. The example is based on an investment of $1,000 invested at the beginning of the period and held for the entire period (7/1/2010 - 12/31/2010).
Actual Expenses
The first line of the table below provides information about actual account values based on actual returns and actual expenses. You may use the information in this line, together with the amount you invested, to estimate the expenses that you paid over the period. Simply divide your account value by $1,000 (for example, an $8,600 account value divided by $1,000 = 8.6), then multiply the result by the number in the first line under the heading entitled “Expenses Paid During the Period’’ to estimate the expenses you paid on your account during this period.
Hypothetical Example for Comparison Purposes
The second line of the table below provides information about hypothetical account values and hypothetical expenses based on the Fund’s actual expense ratio and an assumed rate of return of 5% per year before expenses, which is not the Fund’s actual return. The hypothetical account values and expenses may not be used to estimate the actual ending account balance or expenses you paid for the period. You may use this information to compare the ongoing costs of investing in the Fund and other funds. To do so, compare this 5% hypothetical example with the 5% hypothetical examples that appear in the shareholder reports of the other funds. Please note that the expenses shown in the table are meant to highlight your ongoing costs only and do not reflect any transactional costs, such as redemption f ees. Therefore, the second line of the table is useful in comparing ongoing costs only, and will not help you determine the relative total costs of owning different funds. In addition, if these transactional costs were included, your costs would have been higher.
| | | | | Expenses Paid |
| | | Beginning | Ending | During the Period |
| | | Account Value | Account Value | 7/1/2010 – |
| | | 7/1/2010 | 12/31/2010 | 12/31/2010* |
| Actual | | $1,000 | $1,099 | $4.99 |
| Hypothetical | | | | |
| (5% annual return before expenses) | | $1,000 | $1,020 | $4.81 |
| * | Expenses are equal to the Fund’s annualized expense ratio of 0.94%, multiplied by the average account value over the period multiplied by 184/365 (to reflect the one-half year period). |
Greenspring Fund, Incorporated
SCHEDULE OF INVESTMENTS at December 31, 2010 |
| Shares | | | | Value | |
| COMMON STOCKS: 39.0% | | | |
| | | | |
| Business Services: 2.8% | | | |
| | 795,184 | | j2 Global Communications, Inc.* | | $ | 23,020,577 | |
| | | | | |
| Commercial Banks & Thrifts: 1.3% | | | | |
| | 40,074 | | American National Bankshares, Inc. | | | 943,743 | |
| | 109,287 | | BCSB Bancorp, Inc.* | | | 1,229,479 | |
| | 398,801 | | Cardinal Financial Corp. | | | 4,638,056 | |
| | 2,980 | | Chicopee Bancorp, Inc.* | | | 37,697 | |
| | 31,987 | | Heritage Financial Group, Inc. | | | 397,279 | |
| | 65,000 | | Middleburg Financial Corp. | | | 929,500 | |
| | 56,400 | | OceanFirst Financial Corp. | | | 725,868 | |
| | 12,139 | | OmniAmerican Bancorp, Inc.* | | | 164,484 | |
| | 4,450 | | Shore Bancshares, Inc. | | | 46,903 | |
| | 199,862 | | Southern National Bancorp of Virginia* | | | 1,518,951 | |
| | | | | | | 10,631,960 | |
| Communications Equipment: 2.3% | | | | |
| | 2,213,425 | | Harmonic, Inc.* | | | 18,969,052 | |
| | | | | |
| Construction & Engineering: 4.4% | | | | |
| | 315,700 | | EMCOR Group, Inc.* | | | 9,148,986 | |
| | 526,448 | | MasTec, Inc.* | | | 7,680,876 | |
| | 638,455 | | Michael Baker Corp.* º | | | 19,855,951 | |
| | | | | | | 36,685,813 | |
| Consumer Goods: 1.6% | | | | |
| | 1,096,472 | | Prestige Brands Holdings, Inc.* | | | 13,102,840 | |
| | | | | |
| Electrical Equipment: 0.1% | | | | |
| | 17,400 | | Emerson Electric Co. | | | 994,758 | |
| | | | | |
Food – Packaged: 2.8% | | | | |
| | 359,870 | | Ralcorp Holdings, Inc.* | | | 23,395,149 | |
| | | | | |
| Insurance: 7.1% | | | | |
| | 505,425 | | Assurant, Inc. | | | 19,468,971 | |
| | 520,917 | | Global Indemnity plc * # | | | 10,652,753 | |
| | 281,367 | | PartnerRe, Ltd.# | | | 22,607,838 | |
| | 236,050 | | W.R. Berkley Corp. | | | 6,463,049 | |
| | | | | | | 59,192,611 | |
| Machinery: 0.1% | | | | |
| | 20,000 | | Pentair, Inc. | | | 730,200 | |
| | | | | |
| Management Consulting: 3.2% | | | | |
| | 708,036 | | FTI Consulting, Inc.* | | | 26,395,582 | |
| | | | | |
| Oil & Gas Exploration & Production: 3.5% | | | | |
| | 5,626 | | ConocoPhillips | | | 383,131 | |
| | 108,400 | | Energen Corp. | | | 5,231,384 | |
| | 22,280 | | EOG Resources, Inc. | | | 2,036,615 | |
| | 375,296 | | Rosetta Resources, Inc.* | | | 14,126,141 | |
| | 192,000 | | Suncor Energy, Inc.# | | | 7,351,680 | |
| | | | | | | 29,128,951 | |
| Real Estate: 0.1% | | | | |
| | 4,500 | | First Potomac Realty Trust | | | 75,690 | |
| | 27,500 | | Urstadt Biddle Properties, Inc. – Class A | | | 534,875 | |
| | | | | | | 610,565 | |
| Restaurants: 0.6% | | | | |
| | 216,475 | | Red Robin Gourmet Burgers, Inc. * | | | 4,647,718 | |
| | | | | |
| Semiconductors & Semiconductor Equipment: 0.7% | | | | |
| | 34,093 | | Rudolph Technologies, Inc.* | | | 280,585 | |
| | 264,405 | | Tessera Technologies, Inc.* | | | 5,856,571 | |
| | | | | | | 6,137,156 | |
| Specialty Metals: 1.7% | | | | |
| | 352,967 | | Carpenter Technology Corp. | | | 14,203,392 | |
| | | | | |
| Telecommunications: 1.0% | | | | |
| | 459,785 | | NTELOS Holdings Corp. | | | 8,758,904 | |
| | | | | |
| Truck Dealerships: 1.2% | | | | |
| | 211,930 | | Rush Enterprises, Inc. – Class A* | | | 4,331,849 | |
| | 295,798 | | Rush Enterprises, Inc. – Class B* | | | 5,318,448 | |
| | | | | | | 9,650,297 | |
| Utilities: 2.4% | | | | |
| | 766,067 | | PPL Corp. | | | 20,162,883 | |
| | | | | |
| Waste Management Services: 2.1% | | | | |
| | 577,958 | | Republic Services, Inc. | | | 17,257,826 | |
| | | | | |
| TOTAL COMMON STOCKS | | | | |
| (cost $237,356,800) | | | 323,676,234 | |
| | | | | |
| INVESTMENT COMPANIES: 0.1% | | | | |
| | 94,140 | | NGP Capital Resources Co. | | | | |
| | | | (cost $1,243,376) | | | 866,088 | |
The accompanying notes are an integral part of these financial statements.
Greenspring Fund, Incorporated
SCHEDULE OF INVESTMENTS at December 31, 2010 (Con’t) |
| Principal | | | | Value | |
| CONVERTIBLE BONDS: 16.2% | | | |
| | | | |
| Biotechnology: 2.1% | | | |
| $ | 17,435,000 | | Affymetrix, Inc., 3.500%, 1/15/38 | | $ | 17,108,094 | |
| | | | | |
| Communication Equipment Manufacturing: 0.7% | | | | |
| | 5,966,000 | | ADC Telecommunications, 0.831%, 6/15/13 | | | 5,980,915 | |
| | | | | |
| Educational: 2.0% | | | | |
| | 17,175,000 | | School Specialty, Inc., 3.750%, 11/30/26 | | | 16,831,500 | |
| | | | | |
| Financial Services: 2.0% | | | | |
| | 3,834,000 | | Dollar Financial Corp., 2.875%, 6/30/27 | | | 3,867,547 | |
| | 12,527,000 | | Euronet Worldwide, Inc., 3.500%, 10/15/25 | | | 12,448,706 | |
| | | | | | | 16,316,253 | |
| Home Improvements: 2.1% | | | | |
| | 33,909,000 | | Masco Corp., 0.000%, 7/20/31 | | | 17,759,839 | |
| | | | | |
| Housewares: 0.0% | | | | |
| | 226,000 | | Lifetime Brands, Inc., 4.750%, 7/15/11 | | | 227,695 | |
| | | | | |
| Medical Equipment: 3.5% | | | | |
| | 20,645,000 | | Hologic, Inc., 2.000%, 12/15/37 | | | 19,432,106 | |
| | 9,496,000 | | Integra Lifesciences Holdings, | | | | |
| | | | 2.375%, 6/1/12 – 144A | | | 9,543,480 | |
| | | | | | | 28,975,586 | |
| Movie Theater: 0.1% | | | | |
| | 433,000 | | Regal Entertainment Group, | | | | |
| | | | 6.250%, 3/15/11 – 144A | | | 438,954 | |
| | | | | |
| Oil & Gas Exploration & Production: 0.7% | | | | |
| | 6,885,000 | | GMX Resources, Inc., 5.000%, 2/1/13 | | | 5,835,038 | |
| | 375,000 | | GMX Resources, Inc., 4.500%, 5/1/15 | | | 281,719 | |
| | | | | | | 6,116,757 | |
| | | | | |
| Real Estate: 0.7% | | | | |
| | 5,375,000 | | Alexandria Real Estate, Inc., | | | | |
| | | | 3.700%, 1/15/27 – 144A | | | 5,455,625 | |
| | | | | |
| Semiconductors & Semiconductor Equipment: 2.3% | | | | |
| | 4,911,000 | | Advance Micro Devices, Inc., | | | | |
| | | | 5.750%, 8/15/12 | | | 5,058,330 | |
| | 14,875,000 | | Sandisk Corp., 1.000%, 5/15/13 | | | 14,391,563 | |
| | | | | | | 19,449,893 | |
| TOTAL CONVERTIBLE BONDS | | | | |
| (cost $128,604,333) | | | 134,661,111 | |
| | | | | |
| CORPORATE BONDS: 32.1% | | | | |
| | | | | |
| Asset Management: 0.2% | | | | |
| | 580,000 | | Janus Capital Group, Inc., 6.500%, 6/15/12 | | | 627,512 | |
| | 30,000 | | Janus Capital Group, Inc., 6.369%, 4/15/14 | | | 30,809 | |
| | 625,000 | | Waddell & Reed Financial, Inc., | | | | |
| | | | 5.600%, 1/15/11 | | | 625,789 | |
| | | | | | | 1,284,110 | |
| Automotive: 1.1% | | | | |
| | 8,700,000 | | Sonic Automotive, Inc., 8.625%, 8/15/13 | | | 8,874,000 | |
| | | | | |
| Business Equipment: 0.0% | | | | |
| | 100,000 | | Xerox Corp., 6.875%, 8/15/11 | | | 103,448 | |
| | | | | |
| Consumer Goods: 3.0% | | | | |
| | 24,883,000 | | Hanesbrands, Inc., 3.831%, 12/15/14 | | | 24,851,896 | |
| | | | | |
| Floor Covering: 0.4% | | | | |
| | 3,453,000 | | Mohawk Industries, Inc., 6.500%, 1/15/11 | | | 3,461,633 | |
| | | | | |
| Footwear: 1.3% | | | | |
| | 10,776,000 | | Brown Shoe Company, Inc., 8.750%, 5/1/12 | | | 11,018,460 | |
| | | | | |
| Healthcare: 7.3% | | | | |
| | 35,109,000 | | HealthSouth Corp., 10.750%, 6/15/16 | | | 38,005,493 | |
| | 1,339,000 | | Omnicare, Inc., 6.125%, 6/1/13 | | | 1,352,390 | |
| | 20,116,000 | | US Oncology, Inc., 10.750%, 8/15/14 | | | 20,945,785 | |
| | | | | | | 60,303,668 | |
| Hotels & Resorts: 0.1% | | | | |
| | 710,000 | | Host Hotels & Resorts LP., 7.125%, 11/1/13 | | | 724,200 | |
| | | | | |
| Insurance: 1.0% | | | | |
| | 7,989,000 | | Assurant, Inc., 5.625%, 2/15/14 | | | 8,405,562 | |
| | | | | |
| Machinery: 1.4% | | | | |
| | 10,637,000 | | Gardner Denver, Inc., 8.000%, 5/1/13 | | | 10,876,332 | |
| | 540,000 | | Terex Corp., 7.375%, 1/15/14 | | | 549,450 | |
| | | | | | | 11,425,782 | |
| Oil & Gas Exploration & Production: 2.7% | | | | |
| | 7,204,000 | | Forest Oil Corp., 8.000%, 12/15/11 | | | 7,564,200 | |
| | 1,537,000 | | KCS Energy, Inc., 7.125%, 4/1/12 | | | 1,544,685 | |
| | 8,799,000 | | Plains Exploration & Production, Co., | | | | |
| | | | 7.750%, 6/15/15 | | | 9,216,952 | |
| | 655,000 | | Plains Exploration & Production, Co., | | | | |
| | | | 10.000%, 3/1/16 | | | 735,238 | |
| | 3,041,000 | | Rosetta Resources, Inc., 9.500%, 4/15/18 | | | 3,299,485 | |
| | | | | | | 22,360,560 | |
The accompanying notes are an integral part of these financial statements.
Greenspring Fund, Incorporated
SCHEDULE OF INVESTMENTS at December 31, 2010 (Con’t) |
| Principal | | | | Value | |
| CORPORATE BONDS: 32.1% (Con’t) | | | |
| | | | |
| Oil & Gas Pipelines: 0.3% | | | |
| $ | 1,484,000 | | El Paso Corp., 7.000%, 5/15/11 | | $ | 1,516,973 | |
| | 1,237,000 | | Sonat, Inc., 7.625%, 7/15/11 | | | 1,273,318 | |
| | | | | | | 2,790,291 | |
Retail – Electronics: 2.0% | | | | |
| | 10,724,000 | | GameStop Corp., 8.000%, 10/1/12 | | | 11,018,910 | |
| | 5,692,000 | | RadioShack Corp., 7.375%, 5/15/11 | | | 5,848,530 | |
| | | | | | | 16,867,440 | |
| Telecommunications: 0.7% | | | | |
| | 6,036,000 | | Sprint Capital Corp., 7.625%, 1/30/11 | | | 6,058,635 | |
| | | | | |
| Transportation Equipment Manufacturing: 1.2% | | | | |
| | 9,094,000 | | Westinghouse Air Brake | | | | |
| | | | Technologies Corp., 6.875%, 7/31/13 | | | 9,594,170 | |
| | | | | |
| Utilities: 5.5% | | | | |
| | 59,000 | | Aquila, Inc., 7.950%, 2/1/11 | | | 59,297 | |
| | 13,477,000 | | Aquila, Inc., 11.875%, 7/1/12 | | | 15,292,379 | |
| | 25,546,000 | | Mirant North America, LLC, | | | | |
| | | | 7.375%, 12/31/13 | | | 26,027,287 | |
| | 3,582,000 | | National Fuel Gas Co., 6.700%, 11/21/11 | | | 3,750,483 | |
| | 700,000 | | Reliant Energy Reserve Corp., | | | | |
| | | | 7.750%, 2/15/11 | | | 705,267 | |
| | | | | | | 45,834,713 | |
| Warehousing & Storage: 1.4% | | | | |
| | 11,404,000 | | Iron Mountain, Inc., 7.750%, 1/15/15 | | | 11,461,020 | |
| | | | | |
| Waste Management Services: 0.1% | | | | |
| | 185,000 | | Allied Waste North America, Inc., | | | | |
| | | | 5.750%, 2/15/11 | | | 185,867 | |
| | 783,000 | | Allied Waste North America, Inc., | | | | |
| | | | 6.375%, 4/15/11 | | | 794,620 | |
| | | | | | | 980,487 | |
| Wood Product Manufacturing: 2.4% | | | | |
| | 18,318,000 | | Leucadia National Corp., 7.000%, 8/15/13 | | | 19,714,748 | |
| | 394,000 | | Leucadia National Corp., 7.750%, 8/15/13 | | | 427,490 | |
| | | | | | | 20,142,238 | |
| TOTAL CORPORATE BONDS | | | | |
| (cost $263,251,046) | | | 266,542,313 | |
| | | | | | | | |
| Shares | | | | Value | |
| SHORT-TERM INVESTMENTS: 11.7% | | | | |
| | | | | |
| Money Market Instruments^ | | | | |
| | 34,298,530 | | AIM Liquid Assets, 0.190% | | | 34,298,530 | |
| | 33,590,514 | | AIM STIC Prime Portfolio, 0.160% | | | 33,590,514 | |
| | 29,662,598 | | Fidelity Money Market Portfolio, 0.210% | | | 29,662,598 | |
| | | | | |
| TOTAL SHORT-TERM INVESTMENTS | | | | |
| (cost $97,551,642) | | | 97,551,642 | |
| | | | | |
| TOTAL INVESTMENTS IN SECURITIES | | | | |
| (cost $728,007,197): 99.1% | | | 823,297,388 | |
| Other Assets less Liabilities: 0.9% | | | 7,413,281 | |
| NET ASSETS: 100.0% | | $ | 830,710,669 | |
| * | Non-income producing security. |
| º | Investment in affiliated security (note 5). |
| # | U.S. security of foreign issuer. |
| 144A | Securities purchased pursuant to Rule 144A of the Securities Act of 1933, as amended, and may be sold only to dealers in that program or other “qualified institutional buyers.” These securities have been determined to be liquid by the Fund’s adviser under the supervision of the Board of Directors. As of December 31, 2010, the value of these investments was $15,438,059, or 1.9% of total net assets. |
| ^ | Rate shown is the 7-day effective yield at December 31, 2010. |
The accompanying notes are an integral part of these financial statements.
Greenspring Fund, Incorporated
STATEMENT OF ASSETS AND LIABILITIES at December 31, 2010 |
| ASSETS | | | |
| Investments in securities, at value (cost $728,007,197) | | $ | 823,297,388 | |
| Receivables: | | | | |
| Fund shares sold | | | 2,554,972 | |
| Dividends and interest | | | 6,096,395 | |
| Prepaid expenses | | | 38,821 | |
| Total assets | | | 831,987,576 | |
| | | | | |
| LIABILITIES | | | | |
| Payables: | | | | |
| Due to affiliate (Note 5) | | | 490,050 | |
| Securities purchased | | | 77,400 | |
| Fund shares redeemed | | | 447,586 | |
| Accrued expenses | | | 261,871 | |
| Total liabilities | | | 1,276,907 | |
| | | | | |
| NET ASSETS | | $ | 830,710,669 | |
| | | | | |
| Capital shares issued and outstanding (60,000,000 shares authorized, $0.01 par value) | | | 34,334,664 | |
| | | | | |
| Net asset value, offering and redemption price per share | | $ | 24.19 | |
| | | | | |
| COMPONENTS OF NET ASSETS | | | | |
| Capital stock at par value | | $ | 343,345 | |
| Paid-in capital | | | 738,399,149 | |
| Accumulated net investment loss | | | (3,915,693 | ) |
| Undistributed net realized gain on investments | | | 593,677 | |
| Net unrealized appreciation on investments | | | 95,290,191 | |
| NET ASSETS | | $ | 830,710,669 | |
The accompanying notes are an integral part of these financial statements.
Greenspring Fund, Incorporated
STATEMENT OF OPERATIONS For the Year Ended December 31, 2010 |
| INVESTMENT INCOME | | | |
| Income | | | |
| Interest | | $ | 18,808,696 | |
| Dividends (net of foreign withholding taxes of $11,017) | | | 3,984,505 | |
| Total income | | | 22,793,201 | |
| | | | | |
| Expenses | | | | |
| Advisory fees (Note 5) | | | 4,651,052 | |
| Transfer agent fees (Note 6) | | | 694,680 | |
| Administration fees | | | 354,242 | |
| Fund accounting fees | | | 104,519 | |
| Administration fees - Corbyn (Note 5) | | | 95,785 | |
| Custody fees | | | 80,663 | |
| Reports to shareholders | | | 61,585 | |
| Legal fees | | | 57,992 | |
| Blue sky fees | | | 44,123 | |
| Miscellaneous fees | | | 33,551 | |
| Registration fees | | | 28,759 | |
| Audit fees | | | 26,800 | |
| Insurance fees | | | 22,100 | |
| Directors fees | | | 18,750 | |
| Total expenses | | | 6,274,601 | |
| Net investment income | | | 16,518,600 | |
| | | | | |
| REALIZED AND UNREALIZED GAIN ON INVESTMENTS | | | | |
| Net realized gain on investments | | | 10,392,646 | |
| Change in net unrealized appreciation/depreciation on investments | | | 44,738,105 | |
| Net realized and unrealized gain on investments | | | 55,130,751 | |
| Net increase in net assets resulting from operations | | $ | 71,649,351 | |
The accompanying notes are an integral part of these financial statements.
Greenspring Fund, Incorporated
| STATEMENTS OF CHANGES IN NET ASSETS |
| | | Year Ended | | | Year Ended | |
| | | December 31, 2010 | | | December 31, 2009 | |
| INCREASE (DECREASE) IN NET ASSETS FROM: | | | | | | |
| | | | | | | |
| OPERATIONS | | | | | | |
| Net investment income | | $ | 16,518,600 | | | $ | 15,295,581 | |
| Net realized gain on investments | | | 10,392,646 | | | | 4,198,368 | |
| Change in net unrealized appreciation/depreciation on investments | | | 44,738,105 | | | | 47,403,220 | |
| Net increase in net assets resulting from operations | | | 71,649,351 | | | | 66,897,169 | |
| | | | | | | | | |
| DISTRIBUTIONS TO SHAREHOLDERS | | | | | | | | |
| From net investment income | | | (22,581,527 | ) | | | (17,520,873 | ) |
| From net realized gain | | | (5,386,895 | ) | | | (466,637 | ) |
| Total distributions to shareholders | | | (27,968,422 | ) | | �� | (17,987,510 | ) |
| | | | | | | | | |
| CAPITAL SHARE TRANSACTIONS | | | | | | | | |
| Net increase in net assets derived from net change in outstanding shares (a)+ | | | 258,531,954 | | | | 171,393,156 | |
| Total increase in net assets | | | 302,212,883 | | | | 220,302,815 | |
| | | | | | | | | |
| NET ASSETS | | | | | | | | |
| Beginning of year | | | 528,497,786 | | | | 308,194,971 | |
| End of year (including accumulated net investment loss | | | | | | | | |
| of ($3,915,693) and ($1,058,295), respectively) | | $ | 830,710,669 | | | $ | 528,497,786 | |
| (a) | A summary of capital share transactions is as follows: |
| | | Year Ended | | | Year Ended | |
| | | December 31, 2010 | | | December 31, 2009 | |
| | | Shares | | | Value | | | Shares | | | Value | |
| Shares sold | | | 15,468,309 | | | $ | 361,466,064 | | | | 13,178,198 | | | $ | 276,898,159 | |
| Shares issued in reinvestment of distributions | | | 1,166,189 | | | | 27,536,092 | | | | 811,228 | | | | 17,657,563 | |
| Shares redeemed + | | | (5,595,309 | ) | | | (130,470,202 | ) | | | (5,832,422 | ) | | | (123,162,566 | ) |
| Net increase | | | 11,039,189 | | | $ | 258,531,954 | | | | 8,157,004 | | | $ | 171,393,156 | |
| + | Net of redemption fees of $52,507 and $63,422, respectively. |
The accompanying notes are an integral part of these financial statements.
Greenspring Fund, Incorporated
FINANCIAL HIGHLIGHTS For a capital share outstanding throughout each year |
| | | Year Ended December 31, | |
| | | 2010 | | | 2009 | | | 2008 | | | 2007 | | | 2006 | |
| Net asset value, beginning of year | | $ | 22.69 | | | $ | 20.36 | | | $ | 23.59 | | | $ | 23.43 | | | $ | 21.57 | |
| | | | | | | | | | | | | | | | | | | | | |
| INCOME (LOSS) FROM INVESTMENT OPERATIONS: | | | | | | | | | | | | | | | | | | | | |
| Net investment income | | | 0.56 | | | | 0.71 | | | | 0.43 | | | | 0.55 | | | | 0.53 | |
| Net realized and unrealized gain (loss) on investments | | | 1.82 | | | | 2.47 | | | | (3.18 | ) | | | 0.70 | | | | 2.10 | |
| Total from investment operations | | | 2.38 | | | | 3.18 | | | | (2.75 | ) | | | 1.25 | | | | 2.63 | |
| | | | | | | | | | | | | | | | | | | | | |
| LESS DISTRIBUTIONS: | | | | | | | | | | | | | | | | | | | | |
| From net investment income | | | (0.72 | ) | | | (0.83 | ) | | | (0.34 | ) | | | (0.56 | ) | | | (0.58 | ) |
| From net realized gain | | | (0.16 | ) | | | (0.02 | ) | | | (0.16 | ) | | | (0.53 | ) | | | (0.19 | ) |
| Total distributions | | | (0.88 | ) | | | (0.85 | ) | | | (0.50 | ) | | | (1.09 | ) | | | (0.77 | ) |
| Paid-in capital from redemption fees (Note 1) | | | — | * | | | — | * | | | 0.02 | | | | — | * | | | — | * |
| Net asset value, end of year | | $ | 24.19 | | | $ | 22.69 | | | $ | 20.36 | | | $ | 23.59 | | | $ | 23.43 | |
| Total return | | | 10.63 | % | | | 15.83 | % | | | (11.72 | )% | | | 5.32 | % | | | 12.29 | % |
| | | | | | | | | | | | | | | | | | | | | |
| RATIOS/SUPPLEMENTAL DATA: | | | | | | | | | | | | | | | | | | | | |
| Net assets, end of year (millions) | | $ | 830.7 | | | $ | 528.5 | | | $ | 308.2 | | | $ | 257.9 | | | $ | 243.9 | |
| Ratio of expenses to average net assets | | | 0.95 | % | | | 1.03 | % | | | 1.06 | % | | | 1.03 | % | | | 1.07 | % |
| Ratio of net investment income to average net assets | | | 2.51 | % | | | 3.67 | % | | | 2.15 | % | | | 2.24 | % | | | 2.56 | % |
| Portfolio turnover rate | | | 59.99 | % | | | 46.77 | % | | | 47.11 | % | | | 53.75 | % | | | 38.58 | % |
| * | Amount less than $0.01 per share. |
The accompanying notes are an integral part of these financial statements.
Greenspring Fund, Incorporated
NOTES TO FINANCIAL STATEMENTS December 31, 2010 |
Note 1 – Significant Accounting Policies |
Greenspring Fund, Incorporated (the “Fund”) is a diversified, open-end management investment company registered under the Investment Company Act of 1940, as amended (the “1940 Act”). The Fund is organized as a Maryland corporation and commenced operations on July 1, 1983.
The preparation of the financial statements in accordance with accounting principles generally accepted in the United States of America requires management to make estimates and assumptions that affect the reported amounts and disclosures in the financial statements. Actual results could differ from those estimates. In preparing these financial statements, the Fund has evaluated events and transactions for potential recognition or disclosure through the date the financial statements were issued.
Investment transactions and related investment income – Investment transactions are recorded on the trade date. Dividend income is recorded on the ex-dividend date and interest income, including amortization of premiums and accretion of discounts, is recorded on the accrual basis. Dividends determined to be a return of capital are recorded as a reduction of the cost basis of the security. Realized gains and losses from investment transactions are reported on an identified cost basis.
Valuation of investments – Securities listed on a national securities exchange or the NASDAQ National Market are valued at the last reported sale price or the official closing price for certain markets on the exchange of major listing as of the close of the regular session of the New York Stock Exchange.
Securities that are traded principally in the over-the-counter market, listed securities for which no sale was reported on the day of valuation, and listed securities whose primary market is believed by Corbyn Investment Management, Inc. (“Corbyn” or the “Adviser”) to be over-the-counter are valued at the mean of the closing bid and asked prices obtained from sources that the Adviser deems appropriate.
Short-term investments are valued at amortized cost, which approximates fair market value. The value of securities that mature, or have an announced call, within 60 days will be valued at market value.
Securities for which market quotations are not readily available are valued at fair value as determined in good faith by the Adviser as directed by the Fund’s Board of Directors (the “Board”).
In determining fair value, the Adviser, as directed by the Board, considers all relevant qualitative and quantitative information available. These factors are subject to change over time and are reviewed periodically. The values assigned to fair value investments are based on available information and do not necessarily represent amounts that might ultimately be realized, since such amounts depend on future developments inherent in long-term investments. Further, because of the inherent uncertainty of valuation, those estimated values may differ significantly from the values that would have been used had a ready market of the investments existed, and the differences could be material.
The Fund has adopted fair valuation accounting standards that establish an authoritative definition of fair value and set out a hierarchy for measuring fair value. These standards require additional disclosures about the various input and valuation techniques used in measuring fair value. Fair value inputs are summarized in the three broad levels listed below:
Greenspring Fund, Incorporated
NOTES TO FINANCIAL STATEMENTS December 31, 2010 (Con’t) |
| Level 1 – | Unadjusted quoted prices in active markets for identical securities that the Fund has the ability to access. |
| Level 2 – | Observable inputs other than quoted prices included in Level 1 that are observable for the security, either directly or indirectly. These inputs may include quoted prices for the identical instrument on an inactive market, prices for similar instruments, interest rates, prepayment speeds, credit risk, yield curves, default rates and similar data. |
| Level 3 – | Unobservable inputs for the security, to the extent relevant observable inputs are not available, representing the Fund’s own assumptions about the assumptions a market participant would use in valuing the security, and which would be based on the best information available. |
The inputs or methodology used for valuing securities are not necessarily an indication of the risk associated with investing in these securities. The following is a summary of the inputs used to value the Fund’s net assets as of December 31, 2010:
| | | Quoted Prices | | | Significant Other | | | Significant | | | Carrying Value | |
| | | in Active | | | Observable | | | Unobservable | | | at December 31, | |
| | | Markets | | | Inputs | | | Inputs | | | 2010 | |
| | | Level 1 | | | Level 2 | | | Level 3 | | | Total | |
| Common Stocks | | $ | 323,676,234 | | | $ | — | | | $ | — | | | $ | 323,676,234 | |
| Investment Companies | | | 866,088 | | | | — | | | | — | | | | 866,088 | |
| Convertible Bonds | | | — | | | | 134,661,111 | | | | — | | | | 134,661,111 | |
| Corporate Bonds | | | — | | | | 266,542,313 | | | | — | | | | 266,542,313 | |
| Short-Term Investments | | | 97,551,642 | | | | — | | | | — | | | | 97,551,642 | |
| Total | | $ | 422,093,964 | | | $ | 401,203,424 | | | $ | — | | | $ | 823,297,388 | |
See Schedule of Investments for industry breakdown.
Transfers between levels are recognized at the end of the reporting period. During the year ended December 31, 2010, the Fund recognized no significant transfers between valuation levels.
Dividends and distributions to stockholders – The Fund records dividends and distributions to shareholders on the ex-dividend date.
Redemption fees – The Board has adopted policies and procedures with respect to frequent purchases and redemptions of Fund shares by Fund shareholders. The Fund is intended for long-term investors. The Fund discourages and does not accommodate frequent purchases and redemptions of Fund shares by Fund shareholders. The Fund reserves the right to decline a purchase order for any reason.
“Market-timers” who engage in frequent purchases and redemptions over a short period can disrupt the Fund’s investment program by requiring the Fund to have excess cash on hand or to liquidate holdings to accommodate redemptions. In addition, frequent purchases and redemptions may impede efficient Fund management and create additional transaction costs that are borne by all shareholders. To the extent that the Fund invests a significant portion of its assets in small-cap securities or high-yield bonds, it may be subject to the risks of market timing more than a fund that does not. Therefore, the Fund imposes a 2% redemption fee for shares held 60 days or less. The fee is deducted from the seller’s redemption proceeds and deposited into the Fund to help offset brokerage commissions, market impact, and other costs associated with fluctuations in Fund asset levels and cash flow caused by short-term trading. All shareholders are
Greenspring Fund, Incorporated
NOTES TO FINANCIAL STATEMENTS December 31, 2010 (Con’t) |
subject to these restrictions regardless of whether you purchased your shares directly from the Fund or through a financial intermediary. However, the Fund is limited in its ability to determine whether trades placed through financial intermediaries may signal excessive trading. Accordingly, the Fund may not be able to determine whether trading in combined orders or in omnibus accounts is contrary to the Fund’s policies. The Fund reserves the right to reject combined or omnibus orders in whole or in part.
The “first-in, first-out” method is used to determine the holding period. Under this method, the date of redemption will be compared with the earliest purchase date of shares held in the account. If the holding period for shares purchased is 60 days or less, the fee will be charged. The redemption fee may be modified or discontinued at any time, in which case, shareholders will be notified.
In compliance with Rule 22c-2 under the 1940 Act, Quasar Distributors, LLC, on behalf of the Fund, has entered into written agreements with each of the Fund’s financial intermediaries, under which the intermediaries must, upon request, provide the Fund with certain shareholder and identity trading information so that the Fund can enforce its frequent trading policies.
The fee does not apply to shares acquired through the reinvestment of dividends or other distributions, or shares redeemed pursuant to a systematic withdrawal plan or a mandatory IRA distribution.
Risk of loss arising from indemnifications – In the normal course of business, the Fund enters into contracts that contain a variety of representations, which provide general indemnifications. The Fund’s maximum exposure under these arrangements is unknown as this would involve future claims that may be made against the Fund that have not yet occurred. However, based on experience, the Fund expects the risk of loss to be remote.
Note 2 – Dividends and Distributions |
It is the Fund’s policy to declare dividends from net investment income and distributions from net realized gains as determined in accordance with income tax regulations, which may differ from accounting principles generally accepted in the United States of America. Accordingly, periodic reclassifications are made within the portfolio’s capital accounts to reflect income and gains available for distribution under income tax regulations.
On July 14, 2010 an income dividend of $0.29000 per share was declared, payable on July 15, 2010, to shareholders of record on July 13, 2010. Additionally, on December 15, 2010, an income dividend of $0.42852 per share, a short-term capital gain distribution of $0.05455 per share and a long-term capital gain distribution of $0.10816 were declared, payable on December 16, 2010 to shareholders of record on December 14, 2010. The tax character of distributions paid during the years ended December 31, 2010 and 2009 were as follows:
| Distributions paid from: | December 31, 2010 | December 31, 2009 |
| Ordinary income | $24,387,532 | $17,987,510 |
| Long-term capital gain | $ 3,580,890 | $ — |
These dividends are either distributed to shareholders or reinvested in the Fund as additional shares issued to shareholders. For those shareholders reinvesting the dividends, the number of shares issued is based on the net asset value per share as of the close of business on the ex-dividend date.
The Fund designated as long-term capital gain dividend, pursuant to Internal Revenue Code Section 852(b)(3), the amount necessary to reduce the earnings and profits of the Fund related to net capital gain to zero for the tax year ended December 31, 2010.
Greenspring Fund, Incorporated
NOTES TO FINANCIAL STATEMENTS December 31, 2010 (Con’t) |
Note 3 – Purchases and Sales of Investments |
For the year ended December 31, 2010, purchases and sales of investments, other than short-term investments, aggregated $543,146,214 and $336,034,393, respectively.
Note 4 – Federal Income Taxes |
It is the Fund’s policy to comply with the requirements of the Internal Revenue Code applicable to regulated investment companies. Accordingly, the Fund intends to distribute substantially all of its taxable income. Therefore, no federal income tax provision is required.
As of and during the year ended December 31, 2010, the Fund did not have any tax positions that did not meet the “more-likely-than-not” threshold of being sustained by the applicable tax authority. Tax positions not deemed to meet the “more-likely-than-not” threshold would be recorded as a tax benefit or expense in the current year. Generally, tax authorities can examine tax returns filed for all open tax years (2007-2010).
Required Fund distributions are based on income and capital gain amounts determined in accordance with federal income tax regulations, which differ from net investment income and realized gains recognized for financial reporting purposes.
Accordingly, the composition of net assets and distributions on a tax basis may differ from those reflected in the accompanying financial statements. As of December 31, 2010, the components of accumulated earnings (losses) for income tax purposes were as follows:
| Cost of investments | | $ | 732,092,701 | |
| Gross tax unrealized appreciation | | | 97,317,800 | |
| Gross tax unrealized depreciation | | | (6,113,113 | ) |
| Net tax unrealized appreciation | | | 91,204,687 | |
| Undistributed ordinary income | | | 169,811 | |
| Undistributed long-term capital gain | | | 593,677 | |
| Total distributable earnings | | | 763,488 | |
| Other accumulated gains/(losses) | | | — | |
| Total accumulated earnings/(losses) | | $ | 91,968,175 | |
Accounting principles generally accepted in the United States of America require that certain components of net assets relating to permanent differences be reclassified between financial and tax reporting. These reclassifications have no effect on net assets or net asset value per share. For the year ended December 31, 2010, the Fund decreased accumulated net investment loss by $3,205,529 and decreased undistributed net realized gain on investments by $3,205,529.
As of December 31, 2010, the Fund had utilized its capital loss carryforward of $463,089.
Greenspring Fund, Incorporated
NOTES TO FINANCIAL STATEMENTS December 31, 2010 (Con’t) |
Note 5 – Transactions with Affiliated Parties |
Corbyn serves as the Fund’s investment adviser. Under an agreement between the Fund and Corbyn, the Fund pays Corbyn a fee of 0.75% of the first $250 million of average daily net assets, 0.70% of average daily net assets between $250 million and $500 million and 0.65% of average daily net assets in excess of $500 million, which is computed daily and paid monthly. For the year ended December 31, 2010, the Fund incurred $4,651,052 in advisory fees.
The Fund has also entered into a Services Agreement with Corbyn to provide various administrative services. As compensation, the Fund pays Corbyn a fee of $2,500 per month plus 0.01% of average daily net assets, which is computed daily and paid monthly. For the year ended December 31, 2010, the Fund incurred $95,785 in administrative fees to Corbyn.
At December 31, 2010, investors for whom Corbyn was investment adviser held 807,475 shares of the Fund.
A company is considered to be an affiliate of the Fund under the 1940 Act if the Fund’s holdings of that company represent 5% or more of the outstanding voting securities of the company. Transactions with companies that are or were affiliates during the year ended December 31, 2010 are as follows:
| | Beginning | Purchase | Sales | Ending | Dividend | | |
| Issuer | Cost | Cost | Cost | Cost | Income | Shares | Value |
| Michael Baker Corp. | $7,704,447 | $8,501,220 | $ — | $16,205,667 | $ — | 638,455 | $19,855,951 |
| Note 6 – Shareholder Servicing Fees |
Both the Fund and Corbyn have entered into various Shareholder Servicing Agreements, whereby a fee is paid to certain service agents who administer omnibus accounts for indirect shareholders of the Fund. The Board of Directors has authorized the Fund to pay the amount of the fees it estimates the Fund would have been charged by its transfer agent for administering the accounts on an individual basis. The amount is included in “Transfer agent fees” on the accompanying Statement of Operations. For the year ended December 31, 2010, the Fund incurred $607,125 of such fees.
| Note 7 – New Accounting Pronouncement |
On January 21, 2010, the Financial Accounting Standards Board issued an Accounting Standards Update, Fair Value Measurements and Disclosures (Topic 820): Improving Disclosures about Fair Value Measurements, which provides guidance on how investment securities are to be valued and disclosed. Specifically, the amendment requires reporting entities to disclose purchases, sales, issuances and settlements on a gross basis in the Level 3 rollforward rather than as one net number. The effective date of the amendment is for interim and annual periods beginning after December 15, 2010. At this time, the Fund is evaluating the implications of the update and the impact to the financial statements.
Greenspring Fund, Incorporated
NOTES TO FINANCIAL STATEMENTS December 31, 2010 (Con’t) |
| Note 8 – Regulated Investment Company Modernization Act |
On December 22, 2010, the Regulated Investment Company Modernization Act of 2010 (the “Modernization Act”) was signed by the President. The Modernization Act is the first major piece of legislation affecting Regulated Investment Companies (“RICs”) since 1986 and it modernizes several of the federal income and excise tax provisions related to RICs. Some highlights of the enacted provisions are as follows:
New capital losses may now be carried forward indefinitely, and retain the character of the original loss. Under pre-enactment law, capital losses could be carried forward for eight years, and carried forward as short-term capital, irrespective of the character of the original loss.
The Modernization Act contains simplification provisions, which are aimed at preventing disqualification of a RIC for “inadvertent” failures of the asset diversification and/or qualifying income tests. Additionally, the Modernization Act exempts RICs from the preferential dividend rule, and repealed the 60-day designation requirement for certain types of pay-through income and gains.
Finally, the Modernization Act contains several provisions aimed at preserving the character of distributions made by a fiscal year RIC during the portion of its taxable year ending after October 31 or December 31, reducing the circumstances under which a RIC might be required to file amended Forms 1099 to restate previously reported distributions.
Except for the simplification provisions related to RIC qualification, the Modernization Act is effective for taxable years beginning after December 22, 2010. The provisions related to RIC qualification are effective for taxable years for which the extended due date of the tax return is after December 22, 2010.
Greenspring Fund, Incorporated
REPORT OF INDEPENDENT REGISTERED PUBLIC ACCOUNTING FIRM
Board of Directors and Shareholders
Greenspring Fund, Incorporated
Lutherville, Maryland
We have audited the accompanying statement of assets and liabilities of the Greenspring Fund, Incorporated (the “Fund”), including the schedule of investments, as of December 31, 2010, and the related statement of operations for the year then ended, the statements of changes in net assets for each of the two years in the period then ended, and financial highlights for each of the five years in the period then ended. These financial statements and financial highlights are the responsibility of the Fund’s management. Our responsibility is to express an opinion on these financial statements and financial highlights based on our audits.
We conducted our audits in accordance with the standards of the Public Company Accounting Oversight Board (United States). Those standards require that we plan and perform the audit to obtain reasonable assurance about whether the financial statements and financial highlights are free of material misstatement. The Fund is not required to have, nor were we engaged to perform, an audit of its internal control over financial reporting. Our audits included consideration of internal control over financial reporting as a basis for designing audit procedures that are appropriate in the circumstances, but not for the purpose of expressing an opinion on the effectiveness of the Fund’s internal control over financial reporting. Accordingly, we express no such opinion. An audit includes examining, on a test basis, evidence supporting the amounts and disclosures in the financial statements. Our procedures included confirmation of securities owned as of December 31, 2010, by correspondence with the custodian and brokers or by other appropriate auditing procedures where replies from brokers were not received. An audit also includes assessing the accounting principles used and significant estimates made by management, as well as evaluating the overall financial statement presentation. We believe that our audits provide a reasonable basis for our opinion.
In our opinion, the financial statements and financial highlights referred to above present fairly, in all material respects, the financial position of the Greenspring Fund, Incorporated as of December 31, 2010, the results of its operations for the year then ended, the changes in its net assets for each of the two years in the period then ended, and the financial highlights for each of the five years in the period then ended, in conformity with accounting principles generally accepted in the United States of America.
Philadelphia, Pennsylvania
February 16, 2011
Greenspring Fund, Incorporated
NOTICE TO SHAREHOLDERS December 31, 2010 (Unaudited) |
Tax Information
The Fund designates 14.20% of dividends declared from net investment income during the fiscal year ended December 31, 2010 as qualified income under the Jobs and Growth Tax Relief Reconciliation Act of 2003.
For corporate shareholders in the Fund, the percentage of ordinary dividend income distributed for the year ended December 31, 2010, which is designated as qualifying for the dividends-received deduction, is 13.91%.
For foreign shareholders in the Fund, for the year ended December 31, 2010, 61.00% of the ordinary distributions paid qualify as interest-related dividends under the Internal Revenue Code Section 871(k)(1)(c), and 7.07% of the ordinary income distributions are designated as short-term capital gain distributions under Internal Revenue Code Section 871(k)(2)(c).
Proxy Voting Policies and Proxy Voting Record
The Fund’s proxy voting policies and procedures, as well as its proxy voting record for the most recent 12-month period ended June 30, are available without charge, upon request, by contacting the Fund at (800) 366-3863 or greenspring@greenspringfund.com. The Fund will send the information within three business days of receipt of the request, by first class mail or other means designed to ensure equally prompt delivery. The Fund’s proxy voting record is also available on the U.S. Securities and Exchange Commission’s website at www.sec.gov.
Form N-Q Holdings Information
The Fund files its complete schedule of portfolio holdings with the U.S. Securities and Exchange Commission for the first and third quarters of each fiscal year on Form N-Q. The Fund’s Forms N-Q are available on the Commission’s website at www.sec.gov and may be reviewed and copied at the Commission’s Public Reference Room in Washington, DC. Information on the operation of the Public Reference Room may be obtained by calling (800) SEC-0330.
Reports and Householding
In an attempt to reduce shareholder expenses, we will mail only one copy of the Fund’s Prospectus and each Annual and Semi-Annual Report to those addresses shared by two or more accounts. If you wish to receive individual copies of these documents, please call us at (800) 366-3863. We will begin sending you individual copies 30 days after receiving your request.
The Fund’s Prospectus, Statement of Additional Information, Annual Report, and Semi-Annual Report along with its first and third quarter portfolio holdings, are available on the Fund’s website at www.greenspringfund.com.
Greenspring Fund, Incorporated
BASIC INFORMATION ABOUT FUND DIRECTORS AND OFFICERS (Unaudited) |
The Board of Directors supervises the management of the Fund. The following list summarizes information on the directors and officers of the Fund for the past five years. The address of each is 2330 West Joppa Road, Suite 110, Lutherville, MD 21093. The Fund’s Statement of Additional Information contains additional information about Fund directors and is available, without charge, upon request, by calling the Fund at (800) 366-3863, or by emailing the Fund at greenspring@greenspringfund.com.
| | | | | Number | |
| | Position(s) Held | Term of Office and | Principal Occupation(s) | of Funds | Other |
| Name and Age | with the Fund | Length of Time Served | During the Past Five Years | Overseen | Directorships |
| | | Term of Director | | | |
| | | Indefinite | | | |
| | | Term of Officer | | | |
| | | One year | | | |
| | | | | | |
| Interested | | | | | |
| Directors/Officers | | | | | |
| Charles vK. Carlson | President | From March 1993 to present. | President and Director of the | One | None |
| 51 | Chairman of the Board | From January 1994 to present. | Fund’s Adviser. | | |
| | Chief Executive Officer | From February 1994 to present. | | | |
| | Director | From March 1987 to present. | | | |
| | | | | | |
| William E. Carlson | Director | From February 1994 to present. | President of Shapiro Sher Guinot | One | None |
| 53 | | | & Sandler (a law firm) from | | |
| | | | February 1999 to present. Partner | | |
| | | | of Shapiro Sher Guinot & Sandler | | |
| | | | from February 1990 to present. | | |
| | | | | | |
| Michael J. Fusting | Sr. Vice President | From May 1998 to present. | Sr. Vice President and Director | One | None |
| 49 | Chief Financial Officer | From February 1994 to present. | of the Fund’s Adviser. | | |
| | Director | From March 1992 to present. | | | |
| | | | | | |
| Richard Hynson, Jr. | Director | From March 1985 to present. | Sr. Vice President of the Fund’s | One | None |
| 66 | | | Adviser. | | |
| | | | | | |
| Disinterested Directors | | | | | |
| David T. Fu | Director | From May 1990 to present. | Managing Director of Kanturk | One | None |
| 54 | | | Partners, LLC (a merchant bank) | | |
| | | | from February 2004 to present. | | |
| | | | | | |
| Sean T. Furlong | Director | From March 2003 to present. | Director of Finance and | One | None |
| 45 | | | Administration at the Gilman | | |
| | | | School from June 2003 to present. | | |
Greenspring Fund, Incorporated
BASIC INFORMATION ABOUT FUND DIRECTORS AND OFFICERS (Unaudited) (Con’t) |
| | | | | Number | |
| | Position(s) Held | Term of Office and | Principal Occupation(s) | of Funds | Other |
| Name and Age | with the Fund | Length of Time Served | During the Past Five Years | Overseen | Directorships |
| | | Term of Director | | | |
| | | Indefinite | | | |
| | | Term of Officer | | | |
| | | One year | | | |
| | | | | | |
| Michael P. O’Boyle | Director | From July 2000 to present. | President of UnitedHealth | One | None |
| 54 | | | Networks, a division of United | | |
| | | | Healthcare (a managed health | | |
| | | | care company) from May 2008 | | |
| | | | to present. Chief Operating | | |
| | | | Officer of The Cleveland Clinic | | |
| | | | Foundation (world-renowned | | |
| | | | non-profit provider of health care | | |
| | | | services, education and research) | | |
| | | | and The Cleveland Clinic Health | | |
| | | | System from July 2005 to March | | |
| | | | 2008. | | |
| | | | | | |
| Officers | | | | | |
| Elizabeth Agresta Swam | Secretary and Treasurer | From May 1998 to present. | Employee of the Fund’s Adviser | | None |
| 43 | AML Officer | From July 2002 to present. | from May 1998 to present. | | |
| | Chief Compliance Officer | From July 2004 to present. | | | |
Greenspring Fund, Incorporated
Performance Since Inception on
July 1, 1983 through December 31, 2010
(Unaudited)
| |
| HOW $10,000 INVESTED ON 7/1/83 WOULD HAVE GROWN* |
| |
 |
| |
| * | Figures include changes in principal value, reinvested dividends and capital gains distributions. Past expense limitations increased the Fund's return. This chart illustrates the performance of a hypothetical $10,000 investment made in the Fund since inception through December 31, 2010. The total value of $144,136 assumes the reinvestment of dividends and capital gains, but does not reflect the effect of any redemption fees. This chart does not imply any future performance. |
Average annual total returns for the one, three, five and ten year periods ended December 31, 2010 were 10.63%, 4.20%, 5.99% and 7.75%, respectively. Average annual returns for more than one year assume a compounded rate of return and are not the Fund's year-by-year results, which fluctuated over the periods shown. Returns do not reflect taxes that shareholders may pay on Fund distributions or redemption of Fund shares.
(This Page Intentionally Left Blank.)
Greenspring Fund, Incorporated
Privacy Policy
The Greenspring Fund recognizes that individuals expect an exceptional level of privacy in their financial affairs. The Fund assures the confidentiality of personal information provided to it.
The information we collect is limited to what the Fund believes is necessary or useful to conduct our business; administer your records, accounts and funds; to comply with laws and regulations; and to help us design or improve products and services. The Fund collects non-public personal information about you from information it receives from you on applications or other forms or through its website, as well as from information about your transactions with the Fund.
Some of this information may be disclosed to the Fund’s investment adviser, but not for marketing solicitation, as well as non-affiliated third parties who provide non-financial services to the Fund such as our Transfer Agent, in order to administer customer accounts and mail transaction confirmations and tax forms, and the mailing house the Fund utilizes for mailing shareholder reports. Such information may also be disclosed to a non-affiliated third party engaged to provide fund accounting and administrative services to us. Disclosing this information enables us to meet customers’ financial needs and regulatory requirements. These third parties act on its behalf and are obligated to keep the information we provide to them confidential and to use the information only for the purposes authorized. The Fund does not disclose any non-public personal information about you or former customers to anyone, except as permitted by law.
To protect your non-public personal information, the Fund permits access to it only by authorized employees and maintains security practices to safeguard your information.
If you have any questions regarding our Privacy Policy, please contact us at 1-800-366-3863 or greenspring@greenspringfund.com. Thank you.
Greenspring Fund, Incorporated
2330 West Joppa Road, Suite 110
Lutherville, MD 21093
(410) 823-5353
(800) 366-3863
www.greenspringfund.com
DIRECTORS
Charles vK. Carlson, Chairman
William E. Carlson
David T. Fu
Sean T. Furlong
Michael J. Fusting
Richard Hynson, Jr.
Michael P. O’Boyle
OFFICERS
Charles vK. Carlson
President and Chief Executive Officer
Michael J. Fusting
Sr. Vice President and
Chief Financial Officer
Elizabeth Agresta Swam
Chief Compliance Officer,
Secretary, Treasurer
and AML Officer
INVESTMENT ADVISER
Corbyn Investment Management, Inc.
2330 West Joppa Road, Suite 108
Lutherville, MD 21093-7207
ADMINISTRATOR, FUND ACCOUNTANT
AND TRANSFER AGENT
U.S. Bancorp Fund Services, LLC
615 East Michigan Street
Milwaukee, WI 53202
DISTRIBUTOR
Quasar Distributors, LLC
615 East Michigan Street
Milwaukee, WI 53202
CUSTODIAN
U.S. Bank, N.A.
1555 N. RiverCenter Dr., Suite 302
Milwaukee, WI 53212
INDEPENDENT REGISTERED
PUBLIC ACCOUNTING FIRM
Tait, Weller & Baker LLP
1818 Market Street, Suite 2400
Philadelphia, PA 19103
LEGAL COUNSEL
K&L Gates LLP
1601 K Street NW
Washington, DC 20006
Symbol – GRSPX
CUSIP – 395724107
Item 2. Code of Ethics.
The registrant has adopted a code of ethics that applies to the registrant’s principal executive officer and principal financial officer. The registrant has not made any amendments to its code of ethics during the period covered by this report. The registrant has not granted any waivers from any provisions of the code of ethics during the period covered by this report.
A copy of the registrant’s Code of Ethics is filed herewith.
Item 3. Audit Committee Financial Expert.
The registrant’s board of directors has determined that there is at least one audit committee financial expert serving on its audit committee. Mr. Sean T. Furlong is the “audit committee financial expert” and is considered to be “independent” as each term is defined in Item 3 of Form N-CSR.
Item 4. Principal Accountant Fees and Services.
The registrant has engaged its principal accountant to perform audit services, audit-related services, tax services or other services during the past two fiscal years. “Audit services” refer to performing an audit of the registrant's annual financial statements or services that are normally provided by the accountant in connection with statutory and regulatory filings or engagements for those fiscal years. “Audit-related services” refer to the assurance and related services by the principal accountant that are reasonably related to the performance of the audit. “Tax services” refer to professional services rendered by the principal accountant for tax compliance, tax advice, and tax planning. There were no “other services” provided by the principal accountant. The following table details the aggregate fees billed, or expected to be billed, for each of the last two fiscal years for audit fees, audit-related fees, tax fees or other fees by the principal accountant:
| | FYE 12/31/2010 | FYE 12/31/2009 |
| Audit Fees | $23,700 | $23,000 |
| Audit-Related Fees | N/A | N/A |
| Tax Fees | $3,100 | $3,000 |
| All Other Fees | N/A | N/A |
The audit committee has adopted pre-approval policies and procedures that require the audit committee to pre-approve all audit and non-audit services of the registrant, including services provided to any entity affiliated with the registrant. All of the principal accountant’s hours spent on auditing the registrant’s financial statements were attributed to work performed by full-time permanent employees of the principal accountant.
The percentage of fees billed by Tait, Weller & Baker LLP applicable to non-audit services pursuant to waiver of pre-approval requirement were as follows:
| | FYE 12/31/2010 | FYE 12/31/2009 |
| Audit-Related Fees | 0% | |
| Tax Fees | | |
| All Other Fees | | |
The following table indicates the non-audit fees billed, or expected to be billed, by the registrant’s accountant for services to the registrant and to the registrant’s investment adviser for the last two years. The audit committee of the board of directors has considered whether the provision of non-audit services that were rendered to the registrant's investment adviser is compatible with maintaining the principal accountant's independence and has concluded that the provision of such non-audit services by the accountant has not compromised the accountant’s independence.
| Non-Audit Related Fees | FYE 12/31/2010 | FYE 12/31/2009 |
| Registrant | N/A | N/A |
| Registrant’s Investment Adviser | N/A | N/A |
Item 5. Audit Committee of Listed Registrants.
Not applicable to registrants who are not listed issuers (as defined in Rule 10A-3 under the Securities Exchange Act of 1934).
Item 6. Investments.
Schedule of Investments is included as part of the report to shareholders filed under Item 1 of this Form.
Item 7. Disclosure of Proxy Voting Policies and Procedures for Closed-End Management Investment Companies.
Not applicable to open-end investment companies.
Item 8. Portfolio Managers of Closed-End Management Investment Companies.
Not applicable to open-end investment companies.
Item 9. Purchases of Equity Securities by Closed-End Management Investment Company and Affiliated Purchasers.
Not applicable to open-end investment companies.
Item 10. Submission of Matters to a Vote of Security Holders.
Not Applicable.
Item 11. Controls and Procedures.
| (a) | The Registrant’s Chief Executive Officer and Chief Financial Officer have reviewed the Registrant's disclosure controls and procedures (as defined in Rule 30a-3(c) under the Investment Company Act of 1940 (the “Act”)) as of a date within 90 days of the filing of this report, as required by Rule 30a-3(b) under the Act and Rules 13a-15(b) or 15d-15(b) under the Securities Exchange Act of 1934. Based on their review, such officers have concluded that the disclosure controls and procedures are effective in ensuring that information required to be disclosed in this report is appropriately recorded, processed, summarized and reported and made known to them by others within the Registrant and by the Registrant’s service provider. |
| (b) | There were no changes in the Registrant's internal control over financial reporting (as defined in Rule 30a-3(d) under the Act) that occurred during the second fiscal quarter of the period covered by this report that has materially affected, or is reasonably likely to materially affect, the Registrant's internal control over financial reporting. |
Item 12. Exhibits.
| (a) | (1) Any code of ethics or amendment thereto, that is the subject of the disclosure required by Item 2, to the extent that the registrant intends to satisfy Item 2 requirements through filing an exhibit. Filed herewith. |
(2) A separate certification for each principal executive and principal financial officer pursuant to Section 302 of the Sarbanes-Oxley Act of 2002. Filed herewith.
(3) Any written solicitation to purchase securities under Rule 23c-1 under the Act sent or given during the period covered by the report by or on behalf of the registrant to 10 or more persons. Not applicable to open-end investment companies.
| (b) | Certifications pursuant to Section 906 of the Sarbanes-Oxley Act of 2002. Furnished herewith. |
SIGNATURES
Pursuant to the requirements of the Securities Exchange Act of 1934 and the Investment Company Act of 1940, the registrant has duly caused this report to be signed on its behalf by the undersigned, thereunto duly authorized.
(Registrant) Greenspring Fund, Incorporated
By (Signature and Title)* /s/ Charles vK. Carlson
Charles vK. Carlson, Chief Executive Officer
Date March 3, 2011
Pursuant to the requirements of the Securities Exchange Act of 1934 and the Investment Company Act of 1940, this report has been signed below by the following persons on behalf of the registrant and in the capacities and on the dates indicated.
By (Signature and Title)* /s/ Charles vK. Carlson
Charles vK. Carlson, Chief Executive Officer
Date March 3, 2011
By (Signature and Title)* /s/ Michael J. Fusting
Michael J. Fusting, Chief Financial Officer
Date March 3, 2011
* Print the name and title of each signing officer under his or her signature.